UNITED STATES
SECURITIES AND EXCHANGE COMMISSION
Washington, D.C. 20549
Form N-CSR
CERTIFIED SHAREHOLDER REPORT OF
REGISTERED MANAGEMENT INVESTMENT COMPANIES
Investment Company Act file number: 811-05629
Voya Investors Trust
(Exact name of registrant as specified in charter)
| 7337 East Doubletree Ranch Road, Suite 100, Scottsdale, AZ | 85258 |
| (Address of principal executive offices) | (Zip code) |
CT Corporation System, 101 Federal Street, Boston, MA 02110
(Name and address of agent for service)
Registrant’s telephone number, including area code: 1-800-366-0066
Date of fiscal year end: December 31
Date of reporting period: December 31, 2020
Item 1. Reports to Stockholders.
The following is a copy of the report transmitted to stockholders pursuant to Rule 30e-1 under the Act (17 CFR 270.30e-1):
Annual Report
December 31, 2020
Classes ADV, I, R6, S and S2
Voya Investors Trust | | ■ | VY® Morgan Stanley Global Franchise Portfolio |
| ■ | | Voya Government Liquid Assets Portfolio | | ■ | VY® T. Rowe Price Capital Appreciation Portfolio |
| ■ | | VY® Clarion Global Real Estate Portfolio | | ■ | VY® T. Rowe Price Equity Income Portfolio |
| ■ | | VY® Invesco Growth and Income Portfolio | | ■ | VY® T. Rowe Price International Stock Portfolio |
| ■ | | VY® JPMorgan Emerging Markets Equity Portfolio | | | |
As permitted by regulations adopted by the U.S. Securities and Exchange Commission, paper copies of each Portfolio’s annual and semi-annual shareholder reports, like this annual report, are not sent by mail, unless you specifically request paper copies of the reports. Instead, the reports will be made available on a website and you will be notified by mail each time a report is posted and provided with a website link to access the report.
If you already elected to receive shareholder reports electronically, you need not take any action. You may elect to receive shareholder reports and other communications from your insurance carrier electronically by contacting them directly.
You may elect to receive all future reports in paper free of charge. If you received this document in the mail, please follow the instructions provided to elect to continue receiving paper copies of your shareholder reports. You can inform us that you wish to continue receiving paper copies by calling 1-800-283-3427. Your election to receive reports in paper will apply to all the funds in which you invest. |
| This report is submitted for general information to shareholders of the Voya mutual funds. It is not authorized for distribution to prospective shareholders unless accompanied or preceded by a prospectus which includes details regarding the funds’ investment objectives, risks, charges, expenses and other information. This information should be read carefully. |
INVESTMENT MANAGEMENT
voyainvestments.com |  |
TABLE OF CONTENTS
| | 1 | |
| | 3 | |
| | 19 | |
| | 21 | |
| | 22 | |
| | 26 | |
| | 28 | |
| | 32 | |
| | 37 | |
| | 56 | |
| | 93 | |
| | 95 | |
| | 99 | |
PROXY VOTING INFORMATION
A description of the policies and procedures that the Portfolios use to determine how to vote proxies related to portfolio securities is available: (1) without charge, upon request, by calling Shareholder Services toll-free at (800) 992-0180; (2) on the Portfolios’ website at www.voyainvestments.com; and (3) on the U.S. Securities and Exchange Commission’s (“SEC’s”) website at www.sec.gov. Information regarding how the Portfolios voted proxies related to portfolio securities during the most recent 12-month year ended June 30 is available without charge on the Portfolios’ website at www.voyainvestments.com and on the SEC’s website at www.sec.gov.
QUARTERLY PORTFOLIO HOLDINGS
The Portfolios file their complete schedule of portfolio holdings with the SEC for the first and third quarters of each fiscal year on Form NPORT-P. This report contains a summary portfolio of investments for the Portfolios. The Portfolios’ Forms NPORT-P are available on the SEC’s website at www.sec.gov. Each Portfolio’s complete schedule of portfolio holdings is available at: www.voyainvestments.com and without charge upon request from the Portfolio by calling Shareholder Services toll-free at (800) 992-0180. Voya Government Liquid Assets Portfolio does not file on Form N-PORT.
The Voya Government Liquid Assets Portfolio files its complete schedule of portfolio holdings with the SEC monthly on Form N-MFP. The Portfolio’s Form N-MFP is available on the SEC’s website at www.sec.gov or the monthly schedule of portfolio holdings are also available at: www.voyainvestments.com and without charge upon request from the Portfolio by calling Shareholder Services toll-free at (800) 992-0180.
(THIS PAGE INTENTIONALLY LEFT BLANK)
 Beyond the Headlines, a Glimpse of Global Economic Recovery
Dear Shareholder,
For those of us hoping that 2021 would bring more encouraging headlines, it has been a rough start to the year: political turmoil, surging COVID-19 cases and a new, more virulent strain of the coronavirus. On the surface, economic news also has seemed disappointing: labor markets have cooled, manufacturing and services activity has slowed and consumer sentiment has dropped. Yet, the financial markets continue to march higher, begging the question: Where are the markets getting their news?
Voya investment strategists have written about the uneven pressures that have created a “two-speed” or “K-shaped” economic recovery. Consumers on the higher end of the income distribution have largely kept their jobs and adapted to the pandemic by working from home. By contrast, jobs in lower paying segments of the labor market such as leisure, lodging and retail have been eliminated or furloughed and have yet to return. For lower income consumers, the good news is that the fiscal response to help offset job losses has been enormous — and fiscal relief is expected to grow under a Democratic-controlled government. The initial rollout of the coronavirus vaccines, while slower than many had hoped, still represents a significant milestone as vaccines are the bridge that are expected to allow the economy to reopen fully.
In addition to fiscal support, the response from central banks has been extraordinary. The U.S. Federal Reserve Board (“Fed”) has adjusted its policy framework in ways that make the Fed more likely to remain accommodative longer than might otherwise be expected during economic recovery phases, a game changer for financial assets. We believe that analogous developments across the world should help reignite global economic growth in 2021 and breathe new life into struggling sectors. Despite today’s negative headlines, the data is telling us that the future is likely to be better. Looking broadly at the economic picture, in our opinion, it appears that a global synchronous expansion is underway.
Of course there are still risks, and we believe that one should not overlook the potential for episodic market stresses connected to the vaccine rollout or other global factors. As always, we glimpse the future “through a glass darkly,” and must allow for contingencies we can’t foresee. For this reason, we maintain that staying fully invested and broadly diversified is the most likely way to achieve one’s long-term investment goals. Should your goals change, discuss them thoroughly with your investment advisor before making any changes to your portfolio.
We remain humble and realistic in the face of the challenges ahead, but well prepared for and fully committed to serving our clients without disruption. We appreciate your continued confidence in us, and we look forward to serving your investment needs in the future.
Dina Santoro
President
Voya Family of Funds
January 22, 2021
The views expressed in the President’s Letter reflect those of the President as of the date of the letter. Any such views are subject to change at any time based upon market or other conditions and the Voya mutual funds disclaim any responsibility to update such views. These views may not be relied on as investment advice and because investment decisions for a Voya mutual fund are based on numerous factors, may not be relied on as an indication of investment intent on behalf of any Voya mutual fund. Reference to specific company securities should not be construed as recommendations or investment advice.
International investing poses special risks including currency fluctuation, economic and political risks not found in investments that are solely domestic.
1
BENCHMARK DESCRIPTIONS
| Index | | Description |
|---|
| Bloomberg Barclays U.S. Aggregate Bond Index | | An index of publicly issued investment grade U.S. government, mortgage-backed, asset-backed and corporate debt securities. |
| Bloomberg Barclays U.S. Government/Credit Index | | An index made up of the Barclays Government and Credit indices, including securities issued by the U.S. government and its agencies and publicly issued U.S. corporate and foreign debentures and secured notes that meet specified maturity, liquidity and quality requirements. |
| FTSE EPRA Nareit Developed Index | | The index is designed to track the performance of listed real estate companies and real-estate investment trusts (REITs) worldwide. Relevant activities are defined as the ownership, disposal and development of income-producing real estate. Constituents are classified into distinct property sectors based on gross invested book assets, as disclosed in the latest published financial statement. Index constituents are free-float adjusted, liquidity, size and revenue screened. |
| iMoneyNet Government Institutional Index | | The average return for a category of money market funds that includes all government institutional funds: Treasury Institutional, Treasury and Repo Institutional and Government and Agencies Institutional. |
MSCI All Country World (ex-US) IndexSM | | A free float-adjusted market capitalization index that is designed to measure equity market performance in global developed and emerging markets, excluding the U.S. It includes the reinvestment of dividends net of withholding taxes, but does not reflect fees, brokerage commissions or other expenses of investing. |
MSCI Emerging Markets IndexSM | | An index that measures the performance of securities listed on exchanges in developing nations throughout the world. It includes the reinvestment of dividends and distributions net of withholding taxes, but does not reflect fees, brokerage commissions or other expenses of investing. |
MSCI World IndexSM | | An index that measures the performance of over 1,600 securities listed on exchanges in the U.S., Europe, Canada, Australia, New Zealand and the Far East. |
| Russell 1000® Value Index | | An index that measures the performance of those Russell 1000® securities with lower price-to-book ratios and lower forecasted growth values. |
| S&P 500® Index | | An index that measures the performance of securities of approximately 500 large-capitalization companies whose securities are traded on major U.S. stock markets. |
2
PORTFOLIO MANAGERS’ REPORT | VOYA GOVERNMENT LIQUID ASSETS PORTFOLIO
|
Voya Government Liquid Assets Portfolio (the “Portfolio”) seeks a high level of current income consistent with the preservation of capital and liquidity. The Portfolio is managed by David S. Yealy, Portfolio Manager of Voya Investment Management Co. LLC (“Voya IM”) — the Sub-Adviser.
Performance*: For the year ended December 31, 2020, the Portfolio’s Class S shares provided a total return of 0.24% compared to the iMoneyNet Government Institutional Index, which returned 0.31% for the same period.
The Portfolio has waived fees in order to maintain a zero or positive yield, as have other money market funds. The Portfolio was able to realize some capital gains by primarily buying longer-term new issue T-Bills, and selling them after yields declined to market levels over time. These gains were distributed to the shareholders and allowed the Portfolio to increase the total return over the yield of the fund. The Portfolio continued to maintain an exposure to floating rate money market securities, shifting out of floaters tied to 3-month London inter-bank offered rate (“LIBOR”) or 1-month LIBOR, and into floaters tied to 1-day secured overnight financing rate (“SOFR”), as the market prepares for LIBOR to be replaced by SOFR.
Portfolio Specifics: The year ended December 31, 2020, can be summed up by the COVID-19 pandemic and the Federal Open Market Committee (“FOMC”), the U.S. Federal Reserve Board (the “Fed”), the U.S. Treasury and U.S. government’s response to the impact that the coronavirus had on the markets and the economy. On March 3, prior to their regularly scheduled meeting on March 15, the FOMC lowered the federal funds rate by 0.50% to a range of 1.00% to 1.25%. They took that action in light of the risks posed to economic activity by the coronavirus despite the current strong economy and low level of unemployment. The FOMC again lowered the federal funds rate another 1% at the March 15 meeting, lowering it to a range of 0% to 0.25%. The FOMC indicated that global financial conditions had been significantly affected by the coronavirus. In addition, the Fed also agreed to purchase $500 billion of U.S. Treasury securities and $200 billion of mortgage-backed securities (“MBS”), and expand overnight and term repurchase agreement operations. The Fed and U.S. Treasury were forced to institute various programs in order to stabilize the markets, provide liquidity and support the smooth operations of the various markets. The U.S. government instituted a stimulus program to lessen the impact from the coronavirus on the U.S. economy. The federal funds rate has remained at the 0% to 0.25% range, and the Fed continues to purchase U.S. Treasury securities and MBS, as well as reinvest maturities and paydowns on a monthly basis as the coronavirus continued to have a major impact on the U.S. economy and global economies. Money market rates of securities purchased by the Portfolio as well as other money market funds declined in direct response to the FOMC actions.
Top Ten Holdings
as of December 31, 2020
(as a percentage of net assets) |
| United States Treasury Bill, 0.070%, 01/28/21 | | 26.9 | % |
| United States Cash Management Bill, 0.080%, 03/30/21 | | 14.0 | % |
| Fannie Mae, 0.210%, 03/16/21 | | 11.1 | % |
| Deutsche Bank Repurchase Agreement dated 12/31/2020, 0.070%, due 1/4/2021, $81,392,633 to be received upon repurchase (Collateralized by $83,044,000, Bill, 0.00%, Market Value plus accrued interest $83,019,938 due 2/9/2021-8/12/2021) | | 8.4 | % |
Deutsche Bank Repurchase Agreement dated 12/31/2020, 0.070%, due 1/4/2021, $55,000,428 to be received upon repurchase (Collateralized by $53,311,300, Note, 2.125-2.875%, Market Value plus accrued interest $56,100,064 due 5/31/21-
11/30/2023) | | 5.7 | % |
| United States Treasury Bill, 0.070%, 02/09/21 | | 5.5 | % |
| Federal Home Loan Banks, 0.125%, 12/10/21 | | 5.2 | % |
| United States Treasury Bill, 0.070%, 01/12/21 | | 4.0 | % |
| United States Cash Management Bill, 0.080%, 03/23/21 | | 2.8 | % |
| United States Treasury Bill, 0.090%, 03/25/21 | | 2.8 | % |
Portfolio holdings are subject to change daily. |
Current Strategy and Outlook: Looking ahead we believe that the U.S. economy and employment will take a significant amount of time to fully recover as the effects from the coronavirus will continue well into 2021, the vaccine rollout takes time and additional stimulus is needed to bridge the gap. The FOMC has indicated that they expect to hold rates at the current level till at least 2023, based on their dot plot estimates of the federal funds rate. We do not envision a scenario where the FOMC will be in a position to raise rates in the upcoming year. Any increases in short-term money market rates would be viewed by us as temporary and as an opportunity to add a few basis points of yield or the ability to capture some capital gains. We will otherwise maintain a shorter weighted average maturity, an exposure to floating rate securities and look to take advantage of any market dislocations due to temporary supply and demand imbalances for short-term U.S. Treasury and agency securities.
| |
| * | | Please see Note 5 for more information regarding the contractual waiver in place to reimburse certain expenses of the Portfolio to the extent necessary to assist the Portfolio in maintaining a yield of not less than zero. |
You could lose money by investing in the Portfolio. Although the Portfolio seeks to preserve the value of your investment at $1.00 per share, it cannot guarantee it will do so. An investment in the Portfolio is not insured or guaranteed by the Federal Deposit Insurance Corporation or any other government agency. The Portfolio’s sponsor has no legal obligation to provide financial support to the Portfolio, and you should not expect that the sponsor will provide financial support to the Portfolio at any time.
The views expressed in this commentary are informed opinions. They should not be considered promises or advice. The views expressed reflect those of the portfolio managers, only through the end of the period as stated on the cover. The portfolio managers’ views are subject to change at any time based on market and other conditions.
Portfolio holdings and characteristics are subject to change and may not be representative of current holdings and characteristics. Portfolio holdings are subject to change daily. The outlook for this Portfolio may differ from that presented for other Voya mutual funds. This report contains statements that may be “forward-looking” statements. Actual results may differ materially from those projected in the “forward-looking” statements. The Portfolio’s performance returns shown reflect applicable fee waivers and/or expense limits in effect during this period. Absent such fee waivers/expense limitations, if any, performance would have been lower. Performance for the different classes of shares will vary based on differences in fees associated with each class. An index has no cash in its portfolio and imposes no sales charges. An investor cannot invest directly in an index.
3
| VY® CLARION GLOBAL REAL ESTATE PORTFOLIO | PORTFOLIO MANAGERS’ REPORT |
Geographic Diversification
as of December 31, 2020
(as a percentage of net assets) |
| United States | | 52.5 | % |
| Japan | | 10.9 | % |
| Germany | | 7.8 | % |
| Hong Kong | | 6.5 | % |
| United Kingdom | | 3.8 | % |
| Australia | | 3.7 | % |
| Singapore | | 3.5 | % |
| Canada | | 2.8 | % |
| Sweden | | 1.8 | % |
| Belgium | | 1.3 | % |
| Countries between 0.3%–1.0%ˆ | | 2.8 | % |
| Assets in Excess of Other Liabilities* | | 2.6 | % |
| Net Assets | | 100.0 | % |
| * Includes short-term investments. |
| ** Includes 4 countries, which each represents 0.3%-1.0% of net assets. |
Portfolio holdings are subject to change daily. |
VY® Clarion Global Real Estate Portfolio (the “Portfolio”) seeks high total return consisting of capital appreciation and current income. The Portfolio is managed* by T. Ritson Ferguson, CFA, Chief Executive Officer and Global Chief Investment Officer, Joseph P. Smith, CFA, President and Co-Chief Investment Officer and Christopher S. Reich, CFA, Senior Global Portfolio Manager, Portfolio Managers of CBRE Clarion Securities LLC — the Sub-Adviser.
Performance: For the year ended December 31, 2020, the Portfolio’s Class S shares provided a total return of -5.04% compared to the FTSE EPRA Nareit Developed Index and S&P 500® Index, which returned -9.04% and 18.40%, respectively, for the same period.
Portfolio Specifics: Global real estate stocks rallied materially in the fourth quarter but were down for the year. In our opinion, real estate stocks may have “bounced,” but the stocks have not “recovered.” Global real estate stocks rebounded powerfully in the fourth quarter in response to positive developments concerning the availability of effective COVID-19 vaccines as well as the U.S. Presidential Election outcome. Despite rallying in the fourth quarter, global real estate stocks were down -9.0% for the year, materially underperforming many asset classes including the S&P 500® Index, the Bloomberg Barclays U.S. Aggregate Bond Index, and the MSCI World IndexSM. Global real estate stocks still have tremendous ground to make up versus broader market indices.
Since bottoming in early May, real estate stocks have performed well when news was announced about either improving economic conditions or positive news about a vaccine to fight the COVID-19 virus. We believe real estate stocks will outperform when investors become more certain about the timing and scale of an “economic re-opening.” In our opinion, this will help catalyze the realization of the good relative value, improving earnings growth, and attractive dividend yields in the current low yield environment, in our view.
We believe a moderate and controlled re-opening of the global economy will occur in 2021 and may act as a further catalyst for good absolute and relative performance of real estate securities. As a result, we estimate earnings for global real estate stocks will grow in the mid-single-digit range in 2021 and 2022 assuming the vaccines and health policies are effective to minimize the pandemic and that the global economy can re-open in 2021.
The Portfolio outperformed the FTSE EPRA Nareit Developed Index during the period as value was added in each of the three major geographic regions. Stock selection was the main driver of relative outperformance and sector allocation decisions also added value during the period. The Americas region was the top contributor to performance, followed closely by outperformance in the Asia-Pacific region. The European region was a modest contributor as stock selection was mostly offset by sector allocation decisions.
Top Ten Holdings
as of December 31, 2020
(as a percentage of net assets) |
| ProLogis, Inc. | | 5.4 | % |
| Simon Property Group, Inc. | | 4.5 | % |
| Duke Realty Corp. | | 2.8 | % |
| Invitation Homes, Inc. | | 2.7 | % |
| Vonovia SE | | 2.6 | % |
| VEREIT, Inc. | | 2.5 | % |
| Alexandria Real Estate Equities, Inc. | | 2.4 | % |
| Link REIT | | 2.1 | % |
| Life Storage, Inc. | | 2.1 | % |
| STORE Capital Corp. | | 2.0 | % |
Portfolio holdings are subject to change daily. |
In the Americas, positioning in the U.S. and Canada was positive. Notable contributors included stock selection in the U.S. healthcare, mall and industrial sectors. Sector allocation decisions in the U.S. tower, mall and hotel sectors also benefited relative performance. Meanwhile, sector allocation in the U.S. residential sector detracted from relative performance. In the Asia-Pacific region, stock selection was positive in all markets within the region and was led by good stock selection in Japan and Hong Kong. Sector allocation was essentially flat during the period. In Europe, positive stock selection on the Continent was somewhat offset by sub-par stock selection in the U.K. Sector allocation was a modest detractor from relative performance for the year.
Current Strategy and Outlook: We believe that long-term investors have a unique opportunity to invest in high-quality real estate assets at very attractive valuations. Based on our proprietary analytical tools, we believe that global real estate securities are cheap relative to the private real estate market, the fixed income market, and the broader stock market. We also believe investors committing capital to listed real estate at this time have the potential to earn above average absolute and relative long-term total returns.
We own a well-balanced portfolio of securities, in our view, that have been screened for their growth prospects in combination with the quality of their business models, assets, balance sheets, and management teams. We are positive on property types, regions, and stocks that offer these qualities at reasonable valuations. In the U.S., we favor towers, net lease, industrial, gaming, retail, and storage sectors. Since the beginning of the fourth quarter, we have added to the portfolio “over-sold” stocks that represent what we believe to be “great value” in the net lease, mall, and grocery-anchored shopping center sectors and we have funded these purchases by selling YTD outperforming stocks, particularly in the data center sector.
4
| PORTFOLIO MANAGERS’ REPORT | VY® CLARION GLOBAL REAL ESTATE PORTFOLIO |
In Japan, we prefer mid-cap office stocks that are providing earnings resiliency at what we see as a very attractive relative valuation, and we continue to overweight select larger diversified real estate companies that have committed to improving their corporate governance. In Hong Kong, we are overweight residential companies, diversified companies with a residential bias, non-discretionary retail, and decentralized office. In Australia, we prefer residential companies and a few select diversified companies.
In the U.K., we favor the storage, industrial, and residential sectors, and companies with, in our view, superior balance sheets and the management acumen to create value in times of uncertainty. In continental Europe, we own German residential companies and we continue to prefer property companies in markets with a positive earnings growth profile, which favors mid to small cap stocks in Germany, the Nordics and Switzerland.
| * | | Effective January 1, 2020, Mr. Steven D. Burton retired as a portfolio manager to the Portfolio and Christopher S. Reich has been added as a portfolio manager to the Portfolio. |
The views expressed in this commentary are informed opinions. They should not be considered promises or advice. The views expressed reflect those of the portfolio managers, only through the end of the period as stated on the cover. The portfolio managers’ views are subject to change at any time based on market and other conditions.
Portfolio holdings and characteristics are subject to change and may not be representative of current holdings and characteristics. Portfolio holdings are subject to change daily. The outlook for this Portfolio may differ from that presented for other Voya mutual funds. This report contains statements that may be “forward-looking” statements. Actual results may differ materially from those projected in the “forward-looking” statements. The Portfolio’s performance returns shown reflect applicable fee waivers and/or expense limits in effect during this period. Absent such fee waivers/expense limitations, if any, performance would have been lower. Performance for the different classes of shares will vary based on differences in fees associated with each class. An index has no cash in its portfolio and imposes no sales charges. An investor cannot invest directly in an index.
5
| VY® CLARION GLOBAL REAL ESTATE PORTFOLIO | PORTFOLIO MANAGERS’ REPORT |

| | Average Annual Total Returns for the Periods Ended December 31, 2020 | |
| | | | | | 1 Year | | 5 Year | | 10 Year | |
|---|
| | Class ADV | | | | | –5.37 | % | | | 3.33 | % | | | 4.80 | % | |
| | Class I | | | | | –4.83 | % | | | 3.95 | % | | | 5.43 | % | |
| | Class S | | | | | –5.04 | % | | | 3.68 | % | | | 5.17 | % | |
| | Class S2 | | | | | –5.19 | % | | | 3.54 | % | | | 5.01 | % | |
| | FTSE EPRA Nareit Developed Index | | | | | –9.04 | % | | | 3.74 | % | | | 5.44 | % | |
| | S&P 500® Index | | | | | 18.40 | % | | | 15.22 | % | | | 13.88 | % | |
Based on a $10,000 initial investment the graph and table above illustrate the total return of VY® Clarion Global Real Estate Portfolio against the indices indicated. An index is unmanaged and has no cash in its portfolio and imposes no sales charges. An investor cannot invest directly in the index.
The Portfolio’s performance is shown without the imposition of any expenses or charges which are, or may be, imposed under your variable annuity contract or variable life insurance policy. Total returns would have been lower if such expenses or charges were included.
The graph and performance table do not reflect the deduction of taxes that a shareholder will pay on Portfolio distributions or the redemption of Portfolio shares.
The performance shown includes, if applicable, the effect of fee waivers and/or expense reimbursements by the Investment Adviser and/or other
service providers, which have the effect of increasing total return. Had all fees and expenses been considered, the total returns would have been lower.
The performance update illustrates performance for a variable investment option available through a variable annuity contract or a variable life insurance policy. The performance shown indicates past performance and is not a projection or prediction of future results. Actual investment returns and principal value will fluctuate so that shares and/or units, at redemption, may be worth more or less than their original cost. Please log on to www.voyainvestments.com or call (800) 366-0066 to get performance through the most recent month end.
Portfolio holdings are subject to change daily.
6
PORTFOLIO MANAGERS’ REPORT | VY® INVESCO GROWTH AND INCOME PORTFOLIO |
Sector Diversification
as of December 31, 2020
(as a percentage of net assets) |
| Financials | | 22.6 | % |
| Health Care | | 15.7 | % |
| Information Technology | | 13.3 | % |
| Industrials | | 11.6 | % |
| Consumer Discretionary | | 7.5 | % |
| Consumer Staples | | 5.9 | % |
| Communication Services | | 5.9 | % |
| Materials | | 5.4 | % |
| Energy | | 5.3 | % |
| Utilities | | 2.7 | % |
| Real Estate | | 2.2 | % |
| Assets in Excess of Other Liabilities* | | 1.9 | % |
| Net Assets | | 100.0 | % |
| * Includes short-term investments. |
Portfolio holdings are subject to change daily. |
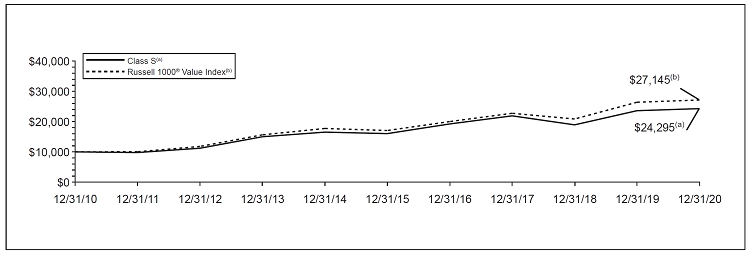
VY® Invesco Growth and Income Portfolio (the “Portfolio”) seeks long-term growth of capital and income. The Portfolio is managed by Brian Jurkash, Co-lead Portfolio Manager, Matthew Titus, Co-lead Portfolio Manager and Sergio Marcheli, Portfolio Manager, of Invesco Advisers, Inc. — the Sub-Adviser.
Performance: For the year ended December 31, 2020, the Portfolio’s Class S shares provided a total return of 2.90%, compared to the Russell 1000® Value Index, which returned 2.80%, for the same period.
Portfolio Specifics: For the year ended December 31, 2020, the Portfolio outperformed the Russell 1000 Value® Index.
Stock selection and an overweight in the information technology (“IT”) sector was the largest contributor to the Portfolio’s relative performance for the year. Within the sector, Apple, Qualcomm and Cognizant Technology Solutions were the largest contributors, benefitting from a strong rally in the sector that began in the second quarter of 2020.
Stock selection and an underweight in real estate also helped relative performance as the sector underperformed, posting a decline for the year.
Security selection in the financials sector also contributed to the Portfolio’s relative performance. Large banks and capital markets firms benefited from a rise in yields during the quarter and these stocks performed well amid a broader rally in cyclical stocks.
Security selection in the consumer discretionary sector was the largest detractor from the Portfolio’s relative performance for the year. Within the sector, Carnival and Capri Holdings were significant detractors, driven in large part by the pandemic-related sell-off in early 2020.
Security selection and an overweight in energy also detracted from relative performance, as oil prices declined sharply due to an ongoing supply/demand imbalance, exacerbated by the sharp deceleration in demand due to COVID-19 pandemic. Key detractors from relative performance included Royal Dutch Shell and Marathon Oil.
Security selection in and underweight in consumer staples also detracted from the Portfolio’s relative performance. Restaurant supplier US Foods was a key detractor from Portfolio performance as demand declined sharply due to COVID-19-related restaurant closures.
Top Ten Holdings
as of December 31, 2020
(as a percentage of net assets) |
| General Motors Co. | | 3.4 | % |
| Cognizant Technology Solutions Corp. | | 3.1 | % |
| Morgan Stanley | | 2.7 | % |
| Philip Morris International, Inc. | | 2.7 | % |
| Wells Fargo & Co. | | 2.6 | % |
| Goldman Sachs Group, Inc. | | 2.5 | % |
| Corteva, Inc. | | 2.3 | % |
| Anthem, Inc. | | 2.2 | % |
| American International Group, Inc. | | 2.2 | % |
| CSX Corp. | | 2.2 | % |
Portfolio holdings are subject to change daily. |
The Portfolio held currency forward contracts during the fiscal year for the purpose of hedging currency exposure of non-U.S.-based companies held in the Portfolio. These derivatives were not for speculative purposes or leverage, and these positions had a small negative impact on the Portfolio’s relative performance for the year.
Current Strategy and Outlook: During the fiscal year, the team reduced the Portfolio’s relative overweight exposure to the financials and energy sectors, and increased exposure to the industrials, communication services, IT and real estate sectors. At the end of the fiscal year, the Portfolio’s largest overweight exposures were in the financials, IT and health care sectors, while the largest underweight exposures were to the communication services, utilities and real estate sectors.
The views expressed in this commentary are informed opinions. They should not be considered promises or advice. The views expressed reflect those of the portfolio managers, only through the end of the period as stated on the cover. The portfolio managers’ views are subject to change at any time based on market and other conditions.
Portfolio holdings and characteristics are subject to change and may not be representative of current holdings and characteristics. Portfolio holdings are subject to change daily. The outlook for this Portfolio may differ from that presented for other Voya mutual funds. This report contains statements that may be “forward-looking” statements. Actual results may differ materially from those projected in the “forward-looking” statements. The Portfolio’s performance returns shown reflect applicable fee waivers and/or expense limits in effect during this period. Absent such fee waivers/expense limitations, if any, performance would have been lower. Performance for the different classes of shares will vary based on differences in fees associated with each class. An index has no cash in its portfolio and imposes no sales charges. An investor cannot invest directly in an index.
7
| VY® INVESCO GROWTHAND INCOME PORTFOLIO | PORTFOLIO MANAGERS’ REPORT |
| | Average Annual Total Returns for the Periods Ended December 31, 2020 | |
| | | | | | 1 Year | | 5 Year | | 10 Year | |
|---|
| | Class ADV | | | | | 2.55 | % | | | 8.28 | % | | | 8.90 | % | |
| | Class I | | | | | 3.22 | % | | | 8.94 | % | | | 9.56 | % | |
| | Class S | | | | | 2.90 | % | | | 8.66 | % | | | 9.28 | % | |
| | Class S2 | | | | | 2.77 | % | | | 8.50 | % | | | 9.12 | % | |
| | Russell 1000® Value Index | | | | | 2.80 | % | | | 9.74 | % | | | 10.50 | % | |
| | | | | | | | | | | | | | | | | |
Based on a $10,000 initial investment, the graph and table above illustrate the total return of VY® Invesco Growth and Income Portfolio against the index indicated. The index is unmanaged and has no cash in its portfolio and imposes no sales charges. An investor cannot invest directly in an index.
The Portfolio’s performance is shown without the imposition of any expenses or charges which are, or may be, imposed under your variable annuity contract or variable life insurance policy. Total returns would have been lower if such expenses or charges were included.
The performance graph and table do not reflect the deduction of taxes that a shareholder will pay on Portfolio distributions or the redemption of Portfolio shares.
The performance shown includes, if applicable, the effect of fee waivers and/or expense reimbursements by the Investment Adviser and/or other
service providers, which have the effect of increasing total return. Had all fees and expenses been considered, the total returns would have been lower.
The performance update illustrates performance for a variable investment option available through a variable annuity contract or a variable life insurance policy. The performance shown indicates past performance and is not a projection or prediction of future results. Actual investment returns and principal value will fluctuate so that shares and/or units, at redemption, may be worth more or less than their original cost. Please log on to www.voyainvestments.com or call (800) 366-0066 to get performance through the most recent month end.
Portfolio holdings are subject to change daily.
8
PORTFOLIO MANAGERS’ REPORT | VY® JPMORGAN EMERGING
MARKETS EQUITY PORTFOLIO |
Geographic Diversification
as of December 31, 2020
(as a percentage of net assets) |
| China | | 38.6 | % |
| India | | 18.0 | % |
| Taiwan | | 7.6 | % |
| South Korea | | 6.9 | % |
| Brazil | | 6.2 | % |
| Hong Kong | | 5.7 | % |
| Singapore | | 3.3 | % |
| Argentina | | 3.0 | % |
| United States | | 2.6 | % |
| Indonesia | | 2.0 | % |
| Countries between 0.3%–1.8%ˆ | | 7.8 | % |
| Liabilities in Excess of Other Assets* | | (1.7 | )% |
| Net Assets | | 100.0 | % |
| * Includes short-term investments. |
| ** Includes 9 countries, which each represents 0.3%–1.8% of net assets. |
Portfolio holdings are subject to change daily. |
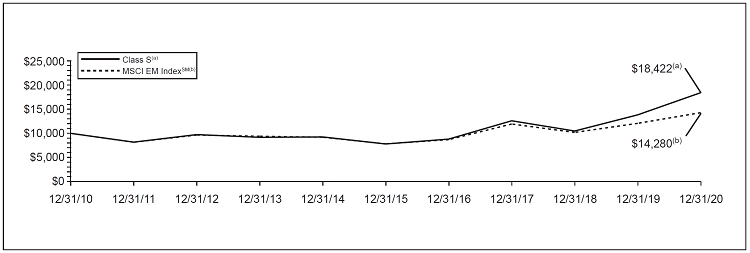
VY® JPMorgan Emerging Markets Equity Portfolio (the “Portfolio”) seeks capital appreciation. The Portfolio is managed by Austin Forey, Managing Director, Leon Eidelman, CFA and Managing Director, and Amit Mehta, CFA and Executive Director; each a Portfolio Manager of J.P. Morgan Investment Management Inc. — the Sub-Adviser.
Performance: For the year ended December 31, 2020, the Portfolio’s Class S Shares provided a total return of 33.23% compared to the MSCI Emerging Markets IndexSM (“MSCI EM IndexSM”), which returned 18.31% for the same period.
Portfolio Specifics: The Portfolio outperformed MSCI EM IndexSM for the year ended December 31, 2020, as stock selection and country allocation contributed to returns.
Stock selection in China was the leading contributor to performance. The Portfolio’s position in Techtronic Industries, which manufactures power tools, was a top contributor in China during the period. The company has delivered solid revenue growth, with the majority of their distributors deemed essential services and permitted to remain open in many countries. At the same time, demand for DIY home improvement and maintenance equipment, such as lawnmowers, saw relatively significant growth.
The Portfolio’s off- benchmark exposure to Singapore, the result of stock selection, also boosted relative returns. Specifically, exposure to Sea Limited, an ASEAN e-commerce and gaming business listed in Singapore, was among the top performers. In our opinion, Sea Limited is an example of a strong business that has benefitted from the shift to online consumption in 2020, which was accelerated by the breakout of the COVID-19 pandemic. During the period, the company consistently reported strong results, growing e-commerce and gaming revenues substantially. The company’s fintech platform and digital entertainment services group both experienced significant new user growth in 2020.
On the downside, stock selection in India weighed on relative returns during the period, most notably led by exposure to IndusInd Bank. The stock fell 42.1% (in USD terms) on the back of concerns over its asset quality during the reporting period.
The Portfolio’s underweight to South Korea, the result of stock selection, also weighed on relative performance. Relatively better control of the pandemic by South Korea relative to other countries in the West and a heavier tilt towards the tech hardware sector buoyed South Korean equities in the year.
Top Ten Holdings
as of December 31, 2020
(as a percentage of net assets) |
| Samsung Electronics Co., Ltd. | | 5.5 | % |
| Taiwan Semiconductor Manufacturing Co., Ltd. ADR | | 4.8 | % |
| HDFC Bank Ltd. ADR | | 4.1 | % |
| Tencent Holdings Ltd. | | 3.9 | % |
| Housing Development Finance Corp. | | 3.7 | % |
| Sea Ltd. ADR | | 3.3 | % |
| MercadoLibre, Inc. | | 3.0 | % |
| Wuxi Biologics Cayman, Inc. | | 2.9 | % |
| Alibaba Group Holding Ltd. ADR | | 2.8 | % |
| Taiwan Semiconductor Manufacturing Co., Ltd. | | 2.8 | % |
| Portfolio holdings are subject to change daily. |
Current Strategy and Outlook: How long the COVID-19 pandemic persists as a health risk is crucial for economies and financial markets. Medical developments could mean a path to normalcy is possible in 2021, in our opinion. A growing list of developed market and emerging market (“EM”) economies appear to be discussing vaccination plans. However, speeds of vaccine rollouts differ greatly and uncertainties still remain, especially in the near term.
The path of U.S. fiscal stimulus now has the chance to be larger than the base case prior to January given Democratic control of the U.S. government following the special elections in Georgia. For EM equities, protectionism has already re-emerged in 2021 and we will watch how the U.S.-China relationship evolves.
Valuations are slightly above average, but earnings revisions are turning positive across a broader range of sectors. We believe that the path of the dollar will be key, as it has weakened considerably over the past quarter. In our view, further weakness would provide support to EM equities.
The views expressed in this commentary are informed opinions. They should not be considered promises or advice. The views expressed reflect those of the portfolio managers, only through the end of the period as stated on the cover. The portfolio managers’ views are subject to change at any time based on market and other conditions.
Portfolio holdings and characteristics are subject to change and may not be representative of current holdings and characteristics. Portfolio holdings are subject to change daily. The outlook for this Portfolio may differ from that presented for other Voya mutual funds. This report contains statements that may be “forward-looking” statements. Actual results may differ materially from those projected in the “forward-looking” statements. The Portfolio’s performance returns shown reflect applicable fee waivers and/or expense limits in effect during this period. Absent such fee waivers/expense limitations, if any, performance would have been lower. Performance for the different classes of shares will vary based on differences in fees associated with each class. An index has no cash in its portfolio and imposes no sales charges. An investor cannot invest directly in an index.
9
VY® JPMORGAN EMERGING
MARKETS EQUITY PORTFOLIO | PORTFOLIO MANAGERS’ REPORT |
| | Average Annual Total Returns for the Periods Ended December 31, 2020 | |
| | | | | | 1 Year | | 5 Year | | 10 Year | |
| | Class ADV | | | | | 32.71 | % | | | 18.35 | % | | | 5.92 | % | |
| | Class I | | | | | 33.52 | % | | | 19.07 | % | | | 6.56 | % | |
| | Class S | | | | | 33.23 | % | | | 18.77 | % | | | 6.30 | % | |
| | Class S2 | | | | | 33.03 | % | | | 18.58 | % | | | 6.13 | % | |
| | MSCI EM IndexSM | | | | | 18.31 | % | | | 12.81 | % | | | 3.63 | % | |
| | | | | | | | | | | | | | | | | |
Based on a $10,000 initial investment, the graph and table above illustrate the total return of the VY® JPMorgan Emerging Markets Equity Portfolio against the index indicated. The index is unmanaged and has no cash in its portfolio and imposes no sales charges. An investor cannot invest directly in an index.
The Portfolio’s performance is shown without the imposition of any expenses or charges which are, or may be, imposed under your variable annuity contract or variable life insurance policy. Total returns would have been lower if such expenses or charges were included.
The performance graph and table do not reflect the deduction of taxes that a shareholder will pay on Portfolio distributions or the redemption of Portfolio shares.
The performance shown includes, if applicable, the effect of fee waivers and/or expense reimbursements by the Investment Adviser and/or other
service providers, which have the effect of increasing total return. Had all fees and expenses been considered, the total returns would have been lower.
The performance update illustrates performance for a variable investment option available through a variable annuity contract or a variable life insurance policy. The performance shown indicates past performance and is not a projection or prediction of future results. Actual investment returns and principal value will fluctuate so that shares and/or units, at redemption, may be worth more or less than their original cost. Please log on to www.voyainvestments.com or call (800) 366-0066 to get performance through the most recent month end.
Portfolio holdings are subject to change daily.
10
| PORTFOLIO MANAGERS’ REPORT | VY® MORGAN STANLEY GLOBAL
FRANCHISE PORTFOLIO |
Geographic Diversification
as of December 31, 2020
(as a percentage of net assets) |
| United States | | 68.7 | % |
| United Kingdom | | 15.9 | % |
| France | | 5.8 | % |
| Germany | | 4.4 | % |
| Netherlands | | 2.3 | % |
| Italy | | 0.5 | % |
| Assets in Excess of Other Liabilities* | | 2.4 | % |
| Net Assets | | 100.0 | % |
| * Includes short-term investments. |
| Portfolio holdings are subject to change daily. |
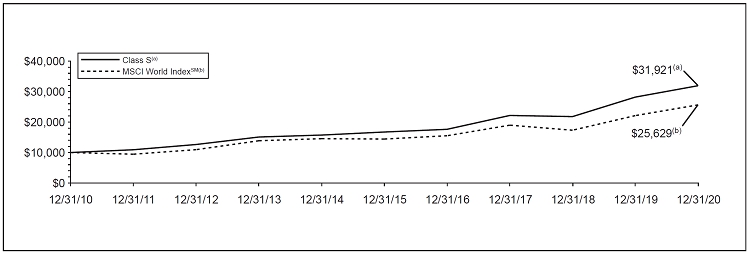
VY® Morgan Stanley Global Franchise Portfolio (the “Portfolio”) seeks long-term capital appreciation. The Portfolio is managed by William D. Lock, Managing Director, Bruno Paulson, Managing Director, Nic Sochovsky, Managing Director, Vladimir A. Demine, Executive Director, Dirk Hoffmann-Becking, Executive Director, Marcus Watson, Executive Director, Alex Gabriele, Executive Director, Nathan Wong, Executive Director, and Richard Perrott, Executive Director, Portfolio Managers* of Morgan Stanley Investment Management Inc.— the Sub-Adviser.
Performance: For the year ended December 31, 2020, the Portfolio’s Class S shares provided a total return of 13.28% compared to the MSCI World IndexSM (the “Index”), which returned 15.90% for the same period.
Portfolio Specifics: For the one-year period, sector allocation was positive, but stock selection was negative. The overweight in information technology helped a great deal with sector allocation, as did the underweight in financials and the lack of energy stocks, despite the two sectors’ strong performance in the fourth quarter. These positive effects were significantly larger than the negative impacts of the consumer staples overweight and consumer discretionary underweight. The underperformance in information technology was the main driver of the negative stock selection. Communication services also underperformed for 2020 as a whole, while health care and financials outperformed.
Top Ten Holdings
as of December 31, 2020
(as a percentage of net assets) |
| Microsoft Corp. | | 8.6 | % |
| Reckitt Benckiser Group PLC | | 7.9 | % |
| Philip Morris International, Inc. | | 7.8 | % |
| Visa, Inc.—Class A | | 5.6 | % |
| Accenture PLC | | 4.8 | % |
| Procter & Gamble Co. | | 4.7 | % |
| SAP SE | | 4.4 | % |
| Baxter International, Inc. | | 4.0 | % |
| Danaher Corp. | | 4.0 | % |
| Automatic Data Processing, Inc. | | 3.9 | % |
| Portfolio holdings are subject to change daily. |
Current Strategy and Outlook: We believe, there are only two ways of losing money in equities: either the earnings go away or the valuation goes away. Our quality-obsessed investment philosophy looks to minimize the former, and the rise in the Portfolio’s 2020 earnings has provided further evidence of market resilience, despite some of the idiosyncratic headwinds the COVID-19 pandemic has produced. We have also looked to reduce the risk of the latter. The Portfolio’s shift to cheaper stocks has been to the detriment of performance, given the continued progress for growthier names, but we believe should support the Portfolio’s resilience in the future.
We do not claim that the Portfolio is cheap in absolute terms. Now more than ever, we believe it is time to focus on keeping the lights on, rather than attempting to shoot them out, and it is our opinion that reasonably priced compounders seem a reasonable way of avoiding a plunge into darkness.
| |
| * | | Effective March 31, 2021, Dirk Hoffmann-Becking will retire and will no longer serve as a portfolio manager of the Portfolio. |
The views expressed in this commentary are informed opinions. They should not be considered promises or advice. The views expressed reflect those of the portfolio managers, only through the end of the period as stated on the cover. The portfolio managers’ views are subject to change at any time based on market and other conditions.
Portfolio holdings and characteristics are subject to change and may not be representative of current holdings and characteristics. Portfolio holdings are subject to change daily. The outlook for this Portfolio may differ from that presented for other Voya mutual funds. This report contains statements that may be “forward-looking” statements. Actual results may differ materially from those projected in the “forward-looking” statements. The Portfolio’s performance returns shown reflect applicable fee waivers and/or expense limits in effect during this period. Absent such fee waivers/expense limitations, if any, performance would have been lower. Performance for the different classes of shares will vary based on differences in fees associated with each class. An index has no cash in its portfolio and imposes no sales charges. An investor cannot invest directly in an index.
11
VY® MORGAN STANLEY GLOBAL
FRANCHISE PORTFOLIO | PORTFOLIO MANAGERS’ REPORT |
| | Average Annual Total Returns for the Periods Ended December 31, 2020 | |
| | | | | | 1 Year | | 5 Year | | 10 Year | |
| | Class ADV | | | | | 12.87 | % | | | 13.41 | % | | | 11.92 | % | |
| | Class R6(1) | | | | | 13.55 | % | | | 14.07 | % | | | 12.44 | % | |
| | Class S | | | | | 13.28 | % | | | 13.80 | % | | | 12.30 | % | |
| | Class S2 | | | | | 13.06 | % | | | 13.62 | % | | | 12.13 | % | |
| | MSCI World IndexSM | | | | | 15.90 | % | | | 12.19 | % | | | 9.87 | % | |
| | | | | | | | | | | | | | | | | |
Based on a $10,000 initial investment, the graph and table above illustrate the total return of VY® Morgan Stanley Global Franchise Portfolio against the index indicated. The index is unmanaged and has no cash in its portfolio and imposes no sales charges. An investor cannot invest directly in an index.
The Portfolio’s performance is shown without the imposition of any expenses or charges which are, or may be, imposed under your variable annuity contract or variable life insurance policy. Total returns would have been lower if such expenses or charges were included.
The performance graph and table do not reflect the deduction of taxes that a shareholder will pay on Portfolio distributions or the redemption of Portfolio shares.
The performance shown includes, if applicable, the effect of fee waivers and/or expense reimbursements by the Investment Adviser and/or other service providers, which have the effect of increasing total return. Had all fees and expenses been considered, the total returns would have been lower.
The performance update illustrates performance for a variable investment option available through a variable annuity contract or a variable life insurance policy. The performance shown indicates past performance and is not a projection or prediction of future results. Actual investment returns and principal value will fluctuate so that shares and/or units, at redemption, may be worth more or less than their original cost. Please log on to www.voyainvestments.com or call (800) 366-0066 to get performance through the most recent month end.
Portfolio holdings are subject to change daily.
| (1) | | Class R6 incepted on May 3, 2016. The Class R6 shares performance shown for the period prior to their inception date is the performance of Class S shares without adjustment for any differences in the expenses between the two classes. If adjusted for such differences, returns would be different. |
12
| PORTFOLIO MANAGERS’ REPORT | VY® T. ROWE PRICE CAPITAL
APPRECIATION PORTFOLIO |
Investment Type Allocation
as of December 31, 2020
(as a percentage of net assets) |
| Common Stock | | | | | 68.0 | % |
| Bank Loans | | | | | 11.3 | % |
| Corporate Bonds/Notes | | | | | 9.3 | % |
| Preferred Stock | | | | | 2.8 | % |
| Asset-Backed Securities | | | | | 0.3 | % |
| Convertible Bonds/Notes** | | | | | 0.0 | % |
| Assets in Excess of Other Liabilities* | | | | | 8.3 | % |
| Net Assets | | | | | 100.0 | % |
| * Includes short-term investments. | |
| ** Amount is less than 0.05% |
| Portfolio holdings are subject to change daily. |
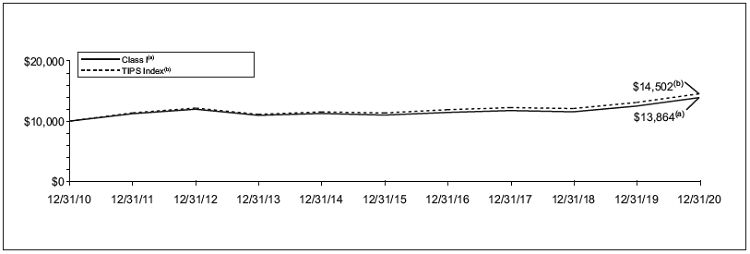
VY® T. Rowe Price Capital Appreciation Portfolio (the “Portfolio”) seeks, over the long-term, a high total investment return, consistent with the preservation of capital and with prudent investment risk. The Portfolio is managed by David R. Giroux, CFA and Vice President of T. Rowe Price Associates, Inc. — the Sub-Adviser.
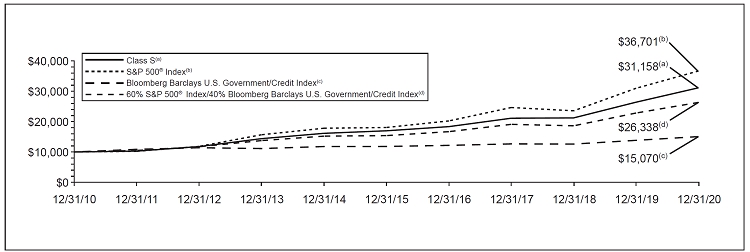
Performance: For the year ended December 31, 2020, the Portfolio’s Class S shares provided a total return of 17.97%. By comparison, the S&P 500® Index, the Bloomberg Barclays U.S. Government/Credit Index, and the 60% S&P 500® Index/40% Bloomberg Barclays U.S. Government/Credit Index returned 18.40%, 8.93% and 15.30%, respectively, for the same period.
Portfolio Specifics: In 2020, the Portfolio posted a positive return and outperformed the S&P 500® Index, before fees and expenses. The Portfolio performed well versus its peers, ranking in the top decile of both its Morningstar and Lipper peer groups. The Portfolio’s equity holdings posted a strongly positive return, outpacing its S&P 500® Index benchmark. The Portfolio’s fixed income holdings posted a positive return during the one-year period, slightly outperforming its benchmark, the Bloomberg Barclays U.S. Government/Credit Index.
Our overall fixed income weight declined from the prior year, as we trimmed our allocations in high yield bonds and investment-grade corporates. Our largest exposure in fixed income is in bank loans, where we have found select issues that at current levels offer compelling risk-adjusted return profiles.
Within equities, the financials sector contributed to relative returns due to stock picks, such as Intercontinental Exchange, and a beneficial underweight. Intercontinental Exchange, a data service provider and global operator of exchanges, benefited from growth in data revenue throughout the year as well as from its less cyclical business model relative to many banks and capital markets companies. Health care further aided results due to stock choices such as Danaher. Diversified medical equipment and supplies conglomerate Danaher benefited from growing demand for diagnostic tools needed to test for the coronavirus, as well as from organic growth and margins from recently acquired Cytiva, formerly GE Healthcare Life Sciences. An underweight allocation to the energy sector further aided relative results. Conversely, the information technology sector weighed on relative results due to security selection, led by Fiserv. Fiserv lagged within the very strong-performing information technology sector on significant disruption to its merchant acceptance business due to the coronavirus pandemic. An unexpected announcement in early May that the company’s CEO would retire in mid-2020 also raised some investor concern amid a challenging market environment. An overweight allocation to the utilities sector further hindered relative results. Utilities lagged the broader market’s strong one-year return as investors mostly favored areas of the market with exposure to such things as e-commerce and the broader digitalization of the economy due to the circumstances that were caused by the coronavirus pandemic.
Top Ten Holdings
as of December 31, 2020*
(as a percentage of net assets) |
| Microsoft Corp. | | 5.3 | % |
| Amazon.com, Inc. | | 3.7 | % |
| General Electric Co. | | 3.6 | % |
| PNC Financial Services Group, Inc. | | 3.4 | % |
| Alphabet, Inc. — Class C | | 3.4 | % |
| Marsh & McLennan Cos., Inc. | | 3.0 | % |
| Fiserv, Inc. | | 3.0 | % |
| American Electric Power Co., Inc. | | 2.9 | % |
| Visa, Inc. — Class A | | 2.8 | % |
| Humana, Inc. | | 2.7 | % |
| * Excludes short-term investments. |
| Portfolio holdings are subject to change daily. |
During the reporting period, the covered call strategy represented, on average, 8.33% of the overall Portfolio and generated a return of approximately 7.68%. The covered call strategy’s estimated contribution to the Portfolio’s total return was 1.30%. The estimated return impact from employing options was -18 basis points (-0.18%) for the reporting period December 31, 2020.
Current Strategy and Outlook: After a year dominated by the devastating impacts of the coronavirus pandemic, optimism has risen that the successful development of vaccines and their subsequent distribution will bring an end to economic harm the virus has left in its wake. This optimism has, however, broadened a market rally that had been more narrowly concentrated in perceived “COVID winners” earlier in 2020, leaving valuations constrained and compelling opportunities harder to come by, in our view. After initial expectations for a divided government, Democrats ultimately won control of both chambers of Congress as well as the White House, giving rise to hopes for additional economic relief. While further stimulus may provide a tailwind for markets, we believe it will likely be short-lived. Taking a longer view, it is our opinion that markets already appear expensive with an optimistic outlook for growth priced-in, and the potential for regulatory and tax policy reform merits caution. We have a balanced view of the current market and have positioned the Portfolio accordingly. We remain focused on identifying high-quality businesses with strong fundamentals that we believe can deliver solid earnings and the potential for growth over the long term.
The views expressed in this commentary are informed opinions. They should not be considered promises or advice. The views expressed reflect those of the portfolio managers, only through the end of the period as stated on the cover. The portfolio managers’ views are subject to change at any time based on market and other conditions.
Portfolio holdings and characteristics are subject to change and may not be representative of current holdings and characteristics. Portfolio holdings are subject to change daily. The outlook for this Portfolio may differ from that presented for other Voya mutual funds. This report contains statements that may be “forward-looking” statements. Actual results may differ materially from those projected in the “forward-looking” statements. The Portfolio’s performance returns shown reflect applicable fee waivers and/or expense limits in effect during this period. Absent such fee waivers/expense limitations, if any, performance would have been lower. Performance for the different classes of shares will vary based on differences in fees associated with each class. An index has no cash in its portfolio and imposes no sales charges. An investor cannot invest directly in an index.
13
VY® T. ROWE PRICE CAPITAL
APPRECIATION PORTFOLIO | PORTFOLIO MANAGERS’ REPORT |
| | Average Annual Total Returns for the Periods Ended December 31, 2020 | |
| | | | 1 Year | | 5 Year | | 10 Year | |
|---|
| | Class ADV | | | 17.54 | % | | | 12.50 | % | | | 11.65 | % | |
| | Class I | | | 18.28 | % | | | 13.18 | % | | | 12.32 | % | |
| | Class R6(1) | | | 18.27 | % | | | 13.18 | % | | | 13.32 | % | |
| | Class S | | | 17.97 | % | | | 12.89 | % | | | 11.03 | % | |
| | Class S2 | | | 17.82 | % | | | 12.73 | % | | | 11.87 | % | |
| | S&P 500® Index | | | 18.40 | % | | | 15.22 | % | | | 13.88 | % | |
| | Bloomberg Barclays U.S. Government/Credit Index | | | 8.93 | % | | | 4.98 | % | | | 4.19 | % | |
| | 60% S&P 500® Index/40% Bloomberg Barclays U.S. Government/Credit Index | | | 15.30 | % | | | 11.34 | % | | | 10.17 | % | |
Based on a $10,000 initial investment, the graph and table above illustrate the total return of VY® T. Rowe Price Capital Appreciation Portfolio against the indices indicated. An index is unmanaged and has no cash in its portfolio and imposes no sales charges. An investor cannot invest directly in an index.
The Portfolio’s performance is shown without the imposition of any expenses or charges which are, or may be, imposed under your variable annuity contract or variable life insurance policy. Total returns would have been lower if such expenses or charges were included.
The performance graph and table do not reflect the deduction of taxes that a shareholder will pay on Portfolio distributions or the redemption of Portfolio shares.
The performance shown includes, if applicable, the effect of fee waivers and/or expense reimbursements by the Investment Adviser and/or other service providers, which have the effect of increasing total return. Had all fees and expenses been considered, the total returns would have been lower.
The performance update illustrates performance for a variable investment option available through a variable annuity contract or a variable life insurance policy. The performance shown indicates past performance and is not a projection or prediction of future results. Actual investment returns and principal value will fluctuate so that shares and/or units, at redemption, may be worth more or less than their original cost. Please log on to www.voyainvestments.com or call (800) 366-0066 to get performance through the most recent month end.
Portfolio holdings are subject to change daily.
| (1) | | Class R6 incepted on May 3, 2016. The Class R6 shares performance shown for the period prior to their inception date is the performance of Class I shares without adjustment for any differences in the expenses between the two classes. If adjusted for such differences, returns would be different. |
14
| PORTFOLIO MANAGERS’ REPORT | VY® T. ROWE PRICE EQUITY INCOME PORTFOLIO |
Sector Diversification
as of December 31, 2020
(as a percentage of net assets) |
| Financials | | 21.0 | % |
| Health Care | | 13.2 | % |
| Industrials | | 12.1 | % |
| Information Technology | | 9.5 | % |
| Utilities | | 9.0 | % |
| Consumer Staples | | 7.4 | % |
| Energy | | 6.5 | % |
| Materials | | 6.1 | % |
| Communication Services | | 5.4 | % |
| Real Estate | | 4.5 | % |
| Consumer Discretionary | | 4.1 | % |
| Assets in Excess of Other Liabilities* | | 1.2 | % |
| Net Assets | | 100.0 | % |
| * Includes short-term investments. |
| Portfolio holdings are subject to change daily. |
VY® T. Rowe Price Equity Income Portfolio (the “Portfolio”) seeks a high level of dividend income as well as long-term growth of capital primarily through investments in stocks. The Portfolio is managed by John Linehan, CFA, Head of U.S. Equity and Portfolio Manager of T. Rowe Price Associates, Inc. — the Sub-Adviser.
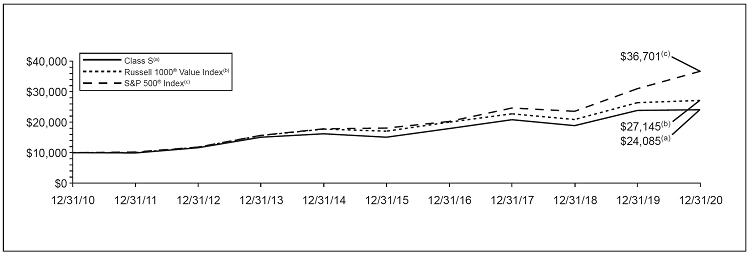
Performance: For the year ended December 31, 2020, the Portfolio’s Class S shares provided a total return of 0.95% compared to the Russell 1000® Value Index and the S&P 500® Index, which returned 2.80% and 18.40%, respectively, for the same period.
Portfolio Specifics: The Portfolio underperformed its benchmark, the Russell 1000® Value Index due to stock selection in the health care sector detracted from relative results. CVS Health traded lower throughout the year amid short-term concerns over a potential decline in demand due to coronavirus lockdowns.
Stock choices in the consumer staples sector hindered relative returns. During the first half of the year, shares of Tyson Foods lagged the broader market as the company grappled with uncertainty stemming from the coronavirus outbreak and a shift from commercial to residential consumption. Additionally, shares were pressured due to reports of coronavirus outbreaks at numerous plants. In the fourth quarter, the company came under fire after reports surfaced of management’s actions related to the coronavirus.
Within industrials and business services, stock choices and an unfavorable overweight allocation detracted from relative performance. Despite finishing lower for the one-year period, shares of Boeing significantly rebounded from March lows. Boeing shares began trending upward late in the first half of the year as airlines began rescheduling more flights. Additionally, late in the fourth quarter, shares trended upward following the recertification of the 737 MAX but ultimately remained well below the level we saw early in the year.
In contrast, stock selection in information technology contributed to relative returns for the 12-month period. Shares of Qualcomm regained from the first-quarter sell-off and were up considerably for the one-year period, stemming from favorable earnings reports (which exceeded market expectations) and the unveiling of the company’s new Snapdragon 888 5G mobile platform.
Top Ten Holdings
as of December 31, 2020
(as a percentage of net assets) |
| Qualcomm, Inc. | | 3.1 | % |
| Wells Fargo & Co. | | 2.8 | % |
| Southern Co. | | 2.7 | % |
| General Electric Co. | | 2.6 | % |
| DuPont de Nemours, Inc. | | 2.5 | % |
| Chubb Ltd. | | 2.3 | % |
| United Parcel Service, Inc. — Class B | | 2.3 | % |
| Morgan Stanley | | 2.1 | % |
| Metlife, Inc. | | 2.0 | % |
| Total SE ADR | | 1.9 | % |
| Portfolio holdings are subject to change daily. |
Stock selection in energy also contributed to relative results, led by TC Energy. However, the impact was partially offset by an unfavorable overweight position in the sector.
Current Strategy and Outlook: Given market performance in 2020, in our view we are beginning to see signs of exuberance, with narrow leadership, high index concentration, and increased special purpose acquisition company and initial public offering activity. Considering this, we believe 2021 will present a stock pickers’ market, where more tempered returns may remind investors of the importance of dividends. Additionally, in the event of an economic recovery, we believe this may be an environment where we could see inflation, as consumers and businesses have capital to deploy while household net worth is at an all-time high. Ultimately, there may be a recoupling between the market and the economy, which might benefit areas of the market that were left behind over the course of 2020, in our opinion.
The views expressed in this commentary are informed opinions. They should not be considered promises or advice. The views expressed reflect those of the portfolio managers, only through the end of the period as stated on the cover. The portfolio managers’ views are subject to change at any time based on market and other conditions.
Portfolio holdings and characteristics are subject to change and may not be representative of current holdings and characteristics. Portfolio holdings are subject to change daily. The outlook for this Portfolio may differ from that presented for other Voya mutual funds. This report contains statements that may be “forward-looking“ statements. Actual results may differ materially from those projected in the “forward-looking“ statements. The Portfolio’s performance returns shown reflect applicable fee waivers and/or expense limits in effect during this period. Absent such fee waivers/expense limitations, if any, performance would have been lower. Performance for the different classes of shares will vary based on differences in fees associated with each class. An index has no cash in its portfolio and imposes no sales charges. An investor cannot invest directly in an index.
15
| VY® T. ROWE PRICE EQUITY INCOME PORTFOLIO | PORTFOLIO MANAGERS’ REPORT |
| | Average Annual Total Returns for the Periods Ended December 31, 2020 | |
| | | | 1 Year | | 5 Year | | 10 Year | |
|---|
| | Class ADV | | | 0.64 | % | | | 9.43 | % | | | 8.80 | % | |
| | Class I | | | 1.27 | % | | | 10.09 | % | | | 9.46 | % | |
| | Class S | | | 0.95 | % | | | 9.82 | % | | | 9.19 | % | |
| | Class S2 | | | 0.85 | % | | | 9.65 | % | | | 9.03 | % | |
| | Russell 1000® Value Index | | | 2.80 | % | | | 9.74 | % | | | 10.50 | % | |
| | S&P 500® Index | | | 18.40 | % | | | 15.22 | % | | | 13.88 | % | |
Based on a $10,000 initial investment, the graph and table above illustrate the total return of VY® T. Rowe Price Equity Income Portfolio against the indices indicated. An index is unmanaged and has no cash in its portfolio and imposes no sales charges. An investor cannot invest directly in an index.
The Portfolio’s performance is shown without the imposition of any expenses or charges which are, or may be, imposed under your variable annuity contract or variable life insurance policy. Total returns would have been lower if such expenses or charges were included.
The performance graph and table do not reflect the deduction of taxes that a shareholder will pay on Portfolio distributions or the redemption of Portfolio shares.
The performance shown includes, if applicable, the effect of fee waivers and/or expense reimbursements by the Investment Adviser and/or other service providers, which have the effect of increasing total return. Had all fees and expenses been considered, the total returns would have been lower.
The performance update illustrates performance for a variable investment option available through a variable annuity contract or a variable life insurance policy. The performance shown indicates past performance and is not a projection or prediction of future results. Actual investment returns and principal value will fluctuate so that shares and/or units, at redemption, may be worth more or less than their original cost. Please log on to www.voyainvestments.com or call (800) 366-0066 to get performance through the most recent month end.
Portfolio holdings are subject to change daily.
Effective May 25, 2018, the Portfolio changed its benchmark from the S&P 500® Index to the Russell 1000® Value Index because the Russell 1000® Value Index is considered by the Sub-Adviser to be a more appropriate benchmark that better aligns with the Portfolio’s value-focused investment style.
16
| PORTFOLIO MANAGERS’ REPORT | VY® T. ROWE PRICE INTERNATIONAL
STOCK PORTFOLIO |
Geographic Diversification
as of December 31, 2020
(as a percentage of net assets) |
| Japan | | 15.2 | % |
| United Kingdom | | 8.8 | % |
| China | | 8.2 | % |
| Netherlands | | 7.9 | % |
| France | | 6.9 | % |
| Switzerland | | 6.8 | % |
| South Korea | | 5.7 | % |
| India | | 4.5 | % |
| Germany | | 4.3 | % |
| Canada | | 3.8 | % |
| Countries between 0.0%-3.4%ˆ | | 24.7 | % |
| Assets in Excess of Other Liabilities* | | 3.2 | % |
| Net Assets | | 100.0 | % |
| * Includes short-term investments. |
| ** Includes 19 countries, which each represents 0.0%–3.4% of net assets. |
| Portfolio holdings are subject to change daily. |
VY® T. Rowe Price International Stock Portfolio (the “Portfolio”) seeks long-term growth of capital. The Portfolio is managed by Richard N. Clattenburg, CFA and Vice President, Portfolio Manager of T. Rowe Price Associates, Inc. — the Sub-Adviser.
Performance: For the year ended December 31, 2020, the Portfolio’s Class I shares provided a total return of 14.74% compared to the MSCI All Country World (ex-U.S.) IndexSM (“MSCI ACWI ex-U.S.”), which returned 10.65% for the same period.
Portfolio Specifics: The Portfolio outperformed its benchmark, the MSCI ACWI ex-U.S., for the reporting period. Broadly speaking, sector allocation aided relative performance. At the sector level, communication services was the largest contributor due to security selection. Financials aided relative returns due to stock selection and a favorable underweight. Energy also boosted relative results with a favorable underweight position. In contrast, holdings within industrials and business services detracted. Health care also hindered relative performance due to stock choices.
Regionally, the Portfolio found relative success in developed Europe — particularly the United Kingdom — due to beneficial security selection. No regions detracted from relative performance.
Within the communication services sector, NAVER was one of the top relative contributors to the Portfolio in 2020. The company reported in-line results in late July that showed core revenues growing steadily as the investments made over the last three years pay off. That was reinforced in October’s earnings, where NAVER beat consensus estimates for revenue and noted that it continued to invest in new e-commerce, fintech, and cloud initiatives.
Top Ten Holdings
as of December 31, 2020*
(as a percentage of net assets) |
| Taiwan Semiconductor Manufacturing Co., Ltd. | | 3.4 | % |
| Samsung Electronics Co., Ltd. | | 2.7 | % |
| Alibaba Group Holding Ltd. ADR | | 2.6 | % |
| Naspers Ltd. | | 2.5 | % |
| NAVER Corp. | | 2.3 | % |
| Thales S.A. | | 2.2 | % |
| Unilever PLC | | 2.1 | % |
| AIA Group Ltd. | | 2.0 | % |
| Housing Development Finance Corp. | | 1.9 | % |
| Prosus NV | | 1.8 | % |
| * Excludes short-term investments. |
| Portfolio holdings are subject to change daily. |
The Portfolio’s weakness in the industrials and business services sector was largely explained by Thales, a global aerospace and defense company that specializes in electrical systems. The near-complete halting of air travel due to the coronavirus pandemic, and fears for what that means for aircraft suppliers like Thales, sent shares sharply lower. However, earnings in late July showed in-line performance at the group level, with the headwinds in the aerospace segments offset somewhat by good results in other areas. Earnings in October again met expectations and showed business was returning to normal, a very welcome sign.
Current Strategy and Outlook: The historically extraordinary divide between growth and value stocks persisted in the final quarter of 2020 even as the coronavirus pandemic spiraled in many countries. We believe a value snapback lasting more than a few days is likely at some point in a post-pandemic recovery and could be violent, consistent with past value rallies. However, the timing of a value-driven rally is impossible to predict. Our focus remains on leveraging the strengths of our fundamental research platform and investing in companies that we think reflect the most compelling trade-off between valuation and fundamentals. Near term, we believe that massive and frequent virus testing is key to a recovery before vaccines become widely available. We expect a strong recovery in travel demand as more people get vaccinated. However, it is our opinion that international travel will take longer to rebound than domestic travel, and business travel may not fully return to pre-pandemic levels as videoconferencing replaces in-person meetings in the near term.
The views expressed in this commentary are informed opinions. They should not be considered promises or advice. The views expressed reflect those of the portfolio managers, only through the end of the period as stated on the cover. The portfolio managers’ views are subject to change at any time based on market and other conditions.
Portfolio holdings and characteristics are subject to change and may not be representative of current holdings and characteristics. Portfolio holdings are subject to change daily. The outlook for this Portfolio may differ from that presented for other Voya mutual funds. This report contains statements that may be “forward-looking” statements. Actual results may differ materially from those projected in the “forward-looking” statements. The Portfolio’s performance returns shown reflect applicable fee waivers and/or expense limits in effect during this period. Absent such fee waivers/expense limitations, if any, performance would have been lower. Performance for the different classes of shares will vary based on differences in fees associated with each class. An index has no cash in its portfolio and imposes no sales charges. An investor cannot invest directly in an index.
17
VY® T. ROWE PRICE INTERNATIONAL
STOCK PORTFOLIO | PORTFOLIO MANAGERS’ REPORT |

| | Average Annual Total Returns for the Periods Ended December 31, 2020 | |
| | | | | | 1 Year | | 5 Year | | 10 Year | |
|---|
| | Class ADV | | | | | 14.11 | % | | | 9.96 | % | | | 6.29 | % | |
| | Class I | | | | | 14.74 | % | | | 10.61 | % | | | 6.94 | % | |
| | Class S | | | | | 14.49 | % | | | 10.33 | % | | | 6.67 | % | |
| | MSCI ACWI ex-U.S. | | | | | 10.65 | % | | | 8.93 | % | | | 4.92 | % | |
Based on a $10,000 initial investment, the graph and table above illustrate the total return of VY® T. Rowe Price International Stock Portfolio against the index indicated. The index is unmanaged and has no cash in its portfolio and imposes no sales charges. An investor cannot invest directly in an index.
The Portfolio’s performance is shown without the imposition of any expenses or charges which are, or may be, imposed under your variable annuity contract or variable life insurance policy. Total returns would have been lower if such expenses or charges were included.
The performance graph and table do not reflect the deduction of taxes that a shareholder will pay on Portfolio distributions or the redemption of Portfolio shares.
The performance shown includes, if applicable, the effect of fee waivers and/or expense reimbursements by the Investment Adviser and/or other
service providers, which have the effect of increasing total return. Had all fees and expenses been considered, the total returns would have been lower.
The performance update illustrates performance for a variable investment option available through a variable annuity contract or a variable life insurance policy. The performance shown indicates past performance and is not a projection or prediction of future results. Actual investment returns and principal value will fluctuate so that shares and/or units, at redemption, may be worth more or less than their original cost. Please log on to www.voyainvestments.com or call (800) 366-0066 to get performance through the most recent month end.
Portfolio holdings are subject to change daily.
18
SHAREHOLDER EXPENSE EXAMPLES (UNAUDITED) As a shareholder of a Portfolio, you incur two types of costs: (1) transaction costs, including redemption fees and exchange fees; and (2) ongoing costs, including management fees, distribution and/or service (12b-1) fees, and other Portfolio expenses. These Examples are intended to help you understand your ongoing costs (in dollars) of investing in a Portfolio and to compare these costs with the ongoing costs of investing in other mutual funds.
The Examples are based on an investment of $1,000 invested at the beginning of the period and held for the entire period from July 1, 2020 to December 31, 2020. The Portfolios’ expenses are shown without the imposition of any charges which are, or may be, imposed under your variable annuity contract, variable life insurance policy, qualified pension, or retirement plan. Expenses would have been higher if such charges were included.
Actual Expenses
The left section of the table shown below, “Actual Portfolio Return,” provides information about actual account values and actual expenses. You may use the information in this section, together with the amount you invested, to estimate the expenses that you paid over the period. Simply divide your account value by $1,000 (for example, an $8,600 account value divided by $1,000 = 8.6), then multiply the result by the number in the first section under the heading entitled “Expenses Paid During the Period” to estimate the expenses you paid on your account during this period.
Hypothetical Example for Comparison Purposes
The right section of the table shown below, “Hypothetical (5% return before expenses),” provides information about hypothetical account values and hypothetical expenses based on a Portfolio’s actual expense ratio and an assumed rate of return of 5% per year before expenses, which is not a Portfolio’s actual return. The hypothetical account values and expenses may not be used to estimate the actual ending account balance or expenses you paid for the period. You may use this information to compare the ongoing costs of investing in a Portfolio and other mutual funds. To do so, compare this 5% hypothetical example with the 5% hypothetical examples that appear in the shareholder reports of the other mutual funds.
Please note that the expenses shown in the table are meant to highlight your ongoing costs only and do not reflect any transactional costs, such as redemption fees or exchange fees. Therefore, the hypothetical section of the table is useful in comparing ongoing costs only, and will not help you determine the relative total costs of owning different mutual funds. In addition, if these transactional costs were included, your costs would have been higher.
| | | | Actual Portfolio Return | | Hypothetical (5% return before expenses) | |
|---|
| | | | Beginning
Account
Value
July 1,
2020 | | Ending
Account
Value
December 31,
2020 | | Annualized
Expense
Ratio | | Expenses Paid
During the
Period Ended
December 31,
2020* | | Beginning
Account
Value
July 1,
2020 | | Ending
Account
Value
December 31,
2020 | | Annualized
Expense
Ratio | | Expenses Paid
During the
Period Ended
December 31,
2020* | |
|---|
| | Voya Government Liquid Assets Portfolio |
| | Class I | | $ | 1,000.00 | | | $ | 1,000.10 | | | | 0.17 | % | | $ | 0.85 | | | $ | 1,000.00 | | | $ | 1,024.28 | | | | 0.17 | % | | $ | 0.87 | | |
| | Class S | | | 1,000.00 | | | | 1,000.10 | | | | 0.21 | | | | 1.06 | | | | 1,000.00 | | | | 1,024.08 | | | | 0.21 | | | | 1.07 | | |
| | Class S2 | | | 1,000.00 | | | | 1,000.10 | | | | 0.23 | | | | 1.16 | | | | 1,000.00 | | | | 1,023.98 | | | | 0.23 | | | | 1.17 | | |
| | VY® Clarion Global Real Estate Portfolio |
| | Class ADV | | | 1,000.00 | | | | 1,163.00 | | | | 1.47 | % | | | 7.99 | | | | 1,000.00 | | | | 1,017.75 | | | | 1.47 | % | | | 7.46 | | |
| | Class I | | | 1,000.00 | | | | 1,166.10 | | | | 0.87 | | | | 4.74 | | | | 1,000.00 | | | | 1,020.76 | | | | 0.87 | | | | 4.42 | | |
| | Class S | | | 1,000.00 | | | | 1,164.90 | | | | 1.12 | | | | 6.09 | | | | 1,000.00 | | | | 1,019.51 | | | | 1.12 | | | | 5.69 | | |
| | Class S2 | | | 1,000.00 | | | | 1,165.20 | | | | 1.27 | | | | 6.91 | | | | 1,000.00 | | | | 1,018.75 | | | | 1.27 | | | | 6.44 | | |
| | VY® Invesco Growth and Income Portfolio |
| | Class ADV | | | 1,000.00 | | | | 1,275.90 | | | | 1.24 | % | | | 7.09 | | | | 1,000.00 | | | | 1,018.90 | | | | 1.24 | % | | | 6.29 | | |
| | Class I | | | 1,000.00 | | | | 1,279.70 | | | | 0.64 | | | | 3.67 | | | | 1,000.00 | | | | 1,021.92 | | | | 0.64 | | | | 3.25 | | |
| | Class S | | | 1,000.00 | | | | 1,278.00 | | | | 0.89 | | | | 5.10 | | | | 1,000.00 | | | | 1,020.66 | | | | 0.89 | | | | 4.52 | | |
| | Class S2 | | | 1,000.00 | | | | 1,277.10 | | | | 1.04 | | | | 5.95 | | | | 1,000.00 | | | | 1,019.91 | | | | 1.04 | | | | 5.28 | | |
19
SHAREHOLDER EXPENSE EXAMPLES (UNAUDITED) (CONTINUED)
| | | | Actual Portfolio Return | | Hypothetical (5% return before expenses) | |
|---|
| | | | Beginning
Account
Value
July 1,
2020 | | Ending
Account
Value
December 31,
2020 | | Annualized
Expense
Ratio | | Expenses Paid
During the
Period Ended
December 31,
2020* | | Beginning
Account
Value
July 1,
2020 | | Ending
Account
Value
December 31,
2020 | | Annualized
Expense
Ratio | | Expenses Paid
During the
Period Ended
December 31,
2020* | |
|---|
| | VY® JPMorgan Emerging Markets Equity Portfolio | | | | | | | | | | | | | | | | | | |
| | Class ADV | | $ | 1,000.00 | | | $ | 1,396.20 | | | | 1.85 | % | | $ | 11.14 | | | $ | 1,000.00 | | | $ | 1,015.84 | | | | 1.85 | % | | $ | 9.37 | | |
| | Class I | | | 1,000.00 | | | | 1,400.10 | | | | 1.25 | | | | 7.54 | | | | 1,000.00 | | | | 1,018.85 | | | | 1.25 | | | | 6.34 | | |
| | Class S | | | 1,000.00 | | | | 1,398.80 | | | | 1.50 | | | | 9.04 | | | | 1,000.00 | | | | 1,017.60 | | | | 1.50 | | | | 7.61 | | |
| | Class S2 | | | 1,000.00 | | | | 1,397.60 | | | | 1.65 | | | | 9.94 | | | | 1,000.00 | | | | 1,016.84 | | | | 1.65 | | | | 8.36 | | |
| | VY® Morgan Stanley Global Franchise Portfolio |
| | Class ADV | | | 1,000.00 | | | | 1,122.50 | | | | 1.54 | % | | | 8.22 | | | | 1,000.00 | | | | 1,017.39 | | | | 1.54 | % | | | 7.81 | | |
| | Class R6 | | | 1,000.00 | | | | 1,125.70 | | | | 0.94 | | | | 5.02 | | | | 1,000.00 | | | | 1,020.41 | | | | 0.94 | | | | 4.77 | | |
| | Class S | | | 1,000.00 | | | | 1,124.40 | | | | 1.19 | | | | 6.35 | | | | 1,000.00 | | | | 1,019.15 | | | | 1.19 | | | | 6.04 | | |
| | Class S2 | | | 1,000.00 | | | | 1,123.40 | | | | 1.34 | | | | 7.15 | | | | 1,000.00 | | | | 1,018.40 | | | | 1.34 | | | | 6.80 | | |
| | VY® T. Rowe Price Capital Appreciation Portfolio |
| | Class ADV | | | 1,000.00 | | | | 1,177.90 | | | | 1.24 | % | | | 6.79 | | | | 1,000.00 | | | | 1,018.90 | | | | 1.24 | % | | | 6.29 | | |
| | Class I | | | 1,000.00 | | | | 1,181.60 | | | | 0.64 | | | | 3.51 | | | | 1,000.00 | | | | 1,021.92 | | | | 0.64 | | | | 3.25 | | |
| | Class R6 | | | 1,000.00 | | | | 1,181.50 | | | | 0.64 | | | | 3.51 | | | | 1,000.00 | | | | 1,021.92 | | | | 0.64 | | | | 3.25 | | |
| | Class S | | | 1,000.00 | | | | 1,179.70 | | | | 0.89 | | | | 4.88 | | | | 1,000.00 | | | | 1,020.66 | | | | 0.89 | | | | 4.52 | | |
| | Class S2 | | | 1,000.00 | | | | 1,179.40 | | | | 1.04 | | | | 5.70 | | | | 1,000.00 | | | | 1,019.91 | | | | 1.04 | | | | 5.28 | | |
| | VY® T. Rowe Price Equity Income Portfolio |
| | Class ADV | | | 1,000.00 | | | | 1,243.40 | | | | 1.21 | % | | | 6.82 | | | | 1,000.00 | | | | 1,019.05 | | | | 1.21 | % | | | 6.14 | | |
| | Class I | | | 1,000.00 | | | | 1,248.60 | | | | 0.61 | | | | 3.45 | | | | 1,000.00 | | | | 1,022.07 | | | | 0.61 | | | | 3.10 | | |
| | Class S | | | 1,000.00 | | | | 1,246.50 | | | | 0.86 | | | | 4.86 | | | | 1,000.00 | | | | 1,020.81 | | | | 0.86 | | | | 4.37 | | |
| | Class S2 | | | 1,000.00 | | | | 1,246.00 | | | | 1.01 | | | | 5.70 | | | | 1,000.00 | | | | 1,020.06 | | | | 1.01 | | | | 5.13 | | |
| | VY® T. Rowe Price International Stock Portfolio |
| | Class ADV | | | 1,000.00 | | | | 1,222.40 | | | | 1.36 | % | | | 7.60 | | | | 1,000.00 | | | | 1,018.30 | | | | 1.36 | % | | | 6.90 | | |
| | Class I | | | 1,000.00 | | | | 1,226.10 | | | | 0.76 | | | | 4.25 | | | | 1,000.00 | | | | 1,021.32 | | | | 0.76 | | | | 3.86 | | |
| | Class S | | | 1,000.00 | | | | 1,224.60 | | | | 1.01 | | | | 5.65 | | | | 1,000.00 | | | | 1,020.06 | | | | 1.01 | | | | 5.13 | | |
| * | | Expenses are equal to each Portfolio’s respective annualized expense ratios multiplied by the average account value over the period, multiplied by 184/366 to reflect the most recent fiscal half-year. |
20
REPORT OF INDEPENDENT REGISTERED PUBLIC ACCOUNTING FIRM To the Shareholders of Voya Government Liquid Assets Portfolio, VY® Clarion Global Real Estate Portfolio, VY® Invesco Growth and Income Portfolio, VY® JPMorgan Emerging Markets Equity Portfolio, VY® Morgan Stanley Global Franchise Portfolio, VY® T. Rowe Price Capital Appreciation Portfolio, VY® T. Rowe Price Equity Income Portfolio and VY® T. Rowe Price International Stock Portfolio and the Board of Trustees of Voya Investors Trust
Opinion on the Financial Statements
We have audited the accompanying statements of assets and liabilities of Voya Government Liquid Assets Portfolio, VY® Clarion Global Real Estate Portfolio, VY® Invesco Growth and Income Portfolio, VY® JPMorgan Emerging Markets Equity Portfolio, VY® Morgan Stanley Global Franchise Portfolio, VY® T. Rowe Price Capital Appreciation Portfolio, VY® T. Rowe Price Equity Income Portfolio and VY® T. Rowe Price International Stock Portfolio (collectively referred to as the “Portfolios”) (eight of the portfolios constituting Voya Investors Trust (the “Trust”)), including the portfolios of investments and summary portfolios of investments, as applicable, as of December 31, 2020, and the related statements of operations and changes in net assets and the financial highlights for the year then ended and the related notes (collectively referred to as the “financial statements”). In our opinion, the financial statements present fairly, in all material respects, the financial position of the Portfolios (eight of the portfolios constituting Voya Investors Trust) at December 31, 2020, the results of their operations, the changes in their net assets and their financial highlights for the year then ended, in conformity with U.S. generally accepted accounting principles.
The statement of changes in net assets for the year ended December 31, 2019, and the financial highlights for each of the periods in the four-year period then ended, were audited by another independent registered public accounting firm whose report, dated February 21, 2020, expressed an unqualified opinion on that statement of changes in net assets and those financial highlights.
Basis for Opinion
These financial statements are the responsibility of the Trust’s management. Our responsibility is to express an opinion on the Portfolios’ financial statements based on our audits. We are a public accounting firm registered with the Public Company Accounting Oversight Board (United States) (“PCAOB”) and are required to be independent with respect to the Trust in accordance with the U.S. federal securities laws and the applicable rules and regulations of the Securities and Exchange Commission and the PCAOB.
We conducted our audits in accordance with the standards of the PCAOB. Those standards require that we plan and perform the audits to obtain reasonable assurance about whether the financial statements are free of material misstatement, whether due to error or fraud. The Trust is not required to have, nor were we engaged to perform, an audit of the Trust’s internal control over financial reporting. As part of our audits, we are required to obtain an understanding of internal control over financial reporting, but not for the purpose of expressing an opinion on the effectiveness of the Trust’s internal control over financial reporting. Accordingly, we express no such opinion.
Our audits included performing procedures to assess the risks of material misstatement of the financial statements, whether due to error or fraud, and performing procedures that respond to those risks. Such procedures included examining, on a test basis, evidence regarding the amounts and disclosures in the financial statements. Our procedures included confirmation of securities owned as of December 31, 2020, by correspondence with the custodian and others or by other appropriate auditing procedures where replies from others were not received. Our audits also included evaluating the accounting principles used and significant estimates made by management, as well as evaluating the overall presentation of the financial statements. We believe that our audits provide a reasonable basis for our opinion.

We have served as the auditor of one or more Voya investment companies since 2019.
Boston, Massachusetts
February 24, 2021
21
STATEMENTS OF ASSETS AND LIABILITIES AS OF DECEMBER 31, 2020 | | Voya
Government
Liquid Assets
Portfolio | | VY®
Clarion Global
Real Estate
Portfolio | | VY®
Invesco
Growth and Income
Portfolio | | VY®
JPMorgan Emerging
Markets Equity
Portfolio |
|---|
ASSETS: | | | | | | | | | | | | | | | | | | | | |
| Investments in securities at fair value+* | | | $ | — | | | | $ | 188,532,246 | | | | $ | 380,645,829 | | | | $ | 586,870,610 | |
Short-term investments at fair value† | | | | — | | | | | 1,699,470 | | | | | 8,467,244 | | | | | 2,790,179 | |
| Short-term investments at amortized cost | | | | 814,681,461 | | | | | — | | | | | — | | | | | — | |
| Repurchase agreements | | | | 136,392,000 | | | | | — | | | | | — | | | | | — | |
| Cash | | | | 517 | | | | | — | | | | | — | | | | | — | |
Foreign currencies at value‡ | | | | — | | | | | — | | | | | 8,194 | | | | | 27,839 | |
| Receivables: | | | | | | | | | | | | | | | | | | | | |
| Investment securities and currencies sold | | | | 11,999,004 | | | | | 5,515,753 | | | | | 1,151,407 | | | | | 3,852,238 | |
| Fund shares sold | | | | 3,784,307 | | | | | 2,019,948 | | | | �� | 390,551 | | | | | 68,690 | |
| Dividends | | | | — | | | | | 843,284 | | | | | 640,790 | | | | | 339,358 | |
| Interest | | | | 38,720 | | | | | — | | | | | — | | | | | — | |
| Foreign tax reclaims | | | | — | | | | | 75,555 | | | | | 176,821 | | | | | 48,464 | |
| Unrealized appreciation on forward foreign currency contracts | | | | — | | | | | 213 | | | | | 12,014 | | | | | 4 | |
| Prepaid expenses | | | | — | | | | | 910 | | | | | — | | | | | — | |
| Reimbursement due from Investment Adviser | | | | 406,161 | | | | | 27,643 | | | | | — | | | | | — | |
| Other assets | | | | 26,804 | | | | | 12,654 | | | | | 23,846 | | | | | 25,637 | |
| Total assets | | | | 967,328,974 | | | | | 198,727,676 | | | | | 391,516,696 | | | | | 594,023,019 | |
LIABILITIES: | | | | | | | | | | | | | | | | | | | | |
| Payable for investment securities and currencies purchased | | | | — | | | | | 3,461,777 | | | | | 1,254,342 | | | | | 2,917,141 | |
| Payable for fund shares redeemed | | | | 60,637 | | | | | 30,812 | | | | | 169,696 | | | | | 8,237,219 | |
| Payable upon receipt of securities loaned | | | | — | | | | | 1,047,089 | | | | | 1,415,614 | | | | | 2,601,075 | |
| Unrealized depreciation on forward foreign currency contracts | | | | — | | | | | 6 | | | | | 222,338 | | | | | — | |
| Payable for unified fees | | | | 227,236 | | | | | — | | | | | 207,746 | | | | | 597,099 | |
| Payable for investment management fees | | | | — | | | | | 139,095 | | | | | — | | | | | — | |
| Payable for distribution and shareholder service fees | | | | 259,823 | | | | | 24,083 | | | | | 82,987 | | | | | 118,991 | |
Payable to custodian due to foreign currency overdraft§ | | | | — | | | | | 315,178 | | | | | — | | | | | — | |
| Payable to trustees under the deferred compensation plan (Note 6) | | | | 26,804 | | | | | 12,654 | | | | | 23,846 | | | | | 25,637 | |
| Payable for trustee fees | | | | 28,258 | | | | | 939 | | | | | — | | | | | — | |
| Payable for foreign capital gains tax | | | | — | | | | | — | | | | | — | | | | | 2,397,450 | |
| Other accrued expenses and liabilities | | | | — | | | | | 165,015 | | | | | — | | | | | — | |
| Total liabilities | | | | 602,758 | | | | | 5,196,648 | | | | | 3,376,569 | | | | | 16,894,612 | |
NET ASSETS | | | $ | 966,726,216 | | | | $ | 193,531,028 | | | | $ | 388,140,127 | | | | $ | 577,128,407 | |
NET ASSETS WERE COMPRISED OF: | | | | | | | | | | | | | | | | | | | | |
| Paid-in capital | | | $ | 966,745,066 | | | | $ | 171,342,472 | | | | $ | 310,570,356 | | | | $ | 261,329,030 | |
| Total distributable earnings (loss) | | | | (18,850 | ) | | | | 22,188,556 | | | | | 77,569,771 | | | | | 315,799,377 | |
NET ASSETS | | | $ | 966,726,216 | | | | $ | 193,531,028 | | | | $ | 388,140,127 | | | | $ | 577,128,407 | |
| | | | | | | | | | | | | | | | | | | | | | |
| + Including securities loaned at value | | | $ | — | | | | $ | 135,350 | | | | $ | 1,383,873 | | | | $ | 2,539,430 | |
| * Cost of investments in securities | | | $ | — | | | | $ | 150,659,248 | | | | $ | 304,979,769 | | | | $ | 308,479,159 | |
| † Cost of short-term investments | | | $ | — | | | | $ | 1,699,470 | | | | $ | 8,467,244 | | | | $ | 2,790,179 | |
| ‡ Cost of foreign currencies | | | $ | — | | | | $ | — | | | | $ | 8,204 | | | | $ | 27,908 | |
| § Cost of foreign currency overdraft | | | $ | — | | | | $ | 315,206 | | | | $ | — | | | | $ | — | |
See Accompanying Notes to Financial Statements
22
STATEMENTS OF ASSETS AND LIABILITIES AS OF DECEMBER 31, 2020 (CONTINUED)
| | Voya
Government
Liquid Assets
Portfolio | | VY®
Clarion Global
Real Estate
Portfolio | | VY®
Invesco
Growth and Income
Portfolio | | VY®
JPMorgan Emerging
Markets Equity
Portfolio |
|---|
Class ADV | | | | | | | | | | | | | | | | |
| Net assets | | | n/a | | | $ | 14,367,019 | | | $ | 15,542,632 | | | $ | 58,266,478 | |
| Shares authorized | | | n/a | | | | unlimited | | | | unlimited | | | | unlimited | |
| Par value | | | n/a | | | $ | 0.001 | | | $ | 0.001 | | | $ | 0.001 | |
| Shares outstanding | | | n/a | | | | 1,400,612 | | | | 753,721 | | | | 2,247,528 | |
| Net asset value and redemption price per share | | | n/a | | | $ | 10.26 | | | $ | 20.62 | | | $ | 25.92 | |
| | | | | | | | | | | | | | | | | |
Class I | | | | | | | | | | | | | | | | |
| Net assets | | $ | 64,002,335 | | | $ | 96,799,285 | | | $ | 30,671,964 | | | $ | 94,066,970 | |
| Shares authorized | | | unlimited | | | | unlimited | | | | unlimited | | | | unlimited | |
| Par value | | $ | 0.001 | | | $ | 0.001 | | | $ | 0.001 | | | $ | 0.001 | |
| Shares outstanding | | | 63,996,885 | | | | 9,174,334 | | | | 1,470,712 | | | | 3,414,295 | |
| Net asset value and redemption price per share | | $ | 1.00 | | | $ | 10.55 | | | $ | 20.86 | | | $ | 27.55 | |
| | | | | | | | | | | | | | | | | |
Class S | | | | | | | | | | | | | | | | |
| Net assets | | $ | 375,267,100 | | | $ | 81,568,330 | | | $ | 317,890,490 | | | $ | 411,371,277 | |
| Shares authorized | | | unlimited | | | | unlimited | | | | unlimited | | | | unlimited | |
| Par value | | $ | 0.001 | | | $ | 0.001 | | | $ | 0.001 | | | $ | 0.001 | |
| Shares outstanding | | | 375,235,256 | | | | 7,766,201 | | | | 15,048,782 | | | | 15,042,313 | |
| Net asset value and redemption price per share | | $ | 1.00 | | | $ | 10.50 | | | $ | 21.12 | | | $ | 27.35 | |
| | | | | | | | | | | | | | | | | |
Class S2 | | | | | | | | | | | | | | | | |
| Net assets | | $ | 527,456,781 | | | $ | 796,394 | | | $ | 24,035,041 | | | $ | 13,423,682 | |
| Shares authorized | | | unlimited | | | | unlimited | | | | unlimited | | | | unlimited | |
| Par value | | $ | 0.001 | | | $ | 0.001 | | | $ | 0.001 | | | $ | 0.001 | |
| Shares outstanding | | | 527,412,003 | | | | 75,078 | | | | 1,150,864 | | | | 497,470 | |
| Net asset value and redemption price per share | | $ | 1.00 | | | $ | 10.61 | | | $ | 20.88 | | | $ | 26.98 | |
See Accompanying Notes to Financial Statements
23
STATEMENTS OF ASSETS AND LIABILITIES AS OF DECEMBER 31, 2020
| | VY®
Morgan Stanley
Global Franchise
Portfolio | | VY®
T. Rowe Price
Capital Appreciation
Portfolio | | VY®
T. Rowe Price
Equity Income
Portfolio | | VY®
T. Rowe Price
International Stock
Portfolio |
|---|
ASSETS: | | | | | | | | | | | | | | | | | | | | |
| Investments in securities at fair value+* | | | $ | 411,624,451 | | | | $ | 7,224,313,913 | | | | $ | 342,319,809 | | | | $ | 215,842,701 | |
Short-term investments at fair value† | | | �� | 7,019,081 | | | | | 847,122,815 | | | | | 4,499,483 | | | | | 9,593,748 | |
| Cash | | | | — | | | | | 15,115,214 | | | | | 2,193,985 | | | | | 1,358,956 | |
Foreign currencies at value‡ | | | | — | | | | | — | | | | | — | | | | | 270,615 | |
| Receivables: | | | | | | | | | | | | | | | | | | | | |
| Investment securities and currencies sold | | | | — | | | | | 32,377,529 | | | | | 945,197 | | | | | 336,293 | |
| Fund shares sold | | | | 2,242,716 | | | | | 1,770,549 | | | | | 288,951 | | | | | 119,831 | |
| Dividends | | | | 835,108 | | | | | 2,039,565 | | | | | 696,462 | | | | | 189,703 | |
| Interest | | | | — | | | | | 11,324,331 | | | | | 8,811 | | | | | 779 | |
| Foreign tax reclaims | | | | 143,132 | | | | | — | | | | | 53,122 | | | | | 289,137 | |
| Unrealized appreciation on forward foreign currency contracts | | | | — | | | | | — | | | | | — | | | | | 15 | |
| Prepaid expenses | | | | — | | | | | — | | | | | — | | | | | 868 | |
| Other assets | | | | 16,447 | | | | | 222,245 | | | | | 43,507 | | | | | 11,029 | |
| Total assets | | | | 421,880,935 | | | | | 8,134,286,161 | | | | | 351,049,327 | | | | | 228,013,675 | |
LIABILITIES: | | | | | | | | | | | | | | | | | | | | |
| Payable for investment securities and currencies purchased | | | | — | | | | | 40,768,731 | | | | | 1,028,138 | | | | | 197,257 | |
| Payable for fund shares redeemed | | | | 15,743 | | | | | 5,282,640 | | | | | 874,940 | | | | | 216,787 | |
| Payable upon receipt of securities loaned | | | | — | | | | | 108,320,448 | | | | | 2,311,754 | | | | | 4,249,056 | |
| Unrealized depreciation on forward foreign currency contracts | | | | — | | | | | — | | | | | — | | | | | 282 | |
| Payable for unified fees | | | | 327,858 | | | | | 4,347,781 | | | | | 176,224 | | | | | — | |
| Payable for investment management fees | | | | — | | | | | — | | | | | — | | | | | 121,183 | |
| Payable for distribution and shareholder service fees | | | | 127,046 | | | | | 1,733,092 | | | | | 80,585 | | | | | 44,072 | |
| Payable to trustees under the deferred compensation plan (Note 6) | | | | 16,447 | | | | | 222,245 | | | | | 43,507 | | | | | 11,029 | |
| Payable for trustee fees | | | | — | | | | | — | | | | | — | | | | | 983 | |
| Other accrued expenses and liabilities | | | | — | | | | | — | | | | | — | | | | | 174,790 | |
| Written options, at fair valueˆ | | | | — | | | | | 98,227,223 | | | | | — | | | | | 35,730 | |
| Total liabilities | | | | 487,094 | | | | | 258,902,160 | | | | | 4,515,148 | | | | | 5,051,169 | |
NET ASSETS | | | $ | 421,393,841 | | | | $ | 7,875,384,001 | | | | $ | 346,534,179 | | | | $ | 222,962,506 | |
NET ASSETS WERE COMPRISED OF: | | | | | | | | | | | | | | | | | | | | |
| Paid-in capital | | | $ | 260,374,193 | | | | $ | 5,579,214,601 | | | | $ | 276,340,099 | | | | $ | 158,249,595 | |
| Total distributable earnings | | | | 161,019,648 | | | | | 2,296,169,400 | | | | | 70,194,080 | | | | | 64,712,911 | |
NET ASSETS | | | $ | 421,393,841 | | | | $ | 7,875,384,001 | | | | $ | 346,534,179 | | | | $ | 222,962,506 | |
| | | | | | | | | | | | | | | | | | | | | | |
| + Including securities loaned at value | | | $ | — | | | | $ | 105,920,925 | | | | $ | 2,260,606 | | | | $ | 4,044,443 | |
| * Cost of investments in securities | | | $ | 288,591,705 | | | | $ | 5,843,146,771 | | | | $ | 277,562,541 | | | | $ | 154,512,920 | |
| † Cost of short-term investments | | | $ | 7,019,081 | | | | $ | 847,122,815 | | | | $ | 4,499,483 | | | | $ | 9,593,748 | |
| ‡ Cost of foreign currencies | | | $ | — | | | | $ | — | | | | $ | — | | | | $ | 274,140 | |
| ˆ Premiums received on written options | | | $ | — | | | | $ | 51,671,233 | | | | $ | — | | | | $ | 21,937 | |
See Accompanying Notes to Financial Statements
24
STATEMENTS OF ASSETS AND LIABILITIES AS OF DECEMBER 31, 2020 (CONTINUED)
| | VY®
Morgan Stanley
Global Franchise
Portfolio | | VY®
T. Rowe Price
Capital Appreciation
Portfolio | | VY®
T. Rowe Price
Equity Income
Portfolio | | VY®
T. Rowe Price
International Stock
Portfolio |
|---|
Class ADV | | | | | | | | | | | | | | | | |
| Net assets | | $ | 120,606,174 | | | $ | 1,555,872,906 | | | $ | 47,110,233 | | | $ | 24,010,121 | |
| Shares authorized | | | unlimited | | | | unlimited | | | | unlimited | | | | unlimited | |
| Par value | | $ | 0.001 | | | $ | 0.001 | | | $ | 0.001 | | | $ | 0.001 | |
| Shares outstanding | | | 7,300,846 | | | | 52,010,762 | | | | 4,980,967 | | | | 1,354,888 | |
| Net asset value and redemption price per share | | $ | 16.52 | | | $ | 29.91 | | | $ | 9.46 | | | $ | 17.72 | |
| | | | | | | | | | | | | | | | | |
Class I | | | | | | | | | | | | | | | | |
| Net assets | | | n/a | | | $ | 1,280,224,105 | | | $ | 77,346,447 | | | $ | 45,033,272 | |
| Shares authorized | | | n/a | | | | unlimited | | | | unlimited | | | | unlimited | |
| Par value | | | n/a | | | $ | 0.001 | | | $ | 0.001 | | | $ | 0.001 | |
| Shares outstanding | | | n/a | | | | 40,463,549 | | | | 7,977,072 | | | | 2,527,915 | |
| Net asset value and redemption price per share | | | n/a | | | $ | 31.64 | | | $ | 9.70 | | | $ | 17.81 | |
| | | | | | | | | | | | | | | | | |
Class R6 | | | | | | | | | | | | | | | | |
| Net assets | | $ | 1,301,375 | | | $ | 542,043,001 | | | | n/a | | | | n/a | |
| Shares authorized | | | unlimited | | | | unlimited | | | | n/a | | | | n/a | |
| Par value | | $ | 0.001 | | | $ | 0.001 | | | | n/a | | | | n/a | |
| Shares outstanding | | | 72,423 | | | | 17,121,254 | | | | n/a | | | | n/a | |
| Net asset value and redemption price per share | | $ | 17.97 | | | $ | 31.66 | | | | n/a | | | | n/a | |
| | | | | | | | | | | | | | | | | |
Class S | | | | | | | | | | | | | | | | |
| Net assets | | $ | 260,900,938 | | | $ | 4,426,278,184 | | | $ | 141,486,075 | | | $ | 153,919,113 | |
| Shares authorized | | | unlimited | | | | unlimited | | | | unlimited | | | | unlimited | |
| Par value | | $ | 0.001 | | | $ | 0.001 | | | $ | 0.001 | | | $ | 0.001 | |
| Shares outstanding | | | 14,487,916 | | | | 139,877,825 | | | | 14,371,311 | | | | 8,676,535 | |
| Net asset value and redemption price per share | | $ | 18.01 | | | $ | 31.64 | | | $ | 9.85 | | | $ | 17.74 | |
| | | | | | | | | | | | | | | | | |
Class S2 | | | | | | | | | | | | | | | | |
| Net assets | | $ | 38,585,354 | | | $ | 70,965,805 | | | $ | 80,591,424 | | | | n/a | |
| Shares authorized | | | unlimited | | | | unlimited | | | | unlimited | | | | n/a | |
| Par value | | $ | 0.001 | | | $ | 0.001 | | | $ | 0.001 | | | | n/a | |
| Shares outstanding | | | 2,167,147 | | | | 2,262,462 | | | | 8,440,668 | | | | n/a | |
| Net asset value and redemption price per share | | $ | 17.80 | | | $ | 31.37 | | | $ | 9.55 | | | | n/a | |
See Accompanying Notes to Financial Statements
25
STATEMENTS OF OPERATIONS FOR THE YEAR ENDED DECEMBER 31, 2020 | | Voya
Government
Liquid Assets
Portfolio | | VY®
Clarion Global
Real Estate
Portfolio | | VY®
Invesco
Growth and Income
Portfolio | | VY®
JPMorgan Emerging
Markets Equity
Portfolio |
|---|
INVESTMENT INCOME: | | | | | | | | | | | | | | | | | | | | |
| Dividends, net of foreign taxes withheld* | | | $ | 156,168 | | | | $ | 5,556,104 | | | | $ | 9,522,838 | | | | $ | 5,018,194 | |
| Interest | | | | 3,248,978 | | | | | — | | | | | — | | | | | — | |
| Securities lending income, net | | | | — | | | | | 13,181 | | | | | 41,767 | | | | | 10,990 | |
| Total investment income | | | | 3,405,146 | | | | | 5,569,285 | | | | | 9,564,605 | | | | | 5,029,184 | |
EXPENSES: | | | | | | | | | | | | | | | | | | | | |
| Investment management fees | | | | — | | | | | 1,689,264 | | | | | — | | | | | — | |
| Unified fees | | | | 2,538,120 | | | | | — | | | | | 2,256,269 | | | | | 5,977,571 | |
| Distribution and shareholder service fees: | | | | | | | | | | | | | | | | | | | | |
| Class ADV | | | | — | | | | | 82,527 | | | | | 84,805 | | | | | 287,024 | |
| Class S | | | | 936,796 | | | | | 195,382 | | | | | 729,164 | | | | | 856,453 | |
| Class S2 | | | | 1,927,404 | | | | | 2,998 | | | | | 88,452 | | | | | 44,547 | |
| Transfer agent fees: | | | | | | | | | | | | | | | | | | | | |
| Class ADV | | | | — | | | | | 16,829 | | | | | — | | | | | — | |
| Class I | | | | — | | | | | 116,189 | | | | | — | | | | | — | |
| Class S | | | | — | | | | | 95,572 | | | | | — | | | | | — | |
| Class S2 | | | | — | | | | | 914 | | | | | — | | | | | — | |
| Shareholder reporting expense | | | | — | | | | | 35,950 | | | | | — | | | | | — | |
| Professional fees | | | | — | | | | | 14,960 | | | | | — | | | | | — | |
| Custody and accounting expense | | | | — | | | | | 35,164 | | | | | — | | | | | — | |
| Trustee fees and expenses | | | | 45,548 | | | | | 7,508 | | | | | 16,403 | | | | | 19,257 | |
| Miscellaneous expense | | | | — | | | | | 15,552 | | | | | — | | | | | — | |
| Interest expense | | | | — | | | | | 723 | | | | | — | | | | | 1,615 | |
| Total expenses | | | | 5,447,868 | | | | | 2,309,532 | | | | | 3,175,093 | | | | | 7,186,467 | |
| Waived and reimbursed fees | | | | (3,463,182 | ) | | | | (394,310 | ) | | | | — | | | | | — | |
| Brokerage commission recapture | | �� | | — | | | | | (1,884 | ) | | | | — | | | | | (1,672 | ) |
| Net expenses | | | | 1,984,686 | | | | | 1,913,338 | | | | | 3,175,093 | | | | | 7,184,795 | |
| Net investment income (loss) | | | | 1,420,460 | | | | | 3,655,947 | | | | | 6,389,512 | | | | | (2,155,611 | ) |
REALIZED AND UNREALIZED GAIN (LOSS): | | | | | | | | | | | | | | | | | | | | |
| Net realized gain (loss) on: | | | | | | | | | | | | | | | | | | | | |
| Investments (net of foreign capital gains taxes withheldˆ) | | | | 330,328 | | | | | (7,044,793 | ) | | | | (2,572,677 | ) | | | | 43,148,944 | |
| Forward foreign currency contracts | | | | — | | | | | 1,652 | | | | | (1,757,104 | ) | | | | 2,551 | |
| Foreign currency related transactions | | | | — | | | | | 35,356 | | | | | 674,911 | | | | | (79,619 | ) |
| Net realized gain (loss) | | | | 330,328 | | | | | (7,007,785 | ) | | | | (3,654,870 | ) | | | | 43,071,876 | |
| Net change in unrealized appreciation (depreciation) on: | | | | | | | | | | | | | | | | | | | | |
| Investments (net of foreign capital gains taxes accrued#) | | | | — | | | | | (9,673,960 | ) | | | | (21,848 | ) | | | | 103,204,018 | |
| Forward foreign currency contracts | | | | — | | | | | 142 | | | | | 492,370 | | | | | 4 | |
| Foreign currency related transactions | | | | — | | | | | 5,409 | | | | | 10,383 | | | | | 5,598 | |
| Net change in unrealized appreciation (depreciation) | | | | — | | | | | (9,668,409 | ) | | | | 480,905 | | | | | 103,209,620 | |
| Net realized and unrealized gain (loss) | | | | 330,328 | | | | | (16,676,194 | ) | | | | (3,173,965 | ) | | | | 146,281,496 | |
Increase (decrease) in net assets resulting from operations | | | $ | 1,750,788 | | | | $ | (13,020,247 | ) | | | $ | 3,215,547 | | | | $ | 144,125,885 | |
| | | | | | | | | | | | | | | | | | | | | | |
| * Foreign taxes withheld | | | $ | — | | | | $ | 230,156 | | | | $ | 116,649 | | | | $ | 688,142 | |
| ˆ Foreign capital gains taxes withheld | | | $ | — | | | | $ | — | | | | $ | — | | | | $ | 180,866 | |
| # Foreign capital gains taxes accrued | | | $ | — | | | | $ | — | | | | $ | — | | | | $ | 2,397,450 | |
See Accompanying Notes to Financial Statements
26
STATEMENTS OF OPERATIONS FOR THE YEAR ENDED DECEMBER 31, 2020
| | VY®
Morgan Stanley
Global Franchise
Portfolio | | VY®
T. Rowe Price
Capital Appreciation
Portfolio | | VY®
T. Rowe Price
Equity Income
Portfolio | | VY®
T. Rowe Price
International Stock
Portfolio |
|---|
INVESTMENT INCOME: | | | | | | | | | | | | | | | | | | | | |
| Dividends, net of foreign taxes withheld* | | | $ | 7,711,850 | | | | $ | 71,749,820 | | | | $ | 9,605,402 | | | | $ | 2,945,445 | |
| Interest | | | | — | | | | | 71,822,424 | | | | | 60,660 | | | | | 2,668 | |
| Securities lending income, net | | | | 22,089 | | | | | 692,484 | | | | | 15,725 | | | | | 17,423 | |
| Total investment income | | | | 7,733,939 | | | | | 144,264,728 | | | | | 9,681,787 | | | | | 2,965,536 | |
EXPENSES: | | | | | | | | | | | | | | | | | | | | |
| Investment management fees | | | | — | | | | | — | | | | | — | | | | | 1,258,029 | |
| Unified fees | | | | 3,839,262 | | | | | 47,065,592 | | | | | 1,998,196 | | | | | — | |
| Distribution and shareholder service fees: | | | | | | | | | | | | | | | | | | | | |
| Class ADV | | | | 655,268 | | | | | 8,233,206 | | | | | 252,871 | | | | | 128,504 | |
| Class S | | | | 628,730 | | | | | 10,159,795 | | | | | 324,830 | | | | | 340,946 | |
| Class S2 | | | | 148,385 | | | | | 267,351 | | | | | 292,775 | | | | | — | |
| Transfer agent fees: | | | | | | | | | | | | | | | | | | | | |
| Class ADV | | | | — | | | | | — | | | | | — | | | | | 9,358 | |
| Class I | | | | — | | | | | — | | | | | — | | | | | 16,934 | |
| Class S | | | | — | | | | | — | | | | | — | | | | | 59,585 | |
| Shareholder reporting expense | | | | — | | | | | — | | | | | — | | | | | 39,517 | |
| Professional fees | | | | — | | | | | — | | | | | — | | | | | 31,672 | |
| Custody and accounting expense | | | | — | | | | | — | | | | | — | | | | | 93,054 | |
| Trustee fees and expenses | | | | 16,174 | | | | | 276,104 | | | | | 20,295 | | | | | 13,977 | |
| Miscellaneous expense | | | | — | | | | | — | | | | | — | | | | | 9,327 | |
| Total expenses | | | | 5,287,819 | | | | | 66,002,048 | | | | | 2,888,967 | | | | | 2,000,903 | |
| Waived and reimbursed fees | | | | (103,692 | ) | | | | — | | | | | (94,011 | ) | | | | (32,467 | ) |
| Net expenses | | | | 5,184,127 | | | | | 66,002,048 | | | | | 2,794,956 | | | | | 1,968,436 | |
| Net investment income | | | | 2,549,812 | | | | | 78,262,680 | | | | | 6,886,831 | | | | | 997,100 | |
REALIZED AND UNREALIZED GAIN (LOSS): | | | | | | | | | | | | | | | | | | | | |
| Net realized gain (loss) on: | | | | | | | | | | | | | | | | | | | | |
| Investments | | | | 36,008,957 | | | | | 952,745,094 | | | | | 6,122,082 | | | | | 5,831,465 | |
| Forward foreign currency contracts | | | | — | | | | | (5,109 | ) | | | | — | | | | | (40,544 | ) |
| Foreign currency related transactions | | | | (16,884 | ) | | | | 23,992 | | | | | 766 | | | | | (44,948 | ) |
| Futures | | | | — | | | | | — | | | | | 128,992 | | | | | — | |
| Written options | | | | — | | | | | 21,056,885 | | | | | — | | | | | 105,135 | |
| Net realized gain | | | | 35,992,073 | | | | | 973,820,862 | | | | | 6,251,840 | | | | | 5,851,108 | |
| Net change in unrealized appreciation (depreciation) on: | | | | | | | | | | | | | | | | | | | | |
| Investments | | | | 9,925,133 | | | | | 194,069,173 | | | | | (14,817,343 | ) | | | | 20,033,222 | |
| Forward foreign currency contracts | | | | — | | | | | (161 | ) | | | | — | | | | | (3,157 | ) |
| Foreign currency related transactions | | | | 9,596 | | | | | (26,044 | ) | | | | (1,525 | ) | | | | 27,067 | |
| Written options | | | | — | | | | | (6,919,637 | ) | | | | — | | | | | (11,535 | ) |
| Net change in unrealized appreciation (depreciation) | | | | 9,934,729 | | | | | 187,123,331 | | | | | (14,818,868 | ) | | | | 20,045,597 | |
| Net realized and unrealized gain (loss) | | | | 45,926,802 | | | | | 1,160,944,193 | | | | | (8,567,028 | ) | | | | 25,896,705 | |
Increase (decrease) in net assets resulting from operations | | | $ | 48,476,614 | | | | $ | 1,239,206,873 | | | | $ | (1,680,197 | ) | | | $ | 26,893,805 | |
| | | | | | | | | | | | | | | | | | | | | | |
| * Foreign taxes withheld | | | $ | 108,802 | | | | $ | 327,447 | | | | $ | 188,633 | | | | $ | 363,898 | |
See Accompanying Notes to Financial Statements
27
STATEMENTS OF CHANGES IN NET ASSETS
| | Voya Government
Liquid Assets Portfolio | | VY® Clarion
Global Real Estate Portfolio |
|---|
| | Year Ended
December 31,
2020 | | Year Ended
December 31,
2019 | | Year Ended
December 31,
2020 | | Year Ended
December 31,
2019 |
|---|
FROM OPERATIONS: | | | | | | | | | | | | | | | | | | | | |
| Net investment income | | | $ | 1,420,460 | | | | $ | 12,239,407 | | | | $ | 3,655,947 | | | | $ | 4,326,494 | |
| Net realized gain (loss) | | | | 330,328 | | | | | 539,733 | | | | | (7,007,785 | ) | | | | 19,745,806 | |
| Net change in unrealized appreciation (depreciation) | | | | — | | | | | — | | | | | (9,668,409 | ) | | | | 25,795,968 | |
| Increase (decrease) in net assets resulting from operations | | | | 1,750,788 | | | | | 12,779,140 | | | | | (13,020,247 | ) | | | | 49,868,268 | |
| | | | | | | | | | | | | | | | | | | | | |
FROM DISTRIBUTIONS TO SHAREHOLDERS: | | | | | | | | | | | | | | | | | | | | |
| Total distributions (excluding return of capital): | | | | | | | | | | | | | | | | | | | | |
| Class ADV | | | | — | | | | | — | | | | | (1,943,130 | ) | | | | (394,514 | ) |
| Class I | | | | (160,481 | ) | | | | (1,149,041 | ) | | | | (13,539,081 | ) | | | | (3,315,314 | ) |
| Class S | | | | (795,507 | ) | | | | (5,870,729 | ) | | | | (11,140,696 | ) | | | | (2,549,899 | ) |
| Class S2 | | | | (801,847 | ) | | | | (5,767,381 | ) | | | | (103,320 | ) | | | | (23,042 | ) |
| Total distributions | | | | (1,757,835 | ) | | | | (12,787,151 | ) | | | | (26,726,227 | ) | | | | (6,282,769 | ) |
| | | | | | | | | | | | | | | | | | | | | |
FROM CAPITAL SHARE TRANSACTIONS: | | | | | | | | | | | | | | | | | | | | |
| Net proceeds from sale of shares | | | | 588,651,285 | | | | | 214,336,336 | | | | | 15,969,658 | | | | | 9,881,253 | |
| Reinvestment of distributions | | | | 1,757,835 | | | | | 12,787,151 | | | | | 26,726,227 | | | | | 6,282,769 | |
| | | | | 590,409,120 | | | | | 227,123,487 | | | | | 42,695,885 | | | | | 16,164,022 | |
| Cost of shares redeemed | | | | (350,271,057 | ) | | | | (303,425,500 | ) | | | | (43,792,715 | ) | | | | (36,020,088 | ) |
| Net increase (decrease) in net assets resulting from capital share transactions | | | | 240,138,063 | | | | | (76,302,013 | ) | | | | (1,096,830 | ) | | | | (19,856,066 | ) |
| Net increase (decrease) in net assets | | | | 240,131,016 | | | | | (76,310,024 | ) | | | | (40,843,304 | ) | | | | 23,729,433 | |
| | | | | | | | | | | | | | | | | | | | | |
NET ASSETS: | | | | | | | | | | | | | | | | | | | | |
| Beginning of year or period | | | | 726,595,200 | | | | | 802,905,224 | | | | | 234,374,332 | | | | | 210,644,899 | |
| End of year or period | | | $ | 966,726,216 | | | | $ | 726,595,200 | | | | $ | 193,531,028 | | | | $ | 234,374,332 | |
See Accompanying Notes to Financial Statements
28
STATEMENTS OF CHANGES IN NET ASSETS
| | VY® Invesco
Growth and Income Portfolio | | VY® JPMorgan
Emerging Markets Equity Portfolio |
|---|
| | Year Ended
December 31,
2020 | | Year Ended
December 31,
2019 | | Year Ended
December 31,
2020 | | Year Ended
December 31,
2019 |
|---|
FROM OPERATIONS: | | | | | | | | | | | | | | | | | | | | |
| Net investment income (loss) | | | $ | 6,389,512 | | | | $ | 7,902,172 | | | | $ | (2,155,611 | ) | | | $ | 1,847,925 | |
| Net realized gain (loss) | | | | (3,654,870 | ) | | | | 32,581,418 | | | | | 43,071,876 | | | | | 31,891,901 | |
| Net change in unrealized appreciation (depreciation) | | | | 480,905 | | | | | 57,251,391 | | | | | 103,209,620 | | | | | 98,284,611 | |
| Increase in net assets resulting from operations | | | | 3,215,547 | | | | | 97,734,981 | | | | | 144,125,885 | | | | | 132,024,437 | |
| | | | | | | | | | | | | | | | | | | | | |
FROM DISTRIBUTIONS TO SHAREHOLDERS: | | | | | | | | | | | | | | | | | | | | |
| Total distributions (excluding return of capital): | | | | | | | | | | | | | | | | | | | | |
| Class ADV | | | | (1,511,379 | ) | | | | (2,498,575 | ) | | | | (3,335,242 | ) | | | | (2,713,856 | ) |
| Class I | | | | (2,995,867 | ) | | | | (4,251,471 | ) | | | | (5,482,509 | ) | | | | (4,082,963 | ) |
| Class S | | | | (31,609,283 | ) | | | | (51,840,265 | ) | | | | (23,848,555 | ) | | | | (20,116,064 | ) |
| Class S2 | | | | (2,436,023 | ) | | | | (3,938,465 | ) | | | | (770,608 | ) | | | | (656,400 | ) |
| Total distributions | | | | (38,552,552 | ) | | | | (62,528,776 | ) | | | | (33,436,914 | ) | | | | (27,569,283 | ) |
| | | | | | | | | | | | | | | | | | | | | |
FROM CAPITAL SHARE TRANSACTIONS: | | | | | | | | | | | | | | | | | | | | |
| Net proceeds from sale of shares | | | | 13,095,950 | | | | | 6,101,952 | | | | | 29,912,036 | | | | | 30,196,135 | |
| Reinvestment of distributions | | | | 38,552,552 | | | | | 62,528,776 | | | | | 33,436,914 | | | | | 27,569,283 | |
| | | | | 51,648,502 | | | | | 68,630,728 | | | | | 63,348,950 | | | | | 57,765,418 | |
| Cost of shares redeemed | | | | (71,563,036 | ) | | | | (82,036,184 | ) | | | | (108,814,057 | ) | | | | (83,129,759 | ) |
| Net decrease in net assets resulting from capital share transactions | | | | (19,914,534 | ) | | | | (13,405,456 | ) | | | | (45,465,107 | ) | | | | (25,364,341 | ) |
| Net increase (decrease) in net assets | | | | (55,251,539 | ) | | | | 21,800,749 | | | | | 65,223,864 | | | | | 79,090,813 | |
| | | | | | | | | | | | | | | | | | | | | |
NET ASSETS: | | | | | | | | | | | | | | | | | | | | |
| Beginning of year or period | | | | 443,391,666 | | | | | 421,590,917 | | | | | 511,904,543 | | | | | 432,813,730 | |
| End of year or period | | | $ | 388,140,127 | | | | $ | 443,391,666 | | | | $ | 577,128,407 | | | | $ | 511,904,543 | |
See Accompanying Notes to Financial Statements
29
STATEMENTS OF CHANGES IN NET ASSETS
| | VY® Morgan
Stanley Global Franchise Portfolio | | VY® T. Rowe Price
Capital Appreciation Portfolio |
|---|
| | Year Ended
December 31,
2020 | | | Year Ended
December 31,
2019 | | Year Ended
December 31,
2020 | | Year Ended
December 31,
2019 |
|---|
FROM OPERATIONS: | | | | | | | | | | | | | | | | | | | | |
| Net investment income | | | $ | 2,549,812 | | | | $ | 2,892,648 | | | | $ | 78,262,680 | | | | $ | 95,001,429 | |
| Net realized gain | | | | 35,992,073 | | | | | 31,318,348 | | | | | 973,820,862 | | | | | 561,644,298 | |
| Net change in unrealized appreciation (depreciation) | | | | 9,934,729 | | | | | 66,323,321 | | | | | 187,123,331 | | | | | 814,191,686 | |
| Increase in net assets resulting from operations | | | | 48,476,614 | | | | | 100,534,317 | | | | | 1,239,206,873 | | | | | 1,470,837,413 | |
| | | | | | | | | | | | | | | | | | | | | |
FROM DISTRIBUTIONS TO SHAREHOLDERS: | | | | | | | | | | | | | | | | | | | | |
| Total distributions (excluding return of capital): | | | | | | | | | | | | | | | | | | | | |
| Class ADV | | | | (9,746,549 | ) | | | | (11,237,040 | ) | | | | (125,242,472 | ) | | | | (79,837,274 | ) |
| Class I | | | | — | | | | | — | | | | | (146,443,507 | ) | | | | (105,346,487 | ) |
| Class R6 | | | | (83,242 | ) | | | | (75,422 | ) | | | | (22,268,407 | ) | | | | (10,487,555 | ) |
| Class S | | | | (21,154,417 | ) | | | | (29,140,576 | ) | | | | (361,997,134 | ) | | | | (265,075,287 | ) |
| Class S2 | | | | (3,140,746 | ) | | | | (4,241,616 | ) | | | | (5,800,989 | ) | | | | (4,744,849 | ) |
| Total distributions | | | | (34,124,954 | ) | | | | (44,694,654 | ) | | | | (661,752,509 | ) | | | | (465,491,452 | ) |
| | | | | | | | | | | | | | | | | | | | | |
FROM CAPITAL SHARE TRANSACTIONS: | | | | | | | | | | | | | | | | | | | | |
| Net proceeds from sale of shares | | | | 14,807,838 | | | | | 18,802,058 | | | | | 780,080,807 | | | | | 630,958,784 | |
| Reinvestment of distributions | | | | 34,124,954 | | | | | 44,694,654 | | | | | 661,752,509 | | | | | 465,491,452 | |
| | | | | 48,932,792 | | | | | 63,496,712 | | | | | 1,441,833,316 | | | | | 1,096,450,236 | |
| Cost of shares redeemed | | | | (58,139,153 | ) | | | | (60,226,756 | ) | | | | (1,589,155,945 | ) | | | | (696,028,997 | ) |
| Net increase (decrease) in net assets resulting from capital share transactions | | | | (9,206,361 | ) | | | | 3,269,956 | | | | | (147,322,629 | ) | | | | 400,421,239 | |
| Net increase in net assets | | | | 5,145,299 | | | | | 59,109,619 | | | | | 430,131,735 | | | | | 1,405,767,200 | |
| | | | | | | | | | | | | | | | | | | | | |
NET ASSETS: | | | | | | | | | | | | | | | | | | | | |
| Beginning of year or period | | | | 416,248,542 | | | | | 357,138,923 | | | | | 7,445,252,266 | | | | | 6,039,485,066 | |
| End of year or period | | | $ | 421,393,841 | | | | $ | 416,248,542 | | | | $ | 7,875,384,001 | | | | $ | 7,445,252,266 | |
See Accompanying Notes to Financial Statements
30
STATEMENTS OF CHANGES IN NET ASSETS
| | VY® T. Rowe Price
Equity Income Portfolio | | VY® T. Rowe Price
International Stock Portfolio |
|---|
| | Year Ended
December 31,
2020 | | Year Ended
December 31,
2019 | | Year Ended
December 31,
2020 | | Year Ended
December 31,
2019 |
|---|
FROM OPERATIONS: | | | | | | | | | | | | | | | | | | | | |
| Net investment income | | | $ | 6,886,831 | | | | $ | 16,817,266 | | | | $ | 997,100 | | | | $ | 2,536,063 | |
| Net realized gain | | | | 6,251,840 | | | | | 146,253,435 | | | | | 5,851,108 | | | | | 4,782,483 | |
| Net change in unrealized appreciation (depreciation) | | | | (14,818,868 | ) | | | | 16,621,155 | | | | | 20,045,597 | | | | | 42,909,045 | |
| Increase (decrease) in net assets resulting from operations | | | | (1,680,197 | ) | | | | 179,691,856 | | | | | 26,893,805 | | | | | 50,227,591 | |
| | | | | | | | | | | | | | | | | | | | | |
FROM DISTRIBUTIONS TO SHAREHOLDERS: | | | | | | | | | | | | | | | | | | | | |
| Total distributions (excluding return of capital): | | | | | | | | | | | | | | | | | | | | |
| Class ADV | | | | (2,417,696 | ) | | | | (14,085,259 | ) | | | | (951,655 | ) | | | | (1,356,151 | ) |
| Class I | | | | (4,638,752 | ) | | | | (22,140,633 | ) | | | | (1,967,794 | ) | | | | (2,725,607 | ) |
| Class S | | | | (6,991,587 | ) | | | | (162,548,177 | ) | | | | (6,557,580 | ) | | | | (9,755,870 | ) |
| Class S2 | | | | (4,344,569 | ) | | | | (28,955,674 | ) | | | | — | | | | | — | |
| Total distributions | | | | (18,392,604 | ) | | | | (227,729,743 | ) | | | | (9,477,029 | ) | | | | (13,837,628 | ) |
| | | | | | | | | | | | | | | | | | | | | |
FROM CAPITAL SHARE TRANSACTIONS: | | | | | | | | | | | | | | | | | | | | |
| Net proceeds from sale of shares | | | | 17,085,747 | | | | | 34,697,046 | | | | | 10,128,091 | | | | | 9,219,945 | |
| Reinvestment of distributions | | | | 18,392,604 | | | | | 227,729,743 | | | | | 9,477,029 | | | | | 13,837,628 | |
| | | | | 35,478,351 | | | | | 262,426,789 | | | | | 19,605,120 | | | | | 23,057,573 | |
| Cost of shares redeemed | | | | (53,320,095 | ) | | | | (589,365,595 | ) | | | | (30,264,106 | ) | | | | (34,974,404 | ) |
| Net decrease in net assets resulting from capital share transactions | | | | (17,841,744 | ) | | | | (326,938,806 | ) | | | | (10,658,986 | ) | | | | (11,916,831 | ) |
| Net increase (decrease) in net assets | | | | (37,914,545 | ) | | | | (374,976,693 | ) | | | | 6,757,790 | | | | | 24,473,132 | |
| | | | | | | | | | | | | | | | | | | | | |
NET ASSETS: | | | | | | | | | | | | | | | | | | | | |
| Beginning of year or period | | | | 384,448,724 | | | | | 759,425,417 | | | | | 216,204,716 | | | | | 191,731,584 | |
| End of year or period | | | $ | 346,534,179 | | | | $ | 384,448,724 | | | | $ | 222,962,506 | | | | $ | 216,204,716 | |
See Accompanying Notes to Financial Statements
31
Selected data for a share of beneficial interest outstanding throughout each year or period.
| | | | | | | Income (loss)
from investment
operations | | | | | | Less distributions | | | | | | | | | | | | | | | | | | Ratios to average
net assets | | Supplemental
data |
|---|
Year or
period | | Net asset
value,
beginning
of year
or period | | Net
investment
income
(loss) | | Net
realized
and
unrealized
gain (loss) | | Total from
investment
operations | | From net
investment
income | | From net
realized
gains | | From
return of
capital | | Total
distributions | | Payment
by
affiliate | | Net asset
value,
end of
year or
period | | Total
Return(1) | | Expenses
before
reductions/
additions(2)(3)(4) | | Expenses
net of fee
waivers
and/or
recoupments
if any(2)(3)(4) | | Expenses
net of all
reductions/
additions(2)(3)(4) | | Net
investment
income
(loss)(2)(3) | | Net assets,
end of
year or
period | | Portfolio
turnover
rate |
|---|
| ended | | ($) | | ($) | | ($) | | ($) | | ($) | | ($) | | ($) | | ($) | | ($) | | ($) | | (%) | | (%) | | (%) | | (%) | | (%) | | ($000’s) | | (%) |
|---|
Voya Government Liquid Assets Portfolio |
Class I | | | | | | | | | | | | | | | | | | | | | | | | | | | | | | | | | | | | | | | | | | | | | | | | | | | | | | | | | | | | | | | | | | | | |
| 12-31-20 | | | 1.00 | | | | 0.00 | * | | | 0.00 | * | | | 0.00 | * | | | 0.00 | * | | | 0.00 | * | | | — | | | | 0.00 | * | | | — | | | | 1.00 | | | | 0.30 | | | | 0.28 | | | | 0.17 | | | | 0.17 | | | | 0.23 | | | | 64,002 | | | | — | |
| 12-31-19 | | | 1.00 | | | | 0.02 | | | | 0.00 | * | | | 0.02 | | | | 0.02 | | | | 0.00 | * | | | — | | | | 0.02 | | | | — | | | | 1.00 | | | | 2.01 | | | | 0.29 | | | | 0.29 | | | | 0.29 | | | | 1.93 | | | | 52,515 | | | | — | |
| 12-31-18 | | | 1.00 | | | | 0.02 | | | | 0.00 | * | | | 0.02 | | | | 0.02 | | | | 0.00 | * | | | — | | | | 0.02 | | | | — | | | | 1.00 | | | | 1.61 | | | | 0.29 | | | | 0.29 | | | | 0.29 | | | | 1.61 | | | | 62,115 | | | | — | |
| 12-31-17 | | | 1.00 | | | | 0.01 | | | | 0.00 | * | | | 0.01 | | | | 0.01 | | | | 0.00 | * | | | — | | | | 0.01 | | | | — | | | | 1.00 | | | | 0.66 | | | | 0.29 | | | | 0.29 | | | | 0.29 | | | | 0.62 | | | | 50,773 | | | | — | |
| 12-31-16 | | | 1.00 | | | | 0.00 | * | | | 0.00 | * | | | 0.00 | * | | | 0.00 | * | | | 0.00 | * | | | — | | | | 0.00 | * | | | — | | | | 1.00 | | | | 0.23 | | | | 0.28 | | | | 0.28 | | | | 0.28 | | | | 0.13 | | | | 66,214 | | | | — | |
Class S | | | | | | | | | | | | | | | | | | | | | | | | | | | | | | | | | | | | | | | | | | | | | | | | | | | | | | | | | | | | | | | | | | | | |
| 12-31-20 | | | 1.00 | | | | 0.00 | * | | | 0.00 | * | | | 0.00 | * | | | 0.00 | * | | | 0.00 | * | | | — | | | | 0.00 | * | | | — | | | | 1.00 | | | | 0.24 | | | | 0.53 | | | | 0.21 | | | | 0.21 | | | | 0.17 | | | | 375,267 | | | | — | |
| 12-31-19 | | | 1.00 | | | | 0.02 | | | | 0.00 | * | | | 0.02 | | | | 0.02 | | | | 0.00 | * | | | — | | | | 0.02 | | | | — | | | | 1.00 | | | | 1.75 | | | | 0.54 | | | | 0.54 | | | | 0.54 | | | | 1.68 | | | | 314,786 | | | | — | |
| 12-31-18 | | | 1.00 | | | | 0.01 | | | | 0.00 | * | | | 0.01 | | | | 0.01 | | | | 0.00 | * | | | — | | | | 0.01 | | | | — | | | | 1.00 | | | | 1.36 | | | | 0.54 | | | | 0.54 | | | | 0.54 | | | | 1.33 | | | | 354,423 | | | | — | |
| 12-31-17 | | | 1.00 | | | | 0.00 | * | | | 0.00 | * | | | 0.00 | * | | | 0.00 | * | | | 0.00 | * | | | — | | | | 0.00 | * | | | — | | | | 1.00 | | | | 0.41 | | | | 0.54 | | | | 0.54 | | | | 0.54 | | | | 0.37 | | | | 372,943 | | | | — | |
| 12-31-16 | | | 1.00 | | | | — | | | | 0.00 | * | | | 0.00 | | | | 0.00 | * | | | 0.00 | * | | | — | | | | 0.00 | * | | | — | | | | 1.00 | | | | 0.09 | | | | 0.53 | | | | 0.42 | | | | 0.42 | | | | 0.00 | * | | | 488,208 | | | | — | |
Class S2 | | | | | | | | | | | | | | | | | | | | | | | | | | | | | | | | | | | | | | | | | | | | | | | | | | | | | | | | | | | | | | | | | | | | |
| 12-31-20 | | | 1.00 | | | | 0.00 | * | | | 0.00 | * | | | 0.00 | * | | | 0.00 | * | | | 0.00 | * | | | — | | | | 0.00 | * | | | — | | | | 1.00 | | | | 0.21 | | | | 0.68 | | | | 0.23 | | | | 0.23 | | | | 0.13 | | | | 527,457 | | | | — | |
| 12-31-19 | | | 1.00 | | | | 0.02 | | | | 0.00 | * | | | 0.02 | | | | 0.02 | | | | 0.00 | * | | | — | | | | 0.02 | | | | — | | | | 1.00 | | | | 1.60 | | | | 0.69 | | | | 0.69 | | | | 0.69 | | | | 1.52 | | | | 359,294 | | | | — | |
| 12-31-18 | | | 1.00 | | | | 0.01 | | | | 0.00 | * | | | 0.01 | | | | 0.01 | | | | 0.00 | * | | | — | | | | 0.01 | | | | — | | | | 1.00 | | | | 1.21 | | | | 0.69 | | | | 0.69 | | | | 0.69 | | | | 1.19 | | | | 386,368 | | | | — | |
| 12-31-17 | | | 1.00 | | | | 0.00 | * | | | 0.00 | * | | | 0.00 | * | | | 0.00 | * | | | 0.00 | * | | | — | | | | 0.00 | * | | | — | | | | 1.00 | | | | 0.28 | | | | 0.69 | | | | 0.67 | | | | 0.67 | | | | 0.25 | | | | 358,525 | | | | — | |
| 12-31-16 | | | 1.00 | | | | — | | | | 0.00 | * | | | 0.00 | | | | — | | | | 0.00 | * | | | — | | | | 0.00 | * | | | — | | | | 1.00 | | | | 0.09 | | | | 0.71 | | | | 0.42 | | | | 0.42 | | | | (0.00 | )* | | | 416,495 | | | | — | |
VY® Clarion Global Real Estate Portfolio |
Class ADV | | | | | | | | | | | | | | | | | | | | | | | | | | | | | | | | | | | | | | | | | | | | | | | | | | | | | | | | | | | | | | | | | | | | |
| 12-31-20 | | | 12.77 | | | | 0.15 | • | | | (1.11 | ) | | | (0.96 | ) | | | 0.60 | | | | 0.95 | | | | — | | | | 1.55 | | | | — | | | | 10.26 | | | | (5.37 | ) | | | 1.68 | | | | 1.47 | | | | 1.47 | | | | 1.47 | | | | 14,367 | | | | 97 | |
| 12-31-19 | | | 10.53 | | | | 0.17 | • | | | 2.34 | | | | 2.51 | | | | 0.27 | | | | — | | | | — | | | | 0.27 | | | | — | | | | 12.77 | | | | 23.99 | | | | 1.62 | | | | 1.49 | | | | 1.49 | | | | 1.40 | | | | 17,308 | | | | 77 | |
| 12-31-18 | | | 12.17 | | | | 0.18 | • | | | (1.24 | ) | | | (1.06 | ) | | | 0.58 | | | | — | | | | — | | | | 0.58 | | | | — | | | | 10.53 | | | | (9.10 | ) | | | 1.62 | | | | 1.49 | | | | 1.49 | | | | 1.54 | | | | 16,608 | | | | 107 | |
| 12-31-17 | | | 11.41 | | | | 0.19 | • | | | 0.95 | | | | 1.14 | | | | 0.38 | | | | — | | | | — | | | | 0.38 | | | | — | | | | 12.17 | | | | 10.20 | | | | 1.57 | | | | 1.49 | | | | 1.49 | | | | 1.63 | | | | 22,826 | | | | 90 | |
| 12-31-16 | | | 11.47 | | | | 0.16 | | | | (0.13 | ) | | | 0.03 | | | | 0.09 | | | | — | | | | — | | | | 0.09 | | | | — | | | | 11.41 | | | | 0.23 | | | | 1.61 | | | | 1.49 | | | | 1.49 | | | | 1.33 | | | | 25,983 | | | | 49 | |
Class I | | | | | | | | | | | | | | | | | | | | | | | | | | | | | | | | | | | | | | | | | | | | | | | | | | | | | | | | | | | | | | | | | | | | |
| 12-31-20 | | | 13.11 | | | | 0.28 | | | | (1.21 | ) | | | (0.93 | ) | | | 0.68 | | | | 0.95 | | | | — | | | | 1.63 | | | | — | | | | 10.55 | | | | (4.83 | ) | | | 1.08 | | | | 0.87 | | | | 0.87 | | | | 2.09 | | | | 96,799 | | | | 97 | |
| 12-31-19 | | | 10.81 | | | | 0.25 | • | | | 2.41 | | | | 2.66 | | | | 0.36 | | | | — | | | | — | | | | 0.36 | | | | — | | | | 13.11 | | | | 24.74 | | | | 1.02 | | | | 0.89 | | | | 0.89 | | | | 2.02 | | | | 119,642 | | | | 77 | |
| 12-31-18 | | | 12.49 | | | | 0.25 | • | | | (1.27 | ) | | | (1.02 | ) | | | 0.66 | | | | — | | | | — | | | | 0.66 | | | | — | | | | 10.81 | | | | (8.52 | ) | | | 1.02 | | | | 0.89 | | | | 0.89 | | | | 2.14 | | | | 103,029 | | | | 107 | |
| 12-31-17 | | | 11.72 | | | | 0.27 | • | | | 0.96 | | | | 1.23 | | | | 0.46 | | | | — | | | | — | | | | 0.46 | | | | — | | | | 12.49 | | | | 10.77 | | | | 0.97 | | | | 0.89 | | | | 0.89 | | | | 2.28 | | | | 183,921 | | | | 90 | |
| 12-31-16 | | | 11.77 | | | | 0.22 | | | | (0.10 | ) | | | 0.12 | | | | 0.17 | | | | — | | | | — | | | | 0.17 | | | | — | | | | 11.72 | | | | 0.89 | | | | 0.96 | | | | 0.89 | | | | 0.89 | | | | 1.94 | | | | 183,084 | | | | 49 | |
Class S | | | | | | | | | | | | | | | | | | | | | | | | | | | | | | | | | | | | | | | | | | | | | | | | | | | | | | | | | | | | | | | | | | | | |
| 12-31-20 | | | 13.04 | | | | 0.22 | | | | (1.16 | ) | | | (0.94 | ) | | | 0.65 | | | | 0.95 | | | | — | | | | 1.60 | | | | — | | | | 10.50 | | | | (5.04 | ) | | | 1.33 | | | | 1.12 | | | | 1.12 | | | | 1.85 | | | | 81,568 | | | | 97 | |
| 12-31-19 | | | 10.76 | | | | 0.22 | • | | | 2.39 | | | | 2.61 | | | | 0.33 | | | | — | | | | — | | | | 0.33 | | | | — | | | | 13.04 | | | | 24.35 | | | | 1.27 | | | | 1.14 | | | | 1.14 | | | | 1.76 | | | | 96,519 | | | | 77 | |
| 12-31-18 | | | 12.43 | | | | 0.22 | • | | | (1.26 | ) | | | (1.04 | ) | | | 0.63 | | | | — | | | | — | | | | 0.63 | | | | — | | | | 10.76 | | | | (8.74 | ) | | | 1.27 | | | | 1.14 | | | | 1.14 | | | | 1.91 | | | | 90,159 | | | | 107 | |
| 12-31-17 | | | 11.66 | | | | 0.24 | • | | | 0.96 | | | | 1.20 | | | | 0.43 | | | | — | | | | — | | | | 0.43 | | | | — | | | | 12.43 | | | | 10.50 | | | | 1.22 | | | | 1.14 | | | | 1.14 | | | | 2.00 | | | | 113,281 | | | | 90 | |
| 12-31-16 | | | 11.71 | | | | 0.20 | • | | | (0.12 | ) | | | 0.08 | | | | 0.13 | | | | — | | | | — | | | | 0.13 | | | | — | | | | 11.66 | | | | 0.62 | | | | 1.21 | | | | 1.14 | | | | 1.14 | | | | 1.67 | | | | 123,103 | | | | 49 | |
Class S2 | | | | | | | | | | | | | | | | | | | | | | | | | | | | | | | | | | | | | | | | | | | | | | | | | | | | | | | | | | | | | | | | | | | | |
| 12-31-20 | | | 13.15 | | | | 0.20 | | | | (1.17 | ) | | | (0.97 | ) | | | 0.62 | | | | 0.95 | | | | — | | | | 1.57 | | | | — | | | | 10.61 | | | | (5.19 | ) | | | 1.48 | | | | 1.27 | | | | 1.27 | | | | 1.76 | | | | 796 | | | | 97 | |
| 12-31-19 | | | 10.85 | | | | 0.20 | • | | | 2.41 | | | | 2.61 | | | | 0.31 | | | | — | | | | — | | | | 0.31 | | | | — | | | | 13.15 | | | | 24.15 | | | | 1.42 | | | | 1.29 | | | | 1.29 | | | | 1.61 | | | | 906 | | | | 77 | |
| 12-31-18 | | | 12.52 | | | | 0.21 | • | | | (1.27 | ) | | | (1.06 | ) | | | 0.61 | | | | — | | | | — | | | | 0.61 | | | | — | | | | 10.85 | | | | (8.84 | ) | | | 1.42 | | | | 1.29 | | | | 1.29 | | | | 1.76 | | | | 850 | | | | 107 | |
| 12-31-17 | | | 11.73 | | | | 0.22 | • | | | 0.98 | | | | 1.20 | | | | 0.41 | | | | — | | | | — | | | | 0.41 | | | | — | | | | 12.52 | | | | 10.42 | | | | 1.37 | | | | 1.29 | | | | 1.29 | | | | 1.87 | | | | 1,048 | | | | 90 | |
| 12-31-16 | | | 11.78 | | | | 0.18 | • | | | (0.12 | ) | | | 0.06 | | | | 0.11 | | | | — | | | | — | | | | 0.11 | | | | — | | | | 11.73 | | | | 0.44 | | | | 1.39 | | | | 1.29 | | | | 1.29 | | | | 1.52 | | | | 1,117 | | | | 49 | |
VY® Invesco Growth and Income Portfolio |
Class ADV | | | | | | | | | | | | | | | | | | | | | | | | | | | | | | | | | | | | | | | | | | | | | | | | | | | | | | | | | | | | | | | | | | | | |
| 12-31-20 | | | 22.73 | | | | 0.32 | | | | (0.32 | ) | | | 0.00 | * | | | 0.35 | | | | 1.76 | | | | — | | | | 2.11 | | | | — | | | | 20.62 | | | | 2.55 | | | | 1.24 | | | | 1.24 | | | | 1.24 | | | | 1.45 | | | | 15,543 | | | | 32 | |
| 12-31-19 | | | 21.15 | | | | 0.32 | • | | | 4.64 | | | | 4.96 | | | | 0.50 | | | | 2.88 | | | | — | | | | 3.38 | | | | — | | | | 22.73 | | | | 24.30 | | | | 1.24 | | | | 1.24 | | | | 1.24 | | | | 1.43 | | | | 18,401 | | | | 22 | |
| 12-31-18 | | | 27.94 | | | | 0.32 | • | | | (3.71 | ) | | | (3.39 | ) | | | 0.30 | | | | 3.10 | | | | — | | | | 3.40 | | | | — | | | | 21.15 | | | | (13.88 | ) | | | 1.24 | | | | 1.24 | | | | 1.24 | | | | 1.22 | | | | 16,868 | | | | 31 | |
| 12-31-17 | | | 26.55 | | | | 0.38 | • | | | 3.04 | | | | 3.42 | | | | 0.51 | | | | 1.52 | | | | — | | | | 2.03 | | | | — | | | | 27.94 | | | | 13.46 | | | | 1.24 | | | | 1.24 | | | | 1.24 | | | | 1.43 | | | | 22,246 | | | | 17 | |
| 12-31-16 | | | 25.48 | | | | 0.30 | • | | | 4.19 | | | | 4.49 | | | | 0.52 | | | | 2.90 | | | | — | | | | 3.42 | | | | — | | | | 26.55 | | | | 19.52 | | | | 1.29 | | | | 1.24 | | | | 1.24 | | | | 1.21 | | | | 18,641 | | | | 23 | |
See Accompanying Notes to Financial Statements
32
FINANCIAL HIGHLIGHTS (CONTINUED)
Selected data for a share of beneficial interest outstanding throughout each year or period.
| | | | | | | Income (loss)
from investment
operations | | | | | | Less distributions | | | | | | | | | | | | | | | | | | Ratios to average
net assets | | Supplemental
data |
|---|
Year or
period | | Net asset
value,
beginning
of year
or period | | Net
investment
income
(loss) | | Net
realized
and
unrealized
gain (loss) | | Total from
investment
operations | | From net
investment
income | | From net
realized
gains | | From
return of
capital | | Total
distributions | | Payment
by
affiliate | | Net asset
value,
end of
year or
period | | Total
Return(1) | | Expenses
before
reductions/
additions(2)(3)(4) | | Expenses
net of fee
waivers
and/or
recoupments
if any(2)(3)(4) | | Expenses
net of all
reductions/
additions(2)(3)(4) | | Net
investment
income
(loss)(2)(3) | | Net assets,
end of
year or
period | | Portfolio
turnover
rate |
|---|
| ended | | ($) | | ($) | | ($) | | ($) | | ($) | | ($) | | ($) | | ($) | | ($) | | ($) | | (%) | | (%) | | (%) | | (%) | | (%) | | ($000’s) | | (%) |
|---|
VY® Invesco Growth and Income Portfolio (continued) |
Class I | | | | | | | | | | | | | | | | | | | | | | | | | | | | | | | | | | | | | | | | | | | | | | | | | | | | | | | | | | | | | | | | | | | | |
| 12-31-20 | | | 23.01 | | | | 0.39 | • | | | (0.28 | ) | | | 0.11 | | | | 0.50 | | | | 1.76 | | | | — | | | | 2.26 | | | | — | | | | 20.86 | | | | 3.22 | | | | 0.64 | | | | 0.64 | | | | 0.64 | | | | 2.05 | | | | 30,672 | | | | 32 | |
| 12-31-19 | | | 21.41 | | | | 0.46 | • | | | 4.69 | | | | 5.15 | | | | 0.67 | | | | 2.88 | | | | — | | | | 3.55 | | | | — | | | | 23.01 | | | | 24.98 | | | | 0.64 | | | | 0.64 | | | | 0.64 | | | | 2.02 | | | | 29,773 | | | | 22 | |
| 12-31-18 | | | 28.23 | | | | 0.48 | • | | | (3.73 | ) | | | (3.25 | ) | | | 0.47 | | | | 3.10 | | | | — | | | | 3.57 | | | | — | | | | 21.41 | | | | (13.31 | ) | | | 0.64 | | | | 0.64 | | | | 0.64 | | | | 1.82 | | | | 27,943 | | | | 31 | |
| 12-31-17 | | | 26.77 | | | | 0.55 | • | | | 3.07 | | | | 3.62 | | | | 0.64 | | | | 1.52 | | | | — | | | | 2.16 | | | | — | | | | 28.23 | | | | 14.13 | | | | 0.64 | | | | 0.64 | | | | 0.64 | | | | 2.02 | | | | 33,894 | | | | 17 | |
| 12-31-16 | | | 25.68 | | | | 0.45 | • | | | 4.23 | | | | 4.68 | | | | 0.69 | | | | 2.90 | | | | — | | | | 3.59 | | | | — | | | | 26.77 | | | | 20.23 | | | | 0.64 | | | | 0.64 | | | | 0.64 | | | | 1.81 | | | | 28,117 | | | | 23 | |
Class S | | | | | | | | | | | | | | | | | | | | | | | | | | | | | | | | | | | | | | | | | | | | | | | | | | | | | | | | | | | | | | | | | | | | |
| 12-31-20 | | | 23.25 | | | | 0.39 | | | | (0.33 | ) | | | 0.06 | | | | 0.43 | | | | 1.76 | | | | — | | | | 2.19 | | | | — | | | | 21.12 | | | | 2.90 | | | | 0.89 | | | | 0.89 | | | | 0.89 | | | | 1.81 | | | | 317,890 | | | | 32 | |
| 12-31-19 | | | 21.58 | | | | 0.41 | • | | | 4.73 | | | | 5.14 | | | | 0.59 | | | | 2.88 | | | | — | | | | 3.47 | | | | — | | | | 23.25 | | | | 24.73 | | | | 0.89 | | | | 0.89 | | | | 0.89 | | | | 1.78 | | | | 367,941 | | | | 22 | |
| 12-31-18 | | | 28.43 | | | | 0.42 | • | | | (3.78 | ) | | | (3.36 | ) | | | 0.39 | | | | 3.10 | | | | — | | | | 3.49 | | | | — | | | | 21.58 | | | | (13.58 | ) | | | 0.89 | | | | 0.89 | | | | 0.89 | | | | 1.56 | | | | 350,968 | | | | 31 | |
| 12-31-17 | | | 26.94 | | | | 0.48 | • | | | 3.10 | | | | 3.58 | | | | 0.57 | | | | 1.52 | | | | — | | | | 2.09 | | | | — | | | | 28.43 | | | | 13.89 | | | | 0.89 | | | | 0.89 | | | | 0.89 | | | | 1.76 | | | | 476,317 | | | | 17 | |
| 12-31-16 | | | 25.81 | | | | 0.41 | | | | 4.23 | | | | 4.64 | | | | 0.61 | | | | 2.90 | | | | — | | | | 3.51 | | | | — | | | | 26.94 | | | | 19.92 | | | | 0.89 | | | | 0.89 | | | | 0.89 | | | | 1.56 | | | | 507,524 | | | | 23 | |
Class S2 | | | | | | | | | | | | | | | | | | | | | | | | | | | | | | | | | | | | | | | | | | | | | | | | | | | | | | | | | | | | | | | | | | | | |
| 12-31-20 | | | 23.00 | | | | 0.34 | | | | (0.30 | ) | | | 0.04 | | | | 0.40 | | | | 1.76 | | | | — | | | | 2.16 | | | | — | | | | 20.88 | | | | 2.77 | | | | 1.04 | | | | 1.04 | | | | 1.04 | | | | 1.66 | | | | 24,035 | | | | 32 | |
| 12-31-19 | | | 21.39 | | | | 0.37 | • | | | 4.67 | | | | 5.04 | | | | 0.55 | | | | 2.88 | | | | — | | | | 3.43 | | | | — | | | | 23.00 | | | | 24.47 | | | | 1.04 | | | | 1.04 | | | | 1.04 | | | | 1.63 | | | | 27,277 | | | | 22 | |
| 12-31-18 | | | 28.19 | | | | 0.37 | • | | | (3.73 | ) | | | (3.36 | ) | | | 0.34 | | | | 3.10 | | | | — | | | | 3.44 | | | | — | | | | 21.39 | | | | (13.67 | ) | | | 1.04 | | | | 1.04 | | | | 1.04 | | | | 1.41 | | | | 25,812 | | | | 31 | |
| 12-31-17 | | | 26.73 | | | | 0.44 | • | | | 3.06 | | | | 3.50 | | | | 0.52 | | | | 1.52 | | | | — | | | | 2.04 | | | | — | | | | 28.19 | | | | 13.67 | | | | 1.04 | | | | 1.04 | | | | 1.04 | | | | 1.62 | | | | 33,409 | | | | 17 | |
| 12-31-16 | | | 25.62 | | | | 0.35 | • | | | 4.23 | | | | 4.58 | | | | 0.57 | | | | 2.90 | | | | — | | | | 3.47 | | | | — | | | | 26.73 | | | | 19.80 | | | | 1.07 | | | | 1.04 | | | | 1.04 | | | | 1.41 | | | | 38,721 | | | | 23 | |
VY® JPMorgan Emerging Markets Equity Portfolio |
Class ADV | | | | | | | | | | | | | | | | | | | | | | | | | | | | | | | | | | | | | | | | | | | | | | | | | | | | | | | | | | | | | | | | | | | | |
| 12-31-20 | | | 21.02 | | | | (0.17 | ) | | | 6.57 | | | | 6.40 | | | | 0.01 | | | | 1.49 | | | | — | | | | 1.50 | | | | — | | | | 25.92 | | | | 32.71 | | | | 1.85 | | | | 1.85 | | | | 1.85 | | | | (0.80 | ) | | | 58,266 | | | | 22 | |
| 12-31-19 | | | 16.95 | | | | 0.01 | | | | 5.24 | | | | 5.25 | | | | — | | | | 1.18 | | | | — | | | | 1.18 | | | | — | | | | 21.02 | | | | 31.47 | | | | 1.86 | | | | 1.86 | | | | 1.86 | | | | 0.03 | | | | 50,224 | | | | 21 | |
| 12-31-18 | | | 20.52 | | | | (0.01 | ) | | | (3.49 | ) | | | (3.50 | ) | | | 0.07 | | | | — | | | | — | | | | 0.07 | | | | — | | | | 16.95 | | | | (17.12 | ) | | | 1.86 | | | | 1.86 | | | | 1.86 | | | | (0.07 | ) | | | 40,881 | | | | 21 | |
| 12-31-17 | | | 14.43 | | | | (0.05 | ) | | | 6.19 | | | | 6.14 | | | | 0.05 | | | | — | | | | — | | | | 0.05 | | | | — | | | | 20.52 | | | | 42.55 | | | | 1.86 | | | | 1.86 | | | | 1.86 | | | | (0.24 | ) | | | 57,093 | | | | 26 | |
| 12-31-16 | | | 12.92 | | | | 0.02 | • | | | 1.61 | | | | 1.63 | | | | 0.12 | | | | — | | | | — | | | | 0.12 | | | | — | | | | 14.43 | | | | 12.62 | | | | 1.90 | | | | 1.85 | | | | 1.85 | | | | 0.12 | | | | 35,873 | | | | 24 | |
Class I | | | | | | | | | | | | | | | | | | | | | | | | | | | | | | | | | | | | | | | | | | | | | | | | | | | | | | | | | | | | | | | | | | | | |
| 12-31-20 | | | 22.24 | | | | (0.04 | ) | | | 6.98 | | | | 6.94 | | | | 0.14 | | | | 1.49 | | | | — | | | | 1.63 | | | | — | | | | 27.55 | | | | 33.52 | | | | 1.25 | | | | 1.25 | | | | 1.25 | | | | (0.20 | ) | | | 94,067 | | | | 22 | |
| 12-31-19 | | | 17.80 | | | | 0.13 | | | | 5.52 | | | | 5.65 | | | | 0.03 | | | | 1.18 | | | | — | | | | 1.21 | | | | — | | | | 22.24 | | | | 32.23 | | | | 1.26 | | | | 1.26 | | | | 1.26 | | | | 0.62 | | | | 79,674 | | | | 21 | |
| 12-31-18 | | | 21.52 | | | | 0.12 | | | | (3.67 | ) | | | (3.55 | ) | | | 0.17 | | | | — | | | | — | | | | 0.17 | | | | — | | | | 17.80 | | | | (16.58 | ) | | | 1.26 | | | | 1.26 | | | | 1.26 | | | | 0.53 | | | | 61,663 | | | | 21 | |
| 12-31-17 | | | 15.10 | | | | 0.08 | | | | 6.47 | | | | 6.55 | | | | 0.13 | | | | — | | | | — | | | | 0.13 | | | | — | | | | 21.52 | | | | 43.45 | | | | 1.26 | | | | 1.26 | | | | 1.26 | | | | 0.34 | | | | 82,567 | | | | 26 | |
| 12-31-16 | | | 13.52 | | | | 0.10 | • | | | 1.70 | | | | 1.80 | | | | 0.22 | | | | — | | | | — | | | | 0.22 | | | | — | | | | 15.10 | | | | 13.27 | | | | 1.25 | | | | 1.25 | | | | 1.25 | | | | 0.71 | | | | 63,276 | | | | 24 | |
Class S | | | | | | | | | | | | | | | | | | | | | | | | | | | | | | | | | | | | | | | | | | | | | | | | | | | | | | | | | | | | | | | | | | | | |
| 12-31-20 | | | 22.08 | | | | (0.10 | )• | | | 6.94 | | | | 6.84 | | | | 0.08 | | | | 1.49 | | | | — | | | | 1.57 | | | | — | | | | 27.35 | | | | 33.23 | | | | 1.50 | | | | 1.50 | | | | 1.50 | | | | (0.45 | ) | | | 411,371 | | | | 22 | |
| 12-31-19 | | | 17.70 | | | | 0.08 | | | | 5.48 | | | | 5.56 | | | | 0.00 | * | | | 1.18 | | | | — | | | | 1.18 | | | | — | | | | 22.08 | | | | 31.91 | | | | 1.51 | | | | 1.51 | | | | 1.51 | | | | 0.38 | | | | 370,441 | | | | 21 | |
| 12-31-18 | | | 21.40 | | | | 0.05 | • | | | (3.63 | ) | | | (3.58 | ) | | | 0.12 | | | | — | | | | — | | | | 0.12 | | | | — | | | | 17.70 | | | | (16.81 | ) | | | 1.51 | | | | 1.51 | | | | 1.51 | | | | 0.27 | | | | 319,682 | | | | 21 | |
| 12-31-17 | | | 15.02 | | | | 0.03 | | | | 6.44 | | | | 6.47 | | | | 0.09 | | | | — | | | | — | | | | 0.09 | | | | — | | | | 21.40 | | | | 43.11 | | | | 1.51 | | | | 1.51 | | | | 1.51 | | | | 0.11 | | | | 454,764 | | | | 26 | |
| 12-31-16 | | | 13.45 | | | | 0.07 | • | | | 1.67 | | | | 1.74 | | | | 0.17 | | | | — | | | | — | | | | 0.17 | | | | — | | | | 15.02 | | | | 12.95 | | | | 1.50 | | | | 1.50 | | | | 1.50 | | | | 0.47 | | | | 362,865 | | | | 24 | |
Class S2 | | | | | | | | | | | | | | | | | | | | | | | | | | | | | | | | | | | | | | | | | | | | | | | | | | | | | | | | | | | | | | | | | | | | |
| 12-31-20 | | | 21.80 | | | | (0.13 | )• | | | 6.85 | | | | 6.72 | | | | 0.05 | | | | 1.49 | | | | — | | | | 1.54 | | | | — | | | | 26.98 | | | | 33.03 | | | | 1.65 | | | | 1.65 | | | | 1.65 | | | | (0.60 | ) | | | 13,424 | | | | 22 | |
| 12-31-19 | | | 17.52 | | | | 0.05 | | | | 5.41 | | | | 5.46 | | | | — | | | | 1.18 | | | | — | | | | 1.18 | | | | — | | | | 21.80 | | | | 31.64 | | | | 1.66 | | | | 1.66 | | | | 1.66 | | | | 0.24 | | | | 11,567 | | | | 21 | |
| 12-31-18 | | | 21.17 | | | | 0.04 | | | | (3.61 | ) | | | (3.57 | ) | | | 0.08 | | | | — | | | | — | | | | 0.08 | | | | — | | | | 17.52 | | | | (16.92 | ) | | | 1.66 | | | | 1.66 | | | | 1.66 | | | | 0.12 | | | | 10,587 | | | | 21 | |
| 12-31-17 | | | 14.86 | | | | (0.01 | )• | | | 6.37 | | | | 6.36 | | | | 0.05 | | | | — | | | | — | | | | 0.05 | | | | — | | | | 21.17 | | | | 42.85 | | | | 1.66 | | | | 1.66 | | | | 1.66 | | | | (0.03 | ) | | | 15,050 | | | | 26 | |
| 12-31-16 | | | 13.30 | | | | 0.05 | • | | | 1.65 | | | | 1.70 | | | | 0.14 | | | | — | | | | — | | | | 0.14 | | | | — | | | | 14.86 | | | | 12.79 | | | | 1.68 | | | | 1.65 | | | | 1.65 | | | | 0.32 | | | | 14,570 | | | | 24 | |
VY® Morgan Stanley Global Franchise Portfolio |
Class ADV | | | | | | | | | | | | | | | | | | | | | | | | | | | | | | | | | | | | | | | | | | | | | | | | | | | | | | | | | | | | | | | | | | | | |
| 12-31-20 | | | 16.06 | | | | 0.06 | | | | 1.86 | | | | 1.92 | | | | 0.09 | | | | 1.37 | | | | — | | | | 1.46 | | | | — | | | | 16.52 | | | | 12.87 | | | | 1.57 | | | | 1.54 | | | | 1.54 | | | | 0.40 | | | | 120,606 | | | | 16 | |
| 12-31-19 | | | 14.01 | | | | 0.06 | | | | 3.89 | | | | 3.95 | | | | 0.10 | | | | 1.80 | | | | — | | | | 1.90 | | | | — | | | | 16.06 | | | | 28.89 | | | | 1.57 | | | | 1.54 | | | | 1.54 | | | | 0.48 | | | | 110,093 | | | | 16 | |
| 12-31-18 | | | 16.98 | | | | 0.07 | | | | (0.23 | ) | | | (0.16 | ) | | | 0.14 | | | | 2.67 | | | | — | | | | 2.81 | | | | — | | | | 14.01 | | | | (2.07 | ) | | | 1.57 | | | | 1.54 | | | | 1.54 | | | | 0.47 | | | | 78,112 | | | | 27 | |
| 12-31-17 | | | 14.58 | | | | 0.10 | | | | 3.53 | | | | 3.63 | | | | 0.17 | | | | 1.06 | | | | — | | | | 1.23 | | | | — | | | | 16.98 | | | | 25.47 | | | | 1.57 | | | | 1.55 | | | | 1.55 | | | | 0.60 | | | | 83,492 | | | | 29 | |
| 12-31-16 | | | 15.29 | | | | 0.13 | • | | | 0.68 | | | | 0.81 | | | | 0.17 | | | | 1.35 | | | | — | | | | 1.52 | | | | — | | | | 14.58 | | | | 4.94 | | | | 1.61 | | | | 1.54 | | | | 1.54 | | | | 0.83 | | | | 68,606 | | | | 26 | |
See Accompanying Notes to Financial Statements
33
FINANCIAL HIGHLIGHTS (CONTINUED)
Selected data for a share of beneficial interest outstanding throughout each year or period.
| | | | | | | Income (loss)
from investment
operations | | | | | | Less distributions | | | | | | | | | | | | | | | | | | Ratios to average
net assets | | Supplemental
data |
|---|
Year or
period | | Net asset
value,
beginning
of year
or period | | Net
investment
income
(loss) | | Net
realized
and
unrealized
gain (loss) | | Total from
investment
operations | | From net
investment
income | | From net
realized
gains | | From
return of
capital | | Total
distributions | | Payment
by
affiliate | | Net asset
value,
end of
year or
period | | Total
Return(1) | | Expenses
before
reductions/
additions(2)(3)(4) | | Expenses
net of fee
waivers
and/or
recoupments
if any(2)(3)(4) | | Expenses
net of all
reductions/
additions(2)(3)(4) | | Net
investment
income
(loss)(2)(3) | | Net assets,
end of
year or
period | | Portfolio
turnover
rate |
|---|
| ended | | ($) | | ($) | | ($) | | ($) | | ($) | | ($) | | ($) | | ($) | | ($) | | ($) | | (%) | | (%) | | (%) | | (%) | | (%) | | ($000’s) | | (%) |
|---|
VY® Morgan Stanley Global Franchise Portfolio (continued) |
Class R6 | | | | | | | | | | | | | | | | | | | | | | | | | | | | | | | | | | | | | | | | | | | | | | | | | | | | | | | | | | | | | | | | | | | | |
| 12-31-20 | | | 17.33 | | | | 0.17 | • | | | 2.01 | | | | 2.18 | | | | 0.17 | | | | 1.37 | | | | — | | | | 1.54 | | | | — | | | | 17.97 | | | | 13.55 | | | | 0.97 | | | | 0.94 | | | | 0.94 | | | | 0.98 | | | | 1,301 | | | | 16 | |
| 12-31-19 | | | 14.97 | | | | 0.18 | • | | | 4.17 | | | | 4.35 | | | | 0.19 | | | | 1.80 | | | | — | | | | 1.99 | | | | — | | | | 17.33 | | | | 29.74 | | | | 0.97 | | | | 0.94 | | | | 0.94 | | | | 1.07 | | | | 635 | | | | 16 | |
| 12-31-18 | | | 17.96 | | | | 0.19 | • | | | (0.27 | ) | | | (0.08 | ) | | | 0.24 | | | | 2.67 | | | | — | | | | 2.91 | | | | — | | | | 14.97 | | | | (1.51 | ) | | | 0.97 | | | | 0.94 | | | | 0.94 | | | | 1.14 | | | | 84 | | | | 27 | |
| 12-31-17 | | | 15.35 | | | | 0.21 | • | | | 3.71 | | | | 3.92 | | | | 0.25 | | | | 1.06 | | | | — | | | | 1.31 | | | | — | | | | 17.96 | | | | 26.16 | | | | 0.97 | | | | 0.95 | | | | 0.95 | | | | 1.21 | | | | 44 | | | | 29 | |
05-03-16(5) – 12-31-16 | | | 16.66 | | | | 0.22 | • | | | 0.07 | | | | 0.29 | | | | 0.25 | | | | 1.35 | | | | — | | | | 1.60 | | | | — | | | | 15.35 | | | | 1.46 | | | | 0.96 | | | | 0.94 | | | | 0.94 | | | | 1.48 | | | | 49 | | | | 26 | |
Class S | | | | | | | | | | | | | | | | | | | | | | | | | | | | | | | | | | | | | | | | | | | | | | | | | | | | | | | | | | | | | | | | | | | | |
| 12-31-20 | | | 17.36 | | | | 0.14 | | | | 2.01 | | | | 2.15 | | | | 0.13 | | | | 1.37 | | | | — | | | | 1.50 | | | | — | | | | 18.01 | | | | 13.28 | | | | 1.22 | | | | 1.19 | | | | 1.19 | | | | 0.74 | | | | 260,901 | | | | 16 | |
| 12-31-19 | | | 15.00 | | | | 0.14 | • | | | 4.16 | | | | 4.30 | | | | 0.14 | | | | 1.80 | | | | — | | | | 1.94 | | | | — | | | | 17.36 | | | | 29.34 | | | | 1.22 | | | | 1.19 | | | | 1.19 | | | | 0.82 | | | | 266,633 | | | | 16 | |
| 12-31-18 | | | 17.97 | | | | 0.14 | • | | | (0.25 | ) | | | (0.11 | ) | | | 0.19 | | | | 2.67 | | | | — | | | | 2.86 | | | | — | | | | 15.00 | | | | (1.69 | ) | | | 1.22 | | | | 1.19 | | | | 1.19 | | | | 0.81 | | | | 243,512 | | | | 27 | |
| 12-31-17 | | | 15.36 | | | | 0.16 | • | | | 3.71 | | | | 3.87 | | | | 0.20 | | | | 1.06 | | | | — | | | | 1.26 | | | | — | | | | 17.97 | | | | 25.81 | | | | 1.22 | | | | 1.20 | | | | 1.20 | | | | 0.95 | | | | 282,442 | | | | 29 | |
| 12-31-16 | | | 16.02 | | | | 0.20 | | | | 0.70 | | | | 0.90 | | | | 0.21 | | | | 1.35 | | | | — | | | | 1.56 | | | | — | | | | 15.36 | | | | 5.30 | | | | 1.21 | | | | 1.19 | | | | 1.19 | | | | 1.20 | | | | 299,965 | | | | 26 | |
Class S2 | | | | | | | | | | | | | | | | | | | | | | | | | | | | | | | | | | | | | | | | | | | | | | | | | | | | | | | | | | | | | | | | | | | | |
| 12-31-20 | | | 17.18 | | | | 0.11 | | | | 1.98 | | | | 2.09 | | | | 0.10 | | | | 1.37 | | | | — | | | | 1.47 | | | | — | | | | 17.80 | | | | 13.06 | | | | 1.37 | | | | 1.34 | | | | 1.34 | | | | 0.60 | | | | 38,585 | | | | 16 | |
| 12-31-19 | | | 14.86 | | | | 0.11 | • | | | 4.13 | | | | 4.24 | | | | 0.12 | | | | 1.80 | | | | — | | | | 1.92 | | | | — | | | | 17.18 | | | | 29.15 | | | | 1.37 | | | | 1.34 | | | | 1.34 | | | | 0.67 | | | | 38,888 | | | | 16 | |
| 12-31-18 | | | 17.83 | | | | 0.12 | | | | (0.26 | ) | | | (0.14 | ) | | | 0.16 | | | | 2.67 | | | | — | | | | 2.83 | | | | — | | | | 14.86 | | | | (1.89 | ) | | | 1.37 | | | | 1.34 | | | | 1.34 | | | | 0.66 | | | | 35,431 | | | | 27 | |
| 12-31-17 | | | 15.24 | | | | 0.14 | • | | | 3.69 | | | | 3.83 | | | | 0.18 | | | | 1.06 | | | | — | | | | 1.24 | | | | — | | | | 17.83 | | | | 25.69 | | | | 1.37 | | | | 1.35 | | | | 1.35 | | | | 0.80 | | | | 41,831 | | | | 29 | |
| 12-31-16 | | | 15.90 | | | | 0.17 | • | | | 0.70 | | | | 0.87 | | | | 0.18 | | | | 1.35 | | | | — | | | | 1.53 | | | | — | | | | 15.24 | | | | 5.16 | | | | 1.39 | | | | 1.34 | | | | 1.34 | | | | 1.05 | | | | 44,381 | | | | 26 | |
VY® T. Rowe Price Capital Appreciation Portfolio |
Class ADV | | | | | | | | | | | | | | | | | | | | | | | | | | | | | | | | | | | | | | | | | | | | | | | | | | | | | | | | | | | | | | | | | | | | |
| 12-31-20 | | | 27.98 | | | | 0.20 | • | | | 4.33 | | | | 4.53 | | | | 0.29 | | | | 2.31 | | | | — | | | | 2.60 | | | | — | | | | 29.91 | | | | 17.54 | | | | 1.24 | | | | 1.24 | | | | 1.24 | | | | 0.71 | | | | 1,555,873 | | | | 98 | |
| 12-31-19 | | | 24.10 | | | | 0.25 | | | | 5.46 | | | | 5.71 | | | | 0.34 | | | | 1.49 | | | | — | | | | 1.83 | | | | — | | | | 27.98 | | | | 23.99 | | | | 1.24 | | | | 1.24 | | | | 1.24 | | | | 1.02 | | | | 1,353,246 | | | | 53 | |
| 12-31-18 | | | 26.53 | | | | 0.48 | | | | (0.36 | ) | | | 0.12 | | | | 0.50 | | | | 2.05 | | | | — | | | | 2.55 | | | | — | | | | 24.10 | | | | 0.10 | | | | 1.24 | | | | 1.24 | | | | 1.24 | | | | 1.94 | | | | 990,787 | | | | 75 | |
| 12-31-17 | | | 24.54 | | | | 0.19 | | | | 3.36 | | | | 3.55 | | | | 0.25 | | | | 1.31 | | | | — | | | | 1.56 | | | | — | | | | 26.53 | | | | 14.72 | | | | 1.24 | | | | 1.24 | | | | 1.24 | | | | 0.78 | | | | 954,071 | | | | 61 | |
| 12-31-16 | | | 25.27 | | | | 0.24 | • | | | 1.68 | | | | 1.92 | | | | 0.28 | | | | 2.37 | | | | — | | | | 2.65 | | | | — | | | | 24.54 | | | | 7.65 | | | | 1.29 | | | | 1.24 | | | | 1.24 | | | | 0.97 | | | | 778,133 | | | | 69 | |
Class I | | | | | | | | | | | | | | | | | | | | | | | | | | | | | | | | | | | | | | | | | | | | | | | | | | | | | | | | | | | | | | | | | | | | |
| 12-31-20 | | | 29.41 | | | | 0.38 | • | | | 4.61 | | | | 4.99 | | | | 0.45 | | | | 2.31 | | | | — | | | | 2.76 | | | | — | | | | 31.64 | | | | 18.28 | | | | 0.64 | | | | 0.64 | | | | 0.64 | | | | 1.31 | | | | 1,280,224 | | | | 98 | |
| 12-31-19 | | | 25.23 | | | | 0.43 | | | | 5.73 | | | | 6.16 | | | | 0.49 | | | | 1.49 | | | | — | | | | 1.98 | | | | — | | | | 29.41 | | | | 24.71 | | | | 0.64 | | | | 0.64 | | | | 0.64 | | | | 1.62 | | | | 1,673,642 | | | | 53 | |
| 12-31-18 | | | 27.64 | | | | 0.67 | | | | (0.38 | ) | | | 0.29 | | | | 0.65 | | | | 2.05 | | | | — | | | | 2.70 | | | | — | | | | 25.23 | | | | 0.74 | | | | 0.64 | | | | 0.64 | | | | 0.64 | | | | 2.57 | | | | 1,245,366 | | | | 75 | |
| 12-31-17 | | | 25.49 | | | | 0.36 | | | | 3.50 | | | | 3.86 | | | | 0.40 | | | | 1.31 | | | | — | | | | 1.71 | | | | — | | | | 27.64 | | | | 15.39 | | | | 0.64 | | | | 0.64 | | | | 0.64 | | | | 1.38 | | | | 1,217,289 | | | | 61 | |
| 12-31-16 | | | 26.12 | | | | 0.40 | | | | 1.75 | | | | 2.15 | | | | 0.41 | | | | 2.37 | | | | — | | | | 2.78 | | | | — | | | | 25.49 | | | | 8.31 | | | | 0.64 | | | | 0.64 | | | | 0.64 | | | | 1.55 | | | | 1,084,776 | | | | 69 | |
Class R6 | | | | | | | | | | | | | | | | | | | | | | | | | | | | | | | | | | | | | | | | | | | | | | | | | | | | | | | | | | | | | | | | | | | | |
| 12-31-20 | | | 29.43 | | | | 0.38 | • | | | 4.61 | | | | 4.99 | | | | 0.45 | | | | 2.31 | | | | — | | | | 2.76 | | | | — | | | | 31.66 | | | | 18.27 | | | | 0.64 | | | | 0.64 | | | | 0.64 | | | | 1.30 | | | | 542,043 | | | | 98 | |
| 12-31-19 | | | 25.24 | | | | 0.46 | • | | | 5.71 | | | | 6.17 | | | | 0.49 | | | | 1.49 | | | | — | | | | 1.98 | | | | — | | | | 29.43 | | | | 24.74 | | | | 0.64 | | | | 0.64 | | | | 0.64 | | | | 1.62 | | | | 181,835 | | | | 53 | |
| 12-31-18 | | | 27.66 | | | | 0.70 | • | | | (0.42 | ) | | | 0.28 | | | | 0.65 | | | | 2.05 | | | | — | | | | 2.70 | | | | — | | | | 25.24 | | | | 0.70 | | | | 0.64 | | | | 0.64 | | | | 0.64 | | | | 2.57 | | | | 94,159 | | | | 75 | |
| 12-31-17 | | | 25.49 | | | | 0.38 | • | | | 3.50 | | | | 3.88 | | | | 0.40 | | | | 1.31 | | | | — | | | | 1.71 | | | | — | | | | 27.66 | | | | 15.47 | | | | 0.64 | | | | 0.64 | | | | 0.64 | | | | 1.38 | | | | 59,752 | | | | 61 | |
05-03-16(5) – 12-31-16 | | | 27.00 | | | | 0.48 | • | | | 0.79 | | | | 1.27 | | | | 0.41 | | | | 2.37 | | | | — | | | | 2.78 | | | | — | | | | 25.49 | | | | 4.78 | | | | 0.64 | | | | 0.64 | | | | 0.64 | | | | 1.91 | | | | 8,696 | | | | 69 | |
Class S | | | | | | | | | | | | | | | | | | | | | | | | | | | | | | | | | | | | | | | | | | | | | | | | | | | | | | | | | | | | | | | | | | | | |
| 12-31-20 | | | 29.42 | | | | 0.32 | | | | 4.59 | | | | 4.91 | | | | 0.38 | | | | 2.31 | | | | — | | | | 2.69 | | | | — | | | | 31.64 | | | | 17.97 | | | | 0.89 | | | | 0.89 | | | | 0.89 | | | | 1.06 | | | | 4,426,278 | | | | 98 | |
| 12-31-19 | | | 25.25 | | | | 0.39 | • | | | 5.69 | | | | 6.08 | | | | 0.42 | | | | 1.49 | | | | — | | | | 1.91 | | | | — | | | | 29.42 | | | | 24.36 | | | | 0.89 | | | | 0.89 | | | | 0.89 | | | | 1.37 | | | | 4,163,308 | | | | 53 | |
| 12-31-18 | | | 27.65 | | | | 0.63 | • | | | (0.40 | ) | | | 0.23 | | | | 0.58 | | | | 2.05 | | | | — | | | | 2.63 | | | | — | | | | 25.25 | | | | 0.51 | | | | 0.89 | | | | 0.89 | | | | 0.89 | | | | 2.29 | | | | 3,640,431 | | | | 75 | |
| 12-31-17 | | | 25.50 | | | | 0.31 | • | | | 3.48 | | | | 3.79 | | | | 0.33 | | | | 1.31 | | | | — | | | | 1.64 | | | | — | | | | 27.65 | | | | 15.10 | | | | 0.89 | | | | 0.89 | | | | 0.89 | | | | 1.13 | | | | 4,050,729 | | | | 61 | |
| 12-31-16 | | | 26.13 | | | | 0.34 | | | | 1.74 | | | | 2.08 | | | | 0.34 | | | | 2.37 | | | | — | | | | 2.71 | | | | — | | | | 25.50 | | | | 8.05 | | | | 0.89 | | | | 0.89 | | | | 0.89 | | | | 1.30 | | | | 4,074,922 | | | | 69 | |
Class S2 | | | | | | | | | | | | | | | | | | | | | | | | | | | | | | | | | | | | | | | | | | | | | | | | | | | | | | | | | | | | | | | | | | | | |
| 12-31-20 | | | 29.19 | | | | 0.28 | | | | 4.54 | | | | 4.82 | | | | 0.33 | | | | 2.31 | | | | — | | | | 2.64 | | | | — | | | | 31.37 | | | | 17.82 | | | | 1.04 | | | | 1.04 | | | | 1.04 | | | | 0.91 | | | | 70,966 | | | | 98 | |
| 12-31-19 | | | 25.06 | | | | 0.34 | • | | | 5.65 | | | | 5.99 | | | | 0.37 | | | | 1.49 | | | | — | | | | 1.86 | | | | — | | | | 29.19 | | | | 24.19 | | | | 1.04 | | | | 1.04 | | | | 1.04 | | | | 1.22 | | | | 73,222 | | | | 53 | |
| 12-31-18 | | | 27.47 | | | | 0.58 | • | | | (0.40 | ) | | | 0.18 | | | | 0.54 | | | | 2.05 | | | | — | | | | 2.59 | | | | — | | | | 25.06 | | | | 0.33 | | | | 1.04 | | | | 1.04 | | | | 1.04 | | | | 2.13 | | | | 68,741 | | | | 75 | |
| 12-31-17 | | | 25.33 | | | | 0.26 | • | | | 3.47 | | | | 3.73 | | | | 0.28 | | | | 1.31 | | | | — | | | | 1.59 | | | | — | | | | 27.47 | | | | 14.96 | | | | 1.04 | | | | 1.04 | | | | 1.04 | | | | 0.98 | | | | 74,919 | | | | 61 | |
| 12-31-16 | | | 25.98 | | | | 0.31 | | | | 1.71 | | | | 2.02 | | | | 0.30 | | | | 2.37 | | | | — | | | | 2.67 | | | | — | | | | 25.33 | | | | 7.86 | | | | 1.07 | | | | 1.04 | | | | 1.04 | | | | 1.15 | | | | 82,812 | | | | 69 | |
See Accompanying Notes to Financial Statements
34
FINANCIAL HIGHLIGHTS (CONTINUED)
| | | | | | | Income (loss)
from investment
operations | | | | | | Less distributions | | | | | | | | | | | | | | | | | | Ratios to average
net assets | | Supplemental
data |
|---|
| | Net asset
value,
beginning
of year
or period | | Net
investment
income
(loss) | | Net
realized
and
unrealized
gain (loss) | | Total from
investment
operations | | From net
investment
income | | From net
realized
gains | | From
return of
capital | | Total
distributions | | Payment
by
affiliate | | Net asset
value,
end of
year or
period | | Total
Return(1) | | Expenses
before
reductions/
additions(2)(3)(4) | | Expenses
net of fee
waivers
and/or
recoupments
if any(2)(3)(4) | | Expenses
net of all
reductions/
additions(2)(3)(4) | | Net
investment
income
(loss)(2)(3) | | Net assets,
end of
year or
period | | Portfolio
turnover
rate |
|---|
| Year or period ended | | ($) | | ($) | | ($) | | ($) | | ($) | | ($) | | ($) | | ($) | | ($) | | ($) | | (%) | | (%) | | (%) | | (%) | | (%) | | ($000’s) | | (%) |
|---|
VY® T. Rowe Price Equity Income Portfolio | | | | | | | | | | | | | | | | | | | | | | | | | | | | | | | | | | | | | | | | | | | | | | | | | | | | | | | | | |
Class ADV | | | | | | | | | | | | | | | | | | | | | | | | | | | | | | | | | | | | | | | | | | | | | | | | | | | | | | | | | | | | | | | | | | | | |
| 12-31-20 | | | 9.97 | | | | 0.17 | | | | (0.19 | ) | | | (0.02 | ) | | | 0.37 | | | | 0.12 | | | | — | | | | 0.49 | | | | — | | | | 9.46 | | | | 0.64 | | | | 1.24 | | | | 1.21 | | | | 1.21 | | | | 1.87 | | | | 47,110 | | | | 25 | |
| 12-31-19 | | | 10.74 | | | | 0.21 | • | | | 2.42 | | | | 2.63 | | | | 0.26 | | | | 3.14 | | | | — | | | | 3.40 | | | | — | | | | 9.97 | | | | 25.93 | | | | 1.24 | | | | 1.21 | | | | 1.21 | | | | 1.82 | | | | 51,293 | | | | 17 | |
| 12-31-18 | | | 14.34 | | | | 0.23 | | | | (1.38 | ) | | | (1.15 | ) | | | 0.23 | | | | 2.22 | | | | — | | | | 2.45 | | | | — | | | | 10.74 | | | | (9.69 | )(a) | | | 1.24 | | | | 1.09 | (b) | | | 1.09 | | | | 1.80 | (c) | | | 43,287 | | | | 16 | |
| 12-31-17 | | | 13.63 | | | | 0.20 | | | | 1.86 | | | | 2.06 | | | | 0.25 | | | | 1.10 | | | | — | | | | 1.35 | | | | — | | | | 14.34 | | | | 15.89 | | | | 1.24 | | | | 1.24 | | | | 1.24 | | | | 1.38 | | | | 53,101 | | | | 19 | |
| 12-31-16 | | | 13.03 | | | | 0.23 | | | | 2.04 | | | | 2.27 | | | | 0.26 | | | | 1.41 | | | | — | | | | 1.67 | | | | — | | | | 13.63 | | | | 18.30 | | | | 1.29 | | | | 1.24 | | | | 1.24 | | | | 1.67 | | | | 50,794 | | | | 26 | |
Class I | | | | | | | | | | | | | | | | | | | | | | | | | | | | | | | | | | | | | | | | | | | | | | | | | | | | | | | | | | | | | | | | | | | | |
| 12-31-20 | | | 10.27 | | | | 0.23 | | | | (0.20 | ) | | | 0.03 | | | | 0.48 | | | | 0.12 | | | | — | | | | 0.60 | | | | — | | | | 9.70 | | | | 1.27 | | | | 0.64 | | | | 0.61 | | | | 0.61 | | | | 2.47 | | | | 77,346 | | | | 25 | |
| 12-31-19 | | | 10.97 | | | | 0.29 | • | | | 2.47 | | | | 2.76 | | | | 0.32 | | | | 3.14 | | | | — | | | | 3.46 | | | | — | | | | 10.27 | | | | 26.66 | | | | 0.64 | | | | 0.61 | | | | 0.61 | | | | 2.42 | | | | 81,596 | | | | 17 | |
| 12-31-18 | | | 14.59 | | | | 0.31 | | | | (1.41 | ) | | | (1.10 | ) | | | 0.30 | | | | 2.22 | | | | — | | | | 2.52 | | | | — | | | | 10.97 | | | | (9.09 | )(a) | | | 0.64 | | | | 0.49 | (b) | | | 0.49 | | | | 2.40 | (c) | | | 82,300 | | | | 16 | |
| 12-31-17 | | | 13.85 | | | | 0.28 | • | | | 1.90 | | | | 2.18 | | | | 0.34 | | | | 1.10 | | | | — | | | | 1.44 | | | | — | | | | 14.59 | | | | 16.48 | | | | 0.64 | | | | 0.64 | | | | 0.64 | | | | 1.94 | | | | 99,204 | | | | 19 | |
| 12-31-16 | | | 13.20 | | | | 0.31 | • | | | 2.09 | | | | 2.40 | | | | 0.34 | | | | 1.41 | | | | — | | | | 1.75 | | | | — | | | | 13.85 | | | | 19.07 | | | | 0.64 | | | | 0.64 | | | | 0.64 | | | | 2.32 | | | | 135,151 | | | | 26 | |
Class S | | | | | | | | | | | | | | | | | | | | | | | | | | | | | | | | | | | | | | | | | | | | | | | | | | | | | | | | | | | | | | | | | | | | |
| 12-31-20 | | | 10.31 | | | | 0.22 | | | | (0.20 | ) | | | 0.02 | | | | 0.36 | | | | 0.12 | | | | — | | | | 0.48 | | | | — | | | | 9.85 | | | | 0.95 | | | | 0.89 | | | | 0.86 | | | | 0.86 | | | | 2.22 | | | | 141,486 | | | | 25 | |
| 12-31-19 | | | 11.00 | | | | 0.25 | • | | | 2.50 | | | | 2.75 | | | | 0.30 | | | | 3.14 | | | | — | | | | 3.44 | | | | — | | | | 10.31 | | | | 26.42 | | | | 0.89 | | | | 0.86 | | | | 0.86 | | | | 2.13 | | | | 161,388 | | | | 17 | |
| 12-31-18 | | | 14.62 | | | | 0.29 | | | | (1.42 | ) | | | (1.13 | ) | | | 0.27 | | | | 2.22 | | | | — | | | | 2.49 | | | | — | | | | 11.00 | | | | (9.32 | )(a) | | | 0.89 | | | | 0.74 | (b) | | | 0.74 | | | | 2.15 | (c) | | | 541,914 | | | | 16 | |
| 12-31-17 | | | 13.87 | | | | 0.25 | • | | | 1.90 | | | | 2.15 | | | | 0.30 | | | | 1.10 | | | | — | | | | 1.40 | | | | — | | | | 14.62 | | | | 16.23 | | | | 0.89 | | | | 0.89 | | | | 0.89 | | | | 1.73 | | | | 694,870 | | | | 19 | |
| 12-31-16 | | | 13.22 | | | | 0.28 | | | | 2.08 | | | | 2.36 | | | | 0.30 | | | | 1.41 | | | | — | | | | 1.71 | | | | — | | | | 13.87 | | | | 18.77 | | | | 0.89 | | | | 0.89 | | | | 0.89 | | | | 2.01 | | | | 772,218 | | | | 26 | |
Class S2 | | | | | | | | | | | | | | | | | | | | | | | | | | | | | | | | | | | | | | | | | | | | | | | | | | | | | | | | | | | | | | | | | | | | |
| 12-31-20 | | | 10.07 | | | | 0.20 | | | | (0.20 | ) | | | 0.00 | * | | | 0.40 | | | | 0.12 | | | | — | | | | 0.52 | | | | — | | | | 9.55 | | | | 0.85 | | | | 1.04 | | | | 1.01 | | | | 1.01 | | | | 2.07 | | | | 80,591 | | | | 25 | |
| 12-31-19 | | | 10.82 | | | | 0.23 | • | | | 2.44 | | | | 2.67 | | | | 0.28 | | | | 3.14 | | | | — | | | | 3.42 | | | | — | | | | 10.07 | | | | 26.13 | | | | 1.04 | | | | 1.01 | | | | 1.01 | | | | 2.01 | | | | 90,172 | | | | 17 | |
| 12-31-18 | | | 14.42 | | | | 0.26 | | | | (1.39 | ) | | | (1.13 | ) | | | 0.25 | | | | 2.22 | | | | — | | | | 2.47 | | | | — | | | | 10.82 | | | | (9.45 | )(a) | | | 1.04 | | | | 0.89 | (b) | | | 0.89 | | | | 2.00 | (c) | | | 91,924 | | | | 16 | |
| 12-31-17 | | | 13.70 | | | | 0.23 | | | | 1.87 | | | | 2.10 | | | | 0.28 | | | | 1.10 | | | | — | | | | 1.38 | | | | — | | | | 14.42 | | | | 16.07 | | | | 1.04 | | | | 1.04 | | | | 1.04 | | | | 1.58 | | | | 113,247 | | | | 19 | |
| 12-31-16 | | | 13.08 | | | | 0.25 | | | | 2.06 | | | | 2.31 | | | | 0.28 | | | | 1.41 | | | | — | | | | 1.69 | | | | — | | | | 13.70 | | | | 18.59 | | | | 1.07 | | | | 1.04 | | | | 1.04 | | | | 1.86 | | | | 113,380 | | | | 26 | |
VY® T. Rowe Price International Stock Portfolio | | | | | | | | | | | | | | | | | | | | | | | | | | | | | | | | | | | | | | | | | | | | | |
Class ADV | | | | | | | | | | | | | | | | | | | | | | | | | | | | | | | | | | | | | | | | | | | | | | | | | | | | | | | | | | | | | | | | | | | | |
| 12-31-20 | | | 16.26 | | | | 0.02 | • | | | 2.15 | | | | 2.17 | | | | 0.34 | | | | 0.37 | | | | — | | | | 0.71 | | | | — | | | | 17.72 | | | | 14.11 | | | | 1.38 | | | | 1.36 | | | | 1.36 | | | | 0.14 | | | | 24,010 | | | | 30 | |
| 12-31-19 | | | 13.63 | | | | 0.12 | | | | 3.49 | | | | 3.61 | | | | 0.06 | | | | 0.92 | | | | — | | | | 0.98 | | | | — | | | | 16.26 | | | | 27.20 | | | | 1.41 | | | | 1.36 | | | | 1.36 | | | | 0.87 | | | | 23,415 | | | | 30 | |
| 12-31-18 | | | 16.16 | | | | 0.10 | | | | (2.41 | ) | | | (2.31 | ) | | | 0.22 | | | | — | | | | — | | | | 0.22 | | | | — | | | | 13.63 | | | | (14.46 | ) | | | 1.45 | | | | 1.40 | | | | 1.40 | | | | 0.70 | | | | 18,465 | | | | 35 | |
| 12-31-17 | | | 12.79 | | | | 0.08 | | | | 3.42 | | | | 3.50 | | | | 0.13 | | | | — | | | | — | | | | 0.13 | | | | — | | | | 16.16 | | | | 27.42 | | | | 1.40 | | | | 1.40 | | | | 1.40 | | | | 0.64 | | | | 21,086 | | | | 37 | |
| 12-31-16 | | | 12.73 | | | | 0.11 | | | | 0.09 | | | | 0.20 | | | | 0.14 | | | | — | | | | — | | | | 0.14 | | | | — | | | | 12.79 | | | | 1.59 | | | | 1.43 | | | | 1.38 | | | | 1.38 | | | | 0.82 | | | | 15,001 | | | | 33 | |
Class I | | | | | | | | | | | | | | | | | | | | | | | | | | | | | | | | | | | | | | | | | | | | | | | | | | | | | | | | | | | | | | | | | | | | |
| 12-31-20 | | | 16.35 | | | | 0.13 | | | | 2.13 | | | | 2.26 | | | | 0.43 | | | | 0.37 | | | | — | | | | 0.80 | | | | — | | | | 17.81 | | | | 14.74 | | | | 0.78 | | | | 0.76 | | | | 0.76 | | | | 0.75 | | | | 45,033 | | | | 30 | |
| 12-31-19 | | | 13.69 | | | | 0.23 | | | | 3.50 | | | | 3.73 | | | | 0.15 | | | | 0.92 | | | | — | | | | 1.07 | | | | — | | | | 16.35 | | | | 28.04 | | | | 0.81 | | | | 0.76 | | | | 0.76 | | | | 1.47 | | | | 41,352 | | | | 30 | |
| 12-31-18 | | | 16.22 | | | | 0.20 | • | | | (2.42 | ) | | | (2.22 | ) | | | 0.31 | | | | — | | | | — | | | | 0.31 | | | | — | | | | 13.69 | | | | (13.96 | ) | | | 0.85 | | | | 0.80 | | | | 0.80 | | | | 1.30 | | | | 35,717 | | | | 35 | |
| 12-31-17 | | | 12.82 | | | | 0.19 | • | | | 3.41 | | | | 3.60 | | | | 0.20 | | | | — | | | | — | | | | 0.20 | | | | — | | | | 16.22 | | | | 28.21 | | | | 0.80 | | | | 0.80 | | | | 0.80 | | | | 1.26 | | | | 44,832 | | | | 37 | |
| 12-31-16 | | | 12.76 | | | | 0.19 | | | | 0.09 | | | | 0.28 | | | | 0.22 | | | | — | | | | — | | | | 0.22 | | | | — | | | | 12.82 | | | | 2.18 | | | | 0.78 | | | | 0.78 | | | | 0.78 | | | | 1.41 | | | | 38,010 | | | | 33 | |
Class S | | | | | | | | | | | | | | | | | | | | | | | | | | | | | | | | | | | | | | | | | | | | | | | | | | | | | | | | | | | | | | | | | | | | |
| 12-31-20 | | | 16.28 | | | | 0.08 | • | | | 2.14 | | | | 2.22 | | | | 0.39 | | | | 0.37 | | | | — | | | | 0.76 | | | | — | | | | 17.74 | | | | 14.49 | | | | 1.03 | | | | 1.01 | | | | 1.01 | | | | 0.49 | | | | 153,919 | | | | 30 | |
| 12-31-19 | | | 13.64 | | | | 0.18 | • | | | 3.49 | | | | 3.67 | | | | 0.11 | | | | 0.92 | | | | — | | | | 1.03 | | | | — | | | | 16.28 | | | | 27.64 | | | | 1.06 | | | | 1.01 | | | | 1.01 | | | | 1.20 | | | | 151,437 | | | | 30 | |
| 12-31-18 | | | 16.15 | | | | 0.17 | • | | | (2.42 | ) | | | (2.25 | ) | | | 0.26 | | | | — | | | | — | | | | 0.26 | | | | — | | | | 13.64 | | | | (14.12 | ) | | | 1.10 | | | | 1.05 | | | | 1.05 | | | | 1.07 | | | | 137,550 | | | | 35 | |
| 12-31-17 | | | 12.77 | | | | 0.15 | • | | | 3.40 | | | | 3.55 | | | | 0.17 | | | | — | | | | — | | | | 0.17 | | | | — | | | | 16.15 | | | | 27.87 | | | | 1.05 | | | | 1.05 | | | | 1.05 | | | | 1.01 | | | | 175,297 | | | | 37 | |
| 12-31-16 | | | 12.71 | | | | 0.15 | • | | | 0.09 | | | | 0.24 | | | | 0.18 | | | | — | | | | — | | | | 0.18 | | | | — | | | | 12.77 | | | | 1.90 | | | | 1.03 | | | | 1.03 | | | | 1.03 | | | | 1.17 | | | | 154,225 | | | | 33 | |
(1) | | Total return is calculated assuming reinvestment of all dividends, capital gain distributions and return of capital distributions, if any, at net asset value and does not reflect the effect of insurance contract charges. Total return for periods less than one year is not annualized. |
(2) | | Annualized for periods less than one year. |
(3) | | Ratios reflect operating expenses of a Portfolio. Expenses before reductions/additions do not reflect amounts reimbursed or recouped |
| | | |
| | | by the Investment Adviser and/or Distributor or reductions from brokerage service arrangements or other expense offset arrangements and do not represent the amount paid by a Portfolio during periods when reimbursements or reductions occur. Expenses net of fee waivers reflect expenses after reimbursement by the Investment Adviser and/or Distributor or recoupment of previously reimbursed fees by the Investment Adviser, but prior to reductions from brokerage service arrangements or other expense offset arrangements. Expenses net of all reductions/additions |
See Accompanying Notes to Financial Statements
35
FINANCIAL HIGHLIGHTS (CONTINUED)
| | represent the net expenses paid by a Portfolio. Net investment income (loss) is net of all such additions or reductions. |
(4) | | Ratios do not include fees and expenses charged under the variable annuity contract or variable life insurance policy. |
(5) | | Commencement of operations. |
(a) | | Excluding amounts related to a securities lending settlement and a cumulative underpayment of prior years’ waivers of management fees recorded in the year ended December 31, 2018, total return for VY® T.Rowe Price Equity Income Portfolio would have been (9.84)%, (9.24)%, (9.47)% and (9.60)% for Classes ADV, I, S and S2, respectively. |
(b) | | Excluding amounts related to a cumulative underpayment of prior years’ waivers of management fees recorded in the year ended |
| | | December 31, 2018, the net expense ratios for VY® T.Rowe Price Equity Income Portfolio would have been 1.23%, 0.63%, 0.88% and 1.03% for Class ADV, I, S and S2, respectively. |
(c) | | Excluding amounts related to a securities lending settlement and a cumulative underpayment of prior years’ waivers of management fees recorded in the year ended December 31, 2018, the net investment income ratios for VY® T.Rowe Price Equity Income Portfolio would have been 1.65%, 2.25%, 2.00% and 1.85% for Classes ADV, I, S and S2, respectively. |
• | | Calculated using average number of shares outstanding throughout the year or period. |
| * | | Amount is less than $0.005 or 0.005% or more than $(0.005) or (0.005)%. |
See Accompanying Notes to Financial Statements
36
NOTES TO FINANCIAL STATEMENTS AS OF DECEMBER 31, 2020 NOTE 1 — ORGANIZATION
Voya Investors Trust (the “Trust”) is registered under the Investment Company Act of 1940, as amended (the “1940 Act” or the “Act”), as an open-end management investment company. The Trust was organized as a Massachusetts business trust on August 3, 1988. The Trust consists of twenty-two active separate investment series. The eight series (each a “Portfolio” and collectively, the “Portfolios”) included in this report are: Voya Government Liquid Assets Portfolio (“Government Liquid Assets”), VY® Clarion Global Real Estate Portfolio (“Clarion Global Real Estate”), VY® Invesco Growth and Income Portfolio (“Invesco Growth and Income”), VY® JPMorgan Emerging Markets Equity Portfolio (“JPMorgan Emerging Markets Equity”), VY® Morgan Stanley Global Franchise Portfolio (“Morgan Stanley Global Franchise”), VY® T. Rowe Price Capital Appreciation Portfolio (“T. Rowe Price Capital Appreciation”), VY® T. Rowe Price Equity Income Portfolio (“T. Rowe Price Equity Income”), and VY® T. Rowe Price International Stock Portfolio (“T. Rowe Price International Stock”). All of the Portfolios are diversified except for Morgan Stanley Global Franchise, which is a non-diversified Portfolio of the Trust. The investment objective of the Portfolios is described in the respective Portfolio’s Prospectus.
The classes of shares included in this report are: Adviser (“Class ADV”), Institutional (“Class I”), Class R6, Service (“Class S”) and Service 2 (“Class S2”); however, each Portfolio may not offer all share classes. With the exception of class specific matters, each class has equal voting rights as to voting privileges. For class specific proposals, only the applicable class would have voting privileges. The classes differ principally in the applicable distribution and shareholder service fees. Generally, shareholders of each class also bear certain expenses that pertain to that particular class. All shareholders are allocated the common expenses of a portfolio and earn income and realized gains/losses from a portfolio pro rata based on the daily ending net assets of each class, without distinction between share classes. Expenses that are specific to a portfolio or a class are charged directly to that portfolio or class. Other operating expenses shared by several portfolios are generally allocated among those portfolios based on average net assets. Distributions are determined separately for each class based on income and expenses allocated to each class. Realized gain distributions are allocated to each class pro rata based on the shares outstanding of each class on the date of distribution. Differences in per share dividend rates generally result from differences in separate class expenses, including distribution and shareholder service fees, if any, as well as differences in the amount of waiver of fees and
reimbursement of expenses between the separate classes, if any.
Voya Investments, LLC (“Voya Investments” or the “Investment Adviser”), an Arizona limited liability company, serves as the Investment Adviser to the Portfolios. Voya Investment Management Co. LLC (“Voya IM”), a Delaware limited liability company, serves as the sub-adviser to Government Liquid Assets. Voya Investments Distributor, LLC (“VID” or the “Distributor”), a Delaware limited liability company, serves as the principal underwriter to the Portfolios.
NOTE 2 — SIGNIFICANT ACCOUNTING POLICIES
The following significant accounting policies are consistently followed by the Portfolios in the preparation of their financial statements. Each Portfolio is considered an investment company under U.S. generally accepted accounting principles (“GAAP”) and follows the accounting and reporting guidance applicable to investment companies.
A. Security Valuation. Each Portfolio is open for business every day the New York Stock Exchange (“NYSE”) opens for regular trading (each such day, a “Business Day”). The net asset value (“NAV”) per share for each class of each Portfolio, (except Government Liquid Assets), is determined each Business Day as of the close of the regular trading session (“Market Close”), as determined by the Consolidated Tape Association (“CTA”), the central distributor of transaction prices for exchange-traded securities (normally 4:00 p.m. Eastern time unless otherwise designated by the CTA). The data reflected on the consolidated tape provided by the CTA is generated by various market centers, including all securities exchanges, electronic communications networks, and third-market broker-dealers. The NAV per share of each class of each Portfolio is calculated by taking the value of the Portfolio’s assets attributable to that class, subtracting the Portfolio’s liabilities attributable to that class, and dividing by the number of shares of that class that are outstanding. On days when a Portfolio is closed for business, Portfolio shares will not be priced and a Portfolio does not transact purchase and redemption orders. To the extent a Portfolio’s assets are traded in other markets on days when a Portfolio does not price its shares, the value of a Portfolio’s assets will likely change and you will not be able to purchase or redeem shares of a Portfolio.
Assets for which market quotations are readily available are valued at market value. A security listed or traded on an exchange is valued at its last sales price or official closing price as of the close of the regular trading session on the exchange where the security is principally traded or, if such price is not available, at the last sale price as of the Market
37
NOTES TO FINANCIAL STATEMENTS AS OF DECEMBER 31, 2020 (CONTINUED)
NOTE 2 — SIGNIFICANT ACCOUNTING POLICIES (continued)
Close for such security provided by the CTA. Bank loans are valued at the average of the averages of the bid and ask prices provided to an independent loan pricing service by brokers. Futures contracts are valued at the final settlement price set by an exchange on which they are principally traded. Listed options are valued at the mean between the last bid and ask prices from the exchange on which they are principally traded. Investments in open-end registered investment companies that do not trade on an exchange are valued at the end of day NAV per share. Investments in registered investment companies that trade on an exchange are valued at the last sales price or official closing price as of the close of the regular trading session on the exchange where the security is principally traded.
When a market quotation is not readily available or is deemed unreliable, each Portfolio will determine a fair value for the relevant asset in accordance with procedures adopted by the Portfolios’ Board of Trustees (“Board”). Such procedures provide, for example, that: (a) Exchange-traded securities are valued at the mean of the closing bid and ask; (b) Debt obligations are valued using an evaluated price provided by an independent pricing service. Evaluated prices provided by the pricing service may be determined without exclusive reliance on quoted prices, and may reflect factors such as institution-size trading in similar groups of securities, developments related to specific securities, benchmark yield, quality, type of issue, coupon rate, maturity, individual trading characteristics and other market data; (c) Securities traded in the over-the-counter (“OTC”) market are valued based on prices provided by independent pricing services or market makers; (d) Options not listed on an exchange are valued by an independent source using an industry accepted model, such as Black-Scholes; (e) Centrally cleared swap agreements are valued using a price provided by the central counterparty clearinghouse; (f) OTC swap agreements are valued using a price provided by an independent pricing service; (g) Forward foreign currency exchange contracts are valued utilizing current and forward rates obtained from an independent pricing service. Such prices from the third party pricing service are for specific settlement periods and each Portfolio’s forward foreign currency exchange contracts are valued at an interpolated rate between the closest preceding and subsequent period reported by the independent pricing service; and (h) Securities for which market prices are not provided by any of the above methods may be valued based upon quotes furnished by brokers.
The prospectuses of the open-end registered investment companies in which each Portfolio may invest explain the
circumstances under which they will use fair value pricing and the effects of using fair value pricing.
Foreign securities’ (including forward foreign currency exchange contracts) prices are converted into U.S. dollar amounts using the applicable exchange rates as of Market Close. If market quotations are available and believed to be reliable for foreign exchange-traded equity securities, the securities will be valued at the market quotations. Because trading hours for certain foreign securities end before Market Close, closing market quotations may become unreliable. An independent pricing service determines the degree of certainty, based on historical data, that the closing price in the principal market where a foreign security trades is not the current value as of Market Close. Foreign securities’ prices meeting the approved degree of certainty that the price is not reflective of current value will be valued by the independent pricing service using pricing models designed to estimate likely changes in the values of those securities between the times in which the trading in those securities is substantially completed and Market Close. Multiple factors may be considered by the independent pricing service in determining the value of such securities and may include information relating to sector indices, American Depositary Receipts and domestic and foreign index futures.
All other assets for which market quotations are not readily available or became unreliable (or if the above fair valuation methods are unavailable or determined to be unreliable) are valued at fair value as determined in good faith by or under the supervision of the Board following procedures approved by the Board. The Board has delegated to the Investment Adviser responsibility for overseeing the implementation of the Portfolios’ valuation procedures; a “Pricing Committee” comprised of employees of the Investment Adviser or its affiliates has responsibility for applying the fair valuation methods set forth in the procedures and, if a fair valuation cannot be determined pursuant to the fair valuation methods, determining the fair value of assets held by the Portfolios. Issuer specific events, transaction price, position size, nature and duration of restrictions on disposition of the security, market trends, bid/ask quotes of brokers and other market data may be reviewed in the course of making a good faith determination of a security’s fair value. Valuations change in response to many factors including the historical and prospective earnings of the issuer, the value of the issuer’s assets, general economic conditions, interest rates, investor perceptions and market liquidity. Because of the inherent uncertainties of fair valuation, the values used to determine each Portfolio’s NAV may materially differ from the value received upon actual sale of those investments. Thus, fair valuation may have an unintended dilutive or accretive
38
NOTES TO FINANCIAL STATEMENTS AS OF DECEMBER 31, 2020 (CONTINUED)
NOTE 2 — SIGNIFICANT ACCOUNTING POLICIES (continued)
effect on the value of shareholders’ investments in each Portfolio.
Government Liquid Assets uses the amortized cost method to value its portfolio securities and seeks to maintain a constant NAV of $1.00 per share, although there may be circumstances under which this goal cannot be achieved. The amortized cost method involves valuing a security at its cost and amortizing any discount or premium over the period until maturity, regardless of the impact of fluctuating interest rates or the market value of the security. Although the Board has established procedures designed to stabilize, to the extent reasonably possible, the share price of Government Liquid Assets, there can be no assurance that the Portfolio’s NAV can be maintained at $1.00 per share.
Each investment asset or liability of the Portfolios is assigned a level at measurement date based on the significance and source of the inputs to its valuation. Quoted prices in active markets for identical securities are classified as “Level 1,” inputs other than quoted prices for an asset or liability that are observable are classified as “Level 2” and significant unobservable inputs, including the sub-advisers’ or Pricing Committee’s judgment about the assumptions that a market participant would use in pricing an asset or liability are classified as “Level 3.” The inputs used for valuing securities are not necessarily an indication of the risks associated with investing in those securities. Short-term securities of sufficient credit quality are generally considered to be Level 2 securities under applicable accounting rules. A table summarizing the Portfolios’ investments under these levels of classification is included within the Portfolio of Investments.
GAAP requires a reconciliation of the beginning to ending balances for reported fair values that presents changes attributable to total realized and unrealized gains or losses, purchases and sales, and transfers in or out of the Level 3 category during the period. A reconciliation of Level 3 investments within the Portfolio of Investments is presented only when a Portfolio has a significant amount of Level 3 investments.
B. Securities Transactions and Revenue Recognition. Securities transactions are accounted for on the trade date. Realized gains and losses are reported on the basis of identified cost of securities sold. Interest income is recorded on an accrual basis. Dividend income is recorded on the ex-dividend date, or for certain foreign securities, when the information becomes available to the Portfolios. Premium amortization and discount accretion are determined by the effective yield method. Clarion Global Real Estate estimates components of distributions from
real estate investment trusts (“REITs”). Distributions received in excess of income are recorded as a reduction of cost of the related investments. If Clarion Global Real Estate no longer owns the applicable securities, any distributions received in excess of income are recorded as realized gains.
C. Foreign Currency Translation. The books and records of the Portfolios are maintained in U.S. dollars. Any foreign currency amounts are translated into U.S. dollars on the following basis:
| (1) | | Market value of investment securities, other assets andliabilities — at the exchange rates prevailing at Market Close. |
| (2) | | Purchases and sales of investment securities, income and expenses — at the rates of exchange prevailing on the respective dates of such transactions. |
Although the net assets and the market values are presented at the foreign exchange rates at Market Close, the Portfolios do not isolate the portion of the results of operations resulting from changes in foreign exchange rates on investments from the fluctuations arising from changes in market prices of securities held. Such fluctuations are included with the net realized and unrealized gains or losses from investments. For securities which are subject to foreign withholding tax upon disposition, liabilities are recorded on the Statements of Assets and Liabilities for the estimated tax withholding based on the securities’ current market value. Upon disposition, realized gains or losses on such securities are recorded net of foreign withholding tax.
Reported net realized foreign exchange gains or losses arise from sales of foreign currencies, currency gains or losses realized between the trade and settlement dates on securities transactions, the difference between the amounts of dividends, interest, and foreign withholding tax reclaims recorded on each Portfolios’ books, and the U.S. dollar equivalent of the amounts actually received or paid. Net unrealized foreign exchange gains and losses arise from changes in the value of assets and liabilities other than investments in securities, resulting from changes in the exchange rate. Foreign security and currency transactions may involve certain considerations and risks not typically associated with investing in U.S. companies and U.S. government securities. These risks include, but are not limited to, revaluation of currencies and future adverse political and economic developments which could cause securities and their markets to be less liquid and prices more volatile than those of comparable U.S. companies and U.S. government securities. The foregoing risks are
39
NOTES TO FINANCIAL STATEMENTS AS OF DECEMBER 31, 2020 (CONTINUED)
NOTE 2 — SIGNIFICANT ACCOUNTING POLICIES (continued)
even greater with respect to securities of issuers in emerging markets.
D. Distributions to Shareholders. The Portfolios record distributions to their shareholders on the ex-dividend date. Dividends from net investment income, if any, are declared daily and paid monthly, net short-term capital gain distributions, if any, are declared and paid monthly and net long-term capital gain distributions, if any, are declared and paid annually by Government Liquid Assets. Dividends from net investment income, if any, are declared and paid semi-annually and net capital gains distributions, if any, are declared and paid annually by T. Rowe Price Capital Appreciation and T. Rowe Price Equity Income. For all other Portfolios, dividends from net investment income and net capital gain distributions, if any, are declared and paid annually. The Portfolios may make distributions on a more frequent basis to comply with the distribution requirements of the Internal Revenue Code. The characteristics of income and gains to be distributed are determined in accordance with income tax regulations, which may differ from GAAP for investment companies.
E. Federal Income Taxes. It is the policy of each Portfolio to comply with the requirements of subchapter M of the Internal Revenue Code that are applicable to regulated investment companies and to distribute substantially all of its net investment income and any net realized capital gains to its shareholders. Therefore, a federal income tax or excise tax provision is not required. Management has considered the sustainability of the Portfolios’ tax positions taken on federal income tax returns for all open tax years in making this determination. No capital gain distributions shall be made until the capital loss carryforwards have been fully utilized.
The Portfolios may utilize equalization accounting for tax purposes, whereby a portion of redemption payments are treated as distributions of income or gain.
F. Use of Estimates. The preparation of financial statements in conformity with GAAP requires management to make estimates and assumptions that affect the reported amounts of assets and liabilities and disclosure of contingent assets and liabilities at the date of the financial statements and the reported amounts of increases and decreases in net assets from operations during the reporting period. Actual results could differ from those estimates.
G. Risk Exposures and the Use of Derivative Instruments. The Portfolios’ investment strategies permit the Portfolios to enter into various types of derivatives contracts, including, but not limited to, futures contracts, forward foreign currency exchange contracts, credit default
swaps, interest rate swaps, total return swaps, and purchased and written options. In doing so, a Portfolio will employ strategies in differing combinations to permit it to increase or decrease the level of risk, or change the level or types of exposure to risk factors. This may allow a Portfolio to pursue its objectives more quickly, and efficiently than if it were to make direct purchases or sales of securities capable of affecting a similar response to market or credit factors.
In pursuit of its investment objectives, a Portfolio may seek to increase or decrease its exposure to the following market or credit risk factors:
Credit Risk. The price of a bond or other debt instrument is likely to fall if the issuer’s actual or perceived financial health deteriorates, whether because of broad economic or issuer-specific reasons. In certain cases, the issuer could be late in paying interest or principal, or could fail to pay its financial obligations altogether.
Equity Risk. Stock prices may be volatile or have reduced liquidity in response to real or perceived impacts of factors including, but not limited to, economic conditions, changes in market interest rates, and political events. Stock markets tend to be cyclical, with periods when stock prices generally rise and periods when stock prices generally decline. Any given stock market segment may remain out of favor with investors for a short or long period of time, and stocks as an asset class may underperform bonds or other asset classes during some periods. Additionally, legislative, regulatory or tax policies or developments in these areas may adversely impact the investment techniques available to a manager, add to costs and impair the ability of a Portfolio to achieve its investment objectives.
Foreign Exchange Rate Risk. To the extent that a Portfolio invests directly in foreign (non-U.S.) currencies or in securities denominated in, or that trade in, foreign (non-U.S.) currencies, it is subject to the risk that those foreign (non-U.S.) currencies will decline in value relative to the U.S. dollar or, in the case of hedging positions, that the U.S. dollar will decline in value relative to the currency being hedged by a Portfolio through foreign currency exchange transactions.
Currency rates may fluctuate significantly over short periods of time. Currency rates may be affected by changes in market interest rates, intervention (or the failure to intervene) by U.S. or foreign governments, central banks or supranational entities such as the International Monetary Fund, by the imposition of currency controls, or other political or economic developments in the United States or abroad.
Interest Rate Risk. With bonds and other fixed rate debt instruments, a rise in market interest rates generally
40
NOTES TO FINANCIAL STATEMENTS AS OF DECEMBER 31, 2020 (CONTINUED)
NOTE 2 — SIGNIFICANT ACCOUNTING POLICIES (continued)
causes values to fall; conversely, values generally rise as market interest rates fall. The higher the credit quality of the instrument, and the longer its maturity or duration, the more sensitive it is likely to be to interest rate risk. In the case of inverse securities, the interest rate paid by the securities is a floating rate, which generally will decrease when the market rate of interest to which the inverse security is indexed increases and will increase when the market rate of interest to which the inverse security is indexed decreases. As of the date of this report, the United States experiences a low interest rate environment, which may increase a Portfolio’s exposure to risks associated with rising market interest rates. Rising market interest rates could have unpredictable effects on the markets and may expose fixed-income and related markets to heightened volatility. For a fund that invests in fixed-income securities, an increase in market interest rates may lead to increased redemptions and increased portfolio turnover, which could reduce liquidity for certain investments, adversely affect values, and increase costs. If dealer capacity in fixed-income markets is insufficient for market conditions, it may further inhibit liquidity and increase volatility in the fixed-income markets. Further, recent and potential changes in government policy may affect interest rates.
Risks of Investing in Derivatives. A Portfolio’s use of derivatives can result in losses due to unanticipated changes in the market or credit risk factors and the overall market. In instances where a Portfolio is using derivatives to decrease, or hedge, exposures to market or credit risk factors for securities held by a Portfolio, there are also risks that those derivatives may not perform as expected resulting in losses for the combined or hedged positions.
Derivative instruments are subject to a number of risks, including the risk of changes in the market price of the underlying securities, credit risk with respect to the counterparty, risk of loss due to changes in market interest rates and liquidity and volatility risk. The amounts required to purchase certain derivatives may be small relative to the magnitude of exposure assumed by a Portfolio. Therefore, the purchase of certain derivatives may have an economic leveraging effect on a Portfolio and exaggerate any increase or decrease in the NAV. Derivatives may not perform as expected, so a Portfolio may not realize the intended benefits. When used for hedging purposes, the change in value of a derivative may not correlate as expected with the currency, security or other risk being hedged. When used as an alternative or substitute for direct cash investments, the return provided by the derivative may not provide the same return as direct cash investment. In addition, given their complexity, derivatives expose a Portfolio to the risk of improper valuation.
Generally, derivatives are sophisticated financial instruments whose performance is derived, at least in part, from the performance of an underlying asset or assets. Derivatives include, among other things, swap agreements, options, forwards and futures. Investments in derivatives are generally negotiated OTC with a single counterparty and as a result are subject to credit risks related to the counterparty’s ability or willingness to perform its obligations; any deterioration in the counterparty’s creditworthiness could adversely affect the value of the derivative. In addition, derivatives and their underlying securities may experience periods of illiquidity which could cause a Portfolio to hold a security it might otherwise sell, or to sell a security it otherwise might hold at inopportune times or at an unanticipated price. A manager might imperfectly judge the direction of the market. For instance, if a derivative is used as a hedge to offset investment risk in another security, the hedge might not correlate to the market’s movements and may have unexpected or undesired results such as a loss or a reduction in gains.
Counterparty Credit Risk and Credit Related Contingent Features. Certain derivative positions are subject to counterparty credit risk, which is the risk that the counterparty will not fulfill its obligation to a Portfolio. Each Portfolio’s derivative counterparties are financial institutions who are subject to market conditions that may weaken their financial position. A Portfolio intends to enter into financial transactions with counterparties that it believes to be creditworthy at the time of the transaction. To reduce this risk, a Portfolio enters into master netting arrangements, established within each Portfolio’s International Swap and Derivatives Association, Inc. (“ISDA”) Master Agreements (“Master Agreements”). These Master Agreements are with select counterparties and they govern transactions, including certain OTC derivative and forward foreign currency contracts, entered into by a Portfolio and the counterparty. The Master Agreements maintain provisions for general obligations, representations, agreements, collateral, and events of default or termination. The occurrence of a specified event of termination may give a counterparty the right to terminate all of its contracts and affect settlement of all outstanding transactions under the applicable Master Agreement.
A Portfolio may also enter into collateral agreements with certain counterparties to further mitigate counterparty credit risk on OTC derivative and forward foreign currency contracts. Subject to established minimum levels, collateral is generally determined based on the net aggregate unrealized gain or loss on contracts with a certain counterparty. Collateral pledged to or from a Portfolio is held in a segregated account by a third-party
41
NOTES TO FINANCIAL STATEMENTS AS OF DECEMBER 31, 2020 (CONTINUED)
NOTE 2 — SIGNIFICANT ACCOUNTING POLICIES (continued)
agent and can be in the form of cash or debt securities issued by the U.S. government or related agencies.
As of December 31, 2020, the maximum amount of loss that Clarion Global Real Estate, Invesco Growth and Income, JPMorgan Emerging Markets Equity and T. Rowe Price International Stock would incur if its counterparties failed to perform would be $213, $12,014, $4 and $15, respectively, which represents the gross payments to be received on open forward foreign currency contracts were they to be unwound as of December 31, 2020. There was no collateral pledged by any counterparty at December 31, 2020 to any Portfolio.
Certain Portfolios have entered into derivative contracts that contain credit related contingent features that if triggered would allow its derivative counterparties to close out and demand payment or additional collateral to cover their exposure from a Portfolio. Credit related contingent features are established between each Portfolio and its derivatives counterparties to reduce the risk that a Portfolio will not fulfill its payment obligations to its counterparties. These triggering features include, but are not limited to, a percentage decrease in a Portfolio’s net assets and/or a percentage decrease in a Portfolio’s NAV, which could cause a Portfolio to accelerate payment of any net liability owed to the counterparty. The contingent features are established within each Portfolio’s Master Agreements.
As of December 31, 2020, Clarion Global Real Estate, Invesco Growth Income, T. Rowe Price Capital Appreciation and T. Rowe Price International Stock had a liability position of $6, $222,338, $98,227,223 and $36,012, respectively, on open forward foreign currency contracts and open OTC written options. If a contingent feature would have been triggered as of December 31, 2020, each Portfolio could have been required to pay these amounts in cash to its counterparties. There was no collateral pledged by any Portfolio as of December 31, 2020.
H. Forward Foreign Currency Transactions and Futures Contracts. Certain Portfolios may enter into forward foreign currency contracts primarily to hedge against foreign currency exchange rate risks on their non-U.S. dollar denominated investment securities. When entering into a forward currency contract, the Portfolio agrees to receive or deliver a fixed quantity of foreign currency for an agreed-upon price on an agreed future date. These contracts are valued daily and a Portfolio’s net equity therein, representing unrealized gain or loss on the contracts as measured by the difference between the forward foreign exchange rates at the dates of entry into the contracts and the forward rates at the reporting date, is included in the Statements of Assets and Liabilities.
Realized and unrealized gains and losses are included in the Statements of Operations. These instruments involve market and/or credit risk in excess of the amount recognized in the Statements of Assets and Liabilities. Risks arise from the possible inability of counterparties to meet the terms of their contracts and from movement in currency and securities values and interest rates. Open forward foreign currency contracts are presented following the respective Portfolio of Investments.
During the year ended December 31, 2020, the following Portfolios had average contract amounts on forward foreign currency contracts purchased and sold as disclosed below. The Portfolios used forward foreign currency contracts primarily to protect any non-U.S. dollar-denominated holdings from adverse currency movements. Please refer to the tables within each respective Portfolio of Investments for open forward currency contracts at December 31, 2020.
| | Purchased | | Sold |
|---|
| Clarion Global Real Estate | | $ | — | | | $ | 172,760 | |
| Invesco Growth and Income | | | 2,160,557 | | | | 25,346,379 | |
| JPMorgan Emerging Markets Equity | | | 371,218 | | | | — | |
| T. Rowe Price Capital Appreciation | | | 1,553,571 | | | | — | |
| T. Rowe Price International Stock | | | 84,429 | | | | 757,318 | |
Each Portfolio may enter into futures contracts involving foreign currency, interest rates, securities and security indices. A futures contract is a commitment to buy or sell a specific amount of a financial instrument at a negotiated price on a stipulated future date. Each Portfolio may buy and sell futures contracts. Futures contracts traded on a commodities or futures exchange will be valued at the final settlement price or official closing price on the principal exchange as reported by such principal exchange at its trading session ending at, or most recently prior to, the time when the Portfolio’s assets are valued.
Upon entering into a futures contract, each Portfolio is required to deposit either cash or securities (initial margin) in an amount equal to a certain percentage of the contract value. Subsequent payments (variation margin) are made or received by the Portfolio each day. The variation margin payments are equal to the daily changes in the contract value and are recorded as unrealized gains and losses and included within Cash collateral for futures contracts on the Statement of Assets and Liabilities. Open futures contracts are reported on a table following each Portfolio of Investments. Securities held in collateralized accounts to cover initial margin requirements on open futures contracts are footnoted in the Portfolio of Investments, if any. Cash collateral held by the broker to cover initial margin requirements on open futures contracts are noted in each Portfolio’s Statement of Assets and Liabilities. The net change in unrealized appreciation and depreciation is reported in each Portfolio’s Statement of Operations.
42
NOTES TO FINANCIAL STATEMENTS AS OF DECEMBER 31, 2020 (CONTINUED)
NOTE 2 — SIGNIFICANT ACCOUNTING POLICIES (continued)
Realized gains (losses) are reported in each Portfolio’s Statement of Operations at the closing or expiration of futures contracts.
Futures contracts are exposed to the market risk factor of the underlying financial instrument. During the year ended December 31, 2020, T. Rowe Price Equity Income had purchased futures contracts on various equity indices to “equitize” cash. Futures contracts are purchased to provide immediate market exposure proportionate to the size of the Portfolio’s respective cash flows and residual cash balances in order to decrease potential tracking error if the cash remained uninvested in the market. Additional associated risks of entering into futures contracts include the possibility that there may be an illiquid market where the Portfolios are unable to liquidate the contract or enter into an offsetting position and, if used for hedging purposes, the risk that the price of the contract will correlate imperfectly with the prices of the Portfolios’ securities. With futures, there is minimal counterparty credit risk to the Portfolios since futures are exchange traded and the exchange’s clearinghouse, as counterparty to all exchange traded futures, guarantees the futures against default.
During the year ended December 31, 2020, T. Rowe Price Equity Income had an average notional value on futures contracts purchased of $2,317,650. The Portfolio did not have any open futures contracts at December 31, 2020.
I. Options Contracts. Certain Portfolios may purchase put and call options and may write (sell) put options and covered call options. The Portfolios may engage in option transactions as a hedge against adverse movements in the value of portfolio holdings or to increase market exposure. Option contracts are valued daily and unrealized gains or losses are recorded based upon the last sales price on the principal exchange on which the options are traded. An amount equal to the proceeds of the premium received by the Portfolios upon the writing of a put or call option is included in the Statements of Assets and Liabilities as an asset and equivalent liability which is subsequently marked-to-market until it is exercised or closed, or it expires. The Portfolios will realize a gain or loss upon the expiration or closing of the option contract. When an option is exercised, the proceeds on sales of the underlying security for a written call option, the purchase cost of the security for a written put option, or the cost of the security for a purchased put or call option is adjusted by the amount of premium received or paid. Realized and unrealized gains or losses on option contracts are reflected in the accompanying financial statements. The risk in writing a covered call option is that the Portfolios give up the opportunity for profit if the market price of the security increases and the option is exercised. The risk in writing a
put option is that the Portfolios may incur a loss if the market price of the security decreases and the option is exercised. The risk in buying an option is that the Portfolios pay a premium whether or not the option is exercised. Risks may also arise from an illiquid secondary market or from the inability of counterparties to meet the terms of the contract.
During the year ended December 31, 2020, T. Rowe Price Capital Appreciation and T. Rowe Price International Stock had written equity options with an average notional value of $758,338,459 and $743,873, respectively, to generate income. Please refer to the tables within the Portfolio of Investments for T. Rowe Price Capital Appreciation and T. Rowe Price International Stock for open written equity options at December 31, 2020. At December 31, 2020, T. Rowe Price Capital Appreciation had pledged securities fair valued at $229,273,351 for open written call options and these are footnoted within the Portfolio of Investments. T. Rowe Price International Stock did not pledge any securities for its open written call options.
J. Repurchase Agreements. Each Portfolio may invest in repurchase agreements only with government securities dealers recognized by the Board of Governors of the Federal Reserve System. Under such agreements, the seller of the security agrees to repurchase it at a mutually agreed upon time and price. The resale price is in excess of the purchase price and reflects an agreed upon interest rate for the period of time the agreement is outstanding. The period of the repurchase agreements is usually short, from overnight to one week, while the underlying securities generally have longer maturities. Each Portfolio will receive as collateral securities acceptable to it whose market value is equal to at least 100% of the carrying amount of the repurchase agreement, plus accrued interest, being invested by a Portfolio. The underlying collateral is valued daily on a mark-to-market basis to assure that the value, including accrued interest, is at least equal to the repurchase price. If the seller defaults, a Portfolio might incur a loss or delay in the realization of proceeds if the value of the security collateralizing the repurchase agreement declines, and may incur disposition costs in liquidating the collateral.
Repurchase agreements are entered into by the Portfolios under Master Repurchase Agreements (“MRA”) which permit the Portfolios, under certain circumstances, including an event of default (such as bankruptcy or insolvency), to offset receivables or payables under the MRA with collateral held and/or pledged by the counterparty and create one single net payment due to or from the respective Portfolio. Please refer to the table following the Portfolio of Investments for Government Liquid Assets for open repurchase agreements subject to the MRA on a net basis at December 31, 2020.
43
NOTES TO FINANCIAL STATEMENTS AS OF DECEMBER 31, 2020 (CONTINUED)
NOTE 2 — SIGNIFICANT ACCOUNTING POLICIES (continued)
K. Securities Lending. Each Portfolio may temporarily loan up to 33⅓% (except for JPMorgan Emerging Markets Equity which may temporarily loan up to 30%) of its total assets to brokers, dealers or other financial institutions in exchange for a negotiated lender’s fee. Securities lending involves two primary risks: “investment risk” and “borrower default risk.” When lending securities, the Portfolios will receive cash or U.S. government securities as collateral. Investment risk is the risk that the Portfolios will lose money from the investment of the cash collateral received from the borrower. Borrower default risk is the risk that the Portfolios will lose money due to the failure of a borrower to return a borrowed security. Loans are subject to termination at the option of the borrower or the Portfolios. Securities lending may result in leverage. The use of leverage may exaggerate any increase or decrease in the NAV, causing the Portfolios to be more volatile. The use of leverage may increase expenses and increase the impact of the Portfolios’ other risks.
L. Restricted Securities. The Portfolios may invest in restricted securities, which include those sold under Rule 144A of the Securities Act of 1933, as amended (“1933 Act”) or securities offered pursuant to Section 4(a)(2) of the 1933 Act, and/or are subject to legal or contractual restrictions on resale and may not be publicly sold without registration under the 1933 Act. Restricted securities are fair valued using market quotations when readily available. In the absence of market quotations, the securities are valued based upon their fair value determined in good faith under procedures approved by the Board.
Securities that are not registered for sale to the public under the 1933 Act are referred to as “restricted securities.” These securities may be sold in private placement transactions between issuers and their purchasers and may be neither listed on an exchange nor traded in other established markets. Many times these securities are subject to legal or contractual restrictions on resale. As a result of the absence of a public trading market, the prices of these securities may be more volatile, less liquid and more difficult to value than publicly traded securities. The price realized from the sale of these securities could be less than the amount originally paid or less than their fair value if they are resold in privately negotiated transactions. In addition, these securities may not be subject to disclosure and other investment protection requirements that are afforded to publicly traded securities. Certain investments may include investment in smaller, less seasoned issuers, which may involve greater risk.
M. Indemnifications. In the normal course of business, the Trust may enter into contracts that provide certain indemnifications. The Trust’s maximum exposure under
these arrangements is dependent on future claims that may be made against the Portfolios and, therefore, cannot be estimated; however, based on experience, management considers the risk of loss from such claims remote.
NOTE 3 — INVESTMENT TRANSACTIONS
For the year ended December 31, 2020, the cost of purchases and the proceeds from the sales of securities, excluding U.S. government and short-term securities were as follows:
| | Purchases | | Sales |
|---|
| Clarion Global Real Estate | | $ | 180,517,213 | | | $ | 203,548,859 | |
| Invesco Growth and Income | | | 111,299,266 | | | | 156,247,858 | |
| JPMorgan Emerging Markets Equity | | | 102,655,394 | | | | 176,846,122 | |
| Morgan Stanley Global Franchise | | | 60,996,445 | | | | 104,963,273 | |
| T. Rowe Price Capital Appreciation | | | 6,532,012,722 | | | | 7,170,792,703 | |
| T. Rowe Price Equity Income | | | 78,399,549 | | | | 106,550,815 | |
| T. Rowe Price International Stock | | | 57,876,635 | | | | 79,863,245 | |
NOTE 4 — INVESTMENT MANAGEMENT FEES
Clarion Global Real Estate and T. Rowe Price International Stock have entered into investment management agreements (“Management Agreements”) with the Investment Adviser. The Investment Adviser has overall responsibility for the management of the Portfolios. The Investment Adviser oversees all investment management and portfolio management services for the Portfolios and assists in managing and supervising all aspects of the general day-to-day business activities and operations of the Portfolios, including custodial, transfer agency, dividend disbursing, accounting, auditing, compliance and related services. Each Management Agreement compensates the Investment Adviser with a management fee, computed daily and payable monthly, based on the average daily net assets of each Portfolio, at the following annual rates:
| Portfolio | | Fee |
|---|
Clarion Global Real Estate(1) | | 0.90% on the first $250 million;
0.875% on the next $250 million;
0.80% on the amount in excess of $500 million |
T. Rowe Price International Stock(1) | | 0.64% on the first $4 billion;
0.63% on the amount in excess of $4 billion |
(1) | | The Investment Adviser is contractually obligated to waive 0.033% and 0.04% of the management fee for Clarion Global Real Estate and T. Rowe Price International Stock, respectively. Any fees waived or reimbursed are not eligible for recoupment. Termination or modification of these obligations requires approval by the Board. Prior to January 1, 2020, the Investment Adviser had contractually agreed to waive 0.010% of the management fee for Clarion Global Real Estate. Any fees waived or reimbursed were not eligible for recoupment. Modification of this obligation was approved by the Board. |
44
NOTES TO FINANCIAL STATEMENTS AS OF DECEMBER 31, 2020 (CONTINUED)
NOTE 4 — INVESTMENT MANAGEMENT FEES (continued)
With the exception of the Portfolios in the table above, the Investment Adviser provides the Portfolios with advisory and administrative services under a management agreement (the “Unified Agreement”). Under the Unified Agreement, the Investment Adviser has overall responsibility for engaging sub-advisers and for monitoring and evaluating the management of the assets of each Portfolio. Sub-advisers have full investment discretion and make all determinations with respect to the investment of a Portfolio’s assets and the purchase and sale of portfolio securities and other investments. Pursuant to this Unified Agreement, the Investment Adviser is also responsible for providing or procuring, at the Investment Adviser’s expense, the services reasonably necessary for the ordinary operation of each Portfolio, including, among other things, custodial, administrative, transfer agency, portfolio accounting, auditing, affiliated recordkeeping services and ordinary legal expenses. As compensation for its services under the Unified Agreement, the Trust pays the Investment Adviser a monthly fee (a “Unified Fee”) based on the following annual rates of the average daily net assets of the Portfolios:
| Portfolio | | Fee |
Government Liquid Assets(1) | | 0.35% on the first $200 million;
0.30% on the next $300 million;
0.25% on the amount in excess of $500 million |
| JPMorgan Emerging Markets Equity | | 1.25% |
Morgan Stanley Global Franchise(2) | | 1.00% on the first $250 million;
0.90% on the next $250 million;
0.75% on the amount in excess of $500 million |
Invesco Growth and Income,
T. Rowe Price Capital Appreciation, and
T. Rowe Price Equity Income(2)(3) | | 0.75% first $750 million;
0.70% on the next $1.25 billion;
0.65% on the next $1.5 billion;
0.60% on the amount in excess of $3.5 billion |
(1) | | The assets of Government Liquid Assets are aggregated with those of Voya Limited Maturity Bond Portfolio, which is not included in this report, to determine the Unified Fee applicable to the Portfolio. |
(2) | | The Investment Adviser is contractually obligated to waive 0.026% and 0.030% of the Unified Fee for Morgan Stanley Global Franchise and T. Rowe Price Equity Income, respectively. Any fees waived or reimbursed are not eligible for recoupment. Termination or modification of these obligations requires approval by the Board. |
(3) | | The assets of Invesco Growth and Income, T. Rowe Price Capital Appreciation and T. Rowe Price Equity Income are aggregated with those of VY® Clarion Real Estate Portfolio, which is not included in this report, to determine the Unified Fee applicable to the respective Portfolios. |
The Investment Adviser has entered into a sub-advisory agreement with each respective sub-adviser. These sub-advisers provide investment advice for certain Portfolios and are paid by the Investment Adviser based on the
average daily net assets of the respective Portfolios. Subject to such policies as the Board or Investment Adviser may determine, the sub-advisers manage each respective Portfolio’s assets in accordance with the Portfolio’s investment objectives, policies, and limitations. The sub-advisers of the Portfolios are as follows (*denotes an affiliated sub-adviser):
| Portfolio | | Sub-Adviser |
| Government Liquid Assets | | Voya Investment Management Co. LLC* |
| Clarion Global Real Estate | | CBRE Clarion Securities LLC |
| Invesco Growth and Income | | Invesco Advisers, Inc. |
| JPMorgan Emerging Markets Equity | | J.P. Morgan Investment Management Inc. |
| Morgan Stanley Global Franchise | | Morgan Stanley Investment Management Inc. |
T. Rowe Price Capital
Appreciation | | T. Rowe Price Associates, Inc. |
| T. Rowe Price Equity Income | | T. Rowe Price Associates, Inc. |
| T. Rowe Price International Stock | | T. Rowe Price Associates, Inc. |
NOTE 5 — DISTRIBUTION AND SERVICE FEES
The Trust has entered into a shareholder service plan (the “Plan”) for each Portfolio that offers Class S and Class S2 shares. The Plan compensates the Distributor for the provision of shareholder services and/or account maintenance services to direct or indirect beneficial owners of Class S and Class S2 shares. Under the Plan, each Portfolio makes payments to the Distributor at an annual rate of 0.25% of the Portfolio’s average daily net assets attributable to Class S and Class S2 shares, respectively. Each Portfolio that offers Class S2 shares has entered into a distribution plan (the “Class S2 Plan”) with the Distributor on behalf of the Class S2 shares of the Portfolio. The Class S2 Plan provides that the Class S2 shares shall pay a distribution fee for distribution services, including payments to the Distributor at an annual rate of 0.15% of the average daily net assets attributable to Class S2 shares.
Each Portfolio that offers Class ADV shares has a shareholder service and distribution plan. Class ADV shares pay a service fee of 0.25% and a distribution fee of 0.35% of each Portfolio’s average daily net assets attributable to Class ADV shares.
The Distributor and the Investment Adviser have contractually agreed to waive a portion of their distribution and/or shareholder servicing fees and Unified Fee, as applicable, and to reimburse certain expenses to the extent necessary to assist Government Liquid Assets in maintaining a yield of not less than zero. There is no guarantee that the Portfolio will maintain such a yield. Unified Fees waived or expenses reimbursed are subject to possible recoupment by the Investment Adviser, as applicable, within three years subject to certain restrictions. In no event will the amount of the recoupment on any day
45
NOTES TO FINANCIAL STATEMENTS AS OF DECEMBER 31, 2020 (CONTINUED)
NOTE 5 — DISTRIBUTION AND SERVICE FEES (continued)
exceed 20% of the yield (net of all expenses) of the Portfolio on that day. Distribution and shareholder servicing fees waived are not subject to recoupment. For the year ended December 31, 2020, the Distributor waived $2,371,489 of class specific distribution and shareholder servicing fees and the Investment Adviser waived $1,091,693 of Unified Fees and/or certain expenses to assist the Portfolio in maintaining a yield of not less than zero. The class specific waivers were comprised of the following amounts:
| | Distribution
Fee | | Shareholder
Servicing Fee | |
|---|
| Class S | | $ | — | | | $ | 760,070 | |
| Class S2 | | | 608,154 | | | | 1,003,265 | |
Termination or modification of this obligation requires approval by the Board. Please note that these waivers or reimbursements are in addition to existing contractual expense limitations, if any. As of December 31, 2020, the amounts of waived and/or reimbursed fees that are subject to possible recoupment by the Investment Adviser, and the related expiration dates, are as follows:
| | December 31, | | | | |
|---|
| | 2021 | | 2022 | | 2023 | | Total |
|---|
| Government Liquid Assets | | $ | — | | | $ | — | | | $ | 1,091,693 | | | $ | 1,091,693 | |
NOTE 6 — OTHER TRANSACTIONS WITH AFFILIATES AND RELATED PARTIES
At December 31, 2020, the following direct or indirect, wholly-owned subsidiaries of Voya Financial, Inc. owned more than 5% of the following Portfolios:
| Subsidiary | | Portfolio | | Percentage |
|---|
| ReliaStar Life Insurance | | Invesco Growth and Income | | | 5.08 | % |
| Company | | T. Rowe Price Equity Income | | | 6.75 | |
| | | T. Rowe Price International Stock | | | 13.71 | |
| Security Life of Denver | | Clarion Global Real Estate | | | 5.74 | |
| Insurance Company | | JPMorgan Emerging Markets Equity | | | 7.77 | |
| | | T. Rowe Price Equity Income | | | 8.98 | |
| | | T. Rowe Price International Stock | | | 5.92 | |
| Voya Institutional Trust | | Government Liquid Assets | | | 54.21 | |
| Company | | Clarion Global Real Estate | | | 12.26 | |
| | | JPMorgan Emerging Markets Equity | | | 10.48 | |
| | | Morgan Stanley Global Franchise | | | 30.09 | |
| | | T. Rowe Price Capital Appreciation | | | 28.72 | |
| | | T. Rowe Price Equity Income | | | 37.37 | |
| | | T. Rowe Price International Stock | | | 11.21 | |
| Voya Retirement | | Clarion Global Real Estate | | | 35.74 | |
| Insurance and Annuity | | Invesco Growth and Income | | | 17.71 | |
| Company | | JPMorgan Emerging Markets Equity | | | 15.71 | |
| | | T. Rowe Price Capital Appreciation | | | 31.11 | |
| | | T. Rowe Price Equity Income | | | 46.00 | |
| | | T. Rowe Price International Stock | | | 8.27 | |
The Investment Adviser may direct the Portfolios’ sub-advisers to use their best efforts (subject to obtaining best execution of each transaction) to allocate a Portfolio’s equity security transactions through certain designated broker-dealers. The designated broker-dealer, in turn, will reimburse a portion of the brokerage commissions to pay certain expenses of that Portfolio. Any amounts credited to the Portfolios are reflected as brokerage commission recapture on the accompanying Statements of Operations.
The Portfolios have adopted a deferred compensation plan (the “DC Plan”), which allows eligible independent trustees, as described in the DC Plan, to defer the receipt of all or a portion of the trustees’ fees that they are entitled to receive from the Portfolios. For purposes of determining the amount owed to the trustee under the DC Plan, the amounts deferred are invested in shares of the funds selected by the trustee (the “Notional Funds”). When the Portfolios purchase shares of the Notional Funds, which are all advised by Voya Investments, in amounts equal to the trustees’ deferred fees, this results in a Portfolio asset equal to the deferred compensation liability. Such assets, if applicable, are included as a component of “Other assets” on the accompanying Statements of Assets and Liabilities. Deferral of trustees’ fees under the DC Plan will not affect net assets of the Portfolios, and will not materially affect the Portfolios’ assets, liabilities or net investment income per share. Amounts will be deferred until distributed in accordance with the DC Plan.
The Portfolios may engage in purchase and sale transactions with funds that have a common investment adviser (or affiliated investment adviser) and/or have a common sub-adviser. These interfund transactions are made pursuant to Rule 17a-7 under the 1940 Act. For the year ended December 31, 2020, T. Rowe Price Capital Appreciation engaged in such purchase and sale transactions totaling $11,323,048 and $267,772,183, respectively.
Effective January 1, 2020, the Portfolios may pay per account fees to affiliates of Voya Investments for recordkeeping services provided on certain assets. For the year ended December 31, 2020, the per account fees for affiliated recordkeeping services paid by each Portfolio were as follows:
| Portfolio | | Amount |
|---|
| Clarion Global Real Estate | | $ | 229,114 | |
| T. Rowe Price International Stock | | | 85,129 | |
NOTE 7 — EXPENSE LIMITATION AGREEMENTS
The Investment Adviser has entered into written expense limitation agreements (“Expense Limitation Agreements”) with the below Portfolios, whereby the Investment Adviser has agreed to limit expenses, excluding interest, taxes,
46
NOTES TO FINANCIAL STATEMENTS AS OF DECEMBER 31, 2020 (CONTINUED)
NOTE 7 — EXPENSE LIMITATION AGREEMENTS (continued)
investment-related costs, leverage expenses, extraordinary expenses, and acquired fund fees and expenses to the levels listed below:
| Portfolio | | Class ADV | | Class I | | Class S | | Class S2 |
|---|
Clarion Global
Real Estate | | | 1.50 | % | | | 0.90 | % | | | 1.15 | % | | | 1.30 | % |
T. Rowe Price
International
Stock | | | 1.40 | % | | | 0.80 | % | | | 1.05 | % | | | N/A | |
With the exception of the non-recoupable management fee waivers for certain Portfolios, the Investment Adviser may, at a later date, recoup from a Portfolio for fees waived and/or other expenses reimbursed by the Investment Adviser during the previous 36 months, but only if, after such recoupment, a Portfolio’s expense ratio does not exceed the percentage described above. Waived and reimbursed fees net of any recoupment by the Investment Adviser of such waived and reimbursed fees are reflected on the accompanying Statements of Operations. Amounts payable by the Investment Adviser are reflected on the accompanying Statements of Assets and Liabilities.
As of December 31, 2020, the amounts of waived and/or reimbursed fees that are subject to possible recoupment by the Investment Adviser, and the related expiration dates are as follows:
| | December 31, | | | | |
|---|
| | 2021 | | 2022 | | 2023 | | Total |
|---|
| Clarion Global Real Estate | | $ | 336,627 | | | $ | 271,097 | | | $ | 332,373 | | | $ | 940,097 | |
| T. Rowe Price International Stock | | | 54,274 | | | | 7,153 | | | | — | | | | 61,427 | |
The Expense Limitation Agreements are contractual through May 1, 2021, and shall renew automatically for one-year terms. Termination or modification of these obligations requires approval by the Board.
NOTE 8 — LINE OF CREDIT
Effective May 15, 2020, each Portfolio, in addition to certain other funds managed by the Investment Adviser, has entered into a 364-day unsecured committed revolving line of credit agreement (the “Credit Agreement”) with The Bank of New York Mellon (“BNY”) for an aggregate amount of $400,000,000 through May 14, 2021. The proceeds may be used only to finance temporarily: (1) the purchase or sale of investment securities; or (2) the repurchase or redemption of shares of a Portfolio or certain other funds managed by the Investment Adviser. The funds to which the line of credit is available pay a commitment fee equal to 0.15% per annum on the daily unused portion of the committed line amount payable quarterly in arrears. Prior to May 15, 2020, the predecessor line of credit was for an aggregate amount of $400,000,000 and the funds to which a line of credit was available paid a commitment fee equal to 0.15% per annum on the daily unused portion of the committed line amount through May 15, 2020.
Borrowings under the Credit Agreement accrue interest at the federal funds rate plus a specified margin. Repayments generally must be made within 60 days after the date of a revolving credit advance.
The below Portfolios utilized the line of credit during the year ended December 31, 2020 as follows:
| Portfolio | | | Days
Utilized | | | Approximate
Average
Daily Balance
For Days
Utilized | | Approximate
Weighted
Average
Interest Rate
For Days
Utilized |
|---|
| Clarion Global Real Estate | | | 5 | | | $ | 3,141,800 | | | | 1.64 | % |
| JPMorgan Emerging Markets Equity | | | 42 | | | | 988,881 | | | | 1.40 | |
NOTE 9 — CAPITAL SHARES TRANSACTIONS
Transactions in capital shares and dollars were as follows:
Year or
period | | Shares
sold | | Shares
issued in
merger | | Reinvestment
of
distributions | | Shares
redeemed | | Net
increase
(decrease)
in shares
outstanding | | Shares
sold | | Proceeds
from shares
issued in
merger | | Reinvestment
of
distributions | | Shares
redeemed | | Net
increase
(decrease) |
| ended | | # | | # | | # | | # | | # | | ($) | | ($) | | ($) | | ($) | | ($) |
Government Liquid Assets | | | | | | | | | | | | | | | | | | | | | | | | | | | | | | | | | | | |
Class I | | | | | | | | | | | | | | | | | | | | | | | | | | | | | | | | | | | | | | | | |
| 12/31/2020 | | | 43,551,255 | | | | — | | | | 160,481 | | | | (32,223,268 | ) | | | 11,488,468 | | | | 43,551,255 | | | | — | | | | 160,481 | | | | (32,223,268 | ) | | | 11,488,468 | |
| 12/31/2019 | | | 27,338,984 | | | | — | | | | 1,149,040 | | | | (38,086,906 | ) | | | (9,598,882 | ) | | | 27,338,984 | | | | — | | | | 1,149,041 | | | | (38,086,906 | ) | | | (9,598,881 | ) |
Class S | | | | | | | | | | | | | | | | | | | | | | | | | | | | | | | | | | | | | | | | |
| 12/31/2020 | | | 218,599,473 | | | | — | | | | 795,507 | | | | (158,907,023 | ) | | | 60,487,956 | | | | 218,599,472 | | | | — | | | | 795,507 | | | | (158,907,023 | ) | | | 60,487,956 | |
| 12/31/2019 | | | 105,890,206 | | | | — | | | | 5,870,727 | | | | (151,393,326 | ) | | | (39,632,393 | ) | | | 105,890,204 | | | | — | | | | 5,870,729 | | | | (151,393,326 | ) | | | (39,632,393 | ) |
Class S2 | | | | | | | | | | | | | | | | | | | | | | | | | | | | | | | | | | | | | | | | |
| 12/31/2020 | | | 326,500,557 | | | | — | | | | 801,848 | | | | (159,140,766 | ) | | | 168,161,639 | | | | 326,500,558 | | | | — | | | | 801,847 | | | | (159,140,766 | ) | | | 168,161,639 | |
| 12/31/2019 | | | 81,107,149 | | | | — | | | | 5,767,380 | | | | (113,945,268 | ) | | | (27,070,739 | ) | | | 81,107,148 | | | | — | | | | 5,767,381 | | | | (113,945,268 | ) | | | (27,070,739 | ) |
47
NOTES TO FINANCIAL STATEMENTS AS OF DECEMBER 31, 2020 (CONTINUED)
NOTE 9 — CAPITAL SHARES TRANSACTIONS (continued)
Year or
period | | Shares
sold | | Shares
issued in
merger | | Reinvestment
of
distributions | | Shares
redeemed | | Net
increase
(decrease)
in shares
outstanding | | Shares
sold | | Proceeds
from shares
issued in
merger | | Reinvestment
of
distributions | | Shares
redeemed | | Net
increase
(decrease) |
| ended | | # | | # | | # | | # | | # | | ($) | | ($) | | ($) | | ($) | | ($) |
Clarion Global Real Estate |
Class ADV | | | | | | | | | | | | | | | | | | | | | | | | | | | | | | | | | | | | | | | | |
| 12/31/2020 | | | 129,528 | | | | — | | | | 223,348 | | | | (307,974 | ) | | | 44,902 | | | | 1,270,587 | | | | — | | | | 1,943,130 | | | | (3,108,493 | ) | | | 105,224 | |
| 12/31/2019 | | | 70,100 | | | | — | | | | 32,152 | | | | (323,215 | ) | | | (220,963 | ) | | | 860,644 | | | | — | | | | 394,514 | | | | (3,916,605 | ) | | | (2,661,447 | ) |
Class I | | | | | | | | | | | | | | | | | | | | | | | | | | | | | | | | | | | | | | | | |
| 12/31/2020 | | | 963,954 | | | | — | | | | 1,516,134 | | | | (2,433,184 | ) | | | 46,904 | | | | 9,270,177 | | | | — | | | | 13,539,081 | | | | (25,979,247 | ) | | | (3,169,989 | ) |
| 12/31/2019 | | | 526,561 | | | | — | | | | 263,954 | | | | (1,189,789 | ) | | | (399,274 | ) | | | 6,485,548 | | | | — | | | | 3,315,314 | | | | (14,748,857 | ) | | | (4,947,995 | ) |
Class S | | | | | | | | | | | | | | | | | | | | | | | | | | | | | | | | | | | | | | | | |
| 12/31/2020 | | | 531,792 | | | | — | | | | 1,251,764 | | | | (1,417,015 | ) | | | 366,541 | | | | 5,413,868 | | | | — | | | | 11,140,696 | | | | (14,634,393 | ) | | | 1,920,171 | |
| 12/31/2019 | | | 202,999 | | | | — | | | | 203,825 | | | | (1,384,294 | ) | | | (977,470 | ) | | | 2,531,379 | | | | — | | | | 2,549,899 | | | | (17,208,225 | ) | | | (12,126,947 | ) |
Class S2 | | | | | | | | | | | | | | | | | | | | | | | | | | | | | | | | | | | | | | | | |
| 12/31/2020 | | | 1,463 | | | | — | | | | 11,493 | | | | (6,770 | ) | | | 6,186 | | | | 15,026 | | | | — | | | | 103,320 | | | | (70,582 | ) | | | 47,764 | |
| 12/31/2019 | | | 284 | | | | — | | | | 1,826 | | | | (11,562 | ) | | | (9,452 | ) | | | 3,682 | | | | — | | | | 23,042 | | | | (146,401 | ) | | | (119,677 | ) |
Invesco Growth and Income |
Class ADV | | | | | | | | | | | | | | | | | | | | | | | | | | | | | | | | | | | | | | | | |
| 12/31/2020 | | | 69,867 | | | | — | | | | 93,526 | | | | (219,291 | ) | | | (55,898 | ) | | | 1,261,128 | | | | — | | | | 1,511,379 | | | | (3,962,904 | ) | | | (1,190,397 | ) |
| 12/31/2019 | | | 32,842 | | | | — | | | | 115,836 | | | | (136,407 | ) | | | 12,271 | | | | 752,320 | | | | — | | | | 2,498,575 | | | | (3,095,163 | ) | | | 155,732 | |
Class I | | | | | | | | | | | | | | | | | | | | | | | | | | | | | | | | | | | | | | | | |
| 12/31/2020 | | | 278,527 | | | | — | | | | 183,796 | | | | (285,492 | ) | | | 176,831 | | | | 5,017,662 | | | | — | | | | 2,995,867 | | | | (5,157,613 | ) | | | 2,855,916 | |
| 12/31/2019 | | | 53,646 | | | | — | | | | 195,201 | | | | (260,360 | ) | | | (11,513 | ) | | | 1,206,116 | | | | — | | | | 4,251,471 | | | | (5,977,085 | ) | | | (519,498 | ) |
Class S | | | | | | | | | | | | | | | | | | | | | | | | | | | | | | | | | | | | | | | | |
| 12/31/2020 | | | 340,779 | | | | — | | | | 1,912,238 | | | | (3,031,679 | ) | | | (778,662 | ) | | | 6,067,646 | | | | — | | | | 31,609,283 | | | | (58,221,302 | ) | | | (20,544,373 | ) |
| 12/31/2019 | | | 161,662 | | | | — | | | | 2,353,167 | | | | (2,948,227 | ) | | | (433,398 | ) | | | 3,651,614 | | | | — | | | | 51,840,265 | | | | (67,944,103 | ) | | | (12,452,224 | ) |
Class S2 | | | | | | | | | | | | | | | | | | | | | | | | | | | | | | | | | | | | | | | | |
| 12/31/2020 | | | 41,348 | | | | — | | | | 148,992 | | | | (225,207 | ) | | | (34,867 | ) | | | 749,514 | | | | — | | | | 2,436,023 | | | | (4,221,217 | ) | | | (1,035,680 | ) |
| 12/31/2019 | | | 21,817 | | | | — | | | | 180,581 | | | | (223,561 | ) | | | (21,163 | ) | | | 491,902 | | | | — | | | | 3,938,465 | | | | (5,019,833 | ) | | | (589,466 | ) |
JPMorgan Emerging Markets Equity |
Class ADV | | | | | | | | | | | | | | | | | | | | | | | | | | | | | | | | | | | | | | | | |
| 12/31/2020 | | | 267,174 | | | | — | | | | 168,788 | | | | (577,958 | ) | | | (141,996 | ) | | | 5,770,513 | | | | — | | | | 3,335,242 | | | | (11,945,482 | ) | | | (2,839,727 | ) |
| 12/31/2019 | | | 281,136 | | | | — | | | | 138,039 | | | | (441,406 | ) | | | (22,231 | ) | | | 5,470,948 | | | | — | | | | 2,713,856 | | | | (8,522,028 | ) | | | (337,224 | ) |
Class I | | | | | | | | | | | | | | | | | | | | | | | | | | | | | | | | | | | | | | | | |
| 12/31/2020 | | | 550,474 | | | | — | | | | 261,820 | | | | (980,967 | ) | | | (168,673 | ) | | | 12,167,260 | | | | — | | | | 5,482,509 | | | | (21,408,539 | ) | | | (3,758,770 | ) |
| 12/31/2019 | | | 467,321 | | | | — | | | | 196,864 | | | | (545,797 | ) | | | 118,388 | | | | 9,650,512 | | | | — | | | | 4,082,963 | | | | (11,218,091 | ) | | | 2,515,384 | |
Class S | | | | | | | | | | | | | | | | | | | | | | | | | | | | | | | | | | | | | | | | |
| 12/31/2020 | | | 534,104 | | | | — | | | | 1,146,014 | | | | (3,414,754 | ) | | | (1,734,636 | ) | | | 11,580,698 | | | | — | | | | 23,848,555 | | | | (73,515,273 | ) | | | (38,086,020 | ) |
| 12/31/2019 | | | 723,015 | | | | — | | | | 975,561 | | | | (2,981,926 | ) | | | (1,283,350 | ) | | | 14,525,557 | | | | — | | | | 20,116,064 | | | | (60,692,033 | ) | | | (26,050,412 | ) |
Class S2 | | | | | | | | | | | | | | | | | | | | | | | | | | | | | | | | | | | | | | | | |
| 12/31/2020 | | | 18,152 | | | | — | | | | 37,499 | | | | (88,666 | ) | | | (33,015 | ) | | | 393,565 | | | | — | | | | 770,608 | | | | (1,944,763 | ) | | | (780,590 | ) |
| 12/31/2019 | | | 27,135 | | | | — | | | | 32,208 | | | | (133,304 | ) | | | (73,961 | ) | | | 549,118 | | | | — | | | | 656,400 | | | | (2,697,607 | ) | | | (1,492,089 | ) |
Morgan Stanley Global Franchise |
Class ADV | | | | | | | | | | | | | | | | | | | | | | | | | | | | | | | | | | | | | | | | |
| 12/31/2020 | | | 548,605 | | | | — | | | | 650,203 | | | | (752,027 | ) | | | 446,781 | | | | 8,726,056 | | | | — | | | | 9,746,549 | | | | (11,298,930 | ) | | | 7,173,675 | |
| 12/31/2019 | | | 884,610 | | | | — | | | | 733,488 | | | | (339,344 | ) | | | 1,278,754 | | | | 13,740,896 | | | | — | | | | 11,237,040 | | | | (5,296,512 | ) | | | 19,681,424 | |
Class R6 | | | | | | | | | | | | | | | | | | | | | | | | | | | | | | | | | | | | | | | | |
| 12/31/2020 | | | 54,732 | | | | — | | | | 5,119 | | | | (24,069 | ) | | | 35,782 | | | | 931,719 | | | | — | | | | 83,242 | | | | (418,085 | ) | | | 596,876 | |
| 12/31/2019 | | | 36,839 | | | | — | | | | 4,577 | | | | (10,413 | ) | | | 31,003 | | | | 624,916 | | | | — | | | | 75,422 | | | | (172,697 | ) | | | 527,641 | |
Class S | | | | | | | | | | | | | | | | | | | | | | | | | | | | | | | | | | | | | | | | |
| 12/31/2020 | | | 251,313 | | | | — | | | | 1,297,021 | | | | (2,418,030 | ) | | | (869,696 | ) | | | 4,372,052 | | | | — | | | | 21,154,417 | | | | (40,749,327 | ) | | | (15,222,858 | ) |
| 12/31/2019 | | | 248,447 | | | | — | | | | 1,762,890 | | | | (2,887,863 | ) | | | (876,526 | ) | | | 4,196,048 | | | | — | | | | 29,140,576 | | | | (48,204,362 | ) | | | (14,867,738 | ) |
Class S2 | | | | | | | | | | | | | | | | | | | | | | | | | | | | | | | | | | | | | | | | |
| 12/31/2020 | | | 46,784 | | | | — | | | | 194,594 | | | | (337,650 | ) | | | (96,272 | ) | | | 778,011 | | | | — | | | | 3,140,746 | | | | (5,672,811 | ) | | | (1,754,054 | ) |
| 12/31/2019 | | | 14,454 | | | | — | | | | 259,109 | �� | | | (394,495 | ) | | | (120,932 | ) | | | 240,198 | | | | — | | | | 4,241,616 | | | | (6,553,185 | ) | | | (2,071,371 | ) |
T. Rowe Price Capital Appreciation |
Class ADV | | | | | | | | | | | | | | | | | | | | | | | | | | | | | | | | | | | | | | | | |
| 12/31/2020 | | | 3,740,800 | | | | — | | | | 4,755,912 | | | | (4,851,630 | ) | | | 3,645,082 | | | | 102,816,047 | | | | — | | | | 125,242,472 | | | | (126,741,872 | ) | | | 101,316,647 | |
| 12/31/2019 | | | 5,575,422 | | | | — | | | | 2,946,529 | | | | (1,260,108 | ) | | | 7,261,843 | | | | 150,351,658 | | | | — | | | | 79,837,274 | | | | (33,969,913 | ) | | | 196,219,019 | |
Class I | | | | | | | | | | | | | | | | | | | | | | | | | | | | | | | | | | | | | | | | |
| 12/31/2020 | | | 6,028,340 | | | | — | | | | 5,239,834 | | | | (27,708,303 | ) | | | (16,440,129 | ) | | | 171,166,595 | | | | — | | | | 146,443,507 | | | | (843,395,333 | ) | | | (525,785,231 | ) |
| 12/31/2019 | | | 9,759,628 | | | | — | | | | 3,684,129 | | | | (5,896,777 | ) | | | 7,546,980 | | | | 277,225,757 | | | | — | | | | 105,346,487 | | | | (167,049,242 | ) | | | 215,523,002 | |
Class R6 | | | | | | | | | | | | | | | | | | | | | | | | | | | | | | | | | | | | | | | | |
| 12/31/2020 | | | 13,692,166 | | | | — | | | | 779,163 | | | | (3,529,227 | ) | | | 10,942,102 | | | | 427,082,165 | | | | — | | | | 22,268,407 | | | | (109,303,753 | ) | | | 340,046,819 | |
| 12/31/2019 | | | 2,439,618 | | | | — | | | | 366,413 | | | | (356,708 | ) | | | 2,449,323 | | | | 68,813,223 | | | | — | | | | 10,487,555 | | | | (10,246,153 | ) | | | 69,054,625 | |
Class S | | | | | | | | | | | | | | | | | | | | | | | | | | | | | | | | | | | | | | | | |
| 12/31/2020 | | | 2,541,238 | | | | — | | | | 12,945,953 | | | | (17,100,702 | ) | | | (1,613,511 | ) | | | 75,038,932 | | | | — | | | | 361,997,134 | | | | (493,096,419 | ) | | | (56,060,353 | ) |
| 12/31/2019 | | | 4,635,615 | | | | — | | | | 9,290,071 | | | | (16,631,924 | ) | | | (2,706,238 | ) | | | 130,238,436 | | | | — | | | | 265,075,287 | | | | (469,100,432 | ) | | | (73,786,709 | ) |
48
NOTES TO FINANCIAL STATEMENTS AS OF DECEMBER 31, 2020 (CONTINUED)
NOTE 9 — CAPITAL SHARES TRANSACTIONS (continued)
Year or
period | | Shares
sold | | Shares
issued in
merger | | Reinvestment
of
distributions | | Shares
redeemed | | Net
increase
(decrease)
in shares
outstanding | | Shares
sold | | Proceeds
from shares
issued in
merger | | Reinvestment
of
distributions | | Shares
redeemed | | Net
increase
(decrease) |
| ended | | # | | # | | # | | # | | # | | ($) | | ($) | | ($) | | ($) | | ($) |
T. Rowe Price Capital Appreciation (continued) |
Class S2 | | | | | | | | | | | | | | | | | | | | | | | | | | | | | | | | | | | | | | | | |
| 12/31/2020 | | | 136,942 | | | | — | | | | 209,860 | | | | (592,588 | ) | | | (245,786 | ) | | | 3,977,068 | | | | — | | | | 5,800,989 | | | | (16,618,568 | ) | | | (6,840,511 | ) |
| 12/31/2019 | | | 155,586 | | | | — | | | | 167,850 | | | | (558,499 | ) | | | (235,063 | ) | | | 4,329,710 | | | | — | | | | 4,744,849 | | | | (15,663,257 | ) | | | (6,588,698 | ) |
T. Rowe Price Equity Income |
Class ADV | | | | | | | | | | | | | | | | | | | | | | | | | | | | | | | | | | | | | | | | |
| 12/31/2020 | | | 472,756 | | | | — | | | | 294,459 | | | | (929,253 | ) | | | (162,038 | ) | | | 3,958,435 | | | | — | | | | 2,417,696 | | | | (7,709,752 | ) | | | (1,333,621 | ) |
| 12/31/2019 | | | 353,400 | | | | — | | | | 1,377,723 | | | | (617,449 | ) | | | 1,113,674 | | | | 4,050,764 | | | | — | | | | 14,085,259 | | | | (7,032,973 | ) | | | 11,103,050 | |
Class I | | | | | | | | | | | | | | | | | | | | | | | | | | | | | | | | | | | | | | | | |
| 12/31/2020 | | | 791,408 | | | | — | | | | 546,897 | | | | (1,303,524 | ) | | | 34,781 | | | | 6,818,383 | | | | — | | | | 4,638,752 | | | | (11,392,802 | ) | | | 64,333 | |
| 12/31/2019 | | | 568,006 | | | | — | | | | 2,106,466 | | | | (2,233,897 | ) | | | 440,575 | | | | 6,692,225 | | | | — | | | | 22,140,633 | | | | (26,950,544 | ) | | | 1,882,314 | |
Class S | | | | | | | | | | | | | | | | | | | | | | | | | | | | | | | | | | | | | | | | |
| 12/31/2020 | | | 391,297 | | | | — | | | | 809,460 | | | | (2,489,739 | ) | | | (1,288,982 | ) | | | 3,372,422 | | | | — | | | | 6,991,587 | | | | (22,456,940 | ) | | | (12,092,931 | ) |
| 12/31/2019 | | | 1,718,437 | | | | — | | | | 15,400,962 | | | | (50,726,943 | ) | | | (33,607,544 | ) | | | 19,394,247 | | | | — | | | | 162,548,177 | | | | (526,249,689 | ) | | | (344,307,265 | ) |
Class S2 | | | | | | | | | | | | | | | | | | | | | | | | | | | | | | | | | | | | | | | | |
| 12/31/2020 | | | 370,460 | | | | — | | | | 522,177 | | | | (1,403,557 | ) | | | (510,920 | ) | | | 2,936,507 | | | | — | | | | 4,344,569 | | | | (11,760,601 | ) | | | (4,479,525 | ) |
| 12/31/2019 | | | 392,404 | | | | — | | | | 2,805,920 | | | | (2,743,533 | ) | | | 454,791 | | | | 4,559,810 | | | | — | | | | 28,955,674 | | | | (29,132,389 | ) | | | 4,383,095 | |
T. Rowe Price International Stock |
Class ADV | | | | | | | | | | | | | | | | | | | | | | | | | | | | | | | | | | | | | | | | |
| 12/31/2020 | | | 139,759 | | | | — | | | | 63,528 | | | | (288,340 | ) | | | (85,053 | ) | | | 2,138,357 | | | | — | | | | 951,655 | | | | (4,273,302 | ) | | | (1,183,290 | ) |
| 12/31/2019 | | | 140,915 | | | | — | | | | 90,834 | | | | (146,404 | ) | | | 85,345 | | | | 2,134,977 | | | | — | | | | 1,356,151 | | | | (2,216,933 | ) | | | 1,274,195 | |
Class I | | | | | | | | | | | | | | | | | | | | | | | | | | | | | | | | | | | | | | | | |
| 12/31/2020 | | | 146,615 | | | | — | | | | 131,012 | | | | (279,650 | ) | | | (2,023 | ) | | | 2,285,500 | | | | — | | | | 1,967,794 | | | | (4,273,597 | ) | | | (20,303 | ) |
| 12/31/2019 | | | 155,424 | | | | — | | | | 182,071 | | | | (415,646 | ) | | | (78,151 | ) | | | 2,322,996 | | | | — | | | | 2,725,607 | | | | (6,317,799 | ) | | | (1,269,196 | ) |
Class S | | | | | | | | | | | | | | | | | | | | | | | | | | | | | | | | | | | | | | | | |
| 12/31/2020 | | | 372,173 | | | | — | | | | 438,048 | | | | (1,437,827 | ) | | | (627,606 | ) | | | 5,704,234 | | | | — | | | | 6,557,580 | | | | (21,717,207 | ) | | | (9,455,393 | ) |
| 12/31/2019 | | | 312,719 | | | | — | | | | 653,879 | | | | (1,749,366 | ) | | | (782,768 | ) | | | 4,761,972 | | | | — | | | | 9,755,870 | | | | (26,439,672 | ) | | | (11,921,830 | ) |
NOTE 10 — SECURITIES LENDING
Under a Master Securities Lending Agreement (the “Agreement”) with BNY, the Portfolios can lend their securities to approved brokers, dealers and other financial institutions. Loans are collateralized by cash and U.S. government securities. The collateral is equal to at least 105% of the market value of non-U.S. securities loaned and 102% of the market value of U.S. securities loaned. The market value of the loaned securities is determined at Market Close of the Portfolios at their last sale price or official closing price on the principal exchange or system on which they are traded and any additional collateral is delivered to the Portfolios on the next business day. The cash collateral received is invested in approved investments as defined in the Agreement with BNY. The Portfolios bear the risk of loss with respect to the investment of collateral with the following exception: BNY provides the Portfolios indemnification from loss with respect to the investment of collateral to the extent the cash collateral is invested in overnight repurchase agreements.
Cash collateral received in connection with securities lending is invested in cash equivalents, money market funds, repurchase agreements with maturities of not more than 99 days that are collateralized with U.S. Government securities, or certain short-term investments that have a
remaining maturity of 190 days or less (“Permitted Investments”). Short-term investments include: securities, units, shares or other participations in short-term investment funds, pools or trusts; commercial paper, notes, bonds or other debt obligations, certificates of deposit, time deposits and other bank obligations and asset-backed commercial paper backed by diversified receivables and repurchase-backed programs. Permitted Investments are subject to certain guidelines established by the Adviser regarding liquidity, diversification, credit quality and average credit life/duration requirements. The securities purchased with cash collateral received are reflected in the Portfolio of Investments under Short-Term Investments.
Generally, in the event of counterparty default, the Portfolios have the right to use the collateral to offset losses incurred. The Agreement contains certain guarantees by BNY in the event of counterparty default and/or a borrower’s failure to return a loaned security; however, there would be a potential loss to the Portfolios in the event the Portfolios are delayed or prevented from exercising its right to dispose of the collateral. Engaging in securities lending could have a leveraging effect, which may intensify the credit, market and other risks associated with investing in a Portfolio.
49
NOTES TO FINANCIAL STATEMENTS AS OF DECEMBER 31, 2020 (CONTINUED)
NOTE 10 — SECURITIES LENDING (continued)
The following tables represent a summary of each respective Portfolio’s securities lending agreements by counterparty which are subject to offset under the Agreement as of December 31, 2020:
| Clarion Global Real Estate |
| |
| Counterparty | | Securities
Loaned at
Value | | Cash
Collateral
Received(1) | | Net
Amount |
|---|
| JP Morgan Securities, Plc. | | | $ | 5,389 | | | | $ | (5,389 | ) | | | $ | — | |
| State Street Bank and Trust Company | | | | 129,961 | | | | | (129,961 | ) | | | | — | |
| Total | | | $ | 135,350 | | | | $ | (135,350 | ) | | | $ | — | |
(1) | | Cash collateral with a fair value of $1,047,089 has been received in connection with the above securities lending transactions. Excess cash collateral received from the individual counterparty is not shown for financial reporting purposes. |
| Invesco Growth and Income |
| |
| Counterparty | | Securities
Loaned at
Value | | Cash
Collateral
Received(1) | | Net
Amount |
|---|
| Scotia Capital (USA) INC | | | $ | 1,383,873 | | | | $ | (1,383,873 | ) | | | $ | — | |
| Total | | | $ | 1,383,873 | | | | $ | (1,383,873 | ) | | | $ | — | |
(1) | | Cash collateral with a fair value of $1,415,614 has been received in connection with the above securities lending transactions. Excess cash collateral received from the individual counterparty is not shown for financial reporting purposes. |
| JPMorgan Emerging Markets Equity |
| |
| Counterparty | | Securities
Loaned at
Value | | Cash
Collateral
Received(1) | | Net
Amount |
|---|
| Morgan Stanley & Co. LLC | | | $ | 1,468,115 | | | | $ | (1,468,115 | ) | | | $ | — | |
| National Financial Services LLC | | | | 1,052,520 | | | | | (1,052,520 | ) | | | | — | |
| Wells Fargo Securities LLC | | | | 18,795 | | | | | (18,795 | ) | | | | — | |
| Total | | | $ | 2,539,430 | | | | $ | (2,539,430 | ) | | | $ | — | |
(1) | | Cash collateral with a fair value of $2,601,075 has been received in connection with the above securities lending transactions. Excess cash collateral received from the individual counterparty is not shown for financial reporting purposes. |
| T. Rowe Price Capital Appreciation | |
|---|
| | |
|---|
| Counterparty | | Securities
Loaned at
Value | | Cash
Collateral
Received(1) | | Net
Amount |
|---|
| Barclays Bank PLC | | | $ | 7,391,296 | | | | $ | (7,391,296 | ) | | | $ | — | |
| Barclays Capital Inc. | | | | 10,768,679 | | | | | (10,768,679 | ) | | | | — | |
| BMO Capital Markets Corp | | | | 2,725 | | | | | (2,725 | ) | | | | — | |
| BNP Paribas Prime Brokerage Intl Ltd | | | | 4,500,085 | | | | | (4,500,085 | ) | | | | — | |
| BofA Securities Inc | | | | 791,202 | | | | | (791,202 | ) | | | | — | |
| Citadel Securities LLC | | | | 186,673 | | | | | (186,673 | ) | | | | — | |
| Citigroup Global Markets Inc. | | | | 23,840,789 | | | | | (23,840,789 | ) | | | | — | |
| Goldman, Sachs & Co. LLC | | | | 11,253,471 | | | | | (11,253,471 | ) | | | | — | |
| Janney Montgomery Scott LLC | | | | 206,830 | | | | | (206,830 | ) | | | | — | |
| J.P. Morgan Securities LLC | | | | 29,181,701 | | | | | (29,181,701 | ) | | | | — | |
| MUFG Securities Americas Inc. | | | | 2,493,199 | | | | | (2,493,199 | ) | | | | — | |
| Mizuho Securities USA LLC. | | | | 187,306 | | | | | (187,306 | ) | | | | — | |
| National Financial Services LLC | | | | 687,341 | | | | | (687,341 | ) | | | | — | |
| Nomura Securities International, Inc. | | | | 22,638 | | | | | (22,638 | ) | | | | — | |
| RBC Capital Markets, LLC | | | | 5,186,196 | | | | | (5,186,196 | ) | | | | — | |
| Scotia Capital (USA) INC | | | | 260,715 | | | | | (260,715 | ) | | | | — | |
| State Street Bank and Trust Company | | | | 1,576,946 | | | | | (1,576,946 | ) | | | | — | |
| UBS Securities LLC. | | | | 84,372 | | | | | (84,372 | ) | | | | — | |
| Wells Fargo Bank NA | | | | 1,375,210 | | | | | (1,375,210 | ) | | | | — | |
| Wells Fargo Securities LLC | | | | 5,923,551 | | | | | (5,923,551 | ) | | | | — | |
| Total | | | $ | 105,920,925 | | | | $ | (105,920,925 | ) | | | $ | — | |
(1) | | Cash collateral with a fair value of $108,320,448 has been received in connection with the above securities lending transactions. Excess cash collateral received from the individual counterparty is not shown for financial reporting purposes. |
| T. Rowe Price Equity Income | |
|---|
| | |
|---|
| Counterparty | | Securities
Loaned at
Value | | Cash
Collateral
Received(1) | | Net
Amount |
|---|
| BofA Securities Inc | | | $ | 1,443,310 | | | | $ | (1,443,310 | ) | | | $ | — | |
| Citadel Securities LLC | | | | 20,478 | | | | | (20,478 | ) | | | | — | |
| J.P. Morgan Securities LLC | | | | 256,947 | | | | | (256,947 | ) | | | | — | |
| Mizuho Securities USA LLC. | | | | 14,508 | | | | | (14,508 | ) | | | | — | |
| Wells Fargo Securities LLC | | | | 525,363 | | | | | (525,363 | ) | | | | — | |
| Total | | | $ | 2,260,606 | | | | $ | (2,260,606 | ) | | | $ | — | |
(1) | | Cash collateral with a fair value of $2,311,754 has been received in connection with the above securities lending transactions. Excess cash collateral received from the individual counterparty is not shown for financial reporting purposes. |
50
NOTES TO FINANCIAL STATEMENTS AS OF DECEMBER 31, 2020 (CONTINUED)
NOTE 10 — SECURITIES LENDING (continued)
| T. Rowe Price International Stock |
| |
| Counterparty | | Securities
Loaned at
Value | | Cash
Collateral
Received(1) | | Net
Amount |
|---|
| Goldman, Sachs & Co. LLC | | | $ | 2,295,635 | | | | $ | (2,295,635 | ) | | | $ | — | |
| Morgan Stanley & Co. LLC | | | | 1,748,808 | | | | | (1,748,808 | ) | | | | — | |
| Total | | | $ | 4,044,443 | | | | $ | (4,044,443 | ) | | | $ | — | |
(1) | | Cash collateral with a fair value of $4,249,056 has been received in connection with the above securities lending transactions. Excess cash collateral received from the individual counterparty is not shown for financial reporting purposes. |
NOTE 11 — UNFUNDED LOAN COMMITMENTS
Certain Portfolios may enter in credit agreements, all or a portion of which may be unfunded. The Portfolios are obligated to fund these loan commitments at the borrower’s discretion. Funded portions of the credit agreements are presented in the Portfolio of Investments. There were no unfunded loan commitments at December 31, 2020.
NOTE 12 — FEDERAL INCOME TAXES
The amount of distributions from net investment income and net realized capital gains are determined in accordance with federal income tax regulations, which may differ from GAAP for investment companies. These book/tax differences may be either temporary or permanent. Permanent differences are reclassified within the capital accounts based on their federal tax-basis treatment; temporary differences are not reclassified. Key differences include the treatment of foreign currency transactions, income from passive foreign investment companies (PFICs), wash sale deferrals and de minimis distributions in excess of net investment income.
The following permanent tax differences have been reclassified as of December 31, 2020:
| | Paid-in
Capital | | Distributable
Earnings |
|---|
| Government Liquid Assets | | $ | (9,754 | ) | | $ | 9,754 | |
| T. Rowe Price Capital Appreciation | | | (203,586 | ) | | | 203,586 | |
Dividends paid by the Portfolios from net investment income and distributions of net realized short-term capital gains are, for federal income tax purposes, taxable as ordinary income to shareholders.
The tax composition of dividends and distributions to shareholders was as follows:
| | Year Ended December 31, 2020
| | Year Ended December 31, 2019
|
|---|
| | Ordinary
Income
| | Long-term
Capital Gains
| | Ordinary
Income
| | Long-term
Capital Gains
|
|---|
| Government Liquid Assets | | $ | 1,757,835 | | | $ | — | | | $ | 12,787,150 | | | $ | — | |
| Clarion Global Real Estate | | | 12,158,955 | | | | 14,567,272 | | | | 6,282,769 | | | | — | |
| Invesco Growth and Income | | | 7,565,414 | | | | 30,987,138 | | | | 10,636,889 | | | | 51,891,887 | |
| JPMorgan Emerging Markets Equity | | | 1,701,704 | | | | 31,735,210 | | | | 1,435,190 | | | | 26,134,093 | |
| Morgan Stanley Global Franchise | | | 3,590,119 | | | | 30,534,835 | | | | 3,001,531 | | | | 41,693,123 | |
| T. Rowe Price Capital Appreciation | | | 192,004,958 | | | | 469,747,551 | | | | 104,681,934 | | | | 360,809,518 | |
| T. Rowe Price Equity Income | | | 17,191,718 | | | | 1,200,886 | | | | 22,961,755 | | | | 204,767,988 | |
| T. Rowe Price International Stock | | | 5,238,296 | | | | 4,238,733 | | | | 2,426,161 | | | | 11,411,467 | |
The tax-basis components of distributable earnings and the capital loss carryforwards which may be used to offset future realized capital gains for federal income tax purposes as of December 31, 2020 were:
| | Undistributed
Ordinary
Income | | Undistributed
Long-term
Capital Gains | | Unrealized
Appreciation/
(Depreciation) | | Capital Loss Carryforwards | |
|---|
| | | | | | | | | | | | | | | Amount | | Character | | Expiration | |
| Government Liquid Assets | | $ | — | | | $ | — | | | $ | — | | | $ | — | | — | | — | |
| Clarion Global Real Estate | | | 6,051,306 | | | | — | | | | 27,497,656 | | | | (9,437,411 | ) | Short-term | | None | |
| | | | | | | | | | | | | | | | (1,914,562 | ) | Long-term | | None | |
| | | | | | | | | | | | | | | $ | (11,351,973 | ) | | | | |
| Invesco Growth and Income | | | 5,792,745 | | | | — | | | | 73,553,149 | | | | (1,759,618 | ) | Long-term | | None | |
| JPMorgan Emerging Markets Equity | | | 1,437,832 | | | | 38,565,165 | | | | 278,211,633 | | | | — | | — | | — | |
| Morgan Stanley Global Franchise | | | 3,004,556 | | | | 35,901,079 | | | | 122,124,852 | | | | — | | — | | — | |
| T. Rowe Price Capital Appreciation | | | 246,985,244 | | | | 741,248,899 | | | | 1,308,075,240 | | | | — | | — | | — | |
| T. Rowe Price Equity Income | | | 417,076 | | | | 6,146,353 | | | | 63,671,477 | | | | — | | — | | — | |
| T. Rowe Price International Stock | | | 1,413,911 | | | | 5,565,038 | | | | 57,741,553 | | | | — | | — | | — | |
51
NOTES TO FINANCIAL STATEMENTS AS OF DECEMBER 31, 2020 (CONTINUED)
NOTE 12 — FEDERAL INCOME TAXES (continued)
The Portfolios’ major tax jurisdictions are U.S. federal, Arizona state, and Massachusetts state.
As of December 31, 2020, no provision for income tax is required in the Portfolios’ financial statements as a result of tax positions taken on federal and state income tax returns for open tax years. The Portfolios’ federal and state income and federal excise tax returns for tax years for which the applicable statutes of limitations have not expired are subject to examination by the Internal Revenue Service and state department of revenue. Generally, the preceding four tax years remain subject to examination by these jurisdictions.
NOTE 13 — LITIGATION
On September 24, 2012, certain Voya mutual funds, including T. Rowe Price Equity Income (the “Subject Fund”), were officially served and included as shareholder defendants in the matter of Official Committee of Unsecured Creditors of the Tribune Company v. FitzSimons, et al. (the “FitzSimons Action”). The FitzSimons Action arises from the Tribune Company (“Tribune”) Chapter 11 bankruptcy proceedings before the United States Bankruptcy Court for the District of Delaware (the “Bankruptcy Court”).
In the FitzSimons Action, the plaintiff (a litigation trustee appointed by the Bankruptcy Court, the “Trustee”) alleges that Tribune acted with actual intent to defraud its creditors when it redeemed its shares from shareholders as part of a leveraged buy-out (“LBO”) of Tribune through which it converted to a privately-held company in 2007, and that those share transfers must now be unwound. To succeed on this claim, the Trustee must prove that Tribune — not the Subject Fund — acted with actual fraudulent intent when Tribune redeemed its shares. With regard to the Subject Fund, the Trustee need only show that the Subject Fund tendered its shares as part of the LBO and not on the open market. The Subject Fund’s lack of fraudulent intent in tendering its shares is not a defense to the Trustee’s actual fraud claim.
In addition to the FitzSimons Action, various additional actions, which also included the Subject Fund as a defendant, stemming from the same facts and circumstances underlying the FitzSimons Action, were filed in multiple U.S. District Courts (collectively, the “State Law Constructive Fraudulent Transfer Cases”). The plaintiffs in the State Law Constructive Fraudulent Transfer Cases (former creditors of Tribune) allege that these same share redemptions that were part of the LBO were constructively, as opposed to actually, fraudulent. Specifically, those suits assert that the LBO rendered Tribune insolvent, that there was not reasonably equivalent
value for the redemptions, and therefore the redemptions are voidable under constructive fraudulent transfer law.
Procedural History of the State Law Constructive Fraudulent Transfer Cases
A motion was filed with the Multidistrict Litigation (“MDL”) Panel to consolidate the State Law Constructive Fraudulent Transfer Cases for purposes of all pretrial proceedings. On December 19, 2011, the MDL Panel ordered the State Law Constructive Fraudulent Transfer Cases to be transferred to the Southern District of New York (the “District Court”).
On September 23, 2013, the District Court dismissed the claims against the shareholder defendants, holding that the plaintiffs lacked standing to pursue the claims so long as the Trustee in the FitzSimons Action maintained the actual fraudulent transfer claims in the FitzSimons case against the same shareholders.
On December 20, 2013, the plaintiffs appealed the decision to the Second Circuit Court of Appeals (the “Second Circuit”). The Second Circuit affirmed the dismissal on March 24, 2016. The Second Circuit held that Section 546(e) of the Bankruptcy Code barred the state-law fraudulent constructive transfer claims, finding that the claims were preempted because they conflict with the purpose of Section 546(e). On April 12, 2016, the plaintiffs moved for rehearing en banc in the Second Circuit; the motion was subsequently denied. The plaintiffs filed a petition for a writ of certiorari in the United States Supreme Court on September 9, 2016. The shareholder defendants filed their opposition on October 24, 2016, to which the plaintiffs filed a reply on November 4, 2016.
On February 27, 2018, the Supreme Court issued its decision in Merit Management Group v. FTI Consulting (“Merit Management”), a case that, like Tribune, deals with the appropriate scope of section 546(e) of the Bankruptcy Code. On April 3, 2018, the Supreme Court issued a “statement” from two justices announcing that consideration of plaintiffs’ certiorari petition would be deferred for an undetermined period of time to “allow” the Second Circuit or the District Court to consider, among other things, whether the Second Circuit’s March 2016 decision should be vacated in light of Merit Management. On April 10, 2018, the plaintiffs asked the Second Circuit to vacate its prior decision and remand to the District Court for further proceedings. The shareholder defendants filed an opposition on April 20, 2018. On May 15, 2018, the Second Circuit entered an order recalling the mandate “in anticipation of further panel review.” The order did not provide any specific timing for, or guidance on, next steps.
Following the Second Circuit’s recall of its prior mandate in light of the Supreme Court’s decision in Merit Management,
52
NOTES TO FINANCIAL STATEMENTS AS OF DECEMBER 31, 2020 (CONTINUED)
NOTE 13 — LITIGATION (continued)
on December 19, 2019, the Second Circuit issued an amended opinion which vacated its prior March 24, 2016 opinion. This amended opinion once again affirmed the dismissal of the case — affirming the Circuit’s prior ruling regarding preemption, and holding that Tribune qualified as a “financial institution.” A new mandate was also issued. The plaintiffs once again moved for rehearing en banc in connection with this ruling on January 2, 2020, but this request was denied by the Second Circuit on February 6, 2020. On July 6, 2020 the plaintiffs filed a petition for writ of certiorari appealing the Second Circuit’s decision up to the Supreme Court. On August 26, 2020 the shareholder defendants filed an opposition to the petition for writ. The Supreme Court has not yet issued its determination on whether to accept or deny certiorari.
Procedural History of the FitzSimons Action
Similar to the State Law Constructive Fraudulent Transfer Cases, the FitzSimons Action was transferred to the District Court for pre-trial purposes. On November 20, 2013, the District Court entered an order stating that the FitzSimons Action would remain with the District Court. On January 6, 2017, the District Court dismissed the actual fraudulent transfer claims against the shareholder defendants without leave to replead. Because the January 6 decision did not fully dispose of all claims asserted in the complaint, the Trustee could not automatically appeal the decision. On February 1, 2017, the Trustee sought leave to file a motion for certification of the Motion to Dismiss. On February 23, 2017, the District Court issued an order stating that it intended to delay certification of the Motion to Dismiss until certain other pending motions to dismiss (not involving the shareholder defendants) were resolved.
On July 18, 2017, the Trustee sought permission from the District Court to file a motion seeking leave to amend its complaint to include a constructive fraudulent transfer claim based on the anticipated ruling in Merit Management. On August 24, 2017, the District Court denied the request without prejudice, but noted that affirmance of Merit Management would give the Trustee a strong argument that he should be allowed to amend his complaint. On March 8, 2018, the Trustee renewed his request to amend his complaint to add a constructive fraudulent transfer claim in light of the Merit Management decision. On March 13, 2018, counsel for a number of shareholder defendants (including counsel for the Subject Fund) filed an opposition.
On June 18, 2018, the District Court entered an order staying any decision on the Trustee’s request on the grounds that it would be preferable to hold off until the Second Circuit issued a further ruling in the State Law
Constructive Fraudulent Transfer Cases. The District Court also instructed the parties to file a joint letter indicating their views on proceeding with efforts to seek to achieve a global resolution of the case. On July 9, 2018, the parties submitted a joint letter that voiced general support for a broad based mediation effort.
On November 30, 2018, Judge Sullivan granted motions to dismiss brought by certain Tribune directors and officers. This decision did not directly impact the shareholder defendants, and because it did not resolve all of the pending motions to dismiss, it did not facilitate an appeal of the dismissal of claims against the shareholder defendants (which had been dismissed almost two years prior). On December 1, 2018, the FitzSimons Action (along with all other Tribune cases still pending in the District Court) were reassigned from Judge Sullivan to Judge Denise Cote. On December 17, 2018, the Trustee filed a motion for reconsideration of Judge Sullivan’s November 30, 2018 decision. On February 12, 2019, Judge Cote denied the Trustee’s motion for reconsideration in its entirety.
On March 27, 2019, Judge Cote lifted the stay previously imposed by Judge Sullivan and allowed the Trustee to move to amend the complaint to assert a constructive fraudulent transfer claim. The Trustee filed his motion on April 4, 2019. The shareholder defendants’ opposition was filed on April 12, 2019. On April 23, 2019, Judge Cote denied the Trustee’s motion. Significantly, Judge Cote held that Tribune qualifies as a “financial institution” under section 546(e) of the Bankruptcy Code.
In mid-July 2019, the Trustee filed a notice of appeal from, among other things, the District Court’s order dismissing the intentional fraudulent transfer claims against the shareholder defendants as well as the order denying the Trustee’s request to amend the complaint to include constructive fraudulent transfer claims against the shareholder defendants. The Trustee filed his opening brief in early January 2020. The Second Circuit has directed that this appeal be heard in tandem with the appeal of the separate suit pursued by the Trustee against financial advisors Citigroup and Merrill Lynch. The defendants’ brief in the appeal of the Trustee’s fraudulent transfer action was filed on April 27, 2020, and a reply brief was filed by the Trustee on May 18, 2020. Oral argument in front of the Second Circuit occurred on August 24, 2020. The parties now await a ruling.
Potential Exposure
For the Subject Fund, if the plaintiffs obtain further review of the dismissal of the FitzSimons Action or the State Law Constructive Fraudulent Transfer Cases, and the decision to dismiss these cases is ultimately overturned, the potential exposure of the Subject Fund is the value of all
53
NOTES TO FINANCIAL STATEMENTS AS OF DECEMBER 31, 2020 (CONTINUED)
NOTE 13 — LITIGATION (continued)
shares sold in conjunction with the LBO transaction (i.e., $18,125,400) , plus any pre-judgement interest granted by the court. The Subject Fund believes the claims raised in these actions are without merit and intends to vigorously defend against them.
NOTE 14 — LONDON INTERBANK OFFERED RATE (“LIBOR”)
The U.K. Financial Conduct Authority has announced that it intends to stop persuading or compelling banks to submit LIBOR rates after 2021, and it remains unclear whether LIBOR will continue to exist after that date and, if so, in what form. Actions by regulators have resulted in the establishment of alternative reference rates to LIBOR in many major currencies. The U.S. Federal Reserve Board, based on the recommendations of the New York Federal Reserve’s Alternative Reference Rate Committee (comprised of major derivative market participants and their regulators), has begun publishing a Secured Overnight Funding Rate (“SOFR”) that is intended to replace U.S. dollar LIBOR. Proposals for alternative reference rates for other currencies have also been announced or have already begun publication.
Discontinuance of LIBOR and adoption/implementation of alternative rates pose a number of risks, including among others whether any substitute rate will experience the market participation and liquidity necessary to provide a workable substitute for LIBOR; the effect on parties’ existing contractual arrangements, hedging transactions, and investment strategies generally from a conversion from LIBOR to alternative rates; the effect on a Portfolio’s existing investments (including, for example, fixed-income investments; senior loans; CLOs and CDOs; and derivatives transactions), including the possibility that some of those investments may terminate or their terms may be adjusted to the disadvantage of a Portfolio; and the risk of general market disruption during the period of the conversion. It is difficult to predict at this time the likely impact of the transition away from LIBOR on a Portfolio. On November 30, 2020, the administrator of LIBOR announced a delay in the phase out of a majority of the U.S. dollar LIBOR publications until June 30, 2023, with the remainder of LIBOR publications to still end at the end of 2021.
NOTE 15 — MARKET DISRUPTION
A Portfolio is subject to the risk that geopolitical events will disrupt securities markets and adversely affect global economies and markets. Due to the increasing interdependence among global economies and markets, conditions in one country, market, or region might
adversely impact markets, issuers and/or foreign exchange rates in other countries, including the United States. War, terrorism, global health crises and pandemics, and other geopolitical events have led, and in the future may lead, to increased market volatility and may have adverse short- or long-term effects on U.S. and world economies and markets generally. For example, the COVID-19 pandemic has resulted, and may continue to result, in significant market volatility, exchange trading suspensions and closures, declines in global financial markets, higher default rates, and a substantial economic downturn in economies throughout the world. Natural and environmental disasters and systemic market dislocations are also highly disruptive to economies and markets. Those events as well as other changes in non-U.S. and domestic economic, social, and political conditions also could adversely affect individual issuers or related groups of issuers, securities markets, interest rates, credit ratings, inflation, investor sentiment, and other factors affecting the value of the investments of the portfolio and of the Portfolios. Any of these occurrences could disrupt the operations of a Portfolio and of the Portfolios’ service providers.
NOTE 16 — OTHER ACCOUNTING PRONOUNCEMENTS
The Portfolios have adopted the provisions of Financial Accounting Standards Board Accounting Standards Update 2018-13 (“ASU 2018-13”), Fair Value Measurement (Topic 820): Disclosure Framework — Changes to the Disclosure Requirements for Fair Value Measurement. ASU 2018-13 introduces new fair value disclosure requirements as well as provides guidance that eliminates, adds and modifies certain disclosure requirements for fair value measurements. The impact of the Portfolios’ adoption was limited to changes in the Portfolios’ financial statement disclosures regarding fair value, primarily those disclosures related to transfers between levels of the fair value hierarchy and disclosure of the range and weighted average used to develop significant unobservable inputs for Level 3 fair value measurements, when applicable. Upon evaluation, the Portfolios have concluded that the adoption of the new accounting standard does not materially impact the financial statement amounts.
In March 2020, the Financial Accounting Standards Board issued Accounting Standards Update No. 2020-04 (“ASU 2020-04”), Reference Rate Reform (Topic 848) — Facilitation of the Effects of Reference Rate Reform on Financial Reporting. The amendments in ASU 2020-04 provide optional temporary financial reporting relief from the effect of certain types of contract modifications due to the planned discontinuation of LIBOR and other interbank-
54
NOTES TO FINANCIAL STATEMENTS AS OF DECEMBER 31, 2020 (CONTINUED)
NOTE 16 — OTHER ACCOUNTING PRONOUNCEMENTS (continued)
offered based reference rates as of the end of 2021. ASU 2020-04 is effective for certain reference rate-related contract modifications that occur during the period March 12, 2020 through December 31, 2022. Management is currently evaluating the impact, if any, of applying ASU 2020-04.
NOTE 17 — SUBSEQUENT EVENTS
Dividends: Subsequent to December 31, 2020, the following Portfolio paid distributions of:
| | Type | | | Per Share
Amount | | Payable
Date | | Record
Date |
|---|
Government Liquid Assets | | | | | | | | | |
| All Classes | | STCG | | | $0.0000* | | February 1, 2021 | | January 28, 2021 |
STCG—Short-term capital gain
| * | | Amount rounds to $0.0000. |
The Portfolios have evaluated events occurring after the Statements of Assets and Liabilities date through the date that the financial statements were issued (“subsequent events”) to determine whether any subsequent events necessitated adjustment to or disclosure in the financial statements. Other than the above, no such subsequent events were identified.
55
VOYA GOVERNMENT LIQUID
ASSETS PORTFOLIO | PORTFOLIO OF INVESTMENTS
AS OF DECEMBER 31, 2020 |
Principal
Amount† | | | | | | | | Value | | Percentage
of Net
Assets |
|---|
| | | | | | | | | | | | | | | |
| U.S. GOVERNMENT AGENCY DEBT: 24.3% | | | | | |
| 26,000,000 | | | | | | Fannie Mae, 0.130%, (SOFRRATE + 0.040%), 01/29/2021 | | $ | 25,999,391 | | | | 2.7 | |
| 107,000,000 | | | | | | Fannie Mae, 0.210%, (SOFRRATE + 0.120%), 03/16/2021 | | | 107,000,000 | | | | 11.1 | |
| 14,000,000 | | | | | | Fannie Mae, 0.370%, (SOFRRATE + 0.280%), 04/26/2021 | | | 14,000,000 | | | | 1.4 | |
| 14,000,000 | | | | | | Federal Farm Credit Banks, 0.153%, (US0001M + 0.005%), 06/25/2021 | | | 14,000,000 | | | | 1.4 | |
| 8,250,000 | | | | | | Federal Farm Credit Banks, 0.210%, (FEDL01 + 0.120%), 04/23/2021 | | | 8,246,669 | | | | 0.9 | |
| 50,000,000 | | | | | | Federal Home Loan Banks, 0.125%, (SOFRRATE + 0.035%), 12/10/2021 | | | 50,000,000 | | | | 5.2 | |
| 15,500,000 | | | | | | Federal Home Loan Banks, 0.170%, (SOFRRATE + 0.080%), 03/04/2021 | | | 15,500,000 | | | | 1.6 | |
| | | | | | | | | | | | | | | |
| | | | | | | Total U.S. Government Agency Debt
(Cost $234,746,060) | | | 234,746,060 | | | | 24.3 | |
| | | | | | | | | | | | | | | |
| U.S. TREASURY DEBT: 60.0% | | | | | | | | |
| 27,000,000 | | | | (1) | | United States Cash Management Bill, 0.080%, 03/23/2021 | | | 26,994,988 | | | | 2.8 | |
| 135,500,000 | | | | (1) | | United States Cash Management Bill, 0.080%, 03/30/2021 | | | 135,472,709 | | | | 14.0 | |
| 39,000,000 | | | | (1) | | United States Treasury Bill, 0.070%, 01/12/2021 | | | 38,999,142 | | | | 4.0 | |
| 25,000,000 | | | | (1) | | United States Treasury Bill, 0.070%, 01/21/2021 | | | 24,998,958 | | | | 2.6 | |
| 260,000,000 | | | | (1) | | United States Treasury Bill, 0.070%, 01/28/2021 | | | 259,985,094 | | | | 26.9 | |
| 53,500,000 | | | | (1) | | United States Treasury Bill, 0.070%, 02/09/2021 | | | 53,495,769 | | | | 5.5 | |
| 27,000,000 | | | | (1) | | United States Treasury Bill, 0.090%, 03/25/2021 | | | 26,994,553 | | | | 2.8 | |
| 13,000,000 | | | | (1) | | United States Treasury Bill, 0.090%, 06/24/2021 | | | 12,994,188 | | | | 1.4 | |
| | | | | | | Total U.S. Treasury Debt (Cost $579,935,401) | | | 579,935,401 | | | | 60.0 | |
| | | | | | | | | | | | | | | |
| U.S. TREASURY REPURCHASE AGREEMENT: 14.1% |
| | Repurchase Agreement: 14.1% |
| 55,000,000 | | | | | | Deutsche Bank Repurchase Agreement dated 12/31/2020, 0.070%, due 1/4/2021, $55,000,428 to be received upon repurchase (Collateralized by $53,311,300, Note, 2.125-2.875%, Market Value plus accrued interest $56,100,064 due 5/31/21–11/30/2023) | | | 55,000,000 | | | | 5.7 | |
Principal
Amount† | | | | | | | | Value | | Percentage
of Net
Assets |
|---|
| | | | | | | | | | | | | | | |
| U.S. TREASURY REPURCHASE AGREEMENT: (continued) | |
| | Repurchase Agreement: (continued) |
| 81,392,000 | | | | | | Deutsche Bank Repurchase Agreement dated 12/31/2020, 0.070%, due 1/4/2021, $81,392,633 to be received upon repurchase (Collateralized by $83,044,000, Bill, 0.00%, Market Value plus accrued interest $83,019,938 due 2/9/2021–8/12/2021) | | $ | 81,392,000 | | | | 8.4 | |
| | | | | | | Total U.S. Treasury Repurchase Agreement (Cost $136,392,000) | | | 136,392,000 | | | | 14.1 | |
| | | | | | | Total Investments in Securities
(Cost $951,073,461) | | $ | 951,073,461 | | | | 98.4 | |
| | | | | | | Assets in Excess of Other Liabilities | | | 15,652,755 | | | | 1.6 | |
| | | | | | | Net Assets | | $ | 966,726,216 | | | | 100.0 | |
| † | | Unless otherwise indicated, principal amount is shown in USD. |
| (1) | | Represents a zero coupon bond. Rate shown reflects the effective yield as of December 31, 2020. |
Reference Rate Abbreviations:
| FEDL01 | Federal Funds Effective Rate |
| SOFRRATE | Secured Overnight Financing Rate |
| US0001M | 1-month LIBOR |
At December 31, 2020, the aggregate cost of securities for federal income tax purposes is the same for financial purposes.
See Accompanying Notes to Financial Statements
56
VOYA GOVERNMENT LIQUID
ASSETS PORTFOLIO | PORTFOLIO OF INVESTMENTS
AS OF DECEMBER 31, 2020 (CONTINUED) |
Fair Value Measurementsˆ
The following is a summary of the fair valuations according to the inputs used as of December 31, 2020 in valuing the assets and liabilities:
| | Quoted Prices
in Active Markets
for Identical
Investments
(Level 1) | | Significant
Other
Observable
Inputs
(Level 2) | | Significant
Unobservable
Inputs
(Level 3) | | Fair Value
at
December 31, 2020 |
|---|
Asset Table | | | | | | | | | | | | | | | | | | | | |
Investments, at fair value | | | | | | | | | | | | | | | | | | | | |
| U.S. Government Agency Debt | | | $ | — | | | | $ | 234,746,060 | | | | $ | — | | | | $ | 234,746,060 | |
| U.S. Treasury Debt | | | | — | | | | | 579,935,401 | | | | | — | | | | | 579,935,401 | |
| U.S. Treasury Repurchase Agreement | | | | — | | | | | 136,392,000 | | | | | — | | | | | 136,392,000 | |
| Total Investments, at fair value | | | $ | — | | | | $ | 951,073,461 | | | | $ | — | | | | $ | 951,073,461 | |
| ˆ | | See Note 2, “Significant Accounting Policies” in the Notes to Financial Statements for additional information. |
The following table is a summary of the Portfolio’s repurchase agreements by counterparty which are subject to offset under a MRA as of December 31, 2019:
| Counterparty | | | Government Repurchase
Agreement, at fair value | | Fair Value of
Non-Cash Collateral
Received Including
Accrued Interest(1) | | Net
Amount |
|---|
| Deutsche Bank | | | $ | 136,392,000 | | | | $ | (136,392,000 | ) | | | $ | — | |
| Totals | | | $ | 136,392,000 | | | | $ | (136,392,000 | ) | | | $ | — | |
| | | | | | | | | | | | | | | | | |
(1) | | Collateral with a fair value of $139,120,002 has been pledged in connection with the above government repurchase agreement. Excess collateral received from the individual counterparty is not shown for financial reporting purposes. |
See Accompanying Notes to Financial Statements
57
VY® CLARION GLOBAL
REAL ESTATE PORTFOLIO | SUMMARY PORTFOLIO OF INVESTMENTS
AS OF DECEMBER 31, 2020 |
| Shares | | | | | | | | Value | | Percentage
of Net Assets |
|---|
| | | | | | | | | | | | | | | |
COMMON STOCK: 97.4% | |
| | |
| 310,612 | | | | | | Dexus | | $ | 2,252,849 | | | | 1.2 | |
| 149,642 | | | | (1) | | Lifestyle Communities Ltd. | | | 1,475,806 | | | | 0.8 | |
| 456,454 | | | | | | Stockland | | | 1,473,696 | | | | 0.7 | |
| 1,037,719 | | | | | | Other Securities | | | 2,001,322 | | | | 1.0 | |
| | | | | | | | | | 7,203,673 | | | | 3.7 | |
| | | | | | | | | | | | | | | |
| | |
| 52,083 | | | | (2) | | Other Securities | | | 2,525,988 | | | | 1.3 | |
| | | | | | | | | | | | | | | |
| | |
| 81,134 | | | | | | Canadian Apartment Properties REIT | | | 3,186,337 | | | | 1.7 | |
| 136,176 | | | | | | H&R Real Estate Investment Trust | | | 1,421,776 | | | | 0.7 | |
| 28,003 | | | | | | Other Securities | | | 742,259 | | | | 0.4 | |
| | | | | | | | | | 5,350,372 | | | | 2.8 | |
| | | | | | | | | | | | | | | |
| | |
| 79,330 | | | | | | Kojamo Oyj | | | 1,760,731 | | | | 0.9 | |
| | | | | | | | | | | | | | | |
| | |
| 126,674 | | | | | | Other Securities | | | 1,906,808 | | | | 1.0 | |
| | | | | | | | | | | | | | | |
| | |
| 40,336 | | | | (3),(4) | | ADLER Group SA | | | 1,429,009 | | | | 0.7 | |
| 222,552 | | | | | | Aroundtown SA | | | 1,659,323 | | | | 0.9 | |
| 33,168 | | | | | | Deutsche Wohnen SE | | | 1,769,661 | | | | 0.9 | |
| 13,666 | | | | | | LEG Immobilien AG | | | 2,120,197 | | | | 1.1 | |
| 61,396 | | | | | | TAG Immobilien AG | | | 1,959,255 | | | | 1.0 | |
| 70,386 | | | | | | Vonovia SE | | | 5,140,546 | | | | 2.6 | |
| 48,642 | | | | (5) | | Other Securities | | | 1,101,229 | | | | 0.6 | |
| | | | | | | | | | 15,179,220 | | | | 7.8 | |
| | | | | | | | | | | | | | | |
| | |
| 459,105 | | | | | | Link REIT | | | 4,169,489 | | | | 2.1 | |
| 1,442,192 | | | | | | Sino Land Co. | | | 1,876,747 | | | | 1.0 | |
| 290,195 | | | | | | Sun Hung Kai Properties Ltd. | | | 3,711,298 | | | | 1.9 | |
| 636,000 | | | | | | Swire Properties Ltd. | | | 1,849,127 | | | | 0.9 | |
| 263,000 | | | | | | Other Securities | | | 1,086,234 | | | | 0.6 | |
| | | | | | | | | | 12,692,895 | | | | 6.5 | |
| | | | | | | | | | | | | | | |
| | |
| 385,733 | | | | | | Other Securities | | | 532,487 | | | | 0.3 | |
| | | | | | | | | | | | | | | |
| | |
| 230 | | | | | | Kenedix Office Investment Corp. | | | 1,561,561 | | | | 0.8 | |
| 381 | | | | | | Kenedix Retail REIT Corp. | | | 929,749 | | | | 0.5 | |
| 1,675 | | | | | | LaSalle Logiport REIT | | | 2,702,922 | | | | 1.4 | |
| 1,660 | | | | | | MCUBS MidCity Investment Corp. | | | 1,513,521 | | | | 0.8 | |
| 184,035 | | | | | | Mitsui Fudosan Co., Ltd. | | | 3,853,614 | | | | 2.0 | |
| 85,100 | | | | | | Nomura Real Estate Holdings, Inc. | | | 1,886,975 | | | | 1.0 | |
| 1,894 | | | | | | Orix JREIT, Inc. | | | 3,133,299 | | | | 1.6 | |
| Shares | | | | | | | | Value | | Percentage
of Net Assets |
|---|
| | | | | | | | | | | | | | | |
COMMON STOCK: (continued) |
| | |
| 159,811 | | | | | | Tokyo Tatemono Co., Ltd. | | $ | 2,194,116 | | | | 1.1 | |
| 2,064 | | | | | | Other Securities | | | 3,247,622 | | | | 1.7 | |
| | | | | | | | | | 21,023,379 | | | | 10.9 | |
| | | | | | | | | | | | | | | |
| | |
| 45,743 | | | | | | Other Securities | | | 1,181,877 | | | | 0.6 | |
| | | | | | | | | | | | | | | |
| | |
| 842,200 | | | | | | CapitaLand Integrated Commercial Trust | | | 1,377,358 | | | | 0.7 | |
| 1,235,219 | | | | | | CapitaLand Ltd. | | | 3,064,912 | | | | 1.6 | |
| 1,494,200 | | | | | | Other Securities | | | 2,351,869 | | | | 1.2 | |
| | | | | | | | | | 6,794,139 | | | | 3.5 | |
| | | | | | | | | | | | | | | |
| | |
| 110,469 | | | | | | Castellum AB | | | 2,815,939 | | | | 1.4 | |
| 15,915 | | | | | | Other Securities | | | 747,978 | | | | 0.4 | |
| | | | | | | | | | 3,563,917 | | | | 1.8 | |
| | | | | | | | | | | | | | | |
| | |
| 41,021 | | | | | | Derwent London PLC | | | 1,743,360 | | | | 0.9 | |
| 654,149 | | | | | | Other Securities | | | 5,533,603 | | | | 2.9 | |
| | | | | | | | | | 7,276,963 | | | | 3.8 | |
| | | | | | | | | | | | | | | |
| | |
| 26,074 | | | | | | Alexandria Real Estate Equities, Inc. | | | 4,646,908 | | | | 2.4 | |
| 58,585 | | | | | | American Campus Communities, Inc. | | | 2,505,680 | | | | 1.3 | |
| 10,825 | | | | | | American Tower Corp. | | | 2,429,780 | | | | 1.3 | |
| 93,760 | | | | (3) | | Apartment Income REIT Corp. | | | 3,601,322 | | | | 1.9 | |
| 110,429 | | | | | | Brixmor Property Group, Inc. | | | 1,827,600 | | | | 0.9 | |
| 30,932 | | | | | | Camden Property Trust | | | 3,090,725 | | | | 1.6 | |
| 68,131 | | | | | | Cousins Properties, Inc. | | | 2,282,389 | | | | 1.2 | |
| 111,726 | | | | | | CubeSmart | | | 3,755,111 | | | | 1.9 | |
| 134,487 | | | | | | Duke Realty Corp. | | | 5,375,445 | | | | 2.8 | |
| 32,533 | | | | | | Extra Space Storage, Inc. | | | 3,769,273 | | | | 1.9 | |
| 110,987 | | | | | | Healthcare Trust of America, Inc. | | | 3,056,582 | | | | 1.6 | |
| 74,552 | | | | | | Hudson Pacific Properties, Inc. | | | 1,790,739 | | | | 0.9 | |
| 174,934 | | | | | | Invitation Homes, Inc. | | | 5,195,540 | | | | 2.7 | |
| 33,239 | | | | | | Life Storage, Inc. | | | 3,968,404 | | | | 2.1 | |
| 63,218 | | | | | | MGM Growth Properties LLC | | | 1,978,723 | | | | 1.0 | |
| 24,916 | | | | | | Mid-America Apartment Communities, Inc. | | | 3,156,608 | | | | 1.6 | |
| 105,061 | | | | | | ProLogis, Inc. | | | 10,470,379 | | | | 5.4 | |
| 103,131 | | | | | | Simon Property Group, Inc. | | | 8,795,012 | | | | 4.5 | |
| 50,765 | | | | | | Spirit Realty Capital, Inc. | | | 2,039,230 | | | | 1.1 | |
| 115,622 | | | | | | STORE Capital Corp. | | | 3,928,836 | | | | 2.0 | |
| 46,475 | | | | | | Ventas, Inc. | | | 2,279,134 | | | | 1.2 | |
| 125,890 | | | | | | VEREIT, Inc. | | | 4,757,383 | | | | 2.5 | |
| 138,289 | | | | | | VICI Properties, Inc. | | | 3,526,370 | | | | 1.8 | |
See Accompanying Notes to Financial Statements
58
VY® CLARION GLOBAL
REAL ESTATE PORTFOLIO | SUMMARY PORTFOLIO OF INVESTMENTS
AS OF DECEMBER 31, 2020 (CONTINUED) |
| Shares | | | | | | | | Value | | Percentage
of Net Assets |
| | | | | | | | | | | | | | | |
COMMON STOCK: (continued) |
| | United States: (continued) |
| 60,600 | | | | | | Welltower, Inc. | | $ | 3,915,972 | | | | 2.0 | |
| 535,355 | | | | | | Other Securities | | | 9,396,652 | | | | 4.9 | |
| | | | | | | | | | 101,539,797 | | | | 52.5 | |
| | | | | | | Total Common Stock (Cost $150,659,248) | | | 188,532,246 | | | | 97.4 | |
Principal
Amount† | | | | | | | | Value | | Percentage
of Net
Assets |
|---|
| | | | | | | | | | | | | | | |
SHORT-TERM INVESTMENTS: 0.9% |
| | Repurchase Agreements: 0.6% |
| 47,089 | | | | (6) | | Bank of America Inc., Repurchase Agreement dated 12/31/20, 0.08%, due 01/04/21 (Repurchase Amount $47,089, collateralized by various U.S. Government Agency Obligations, 1.500%–3.500%, Market Value plus accrued interest $48,031, due 02/01/48–01/01/51) | | | 47,089 | | | | 0.1 | |
| 1,000,000 | | | | (6) | | RBC Dominion Securities Inc., Repurchase Agreement dated 12/31/20, 0.08%, due 01/04/21 (Repurchase Amount $1,000,009, collateralized by various U.S. Government/U.S. Government Agency Obligations, 0.000%–6.000%, Market Value plus accrued interest $1,020,000, due 01/05/21–12/20/50) | | | 1,000,000 | | | | 0.5 | |
| | | | | | | Total Repurchase Agreements
(Cost $1,047,089) | | | 1,047,089 | | | | 0.6 | |
| Shares | | | | | | | | Value | | Percentage
of Net
Assets |
|---|
| | |
| 652,381 | | | | (7) | | BlackRock Liquidity Funds, FedFund, Institutional Class, 0.000% (Cost $652,381) | | | 652,381 | | | | 0.3 | |
| | | | | | | Total Short-Term Investments
(Cost $1,699,470) | | | 1,699,470 | | | | 0.9 | |
| | | | | | | Total Investments in Securities
(Cost $152,358,718) | | $ | 190,231,716 | | | | 98.3 | |
| | | | | | | Assets in Excess of Other Liabilities | | | 3,299,312 | | | | 1.7 | |
| | | | | | | Net Assets | | $ | 193,531,028 | | | | 100.0 | |
“Other Securities” represents issues not identified as the top 50 holdings in terms of market value and issues or issuers not exceeding 1% of net assets individually or in aggregate respectively as of December 31, 2020.
The following footnotes apply to either the individual securities noted or one or more of the securities aggregated and listed as a single line item.
| † | | Unless otherwise indicated, principal amount is shown in USD. |
| (1) | | Security, or a portion of the security, is on loan. |
| (2) | | The grouping contains securities on loan. |
| (3) | | Non-income producing security. |
| (4) | | Securities with purchases pursuant to Rule 144A or section 4(a)(2), under the Securities Act of 1933 and may not be resold subject to that rule except to qualified institutional buyers. |
| (5) | | The grouping contains non-income producing securities. |
| (6) | | All or a portion of the security represents securities purchased with cash collateral received for securities on loan. |
| (7) | | Rate shown is the 7-day yield as of December 31, 2020. |
| REIT Diversification | | | Percentage
of Net Assets |
|---|
| Retail REITs | | | 14.1 | % |
| Real Estate Operating Companies | | | 13.9 | |
| Office REITs | | | 13.1 | |
| Residential REITs | | | 11.6 | |
| Industrial REITs | | | 11.4 | |
| Specialized REITs | | | 10.8 | |
| Diversified Real Estate Activities | | | 7.6 | |
| Diversified REITs | | | 7.4 | |
| Health Care REITs | | | 4.8 | |
| Real Estate Development | | | 1.7 | |
| Hotel & Resort REITs | | | 1.0 | |
| Assets in Excess of Other Liabilities* | | | 2.6 | |
Net Assets | | | 100.0 | % |
| | | | | | |
| * | | Includes short-term investments. |
See Accompanying Notes to Financial Statements
59
VY® CLARION GLOBAL
REAL ESTATE PORTFOLIO | SUMMARY PORTFOLIO OF INVESTMENTS
AS OF DECEMBER 31, 2020 (CONTINUED) |
Fair Value Measurementsˆ
The following is a summary of the fair valuations according to the inputs used as of December 31, 2020 in valuing the assets and liabilities:
| | Quoted Prices
in Active Markets
for Identical
Investments
(Level 1) | | Significant
Other
Observable
Inputs#
(Level 2) | | Significant
Unobservable
Inputs
(Level 3) | | Fair Value
at
December 31, 2020 |
|---|
Asset Table | | | | | | | | | | | | | | | | | | | | |
Investments, at fair value | | | | | | | | | | | | | | | | | | | | |
| Common Stock | | | | | | | | | | | | | | | | | | | | |
| Australia | | | $ | — | | | | $ | 7,203,673 | | | | $ | — | | | | $ | 7,203,673 | |
| Belgium | | | | — | | | | | 2,525,988 | | | | | — | | | | | 2,525,988 | |
| Canada | | | | 5,350,372 | | | | | — | | | | | — | | | | | 5,350,372 | |
| Finland | | | | — | | | | | 1,760,731 | | | | | — | | | | | 1,760,731 | |
| France | | | | — | | | | | 1,906,808 | | | | | — | | | | | 1,906,808 | |
| Germany | | | | 1,429,009 | | | | | 13,750,211 | | | | | — | | | | | 15,179,220 | |
| Hong Kong | | | | — | | | | | 12,692,895 | | | | | — | | | | | 12,692,895 | |
| Ireland | | | | 532,487 | | | | | — | | | | | — | | | | | 532,487 | |
| Japan | | | | — | | | | | 21,023,379 | | | | | — | | | | | 21,023,379 | |
| Luxembourg | | | | — | | | | | 1,181,877 | | | | | — | | | | | 1,181,877 | |
| Singapore | | | | — | | | | | 6,794,139 | | | | | — | | | | | 6,794,139 | |
| Sweden | | | | — | | | | | 3,563,917 | | | | | — | | | | | 3,563,917 | |
| United Kingdom | | | | — | | | | | 7,276,963 | | | | | — | | | | | 7,276,963 | |
| United States | | | | 101,539,797 | | | | | — | | | | | — | | | | | 101,539,797 | |
| Total Common Stock | | | | 108,851,665 | | | | | 79,680,581 | | | | | — | | | | | 188,532,246 | |
| Short-Term Investments | | | | 652,381 | | | | | 1,047,089 | | | | | — | | | | | 1,699,470 | |
| Total Investments, at fair value | | | $ | 109,504,046 | | | | $ | 80,727,670 | | | | $ | — | | | | $ | 190,231,716 | |
Other Financial Instruments+ | | | | | | | | | | | | | | | | | | | | |
| Forward Foreign Currency Contracts | | | | — | | | | | 213 | | | | | — | | | | | 213 | |
| Total Assets | | | $ | 109,504,046 | | | | $ | 80,727,883 | | | | $ | — | | | | $ | 190,231,929 | |
Liabilities Table | | | | | | | | | | | | | | | | | | | | |
Other Financial Instruments+ | | | | | | | | | | | | | | | | | | | | |
| Forward Foreign Currency Contracts | | | $ | — | | | | $ | (6 | ) | | | $ | — | | | | $ | (6 | ) |
| Total Liabilities | | | $ | — | | | | $ | (6 | ) | | | $ | — | | | | $ | (6 | ) |
| ˆ | | See Note 2, “Significant Accounting Policies” in the Notes to Financial Statements for additional information. |
| + | | Other Financial Instruments may include open forward foreign currency contracts, futures, centrally cleared swaps, OTC swaps and written options. Forward foreign currency contracts, futures and centrally cleared swaps are fair valued at the unrealized appreciation (depreciation) on the instrument. OTC swaps and written options are valued at the fair value of the instrument. |
| # | | The earlier close of the foreign markets gives rise to the possibility that significant events, including broad market moves, may have occurred in the interim and may materially affect the value of those securities. To account for this, the Portfolio may frequently value many of its foreign equity securities using fair value prices based on third party vendor modeling tools to the extent available. Accordingly, a portion of the Portfolio’s investments are categorized as Level 2 investments. |
A summary of derivative instruments by primary risk exposure is outlined in the following tables.
The fair value of derivative instruments as of December 31, 2020 was as follows:
Derivatives not accounted for as
hedging instruments | | | Location on Statement
of Assets and Liabilities | | | Fair Value |
|---|
Asset Derivatives | | | | | | | |
| Foreign exchange contracts | | Unrealized appreciation on forward foreign currency contracts | | | $ | 213 | |
Total Asset Derivatives | | | | | $ | 213 | |
| | | | | | | | | | |
Liability Derivatives | | | | | | | |
| Foreign exchange contracts | | Unrealized depreciation on forward foreign currency contracts | | | $ | 6 | |
Total Liability Derivatives | | | | | $ | 6 | |
See Accompanying Notes to Financial Statements
60
VY® CLARION GLOBAL
REAL ESTATE PORTFOLIO | SUMMARY PORTFOLIO OF INVESTMENTS
AS OF DECEMBER 31, 2020 (CONTINUED) |
The effect of derivative instruments on the Portfolio’s Statement of Operations for the year ended December 31, 2020 was as follows:
| | | Amount of Realized Gain or (Loss) on
Derivatives Recognized in Income |
|---|
| Derivatives not accounted for as hedging instruments | | | Forward foreign
currency contracts |
|---|
| Foreign exchange contracts | | | | $ | 1,652 | |
Total | | | | $ | 1,652 | |
| | | Change in Unrealized Appreciation or (Depreciation)
on Derivatives Recognized in Income |
|---|
| Derivatives not accounted for as hedging instruments | | | Forward foreign
currency contracts |
|---|
| Foreign exchange contracts | | | | $ | 142 | |
Total | | | | $ | 142 | |
At December 31, 2020, the aggregate cost of securities and other investments and the composition of unrealized appreciation and depreciation of securities and other investments on a tax basis were:
| Cost for federal income tax purposes was $162,425,936. |
| Net unrealized appreciation consisted of: | | | | |
| Gross Unrealized Appreciation | | $ | 34,138,971 | |
| Gross Unrealized Depreciation | | | (6,641,315 | ) |
| Net Unrealized Appreciation | | $ | 27,497,656 | |
See Accompanying Notes to Financial Statements
61
VY® INVESCO GROWTH
AND INCOME PORTFOLIO | SUMMARY PORTFOLIO OF INVESTMENTS
AS OF DECEMBER 31, 2020 |
| Shares | | | | | | | | Value | | Percentage
of Net
Assets |
|---|
| | | | | | | | | | | | | | | |
COMMON STOCK: 98.1% |
| | Communication Services: 5.9% |
| 6,824 | | | | (1) | | Charter Communications, Inc. | | $ | 4,514,417 | | | | 1.2 | |
| 105,287 | | | | | | Comcast Corp. — Class A | | | 5,517,039 | | | | 1.4 | |
| 3,355,082 | | | | | | Vodafone Group PLC | | | 5,510,692 | | | | 1.4 | |
| 41,287 | | | | (1) | | Walt Disney Co. | | | 7,480,379 | | | | 1.9 | |
| | | | | | | | | | 23,022,527 | | | | 5.9 | |
| | | | | | | | | | | | | | | |
| | Consumer Discretionary: 7.5% |
| 2,673 | | | | (1) | | Booking Holdings, Inc. | | | 5,953,493 | | | | 1.5 | |
| 314,055 | | | | | | General Motors Co. | | | 13,077,250 | | | | 3.4 | |
| 1,068,779 | | | | (1) | | Kingfisher PLC | | | 3,949,298 | | | | 1.0 | |
| 90,325 | | | | | | TJX Cos., Inc. | | | 6,168,294 | | | | 1.6 | |
| | | | | | | | | | 29,148,335 | | | | 7.5 | |
| | | | | | | | | | | | | | | |
| | |
| 126,755 | | | | | | Philip Morris International, Inc. | | | 10,494,047 | | | | 2.7 | |
| 77,440 | | | | | | Sysco Corp. | | | 5,750,694 | | | | 1.5 | |
| 162,473 | | | | (1) | | US Foods Holding Corp. | | | 5,411,976 | | | | 1.4 | |
| 23,669 | | | | | | Other Securities | | | 1,383,926 | | | | 0.3 | |
| | | | | | | | | | 23,040,643 | | | | 5.9 | |
| | | | | | | | | | | | | | | |
| | |
| 155,556 | | | | | | Canadian Natural Resources Ltd. | | | 3,738,281 | | | | 1.0 | |
| 62,924 | | | | | | Chevron Corp. | | | 5,313,932 | | | | 1.4 | |
| 552,257 | | | | | | Other Securities | | | 11,373,773 | | | | 2.9 | |
| | | | | | | | | | 20,425,986 | | | | 5.3 | |
| | | | | | | | | | | | | | | |
| | |
| 34,379 | | | | | | American Express Co. | | | 4,156,765 | | | | 1.1 | |
| 225,801 | | | | | | American International Group, Inc. | | | 8,548,826 | | | | 2.2 | |
| 161,784 | | | | | | Bank of America Corp. | | | 4,903,673 | | | | 1.3 | |
| 89,638 | | | | | | Citigroup, Inc. | | | 5,527,079 | | | | 1.4 | |
| 231,031 | | | | | | Citizens Financial Group, Inc. | | | 8,261,668 | | | | 2.1 | |
| 36,897 | | | | | | Goldman Sachs Group, Inc. | | | 9,730,108 | | | | 2.5 | |
| 154,021 | | | | | | Morgan Stanley | | | 10,555,059 | | | | 2.7 | |
| 56,134 | | | | | | PNC Financial Services Group, Inc. | | | 8,363,966 | | | | 2.2 | |
| 153,732 | | | | | | Truist Financial Corp. | | | 7,368,375 | | | | 1.9 | |
| 329,123 | | | | | | Wells Fargo & Co. | | | 9,932,932 | | | | 2.6 | |
| 211,737 | | | | | | Other Securities | | | 10,220,559 | | | | 2.6 | |
| | | | | | | | | | 87,569,010 | | | | 22.6 | |
| | | | | | | | | | | | | | | |
| | |
| 27,027 | | | | | | Anthem, Inc. | | | 8,678,100 | | | | 2.2 | |
| 113,968 | | | | | | Bristol-Myers Squibb Co. | | | 7,069,435 | | | | 1.8 | |
| 21,245 | | | | | | Cigna Corp. | | | 4,422,784 | | | | 1.1 | |
| 56,781 | | | | | | CVS Health Corp. | | | 3,878,142 | | | | 1.0 | |
| 30,428 | | | | | | McKesson Corp. | | | 5,292,038 | | | | 1.4 | |
| 62,566 | | | | | | Medtronic PLC | | | 7,328,981 | | | | 1.9 | |
| 51,997 | | | | | | Sanofi | | | 5,039,676 | | | | 1.3 | |
| 25,580 | | | | | | Zimmer Biomet Holdings, Inc. | | | 3,941,622 | | | | 1.0 | |
| 314,185 | | | | (2) | | Other Securities | | | 15,412,496 | | | | 4.0 | |
| | | | | | | | | | 61,063,274 | | | | 15.7 | |
| | | | | | | | | | | | | | | |
| | |
| 93,938 | | | | | | CSX Corp. | | | 8,524,874 | | | | 2.2 | |
| 50,261 | | | | | | General Dynamics Corp. | | | 7,479,842 | | | | 1.9 | |
| Shares | | | | | | | | Value | | Percentage
of Net
Assets |
|---|
| | | | | | | | | | | | | | | |
COMMON STOCK: (continued) |
| | |
| 175,374 | | | | | | Johnson Controls International plc | | $ | 8,170,675 | | | | 2.1 | |
| 88,469 | | | | | | Raytheon Technologies Corp. | | | 6,326,418 | | | | 1.7 | |
| 98,577 | | | | | | Textron, Inc. | | | 4,764,226 | | | | 1.2 | |
| 30,212 | | | | | | Trane Technologies PLC | | | 4,385,574 | | | | 1.1 | |
| 78,615 | | | | | | Other Securities | | | 5,426,039 | | | | 1.4 | |
| | | | | | | | | | 45,077,648 | | | | 11.6 | |
| | | | | | | | | | | | | | | |
| | Information Technology: 13.3% |
| 28,816 | | | | | | Apple, Inc. | | | 3,823,595 | | | | 1.0 | |
| 148,837 | | | | | | Cognizant Technology Solutions Corp. | | | 12,197,192 | | | | 3.1 | |
| 109,190 | | | | | | Corning, Inc. | | | 3,930,840 | | | | 1.0 | |
| 36,095 | | | | (1) | | Fiserv, Inc. | | | 4,109,777 | | | | 1.1 | |
| 32,707 | | | | | | NXP Semiconductor NV — NXPI — US | | | 5,200,740 | | | | 1.3 | |
| 108,124 | | | | | | Oracle Corp. | | | 6,994,542 | | | | 1.8 | |
| 49,741 | | | | | | Qualcomm, Inc. | | | 7,577,544 | | | | 2.0 | |
| 34,318 | | | | | | TE Connectivity Ltd. | | | 4,154,880 | | | | 1.1 | |
| 47,423 | | | | (2) | | Other Securities | | | 3,565,261 | | | | 0.9 | |
| | | | | | | | | | 51,554,371 | | | | 13.3 | |
| | | | | | | | | | | | | | | |
| | |
| 232,133 | | | | | | Corteva, Inc. | | | 8,988,190 | | | | 2.3 | |
| 77,331 | | | | | | Dow, Inc. | | | 4,291,871 | | | | 1.1 | |
| 62,059 | | | | | | DuPont de Nemours, Inc. | | | 4,413,015 | | | | 1.1 | |
| 69,483 | | | | (3) | | Other Securities | | | 3,346,301 | | | | 0.9 | |
| | | | | | | | | | 21,039,377 | | | | 5.4 | |
| | | | | | | | | | | | | | | |
| | |
| 132,954 | | | | (1) | | CBRE Group, Inc. | | | 8,338,875 | | | | 2.2 | |
| | | | | | | | | | | | | | | |
| | |
| 90,768 | | | | | | Exelon Corp. | | | 3,832,225 | | | | 1.0 | |
| 143,969 | | | | | | Other Securities | | | 6,533,558 | | | | 1.7 | |
| | | | | | | | | | 10,365,783 | | | | 2.7 | |
| | | | | | | Total Common Stock
(Cost $304,979,769) | | | 380,645,829 | | | | 98.1 | |
Principal
Amount† | | | | | | | | Value | | Percentage
of Net
Assets | |
|---|
| | | | | | | | | | | | | | | |
SHORT-TERM INVESTMENTS: 2.2% |
| | Repurchase Agreements: 0.4% |
| 415,614 | | | | (4) | | Deutsche Bank Securities Inc., Repurchase Agreement dated 12/31/20, 0.06%, due 01/04/21 (Repurchase Amount $415,617, collateralized by various U.S. Government/U.S. Government Agency Obligations, 0.000%–6.500%, Market Value plus accrued interest $423,926, due 01/15/21–01/01/51) | | | 415,614 | | | | 0.1 | |
See Accompanying Notes to Financial Statements
62
VY® INVESCO GROWTH
AND INCOME PORTFOLIO | SUMMARY PORTFOLIO OF INVESTMENTS
AS OF DECEMBER 31, 2020 (CONTINUED) |
Principal
Amount† | | | | | | | | | Value | | | | Percentage
of Net
Assets | |
|---|
| | | | | | | | | | | | | | | |
SHORT-TERM INVESTMENTS: (continued) |
| | Repurchase Agreements: (continued) |
| 1,000,000 | | | | (4) | | RBC Dominion Securities Inc., Repurchase Agreement dated 12/31/20, 0.08%, due 01/04/21 (Repurchase Amount $1,000,009, collateralized by various U.S. Government/U.S. Government Agency Obligations, 0.000%–6.000%, Market Value plus accrued interest $1,020,000, due 01/05/21–12/20/50) | | $ | 1,000,000 | | | | 0.3 | |
| | | | | | | Total Repurchase Agreements
(Cost $1,415,614) | | | 1,415,614 | | | | 0.4 | |
| Shares | | | | | | | | | Value | | | | Percentage
of Net
Assets | |
|---|
| | |
| 7,051,630 | | | | (5) | | BlackRock Liquidity Funds, FedFund, Institutional Class, 0.000% (Cost $7,051,630) | | | 7,051,630 | | | | 1.8 | |
| | | | | | | Total Short-Term Investments (Cost $8,467,244) | | | 8,467,244 | | | | 2.2 | |
| | | | | | | Total Investments in Securities
(Cost $313,447,013) | | $ | 389,113,073 | | | | 100.3 | |
| | | | | | | Liabilities in Excess of Other Assets | | | (972,946 | ) | | | (0.3 | ) |
| | | | | | | Net Assets | | $ | 388,140,127 | | | | 100.0 | |
“Other Securities” represents issues not identified as the top 50 holdings in terms of market value and issues or issuers not exceeding 1% of net assets individually or in aggregate respectively as of December 31, 2020.
The following footnotes apply to either the individual securities noted or one or more of the securities aggregated and listed as a single line item.
| † | | Unless otherwise indicated, principal amount is shown in USD. |
| (1) | | Non-income producing security. |
| (2) | | The grouping contains non-income producing securities. |
| (3) | | The grouping contains securities on loan. |
| (4) | | All or a portion of the security represents securities purchased with cash collateral received for securities on loan. |
| (5) | | Rate shown is the 7-day yield as of December 31, 2020. |
Fair Value Measurementsˆ
The following is a summary of the fair valuations according to the inputs used as of December 31, 2020 in valuing the assets and liabilities:
| | Quoted Prices
in Active Markets
for Identical
Investments
(Level 1) | | Significant
Other
Observable
Inputs#
(Level 2) | | Significant
Unobservable
Inputs
(Level 3) | | Fair Value
at
December 31, 2020 |
|---|
Asset Table | | | | | | | | | | | | | | | | | | | | |
Investments, at fair value | | | | | | | | | | | | | | | | | | | | |
| Common Stock | | | | | | | | | | | | | | | | | | | | |
| Communication Services | | | $ | 17,511,835 | | | | $ | 5,510,692 | | | | $ | — | | | | $ | 23,022,527 | |
| Consumer Discretionary | | | | 25,199,037 | | | | | 3,949,298 | | | | | — | | | | | 29,148,335 | |
| Consumer Staples | | | | 23,040,643 | | | | | — | | | | | — | | | | | 23,040,643 | |
| Energy | | | | 20,425,986 | | | | | — | | | | | — | | | | | 20,425,986 | |
| Financials | | | | 87,569,010 | | | | | — | | | | | — | | | | | 87,569,010 | |
| Health Care | | | | 50,619,295 | | | | | 10,443,979 | | | | | — | | | | | 61,063,274 | |
| Industrials | | | | 42,178,071 | | | | | 2,899,577 | | | | | — | | | | | 45,077,648 | |
| Information Technology | | | | 51,554,371 | | | | | — | | | | | — | | | | | 51,554,371 | |
| Materials | | | | 21,039,377 | | | | | — | | | | | — | | | | | 21,039,377 | |
| Real Estate | | | | 8,338,875 | | | | | — | | | | | — | | | | | 8,338,875 | |
| Utilities | | | | 10,365,783 | | | | | — | | | | | — | | | | | 10,365,783 | |
| Total Common Stock | | | | 357,842,283 | | | | | 22,803,546 | | | | | — | | | | | 380,645,829 | |
| Short-Term Investments | | | | 7,051,630 | | | | | 1,415,614 | | | | | — | | | | | 8,467,244 | |
| Total Investments, at fair value | | | $ | 364,893,913 | | | | $ | 24,219,160 | | | | $ | — | | | | $ | 389,113,073 | |
See Accompanying Notes to Financial Statements
63
VY® INVESCO GROWTH
AND INCOME PORTFOLIO | SUMMARY PORTFOLIO OF INVESTMENTS
AS OF DECEMBER 31, 2020 (CONTINUED) |
| | Quoted Prices
in Active Markets
for Identical
Investments
(Level 1) | | Significant
Other
Observable
Inputs#
(Level 2) | | Significant
Unobservable
Inputs
(Level 3) | | Fair Value
at
December 31, 2020 |
|---|
Other Financial Instruments+ | | | | | | | | | | | | | | | | | | | | |
| Forward Foreign Currency Contracts | | | $ | — | | | | $ | 12,014 | | | | $ | — | | | | $ | 12,014 | |
| Total Assets | | | $ | 364,893,913 | | | | $ | 24,231,174 | | | | $ | — | | | | $ | 389,125,087 | |
Liabilities Table | | | | | | | | | | | | | | | | | | | | |
Other Financial Instruments+ | | | | | | | | | | | | | | | | | | | | |
| Forward Foreign Currency Contracts | | | $ | — | | | | $ | (222,338 | ) | | | $ | — | | | | $ | (222,338 | ) |
| Total Liabilities | | | $ | — | | | | $ | (222,338 | ) | | | $ | — | | | | $ | (222,338 | ) |
| ˆ | | See Note 2, “Significant Accounting Policies” in the Notes to Financial Statements for additional information. |
| + | | Other Financial Instruments may include open forward foreign currency contracts, futures, centrally cleared swaps, OTC swaps and written options. Forward foreign currency contracts, futures and centrally cleared swaps are fair valued at the unrealized appreciation (depreciation) on the instrument. OTC swaps and written options are valued at the fair value of the instrument. |
| # | | The earlier close of the foreign markets gives rise to the possibility that significant events, including broad market moves, may have occurred in the interim and may materially affect the value of those securities. To account for this, the Portfolio may frequently value many of its foreign equity securities using fair value prices based on third party vendor modeling tools to the extent available. Accordingly, a portion of the Portfolio’s investments are categorized as Level 2 investments. |
At December 31, 2020, the following forward foreign currency contracts were outstanding for VY® Invesco Growth and Income Portfolio:
| Currency Purchased | | Currency Sold | | Counterparty | | | Settlement
Date | | Unrealized
Appreciation
(Depreciation) |
|---|
| CAD 54,834 | | USD 42,965 | | State Street Bank and Trust Co. | | | 01/15/21 | | | $ | 116 | |
| USD 80,492 | | CHF 71,132 | | State Street Bank and Trust Co. | | | 01/15/21 | | | | 115 | |
| USD 91,507 | | CAD 117,315 | | State Street Bank and Trust Co. | | | 01/15/21 | | | | (661 | ) |
| CAD 46,908 | | USD 36,492 | | State Street Bank and Trust Co. | | | 01/15/21 | | | | 361 | |
| USD 83,670 | | EUR 68,637 | | State Street Bank and Trust Co. | | | 01/15/21 | | | | (203 | ) |
| USD 59,137 | | CHF 52,524 | | State Street Bank and Trust Co. | | | 01/15/21 | | | | (213 | ) |
| CAD 91,472 | | USD 70,912 | | State Street Bank and Trust Co. | | | 01/15/21 | | | | 952 | |
| CHF 57,805 | | USD 65,035 | | State Street Bank and Trust Co. | | | 01/15/21 | | | | 282 | |
| EUR 70,587 | | USD 85,921 | | State Street Bank and Trust Co. | | | 01/15/21 | | | | 334 | |
| USD 65,442 | | EUR 53,427 | | State Street Bank and Trust Co. | | | 01/15/21 | | | | 155 | |
| GBP 99,189 | | USD 133,538 | | State Street Bank and Trust Co. | | | 01/15/21 | | | | 2,115 | |
| CAD 92,079 | | USD 72,364 | | State Street Bank and Trust Co. | | | 01/15/21 | | | | (22 | ) |
| USD 67,530 | | EUR 54,987 | | State Street Bank and Trust Co. | | | 01/15/21 | | | | 337 | |
| EUR 63,176 | | USD 77,083 | | State Street Bank and Trust Co. | | | 01/15/21 | | | | 117 | |
| GBP 161,979 | | USD 218,421 | | State Street Bank and Trust Co. | | | 01/15/21 | | | | 3,105 | |
| USD 23,857 | | CHF 21,141 | | State Street Bank and Trust Co. | | | 01/15/21 | | | | (31 | ) |
| USD 77,240 | | GBP 57,690 | | State Street Bank and Trust Co. | | | 01/15/21 | | | | (1,657 | ) |
| USD 4,414,381 | | CHF 3,910,184 | | State Street Bank and Trust Co. | | | 01/15/21 | | | | (3,983 | ) |
| GBP 128,335 | | USD 171,488 | | State Street Bank and Trust Co. | | | 01/15/21 | | | | 4,025 | |
| USD 53,967 | | CAD 68,834 | | State Street Bank and Trust Co. | | | 01/15/21 | | | | (236 | ) |
| USD 3,692,334 | | EUR 3,035,974 | | The Bank of New York Mellon | | | 01/15/21 | | | | (17,556 | ) |
| USD 9,208,138 | | GBP 6,876,040 | | The Bank of New York Mellon | | | 01/15/21 | | | | (195,667 | ) |
| USD 2,921,786 | | CAD 3,721,654 | | The Bank of New York Mellon | | | 01/15/21 | | | | (2,109 | ) |
| | | | | | | | | | | $ | (210,324 | ) |
Currency Abbreviations
| CAD | | — Canadian Dollar |
| CHF | | — Swiss Franc |
| EUR | | — EU Euro |
| GBP | | — British Pound |
| USD | | — United States Dollar |
See Accompanying Notes to Financial Statements
64
VY® INVESCO GROWTH
AND INCOME PORTFOLIO | SUMMARY PORTFOLIO OF INVESTMENTS
AS OF DECEMBER 31, 2020 (CONTINUED) |
A summary of derivative instruments by primary risk exposure is outlined in the following tables.
The fair value of derivative instruments as of December 31, 2020 was as follows:
Derivatives not accounted for as
hedging instruments | | | Location on Statement
of Assets and Liabilities | | | Fair Value |
|---|
Asset Derivatives | | | | | | | |
| Foreign exchange contracts | | Unrealized appreciation on forward foreign currency contracts | | | $ | 12,014 | |
Total Asset Derivatives | | | | | $ | 12,014 | |
| | | | | | | | | | |
Liability Derivatives | | | | | | | |
| Foreign exchange contracts | | Unrealized depreciation on forward foreign currency contracts | | | $ | 222,338 | |
Total Liability Derivatives | | | | | $ | 222,338 | |
The effect of derivative instruments on the Portfolio’s Statement of Operations for the year ended December 31, 2020 was as follows:
| | Amount of Realized Gain or (Loss) on
Derivatives Recognized in Income |
|---|
| Derivatives not accounted for as hedging instruments | | Forward foreign
currency contracts |
|---|
| Foreign exchange contracts | | | $ | (1,757,104 | ) |
Total | | | $ | (1,757,104 | ) |
| | Change in Unrealized Appreciation or (Depreciation)
on Derivatives Recognized in Income |
|---|
| Derivatives not accounted for as hedging instruments | | Forward foreign
currency contracts |
|---|
| Foreign exchange contracts | | | $ | 492,370 | |
Total | | | $ | 492,370 | |
The following is a summary by counterparty of the fair value of OTC derivative instruments subject to Master Netting Agreements and collateral pledged (received), if any, at December 31, 2020:
| | State Street
Bank and Trust Co. | | The Bank
of New York Mellon | | Totals |
|---|
Assets: | | | | | | | | | | | | | | | |
| Forward foreign currency contracts | | | $ | 12,014 | | | | $ | — | | | | $ | 12,014 | |
Total Assets | | | $ | 12,014 | | | | $ | — | | | | $ | 12,014 | |
Liabilities: | | | | | | | | | | | | | | | |
| Forward foreign currency contracts | | | $ | 7,006 | | | | $ | 215,332 | | | | $ | 222,338 | |
Total Liabilities | | | $ | 7,006 | | | | $ | 215,332 | | | | $ | 222,338 | |
Net OTC derivative instruments by counterparty, at fair value | | | $ | 5,008 | | | | $ | (215,332 | ) | | | | (210,324 | ) |
Total collateral pledged by the Portfolio/(Received from counterparty) | | | $ | — | | | | $ | — | | | | $ | — | |
Net Exposure(1) | | | $ | 5,008 | | | | $ | (215,332 | ) | | | $ | (210,324 | ) |
(1) | | Positive net exposure represents amounts due from each respective counterparty. Negative exposure represents amounts due from the Portfolio. Please refer to Note 2 for additional details regarding counterparty credit risk and credit related contingent features. |
At December 31, 2020, the aggregate cost of securities and other investments and the composition of unrealized appreciation and depreciation of securities and other investments on a tax basis were:
| Cost for federal income tax purposes was $315,379,606. | |
| | |
| Net unrealized appreciation consisted of: | | | | |
| Gross Unrealized Appreciation | | $ | 88,116,641 | |
| Gross Unrealized Depreciation | | | (14,563,492 | ) |
| Net Unrealized Appreciation | | $ | 73,553,149 | |
See Accompanying Notes to Financial Statements
65
VY® JPMORGAN EMERGING
MARKETS EQUITY PORTFOLIO | SUMMARY PORTFOLIO OF INVESTMENTS
AS OF DECEMBER 31, 2020 |
| Shares | | | | | | | | Value | | Percentage
of Net
Assets |
|---|
| | | | | | | | | | | | | | | |
COMMON STOCK: 101.7% |
| | |
| 10,423 | | | | (1) | | MercadoLibre, Inc. | | $ | 17,460,818 | | | | 3.0 | |
| | | | | | | | | | | | | | | |
| | |
| 540,488 | | | | | | B3 SA — Brasil Bolsa Balcao | | | 6,449,395 | | | | 1.1 | |
| 390,185 | | | | | | Localiza Rent a Car SA | | | 5,179,480 | | | | 0.9 | |
| 1,451,140 | | | | | | Magazine Luiza SA | | | 6,970,456 | | | | 1.2 | |
| 133,830 | | | | (1) | | Pagseguro Digital Ltd. | | | 7,612,251 | | | | 1.3 | |
| 108,063 | | | | (1) | | XP, Inc. | | | 4,286,859 | | | | 0.8 | |
| 849,949 | | | | | | Other Securities | | | 5,281,206 | | | | 0.9 | |
| | | | | | | | | | 35,779,647 | | | | 6.2 | |
| | | | | | | | | | | | | | | |
| | |
| 70,045 | | | | (1) | | Alibaba Group Holding Ltd. ADR | | | 16,301,573 | | | | 2.8 | |
| 379,096 | | | | (1) | | Alibaba Group Holding Ltd. | | | 11,025,829 | | | | 1.9 | |
| 2,302,800 | | | | (2) | | Budweiser Brewing Co. APAC Ltd. | | | 7,606,918 | | | | 1.3 | |
| 1,450,600 | | | | | | China Gas Holdings Ltd. | | | 5,748,296 | | | | 1.0 | |
| 361,011 | | | | | | Foshan Haitian Flavouring & Food Co. Ltd. — A Shares | | | 11,084,944 | | | | 1.9 | |
| 298,780 | | | | | | Hundsun Technologies, Inc. — A Shares | | | 4,797,698 | | | | 0.8 | |
| 55,644 | | | | (1) | | JD.com, Inc. ADR | | | 4,891,108 | | | | 0.9 | |
| 132,714 | | | | (1) | | JD.com, Inc. — Class A | | | 5,845,046 | | | | 1.0 | |
| 545,887 | | | | | | Jiangsu Hengli Hydraulic Co. Ltd. | | | 9,444,743 | | | | 1.7 | |
| 22,400 | | | | | | Kweichow Moutai Co. Ltd. — A Shares (Shanghai) | | | 6,845,411 | | | | 1.2 | |
| 397,877 | | | | (1) | | Meituan Class B | | | 14,977,466 | | | | 2.6 | |
| 692,000 | | | | | | Midea Group Co. Ltd. — A Shares | | | 10,421,802 | | | | 1.8 | |
| 291,500 | | | | | | NetEase, Inc. | | | 5,568,200 | | | | 1.0 | |
| 54,161 | | | | | | NetEase, Inc. ADR | | | 5,186,999 | | | | 0.9 | |
| 47,088 | | | | (1) | | New Oriental Education & Technology Group, Inc. ADR | | | 8,749,421 | | | | 1.5 | |
| 3,340,675 | | | | | | Ping An Bank Co. Ltd. — A Shares | | | 9,885,477 | | | | 1.7 | |
| 626,000 | | | | | | Ping An Insurance Group Co. of China Ltd. — H Shares | | | 7,618,180 | | | | 1.3 | |
| 77,221 | | | | | | Shenzhen Mindray Bio-Medical Electronics Co. Ltd. — A Shares | | | 5,023,390 | | | | 0.9 | |
| 349,300 | | | | | | Shenzhou International Group Holdings Ltd. | | | 6,845,669 | | | | 1.2 | |
| 318,200 | | | | | | Sunny Optical Technology Group Co. Ltd. | | | 6,952,189 | | | | 1.2 | |
| 315,000 | | | | | | Tencent Holdings Ltd. | | | 22,665,447 | | | | 3.9 | |
| 1,277,000 | | | | (1),(2) | | Wuxi Biologics Cayman, Inc. | | | 16,934,736 | | | | 2.9 | |
| 120,806 | | | | | | Yum China Holdings, Inc. | | | 6,896,815 | | | | 1.2 | |
| 1,940,693 | | | | (3),(4) | | Other Securities | | | 11,198,273 | | | | 2.0 | |
| | | | | | | | | | 222,515,630 | | | | 38.6 | |
| | | | | | | | | | | | | | | |
| | |
| 419,408 | | | | | | Other Securities | | | 1,573,256 | | | | 0.3 | |
| Shares | | | | | | | | Value | | Percentage
of Net
Assets |
|---|
| | | | | | | | | | | | | | | |
COMMON STOCK: (continued) |
| | |
| 1,128,600 | | | | | | AIA Group Ltd. | | $ | 13,753,258 | | | | 2.4 | |
| 105,200 | | | | | | Hong Kong Exchanges and Clearing Ltd. | | | 5,770,402 | | | | 1.0 | |
| 920,500 | | | | | | Techtronic Industries Co., Ltd. | | | 13,157,098 | | | | 2.3 | |
| | | | | | | | | | 32,680,758 | | | | 5.7 | |
| | | | | | | | | | | | | | | |
| | |
| 71,515 | | | | (4) | | Other Securities | | | 3,222,793 | | | | 0.6 | |
| | | | | | | | | | | | | | | |
| | |
| 153,900 | | | | | | Asian Paints Ltd. | | | 5,829,473 | | | | 1.0 | |
| 324,399 | | | | (1) | | HDFC Bank Ltd. ADR | | | 23,441,072 | | | | 4.1 | |
| 800,953 | | | | (1),(2) | | HDFC Life Insurance Co., Ltd. | | | 7,435,239 | | | | 1.3 | |
| 162,230 | | | | | | Hindustan Unilever Ltd. | | | 5,325,856 | | | | 0.9 | |
| 607,624 | | | | | | Housing Development Finance Corp. | | | 21,288,685 | | | | 3.7 | |
| 410,367 | | | | (1) | | Kotak Mahindra Bank Ltd. | | | 11,215,602 | | | | 2.0 | |
| 304,254 | | | | | | Reliance Industries Ltd. | | | 8,278,427 | | | | 1.4 | |
| 294,018 | | | | | | Tata Consultancy Services Ltd. | | | 11,544,656 | | | | 2.0 | |
| 1,197,569 | | | | (4) | | Other Securities | | | 9,251,786 | | | | 1.6 | |
| | | | | | | | | | 103,610,796 | | | | 18.0 | |
| | | | | | | | | | | | | | | |
| | |
| 2,820,400 | | | | | | Bank Central Asia Tbk PT | | | 6,798,658 | | | | 1.2 | |
| 16,362,900 | | | | | | Bank Rakyat Indonesia | | | 4,864,747 | | | | 0.8 | |
| | | | | | | | | | 11,663,405 | | | | 2.0 | |
| | | | | | | | | | | | | | | |
| | |
| 1,247,600 | | | | | | Sands China Ltd. | | | 5,448,768 | | | | 0.9 | |
| | | | | | | | | | | | | | | |
| | |
| 2,527,495 | | | | | | Wal-Mart de Mexico SAB de CV | | | 7,100,026 | | | | 1.2 | |
| | | | | | | | | | | | | | | |
| | |
| 47,480 | | | | | | Other Securities | | | 3,666,880 | | | | 0.6 | |
| | | | | | | | | | | | | | | |
| | |
| 213,986 | | | | (1),(2) | | Allegro.eu SA | | | 4,851,732 | | | | 0.8 | |
| | | | | | | | | | | | | | | |
| | |
| 341,051 | | | | | | Jeronimo Martins SGPS SA | | | 5,732,938 | | | | 1.0 | |
| | | | | | | | | | | | | | | |
| | |
| 96,183 | | | | (1) | | Sea Ltd. ADR | | | 19,145,226 | | | | 3.3 | |
| | | | | | | | | | | | | | | |
| | |
| 345,043 | | | | | | Bid Corp. Ltd. | | | 6,200,589 | | | | 1.1 | |
| 39,656 | | | | (4) | | Other Securities | | | 3,878,168 | | | | 0.7 | |
| | | | | | | | | | 10,078,757 | | | | 1.8 | |
See Accompanying Notes to Financial Statements
66
VY® JPMORGAN EMERGING
MARKETS EQUITY PORTFOLIO | SUMMARY PORTFOLIO OF INVESTMENTS
AS OF DECEMBER 31, 2020 (CONTINUED) |
| Shares | | | | | | | | Value | | Percentage
of Net
Assets |
|---|
| | | | | | | | | | | | | | | |
COMMON STOCK: (continued) |
| | |
| 9,270 | | | | | | NCSoft Corp. | | $ | 7,958,770 | | | | 1.4 | |
| 427,622 | | | | | | Samsung Electronics Co., Ltd. | | | 31,932,896 | | | | 5.5 | |
| | | | | | | | | | 39,891,666 | | | | 6.9 | |
| | | | | | | | | | | | | | | |
| | |
| 255,822 | | | | | | Taiwan Semiconductor Manufacturing Co., Ltd. ADR | | | 27,894,831 | | | | 4.8 | |
| 847,223 | | | | | | Taiwan Semiconductor Manufacturing Co., Ltd. | | | 16,027,318 | | | | 2.8 | |
| | | | | | | | | | 43,922,149 | | | | 7.6 | |
| | | | | | | | | | | | | | | |
| | |
| 350,796 | | | | | | Other Securities | | | 3,548,127 | | | | 0.6 | |
| | | | | | | | | | | | | | | |
| | |
| 41,795 | | | | (1) | | EPAM Systems, Inc. | | | 14,977,238 | | | | 2.6 | |
| | | | | | | Total Common Stock (Cost $308,479,159) | | | 586,870,610 | | | | 101.7 | |
Principal
Amount† | | | | | | | | | Value | | | | Percentage
of Net
Assets | |
|---|
| | | | | | | | | | | | | | | |
SHORT-TERM INVESTMENTS: 0.5% |
| | Repurchase Agreements: 0.5% |
| 1,000,000 | | | | (5) | | Citigroup, Inc., Repurchase Agreement dated 12/31/20, 0.07%, due 01/04/21 (Repurchase Amount $1,000,008, collateralized by various U.S. Government/U.S. Government Agency Obligations, 0.000%–4.000%, Market Value plus accrued interest $1,020,000, due
09/15/21–01/01/51) | | | 1,000,000 | | | | 0.2 | |
| 601,075 | | | | (5) | | Daiwa Capital Markets, Repurchase Agreement dated 12/31/20, 0.07%, due 01/04/21 (Repurchase Amount $601,080, collateralized by various U.S. Government/U.S. Government Agency Obligations, 0.000%–6.500%, Market Value plus accrued interest $613,097, due 01/26/21–01/01/51) | | | 601,075 | | | | 0.1 | |
Principal
Amount† | | | | | | | | | Value | | | | Percentage
of Net
Assets | |
|---|
| | | | | | | | | | | | | | | |
SHORT-TERM INVESTMENTS: (continued) |
| | Repurchase Agreements: (continued) |
| 1,000,000 | | | | (5) | | RBC Dominion Securities Inc., Repurchase Agreement dated 12/31/20, 0.08%, due 01/04/21 (Repurchase Amount $1,000,009, collateralized by various U.S. Government/U.S. Government Agency Obligations, 0.000%-6.000%, Market Value plus accrued interest $1,020,000, due 01/05/21-12/20/50) | | $ | 1,000,000 | | | | 0.2 | |
| | | | | | | Total Repurchase Agreements
(Cost $2,601,075) | | | 2,601,075 | | | | 0.5 | |
| Shares | | | | | | | | | Value | | | | Percentage
of Net
Assets | |
|---|
| | |
| 189,104 | | | | (6) | | BlackRock Liquidity Funds, FedFund, Institutional Class, 0.000%
(Cost $189,104) | | | 189,104 | | | | 0.0 | |
| | | | | | | Total Short-Term Investments
(Cost $2,790,179) | | | 2,790,179 | | | | 0.5 | |
| | | | | | | Total Investments in Securities
(Cost $311,269,338) | | $ | 589,660,789 | | | | 102.2 | |
| | | | | | | Liabilities in Excess of Other Assets | | | (12,532,382 | ) | | | (2.2 | ) |
| | | | | | | Net Assets | | $ | 577,128,407 | | | | 100.0 | |
“Other Securities” represents issues not identified as the top 50 holdings in terms of market value and issues or issuers not exceeding 1% of net assets individually or in aggregate respectively as of December 31, 2020.
The following footnotes apply to either the individual securities noted or one or more of the securities aggregated and listed as a single line item.
| † | | Unless otherwise indicated, principal amount is shown in USD. |
| ADR | | American Depositary Receipt |
| (1) | | Non-income producing security. |
| (2) | | Securities with purchases pursuant to Rule 144A or section 4(a)(2), under the Securities Act of 1933 and may not be resold subject to that rule except to qualified institutional buyers. |
| (3) | | The grouping contains securities on loan. |
| (4) | | The grouping contains non-income producing securities. |
| (5) | | All or a portion of the security represents securities purchased with cash collateral received for securities on loan. |
| (6) | | Rate shown is the 7-day yield as of December 31, 2020. |
See Accompanying Notes to Financial Statements
67
VY® JPMORGAN EMERGING
MARKETS EQUITY PORTFOLIO | SUMMARY PORTFOLIO OF INVESTMENTS
AS OF DECEMBER 31, 2020 (CONTINUED) |
| Sector Diversification | | | Percentage
of Net Assets |
|---|
| Financials | | | 23.2 | % |
| Consumer Discretionary | | | 22.1 | |
| Information Technology | | | 21.8 | |
| Consumer Staples | | | 11.4 | |
| Communication Services | | | 10.5 | |
| Industrials | | | 5.5 | |
| Health Care | | | 3.8 | |
| Energy | | | 1.4 | |
| | | | | |
| | | | | | |
| | | | | | |
| Sector Diversification | | | Percentage
of Net Assets |
|---|
| Utilities | | | 1.0 | % |
| Materials | | | 1.0 | |
| Short-Term Investments | | | 0.5 | |
| Liabilities in Excess of Other Assets | | | (2.2 | ) |
Net Assets | | | 100.0 | % |
| | | | | | |
Fair Value Measurementsˆ
The following is a summary of the fair valuations according to the inputs used as of December 31, 2020 in valuing the assets and liabilities:
| | Quoted Prices
in Active Markets
for Identical
Investments
(Level 1) | | Significant
Other
Observable
Inputs#
(Level 2) | | Significant
Unobservable
Inputs
(Level 3) | | Fair Value
at
December 31, 2020 |
|---|
Asset Table | | | | | | | | | | | | | | | | | | | | |
Investments, at fair value | | | | | | | | | | | | | | | | | | | | |
| Common Stock | | | | | | | | | | | | | | | | | | | | |
| Argentina | | | $ | 17,460,818 | | | | $ | — | | | | $ | — | | | | $ | 17,460,818 | |
| Brazil | | | | 35,779,647 | | | | | — | | | | | — | | | | | 35,779,647 | |
| China | | | | 45,909,261 | | | | | 176,606,369 | | | | | — | | | | | 222,515,630 | |
| Egypt | | | | — | | | | | 1,573,256 | | | | | — | | | | | 1,573,256 | |
| Hong Kong | | | | — | | | | | 32,680,758 | | | | | — | | | | | 32,680,758 | |
| Hungary | | | | — | | | | | 3,222,793 | | | | | — | | | | | 3,222,793 | |
| India | | | | 23,441,072 | | | | | 80,169,724 | | | | | — | | | | | 103,610,796 | |
| Indonesia | | | | — | | | | | 11,663,405 | | | | | — | | | | | 11,663,405 | |
| Macau | | | | — | | | | | 5,448,768 | | | | | — | | | | | 5,448,768 | |
| Mexico | | | | 7,100,026 | | | | | — | | | | | — | | | | | 7,100,026 | |
| Panama | | | | 3,666,880 | | | | | — | | | | | — | | | | | 3,666,880 | |
| Poland | | | | 4,851,732 | | | | | — | | | | | — | | | | | 4,851,732 | |
| Portugal | | | | — | | | | | 5,732,938 | | | | | — | | | | | 5,732,938 | |
| Singapore | | | | 19,145,226 | | | | | — | | | | | — | | | | | 19,145,226 | |
| South Africa | | | | — | | | | | 10,078,757 | | | | | — | | | | | 10,078,757 | |
| South Korea | | | | — | | | | | 39,891,666 | | | | | — | | | | | 39,891,666 | |
| Taiwan | | | | 27,894,831 | | | | | 16,027,318 | | | | | — | | | | | 43,922,149 | |
| Turkey | | | | — | | | | | 3,548,127 | | | | | — | | | | | 3,548,127 | |
| United States | | | | 14,977,238 | | | | | — | | | | | — | | | | | 14,977,238 | |
| Total Common Stock | | | | 200,226,731 | | | | | 386,643,879 | | | | | — | | | | | 586,870,610 | |
| Short-Term Investments | | | | 189,104 | | | | | 2,601,075 | | | | | — | | | | | 2,790,179 | |
| Total Investments, at fair value | | | $ | 200,415,835 | | | | $ | 389,244,954 | | | | $ | — | | | | $ | 589,660,789 | |
Other Financial Instruments+ | | | | | | | | | | | | | | | | | | | | |
| Forward Foreign Currency Contracts | | | | — | | | | | 4 | | | | | — | | | | | 4 | |
| Total Assets | | | $ | 200,415,835 | | | | $ | 389,244,958 | | | | $ | — | | | | $ | 589,660,793 | |
| ˆ | | See Note 2, “Significant Accounting Policies” in the Notes to Financial Statements for additional information. |
| + | | Other Financial Instruments may include open forward foreign currency contracts, futures, centrally cleared swaps, OTC swaps and written options. Forward foreign currency contracts, futures and centrally cleared swaps are fair valued at the unrealized appreciation (depreciation) on the instrument. OTC swaps and written options are valued at the fair value of the instrument. |
| # | | The earlier close of the foreign markets gives rise to the possibility that significant events, including broad market moves, may have occurred in the interim and may materially affect the value of those securities. To account for this, the Portfolio may frequently value many of its foreign equity securities using fair value prices based on third party vendor modeling tools to the extent available. Accordingly, a portion of the Portfolio’s investments are categorized as Level 2 investments. |
See Accompanying Notes to Financial Statements
68
VY® JPMORGAN EMERGING
MARKETS EQUITY PORTFOLIO | SUMMARY PORTFOLIO OF INVESTMENTS
AS OF DECEMBER 31, 2020 (CONTINUED) |
At December 31, 2020, the following forward foreign currency contracts were outstanding for VY® JPMorgan Emerging Markets Equity Portfolio:
| Currency Purchased | | Currency Sold | | Counterparty | | Settlement
Date | | Unrealized
Appreciation
(Depreciation) |
|---|
| HKD 1,399,755 | | USD 180,552 | | State Street Bank and Trust Co. | | 01/04/21 | | | $ | 4 | |
| | | | | | | | | | $ | 4 | |
Currency Abbreviations
| HKD | | — Hong Kong Sar Dollar |
| USD | | — United States Dollar |
A summary of derivative instruments by primary risk exposure is outlined in the following tables.
The fair value of derivative instruments as of December 31, 2020 was as follows:
Derivatives not accounted for as
hedging instruments | | | Location on Statement
of Assets and Liabilities | | | Fair Value |
|---|
Asset Derivatives | | | | | | | | | |
| Foreign exchange contracts | | Unrealized appreciation on forward foreign currency contracts | | | $ | 4 | |
Total Asset Derivatives | | | | | $ | 4 | |
The effect of derivative instruments on the Portfolio’s Statement of Operations for the year ended December 31, 2020 was as follows:
| | Amount of Realized Gain or (Loss) on
Derivatives Recognized in Income |
|---|
| Derivatives not accounted for as hedging instruments | | Forward foreign
currency contracts |
|---|
| Foreign exchange contracts | | | $ | 2,551 | |
Total | | | $ | 2,551 | |
| | Change in Unrealized Appreciation or (Depreciation)
on Derivatives Recognized in Income |
|---|
| Derivatives not accounted for as hedging instruments | | Forward foreign
currency contracts |
|---|
| Foreign exchange contracts | | | $ | 4 | |
Total | | | $ | 4 | |
The following is a summary by counterparty of the fair value of OTC derivative instruments subject to Master Netting Agreements and collateral pledged (received), if any, at December 31, 2020:
| | State Street
Bank and Trust Co. |
|---|
Assets: | | | | | |
| Forward foreign currency contracts | | | $ | 4 | |
Total Assets | | | $ | 4 | |
Net OTC derivative instruments by counterparty, at fair value | | | $ | 4 | |
Total collateral pledged by the Portfolio/(Received from counterparty) | | | $ | — | |
Net Exposure(1) | | | $ | 4 | |
(1) | | Positive net exposure represents amounts due from each respective counterparty. Negative exposure represents amounts due from the Portfolio. Please refer to Note 2 for additional details regarding counterparty credit risk and credit related contingent features. |
At December 31, 2020, the aggregate cost of securities and other investments and the composition of unrealized appreciation and depreciation of securities and other investments on a tax basis were:
| Cost for federal income tax purposes was $311,483,765. | |
| Net unrealized appreciation consisted of: | | | | |
| Gross Unrealized Appreciation | | $ | 284,047,016 | |
| Gross Unrealized Depreciation | | | (5,835,383 | ) |
| Net Unrealized Appreciation | | $ | 278,211,633 | |
See Accompanying Notes to Financial Statements
69
VY® MORGAN STANLEY GLOBAL
FRANCHISE PORTFOLIO | PORTFOLIO OF INVESTMENTS
AS OF DECEMBER 31, 2020 |
| Shares | | | | | | | | Value | | Percentage
of Net
Assets |
|---|
| | | | | | | | | | | | | | | |
COMMON STOCK: 97.6% |
| | |
| 27,689 | | | | | | L’Oreal S.A. | | $ | 10,564,734 | | | | 2.5 | |
| 11,393 | | | | | | LVMH Moet Hennessy Louis Vuitton SE | | | 7,131,991 | | | | 1.7 | |
| 34,311 | | | | | | Pernod Ricard SA | | | 6,589,269 | | | | 1.6 | |
| | | | | | | | | | 24,285,994 | | | | 5.8 | |
| | | | | | | | | | | | | | | |
| | |
| 142,602 | | | | | | SAP SE | | | 18,469,527 | | | | 4.4 | |
| | | | | | | | | | | | | | | |
| | |
| 198,324 | | | | | | Davide Campari-Milano NV | | | 2,273,242 | | | | 0.5 | |
| | | | | | | | | | | | | | | |
| | |
| 89,230 | | | | | | Heineken NV | | | 9,943,634 | | | | 2.3 | |
| | | | | | | | | | | | | | | |
| | |
| 269,070 | | | | | | British American Tobacco PLC | | | 9,992,436 | | | | 2.4 | |
| 101,575 | | | | | | Experian PLC | | | 3,858,704 | | | | 0.9 | |
| 375,036 | | | | | | Reckitt Benckiser Group PLC | | | 33,473,607 | | | | 7.9 | |
| 142,216 | | | | | | Relx PLC (EUR Exchange) | | | 3,475,254 | | | | 0.8 | |
| 367,738 | | | | | | Relx PLC (GBP Exchange) | | | 8,997,615 | | | | 2.1 | |
| 123,056 | | | | | | Unilever PLC | | | 7,380,135 | | | | 1.8 | |
| | | | | | | | | | 67,177,751 | | | | 15.9 | |
| | | | | | | | | | | | | | | |
| | |
| 149,744 | | | | | | Abbott Laboratories | | | 16,395,470 | | | | 3.9 | |
| 77,790 | | | | | | Accenture PLC | | | 20,319,526 | | | | 4.8 | |
| 94,039 | | | | | | Automatic Data Processing, Inc. | | | 16,569,672 | | | | 3.9 | |
| 212,454 | | | | | | Baxter International, Inc. | | | 17,047,309 | | | | 4.0 | |
| 62,228 | | | | | | Becton Dickinson & Co. | | | 15,570,690 | | | | 3.7 | |
| 149,915 | | | | | | Coca-Cola Co. | | | 8,221,339 | | | | 2.0 | |
| 76,063 | | | | | | Danaher Corp. | | | 16,896,635 | | | | 4.0 | |
| 8,249 | | | | | | Factset Research Systems, Inc. | | | 2,742,792 | | | | 0.6 | |
| 71,669 | | | | | | Fidelity National Information Services, Inc. | | | 10,138,297 | | | | 2.4 | |
| 86,592 | | | | | | Fox Corp. — Class A | | | 2,521,559 | | | | 0.6 | |
| 66,661 | | | | | | Fox Corp. — Class B | | | 1,925,170 | | | | 0.5 | |
| 102,743 | | | | | | Intercontinental Exchange, Inc. | | | 11,845,240 | | | | 2.8 | |
| 162,611 | | | | | | Microsoft Corp. | | | 36,167,939 | | | | 8.6 | |
| 15,549 | | | | | | Moody’s Corp. | | | 4,512,942 | | | | 1.1 | |
| 50,340 | | | | | | Nike, Inc. — Class B | | | 7,121,600 | | | | 1.7 | |
| 398,984 | | | | | | Philip Morris International, Inc. | | | 33,031,885 | | | | 7.8 | |
| 142,184 | | | | | | Procter & Gamble Co. | | | 19,783,482 | | | | 4.7 | |
| 8,984 | | | | | | Roper Technologies, Inc. | | | 3,872,912 | | | | 0.9 | |
| 32,652 | | | | | | Thermo Fisher Scientific, Inc. | | | 15,208,649 | | | | 3.6 | |
| 107,133 | | | | | | Visa, Inc. — Class A | | | 23,433,201 | | | | 5.6 | |
| 37,148 | | | | | | Zoetis, Inc. | | | 6,147,994 | | | | 1.5 | |
| | | | | | | | | | 289,474,303 | | | | 68.7 | |
| | | | | | | Total Common Stock
(Cost $288,591,705) | | | 411,624,451 | | | | 97.6 | |
| Shares | | | | | | | | Value | | Percentage
of Net
Assets |
|---|
| | | | | | | | | | | | | | | |
SHORT-TERM INVESTMENTS: 1.7% |
| | |
| 7,019,081 | | | | (1) | | BlackRock Liquidity Funds, FedFund, Institutional Class, 0.000%
(Cost $7,019,081) | | $ | 7,019,081 | | | | 1.7 | |
| | | | | | | Total Short-Term Investments
(Cost $7,019,081) | | | 7,019,081 | | | | 1.7 | |
| | | | | | | Total Investments in Securities
(Cost $295,610,786) | | $ | 418,643,532 | | | | 99.3 | |
| | | | | | | Assets in Excess of Other Liabilities | | | 2,750,309 | | | | 0.7 | |
| | | | | | | Net Assets | | $ | 421,393,841 | | | | 100.0 | |
| (1) | | Rate shown is the 7-day yield as of December 31, 2020. |
| Sector Diversification | | | Percentage
of Net Assets |
|---|
| Consumer Staples | | | 33.5 | % |
| Information Technology | | | 29.7 | |
| Health Care | | | 20.7 | |
| Industrials | | | 4.8 | |
| Financials | | | 4.5 | |
| Consumer Discretionary | | | 3.4 | |
| Communication Services | | | 1.0 | |
| Short-Term Investments | | | 1.7 | |
| Assets in Excess of Other Liabilities | | | 0.7 | |
Net Assets | | | 100.0 | % |
| | | | | | |
See Accompanying Notes to Financial Statements
70
VY® MORGAN STANLEY GLOBAL
FRANCHISE PORTFOLIO | PORTFOLIO OF INVESTMENTS
AS OF DECEMBER 31, 2020 (CONTINUED) |
Fair Value Measurementsˆ
The following is a summary of the fair valuations according to the inputs used as of December 31, 2020 in valuing the assets and liabilities:
| | Quoted Prices
in Active Markets
for Identical
Investments
(Level 1) | | Significant
Other
Observable
Inputs#
(Level 2) | | Significant
Unobservable
Inputs
(Level 3) | | Fair Value
at
December 31, 2020 |
|---|
Asset Table | | | | | | | | | | | | | | | | | | | | |
Investments, at fair value | | | | | | | | | | | | | | | | | | | | |
| Common Stock | | | | | | | | | | | | | | | | | | | | |
| France | | | $ | — | | | | $ | 24,285,994 | | | | $ | — | | | | $ | 24,285,994 | |
| Germany | | | | — | | | | | 18,469,527 | | | | | — | | | | | 18,469,527 | |
| Italy | | | | — | | | | | 2,273,242 | | | | | — | | | | | 2,273,242 | |
| Netherlands | | | | 9,943,634 | | | | | — | | | | | — | | | | | 9,943,634 | |
| United Kingdom | | | | — | | | | | 67,177,751 | | | | | — | | | | | 67,177,751 | |
| United States | | | | 289,474,303 | | | | | — | | | | | — | | | | | 289,474,303 | |
| Total Common Stock | | | | 299,417,937 | | | | | 112,206,514 | | | | | — | | | | | 411,624,451 | |
| Short-Term Investments | | | | 7,019,081 | | | | | — | | | | | — | | | | | 7,019,081 | |
| Total Investments, at fair value | | | $ | 306,437,018 | | | | $ | 112,206,514 | | | | $ | — | | | | $ | 418,643,532 | |
| ˆ | | See Note 2, “Significant Accounting Policies” in the Notes to Financial Statements for additional information. |
| # | | The earlier close of the foreign markets gives rise to the possibility that significant events, including broad market moves, may have occurred in the interim and may materially affect the value of those securities. To account for this, the Portfolio may frequently value many of its foreign equity securities using fair value prices based on third party vendor modeling tools to the extent available. Accordingly, a portion of the Portfolio’s investments are categorized as Level 2 investments. |
At December 31, 2020, the aggregate cost of securities and other investments and the composition of unrealized appreciation and depreciation of securities and other investments on a tax basis were:
| Cost for federal income tax purposes was $296,531,393. | |
| Net unrealized appreciation consisted of: | | | | |
| Gross Unrealized Appreciation | | $ | 131,194,651 | |
| Gross Unrealized Depreciation | | | (9,069,799 | ) |
| Net Unrealized Appreciation | | $ | 122,124,852 | |
See Accompanying Notes to Financial Statements
71
VY® T. ROWE PRICE
CAPITAL APPRECIATION PORTFOLIO | SUMMARY PORTFOLIO OF INVESTMENTS
AS OF DECEMBER 31, 2020 |
| Shares | | | | | | | | Value | | Percentage
of Net
Assets |
|---|
| |
COMMON STOCK: 68.0% |
| Communication Services: 4.5% |
| 11,604 | | | | (1) | | Alphabet, Inc. — Class A | | $ | 20,337,634 | | | | 0.2 | |
| 152,226 | | | | (1),(2) | | Alphabet, Inc. — Class C | | | 266,681,685 | | | | 3.4 | |
| 251,635 | | | | (1) | | Facebook, Inc. — Class A | | | 68,736,617 | | | | 0.9 | |
| | | | | | | | | | 355,755,936 | | | | 4.5 | |
| |
| Consumer Discretionary: 8.1% |
| 89,750 | | | | (1) | | Amazon.com, Inc. | | | 292,309,467 | | | | 3.7 | |
| 513,169 | | | | (3) | | Hilton Worldwide Holdings, Inc. | | | 57,095,183 | | | | 0.7 | |
| 550,280 | | | | | | Marriott International, Inc. | | | 72,592,938 | | | | 0.9 | |
| 452,749 | | | | | | Ross Stores, Inc. | | | 55,602,105 | | | | 0.7 | |
| 1,472,472 | | | | (2) | | Yum! Brands, Inc. | | | 159,851,560 | | | | 2.1 | |
| | | | | | | | | | 637,451,253 | | | | 8.1 | |
| |
| |
| 3,931,847 | | | | (3) | | Keurig Dr Pepper, Inc. | | | 125,819,104 | | | | 1.6 | |
| |
| |
| 350,502 | | | | (3) | | Arthur J. Gallagher & Co. | | | 43,360,603 | | | | 0.6 | |
| 5,730,937 | | | | | | Bank of America Corp. | | | 173,704,701 | | | | 2.2 | |
| 243,926 | | | | | | CME Group, Inc. | | | 44,406,728 | | | | 0.6 | |
| 695,039 | | | | | | Intercontinental Exchange, Inc. | | | 80,131,046 | | | | 1.0 | |
| 2,032,529 | | | | | | Marsh & McLennan Cos., Inc. | | | 237,805,893 | | | | 3.0 | |
| 1,797,649 | | | | | | PNC Financial Services Group, Inc. | | | 267,849,701 | | | | 3.4 | |
| 770,157 | | | | | | Other Securities | | | 9,727,083 | | | | 0.1 | |
| | | | | | | | | | 856,985,755 | | | | 10.9 | |
| |
| |
| 108,600 | | | | (2) | | Becton Dickinson & Co. | | | 27,173,892 | | | | 0.3 | |
| 644,003 | | | | | | Danaher Corp. | | | 143,058,826 | | | | 1.8 | |
| 2,111,116 | | | | (1),(3) | | Envista Holdings Corp. | | | 71,207,943 | | | | 0.9 | |
| 511,182 | | | | | | Humana, Inc. | | | 209,722,639 | | | | 2.7 | |
| 320,168 | | | | | | PerkinElmer, Inc. | | | 45,944,108 | | | | 0.6 | |
| 219,172 | | | | | | Thermo Fisher Scientific, Inc. | | | 102,085,934 | | | | 1.3 | |
| 468,878 | | | | | | UnitedHealth Group, Inc. | | | 164,426,137 | | | | 2.1 | |
| 719,129 | | | | (4) | | Other Securities | | | 25,852,688 | | | | 0.3 | |
| | | | | | | | | | 789,472,167 | | | | 10.0 | |
| |
| |
| 26,193,731 | | | | | | General Electric Co. | | | 282,892,295 | | | | 3.6 | |
| 1,674,126 | | | | (1) | | Ingersoll Rand, Inc. | | | 76,273,181 | | | | 0.9 | |
| 159,105 | | | | (2) | | Roper Technologies, Inc. | | | 68,588,574 | | | | 0.9 | |
| 463,048 | | | | | | Waste Connections, Inc. | | | 47,494,833 | | | | 0.6 | |
| 77,752 | | | | (4) | | Other Securities | | | 30,477,229 | | | | 0.4 | |
| | | | | | | | | | 505,726,112 | | | | 6.4 | |
| |
| Information Technology: 18.3% |
| 2,050,649 | | | | (1) | | Fiserv, Inc. | | | 233,486,895 | | | | 3.0 | |
| 918,922 | | | | | | Global Payments, Inc. | | | 197,954,177 | | | | 2.5 | |
| 167,467 | | | | (2) | | Mastercard, Inc. — Class A | | | 59,775,671 | | | | 0.8 | |
| 1,868,095 | | | | | | Microsoft Corp. | | | 415,501,690 | | | | 5.3 | |
| 899,938 | | | | | | NXP Semiconductor NV — NXPI — US | | | 143,099,141 | | | | 1.8 | |
| 252,937 | | | | (1) | | Salesforce.com, Inc. | | | 56,286,071 | | | | 0.7 | |
| 915,702 | | | | | | TE Connectivity Ltd. | | | 110,864,041 | | | | 1.4 | |
| 1,002,628 | | | | (2) | | Visa, Inc. — Class A | | | 219,304,823 | | | | 2.8 | |
| | | | | | | | | | 1,436,272,509 | | | | 18.3 | |
| Shares | | | | | | | | Value | | Percentage
of Net
Assets |
|---|
| |
COMMON STOCK: (continued) |
| |
| 1,608,789 | | | | (3) | | Ameren Corp. | | $ | 125,582,069 | | | | 1.6 | |
| 2,760,856 | | | | | | American Electric Power Co., Inc. | | | 229,896,479 | | | | 2.9 | |
| 2,285,543 | | | | | | Exelon Corp. | | | 96,495,625 | | | | 1.2 | |
| 3,936,307 | | | | | | NiSource, Inc. | | | 90,298,883 | | | | 1.2 | |
| 1,805,933 | | | | | | Public Service Enterprise Group, Inc. | | | 105,285,894 | | | | 1.3 | |
| | | | | | | | | | 647,558,950 | | | | 8.2 | |
| |
| | | | | | | Total Common Stock
(Cost $4,074,397,282) | | | 5,355,041,786 | | | | 68.0 | |
| |
PREFERRED STOCK: 2.8% |
| Consumer Discretionary: 0.6% |
| 576,340 | | | | (1),
(5),(6) | | Aurora Innovation, Inc., — Series B | | | 11,328,979 | | | | 0.1 | |
| 413,251 | | | | (1),
(5),(6) | | Waymo LLC., Series A-2 | | | 35,484,706 | | | | 0.5 | |
| | | | | | | | | | 46,813,685 | | | | 0.6 | |
| |
| |
| 23,000 | | | | (4),(7) | | Other Securities | | | 598,920 | | | | 0.0 | |
| |
| |
| 375,506 | | | | (3) | | Avantor, Inc. | | | 33,386,238 | | | | 0.4 | |
| 227,135 | | | | (4),(7) | | Other Securities | | | 24,887,182 | | | | 0.3 | |
| | | | | | | | | | 58,273,420 | | | | 0.7 | |
| |
| |
| 1,719,056 | | | | (3),(8) | | CMS Energy Corp. | | | 48,339,521 | | | | 0.6 | |
| 2,262,090 | | | | (4),(7) | | Other Securities | | | 66,531,279 | | | | 0.9 | |
| | | | | | | | | | 114,870,800 | | | | 1.5 | |
| |
| | | | | | | Total Preferred Stock
(Cost $188,223,610) | | | 220,556,825 | | | | 2.8 | |
| | | | | | | | | | | |
|---|
Principal
Amount† | | | | | | | | Value | | Percentage
of Net
Assets |
|---|
| |
CORPORATE BONDS/NOTES: 9.3% |
| |
| 8,415,000 | | | | (9) | | CCO Holdings LLC / CCO Holdings Capital Corp., 4.000%, 03/01/2023 | | | 8,483,372 | | | | 0.1 | |
| 25,960,000 | | | | (9) | | CCO Holdings LLC / CCO Holdings Capital Corp., 5.125%, 05/01/2027 | | | 27,583,149 | | | | 0.4 | |
| 38,178,000 | | | | (9) | | CCO Holdings LLC / CCO Holdings Capital Corp., 5.000%, 02/01/2028 | | | 40,411,413 | | | | 0.5 | |
| 30,010,000 | | | | | | Netflix, Inc., 4.875%, 04/15/2028 | | | 33,891,193 | | | | 0.4 | |
| 38,795,000 | | | | | | Netflix, Inc., 5.875%, 11/15/2028 | | | 46,574,756 | | | | 0.6 | |
| 62,200,000 | | | | (3) | | Netflix, Inc., 4.375%–6.375%,
02/15/2022-05/15/2029 | | | 72,348,678 | | | | 0.9 | |
| 1,070,000 | | | | (9) | | Sirius XM Radio, Inc., 3.875%, 08/01/2022 | | | 1,087,387 | | | | 0.0 | |
| 4,280,000 | | | | | | Other Securities | | | 4,338,288 | | | | 0.1 | |
| | | | | | | | | | 234,718,236 | | | | 3.0 | |
See Accompanying Notes to Financial Statements
72
VY® T. ROWE PRICE
CAPITAL APPRECIATION PORTFOLIO | SUMMARY PORTFOLIO OF INVESTMENTS
AS OF DECEMBER 31, 2020 (CONTINUED) |
Principal
Amount† | | | | | | | | Value | | Percentage
of Net
Assets |
|---|
| |
CORPORATE BONDS/NOTES: (continued) |
| |
| 12,920,000 | | | | | | Cedar Fair L.P. / Canada’s Wonderland Co. / Magnum Management Corp. / Millennium Op, 5.375%, 04/15/2027 | | $ | 13,234,925 | | | | 0.2 | |
| 18,435,000 | | | | (3) | | Cedar Fair L.P. / Canada’s Wonderland Co. / Magnum Management Corp., 5.375%, 06/01/2024 | | | 18,527,175 | | | | 0.2 | |
| 13,970,000 | | | | (3) | | Cedar Fair L.P., 5.250%, 07/15/2029 | | | 14,406,423 | | | | 0.2 | |
| 640,000 | | | | (9) | | Cedar Fair L.P. / Canada’s Wonderland Co. / Magnum Management Corp. / Millennium Op, 5.500%, 05/01/2025 | | | 668,000 | | | | 0.0 | |
| 10,835,000 | | | | (3),(9) | | Cedar Fair L.P. / Canada’s Wonderland Co. / Magnum Management Corp. / Millennium Op, 6.500%, 10/01/2028 | | | 11,769,790 | | | | 0.2 | |
| 12,595,000 | | | | (9) | | Delta Air Lines, Inc. / SkyMiles IP Ltd., 4.500%, 10/20/2025 | | | 13,466,633 | | | | 0.2 | |
| 7,010,000 | | | | (9) | | Delta Air Lines, Inc. / SkyMiles IP Ltd., 4.750%, 10/20/2028 | | | 7,657,186 | | | | 0.1 | |
| 28,280,000 | | | | (9) | | KFC Holding Co/Pizza Hut Holdings LLC/Taco Bell of America LLC, 4.750%, 06/01/2027 | | | 29,946,116 | | | | 0.4 | |
| 21,094,000 | | | | (9) | | KFC Holding Co/Pizza Hut Holdings LLC/Taco Bell of America LLC, 5.250%, 06/01/2026 | | | 21,924,576 | | | | 0.3 | |
| 2,340,000 | | | | | | Marriott International, Inc./MD, 0.876%, (US0003M + 0.650%), 03/08/2021 | | | 2,340,948 | | | | 0.0 | |
| 7,550,000 | | | | (9) | | Mileage Plus Holdings LLC / Mileage Plus Intellectual Property Assets Ltd., 6.500%, 06/20/2027 | | | 8,130,406 | | | | 0.1 | |
| 23,709,000 | | | | (9) | | Six Flags Entertainment Corp., 4.875%, 07/31/2024 | | | 23,816,165 | | | | 0.3 | |
| 18,612,000 | | | | (3),(9) | | Six Flags Entertainment Corp., 5.500%, 04/15/2027 | | | 19,147,095 | | | | 0.2 | |
| 7,969,000 | | | | (3),(9) | | Six Flags Theme Parks, Inc., 7.000%, 07/01/2025 | | | 8,621,462 | | | | 0.1 | |
| 2,175,000 | | | | (9) | | Yum! Brands, Inc., 4.750%, 01/15/2030 | | | 2,388,150 | | | | 0.0 | |
| 46,795,000 | | | | (3) | | Yum! Brands, Inc., 3.750%-6.875%, 11/01/2021-11/01/2043 | | | 51,060,085 | | | | 0.7 | |
| 9,864,215 | | | | | | Other Securities | | | 9,735,836 | | | | 0.1 | |
| | | | | | | | | | 256,840,971 | | | | 3.3 | |
| |
| Consumer, Non-cyclical: 0.6% |
| 2,345,000 | | | | (9) | | Korn Ferry, 4.625%, 12/15/2027 | | | 2,447,593 | | | | 0.0 | |
| 9,125,000 | | | | (9) | | Refinitiv US Holdings, Inc., 6.250%, 05/15/2026 | | | 9,758,047 | | | | 0.1 | |
Principal
Amount† | | | | | | | | Value | | Percentage
of Net
Assets |
|---|
| |
CORPORATE BONDS/NOTES: (continued) |
| Consumer, Non-cyclical: (continued) |
| 11,030,000 | | | | (9) | | Refinitiv US Holdings, Inc., 8.250%, 11/15/2026 | | $ | 12,050,275 | | | | 0.2 | |
| 19,825,000 | | | | | | Other Securities | | | 20,704,382 | | | | 0.3 | |
| | | | | | | | | | 44,960,297 | | | | 0.6 | |
| |
| |
| 555,000 | | | | (9) | | AmWINS Group, Inc., 7.750%, 07/01/2026 | | | 597,990 | | | | 0.0 | |
| 8,400,000 | | | | (10) | | Bank of New York Mellon Corp., 3.659%, (US0003M + 3.420%), 12/31/2199 | | | 8,409,426 | | | | 0.1 | |
| 16,343,000 | | | | (9) | | HUB International Ltd., 7.000%, 05/01/2026 | | | 17,107,771 | | | | 0.2 | |
| 3,510,000 | | | | (9) | | SBA Communications Corp., 3.875%, 02/15/2027 | | | 3,690,941 | | | | 0.1 | |
| 6,360,000 | | | | (9) | | USI, Inc./NY, 6.875%, 05/01/2025 | | | 6,538,811 | | | | 0.1 | |
| 33,420,000 | | | | | | Other Securities | | | 34,389,490 | | | | 0.4 | |
| | | | | | | | | | 70,734,429 | | | | 0.9 | |
| |
| |
| 49,630,000 | | | | (10) | | General Electric Co., 5.000%, 12/31/2199 | | | 46,081,951 | | | | 0.6 | |
| 256,000 | | | | (9) | | Reynolds Group Issuer, Inc. / Reynolds Group Issuer LLC / Reynolds Group Issuer Lu, 5.125%, 07/15/2023 | | | 259,277 | | | | 0.0 | |
| 4,220,000 | | | | (9) | | Sensata Technologies BV, 4.875%, 10/15/2023 | | | 4,562,875 | | | | 0.0 | |
| 5,100,000 | | | | (9) | | Sensata Technologies BV, 5.000%, 10/01/2025 | | | 5,683,312 | | | | 0.1 | |
| 1,430,000 | | | | (9) | | Sensata Technologies BV, 5.625%, 11/01/2024 | | | 1,602,551 | | | | 0.0 | |
| 8,235,000 | | | | (7) | | Other Securities | | | 8,553,497 | | | | 0.1 | |
| | | | | | | | | | 66,743,463 | | | | 0.8 | |
| |
| |
| 2,840,000 | | | | (9) | | Sensata Technologies UK Financing Co. PLC, 6.250%, 02/15/2026 | | | 2,957,150 | | | | 0.1 | |
| 40,366,000 | | | | (9) | | Solera LLC / Solera Finance, Inc., 10.500%, 03/01/2024 | | | 41,879,725 | | | | 0.5 | |
| | | | | | | | | | 44,836,875 | | | | 0.6 | |
| |
| |
| 9,465,000 | | | | | | Other Securities | | | 9,737,119 | | | | 0.1 | |
| |
| | | | | | | Total Corporate Bonds/Notes
(Cost $673,394,103) | | | 728,571,390 | | | | 9.3 | |
| |
BANK LOANS: 11.3% |
| | Aerospace & Defense: 0.2% |
| 16,875,000 | | | | | | SkyMiles IP Ltd. 2020 Skymiles Term Loan B, 4.750%, (US0003M + 3.750%), 10/20/2027 | | | 17,531,016 | | | | 0.2 | |
See Accompanying Notes to Financial Statements
73
VY® T. ROWE PRICE
CAPITAL APPRECIATION PORTFOLIO | SUMMARY PORTFOLIO OF INVESTMENTS
AS OF DECEMBER 31, 2020 (CONTINUED) |
Principal
Amount† | | | | | | | | Value | | Percentage
of Net
Assets |
|---|
| |
BANK LOANS: (continued) |
| |
| 2,193,938 | | | | | | HB Fuller Co. 1st Lien Term Loan B, 2.152%, (US0001M + 2.000%), 10/20/2024 | | $ | 2,185,101 | | | | 0.0 | |
| |
| |
| 2,525,000 | | | | | | Mega Broadband Investments LLC TL B 1L, 3.144%, (US0001M + 3.000%), 10/19/2027 | | | 2,526,053 | | | | 0.0 | |
| |
| |
| 32,950,000 | | | | | | Formula One TL B3 1L, 3.500%, (US0003M + 2.500%), 02/01/2024 | | | 32,699,448 | | | | 0.4 | |
| 5,171,594 | | | | | | Four Seasons Hotels Ltd. — TL B 1L, 2.254%, (US0003M + 2.000%), 11/30/2023 | | | 5,141,294 | | | | 0.1 | |
| 15,071,701 | | | | | | Life Time, Inc. 2017 Term Loan B 1L, 3.750%, (US0003M + 2.750%), 06/10/2022 | | | 14,718,451 | | | | 0.2 | |
| 4,224,028 | | | | | | SeaWorld Parks & Entertainment, Inc. — TL B5 1L, 3.750%, (US0003M + 3.000%), 04/01/2024 | | | 4,114,909 | | | | 0.1 | |
| 2,825,000 | | | | | | WellPet — TL B 1L, 4.500%, (US0001M + 3.750%), 12/11/2027 | | | 2,828,531 | | | | 0.0 | |
| 38,690,000 | | | | | | Mileage Plus Holdings LLC 2020 Term Loan B, 6.250%, (US0003M + 5.250%), 06/25/2027 | | | 40,385,357 | | | | 0.5 | |
| | | | | | | | | | 99,887,990 | | | | 1.3 | |
| |
| Consumer, Non-cyclical: 3.3% |
| 7,610,000 | | | | | | Aspen Dental — TL B 1L, 4.144%, (US0001M + 4.000%), 12/15/2027 | | | 7,630,927 | | | | 0.1 | |
| 1,855,243 | | | | | | Dentalcorp Health Services ULC — TL 1L, 4.750%, (US0003M + 3.750%), 06/06/2025 | | | 1,827,993 | | | | 0.0 | |
| 11,112,818 | | | | | | Heartland Dental LLC — TL 1L, 3.966%, (US0003M + 3.750%), 04/30/2025 | | | 10,851,200 | | | | 0.2 | |
| 1,037,360 | | | | | | Heartland Dental LLC — TL 1L, 4.739%, (US0003M + 3.750%), 04/30/2025 | | | 1,012,939 | | | | 0.0 | |
| 20,875,231 | | | | | | Loire Finco Luxembourg Sarl — TL B 1L, 3.647%, (US0003M + 3.250%), 01/24/2027 | | | 20,588,197 | | | | 0.3 | |
| 15,225,000 | | | | | | NVA Holdings Inc. — TL A-3 1L, 2.438%, (US0003M + 2.250%), 09/19/2022 | | | 15,072,750 | | | | 0.2 | |
| 2,820,944 | | | | | | PetVet Care Centers LLC — TL B-DD 1L, 5.250%, (US0001M + 4.250%), 02/14/2025 | | | 2,835,049 | | | | 0.0 | |
| 1,813,013 | | | | | | PetVet Care Centers LLC TL 1L, 2.897%, (US0003M + 2.750%), 02/14/2025 | | | 1,777,886 | | | | 0.0 | |
Principal
Amount† | | | | | | | | Value | | Percentage
of Net
Assets |
|---|
| |
BANK LOANS: (continued) |
| Consumer, Non-cyclical: (continued) |
| 2,979,504 | | | | | | PetVet Care Centers LLC, 3.455%, (US0003M + 3.250%), 02/14/2025 | | $ | 2,921,776 | | | | 0.0 | |
| 311,016 | | | | | | Prestige Brands, Inc.
Term Loan B4, 2.147%, (US0001M + 2.000%), 01/26/2024 | | | 312,020 | | | | 0.0 | |
| 172,871,622 | | | | | | Refinitiv — TL B 1L, 3.397%, (US0001M + 3.750%), 10/01/2025 | | | 172,831,170 | | | | 2.2 | |
| 23,470,419 | | | | | | Sunshine Luxembourg VII Sarl — TL B 1L, 4.254%, (US0003M + 4.250%), 07/17/2026 | | | 23,568,901 | | | | 0.3 | |
| | | | | | | | | | 261,230,808 | | | | 3.3 | |
| |
| |
| 7,232,479 | | | | | | Alliant Holdings Intermediate, LLC Term Loan B 1L, 3.397%, (US0003M + 3.000%), 05/09/2025 | | | 7,118,466 | | | | 0.1 | |
| 3,794,285 | | | | | | AmWINS Group, Inc. — TL B 1L, 3.750%, (US0003M + 2.750%), 01/25/2024 | | | 3,798,596 | | | | 0.0 | |
| 43,717,112 | | | | | | HUB International Ltd. — TL B 1L, 5.000%, (US0001M + 4.000%), 04/25/2025 | | | 43,902,079 | | | | 0.6 | |
| 8,090,813 | | | | | | Hyperion Insurance — TL B-DD 1L, 4.750%, (US0001M + 3.750%), 10/22/2027 | | | 8,095,869 | | | | 0.1 | |
| 4,344,113 | | | | | | Ryan Specialty Group, LLC TL B 1L, 4.000%, (US0001M + 3.250%), 07/23/2027 | | | 4,344,112 | | | | 0.1 | |
| 32,212,294 | | | | | | USI Inc/NY — TL B 1L, 3.254%, (US0003M + 3.000%), 05/16/2024 | | | 31,806,290 | | | | 0.4 | |
| 7,236,863 | | | | | | USI, Inc. Term Loan B 1L, 4.500%, (US0001M + 4.000%), 12/02/2026 | | | 7,240,481 | | | | 0.1 | |
| 105,281,965 | | | | | | HUB International Ltd. TL B 1L, 2.965%, (US0001M + 3.000%), 04/25/2025 | | | 103,535,232 | | | | 1.3 | |
| | | | | | | | | | 209,841,125 | | | | 2.7 | |
| |
| |
| 6,870,000 | | | | | | IRB Holding Corp 2020 Fourth Amendment Incremental Term Loan, 3.478%, (US0003M + 3.250%), 12/15/2027 | | | 6,879,446 | | | | 0.1 | |
| |
| |
| 2,153,725 | | | | | | CPI Holdco, LLC 2019 TL 1L, 5.701%, (US0003M + 4.250%), 11/04/2026 | | | 2,160,455 | | | | 0.0 | |
| |
| |
| EUR 9,450,000 | | | | | | Filtration Group — TL B 1L, 3.238%, (US0003M + 3.000%), 03/29/2025 | | | 11,486,800 | | | | 0.2 | |
See Accompanying Notes to Financial Statements
74
VY® T. ROWE PRICE
CAPITAL APPRECIATION PORTFOLIO | SUMMARY PORTFOLIO OF INVESTMENTS
AS OF DECEMBER 31, 2020 (CONTINUED) |
Principal
Amount† | | | | | | | | Value | | Percentage
of Net
Assets |
|---|
| |
BANK LOANS: (continued) |
| |
| 1,795,500 | | | | | | Filtration Group Corp. — TL B 1L, 4.500%, (US0001M + 3.750%), 03/29/2025 | | $ | 1,801,485 | | | | 0.0 | |
| 2,807,487 | | | | | | Filtration Group Corp. 2018 1st Lien Term Loan, 3.147%, (US0003M + 3.000%), 03/31/2025 | | | 2,784,676 | | | | 0.0 | |
| 27,880,000 | | | | | | Thyssenkrupp Elevator TL B 1L, 4.570%, (US0001M + 4.250%), 06/30/2027 | | | 28,043,349 | | | | 0.4 | |
| 3,050,000 | | | | | | Welbilt, Inc. 2018 Term Loan B 1L, 2.645%, (US0003M + 2.500%), 10/23/2025 | | | 2,902,584 | | | | 0.0 | |
| | | | | | | | | | 47,018,894 | | | | 0.6 | |
| |
| Industrial Equipment: 0.0% |
| 2,069,600 | | | | | | Gardner Denver, Inc. 2020 USD Term Loan B, 2.897%, (US0001M + 2.750%), 03/01/2027 | | | 2,072,617 | | | | 0.0 | |
| |
| |
| 8,208,078 | | | | | | Alliant Holdings Intermediate, LLC 2020 Term Loan B3, 4.250%, (US0003M + 3.750%), 10/08/2027 | | | 8,228,598 | | | | 0.1 | |
| 5,917,527 | | | | | | Alliant Holdings Intermediate, LLC Term Loan B, 3.397%, (US0003M + 3.250%), 05/09/2025 | | | 5,824,243 | | | | 0.1 | |
| 9,187,829 | | | | | | USI, Inc. 2019 Incremental Term Loan B, 4.254%, (US0003M + 4.000%), 12/02/2026 | | | 9,192,422 | | | | 0.1 | |
| | | | | | | | | | 23,245,263 | | | | 0.3 | |
| |
| |
| 3,622,226 | | | | | | Applied Systems, Inc. 2017 1st Lien Term Loan, 4.000%, (US0003M + 3.250%), 09/19/2024 | | | 3,626,754 | | | | 0.1 | |
| 640,000 | | | | | | Ascend Learning LLC — TL B 1L, 3.238%, (US0003M + 3.000%), 07/12/2024 | | | 642,933 | | | | 0.0 | |
| 3,320,000 | | | | | | Azalea Topco, Inc. — TL 1L, 4.750%, (US0001M + 4.000%), 07/25/2026 | | | 3,332,450 | | | | 0.1 | |
| 17,725,000 | | | | | | Clarivate / Camelot Finance SA TL B 1L, 4.000%, (US0003M + 3.000%), 10/31/2026 | | | 17,721,313 | | | | 0.2 | |
| 92,283,738 | | | | | | Ultimate Software Group, Inc. TL 1L, 4.750%, (US0003M + 3.750%), 05/03/2026 | | | 92,941,259 | | | | 1.2 | |
| 3,050,000 | | | | | | Ultimate Software Group, Inc. TL 2L, 7.500%, (US0001M + 6.750%), 05/03/2027 | | | 3,145,313 | | | | 0.0 | |
Principal
Amount† | | | | | | | | Value | | Percentage
of Net
Assets |
|---|
| |
BANK LOANS: (continued) |
| |
| 72,123,231 | | | | | | Cypress Intermediate Holdings III Inc TL B 1L, 4.000%, (US0001M + 3.000%), 04/29/2024 | | $ | 72,070,653 | | | | 0.9 | |
| 20,280,140 | | | | | | Emerald TopCo Inc Term Loan, 3.656%, (US0001M + 3.500%), 07/24/2026 | | | 20,102,689 | | | | 0.3 | |
| 2,839,063 | | | | | | Ultimate Software Group, Inc. — TL 1L, 3.897%, (US0003M + 3.750%), 05/04/2026 | | | 2,841,902 | | | | 0.0 | |
| | | | | | | | | | 216,425,266 | | | | 2.8 | |
| |
| | | | | | | Total Bank Loans
(Cost $879,845,116) | | | 891,004,034 | | | | 11.3 | |
| |
ASSET-BACKED SECURITIES: 0.3% |
| Other Asset-Backed Securities: 0.3% |
| 7,927,810 | | | | (9) | | Domino’s Pizza Master Issuer LLC 2017-1A A23, 4.118%, 07/25/2047 | | | 8,522,542 | | | | 0.1 | |
| 7,419,225 | | | | (9) | | Domino’s Pizza Master Issuer LLC 2018-1A A2I, 4.116%, 07/25/2048 | | | 7,821,390 | | | | 0.1 | |
| 3,672,900 | | | | (9) | | Domino’s Pizza Master Issuer LLC 2019-1A A2, 3.668%, 10/25/2049 | | | 3,914,166 | | | | 0.0 | |
| 5,011,990 | | | | (9) | | Wendys Funding LLC 2018-1A A2I, 3.573%, 03/15/2048 | | | 5,172,825 | | | | 0.1 | |
| |
| | | | | | | Total Asset-Backed Securities
(Cost $23,827,660) | | | 25,430,923 | | | | 0.3 | |
| |
CONVERTIBLE BONDS/NOTES: 0.0% |
| |
| 3,459,000 | | | | (9) | | Liberty Broadband Corp., 2.750%, 09/30/2050 | | | 3,708,955 | | | | 0.0 | |
| |
| | | | | | | Total Convertible Bonds/Notes
(Cost $3,459,000) | | | 3,708,955 | | | | 0.0 | |
| |
| | | | | | | Total Long-Term Investments
(Cost $5,843,146,771) | | | 7,224,313,913 | | | | 91.7 | |
| |
SHORT-TERM INVESTMENTS: 10.8% |
| Repurchase Agreements: 1.3% |
| 5,504,736 | | | | (11) | | Amherst Pierpoint Securities LLC, Repurchase Agreement dated 12/31/20, 0.10%, due 01/04/21 (Repurchase Amount $5,504,796, collateralized by various U.S. Government/U.S. Government Agency Obligations, 0.000%–4.628%, Market Value plus accrued interest $5,614,831, due 02/03/21–11/20/70) | | | 5,504,736 | | | | 0.1 | |
See Accompanying Notes to Financial Statements
75
VY® T. ROWE PRICE
CAPITAL APPRECIATION PORTFOLIO | SUMMARY PORTFOLIO OF INVESTMENTS
AS OF DECEMBER 31, 2020 (CONTINUED) |
Principal
Amount† | | | | | | | | Value | | Percentage
of Net
Assets |
|---|
| |
SHORT-TERM INVESTMENTS: (continued) |
| Repurchase Agreements: (continued) |
| 3,460,120 | | | | (11) | | Bethesda Securities LLC, Repurchase Agreement dated 12/31/20, 0.10%, due 01/04/21 (Repurchase Amount $3,460,158, collateralized by various U.S. Government Agency Obligations, 2.500%–5.500%, Market Value plus accrued interest $3,529,322,
due 07/01/24–10/01/50) | | $ | 3,460,120 | | | | 0.0 | |
| 4,673,409 | | | | (11) | | BNP Paribas S.A., Repurchase Agreement dated 12/31/20, 0.24%, due 01/04/21 (Repurchase Amount $4,673,532, collateralized by various U.S. Government Securities, 0.750%–8.750%, Market Value plus accrued interest $4,907,079, due 03/01/21–11/20/40) | | | 4,673,409 | | | | 0.1 | |
| 16,335,711 | | | | (11) | | Cantor Fitzgerald Securities, Repurchase Agreement dated 12/31/20, 0.07%, due 01/04/21 (Repurchase Amount $16,335,836, collateralized by various U.S. Government/U.S. Government Agency Obligations, 0.000%–9.500%, Market Value plus accrued interest $16,662,425, due 01/25/21–10/15/62) | | | 16,335,711 | | | | 0.2 | |
| 5,590,969 | | | | (11) | | CF Secured LLC, Repurchase Agreement dated 12/31/20, 0.07%, due 01/04/21 (Repurchase Amount $5,591,012, collateralized by various U.S. Government/U.S. Government Agency Obligations, 0.000%–4.750%, Market Value plus accrued interest $5,702,789, due 01/14/21–01/20/69) | | | 5,590,969 | | | | 0.1 | |
| 10,227,239 | | | | (11) | | Citadel Securities LLC, Repurchase Agreement dated 12/31/20, 0.13%, due 01/04/21 (Repurchase Amount $10,227,385, collateralized by various U.S. Government Securities, 0.000%–7.875%, Market Value plus accrued interest $10,431,943, due 01/31/21–05/15/49) | | | 10,227,239 | | | | 0.1 | |
Principal
Amount† | | | | | | | | Value | | Percentage
of Net
Assets |
|---|
| |
SHORT-TERM INVESTMENTS: (continued) |
| Repurchase Agreements: (continued) |
| 14,547,880 | | | | (11) | | Daiwa Capital Markets, Repurchase Agreement dated 12/31/20, 0.07%, due 01/04/21 (Repurchase Amount $14,547,992, collateralized by various U.S. Government/U.S. Government Agency Obligations, 0.000%–6.500%, Market Value plus accrued interest $14,838,837,
due 01/26/21–01/01/51) | | $ | 14,547,880 | | | | 0.2 | |
| 2,255,491 | | | | (11) | | Industrial & Comm. Bank of China, Repurchase Agreement dated 12/31/20, 0.07%, due 01/04/21 (Repurchase Amount $2,255,508, collateralized by various U.S. Government/U.S. Government Agency Obligations, 0.000%–9.000%, Market Value plus accrued interest $2,300,601, due 01/04/21–12/01/50) | | | 2,255,491 | | | | 0.0 | |
| 6,387,247 | | | | (11) | | JVB Financial Group LLC, Repurchase Agreement dated 12/31/20, 0.13%, due 01/04/21 (Repurchase Amount $6,387,338, collateralized by various U.S. Government/U.S. Government Agency Obligations, 0.125%–7.000%, Market Value plus accrued interest $6,514,992, due 07/01/22–12/01/50) | | | 6,387,247 | | | | 0.1 | |
| 7,298,162 | | | | (11) | | Mirae Asset Securities USA Inc., Repurchase Agreement dated 12/31/20, 0.13%, due 01/04/21 (Repurchase Amount $7,298,266, collateralized by various U.S. Government/U.S. Government Agency Obligations, 0.000%–8.125%, Market Value plus accrued interest $7,444,233, due 02/18/21–01/15/62) | | | 7,298,162 | | | | 0.1 | |
| 5,734,596 | | | | (11) | | Palafox Trading LLC, Repurchase Agreement dated 12/31/20, 0.13%, due 01/04/21 (Repurchase Amount $5,734,678, collateralized by various U.S. Government Securities, 0.250%–1.125%, Market Value plus accrued interest $5,851,406, due 02/28/25–05/31/25) | | | 5,734,596 | | | | 0.1 | |
See Accompanying Notes to Financial Statements
76
VY® T. ROWE PRICE
CAPITAL APPRECIATION PORTFOLIO | SUMMARY PORTFOLIO OF INVESTMENTS
AS OF DECEMBER 31, 2020 (CONTINUED) |
Principal
Amount† | | | | | | | | Value | | Percentage
of Net
Assets |
|---|
| |
SHORT-TERM INVESTMENTS: (continued) |
| Repurchase Agreements: (continued) |
| 1,791,208 | | | | (11) | | Royal Bank of Canada, Repurchase Agreement dated 12/31/20, 0.21%, due 01/04/21 (Repurchase Amount $1,791,249, collateralized by various U.S. Government Securities, 0.379%–10.200%, Market Value plus accrued interest $1,869,726, due 05/13/21–11/01/40) | | $ | 1,791,208 | | | | 0.0 | |
| 16,213,680 | | | | (11) | | State of Wisconsin Investment Board, Repurchase Agreement dated 12/31/20, 0.16%, due 01/04/21 (Repurchase Amount $16,213,964, collateralized by various U.S. Government Securities, 0.125%–3.875%, Market Value plus accrued interest $16,579,174, due 07/15/22–02/15/47) | | | 16,213,680 | | | | 0.2 | |
| |
| | | | | | | Total Repurchase Agreements
(Cost $100,020,448) | | | 100,020,448 | | | | 1.3 | |
| | | | | | | | | | | |
|---|
| Shares | | | | | | | | Value | | Percentage
of Net
Assets |
|---|
| | |
| 2,630,000 | | | | (11),
(12) | | BlackRock Liquidity Funds, FedFund, Institutional Class, 0.000% | | | 2,630,000 | | | | 0.0 | |
| 2,660,000 | | | | (11),
(12) | | Goldman Sachs Financial Square Government Fund — Institutional Shares, 0.020% | | | 2,660,000 | | | | 0.0 | |
| 3,010,000 | | | | (11),
(12) | | Morgan Stanley Institutional Liquidity Funds — Government Portfolio (Institutional Share Class), 0.030% | | | 3,010,000 | | | | 0.1 | |
| 738,802,367 | | | | (12) | | T. Rowe Price Government Reserve Fund, 0.080% | | | 738,802,367 | | | | 9.4 | |
| |
| | | | | | | Total Mutual Funds
(Cost $747,102,367) | | | 747,102,367 | | | | 9.5 | |
| |
| | | | | | | Total Short-Term Investments
(Cost $847,122,815) | | | 847,122,815 | | | | 10.8 | |
| |
| | | | | | | Total Investments in Securities
(Cost $6,690,269,586) | | $ | 8,071,436,728 | | | | 102.5 | |
| | | | | | | Liabilities in Excess of Other Assets | | | (196,052,727 | ) | | | (2.5 | ) |
| | | | | | | Net Assets | | $ | 7,875,384,001 | | | | 100.0 | |
“Other Securities” represents issues not identified as the top 50 holdings in terms of market value and issues or issuers not exceeding 1% of net assets individually or in aggregate respectively as of December 31, 2020.
The following footnotes apply to either the individual securities noted or one or more of the securities aggregated and listed as a single line item.
| † | | Unless otherwise indicated, principal amount is shown in USD. |
| (1) | | Non-income producing security. |
| (2) | | All or a portion of this security is pledged to cover open written call options at December 31, 2020. |
| (3) | | Security, or a portion of the security, is on loan. |
| (4) | | The grouping contains non-income producing securities. |
| (5) | | For fair value measurement disclosure purposes, security is categorized as Level 3, whose value was determined using significant unobservable inputs. |
| (6) | | Restricted security as to resale, excluding Rule 144A securities. As of December 31, 2020, the Portfolio held restricted securities with a fair value of $46,813,685 or 0.6% of net assets. Please refer to the table below for additional details. |
| (7) | | The grouping contains securities on loan. |
| (8) | | Preferred Stock may be called prior to convertible date. |
| (9) | | Securities with purchases pursuant to Rule 144A or section 4(a)(2), under the Securities Act of 1933 and may not be resold subject to that rule except to qualified institutional buyers. |
| (10) | | Variable rate security. Rate shown is the rate in effect as of December 31, 2020. |
| (11) | | All or a portion of the security represents securities purchased with cash collateral received for securities on loan. |
| (12) | | Rate shown is the 7-day yield as of December 31, 2020. |
| Currency Abbreviations: |
| EUR | | EU Euro |
| Reference Rate Abbreviations: |
| US0001M | | 1-month LIBOR |
| US0003M | | 3-month LIBOR |
See Accompanying Notes to Financial Statements
77
VY® T. ROWE PRICE
CAPITAL APPRECIATION PORTFOLIO | SUMMARY PORTFOLIO OF INVESTMENTS
AS OF DECEMBER 31, 2020 (CONTINUED) |
Fair Value Measurementsˆ
The following is a summary of the fair valuations according to the inputs used as of December 31, 2020 in valuing the assets and liabilities:
| | | | Quoted Prices
in Active Markets
for Identical
Investments
(Level 1) | | Significant
Other
Observable
Inputs
(Level 2) | | Significant
Unobservable
Inputs
(Level 3) | | Fair Value
at
December 31, 2020 |
|---|
Asset Table | | | | | | | | | | | | | | | | | | |
Investments, at fair value | | | | | | | | | | | | | | | | | | |
| Common Stock* | | | | $ | 5,355,041,786 | | | $ | — | | | $ | — | | | $ | 5,355,041,786 | |
| Preferred Stock | | | | | 148,855,958 | | | | 24,887,182 | | | | 46,813,685 | | | | 220,556,825 | |
| Corporate Bonds/Notes | | | | | — | | | | 728,571,390 | | | | — | | | | 728,571,390 | |
| Bank Loans | | | | | — | | | | 891,004,034 | | | | — | | | | 891,004,034 | |
| Asset-Backed Securities | | | | | — | | | | 25,430,923 | | | | — | | | | 25,430,923 | |
| Convertible Bonds/Notes | | | | | — | | | | 3,708,955 | | | | — | | | | 3,708,955 | |
| Short-Term Investments | | | | | 747,102,367 | | | | 100,020,448 | | | | — | | | | 847,122,815 | |
| Total Investments, at fair value | | | | $ | 6,251,000,111 | | | $ | 1,773,622,932 | | | $ | 46,813,685 | | | $ | 8,071,436,728 | |
Liabilities Table | | | | | | | | | | | | | | | | | | |
Other Financial Instruments+ | | | | | | | | | | | | | | | | | | |
| Written Options | | | | $ | — | | | $ | (98,227,223 | ) | | $ | — | | | $ | (98,227,223 | ) |
| Total Liabilities | | | | $ | — | | | $ | (98,227,223 | ) | | $ | — | | | $ | (98,227,223 | ) |
| ˆ | | See Note 2, “Significant Accounting Policies” in the Notes to Financial Statements for additional information. |
| + | | Other Financial Instruments may include open forward foreign currency contracts, futures, centrally cleared swaps, OTC swaps and written options. Forward foreign currency contracts, futures and centrally cleared swaps are fair valued at the unrealized appreciation (depreciation) on the instrument. OTC swaps and written options are valued at the fair value of the instrument. |
| * | | For further breakdown of Common Stock by sector, please refer to the Portfolio of Investments. |
At December 31, 2020, VY® T. Rowe Price Capital Appreciation Portfolio held the following restricted securities:
| Security | | | | Acquisition
Date | | Acquisition
Cost | | Fair
Value | |
|---|
| Aurora Innovation, Inc., — Series B | | | | | 3/1/2019 | | | | $ | 5,325,555 | | | | $ | 11,328,979 | | |
| Waymo LLC., Series A-2 | | | | | 5/8/2020 | | | | | 35,484,706 | | | | | 35,484,706 | | |
| | | | | | | | | | $ | 40,810,261 | | | | $ | 46,813,685 | | |
| | | | | | | | | | | | | | | | | | | |
At December 31, 2020, the following OTC written equity options were outstanding for VY® T. Rowe Price Capital Appreciation Portfolio:
| Description | | Counterparty | | Put/Call | | Expiration
Date | | Exercise
Price | | Number of
Contracts | | Notional
Amount | | Premiums
Received | | Fair
Value |
|---|
| Alphabet, Inc. — Class C | | Citigroup Global Markets | | | Call | | | | 01/15/21 | | | USD | 1,500.000 | | | | 39 | | | USD | 6,832,332 | | | $ | 288,093 | | | $ | (983,701 | ) |
| Alphabet, Inc.— Class C | | Citigroup Global Markets | | | Call | | | | 01/15/21 | | | USD | 1,500.000 | | | | 38 | | | USD | 6,657,144 | | | | 304,266 | | | | (958,478 | ) |
| Alphabet, Inc. — Class C | | Citigroup Global Markets | | | Call | | | | 01/15/21 | | | USD | 1,500.000 | | | | 25 | | | USD | 4,379,700 | | | | 159,425 | | | | (630,578 | ) |
| Alphabet, Inc. — Class C | | Citigroup Global Markets | | | Call | | | | 01/15/21 | | | USD | 1,500.000 | | | | 38 | | | USD | 6,657,144 | | | | 286,786 | | | | (958,478 | ) |
| Alphabet, Inc. — Class C | | Goldman Sachs & Co. | | | Call | | | | 01/15/21 | | | USD | 1,740.000 | | | | 14 | | | USD | 2,452,632 | | | | 61,978 | | | | (60,786 | ) |
| Alphabet, Inc. — Class C | | Goldman Sachs & Co. | | | Call | | | | 01/15/21 | | | USD | 1,740.000 | | | | 12 | | | USD | 2,102,256 | | | | 56,604 | | | | (52,102 | ) |
| Alphabet, Inc. — Class C | | Goldman Sachs & Co. | | | Call | | | | 01/15/21 | | | USD | 1,740.000 | | | | 13 | | | USD | 2,277,444 | | | | 60,931 | | | | (56,444 | ) |
| Alphabet, Inc. — Class C | | Goldman Sachs & Co. | | | Call | | | | 01/15/21 | | | USD | 1,760.000 | | | | 13 | | | USD | 2,277,444 | | | | 54,951 | | | | (42,573 | ) |
| Alphabet, Inc. — Class C | | Goldman Sachs & Co. | | | Call | | | | 01/15/21 | | | USD | 1,760.000 | | | | 14 | | | USD | 2,452,632 | | | | 55,958 | | | | (45,848 | ) |
| Alphabet, Inc. — Class C | | Goldman Sachs & Co. | | | Call | | | | 01/15/21 | | | USD | 1,760.000 | | | | 12 | | | USD | 2,102,256 | | | | 50,964 | | | | (39,298 | ) |
| Alphabet, Inc. — Class C | | Goldman Sachs & Co. | | | Call | | | | 01/15/21 | | | USD | 1,780.000 | | | | 12 | | | USD | 2,102,256 | | | | 45,924 | | | | (28,601 | ) |
| Alphabet, Inc. — Class C | | Goldman Sachs & Co. | | | Call | | | | 01/15/21 | | | USD | 1,780.000 | | | | 13 | | | USD | 2,277,444 | | | | 49,751 | | | | (30,985 | ) |
| Alphabet, Inc. — Class C | | Goldman Sachs & Co. | | | Call | | | | 01/15/21 | | | USD | 1,780.000 | | | | 14 | | | USD | 2,452,632 | | | | 50,218 | | | | (33,368 | ) |
| Alphabet, Inc. — Class C | | Goldman Sachs & Co. | | | Call | | | | 01/15/21 | | | USD | 1,800.000 | | | | 14 | | | USD | 2,452,632 | | | | 45,038 | | | | (23,382 | ) |
| Alphabet, Inc. — Class C | | Goldman Sachs & Co. | | | Call | | | | 01/15/21 | | | USD | 1,800.000 | | | | 13 | | | USD | 2,277,444 | | | | 44,681 | | | | (21,712 | ) |
| Alphabet, Inc. — Class C | | Goldman Sachs & Co. | | | Call | | | | 01/15/21 | | | USD | 1,800.000 | | | | 12 | | | USD | 2,102,256 | | | | 41,364 | | | | (20,042 | ) |
| Alphabet, Inc. — Class C | | Goldman Sachs & Co. | | | Call | | | | 01/21/22 | | | USD | 1,760.000 | | | | 85 | | | USD | 14,890,980 | | | | 856,157 | | | | (1,861,685 | ) |
| Alphabet, Inc. — Class C | | Goldman Sachs & Co. | | | Call | | | | 01/21/22 | | | USD | 1,780.000 | | | | 85 | | | USD | 14,890,980 | | | | 805,902 | | | | (1,784,014 | ) |
| Alphabet, Inc. — Class C | | Goldman Sachs & Co. | | | Call | | | | 01/21/22 | | | USD | 1,800.000 | | | | 85 | | | USD | 14,890,980 | | | | 759,898 | | | | (1,706,500 | ) |
| Amazon.com, Inc | | Citigroup Global Markets | | | Call | | | | 01/21/22 | | | USD | 4,000.000 | | | | 24 | | | USD | 7,816,632 | | | | 655,848 | | | | (514,121 | ) |
| Amazon.com, Inc | | Citigroup Global Markets | | | Call | | | | 01/21/22 | | | USD | 4,100.000 | | | | 24 | | | USD | 7,816,632 | | | | 604,008 | | | | (462,389 | ) |
See Accompanying Notes to Financial Statements
78
VY® T. ROWE PRICE
CAPITAL APPRECIATION PORTFOLIO | SUMMARY PORTFOLIO OF INVESTMENTS
AS OF DECEMBER 31, 2020 (CONTINUED) |
| Description | | Counterparty | | Put/Call | | Expiration
Date | | Exercise
Price | | Number of
Contracts | | Notional
Amount | | Premiums
Received | | Fair
Value |
|---|
| Amazon.com, Inc | | Citigroup Global Markets | | | Call | | | | 01/21/22 | | | USD | 4,200.000 | | | | 24 | | | USD | 7,816,632 | | | $ | 555,048 | | | $ | (415,340 | ) |
| Amazon.com, Inc | | Citigroup Global Markets | | | Call | | | | 01/21/22 | | | USD | 4,300.000 | | | | 23 | | | USD | 7,490,939 | | | | 490,061 | | | | (358,709 | ) |
| Amazon.com, Inc | | Credit Suisse Securities (USA) LLC | | | Call | | | | 01/21/22 | | | USD | 3,800.000 | | | | 12 | | | USD | 3,908,316 | | | | 397,375 | | | | (317,793 | ) |
| Amazon.com, Inc | | Credit Suisse Securities (USA) LLC | | | Call | | | | 01/21/22 | | | USD | 3,800.000 | | | | 12 | | | USD | 3,908,316 | | | | 498,318 | | | | (317,793 | ) |
| Amazon.com, Inc | | Credit Suisse Securities (USA) LLC | | | Call | | | | 01/21/22 | | | USD | 3,800.000 | | | | 14 | | | USD | 4,559,702 | | | | 483,582 | | | | (370,758 | ) |
| Amazon.com, Inc | | Credit Suisse Securities (USA) LLC | | | Call | | | | 01/21/22 | | | USD | 3,900.000 | | | | 14 | | | USD | 4,559,702 | | | | 446,600 | | | | (333,008 | ) |
| Amazon.com, Inc | | Credit Suisse Securities (USA) LLC | | | Call | | | | 01/21/22 | | | USD | 3,900.000 | | | | 12 | | | USD | 3,908,316 | | | | 363,328 | | | | (285,435 | ) |
| Amazon.com, Inc | | Credit Suisse Securities (USA) LLC | | | Call | | | | 01/21/22 | | | USD | 3,900.000 | | | | 12 | | | USD | 3,908,316 | | | | 460,058 | | | | (285,435 | ) |
| Amazon.com, Inc | | Credit Suisse Securities (USA) LLC | | | Call | | | | 01/21/22 | | | USD | 4,000.000 | | | | 15 | | | USD | 4,885,395 | | | | 442,314 | | | | (321,326 | ) |
| Amazon.com, Inc | | Credit Suisse Securities (USA) LLC | | | Call | | | | 01/21/22 | | | USD | 4,000.000 | | | | 12 | | | USD | 3,908,316 | | | | 332,230 | | | | (257,060 | ) |
| Amazon.com, Inc | | Credit Suisse Securities (USA) LLC | | | Call | | | | 01/21/22 | | | USD | 4,000.000 | | | | 12 | | | USD | 3,908,316 | | | | 428,471 | | | | (257,060 | ) |
| Amazon.com, Inc | | RBC Capital Markets LLC | | | Call | | | | 01/21/22 | | | USD | 3,900.000 | | | | 15 | | | USD | 4,885,395 | | | | 359,955 | | | | (356,794 | ) |
| Amazon.com, Inc | | RBC Capital Markets LLC | | | Call | | | | 01/21/22 | | | USD | 4,000.000 | | | | 15 | | | USD | 4,885,395 | | | | 326,955 | | | | (321,326 | ) |
| Amazon.com, Inc | | RBC Capital Markets LLC | | | Call | | | | 01/21/22 | | | USD | 4,100.000 | | | | 16 | | | USD | 5,211,088 | | | | 315,152 | | | | (308,260 | ) |
| Amazon.com, Inc | | RBC Capital Markets LLC | | | Call | | | | 01/21/22 | | | USD | 4,200.000 | | | | 15 | | | USD | 4,885,395 | | | | 267,405 | | | | (259,588 | ) |
| Amazon.com, Inc | | RBC Capital Markets LLC | | | Call | | | | 01/21/22 | | | USD | 4,300.000 | | | | 16 | | | USD | 5,211,088 | | | | 262,352 | | | | (249,537 | ) |
| American Electric Power Co., Inc. | | Citigroup Global Markets | | | Call | | | | 01/15/21 | | | USD | 105.000 | | | | 1,000 | | | USD | 8,327,000 | | | | 157,000 | | | | — | |
| American Electric Power Co., Inc. | | Citigroup Global Markets | | | Call | | | | 01/15/21 | | | USD | 105.000 | | | | 988 | | | USD | 8,227,076 | | | | 155,116 | | | | — | |
| American Electric Power Co., Inc. | | Citigroup Global Markets | | | Call | | | | 01/15/21 | | | USD | 115.000 | | | | 597 | | | USD | 4,971,219 | | | | 105,376 | | | | — | |
| American Electric Power Co., Inc. | | JPMorgan Chase Bank N.A. | | | Call | | | | 01/21/22 | | | USD | 90.000 | | | | 196 | | | USD | 1,632,092 | | | | 70,315 | | | | (58,416 | ) |
| American Electric Power Co., Inc. | | JPMorgan Chase Bank N.A. | | | Call | | | | 01/21/22 | | | USD | 90.000 | | | | 1,134 | | | USD | 9,442,818 | | | | 412,810 | | | | (337,979 | ) |
| American Electric Power Co., Inc. | | JPMorgan Chase Bank N.A. | | | Call | | | | 01/21/22 | | | USD | 90.000 | | | | 127 | | | USD | 1,057,529 | | | | 43,876 | | | | (37,851 | ) |
| American Electric Power Co., Inc. | | JPMorgan Chase Bank N.A. | | | Call | | | | 01/21/22 | | | USD | 95.000 | | | | 393 | | | USD | 3,272,511 | | | | 88,869 | | | | (64,907 | ) |
| American Electric Power Co., Inc. | | JPMorgan Chase Bank N.A. | | | Call | | | | 01/21/22 | | | USD | 95.000 | | | | 254 | | | USD | 2,115,058 | | | | 53,162 | | | | (41,950 | ) |
| American Electric Power Co., Inc. | | JPMorgan Chase Bank N.A. | | | Call | | | | 01/21/22 | | | USD | 95.000 | | | | 1,134 | | | USD | 9,442,818 | | | | 250,070 | | | | (187,290 | ) |
| Bank of America Corp. | | Credit Suisse Securities (USA) LLC | | | Call | | | | 01/21/22 | | | USD | 30.000 | | | | 4,536 | | | USD | 13,748,616 | | | | 952,560 | | | | (1,824,722 | ) |
| Bank of America Corp. | | Credit Suisse Securities (USA) LLC | | | Call | | | | 01/21/22 | | | USD | 32.000 | | | | 2,346 | | | USD | 7,110,726 | | | | 575,239 | | | | (735,919 | ) |
| Bank of America Corp. | | Credit Suisse Securities (USA) LLC | | | Call | | | | 01/21/22 | | | USD | 35.000 | | | | 4,692 | | | USD | 14,221,452 | | | | 734,767 | | | | (986,344 | ) |
| Bank of America Corp. | | Susqehanna Financial Group, LLP | | | Call | | | | 01/21/22 | | | USD | 30.000 | | | | 7,501 | | | USD | 22,735,531 | | | | 1,927,757 | | | | (3,017,469 | ) |
| Becton Dickinson & Co. | | Goldman Sachs & Co. | | | Call | | | | 01/15/21 | | | USD | 260.000 | | | | 123 | | | USD | 3,077,706 | | | | 216,041 | | | | (16,626 | ) |
| Becton Dickinson & Co. | | Goldman Sachs & Co. | | | Call | | | | 01/15/21 | | | USD | 270.000 | | | | 123 | | | USD | 3,077,706 | | | | 172,893 | | | | (4,125 | ) |
| Becton Dickinson & Co. | | Goldman Sachs & Co. | | | Call | | | | 01/15/21 | | | USD | 280.000 | | | | 92 | | | USD | 2,302,024 | | | | 127,453 | | | | (837 | ) |
| Becton Dickinson & Co. | | Goldman Sachs & Co. | | | Call | | | | 01/15/21 | | | USD | 280.000 | | | | 91 | | | USD | 2,277,002 | | | | 115,160 | | | | (828 | ) |
| Becton Dickinson & Co. | | Goldman Sachs & Co. | | | Call | | | | 01/15/21 | | | USD | 300.000 | | | | 92 | | | USD | 2,302,024 | | | | 68,919 | | | | (94 | ) |
| Becton Dickinson & Co. | | Goldman Sachs & Co. | | | Call | | | | 01/15/21 | | | USD | 300.000 | | | | 75 | | | USD | 1,876,650 | | | | 70,180 | | | | (76 | ) |
| Becton Dickinson & Co. | | Goldman Sachs & Co. | | | Call | | | | 01/15/21 | | | USD | 300.000 | | | | 175 | | | USD | 4,378,850 | | | | 159,917 | | | | (178 | ) |
| Becton Dickinson & Co. | | Goldman Sachs & Co. | | | Call | | | | 01/15/21 | | | USD | 300.000 | | | | 212 | | | USD | 5,304,664 | | | | 257,181 | | | | (216 | ) |
| Becton Dickinson & Co. | | Goldman Sachs & Co. | | | Call | | | | 01/15/21 | | | USD | 300.000 | | | | 91 | | | USD | 2,277,002 | | | | 61,231 | | | | (93 | ) |
| Becton Dickinson & Co. | �� | Goldman Sachs & Co. | | | Call | | | | 01/15/21 | | | USD | 300.000 | | | | 12 | | | USD | 300,264 | | | | 11,991 | | | | (12 | ) |
| Danaher Corporation | | Credit Suisse Securities (USA) LLC | | | Call | | | | 01/21/22 | | | USD | 250.000 | | | | 726 | | | USD | 16,127,364 | | | | 1,384,482 | | | | (1,210,106 | ) |
See Accompanying Notes to Financial Statements
79
VY® T. ROWE PRICE
CAPITAL APPRECIATION PORTFOLIO | SUMMARY PORTFOLIO OF INVESTMENTS
AS OF DECEMBER 31, 2020 (CONTINUED) |
| Description | | Counterparty | | Put/Call | | Expiration
Date | | Exercise
Price | | Number of
Contracts | | Notional
Amount | | Premiums
Received | | Fair
Value |
|---|
| Facebook, Inc. — Class A | | JPMorgan Chase Bank N.A. | | | Call | | | | 01/15/21 | | | USD | 195.000 | | | | 246 | | | USD | 6,719,736 | | | $ | 275,793 | | | $ | (1,923,879 | ) |
| Facebook, Inc. — Class A | | JPMorgan Chase Bank N.A. | | | Call | | | | 01/15/21 | | | USD | 200.000 | | | | 246 | | | USD | 6,719,736 | | | | 235,479 | | | | (1,801,200 | ) |
| Facebook, Inc. — Class A | | JPMorgan Chase Bank N.A. | | | Call | | | | 01/15/21 | | | USD | 265.000 | | | | 158 | | | USD | 4,315,928 | | | | 156,736 | | | | (192,562 | ) |
| Facebook, Inc. — Class A | | JPMorgan Chase Bank N.A. | | | Call | | | | 01/15/21 | | | USD | 265.000 | | | | 186 | | | USD | 5,080,776 | | | | 186,372 | | | | (226,686 | ) |
| Facebook, Inc. — Class A | | JPMorgan Chase Bank N.A. | | | Call | | | | 01/15/21 | | | USD | 270.000 | | | | 186 | | | USD | 5,080,776 | | | | 164,982 | | | | (165,869 | ) |
| Facebook, Inc. — Class A | | JPMorgan Chase Bank N.A. | | | Call | | | | 01/15/21 | | | USD | 270.000 | | | | 158 | | | USD | 4,315,928 | | | | 138,566 | | | | (140,899 | ) |
| Facebook, Inc. — Class A | | JPMorgan Chase Bank N.A. | | | Call | | | | 01/15/21 | | | USD | 275.000 | | | | 186 | | | USD | 5,080,776 | | | | 145,452 | | | | (116,198 | ) |
| Facebook, Inc. — Class A | | JPMorgan Chase Bank N.A. | | | Call | | | | 01/15/21 | | | USD | 275.000 | | | | 158 | | | USD | 4,315,928 | | | | 121,186 | | | | (98,706 | ) |
| Facebook, Inc. — Class A | | JPMorgan Chase Bank N.A. | | | Call | | | | 01/21/22 | | | USD | 380.000 | | | | 94 | | | USD | 2,567,704 | | | | 182,268 | | | | (105,625 | ) |
| Facebook, Inc. — Class A | | JPMorgan Chase Bank N.A. | | | Call | | | | 01/21/22 | | | USD | 400.000 | | | | 898 | | | USD | 24,529,768 | | | | 1,933,125 | | | | (791,311 | ) |
| General Electric Co. | | JPMorgan Chase Bank N.A. | | | Call | | | | 01/15/21 | | | USD | 15.000 | | | | 6,248 | | | USD | 6,747,840 | | | | 353,137 | | | | (5,110 | ) |
| General Electric Co. | | JPMorgan Chase Bank N.A. | | | Call | | | | 01/15/21 | | | USD | 15.000 | | | | 3,732 | | | USD | 4,030,560 | | | | 325,654 | | | | (3,052 | ) |
| General Electric Co. | | JPMorgan Chase Bank N.A. | | | Call | | | | 01/15/21 | | | USD | 15.000 | | | | 12,416 | | | USD | 13,409,280 | | | | 1,044,806 | | | | (10,155 | ) |
| General Electric Co. | | JPMorgan Chase Bank N.A. | | | Call | | | | 01/15/21 | | | USD | 15.000 | | | | 6,247 | | | USD | 6,746,760 | | | | 324,844 | | | | (5,109 | ) |
| General Electric Co. | | JPMorgan Chase Bank N.A. | | | Call | | | | 01/15/21 | | | USD | 15.000 | | | | 6,208 | | | USD | 6,704,640 | | | | 530,039 | | | | (5,077 | ) |
| General Electric Co. | | JPMorgan Chase Bank N.A. | | | Call | | | | 01/15/21 | | | USD | 8.000 | | | | 6,168 | | | USD | 6,661,440 | | | | 746,945 | | | | (1,732,036 | ) |
| General Electric Co. | | JPMorgan Chase Bank N.A. | | | Call | | | | 01/15/21 | | | USD | 8.000 | | | | 7,088 | | | USD | 7,655,040 | | | | 524,512 | | | | (1,990,381 | ) |
| General Electric Co. | | JPMorgan Chase Bank N.A. | | | Call | | | | 01/15/21 | | | USD | 8.000 | | | | 6,016 | | | USD | 6,497,280 | | | | 454,870 | | | | (1,689,353 | ) |
| General Electric Co. | | JPMorgan Chase Bank N.A. | | | Call | | | | 01/15/21 | | | USD | 9.000 | | | | 6,016 | | | USD | 6,497,280 | | | | 297,491 | | | | (1,102,626 | ) |
| General Electric Co. | | JPMorgan Chase Bank N.A. | | | Call | | | | 01/15/21 | | | USD | 9.000 | | | | 7,088 | | | USD | 7,655,040 | | | | 340,224 | | | | (1,299,105 | ) |
| Hilton Worldwide Holdings, Inc. | | Citigroup Global Markets | | | Call | | | | 01/15/21 | | | USD | 125.000 | | | | 171 | | | USD | 1,902,546 | | | | 92,492 | | | | (2,889 | ) |
| Hilton Worldwide Holdings, Inc. | | Citigroup Global Markets | | | Call | | | | 01/15/21 | | | USD | 125.000 | | | | 6 | | | USD | 66,756 | | | | 3,306 | | | | (101 | ) |
| Hilton Worldwide Holdings, Inc. | | Citigroup Global Markets | | | Call | | | | 01/15/21 | | | USD | 130.000 | | | | 6 | | | USD | 66,756 | | | | 2,388 | | | | (30 | ) |
| Hilton Worldwide Holdings, Inc. | | Citigroup Global Markets | | | Call | | | | 01/15/21 | | | USD | 130.000 | | | | 172 | | | USD | 1,913,672 | | | | 67,427 | | | | (847 | ) |
| Hilton Worldwide Holdings, Inc. | | Credit Suisse Securities (USA) LLC | | | Call | | | | 01/15/21 | | | USD | 87.500 | | | | 62 | | | USD | 689,812 | | | | 46,853 | | | | (147,494 | ) |
| Hilton Worldwide Holdings, Inc. | | Credit Suisse Securities (USA) LLC | | | Call | | | | 01/15/21 | | | USD | 90.000 | | | | 62 | | | USD | 689,812 | | | | 41,236 | | | | (132,120 | ) |
| Humana, Inc. | | Credit Suisse Securities (USA) LLC | | | Call | | | | 01/15/21 | | | USD | 370.000 | | | | 122 | | | USD | 5,005,294 | | | | 412,201 | | | | (507,360 | ) |
| Humana, Inc. | | Credit Suisse Securities (USA) LLC | | | Call | | | | 01/15/21 | | | USD | 380.000 | | | | 122 | | | USD | 5,005,294 | | | | 359,778 | | | | (397,104 | ) |
| Humana, Inc. | | Credit Suisse Securities (USA) LLC | | | Call | | | | 01/15/21 | | | USD | 420.000 | | | | 91 | | | USD | 3,733,457 | | | | 251,742 | | | | (55,084 | ) |
| Humana, Inc. | | Credit Suisse Securities (USA) LLC | | | Call | | | | 01/15/21 | | | USD | 430.000 | | | | 91 | | | USD | 3,733,457 | | | | 218,436 | | | | (28,686 | ) |
| Intercontinental Exchange, Inc. | | JPMorgan Chase Bank N.A. | | | Call | | | | 01/15/21 | | | USD | 100.000 | | | | 364 | | | USD | 4,196,556 | | | | 215,594 | | | | (559,084 | ) |
| Intercontinental Exchange, Inc. | | JPMorgan Chase Bank N.A. | | | Call | | | | 01/15/21 | | | USD | 105.000 | | | | 364 | | | USD | 4,196,556 | | | | 147,067 | | | | (381,722 | ) |
| Mastercard Inc — Class A | | Goldman Sachs & Co. | | | Call | | | | 01/21/22 | | | USD | 400.000 | | | | 530 | | | USD | 18,893,864 | | | | 945,817 | | | | (1,513,955 | ) |
| Microsoft Corp. | | Citigroup Global Markets | | | Call | | | | 01/15/21 | | | USD | 165.000 | | | | 726 | | | USD | 16,147,692 | | | | 923,654 | | | | (4,168,692 | ) |
| Microsoft Corp. | | Citigroup Global Markets | | | Call | | | | 01/15/21 | | | USD | 170.000 | | | | 726 | | | USD | 16,147,692 | | | | 782,062 | | | | (3,805,692 | ) |
| Microsoft Corp. | | Credit Suisse Securities (USA) LLC | | | Call | | | | 01/15/21 | | | USD | 165.000 | | | | 1,200 | | | USD | 26,690,400 | | | | 830,400 | | | | (6,890,400 | ) |
| Microsoft Corp. | | Credit Suisse Securities (USA) LLC | | | Call | | | | 01/15/21 | | | USD | 165.000 | | | | 1,258 | | | USD | 27,980,436 | | | | 849,276 | | | | (7,223,436 | ) |
| Microsoft Corp. | | JPMorgan Chase Bank N.A. | | | Call | | | | 01/15/21 | | | USD | 170.000 | | | | 973 | | | USD | 21,641,466 | | | | 1,034,601 | | | | (5,100,466 | ) |
See Accompanying Notes to Financial Statements
80
VY® T. ROWE PRICE
CAPITAL APPRECIATION PORTFOLIO | SUMMARY PORTFOLIO OF INVESTMENTS
AS OF DECEMBER 31, 2020 (CONTINUED) |
| Description | | Counterparty | | Put/Call | | Expiration
Date | | Exercise
Price | | Number of
Contracts | | Notional
Amount | | Premiums
Received | | Fair
Value |
|---|
| Microsoft Corp. | | JPMorgan Chase Bank N.A. | | | Call | | | | 01/15/21 | | | USD | 170.000 | | | | 1,836 | | | USD | 40,836,312 | | | $ | 1,995,732 | | | $ | (9,624,312 | ) |
| Microsoft Corp. | | Citigroup Global Markets | | | Call | | | | 01/21/22 | | | USD | 280.000 | | | | 1,167 | | | USD | 25,956,414 | | | | 2,394,684 | | | | (1,021,083 | ) |
| NXP Semiconductors NV — NXPI — US | | Credit Suisse Securities (USA) LLC | | | Call | | | | 01/15/21 | | | USD | 140.000 | | | | 409 | | | USD | 6,503,509 | | | | 302,987 | | | | (793,113 | ) |
| NXP Semiconductors NV — NXPI — US | | Credit Suisse Securities (USA) LLC | | | Call | | | | 01/15/21 | | | USD | 140.000 | | | | 973 | | | USD | 15,471,673 | | | | 737,145 | | | | (1,886,794 | ) |
| NXP Semiconductors NV — NXPI — US | | Credit Suisse Securities (USA) LLC | | | Call | | | | 01/15/21 | | | USD | 140.000 | | | | 174 | | | USD | 2,766,774 | | | | 121,835 | | | | (337,412 | ) |
| NXP Semiconductors NV — NXPI — US | | JPMorgan Chase Bank N.A. | | | Call | | | | 01/15/21 | | | USD | 125.000 | | | | 152 | | | USD | 2,416,952 | | | | 103,659 | | | | (517,691 | ) |
| NXP Semiconductors NV — NXPI — US | | JPMorgan Chase Bank N.A. | | | Call | | | | 01/15/21 | | | USD | 135.000 | | | | 148 | | | USD | 2,353,348 | | | | 129,843 | | | | (358,155 | ) |
| NXP Semiconductors NV — NXPI — US | | JPMorgan Chase Bank N.A. | | | Call | | | | 01/15/21 | | | USD | 135.000 | | | | 90 | | | USD | 1,431,090 | | | | 82,094 | | | | (217,797 | ) |
| NXP Semiconductors NV — NXPI — US | | JPMorgan Chase Bank N.A. | | | Call | | | | 01/15/21 | | | USD | 135.000 | | | | 180 | | | USD | 2,862,180 | | | | 163,926 | | | | (435,594 | ) |
| NXP Semiconductors NV — NXPI — US | | JPMorgan Chase Bank N.A. | | | Call | | | | 01/15/21 | | | USD | 140.000 | | | | 180 | | | USD | 2,862,180 | | | | 133,706 | | | | (349,047 | ) |
| NXP Semiconductors NV — NXPI — US | | JPMorgan Chase Bank N.A. | | | Call | | | | 01/15/21 | | | USD | 140.000 | | | | 90 | | | USD | 1,431,090 | | | | 65,054 | | | | (174,524 | ) |
| NXP Semiconductors NV — NXPI — US | | JPMorgan Chase Bank N.A. | | | Call | | | | 01/15/21 | | | USD | 140.000 | | | | 148 | | | USD | 2,353,348 | | | | 105,598 | | | | (286,994 | ) |
| NXP Semiconductors NV — NXPI — US | | JPMorgan Chase Bank N.A. | | | Call | | | | 01/15/21 | | | USD | 145.000 | | | | 148 | | | USD | 2,353,348 | | | | 84,313 | | | | (218,633 | ) |
| NXP Semiconductors NV — NXPI — US | | JPMorgan Chase Bank N.A. | | | Call | | | | 01/15/21 | | | USD | 145.000 | | | | 90 | | | USD | 1,431,090 | | | | 50,703 | | | | (132,953 | ) |
| NXP Semiconductors NV — NXPI — US | | JPMorgan Chase Bank N.A. | | | Call | | | | 01/15/21 | | | USD | 145.000 | | | | 180 | | | USD | 2,862,180 | | | | 107,086 | | | | (265,906 | ) |
| Roper Technologies Inc | | Goldman Sachs & Co. | | | Call | | | | 05/21/21 | | | USD | 420.000 | | | | 146 | | | USD | 6,285,548 | | | | 228,782 | | | | (516,217 | ) |
| Roper Technologies Inc | | Goldman Sachs & Co. | | | Call | | | | 05/21/21 | | | USD | 440.000 | | | | 175 | | | USD | 7,534,048 | | | | 153,475 | | | | (424,693 | ) |
| Thermo Fisher Scientific, Inc. | | RBC Capital Markets LLC | | | Call | | | | 01/15/21 | | | USD | 370.000 | | | | 115 | | | USD | 5,356,470 | | | | 161,667 | | | | (1,103,317 | ) |
| Thermo Fisher Scientific, Inc. | | RBC Capital Markets LLC | | | Call | | | | 01/15/21 | | | USD | 390.000 | | | | 115 | | | USD | 5,356,470 | | | | 95,242 | | | | (875,287 | ) |
| UnitedHealth Group, Inc. | | JPMorgan Chase Bank N.A. | | | Call | | | | 01/15/21 | | | USD | 320.000 | | | | 132 | | | USD | 4,628,976 | | | | 238,905 | | | | (423,036 | ) |
| UnitedHealth Group, Inc. | | JPMorgan Chase Bank N.A. | | | Call | | | | 01/15/21 | | | USD | 320.000 | | | | 150 | | | USD | 5,260,200 | | | | 305,012 | | | | (480,722 | ) |
| UnitedHealth Group, Inc. | | JPMorgan Chase Bank N.A. | | | Call | | | | 01/15/21 | | | USD | 320.000 | | | | 234 | | | USD | 8,205,912 | | | | 445,389 | | | | (749,927 | ) |
| UnitedHealth Group, Inc. | | JPMorgan Chase Bank N.A. | | | Call | | | | 01/15/21 | | | USD | 320.000 | | | | 122 | | | USD | 4,278,296 | | | | 209,126 | | | | (390,988 | ) |
| UnitedHealth Group, Inc. | | JPMorgan Chase Bank N.A. | | | Call | | | | 01/15/21 | | | USD | 320.000 | | | | 18 | | | USD | 631,224 | | | | 29,980 | | | | (57,687 | ) |
| UnitedHealth Group, Inc. | | JPMorgan Chase Bank N.A. | | | Call | | | | 01/15/21 | | | USD | 320.000 | | | | 90 | | | USD | 3,156,120 | | | | 193,073 | | | | (288,433 | ) |
| UnitedHealth Group, Inc. | | JPMorgan Chase Bank N.A. | | | Call | | | | 01/15/21 | | | USD | 330.000 | | | | 122 | | | USD | 4,278,296 | | | | 168,351 | | | | (282,746 | ) |
| Visa, Inc. — Class A | | Credit Suisse Securities (USA) LLC | | | Call | | | | 01/15/21 | | | USD | 230.000 | | | | 303 | | | USD | 6,627,519 | | | | 215,433 | | | | (27,192 | ) |
| Visa, Inc. — Class A | | Credit Suisse Securities (USA) LLC | | | Call | | | | 01/15/21 | | | USD | 230.000 | | | | 497 | | | USD | 10,870,881 | | | | 387,511 | | | | (44,602 | ) |
| Visa, Inc. — Class A | | Credit Suisse Securities (USA) LLC | | | Call | | | | 01/15/21 | | | USD | 235.000 | | | | 497 | | | USD | 10,870,881 | | | | 314,999 | | | | (21,762 | ) |
| Visa, Inc. — Class A | | Credit Suisse Securities (USA) LLC | | | Call | | | | 01/15/21 | | | USD | 235.000 | | | | 303 | | | USD | 6,627,519 | | | | 175,255 | | | | (13,267 | ) |
| Visa, Inc. — Class A | | Credit Suisse Securities (USA) LLC | | | Call | | | | 01/15/21 | | | USD | 240.000 | | | | 497 | | | USD | 10,870,881 | | | | 254,911 | | | | (11,258 | ) |
| Visa, Inc. — Class A | | Credit Suisse Securities (USA) LLC | | | Call | | | | 01/15/21 | | | USD | 240.000 | | | | 303 | | | USD | 6,627,519 | | | | 140,865 | | | | (6,863 | ) |
| Visa, Inc. — Class A | | Goldman Sachs & Co. | | | Call | | | | 01/15/21 | | | USD | 185.000 | | | | 123 | | | USD | 2,690,379 | | | | 222,252 | | | | (416,356 | ) |
| Visa, Inc. — Class A | | Goldman Sachs & Co. | | | Call | | | | 01/15/21 | | | USD | 195.000 | | | | 123 | | | USD | 2,690,379 | | | | 169,856 | | | | (295,687 | ) |
| Visa, Inc. — Class A | | Goldman Sachs & Co. | | | Call | | | | 01/15/21 | | | USD | 200.000 | | | | 245 | | | USD | 5,358,885 | | | | 274,253 | | | | (471,668 | ) |
| Visa, Inc. — Class A | | Goldman Sachs & Co. | | | Call | | | | 01/15/21 | | | USD | 210.000 | | | | 245 | | | USD | 5,358,885 | | | | 195,201 | | | | (253,049 | ) |
| Visa, Inc. — Class A | | Goldman Sachs & Co. | | | Call | | | | 01/15/21 | | | USD | 210.000 | | | | 121 | | | USD | 2,646,633 | | | | 156,097 | | | | (124,975 | ) |
| Visa, Inc. — Class A | | Goldman Sachs & Co. | | | Call | | | | 01/15/21 | | | USD | 210.000 | | | | 93 | | | USD | 2,034,189 | | | | 84,668 | | | | (96,055 | ) |
| Visa, Inc. — Class A | | Goldman Sachs & Co. | | | Call | | | | 01/15/21 | | | USD | 210.000 | | | | 94 | | | USD | 2,056,062 | | | | 80,942 | | | | (97,088 | ) |
| Visa, Inc. — Class A | | Goldman Sachs & Co. | | | Call | | | | 01/15/21 | | | USD | 210.000 | | | | 304 | | | USD | 6,649,392 | | | | 384,429 | | | | (313,988 | ) |
See Accompanying Notes to Financial Statements
81
VY® T. ROWE PRICE
CAPITAL APPRECIATION PORTFOLIO | SUMMARY PORTFOLIO OF INVESTMENTS
AS OF DECEMBER 31, 2020 (CONTINUED) |
| Description | | Counterparty | | Put/Call | | Expiration
Date | | Exercise
Price | | Number of
Contracts | | Notional
Amount | | Premiums
Received | | Fair
Value |
|---|
| Visa, Inc. �� Class A | | Goldman Sachs & Co. | | | Call | | | | 01/15/21 | | | USD | 215.000 | | | | 94 | | | USD | 2,056,062 | | | $ | 59,749 | | | $ | (61,892 | ) |
| Visa, Inc. — Class A | | Goldman Sachs & Co. | | | Call | | | | 01/15/21 | | | USD | 215.000 | | | | 93 | | | USD | 2,034,189 | | | | 63,191 | | | | (61,234 | ) |
| Visa, Inc. — Class A | | Goldman Sachs & Co. | | | Call | | | | 01/15/21 | | | USD | 220.000 | | | | 93 | | | USD | 2,034,189 | | | | 55,526 | | | | (34,435 | ) |
| Visa, Inc. — Class A | | Goldman Sachs & Co. | | | Call | | | | 01/15/21 | | | USD | 220.000 | | | | 94 | | | USD | 2,056,062 | | | | 52,646 | | | | (34,805 | ) |
| Visa, Inc. — Class A | | Goldman Sachs & Co. | | | Call | | | | 01/15/21 | | | USD | 220.000 | | | | 121 | | | USD | 2,646,633 | | | | 106,739 | | | | (44,802 | ) |
| Visa, Inc. — Class A | | Goldman Sachs & Co. | | | Call | | | | 01/15/21 | | | USD | 230.000 | | | | 124 | | | USD | 2,712,252 | | | | 116,895 | | | | (11,128 | ) |
| Visa, Inc. — Class A | | Goldman Sachs & Co. | | | Call | | | | 01/15/21 | | | USD | 230.000 | | | | 151 | | | USD | 3,302,823 | | | | 154,485 | | | | (13,551 | ) |
| Visa, Inc. — Class A | | Goldman Sachs & Co. | | | Call | | | | 01/15/21 | | | USD | 240.000 | | | | 124 | | | USD | 2,712,252 | | | | 79,219 | | | | (2,809 | ) |
| Visa, Inc. — Class A | | Goldman Sachs & Co. | | | Call | | | | 01/15/21 | | | USD | 240.000 | | | | 151 | | | USD | 3,302,823 | | | | 106,253 | | | | (3,420 | ) |
| Visa, Inc. — Class A | | Citigroup Global Markets | | | Call | | | | 01/21/22 | | | USD | 250.000 | | | | 774 | | | USD | 16,929,702 | | | | 660,818 | | | | (976,687 | ) |
| Visa, Inc. —Class A | | Goldman Sachs & Co. | | | Call | | | | 01/21/22 | | | USD | 225.000 | | | | 248 | | | USD | 5,424,504 | | | | 323,084 | | | | (549,121 | ) |
| Visa, Inc. — Class A | | Goldman Sachs & Co. | | | Call | | | | 01/21/22 | | | USD | 225.000 | | | | 123 | | | USD | 2,690,379 | | | | 146,616 | | | | (272,346 | ) |
| Visa, Inc. — Class A | | Goldman Sachs & Co. | | | Call | | | | 01/21/22 | | | USD | 225.000 | | | | 120 | | | USD | 2,624,760 | | | | 161,640 | | | | (265,704 | ) |
| Visa, Inc. — Class A | | Goldman Sachs & Co. | | | Call | | | | 01/21/22 | | | USD | 230.000 | | | | 123 | | | USD | 2,690,379 | | | | 125,706 | | | | (245,266 | ) |
| Visa, Inc. — Class A | | Goldman Sachs & Co. | | | Call | | | | 01/21/22 | | | USD | 230.000 | | | | 248 | | | USD | 5,424,504 | | | | 289,044 | | | | (494,520 | ) |
| Visa, Inc. — Class A | | Goldman Sachs & Co. | | | Call | | | | 01/21/22 | | | USD | 230.000 | | | | 120 | | | USD | 2,624,760 | | | | 140,640 | | | | (239,284 | ) |
| Visa, Inc. — Class A | | Goldman Sachs & Co. | | | Call | | | | 01/21/22 | | | USD | 250.000 | | | | 237 | | | USD | 5,183,901 | | | | 289,614 | | | | (299,063 | ) |
| Visa, Inc. — Class A | | Goldman Sachs & Co. | | | Call | | | | 01/21/22 | | | USD | 260.000 | | | | 237 | | | USD | 5,183,901 | | | | 222,069 | | | | (234,677 | ) |
| Visa, Inc. — Class A | | Goldman Sachs & Co. | | | Call | | | | 01/21/22 | | | USD | 270.000 | | | | 237 | | | USD | 5,183,901 | | | | 168,744 | | | | (182,743 | ) |
| Yum! Brands, Inc. | | Bank of America N.A. | | | Call | | | | 01/15/21 | | | USD | 100.000 | | | | 89 | | | USD | 966,184 | | | | 43,343 | | | | (77,938 | ) |
| Yum! Brands, Inc. | | Bank of America N.A. | | | Call | | | | 01/15/21 | | | USD | 100.000 | | | | 278 | | | USD | 3,017,968 | | | | 111,887 | | | | (243,447 | ) |
| Yum! Brands, Inc. | | Bank of America N.A. | | | Call | | | | 01/15/21 | | | USD | 95.000 | | | | 278 | | | USD | 3,017,968 | | | | 156,397 | | | | (378,297 | ) |
| Yum! Brands, Inc. | | Bank of America N.A. | | | Call | | | �� | 01/15/21 | | | USD | 95.000 | | | | 89 | | | USD | 966,184 | | | | 58,829 | | | | (121,109 | ) |
| Yum! Brands, Inc. | | Citigroup Global Markets | | | Call | | | | 01/15/21 | | | USD | 100.000 | | | | 303 | | | USD | 3,289,368 | | | | 150,543 | | | | (265,340 | ) |
| Yum! Brands, Inc. | | Citigroup Global Markets | | | Call | | | | 01/15/21 | | | USD | 100.000 | | | | 303 | | | USD | 3,289,368 | | | | 129,802 | | | | (265,340 | ) |
| Yum! Brands, Inc. | | Citigroup Global Markets | | | Call | | | | 01/15/21 | | | USD | 105.000 | | | | 303 | | | USD | 3,289,368 | | | | 83,125 | | | | (132,474 | ) |
| Yum! Brands, Inc. | | Citigroup Global Markets | | | Call | | | | 01/15/21 | | | USD | 105.000 | | | | 303 | | | USD | 3,289,368 | | | | 103,465 | | | | (132,474 | ) |
| | | | | | | | | | | | | | | | | | | | | | | | | $ | 51,671,233 | | | $ | (98,227,223 | ) |
| Currency Abbreviations |
| USD | | — United States Dollar |
A summary of derivative instruments by primary risk exposure is outlined in the following tables.
The fair value of derivative instruments as of December 31, 2020 was as follows:
Derivatives not accounted for as
hedging instruments | | | Location on Statement
of Assets and Liabilities | | Fair Value |
|---|
Liability Derivatives | | | | | | | | |
| Equity contracts | | | Written options, at fair value | | | $ | 98,227,223 | |
Total Liability Derivatives | | | | | | $ | 98,227,223 | |
The effect of derivative instruments on the Portfolio’s Statement of Operations for the year ended December 31, 2020 was as follows:
| | | Amount of Realized Gain or (Loss)
on Derivatives Recognized in Income |
|---|
Derivatives not accounted for as
hedging instruments | | Forward foreign
currency contracts | | Written Options | | Totals |
|---|
| Equity contracts | | | $ | — | | | | $ | 21,056,885 | | | | $ | 21,056,885 | |
| Foreign exchange contracts | | | | (5,109 | ) | | | | — | | | | | (5,109 | ) |
Total | | | $ | (5,109 | ) | | | $ | 21,056,885 | | | | $ | 21,051,776 | |
| | | | | | | | | | | |
|---|
Derivatives not accounted for as
hedging instruments | | Forward foreign
currency contracts | | Written Options | | Totals |
|---|
| Equity contracts | | | $ | — | | | | $ | (6,919,637 | ) | | | $ | (6,919,637 | ) |
| Foreign exchange contracts | | | | (161 | ) | | | | — | | | | | (161 | ) |
Total | | | $ | (161 | ) | | | $ | (6,919,637 | ) | | | $ | (6,919,798 | ) |
| * | | Amounts recognized for purchased options are included in net realized gain (loss) on investments and net change in unrealized appreciation or depreciation on investments. |
See Accompanying Notes to Financial Statements
82
VY® T. ROWE PRICE
CAPITAL APPRECIATION PORTFOLIO | SUMMARY PORTFOLIO OF INVESTMENTS
AS OF DECEMBER 31, 2020 (CONTINUED) |
The following is a summary by counterparty of the fair value of OTC derivative instruments subject to Master Netting Agreements and collateral pledged (received), if any, at December 31, 2020:
| | Bank of
America N.A. | | Citigroup
Global
Markets | | Credit Suisse
Securities
(USA) LLC | | Goldman
Sachs & Co. | | JPMorgan
Chase
Bank N.A. | | RBC
Capital
Markets | | Susqehanna
Financial
Group,LLP | | Totals |
|---|
Liabilities: | | | | | | | | | | | | | | | | | | | | | | | | | | | | | | | | |
| Written options | | $ | 820,791 | | | $ | 16,053,443 | | | $ | 26,026,706 | | | $ | 13,404,956 | | | $ | 35,429,749 | | | $ | 3,474,109 | | | $ | 3,017,469 | | | $ | 98,227,223 | |
Total Liabilities | | $ | 820,791 | | | $ | 16,053,443 | | | $ | 26,026,706 | | | $ | 13,404,956 | | | $ | 35,429,749 | | | $ | 3,474,109 | | | $ | 3,017,469 | | | $ | 98,227,223 | |
Net OTC derivative instruments by counterparty, at fair value | | $ | (820,791 | ) | | $ | (16,053,443 | ) | | $ | (26,026,706 | ) | | $ | (13,404,956 | ) | | $ | (35,429,749 | ) | | $ | (3,474,109 | ) | | $ | (3,017,469 | ) | | $ | (98,227,223 | ) |
Total collateral pledged by the Portfolio/(Received from counterparty) | | $ | — | | | $ | — | | | $ | — | | | $ | — | | | $ | — | | | $ | — | | | $ | — | | | $ | — | |
Net Exposure(1) | | $ | (820,791 | ) | | $ | (16,053,443 | ) | | $ | (26,026,706 | ) | | $ | (13,404,956 | ) | | $ | (35,429,749 | ) | | $ | (3,474,109 | ) | | $ | (3,017,469 | ) | | $ | (98,227,223 | ) |
(1) | | Positive net exposure represents amounts due from each respective counterparty. Negative exposure represents amounts due from the Portfolio. Please refer to Note 2 for additional details regarding counterparty credit risk and credit related contingent features. |
At December 31, 2020, the aggregate cost of securities and other investments and the composition of unrealized appreciation and depreciation of securities and other investments on a tax basis were:
| Cost for federal income tax purposes was $6,665,105,224. | | | | | | |
| Net unrealized appreciation consisted of: | | | | | | |
| Gross Unrealized Appreciation | | | | $ | 1,400,479,671 | |
| Gross Unrealized Depreciation | | | | | (92,404,431 | ) |
| Net Unrealized Appreciation | | | | $ | 1,308,075,240 | |
See Accompanying Notes to Financial Statements
83
VY® T. ROWE PRICE
EQUITY INCOME PORTFOLIO | SUMMARY PORTFOLIO OF INVESTMENTS
AS OF DECEMBER 31, 2020 |
| Shares | | | | | | | | Value | | Percentage
of Net
Assets |
|---|
| |
COMMON STOCK: 96.6% |
| | Communication Services: 5.4% |
| 116,983 | | | | | | Comcast Corp. — Class A | | $ | 6,129,909 | | | | 1.8 | |
| 242,934 | | | | | | News Corp — Class A | | | 4,365,524 | | | | 1.2 | |
| 20,384 | | | | (1) | | Walt Disney Co. | | | 3,693,173 | | | | 1.1 | |
| 138,036 | | | | | | Other Securities | | | 4,584,847 | | | | 1.3 | |
| | | | | | | | | | 18,773,453 | | | | 5.4 | |
| |
| | Consumer Discretionary: 4.1% |
| 64,611 | | | | | | Kohl’s Corp. | | | 2,629,022 | | | | 0.8 | |
| 59,423 | | | | | | Las Vegas Sands Corp. | | | 3,541,611 | | | | 1.0 | |
| 150,917 | | | | | | Volkswagen AG ADR | | | 2,810,059 | | | | 0.8 | |
| 187,416 | | | | (2) | | Other Securities | | | 5,322,666 | | | | 1.5 | |
| | | | | | | | | | 14,303,358 | | | | 4.1 | |
| |
| | |
| 125,312 | | | | | | Conagra Brands, Inc. | | | 4,543,813 | | | | 1.3 | |
| 24,540 | | | | | | Kimberly-Clark Corp. | | | 3,308,728 | | | | 1.0 | |
| 74,828 | | | | | | Philip Morris International, Inc. | | | 6,195,010 | | | | 1.8 | |
| 90,117 | | | | | | Tyson Foods, Inc. | | | 5,807,140 | | | | 1.7 | |
| 85,049 | | | | | | Other Securities | | | 5,667,127 | | | | 1.6 | |
| | | | | | | | | | 25,521,818 | | | | 7.4 | |
| |
| | |
| 157,991 | | | | | | Total SE ADR | | | 6,621,403 | | | | 1.9 | |
| 486,097 | | | | | | Other Securities | | | 16,036,038 | | | | 4.6 | |
| | | | | | | | | | 22,657,441 | | | | 6.5 | |
| |
| | |
| 172,421 | | | | | | American International Group, Inc. | | | 6,527,859 | | | | 1.9 | |
| 51,475 | | | | | | Chubb Ltd. | | | 7,923,032 | | | | 2.3 | |
| 106,998 | | | | | | Equitable Holdings, Inc. | | | 2,738,079 | | | | 0.8 | |
| 184,260 | | | | | | Fifth Third Bancorp | | | 5,080,048 | | | | 1.5 | |
| 25,623 | | | | | | JPMorgan Chase & Co. | | | 3,255,915 | | | | 0.9 | |
| 107,776 | | | | | | Loews Corp. | | | 4,852,075 | | | | 1.4 | |
| 146,026 | | | | | | Metlife, Inc. | | | 6,855,921 | | | | 2.0 | |
| 106,419 | | | | | | Morgan Stanley | | | 7,292,894 | | | | 2.1 | |
| 23,832 | | | | | | PNC Financial Services Group, Inc. | | | 3,550,968 | | | | 1.0 | |
| 61,951 | | | | | | State Street Corp. | | | 4,508,794 | | | | 1.3 | |
| 320,733 | | | | | | Wells Fargo & Co. | | | 9,679,722 | | | | 2.8 | |
| 148,370 | | | | | | Other Securities | | | 9,310,063 | | | | 2.7 | |
| | | | | | | | | | 71,575,370 | | | | 20.7 | |
| |
| | |
| 58,509 | | | | | | AbbVie, Inc. | | | 6,269,239 | | | | 1.8 | |
| 17,950 | | | | | | Anthem, Inc. | | | 5,763,565 | | | | 1.7 | |
| 18,545 | | | | | | Becton Dickinson & Co. | | | 4,640,330 | | | | 1.3 | |
| 66,451 | | | | | | CVS Health Corp. | | | 4,538,603 | | | | 1.3 | |
| 30,574 | | | | | | Johnson & Johnson | | | 4,811,736 | | | | 1.4 | |
| 48,061 | | | | | | Medtronic PLC | | | 5,629,866 | | | | 1.6 | |
| 111,755 | | | | | | Pfizer, Inc. | | | 4,113,702 | | | | 1.2 | |
| 167,435 | | | | (2),(3) | | Other Securities | | | 8,703,800 | | | | 2.5 | |
| | | | | | | | | | 44,470,841 | | | | 12.8 | |
| |
| | |
| 20,964 | | | | | | Boeing Co. | | | 4,487,554 | | | | 1.3 | |
| 845,260 | | | | | | General Electric Co. | | | 9,128,808 | | | | 2.6 | |
| Shares | | | | | | | | Value | | Percentage
of Net
Assets |
|---|
| |
COMMON STOCK: (continued) |
| | |
| 26,631 | | | | | | L3Harris Technologies, Inc. | | $ | 5,033,792 | | | | 1.4 | |
| 126,067 | | | | | | Nielsen Holdings PLC | | | 2,631,018 | | | | 0.8 | |
| 38,747 | | | | (1) | | Stericycle, Inc. | | | 2,686,329 | | | | 0.8 | |
| 46,869 | | | | | | United Parcel Service, Inc. — Class B | | | 7,892,740 | | | | 2.3 | |
| 118,370 | | | | | | Other Securities | | | 10,067,401 | | | | 2.9 | |
| | | | | | | | | | 41,927,642 | | | | 12.1 | |
| |
| | Information Technology: 9.5% |
| 54,516 | | | | | | Applied Materials, Inc. | | | 4,704,731 | | | | 1.4 | |
| 121,114 | | | | | | Cisco Systems, Inc. | | | 5,419,851 | | | | 1.6 | |
| 21,124 | | | | | | Microsoft Corp. | | | 4,698,400 | | | | 1.3 | |
| 70,737 | | | | | | Qualcomm, Inc. | | | 10,776,075 | | | | 3.1 | |
| 22,861 | | | | | | Texas Instruments, Inc. | | | 3,752,176 | | | | 1.1 | |
| 25,245 | | | | | | Other Securities | | | 3,446,521 | | | | 1.0 | |
| | | | | | | | | | 32,797,754 | | | | 9.5 | |
| |
| | |
| 138,543 | | | | | | CF Industries Holdings, Inc. | | | 5,363,000 | | | | 1.5 | |
| 120,021 | | | | | | DuPont de Nemours, Inc. | | | 8,534,693 | | | | 2.5 | |
| 117,418 | | | | | | International Paper Co. | | | 5,838,023 | | | | 1.7 | |
| 12,438 | | | | | | Other Securities | | | 1,537,561 | | | | 0.4 | |
| | | | | | | | | | 21,273,277 | | | | 6.1 | |
| |
| | |
| 64,716 | | | | | | Equity Residential | | | 3,836,365 | | | | 1.1 | |
| 96,860 | | | | | | Rayonier, Inc. | | | 2,845,747 | | | | 0.8 | |
| 195,274 | | | | | | Weyerhaeuser Co. | | | 6,547,537 | | | | 1.9 | |
| 36,802 | | | | | | Other Securities | | | 2,252,639 | | | | 0.7 | |
| | | | | | | | | | 15,482,288 | | | | 4.5 | |
| |
| | |
| 54,250 | | | | | | Edison International | | | 3,407,985 | | | | 1.0 | |
| 244,253 | | | | | | NiSource, Inc. | | | 5,603,164 | | | | 1.6 | |
| 21,450 | | | | | | Sempra Energy | | | 2,732,944 | | | | 0.8 | |
| 151,728 | | | | | | Southern Co. | | | 9,320,651 | | | | 2.7 | |
| 63,380 | | | | | | Other Securities | | | 4,990,437 | | | | 1.4 | |
| | | | | | | | | | 26,055,181 | | | | 7.5 | |
| |
| | | | | | | Total Common Stock
(Cost $270,453,640) | | | 334,838,423 | | | | 96.6 | |
| |
PREFERRED STOCK: 1.9% |
| | |
| 26,624 | | | | (2),(3) | | Other Securities | | | 1,467,781 | | | | 0.4 | |
| |
| | | | | | | | | | | | | | | |
| | |
| 76,503 | | | | (2),(3) | | Other Securities | | | 5,076,369 | | | | 1.5 | |
| |
| | | | | | | Total Preferred Stock
(Cost $6,297,815) | | | 6,544,150 | | | | 1.9 | |
| |
WARRANTS: 0.0% |
| | |
| 7,897 | | | | (2) | | Other Securities | | | 53,779 | | | | 0.0 | |
| |
| | | | | | | Total Warrants
(Cost $39,086) | | | 53,779 | | | | 0.0 | |
See Accompanying Notes to Financial Statements
84
VY® T. ROWE PRICE
EQUITY INCOME PORTFOLIO | SUMMARY PORTFOLIO OF INVESTMENTS
AS OF DECEMBER 31, 2020 (CONTINUED) |
Principal
Amount† | | | | | | | | Value | | Percentage
of Net
Assets |
|---|
| |
CONVERTIBLE BONDS/NOTES: 0.3% |
| | |
| 772,000 | | | | (4) | | AXA SA, 7.250%,
05/15/2021 | | $ | 883,457 | | | | 0.3 | |
| |
| | | | | | | Total Convertible Bonds/Notes
(Cost $772,000) | | | 883,457 | | | | 0.3 | |
| |
| | | | | | | Total Long-Term
Investments
(Cost $277,562,541) | | | 342,319,809 | | | | 98.8 | |
| |
SHORT-TERM INVESTMENTS: 1.3% |
| | Repurchase Agreements: 0.7% |
| 1,000,000 | | | | (5) | | Citigroup, Inc., Repurchase Agreement dated 12/31/20, 0.07%, due 01/04/21 (Repurchase Amount $1,000,008, collateralized by various U.S. Government/U.S. Government Agency Obligations, 0.000%–4.000%, Market Value plus accrued interest $1,020,000, due 09/15/21–01/01/51) | | | 1,000,000 | | | | 0.3 | |
| 311,754 | | | | (5) | | Nomura Securities, Repurchase Agreement dated 12/31/20, 0.07%, due 01/04/21 (Repurchase Amount $311,756, collateralized by various U.S. Government/U.S. Government Agency Obligations, 0.000%–8.500%, Market Value plus accrued interest $317,989, due 01/31/21–01/15/56) | | | 311,754 | | | | 0.1 | |
| 1,000,000 | | | | (5) | | RBC Dominion Securities Inc., Repurchase Agreement dated 12/31/20, 0.08%, due 01/04/21 (Repurchase Amount $1,000,009, collateralized by various U.S. Government/U.S. Government Agency Obligations, 0.000%–6.000%, Market Value plus accrued interest $1,020,000, due 01/05/21–12/20/50) | | | 1,000,000 | | | | 0.3 | |
| |
| | | | | | | Total Repurchase Agreements
(Cost $2,311,754) | | | 2,311,754 | | | | 0.7 | |
| Shares | | | | | | | | Value | | Percentage
of Net
Assets |
|---|
| |
SHORT-TERM INVESTMENTS: (continued) |
| | |
| 2,187,729 | | | | (6) | | T. Rowe Price Government Reserve Fund, 0.080%
(Cost $2,187,729) | | $ | 2,187,729 | | | | 0.6 | |
| |
| | | | | | | Total Short-Term
Investments
(Cost $4,499,483) | | | 4,499,483 | | | | 1.3 | |
| |
| | | | | | | Total Investments in Securities
(Cost $282,062,024) | | $ | 346,819,292 | | | | 100.1 | |
| | | | | | | Liabilities in Excess of Other Assets | | | (285,113 | ) | | | (0.1 | ) |
| | | | | | | Net Assets | | $ | 346,534,179 | | | | 100.0 | |
“Other Securities” represents issues not identified as the top 50 holdings in terms of market value and issues or issuers not exceeding 1% of net assets individually or in aggregate respectively as of December 31, 2020.
The following footnotes apply to either the individual securities noted or one or more of the securities aggregated and listed as a single line item.
| † | | Unless otherwise indicated, principal amount is shown in USD. |
| ADR | | American Depositary Receipt |
| (1) | | Non-income producing security. |
| (2) | | The grouping contains non-income producing securities. |
| (3) | | The grouping contains securities on loan. |
| (4) | | Securities with purchases pursuant to Rule 144A or section 4(a)(2), under the Securities Act of 1933 and may not be resold subject to that rule except to qualified institutional buyers. |
| (5) | | All or a portion of the security represents securities purchased with cash collateral received for securities on loan. |
| (6) | | Rate shown is the 7-day yield as of December 31, 2020. |
See Accompanying Notes to Financial Statements
85
VY® T. ROWE PRICE
EQUITY INCOME PORTFOLIO | SUMMARY PORTFOLIO OF INVESTMENTS
AS OF DECEMBER 31, 2020 (CONTINUED) |
Fair Value Measurementsˆ
The following is a summary of the fair valuations according to the inputs used as of December 31, 2020 in valuing the assets and liabilities:
| | Quoted Prices
in Active Markets
for Identical
Investments
(Level 1) | | Significant
Other
Observable
Inputs#
(Level 2) | | Significant
Unobservable
Inputs
(Level 3) | | Fair Value
at
December 31, 2020 |
|---|
Asset Table | | | | | | | | | | | | | | | | | | | | |
Investments, at fair value | | | | | | | | | | | | | | | | | | | | |
| Common Stock | | | | | | | | | | | | | | | | | | | | |
| Communication Services | | | $ | 18,773,453 | | | | $ | — | | | | $ | — | | | | $ | 18,773,453 | |
| Consumer Discretionary | | | | 14,303,358 | | | | | — | | | | | — | | | | | 14,303,358 | |
| Consumer Staples | | | | 25,521,818 | | | | | — | | | | | — | | | | | 25,521,818 | |
| Energy | | | | 22,657,441 | | | | | — | | | | | — | | | | | 22,657,441 | |
| Financials | | | | 71,575,370 | | | | | — | | | | | — | | | | | 71,575,370 | |
| Health Care | | | | 43,311,114 | | | | | 1,159,727 | | | | | — | | | | | 44,470,841 | |
| Industrials | | | | 41,927,642 | | | | | — | | | | | — | | | | | 41,927,642 | |
| Information Technology | | | | 32,797,754 | | | | | — | | | | | — | | | | | 32,797,754 | |
| Materials | | | | 20,527,628 | | | | | 745,649 | | | | | — | | | | | 21,273,277 | |
| Real Estate | | | | 15,482,288 | | | | | — | | | | | — | | | | | 15,482,288 | |
| Utilities | | | | 26,055,181 | | | | | — | | | | | — | | | | | 26,055,181 | |
| Total Common Stock | | | | 332,933,047 | | | | | 1,905,376 | | | | | — | | | | | 334,838,423 | |
| Preferred Stock | | | | 5,076,369 | | | | | 1,467,781 | | | | | — | | | | | 6,544,150 | |
| Warrants | | | | 53,779 | | | | | — | | | | | — | | | | | 53,779 | |
| Convertible Bonds/Notes | | | | — | | | | | 883,457 | | | | | — | | | | | 883,457 | |
| Short-Term Investments | | | | 2,187,729 | | | | | 2,311,754 | | | | | — | | | | | 4,499,483 | |
| Total Investments, at fair value | | | $ | 340,250,924 | | | | $ | 6,568,368 | | | | $ | — | | | | $ | 346,819,292 | |
| ˆ | | See Note 2, “Significant Accounting Policies” in the Notes to Financial Statements for additional information. |
| # | | The earlier close of the foreign markets gives rise to the possibility that significant events, including broad market moves, may have occurred in the interim and may materially affect the value of those securities. To account for this, the Portfolio may frequently value many of its foreign equity securities using fair value prices based on third party vendor modeling tools to the extent available. Accordingly, a portion of the Portfolio’s investments are categorized as Level 2 investments. |
The effect of derivative instruments on the Portfolio’s Statement of Operations for the year ended December 31, 2020 was as follows:
| | | Amount of Realized Gain or (Loss)
on Derivatives Recognized in Income |
|---|
| Derivatives not accounted for as hedging instruments | | | | Futures |
|---|
| Equity contracts | | | | $ | 128,992 | |
Total | | | | $ | 128,992 | |
| | | | | | | | |
At December 31, 2020, the aggregate cost of securities and other investments and the composition of unrealized appreciation and depreciation of securities and other investments on a tax basis were:
| Cost for federal income tax purposes was $283,148,577. |
| | | | | | | |
| Net unrealized appreciation consisted of: | | | | | | |
| Gross Unrealized Appreciation | | | | $ | 79,537,348 | |
| Gross Unrealized Depreciation | | | | | (15,865,871 | ) |
| Net Unrealized Appreciation | | | | $ | 63,671,477 | |
See Accompanying Notes to Financial Statements
86
VY® T. ROWE PRICE INTERNATIONAL
STOCK PORTFOLIO | SUMMARY PORTFOLIO OF INVESTMENTS
AS OF DECEMBER 31, 2020 |
| Shares | | | | | | | | Value | | Percentage
of Net
Assets |
|---|
| |
COMMON STOCK: 96.2% |
| | |
| 132,819 | | | | | | Other Securities | | $ | 1,577,256 | | | | 0.7 | |
| |
| | |
| 59,463 | | | | (1) | | Erste Group Bank AG | | | 1,811,395 | | | | 0.8 | |
| |
| | |
| 343 | | | | (2) | | Other Securities | | | 33,948 | | | | 0.0 | |
| |
| | |
| 287,563 | | | | (2) | | Other Securities | | | 3,724,763 | | | | 1.7 | |
| |
| | |
| 29,176 | | | | | | Magna International, Inc. | | | 2,065,661 | | | | 0.9 | |
| 22,807 | | | | | | TMX Group Ltd. | | | 2,278,012 | | | | 1.0 | |
| 387,141 | | | | (2) | | Other Securities | | | 4,183,639 | | | | 1.9 | |
| | | | | | | | | | 8,527,312 | | | | 3.8 | |
| |
| | |
| 25,338 | | | | (1) | | Alibaba Group Holding Ltd. ADR | | | 5,896,913 | | | | 2.6 | |
| 10,507 | | | | (1) | | Baidu, Inc. ADR | | | 2,272,034 | | | | 1.0 | |
| 220,100 | | | | | | Gree Electric Appliances, Inc. of Zhuhai — A Shares | | | 2,086,211 | | | | 0.9 | |
| 6,600 | | | | (1),(3) | | JD Health International, Inc. | | | 127,702 | | | | 0.1 | |
| 6,889 | | | | | | Kweichow Moutai Co. Ltd. — A Shares (Nth SSE-SEHK) | | | 2,105,269 | | | | 0.9 | |
| 36,600 | | | | | | Tencent Holdings Ltd. | | | 2,633,509 | | | | 1.2 | |
| 625,100 | | | | | | Other Securities | | | 2,830,478 | | | | 1.3 | |
| | | | | | | | | | 17,952,116 | | | | 8.0 | |
| |
| | |
| 2,142 | | | | (1) | | Dassault Aviation SA | | | 2,332,461 | | | | 1.0 | |
| 19,343 | | | | | | EssilorLuxottica SA | | | 3,014,287 | | | | 1.4 | |
| 31,462 | | | | | | Sanofi | | | 3,049,373 | | | | 1.4 | |
| 53,951 | | | | | | Thales S.A. | | | 4,936,097 | | | | 2.2 | |
| 8,356 | | | | | | Other Securities | | | 1,955,814 | | | | 0.9 | |
| | | | | | | | | | 15,288,032 | | | | 6.9 | |
| |
| | |
| 48,022 | | | | (1),(4) | | Evotec AG | | | 1,774,493 | | | | 0.8 | |
| 20,149 | | | | (1),(3) | | TeamViewer AG | | | 1,082,346 | | | | 0.5 | |
| 6,015 | | | | (1),(3) | | Zalando SE | | | 669,053 | | | | 0.3 | |
| 56,636 | | | | (2) | | Other Securities | | | 5,756,374 | | | | 2.6 | |
| | | | | | | | | | 9,282,266 | | | | 4.2 | |
| |
| | |
| 364,200 | | | | | | AIA Group Ltd. | | | 4,438,186 | | | | 2.0 | |
| |
| | |
| 234,082 | | | | (1) | | Axis Bank Ltd. | | | 1,992,489 | | | | 0.9 | |
| 119,389 | | | | | | Housing Development Finance Corp. | | | 4,182,908 | | | | 1.9 | |
| 1,406,378 | | | | | | NTPC Ltd. | | | 1,914,940 | | | | 0.8 | |
| 41,173 | | | | (2) | | Other Securities | | | 2,051,374 | | | | 0.9 | |
| | | | | | | | | | 10,141,711 | | | | 4.5 | |
| |
| | |
| 1,052,200 | | | | | | Bank Central Asia Tbk PT | | | 2,536,360 | | | | 1.1 | |
| 19,896,300 | | | | | | Other Securities | | | 1,360,244 | | | | 0.6 | |
| | | | | | | | | | 3,896,604 | | | | 1.7 | |
| Shares | | | | | | | | Value | | Percentage
of Net
Assets |
|---|
| |
COMMON STOCK: (continued) |
| | |
| 230,337 | | | | | | Other Securities | | $ | 3,183,158 | | | | 1.4 | |
| |
| | |
| 69,400 | | | | | | Fujitsu General Ltd. | | | 1,882,089 | | | | 0.9 | |
| 29,600 | | | | | | Murata Manufacturing Co., Ltd. | | | 2,679,675 | | | | 1.2 | |
| 140,900 | | | | | | Nippon Telegraph & Telephone Corp. | | | 3,615,354 | | | | 1.6 | |
| 72,300 | | | | (4) | | Otsuka Holdings Co. Ltd. | | | 3,097,796 | | | | 1.4 | |
| 46,300 | | | | | | Seven & I Holdings Co., Ltd. | | | 1,639,510 | | | | 0.7 | |
| 80,360 | | | | | | Takeda Pharmaceutical Co., Ltd. | | | 2,908,178 | | | | 1.3 | |
| 505,300 | | | | | | Z Holdings Corp. | | | 3,057,689 | | | | 1.4 | |
| 458,800 | | | | (5) | | Other Securities | | | 14,938,710 | | | | 6.7 | |
| | | | | | | | | | 33,819,001 | | | | 15.2 | |
| |
| | |
| 378 | | | | (1),(3) | | Adyen NV | | | 878,294 | | | | 0.4 | |
| 24,192 | | | | | | Akzo Nobel NV | | | 2,596,623 | | | | 1.2 | |
| 7,659 | | | | | | ASML Holding NV | | | 3,708,291 | | | | 1.6 | |
| 68,136 | | | | (1) | | Koninklijke Philips NV | | | 3,670,297 | | | | 1.6 | |
| 17,832 | | | | | | NXP Semiconductor NV — NXPI — US | | | 2,835,466 | | | | 1.3 | |
| 36,889 | | | | | | Prosus NV | | | 3,983,202 | | | | 1.8 | |
| | | | | | | | | | 17,672,173 | | | | 7.9 | |
| |
| | |
| 6,764 | | | | | | Other Securities | | | 1,109,431 | | | | 0.5 | |
| |
| | |
| 36,995 | | | | | | Other Securities | | | 808,548 | | | | 0.4 | |
| |
| | |
| 183,782 | | | | (1) | | Powszechny Zaklad Ubezpieczen SA | | | 1,596,659 | | | | 0.7 | |
| |
| | |
| 253,361 | | | | | | Galp Energia SGPS SA | | | 2,684,698 | | | | 1.2 | |
| 134,307 | | | | | | Jeronimo Martins SGPS SA | | | 2,257,649 | | | | 1.0 | |
| | | | | | | | | | 4,942,347 | | | | 2.2 | |
| |
| | |
| 78,338 | | | | | | Other Securities | | | 1,135,901 | | | | 0.5 | |
| |
| | |
| 27,867 | | | | | | Naspers Ltd. | | | 5,706,456 | | | | 2.5 | |
| 10,643 | | | | (2) | | Other Securities | | | 1,040,835 | | | | 0.5 | |
| | | | | | | | | | 6,747,291 | | | | 3.0 | |
| |
| | |
| 1,080 | | | | | | LG Household & Health Care Ltd. | | | 1,611,927 | | | | 0.7 | |
| 18,618 | | | | | | NAVER Corp. | | | 5,018,841 | | | | 2.3 | |
| 80,231 | | | | | | Samsung Electronics Co., Ltd. | | | 5,991,291 | | | | 2.7 | |
| | | | | | | | | | 12,622,059 | | | | 5.7 | |
| |
| | |
| 11,378 | | | | | | Other Securities | | | 839,888 | | | | 0.4 | |
See Accompanying Notes to Financial Statements
87
VY® T. ROWE PRICE INTERNATIONAL
STOCK PORTFOLIO | SUMMARY PORTFOLIO OF INVESTMENTS
AS OF DECEMBER 31, 2020 (CONTINUED) |
| Shares | | | | | | | | Value | | Percentage
of Net
Assets |
|---|
| |
COMMON STOCK: (continued) |
| | |
| 100,602 | | | | (1) | | Swedbank AB | | $ | 1,764,598 | | | | 0.8 | |
| 70,026 | | | | | | Other Securities | | | 1,968,483 | | | | 0.9 | |
| | | | | | | | | | 3,733,081 | | | | 1.7 | |
| |
| | |
| 51,691 | | | | | | Julius Baer Group Ltd. | | | 2,977,998 | | | | 1.3 | |
| 5,915 | | | | | | Lonza Group AG | | | 3,810,247 | | | | 1.7 | |
| 33,459 | | | | | | Nestle SA | | | 3,955,232 | | | | 1.8 | |
| 6,213 | | | | | | Roche Holding AG | | | 2,163,979 | | | | 1.0 | |
| 25,175 | | | | (2) | | Other Securities | | | 2,226,984 | | | | 1.0 | |
| | | | | | | | | | 15,134,440 | | | | 6.8 | |
| |
| | |
| 397,000 | | | | | | Taiwan Semiconductor Manufacturing Co., Ltd. | | | 7,510,237 | | | | 3.4 | |
| |
| | |
| 614,300 | | | | (2) | | Other Securities | | | 1,193,874 | | | | 0.5 | |
| |
| | United Arab Emirates: 0.7% |
| 352,606 | | | | (1),(3) | | Network International Holdings PLC | | | 1,588,740 | | | | 0.7 | |
| |
| | |
| 11,306 | | | | | | Linde PLC | | | 2,981,109 | | | | 1.3 | |
| 23,976 | | | | | | London Stock Exchange Group PLC | | | 2,959,520 | | | | 1.3 | |
| 83,660 | | | | | | Smith & Nephew PLC | | | 1,737,828 | | | | 0.8 | |
| 76,929 | | | | | | Unilever PLC | | | 4,658,106 | | | | 2.1 | |
| 566,427 | | | | (2) | | Other Securities | | | 6,576,203 | | | | 3.0 | |
| | | | | | | | | | 18,912,766 | | | | 8.5 | |
| |
| | |
| 41,459 | | | | | | Philip Morris International, Inc. | | | 3,432,390 | | | | 1.6 | |
| 8,305 | | | | | | Visa, Inc. — Class A | | | 1,816,553 | | | | 0.8 | |
| | | | | | | | | | 5,248,943 | | | | 2.4 | |
| |
| | | | | | | Total Common Stock
(Cost $153,738,918) | | | 214,472,126 | | | | 96.2 | |
| |
PREFERRED STOCK: 0.6% |
| | |
| 9,427 | | | | (1),
(6),(7) | | Xiaoju Kuaizhi, Inc., Series A-17 (DiDi Chuxing, Inc.) | | | 395,934 | | | | 0.2 | |
| |
| | |
| 802 | | | | | | Other Securities | | | 337,784 | | | | 0.1 | |
| |
| | |
| 990 | | | | (1),
(6),(7) | | Roofoods Ltd. — Series G | | | 636,857 | | | | 0.3 | |
| |
| | | | | | | Total Preferred Stock
(Cost $774,002) | | | 1,370,575 | | | | 0.6 | |
| |
| | | | | | | Total Long-Term Investments
(Cost $154,512,920) | | | 215,842,701 | | | | 96.8 | |
Principal
Amount† | | | | | | | | Value | | Percentage
of Net
Assets |
|---|
| |
SHORT-TERM INVESTMENTS: 4.3% |
| Repurchase Agreements: 1.9% |
| 1,000,000 | | | | (8) | | Citigroup, Inc., Repurchase Agreement dated 12/31/20, 0.07%, due 01/04/21 (Repurchase Amount $1,000,008, collateralized by various U.S. Government/U.S. Government Agency Obligations, 0.000%–4.000%, Market Value plus accrued interest $1,020,000, due 09/15/21–01/01/51) | | $ | 1,000,000 | | | | 0.5 | |
| 1,000,000 | | | | (8) | | Daiwa Capital Markets, Repurchase Agreement dated 12/31/20, 0.07%, due 01/04/21 (Repurchase Amount $1,000,008, collateralized by various U.S. Government/U.S. Government Agency Obligations, 0.000%–6.500%, Market Value plus accrued interest $1,020,000, due 01/26/21–01/01/51) | | | 1,000,000 | | | | 0.4 | |
| 1,000,000 | | | | (8) | | Deutsche Bank Securities Inc., Repurchase Agreement dated 12/31/20, 0.06%, due 01/04/21 (Repurchase Amount $1,000,007, collateralized by various U.S. Government/U.S. Government Agency Obligations, 0.000%–6.500%, Market Value plus accrued interest $1,020,000, due 01/15/21–01/01/51) | | | 1,000,000 | | | | 0.4 | |
| 249,056 | | | | (8) | | Nomura Securities, Repurchase Agreement dated 12/31/20, 0.07%, due 01/04/21 (Repurchase Amount $249,058, collateralized by various U.S. Government/U.S. Government Agency Obligations, 0.000%–8.500%, Market Value plus accrued interest $254,037, due 01/31/21–01/15/56) | | | 249,056 | | | | 0.1 | |
See Accompanying Notes to Financial Statements
88
VY® T. ROWE PRICE INTERNATIONAL
STOCK PORTFOLIO | SUMMARY PORTFOLIO OF INVESTMENTS
AS OF DECEMBER 31, 2020 (CONTINUED) |
Principal
Amount† | | | | | | | | Value | | Percentage
of Net
Assets |
|---|
| |
SHORT-TERM INVESTMENTS: (continued) |
| Repurchase Agreements: (continued) |
| 1,000,000 | | | | (8) | | RBC Dominion Securities Inc., Repurchase Agreement dated 12/31/20, 0.08%, due 01/04/21 (Repurchase Amount $1,000,009, collateralized by various U.S. Government/U.S. Government Agency Obligations, 0.000%– 6.000%, Market Value plus accrued interest $1,020,000, due 01/05/21–12/20/50) | | $ | 1,000,000 | | | | 0.5 | |
| |
| | | | | | | Total Repurchase Agreements
(Cost $4,249,056) | | | 4,249,056 | | | | 1.9 | |
| | | | | | | | | | | | | | | |
| Shares | | | | | | | | Value | | Percentage
of Net
Assets |
|---|
| | |
| 5,344,692 | | | | (9) | | T. Rowe Price Government Reserve Fund, 0.080%
(Cost $5,344,692) | | | 5,344,692 | | | | 2.4 | |
| |
| | | | | | | Total Short-Term Investments
(Cost $9,593,748) | | | 9,593,748 | | | | 4.3 | |
| |
| | | | | | | Total Investments in Securities
(Cost $164,106,668) | | $ | 225,436,449 | | | | 101.1 | |
| | | | | | | Liabilities in Excess of Other Assets | | | (2,473,943 | ) | | | (1.1 | ) |
| | | | | | | Net Assets | | $ | 222,962,506 | | | | 100.0 | |
“Other Securities” represents issues not identified as the top 50 holdings in terms of market value and issues or issuers not exceeding 1% of net assets individually or in aggregate respectively as of December 31, 2020.
The following footnotes apply to either the individual securities noted or one or more of the securities aggregated and listed as a single line item.
| † | | Unless otherwise indicated, principal amount is shown in USD. |
| ADR | | American Depositary Receipt |
| (1) | | Non-income producing security. |
| (2) | | The grouping contains non-income producing securities. |
| (3) | | Securities with purchases pursuant to Rule 144A or section 4(a)(2), under the Securities Act of 1933 and may not be resold subject to that rule except to qualified institutional buyers. |
| (4) | | Security, or a portion of the security, is on loan. |
| (5) | | The grouping contains securities on loan. |
| (6) | | For fair value measurement disclosure purposes, security is categorized as Level 3, whose value was determined using significant unobservable inputs. |
| (7) | | Restricted security as to resale, excluding Rule 144A securities. As of December 31, 2020, the Portfolio held restricted securities with a fair value of $1,032,791 or 0.5% of net assets. Please refer to the table below for additional details. |
| (8) | | All or a portion of the security represents securities purchased with cash collateral received for securities on loan. |
| (9) | | Rate shown is the 7-day yield as of December 31, 2020. |
| Sector Diversification | | | | | Percentage
of Net Assets |
|---|
| Consumer Discretionary | | | | | 16.8 | % |
| Financials | | | | | 15.5 | |
| Information Technology | | | | | 15.3 | |
| Health Care | | | | | 13.4 | |
| Consumer Staples | | | | | 11.5 | |
| Industrials | | | | | 8.3 | |
| Communication Services | | | | | 8.2 | |
| Materials | | | | | 4.9 | |
| Energy | | | | | 1.8 | |
| Utilities | | | | | 1.1 | |
| Short-Term Investments | | | | | 4.3 | |
| Liabilities in Excess of Other Assets | | | | | (1.1 | ) |
Net Assets | | | | | 100.0 | % |
| | | | | | | | |
Fair Value Measurementsˆ
The following is a summary of the fair valuations according to the inputs used as of December 31, 2020 in valuing the assets and liabilities:
| | | Quoted Prices
in Active Markets
for Identical
Investments
(Level 1) | | Significant
Other
Observable
Inputs#
(Level 2) | | Significant
Unobservable
Inputs
(Level 3) | | Fair Value
at
December 31, 2020 |
|---|
Asset Table | | | | | | | | | | | | | | | | | |
Investments, at fair value | | | | | | | | | | | | | | | | | |
| Common Stock | | | | | | | | | | | | | | | | | |
| Australia | | | $ | — | | | $ | 1,577,256 | | | $ | — | | | $ | 1,577,256 | |
| Austria | | | | — | | | | 1,811,395 | | | | — | | | | 1,811,395 | |
| Belgium | | | | — | | | | 33,948 | | | | — | | | | 33,948 | |
| Brazil | | | | 3,724,763 | | | | — | | | | — | | | | 3,724,763 | |
| Canada | | | | 8,527,312 | | | | — | | | | — | | | | 8,527,312 | |
| China | | | | 8,296,649 | | | | 9,655,467 | | | | — | | | | 17,952,116 | |
| France | | | | — | | | | 15,288,032 | | | | — | | | | 15,288,032 | |
| Germany | | | | 1,363,512 | | | | 7,918,754 | | | | — | | | | 9,282,266 | |
| Hong Kong | | | | — | | | | 4,438,186 | | | | — | | | | 4,438,186 | |
| India | | | | — | | | | 10,141,711 | | | | — | | | | 10,141,711 | |
| Indonesia | | | | — | | | | 3,896,604 | | | | — | | | | 3,896,604 | |
| Italy | | | | — | | | | 3,183,158 | | | | — | | | | 3,183,158 | |
See Accompanying Notes to Financial Statements
89
VY® T. ROWE PRICE INTERNATIONAL
STOCK PORTFOLIO | SUMMARY PORTFOLIO OF INVESTMENTS
AS OF DECEMBER 31, 2020 (CONTINUED) |
| | Quoted Prices
in Active Markets
for Identical
Investments
(Level 1) | | Significant
Other
Observable
Inputs#
(Level 2) | | Significant
Unobservable
Inputs
(Level 3) | | Fair Value
at
December 31, 2020 |
|---|
| Common Stock (continued) | | | | | | | | | | | | | | | | | | | | |
| Japan | | | $ | — | | | | $ | 33,819,001 | | | | $ | — | | | | $ | 33,819,001 | |
| Netherlands | | | | 2,835,466 | | | | | 14,836,707 | | | | | — | | | | | 17,672,173 | |
| Peru | | | | 1,109,431 | | | | | — | | | | | — | | | | | 1,109,431 | |
| Philippines | | | | — | | | | | 808,548 | | | | | — | | | | | 808,548 | |
| Poland | | | | — | | | | | 1,596,659 | | | | | — | | | | | 1,596,659 | |
| Portugal | | | | — | | | | | 4,942,347 | | | | | — | | | | | 4,942,347 | |
| Russia | | | | 1,135,901 | | | | | — | | | | | — | | | | | 1,135,901 | |
| South Africa | | | | — | | | | | 6,747,291 | | | | | — | | | | | 6,747,291 | |
| South Korea | | | | — | | | | | 12,622,059 | | | | | — | | | | | 12,622,059 | |
| Spain | | | | — | | | | | 839,888 | | | | | — | | | | | 839,888 | |
| Sweden | | | | — | | | | | 3,733,081 | | | | | — | | | | | 3,733,081 | |
| Switzerland | | | | — | | | | | 15,134,440 | | | | | — | | | | | 15,134,440 | |
| Taiwan | | | | — | | | | | 7,510,237 | | | | | — | | | | | 7,510,237 | |
| Thailand | | | | — | | | | | 1,193,874 | | | | | — | | | | | 1,193,874 | |
| United Arab Emirates | | | | — | | | | | 1,588,740 | | | | | — | | | | | 1,588,740 | |
| United Kingdom | | | | 5,861,103 | | | | | 13,051,663 | | | | | — | | | | | 18,912,766 | |
| United States | | | | 5,248,943 | | | | | — | | | | | — | | | | | 5,248,943 | |
| Total Common Stock | | | | 38,103,080 | | | | | 176,369,046 | | | | | — | | | | | 214,472,126 | |
| Preferred Stock | | | | — | | | | | 337,784 | | | | | 1,032,791 | | | | | 1,370,575 | |
| Short-Term Investments | | | | 5,344,692 | | | | | 4,249,056 | | | | | — | | | | | 9,593,748 | |
| Total Investments, at fair value | | | $ | 43,447,772 | | | | $ | 180,955,886 | | | | $ | 1,032,791 | | | | $ | 225,436,449 | |
Other Financial Instruments+ | | | | | | | | | | | | | | | | | | | | |
| Forward Foreign Currency Contracts | | | | — | | | | | 15 | | | | | — | | | | | 15 | |
| Total Assets | | | $ | 43,447,772 | | | | $ | 180,955,901 | | | | $ | 1,032,791 | | | | $ | 225,436,464 | |
Liabilities Table | | | | | | | | | | | | | | | | | | | | |
Other Financial Instruments+ | | | | | | | | | | | | | | | | | | | | |
| Forward Foreign Currency Contracts | | | $ | — | | | | $ | (282 | ) | | | $ | — | | | | $ | (282 | ) |
| Written Options | | | | — | | | | | (35,730 | ) | | | | — | | | | | (35,730 | ) |
| Total Liabilities | | | $ | — | | | | $ | (36,012 | ) | | | $ | — | | | | $ | (36,012 | ) |
| ˆ | | See Note 2, “Significant Accounting Policies” in the Notes to Financial Statements for additional information. |
| + | | Other Financial Instruments may include open forward foreign currency contracts, futures, centrally cleared swaps, OTC swaps and written options. Forward foreign currency contracts, futures and centrally cleared swaps are fair valued at the unrealized appreciation (depreciation) on the instrument. OTC swaps and written options are valued at the fair value of the instrument. |
| # | | The earlier close of the foreign markets gives rise to the possibility that significant events, including broad market moves, may have occurred in the interim and may materially affect the value of those securities. To account for this, the Portfolio may frequently value many of its foreign equity securities using fair value prices based on third party vendor modeling tools to the extent available. Accordingly, a portion of the Portfolio’s investments are categorized as Level 2 investments. |
At December 31, 2020, VY® T. Rowe Price International Stock Portfolio held the following restricted securities:
| Security | | | | | Acquisition
Date | | Acquisition
Cost | | Fair
Value | |
|---|
| Roofoods Ltd. — Series G | | | | | 5/16/2019 | | | | $ | 413,722 | | | | $ | 636,857 | | |
| Xiaoju Kuaizhi, Inc., Series A-17 (DiDi Chuxing, Inc.) | | | | | 10/19/2015 | | | | | 258,547 | | | | | 395,934 | | |
| | | | | | | | | | $ | 672,269 | | | | $ | 1,032,791 | | |
At December 31, 2020, the following forward foreign currency contracts were outstanding for VY® T. Rowe Price International Stock Portfolio:
| Currency Purchased | | | | | Currency Sold | | Counterparty | | Settlement
Date | | Unrealized
Appreciation
(Depreciation) | |
|---|
| SEK 363,450 | | | | USD 44,372 | | The Bank of New York Mellon | | | 01/04/21 | | | | $ | (198 | ) | |
| SEK 24,570 | | | | USD 2,994 | | The Bank of New York Mellon | | | 01/04/21 | | | | | (8 | ) | |
| JPY 942,151 | | | | USD 9,120 | | The Bank of New York Mellon | | | 01/05/21 | | | | | 5 | | |
| SEK 159,818 | | | | USD 19,501 | | The Bank of New York Mellon | | | 01/05/21 | | | | | (76 | ) | |
| GBP 4,181 | | | | USD 5,714 | | The Bank of New York Mellon | | | 01/05/21 | | | | | 3 | | |
| USD 6,029 | | | | EUR 4,930 | | The Bank of New York Mellon | | | 01/05/21 | | | | | 7 | | |
| | | | | | | | | | | | | | $ | (267 | ) | |
| | | | | | | | | | | | | | | | | | |
See Accompanying Notes to Financial Statements
90
VY® T. ROWE PRICE INTERNATIONAL
STOCK PORTFOLIO | SUMMARY PORTFOLIO OF INVESTMENTS
AS OF DECEMBER 31, 2020 (CONTINUED) |
At December 31, 2020, the following OTC written equity options were outstanding for VY® T. Rowe Price International Stock Portfolio:
| Description | | Counterparty | | Put/Call | | Expiration
Date | | Exercise
Price | | Number of
Contracts | | Notional
Amount | | Premiums
Received | | Fair
Value |
|---|
| NXP Semiconductors NV—NXPI—US | | JPMorgan Chase Bank N.A. | | | Call | | | | 01/15/21 | | | USD | 140.000 | | | | 4 | USD | | | 63,604 | | | | $ | 2,891 | | | | $ | (7,757 | ) |
| NXP Semiconductors NV—NXPI—US | �� | JPMorgan Chase Bank N.A. | | | Call | | | | 01/15/21 | | | USD | 145.000 | | | | 4 | USD | | | 63,604 | | | | | 2,254 | | | | | (5,909 | ) |
| NXP Semiconductors NV—NXPI—US | | JPMorgan Chase Bank N.A. | | | Call | | | | 01/15/21 | | | USD | 150.000 | | | | 15 | USD | | | 238,515 | | | | | 12,306 | | | | | (15,760 | ) |
| NXP Semiconductors NV—NXPI—US | | JPMorgan Chase Bank N.A. | | | Call | | | | 01/15/21 | | | USD | 150.000 | | | | 6 | USD | | | 95,406 | | | | | 4,486 | | | | | (6,304 | ) |
| | | | | | | | | | | | | | | | | | | | | | | | | | $ | 21,937 | | | | $ | (35,730 | ) |
| Currency Abbreviations |
| EUR | | — EU Euro |
| GBP | | — British Pound |
| JPY | | — Japanese Yen |
| SEK | | — Swedish Krona |
| USD | | — United States Dollar |
A summary of derivative instruments by primary risk exposure is outlined in the following tables.
The fair value of derivative instruments as of December 31, 2020 was as follows:
Derivatives not accounted for as
hedging instruments | | | | | Location on Statement
of Assets and Liabilities | | | Fair Value |
|---|
Asset Derivatives | | | | | | | | |
| Foreign exchange contracts | | | | Unrealized appreciation on forward foreign currency contracts | | $ | 15 | |
Total Asset Derivatives | | | | | | $ | 15 | |
| | | | | | | | | | | | |
Liability Derivatives | | | | | | | | |
| Foreign exchange contracts | | | | Unrealized depreciation on forward foreign currency contracts | | $ | 282 | |
| Equity contracts | | | | Written options, at fair value | | | 35,730 | |
Total Liability Derivatives | | | | | | $ | 36,012 | |
The effect of derivative instruments on the Portfolio’s Statement of Operations for the year ended December 31, 2020 was as follows:
| | Amount of Realized Gain or (Loss)
on Derivatives Recognized in Income | |
|---|
Derivatives not accounted for as
hedging instruments | | Forward foreign
currency contracts | | Written Options | | Total | |
|---|
| Equity contracts | | | $ | — | | | | $ | 105,135 | | | | $ | 105,135 | | |
| Foreign exchange contracts | | | | (40,544 | ) | | | | — | | | | | (40,544 | ) | |
Total | | | $ | (40,544 | ) | | | $ | 105,135 | | | | $ | 64,591 | | |
| | | | | |
|---|
| | | Change in Unrealized Appreciation or (Depreciation)
on Derivatives Recognized in Income | |
|---|
Derivatives not accounted for as
hedging instruments | | Forward foreign
currency contracts | | Written options | | Total | |
|---|
| Equity contracts | | | $ | — | | | | $ | (11,535 | ) | | | $ | (11,535 | ) | |
| Foreign exchange contracts | | | | (3,157 | ) | | | | — | | | | | (3,157 | ) | |
Total | | | $ | (3,157 | ) | | | $ | (11,535 | ) | | | $ | (14,692 | ) | |
See Accompanying Notes to Financial Statements
91
VY® T. ROWE PRICE INTERNATIONAL
STOCK PORTFOLIO | SUMMARY PORTFOLIO OF INVESTMENTS
AS OF DECEMBER 31, 2020 (CONTINUED) |
The following is a summary by counterparty of the fair value of OTC derivative instruments subject to Master Netting Agreements and collateral pledged (received), if any, at December 31, 2020:
| | | JPMorgan
Chase Bank N.A. | | The Bank of
New York Mellon | | Totals |
|---|
Assets: | | | | | | | | | | | | | | | | |
| Forward foreign currency contracts | | | | $ | — | | | | $ | 15 | | | | $ | 15 | |
Total Assets | | | | $ | — | | | | $ | 15 | | | | $ | 15 | |
Liabilities: | | | | | | | | | | | | | | | | |
| Forward foreign currency contracts | | | | $ | — | | | | $ | 282 | | | | $ | 282 | |
| Written options | | | | | 35,730 | | | | | — | | | | | 35,730 | |
Total Liabilities | | | | $ | 35,730 | | | | $ | 282 | | | | $ | 36,012 | |
| | | | | | | | | | | | | | | | | |
Net OTC derivative instruments by counterparty, at fair value | | | | $ | (35,730 | ) | | | $ | (267 | ) | | | | (35,997 | ) |
Total collateral pledged by the Portfolio/(Received from counterparty) | | | | $ | — | | | | $ | — | | | | $ | — | |
Net Exposure(1) | | | | $ | (35,730 | ) | | | $ | (267 | ) | | | | (35,997 | ) |
(1) | | Positive net exposure represents amounts due from each respective counterparty. Negative exposure represents amounts due from the Portfolio. Please refer to Note 2 for additional details regarding counterparty credit risk and credit related contingent features. |
At December 31, 2020, the aggregate cost of securities and other investments and the composition of unrealized appreciation and depreciation of securities and other investments on a tax basis were:
| Cost for federal income tax purposes was $167,953,741. |
| Net unrealized appreciation consisted of: | | | | | | |
| Gross Unrealized Appreciation | | | | $ | 64,294,021 | |
| Gross Unrealized Depreciation | | | | | (6,552,468 | ) |
| Net Unrealized Appreciation | | | | $ | 57,741,553 | |
See Accompanying Notes to Financial Statements
92
TAX INFORMATION (UNAUDITED)
Dividends and distributions paid during the year ended December 31, 2020 were as follows:
| Portfolio Name | | | Type | | Per Share Amount |
|---|
| Voya Government Liquid Assets Portfolio |
| Class I | | | NII | | $ | 0.0026 | |
| | | | | | | | |
| Class S | | | NII | | $ | 0.0020 | |
| Class S2 | | | NII | | $ | 0.0017 | |
| All Classes | | | STCG | | $ | 0.0004 | |
VY® Clarion Global Real Estate Portfolio |
| Class ADV | | | NII | | $ | 0.5970 | |
| Class I | | | NII | | $ | 0.6814 | |
| Class S | | | NII | | $ | 0.6463 | |
| Class S2 | | | NII | | $ | 0.6243 | |
| All Classes | | | STCG | | $ | 0.0723 | |
| All Classes | | | LTCG | | $ | 0.8773 | |
VY® Invesco Growth and Income Portfolio | |
| Class ADV | | | NII | | $ | 0.3453 | |
| Class I | | | NII | | $ | 0.4957 | |
| Class S | | | NII | | $ | 0.4313 | |
| Class S2 | | | NII | | $ | 0.3967 | |
| All Classes | | | LTCG | | $ | 1.7631 | |
VY® JPMorgan Emerging Markets Equity Portfolio | |
| Class ADV | | | NII | | $ | 0.0124 | |
| Class I | | | NII | | $ | 0.1371 | |
| Class S | | | NII | | $ | 0.0785 | |
| Class S2 | | | NII | | $ | 0.0453 | |
| All Classes | | | LTCG | | $ | 1.4938 | |
| | | | | | | | | |
| VY® Morgan Stanley Global Franchise Portfolio |
| Class ADV | | | NII | | $ | 0.0864 | |
| Class R6 | | | NII | | $ | 0.1730 | |
| Class S | | | NII | | $ | 0.1263 | |
| Class S2 | | | NII | | $ | 0.1003 | |
| All Classes | | | STCG | | $ | 0.0438 | |
| All Classes | | | LTCG | | $ | 1.3285 | |
| Portfolio Name | | | Type | | Per Share Amount |
|---|
VY® T. Rowe Price Capital Appreciation Portfolio |
| Class ADV | | | NII | | $ | 0.2944 | |
| Class I | | | NII | | $ | 0.4528 | |
| Class R6 | | | NII | | $ | 0.4528 | |
| Class S | | | NII | | $ | 0.3798 | |
| Class S2 | | | NII | | $ | 0.3338 | |
| All Classes | | | STCG | | $ | 0.3976 | |
| All Classes | | | LTCG | | $ | 1.9099 | |
| | | | | | | | | | |
VY® T. Rowe Price Equity Income Portfolio |
| Class ADV | | | NII | | $ | 0.3722 | |
| Class I | | | NII | | $ | 0.4828 | |
| Class S | | | NII | | $ | 0.3637 | |
| Class S2 | | | NII | | $ | 0.4001 | |
| All Classes | | | STCG | | $ | 0.0866 | |
| All Classes | | | LTCG | | $ | 0.0338 | |
VY® T. Rowe Price International Stock Portfolio |
| Class ADV | | | NII | | $ | 0.3376 | |
| Class I | | | NII | | $ | 0.4322 | |
| Class S | | | NII | | $ | 0.3897 | |
| All Classes | | | STCG | | $ | 0.0281 | |
| All Classes | | | LTCG | | $ | 0.3403 | |
NII — Net investment income
STCG — Short-term capital gain
LTCG — Long-term capital gain
Of the ordinary distributions made during the year ended December 31, 2020, the following percentages qualify for the dividends received deduction (DRD) available to corporate shareholders:
VY® Invesco Growth and Income Portfolio | | 100.00% |
VY® JPMorgan Emerging Markets Equity Portfolio | | 2.34% |
VY® Morgan Stanley Global Franchise Portfolio | | 100.00% |
VY® T. Rowe Price Capital Appreciation Portfolio | | 25.78% |
VY® T. Rowe Price Equity Income Portfolio | | 79.33% |
VY® T. Rowe Price International Stock Portfolio | | 2.95% |
The Portfolios designate the following amounts of long-term capital gain distributions as 20% rate long-term capital gain dividends under Internal Revenue Code Section 852(b)(3)(C):
VY® Clarion Global Real Estate Portfolio | $ | 14,567,272 | |
VY® Invesco Growth and Income Portfolio | $ | 30,987,138 | |
VY® JPMorgan Emerging Markets Equity Portfolio | $ | 31,735,210 | |
VY® Morgan Stanley Global Franchise Portfolio | $ | 30,534,835 | |
VY® T. Rowe Price Capital Appreciation Portfolio | $ | 469,747,551 | |
VY® T. Rowe Price Equity Income Portfolio | $ | 1,200,886 | |
VY® T. Rowe Price International Stock Portfolio | $ | 4,238,733 | |
93
TAX INFORMATION (UNAUDITED) (CONTINUED)
Pursuant to Section 853 of the Internal Revenue Code, the Portfolios designate the following amounts as foreign taxes paid for the year ended December 31, 2020. Foreign taxes paid for purposes of Section 853 may be less than actual foreign taxes paid for financial statement purposes.
| | Creditable
Foreign Taxes
Paid | | Per Share
Amount | | Portion of Ordinary Income
Distribution Derived from
Foreign Sourced Income* |
|---|
VY® JPMorgan Emerging Markets Equity Portfolio | | | $806,039 | | | $ | 0.0375 | | | | 59.66 | % |
VY® T. Rowe Price International Stock Portfolio | | | $283,422 | | | $ | 0.0226 | | | | 82.31 | % |
| * | | None of the Portfolios listed above derived any income from ineligible foreign sources as defined under Section 901(j) of the Internal Revenue Code. |
Foreign taxes paid or withheld must be included in taxable income with an offsetting deduction from gross income or as a credit for taxes paid to foreign governments. Shareholders are strongly advised to consult their own tax advisors regarding the appropriate treatment of foreign taxes paid.
Above figures may differ from those cited elsewhere in this report due to differences in the calculation of income and gains under U.S. generally accepted accounting principles (book) purposes and Internal Revenue Service (tax) purposes.
Shareholders are strongly advised to consult their own tax advisers with respect to the tax consequences of their investments in the Portfolios. In January, shareholders, excluding corporate shareholders, receive an IRS 1099-DIV regarding the federal tax status of the dividends and distributions they received in the calendar year.
94
TRUSTEE AND OFFICER INFORMATION (UNAUDITED)
The business and affairs of the Trust are managed under the direction of the Board. A Trustee, who is not an interested person of the Trust, as defined in the 1940 Act, is an independent trustee (“Independent Trustee”). The Trustees and Officers of the Trust are listed below. The Statement of Additional Information includes additional information about Trustees of the Trust and is available, without charge, upon request at (800) 366-0066.
| Name, Address and Age | | Position(s) Held with
the Trust | | Term of Office
and Length of
Time Served(1) | | Principal Occupation(s) —
During the Past 5 Years | | Number of
funds in
Fund Complex
Overseen by
Trustee(2) | | Other Board Positions
Held by Trustee |
|---|
| | | | | | | | | | | |
|---|
Independent Trustees: |
| | | | | | | | | | | |
Colleen D. Baldwin
7337 East Doubletree Ranch Rd.
Suite 100
Scottsdale, Arizona 85258
Age: 60 | | Trustee
Chairperson | | November
2007–Present
January
2020–Present | | President, Glantuam Partners, LLC, a business consulting firm (January 2009–Present). | | 133 | | Dentaquest
(February 2014–Present);
RSR Partners, Inc. (2016–Present). |
| | | | | | | | | | | |
John V. Boyer
7337 East Doubletree Ranch Rd.
Suite 100
Scottsdale, Arizona 85258
Age: 67 | | Trustee | | January
2005–Present | | Retired. Formerly, President and Chief Executive Officer, Bechtler Arts Foundation, an arts and education foundation (January 2008–December 2019). | | 133 | | None. |
| | | | | | | | | | | |
Patricia W. Chadwick
7337 East Doubletree Ranch Rd.
Suite 100
Scottsdale, Arizona 85258
Age: 72 | | Trustee | | January
2006–Present | | Consultant and President, Ravengate Partners LLC, a consulting firm that provides advice regarding financial markets and the global economy (January
2000–Present). | | 133 | | Wisconsin Energy Corporation
(June 2006–Present); The Royce Funds (22 funds) (December 2009–Present); and AMICA Mutual Insurance Company (1992–Present). |
| | | | | | | | | | | |
Martin J. Gavin
7337 East Doubletree Ranch Rd. Suite 100
Scottsdale, AZ 85258
Age: 70 | | Trustee | | August
2015–Present | | Retired. Formerly, President and Chief Executive Officer, Connecticut Children’s Medical Center (May 2006–November 2015). | | 133 | | None. |
| | | | | | | | | | | |
Joseph E. Obermeyer
7337 East Doubletree Ranch Rd.
Suite 100
Scottsdale, Arizona 85258
Age: 63 | | Trustee | | May
2013–Present | | President, Obermeyer & Associates, Inc., a provider of financial and economic consulting services (November 1999–Present). | | 133 | | None. |
| | | | | | | | | | | |
Sheryl K. Pressler
7337 East Doubletree Ranch Rd.
Suite 100
Scottsdale, Arizona 85258
Age: 70 | | Trustee | | January
2006–Present | | Consultant (May
2001–Present). | | 133 | | None. |
| | | | | | | | | | | |
Christopher P. Sullivan
7337 East Doubletree Ranch Rd.
Suite 100
Scottsdale, Arizona 85258
Age: 67 | | Trustee | | October
2015–Present | | Retired. | | 133 | | None. |
95
TRUSTEE AND OFFICER INFORMATION (UNAUDITED) (CONTINUED)
| Name, Address and Age | | Position(s) Held with
the Trust | | Term of Office
and Length of
Time Served(1) | | Principal Occupation(s) —
During the Past 5 Years | | Number of
funds in
Fund Complex
Overseen by
Trustee(2) | | Other Board Positions
Held by Trustee |
|---|
| | | | | | | | | | | |
|---|
| Trustee who is an “interested person”: |
|---|
| |
|---|
Dina Santoro
230 Park Avenue
New York, New York 10169
Age: 47 | | Trustee | | July 2018–Present | | President, Voya Investments, LLC and Voya Capital, LLC (March 2018–Present); Senior Vice President, Voya Investments Distributor, LLC (April 2018–Present); Senior Managing Director, Head of Product and Marketing Strategy, Voya Investment Management (September 2017–Present). Formerly, Managing Director, Quantitative Management Associates, LLC (January
2004–August 2017). | �� | 133 | | Voya Investments, LLC, Voya Capital, LLC, and Voya Funds Services, LLC (March 2018–Present); Voya Investments Distributor, LLC (April
2018–Present). |
(1) | | Trustees serve until their successors are duly elected and qualified. The tenure of each Trustee who is not an “interested person” as defined in the 1940 Act, of each Portfolio (“Independent Trustee”) is subject to the Board’s retirement policy which states that each duly elected or appointed Independent Trustee shall retire from and cease to be a member of the Board of Trustees at the close of business on December 31 of the calendar year in which the Independent Trustee attains the age of 75. A majority vote of the Board’s other Independent Trustees may extend the retirement date of an Independent Trustee if the retirement would trigger a requirement to hold a meeting of shareholders of the Trust under applicable law, whether for the purposes of appointing a successor to the Independent Trustee or otherwise comply under applicable law, in which case the extension would apply until such time as the shareholder meeting can be held or is no longer required (as determined by a vote of a majority of the other Independent Trustees). |
(2) | | For the purposes of this table, “Fund Complex” means the Voya family of funds including the following investment companies: Voya Asia Pacific High Dividend Equity Income Fund; Voya Balanced Portfolio, Inc.; Voya Emerging Markets High Dividend Equity Fund; Voya Equity Trust; Voya Funds Trust; Voya Global Advantage and Premium Opportunity Fund; Voya Global Equity Dividend and Premium Opportunity Fund; Voya Government Money Market Portfolio; Voya Infrastructure, Industrials and Materials Fund; Voya Intermediate Bond Portfolio; Voya International High Dividend Equity Income Fund; Voya Investors Trust; Voya Mutual Funds; Voya Natural Resources Equity Income Fund; Voya Partners, Inc.; Voya Senior Income Fund; Voya Separate Portfolios Trust; Voya Strategic Allocation Portfolios, Inc.; Voya Variable Funds; Voya Variable Insurance Trust; Voya Variable Portfolios, Inc.; and Voya Variable Products Trust. The number of funds in the Fund Complex is as of January 31, 2021. |
96
TRUSTEE AND OFFICER INFORMATION (UNAUDITED) (CONTINUED)
| Name, Address and Age | | Position(s) Held
With the Trust | | Term of Office and Length
of Time Served(1) | | Principal Occupation(s) —
During the Past 5 Years |
|---|
| | | | | | | |
|---|
Michael Bell
One Orange WayWindsor, Connecticut 06095
Age: 52 | | Chief Executive Officer | | March 2018–Present | | Chief Executive Officer and Director, Voya Investments, LLC, Voya Capital, LLC, and Voya Funds Services, LLC (March 2018–Present); Senior Vice President and Chief Financial Officer, Voya Investments Distributor, LLC (September 2019–Present); Chief Financial Officer, Voya Investment Management (September 2014–Present). Formerly, Senior Vice President, Chief Financial Officer and Treasurer, Voya Investments, LLC (November 2015–March 2018). |
| | | | | | | |
Dina Santoro
230 Park Avenue
New York, New York 10169
Age: 47 | | President | | March 2018–Present | | President and Director, Voya Investments, LLC and Voya Capital, LLC (March 2018–Present); Director, Voya Funds Services, LLC (March 2018-Present); Director and Senior Vice President, Voya Investments Distributor, LLC (April 2018–Present); Senior Managing Director, Head of Product and Marketing Strategy, Voya Investment Management (September 2017–Present). Formerly, Managing Director, Quantitative Management Associates, LLC (January 2004-August 2017). |
| | | | | | | |
Jonathan Nash
230 Park Avenue
New York, New York 10169
Age: 53 | | Executive Vice President
Chief Investment Risk Officer | | March 2020–Present
March 2020–Present | | Senior Vice President, Investment Risk Management, Voya Investment Management (March 2017–Present); Formerly, Consultant, DA Capital LLC (January 2016–March 2017); Managing Director, Enterprise Risk, American International Group (AIG) (September 2014– March 2015). |
| | | | | | | |
James M. Fink
5780 Powers Ferry Road NW
Atlanta, Georgia 30327
Age: 62 | | Executive Vice President | | March 2018–Present | | Managing Director, Voya Investments, LLC, Voya Capital, LLC, and Voya Funds Services, LLC (March 2018–Present); Senior Vice President, Voya Investments Distributor, LLC (April 2018–Present); Chief Administrative Officer, Voya Investment Management (September 2017–Present). Formerly, Managing Director, Operations, Voya Investment Management (March 1999–September 2017). |
| | | | | | | |
Kevin M. Gleason
7337 East Doubletree Ranch Rd.
Suite 100
Scottsdale, Arizona 85258
Age: 54 | | Chief Compliance Officer | | February 2012–Present | | Senior Vice President, Voya Investment Management and Chief Compliance Officer, Voya Family of Funds (February 2012–Present). |
| | | | | | | |
Todd Modic
7337 East Doubletree Ranch Rd.
Suite 100
Scottsdale, Arizona 85258
Age: 53 | | Senior Vice President, Chief/Principal Financial Officer and Assistant Secretary | | March 2005–Present | | President, Voya Funds Services, LLC (March 2018–Present) and Senior Vice President, Voya Investments, LLC (April 2005–Present). |
| | | | | | | |
Kimberly A. Anderson
7337 East Doubletree Ranch Rd.
Suite 100
Scottsdale, Arizona 85258
Age: 56 | | Senior Vice President | | November 2003–Present | | Senior Vice President, Voya Investments, LLC (September 2003–Present). |
| | | | | | | |
Micheline S. Faver
7337 East Doubletree Ranch Rd.
Suite 100
Scottsdale, Arizona 85258
Age: 43 | | Senior Vice President | | September 2020–Present | | Vice President, Head of Fund Compliance and Chief Compliance Officer, Voya Investments, LLC (June 2016–Present). Formerly, Vice President, Mutual Fund Compliance (March 2014–June 2016). |
| | | | | | | |
Robert Terris
5780 Powers Ferry Road NW
Atlanta, Georgia 30327
Age: 50 | | Senior Vice President | | May 2006–Present | | Senior Vice President, Voya Investments Distributor, LLC (April 2018–Present); Senior Vice President, Head of Investment Services, Voya Investments, LLC (April 2018–Present) and Voya Funds Services, LLC (March 2006– Present). Formerly, Senior Vice President, Head of Division Operations, Voya Investments, LLC (October 2015–April 2018). |
| | | | | | | |
Fred Bedoya
7337 East Doubletree Ranch Rd.
Suite 100
Scottsdale, Arizona 85258
Age: 48 | | Vice President
and Treasurer | | September 2012–Present | | Vice President, Voya Investments, LLC (October 2015–Present) and Voya Funds Services, LLC (July 2012–Present). |
97
TRUSTEE AND OFFICER INFORMATION (UNAUDITED) (CONTINUED)
| Name, Address and Age | | Position(s) Held
With the Trust | | Term of Office and Length
of Time Served(1) | | Principal Occupation(s) —
During the Past 5 Years |
|---|
| | | | | | | |
|---|
Maria M. Anderson
7337 East Doubletree Ranch Rd.
Suite 100
Scottsdale, Arizona 85258
Age: 62 | | Vice President | | September 2004–Present | | Vice President, Voya Investments, LLC (October 2015–Present) and Voya Funds Services, LLC (September 2004–Present). |
| | | | | | | |
Sara M. Donaldson
7337 East Doubletree Ranch Rd.
Suite 100
Scottsdale, Arizona 85258
Age: 61 | | Vice President | | September 2014–Present | | Vice President, Voya Investments, LLC (October 2015–Present). |
| |
Robyn L. Ichilov
7337 East Doubletree Ranch Rd.
Suite 100
Scottsdale, Arizona 85258
Age: 53 | | Vice President | | November 1999–Present | | Vice President, Voya Funds Services, LLC (November 1995–Present) and Voya Investments, LLC (August 1997–Present). |
| | | | | | | |
Jason Kadavy
7337 East Doubletree Ranch Rd.
Suite 100
Scottsdale, Arizona 85258
Age: 44 | | Vice President | | September 2012–Present | | Vice President, Voya Investments, LLC (October 2015–Present) and Voya Funds Services, LLC (July 2007–Present). |
| | | | | | | |
Andrew K. Schlueter
7337 East Doubletree Ranch Rd.
Suite 100
Scottsdale, Arizona 85258
Age: 44 | | Vice President | | March 2018–Present | | Vice President, Voya Investments Distributor, LLC (April 2018–Present); Vice President, Voya Investments, LLC and Voya Funds Services, LLC (March 2018–Present); Vice President, Head of Mutual Fund Operations, Voya Investment Management (February 2018– Present). Formerly, Vice President, Voya Investment Management (March 2014– February 2018). |
| | | | | | | |
Craig Wheeler
7337 East Doubletree Ranch Rd.
Suite 100
Scottsdale, Arizona 85258
Age: 51 | | Vice President | | May 2013–Present | | Vice President–Director of Tax, Voya Investments, LLC (October 2015–Present). |
| | | | | | | |
Monia Piacenti
One Orange Way
Windsor, Connecticut 06095
Age: 44 | | Anti-Money Laundering Officer | | June 2018–Present | | Anti-Money Laundering Officer, Voya Investments Distributor, LLC, Voya Investment Management and Voya Investment Management Trust Co. (June 2018–Present); Compliance Consultant, Voya Financial, Inc. (January 2019– Present). Formerly, Senior Compliance Officer, Voya Investment Management (December 2009–December 2018). |
| | | | | | | |
Joanne F. Osberg
7337 East Doubletree Ranch Rd.
Suite 100
Scottsdale, Arizona 85258
Age: 39 | | Secretary | | September 2020–Present | | Vice President and Senior Counsel, Voya Investment Management–Mutual Fund Legal Department (September 2020–Present). Formerly, Vice President, Counsel II, Voya Investment Management –Mutual Fund Legal Department (January 2013–September 2020). |
| | | | | | | |
Paul A. Caldarelli
7337 East Doubletree Ranch Rd.
Suite 100
Scottsdale, Arizona 85258
Age: 69 | | Assistant Secretary | | June 2010–Present | | Vice President and Senior Counsel, Voya Investment Management–Mutual Fund Legal Department (March 2010–Present). |
(1) | | The Officers hold office until the next annual meeting of the Board of Trustees and until their successors shall have been elected and qualified. |
98
ADVISORY AND SUB-ADVISORY CONTRACT APPROVAL DISCUSSION (UNAUDITED)
BOARD CONSIDERATION AND APPROVAL OF INVESTMENT MANAGEMENT CONTRACTS AND SUB-ADVISORY CONTRACTS
At a meeting held on November 19, 2020, the Board of Trustees (“Board”) of Voya Investors Trust (the “Trust”), including a majority of the Board members who have no direct or indirect interest in the management, sub-advisory and sub-sub-advisory contracts, and who are not “interested persons” of Voya Government Liquid Assets Portfolio, VY® Clarion Global Real Estate Portfolio, VY® Invesco Growth and Income Portfolio, VY® JPMorgan Emerging Markets Equity Portfolio, VY® Morgan Stanley Global Franchise Portfolio, VY® T. Rowe Price Capital Appreciation Portfolio, VY® T. Rowe Price Equity Income Portfolio, and VY® T. Rowe Price International Stock Portfolio, each a series of the Trust (the “Portfolios”), as such term is defined under the Investment Company Act of 1940, as amended(the “Independent Trustees”), considered and approved the renewal of the investment management contracts (the “Management Contracts”) between Voya Investments, LLC (the “Manager”) and the Trust, on behalf of the Portfolios, the sub-advisory contracts (the “Sub-Advisory Contracts”) with Voya Investment Management Co. LLC, CBRE Clarion Securities LLC, Invesco Advisers, Inc., J.P. Morgan Investment Management Inc., Morgan Stanley Investment Management Inc., and T. Rowe Price Associates, Inc., the respective sub-advisers to each Portfolio (the “Sub-Advisers”), and the sub-sub-advisory contracts (the “Sub-Sub-Advisory Contracts,” and together with the Management Contracts and Sub-Advisory Contracts, the “Contracts”) with Morgan Stanley Investment Management Limited and T. Rowe Price International Ltd, the respective sub-sub-adviser to VY® Morgan Stanley Global Franchise Portfolio and VY® T. Rowe Price International Stock Portfolio (the “Sub-Sub-Advisers”) for an additional one year period ending November 30, 2021.
In addition to the Board meeting on November 19, 2020, the Independent Trustees also held meetings outside the presence of personnel representing the Manager, Sub-Advisers, or Sub-Sub-Advisers (collectively, such persons are referred to herein as “management”) on October 8, 2020, and November 17, 2020. At those meetings the Board reviewed and considered materials related to the proposed continuance of the Contracts that they had requested and believed to be relevant to the renewal of the Contracts in light of their own business judgment and the legal advice furnished to them by K&L Gates LLP, their independent legal counsel. The Board also considered information furnished to it throughout the year at meetings of the Board and its committees, including information regarding performance, expenses, and other matters. While the Board considered the renewal of the management contracts, sub-advisory contracts, and sub-
sub-advisory contracts for all of the applicable investment companies in the Voya family of funds at the same meetings, the Board considered each Voya fund’s investment management, sub-advisory, and sub-sub-advisory relationships separately.
The Board has established a Contracts Committee and Investment Review Committees (the “IRCs”), each of which includes only Independent Trustees as members. The Contracts Committee meets several times throughout the year to provide oversight with respect to the management, sub-advisory and sub-sub-advisory contracts approval and renewal process for each Voya fund, among other functions, and each IRC meets several times throughout the year with respect to each Voya fund that is assigned to that IRC to provide oversight regarding the investment performance of the sub-advisers and sub-sub-advisers, as well as the Manager’s role in monitoring the sub-advisers and sub-sub-advisers.
The Contracts Committee oversees, and annually recommends Board approval of updates to, a methodology guide for the Voya funds (“Methodology Guide”), which sets out a framework pursuant to which the Independent Trustees request, and management provides, certain information that the Independent Trustees deem to be important or potentially relevant. The Independent Trustees retain the services of an independent consultant with experience in the mutual fund industry to assist the Contracts Committee in developing and recommending to the Board: (1) a selected peer group of investment companies for each Portfolio (“Selected Peer Group”) based on that Portfolio’s particular attributes, such as fund type and size, fund category (as determined by Morningstar, Inc., an independent provider of mutual fund data (“Morningstar”)), sales channels and structure and the Portfolio share class being compared to the Selected Peer Group; and (2) updates to the Methodology Guide with respect to the content and format of various data prepared in connection with the renewal process, including, but not limited to, investment performance, fee structure, and expense information. In addition, the Independent Trustees periodically have retained an independent firm to test and verify the accuracy of certain information presented to the Board for a representative sample of the Voya funds.
The Manager, a Sub-Adviser or a Sub-Sub-Adviser may not have been able to, or opted not to, provide information in response to certain information requests, in which case the Board conducted its evaluation of the firm based on information that was provided. In such cases, the Board determined that the omission of any such information was not material to its considerations. Additionally, the Board considered the impact of significant market volatility that occurred during and after the period for which information
99
ADVISORY AND SUB-ADVISORY CONTRACT APPROVAL DISCUSSION (UNAUDITED) (CONTINUED)
was requested in conducting its evaluation of the Manager, a Sub-Adviser or a Sub-Sub-Adviser.
Provided below is an overview of certain material factors that the Board considered at its meetings regarding the renewal of the Contracts and the compensation to be paid thereunder. The Board members did not identify any particular information or factor that was most relevant to its consideration, and each Board member may have accorded different weight to the various factors in reaching his or her conclusions with respect to each Portfolio’s investment management, sub-advisory and, as applicable, sub-sub-advisory arrangements.
Nature, Extent and Quality of Services
The Manager oversees, subject to the authority of the Board, and is responsible for the provision of, all investment advisory and portfolio management services for the Portfolios, but may delegate certain of these responsibilities to one or more sub-advisers and their sub-sub-advisers, if any. In addition, the Manager provides administrative services reasonably necessary for the operation of the Portfolios as set forth in the Management Contracts, including oversight of the Portfolios’ operations and risk management and the oversight of their various other service providers.
The Board considered the “manager-of-managers” platform of the Voya funds that has been developed by the Manager pursuant to which the Manager selects, subject to the Board’s approval, sub-advisers and their sub-sub-advisers, if any, to provide day-to-day management services to all or a portion of each Voya fund. The Board recognized that the Manager is responsible for monitoring the investment program, performance, developments, ongoing operations, and compliance with applicable regulations and investment policies and restrictions of the Sub-Advisers and Sub-Sub-Advisers with respect to the Portfolios under this manager-of-managers arrangement. The Board also considered the techniques and resources that the Manager has developed to provide this ongoing oversight and due diligence with respect to the sub-advisers and sub-sub-advisers and to advocate or recommend, when it believes appropriate, changes in investment strategies or investment sub-advisers and sub-sub-advisers designed to assist in improving a Voya fund’s performance. In connection with the Manager’s performance of these duties, the Board considered that the Manager has developed an oversight process formulated by its Manager Research & Selection Group which reviews, among other matters, performance data, each Sub-Adviser’s and Sub-Sub-Adviser’s management team, portfolio data and attribution analysis related to each Sub-Adviser and Sub-Sub-Adviser through various means, including, but not limited to, in-person meetings, on-site or
virtual visits, and telephonic meetings with each Sub-Adviser and Sub-Sub-Adviser.
Further, the Board considered periodic compliance reports it receives from the Trust’s Chief Compliance Officer evaluating whether the regulatory compliance systems and procedures of the Manager, Sub-Advisers, and Sub-Sub-Advisers are reasonably designed to ensure compliance with the federal securities laws and whether the investment policies and restrictions for each Portfolio are consistently complied with, and other periodic reports covering related matters.
The Board considered the portfolio management team assigned by the Sub-Advisers and Sub-Sub-Advisers to the Portfolios and the level of resources committed to the Portfolios (and other relevant funds in the Voya funds) by the Manager, Sub-Advisers, and Sub-Sub-Advisers, and whether those resources are sufficient to provide high-quality services to the Portfolios.
Based on their deliberations and the materials presented to them, the Board concluded that the nature, extent and quality of the overall services provided by the Manager and each Sub-Adviser and Sub-Sub-Adviser under the Contracts were appropriate.
Portfolio Performance
In assessing the investment management, sub-advisory and sub-sub-advisory relationships, the Board placed emphasis on the investment returns of each Portfolio, including its investment performance over certain time periods compared to the Portfolio’s Morningstar category and primary benchmark, a broad-based securities market index identified in the Portfolio’s prospectus. The Board also considered information from the Manager Research & Selection Group and received reports summarizing a separate analysis of each Portfolio’s performance and risk, including risk-adjusted investment return information, from the Trust’s Chief Investment Risk Officer.
Economies of Scale
When evaluating the reasonableness of the management fee schedules, the Board considered whether economies of scale have been or likely will be realized by the Manager, Sub-Advisers, and Sub-Sub-Advisers as a Portfolio grows larger and the extent to which any such economies are shared with the Portfolio. In this regard, the Board noted any breakpoints in management fee schedules that will result in a lower management fee rate when a Portfolio achieves sufficient asset levels to receive a breakpoint discount. The Board also considered that, while some of the Portfolios do not have management fee breakpoints, the Portfolios may have fee waiver and expense reimbursement arrangements. The Board considered the extent to which economies of scale realized by the
100
ADVISORY AND SUB-ADVISORY CONTRACT APPROVAL DISCUSSION (UNAUDITED) (CONTINUED)
Manager, Sub-Advisers, or Sub-Sub-Advisers could be shared with each Portfolio through such fee waivers, expense reimbursements or other expense reductions. In evaluating these matters, the Independent Trustees also considered periodic management reports, Selected Peer Group comparisons, and industry information regarding economies of scale. In the case of sub-advisory and sub-sub-advisory fees, the Board considered that breakpoints, if any, would inure to the benefit of the Manager and the relevant Sub-Adviser, respectively.
Information Regarding Services, Performance, and Fee Schedules Offered to Other Clients
The Board considered comparative information regarding the nature of services, performance, and fee schedules offered by the Manager, Sub-Advisers and Sub-Sub-Advisers to other clients with similar investment objectives, if applicable, including other registered investment companies and relevant institutional accounts. When the fee schedules offered to or the performance of such other clients differed materially from a Portfolio, the Board took into account the underlying rationale provided by the Manager, Sub-Advisers or Sub-Sub-Advisers, as applicable, for these differences. For the non-Voya-affiliated Sub-Advisers and Sub-Sub-Advisers, the Board viewed the information related to any material differences in the fee schedules as not being a key factor in its deliberations because of the arm’s-length nature of negotiations between the Manager and non-Voya-affiliated Sub-Advisers and their Sub-Sub-Advisers with respect to sub-advisory and sub-sub-advisory fee schedules, that the Manager is responsible for paying the fees of the Sub-Advisers and that the applicable Sub-Advisers are responsible for paying the fees of the Sub-Sub-Advisers.
Fee Schedules, Profitability, and Fall-out Benefits
The Board reviewed and considered the contractual management fee schedule and net management fee rate payable by each Portfolio to the Manager compared to the Portfolio’s Selected Peer Group and which additional services the Manager pays for on behalf of the Portfolio under the “bundled fee” arrangement in return for a single management fee (“Unified Fee Structure”). The Board also considered the compensation payable by the Manager to each Sub-Adviser for sub-advisory services for each Portfolio, including the portion of the contractual and net management fee rates that are paid to each Sub-Adviser, as compared to the compensation paid to the Manager. In this regard, the Board considered that each Sub-Sub-Adviser is compensated by the relevant Sub-Adviser and not the Manager. In addition, the Board considered any fee waivers, expense limitations, and/or recoupment arrangements that apply to the fees payable by the Portfolios, including whether the Manager intends to propose any changes thereto. For each Portfolio, the Board
separately determined that the fees payable to the Manager and the fee schedule payable to each Sub-Adviser and Sub-Sub-Adviser are reasonable for the services that each performs, which were considered in light of the nature, extent and quality of the services that each has performed and is expected to perform.
For each Portfolio, the Board considered information on revenues, costs and profits or losses realized by the Manager and the Voya-affiliated Sub-Adviser related to their services to the Portfolio. In analyzing the profitability of the Manager and its affiliated service providers in connection with services they render to a Portfolio, the Board took into account the sub-advisory fee rate payable by the Manager to each Sub-Adviser. The Board also considered the profitability of the Manager and its affiliated Sub-Adviser attributable to servicing each Portfolio both with and without taking into account the profitability of the distributor of the Portfolios and any revenue sharing payments made by the Manager and both before and after giving effect to any expenses incurred by the Manager or the affiliated Sub-Adviser in making payments to affiliated insurance companies. The Board did not request profitability data from the Sub-Advisers and Sub-Sub-Advisers that are not affiliated with the Manager because the Board did not view this data as a key factor to its deliberations given the arm’s-length nature of the relationship between the Manager and these non-Voya-affiliated Sub-Advisers and Sub-Sub-Advisers with respect to the negotiation of sub-advisory and sub-sub-advisory fee schedules. In addition, the Board noted that non-Voya-affiliated sub-advisers and sub-sub-advisers may not account for their profits on an account-by-account basis and those that do typically employ different methodologies in connection with these calculations.
Although the Methodology Guide establishes a framework for profit calculation, the Board recognized that there is no uniform methodology within the asset management industry for determining profitability for this purpose. The Board also recognized that the use of different reasonable methodologies can give rise to dramatically different reported profit and loss results with respect to the Manager and the Voya-affiliated Sub-Adviser, as well as other industry participants with whom the profits of the Manager and its affiliated Sub-Adviser could be compared. In addition, the Board recognized that management’s calculations regarding its costs incurred in establishing the infrastructure necessary for the Portfolios’ operations may not be fully reflected in the expenses allocated to each Portfolio in determining profitability, and that the information presented may not portray all of the costs borne by the Manager or reflect all risks, including entrepreneurial, regulatory, legal and operational risks, associated with offering and managing a mutual fund complex in the current regulatory and market environment.
101
ADVISORY AND SUB-ADVISORY CONTRACT APPROVAL DISCUSSION (UNAUDITED) (CONTINUED)
The Board also considered that the Manager and the Voya-affiliated Sub-Adviser are entitled to earn a reasonable level of profits for the services that they provide to the Portfolios. The Board also considered information regarding the potential fall-out benefits to the Manager, Sub-Advisers and Sub-Sub-Advisers and their respective affiliates from their association with the Portfolios, including their ability to engage in soft-dollar transactions on behalf of the Portfolios. Following its reviews, the Board determined that the Manager’s and the Voya-affiliated Sub-Adviser’s profitability with respect to their services to the Portfolios and the Manager’s, Sub-Advisers’ and Sub-Sub-Advisers’ potential fall-out benefits were not unreasonable.
Portfolio-by-Portfolio Analysis
Set forth below are certain of the specific factors that the Board considered at its October 7, 2020, November 17, 2020, and/or November 19, 2020 meetings in relation to approving each Portfolio’s Contracts and the conclusions reached by the Board. These specific factors are in addition to those considerations discussed above. In each case, the Portfolio’s performance was compared to its Morningstar category, as well as its primary benchmark. The performance data provided to the Board primarily was for various periods ended March 31, 2020. In addition, the Board also considered at its October 7, 2020, November 17, 2020, and November 19, 2020 meetings certain additional data regarding each Portfolio’s more recent performance, asset levels and asset flows. Each Portfolio’s management fee rate and expense ratio were compared to the management fee rates and expense ratios of the funds in its Selected Peer Group. With respect to the quintile rankings noted below, the first quintile represents the range of funds with the highest performance or the lowest management fee rate or expense ratio, as applicable, and the fifth quintile represents the range of funds with the lowest performance or the highest management fee rate or expense ratio, as applicable.
Voya Government Liquid Assets Portfolio
In considering whether to approve the renewal of the Contracts for Voya Government Liquid Assets Portfolio, the Board considered that, based on performance data for the periods ended March 31, 2020, the Portfolio outperformed its primary benchmark for all periods presented, with the exception of the year-to-date period, during which its performance was equal to the performance of its primary benchmark.
In considering the fees payable under the Contracts for the Portfolio, the Board took into account the factors described above and also considered: (1) the economies of scale benefits to the Portfolio and its shareholders from breakpoint discounts applicable to the Portfolio’s management fee rate, which result in lower fees at higher
asset levels; and (2) the pricing structure (including the net expense ratio to be borne by shareholders) of the Portfolio, as compared to its Selected Peer Group, including that: (a) the net management fee rate for the Portfolio is ranked in the first quintile of net management fee rates of the funds in its Selected Peer Group; (b) the contractual management fee rate for the Portfolio is ranked in the first quintile of contractual management fee rates of the funds in its Selected Peer Group; and (c) the net expense ratio for the Portfolio is ranked in the first quintile of net expense ratios of the funds in its Selected Peer Group. In analyzing this fee data, the Board took into account the expense borne by the Manager for the provision of services, such as transfer agency, custody, accounting and legal services, to the Portfolio pursuant to the Portfolio’s Unified Fee Structure.
After its deliberation, the Board reached the following conclusions: (1) the Portfolio’s management fee rate is reasonable in the context of all factors considered by the Board; (2) the Portfolio’s net expense ratio is reasonable in the context of all factors considered by the Board; (3) the Portfolio’s performance is reasonable in the context of all factors considered by the Board; and (4) the sub-advisory fee rate payable by the Manager to the Sub-Adviser is reasonable in the context of all factors considered by the Board. Based on these conclusions and other factors, the Board voted to renew the Contracts for the Portfolio for the year ending November 30, 2021. During this renewal process, different Board members may have given different weight to different individual factors and related conclusions.
VY® Clarion Global Real Estate Portfolio
In considering whether to approve the renewal of the Contracts for VY® Clarion Global Real Estate Portfolio, the Board considered that, based on performance data for the periods ended March 31, 2020: (1) the Portfolio is ranked in the third quintile of its Morningstar category for the one-year period, and the fourth quintile for the year-to-date, three-year, five-year and ten-year periods; and (2) the Portfolio outperformed its primary benchmark for the year-to-date, one-year and three-year periods and underperformed for the five-year and ten-year periods. In analyzing this performance data, the Board took into account management’s representations regarding: (1) the impact of security selection, sector allocation and geographic positioning on the Portfolio’s performance; (2) changes to the Portfolio’s portfolio management team, effective January 1, 2020; and (3) ongoing periodic monitoring of the Portfolio’s performance by management and the Board or its Investment Review Committee.
In considering the fees payable under the Contracts for the Portfolio, the Board took into account the factors described above and also considered: (1) the fairness of the
102
ADVISORY AND SUB-ADVISORY CONTRACT APPROVAL DISCUSSION (UNAUDITED) (CONTINUED)
compensation under a Management Contract with a breakpoint fee schedule where the asset level necessary to achieve a breakpoint discount had not been reached by the Portfolio; and (2) the pricing structure (including the net expense ratio to be borne by shareholders) of the Portfolio, as compared to its Selected Peer Group, including that: (a) the net management fee rate for the Portfolio is ranked in the first quintile of net management fee rates of the funds in its Selected Peer Group; (b) the contractual management fee rate for the Portfolio is ranked in the fourth quintile of contractual management fee rates of the funds in its Selected Peer Group; and (c) the net expense ratio for the Portfolio is ranked in the second quintile of net expense ratios of the funds in its Selected Peer Group.
After its deliberation, the Board reached the following conclusions: (1) the Portfolio’s management fee rate is reasonable in the context of all factors considered by the Board; (2) the Portfolio’s net expense ratio is reasonable in the context of all factors considered by the Board; (3) the Portfolio’s performance is reasonable in the context of all factors considered by the Board; and (4) the sub-advisory fee rate payable by the Manager to the Sub-Adviser is reasonable in the context of all factors considered by the Board. Based on these conclusions and other factors, the Board voted to renew the Contracts for the Portfolio for the year ending November 30, 2021. During this renewal process, different Board members may have given different weight to different individual factors and related conclusions.
VY® Invesco Growth and Income Portfolio
In considering whether to approve the renewal of the Contracts for VY® Invesco Growth and Income Portfolio, the Board considered that, based on performance data for the periods ended March 31, 2020: (1) the Portfolio is ranked in the fourth quintile of its Morningstar category for the five-year period, and the fifth quintile for the year-to-date, one-year, three-year and ten-year periods; and (2) the Portfolio underperformed its primary benchmark for all periods presented. In analyzing this performance data, the Board took into account management’s representations regarding: (1) the impact of investment style, as well as security selection and sector allocation on the Portfolio’s performance; (2) the recent change in portfolio managers; and (3) the fact that management would continue to monitor, and the Board or its Investment Review Committee would periodically review, the Portfolio’s performance.
In considering the fees payable under the Contracts for the Portfolio, the Board took into account the factors described above and also considered: (1) the economies of scale benefits to the Portfolio and its shareholders from breakpoint discounts applicable to the Portfolio’s management fee rate, which result in lower fees at higher
asset levels; and (2) the pricing structure (including the net expense ratio to be borne by shareholders) of the Portfolio, as compared to its Selected Peer Group, including that: (a) the net management fee rate for the Portfolio is ranked in the second quintile of net management fee rates of the funds in its Selected Peer Group; (b) the contractual management fee rate for the Portfolio is ranked in the second quintile of contractual management fee rates of the funds in its Selected Peer Group; and (c) the net expense ratio for the Portfolio is ranked in the first quintile of net expense ratios of the funds in its Selected Peer Group.
After its deliberation, the Board reached the following conclusions: (1) the Portfolio’s management fee rate is reasonable in the context of all factors considered by the Board; (2) the Portfolio’s net expense ratio is reasonable in the context of all factors considered by the Board; (3) the Portfolio���s performance is reasonable in the context of all factors considered by the Board; and (4) the sub-advisory fee rate payable by the Manager to the Sub-Adviser is reasonable in the context of all factors considered by the Board. Based on these conclusions and other factors, the Board voted to renew the Contracts for the Portfolio for the year ending November 30, 2021. During this renewal process, different Board members may have given different weight to different individual factors and related conclusions.
VY® JPMorgan Emerging Markets Equity Portfolio
In considering whether to approve the renewal of the Contracts for VY® JPMorgan Emerging Markets Equity Portfolio, the Board considered that, based on performance data for the periods ended March 31, 2020: (1) the Portfolio is ranked in the first quintile of its Morningstar category for the one-year, three-year, five-year and ten-year periods, and the second quintile for the year-to-date period; and (2) the Portfolio outperformed its primary benchmark for all periods presented.
In considering the fees payable under the Contracts for the Portfolio, the Board took into account the factors described above and also considered: (1) the fairness of the compensation under a Management Contract with a level fee rate that does not include breakpoints; and (2) the pricing structure (including the net expense ratio to be borne by shareholders) of the Portfolio, as compared to its Selected Peer Group, including that: (a) the net management fee rate for the Portfolio is ranked in the fifth quintile of net management fee rates of the funds in its Selected Peer Group; (b) the contractual management fee rate for the Portfolio is ranked in the fifth quintile of contractual management fee rates of the funds in its Selected Peer Group; and (c) the net expense ratio for the Portfolio is ranked in the fourth quintile of net expense ratios of the funds in its Selected Peer Group. In analyzing this fee data, the Board took into account management’s
103
ADVISORY AND SUB-ADVISORY CONTRACT APPROVAL DISCUSSION (UNAUDITED) (CONTINUED)
representations regarding: (1) the expense borne by the Manager for the provision of services to the Portfolio, such as transfer agency, custody, accounting, and legal services, pursuant to the Portfolio’s Unified Fee Structure; and (2) its belief that the Portfolio’s pricing is competitive.
After its deliberation, the Board reached the following conclusions: (1) the Portfolio’s management fee rate is reasonable in the context of all factors considered by the Board; (2) the Portfolio’s net expense ratio is reasonable in the context of all factors considered by the Board; (3) the Portfolio’s performance is reasonable in the context of all factors considered by the Board; and (4) the sub-advisory fee rate payable by the Manager to the Sub-Adviser is reasonable in the context of all factors considered by the Board. Based on these conclusions and other factors, the Board voted to renew the Contracts for the Portfolio for the year ending November 30, 2021. During this renewal process, different Board members may have given different weight to different individual factors and related conclusions.
VY® Morgan Stanley Global Franchise Portfolio
In considering whether to approve the renewal of the Contracts for VY® Morgan Stanley Global Franchise Portfolio, the Board considered that, based on performance data for the periods ended March 31, 2020: (1) the Portfolio is ranked in the first quintile of its Morningstar category for all periods presented; and (2) the Portfolio outperformed its primary benchmark for all periods presented.
In considering the fees payable under the Contracts for the Portfolio, the Board took into account the factors described above and also considered: (1) the economies of scale benefits to the Portfolio and its shareholders from breakpoint discounts applicable to the Portfolio’s management fee rate, which result in lower fees at higher asset levels; and (2) the pricing structure (including the net expense ratio to be borne by shareholders) of the Portfolio, as compared to its Selected Peer Group, including that: (a) the net management fee rate for the Portfolio is ranked in the fifth quintile of net management fee rates of the funds in its Selected Peer Group; (b) the contractual management fee rate for the Portfolio is ranked in the fifth quintile of contractual management fee rates of the funds in its Selected Peer Group; and (c) the net expense ratio for the Portfolio is ranked in the fifth quintile of net expense ratios of the funds in its Selected Peer Group. In analyzing this fee data, the Board took into account management’s representations regarding: (1) the expense borne by the Manager for the provision of services to the Portfolio, such as transfer agency, custody, accounting, and legal services, pursuant to the Portfolio’s Unified Fee Structure; and (2) its belief that the Portfolio’s pricing is competitive.
After its deliberation, the Board reached the following conclusions: (1) the Portfolio’s management fee rate is reasonable in the context of all factors considered by the Board; (2) the Portfolio’s net expense ratio is reasonable in the context of all factors considered by the Board; (3) the Portfolio’s performance is reasonable in the context of all factors considered by the Board; and (4) the sub-advisory fee rate payable by the Manager to the Sub-Adviser and the sub-sub-advisory fee rate payable by the Sub-Adviser to the Sub-Sub-Adviser are reasonable in the context of all factors considered by the Board. Based on these conclusions and other factors, the Board voted to renew the Contracts for the Portfolio for the year ending November 30, 2021. During this renewal process, different Board members may have given different weight to different individual factors and related conclusions.
VY® T. Rowe Price Capital Appreciation Portfolio
In considering whether to approve the renewal of the Contracts for VY® T. Rowe Price Capital Appreciation Portfolio, the Board considered that, based on performance data for the periods ended March 31, 2020: (1) the Portfolio is ranked in the first quintile of its Morningstar category for the one-year, three-year, five-year and ten-year periods, and the second quintile for the year-to-date period; and (2) the Portfolio outperformed its primary benchmark for all periods presented, with the exception of the ten-year period, during which it underperformed.
In considering the fees payable under the Contracts for the Portfolio, the Board took into account the factors described above and also considered: (1) the economies of scale benefits to the Portfolio and its shareholders from breakpoint discounts applicable to the Portfolio’s management fee rate, which result in lower fees at higher asset levels; and (2) the pricing structure (including the net expense ratio to be borne by shareholders) of the Portfolio, as compared to its Selected Peer Group, including that: (a) the net management fee rate for the Portfolio is ranked in the second quintile of net management fee rates of the funds in its Selected Peer Group; (b) the contractual management fee rate for the Portfolio is ranked in the second quintile of contractual management fee rates of the funds in its Selected Peer Group; and (c) the net expense ratio for the Portfolio is ranked in the second quintile of net expense ratios of the funds in its Selected Peer Group. In analyzing this fee data, the Board took into account the expense borne by the Manager for the provision of services to the Portfolio, such as transfer agency, custody, accounting and legal services, pursuant to the Portfolio’s Unified Fee Structure.
After its deliberation, the Board reached the following conclusions: (1) the Portfolio’s management fee rate is reasonable in the context of all factors considered by the
104
ADVISORY AND SUB-ADVISORY CONTRACT APPROVAL DISCUSSION (UNAUDITED) (CONTINUED)
Board; (2) the Portfolio’s net expense ratio is reasonable in the context of all factors considered by the Board; (3) the Portfolio’s performance is reasonable in the context of all factors considered by the Board; and (4) the sub-advisory fee rate payable by the Manager to the Sub-Adviser is reasonable in the context of all factors considered by the Board. Based on these conclusions and other factors, the Board voted to renew the Contracts for the Portfolio for the year ending November 30, 2021. During this renewal process, different Board members may have given different weight to different individual factors and related conclusions.
VY® T. Rowe Price Equity Income Portfolio
In considering whether to approve the renewal of the Contracts for VY® T. Rowe Price Equity Income Portfolio, the Board considered that, based on performance data for the periods ended March 31, 2020: (1) the Portfolio is ranked in the third quintile of its Morningstar category for the one-year, three-year and five-year periods, and the fourth quintile for the year-to-date and ten-year periods; and (2) the Portfolio underperformed its primary benchmark for all periods presented. In analyzing this performance data, the Board took into account management’s representations regarding the Portfolio’s improved performance during more recent periods.
In considering the fees payable under the Contracts for the Portfolio, the Board took into account the factors described above and also considered: (1) the economies of scale benefits to the Portfolio and its shareholders from breakpoint discounts applicable to the Portfolio’s management fee rate, which result in lower fees at higher asset levels; and (2) the pricing structure (including the net expense ratio to be borne by shareholders) of the Portfolio, as compared to its Selected Peer Group, including that: (a) the net management fee rate for the Portfolio is ranked in the third quintile of net management fee rates of the funds in its Selected Peer Group; (b) the contractual management fee rate for the Portfolio is ranked in the third quintile of contractual management fee rates of the funds in its Selected Peer Group; and (c) the net expense ratio for the Portfolio is ranked in the second quintile of net expense ratios of the funds in its Selected Peer Group.
After its deliberation, the Board reached the following conclusions: (1) the Portfolio’s management fee rate is reasonable in the context of all factors considered by the Board; (2) the Portfolio’s net expense ratio is reasonable in the context of all factors considered by the Board; (3) the Portfolio’s performance is reasonable in the context of all factors considered by the Board; and (4) the sub-advisory fee rate payable by the Manager to the Sub-Adviser is reasonable in the context of all factors considered by the Board. Based on these conclusions and other factors, the Board voted to renew the Contracts for the Portfolio for the year ending November 30, 2021. During this renewal
process, different Board members may have given different weight to different individual factors and related conclusions.
VY® T. Rowe Price International Stock Portfolio
In considering whether to approve the renewal of the Contracts for VY® T. Rowe Price International Stock Portfolio, the Board considered that, based on performance data for the periods ended March 31, 2020: (1) the Portfolio is ranked in the third quintile of its Morningstar category for the five-year and ten-year periods, and the fourth quintile for the year-to-date, one-year and three-year periods; and (2) the Portfolio outperformed its primary benchmark for all periods presented. In analyzing this performance data, the Board took into account management’s representations regarding: (1) its confidence in the Sub-Adviser’s ability to achieve its investment philosophy and process; and (2) ongoing periodic monitoring of the Portfolio’s performance by management and the Board or its Investment Review Committee.
In considering the fees payable under the Contracts for the Portfolio, the Board took into account the factors described above and also considered: (1) the fairness of the compensation under a Management Contract with a breakpoint fee schedule where the asset level necessary to achieve a breakpoint discount had not been reached by the Portfolio; and (2) the pricing structure (including the net expense ratio to be borne by shareholders) of the Portfolio, as compared to its Selected Peer Group, including that: (a) the net management fee rate for the Portfolio is ranked in the first quintile of net management fee rates of the funds in its Selected Peer Group; (b) the contractual management fee rate for the Portfolio is ranked in the first quintile of contractual management fee rates of the funds in its Selected Peer Group; and (c) the net expense ratio for the Portfolio is ranked in the first quintile of net expense ratios of the funds in its Selected Peer Group.
After its deliberation, the Board reached the following conclusions: (1) the Portfolio’s management fee rate is reasonable in the context of all factors considered by the Board; (2) the Portfolio’s net expense ratio is reasonable in the context of all factors considered by the Board; (3) the Portfolio’s performance is reasonable in the context of all factors considered by the Board; and (4) the sub-advisory fee rate payable by the Manager to the Sub-Adviser and the sub-sub-advisory fee rate payable by the Sub-Adviser to the Sub-Sub-Adviser are reasonable in the context of all factors considered by the Board. Based on these conclusions and other factors, the Board voted to renew the Contracts for the Portfolio for the year ending November 30, 2021. During this renewal process, different Board members may have given different weight to different individual factors and related conclusions.
105
(THIS PAGE INTENTIONALLY LEFT BLANK)
(THIS PAGE INTENTIONALLY LEFT BLANK)
Investment Adviser
Voya Investments, LLC
7337 East Doubletree Ranch Road, Suite 100
Scottsdale, Arizona 85258
Distributor
Voya Investments Distributor, LLC
7337 East Doubletree Ranch Road, Suite 100
Scottsdale, Arizona 85258
Transfer Agent
BNY Mellon Investment Servicing (U.S.) Inc.
301 Bellevue Parkway
Wilmington, Delaware 19809
Independent Registered Public Accounting Firm
Ernst & Young LLP
200 Clarendon Street
Boston, Massachusetts 02116
Custodian
The Bank of New York Mellon
225 Liberty Street
New York, New York 10286
Legal Counsel
Ropes & Gray LLP
Prudential Tower
800 Boylston Street
Boston, Massachusetts 02199
Before investing, carefully consider the investment objectives, risks, charges and expenses of the variable annuity contract or variable life insurance policy and the underlying variable investment options. This and other information is contained in the prospectus for the variable annuity contract or variable life insurance policy and the underlying variable investment options. Obtain these prospectuses from your agent/registered representative and read them carefully before investing.
| RETIREMENT | INVESTMENTS | INSURANCE | |
| |
| voyainvestments.com | VPAR-VIT1AISS2 (1220-022221) |
Annual Report
December 31, 2020
Classes ADV, I, P2, R6, S and S2
Voya Investors Trust
| | ■
Voya Balanced Income Portfolio | | | ■
Voya Limited Maturity Bond Portfolio | |
| | ■
Voya High Yield Portfolio | | | ■
Voya U.S. Stock Index Portfolio | |
| | ■
Voya Large Cap Growth Portfolio | | | ■
VY® Clarion Real Estate Portfolio | |
| | ■
Voya Large Cap Value Portfolio | | | ■
VY® JPMorgan Small Cap Core Equity Portfolio | |
| | | As permitted by regulations adopted by the U.S. Securities and Exchange Commission, paper copies of each Portfolio’s annual and semi-annual shareholder reports, like this annual report, are not sent by mail, unless you specifically request paper copies of the reports. Instead, the reports will be made available on a website and you will be notified by mail each time a report is posted and provided with a website link to access the report. | | |
| | | If you already elected to receive shareholder reports electronically, you need not take any action. You may elect to receive shareholder reports and other communications from your insurance carrier electronically by contacting them directly. | | |
| | | You may elect to receive all future reports in paper free of charge. If you received this document in the mail, please follow the instructions provided to elect to continue receiving paper copies of your shareholder reports. You can inform us that you wish to continue receiving paper copies by calling 1-800-283-3427. Your election to receive reports in paper will apply to all the funds in which you invest. | | |
| | | This report is submitted for general information to shareholders of the Voya mutual funds. It is not authorized for distribution to prospective shareholders unless accompanied or preceded by a prospectus which includes details regarding the funds’ investment objectives, risks, charges, expenses and other information. This information should be read carefully. | | |
PROXY VOTING INFORMATION
A description of the policies and procedures that the Portfolios use to determine how to vote proxies related to portfolio securities is available: (1) without charge, upon request, by calling Shareholder Services toll-free at (800) 992-0180; (2) on the Portfolios’ website at www.voyainvestments.com; and (3) on the U.S. Securities and Exchange Commission’s (“SEC’s”) website at www.sec.gov. Information regarding how the Portfolios voted proxies related to portfolio securities during the most recent 12-month period ended June 30 is available without charge on the Portfolios’ website at www.voyainvestments.com and on the SEC’s website at www.sec.gov.
QUARTERLY PORTFOLIO HOLDINGS
The Portfolios file their complete schedule of portfolio holdings with the SEC for the first and third quarters of each fiscal year on Form NPORT-P. This report contains certain summary portfolio of investments for the Portfolios. The Portfolios’ Forms NPORT-P are available on the SEC’s website at www.sec.gov. Each Portfolio’s complete schedule of portfolio holdings is available at: www.voyainvestments.com and without charge upon request from the Portfolio by calling Shareholder Services toll-free at (800) 992-0180.
Beyond the Headlines, a Glimpse of Global Economic Recovery
Dear Shareholder,
For those of us hoping that 2021 would bring more encouraging headlines, it has been a rough start to the year: political turmoil, surging COVID-19 cases and a new, more virulent strain of the coronavirus. On the surface, economic news also has seemed disappointing: labor markets have cooled, manufacturing and services activity has slowed and consumer sentiment has dropped. Yet, the financial markets continue to march higher, begging the question: Where are the markets getting their news?
Voya investment strategists have written about the uneven pressures that have created a “two-speed” or “K-shaped” economic recovery. Consumers on the higher end of the income distribution have largely kept their jobs and adapted to the pandemic by working from home. By contrast, jobs in lower paying segments of the labor market such as leisure, lodging and retail have been eliminated or furloughed and have yet to return. For lower income consumers, the good news is that the fiscal response to help offset job losses has been enormous — and fiscal relief is expected to grow under a Democratic-controlled government. The initial rollout of the coronavirus vaccines, while slower than many had hoped, still represents a significant milestone as vaccines are the bridge that are expected to allow the economy to reopen fully.
In addition to fiscal support, the response from central banks has been extraordinary. The U.S. Federal Reserve Board (“Fed”) has adjusted its policy framework in ways that make the Fed more likely to remain accommodative longer than might otherwise be expected during economic recovery phases, a game changer for financial assets. We believe that analogous developments across the world should help reignite global economic growth in 2021 and breathe new life into struggling sectors. Despite today’s negative headlines, the data is telling us that the future is likely to be better. Looking broadly at the economic picture, in our opinion, it appears that a global synchronous expansion is underway.
Of course there are still risks, and we believe that one should not overlook the potential for episodic market stresses connected to the vaccine rollout or other global factors. As always, we glimpse the future “through a glass darkly,” and must allow for contingencies we can’t foresee. For this reason, we maintain that staying fully invested and broadly diversified is the most likely way to achieve one’s long-term investment goals. Should your goals change, discuss them thoroughly with your investment advisor before making any changes to your portfolio.
We remain humble and realistic in the face of the challenges ahead, but well prepared for and fully committed to serving our clients without disruption. We appreciate your continued confidence in us, and we look forward to serving your investment needs in the future.
Sincerely,
Dina Santoro
President
Voya Family of Funds
January 22, 2021
The views expressed in the President’s Letter reflect those of the President as of the date of the letter. Any such views are subject to change at any time based upon market or other conditions and the Voya mutual funds disclaim any responsibility to update such views. These views may not be relied on as investment advice and because investment decisions for a Voya mutual fund are based on numerous factors, may not be relied on as an indication of investment intent on behalf of any Voya mutual fund. Reference to specific company securities should not be construed as recommendations or investment advice.
International investing poses special risks including currency fluctuation, economic and political risks not found in investments that are solely domestic.
| | | Index | | | | Description | | |
| | | Bloomberg Barclays High Yield Bond — 2% Issuer Constrained Composite Index | | | | An index that includes all fixed-income securities having a maximum quality rating of Ba1, a minimum amount outstanding of $150 million, and at least one year to maturity. | | |
| | | Bloomberg Barclays U.S. 1-3 Year Government/Credit Bond Index | | | | A widely recognized index of publicly issued fixed rate, investment grade debt securities, including Treasuries, Agencies and credit securities with a maturity of one to three years. | | |
| | | Bloomberg Barclays U.S. Aggregate Bond Index | | | | An index of publicly issued investment grade U.S. government, mortgage-backed, asset-backed and corporate debt securities. | | |
| | | MSCI Europe, Australasia and Far East®
(“MSCI EAFE®”) Index | | | | An index that measures the performance of securities listed on exchanges in Europe, Australasia and the Far East. It includes the reinvestment of dividends net of withholding taxes, but does not reflect fees, brokerage commissions or other expenses of investing. | | |
| | | MSCI World IndexSM | | | | An index that measures the performance of over 1,600 securities listed on exchanges in the U.S., Europe, Canada, Australia, New Zealand and the Far East. | | |
| | | MSCI U.S. REIT® Index | | | | A free float-adjusted market capitalization weighted index that is comprised of equity real estate investment trusts that are included in the MSCI U.S. Investable Market 2500 Index (with the exception of specialty REITs that do not generate a majority of their revenue and income from real estate rental and leasing obligations). The index represents approximately 85% of the U.S. REIT market. | | |
| | | Russell 1000® Index | | | | A comprehensive large-cap index measuring the performance of the largest 1,000 U.S. incorporated companies. | | |
| | | Russell 1000® Growth Index | | | | Measures the performance of the 1,000 largest companies in the Russell 3000® Index with higher price-to-book ratios and higher forecasted growth. | | |
| | | Russell 1000® Value Index | | | | An index that measures the performance of those Russell 1000® securities with lower price-to-book ratios and lower forecasted growth values. | | |
| | | Russell 2000® Index | | | | An index that measures the performance of securities of small U.S. companies. | | |
| | | S&P 500® Index | | | | An index that measures the performance of securities of approximately 500 large-capitalization companies whose securities are traded on major U.S. stock markets. | | |
| Portfolio Managers’ Report | Voya Balanced Income Portfolio |
| | Investment Type Allocation
as of December 31, 2020
(as a percentage of net assets) | |
| | | | | | |
| | Common Stock | | | 44.8% | |
| | Collateralized Mortgage Obligations | | | 14.0% | |
| | Commercial Mortgage-Backed Securities | | | 10.6% | |
| | Asset-Backed Securities | | | 9.6% | |
| | Corporate Bonds/Notes | | | 8.4% | |
| | Mutual Funds | | | 7.7% | |
| | Sovereign Bonds | | | 1.6% | |
| | U.S. Treasury Obligations | | | 0.7% | |
| | Preferred Stock | | | 0.4% | |
| | Exchange-Traded Funds | | | 0.2% | |
| | Purchased Options* | | | 0.0% | |
| | Rights* | | | 0.0% | |
| | Other* | | | 0.0% | |
| | Assets in Excess of Other Liabilities** | | | 2.0% | |
| | Net Assets | | | 100.0% | |
| | *
Amount is less than 0.05% | |
| | **
Includes short-term investments and exchange-traded funds. | |
| | Portfolio holdings are subject to change daily. | |
Voya Balanced Income Portfolio (the “Portfolio”) seeks to maximize income while maintaining prospects for capital appreciation
. The Portfolio is managed by Paul Zemsky, CFA, Brian Timberlake, Ph.D., CFA, and Vincent Costa, CFA, Portfolio Managers of Voya Investment Management Co. LLC (“VIM”) — the Sub-Adviser.
Performance: For the year ended December 31, 2020, the Portfolio’s Class S shares provided a total return of 3.03% compared to the 60% Bloomberg Barclays U.S. Aggregate Bond Index/ 30% Russell 1000® Index/10% MSCI EAFE® Index, and the Bloomberg Barclays U.S. Aggregate Bond Index, which returned 12.29% and 7.51%, respectively, for the same period.
Portfolio Specifics: The Portfolio started the year in a neutral posture between equities and fixed income assets.
As part of its annual review process, the Portfolio made modest adjustments to its strategic asset allocation based on our latest long-term capital market assumptions. The update resulted in a modest increase to the Portfolio’s domestic equity allocations funded by decreases to developed international and core fixed income.
During the year, tactical moves relative to the strategic benchmark had a positive impact across the Portfolios.
| | Top Ten Holdings
as of December 31, 2020
(as a percentage of net assets) | |
| | | | | | |
| | Voya Floating Rate Fund - Class P | | | 7.0% | |
| | Microsoft Corp. | | | 2.2% | |
| | Johnson & Johnson | | | 0.7% | |
| | Citigroup Commercial Mortgage Trust
2013-GC15 D, 5.181%, 09/10/46 | | | 0.7% | |
| | Voya High Yield Bond Fund - Class P | | | 0.7% | |
| | Procter & Gamble Co. | | | 0.6% | |
| | Towd Point Mortgage Trust 2015-4 M2, 3.750%, 04/25/55 | | | 0.6% | |
| | Nvidia Corp. | | | 0.6% | |
| | CALI Mortgage Trust 2019-101C E, 4.324%, 03/10/39 | | | 0.6% | |
| | KNDL 2019-KNSQ E Mortgage Trust, 1.959%, 05/15/36 | | | 0.6% | |
| | Portfolio holdings are subject to change daily. | |
The Portfolio is comprised of three strategies in weights matching that of the asset classes — Voya Strategic Income Opportunities Fund for fixed income exposure, Voya U.S. High Dividend Low Volatility Fund for domestic equity exposure and International High Dividend Low Volatility Fund for international equity exposures. The underlying funds detracted from performance during the year, with all strategies underperforming their respective benchmarks.
Current Strategy and Outlook: The strategy maintains its conservative risk-adjusted return profile with investments split between 58% fixed income and 42% equities with an emphasis on income-producing securities and generation of above-average yield.
The views expressed in this commentary are informed opinions. They should not be considered promises or advice. The views expressed reflect those of the portfolio managers, only through the end of the period as stated on the cover. The portfolio managers’ views are subject to change at any time based on market and other conditions.
Portfolio holdings and characteristics are subject to change and may not be representative of current holdings and characteristics. Portfolio holdings are subject to change daily. The outlook for this Portfolio may differ from that presented for other Voya mutual funds. This report contains statements that may be “forward-looking” statements. Actual results may differ materially from those projected in the “forward-looking” statements. The Portfolio’s performance returns shown reflect applicable fee waivers and/or expense limits in effect during this period. Absent such fee waivers/expense limitations, if any, performance would have been lower. Performance for the different classes of shares will vary based on differences in fees associated with each class. An index has no cash in its portfolio and imposes no sales charges. An investor cannot invest directly in an index.
| Voya Balanced Income Portfolio | Portfolio Managers’ Report |
| | | Average Annual Total Returns for the Periods Ended December 31, 2020 | | |
| | | | | | 1 Year | | | 5 Year | | | 10 Year | | |
| | | Class ADV | | | | | 2.80% | | | | | | 7.78% | | | | 6.39% | | |
| | | Class I | | | | | 3.33% | | | | | | 8.42% | | | | 7.01% | | |
| | | Class S | | | | | 3.03% | | | | | | 8.14% | | | | 6.76% | | |
| | | Class S2 | | | | | 3.02% | | | | | | 8.00% | | | | 6.61% | | |
| | | 60% Bloomberg Barclays U.S. Aggregate Bond Index/30% Russell 1000® Index/10% MSCI EAFE® Index | | | | | 12.29% | | | | | | 8.32% | | | | 7.25% | | |
| | | Bloomberg Barclays U.S. Aggregate Bond Index | | | | | 7.51% | | | | | | 4.44% | | | | 3.84% | | |
| | | Russell 1000® Index | | | | | 20.96% | | | | | | 15.60% | | | | 14.01% | | |
| | | MSCI EAFE® Index | | | | | 7.82% | | | | | | 7.45% | | | | 5.51% | | |
| | | | | |
Based on a $10,000 initial investment, the graph and table above illustrate the total return of Voya Balanced Income Portfolio against the indices indicated. An index is unmanaged and has no cash in its portfolio and imposes no sales charges. An investor cannot invest directly in an index.
The Portfolio’s performance is shown without the imposition of any expenses or charges which are, or may be, imposed under your variable annuity contract or variable life insurance policy. Total returns would have been lower if such expenses or charges were included.
The performance graph and table do not reflect the deduction of taxes that a shareholder will pay on Portfolio distributions or the redemption of Portfolio shares.
The performance shown includes, if applicable, the effect of fee waivers and/or expense reimbursements by the Investment Adviser and/or other service providers, which have
the effect of increasing total return. Had all fees and expenses been considered, the total returns would have been lower.
The performance update illustrates performance for a variable investment option available through a variable annuity contract or a variable life insurance policy. The performance shown indicates past performance and is not a projection or prediction of future results. Actual investment returns and principal value will fluctuate so that shares and/or units, at redemption, may be worth more or less than their original cost. Please log on to www.voyainvestments.com or call (800) 366-0066 to get performance through the most recent month end.
Portfolio holdings are subject to change daily.
Prior to May 1, 2019, the Portfolio was managed by a different sub-adviser.
| Portfolio Managers’ Report | Voya High Yield Portfolio |
| | Investment Type Allocation
as of December 31, 2020
(as a percentage of net assets) | |
| | | | | | |
| | Corporate Bonds/Notes | | | 94.3% | |
| | Bank Loans | | | 1.0% | |
| | Common Stock | | | 0.3% | |
| | Convertible Bonds/Notes | | | 0.1% | |
| | Preferred Stock* | | | 0.0% | |
| | Other* | | | 0.0% | |
| | Warrants* | | | 0.0% | |
| | Assets in Excess of Other Liabilities** | | | 4.3% | |
| | Net Assets | | | 100.0% | |
| | *
Amount is less than 0.05% | |
| | **
Includes short-term investments. | |
| | Portfolio holdings are subject to change daily. | |
Voya High Yield Portfolio (the “Portfolio”) seeks to provide investors with a high level of current income and total return. The Portfolio is managed by Rick Cumberledge, CFA, and Randall Parrish, CFA, Portfolio Managers of Voya Investment Management Co. LLC — the Sub-Adviser.
Performance: For the year ended December 31, 2020, the Portfolio’s Class S shares provided a total return of 5.63% compared to the Bloomberg Barclays High Yield Bond — 2% Issuer Constrained Composite Index (the “Index”), which returned 7.05% for the same period.
Portfolio Specifics: The Portfolio underperformed the Index for the year. The Portfolio maintained an underweight to energy-related sectors and an overweight position to consumer driven industries given the strength of the consumer prior to the COVID-19 pandemic. The underweight to oil field services added the most to performance as energy was the biggest underperformer in the first quarter 2020 sell-off, driven by unprecedented demand destruction due to coronavirus-related constraints on travel, and a flood of supply to the market by Saudi Arabia resulting in a massive drop in oil prices. On the other hand, security selection within independent energy was the largest detractor, followed by cash, which was a drag on performance as sectors rebounded from March lows. The leisure sector also detracted from performance as the sector was impacted by the closure of movie theatres, amusement parks and other leisure businesses due to COVID-19.
Current Strategy and Outlook: Credit fundamentals for the high-yield (“HY”) market are mixed. Earnings and operations in some COVID-19-impacted sectors (such as leisure, restaurant and airlines) continue to be challenged on a year-over-year basis. However, the market has generally seen better-than-feared corporate earnings, as well as auto and home sales continuing to show momentum month-over-month given the current interest rate environment.
| | Top Ten Holdings
as of December 31, 2020*
(as a percentage of net assets) | |
| | | | | | |
| | Sprint Corp., 7.125%, 06/15/24 | | | 0.7% | |
| | HCA, Inc., 5.375%, 02/01/25 | | | 0.6% | |
| | Bausch Health Americas, Inc., 8.500%, 01/31/27 | | | 0.6% | |
| | Kraft Heinz Foods Co., 5.000%, 07/15/35 | | | 0.6% | |
| | Freeport-McMoRan, Inc., 4.125%, 03/01/28 | | | 0.5% | |
| | Change Healthcare Holdings LLC / Change Healthcare Finance, Inc., 5.750%, 03/01/25 | | | 0.5% | |
| | Occidental Petroleum Corp., 4.200%, 03/15/48 | | | 0.5% | |
| | Tenet Healthcare Corp., 6.750%, 06/15/23 | | | 0.5% | |
| | CCO Holdings LLC / CCO Holdings Capital Corp., 4.500%, 05/01/32 | | | 0.5% | |
| | Occidental Petroleum Corp., 6.625%, 09/01/30 | | | 0.5% | |
| | *
Excludes short-term investments. | |
| | Portfolio holdings are subject to change daily. | |
In the HY market, defaults have been focused in the energy, communications and retail sectors, as the coronavirus outbreak pushed companies that were already facing challenges over the edge. We believe that the majority of defaults are behind us and the HY market has since shifted up in quality given not only defaulted issuers exiting the market, but the addition of fallen angels, investment-grade (“IG”) issuers downgraded to below-IG, entering the HY market.
Notably, oil prices have begun to rise off of the lows as the Organization of the Petroleum Exporting Countries and its allies agreed to throttle production in efforts to stabilize prices along with the prospect for increased demand on an economic recovery. While still not at levels that are ideal for energy related HY issuers, the oil price rise does help to improve prospects, in our opinion, and bond prices are reflecting that improvement.
We remain cautious on the oil field services sector given the still-challenged fundamentals. Most of our energy exposure remains in fallen angels, higher-quality and more diversified issuers and higher-quality midstream issuers. We favor building materials, as the sector has benefitted from a healthy housing market, as well as the chemicals and media and entertainment sectors. From a long-term perspective, we believe valuations remain decent and we remain focused on finding pockets of value in what we see as an increasingly tight market.
The views expressed in this commentary are informed opinions. They should not be considered promises or advice. The views expressed reflect those of the portfolio managers, only through the end of the period as stated on the cover. The portfolio managers’ views are subject to change at any time based on market and other conditions.
Portfolio holdings and characteristics are subject to change and may not be representative of current holdings and characteristics. Portfolio holdings are subject to change daily. The outlook for this Portfolio may differ from that presented for other Voya mutual funds. This report contains statements that may be “forward-looking” statements. Actual results may differ materially from those projected in the “forward-looking” statements. The Portfolio’s performance returns shown reflect applicable fee waivers and/or expense limits in effect during this period. Absent such fee waivers/expense limitations, if any, performance would have been lower. Performance for the different classes of shares will vary based on differences in fees associated with each class. An index has no cash in its portfolio and imposes no sales charges. An investor cannot invest directly in an index.
| Voya High Yield Portfolio | Portfolio Managers’ Report |
| | | Average Annual Total Returns for the Periods Ended December 31, 2020 | | |
| | | | | | 1 Year | | | 5 Year | | | 10 Year | | |
| | | Class ADV | | | | | 5.26% | | | | | | 7.10% | | | | 5.61% | | |
| | | Class I | | | | | 6.00% | | | | | | 7.76% | | | | 6.26% | | |
| | | Class S | | | | | 5.63% | | | | | | 7.47% | | | | 5.98% | | |
| | | Class S2 | | | | | 5.48% | | | | | | 7.31% | | | | 5.83% | | |
| | | Bloomberg Barclays High Yield Bond - 2% Issuer Constrained Composite Index | | | | | 7.05% | | | | | | 8.57% | | | | 6.79% | | |
| | | | | |
Based on a $10,000 initial investment, the graph and table above illustrate the total return of Voya High Yield Portfolio against the index indicated. The index is unmanaged and has no cash in its portfolio and imposes no sales charges. An investor cannot invest directly in an index.
The Portfolio’s performance is shown without the imposition of any expenses or charges which are, or may be, imposed under your variable annuity contract or variable life insurance policy. Total returns would have been lower if such expenses or charges were included.
The performance graph and table do not reflect the deduction of taxes that a shareholder will pay on Portfolio distributions or the redemption of Portfolio shares.
The performance shown includes, if applicable, the effect of fee waivers and/or expense reimbursements by the Investment Adviser and/or other service providers, which
have the effect of increasing total return. Had all fees and expenses been considered, the total returns would have been lower.
The performance update illustrates performance for a variable investment option available through a variable annuity contract or a variable life insurance policy. The performance shown indicates past performance and is not a projection or prediction of future results. Actual investment returns and principal value will fluctuate so that shares and/or units, at redemption, may be worth more or less than their original cost. Please log on to www.voyainvestments.com or call (800) 366-0066 to get performance through the most recent month end.
Portfolio holdings are subject to change daily.
Prior to February 5, 2014, the Portfolio was managed by a different sub-adviser.
| Portfolio Managers’ Report | Voya Large Cap Growth Portfolio |
| | Sector Diversification
as of December 31, 2020
(as a percentage of net assets) | |
| | | | | | |
| | Information Technology | | | 45.4% | |
| | Consumer Discretionary | | | 17.1% | |
| | Health Care | | | 12.9% | |
| | Communication Services | | | 10.2% | |
| | Industrials | | | 4.7% | |
| | Consumer Staples | | | 4.5% | |
| | Financials | | | 2.1% | |
| | Materials | | | 1.6% | |
| | Real Estate | | | 1.3% | |
| | Assets in Excess of Other Liabilities* | | | 0.2% | |
| | Net Assets | | | 100.0% | |
| | *
Includes short-term investments. | |
| | Portfolio holdings are subject to change daily. | |
Voya Large Cap Growth Portfolio (the “Portfolio”) seeks long-term capital growth. The Portfolio is managed by Jeffrey Bianchi, CFA, Kristy Finnegan, CFA, and Michael Pytosh, Portfolio Managers of Voya Investment Management Co. LLC — the Sub-Adviser.
Performance: For the year ended December 31, 2020, the Portfolio’s Class S shares, provided a total return of 30.59% compared to the Russell 1000® Growth Index, which returned 38.49% for the same period.
Portfolio Specifics: The Portfolio underperformed the Russell 1000® Growth Index during the reporting period, namely due to stock selection effects. Stock selection within the information technology sector, and to a lesser extent, the consumer discretionary sector detracted the most from performance. On an individual stock basis, not owning Tesla Inc., an underweight in Apple Inc. and an overweight to Boston Scientific Corporation had the greatest negative impact. Conversely, stock selection within the communication services sector, and to a lesser extent, the industrials sector contributed the most to performance. On an individual stock basis, owning a non-benchmark position in Snap, Inc. and overweight positions in Advanced Micro Devices, Inc. and Amazon.com, Inc. added the most value.
Current Strategy and Outlook: Despite historically weak, choppy economic data and unsettling, pandemic-related headlines, in our opinion risk assets have pushed higher on investor confidence that the future will be better than the
| | Top Ten Holdings
as of December 31, 2020
(as a percentage of net assets) | |
| | | | | | |
| | Apple, Inc. | | | 12.8% | |
| | Amazon.com, Inc. | | | 9.9% | |
| | Visa, Inc. - Class A | | | 4.7% | |
| | Facebook, Inc.- Class A | | | 4.6% | |
| | Microsoft Corp. | | | 3.5% | |
| | Eli Lilly & Co. | | | 3.1% | |
| | Intuit, Inc. | | | 3.1% | |
| | PayPal Holdings, Inc. | | | 2.5% | |
| | Philip Morris International, Inc. | | | 2.4% | |
| | Advanced Micro Devices, Inc. | | | 2.0% | |
| | Portfolio holdings are subject to change daily. | |
present. With two COVID-19 vaccines in distribution and a new round of fiscal stimulus about to be deployed, we believe the U.S. economy is primed to accelerate in 2021. In our view, there is a clear bridge (vaccine) to post-COVID-19 normalcy and abutments (fiscal stimulus and prolonged, accommodative monetary policy) that should keep the recovery on track and absorb unexpected jolts along with way.
The views expressed in this commentary are informed opinions. They should not be considered promises or advice. The views expressed reflect those of the portfolio managers, only through the end of the period as stated on the cover. The portfolio managers’ views are subject to change at any time based on market and other conditions.
Portfolio holdings and characteristics are subject to change and may not be representative of current holdings and characteristics. Portfolio holdings are subject to change daily. The outlook for this Portfolio may differ from that presented for other Voya mutual funds. This report contains statements that may be “forward-looking” statements. Actual results may differ materially from those projected in the “forward-looking” statements. The Portfolio’s performance returns shown reflect applicable fee waivers and/or expense limits in effect during this period. Absent such fee waivers/expense limitations, if any, performance would have been lower. Performance for the different classes of shares will vary based on differences in fees associated with each class. An index has no cash in its portfolio and imposes no sales charges. An investor cannot invest directly in an index.
| Voya Large Cap Growth Portfolio | Portfolio Managers’ Report |
| | | Average Annual Total Returns for the Periods Ended December 31, 2020 | | |
| | | | | | 1 Year | | | 5 Year | | | 10 Year | | |
| | | Class ADV | | | | | 30.11% | | | | | | 17.51% | | | | 15.36% | | |
| | | Class I | | | | | 30.88% | | | | | | 18.22% | | | | 16.03% | | |
| | | Class R6(1) | | | | | 30.86% | | | | | | 18.22% | | | | 16.03% | | |
| | | Class S | | | | | 30.59% | | | | | | 17.92% | | | | 15.74% | | |
| | | Class S2 | | | | | 30.43% | | | | | | 17.75% | | | | 15.58% | | |
| | | Russell 1000® Growth Index | | | | | 38.49% | | | | | | 21.00% | | | | 17.21% | | |
| | | | | |
Based on a $10,000 initial investment, the graph and table above illustrate the total return of Voya Large Cap Growth Portfolio against the index indicated. The index is unmanaged and has no cash in its portfolio and imposes no sales charges. An investor cannot invest directly in an index.
The Portfolio’s performance is shown without the imposition of any expenses or charges which are, or may be, imposed under your variable annuity contract or variable life insurance policy. Total returns would have been lower if such expenses or charges were included.
The performance graph and table do not reflect the deduction of taxes that a shareholder will pay on Portfolio distributions or the redemption of Portfolio shares.
The performance shown includes, if applicable, the effect of fee waivers and/or expense reimbursements by the Investment Adviser and/or other service providers, which have the effect of increasing total return. Had all fees and expenses been considered, the total returns would have been lower.
The performance update illustrates performance for a variable investment option available through a variable annuity contract or a variable life insurance policy. The performance shown indicates past performance and is not a projection or prediction of future results. Actual investment returns and principal value will fluctuate so that shares and/or units, at redemption, may be worth more or less than their original cost. Please log on to www.voyainvestments.com or call (800) 366-0066 to get performance through the most recent month end.
Portfolio holdings are subject to change daily.
Prior to June 11, 2010, the Portfolio was managed by a different sub-adviser.
(1)
Class R6 incepted on November 24, 2015. The Class R6 shares performance shown for the period prior to their inception date is the performance of Class I shares without adjustment for any differences in the expenses between the two classes. If adjusted for such differences, returns would be different.
| Portfolio Managers’ Report | Voya Large Cap Value Portfolio |
| | Sector Diversification
as of December 31, 2020
(as a percentage of net assets) | |
| | | | | | |
| | Financials | | | 20.0% | |
| | Health Care | | | 13.7% | |
| | Industrials | | | 12.9% | |
| | Information Technology | | | 9.6% | |
| | Communication Services | | | 8.7% | |
| | Consumer Discretionary | | | 7.8% | |
| | Consumer Staples | | | 7.4% | |
| | Utilities | | | 5.4% | |
| | Materials | | | 4.9% | |
| | Energy | | | 4.6% | |
| | Real Estate | | | 4.6% | |
| | Communications* | | | 0.0% | |
| | Assets in Excess of Other Liabilities** | | | 0.4% | |
| | Net Assets | | | 100.0% | |
| | *
Amount is less than 0.05% | |
| | **
Includes short-term investments. | |
| | Portfolio holdings are subject to change daily. | |
Voya Large Cap Value Portfolio (the “Portfolio”) seeks long-term growth of capital and current income. The Portfolio is managed by Vincent Costa, CFA, and James Dorment, CFA, Portfolio Managers of Voya Investment Management Co. LLC — the Sub-Adviser.
Performance: For the year ended December 31, 2020, the Portfolio’s Class S shares provided a total return of 5.97% compared to the Russell 1000® Value Index (the “Index” or “Russell 1000® Value”), which returned 2.80% for the same period.
Portfolio Specifics: For the year ended December 31, 2020, the Portfolio outperformed the Index, primarily due to strong security selection. On the sector level, stock selection within the industrials and information technology sectors had the largest positive impact on relative performance. Key contributors included positioning in AT&T Inc., which was bought and sold during the year resulting in an equal average weight over the 12-month period, and overweight positions in United Rentals Inc. and ViacomCBS Inc.
By contrast, health care and consumer discretionary sectors had the largest negative impact on performance. At the
| | Top Ten Holdings
as of December 31, 2020
(as a percentage of net assets) | |
| | | | | | |
| | Walt Disney Co. | | | 3.3% | |
| | Johnson & Johnson | | | 2.7% | |
| | Comcast Corp. – Class A | | | 2.7% | |
| | Medtronic PLC | | | 2.6% | |
| | Citigroup, Inc. | | | 2.5% | |
| | Bank of America Corp. | | | 2.5% | |
| | Raytheon Technologies Corp. | | | 2.4% | |
| | Norfolk Southern Corp. | | | 2.4% | |
| | Fiserv, Inc. | | | 2.3% | |
| | Walmart, Inc. | | | 2.2% | |
| | Portfolio holdings are subject to change daily. | |
individual stock level, the biggest detractors included the overweights to MGM Resorts International and L Brands, Inc., and the underweight to Verizon Communications Inc.
Current Strategy and Outlook: We continue to see what we believe are attractive valuations in companies in a variety of sectors. Going forward, we believe that dividends will continue to be in demand by investors, who are searching for income and for funds with good downside capture such as the Portfolio's strategy has sought to provide.
The views expressed in this commentary are informed opinions. They should not be considered promises or advice. The views expressed reflect those of the portfolio managers, only through the end of the period as stated on the cover. The portfolio managers’ views are subject to change at any time based on market and other conditions.
Portfolio holdings and characteristics are subject to change and may not be representative of current holdings and characteristics. Portfolio holdings are subject to change daily. The outlook for this Portfolio may differ from that presented for other Voya mutual funds. This report contains statements that may be “forward-looking” statements. Actual results may differ materially from those projected in the “forward-looking” statements. The Portfolio’s performance returns shown reflect applicable fee waivers and/or expense limits in effect during this period. Absent such fee waivers/expense limitations, if any, performance would have been lower. Performance for the different classes of shares will vary based on differences in fees associated with each class. An index has no cash in its portfolio and imposes no sales charges. An investor cannot invest directly in an index.
| Voya Large Cap Value Portfolio | Portfolio Managers’ Report |
| | | Average Annual Total Returns for the Periods Ended December 31, 2020 | | |
| | | | | | 1 Year | | | 5 Year | | | 10 Year | | | Since Inception
of Class S2
September 9, 2013 | | |
| | | Class ADV | | | | | 5.61% | | | | | | 9.00% | | | | | | 9.32% | | | | | | — | | | |
| | | Class I | | | | | 6.28% | | | | | | 9.65% | | | | | | 9.99% | | | | | | — | | | |
| | | Class R6(1) | | | | | 6.27% | | | | | | 9.64% | | | | | | 9.98% | | | | | | — | | | |
| | | Class S | | | | | 5.97% | | | | | | 9.36% | | | | | | 9.71% | | | | | | — | | | |
| | | Class S2 | | | | | 5.86% | | | | | | 9.23% | | | | | | — | | | | | | 8.13% | | | |
| | | Russell 1000® Value Index | | | | | 2.80% | | | | | | 9.74% | | | | | | 10.50% | | | | | | 9.28% | | | |
| | | | | |
Based on a $10,000 initial investment, the graph and table above illustrate the total return of Voya Large Cap Value Portfolio against the index indicated. The index is unmanaged and has no cash in its portfolio and imposes no sales charges. An investor cannot invest directly in an index.
The Portfolio’s performance is shown without the imposition of any expenses or charges which are, or may be, imposed under your variable annuity contract or variable life insurance policy. Total returns would have been lower if such expenses or charges were included.
The performance graph and table do not reflect the deduction of taxes that a shareholder will pay on Portfolio distributions or the redemption of Portfolio shares.
The performance shown includes, if applicable, the effect of fee waivers and/or expense reimbursements by the Investment Adviser and/or other service providers, which have the effect of increasing total return. Had all fees and expenses been considered, the total returns would have been lower.
The performance update illustrates performance for a variable investment option available through a variable annuity contract or a variable life insurance policy. The performance shown indicates past performance and is not a projection or prediction of future results. Actual investment returns and principal value will fluctuate so that shares and/or units, at redemption, may be worth more or less than their original cost. Please log on to www.voyainvestments.com or call (800) 366-0066 to get performance through the most recent month end.
Portfolio holdings are subject to change daily.
Prior to January 21, 2011, the Portfolio was managed by a different sub-adviser.
(1)
Class R6 incepted on November 24, 2015. The Class R6 shares performance shown for the period prior to their inception date is the performance of Class I shares without adjustment for any differences in the expenses between the two classes. If adjusted for such differences, returns would be different.
| Portfolio Managers’ Report | Voya Limited Maturity Bond Portfolio |
| | Investment Type Allocation
as of December 31, 2020
(as a percentage of net assets) | |
| | | | | | |
| | Corporate Bonds/Notes | | | 34.2% | |
| | U.S. Treasury Obligations | | | 22.0% | |
| | Asset-Backed Securities | | | 18.0% | |
| | Commercial Mortgage-Backed Securities | | | 17.1% | |
| | Collateralized Mortgage Obligations | | | 6.0% | |
| | U.S. Government Agency Obligations* | | | 0.0% | |
| | Assets in Excess of Other Liabilities** | | | 2.7% | |
| | Net Assets | | | 100.0% | |
| | *
Amount is less than 0.05% | |
| | **
Includes short-term investments. | |
| | Portfolio holdings are subject to change daily. | |
Voya Limited Maturity Bond Portfolio (the “Portfolio”) seeks highest current income consistent with low risk to principal and liquidity. As a secondary objective, the Portfolio seeks to enhance its total return through capital appreciation when market factors, such as falling interest rates and rising bond prices, indicate that capital appreciation may be available without significant risk to principal. The Portfolio is managed by David Goodson, Randall Parrish, CFA, and Matthew Toms, CFA, Portfolio Managers of Voya Investment Management Co. LLC — the Sub-Adviser.
Performance: For the year ended December 31, 2020, the Portfolio’s Class S shares provided a total return of 3.19% compared to the Bloomberg Barclays U.S. 1-3 Year Government/Credit Bond Index, which returned 3.33% for the same period.
Portfolio Specifics: Both asset allocation and security selection drove outperformance, before fees and expenses, for the reporting period. Overall, favorable security selection and asset allocation added to relative returns. Additionally, although the Portfolio duration was relatively flat versus the benchmark, duration (interest-rate risk) management contributed modestly to relative results. Our decision to remain underweight to U.S. Treasuries versus
| | Top Ten Holdings
as of December 31, 2020*
(as a percentage of net assets) | |
| | | | | | |
| | United States Treasury Note, 1.500%, 11/30/21 | | | 10.3% | |
| | United States Treasury Note, 0.125%, 12/31/22 | | | 7.0% | |
| | United States Treasury Note, 0.125%, 12/15/23 | | | 4.2% | |
| | Ginnie Mae Series 2016-H06 FD, 1.060%, 07/20/65 | | | 0.8% | |
| | JP Morgan Chase Commercial Mortgage Securities Trust 2013-C10 B, 3.674%, 12/15/47 | | | 0.7% | |
| | JP Morgan Chase Commercial Mortgage Securities Trust 2011-C5 B, 5.424%, 08/15/46 | | | 0.6% | |
| | Ginnie Mae Series 2012-H31 FD, 0.480%, 12/20/62 | | | 0.6% | |
| | BXMT 2020-FL2 AS Ltd., 1.303%, 02/16/37 | | | 0.5% | |
| | UBS-Barclays Commercial Mortgage Trust 2012-C4 AS, 3.317%, 12/10/45 | | | 0.5% | |
| | UBS-Barclays Commercial Mortgage Trust 2012-C4 B, 3.718%, 12/10/45 | | | 0.5% | |
| | *
Excludes short-term investments. | |
| | Portfolio holdings are subject to change daily. | |
| | | | |
overweight to other asset classes, such as investment-grade (“IG”) credit and asset-backed securities (“ABS”), contributed to results. Our overweight to IG corporates contributed positively to returns, as this sector was supported by stronger-than-expected earnings seasons, tighter spreads and a muted supply in the latter half of the period. We maintained our overweight to commercial mortgage-backed securities. This allocation detracted from relative returns, primarily due to the negative impact of the COVID-19 pandemic at the start of the period. In the last few months of the period, however, vaccine developments have supported the recovery of this sector. In addition, we maintained our overweight to high-quality ABS, as we believed this sector would continue to be well-bid. This allocation proved to be additive, driven by the support of a term asset-backed securities loan facility during the period. Security selection overall also contributed to performance. IG credit contributed the most while U.S. Treasury security selection detracted, but in our view this is a by-product of our overall duration management as opposed to a security specific issue.
Futures were used in conjunction with cash bonds for duration and yield curve management. These investment decisions in total (derivative instruments and cash securities) added to performance over the reporting period.
Current Strategy and Outlook: Heading into 2021, we believe that the market backdrop for cyclical sectors is extraordinarily positive. We also believe that consumers, supported by excess savings, robust net worth and additional fiscal aid, will drive a recovery in discretionary spending, leading to a full re-engagement of the service sector as the vaccine rollout becomes more widespread. In our opinion, the recovery in services spending, coupled with resilience in goods demand, should usher in an extended period of synchronous, above-trend global growth, easing pressures on the income divide.
In the near-term, we believe that cyclical sectors across securitized credit, corporate credit and emerging market debt are relatively attractive. We believe that a rebound in economic growth, fostered by a duality of fiscal and central bank support, will push spreads uncomfortably tight in 2021.
| Voya Limited Maturity Bond Portfolio | Portfolio Managers’ Report |
However, we also recognize the market seems to be very aligned on the near-term positive direction of risk assets. This one-way sentiment opens the door for volatility, in our view. The vaccine news is overwhelmingly positive, and we believe the vaccine ultimately will succeed. However, we believe that the potential for episodic market stresses, whether connected to the vaccine or other global factors, should not be overlooked.
The heavy use of economic stabilizers creates vulnerability to shocks and we believe that will leave investors exposed to increasingly asymmetric risk profiles. Security selection, which we believe is always important, will be critical, as the dispersion between “winning” and “losing” investments within sectors will remain extremely wide, in our view. Diversification, risk hedging and careful analysis of cyclical versus structural factors are necessary, in our view, to mitigate downside risks and prepare portfolios for the income-starved world that we believe is ahead of us.
The views expressed in this commentary are informed opinions. They should not be considered promises or advice. The views expressed reflect those of the portfolio managers, only through the end of the period as stated on the cover. The portfolio managers’ views are subject to change at any time based on market and other conditions.
Portfolio holdings and characteristics are subject to change and may not be representative of current holdings and characteristics. Portfolio holdings are subject to change daily. The outlook for this Portfolio may differ from that presented for other Voya mutual funds. This report contains statements that may be “forward-looking” statements. Actual results may differ materially from those projected in the “forward-looking” statements. The Portfolio’s performance returns shown reflect applicable fee waivers and/or expense limits in effect during this period. Absent such fee waivers/expense limitations, if any, performance would have been lower. Performance for the different classes of shares will vary based on differences in fees associated with each class. An index has no cash in its portfolio and imposes no sales charges. An investor cannot invest directly in an index.
| Portfolio Managers’ Report | Voya Limited Maturity Bond Portfolio |
| | | Average Annual Total Returns for the Periods Ended December 31, 2020 | | |
| | | | | | 1 Year | | | 5 Year | | | 10 Year | | |
| | | Class ADV | | | | | 2.87% | | | | | | 1.81% | | | | | | 1.81% | | | |
| | | Class I | | | | | 3.46% | | | | | | 2.41% | | | | | | 1.78% | | | |
| | | Class S | | | | | 3.19% | | | | | | 2.15% | | | | | | 1.53% | | | |
| | | Bloomberg Barclays U.S. 1-3 Year Government/Credit Bond Index | | | | | 3.33% | | | | | | 2.21% | | | | | | 1.60% | | | |
| | | | | |
Based on a $10,000 initial investment, the graph and table above illustrate the total return of Voya Limited Maturity Bond Portfolio against the index indicated. The index is unmanaged and has no cash in its portfolio and imposes no sales charges. An investor cannot invest directly in an index.
The Portfolio’s performance is shown without the imposition of any expenses or charges which are, or may be, imposed under your variable annuity contract or variable life insurance policy. Total returns would have been lower if such expenses or charges were included.
The performance graph and table do not reflect the deduction of taxes that a shareholder will pay on Portfolio distributions or the redemption of Portfolio shares.
The performance shown includes, if applicable, the effect of fee waivers and/or expense reimbursements by the
Investment Adviser and/or other service providers, which have the effect of increasing total return. Had all fees and expenses been considered, the total returns would have been lower.
The performance update illustrates performance for a variable investment option available through a variable annuity contract or a variable life insurance policy. The performance shown indicates past performance and is not a projection or prediction of future results. Actual investment returns and principal value will fluctuate so that shares and/or units, at redemption, may be worth more or less than their original cost. Please log on to www.voyainvestments.com or call (800) 366-0066 to get performance through the most recent month end.
Portfolio holdings are subject to change daily.
| Voya U.S. Stock Index Portfolio | Portfolio Managers’ Report |
| | Sector Diversification
as of December 31, 2020
(as a percentage of net assets) | |
| | | | | | |
| | Information Technology | | | 26.8% | |
| | Health Care | | | 13.1% | |
| | Consumer Discretionary | | | 12.4% | |
| | Communication Services | | | 10.5% | |
| | Financials | | | 10.1% | |
| | Industrials | | | 8.2% | |
| | Consumer Staples | | | 6.3% | |
| | Utilities | | | 2.7% | |
| | Materials | | | 2.5% | |
| | Real Estate | | | 2.3% | |
| | Energy | | | 2.2% | |
| | Assets in Excess of Other Liabilities* | | | 2.9% | |
| | Net Assets | | | 100.0% | |
| | *
Includes short-term investments. | |
| | Portfolio holdings are subject to change daily. | |
Voya U.S. Stock Index Portfolio (the “Portfolio”) seeks total return. The Portfolio is managed by Steve Wetter and Kai Yee Wong, Portfolio Managers of Voya Investment Management Co. LLC — the Sub-Adviser.
Performance: For the year ended December 31, 2020, the Portfolio’s Class I shares provided a total return of 18.11% compared to the S&P 500® Index, which returned 18.40% for the same period.
Portfolio Specifics*: The Portfolio employs a “passive management” approach designed to track the performance of the S&P 500® Index. The Portfolio attempts to track the S&P 500® Index by principally investing in stocks that make up the S&P 500® Index. The Portfolio may not always hold all of the same securities as the S&P 500® Index.
For the reporting period, absolute performance was strongest within information technology, consumer discretionary, and communication services. By contract, energy, real estate, and financials were the bottom absolute performing sectors posting negative returns for the reporting period.
Current Strategy and Outlook: The Portfolio currently invests principally in common stocks and employs a “passive
| | Top Ten Holdings
as of December 31, 2020*
(as a percentage of net assets) | |
| | | | | | |
| | Apple, Inc. | | | 6.5% | |
| | Microsoft Corp. | | | 5.2% | |
| | Amazon.com, Inc. | | | 4.3% | |
| | Facebook, Inc. - Class A | | | 2.0% | |
| | Tesla, Inc. | | | 1.6% | |
| | Alphabet, Inc. - Class A | | | 1.6% | |
| | Alphabet, Inc. - Class C | | | 1.6% | |
| | Berkshire Hathaway, Inc. – Class B | | | 1.4% | |
| | Johnson & Johnson | | | 1.3% | |
| | JPMorgan Chase & Co. | | | 1.2% | |
| | *
Excludes short-term investments. | |
| | Portfolio holdings are subject to change daily. | |
management” approach designed to track the performance of the S&P 500
® Index.
*
Please note that this discussion refers to the Portfolio’s gross performance versus the benchmark. Returns presented in the preceding paragraph refer to the Portfolio’s performance net of expenses. The benchmark does not incur expenses. An investor cannot invest directly in the benchmark.
The views expressed in this commentary are informed opinions. They should not be considered promises or advice. The views expressed reflect those of the portfolio managers, only through the end of the period as stated on the cover. The portfolio managers’ views are subject to change at any time based on market and other conditions.
Portfolio holdings and characteristics are subject to change and may not be representative of current holdings and characteristics. Portfolio holdings are subject to change daily. The outlook for this Portfolio may differ from that presented for other Voya mutual funds. This report contains statements that may be “forward-looking” statements. Actual results may differ materially from those projected in the “forward-looking” statements. The Portfolio’s performance returns shown reflect applicable fee waivers and/or expense limits in effect during this period. Absent such fee waivers/expense limitations, if any, performance would have been lower. Performance for the different classes of shares will vary based on differences in fees associated with each class. An index has no cash in its portfolio and imposes no sales charges. An investor cannot invest directly in an index.
| Portfolio Managers’ Report | Voya U.S. Stock Index Portfolio |
| | | Average Annual Total Returns for the Periods Ended December 31, 2020 | | |
| | | | | | 1 Year | | | 5 Year | | | 10 Year | | |
| | | Class ADV | | | | | 17.48% | | | | | | 14.31% | | | | 12.99% | | |
| | | Class I | | | | | 18.11% | | | | | | 14.91% | | | | 13.58% | | |
| | | Class P2(1) | | | | | 18.23% | | | | | | 15.00% | | | | 13.63% | | |
| | | Class S | | | | | 17.87% | | | | | | 14.64% | | | | 13.32% | | |
| | | Class S2 | | | | | 17.62% | | | | | | 14.44% | | | | 13.13% | | |
| | | S&P 500® Index | | | | | 18.40% | | | | | | 15.22% | | | | 13.88% | | |
| | | | | |
Based on a $10,000 initial investment, the graph and table above illustrate the total return of Voya U.S. Stock Index Portfolio against the index indicated. The index is unmanaged and has no cash in its portfolio and imposes no sales charges. An investor cannot invest directly in an index.
The Portfolio’s performance is shown without the imposition of any expenses or charges which are, or may be, imposed under your variable annuity contract or variable life insurance policy. Total returns would have been lower if such expenses or charges were included.
The performance graph and table do not reflect the deduction of taxes that a shareholder will pay on Portfolio distributions or the redemption of Portfolio shares.
The performance shown includes, if applicable, the effect of fee waivers and/or expense reimbursements by the Investment Adviser and/or other service providers, which have the effect of increasing total return. Had all fees and expenses been considered, the total returns would have been lower.
The performance update illustrates performance for a variable investment option available through a variable annuity contract or a variable life insurance policy. The performance shown indicates past performance and is not a projection or prediction of future results. Actual investment returns and principal value will fluctuate so that shares and/or units, at redemption, may be worth more or less than their original cost. Please log on to www.voyainvestments.com or call (800) 366-0066 to get performance through the most recent month end.
Portfolio holdings are subject to change daily.
(1)
Class P2 incepted on May 3, 2017. The Class P2 shares performance shown for the period prior to their inception date is the performance of Class I shares without adjustment for any differences in the expenses between the two classes. If adjusted for such differences, returns would be different.
| VY® Clarion Real Estate Portfolio | Portfolio Managers’ Report |
| | REIT Diversification
as of December 31, 2020
(as a percentage of net assets) | |
| | | | | | |
| | Specialized REITs | | | 26.5% | |
| | Industrial REITs | | | 16.6% | |
| | Residential REITs | | | 14.6% | |
| | Retail REITs | | | 12.0% | |
| | Office REITs | | | 11.6% | |
| | Health Care REITs | | | 8.9% | |
| | Diversified REITs | | | 4.4% | |
| | Hotel & Resort REITs | | | 3.5% | |
| | Hotels, Resorts & Cruise Lines | | | 0.6% | |
| | Assets in Excess of Other Liabilities* | | | 1.3% | |
| | Net Assets | | | 100.0% | |
| | *
Includes short-term investments. | |
| | Portfolio holdings are subject to change daily. | |
VY
® Clarion Real Estate Portfolio (the “Portfolio”) seeks total return including capital appreciation and current income. The Portfolio is managed* by T. Ritson Ferguson, CFA, Chief Executive Officer and Global Chief Investment Officer, Joseph P. Smith, CFA, President and Co-Chief Investment Officer, Jonathan D. Miniman, CFA, and Kenneth S. Weinberg, CFA, Portfolio Managers of CBRE Clarion Securities LLC (“CBRE”) — the Sub-Adviser.
Performance: For the year ended December 31, 2020, the Portfolio’s Class S shares provided a total return of -6.53% compared to the MSCI U.S. REIT® Index, which returned -7.57% for the same period.
Portfolio Specifics: Real estate stocks rallied materially in the fourth quarter but were down for the year. Real estate stocks may have “bounced,” but the stocks have not “recovered.” Real estate stocks rebounded powerfully in the fourth quarter in response to positive developments concerning the availability of effective COVID-19 pandemic vaccines as well as the U.S. Presidential Election outcome. Despite rallying in the fourth quarter, real estate stocks were down 7.6% for the year, materially underperforming many asset classes including the S&P 500® Index, the Bloomberg Barclays U.S. Aggregate Bond Index, and the MSCI World IndexSM. U.S. real estate stocks still have tremendous ground to make up versus broader market indices.
Since bottoming in early May, real estate stocks performed well when news was announced about either improving economic conditions or positive news about a vaccine to fight the COVID-19 pandemic. We believe real estate stocks will outperform when investors become more certain about the timing and scale of an “economic re-opening.” In our opinion, this will help catalyze the realization of the good relative value, improving earnings growth, and attractive dividend yields in the current low yield environment.
| | Top Ten Holdings
as of December 31, 2020
(as a percentage of net assets) | |
| | | | | | |
| | ProLogis, Inc. | | | 9.4% | |
| | Simon Property Group, Inc. | | | 6.0% | |
| | Duke Realty Corp. | | | 5.2% | |
| | CubeSmart | | | 4.5% | |
| | VEREIT, Inc. | | | 4.4% | |
| | Life Storage, Inc. | | | 4.0% | |
| | Alexandria Real Estate Equities, Inc. | | | 3.9% | |
| | Equinix, Inc. | | | 3.6% | |
| | Ventas, Inc. | | | 3.3% | |
| | Healthcare Trust of America, Inc. | | | 3.0% | |
| | Portfolio holdings are subject to change daily. | |
We believe a moderate and controlled re-opening of the global economy will occur in 2021 and may act as a further catalyst for good absolute and relative performance of real estate securities. As a result, we estimate earnings for real estate stocks will grow in the mid-single-digit range in 2021 and 2022 assuming the vaccines and health policies are effective to minimize the pandemic and that the global economy can re-open in 2021.
The Portfolio outperformed the MSCI U.S. REIT® Index during the period primarily as the result of sector allocation decisions. Stock selection also added value. Positioning in the mall sector was the top contributor to relative performance for the year. The Portfolio was underweight the mall sector until the fourth quarter, moving to an overweight position in conjunction with the vaccine news. Timing was good as the mall sector had underperformed most of the year but was one of the strongest performing sectors in the fourth quarter. Underweight exposure to the underperforming hotel and shopping centers contributed to relative performance as did overweight exposure to the outperforming tower and data center sectors. Stock selection was a modest contributor to performance as the outperformance of holdings in the healthcare and mall sectors was largely offset by the relative underperformance of holdings in the net lease, hotel and shopping center sectors.
Current Strategy and Outlook: We believe long-term investors have a unique opportunity to invest in high-quality real estate assets at very attractive valuations. Based on our proprietary analytical tools, we believe that real estate securities are cheap relative to the private real estate market, the fixed income market, and the broader stock market. We believe investors committing capital to listed real estate at this time have the potential to earn above average absolute and relative long-term total returns.
| Portfolio Managers’ Report | VY® Clarion Real Estate Portfolio |
We own what we believe is a well-balanced portfolio of securities that have been screened for their growth prospects in combination with the quality of their business models, assets, balance sheets, and management teams. We are positive on property types and stocks that offer these qualities at what we believe are reasonable valuations. We favor storage, towers, A-Malls, gaming, timber, lab space and industrial. Since the beginning of the fourth quarter, we have added to the Portfolio “over-sold” stocks that represent what we see as “great value” in the storage and mall sectors and we have funded these purchases by selling year-to-date outperforming stocks, particularly in the data center sector and those sectors which rallied hard on the vaccine news but beyond where the fundamentals and valuation is justified, like hotels.
*
Jonathan D. Miniman and Kenneth S. Weinberg were added as Portfolio Managers to the Portfolio in January 2020.
The views expressed in this commentary are informed opinions. They should not be considered promises or advice. The views expressed reflect those of the portfolio managers, only through the end of the period as stated on the cover. The portfolio managers’ views are subject to change at any time based on market and other conditions.
Portfolio holdings and characteristics are subject to change and may not be representative of current holdings and characteristics. Portfolio holdings are subject to change daily. The outlook for this Portfolio may differ from that presented for other Voya mutual funds. This report contains statements that may be “forward-looking” statements. Actual results may differ materially from those projected in the “forward-looking” statements. The Portfolio’s performance returns shown reflect applicable fee waivers and/or expense limits in effect during this period. Absent such fee waivers/expense limitations, if any, performance would have been lower. Performance for the different classes of shares will vary based on differences in fees associated with each class. An index has no cash in its portfolio and imposes no sales charges. An investor cannot invest directly in an index.
| VY® Clarion Real Estate Portfolio | Portfolio Managers’ Report |
| | | Average Annual Total Returns for the Periods Ended December 31, 2020 | | |
| | | | | | 1 Year | | | 5 Year | | | 10 Year | | |
| | | Class ADV | | | | | -6.89% | | | | | | 3.57% | | | | 7.29% | | |
| | | Class I | | | | | -6.32% | | | | | | 4.19% | | | | 7.94% | | |
| | | Class S | | | | | -6.53% | | | | | | 3.93% | | | | 7.67% | | |
| | | Class S2 | | | | | -6.69% | | | | | | 3.77% | | | | 7.51% | | |
| | | MSCI U.S. REIT® Index | | | | | -7.57% | | | | | | 4.84% | | | | 8.30% | | |
| | | | | |
Based on a $10,000 initial investment, the graph and table above illustrate the total return of VY® Clarion Real Estate Portfolio against the index indicated. The index is unmanaged and has no cash in its portfolio and imposes no sales charges. An investor cannot invest directly in an index.
The Portfolio’s performance is shown without the imposition of any expenses or charges which are, or may be, imposed under your variable annuity contract or variable life insurance policy. Total returns would have been lower if such expenses or charges were included.
The performance graph and table do not reflect the deduction of taxes that a shareholder will pay on Portfolio distributions or the redemption of Portfolio shares.
The performance shown includes, if applicable, the effect of fee waivers and/or expense reimbursements by the
Investment Adviser and/or other service providers, which have the effect of increasing total return. Had all fees and expenses been considered, the total returns would have been lower.
The performance update illustrates performance for a variable investment option available through a variable annuity contract or a variable life insurance policy. The performance shown indicates past performance and is not a projection or prediction of future results. Actual investment returns and principal value will fluctuate so that shares and/or units, at redemption, may be worth more or less than their original cost. Please log on to www.voyainvestments.com or call (800) 366-0066 to get performance through the most recent month end.
Portfolio holdings are subject to change daily.
| Portfolio Managers’ Report | VY® JPMorgan Small Cap Core Equity Portfolio |
| | Sector Diversification
as of December 31, 2020
(as a percentage of net assets) | |
| | | | | | |
| | Industrials | | | 18.5% | |
| | Health Care | | | 16.6% | |
| | Financials | | | 16.5% | |
| | Information Technology | | | 14.0% | |
| | Consumer Discretionary | | | 10.1% | |
| | Real Estate | | | 6.3% | |
| | Materials | | | 5.8% | |
| | Consumer Staples | | | 3.6% | |
| | Communication Services | | | 2.3% | |
| | Utilities | | | 2.2% | |
| | Energy | | | 1.4% | |
| | Assets in Excess of Other Liabilities* | | | 2.7% | |
| | Net Assets | | | 100.0% | |
| | *
Includes short-term investments. | |
| | Portfolio holdings are subject to change daily. | |
VY
® JPMorgan Small Cap Core Equity Portfolio (the “Portfolio”) seeks capital growth over the long-term. The Portfolio is managed using two investment styles — quantitative and fundamental analysis. The Portfolio is managed in two sleeves — the quantitative sleeve managed by Wonseok Choi, Managing Director, Akash Gupta, CFA and Executive Director, Lindsey J. Houghton, Executive Director, Johnathon L. Tse, Executive Director and Phillip D. Hart, CFA, Managing Director, and the fundamental sleeve managed by Daniel J. Percella, CFA, Managing Director and Don San Jose, CFA, Managing Director, Portfolio Managers of J.P. Morgan Investment Management Inc. — the Sub-Adviser.
Performance: For the year ended December 31, 2020, the Portfolio’s Class S shares provided a total return of 16.30% compared to the Russell 2000® Index, which returned 19.96% for the same period.
Portfolio Specifics: The quantitative sleeve underperformed the Russell 2000® Index during the year.
Stock selection in the industrial cyclical and health services & systems sectors detracted most from performance. At the individual stock level, underweights in Teladoc and Plug Power were the top detractors. Within the health services & systems sector, Teladoc, a telemedicine and virtual healthcare company, has seen a significant increase in usage during the COVID-19 pandemic, particularly in the first half of the year. Stay at home orders forced increased virtual healthcare visits which boosted shares. Within the industrial cyclical sector, Plug Power shares rallied around the U.S. Presidential election with the belief that a new Biden administration will accelerate the shift to renewable energy and away from fossil fuels, benefitting Plug Power and alternative energy stocks. Plug Power got another boost late in the year after it announced it’s expanding its relationship with Walmart and will be supplying sustainable solutions for use in its eCommerce network.
Alternatively, stock selection in the pharmaceutical and utilities sectors contributed most to performance. At the individual
| | Top Ten Holdings
as of December 31, 2020*
(as a percentage of net assets) | |
| | | | | | |
| | Performance Food Group Co. | | | 1.2% | |
| | Aptargroup, Inc. | | | 1.2% | |
| | Toro Co. | | | 1.1% | |
| | Encompass Health Corp. | | | 0.9% | |
| | Q2 Holdings, Inc. | | | 0.9% | |
| | WillScot Mobile Mini Holdings Corp. | | | 0.8% | |
| | RBC Bearings, Inc. | | | 0.8% | |
| | Lincoln Electric Holdings, Inc. | | | 0.8% | |
| | WEX, Inc. | | | 0.8% | |
| | MSA Safety, Inc. | | | 0.7% | |
| | *
Excludes short-term investments. | |
| | Portfolio holdings are subject to change daily. | |
stock level, overweights in Immunomedics and Owens & Minor were the top contributors. Within the pharmaceutical sector, Immunomedics shares increased following the announcement that Gilead Sciences agreed to acquire the company for approximately $21 billion. Within the health services & systems sector, Owens & Minor largely benefitted from the COVID-19 pandemic. Shares initially rallied in the year on news that the hospital supplier added shifts and expanded factory production time to meet global demand for personal protective equipment. The improved productivity and increased manufacturing output in response to the unprecedented demand for personal protective equipment helped the company post strong results throughout the year.
The fundamental sleeve performed in line with the Russell 2000® Index during the year. Stock selection in the financials and industrials sectors contributed the most to performance. An underweight allocation to the health care sector was the primary detractor from performance followed by stock selection in technology.
Pool Corporation and Catalent were top contributors during the year. Pool Corporation outperformed as investors embraced the defensive characteristics of the business amid volatility to start the year. The company continued to benefit from exceptional fundamentals as the COVID-19 pandemic drove a large uptick in back yard spending by consumers. Catalent traded higher after consistently beating earnings and revenue expectations throughout the year. The company also benefitted from announced partnerships to manufacture COVID-19 vaccines and therapies in the back half of the year.
Cinemark Holdings and Patterson-UTI Energy were top detractors. Cinemark Holdings traded lower as a result of the economic impacts of the COVID-19 pandemic on the movie theatre industry. We eliminated our position in the second quarter as the pandemic permanently accelerated secular headwinds with studios launching content directly to streaming
| VY® JPMorgan Small Cap Core Equity Portfolio | Portfolio Managers’ Report |
services. Patterson-UTI Energy underperformed as weakness in the commodity market weighed on the energy sector early in the year. We eliminated our position in the second quarter as we think that oil prices may stay lower for a longer period of time and we have lost conviction in the company’s execution.
Current Strategy and Outlook: We continue to focus on fundamentals of the economy and company earnings. We believe that unemployment and other uncertainties, such as fiscal stimulus, COVID-19 vaccine distribution, and the conclusion of the U.S. Senate elections in Georgia, will be integral to investor sentiment moving forward.
While we believe the economy will recover, it will first need time to heal, and hence we remain balanced and continue to monitor incremental risks that in our view could represent headwinds for U.S. stocks. Through the volatility, we continue to focus on what we see as high-conviction ideas and take advantage of market dislocations for compelling stock selection opportunities.
We seek to own what we consider to be high-quality businesses, run by management teams with a proven track record of creating shareholder value, at what we believe are attractive valuations. While positioning has not materially changed we continue to lean into quality cyclicals given reasonable valuations. Industrials and financials remain top overweight exposures which expanded during the year. Health care remains the top underweight in the Portfolio due to our lack of biotech exposure, followed by energy.
The views expressed in this commentary are informed opinions. They should not be considered promises or advice. The views expressed reflect those of the portfolio managers, only through the end of the period as stated on the cover. The portfolio managers’ views are subject to change at any time based on market and other conditions.
Portfolio holdings and characteristics are subject to change and may not be representative of current holdings and characteristics. Portfolio holdings are subject to change daily. The outlook for this Portfolio may differ from that presented for other Voya mutual funds. This report contains statements that may be “forward-looking” statements. Actual results may differ materially from those projected in the “forward-looking” statements. The Portfolio’s performance returns shown reflect applicable fee waivers and/or expense limits in effect during this period. Absent such fee waivers/expense limitations, if any, performance would have been lower. Performance for the different classes of shares will vary based on differences in fees associated with each class. An index has no cash in its portfolio and imposes no sales charges. An investor cannot invest directly in an index.
| Portfolio Managers’ Report | VY® JPMorgan Small Cap Core Equity Portfolio |
| | | Average Annual Total Returns for the Periods Ended December 31, 2020 | | |
| | | | | | 1 Year | | | 5 Year | | | 10 Year | | |
| | | Class ADV | | | | | 15.84% | | | | | | 12.67% | | | | 11.73% | | |
| | | Class I | | | | | 16.53% | | | | | | 13.35% | | | | 12.40% | | |
| | | Class R6(1) | | | | | 16.48% | | | | | | 13.33% | | | | 12.39% | | |
| | | Class S | | | | | 16.30% | | | | | | 13.07% | | | | 12.12% | | |
| | | Class S2 | | | | | 16.07% | | | | | | 12.90% | | | | 11.95% | | |
| | | Russell 2000® Index | | | | | 19.96% | | | | | | 13.26% | | | | 11.20% | | |
| | | | | |
Based on a $10,000 initial investment, the graph and table above illustrate the total return of VY® JPMorgan Small Cap Core Equity Portfolio against the index indicated. The index is unmanaged and has no cash in its portfolio and imposes no sales charges. An investor cannot invest directly in an index.
The Portfolio’s performance is shown without the imposition of any expenses or charges which are, or may be, imposed under your variable annuity contract or variable life insurance policy. Total returns would have been lower if such expenses or charges were included.
The performance graph and table do not reflect the deduction of taxes that a shareholder will pay on Portfolio distributions or the redemption of Portfolio shares.
The performance shown includes, if applicable, the effect of fee waivers and/or expense reimbursements by the Investment Adviser and/or other service providers, which have the effect of increasing total return. Had all fees and expenses been considered, the total returns would have been lower.
The performance update illustrates performance for a variable investment option available through a variable annuity contract or a variable life insurance policy. The performance shown indicates past performance and is not a projection or prediction of future results. Actual investment returns and principal value will fluctuate so that shares and/or units, at redemption, may be worth more or less than their original cost. Please log on to www.voyainvestments.com or call (800) 366-0066 to get performance through the most recent month end.
Portfolio holdings are subject to change daily.
(1)
Class R6 incepted on May 3, 2016. The Class R6 shares performance shown for the period prior to their inception date is the performance of Class I shares without adjustment for any differences in the expenses between the two classes. If adjusted for such differences, returns would be different.
SHAREHOLDER EXPENSE EXAMPLES (Unaudited)
As a shareholder of a Portfolio, you incur two types of costs: (1) transaction costs, including redemption fees and exchange fees; and (2) ongoing costs, including management fees, distribution and/or service (12b-1) fees, and other Portfolio expenses. These Examples are intended to help you understand your ongoing costs (in dollars) of investing in a Portfolio and to compare these costs with the ongoing costs of investing in other mutual funds.
The Examples are based on an investment of $1,000 invested at the beginning of the period and held for the entire period from July 1, 2020 to December 31, 2020. The Portfolios’ expenses are shown without the imposition of any charges which are, or may be, imposed under your variable annuity contract, variable life insurance policy, qualified pension, or retirement plan. Expenses would have been higher if such charges were included.
Actual Expenses
The left section of the table shown below, “Actual Portfolio Return,” provides information about actual account values and actual expenses. You may use the information in this section, together with the amount you invested, to estimate the expenses that you paid over the period. Simply divide your account value by $1,000 (for example, an $8,600 account value divided by $1,000 = 8.6), then multiply the result by the number in the first section under the heading entitled “Expenses Paid During the Period” to estimate the expenses you paid on your account during this period.
Hypothetical Example for Comparison Purposes
The right section of the table shown below, “Hypothetical (5% return before expenses),” provides information about hypothetical account values and hypothetical expenses based on a Portfolio’s actual expense ratio and an assumed rate of return of 5% per year before expenses, which is not a Portfolio’s actual return. The hypothetical account values and expenses may not be used to estimate the actual ending account balance or expenses you paid for the period. You may use this information to compare the ongoing costs of investing in a Portfolio and other mutual funds. To do so, compare this 5% hypothetical example with the 5% hypothetical examples that appear in the shareholder reports of the other mutual funds.
Please note that the expenses shown in the table are meant to highlight your ongoing costs only and do not reflect any transactional costs, such as redemption fees or exchange fees. Therefore, the hypothetical section of the table is useful in comparing ongoing costs only, and will not help you determine the relative total costs of owning different mutual funds. In addition, if these transactional costs were included, your costs would have been higher.
| | | | Actual Portfolio Return | | | Hypothetical (5% return before expenses) | |
| | | | Beginning
Account
Value
July 1,
2020 | | | Ending
Account
Value
December 31,
2020 | | | Annualized
Expense
Ratio | | | Expenses Paid
During the
Period Ended
December 31,
2020* | | | Beginning
Account
Value
July 1,
2020 | | | Ending
Account
Value
December 31,
2020 | | | Annualized
Expense
Ratio | | | Expenses Paid
During the
Period Ended
December 31,
2020* | |
| Voya Balanced Income Portfolio | |
| Class ADV | | | | $ | 1,000.00 | | | | | $ | 1,102.50 | | | | | | 1.20% | | | | | $ | 6.34 | | | | | $ | 1,000.00 | | | | | $ | 1,019.10 | | | | | | 1.20% | | | | | $ | 6.09 | | |
| Class I | | | | | 1,000.00 | | | | | | 1,105.40 | | | | | | 0.60 | | | | | | 3.18 | | | | | | 1,000.00 | | | | | | 1,022.12 | | | | | | 0.60 | | | | | | 3.05 | | |
| Class S | | | | | 1,000.00 | | | | | | 1,103.70 | | | | | | 0.85 | | | | | | 4.49 | | | | | | 1,000.00 | | | | | | 1,020.86 | | | | | | 0.85 | | | | | | 4.32 | | |
| Class S2 | | | | | 1,000.00 | | | | | | 1,103.80 | | | | | | 1.00 | | | | | | 5.29 | | | | | | 1,000.00 | | | | | | 1,020.11 | | | | | | 1.00 | | | | | | 5.08 | | |
| Voya High Yield Portfolio | |
| Class ADV | | | | $ | 1,000.00 | | | | | $ | 1,107.00 | | | | | | 1.08% | | | | | $ | 5.72 | | | | | $ | 1,000.00 | | | | | $ | 1,019.71 | | | | | | 1.08% | | | | | $ | 5.48 | | |
| Class I | | | | | 1,000.00 | | | | | | 1,110.20 | | | | | | 0.48 | | | | | | 2.55 | | | | | | 1,000.00 | | | | | | 1,022.72 | | | | | | 0.48 | | | | | | 2.44 | | |
| Class S | | | | | 1,000.00 | | | | | | 1,108.90 | | | | | | 0.73 | | | | | | 3.87 | | | | | | 1,000.00 | | | | | | 1,021.47 | | | | | | 0.73 | | | | | | 3.71 | | |
| Class S2 | | | | | 1,000.00 | | | | | | 1,108.00 | | | | | | 0.88 | | | | | | 4.66 | | | | | | 1,000.00 | | | | | | 1,020.71 | | | | | | 0.88 | | | | | | 4.47 | | |
| Voya Large Cap Growth Portfolio | |
| Class ADV | | | | $ | 1,000.00 | | | | | $ | 1,224.10 | | | | | | 1.27% | | | | | $ | 7.10 | | | | | $ | 1,000.00 | | | | | $ | 1,018.75 | | | | | | 1.27% | | | | | $ | 6.44 | | |
| Class I | | | | | 1,000.00 | | | | | | 1,228.30 | | | | | | 0.67 | | | | | | 3.75 | | | | | | 1,000.00 | | | | | | 1,021.77 | | | | | | 0.67 | | | | | | 3.40 | | |
| Class R6 | | | | | 1,000.00 | | | | | | 1,227.50 | | | | | | 0.67 | | | | | | 3.75 | | | | | | 1,000.00 | | | | | | 1,021.77 | | | | | | 0.67 | | | | | | 3.40 | | |
| Class S | | | | | 1,000.00 | | | | | | 1,226.10 | | | | | | 0.92 | | | | | | 5.15 | | | | | | 1,000.00 | | | | | | 1,020.51 | | | | | | 0.92 | | | | | | 4.67 | | |
| Class S2 | | | | | 1,000.00 | | | | | | 1,225.70 | | | | | | 1.07 | | | | | | 5.99 | | | | | | 1,000.00 | | | | | | 1,019.76 | | | | | | 1.07 | | | | | | 5.43 | | |
SHAREHOLDER EXPENSE EXAMPLES (Unaudited) (continued)
| | | | Actual Portfolio Return | | | Hypothetical (5% return before expenses) | |
| | | | Beginning
Account
Value
July 1,
2020 | | | Ending
Account
Value
December 31,
2020 | | | Annualized
Expense
Ratio | | | Expenses Paid
During the
Period Ended
December 31,
2020* | | | Beginning
Account
Value
July 1,
2020 | | | Ending
Account
Value
December 31,
2020 | | | Annualized
Expense
Ratio | | | Expenses Paid
During the
Period Ended
December 31,
2020* | |
| Voya Large Cap Value Portfolio | |
| Class ADV | | | | $ | 1,000.00 | | | | | $ | 1,242.00 | | | | | | 1.24% | | | | | $ | 6.99 | | | | | $ | 1,000.00 | | | | | $ | 1,018.90 | | | | | | 1.24% | | | | | $ | 6.29 | | |
| Class I | | | | | 1,000.00 | | | | | | 1,245.20 | | | | | | 0.64 | | | | | | 3.61 | | | | | | 1,000.00 | | | | | | 1,021.92 | | | | | | 0.64 | | | | | | 3.25 | | |
| Class R6 | | | | | 1,000.00 | | | | | | 1,245.30 | | | | | | 0.64 | | | | | | 3.61 | | | | | | 1,000.00 | | | | | | 1,021.92 | | | | | | 0.64 | | | | | | 3.25 | | |
| Class S | | | | | 1,000.00 | | | | | | 1,243.60 | | | | | | 0.89 | | | | | | 5.02 | | | | | | 1,000.00 | | | | | | 1,020.66 | | | | | | 0.89 | | | | | | 4.52 | | |
| Class S2 | | | | | 1,000.00 | | | | | | 1,243.10 | | | | | | 1.04 | | | | | | 5.86 | | | | | | 1,000.00 | | | | | | 1,019.91 | | | | | | 1.04 | | | | | | 5.28 | | |
| Voya Limited Maturity Bond Portfolio | |
| Class ADV | | | | $ | 1,000.00 | | | | | $ | 1,011.20 | | | | | | 0.88% | | | | | $ | 4.45 | | | | | $ | 1,000.00 | | | | | $ | 1,020.71 | | | | | | 0.88% | | | | | $ | 4.47 | | |
| Class I | | | | | 1,000.00 | | | | | | 1,014.20 | | | | | | 0.28 | | | | | | 1.42 | | | | | | 1,000.00 | | | | | | 1,023.73 | | | | | | 0.28 | | | | | | 1.42 | | |
| Class S | | | | | 1,000.00 | | | | | | 1,012.90 | | | | | | 0.53 | | | | | | 2.68 | | | | | | 1,000.00 | | | | | | 1,022.47 | | | | | | 0.53 | | | | | | 2.69 | | |
| Voya U.S. Stock Index Portfolio | |
| Class ADV | | | | $ | 1,000.00 | | | | | $ | 1,217.20 | | | | | | 0.79% | | | | | $ | 4.40 | | | | | $ | 1,000.00 | | | | | $ | 1,021.17 | | | | | | 0.79% | | | | | $ | 4.01 | | |
| Class I | | | | | 1,000.00 | | | | | | 1,219.90 | | | | | | 0.26 | | | | | | 1.45 | | | | | | 1,000.00 | | | | | | 1,023.83 | | | | | | 0.26 | | | | | | 1.32 | | |
| Class P2 | | | | | 1,000.00 | | | | | | 1,220.20 | | | | | | 0.15 | | | | | | 0.84 | | | | | | 1,000.00 | | | | | | 1,024.38 | | | | | | 0.15 | | | | | | 0.76 | | |
| Class S | | | | | 1,000.00 | | | | | | 1,218.50 | | | | | | 0.50 | | | | | | 2.79 | | | | | | 1,000.00 | | | | | | 1,022.62 | | | | | | 0.50 | | | | | | 2.54 | | |
| Class S2 | | | | | 1,000.00 | | | | | | 1,217.20 | | | | | | 0.66 | | | | | | 3.68 | | | | | | 1,000.00 | | | | | | 1,021.82 | | | | | | 0.66 | | | | | | 3.35 | | |
| VY® Clarion Real Estate Portfolio | |
| Class ADV | | | | $ | 1,000.00 | | | | | $ | 1,124.60 | | | | | | 1.28% | | | | | $ | 6.84 | | | | | $ | 1,000.00 | | | | | $ | 1,018.70 | | | | | | 1.28% | | | | | $ | 6.50 | | |
| Class I | | | | | 1,000.00 | | | | | | 1,128.20 | | | | | | 0.68 | | | | | | 3.64 | | | | | | 1,000.00 | | | | | | 1,021.72 | | | | | | 0.68 | | | | | | 3.46 | | |
| Class S | | | | | 1,000.00 | | | | | | 1,126.60 | | | | | | 0.93 | | | | | | 4.97 | | | | | | 1,000.00 | | | | | | 1,020.46 | | | | | | 0.93 | | | | | | 4.72 | | |
| Class S2 | | | | | 1,000.00 | | | | | | 1,125.90 | | | | | | 1.08 | | | | | | 5.77 | | | | | | 1,000.00 | | | | | | 1,019.71 | | | | | | 1.08 | | | | | | 5.48 | | |
| VY®JPMorgan Small Cap Core Equity Portfolio | |
| Class ADV | | | | $ | 1,000.00 | | �� | | | $ | 1,348.40 | | | | | | 1.47% | | | | | $ | 8.68 | | | | | $ | 1,000.00 | | | | | $ | 1,017.75 | | | | | | 1.47% | | | | | $ | 7.46 | | |
| Class I | | | | | 1,000.00 | | | | | | 1,352.20 | | | | | | 0.87 | | | | | | 5.14 | | | | | | 1,000.00 | | | | | | 1,020.76 | | | | | | 0.87 | | | | | | 4.42 | | |
| Class R6 | | | | | 1,000.00 | | | | | | 1,351.70 | | | | | | 0.87 | | | | | | 5.14 | | | | | | 1,000.00 | | | | | | 1,020.76 | | | | | | 0.87 | | | | | | 4.42 | | |
| Class S | | | | | 1,000.00 | | | | | | 1,351.10 | | | | | | 1.12 | | | | | | 6.62 | | | | | | 1,000.00 | | | | | | 1,019.51 | | | | | | 1.12 | | | | | | 5.69 | | |
| Class S2 | | | | | 1,000.00 | | | | | | 1,349.30 | | | | | | 1.27 | | | | | | 7.50 | | | | | | 1,000.00 | | | | | | 1,018.75 | | | | | | 1.27 | | | | | | 6.44 | | |
*
Expenses are equal to each Portfolio’s respective annualized expense ratios multiplied by the average account value over the period, multiplied by 184/366 to reflect the most recent fiscal half-year.
Report of Independent Registered Public Accounting Firm
To the Shareholders of Voya Balanced Income Portfolio, Voya High Yield Portfolio, Voya Large Cap Growth Portfolio, Voya Large Cap Value Portfolio, Voya Limited Maturity Bond Portfolio, Voya U.S. Stock Index Portfolio, VY® Clarion Real Estate Portfolio and VY® JPMorgan Small Cap Core Equity Portfolio and the Board of Trustees of Voya Investors Trust
Opinion on the Financial Statements
We have audited the accompanying statements of assets and liabilities of Voya Balanced Income Portfolio, Voya High Yield Portfolio, Voya Large Cap Growth Portfolio, Voya Large Cap Value Portfolio, Voya Limited Maturity Bond Portfolio, Voya U.S. Stock Index Portfolio, VY® Clarion Real Estate Portfolio and VY® JPMorgan Small Cap Core Equity Portfolio (collectively referred to as the “Portfolios”) (eight of the portfolios constituting Voya Investors Trust (the “Trust”)), including the portfolio of investments and summary portfolios of investments, as applicable, as of December 31, 2020, and the related statements of operations and changes in net assets and the financial highlights for the year then ended and the related notes (collectively referred to as the “financial statements”). In our opinion, the financial statements present fairly, in all material respects, the financial position of the Portfolios (eight of the portfolios constituting Voya Investors Trust) at December 31, 2020, the results of their operations, the changes in their net assets and their financial highlights for the year then ended, in conformity with U.S. generally accepted accounting principles.
The statement of changes in net assets for the year ended December 31, 2019, and the financial highlights for each of the periods in the four-year period then ended, were audited by another independent registered public accounting firm whose report, dated February 21, 2020, expressed an unqualified opinion on that statement of changes in net assets and those financial highlights.
Basis for Opinion
These financial statements are the responsibility of the Trust’s management. Our responsibility is to express an opinion on the Portfolios’ financial statements based on our audits. We are a public accounting firm registered with the Public Company Accounting Oversight Board (United States) (“PCAOB”) and are required to be independent with respect to the Trust in accordance with the U.S. federal securities laws and the applicable rules and regulations of the Securities and Exchange Commission and the PCAOB.
We conducted our audits in accordance with the standards of the PCAOB. Those standards require that we plan and perform the audits to obtain reasonable assurance about whether the financial statements are free of material misstatement, whether due to error or fraud. The Trust is not required to have, nor were we engaged to perform, an audit of the Trust’s internal control over financial reporting. As part of our audits, we are required to obtain an understanding of internal control over financial reporting, but not for the purpose of expressing an opinion on the effectiveness of the Trust’s internal control over financial reporting. Accordingly, we express no such opinion.
Our audits included performing procedures to assess the risks of material misstatement of the financial statements, whether due to error or fraud, and performing procedures that respond to those risks. Such procedures included examining, on a test basis, evidence regarding the amounts and disclosures in the financial statements. Our procedures included confirmation of securities owned as of December 31, 2020, by correspondence with the custodian and others or by other appropriate auditing procedures where replies from others were not received. Our audits also included evaluating the accounting principles used and significant estimates made by management, as well as evaluating the overall presentation of the financial statements. We believe that our audits provide a reasonable basis for our opinion.
We have served as the auditor of one or more Voya investment companies since 2019.
Boston, Massachusetts
February 24, 2021
STATEMENTS OF ASSETS AND LIABILITIES as of December 31, 2020
| | | | Voya Balanced
Income Portfolio | | | Voya High Yield
Portfolio | | | Voya Large Cap
Growth Portfolio | | | Voya Large Cap
Value Portfolio | |
| ASSETS: | | | | | | | | | | | | | | | | | | | | | | | | | |
| Investments in securities at fair value+* | | | | $ | 312,979,173 | | | | | $ | 517,980,194 | | | | | $ | 6,520,381,153 | | | | | $ | 984,583,063 | | |
| Investments in affiliates at fair value** | | | | | 26,571,781 | | | | | | — | | | | | | — | | | | | | — | | |
| Short-term investments at fair value† | | | | | 1,605,627 | | | | | | 28,170,098 | | | | | | 96,057,934 | | | | | | 20,788,737 | | |
| Cash | | | | | 2,196,341 | | | | | ��� | 113,451 | | | | | | 71,529 | | | | | | 339,862 | | |
| Cash collateral for futures contracts | | | | | 180,932 | | | | | | — | | | | | | — | | | | | | — | | |
| Cash pledged for centrally cleared swaps (Note 2) | | | | | 350,000 | | | | | | — | | | | | | — | | | | | | — | | |
| Foreign currencies at value‡ | | | | | 8,870 | | | | | | — | | | | | | — | | | | | | 155,852 | | |
| Receivables: | | | | | | | | | | | | | | | | | | | | | | | | | |
| Investment securities and currencies sold | | | | | 3,903 | | | | | | 11,507,667 | | | | | | — | | | | | | — | | |
| Fund shares sold | | | | | 2,977,866 | | | | | | 2,758,988 | | | | | | 253,347 | | | | | | 180,064 | | |
| Dividends | | | | | 198,196 | | | | | | — | | | | | | 2,933,132 | | | | | | 1,757,765 | | |
| Interest | | | | | 1,025,046 | | | | | | 7,724,944 | | | | | | 190 | | | | | | — | | |
| Foreign tax reclaims | | | | | 189,513 | | | | | | — | | | | | | — | | | | | | 214,435 | | |
| Unrealized appreciation on forward foreign currency contracts | | | | | 529,175 | | | | | | — | | | | | | — | | | | | | — | | |
| Prepaid expenses | | | | | 1,652 | | | | | | — | | | | | | 24,487 | | | | | | 4,237 | | |
| Reimbursement due from Investment Adviser | | | | | 3,933 | | | | | | — | | | | | | 234,427 | | | | | | 149,143 | | |
| Other assets | | | | | 21,032 | | | | | | 30,449 | | | | | | 235,678 | | | | | | 65,069 | | |
| Total assets | | | | | 348,843,040 | | | | | | 568,285,791 | | | | | | 6,620,191,877 | | | | | | 1,008,238,227 | | |
| LIABILITIES: | | | | | | | | | | | | | | | | | | | | | | | | | |
| Payable for investment securities and currencies purchased | | | | | 3,928 | | | | | | 1,400,000 | | | | | | 6,202,455 | | | | | | — | | |
| Payable for fund shares redeemed | | | | | 35,765 | | | | | | 691,012 | | | | | | 32,954,996 | | | | | | 594,990 | | |
| Payable upon receipt of securities loaned | | | | | 1,605,627 | | | | | | 24,820,659 | | | | | | 43,633,823 | | | | | | 17,606,724 | | |
| Unrealized depreciation on forward foreign currency contracts | | | | | 615,118 | | | | | | — | | | | | | — | | | | | | — | | |
| Variation margin payable on centrally cleared swaps | | | | | 7,315 | | | | | | — | | | | | | — | | | | | | — | | |
| Payable for unified fees | | | | | — | | | | | | 215,860 | | | | | | — | | | | | | — | | |
| Payable for investment management fees | | | | | 159,719 | | | | | | — | | | | | | 3,549,802 | | | | | | 594,672 | | |
| Payable for distribution and shareholder service fees | | | | | 90,966 | | | | | | 96,900 | | | | | | 1,458,026 | | | | | | 151,830 | | |
| Payable to trustees under the deferred compensation plan (Note 6) | | | | | 21,032 | | | | | | 30,449 | | | | | | 235,678 | | | | | | 65,069 | | |
| Payable for trustee fees | | | | | 1,732 | | | | | | — | | | | | | 29,195 | | | | | | 4,557 | | |
| Other accrued expenses and liabilities | | | | | 106,924 | | | | | | — | | | | | | 1,197,869 | | | | | | 266,287 | | |
| Written options, at fair value^ | | | | | 11,051 | | | | | | — | | | | | | — | | | | | | — | | |
| Total liabilities | | | | | 2,659,177 | | | | | | 27,254,880 | | | | | | 89,261,844 | | | | | | 19,284,129 | | |
| NET ASSETS | | | | $ | 346,183,863 | | | | | $ | 541,030,911 | | | | | $ | 6,530,930,033 | | | | | $ | 988,954,098 | | |
| NET ASSETS WERE COMPRISED OF: | | | | | | | | | | | | | | | | | | | | | | | | | |
| Paid-in capital | | | | $ | 321,322,409 | | | | | $ | 564,601,508 | | | | | $ | 3,758,507,936 | | | | | $ | 845,033,952 | | |
| Total distributable earnings (loss) | | | | | 24,861,454 | | | | | | (23,570,597) | | | | | | 2,772,422,097 | | | | | | 143,920,146 | | |
| NET ASSETS | | | | $ | 346,183,863 | | | | | $ | 541,030,911 | | | | | $ | 6,530,930,033 | | | | | $ | 988,954,098 | | |
+
Including securities loaned at value | | | | $ | 1,551,438 | | | | | $ | 24,223,467 | | | | | $ | 42,706,980 | | | | | $ | 17,203,923 | | |
*
Cost of investments in securities | | | | $ | 281,527,818 | | | | | $ | 482,802,238 | | | | | $ | 4,881,110,469 | | | | | $ | 832,669,886 | | |
**
Cost of investments in affiliates | | | | $ | 27,861,222 | | | | | $ | — | | | | | $ | — | | | | | $ | — | | |
†
Cost of short-term investments | | | | $ | 1,605,627 | | | | | $ | 28,170,015 | | | | | $ | 96,057,934 | | | | | $ | 20,788,737 | | |
‡
Cost of foreign currencies | | | | $ | 8,626 | | | | | $ | — | | | | | $ | — | | | | | $ | 140,765 | | |
^
Premiums received on written options | | | | $ | 68,117 | | | | | $ | — | | | | | $ | — | | | | | $ | — | | |
See Accompanying Notes to Financial Statements
STATEMENTS OF ASSETS AND LIABILITIES as of December 31, 2020 (continued)
| | | | Voya Balanced
Income Portfolio | | | Voya High Yield
Portfolio | | | Voya Large Cap
Growth Portfolio | | | Voya Large Cap
Value Portfolio | |
| Class ADV | | | | | | | | | | | | | | | | | | | | | | | | | |
| Net assets | | | | $ | 66,515,355 | | | | | $ | 80,017,125 | | | | | $ | 2,073,088,401 | | | | | $ | 47,670,584 | | |
| Shares authorized | | | | | unlimited | | | | | | unlimited | | | | | | unlimited | | | | | | unlimited | | |
| Par value | | | | $ | 0.001 | | | | | $ | 0.001 | | | | | $ | 0.001 | | | | | $ | 0.001 | | |
| Shares outstanding | | | | | 6,810,505 | | | | | | 8,034,554 | | | | | | 101,359,594 | | | | | | 4,273,223 | | |
| Net asset value and redemption price per share | | | | $ | 9.77 | | | | | $ | 9.96 | | | | | $ | 20.45 | | | | | $ | 11.16 | | |
| Class I | | | | | | | | | | | | | | | | | | | | | | | | | |
| Net assets | | | | $ | 7,943,045 | | | | | $ | 191,357,554 | | | | | $ | 2,436,873,036 | | | | | $ | 329,385,317 | | |
| Shares authorized | | | | | unlimited | | | | | | unlimited | | | | | | unlimited | | | | | | unlimited | | |
| Par value | | | | $ | 0.001 | | | | | $ | 0.001 | | | | | $ | 0.001 | | | | | $ | 0.001 | | |
| Shares outstanding | | | | | 770,293 | | | | | | 19,199,281 | | | | | | 106,421,432 | | | | | | 28,771,433 | | |
| Net asset value and redemption price per share | | | | $ | 10.31 | | | | | $ | 9.97 | | | | | $ | 22.90 | | | | | $ | 11.45 | | |
| Class R6 | | | | | | | | | | | | | | | | | | | | | | | | | |
| Net assets | | | | | n/a | | | | | | n/a | | | | | $ | 88,303,240 | | | | | $ | 230,227 | | |
| Shares authorized | | | | | n/a | | | | | | n/a | | | | | | unlimited | | | | | | unlimited | | |
| Par value | | | | | n/a | | | | | | n/a | | | | | $ | 0.001 | | | | | $ | 0.001 | | |
| Shares outstanding | | | | | n/a | | | | | | n/a | | | | | | 3,853,827 | | | | | | 20,122 | | |
| Net asset value and redemption price per share | | | | | n/a | | | | | | n/a | | | | | $ | 22.91 | | | | | $ | 11.44 | | |
| Class S | | | | | | | | | | | | | | | | | | | | | | | | | |
| Net assets | | | | $ | 266,536,382 | | | | | $ | 266,537,308 | | | | | $ | 1,867,154,335 | | | | | $ | 611,513,713 | | |
| Shares authorized | | | | | unlimited | | | | | | unlimited | | | | | | unlimited | | | | | | unlimited | | |
| Par value | | | | $ | 0.001 | | | | | $ | 0.001 | | | | | $ | 0.001 | | | | | $ | 0.001 | | |
| Shares outstanding | | | | | 25,995,912 | | | | | | 26,762,394 | | | | | | 84,478,974 | | | | | | 54,346,134 | | |
| Net asset value and redemption price per share | | | | $ | 10.25 | | | | | $ | 9.96 | | | | | $ | 22.10 | | | | | $ | 11.25 | | |
| Class S2 | | | | | | | | | | | | | | | | | | | | | | | | | |
| Net assets | | | | $ | 5,189,081 | | | | | $ | 3,118,924 | | | | | $ | 65,511,021 | | | | | $ | 154,257 | | |
| Shares authorized | | | | | unlimited | | | | | | unlimited | | | | | | unlimited | | | | | | unlimited | | |
| Par value | | | | $ | 0.001 | | | | | $ | 0.001 | | | | | $ | 0.001 | | | | | $ | 0.001 | | |
| Shares outstanding | | | | | 507,853 | | | | | | 312,726 | | | | | | 2,995,777 | | | | | | 13,692 | | |
| Net asset value and redemption price per share | | | | $ | 10.22 | | | | | $ | 9.97 | | | | | $ | 21.87 | | | | | $ | 11.27 | | |
See Accompanying Notes to Financial Statements
STATEMENTS OF ASSETS AND LIABILITIES as of December 31, 2020
| | | | Voya Limited
Maturity Bond
Portfolio | | | Voya U.S. Stock
Index Portfolio | | | VY® Clarion Real
Estate Portfolio | | | VY® JPMorgan
Small Cap Core
Equity Portfolio | |
| ASSETS: | | | | | | | | | | | | | | | | | | | | | | | | | |
| Investments in securities at fair value+* | | | | $ | 407,887,782 | | | | | $ | 7,476,123,591 | | | | | $ | 244,608,931 | | | | | $ | 572,554,292 | | |
| Short-term investments at fair value† | | | | | 15,085,224 | | | | | | 374,214,625 | | | | | | 3,122,196 | | | | | | 30,841,079 | | |
| Cash | | | | | 20,484 | | | | | | 2,921,434 | | | | | | — | | | | | | 4,863,954 | | |
| Cash collateral for futures contracts | | | | | 196,030 | | | | | | 12,717,289 | | | | | | — | | | | | | 329,410 | | |
| Receivables: | | | | | | | | | | | | | | | | | | | | | | | | | |
| Investment securities sold | | | | | 7,812 | | | | | | — | | | | | | 152,387 | | | | | | 669,582 | | |
| Fund shares sold | | | | | 1,183,494 | | | | | | 50,438,165 | | | | | | 2,359,085 | | | | | | 41,225 | | |
| Dividends | | | | | 198 | | | | | | 5,648,361 | | | | | | 1,289,623 | | | | | | 508,055 | | |
| Interest | | | | | 1,354,281 | | | | | | 618 | | | | | | — | | | | | | 67 | | |
| Foreign tax reclaims | | | | | — | | | | | | — | | | | | | — | | | | | | 2,914 | | |
| Prepaid expenses | | | | | — | | | | | | — | | | | | | 1,300 | | | | | | — | | |
| Reimbursement due from Investment Adviser | | | | | — | | | | | | 259,258 | | | | | | 65,664 | | | | | | — | | |
| Other assets | | | | | 13,562 | | | | | | 167,187 | | | | | | 23,938 | | | | | | 24,974 | | |
| Total assets | | | | | 425,748,867 | | | | | | 7,922,490,528 | | | | | | 251,623,124 | | | | | | 609,835,552 | | |
| LIABILITIES: | | | | | | | | | | | | | | | | | | | | | | | | | |
| Payable for investment securities purchased | | | | | 5,000,391 | | | | | | — | | | | | | 839,543 | | | | | | 974,805 | | |
| Payable for fund shares redeemed | | | | | 280,550 | | | | | | 24,481,380 | | | | | | 951,910 | | | | | | 4,773,489 | | |
| Payable upon receipt of securities loaned | | | | | 1,212,194 | | | | | | 196,535,392 | | | | | | 1,714,962 | | | | | | 14,734,711 | | |
| Payable for unified fees | | | | | 97,392 | | | | | | 1,688,235 | | | | | | — | | | | | | 443,033 | | |
| Payable for investment management fees | | | | | — | | | | | | — | | | | | | 160,840 | | | | | | — | | |
| Payable for distribution and shareholder service fees | | | | | 22,545 | | | | | | 151,666 | | | | | | 64,671 | | | | | | 94,178 | | |
| Payable to trustees under the deferred compensation plan (Note 6) | | | | | 13,562 | | | | | | 167,187 | | | | | | 23,938 | | | | | | 24,974 | | |
| Payable for trustee fees | | | | | — | | | | | | — | | | | | | 1,294 | | | | | | — | | |
| Other accrued expenses and liabilities | | | | | — | | | | | | — | | | | | | 136,036 | | | | | | — | | |
| Total liabilities | | | | | 6,626,634 | | | | | | 223,023,860 | | | | | | 3,893,194 | | | | | | 21,045,190 | | |
| NET ASSETS | | | | $ | 419,122,233 | | | | | $ | 7,699,466,668 | | | | | $ | 247,729,930 | | | | | $ | 588,790,362 | | |
| NET ASSETS WERE COMPRISED OF: | | | | | | | | | | | | | | | | | | | | | | | | | |
| Paid-in capital | | | | $ | 413,877,279 | | | | | $ | 3,924,904,945 | | | | | $ | 241,613,572 | | | | | $ | 423,081,225 | | |
| Total distributable earnings | | | | | 5,244,954 | | | | | | 3,774,561,723 | | | | | | 6,116,358 | | | | | | 165,709,137 | | |
| NET ASSETS | | | | $ | 419,122,233 | | | | | $ | 7,699,466,668 | | | | | $ | 247,729,930 | | | | | $ | 588,790,362 | | |
+
Including securities loaned at value | | | | $ | 1,182,010 | | | | | $ | 192,476,372 | | | | | $ | 1,679,783 | | | | | $ | 14,408,339 | | |
*
Cost of investments in securities | | | | $ | 404,029,569 | | | | | $ | 4,410,271,425 | | | | | $ | 219,315,951 | | | | | $ | 432,989,218 | | |
†
Cost of short-term investments | | | | $ | 15,085,224 | | | | | $ | 374,214,625 | | | | | $ | 3,122,196 | | | | | $ | 30,841,079 | | |
See Accompanying Notes to Financial Statements
STATEMENTS OF ASSETS AND LIABILITIES as of December 31, 2020 (continued)
| | | | Voya Limited
Maturity Bond
Portfolio | | | Voya U.S. Stock
Index Portfolio | | | VY® Clarion Real
Estate Portfolio | | | VY® JPMorgan
Small Cap Core
Equity Portfolio | |
| Class ADV | | | | | | | | | | | | | | | | | | | | | | | | | |
| Net assets | | | | $ | 15,015,519 | | | | | $ | 100,049,218 | | | | | $ | 48,780,607 | | | | | $ | 128,294,979 | | |
| Shares authorized | | | | | unlimited | | | | | | unlimited | | | | | | unlimited | | | | | | unlimited | | |
| Par value | | | | $ | 0.001 | | | | | $ | 0.001 | | | | | $ | 0.001 | | | | | $ | 0.001 | | |
| Shares outstanding | | | | | 1,496,995 | | | | | | 5,495,491 | | | | | | 1,676,629 | | | | | | 7,433,802 | | |
| Net asset value and redemption price per share | | | | $ | 10.03 | | | | | $ | 18.21 | | | | | $ | 29.09 | | | | | $ | 17.26 | | |
| Class I | | | | | | | | | | | | | | | | | | | | | | | | | |
| Net assets | | | | $ | 332,196,156 | | | | | $ | 4,258,516,997 | | | | | $ | 14,402,742 | | | | | $ | 211,266,456 | | |
| Shares authorized | | | | | unlimited | | | | | | unlimited | | | | | | unlimited | | | | | | unlimited | | |
| Par value | | | | $ | 0.001 | | | | | $ | 0.001 | | | | | $ | 0.001 | | | | | $ | 0.001 | | |
| Shares outstanding | | | | | 32,459,377 | | | | | | 224,853,759 | | | | | | 466,362 | | | | | | 11,182,283 | | |
| Net asset value and redemption price per share | | | | $ | 10.23 | | | | | $ | 18.94 | | | | | $ | 30.88 | | | | | $ | 18.89 | | |
| Class P2 | | | | | | | | | | | | | | | | | | | | | | | | | |
| Net assets | | | | | n/a | | | | | $ | 2,908,826,062 | | | | | | n/a | | | | | | n/a | | |
| Shares authorized | | | | | n/a | | | | | | unlimited | | | | | | n/a | | | | | | n/a | | |
| Par value | | | | | n/a | | | | | $ | 0.001 | | | | | | n/a | | | | | | n/a | | |
| Shares outstanding | | | | | n/a | | | | | | 152,825,731 | | | | | | n/a | | | | | | n/a | | |
| Net asset value and redemption price per share | | | | | n/a | | | | | $ | 19.03 | | | | | | n/a | | | | | | n/a | | |
| Class R6 | | | | | | | | | | | | | | | | | | | | | | | | | |
| Net assets | | | | | n/a | | | | | | n/a | | | | | | n/a | | | | | $ | 118,342,100 | | |
| Shares authorized | | | | | n/a | | | | | | n/a | | | | | | n/a | | | | | | unlimited | | |
| Par value | | | | | n/a | | | | | | n/a | | | | | | n/a | | | | | $ | 0.001 | | |
| Shares outstanding | | | | | n/a | | | | | | n/a | | | | | | n/a | | | | | | 6,270,371 | | |
| Net asset value and redemption price per share | | | | | n/a | | | | | | n/a | | | | | | n/a | | | | | $ | 18.87 | | |
| Class S | | | | | | | | | | | | | | | | | | | | | | | | | |
| Net assets | | | | $ | 71,910,558 | | | | | $ | 280,432,385 | | | | | $ | 173,126,147 | | | | | $ | 122,575,037 | | |
| Shares authorized | | | | | unlimited | | | | | | unlimited | | | | | | unlimited | | | | | | unlimited | | |
| Par value | | | | $ | 0.001 | | | | | $ | 0.001 | | | | | $ | 0.001 | | | | | $ | 0.001 | | |
| Shares outstanding | | | | | 6,973,237 | | | | | | 14,966,330 | | | | | | 5,607,970 | | | | | | 6,609,442 | | |
| Net asset value and redemption price per share | | | | $ | 10.31 | | | | | $ | 18.74 | | | | | $ | 30.87 | | | | | $ | 18.55 | | |
| Class S2 | | | | | | | | | | | | | | | | | | | | | | | | | |
| Net assets | | | | | n/a | | | | | $ | 151,642,006 | | | | | $ | 11,420,434 | | | | | $ | 8,311,790 | | |
| Shares authorized | | | | | n/a | | | | | | unlimited | | | | | | unlimited | | | | | | unlimited | | |
| Par value | | | | | n/a | | | | | $ | 0.001 | | | | | $ | 0.001 | | | | | $ | 0.001 | | |
| Shares outstanding | | | | | n/a | | | | | | 8,200,409 | | | | | | 372,682 | | | | | | 455,016 | | |
| Net asset value and redemption price per share | | | | | n/a | | | | | $ | 18.49 | | | | | $ | 30.64 | | | | | $ | 18.27 | | |
See Accompanying Notes to Financial Statements
STATEMENTS OF OPERATIONS for the year ended December 31, 2020
| | | | Voya Balanced
Income Portfolio | | | Voya High Yield
Portfolio | | | Voya Large Cap
Growth Portfolio | | | Voya Large Cap
Value Portfolio | |
| INVESTMENT INCOME: | | | | | | | | | | | | | | | | | | | | | | | | | |
| Dividends, net of foreign taxes withheld* | | | | $ | 4,025,305 | | | | | $ | — | | | | | $ | 49,193,360 | | | | | $ | 24,313,652 | | |
| Dividends from affiliated underlying funds | | | | | 1,299,381 | | | | | | — | | | | | | — | | | | | | — | | |
| Interest, net of foreign taxes withheld* | | | | | 6,484,894 | | | | | | 31,202,464 | | | | | | 1,357 | | | | | | — | | |
| Securities lending income, net | | | | | 14,455 | | | | | | 254,879 | | | | | | 70,992 | | | | | | 48,387 | | |
| Total investment income | | | | | 11,824,035 | | | | | | 31,457,343 | | | | | | 49,265,709 | | | | | | 24,362,039 | | |
| EXPENSES: | | | | | | | | | | | | | | | | | | | | | | | | | |
| Investment management fees | | | | | 1,905,407 | | | | | | — | | | | | | 37,824,861 | | | | | | 6,629,788 | | |
| Unified fees | | | | | — | | | | | | 2,614,695 | | | | | | — | | | | | | — | | |
| Distribution and shareholder service fees: | | | | | | | | | | | | | | | | | | | | | | | | | |
| Class ADV | | | | | 404,897 | | | | | | 475,509 | | | | | | 11,285,825 | | | | | | 263,856 | | |
| Class S | | | | | 665,449 | | | | | | 671,301 | | | | | | 4,323,029 | | | | | | 1,398,717 | | |
| Class S2 | | | | | 20,375 | | | | | | 11,931 | | | | | | 238,856 | | | | | | 523 | | |
| Transfer agent fees: | | | | | | | | | | | | | | | | | | | | | | | | | |
| Class ADV | | | | | 16,825 | | | | | | — | | | | | | 868,923 | | | | | | 29,627 | | |
| Class I | | | | | 1,915 | | | | | | — | | | | | | 967,610 | | | | | | 207,182 | | |
| Class R6 | | | | | — | | | | | | — | | | | | | 76 | | | | | | 17 | | |
| Class S | | | | | 66,302 | | | | | | — | | | | | | 799,768 | | | | | | 377,135 | | |
| Class S2 | | | | | 1,270 | | | | | | — | | | | | | 27,589 | | | | | | 88 | | |
| Shareholder reporting expense | | | | | 20,872 | | | | | | — | | | | | | 283,172 | | | | | | 81,104 | | |
| Professional fees | | | | | 18,310 | | | | | | — | | | | | | 184,260 | | | | | | 42,942 | | |
| Custody and accounting expense | | | | | 73,953 | | | | | | — | | | | | | 472,945 | | | | | | 87,801 | | |
| Trustee fees and expenses | | | | | 13,858 | | | | | | 23,320 | | | | | | 233,559 | | | | | | 36,456 | | |
| Miscellaneous expense | | | | | 16,662 | | | | | | — | | | | | | 253,288 | | | | | | 53,031 | | |
| Interest expense | | | | | 524 | | | | | | 17 | | | | | | 2,007 | | | | | | 1,026 | | |
| Total expenses | | | | | 3,226,619 | | | | | | 3,796,773 | | | | | | 57,765,768 | | | | | | 9,209,293 | | |
| Waived and reimbursed fees | | | | | (46,786) | | | | | | (80,035) | | | | | | (2,632,460) | | | | | | (1,687,447) | | |
| Net expenses | | | | | 3,179,833 | | | | | | 3,716,738 | | | | | | 55,133,308 | | | | | | 7,521,846 | | |
| Net investment income (loss) | | | | | 8,644,202 | | | | | | 27,740,605 | | | | | | (5,867,599) | | | | | | 16,840,193 | | |
| REALIZED AND UNREALIZED GAIN (LOSS): | | | | | | | | | | | | | | | | | | | | | | | | | |
| Net realized gain (loss) on: | | | | | | | | | | | | | | | | | | | | | | | | | |
| Investments | | | | | (16,083,201) | | | | | | (20,138,392) | | | | | | 1,147,315,271 | | | | | | (7,237,738) | | |
| Sale of affiliated underlying funds | | | | | (1,509,487) | | | | | | — | | | | | | — | | | | | | — | | |
| Forward foreign currency contracts | | | | | 377,575 | | | | | | — | | | | | | — | | | | | | — | | |
| Foreign currency related transactions | | | | | 158,233 | | | | | | — | | | | | | — | | | | | | (231) | | |
| Futures | | | | | 2,050,796 | | | | | | — | | | | | | — | | | | | | — | | |
| Swaps | | | | | 1,087,784 | | | | | | — | | | | | | — | | | | | | — | | |
| Written options | | | | | 366,074 | | | | | | — | | | | | | — | | | | | | — | | |
| Net realized gain (loss) | | | | | (13,552,226) | | | | | | (20,138,392) | | | | | | 1,147,315,271 | | | | | | (7,237,969) | | |
| Net change in unrealized appreciation (depreciation) on: | | | | | | | | | | | | | | | | | | | | | | | | | |
| Investments | | | | | 12,566,162 | | | | | | 18,077,591 | | | | | | 447,817,571 | | | | | | 32,995,299 | | |
| Affiliated underlying funds | | | | | (674,393) | | | | | | — | | | | | | — | | | | | | — | | |
| Forward foreign currency contracts | | | | | (425,763) | | | | | | — | | | | | | — | | | | | | — | | |
| Foreign currency related transactions | | | | | 106,577 | | | | | | — | | | | | | — | | | | | | 16,581 | | |
| Futures | | | | | 160,812 | | | | | | — | | | | | | — | | | | | | — | | |
| Swaps | | | | | (44,926) | | | | | | — | | | | | | — | | | | | | — | | |
| Written options | | | | | 29,377 | | | | | | — | | | | | | — | | | | | | — | | |
| Net change in unrealized appreciation (depreciation) | | | | | 11,717,846 | | | | | | 18,077,591 | | | | | | 447,817,571 | | | | | | 33,011,880 | | |
| Net realized and unrealized gain (loss) | | | | | (1,834,380) | | | | | | (2,060,801) | | | | | | 1,595,132,842 | | | | | | 25,773,911 | | |
| Increase in net assets resulting from operations | | | | $ | 6,809,822 | | | | | $ | 25,679,804 | | | | | $ | 1,589,265,243 | | | | | $ | 42,614,104 | | |
*
Foreign taxes withheld | | | | $ | 70,729 | | | | | $ | — | | | | | $ | 92,741 | | | | | $ | 73,861 | | |
See Accompanying Notes to Financial Statements
STATEMENTS OF OPERATIONS for the year ended December 31, 2020
| | | | Voya Limited
Maturity Bond
Portfolio | | | Voya U.S. Stock
Index Portfolio | | | VY® Clarion Real
Estate Portfolio | | | VY® JPMorgan
Small Cap Core
Equity Portfolio | |
| INVESTMENT INCOME: | | | | | | | | | | | | | | | | | | | | | | | | | |
| Dividends, net of foreign taxes withheld* | | | | $ | 46,072 | | | | | $ | 126,660,374 | | | | | $ | 6,820,970 | | | | | $ | 6,594,255 | | |
| Interest | | | | | 7,332,413 | | | | | | 9,419 | | | | | | — | | | | | | 1,175 | | |
| Securities lending income, net | | | | | 13,211 | | | | | | 344,198 | | | | | | 10,596 | | | | | | 231,133 | | |
| Total investment income | | | | | 7,391,696 | | | | | | 127,013,991 | | | | | | 6,831,566 | | | | | | 6,826,563 | | |
| EXPENSES: | | | | | | | | | | | | | | | | | | | | | | | | | |
| Investment management fees | | | | | — | | | | | | — | | | | | | 2,169,960 | | | | | | — | | |
| Unified fees | | | | | 1,027,305 | | | | | | 18,139,269 | | | | | | — | | | | | | 4,108,186 | | |
| Distribution and shareholder service fees: | | | | | | | | | | | | | | | | | | | | | | | | | |
| Class ADV | | | | | 89,673 | | | | | | 500,416 | | | | | | 301,685 | | | | | | 664,900 | | |
| Class S | | | | | 185,723 | | | | | | 647,737 | | | | | | 450,376 | | | | | | 269,824 | | |
| Class S2 | | | | | — | | | | | | 550,655 | | | | | | 49,508 | | | | | | 29,779 | | |
| Transfer agent fees: | | | | | | | | | | | | | | | | | | | | | | | | | |
| Class ADV | | | | | — | | | | | | — | | | | | | 74,161 | | | | | | — | | |
| Class I | | | | | — | | | | | | — | | | | | | 23,631 | | | | | | — | | |
| Class S | | | | | — | | | | | | — | | | | | | 265,706 | | | | | | — | | |
| Class S2 | | | | | — | | | | | | — | | | | | | 18,250 | | | | | | — | | |
| Shareholder reporting expense | | | | | — | | | | | | — | | | | | | 37,325 | | | | | | — | | |
| Professional fees | | | | | — | | | | | | — | | | | | | 13,908 | | | | | | — | | |
| Custody and accounting expense | | | | | — | | | | | | — | | | | | | 36,785 | | | | | | — | | |
| Trustee fees and expenses | | | | | 12,445 | | | | | | 253,123 | | | | | | 10,350 | | | | | | 23,300 | | |
| Miscellaneous expense | | | | | — | | | | | | — | | | | | | 18,502 | | | | | | — | | |
| Interest expense | | | | | — | | | | | | 11,283 | | | | | | 500 | | | | | | — | | |
| Total expenses | | | | | 1,315,146 | | | | | | 20,102,483 | | | | | | 3,470,647 | | | | | | 5,095,989 | | |
| Waived and reimbursed fees | | | | | — | | | | | | (2,837,673) | | | | | | (893,172) | | | | | | — | | |
| Brokerage commission recapture | | | | | — | | | | | | — | | | | | | (4,828) | | | | | | (49,485) | | |
| Net expenses | | | | | 1,315,146 | | | | | | 17,264,810 | | | | | | 2,572,647 | | | | | | 5,046,504 | | |
| Net investment income | | | | | 6,076,550 | | | | | | 109,749,181 | | | | | | 4,258,919 | | | | | | 1,780,059 | | |
| REALIZED AND UNREALIZED GAIN (LOSS): | | | | | | | | | | | | | | | | | | | | | | | | | |
| Net realized gain (loss) on: | | | | | | | | | | | | | | | | | | | | | | | | | |
| Investments | | | | | 2,640,318 | | | | | | 709,805,544 | | | | | | (18,888,871) | | | | | | 26,234,013 | | |
| Futures | | | | | 407,915 | | | | | | 21,148,273 | | | | | | — | | | | | | 1,810,828 | | |
| Net realized gain (loss) | | | | | 3,048,233 | | | | | | 730,953,817 | | | | | | (18,888,871) | | | | | | 28,044,841 | | |
| Net change in unrealized appreciation (depreciation) on: | | | | | | | | | | | | | | | | | | | | | | | | | |
| Investments | | | | | 2,408,607 | | | | | | 428,935,981 | | | | | | (10,732,222) | | | | | | 54,175,481 | | |
| Futures | | | | | 18,772 | | | | | | (397,700) | | | | | | — | | | | | | (109,206) | | |
| Net change in unrealized appreciation (depreciation) | | | | | 2,427,379 | | | | | | 428,538,281 | | | | | | (10,732,222) | | | | | | 54,066,275 | | |
| Net realized and unrealized gain (loss) | | | | | 5,475,612 | | | | | | 1,159,492,098 | | | | | | (29,621,093) | | | | | | 82,111,116 | | |
| Increase (decrease) in net assets resulting from operations | | | | $ | 11,552,162 | | | | | $ | 1,269,241,279 | | | | | $ | (25,362,174) | | | | | $ | 83,891,175 | | |
*
Foreign taxes withheld | | | | $ | — | | | | | $ | — | | | | | $ | — | | | | | $ | 18,739 | | |
See Accompanying Notes to Financial Statements
STATEMENTS OF CHANGES IN NET ASSETS
| | | | Voya Balanced Income Portfolio | | | Voya High Yield Portfolio | |
| | | | Year Ended
December 31,
2020 | | | Year Ended
December 31,
2019 | | | Year Ended
December 31,
2020 | | | Year Ended
December 31,
2019 | |
| FROM OPERATIONS: | | | | | | | | | | | | | | | | | | | | | | | | | |
| Net investment income | | | | $ | 8,644,202 | | | | | $ | 12,118,264 | | | | | $ | 27,740,605 | | | | | $ | 29,186,347 | | |
| Net realized gain (loss) | | | | | (13,552,226) | | | | | | 23,047,290 | | | | | | (20,138,392) | | | | | | (2,317,504) | | |
| Net change in unrealized appreciation (depreciation) | | | | | 11,717,846 | | | | | | 29,869,426 | | | | | | 18,077,591 | | | | | | 45,325,720 | | |
| Increase in net assets resulting from operations | | | | | 6,809,822 | | | | | | 65,034,980 | | | | | | 25,679,804 | | | | | | 72,194,563 | | |
| FROM DISTRIBUTIONS TO SHAREHOLDERS: | | | | | | | | | | | | | | | | | | | | | | | | | |
| Total distributions (excluding return of capital): | | | | | | | | | | | | | | | | | | | | | | | | | |
| Class ADV | | | | | (7,134,246) | | | | | | (7,922,532) | | | | | | (3,864,352) | | | | | | (4,184,086) | | |
| Class I | | | | | (809,293) | | | | | | (894,071) | | | | | | (10,017,767) | | | | | | (5,691,493) | | |
| Class S | | | | | (27,521,585) | | | | | | (30,519,786) | | | | | | (14,033,668) | | | | | | (17,552,628) | | |
| Class S2 | | | | | (530,338) | | | | | | (501,395) | | | | | | (151,411) | | | | | | (198,505) | | |
| Return of capital: | | | | | | | | | | | | | | | | | | | | | | | | | |
| Class ADV | | | | | — | | | | | | — | | | | | | (43,781) | | | | | | — | | |
| Class I | | | | | — | | | | | | — | | | | | | (101,134) | | | | | | — | | |
| Class S | | | | | — | | | | | | — | | | | | | (147,736) | | | | | | — | | |
| Class S2 | | | | | — | | | | | | — | | | | | | (1,649) | | | | | | — | | |
| Total distributions | | | | | (35,995,462) | | | | | | (39,837,784) | | | | | | (28,361,498) | | | | | | (27,626,712) | | |
| FROM CAPITAL SHARE TRANSACTIONS: | | | | | | | | | | | | | | | | | | | | | | | | | |
| Net proceeds from sale of shares | | | | | 17,474,471 | | | | | | 11,771,113 | | | | | | 52,668,235 | | | | | | 64,608,084 | | |
| Proceeds from shares issued in merger (Note 15) | | | | | — | | | | | | — | | | | | | — | | | | | | 98,023,284 | | |
| Reinvestment of distributions | | | | | 35,995,462 | | | | | | 39,837,784 | | | | | | 28,361,498 | | | | | | 27,626,712 | | |
| | | | | | 53,469,933 | | | | | | 51,608,897 | | | | | | 81,029,733 | | | | | | 190,258,080 | | |
| Cost of shares redeemed | | | | | (66,713,173) | | | | | | (56,146,969) | | | | | | (124,621,505) | | | | | | (121,673,150) | | |
| Net increase (decrease) in net assets resulting from capital share transactions | | | | | (13,243,240) | | | | | | (4,538,072) | | | | | | (43,591,772) | | | | | | 68,584,930 | | |
| Net increase (decrease) in net assets | | | | | (42,428,880) | | | | | | 20,659,124 | | | | | | (46,273,466) | | | | | | 113,152,781 | | |
| NET ASSETS: | | | | | | | | | | | | | | | | | | | | | | | | | |
| Beginning of year or period | | | | | 388,612,743 | | | | | | 367,953,619 | | | | | | 587,304,377 | | | | | | 474,151,596 | | |
| End of year or period | | | | $ | 346,183,863 | | | | | $ | 388,612,743 | | | | | $ | 541,030,911 | | | | | $ | 587,304,377 | | |
See Accompanying Notes to Financial Statements
STATEMENTS OF CHANGES IN NET ASSETS
| | | | Voya Large Cap Growth Portfolio | | | Voya Large Cap Value Portfolio | |
| | | | Year Ended
December 31,
2020 | | | Year Ended
December 31,
2019 | | | Year Ended
December 31,
2020 | | | Year Ended
December 31,
2019 | |
| FROM OPERATIONS: | | | | | | | | | | | | | | | | | | | | | | | | | |
| Net investment income (loss) | | | | $ | (5,867,599) | | | | | $ | 14,933,524 | | | | | $ | 16,840,193 | | | | | $ | 19,477,629 | | |
| Net realized gain (loss) | | | | | 1,147,315,271 | | | | | | 682,748,213 | | | | | | (7,237,969) | | | | | | 85,833,238 | | |
| Net change in unrealized appreciation (depreciation) | | | | | 447,817,571 | | | | | | 862,626,519 | | | | | | 33,011,880 | | | | | | 131,837,482 | | |
| Increase in net assets resulting from operations | | | | | 1,589,265,243 | | | | | | 1,560,308,256 | | | | | | 42,614,104 | | | | | | 237,148,349 | | |
| FROM DISTRIBUTIONS TO SHAREHOLDERS: | | | | | | | | | | | | | | | | | | | | | | | | | |
| Total distributions (excluding return of capital): | | | | | | | | | | | | | | | | | | | | | | | | | |
| Class ADV | | | | | (235,045,550) | | | | | | (322,539,115) | | | | | | (4,976,325) | | | | | | (4,505,178) | | |
| Class I | | | | | (247,062,817) | | | | | | (308,037,331) | | | | | | (35,461,124) | | | | | | (31,729,269) | | |
| Class R6 | | | | | (8,738,453) | | | | | | (8,633,943) | | | | | | (21,589) | | | | | | (25,122) | | |
| Class S | | | | | (203,650,756) | | | | | | (304,557,434) | | | | | | (64,530,149) | | | | | | (59,337,191) | | |
| Class S2 | | | | | (7,235,193) | | | | | | (10,362,576) | | | | | | (15,065) | | | | | | (13,567) | | |
| Total distributions | | | | | (701,732,769) | | | | | | (954,130,399) | | | | | | (105,004,252) | | | | | | (95,610,327) | | |
| FROM CAPITAL SHARE TRANSACTIONS: | | | | | | | | | | | | | | | | | | | | | | | | | |
| Net proceeds from sale of shares | | | | | 282,173,067 | | | | | | 151,286,163 | | | | | | 18,878,124 | | | | | | 13,066,833 | | |
| Reinvestment of distributions | | | | | 701,732,769 | | | | | | 954,130,399 | | | | | | 105,004,252 | | | | | | 95,610,327 | | |
| | | | | | 983,905,836 | | | | | | 1,105,416,562 | | | | | | 123,882,376 | | | | | | 108,677,160 | | |
| Cost of shares redeemed | | | | | (1,192,592,025) | | | | | | (953,005,018) | | | | | | (158,984,653) | | | | | | (174,590,335) | | |
Net increase (decrease) in net assets resulting from capital
share transactions | | | | | (208,686,189) | | | | | | 152,411,544 | | | | | | (35,102,277) | | | | | | (65,913,175) | | |
| Net increase (decrease) in net assets | | | | | 678,846,285 | | | | | | 758,589,401 | | | | | | (97,492,425) | | | | | | 75,624,847 | | |
| NET ASSETS: | | | | | | | | | | | | | | | | | | | | | | | | | |
| Beginning of year or period | | | | | 5,852,083,748 | | | | | | 5,093,494,347 | | | | | | 1,086,446,523 | | | | | | 1,010,821,676 | | |
| End of year or period | | | | $ | 6,530,930,033 | | | | | $ | 5,852,083,748 | | | | | $ | 988,954,098 | | | | | $ | 1,086,446,523 | | |
See Accompanying Notes to Financial Statements
STATEMENTS OF CHANGES IN NET ASSETS
| | | | Voya Limited Maturity Bond Portfolio | | | Voya U.S. Stock Index Portfolio | |
| | | | Year Ended
December 31,
2020 | | | Year Ended
December 31,
2019 | | | Year Ended
December 31,
2020 | | | Year Ended
December 31,
2019 | |
| FROM OPERATIONS: | | | | | | | | | | | | | | | | | | | | | | | | | |
| Net investment income | | | | $ | 6,076,550 | | | | | $ | 6,462,238 | | | | | $ | 109,749,181 | | | | | $ | 104,743,818 | | |
| Net realized gain | | | | | 3,048,233 | | | | | | 1,539,817 | | | | | | 730,953,817 | | | | | | 273,563,829 | | |
| Net change in unrealized appreciation (depreciation) | | | | | 2,427,379 | | | | | | 3,261,550 | | | | | | 428,538,281 | | | | | | 1,160,799,021 | | |
| Increase in net assets resulting from operations | | | | | 11,552,162 | | | | | | 11,263,605 | | | | | | 1,269,241,279 | | | | | | 1,539,106,668 | | |
| FROM DISTRIBUTIONS TO SHAREHOLDERS: | | | | | | | | | | | | | | | | | | | | | | | | | |
| Total distributions (excluding return of capital): | | | | | | | | | | | | | | | | | | | | | | | | | |
| Class ADV | | | | | (242,778) | | | | | | (201,180) | | | | | | (5,102,873) | | | | | | (6,766,870) | | |
| Class I | | | | | (6,269,649) | | | | | | (3,418,858) | | | | | | (236,749,487) | | | | | | (280,363,883) | | |
| Class P2 | | | | | — | | | | | | — | | | | | | (145,581,699) | | | | | | (148,647,312) | | |
| Class S | | | | | (1,467,187) | | | | | | (1,202,654) | | | | | | (14,342,616) | | | | | | (6,466,557) | | |
| Class S2 | | | | | — | | | | | | — | | | | | | (7,572,526) | | | | | | (10,110,281) | | |
| Total distributions | | | | | (7,979,614) | | | | | | (4,822,692) | | | | | | (409,349,201) | | | | | | (452,354,903) | | |
| FROM CAPITAL SHARE TRANSACTIONS: | | | | | | | | | | | | | | | | | | | | | | | | | |
| Net proceeds from sale of shares | | | | | 232,269,160 | | | | | | 83,942,429 | | | | | | 1,646,848,722 | | | | | | 1,995,915,747 | | |
| Reinvestment of distributions | | | | | 7,953,023 | | | | | | 4,808,922 | | | | | | 409,349,201 | | | | | | 452,354,903 | | |
| | | | | | 240,222,183 | | | | | | 88,751,351 | | | | | | 2,056,197,923 | | | | | | 2,448,270,650 | | |
| Cost of shares redeemed | | | | | (112,500,304) | | | | | | (94,912,870) | | | | | | (2,212,680,724) | | | | | | (1,238,299,796) | | |
| Net increase (decrease) in net assets resulting from capital share transactions | | | | | 127,721,879 | | | | | | (6,161,519) | | | | | | (156,482,801) | | | | | | 1,209,970,854 | | |
| Net increase in net assets | | | | | 131,294,427 | | | | | | 279,394 | | | | | | 703,409,277 | | | | | | 2,296,722,619 | | |
| NET ASSETS: | | | | | | | | | | | | | | | | | | | | | | | | | |
| Beginning of year or period | | | | | 287,827,806 | | | | | | 287,548,412 | | | | | | 6,996,057,391 | | | | | | 4,699,334,772 | | |
| End of year or period | | | | $ | 419,122,233 | | | | | $ | 287,827,806 | | | | | $ | 7,699,466,668 | | | | | $ | 6,996,057,391 | | |
See Accompanying Notes to Financial Statements
STATEMENTS OF CHANGES IN NET ASSETS
| | | | VY® Clarion Real Estate Portfolio | | | VY® JPMorgan Small
Cap Core Equity Portfolio | |
| | | | Year Ended
December 31,
2020 | | | Year Ended
December 31,
2019 | | | Year Ended
December 31,
2020 | | | Year Ended
December 31,
2019 | |
| FROM OPERATIONS: | | | | | | | | | | | | | | | | | | | | | | | | | |
| Net investment income | | | | $ | 4,258,919 | | | | | $ | 6,042,407 | | | | | $ | 1,780,059 | | | | | $ | 3,028,173 | | |
| Net realized gain (loss) | | | | | (18,888,871) | | | | | | 27,661,531 | | | | | | 28,044,841 | | | | | | 108,274,583 | | |
| Net change in unrealized appreciation (depreciation) | | | | | (10,732,222) | | | | | | 51,173,622 | | | | | | 54,066,275 | | | | | | 54,303,178 | | |
| Increase (decrease) in net assets resulting from operations | | | | | (25,362,174) | | | | | | 84,877,560 | | | | | | 83,891,175 | | | | | | 165,605,934 | | |
| FROM DISTRIBUTIONS TO SHAREHOLDERS: | | | | | | | | | | | | | | | | | | | | | | | | | |
| Total distributions (excluding return of capital): | | | | | | | | | | | | | | | | | | | | | | | | | |
| Class ADV | | | | | (6,700,379) | | | | | | (1,436,002) | | | | | | — | | | | | | (33,003,163) | | |
| Class I | | | | | (2,012,016) | | | | | | (626,652) | | | | | | — | | | | | | (58,503,358) | | |
| Class R6 | | | | | — | | | | | | — | | | | | | — | | | | | | (8,660,615) | | |
| Class S | | | | | (23,267,019) | | | | | | (5,986,907) | | | | | | — | | | | | | (85,946,558) | | |
| Class S2 | | | | | (1,602,043) | | | | | | (359,516) | | | | | | — | | | | | | (7,278,863) | | |
| Return of capital: | | | ��� | | | | | | | | | | | | | | | | | | | | | | |
| Class ADV | | | | | — | | | | | | — | | | | | | — | | | | | | (1,680,212) | | |
| Class I | | | | | — | | | | | | — | | | | | | — | | | | | | (2,858,137) | | |
| Class R6 | | | | | — | | | | | | — | | | | | | — | | | | | | (437,725) | | |
| Class S | | | | | — | | | | | | — | | | | | | — | | | | | | (4,217,107) | | |
| Class S2 | | | | | — | | | | | | — | | | | | | — | | | | | | (357,279) | | |
| Total distributions | | | | | (33,581,457) | | | | | | (8,409,077) | | | | | | — | | | | | | (202,943,017) | | |
| FROM CAPITAL SHARE TRANSACTIONS: | | | | | | | | | | | | | | | | | | | | | | | | | |
| Net proceeds from sale of shares | | | | | 18,588,194 | | | | | | 18,492,283 | | | | | | 174,298,740 | | | | | | 93,535,915 | | |
| Reinvestment of distributions | | | | | 33,581,457 | | | | | | 8,409,077 | | | | | | — | | | | | | 202,943,018 | | |
| | | | | | 52,169,651 | | | | | | 26,901,360 | | | | | | 174,298,740 | | | | | | 296,478,933 | | |
| Cost of shares redeemed | | | | | (79,521,435) | | | | | | (90,802,217) | | | | | | (217,374,403) | | | | | | (370,553,943) | | |
| Net decrease in net assets resulting from capital share transactions | | | | | (27,351,784) | | | | | | (63,900,857) | | | | | | (43,075,663) | | | | | | (74,075,010) | | |
| Net increase (decrease) in net assets | | | | | (86,295,415) | | | | | | 12,567,626 | | | | | | 40,815,512 | | | | | | (111,412,093) | | |
| NET ASSETS: | | | | | | | | | | | | | | | | | | | | | | | | | |
| Beginning of year or period | | | | | 334,025,345 | | | | | | 321,457,719 | | | | | | 547,974,850 | | | | | | 659,386,943 | | |
| End of year or period | | | | $ | 247,729,930 | | | | | $ | 334,025,345 | | | | | $ | 588,790,362 | | | | | $ | 547,974,850 | | |
See Accompanying Notes to Financial Statements
Selected data for a share of beneficial interest outstanding throughout each year or period.
| | | | | | | | | | Income
(loss) from
investment
operations | | | | | | | | | Less
Distributions | | | | | | Ratios to average
net assets | | | Supplemental
Data | |
| | | | Net asset value, beginning of year
or period | | | Net investment income (loss) | | | Net realized and unrealized
gain (loss) | | | Total from investment operations | | | From net investment income | | | From net realized gains | | | From return of capital | | | Total distributions | | | Payment by affiliate | | | Net asset value, end of year
or period | | | Total Return(1) | | | Expenses before
reductions/additions(2)(3)(4) | | | Expenses net of fee waivers
and/or recoupments if any(2)(3)(4) | | | Expenses net of all
reductions/additions(2)(3)(4) | | | Net investment income (loss)(2)(3) | | | Net assets, end of year or period | | | Portfolio turnover rate | |
Year or
period ended | | | ($) | | | ($) | | | ($) | | | ($) | | | ($) | | | ($) | | | ($) | | | ($) | | | ($) | | | ($) | | | (%) | | | (%) | | | (%) | | | (%) | | | (%) | | | ($000’s) | | | (%) | |
| Voya Balanced Income Portfolio | | | | | | | | | | | | | | | | | | | | | | | | | | | | | | | | | | | | | | | | | | | | | | | | | | | | | | | | | | | | | | | | | | | | | | | | | | | | | | | | | | | | | | | | | | | | | | | | | | | | | | | |
| Class ADV | | | | | | | | | | | | | | | | | | | | | | | | | | | | | | | | | | | | | | | | | | | | | | | | | | | | | | | | | | | | | | | | | | | | | | | | | | | | | | | | | | | | | | | | | | | | | | | | | | | | | | | |
| 12-31-20 | | | | | 10.65 | | | | | | 0.21• | | | | | | (0.01) | | | | | | 0.20 | | | | | | 0.36 | | | | | | 0.72 | | | | | | — | | | | | | 1.08 | | | | | | — | | | | | | 9.77 | | | | | | 2.80 | | | | | | 1.22 | | | | | | 1.20 | | | | | | 1.20 | | | | | | 2.20 | | | | | | 66,515 | | | | | | 69 | | |
| 12-31-19 | | | | | 10.05 | | | | | | 0.30 | | | | | | 1.47 | | | | | | 1.77 | | | | | | 0.50 | | | | | | 0.67 | | | | | | — | | | | | | 1.17 | | | | | | — | | | | | | 10.65 | | | | | | 17.93 | | | | | | 1.26 | | | | | | 1.22 | | | | | | 1.22 | | | | | | 2.79 | | | | | | 78,155 | | | | | | 231 | | |
| 12-31-18 | | | | | 11.18 | | | | | | 0.43• | | | | | | (1.00) | | | | | | (0.57) | | | | | | 0.56 | | | | | | — | | | | | | — | | | | | | 0.56 | | | | | | — | | | | | | 10.05 | | | | | | (5.39) | | | | | | 1.39 | | | | | | 1.26 | | | | | | 1.26 | | | | | | 3.91 | | | | | | 69,593 | | | | | | 45 | | |
| 12-31-17 | | | | | 10.62 | | | | | | 0.46• | | | | | | 0.58 | | | | | | 1.04 | | | | | | 0.48 | | | | | | — | | | | | | — | | | | | | 0.48 | | | | | | — | | | | | | 11.18 | | | | | | 10.03 | | | | | | 1.39 | | | | | | 1.26 | | | | | | 1.26 | | | | | | 4.16 | | | | | | 81,767 | | | | | | 22 | | |
| 12-31-16 | | | | | 9.82 | | | | | | 0.42• | | | | | | 1.05 | | | | | | 1.47 | | | | | | 0.67 | | | | | | — | | | | | | — | | | | | | 0.67 | | | | | | — | | | | | | 10.62 | | | | | | 15.26 | | | | | | 1.43 | | | | | | 1.36 | | | | | | 1.36 | | | | | | 4.14 | | | | | | 72,064 | | | | | | 42 | | |
| Class I | | | | | | | | | | | | | | | | | | | | | | | | | | | | | | | | | | | | | | | | | | | | | | | | | | | | | | | | | | | | | | | | | | | | | | | | | | | | | | | | | | | | | | | | | | | | | | | | | | | | | | | |
| 12-31-20 | | | | | 11.19 | | | | | | 0.29• | | | | | | (0.03) | | | | | | 0.26 | | | | | | 0.42 | | | | | | 0.72 | | | | | | — | | | | | | 1.14 | | | | | | — | | | | | | 10.31 | | | | | | 3.33 | | | | | | 0.62 | | | | | | 0.60 | | | | | | 0.60 | | | | | | 2.79 | | | | | | 7,943 | | | | | | 69 | | |
| 12-31-19 | | | | | 10.50 | | | | | | 0.38• | | | | | | 1.55 | | | | | | 1.93 | | | | | | 0.57 | | | | | | 0.67 | | | | | | — | | | | | | 1.24 | | | | | | — | | | | | | 11.19 | | | | | | 18.73 | | | | | | 0.66 | | | | | | 0.62 | | | | | | 0.62 | | | | | | 3.38 | | | | | | 8,836 | | | | | | 231 | | |
| 12-31-18 | | | | | 11.65 | | | | | | 0.51• | | | | | | (1.03) | | | | | | (0.52) | | | | | | 0.63 | | | | | | — | | | | | | — | | | | | | 0.63 | | | | | | — | | | | | | 10.50 | | | | | | (4.79) | | | | | | 0.79 | | | | | | 0.66 | | | | | | 0.66 | | | | | | 4.51 | | | | | | 7,921 | | | | | | 45 | | |
| 12-31-17 | | | | | 11.05 | | | | | | 0.54• | | | | | | 0.60 | | | | | | 1.14 | | | | | | 0.54 | | | | | | — | | | | | | — | | | | | | 0.54 | | | | | | — | | | | | | 11.65 | | | | | | 10.56 | | | | | | 0.79 | | | | | | 0.66 | | | | | | 0.66 | | | | | | 4.76 | | | | | | 9,393 | | | | | | 22 | | |
| 12-31-16 | | | | | 10.18 | | | | | | 0.50• | | | | | | 1.09 | | | | | | 1.59 | | | | | | 0.72 | | | | | | — | | | | | | — | | | | | | 0.72 | | | | | | — | | | | | | 11.05 | | | | | | 16.02 | | | | | | 0.78 | | | | | | 0.76 | | | | | | 0.76 | | | | | | 4.74 | | | | | | 9,478 | | | | | | 42 | | |
| Class S | | | | | | | | | | | | | | | | | | | | | | | | | | | | | | | | | | | | | | | | | | | | | | | | | | | | | | | | | | | | | | | | | | | | | | | | | | | | | | | | | | | | | | | | | | | | | | | | | | | | | | | |
| 12-31-20 | | | | | 11.13 | | | | | | 0.26• | | | | | | (0.03) | | | | | | 0.23 | | | | | | 0.39 | | | | | | 0.72 | | | | | | — | | | | | | 1.11 | | | | | | — | | | | | | 10.25 | | | | | | 3.03 | | | | | | 0.87 | | | | | | 0.85 | | | | | | 0.85 | | | | | | 2.55 | | | | | | 266,536 | | | | | | 69 | | |
| 12-31-19 | | | | | 10.45 | | | | | | 0.36• | | | | | | 1.52 | | | | | | 1.88 | | | | | | 0.53 | | | | | | 0.67 | | | | | | — | | | | | | 1.20 | | | | | | — | | | | | | 11.13 | | | | | | 18.40 | | | | | | 0.91 | | | | | | 0.87 | | | | | | 0.87 | | | | | | 3.18 | | | | | | 295,942 | | | | | | 231 | | |
| 12-31-18 | | | | | 11.59 | | | | | | 0.48• | | | | | | (1.02) | | | | | | (0.54) | | | | | | 0.60 | | | | | | — | | | | | | — | | | | | | 0.60 | | | | | | — | | | | | | 10.45 | | | | | | (5.01) | | | | | | 1.04 | | | | | | 0.91 | | | | | | 0.91 | | | | | | 4.26 | | | | | | 285,793 | | | | | | 45 | | |
| 12-31-17 | | | | | 10.99 | | | | | | 0.51• | | | | | | 0.60 | | | | | | 1.11 | | | | | | 0.51 | | | | | | — | | | | | | — | | | | | | 0.51 | | | | | | — | | | | | | 11.59 | | | | | | 10.33 | | | | | | 1.04 | | | | | | 0.91 | | | | | | 0.91 | | | | | | 4.52 | | | | | | 361,336 | | | | | | 22 | | |
| 12-31-16 | | | | | 10.14 | | | | | | 0.47• | | | | | | 1.09 | | | | | | 1.56 | | | | | | 0.71 | | | | | | — | | | | | | — | | | | | | 0.71 | | | | | | — | | | | | | 10.99 | | | | | | 15.68 | | | | | | 1.03 | | | | | | 1.01 | | | | | | 1.01 | | | | | | 4.49 | | | | | | 411,297 | | | | | | 42 | | |
| Class S2 | | | | | | | | | | | | | | | | | | | | | | | | | | | | | | | | | | | | | | | | | | | | | | | | | | | | | | | | | | | | | | | | | | | | | | | | | | | | | | | | | | | | | | | | | | | | | | | | | | | | | | | |
| 12-31-20 | | | | | 11.10 | | | | | | 0.27 | | | | | | (0.04) | | | | | | 0.23 | | | | | | 0.39 | | | | | | 0.72 | | | | | | — | | | | | | 1.11 | | | | | | — | | | | | | 10.22 | | | | | | 3.02 | | | | | | 1.02 | | | | | | 1.00 | | | | | | 1.00 | | | | | | 2.40 | | | | | | 5,189 | | | | | | 69 | | |
| 12-31-19 | | | | | 10.43 | | | | | | 0.32 | | | | | | 1.54 | | | | | | 1.86 | | | | | | 0.52 | | | | | | 0.67 | | | | | | — | | | | | | 1.19 | | | | | | — | | | | | | 11.10 | | | | | | 18.15 | | | | | | 1.06 | | | | | | 1.02 | | | | | | 1.02 | | | | | | 2.97 | | | | | | 5,679 | | | | | | 231 | | |
| 12-31-18 | | | | | 11.56 | | | | | | 0.46• | | | | | | (1.02) | | | | | | (0.56) | | | | | | 0.57 | | | | | | — | | | | | | — | | | | | | 0.57 | | | | | | — | | | | | | 10.43 | | | | | | (5.15) | | | | | | 1.19 | | | | | | 1.06 | | | | | | 1.06 | | | | | | 4.11 | | | | | | 4,647 | | | | | | 45 | | |
| 12-31-17 | | | | | 10.96 | | | | | | 0.50• | | | | | | 0.59 | | | | | | 1.09 | | | | | | 0.49 | | | | | | — | | | | | | — | | | | | | 0.49 | | | | | | — | | | | | | 11.56 | | | | | | 10.16 | | | | | | 1.19 | | | | | | 1.06 | | | | | | 1.06 | | | | | | 4.38 | | | | | | 5,389 | | | | | | 22 | | |
| 12-31-16 | | | | | 10.11 | | | | | | 0.45• | | | | | | 1.09 | | | | | | 1.54 | | | | | | 0.69 | | | | | | — | | | | | | — | | | | | | 0.69 | | | | | | — | | | | | | 10.96 | | | | | | 15.52 | | | | | | 1.21 | | | | | | 1.16 | | | | | | 1.16 | | | | | | 4.34 | | | | | | 7,701 | | | | | | 42 | | |
| Voya High Yield Portfolio | | | | | | | | | | | | | | | | | | | | | | | | | | | | | | | | | | | | | | | | | | | | | | | | | | | | | | | | | | | | | | | | | | | | | | | | | | | | | | | | | | | | | | | | | | | | | | | | | | | | | | | |
| Class ADV | | | | | | | | | | | | | | | | | | | | | | | | | | | | | | | | | | | | | | | | | | | | | | | | | | | | | | | | | | | | | | | | | | | | | | | | | | | | | | | | | | | | | | | | | | | | | | | | | | | | | | | |
| 12-31-20 | | | | | 9.94 | | | | | | 0.46• | | | | | | 0.03 | | | | | | 0.49 | | | | | | 0.46 | | | | | | — | | | | | | 0.01 | | | | | | 0.47 | | | | | | — | | | | | | 9.96 | | | | | | 5.26 | | | | | | 1.10 | | | | | | 1.08 | | | | | | 1.08 | | | | | | 4.80 | | | | | | 80,017 | | | | | | 90 | | |
| 12-31-19 | | | | | 9.09 | | | | | | 0.50 | | | | | | 0.83 | | | | | | 1.33 | | | | | | 0.48 | | | | | | — | | | | | | — | | | | | | 0.48 | | | | | | — | | | | | | 9.94 | | | | | | 14.82 | | | | | | 1.10 | | | | | | 1.08 | | | | | | 1.08 | | | | | | 5.20 | | | | | | 87,540 | | | | | | 59 | | |
| 12-31-18 | | | | | 9.94 | | | | | | 0.48 | | | | | | (0.81) | | | | | | (0.33) | | | | | | 0.52 | | | | | | — | | | | | | — | | | | | | 0.52 | | | | | | — | | | | | | 9.09 | | | | | | (3.53) | | | | | | 1.10 | | | | | | 1.08 | | | | | | 1.08 | | | | | | 5.02 | | | | | | 80,872 | | | | | | 35 | | |
| 12-31-17 | | | | | 10.01 | | | | | | 0.54 | | | | | | 0.03 | | | | | | 0.57 | | | | | | 0.62 | | | | | | — | | | | | | 0.02 | | | | | | 0.64 | | | | | | — | | | | | | 9.94 | | | | | | 5.83 | | | | | | 1.10 | | | | | | 1.08 | | | | | | 1.08 | | | | | | 5.36 | | | | | | 96,011 | | | | | | 37 | | |
| 12-31-16 | | | | | 9.33 | | | | | | 0.55 | | | | | | 0.74 | | | | | | 1.29 | | | | | | 0.61 | | | | | | — | | | | | | — | | | | | | 0.61 | | | | | | — | | | | | | 10.01 | | | | | | 14.21 | | | | | | 1.14 | | | | | | 1.08 | | | | | | 1.08 | | | | | | 5.56 | | | | | | 98,835 | | | | | | 31 | | |
| Class I | | | | | | | | | | | | | | | | | | | | | | | | | | | | | | | | | | | | | | | | | | | | | | | | | | | | | | | | | | | | | | | | | | | | | | | | | | | | | | | | | | | | | | | | | | | | | | | | | | | | | | | |
| 12-31-20 | | | | | 9.94 | | | | | | 0.51• | | | | | | 0.05 | | | | | | 0.56 | | | | | | 0.52 | | | | | | — | | | | | | 0.01 | | | | | | 0.53 | | | | | | — | | | | | | 9.97 | | | | | | 6.00 | | | | | | 0.50 | | | | | | 0.48 | | | | | | 0.48 | | | | | | 5.40 | | | | | | 191,358 | | | | | | 90 | | |
| 12-31-19 | | | | | 9.10 | | | | | | 0.57• | | | | | | 0.81 | | | | | | 1.38 | | | | | | 0.54 | | | | | | — | | | | | | — | | | | | | 0.54 | | | | | | — | | | | | | 9.94 | | | | | | 15.37 | | | | | | 0.50 | | | | | | 0.48 | | | | | | 0.48 | | | | | | 5.84 | | | | | | 189,247 | | | | | | 59 | | |
| 12-31-18 | | | | | 9.95 | | | | | | 0.54 | | | | | | (0.82) | | | | | | (0.28) | | | | | | 0.57 | | | | | | — | | | | | | — | | | | | | 0.57 | | | | | | — | | | | | | 9.10 | | | | | | (2.96) | | | | | | 0.50 | | | | | | 0.48 | | | | | | 0.48 | | | | | | 5.62 | | | | | | 56,385 | | | | | | 35 | | |
| 12-31-17 | | | | | 10.01 | | | | | | 0.60 | | | | | | 0.04 | | | | | | 0.64 | | | | | | 0.68 | | | | | | — | | | | | | 0.02 | | | | | | 0.70 | | | | | | — | | | | | | 9.95 | | | | | | 6.58 | | | | | | 0.50 | | | | | | 0.48 | | | | | | 0.48 | | | | | | 5.96 | | | | | | 62,380 | | | | | | 37 | | |
| 12-31-16 | | | | | 9.33 | | | | | | 0.60• | | | | | | 0.75 | | | | | | 1.35 | | | | | | 0.67 | | | | | | — | | | | | | — | | | | | | 0.67 | | | | | | — | | | | | | 10.01 | | | | | | 14.89 | | | | | | 0.49 | | | | | | 0.48 | | | | | | 0.48 | | | | | | 6.16 | | | | | | 57,828 | | | | | | 31 | | |
See Accompanying Notes to Financial Statements
Financial Highlights (continued)
| | | | | | | | | | Income
(loss) from
investment
operations | | | | | | | | | Less
Distributions | | | | | | Ratios to average
net assets | | | Supplemental
Data | |
| | | | Net asset value, beginning of year
or period | | | Net investment income (loss) | | | Net realized and unrealized
gain (loss) | | | Total from investment operations | | | From net investment income | | | From net realized gains | | | From return of capital | | | Total distributions | | | Payment by affiliate | | | Net asset value, end of year
or period | | | Total Return(1) | | | Expenses before
reductions/additions(2)(3)(4) | | | Expenses net of fee waivers
and/or recoupments if any(2)(3)(4) | | | Expenses net of all
reductions/additions(2)(3)(4) | | | Net investment income (loss)(2)(3) | | | Net assets, end of year or period | | | Portfolio turnover rate | |
Year or
period ended | | | ($) | | | ($) | | | ($) | | | ($) | | | ($) | | | ($) | | | ($) | | | ($) | | | ($) | | | ($) | | | (%) | | | (%) | | | (%) | | | (%) | | | (%) | | | ($000’s) | | | (%) | |
| Voya High Yield Portfolio (continued) | | | | | | | | | | | | | | | | | | | | | | | | | | | | | | | | | | | | | | | | | | | | | | | | | | | | | | | | | | | | | | | | | | | | | | | | | | | | | | | | | | | | | | | | | | | | | | | | | | | | | | | |
| Class S | | | | | | | | | | | | | | | | | | | | | | | | | | | | | | | | | | | | | | | | | | | | | | | | | | | | | | | | | | | | | | | | | | | | | | | | | | | | | | | | | | | | | | | | | | | | | | | | | | | | | | | |
| 12-31-20 | | | | | 9.94 | | | | | | 0.49• | | | | | | 0.04 | | | | | | 0.53 | | | | | | 0.50 | | | | | | — | | | | | | 0.01 | | | | | | 0.51 | | | | | | — | | | | | | 9.96 | | | | | | 5.63 | | | | | | 0.75 | | | | | | 0.73 | | | | | | 0.73 | | | | | | 5.15 | | | | | | 266,537 | | | | | | 90 | | |
| 12-31-19 | | | | | 9.09 | | | | | | 0.54 | | | | | | 0.82 | | | | | | 1.36 | | | | | | 0.51 | | | | | | — | | | | | | — | | | | | | 0.51 | | | | | | — | | | | | | 9.94 | | | | | | 15.22 | | | | | | 0.75 | | | | | | 0.73 | | | | | | 0.73 | | | | | | 5.54 | | | | | | 307,506 | | | | | | 59 | | |
| 12-31-18 | | | | | 9.94 | | | | | | 0.51 | | | | | | (0.81) | | | | | | (0.30) | | | | | | 0.55 | | | | | | — | | | | | | — | | | | | | 0.55 | | | | | | — | | | | | | 9.09 | | | | | | (3.20) | | | | | | 0.75 | | | | | | 0.73 | | | | | | 0.73 | | | | | | 5.36 | | | | | | 332,669 | | | | | | 35 | | |
| 12-31-17 | | | | | 10.01 | | | | | | 0.58 | | | | | | 0.02 | | | | | | 0.60 | | | | | | 0.65 | | | | | | — | | | | | | 0.02 | | | | | | 0.67 | | | | | | — | | | | | | 9.94 | | | | | | 6.20 | | | | | | 0.75 | | | | | | 0.73 | | | | | | 0.73 | | | | | | 5.71 | | | | | | 403,630 | | | | | | 37 | | |
| 12-31-16 | | | | | 9.33 | | | | | | 0.58 | | | | | | 0.75 | | | | | | 1.33 | | | | | | 0.65 | | | | | | — | | | | | | — | | | | | | 0.65 | | | | | | — | | | | | | 10.01 | | | | | | 14.61 | | | | | | 0.74 | | | | | | 0.73 | | | | | | 0.73 | | | | | | 5.91 | | | | | | 484,963 | | | | | | 31 | | |
| Class S2 | | | | | | | | | | | | | | | | | | | | | | | | | | | | | | | | | | | | | | | | | | | | | | | | | | | | | | | | | | | | | | | | | | | | | | | | | | | | | | | | | | | | | | | | | | | | | | | | | | | | | | | |
| 12-31-20 | | | | | 9.95 | | | | | | 0.48• | | | | | | 0.03 | | | | | | 0.51 | | | | | | 0.48 | | | | | | — | | | | | | 0.01 | | | | | | 0.49 | | | | | | — | | | | | | 9.97 | | | | | | 5.48 | | | | | | 0.90 | | | | | | 0.88 | | | | | | 0.88 | | | | | | 4.99 | | | | | | 3,119 | | | | | | 90 | | |
| 12-31-19 | | | | | 9.11 | | | | | | 0.51 | | | | | | 0.83 | | | | | | 1.34 | | | | | | 0.50 | | | | | | — | | | | | | — | | | | | | 0.50 | | | | | | — | | | | | | 9.95 | | | | | | 14.91 | | | | | | 0.90 | | | | | | 0.88 | | | | | | 0.88 | | | | | | 5.37 | | | | | | 3,012 | | | | | | 59 | | |
| 12-31-18 | | | | | 9.95 | | | | | | 0.50 | | | | | | (0.80) | | | | | | (0.30) | | | | | | 0.54 | | | | | | — | | | | | | — | | | | | | 0.54 | | | | | | — | | | | | | 9.11 | | | | | | (3.23) | | | | | | 0.90 | | | | | | 0.88 | | | | | | 0.88 | | | | | | 5.20 | | | | | | 4,226 | | | | | | 35 | | |
| 12-31-17 | | | | | 10.02 | | | | | | 0.56 | | | | | | 0.03 | | | | | | 0.59 | | | | | | 0.64 | | | | | | — | | | | | | 0.02 | | | | | | 0.66 | | | | | | — | | | | | | 9.95 | | | | | | 6.04 | | | | | | 0.90 | | | | | | 0.88 | | | | | | 0.88 | | | | | | 5.56 | | | | | | 5,792 | | | | | | 37 | | |
| 12-31-16 | | | | | 9.34 | | | | | | 0.56 | | | | | | 0.75 | | | | | | 1.31 | | | | | | 0.63 | | | | | | — | | | | | | — | | | | | | 0.63 | | | | | | — | | | | | | 10.02 | | | | | | 14.43 | | | | | | 0.92 | | | | | | 0.88 | | | | | | 0.88 | | | | | | 5.76 | | | | | | 5,815 | | | | | | 31 | | |
| Voya Large Cap Growth Portfolio | | | | | | | | | | | | | | | | | | | | | | | | | | | | | | | | | | | | | | | | | | | | | | | | | | | | | | | | | | | | | | | | | | | | | | | | | | | | | | | | | | | | | | | | | | | | | | | | | | | | | | | |
| Class ADV | | | | | | | | | | | | | | | | | | | | | | | | | | | | | | | | | | | | | | | | | | | | | | | | | | | | | | | | | | | | | | | | | | | | | | | | | | | | | | | | | | | | | | | | | | | | | | | | | | | | | | | |
| 12-31-20 | | | | | 17.96 | | | | | | (0.08) | | | | | | 5.00 | | | | | | 4.92 | | | | | | — | | | | | | 2.43 | | | | | | — | | | | | | 2.43 | | | | | | — | | | | | | 20.45 | | | | | | 30.11 | | | | | | 1.32 | | | | | | 1.27 | | | | | | 1.27 | | | | | | (0.43) | | | | | | 2,073,088 | | | | | | 86 | | |
| 12-31-19 | | | | | 16.37 | | | | | | (0.01) | | | | | | 4.97 | | | | | | 4.96 | | | | | | 0.02 | | | | | | 3.35 | | | | | | — | | | | | | 3.37 | | | | | | — | | | | | | 17.96 | | | | | | 31.90 | | | | | | 1.27 | | | | | | 1.27 | | | | | | 1.27 | | | | | | (0.05) | | | | | | 1,890,631 | | | | | | 78 | | |
| 12-31-18 | | | | | 19.36 | | | | | | 0.01 | | | | | | (0.11) | | | | | | (0.10) | | | | | | 0.01 | | | | | | 2.88 | | | | | | — | | | | | | 2.89 | | | | | | — | | | | | | 16.37 | | | | | | (2.07) | | | | | | 1.27 | | | | | | 1.27 | | | | | | 1.27 | | | | | | 0.04 | | | | | | 1,686,805 | | | | | | 85 | | |
| 12-31-17 | | | | | 16.22 | | | | | | 0.02 | | | | | | 4.53 | | | | | | 4.55 | | | | | | 0.01 | | | | | | 1.40 | | | | | | — | | | | | | 1.41 | | | | | | — | | | | | | 19.36 | | | | | | 29.01 | | | | | | 1.27 | | | | | | 1.27 | | | | | | 1.27 | | | | | | 0.04 | | | | | | 2,015,843 | | | | | | 65 | | |
| 12-31-16 | | | | | 18.13 | | | | | | 0.01 | | | | | | 0.57 | | | | | | 0.58 | | | | | | — | | | | | | 2.49 | | | | | | — | | | | | | 2.49 | | | | | | — | | | | | | 16.22 | | | | | | 3.33 | | | | | | 1.32 | | | | | | 1.27 | | | | | | 1.27 | | | | | | 0.08 | | | | | | 1,986,387 | | | | | | 74 | | |
| Class I | | | | | | | | | | | | | | | | | | | | | | | | | | | | | | | | | | | | | | | | | | | | | | | | | | | | | | | | | | | | | | | | | | | | | | | | | | | | | | | | | | | | | | | | | | | | | | | | | | | | | | | |
| 12-31-20 | | | | | 19.83 | | | | | | 0.04 | | | | | | 5.57 | | | | | | 5.61 | | | | | | 0.11 | | | | | | 2.43 | | | | | | — | | | | | | 2.54 | | | | | | — | | | | | | 22.90 | | | | | | 30.88 | | | | | | 0.72 | | | | | | 0.67 | | | | | | 0.67 | | | | | | 0.17 | | | | | | 2,436,873 | | | | | | 86 | | |
| 12-31-19 | | | | | 17.78 | | | | | | 0.11 | | | | | | 5.43 | | | | | | 5.54 | | | | | | 0.14 | | | | | | 3.35 | | | | | | — | | | | | | 3.49 | | | | | | — | | | | | | 19.83 | | | | | | 32.77 | | | | | | 0.67 | | | | | | 0.67 | | | | | | 0.67 | | | | | | 0.54 | | | | | | 2,000,466 | | | | | | 78 | | |
| 12-31-18 | | | | | 20.80 | | | | | | 0.13• | | | | | | (0.13) | | | | | | 0.00* | | | | | | 0.14 | | | | | | 2.88 | | | | | | — | | | | | | 3.02 | | | | | | — | | | | | | 17.78 | | | | | | (1.48) | | | | | | 0.67 | | | | | | 0.67 | | | | | | 0.67 | | | | | | 0.63 | | | | | | 1,623,952 | | | | | | 85 | | |
| 12-31-17 | | | | | 17.34 | | | | | | 0.12 | | | | | | 4.87 | | | | | | 4.99 | | | | | | 0.13 | | | | | | 1.40 | | | | | | — | | | | | | 1.53 | | | | | | — | | | | | | 20.80 | | | | | | 29.74 | | | | | | 0.67 | | | | | | 0.67 | | | | | | 0.67 | | | | | | 0.63 | | | | | | 2,124,109 | | | | | | 65 | | |
| 12-31-16 | | | | | 19.21 | | | | | | 0.13 | | | | | | 0.60 | | | | | | 0.73 | | | | | | 0.11 | | | | | | 2.49 | | | | | | — | | | | | | 2.60 | | | | | | — | | | | | | 17.34 | | | | | | 3.96 | | | | | | 0.67 | | | | | | 0.67 | | | | | | 0.67 | | | | | | 0.68 | | | | | | 1,769,295 | | | | | | 74 | | |
| Class R6 | | | | | | | | | | | | | | | | | | | | | | | | | | | | | | | | | | | | | | | | | | | | | | | | | | | | | | | | | | | | | | | | | | | | | | | | | | | | | | | | | | | | | | | | | | | | | | | | | | | | | | | |
| 12-31-20 | | | | | 19.84 | | | | | | 0.03 | | | | | | 5.58 | | | | | | 5.61 | | | | | | 0.11 | | | | | | 2.43 | | | | | | — | | | | | | 2.54 | | | | | | — | | | | | | 22.91 | | | | | | 30.86 | | | | | | 0.67 | | | | | | 0.67 | | | | | | 0.67 | | | | | | 0.16 | | | | | | 88,303 | | | | | | 86 | | |
| 12-31-19 | | | | | 17.78 | | | | | | 0.11 | | | | | | 5.44 | | | | | | 5.55 | | | | | | 0.14 | | | | | | 3.35 | | | | | | — | | | | | | 3.49 | | | | | | — | | | | | | 19.84 | | | | | | 32.82 | | | | | | 0.67 | | | | | | 0.67 | | | | | | 0.67 | | | | | | 0.54 | | | | | | 59,938 | | | | | | 78 | | |
| 12-31-18 | | | | | 20.81 | | | | | | 0.12 | | | | | | (0.13) | | | | | | (0.01) | | | | | | 0.14 | | | | | | 2.88 | | | | | | — | | | | | | 3.02 | | | | | | — | | | | | | 17.78 | | | | | | (1.53) | | | | | | 0.67 | | | | | | 0.67 | | | | | | 0.67 | | | | | | 0.68 | | | | | | 46,242 | | | | | | 85 | | |
| 12-31-17 | | | | | 17.34 | | | | | | 0.13• | | | | | | 4.87 | | | | | | 5.00 | | | | | | 0.13 | | | | | | 1.40 | | | | | | — | | | | | | 1.53 | | | | | | — | | | | | | 20.81 | | | | | | 29.80 | | | | | | 0.67 | | | | | | 0.67 | | | | | | 0.67 | | | | | | 0.65 | | | | | | 33,736 | | | | | | 65 | | |
| 12-31-16 | | | | | 19.21 | | | | | | 0.13• | | | | | | 0.60 | | | | | | 0.73 | | | | | | 0.11 | | | | | | 2.49 | | | | | | — | | | | | | 2.60 | | | | | | — | | | | | | 17.34 | | | | | | 3.95 | | | | | | 0.67 | | | | | | 0.67 | | | | | | 0.67 | | | | | | 0.77 | | | | | | 6,970 | | | | | | 74 | | |
| Class S | | | | | | | | | | | | | | | | | | | | | | | | | | | | | | | | | | | | | | | | | | | | | | | | | | | | | | | | | | | | | | | | | | | | | | | | | | | | | | | | | | | | | | | | | | | | | | | | | | | | | | | |
| 12-31-20 | | | | | 19.21 | | | | | | (0.01) | | | | | | 5.38 | | | | | | 5.37 | | | | | | 0.05 | | | | | | 2.43 | | | | | | — | | | | | | 2.48 | | | | | | — | | | | | | 22.10 | | | | | | 30.59 | | | | | | 0.97 | | | | | | 0.92 | | | | | | 0.92 | | | | | | (0.08) | | | | | | 1,867,154 | | | | | | 86 | | |
| 12-31-19 | | | | | 17.31 | | | | | | 0.06 | | | | | | 5.27 | | | | | | 5.33 | | | | | | 0.08 | | | | | | 3.35 | | | | | | — | | | | | | 3.43 | | | | | | — | | | | | | 19.21 | | | | | | 32.41 | | | | | | 0.92 | | | | | | 0.92 | | | | | | 0.92 | | | | | | 0.30 | | | | | | 1,839,829 | | | | | | 78 | | |
| 12-31-18 | | | | | 20.32 | | | | | | 0.08• | | | | | | (0.13) | | | | | | (0.05) | | | | | | 0.08 | | | | | | 2.88 | | | | | | — | | | | | | 2.96 | | | | | | — | | | | | | 17.31 | | | | | | (1.73) | | | | | | 0.92 | | | | | | 0.92 | | | | | | 0.92 | | | | | | 0.39 | | | | | | 1,677,848 | | | | | | 85 | | |
| 12-31-17 | | | | | 16.97 | | | | | | 0.07• | | | | | | 4.76 | | | | | | 4.83 | | | | | | 0.08 | | | | | | 1.40 | | | | | | — | | | | | | 1.48 | | | | | | — | | | | | | 20.32 | | | | | | 29.42 | | | | | | 0.92 | | | | | | 0.92 | | | | | | 0.92 | | | | | | 0.39 | | | | | | 2,040,159 | | | | | | 65 | | |
| 12-31-16 | | | | | 18.85 | | | | | | 0.08 | | | | | | 0.59 | | | | | | 0.67 | | | | | | 0.06 | | | | | | 2.49 | | | | | | — | | | | | | 2.55 | | | | | | — | | | | | | 16.97 | | | | | | 3.69 | | | | | | 0.92 | | | | | | 0.92 | | | | | | 0.92 | | | | | | 0.43 | | | | | | 2,014,562 | | | | | | 74 | | |
See Accompanying Notes to Financial Statements
Financial Highlights (continued)
| | | | | | | | | | Income
(loss) from
investment
operations | | | | | | | | | Less
Distributions | | | | | | Ratios to average
net assets | | | Supplemental
Data | |
| | | | Net asset value, beginning of year
or period | | | Net investment income (loss) | | | Net realized and unrealized
gain (loss) | | | Total from investment operations | | | From net investment income | | | From net realized gains | | | From return of capital | | | Total distributions | | | Payment by affiliate | | | Net asset value, end of year
or period | | | Total Return(1) | | | Expenses before
reductions/additions(2)(3)(4) | | | Expenses net of fee waivers
and/or recoupments if any(2)(3)(4) | | | Expenses net of all
reductions/additions(2)(3)(4) | | | Net investment income (loss)(2)(3) | | | Net assets, end of year or period | | | Portfolio turnover rate | |
Year or
period ended | | | ($) | | | ($) | | | ($) | | | ($) | | | ($) | | | ($) | | | ($) | | | ($) | | | ($) | | | ($) | | | (%) | | | (%) | | | (%) | | | (%) | | | (%) | | | ($000’s) | | | (%) | |
| Voya Large Cap Growth Portfolio (continued) | | | | | | | | | | | | | | | | | | | | | | | | | | | | | | | | | | | | | | | | | | | | | | | | | | | | | | | | | | | | | | | | | | | | | | | | | | | | | | | | | | | | | | | | | | | | | | | | | | | | | | | |
| Class S2 | | | | | | | | | | | | | | | | | | | | | | | | | | | | | | | | | | | | | | | | | | | | | | | | | | | | | | | | | | | | | | | | | | | | | | | | | | | | | | | | | | | | | | | | | | | | | | | | | | | | | | | |
| 12-31-20 | | | | | 19.03 | | | | | | (0.04) | | | | | | 5.33 | | | | | | 5.29 | | | | | | 0.02 | | | | | | 2.43 | | | | | | — | | | | | | 2.45 | | | | | | — | | | | | | 21.87 | | | | | | 30.43 | | | | | | 1.12 | | | | | | 1.07 | | | | | | 1.07 | | | | | | (0.22) | | | | | | 65,511 | | | | | | 86 | | |
| 12-31-19 | | | | | 17.18 | | | | | | 0.04 | | | | | | 5.21 | | | | | | 5.25 | | | | | | 0.05 | | | | | | 3.35 | | | | | | — | | | | | | 3.40 | | | | | | — | | | | | | 19.03 | | | | | | 32.16 | | | | | | 1.07 | | | | | | 1.07 | | | | | | 1.07 | | | | | | 0.15 | | | | | | 61,219 | | | | | | 78 | | |
| 12-31-18 | | | | | 20.18 | | | | | | 0.05 | | | | | | (0.12) | | | | | | (0.07) | | | | | | 0.05 | | | | | | 2.88 | | | | | | — | | | | | | 2.93 | | | | | | — | | | | | | 17.18 | | | | | | (1.86) | | | | | | 1.07 | | | | | | 1.07 | | | | | | 1.07 | | | | | | 0.25 | | | | | | 58,647 | | | | | | 85 | | |
| 12-31-17 | | | | | 16.86 | | | | | | 0.04• | | | | | | 4.73 | | | | | | 4.77 | | | | | | 0.05 | | | | | | 1.40 | | | | | | — | | | | | | 1.45 | | | | | | — | | | | | | 20.18 | | | | | | 29.22 | | | | | | 1.07 | | | | | | 1.07 | | | | | | 1.07 | | | | | | 0.24 | | | | | | 66,024 | | | | | | 65 | | |
| 12-31-16 | | | | | 18.73 | | | | | | 0.05 | | | | | | 0.59 | | | | | | 0.64 | | | | | | 0.02 | | | | | | 2.49 | | | | | | — | | | | | | 2.51 | | | | | | — | | | | | | 16.86 | | | | | | 3.57 | | | | | | 1.10 | | | | | | 1.07 | | | | | | 1.07 | | | | | | 0.28 | | | | | | 66,897 | | | | | | 74 | | |
| Voya Large Cap Value Portfolio | | | | | | | | | | | | | | | | | | | | | | | | | | | | | | | | | | | | | | | | | | | | | | | | | | | | | | | | | | | | | | | | | | | | | | | | | | | | | | | | | | | | | | | | | | | | | | | | | | | | | | | |
| Class ADV | | | | | | | | | | | | | | | | | | | | | | | | | | | | | | | | | | | | | | | | | | | | | | | | | | | | | | | | | | | | | | | | | | | | | | | | | | | | | | | | | | | | | | | | | | | | | | | | | | | | | | | |
| 12-31-20 | | | | | 11.96 | | | | | | 0.15 | | | | | | 0.26 | | | | | | 0.41 | | | | | | 0.18 | | | | | | 1.03 | | | | | | — | | | | | | 1.21 | | | | | | — | | | | | | 11.16 | | | | | | 5.61 | | | | | | 1.43 | | | | | | 1.24 | | | | | | 1.24 | | | | | | 1.43 | | | | | | 47,671 | | | | | | 130 | | |
| 12-31-19 | | | | | 10.48 | | | | | | 0.17 | | | | | | 2.34 | | | | | | 2.51 | | | | | | 0.18 | | | | | | 0.85 | | | | | | — | | | | | | 1.03 | | | | | | — | | | | | | 11.96 | | | | | | 24.45 | | | | | | 1.35 | | | | | | 1.24 | | | | | | 1.24 | | | | | | 1.40 | | | | | | 53,098 | | | | | | 95 | | |
| 12-31-18 | | | | | 13.06 | | | | | | 0.18 | | | | | | (1.15) | | | | | | (0.97) | | | | | | 0.17 | | | | | | 1.44 | | | | | | — | | | | | | 1.61 | | | | | | — | | | | | | 10.48 | | | | | | (8.33)(a) | | | | | | 1.35 | | | | | | 1.24 | | | | | | 1.24 | | | | | | 1.41(b) | | | | | | 49,230 | | | | | | 97 | | |
| 12-31-17 | | | | | 11.79 | | | | | | 0.18• | | | | | | 1.33 | | | | | | 1.51 | | | | | | 0.24 | | | | | | — | | | | | | — | | | | | | 0.24 | | | | | | — | | | | | | 13.06 | | | | | | 12.84 | | | | | | 1.35 | | | | | | 1.24 | | | | | | 1.24 | | | | | | 1.44 | | | | | | 61,244 | | | | | | 79 | | |
| 12-31-16 | | | | | 10.94 | | | | | | 0.21 | | | | | | 1.21 | | | | | | 1.42 | | | | | | 0.22 | | | | | | 0.35 | | | | | | — | | | | | | 0.57 | | | | | | — | | | | | | 11.79 | | | | | | 13.20 | | | | | | 1.40 | | | | | | 1.24 | | | | | | 1.24 | | | | | | 1.79 | | | | | | 64,578 | | | | | | 118 | | |
| Class I | | | | | | | | | | | | | | | | | | | | | | | | | | | | | | | | | | | | | | | | | | | | | | | | | | | | | | | | | | | | | | | | | | | | | | | | | | | | | | | | | | | | | | | | | | | | | | | | | | | | | | | |
| 12-31-20 | | | | | 12.22 | | | | | | 0.22 | | | | | | 0.28 | | | | | | 0.50 | | | | | | 0.24 | | | | | | 1.03 | | | | | | — | | | | | | 1.27 | | | | | | — | | | | | | 11.45 | | | | | | 6.28 | | | | | | 0.83 | | | | | | 0.64 | | | | | | 0.64 | | | | | | 2.02 | | | | | | 329,385 | | | | | | 130 | | |
| 12-31-19 | | | | | 10.69 | | | | | | 0.24 | | | | | | 2.39 | | | | | | 2.63 | | | | | | 0.25 | | | | | | 0.85 | | | | | | — | | | | | | 1.10 | | | | | | — | | | | | | 12.22 | | | | | | 25.12 | | | | | | 0.75 | | | | | | 0.64 | | | | | | 0.64 | | | | | | 2.00 | | | | | | 367,345 | | | | | | 95 | | |
| 12-31-18 | | | | | 13.30 | | | | | | 0.25• | | | | | | (1.17) | | | | | | (0.92) | | | | | | 0.25 | | | | | | 1.44 | | | | | | — | | | | | | 1.69 | | | | | | — | | | | | | 10.69 | | | | | | (7.81)(a) | | | | | | 0.75 | | | | | | 0.64 | | | | | | 0.64 | | | | | | 2.01(b) | | | | | | 330,038 | | | | | | 97 | | |
| 12-31-17 | | | | | 12.00 | | | | | | 0.26• | | | | | | 1.36 | | | | | | 1.62 | | | | | | 0.32 | | | | | | — | | | | | | — | | | | | | 0.32 | | | | | | — | | | | | | 13.30 | | | | | | 13.55 | | | | | | 0.75 | | | | | | 0.64 | | | | | | 0.64 | | | | | | 2.06 | | | | | | 428,068 | | | | | | 79 | | |
| 12-31-16 | | | | | 11.12 | | | | | | 0.28 | | | | | | 1.23 | | | | | | 1.51 | | | | | | 0.28 | | | | | | 0.35 | | | | | | — | | | | | | 0.63 | | | | | | — | | | | | | 12.00 | | | | | | 13.89 | | | | | | 0.75 | | | | | | 0.64 | | | | | | 0.64 | | | | | | 2.39 | | | | | | 572,744 | | | | | | 118 | | |
| Class R6 | | | | | | | | | | | | | | | | | | | | | | | | | | | | | | | | | | | | | | | | | | | | | | | | | | | | | | | | | | | | | | | | | | | | | | | | | | | | | | | | | | | | | | | | | | | | | | | | | | | | | | | |
| 12-31-20 | | | | | 12.21 | | | | | | 0.21• | | | | | | 0.29 | | | | | | 0.50 | | | | | | 0.24 | | | | | | 1.03 | | | | | | — | | | | | | 1.27 | | | | | | — | | | | | | 11.44 | | | | | | 6.27 | | | | | | 0.77 | | | | | | 0.64 | | | | | | 0.64 | | | | | | 2.01 | | | | | | 230 | | | | | | 130 | | |
| 12-31-19 | | | | | 10.68 | | | | | | 0.25• | | | | | | 2.38 | | | | | | 2.63 | | | | | | 0.25 | | | | | | 0.85 | | | | | | — | | | | | | 1.10 | | | | | | — | | | | | | 12.21 | | | | | | 25.14 | | | | | | 0.75 | | | | | | 0.64 | | | | | | 0.64 | | | | | | 2.16 | | | | | | 306 | | | | | | 95 | | |
| 12-31-18 | | | | | 13.28 | | | | | | 0.25• | | | | | | (1.16) | | | | | | (0.91) | | | | | | 0.25 | | | | | | 1.44 | | | | | | — | | | | | | 1.69 | | | | | | — | | | | | | 10.68 | | | | | | (7.74)(a) | | | | | | 0.75 | | | | | | 0.64 | | | | | | 0.64 | | | | | | 2.03(b) | | | | | | 1,182 | | | | | | 97 | | |
| 12-31-17 | | | | | 11.99 | | | | | | 0.26• | | | | | | 1.35 | | | | | | 1.61 | | | | | | 0.32 | | | | | | — | | | | | | — | | | | | | 0.32 | | | | | | — | | | | | | 13.28 | | | | | | 13.47 | | | | | | 0.75 | | | | | | 0.64 | | | | | | 0.64 | | | | | | 2.06 | | | | | | 836 | | | | | | 79 | | |
| 12-31-16 | | | | | 11.12 | | | | | | 0.23• | | | | | | 1.27 | | | | | | 1.50 | | | | | | 0.28 | | | | | | 0.35 | | | | | | — | | | | | | 0.63 | | | | | | — | | | | | | 11.99 | | | | | | 13.80 | | | | | | 0.75 | | | | | | 0.64 | | | | | | 0.64 | | | | | | 2.01 | | | | | | 550 | | | | | | 118 | | |
| Class S | | | | | | | | | | | | | | | | | | | | | | | | | | | | | | | | | | | | | | | | | | | | | | | | | | | | | | | | | | | | | | | | | | | | | | | | | | | | | | | | | | | | | | | | | | | | | | | | | | | | | | | |
| 12-31-20 | | | | | 12.04 | | | | | | 0.19 | | | | | | 0.27 | | | | | | 0.46 | | | | | | 0.22 | | | | | | 1.03 | | | | | | — | | | | | | 1.25 | | | | | | — | | | | | | 11.25 | | | | | | 5.97 | | | | | | 1.08 | | | | | | 0.89 | | | | | | 0.89 | | | | | | 1.78 | | | | | | 611,514 | | | | | | 130 | | |
| 12-31-19 | | | | | 10.55 | | | | | | 0.20• | | | | | | 2.36 | | | | | | 2.56 | | | | | | 0.22 | | | | | | 0.85 | | | | | | — | | | | | | 1.07 | | | | | | — | | | | | | 12.04 | | | | | | 24.78 | | | | | | 1.00 | | | | | | 0.89 | | | | | | 0.89 | | | | | | 1.75 | | | | | | 665,553 | | | | | | 95 | | |
| 12-31-18 | | | | | 13.14 | | | | | | 0.22• | | | | | | (1.15) | | | | | | (0.93) | | | | | | 0.22 | | | | | | 1.44 | | | | | | — | | | | | | 1.66 | | | | | | — | | | | | | 10.55 | | | | | | (8.00)(a) | | | | | | 1.00 | | | | | | 0.89 | | | | | | 0.89 | | | | | | 1.76(b) | | | | | | 630,221 | | | | | | 97 | | |
| 12-31-17 | | | | | 11.86 | | | | | | 0.23• | | | | | | 1.34 | | | | | | 1.57 | | | | | | 0.29 | | | | | | — | | | | | | — | | | | | | 0.29 | | | | | | — | | | | | | 13.14 | | | | | | 13.23 | | | | | | 1.00 | | | | | | 0.89 | | | | | | 0.89 | | | | | | 1.80 | | | | | | 800,421 | | | | | | 79 | | |
| 12-31-16 | | | | | 11.00 | | | | | | 0.24• | | | | | | 1.22 | | | | | | 1.46 | | | | | | 0.25 | | | | | | 0.35 | | | | | | — | | | | | | 0.60 | | | | | | — | | | | | | 11.86 | | | | | | 13.58 | | | | | | 1.00 | | | | | | 0.89 | | | | | | 0.89 | | | | | | 2.14 | | | | | | 934,779 | | | | | | 118 | | |
| Class S2 | | | | | | | | | | | | | | | | | | | | | | | | | | | | | | | | | | | | | | | | | | | | | | | | | | | | | | | | | | | | | | | | | | | | | | | | | | | | | | | | | | | | | | | | | | | | | | | | | | | | | | | |
| 12-31-20 | | | | | 12.06 | | | | | | 0.17• | | | | | | 0.27 | | | | | | 0.44 | | | | | | 0.20 | | | | | | 1.03 | | | | | | — | | | | | | 1.23 | | | | | | — | | | | | | 11.27 | | | | | | 5.86 | | | | | | 1.23 | | | | | | 1.04 | | | | | | 1.04 | | | | | | 1.63 | | | | | | 154 | | | | | | 130 | | |
| 12-31-19 | | | | | 10.56 | | | | | | 0.19• | | | | | | 2.36 | | | | | | 2.55 | | | | | | 0.20 | | | | | | 0.85 | | | | | | — | | | | | | 1.05 | | | | | | — | | | | | | 12.06 | | | | | | 24.63 | | | | | | 1.15 | | | | | | 1.04 | | | | | | 1.04 | | | | | | 1.60 | | | | | | 145 | | | | | | 95 | | |
| 12-31-18 | | | | | 13.15 | | | | | | 0.20 | | | | | | (1.15) | | | | | | (0.95) | | | | | | 0.20 | | | | | | 1.44 | | | | | | — | | | | | | 1.64 | | | | | | — | | | | | | 10.56 | | | | | | (8.12)(a) | | | | | | 1.15 | | | | | | 1.04 | | | | | | 1.04 | | | | | | 1.60(b) | | | | | | 151 | | | | | | 97 | | |
| 12-31-17 | | | | | 11.86 | | | | | | 0.20• | | | | | | 1.35 | | | | | | 1.55 | | | | | | 0.26 | | | | | | — | | | | | | — | | | | | | 0.26 | | | | | | — | | | | | | 13.15 | | | | | | 13.10 | | | | | | 1.15 | | | | | | 1.04 | | | | | | 1.04 | | | | | | 1.64 | | | | | | 229 | | | | | | 79 | | |
| 12-31-16 | | | | | 11.00 | | | | | | 0.22• | | | | | | 1.22 | | | | | | 1.44 | | | | | | 0.23 | | | | | | 0.35 | | | | | | — | | | | | | 0.58 | | | | | | — | | | | | | 11.86 | | | | | | 13.40 | | | | | | 1.18 | | | | | | 1.04 | | | | | | 1.04 | | | | | | 2.00 | | | | | | 537 | | | | | | 118 | | |
See Accompanying Notes to Financial Statements
Financial Highlights (continued)
| | | | | | | | | | Income
(loss) from
investment
operations | | | | | | | | | Less
Distributions | | | | | | Ratios to average
net assets | | | Supplemental
Data | |
| | | | Net asset value, beginning of year
or period | | | Net investment income (loss) | | | Net realized and unrealized
gain (loss) | | | Total from investment operations | | | From net investment income | | | From net realized gains | | | From return of capital | | | Total distributions | | | Payment by affiliate | | | Net asset value, end of year
or period | | | Total Return(1) | | | Expenses before
reductions/additions(2)(3)(4) | | | Expenses net of fee waivers
and/or recoupments if any(2)(3)(4) | | | Expenses net of all
reductions/additions(2)(3)(4) | | | Net investment income (loss)(2)(3) | | | Net assets, end of year or period | | | Portfolio turnover rate | |
Year or
period ended | | | ($) | | | ($) | | | ($) | | | ($) | | | ($) | | | ($) | | | ($) | | | ($) | | | ($) | | | ($) | | | (%) | | | (%) | | | (%) | | | (%) | | | (%) | | | ($000’s) | | | (%) | |
| Voya Limited Maturity Bond Portfolio | | | | | | | | | | | | | | | | | | | | | | | | | | | | | | | | | | | | | | | | | | | | | | | | | | | | | | | | | | | | | | | | | | | | | | | | | | | | | | | | | | | | | | | | | | | | | | | | | | | | | | | |
| Class ADV | | | | | | | | | | | | | | | | | | | | | | | | | | | | | | | | | | | | | | | | | | | | | | | | | | | | | | | | | | | | | | | | | | | | | | | | | | | | | | | | | | | | | | | | | | | | | | | | | | | | | | | |
| 12-31-20 | | | | | 9.91 | | | | | | 0.12 | | | | | | 0.16 | | | | | | 0.28 | | | | | | 0.16 | | | | | | — | | | | | | — | | | | | | 0.16 | | | | | | — | | | | | | 10.03 | | | | | | 2.87 | | | | | | 0.88 | | | | | | 0.88 | | | | | | 0.88 | | | | | | 1.15 | | | | | | 15,016 | | | | | | 263 | | |
| 12-31-19 | | | | | 9.68 | | | | | | 0.19 | | | | | | 0.16 | | | | | | 0.35 | | | | | | 0.12 | | | | | | — | | | | | | — | | | | | | 0.12 | | | | | | — | | | | | | 9.91 | | | | | | 3.66 | | | | | | 0.89 | | | | | | 0.89 | | | | | | 0.89 | | | | | | 1.85 | | | | | | 15,579 | | | | | | 330 | | |
| 12-31-18 | | | | | 9.72 | | | | | | 0.17 | | | | | | (0.10) | | | | | | 0.07 | | | | | | 0.11 | | | | | | — | | | | | | — | | | | | | 0.11 | | | | | | — | | | | | | 9.68 | | | | | | 0.71 | | | | | | 0.89 | | | | | | 0.89 | | | | | | 0.89 | | | | | | 1.67 | | | | | | 16,812 | | | | | | 281 | | |
| 12-31-17 | | | | | 9.76 | | | | | | 0.10 | | | | | | 0.00* | | | | | | 0.10 | | | | | | 0.13 | | | | | | — | | | | | | 0.01 | | | | | | 0.14 | | | | | | — | | | | | | 9.72 | | | | | | 0.94 | | | | | | 0.89 | | | | | | 0.89 | | | | | | 0.89 | | | | | | 1.03 | | | | | | 19,695 | | | | | | 305 | | |
| 12-31-16 | | | | | 9.83 | | | | | | 0.09• | | | | | | 0.00* | | | | | | 0.09 | | | | | | 0.16 | | | | | | — | | | | | | — | | | | | | 0.16 | | | | | | — | | | | | | 9.76 | | | | | | 0.91 | | | | | | 0.93 | | | | | | 0.88 | | | | | | 0.88 | | | | | | 0.87 | | | | | | 22,864 | | | | | | 174 | | |
| Class I | | | | | | | | | | | | | | | | | | | | | | | | | | | | | | | | | | | | | | | | | | | | | | | | | | | | | | | | | | | | | | | | | | | | | | | | | | | | | | | | | | | | | | | | | | | | | | | | | | | | | | | |
| 12-31-20 | | | | | 10.11 | | | | | | 0.17• | | | | | | 0.18 | | | | | | 0.35 | | | | | | 0.23 | | | | | | — | | | | | | — | | | | | | 0.23 | | | | | | — | | | | | | 10.23 | | | | | | 3.46 | | | | | | 0.28 | | | | | | 0.28 | | | | | | 0.28 | | | | | | 1.70 | | | | | | 332,196 | | | | | | 263 | | |
| 12-31-19 | | | | | 9.87 | | | | | | 0.24 | | | | | | 0.19 | | | | | | 0.43 | | | | | | 0.19 | | | | | | — | | | | | | — | | | | | | 0.19 | | | | | | — | | | | | | 10.11 | | | | | | 4.33 | | | | | | 0.29 | | | | | | 0.29 | | | | | | 0.29 | | | | | | 2.44 | | | | | | 197,182 | | | | | | 330 | | |
| 12-31-18 | | | | | 9.91 | | | | | | 0.22 | | | | | | (0.09) | | | | | | 0.13 | | | | | | 0.17 | | | | | | — | | | | | | — | | | | | | 0.17 | | | | | | — | | | | | | 9.87 | | | | | | 1.33 | | | | | | 0.29 | | | | | | 0.29 | | | | | | 0.29 | | | | | | 2.30 | | | | | | 195,851 | | | | | | 281 | | |
| 12-31-17 | | | | | 9.96 | | | | | | 0.16 | | | | | | (0.01) | | | | | | 0.15 | | | | | | 0.19 | | | | | | — | | | | | | 0.01 | | | | | | 0.20 | | | | | | — | | | | | | 9.91 | | | | | | 1.45 | | | | | | 0.29 | | | | | | 0.29 | | | | | | 0.29 | | | | | | 1.63 | | | | | | 188,672 | | | | | | 305 | | |
| 12-31-16 | | | | | 10.09 | | | | | | 0.15• | | | | | | 0.00* | | | | | | 0.15 | | | | | | 0.28 | | | | | | — | | | | | | — | | | | | | 0.28 | | | | | | — | | | | | | 9.96 | | | | | | 1.53 | | | | | | 0.28 | | | | | | 0.28 | | | | | | 0.28 | | | | | | 1.46 | | | | | | 170,578 | | | | | | 174 | | |
| Class S | | | | | | | | | | | | | | | | | | | | | | | | | | | | | | | | | | | | | | | | | | | | | | | | | | | | | | | | | | | | | | | | | | | | | | | | | | | | | | | | | | | | | | | | | | | | | | | | | | | | | | | |
| 12-31-20 | | | | | 10.19 | | | | | | 0.16 | | | | | | 0.16 | | | | | | 0.32 | | | | | | 0.20 | | | | | | — | | | | | | — | | | | | | 0.20 | | | | | | — | | | | | | 10.31 | | | | | | 3.19 | | | | | | 0.53 | | | | | | 0.53 | | | | | | 0.53 | | | | | | 1.50 | | | | | | 71,911 | | | | | | 263 | | |
| 12-31-19 | | | | | 9.95 | | | | | | 0.22 | | | | | | 0.18 | | | | | | 0.40 | | | | | | 0.16 | | | | | | — | | | | | | — | | | | | | 0.16 | | | | | | — | | | | | | 10.19 | | | | | | 4.06 | | | | | | 0.54 | | | | | | 0.54 | | | | | | 0.54 | | | | | | 2.20 | | | | | | 75,066 | | | | | | 330 | | |
| 12-31-18 | | | | | 9.99 | | | | | | 0.20 | | | | | | (0.09) | | | | | | 0.11 | | | | | | 0.15 | | | | | | — | | | | | | — | | | | | | 0.15 | | | | | | — | | | | | | 9.95 | | | | | | 1.07 | | | | | | 0.54 | | | | | | 0.54 | | | | | | 0.54 | | | | | | 2.02 | | | | | | 74,885 | | | | | | 281 | | |
| 12-31-17 | | | | | 10.04 | | | | | | 0.14 | | | | | | (0.02) | | | | | | 0.12 | | | | | | 0.16 | | | | | | — | | | | | | 0.01 | | | | | | 0.17 | | | | | | — | | | | | | 9.99 | | | | | | 1.20 | | | | | | 0.54 | | | | | | 0.54 | | | | | | 0.54 | | | | | | 1.38 | | | | | | 83,412 | | | | | | 305 | | |
| 12-31-16 | | | | | 10.15 | | | | | | 0.13 | | | | | | 0.00* | | | | | | 0.13 | | | | | | 0.24 | | | | | | — | | | | | | — | | | | | | 0.24 | | | | | | — | | | | | | 10.04 | | | | | | 1.28 | | | | | | 0.53 | | | | | | 0.53 | | | | | | 0.53 | | | | | | 1.21 | | | | | | 99,063 | | | | | | 174 | | |
| Voya U.S. Stock Index Portfolio | | | | | | | | | | | | | | | | | | | | | | | | | | | | | | | | | | | | | | | | | | | | | | | | | | | | | | | | | | | | | | | | | | | | | | | | | | | | | | | | | | | | | | | | | | | | | | | | | | | | | | | |
| Class ADV | | | | | | | | | | | | | | | | | | | | | | | | | | | | | | | | | | | | | | | | | | | | | | | | | | | | | | | | | | | | | | | | | | | | | | | | | | | | | | | | | | | | | | | | | | | | | | | | | | | | | | | |
| 12-31-20 | | | | | 16.38 | | | | | | 0.18 | | | | | | 2.55 | | | | | | 2.73 | | | | | | 0.24 | | | | | | 0.66 | | | | | | — | | | | | | 0.90 | | | | | | — | | | | | | 18.21 | | | | | | 17.48 | | | | | | 0.79 | | | | | | 0.79 | | | | | | 0.79 | | | | | | 1.03 | | | | | | 100,049 | | | | | | 9 | | |
| 12-31-19 | | | | | 13.44 | | | | | | 0.19• | | | | | | 3.82 | | | | | | 4.01 | | | | | | 0.17 | | | | | | 0.90 | | | | | | — | | | | | | 1.07 | | | | | | — | | | | | | 16.38 | | | | | | 30.43 | | | | | | 0.80 | | | | | | 0.80 | | | | | | 0.80 | | | | | | 1.22 | | | | | | 102,813 | | | | | | 9 | | |
| 12-31-18 | | | | | 15.19 | | | | | | 0.17• | | | | | | (0.86) | | | | | | (0.69) | | | | | | 0.18 | | | | | | 0.88 | | | | | | — | | | | | | 1.06 | | | | | | — | | | | | | 13.44 | | | | | | (5.10) | | | | | | 0.80 | | | | | | 0.80 | | | | | | 0.80 | | | | | | 1.14 | | | | | | 92,071 | | | | | | 12 | | |
| 12-31-17 | | | | | 13.38 | | | | | | 0.18• | | | | | | 2.53 | | | | | | 2.71 | | | | | | 0.18 | | | | | | 0.72 | | | | | | — | | | | | | 0.90 | | | | | | — | | | | | | 15.19 | | | | | | 20.82 | | | | | | 0.80 | | | | | | 0.80 | | | | | | 0.80 | | | | | | 1.23 | | | | | | 116,091 | | | | | | 6 | | |
| 12-31-16 | | | | | 12.97 | | | | | | 0.19 | | | | | | 1.21 | | | | | | 1.40 | | | | | | 0.20 | | | | | | 0.79 | | | | | | — | | | | | | 0.99 | | | | | | — | | | | | | 13.38 | | | | | | 11.11 | | | | | | 0.87 | | | | | | 0.80 | | | | | | 0.80 | | | | | | 1.37 | | | | | | 116,242 | | | | | | 5 | | |
| Class I | | | | | | | | | | | | | | | | | | | | | | | | | | | | | | | | | | | | | | | | | | | | | | | | | | | | | | | | | | | | | | | | | | | | | | | | | | | | | | | | | | | | | | | | | | | | | | | | | | | | | | | |
| 12-31-20 | | | | | 16.99 | | | | | | 0.28 | | | | | | 2.66 | | | | | | 2.94 | | | | | | 0.33 | | | | | | 0.66 | | | | | | — | | | | | | 0.99 | | | | | | — | | | | | | 18.94 | | | | | | 18.11 | | | | | | 0.26 | | | | | | 0.26 | | | | | | 0.26 | | | | | | 1.55 | | | | | | 4,258,517 | | | | | | 9 | | |
| 12-31-19 | | | | | 13.90 | | | | | | 0.26 | | | | | | 3.99 | | | | | | 4.25 | | | | | | 0.26 | | | | | | 0.90 | | | | | | — | | | | | | 1.16 | | | | | | — | | | | | | 16.99 | | | | | | 31.12 | | | | | | 0.27 | | | | | | 0.27 | | | | | | 0.27 | | | | | | 1.75 | | | | | | 4,065,091 | | | | | | 9 | | |
| 12-31-18 | | | | | 15.69 | | | | | | 0.26• | | | | | | (0.90) | | | | | | (0.64) | | | | | | 0.27 | | | | | | 0.88 | | | | | | — | | | | | | 1.15 | | | | | | — | | | | | | 13.90 | | | | | | (4.62) | | | | | | 0.27 | | | | | | 0.27 | | | | | | 0.27 | | | | | | 1.67 | | | | | | 2,966,664 | | | | | | 12 | | |
| 12-31-17 | | | | | 13.79 | | | | | | 0.26• | | | | | | 2.63 | | | | | | 2.89 | | | | | | 0.27 | | | | | | 0.72 | | | | | | — | | | | | | 0.99 | | | | | | — | | | | | | 15.69 | | | | | | 21.46 | | | | | | 0.27 | | | | | | 0.27 | | | | | | 0.27 | | | | | | 1.75 | | | | | | 3,469,721 | | | | | | 6 | | |
| 12-31-16 | | | | | 13.34 | | | | | | 0.26 | | | | | | 1.25 | | | | | | 1.51 | | | | | | 0.27 | | | | | | 0.79 | | | | | | — | | | | | | 1.06 | | | | | | — | | | | | | 13.79 | | | | | | 11.65 | | | | | | 0.27 | | | | | | 0.27 | | | | | | 0.27 | | | | | | 1.90 | | | | | | 4,195,761 | | | | | | 5 | | |
| Class P2 | | | | | | | | | | | | | | | | | | | | | | | | | | | | | | | | | | | | | | | | | | | | | | | | | | | | | | | | | | | | | | | | | | | | | | | | | | | | | | | | | | | | | | | | | | | | | | | | | | | | | | | |
| 12-31-20 | | | | | 17.05 | | | | | | 0.28• | | | | | | 2.69 | | | | | | 2.97 | | | | | | 0.33 | | | | | | 0.66 | | | | | | — | | | | | | 0.99 | | | | | | — | | | | | | 19.03 | | | | | | 18.23 | | | | | | 0.26 | | | | | | 0.15 | | | | | | 0.15 | | | | | | 1.67 | | | | | | 2,908,826 | | | | | | 9 | | |
| 12-31-19 | | | | | 13.93 | | | | | | 0.30• | | | | | | 3.98 | | | | | | 4.28 | | | | | | 0.26 | | | | | | 0.90 | | | | | | — | | | | | | 1.16 | | | | | | — | | | | | | 17.05 | | | | | | 31.27 | | | | | | 0.27 | | | | | | 0.15 | | | | | | 0.15 | | | | | | 1.86 | | | | | | 2,395,089 | | | | | | 9 | | |
| 12-31-18 | | | | | 15.71 | | | | | | 0.26 | | | | | | (0.89) | | | | | | (0.63) | | | | | | 0.27 | | | | | | 0.88 | | | | | | — | | | | | | 1.15 | | | | | | — | | | | | | 13.93 | | | | | | (4.55) | | | | | | 0.27 | | | | | | 0.15 | | | | | | 0.15 | | | | | | 1.80 | | | | | | 1,442,733 | | | | | | 12 | | |
05-03-17(5) -
12-31-17 | | | | | 14.79 | | | | | | 0.19• | | | | | | 1.72 | | | | | | 1.91 | | | | | | 0.27 | | | | | | 0.72 | | | | | | — | | | | | | 0.99 | | | | | | — | | | | | | 15.71 | | | | | | 13.39 | | | | | | 0.27 | | | | | | 0.15 | | | | | | 0.15 | | | | | | 1.92 | | | | | | 1,225,483 | | | | | | 6 | | |
See Accompanying Notes to Financial Statements
Financial Highlights (continued)
| | | | | | | | | | Income
(loss) from
investment
operations | | | | | | | | | Less
Distributions | | | | | | Ratios to average
net assets | | | Supplemental
Data | |
| | | | Net asset value, beginning of year
or period | | | Net investment income (loss) | | | Net realized and unrealized
gain (loss) | | | Total from investment operations | | | From net investment income | | | From net realized gains | | | From return of capital | | | Total distributions | | | Payment by affiliate | | | Net asset value, end of year
or period | | | Total Return(1) | | | Expenses before
reductions/additions(2)(3)(4) | | | Expenses net of fee waivers
and/or recoupments if any(2)(3)(4) | | | Expenses net of all
reductions/additions(2)(3)(4) | | | Net investment income (loss)(2)(3) | | | Net assets, end of year or period | | | Portfolio turnover rate | |
Year or
period ended | | | ($) | | | ($) | | | ($) | | | ($) | | | ($) | | | ($) | | | ($) | | | ($) | | | ($) | | | ($) | | | (%) | | | (%) | | | (%) | | | (%) | | | (%) | | | ($000’s) | | | (%) | |
| Voya U.S. Stock Index Portfolio (continued) | | | | | | | | | | | | | | | | | | | | | | | | | | | | | | | | | | | | | | | | | | | | | | | | | | | | | | | | | | | | | | | | | | | | | | | | | | | | | | | | | | | | | | | | | | | | | | | | | | | | | | | |
| Class S | | | | | | | | | | | | | | | | | | | | | | | | | | | | | | | | | | | | | | | | | | | | | | | | | | | | | | | | | | | | | | | | | | | | | | | | | | | | | | | | | | | | | | | | | | | | | | | | | | | | | | | |
| 12-31-20 | | | | | 16.82 | | | | | | 0.24 | | | | | | 2.63 | | | | | | 2.87 | | | | | | 0.29 | | | | | | 0.66 | | | | | | — | | | | | | 0.95 | | | | | | — | | | | | | 18.74 | | | | | | 17.87 | | | | | | 0.51 | | | | | | 0.50 | | | | | | 0.50 | | | | | | 1.32 | | | | | | 280,432 | | | | | | 9 | | |
| 12-31-19 | | | | | 13.80 | | | | | | 0.23• | | | | | | 3.94 | | | | | | 4.17 | | | | | | 0.25 | | | | | | 0.90 | | | | | | — | | | | | | 1.15 | | | | | | — | | | | | | 16.82 | | | | | | 30.77 | | | | | | 0.52 | | | | | | 0.51 | | | | | | 0.51 | | | | | | 1.46 | | | | | | 283,768 | | | | | | 9 | | |
| 12-31-18 | | | | | 15.57 | | | | | | 0.22• | | | | | | (0.88) | | | | | | (0.66) | | | | | | 0.23 | | | | | | 0.88 | | | | | | — | | | | | | 1.11 | | | | | | — | | | | | | 13.80 | | | | | | (4.84) | | | | | | 0.52 | | | | | | 0.51 | | | | | | 0.51 | | | | | | 1.42 | | | | | | 47,740 | | | | | | 12 | | |
| 12-31-17 | | | | | 13.69 | | | | | | 0.21 | | | | | | 2.62 | | | | | | 2.83 | | | | | | 0.23 | | | | | | 0.72 | | | | | | — | | | | | | 0.95 | | | | | | — | | | | | | 15.57 | | | | | | 21.22 | | | | | | 0.52 | | | | | | 0.51 | | | | | | 0.51 | | | | | | 1.52 | | | | | | 78,577 | | | | | | 6 | | |
| 12-31-16 | | | | | 13.26 | | | | | | 0.22�� | | | | | | 1.25 | | | | | | 1.47 | | | | | | 0.25 | | | | | | 0.79 | | | | | | — | | | | | | 1.04 | | | | | | — | | | | | | 13.69 | | | | | | 11.35 | | | | | | 0.52 | | | | | | 0.51 | | | | | | 0.51 | | | | | | 1.66 | | | | | | 61,754 | | | | | | 5 | | |
| Class S2 | | | | | | | | | | | | | | | | | | | | | | | | | | | | | | | | | | | | | | | | | | | | | | | | | | | | | | | | | | | | | | | | | | | | | | | | | | | | | | | | | | | | | | | | | | | | | | | | | | | | | | | |
| 12-31-20 | | | | | 16.62 | | | | | | 0.20 | | | | | | 2.59 | | | | | | 2.79 | | | | | | 0.26 | | | | | | 0.66 | | | | | | — | | | | | | 0.92 | | | | | | — | | | | | | 18.49 | | | | | | 17.62 | | | | | | 0.66 | | | | | | 0.66 | | | | | | 0.66 | | | | | | 1.16 | | | | | | 151,642 | | | | | | 9 | | |
| 12-31-19 | | | | | 13.62 | | | | | | 0.21• | | | | | | 3.88 | | | | | | 4.09 | | | | | | 0.19 | | | | | | 0.90 | | | | | | — | | | | | | 1.09 | | | | | | — | | | | | | 16.62 | | | | | | 30.60 | | | | | | 0.67 | | | | | | 0.67 | | | | | | 0.67 | | | | | | 1.35 | | | | | | 149,297 | | | | | | 9 | | |
| 12-31-18 | | | | | 15.39 | | | | | | 0.20• | | | | | | (0.88) | | | | | | (0.68) | | | | | | 0.21 | | | | | | 0.88 | | | | | | — | | | | | | 1.09 | | | | | | — | | | | | | 13.62 | | | | | | (5.03) | | | | | | 0.67 | | | | | | 0.67 | | | | | | 0.67 | | | | | | 1.27 | | | | | | 150,127 | | | | | | 12 | | |
| 12-31-17 | | | | | 13.54 | | | | | | 0.21 | | | | | | 2.56 | | | | | | 2.77 | | | | | | 0.20 | | | | | | 0.72 | | | | | | — | | | | | | 0.92 | | | | | | — | | | | | | 15.39 | | | | | | 21.03 | | | | | | 0.67 | | | | | | 0.67 | | | | | | 0.67 | | | | | | 1.35 | | | | | | 189,330 | | | | | | 6 | | |
| 12-31-16 | | | | �� | 13.12 | | | | | | 0.21 | | | | | | 1.22 | | | | | | 1.43 | | | | | | 0.22 | | | | | | 0.79 | | | | | | — | | | | | | 1.01 | | | | | | — | | | | | | 13.54 | | | | | | 11.19 | | | | | | 0.70 | | | | | | 0.67 | | | | | | 0.67 | | | | | | 1.50 | | | | | | 175,340 | | | | | | 5 | | |
VY® Clarion Real Estate Portfolio | | | | | | | | | | | | | | | | | | | | | | | | | | | | | | | | | | | | | | | | | | | | | | | | | | | | | | | | | | | | | | | | | | | | | | | | | | | | | | | | | | | | | | | | | | | | | | | | | | | | | | | |
| Class ADV | | | | | | | | | | | | | | | | | | | | | | | | | | | | | | | | | | | | | | | | | | | | | | | | | | | | | | | | | | | | | | | | | | | | | | | | | | | | | | | | | | | | | | | | | | | | | | | | | | | | | | | |
| 12-31-20 | | | | | 36.39 | | | | | | 0.41• | | | | | | (3.54) | | | | | | (3.13) | | | | | | 0.66 | | | | | | 3.51 | | | | | | — | | | | | | 4.17 | | | | | | — | | | | | | 29.09 | | | | | | (6.89) | | | | | | 1.63 | | | | | | 1.28 | | | | | | 1.28 | | | | | | 1.38 | | | | | | 48,781 | | | | | | 103 | | |
| 12-31-19 | | | | | 29.16 | | | | | | 0.51• | | | | | | 7.53 | | | | | | 8.04 | | | | | | 0.63 | | | | | | 0.18 | | | | | | — | | | | | | 0.81 | | | | | | — | | | | | | 36.39 | | | | | | 27.71 | | | | | | 1.46 | | | | | | 1.31 | | | | | | 1.31 | | | | | | 1.49 | | | | | | 63,873 | | | | | | 69 | | |
| 12-31-18 | | | | | 36.01 | | | | | | 0.49• | | | | | | (3.01) | | | | | | (2.52) | | | | | | 0.83 | | | | | | 3.50 | | | | | | — | | | | | | 4.33 | | | | | | — | | | | | | 29.16 | | | | | | (7.97) | | | | | | 1.47 | | | | | | 1.31 | | | | | | 1.31 | | | | | | 1.50 | | | | | | 56,062 | | | | | | 103 | | |
| 12-31-17 | | | | | 35.00 | | | | | | 0.53• | | | | | | 1.14 | | | | | | 1.67 | | | | | | 0.66 | | | | | | — | | | | | | — | | | | | | 0.66 | | | | | | — | | | | | | 36.01 | | | | | | 4.82 | | | | | | 1.45 | | | | | | 1.31 | | | | | | 1.31 | | | | | | 1.50 | | | | | | 75,575 | | | | | | 82 | | |
| 12-31-16 | | | | | 34.11 | | | | | | 0.47• | | | | | | 0.88 | | | | | | 1.35 | | | | | | 0.46 | | | | | | — | | | | | | — | | | | | | 0.46 | | | | | | — | | | | | | 35.00 | | | | | | 3.86 | | | | | | 1.49 | | | | | | 1.31 | | | | | | 1.31 | | | | | | 1.33 | | | | | | 90,084 | | | | | | 43 | | |
| Class I | | | | | | | | | | | | | | | | | | | | | | | | | | | | | | | | | | | | | | | | | | | | | | | | | | | | | | | | | | | | | | | | | | | | | | | | | | | | | | | | | | | | | | | | | | | | | | | | | | | | | | | |
| 12-31-20 | | | | | 38.38 | | | | | | 0.55• | | | | | | (3.64) | | | | | | (3.09) | | | | | | 0.90 | | | | | | 3.51 | | | | | | — | | | | | | 4.41 | | | | | | — | | | | | | 30.88 | | | | | | (6.32) | | | | | | 1.03 | | | | | | 0.68 | | | | | | 0.68 | | | | | | 1.76 | | | | | | 14,403 | | | | | | 103 | | |
| 12-31-19 | | | | | 30.72 | | | | | | 0.68• | | | | | | 8.01 | | | | | | 8.69 | | | | | | 0.85 | | | | | | 0.18 | | | | | | — | | | | | | 1.03 | | | | | | — | | | | | | 38.38 | | | | | | 28.47 | | | | | | 0.86 | | | | | | 0.71 | | | | | | 0.71 | | | | | | 1.88 | | | | | | 24,412 | | | | | | 69 | | |
| 12-31-18 | | | | | 37.76 | | | | | | 0.71• | | | | | | (3.15) | | | | | | (2.44) | | | | | | 1.10 | | | | | | 3.50 | | | | | | — | | | | | | 4.60 | | | | | | — | | | | | | 30.72 | | | | | | (7.42) | | | | | | 0.87 | | | | | | 0.71 | | | | | | 0.71 | | | | | | 2.05 | | | | | | 38,978 | | | | | | 103 | | |
| 12-31-17 | | | | | 36.68 | | | | | | 0.79• | | | | | | 1.19 | | | | | | 1.98 | | | | | | 0.90 | | | | | | — | | | | | | — | | | | | | 0.90 | | | | | | — | | | | | | 37.76 | | | | | | 5.47 | | | | | | 0.85 | | | | | | 0.71 | | | | | | 0.71 | | | | | | 2.14 | | | | | | 100,423 | | | | | | 82 | | |
| 12-31-16 | | | | | 35.71 | | | | | | 0.72• | | | | | | 0.92 | | | | | | 1.64 | | | | | | 0.67 | | | | | | — | | | | | | — | | | | | | 0.67 | | | | | | — | | | | | | 36.68 | | | | | | 4.47 | | | | | | 0.84 | | | | | | 0.71 | | | | | | 0.71 | | | | | | 1.96 | | | | | | 105,754 | | | | | | 43 | | |
| Class S | | | | | | | | | | | | | | | | | | | | | | | | | | | | | | | | | | | | | | | | | | | | | | | | | | | | | | | | | | | | | | | | | | | | | | | | | | | | | | | | | | | | | | | | | | | | | | | | | | | | | | | |
| 12-31-20 | | | | | 38.32 | | | | | | 0.53• | | | | | | (3.68) | | | | | | (3.15) | | | | | | 0.79 | | | | | | 3.51 | | | | | | — | | | | | | 4.30 | | | | | | — | | | | | | 30.87 | | | | | | (6.53) | | | | | | 1.28 | | | | | | 0.93 | | | | | | 0.93 | | | | | | 1.71 | | | | | | 173,126 | | | | | | 103 | | |
| 12-31-19 | | | | | 30.67 | | | | | | 0.66• | | | | | | 7.93 | | | | | | 8.59 | | | | | | 0.76 | | | | | | 0.18 | | | | | | — | | | | | | 0.94 | | | | | | — | | | | | | 38.32 | | | | | | 28.15 | | | | | | 1.11 | | | | | | 0.96 | | | | | | 0.96 | | | | | | 1.82 | | | | | | 230,346 | | | | | | 69 | | |
| 12-31-18 | | | | | 37.67 | | | | | | 0.63• | | | | | | (3.16) | | | | | | (2.53) | | | | | | 0.97 | | | | | | 3.50 | | | | | | — | | | | | | 4.47 | | | | | | — | | | | | | 30.67 | | | | | | (7.65) | | | | | | 1.12 | | | | | | 0.96 | | | | | | 0.96 | | | | | | 1.85 | | | | | | 212,673 | | | | | | 103 | | |
| 12-31-17 | | | | | 36.58 | | | | | | 0.68• | | | | | | 1.19 | | | | | | 1.87 | | | | | | 0.78 | | | | | | — | | | | | | — | | | | | | 0.78 | | | | | | — | | | | | | 37.67 | | | | | | 5.18 | | | | | | 1.10 | | | | | | 0.96 | | | | | | 0.96 | | | | | | 1.83 | | | | | | 290,716 | | | | | | 82 | | |
| 12-31-16 | | | | | 35.60 | | | | | | 0.61• | | | | | | 0.94 | | | | | | 1.55 | | | | | | 0.57 | | | | | | — | | | | | | — | | | | | | 0.57 | | | | | | — | | | | | | 36.58 | | | | | | 4.24 | | | | | | 1.09 | | | | | | 0.96 | | | | | | 0.96 | | | | | | 1.66 | | | | | | 375,761 | | | | | | 43 | | |
| Class S2 | | | | | | | | | | | | | | | | | | | | | | | | | | | | | | | | | | | | | | | | | | | | | | | | | | | | | | | | | | | | | | | | | | | | | | | | | | | | | | | | | | | | | | | | | | | | | | | | | | | | | | | |
| 12-31-20 | | | | | 38.07 | | | | | | 0.46• | | | | | | (3.64) | | | | | | (3.18) | | | | | | 0.74 | | | | | | 3.51 | | | | | | — | | | | | | 4.25 | | | | | | — | | | | | | 30.64 | | | | | | (6.69) | | | | | | 1.43 | | | | | | 1.08 | | | | | | 1.08 | | | | | | 1.49 | | | | | | 11,420 | | | | | | 103 | | |
| 12-31-19 | | | | | 30.47 | | | | | | 0.60• | | | | | | 7.88 | | | | | | 8.48 | | | | | | 0.70 | | | | | | 0.18 | | | | | | — | | | | | | 0.88 | | | | | | — | | | | | | 38.07 | | | | | | 27.97 | | | | | | 1.26 | | | | | | 1.11 | | | | | | 1.11 | | | | | | 1.67 | | | | | | 15,394 | | | | | | 69 | | |
| 12-31-18 | | | | | 37.44 | | | | | | 0.58• | | | | | | (3.14) | | | | | | (2.56) | | | | | | 0.91 | | | | | | 3.50 | | | | | | — | | | | | | 4.41 | | | | | | — | | | | | | 30.47 | | | | | | (7.78) | | | | | | 1.27 | | | | | | 1.11 | | | | | | 1.11 | | | | | | 1.71 | | | | | | 13,745 | | | | | | 103 | | |
| 12-31-17 | | | | | 36.35 | | | | | | 0.62• | | | | | | 1.18 | | | | | | 1.80 | | | | | | 0.71 | | | | | | — | | | | | | — | | | | | | 0.71 | | | | | | — | | | | | | 37.44 | | | | | | 5.02 | | | | | | 1.25 | | | | | | 1.11 | | | | | | 1.11 | | | | | | 1.68 | | | | | | 17,937 | | | | | | 82 | | |
| 12-31-16 | | | | | 35.39 | | | | | | 0.55• | | | | | | 0.93 | | | | | | 1.48 | | | | | | 0.52 | | | | | | — | | | | | | — | | | | | | 0.52 | | | | | | — | | | | | | 36.35 | | | | | | 4.07 | | | | | | 1.27 | | | | | | 1.11 | | | | | | 1.11 | | | | | | 1.52 | | | | | | 22,911 | | | | | | 43 | | |
See Accompanying Notes to Financial Statements
Financial Highlights (continued)
| | | | | | | | | | Income
(loss) from
investment
operations | | | | | | | | | Less
Distributions | | | | | | Ratios to average
net assets | | | Supplemental
Data | |
| | | | Net asset value, beginning of year
or period | | | Net investment income (loss) | | | Net realized and unrealized
gain (loss) | | | Total from investment operations | | | From net investment income | | | From net realized gains | | | From return of capital | | | Total distributions | | | Payment by affiliate | | | Net asset value, end of year
or period | | | Total Return(1) | | | Expenses before
reductions/additions(2)(3)(4) | | | Expenses net of fee waivers
and/or recoupments if any(2)(3)(4) | | | Expenses net of all
reductions/additions(2)(3)(4) | | | Net investment income (loss)(2)(3) | | | Net assets, end of year or period | | | Portfolio turnover rate | |
Year or
period ended | | | ($) | | | ($) | | | ($) | | | ($) | | | ($) | | | ($) | | | ($) | | | ($) | | | ($) | | | ($) | | | (%) | | | (%) | | | (%) | | | (%) | | | (%) | | | ($000’s) | | | (%) | |
VY® JPMorgan Small Cap Core Equity Portfolio | | | | | | | | | | | | | | | | | | | | | | | | | | | | | | | | | | | | | | | | | | | | | | | | | | | | | | | | | | | | | | | | | | | | | | | | | | | | | | | | | | | | | | | | | | | | | | | | | | | | | | | |
| Class ADV | | | | | | | | | | | | | | | | | | | | | | | | | | | | | | | | | | | | | | | | | | | | | | | | | | | | | | | | | | | | | | | | | | | | | | | | | | | | | | | | | | | | | | | | | | | | | | | | | | | | | | | |
| 12-31-20 | | | | | 14.90 | | | | | | (0.01) | | | | | | 2.37 | | | | | | 2.36 | | | | | | — | | | | | | — | | | | | | — | | | | | | — | | | | | | — | | | | | | 17.26 | | | | | | 15.84 | | | | | | 1.47 | | | | | | 1.47 | | | | | | 1.46 | | | | | | (0.03) | | | | | | 128,295 | | | | | | 71 | | |
| 12-31-19 | | | | | 15.79 | | | | | | 0.00* | | | | | | 3.92 | | | | | | 3.92 | | | | | | 0.03 | | | | | | 4.55 | | | | | | 0.23 | | | | | | 4.81 | | | | | | — | | | | | | 14.90 | | | | | | 25.96 | | | | | | 1.45 | | | | | | 1.45 | | | | | | 1.44 | | | | | | 0.05 | | | | | | 130,058 | | | | | | 50 | | |
| 12-31-18 | | | | | 20.12 | | | | | | (0.02) | | | | | | (1.67) | | | | | | (1.69) | | | | | | 0.02 | | | | | | 2.62 | | | | | | — | | | | | | 2.64 | | | | | | — | | | | | | 15.79 | | | | | | (10.82) | | | | | | 1.45 | | | | | | 1.45 | | | | | | 1.45 | | | | | | (0.07) | | | | | | 114,664 | | | | | | 43 | | |
| 12-31-17 | | | | | 18.54 | | | | | | 0.01 | | | | | | 2.71 | | | | | | 2.72 | | | | | | 0.04 | | | | | | 1.10 | | | | | | — | | | | | | 1.14 | | | | | | — | | | | | | 20.12 | | | | | | 15.17 | | | | | | 1.45 | | | | | | 1.45 | | | | | | 1.45 | | | | | | 0.03 | | | | | | 131,488 | | | | | | 36 | | |
| 12-31-16 | | | | | 16.82 | | | | | | 0.03 | | | | | | 3.33 | | | | | | 3.36 | | | | | | 0.04 | | | | | | 1.60 | | | | | | — | | | | | | 1.64 | | | | | | — | | | | | | 18.54 | | | | | | 21.17 | | | | | | 1.50 | | | | | | 1.45 | | | | | | 1.45 | | | | | | 0.17 | | | | | | 120,442 | | | | | | 40 | | |
| Class I | | | | | | | | | | | | | | | | | | | | | | | | | | | | | | | | | | | | | | | | | | | | | | | | | | | | | | | | | | | | | | | | | | | | | | | | | | | | | | | | | | | | | | | | | | | | | | | | | | | | | | | |
| 12-31-20 | | | | | 16.21 | | | | | | 0.10 | | | | | | 2.58 | | | | | | 2.68 | | | | | | — | | | | | | — | | | | | | — | | | | | | — | | | | | | — | | | | | | 18.89 | | | | | | 16.53 | | | | | | 0.87 | | | | | | 0.87 | | | | | | 0.86 | | | | | | 0.57 | | | | | | 211,266 | | | | | | 71 | | |
| 12-31-19 | | | | | 16.89 | | | | | | 0.12 | | | | | | 4.20 | | | | | | 4.32 | | | | | | 0.22 | | | | | | 4.55 | | | | | | 0.23 | | | | | | 5.00 | | | | | | — | | | | | | 16.21 | | | | | | 26.75 | | | | | | 0.85 | | | | | | 0.85 | | | | | | 0.84 | | | | | | 0.66 | | | | | | 240,957 | | | | | | 50 | | |
| 12-31-18 | | | | | 21.35 | | | | | | 0.11 | | | | | | (1.81) | | | | | | (1.70) | | | | | | 0.14 | | | | | | 2.62 | | | | | | — | | | | | | 2.76 | | | | | | — | | | | | | 16.89 | | | | | | (10.34) | | | | | | 0.85 | | | | | | 0.85 | | | | | | 0.85 | | | | | | 0.53 | | | | | | 165,568 | | | | | | 43 | | |
| 12-31-17 | | | | | 19.59 | | | | | | 0.13 | | | | | | 2.88 | | | | | | 3.01 | | | | | | 0.15 | | | | | | 1.10 | | | | | | — | | | | | | 1.25 | | | | | | — | | | | | | 21.35 | | | | | | 15.86 | | | | | | 0.85 | | | | | | 0.85 | | | | | | 0.85 | | | | | | 0.62 | | | | | | 188,213 | | | | | | 36 | | |
| 12-31-16 | | | | | 17.68 | | | | | | 0.14 | | | | | | 3.52 | | | | | | 3.66 | | | | | | 0.15 | | | | | | 1.60 | | | | | | — | | | | | | 1.75 | | | | | | — | | | | | | 19.59 | | | | | | 21.92 | | | | | | 0.85 | | | | | | 0.85 | | | | | | 0.85 | | | | | | 0.77 | | | | | | 178,586 | | | | | | 40 | | |
| Class R6 | | | | | | | | | | | | | | | | | | | | | | | | | | | | | | | | | | | | | | | | | | | | | | | | | | | | | | | | | | | | | | | | | | | | | | | | | | | | | | | | | | | | | | | | | | | | | | | | | | | | | | | |
| 12-31-20 | | | | | 16.20 | | | | | | 0.11• | | | | | | 2.56 | | | | | | 2.67 | | | | | | — | | | | | | — | | | | | | — | | | | | | — | | | | | | — | | | | | | 18.87 | | | | | | 16.48 | | | | | | 0.87 | | | | | | 0.87 | | | | | | 0.86 | | | | | | 0.70 | | | | | | 118,342 | | | | | | 71 | | |
| 12-31-19 | | | | | 16.88 | | | | | | 0.12 | | | | | | 4.20 | | | | | | 4.32 | | | | | | 0.22 | | | | | | 4.55 | | | | | | 0.23 | | | | | | 5.00 | | | | | | — | | | | | | 16.20 | | | | | | 26.78 | | | | | | 0.85 | | | | | | 0.85 | | | | | | 0.84 | | | | | | 0.66 | | | | | | 38,161 | | | | | | 50 | | |
| 12-31-18 | | | | | 21.34 | | | | | | 0.09 | | | | | | (1.79) | | | | | | (1.70) | | | | | | 0.14 | | | | | | 2.62 | | | | | | — | | | | | | 2.76 | | | | | | — | | | | | | 16.88 | | | | | | (10.34) | | | | | | 0.85 | | | | | | 0.85 | | | | | | 0.85 | | | | | | 0.55 | | | | | | 23,951 | | | | | | 43 | | |
| 12-31-17 | | | | | 19.58 | | | | | | 0.15• | | | | | | 2.86 | | | | | | 3.01 | | | | | | 0.15 | | | | | | 1.10 | | | | | | — | | | | | | 1.25 | | | | | | — | | | | | | 21.34 | | | | | | 15.87 | | | | | | 0.85 | | | | | | 0.85 | | | | | | 0.85 | | | | | | 0.73 | | | | | | 17,009 | | | | | | 36 | | |
05-03-16(5) -
12-31-16 | | | | | 17.80 | | | | | | 0.15• | | | | | | 3.38 | | | | | | 3.53 | | | | | | 0.15 | | | | | | 1.60 | | | | | | — | | | | | | 1.75 | | | | | | — | | | | | | 19.58 | | | | | | 21.04 | | | | | | 0.85 | | | | | | 0.85 | | | | | | 0.85 | | | | | | 1.22 | | | | | | 30 | | | | | | 40 | | |
| Class S | | | | | | | | | | | | | | | | �� | | | | | | | | | | | | | | | | | | | | | | | | | | | | | | | | | | | | | | | | | | | | | | | | | | | | | | | | | | | | | | | | | | | | | | | | | | | | | | | | | | | | | | | |
| 12-31-20 | | | | | 15.95 | | | | | | 0.05 | | | | | | 2.55 | | | | | | 2.60 | | | | | | — | | | | | | — | | | | | | — | | | | | | — | | | | | | — | | | | | | 18.55 | | | | | | 16.30 | | | | | | 1.12 | | | | | | 1.12 | | | | | | 1.11 | | | | | | 0.31 | | | | | | 122,575 | | | | | | 71 | | |
| 12-31-19 | | | | | 16.65 | | | | | | 0.07 | | | | | | 4.14 | | | | | | 4.21 | | | | | | 0.13 | | | | | | 4.55 | | | | | | 0.23 | | | | | | 4.91 | | | | | | — | | | | | | 15.95 | | | | | | 26.39 | | | | | | 1.10 | | | | | | 1.10 | | | | | | 1.09 | | | | | | 0.37 | | | | | | 129,784 | | | | | | 50 | | |
| 12-31-18 | | | | | 21.07 | | | | | | 0.06 | | | | | | (1.78) | | | | | | (1.72) | | | | | | 0.08 | | | | | | 2.62 | | | | | | — | | | | | | 2.70 | | | | | | — | | | | | | 16.65 | | | | | | (10.52) | | | | | | 1.10 | | | | | | 1.10 | | | | | | 1.10 | | | | | | 0.28 | | | | | | 327,752 | | | | | | 43 | | |
| 12-31-17 | | | | | 19.35 | | | | | | 0.07• | | | | | | 2.85 | | | | | | 2.92 | | | | | | 0.10 | | | | | | 1.10 | | | | | | — | | | | | | 1.20 | | | | | | — | | | | | | 21.07 | | | | | | 15.56 | | | | | | 1.10 | | | | | | 1.10 | | | | | | 1.10 | | | | | | 0.37 | | | | | | 385,636 | | | | | | 36 | | |
| 12-31-16 | | | | | 17.48 | | | | | | 0.10 | | | | | | 3.46 | | | | | | 3.56 | | | | | | 0.09 | | | | | | 1.60 | | | | | | — | | | | | | 1.69 | | | | | | — | | | | | | 19.35 | | | | | | 21.59 | | | | | | 1.10 | | | | | | 1.10 | | | | | | 1.10 | | | | | | 0.52 | | | | | | 436,518 | | | | | | 40 | | |
| Class S2 | | | | | | | | | | | | | | | | | | | | | | | | | | | | | | | | | | | | | | | | | | | | | | | | | | | | | | | | | | | | | | | | | | | | | | | | | | | | | | | | | | | | | | | | | | | | | | | | | | | | | | | |
| 12-31-20 | | | | | 15.74 | | | | | | 0.03 | | | | | | 2.50 | | | | | | 2.53 | | | | | | — | | | | | | — | | | | | | — | | | | | | — | | | | | | — | | | | | | 18.27 | | | | | | 16.07 | | | | | | 1.27 | | | | | | 1.27 | | | | | | 1.26 | | | | | | 0.16 | | | | | | 8,312 | | | | | | 71 | | |
| 12-31-19 | | | | | 16.46 | | | | | | 0.04• | | | | | | 4.09 | | | | | | 4.13 | | | | | | 0.07 | | | | | | 4.55 | | | | | | 0.23 | | | | | | 4.85 | | | | | | — | | | | | | 15.74 | | | | | | 26.20 | | | | | | 1.25 | | | | | | 1.25 | | | | | | 1.24 | | | | | | 0.22 | | | | | | 9,014 | | | | | | 50 | | |
| 12-31-18 | | | | | 20.85 | | | | | | 0.03 | | | | | | (1.76) | | | | | | (1.73) | | | | | | 0.04 | | | | | | 2.62 | | | | | | — | | | | | | 2.66 | | | | | | — | | | | | | 16.46 | | | | | | (10.64) | | | | | | 1.25 | | | | | | 1.25 | | | | | | 1.25 | | | | | | 0.13 | | | | | | 27,453 | | | | | | 43 | | |
| 12-31-17 | | | | | 19.15 | | | | | | 0.04• | | | | | | 2.82 | | | | | | 2.86 | | | | | | 0.06 | | | | | | 1.10 | | | | | | — | | | | | | 1.16 | | | | | | — | | | | | | 20.85 | | | | | | 15.42 | | | | | | 1.25 | | | | | | 1.25 | | | | | | 1.25 | | | | | | 0.22 | | | | | | 35,440 | | | | | | 36 | | |
| 12-31-16 | | | | | 17.31 | | | | | | 0.06• | | | | | | 3.44 | | | | | | 3.50 | | | | | | 0.06 | | | | | | 1.60 | | | | | | — | | | | | | 1.66 | | | | | | — | | | | | | 19.15 | | | | | | 21.39 | | | | | | 1.28 | | | | | | 1.25 | | | | | | 1.25 | | | | | | 0.37 | | | | | | 39,721 | | | | | | 40 | | |
(1)
Total return is calculated assuming reinvestment of all dividends, capital gain distributions and return of capital distributions, if any, at net asset value and does not reflect the effect of insurance contract charges. Total return for periods less than one year is not annualized.
(2)
Annualized for periods less than one year.
(3)
Ratios reflect operating expenses of a Portfolio. Expenses before reductions/additions do not reflect amounts reimbursed or recouped by the Investment Adviser and/or Distributor or reductions from brokerage service arrangements or other expense offset arrangements and do not represent the amount paid by a Portfolio during periods when reimbursements or reductions occur. Expenses net of fee waivers reflect expenses after reimbursement by the Investment Adviser and/or Distributor or recoupment of previously reimbursed fees by the Investment Adviser, but prior to reductions from brokerage service arrangements or other expense offset arrangements. Expenses net of all reductions/additions represent the net expenses paid by a Portfolio. Net investment income (loss) is net of all such additions or reductions.
(4)
Ratios do not include fees and expenses charged under the variable annuity contract or variable life insurance policy.
(5)
Commencement of operations.
See Accompanying Notes to Financial Statements
Financial Highlights (continued)
(a)
Excluding amounts related to a securities lending settlement recorded in the year ended December 31, 2018, total return for Voya Large Cap Value Portfolio would have been (8.34)%, (7.82)%, (7.75)%, (8.01)% and (8.13)% for Classes ADV, I, R6, S and S2, respectively.
(b)
Excluding amounts related to a securities lending settlement recorded in the year ended December 31, 2018, the net investment income ratios for Voya Large Cap Value Portfolio would have been 1.40%, 2.00%, 2.02%, 1.75% and 1.59% for Classes ADV, I, R6, S and S2, respectively.
•
Calculated using average number of shares outstanding throughout the year or period.
*
Amount is less than $0.005 or 0.005% or more than $(0.005) or (0.005)%.
See Accompanying Notes to Financial Statements
NOTES TO FINANCIAL STATEMENTS as of December 31, 2020
NOTE 1 — ORGANIZATION
Voya Investors Trust (the “Trust”) is registered under the Investment Company Act of 1940, as amended (the “1940 Act” or the “Act”), as an open-end management investment company. The Trust was organized as a Massachusetts business trust on August 3, 1988. The Trust consists of twenty-two active separate investment series. The eight series (each a “Portfolio” and collectively the “Portfolios”) included in this report are: Voya Balanced Income Portfolio (“Balanced Income”), Voya High Yield Portfolio (“High Yield”), Voya Large Cap Growth Portfolio (“Large Cap Growth”), Voya Large Cap Value Portfolio (“Large Cap Value”), Voya Limited Maturity Bond Portfolio (“Limited Maturity Bond”), Voya U.S. Stock Index Portfolio (“U.S. Stock Index”), VY® Clarion Real Estate Portfolio (“Clarion Real Estate”), and VY® JPMorgan Small Cap Core Equity Portfolio (“JPMorgan Small Cap Core Equity”), each a diversified series of the Trust. However, in seeking to track the performance of the index, U.S. Stock Index may become non-diversified as a result of a change in relative market capitalizations or index weightings of one or more components of the index. As a result, whether at any time U.S. Stock Index will be considered diversified or non-diversified will depend largely on the make-up of the index at the time. The investment objective of the Portfolios is described in the respective Portfolio’s Prospectus.
The classes of shares included in this report are: Adviser (“Class ADV”), Institutional (“Class I”), Class P2, Class R6, Service (“Class S”) and Service 2 (“Class S2”); however, each Portfolio may not offer all share classes. With the exception of class specific matters, each class has equal voting rights as to voting privileges. For class specific proposals, only the applicable class would have voting privileges. The classes differ principally in the applicable distribution and shareholder service fees. Generally, shareholders of each class also bear certain expenses that pertain to that particular class. All shareholders are allocated the common expenses of a portfolio and earn income and realized gains/losses from a portfolio pro rata based on the daily ending net assets of each class, without distinction between share classes. Expenses that are specific to a portfolio or a class are charged directly to that portfolio or class. Other operating expenses shared by several portfolios are generally allocated among those portfolios based on average net assets. Distributions are determined separately for each class based on income and expenses allocated to each class. Realized gain distributions are allocated to each class pro rata based on the shares outstanding of each class on the date of distribution. Differences in per share dividend rates generally result from differences in separate class expenses, including distribution and shareholder service fees, if any, as well as differences in the amount of waiver
of fees and reimbursement of expenses between the separate classes, if any.
Voya Investments, LLC (“Voya Investments” or the “Investment Adviser), an Arizona limited liability company, serves as the Investment Adviser to the Portfolios. Voya Investment Management Co. LLC (“Voya IM”), a Delaware limited liability company, serves as the sub-adviser to Balanced Income, High Yield, Large Cap Growth, Large Cap Value, Limited Maturity Bond, and U.S. Stock Index. Voya Investments Distributor, LLC (“VID” or the “Distributor”), a Delaware limited liability company, serves as the principal underwriter to the Portfolios.
NOTE 2 — SIGNIFICANT ACCOUNTING POLICIES
The following significant accounting policies are consistently followed by the Portfolios in the preparation of their financial statements. Each Portfolio is considered an investment company under U.S. generally accepted accounting principles (“GAAP”) and follows the accounting and reporting guidance applicable to investment companies.
A. Security Valuation. Each Portfolio is open for business every day the New York Stock Exchange (“NYSE”) opens for regular trading (each such day, a “Business Day”). The net asset value (“NAV”) per share for each class of each Portfolio is determined each Business Day as of the close of the regular trading session (“Market Close”), as determined by the Consolidated Tape Association (“CTA”), the central distributor of transaction prices for exchange-traded securities (normally 4:00 p.m. Eastern time unless otherwise designated by the CTA). The data reflected on the consolidated tape provided by the CTA is generated by various market centers, including all securities exchanges, electronic communications networks, and third-market broker-dealers. The NAV per share of each class of each Portfolio is calculated by taking the value of the Portfolio’s assets attributable to that class, subtracting the Portfolio’s liabilities attributable to that class, and dividing by the number of shares of that class that are outstanding. On days when a Portfolio is closed for business, Portfolio shares will not be priced and a Portfolio does not transact purchase and redemption orders. To the extent a Portfolio’s assets are traded in other markets on days when a Portfolio does not price its shares, the value of a Portfolio’s assets will likely change and you will not be able to purchase or redeem shares of a Portfolio.
Assets for which market quotations are readily available are valued at market value. A security listed or traded on an exchange is valued at its last sales price or official closing price as of the close of the regular trading session on the exchange where the security is principally traded or, if such price is not available, at the last sale price as of the
NOTES TO FINANCIAL STATEMENTS as of December 31, 2020 (continued)
NOTE 2 — SIGNIFICANT ACCOUNTING POLICIES (continued)
Market Close for such security provided by the CTA. Bank loans are valued at the average of the averages of the bid and ask prices provided to an independent loan pricing service by brokers. Futures contracts are valued at the final settlement price set by an exchange on which they are principally traded. Listed options are valued at the mean between the last bid and ask prices from the exchange on which they are principally traded. Investments in open-end registered investment companies that do not trade on an exchange are valued at the end of day NAV per share. Investments in registered investment companies that trade on an exchange are valued at the last sales price or official closing price as of the close of the regular trading session on the exchange where the security is principally traded.
When a market quotation is not readily available or is deemed unreliable, each Portfolio will determine a fair value for the relevant asset in accordance with procedures adopted by the Portfolios’ Board of Trustees (“Board”). Such procedures provide, for example, that: (a) Exchange-traded securities are valued at the mean of the closing bid and ask; (b) Debt obligations are valued using an evaluated price provided by an independent pricing service. Evaluated prices provided by the pricing service may be determined without exclusive reliance on quoted prices, and may reflect factors such as institution-size trading in similar groups of securities, developments related to specific securities, benchmark yield, quality, type of issue, coupon rate, maturity, individual trading characteristics and other market data; (c) Securities traded in the over-the-counter (“OTC”) market are valued based on prices provided by independent pricing services or market makers; (d) Options not listed on an exchange are valued by an independent source using an industry accepted model, such as Black-Scholes; (e) Centrally cleared swap agreements are valued using a price provided by the central counterparty clearinghouse; (f) OTC swap agreements are valued using a price provided by an independent pricing service; (g) Forward foreign currency exchange contracts are valued utilizing current and forward rates obtained from an independent pricing service. Such prices from the third party pricing service are for specific settlement periods and each Portfolio’s forward foreign currency exchange contracts are valued at an interpolated rate between the closest preceding and subsequent period reported by the independent pricing service; and (h) Securities for which market prices are not provided by any of the above methods may be valued based upon quotes furnished by brokers.
The prospectuses of the open-end registered investment companies in which each Portfolio may invest explain the
circumstances under which they will use fair value pricing and the effects of using fair value pricing.
Foreign securities’ (including forward foreign currency exchange contracts) prices are converted into U.S. dollar amounts using the applicable exchange rates as of Market Close. If market quotations are available and believed to be reliable for foreign exchange-traded equity securities, the securities will be valued at the market quotations. Because trading hours for certain foreign securities end before Market Close, closing market quotations may become unreliable. An independent pricing service determines the degree of certainty, based on historical data, that the closing price in the principal market where a foreign security trades is not the current value as of Market Close. Foreign securities’ prices meeting the approved degree of certainty that the price is not reflective of current value will be valued by the independent pricing service using pricing models designed to estimate likely changes in the values of those securities between the times in which the trading in those securities is substantially completed and Market Close. Multiple factors may be considered by the independent pricing service in determining the value of such securities and may include information relating to sector indices, American Depositary Receipts and domestic and foreign index futures.
All other assets for which market quotations are not readily available or became unreliable (or if the above fair valuation methods are unavailable or determined to be unreliable) are valued at fair value as determined in good faith by or under the supervision of the Board following procedures approved by the Board. The Board has delegated to the Investment Adviser responsibility for overseeing the implementation of the Portfolios’ valuation procedures; a “Pricing Committee” comprised of employees of the Investment Adviser or its affiliates has responsibility for applying the fair valuation methods set forth in the procedures and, if a fair valuation cannot be determined pursuant to the fair valuation methods, determining the fair value of assets held by the Portfolios. Issuer specific events, transaction price, position size, nature and duration of restrictions on disposition of the security, market trends, bid/ask quotes of brokers and other market data may be reviewed in the course of making a good faith determination of a security’s fair value. Valuations change in response to many factors including the historical and prospective earnings of the issuer, the value of the issuer’s assets, general economic conditions, interest rates, investor perceptions and market liquidity. Because of the inherent uncertainties of fair valuation, the values used to determine each Portfolio’s NAV may materially differ from the value received upon actual sale of
NOTES TO FINANCIAL STATEMENTS as of December 31, 2020 (continued)
NOTE 2 — SIGNIFICANT ACCOUNTING POLICIES (continued)
those investments. Thus, fair valuation may have an unintended dilutive or accretive effect on the value of shareholders’ investments in each Portfolio.
Each investment asset or liability of the Portfolios is assigned a level at measurement date based on the significance and source of the inputs to its valuation. Quoted prices in active markets for identical securities are classified as “Level 1,” inputs other than quoted prices for an asset or liability that are observable are classified as “Level 2” and significant unobservable inputs, including the sub-advisers’ or Pricing Committee’s judgmentabout the assumptions that a market participant would use in pricing an asset or liability are classified as “Level 3.” The inputs used for valuing securities are not necessarily an indication of the risks associated with investing in those securities. Short-term securities of sufficient credit quality are generally considered to be Level 2 securities under applicable accounting rules. A table summarizing the Portfolios’ investments under these levels of classification is included within the Portfolio of Investments.
GAAP requires a reconciliation of the beginning to ending balances for reported fair values that presents changes attributable to total realized and unrealized gains or losses, purchases and sales, and transfers in or out of the Level 3 category during the period. A reconciliation of Level 3 investments within the Portfolio of Investments is presented only when a Portfolio has a significant amount of Level 3 investments.
B. Securities Transactions and Revenue Recognition. Securities transactions are accounted for on the trade date. Realized gains and losses are reported on the basis of identified cost of securities sold. Interest income is recorded on an accrual basis. Dividend income is recorded on the ex-dividend date, or for certain foreign securities, when the information becomes available to the Portfolios. Premium amortization and discount accretion are determined by the effective yield method. Clarion Real Estate estimates components of distributions from real estate investment trusts (“REITs”). Distributions received in excess of income are recorded as a reduction of cost of the related investments. If Clarion Real Estate no longer owns the applicable securities, any distributions received in excess of income are recorded as realized gains.
C. Foreign Currency Translation. The books and records of the Portfolios are maintained in U.S. dollars. Any foreign currency amounts are translated into U.S. dollars on the following basis:
(1)
Market value of investment securities, other assets and liabilities — at the exchange rates prevailing at Market Close.
(2)
Purchases and sales of investment securities, income and expenses — at the rates of exchange prevailing on the respective dates of such transactions.
Although the net assets and the market values are presented at the foreign exchange rates at Market Close, the Portfolios do not isolate the portion of the results of operations resulting from changes in foreign exchange rates on investments from the fluctuations arising from changes in market prices of securities held. Such fluctuations are included with the net realized and unrealized gains or losses from investments. For securities, which are subject to foreign withholding tax upon disposition, liabilities are recorded on the Statements of Assets and Liabilities for the estimated tax withholding based on the securities’ current market value. Upon disposition, realized gains or losses on such securities are recorded net of foreign withholding tax.
Reported net realized foreign exchange gains or losses arise from sales of foreign currencies, currency gains or losses realized between the trade and settlement dates on securities transactions, the difference between the amounts of dividends, interest, and foreign withholding tax reclaims recorded on each Portfolio’s books, and the U.S. dollar equivalent of the amounts actually received or paid. Net unrealized foreign exchange gains and losses arise from changes in the value of assets and liabilities other than investments in securities, resulting from changes in the exchange rate. Foreign security and currency transactions may involve certain considerations and risks not typically associated with investing in U.S. companies and U.S. government securities. These risks include, but are not limited to, revaluation of currencies and future adverse political and economic developments which could cause securities and their markets to be less liquid and prices more volatile than those of comparable U.S. companies and U.S. government securities. The foregoing risks are even greater with respect to securities of issuers in emerging markets.
D. Distributions to Shareholders. The Portfolios record distributions to their shareholders on the ex-dividend date. Dividends from net investment income, if any, are declared daily and paid monthly and net capital gains distributions, if any, are declared and paid annually by High Yield and Limited Maturity Bond. Dividends from net investment income, if any, are declared and paid semi-annually and net capital gains distributions, if any, are declared and paid annually by Large Cap Value and U.S. Stock Index. For all other Portfolios, dividends from net investment income and net capital gain distributions, if any, are declared and paid annually. The Portfolios may make distributions on a more frequent basis to comply with the distribution requirements of the Internal Revenue Code. The characteristics of
NOTES TO FINANCIAL STATEMENTS as of December 31, 2020 (continued)
NOTE 2 — SIGNIFICANT ACCOUNTING POLICIES (continued)
income and gains to be distributed are determined in accordance with income tax regulations, which may differ from GAAP for investment companies.
E. Federal Income Taxes. It is the policy of each Portfolio to comply with the requirements of subchapter M of the Internal Revenue Code that are applicable to regulated investment companies and to distribute substantially all of its net investment income and any net realized capital gains to its shareholders. Therefore, a federal income tax or excise tax provision is not required. Management has considered the sustainability of the Portfolios’ tax positions taken on federal income tax returns for all open tax years in making this determination. No capital gain distributions shall be made until the capital loss carryforwards have been fully utilized.
The Portfolios may utilize equalization accounting for tax purposes, whereby a portion of redemption payments are treated as distributions of income or gain.
F. Use of Estimates. The preparation of financial statements in conformity with GAAP requires management to make estimates and assumptions that affect the reported amounts of assets and liabilities and disclosure of contingent assets and liabilities at the date of the financial statements and the reported amounts of increases and decreases in net assets from operations during the reporting period. Actual results could differ from those estimates.
G. Risk Exposures and the Use of Derivative Instruments. The Portfolios’ investment strategies permit the Portfolios to enter into various types of derivatives contracts, including, but not limited to, futures contracts, forward foreign currency exchange contracts, credit default swaps, interest rate swaps, total return swaps, and purchased and written options. In doing so, a Portfolio will employ strategies in differing combinations to permit it to increase or decrease the level of risk, or change the level or types of exposure to risk factors. This may allow a Portfolio to pursue its objectives more quickly, and efficiently than if it were to make direct purchases or sales of securities capable of affecting a similar response to market or credit factors.
In pursuit of its investment objectives, a Portfolio may seek to increase or decrease its exposure to the following market or credit risk factors:
Credit Risk. The price of a bond or other debt instrument is likely to fall if the issuer’s actual or perceived financial health deteriorates, whether because of broad economic
or issuer-specific reasons. In certain cases, the issuer could be late in paying interest or principal, or could fail to pay its financial obligations altogether.
Equity Risk. Stock prices may be volatile or have reduced liquidity in response to real or perceived impacts of factors including, but not limited to, economic conditions, changes in market interest rates, and political events. Stock markets tend to be cyclical, with periods when stock prices generally rise and periods when stock prices generally decline. Any given stock market segment may remain out of favor with investors for a short or long period of time, and stocks as an asset class may underperform bonds or other asset classes during some periods. Additionally, legislative, regulatory or tax policies or developments in these areas may adversely impact the investment techniques available to a manager, add to costs and impair the ability of a Portfolio to achieve its investment objectives.
Foreign Exchange Rate Risk. To the extent that a Portfolio invests directly in foreign (non-U.S.) currencies or in securities denominated in, or that trade in, foreign (non-U.S.) currencies, it is subject to the risk that those foreign (non-U.S.) currencies will decline in value relative to the U.S. dollar or, in the case of hedging positions, that the U.S. dollar will decline in value relative to the currency being hedged by a Portfolio through foreign currency exchange transactions.
Currency rates may fluctuate significantly over short periods of time. Currency rates may be affected by changes in market interest rates, intervention (or the failure to intervene) by U.S. or foreign governments, central banks or supranational entities such as the International Monetary Fund, by the imposition of currency controls, or other political or economic developments in the United States or abroad.
Interest Rate Risk. With bonds and other fixed rate debt instruments, a rise in market interest rates generally causes values to fall; conversely, values generally rise as market interest rates fall. The higher the credit quality of the instrument, and the longer its maturity or duration, the more sensitive it is likely to be to interest rate risk. In the case of inverse securities, the interest rate paid by the securities is a floating rate, which generally will decrease when the market rate of interest to which the inverse security is indexed increases and will increase when the market rate of interest to which the inverse security is indexed decreases. As of the date of this report, the United States experiences a low interest rate environment, which may increase a Portfolio’s exposure to risks associated with rising market interest rates. Rising market interest rates could have unpredictable effects on the markets and may expose fixed-income and related markets
NOTES TO FINANCIAL STATEMENTS as of December 31, 2020 (continued)
NOTE 2 — SIGNIFICANT ACCOUNTING POLICIES (continued)
to heightened volatility. For a fund that invests in fixed-income securities, an increase in market interest rates may lead to increased redemptions and increased portfolio turnover, which could reduce liquidity for certain investments, adversely affect values, and increase costs. If dealer capacity in fixed-income markets is insufficient for market conditions, it may further inhibit liquidity and increase volatility in the fixed-income markets. Further, recent and potential changes in government policy may affect interest rates.
Risks of Investing in Derivatives. A Portfolio’s use of derivatives can result in losses due to unanticipated changes in the market or credit risk factors and the overall market. In instances where a Portfolio is using derivatives to decrease, or hedge, exposures to market or credit risk factors for securities held by a Portfolio, there are also risks that those derivatives may not perform as expected resulting in losses for the combined or hedged positions.
Derivative instruments are subject to a number of risks, including the risk of changes in the market price of the underlying securities, credit risk with respect to the counterparty, risk of loss due to changes in market interest rates and liquidity and volatility risk. The amounts required to purchase certain derivatives may be small relative to the magnitude of exposure assumed by a Portfolio. Therefore, the purchase of certain derivatives may have an economic leveraging effect on a Portfolio and exaggerate any increase or decrease in the NAV. Derivatives may not perform as expected, so a Portfolio may not realize the intended benefits. When used for hedging purposes, the change in value of a derivative may not correlate as expected with the currency, security or other risk being hedged. When used as an alternative or substitute for direct cash investments, the return provided by the derivative may not provide the same return as direct cash investment. In addition, given their complexity, derivatives expose a Portfolio to the risk of improper valuation.
Generally, derivatives are sophisticated financial instruments whose performance is derived, at least in part, from the performance of an underlying asset or assets. Derivatives include, among other things, swap agreements, options, forwards and futures. Investments in derivatives are generally negotiated OTC with a single counterparty and as a result are subject to credit risks related to the counterparty’s ability or willingness to perform its obligations; any deterioration in the counterparty’s creditworthiness could adversely affect the value of the derivative. In addition, derivatives and their underlying securities may experience periods of illiquidity which could cause a Portfolio to hold a security it might
otherwise sell, or to sell a security it otherwise might hold at inopportune times or at an unanticipated price. A manager might imperfectly judge the direction of the market. For instance, if a derivative is used as a hedge to offset investment risk in another security, the hedge might not correlate to the market’s movements and may have unexpected or undesired results such as a loss or a reduction in gains.
Counterparty Credit Risk and Credit Related Contingent Features. Certain derivative positions are subject to counterparty credit risk, which is the risk that the counterparty will not fulfill its obligation to a Portfolio. Each Portfolio’s derivative counterparties are financial institutions who are subject to market conditions that may weaken their financial position. A Portfolio intends to enter into financial transactions with counterparties that it believes to be creditworthy at the time of the transaction. To reduce this risk, a Portfolio has entered into master netting arrangements, established within each Portfolio’s International Swap and Derivatives Association, Inc. (“ISDA”) Master Agreements (“Master Agreements”). These Master Agreements are with select counterparties and they govern transactions, including certain OTC derivative and forward foreign currency contracts, entered into by a Portfolio and the counterparty. The Master Agreements maintain provisions for general obligations, representations, agreements, collateral, and events of default or termination. The occurrence of a specified event of termination may give a counterparty the right to terminate all of its contracts and affect settlement of all outstanding transactions under the applicable Master Agreement.
A Portfolio may also enter into collateral agreements with certain counterparties to further mitigate counterparty credit risk on OTC derivative and forward foreign currency contracts. Subject to established minimum levels, collateral is generally determined based on the net aggregate unrealized gain or loss on contracts with a certain counterparty. Collateral pledged to or from a Portfolio is held in a segregated account by a third-party agent and can be in the form of cash or debt securities issued by the U.S. government or related agencies.
As of December 31, 2020, the maximum amount of loss that Balanced Income would incur if its counterparties failed to perform would be $603,918 which represents the gross payments to be received on open forward foreign currency contracts and OTC purchased options were they to be unwound as of December 31, 2020. At December 31, 2020, the Portfolio did not receive cash collateral for open OTC derivatives.
Certain Portfolios have entered into derivative contracts that contain credit related contingent features that if
NOTES TO FINANCIAL STATEMENTS as of December 31, 2020 (continued)
NOTE 2 — SIGNIFICANT ACCOUNTING POLICIES (continued)
triggered would allow its derivative counterparties to close out and demand payment or additional collateral to cover their exposure from a Portfolio. Credit related contingent features are established between each Portfolio and its derivatives counterparties to reduce the risk that a Portfolio will not fulfill its payment obligations to its counterparties. These triggering features include, but are not limited to, a percentage decrease in a Portfolio’s net assets and/or a percentage decrease in a Portfolio’s NAV, which could cause a Portfolio to accelerate payment of any net liability owed to the counterparty. The contingent features are established within each Portfolio’s Master Agreements.
As of December 31, 2020, Balanced Income had a liability position of $626,169 on open forward foreign currency contracts and OTC written options. If a contingent feature would have been triggered as of December 31, 2020, the Portfolio could have been required to pay these amounts in cash to its counterparties. There was no collateral pledged by the Portfolio as of December 31, 2020.
H. Forward Foreign Currency Contracts. Certain Portfolios may enter into forward foreign currency contracts primarily to hedge against foreign currency exchange rate risks on their non-U.S. dollar denominated investment securities. When entering into a forward currency contract, a Portfolio agrees to receive or deliver a fixed quantity of foreign currency for an agreed-upon price on an agreed future date. These contracts are valued daily and a Portfolio’s net equity therein, representing unrealized gain or loss on the contracts as measured by the difference between the forward foreign exchange rates at the dates of entry into the contracts and the forward rates at the reporting date, is included in the Statements of Assets and Liabilities. Realized and unrealized gains and losses are included in the Statements of Operations. These instruments involve market and/or credit risk in excess of the amount recognized in the Statements of Assets and Liabilities. Risks arise from the possible inability of counterparties to meet the terms of their contracts and from movement in currency and securities values and interest rates. Open forward foreign currency contracts are presented following the respective Portfolio of Investments.
During the year ended December 31, 2020, Balanced Income had average contract amounts on forward foreign currency contracts purchased and sold of $54,358,958 and $49,892,846, respectively. The Portfolio used forward foreign currency contracts primarily to protect any non-U.S. dollar-denominated holdings from adverse currency movements. Please refer to the tables within the Portfolio of Investments for open forward foreign currency contracts at December 31, 2020.
I. Futures Contracts. Each Portfolio may enter into futures contracts involving foreign currency, interest rates, securities and security indices. A futures contract is a commitment to buy or sell a specific amount of a financial instrument at a negotiated price on a stipulated future date. Each Portfolio may buy and sell futures contracts. Futures contracts traded on a commodities or futures exchange will be valued at the final settlement price or official closing price on the principal exchange as reported by such principal exchange at its trading session ending at, or most recently prior to, the time when the Portfolio’s assets are valued.
Upon entering into a futures contract, each Portfolio is required to deposit either cash or securities (initial margin) in an amount equal to a certain percentage of the contract value. Subsequent payments (variation margin) are made or received by the Portfolio each day. The variation margin payments are equal to the daily changes in the contract value and are recorded as unrealized gains and losses and included within Cash collateral for futures contracts on the Statement of Assets and Liabilities. Open futures contracts are reported on a table following each Portfolio’s Portfolio of Investments. Securities held in collateralized accounts to cover initial margin requirements on open futures contracts are footnoted in the Portfolio of Investments. Cash collateral held by the broker to cover initial margin requirements on open futures contracts are noted in each Portfolio’s Statement of Assets and Liabilities. The net change in unrealized appreciation and depreciation is reported in each Portfolio’s Statement of Operations. Realized gains (losses) are reported in each Portfolio’s Statement of Operations at the closing or expiration of futures contracts.
Futures contracts are exposed to the market risk factor of the underlying financial instrument. During the year ended December 31, 2020, Balanced Income, U.S. Stock Index and JPMorgan Small Cap Core Equity have purchased futures contracts on various equity indexes to “equitize” cash. Futures contracts are purchased to provide immediate market exposure proportionate to the size of the Portfolio’s respective cash flows and residual cash balances in order to decrease potential tracking error if the cash remained uninvested in the market. In addition, Balanced Income and Limited Maturity Bond had purchased and sold futures contracts on treasury futures to manage the duration and yield curve of the Portfolios. Additional associated risks of entering into futures contracts include the possibility that there may be an illiquid market where each Portfolio is unable to liquidate the contract or enter into an offsetting position and, if used for hedging purposes, the risk that the price of the contract will correlate imperfectly with the prices of each Portfolio’s securities. With futures, there is minimal counterparty
NOTES TO FINANCIAL STATEMENTS as of December 31, 2020 (continued)
NOTE 2 — SIGNIFICANT ACCOUNTING POLICIES (continued)
credit risk to the Portfolios since futures are exchange traded and the exchange’s clearinghouse, as counterparty to all exchange traded futures, guarantees the futures against counterparty default.
During the year ended December 31, 2020, the following Portfolios had average notional values on futures contracts purchased and sold as disclosed below. Please refer to the tables within each respective Portfolio of Investments for open futures contracts at December 31, 2020.
| | | | Purchased | | | Sold | |
| Balanced Income | | | | $ | 125,110,132 | | | | | $ | 18,782,250 | | |
| Limited Maturity Bond | | | | | 101,095,349 | | | | | | 29,083,230 | | |
| U.S. Stock Index | | | | | 166,988,058 | | | | | | — | | |
| JPMorgan Small Cap Core Equity | | | | | 5,168,842 | | | | | | — | | |
J. Repurchase Agreements. Each Portfolio may invest in repurchase agreements only with government securities dealers recognized by the Board of Governors of the Federal Reserve System. Under such agreements, the seller of the security agrees to repurchase it at a mutually agreed upon time and price. The resale price is in excess of the purchase price and reflects an agreed upon interest rate for the period of time the agreement is outstanding. The period of the repurchase agreements is usually short, from overnight to one week, while the underlying securities generally have longer maturities. Each Portfolio will receive as collateral securities acceptable to it whose market value is equal to at least 100% of the carrying amount of the repurchase agreement, plus accrued interest, being invested by a Portfolio. The underlying collateral is valued daily on a mark-to-market basis to assure that the value, including accrued interest, is at least equal to the repurchase price. If the seller defaults, a Portfolio might incur a loss or delay in the realization of proceeds if the value of the security collateralizing the repurchase agreement declines, and may incur disposition costs in liquidating the collateral.
Repurchase agreements are entered into by the Portfolios under Master Repurchase Agreements (“MRA”) which permit the Portfolios, under certain circumstances, including an event of default (such as bankruptcy or insolvency), to offset receivables or payables under the MRA with collateral held and/or pledged by the counterparty and create one single net payment due to or from the respective Portfolio. There were no open repurchase agreements for any Portfolio at December 31, 2020.
K. Securities Lending. Each Portfolio may loan up to 33 1∕3% of its total assets to brokers, dealers or other financial institutions in exchange for a negotiated lender’s
fee. Securities lending involves two primary risks: “investment risk” and “borrower default risk.” When lending securities, the Portfolios will receive cash or U.S. government securities as collateral. Investment risk is the risk that the Portfolios will lose money from the investment of the cash collateral received from the borrower. Borrower default risk is the risk that the Portfolios will lose money due to the failure of a borrower to return a borrowed security. Loans are subject to termination at the option of the borrower or the Portfolios. Securities lending may result in leverage. The use of leverage may exaggerate any increase or decrease in the NAV, causing the Portfolios to be more volatile. The use of leverage may increase expenses and increase the impact of the Portfolios’ other risks.
L. Restricted Securities. The Portfolios may invest in restricted securities, which include those sold under Rule 144A of the Securities Act of 1933, as amended (“1933 Act”) or securities offered pursuant to Section 4(a)(2) of the 1933 Act, and/or are subject to legal or contractual restrictions on resale and may not be publicly sold without registration under the 1933 Act. Restricted securities are fair valued using market quotations when readily available. In the absence of market quotations, the securities are valued based upon their fair value determined in good faith under procedures approved by the Board.
Securities that are not registered for sale to the public under the 1933 Act are referred to as “restricted securities.” These securities may be sold in private placement transactions between issuers and their purchasers and may be neither listed on an exchange nor traded in other established markets. Many times these securities are subject to legal or contractual restrictions on resale. As a result of the absence of a public trading market, the prices of these securities may be more volatile, less liquid and more difficult to value than publicly traded securities. The price realized from the sale of these securities could be less than the amount originally paid or less than their fair value if they are resold in privately negotiated transactions. In addition, these securities may not be subject to disclosure and other investment protection requirements that are afforded to publicly traded securities. Certain investments may include investment in smaller, less seasoned issuers, which may involve greater risk.
M. Delayed-Delivery Transactions. Each Portfolio may purchase or sell securities on a when-issued or forward commitment basis. The price of the underlying securities and date when the securities will be delivered and paid for are fixed at the time the transaction is negotiated. The fair value of such securities is identified in each Portfolio’s Portfolio of Investments. Losses may arise due to changes
NOTES TO FINANCIAL STATEMENTS as of December 31, 2020 (continued)
NOTE 2 — SIGNIFICANT ACCOUNTING POLICIES (continued)
in the fair value of the securities or from the inability of counterparties to meet the terms of the contract. In connection with such purchases, the Portfolios are required to identify liquid assets sufficient to cover the purchase price.
N. Options Contracts. Certain Portfolios may purchase put and call options and may write (sell) put options and covered call options on futures, swaps (“swaptions”), securities, commodities or foreign currencies it owns or in which it may invest. The Portfolios may engage in option transactions as a hedge against adverse movements in the value of portfolio holdings or to increase market exposure. Option contracts are valued daily and unrealized gains or losses are recorded based upon the last sales price on the principal exchange on which the options are traded. An amount equal to the proceeds of the premium received by the Portfolios upon the writing of a put or call option is included in the Statements of Assets and Liabilities as an asset and equivalent liability which is subsequently marked-to-market until it is exercised or closed, or it expires. The Portfolios will realize a gain or loss upon the expiration or closing of the option contract. When an option is exercised, the proceeds on sales of the underlying security for a written call option, the purchase cost of the security for a written put option, or the cost of the security for a purchased put or call option is adjusted by the amount of premium received or paid. Realized and unrealized gains or losses on option contracts are reflected in the accompanying financial statements. The risk in writing a covered call option is that the Portfolios give up the opportunity for profit if the market price of the security increases and the option is exercised. The risk in writing a put option is that the Portfolios may incur a loss if the market price of the security decreases and the option is exercised. The risk in buying an option is that the Portfolios pay a premium whether or not the option is exercised. Risks may also arise from an illiquid secondary market or from the inability of counterparties to meet the terms of the contract.
During the year ended December 31, 2020, Balanced Income had purchased options on exchange-traded funds with a notional value of $5,430,821 to increase exposure to certain market sectors. There were no open purchased options on exchange-traded funds at December 31, 2020.
During the year ended December 31, 2020, Balanced Income had purchased and written foreign currency options with a notional value of $15,603,592 and $5,881,365, respectively, to gain exposure to foreign currencies and to generate income. Please refer to the tables within the Portfolio of Investments for open
purchased and written foreign currency options at December 31, 2020.
During the year ended December 31, 2020, Balanced Income had purchased and written credit default swaptions with an average notional value of $5,546,000 and $7,265,000, respectively, to gain exposure to certain credit markets and to generate income. Please refer to the tables within the Portfolio of Investments for open purchased credit default swaptions at December 31, 2020. There were no open written credit default swaptions at December 31, 2020.
During the year ended December 31, 2020, Balanced Income had written interest rate swaptions to generate income. Balanced Income had an average notional value of $4,878,000. There were no open written interest rate swaptions at December 31, 2020.
O. Swap Agreements. Certain Portfolios may enter into swap agreements. A swap is an agreement between two parties pursuant to which each party agrees to make one or more payments to the other at specified future intervals based on the return of an asset (such as a stock, bond or currency) or non-asset reference (such as an interest rate or index). Swap agreements are privately negotiated in the OTC market and may be executed in a multilateral or other trade facility platform, such as a registered commodities exchange (“centrally cleared swaps”).
The swap agreement will specify the “notional” amount of the asset or non-asset reference to which the contract relates. Subsequent changes in fair value, if any, are calculated based upon changes in the performance of the asset or non-asset reference multiplied by the notional value of the contract. A Portfolio may enter into credit default, interest rate, total return and currency swaps to manage its exposure to credit, currency and interest rate risk. All outstanding swap agreements are reported following each Portfolio’s Summary Portfolio of Investments.
Swaps are marked to market daily using quotations primarily from third party pricing services, registered commodities exchange(s), counterparties or brokers. The fair value of an OTC swap contract is recorded on each Portfolio’s Statements of Assets and Liabilities. Daily changes in the value of centrally cleared swaps, if any, are recorded as variation margin receivable or payable on the Statement of Assets and Liabilities. During the term of the swap, changes in the value of the swap, if any, are recorded as unrealized gains or losses on the Statements of Operations. Upfront payments paid or received on OTC swaps by a Portfolio when entering into the agreements are reported on the Statements of Assets and Liabilities and as a component of the changes in unrealized gains or
NOTES TO FINANCIAL STATEMENTS as of December 31, 2020 (continued)
NOTE 2 — SIGNIFICANT ACCOUNTING POLICIES (continued)
losses on the Statements of Operations. These upfront payments represent the amounts paid or received when initially entering into the swap agreement to compensate for differences between the stated terms of the swap agreement and the prevailing market conditions. The upfront payments are included as a component in the realized gains or losses on each Portfolio’s Statement of Operations upon termination or maturity of the swap. A Portfolio also records net periodic payments paid or received on the swap contract as a realized gain or loss on the Statements of Operations.
In a centrally cleared swap, immediately following execution of the swap agreement, the swap agreement is novated to a central counterparty (the “CCP”) and the Portfolio’s counterparty on the swap agreement becomes the CCP. The Portfolios are required to interface with the CCP through a broker. Upon entering into a centrally cleared swap, the Portfolios are required to deposit initial margin with the broker in the form of cash or securities in an amount that varies depending on the size and risk profile of the particular swap. Securities deposited as initial margin are footnoted as pledged on the Portfolio of Investments and cash deposited is recorded on the Statements of Assets and Liabilities as cash pledged for centrally cleared swaps. The daily change in valuation of centrally cleared swaps is recorded as a receivable or payable for variation margin in the Statements of Assets and Liabilities. Payments received from (paid to) the counterparty, including at termination, are recorded as realized gain (loss) on the Statements of Operations.
Entering into swap agreements involves the risk that the maximum potential loss of an investment exceeds the current value of the investment as reported on each Portfolio’s Statements of Assets and Liabilities. Other risks involve the possibility that the counterparty to the agreements may default on its obligation to perform, that there will be no liquid market for these investments and that unfavorable changes in the market will have a negative impact on the value of the index or securities underlying the respective swap agreement.
Credit Default Swap Contracts. A credit default swap is a bilateral agreement between counterparties in which the buyer of the protection agrees to make a stream of periodic payments to the seller of protection in exchange for the right to receive a specified return in the event of a default or other credit event for a referenced entity, obligation or index. As a seller of protection on credit default swaps, a Portfolio will generally receive from the buyer a fixed payment stream based on the notional
amount of the swap contract. This fixed payment stream will continue until the swap contract expires or a defined credit event occurs.
A Portfolio is subject to credit risk in the normal course of pursuing its investment objectives. As a seller of protection in a credit default swap, a Portfolio may execute these contracts to manage its exposure to the market or certain sectors of the market. Certain Portfolios may also enter into credit default swaps to speculate on changes in an issuer’s credit quality, to take advantage of perceived spread advantages, or to offset an existing short equivalent (i.e. buying protection on an equivalent reference entity).
Certain Portfolios may sell credit default swaps which expose these Portfolios to the risk of loss from credit risk- related events specified in the contract. Although contract specific, credit events are generally defined as bankruptcy, failure to pay, restructuring, obligation acceleration, obligation default or repudiation/moratorium. If a Portfolio is a seller of protection, and a credit event occurs, as defined under the terms of that particular swap agreement, a Portfolio will generally either (i) pay to the buyer an amount equal to the notional amount of the swap and take delivery of the referenced obligation, other deliverable obligations, or underlying securities comprising a referenced index or (ii) pay a net settlement amount in the form of cash or securities equal to the notional amount of the swap less the recovery value of the referenced obligation or underlying securities comprising a referenced index. If a Portfolio is a buyer of protection and a credit event occurs, as defined under the terms of that particular swap agreement, a Portfolio will either (i) receive from the seller of protection an amount equal to the notional amount of the swap and deliver the referenced obligation, other deliverable obligations or underlying securities comprising the referenced index or (ii) receive a net settlement amount in the form of cash or securities equal to the notional amount of the swap less the recovery value of the referenced obligation or underlying securities comprising the referenced index. Recovery values are assumed by market makers considering either industry standard recovery rates or entity specific factors and considerations until a credit event occurs. If a credit event has occurred, the recovery value is determined by a facilitated auction whereby a minimum number of allowable broker bids, together with a specified valuation method, are used to calculate the settlement value.
Implied credit spreads, represented in absolute terms, utilized in determining the fair value of credit default swap agreements on corporate issues or sovereign issues are disclosed in each Portfolio’s Portfolio of Investments and serve as an indicator of the current status of the payment/
NOTES TO FINANCIAL STATEMENTS as of December 31, 2020 (continued)
NOTE 2 — SIGNIFICANT ACCOUNTING POLICIES (continued)
performance risk and represent the likelihood or risk of default for the credit derivative. The implied credit spread of a particular referenced entity reflects the cost of buying/selling protection and may include upfront payments required to be made to enter into the agreement. For credit default swaps on asset-backed securities or credit indices, the quoted market prices and resulting fair values serve as the indicator of the current status of the payment/performance risk. Wider credit spreads and increasing fair values, in absolute terms when compared to the notional amount of the swap, represent a deterioration of the referenced entity’s credit soundness and a greater likelihood or risk of default or other credit event occurring as defined under the terms of the agreement.
The maximum amount of future payments (undiscounted) that a Portfolio as seller of protection could be required to make under a credit default swap agreement would be an amount equal to the notional amount of the agreement. These potential amounts would be partially offset by any recovery values of the respective referenced obligations, upfront payments received upon entering into the agreements, or net amounts received from the settlement of buy protection credit default swap agreements entered into by a Portfolio for the same referenced entity or entities.
For the year ended December 31, 2020, Balanced Income had bought and sold credit protection on credit default swap indices (“CDX”) and single name issuers (corporate or sovereign). A CDX is a basket of credit instruments or exposures designed to be representative of some part of the credit market as a whole. Balanced Income used CDX swaps to gain additional exposure within various sectors and to hedge the credit risk associated with various sectors within the credit market. In addition, Balanced Income bought credit protection on single name issuers to reduce its risk exposure to defaults of corporate and/or sovereign issuers.
For the year ended December 31, 2020, Balanced Income had an average notional amount of $8,332,002 and $1,804,658 on credit default swaps to buy and sell protection, respectively. Please refer to the tables within the Portfolio of Investments for open credit default swaps to buy protection at December 31, 2020. There were no open credit default swaps to sell protectionat December 31, 2020
At December 31, 2020, Balanced Income had pledged $350,000 in cash collateral for open centrally cleared credit default swaps.
Interest Rate Swap Contracts. An interest rate swap involves the agreement between counterparties to
exchange periodic payments based on interest rates. One payment will be based on a floating rate of a specified interest rate while the other will be a fixed rate. Risks involve the future fluctuations of interest rates in which a Portfolio may make payments that are greater than what a Portfolio received from the counterparty. Other risks include credit, liquidity and market risk.
For the year ended December 31, 2020, Balanced Income had entered into interest rate swaps in which it pays a floating interest rate and receives a fixed interest rate (“interest rate swap”) in order to decrease exposure to interest rate risk. Average notional amounts on interest rate swaps was $288,000.
For the year ended December 31, 2020, Balanced Income had entered into interest rate swaps in which it pays a fixed interest rate and receives a floating interest rate (“Short interest rate swap”) in order to decrease exposure to interest rate risk. Average notional amounts on short interest rate swaps was $29,160,500.
Balanced Income entered into interest rate swaps to adjust interest rate and yield curve exposures and to substitute for physical fixed-income securities. There were no open centrally cleared interest rate swaps at December 31, 2020.
Volatility Swap Contracts. Certain Portfolios may enter into volatility swaps. Volatility swaps are agreements in which the counterparties agree to make payments in connection with changes in the volatility (i.e., the magnitude of change over a specified period of time) of an underlying referenced instrument, such as a currency, rate, index, security or other financial instrument. Volatility swaps permit the parties to attempt to hedge volatility risk and/or take positions on the projected future volatility of an underlying referenced instrument. As a receiver of the realized price volatility, a Portfolio would receive the payoff amount when the realized price volatility of the referenced instrument is greater than the strike and would owe the payoff amount when the volatility is less than the strike. As a payer of the realized price volatility, a Portfolio would owe the payoff amount when the realized price volatility of the referenced instrument is greater than the strike and would receive the payoff amount when the volatility is less than the strike.
During the year ended December 31, 2020, Balanced Income had an average notional amount of $69,000 on foreign currency volatility swaps (receiver). There were no open volatility swap contracts at December 31, 2020.
P. Indemnifications. In the normal course of business, the Trust may enter into contracts that provide certain indemnifications. The Trust’s maximum exposure under these arrangements is dependent on future claims that
NOTES TO FINANCIAL STATEMENTS as of December 31, 2020 (continued)
NOTE 2 — SIGNIFICANT ACCOUNTING POLICIES (continued)
may be made against the Portfolios and, therefore, cannot be estimated; however, based on experience, management considers the risk of loss from such claims remote.
NOTE 3 — INVESTMENT TRANSACTIONS
For the year ended December 31, 2020, the cost of purchases and the proceeds from the sales of securities, excluding U.S. government and short-term securities were as follows:
| | | | Purchases | | | Sales | |
| Balanced Income | | | | $ | 164,169,789 | | | | | $ | 171,311,352 | | |
| High Yield | | | | | 468,385,750 | | | | | | 516,492,918 | | |
| Large Cap Growth | | | | | 4,953,592,956 | | | | | | 5,845,830,787 | | |
| Large Cap Value | | | | | 1,181,877,507 | | | | | | 1,302,423,843 | | |
| Limited Maturity Bond | | | | | 181,155,303 | | | | | | 91,959,711 | | |
| U.S. Stock Index | | | | | 646,911,526 | | | | | | 1,212,425,510 | | |
| Clarion Real Estate | | | | | 264,148,439 | | | | | | 310,850,970 | | |
| JPMorgan Small Cap Core Equity | | | | | 325,862,620 | | | | | | 362,552,302 | | |
U.S. government securities not included above were as follows:
| | | | Purchases | | | Sales | |
| Balanced Income | | | | $ | 70,469,610 | | | | | $ | 91,248,700 | | |
| Limited Maturity Bond | | | | | 882,842,459 | | | | | | 846,510,630 | | |
NOTE 4 — INVESTMENT MANAGEMENT FEES
Balanced Income, Large Cap Growth, Large Cap Value and Clarion Real Estate have entered into an investment management agreement (“Management Agreement”) with the Investment Adviser. The Investment Adviser has overall responsibility for the management of the Portfolios. The Investment Adviser oversees all investment management and portfolio management services for the Portfolios and assists in managing and supervising all aspects of the general day-to-day business activities and operations of the Portfolios, including custodial, transfer agency, dividend disbursing, accounting, auditing, compliance and related services. This Management Agreement compensates the Investment Adviser with a management fee, computed daily and payable monthly, based on the average daily net assets of each Portfolio, at the following annual rates:
| Portfolio | | | Fee | |
| Balanced Income | | | 0.55% on all assets | |
| Large Cap Growth | | | 0.65% on the first $5.5 billion;
0.62% on the next $1.5 billion;
0.60% on the next $3 billion; and
0.59% on the amount in excess of $10 billion | |
| Portfolio | | | Fee | |
Large Cap Value(1) | | | 0.75% on the first $500 million;
0.70% on the next $1.5 billion; and
0.65% on the amount in excess of $2 billion | |
| Clarion Real Estate(1) | | | 0.85% on the first $200 million;
0.80% on the next $550 million; and
0.75% on the amount in excess of $750 million | |
(1)
The Investment Adviser is contractually obligated to waive 0.010% and 0.067% of the management fee for Large Cap Value and Clarion Real Estate, respectively. Any fees waived or reimbursed are not eligible for recoupment. Termination or modification of these obligations requires approval by the Board. Prior to January 1, 2020, the Investment Adviser had contractually agreed to waive 0.044% of the management fee for Clarion Real Estate. Any fees waived or reimbursed were not eligible for recoupment. Modification of this obligation was approved by the Board.
With the exception of the Portfolios in the table above, the Investment Adviser provides the below Portfolios with advisory and administrative services under a management agreement (the “Unified Agreement”). Under the Unified Agreement, the Investment Adviser has overall responsibility for engaging sub-advisers and for monitoring and evaluating the management of the assets of each Portfolio. Sub-advisers have full investment discretion and make all determinations with respect to the investment of a Portfolio’s assets and the purchase and sale of portfolio securities and other investments. Pursuant to the Unified Agreement, the Investment Adviser also is responsible for providing or procuring, at the Investment Adviser’s expense, the services reasonably necessary for the ordinary operation of a Portfolio, including, among other things, custodial, administrative, transfer agency, portfolio accounting, auditing, affiliated record keeping services and ordinary legal expenses. As compensation for its services under the Unified Agreement, the Trust pays the Investment Adviser a monthly fee (a “Unified Fee”) based on the following annual rates of the average daily net assets of each Portfolio:
| Portfolio | | | Fee | |
| High Yield(2) | | | 0.490% on the first $1 billion;
0.480% on the next $1 billion;
0.470% on the amount in excess of $2 billion | |
Limited Maturity Bond(3) | | | 0.350% on the first $200 million;
0.300% on the next $300 million;
0.250% on the amount in excess of $500 million | |
| U.S. Stock Index | | | 0.260% | |
| JPMorgan Small Cap Core Equity | | | 0.900% on the first $200 million;
0.850% on the next $300 million;
0.800% on the next $250 million;
0.750% on the amount in excess of $750 million | |
NOTES TO FINANCIAL STATEMENTS as of December 31, 2020 (continued)
NOTE 4 — INVESTMENT MANAGEMENT FEES (continued)
(2)
The Investment Adviser is contractually obligated to waive 0.015% of the Unified Fee for High Yield. Any fees waived or reimbursed are not eligible for recoupment. Termination or modification of this obligation requires approval by the Board.
(3)
The assets of Limited Maturity Bond are aggregated with those of Voya Government Liquid Assets Portfolio, which is not included in this report, to determine the Unified Fee applicable to the Portfolio.
The Investment Adviser has entered into a sub-advisory agreement with each respective sub-adviser. These sub-advisers provide investment advice for certain Portfolios and are paid by the Investment Adviser based on the average daily net assets of the respective Portfolios. Subject to such policies as the Board or the Investment Adviser may determine, the sub-advisers manage each respective Portfolio’s assets in accordance with the Portfolio’s investment objectives, policies, and limitations. The sub-advisers of the Portfolios are as follows (*denotes an affiliated sub-adviser):
| Portfolio | | | Sub-Adviser | |
| Balanced Income | | | Voya Investment Management Co. LLC* | |
| High Yield | | | Voya Investment Management Co. LLC* | |
| Large Cap Growth | | | Voya Investment Management Co. LLC* | |
| Large Cap Value | | | Voya Investment Management Co. LLC* | |
| Limited Maturity Bond | | | Voya Investment Management Co. LLC* | |
| U.S. Stock Index | | | Voya Investment Management Co. LLC* | |
| Clarion Real Estate | | | CBRE Clarion Securities LLC | |
| JPMorgan Small Cap Core Equity | | | J.P. Morgan Investment Management Inc. | |
NOTE 5 — DISTRIBUTION AND SERVICE FEES
The Trust has entered into a shareholder service plan (the “Plan”) for each Portfolio that offers Class S and Class S2 shares. The Plan compensates the Distributor for the provision of shareholder services and/or account maintenance services to direct or indirect beneficial owners of Class S and Class S2 shares. Under the Plan, each Portfolio makes payments to the Distributor at an annual rate of 0.25% of the Portfolio’s average daily net assets attributable to Class S and Class S2 shares, respectively. Each Portfolio that offers Class S2 shares has entered into a distribution plan (the “Class S2 Plan”) with the Distributor on behalf of the Class S2 shares of the Portfolio. The Class S2 Plan provides that the Class S2 shares shall pay a distribution fee for distribution services including payments to the Distributor at an annual rate of 0.15% of the average daily net assets. The Distributor has contractually agreed to waive 0.01% of the shareholder
service fee for Class S shares of U.S. Stock Index. Termination or modification of this obligation requires approval by the Board.
Class ADV shares of the Portfolios have a shareholder service and distribution plan. The respective Portfolios pay the Distributor a service fee of 0.25% and a distribution fee of 0.35% of each Portfolio’s average daily net assets attributable to Class ADV shares, except for U.S. Stock Index, which pays a distribution fee of 0.28%.
NOTE 6 — OTHER TRANSACTIONS WITH AFFILIATES AND RELATED PARTIES
At December 31, 2020, the following direct or indirect, wholly-owned subsidiaries of Voya Financial, Inc. or affiliated investment companies owned more than 5% of the following Portfolios:
Subsidiary/Affiliated Investment
Company | | | Portfolio | | | Percentage | |
| ReliaStar Life Insurance Company | | | JPMorgan Small Cap
Core Equity | | | | | 10.01% | | |
Security Life of Denver Insurance
Company | | | Limited Maturity Bond | | | | | 6.55 | | |
| | | | JPMorgan Small Cap
Core Equity | | | | | 6.72 | | |
| Voya Index Solution 2025 Portfolio | | | U.S. Stock Index | | | | | 5.77 | | |
| Voya Index Solution 2035 Portfolio | | | U.S. Stock Index | | | | | 7.32 | | |
| Voya Index Solution 2045 Portfolio | | | U.S. Stock Index | | | | | 6.12 | | |
| Voya Institutional Trust Company | | | Balanced Income | | | | | 19.50 | | |
| | | | High Yield | | | | | 14.36 | | |
| | | | Large Cap Growth | | | | | 20.65 | | |
| | | | Large Cap Value | | | | | 5.04 | | |
| | | | Clarion Real Estate | | | | | 23.38 | | |
| | | | JPMorgan Small Cap
Core Equity | | | | | 35.02 | | |
| Voya Retirement Growth Portfolio | | | U.S. Stock Index | | | | | 16.67 | | |
Voya Retirement Insurance and
Annuity Company | | | High Yield | | | | | 32.17 | | |
| | | | Large Cap Growth | | | | | 25.69 | | |
| | | | Large Cap Value | | | | | 30.39 | | |
| | | | U.S. Stock Index | | | | | 8.44 | | |
| | | | Clarion Real Estate | | | | | 34.40 | | |
| | | | JPMorgan Small Cap
Core Equity | | | | | 35.69 | | |
Voya Retirement Moderate Growth
Portfolio | | | U.S. Stock Index | | | | | 11.55 | | |
| Voya Retirement Moderate Portfolio | | | U.S. Stock Index | | | | | 5.19 | | |
Voya Solution Moderately Aggressive
Portfolio | | | JPMorgan Small Cap
Core Equity | | | | | 6.10 | | |
The Investment Adviser may direct the Portfolios’ sub-advisers to use their best efforts (subject to obtaining best execution of each transaction) to allocate a Portfolio’s equity security transactions through certain designated broker-dealers. The designated broker-dealer, in turn, will reimburse a portion of the brokerage commissions to pay
NOTES TO FINANCIAL STATEMENTS as of December 31, 2020 (continued)
NOTE 6 — OTHER TRANSACTIONS WITH AFFILIATES AND RELATED PARTIES (continued)
certain expenses of that Portfolio. Any amounts credited to the Portfolios are reflected as brokerage commission recapture on the accompanying Statements of Operations.
The Portfolios have adopted a deferred compensation plan (the “DC Plan”), which allows eligible independent trustees, as described in the DC Plan, to defer the receipt of all or a portion of the trustees’ fees that they are entitled to receive from the Portfolios. For purposes of determining the amount owed to the trustee under the DC Plan, the amounts deferred are invested in shares of the funds selected by the trustee (the “Notional Funds”). When the Portfolios purchase shares of the Notional Funds, which are all advised by Voya Investments, in amounts equal to the trustees’ deferred fees, this results in a Portfolio asset equal to the deferred compensation liability. Such assets, if applicable, are included as a component of “Other assets” on the accompanying Statements of Assets and Liabilities. Deferral of trustees’ fees under the DC Plan will not affect net assets of the Portfolios, and will not materially affect the Portfolios’ assets, liabilities or net investment income per share. Amounts will be deferred until distributed in accordance with the DC Plan.
Effective January 1, 2020, the Portfolios may pay per account fees to affiliates of Voya Investments for recordkeeping services provided on certain assets. For the year ended December 31, 2020, the per account fees for affiliated recordkeeping services paid by each Portfolio were as follows:
| Portfolio | | | Amount | |
| Balanced Income | | | | $ | 85,836 | | |
| Large Cap Growth | | | | | 2,657,131 | | |
| Large Cap Value | | | | | 612,670 | | |
| Clarion Real Estate | | | | | 381,315 | | |
NOTE 7 — EXPENSE LIMITATION AGREEMENTS
The Investment Adviser has entered into written expense limitation agreements (“Expense Limitation Agreements”) with the following Portfolios, whereby the Investment Adviser has agreed to limit expenses, excluding interest, taxes, investment-related costs, leverage expenses, extraordinary expenses, and acquired fund fees and expenses to the levels listed below:
| Portfolio | | | Class
ADV | | | Class
I | | | Class
P2 | | | Class
R6 | | | Class
S | | | Class
S2 | |
| Balanced Income | | | | | 1.20% | | | | | | 0.60% | | | | | | N/A | | | | | | N/A | | | | | | 0.85% | | | | | | 1.00% | | |
| Large Cap Growth(1) | | | | | 1.27% | | | | | | 0.67% | | | | | | N/A | | | | | | 0.67% | | | | | | 0.92% | | | | | | 1.07% | | |
| Large Cap Value(2) | | | | | 1.29% | | | | | | 0.69% | | | | | | N/A | | | | | | 0.69% | | | | | | 0.94% | | | | | | 1.09% | | |
| U.S. Stock Index | | | | | N/A | | | | | | N/A | | | | | | 0.15% | | | | | | N/A | | | | | | N/A | | | | | | N/A | | |
| Clarion Real Estate | | | | | 1.35% | | | | | | 0.75% | | | | | | N/A | | | | | | N/A | | | | | | 1.00% | | | | | | 1.15% | | |
(1)
Any fees waived pursuant to the Expense Limitation Agreement shall not be eligible for recoupment.
(2)
Pursuant to a side letter agreement, through May 1, 2021, the Investment Adviser has further lowered the expense limits for Large Cap Value to 1.25%, 0.65%, 0.65%, 0.90%, and 1.05% for Class ADV, Class I, Class R6, Class S, and Class S2, respectively. Termination or modification of this obligation requires approval by the Board. Any fees waived pursuant to the side letter agreement shall not be eligible for recoupment.
Unless otherwise specified above and with the exception of the non-recoupable management fee waivers for certain Portfolios, the Investment Adviser may, at a later date, recoup from a Portfolio for fees waived and/or other expenses reimbursed by the Investment Adviser during the previous 36 months, but only if, after such recoupment, a Portfolio’s expense ratio does not exceed the percentage described above. Waived and reimbursed fees net of any recoupment by the Investment Adviser of such waived and reimbursed fees are reflected on the accompanying Statements of Operations. Amounts payable by the Investment Adviser are reflected on the accompanying Statements of Assets and Liabilities.
As of December 31, 2020, the amounts of waived and/or reimbursed fees that are subject to possible recoupment by the Investment Adviser, and the related expiration dates are as follows:
| | | | December 31, | | | | | | | |
| | | | 2021 | | | 2022 | | | 2023 | | | Total | |
| Balanced Income | | | | $ | 448,434 | | | | | $ | 98,813 | | | | | $ | 46,785 | | | | | $ | 594,032 | | |
| U.S. Stock Index | | | | | 1,667,050 | | | | | | 2,287,877 | | | | | | 2,811,766 | | | | | | 6,766,693 | | |
| Clarion Real Estate | | | | | 452,664 | | | | | | 365,899 | | | | | | 719,807 | | | | | | 1,538,370 | | |
The Expense Limitation Agreements are contractual through May 1, 2021 and shall renew automatically for one-year terms. Termination or modification of this obligation requires approval by the Board.
NOTE 8 — LINE OF CREDIT
Effective May 15, 2020, each Portfolio, in addition to certain other funds managed by the Investment Adviser, has entered into a 364-day unsecured committed revolving line of credit agreement (the “Credit Agreement”) with The Bank of New York Mellon (“BNY”) for an aggregate amount of $400,000,000 through May 14, 2021. The proceeds may be used only to finance temporarily: (1) the purchase or sale of investment securities; or (2) the repurchase or redemption of shares of a Portfolio or certain other funds managed by the Investment Adviser. The funds to which the line of credit is available pay a commitment fee equal to 0.15% per annum on the daily unused portion of the committed line amount payable quarterly in arrears. Prior to May 15, 2020, the predecessor line of credit was for an aggregate amount of $400,000,000 and the funds to which the line of credit was available paid a commitment fee
NOTES TO FINANCIAL STATEMENTS as of December 31, 2020 (continued)
NOTE 8 — LINE OF CREDIT (continued)
equal to 0.15% per annum on the daily unused portion of the committed line amount through May 15, 2020.
Borrowings under the Credit Agreement accrue interest at the federal funds rate plus a specified margin. Repayments generally must be made within 60 days after the date of a revolving credit advance.
The below Portfolios utilized the line of credit during the year ended December 31, 2020 as follows:
| Portfolio | | | Days
Utilized | | | Approximate
Average Daily
Balance
For Days
Utilized | | | Approximate
Weighted
Average
Interest Rate
For Days
Utilized | |
| Balanced Income | | | | | 8 | | | | | $ | 1,828,000 | | | | | | 1.29% | | |
| Portfolio | | | Days
Utilized | | | Approximate
Average Daily
Balance
For Days
Utilized | | | Approximate
Weighted
Average
Interest Rate
For Days
Utilized | |
| High Yield | | | | | 1 | | | | | | 503,000 | | | | | | 1.25 | | |
| Large Cap Growth | | | | | 4 | | | | | | 14,448,250 | | | | | | 1.25 | | |
| Large Cap Value | | | | | 17 | | | | | | 1,751,471 | | | | | | 1.24 | | |
| U.S. Stock Index | | | | | 4 | | | | | | 55,190,250 | | | | | | 1.84 | | |
| Clarion Real Estate | | | | | 4 | | | | | | 1,600,500 | | | | | | 2.34 | | |
NOTE 9 — CAPITAL SHARES
Transactions in capital shares and dollars were as follows:
| | | | Shares
sold | | | Shares
issued
in merger | | | Reinvestment
of
distributions | | | Shares
redeemed | | | Net increase
(decrease)
in shares
outstanding | | | Shares
sold | | | Proceeds
from shares
issued in
merger | | | Reinvestment
of
distributions | | | Shares
redeemed | | | Net increase
(decrease) | |
Year or
period ended | | | # | | | # | | | # | | | # | | | # | | | ($) | | | ($) | | | ($) | | | ($) | | | ($) | |
| Balanced Income | |
| Class ADV | | | | | | | | | | | | | | | | | | | | | | | | | | | | | | | | | | | | | | | | | | | | | | | | | | | | | | | | | | | | | |
| 12/31/2020 | | | | | 288,153 | | | | | | — | | | | | | 800,701 | | | | | | (1,615,563) | | | | | | (526,709) | | | | | | 2,865,188 | | | | | | — | | | | | | 7,134,246 | | | | | | (15,420,756) | | | | | | (5,421,322) | | |
| 12/31/2019 | | | | | 483,953 | | | | | | — | | | | | | 765,462 | | | | | | (839,081) | | | | | | 410,334 | | | | | | 5,164,269 | | | | | | — | | | | | | 7,922,532 | | | | | | (8,959,080) | | | | | | 4,127,721 | | |
| Class I | | | | | | | | | | | | | | | | | | | | | | | | | | | | | | | | | | | | | | | | | | | | | | | | | | | | | | | | | | | | | |
| 12/31/2020 | | | | | 41,869 | | | | | | — | | | | | | 86,279 | | | | | | (147,582) | | | | | | (19,434) | | | | | | 431,117 | | | | | | — | | | | | | 809,293 | | | | | | (1,424,770) | | | | | | (184,360) | | |
| 12/31/2019 | | | | | 23,412 | | | | | | — | | | | | | 82,479 | | | | | | (70,383) | | | | | | 35,508 | | | | | | 262,125 | | | | | | — | | | | | | 894,071 | | | | | | (784,282) | | | | | | 371,914 | | |
| Class S | | | | | | | | | | | | | | | | | | | | | | | | | | | | | | | | | | | | | | | | | | | | | | | | | | | | | | | | | | | | | |
| 12/31/2020 | | | | | 1,349,030 | | | | | | — | | | | | | 2,946,637 | | | | | | (4,899,808) | | | | | | (604,141) | | | | | | 14,123,514 | | | | | | — | | | | | | 27,521,585 | | | | | | (49,186,069) | | | | | | (7,540,970) | | |
| 12/31/2019 | | | | | 461,969 | | | | | | — | | | | | | 2,828,525 | | | | | | (4,051,474) | | | | | | (760,980) | | | | | | 5,118,548 | | | | | | — | | | | | | 30,519,786 | | | | | | (45,382,273) | | | | | | (9,743,939) | | |
| Class S2 | | | | | | | | | | | | | | | | | | | | | | | | | | | | | | | | | | | | | | | | | | | | | | | | | | | | | | | | | | | | | |
| 12/31/2020 | | | | | 5,203 | | | | | | — | | | | | | 56,964 | | | | | | (65,736) | | | | | | (3,569) | | | | | | 54,652 | | | | | | — | | | | | | 530,338 | | | | | | (681,578) | | | | | | (96,588) | | |
| 12/31/2019 | | | | | 112,288 | | | | | | — | | | | | | 46,512 | | | | | | (93,027) | | | | | | 65,773 | | | | | | 1,226,171 | | | | | | — | | | | | | 501,395 | | | | | | (1,021,334) | | | | | | 706,232 | | |
| High Yield | |
| Class ADV | | | | | | | | | | | | | | | | | | | | | | | | | | | | | | | | | | | | | | | | | | | | | | | | | | | | | | | | | | | | | |
| 12/31/2020 | | | | | 771,091 | | | | | | — | | | | | | 412,648 | | | | | | (1,960,222) | | | | | | (776,483) | | | | | | 7,269,990 | | | | | | — | | | | | | 3,908,133 | | | | | | (18,446,185) | | | | | | (7,268,062) | | |
| 12/31/2019 | | | | | 634,371 | | | | | | — | | | | | | 429,020 | | | | | | (1,145,593) | | | | | | (82,202) | | | | | | 6,187,500 | | | | | | — | | | | | | 4,184,086 | | | | | | (11,117,739) | | | | | | (746,153) | | |
| Class I | | | | | | | | | | | | | | | | | | | | | | | | | | | | | | | | | | | | | | | | | | | | | | | | | | | | | | | | | | | | | |
| 12/31/2020 | | | | | 2,919,331 | | | | | | — | | | | | | 1,066,867 | | | | | | (3,820,408) | | | | | | 165,790 | | | | | | 27,954,639 | | | | | | — | | | | | | 10,118,901 | | | | | | (35,323,365) | | | | | | 2,750,175 | | |
| 12/31/2019 | | | | | 4,042,390 | | | | | | 9,811,076 | | | | | | 581,119 | | | | | | (1,596,538) | | | | | | 12,838,047 | | | | | | 39,614,104 | | | | | | 96,181,491 | | | | | | 5,691,493 | | | | | | (15,569,611) | | | | | | 125,917,477 | | |
| Class S | | | | | | | | | | | | | | | | | | | | | | | | | | | | | | | | | | | | | | | | | | | | | | | | | | | | | | | | | | | | | |
| 12/31/2020 | | | | | 1,738,229 | | | | | | — | | | | | | 1,497,311 | | | | | | (7,422,990) | | | | | | (4,187,450) | | | | | | 16,647,706 | | | | | | — | | | | | | 14,181,404 | | | | | | (69,989,395) | | | | | | (39,160,285) | | |
| 12/31/2019 | | | | | 1,874,367 | | | | | | 188,038 | | | | | | 1,800,210 | | | | | | (9,495,599) | | | | | | (5,632,984) | | | | | | 18,111,582 | | | | | | 1,841,793 | | | | | | 17,552,628 | | | | | | (92,507,126) | | | | | | (55,001,123) | | |
| Class S2 | | | | | | | | | | | | | | | | | | | | | | | | | | | | | | | | | | | | | | | | | | | | | | | | | | | | | | | | | | | | | |
| 12/31/2020 | | | | | 83,380 | | | | | | — | | | | | | 16,119 | | | | | | (89,468) | | | | | | 10,031 | | | | | | 795,900 | | | | | | — | | | | | | 153,060 | | | | | | (862,560) | | | | | | 86,400 | | |
| 12/31/2019 | | | | | 71,454 | | | | | | — | | | | | | 20,355 | | | | | | (253,238) | | | | | | (161,429) | | | | | | 694,898 | | | | | | — | | | | | | 198,505 | | | | | | (2,478,674) | | | | | | (1,585,271) | | |
| Large Cap Growth | |
| Class ADV | | | | | | | | | | | | | | | | | | | | | | | | | | | | | | | | | | | | | | | | | | | | | | | | | | | | | | | | | | | | | |
| 12/31/2020 | | | | | 1,207,604 | | | | | | — | | | | | | 13,785,663 | | | | | | (18,882,473) | | | | | | (3,889,206) | | | | | | 21,673,309 | | | | | | — | | | | | | 235,045,550 | | | | | | (344,565,368) | | | | | | (87,846,509) | | |
| 12/31/2019 | | | | | 1,035,445 | | | | | | — | | | | | | 19,360,091 | | | | | | (18,219,100) | | | | | | 2,176,436 | | | | | | 18,555,068 | | | | | | — | | | | | | 322,539,115 | | | | | | (322,447,976) | | | | | | 18,646,207 | | |
| Class I | | | | | | | | | | | | | | | | | | | | | | | | | | | | | | | | | | | | | | | | | | | | | | | | | | | | | | | | | | | | | |
| 12/31/2020 | | | | | 11,468,183 | | | | | | — | | | | | | 12,982,807 | | | | | | (18,934,323) | | | | | | 5,516,667 | | | | | | 217,805,648 | | | | | | — | | | | | | 247,062,817 | | | | | | (374,975,631) | | | | | | 89,892,834 | | |
| 12/31/2019 | | | | | 4,994,678 | | | | | | — | | | | | | 16,795,929 | | | | | | (12,234,448) | | | | | | 9,556,159 | | | | | | 97,655,872 | | | | | | — | | | | | | 308,037,331 | | | | | | (235,572,055) | | | | | | 170,121,148 | | |
NOTES TO FINANCIAL STATEMENTS as of December 31, 2020 (continued)
NOTE 9 — CAPITAL SHARES (continued)
| | | | Shares
sold | | | Shares
issued
in merger | | | Reinvestment
of
distributions | | | Shares
redeemed | | | Net increase
(decrease)
in shares
outstanding | | | Shares
sold | | | Proceeds
from shares
issued in
merger | | | Reinvestment
of
distributions | | | Shares
redeemed | | | Net increase
(decrease) | |
Year or
period ended | | | # | | | # | | | # | | | # | | | # | | | ($) | | | ($) | | | ($) | | | ($) | | | ($) | |
| Large Cap Growth (continued) | |
| Class R6 | | | | | | | | | | | | | | | | | | | | | | | | | | | | | | | | | | | | | | | | | | | | | | | | | | | | | | | | | | | | | |
| 12/31/2020 | | | | | 1,189,799 | | | | | | — | | | | | | 458,711 | | | | | | (816,503) | | | | | | 832,007 | | | | | | 22,619,454 | | | | | | — | | | | | | 8,738,453 | | | | | | (16,352,499) | | | | | | 15,005,408 | | |
| 12/31/2019 | | | | | 486,351 | | | | | | — | | | | | | 470,515 | | | | | | (535,128) | | | | | | 421,738 | | | | | | 9,358,324 | | | | | | — | | | | | | 8,633,943 | | | | | | (10,360,682) | | | | | | 7,631,585 | | |
| Class S | | | | | | | | | | | | | | | | | | | | | | | | | | | | | | | | | | | | | | | | | | | | | | | | | | | | | | | | | | | | | |
| 12/31/2020 | | | | | 831,207 | | | | | | — | | | | | | 11,073,994 | | | | | | (23,181,554) | | | | | | (11,276,353) | | | | | | 15,951,048 | | | | | | — | | | | | | 203,650,756 | | | | | | (440,742,715) | | | | | | (221,140,911) | | |
| 12/31/2019 | | | | | 1,219,268 | | | | | | — | | | | | | 17,119,586 | | | | | | (19,498,439) | | | | | | (1,159,585) | | | | | | 23,058,635 | | | | | | — | | | | | | 304,557,434 | | | | | | (367,320,864) | | | | | | (39,704,795) | | |
| Class S2 | | | | | | | | | | | | | | | | | | | | | | | | | | | | | | | | | | | | | | | | | | | | | | | | | | | | | | | | | | | | | |
| 12/31/2020 | | | | | 219,527 | | | | | | — | | | | | | 397,320 | | | | | | (837,286) | | | | | | (220,439) | | | | | | 4,123,608 | | | | | | — | | | | | | 7,235,193 | | | | | | (15,955,812) | | | | | | (4,597,011) | | |
| 12/31/2019 | | | | | 143,587 | | | | | | — | | | | | | 587,448 | | | | | | (929,352) | | | | | | (198,317) | | | | | | 2,658,264 | | | | | | — | | | | | | 10,362,576 | | | | | | (17,303,441) | | | | | | (4,282,601) | | |
| Large Cap Value | |
| Class ADV | | | | | | | | | | | | | | | | | | | | | | | | | | | | | | | | | | | | | | | | | | | | | | | | | | | | | | | | | | | | | |
| 12/31/2020 | | | | | 238,237 | | | | | | — | | | | | | 535,379 | | | | | | (941,265) | | | | | | (167,649) | | | | | | 2,353,718 | | | | | | — | | | | | | 4,976,325 | | | | | | (9,448,165) | | | | | | (2,118,122) | | |
| 12/31/2019 | | | | | 112,168 | | | | | | — | | | | | | 391,693 | | | | | | (759,527) | | | | | | (255,666) | | | | | | 1,285,654 | | | | | | — | | | | | | 4,505,178 | | | | | | (8,725,259) | | | | | | (2,934,427) | | |
| Class I | | | | | | | | | | | | | | | | | | | | | | | | | | | | | | | | | | | | | | | | | | | | | | | | | | | | | | | | | | | | | |
| 12/31/2020 | | | | | 637,912 | | | | | | — | | | | | | 3,681,759 | | | | | | (5,604,265) | | | | | | (1,284,594) | | | | | | 6,560,375 | | | | | | — | | | | | | 35,461,124 | | | | | | (58,604,196) | | | | | | (16,582,697) | | |
| 12/31/2019 | | | | | 577,141 | | | | | | — | | | | | | 2,685,229 | | | | | | (4,077,981) | | | | | | (815,611) | | | | | | 6,825,780 | | | | | | — | | | | | | 31,729,269 | | | | | | (48,240,843) | | | | | | (9,685,794) | | |
| Class R6 | | | | | | | | | | | | | | | | | | | | | | | | | | | | | | | | | | | | | | | | | | | | | | | | | | | | | | | | | | | | | |
| 12/31/2020 | | | | | 6,497 | | | | | | — | | | | | | 2,231 | | | | | | (13,681) | | | | | | (4,953) | | | | | | 64,658 | | | | | | — | | | | | | 21,589 | | | | | | (157,306) | | | | | | (71,059) | | |
| 12/31/2019 | | | | | 14,817 | | | | | | — | | | | | | 2,126 | | | | | | (102,570) | | | | | | (85,627) | | | | | | 176,027 | | | | | | — | | | | | | 25,122 | | | | | | (1,219,884) | | | | | | (1,018,735) | | |
| Class S | | | | | | | | | | | | | | | | | | | | | | | | | | | | | | | | | | | | | | | | | | | | | | | | | | | | | | | | | | | | | |
| 12/31/2020 | | | | | 1,043,450 | | | | | | — | | | | | | 6,841,823 | | | | | | (8,807,365) | | | | | | (922,092) | | | | | | 9,898,341 | | | | | | — | | | | | | 64,530,149 | | | | | | (90,774,725) | | | | | | (16,346,235) | | |
| 12/31/2019 | | | | | 406,811 | | | | | | — | | | | | | 5,109,077 | | | | | | (9,995,327) | | | | | | (4,479,439) | | | | | | 4,776,267 | | | | | | — | | | | | | 59,337,191 | | | | | | (116,360,700) | | | | | | (52,247,242) | | |
| Class S2 | | | | | | | | | | | | | | | | | | | | | | | | | | | | | | | | | | | | | | | | | | | | | | | | | | | | | | | | | | | | | |
| 12/31/2020 | | | | | 108 | | | | | | — | | | | | | 1,595 | | | | | | (25) | | | | | | 1,678 | | | | | | 1,032 | | | | | | — | | | | | | 15,065 | | | | | | (261) | | | | | | 15,836 | | |
| 12/31/2019 | | | | | 278 | | | | | | — | | | | | | 1,168 | | | | | | (3,730) | | | | | | (2,284) | | | | | | 3,105 | | | | | | — | | | | | | 13,567 | | | | | | (43,649) | | | | | | (26,977) | | |
| Limited Maturity Bond | |
| Class ADV | | | | | | | | | | | | | | | | | | | | | | | | | | | | | | | | | | | | | | | | | | | | | | | | | | | | | | | | | | | | | |
| 12/31/2020 | | | | | 150,033 | | | | | | — | | | | | | 24,334 | | | | | | (249,264) | | | | | | (74,897) | | | | | | 1,497,488 | | | | | | — | | | | | | 242,778 | | | | | | (2,468,058) | | | | | | (727,792) | | |
| 12/31/2019 | | | | | 42,085 | | | | | | — | | | | | | 20,414 | | | | | | (228,289) | | | | | | (165,790) | | | | | | 412,070 | | | | | | — | | | | | | 201,180 | | | | | | (2,241,012) | | | | | | (1,627,762) | | |
| Class I | | | | | | | | | | | | | | | | | | | | | | | | | | | | | | | | | | | | | | | | | | | | | | | | | | | | | | | | | | | | | |
| 12/31/2020 | | | | | 21,616,820 | | | | | | — | | | | | | 612,954 | | | | | | (9,268,414) | | | | | | 12,961,360 | | | | | | 220,273,815 | | | | | | — | | | | | | 6,243,058 | | | | | | (94,074,378) | | | | | | 132,442,495 | | |
| 12/31/2019 | | | | | 7,089,807 | | | | | | — | | | | | | 338,544 | | | | | | (7,771,113) | | | | | | (342,762) | | | | | | 71,343,640 | | | | | | — | | | | | | 3,405,088 | | | | | | (77,660,342) | | | | | | (2,911,614) | | |
| Class S | | | | | | | | | | | | | | | | | | | | | | | | | | | | | | | | | | | | | | | | | | | | | | | | | | | | | | | | | | | | | |
| 12/31/2020 | | | | | 1,021,891 | | | | | | — | | | | | | 143,024 | | | | | | (1,558,667) | | | | | | (393,752) | | | | | | 10,497,857 | | | | | | — | | | | | | 1,467,187 | | | | | | (15,957,868) | | | | | | (3,992,824) | | |
| 12/31/2019 | | | | | 1,202,703 | | | | | | — | | | | | | 118,672 | | | | | | (1,482,759) | | | | | | (161,384) | | | | | | 12,186,719 | | | | | | — | | | | | | 1,202,654 | | | | | | (15,011,516) | | | | | | (1,622,143) | | |
| U.S. Stock Index | |
| Class ADV | | | | | | | | | | | | | | | | | | | | | | | | | | | | | | | | | | | | | | | | | | | | | | | | | | | | | | | | | | | | | |
| 12/31/2020 | | | | | 677,999 | | | | | | — | | | | | | 321,105 | | | | | | (1,781,888) | | | | | | (782,784) | | | | | | 10,678,167 | | | | | | — | | | | | | 5,102,873 | | | | | | (28,430,410) | | | | | | (12,649,370) | | |
| 12/31/2019 | | | | | 555,076 | | | | | | — | | | | | | 438,702 | | | | | | (1,568,533) | | | | | | (574,755) | | | | | | 8,469,406 | | | | | | — | | | | | | 6,766,870 | | | | | | (23,904,340) | | | | | | (8,668,064) | | |
| Class I | | | | | | | | | | | | | | | | | | | | | | | | | | | | | | | | | | | | | | | | | | | | | | | | | | | | | | | | | | | | | |
| 12/31/2020 | | | | | 58,658,629 | | | | | | — | | | | | | 14,180,842 | | | | | | (87,251,957) | | | | | | (14,412,486) | | | | | | 955,381,741 | | | | | | — | | | | | | 236,749,487 | | | | | | (1,492,728,968) | | | | | | (300,597,740) | | |
| 12/31/2019 | | | | | 60,694,599 | | | | | | — | | | | | | 17,421,336 | | | | | | (52,302,066) | | | | | | 25,813,869 | | | | | | 983,475,304 | | | | | | — | | | | | | 280,363,883 | | | | | | (822,981,841) | | | | | | 440,857,346 | | |
| Class P2 | | | | | | | | | | | | | | | | | | | | | | | | | | | | | | | | | | | | | | | | | | | | | | | | | | | | | | | | | | | | | |
| 12/31/2020 | | | | | 39,809,410 | | | | | | — | | | | | | 8,643,180 | | | | | | (36,093,364) | | | | | | 12,359,226 | | | | | | 654,982,138 | | | | | | — | | | | | | 145,581,700 | | | | | | (600,509,325) | | | | | | 200,054,513 | | |
| 12/31/2019 | | | | | 47,769,380 | | | | | | — | | | | | | 9,196,809 | | | | | | (20,074,473) | | | | | | 36,891,716 | | | | | | 754,993,771 | | | | | | — | | | | | | 148,647,312 | | | | | | (318,047,628) | | | | | | 585,593,455 | | |
| Class S | | | | | | | | | | | | | | | | | | | | | | | | | | | | | | | | | | | | | | | | | | | | | | | | | | | | | | | | | | | | | |
| 12/31/2020 | | | | | 658,266 | | | | | | — | | | | | | 870,434 | | | | | | (3,429,671) | | | | | | (1,900,971) | | | | | | 10,370,387 | | | | | | — | | | | | | 14,342,615 | | | | | | (55,575,289) | | | | | | (30,862,287) | | |
| 12/31/2019 | | | | | 14,345,061 | | | | | | — | | | | | | 396,914 | | | | | | (1,334,663) | | | | | | 13,407,312 | | | | | | 238,856,166 | | | | | | — | | | | | | 6,466,557 | | | | | | (21,719,201) | | | | | | 223,603,522 | | |
| Class S2 | | | | | | | | | | | | | | | | | | | | | | | | | | | | | | | | | | | | | | | | | | | | | | | | | | | | | | | | | | | | | |
| 12/31/2020 | | | | | 968,231 | | | | | | — | | | | | | 466,994 | | | | | | (2,218,217) | | | | | | (782,992) | | | | | | 15,436,289 | | | | | | — | | | | | | 7,572,526 | | | | | | (35,436,732) | | | | | | (12,427,917) | | |
| 12/31/2019 | | | | | 654,067 | | | | | | — | | | | | | 645,397 | | | | | | (3,340,876) | | | | | | (2,041,412) | | | | | | 10,121,100 | | | | | | — | | | | | | 10,110,281 | | | | | | (51,646,786) | | | | | | (31,415,405) | | |
| Clarion Real Estate | |
| Class ADV | | | | | | | | | | | | | | | | | | | | | | | | | | | | | | | | | | | | | | | | | | | | | | | | | | | | | | | | | | | | | |
| 12/31/2020 | | | | | 134,170 | | | | | | — | | | | | | 264,628 | | | | | | (477,527) | | | | | | (78,729) | | | | | | 3,900,258 | | | | | | — | | | | | | 6,700,379 | | | | | | (14,055,127) | | | | | | (3,454,490) | | |
| 12/31/2019 | | | | | 122,043 | | | | | | — | | | | | | 41,563 | | | | | | (330,899) | | | | | | (167,293) | | | | | | 4,297,969 | | | | | | — | | | | | | 1,436,002 | | | | | | (11,385,004) | | | | | | (5,651,033) | | |
| Class I | | | | | | | | | | | | | | | | | | | | | | | | | | | | | | | | | | | | | | | | | | | | | | | | | | | | | | | | | | | | | |
NOTES TO FINANCIAL STATEMENTS as of December 31, 2020 (continued)
NOTE 9 — CAPITAL SHARES (continued)
| | | | Shares
sold | | | Shares
issued
in merger | | | Reinvestment
of
distributions | | | Shares
redeemed | | | Net increase
(decrease)
in shares
outstanding | | | Shares
sold | | | Proceeds
from shares
issued in
merger | | | Reinvestment
of
distributions | | | Shares
redeemed | | | Net increase
(decrease) | |
Year or
period ended | | | # | | | # | | | # | | | # | | | # | | | ($) | | | ($) | | | ($) | | | ($) | | | ($) | |
| Clarion Real Estate (continued) | |
| 12/31/2020 | | | | | 251,739 | | | | | | — | | | | | | 75,075 | | | | | | (496,504) | | | | | | (169,690) | | | | | | 7,964,181 | | | | | | — | | | | | | 2,012,016 | | | | | | (16,483,579) | | | | | | (6,507,382) | | |
| 12/31/2019 | | | | | 152,211 | | | | | | — | | | | | | 17,244 | | | | | | (802,224) | | | | | | (632,769) | | | | | | 5,565,892 | | | | | | — | | | | | | 626,652 | | | | | | (29,242,868) | | | | | | (23,050,324) | | |
| Class S | | | | | | | | | | | | | | | | | | | | | | | | | | | | | | | | | | | | | | | | | | | | | | | | | | | | | | | | | | | | | |
| 12/31/2020 | | | | | 185,770 | | | | | | — | | | | | | 867,525 | | | | | | (1,455,915) | | | | | | (402,620) | | | | | | 5,686,150 | | | | | | — | | | | | | 23,267,019 | | | | | | (45,173,752) | | | | | | (16,220,583) | | |
| 12/31/2019 | | | | | 186,835 | | | | | | — | | | | | | 164,792 | | | | | | (1,274,973) | | | | | | (923,346) | | | | | | 6,777,048 | | | | | | — | | | | | | 5,986,907 | | | | | | (46,338,103) | | | | | | (33,574,148) | | |
| Class S2 | | | | | | | | | | | | | | | | | | | | | | | | | | | | | | | | | | | | | | | | | | | | | | | | | | | | | | | | | | | | | |
| 12/31/2020 | | | | | 33,197 | | | | | | — | | | | | | 60,137 | | | | | | (125,023) | | | | | | (31,689) | | | | | | 1,037,605 | | | | | | — | | | | | | 1,602,043 | | | | | | (3,808,977) | | | | | | (1,169,329) | | |
| 12/31/2019 | | | | | 49,904 | | | | | | — | | | | | | 9,953 | | | | | | (106,580) | | | | | | (46,723) | | | | | | 1,851,374 | | | | | | — | | | | | | 359,516 | | | | | | (3,836,242) | | | | | | (1,625,352) | | |
| JPMorgan Small Cap Core Equity | |
| Class ADV | | | | | | | | | | | | | | | | | | | | | | | | | | | | | | | | | | | | | | | | | | | | | | | | | | | | | | | | | | | | | |
| 12/31/2020 | | | | | 560,706 | | | | | | — | | | | | | — | | | | | | (1,855,900) | | | | | | (1,295,194) | | | | | | 6,891,934 | | | | | | — | | | | | | — | | | | | | (25,626,677) | | | | | | (18,734,743) | | |
| 12/31/2019 | | | | | 401,726 | | | | | | — | | | | | | 2,259,407 | | | | | | (1,195,069) | | | | | | 1,466,064 | | | | | | 6,885,294 | | | | | | — | | | | | | 34,683,375 | | | | | | (20,300,223) | | | | | | 21,268,446 | | |
| Class I | | | | | | | | | | | | | | | | | | | | | | | | | | | | | | | | | | | | | | | | | | | | | | | | | | | | | | | | | | | | | |
| 12/31/2020 | | | | | 3,469,734 | | | | | | — | | | | | | — | | | | | | (7,150,628) | | | | | | (3,680,894) | | | | | | 51,001,521 | | | | | | — | | | | | | — | | | | | | (108,785,155) | | | | | | (57,783,634) | | |
| 12/31/2019 | | | | | 3,148,820 | | | | | | — | | | | | | 3,686,325 | | | | | | (1,772,364) | | | | | | 5,062,781 | | | | | | 61,273,417 | | | | | | — | | | | | | 61,361,495 | | | | | | (32,081,291) | | | | | | 90,553,621 | | |
| Class R6 | | | | | | | | | | | | | | | | | | | | | | | | | | | | | | | | | | | | | | | | | | | | | | | | | | | | | | | | | | | | | |
| 12/31/2020 | | | | | 6,796,906 | | | | | | — | | | | | | — | | | | | | (2,882,333) | | | | | | 3,914,573 | | | | | | 108,537,576 | | | | | | — | | | | | | — | | | | | | (50,615,963) | | | | | | 57,921,613 | | |
| 12/31/2019 | | | | | 659,970 | | | | | | — | | | | | | 548,604 | | | | | | (271,262) | | | | | | 937,312 | | | | | | 12,104,470 | | | | | | — | | | | | | 9,098,340 | | | | | | (4,926,046) | | | | | | 16,276,764 | | |
| Class S | | | | | | | | | | | | | | | | | | | | | | | | | | | | | | | | | | | | | | | | | | | | | | | | | | | | | | | | | | | | | |
| 12/31/2020 | | | | | 510,443 | | | | | | — | | | | | | — | | | | | | (2,035,474) | | | | | | (1,525,031) | | | | | | 7,061,829 | | | | | | — | | | | | | — | | | | | | (29,738,877) | | | | | | (22,677,048) | | |
| 12/31/2019 | | | | | 658,703 | | | | | | — | | | | | | 5,496,427 | | | | | | (17,703,790) | | | | | | (11,548,660) | | | | | | 12,062,734 | | | | | | — | | | | | | 90,163,666 | | | | | | (287,137,394) | | | | | | (184,910,994) | | |
| Class S2 | | | | | | | | | | | | | | | | | | | | | | | | | | | | | | | | | | | | | | | | | | | | | | | | | | | | | | | | | | | | | |
| 12/31/2020 | | | | | 58,798 | | | | | | — | | | | | | — | | | | | | (176,495) | | | | | | (117,697) | | | | | | 805,880 | | | | | | — | | | | | | — | | | | | | (2,607,731) | | | | | | (1,801,851) | | |
| 12/31/2019 | | | | | 66,390 | | | | | | — | | | | | | 471,344 | | | | | | (1,633,302) | | | | | | (1,095,568) | | | | | | 1,210,000 | | | | | | — | | | | | | 7,636,142 | | | | | | (26,108,989) | | | | | | (17,262,847) | | |
NOTE 10 — SECURITIES LENDING
Under a Master Securities Lending Agreement (the “Agreement”) with BNY, the Portfolios can lend their securities to approved brokers, dealers and other financial institutions. Loans are collateralized by cash and U.S. government securities. The collateral is equal to at least 105% of the market value of non-U.S. securities loaned and 102% of the market value of U.S. securities loaned. The market value of the loaned securities is determined at Market Close of the Portfolios at their last sale price or official closing price on the principal exchange or system on which they are traded and any additional collateral is delivered to the Portfolios on the next business day. The cash collateral received is invested in approved investments as defined in the Agreement with BNY. The Portfolios bear the risk of loss with respect to the investment of collateral with the following exception: BNY provides the Portfolios indemnification from loss with respect to the investment of collateral to the extent the cash collateral is invested in overnight repurchase agreements.
Cash collateral received in connection with securities lending is invested in cash equivalents, money market funds, repurchase agreements with maturities of not more than 99 days that are collateralized with U.S. Government
securities, or certain short-term investments that have a remaining maturity of 190 days or less (“Permitted Investments”). Short-term investments include: securities, units, shares or other participations in short-term investment funds, pools or trusts; commercial paper, notes, bonds or other debt obligations, certificates of deposit, time deposits and other bank obligations and asset-backed commercial paper backed by diversified receivables and repurchase-backed programs. Permitted Investments are subject to certain guidelines established by the Adviser regarding liquidity, diversification, credit quality and average credit life/duration requirements. The securities purchased with cash collateral received are reflected in the Portfolio of Investments under Short-Term Investments.
Generally, in the event of counterparty default, the Portfolios have the right to use the collateral to offset losses incurred. The Agreement contains certain guarantees by BNY in the event of counterparty default and/or a borrower’s failure to return a loaned security; however, there would be a potential loss to the Portfolios in the event the Portfolios are delayed or prevented from exercising its right to dispose of the collateral. Engaging in securities lending could have a leveraging effect, which may intensify the credit, market and other risks associated with investing in a Portfolio.
NOTES TO FINANCIAL STATEMENTS as of December 31, 2020 (continued)
NOTE 10 — SECURITIES LENDING (continued)
The following tables represent a summary of each respective Portfolio’s securities lending agreements by counterparty which are subject to offset under the Agreement as of December 31, 2020:
Balanced Income
| Counterparty | | | Securities
Loaned at
Value | | | Cash
Collateral
Received(1) | | | Net Amount | |
| Barclays Bank PLC | | | | $ | 87,920 | | | | | $ | (87,920) | | | | | $ | — | | |
| Barclays Capital Inc. | | | | | 310,037 | | | | | | (310,037) | | | | | | — | | |
| BofA Securities Inc | | | | | 245,648 | | | | | | (245,648) | | | | | | — | | |
| Goldman, Sachs & Co. LLC | | | | | 126,234 | | | | | | (126,234) | | | | | | — | | |
| HSBC Bank PLC | | | | | 46,360 | | | | | | (46,360) | | | | | | — | | |
| J.P. Morgan Securities LLC | | | | | 32,677 | | | | | | (32,677) | | | | | | — | | |
| Jefferies LLC | | | | | 102,524 | | | | | | (102,524) | | | | | | — | | |
| JP Morgan Securities, Plc. | | | | | 375,979 | | | | | | (375,979) | | | | | | — | | |
| Scotia Capital (USA) INC | | | | | 64,218 | | | | | | (64,218) | | | | | | — | | |
| State Street Bank and Trust Company | | | | | 159,526 | | | | | | (159,526) | | | | | | — | | |
| UBS Securities LLC. | | | | | 315 | | | | | | (315) | | | | | | — | | |
| Total | | | | $ | 1,551,438 | | | | | $ | (1,551,438) | | | | | $ | — | | |
(1)
Cash collateral with a fair value of $1,605,627 has been received in connection with the above securities lending transactions. Excess cash collateral received from the individual counterparty is not shown for financial reporting purposes.
High Yield
| Counterparty | | | Securities
Loaned at
Value | | | Cash
Collateral
Received(1) | | | Net Amount | |
| Barclays Bank PLC | | | | $ | 3,725,578 | | | | | $ | (3,725,578) | | | | | $ | — | | |
| Barclays Capital Inc. | | | | | 4,823,028 | | | | | | (4,823,028) | | | | | | — | | |
| BMO Capital Markets Corp | | | | | 1,068,573 | | | | | | (1,068,573) | | | | | | — | | |
| BNP Paribas Securities Corp. | | | | | 337,307 | | | | | | (337,307) | | | | | | — | | |
BNP Paribas Prime Brokerage
Intl Ltd | | | | | 1,239,697 | | | | | | (1,239,697) | | | | | | — | | |
| BofA Securities Inc | | | | | 318,726 | | | | | | (318,726) | | | | | | — | | |
Credit Suisse Securities (USA)
LLC | | | | | 580,406 | | | | | | (580,406) | | | | | | — | | |
| Deutsche Bank Securities Inc. | | | | | 177,120 | | | | | | (177,120) | | | | | | — | | |
| Goldman, Sachs & Co. LLC | | | | | 3,027,261 | | | | | | (3,027,261) | | | | | | — | | |
| Janney Montgomery Scott LLC | | | | | 1,047,215 | | | | | | (1,047,215) | | | | | | — | | |
| J.P. Morgan Securities LLC | | | | | 3,819,473 | | | | | | (3,819,473) | | | | | | — | | |
| Morgan Stanley & Co. LLC | | | | | 737,238 | | | | | | (737,238) | | | | | | — | | |
| RBC Capital Markets, LLC | | | | | 611,691 | | | | | | (611,691) | | | | | | — | | |
| Scotia Capital (USA) INC | | | | | 528,333 | | | | | | (528,333) | | | | | | — | | |
| State Street Bank and Trust Company | | | | | 18,240 | | | | | | (18,240) | | | | | | — | | |
| SunTrust Robinson Humphrey,Inc | | | | | 111,821 | | | | | | (111,821) | | | | | | — | | |
| Wells Fargo Securities LLC | | | | | 2,051,760 | | | | | | (2,051,760) | | | | | | — | | |
| Total | | | | $ | 24,223,467 | | | | | $ | (24,223,467) | | | | | $ | — | | |
(1)
Cash collateral with a fair value of $24,820,659 has been received in connection with the above securities lending transactions. Excess cash collateral received from the individual counterparty is not shown for financial reporting purposes.
Large Cap Growth
| Counterparty | | | Securities
Loaned at
Value | | | Cash
Collateral
Received(1) | | | Net
Amount | |
| J.P. Morgan Securities LLC | | | | $ | 15,007,060 | | | | | $ | (15,007,060) | | | | | $ | — | | |
| Mirae Asset Securities (USA) INC. | | | | | 2,796,480 | | | | | | (2,796,480) | | | | | | — | | |
| State Street Bank and Trust Company | | | | | 4,466,003 | | | | | | (4,466,003) | | | | | | — | | |
| Wells Fargo Bank NA | | | | | 19,882,297 | | | | | | (19,882,297) | | | | | | — | | |
| Wells Fargo Securities LLC | | | | | 555,140 | | | | | | (555,140) | | | | | | — | | |
| Total | | | | $ | 42,706,980 | | | | | $ | (42,706,980) | | | | | $ | — | | |
(1)
Cash collateral with a fair value of $43,633,823 has been received in connection with the above securities lending transactions. Excess cash collateral received from the individual counterparty is not shown for financial reporting purposes.
Large Cap Value
| Counterparty | | | Securities
Loaned
at Value | | | Cash
Collateral
Received(1) | | | Net
Amount | |
| BofA Securities Inc | | | | $ | 4,050,252 | | | | | $ | (4,050,252) | | | | | $ | — | | |
| Janney Montgomery Scott LLC | | | | | 207,207 | | | | | | (207,207) | | | | | | — | | |
| Mizuho Securities USA LLC. | | | | | 15,939 | | | | | | (15,939) | | | | | | — | | |
National Bank of Canada Financial
INC | | | | | 3,120,876 | | | | | | (3,120,876) | | | | | | — | | |
| State street Bank and Trust Company | | | | | 9,727,368 | | | | | | (9,727,368) | | | | | | — | | |
| Wells Fargo Bank NA | | | | | 82,281 | | | | | | (82,281) | | | | | | — | | |
| Total | | | | $ | 17,203,923 | | | | | $ | (17,203,923) | | | | | $ | — | | |
(1)
Cash collateral with a fair value of $17,606,724 has been received in connection with the above securities lending transactions. Excess cash collateral received from the individual counterparty is not shown for financial reporting purposes.
Limited Maturity Bond
| Counterparty | | | Securities
Loaned
at Value | | | Cash
Collateral
Received(1) | | | Net
Amount | |
| Citadel Clearing LLC | | | | $ | 55,516 | | | | | $ | (55,516) | | | | | $ | — | | |
| Citigroup Global Markets Inc. | | | | | 665,094 | | | | | | (665,094) | | | | | | — | | |
| Jefferies LLC | | | | | 358,395 | | | | | | (358,395) | | | | | | — | | |
| Morgan Stanley & Co. LLC | | | | | 103,005 | | | | | | (103,005) | | | | | | — | | |
| Total | | | | $ | 1,182,010 | | | | | $ | (1,182,010) | | | | | $ | — | | |
(1)
Cash collateral with a fair value of $1,212,194 has been received in connection with the above securities lending transactions. Excess cash collateral received from the individual counterparty is not shown for financial reporting purposes.
NOTES TO FINANCIAL STATEMENTS as of December 31, 2020 (continued)
NOTE 10 — SECURITIES LENDING (continued)
U.S. Stock Index
| Counterparty | | | Securities
Loaned
at Value | | | Cash
Collateral
Received(1) | | | Net
Amount | |
| Barclays Bank PLC | | | | $ | 24,923 | | | | | $ | (24,923) | | | | | $ | — | | |
| Barclays Capital Inc. | | | | | 85,304 | | | | | | (85,304) | | | | | | — | | |
| BofA Securities Inc | | | | | 2,313,540 | | | | | | (2,313,540) | | | | | | — | | |
| Citigroup Global Markets Inc. | | | | | 1,037,926 | | | | | | (1,037,926) | | | | | | — | | |
| Credit Suisse Securities (USA) LLC | | | | | 360,037 | | | | | | (360,037) | | | | | | — | | |
| Goldman, Sachs & Co. LLC | | | | | 1,785,819 | | | | | | (1,785,819) | | | | | | — | | |
| Jefferies LLC | | | | | 450,315 | | | | | | (450,315) | | | | | | — | | |
| J.P. Morgan Securities LLC | | | | | 153,860,055 | | | | | | (153,860,055) | | | | | | — | | |
| Mizuho Securities USA LLC. | | | | | 1,020,886 | | | | | | (1,020,886) | | | | | | — | | |
| Morgan Stanley & Co. LLC | | | | | 3,903,994 | | | | | | (3,903,994) | | | | | | — | | |
| National Financial Services LLC | | | | | 1,445,499 | | | | | | (1,445,499) | | | | | | — | | |
| Natixis Securities America LLC | | | | | 3,230 | | | | | | (3,230) | | | | | | — | | |
| National Bank of Canada Financial INC | | | | | 3,054,908 | | | | | | (3,054,908) | | | | | | — | | |
| State Street Bank and Trust company | | | | | 13,894,376 | | | | | | (13,894,376) | | | | | | — | | |
| UBS AG | | | | | 328,887 | | | | | | (328,887) | | | | | | — | | |
| UBS Securities LLC. | | | | | 408,950 | | | | | | (408,950) | | | | | | — | | |
| Wells Fargo Bank NA | | | | | 1,603,396 | | | | | | (1,603,396) | | | | | | — | | |
| Wells Fargo Securities LLC | | | | | 6,894,327 | | | | | | (6,894,327) | | | | | | — | | |
| Total | | | | $ | 192,476,372 | | | | | $ | (192,476,372) | | | | | $ | — | | |
(1)
Cash collateral with a fair value of $196,535,392 has been received in connection with the above securities lending transactions. Excess cash collateral received from the individual counterparty is not shown for financial reporting purposes.
Clarion Real Estate
| Counterparty | | | Securities
Loaned
at Value | | | Cash
Collateral
Received(1) | | | Net
Amount | |
| BofA Securities Inc | | | | $ | 1,654,182 | | | | | $ | (1,654,182) | | | | | $ | — | | |
| Natixis Securities America LLC | | | | | 25,601 | | | | | | (25,601) | | | | | | — | | |
| Total | | | | $ | 1,679,783 | | | | | $ | (1,679,783) | | | | | $ | — | | |
(1)
Cash collateral with a fair value of $1,714,962 has been received in connection with the above securities lending transactions. Excess cash collateral received from the individual counterparty is not shown for financial reporting purposes.
JPMorgan Small Cap Core Equity
| Counterparty | | | Securities
Loaned
at Value | | | Cash
Collateral
Received(1) | | | Net
Amount | |
| Barclays Capital Inc. | | | | $ | 62,231 | | | | | $ | (62,231) | | | | | $ | — | | |
BNP Paribas Prime Brokerage Intl
Ltd | | | | | 1,418,008 | | | | | | (1,418,008) | | | | | | — | | |
| BofA Securities Inc | | | | | 799,408 | | | | | | (799,408) | | | | | | — | | |
| Citadel Securiites LLC | | | | | 141,403 | | | | | | (141,403) | | | | | | — | | |
| Citigroup Global Markets Inc. | | | | | 1,559,579 | | | | | | (1,559,579) | | | | | | — | | |
| Credit Suisse Securities (USA) LLC | | | | | 32,370 | | | | | | (32,370) | | | | | | — | | |
| Daiwa Capital Markets America Inc. | | | | | 2,044,673 | | | | | | (2,044,673) | | | | | | — | | |
| Deutsche Bank Securities Inc. | | | | | 100,112 | | | | | | (100,112) | | | | | | — | | |
| Goldman, Sachs & Co. LLC | | | | | 1,188,116 | | | | | | (1,188,116) | | | | | | — | | |
| Jefferies LLC | | | | | 1,136,427 | | | | | | (1,136,427) | | | | | | — | | |
| Mizuho Securities USA LLC. | | | | | 3,214 | | | | | | (3,214) | | | | | | — | | |
| Morgan Stanley & Co. LLC | | | | | 2,918,155 | | | | | | (2,918,155) | | | | | | — | | |
National Bank of Canada Financial
INC | | | | | 441,787 | | | | | | (441,787) | | | | | | — | | |
| National Financial Services LLC | | | | | 645,104 | | | | | | (645,104) | | | | | | — | | |
| Natixis Securities America LLC | | | | | 407,157 | | | | | | (407,157) | | | | | | — | | |
| Nomura Securities International, Inc. | | | | | 145,247 | | | | | | (145,247) | | | | | | — | | |
| Raymond James & Associates, Inc. | | | | | 46,812 | | | | | | (46,812) | | | | | | — | | |
| SG Americas Securities, LLC | | | | | 2,178 | | | | | | (2,178) | | | | | | — | | |
| State Street Bank and Trust Company | | | | | 17,307 | | | | | | (17,307) | | | | | | — | | |
| UBS AG | | | | | 785,608 | | | | | | (785,608) | | | | | | — | | |
| UBS Securities LLC. | | | | | 25,896 | | | | | | (25,896) | | | | | | — | | |
| Wells Fargo Securities LLC | | | | | 487,547 | | | | | | (487,547) | | | | | | — | | |
| Total | | | | $ | 14,408,339 | | | | | $ | (14,408,339) | | | | | $ | — | | |
(1)
Cash collateral with a fair value of $14,734,711 has been received in connection with the above securities lending transactions. Excess cash collateral received from the individual counterparty is not shown for financial reporting purposes.
NOTE 11 — FEDERAL INCOME TAXES
The amount of distributions from net investment income and net realized capital gains are determined in accordance with federal income tax regulations, which may differ from GAAP for investment companies. These book/tax differences may be either temporary or permanent. Permanent differences are reclassified within the capital accounts based on their federal tax-basis treatment; temporary differences are not reclassified. Key differences include the treatment of foreign currency transactions, futures contracts, capital loss carryforwards, paydowns, straddle loss deferrals and wash sale deferrals. Distributions in excess of net investment income and/or net realized capital gains for tax purposes are reported as return of capital.
NOTES TO FINANCIAL STATEMENTS as of December 31, 2020 (continued)
NOTE 11 — FEDERAL INCOME TAXES (continued)
The following permanent tax differences have been reclassified as of December 31, 2020:
| | | | Paid-in
Capital | | | Distributable
Earnings | |
| High Yield | | | | $ | (71,853) | | | | | $ | 71,853 | | |
| JPMorgan Small Cap Core Equity | | | | | (32,450) | | | | | | 32,450 | | |
Dividends paid by the Portfolios from net investment income and distributions of net realized short-term capital gains are, for federal income tax purposes, taxable as ordinary income to shareholders.
The tax composition of dividends and distributions to shareholders was as follows:
| | | | Year Ended December 31, 2020 | | | Year Ended December 31, 2019 | |
| | | | Ordinary
Income | | | Long-term
Capital Gains | | | Return of
Capital | | | Ordinary
Income | | | Long-term
Capital Gains | | | Return of
Capital | |
| Balanced Income | | | | $ | 21,828,359 | | | | | $ | 14,167,103 | | | | | $ | — | | | | | $ | 17,507,119 | | | | | $ | 22,330,665 | | | | | $ | — | | |
| High Yield | | | | | 28,067,198 | | | | | | — | | | | | | 294,300 | | | | | | 27,626,712 | | | | | | — | | | | | | — | | |
| Large Cap Growth | | | | | 31,912,449 | | | | | | 669,820,320 | | | | | | — | | | | | | 92,570,069 | | | | | | 861,560,330 | | | | | | — | | |
| Large Cap Value | | | | | 19,583,697 | | | | | | 85,420,555 | | | | | | — | | | | | | 20,135,479 | | | | | | 75,474,848 | | | | | | — | | |
| Limited Maturity Bond | | | | | 7,979,614 | | | | | | — | | | | | | — | | | | | | 4,822,692 | | | | | | — | | | | | | — | | |
| U.S. Stock Index | | | | | 137,870,577 | | | | | | 271,478,624 | | | | | | — | | | | | | 102,304,549 | | | | | | 350,050,354 | | | | | | — | | |
| Clarion Real Estate | | | | | 14,713,230 | | | | | | 18,868,227 | | | | | | — | | | | | | 6,789,635 | | | | | | 1,619,442 | | | | | | — | | |
| JPMorgan Small Cap Core Equity | | | | | — | | | | | | — | | | | | | — | | | | | | 17,498,317 | | | | | | 175,897,372 | | | | | | 9,547,328 | | |
The tax-basis components of distributable earnings and the capital loss carryforwards which may be used to offset future realized capital gains for federal income tax purposes as of December 31, 2020 were:
| | | | Undistributed
Ordinary
Income | | | Undistributed
Long-term
Capital Gains | | | Unrealized
Appreciation/
(Depreciation) | | | Capital Loss Carryforwards | |
| | | | Amount | | | Character | | | Expiration | |
| Balanced Income | | | | $ | 7,904,895 | | | | | $ | — | | | | | $ | 29,800,383 | | | | | $ | (7,029,923) | | | | Short-term | | | | | None | | |
| | | | | | | | | | | | | | | | | | | | | | | | (5,799,991) | | | | Long-term | | | ��� | | None | | |
| | | | | | | | | | | | | | | | | | | | | | | $ | (12,829,914) | | | | | | | | | | | |
| High Yield | | | | | — | | | | | | — | | | | | | 34,591,166 | | | | | | (6,970,054) | | | | Short-term | | | | | None | | |
| | | | | | | | | | | | | | | | | | | | | | | | (51,171,152) | | | | Long-term | | | | | None | | |
| | | | | | | | | | | | | | | | | | | | | | | $ | (58,141,206) | | | | | | | | | | | |
| Large Cap Growth | | | | | 245,070,058 | | | | | | 908,603,578 | | | | | | 1,618,910,762 | | | | | | — | | | | — | | | | | — | | |
| Large Cap Value | | | | | 1,180,544 | | | | | | 12,721,120 | | | | | | 130,064,846 | | | | | | — | | | | — | | | | | — | | |
| Limited Maturity Bond | | | | | 1,636,649 | | | | | | — | | | | | | 3,858,212 | | | | | | (216,505) | | | | Long-term | | | | | None | | |
| U.S. Stock Index | | | | | 8,702,208 | | | | | | 724,836,786 | | | | | | 3,041,124,837 | | | | | | — | | | | — | | | | | — | | |
| Clarion Real Estate | | | | | 4,737,632 | | | | | | — | | | | | | 14,966,211 | | | | | | (13,570,778) | | | | Short-term | | | | | None | | |
| JPMorgan Small Cap Core Equity | | | | | 9,561,293 | | | | | | 25,500,746 | | | | | | 130,663,024 | | | | | | — | | | | — | | | | | — | | |
The Portfolios’ major tax jurisdictions are U.S. federal, Arizona state, and Massachusetts state.
As of December 31, 2020, no provision for income tax is required in the Portfolios’ financial statements as a result of tax positions taken on federal and state income tax returns for open tax years. The Portfolios’ federal and state income and federal excise tax returns for tax years for which the applicable statutes of limitations have not expired are subject to examination by the Internal Revenue Service and state department of revenue. Generally, the preceding four tax years remain subject to examination by these jurisdictions.
NOTE 12 — LONDON INTERBANK OFFERED RATE (“LIBOR”)
The U.K. Financial Conduct Authority has announced that it intends to stop persuading or compelling banks to submit LIBOR rates after 2021, and it remains unclear whether
LIBOR will continue to exist after that date and, if so, in what form. Actions by regulators have resulted in the establishment of alternative reference rates to LIBOR in many major currencies. The U.S. Federal Reserve Board, based on the recommendations of the New York Federal
NOTES TO FINANCIAL STATEMENTS as of December 31, 2020 (continued)
NOTE 12 — LONDON INTERBANK OFFERED RATE (“LIBOR”) (continued)
Reserve’s Alternative Reference Rate Committee (comprised of major derivative market participants and their regulators), has begun publishing a Secured Overnight Funding Rate (“SOFR”) that is intended to replace U.S. dollar LIBOR. Proposals for alternative reference rates for other currencies have also been announced or have already begun publication.
Discontinuance of LIBOR and adoption/implementation of alternative rates pose a number of risks, including among others whether any substitute rate will experience the market participation and liquidity necessary to provide a workable substitute for LIBOR; the effect on parties’ existing contractual arrangements, hedging transactions, and investment strategies generally from a conversion from LIBOR to alternative rates; the effect on a Portfolio’s existing investments (including, for example, fixed-income investments; senior loans; CLOs and CDOs; and derivatives transactions), including the possibility that some of those investments may terminate or their terms may be adjusted to the disadvantage of a Portfolio; and the risk of general market disruption during the period of the conversion. It is difficult to predict at this time the likely impact of the transition away from LIBOR on a Portfolio. On November 30, 2020, the administrator of LIBOR announced a delay in the phase out of a majority of the U.S. dollar LIBOR publications until June 30, 2023, with the remainder of LIBOR publications to still end at the end of 2021.
NOTE 13 — MARKET DISRUPTION
A Portfolio is subject to the risk that geopolitical events will disrupt securities markets and adversely affect global economies and markets. Due to the increasing interdependence among global economies and markets, conditions in one country, market, or region might adversely impact markets, issuers and/or foreign exchange rates in other countries, including the United States. War, terrorism, global health crises and pandemics, and other geopolitical events have led, and in the future may lead, to increased market volatility and may have adverse short- or long-term effects on U.S. and world economies and markets generally. For example, the COVID-19 pandemic has resulted, and may continue to result, in significant market volatility, exchange trading suspensions and closures, declines in global financial markets, higher default rates, and a substantial economic downturn in economies throughout the world. Natural and environmental disasters and systemic market dislocations are also highly disruptive to economies and markets. Those events as well as other changes in non-U.S. and domestic economic, social, and political conditions also
could adversely affect individual issuers or related groups of issuers, securities markets, interest rates, credit ratings, inflation, investor sentiment, and other factors affecting the value of the investments of the portfolio and of the Portfolios. Any of these occurrences could disrupt the operations of a Portfolio and of the Portfolios’ service providers.
NOTE 14 — OTHER ACCOUNTING PRONOUNCEMENTS
The Portfolios have adopted the provisions of Financial Accounting Standards Board Accounting Standards Update 2018-13 (“ASU 2018-13”), Fair Value Measurement (Topic 820): Disclosure Framework — Changes to the Disclosure Requirements for Fair Value Measurement. ASU 2018-13 introduces new fair value disclosure requirements as well as provides guidance that eliminates, adds and modifies certain disclosure requirements for fair value measurements. The impact of the Portfolios’ adoption was limited to changes in the Portfolios’ financial statement disclosures regarding fair value, primarily those disclosures related to transfers between levels of the fair value hierarchy and disclosure of the range and weighted average used to develop significant unobservable inputs for Level 3 fair value measurements, when applicable. Upon evaluation, the Portfolios have concluded that the adoption of the new accounting standard does not materially impact the financial statement amounts.
In March 2020, the Financial Accounting Standards Board issued Accounting Standards Update No. 2020-04 (“ASU 2020-04”), Reference Rate Reform (Topic 848) — Facilitation of the Effects of Reference Rate Reform on Financial Reporting. The amendments in ASU 2020-04 provide optional temporary financial reporting relief from the effect of certain types of contract modifications due to the planned discontinuation of LIBOR and other interbank-offered based reference rates as of the end of 2021. ASU 2020-04 is effective for certain reference rate-related contract modifications that occur during the period March 12, 2020 through December 31, 2022. Management is currently evaluating the impact, if any, of applying ASU 2020-04.
NOTE 15 — REORGANIZATION
On August 23, 2019, High Yield (“Acquiring Portfolio”) acquired all of the net assets and assumed all liabilities of VY® Pioneer High Yield Portfolio (“Acquired Portfolio”), an open-end investment company that is not included in this report, in a tax-free reorganization in exchange for shares of the Acquiring Portfolio, pursuant to a plan of reorganization approved by the shareholders of the Acquired Portfolio on July 30, 2019. For financial reporting
NOTES TO FINANCIAL STATEMENTS as of December 31, 2020 (continued)
NOTE 15 — REORGANIZATION (continued)
purposes, assets received and shares issued by the Acquiring Portfolio were recorded at fair value; however, the cost basis of the investments received from the Acquired Portfolio were carried forward to align ongoing reporting of the Acquiring Portfolio’s realized and unrealized gains and losses with amounts distributable to shareholders for tax purposes.
Assuming the acquisition had been completed on January 1, 2019, the beginning of the annual reporting period of the Acquiring Portfolio, the Acquiring Portfolio’s pro forma results of operations for the year ended December 31, 2019, are as follows (Unaudited):
| | Net investment income | | | | $ | 32,344,944 | | |
| | Net realized and unrealized loss on investments | | | | $ | 49,001,240 | | |
| | Net decrease in net assets resulting from operations | | | | $ | 81,346,184 | | |
Because the combined investment portfolios have been managed as a single integrated portfolio since the acquisition was completed, it is not practicable to separate the amounts of revenue and earnings of the Acquired Portfolio that have been included in the Acquiring Portfolio’s statement of operations since August 23, 2019. Net assets and unrealized appreciation or depreciation as of the reorganization date were as follows:
| | Total Net
Assets of
Acquired
Portfolio
(000s) | | | Total Net
Assets of
Acquiring
Portfolio
(000s) | | | Acquired
Portfolio’s
Capital Loss
Carryforwards
(000s) | | | Acquired
Portfolio’s
Unrealized
Depreciation
(000s) | | | Portfolios’
Conversion
Ratio | |
| | $98,023 | | | | $ | 492,447 | | | | | $ | 3,146 | | | | | $ | 911 | | | | | | 1.1651 | | |
The net assets of the Acquiring Portfolio after the acquisition of Acquired Portfolio were $590,470,175.
NOTE 16 — SUBSEQUENT EVENTS
Dividends: Subsequent to December 31, 2020, the following Portfolios paid dividends from net investment income of:
| | | | Per Share
Amount | | | Payable
Date | | | Record
Date | |
| High Yield | | | | | | | | | | | | | | | | |
| Class ADV | | | | $ | 0.0416 | | | | February 1, 2021 | | | | | Daily | | |
| Class I | | | | $ | 0.0467 | | | | February 1, 2021 | | | | | Daily | | |
| Class S | | | | $ | 0.0445 | | | | February 1, 2021 | | | | | Daily | | |
| Class S2 | | | | $ | 0.0434 | | | | February 1, 2021 | | | | | Daily | | |
| Limited Maturity Bond | | | | | | | | | | | | | | | | |
| Class ADV | | | | $ | 0.0138 | | | | February 1, 2021 | | | | | Daily | | |
| Class I | | | | $ | 0.0193 | | | | February 1, 2021 | | | | | Daily | | |
| Class S | | | | $ | 0.0172 | | | | February 1, 2021 | | | | | Daily | | |
The Portfolios have evaluated events occurring after the Statements of Assets and Liabilities date through the date that the financial statements were issued (“subsequent events”) to determine whether any subsequent events necessitated adjustment to or disclosure in the financial statements. Other than above, no such subsequent events were identified.
SUMMARY PORTFOLIO OF INVESTMENTS
| Voya Balanced Income Portfolio | as of December 31, 2020 |
| Shares | | | Value | | | Percentage
of Net
Assets | |
| COMMON STOCK: 44.8% | |
| | | | Communication Services: 2.7% | |
| 13,213 | | | Activision Blizzard, Inc. | | | | $ | 1,226,827 | | | | | | 0.4 | | |
| 56,310 | | | AT&T, Inc. | | | | | 1,619,476 | | | | | | 0.5 | | |
| 35,993 | | | Comcast Corp. — Class A | | | | | 1,886,033 | | | | | | 0.5 | | |
| 30,130 | | | Verizon Communications,
Inc. | | | | | 1,770,137 | | | | | | 0.5 | | |
| 319,341 | | | Other Securities | | | | | 2,743,371 | | | | | | 0.8 | | |
| | | | | | | | | 9,245,844 | | | | | | 2.7 | | |
| | | | Consumer Discretionary: 2.5% | |
| 7,311 | | | Target Corp. | | | | | 1,290,611 | | | | | | 0.4 | | |
| 106,409 (1) | | | Other Securities | | | | | 7,235,319 | | | | | | 2.1 | | |
| | | | | | | | | 8,525,930 | | | | | | 2.5 | | |
| | | | Consumer Staples: 3.9% | |
| 8,994 | | | PepsiCo, Inc. | | | | | 1,333,810 | | | | | | 0.4 | | |
| 16,880 | | | Philip Morris International,
Inc. | | | | | 1,397,495 | | | | | | 0.4 | | |
| 15,777 | | | Procter & Gamble Co. | | | | | 2,195,212 | | | | | | 0.6 | | |
| 9,393 | | | Walmart, Inc. | | | | | 1,354,001 | | | | | | 0.4 | | |
| 188,550 | | | Other Securities | | | | | 7,407,730 | | | | | | 2.1 | | |
| | | | | | | | | 13,688,248 | | | | | | 3.9 | | |
| | | | Energy: 1.1% | |
| 254,542 (1) | | | Other Securities | | | | | 3,830,114 | | | | | | 1.1 | | |
| | |
| | | | Financials: 3.9% | |
| 11,046 | | | JPMorgan Chase & Co. | | | | | 1,403,615 | | | | | | 0.4 | | |
| 382,639 (2) | | | Other Securities | | | | | 12,211,354 | | | | | | 3.5 | | |
| | | | | | | | | 13,614,969 | | | | | | 3.9 | | |
| | | | Health Care: 6.8% | |
| 16,331 | | | AbbVie, Inc. | | | | | 1,749,867 | | | | | | 0.5 | | |
| 5,761 | | | Amgen, Inc. | | | | | 1,324,569 | | | | | | 0.4 | | |
| 22,526 | | | Bristol-Myers Squibb Co. | | | | | 1,397,288 | | | | | | 0.4 | | |
| 8,848 | | | Eli Lilly & Co. | | | | | 1,493,896 | | | | | | 0.4 | | |
| 16,217 | | | Johnson & Johnson | | | | | 2,552,231 | | | | | | 0.7 | | |
| 20,047 | | | Merck & Co., Inc. | | | | | 1,639,845 | | | | | | 0.5 | | |
| 45,000 | | | Pfizer, Inc. | | | | | 1,656,450 | | | | | | 0.5 | | |
| 145,804 (2) | | | Other Securities | | | | | 11,761,715 | | | | | | 3.4 | | |
| | | | | | | | | 23,575,861 | | | | | | 6.8 | | |
| | | | Industrials: 4.4% | |
| 242,538 (2) | | | Other Securities | | | | | 15,121,474 | | | | | | 4.4 | | |
| | |
| | | | Information Technology: 14.8% | |
| 6,015 | | | Accenture PLC | | | | | 1,571,178 | | | | | | 0.4 | | |
| 7,868 | | | Automatic Data
Processing, Inc. | | | | | 1,386,342 | | | | | | 0.4 | | |
| Shares | | | Value | | | Percentage
of Net
Assets | |
| COMMON STOCK: (continued) | |
| | | | Information Technology (continued) | |
| 37,919 | | | Cisco Systems, Inc. | | | | $ | 1,696,875 | | | | | | 0.5 | | |
| 33,480 | | | Intel Corp. | | | | | 1,667,974 | | | | | | 0.5 | | |
| 3,529 | | | Intuit, Inc. | | | | | 1,340,491 | | | | | | 0.4 | | |
| 34,268 | | | Microsoft Corp. | | | | | 7,621,888 | | | | | | 2.2 | | |
| 3,315 | | | Monolithic Power Systems,
Inc. | | | | | 1,214,052 | | | | | | 0.3 | | |
| 4,003 | | | Nvidia Corp. | | | | | 2,090,367 | | | | | | 0.6 | | |
| 21,217 | | | Oracle Corp. | | | | | 1,372,528 | | | | | | 0.4 | | |
| 500 | | | Oracle Corp. Japan | | | | | 65,177 | | | | | | 0.0 | | |
| 11,715 | | | Qualcomm, Inc. | | | | | 1,784,663 | | | | | | 0.5 | | |
| 9,594 | | | Texas Instruments, Inc. | | | | | 1,574,663 | | | | | | 0.5 | | |
| 8,793 | | | Xilinx, Inc. | | | | | 1,246,584 | | | | | | 0.4 | | |
| 437,539 (1) | | | Other Securities | | | | | 26,638,075 | | | | | | 7.7 | | |
| | | | | | | | | 51,270,857 | | | | | | 14.8 | | |
| | | | Materials: 2.0% | |
| 119,824 | | | Other Securities | | | | | 6,932,213 | | | | | | 2.0 | | |
| | |
| | | | Real Estate: 0.5% | |
| 17,272 | | | Other Securities | | | | | 1,706,857 | | | | | | 0.5 | | |
| | |
| | | | Utilities: 2.2% | |
229,378 (1)(2) | | | Other Securities | | | | | 7,672,079 | | | | | | 2.2 | | |
| | | | Total Common Stock
(Cost $123,224,404) | | | | | 155,184,446 | | | | | | 44.8 | | |
| EXCHANGE-TRADED FUNDS: 0.2% | |
| 4,305 | | | Other Securities | | | | | 675,320 | | | | | | 0.2 | | |
| | | | Total Exchange-Traded
Funds
(Cost $622,394) | | | | | 675,320 | | | | | | 0.2 | | |
| MUTUAL FUNDS: 7.7% | |
| | | | Affiliated Investment Companies: 7.7% | |
| 2,712,877 | | | Voya Floating Rate
Fund — Class P | | | | | 24,307,381 | | | | | | 7.0 | | |
| 280,943 | | | Voya High Yield Bond
Fund — Class P | | | | | 2,264,400 | | | | | | 0.7 | | |
| | | | Total Mutual Funds
(Cost $27,861,222) | | | | | 26,571,781 | | | | | | 7.7 | | |
| PREFERRED STOCK: 0.4% | |
| | | | Consumer Staples: 0.0% | |
| 223 | | | Other Securities | | | | | 25,144 | | | | | | 0.0 | | |
| | |
| | | | Financials: 0.4% | |
| 50 (3)(4) | | | Fannie Mae | | | | | 1,562,500 | | | | | | 0.4 | | |
| | | | Total Preferred Stock
(Cost $4,117,533) | | | | | 1,587,644 | | | | | | 0.4 | | |
| |
See Accompanying Notes to Financial Statements
SUMMARY PORTFOLIO OF INVESTMENTS
| Voya Balanced Income Portfolio | as of December 31, 2020 (continued) |
| Shares | | | Value | | | Percentage
of Net
Assets | |
| RIGHTS: 0.0% | |
| | | | Energy: 0.0% | |
| 2,302 (2) | | | Other Securities | | | | $ | 790 | | | | | | 0.0 | | |
| | | | Total Rights
(Cost $813) | | | | | 790 | | | | | | 0.0 | | |
| OTHER(5): — % | |
| | | | Consumer Discretionary: —% | |
120,000 (6)(7) | | | General Motors Co.
Escrow | | | | | — | | | | | | — | | |
| | | | Total Other
(Cost $—) | | | | | — | | | | | | — | | |
| |
Principal
Amount† | | | Value | | | Percentage
of Net
Assets | |
| CORPORATE BONDS/NOTES: 8.4% | |
| | | | Basic Materials: 0.7% | |
| 200,000 (8) | | | Celulosa Arauco y
Constitucion SA, 4.250%,
04/30/2029 | | | | | 225,377 | | | | | | 0.1 | | |
| 70,000 (8) | | | Cleveland-Cliffs, Inc., 6.750%,
03/15/2026 | | | | | 75,687 | | | | | | 0.0 | | |
| 70,000 (8) | | | Compass Minerals
International, Inc., 6.750%,
12/01/2027 | | | | | 76,007 | | | | | | 0.0 | | |
| 70,000 (8) | | | Element Solutions, Inc.,
3.875%, 09/01/2028 | | | | | 72,144 | | | | | | 0.0 | | |
| 250,000 (8) | | | Evraz PLC, 5.250%,
04/02/2024 | | | | | 274,356 | | | | | | 0.1 | | |
| 200,000 (8) | | | Gold Fields Orogen Holdings
BVI Ltd., 5.125%, 05/15/2024 | | | | | 221,771 | | | | | | 0.1 | | |
| 70,000 (8) | | | Hudbay Minerals, Inc.,
6.125%, 04/01/2029 | | | | | 75,600 | | | | | | 0.0 | | |
| 70,000 (8) | | | Illuminate Buyer LLC /
Illuminate Holdings IV, Inc.,
9.000%, 07/01/2028 | | | | | 77,087 | | | | | | 0.0 | | |
| 18,000 (8) | | | Joseph T Ryerson & Son,
Inc., 8.500%, 08/01/2028 | | | | | 20,419 | | | | | | 0.0 | | |
| 70,000 (8) | | | Kraton Polymers LLC / Kraton
Polymers Capital Corp.,
4.250%, 12/15/2025 | | | | | 71,494 | | | | | | 0.0 | | |
| 225,000 (8) | | | MMK International Capital
DAC, 4.375%, 06/13/2024 | | | | | 243,077 | | | | | | 0.1 | | |
| 70,000 (8) | | | Novelis Corp., 5.875%,
09/30/2026 | | | | | 73,238 | | | | | | 0.0 | | |
| 70,000 (8) | | | Rayonier AM Products, Inc.,
7.625%, 01/15/2026 | | | | | 73,080 | | | | | | 0.0 | | |
| 70,000 (8) | | | Schweitzer-Mauduit
International, Inc., 6.875%,
10/01/2026 | | | | | 74,449 | | | | | | 0.0 | | |
| 70,000 (8) | | | Trinseo Materials Operating
SCA / Trinseo Materials
Finance, Inc., 5.375%,
09/01/2025 | | | | | 71,619 | | | | | | 0.0 | | |
Principal
Amount† | | | Value | | | Percentage
of Net
Assets | |
| CORPORATE BONDS/NOTES: (continued) | |
| | | | Basic Materials (continued) | |
| 30,000 (8) | | | Tronox, Inc., 6.500%,
04/15/2026 | | | | $ | 31,275 | | | | | | 0.0 | | |
| 115,000 (8) | | | Venator Finance Sarl /
Venator Materials LLC,
5.750%, 07/15/2025 | | | | | 107,741 | | | | | | 0.1 | | |
| 70,000 (8) | | | WR Grace & Co-Conn,
4.875%, 06/15/2027 | | | | | 74,324 | | | | | | 0.0 | | |
| 600,000 | | | Other Securities | | | | | 658,782 | | | | | | 0.2 | | |
| | | | | | | | | 2,597,527 | | | | | | 0.7 | | |
| | | | Communications: 0.7% | |
| 70,000 (8) | | | ANGI Group LLC, 3.875%,
08/15/2028 | | | | | 71,373 | | | | | | 0.0 | | |
| 70,000 (8) | | | CCO Holdings LLC / CCO
Holdings Capital Corp.,
5.125%, 05/01/2027 | | | | | 74,377 | | | | | | 0.0 | | |
| 70,000 (8) | | | CommScope Technologies
LLC, 5.000%, 03/15/2027 | | | | | 69,431 | | | | | | 0.0 | | |
| 70,000 (8) | | | Consolidated
Communications, Inc.,
6.500%, 10/01/2028 | | | | | 75,005 | | | | | | 0.1 | | |
| 64,000 (8) | | | Cumulus Media New
Holdings, Inc., 6.750%,
07/01/2026 | | | | | 65,545 | | | | | | 0.0 | | |
| 35,000 (8) | | | Diamond Sports Group LLC /
Diamond Sports Finance Co.,
5.375%, 08/15/2026 | | | | | 28,503 | | | | | | 0.0 | | |
| 35,000 (8)(9) | | | Diamond Sports Group LLC /
Diamond Sports Finance Co.,
6.625%, 08/15/2027 | | | | | 21,219 | | | | | | 0.0 | | |
| 70,000 (8)(9) | | | Entercom Media Corp.,
7.250%, 11/01/2024 | | | | | 69,956 | | | | | | 0.0 | | |
| 70,000 (8) | | | Frontier Communications
Corp., 5.000%, 05/01/2028 | | | | | 73,106 | | | | | | 0.0 | | |
| 70,000 (8) | | | GCI LLC, 4.750%, 10/15/2028 | | | | | 74,790 | | | | | | 0.0 | | |
| 70,000 (8) | | | LogMeIn, Inc., 5.500%,
09/01/2027 | | | | | 73,413 | | | | | | 0.0 | | |
| 70,000 (8) | | | Match Group Holdings II LLC,
4.125%, 08/01/2030 | | | | | 72,746 | | | | | | 0.0 | | |
| 70,000 (8) | | | MDC Partners, Inc., 6.500%,
05/01/2024 | | | | | 71,068 | | | | | | 0.0 | | |
| 70,000 (8) | | | Midcontinent Communications
/ Midcontinent Finance Corp.,
5.375%, 08/15/2027 | | | | | 73,399 | | | | | | 0.0 | | |
| 30,000 (8) | | | National CineMedia LLC,
5.875%, 04/15/2028 | | | | | 25,500 | | | | | | 0.0 | | |
| 70,000 (8) | | | Nexstar Broadcasting, Inc.,
5.625%, 07/15/2027 | | | | | 75,097 | | | | | | 0.1 | | |
| 70,000 (8) | | | Radiate Holdco LLC / Radiate
Finance, Inc., 4.500%,
09/15/2026 | | | | | 72,363 | | | | | | 0.0 | | |
| 70,000 (8) | | | Scripps Escrow II, Inc.,
3.875%, 01/15/2029 | | | | | 73,106 | | | | | | 0.0 | | |
See Accompanying Notes to Financial Statements
SUMMARY PORTFOLIO OF INVESTMENTS
| Voya Balanced Income Portfolio | as of December 31, 2020 (continued) |
Principal
Amount† | | | Value | | | Percentage
of Net
Assets | |
| CORPORATE BONDS/NOTES: (continued) | |
| | | | Communications (continued) | |
| 70,000 (8) | | | Sinclair Television
Group, Inc., 4.125%,
12/01/2030 | | | | $ | 71,820 | | | | | | 0.0 | | |
| 70,000 (8) | | | Sirius XM Radio, Inc.,
5.000%, 08/01/2027 | | | | | 74,478 | | | | | | 0.0 | | |
| 70,000 (8) | | | Terrier Media Buyer, Inc.,
8.875%, 12/15/2027 | | | | | 77,306 | | | | | | 0.1 | | |
| 70,000 (8) | | | Univision Communications,
Inc., 6.625%, 06/01/2027 | | | | | 75,304 | | | | | | 0.1 | | |
| 70,000 (8) | | | ViaSat, Inc., 5.625%,
09/15/2025 | | | | | 71,684 | | | | | | 0.0 | | |
| 70,000 (8) | | | Zayo Group Holdings, Inc.,
6.125%, 03/01/2028 | | | | | 74,145 | | | | | | 0.0 | | |
| 840,000 | | | Other Securities | | | | | 941,011 | | | | | | 0.3 | | |
| | | | | | | | | 2,545,745 | | | | | | 0.7 | | |
| | | | Consumer, Cyclical: 1.3% | |
| 70,000 (8) | | | 1011778 BC ULC / New Red
Finance, Inc., 4.000%,
10/15/2030 | | | | | 71,079 | | | | | | 0.0 | | |
| 70,000 (8) | | | Academy Ltd., 6.000%,
11/15/2027 | | | | | 73,500 | | | | | | 0.0 | | |
| 70,000 (8) | | | Adams Homes, Inc., 7.500%,
02/15/2025 | | | | | 73,544 | | | | | | 0.0 | | |
| 70,000 (8) | | | Affinity Gaming, 6.875%,
12/15/2027 | | | | | 73,412 | | | | | | 0.0 | | |
| 70,000 (8) | | | Allison Transmission, Inc.,
5.875%, 06/01/2029 | | | | | 77,621 | | | | | | 0.1 | | |
| 70,000 (8) | | | Ashton Woods USA LLC /
Ashton Woods Finance Co.,
6.750%, 08/01/2025 | | | | | 73,055 | | | | | | 0.0 | | |
| 70,000 (8) | | | Beacon Roofing Supply, Inc.,
4.875%, 11/01/2025 | | | | | 71,790 | | | | | | 0.0 | | |
| 70,000 (8) | | | Boyd Gaming Corp., 8.625%,
06/01/2025 | | | | | 77,941 | | | | | | 0.1 | | |
| 70,000 (8) | | | Caesars Entertainment, Inc.,
6.250%, 07/01/2025 | | | | | 74,638 | | | | | | 0.0 | | |
| 70,000 (8) | | | Caesars Resort Collection
LLC / CRC Finco, Inc.,
5.250%, 10/15/2025 | | | | | 70,833 | | | | | | 0.0 | | |
| 70,000 (8) | | | CCM Merger, Inc., 6.375%,
05/01/2026 | | | | | 73,675 | | | | | | 0.0 | | |
| 70,000 (8) | | | Core & Main L.P., 6.125%,
08/15/2025 | | | | | 72,494 | | | | | | 0.0 | | |
| 165,000 (8) | | | Delta Air Lines, Inc. /
SkyMiles IP Ltd., 4.750%,
10/20/2028 | | | | | 180,233 | | | | | | 0.1 | | |
| 70,000 (8) | | | Golden Entertainment, Inc.,
7.625%, 04/15/2026 | | | | | 75,370 | | | | | | 0.1 | | |
| 70,000 (8) | | | H&E Equipment Services,
Inc., 3.875%, 12/15/2028 | | | | | 70,615 | | | | | | 0.0 | | |
| 35,000 (8) | | | Hilton Domestic Operating
Co., Inc., 5.750%, 05/01/2028 | | | | | 38,128 | | | | | | 0.0 | | |
Principal
Amount† | | | Value | | | Percentage
of Net
Assets | |
| CORPORATE BONDS/NOTES: (continued) | |
| | | | Consumer, Cyclical (continued) | |
| 70,000 (8) | | | IAA, Inc., 5.500%, 06/15/2027 | | | | $ | 74,331 | | | | | | 0.0 | | |
| 70,000 (8) | | | Installed Building Products,
Inc., 5.750%, 02/01/2028 | | | | | 74,799 | | | | | | 0.0 | | |
| 70,000 (8) | | | Interface, Inc., 5.500%,
12/01/2028 | | | | | 73,806 | | | | | | 0.0 | | |
| 70,000 (8) | | | IRB Holding Corp., 7.000%,
06/15/2025 | | | | | 76,599 | | | | | | 0.1 | | |
| 70,000 (8) | | | LBM Acquisition LLC,
6.250%, 01/15/2029 | | | | | 72,954 | | | | | | 0.0 | | |
| 70,000 (8) | | | Lions Gate Capital Holdings
LLC, 5.875%, 11/01/2024 | | | | | 71,305 | | | | | | 0.0 | | |
| 70,000 (8) | | | Meritor, Inc., 4.500%,
12/15/2028 | | | | | 71,881 | | | | | | 0.0 | | |
| 70,000 (8)(9) | | | Michaels Stores, Inc.,
8.000%, 07/15/2027 | | | | | 75,368 | | | | | | 0.1 | | |
| 70,000 (8) | | | Navistar International Corp.,
6.625%, 11/01/2025 | | | | | 73,423 | | | | | | 0.0 | | |
| 70,000 (8) | | | Penn National Gaming, Inc.,
5.625%, 01/15/2027 | | | | | 73,157 | | | | | | 0.0 | | |
| 50,000 (8) | | | PetSmart, Inc., 5.875%,
06/01/2025 | | | | | 51,469 | | | | | | 0.0 | | |
| 70,000 (8) | | | Royal Caribbean Cruises Ltd.,
9.125%, 06/15/2023 | | | | | 76,038 | | | | | | 0.1 | | |
| 35,000 (8) | | | Scientific Games
International, Inc., 5.000%,
10/15/2025 | | | | | 36,160 | | | | | | 0.0 | | |
| 35,000 (8) | | | Scientific Games
International, Inc., 8.250%,
03/15/2026 | | | | | 37,776 | | | | | | 0.0 | | |
| 70,000 (8) | | | SeaWorld Parks &
Entertainment, Inc., 9.500%,
08/01/2025 | | | | | 76,125 | | | | | | 0.1 | | |
| 70,000 (8) | | | Sizzling Platter LLC / Sizzling
Platter Finance Corp.,
8.500%, 11/28/2025 | | | | | 72,989 | | | | | | 0.0 | | |
| 70,000 (8) | | | Specialty Building Products
Holdings LLC / SBP Finance
Corp., 6.375%, 09/30/2026 | | | | | 74,269 | | | | | | 0.0 | | |
| 70,000 (8) | | | Speedway Motorsports LLC /
Speedway Funding II, Inc.,
4.875%, 11/01/2027 | | | | | 69,475 | | | | | | 0.0 | | |
| 70,000 (8) | | | Station Casinos LLC, 4.500%,
02/15/2028 | | | | | 70,656 | | | | | | 0.0 | | |
| 70,000 (8) | | | STL Holding Co. LLC,
7.500%, 02/15/2026 | | | | | 72,625 | | | | | | 0.0 | | |
| 35,000 (8) | | | Tenneco, Inc., 7.875%,
01/15/2029 | | | | | 39,362 | | | | | | 0.0 | | |
| 70,000 (8) | | | Univar Solutions USA,
Inc./Washington, 5.125%,
12/01/2027 | | | | | 74,056 | | | | | | 0.0 | | |
| 35,000 (8) | | | Viking Cruises Ltd., 5.875%,
09/15/2027 | | | | | 34,295 | | | | | | 0.0 | | |
See Accompanying Notes to Financial Statements
SUMMARY PORTFOLIO OF INVESTMENTS
| Voya Balanced Income Portfolio | as of December 31, 2020 (continued) |
Principal
Amount† | | | Value | | | Percentage
of Net
Assets | |
| CORPORATE BONDS/NOTES: (continued) | |
| | | | Consumer, Cyclical (continued) | |
| 35,000 (8) | | | Viking Cruises Ltd.,
13.000%, 05/15/2025 | | | | $ | 41,891 | | | | | | 0.1 | | |
| 70,000 (8) | | | William Carter Co/The,
5.625%, 03/15/2027 | | | | | 73,806 | | | | | | 0.0 | | |
| 70,000 (8) | | | Williams Scotsman
International, Inc., 4.625%,
08/15/2028 | | | | | 72,581 | | | | | | 0.0 | | |
| 70,000 (8) | | | Wolverine World Wide, Inc.,
5.000%, 09/01/2026 | | | | | 71,619 | | | | | | 0.0 | | |
| 35,000 (8) | | | Wyndham Hotels & Resorts,
Inc., 4.375%, 08/15/2028 | | | | | 36,432 | | | | | | 0.0 | | |
| 35,000 (8) | | | Wyndham Hotels & Resorts,
Inc., 5.375%, 04/15/2026 | | | | | 36,291 | | | | | | 0.0 | | |
| 1,315,394 (1) | | | Other Securities | | | | | 1,426,466 | | | | | | 0.4 | | |
| | | | | | | | | 4,529,932 | | | | | | 1.3 | | |
| | | | Consumer, Non-cyclical: 1.2% | |
| 70,000 (8) | | | Acadia Healthcare Co., Inc.,
5.500%, 07/01/2028 | | | | | 75,315 | | | | | | 0.0 | | |
| 200,000 (8) | | | Adani Ports & Special
Economic Zone Ltd., 4.375%,
07/03/2029 | | | | | 217,328 | | | | | | 0.1 | | |
| 70,000 (8) | | | Albertsons Cos, Inc. /
Safeway, Inc. / New
Albertsons L.P. / Albertsons
LLC, 3.500%, 03/15/2029 | | | | | 70,805 | | | | | | 0.0 | | |
| 25,000 (8) | | | Allied Universal Holdco LLC /
Allied Universal Finance
Corp., 6.625%, 07/15/2026 | | | | | 26,689 | | | | | | 0.0 | | |
| 50,000 (8) | | | Allied Universal Holdco LLC /
Allied Universal Finance
Corp., 9.750%, 07/15/2027 | | | | | 54,587 | | | | | | 0.1 | | |
| 70,000 (8) | | | AMN Healthcare, Inc.,
4.625%, 10/01/2027 | | | | | 73,461 | | | | | | 0.0 | | |
| 70,000 (8) | | | Avantor Funding, Inc.,
4.625%, 07/15/2028 | | | | | 74,112 | | | | | | 0.0 | | |
| 35,000 (8) | | | Bausch Health Cos, Inc.,
5.250%, 01/30/2030 | | | | | 36,702 | | | | | | 0.0 | | |
| 70,000 (8) | | | Cardtronics, Inc. / Cardtronics
USA, Inc., 5.500%,
05/01/2025 | | | | | 72,618 | | | | | | 0.0 | | |
| 70,000 (8) | | | Catalent Pharma Solutions,
Inc., 5.000%, 07/15/2027 | | | | | 74,048 | | | | | | 0.0 | | |
| 25,000 (8) | | | Chobani LLC / Chobani
Finance Corp., Inc., 4.625%,
11/15/2028 | | | | | 25,437 | | | | | | 0.0 | | |
| 70,000 (8) | | | DaVita, Inc., 4.625%,
06/01/2030 | | | | | 74,244 | | | | | | 0.0 | | |
| 225,000 (8)(9) | | | DP World Crescent Ltd.,
3.750%, 01/30/2030 | | | | | 245,418 | | | | | | 0.1 | | |
| 70,000 (8) | | | Emergent BioSolutions, Inc.,
3.875%, 08/15/2028 | | | | | 72,616 | | | | | | 0.0 | | |
| 70,000 (8) | | | Gartner, Inc., 4.500%,
07/01/2028 | | | | | 73,937 | | | | | | 0.0 | | |
| 70,000 (8) | | | Graham Holdings Co.,
5.750%, 06/01/2026 | | | | | 73,749 | | | | | | 0.0 | | |
Principal
Amount† | | | Value | | | Percentage
of Net
Assets | |
| CORPORATE BONDS/NOTES: (continued) | |
| | | | Consumer, Non-cyclical (continued) | |
| 70,000 (8) | | | Hill-Rom Holdings, Inc.,
4.375%, 09/15/2027 | | | | $ | 74,126 | | | | | | 0.0 | | |
| 200,000 (8) | | | Hutama Karya Persero PT,
3.750%, 05/11/2030 | | | | | 224,300 | | | | | | 0.1 | | |
| 70,000 (8) | | | Jaguar Holding Co. II / PPD
Development L.P., 5.000%,
06/15/2028 | | | | | 74,812 | | | | | | 0.0 | | |
| 70,000 (8) | | | JBS USA LUX SA / JBS USA
Finance, Inc., 6.750%,
02/15/2028 | | | | | 78,734 | | | | | | 0.1 | | |
| 70,000 (8) | | | KeHE Distributors LLC / KeHE
Finance Corp., 8.625%,
10/15/2026 | | | | | 78,739 | | | | | | 0.1 | | |
| 70,000 (8) | | | Legacy LifePoint Health LLC,
4.375%, 02/15/2027 | | | | | 71,225 | | | | | | 0.0 | | |
| 70,000 (8) | | | Molina Healthcare, Inc.,
3.875%, 11/15/2030 | | | | | 75,250 | | | | | | 0.0 | | |
| 70,000 (8) | | | MPH Acquisition Holdings
LLC, 5.750%, 11/01/2028 | | | | | 68,513 | | | | | | 0.0 | | |
| 70,000 (8) | | | Nielsen Finance LLC / Nielsen
Finance Co., 5.625%,
10/01/2028 | | | | | 76,190 | | | | | | 0.1 | | |
| 70,000 (8) | | | Par Pharmaceutical, Inc.,
7.500%, 04/01/2027 | | | | | 76,042 | | | | | | 0.1 | | |
| 70,000 (8) | | | Pilgrim’s Pride Corp., 5.875%,
09/30/2027 | | | | | 76,010 | | | | | | 0.0 | | |
| 70,000 (8) | | | Post Holdings, Inc., 4.625%,
04/15/2030 | | | | | 73,725 | | | | | | 0.0 | | |
| 70,000 (8) | | | Primo Water Holdings, Inc.,
5.500%, 04/01/2025 | | | | | 72,362 | | | | | | 0.0 | | |
| 70,000 (8) | | | Select Medical Corp., 6.250%,
08/15/2026 | | | | | 75,492 | | | | | | 0.0 | | |
| 70,000 (8) | | | Tenet Healthcare Corp.,
6.125%, 10/01/2028 | | | | | 73,187 | | | | | | 0.0 | | |
| 45,000 (8) | | | United Natural Foods, Inc.,
6.750%, 10/15/2028 | | | | | 47,137 | | | | | | 0.0 | | |
| 70,000 (8) | | | Vizient, Inc., 6.250%,
05/15/2027 | | | | | 75,499 | | | | | | 0.0 | | |
| 70,000 (8) | | | West Street Merger Sub, Inc.,
6.375%, 09/01/2025 | | | | | 71,881 | | | | | | 0.0 | | |
| 1,010,000 | | | Other Securities | | | | | 1,192,794 | | | | | | 0.4 | | |
| | | | | | | | | 3,997,084 | | | | | | 1.2 | | |
| | | | Energy: 1.7% | |
| 70,000 (8) | | | Archrock Partners L.P. /
Archrock Partners Finance
Corp., 6.250%, 04/01/2028 | | | | | 73,042 | | | | | | 0.0 | | |
| 70,000 (8) | | | Ascent Resources Utica
Holdings LLC / ARU Finance
Corp., 8.250%, 12/31/2028 | | | | | 70,000 | | | | | | 0.0 | | |
| 35,000 (8) | | | Blue Racer Midstream LLC /
Blue Racer Finance Corp.,
6.625%, 07/15/2026 | | | | | 35,350 | | | | | | 0.0 | | |
| 70,000 (8) | | | CNX Resources Corp.,
7.250%, 03/14/2027 | | | | | 74,989 | | | | | | 0.1 | | |
See Accompanying Notes to Financial Statements
SUMMARY PORTFOLIO OF INVESTMENTS
| Voya Balanced Income Portfolio | as of December 31, 2020 (continued) |
Principal
Amount† | | | Value | | | Percentage
of Net
Assets | |
| CORPORATE BONDS/NOTES: (continued) | |
| | | | Energy (continued) | |
| 70,000 (8) | | | Enviva Partners L.P. /
Enviva Partners Finance
Corp., 6.500%, 01/15/2026 | | | | $ | 74,507 | | | | | | 0.0 | | |
| 60,000 (8) | | | EQM Midstream Partners
L.P., 6.000%, 07/01/2025 | | | | | 65,775 | | | | | | 0.0 | | |
| 70,000 (8) | | | Hess Midstream Operations
L.P., 5.625%, 02/15/2026 | | | | | 72,931 | | | | | | 0.0 | | |
| 70,000 (8) | | | Hilcorp Energy I L.P. / Hilcorp
Finance Co., 5.000%,
12/01/2024 | | | | | 69,730 | | | | | | 0.0 | | |
| 70,000 (8) | | | Indigo Natural Resources
LLC, 6.875%, 02/15/2026 | | | | | 71,750 | | | | | | 0.0 | | |
| 70,000 (8) | | | Parsley Energy LLC / Parsley
Finance Corp., 5.625%,
10/15/2027 | | | | | 76,720 | | | | | | 0.1 | | |
| 70,000 (8) | | | SunCoke Energy Partners
L.P. / SunCoke Energy
Partners Finance Corp.,
7.500%, 06/15/2025 | | | | | 69,620 | | | | | | 0.0 | | |
| 70,000 (8) | | | Sunoco L.P. / Sunoco Finance
Corp., 4.500%, 05/15/2029 | | | | | 72,931 | | | | | | 0.0 | | |
| 70,000 (8) | | | Tallgrass Energy Partners
L.P. / Tallgrass Energy
Finance Corp., 5.500%,
01/15/2028 | | | | | 71,691 | | | | | | 0.0 | | |
| 70,000 (8) | | | Targa Resources Partners
L.P. / Targa Resources
Partners Finance Corp.,
4.875%, 02/01/2031 | | | | | 76,055 | | | | | | 0.1 | | |
| 70,000 (8) | | | Viper Energy Partners L.P.,
5.375%, 11/01/2027 | | | | | 73,269 | | | | | | 0.0 | | |
| 4,471,000 (1) | | | Other Securities | | | | | 4,838,381 | | | | | | 1.4 | | |
| | | | | | | | | 5,886,741 | | | | | | 1.7 | | |
| | | | Financial: 0.6% | |
| 70,000 (8) | | | Cushman & Wakefield US
Borrower LLC, 6.750%,
05/15/2028 | | | | | 77,394 | | | | | | 0.0 | | |
| 70,000 (8) | | | ESH Hospitality, Inc., 5.250%,
05/01/2025 | | | | | 71,853 | | | | | | 0.0 | | |
| 70,000 (8) | | | Freedom Mortgage Corp.,
8.250%, 04/15/2025 | | | | | 73,325 | | | | | | 0.0 | | |
| 70,000 (8) | | | Iron Mountain, Inc., 5.250%,
07/15/2030 | | | | | 75,687 | | | | | | 0.0 | | |
| 530,000 (10) | | | JPMorgan Chase & Co.,
4.600%, 12/31/2199 | | | | | 547,888 | | | | | | 0.2 | | |
| 200,000 (8)(10) | | | Kookmin Bank, 4.350%,
12/31/2199 | | | | | 211,341 | | | | | | 0.1 | | |
| 70,000 (8) | | | LPL Holdings, Inc., 4.625%,
11/15/2027 | | | | | 72,669 | | | | | | 0.0 | | |
| 70,000 (8) | | | MGM Growth Properties
Operating Partnership L.P. /
MGP Finance Co-Issuer, Inc.,
3.875%, 02/15/2029 | | | | | 71,706 | | | | | | 0.0 | | |
| 70,000 (8) | | | Quicken Loans LLC, 5.250%,
01/15/2028 | | | | | 74,856 | | | | | | 0.0 | | |
Principal
Amount† | | | Value | | | Percentage
of Net
Assets | |
| CORPORATE BONDS/NOTES: (continued) | |
| | | | Financial (continued) | |
| 70,000 (8) | | | SBA Communications
Corp., 3.875%,
02/15/2027 | | | | $ | 73,609 | | | | | | 0.0 | | |
| 710,000 | | | Other Securities | | | | | 778,751 | | | | | | 0.3 | | |
| | | | | | | | | 2,129,079 | | | | | | 0.6 | | |
| | | | Industrial: 0.7% | |
| 70,000 (8) | | | Berry Global, Inc., 5.625%,
07/15/2027 | | | | | 75,403 | | | | | | 0.0 | | |
| 70,000 (8) | | | Builders FirstSource, Inc.,
5.000%, 03/01/2030 | | | | | 75,338 | | | | | | 0.0 | | |
| 70,000 (8) | | | Cargo Aircraft Management,
Inc., 4.750%, 02/01/2028 | | | | | 72,319 | | | | | | 0.0 | | |
| 70,000 (8) | | | Cascades, Inc./Cascades
USA, Inc., 5.375%,
01/15/2028 | | | | | 74,528 | | | | | | 0.0 | | |
| 70,000 (8) | | | Clark Equipment Co., 5.875%,
06/01/2025 | | | | | 74,069 | | | | | | 0.0 | | |
| 70,000 (8) | | | Clean Harbors, Inc., 5.125%,
07/15/2029 | | | | | 76,680 | | | | | | 0.0 | | |
| 70,000 (8) | | | GFL Environmental, Inc.,
8.500%, 05/01/2027 | | | | | 77,831 | | | | | | 0.1 | | |
| 70,000 (8) | | | GrafTech Finance, Inc.,
4.625%, 12/15/2028 | | | | | 71,053 | | | | | | 0.0 | | |
| 70,000 (8) | | | Graham Packaging Co., Inc.,
7.125%, 08/15/2028 | | | | | 77,481 | | | | | | 0.1 | | |
| 70,000 (8) | | | Granite US Holdings Corp.,
11.000%, 10/01/2027 | | | | | 78,050 | | | | | | 0.1 | | |
| 70,000 (8) | | | Intelligent Packaging Ltd.
Finco, Inc. / Intelligent
Packaging Ltd. Co-Issuer
LLC, 6.000%, 09/15/2028 | | | | | 72,056 | | | | | | 0.0 | | |
| 200,000 (8)(9) | | | Klabin Austria GmbH,
5.750%, 04/03/2029 | | | | | 232,852 | | | | | | 0.1 | | |
| 70,000 (8) | | | Koppers, Inc., 6.000%,
02/15/2025 | | | | | 72,231 | | | | | | 0.0 | | |
| 70,000 (8) | | | New Enterprise Stone & Lime
Co., Inc., 9.750%, 07/15/2028 | | | | | 77,000 | | | | | | 0.0 | | |
| 70,000 (8) | | | Norbord, Inc., 5.750%,
07/15/2027 | | | | | 75,501 | | | | | | 0.0 | | |
| 70,000 (8) | | | PGT Innovations, Inc.,
6.750%, 08/01/2026 | | | | | 74,712 | | | | | | 0.0 | | |
| 70,000 (8) | | | Plastipak Holdings, Inc.,
6.250%, 10/15/2025 | | | | | 72,231 | | | | | | 0.0 | | |
| 70,000 (8) | | | SSL Robotics LLC, 9.750%,
12/31/2023 | | | | | 79,231 | | | | | | 0.1 | | |
| 55,000 (8) | | | Standard Industries, Inc./NJ,
3.375%, 01/15/2031 | | | | | 55,344 | | | | | | 0.0 | | |
| 20,000 (8) | | | Stericycle, Inc., 3.875%,
01/15/2029 | | | | | 20,575 | | | | | | 0.0 | | |
| 70,000 (8) | | | Stevens Holding Co., Inc.,
6.125%, 10/01/2026 | | | | | 75,849 | | | | | | 0.0 | | |
See Accompanying Notes to Financial Statements
SUMMARY PORTFOLIO OF INVESTMENTS
| Voya Balanced Income Portfolio | as of December 31, 2020 (continued) |
Principal
Amount† | | | Value | | | Percentage
of Net
Assets | |
| CORPORATE BONDS/NOTES: (continued) | |
| | | | Industrial (continued) | |
| 70,000 (8) | | | Summit Materials LLC /
Summit Materials Finance
Corp., 5.125%, 06/01/2025 | | | | $ | 71,480 | | | | | | 0.0 | | |
| 15,000 (8) | | | Vertical Holdco GmbH,
7.625%, 07/15/2028 | | | | | 16,378 | | | | | | 0.0 | | |
| 70,000 (8) | | | Weekley Homes LLC /
Weekley Finance Corp.,
4.875%, 09/15/2028 | | | | | 73,325 | | | | | | 0.0 | | |
| 661,000 | | | Other Securities | | | | | 753,170 | | | | | | 0.2 | | |
| | | | | | | | | 2,574,687 | | | | | | 0.7 | | |
| | | | Technology: 0.4% | |
| 70,000 (8) | | | Ascend Learning LLC,
6.875%, 08/01/2025 | | | | | 72,180 | | | | | | 0.0 | | |
| 70,000 (8) | | | Austin BidCo, Inc., 7.125%,
12/15/2028 | | | | | 73,194 | | | | | | 0.0 | | |
| 70,000 (8) | | | Booz Allen Hamilton, Inc.,
3.875%, 09/01/2028 | | | | | 72,231 | | | | | | 0.0 | | |
| 70,000 (8) | | | BY Crown Parent LLC / BY
Bond Finance, Inc., 4.250%,
01/31/2026 | | | | | 71,837 | | | | | | 0.0 | | |
| 100,000 (8) | | | Castle US Holding Corp.,
9.500%, 02/15/2028 | | | | | 100,234 | | | | | | 0.1 | | |
| 70,000 (8) | | | Change Healthcare Holdings
LLC / Change Healthcare
Finance, Inc., 5.750%,
03/01/2025 | | | | | 71,488 | | | | | | 0.0 | | |
| 70,000 (8) | | | Entegris, Inc., 4.375%,
04/15/2028 | | | | | 74,725 | | | | | | 0.0 | | |
| 70,000 (8) | | | Microchip Technology, Inc.,
4.250%, 09/01/2025 | | | | | 74,074 | | | | | | 0.0 | | |
| 70,000 (8) | | | MTS Systems Corp., 5.750%,
08/15/2027 | | | | | 76,183 | | | | | | 0.0 | | |
| 70,000 (8) | | | ON Semiconductor Corp.,
3.875%, 09/01/2028 | | | | | 72,363 | | | | | | 0.0 | | |
| 70,000 (8) | | | Open Text Corp., 3.875%,
02/15/2028 | | | | | 72,745 | | | | | | 0.0 | | |
| 15,000 (8) | | | Rackspace Technology
Global, Inc., 5.375%,
12/01/2028 | | | | | 15,744 | | | | | | 0.0 | | |
| 70,000 (8) | | | Science Applications
International Corp., 4.875%,
04/01/2028 | | | | | 74,320 | | | | | | 0.0 | | |
| 40,000 (8) | | | Tempo Acquisition LLC /
Tempo Acquisition Finance
Corp., 6.750%, 06/01/2025 | | | | | 41,392 | | | | | | 0.0 | | |
| 70,000 (8) | | | Unisys Corp., 6.875%,
11/01/2027 | | | | | 76,650 | | | | | | 0.1 | | |
| 75,000 (8) | | | Veritas US, Inc. / Veritas
Bermuda Ltd., 7.500%,
09/01/2025 | | | | | 77,063 | | | | | | 0.1 | | |
| 185,000 | | | Other Securities | | | | | 202,147 | | | | | | 0.1 | | |
| | | | | | | | | 1,318,570 | | | | | | 0.4 | | |
Principal
Amount† | | | Value | | | Percentage
of Net
Assets | |
| CORPORATE BONDS/NOTES: (continued) | |
| | | | Utilities: 1.1% | |
| 70,000 (8) | | | Clearway Energy
Operating LLC, 4.750%,
03/15/2028 | | | | $ | 75,141 | | | | | | 0.0 | | |
| 200,000 (8) | | | Colbun SA, 3.150%,
03/06/2030 | | | | | 216,000 | | | | | | 0.1 | | |
| 70,000 (8) | | | NRG Energy, Inc., 3.625%,
02/15/2031 | | | | | 72,147 | | | | | | 0.0 | | |
| 70,000 (8) | | | Vistra Operations Co. LLC,
5.625%, 02/15/2027 | | | | | 74,557 | | | | | | 0.0 | | |
| 2,883,000 | | | Other Securities | | | | | 3,226,476 | | | | | | 1.0 | | |
| | | | | | | | | 3,664,321 | | | | | | 1.1 | | |
| | | | Total Corporate
Bonds/Notes
(Cost $27,453,761) | | | | | 29,243,686 | | | | | | 8.4 | | |
| COLLATERALIZED MORTGAGE OBLIGATIONS: 14.0% | |
| 780,872 (8)(10) | | | Agate Bay Mortgage Trust
2015-1 B4, 3.793%,
01/25/2045 | | | | | 759,103 | | | | | | 0.2 | | |
| 500,000 (8)(10) | | | Chase Home Lending
Mortgage Trust 2019-ATR1
A5, 4.000%, 04/25/2049 | | | | | 524,843 | | | | | | 0.2 | | |
| 357,011 (8)(10) | | | Chase Mortgage Finance
Corp. 2016-SH1 M2, 3.750%,
04/25/2045 | | | | | 363,966 | | | | | | 0.1 | | |
| 803,249 (8)(10) | | | CIM Trust 2019-INV2 A3,
4.000%, 05/25/2049 | | | | | 828,376 | | | | | | 0.2 | | |
| 479,792 (8)(10) | | | CIM Trust 2019-J1 B2,
4.031%, 08/25/2049 | | | | | 502,838 | | | | | | 0.2 | | |
| 435,929 (8)(10) | | | CIM Trust 2019-J2 A13,
3.500%, 10/25/2049 | | | | | 447,944 | | | | | | 0.1 | | |
| 1,000,000 (8) | | | Connecticut Avenue
Securities Trust 2020-R02
2M2, 2.148%, (US0001M +
2.000)%, 01/25/2040 | | | | | 998,366 | | | | | | 0.3 | | |
| 5,435,490 (11) | | | Fannie Mae Interest Strip
Series 367 2, 5.500%,
01/01/2036 | | | | | 1,074,873 | | | | | | 0.3 | | |
| 1,198,637 (11) | | | Fannie Mae REMICS 2005-66
LS, 6.482%,
(-1.000*US0001M + 6.630)%,
07/25/2035 | | | | | 250,022 | | | | | | 0.1 | | |
| 4,553,804 (11) | | | Fannie Mae REMICS
2012-144 SC, 5.952%,
(-1.000*US0001M + 6.100)%,
01/25/2043 | | | | | 1,037,560 | | | | | | 0.3 | | |
| 2,160,003 (11) | | | Fannie Mae REMICS
2012-151 WS, 6.052%,
(-1.000*US0001M + 6.200)%,
03/25/2042 | | | | | 383,371 | | | | | | 0.1 | | |
| 5,160,203 (11) | | | Fannie Mae REMICS 2012-35
LS, 6.452%,
(-1.000*US0001M + 6.600)%,
04/25/2041 | | | | | 771,287 | | | | | | 0.2 | | |
See Accompanying Notes to Financial Statements
SUMMARY PORTFOLIO OF INVESTMENTS
| Voya Balanced Income Portfolio | as of December 31, 2020 (continued) |
Principal
Amount† | | | Value | | | Percentage
of Net
Assets | |
| COLLATERALIZED MORTGAGE OBLIGATIONS: (continued) | |
| 3,816,354 (11) | | | Fannie Mae REMICS
2013-20 SK, 6.052%,
(-1.000*US0001M +
6.200)%, 05/25/2041 | | | | $ | 486,431 | | | | | | 0.1 | | |
| 1,378,954 (11) | | | Fannie Mae REMICS
2015-65 KI, 6.852%,
(-1.000*US0001M + 7.000)%,
08/25/2035 | | | | | 291,649 | | | | | | 0.1 | | |
| 899,515 (11) | | | Fannie Mae REMICS 2018-86
DS, 5.952%,
(-1.000*US0001M +
6.100)%, 12/25/2048 | | | | | 136,368 | | | | | | 0.0 | | |
| 7,017,910 (11) | | | Freddie Mac REMICS 4517
KI, 1.015%,
(-0.357*US0001M + 1.071)%,
04/15/2043 | | | | | 134,405 | | | | | | 0.0 | | |
| 5,686,023 (11) | | | Freddie Mac REMICS 4596
DI, 3.500%, 06/15/2046 | | | | | 670,918 | | | | | | 0.2 | | |
| 2,823,283 (11) | | | Freddie Mac REMICS 4619
KS, 4.095%,
(-1.000*US0001M + 4.250)%,
06/15/2039 | | | | | 435,930 | | | | | | 0.1 | | |
| 1,266,321 (11) | | | Ginnie Mae Series
2013-148 DS, 5.527%,
(-1.000*US0001M +
5.680)%, 10/16/2043 | | | | | 272,394 | | | | | | 0.1 | | |
| 9,513,218 (11) | | | Ginnie Mae Series 2015-20
CI, 3.500%, 02/20/2030 | | | | | 833,470 | | | | | | 0.3 | | |
| 872,850 (11) | | | Ginnie Mae Series 2015-42
IY, 5.500%, 08/20/2039 | | | | | 88,802 | | | | | | 0.0 | | |
| 7,750,717 (11) | | | Ginnie Mae Series 2019-23
MT, 0.600%,
(-1.000*US0001M + 6.700)%,
03/20/2042 | | | | | 146,502 | | | | | | 0.1 | | |
| 866,893 (8)(10) | | | GS Mortgage-Backed
Securities Trust 2020-NQM1
A2, 1.791%, 09/27/2060 | | | | | 872,760 | | | | | | 0.3 | | |
| 789,674 (8)(10) | | | JP Morgan Mortgage Trust
2018-8 A13, 4.000%,
01/25/2049 | | | | | 813,192 | | | | | | 0.2 | | |
| 728,658 (8)(10) | | | JP Morgan Mortgage Trust
2020-3 A15, 3.500%,
08/25/2050 | | | | | 748,719 | | | | | | 0.2 | | |
| 621,529 (8)(10) | | | Mello Mortgage Capital
Acceptance 2018-MTG2 A2,
4.000%, 10/25/2048 | | | | | 633,768 | | | | | | 0.2 | | |
| 1,096,654 (8)(10) | | | Starwood Mortgage
Residential Trust 2019-1 A3,
3.299%, 06/25/2049 | | | | | 1,112,111 | | | | | | 0.3 | | |
| 1,000,000 (8)(10) | | | Deephaven Residential
Mortgage Trust 2018-1A M1,
3.939%, 12/25/2057 | | | | | 1,018,484 | | | | | | 0.3 | | |
| 800,000 (8) | | | Deephaven Residential
Mortgage Trust 2020-2 A2,
2.594%, 05/25/2065 | | | | | 821,345 | | | | | | 0.2 | | |
| 525,573 | | | Fannie Mae Connecticut
Avenue Securities 2017-C02
2M2, 3.798%, (US0001M +
3.650)%, 09/25/2029 | | | | | 539,795 | | | | | | 0.2 | | |
Principal
Amount† | | | Value | | | Percentage
of Net
Assets | |
| COLLATERALIZED MORTGAGE OBLIGATIONS: (continued) | |
| 297,782 | | | Fannie Mae Connecticut
Avenue Securities
2017-C06 1M2, 2.798%,
(US0001M + 2.650)%,
02/25/2030 | | | | $ | 299,805 | | | | | | 0.1 | | |
| 332,482 | | | Fannie Mae Connecticut
Avenue Securities
2017-CO6 2M2, 2.948%,
(US0001M + 2.800)%,
02/25/2030 | | | | | 336,484 | | | | | | 0.1 | | |
| 787,255 | | | Fannie Mae Connecticut
Avenue Securities
2018-C05 1M2, 2.498%,
(US0001M + 2.350)%,
01/25/2031 | | | | | 791,712 | | | | | | 0.2 | | |
| 676,704 | | | Fannie Mae Connecticut
Avenue Securities
2018-C06 1M2, 2.148%,
(US0001M + 2.000)%,
03/25/2031 | | | | | 674,992 | | | | | | 0.2 | | |
| 218,694 | | | Fannie Mae Connecticut
Avenue Securities
2018-CO1 1M2, 2.398%,
(US0001M + 2.250)%,
07/25/2030 | | | | | 218,515 | | | | | | 0.1 | | |
| 644,136 (8) | | | Fannie Mae Connecticut
Avenue Securities
2019-R02 1M2, 2.448%,
(US0001M + 2.300)%,
08/25/2031 | | | | | 645,833 | | | | | | 0.2 | | |
| 659,605 (8) | | | Fannie Mae Connecticut
Avenue Securities 2019-R04
2M2, 2.248%, (US0001M +
2.100)%, 06/25/2039 | | | | | 660,510 | | | | | | 0.2 | | |
| 521,037 (8) | | | Fannie Mae Connecticut
Avenue Securities Trust
2018-R07 1M2, 2.548%,
(US0001M + 2.400)%,
04/25/2031 | | | | | 522,697 | | | | | | 0.1 | | |
| 464,679 (8) | | | Fannie Mae Connecticut
Avenue Securities Trust
2019-R06 2M2, 2.248%,
(US0001M + 2.100)%,
09/25/2039 | | | | | 465,702 | | | | | | 0.1 | | |
| 2,106,799 (11) | | | Fannie Mae REMICS
2008-36 YI, 7.052%,
(-1.000*US0001M +
7.200)%, 07/25/2036 | | | | | 347,159 | | | | | | 0.1 | | |
| 936,263 (11) | | | Fannie Mae REMICS
2010-59 NS, 5.622%,
(-1.000*US0001M +
5.770)%, 06/25/2040 | | | | | 177,477 | | | | | | 0.0 | | |
| 4,488,910 (11) | | | Fannie Mae REMICS
2012-121 ID, 3.000%,
11/25/2027 | | | | | 301,398 | | | | | | 0.1 | | |
| 5,381,622 (11) | | | Fannie Mae REMICS
2013-71 AI, 3.000%, 07/25/
2028 | | | | | 374,670 | | | | | | 0.1 | | |
| 500,000 (8)(10) | | | Flagstar Mortgage Trust
2017-1 1A7, 3.500%,
03/25/2047 | | | | | 516,039 | | | | | | 0.1 | | |
See Accompanying Notes to Financial Statements
SUMMARY PORTFOLIO OF INVESTMENTS
| Voya Balanced Income Portfolio | as of December 31, 2020 (continued) |
Principal
Amount† | | | Value | | | Percentage
of Net
Assets | |
| COLLATERALIZED MORTGAGE OBLIGATIONS: (continued) | |
| 900,672 (8)(10) | | | Flagstar Mortgage Trust
2017-1 B3, 3.677%,
03/25/2047 | | | | $ | 917,221 | | | | | | 0.3 | | |
| 1,216,786 (8)(10) | | | Flagstar Mortgage Trust
2018-3INV A3, 4.000%,
05/25/2048 | | | | | 1,258,408 | | | | | | 0.4 | | |
| 1,200,000 (8) | | | Freddie Mac STACR REMIC
Trust 2020-HQA1 M2,
2.048%, (US0001M +
1.900)%, 01/25/2050 | | | | | 1,200,706 | | | | | | 0.4 | | |
| 408,740 | | | Freddie Mac Structured
Agency Credit Risk Debt
Notes 2015-DNA2 M3,
4.048%, (US0001M +
3.900)%, 12/25/2027 | | | | | 415,927 | | | | | | 0.1 | | |
| 37,618 | | | Freddie Mac Structured
Agency Credit Risk Debt
Notes 2015-HQ1 M3, 3.948%,
(US0001M + 3.800)%,
03/25/2025 | | | | | 37,680 | | | | | | 0.0 | | |
| 1,152,702 (8) | | | Freddie Mac Structured
Agency Credit Risk Debt
Notes 2019-DNA1 M2,
2.798%, (US0001M +
2.650)%, 01/25/2049 | | | | | 1,155,060 | | | | | | 0.3 | | |
| 837,933 (8) | | | Freddie Mac Structured
Agency Credit Risk Debt
Notes 2019-HQA2 M2,
2.198%, (US0001M +
2.050)%, 04/25/2049 | | | | | 829,625 | | | | | | 0.3 | | |
| 804,399 (11) | | | Freddie Mac REMICS 3318
KS, 6.251%,
(-1.000*US0001M + 6.410)%,
05/15/2037 | | | | | 111,332 | | | | | | 0.0 | | |
| 1,140,476 (11) | | | Freddie Mac REMICS 3879
SL, 6.441%,
(-1.000*US0001M + 6.600)%,
01/15/2041 | | | | | 165,995 | | | | | | 0.1 | | |
| 4,398,119 (11) | | | Freddie Mac REMICS 4120
JS, 6.041%,
(-1.000*US0001M + 6.200)%,
10/15/2032 | | | | | 760,396 | | | | | | 0.2 | | |
| 2,909,578 (11) | | | Freddie Mac REMICS 4141
EI, 3.000%, 09/15/2027 | | | | | 148,048 | | | | | | 0.0 | | |
| 3,806,381 (11) | | | Freddie Mac REMICS 4153
IB, 2.500%, 01/15/2028 | | | | | 208,294 | | | | | | 0.1 | | |
| 283,445 (8)(10) | | | GS Mortgage-Backed
Securities Corp. Trust
2019-PJ2 A1, 4.000%,
11/25/2049 | | | | | 287,514 | | | | | | 0.1 | | |
| 294,573 (8)(10) | | | J.P. Morgan Mortgage Trust
2019-2 A15, 4.000%,
08/25/2049 | | | | | 302,868 | | | | | | 0.1 | | |
| 720,729 (8)(10) | | | J.P. Morgan Mortgage Trust
2019-LTV1 A3, 4.000%,
06/25/2049 | | | | | 742,166 | | | | | | 0.2 | | |
| 1,325,304 (8)(10) | | | JP Morgan Mortgage Trust
2016-4 A13, 3.500%,
10/25/2046 | | | | | 1,350,277 | | | | | | 0.4 | | |
| 867,002 (8)(10) | | | JP Morgan Mortgage Trust
2017-5 B2, 3.128%,
10/26/2048 | | | | | 855,608 | | | | | | 0.3 | | |
Principal
Amount† | | | Value | | | Percentage
of Net
Assets | |
| COLLATERALIZED MORTGAGE OBLIGATIONS: (continued) | |
| 1,129,472 (8)(10) | | | JP Morgan Mortgage Trust
2018-3 B2, 3.753%,
09/25/2048 | | | | $ | 1,173,485 | | | | | | 0.3 | | |
| 733,123 (8)(10) | | | JP Morgan Mortgage Trust
2018-4 B2, 3.750%,
10/25/2048 | | | | | 766,476 | | | | | | 0.2 | | |
| 951,610 (8)(10) | | | JP Morgan Mortgage Trust
2018-5 A13, 3.500%,
10/25/2048 | | | | | 989,643 | | | | | | 0.3 | | |
| 311,420 (8)(10) | | | JP Morgan Mortgage Trust
2019-1 A3, 4.000%,
05/25/2049 | | | | | 322,158 | | | | | | 0.1 | | |
| 337,530 (8)(10) | | | JP Morgan Mortgage Trust
2019-5 A3, 4.000%,
11/25/2049 | | | | | 350,057 | | | | | | 0.1 | | |
| 97,178 (8)(10) | | | JP Morgan Mortgage Trust
2019-8 A15, 3.500%,
03/25/2050 | | | | | 100,602 | | | | | | 0.0 | | |
| 973,563 (8)(10) | | | JP Morgan Mortgage Trust
2019-INV1 B2, 5.083%,
10/25/2049 | | | | | 1,049,149 | | | | | | 0.3 | | |
| 607,053 (8)(10) | | | JP Morgan Mortgage Trust
2019-LTV2 A18, 4.000%,
12/25/2049 | | | | | 626,005 | | | | | | 0.2 | | |
| 584,928 (8)(10) | | | JP Morgan Mortgage Trust
2019-LTV2 B3, 4.809%,
12/25/2049 | | | | | 620,966 | | | | | | 0.2 | | |
| 477,078 (8)(10) | | | Mello Mortgage Capital
Acceptance 2018-MTG2 B1,
4.463%, 10/25/2048 | | | | | 515,515 | | | | | | 0.1 | | |
| 893,086 (8)(10) | | | New Residential Mortgage
Loan Trust 2019-NQM3 A3,
3.086%, 07/25/2049 | | | | | 904,716 | | | | | | 0.3 | | |
| 506,313 (8)(10) | | | OBX 2019-INV2 A25 Trust,
4.000%, 05/27/2049 | | | | | 519,066 | | | | | | 0.2 | | |
| 1,153,365 (8)(10) | | | Sequoia Mortgage Trust
2019-2 B2, 4.252%,
06/25/2049 | | | | | 1,221,863 | | | | | | 0.4 | | |
| 1,155,063 (8)(10) | | | Sequoia Mortgage Trust
2019-2 B3, 4.252%,
06/25/2049 | | | | | 1,195,187 | | | | | | 0.3 | | |
| 126,287 (8)(10) | | | Sequoia Mortgage Trust
2019-3 A2, 3.500%,
09/25/2049 | | | | | 129,385 | | | | | | 0.0 | | |
| 360,930 (8)(10) | | | Sequoia Mortgage Trust
2019-4 A19, 3.500%,
11/25/2049 | | | | | 368,274 | | | | | | 0.1 | | |
| 356,760 (8)(10) | | | Sequoia Mortgage Trust
2019-CH2 A1, 4.500%,
08/25/2049 | | | | | 366,930 | | | | | | 0.1 | | |
| 200,297 (8)(10) | | | Verus Securitization Trust
2018-INV1 A1, 3.626%,
03/25/2058 | | | | | 202,341 | | | | | | 0.0 | | |
| 569,523 (8)(10) | | | Verus Securitization Trust
2019-INV2 A2, 3.117%,
07/25/2059 | | | | | 585,772 | | | | | | 0.2 | | |
| 566,904 (8)(10) | | | Wells Fargo Mortgage Backed
Securities 2018-1 B3,
3.688%, 07/25/2047 | | | | | 576,981 | | | | | | 0.2 | | |
See Accompanying Notes to Financial Statements
SUMMARY PORTFOLIO OF INVESTMENTS
| Voya Balanced Income Portfolio | as of December 31, 2020 (continued) |
Principal
Amount† | | | Value | | | Percentage
of Net
Assets | |
| COLLATERALIZED MORTGAGE OBLIGATIONS: (continued) | |
| 859,819 (8)(10) | | | Wells Fargo Mortgage Backed
Securities 2020-4 A17 Trust,
3.000%, 07/25/2050 | | | | $ | 876,710 | | | | | | 0.2 | | |
| | | | Total Collateralized
Mortgage Obligations
(Cost $47,846,066) | | | | | 48,540,991 | | | | | | 14.0 | | |
| COMMERCIAL MORTGAGE-BACKED SECURITIES: 10.6% | |
| 330,000 (8)(10) | | | BAMLL Re-REMIC Trust
2016-FRR16 B, 0.860%,
05/27/2021 | | | | | 325,081 | | | | | | 0.1 | | |
| 650,000 (8) | | | BANK 2017-BNK4 D, 3.357%,
05/15/2050 | | | | | 576,116 | | | | | | 0.1 | | |
| 1,170,000 (8) | | | BANK 2017-BNK8 D, 2.600%,
11/15/2050 | | | | | 985,466 | | | | | | 0.3 | | |
| 1,460,000 (8) | | | BANK 2019-BNK17 D,
3.000%, 04/15/2052 | | | | | 1,386,796 | | | | | | 0.4 | | |
| 1,000,000 (8)(10) | | | BENCHMARK 2018-B3 D
Mortgage Trust, 3.056%,
04/10/2051 | | | | | 924,007 | | | | | | 0.3 | | |
| 12,389,183 (10)(11) | | | BENCHMARK 2019-B10 XA
Mortgage Trust, 1.229%,
03/15/2062 | | | | | 981,015 | | | | | | 0.3 | | |
| 180,000 (8) | | | Benchmark 2020-B18 AGNE
Mortgage Trust, 3.759%,
08/15/2053 | | | | | 184,353 | | | | | | 0.0 | | |
| 5,497,544 (10)(11) | | | Benchmark 2020-B17 XA
Mortgage Trust, 1.420%,
03/15/2053 | | | | | 509,792 | | | | | | 0.1 | | |
| 5,747,989 (10)(11) | | | Benchmark 2020-B18 XA
Mortgage Trust, 1.794%,
07/15/2053 | | | | | 690,516 | | | | | | 0.2 | | |
| 759,438 (8) | | | BX Commercial Mortgage
Trust 2019-XL J, 2.809%,
(US0001M + 2.650)%,
10/15/2036 | | | | | 749,318 | | | | | | 0.2 | | |
| 729,332 (8) | | | BX Commercial Mortgage
Trust 2020-BXLP G, 2.659%,
(US0001M + 2.500)%,
12/15/2029 | | | | | 716,080 | | | | | | 0.2 | | |
| 100,000 (8) | | | BX Commercial Mortgage
Trust 2020-VKNG E, 2.259%,
(US0001M + 2.100)%,
10/15/2037 | | | | | 100,085 | | | | | | 0.0 | | |
| 210,000 (8)(10) | | | BX Trust 2019-OC11 E,
4.076%, 12/09/2041 | | | | | 214,083 | | | | | | 0.1 | | |
| 2,000,000 (8)(10) | | | CALI Mortgage Trust
2019-101C E, 4.324%,
03/10/2039 | | | | | 2,024,841 | | | | | | 0.6 | | |
| 16,205,823 (10)(11) | | | Citigroup Commercial
Mortgage Trust 2019-C7 XA,
0.878%, 12/15/2072 | | | | | 1,079,442 | | | | | | 0.3 | | |
| 2,350,000 (8)(10) | | | Citigroup Commercial
Mortgage Trust 2013-GC15 D,
5.181%, 09/10/2046 | | | | | 2,288,787 | | | | | | 0.7 | | |
| 130,000 (8)(10) | | | COMM 2013-CR10 E
Mortgage Trust, 4.789%,
08/10/2046 | | | | | 116,353 | | | | | | 0.1 | | |
| 2,000,000 (10) | | | COMM 2015-CCRE26 D
Mortgage Trust, 3.480%,
10/10/2048 | | | | | 1,837,132 | | | | | | 0.5 | | |
Principal
Amount† | | | Value | | | Percentage
of Net
Assets | |
COMMERCIAL MORTGAGE-BACKED
SECURITIES: (continued) | |
| 520,000 (8) | | | Credit Suisse Mortgage
Capital Certificates
2019-ICE4 F, 2.809%,
(US0001M + 2.650)%,
05/15/2036 | | | | $ | 515,398 | | | | | | 0.1 | | |
| 100,000 (8)(10) | | | Credit Suisse Mortgage
Capital Certificates 2020-NET
C, 3.526%, 08/15/2037 | | | | | 104,808 | | | | | | 0.0 | | |
| 2,000,000 (10) | | | Csail 2015-C2 C Commercial
Mortgage Trust, 4.190%,
06/15/2057 | | | | | 1,673,920 | | | | | | 0.5 | | |
| 350,000 (8) | | | DBUBS 2011-LC2A F
Mortgage Trust, 3.805%,
(US0001M + 3.650)%,
07/10/2044 | | | | | 262,848 | | | | | | 0.1 | | |
| 190,000 (8)(10) | | | DBUBS 2017-BRBK E
Mortgage Trust, 3.530%,
10/10/2034 | | | | | 194,542 | | | | | | 0.1 | | |
| 1,458,953 (10)(11) | | | Freddie Mac Multifamily
Structured Pass Through
Certificates K109 X1, 1.584%,
04/25/2030 | | | | | 184,697 | | | | | | 0.0 | | |
| 205,000 (8)(10) | | | GRACE 2014-GRCE F
Mortgage Trust, 3.590%,
06/10/2028 | | | | | 204,846 | | | | | | 0.1 | | |
| 293,000 (8)(10) | | | Grace Trust 2020-GRCE E,
2.680%, 12/10/2040 | | | | | 276,478 | | | | | | 0.1 | | |
| 172,185 (8)(10) | | | GS Mortgage Securities Trust
2011-GC3 B, 5.361%,
03/10/2044 | | | | | 172,124 | | | | | | 0.0 | | |
| 13,737,246 (10)(11) | | | GS Mortgage Securities Trust
2019-GC39 XA, 1.139%,
05/10/2052 | | | | | 969,028 | | | | | | 0.3 | | |
| 200,000 (8)(10) | | | JPMBB Commercial
Mortgage Securities Trust
2013-C17 F, 3.867%, 01/15/
2047 | | | | | 148,854 | | | | | | 0.0 | | |
| 370,000 (8)(10) | | | JPMCC Re-REMIC Trust
2015-FRR2 AK36, 2.164%,
12/27/2046 | | | | | 367,381 | | | | | | 0.1 | | |
| 420,000 (8)(10) | | | JP Morgan Chase
Commercial Mortgage
Securities Trust 2011-C5 B,
5.424%, 08/15/2046 | | | | | 423,650 | | | | | | 0.1 | | |
| 27,410,333 (10)(11) | | | JPMDB Commercial
Mortgage Securities Trust
2018-C8 XA, 0.641%,
06/15/2051 | | | | | 912,690 | | | | | | 0.3 | | |
| 2,000,000 (8) | | | KNDL 2019-KNSQ E
Mortgage Trust, 1.959%,
(US0001M + 1.800)%,
05/15/2036 | | | | | 1,995,345 | | | | | | 0.6 | | |
| 560,000 (8) | | | Morgan Stanley Bank of
America Merrill Lynch Trust
2013-C13 F, 3.707%, 11/15/
2046 | | | | | 363,106 | | | | | | 0.1 | | |
| 530,000 (8) | | | Morgan Stanley Capital I
Trust 2011-C1 M, 4.193%,
09/15/2047 | | | | | 63,693 | | | | | | 0.0 | | |
See Accompanying Notes to Financial Statements
SUMMARY PORTFOLIO OF INVESTMENTS
| Voya Balanced Income Portfolio | as of December 31, 2020 (continued) |
Principal
Amount† | | | Value | | | Percentage
of Net
Assets | |
COMMERCIAL MORTGAGE-BACKED
SECURITIES: (continued) | |
| 1,955,000 (8)(10) | | | Morgan Stanley Capital I
Trust 2016-BNK2 D,
3.000%, 11/15/2049 | | | | $ | 1,603,258 | | | | | | 0.5 | | |
| 17,689,067 (10)(11) | | | Morgan Stanley Capital I
Trust 2019-L3 XA, 0.643%,
11/15/2029 | | | | | 876,856 | | | | | | 0.2 | | |
| 200,000 (8) | | | MRCD 2019-PARK E
Mortgage Trust, 2.718%,
12/15/2036 | | | | | 197,342 | | | | | | 0.1 | | |
| 140,000 (8)(10) | | | UBS-Barclays Commercial
Mortgage Trust 2012-C4 D,
4.470%, 12/10/2045 | | | | | 81,687 | | | | | | 0.0 | | |
| 240,000 (8)(10) | | | UBS-Barclays Commercial
Mortgage Trust 2012-C4 E,
4.470%, 12/10/2045 | | | | | 119,358 | | | | | | 0.1 | | |
| 2,240,000 (8) | | | Wells Fargo Commercial
Mortgage Trust 2019-C49 D,
3.000%, 03/15/2052 | | | | | 1,758,768 | | | | | | 0.5 | | |
| 1,920,000 (10) | | | WFRBS Commercial
Mortgage Trust 2014-C19 C,
4.646%, 03/15/2047 | | | | | 1,906,604 | | | | | | 0.6 | | |
| 420,000 (8)(10) | | | WFRBS Commercial
Mortgage Trust 2011-C5 B,
5.656%, 11/15/2044 | | | | | 428,379 | | | | | | 0.1 | | |
| 2,000,000 (8)(10) | | | WFRBS Commercial
Mortgage Trust 2011-C5 E,
5.656%, 11/15/2044 | | | | | 1,905,423 | | | | | | 0.6 | | |
| 2,210,000 (8) | | | WFRBS Commercial
Mortgage Trust 2013-C12 E,
3.500%, 03/15/2048 | | | | | 1,808,162 | | | | | | 0.5 | | |
| 1,320,000 | | | Other Securities | | | | | 1,317,923 | | | | | | 0.4 | | |
| | | | Total Commercial
Mortgage-Backed
Securities
(Cost $37,903,081) | | | | | 36,526,431 | | | | | | 10.6 | | |
| ASSET-BACKED SECURITIES: 9.6% | |
| | | | Automobile Asset-Backed Securities: 1.7% | |
| 1,200,000 | | | Carmax Auto Owner Trust
2019-3 D, 2.850%,
01/15/2026 | | | | | 1,242,040 | | | | | | 0.3 | | |
| 550,000 (8) | | | Oscar US Funding XI LLC
2019-2A A4, 2.680%,
09/10/2026 | | | | | 577,351 | | | | | | 0.2 | | |
| 550,000 | | | Santander Drive Auto
Receivables Trust 2019-1 D,
3.650%, 04/15/2025 | | | | | 574,037 | | | | | | 0.2 | | |
| 1,000,000 | | | Santander Drive Auto
Receivables Trust 2019-2 D,
3.220%, 07/15/2025 | | | | | 1,040,592 | | | | | | 0.3 | | |
| 150,000 | | | Santander Drive Auto
Receivables Trust 2019-3 C,
2.490%, 10/15/2025 | | | | | 153,168 | | | | | | 0.0 | | |
| 350,000 | | | Santander Drive Auto
Receivables Trust 2019-3 D,
2.680%, 10/15/2025 | | | | | 360,062 | | | | | | 0.1 | | |
| 600,000 (8) | | | Santander Retail Auto Lease
Trust 2019-B C, 2.770%,
08/21/2023 | | | | | 617,793 | | | | | | 0.2 | | |
Principal
Amount† | | | Value | | | Percentage
of Net
Assets | |
| ASSET-BACKED SECURITIES: (continued) | |
| | | | Automobile Asset-Backed
Securities (continued) | |
| 1,250,000 | | | Other Securities | | | | $ | 1,307,550 | | | | | | 0.4 | | |
| | | | | | | | | 5,872,593 | | | | | | 1.7 | | |
| | | | Home Equity Asset-Backed Securities: 0.1% | |
| 586,611 (8)(10)(12) | | | ACE Securities Corp.
Mortgage Loan Trust
Series 2007-D1 A2, 6.336%,
02/25/2038 | | | | | 582,966 | | | | | | 0.1 | | |
| | | | Other Asset-Backed Securities: 7.6% | |
| 149,625 (8) | | | Applebee’s Funding LLC /
IHOP Funding LLC 2019-1A
A2II, 4.723%, 06/07/2049 | | | | | 146,371 | | | | | | 0.1 | | |
| 399,000 (8) | | | Applebee’s Funding LLC /
IHOP Funding LLC 2019-1A
A2I, 4.194%, 06/07/2049 | | | | | 395,734 | | | | | | 0.1 | | |
| 300,000 (8) | | | Babson CLO Ltd. 2018-3A C,
2.118%, (US0003M +
1.900)%, 07/20/2029 | | | | | 296,489 | | | | | | 0.1 | | |
| 750,000 (8) | | | Benefit Street Partners CLO II
Ltd. 2013-IIA BR, 2.787%,
(US0003M + 2.550)%,
07/15/2029 | | | | | 737,255 | | | | | | 0.2 | | |
| 750,000 (8) | | | Benefit Street Partners CLO X
Ltd. 2016-10A BR, 2.637%,
(US0003M + 2.400)%,
01/15/2029 | | | | | 742,491 | | | | | | 0.2 | | |
| 700,000 (8) | | | Dryden 43 Senior Loan Fund
2016-43A CR, 2.618%,
(US0003M + 2.400)%,
07/20/2029 | | | | | 700,084 | | | | | | 0.2 | | |
| 423,914 (8) | | | J.G. Wentworth XXXVIII LLC
2017-1A A, 3.990%,
08/16/2060 | | | | | 494,221 | | | | | | 0.1 | | |
| 750,000 (8) | | | LCM XV L.P. 15A CR,
2.618%, (US0003M +
2.400)%, 07/20/2030 | | | | | 737,925 | | | | | | 0.2 | | |
| 750,000 (8) | | | Neuberger Berman CLO XVII
Ltd. 2014-17A CR2, 2.216%,
(US0003M + 2.000)%,
04/22/2029 | | | | | 748,009 | | | | | | 0.2 | | |
| 1,000,000 (8) | | | Neuberger Berman Loan
Advisers CLO 25 Ltd.
2017-25A C, 2.368%,
(US0003M + 2.150)%,
10/18/2029 | | | | | 999,434 | | | | | | 0.3 | | |
| 750,000 (8) | | | Neuberger Berman Loan
Advisers CLO 33 Ltd.
2019-33A C, 2.680%,
(US0003M + 2.450)%,
10/16/2032 | | | | | 751,791 | | | | | | 0.2 | | |
| 800,000 (8) | | | Palmer Square Loan Funding
2019-2A B Ltd., 2.468%,
(US0003M + 2.250)%,
04/20/2027 | | | | | 799,671 | | | | | | 0.2 | | |
| 750,000 (8) | | | Palmer Square Loan Funding
2020-2A B Ltd., 2.468%,
(US0003M + 2.250)%,
04/20/2028 | | | | | 749,315 | | | | | | 0.2 | | |
See Accompanying Notes to Financial Statements
SUMMARY PORTFOLIO OF INVESTMENTS
| Voya Balanced Income Portfolio | as of December 31, 2020 (continued) |
Principal
Amount† | | | Value | | | Percentage
of Net
Assets | |
| ASSET-BACKED SECURITIES: (continued) | |
| | | | Other Asset-Backed Securities (continued) | |
| 500,000 (8) | | | Shackleton CLO Ltd.
2019-15A C, 3.037%,
(US0003M + 2.800)%,
01/15/2030 | | | | $ | 500,035 | | | | | | 0.2 | | |
| 500,000 (8) | | | Silver Creek CLO Ltd.
2014-1A CR, 2.518%,
(US0003M + 2.300)%,
07/20/2030 | | | | | 498,610 | | | | | | 0.2 | | |
| 500,000 (8) | | | BlueMountain CLO XXV Ltd.
2019-25A C, 2.687%,
(US0003M + 2.450)%,
07/15/2032 | | | | | 497,254 | | | | | | 0.1 | | |
| 388,000 (8) | | | Domino’s Pizza Master Issuer
LLC 2017-1A A2II, 3.082%,
07/25/2047 | | | | | 391,977 | | | | | | 0.1 | | |
| 603,118 (8) | | | Domino’s Pizza Master Issuer
LLC 2018-1A A2I, 4.116%,
07/25/2048 | | | | | 635,810 | | | | | | 0.2 | | |
| 500,000 (8) | | | Dryden 75 CLO Ltd.
2019-75A CR, 2.637%,
(US0003M + 2.400)%,
07/15/2030 | | | | | 500,145 | | | | | | 0.2 | | |
| 750,000 (8) | | | LCM XXII Ltd. 22A BR,
2.218%, (US0003M +
2.000)%, 10/20/2028 | | | | | 732,580 | | | | | | 0.2 | | |
| 1,200,000 (8) | | | LCM XXIV Ltd. 24A C,
2.468%, (US0003M +
2.250)%, 03/20/2030 | | | | | 1,183,679 | | | | | | 0.4 | | |
| 500,000 (8) | | | Madison Park Funding XXI
Ltd. 2016-21A BR, 3.087%,
(US0003M + 2.850)%,
10/15/2032 | | | | | 500,547 | | | | | | 0.2 | | |
| 650,000 (8) | | | Marlette Funding Trust
2019-3A B, 3.070%,
09/17/2029 | | | | | 660,002 | | | | | | 0.2 | | |
| 444,495 (8) | | | Mill City Solar Loan
2019-2GS A Ltd., 3.690%,
07/20/2043 | | | | | 469,674 | | | | | | 0.1 | | |
| 770,684 (8) | | | Mosaic Solar Loans 2017-2A
A LLC, 3.820%, 06/22/2043 | | | | | 831,656 | | | | | | 0.2 | | |
| 750,000 (8) | | | OCP Clo 2019-17A C1 Ltd.,
2.768%, (US0003M +
2.550)%, 07/20/2032 | | | | | 750,367 | | | | | | 0.2 | | |
| 250,000 (8) | | | Octagon Loan Funding Ltd.
2014-1A CRR, 2.420%,
(US0003M + 2.200)%,
11/18/2031 | | | | | 246,750 | | | | | | 0.1 | | |
| 750,000 (8) | | | OHA Credit Funding 3 Ltd.
2019-3A C, 2.668%,
(US0003M + 2.450)%,
07/20/2032 | | | | | 750,284 | | | | | | 0.2 | | |
| 1,000,000 (8) | | | Palmer Square CLO 2015-1A
BR2 Ltd., 2.463%, (US0003M
+ 2.250)%, 05/21/2029 | | | | | 1,000,225 | | | | | | 0.3 | | |
| 150,000 (8) | | | Sofi Consumer Loan Program
2018-2 B Trust, 3.790%,
04/26/2027 | | | | | 153,291 | | | | | | 0.1 | | |
| 150,000 (8) | | | SoFi Consumer Loan
Program 2018-4 B Trust,
3.960%, 11/26/2027 | | | | | 151,991 | | | | | | 0.0 | | |
Principal
Amount† | | | Value | | | Percentage
of Net
Assets | |
| ASSET-BACKED SECURITIES: (continued) | |
| | | | Other Asset-Backed Securities (continued) | |
| 1,000,000 (8) | | | SoFi Consumer Loan
Program 2019-3 D Trust,
3.890%, 05/25/2028 | | | | $ | 1,037,097 | | | | | | 0.3 | | |
| 200,000 (8) | | | SoFi Consumer Loan
Program 2019-4 C Trust,
2.840%, 08/25/2028 | | | | | 205,613 | | | | | | 0.1 | | |
| 100,000 (8) | | | SoFi Consumer Loan
Program 2019-4 D Trust,
3.480%, 08/25/2028 | | | | | 102,070 | | | | | | 0.0 | | |
| 400,000 (8) | | | SoFi Consumer Loan
Program 2020-1 C Trust,
2.500%, 01/25/2029 | | | | | 405,491 | | | | | | 0.1 | | |
| 349,526 (8) | | | Sunrun Xanadu Issuer
2019-1A A LLC, 3.980%,
06/30/2054 | | | | | 369,597 | | | | | | 0.1 | | |
| 750,000 (8) | | | THL Credit Wind River
2016-1A CR CLO Ltd.,
2.337%, (US0003M +
2.100)%, 07/15/2028 | | | | | 736,643 | | | | | | 0.2 | | |
| 2,000,000 (8)(10) | | | Towd Point Mortgage Trust
2015-4 M2, 3.750%,
04/25/2055 | | | | | 2,163,741 | | | | | | 0.6 | | |
| 180,000 (8)(10) | | | Towd Point Mortgage Trust
2015-6 M2, 3.750%,
04/25/2055 | | | | | 197,651 | | | | | | 0.1 | | |
| 1,164,000 (8) | | | Wendy’s Funding LLC
2018-1A A2II, 3.884%,
03/15/2048 | | | | | 1,236,564 | | | | | | 0.3 | | |
| 241,250 (8) | | | Wendy’s Funding LLC
2019-1A A2I, 3.783%,
06/15/2049 | | | | | 257,011 | | | | | | 0.1 | | |
| 780,000 (8) | | | Westcott Park CLO Ltd.
2016-1A CR, 2.468%,
(US0003M + 2.250)%,
07/20/2028 | | | | | 780,120 | | | | | | 0.2 | | |
| | | | | | | | | 26,245,265 | | | | | | 7.6 | | |
| | | | Student Loan Asset-Backed Securities: 0.2% | |
| 600,000 (8) | | | Sofi Professional Loan
Program 2019-C BFX LLC,
3.050%, 11/16/2048 | | | | | 624,528 | | | | | | 0.2 | | |
| | | | Total Asset-Backed
Securities
(Cost $32,654,561) | | | | | 33,325,352 | | | | | | 9.6 | | |
| U.S. TREASURY OBLIGATIONS: 0.7% | |
| | | | U.S. Treasury Bonds: 0.2% | |
| 539,000 | | | 1.250%-1.375%,
05/15/2050-08/15/2050 | | | | | 503,767 | | | | | | 0.2 | | |
| | | | | |
| | | | U.S. Treasury Notes: 0.5% | |
| 1,800,000 | | | 0.125%,12/15/2023 | | | | | 1,797,820 | | | | | | 0.5 | | |
| 90,000 | | | 0.875%,11/15/2030 | | | | | 89,663 | | | | | | 0.0 | | |
| | | | | | | | | 1,887,483 | | | | | | 0.5 | | |
| | | | Total U.S. Treasury
Obligations
(Cost $2,390,668) | | | | | 2,391,250 | | | | | | 0.7 | | |
| |
See Accompanying Notes to Financial Statements
SUMMARY PORTFOLIO OF INVESTMENTS
| Voya Balanced Income Portfolio | as of December 31, 2020 (continued) |
Principal
Amount† | | | Value | | | Percentage
of Net
Assets | |
| SOVEREIGN BONDS: 1.6% | |
| 200,000 (8) | | | Dominican Republic
International Bond, 4.500%,
01/30/2030 | | | | $ | 217,750 | | | | | | 0.1 | | |
| 325,000 (8) | | | Ghana Government
International Bond, 6.375%,
02/11/2027 | | | | | 338,548 | | | | | | 0.1 | | |
| 4,416,000 (1) | | | Other Securities | | | | | 4,872,222 | | | | | | 1.4 | | |
| | | | Total Sovereign Bonds
(Cost $5,130,111) | | | | | 5,428,520 | | | | | | 1.6 | | |
| PURCHASED OPTIONS(13): 0.0% | |
| | | | Total Purchased Options
(Cost $184,426) | | | | | 74,743 | | | | | | 0.0 | | |
| | | | Total Long-Term Investments
(Cost $309,389,040) | | | | | 339,550,954 | | | | | | 98.0 | | |
| SHORT-TERM INVESTMENTS: 0.5% | |
| | | | Repurchase Agreements: 0.5% | |
| 605,627 (14) | | | Citigroup, Inc., Repurchase
Agreement dated 12/31/20,
0.07%, due 01/04/21
(Repurchase Amount
$605,632, collateralized by
various U.S. Government/U.S.
Government Agency
Obligations, 0.000%-4.000%,
Market Value plus accrued
interest $617,740, due
09/15/21-01/01/51) | | | | | 605,627 | | | | | | 0.2 | | |
| 1,000,000 (14) | | | RBC Dominion Securities
Inc., Repurchase Agreement
dated 12/31/20, 0.08%, due
01/04/21 (Repurchase
Amount $1,000,009,
collateralized by various U.S.
Government/U.S. Government
Agency Obligations,
0.000%-6.000%, Market
Value plus accrued interest
$1,020,000, due 01/05/21-12/
20/50) | | | | | 1,000,000 | | | | | | 0.3 | | |
| | | | Total Short-Term
Investments
(Cost $1,605,627) | | | | | 1,605,627 | | | | | | 0.5 | | |
| | | | Total Investments in
Securities
(Cost $310,994,667) | | | | $ | 341,156,581 | | | | | | 98.5 | | |
| | | | Assets in Excess of
Other Liabilities | | | | | 5,027,282 | | | | | | 1.5 | | |
| | | | Net Assets | | | | $ | 346,183,863 | | | | | | 100.0 | | |
| |
“Other Securities” represents issues not identified as the top 50 holdings in terms of market value and issues or issuers not
exceeding 1% of net assets individually or in aggregate respectively as of December 31, 2020.
The following footnotes apply to either the individual securities noted or one or more of the securities aggregated and listed as a single line item.
†
Unless otherwise indicated, principal amount is shown in USD.
(1)
The grouping contains securities on loan.
(2)
The grouping contains non-income producing securities.
(3)
Preferred Stock may be called prior to convertible date.
(4)
Non-income producing security.
(5)
Represents an escrow position for future entitlements, if any, on the defaulted bond. The escrow position was received in exchange for the defaulted bond as part of the bankruptcy reorganization of the bond issuer. These holdings are non-income producing.
(6)
For fair value measurement disclosure purposes, security is categorized as Level 3, whose value was determined using significant unobservable inputs.
(7)
Restricted security as to resale, excluding Rule 144A securities. As of December 31, 2020, the Portfolio held restricted securities with a fair value of $— or 0.0% of net assets. Please refer to the table below for additional details.
(8)
Securities with purchases pursuant to Rule 144A or section 4(a)(2), under the Securities Act of 1933 and may not be resold subject to that rule except to qualified institutional buyers.
(9)
Security, or a portion of the security, is on loan.
(10)
Variable rate security. Rate shown is the rate in effect as of December 31, 2020.
(11)
Interest only securities represent the right to receive the monthly interest payments on an underlying pool of mortgage loans. Principal amount shown represents the notional amount on which current interest is calculated. Payments of principal on the pool reduce the value of the interest only security.
(12)
Step-up bond that pays an initial coupon rate for the first period and then a higher coupon rate for the following periods. Rates shown reflect the current and next coupon rate as of December 31, 2020.
(13)
The tables within the Portfolio of Investments detail open purchased options which are non-income producing securities.
(14)
All or a portion of the security represents securities purchased with cash collateral received for securities on loan.
Currency Abbreviations:
EUR EU Euro
Reference Rate Abbreviations:
US0001M 1-month LIBOR
US0003M 3-month LIBOR
See Accompanying Notes to Financial Statements
SUMMARY PORTFOLIO OF INVESTMENTS
| Voya Balanced Income Portfolio | as of December 31, 2020 (continued) |
Fair Value Measurements^
The following is a summary of the fair valuations according to the inputs used as of December 31, 2020 in valuing the assets and liabilities:
| | | | Quoted Prices
in Active Markets
for Identical
Investments
(Level 1) | | | Significant
Other
Observable
Inputs#
(Level 2) | | | Significant
Unobservable
Inputs
(Level 3) | | | Fair Value
at
December 31, 2020 | |
| Asset Table | | | | | | | | | | | | | | | | | | | | | | | | | |
| Investments, at fair value | | | | | | | | | | | | | | | | | | | | | | | | | |
| Common Stock | | | | | | | | | | | | | | | | | | | | | | | | | |
| Communication Services | | | | $ | 8,014,701 | | | | | $ | 1,231,143 | | | | | $ | — | | | | | $ | 9,245,844 | | |
| Consumer Discretionary | | | | | 7,481,445 | | | | | | 1,044,485 | | | | | | — | | | | | | 8,525,930 | | |
| Consumer Staples | | | | | 11,571,132 | | | | | | 2,117,116 | | | | | | — | | | | | | 13,688,248 | | |
| Energy | | | | | 3,500,873 | | | | | | 329,241 | | | | | | — | | | | | | 3,830,114 | | |
| Financials | | | | | 11,108,980 | | | | | | 2,505,989 | | | | | | — | | | | | | 13,614,969 | | |
| Health Care | | | | | 21,251,447 | | | | | | 2,324,414 | | | | | | — | | | | | | 23,575,861 | | |
| Industrials | | | | | 12,273,572 | | | | | | 2,847,902 | | | | | | — | | | | | | 15,121,474 | | |
| Information Technology | | | | | 50,145,077 | | | | | | 1,125,780 | | | | | | — | | | | | | 51,270,857 | | |
| Materials | | | | | 5,326,433 | | | | | | 1,605,780 | | | | | | — | | | | | | 6,932,213 | | |
| Real Estate | | | | | 1,518,189 | | | | | | 188,668 | | | | | | — | | | | | | 1,706,857 | | |
| Utilities | | | | | 6,717,429 | | | | | | 954,650 | | | | | | — | | | | | | 7,672,079 | | |
| Total Common Stock | | | | | 138,909,278 | | | | | | 16,275,168 | | | | | | — | | | | | | 155,184,446 | | |
| Exchange-Traded Funds | | | | | 675,320 | | | | | | — | | | | | | — | | | | | | 675,320 | | |
| Mutual Funds | | | | | 26,571,781 | | | | | | — | | | | | | — | | | | | | 26,571,781 | | |
| Preferred Stock | | | | | — | | | | | | 1,587,644 | | | | | | — | | | | | | 1,587,644 | | |
| Rights | | | | | 790 | | | | | | — | | | | | | — | | | | | | 790 | | |
| Purchased Options | | | | | — | | | | | | 74,743 | | | | | | — | | | | | | 74,743 | | |
| Corporate Bonds/Notes | | | | | — | | | | | | 29,243,686 | | | | | | — | | | | | | 29,243,686 | | |
| Collateralized Mortgage Obligations | | | | | — | | | | | | 48,540,991 | | | | | | — | | | | | | 48,540,991 | | |
| Asset-Backed Securities | | | | | — | | | | | | 33,325,352 | | | | | | — | | | | | | 33,325,352 | | |
| Commercial Mortgage-Backed Securities | | | | | — | | | | | | 36,526,431 | | | | | | — | | | | | | 36,526,431 | | |
| Sovereign Bonds | | | | | — | | | | | | 5,428,520 | | | | | | — | | | | | | 5,428,520 | | |
| Other | | | | | — | | | | | | — | | | | | | — | | | | | | — | | |
| U.S. Treasury Obligations | | | | | — | | | | | | 2,391,250 | | | | | | — | | | | | | 2,391,250 | | |
| Short-Term Investments | | | | | — | | | | | | 1,605,627 | | | | | | — | | | | | | 1,605,627 | | |
| Total Investments, at fair value | | | | $ | 166,157,169 | | | | | $ | 174,999,412 | | | | | $ | — | | | | | $ | 341,156,581 | | |
| Other Financial Instruments+ | | | | | | | | | | | | | | | | | | | | | | | | | |
| Centrally Cleared Swaps | | | | | — | | | | | | 3,109 | | | | | | — | | | | | | 3,109 | | |
| Forward Foreign Currency Contracts | | | | | — | | | | | | 529,175 | | | | | | — | | | | | | 529,175 | | |
| Futures | | | | | 237,070 | | | | | | — | | | | | | — | | | | | | 237,070 | | |
| Total Assets | | | | $ | 166,394,239 | | | | | $ | 175,531,696 | | | | | $ | — | | | | | $ | 341,925,935 | | |
| Liabilities Table | | | | | | | | | | | | | | | | | | | | | | | | | |
| Other Financial Instruments+ | | | | | | | | | | | | | | | | | | | | | | | | | |
| Forward Foreign Currency Contracts | | | | $ | — | | | | | $ | (615,118) | | | | | $ | — | | | | | $ | (615,118) | | |
| Futures | | | | | (671) | | | | | | — | | | | | | — | | | | | | (671) | | |
| Written Options | | | | | — | | | | | | (11,051) | | | | | | — | | | | | | (11,051) | | |
| Total Liabilities | | | | $ | (671) | | | | | $ | (626,169) | | | | | $ | — | | | | | $ | (626,840) | | |
^
See Note 2, “Significant Accounting Policies” in the Notes to Financial Statements for additional information.
+
Other Financial Instruments may include open forward foreign currency contracts, futures, centrally cleared swaps, OTC swaps and written options. Forward foreign currency contracts, futures and centrally cleared swaps are fair valued at the unrealized appreciation (depreciation) on the instrument. OTC swaps and written options are valued at the fair value of the instrument.
#
The earlier close of the foreign markets gives rise to the possibility that significant events, including broad market moves, may have occurred in the interim and may materially affect the value of those securities. To account for this, the Portfolio may frequently value many of its foreign equity securities using fair value prices based on third party vendor modeling tools to the extent available. Accordingly, a portion of the Portfolio’s investments are categorized as Level 2 investments.
See Accompanying Notes to Financial Statements
SUMMARY PORTFOLIO OF INVESTMENTS
| Voya Balanced Income Portfolio | as of December 31, 2020 (continued) |
At December 31, 2020, Voya Balanced Income Portfolio held the following restricted securities:
| Security | | | Acquisition Date | | | Acquisition Cost | | | Fair Value | |
| General Motors Co. Escrow | | | | | 11/24/2020 | | | | | $ | — | | | | | $ | — | | |
| | | | | | | | | | | $ | — | | | | | $ | — | | |
Transactions with Affiliates
An investment of at least 5% of the voting securities of an issuer, or a company which is under common control with the issuer, results in that issuer becoming an affiliated person as defined by the 1940 Act.
The following table provides transactions during the year ended December 31, 2020, where the following issuers were considered an affiliate:
| Issuer | | | Beginning
Fair Value
at 12/31/19 | | | Purchases
at Cost | | | Sales
at Cost | | | Change in
Unrealized
Appreciation/
(Depreciation) | | | Ending Fair
Value at
12/31/20 | | | Investment
Income | | | Realized
Gains/
(Losses) | | | Net
Capital Gain
Distributions | |
| Voya Floating Rate Fund – Class P | | | | $ | 33,156,275 | | | | | $ | 4,869,626 | | | | | $ | (12,908,886) | | | | | $ | (809,634) | | | | | $ | 24,307,381 | | | | | $ | 1,169,625 | | | | | $ | (1,658,886) | | | | | $ | — | | |
| Voya High Yield Bond Fund – Class P | | | | | — | | | | | | 5,679,752 | | | | | | (3,550,593) | | | | | | 135,241 | | | | | | 2,264,400 | | | | | | 129,756 | | | | | | 149,399 | | | | | | — | | |
| | | | | $ | 33,156,275 | | | | | $ | 10,549,378 | | | | | $ | (16,459,479) | | | | | $ | (674,393) | | | | | $ | 26,571,781 | | | | | $ | 1,299,381 | | | | | $ | (1,509,487) | | | | | $ | — | | |
The financial statements for the above mutual fund[s] can be found at www.sec.gov.
At December 31, 2020, the following forward foreign currency contracts were outstanding for Voya Balanced Income Portfolio:
| Currency Purchased | | | Currency Sold | | | Counterparty | | | Settlement Date | | | Unrealized
Appreciation
(Depreciation) | |
| USD 2,197,390 | | | GBP 1,651,726 | | | BNP Paribas | | | | | 02/05/21 | | | | | $ | (61,897) | | |
| USD 1,606,234 | | | NZD 2,288,291 | | | BNP Paribas | | | | | 02/05/21 | | | | | | (40,549) | | |
| USD 1,215,223 | | | NZD 1,722,316 | | | BNP Paribas | | | | | 02/05/21 | | | | | | (24,252) | | |
| CHF 2,371,722 | | | USD 2,685,404 | | | BNP Paribas | | | | | 02/05/21 | | | | | | (3,652) | | |
| SEK 10,954,505 | | | USD 1,293,700 | | | BNP Paribas | | | | | 02/05/21 | | | | | | 38,260 | | |
| USD 1,045,828 | | | NOK 9,030,838 | | | Brown Brothers Harriman & Co. | | | | | 02/05/21 | | | | | | (7,384) | | |
| SEK 4,975,132 | | | USD 606,718 | | | Brown Brothers Harriman & Co. | | | | | 02/05/21 | | | | | | (1,792) | | |
| USD 888,836 | | | CAD 1,138,377 | | | Brown Brothers Harriman & Co. | | | | | 02/05/21 | | | | | | (5,597) | | |
| GBP 924,922 | | | USD 1,235,333 | | | Brown Brothers Harriman & Co. | | | | | 02/05/21 | | | | | | 29,807 | | |
| AUD 2,175,145 | | | USD 1,654,035 | | | Brown Brothers Harriman & Co. | | | | | 02/05/21 | | | | | | 23,496 | | |
| GBP 1,186,740 | | | USD 1,608,673 | | | Brown Brothers Harriman & Co. | | | | | 02/05/21 | | | | | | 14,590 | | |
| EUR 694,840 | | | USD 831,692 | | | Brown Brothers Harriman & Co. | | | | | 02/05/21 | | | | | | 17,822 | | |
| NOK 3,629,998 | | | USD 410,380 | | | Brown Brothers Harriman & Co. | | | | | 02/05/21 | | | | | | 12,965 | | |
| CAD 1,630,314 | | | USD 1,280,349 | | | Brown Brothers Harriman & Co. | | | | | 02/05/21 | | | | | | 603 | | |
| USD 351,034 | | | NOK 3,114,885 | | | Brown Brothers Harriman & Co. | | | | | 02/05/21 | | | | | | (12,236) | | |
| USD 1,327,230 | | | EUR 1,087,704 | | | Brown Brothers Harriman & Co. | | | | | 02/05/21 | | | | | | (2,602) | | |
| EUR 414,396 | | | USD 503,892 | | | Brown Brothers Harriman & Co. | | | | | 02/05/21 | | | | | | 2,750 | | |
| GBP 266,555 | | | USD 359,846 | | | Citibank N.A. | | | | | 02/05/21 | | | | | | 4,758 | | |
| NZD 793,934 | | | USD 563,680 | | | Citibank N.A. | | | | | 02/05/21 | | | | | | 7,679 | | |
| BRL 3,379 | | | USD 655 | | | Citibank N.A. | | | | | 02/05/21 | | | | | | (4) | | |
| USD 654,103 | | | CAD 844,736 | | | Citibank N.A. | | | | | 02/05/21 | | | | | | (9,614) | | |
| CHF 581,566 | | | USD 650,690 | | | Citibank N.A. | | | | | 02/05/21 | | | | | | 6,898 | | |
| CHF 582,601 | | | USD 655,862 | | | Citibank N.A. | | | | | 02/05/21 | | | | | | 2,896 | | |
| COP 1,245,879 | | | USD 358 | | | Citibank N.A. | | | | | 02/05/21 | | | | | | 7 | | |
See Accompanying Notes to Financial Statements
SUMMARY PORTFOLIO OF INVESTMENTS
| Voya Balanced Income Portfolio | as of December 31, 2020 (continued) |
| Currency Purchased | | | Currency Sold | | | Counterparty | | | Settlement Date | | | Unrealized
Appreciation
(Depreciation) | |
| PEN 252,020 | | | USD 69,945 | | | Citibank N.A. | | | | | 02/05/21 | | | | | | (306) | | |
| RUB 5,019,526 | | | USD 63,650 | | | JPMorgan Chase Bank N.A. | | | | | 01/15/21 | | | | | | 4,124 | | |
| PLN 475 | | | USD 124 | | | Morgan Stanley Capital Services LLC | | | | | 01/08/21 | | | | | | 3 | | |
| USD 465,502 | | | SEK 3,927,429 | | | Morgan Stanley Capital Services LLC | | | | | 02/05/21 | | | | | | (12,035) | | |
| EUR 4,203,234 | | | USD 5,047,238 | | | Morgan Stanley Capital Services LLC | | | | | 02/05/21 | | | | | | 91,654 | | |
| GBP 477,955 | | | USD 645,720 | | | Morgan Stanley Capital Services LLC | | | | | 02/05/21 | | | | | | 8,044 | | |
| SEK 5,107,652 | | | USD 617,066 | | | Morgan Stanley Capital Services LLC | | | | | 02/05/21 | | | | | | 3,974 | | |
| NZD 1,149,248 | | | USD 808,012 | | | Morgan Stanley Capital Services LLC | | | | | 02/05/21 | | | | | | 19,051 | | |
| USD 631,314 | | | EUR 518,362 | | | Morgan Stanley Capital Services LLC | | | | | 02/05/21 | | | | | | (2,438) | | |
| USD 2,346,937 | | | CHF 2,089,165 | | | Morgan Stanley Capital Services LLC | | | | | 02/05/21 | | | | | | (15,323) | | |
| GBP 214,918 | | | USD 289,908 | | | Morgan Stanley Capital Services LLC | | | | | 02/05/21 | | | | | | 4,064 | | |
| CHF 553,559 | | | USD 623,181 | | | Morgan Stanley Capital Services LLC | | | | | 02/05/21 | | | | | | 2,740 | | |
| IDR 87,562,411 | | | USD 5,898 | | | Standard Chartered Bank | | | | | 01/08/21 | | | | | | 341 | | |
| NZD 483,945 | | | USD 343,437 | | | Standard Chartered Bank | | | | | 02/05/21 | | | | | | 4,837 | | |
| USD 633,418 | | | EUR 516,270 | | | Standard Chartered Bank | | | | | 02/05/21 | | | | | | 2,225 | | |
| NZD 476,273 | | | USD 335,522 | | | Standard Chartered Bank | | | | | 02/05/21 | | | | | | 7,231 | | |
| USD 622,222 | | | EUR 510,276 | | | Standard Chartered Bank | | | | | 02/05/21 | | | | | | (1,644) | | |
| CAD 1,056,776 | | | USD 816,012 | | | Standard Chartered Bank | | | | | 02/05/21 | | | | | | 14,307 | | |
| USD 3,059 | | | JPY 318,344 | | | Standard Chartered Bank | | | | | 02/05/21 | | | | | | (26) | | |
| USD 327,398 | | | GBP 245,061 | | | Standard Chartered Bank | | | | | 02/05/21 | | | | | | (7,805) | | |
| USD 751,044 | | | EUR 612,582 | | | Standard Chartered Bank | | | | | 02/05/21 | | | | | | 2,098 | | |
| USD 974,034 | | | CAD 1,263,661 | | | State Street Bank and Trust Co. | | | | | 02/05/21 | | | | | | (18,836) | | |
| GBP 215,481 | | | USD 290,532 | | | State Street Bank and Trust Co. | | | | | 02/05/21 | | | | | | 4,211 | | |
| SEK 4,845,063 | | | USD 588,873 | | | State Street Bank and Trust Co. | | | | | 02/05/21 | | | | | | 239 | | |
| USD 355,058 | | | NZD 500,051 | | | State Street Bank and Trust Co. | | | | | 02/05/21 | | | | | | (4,806) | | |
| CAD 2,304,947 | | | USD 1,817,177 | | | State Street Bank and Trust Co. | | | | | 02/05/21 | | | | | | (6,160) | | |
| GBP 504,184 | | | USD 678,309 | | | State Street Bank and Trust Co. | | | | | 02/05/21 | | | | | | 11,331 | | |
| USD 651,722 | | | CHF 575,996 | | | State Street Bank and Trust Co. | | | | | 02/05/21 | | | | | | 432 | | |
| USD 1,058,493 | | | SEK 8,864,513 | | | State Street Bank and Trust Co. | | | | | 02/05/21 | | | | | | (19,344) | | |
| NZD 514,163 | | | USD 365,610 | | | State Street Bank and Trust Co. | | | | | 02/05/21 | | | | | | 4,410 | | |
| USD 1,552,063 | | | AUD 2,051,200 | | | State Street Bank and Trust Co. | | | | | 02/05/21 | | | | | | (29,877) | | |
| NZD 851,740 | | | USD 598,875 | | | State Street Bank and Trust Co. | | | | | 02/05/21 | | | | | | 14,085 | | |
| SEK 5,709,010 | | | USD 672,167 | | | State Street Bank and Trust Co. | | | | | 02/05/21 | | | | | | 21,992 | | |
| USD 604,432 | | | GBP 451,704 | | | State Street Bank and Trust Co. | | | | | 02/05/21 | | | | | | (13,424) | | |
| USD 819,329 | | | EUR 677,840 | | | State Street Bank and Trust Co. | | | | | 02/05/21 | | | | | | (9,401) | | |
| AUD 1,168,464 | | | USD 866,043 | | | State Street Bank and Trust Co. | | | | | 02/05/21 | | | | | | 35,107 | | |
| USD 538,335 | | | CAD 689,849 | | | State Street Bank and Trust Co. | | | | | 02/05/21 | | | | | | (3,685) | | |
| AUD 1,226,107 | | | USD 910,846 | | | State Street Bank and Trust Co. | | | | | 02/05/21 | | | | | | 34,761 | | |
| CHF 705,073 | | | USD 796,818 | | | State Street Bank and Trust Co. | | | | | 02/05/21 | | | | | | 422 | | |
| SEK 9,288,239 | | | USD 1,125,069 | | | State Street Bank and Trust Co. | | | | | 02/05/21 | | | | | | 4,289 | | |
| NZD 1,036,490 | | | USD 736,910 | | | State Street Bank and Trust Co. | | | | | 02/05/21 | | | | | | 9,007 | | |
| USD 927,773 | | | EUR 756,658 | | | State Street Bank and Trust Co. | | | | | 02/05/21 | | | | | | 2,679 | | |
| GBP 454,532 | | | USD 611,966 | | | State Street Bank and Trust Co. | | | | | 02/05/21 | | | | | | 9,759 | | |
| USD 2,123,790 | | | AUD 2,881,412 | | | State Street Bank and Trust Co. | | | | | 02/05/21 | | | | | | (98,432) | | |
| USD 647,816 | | | SEK 5,464,373 | | | State Street Bank and Trust Co. | | | | | 02/05/21 | | | | | | (16,598) | | |
| USD 1,487,780 | | | GBP 1,115,798 | | | State Street Bank and Trust Co. | | | | | 02/05/21 | | | | | | (38,446) | | |
| USD 632,529 | | | SEK 5,355,310 | | | State Street Bank and Trust Co. | | | | | 02/05/21 | | | | | | (18,624) | | |
| GBP 455,608 | | | USD 611,614 | | | State Street Bank and Trust Co. | | | | | 02/05/21 | | | | | | 11,582 | | |
| USD 1,739,353 | | | SEK 14,795,981 | | | State Street Bank and Trust Co. | | | | | 02/05/21 | | | | | | (59,692) | | |
| USD 1,286,253 | | | CHF 1,155,852 | | | State Street Bank and Trust Co. | | | | | 02/05/21 | | | | | | (20,692 | ) |
See Accompanying Notes to Financial Statements
SUMMARY PORTFOLIO OF INVESTMENTS
| Voya Balanced Income Portfolio | as of December 31, 2020 (continued) |
| Currency Purchased | | | Currency Sold | | | Counterparty | | | Settlement Date | | | Unrealized
Appreciation
(Depreciation) | |
| USD 1,202,697 | | | CHF 1,087,196 | | | State Street Bank and Trust Co. | | | | | 02/05/21 | | | | | | (26,616) | | |
| GBP 458,518 | | | USD 613,179 | | | State Street Bank and Trust Co. | | | | | 02/05/21 | | | | | | 13,997 | | |
| CHF 587,340 | | | USD 660,507 | | | State Street Bank and Trust Co. | | | | | 02/05/21 | | | | | | 3,609 | | |
| CHF 601,447 | | | USD 681,840 | | | State Street Bank and Trust Co. | | | | | 02/05/21 | | | | | | (1,772) | | |
| USD 531,775 | | | CAD 680,553 | | | State Street Bank and Trust Co. | | | | | 02/05/21 | | | | | | (2,941) | | |
| NOK 7,551,376 | | | USD 882,908 | | | State Street Bank and Trust Co. | | | | | 02/05/21 | | | | | | (2,237) | | |
| SEK 5,005,311 | | | USD 610,564 | | | State Street Bank and Trust Co. | | | | | 02/05/21 | | | | | | (1,968) | | |
| USD 753,195 | | | CAD 961,601 | | | State Street Bank and Trust Co. | | | | | 02/05/21 | | | | | | (2,344) | | |
| AUD 1,714,775 | | | USD 1,305,394 | | | State Street Bank and Trust Co. | | | | | 02/05/21 | | | | | | 17,086 | | |
| CHF 575,586 | | | USD 647,874 | | | State Street Bank and Trust Co. | | | | | 02/05/21 | | | | | | 2,953 | | |
| USD 611,284 | | | NZD 863,400 | | | State Street Bank and Trust Co. | | | | | 02/05/21 | | | | | | (10,067) | | |
| USD 2,842 | | | EUR 2,326 | | | The Bank of New York Mellon | | | | | 01/05/21 | | | | | | — | | |
| | | | | | | | | | | | | | | | | $ | (85,943) | | |
| |
At December 31, 2020, the following futures contracts were outstanding for Voya Balanced Income Portfolio:
| Description | | | Number
of Contracts | | | Expiration
Date | | | Notional
Amount | | | Unrealized
Appreciation/
(Depreciation) | |
| Long Contracts: | | | | | | | | | | | | | | | | | | | | | | | | | |
| U.S. Treasury 2-Year Note | | | | | 173 | | | | | | 03/31/21 | | | | | $ | 38,228,945 | | | | | $ | 38,448 | | |
| U.S. Treasury 5-Year Note | | | | | 513 | | | | | | 03/31/21 | | | | | | 64,722,164 | | | | | | 146,023 | | |
| | | | | | | | | | | | | | | | | $ | 102,951,109 | | | | | $ | 184,471 | | |
| Short Contracts: | | | | | | | | | | | | | | | | | | | | | | | | | |
| U.S. Treasury 10-Year Note | | | | | (60) | | | | | | 03/22/21 | | | | | | (8,284,687) | | | | | | (671) | | |
| U.S. Treasury Long Bond | | | | | (23) | | | | | | 03/22/21 | | | | | | (3,983,312) | | | | | | 16,366 | | |
| U.S. Treasury Ultra 10-Year Note | | | | | (7) | | | | | | 03/22/21 | | | | | | (1,094,516) | | | | | | 2,349 | | |
| U.S. Treasury Ultra Long Bond | | | | | (14) | | | | | | 03/22/21 | | | | | | (2,989,875) | | | | | | 33,884 | | |
| | | | | | | | | | | | | | | | | $ | (16,352,390) | | | | | $ | 51,928 | | |
At December 31, 2020, the following centrally cleared credit default swaps were outstanding for Voya Balanced Income Portfolio:
Centrally Cleared Credit Default Swaps on Corporate and Sovereign Issues — Buy Protection(1)
Reference
Entity/Obligation | | | Buy/Sell
Protection | | | (Pay)/
Receive
Financing
Rate (%)(2) | | | Termination
Date | | | Notional Amount(3) | | | Fair
Value(4) | | | Unrealized
Appreciation/
(Depreciation) | |
| Prudential Financial Inc. 3.50%, due 05/15/2024 | | | | | Buy | | | | | | (1.000) | | | | | | 12/20/24 | | | | USD 1,140,000 | | | | $ | (27,179) | | | | | $ | 3,109 | | |
| | | | | | | | | | | | | | | | | | | | | | | | | | $ | (27,179) | | | | | $ | 3,109 | | |
(1)
If a Portfolio is a buyer of protection and a credit event occurs, as defined under the terms of that particular swap agreement, a Portfolio will either i) receive from the seller of protection an amount equal to the notional amount of the swap and deliver the referenced obligation, other deliverable obligations or underlying securities comprising the referenced index or ii) receive a net settlement amount in the form of cash or securities equal to the notional amount of the swap less the recovery value of the referenced obligation or underlying securities comprising the referenced index.
(2)
Payments made quarterly.
(3)
The maximum amount of future payments (undiscounted) that a Portfolio as seller of protection could be required to make or receive as a buyer of credit protection under a credit default swap agreement would be an amount equal to the notional amount of the agreement.
(4)
The fair values for credit default swap agreements serve as an indicator of the current status of the payment/performance risk and represent the likelihood or risk of default for the credit derivative. Increasing fair values, in absolute terms, when compared to the notional amount of the agreement, represent a deterioration of the referenced obligation’s credit soundness and a greater likelihood or risk of default or other credit event occurring.
See Accompanying Notes to Financial Statements
SUMMARY PORTFOLIO OF INVESTMENTS
| Voya Balanced Income Portfolio | as of December 31, 2020 (continued) |
At December 31, 2020, the following OTC purchased credit default swaptions were outstanding for Voya Balanced Income Portfolio:
| Description | | | Counterparty | | | Reference Entity(1) | | | Fixed Rate | | | Pay/
Receive
Financing
Rate | | | Strike
Price | | | Expiration
Date | | | Notional
Amount | | | Cost | | | Fair Value | |
Put on 5-Year
Credit Default
Swap | | | JPMorgan Chase
Bank N.A. | | | CDX North American
High Yield Index,
Series 35, Version 1 | | | | | 5.000% | | | | | | Pay | | | | | | 103.500% | | | | | | 02/17/21 | | | | USD 3,457,000 | | | | $ | 39,756 | | | | | $ | 10,699 | | |
| | | | | | | | | | | | | | | | | | | | | | | | | | | | | | | | | | | | | | $ | 39,756 | | | | | $ | 10,699 | | |
At December 31, 2020, the following OTC purchased foreign currency options were outstanding for Voya Balanced Income Portfolio:
| Description | | | Counterparty | | | Expiration
Date | | | Exercise
Price | | | Notional Amount | | | Cost | | | Fair Value | |
| Call USD vs. Put AUD | | | Morgan Stanley
Capital Services
LLC | | | | | 03/15/21 | | | | 0.728 USD | | | | | 17,194,000 | | | | | $ | 144,670 | | | | | $ | 64,044 | | |
| | | | | | | | | | | | | | | | | | | | | | | $ | 144,670 | | | | | $ | 64,044 | | |
At December 31, 2020, the following OTC written foreign currency options were outstanding for Voya Balanced Income Portfolio:
| Description | | | Counterparty | | | Expiration
Date | | | Exercise
Price | | | Notional Amount | | | Premiums
Received | | | Fair Value | |
| Call USD vs. Put AUD | | | Standard Chartered Bank | | | | | 01/15/21 | | | | 0.745 USD | | | | | 10,685,000 | | | | | $ | 68,117 | | | | | $ | (11,051) | | |
| | | | | | | | | | | | | | | | | | | | | | | $ | 68,117 | | | | | $ | (11,051) | | |
(1)
Payments received quarterly.
Currency Abbreviations
| | AUD | | | – | | | Australian Dollar | |
| | BRL | | | – | | | Brazilian Real | |
| | CAD | | | – | | | Canadian Dollar | |
| | CHF | | | – | | | Swiss Franc | |
| | COP | | | – | | | Colombian Peso | |
| | EUR | | | – | | | EU Euro | |
| | GBP | | | – | | | British Pound | |
| | IDR | | | – | | | Indonesian Rupiah | |
| | JPY | | | – | | | Japanese Yen | |
| | NOK | | | – | | | Norwegian Krone | |
| | NZD | | | – | | | New Zealand Dollar | |
| | PEN | | | – | | | Peruvian Nuevo Sol | |
| | PLN | | | – | | | Polish Zloty | |
| | RUB | | | – | | | Russian Ruble | |
| | SEK | | | – | | | Swedish Krona | |
| | USD | | | – | | | United States Dollar | |
See Accompanying Notes to Financial Statements
SUMMARY PORTFOLIO OF INVESTMENTS
| Voya Balanced Income Portfolio | as of December 31, 2020 (continued) |
A summary of derivative instruments by primary risk exposure is outlined in the following tables.
The fair value of derivative instruments as of December 31, 2020 was as follows:
| Derivatives not accounted for as hedging instruments | | | Location on Statement
of Assets and Liabilities | | | Fair Value | |
| Asset Derivatives | | | | | | | | | | |
| Foreign exchange contracts | | | Investments in securities at value* | | | | $ | 64,044 | | |
| Credit Contracts | | | Investments in securities at value* | | | | | 10,699 | | |
| Foreign exchange contracts | | | Unrealized appreciation on forward foreign currency contracts | | | | | 529,175 | | |
| Interest rate contracts | | | Net Assets — Unrealized appreciation** | | | | | 237,070 | | |
| Credit contracts | | | Net Assets — Unrealized appreciation*** | | | | | 3,109 | | |
| Total Asset Derivatives | | | | | | | $ | 844,097 | | |
| Liability Derivatives | | | | | | | | | | |
| Foreign exchange contracts | | | Unrealized depreciation on forward foreign currency contracts | | | | $ | 615,118 | | |
| Interest rate contracts | | | Net Assets — Unrealized depreciation** | | | | | 671 | | |
| Foreign exchange contracts | | | Written options, at fair value | | | | | 11,051 | | |
| Total Liability Derivatives | | | | | | | $ | 626,840 | | |
*
Includes purchased options.
**
Includes cumulative appreciation/depreciation of futures contracts as reported in the table within the Portfolio of Investments.
***
Includes cumulative appreciation/depreciation of centrally cleared swaps as reported in the table within the Portfolio of Investments. Only current day’s variation margin receivable/payable is shown on the Statement of Assets and Liabiliites.
The effect of derivative instruments on the Portfolio’s Statement of Operations for the year ended December 31, 2020 was as follows:
Amount of Realized Gain or (Loss) on Derivatives Recognized in Income
| Derivatives not accounted for as hedging instruments | | | Investments* | | | Forward foreign
currency
contracts | | | Futures | | | Swaps | | | Written
options | | | Total | |
| Credit contracts | | | | $ | (68,964) | | | | | $ | — | | | | | $ | — | | | | | $ | 1,497,998 | | | | | $ | 18,362 | | | | | $ | 1,447,396 | | |
| Equity contracts | | | | | (67,534) | | | | | | — | | | | | | (45,353) | | | | | | — | | | | | | — | | | | | | (112,887) | | |
| Foreign exchange contracts | | | | | (739,120) | | | | | | 377,575 | | | | | | — | | | | | | (74,566) | | | | | | 169,776 | | | | | | (266,335) | | |
| Interest rate contracts | | | | | 178,431 | | | | | | — | | | | | | 2,096,149 | | | | | | (335,648) | | | | | | 177,936 | | | | | | 2,116,868 | | |
| Total | | | | $ | (697,187) | | | | | $ | 377,575 | | | | | $ | 2,050,796 | | | | | $ | 1,087,784 | | | | | $ | 366,074 | | | | | $ | 3,185,042 | | |
Change in Unrealized Appreciation or (Depreciation) on Derivatives Recognized in Income
| Derivatives not accounted for as hedging instruments | | | Investments* | | | Forward foreign
currency
contracts | | | Futures | | | Swaps | | | Written
options | | | Total | |
| Credit contracts | | | | $ | (29,057) | | | | | $ | — | | | | | $ | — | | | | | $ | (81,513) | | | | | $ | — | | | | | $ | (110,570) | | |
| Equity contracts | | | | | — | | | | | | — | | | | | | — | | | | | | — | | | | | | — | | | | | | — | | |
| Foreign exchange contracts | | | | | (67,359) | | | | | | (425,763) | | | | | | — | | | | | | 36,587 | | | | | | 29,377 | | | | | | (427,158) | | |
| Interest rate contracts | | | | | — | | | | | | — | | | | | | 160,812 | | | | | | — | | | | | | — | | | | | | 160,812 | | |
| Total | | | | $ | (96,416) | | | | | $ | (425,763) | | | | | $ | 160,812 | | | | | $ | (44,926) | | | | | $ | 29,377 | | | | | $ | (376,916) | | |
*
Amounts recognized for purchased options are included in net realized gain (loss) on investments and in net change in unrealized apppreciation (depreciation) on investments.
See Accompanying Notes to Financial Statements
SUMMARY PORTFOLIO OF INVESTMENTS
| Voya Balanced Income Portfolio | as of December 31, 2020 (continued) |
The following is a summary by counterparty of the fair value of OTC derivative instruments subject to Master Netting Agreements and collateral pledged (received), if any, at December 31, 2020:
| | | | BNP
Paribas | | | Brown
Brothers
Harriman | | | Citibank N.A. | | | JPMorgan
Chase
Bank N.A. | | | Morgan Stanley
Capital
Services LLC | | | Standard
Chartered
Bank | | | State Street
Bank and
Trust Co. | | | Totals | |
| Assets: | | | | | | | | | | | | | | | | | | | | | | | | | | | | | | | | | | | | | | | | | | | | | | | | | |
| Purchased options | | | | $ | — | | | | | $ | — | | | | | $ | — | | | | | $ | 10,699 | | | | | $ | 64,044 | | | | | $ | — | | | | | $ | — | | | | | $ | 74,743 | | |
| Forward foreign currency contracts | | | | | 38,260 | | | | | | 102,033 | | | | | | 22,238 | | | | | | 4,124 | | | | | | 129,530 | | | | | | 31,039 | | | | | | 201,951 | | | | | | 529,175 | | |
| Total Assets | | | | $ | 38,260 | | | | | $ | 102,033 | | | | | $ | 22,238 | | | | | $ | 14,823 | | | | | $ | 193,574 | | | | | $ | 31,039 | | | | | $ | 201,951 | | | | | $ | 603,918 | | |
| Liabilities: | | | | | | | | | | | | | | | | | | | | | | | | | | | | | | | | | | | | | | | | | | | | | | | | | |
| Forward foreign currency contracts | | | | $ | 130,350 | | | | | $ | 29,611 | | | | | $ | 9,924 | | | | | $ | — | | | | | $ | 29,796 | | | | | $ | 9,475 | | | | | $ | 405,962 | | | | | $ | 615,118 | | |
| Written options | | | | | — | | | | | | — | | | | | | — | | | | | | — | | | | | | — | | | | | | 11,051 | | | | | | — | | | | | | 11,051 | | |
| Total Liabilities | | | | $ | 130,350 | | | | | $ | 29,611 | | | | | $ | 9,924 | | | | | $ | — | | | | | $ | 29,796 | | | | | $ | 20,526 | | | | | $ | 405,962 | | | | | $ | 626,169 | | |
| Net OTC derivative instruments by counterparty, at fair value | | | | $ | (92,090) | | | | | $ | 72,422 | | | | | $ | 12,314 | | | | | $ | 14,823 | | | | | $ | 163,778 | | | | | $ | 10,513 | | | | | $ | (204,011) | | | | | | (22,251) | | |
| Total collateral pledged by the Portfolio/(Received from counterparty) | | | | $ | — | | | | | $ | — | | | | | $ | — | | | | | $ | — | | | | | $ | — | | | | | $ | — | | | | | $ | — | | | | | $ | — | | |
Net Exposure(1) | | | | $ | (92,090) | | | | | $ | 72,422 | | | | | $ | 12,314 | | | | | $ | 14,823 | | | | | $ | 163,778 | | | | | $ | 10,513 | | | | | $ | (204,011) | | | | | $ | (22,251) | | |
(1)
Positive net exposure represents amounts due from each respective counterparty. Negative exposure represents amounts due from the Portfolio. Please refer to Note 2 for additional details regarding counterparty credit risk and credit related contingent features.
At December 31, 2020, the aggregate cost of securities and other investments and the composition of unrealized appreciation and depreciation of securities and other investments on a tax basis were:
| | Cost for federal income tax purposes was $311,579,699. | | |
| | Net unrealized appreciation consisted of: | | |
| | Gross Unrealized Appreciation | | | | $ | 39,657,091 | | |
| | Gross Unrealized Depreciation | | | | | (9,856,708) | | |
| | Net Unrealized Appreciation | | | | $ | 29,800,383 | | |
See Accompanying Notes to Financial Statements
SUMMARY PORTFOLIO OF INVESTMENTS
| Voya High Yield Portfolio | as of December 31, 2020 |
Principal
Amount† | | | Value | | | Percentage
of Net
Assets | |
| CORPORATE BONDS/NOTES: 94.3% | |
| | | | Basic Materials: 6.4% | |
| 1,580,000 (1) | | | Cleveland-Cliffs, Inc.,
6.750%, 03/15/2026 | | | | $ | 1,708,375 | | | | | | 0.3 | | |
| 900,000 | | | Cleveland-Cliffs, Inc.,
5.750%-5.875%,
03/01/2025-06/01/2027 | | | | | 915,487 | | | | | | 0.2 | | |
| 1,050,000 (1) | | | Compass Minerals
International, Inc., 6.750%,
12/01/2027 | | | | | 1,140,100 | | | | | | 0.2 | | |
| 1,150,000 (1)(2) | | | Constellium SE, 5.625%,
06/15/2028 | | | | | 1,241,281 | | | | | | 0.2 | | |
| 850,000 (1) | | | Constellium SE, 6.625%,
03/01/2025 | | | | | 869,656 | | | | | | 0.2 | | |
| 1,150,000 (1) | | | Element Solutions, Inc.,
3.875%, 09/01/2028 | | | | | 1,185,219 | | | | | | 0.2 | | |
| 1,500,000 (1) | | | First Quantum Minerals
Ltd., 6.875%, 10/15/2027 | | | | | 1,629,375 | | | | | | 0.3 | | |
| 2,825,000 | | | Freeport-McMoRan, Inc.,
4.125%, 03/01/2028 | | | | | 2,968,016 | | | | | | 0.5 | | |
| 1,360,000 | | | Freeport-McMoRan, Inc.,
4.250%-4.625%,
11/14/2024-08/01/2030 | | | | | 1,488,029 | | | | | | 0.3 | | |
| 1,175,000 (1) | | | Hudbay Minerals, Inc.,
6.125%, 04/01/2029 | | | | | 1,269,000 | | | | | | 0.2 | | |
| 1,150,000 (1) | | | Illuminate Buyer LLC /
Illuminate Holdings IV, Inc.,
9.000%, 07/01/2028 | | | | | 1,266,437 | | | | | | 0.2 | | |
| 1,272,000 (1) | | | Joseph T Ryerson & Son,
Inc., 8.500%, 08/01/2028 | | | | | 1,442,925 | | | | | | 0.3 | | |
| 1,300,000 (1) | | | Kraton Polymers LLC /
Kraton Polymers Capital
Corp., 4.250%, 12/15/2025 | | | | | 1,327,755 | | | | | | 0.2 | | |
| 2,000,000 (1) | | | Novelis Corp., 5.875%,
09/30/2026 | | | | | 2,092,500 | | | | | | 0.4 | | |
| 635,000 (1) | | | OCI NV, 4.625%,
10/15/2025 | | | | | 660,003 | | | | | | 0.1 | | |
| 750,000 (1) | | | OCI NV, 5.250%,
11/01/2024 | | | | | 780,469 | | | | | | 0.2 | | |
| 1,300,000 (1) | | | Rayonier AM Products,
Inc., 7.625%, 01/15/2026 | | | | | 1,357,200 | | | | | | 0.3 | | |
| 1,500,000 (1) | | | Schweitzer-Mauduit
International, Inc., 6.875%,
10/01/2026 | | | | | 1,595,340 | | | | | | 0.3 | | |
| 1,215,000 (1) | | | SPCM SA, 4.875%,
09/15/2025 | | | | | 1,254,487 | | | | | | 0.2 | | |
| 2,350,000 (1) | | | Trinseo Materials
Operating SCA / Trinseo
Materials Finance, Inc.,
5.375%, 09/01/2025 | | | | | 2,404,344 | | | | | | 0.4 | | |
| 1,875,000 (1)(2) | | | Tronox, Inc., 6.500%,
04/15/2026 | | | | | 1,954,688 | | | | | | 0.4 | | |
| 1,450,000 (1) | | | Venator Finance Sarl /
Venator Materials LLC,
5.750%, 07/15/2025 | | | | | 1,358,469 | | | | | | 0.3 | | |
| 1,375,000 (1) | | | WR Grace & Co-Conn,
4.875%, 06/15/2027 | | | | | 1,459,934 | | | | | | 0.3 | | |
| 1,025,000 | | | Other Securities | | | | | 1,077,062 | | | | | | 0.2 | | |
| | | | | | | | | 34,446,151 | | | | | | 6.4 | | |
Principal
Amount† | | | Value | | | Percentage
of Net
Assets | |
| CORPORATE BONDS/NOTES: (continued) | |
| | | | Communications: 16.9% | |
| 1,200,000 (1) | | | Altice France Holding SA,
6.000%, 02/15/2028 | | | | $ | 1,217,502 | | | | | | 0.3 | | |
| 2,038,000 (1) | | | Altice France Holding SA,
10.500%, 05/15/2027 | | | | | 2,291,476 | | | | | | 0.4 | | |
| 875,000 (1) | | | Altice France SA/France,
5.125%, 01/15/2029 | | | | | 907,266 | | | | | | 0.2 | | |
| 1,225,000 (1) | | | Altice France SA/France,
8.125%, 02/01/2027 | | | | | 1,351,977 | | | | | | 0.2 | | |
| 1,180,000 (1) | | | ANGI Group LLC, 3.875%,
08/15/2028 | | | | | 1,203,146 | | | | | | 0.2 | | |
| 350,000 (1) | | | Arches Buyer, Inc.,
4.250%, 06/01/2028 | | | | | 355,101 | | | | | | 0.1 | | |
| 825,000 (1) | | | Arches Buyer, Inc.,
6.125%, 12/01/2028 | | | | | 853,525 | | | | | | 0.1 | | |
| 2,430,000 (1) | | | CCO Holdings LLC / CCO
Holdings Capital Corp.,
4.500%, 05/01/2032 | | | | | 2,597,597 | | | | | | 0.5 | | |
| 2,250,000 (1) | | | CCO Holdings LLC / CCO
Holdings Capital Corp.,
5.125%, 05/01/2027 | | | | | 2,390,681 | | | | | | 0.4 | | |
| 1,075,000 (1) | | | CCO Holdings LLC / CCO
Holdings Capital Corp.,
5.000%, 02/01/2028 | | | | | 1,137,888 | | | | | | 0.2 | | |
| 450,000 (1) | | | CCO Holdings LLC / CCO
Holdings Capital Corp.,
5.500%, 05/01/2026 | | | | | 466,945 | | | | | | 0.1 | | |
| 1,790,000 (1) | | | CommScope Tech Finance
LLC, 6.000%, 06/15/2025 | | | | | 1,832,692 | | | | | | 0.4 | | |
| 175,000 (1) | | | CommScope Technologies
LLC, 5.000%, 03/15/2027 | | | | | 173,578 | | | | | | 0.0 | | |
| 890,000 (1) | | | CommScope, Inc., 7.125%,
07/01/2028 | | | | | 949,372 | | | | | | 0.2 | | |
| 1,725,000 (1) | | | Connect Finco SARL /
Connect US Finco LLC,
6.750%, 10/01/2026 | | | | | 1,860,533 | | | | | | 0.3 | | |
| 1,225,000 (1) | | | Consolidated
Communications, Inc.,
6.500%, 10/01/2028 | | | | | 1,312,587 | | | | | | 0.2 | | |
| 1,400,000 (1) | | | CSC Holdings LLC,
4.625%, 12/01/2030 | | | | | 1,463,189 | | | | | | 0.3 | | |
| 1,125,000 (1) | | | CSC Holdings LLC,
5.750%, 01/15/2030 | | | | | 1,234,693 | | | | | | 0.2 | | |
| 650,000 (1) | | | CSC Holdings LLC,
7.500%, 04/01/2028 | | | | | 731,878 | | | | | | 0.1 | | |
| 1,485,000 | | | CSC Holdings LLC,
5.250%, 06/01/2024 | | | | | 1,610,148 | | | | | | 0.3 | | |
| 1,400,000 (1) | | | Cumulus Media New
Holdings, Inc., 6.750%,
07/01/2026 | | | | | 1,433,789 | | | | | | 0.3 | | |
| 1,075,000 (1) | | | Diamond Sports Group
LLC / Diamond Sports
Finance Co., 5.375%,
08/15/2026 | | | | | 875,453 | | | | | | 0.1 | | |
| 625,000 (1)(2) | | | Diamond Sports Group
LLC / Diamond Sports
Finance Co., 6.625%,
08/15/2027 | | | | | 378,906 | | | | | | 0.1 | | |
See Accompanying Notes to Financial Statements
SUMMARY PORTFOLIO OF INVESTMENTS
| Voya High Yield Portfolio | as of December 31, 2020 (continued) |
Principal
Amount† | | | Value | | | Percentage
of Net
Assets | |
| CORPORATE BONDS/NOTES: (continued) | |
| | | | Communications (continued) | |
| 3,810,000 | | | DISH DBS Corp.,
5.000%-7.375%,
03/15/2023-07/01/2028 | | | | $ | 4,019,350 | | | | | | 0.7 | | |
| 1,600,000 (1)(2) | | | Entercom Media Corp.,
7.250%, 11/01/2024 | | | | | 1,599,000 | | | | | | 0.3 | | |
| 325,000 (1) | | | Frontier Communications
Corp., 5.000%, 05/01/2028 | | | | | 339,422 | | | | | | 0.0 | | |
| 1,350,000 (1) | | | Frontier Communications
Corp., 6.750%, 05/01/2029 | | | | | 1,447,031 | | | | | | 0.3 | | |
| 1,225,000 (1) | | | GCI LLC, 4.750%,
10/15/2028 | | | | | 1,308,821 | | | | | | 0.2 | | |
| 525,000 (1) | | | iHeartCommunications,
Inc., 5.250%, 08/15/2027 | | | | | 550,825 | | | | | | 0.1 | | |
| 1,875,000 | | | iHeartCommunications,
Inc., 8.375%, 05/01/2027 | | | | | 2,004,703 | | | | | | 0.4 | | |
| 1,600,000 (1) | | | LCPR Senior Secured
Financing DAC, 6.750%,
10/15/2027 | | | | | 1,724,000 | | | | | | 0.3 | | |
| 1,325,000 (1) | | | LogMeIn, Inc., 5.500%,
09/01/2027 | | | | | 1,389,594 | | | | | | 0.3 | | |
| 650,000 (1) | | | Match Group Holdings II
LLC, 4.125%, 08/01/2030 | | | | | 675,493 | | | | | | 0.1 | | |
| 300,000 (1) | | | Match Group Holdings II
LLC, 4.625%, 06/01/2028 | | | | | 315,000 | | | | | | 0.1 | | |
| 1,000,000 (1) | | | MDC Partners, Inc.,
6.500%, 05/01/2024 | | | | | 1,015,260 | | | | | | 0.2 | | |
| 1,975,000 (2) | | | Meredith Corp., 6.875%,
02/01/2026 | | | | | 1,929,328 | | | | | | 0.4 | | |
| 1,125,000 (1) | | | Midcontinent
Communications /
Midcontinent Finance
Corp., 5.375%, 08/15/2027 | | | | | 1,179,630 | | | | | | 0.2 | | |
| 540,000 (1) | | | National CineMedia LLC,
5.875%, 04/15/2028 | | | | | 459,000 | | | | | | 0.1 | | |
| 850,000 (1) | | | Netflix, Inc., 4.875%,
06/15/2030 | | | | | 979,094 | | | | | | 0.2 | | |
| 1,625,000 | | | Netflix, Inc., 5.875%,
11/15/2028 | | | | | 1,950,869 | | | | | | 0.3 | | |
| 1,425,000 (1) | | | Nexstar Broadcasting, Inc.,
5.625%, 07/15/2027 | | | | | 1,528,761 | | | | | | 0.3 | | |
| 1,875,000 (1) | | | Radiate Holdco LLC /
Radiate Finance, Inc.,
6.500%, 09/15/2028 | | | | | 1,972,266 | | | | | | 0.4 | | |
| 225,000 (1)(2) | | | Scripps Escrow II, Inc.,
3.875%, 01/15/2029 | | | | | 234,983 | | | | | | 0.0 | | |
| 300,000 (1)(2) | | | Scripps Escrow II, Inc.,
5.375%, 01/15/2031 | | | | | 316,044 | | | | | | 0.1 | | |
| 1,100,000 (1) | | | Scripps Escrow, Inc.,
5.875%, 07/15/2027 | | | | | 1,150,545 | | | | | | 0.2 | | |
| 1,700,000 (1) | | | Sinclair Television Group,
Inc., 4.125%, 12/01/2030 | | | | | 1,744,208 | | | | | | 0.3 | | |
| 1,775,000 (1) | | | Sirius XM Radio, Inc.,
5.000%, 08/01/2027 | | | | | 1,888,556 | | | | | | 0.4 | | |
| 925,000 | | | Sprint Communications,
Inc., 6.000%, 11/15/2022 | | | | | 1,002,469 | | | | | | 0.2 | | |
| 3,100,000 | | | Sprint Corp., 7.125%,
06/15/2024 | | | | | 3,629,015 | | | | | | 0.7 | | |
| 1,100,000 | | | Sprint Corp., 7.625%,
03/01/2026 | | | | | 1,366,981 | | | | | | 0.2 | | |
Principal
Amount† | | | Value | | | Percentage
of Net
Assets | |
| CORPORATE BONDS/NOTES: (continued) | |
| | | | Communications (continued) | |
| 220,000 (1) | | | TEGNA, Inc., 4.625%,
03/15/2028 | | | | $ | 225,363 | | | | | | 0.0 | | |
| 525,000 (1) | | | TEGNA, Inc., 4.750%,
03/15/2026 | | | | | 561,251 | | | | | | 0.1 | | |
| 1,325,000 | | | TEGNA, Inc., 5.000%,
09/15/2029 | | | | | 1,400,998 | | | | | | 0.3 | | |
| 1,875,000 | | | Telecom Italia Capital SA,
6.000%-6.375%,
11/15/2033-09/30/2034 | | | | | 2,300,917 | | | | | | 0.4 | | |
| 1,700,000 (1) | | | Terrier Media Buyer, Inc.,
8.875%, 12/15/2027 | | | | | 1,877,438 | | | | | | 0.4 | | |
| 350,000 (1) | | | Townsquare Media, Inc.,
6.875%, 02/01/2026 | | | | | 367,596 | | | | | | 0.1 | | |
| 2,175,000 (1) | | | Univision Communications,
Inc., 6.625%, 06/01/2027 | | | | | 2,339,811 | | | | | | 0.4 | | |
| 425,000 (1) | | | Univision Communications,
Inc., 9.500%, 05/01/2025 | | | | | 474,937 | | | | | | 0.1 | | |
| 1,350,000 (1) | | | ViaSat, Inc., 5.625%,
09/15/2025 | | | | | 1,382,467 | | | | | | 0.3 | | |
| 250,000 (1) | | | ViaSat, Inc., 5.625%,
04/15/2027 | | | | | 262,969 | | | | | | 0.0 | | |
| 625,000 (1)(2) | | | ViaSat, Inc., 6.500%,
07/15/2028 | | | | | 677,347 | | | | | | 0.1 | | |
| 400,000 (1) | | | Virgin Media Finance PLC,
5.000%, 07/15/2030 | | | | | 415,500 | | | | | | 0.1 | | |
| 1,200,000 (1) | | | Virgin Media Secured
Finance PLC, 5.500%,
05/15/2029 | | | | | 1,302,408 | | | | | | 0.2 | | |
| 750,000 (1) | | | Virgin Media Vendor
Financing Notes IV DAC,
5.000%, 07/15/2028 | | | | | 780,750 | | | | | | 0.1 | | |
| 250,000 (1) | | | VTR Comunicaciones SpA,
5.125%, 01/15/2028 | | | | | 266,650 | | | | | | 0.1 | | |
| 400,000 (1) | | | VTR Finance NV, 6.375%,
07/15/2028 | | | | | 437,500 | | | | | | 0.1 | | |
| 1,850,000 (1) | | | Zayo Group Holdings, Inc.,
6.125%, 03/01/2028 | | | | | 1,959,557 | | | | | | 0.4 | | |
| 7,150,000 | | | Other Securities | | | | | 8,046,289 | | | | | | 1.5 | | |
| | | | | | | | | 91,429,918 | | | | | | 16.9 | | |
| | | | Consumer, Cyclical: 20.8% | |
| 1,225,000 (1) | | | 1011778 BC ULC / New
Red Finance, Inc., 4.000%,
10/15/2030 | | | | | 1,243,877 | | | | | | 0.2 | | |
| 1,350,000 (1) | | | Academy Ltd., 6.000%,
11/15/2027 | | | | | 1,417,500 | | | | | | 0.3 | | |
| 1,475,000 (1) | | | Adams Homes, Inc.,
7.500%, 02/15/2025 | | | | | 1,549,672 | | | | | | 0.3 | | |
| 1,775,000 (1)(2) | | | Adient Global Holdings
Ltd., 4.875%, 08/15/2026 | | | | | 1,826,031 | | | | | | 0.3 | | |
| 400,000 (1) | | | Adient US LLC, 9.000%,
04/15/2025 | | | | | 446,500 | | | | | | 0.1 | | |
| 1,825,000 (1) | | | Affinity Gaming, 6.875%,
12/15/2027 | | | | | 1,913,969 | | | | | | 0.4 | | |
| 1,575,000 (1) | | | Allison Transmission, Inc.,
5.875%, 06/01/2029 | | | | | 1,746,462 | | | | | | 0.3 | | |
| 625,000 (1)(2) | | | American Airlines Group,
Inc., 3.750%, 03/01/2025 | | | | | 484,375 | | | | | | 0.1 | | |
See Accompanying Notes to Financial Statements
SUMMARY PORTFOLIO OF INVESTMENTS
| Voya High Yield Portfolio | as of December 31, 2020 (continued) |
Principal
Amount† | | | Value | | | Percentage
of Net
Assets | |
| CORPORATE BONDS/NOTES: (continued) | |
| | | | Consumer, Cyclical (continued) | |
| 800,000 (1) | | | Ashton Woods USA LLC /
Ashton Woods Finance
Co., 6.625%, 01/15/2028 | | | | $ | 844,000 | | | | | | 0.2 | | |
| 625,000 (1) | | | Ashton Woods USA LLC /
Ashton Woods Finance
Co., 6.750%, 08/01/2025 | | | | | 652,278 | | | | | | 0.1 | | |
| 1,675,000 (1) | | | Beacon Roofing Supply,
Inc., 4.875%, 11/01/2025 | | | | | 1,717,821 | | | | | | 0.3 | | |
| 1,225,000 | | | Boyd Gaming Corp.,
6.000%, 08/15/2026 | | | | | 1,274,000 | | | | | | 0.2 | | |
| 1,250,000 (1) | | | Boyd Gaming Corp.,
8.625%, 06/01/2025 | | | | | 1,391,800 | | | | | | 0.3 | | |
| 1,300,000 (1) | | | Caesars Entertainment,
Inc., 6.250%, 07/01/2025 | | | | | 1,386,131 | | | | | | 0.3 | | |
| 1,825,000 (1) | | | Caesars Resort Collection
LLC / CRC Finco, Inc.,
5.250%, 10/15/2025 | | | | | 1,846,727 | | | | | | 0.3 | | |
| 1,250,000 (1) | | | Carnival Corp., 7.625%,
03/01/2026 | | | | | 1,364,206 | | | | | | 0.3 | | |
| 700,000 (1) | | | Carnival Corp., 9.875%,
08/01/2027 | | | | | 806,313 | | | | | | 0.1 | | |
| 1,400,000 (1) | | | CCM Merger, Inc., 6.375%,
05/01/2026 | | | | | 1,473,500 | | | | | | 0.3 | | |
| 1,850,000 | | | Century Communities, Inc.,
5.875%, 07/15/2025 | | | | | 1,930,743 | | | | | | 0.4 | | |
| 1,225,000 (1) | | | Cinemark USA, Inc.,
8.750%, 05/01/2025 | | | | | 1,328,359 | | | | | | 0.2 | | |
| 325,000 (1)(3) | | | Core & Main Holdings L.P.,
8.625% (PIK Rate 9.375%,
Cash Rate 8.625)%,
09/15/2024 | | | | | 333,294 | | | | | | 0.1 | | |
| 1,875,000 (1) | | | Core & Main L.P., 6.125%,
08/15/2025 | | | | | 1,941,797 | | | | | | 0.4 | | |
| 700,000 (1) | | | Delta Air Lines, Inc. /
SkyMiles IP Ltd., 4.750%,
10/20/2028 | | | | | 764,626 | | | | | | 0.1 | | |
| 1,990,000 | | | Delta Air Lines, Inc.,
2.900%-7.375%,
10/28/2024-01/15/2026 | | | | | 2,008,884 | | | | | | 0.4 | | |
| 1,775,000 | | | Ford Motor Credit Co. LLC,
5.113%, 05/03/2029 | | | | | 1,979,036 | | | | | | 0.4 | | |
| 2,100,000 | | | Ford Motor Credit Co. LLC,
5.584%, 03/18/2024 | | | | | 2,268,000 | | | | | | 0.4 | | |
| 2,875,000 | | | Ford Motor Credit Co. LLC,
4.125%-4.542%,
08/01/2026-08/17/2027 | | | | | 3,050,656 | | | | | | 0.5 | | |
| 990,000 (1)(2) | | | Golden Entertainment, Inc.,
7.625%, 04/15/2026 | | | | | 1,065,948 | | | | | | 0.2 | | |
| 1,650,000 (1) | | | H&E Equipment Services,
Inc., 3.875%, 12/15/2028 | | | | | 1,664,487 | | | | | | 0.3 | | |
| 435,000 (1) | | | Hilton Domestic Operating
Co., Inc., 5.750%,
05/01/2028 | | | | | 473,878 | | | | | | 0.1 | | |
| 1,025,000 (1) | | | IAA, Inc., 5.500%,
06/15/2027 | | | | | 1,088,422 | | | | | | 0.2 | | |
| 1,125,000 (1) | | | Installed Building Products,
Inc., 5.750%, 02/01/2028 | | | | | 1,202,130 | | | | | | 0.2 | | |
Principal
Amount† | | | Value | | | Percentage
of Net
Assets | |
| CORPORATE BONDS/NOTES: (continued) | |
| | | | Consumer, Cyclical (continued) | |
| 1,025,000 (1) | | | Interface, Inc., 5.500%,
12/01/2028 | | | | $ | 1,080,734 | | | | | | 0.2 | | |
| 775,000 (1) | | | IRB Holding Corp.,
6.750%, 02/15/2026 | | | | | 800,846 | | | | | | 0.1 | | |
| 1,925,000 | | | L Brands, Inc., 6.750%,
07/01/2036 | | | | | 2,148,300 | | | | | | 0.4 | | |
| 715,000 (1) | | | L Brands, Inc., 6.875%,
07/01/2025 | | | | | 777,413 | | | | | | 0.1 | | |
| 325,000 (1) | | | L Brands, Inc., 9.375%,
07/01/2025 | | | | | 400,156 | | | | | | 0.1 | | |
| 1,300,000 (1) | | | LBM Acquisition LLC,
6.250%, 01/15/2029 | | | | | 1,354,866 | | | | | | 0.2 | | |
| 1,975,000 (1) | | | Lions Gate Capital
Holdings LLC, 5.875%,
11/01/2024 | | | | | 2,011,824 | | | | | | 0.4 | | |
| 2,075,000 | | | Meritage Homes Corp.,
5.125%-7.000%,
04/01/2022-06/06/2027 | | | | | 2,267,026 | | | | | | 0.4 | | |
| 1,950,000 (1) | | | Meritor, Inc., 4.500%,
12/15/2028 | | | | | 2,002,406 | | | | | | 0.4 | | |
| 1,400,000 (1)(2) | | | Michaels Stores, Inc.,
8.000%, 07/15/2027 | | | | | 1,507,366 | | | | | | 0.3 | | |
| 850,000 (1) | | | Mileage Plus Holdings LLC
/ Mileage Plus Intellectual
Property Assets Ltd.,
6.500%, 06/20/2027 | | | | | 915,344 | | | | | | 0.2 | | |
| 1,400,000 (1)(2) | | | Motion Bondco DAC,
6.625%, 11/15/2027 | | | | | 1,468,250 | | | | | | 0.3 | | |
| 1,375,000 | | | Murphy Oil USA, Inc.,
4.750%-5.625%,
05/01/2027-09/15/2029 | | | | | 1,464,463 | | | | | | 0.3 | | |
| 1,225,000 (1) | | | Navistar International
Corp., 6.625%, 11/01/2025 | | | | | 1,284,903 | | | | | | 0.2 | | |
| 1,475,000 (1)(2) | | | Penn National Gaming,
Inc., 5.625%, 01/15/2027 | | | | | 1,541,523 | | | | | | 0.3 | | |
| 850,000 (1) | | | PetSmart, Inc., 5.875%,
06/01/2025 | | | | | 874,969 | | | | | | 0.1 | | |
| 945,000 (1) | | | PetSmart, Inc., 7.125%,
03/15/2023 | | | | | 945,850 | | | | | | 0.2 | | |
| 1,400,000 (1) | | | Picasso Finance Sub, Inc.,
6.125%, 06/15/2025 | | | | | 1,500,030 | | | | | | 0.3 | | |
| 355,000 (1) | | | Royal Caribbean Cruises
Ltd., 9.125%, 06/15/2023 | | | | | 385,619 | | | | | | 0.1 | | |
| 1,225,000 (1) | | | Royal Caribbean Cruises
Ltd., 11.500%, 06/01/2025 | | | | | 1,433,617 | | | | | | 0.2 | | |
| 725,000 (1) | | | Scientific Games
International, Inc., 5.000%,
10/15/2025 | | | | | 749,026 | | | | | | 0.2 | | |
| 875,000 (1) | | | Scientific Games
International, Inc., 7.000%,
05/15/2028 | | | | | 942,288 | | | | | | 0.2 | | |
| 625,000 (1) | | | Scientific Games
International, Inc., 8.250%,
03/15/2026 | | | | | 674,566 | | | | | | 0.1 | | |
| 600,000 (1) | | | Scientific Games
International, Inc., 8.625%,
07/01/2025 | | | | | 657,750 | | | | | | 0.1 | | |
See Accompanying Notes to Financial Statements
SUMMARY PORTFOLIO OF INVESTMENTS
| Voya High Yield Portfolio | as of December 31, 2020 (continued) |
Principal
Amount† | | | Value | | | Percentage
of Net
Assets | |
| CORPORATE BONDS/NOTES: (continued) | |
| | | | Consumer, Cyclical (continued) | |
| 1,900,000 (1) | | | SeaWorld Parks &
Entertainment, Inc.,
9.500%, 08/01/2025 | | | | $ | 2,066,250 | | | | | | 0.4 | | |
| 1,125,000 (1) | | | Sizzling Platter LLC /
Sizzling Platter Finance
Corp., 8.500%, 11/28/2025 | | | | | 1,173,038 | | | | | | 0.2 | | |
| 1,575,000 (1) | | | Specialty Building Products
Holdings LLC / SBP
Finance Corp., 6.375%,
09/30/2026 | | | | | 1,671,059 | | | | | | 0.3 | | |
| 1,140,000 (1) | | | Speedway Motorsports
LLC / Speedway Funding
II, Inc., 4.875%, 11/01/2027 | | | | | 1,131,450 | | | | | | 0.2 | | |
| 425,000 (1) | | | Station Casinos LLC,
4.500%, 02/15/2028 | | | | | 428,984 | | | | | | 0.1 | | |
| 1,275,000 (1) | | | Station Casinos LLC,
5.000%, 10/01/2025 | | | | | 1,292,117 | | | | | | 0.2 | | |
| 1,375,000 (1) | | | STL Holding Co. LLC,
7.500%, 02/15/2026 | | | | | 1,426,563 | | | | | | 0.3 | | |
| 500,000 (1) | | | Tenneco, Inc., 7.875%,
01/15/2029 | | | | | 562,318 | | | | | | 0.1 | | |
| 1,500,000 (1) | | | Univar Solutions USA,
Inc./Washington, 5.125%,
12/01/2027 | | | | | 1,586,910 | | | | | | 0.3 | | |
| 1,200,000 (1) | | | Viking Cruises Ltd.,
5.875%, 09/15/2027 | | | | | 1,175,825 | | | | | | 0.2 | | |
| 830,000 (1) | | | Viking Cruises Ltd.,
13.000%, 05/15/2025 | | | | | 993,406 | | | | | | 0.2 | | |
| 1,200,000 (1) | | | White Cap Buyer LLC,
6.875%, 10/15/2028 | | | | | 1,281,750 | | | | | | 0.2 | | |
| 1,175,000 (1) | | | William Carter Co/The,
5.625%, 03/15/2027 | | | | | 1,238,891 | | | | | | 0.2 | | |
| 700,000 (1) | | | Williams Scotsman
International, Inc., 4.625%,
08/15/2028 | | | | | 725,813 | | | | | | 0.1 | | |
| 1,350,000 (1) | | | Wolverine World Wide, Inc.,
5.000%, 09/01/2026 | | | | | 1,381,219 | | | | | | 0.2 | | |
| 300,000 (1) | | | Wolverine World Wide, Inc.,
6.375%, 05/15/2025 | | | | | 320,812 | | | | | | 0.1 | | |
| 1,000,000 (1) | | | Wyndham Hotels &
Resorts, Inc., 4.375%,
08/15/2028 | | | | | 1,040,925 | | | | | | 0.2 | | |
| 690,000 (1) | | | Wyndham Hotels &
Resorts, Inc., 5.375%,
04/15/2026 | | | | | 715,444 | | | | | | 0.1 | | |
| 18,163,446 (4) | | | Other Securities | | | | | 18,902,336 | | | | | | 3.5 | | |
| | | | | | | | | 112,789,667 | | | | | | 20.8 | | |
| | | | Consumer, Non-cyclical: 16.4% | |
| 1,600,000 (1) | | | Acadia Healthcare Co.,
Inc., 5.500%, 07/01/2028 | | | | | 1,721,480 | | | | | | 0.3 | | |
| 1,125,000 (1) | | | Albertsons Cos, Inc. /
Safeway, Inc. / New
Albertsons L.P. / Albertsons
LLC, 3.500%, 03/15/2029 | | | | | 1,137,937 | | | | | | 0.2 | | |
| 550,000 (1) | | | Albertsons Cos, Inc. /
Safeway, Inc. / New
Albertsons L.P. / Albertsons
LLC, 4.875%, 02/15/2030 | | | | | 606,584 | | | | | | 0.1 | | |
Principal
Amount† | | | Value | | | Percentage
of Net
Assets | |
| CORPORATE BONDS/NOTES: (continued) | |
| | | | Consumer, Non-cyclical (continued) | |
| 1,325,000 (1) | | | Albertsons Cos, Inc. /
Safeway, Inc. / New
Albertsons L.P. / Albertsons
LLC, 5.875%, 02/15/2028 | | | | $ | 1,444,091 | | | | | | 0.3 | | |
| 1,035,000 (1) | | | Allied Universal Holdco
LLC / Allied Universal
Finance Corp., 6.625%,
07/15/2026 | | | | | 1,104,914 | | | | | | 0.2 | | |
| 1,525,000 (1) | | | Allied Universal Holdco
LLC / Allied Universal
Finance Corp., 9.750%,
07/15/2027 | | | | | 1,664,904 | | | | | | 0.3 | | |
| 300,000 (1) | | | AMN Healthcare, Inc.,
4.000%, 04/15/2029 | | | | | 307,500 | | | | | | 0.1 | | |
| 1,485,000 (1) | | | AMN Healthcare, Inc.,
4.625%, 10/01/2027 | | | | | 1,558,426 | | | | | | 0.3 | | |
| 1,175,000 (1) | | | Avantor Funding, Inc.,
4.625%, 07/15/2028 | | | | | 1,244,031 | | | | | | 0.2 | | |
| 3,025,000 (1) | | | Bausch Health Americas,
Inc., 8.500%, 01/31/2027 | | | | | 3,368,595 | | | | | | 0.6 | | |
| 1,230,000 (1) | | | Bausch Health Cos, Inc.,
5.250%, 01/30/2030 | | | | | 1,289,803 | | | | | | 0.2 | | |
| 1,300,000 (1) | | | Bausch Health Cos, Inc.,
5.250%, 02/15/2031 | | | | | 1,360,573 | | | | | | 0.3 | | |
| 950,000 (1) | | | Bausch Health Cos, Inc.,
7.000%, 01/15/2028 | | | | | 1,045,845 | | | | | | 0.2 | | |
| 1,100,000 (1)(2) | | | Cardtronics, Inc. /
Cardtronics USA, Inc.,
5.500%, 05/01/2025 | | | | | 1,141,135 | | | | | | 0.2 | | |
| 1,020,000 (1) | | | Catalent Pharma
Solutions, Inc., 5.000%,
07/15/2027 | | | | | 1,078,987 | | | | | | 0.2 | | |
| 2,025,000 | | | Centene Corp., 4.625%,
12/15/2029 | | | | | 2,250,798 | | | | | | 0.4 | | |
| 550,000 (1) | | | Centene Corp., 5.375%,
06/01/2026 | | | | | 580,778 | | | | | | 0.1 | | |
| 1,350,000 | | | Centene Corp.,
3.375%-4.750%,
01/15/2025-02/15/2030 | | | | | 1,408,038 | | | | | | 0.3 | | |
| 1,400,000 (1) | | | Cheplapharm Arzneimittel
GmbH, 5.500%,
01/15/2028 | | | | | 1,464,750 | | | | | | 0.3 | | |
| 505,000 (1) | | | Chobani LLC / Chobani
Finance Corp., Inc.,
4.625%, 11/15/2028 | | | | | 513,838 | | | | | | 0.1 | | |
1,550,000 (1) | | | Chobani LLC / Chobani
Finance Corp., Inc.,
7.500%, 04/15/2025 | | | | | 1,630,158 | | | | | | 0.3 | | |
| 575,000 (1) | | | CHS/Community Health
Systems, Inc., 5.625%,
03/15/2027 | | | | | 618,987 | | | | | | 0.1 | | |
| 300,000 (1)(2) | | | CHS/Community Health
Systems, Inc., 6.000%,
01/15/2029 | | | | | 324,453 | | | | | | 0.1 | | |
| 1,585,000 (1) | | | CHS/Community Health
Systems, Inc., 6.625%,
02/15/2025 | | | | | 1,671,153 | | | | | | 0.3 | | |
See Accompanying Notes to Financial Statements
SUMMARY PORTFOLIO OF INVESTMENTS
| Voya High Yield Portfolio | as of December 31, 2020 (continued) |
Principal
Amount† | | | Value | | | Percentage
of Net
Assets | |
| CORPORATE BONDS/NOTES: (continued) | |
| | | | Consumer, Non-cyclical (continued) | |
| 450,000 (1) | | | CHS/Community Health
Systems, Inc., 8.125%,
06/30/2024 | | | | $ | 466,875 | | | | | | 0.1 | | |
| 600,000 (1) | | | DaVita, Inc., 3.750%,
02/15/2031 | | | | | 610,341 | | | | | | 0.1 | | |
| 650,000 (1) | | | DaVita, Inc., 4.625%,
06/01/2030 | | | | | 689,406 | | | | | | 0.2 | | |
| 1,225,000 (1) | | | Emergent BioSolutions,
Inc., 3.875%, 08/15/2028 | | | | | 1,270,784 | | | | | | 0.2 | | |
| 497,000 (1) | | | Endo Dac / Endo Finance
LLC / Endo Finco, Inc.,
6.000%, 06/30/2028 | | | | | 422,947 | | | | | | 0.1 | | |
| 331,000 (1) | | | Endo Dac / Endo Finance
LLC / Endo Finco, Inc.,
9.500%, 07/31/2027 | | | | | 370,099 | | | | | | 0.1 | | |
| 525,000 (1) | | | Gartner, Inc., 3.750%,
10/01/2030 | | | | | 551,906 | | | | | | 0.1 | | |
| 1,140,000 (1) | | | Gartner, Inc., 4.500%,
07/01/2028 | | | | | 1,204,125 | | | | | | 0.2 | | |
| 1,225,000 (1) | | | Graham Holdings Co.,
5.750%, 06/01/2026 | | | | | 1,290,611 | | | | | | 0.2 | | |
| 3,025,000 | | | HCA, Inc., 5.375%,
02/01/2025 | | | | | 3,406,196 | | | | | | 0.6 | | |
| 1,850,000 | | | HCA, Inc., 3.500%-5.625%,
09/01/2028-09/01/2030 | | | | | 2,053,405 | | | | | | 0.4 | | |
| 975,000 (1) | | | Hill-Rom Holdings, Inc.,
4.375%, 09/15/2027 | | | | | 1,032,471 | | | | | | 0.2 | | |
| 425,000 (1) | | | Jaguar Holding Co. II /
PPD Development L.P.,
4.625%, 06/15/2025 | | | | | 448,902 | | | | | | 0.1 | | |
| 1,160,000 (1) | | | Jaguar Holding Co. II /
PPD Development L.P.,
5.000%, 06/15/2028 | | | | | 1,239,750 | | | | | | 0.2 | | |
| 1,790,000 (1) | | | JBS USA LUX SA / JBS
USA Finance, Inc.,
6.750%, 02/15/2028 | | | | | 2,013,338 | | | | | | 0.4 | | |
| 1,100,000 (1) | | | JBS USA LUX SA / JBS
USA Food Co. / JBS USA
Finance, Inc., 5.500%,
01/15/2030 | | | | | 1,265,286 | | | | | | 0.2 | | |
| 1,575,000 (1) | | | KeHE Distributors LLC /
KeHE Finance Corp.,
8.625%, 10/15/2026 | | | | | 1,771,631 | | | | | | 0.3 | | |
| 1,875,000 | | | Kraft Heinz Foods Co.,
4.375%, 06/01/2046 | | | | | 2,028,729 | | | | | | 0.4 | | |
| 2,750,000 | | | Kraft Heinz Foods Co.,
5.000%, 07/15/2035 | | | | | 3,334,835 | | | | | | 0.6 | | |
| 1,025,000 (1) | | | Kraft Heinz Foods Co.,
5.500%, 06/01/2050 | | | | | 1,294,403 | | | | | | 0.2 | | |
| 1,095,000 (1) | | | Legacy LifePoint Health
LLC, 4.375%, 02/15/2027 | | | | | 1,114,163 | | | | | | 0.2 | | |
| 425,000 (1) | | | LifePoint Health, Inc.,
5.375%, 01/15/2029 | | | | | 425,234 | | | | | | 0.1 | | |
| 200,000 (1) | | | Molina Healthcare, Inc.,
3.875%, 11/15/2030 | | | | | 215,000 | | | | | | 0.0 | | |
| 825,000 (1) | | | Molina Healthcare, Inc.,
4.375%, 06/15/2028 | | | | | 869,138 | | | | | | 0.2 | | |
| 1,200,000 (1) | | | MPH Acquisition Holdings
LLC, 5.750%, 11/01/2028 | | | | | 1,174,500 | | | | | | 0.2 | | |
Principal
Amount† | | | Value | | | Percentage
of Net
Assets | |
| CORPORATE BONDS/NOTES: (continued) | |
| | | | Consumer, Non-cyclical (continued) | |
| 175,000 (1) | | | Nielsen Finance LLC /
Nielsen Finance Co.,
5.625%, 10/01/2028 | | | | $ | 190,474 | | | | | | 0.0 | | |
| 1,175,000 (1) | | | Nielsen Finance LLC /
Nielsen Finance Co.,
5.875%, 10/01/2030 | | | | | 1,331,422 | | | | | | 0.3 | | |
| 1,021,000 (1) | | | Par Pharmaceutical, Inc.,
7.500%, 04/01/2027 | | | | | 1,109,123 | | | | | | 0.2 | | |
| 1,275,000 (1) | | | Pilgrim’s Pride Corp.,
5.750%, 03/15/2025 | | | | | 1,310,509 | | | | | | 0.2 | | |
| 1,325,000 (1) | | | Pilgrim’s Pride Corp.,
5.875%, 09/30/2027 | | | | | 1,438,764 | | | | | | 0.3 | | |
| 625,000 (1) | | | Post Holdings, Inc.,
4.625%, 04/15/2030 | | | | | 658,256 | | | | | | 0.1 | | |
| 1,900,000 (1) | | | Post Holdings, Inc.,
5.625%, 01/15/2028 | | | | | 2,027,063 | | | | | | 0.4 | | |
| 1,575,000 (1) | | | Primo Water Holdings, Inc.,
5.500%, 04/01/2025 | | | | | 1,628,156 | | | | | | 0.3 | | |
| 1,850,000 (1) | | | Select Medical Corp.,
6.250%, 08/15/2026 | | | | | 1,995,151 | | | | | | 0.4 | | |
| 700,000 (1) | | | Spectrum Brands, Inc.,
5.500%, 07/15/2030 | | | | | 755,563 | | | | | | 0.1 | | |
| 700,000 (1) | | | Syneos Health, Inc.,
3.625%, 01/15/2029 | | | | | 703,248 | | | | | | 0.1 | | |
| 1,040,000 | | | Tenet Healthcare Corp.,
5.125%, 05/01/2025 | | | | | 1,061,570 | | | | | �� | 0.2 | | |
| 2,425,000 | | | Tenet Healthcare Corp.,
6.750%, 06/15/2023 | | | | | 2,611,240 | | | | | | 0.5 | | |
| 1,450,000 (1) | | | Tenet Healthcare Corp.,
6.125%, 10/01/2028 | | | | | 1,516,018 | | | | | | 0.3 | | |
| 800,000 (1)(2) | | | United Natural Foods, Inc.,
6.750%, 10/15/2028 | | | | | 837,984 | | | | | | 0.2 | | |
| 1,125,000 (1) | | | Vizient, Inc., 6.250%,
05/15/2027 | | | | | 1,213,380 | | | | | | 0.2 | | |
| 1,375,000 (1) | | | West Street Merger Sub,
Inc., 6.375%, 09/01/2025 | | | | | 1,411,953 | | | | | | 0.3 | | |
| 5,165,000 | | | Other Securities | | | | | 5,595,238 | | | | | | 1.0 | | |
| | | | | | | | | 88,496,945 | | | | | | 16.4 | | |
| | | | Energy: 11.7% | |
| 3,180,000 | | | Apache Corp.,
4.375%-5.100%, 10/15/
2028-09/01/2040 | | | | | 3,366,118 | | | | | | 0.6 | | |
| 795,000 (1) | | | Archrock Partners L.P. /
Archrock Partners Finance
Corp., 6.250%, 04/01/2028 | | | | | 829,551 | | | | | | 0.1 | | |
| 400,000 (1) | | | Archrock Partners L.P. /
Archrock Partners Finance
Corp., 6.875%, 04/01/2027 | | | | | 431,500 | | | | | | 0.1 | | |
| 1,300,000 (1) | | | Ascent Resources Utica
Holdings LLC / ARU
Finance Corp., 8.250%,
12/31/2028 | | | | | 1,300,000 | | | | | | 0.2 | | |
| 1,300,000 (1) | | | Blue Racer Midstream LLC
/ Blue Racer Finance
Corp., 6.625%, 07/15/2026 | | | | | 1,313,000 | | | | | | 0.3 | | |
| 600,000 (1) | | | Blue Racer Midstream LLC
/ Blue Racer Finance
Corp., 7.625%, 12/15/2025 | | | | | 640,500 | | | | | | 0.1 | | |
See Accompanying Notes to Financial Statements
SUMMARY PORTFOLIO OF INVESTMENTS
| Voya High Yield Portfolio | as of December 31, 2020 (continued) |
Principal
Amount† | | | Value | | | Percentage
of Net
Assets | |
| CORPORATE BONDS/NOTES: (continued) | |
| | | | Energy (continued) | |
| 350,000 (1) | | | CNX Resources Corp.,
6.000%, 01/15/2029 | | | | $ | 359,226 | | | | | | 0.1 | | |
| 1,550,000 (1) | | | CNX Resources Corp.,
7.250%, 03/14/2027 | | | | | 1,660,468 | | | | | | 0.3 | | |
| 1,600,000 | | | Comstock Resources, Inc.,
9.750%, 08/15/2026 | | | | | 1,718,400 | | | | | | 0.3 | | |
| 490,000 | | | Comstock Resources, Inc.,
9.750%, 08/15/2026 | | | | | 526,137 | | | | | | 0.1 | | |
| 375,000 (1) | | | Continental
Resources, Inc./OK,
5.750%, 01/15/2031 | | | | | 416,946 | | | | | | 0.1 | | |
| 2,470,000 | | | DCP Midstream
Operating L.P.,
5.125%-5.625%,
07/15/2025-04/01/2044 | | | | | 2,728,494 | | | | | | 0.5 | | |
| 2,200,000 | | | EnLink Midstream LLC,
5.375%, 06/01/2029 | | | | | 2,143,625 | | | | | | 0.4 | | |
| 2,285,000 (1) | | | Enviva Partners L.P. /
Enviva Partners Finance
Corp., 6.500%, 01/15/2026 | | | | | 2,432,097 | | | | | | 0.4 | | |
| 725,000 (1) | | | EQM Midstream
Partners L.P., 6.000%,
07/01/2025 | | | | | 794,781 | | | | | | 0.1 | | |
| 525,000 (1) | | | Hess Midstream
Operations L.P., 5.125%,
06/15/2028 | | | | | 549,281 | | | | | | 0.1 | | |
| 1,000,000 (1) | | | Hess Midstream
Operations L.P., 5.625%,
02/15/2026 | | | | | 1,041,875 | | | | | | 0.2 | | |
| 1,450,000 (1) | | | Hilcorp Energy I L.P. /
Hilcorp Finance Co.,
5.750%, 10/01/2025 | | | | | 1,471,598 | | | | | | 0.3 | | |
| 650,000 (1) | | | Hilcorp Energy I L.P. /
Hilcorp Finance Co.,
5.000%, 12/01/2024 | | | | | 647,494 | | | | | | 0.1 | | |
| 1,250,000 (1) | | | Indigo Natural
Resources LLC, 6.875%,
02/15/2026 | | | | | 1,281,250 | | | | | | 0.2 | | |
| 1,850,000 (1) | | | Moss Creek Resources
Holdings, Inc., 7.500%,
01/15/2026 | | | | | 1,410,625 | | | | | | 0.3 | | |
| 1,450,000 | | | Murphy Oil Corp.,
5.750%-5.875%,
08/15/2025-12/01/2027 | | | | | 1,440,403 | | | | | | 0.3 | | |
| 3,375,000 | | | Occidental Petroleum
Corp., 4.200%, 03/15/2048 | | | | | 2,750,625 | | | | | | 0.5 | | |
| 2,350,000 | | | Occidental Petroleum
Corp., 6.625%, 09/01/2030 | | | | | 2,555,038 | | | | | | 0.5 | | |
| 2,300,000 | | | Occidental Petroleum
Corp., 4.400%-8.500%,
12/01/2025-04/15/2046 | | | | | 2,431,965 | | | | | | 0.4 | | |
| 1,800,000 | | | Ovintiv Exploration, Inc.,
5.375%, 01/01/2026 | | | | | 1,932,895 | | | | | | 0.4 | | |
| 1,750,000 (1) | | | Parsley Energy LLC /
Parsley Finance Corp.,
5.625%, 10/15/2027 | | | | | 1,918,000 | | | | | | 0.3 | | |
Principal
Amount† | | | Value | | | Percentage
of Net
Assets | |
| CORPORATE BONDS/NOTES: (continued) | |
| | | | Energy (continued) | |
| 2,100,000 (1) | | | SunCoke Energy Partners
L.P. / SunCoke Energy
Partners Finance Corp.,
7.500%, 06/15/2025 | | | | $ | 2,088,608 | | | | | | 0.4 | | |
| 350,000 (1) | | | Sunoco L.P. / Sunoco
Finance Corp., 4.500%,
05/15/2029 | | | | | 364,656 | | | | | | 0.1 | | |
| 675,000 (1) | | | Tallgrass Energy Partners
L.P. / Tallgrass Energy
Finance Corp., 5.500%,
01/15/2028 | | | | | 691,305 | | | | | | 0.1 | | |
| 900,000 (1) | | | Tallgrass Energy Partners
L.P. / Tallgrass Energy
Finance Corp., 7.500%,
10/01/2025 | | | | | 973,318 | | | | | | 0.2 | | |
| 1,325,000 (1) | | | Targa Resources
Partners L.P. / Targa
Resources Partners
Finance Corp., 4.875%,
02/01/2031 | | | | | 1,439,613 | | | | | | 0.3 | | |
| 825,000 (1) | | | Viper Energy Partners L.P.,
5.375%, 11/01/2027 | | | | | 863,519 | | | | | | 0.2 | | |
| 550,000 | | | Western Midstream
Operating L.P., 5.300%,
03/01/2048 | | | | | 547,778 | | | | | | 0.1 | | |
| 2,075,000 | | | Western Midstream
Operating L.P., 5.450%,
04/01/2044 | | | | | 2,102,276 | | | | | | 0.4 | | |
| 13,735,000 (4) | | | Other Securities | | | | | 13,989,151 | | | | | | 2.6 | | |
| | | | | | | | | 63,152,116 | | | | | | 11.7 | | |
| | | | Financial: 5.1% | |
| 1,050,000 (1) | | | AssuredPartners, Inc.,
5.625%, 01/15/2029 | | | | | 1,097,250 | | | | | | 0.2 | | |
| 1,125,000 (1) | | | Cushman & Wakefield US
Borrower LLC, 6.750%,
05/15/2028 | | | | | 1,243,828 | | | | | | 0.2 | | |
| 1,950,000 (1) | | | ESH Hospitality, Inc.,
5.250%, 05/01/2025 | | | | | 2,001,626 | | | | | | 0.4 | | |
| 775,000 (1) | | | Freedom Mortgage Corp.,
7.625%, 05/01/2026 | | | | | 820,686 | | | | | | 0.1 | | |
| 1,375,000 (1) | | | Freedom Mortgage Corp.,
8.250%, 04/15/2025 | | | | | 1,440,313 | | | | | | 0.3 | | |
| 420,000 (1) | | | Iron Mountain, Inc.,
5.000%, 07/15/2028 | | | | | 446,725 | | | | | | 0.1 | | |
| 690,000 (1) | | | Iron Mountain, Inc.,
5.250%, 07/15/2030 | | | | | 746,062 | | | | | | 0.1 | | |
| 560,000 (1) | | | Iron Mountain, Inc.,
5.625%, 07/15/2032 | | | | | 618,164 | | | | | | 0.1 | | |
| 1,150,000 (1) | | | LPL Holdings, Inc.,
4.625%, 11/15/2027 | | | | | 1,193,844 | | | | | | 0.2 | | |
| 300,000 (1) | | | MGM Growth Properties
Operating Partnership L.P. /
MGP Finance
Co-Issuer, Inc., 3.875%,
02/15/2029 | | | | | 307,312 | | | | | | 0.1 | | |
See Accompanying Notes to Financial Statements
SUMMARY PORTFOLIO OF INVESTMENTS
| Voya High Yield Portfolio | as of December 31, 2020 (continued) |
Principal
Amount† | | | Value | | | Percentage
of Net
Assets | |
| CORPORATE BONDS/NOTES: (continued) | |
| | | | Financial (continued) | |
| 665,000 (1) | | | MGM Growth Properties
Operating Partnership L.P. /
MGP Finance
Co-Issuer, Inc., 4.625%,
06/15/2025 | | | | $ | 712,880 | | | | | | 0.1 | | |
| 1,250,000 (1) | | | Nationstar Mortgage
Holdings, Inc., 5.125%,
12/15/2030 | | | | | 1,308,088 | | | | | | 0.2 | | |
| 275,000 | | | OneMain Finance Corp.,
4.000%, 09/15/2030 | | | | | 285,687 | | | | | | 0.1 | | |
| 2,100,000 | | | OneMain Finance Corp.,
5.375%, 11/15/2029 | | | | | 2,367,750 | | | | | | 0.4 | | |
| 1,575,000 (1) | | | Quicken Loans LLC,
5.250%, 01/15/2028 | | | | | 1,684,266 | | | | | | 0.3 | | |
| 1,775,000 (1) | | | SBA Communications
Corp., 3.875%, 02/15/2027 | | | | | 1,866,501 | | | | | | 0.4 | | |
| 9,115,000 | | | Other Securities | | | | | 9,633,347 | | | | | | 1.8 | | |
| | | | | | | | | 27,774,329 | | | | | | 5.1 | | |
| | | | Industrial: 9.4% | |
| 1,875,000 | | | AECOM, 5.875%,
10/15/2024 | | | | | 2,095,837 | | | | | | 0.4 | | |
| 2,150,000 (1)(3) | | | ARD Finance SA, 6.500%
(PIK Rate 7.250%, Cash
Rate 6.500)%, 06/30/2027 | | | | | 2,297,812 | | | | | | 0.4 | | |
| 1,875,000 (1)(2) | | | Berry Global, Inc., 5.625%,
07/15/2027 | | | | | 2,019,727 | | | | | | 0.4 | | |
| 400,000 (1)(2) | | | Bombardier, Inc., 6.000%,
10/15/2022 | | | | | 393,660 | | | | | | 0.1 | | |
| 975,000 (1) | | | Bombardier, Inc., 8.750%,
12/01/2021 | | | | | 1,015,623 | | | | | | 0.2 | | |
| 750,000 (1) | | | Builders FirstSource, Inc.,
5.000%, 03/01/2030 | | | | | 807,187 | | | | | | 0.2 | | |
| 725,000 (1) | | | Builders FirstSource, Inc.,
6.750%, 06/01/2027 | | | | | 787,321 | | | | | | 0.1 | | |
| 1,150,000 (1) | | | Cargo Aircraft
Management, Inc., 4.750%,
02/01/2028 | | | | | 1,188,094 | | | | | | 0.2 | | |
| 2,125,000 (1) | | | Cascades, Inc./Cascades
USA, Inc., 5.375%,
01/15/2028 | | | | | 2,262,461 | | | | | | 0.4 | | |
| 1,200,000 (1) | | | Clark Equipment Co.,
5.875%, 06/01/2025 | | | | | 1,269,750 | | | | | | 0.2 | | |
| 625,000 (1) | | | Clean Harbors, Inc.,
4.875%, 07/15/2027 | | | | | 653,125 | | | | | | 0.1 | | |
| 485,000 (1) | | | Clean Harbors, Inc.,
5.125%, 07/15/2029 | | | | | 531,286 | | | | | | 0.1 | | |
| 1,300,000 (1) | | | CP Atlas Buyer, Inc.,
7.000%, 12/01/2028 | | | | | 1,351,187 | | | | | | 0.2 | | |
| 625,000 (1) | | | GFL Environmental, Inc.,
4.000%, 08/01/2028 | | | | | 630,859 | | | | | | 0.1 | | |
| 375,000 (1) | | | GFL Environmental, Inc.,
4.250%, 06/01/2025 | | | | | 389,766 | | | | | | 0.1 | | |
| 1,020,000 (1) | | | GFL Environmental, Inc.,
8.500%, 05/01/2027 | | | | | 1,134,113 | | | | | | 0.2 | | |
| 1,300,000 (1) | | | GrafTech Finance, Inc.,
4.625%, 12/15/2028 | | | | | 1,319,552 | | | | | | 0.2 | | |
| 1,175,000 (1) | | | Graham Packaging Co.,
Inc., 7.125%, 08/15/2028 | | | | | 1,300,578 | | | | | | 0.2 | | |
| 1,275,000 (1)(2) | | | Granite US Holdings Corp.,
11.000%, 10/01/2027 | | | | | 1,421,625 | | | | | | 0.3 | | |
Principal
Amount† | | | Value | | | Percentage
of Net
Assets | |
| CORPORATE BONDS/NOTES: (continued) | |
| | | | Industrial (continued) | |
| 575,000 (1)(3) | | | Intelligent Packaging
Holdco Issuer L.P., 9.000%
(PIK Rate 9.750%, Cash
Rate 9.000)%, 01/15/2026 | | | | $ | 578,594 | | | | | | 0.1 | | |
| 1,475,000 (1) | | | Intelligent Packaging Ltd.
Finco, Inc. / Intelligent
Packaging Ltd. Co-Issuer
LLC, 6.000%, 09/15/2028 | | | | | 1,518,328 | | | | | | 0.3 | | |
| 1,575,000 (1) | | | Koppers, Inc., 6.000%,
02/15/2025 | | | | | 1,625,203 | | | | | | 0.3 | | |
| 1,665,000 (1) | | | New Enterprise Stone &
Lime Co., Inc., 9.750%,
07/15/2028 | | | | | 1,831,500 | | | | | | 0.3 | | |
| 1,375,000 (1) | | | Norbord, Inc., 5.750%,
07/15/2027 | | | | | 1,483,047 | | | | | | 0.3 | | |
| 1,550,000 (1) | | | PGT Innovations, Inc.,
6.750%, 08/01/2026 | | | | | 1,654,330 | | | | | | 0.3 | | |
| 2,020,000 (1)(2) | | | Plastipak Holdings, Inc.,
6.250%, 10/15/2025 | | | | | 2,084,388 | | | | | | 0.4 | | |
| 1,300,000 (1) | | | Rolls-Royce PLC, 5.750%,
10/15/2027 | | | | | 1,441,375 | | | | | | 0.3 | | |
| 1,400,000 (1) | | | SSL Robotics LLC,
9.750%, 12/31/2023 | | | | | 1,584,625 | | | | | | 0.3 | | |
| 850,000 (1) | | | Standard Industries,
Inc./NJ, 3.375%, 01/15/
2031 | | | | | 855,313 | | | | | | 0.2 | | |
| 350,000 (1) | | | Stericycle, Inc., 3.875%,
01/15/2029 | | | | | 360,063 | | | | | | 0.1 | | |
| 1,325,000 (1) | | | Stevens Holding Co., Inc.,
6.125%, 10/01/2026 | | | | | 1,435,717 | | | | | | 0.3 | | |
| 375,000 (1) | | | Summit Materials LLC /
Summit Materials Finance
Corp., 5.125%, 06/01/2025 | | | | | 382,929 | | | | | | 0.1 | | |
| 950,000 (1) | | | Summit Materials LLC /
Summit Materials Finance
Corp., 5.250%, 01/15/2029 | | | | | 998,688 | | | | | | 0.2 | | |
| 1,125,000 (1) | | | Summit Materials LLC /
Summit Materials Finance
Corp., 6.500%, 03/15/2027 | | | | | 1,199,317 | | | | | | 0.2 | | |
| 2,975,000 | | | TransDigm, Inc.,
5.500%-6.500%,
05/15/2025-11/15/2027 | | | | | 3,094,816 | | | | | | 0.6 | | |
| 1,625,000 (1) | | | Vertical Holdco GmbH,
7.625%, 07/15/2028 | | | | | 1,774,297 | | | | | | 0.3 | | |
| 275,000 (1) | | | Vertical US Newco, Inc.,
5.250%, 07/15/2027 | | | | | 292,016 | | | | | | 0.0 | | |
| 1,250,000 (1) | | | Weekley Homes LLC /
Weekley Finance Corp.,
4.875%, 09/15/2028 | | | | | 1,309,375 | | | | | | 0.2 | | |
| 2,455,000 | | | Other Securities | | | | | 2,551,769 | | | | | | 0.5 | | |
| | | | | | | | | 50,925,253 | | | | | | 9.4 | | |
| | | | Technology: 5.5% | |
| 1,850,000 (1) | | | Ascend Learning LLC,
6.875%, 08/01/2025 | | | | | 1,907,618 | | | | | | 0.4 | | |
| 1,305,000 (1) | | | Austin BidCo, Inc., 7.125%,
12/15/2028 | | | | | 1,364,541 | | | | | | 0.3 | | |
| 1,175,000 (1) | | | Booz Allen Hamilton, Inc.,
3.875%, 09/01/2028 | | | | | 1,212,453 | | | | | | 0.2 | | |
| 420,000 (1) | | | Boxer Parent Co., Inc.,
7.125%, 10/02/2025 | | | | | 456,493 | | | | | | 0.1 | | |
See Accompanying Notes to Financial Statements
SUMMARY PORTFOLIO OF INVESTMENTS
| Voya High Yield Portfolio | as of December 31, 2020 (continued) |
Principal
Amount† | | | Value | | | Percentage
of Net
Assets | |
| CORPORATE BONDS/NOTES: (continued) | |
| | | | Technology (continued) | |
| 420,000 (1) | | | Boxer Parent Co., Inc.,
9.125%, 03/01/2026 | | | | $ | 453,075 | | | | | | 0.1 | | |
| 465,000 (1) | | | BY Crown Parent LLC / BY
Bond Finance, Inc.,
4.250%, 01/31/2026 | | | | | 477,206 | | | | | | 0.1 | | |
| 1,205,000 (1) | | | BY Crown Parent LLC,
7.375%, 10/15/2024 | | | | | 1,230,480 | | | | | | 0.2 | | |
| 1,400,000 (1) | | | Castle US Holding Corp.,
9.500%, 02/15/2028 | | | | | 1,403,283 | | | | | | 0.3 | | |
| 2,470,000 | | | CDW LLC / CDW Finance
Corp., 3.250%-5.500%,
12/01/2024-02/15/2029 | | | | | 2,637,602 | | | | | | 0.5 | | |
| 2,825,000 (1) | | | Change Healthcare
Holdings LLC / Change
Healthcare Finance, Inc.,
5.750%, 03/01/2025 | | | | | 2,885,031 | | | | | | 0.5 | | |
| 795,000 (1) | | | Entegris, Inc., 4.375%,
04/15/2028 | | | | | 848,663 | | | | | | 0.1 | | |
| 400,000 (1) | | | Entegris, Inc., 4.625%,
02/10/2026 | | | | | 415,500 | | | | | | 0.1 | | |
| 1,705,000 (1) | | | Microchip Technology, Inc.,
4.250%, 09/01/2025 | | | | | 1,804,232 | | | | | | 0.3 | | |
| 1,225,000 (1) | | | MTS Systems Corp.,
5.750%, 08/15/2027 | | | | | 1,333,198 | | | | | | 0.2 | | |
| 1,125,000 (1) | | | ON Semiconductor Corp.,
3.875%, 09/01/2028 | | | | | 1,162,969 | | | | | | 0.2 | | |
| 225,000 (1) | | | Open Text Corp., 3.875%,
02/15/2028 | | | | | 233,825 | | | | | | 0.1 | | |
| 685,000 (1) | | | Open Text Corp., 5.875%,
06/01/2026 | | | | | 713,256 | | | | | | 0.1 | | |
| 1,225,000 (1) | | | Open Text Holdings, Inc.,
4.125%, 02/15/2030 | | | | | 1,305,409 | | | | | | 0.2 | | |
| 285,000 (1) | | | Rackspace Technology
Global, Inc., 5.375%,
12/01/2028 | | | | | 299,129 | | | | | | 0.1 | | |
| 1,070,000 (1) | | | Science Applications
International Corp.,
4.875%, 04/01/2028 | | | | | 1,136,040 | | | | | | 0.2 | | |
| 1,280,000 (1) | | | Tempo Acquisition LLC /
Tempo Acquisition Finance
Corp., 6.750%, 06/01/2025 | | | | | 1,324,544 | | | | | | 0.2 | | |
| 1,225,000 (1) | | | Unisys Corp., 6.875%,
11/01/2027 | | | | | 1,341,375 | | | | | | 0.3 | | |
| 1,025,000 (1)(2) | | | Veritas US, Inc. / Veritas
Bermuda Ltd.., 10.500%,
02/01/2024 | | | | | 1,046,182 | | | | | | 0.2 | | |
| 1,550,000 (1) | | | Veritas US, Inc. / Veritas
Bermuda Ltd., 7.500%,
09/01/2025 | | | | | 1,592,625 | | | | | | 0.3 | | |
| 1,250,000 | | | Other Securities | | | | | 1,329,556 | | | | | | 0.2 | | |
| | | | | | | | | 29,914,285 | | | | | | 5.5 | | |
| | | | Utilities: 2.1% | |
| 1,300,000 (1) | | | Clearway Energy
Operating LLC, 4.750%,
03/15/2028 | | | | | 1,395,472 | | | | | | 0.3 | | |
| 1,750,000 (1) | | | Drax Finco PLC, 6.625%,
11/01/2025 | | | | | 1,836,406 | | | | | | 0.3 | | |
Principal
Amount† | | | Value | | | Percentage
of Net
Assets | |
| CORPORATE BONDS/NOTES: (continued) | |
| | | | Utilities (continued) | |
| 1,550,000 (1) | | | LBC Tank Terminals
Holding Netherlands BV,
6.875%, 05/15/2023 | | | | $ | 1,554,844 | | | | | | 0.3 | | |
| 1,000,000 (1) | | | NRG Energy, Inc., 3.375%,
02/15/2029 | | | | | 1,025,675 | | | | | | 0.2 | | |
| 950,000 (1) | | | NRG Energy, Inc., 3.625%,
02/15/2031 | | | | | 979,141 | | | | | | 0.2 | | |
| 1,100,000 | | | NRG Energy, Inc., 6.625%,
01/15/2027 | | | | | 1,163,250 | | | | | | 0.2 | | |
| 775,000 (1) | | | Vistra Operations Co. LLC,
5.500%, 09/01/2026 | | | | | 808,674 | | | | | | 0.1 | | |
| 1,025,000 (1) | | | Vistra Operations Co. LLC,
5.625%, 02/15/2027 | | | | | 1,091,727 | | | | | | 0.2 | | |
| 1,490,000 | | | Other Securities | | | | | 1,640,863 | | | | | | 0.3 | | |
| | | | | | | | | 11,496,052 | | | | | | 2.1 | | |
| | | | Total Corporate
Bonds/Notes
(Cost $476,074,072) | | | | | 510,424,716 | | | | | | 94.3 | | |
| BANK LOANS: 1.0% | |
| | | | Consumer, Cyclical: 0.5% | |
| 1,496,914 | | | Golden Nugget LLC TL
B 1L, 3.250%, (US0001M +
2.500)%, 10/04/2023 | | | | | 1,450,759 | | | | | | 0.3 | | |
| 1,293,350 | | | IRB Holding Corp - TL
B 1L, 3.750%, (US0001M +
2.750)%, 02/05/2025 | | | | | 1,284,782 | | | | | | 0.2 | | |
| | | | | | | | | 2,735,541 | | | | | | 0.5 | | |
| | | | Electronics/Electrical: 0.4% | |
| 1,901,270 | | | Rackspace Hosting, Inc.
2017 Incremental 1st Lien
Term Loan, 4.000%,
(US0003M + 3.000)%,
11/03/2023 | | | | | 1,902,063 | | | | | | 0.4 | | |
| | | | | |
| | | | Health Care: 0.1% | |
| 704,366 | | | Bausch Health Companies,
Inc. 2018 Term Loan B,
3.148%, (US0001M +
3.000)%, 06/02/2025 | | | | | 702,495 | | | | | | 0.1 | | |
| | | | Total Bank Loans
(Cost $5,058,905) | | | | | 5,340,099 | | | | | | 1.0 | | |
| | | | | |
| CONVERTIBLE BONDS/NOTES: 0.1% | |
| | | | Communications: 0.1% | |
| 400,000 | | | Other Securities | | | | | 382,292 | | | | | | 0.1 | | |
| | | | | |
| | | | Financial: 0.0% | |
| 499,200 (1)(5) | | | Lehman Brothers Holdings,
Inc., 8.160%, 05/30/2009 | | | | | 824 | | | | | | 0.0 | | |
| | | | Total Convertible
Bonds/Notes
(Cost $844,544) | | | | | 383,116 | | | | | | 0.1 | | |
| |
See Accompanying Notes to Financial Statements
SUMMARY PORTFOLIO OF INVESTMENTS
| Voya High Yield Portfolio | as of December 31, 2020 (continued) |
| Shares | | | Value | | | Percentage
of Net
Assets | |
| COMMON STOCK: 0.3% | |
| | | | Consumer Discretionary: 0.0% | |
| 1,476 (1)(6)(7) | | | Perseus Holding Corp. | | | | $ | — | | | | | | — | | |
| 474 | | | Other Securities | | | | | 75,380 | | | | | | 0.0 | | |
| | | | | | | | | 75,380 | | | | | | 0.0 | | |
| | | | Consumer Staples: 0.3% | |
| 24,842 (8)(9) | | | Other Securities | | | | | 1,751,361 | | | | | | 0.3 | | |
| | | | | |
| | | | Energy: 0.0% | |
| 424,443 (8)(9) | | | Other Securities | | | | | 5,096 | | | | | | 0.0 | | |
| | | | | |
| | | | Health Care: 0.0% | |
| 26 (8) | | | Other Securities | | | | | 407 | | | | | | 0.0 | | |
| | | | | |
| | | | Information Technology: 0.0% | |
| 1 (8) | | | Other Securities | | | | | 19 | | | | | | 0.0 | | |
| | | | | |
| | | | Total Common Stock
(Cost $824,717) | | | | | 1,832,263 | | | | | | 0.3 | | |
| PREFERRED STOCK: —% | |
| | | | Consumer Discretionary: —% | |
| 775 (1)(6)(7) | | | Perseus Holding Corp. | | | | | — | | | | | | — | | |
| | | | Total Preferred Stock
(Cost $—) | | | | | — | | | | | | — | | |
| WARRANTS: —% | |
| | | | Health Care: —% | |
| 252 (8)(9) | | | Other Securities | | | | | — | | | | | | — | | |
| | | | Total Warrants
(Cost $—) | | | | | — | | | | | | — | | |
| OTHER(10): —% | |
| | | | Communications: —% | |
| 1,445,000(6), (11) | | | Millicom International
Cellular S.A. (Escrow) | | | | | — | | | | | | — | | |
| | | | | |
| | | | Energy: —% | |
| 2,000(6), (11) | | | Green Field Energy
Services, Inc. (Escrow) | | | | | — | | | | | | — | | |
| | | | Total Other
(Cost $—) | | | | | — | | | | | | — | | |
| | | | | |
| | | | Total Long-Term
Investments
(Cost $482,802,238) | | | | | 517,980,194 | | | | | | 95.7 | | |
Principal
Amount† | | | Value | | | Percentage
of Net
Assets | |
| SHORT-TERM INVESTMENTS: 5.2% | |
| | | | Commercial Paper: 0.5% | |
| 2,500,000 | | | American Electric
Power Co., 0.230%,
02/03/2021
(Cost $2,499,473) | | | | $ | 2,499,469 | | | | | | 0.5 | | |
| | | | | |
| | | | U.S. Treasury Bills: 0.1% | |
| 850,000 (12) | | | United States Treasury Bill,
0.030%, 02/09/2021
(Cost $849,883) | | | | | 849,970 | | | | | | 0.1 | | |
| | | | | |
| | | | Repurchase Agreements: 4.3% | |
| 1,298,691 (13) | | | Amherst Pierpoint
Securities LLC, Repurchase
Agreement dated 12/31/20,
0.10%, due 01/04/21
(Repurchase Amount
$1,298,705, collateralized
by various U.S.
Government/U.S.
Government Agency
Obligations,
0.000%-4.628%, Market
Value plus accrued interest
$1,324,665, due
02/03/21-11/20/70) | | | | | 1,298,691 | | | | | | 0.2 | | |
| 1,082,346 (13) | | | BNP Paribas S.A.,
Repurchase Agreement
dated 12/31/20, 0.24%, due
01/04/21 (Repurchase
Amount $1,082,374,
collateralized by various
U.S. Government
Securities, 0.750%-8.750%,
Market Value plus accrued
interest $1,136,463, due
03/01/21-11/20/40) | | | | | 1,082,346 | | | | | | 0.2 | | |
| 3,853,961 (13) | | | Cantor Fitzgerald
Securities, Repurchase
Agreement dated 12/31/20,
0.07%, due 01/04/21
(Repurchase Amount
$3,853,991, collateralized
by various U.S.
Government/U.S.
Government Agency
Obligations,
0.000%-9.500%, Market
Value plus accrued interest
$3,931,040, due
01/25/21-10/15/62) | | | | | 3,853,961 | | | | | | 0.7 | | |
See Accompanying Notes to Financial Statements
SUMMARY PORTFOLIO OF INVESTMENTS
| Voya High Yield Portfolio | as of December 31, 2020 (continued) |
Principal
Amount† | | | Value | | | Percentage
of Net
Assets | |
| SHORT-TERM INVESTMENTS: (continued) | |
| | | | Repurchase Agreements (continued) | |
| 1,319,035 (13) | | | CF Secured LLC,
Repurchase Agreement
dated 12/31/20, 0.07%, due
01/04/21 (Repurchase
Amount $1,319,045,
collateralized by various
U.S. Government/U.S.
Government Agency
Obligations,
0.000%-4.750%, Market
Value plus accrued interest
$1,345,416, due
01/14/21-01/20/69) | | | | $ | 1,319,035 | | | | | | 0.3 | | |
| 2,894,411 (13) | | | Citadel Securities LLC,
Repurchase Agreement
dated 12/31/20, 0.13%, due
01/04/21 (Repurchase
Amount $2,894,452,
collateralized by various
U.S. Government
Securities, 0.000%-7.875%,
Market Value plus accrued
interest $2,952,344, due
01/31/21-05/15/49) | | | | | 2,894,411 | | | | | | 0.5 | | |
| 4,185,399 (13) | | | Citigroup, Inc., Repurchase
Agreement dated 12/31/20,
0.07%, due 01/04/21
(Repurchase Amount
$4,185,431, collateralized
by various U.S.
Government/U.S.
Government Agency
Obligations,
0.000%-4.000%, Market
Value plus accrued interest
$4,269,107, due
09/15/21-01/01/51) | | | | | 4,185,399 | | | | | | 0.8 | | |
| 1,506,895 (13) | | | JVB Financial Group LLC,
Repurchase Agreement
dated 12/31/20, 0.13%, due
01/04/21 (Repurchase
Amount $1,506,916,
collateralized by various
U.S. Government/U.S.
Government Agency
Obligations,
0.125%-7.000%, Market
Value plus accrued interest
$1,537,033, due
07/01/22-12/01/50) | | | | | 1,506,895 | | | | | | 0.3 | | |
Principal
Amount† | | | Value | | | Percentage
of Net
Assets | |
| SHORT-TERM INVESTMENTS: (continued) | |
| | | | Repurchase Agreements (continued) | |
| 1,721,800 (13) | | | Mirae Asset Securities USA
Inc., Repurchase
Agreement dated 12/31/20,
0.13%, due 01/04/21
(Repurchase Amount
$1,721,825, collateralized
by various U.S.
Government/U.S.
Government Agency
Obligations,
0.000%-8.125%, Market
Value plus accrued interest
$1,756,261, due
02/18/21-01/15/62) | | | | $ | 1,721,800 | | | | | | 0.3 | | |
| 1,622,950 (13) | | | Palafox Trading LLC,
Repurchase Agreement
dated 12/31/20, 0.13%, due
01/04/21 (Repurchase
Amount $1,622,973,
collateralized by various
U.S. Government
Securities, 0.250%-1.125%,
Market Value plus accrued
interest $1,656,009, due
02/28/25-05/31/25) | | | | | 1,622,950 | | | | | | 0.3 | | |
| 3,825,171 (13) | | | State of Wisconsin
Investment Board,
Repurchase Agreement
dated 12/31/20, 0.16%, due
01/04/21 (Repurchase
Amount $3,825,238,
collateralized by various
U.S. Government
Securities, 0.125%-3.875%,
Market Value plus accrued
interest $3,911,399, due
07/15/22-02/15/47) | | | | | 3,825,171 | | | | | | 0.7 | | |
| | | | Total Repurchase
Agreements | | | | | | | | | | | | | |
| | | | (Cost $23,310,659) | | | | | 23,310,659 | | | | | | 4.3 | | |
| Shares | | | | | Value | | | | |
| Percentage
ofNet
Assets | | |
| | | | Mutual Funds (13): 0.3% | |
| 455,000 (13)(14) | | | BlackRock Liquidity Funds,
FedFund, Institutional
Class, 0.000% | | | | | 455,000 | | | | | | 0.1 | | |
See Accompanying Notes to Financial Statements
SUMMARY PORTFOLIO OF INVESTMENTS
| Voya High Yield Portfolio | as of December 31, 2020 (continued) |
Principal
Amount† | | | Value | | | Percentage
of Net
Assets | |
| SHORT-TERM INVESTMENTS: (continued) | |
| | | | Mutual Funds (13) (continued) | |
| 455,000 (13)(14) | | | Goldman Sachs Financial
Square Government
Fund — Institutional
Shares, 0.020% | | | | $ | 455,000 | | | | | | 0.1 | | |
| 600,000 (13)(14) | | | Morgan Stanley Institutional
Liquidity Funds —
Government Portfolio
(Institutional Share Class),
0.030% | | | | | 600,000 | | | | | | 0.1 | | |
| | | | Total Mutual Funds
(Cost $1,510,000) | | | | | 1,510,000 | | | | | | 0.3 | | |
| | | | Total Short-Term
Investments
(Cost $28,170,015) | | | | | 28,170,098 | | | | | | 5.2 | | |
| | | | Total Investments in
Securities
(Cost $510,972,253) | | | | $ | 546,150,292 | | | | | | 100.9 | | |
| | | | Liabilities in Excess of
Other Assets | | | | | (5,119,381) | | | | | | (0.9) | | |
| | | | Net Assets | | | | $ | 541,030,911 | | | | | | 100.0 | | |
| |
“Other Securities” represents issues not identified as the top 50 holdings in terms of market value and issues or issuers not exceeding 1% of net assets individually or in aggregate respectively as of December 31, 2020.
The following footnotes apply to either the individual securities noted or one or more of the securities aggregated and listed as a single line item.
†
Unless otherwise indicated, principal amount is shown in USD.
(1)
Securities with purchases pursuant to Rule 144A or section 4(a)(2),
under the Securities Act of 1933 and may not be resold subject to that rule except to qualified institutional buyers.
(2)
Security, or a portion of the security, is on loan.
(3)
All or a portion of this security is payment-in-kind (“PIK”) which may pay interest or additional principal at the issuer’s discretion. Rates shown are the current rate and possible
payment rates.
(4)
The grouping contains securities on loan.
(5)
Defaulted security.
(6)
For fair value measurement disclosure purposes, security is categorized as Level 3, whose value was determined using significant unobservable inputs.
(7)
Non-income producing security.
(8)
The grouping contains non-income producing securities.
(9)
The grouping contains Level 3 securities.
(10)
Represents an escrow position for future entitlements, if any, on the defaulted bond. The escrow position was received in exchange for the defaulted bond as part of the bankruptcy reorganization of the bond issuer. These holdings are non-income producing.
(11)
Restricted security as to resale, excluding Rule 144A securities. As of December 31, 2020, the Portfolio held restricted securities with a fair value of $— or 0.0% of net assets. Please refer to the table below for additional details.
(12)
Represents a zero coupon bond. Rate shown reflects the effective yield as of December 31, 2020.
(13)
All or a portion of the security represents securities purchased with cash collateral received for securities on loan.
(14)
Rate shown is the 7-day yield as of December 31, 2020.
Reference Rate Abbreviations:
US0001M 1-month LIBOR
US0003M 3-month LIBOR
See Accompanying Notes to Financial Statements
SUMMARY PORTFOLIO OF INVESTMENTS
| Voya High Yield Portfolio | as of December 31, 2020 (continued) |
Fair Value Measurements^
The following is a summary of the fair valuations according to the inputs used as of December 31, 2020 in valuing the assets and liabilities:
| | | | Quoted Prices
in Active Markets
for Identical
Investments
(Level 1) | | | Significant
Other
Observable
Inputs
(Level 2) | | | Significant
Unobservable
Inputs
(Level 3) | | | Fair Value
at
December 31, 2020 | |
| Asset Table | | | | | | | | | | | | | | | | | | | | | | | | | |
| Investments, at fair value | | | | | | | | | | | | | | | | | | | | | | | | | |
| Common Stock | | | | | | | | | | | | | | | | | | | | | | | | | |
| Consumer Discretionary | | | | $ | 75,380 | | | | | $ | — | | | | | $ | — | | | | | $ | 75,380 | | |
| Consumer Staples | | | | | — | | | | | | — | | | | | | 1,751,361 | | | | | | 1,751,361 | | |
| Energy | | | | | 3 | | | | | | — | | | | | | 5,093 | | | | | | 5,096 | | |
| Health Care | | | | | 407 | | | | | | — | | | | | | — | | | | | | 407 | | |
| Information Technology | | | | | 19 | | | | | | — | | | | | | — | | | | | | 19 | | |
| Total Common Stock | | | | | 75,809 | | | | | | — | | | | | | 1,756,454 | | | | | | 1,832,263 | | |
| Preferred Stock | | | | | — | | | | | | — | | | | | | — | | | | | | — | | |
| Warrants | | | | | — | | | | | | — | | | | | | — | | | | | | — | | |
| Corporate Bonds/Notes | | | | | — | | | | | | 510,424,716 | | | | | | — | | | | | | 510,424,716 | | |
| Convertible Bonds/Notes | | | | | — | | | | | | 383,116 | | | | | | — | | | | | | 383,116 | | |
| Other | | | | | — | | | | | | — | | | | | | — | | | | | | — | | |
| Bank Loans | | | | | — | | | | | | 5,340,099 | | | | | | — | | | | | | 5,340,099 | | |
| Short-Term Investments | | | | | 1,510,000 | | | | | | 26,660,098 | | | | | | — | | | | | | 28,170,098 | | |
| Total Investments, at fair value | | | | $ | 1,585,809 | | | | | $ | 542,808,029 | | | | | $ | 1,756,454 | | | | | $ | 546,150,292 | | |
^
See Note 2, “Significant Accounting Policies” in the Notes to Financial Statements for additional information.
At December 31, 2020, Voya High Yield Portfolio held the following restricted securities:
| Security | | | Acquisition Date | | | Acquisition Cost | | | Fair Value | |
| Green Field Energy Services, Inc. (Escrow) | | | | | 8/25/2019 | | | | | $ | — | | | | | $ | — | | |
| Millicom International Cellular S.A. (Escrow) | | | | | 9/9/2017 | | | | | | — | | | | | | — | | |
| | | | | | | | | | | $ | — | | | | | $ | — | | |
At December 31, 2020, the aggregate cost of securities and other investments and the composition of unrealized appreciation and depreciation of securities and other investments on a tax basis were:
| | Cost for federal income tax purposes was $511,559,126. | | |
| | Net unrealized appreciation consisted of: | | |
| | Gross Unrealized Appreciation | | | | $ | 35,687,999 | | |
| | Gross Unrealized Depreciation | | | | | (1,096,833) | | |
| | Net Unrealized Appreciation | | | | $ | 34,591,166 | | |
See Accompanying Notes to Financial Statements
SUMMARY PORTFOLIO OF INVESTMENTS
| Voya Large Cap Growth Portfolio | as of December 31, 2020 |
| Shares | | | Value | | | Percentage
of Net
Assets | |
| COMMON STOCK: 99.8% | |
| | | | Communication Services: 10.2% | |
| 1,287,605 (1) | | | Altice USA, Inc. | | | | $ | 48,761,601 | | | | | | 0.7 | | |
1,108,450 (1) | | | Facebook, Inc.–
Class A | | | | | 302,784,202 | | | | | | 4.6 | | |
| 1,694,892 (1)(2) | | | Snap, Inc. | | | | | 84,863,243 | | | | | | 1.3 | | |
| 244,288 (1) | | | Spotify Technology SA | | | | | 76,867,662 | | | | | | 1.2 | | |
| 603,448 (1) | | | Take-Two Interactive
Software, Inc. | | | | | 125,390,460 | | | | | | 1.9 | | |
| 17,314 (3) | | | Other Securities | | | | | 30,345,209 | | | | | | 0.5 | | |
| | | | | | | | | 669,012,377 | | | | | | 10.2 | | |
| | | | Consumer Discretionary: 17.1% | |
| 199,532 (1) | | | Amazon.com, Inc. | | | | | 649,861,757 | | | | | | 9.9 | | |
| 579,926 | | | Darden Restaurants, Inc. | | | | | 69,080,785 | | | | | | 1.1 | | |
| 514,814 | | | Expedia Group, Inc. | | | | | 68,161,373 | | | | | | 1.0 | | |
| 473,152 (1)(2) | | | Five Below, Inc. | | | | | 82,792,137 | | | | | | 1.3 | | |
| 258,766 (1) | | | O’Reilly Automotive, Inc. | | | | | 117,109,729 | | | | | | 1.8 | | |
| 1,039,210 | | | Ross Stores, Inc. | | | | | 127,625,380 | | | | | | 2.0 | | |
| | | | | | | | | 1,114,631,161 | | | | | | 17.1 | | |
| | | | Consumer Staples: 4.5% | |
| 412,206 | | | Church & Dwight Co., Inc. | | | | | 35,956,729 | | | | | | 0.5 | | |
| 488,892 | | | Constellation Brands, Inc. | | | | | 107,091,793 | | | | | | 1.6 | | |
| 1,855,139 | | | Philip Morris
International, Inc. | | | | | 153,586,958 | | | | | | 2.4 | | |
| | | | | | | | | 296,635,480 | | | | | | 4.5 | | |
| | | | Financials: 2.1% | |
| 503,710 | | | Progressive Corp. | | | | | 49,806,845 | | | | | | 0.8 | | |
| 259,311 | | | S&P Global, Inc. | | | | | 85,243,305 | | | | | | 1.3 | | |
| | | | | | | | | 135,050,150 | | | | | | 2.1 | | |
| | | | Health Care: 12.9% | |
| 823,201 | | | Agilent Technologies, Inc. | | | | | 97,541,087 | | | | | | 1.5 | | |
| 115,539 (1) | | | Align Technology, Inc. | | | | | 61,741,731 | | | | | | 0.9 | | |
| 574,911 | | | Danaher Corp. | | | | | 127,710,730 | | | | | | 2.0 | | |
| 220,777 (1)(2) | | | DexCom, Inc. | | | | | 81,625,672 | | | | | | 1.2 | | |
| 1,192,294 | | | Eli Lilly & Co. | | | | | 201,306,919 | | | | | | 3.1 | | |
| 483,774 (1)(2) | | | Exact Sciences Corp. | | | | | 64,095,217 | | | | | | 1.0 | | |
| 708,371 (1) | | | Horizon Therapeutics Plc | | | | | 51,817,339 | | | | | | 0.8 | | |
| 230,424 | | | Humana, Inc. | | | | | 94,536,054 | | | | | | 1.4 | | |
| 332,011 (1) | | | Tandem Diabetes Care,
Inc. | | | | | 31,766,812 | | | | | | 0.5 | | |
| 112,868 (3)(4) | | | Other Securities | | | | | 30,728,313 | | | | | | 0.5 | | |
| | | | | | | | | 842,869,874 | | | | | | 12.9 | | |
| Shares | | | Value | | | Percentage
of Net
Assets | |
| COMMON STOCK: (continued) | |
| | | | Industrials: 4.7% | |
| 505,612 | | | Ametek, Inc. | | | | $ | 61,148,715 | | | | | | 0.9 | | |
| 53,889 (1) | | | CoStar Group, Inc. | | | | | 49,808,525 | | | | | | 0.8 | | |
| 1,201,019 | | | CSX Corp. | | | | | 108,992,474 | | | | | | 1.7 | | |
| 188,462 | | | Roper Technologies, Inc. | | | | | 81,244,083 | | | | | | 1.2 | | |
| 60,431 | | | Other Securities | | | | | 6,198,408 | | | | | | 0.1 | | |
| | | | | | | | | 307,392,205 | | | | | �� | 4.7 | | |
| | | | Information Technology: 45.4% | |
| 1,456,710 (1) | | | Advanced Micro Devices,
Inc. | | | | | 133,594,874 | | | | | | 2.0 | | |
| 6,285,084 | | | Apple, Inc. | | | | | 833,967,796 | | | | | | 12.8 | | |
| 360,928 (1) | | | Autodesk, Inc. | | | | | 110,205,756 | | | | | | 1.7 | | |
| 534,117 (1) | | | Cadence Design
Systems, Inc. | | | | | 72,869,582 | | | | | | 1.1 | | |
| 339,216 (1) | | | Five9, Inc. | | | | | 59,159,270 | | | | | | 0.9 | | |
| 364,722 | | | Global Payments, Inc. | | | | | 78,568,413 | | | | | | 1.2 | | |
| 529,328 | | | Intuit, Inc. | | | | | 201,065,241 | | | | | | 3.1 | | |
| 185,720 | | | Lam Research Corp. | | | | | 87,709,984 | | | | | | 1.3 | | |
| 1,030,427 | | | Microsoft Corp. | | | | | 229,187,573 | | | | | | 3.5 | | |
| 193,782 | | | Monolithic Power
Systems, Inc. | | | | | 70,968,782 | | | | | | 1.1 | | |
| 192,964 (1) | | | Paycom Software, Inc. | | | | | 87,267,969 | | | | | | 1.3 | | |
| 696,257 (1) | | | PayPal Holdings, Inc. | | | | | 163,063,389 | | | | | | 2.5 | | |
| 841,619 | | | Qualcomm, Inc. | | | | | 128,212,239 | | | | | | 2.0 | | |
| 323,579 (1)(2) | | | RingCentral, Inc. | | | | | 122,626,734 | | | | | | 1.9 | | |
| 193,163 (1) | | | ServiceNow, Inc. | | | | | 106,322,710 | | | | | | 1.6 | | |
| 320,901 (1)(2) | | | Twilio, Inc. | | | | | 108,624,989 | | | | | | 1.7 | | |
| 1,387,719 | | | Visa, Inc. - Class A | | | | | 303,535,777 | | | | | | 4.7 | | |
| 91,403 (1) | | | Zebra Technologies Corp. | | | | | 35,128,915 | | | | | | 0.5 | | |
| 317,334 | | | Other Securities | | | | | 30,495,797 | | | | | | 0.5 | | |
| | | | | | | | | 2,962,575,790 | | | | | | 45.4 | | |
| | | | Materials: 1.6% | |
| 261,321 | | | Avery Dennison Corp. | | | | | 40,533,500 | | | | | | 0.6 | | |
| 668,467 (1) | | | Crown Holdings, Inc. | | | | | 66,980,394 | | | | | | 1.0 | | |
| | | | | | | | | 107,513,894 | | | | | | 1.6 | | |
| | | | Real Estate: 1.3% | |
| 300,217 | | | SBA Communications
Corp. | | | | | 84,700,222 | | | | | | 1.3 | | |
| | | | Total Common Stock
(Cost $4,881,110,469) | | | | | 6,520,381,153 | | | | | | 99.8 | | |
| |
See Accompanying Notes to Financial Statements
SUMMARY PORTFOLIO OF INVESTMENTS
| Voya Large Cap Growth Portfolio | as of December 31, 2020 (continued) |
Principal
Amount† | | | Value | | | Percentage
of Net
Assets | |
| SHORT-TERM INVESTMENTS: 1.5% | |
| | | | Repurchase Agreements: 0.6% | |
| 2,222,417 (5) | | | Amherst Pierpoint
Securities LLC,
Repurchase Agreement
dated 12/31/20, 0.10%,
due 01/04/21
(Repurchase Amount
$2,222,441, collateralized
by various U.S.
Government/U.S.
Government Agency
Obligations,
0.000%-4.628%, Market
Value plus accrued
interest $2,266,865, due
02/03/21-11/20/70) | | | | $ | 2,222,417 | | | | | 0.0 | | |
| 1,396,946 (5) | | | Bethesda Securities LLC,
Repurchase Agreement
dated 12/31/20, 0.10%,
due 01/04/21
(Repurchase Amount
$1,396,961, collateralized
by various U.S.
Government Agency
Obligations,
2.500%-5.500%, Market
Value plus accrued
interest $1,424,885, due
07/01/24-10/01/50) | | | | | 1,396,946 | | | | | | 0.0 | | |
| 1,851,088 (5) | | | BNP Paribas S.A.,
Repurchase Agreement
dated 12/31/20, 0.24%,
due 01/04/21
(Repurchase Amount
$1,851,137, collateralized
by various U.S.
Government Securities,
0.750%-8.750%, Market
Value plus accrued
interest $1,943,642, due
03/01/21-11/20/40) | | | | | 1,851,088 | | | | | | 0.0 | | |
Principal
Amount† | | | Value | | | Percentage
of Net
Assets | |
| SHORT-TERM INVESTMENTS: (continued) | |
| | | | Repurchase Agreements (continued) | |
| 6,595,181 (5) | | | Cantor Fitzgerald
Securities, Repurchase
Agreement dated
12/31/20, 0.07%, due
01/04/21 (Repurchase
Amount $6,595,232,
collateralized by various
U.S. Government/U.S.
Government Agency
Obligations,
0.000%-9.500%, Market
Value plus accrued
interest $6,727,085, due
01/25/21-10/15/62) | | | | $ | 6,595,181 | | | | | | 0.1 | | |
| 2,257,230 (5) | | | CF Secured LLC,
Repurchase Agreement
dated 12/31/20, 0.07%,
due 01/04/21
(Repurchase Amount
$2,257,247, collateralized
by various U.S.
Government/U.S.
Government Agency
Obligations,
0.000%-4.750%, Market
Value plus accrued
interest $2,302,375, due
01/14/21-01/20/69) | | | | | 2,257,230 | | | | | | 0.0 | | |
| 4,452,521 (5) | | | Citadel Securities LLC,
Repurchase Agreement
dated 12/31/20, 0.13%,
due 01/04/21
(Repurchase Amount
$4,452,584, collateralized
by various U.S.
Government Securities,
0.000%-7.875%, Market
Value plus accrued
interest $4,541,641, due
01/31/21-05/15/49) | | | | | 4,452,521 | | | | | | 0.1 | | |
See Accompanying Notes to Financial Statements
SUMMARY PORTFOLIO OF INVESTMENTS
| Voya Large Cap Growth Portfolio | as of December 31, 2020 (continued) |
Principal
Amount† | | | Value | | | Percentage
of Net
Assets | |
| SHORT-TERM INVESTMENTS: (continued) | |
| | | | Repurchase Agreements (continued) | |
| 6,546,736 (5) | | | Citigroup, Inc.,
Repurchase Agreement
dated 12/31/20, 0.07%,
due 01/04/21
(Repurchase Amount
$6,546,786, collateralized
by various U.S.
Government/U.S.
Government Agency
Obligations,
0.000%-4.000%, Market
Value plus accrued
interest $6,677,671, due
09/15/21-01/01/51) | | | | $ | 6,546,736 | | | | | | 0.1 | | |
| 2,578,709 (5) | | | JVB Financial Group LLC,
Repurchase Agreement
dated 12/31/20, 0.13%,
due 01/04/21
(Repurchase Amount
$2,578,746, collateralized
by various U.S.
Government/U.S.
Government Agency
Obligations,
0.125%-7.000%, Market
Value plus accrued
interest $2,630,283, due
07/01/22-12/01/50) | | | | | 2,578,709 | | | | | | 0.1 | | |
| 2,946,470 (5) | | | Mirae Asset Securities
USA Inc., Repurchase
Agreement dated
12/31/20, 0.13%, due
01/04/21 (Repurchase
Amount $2,946,512,
collateralized by various
U.S. Government/U.S.
Government Agency
Obligations,
0.000%-8.125%, Market
Value plus accrued
interest $3,005,443, due
02/18/21-01/15/62) | | | | | 2,946,470 | | | | | | 0.1 | | |
Principal
Amount† | | | Value | | | Percentage
of Net
Assets | |
| SHORT-TERM INVESTMENTS: (continued) | |
| | | | Repurchase Agreements (continued) | |
| 2,496,610 (5) | | | Palafox Trading LLC,
Repurchase Agreement
dated 12/31/20, 0.13%,
due 01/04/21
(Repurchase Amount
$2,496,646, collateralized
by various U.S.
Government Securities,
0.250%-1.125%, Market
Value plus accrued
interest $2,547,464, due
02/28/25-05/31/25) | | | | $ | 2,496,610 | | | | | | 0.0 | | |
| 6,545,915 (5) | | | State of Wisconsin
Investment Board,
Repurchase Agreement
dated 12/31/20, 0.16%,
due 01/04/21
(Repurchase Amount
$6,546,030, collateralized
by various U.S.
Government Securities,
0.125%-3.875%, Market
Value plus accrued
interest $6,693,475, due
07/15/22-02/15/47) | | | | | 6,545,915 | | | | | | 0.1 | | |
| | | | Total Repurchase
Agreements
(Cost $39,889,823) | | | | | 39,889,823 | | | | | | 0.6 | | |
| Shares | | | Value | | | Percentage
of Net
Assets | |
| | | | Mutual Funds(5): 0.9% | |
| 53,672,111 (5)(6) | | | BlackRock Liquidity Funds,
FedFund, Institutional Class,
0.000% | | | | | 53,672,111 | | | | | | 0.9 | | |
| 1,248,000 (5)(6) | | | Goldman Sachs Financial
Square Government
Fund – Institutional Shares,
0.020% | | | | | 1,248,000 | | | | | | 0.0 | | |
See Accompanying Notes to Financial Statements
SUMMARY PORTFOLIO OF INVESTMENTS
| Voya Large Cap Growth Portfolio | as of December 31, 2020 (continued) |
| Shares | | | Value | | | Percentage
of Net
Assets | |
| | | | Mutual Funds(5): (continued) | |
| 1,248,000 (5)(6) | | | Morgan Stanley
Institutional Liquidity
Funds – Government
Portfolio (Institutional
Share Class), 0.030% | | | | $ | 1,248,000 | | | | | | 0.0 | | |
| | | | Total Mutual Funds
(Cost $56,168,111) | | | | | 56,168,111 | | | | | | 0.9 | | |
| | | | Total Short-Term
Investments
(Cost $96,057,934) | | | | | 96,057,934 | | | | | | 1.5 | | |
| | | | Total Investments in
Securities
(Cost $4,977,168,403) | | | | $ | 6,616,439,087 | | | | | | 101.3 | | |
| | | | Liabilities in Excess of
Other Assets | | | | | (85,509,054) | | | | | | (1.3) | | |
| | | | Net Assets | | | | $ | 6,530,930,033 | | | | | | 100.0 | | |
| |
“Other Securities” represents issues not identified as the top 50 holdings in terms of market value and issues or issuers not exceeding 1% of net assets individually or in aggregate respectively as of December 31, 2020.
The following footnotes apply to either the individual securities noted or one or more of the securities aggregated and listed as a single line item.
†
Unless otherwise indicated, principal amount is shown in USD.
(1)
Non-income producing security.
(2)
Security, or a portion of the security, is on loan.
(3)
The grouping contains non-income producing securities.
(4)
The grouping contains securities on loan.
(5)
All or a portion of the security represents securities purchased with cash collateral received for securities on loan.
(6)
Rate shown is the 7-day yield as of December 31, 2020.
Fair Value Measurements^
The following is a summary of the fair valuations according to the inputs used as of December 31, 2020 in valuing the assets and liabilities:
| | | | Quoted Prices
in Active Markets
for Identical
Investments
(Level 1) | | | Significant
Other
Observable
Inputs
(Level 2) | | | Significant
Unobservable
Inputs
(Level 3) | | | Fair Value
at
December 31, 2020 | |
| Common Stock* | | | | $ | 6,520,381,153 | | | | | $ | — | | | | | $ | — | | | | | $ | 6,520,381,153 | | |
| Short-Term Investments | | | | | 56,168,111 | | | | | | 39,889,823 | | | | | | — | | | | | | 96,057,934 | | |
| Total Investments, at fair value | | | | $ | 6,576,549,264 | | | | | $ | 39,889,823 | | | | | $ | — | | | | | $ | 6,616,439,087 | | |
^
See Note 2, “Significant Accounting Policies” in the Notes to Financial Statements for additional information.
*
For further breakdown of Common Stock by sector, please refer to the Portfolio of Investments.
At December 31, 2020, the aggregate cost of securities and other investments and the composition of unrealized appreciation and depreciation of securities and other investments on a tax basis were:
| | Cost for federal income tax purposes was $4,997,528,326. | | | | | | | |
| | Net unrealized appreciation consisted of: | | | | | | | |
| | Gross Unrealized Appreciation | | | | $ | 1,651,353,832 | | |
| | Gross Unrealized Depreciation | | | | | (32,443,070) | | |
| | Net Unrealized Appreciation | | | | $ | 1,618,910,762 | | |
See Accompanying Notes to Financial Statements
SUMMARY PORTFOLIO OF INVESTMENTS
| Voya Large Cap Value Portfolio | as of December 31, 2020 |
| Shares | | | Value | | | Percentage
of Net
Assets | |
| COMMON STOCK: 99.6% | |
| | | | Communication Services: 8.7% | |
| 135,198 | | | Activision Blizzard, Inc. | | | | $ | 12,553,134 | | | | | | 1.3 | | |
| 505,820 | | | Comcast Corp. – Class A | | | | | 26,504,968 | | | | | | 2.7 | | |
| 586,185 | | | Interpublic Group of
Cos., Inc. | | | | | 13,787,071 | | | | | | 1.4 | | |
| 182,325 (1) | | | Walt Disney Co. | | | | | 33,033,644 | | | | | | 3.3 | | |
| | | | | | | | | 85,878,817 | | | | | | 8.7 | | |
| | | | Consumer Discretionary: 7.8% | |
| 87,192 | | | Darden Restaurants, Inc. | | | | | 10,386,311 | | | | | | 1.1 | | |
| 89,877 | | | Expedia Group, Inc. | | | | | 11,899,715 | | | | | | 1.2 | | |
| 135,499 | | | Hasbro, Inc. | | | | | 12,674,576 | | | | | | 1.3 | | |
| 266,047 | | | Las Vegas Sands Corp. | | | | | 15,856,401 | | | | | | 1.6 | | |
| 354,687 | | | Other Securities | | | | | 26,144,950 | | | | | | 2.6 | | |
| | | | | | | | | 76,961,953 | | | | | | 7.8 | | |
| | | | Consumer Staples: 7.4% | |
| 322,982 | | | Coca-Cola Co. | | | | | 17,712,333 | | | | | | 1.8 | | |
| 56,388 | | | Constellation Brands,
Inc. | | | | | 12,351,791 | | | | | | 1.2 | | |
| 259,473 | | | Philip Morris
International, Inc. | | | | | 21,481,770 | | | | | | 2.2 | | |
| 153,640 | | | Walmart, Inc. | | | | | 22,147,206 | | | | | | 2.2 | | |
| | | | | | | | | 73,693,100 | | | | | | 7.4 | | |
| | | | Energy: 4.6% | |
| 184,968 | | | Chevron Corp. | | | | | 15,620,547 | | | | | | 1.6 | | |
| 196,946 (2) | | | Diamondback Energy,
Inc. | | | | | 9,532,187 | | | | | | 1.0 | | |
| 516,698 | | | Other Securities | | | | | 20,483,921 | | | | | | 2.0 | | |
| | | | | | | | | 45,636,655 | | | | | | 4.6 | | |
| | | | Financials: 20.0% | |
| 446,831 | | | American International
Group, Inc. | | | | | 16,917,022 | | | | | | 1.7 | | |
| 269,626 (2) | | | Apollo Global
Management, Inc. | | | | | 13,206,282 | | | | | | 1.3 | | |
| 95,792 | | | Assurant, Inc. | | | | | 13,048,786 | | | | | | 1.3 | | |
| 812,123 | | | Bank of America Corp. | | | | | 24,615,448 | | | | | | 2.5 | | |
| 399,564 | | | Citigroup, Inc. | | | | | 24,637,116 | | | | | | 2.5 | | |
| 157,688 | | | Discover Financial
Services | | | | | 14,275,495 | | | | | | 1.4 | | |
| 69,264 | | | Goldman Sachs Group,
Inc. | | | | | 18,265,609 | | | | | | 1.9 | | |
| 385,499 | | | Hartford Financial
Services Group, Inc. | | | | | 18,881,741 | | | | | | 1.9 | | |
| 105,235 | | | Intercontinental
Exchange, Inc. | | | | | 12,132,543 | | | | | | 1.2 | | |
| 424,634 | | | Truist Financial Corp. | | | | | 20,352,708 | | | | | | 2.1 | | |
| 469,616 | | | US Bancorp | | | | | 21,879,409 | | | | | | 2.2 | | |
| | | | | | | | | 198,212,159 | | | | | | 20.0 | | |
| | | | Health Care: 13.7% | |
| 146,586 (1),(2) | | | Alcon, Inc. | | | | | 9,671,744 | | | | | | 1.0 | | |
| 320,821 | | | Bristol-Myers Squibb Co. | | | | | 19,900,527 | | | | | | 2.0 | | |
| Shares | | | Value | | | Percentage
of Net
Assets | |
| COMMON STOCK: (continued) | |
| | | | Health Care (continued) | |
| 50,880 | | | Cigna Corp. | | | | | 10,592,198 | | | | | | 1.1 | | |
| 170,433 | | | Johnson & Johnson | | | | | 26,822,746 | | | | | | 2.7 | | |
| 219,828 | | | Medtronic PLC | | | | | 25,750,652 | | | | | | 2.6 | | |
| 27,848 | | | Thermo Fisher Scientific,
Inc. | | | | $ | 12,971,042 | | | | | | 1.3 | | |
| 76,715 | | | Zimmer Biomet Holdings,
Inc. | | | | | 11,821,014 | | | | | | 1.2 | | |
| 75,710 (3) | | | Other Securities | | | | | 17,544,231 | | | | | | 1.8 | | |
| | | | | | | | | 135,074,154 | | | | | | 13.7 | | |
| | | | Industrials: 12.9% | |
| 83,949 | | | L3Harris Technologies,
Inc. | | | | | 15,868,040 | | | | | | 1.6 | | |
| 98,577 | | | Norfolk Southern Corp. | | | | | 23,422,881 | | | | | | 2.4 | | |
| 67,820 | | | Parker Hannifin Corp. | | | | | 18,474,846 | | | | | | 1.9 | | |
| 328,035 | | | Raytheon Technologies
Corp. | | | | | 23,457,783 | | | | | | 2.4 | | |
| 137,282 | | | Timken Co. | | | | | 10,620,136 | | | | | | 1.1 | | |
| 57,194 (1) | | | United Rentals, Inc. | | | | | 13,263,861 | | | | | | 1.3 | | |
| 296,952 | | | Other Securities | | | | | 22,264,015 | | | | | | 2.2 | | |
| | | | | | | | | 127,371,562 | | | | | | 12.9 | | |
| | | | Information Technology: 9.6% | |
| 29,323 | | | Broadcom, Inc. | | | | | 12,839,076 | | | | | | 1.3 | | |
| 194,293 (1) | | | Fiserv, Inc. | | | | | 22,122,201 | | | | | | 2.3 | | |
| 520,230 | | | HP, Inc. | | | | | 12,792,456 | | | | | | 1.3 | | |
| 81,191 | | | MKS Instruments, Inc. | | | | | 12,215,186 | | | | | | 1.2 | | |
| 82,191 | | | Motorola Solutions, Inc. | | | | | 13,977,401 | | | | | | 1.4 | | |
| 82,100 (2) | | | NXP Semiconductor
NV — NXPI — US | | | | | 13,054,721 | | | | | | 1.3 | | |
| 54,617 | | | Other Securities | | | | | 7,543,154 | | | | | | 0.8 | | |
| | | | | | | | | 94,544,195 | | | | | | 9.6 | | |
| | | | Materials: 4.9% | |
| 40,379 | | | Air Products &
Chemicals, Inc. | | | | | 11,032,350 | | | | | | 1.1 | | |
| 318,183 | | | CF Industries Holdings,
Inc. | | | | | 12,316,864 | | | | | | 1.2 | | |
| 135,710 | | | Eastman Chemical Co. | | | | | 13,608,999 | | | | | | 1.4 | | |
| 95,871 | | | Reliance Steel &
Aluminum Co. | | | | | 11,480,552 | | | | | | 1.2 | | |
| | | | | | | | | 48,438,765 | | | | | | 4.9 | | |
| | | | Real Estate: 4.6% | |
| 313,977 | | | VEREIT, Inc. | | | | | 11,865,191 | | | | | | 1.2 | | |
| 714,344 | | | Other Securities | | | | | 33,247,761 | | | | | | 3.4 | | |
| | | | | | | | | 45,112,952 | | | | | | 4.6 | | |
| | | | Utilities: 5.4% | |
| 113,805 | | | Entergy Corp. | | | | | 11,362,291 | | | | | | 1.1 | | |
| 301,200 | | | Exelon Corp. | | | | | 12,716,664 | | | | | | 1.3 | | |
| 201,774 | | | NextEra Energy, Inc. | | | | | 15,566,864 | | | | | | 1.6 | | |
See Accompanying Notes to Financial Statements
SUMMARY PORTFOLIO OF INVESTMENTS
| Voya Large Cap Value Portfolio | as of December 31, 2020 (continued) |
| Shares | | | Value | | | Percentage
of Net
Assets | |
| COMMON STOCK: (continued) | |
| | | | Utilities (continued) | |
| 657,205 (3),(4) | | | Other Securities | | | | $ | 14,012,932 | | | | | | 1.4 | | |
| | | | | | | | | 53,658,751 | | | | | | 5.4 | | |
| | | | Total Common Stock
(Cost $831,851,136) | | | | | 984,583,063 | | | | | | 99.6 | | |
| OTHER(5): —% | |
| | | | Communications: —% | |
| 32,517 (6)(7) | | | Tribune Co. (Escrow) | | | | | — | | | | | | — | | |
| | | | | |
| | | | Energy: —% | |
1,685,000 (6)(7) | | | Samson Investment Co.
(Escrow) | | | | | — | | | | | | — | | |
| | | | Total Other
(Cost $30,842) | | | | | — | | | | | | — | | |
| |
Principal
Amount† | | | Value | | | Percentage
of Net
Assets | |
| CORPORATE BONDS/NOTES: —% | |
| | | | Financial: —% | |
1,216,000 (4)(8) | | | Other Securities | | | | | — | | | | | | — | | |
| | | | Total Corporate
Bonds/Notes
(Cost $787,908) | | | | | — | | | | | | — | | |
| | | | Total Long-Term
Investments
(Cost $832,669,886) | | | | | 984,583,063 | | | | | | 99.6 | | |
| | | | | |
| SHORT-TERM INVESTMENTS: 2.1% | |
| | | | Repurchase Agreements: 1.7% | |
| 61,975 (9) | | | Bank of America Inc.,
Repurchase Agreement
dated 12/31/20, 0.08%,
due 01/04/21
(Repurchase Amount
$61,976, collateralized
by various U.S.
Government Agency
Obligations,
1.500%-3.500%, Market
Value plus accrued
interest $63,215, due
02/01/48-01/01/51) | | | | | 61,975 | | | | | | 0.0 | | |
Principal
Amount† | | | Value | | | Percentage
of Net
Assets | |
| SHORT-TERM INVESTMENTS: (continued) | |
| | | | Repurchase Agreements (continued) | |
2,854,144 (9) | | | Cantor Fitzgerald
Securities, Repurchase
Agreement dated
12/31/20, 0.07%, due
01/04/21 (Repurchase
Amount $2,854,166,
collateralized by various
U.S. Government/U.S.
Government Agency
Obligations,
0.000%-9.500%, Market
Value plus accrued
interest $2,911,227, due
01/25/21-10/15/62) | | | | $ | 2,854,144 | | | | | | 0.3 | | |
2,788,630 (9) | | | Citadel Securities LLC,
Repurchase Agreement
dated 12/31/20, 0.13%,
due 01/04/21
(Repurchase Amount
$2,788,670,
collateralized by various
U.S. Government
Securities,
0.000%-7.875%, Market
Value plus accrued
interest $2,844,446, due
01/31/21-05/15/49) | | | | | 2,788,630 | | | | | | 0.3 | | |
1,241,680 (9) | | | JVB Financial Group
LLC, Repurchase
Agreement dated
12/31/20, 0.13%, due
01/04/21 (Repurchase
Amount $1,241,698,
collateralized by various
U.S. Government/U.S.
Government Agency
Obligations,
0.125%-7.000%, Market
Value plus accrued
interest $1,266,514, due
07/01/22-12/01/50) | | | | | 1,241,680 | | | | | | 0.1 | | |
See Accompanying Notes to Financial Statements
SUMMARY PORTFOLIO OF INVESTMENTS
| Voya Large Cap Value Portfolio | as of December 31, 2020 (continued) |
Principal
Amount† | | | Value | | | Percentage
of Net
Assets | |
| SHORT-TERM INVESTMENTS: (continued) | |
| | | | Repurchase Agreements (continued) | |
1,275,121 (9) | | | Mirae Asset Securities
USA Inc., Repurchase
Agreement dated
12/31/20, 0.13%, due
01/04/21 (Repurchase
Amount $1,275,139,
collateralized by various
U.S. Government/U.S.
Government Agency
Obligations,
0.000%-8.125%, Market
Value plus accrued
interest $1,300,642, due
02/18/21-01/15/62) | | | | $ | 1,275,121 | | | | | | 0.1 | | |
1,309,370 (9) | | | Palafox Trading LLC,
Repurchase Agreement
dated 12/31/20, 0.13%,
due 01/04/21
(Repurchase Amount
$1,309,389,
collateralized by various
U.S. Government
Securities,
0.250%-1.125%, Market
Value plus accrued
interest $1,336,041, due
02/28/25-05/31/25) | | | | | 1,309,370 | | | | | | 0.2 | | |
4,097,979 (9) | | | RBC Dominion Securities
Inc., Repurchase
Agreement dated
12/31/20, 0.08%, due
01/04/21 (Repurchase
Amount $4,098,015,
collateralized by various
U.S. Government/U.S.
Government Agency
Obligations,
0.000%-6.000%, Market
Value plus accrued
interest $4,179,939, due
01/05/21-12/20/50) | | | | | 4,097,979 | | | | | | 0.4 | | |
2,832,825 (9) | | | State of Wisconsin
Investment Board,
Repurchase Agreement
dated 12/31/20, 0.16%,
due 01/04/21
(Repurchase Amount
$2,832,875,
collateralized by various
U.S. Government
Securities,
0.125%-3.875%, Market
Value plus accrued
interest $2,896,683, due
07/15/22-02/15/47) | | | | | 2,832,825 | | | | | | 0.3 | | |
Principal
Amount† | | | Value | | | Percentage
of Net
Assets | |
| SHORT-TERM INVESTMENTS: (continued) | |
| | | | Repurchase Agreements (continued) | |
| | | | Total Repurchase
Agreements
(Cost $16,461,724) | | | | $ | 16,461,724 | | | | | | 1.7 | | |
| |
| Shares | | | Value | | | Percentage
of Net
Assets | |
| | | | Mutual Funds (9): 0.4% | |
3,513,013 (9)(10) | | | BlackRock Liquidity
Funds, FedFund,
Institutional Class,
0.000% | | | | | 3,513,013 | | | | | | 0.4 | | |
331,000 (9)(10) | | | Goldman Sachs
Financial Square
Government Fund –
Institutional Shares,
0.020% | | | | | 331,000 | | | | | | 0.0 | | |
483,000 (9)(10) | | | Morgan Stanley
Institutional Liquidity
Funds – Government
Portfolio (Institutional
Share Class), 0.030% | | | | | 483,000 | | | | | | 0.0 | | |
| | | | Total Mutual Funds
(Cost $4,327,013) | | | | | 4,327,013 | | | | | | 0.4 | | |
| | | | Total Short-Term
Investments
(Cost $20,788,737) | | | | | 20,788,737 | | | | | | 2.1 | | |
| | | | Total Investments in
Securities
(Cost $853,458,623) | | | | $ | 1,005,371,800 | | | | | | 101.7 | | |
| | | | Liabilities in Excess
of Other Assets | | | | | (16,417,702) | | | | | | (1.7) | | |
| | | | Net Assets | | | | $ | 988,954,098 | | | | | | 100.0 | | |
“Other Securities” represents issues not identified as the top 50 holdings in terms of market value and issues or issuers not exceeding 1% of net assets individually or in aggregate respectively as of December 31, 2020.
The following footnotes apply to either the individual securities noted or one or more of the securities aggregated and listed as a single line item.
†
Unless otherwise indicated, principal amount is shown in USD.
(1)
Non-income producing security.
(2)
Security, or a portion of the security, is on loan.
(3)
The grouping contains non-income producing securities.
(4)
The grouping contains Level 3 securities.
(5)
Represents an escrow position for future entitlements, if any, on the defaulted bond. The escrow position was received in exchange for the defaulted bond as part of the bankruptcy reorganization of the bond issuer. These holdings are non-income producing.
See Accompanying Notes to Financial Statements
SUMMARY PORTFOLIO OF INVESTMENTS
| Voya Large Cap Value Portfolio | as of December 31, 2020 (continued) |
(6)
For fair value measurement disclosure purposes, security is categorized as Level 3, whose value was determined using significant unobservable inputs.
(7)
Restricted security as to resale, excluding Rule 144A securities. As of December 31, 2020, the Portfolio held restricted securities with a fair value of $— or 0.0% of net assets. Please refer to the table below for additional details.
(8)
The grouping contains securities in default.
(9)
All or a portion of the security represents securities purchased with cash collateral received for securities on loan.
(10)
Rate shown is the 7-day yield as of December 31, 2020.
Fair Value Measurements^
The following is a summary of the fair valuations according to the inputs used as of December 31, 2020 in valuing the assets and liabilities:
| | | | Quoted Prices
in Active Markets
for Identical
Investments
(Level 1) | | | Significant
Other
Observable
Inputs
(Level 2) | | | Significant
Unobservable
Inputs
(Level 3) | | | Fair Value
at
December 31, 2020 | |
| Asset Table | | | | | | | | | | | | | | | | | | | | | | | | | |
| Investments, at fair value | | | | | | | | | | | | | | | | | | | | | | | | | |
| Common Stock | | | | | | | | | | | | | | | | | | | | | | | | | |
| Communication Services | | | | $ | 85,878,817 | | | | | $ | — | | | | | $ | — | | | | | $ | 85,878,817 | | |
| Consumer Discretionary | | | | | 76,961,953 | | | | | | — | | | | | | — | | | | | | 76,961,953 | | |
| Consumer Staples | | | | | 73,693,100 | | | | | | — | | | | | | — | | | | | | 73,693,100 | | |
| Energy | | | | | 45,636,655 | | | | | | — | | | | | | — | | | | | | 45,636,655 | | |
| Financials | | | | | 198,212,159 | | | | | | — | | | | | | — | | | | | | 198,212,159 | | |
| Health Care | | | | | 135,074,154 | | | | | | — | | | | | | — | | | | | | 135,074,154 | | |
| Industrials | | | | | 127,371,562 | | | | | | — | | | | | | — | | | | | | 127,371,562 | | |
| Information Technology | | | | | 94,544,195 | | | | | | — | | | | | | — | | | | | | 94,544,195 | | |
| Materials | | | | | 48,438,765 | | | | | | — | | | | | | — | | | | | | 48,438,765 | | |
| Real Estate | | | | | 45,112,952 | | | | | | — | | | | | | — | | | | | | 45,112,952 | | |
| Utilities | | | | | 53,658,751 | | | | | | — | | | | | | — | | | | | | 53,658,751 | | |
| Total Common Stock | | | | | 984,583,063 | | | | | | — | | | | | | — | | | | | | 984,583,063 | | |
| Corporate Bonds/Notes | | | | | — | | | | | | — | | | | | | — | | | | | | — | | |
| Other | | | | | — | | | | | | — | | | | | | — | | | | | | — | | |
| Short-Term Investments | | | | | 4,327,013 | | | | | | 16,461,724 | | | | | | — | | | | | | 20,788,737 | | |
| Total Investments, at fair value | | | | $ | 988,910,076 | | | | | $ | 16,461,724 | | | | | $ | — | | | | | $ | 1,005,371,800 | | |
^
See Note 2, “Significant Accounting Policies” in the Notes to Financial Statements for additional information.
At December 31, 2020, Voya Large Cap Value Portfolio held the following restricted securities:
| Security | | | Acquisition Date | | | Acquisition Cost | | | Fair Value | |
| Samson Investment Co. (Escrow) | | | | | 6/28/2017 | | | | | $ | 30,842 | | | | | $ | — | | |
| Tribune Co. (Escrow) | | | | | 8/16/2015 | | | | | | — | | | | | | — | | |
| | | | | | | | | | | $ | 30,842 | | | | | $ | — | | |
At December 31, 2020, the aggregate cost of securities and other investments and the composition of unrealized appreciation and depreciation of securities and other investments on a tax basis were:
| | Cost for federal income tax purposes was $875,461,635. | | | | | | | |
| | Net unrealized appreciation consisted of: | | |
| | Gross Unrealized Appreciation | | | | $ | 162,163,039 | | |
| | Gross Unrealized Depreciation | | | | | (32,098,193) | | |
| | Net Unrealized Appreciation | | | | $ | 130,064,846 | | |
See Accompanying Notes to Financial Statements
SUMMARY PORTFOLIO OF INVESTMENTS
| Voya Limited Maturity Bond Portfolio | as of December 31, 2020 |
Principal
Amount† | | | Value | | | Percentage
of Net
Assets | |
| CORPORATE BONDS/NOTES: 34.2% | |
| | | | Basic Materials: 0.5% | |
| 200,000 (1) | | | Anglo American Capital
PLC, 4.125%, 04/15/2021 | | | | $ | 201,609 | | | | | | 0.0 | | |
| 500,000 (1) | | | Georgia-Pacific LLC,
1.750%, 09/30/2025 | | | | | 522,989 | | | | | | 0.1 | | |
| 1,435,000 | | | Other Securities | | | | | 1,508,027 | | | | | | 0.4 | | |
| | | | | | | | | 2,232,625 | | | | | | 0.5 | | |
| | | | Communications: 1.8% | |
| 185,000 (1) | | | Sky Ltd., 3.125%,
11/26/2022 | | | | | 194,591 | | | | | | 0.0 | | |
| 408,000 (1) | | | T-Mobile USA, Inc.,
3.500%, 04/15/2025 | | | | | 451,240 | | | | | | 0.1 | | |
| 6,664,000 | | | Other Securities | | | | | 7,036,226 | | | | | | 1.7 | | |
| | | | | | | | | 7,682,057 | | | | | | 1.8 | | |
| | | | Consumer, Cyclical: 2.2% | |
| 400,000 (1) | | | BMW US Capital LLC,
3.400%, 08/13/2021 | | | | | 407,547 | | | | | | 0.1 | | |
| 431,000 (1) | | | BMW US Capital LLC,
3.900%, 04/09/2025 | | | | | 485,414 | | | | | | 0.1 | | |
| 460,000 (1) | | | Daimler Finance North
America LLC, 3.400%,
02/22/2022 | | | | | 475,230 | | | | | | 0.1 | | |
| 256,000 (1) | | | Delta Air Lines, Inc. /
SkyMiles IP Ltd., 4.500%,
10/20/2025 | | | | | 273,716 | | | | | | 0.1 | | |
| 446,000 (1) | | | Nissan Motor Co. Ltd.,
3.522%, 09/17/2025 | | | | | 478,545 | | | | | | 0.1 | | |
| 450,000 (1) | | | Panasonic Corp., 2.536%,
07/19/2022 | | | | | 462,702 | | | | | | 0.1 | | |
| 330,000 (1) | | | Toyota Industries Corp.,
3.110%, 03/12/2022 | | | | | 339,721 | | | | | | 0.1 | | |
| 815,000 | | | Toyota Motor Credit Corp.,
0.346%, (US0003M +
0.125)%, 08/13/2021 | | | | | 815,445 | | | | | | 0.2 | | |
| 1,148,000 | | | Toyota Motor Credit Corp.,
0.450%-0.500%,
07/22/2022-08/14/2023 | | | | | 1,153,135 | | | | | | 0.3 | | |
| 4,082,054 | | | Other Securities | | | | | 4,216,931 | | | | | | 1.0 | | |
| | | | | | | | | 9,108,386 | | | | | | 2.2 | | |
| | | | Consumer, Non-cyclical: 5.8% | |
| 2,418,000 | | | AbbVie, Inc.,
2.150%-3.450%,
11/14/2021-11/21/2022 | | | | | 2,489,534 | | | | | | 0.6 | | |
| 1,671,000 | | | Bristol-Myers Squibb Co.,
0.750%-2.600%,
05/14/2021-11/13/2025 | | | | | 1,693,986 | | | | | | 0.4 | | |
| 219,000 (1) | | | Cargill, Inc., 1.375%,
07/23/2023 | | | | | 224,537 | | | | | | 0.0 | | |
| 370,000 (1) | | | Imperial Brands Finance
PLC, 3.750%, 07/21/2022 | | | | | 385,954 | | | | | | 0.1 | | |
Principal
Amount† | | | Value | | | Percentage
of Net
Assets | |
| CORPORATE BONDS/NOTES: (continued) | |
| | | | Consumer, Non-cyclical (continued) | |
| 440,000 (1) | | | Mondelez International
Holdings Netherlands BV,
2.125%, 09/19/2022 | | | | $ | 452,741 | | | | | | 0.1 | | |
| 633,000 (1) | | | Mylan, Inc., 3.125%,
01/15/2023 | | | | | 664,855 | | | | | | 0.2 | | |
| 417,000 (1) | | | Royalty Pharma PLC,
0.750%, 09/02/2023 | | | | | 419,239 | | | | | | 0.1 | | |
| 486,000 (1) | | | Seven & i Holdings Co.
Ltd., 3.350%, 09/17/2021 | | | | | 495,612 | | | | | | 0.1 | | |
| 334,000 (1) | | | Takeda Pharmaceutical
Co. Ltd., 2.450%,
01/18/2022 | | | | | 340,615 | | | | | | 0.1 | | |
| 750,000 (1) | | | Viatris, Inc., 1.650%,
06/22/2025 | | | | | 775,863 | | | | | | 0.2 | | |
| 15,933,000 | | | Other Securities | | | | | 16,458,153 | | | | | | 3.9 | | |
| | | | | | | | | 24,401,089 | | | | | | 5.8 | | |
| | | | Energy: 1.9% | |
| 210,000 (1) | | | BG Energy Capital PLC,
4.000%, 10/15/2021 | | | | | 215,655 | | | | | | 0.1 | | |
| 7,364,000 (2) | | | Other Securities | | | | | 7,636,006 | | | | | | 1.8 | | |
| | | | | | | | | 7,851,661 | | | | | | 1.9 | | |
| | | | Financial: 14.3% | |
| 390,000 (1) | | | ABN AMRO Bank NV,
3.400%, 08/27/2021 | | | | | 397,846 | | | | | | 0.1 | | |
| 525,000 (1) | | | AIG Global Funding,
0.900%, 09/22/2025 | | | | | 526,184 | | | | | | 0.1 | | |
| 1,536,000 | | | American Express Co.,
2.500%-3.375%,
05/17/2021-07/30/2024 | | | | | 1,581,499 | | | | | | 0.4 | | |
| 284,000 (1) | | | Athene Global Funding,
2.550%, 06/29/2025 | | | | | 299,957 | | | | | | 0.1 | | |
| 294,000 (1) | | | Aviation Capital Group
LLC, 5.500%, 12/15/2024 | | | | | 325,708 | | | | | | 0.1 | | |
| 2,242,000 (3) | | | Bank of America Corp.,
0.981%-3.499%,
05/17/2022-02/13/2026 | | | | | 2,324,629 | | | | | | 0.5 | | |
| 355,000 (1) | | | Banque Federative du
Credit Mutuel SA, 2.125%,
11/21/2022 | | | | | 366,709 | | | | | | 0.1 | | |
| 250,000 (1) | | | BPCE SA, 2.750%,
01/11/2023 | | | | | 261,517 | | | | | | 0.1 | | |
| 1,000,000 | | | Citibank NA, 3.400%,
07/23/2021 | | | | | 1,014,795 | | | | | | 0.3 | | |
| 1,757,000 (3) | | | Citigroup, Inc.,
1.678%-3.106%,
12/08/2021-04/08/2026 | | | | | 1,802,586 | | | | | | 0.4 | | |
| 1,573,000 | | | Cooperatieve Rabobank
UA, 3.950%, 11/09/2022 | | | | | 1,672,419 | | | | | | 0.4 | | |
See Accompanying Notes to Financial Statements
SUMMARY PORTFOLIO OF INVESTMENTS
| Voya Limited Maturity Bond Portfolio | as of December 31, 2020 (continued) |
Principal
Amount† | | | Value | | | Percentage
of Net
Assets | |
| CORPORATE BONDS/NOTES: (continued) | |
| | | | Financial (continued) | |
| 233,000 | | | Credit Suisse AG/New
York NY, 2.950%,
04/09/2025 | | | | $ | 255,704 | | | | | | 0.1 | | |
| 1,246,000 | | | Credit Suisse AG/New
York NY, 3.625%,
09/09/2024 | | | | | 1,384,688 | | | | | | 0.3 | | |
| 355,000 (1) | | | Danske Bank A/S, 2.000%,
09/08/2021 | | | | | 359,045 | | | | | | 0.1 | | |
| 425,000 (1) | | | Danske Bank A/S, 2.800%,
03/10/2021 | | | | | 426,848 | | | | | | 0.1 | | |
| 455,000 (1)(3) | | | Danske Bank A/S, 3.001%,
09/20/2022 | | | | | 462,320 | | | | | | 0.1 | | |
| 355,000 (1) | | | DNB Bank ASA, 2.150%,
12/02/2022 | | | | | 367,730 | | | | | | 0.1 | | |
| 305,000 (1) | | | Federation des Caisses
Desjardins du Quebec,
2.050%, 02/10/2025 | | | | | 320,767 | | | | | | 0.1 | | |
| 2,259,000 (3) | | | JPMorgan Chase & Co.,
0.653%-3.200%,
01/25/2023-04/22/2026 | | | | | 2,325,396 | | | | | | 0.6 | | |
| 330,000 (1) | | | Metropolitan Life Global
Funding I, 1.950%,
01/13/2023 | | | | | 340,557 | | | | | | 0.1 | | |
| 820,000 | | | Mizuho Financial Group,
Inc., 0.837%, (US0003M +
0.630)%, 05/25/2024 | | | | | 821,717 | | | | | | 0.2 | | |
| 320,000 (1) | | | Mizuho Financial Group,
Inc., 2.632%, 04/12/2021 | | | | | 322,028 | | | | | | 0.1 | | |
| 696,000 (3) | | | Mizuho Financial Group,
Inc., 0.849%-2.555%,
09/08/2024-09/13/2025 | | | | | 715,733 | | | | | | 0.1 | | |
| 1,566,000 | | | Morgan Stanley, 5.500%,
07/28/2021 | | | | | 1,612,219 | | | | | | 0.4 | | |
| 1,341,000 | | | Morgan Stanley,
3.750%-4.000%,
02/25/2023-07/23/2025 | | | | | 1,474,201 | | | | | | 0.3 | | |
| 350,000 (1) | | | National Securities
Clearing Corp., 1.200%,
04/23/2023 | | | | | 357,085 | | | | | | 0.1 | | |
| 250,000 (1) | | | National Securities
Clearing Corp., 1.500%,
04/23/2025 | | | | | 258,897 | | | | | | 0.0 | | |
| 399,000 (1) | | | Nationwide Building
Society, 2.000%,
01/27/2023 | | | | | 411,944 | | | | | | 0.1 | | |
| 380,000 (1) | | | Nationwide Financial
Services, Inc., 5.375%,
03/25/2021 | | | | | 384,137 | | | | | | 0.1 | | |
Principal
Amount† | | | Value | | | Percentage
of Net
Assets | |
| CORPORATE BONDS/NOTES: (continued) | |
| | | | Financial (continued) | |
| 293,000 (1) | | | Nordea Bank Abp,
0.750%, 08/28/2025 | | | | $ | 292,921 | | | | | | 0.0 | | |
| 345,000 (1) | | | Nordea Bank ABP,
4.875%, 05/13/2021 | | | | | 350,331 | | | | | | 0.1 | | |
| 498,000 (1) | | | Pacific Life Global
Funding II, 0.500%,
09/23/2023 | | | | | 499,490 | | | | | | 0.1 | | |
| 495,000 (1) | | | Reliance Standard Life
Global Funding II, 2.150%,
01/21/2023 | | | | | 507,730 | | | | | | 0.1 | | |
| 225,000 | | | Royal Bank of Canada,
0.898%, (US0003M +
0.660)%, 10/05/2023 | | | | | 227,366 | | | | | | 0.0 | | |
| 2,006,000 | | | Royal Bank of Canada,
0.500%-3.700%,
01/17/2023-06/10/2025 | | | | | 2,086,894 | | | | | | 0.5 | | |
| 324,000 (1) | | | Scentre Group Trust 1 /
Scentre Group Trust 2,
3.625%, 01/28/2026 | | | | | 356,671 | | | | | | 0.1 | | |
| 954,000 (1) | | | Skandinaviska Enskilda
Banken AB, 0.550%,
09/01/2023 | | | | | 956,228 | | | | | | 0.2 | | |
| 595,000 | | | Skandinaviska Enskilda
Banken AB, 1.875%,
09/13/2021 | | | | | 601,922 | | | | | | 0.2 | | |
| 800,000 (1) | | | Svenska Handelsbanken
AB, 0.625%, 06/30/2023 | | | | | 805,790 | | | | | | 0.2 | | |
| 825,000 | | | Svenska Handelsbanken
AB, 3.350%, 05/24/2021 | | | | | 835,188 | | | | | | 0.2 | | |
| 425,000 (1) | | | Swedbank AB, 0.600%,
09/25/2023 | | | | | 426,152 | | | | | | 0.1 | | |
| 525,000 (1)(4) | | | Swiss Re Treasury US
Corp., 2.875%, 12/06/2022 | | | | | 540,057 | | | | | | 0.1 | | |
| 1,522,000 | | | Toronto-Dominion Bank/
The, 0.450%-1.150%,
09/11/2023-06/12/2025 | | | | | 1,541,945 | | | | | | 0.4 | | |
| 351,000 (1) | | | UBS AG/London, 1.750%,
04/21/2022 | | | | | 357,301 | | | | | | 0.1 | | |
| 600,000 (1)(3) | | | UBS Group AG, 1.008%,
07/30/2024 | | | | | 606,144 | | | | | | 0.2 | | |
| 565,000 (1)(3) | | | UBS Group AG, 2.859%,
08/15/2023 | | | | | 585,933 | | | | | | 0.1 | | |
| 280,000 (1) | | | USAA Capital Corp.,
1.500%, 05/01/2023 | | | | | 287,292 | | | | | | 0.1 | | |
| 23,675,000 | | | Other Securities | | | | | 24,690,059 | | | | | | 5.9 | | |
| | | | | | | | | 59,730,279 | | | | | | 14.3 | | |
See Accompanying Notes to Financial Statements
SUMMARY PORTFOLIO OF INVESTMENTS
| Voya Limited Maturity Bond Portfolio | as of December 31, 2020 (continued) |
Principal
Amount† | | | Value | | | Percentage
of Net
Assets | |
| CORPORATE BONDS/NOTES: (continued) | |
| | | | Industrial: 2.4% | |
| 1,678,000 | | | Caterpillar Financial
Services Corp.,
0.650%-3.650%,
02/26/2022-05/17/2024 | | | | $ | 1,764,808 | | | | | | 0.4 | | |
| 348,000 (1) | | | Penske Truck Leasing Co.
Lp / PTL Finance Corp.,
3.650%, 07/29/2021 | | | | | 353,437 | | | | | | 0.1 | | |
| 7,641,000 (2) | | | Other Securities | | | | | 8,000,567 | | | | | | 1.9 | | |
| | | | | | | | | 10,118,812 | | | | | | 2.4 | | |
| | | | Technology: 1.7% | |
| 6,627,000 | | | Other Securities | | | | $ | 7,061,099 | | | | | | 1.7 | | |
| | | | | |
| | | | Utilities: 3.6% | |
| 500,000 (1) | | | Dominion Energy, Inc.,
2.450%, 01/15/2023 | | | | | 520,550 | | | | | | 0.1 | | |
| 1,125,000 | | | Duke Energy Corp.,
1.800%, 09/01/2021 | | | | | 1,134,870 | | | | | | 0.3 | | |
| 385,000 | | | Duke Energy Ohio, Inc.,
3.800%, 09/01/2023 | | | | | 416,307 | | | | | | 0.1 | | |
| 290,000 | | | Duke Energy Progress
LLC, 3.375%, 09/01/2023 | | | | | 312,274 | | | | | | 0.1 | | |
| 325,000 (1) | | | Niagara Mohawk Power
Corp., 2.721%, 11/28/2022 | | | | | 338,827 | | | | | | 0.1 | | |
| 11,819,000 (2) | | | Other Securities | | | | | 12,248,397 | | | | | | 2.9 | | |
| | | | | | | | | 14,971,225 | | | | | | 3.6 | | |
| | | | Total Corporate
Bonds/Notes
(Cost $139,401,232) | | | | | 143,157,233 | | | | | | 34.2 | | |
| COLLATERALIZED MORTGAGE OBLIGATIONS: 6.0% | |
| 1,477,636 | | | Fannie Mae REMICS
2006-43-FJ, 0.558%,
(US0001M + 0.410)%,
06/25/2036 | | | | | 1,487,531 | | | | | | 0.4 | | |
| 1,013,775 | | | Fannie Mae REMICS
2007-14 PF, 0.338%,
(US0001M + 0.190)%,
03/25/2037 | | | | | 1,012,117 | | | | | | 0.2 | | |
| 376,644 | | | Fannie Mae REMICS
2010-123 FL, 0.578%,
(US0001M + 0.430)%,
11/25/2040 | | | | | 379,288 | | | | | | 0.1 | | |
| 1,518,591 | | | Fannie Mae REMICS
2011-51 FM, 0.798%,
(US0001M + 0.650)%,
06/25/2041 | | | | | 1,542,668 | | | | | | 0.4 | | |
| 145,409 | | | Fannie Mae REMICS
2011-96 FN, 0.648%,
(US0001M + 0.500)%,
10/25/2041 | | | | | 146,934 | | | | | | 0.0 | | |
Principal
Amount† | | | Value | | | Percentage
of Net
Assets | |
| COLLATERALIZED MORTGAGE OBLIGATIONS: (continued) | |
| 1,120,982 | | | Fannie Mae REMICS
2010-136 FG, 0.648%,
(US0001M + 0.500)%,
12/25/2030 | | | | $ | 1,116,433 | | | | | | 0.3 | | |
| 1,739,827 | | | Fannie Mae REMICS
2011-68 F, 0.418%,
(US0001M + 0.270)%,
07/25/2031 | | | | | 1,733,448 | | | | | | 0.4 | | |
| 85,798 (1)(3) | | | Flagstar Mortgage Trust
2017-2 A3, 3.500%,
10/25/2047 | | | | | 87,749 | | | | | | 0.0 | | |
| 847,299 (1)(3) | | | Flagstar Mortgage Trust
2020-2 A2, 3.000%,
12/25/2049 | | | | | 875,472 | | | | | | 0.2 | | |
| 809,807 | | | Freddie Mac REMICS
3626 FA, 0.809%,
(US0001M + 0.650)%,
05/15/2036 | | | | | 822,140 | | | | | | 0.2 | | |
| 487,337 | | | Freddie Mac REMICS
4508 CF, 0.559%,
(US0001M + 0.400)%,
09/15/2045 | | | | | 490,925 | | | | | | 0.1 | | |
| 2,366,425 | | | Ginnie Mae
Series 2012-H31 FD,
0.480%, (US0001M +
0.340)%, 12/20/2062 | | | | | 2,363,616 | | | | | | 0.6 | | |
| 1,428,548 | | | Ginnie Mae
Series 2014-H05 FB,
0.740%, (US0001M +
0.600)%, 12/20/2063 | | | | | 1,435,017 | | | | | | 0.3 | | |
| 877,433 | | | Ginnie Mae
Series 2016-H08 FT,
0.860%, (US0001M +
0.720)%, 02/20/2066 | | | | | 882,795 | | | | | | 0.2 | | |
| 3,094,646 | | | Ginnie Mae
Series 2016-H06 FD,
1.060%, (US0001M +
0.920)%, 07/20/2065 | | | | | 3,146,995 | | | | | | 0.8 | | |
| 718,554 | | | Ginnie Mae
Series 2017-H09 FG,
0.610%, (US0001M +
0.470)%, 03/20/2067 | | | | | 720,287 | | | | | | 0.2 | | |
| 772,574 | | | Ginnie Mae
Series 2018-H04 FM,
0.440%, (US0001M +
0.300)%, 03/20/2068 | | | | | 770,726 | | | | | | 0.2 | | |
| 1,629,370 | | | Ginnie Mae
Series 2019-H02 FA,
0.590%, (US0001M +
0.450)%, 01/20/2069 | | | | | 1,633,221 | | | | | | 0.4 | | |
See Accompanying Notes to Financial Statements
SUMMARY PORTFOLIO OF INVESTMENTS
| Voya Limited Maturity Bond Portfolio | as of December 31, 2020 (continued) |
Principal
Amount† | | | Value | | | Percentage
of Net
Assets | |
| COLLATERALIZED MORTGAGE OBLIGATIONS: (continued) | |
| 145,228 (1)(3) | | | GS Mortgage-Backed
Securities Corp. Trust
2019-PJ3 A1, 3.500%,
03/25/2050 | | | | $ | 149,720 | | | | | | 0.0 | | |
| 713,190 (1)(3) | | | JP Morgan Mortgage Trust
2019-INV3 A3, 3.500%,
05/25/2050 | | | | | 743,681 | | | | | | 0.2 | | |
| 900,000 (1) | | | Mello Warehouse
Securitization Trust 2020-1
A, 1.048%, (US0001M +
0.900)%, 10/25/2053 | | | | | 901,951 | | | | | | 0.2 | | |
| 450,000 (1) | | | Mello Warehouse
Securitization Trust 2020-2
A, 0.953%, (US0001M +
0.800)%, 11/25/2053 | | | | | 450,279 | | | | | | 0.1 | | |
| 336,863 (1)(3) | | | Sequoia Mortgage Trust
2014-3 B3, 3.930%,
10/25/2044 | | | | | 348,225 | | | | | | 0.1 | | |
| 333,664 (1)(3) | | | Sequoia Mortgage Trust
2014-4 B3, 3.873%,
11/25/2044 | | | | | 337,892 | | | | | | 0.1 | | |
| 379,727 (1)(3) | | | Sequoia Mortgage Trust
2016-3 A11, 3.000%,
11/25/2046 | | | | | 385,734 | | | | | | 0.1 | | |
| 302,130 (1)(3) | | | Sequoia Mortgage Trust
2018-CH1 A19, 4.000%,
02/25/2048 | | | | | 310,661 | | | | | | 0.0 | | |
| 588,550 (1)(3) | | | Wells Fargo Mortgage
Backed Securities 2020-1
A17 Trust, 3.000%,
12/25/2049 | | | | | 601,040 | | | | | | 0.1 | | |
| 456,577 | | | Other Securities | | | | | 462,361 | | | | | | 0.1 | | |
| | | | Total Collateralized
Mortgage Obligations
(Cost $25,222,826) | | | | | 25,338,906 | | | | | | 6.0 | | |
| U.S. TREASURY OBLIGATIONS: 22.0% | |
| | | | U.S. Treasury Notes: 22.0% | |
| 29,521,000 | | | 0.125%,12/31/2022 | | | | | 29,523,306 | | | | | | 7.0 | | |
| 17,604,000 | | | 0.125%,12/15/2023 | | | | | 17,582,683 | | | | | | 4.2 | | |
| 770,000 | | | 0.625%,11/30/2027 | | | | | 769,639 | | | | | | 0.2 | | |
| 42,410,000 | | | 1.500%,11/30/2021 | | | | | 42,943,994 | | | | | | 10.3 | | |
| 1,518,800 | | | 1.625%,12/31/2021 | | | | | 1,541,734 | | | | | | 0.3 | | |
| | | | Total U.S. Treasury
Obligations
(Cost $92,309,846) | | | | | 92,361,356 | | | | | | 22.0 | | |
| COMMERCIAL MORTGAGE-BACKED SECURITIES: 17.1% | |
| 350,000 (1) | | | Austin Fairmont Hotel
Trust 2019-FAIR C,
1.609%, (US0001M +
1.450)%, 09/15/2032 | | | | | 337,565 | | | | | | 0.1 | | |
Principal
Amount† | | | Value | | | Percentage
of Net
Assets | |
COMMERCIAL MORTGAGE-BACKED
SECURITIES: (continued) | |
| 830,000 (1) | | | BFLD 2019-DPLO A,
1.249%, (US0001M +
1.090)%, 10/15/2034 | | | | $ | 823,734 | | | | | | 0.2 | | |
| 1,746,708 (1) | | | BX Commercial Mortgage
Trust 2019-XL D, 1.609%,
(US0001M + 1.450)%,
10/15/2036 | | | | | 1,750,631 | | | | | | 0.4 | | |
| 2,110,000 (1) | | | BXMT 2020-FL2 AS Ltd.,
1.303%, (US0001M +
1.150)%, 02/16/2037 | | | | | 2,091,601 | | | | | | 0.5 | | |
| 200,000 (3) | | | Citigroup Commercial
Mortgage Trust
2013-GC17 C, 5.109%,
11/10/2046 | | | | | 203,278 | | | | | | 0.1 | | |
| 971,000 (1)(3) | | | Citigroup Commercial
Mortgage Trust
2014-GC19, 5.092%,
03/10/2047 | | | | | 1,020,958 | | | | | | 0.2 | | |
| 291,761 | | | Citigroup Commercial
Mortgage Trust
2015-GC27 AAB, 2.944%,
02/10/2048 | | | | | 304,558 | | | | | | 0.1 | | |
| 392,597 | | | Citigroup/Deutsche Bank
Commercial Mortgage
Trust 2006-CD3 AM,
5.648%, 10/15/2048 | | | | | 404,151 | | | | | | 0.1 | | |
| 710,000 (1) | | | CLNY Trust 2019-IKPR A,
1.288%, (US0001M +
1.227)%, 11/15/2038 | | | | | 689,997 | | �� | | | | 0.2 | | |
| 1,178,831 | | | COMM 2013-CCRE12
ASB Mortgage Trust,
3.623%, 10/10/2046 | | | | | 1,231,725 | | | | | | 0.3 | | |
| 1,700,000 | | | COMM 2013-CCRE6 A4
Mortgage Trust, 3.101%,
03/10/2046 | | | | | 1,764,621 | | | | | | 0.4 | | |
| 1,705,000 (3) | | | COMM 2013-LC6 C
Mortgage Trust, 4.242%,
01/10/2046 | | | | | 1,754,068 | | | | | | 0.4 | | |
| 1,287,957 | | | COMM 2015-CR26 ASB
Mortgage Trust, 3.373%,
10/10/2048 | | | | | 1,367,137 | | | | | | 0.3 | | |
| 360,000 (1) | | | COMM 2012-CR2 A3
Mortgage Trust, 2.841%,
08/15/2045 | | | | | 368,368 | | | | | | 0.1 | | |
| 725,000 | | | COMM 2012-CR5 A4
Mortgage Trust, 2.771%,
12/10/2045 | | | | | 750,286 | | | | | | 0.2 | | |
| 81,899 | | | COMM 2012-LC4 A4,
3.288%, 12/10/2044 | | | | | 83,073 | | | | | | 0.0 | | |
See Accompanying Notes to Financial Statements
SUMMARY PORTFOLIO OF INVESTMENTS
| Voya Limited Maturity Bond Portfolio | as of December 31, 2020 (continued) |
Principal
Amount† | | | Value | | | Percentage
of Net
Assets | |
COMMERCIAL MORTGAGE-BACKED
SECURITIES: (continued) | |
| 1,663,000 (1)(3) | | | COMM 2013-CR10 D
Mortgage Trust, 4.789%,
08/10/2046 | | | | $ | 1,628,018 | | | | | | 0.4 | | |
| 1,690,000 (1) | | | Credit Suisse Mortgage
Capital Certificates
2019-ICE4 B, 1.389%,
(US0001M + 1.230)%,
05/15/2036 | | | | | 1,693,125 | | | | | | 0.4 | | |
| 256,000 (1) | | | CSWF 2018-TOP C,
1.609%, (US0001M +
1.450)%, 08/15/2035 | | | | | 249,972 | | | | | | 0.0 | | |
| 1,490,000 (1)(3) | | | DBRR 2011-LC2 A4B
Trust, 4.537%, 07/12/2044 | | | | | 1,497,507 | | | | | | 0.3 | | |
| 1,700,000 (1)(3) | | | DBUBS 2011-LC1A E,
5.565%, 11/10/2046 | | | | | 1,700,502 | | | | | | 0.4 | | |
| 1,130,000 (1)(3) | | | DBUBS 2011-LC2A B
Mortgage Trust, 4.998%,
07/10/2044 | | | | | 1,135,816 | | | | | | 0.3 | | |
| 730,000 (1)(3) | | | DBUBS 2011-LC2A D,
5.487%, 07/10/2044 | | | | | 699,170 | | | | | | 0.2 | | |
| 63,831 (3) | | | Ginnie Mae 2011-53 B,
3.906%, 05/16/2051 | | | | | 65,708 | | | | | | 0.0 | | |
| 129,349 | | | Ginnie Mae 2014-54 AC,
2.874%, 02/16/2049 | | | | | 132,340 | | | | | | 0.0 | | |
| 364,384 | | | Ginnie Mae 2015-183 AC,
2.350%, 07/16/2056 | | | | | 373,933 | | | | | | 0.1 | | |
| 65,241 (3) | | | Ginnie Mae 2015-21 AF,
2.108%, 07/16/2048 | | | | | 66,383 | | | | | | 0.0 | | |
| 262,912 | | | Ginnie Mae 2016-110 AB,
2.000%, 05/16/2049 | | | | | 268,520 | | | | | | 0.1 | | |
| 85,049 | | | Ginnie Mae 2016-86 AB,
2.500%, 09/16/2056 | | | | | 86,756 | | | | | | 0.0 | | |
| 448,417 | | | Ginnie Mae 2017-51 AB,
2.350%, 04/16/2057 | | | | | 460,749 | | | | | | 0.1 | | |
| 152,490 | | | Ginnie Mae 2017-69 AB,
2.350%, 05/16/2053 | | | | | 156,317 | | | | | | 0.0 | | |
| 254,072 | | | Ginnie Mae 2017-70 A,
2.500%, 10/16/2057 | | | | | 261,311 | | | | | | 0.1 | | |
| 634,603 | | | Ginnie Mae 2017-86 AB,
2.300%, 11/16/2051 | | | | | 652,373 | | | | | | 0.2 | | |
| 610,494 | | | Ginnie Mae 2017-89 A,
2.500%, 08/16/2057 | | | | | 629,303 | | | | | | 0.1 | | |
| 1,000,000 (1) | | | Great Wolf Trust
2019-WOLF A, 1.193%,
(US0001M + 1.034)%,
12/15/2029 | | | | | 980,218 | | | | | | 0.2 | | |
Principal
Amount† | | | Value | | | Percentage
of Net
Assets | |
COMMERCIAL MORTGAGE-BACKED
SECURITIES: (continued) | |
| 530,000 (1) | | | GS Mortgage Securities
Corp. Trust 2017-GPTX B,
3.104%, 05/10/2034 | | | | $ | 512,248 | | | | | | 0.1 | | |
| 1,420,000 (1) | | | GS Mortgage Securities
Corp. Trust 2019-70P C,
1.659%, (US0001M +
1.500)%, 10/15/2036 | | | | | 1,354,164 | | | | | | 0.3 | | |
| 1,320,000 (1)(3) | | | GS Mortgage Securities
Trust 2011-GC3 D,
5.545%, 03/10/2044 | | | | | 1,309,048 | | | | | | 0.3 | | |
| 760,000 (1)(3) | | | GS Mortgage Securities
Trust 2012-GC6 C,
5.651%, 01/10/2045 | | | | | 747,671 | | | | | | 0.2 | | |
| 420,000 (1) | | | GS Mortgage Securities
Trust 2018-HART A,
1.249%, (US0001M +
1.090)%, 10/15/2031 | | | | | 420,718 | | | | | | 0.1 | | |
| 583,811 | | | GS Mortgage Securities
Trust 2020-GC45 A1,
2.019%, 02/13/2053 | | | | | 604,623 | | | | | | 0.2 | | |
| 344,371 (1)(3) | | | GS Mortgage Securities
Trust 2011-GC3 B,
5.361%, 03/10/2044 | | | | | 344,247 | | | | | | 0.1 | | |
| 1,330,000 | | | GS Mortgage Securities
Trust 2013-GCJ14 A5,
4.243%, 08/10/2046 | | | | | 1,442,378 | | | | | | 0.3 | | |
| 1,820,000 (1)(3) | | | JPMBB Commercial
Mortgage Securities Trust
2013-C15 D, 5.197%,
11/15/2045 | | | | | 1,753,750 | | | | | | 0.4 | | |
| 977,000 (1)(3) | | | JP Morgan Chase
Commercial Mortgage
Securities Trust 2010-C2
C, 5.655%, 11/15/2043 | | | | | 932,028 | | | | | | 0.2 | | |
| 2,710,000 (1)(3) | | | JP Morgan Chase
Commercial Mortgage
Securities Trust 2011-C5
B, 5.424%, 08/15/2046 | | | | | 2,733,551 | | | | | | 0.6 | | |
| 508,187 | | | JP Morgan Chase
Commercial Mortgage
Securities Trust 2012-C8
A3, 2.829%, 10/15/2045 | | | | | 523,315 | | | | | | 0.1 | | |
| 2,700,000 (3) | | | JP Morgan Chase
Commercial Mortgage
Securities Trust 2013-C10
B, 3.674%, 12/15/2047 | | | | | 2,797,351 | | | | | | 0.7 | | |
See Accompanying Notes to Financial Statements
SUMMARY PORTFOLIO OF INVESTMENTS
| Voya Limited Maturity Bond Portfolio | as of December 31, 2020 (continued) |
Principal
Amount† | | | Value | | | Percentage
of Net
Assets | |
COMMERCIAL MORTGAGE-BACKED
SECURITIES: (continued) | |
| 680,000 (1) | | | JP Morgan Chase
Commercial Mortgage
Securities Trust 2014-C20
A4A2, 3.538%,
07/15/2047 | | | | $ | 716,714 | | | | | | 0.2 | | |
| 4,526 | | | JPMBB Commercial
Mortgage Securities Trust
2 2014-C19 A2, 3.046%,
04/15/2047 | | | | | 4,528 | | | | | | 0.0 | | |
| 1,630,000 (3) | | | JPMBB Commercial
Mortgage Securities Trust
2013-C17 C, 4.888%,
01/15/2047 | | | | | 1,674,131 | | | | | | 0.4 | | |
| 417,674 | | | JPMBB Commercial
Mortgage Securities Trust
2015-C32 ASB, 3.358%,
11/15/2048 | | | | | 443,588 | | | | | | 0.1 | | |
| 400,000 (1) | | | MF1 2020-FL3 A Ltd.,
2.209%, (US0001M +
2.050)%, 07/15/2035 | | | | | 403,088 | | | | | | 0.1 | | |
| 795,000 | | | Morgan Stanley Bank of
America Merrill Lynch
Trust 2012-C5 A4,
3.176%, 08/15/2045 | | | | | 820,162 | | | | | | 0.2 | | |
| 950,000 | | | Morgan Stanley Bank of
America Merrill Lynch
Trust 2013-C7 A4,
2.918%, 02/15/2046 | | | | | 988,068 | | | | | | 0.2 | | |
| 1,250,000 | | | Morgan Stanley Bank of
America Merrill Lynch
Trust 2013-C8 A4 A4,
3.134%, 12/15/2048 | | | | | 1,305,443 | | | | | | 0.3 | | |
| 450,550 | | | Morgan Stanley Bank of
America Merrill Lynch
Trust 2014 C19 ASB,
3.326%, 12/15/2047 | | | | | 474,349 | | | | | | 0.1 | | |
| 1,210,000 (1)(3) | | | Morgan Stanley Capital I
Trust 2011-C1 D, 5.563%,
09/15/2047 | | | | | 1,210,705 | | | | | | 0.3 | | |
| 1,730,000 (1) | | | Morgan Stanley Capital I
Trust 2011-C1 G, 4.193%,
09/15/2047 | | | | | 1,620,007 | | | | | | 0.4 | | |
| 960,000 | | | Morgan Stanley Capital I
Trust 2017-H1 A2,
3.089%, 06/15/2050 | | | | | 1,001,243 | | | | | | 0.3 | | |
| 1,220,000 | | | Morgan Stanley Capital I
Trust 2019-H6 A2,
3.228%, 06/15/2052 | | | | | 1,291,778 | | | | | | 0.3 | | |
Principal
Amount† | | | Value | | | Percentage
of Net
Assets | |
COMMERCIAL MORTGAGE-BACKED
SECURITIES: (continued) | |
| 1,250,000 (3) | | | Morgan Stanley Bank of
America Merrill Lynch
Trust 2013-C10 A4,
4.082%, 07/15/2046 | | | | $ | 1,340,762 | | | | | | 0.3 | | |
| 1,929,980 (1) | | | Ready Capital Mortgage
Financing 2020-FL4 A
LLC, 2.298%, (US0001M +
2.150)%, 02/25/2035 | | | | | 1,937,229 | | | | | | 0.5 | | |
| 1,930,000 (1) | | | UBS-Barclays Commercial
Mortgage Trust 2012-C4
AS, 3.317%, 12/10/2045 | | | | | 2,007,166 | | | | | | 0.5 | | |
| 1,890,000 (1)(3) | | | UBS-Barclays Commercial
Mortgage Trust 2012-C4
B, 3.718%, 12/10/2045 | | | | | 1,953,181 | | | | | | 0.5 | | |
| 721,825 (1) | | | West Town Mall Trust
2017-KNOX A, 3.823%,
07/05/2030 | | | | | 728,259 | | | | | | 0.2 | | |
| 1,510,286 | | | WFRBS Commercial
Mortgage Trust 2011-C5
A4, 3.667%, 11/15/2044 | | | | | 1,528,942 | | | | | | 0.4 | | |
| 840,000 (1)(3) | | | WFRBS Commercial
Mortgage Trust 2011-C5
B, 5.656%, 11/15/2044 | | | | | 856,757 | | | | | | 0.2 | | |
| 360,000 (3) | | | WFRBS Commercial
Mortgage Trust 2013-C18
A5, 4.162%, 12/15/2046 | | | | | 395,105 | | | | | | 0.1 | | |
| 1,720,000 (3) | | | WFRBS Commercial
Mortgage Trust 2013-C14
C, 3.973%, 06/15/2046 | | | | | 1,675,129 | | | | | | 0.4 | | |
| 3,953,790 | | | Other Securities | | | | | 4,084,321 | | | | | | 1.0 | | |
| | | | Total Commercial
Mortgage-Backed
Securities
(Cost $72,445,147) | | | | | 71,619,519 | | | | | | 17.1 | | |
| ASSET-BACKED SECURITIES: 18.0% | |
| | | | Automobile Asset-Backed Securities: 6.4% | |
| 1,800,000 | | | AmeriCredit Automobile
Receivables Trust 2020-1
A3, 1.110%, 08/19/2024 | | | | | 1,817,168 | | | | | | 0.4 | | |
| 1,350,000 | | | AmeriCredit Automobile
Receivables Trust 2020-2
B, 0.970%, 02/18/2026 | | | | | 1,366,368 | | | | | | 0.3 | | |
| 650,000 | | | Honda Auto Receivables
2018-4 A4 Owner Trust,
3.300%, 07/15/2025 | | | | | 675,775 | | | | | | 0.2 | | |
See Accompanying Notes to Financial Statements
SUMMARY PORTFOLIO OF INVESTMENTS
| Voya Limited Maturity Bond Portfolio | as of December 31, 2020 (continued) |
Principal
Amount† | | | Value | | | Percentage
of Net
Assets | |
| ASSET-BACKED SECURITIES: (continued) | |
| | | | Automobile Asset-Backed
Securities (continued) | |
| 550,000 | | | Honda Auto Receivables
2019-3 A3 Owner Trust,
1.780%, 08/15/2023 | | | | $ | 559,118 | | | | | | 0.1 | | |
| 900,000 | | | Honda Auto Receivables
2020-2 A3 Owner Trust,
0.820%, 07/15/2024 | | | | | 908,935 | | | | | | 0.2 | | |
| 250,000 (1) | | | Hyundai Auto Lease
Securitization Trust 2019-B
A4, 2.030%, 06/15/2023 | | | | | 254,241 | | | | | | 0.1 | | |
| 850,000 | | | Santander Drive Auto
Receivables Trust 2019-2
B, 2.790%, 01/16/2024 | | | | | 858,368 | | | | | | 0.2 | | |
| 504,669 | | | Santander Drive Auto
Receivables Trust 2019-3
A3, 2.160%, 11/15/2022 | | | | | 505,501 | | | | | | 0.1 | | |
| 1,800,000 | | | Santander Drive Auto
Receivables Trust 2020-2
B, 0.960%, 11/15/2024 | | | | | 1,811,903 | | | | | | 0.5 | | |
| 1,250,000 | | | Santander Drive Auto
Receivables Trust 2020-3
B, 0.690%, 03/17/2025 | | | | | 1,253,755 | | | | | | 0.3 | | |
| 21,339 (1) | | | Santander Retail Auto
Lease Trust 2019-A A2,
2.720%, 01/20/2022 | | | | | 21,382 | | | | | | 0.0 | | |
| 500,000 (1) | | | Santander Retail Auto
Lease Trust 2019-B A3,
2.300%, 01/20/2023 | | | | | 509,346 | | | | | | 0.1 | | |
| 500,000 (1) | | | Santander Retail Auto
Lease Trust 2019-B A4,
2.380%, 08/21/2023 | | | | | 512,834 | | | | | | 0.1 | | |
| 1,300,000 (1) | | | Santander Retail Auto
Lease Trust 2019-C A4,
1.930%, 11/20/2023 | | | | | 1,329,855 | | | | | | 0.3 | | |
| 425,697 (1) | | | Tesla Auto Lease Trust
2018-B A, 3.710%,
08/20/2021 | | | | | 428,419 | | | | | | 0.1 | | |
| 13,732,050 | | | Other Securities | | | | | 14,044,988 | | | | | | 3.4 | | |
| | | | | | | | | 26,857,956 | | | | | | 6.4 | | |
| | | | Credit Card Asset-Backed Securities: 0.9% | |
| 1,550,000 (1) | | | Evergreen Credit Card
Trust Series 2018-1 A,
2.950%, 03/15/2023 | | | | | 1,560,139 | | | | | | 0.4 | | |
| 2,150,000 | | | Other Securities | | | | | 2,205,562 | | | | | | 0.5 | | |
| | | | | | | | | 3,765,701 | | | | | | 0.9 | | |
| | | | Other Asset-Backed Securities: 10.2% | |
| 850,000 (1) | | | Aimco CLO 11 Ltd.
2020-11A A1, 1.605%,
(US0003M + 1.380)%,
10/15/2031 | | | | | 850,999 | | | | | | 0.2 | | |
Principal
Amount† | | | Value | | | Percentage
of Net
Assets | |
| ASSET-BACKED SECURITIES: (continued) | |
| | | | Other Asset-Backed Securities (continued) | |
| 500,000 (1) | | | Allegany Park CLO Ltd.
2019-1A A, 1.548%,
(US0003M + 1.330)%,
01/20/2033 | | | | $ | 500,741 | | | | | | 0.1 | | |
| 840,000 (1) | | | Apidos Clo XXV 2016-25A
A1R, 1.388%,
(US0003M + 1.170)%,
10/20/2031 | | | | | 840,003 | | | | | | 0.2 | | |
| 560,000 (1) | | | Arbor Realty Commercial
Real Estate Notes
2019-FL2 A Ltd., 1.359%,
(US0001M + 1.200)%,
06/15/2034 | | | | | 556,693 | | | | | | 0.1 | | |
| 700,000 (1) | | | ARES XLVI CLO Ltd.
2017-46A A2, 1.467%,
(US0003M + 1.230)%,
01/15/2030 | | | | | 692,952 | | | | | | 0.2 | | |
| 250,000 (1) | | | Babson CLO Ltd. 2017-1A
A2, 1.568%, (US0003M +
1.350)%, 07/18/2029 | | | | | 249,669 | | | | | | 0.1 | | |
| 250,000 (1) | | | Bain Capital Credit CLO
2017-1A A2, 1.568%,
(US0003M + 1.350)%,
07/20/2030 | | | | | 249,444 | | | | | | 0.0 | | |
| 1,000,000 (1) | | | Barings CLO Ltd. 2020-1A
A1, 1.630%, (US0003M +
1.400)%, 10/15/2032 | | | | | 1,001,904 | | | | | | 0.2 | | |
| 579,691 (1) | | | Benefit Street Partners
CLO II Ltd. 2013-IIA A1R,
1.487%, (US0003M +
1.250)%, 07/15/2029 | | | | | 579,700 | | | | | | 0.1 | | |
| 1,000,000 (1) | | | Benefit Street Partners
CLO XIX Ltd. 2019-19A A,
1.587%, (US0003M +
1.350)%, 01/15/2033 | | | | | 1,001,896 | | | | | | 0.3 | | |
| 250,000 (1) | | | Carbone CLO Ltd.
2017-1A A1, 1.358%,
(US0003M + 1.140)%,
01/20/2031 | | | | | 249,999 | | | | | | 0.1 | | |
| 492,818 (1) | | | Carlyle Global Market
Strategies CLO 2014-2RA
A1 Ltd., 1.271%,
(US0003M + 1.050)%,
05/15/2031 | | | | | 489,492 | | | | | | 0.1 | | |
| 620,000 (1) | | | Cedar Funding VIII Clo
Ltd. 2017-8A A1, 1.468%,
(US0003M + 1.250)%,
10/17/2030 | | | | | 620,008 | | | | | | 0.1 | | |
See Accompanying Notes to Financial Statements
SUMMARY PORTFOLIO OF INVESTMENTS
| Voya Limited Maturity Bond Portfolio | as of December 31, 2020 (continued) |
Principal
Amount† | | | Value | | | Percentage
of Net
Assets | |
| ASSET-BACKED SECURITIES: (continued) | |
| | | | Other Asset-Backed Securities (continued) | |
| 750,000 (1) | | | CIFC Funding 2013-2A
A1LR, 1.428%,
(US0003M + 1.210)%,
10/18/2030 | | | | $ | 749,065 | | | | | | 0.2 | | |
| 600,000 (1) | | | CIFC Funding 2017-4 A1,
1.465%, (US0003M +
1.250)%, 10/24/2030 | | | | | 600,023 | | | | | | 0.2 | | |
| 600,000 (1) | | | CIFC Funding 2018-4A A1
Ltd., 1.368%, (US0003M +
1.150)%, 10/17/2031 | | | | | 599,752 | | | | | | 0.1 | | |
| 900,000 (1) | | | CIFC Funding 2020-2A A1
Ltd., 1.933%, (US0003M +
1.650)%, 08/24/2032 | | | | | 903,850 | | | | | | 0.2 | | |
| 1,000,000 (1) | | | CIFC Funding 2018-1A A
Ltd., 1.218%, (US0003M +
1.000)%, 04/18/2031 | | | | | 994,036 | | | | | | 0.2 | | |
| 600,000 (1) | | | Clear Creek CLO Ltd.
2015-1A AR, 1.418%,
(US0003M + 1.200)%,
10/20/2030 | | | | | 599,408 | | | | | | 0.1 | | |
| 250,000 (1) | | | Deer Creek Clo Ltd.
2017-1A A, 1.398%,
(US0003M + 1.180)%,
10/20/2030 | | | | | 249,590 | | | | | | 0.1 | | |
| 680,000 (1) | | | Dewolf Park Clo Ltd.
2017-1A A, 1.447%,
(US0003M + 1.210)%,
10/15/2030 | | | | | 680,001 | | | | | | 0.2 | | |
| 250,000 (1) | | | Dryden 55 CLO Ltd.
2018-55A A1, 1.257%,
(US0003M + 1.020)%,
04/15/2031 | | | | | 249,015 | | | | | | 0.0 | | |
| 1,120,000 (1) | | | Dryden Senior Loan Fund
2017-47A A2, 1.587%,
(US0003M + 1.350)%,
04/15/2028 | | | | | 1,117,633 | | | | | | 0.3 | | |
| 480,000 (1 ) | | | Dryden XXVIII Senior
Loan Fund 2013-28A
A1LR, 1.421%,
(US0003M + 1.200)%,
08/15/2030 | | | | | 480,049 | | | | | | 0.1 | | |
| 1,000,000 (1) | | | Dryden 78 CLO Ltd.
2020-78A A, 1.398%,
(US0003M + 1.180)%,
04/17/2033 | | | | | 999,446 | | | | | | 0.2 | | |
| 300,000 (1) | | | Eaton Vance Clo 2015-1A
A2R Ltd., 1.468%,
(US0003M + 1.250)%,
01/20/2030 | | | | | 297,221 | | | | | | 0.1 | | |
Principal
Amount† | | | Value | | | Percentage
of Net
Assets | |
| ASSET-BACKED SECURITIES: (continued) | |
| | | | Other Asset-Backed Securities (continued) | |
| 700,000 (1) | | | Elevation CLO 2014-2A
A1R Ltd., 1.467%,
(US0003M + 1.230)%,
10/15/2029 | | | | $ | 699,861 | | | | | | 0.2 | | |
| 750,000 (1) | | | Galaxy XIX CLO Ltd.
2015-19A A1R, 1.435%,
(US0003M + 1.220)%,
07/24/2030 | | | | | 749,998 | | | | | | 0.2 | | |
| 500,000 (1) | | | Galaxy XV CLO Ltd.
2013-15A AR, 1.437%,
(US0003M + 1.200)%,
10/15/2030 | | | | | 499,505 | | | | | | 0.1 | | |
| 300,000 (1) | | | Goldentree Loan
Management US Clo 2
Ltd. 2017-2A A, 1.368%,
(US0003M + 1.150)%,
11/28/2030 | | | | | 299,894 | | | | | | 0.1 | | |
| 489,953 (1) | | | Grand Avenue CRE
2020-FL2 A Ltd., 2.609%,
(US0001M + 2.450)%,
03/15/2035 | | | | | 493,998 | | | | | | 0.1 | | |
| 1,902,176 (1) | | | Invitation Homes
2018-SFR3 A Trust,
1.153%, (US0001M +
1.000)%, 07/17/2037 | | | | | 1,908,863 | | | | | | 0.4 | | |
| 400,107 (1) | | | JGWPT XXXIII LLC
2014-3A A, 3.500%,
06/15/2077 | | | | | 446,403 | | | | | | 0.1 | | |
| 1,300,000 (1) | | | Kayne CLO 6 Ltd. 2019-6A
A1, 1.598%, (US0003M +
1.380)%, 01/20/2033 | | | | | 1,302,890 | | | | | | 0.3 | | |
| 1,000,000 (1) | | | Kayne CLO 7 Ltd. 2020-7A
A1, 1.418%, (US0003M +
1.200)%, 04/17/2033 | | | | | 1,000,257 | | | | | | 0.2 | | |
| 600,000 (1) | | | LCM 26A A2 Ltd., 1.468%,
(US0003M + 1.250)%,
01/20/2031 | | | | | 594,917 | | | | | | 0.1 | | |
| 250,000 (1) | | | LCM XXIV Ltd. 24A A,
1.528%, (US0003M +
1.310)%, 03/20/2030 | | | | | 250,009 | | | | | | 0.1 | | |
| 480,000 (1) | | | LoanCore 2019-CRE2 A
Issuer Ltd., 1.289%,
(US0001M + 1.130)%,
05/09/2036 | | | | | 472,740 | | | | | | 0.1 | | |
| 700,000 (1) | | | Madison Park Funding
XXXV Ltd. 2019-35A A2A,
1.868%, (US0003M +
1.650)%, 04/20/2031 | | | | | 700,487 | | | | | | 0.2 | | |
See Accompanying Notes to Financial Statements
SUMMARY PORTFOLIO OF INVESTMENTS
| Voya Limited Maturity Bond Portfolio | as of December 31, 2020 (continued) |
Principal
Amount† | | | Value | | | Percentage
of Net
Assets | |
| ASSET-BACKED SECURITIES: (continued) | |
| | | | Other Asset-Backed Securities (continued) | |
| 500,000 (1) | | | Magnetite CLO Ltd.
2020-26A A, 1.987%,
(US0003M + 1.750)%,
07/15/2030 | | | | $ | 501,624 | | | | | | 0.1 | | |
| 700,000 (1) | | | Magnetite XXII Ltd.
2019-22A A2, 1.887%,
(US0003M + 1.650)%,
04/15/2031 | | | | | 700,506 | | | | | | 0.2 | | |
| 1,500,000 (1) | | | Magnetite XXVII Ltd.
2020-27A A1, 1.762%,
(US0003M + 1.550)%,
07/20/2033 | | | | | 1,503,909 | | | | | | 0.3 | | |
| 720,000 (1) | | | Marble Point CLO XIV Ltd.
2018-2A A1, 1.548%,
(US0003M + 1.330)%,
01/20/2032 | | | | | 719,385 | | | | | | 0.2 | | |
| 800,000 (1) | | | Marlette Funding Trust
2020-1A B, 2.380%,
03/15/2030 | | | | | 811,189 | | | | | | 0.2 | | |
| 400,000 (1) | | | Octagon Investment
Partners 33 Ltd. 2017-1A
A1, 1.408%, (US0003M +
1.190)%, 01/20/2031 | | | | | 400,001 | | | | | | 0.1 | | |
| 1,000,000 (1) | | | Octagon Investment
Partners 48 Ltd. 2020-3A
A, 1.732%, (US0003M +
1.500)%, 10/20/2031 | | | | | 1,002,322 | | | | | | 0.3 | | |
| 500,000 (1) | | | Octagon Investment
Partners Ltd. 2017-1A A2,
1.587%, (US0003M +
1.350)%, 07/15/2029 | | | | | 498,641 | | | | | | 0.1 | | |
| 500,000 (1) | | | Octagon Investment
Partners XIV Ltd. 2012-1A
A1BR, 1.612%,
(US0003M + 1.375)%,
07/15/2029 | | | | | 498,272 | | | | | | 0.1 | | |
| 400,000 (1) | | | Octagon Investment
Partners XV Ltd. 2013-1A
A2R, 1.568%,
(US0003M + 1.350)%,
07/19/2030 | | | | | 398,188 | | | | | | 0.1 | | |
| 500,000 (1) | | | Palmer Square CLO
2013-2A AARR Ltd.,
1.418%, (US0003M +
1.200)%, 10/17/2031 | | | | | 500,009 | | | | | | 0.1 | | |
| 975,000 (1) | | | Palmer Square CLO
2015-2A A1R2 Ltd.,
1.318%, (US0003M +
1.100)%, 07/20/2030 | | | | | 972,267 | | | | | | 0.3 | | |
Principal
Amount† | | | Value | | | Percentage
of Net
Assets | |
| ASSET-BACKED SECURITIES: (continued) | |
| | | | Other Asset-Backed Securities (continued) | |
| 900,000 (1) | | | Palmer Square CLO
2020-2A A1A Ltd.,
1.904%, (US0003M +
1.700)%, 07/15/2031 | | | | $ | 902,775 | | | | | | 0.2 | | |
| 190,202 (1) | | | SoFi Consumer Loan
Program 2019-2 A Trust,
3.010%, 04/25/2028 | | | | | 192,354 | | | | | | 0.1 | | |
| 187,087 (1) | | | SoFi Consumer Loan
Program 2019-3 A Trust,
2.900%, 05/25/2028 | | | | | 189,086 | | | | | | 0.0 | | |
| 721,870 (1) | | | SoFi Consumer Loan
Program 2020-1 A Trust,
2.020%, 01/25/2029 | | | | | 729,603 | | | | | | 0.2 | | |
| 800,000 (1) | | | SoFi Consumer Loan
Program 2020-1 B Trust,
2.250%, 01/25/2029 | | | | | 809,247 | | | | | | 0.2 | | |
| 400,000 (1) | | | TCI-Flatiron Clo 2017-1A
A Ltd., 1.422%,
(US0003M + 1.200)%,
11/18/2030 | | | | | 399,603 | | | | | | 0.1 | | |
| 500,000 (1) | | | TCI-Symphony CLO
2017-1A A Ltd., 1.467%,
(US0003M + 1.230)%,
07/15/2030 | | | | | 500,005 | | | | | | 0.1 | | |
| 581,909 (1) | | | THL Credit Wind River
2013-2A AR CLO Ltd.,
1.448%, (US0003M +
1.230)%, 10/18/2030 | | | | | 581,716 | | | | | | 0.2 | | |
| 570,000 (1) | | | THL Credit Wind River
2017-2A A CLO Ltd.,
1.448%, (US0003M +
1.230)%, 07/20/2030 | | | | | 569,998 | | | | | | 0.1 | | |
| 850,000 (1) | | | THL Credit Wind River
2018-2 A A2Clo Ltd.,
1.687%, (US0003M +
1.450)%, 07/15/2030 | | | | | 850,009 | | | | | | 0.2 | | |
| 850,000 (1) | | | THL Credit Wind River
2019-2A A2 Clo Ltd.,
1.887%, (US0003M +
1.650)%, 01/15/2033 | | | | | 852,504 | | | | | | 0.2 | | |
| 800,000 (1) | | | Trafigura Securitisation
Finance PLC 2018-1A A2,
3.730%, 03/15/2022 | | | | | 816,779 | | | | | | 0.2 | | |
| 250,000 (1) | | | Venture 34 CLO Ltd.
2018-34A A, 1.467%,
(US0003M + 1.230)%,
10/15/2031 | | | | | 250,000 | | | | | | 0.1 | | |
See Accompanying Notes to Financial Statements
SUMMARY PORTFOLIO OF INVESTMENTS
| Voya Limited Maturity Bond Portfolio | as of December 31, 2020 (continued) |
Principal
Amount† | | | Value | | | Percentage
of Net
Assets | |
| ASSET-BACKED SECURITIES: (continued) | |
| | | | Other Asset-Backed Securities (continued) | |
| 868,488 | | | Other Securities | | | | $ | 878,009 | | | | | | 0.2 | | |
| | | | | | | | | 42,850,412 | | | | | | 10.2 | | |
| | | | Student Loan Asset-Backed
Securities: 0.5% | |
| 850,000 (1) | | | Navient Private Education
Refi Loan Trust 2019-FA
A2, 2.600%, 08/15/2068 | | | | | 878,491 | | | | | | 0.2 | | |
| 998,173 (1) | | | Navient Private Education
Refi Loan Trust 2020-GA
A, 1.170%, 09/16/2069 | | | | | 1,006,182 | | | | | | 0.3 | | |
| | | | | | | | | 1,884,673 | | | | | | 0.5 | | |
| | | | Total Asset-Backed
Securities
(Cost $74,602,816) | | | | | 75,358,742 | | | | | | 18.0 | | |
| U.S. GOVERNMENT AGENCY OBLIGATIONS: 0.0% | |
| | | | Federal Home Loan Mortgage
Corporation: 0.0% | |
| 2 | | | 3.500%, (H15T1Y +
1.997)%,07/01/2024 | | | | | 2 | | | | | | 0.0 | | |
| | | | | |
| | | | Uniform Mortgage-Backed Securities: 0.0% | |
| 46,868 | | | Other Securities | | | | | 52,024 | | | | | | 0.0 | | |
| | | | Total U.S. Government
Agency Obligations
(Cost $47,702) | | | | | 52,026 | | | | | | 0.0 | | |
| | | | Total Long-Term
Investments
(Cost $404,029,569) | | | | | 407,887,782 | | | | | | 97.3 | | |
| SHORT-TERM INVESTMENTS: 3.6% | |
| | | | Repurchase Agreements: 0.3% | |
| 212,194 (5) | | | Nomura Securities,
Repurchase Agreement
dated 12/31/20, 0.07%,
due 01/04/21 (Repurchase
Amount $212,196,
collateralized by various
U.S. Government/U.S.
Government Agency
Obligations,
0.000%-8.500%, Market
Value plus accrued
interest $216,438, due
01/31/21-01/15/56) | | | | | 212,194 | | | | | | 0.1 | | |
Principal
Amount† | | | Value | | | Percentage
of Net
Assets | |
| SHORT-TERM INVESTMENTS: (continued) | |
| | | | Repurchase Agreements: (continued) | |
| 1,000,000 (5) | | | RBC Dominion Securities
Inc., Repurchase
Agreement dated 12/31/
20, 0.08%, due 01/04/21
(Repurchase Amount
$1,000,009, collateralized
by various U.S.
Government/U.S.
Government Agency
Obligations,
0.000%-6.000%, Market
Value plus accrued
interest $1,020,000, due
01/05/21-12/20/50) | | | | $ | 1,000,000 | | | | | | 0.2 | | |
| | | | Total Repurchase
Agreements
(Cost $1,212,194) | | | | | 1,212,194 | | | | | | 0.3 | | |
| |
| Shares | | | Value | | | Percentage
of Net
Assets | |
| | | | Mutual Funds: 3.3% | |
| 13,873,030 (6) | | | BlackRock Liquidity Funds,
FedFund, Institutional
Class, 0.000%
(Cost $13,873,030) | | | | | 13,873,030 | | | | | | 3.3 | | |
| | | | Total Short-Term
Investments
(Cost $15,085,224) | | | | | 15,085,224 | | | | | | 3.6 | | |
| | | | Total Investments in
Securities
(Cost $419,114,793) | | | | $ | 422,973,006 | | | | | | 100.9 | | |
| | | | Liabilities in Excess of
Other Assets | | | | | (3,850,773) | | | | | | (0.9) | | |
| | | | Net Assets | | | | $ | 419,122,233 | | | | | | 100.0 | | |
“Other Securities” represents issues not identified as the top 50 holdings in terms of market value and issues or issuers not exceeding 1% of net assets individually or in aggregate respectively as of December 31, 2020.
The following footnotes apply to either the individual securities noted or one or more of the securities aggregated and listed as a single line item.
†
Unless otherwise indicated, principal amount is shown in USD.
(1)
Securities with purchases pursuant to Rule 144A or section 4(a)(2),
See Accompanying Notes to Financial Statements
SUMMARY PORTFOLIO OF INVESTMENTS
| Voya Limited Maturity Bond Portfolio | as of December 31, 2020 (continued) |
under the Securities Act of 1933 and may not be resold subject to that rule except to qualified institutional buyers.
(2)
The grouping contains securities on loan.
(3)
Variable rate security. Rate shown is the rate in effect as of December 31, 2020.
(4)
Security, or a portion of the security, is on loan.
(5)
All or a portion of the security represents securities purchased with cash collateral received for securities on loan.
(6)
Rate shown is the 7-day yield as of December 31, 2020.
Reference Rate Abbreviations:
H15T1Y
U.S. Treasury 1-Year Constant Maturity
US0001M
1-month LIBOR
US0003M
3-month LIBOR
Fair Value Measurements^
The following is a summary of the fair valuations according to the inputs used as of December 31, 2020 in valuing the assets and liabilities:
| | | | Quoted Prices
in Active Markets
for Identical
Investments
(Level 1) | | | Significant
Other
Observable
Inputs
(Level 2) | | | Significant
Unobservable
Inputs
(Level 3) | | | Fair Value
at
December 31, 2020 | |
| Asset Table | | | | | | | | | | | | | | | | | | | | | | | | | |
| Investments, at fair value | | | | | | | | | | | | | | | | | | | | | | | | | |
| Corporate Bonds/Notes | | | | $ | — | | | | | $ | 143,157,233 | | | | | $ | — | | | | | $ | 143,157,233 | | |
| Collateralized Mortgage Obligations | | | | | — | | | | | | 25,338,906 | | | | | | — | | | | | | 25,338,906 | | |
| Asset-Backed Securities | | | | | — | | | | | | 75,358,742 | | | | | | — | | | | | | 75,358,742 | | |
| Commercial Mortgage-Backed Securities | | | | | — | | | | | | 71,619,519 | | | | | | — | | | | | | 71,619,519 | | |
| U.S. Government Agency Obligations | | | | | — | | | | | | 52,026 | | | | | | — | | | | | | 52,026 | | |
| U.S. Treasury Obligations | | | | | — | | | | | | 92,361,356 | | | | | | — | | | | | | 92,361,356 | | |
| Short-Term Investments | | | | | 13,873,030 | | | | | | 1,212,194 | | | | | | — | | | | | | 15,085,224 | | |
| Total Investments, at fair value | | | | $ | 13,873,030 | | | | | $ | 409,099,976 | | | | | $ | — | | | | | $ | 422,973,006 | | |
| Other Financial Instruments+ | | | | | | | | | | | | | | | | | | | | | | | | | |
| Futures | | | | | 101,744 | | | | | | — | | | | | | — | | | | | | 101,744 | | |
| Total Assets | | | | $ | 13,974,774 | | | | | $ | 409,099,976 | | | | | $ | — | | | | | $ | 423,074,750 | | |
| Liabilities Table | | | | | | | | | | | | | | | | | | | | | | | | | |
| Other Financial Instruments+ | | | | | | | | | | | | | | | | | | | | | | | | | |
| Futures | | | | $ | (78,177) | | | | | $ | — | | | | | $ | — | | | | | $ | (78,177) | | |
| Total Liabilities | | | | $ | (78,177) | | | | | $ | — | | | | | $ | — | | | | | $ | (78,177) | | |
^
See Note 2, “Significant Accounting Policies” in the Notes to Financial Statements for additional information.
+
Other Financial Instruments may include open forward foreign currency contracts, futures, centrally cleared swaps, OTC swaps and written options. Forward foreign currency contracts, futures and centrally cleared swaps are fair valued at the unrealized appreciation (depreciation) on the instrument. OTC swaps and written options are valued at the fair value of the instrument.
At December 31, 2020, the following futures contracts were outstanding for Voya Limited Maturity Bond Portfolio:
| Description | | | Number
of Contracts | | | Expiration
Date | | | Notional
Amount | | | Unrealized
Appreciation/
(Depreciation) | |
| Long Contracts: | | | | | | | | | | | | | | | | | | | | | | | | | |
| U.S. Treasury 2-Year Note | | | | | 482 | | | | | | 03/31/21 | | | | | $ | 106,510,703 | | | | | $ | 101,744 | | |
| | | | | | | | | | | | | | | | | $ | 106,510,703 | | | | | $ | 101,744 | | |
| Short Contracts: | | | | | | | | | | | | | | | | | | | | | | | | | |
| U.S. Treasury 10-Year Note | | | | | (2) | | | | | | 03/22/21 | | | | | | (276,156) | | | | | | (237) | | |
| U.S. Treasury 5-Year Note | | | | | (302) | | | | | | 03/31/21 | | | | | | (38,101,547) | | | | | | (77,940) | | |
| | | | | | | | | | | | | | | | | $ | (38,377,703) | | | | | $ | (78,177) | | |
See Accompanying Notes to Financial Statements
SUMMARY PORTFOLIO OF INVESTMENTS
| Voya Limited Maturity Bond Portfolio | as of December 31, 2020 (continued) |
A summary of derivative instruments by primary risk exposure is outlined in the following tables.
The fair value of derivative instruments as of December 31, 2020 was as follows:
| Derivatives not accounted for as hedging instruments | | | Location on Statement
of Assets and Liabilities | | | Fair Value | |
| Asset Derivatives | | | | | | | | | | |
| Interest rate contracts | | | Net Assets — Unrealized appreciation* | | | | $ | 101,744 | | |
| Total Asset Derivatives | | | | | | | $ | 101,744 | | |
| Liability Derivatives | | | | | | | | | | |
| Interest rate contracts | | | Net Assets — Unrealized depreciation* | | | | $ | 78,177 | | |
| Total Liability Derivatives | | | | | | | $ | 78,177 | | |
*
Includes cumulative appreciation/depreciation of futures contracts as reported in the table within the Portfolio of Investments.
The effect of derivative instruments on the Portfolio’s Statement of Operations for the year ended December 31, 2020 was as follows:
| | |
| Derivatives not accounted for as hedging instruments | | | Futures | | | | |
| Interest rate contracts | | | | $ | 407,915 | | | | | |
| Total | | | | $ | 407,915 | | | | | |
| | |
| Derivatives not accounted for as hedging instruments | | | Futures | | | | |
| Interest rate contracts | | | | $ | 18,772 | | | | | |
| Total | | | | $ | 18,772 | | | | | |
At December 31, 2020, the aggregate cost of securities and other investments and the composition of unrealized appreciation and depreciation of securities and other investments on a tax basis were:
| | Cost for federal income tax purposes was $419,138,361. | | |
| | Net unrealized appreciation consisted of: | | |
| | Gross Unrealized Appreciation | | | | $ | 5,364,951 | | |
| | Gross Unrealized Depreciation | | | | | (1,506,739) | | |
| | Net Unrealized Appreciation | | | | $ | 3,858,212 | | |
See Accompanying Notes to Financial Statements
SUMMARY PORTFOLIO OF INVESTMENTS
| Voya U.S. Stock Index Portfolio | as of December 31, 2020 |
| Shares | | | Value | | | Percentage
of Net
Assets | |
| COMMON STOCK: 97.1% | |
| | | | Communication Services: 10.5% | |
| 70,996 (1) | | | Alphabet, Inc. - Class A | | | | $ | 124,430,429 | | | | | | 1.6 | | |
| 68,550 (1) | | | Alphabet, Inc. - Class C | | | | | 120,091,374 | | | | | | 1.6 | | |
| 1,682,787 | | | AT&T, Inc. | | | | | 48,396,954 | | | | | | 0.6 | | |
| 1,078,221 | | | Comcast Corp. - Class A | | | | | 56,498,780 | | | | | | 0.8 | | |
| 567,691 (1) | | | Facebook, Inc.- Class A | | | | | 155,070,474 | | | | | | 2.0 | | |
| 104,329 (1) | | | NetFlix, Inc. | | | | | 56,413,820 | | | | | | 0.7 | | |
| 977,201 | | | Verizon Communications,
Inc. | | | | | 57,410,559 | | | | | | 0.8 | | |
| 427,542 (1) | | | Walt Disney Co. | | | | | 77,462,060 | | | | | | 1.0 | | |
| 1,584,823 (2)(3) | | | Other Securities | | | | | 109,427,591 | | | | | | 1.4 | | |
| | | | | | | | | 805,202,041 | | | | | | 10.5 | | |
| | | | Consumer Discretionary: 12.4% | |
| 100,714 (1) | | | Amazon.com, Inc. | | | | | 328,018,448 | | | | | | 4.3 | | |
| 254,237 | | | Home Depot, Inc. | | | | | 67,530,432 | | | | | | 0.9 | | |
| 175,956 | | | McDonald’s Corp. | | | | | 37,756,639 | | | | | | 0.5 | | |
| 296,320 | | | Nike, Inc. - Class B | | | | | 41,920,390 | | | | | | 0.6 | | |
| 179,076 (1)(4) | | | Tesla, Inc. | | | | | 126,368,561 | | | | | | 1.6 | | |
| 4,530,559 (2)(3) | | | Other Securities | | | | | 349,503,420 | | | | | | 4.5 | | |
| | | | | | | | | 951,097,890 | | | | | | 12.4 | | |
| | | | Consumer Staples: 6.3% | |
| 913,346 | | | Coca-Cola Co. | | | | | 50,087,895 | | | | | | 0.6 | | |
| 104,195 | | | Costco Wholesale Corp. | | | | | 39,258,592 | | | | | | 0.5 | | |
| 326,346 | | | PepsiCo, Inc. | | | | | 48,397,112 | | | | | | 0.6 | | |
| 585,553 | | | Procter & Gamble Co. | | | | | 81,473,844 | | | | | | 1.1 | | |
| 327,383 | | | Walmart, Inc. | | | | | 47,192,259 | | | | | | 0.6 | | |
| 3,199,552 (2)(3) | | | Other Securities | | | | | 220,443,719 | | | | | | 2.9 | | |
| | | | | | | | | 486,853,421 | | | | | | 6.3 | | |
| | | | Energy: 2.2% | |
| 454,596 | | | Chevron Corp. | | | | | 38,390,632 | | | | | | 0.5 | | |
| 998,487 | | | Exxon Mobil Corp. | | | | | 41,157,634 | | | | | | 0.5 | | |
| 3,365,359 (2) | | | Other Securities | | | | | 90,869,694 | | | | | | 1.2 | | |
| | | | | | | | | 170,417,960 | | | | | | 2.2 | | |
| | | | Financials: 10.1% | |
| 1,797,719 | | | Bank of America Corp. | | | | | 54,488,863 | | | | | | 0.7 | | |
| 459,572 (1) | | | Berkshire Hathaway, Inc. -
Class B | | | | | 106,560,960 | | | | | | 1.4 | | |
| 719,826 | | | JPMorgan Chase & Co. | | | | | 91,468,290 | | | | | | 1.2 | | |
| 7,345,220 (2)(3) | | | Other Securities | | | | | 528,056,920 | | | | | | 6.8 | | |
| | | | | | | | | 780,575,033 | | | | | | 10.1 | | |
| | | | Health Care: 13.1% | |
| 418,539 | | | Abbott Laboratories | | | | | 45,825,835 | | | | | | 0.6 | | |
| 416,912 | | | AbbVie, Inc. | | | | | 44,672,121 | | | | | | 0.6 | | |
| 533,635 | | | Bristol-Myers Squibb Co. | | | | | 33,101,379 | | | | | | 0.4 | | |
| 149,301 | | | Danaher Corp. | | | | | 33,165,724 | | | | | | 0.4 | | |
| 621,669 | | | Johnson & Johnson | | | | | 97,838,267 | | | | | | 1.3 | | |
| Shares | | | Value | | | Percentage
of Net
Assets | |
| COMMON STOCK: (continued) | |
| | | | Health Care (continued) | |
| 317,859 | | | Medtronic PLC | | | | $ | 37,234,003 | | | | | | 0.5 | | |
| 597,461 | | | Merck & Co., Inc. | | | | | 48,872,310 | | | | | | 0.7 | | |
| 1,312,602 | | | Pfizer, Inc. | | | | | 48,316,880 | | | | | | 0.6 | | |
| 93,594 | | | Thermo Fisher Scientific,
Inc. | | | | | 43,594,213 | | | | | | 0.6 | | |
| 224,062 | | | UnitedHealth Group, Inc. | | | | | 78,574,062 | | | | | | 1.0 | | |
| 3,660,599 (3) | | | Other Securities | | | | | 495,317,904 | | | | | | 6.4 | | |
| | | | | | | | | 1,006,512,698 | | | | | | 13.1 | | |
| | | | Industrials: 8.2% | |
| 165,701 | | | Honeywell International,
Inc. | | | | | 35,244,603 | | | | | | 0.5 | | |
| 159,133 | | | Union Pacific Corp. | | | | | 33,134,673 | | | | | | 0.4 | | |
| 6,806,325 (2)(3) | | | Other Securities | | | | | 559,318,221 | | | | | | 7.3 | | |
| | | | | | | | | 627,697,497 | | | | | | 8.2 | | |
| | | | Information Technology: 26.8% | |
| 149,615 | | | Accenture PLC | | | | | 39,080,934 | | | | | | 0.5 | | |
| 113,284 (1) | | | Adobe, Inc. | | | | | 56,655,594 | | | | | | 0.7 | | |
| 3,774,038 | | | Apple, Inc. | | | | | 500,777,102 | | | | | | 6.5 | | |
| 95,522 | | | Broadcom, Inc. | | | | | 41,824,308 | | | | | | 0.6 | | |
| 997,845 | | | Cisco Systems, Inc. | | | | | 44,653,564 | | | | | | 0.6 | | |
| 967,733 | | | Intel Corp. | | | | | 48,212,458 | | | | | | 0.6 | | |
| 207,748 | | | Mastercard, Inc. - Class A | | | | | 74,153,571 | | | | | | 1.0 | | |
| 1,785,393 | | | Microsoft Corp. | | | | | 397,107,111 | | | | | | 5.2 | | |
| 146,175 | | | Nvidia Corp. | | | | | 76,332,585 | | | | | | 1.0 | | |
| 276,692 (1) | | | PayPal Holdings, Inc. | | | | | 64,801,267 | | | | | | 0.8 | | |
| 267,083 | | | Qualcomm, Inc. | | | | | 40,687,424 | | | | | | 0.5 | | |
| 216,075 (1) | | | Salesforce.com, Inc. | | | | | 48,083,170 | | | | | | 0.6 | | |
| 216,770 | | | Texas Instruments, Inc. | | | | | 35,578,460 | | | | | | 0.5 | | |
| 400,430 | | | Visa, Inc. - Class A | | | | | 87,586,054 | | | | | | 1.1 | | |
| 4,844,417 (2)(3) | | | Other Securities | | | | | 508,376,334 | | | | | | 6.6 | | |
| | | | | | | | | 2,063,909,936 | | | | | | 26.8 | | |
| | | | Materials: 2.5% | |
| 123,944 | | | Linde PLC | | | | | 32,660,483 | | | | | | 0.4 | | |
| 2,374,966 (2) | | | Other Securities | | | | | 163,797,941 | | | | | | 2.1 | | |
| | | | | | | | | 196,458,424 | | | | | | 2.5 | | |
| | | | Real Estate: 2.3% | |
| 2,111,881 (2)(3) | | | Other Securities | | | | | 181,010,838 | | | | | | 2.3 | | |
| | | | | |
| | | | Utilities: 2.7% | |
| 462,631 | | | NextEra Energy, Inc. | | | | | 35,691,982 | | | | | | 0.5 | | |
| 2,775,002 | | | Other Securities | | | | | 170,695,871 | | | | | | 2.2 | | |
| | | | | | | | | 206,387,853 | | | | | | 2.7 | | |
| | | | Total Common Stock
(Cost $4,410,271,425) | | | | | 7,476,123,591 | | | | | | 97.1 | | |
| |
See Accompanying Notes to Financial Statements
SUMMARY PORTFOLIO OF INVESTMENTS
| Voya U.S. Stock Index Portfolio | as of December 31, 2020 (continued) |
Principal
Amount† | | | Value | | | Percentage
of Net
Assets | |
| SHORT-TERM INVESTMENTS: 4.9% | |
| | | | Repurchase Agreements: 2.4% | |
| 10,105,480 (5) | | | Amherst Pierpoint
Securities LLC,
Repurchase Agreement
dated 12/31/20, 0.10%,
due 01/04/21
(Repurchase Amount
$10,105,591,
collateralized by various
U.S. Government/U.S.
Government Agency
Obligations,
0.000%-4.628%, Market
Value plus accrued
interest $10,307,590,
due 02/03/21-11/20/70) | | | | $ | 10,105,480 | | | | | | 0.1 | | |
| 6,352,016 (5) | | | Bethesda Securities
LLC, Repurchase
Agreement dated
12/31/20, 0.10%,
due 01/04/21
(Repurchase Amount
$6,352,086,
collateralized by various
U.S. Government
Agency Obligations,
2.500%-5.500%, Market
Value plus accrued
interest $6,479,056,
due 07/01/24-10/01/50) | | | | | 6,352,016 | | | | | | 0.1 | | |
| 8,582,962 (5) | | | BNP Paribas S.A.,
Repurchase Agreement
dated 12/31/20, 0.24%,
due 01/04/21
(Repurchase Amount
$8,583,188,
collateralized by various
U.S. Government
Securities,
0.750%-8.750%, Market
Value plus accrued
interest $9,012,110,
due 03/01/21-11/20/40) | | | | | 8,582,962 | | | | | | 0.1 | | |
Principal
Amount† | | | Value | | | Percentage
of Net
Assets | |
| SHORT-TERM INVESTMENTS: (continued) | |
| | | | Repurchase Agreements (continued) | |
| 29,988,753 (5) | | | Cantor Fitzgerald
Securities, Repurchase
Agreement dated
12/31/20, 0.07%, due
01/04/21 (Repurchase
Amount $29,988,983,
collateralized by various
U.S. Government/U.S.
Government Agency
Obligations,
0.000%-9.500%, Market
Value plus accrued
interest $30,588,528,
due 01/25/21-10/15/62) | | | | $ | 29,988,753 | | | | | | 0.4 | | |
| 10,263,781 (5) | | | CF Secured LLC,
Repurchase Agreement
dated 12/31/20, 0.07%,
due 01/04/21
(Repurchase Amount
$10,263,860,
collateralized by various
U.S. Government/U.S.
Government Agency
Obligations,
0.000%-4.750%, Market
Value plus accrued
interest $10,469,057,
due 01/14/21-01/20/69) | | | | | 10,263,781 | | | | | | 0.1 | | |
| 18,141,196 (5) | | | Citadel Securities LLC,
Repurchase Agreement
dated 12/31/20, 0.13%,
due 01/04/21
(Repurchase Amount
$18,141,454,
collateralized by various
U.S. Government
Securities,
0.000%-7.875%, Market
Value plus accrued
interest $18,504,302,
due 01/31/21-05/15/49) | | | | | 18,141,196 | | | | | | 0.2 | | |
See Accompanying Notes to Financial Statements
SUMMARY PORTFOLIO OF INVESTMENTS
| Voya U.S. Stock Index Portfolio | as of December 31, 2020 (continued) |
Principal
Amount† | | | Value | | | Percentage
of Net
Assets | |
| SHORT-TERM INVESTMENTS: (continued) | |
| | | | Repurchase Agreements (continued) | |
| 25,102,663 (5) | | | Daiwa Capital Markets,
Repurchase Agreement
dated 12/31/20, 0.07%,
due 01/04/21
(Repurchase Amount
$25,102,856,
collateralized by various
U.S. Government/U.S.
Government Agency
Obligations,
0.000%-6.500%, Market
Value plus accrued
interest $25,604,716,
due 01/26/21-01/01/51) | | | | $ | 25,102,663 | | | | | | 0.3 | | |
| 4,140,582 (5) | | | Industrial & Comm. Bank
of China, Repurchase
Agreement dated
12/31/20, 0.07%, due
01/04/21 (Repurchase
Amount $4,140,614,
collateralized by various
U.S. Government/U.S.
Government Agency
Obligations,
0.000%-9.000%, Market
Value plus accrued
interest $4,223,394,
due 01/04/21-12/01/50) | | | | | 4,140,582 | | | | | | 0.1 | | |
| 1,942,254 (5) | | | Jefferies LLC,
Repurchase Agreement
dated 12/31/20, 0.06%,
due 01/04/21
(Repurchase Amount
$1,942,267,
collateralized by various
U.S. Government
Securities,
0.000%-2.250%, Market
Value plus accrued
interest $1,981,099, due
03/02/21-08/15/29) | | | | | 1,942,254 | | | | | | 0.0 | | |
Principal
Amount† | | | Value | | | Percentage
of Net
Assets | |
| SHORT-TERM INVESTMENTS: (continued) | |
| | | | Repurchase Agreements (continued) | |
| 11,725,571 (5) | | | JVB Financial Group
LLC, Repurchase
Agreement dated
12/31/20, 0.13%,
due 01/04/21
(Repurchase Amount
$11,725,738,
collateralized by various
U.S. Government/U.S.
Government Agency
Obligations,
0.125%-7.000%, Market
Value plus accrued
interest $11,960,082,
due 07/01/22-12/01/50) | | | | $ | 11,725,571 | | | | | | 0.2 | | |
| 13,397,811 (5) | | | Mirae Asset Securities
USA Inc., Repurchase
Agreement dated
12/31/20, 0.13%,
due 01/04/21
(Repurchase Amount
$13,398,002,
collateralized by various
U.S. Government/U.S.
Government Agency
Obligations,
0.000%-8.125%, Market
Value plus accrued
interest $13,665,966,
due 02/18/21-01/15/62) | | | | | 13,397,811 | | | | | | 0.2 | | |
| 10,172,095 (5) | | | Palafox Trading LLC,
Repurchase Agreement
dated 12/31/20, 0.13%,
due 01/04/21
(Repurchase Amount
$10,172,240,
collateralized by various
U.S. Government
Securities,
0.250%-1.125%, Market
Value plus accrued
interest $10,379,294,
due 02/28/25- 05/31/25) | | | | | 10,172,095 | | | | | | 0.1 | | |
See Accompanying Notes to Financial Statements
SUMMARY PORTFOLIO OF INVESTMENTS
| Voya U.S. Stock Index Portfolio | as of December 31, 2020 (continued) |
Principal
Amount† | | | Value | | | Percentage
of Net
Assets | |
| SHORT-TERM INVESTMENTS: (continued) | |
| | | | Repurchase Agreements (continued) | |
| 3,289,648 (5) | | | Royal Bank of Canada,
Repurchase Agreement
dated 12/31/20, 0.21%,
due 01/04/21
(Repurchase Amount
$3,289,724,
collateralized by various
U.S. Government
Securities,
0.379%-10.200%,
Market Value plus
accrued interest
$3,433,851, due
05/13/21- 11/01/40) | | | | $ | 3,289,648 | | | | | | 0.1 | | |
| 29,764,730 (5) | | | State of Wisconsin
Investment Board,
Repurchase Agreement
dated 12/31/20, 0.16%,
due 01/04/21
(Repurchase Amount
$29,765,252,
collateralized by various
U.S. Government
Securities,
0.125%-3.875%, Market
Value plus accrued
interest $30,435,696,
due 07/15/22- 02/15/47) | | | | | 29,764,730 | | | | | | 0.4 | | |
| 1,867,850 (5) | | | Stonex Financial Inc.,
Repurchase Agreement
dated 12/31/20, 0.14%,
due 01/04/21
(Repurchase Amount
$1,867,879,
collateralized by various
U.S. Government/U.S.
Government Agency
Obligations,
0.000%-8.000%, Market
Value plus accrued
interest $1,905,210, due
06/17/21-11/20/70) | | | | | 1,867,850 | | | | | | 0.0 | | |
| | | | Total Repurchase
Agreements
(Cost $184,837,392) | | | | | 184,837,392 | | | | | | 2.4 | | |
| |
| Shares | | | Value | | | Percentage
of Net
Assets | |
| SHORT-TERM INVESTMENTS: (continued) | |
| | | | Mutual Funds (5): 2.5% | |
| 182,313,233 (5)(6) | | | BlackRock Liquidity Funds,
FedFund, Institutional Class,
0.000% | | | | $ | 182,313,233 | | | | | | 2.4 | | |
| 4,954,000 (5)(6) | | | Goldman Sachs Financial
Square Government Fund -
Institutional Shares, 0.020% | | | | | 4,954,000 | | | | | | 0.1 | | |
| 2,110,000 (5)(6) | | | Morgan Stanley Institutional
Liquidity Funds -
Government Portfolio
(Institutional Share Class),
0.030% | | | | | 2,110,000 | | | | | | 0.0 | | |
| | | | Total Mutual Funds
(Cost $189,377,233) | | | | | 189,377,233 | | | | | | 2.5 | | |
| | | | Total Short-Term
Investments
(Cost $374,214,625) | | | | | 374,214,625 | | | | | | 4.9 | | |
| | | | Total Investments in
Securities
(Cost $4,784,486,050) | | | | $ | 7,850,338,216 | | | | | | 102.0 | | |
| | | | Liabilities in Excess of
Other Assets | | | | | (150,871,548) | | | | | | (2.0) | | |
| | | | Net Assets | | | | $ | 7,699,466,668 | | | | | | 100.0 | | |
“Other Securities” represents issues not identified as the top 50 holdings in terms of market value and issues or issuers not exceeding 1% of net assets individually or in aggregate respectively as of December 31, 2020.
The following footnotes apply to either the individual securities noted or one or more of the securities aggregated and listed as a single line item.
†
Unless otherwise indicated, principal amount is shown in USD.
(1)
Non-income producing security.
(2)
The grouping contains securities on loan.
(3)
The grouping contains non-income producing securities.
(4)
Security, or a portion of the security, is on loan.
(5)
All or a portion of the security represents securities purchased with cash collateral received for securities on loan.
(6)
Rate shown is the 7-day yield as of December 31, 2020.
See Accompanying Notes to Financial Statements
SUMMARY PORTFOLIO OF INVESTMENTS
| Voya U.S. Stock Index Portfolio | as of December 31, 2020 (continued) |
Fair Value Measurements^
The following is a summary of the fair valuations according to the inputs used as of December 31, 2020 in valuing the assets and liabilities:
| | | | Quoted Prices
in Active Markets
for Identical
Investments
(Level 1) | | | Significant
Other
Observable
Inputs
(Level 2) | | | Significant
Unobservable
Inputs
(Level 3) | | | Fair Value
at
December 31, 2020 | |
| Asset Table | | | | | | | | | | | | | | | | | | | | | | | | | |
| Investments, at fair value | | | | | | | | | | | | | | | | | | | | | | | | | |
| Common Stock* | | | | $ | 7,476,123,591 | | | | | $ | — | | | | | $ | — | | | | | $ | 7,476,123,591 | | |
| Short-Term Investments | | | | | 189,377,233 | | | | | | 184,837,392 | | | | | | — | | | | | | 374,214,625 | | |
| Total Investments, at fair value | | | | $ | 7,665,500,824 | | | | | $ | 184,837,392 | | | | | $ | — | | | | | $ | 7,850,338,216 | | |
| Other Financial Instruments+ | | | | | | | | | | | | | | | | | | | | | | | | | |
| Futures | | | | | 1,190,150 | | | | | | — | | | | | | — | | | | | | 1,190,150 | | |
| Total Assets | | | | $ | 7,666,690,974 | | | | | $ | 184,837,392 | | | | | $ | — | | | | | $ | 7,851,528,366 | | |
^
See Note 2, “Significant Accounting Policies” in the Notes to Financial Statements for additional information.
+
Other Financial Instruments may include open forward foreign currency contracts, futures, centrally cleared swaps, OTC swaps and written options. Forward foreign currency contracts, futures and centrally cleared swaps are fair valued at the unrealized appreciation (depreciation) on the instrument. OTC swaps and written options are valued at the fair value of the instrument.
*
For further breakdown of Common Stock by sector, please refer to the Portfolio of Investments.
At December 31, 2020, the following futures contracts were outstanding for Voya U.S. Stock Index Portfolio:
| Description | | | Number
of Contracts | | | Expiration
Date | | | Notional
Amount | | | Unrealized
Appreciation/
(Depreciation) | |
| Long Contracts: | | | | | | | | | | | | | | | | | | | | | | | | | |
| S&P 500® E-Mini | | | | | 1,378 | | | | | | 03/19/21 | | | | | $ | 258,292,320 | | | | | $ | 1,190,150 | | |
| | | | | | | | | | | | | | | | | $ | 258,292,320 | | | | | $ | 1,190,150 | | |
A summary of derivative instruments by primary risk exposure is outlined in the following tables.
The fair value of derivative instruments as of December 31, 2020 was as follows:
| Derivatives not accounted for as hedging instruments | | | Location on Statement
of Assets and Liabilities | | | Fair Value | |
| Asset Derivatives | | | | | | | | | | |
| Equity contracts | | | Net Assets — Unrealized appreciation* | | | | $ | 1,190,150 | | |
| Total Asset Derivatives | | | | | | | $ | 1,190,150 | | |
*
Includes cumulative appreciation/depreciation of futures contracts as reported in the table within the Portfolio of Investments.
The effect of derivative instruments on the Portfolio’s Statement of Operations for the year ended December 31, 2020 was as follows:
| | | | Amount of Realized Gain or (Loss)
on Derivatives Recognized in Income | |
| Derivatives not accounted for as hedging instruments | | | Futures | |
| Equity contracts | | | | $ | 21,148,273 | | |
| Total | | | | $ | 21,148,273 | | |
| | | | Change in Unrealized Appreciation or (Depreciation)
on Derivatives Recognized in Income | |
| Derivatives not accounted for as hedging instruments | | | Futures | |
| Equity contracts | | | | $ | (397,700) | | |
| Total | | | | $ | (397,700) | | |
See Accompanying Notes to Financial Statements
SUMMARY PORTFOLIO OF INVESTMENTS
| Voya U.S. Stock Index Portfolio | as of December 31, 2020 (continued) |
At December 31, 2020, the aggregate cost of securities and other investments and the composition of unrealized appreciation and depreciation of securities and other investments on a tax basis were:
| | Cost for federal income tax purposes was $4,810,403,529. | | |
| | Net unrealized appreciation consisted of: | | |
| | Gross Unrealized Appreciation | | | | $ | 3,275,703,187 | | |
| | Gross Unrealized Depreciation | | | | | (234,578,350) | | |
| | Net Unrealized Appreciation | | | | $ | 3,041,124,837 | | |
See Accompanying Notes to Financial Statements
PORTFOLIO OF INVESTMENTS
| VY® Clarion Real Estate Portfolio | as of December 31, 2020 |
| Shares | | | Value | | | Percentage
of Net
Assets | |
| COMMON STOCK: 98.7% | |
| | | | Diversified REITs: 4.4% | |
| 288,010 | | | VEREIT, Inc. | | | | $ | 10,883,898 | | | | | | 4.4 | | |
| | | | | |
| | | | Health Care REITs: 8.9% | |
| 274,235 | | | Healthcare Trust of
America, Inc. | | | | | 7,552,432 | | | | | | 3.0 | | |
| 165,653 | | | Ventas, Inc. | | | | | 8,123,623 | | | | | | 3.3 | | |
| 98,335 | | | Welltower, Inc. | | | | | 6,354,408 | | | | | | 2.6 | | |
| | | | | | | | | 22,030,463 | | | | | | 8.9 | | |
| | | | | |
| | | | Hotel & Resort REITs: 3.5% | |
| 180,900 | | | Apple Hospitality REIT, Inc. | | | | | 2,335,419 | | | | | | 1.0 | | |
| 201,031 | | | MGM Growth Properties
LLC | | | | | 6,292,270 | | | | | | 2.5 | | |
| | | | | | | | | 8,627,689 | | | | | | 3.5 | | |
| | | | | |
| | | | Hotels, Resorts & Cruise Lines: 0.6% | |
| 11,465 | | | Marriott International, Inc. | | | | | 1,512,463 | | | | | | 0.6 | | |
| | | | | |
| | | | Industrial REITs: 16.6% | |
| 325,194 | | | Duke Realty Corp. | | | | | 12,998,004 | | | | | | 5.2 | | |
| 233,952 | | | ProLogis, Inc. | | | | | 23,315,657 | | | | | | 9.4 | | |
| 156,832 | | | STAG Industrial, Inc. | | | | | 4,911,978 | | | | | | 2.0 | | |
| | | | | | | | | 41,225,639 | | | | | | 16.6 | | |
| | | | | |
| | | | Office REITs: 11.6% | |
| 54,086 | | | Alexandria Real Estate
Equities, Inc. | | | | | 9,639,207 | | | | | | 3.9 | | |
| 283,654 | | | Brandywine Realty Trust | | | | | 3,378,319 | | | | | | 1.4 | | |
| 98,488 | | | Columbia Property Trust,
Inc. | | | | | 1,412,318 | | | | | | 0.6 | | |
| 83,052 | | | Cousins Properties, Inc. | | | | | 2,782,242 | | | | | | 1.1 | | |
| 88,990 | | | Highwoods Properties, Inc. | | | | | 3,526,674 | | | | | | 1.4 | | |
| 143,184 | | | Hudson Pacific Properties,
Inc. | | | | | 3,439,279 | | | | | | 1.4 | | |
| 110,300 | | | Paramount Group, Inc. | | | | | 997,112 | | | | | | 0.4 | | |
| 222,039 | | | Piedmont Office Realty
Trust, Inc. | | | | | 3,603,693 | | | | | | 1.4 | | |
| | | | | | | | | 28,778,844 | | | | | | 11.6 | | |
| | | | | |
| | | | Residential REITs: 14.6% | |
| 36,755 | | | American Campus
Communities, Inc. | | | | | 1,572,011 | | | | | | 0.6 | | |
| 143,238 (1) | | | Apartment Income REIT
Corp. | | | | | 5,501,772 | | | | | | 2.2 | | |
| 47,956 | | | Camden Property Trust | | | | | 4,791,764 | | | | | | 1.9 | | |
| 89,725 | | | Equity Residential | | | | | 5,318,898 | | | | | | 2.2 | | |
| 192,381 | | | Invitation Homes, Inc. | | | | | 5,713,716 | | | | | | 2.3 | | |
| 42,921 | | | Mid-America Apartment
Communities, Inc. | | | | $ | 5,437,661 | | | | | | 2.2 | | |
| Shares | | | Value | | | Percentage
of Net
Assets | |
| COMMON STOCK: (continued) | |
| | | | Residential REITs (continued) | |
| 13,083 | | | Sun Communities, Inc. | | | | | 1,987,962 | | | | | | 0.8 | | |
| 151,400 | | | UDR, Inc. | | | | | 5,818,302 | | | | | | 2.4 | | |
| | | | | | | | | 36,142,086 | | | | | | 14.6 | | |
| | | | | |
| | | | Retail REITs: 12.0% | |
| 135,700 | | | Acadia Realty Trust | | | | | 1,925,583 | | | | | | 0.8 | | |
| 83,620 | | | NETSTREIT Corp. | | | | | 1,629,754 | | | | | | 0.7 | | |
| 72,475 | | | Regency Centers Corp. | | | | | 3,304,135 | | | | | | 1.3 | | |
| 372,166 | | | Retail Properties of
America, Inc. | | | | | 3,185,741 | | | | | | 1.3 | | |
| 173,340 | | | Simon Property Group, Inc. | | | | | 14,782,435 | | | | | | 6.0 | | |
| 208,400 | | | SITE Centers Corp. | | | | | 2,109,008 | | | | | | 0.8 | | |
| 69,388 | | | Spirit Realty Capital, Inc. | | | | | 2,787,316 | | | | | | 1.1 | | |
| | | | | | | | | 29,723,972 | | | | | | 12.0 | | |
| | | | | |
| | | | Specialized REITs: 26.5% | |
| 22,548 | | | American Tower Corp. | | | | | 5,061,124 | | | | | | 2.0 | | |
| 15,048 | | | Crown Castle International
Corp. | | | | | 2,395,491 | | | | | | 1.0 | | |
| 331,555 | | | CubeSmart | | | | | 11,143,563 | | | | | | 4.5 | | |
| 95,073 | | | CyrusOne, Inc. | | | | | 6,954,590 | | | | | | 2.8 | | |
| 12,566 | | | Equinix, Inc. | | | | | 8,974,386 | | | | | | 3.6 | | |
| 56,034 | | | Extra Space Storage, Inc. | | | | | 6,492,099 | | | | | | 2.6 | | |
| 57,047 (2) | | | Iron Mountain, Inc. | | | | | 1,681,746 | | | | | | 0.7 | | |
| 82,048 | | | Life Storage, Inc. | | | | | 9,795,711 | | | | | | 4.0 | | |
| 81,447 (2) | | | QTS Realty Trust, Inc. | | | | | 5,039,940 | | | | | | 2.0 | | |
| 247,890 | | | VICI Properties, Inc. | | | | | 6,321,195 | | | | | | 2.6 | | |
| 54,400 | | | Weyerhaeuser Co. | | | | | 1,824,032 | | | | | | 0.7 | | |
| | | | | | | | | 65,683,877 | | | | | | 26.5 | | |
| | | | Total Common Stock
(Cost $219,315,951) | | | | | 244,608,931 | | | | | | 98.7 | | |
| |
Principal
Amount† | | | Value | | | Percentage
of Net
Assets | |
| SHORT-TERM INVESTMENTS: 1.3% | |
| | | | Repurchase Agreements: 0.7% | |
| 714,962 (3) | | | Citigroup, Inc., Repurchase
Agreement dated 12/31/20,
0.07%, due 01/04/21
(Repurchase Amount
$714,967, collateralized by
various U.S. Government/
U.S. Government Agency
Obligations, 0.000%-
4.000%, Market Value plus
accrued interest $729,261,
due 09/15/21-01/01/51) | | | | | 714,962 | | | | | | 0.3 | | |
See Accompanying Notes to Financial Statements
PORTFOLIO OF INVESTMENTS
| VY® Clarion Real Estate Portfolio | as of December 31, 2020 (continued) |
Principal
Amount† | | | Value | | | Percentage
of Net
Assets | |
| SHORT-TERM INVESTMENTS: (continued) | |
| | | | Repurchase Agreements (continued) | |
| 1,000,000 (3) | | | RBC Dominion Securities
Inc., Repurchase
Agreement dated 12/31/20,
0.08%, due 01/04/21
(Repurchase Amount
$1,000,009, collateralized
by various U.S.
Government/U.S.
Government Agency
Obligations, 0.000%-
6.000%, Market Value plus
accrued interest
$1,020,000, due
01/05/21-12/20/50) | | | | $ | 1,000,000 | | | | | | 0.4 | | |
| | | | Total Repurchase
Agreements
(Cost $1,714,962) | | | | | 1,714,962 | | | | | | 0.7 | | |
| |
| Shares | | | Value | | | Percentage
of Net
Assets | |
| SHORT-TERM INVESTMENTS: (continued) | |
| | | | Mutual Funds: 0.6% | |
| 1,407,234 (4) | | | BlackRock Liquidity Funds,
FedFund, Institutional
Class, 0.000%
(Cost $1,407,234) | | | | $ | 1,407,234 | | | | | | 0.6 | | |
| | | | Total Short-Term
Investments
(Cost $3,122,196) | | | | | 3,122,196 | | | | | | 1.3 | | |
| | | | Total Investments in
Securities
(Cost $222,438,147) | | | | $ | 247,731,127 | | | | | | 100.0 | | |
| | | | Liabilities in Excess of
Other Assets | | | | | (1,197) | | | | | | — | | |
| | | | Net Assets | | | | $ | 247,729,930 | | | | | | 100.0 | | |
†
Unless otherwise indicated, principal amount is shown in USD.
(1)
Non-income producing security.
(2)
Security, or a portion of the security, is on loan.
(3)
All or a portion of the security represents securities purchased with cash collateral received for securities on loan.
(4)
Rate shown is the 7-day yield as of December 31, 2020.
Fair Value Measurements^
The following is a summary of the fair valuations according to the inputs used as of December 31, 2020 in valuing the assets and liabilities:
| | | | Quoted Prices
in Active Markets
for Identical
Investments
(Level 1) | | | Significant
Other
Observable
Inputs
(Level 2) | | | Significant
Unobservable
Inputs
(Level 3) | | | Fair Value
at
December 31, 2020 | |
| Asset Table | | | | | | | | | | | | | | | | | | | | | | | | | |
| Investments, at fair value | | | | | | | | | | | | | | | | | | | | | | | | | |
| Common Stock* | | | | $ | 244,608,931 | | | | | $ | — | | | | | $ | — | | | | | $ | 244,608,931 | | |
| Short-Term Investments | | | | | 1,407,234 | | | | | | 1,714,962 | | | | | | — | | | | | | 3,122,196 | | |
| Total Investments, at fair value | | | | $ | 246,016,165 | | | | | $ | 1,714,962 | | | | | $ | — | | | | | $ | 247,731,127 | | |
^
See Note 2, “Significant Accounting Policies” in the Notes to Financial Statements for additional information.
*
For further breakdown of Common Stock by sector, please refer to the Portfolio of Investments.
See Accompanying Notes to Financial Statements
PORTFOLIO OF INVESTMENTS
| VY® Clarion Real Estate Portfolio | as of December 31, 2020 (continued) |
At December 31, 2020, the aggregate cost of securities and other investments and the composition of unrealized appreciation and depreciation of securities and other investments on a tax basis were:
| | Cost for federal income tax purposes was $232,764,915. | | | | | | | |
| | Net unrealized appreciation consisted of: | | |
| | Gross Unrealized Appreciation | | | | $ | 27,296,801 | | |
| | Gross Unrealized Depreciation | | | | | (12,330,590) | | |
| | Net Unrealized Appreciation | | | | $ | 14,966,211 | | |
See Accompanying Notes to Financial Statements
| VY® JPMorgan Small Cap | SUMMARY PORTFOLIO OF INVESTMENTS |
| Core Equity Portfolio | as of December 31, 2020 |
| Shares | | | Value | | | Percentage
of Net
Assets | |
| COMMON STOCK: 97.3% | |
| | | | Communication Services: 2.3% | |
| 39,133 (1) | | | Liberty Latin America Ltd. | | | | $ | 433,985 | | | | | | 0.1 | | |
| 43,100 (1) | | | Liberty Latin America Ltd. -
Class A | | | | | 479,703 | | | | | | 0.1 | | |
| 476,300 (1) | | | Liberty TripAdvisor
Holdings, Inc. | | | | | 2,067,142 | | | | | | 0.3 | | |
| 580,500 (2)(3) | | | Other Securities | | | | | 10,679,113 | | | | | | 1.8 | | |
| | | | | | | | | 13,659,943 | | | | | | 2.3 | | |
| | | | Consumer Discretionary: 10.1% | |
| 16,781 (1) | | | Bright Horizons Family
Solutions, Inc. | | | | | 2,902,945 | | | | | | 0.5 | | |
| 55,598 | | | Brunswick Corp. | | | | | 4,238,792 | | | | | | 0.7 | | |
| 11,850 (1) | | | Deckers Outdoor Corp. | | | | | 3,398,343 | | | | | | 0.6 | | |
| 27,236 | | | LCI Industries | | | | | 3,531,964 | | | | | | 0.6 | | |
| 1,394,338 (2)(3) | | | Other Securities | | | | | 45,588,819 | | | | | | 7.7 | | |
| | | | | | | | | 59,660,863 | | | | | | 10.1 | | |
| | | | Consumer Staples: 3.6% | |
| 113,306 (1) | | | BJ’s Wholesale Club
Holdings, Inc. | | | | | 4,224,048 | | | | | | 0.7 | | |
| 150,873 (1) | | | Performance Food Group
Co. | | | | | 7,183,064 | | | | | | 1.2 | | |
| 171,462 | | | Primo Water Corp. | | | | | 2,688,524 | | | | | | 0.5 | | |
| 93,933 (3) | | | Other Securities | | | | | 6,852,149 | | | | | | 1.2 | | |
| | | | | | | | | 20,947,785 | | | | | | 3.6 | | |
| | | | Energy: 1.4% | |
| 713,000 (2)(3) | | | Other Securities | | | | | 8,249,381 | | | | | | 1.4 | | |
| | | | | |
| | | | Financials: 16.5% | |
| 88,158 | | | BankUnited, Inc. | | | | | 3,066,135 | | | | | | 0.5 | | |
| 43,471 | | | Commerce Bancshares,
Inc. | | | | | 2,856,045 | | | | | | 0.5 | | |
| 314,810 | | | First Horizon Corp. | | | | | 4,016,976 | | | | | | 0.7 | | |
| 75,191 (1) | | | Focus Financial Partners,
Inc. | | | | | 3,270,808 | | | | | | 0.6 | | |
| 14,952 | | | Kinsale Capital Group, Inc. | | | | | 2,992,344 | | | | | | 0.5 | | |
| 86,642 | | | Lazard Ltd. | | | | | 3,664,957 | | | | | | 0.6 | | |
| 64,501 | | | Moelis & Co. | | | | | 3,016,067 | | | | | | 0.5 | | |
| 15,145 | | | Morningstar, Inc. | | | | | 3,507,128 | | | | | | 0.6 | | |
| 36,469 | | | RLI Corp. | | | | | 3,798,246 | | | | | | 0.7 | | |
| 30,971 | | | Signature Bank | | | | | 4,190,066 | | | | | | 0.7 | | |
| 60,639 | | | Western Alliance Bancorp. | | | | | 3,635,308 | | | | | | 0.6 | | |
| 58,001 | | | Wintrust Financial Corp. | | | | | 3,543,281 | | | | | | 0.6 | | |
| 2,427,514 (2)(3) | | | Other Securities | | | | | 55,382,730 | | | | | | 9.4 | | |
| | | | | | | | | 96,940,091 | | | | | | 16.5 | | |
| | | | Health Care: 16.6% | |
| 35,876 | | | Cantel Medical Corp. | | | | | 2,829,181 | | | | | | 0.5 | | |
| 62,079 | | | Encompass Health Corp. | | | | | 5,133,313 | | | | | | 0.9 | | |
| 44,732 (1) | | | HealthEquity, Inc. | | | | | 3,118,268 | | | | | | 0.5 | | |
| 83,327 (1) | | | HMS Holdings Corp. | | | | | 3,062,267 | | | | | | 0.5 | | |
| 15,484 (1) | | | ICU Medical, Inc. | | | | | 3,321,163 | | | | | | 0.6 | | |
| 20,512 (1) | | | Molina Healthcare, Inc. | | | | | 4,362,492 | | | | | | 0.7 | | |
| 51,426 (1) | | | Syneos Health, Inc. | | | | | 3,503,654 | | | | | | 0.6 | | |
| Shares | | | Value | | | Percentage
of Net
Assets | |
| COMMON STOCK: (continued) | |
| | | | Health Care (continued) | |
| 3,330,725 (2)(3) | | | Other Securities | | | | $ | 72,694,746 | | | | | | 12.3 | | |
| | | | | | | | | 98,025,084 | | | | | | 16.6 | | |
| | | | Industrials: 18.5% | |
| 59,965 | | | Altra Industrial Motion
Corp. | | | | | 3,323,860 | | | | | | 0.6 | | |
| 44,420 | | | Applied Industrial
Technologies, Inc. | | | | | 3,464,316 | | | | | | 0.6 | | |
| 65,681 (1) | | | IAA, Inc. | | | | | 4,267,951 | | | | | | 0.7 | | |
| 39,832 | | | Lincoln Electric Holdings,
Inc. | | | | | 4,630,470 | | | | | | 0.8 | | |
| 29,804 | | | MSA Safety, Inc. | | | | | 4,452,420 | | | | | | 0.7 | | |
| 25,888 (1) | | | RBC Bearings, Inc. | | | | | 4,634,987 | | | | | | 0.8 | | |
| 69,945 | | | Toro Co. | | | | | 6,633,584 | | | | | | 1.1 | | |
| 38,200 (1) | | | Wesco International, Inc. | | | | | 2,998,700 | | | | | | 0.5 | | |
| 202,017 (1) | | | WillScot Mobile Mini
Holdings Corp. | | | | | 4,680,734 | | | | | | 0.8 | | |
| 33,259 | | | Woodward, Inc. | | | | | 4,041,966 | | | | | | 0.7 | | |
| 1,992,125 (3) | | | Other Securities | | | | | 65,758,342 | | | | | | 11.2 | | |
| | | | | | | | | 108,887,330 | | | | | | 18.5 | | |
| | | | Information Technology: 14.0% | |
| 25,263 | | | CMC Materials, Inc. | | | | | 3,822,292 | | | | | | 0.6 | | |
| 35,531 (1) | | | Envestnet, Inc. | | | | | 2,923,846 | | | | | | 0.5 | | |
| 22,140 (1) | | | Guidewire Software, Inc. | | | | | 2,850,082 | | | | | | 0.5 | | |
| 50,580 | | | Power Integrations, Inc. | | | | | 4,140,479 | | | | | | 0.7 | | |
| 40,419 (1) | | | Q2 Holdings, Inc. | | | | | 5,114,216 | | | | | | 0.9 | | |
| 43,548 (1)(4) | | | RealPage, Inc. | | | | | 3,799,128 | | | | | | 0.6 | | |
| 21,948 (1) | | | WEX, Inc. | | | | | 4,467,076 | | | | | | 0.8 | | |
| 1,811,079 (2)(3) | | | Other Securities | | | | | 55,048,282 | | | | | | 9.4 | | |
| | | | | | | | | 82,165,401 | | | | | | 14.0 | | |
| | | | Materials: 5.8% | |
| 51,446 | | | Aptargroup, Inc. | | | | | 7,042,443 | | | | | | 1.2 | | |
| 14,109 | | | Quaker Chemical Corp. | | | | | 3,575,079 | | | | | | 0.6 | | |
| 1,012,348 (3) | | | Other Securities | | | | | 23,490,545 | | | | | | 4.0 | | |
| | | | | | | | | 34,108,067 | | | | | | 5.8 | | |
| | | | Real Estate: 6.3% | |
| 100,365 | | | CubeSmart | | | | | 3,373,268 | | | | | | 0.6 | | |
| 31,751 | | | EastGroup Properties, Inc. | | | | | 4,383,543 | | | | | | 0.8 | | |
| 77,436 | | | National Retail Properties,
Inc. | | | | | 3,168,681 | | | | | | 0.5 | | |
| 1,419,571 (3) | | | Other Securities | | | | | 25,953,811 | | | | | | 4.4 | | |
| | | | | | | | | 36,879,303 | | | | | | 6.3 | | |
| | | | Utilities: 2.2% | |
| 52,854 | | | NorthWestern Corp. | | | | | 3,081,917 | | | | | | 0.5 | | |
| 76,657 | | | Portland General Electric
Co. | | | | | 3,278,620 | | | | | | 0.6 | | |
| 246,244 (3) | | | Other Securities | | | | | 6,670,507 | | | | | | 1.1 | | |
| | | | | | | | | 13,031,044 | | | | | | 2.2 | | |
| | | | Total Common Stock | | | | | | | | | | | | | |
| | | | (Cost $432,989,218) | | | | | 572,554,292 | | | | | | 97.3 | | |
| |
See Accompanying Notes to Financial Statements
| VY® JPMorgan Small Cap | SUMMARY PORTFOLIO OF INVESTMENTS |
| Core Equity Portfolio | as of December 31, 2020 (continued) |
| Shares | | | Value | | | Percentage
of Net
Assets | |
| RIGHTS: —% | |
| | | | Health Care: —% | |
| 28,260 (1)(5)(6) | | | Aduro Biotech, Inc. - CVR | | | | $ | — | | | | | | — | | |
| | | | Total Rights | | | | | | | | | | | | | |
| | | | (Cost $—) | | | | | — | | | | | | — | | |
| | | | Total Long-Term
Investments | | | | | | | | | | | | | |
| | | | (Cost $432,989,218) | | | | | 572,554,292 | | | | | | 97.3 | | |
| |
Principal
Amount† | | | Value | | | Percentage
of Net
Assets | |
| SHORT-TERM INVESTMENTS: 5.2% | |
| | | | Repurchase Agreements: 2.5% | |
| 2,582,314 (7) | | | Cantor Fitzgerald
Securities, Repurchase
Agreement dated 12/31/20,
0.07%, due 01/04/21
(Repurchase Amount
$2,582,334, collateralized
by various U.S.
Government/U.S.
Government Agency
Obligations,
0.000%-9.500%, Market
Value plus accrued interest
$2,633,960, due 01/25/21-
10/15/62) | | | | | 2,582,314 | | | | | | 0.5 | | |
| 2,530,176 (7) | | | Citadel Securities LLC,
Repurchase Agreement
dated 12/31/20, 0.13%,
due 01/04/21 (Repurchase
Amount $2,530,212,
collateralized by various
U.S. Government
Securities, 0.000%-
7.875%, Market Value plus
accrued interest
$2,580,819, due 01/31/21-
05/15/49) | | | | | 2,530,176 | | | | | | 0.4 | | |
| 1,352,577 (7) | | | Deutsche Bank Securities
Inc., Repurchase
Agreement dated 12/31/20,
0.06%, due 01/04/21
(Repurchase Amount
$1,352,586, collateralized
by various U.S.
Government/U.S.
Government Agency
Obligations, 0.000%-
6.500%, Market Value plus
accrued interest
$1,379,629, due 01/15/21-
01/01/51) | | | | | 1,352,577 | | | | | | 0.2 | | |
Principal
Amount† | | | Value | | | Percentage
of Net
Assets | |
| SHORT-TERM INVESTMENTS: (continued) | |
| | | | Repurchase Agreements (continued) | |
| 1,123,421 (7) | | | JVB Financial Group LLC,
Repurchase Agreement
dated 12/31/20, 0.13%,
due 01/04/21 (Repurchase
Amount $1,123,437,
collateralized by various
U.S. Government/U.S.
Government Agency
Obligations, 0.125%-
7.000%, Market Value plus
accrued interest
$1,145,889, due 07/01/22-
12/01/50) | | | | $ | 1,123,421 | | | | | | 0.2 | | |
| 1,153,678 (7) | | | Mirae Asset Securities
USA Inc., Repurchase
Agreement dated 12/31/20,
0.13%, due 01/04/21
(Repurchase Amount
$1,153,694, collateralized
by various U.S.
Government/U.S.
Government Agency
Obligations, 0.000%-
8.125%, Market Value plus
accrued interest
$1,176,769, due
02/18/21-01/15/62) | | | | | 1,153,678 | | | | | | 0.2 | | |
| 3,429,520 (7) | | | RBC Dominion Securities
Inc., Repurchase
Agreement dated 12/31/20,
0.08%, due 01/04/21
(Repurchase Amount
$3,429,550, collateralized
by various U.S.
Government/U.S.
Government Agency
Obligations, 0.000%-
6.000%, Market Value plus
accrued interest
$3,498,110, due 01/05/21-
12/20/50) | | | | | 3,429,520 | | | | | | 0.6 | | |
See Accompanying Notes to Financial Statements
| VY® JPMorgan Small Cap | SUMMARY PORTFOLIO OF INVESTMENTS |
| Core Equity Portfolio | as of December 31, 2020 (continued) |
Principal
Amount† | | | Value | | | Percentage
of Net
Assets | |
| SHORT-TERM INVESTMENTS: (continued) | |
| | | | Repurchase Agreements (continued) | |
| 2,563,025 (7) | | | State of Wisconsin
Investment Board,
Repurchase Agreement
dated 12/31/20, 0.16%,
due 01/04/21 (Repurchase
Amount $2,563,070,
collateralized by various
U.S. Government
Securities, 0.125%-
3.875%, Market Value plus
accrued interest
$2,620,802, due 07/15/22-
02/15/47) | | | | $ | 2,563,025 | | | | | | 0.4 | | |
| | | | Total Repurchase
Agreements
(Cost $14,734,711) | | | | | 14,734,711 | | | | | | 2.5 | | |
| |
| Shares | | | Value | | | Percentage
of Net
Assets | |
| | | | Mutual Funds: 2.7% | |
| 16,106,368 (8) | | | BlackRock Liquidity Funds,
FedFund, Institutional
Class, 0.000%
(Cost $16,106,368) | | | | | 16,106,368 | | | | | | 2.7 | | |
| | | | Total Short-Term
Investments
(Cost $30,841,079) | | | | | 30,841,079 | | | | | | 5.2 | | |
| | | | Total Investments in
Securities
(Cost $463,830,297) | | | | $ | 603,395,371 | | | | | | 102.5 | | |
| | | | Liabilities in Excess of
Other Assets | | | | | (14,605,009) | | | | | | (2.5) | | |
| | | | Net Assets | | | | $ | 588,790,362 | | | | | | 100.0 | | |
“Other Securities” represents issues not identified as the top 50 holdings in terms of market value and issues or issuers not exceeding 1% of net assets individually or in aggregate respectively as of December 31, 2020.
The following footnotes apply to either the individual securities noted or one or more of the securities aggregated and listed as a single line item.
†
Unless otherwise indicated, principal amount is shown in USD.
(1)
Non-income producing security.
(2)
The grouping contains securities on loan.
(3)
The grouping contains non-income producing securities.
(4)
Security, or a portion of the security, is on loan.
(5)
For fair value measurement disclosure purposes, security is categorized as Level 3, whose value was determined using significant unobservable inputs.
(6)
Restricted security as to resale, excluding Rule 144A securities. As of December 31, 2020, the Portfolio held restricted securities with a fair value of $— or 0.0% of net assets. Please refer to the table below for additional details.
(7)
All or a portion of the security represents securities purchased with cash collateral received for securities on loan.
(8)
Rate shown is the 7-day yield as of December 31, 2020.
Fair Value Measurements^
The following is a summary of the fair valuations according to the inputs used as of December 31, 2020 in valuing the assets and liabilities:
| | | | Quoted Prices
in Active Markets
for Identical
Investments
(Level 1) | | | Significant
Other
Observable
Inputs
(Level 2) | | | Significant
Unobservable
Inputs
(Level 3) | | | Fair Value
at
December 31, 2020 | |
| Asset Table | | | | | | | | | | | | | | | | | | | | | | | | | |
| Investments, at fair value | | | | | | | | | | | | | | | | | | | | | | | | | |
| Common Stock* | | | | $ | 572,554,292 | | | | | $ | — | | | | | $ | — | | | | | $ | 572,554,292 | | |
| Rights | | | | | — | | | | | | — | | | | | | — | | | | | | — | | |
| Short-Term Investments | | | | | 16,106,368 | | | | | | 14,734,711 | | | | | | — | | | | | | 30,841,079 | | |
| Total Investments, at fair value | | | | $ | 588,660,660 | | | | | $ | 14,734,711 | | | | | $ | — | | | | | $ | 603,395,371 | | |
See Accompanying Notes to Financial Statements
| VY® JPMorgan Small Cap | SUMMARY PORTFOLIO OF INVESTMENTS |
| Core Equity Portfolio | as of December 31, 2020 (continued) |
| | | | Quoted Prices
in Active Markets
for Identical
Investments
(Level 1) | | | Significant
Other
Observable
Inputs
(Level 2) | | | Significant
Unobservable
Inputs
(Level 3) | | | Fair Value
at
December 31, 2020 | |
| Liabilities Table | | | | | | | | | | | | | | | | | | | | | | | | | |
| Other Financial Instruments+ | | | | | | | | | | | | | | | | | | | | | | | | | |
| Futures | | | | $ | (16,390) | | | | | $ | — | | | | | $ | — | | | | | $ | (16,390) | | |
| Total Liabilities | | | | $ | (16,390) | | | | | $ | — | | | | | $ | — | | | | | $ | (16,390) | | |
^
See Note 2, “Significant Accounting Policies” in the Notes to Financial Statements for additional information.
+
Other Financial Instruments may include open forward foreign currency contracts, futures, centrally cleared swaps, OTC swaps and written options. Forward foreign currency contracts, futures and centrally cleared swaps are fair valued at the unrealized appreciation (depreciation) on the instrument. OTC swaps and written options are valued at the fair value of the instrument.
*
For further breakdown of Common Stock by sector, please refer to the Portfolio of Investments.
At December 31, 2020, VY® JPMorgan Small Cap Core Equity Portfolio held the following restricted securities:
| Security | | | Acquisition
Date | | | Acquisition
Cost | | | Fair Value | |
| Aduro Biotech, Inc. - CVR | | | | | 10/6/2020 | | | | | $ | — | | | | | $ | — | | |
| | | | | | | | | | | $ | — | | | | | $ | — | | |
At December 31, 2020, the following futures contracts were outstanding for VY® JPMorgan Small Cap Core Equity Portfolio:
| Description | | | Number
of Contracts | | | Expiration
Date | | | Notional
Amount | | | Unrealized
Appreciation/
(Depreciation) | |
| Long Contracts: | | | | | | | | | | | | | | | | | | | | | | | | | |
| E-mini Russell 2000® Index | | | | | 47 | | | | | | 03/19/21 | | | | | $ | 4,640,780 | | | | | $ | (16,390) | | |
| | | | | | | | | | | | | | | | | $ | 4,640,780 | | | | | $ | (16,390) | | |
A summary of derivative instruments by primary risk exposure is outlined in the following tables.
The fair value of derivative instruments as of December 31, 2020 was as follows:
| Derivatives not accounted for as hedging instruments | | | Location on Statement
of Assets and Liabilities | | | Fair Value | |
| Liability Derivatives | | | | | | | | | | |
| Equity contracts | | | Net Assets — Unrealized depreciation* | | | | $ | 16,390 | | |
| | | | | | | | $ | 16,390 | | |
*
Includes cumulative appreciation/depreciation of futures contracts as reported in the table within the Portfolio of Investments.
The effect of derivative instruments on the Portfolio’s Statement of Operations for the year ended December 31, 2020 was as follows:
| | | | Amount of Realized Gain or (Loss)
on Derivatives Recognized in Income | |
| Derivatives not accounted for as hedging instruments | | | Futures | |
| Equity contracts | | | | $ | 1,810,828 | | |
| Total | | | | $ | 1,810,828 | | |
| | | | Change in Unrealized Appreciation or (Depreciation)
on Derivatives Recognized in Income | |
| Derivatives not accounted for as hedging instruments | | | Futures | |
| Equity contracts | | | | $ | (109,206) | | |
| Total | | | | $ | (109,206) | | |
See Accompanying Notes to Financial Statements
| VY® JPMorgan Small Cap | SUMMARY PORTFOLIO OF INVESTMENTS |
| Core Equity Portfolio | as of December 31, 2020 (continued) |
At December 31, 2020, the aggregate cost of securities and other investments and the composition of unrealized appreciation and depreciation of securities and other investments on a tax basis were:
| | Cost for federal income tax purposes was $472,715,956. | |
| | Net unrealized appreciation consisted of: | |
| | Gross Unrealized Appreciation | | | | $ | 151,260,723 | | |
| | Gross Unrealized Depreciation | | | | | (20,597,699) | | |
| | Net Unrealized Appreciation | | | | $ | 130,663,024 | | |
See Accompanying Notes to Financial Statements
TAX INFORMATION (Unaudited)
Dividends and distributions paid during the year ended December 31, 2020 were as follows:
| Portfolio Name | | | Type | | | Per Share
Amount | |
| Voya Balanced Income Portfolio | |
| Class ADV | | | NII | | | | $ | 0.3559 | | |
| Class I | | | NII | | | | $ | 0.4215 | | |
| Class S | | | NII | | | | $ | 0.3912 | | |
| Class S2 | | | NII | | | | $ | 0.3885 | | |
| All Classes | | | STCG | | | | $ | 0.2842 | | |
| All Classes | | | LTCG | | | | $ | 0.4341 | | |
| Voya High Yield Portfolio | |
| Class ADV | | | NII | | | | $ | 0.4627 | | |
| Class I | | | NII | | | | $ | 0.5201 | | |
| Class S | | | NII | | | | $ | 0.4959 | | |
| Class S2 | | | NII | | | | $ | 0.4823 | | |
| All Classes | | | ROC | | | | $ | 0.0053 | | |
| Voya Large Cap Growth Portfolio | |
| Class ADV | | | NII | | | | $ | — | | |
| Class I | | | NII | | | | $ | 0.1056 | | |
| Class R6 | | | NII | | | | $ | 0.1056 | | |
| Class S | | | NII | | | | $ | 0.0520 | | |
| Class S2 | | | NII | | | | $ | 0.0234 | | |
| All Classes | | | STCG | | | | $ | 0.0600 | | |
| All Classes | | | LTCG | | | | $ | 2.3726 | | |
| Voya Large Cap Value Portfolio | |
| Class ADV | | | NII | | | | $ | 0.1797 | | |
| Class I | | | NII | | | | $ | 0.2418 | | |
| Portfolio Name | | | Type | | | Per Share
Amount | |
| Class R6 | | | NII | | | | $ | 0.2419 | | |
| Class S | | | NII | | | | $ | 0.2159 | | |
| Class S2 | | | NII | | | | $ | 0.2038 | | |
| All Classes | | | STCG | | | | $ | 0.0063 | | |
| All Classes | | | LTCG | | | | $ | 1.0247 | | |
| Voya Limited Maturity Bond Portfolio | |
| Class ADV | | | NII | | | | $ | 0.1619 | | |
| Class I | | | NII | | | | $ | 0.2263 | | |
| Class S | | | NII | | | | $ | 0.2024 | | |
| Voya U.S. Stock Index Portfolio | |
| Class ADV | | | NII | | | | $ | 0.2376 | | |
| Class I | | | NII | | | | $ | 0.3293 | | |
| Class P2 | | | NII | | | | $ | 0.3293 | | |
| Class S | | | NII | | | | $ | 0.2875 | | |
| Class S2 | | | NII | | | | $ | 0.2619 | | |
| All Classes | | | STCG | | | | $ | 0.0204 | | |
| All Classes | | | LTCG | | | | $ | 0.6376 | | |
| VY® Clarion Real Estate Portfolio | |
| Class ADV | | | NII | | | | $ | 0.6643 | | |
| Class I | | | NII | | | | $ | 0.8980 | | |
| Class S | | | NII | | | | $ | 0.7893 | | |
| Class S2 | | | NII | | | | $ | 0.7377 | | |
| All Classes | | | STCG | | | | $ | 1.1055 | | |
| All Classes | | | LTCG | | | | $ | 2.4021 | | |
NII – Net investment income
STCG – Short-term capital gain
LTCG – Long-term capital gain
ROC – Return of capital
Of the ordinary distributions made during the year ended December 31, 2020, the following percentages qualify for the dividends received deduction (DRD) available to corporate shareholders:
| | Voya Balanced Income Portfolio | | | | | 14.61% | | |
| | Voya Large Cap Growth Portfolio | | | | | 99.95% | | |
| | Voya Large Cap Value Portfolio | | | | | 100.00% | | |
| | Voya U.S. Stock Index Portfolio | | | | | 93.65% | | |
TAX INFORMATION (Unaudited) (continued)
The Portfolios designate the following amounts of long-term capital gain distributions as 20% rate long-term capital gain dividends under Internal Revenue Code Section 852(b)(3)(C):
| | Voya Balanced Income Portfolio | | | | $ | 14,167,103 | | |
| | Voya Large Cap Growth Portfolio | | | | $ | 669,820,320 | | |
| | Voya Large Cap Value Portfolio | | | | $ | 85,420,555 | | |
| | Voya U.S. Stock Index Portfolio | | | | $ | 271,478,624 | | |
| | VY® Clarion Real Estate Portfolio | | | | $ | 18,868,227 | | |
Above figures may differ from those cited elsewhere in this report due to differences in the calculation of income and gains under U.S. generally accepted accounting principles (book) purposes and Internal Revenue Service (tax) purposes.
Shareholders are strongly advised to consult their own tax advisers with respect to the tax consequences of their investments in the Portfolios. In January, shareholders, excluding corporate shareholders, receive an IRS 1099-DIV regarding the federal tax status of the dividends and distributions they received in the calendar year.
TRUSTEE AND OFFICER INFORMATION (Unaudited)
The business and affairs of the Trust are managed under the direction of the Board. A Trustee, who is not an interested person of the Trust, as defined in the 1940 Act, is an independent trustee (“Independent Trustee”). The Trustees and Officers of the Trust are listed below. The Statement of Additional Information includes additional information about Trustees of the Trust and is available, without charge, upon request at (800) 366-0066.
| Name, Address and Age | | | Position(s)
Held with the
Trust | | | Term of Office and
Length of Time
Served(1) | | | Principal
Occupation(s) −
During the Past 5 Years | | | Number of
funds in
Fund
Complex
Overseen by
Trustee(2) | | | Other Board Positions
Held by Trustee | |
| Independent Trustees: | | | | | | | | | | | | | | | | |
Colleen D. Baldwin
7337 East Doubletree
Ranch Rd.
Suite 100
Scottsdale, Arizona 85258
Age: 60 | | | Trustee Chairperson | | | November 2007 –
Present January 2020 –
Present | | | President, Glantuam Partners, LLC, a business consulting firm (January 2009 – Present). | | | 133 | | | Dentaquest (February 2014 – Present); RSR Partners, Inc. (2016 – Present). | |
John V. Boyer
7337 East Doubletree
Ranch Rd.
Suite 100
Scottsdale, Arizona 85258
Age: 67 | | | Trustee | | | January 2005 –
Present | | | Retired. Formerly, President and Chief Executive Officer, Bechtler Arts Foundation, an arts and education foundation (January 2008 – December
2019). | | | 133 | | | None. | |
Patricia W. Chadwick
7337 East Doubletree
Ranch Rd.
Suite 100
Scottsdale, Arizona 85258
Age: 72 | | | Trustee | | | January 2006 –
Present | | | Consultant and President, Ravengate Partners LLC, a consulting firm that provides advice regarding financial markets and the global economy (January 2000 – Present). | | | 133 | | | Wisconsin Energy Corporation (June 2006 – Present); The Royce Funds (22 funds) (December 2009 – Present); and AMICA Mutual Insurance Company (1992 – Present). | |
Martin J. Gavin
7337 East Doubletree Ranch Rd. Suite 100
Scottsdale, AZ 85258
Age: 70 | | | Trustee | | | August 2015 –
Present | | | Retired. Formerly, President and Chief Executive Officer, Connecticut Children’s Medical Center (May 2006 – November 2015). | | | 133 | | | None. | |
Joseph E. Obermeyer
7337 East Doubletree Ranch Rd.
Suite 100
Scottsdale, Arizona 85258
Age: 63 | | | Trustee | | | May 2013 –
Present | | | President, Obermeyer & Associates, Inc., a provider of financial and economic consulting services (November 1999 – Present). | | | 133 | | | None. | |
Sheryl K. Pressler
7337 East Doubletree Ranch Rd.
Suite 100
Scottsdale, Arizona 85258
Age: 70 | | | Trustee | | | January 2006 –
Present | | | Consultant (May 2001 – Present). | | | 133 | | | None. | |
Christopher P. Sullivan
7337 East Doubletree Ranch Rd.
Suite 100
Scottsdale, Arizona 85258
Age: 67 | | | Trustee | | | October 2015 –
Present | | | Retired. | | | 133 | | | None. | |
TRUSTEE AND OFFICER INFORMATION (Unaudited) (continued)
| Name, Address and Age | | | Position(s)
Held with the
Trust | | | Term of Office and
Length of Time
Served(1) | | | Principal
Occupation(s) −
During the Past 5 Years | | | Number of
funds in
Fund
Complex
Overseen by
Trustee(2) | | | Other Board Positions
Held by Trustee | |
| Trustee who is an “interested person”: | |
Dina Santoro
230 Park Avenue
New York, New York 10169
Age: 47 | | | Trustee | | | July 2018 – Present | | | President, Voya Investments, LLC and Voya Capital, LLC (March 2018 − Present); Senior Vice President, Voya Investments Distributor, LLC (April 2018 – Present); Senior Managing Director, Head of Product and Marketing Strategy, Voya Investment Management (September 2017 – Present). Formerly, Managing Director, Quantitative Management Associates, LLC (January 2004 – August 2017). | | | 133 | | | Voya Investments, LLC, Voya Capital, LLC, and Voya Funds Services, LLC (March 2018 – Present); Voya Investments Distributor, LLC (April 2018 – Present). | |
(1)
Trustees serve until their successors are duly elected and qualified. The tenure of each Trustee who is not an “interested person” as defined in the 1940 Act, of each Portfolio (“Independent Trustee”) is subject to the Board’s retirement policy which states that each duly elected or appointed Independent Trustee shall retire from and cease to be a member of the Board of Trustees at the close of business on December 31 of the calendar year in which the Independent Trustee attains the age of 75. A majority vote of the Board’s other Independent Trustees may extend the retirement date of an Independent Trustee if the retirement would trigger a requirement to hold a meeting of shareholders of the Trust under applicable law, whether for the purposes of appointing a successor to the Independent Trustee or otherwise comply under applicable law, in which case the extension would apply until such time as the shareholder meeting can be held or is no longer required (as determined by a vote of a majority of the other Independent Trustees).
(2)
For the purposes of this table, “Fund Complex” means the Voya family of funds including the following investment companies: Voya Asia Pacific High Dividend Equity Income Fund; Voya Balanced Portfolio, Inc.; Voya Emerging Markets High Dividend Equity Fund; Voya Equity Trust; Voya Funds Trust; Voya Global Advantage and Premium Opportunity Fund; Voya Global Equity Dividend and Premium Opportunity Fund; Voya Government Money Market Portfolio; Voya Infrastructure, Industrials and Materials Fund; Voya Intermediate Bond Portfolio; Voya International High Dividend Equity Income Fund; Voya Investors Trust; Voya Mutual Funds; Voya Natural Resources Equity Income Fund; Voya Partners, Inc.; Voya Senior Income Fund; Voya Separate Portfolios Trust; Voya Strategic Allocation Portfolios, Inc.; Voya Variable Funds; Voya Variable Insurance Trust; Voya Variable Portfolios, Inc.; and Voya Variable Products Trust. The number of funds in the Fund Complex is as of January 31, 2021. .
TRUSTEE AND OFFICER INFORMATION (Unaudited) (continued)
| Name, Address and Age | | | Position(s) Held
With the Trust | | | Term of Office and
Length of Time
Served(1) | | | Principal Occupation(s) – During the Past 5 Years | |
Michael Bell
One Orange Way
Windsor, Connecticut 06095
Age: 52 | | | Chief Executive Officer | | | March 2018 – Present | | | Chief Executive Officer and Director, Voya Investments, LLC, Voya Capital, LLC, and Voya Funds Services, LLC (March 2018 – Present); Senior Vice President and Chief Financial Officer, Voya Investments Distributor, LLC (September 2019 – Present); Chief Financial Officer, Voya Investment Management (September 2014 – Present). Formerly, Senior Vice President, Chief Financial Officer and Treasurer, Voya Investments, LLC (November 2015 – March 2018). | |
Dina Santoro
230 Park Avenue
New York, New York 10169
Age: 47 | | | President | | | March 2018 – Present | | | President and Director, Voya Investments, LLC and Voya Capital, LLC (March 2018 – Present); Director, Voya Funds Services, LLC (March 2018 – Present); Director and Senior Vice President, Voya Investments Distributor, LLC (April 2018 – Present); Senior Managing Director, Head of Product and Marketing Strategy, Voya Investment Management (September 2017 – Present). Formerly, Managing Director, Quantitative Management Associates, LLC (January 2004 – August 2017). | |
Jonathan Nash
230 Park Avenue
New York, New York 10169
Age: 53 | | | Executive Vice President Chief Investment Risk Officer | | | March 2020 – Present March 2020 – Present | | | Senior Vice President, Investment Risk Management, Voya Investment Management (March 2017 – Present); Formerly, Consultant, DA Capital LLC (January 2016 – March 2017); Managing Director, Enterprise Risk, American International Group (AIG) (September 2014 – March 2015). | |
James M. Fink
5780 Powers Ferry Road NW
Atlanta, Georgia 30327
Age: 62 | | | Executive Vice President | | | March 2018 – Present | | | Managing Director, Voya Investments, LLC, Voya Capital, LLC, and Voya Funds Services, LLC (March 2018 – Present); Senior Vice President, Voya Investments Distributor, LLC (April 2018 – Present); Chief Administrative Officer, Voya Investment Management (September 2017 – Present). Formerly, Managing Director, Operations, Voya Investment Management (March 1999-September 2017). | |
Kevin M. Gleason
7337 East Doubletree Ranch Rd.
Suite 100
Scottsdale, Arizona 85258
Age: 54 | | | Chief Compliance Officer | | | February 2012 – Present | | | Senior Vice President, Voya Investment Management and Chief Compliance Officer, Voya Family of Funds (February 2012 – Present). | |
Todd Modic
7337 East Doubletree Ranch Rd.
Suite 100
Scottsdale, Arizona 85258
Age: 53 | | | Senior Vice President, Chief/Principal Financial Officer and Assistant Secretary | | | March 2005 – Present | | | President, Voya Funds Services, LLC (March 2018 – Present) and Senior Vice President, Voya Investments, LLC (April 2005 – Present). | |
Kimberly A. Anderson
7337 East Doubletree Ranch Rd.
Suite 100
Scottsdale, Arizona 85258
Age: 56 | | | Senior Vice President | | | November 2003 – Present | | | Senior Vice President, Voya Investments, LLC (September 2003 – Present). | |
Micheline S. Faver
7337 East Doubletree Ranch Rd.
Suite 100
Scottsdale, Arizona 85258
Age: 43 | | | Senior Vice President | | | September 2020 – Present | | | Vice President, Head of Fund Compliance and Chief Compliance Officer, Voya Investments, LLC (June 2016 – Present). Formerly, Vice President, Mutual Fund Compliance (March 2014 – June 2016). | |
Robert Terris
5780 Powers Ferry Road NW
Atlanta, Georgia 30327
Age: 50 | | | Senior Vice President | | | May 2006 – Present | | | Senior Vice President, Voya Investments Distributor, LLC (April 2018 – Present); Senior Vice President, Head of Investment Services, Voya Investments, LLC (April 2018 – Present) and Voya Funds Services, LLC (March 2006 – Present). Formerly, Senior Vice President, Head of Division Operations, Voya Investments, LLC (October 2015 – April 2018). | |
TRUSTEE AND OFFICER INFORMATION (Unaudited) (continued)
| Name, Address and Age | | | Position(s) Held
With the Trust | | | Term of Office and
Length of Time
Served(1) | | | Principal Occupation(s) – During the Past 5 Years | |
Fred Bedoya
7337 East Doubletree Ranch Rd.
Suite 100
Scottsdale, Arizona 85258
Age: 48 | | | Vice President and Treasurer | | | September 2012 – Present | | | Vice President, Voya Investments, LLC (October 2015 – Present) and Voya Funds Services, LLC (July 2012 – Present). | |
Maria M. Anderson
7337 East Doubletree Ranch Rd.
Suite 100
Scottsdale, Arizona 85258
Age: 62 | | | Vice President | | | September 2004 – Present | | | Vice President, Voya Investments, LLC (October 2015 – Present) and Voya Funds Services, LLC (September 2004 – Present). | |
Sara M. Donaldson
7337 East Doubletree Ranch Rd.
Suite 100
Scottsdale, Arizona 85258
Age: 61 | | | Vice President | | | September 2014 – Present | | | Vice President, Voya Investments, LLC (October 2015 – Present). | |
Robyn L. Ichilov
7337 East Doubletree Ranch Rd.
Suite 100
Scottsdale, Arizona 85258
Age: 53 | | | Vice President | | | November 1999 – Present | | | Vice President, Voya Funds Services, LLC (November 1995 – Present) and Voya Investments, LLC (August 1997 – Present). | |
Jason Kadavy
7337 East Doubletree Ranch Rd.
Suite 100
Scottsdale, Arizona 85258
Age: 44 | | | Vice President | | | September 2012 – Present | | | Vice President, Voya Investments, LLC (October 2015 – Present) and Voya Funds Services, LLC (July 2007 – Present). | |
Andrew K. Schlueter
7337 East Doubletree Ranch Rd.
Suite 100
Scottsdale, Arizona 85258
Age: 44 | | | Vice President | | | March 2018 – Present | | | Vice President, Voya Investments Distributor, LLC (April 2018 – Present); Vice President, Voya Investments, LLC and Voya Funds Services, LLC (March 2018 – Present); Vice President, Head of Mutual Fund Operations, Voya Investment Management (February 2018 – Present). Formerly, Vice President, Voya Investment Management (March 2014 – February 2018). | |
Craig Wheeler
7337 East Doubletree Ranch Rd.
Suite 100
Scottsdale, Arizona 85258
Age: 51 | | | Vice President | | | May 2013 – Present | | | Vice President – Director of Tax, Voya Investments, LLC (October 2015 – Present). | |
Monia Piacenti
One Orange Way
Windsor, Connecticut 06095
Age: 44 | | | Anti-Money Laundering Officer | | | June 2018 – Present | | | Anti-Money Laundering Officer, Voya Investments Distributor, LLC, Voya Investment Management and Voya Investment Management Trust Co. (June 2018 – Present); Compliance Consultant, Voya Financial, Inc. (January 2019 – Present). Formerly, Senior Compliance Officer, Voya Investment Management (December 2009 – December 2018). | |
Joanne F. Osberg
7337 East Doubletree Ranch Rd.
Suite 100
Scottsdale, Arizona 85258
Age: 39 | | | Secretary | | | September 2020 – Present | | | Vice President and Senior Counsel, Voya Investment Management – Mutual Fund Legal Department (September 2020 – Present). Formerly, Vice President, Counsel II, Voya Investment Management – Mutual Fund Legal Department (January 2013 – September 2020). | |
Paul A. Caldarelli
7337 East Doubletree Ranch Rd.
Suite 100
Scottsdale, Arizona 85258
Age: 69 | | | Assistant Secretary | | | June 2010 – Present | | | Vice President and Senior Counsel, Voya Investment Management – Mutual Fund Legal Department (March 2010 – Present). | |
(1)
The Officers hold office until the next annual meeting of the Board of Trustees and until their successors shall have been elected and qualified.
ADVISORY AND SUB-ADVISORY CONTRACT APPROVAL DISCUSSION (Unaudited)
BOARD CONSIDERATION AND APPROVAL OF INVESTMENT MANAGEMENT CONTRACTS AND SUB-ADVISORY CONTRACTS
At a meeting held on November 19, 2020, the Board of Trustees (“Board”) of Voya Investors Trust (the “Trust”), including a majority of the Board members who have no direct or indirect interest in the management and sub-advisory contracts, and who are not “interested persons” of Voya Balanced Income Portfolio, Voya High Yield Portfolio, Voya Large Cap Growth Portfolio, Voya Large Cap Value Portfolio, Voya Limited Maturity Bond Portfolio, Voya U.S. Stock Index Portfolio, VY® Clarion Real Estate Portfolio, and VY® JPMorgan Small Cap Core Equity Portfolio, each a series of the Trust (the “Portfolios”), as such term is defined under the Investment Company Act of 1940, as amended (the “Independent Trustees”), considered and approved the renewal of the investment management contracts (the “Management Contracts”) between Voya Investments, LLC (the “Manager”) and the Trust, on behalf of the Portfolios, and the sub-advisory contracts (the “Sub-Advisory Contracts,” and together with the Management Contracts, the “Contracts”) with Voya Investment Management Co. LLC, CBRE Clarion Securities LLC and JPMorgan Investment Management Inc., the respective sub-advisers to each Portfolio (the “Sub-Advisers”), for an additional one year period ending November 30, 2021.
In addition to the Board meeting on November 19, 2020, the Independent Trustees also held meetings outside the presence of personnel representing the Manager or Sub-Advisers (collectively, such persons are referred to herein as “management”) on October 8, 2020, and November 17, 2020. At those meetings the Board reviewed and considered materials related to the proposed continuance of the Contracts that they had requested and believed to be relevant to the renewal of the Contracts in light of their own business judgment and the legal advice furnished to them by K&L Gates LLP, their independent legal counsel. The Board also considered information furnished to it throughout the year at meetings of the Board and its committees, including information regarding performance, expenses, and other matters. While the Board considered the renewal of the management contracts and sub-advisory contracts for all of the applicable investment companies in the Voya family of funds at the same meetings, the Board considered each Voya fund’s investment management and sub-advisory relationships separately.
The Board has established a Contracts Committee and Investment Review Committees (the “IRCs”), each of which includes only Independent Trustees as members. The Contracts Committee meets several times throughout the year to provide oversight with respect to the
management and sub-advisory contracts approval and renewal process for each Voya fund, among other functions, and each IRC meets several times throughout the year with respect to each Voya fund that is assigned to that IRC to provide oversight regarding the investment performance of the sub-advisers, as well as the Manager’s role in monitoring the sub-advisers.
The Contracts Committee oversees, and annually recommends Board approval of updates to, a methodology guide for the Voya funds (“Methodology Guide”), which sets out a framework pursuant to which the Independent Trustees request, and management provides, certain information that the Independent Trustees deem to be important or potentially relevant. The Independent Trustees retain the services of an independent consultant with experience in the mutual fund industry to assist the Contracts Committee in developing and recommending to the Board: (1) a selected peer group of investment companies for each Portfolio (“Selected Peer Group”) based on that Portfolio’s particular attributes, such as fund type and size, fund category (as determined by Morningstar, Inc., an independent provider of mutual fund data (“Morningstar”)), sales channels and structure and the Portfolio share class being compared to the Selected Peer Group; and (2) updates to the Methodology Guide with respect to the content and format of various data prepared in connection with the renewal process, including, but not limited to, investment performance, fee structure, and expense information. In addition, the Independent Trustees periodically have retained an independent firm to test and verify the accuracy of certain information presented to the Board for a representative sample of the Voya funds.
The Manager or a Sub-Adviser may not have been able to, or opted not to, provide information in response to certain information requests, in which case the Board conducted its evaluation of the firm based on information that was provided. In such cases, the Board determined that the omission of any such information was not material to its considerations. Additionally, the Board considered the impact of significant market volatility that occurred during and after the period for which information was requested in conducting its evaluation of the Manager and a Sub-Adviser.
Provided below is an overview of certain material factors that the Board considered at its meetings regarding the renewal of the Contracts and the compensation to be paid thereunder. The Board members did not identify any particular information or factor that was most relevant to its consideration, and each Board member may have accorded different weight to the various factors in reaching his or her conclusions with respect to each Portfolio’s investment management and sub-advisory arrangements.
ADVISORY AND SUB-ADVISORY CONTRACT APPROVAL DISCUSSION (Unaudited) (continued)
Nature, Extent and Quality of Services
The Manager oversees, subject to the authority of the Board, and is responsible for the provision of, all investment advisory and portfolio management services for the Portfolios but may delegate certain of these responsibilities to one or more sub-advisers. In addition, the Manager provides administrative services reasonably necessary for the operation of the Portfolios as set forth in the Management Contracts, including oversight of the Portfolios’ operations and risk management and the oversight of their various other service providers.
The Board considered the “manager-of-managers” platform of the Voya funds that has been developed by the Manager pursuant to which the Manager selects, subject to the Board’s approval, sub-advisers to provide day-to-day management services to all or a portion of each Voya fund. The Board recognized that the Manager is responsible for monitoring the investment program, performance, developments, ongoing operations, and compliance with applicable regulations and investment policies and restrictions of the Sub-Advisers with respect to the Portfolios under this manager-of-managers arrangement. The Board also considered the techniques and resources that the Manager has developed to provide this ongoing oversight and due diligence with respect to the sub-advisers and to advocate or recommend, when it believes appropriate, changes in investment strategies or investment sub-advisers designed to assist in improving a Voya fund’s performance. In connection with the Manager’s performance of these duties, the Board considered that the Manager has developed an oversight process formulated by its Manager Research & Selection Group which reviews, among other matters, performance data, each Sub-Adviser’s management team, portfolio data and attribution analysis related to each Sub-Adviser through various means, including, but not limited to, in-person meetings, on-site or virtual visits, and telephonic meetings with the Sub-Adviser.
Further, the Board considered periodic compliance reports it receives from the Trust’s Chief Compliance Officer evaluating whether the regulatory compliance systems and procedures of the Manager and the Sub-Advisers are reasonably designed to ensure compliance with the federal securities laws and whether the investment policies and restrictions for each Portfolio are consistently complied with, and other periodic reports covering related matters.
The Board considered the portfolio management team assigned by the Sub-Advisers to the Portfolios and the level of resources committed to the Portfolios (and other relevant funds in the Voya funds) by the Manager and the Sub-Advisers, and whether those resources are sufficient to provide high-quality services to the Portfolios.
Based on their deliberations and the materials presented to them, the Board concluded that the nature, extent and quality of the overall services provided by the Manager and each Sub-Adviser under the Contracts were appropriate.
Portfolio Performance
In assessing the investment management and sub-advisory relationships, the Board placed emphasis on the investment returns of each Portfolio, including its investment performance over certain time periods compared to the Portfolio’s Morningstar category (except for Voya U.S. Stock Index Portfolio, as discussed below) and primary benchmark, a broad-based securities market index identified in the Portfolio’s prospectus. In addition, the Board considered Voya Limited Maturity Bond Portfolio’s investment performance compared to an additional performance peer group that is approved by the Portfolio’s IRC due to the unique investment structure or strategy of that Portfolio. The Board also considered information from the Manager Research & Selection Group and received reports summarizing a separate analysis of each Portfolio’s performance and risk, including risk-adjusted investment return information, from the Trust’s Chief Investment Risk Officer.
In assessing the investment management and sub-advisory relationships, with respect to Voya U.S. Stock Index Portfolio, which seeks investment results corresponding to the performance of an index (commonly referred to an as an “index fund”), the Board focused on the reasonableness of the differences between the Portfolio’s net performance and the total return of such index during these time periods.
Economies of Scale
When evaluating the reasonableness of the management fee schedules, the Board considered whether economies of scale have been or likely will be realized by the Manager and the Sub-Advisers as a Portfolio grows larger and the extent to which any such economies are shared with the Portfolio. In this regard, the Board noted any breakpoints in management fee schedules that will result in a lower management fee rate when a Portfolio achieves sufficient asset levels to receive a breakpoint discount. The Board also considered that, while some of the Portfolios do not have management fee breakpoints, the Portfolios may have fee waiver and expense reimbursement arrangements. The Board considered the extent to which economies of scale realized by the Manager or the Sub-Advisers could be shared with each Portfolio through such fee waivers, expense reimbursements or other expense reductions. In evaluating these matters, the Independent Trustees also considered periodic management reports, Selected Peer Group comparisons,
ADVISORY AND SUB-ADVISORY CONTRACT APPROVAL DISCUSSION (Unaudited) (continued)
and industry information regarding economies of scale. In the case of sub-advisory fees, the Board considered that breakpoints, if any, would inure to the benefit of the Manager.
Information Regarding Services, Performance, and Fee Schedules Offered to Other Clients
The Board considered comparative information regarding the nature of services, performance, and fee schedules offered by the Manager and the Sub-Advisers to other clients with similar investment objectives, if applicable, including other registered investment companies and relevant institutional accounts. When the fee schedules offered to or the performance of such other clients differed materially from a Portfolio, the Board took into account the underlying rationale provided by the Manager or the Sub-Advisers, as applicable, for these differences. For the non-Voya-affiliated Sub-Advisers, the Board viewed the information related to any material differences in the fee schedules as not being a key factor in its deliberations because of the arm’s-length nature of negotiations between the Manager and non-Voya-affiliated Sub-Advisers with respect to sub-advisory fee schedules and that the Manager is responsible for paying the fees of the Sub-Adviser.
Fee Schedules, Profitability, and Fall-out Benefits
The Board reviewed and considered the contractual management fee schedule and net management fee rate payable by each Portfolio to the Manager compared to the Portfolio’s Selected Peer Group and which additional services the Manager pays for on behalf of the Portfolio under the “bundled fee” arrangement in return for a single management fee (“Unified Fee Structure”). The Board also considered the compensation payable by the Manager to each Sub-Adviser for sub-advisory services for each Portfolio, including the portion of the contractual and net management fee rates that are paid to each Sub-Adviser, as compared to the compensation paid to the Manager. In addition, the Board considered any fee waivers, expense limitations, and/or recoupment arrangements that apply to the fees payable by the Portfolios, including whether the Manager intends to propose any changes thereto. The Board also considered the extent to which the Manager currently waives management fees and/or reimburses a Portfolio for other Portfolio-level expenses at different rates for different share classes (“Differential Fee Waiver”), including the basis for the Manager’s determination that any Differential Fee Waiver does not and will not result in any cross-subsidization by one share class of another share class. For each Portfolio, the Board separately determined that the fees payable to the Manager and the fee schedule payable to each Sub-Adviser are reasonable for the services that each performs, which were considered
in light of the nature, extent and quality of the services that each has performed and is expected to perform.
For each Portfolio, the Board considered information on revenues, costs and profits or losses realized by the Manager and the Voya-affiliated Sub-Adviser related to their services to the Portfolio. In analyzing the profitability of the Manager and its affiliated service providers in connection with services they render to a Portfolio, the Board took into account the sub-advisory fee rate payable by the Manager to each Sub-Adviser. The Board also considered the profitability of the Manager and its affiliated Sub-Adviser attributable to servicing each Portfolio both with and without taking into account the profitability of the distributor of the Portfolios and any revenue sharing payments made by the Manager and both before and after giving effect to any expenses incurred by the Manager or the affiliated Sub-Adviser in making payments to affiliated insurance companies. The Board did not request profitability data from the Sub-Advisers that are not affiliated with the Manager because the Board did not view this data as a key factor to its deliberations given the arm’s-length nature of the relationship between the Manager and these non-Voya-affiliated Sub-Advisers with respect to the negotiation of sub-advisory fee schedules. In addition, the Board noted that non-Voya-affiliated sub-advisers may not account for their profits on an account-by-account basis and those that do typically employ different methodologies in connection with these calculations.
Although the Methodology Guide establishes a framework for profit calculation, the Board recognized that there is no uniform methodology within the asset management industry for determining profitability for this purpose. The Board also recognized that the use of different reasonable methodologies can give rise to dramatically different reported profit and loss results with respect to the Manager and the Voya-affiliated Sub-Adviser, as well as other industry participants with whom the profits of the Manager and its affiliated Sub-Adviser could be compared. In addition, the Board recognized that management’s calculations regarding its costs incurred in establishing the infrastructure necessary for the Portfolios’ operations may not be fully reflected in the expenses allocated to each Portfolio in determining profitability, and that the information presented may not portray all of the costs borne by the Manager or reflect all risks, including entrepreneurial, regulatory, legal and operational risks, associated with offering and managing a mutual fund complex in the current regulatory and market environment.
The Board also considered that the Manager and the Voya-affiliated Sub-Adviser are entitled to earn a reasonable level of profits for the services that they provide to the Portfolios. The Board also considered information
ADVISORY AND SUB-ADVISORY CONTRACT APPROVAL DISCUSSION (Unaudited) (continued)
regarding the potential fall-out benefits to the Manager and Sub-Advisers and their respective affiliates from their association with the Portfolios, including their ability to engage in soft-dollar transactions on behalf of the Portfolios. Following its reviews, the Board determined that the Manager’s and the Voya-affiliated Sub-Adviser’s profitability with respect to their services to the Portfolios and the Manager and Sub-Advisers’ potential fall-out benefits were not unreasonable.
Portfolio-by-Portfolio Analysis
Set forth below are certain of the specific factors that the Board considered at its October 7, 2020, November 17, 2020, and/or November 19, 2020 meetings in relation to approving each Portfolio’s Contracts and the conclusions reached by the Board. These specific factors are in addition to those considerations discussed above. In each case, the Portfolio’s performance was compared to its Morningstar category, as well as its primary benchmark and, as applicable, a performance peer group. The performance data provided to the Board primarily was for various periods ended March 31, 2020. In addition, the Board also considered at its October 7, 2020, November 17, 2020, and November 19, 2020 meetings certain additional data regarding each Portfolio’s more recent performance, asset levels and asset flows. Each Portfolio’s management fee rate and expense ratio were compared to the management fee rates and expense ratios of the funds in its Selected Peer Group. With respect to the quintile rankings noted below, the first quintile represents the range of funds with the highest performance or the lowest management fee rate or expense ratio, as applicable, and the fifth quintile represents the range of funds with the lowest performance or the highest management fee rate or expense ratio, as applicable.
Voya Balanced Income Portfolio
In considering whether to approve the renewal of the Contracts for Voya Balanced Income Portfolio, the Board considered that, based on performance data for the periods ended March 31, 2020: (1) the Portfolio is ranked in the first quintile of its Morningstar category for the five-year and ten-year periods, and the fourth quintile for the year-to-date, one-year and three-year periods; and (2) the Portfolio underperformed its primary benchmark for all periods presented. In analyzing this performance data, the Board took into account management’s representations regarding: (1) the competitiveness of the Portfolio’s performance during certain periods; (2) that there was a change in the Portfolio’s Sub-Adviser and investment strategies, effective May 1, 2019; and (3) its confidence in the Sub-Adviser’s ability to meet the Portfolio’s investment objective.
In considering the fees payable under the Contracts for the Portfolio, the Board took into account the factors described above and also considered: (1) the fairness of the compensation under a Management Contract with a level fee rate that does not include breakpoints; and (2) the pricing structure (including the net expense ratio to be borne by shareholders) of the Portfolio, as compared to its Selected Peer Group, including that: (a) the net management fee rate for the Portfolio is ranked in the third quintile of net management fee rates of the funds in its Selected Peer Group; (b) the contractual management fee rate for the Portfolio is ranked in the second quintile of contractual management fee rates of the funds in its Selected Peer Group; and (c) the net expense ratio for the Portfolio is ranked in the second quintile of net expense ratios of the funds in its Selected Peer Group.
After its deliberation, the Board reached the following conclusions: (1) the Portfolio’s management fee rate is reasonable in the context of all factors considered by the Board; (2) the Portfolio’s net expense ratio is reasonable in the context of all factors considered by the Board; (3) the Portfolio’s performance is reasonable in the context of all factors considered by the Board; and (4) the sub-advisory fee rate payable by the Manager to the Sub-Adviser is reasonable in the context of all factors considered by the Board. Based on these conclusions and other factors, the Board voted to renew the Contracts for the Portfolio for the year ending November 30, 2021. During this renewal process, different Board members may have given different weight to different individual factors and related conclusions.
Voya High Yield Portfolio
In considering whether to approve the renewal of the Contracts for Voya High Yield Portfolio, the Board considered that, based on performance data for the periods ended March 31, 2020: (1) the Portfolio is ranked in the first quintile of its Morningstar category for the three-year, five-year and ten-year periods, and the second quintile for the year-to-date and one-year periods; and (2) the Portfolio outperformed its primary benchmark for all periods presented, with the exception of the ten-year period, during which it underperformed.
In considering the fees payable under the Contracts for the Portfolio, the Board took into account the factors described above and also considered: (1) the fairness of the compensation under a Management Contract with a breakpoint fee schedule where the asset level necessary to achieve a breakpoint discount had not been reached by the Portfolio; and (2) the pricing structure (including the net expense ratio to be borne by shareholders) of the Portfolio, as compared to its Selected Peer Group, including that: (a) the net management fee rate for the Portfolio is ranked
ADVISORY AND SUB-ADVISORY CONTRACT APPROVAL DISCUSSION (Unaudited) (continued)
in the first quintile of net management fee rates of the funds in its Selected Peer Group; (b) the contractual management fee rate for the Portfolio is ranked in the first quintile of contractual management fee rates of the funds in its Selected Peer Group; and (c) the net expense ratio for the Portfolio is ranked in the first quintile of net expense ratios of the funds in its Selected Peer Group. In analyzing this fee data, the Board took into account the expense borne by the Manager for the provision of services to the Portfolio, such as transfer agency, custody, accounting and legal services, pursuant to the Portfolio’s Unified Fee Structure.
After its deliberation, the Board reached the following conclusions: (1) the Portfolio’s management fee rate is reasonable in the context of all factors considered by the Board; (2) the Portfolio’s net expense ratio is reasonable in the context of all factors considered by the Board; (3) the Portfolio’s performance is reasonable in the context of all factors considered by the Board; and (4) the sub-advisory fee rate payable by the Manager to the Sub-Adviser is reasonable in the context of all factors considered by the Board. Based on these conclusions and other factors, the Board voted to renew the Contracts for the Portfolio for the year ending November 30, 2021. During this renewal process, different Board members may have given different weight to different individual factors and related conclusions.
Voya Large Cap Growth Portfolio
In considering whether to approve the renewal of the Contracts for Voya Large Cap Growth Portfolio, the Board considered that, based on performance data for the periods ended March 31, 2020: (1) the Portfolio is ranked in the second quintile of its Morningstar category for the one-year, three-year, five-year and ten-year periods, and the third quintile for the year-to-date period; and (2) the Portfolio underperformed its primary benchmark for all periods presented.
In considering the fees payable under the Contracts for the Portfolio, the Board took into account the factors described above and also considered: (1) the economies of scale benefits to the Portfolio and its shareholders from breakpoint discounts applicable to the Portfolio’s management fee rate, which result in lower fees at higher asset levels; and (2) the pricing structure (including the net expense ratio to be borne by shareholders) of the Portfolio, as compared to its Selected Peer Group, including that: (a) the net management fee rate for the Portfolio is ranked in the second quintile of net management fee rates of the funds in its Selected Peer Group; (b) the contractual management fee rate for the Portfolio is ranked in the second quintile of contractual management fee rates of the funds in its Selected Peer Group; and (c) the net
expense ratio for the Portfolio is ranked in the second quintile of net expense ratios of the funds in its Selected Peer.
After its deliberation, the Board reached the following conclusions: (1) the Portfolio’s management fee rate is reasonable in the context of all factors considered by the Board; (2) the Portfolio’s net expense ratio is reasonable in the context of all factors considered by the Board; (3) the Portfolio’s performance is reasonable in the context of all factors considered by the Board; and (4) the sub-advisory fee rate payable by the Manager to the Sub-Adviser is reasonable in the context of all factors considered by the Board. Based on these conclusions and other factors, the Board voted to renew the Contracts for the Portfolio for the year ending November 30, 2021. During this renewal process, different Board members may have given different weight to different individual factors and related conclusions.
Voya Large Cap Value Portfolio
In considering whether to approve the renewal of the Contracts for Voya Large Cap Value Portfolio, the Board considered that, based on performance data for the periods ended March 31, 2020: (1) the Portfolio is ranked in the third quintile of its Morningstar category for the year-to-date, one-year and ten-year periods, and the fourth quintile for the three-year and five-year periods; and (2) the Portfolio underperformed its primary benchmark for all periods presented. In analyzing this performance data, the Board took into account management’s representations regarding: (1) the impact of security selection on the Portfolio’s performance; and (2) the competitiveness of the Portfolio’s performance during certain periods.
In considering the fees payable under the Contracts for the Portfolio, the Board took into account the factors described above and also considered: (1) the economies of scale benefits to the Portfolio and its shareholders from breakpoint discounts applicable to the Portfolio’s management fee rate, which result in lower fees at higher asset levels; and (2) the pricing structure (including the net expense ratio to be borne by shareholders) of the Portfolio, as compared to its Selected Peer Group, including that: (a) the net management fee rate for the Portfolio is ranked in the first quintile of net management fee rates of the funds in its Selected Peer Group; (b) the contractual management fee rate for the Portfolio is ranked in the fourth quintile of contractual management fee rates of the funds in its Selected Peer Group; and (c) the net expense ratio for the Portfolio is ranked in the second quintile of net expense ratios of the funds in its Selected Peer Group.
After its deliberation, the Board reached the following conclusions: (1) the Portfolio’s management fee rate is reasonable in the context of all factors considered by the
ADVISORY AND SUB-ADVISORY CONTRACT APPROVAL DISCUSSION (Unaudited) (continued)
Board; (2) the Portfolio’s net expense ratio is reasonable in the context of all factors considered by the Board; (3) the Portfolio’s performance is reasonable in the context of all factors considered by the Board; and (4) the sub-advisory fee rate payable by the Manager to the Sub-Adviser is reasonable in the context of all factors considered by the Board. Based on these conclusions and other factors, the Board voted to renew the Contracts for the Portfolio for the year ending November 30, 2021. During this renewal process, different Board members may have given different weight to different individual factors and related conclusions.
Voya Limited Maturity Bond Portfolio
In considering whether to approve the renewal of the Contracts for Voya Limited Maturity Bond Portfolio, the Board considered that, based on performance data for the periods ended March 31, 2020: (1) the Portfolio is ranked in the second quintile of its Morningstar category for the year-to-date, one-year, three-year and five-year periods, and the fourth quintile for the ten-year period; and (2) the Portfolio underperformed its primary benchmark for all periods presented. In analyzing this performance data, the Board took into account that the Portfolio outperformed its performance peer group average for all periods presented.
In considering the fees payable under the Contracts for the Portfolio, the Board took into account the factors described above and also considered: (1) the economies of scale benefits to the Portfolio and its shareholders from breakpoint discounts applicable to the Portfolio’s management fee rate, which result in lower fees at higher asset levels; and (2) the pricing structure (including the net expense ratio to be borne by shareholders) of the Portfolio, as compared to its Selected Peer Group, including that: (a) the net management fee rate for the Portfolio is ranked in the first quintile of net management fee rates of the funds in its Selected Peer Group; (b) the contractual management fee rate for the Portfolio is ranked in the first quintile of contractual management fee rates of the funds in its Selected Peer Group; and (c) the net expense ratio for the Portfolio is ranked in the first quintile of net expense ratios of the funds in its Selected Peer Group. In analyzing this fee data, the Board took into account the expense borne by the Manager for the provision of services to the Portfolio, such as transfer agency, custody, accounting, and legal services, pursuant to the Portfolio’s Unified Fee Structure.
After its deliberation, the Board reached the following conclusions: (1) the Portfolio’s management fee rate is reasonable in the context of all factors considered by the Board; (2) the Portfolio’s net expense ratio is reasonable in the context of all factors considered by the Board; (3) the Portfolio’s performance is reasonable in the context of all
factors considered by the Board; and (4) the sub-advisory fee rate payable by the Manager to the Sub-Adviser is reasonable in the context of all factors considered by the Board. Based on these conclusions and other factors, the Board voted to renew the Contracts for the Portfolio for the year ending November 30, 2021. During this renewal process, different Board members may have given different weight to different individual factors and related conclusions.
Voya U.S. Stock Index Portfolio
In considering whether to approve the renewal of the Contracts for Voya U.S. Stock Index Portfolio, the Board considered the difference between the Portfolio’s performance and the performance of its index, and Management’s representations that such difference was reasonable and within expectations.
In considering the fees payable under the Contracts for the Portfolio, the Board took into account the factors described above and also considered: (1) the fairness of the compensation under a Management Contract with a level fee rate that does not include breakpoints; and (2) the pricing structure (including the net expense ratio to be borne by shareholders) of the Portfolio, as compared to its Selected Peer Group, including that: (a) the net management fee rate for the Portfolio is ranked in the fourth quintile of net management fee rates of the funds in its Selected Peer Group; (b) the contractual management fee rate for the Portfolio is ranked in the fourth quintile of contractual management fee rates of the funds in its Selected Peer Group; and (c) the net expense ratio for the Portfolio is ranked in the third quintile of net expense ratios of the funds in its Selected Peer Group. In analyzing this fee data, the Board took into account: (1) management’s representations regarding the expense borne by the Manager for the provision of services to the Portfolio, such as transfer agency, custody, accounting, and legal services, pursuant to the Portfolio’s Unified Fee Structure; and (2) its belief that the Portfolio’s pricing is competitive.
After its deliberation, the Board reached the following conclusions: (1) the Portfolio’s management fee rate is reasonable in the context of all factors considered by the Board; (2) the Portfolio’s net expense ratio is reasonable in the context of all factors considered by the Board; (3) the Portfolio’s performance is reasonable in the context of all factors considered by the Board; and (4) the sub-advisory fee rate payable by the Manager to the Sub-Adviser is reasonable in the context of all factors considered by the Board. Based on these conclusions and other factors, the Board voted to renew the Contracts for the Portfolio for the year ending November 30, 2021. During this renewal process, different Board members may have given different weight to different individual factors and related conclusions.
ADVISORY AND SUB-ADVISORY CONTRACT APPROVAL DISCUSSION (Unaudited) (continued)
VY® Clarion Real Estate Portfolio
In considering whether to approve the renewal of the Contracts for VY® Clarion Real Estate Portfolio, the Board considered that, based on performance data for the periods ended March 31, 2020: (1) the Portfolio is ranked in the fourth quintile of its Morningstar category for all periods presented; and (2) the Portfolio outperformed its primary benchmark for the year-to-date and one-year periods and underperformed for the three-year, five-year and ten-year periods. In analyzing this performance data, the Board took into account management’s representations regarding: (1) the impact of security selection and sector allocation on the Portfolio’s performance; (2) changes to the Portfolio’s portfolio management team, effective January 1, 2020; and (3) ongoing periodic monitoring of the Portfolio’s performance by Management and the Board or its Investment Review Committee.
In considering the fees payable under the Contracts for the Portfolio, the Board took into account the factors described above and also considered: (1) the economies of scale benefits to the Portfolio and its shareholders from breakpoint discounts applicable to the Portfolio’s management fee rate, which result in lower fees at higher asset levels; and (2) the pricing structure (including the net expense ratio to be borne by shareholders) of the Portfolio, as compared to its Selected Peer Group, including that: (a) the net management fee rate for the Portfolio is ranked in the first quintile of net management fee rates of the funds in its Selected Peer Group; (b) the contractual management fee rate for the Portfolio is ranked in the fourth quintile of contractual management fee rates of the funds in its Selected Peer Group; and (c) the net expense ratio for the Portfolio is ranked in the first quintile of net expense ratios of the funds in its Selected Peer Group.
After its deliberation, the Board reached the following conclusions: (1) the Portfolio’s management fee rate is reasonable in the context of all factors considered by the Board; (2) the Portfolio’s net expense ratio is reasonable in the context of all factors considered by the Board; (3) the Portfolio’s performance is reasonable in the context of all factors considered by the Board; and (4) the sub-advisory fee rate payable by the Manager to the Sub-Adviser is reasonable in the context of all factors considered by the Board. Based on these conclusions and other factors, the Board voted to renew the Contracts for the Portfolio for the year ending November 30, 2021. During this renewal process, different Board members may have given different weight to different individual factors and related conclusions.
VY® JPMorgan Small Cap Core Equity Portfolio
In considering whether to approve the renewal of the Contracts for VY® JPMorgan Small Cap Core Equity Portfolio, the Board considered that, based on performance data for the periods ended March 31, 2020: (1) the Portfolio is ranked in the first quintile of its Morningstar category for the three-year, five-year and ten-year periods, and the second quintile for the year-to-date and one-year periods; and (2) the Portfolio outperformed its primary benchmark for all periods presented, with the exception of the year-to-date period, during which it underperformed.
In considering the fees payable under the Contracts for the Portfolio, the Board took into account the factors described above and also considered: (1) the economies of scale benefits to the Portfolio and its shareholders from breakpoint discounts applicable to the Portfolio’s management fee rate, which result in lower fees at higher asset levels; and (2) the pricing structure (including the net expense ratio to be borne by shareholders) of the Portfolio, as compared to its Selected Peer Group, including that: (a) the net management fee rate for the Portfolio is ranked in the fourth quintile of net management fee rates of the funds in its Selected Peer Group; (b) the contractual management fee rate for the Portfolio is ranked in the third quintile of contractual management fee rates of the funds in its Selected Peer Group; and (c) the net expense ratio for the Portfolio is ranked in the second quintile of net expense ratios of the funds in its Selected Peer Group. In analyzing this fee data, the Board took into account management’s representations regarding: (1) the expense borne by the Manager for the provision of services to the Portfolio, such as transfer agency, custody, accounting, and legal services, pursuant to the Portfolio’s Unified Fee Structure; and (2) its belief that the Portfolio’s pricing is competitive.
After its deliberation, the Board reached the following conclusions: (1) the Portfolio’s management fee rate is reasonable in the context of all factors considered by the Board; (2) the Portfolio’s net expense ratio is reasonable in the context of all factors considered by the Board; (3) the Portfolio’s performance is reasonable in the context of all factors considered by the Board; and (4) the sub-advisory fee rate payable by the Manager to the Sub-Adviser is reasonable in the context of all factors considered by the Board. Based on these conclusions and other factors, the Board voted to renew the Contracts for the Portfolio for the year ending November 30, 2021. During this renewal process, different Board members may have given different weight to different individual factors and related conclusions.
Investment Adviser
Voya Investments, LLC
7337 East Doubletree Ranch Road, Suite 100
Scottsdale, Arizona 85258
Distributor
Voya Investments Distributor, LLC
7337 East Doubletree Ranch Road, Suite 100
Scottsdale, Arizona 85258
Transfer Agent
BNY Mellon Investment Servicing (U.S.) Inc.
301 Bellevue Parkway
Wilmington, Delaware 19809
Independent Registered Public Accounting Firm
Ernst & Young LLP
200 Clarendon Street
Boston, Massachusetts 02116
Custodian
The Bank of New York Mellon
225 Liberty Street
New York, New York 10286
Legal Counsel
Ropes & Gray LLP
Prudential Tower
800 Boylston Street
Boston, Massachusetts 02199
Before investing, carefully consider the investment objectives, risks, charges and expenses of the variable annuity contract or variable life insurance policy and the underlying variable investment options. This and other information is contained in the prospectus for the variable annuity contract or variable life insurance policy and the underlying variable investment options. Obtain these prospectuses from your agent/registered representative and read them carefully before investing.
RETIREMENT | INVESTMENTS | INSURANCE
voyainvestments.com
VPAR-VIT2AISS2 (1220-022321)


Annual Report
| Voya Investors Trust | | Voya Variable Insurance Trust |
■ VY® BlackRock Inflation Protected Bond Portfolio
Classes ADV, I and S | | ■ VY® BrandywineGLOBAL — Bond Portfolio |
As permitted by regulations adopted by the U.S. Securities and Exchange Commission, paper copies of each Portfolio’s annual and semi-annual shareholder reports, like this annual report, are not sent by mail, unless you specifically request paper copies of the reports. Instead, the reports will be made available on a website and you will be notified by mail each time a report is posted and provided with a website link to access the report.
If you already elected to receive shareholder reports electronically, you need not take any action. You may elect to receive shareholder reports and other communications from your insurance carrier electronically by contacting them directly.
You may elect to receive all future reports in paper free of charge. If you received this document in the mail, please follow the instructions provided to elect to continue receiving paper copies of your shareholder reports. You can inform us that you wish to continue receiving paper copies by calling 1-800-283-3427. Your election to receive reports in paper will apply to all the funds in which you invest. |
This report is submitted for general information to shareholders of the Voya mutual funds. It is not authorized for distribution to prospective shareholders unless accompanied or preceded by a prospectus which includes details regarding the funds’ investment objectives, risks, charges, expenses and other information. This information should be read carefully. |
INVESTMENT MANAGEMENT
voyainvestments.com |  |
TABLE OF CONTENTS
| President’s Letter | | 1 |
| Portfolio Mangers’ Reports | | 3 |
| Shareholder Expense Examples | | 9 |
| Report of Independent Registered Public Accounting Firm | | 10 |
| Statements of Assets and Liabilities | | 11 |
| Statements of Operations | | 13 |
| Statements of Changes in Net Assets | | 14 |
| Financial Highlights | | 15 |
| Notes to Financial Statements | | 16 |
| Summary Portfolios of Investments (“Portfolio of Investments”) | | 29 |
| Tax Information | | 50 |
| Trustee and Officer Information | | 51 |
| Advisory and Sub-Advisory Contract Approval Discussion | | 55 |
PROXY VOTING INFORMATION
A description of the policies and procedures that the Portfolios use to determine how to vote proxies related to portfolio securities is available: (1) without charge, upon request, by calling Shareholder Services toll-free at (800) 992-0180; (2) on the Portfolios’ website at www.voyainvestments.com; and (3) on the U.S. Securities and Exchange Commission’s (“SEC’s”) website at www.sec.gov. Information regarding how the Portfolios voted proxies related to portfolio securities during the most recent 12-month period ended June 30 is available without charge on the Portfolios’ website at www.voyainvestments.com and on the SEC’s website at www.sec.gov.
QUARTERLY PORTFOLIO HOLDINGS
The Portfolios file their complete schedule of portfolio holdings with the SEC for the first and third quarters of each fiscal year on Form NPORT-P. This report contains a summary portfolio of investments for the Portfolios. The Portfolios’ Forms NPORT-P are available on the SEC’s website at www.sec.gov. Each Portfolio’s complete schedule of portfolio holdings is available at: www.voyainvestments.com and without charge upon request from the Portfolio by calling Shareholder Services toll-free at (800) 992-0180.
(THIS PAGE INTENTIONALLY LEFT BLANK)
PRESIDENT’S LETTER
 Beyond the Headlines, a Glimpse of Global Economic Recovery
Dear Shareholder,
For those of us hoping that 2021 would bring more encouraging headlines, it has been a rough start to the year: political turmoil, surging COVID-19 cases and a new, more virulent strain of the coronavirus. On the surface, economic news also has seemed disappointing: labor markets have cooled, manufacturing and services activity has slowed and consumer sentiment has dropped. Yet, the financial markets continue to march higher, begging the question: Where are the markets getting their news?
Voya investment strategists have written about the uneven pressures that have created a “two-speed” or “K-shaped” economic recovery. Consumers on the higher end of the income distribution have largely kept their jobs and adapted to the pandemic by working from home. By contrast, jobs in lower paying segments of the labor market such as leisure, lodging and retail have been eliminated or furloughed and have yet to return. For lower income consumers, the good news is that the fiscal response to help offset job losses has been enormous — and fiscal relief is expected to grow under a Democratic-controlled government. The initial rollout of the coronavirus vaccines, while slower than many had hoped, still represents a significant milestone as vaccines are the bridge that are expected to allow the economy to reopen fully.
In addition to fiscal support, the response from central banks has been extraordinary. The U.S. Federal Reserve Board (“Fed”) has adjusted its policy framework in ways that make the Fed more likely to remain accommodative longer than might otherwise be expected during economic recovery phases, a game changer for financial assets. We believe that analogous developments across the world should help reignite global economic growth in 2021 and breathe new life into struggling sectors. Despite today’s negative headlines, the data is telling us that the future is likely to be better. Looking broadly at the economic picture, in our opinion, it appears that a global synchronous expansion is underway.
Of course there are still risks, and we believe that one should not overlook the potential for episodic market stresses connected to the vaccine rollout or other global factors. As always, we glimpse the future “through a glass darkly,” and must allow for contingencies we can’t foresee. For this reason, we maintain that staying fully invested and broadly diversified is the most likely way to achieve one’s long-term investment goals. Should your goals change, discuss them thoroughly with your investment advisor before making any changes to your portfolio.
We remain humble and realistic in the face of the challenges ahead, but well prepared for and fully committed to serving our clients without disruption. We appreciate your continued confidence in us, and we look forward to serving your investment needs in the future.
Sincerely,

Dina Santoro
President
Voya Family of Funds
January 22, 2021
The views expressed in the President’s Letter reflect those of the President as of the date of the letter. Any such views are subject to change at any time based upon market or other conditions and the Voya mutual funds disclaim any responsibility to update such views. These views may not be relied on as investment advice and because investment decisions for a Voya mutual fund are based on numerous factors, may not be relied on as an indication of investment intent on behalf of any Voya mutual fund. Reference to specific company securities should not be construed as recommendations or investment advice. International investing poses special risks including currency fluctuation, economic and political risks not found in investments that are solely domestic.
International investing poses special risks including currency fluctuation, economic and political risks not found in investments that are solely domestic.
1
BENCHMARK DESCRIPTIONS
| Index | | Description |
|---|
| Bloomberg Barclays U.S. Aggregate Bond Index | | An index of publicly issued investment grade U.S. government, mortgage-backed, asset-backed and corporate debt securities. |
| Bloomberg Barclays U.S. Treasury Inflation Protected Securities Index | | A market index comprised of all U.S. Treasury Inflation Linked Securities. |
2
PORTFOLIO MANAGERS’ REPORT | VY® BLACKROCK INFLATION PROTECTED
BOND PORTFOLIO
|
Investment Type Allocation
as of December 31, 2020
(as a percentage of net assets) |
| U.S. Treasury Obligations | | | 52.3 | % |
| Corporate Bonds/Notes | | | 24.9 | % |
| U.S. Government Agency Obligations | | | 7.9 | % |
| Sovereign Bonds | | | 6.0 | % |
| Commercial Mortgage-Backed Securities | | | 1.5 | % |
| Asset-Backed Securities | | | 0.4 | % |
| Purchased Options | | | 0.4 | % |
| Municipal Bonds** | | | 0.0 | % |
| Assets in Excess of Other Liabilities* | | | 6.6 | % |
| Net Assets | | | 100.0 | % |
| | | | | |
| * Includes short-term investments. |
| ** Amount is less than 0.05%. |
| |
Portfolio holdings are subject to change daily. |
VY® BlackRock Inflation Protected Bond Portfolio (the “Portfolio”) seeks to maximize real return, consistent with preservation of real capital and prudent investment management. The Portfolio is managed by Chris Allen, Managing Director and Akiva Dickstein, Managing Director, Portfolio Managers of BlackRock Financial Management, Inc. — the Sub-Adviser.
Performance: For the year ended December 31, 2020, the Portfolio’s Class I shares provided a total return of 11.15% compared to the Bloomberg Barclays U.S. Treasury Inflation Protected Securities (“TIPS”) Index, which returned 10.99% for the same period.
Portfolio Specifics: The Portfolio was broadly positioned for a risk-on, reflationary environment entering 2020. The pandemic induced a sharp rally in U.S. rates over the first quarter of 2020 that negatively impacting the portfolio management team’s structural bias to being underweight U.S. nominal rates. However, we believe the easing of political and vaccine uncertainties in the second half of 2020 helped risk assets to stage a strong comeback. The U.S. election outcome and the commencement of mass inoculation added fuel to the reflationary outlook, resulting in a sell-off in U.S. nominal rates. The outbreak induced economic uncertainty that lowered inflation expectations worldwide, alongside the broader flight-to-quality move in the first quarter. This hurt the performance of the Portfolio’s long breakeven expressions in Japan, Italy, and Germany. The strong retracement in breakeven levels in the U.S., along with peripheral European countries and New Zealand, helped offset the losses from early in the year. The shift by central banks globally to ultra-dovish monetary alongside coordinated fiscal support supported the Portfolio’s allocation to spread assets. The Portfolio benefitted from overweight allocations in investment-grade credit, emerging market debt, and collateralized mortgage-backed securities.
Top Ten Holdings
as of December 31, 2020*
(as a percentage of net assets) |
| United States Treasury Inflation Indexed Bonds, 0.375%, 07/15/27 | | 3.5 | % |
| United States Treasury Inflation Indexed Bonds, 0.500%, 01/15/28 | | 3.3 | % |
| United States Treasury Inflation Indexed Bonds, 0.750%, 07/15/28 | | 3.3 | % |
| United States Treasury Inflation Indexed Bonds, 0.375%, 01/15/27 | | 3.2 | % |
| United States Treasury Inflation Indexed Bonds, 0.125%, 07/15/30 | | 3.0 | % |
| United States Treasury Inflation Indexed Bonds, 0.625%, 01/15/26 | | 3.0 | % |
| Fannie Mae, 2.625%, 09/06/24 | | 2.6 | % |
| United States Treasury Inflation Indexed Bonds, 0.125%, 07/15/26 | | 2.3 | % |
| United States Treasury Inflation Indexed Bonds, 0.750%, 02/15/45 | | 2.2 | % |
| United States Treasury Inflation Indexed Bonds, 0.750%, 02/15/42 | | 2.0 | % |
| * Excludes short-term investments. |
Portfolio holdings are subject to change daily. |
Our tactical positioning in relative value themes also added to the outperformance. Positioning between Italy/Spain vs. Germany nominal rates strongly performed, as spreads compressed significantly due to the supportive monetary and fiscal policy that boosted the market’s confidence in Spain and Italy’s ability to recover. The EU-UK post-Brexit trade deal also helped the U.S. vs. UK 10-year breakeven position to outperform. The Portfolio Management Team’s strategic trading in Germany and Italy nominal rates further augmented performance. Our tactical Canadian vs. U.S. FX position and U.S. vs. EU nominal rates pared some of the positive performance.
Market Overview: The global markets in 2020 were shocked by the COVID-19 pandemic and geopolitical uncertainty. The year started with a reflationary outlook, but the emergence of the COVID-19 virus in the early first quarter that quickly spread across the globe sparked a massive risk-off move. The flight-to-safety trade resulted in an unprecedented, in our opinion, rally in rates over the first quarter. The U.S. Federal Reserve Board (“Fed”) lowered interest rates by 150 basis point (“1.50%”) via two emergency rate cuts, effectively bringing the Fed Fund Target rate to 0.00–0.25%. This was accompanied by historic coordinated fiscal and monetary stimulus programs. These programs helped taper market volatility over the second quarter, but the strict lockdown measures across the U.S. contributed to a significant increase in the unemployment rate. The U.S. unemployment rate jumped threefold to 14.7% before halving to approximately 6.7% in the late fourth quarter. The Fed and other major global central banks maintained a dovish tone, while the global governments coordinated fiscal stimulus programs to help their battered economies recover. This combination of fiscal and monetary stimulus helped risk assets to stage a strong comeback, with U.S. equity indices touching record highs and 10-year inflation expectations ending the year on a 1-year high of approximately 1.98%, a material recovery from March’s low of approximately 0.55%. The increasing bifurcation between nominal and real rates contributed to the rise in breakeven levels. Clarity on the U.S. election outcome and positive vaccine development further supported the risk-on tone in late 2020. In Europe, the European Central Bank (“ECB”) and Bank of England announced record quantitative easing and monetary stimulus programs. This was paired with an unprecedented €750bn fiscal stimulus plan in the EU. The recovery plan is seen as a lifeline to many of the hardest-hit European countries to support their economies. The EU and the UK finally reached a trade deal in the fourth
3
VY® BLACKROCK INFLATION PROTECTED
BOND PORTFOLIO | PORTFOLIO MANAGERS’ REPORT |
quarter after a turbulent year of trade negotiations that led to a seesaw in risk sentiment. This brings a marked end to the four-year Brexit saga.
Current Strategy and Outlook: U.S.: The COVID-19 outbreak surged materially across the U.S. Hospitalizations and deaths peaked or are near record highs across many states. Despite the grim outbreak trajectory, positive vaccine developments and confirmed election results brightened the outlook, in our opinion. Risk assets largely retained their positive momentum into year-end 2020. In our opinion, political tail-risk substantially subsided with the confirmation of President-elect Joe Biden. The potential of a divided congress also diminished the plausibility of a material hike in corporate tax rate and sweeping policy reforms. The portfolio management team sees the success of the vaccine deployment as crucial to the recovery narrative in 2021. We believe the timing of effective and widely available COVID-19 vaccines will be a key driver of the restart, particularly in the face of increased risks to U.S. fiscal stimulus needed to sustain households and businesses through the virus shock. Encouraging news on the vaccine front strengthens our base case of a full restart by late 2021.
In our view, the resurgence of COVID-19 cases in the U.S. is likely to dent the economic recovery over the fourth quarter of 2020 and potentially into the first quarter of 2021. Most recent data points, such as the purchasing manager index, nonfarm payroll report, and high-frequency data points (e.g., initial jobless claims), indicated a deceleration in recovery progress. However, we believe robust support in the monetary space and the potential of more fiscal stimulus to support asset prices will maintain the recovery pace in the near term. In our view, monetary stimulus alone will not be enough to sustain the recovery. The success of passing the phase 4 fiscal stimulus will be crucial to the recovery dynamic and, ultimately, the overall economy’s health and prevent any permanent scarring (lost output from pre-COVID-19 levels), in our opinion.
On the inflation front, we believe that the recovery of price levels is likely to be uneven across industries. For example, we expect a prolonged headwind in the airline industry due to the vanishing needs from business travelers, while sectors such as energy may rebound faster due to the direct ties to the activity levels of the economy. The shift in the Fed’s policy framework from a toolkit of suppressing inflation to one that looks to bring back and sustain a reasonable amount of inflation is, in our view, likely to result in higher inflation expectations, in our view. We believe the central bank will likely curb nominal yield rises to prevent an unwanted tightening of financial conditions. Given this dynamic, we believe inflation will move towards the Fed’s 2% target (and potentially higher) over a longer horizon. As it relates to core Consumer Price Index (“CPI”), we estimate it to stay approximately 1.4 — 1.5% year-over-year (“YoY”) into year-end 2020, with headline CPI approximately 0.9% year-over-year by the end of 2020. We expect core CPI to then return to around 1.5% YoY by year-end 2021, before heading higher after that. Please note these estimates are subject to change.
Europe (incl. UK) — We believe that activity in the first quarter of 2021 will continue to be impacted by the virus while the vaccine is rolled out more broadly. In Germany, for example, we are seeing a new round of strict lockdowns, lasting until January 2021. We believe that fiscal and monetary support will remain the main driver of markets in the first quarter of 2021, while risk assets remain well-supported in Europe given the ECB’s significant presence in the market.
One theme we anticipate in the first quarter of 2021 is the backup in European yields as the market prices in a return to normality in the second quarter. Germany’s issuance plan will be of focus, although we expect these to be tilted towards the longer-end (bond issuance vs. bills), providing a further catalyst for a duration selloff. In Italy, debt to GDP is expected to reach almost 160% this year, but in our opinion, we don’t see this as an immediate issue given low yields. Continued ECB buying (the pandemic emergency purchase program was extended in size and duration in early December) is aimed at keeping financial conditions easy and we believe it should dampen any material pick up in volatility. Italy is the largest beneficiary of the recovery fund, however we don’t expect the first funds to be distributed until mid-2021.
In the UK, the Brexit situation remains fluid, which will impact the outlook of the first quarter of 2021. Talks with Europe have extended past the Sunday, December 13th deadline, which the market is taking as a positive indication that a deal is close. The higher reliance on the service sector of the UK economy has resulted in a worse 2020 contraction. Even with a Brexit trade deal, we could see an impact on the recovery pace as businesses adjust to the new regime.
Headline inflation in the Euro area remained in negative territory in November (–0.3% YoY). The pandemic’s resurgence has put a dent in the recovery progress and renewed downside pressure on the demand-side (e.g., energy and consumer). In our opinion, we may not see material recovery in inflation until early-mid 2021, when the vaccine becomes more accessible by the general public.
In Japan — In our view, the Japanese economy’s recovery continued to be bumpy as the recent resurgence of the outbreak cast new uncertainty. The latest economic survey showed that although business conditions continued to improve, the sectorial gap between the manufacturing and non-manufacturing sector further widened. In manufacturing, the outlook continued to improve, leading by autos and production equipment. In non-manufacturing, business sentiment showed bottoming signs, but sectors that were harshly impacted by the pandemic, such as the hospitality sector, continued to face a notable headwind. Corporations readjusted their fiscal year 2020 capital expenditures from +1.4% in September to –1.2% in December, reflecting earnings deterioration and uncertainty around the business outlook. However, the country’s labor market remained robust, compared to its developed market peers, as the understaffing trend continued.
4
PORTFOLIO MANAGERS’ REPORT | VY® BLACKROCK INFLATION PROTECTED
BOND PORTFOLIO |
Nonetheless, any hope of a quick rebound in economic activity has diminished as the country prepares for a protracted recovery. We expect the Bank of Japan to stay dovish in its policymaking. The central bank has taken several easing measures since March, mainly through quantitative easing and yield curve controls . The Japanese government also dished out new fiscal support to further cushion the economy. Most recently, the government announced on Monday, December 14th, that it will compile a third extra budget of approximately 21.84 trillion yen for fiscal 2020 to dampen the economic fallout.
The views expressed in this commentary are informed opinions. They should not be considered promises or advice. The views expressed reflect those of the portfolio managers, only through the end of the period as stated on the cover. The portfolio managers’ views are subject to change at any time based on market and other conditions.
Portfolio holdings and characteristics are subject to change and may not be representative of current holdings and characteristics. Portfolio holdings are subject to change daily. The outlook for this Portfolio may differ from that presented for other Voya mutual funds. This report contains statements that may be “forward-looking” statements. Actual results may differ materially from those projected in the “forward-looking” statements. The Portfolio’s performance returns shown reflect applicable fee waivers and/or expense limits in effect during this period. Absent such fee waivers/expense limitations, if any, performance would have been lower. Performance for the different classes of shares will vary based on differences in fees associated with each class. An index has no cash in its portfolio and imposes no sales charges. An investor cannot invest directly in an index.
5
VY® BLACKROCK INFLATION PROTECTED
BOND PORTFOLIO | PORTFOLIO MANAGERS’ REPORT |
| | Average Annual Total Returns for the Periods Ended December 31, 2020 | |
|---|
| | | | | | 1 Year | | 5 Year | | 10 Year | |
|---|
| | Class ADV | | | | | 10.65 | % | | | 4.15 | % | | | 2.71 | % | |
| | Class I | | | | | 11.15 | % | | | 4.75 | % | | | 3.31 | % | |
| | Class S | | | | | 10.95 | % | | | 4.50 | % | | | 3.07 | % | |
| | TIPS Index | | | | | 10.99 | % | | | 5.08 | % | | | 3.81 | % | |
Based on a $10,000 initial investment, the graph and table above illustrate the total return of VY® BlackRock Inflation Protected Bond Portfolio against the index indicated. The index is unmanaged and has no cash in its portfolio and imposes no sales charges. An investor cannot invest directly in an index.
The Portfolio’s performance is shown without the imposition of any expenses or charges which are, or may be, imposed under your variable annuity contract or variable life insurance policy. Total returns would have been lower if such expenses or charges were included.
The performance graph and table do not reflect the deduction of taxes that a shareholder will pay on Portfolio distributions or the redemption of Portfolio shares.
The performance shown includes, if applicable, the effect of fee waivers and/or expense reimbursements by the Investment Adviser and/or other
service providers, which have the effect of increasing total return. Had all fees and expenses been considered, the total returns would have been lower.
The performance update illustrates performance for a variable investment option available through a variable annuity contract or a variable life insurance policy. The performance shown indicates past performance and is not a projection or prediction of future results. Actual investment returns and principal value will fluctuate so that shares and/or units, at redemption, may be worth more or less than their original cost. Please log on to www.voyainvestments.com or call (800) 366-0066 to get performance through the most recent month end.
Portfolio holdings are subject to change daily.
6
PORTFOLIO MANAGERS’ REPORT | VY® BRANDYWINEGLOBAL —
BOND PORTFOLIO |
Investment Type Allocation
as of December 31, 2020
(as a percentage of net assets) |
| Corporate Bonds/Notes | | 54.9 | % |
| U.S. Treasury Obligations | | 28.1 | % |
| U.S. Government Agency Obligations | | 5.4 | % |
| Commercial Mortgage-Backed Securities | | 3.5 | % |
| Collateralized Mortgage Obligations | | 1.5 | % |
| Asset-Backed Securities | | 0.3 | % |
| Assets in Excess of Other Liabilities* | | 6.3 | % |
| Net Assets | | 100.0 | % |
| * Includes short-term investments. |
Portfolio holdings are subject to change daily. |
VY® BrandywineGLOBAL — Bond Portfolio* (the “Portfolio”) seeks total return consisting of capital appreciation and income. The Portfolio is managed by David F. Hoffman, CFA, John P. McIntyre, CFA, and Anujeet Sareen, CFA, Portfolio Managers** of Brandywine Global Investment Management, LLC (“Brandywine”). — the Sub-Adviser.
Performance: For the year-ended December 31, 2020, the Portfolio’s shares provided a total return of 17.47% compared to the Bloomberg Barclays U.S. Aggregate Bond Index, which returned 7.51% for the same period.
Portfolio Specifics — With the onset of the global pandemic in early March and ensuing market volatility, we increased our investment grade corporate exposure in late March and continued to favor this sector throughout 2020. With the implicit backstop of the U.S. Federal Reserve Board and attractive yields, we felt that investment grade corporates offered the best risk/return opportunity in our investment universe. Corporate spreads narrowed substantially during the remainder of the year and this was the largest contributor to performance.
As economic data began to improve in late summer, our investment team became concerned about interest rate sensitivity in the Portfolio. U.S. Treasury yields fell sharply during the first part of the year and fell again in early August. At this time, our valuation models and macro outlook suggested that yields could move higher. With this in mind, we initiated a short position in long-dated U.S. Treasuries to reduce the Portfolio’s interest rate sensitivity. This short position along with a modest reduction in our corporate credit positions reduced the Portfolio’s duration by almost half. This Portfolio shift contributed to returns during the latter part of the year as Treasury yields moved higher in late 2020.
Top Ten Holdings
as of December 31, 2020
(as a percentage of net assets) |
| United States Treasury Floating Rate Note, 0.209%, 04/30/22 | | 11.4 | % |
| United States Treasury Floating Rate Note, 0.150%, 07/31/22 | | 9.9 | % |
| United States Treasury Floating Rate Note, 0.150%, 10/31/22 | | 6.8 | % |
| Anheuser-Busch InBev Worldwide, Inc., 5.450%, 01/23/39 | | 3.2 | % |
| Federal Home Loan Banks, 1.875%, 07/07/21 | | 3.1 | % |
| FREMF 2012-K23 B Mortgage Trust, 3.656%, 10/25/45 | | 3.0 | % |
| Freeport-McMoRan, Inc., 5.450%, 03/15/43 | | 2.7 | % |
| International Business Machines Corp., 4.250%, 05/15/49 | | 2.5 | % |
| JPMorgan Chase & Co., 4.493%, 03/24/31 | | 2.5 | % |
| Freddie Mac, 1.125%, 08/12/21 | | 2.3 | % |
Portfolio holdings are subject to change daily. |
Markets continued to improve for the remainder of 2020 as investors focused on the prospects of an eventual re-opening of the economy. As our investment grade corporate positions rallied, we trimmed select positions due to valuations and rotated exposure to more cyclically oriented credits with more attractive valuations such as select energy companies. Due to continued concerns around rising Treasury yields, we maintained our short position through the end of the year.
Current Strategy and Outlook: We believe our outlook for 2021 is constructive for growth in the U.S. and globally. We believe the large-scale support from central banks around the world, multiple COVID-19 vaccines and pent up consumer and business demand should support growth in 2021. As such, we continue to overweight select investment grade credit positions which should continue to benefit from an improving growth backdrop, in our opinion. Corporate spreads have narrowed, and we anticipate reducing exposure gradually overtime due to valuations. We remain concerned about rising interest rates and expect to limit the Portfolio’s interest rate sensitivity where possible.
| * | | Effective July 31, 2020, the Investment Adviser entered into a new sub-advisory agreement with Brandywine Global Investment Management, LLC due to a change in control of Legg Mason Inc., its parent company. The new sub-advisory agreement includes the same terms and same portfolio management teams as was in place under the Portfolio’s previous agreement. |
| ** | | Effective December 31, 2020, Stephen S. Smith stepped down from the portfolio management team and no longer serves as a portfolio manager of the Portfolio. Mr. Smith has transitioned to an advisory role at Brandywine. |
The views expressed in this commentary are informed opinions. They should not be considered promises or advice. The views expressed reflect those of the portfolio managers, only through the end of the period as stated on the cover. The portfolio managers’ views are subject to change at any time based on market and other conditions.
Portfolio holdings and characteristics are subject to change and may not be representative of current holdings and characteristics. Portfolio holdings are subject to change daily. The outlook for this Portfolio may differ from that presented for other Voya mutual funds. This report contains statements that may be “forward-looking” statements. Actual results may differ materially from those projected in the “forward-looking” statements. The Portfolio’s performance returns shown reflect applicable fee waivers and/or expense limits in effect during this period. Absent such fee waivers/expense limitations, if any, performance would have been lower. Performance for the different classes of shares will vary based on differences in fees associated with each class. An index has no cash in its portfolio and imposes no sales charges. An investor cannot invest directly in an index.
7
VY® BRANDYWINEGLOBAL — BOND PORTFOLIO | PORTFOLIO MANAGERS’ REPORT |
| | Average Annual Total Returns for the Periods Ended December 31, 2020 | |
|---|
| | | | | | 1 Year | | 5 Year | | Since Inception
February 20, 2015 | |
|---|
| | VY® BrandywineGLOBAL - Bond Portfolio | | | | | 17.47 | % | | | 6.10 | % | | | 5.22 | % | |
| | Bloomberg Barclays U.S. Aggregate Bond Index | | | | | 7.51 | % | | | 4.44 | % | | | 3.79 | % | |
Based on a $10,000 initial investment, the graph and table above illustrate the total return of VY® BrandywineGLOBAL - Bond Portfolio against the index indicated. The index is unmanaged and has no cash in its portfolio and imposes no sales charges. An investor cannot invest directly in an index.
The Portfolio’s performance is shown without the imposition of any expenses or charges which are, or may be, imposed under your variable annuity contract and/or variable life insurance policy. Total returns would have been lower if such expenses or charges were included.
The performance graph and table do not reflect the deduction of taxes that a shareholder will pay on Portfolio distributions or the redemption of Portfolio shares.
The performance shown includes, if applicable, the effect of fee waivers and/or expense reimbursements by the Investment Adviser and/or other service providers, which have the effect of increasing total return. Had all
fees and expenses been considered, the total returns would have been lower.
The performance update illustrates performance for a variable investment option available through a variable annuity contract and/or a variable life insurance policy. The performance shown indicates past performance and is not a projection or prediction of future results. Actual investment returns and principal value will fluctuate so that shares and/or units, at redemption, may be worth more or less than their original cost. Please log on to www.voyainvestments.com or call (800) 992-0180 to get performance through the most recent month end.
Portfolio holdings are subject to change daily.
Prior to August 9, 2019, the Portfolio was managed by a different sub-adviser.
8
SHAREHOLDER EXPENSE EXAMPLES (UNAUDITED)
As a shareholder of a Portfolio, you incur two types of costs: (1) transaction costs, including redemption fees and exchange fees; and (2) ongoing costs, including management fees, distribution and/or service (12b-1) fees and other Portfolio expenses. These Examples are intended to help you understand your ongoing costs (in dollars) of investing in a Portfolio and to compare these costs with the ongoing costs of investing in other mutual funds.
The Examples are based on an investment of $1,000 invested at the beginning of the period and held for the entire period from July 1, 2020 to December 31, 2020. The Portfolios’ expenses are shown without the imposition of any charges which are, or may be, imposed under your variable annuity contract, variable life insurance policy, qualified pension, or retirement plan. Expenses would have been higher if such charges were included.
Actual Expenses
The left section of the table shown below, “Actual Portfolio Return,” provides information about actual account values and actual expenses. You may use the information in this section, together with the amount you invested, to estimate the expenses that you paid over the period. Simply divide your account value by $1,000 (for example, an $8,600 account value divided by $1,000 = 8.6), then multiply the result by the number in the first section under the heading entitled “Expenses Paid During the Period” to estimate the expenses you paid on your account during this period.
Hypothetical Example for Comparison Purposes
The right section of the table shown below, “Hypothetical (5% return before expenses),” provides information about hypothetical account values and hypothetical expenses based on a Portfolio’s actual expense ratio and an assumed rate of return of 5% per year before expenses, which is not a Portfolio’s actual return. The hypothetical account values and expenses may not be used to estimate the actual ending account balance or expenses you paid for the period. You may use this information to compare the ongoing costs of investing in a Portfolio and other mutual funds. To do so, compare this 5% hypothetical example with the 5% hypothetical examples that appear in the shareholder reports of the other mutual funds.
Please note that the expenses shown in the table are meant to highlight your ongoing costs only and do not reflect any transactional costs, such as redemption fees or exchange fees. Therefore, the hypothetical section of the table is useful in comparing ongoing costs only, and will not help you determine the relative total costs of owning different mutual funds. In addition, if these transactional costs were included, your costs would have been higher.
| | | | | Actual Portfolio Return | | Hypothetical (5% return before expenses) | |
|---|
| | | | | Beginning
Account
Value
July 1,
2020 | | Ending
Account
Value
December 31,
2020 | | Annualized
Expense
Ratio | | Expenses Paid
During the
Period Ended
December 31,
2020* | | Beginning
Account
Value
July 1,
2020 | | Ending
Account
Value
December 31,
2020 | | Annualized
Expense
Ratio | | Expenses Paid
During the
Period Ended
December 31,
2020* | |
|---|
| | VY® BlackRock Inflation Protected Bond Portfolio | | | | | | | | | | | | | | | | | | | | | |
| | Class ADV | | | $ | 1,000.00 | | | $ | 1,050.20 | | | | 1.22 | % | | $ | 6.29 | | | $ | 1,000.00 | | | $ | 1,019.00 | | | | 1.22 | % | | $ | 6.19 | | |
| | Class I | | | | 1,000.00 | | | | 1,052.80 | | | | 0.62 | | | | 3.20 | | | | 1,000.00 | | | | 1,022.02 | | | | 0.62 | | | | 3.15 | | |
| | Class S | | | | 1,000.00 | | | | 1,052.10 | | | | 0.87 | | | | 4.49 | | | | 1,000.00 | | | | 1,020.76 | | | | 0.87 | | | | 4.42 | | |
| | | | | | | | | | | | | | | | | | | | | | | | | | | | | | | | | | | | |
| | VY® BrandywineGLOBAL — Bond Portfolio | | | | | | | | | | | | | | | | | | | | | | |
| | | | | $ | 1,000.00 | | | $ | 1,077.30 | | | | 0.58 | % | | $ | 3.03 | | | $ | 1,000.00 | | | $ | 1,022.22 | | | | 0.58 | % | | $ | 2.95 | | |
| * | | Expenses are equal to each Portfolio’s respective annualized expense ratios multiplied by the average account value over the period, multiplied by 184/366 to reflect the most recent fiscal half-year. |
9
REPORT OF INDEPENDENT REGISTERED PUBLIC ACCOUNTING FIRM
To the Shareholders of VY® BlackRock Inflation Protected Bond Portfolio and VY® BrandywineGLOBAL — Bond Portfolio and the Boards of Trustees of Voya Investors Trust and Voya Variable Insurance Trust
Opinion on the Financial Statements
We have audited the accompanying statements of assets and liabilities of VY® BlackRock Inflation Protected Bond Portfolio and VY® BrandywineGLOBAL — Bond Portfolio (collectively referred to as the “Portfolios”) (each a portfolio of Voya Investors Trust and Voya Variable Insurance Trust, respectively (collectively referred to as the “Trusts”)), including the portfolio of investments and summary portfolio of investments, as applicable, as of December 31, 2020, and the related statements of operations and changes in net assets and the financial highlights for the year then ended and the related notes (collectively referred to as the “financial statements”). In our opinion, the financial statements present fairly, in all material respects, the financial position of the Portfolios at December 31, 2020, the results of their operations, the changes in their net assets and their financial highlights for the year then ended, in conformity with U.S. generally accepted accounting principles.
The statement of changes in net assets for the year ended December 31, 2019, and the financial highlights for each of the periods in the four-year period then ended, were audited by another independent registered public accounting firm whose report, dated February 21, 2020, expressed an unqualified opinion on that statement of changes in net assets and those financial highlights.
Basis for Opinion
These financial statements are the responsibility of the Trusts’ management. Our responsibility is to express an opinion on the Portfolios’ financial statements based on our audits. We are a public accounting firm registered with the Public Company Accounting Oversight Board (United States) (“PCAOB”) and are required to be independent with respect to the Trusts in accordance with the U.S. federal securities laws and the applicable rules and regulations of the Securities and Exchange Commission and the PCAOB.
We conducted our audits in accordance with the standards of the PCAOB. Those standards require that we plan and perform the audits to obtain reasonable assurance about whether the financial statements are free of material misstatement, whether due to error or fraud. The Trusts are not required to have, nor were we engaged to perform, an audit of the Trusts’ internal control over financial reporting. As part of our audits, we are required to obtain an understanding of internal control over financial reporting, but not for the purpose of expressing an opinion on the effectiveness of the Trusts’ internal control over financial reporting. Accordingly, we express no such opinion.
Our audits included performing procedures to assess the risks of material misstatement of the financial statements, whether due to error or fraud, and performing procedures that respond to those risks. Such procedures included examining, on a test basis, evidence regarding the amounts and disclosures in the financial statements. Our procedures included confirmation of securities owned as of December 31, 2020, by correspondence with the custodian and others or by other appropriate auditing procedures where replies from others were not received. Our audits also included evaluating the accounting principles used and significant estimates made by management, as well as evaluating the overall presentation of the financial statements. We believe that our audits provide a reasonable basis for our opinion.
We have served as the auditor of one or more Voya investment companies since 2019.
Boston, Massachusetts
February 24, 2021
10
STATEMENTS OF ASSETS AND LIABILITIES AS OF DECEMBER 31, 2020
| | VY®
BlackRock
Inflation
Protected
Bond
Portfolio | | VY®
BrandywineGLOBAL —
Bond
Portfolio |
|---|
ASSETS: | | | | | | | | |
| Investments in securities at fair value* | | $ | 279,600,220 | | | $ | 298,526,408 | |
| Short-term investments at fair value† | | | 14,416,461 | | | | 1,927,459 | |
| Cash collateral for futures contracts | | | 10,114 | | | | 2,658,881 | |
| Cash pledged for centrally cleared swaps (Note 2) | | | 4,000,490 | | | | — | |
| Cash pledged as collateral for OTC derivatives (Note 2) | | | 300,000 | | | | — | |
| Foreign currencies at value‡ | | | 204,791 | | | | — | |
| Receivables: | | | | | | | | |
| Investment securities sold | | | 1,613,603 | | | | 14,478,151 | |
| Fund shares sold | | | 2,133,417 | | | | 98,000 | |
| Dividends | | | 145 | | | | 280 | |
| Interest | | | 1,059,171 | | | | 2,078,288 | |
| Unrealized appreciation on forward foreign currency contracts | | | 4,043 | | | | — | |
| Unrealized appreciation on OTC swap agreements | | | 760,867 | | | | — | |
| Variation margin receivable on centrally cleared swaps | | | 69,898 | | | | — | |
| Prepaid expenses | | | 1,235 | | | | 946 | |
| Other assets | | | 17,771 | | | | 5,621 | |
| Total assets | | | 304,192,226 | | | | 319,774,034 | |
| | | | | | | | | |
LIABILITIES: | | | | | | | | |
| Payable for investment securities purchased | | | 1,868,483 | | | | — | |
| Payable for fund shares redeemed | | | 46,501 | | | | 825,142 | |
| Unrealized depreciation on forward foreign currency contracts | | | 241,343 | | | | — | |
| Unrealized depreciation on OTC swap agreements | | | 461 | | | | — | |
| Cash received as collateral for OTC derivatives (Note 2) | | | 910,000 | | | | — | |
| Payable for investment management fees | | | 123,697 | | | | 158,091 | |
| Payable for distribution and shareholder service fees | | | 56,975 | | | | — | |
| Payable to trustees under the deferred compensation plan (Note 6) | | | 17,771 | | | | 5,621 | |
| Payable for trustee fees | | | 1,409 | | | | 1,412 | |
| Other accrued expenses and liabilities | | | 109,327 | | | | 118,396 | |
| Written options, at fair valueˆ | | | 1,314,217 | | | | — | |
| Total liabilities | | | 4,690,184 | | | | 1,108,662 | |
NET ASSETS | | $ | 299,502,042 | | | $ | 318,665,372 | |
| | | | | | | | | |
NET ASSETS WERE COMPRISED OF: | | | | | | | | |
| Paid-in capital | | $ | 343,857,818 | | | $ | 273,281,851 | |
| Total distributable earnings (loss) | | | (44,355,776 | ) | | | 45,383,521 | |
NET ASSETS | | $ | 299,502,042 | | | $ | 318,665,372 | |
| | | | | | | | | |
| | | | | | | | | | |
| * Cost of investments in securities | | $ | 254,134,686 | | | $ | 280,217,441 | |
| † Cost of short-term investments | | $ | 14,416,461 | | | $ | 1,927,459 | |
| ‡ Cost of foreign currencies | | $ | 202,123 | | | $ | — | |
| ˆ Premiums received on written options | | $ | 1,529,705 | | | $ | — | |
See Accompanying Notes to Financial Statements
11
STATEMENTS OF ASSETS AND LIABILITIES AS OF DECEMBER 31, 2020 (CONTINUED)
| | VY®
BlackRock
Inflation
Protected
Bond
Portfolio | | VY®
BrandywineGLOBAL —
Bond
Portfolio |
|---|
Class ADV | | | | | | | | |
| Net assets | | $ | 47,352,416 | | | | n/a | |
| Shares authorized | | | unlimited | | | | n/a | |
| Par value | | $ | 0.001 | | | | n/a | |
| Shares outstanding | | | 4,608,276 | | | | n/a | |
| Net asset value and redemption price per share | | $ | 10.28 | | | | n/a | |
| | | | | | | | | |
Class I | | | | | | | | |
| Net assets | | $ | 92,766,513 | | | | n/a | |
| Shares authorized | | | unlimited | | | | n/a | |
| Par value | | $ | 0.001 | | | | n/a | |
| Shares outstanding | | | 8,682,526 | | | | n/a | |
| Net asset value and redemption price per share | | $ | 10.68 | | | | n/a | |
| | | | | | | | | |
Class S | | | | | | | | |
| Net assets | | $ | 159,383,113 | | | | n/a | |
| Shares authorized | | | unlimited | | | | n/a | |
| Par value | | $ | 0.001 | | | | n/a | |
| Shares outstanding | | | 15,038,126 | | | | n/a | |
| Net asset value and redemption price per share | | $ | 10.60 | | | | n/a | |
| | | | | | | | | |
Portfolio(1) | | | | | | | | |
| Net assets | | | n/a | | | $ | 318,665,372 | |
| Shares authorized | | | n/a | | | | unlimited | |
| Par value | | | n/a | | | $ | 0.001 | |
| Shares outstanding | | | n/a | | | | 26,480,996 | |
| Net asset value and redemption price per share | | | n/a | | | $ | 12.03 | |
(1) Portfolio does not have a share class designation. |
See Accompanying Notes to Financial Statements
12
STATEMENTS OF OPERATIONS FOR THE YEAR ENDED DECEMBER 31, 2020
| | VY®
BlackRock
Inflation
Protected
Bond
Portfolio | | VY®
BrandywineGLOBAL —
Bond
Portfolio |
|---|
| | | | | | | | |
|---|
INVESTMENT INCOME: | | | | | | | | |
| Dividends | | $ | 12,706 | | | $ | 34,911 | |
| Interest, net of foreign taxes withheld* | | | 4,870,353 | | | | 7,045,669 | |
| Total investment income | | | 4,883,059 | | | | 7,080,580 | |
| | | | | | | | | |
EXPENSES: | | | | | | | | |
| Investment management fees | | | 1,509,070 | | | | 1,412,589 | |
| Distribution and shareholder service fees: | | | | | | | | |
| Class ADV | | | 272,049 | | | | — | |
| Class S | | | 377,122 | | | | — | |
| Transfer agent fees (Note 6): | | | | | | | 1,455 | |
| Class ADV | | | 11,912 | | | | — | |
| Class I | | | 22,519 | | | | — | |
| Class S | | | 39,635 | | | | — | |
| Shareholder reporting expense | | | 32,445 | | | | 15,586 | |
| Professional fees | | | 65,597 | | | | 90,832 | |
| Custody and accounting expense | | | 140,245 | | | | 43,485 | |
| Trustee fees | | | 11,273 | | | | 11,301 | |
| Miscellaneous expense | | | 15,366 | | | | 8,818 | |
| Interest expense | | | 199 | | | | 155 | |
| Total expenses | | | 2,497,432 | | | | 1,584,221 | |
| Recouped/(Waived and reimbursed fees) | | | (112,726 | ) | | | 60,421 | |
| Net expenses | | | 2,384,706 | | | | 1,644,642 | |
| Net investment income | | | 2,498,353 | | | | 5,435,938 | |
| | | | | | | | | |
REALIZED AND UNREALIZED GAIN (LOSS): | | | | | | | | |
| Net realized gain (loss) on: | | | | | | | | |
| Investments | | | 9,117,255 | | | | 19,573,696 | |
| Forward foreign currency contracts | | | (1,053,595 | ) | | | — | |
| Foreign currency related transactions | | | (95,200 | ) | | | — | |
| Futures | | | 909,161 | | | | 1,715,341 | |
| Swaps | | | (800,441 | ) | | | — | |
| Written options | | | 793,385 | | | | — | |
| Net realized gain | | | 8,870,565 | | | | 21,289,037 | |
| Net change in unrealized appreciation (depreciation) on: | | | | | | | | |
| Investments | | | 16,563,738 | | | | 17,806,167 | |
| Forward foreign currency contracts | | | 20,127 | | | | — | |
| Foreign currency related transactions | | | (52,176 | ) | | | — | |
| Futures | | | 223,237 | | | | 378,359 | |
| Swaps | | | 1,534,471 | | | | — | |
| Written options | | | (250,662 | ) | | | — | |
| Net change in unrealized appreciation (depreciation) | | | 18,038,735 | | | | 18,184,526 | |
| Net realized and unrealized gain | | | 26,909,300 | | | | 39,473,563 | |
Increase in net assets resulting from operations | | $ | 29,407,653 | | | $ | 44,909,501 | |
| | | | | | | | | | |
| * Foreign taxes withheld | | $ | 104 | | | $ | — | |
See Accompanying Notes to Financial Statements
13
STATEMENTS OF CHANGES IN NET ASSETS
| | VY® BlackRock Inflation
Protected Bond Portfolio | | VY® BrandywineGLOBAL —
Bond Portfolio |
|---|
| | Year Ended
December 31,
2020 | | Year Ended
December 31,
2019 | | Year Ended
December 31,
2020 | | Year Ended
December 31,
2019 |
|---|
FROM OPERATIONS: | | | | | | | | | | | | | | | | | | | | |
| Net investment income | | | $ | 2,498,353 | | | | $ | 4,538,326 | | | | $ | 5,435,938 | | | | $ | 4,456,750 | |
| Net realized gain | | | | 8,870,565 | | | | | 2,975,651 | | | | | 21,289,037 | | | | | 10,395,524 | |
| Net change in unrealized appreciation (depreciation) | | | | 18,038,735 | | | | | 13,446,499 | | | | | 18,184,526 | | | | | 2,714,705 | |
| Increase in net assets resulting from operations | | | | 29,407,653 | | | | | 20,960,476 | | | | | 44,909,501 | | | | | 17,566,979 | |
| | | | | | | | | | | | | | | | | | | | | |
FROM DISTRIBUTIONS TO SHAREHOLDERS: | | | | | | | | | | | | | | | | | | | | |
| Total distributions (excluding return of capital): | | | | | | | | | | | | | | (7,776,746 | ) | | | | (3,417,729 | ) |
| Class ADV | | | | (369,573 | ) | | | | (858,621 | ) | | | | — | | | | | — | |
| Class I | | | | (1,038,565 | ) | | | | (1,810,500 | ) | | | | — | | | | | — | |
| Class S | | | | (1,464,646 | ) | | | | (3,314,035 | ) | | | | — | | | | | — | |
| Return of capital: | | | | | | | | | | | | | | | | | | | | |
| Class ADV | | | | (258,130 | ) | | | | — | | | | | — | | | | | — | |
| Class I | | | | (465,220 | ) | | | | — | | | | | — | | | | | — | |
| Class S | | | | (834,668 | ) | | | | — | | | | | — | | | | | — | |
| Total distributions | | | | (4,430,802 | ) | | | | (5,983,156 | ) | | | | (7,776,746 | ) | | | | (3,417,729 | ) |
| | | | | | | | | | | | | | | | | | | | | |
FROM CAPITAL SHARE TRANSACTIONS: | | | | | | | | | | | | | | | | | | | | |
| Net proceeds from sale of shares | | | | 59,965,213 | | | | | 68,026,433 | | | | | 216,779,069 | | | | | 43,513,332 | |
| Reinvestment of distributions | | | | 4,430,802 | | | | | 5,983,156 | | | | | 7,776,746 | | | | | 3,417,729 | |
| | | | | 64,396,015 | | | | | 74,009,589 | | | | | 224,555,815 | | | | | 46,931,061 | |
| Cost of shares redeemed | | | | (67,828,595 | ) | | | | (49,588,217 | ) | | | | (125,915,207 | ) | | | | (72,346,903 | ) |
| Net increase (decrease) in net assets resulting from capital share transactions | | | | (3,432,580 | ) | | | | 24,421,372 | | | | | 98,640,608 | | | | | (25,415,842 | ) |
| Net increase (decrease) in net assets | | | | 21,544,271 | | | | | 39,398,692 | | | | | 135,773,363 | | | | | (11,266,592 | ) |
| | | | | | | | | | | | | | | | | | | | | |
NET ASSETS: | | | | | | | | | | | | | | | | | | | | |
| Beginning of year or period | | | | 277,957,771 | | | | | 238,559,079 | | | | | 182,892,009 | | | | | 194,158,601 | |
| End of year or period | | | $ | 299,502,042 | | | | $ | 277,957,771 | | | | $ | 318,665,372 | | | | $ | 182,892,009 | |
See Accompanying Notes to Financial Statements
14
FINANCIAL HIGHLIGHTS
Selected data for a share of beneficial interest outstanding throughout each year or period.
| | | | | Income (loss)
from
investment
operations | | | | | | Less distributions | | | | | | | | | | | Ratios to average
net assets | | Supplemental
data | |
| | | Net asset
value,
beginning
of year
or period | | Net
investment
income
(loss) | | Net
realized
and
unrealized
gain (loss) | | | Total
from
investment
operations | | | From
net
investment
income | | From
net
realized
gains | | From
return of
capital | | Total
distributions | | Payment
by
affiliate | | Net
asset
value,
end of
year or
period | | Total
Return(1) | | | Expenses
before
reductions/
additions(2)(3)(4) | | Expenses
net of
fee
waivers
and/or
recoupments
if any(2)(3)(4) | | Expense
net of
all
reductions/
additions(2)(3)(4) | | Net
investment
income
(loss)(2)(3) | | Net
assets,
end of
year or
period | | Portfolio
turnover
rate | |
| Year or period ended | | ($) | | ($) | | ($) | | | ($) | | | ($) | | ($) | | ($) | | ($) | | ($) | | ($) | | (%) | | | (%) | | (%) | | (%) | | (%) | | ($000’s) | | (%) | |
VY® BlackRock Inflation Protected Bond Portfolio | | | | | | | | | | | | | | | | | | | | | | | | | | | | | |
Class ADV | | | | | | | | | | | | | | | | | | | | | | | | | | | | | | | | | | | | | | |
| 12-31-20 | | 9.42 | | 0.05 | | 0.95 | | | 1.00 | | | 0.08 | | — | | 0.06 | | 0.14 | | — | | 10.28 | | 10.65 | | | 1.26 | | 1.22 | | 1.22 | | 0.52 | | 47,352 | | 87 | |
| 12-31-19 | | 8.93 | | 0.11 | | 0.56 | | | 0.67 | | | 0.18 | | — | | — | | 0.18 | | — | | 9.42 | | 7.53 | | | 1.20 | | 1.16 | | 1.16 | | 1.23 | | 44,885 | | 72 | |
| 12-31-18 | | 9.30 | | 0.14 | | (0.36 | ) | | (0.22 | ) | | 0.15 | | — | | — | | 0.15 | | — | | 8.93 | | (2.39 | ) | | 1.18 | | 1.14 | | 1.14 | | 1.47 | | 44,035 | | 63 | |
| 12-31-17 | | 9.17 | | 0.09 | | 0.11 | | | 0.20 | | | 0.07 | | — | | — | | 0.07 | | — | | 9.30 | | 2.16 | | | 1.17 | | 1.13 | | 1.13 | | 0.94 | | 49,769 | | 101 | |
| 12-31-16 | | 8.88 | | 0.05 | | 0.24 | | | 0.29 | | | — | | — | | — | | — | | — | | 9.17 | | 3.27 | | | 1.21 | | 1.12 | | 1.12 | | 0.53 | | 52,110 | | 73 | |
Class I | | | | | | | | | | | | | | | | | | | | | | | | | | | | | | | | | | | | | | |
| 12-31-20 | | 9.78 | | 0.12 | | 0.97 | | | 1.09 | | | 0.13 | | — | | 0.06 | | 0.19 | | — | | 10.68 | | 11.15 | | | 0.66 | | 0.62 | | 0.62 | | 1.11 | | 92,767 | | 87 | |
| 12-31-19 | | 9.26 | | 0.18 | | 0.57 | | | 0.75 | | | 0.23 | | — | | — | | 0.23 | | — | | 9.78 | | 8.21 | | | 0.60 | | 0.56 | | 0.56 | | 1.98 | | 88,759 | | 72 | |
| 12-31-18 | | 9.66 | | 0.20 | • | (0.37 | ) | | (0.17 | ) | | 0.23 | | — | | — | | 0.23 | | — | | 9.26 | | (1.75 | ) | | 0.58 | | 0.54 | | 0.54 | | 2.14 | | 40,731 | | 63 | |
| 12-31-17 | | 9.55 | | 0.15 | | 0.11 | | | 0.26 | | | 0.15 | | — | | — | | 0.15 | | — | | 9.66 | | 2.72 | | | 0.57 | | 0.53 | | 0.53 | | 1.55 | | 223,463 | | 101 | |
| 12-31-16 | | 9.19 | | 0.11 | | 0.25 | | | 0.36 | | | — | | — | | — | | — | | — | | 9.55 | | 3.92 | | | 0.56 | | 0.52 | | 0.52 | | 1.15 | | 311,949 | | 73 | |
Class S | | | | | | | | | | | | | | | | | | | | | | | | | | | | | | | | | | | | | | |
| 12-31-20 | | 9.70 | | 0.09 | | 0.97 | | | 1.06 | | | 0.10 | | — | | 0.06 | | 0.16 | | — | | 10.60 | | 10.95 | | | 0.91 | | 0.87 | | 0.87 | | 0.86 | | 159,383 | | 87 | |
| 12-31-19 | | 9.18 | | 0.15 | | 0.58 | | | 0.73 | | | 0.21 | | — | | — | | 0.21 | | — | | 9.70 | | 8.01 | | | 0.85 | | 0.81 | | 0.81 | | 1.57 | | 144,313 | | 72 | |
| 12-31-18 | | 9.57 | | 0.17 | | (0.36 | ) | | (0.19 | ) | | 0.20 | | — | | — | | 0.20 | | — | | 9.18 | | (2.04 | ) | | 0.83 | | 0.79 | | 0.79 | | 1.83 | | 153,793 | | 63 | |
| 12-31-17 | | 9.45 | | 0.13 | | 0.10 | | | 0.23 | | | 0.11 | | — | | — | | 0.11 | | — | | 9.57 | | 2.48 | | | 0.82 | | 0.78 | | 0.78 | | 1.29 | | 160,890 | | 101 | |
| 12-31-16 | | 9.12 | | 0.09 | | 0.24 | | | 0.33 | | | — | | — | | — | | — | | — | | 9.45 | | 3.62 | | | 0.81 | | 0.77 | | 0.77 | | 0.89 | | 190,284 | | 73 | |
VY® BrandywineGLOBAL- Bond Portfolio | | | | | | | | | | | | | | | | | | | | | | | | | | | | | | | | |
| 12-31-20 | | 10.51 | | 0.22 | • | 1.59 | | | 1.81 | | | 0.21 | | 0.08 | | — | | 0.29 | | — | | 12.03 | | 17.47 | | | 0.56 | | 0.58 | | 0.58 | | 1.92 | | 318,665 | | 134 | |
| 12-31-19 | | 9.73 | | 0.25 | • | 0.73 | | | 0.98 | | | 0.20 | | — | | — | | 0.20 | | — | | 10.51 | | 10.12 | | | 0.61 | | 0.58 | | 0.58 | | 2.48 | | 182,892 | | 449 | |
| 12-31-18 | | 10.12 | | 0.26 | • | (0.43 | ) | | (0.17 | ) | | 0.22 | | — | | — | | 0.22 | | — | | 9.73 | | (1.65 | ) | | 0.71 | | 0.58 | | 0.58 | | 2.61 | | 194,159 | | 457 | |
| 12-31-17 | | 10.06 | | 0.22 | • | 0.07 | | | 0.29 | | | 0.23 | | — | | — | | 0.23 | | — | | 10.12 | | 2.93 | | | 0.69 | | 0.58 | | 0.58 | | 2.16 | | 214,952 | | 345 | |
| 12-31-16 | | 10.02 | | 0.20 | • | 0.08 | | | 0.28 | | | 0.24 | | — | | — | | 0.24 | | — | | 10.06 | | 2.70 | | | 0.66 | | 0.58 | | 0.58 | | 2.00 | | 226,846 | | 490 | |
(1) | | Total return is calculated assuming reinvestment of all dividends, capital gain distributions and return of capital distributions, if any, at net asset value and does not reflect the effect of insurance contract charges. Total return for periods less than one year is not annualized. |
(2) | | Annualized for periods less than one year. |
(3) | | Ratios reflect operating expenses of a Portfolio. Expenses before reductions/additions do not reflect amounts reimbursed or recouped by the Investment Adviser and/or Distributor or reductions from brokerage service arrangements or other expense offset arrangements and do not represent the amount paid by a Portfolio during periods when reimbursements or reductions occur. |
| | | Expenses net of fee waivers reflect expenses after reimbursement by the Investment Adviser and/or Distributor or recoupment of previously reimbursed fees by the Investment Adviser, but prior to reductions from brokerage service arrangements or other expense offset arrangements. Expenses net of all reductions/additions represent the net expenses paid by a Portfolio. Net investment income (loss) is net of all such additions or reductions. |
(4) | | Ratios do not include fees and expenses charged under the variable annuity contract or variable life insurance policy. |
• | | Calculated using average number of shares outstanding throughout the year or period. |
See Accompanying Notes to Financial Statements
15
NOTES TO FINANCIAL STATEMENTS AS OF DECEMBER 31, 2020
NOTE 1 — ORGANIZATION
Voya Investors Trust is registered under the Investment Company Act of 1940, as amended (the “1940 Act”), as an open-end management investment company and was organized as a Massachusetts business trust on August 3, 1988. Voya Investors Trust currently consists of twenty-two active separate investment series. The one series included in this report is: VY® BlackRock Inflation Protected Bond Portfolio (“BlackRock Inflation Protected Bond”), a diversified series of Voya Investors Trust.
Voya Variable Insurance Trust is registered under the 1940 Act as an open-end management investment company and was organized as a Delaware statutory trust on July 15, 1999. Voya Variable Insurance Trust consists of one active investment series which is included in this report: VY® BrandywineGLOBAL — Bond Portfolio (“Bond Portfolio”), a diversified series of Voya Variable Insurance Trust.
Voya Investors Trust and Voya Variable Insurance Trust are collectively referred to as the “Trusts.” BlackRock Inflation Protected Bond and Bond Portfolio are each, a “Portfolio” and together, the “Portfolios.” The investment objective of the Portfolios is described in each Portfolio’s Prospectus.
The classes of shares included in this report for BlackRock Inflation Protected Bond are: Adviser (“Class ADV”), Institutional (“Class I”), and Service (“Class S”). With the exception of class specific matters, each class has equal voting rights as to voting privileges. For class specific proposals, only the applicable class would have voting privileges. The classes differ principally in the applicable distribution and shareholder service fees. Generally, shareholders of each class also bear certain expenses that pertain to that particular class. All shareholders are allocated the common expenses of a portfolio and earn income and realized gains/losses from a portfolio pro rata based on the daily ending net assets of each class, without distinction between share classes. Expenses that are specific to a portfolio or a class are charged directly to that portfolio or class. Other operating expenses shared by several portfolios are generally allocated among those portfolios based on average net assets. Distributions are determined separately for each class based on income and expenses allocated to each class. Realized gain distributions are allocated to each class pro rata based on the shares outstanding of each class on the date of distribution. Differences in per share dividend rates generally result from differences in separate class expenses, including distribution and shareholder service fees, if any, as well as differences in the amount of waiver of fees and reimbursement of expenses between the separate classes, if any. Bond Portfolio does not have a share class designation.
Voya Investments, LLC (“Voya Investments” or the “Investment Adviser”), an Arizona limited liability company, serves as the Investment Adviser to the Portfolios. Voya Investments Distributor, LLC (“VID” or the “Distributor”), a Delaware limited liability company, serves as the principal underwriter to the Portfolios.
NOTE 2 — SIGNIFICANT ACCOUNTING POLICIES
The following significant accounting policies are consistently followed by the Portfolios in the preparation of their financial statements. Each Portfolio is considered an investment company under U.S. generally accepted accounting principles (“GAAP”) and follows the accounting and reporting guidance applicable to investment companies.
A. Security Valuation. Each Portfolio is open for business every day the New York Stock Exchange (“NYSE”) opens for regular trading (each such day, a “Business Day”). The net asset value (“NAV”) per share for each class, if applicable, of each Portfolio is determined each Business Day as of the close of the regular trading session (“Market Close”), as determined by the Consolidated Tape Association (“CTA”), the central distributor of transaction prices for exchange-traded securities (normally 4:00 p.m. Eastern time unless otherwise designated by the CTA). The data reflected on the consolidated tape provided by the CTA is generated by various market centers, including all securities exchanges, electronic communications networks, and third-market broker-dealers. The NAV per share of each class of each Portfolio is calculated by taking the value of the Portfolio’s assets attributable to that class, subtracting the Portfolio’s liabilities attributable to that class, and dividing by the number of shares of that class that are outstanding. On days when a Portfolio is closed for business, Portfolio shares will not be priced and a Portfolio does not transact purchase and redemption orders. To the extent a Portfolio’s assets are traded in other markets on days when a Portfolio does not price its shares, the value of a Portfolio’s assets will likely change and you will not be able to purchase or redeem shares of a Portfolio.
Assets for which market quotations are readily available are valued at market value. A security listed or traded on an exchange is valued at its last sales price or official closing price as of the close of the regular trading session on the exchange where the security is principally traded or, if such price is not available, at the last sale price as of the Market Close for such security provided by the CTA. Bank loans are valued at the average of the averages of the bid and ask prices provided to an independent loan pricing service by brokers. Futures contracts are valued at the final settlement price set by an exchange on which they are principally traded. Listed options are valued at the mean
16
NOTES TO FINANCIAL STATEMENTS AS OF DECEMBER 31, 2020 (CONTINUED)
NOTE 2 — SIGNIFICANT ACCOUNTING POLICIES (continued)
between the last bid and ask prices from the exchange on which they are principally traded. Investments in open-end registered investment companies that do not trade on an exchange are valued at the end of day NAV per share. Investments in registered investment companies that trade on an exchange are valued at the last sales price or official closing price as of the close of the regular trading session on the exchange where the security is principally traded.
When a market quotation is not readily available or is deemed unreliable, each Portfolio will determine a fair value for the relevant asset in accordance with procedures adopted by the Portfolios’ Boards of Trustees (“Board”). Such procedures provide, for example, that: (a) Exchange-traded securities are valued at the mean of the closing bid and ask; (b) Debt obligations are valued using an evaluated price provided by an independent pricing service. Evaluated prices provided by the pricing service may be determined without exclusive reliance on quoted prices, and may reflect factors such as institution-size trading in similar groups of securities, developments related to specific securities, benchmark yield, quality, type of issue, coupon rate, maturity, individual trading characteristics and other market data; (c) Securities traded in the over-the-counter (“OTC”) market are valued based on prices provided by independent pricing services or market makers; (d) Options not listed on an exchange are valued by an independent source using an industry accepted model, such as Black-Scholes; (e) Centrally cleared swap agreements are valued using a price provided by the central counterparty clearinghouse; (f) OTC swap agreements are valued using a price provided by an independent pricing service; (g) Forward foreign currency exchange contracts are valued utilizing current and forward rates obtained from an independent pricing service. Such prices from the third party pricing service are for specific settlement periods and each Portfolio’s forward foreign currency exchange contracts are valued at an interpolated rate between the closest preceding and subsequent period reported by the independent pricing service; and (h) Securities for which market prices are not provided by any of the above methods may be valued based upon quotes furnished by brokers.
The prospectuses of the open-end registered investment companies in which each Portfolio may invest explain the circumstances under which they will use fair value pricing and the effects of using fair value pricing.
Foreign securities’ (including forward foreign currency exchange contracts) prices are converted into U.S. dollar amounts using the applicable exchange rates as of Market Close. If market quotations are available and believed to be reliable for foreign exchange-traded equity securities, the
securities will be valued at the market quotations. Because trading hours for certain foreign securities end before Market Close, closing market quotations may become unreliable. An independent pricing service determines the degree of certainty, based on historical data, that the closing price in the principal market where a foreign security trades is not the current value as of Market Close. Foreign securities’ prices meeting the approved degree of certainty that the price is not reflective of current value will be valued by the independent pricing service using pricing models designed to estimate likely changes in the values of those securities between the times in which the trading in those securities is substantially completed and Market Close. Multiple factors may be considered by the independent pricing service in determining the value of such securities and may include information relating to sector indices, American Depositary Receipts and domestic and foreign index futures.
All other assets for which market quotations are not readily available or became unreliable (or if the above fair valuation methods are unavailable or determined to be unreliable) are valued at fair value as determined in good faith by or under the supervision of the Board following procedures approved by the Board. The Board has delegated to the Investment Adviser responsibility for overseeing the implementation of the Portfolios’ valuation procedures; a “Pricing Committee” comprised of employees of the Investment Adviser or its affiliates has responsibility for applying the fair valuation methods set forth in the procedures and, if a fair valuation cannot be determined pursuant to the fair valuation methods, determining the fair value of assets held by the Portfolios. Issuer specific events, transaction price, position size, nature and duration of restrictions on disposition of the security, market trends, bid/ask quotes of brokers and other market data may be reviewed in the course of making a good faith determination of a security’s fair value. Valuations change in response to many factors including the historical and prospective earnings of the issuer, the value of the issuer’s assets, general economic conditions, interest rates, investor perceptions and market liquidity. Because of the inherent uncertainties of fair valuation, the values used to determine each Portfolio’s NAV may materially differ from the value received upon actual sale of those investments. Thus, fair valuation may have an unintended dilutive or accretive effect on the value of shareholders’ investments in each Portfolio.
Each investment asset or liability of the Portfolios is assigned a level at measurement date based on the significance and source of the inputs to its valuation. Quoted prices in active markets for identical securities are classified as “Level 1,” inputs other than quoted prices for an asset or liability that are observable are classified as
17
NOTES TO FINANCIAL STATEMENTS AS OF DECEMBER 31, 2020 (CONTINUED)
NOTE 2 — SIGNIFICANT ACCOUNTING POLICIES (continued)
“Level 2” and significant unobservable inputs, including the sub-advisers’ or Pricing Committee’s judgment about the assumptions that a market participant would use in pricing an asset or liability are classified as “Level 3.” The inputs used for valuing securities are not necessarily an indication of the risks associated with investing in those securities. Short-term securities of sufficient credit quality are generally considered to be Level 2 securities under applicable accounting rules. A table summarizing the Portfolios’ investments under these levels of classification is included within the Portfolio of Investments.
GAAP requires a reconciliation of the beginning to ending balances for reported fair values that presents changes attributable to total realized and unrealized gains or losses, purchases and sales, and transfers in or out of the Level 3 category during the period. A reconciliation of Level 3 investments within the Portfolio of Investments is presented only when a Portfolio has a significant amount of Level 3 investments.
B. Securities Transactions and Revenue Recognition. Securities transactions are accounted for on the trade date. Realized gains and losses are reported on the basis of identified cost of securities sold. Interest income is recorded on an accrual basis. Dividend income is recorded on the ex-dividend date, or for certain foreign securities, when the information becomes available to the Portfolios. Premium amortization and discount accretion are determined by the effective yield method.
C. Foreign Currency Translation. The books and records of the Portfolios are maintained in U.S. dollars. Any foreign currency amounts are translated into U.S. dollars on the following basis:
| (1) | | Market value of investment securities, other assets and liabilities — at the exchange rates prevailing at Market Close. |
| (2) | | Purchases and sales of investment securities, income and expenses — at the rates of exchange prevailing on the respective dates of such transactions. |
Although the net assets and the market values are presented at the foreign exchange rates at Market Close, the Portfolios do not isolate the portion of their results of operations resulting from changes in foreign exchange rates on investments from the fluctuations arising from changes in market prices of securities held. Such fluctuations are included with the net realized and unrealized gains or losses from investments. For securities, which are subject to foreign withholding tax upon disposition, liabilities are recorded on the Statement
of Assets and Liabilities for the estimated tax withholding based on the securities’ current market value. Upon disposition, realized gains or losses on such securities are recorded net of foreign withholding tax.
Reported net realized foreign exchange gains or losses arise from sales of foreign currencies, currency gains or losses realized between the trade and settlement dates on securities transactions, the difference between the amounts of dividends, interest, and foreign withholding tax reclaims recorded on the Portfolios’ books, and the U.S. dollar equivalent of the amounts actually received or paid. Net unrealized foreign exchange gains and losses arise from changes in the value of assets and liabilities other than investments in securities, resulting from changes in the exchange rate. Foreign security and currency transactions may involve certain considerations and risks not typically associated with investing in U.S. companies and U.S. government securities. These risks include, but are not limited to, revaluation of currencies and future adverse political and economic developments which could cause securities and their markets to be less liquid and prices more volatile than those of comparable U.S. companies and U.S. government securities. The foregoing risks are even greater with respect to securities of issuers in emerging markets.
D. Distributions to Shareholders. Net investment income dividends and net capital gain distributions, if any, for Bond Portfolio are declared and paid annually. For BlackRock Inflation Protected Bond, dividends from net investment income, if any, are declared and paid monthly and distributions of net capital gains, if any, are declared and paid annually. The Portfolios may make distributions on a more frequent basis to comply with the distribution requirements of the Internal Revenue Code. The characteristics of income and gains to be distributed are determined in accordance with income tax regulations, which may differ from GAAP for investment companies.
E. Federal Income Taxes. It is the policy of each Portfolio to comply with the requirements of subchapter M of the Internal Revenue Code that are applicable to regulated investment companies and to distribute substantially all of its net investment income and any net realized capital gains to its shareholders. Therefore, a federal income tax or excise tax provision is not required. Management has considered the sustainability of the Portfolios’ tax positions taken on federal income tax returns for all open tax years in making this determination. No capital gain distributions shall be made until the capital loss carryforwards have been fully utilized.
The Portfolios may utilize equalization accounting for tax purposes, whereby a portion of redemption payments are treated as distributions of income or gain.
18
NOTES TO FINANCIAL STATEMENTS AS OF DECEMBER 31, 2020 (CONTINUED)
NOTE 2 — SIGNIFICANT ACCOUNTING POLICIES (continued)
F. Use of Estimates. The preparation of financial statements in conformity with GAAP requires management to make estimates and assumptions that affect the reported amounts of assets and liabilities and disclosure of contingent assets and liabilities at the date of the financial statements and the reported amounts of increases and decreases in net assets from operations during the reporting period. Actual results could differ from those estimates.
G. Risk Exposures and the Use of Derivative Instruments. The Portfolios’ investment strategies permit the Portfolios to enter into various types of derivatives contracts, including, but not limited to, futures contracts, forward foreign currency exchange contracts, credit default swaps, interest rate swaps, total return swaps, and purchased and written options. In doing so, a Portfolio will employ strategies in differing combinations to permit it to increase or decrease the level of risk, or change the level or types of exposure to risk factors. This may allow a Portfolio to pursue its objectives more quickly, and efficiently than if it were to make direct purchases or sales of securities capable of affecting a similar response to market or credit factors.
In pursuit of its investment objectives, a Portfolio may seek to increase or decrease its exposure to the following market or credit risk factors:
Credit Risk. The price of a bond or other debt instrument is likely to fall if the issuer’s actual or perceived financial health deteriorates, whether because of broad economic or issuer-specific reasons. In certain cases, the issuer could be late in paying interest or principal, or could fail to pay its financial obligations altogether.
Equity Risk. Stock prices may be volatile or have reduced liquidity in response to real or perceived impacts of factors including, but not limited to, economic conditions, changes in market interest rates, and political events. Stock markets tend to be cyclical, with periods when stock prices generally rise and periods when stock prices generally decline. Any given stock market segment may remain out of favor with investors for a short or long period of time, and stocks as an asset class may underperform bonds or other asset classes during some periods. Additionally, legislative, regulatory or tax policies or developments in these areas may adversely impact the investment techniques available to a manager, add to costs and impair the ability of a Portfolio to achieve its investment objectives.
Foreign Exchange Rate Risk. To the extent that a Portfolio invests directly in foreign (non-U.S.) currencies or in securities denominated in, or that trade in, foreign (non-U.S.) currencies, it is subject to the risk that those foreign
(non-U.S.) currencies will decline in value relative to the U.S. dollar or, in the case of hedging positions, that the U.S. dollar will decline in value relative to the currency being hedged by a Portfolio through foreign currency exchange transactions.
Currency rates may fluctuate significantly over short periods of time. Currency rates may be affected by changes in market interest rates, intervention (or the failure to intervene) by U.S. or foreign governments, central banks or supranational entities such as the International Monetary Fund, by the imposition of currency controls, or other political or economic developments in the United States or abroad.
Interest Rate Risk. With bonds and other fixed rate debt instruments, a rise in market interest rates generally causes values to fall; conversely, values generally rise as market interest rates fall. The higher the credit quality of the instrument, and the longer its maturity or duration, the more sensitive it is likely to be to interest rate risk. In the case of inverse securities, the interest rate paid by the securities is a floating rate, which generally will decrease when the market rate of interest to which the inverse security is indexed increases and will increase when the market rate of interest to which the inverse security is indexed decreases. As of the date of this report, the United States experiences a low interest rate environment, which may increase a Portfolio’s exposure to risks associated with rising market interest rates. Rising market interest rates could have unpredictable effects on the markets and may expose fixed-income and related markets to heightened volatility. For a fund that invests in fixed-income securities, an increase in market interest rates may lead to increased redemptions and increased portfolio turnover, which could reduce liquidity for certain investments, adversely affect values, and increase costs. If dealer capacity in fixed-income markets is insufficient for market conditions, it may further inhibit liquidity and increase volatility in the fixed-income markets. Further, recent and potential changes in government policy may affect interest rates.
Risks of Investing in Derivatives. A Portfolio’s use of derivatives can result in losses due to unanticipated changes in the market or credit risk factors and the overall market. In instances where a Portfolio is using derivatives to decrease, or hedge, exposures to market or credit risk factors for securities held by a Portfolio, there are also risks that those derivatives may not perform as expected resulting in losses for the combined or hedged positions.
Derivative instruments are subject to a number of risks, including the risk of changes in the market price of the underlying securities, credit risk with respect to the counterparty, risk of loss due to changes in market interest rates and liquidity and volatility risk. The amounts required
19
NOTES TO FINANCIAL STATEMENTS AS OF DECEMBER 31, 2020 (CONTINUED)
NOTE 2 — SIGNIFICANT ACCOUNTING POLICIES (continued)
to purchase certain derivatives may be small relative to the magnitude of exposure assumed by a Portfolio. Therefore, the purchase of certain derivatives may have an economic leveraging effect on a Portfolio and exaggerate any increase or decrease in the NAV. Derivatives may not perform as expected, so a Portfolio may not realize the intended benefits. When used for hedging purposes, the change in value of a derivative may not correlate as expected with the currency, security or other risk being hedged. When used as an alternative or substitute for direct cash investments, the return provided by the derivative may not provide the same return as direct cash investment. In addition, given their complexity, derivatives expose a Portfolio to the risk of improper valuation.
Generally, derivatives are sophisticated financial instruments whose performance is derived, at least in part, from the performance of an underlying asset or assets. Derivatives include, among other things, swap agreements, options, forwards and futures. Investments in derivatives are generally negotiated OTC with a single counterparty and as a result are subject to credit risks related to the counterparty’s ability or willingness to perform its obligations; any deterioration in the counterparty’s creditworthiness could adversely affect the value of the derivative. In addition, derivatives and their underlying securities may experience periods of illiquidity which could cause a Portfolio to hold a security it might otherwise sell, or to sell a security it otherwise might hold at inopportune times or at an unanticipated price. A manager might imperfectly judge the direction of the market. For instance, if a derivative is used as a hedge to offset investment risk in another security, the hedge might not correlate to the market’s movements and may have unexpected or undesired results such as a loss or a reduction in gains.
Counterparty Credit Risk and Credit Related Contingent Features. Certain derivative positions are subject to counterparty credit risk, which is the risk that the counterparty will not fulfill its obligation to a Portfolio. Each Portfolio’s derivative counterparties are financial institutions who are subject to market conditions that may weaken their financial position. A Portfolio intends to enter into financial transactions with counterparties that it believes to be creditworthy at the time of the transaction. To reduce this risk, a Portfolio has entered into master netting arrangements, established within each Portfolio’s International Swap and Derivatives Association, Inc. (“ISDA”) Master Agreements (“Master Agreements”). These Master Agreements are with select counterparties and they govern transactions, including certain OTC derivative and forward foreign currency contracts, entered
into by a Portfolio and the counterparty. The Master Agreements maintain provisions for general obligations, representations, agreements, collateral, and events of default or termination. The occurrence of a specified event of termination may give a counterparty the right to terminate all of its contracts and affect settlement of all outstanding transactions under the applicable Master Agreement.
A Portfolio may also enter into collateral agreements with certain counterparties to further mitigate counterparty credit risk on OTC derivative and forward foreign currency contracts. Subject to established minimum levels, collateral is generally determined based on the net aggregate unrealized gain or loss on contracts with a certain counterparty. Collateral pledged to or from a Portfolio is held in a segregated account by a third-party agent and can be in the form of cash or debt securities issued by the U.S. government or related agencies.
At December 31, 2020, the maximum amount of loss that BlackRock Inflation Protected Bond would incur if the counterparties to their derivative transactions failed to perform would be $1,761,255 which represents the gross payments to be received by the Portfolio on OTC purchased options, forward foreign currency contracts, and OTC interest rate swaps were they to be unwound as of December 31, 2020. At December 31, 2020, BlackRock Inflation Protected Bond had received $910,000 in cash collateral from certain counterparties.
Each Portfolio has credit related contingent features that if triggered would allow its derivative counterparties to close out and demand payment or additional collateral to cover their exposure from a Portfolio. Credit related contingent features are established between a Portfolio and its derivatives counterparties to reduce the risk that a Portfolio will not fulfill its payment obligations to its counterparties. These triggering features include, but are not limited to, a percentage decrease in a Portfolio’s net assets and/or a percentage decrease in a Portfolio’s NAV, which could cause a Portfolio to accelerate payment of any net liability owed to the counterparty. The contingent features are established within each Portfolio’s Master Agreements.
At December 31, 2020, BlackRock Inflation Protected Bond had a liability position of $1,497,477 on forward foreign currency contracts, OTC interest rate swaps and OTC written options with credit related contingent features. If a contingent feature would have been triggered as of December 31, 2020, the Portfolio could have been required to pay this amount in cash to its counterparties. At December 31, 2020, BlackRock Inflation Protected Bond pledged $300,000 in cash collateral for their open OTC derivative transactions.
20
NOTES TO FINANCIAL STATEMENTS AS OF DECEMBER 31, 2020 (CONTINUED)
NOTE 2 — SIGNIFICANT ACCOUNTING POLICIES (continued)
H. Forward Foreign Currency Contracts. A Portfolio may enter into forward foreign currency contracts primarily to hedge against foreign currency exchange rate risk on its non-U.S. dollar denominated investment securities. When entering into a forward foreign currency contract, a Portfolio agrees to receive or deliver a fixed quantity of foreign currency for an agreed-upon price on an agreed future date. These contracts are valued daily and a Portfolio’s net equity therein, representing unrealized gain or loss on the contracts as measured by the difference between the forward foreign exchange rates at the dates of entry into the contracts and the forward rates at the reporting date, is included in the Statements of Assets and Liabilities. Realized and unrealized gains and losses are included in the Statements of Operations. These instruments involve market and/or credit risk in excess of the amount recognized in the Statements of Assets and Liabilities. Risks arise from the possible inability of counterparties to meet the terms of their contracts and from movement in currency and securities values and interest rates. Open forward foreign currency contracts are presented within the Portfolio of Investments.
For the year ended December 31, 2020, BlackRock Inflation Protected Bond had entered into forward foreign currency contracts with the obligation to buy and sell specified foreign currencies in the future at a currently negotiated forward rate in order to increase or decrease exposure to foreign exchange rate risk. The Portfolio uses forward foreign currency contracts primarily to protect any non-U.S. dollar-denominated holdings from adverse currency movements and to gain exposure to currencies for the purposes of risk management or enhanced return.
During the year ended December 31, 2020, BlackRock Inflation Protected Bond had average contract amounts of $15,902,263 and $29,899,333 on forward foreign currency contracts purchased and sold, respectively. Please refer to the tables within the Portfolio of Investments for open forward foreign currency contracts at December 31, 2020.
I. Futures Contracts. Each Portfolio may enter into futures contracts involving foreign currency, interest rates, securities and security indices. A futures contract is a commitment to buy or sell a specific amount of a financial instrument at a negotiated price on a stipulated future date. Each Portfolio may buy and sell futures contracts. Futures contracts traded on a commodities or futures exchange will be valued at the final settlement price or official closing price on the principal exchange as reported by such principal exchange at its trading session ending at, or most recently prior to, the time when a Portfolio’s assets are valued.
Upon entering into a futures contract, a Portfolio is required to deposit either cash or securities (initial margin) in an amount equal to a certain percentage of the contract value. Subsequent payments (variation margin) are made or received by a Portfolio each day. The variation margin payments are equal to the daily changes in the contract value and are recorded as unrealized gains and losses and included within Cash collateral for futures contracts on the Statement of Assets and Liabilities. Open futures contracts are reported on a table within the Portfolio of Investments. Securities held in collateralized accounts to cover initial margin requirements on open futures contracts are footnoted in the Portfolio of Investments. Cash collateral held by the broker to cover initial margin requirements on open futures contracts are noted in the Statements of Assets and Liabilities. The net change in unrealized appreciation and depreciation is reported in the Statements of Operations. Realized gains (losses) are reported in the Statements of Operations at the closing or expiration of futures contracts.
Futures contracts are exposed to the market risk factor of the underlying financial instrument. Additional associated risks of entering into futures contracts include the possibility that there may be an illiquid market where a Portfolio is unable to liquidate the contract or enter into an offsetting position and, if used for hedging purposes, the risk that the price of the contract will correlate imperfectly with the prices of a Portfolio’s securities. With futures, there is minimal counterparty credit risk to a Portfolio since futures are exchange traded and the exchange’s clearinghouse, as counterparty to all exchange traded futures, guarantees the futures against default. During the year ended December 31, 2020, BlackRock Inflation Protected Bond and Bond Portfolio had purchased and sold futures contracts on various bonds and notes as part of their duration strategy. During the year ended December 31, 2020, the following Portfolios had average notional values on futures contracts purchased and sold as disclosed below:
| | Purchased | | Sold |
|---|
| BlackRock Inflation Protected Bond | | $ | 65,299,729 | | | $ | 24,491,238 | |
| Bond Portfolio | | | — | | | | 57,695,438 | |
Please refer to the tables within each respective Portfolio of Investments for the above Portfolios’ open futures contracts at December 31, 2020.
At December 31, 2020, BlackRock Inflation Protected Bond had pledged U.S. Treasuries with an original par value of $292,000 as collateral for open futures contracts.
J. Options Contracts. The Portfolios may purchase put and call options and may write (sell) put options and covered call options. The Portfolios may engage in option transactions as a hedge against adverse movements in the
21
NOTES TO FINANCIAL STATEMENTS AS OF DECEMBER 31, 2020 (CONTINUED)
NOTE 2 — SIGNIFICANT ACCOUNTING POLICIES (continued)
value of portfolio holdings or to increase market exposure. Option contracts are valued daily and unrealized gains or losses are recorded based upon the last sales price on the principal exchange on which the options are traded. An amount equal to the premium received by the Portfolios upon the writing of a put or call option is included in the Statements of Assets and Liabilities as a liability which is subsequently marked-to-market until it is exercised or closed, or it expires. The Portfolios will realize a gain or loss upon the expiration or closing of the option contract. When an option is exercised, the proceeds on sales of the underlying security for a written call option, the purchase cost of the security for a written put option, or the cost of the security for a purchased put or call option is adjusted by the amount of premium received or paid. Realized and unrealized gains or losses on option contracts are reflected in the accompanying financial statements. The risk in writing a covered call option is that a Portfolio gives up the opportunity for profit if the market price of the security increases and the option is exercised. The risk in writing a put option is that a Portfolio may incur a loss if the market price of the security decreases and the option is exercised. The risk in buying an option is that a Portfolio pays a premium whether or not the option is exercised. Risks may also arise from an illiquid secondary market or from the inability of counterparties to meet the terms of the contract.
During the year ended December 31, 2020, BlackRock Inflation Protected Bond had purchased and written exchange-traded futures contracts to manage its duration strategy and to generate income. BlackRock Inflation Protected Bond had average notional values of $36,571,388 and $24,749,277, respectively, on purchased and written exchange-traded futures contracts. Please refer to the tables within the Portfolio of Investments for open purchased and written options on exchange-traded futures contracts at December 31, 2020.
During the year ended December 31, 2020, BlackRock Inflation Protected Bond had purchased and written interest rate swap options (“swaptions”) to manage its duration strategy and to generate income. BlackRock Inflation Protected Bond had average notional values of $63,524,658 and $267,390,564, respectively, on purchased and written interest rate swaptions. Please refer to the tables within the Portfolio of Investments for open purchased and written interest rate swaptions at December 31, 2020.
During the year ended December 31, 2020, BlackRock Inflation Protected Bond had purchased and written foreign currency options to manage its foreign exchange exposure and to generate income. BlackRock Inflation Protected Bond had average notional values of $2,082,468 and
$2,752,941, respectively, on purchased and written foreign currency options. There were no open purchased and written foreign currency options at December 31, 2020.
During the year ended December 31, 2020, BlackRock Inflation Protected Bond had purchased and written inflation rate caps and floors to gain exposure to interest rates and generate income as disclosed below. Please refer to the tables within the Portfolio of Investments for open purchased and written inflation rate caps at December 31, 2020. There were no purchased and written inflation rate floors at December 31, 2020.
| | Purchased | | Written |
|---|
| Inflation rate caps | | $ | 14,922,000 | | | $ | 14,922,000 | |
| Inflation rate floors | | | 7,756,667 | | | | 15,503,333 | |
K. Swap Agreements. The Portfolios may enter into swap agreements. A swap is an agreement between two parties pursuant to which each party agrees to make one or more payments to the other at specified future intervals based on the return of an asset (such as a stock, bond or currency) or non-asset reference (such as an interest rate or index). Swap agreements are privately negotiated in the OTC market and may be executed in a multilateral or other trade facility platform, such as a registered commodities exchange (“centrally cleared swaps”).
The swap agreement will specify the “notional” amount of the asset or non-asset reference to which the contract relates. Subsequent changes in market value, if any, are calculated based upon changes in the performance of the asset or non-asset reference multiplied by the notional value of the contract. The Portfolios may enter into credit default, interest rate, total return and currency swaps to manage its exposure to credit, currency and interest rate risk. All outstanding swap agreements are reported within the Portfolio of Investments.
Swaps are marked to market daily using quotations primarily from third party pricing services, counterparties or brokers. The value of the swap contract is recorded on the Statements of Assets and Liabilities. During the term of the swap, changes in the value of the swap, if any, are recorded as unrealized gains or losses on the Statements of Operations. Upfront payments paid or received by a Portfolio when entering into the agreements are reported on the Statements of Assets and Liabilities and as a component of the changes in unrealized gains or losses on the Statements of Operations. These upfront payments represent the amounts paid or received when initially entering into the swap agreement to compensate for differences between the stated terms of the swap agreement and the prevailing market conditions. The upfront payments are included as a component in the realized gains or losses on the Statements of Operations upon termination or maturity of the swap. A Portfolio also
22
NOTES TO FINANCIAL STATEMENTS AS OF DECEMBER 31, 2020 (CONTINUED)
NOTE 2 — SIGNIFICANT ACCOUNTING POLICIES (continued)
records net periodic payments paid or received on the swap contract as a realized gain or loss on the Statements of Operations.
In a centrally cleared swap, immediately following execution of the swap agreement, the swap agreement is novated to a central counterparty (the “CCP”) and a Portfolio’s counterparty on the swap agreement becomes the CCP. A Portfolio is required to interface with the CCP through a broker. Upon entering into a centrally cleared swap, a Portfolio is required to deposit initial margin with the broker in the form of cash or securities in an amount that varies depending on the size and risk profile of the particular swap. Securities deposited as initial margin are footnoted as pledged on the Portfolio of Investments and cash deposited is recorded on the Statements of Assets and Liabilities as cash pledged for centrally cleared swaps. The daily change in valuation of centrally cleared swaps is recorded as a receivable or payable for variation margin in the Statements of Assets and Liabilities. Payments received from (paid to) the counterparty, including at termination, are recorded as realized gain (loss) on the Statements of Operations.
Entering into swap agreements involves the risk that the maximum potential loss of an investment exceeds the current value of the investment as reported on the Statements of Assets and Liabilities. Other risks involve the possibility that the counterparty to the agreements may default on its obligation to perform, that there will be no liquid market for these investments and that unfavorable changes in the market will have a negative impact on the value of the index or securities underlying the respective swap agreement.
Interest Rate Swap Contracts. An interest rate swap involves the agreement between counterparties to exchange periodic payments based on interest rates. One payment will be based on a floating rate of a specified interest rate while the other will be a fixed rate. Risks involve the future fluctuations of interest rates in which a Portfolio may make payments that are greater than what a Portfolio received from the counterparty. Other risks include credit, liquidity and market risk.
For the year ended December 31, 2020, BlackRock Inflation Protected Bond had entered into interest rate
swaps in which they pay a floating interest rate and receive a fixed interest rate (“Long interest rate swap”) in order to increase exposure to interest rate risk. Average notional amount on long interest rate swaps for BlackRock Inflation Protected Bond was $96,642,869.
For the year ended December 31, 2020, BlackRock Inflation Protected Bond had entered into interest rate swaps in which they pay a fixed interest rate and receives a floating interest rate (“Short interest rate swap”) in order to decrease exposure to interest rate risk. Average notional amount on short interest rate swaps for BlackRock Inflation Protected Bond was $110,164,826.
The Portfolios enter into interest rate swaps to adjust interest rate and yield curve exposures and to substitute for physical fixed-income securities. Please refer to the tables within the Portfolio of Investments for BlackRock Inflation Protected Bond for open interest rate swaps at December 31, 2020.
At December 31, 2020, BlackRock Inflation Protected Bond pledged $4,000,490 in cash collateral for open centrally cleared swaps.
Inflation-linked Swap Contracts. In an inflation-linked swap, one party pays a fixed interest rate on a notional amount while the other party pays a floating rate linked to an inflation index on that same notional amount. The party paying the floating rate pays the inflation adjusted rate multiplied by the notional amount.
For the year ended December 31, 2020, BlackRock Inflation Protected Bond had entered into inflation-linked swaps in which they pay a floating rate linked to an inflation index and receive a fixed interest rate (“Long inflation-linked swap”). Average notional amount on long inflation-linked swaps for BlackRock Inflation Protected Bond was $21,973,206.
For the year ended December 31, 2020, BlackRock Inflation Protected Bond had entered into inflation-linked swaps in which it pays a fixed interest rate and receives a floating rate linked to an inflation index (“Short inflation-linked swap”). Average notional amount on short inflation linked-bonds was $159,693,245.
BlackRock Inflation Protected Bond used inflation-linked swaps as part of their inflation strategy. Please refer to the tables within the Portfolio of Investments for BlackRock Inflation Protected Bond for open inflation-linked swaps at December 31, 2020.
L. Inflation-Indexed Bonds. Inflation-indexed bonds are fixed income securities whose principal value is periodically adjusted according to the rate of inflation. If the index measuring inflation rises or falls, the principal value of inflation-indexed bonds will be adjusted upward or downward, and consequently the interest payable on these securities (calculated with respect to a larger or smaller principal amount) will be increased or reduced, respectively. Any upward or downward adjustment in the principal amount of an inflation-indexed bond will be included in interest income in the Statement of Operations, even though investors do not receive their principal until
23
NOTES TO FINANCIAL STATEMENTS AS OF DECEMBER 31, 2020 (CONTINUED)
NOTE 2 — SIGNIFICANT ACCOUNTING POLICIES (continued)
maturity. Repayment of the original bond principal upon maturity (as adjusted for inflation) is guaranteed in the case of US Treasury inflation-indexed bonds. For bonds that do not provide a similar guarantee, the adjusted principal value of the bond repaid at maturity may be less than the original principal.
M. Securities Lending. Each Portfolio may temporarily loan up to 33 1/3% of its total assets to brokers, dealers or other financial institutions in exchange for a negotiated lender’s fee. Securities lending involves two primary risks: “investment risk” and “borrower default risk.” When lending securities, the Portfolios will receive cash or U.S. government securities as collateral. Investment risk is the risk that the Portfolios will lose money from the investment of the cash collateral received from the borrower. Borrower default risk is the risk that the Portfolios will lose money due to the failure of a borrower to return a borrowed security. Loans are subject to termination at the option of the borrower or the Portfolios. Securities lending may result in leverage. The use of leverage may exaggerate any increase or decrease in the NAV, causing the Portfolios to be more volatile. The use of leverage may increase expenses and increase the impact of the Portfolios’ other risks.
N. Indemnifications. In the normal course of business, the Portfolios may enter into contracts that provide certain indemnifications. The Trusts’ maximum exposure under these arrangements is dependent on future claims that may be made against the Portfolios and, therefore, cannot be estimated; however, based on experience, management considers the risk of loss from such claims remote.
NOTE 3 — INVESTMENT TRANSACTIONS
For the year ended December 31, 2020, the cost of purchases and the proceeds from the sales of securities, excluding U.S. government and short-term securities were as follows:
| | Purchases | | Sales |
|---|
| BlackRock Inflation Protected Bond | | $ | 97,614,412 | | | $ | 103,339,421 | |
| Bond Portfolio | | | 242,165,725 | | | | 146,654,877 | |
U.S. government securities not included above were as follows:
| | Purchases | | Sales |
|---|
| BlackRock Inflation Protected Bond | | $ | 139,960,401 | | | $ | 145,380,627 | |
| Bond Portfolio | | | 206,164,286 | | | | 199,431,341 | |
NOTE 4 — INVESTMENT MANAGEMENT FEES
The Portfolios have entered into investment management agreements (“Management Agreements”) with the Investment Adviser. The Investment Adviser has overall responsibility for the management of the Portfolios. The Investment Adviser oversees all investment management and portfolio management services for the Portfolios and assists in managing and supervising all aspects of the general day-to-day business activities and operations of the Portfolios, including custodial, transfer agency, dividend disbursing, accounting, auditing, compliance and related services. Each Management Agreement compensates the Investment Adviser with a management fee, computed daily and payable monthly, based on the average daily net assets of each Portfolio, at the following annual rates:
| Portfolio | | Fee |
|---|
BlackRock Inflation Protected Bond(1) | | 0.55% on the first $200 million;
0.50% on the next $800 million; and
0.40% thereafter |
| Bond Portfolio | | 0.50% on the first $750 million; and
0.48% thereafter |
(1) | | The Investment Adviser has contractually agreed to waive 0.04% of the management fee. Any fees waived or reimbursed are not eligible for recoupment. Termination or modification of this obligation requires approval by the Board. |
The Investment Adviser has entered into sub-advisory agreements with each sub-adviser. These sub-advisers provide investment advice for the Portfolios and are paid by the Investment Adviser based on the average daily net assets of each Portfolio. Subject to such policies as the Board or the Investment Adviser may determine, the sub-advisers manage each Portfolio’s assets in accordance with that Portfolio’s investment objectives, policies, and limitations.
| Portfolio | | Sub-Adviser |
|---|
| BlackRock Inflation Protected Bond | | BlackRock Financial Management, Inc. |
| Bond Portfolio | | Brandywine Global Investment Management, LLC(2) |
(2) | | Effective July 31, 2020, the Investment Adviser entered into a new sub-advisory agreement with Brandywine Global Investment Management, LLC due to a change in control of Legg Mason, Inc., its parent company. The new sub-advisory agreement includes the same terms and same portfolio management team as the previous agreement. |
NOTE 5 — DISTRIBUTION AND SERVICE FEE
Voya Investors Trust has entered into a shareholder service plan (the “Plan”) for the Class S shares of BlackRock Inflation Protected Bond. The Plan compensates the Distributor for the provision of shareholder services and/or account maintenance services to direct or indirect beneficial owners of Class S shares. Under the Plan, the Portfolio makes payments to
24
NOTES TO FINANCIAL STATEMENTS AS OF DECEMBER 31, 2020 (CONTINUED)
NOTE 5 — DISTRIBUTION AND SERVICE FEE
(continued)
the Distributor at an annual rate of 0.25% of the Portfolio’s average daily net assets attributable to Class S shares.
Class ADV shares of BlackRock Inflation Protected Bond have a shareholder service and distribution plan. The Portfolio pays the Distributor a shareholder service fee of 0.25% and a distribution fee of 0.35% of the Portfolio’s average daily net assets attributable to Class ADV shares.
NOTE 6 — OTHER TRANSACTIONS WITH AFFILIATES AND RELATED PARTIES
At December 31, 2020, the following direct or indirect, wholly-owned subsidiaries of Voya Financial, Inc. or affiliated investment companies owned more than 5% of the following Portfolios:
Subsidiary/Affiliated
Investment Company | | Portfolio | | Percentage |
|---|
| Voya Institutional Trust Company | | BlackRock Inflation Protected Bond | | 17.36 | % |
| Voya Solution 2025 Portfolio | | Bond Portfolio | | 17.84 | |
| Voya Solution 2035 Portfolio | | Bond Portfolio | | 8.39 | |
| Voya Solution Income Portfolio | | Bond Portfolio | | 13.41 | |
The Portfolios have adopted a deferred compensation plan (the “DC Plan”), which allows eligible independent trustees, as described in the DC Plan, to defer the receipt of all or a portion of the trustees’ fees that they are entitled to receive from the Portfolios. For purposes of determining the amount owed to the trustee under the DC Plan, the amounts deferred are invested in shares of the funds selected by the trustee (the “Notional Funds”). When the Portfolios purchase shares of the Notional Funds, which are all advised by Voya Investments, in amounts equal to the trustees’ deferred fees, this results in a Portfolio asset equal to the deferred compensation liability. Such assets, if applicable, are included as a component of “Other assets” on the accompanying Statements of Assets and Liabilities. Deferral of trustees’ fees under the DC Plan will not affect net assets of the Portfolios, and will not materially affect a Portfolio’s assets, liabilities or net investment income per share. Amounts will be deferred until distributed in accordance with the DC Plan.
Effective January 1, 2020, the Portfolios may pay per account fees to affiliates of Voya Investments for recordkeeping services provided on certain assets. For the year ended December 31, 2020, the per account fees for
affiliated recordkeeping services paid by each Portfolio were as follows:
| Portfolio | | Amount | |
|---|
| BlackRock Inflation Protected Bond | | $73,034 | |
| Bond Portfolio | | — | |
NOTE 7 — EXPENSE LIMITATION AGREEMENTS
The Investment Adviser has entered into written expense limitation agreements (“Expense Limitation Agreements”) with the below Portfolios, whereby the Investment Adviser has agreed to limit expenses, excluding interest, taxes, investment-related costs, leverage expenses, extraordinary expenses, and acquired fund fees and expenses to the levels listed below:
| Portfolio | | Maximum Operating Expense Limit
(as a percentage of net assets) |
|---|
| BlackRock Inflation Protected Bond | | Class ADV: 1.23%
Class I: 0.63%
Class S: 0.88% |
| Bond Portfolio | | 0.58% |
With the exception of the non-recoupable management fee waiver for BlackRock Inflation Protected Bond, the Investment Adviser may, at a later date, recoup from a Portfolio for fees waived and/or other expenses reimbursed by the Investment Adviser during the previous 36 months, but only if, after such recoupment, a Portfolio’s expense ratio does not exceed the percentage described above. Waived and reimbursed fees net of any recoupment by the Investment Adviser of such waived and reimbursed fees are reflected on the accompanying Statements of Operations. Amounts payable by the Investment Adviser are reflected on the accompanying Statements of Assets and Liabilities.
As of December 31, 2020, the amounts of waived and/or reimbursed fees that are subject to possible recoupment by the Investment Adviser, and the related expiration dates, are as follows:
| | December 31, | | | |
|---|
| Portfolio | | 2021 | | 2022 | | 2023 | | Total | |
|---|
| Bond Portfolio | | $ | 271,640 | | | $ | 46,992 | | | $ | — | | | $ | 318,632 | |
The Expense Limitation Agreements are contractual through May 1, 2021 and shall renew automatically for one-year terms. Termination or modification of these obligations requires approval by the Board.
NOTE 8 — LINE OF CREDIT
Effective May 15, 2020, each Portfolio, in addition to certain other funds managed by the Investment Adviser, has entered into a 364-day unsecured committed revolving line of credit agreement (the “Credit Agreement”) with The Bank of New York Mellon (“BNY”) for an aggregate amount of $400,000,000 through May 14, 2021. The proceeds may
25
NOTES TO FINANCIAL STATEMENTS AS OF DECEMBER 31, 2020 (CONTINUED)
NOTE 8 — LINE OF CREDIT (continued)
be used only to finance temporarily: (1) the purchase or sale of investment securities; or (2) the repurchase or redemption of shares of a Portfolio or certain other funds managed by the Investment Adviser. The funds to which the line of credit is available pay a commitment fee equal to 0.15% per annum on the daily unused portion of the committed line amount payable quarterly in arrears. Prior to May 15, 2020, the predecessor line of credit was for an aggregate amount of $400,000,000 and the funds to which the line of credit was available paid a commitment fee equal to 0.15% per annum on the daily unused portion of the committed line amount through May 15, 2020
Borrowings under the Credit Agreement accrue interest at the federal funds rate plus a specified margin. Repayments
generally must be made within 60 days after the date of a revolving credit advance.
The following Portfolios utilized the line of credit during the year ended December 31, 2020.
| Portfolio | | Days
Utilized | | Approximate
Average
Daily
Balance For
Days Utilized | | Approximate
Weighted
Average
Interest Rate
For Days
Utilized |
|---|
| BlackRock Inflation Protected Bond | | | 4 | | | $ | 1,660,500 | | | | 1.08 | % |
| Bond Portfolio | | | 1 | | | | 3,402,000 | | | | 1.29 | |
NOTE 9 — CAPITAL SHARES
Transactions in capital shares and dollars were as follows:
| | | | Shares
sold | | Shares
issued in
merger | | Reinvestment
of
distributions | | Shares
redeemed | | Net increase
(decrease)
in shares
outstanding | | Shares
sold | | Proceeds
from shares
issued in
merger | | Reinvestment
of
distributions | | Shares
redeemed | | Net increase
(decrease) |
|---|
| Year or period ended | | | | # | | # | | # | | # | | # | | ($) | | ($) | | ($) | | ($) | | ($) |
|---|
| BlackRock Inflation Protected Bond | | | | | | | | | | | | | | | | | | | | | | | | | | | | | | | | | | | | | | | | | | |
Class ADV |
| 12/31/2020 | | | | | 577,915 | | | | — | | | | 63,818 | | | | (796,757 | ) | | | (155,024 | ) | | | 5,686,844 | | | | — | | | | 627,703 | | | | (7,736,821 | ) | | | (1,422,274 | ) |
| 12/31/2019 | | | | | 318,553 | | | | — | | | | 93,232 | | | | (580,639 | ) | | | (168,854 | ) | | | 2,939,064 | | | | — | | | | 858,622 | | | | (5,353,509 | ) | | | (1,555,823 | ) |
| Class I | | | | | | | | | | | | | | | | | | | | | | | | | | | | | | | | | | | | | | | | | | |
| 12/31/2020 | | | | | 3,301,547 | | | | — | | | | 146,726 | | | | (3,843,806 | ) | | | (395,533 | ) | | | 33,787,048 | | | | — | | | | 1,503,785 | | | | (38,878,240 | ) | | | (3,587,407 | ) |
| 12/31/2019 | | | | | 6,137,405 | | | | — | | | | 188,348 | | | | (1,647,916 | ) | | | 4,677,837 | | | | 57,920,215 | | | | — | | | | 1,810,501 | | | | (15,943,201 | ) | | | 43,787,515 | |
Class S |
| 12/31/2020 | | | | | 2,037,324 | | | | — | | | | 225,742 | | | | (2,105,881 | ) | | | 157,185 | | | | 20,491,321 | | | | — | | | | 2,299,314 | | | | (21,213,534 | ) | | | 1,577,101 | |
| 12/31/2019 | | | | | 761,622 | | | | — | | | | 349,295 | | | | (2,978,878 | ) | | | (1,867,961 | ) | | | 7,167,154 | | | | — | | | | 3,314,034 | | | | (28,291,507 | ) | | | (17,810,319 | ) |
| Bond Portfolio | | | | | | | | | | | | | | | | | | | | | | | | | | | | | | | | | | | | | | | | | | |
| 12/31/2020 | | | | | 19,460,953 | | | | — | | | | 684,573 | | | | (11,060,737 | ) | | | 9,084,789 | | | | 216,779,069 | | | | — | | | | 7,776,746 | | | | (125,915,207 | ) | | | 98,640,608 | |
| 12/31/2019 | | | | | 4,249,162 | | | | — | | | | 335,400 | | | | (7,133,760 | ) | | | (2,549,198 | ) | | | 43,513,332 | | | | — | | | | 3,417,729 | | | | (72,346,903 | ) | | | (25,415,842 | ) |
NOTE 10 — SECURITIES LENDING
Under an agreement with BNY, the Portfolios can lend its securities to approved brokers, dealers and other financial institutions. Loans are collateralized by cash and U.S. government securities. The collateral must be equal to at least 105% of the market value of non-U.S. securities loaned and 102% of the market value of U.S. securities loaned. The market value of the loaned securities is determined at Market Close of a Portfolio at their last sale price or official closing price on the principal exchange or system on which they are traded and any additional collateral is delivered to a Portfolio on the next business day. The cash collateral received is invested in approved investments as defined in the Securities Lending Agreement with BNY (the “Agreement”). The Portfolios bear the risk of loss with respect to the investment of collateral with the following exception: BNY provides the Portfolios indemnification from loss with respect to the investment of collateral to the extent the cash collateral is invested in overnight repurchase agreements.
Cash collateral received in connection with securities lending is invested in cash equivalents, money market funds, repurchase agreements with maturities of not more than 99 days that are collateralized with U.S. Government securities, or certain short-term investments that have a remaining maturity of 190 days or less (“Permitted Investments”). Short-term investments include: securities, units, shares or other participations in short-term investment funds, pools or trusts; commercial paper, notes, bonds or other debt obligations, certificates of deposit, time deposits and other bank obligations and asset-backed commercial paper backed by diversified receivables and repurchase-backed programs. Permitted Investments are subject to certain guidelines established by the Adviser regarding liquidity, diversification, credit quality and average credit life/duration requirements. The securities purchased with cash collateral received are reflected in the Portfolio of Investments under Short-Term Investments
26
NOTES TO FINANCIAL STATEMENTS AS OF DECEMBER 31, 2020 (CONTINUED)
NOTE 10 — SECURITIES LENDING (continued)
Generally, in the event of counterparty default, a Portfolio has the right to use the collateral to offset losses incurred. The Agreement contains certain guarantees by BNY in the event of counterparty default and/or a borrower’s failure to return a loaned security; however, there would be a potential loss to a Portfolio in the event a Portfolio is delayed
or prevented from exercising its right to dispose of the collateral. Engaging in securities lending could have a leveraging effect, which may intensify the credit, market and other risks associated with investing in a portfolio.
At December 31, 2020, the Portfolios did not have any outstanding securities on loan.
NOTE 11 — FEDERAL INCOME TAXES
The amount of distributions from net investment income and net realized capital gains are determined in accordance with federal income tax regulations, which may differ from GAAP for investment companies. These book/tax differences may be either temporary or permanent. Permanent differences are reclassified within the capital accounts based on their federal tax-basis treatment; temporary differences are not reclassified. Key differences include the treatment of foreign currency transactions, futures contracts, paydowns, capital loss carryforwards, straddle loss deferrals and wash sale deferrals. Distributions in excess of net investment income and/or net realized capital gains for tax purposes are reported as return of capital.
Dividends paid by the Portfolios from net investment income and distributions of net realized short-term capital gains are, for federal income tax purposes, taxable as ordinary income to shareholders.
The tax composition of dividends and distributions to shareholders was as follows:
| | Year Ended
December 31, 2020 | | Year Ended December 31, 2019 |
|---|
| | Ordinary
Income | | Return
of Capital | | Ordinary
Income |
|---|
| BlackRock Inflation Protected Bond | | $ | 2,872,784 | | | $ | 1,558,018 | | | $ | 5,983,156 | |
| Bond Portfolio | | | 7,776,746 | | | | — | | | | 3,417,729 | |
The tax-basis components of distributable earnings and the capital loss carryforwards which may be used to offset future realized capital gains for federal income tax purposes as of December 31, 2020 were:
| | | Undistributed
Ordinary | | Undistributed
Long-Term | | Unrealized
Appreciation/ | | Capital Loss Carryforwards | |
|---|
| | | Income | | Capital Gains | | (Depreciation) | | Amount | | Character | | Expiration | |
|---|
| BlackRock Inflation Protected Bond | | $ | — | | | $ | — | | | $ | 27,393,950 | | | $ | (4,898,384 | ) | | Short-term | | None | |
| | | | | | | | | | | | | | | | (66,071,834 | ) | | Long-term | | None | |
| | | | | | | | | | | | | | | $ | (70,970,218 | ) | | | | | |
| Bond Portfolio | | | 24,047,353 | | | | 3,030,365 | | | | 18,308,967 | | | $ | — | | | — | | — | |
The Portfolios’ major tax jurisdictions are U.S. federal, Arizona state, and Massachusetts state (BlackRock Inflation Protected Bond).
As of December 31, 2020, no provision for income tax is required in the Portfolios’ financial statements as a result of tax positions taken on federal and state income tax returns for open tax years. The Portfolios’ federal and state income and federal excise tax returns for tax years for which the applicable statutes of limitations have not expired are subject to examination by the Internal Revenue Service and state department of revenue. Generally, the preceding four tax years remain subject to examination by these jurisdictions.
NOTE 12 — LONDON INTERBANK OFFERED RATE (“LIBOR”)
The U.K. Financial Conduct Authority has announced that it intends to stop persuading or compelling banks to submit LIBOR rates after 2021, and it remains unclear whether LIBOR will continue to exist after that date and, if so, in what form. Actions by regulators have resulted in the establishment of alternative reference rates to LIBOR in many major currencies. The U.S. Federal Reserve Board, based on the recommendations of the New York Federal
Reserve’s Alternative Reference Rate Committee (comprised of major derivative market participants and their regulators), has begun publishing a Secured Overnight Funding Rate (“SOFR”) that is intended to replace U.S. dollar LIBOR. Proposals for alternative reference rates for other currencies have also been announced or have already begun publication.
Discontinuance of LIBOR and adoption/implementation of alternative rates pose a number of risks, including among others whether any substitute rate will experience the
27
NOTES TO FINANCIAL STATEMENTS AS OF DECEMBER 31, 2020 (CONTINUED)
NOTE 12 — LONDON INTERBANK OFFERED RATE
(“LIBOR”) (continued)
market participation and liquidity necessary to provide a workable substitute for LIBOR; the effect on parties’ existing contractual arrangements, hedging transactions, and investment strategies generally from a conversion from LIBOR to alternative rates; the effect on a Portfolio’s existing investments (including, for example, fixed-income investments; senior loans; CLOs and CDOs; and derivatives transactions), including the possibility that some of those investments may terminate or their terms may be adjusted to the disadvantage of a Portfolio; and the risk of general market disruption during the period of the conversion. It is difficult to predict at this time the likely impact of the transition away from LIBOR on a Portfolio. On November 30, 2020, the administrator of LIBOR announced a delay in the phase out of a majority of the U.S. dollar LIBOR publications until June 30, 2023, with the remainder of LIBOR publications to still end at the end of 2021.
NOTE 13 — MARKET DISRUPTION
A Portfolio is subject to the risk that geopolitical events will disrupt securities markets and adversely affect global economies and markets. Due to the increasing interdependence among global economies and markets, conditions in one country, market, or region might adversely impact markets, issuers and/or foreign exchange rates in other countries, including the United States. War, terrorism, global health crises and pandemics, and other geopolitical events have led, and in the future may lead, to increased market volatility and may have adverse short- or long-term effects on U.S. and world economies and markets generally. For example, the COVID-19 pandemic has resulted, and may continue to result, in significant market volatility, exchange trading suspensions and closures, declines in global financial markets, higher default rates, and a substantial economic downturn in economies throughout the world. Natural and environmental disasters and systemic market dislocations are also highly disruptive to economies and markets. Those events as well as other changes in non-U.S. and domestic economic, social, and political conditions also could adversely affect individual issuers or related groups of issuers, securities markets, interest rates, credit ratings, inflation, investor sentiment, and other factors affecting the value of the investments of the portfolio and of the
Portfolios. Any of these occurrences could disrupt the operations of a Portfolio and of the Portfolios’ service providers.
NOTE 14 — OTHER ACCOUNTING PRONOUNCEMENTS
The Portfolios have adopted the provisions of Financial Accounting Standards Board Accounting Standards Update 2018-13 (“ASU 2018-13”), Fair Value Measurement (Topic 820): Disclosure Framework — Changes to the Disclosure Requirements for Fair Value Measurement. ASU 2018-13 introduces new fair value disclosure requirements as well as provides guidance that eliminates, adds and modifies certain disclosure requirements for fair value measurements. The impact of the Portfolios’ adoption was limited to changes in the Portfolios’ financial statement disclosures regarding fair value, primarily those disclosures related to transfers between levels of the fair value hierarchy and disclosure of the range and weighted average used to develop significant unobservable inputs for Level 3 fair value measurements, when applicable. Upon evaluation, the Portfolios have concluded that the adoption of the new accounting standard does not materially impact the financial statement amounts.
In March 2020, the Financial Accounting Standards Board issued Accounting Standards Update No. 2020-04 (“ASU 2020-04”), Reference Rate Reform (Topic 848) — Facilitation of the Effects of Reference Rate Reform on Financial Reporting. The amendments in ASU 2020-04 provide optional temporary financial reporting relief from the effect of certain types of contract modifications due to the planned discontinuation of LIBOR and other interbank-offered based reference rates as of the end of 2021. ASU 2020-04 is effective for certain reference rate-related contract modifications that occur during the period March 12, 2020 through December 31, 2022. Management is currently evaluating the impact, if any, of applying ASU 2020-04.
NOTE 15 — SUBSEQUENT EVENTS
The Portfolios have evaluated events occurring after the Statements of Assets and Liabilities date through the date that the financial statements were issued (“subsequent events”) to determine whether any subsequent events necessitated adjustment to or disclosure in the financial statements. No such subsequent events were identified.
28
VY® BLACKROCK INFLATION
PROTECTED BOND PORTFOLIO | SUMMARY PORTFOLIO OF INVESTMENTS
AS OF DECEMBER 31, 2020 |
| | |
Principal
Amount† | | | | | | | | Value | | | Percentage
of Net
Assets |
|---|
| |
CORPORATE BONDS/NOTES: 24.9% |
| |
| 1,000,000 | | | | | | Alibaba Group Holding Ltd., 3.125%, 11/28/2021 | | $ | 1,019,854 | | | | 0.3 | |
| 616,000 | | | | (1) | | T-Mobile USA, Inc., 3.750%, 04/15/2027 | | | 702,117 | | | | 0.2 | |
| 434,000 | | | | | | Other Securities | | | 485,553 | | | | 0.2 | |
| | | | | | | | | | 2,207,524 | | | | 0.7 | |
| |
| |
| 1,750,000 | | | | | | American Honda Finance Corp., 0.650%–2.600%, 11/16/2022–09/08/2023 | | | 1,797,891 | | | | 0.6 | |
| 3,000,000 | | | | (1) | | BMW US Capital LLC, 3.800%, 04/06/2023 | | | 3,222,859 | | | | 1.1 | |
| 150,000 | | | | (1) | | Daimler Finance North America LLC, 2.125%, 03/10/2025 | | | 157,727 | | | | 0.0 | |
| 570,000 | | | | | | Other Securities | | | 592,528 | | | | 0.2 | |
| | | | | | | | | | 5,771,005 | | | | 1.9 | |
| |
| Consumer, Non-cyclical: 1.1% |
| 2,500,000 | | | | | | Philip Morris International, Inc., 2.625%, 03/06/2023 | | | 2,625,950 | | | | 0.9 | |
| 444,000 | | | | | | Other Securities | | | 498,087 | | | | 0.2 | |
| | | | | | | | | | 3,124,037 | | | | 1.1 | |
| |
| |
| 1,550,000 | | | | | | BP Capital Markets PLC, 3.561%, 11/01/2021 | | | 1,591,715 | | | | 0.5 | |
| 1,000,000 | | | | (1) | | Schlumberger Finance Canada Ltd., 2.650%, 11/20/2022 | | | 1,037,896 | | | | 0.3 | |
| 135,000 | | | | | | Other Securities | | | 157,510 | | | | 0.1 | |
| | | | | | | | | | 2,787,121 | | | | 0.9 | |
| |
| |
| 1,885,000 | | | | (1) | | AIA Group Ltd., 0.759%, (US0003M + 0.520%), 09/20/2021 | | | 1,884,755 | | | | 0.6 | |
| 1,000,000 | | | | (1) | | AIG Global Funding, 0.450%, 12/08/2023 | | | 1,000,238 | | | | 0.3 | |
| 200,000 | | | | | | American Express Co., 2.500%, 08/01/2022 | | | 206,425 | | | | 0.1 | |
| 2,000,000 | | | | | | American Express Co., 3.700%, 08/03/2023 | | | 2,166,681 | | | | 0.7 | |
| 2,000,000 | | | | (2) | | Bank of America Corp., 2.816%, 07/21/2023 | | | 2,077,429 | | | | 0.7 | |
| 4,854,000 | | | | (2) | | Bank of America Corp., 1.898%–3.705%,
01/23/2022–07/23/2031 | | | 5,044,599 | | | | 1.7 | |
| 1,300,000 | | | | | | Bank of Montreal, 0.450%, 12/08/2023 | | | 1,304,956 | | | | 0.4 | |
| 1,250,000 | | | | (2) | | Bank of New York Mellon Corp./The, 2.661%, 05/16/2023 | | | 1,288,697 | | | | 0.4 | |
| 740,000 | | | | (1) | | Banque Federative du Credit Mutuel SA, 0.650%, 02/27/2024 | | | 742,318 | | | | 0.2 | |
| 760,000 | | | | (1) | | Banque Federative du Credit Mutuel SA, 2.125%, 11/21/2022 | | | 785,067 | | | | 0.3 | |
| 2,500,000 | | | | (2) | | Citibank NA, 2.844%, 05/20/2022 | | | 2,524,057 | | | | 0.8 | |
| 3,000,000 | | | | (2) | | Citigroup, Inc., 0.776%, 10/30/2024 | | | 3,020,921 | | | | 1.0 | |
Principal
Amount† | | | | | | | | Value | | | Percentage
of Net
Assets |
|---|
| |
CORPORATE BONDS/NOTES: (continued) |
| |
| 125,000 | | | | (2) | | Citigroup, Inc., 2.666%, 01/29/2031 | | $ | 134,190 | | | | 0.1 | |
| 4,000,000 | | | | | | Credit Suisse AG/New York NY, 1.000%,
05/05/2023 | | | 4,061,664 | | | | 1.4 | |
| 200,000 | | | | (1),(2) | | Danske Bank A/S, 1.171%, 12/08/2023 | | | 200,988 | | | | 0.0 | |
| 200,000 | | | | (1) | | Danske Bank A/S, 1.226%, 06/22/2024 | | | 202,915 | | | | 0.1 | |
| 1,000,000 | | | | (2) | | Goldman Sachs Group, Inc./The, 2.876%,
10/31/2022 | | | 1,020,402 | | | | 0.3 | |
| 2,000,000 | | | | (2) | | Goldman Sachs Group, Inc./The, 0.627%,
11/17/2023 | | | 2,008,761 | | | | 0.7 | |
| 3,500,000 | | | | | | JPMorgan Chase & Co., 3.200%, 01/25/2023 | | | 3,706,061 | | | | 1.3 | |
| 1,441,000 | | | | (2) | | JPMorgan Chase & Co., 3.559%–4.493%,
04/23/2024–03/24/2031 | | | 1,592,316 | | | | 0.5 | |
| 870,000 | | | | (2) | | KeyBank NA/Cleveland OH, 0.423%, 01/03/2024 | | | 871,218 | | | | 0.3 | |
| 1,614,000 | | | | (1) | | MassMutual Global Funding II, 0.850%, 06/09/2023 | | | 1,634,209 | | | | 0.6 | |
| 1,170,000 | | | | (1) | | Metropolitan Life Global Funding I, 0.900%, 06/08/2023 | | | 1,185,041 | | | | 0.4 | |
| 2,000,000 | | | | | | Mitsubishi UFJ Financial Group, Inc., 3.218%, 03/07/2022 | | | 2,068,269 | | | | 0.7 | |
| 1,700,000 | | | | (2) | | Mizuho Financial Group, Inc., 1.241%–3.922%, 07/10/2024–09/11/2024 | | | 1,742,773 | | | | 0.6 | |
| 4,000,000 | | | | | | Morgan Stanley, 2.750%, 05/19/2022 | | | 4,131,619 | | | | 1.4 | |
| 239,000 | | | | (2) | | Morgan Stanley, 3.772%–4.000%,
07/23/2025–01/24/2029 | | | 274,723 | | | | 0.1 | |
| 1,000,000 | | | | (1) | | Nationwide Building Society, 2.000%,
01/27/2023 | | | 1,032,441 | | | | 0.3 | |
| 1,800,000 | | | | | | Sumitomo Mitsui Financial Group, Inc., 2.846%–3.936%,
01/11/2022–10/16/2023 | | | 1,916,845 | | | | 0.6 | |
| 1,400,000 | | | | (1) | | Swedbank AB, 0.600%, 09/25/2023 | | | 1,403,794 | | | | 0.5 | |
| 2,100,000 | | | | | | Wells Fargo & Co., 3.500%, 03/08/2022 | | | 2,177,523 | | | | 0.7 | |
| 303,000 | | | | (2) | | Wells Fargo & Co., 3.000%–3.584%,
10/23/2026–05/22/2028 | | | 340,974 | | | | 0.1 | |
| 809,000 | | | | | | Other Securities | | | 841,601 | | | | 0.3 | |
| | | | | | | | | | 54,594,470 | | | | 18.2 | |
| |
| |
| 425,000 | | | | | | Other Securities | | | 480,059 | | | | 0.2 | |
| |
| |
| 1,000,000 | | | | | | Broadcom Corp. / Broadcom Cayman Finance Ltd., 2.650%, 01/15/2023 | | | 1,040,672 | | | | 0.3 | |
See Accompanying Notes to Financial Statements
29
VY® BLACKROCK INFLATION
PROTECTED BOND PORTFOLIO | SUMMARY PORTFOLIO OF INVESTMENTS
AS OF DECEMBER 31, 2020 (CONTINUED) |
| | |
| | Principal
Amount† | | | | | | | | Value | | | Percentage
of Net
Assets |
|---|
| | |
CORPORATE BONDS/NOTES: (continued) |
| |
| | 2,275,000 | | | | | | International Business Machines Corp., 2.850%, 05/13/2022 | | $ | 2,356,213 | | | | 0.8 | |
| | 500,000 | | | | (1) | | NXP BV / NXP Funding LLC / NXP USA, Inc., 3.150%, 05/01/2027 | | | 551,526 | | | | 0.2 | |
| | 1,055,000 | | | | | | Oracle Corp., 2.500%–3.600%,
05/15/2022–04/01/2050 | | | 1,091,126 | | | | 0.4 | |
| | 313,000 | | | | | | Other Securities | | | 355,836 | | | | 0.1 | |
| | | | | | | | | | | 5,395,373 | | | | 1.8 | |
| | |
| |
| | 301,000 | | | | | | Other Securities | | | 322,870 | | | | 0.1 | |
| | | | | | | | Total Corporate Bonds/Notes
(Cost $73,440,633) | | | 74,682,459 | | | | 24.9 | |
| | |
MUNICIPAL BONDS: 0.0% |
| |
| | 85,000 | | | | | | Other Securities | | | 104,897 | | | | 0.0 | |
| | | | | | | | Total Municipal Bonds (Cost $101,108) | | | 104,897 | | | | 0.0 | |
| | |
U.S. TREASURY OBLIGATIONS: 52.3% |
| Treasury Inflation Indexed Protected
Securities: 51.8% |
| | 4,648,242 | | | | | | 0.125%,10/15/2024 | | | 4,984,929 | | | | 1.7 | |
| | 3,903,771 | | | | | | 0.125%,10/15/2025 | | | 4,245,921 | | | | 1.4 | |
| | 6,371,150 | | | | | | 0.125%,07/15/2026 | | | 7,008,657 | | | | 2.3 | |
| | 1,983,657 | | | | | | 0.125%,01/15/2030 | | | 2,213,987 | | | | 0.7 | |
| | 8,124,720 | | | | | | 0.125%,07/15/2030 | | | 9,118,429 | | | | 3.0 | |
| | 2,427,835 | | | | | | 0.250%,07/15/2029 | | | 2,749,598 | | | | 0.9 | |
| | 2,790,292 | | | | | | 0.250%,02/15/2050 | | | 3,330,354 | | | | 1.1 | |
| | 2,992,105 | | | | | | 0.375%,07/15/2025 | | | 3,287,129 | | | | 1.1 | |
| | 8,492,845 | | | | | | 0.375%,01/15/2027 | | | 9,480,328 | | | | 3.2 | |
| | 9,346,047 | | | | | | 0.375%,07/15/2027 | | | 10,518,489 | | | | 3.5 | |
| | 8,674,428 | | | | | | 0.500%,01/15/2028 | | | 9,839,450 | | | | 3.3 | |
| | 8,137,308 | | | | | | 0.625%,01/15/2026 | | | 9,085,461 | | | | 3.0 | |
| | 3,539,250 | | | | | | 0.625%,02/15/2043 | | | 4,416,218 | | | | 1.5 | |
| | 8,381,626 | | | | | | 0.750%,07/15/2028 | | | 9,751,904 | | | | 3.3 | |
| | 4,683,998 | | | | | | 0.750%,02/15/2042 | | | 5,967,564 | | | | 2.0 | |
| | 5,086,542 | | | | (3) | | 0.750%,02/15/2045 | | | 6,566,646 | | | | 2.2 | |
| | 2,770,812 | | | | | | 0.875%,01/15/2029 | | | 3,257,646 | | | | 1.1 | |
| | 2,087,265 | | | | | | 0.875%,02/15/2047 | | | 2,809,471 | | | | 0.9 | |
| | 3,423,198 | | | | | | 1.000%,02/15/2046 | | | 4,673,593 | | | | 1.6 | |
| | 2,819,333 | | | | | | 1.000%,02/15/2048 | | | 3,929,478 | | | | 1.3 | |
| | 2,519,689 | | | | | | 1.000%,02/15/2049 | | | 3,552,364 | | | | 1.2 | |
| | 3,843,374 | | | | | | 1.375%,02/15/2044 | | | 5,539,994 | | | | 1.9 | |
| | 2,789,112 | | | | (3) | | 1.750%,01/15/2028 | | | 3,422,334 | | | | 1.1 | |
| | 3,896,432 | | | | | | 2.000%,01/15/2026 | | | 4,634,049 | | | | 1.6 | |
| | 1,892,977 | | | | | | 2.125%,02/15/2040 | | | 2,934,253 | | | | 1.0 | |
| | 2,514,820 | | | | | | 2.125%,02/15/2041 | | | 3,947,211 | | | | 1.3 | |
| | 3,663,106 | | | | | | 2.375%,01/15/2027 | | | 4,555,460 | | | | 1.5 | |
| | 2,146,656 | | | | | | 2.500%,01/15/2029 | | | 2,821,003 | | | | 0.9 | |
| | 1,863,052 | | | | | | 3.375%,04/15/2032 | | | 2,839,673 | | | | 1.0 | |
| | 2,568,480 | | | | | | 0.125%–3.875%,
04/15/2023–04/15/2029 | | | 3,478,822 | | | | 1.2 | |
| | | | | | | | | | | 154,960,415 | | | | 51.8 | |
| | Principal
Amount† | | | | | | | | Value | | | Percentage
of Net
Assets |
|---|
| U.S. Treasury Bonds: 0.5% |
| | 1,565,000 | | | | (3) | | 1.125%–1.375%,
08/15/2040–08/15/2050 | | $ | 1,493,912 | | | | 0.5 | |
| | | | | | | | Total U.S. Treasury Obligations
(Cost $136,842,924) | | | 156,454,327 | | | | 52.3 | |
| | |
U.S. GOVERNMENT AGENCY OBLIGATIONS(4): 7.9% | | |
| Federal Home Loan Bank: 2.5% |
| | 5,255,000 | | | | | | 2.875%,09/13/2024 | | | 5,764,486 | | | | 1.9 | |
| | 1,515,000 | | | | | | 3.250%,11/16/2028 | | | 1,812,179 | | | | 0.6 | |
| | | | | | | | | | | 7,576,665 | | | | 2.5 | |
| | |
| Federal Home Loan Mortgage
Corporation: 0.3% |
| | 805,000 | | | | | | 2.375%,01/13/2022 | | | 823,662 | | | | 0.3 | |
| | |
| Federal National Mortgage
Association: 4.3%(4) |
| | 4,830,000 | | | | | | 1.875%,09/24/2026 | | | 5,223,936 | | | | 1.7 | |
| | 7,120,000 | | | | | | 2.625%,09/06/2024 | | | 7,744,950 | | | | 2.6 | |
| | | | | | | | | | | 12,968,886 | | | | 4.3 | |
| | |
| Other U.S. Agency Obligations: 0.8% |
| | 2,190,000 | | | | | | 2.875%,12/21/2023 | | | 2,360,459 | | | | 0.8 | |
| | | | | | | | Total U.S. Government Agency Obligations
(Cost $21,579,251) | | | 23,729,672 | | | | 7.9 | |
| | |
SOVEREIGN BONDS: 6.0% | | |
| | 2,500,000 | | | | | | Israel Government AID Bond, 5.500%,
04/26/2024 | | | 2,919,424 | | | | 1.0 | |
| EUR | 1,736,933 | | | | (1) | | Italy Buoni Poliennali Del Tesoro, 1.300%,
05/15/2028 | | | 2,382,047 | | | | 0.8 | |
| JPY | 329,954,880 | | | | | | Japanese Government CPI Linked Bond, 0.100%, 03/10/2028 | | | 3,205,440 | | | | 1.1 | |
| JPY | 249,752,500 | | | | | | Japanese Government CPI Linked Bond, 0.100%, 03/10/2029 | | | 2,431,129 | | | | 0.8 | |
| NZD | 1,335,000 | | | | | | New Zealand Government Bond, 1.750%, 05/15/2041 | | | 947,519 | | | | 0.3 | |
| NZD | 2,055,000 | | | | | | New Zealand Government Inflation Linked Bond, 2.500%, 09/20/2035 | | | 2,223,883 | | | | 0.7 | |
| NZD | 1,158,000 | | | | | | New Zealand Government Inflation Linked Bond, 2.000%, 09/20/2025 | | | 1,036,109 | | | | 0.3 | |
| EUR | 720,000 | | | | (1) | | Spain Government Bond, 0.500%, 04/30/2030 | | | 922,101 | | | | 0.3 | |
| EUR | 435,000 | | | | (1) | | Spain Government Bond, 1.000%, 10/31/2050 | | | 550,556 | | | | 0.2 | |
| EUR | 533,965 | | | | (1) | | Spain Government Inflation Linked Bond, 1.000%, 11/30/2030 | | | 783,645 | | | | 0.3 | |
| | 565,000 | | | | | | Other Securities | | | 619,984 | | | | 0.2 | |
| | | | | | | | Total Sovereign Bonds (Cost $16,136,655) | | | 18,021,837 | | | | 6.0 | |
See Accompanying Notes to Financial Statements
30
VY® BLACKROCK INFLATION
PROTECTED BOND PORTFOLIO | SUMMARY PORTFOLIO OF INVESTMENTS
AS OF DECEMBER 31, 2020 (CONTINUED) |
| | |
Principal
Amount† | | | | | | | | Value | | | Percentage
of Net
Assets |
|---|
| |
COMMERCIAL MORTGAGE-BACKED SECURITIES: 1.5% |
| 1,000,000 | | | | | | BENCHMARK 2018-B3 A5 Mortgage Trust, 4.025%, 04/10/2051 | | $ | 1,176,279 | | | | 0.4 | |
| 1,000,000 | | | | | | GS Mortgage Securities Trust 2017-GS7 A4, 3.430%, 08/10/2050 | | | 1,142,776 | | | | 0.4 | |
| 700,000 | | | | | | Wells Fargo Commercial Mortgage Trust 2017-C39 A5, 3.418%, 09/15/2050 | | | 795,896 | | | | 0.3 | |
| 1,216,000 | | | | | | Other Securities | | | 1,369,822 | | | | 0.4 | |
| | | | | | | Total Commercial Mortgage-Backed Securities
(Cost $3,957,294) | | | 4,484,773 | | | | 1.5 | |
| |
ASSET-BACKED SECURITIES: 0.4% |
| Student Loan Asset-Backed Securities: 0.4% |
| 260,000 | | | | (1) | | Navient Student Loan Trust 2019-BA A2A, 3.390%, 12/15/2059 | | | 272,740 | | | | 0.1 | |
| 800,000 | | | | (1) | | Sofi Professional Loan Program 2018-C A2FX Trust, 3.590%,
01/25/2048 | | | 830,883 | | | | 0.3 | |
| | | | | | | Total Asset-Backed Securities
(Cost $1,067,761) | | | 1,103,623 | | | | 0.4 | |
| | | | | | | | Value | | | Percentage
of Net
Assets |
|---|
| |
PURCHASED OPTIONS(5): 0.4% |
| | | | | | | Total Purchased Options (Cost $1,009,060) | | | 1,018,632 | | | | 0.4 | |
| | | | | | | Total Long-Term Investments
(Cost $254,134,686) | | | 279,600,220 | | | | 93.4 | |
| Shares | | | | | | | | Value | | | Percentage
of Net
Assets |
|---|
| |
SHORT-TERM INVESTMENTS: 4.8% |
| |
| 14,416,461 | | | | (6) | | BlackRock Liquidity Funds, FedFund, Institutional Class, 0.000%
(Cost $14,416,461) | | | 14,416,461 | | | | 4.8 | |
| | | | | | | Total Short-Term Investments
(Cost $14,416,461) | | | 14,416,461 | | | | 4.8 | |
| | | | | | | Total Investments in Securities
(Cost $268,551,147) | | $ | 294,016,681 | | | | 98.2 | |
| | | | | | | Assets in Excess of Other Liabilities | | | 5,485,361 | | | | 1.8 | |
| | | | | | | Net Assets | | $ | 299,502,042 | | | | 100.0 | |
| | “Other Securities” represents issues not identified as the top 50 holdings in terms of market value and issues or issuers not exceeding 1% of net assets individually or in aggregate respectively as of December 31, 2020.
The following footnotes apply to either the individual securities noted or one or more of the securities aggregated and listed as a single line item. |
| † | | Unless otherwise indicated, principal amount is shown in USD. |
| (1) | | Securities with purchases pursuant to Rule 144A or section 4(a)(2), under the Securities Act of 1933 and may not be resold subject to that rule except to qualified institutional buyers. |
| (2) | | Variable rate security. Rate shown is the rate in effect as of December 31, 2020. |
| (3) | | All or a portion of this security has been pledged as collateral in connection with open futures contracts. Please refer to Note 2 for additional details. |
| (4) | | The Federal Housing Finance Agency (“FHFA”) placed the Federal Home Loan Mortgage Corporation and Federal National Mortgage Association into conservatorship with FHFA as the conservator. As such, the FHFA oversees the continuing affairs of these companies. |
| (5) | | The tables within the Portfolio of Investments detail open purchased options which are non-income producing securities. |
| (6) | | Rate shown is the 7-day yield as of December 31, 2020. |
Currency Abbreviations:
| EUR | | EU Euro |
| JPY | | Japanese Yen |
| NZD | | New Zealand Dollar |
Reference Rate Abbreviations:
US0003M 3-month LIBOR
See Accompanying Notes to Financial Statements
31
VY® BLACKROCK INFLATION
PROTECTED BOND PORTFOLIO | SUMMARY PORTFOLIO OF INVESTMENTS
AS OF DECEMBER 31, 2020 (CONTINUED) |
| | |
Fair Value Measurementsˆ
The following is a summary of the fair valuations according to the inputs used as of December 31, 2020 in valuing the assets and liabilities:
| | | Quoted Prices
in Active Markets
for Identical
Investments
(Level 1) | | Significant
Other
Observable
Inputs
(Level 2) | | Significant
Unobservable
Inputs
(Level 3) | | Fair Value
at
December 31, 2020 |
|---|
Asset Table | | | | | | | | | | | | | | | | | | | | | |
Investments, at fair value | | | | | | | | | | | | | | | | | | | | | |
| Purchased Options | | | | $ | 22,287 | | | | $ | 996,345 | | | | $ | — | | | | $ | 1,018,632 | |
| Corporate Bonds/Notes | | | | | — | | | | | 74,682,459 | | | | | — | | | | | 74,682,459 | |
| Municipal Bonds | | | | | — | | | | | 104,897 | | | | | — | | | | | 104,897 | |
| Commercial Mortgage-Backed Securities | | | | | — | | | | | 4,484,773 | | | | | — | | | | | 4,484,773 | |
| Sovereign Bonds | | | | | — | | | | | 18,021,837 | | | | | — | | | | | 18,021,837 | |
| U.S. Government Agency Obligations | | | | | — | | | | | 23,729,672 | | | | | — | | | | | 23,729,672 | |
| Asset-Backed Securities | | | | | — | | | | | 1,103,623 | | | | | — | | | | | 1,103,623 | |
| U.S. Treasury Obligations | | | | | — | | | | | 156,454,327 | | | | | — | | | | | 156,454,327 | |
| Short-Term Investments | | | | | 14,416,461 | | | | | — | | | | | — | | | | | 14,416,461 | |
| Total Investments, at fair value | | | | $ | 14,438,748 | | | | $ | 279,577,933 | | | | $ | — | | | | $ | 294,016,681 | |
Other Financial Instruments+ | | | | | | | | | | | | | | | | | | | | | |
| Centrally Cleared Swaps | | | | | — | | | | | 4,273,102 | | | | | — | | | | | 4,273,102 | |
| Forward Foreign Currency Contracts | | | | | — | | | | | 4,043 | | | | | — | | | | | 4,043 | |
| Futures | | | | | 99,370 | | | | | — | | | | | — | | | | | 99,370 | |
| OTC Swaps | | | | | — | | | | | 760,867 | | | | | — | | | | | 760,867 | |
| Total Assets | | | | $ | 14,538,118 | | | | $ | 284,615,945 | | | | $ | — | | | | $ | 299,154,063 | |
Liabilities Table | | | | | | | | | | | | | | | | | | | | | |
Other Financial Instruments+ | | | | | | | | | | | | | | | | | | | | | |
| Centrally Cleared Swaps | | | | $ | — | | | | $ | (3,091,607 | ) | | | $ | — | | | | $ | (3,091,607 | ) |
| Forward Foreign Currency Contracts | | | | | — | | | | | (241,343 | ) | | | | — | | | | | (241,343 | ) |
| Futures | | | | | (37,135 | ) | | | | — | | | | | — | | | | | (37,135 | ) |
| OTC Swaps | | | | | — | | | | | (461 | ) | | | | — | | | | | (461 | ) |
| Written Options | | | | | (58,544 | ) | | | | (1,255,673 | ) | | | | — | | | | | (1,314,217 | ) |
| Total Liabilities | | | | $ | (95,679 | ) | | | $ | (4,589,084 | ) | | | $ | — | | | | $ | (4,684,763 | ) |
| ˆ | | See Note 2, “Significant Accounting Policies” in the Notes to Financial Statements for additional information. |
| + | | Other Financial Instruments may include open forward foreign currency contracts, futures, centrally cleared swaps, OTC swaps and written options. Forward foreign currency contracts, futures and centrally cleared swaps are fair valued at the unrealized appreciation (depreciation) on the instrument. OTC swaps and written options are valued at the fair value of the instrument. |
At December 31, 2020, the following forward foreign currency contracts were outstanding for VY® BlackRock Inflation Protected Bond Portfolio:
| Currency Purchased | | Currency Sold | | Counterparty | | Settlement Date | | Unrealized
Appreciation
(Depreciation) |
|---|
| CAD | 375,684 | | | USD | 295,000 | | Citibank N.A. | | 03/11/21 | | | $ | 195 | |
| USD | 295,000 | | | CAD | 376,389 | | Citibank N.A. | | 03/17/21 | | | | (753 | ) |
| USD | 134,774 | | | EUR | 110,554 | | Commonwealth Bank of Australia | | 01/06/21 | | | | (290 | ) |
| USD | 5,609,515 | | | JPY | 582,856,000 | | Deutsche Bank AG | | 01/06/21 | | | | (35,449 | ) |
| USD | 2,175,907 | | | EUR | 1,825,000 | | Goldman Sachs International | | 01/06/21 | | | | (53,701 | ) |
| EUR | 1,857,000 | | | USD | 2,272,597 | | UBS AG | | 01/06/21 | | | | (3,893 | ) |
| USD | 2,185,613 | | | EUR | 1,825,000 | | UBS AG | | 01/06/21 | | | | (43,996 | ) |
| USD | 4,075,665 | | | NZD | 5,808,000 | | UBS AG | | 01/06/21 | | | | (103,261 | ) |
| USD | 2,274,131 | | | EUR | 1,857,000 | | UBS AG | | 02/03/21 | | | | 3,848 | |
| | | | | | | | | | | | | $ | (237,300 | ) |
See Accompanying Notes to Financial Statements
32
VY® BLACKROCK INFLATION
PROTECTED BOND PORTFOLIO | SUMMARY PORTFOLIO OF INVESTMENTS
AS OF DECEMBER 31, 2020 (CONTINUED) |
| | |
At December 31, 2020, the following futures contracts were outstanding for VY® BlackRock Inflation Protected Bond Portfolio:
| Description | | | | Number
of Contracts | | Expiration
Date | | Notional
Amount | | Unrealized
Appreciation/
(Depreciation) |
|---|
Long Contracts: | | | | | | | | | | | | | | | | | | | |
| U.S. Treasury 2-Year Note | | | | | 14 | | | | 03/31/21 | | | $ | 3,093,672 | | | | $ | 201 | |
| U.S. Treasury 5-Year Note | | | | | 313 | | | | 03/31/21 | | | | 39,489,352 | | | | | 88,627 | |
| U.S. Treasury Ultra 10-Year Note | | | | | 29 | | | | 03/22/21 | | | | 4,534,422 | | | | | 8,106 | |
| | | | | | | | | | | | | $ | 47,117,446 | | | | $ | 96,934 | |
Short Contracts: | | | | | | | | | | | | | | | | | | | |
| Canada 10-Year Bond | | | | | (16 | ) | | | 03/22/21 | | | | (1,874,146 | ) | | | | (5,329 | ) |
| Euro-Bund | | | | | (23 | ) | | | 03/08/21 | | | | (4,991,290 | ) | | | | (4,514 | ) |
| Euro-Buxl® 30-year German Government Bond | | | | | (2 | ) | | | 03/08/21 | | | | (550,326 | ) | | | | (4,918 | ) |
| Long-Term Euro-BTP | | | | | (11 | ) | | | 03/08/21 | | | | (2,042,721 | ) | | | | (11,431 | ) |
| U.S. Treasury 10-Year Note | | | | | (49 | ) | | | 03/22/21 | | | | (6,765,828 | ) | | | | (10,943 | ) |
| U.S. Treasury Ultra Long Bond | | | | | (1 | ) | | | 03/22/21 | | | | (213,562 | ) | | | | 2,436 | |
| | | | | | | | | | | | | $ | (16,437,873 | ) | | | $ | (34,699 | ) |
At December 31, 2020, the following centrally cleared interest rate swaps were outstanding for VY® BlackRock Inflation Protected Bond Portfolio:
Pay/Receive
Floating Rate | | | | Floating Rate Index | | Floating Rate
Index Payment
Frequency | | Fixed
Rate | | | Fixed Rate
Payment
Frequency | | | Maturity
Date | | | Notional Amount | | | Fair
Value | | | Unrealized
Appreciation/
(Depreciation) |
|---|
| Pay | | | | 6-month EUR-EURIBOR | | Semi-Annual | | (0.298) | % | | Annual | | | 01/16/22 | | | EUR | 2,480,000 | | | $ | 7,032 | | | $ | 7,032 | |
| Pay | | | | 6-month EUR-EURIBOR | | Semi-Annual | | (0.479) | | | Annual | | | 03/05/22 | | | EUR | 1,230,000 | | | | 662 | | | | 662 | |
| Pay | | | | 6-month EUR-EURIBOR | | Semi-Annual | | (0.477) | | | Annual | | | 03/06/22 | | | EUR | 730,000 | | | | 403 | | | | 403 | |
| Pay | | | | 6-month EUR-EURIBOR | | Semi-Annual | | (0.493) | | | Annual | | | 03/09/22 | | | EUR | 880,000 | | | | 296 | | | | 296 | |
| Pay | | | | 6-month EUR-EURIBOR | | Semi-Annual | | (0.250) | | | Annual | | | 06/24/22 | | | EUR | 560,000 | | | | 2,828 | | | | 2,828 | |
| Pay | | | | 6-month EUR-EURIBOR | | Semi-Annual | | (0.290) | | | Annual | | | 06/25/22 | | | EUR | 210,000 | | | | 911 | | | | 911 | |
| Pay | | | | 6-month EUR-EURIBOR | | Semi-Annual | | (0.280) | | | Annual | | | 06/26/22 | | | EUR | 210,000 | | | | 949 | | | | 949 | |
| Pay | | | | 6-month EUR-EURIBOR | | Semi-Annual | | (0.275) | | | Annual | | | 06/30/22 | | | EUR | 210,000 | | | | 971 | | | | 971 | |
| Pay | | | | 6-month EUR-EURIBOR | | Semi-Annual | | (0.292) | | | Annual | | | 07/16/22 | | | EUR | 780,000 | | | | 3,417 | | | | 3,417 | |
| Pay | | | | 6-month EUR-EURIBOR | | Semi-Annual | | (0.301) | | | Annual | | | 07/20/22 | | | EUR | 1,240,000 | | | | 5,229 | | | | 5,229 | |
| Pay | | | | 6-month EUR-EURIBOR | | Semi-Annual | | (0.301) | | | Annual | | | 07/20/22 | | | EUR | 1,300,000 | | | | 5,494 | | | | 5,494 | |
| Pay | | | | 6-month EUR-EURIBOR | | Semi-Annual | | (0.320) | | | Annual | | | 09/29/22 | | | EUR | 1,150,000 | | | | 4,921 | | | | 4,921 | |
| Pay | | | | 6-month EUR-EURIBOR | | Semi-Annual | | (0.340) | | | Annual | | | 10/02/22 | | | EUR | 1,250,000 | | | | 4,874 | | | | 4,874 | |
| Pay | | | | 6-month EUR-EURIBOR | | Semi-Annual | | (0.336) | | | Annual | | | 10/02/22 | | | EUR | 1,170,000 | | | | 4,663 | | | | 4,663 | |
| Pay | | | | 6-month EUR-EURIBOR | | Semi-Annual | | (0.341) | | | Annual | | | 11/02/22 | | | EUR | 810,000 | | | | 3,365 | | | | 3,365 | |
| Pay | | | | 6-month EUR-EURIBOR | | Semi-Annual | | (0.333) | | | Annual | | | 02/12/23 | | | EUR | 610,000 | | | | 2,852 | | | | 2,852 | |
| Pay | | | | 6-month EUR-EURIBOR | | Semi-Annual | | (0.414) | | | Annual | | | 03/02/23 | | | EUR | 1,450,000 | | | | 3,863 | | | | 3,863 | |
| Pay | | | | 6-month EUR-EURIBOR | | Semi-Annual | | (0.474) | | | Annual | | | 03/04/23 | | | EUR | 620,000 | | | | 733 | | | | 733 | |
| Pay | | | | 6-month EUR-EURIBOR | | Semi-Annual | | (0.304) | | | Annual | | | 04/29/23 | | | EUR | 1,240,000 | | | | 6,577 | | | | 6,577 | |
| Pay | | | | 6-month EUR-EURIBOR | | Semi-Annual | | (0.337) | | | Annual | | | 05/03/23 | | | EUR | 810,000 | | | | 3,627 | | | | 3,627 | |
| Pay | | | | 6-month EUR-EURIBOR | | Semi-Annual | | (0.370) | | | Annual | | | 05/04/23 | | | EUR | 760,000 | | | | 2,783 | | | | 2,783 | |
| Pay | | | | 6-month EUR-EURIBOR | | Semi-Annual | | (0.372) | | | Annual | | | 05/06/23 | | | EUR | 400,000 | | | | 1,452 | | | | 1,452 | |
| Pay | | | | 6-month EUR-EURIBOR | | Semi-Annual | | (0.415) | | | Annual | | | 06/24/23 | | | EUR | 610,000 | | | | 1,513 | | | | 1,513 | |
| Pay | | | | 6-month EUR-EURIBOR | | Semi-Annual | | (0.400) | | | Annual | | | 06/25/23 | | | EUR | 610,000 | | | | 1,745 | | | | 1,745 | |
| Pay | | | | 6-month EUR-EURIBOR | | Semi-Annual | | (0.426) | | | Annual | | | 07/02/23 | | | EUR | 720,000 | | | | 1,579 | | | | 1,564 | |
| Pay | | | | 6-month EUR-EURIBOR | | Semi-Annual | | (0.400) | | | Annual | | | 07/08/23 | | | EUR | 590,000 | | | | 1,670 | | | | 1,641 | |
| Pay | | | | 6-month EUR-EURIBOR | | Semi-Annual | | (0.408) | | | Annual | | | 07/20/23 | | | EUR | 1,300,000 | | | | 3,412 | | | | 3,385 | |
| Pay | | | | 6-month EUR-EURIBOR | | Semi-Annual | | (0.408) | | | Annual | | | 07/27/23 | | | EUR | 610,000 | | | | 1,596 | | | | 1,583 | |
| Pay | | | | 6-month EUR-EURIBOR | | Semi-Annual | | (0.423) | | | Annual | | | 08/09/23 | | | EUR | 360,000 | | | | 797 | | | | 790 | |
| Pay | | | | 6-month EUR-EURIBOR | | Semi-Annual | | (0.437) | | | Annual | | | 08/24/23 | | | EUR | 540,000 | | | | 997 | | | | 986 | |
| Pay | | | | 6-month EUR-EURIBOR | | Semi-Annual | | (0.465) | | | Annual | | | 09/13/23 | | | EUR | 1,020,000 | | | | 1,147 | | | | 1,126 | |
| Pay | | | | 6-month EUR-EURIBOR | | Semi-Annual | | (0.436) | | | Annual | | | 10/06/23 | | | EUR | 310,000 | | | | 565 | | | | 565 | |
| Pay | | | | 6-month EUR-EURIBOR | | Semi-Annual | | (0.429) | | | Annual | | | 09/21/25 | | | EUR | 210,000 | | | | 496 | | | | 577 | |
| Pay | | | | 6-month EUR-EURIBOR | | Semi-Annual | | (0.337) | | | Annual | | | 07/20/26 | | | EUR | 490,000 | | | | 3,105 | | | | 3,093 | |
| Pay | | | | 6-month EUR-EURIBOR | | Semi-Annual | | (0.251) | | | Annual | | | 08/16/27 | | | EUR | 480,000 | | | | 3,691 | | | | 3,679 | |
| Pay | | | | 6-month EUR-EURIBOR | | Semi-Annual | | (0.243) | | | Annual | | | 08/16/27 | | | EUR | 480,000 | | | | 3,917 | | | | 3,917 | |
| Pay | | | | 6-month EUR-EURIBOR | | Semi-Annual | | (0.283) | | | Annual | | | 09/19/27 | | | EUR | 190,000 | | | | 1,002 | | | | 997 | |
| Pay | | | | 6-month EUR-EURIBOR | | Semi-Annual | | (0.385) | | | Annual | | | 10/18/27 | | | EUR | 110,000 | | | | (163 | ) | | | (166 | ) |
| Pay | | | | 6-month EUR-EURIBOR | | Semi-Annual | | (0.354) | | | Annual | | | 10/18/27 | | | EUR | 400,000 | | | | 173 | | | | 164 | |
| Pay | | | | 6-month EUR-EURIBOR | | Semi-Annual | | (0.358) | | | Annual | | | 12/12/27 | | | EUR | 240,000 | | | | (121 | ) | | | (127 | ) |
| Pay | | | | 3-month USD-LIBOR | | Quarterly | | 2.526 | | | Semi-Annual | | | 02/07/22 | | | USD | 20,030,000 | | | | 514,905 | | | | 514,905 | |
See Accompanying Notes to Financial Statements
33
VY® BLACKROCK INFLATION
PROTECTED BOND PORTFOLIO | SUMMARY PORTFOLIO OF INVESTMENTS
AS OF DECEMBER 31, 2020 (CONTINUED) |
| | |
Pay/Receive
Floating Rate | | | | Floating Rate Index | | Floating Rate
Index Payment
Frequency | | Fixed
Rate | | | Fixed Rate
Payment
Frequency | | | Maturity
Date | | | Notional Amount | | | Fair
Value | | | Unrealized
Appreciation/
(Depreciation) |
|---|
| Pay | | | | 3-month USD-LIBOR | | Quarterly | | 0.679 | % | | Semi-Annual | | | 03/06/22 | | | USD | 670,000 | | | $ | 3,880 | | | $ | 3,880 | |
| Pay | | | | 3-month USD-LIBOR | | Quarterly | | 2.250 | | | Semi-Annual | | | 04/27/22 | | | USD | 5,370,000 | | | | 146,280 | | | | 146,280 | |
| Pay | | | | 3-month USD-LIBOR | | Quarterly | | 1.713 | | | Semi-Annual | | | 07/13/22 | | | USD | 9,250,000 | | | | 141,449 | | | | 141,449 | |
| Pay | | | | 3-month USD-LIBOR | | Quarterly | | 0.230 | | | Semi-Annual | | | 10/21/22 | | | USD | 310,000 | | | | 240 | | | | 235 | |
| Pay | | | | 3-month USD-LIBOR | | Quarterly | | 1.095 | | | Semi-Annual | | | 03/01/23 | | | USD | 2,840,000 | | | | 51,427 | | | | 51,427 | |
| Pay | | | | 3-month USD-LIBOR | | Quarterly | | 0.250 | | | Semi-Annual | | | 07/08/23 | | | USD | 1,150,000 | | | | 135 | | | | 117 | |
| Pay | | | | 3-month USD-LIBOR | | Quarterly | | 0.400 | | | Semi-Annual | | | 11/22/23 | | | USD | 1,365,000 | | | | 1,171 | | | | 1,149 | |
| Pay | | | | 3-month USD-LIBOR | | Quarterly | | 3.090 | | | Semi-Annual | | | 11/29/24 | | | USD | 4,210,000 | | | | 456,368 | | | | 456,368 | |
| Pay | | | | 3-month USD-LIBOR | | Quarterly | | 2.521 | | | Semi-Annual | | | 02/28/25 | | | USD | 2,390,000 | | | | 216,345 | | | | 216,345 | |
| Pay | | | | 3-month USD-LIBOR | | Quarterly | | 0.358 | | | Semi-Annual | | | 06/02/25 | | | USD | 860,000 | | | | (248 | ) | | | (248 | ) |
| Pay | | | | 3-month USD-LIBOR | | Quarterly | | 0.760 | | | Semi-Annual | | | 09/08/25 | | | USD | 150,000 | | | | 2,579 | | | | 2,579 | |
| Pay | | | | 3-month USD-LIBOR | | Quarterly | | 0.330 | | | Semi-Annual | | | 09/23/25 | | | USD | 400,000 | | | | (1,273 | ) | | | (1,280 | ) |
| Pay | | | | 3-month USD-LIBOR | | Quarterly | | 0.785 | | | Semi-Annual | | | 11/19/25 | | | USD | 3,580,000 | | | | (834 | ) | | | (891 | ) |
| Pay | | | | 3-month USD-LIBOR | | Quarterly | | 0.652 | | | Semi-Annual | | | 06/20/27 | | | USD | 870,000 | | | | (2,813 | ) | | | (2,813 | ) |
| Pay | | | | 3-month USD-LIBOR | | Quarterly | | 0.680 | | | Semi-Annual | | | 06/20/27 | | | USD | 870,000 | | | | (1,628 | ) | | | (1,628 | ) |
| Pay | | | | 3-month USD-LIBOR | | Quarterly | | 0.654 | | | Semi-Annual | | | 07/12/28 | | | USD | 900,000 | | | | (13,909 | ) | | | (13,925 | ) |
| Pay | | | | 3-month USD-LIBOR | | Quarterly | | 0.819 | | | Semi-Annual | | | 04/14/30 | | | USD | 610,000 | | | | (2,789 | ) | | | (2,789 | ) |
| Pay | | | | 3-month USD-LIBOR | | Quarterly | | 1.828 | | | Semi-Annual | | | 02/10/50 | | | USD | 120,000 | | | | 12,957 | | | | 12,957 | |
| Pay | | | | 3-month USD-LIBOR | | Quarterly | | 1.250 | | | Semi-Annual | | | 09/08/50 | | | USD | 92,000 | | | | (3,570 | ) | | | (3,570 | ) |
| Pay | | | | 3-month USD-LIBOR | | Quarterly | | 1.929 | | | Semi-Annual | | | 12/01/56 | | | USD | 25,000 | | | | 1,973 | | | | 1,973 | |
| Receive | | | | 6-month EUR-EURIBOR | | Semi-Annual | | (0.450) | | | Annual | | | 12/16/21 | | | EUR | 1,200,000 | | | | (1,062 | ) | | | (1,062 | ) |
| Receive | | | | 6-month EUR-EURIBOR | | Semi-Annual | | (0.358) | | | Annual | | | 03/20/22 | | | EUR | 1,160,000 | | | | (2,731 | ) | | | (2,731 | ) |
| Receive | | | | 6-month EUR-EURIBOR | | Semi-Annual | | (0.312) | | | Annual | | | 03/23/22 | | | EUR | 2,680,000 | | | | (8,272 | ) | | | (8,272 | ) |
| Receive | | | | 6-month EUR-EURIBOR | | Semi-Annual | | (0.379) | | | Annual | | | 06/19/22 | | | EUR | 1,510,000 | | | | (4,023 | ) | | | (4,024 | ) |
| Receive | | | | 6-month EUR-EURIBOR | | Semi-Annual | | (0.397) | | | Annual | | | 07/21/22 | | | EUR | 1,230,000 | | | | (2,937 | ) | | | (2,963 | ) |
| Receive | | | | 6-month EUR-EURIBOR | | Semi-Annual | | (0.253) | | | Annual | | | 09/22/22 | | | EUR | 1,140,000 | | | | (6,457 | ) | | | (6,457 | ) |
| Receive | | | | 6-month EUR-EURIBOR | | Semi-Annual | | (0.405) | | | Annual | | | 02/16/23 | | | EUR | 1,210,000 | | | | (3,497 | ) | | | (3,522 | ) |
| Receive | | | | 6-month EUR-EURIBOR | | Semi-Annual | | (0.402) | | | Annual | | | 02/16/23 | | | EUR | 1,210,000 | | | | (3,601 | ) | | | (3,601 | ) |
| Receive | | | | 6-month EUR-EURIBOR | | Semi-Annual | | (0.174) | | | Annual | | | 03/23/23 | | | EUR | 4,980,000 | | | | (42,659 | ) | | | (42,659 | ) |
| Receive | | | | 6-month EUR-EURIBOR | | Semi-Annual | | (0.180) | | | Annual | | | 03/24/23 | | | EUR | 2,490,000 | | | | (20,925 | ) | | | (20,925 | ) |
| Receive | | | | 6-month EUR-EURIBOR | | Semi-Annual | | (0.290) | | | Annual | | | 07/26/23 | | | EUR | 1,640,000 | | | | (9,060 | ) | | | (9,060 | ) |
| Receive | | | | 6-month EUR-EURIBOR | | Semi-Annual | | (0.300) | | | Annual | | | 07/27/23 | | | EUR | 3,100,000 | | | | (16,341 | ) | | | (16,341 | ) |
| Receive | | | | 6-month EUR-EURIBOR | | Semi-Annual | | (0.167) | | | Annual | | | 12/13/23 | | | EUR | 1,170,000 | | | | (9,793 | ) | | | (9,793 | ) |
| Receive | | | | 6-month EUR-EURIBOR | | Semi-Annual | | (0.110) | | | Annual | | | 12/27/23 | | | EUR | 300,000 | | | | (2,923 | ) | | | (2,923 | ) |
| Receive | | | | 6-month EUR-EURIBOR | | Semi-Annual | | (0.056) | | | Annual | | | 01/03/24 | | | EUR | 615,000 | | | | (6,806 | ) | | | (6,806 | ) |
| Receive | | | | 6-month EUR-EURIBOR | | Semi-Annual | | (0.050) | | | Annual | | | 01/03/24 | | | EUR | 615,000 | | | | (6,905 | ) | | | (6,905 | ) |
| Receive | | | | 6-month EUR-EURIBOR | | Semi-Annual | | (0.173) | | | Annual | | | 11/11/24 | | | EUR | 260,000 | | | | (3,965 | ) | | | (3,965 | ) |
| Receive | | | | 6-month EUR-EURIBOR | | Semi-Annual | | (0.175) | | | Annual | | | 03/18/25 | | | EUR | 60,000 | | | | (961 | ) | | | (961 | ) |
| Receive | | | | 6-month EUR-EURIBOR | | Semi-Annual | | (0.259) | | | Annual | | | 08/16/27 | | | EUR | 240,000 | | | | (1,725 | ) | | | (1,731 | ) |
| Receive | | | | 6-month EUR-EURIBOR | | Semi-Annual | | 0.185 | | | Annual | | | 01/16/30 | | | EUR | 510,000 | | | | (28,681 | ) | | | (28,681 | ) |
| Receive | | | | 6-month JPY-LIBOR | | Semi-Annual | | 0.336 | | | Semi-Annual | | | 02/08/34 | | | JPY | 860,000 | | | | (237 | ) | | | (237 | ) |
| Receive | | | | 6-month JPY-LIBOR | | Semi-Annual | | 0.295 | | | Semi-Annual | | | 06/17/39 | | | JPY | 5,440,000 | | | | (484 | ) | | | (484 | ) |
| Receive | | | | 6-month JPY-LIBOR | | Semi-Annual | | 0.167 | | | Semi-Annual | | | 08/08/39 | | | JPY | 3,930,000 | | | | 572 | | | | 572 | |
| Receive | | | | 6-month JPY-LIBOR | | Semi-Annual | | 0.225 | | | Semi-Annual | | | 12/22/40 | | | JPY | 3,340,000 | | | | 302 | | | | 301 | |
| Receive | | | | 6-month JPY-LIBOR | | Semi-Annual | | 0.715 | | | Semi-Annual | | | 03/21/44 | | | JPY | 3,980,000 | | | | (2,528 | ) | | | (2,528 | ) |
| Receive | | | | 6-month JPY-LIBOR | | Semi-Annual | | 0.201 | | | Semi-Annual | | | 08/28/44 | | | JPY | 1,960,000 | | | | 729 | | | | 729 | |
| Receive | | | | 6-month JPY-LIBOR | | Semi-Annual | | 0.371 | | | Semi-Annual | | | 01/30/45 | | | JPY | 2,810,000 | | | | 208 | | | | 208 | |
| Receive | | | | 3-month NZD-BBR-FRA | | Quarterly | | 1.080 | | | Semi-Annual | | | 09/16/30 | | | NZD | 4,100,000 | | | | (33,333 | ) | | | (33,333 | ) |
| Receive | | | | 3-month USD-LIBOR | | Quarterly | | 0.554 | | | Semi-Annual | | | 03/12/21 | | | USD | 5,530,000 | | | | (3,647 | ) | | | (3,647 | ) |
| Receive | | | | 3-month USD-LIBOR | | Quarterly | | 1.560 | | | Semi-Annual | | | 03/27/21 | | | USD | 5,280,000 | | | | (16,889 | ) | | | (16,889 | ) |
| Receive | | | | 3-month USD-LIBOR | | Quarterly | | 1.560 | | | Semi-Annual | | | 03/30/21 | | | USD | 1,340,000 | | | | (4,429 | ) | | | (4,429 | ) |
| Receive | | | | 3-month USD-LIBOR | | Quarterly | | 1.770 | | | Semi-Annual | | | 06/15/21 | | | USD | 5,780,000 | | | | (41,455 | ) | | | (41,455 | ) |
| Receive | | | | 3-month USD-LIBOR | | Quarterly | | 1.582 | | | Semi-Annual | | | 11/09/21 | | | USD | 5,250,000 | | | | (62,706 | ) | | | (62,789 | ) |
| Receive | | | | 3-month USD-LIBOR | | Quarterly | | 2.460 | | | Semi-Annual | | | 02/28/22 | | | USD | 2,510,000 | | | | (65,965 | ) | | | (65,966 | ) |
| Receive | | | | 3-month USD-LIBOR | | Quarterly | | 1.870 | | | Semi-Annual | | | 06/03/22 | | | USD | 5,710,000 | | | | (96,385 | ) | | | (96,385 | ) |
| Receive | | | | 3-month USD-LIBOR | | Quarterly | | 0.244 | | | Semi-Annual | | | 12/15/22 | | | USD | 2,800,000 | | | | (3,128 | ) | | | (3,176 | ) |
| Receive | | | | 3-month USD-LIBOR | | Quarterly | | 0.260 | | | Semi-Annual | | | 12/15/22 | | | USD | 6,010,000 | | | | (8,309 | ) | | | (8,344 | ) |
| Receive | | | | 3-month USD-LIBOR | | Quarterly | | 1.535 | | | Semi-Annual | | | 12/15/22 | | | USD | 2,815,000 | | | | (74,183 | ) | | | (74,231 | ) |
| Receive | | | | 3-month USD-LIBOR | | Quarterly | | 0.204 | | | Semi-Annual | | | 12/16/22 | | | USD | 1,420,000 | | | | (468 | ) | | | (492 | ) |
| Receive | | | | 3-month USD-LIBOR | | Quarterly | | 1.530 | | | Semi-Annual | | | 12/16/22 | | | USD | 2,815,000 | | | | (73,997 | ) | | | (74,044 | ) |
| Receive | | | | 3-month USD-LIBOR | | Quarterly | | 1.771 | | | Semi-Annual | | | 07/12/23 | | | USD | 9,400,000 | | | | (143,705 | ) | | | (143,705 | ) |
| Receive | | | | 3-month USD-LIBOR | | Quarterly | | 0.397 | | | Semi-Annual | | | 11/22/23 | | | USD | 1,365,000 | | | | (1,130 | ) | | | (1,151 | ) |
| Receive | | | | 3-month USD-LIBOR | | Quarterly | | 0.571 | | | Semi-Annual | | | 11/21/24 | | | USD | 260,000 | | | | (56 | ) | | | (60 | ) |
See Accompanying Notes to Financial Statements
34
VY® BLACKROCK INFLATION
PROTECTED BOND PORTFOLIO | SUMMARY PORTFOLIO OF INVESTMENTS
AS OF DECEMBER 31, 2020 (CONTINUED) |
| | |
Pay/Receive
Floating Rate | | | | Floating Rate Index | | Floating Rate
Index Payment
Frequency | | Fixed
Rate | | | Fixed Rate
Payment
Frequency | | | Maturity
Date | | | Notional Amount | | | Fair
Value | | | Unrealized
Appreciation/
(Depreciation) |
|---|
| Receive | | | | 3-month USD-LIBOR | | Quarterly | | 2.572% | | | Semi-Annual | | | 02/07/25 | | | USD | 2,610,000 | | | $ | (239,043 | ) | | $ | (239,043 | ) |
| Receive | | | | 3-month USD-LIBOR | | Quarterly | | 0.623 | | | Semi-Annual | | | 04/14/25 | | | USD | 1,180,000 | | | | (13,726 | ) | | | (13,726 | ) |
| Receive | | | | 3-month USD-LIBOR | | Quarterly | | 2.350 | | | Semi-Annual | | | 04/27/25 | | | USD | 1,440,000 | | | | (123,953 | ) | | | (123,953 | ) |
| Receive | | | | 3-month USD-LIBOR | | Quarterly | | 0.820 | | | Semi-Annual | | | 09/08/25 | | | USD | 540,000 | | | | (10,798 | ) | | | (10,798 | ) |
| Receive | | | | 3-month USD-LIBOR | | Quarterly | | 0.652 | | | Semi-Annual | | | 04/20/27 | | | USD | 120,000 | | | | 159 | | | | 159 | |
| Receive | | | | 3-month USD-LIBOR | | Quarterly | | 0.512 | | | Semi-Annual | | | 08/17/27 | | | USD | 1,700,000 | | | | 11,424 | | | | 11,423 | |
| Receive | | | | 3-month USD-LIBOR | | Quarterly | | 0.495 | | | Semi-Annual | | | 08/19/27 | | | USD | 150,000 | | | | 1,184 | | | | 1,184 | |
| Receive | | | | 3-month USD-LIBOR | | Quarterly | | 1.631 | | | Semi-Annual | | | 02/10/30 | | | USD | 300,000 | | | | (20,810 | ) | | | (20,810 | ) |
| Receive | | | | 3-month USD-LIBOR | | Quarterly | | 0.648 | | | Semi-Annual | | | 06/02/30 | | | USD | 440,000 | | | | 9,391 | | | | 9,391 | |
| Receive | | | | 3-month USD-LIBOR | | Quarterly | | 0.961 | | | Semi-Annual | | | 08/15/30 | | | USD | 450,000 | | | | (2,021 | ) | | | (2,030 | ) |
| Receive | | | | 3-month USD-LIBOR | | Quarterly | | 0.680 | | | Semi-Annual | | | 09/16/30 | | | USD | 610,000 | | | | 12,813 | | | | 12,800 | |
| Receive | | | | 3-month USD-LIBOR | | Quarterly | | 0.672 | | | Semi-Annual | | | 10/09/30 | | | USD | 610,000 | | | | 13,652 | | | | 13,639 | |
| Receive | | | | Secured Overnight Financing Rate | | Annual | | 0.537 | | | Annual | | | 10/20/30 | | | USD | 1,250,000 | | | | 17,381 | | | | 17,381 | |
| Receive | | | | Secured Overnight Financing Rate | | Quarterly | | 0.533 | | | Quarterly | | | 10/21/30 | | | USD | 21,996 | | | | (311 | ) | | | (311 | ) |
| Receive | | | | 3-month USD-LIBOR | | Quarterly | | 0.896 | | | Semi-Annual | | | 10/27/30 | | | USD | 60,000 | | | | 79 | | | | 78 | |
| Receive | | | | 3-month USD-LIBOR | | Quarterly | | 0.898 | | | Semi-Annual | | | 10/27/30 | | | USD | 250,000 | | | | 283 | | | | 277 | |
| Receive | | | | 3-month USD-LIBOR | | Quarterly | | 0.652 | | | Semi-Annual | | | 11/04/30 | | | USD | 600,000 | | | | 14,990 | | | | 14,978 | |
| Receive | | | | 3-month USD-LIBOR | | Quarterly | | 0.885 | | | Semi-Annual | | | 11/05/30 | | | USD | 530,000 | | | | 1,365 | | | | 1,036 | |
| Receive | | | | 3-month USD-LIBOR | | Quarterly | | 0.950 | | | Semi-Annual | | | 11/12/30 | | | USD | 330,000 | | | | (1,181 | ) | | | (1,188 | ) |
| Receive | | | | 3-month USD-LIBOR | | Quarterly | | 0.920 | | | Semi-Annual | | | 12/10/30 | | | USD | 450,000 | | | | (63 | ) | | | (72 | ) |
| Receive | | | | 3-month USD-LIBOR | | Quarterly | | 0.962 | | | Semi-Annual | | | 12/11/30 | | | USD | 270,000 | | | | (1,141 | ) | | | (1,147 | ) |
| Receive | | | | 3-month USD-LIBOR | | Quarterly | | 0.971 | | | Semi-Annual | | | 12/29/30 | | | USD | 150,000 | | | | (699 | ) | | | (702 | ) |
| Receive | | | | 3-month USD-LIBOR | | Quarterly | | 0.953 | | | Semi-Annual | | | 12/30/30 | | | USD | 310,000 | | | | (930 | ) | | | (937 | ) |
| Receive | | | | 3-month USD-LIBOR | | Quarterly | | 0.761 | | | Semi-Annual | | | 06/03/31 | | | USD | 138,000 | | | | 3,041 | | | | 3,041 | |
| Receive | | | | 3-month USD-LIBOR | | Quarterly | | 0.858 | | | Semi-Annual | | | 10/04/31 | | | USD | 50,000 | | | | 890 | | | | 889 | |
| Receive | | | | 3-month USD-LIBOR | | Quarterly | | 1.028 | | | Semi-Annual | | | 11/26/31 | | | USD | 150,000 | | | | 515 | | | | 512 | |
| Receive | | | | 3-month USD-LIBOR | | Quarterly | | 1.110 | | | Semi-Annual | | | 03/08/32 | | | USD | 265,000 | | | | (79 | ) | | | (79 | ) |
| Receive | | | | 3-month USD-LIBOR | | Quarterly | | 0.760 | | | Semi-Annual | | | 05/03/32 | | | USD | 800,000 | | | | 28,703 | | | | 28,703 | |
| Receive | | | | 3-month USD-LIBOR | | Quarterly | | 0.765 | | | Semi-Annual | | | 05/04/32 | | | USD | 820,000 | | | | 29,056 | | | | 29,056 | |
| Receive | | | | 3-month USD-LIBOR | | Quarterly | | 0.770 | | | Semi-Annual | | | 05/06/32 | | | USD | 750,000 | | | | 26,269 | | | | 26,269 | |
| Receive | | | | 3-month USD-LIBOR | | Quarterly | | 2.325 | | | Semi-Annual | | | 06/24/34 | | | USD | 70,000 | | | | (5,848 | ) | | | (5,848 | ) |
| Receive | | | | 3-month USD-LIBOR | | Quarterly | | 1.645 | | | Semi-Annual | | | 08/22/34 | | | USD | 300,000 | | | | (5,230 | ) | | | (5,230 | ) |
| Receive | | | | 3-month USD-LIBOR | | Quarterly | | 1.907 | | | Semi-Annual | | | 10/21/34 | | | USD | 320,000 | | | | (12,883 | ) | | | (12,883 | ) |
| Receive | | | | 3-month USD-LIBOR | | Quarterly | | 1.921 | | | Semi-Annual | | | 10/22/34 | | | USD | 300,000 | | | | (12,463 | ) | | | (12,463 | ) |
| Receive | | | | 3-month USD-LIBOR | | Quarterly | | 1.976 | | | Semi-Annual | | | 10/23/34 | | | USD | 145,000 | | | | (6,768 | ) | | | (6,768 | ) |
| Receive | | | | 3-month USD-LIBOR | | Quarterly | | 1.982 | | | Semi-Annual | | | 10/23/34 | | | USD | 145,000 | | | | (6,843 | ) | | | (6,843 | ) |
| Receive | | | | 3-month USD-LIBOR | | Quarterly | | 2.111 | | | Semi-Annual | | | 11/12/34 | | | USD | 70,000 | | | | (4,110 | ) | | | (4,110 | ) |
| Receive | | | | 3-month USD-LIBOR | | Quarterly | | 0.973 | | | Semi-Annual | | | 08/17/40 | | | USD | 150,000 | | | | 9,053 | | | | 9,053 | |
| Receive | | | | 3-month USD-LIBOR | | Quarterly | | 2.110 | | | Semi-Annual | | | 11/15/44 | | | USD | 90,000 | | | | (2,893 | ) | | | (2,893 | ) |
| Receive | | | | 3-month USD-LIBOR | | Quarterly | | 2.378 | | | Semi-Annual | | | 07/05/49 | | | USD | 140,000 | | | | (7,753 | ) | | | (7,753 | ) |
| Receive | | | | 3-month USD-LIBOR | | Quarterly | | 1.709 | | | Semi-Annual | | | 08/16/49 | | | USD | 130,000 | | | | (605 | ) | | | (605 | ) |
| Receive | | | | 3-month USD-LIBOR | | Quarterly | | 1.667 | | | Semi-Annual | | | 08/17/49 | | | USD | 100,000 | | | | (143 | ) | | | (143 | ) |
| Receive | | | | 3-month USD-LIBOR | | Quarterly | | 1.100 | | | Semi-Annual | | | 11/25/50 | | | USD | 160,000 | | | | 12,447 | | | | 12,442 | |
| Receive | | | | 3-month USD-LIBOR | | Quarterly | | 1.090 | | | Semi-Annual | | | 06/20/52 | | | USD | 160,000 | | | | 15,582 | | | | 15,582 | |
| Receive | | | | 3-month USD-LIBOR | | Quarterly | | 1.136 | | | Semi-Annual | | | 06/20/52 | | | USD | 160,000 | | | | 13,716 | | | | 13,716 | |
| Receive | | | | 3-month USD-LIBOR | | Quarterly | | 0.881 | | | Semi-Annual | | | 07/12/53 | | | USD | 160,000 | | | | 25,670 | | | | 25,665 | |
| | | | | | | | | | | | | | | | | | | | | | $ | 570,490 | | | $ | 569,476 | |
At December 31, 2020, the following OTC interest rate swaps were outstanding for VY® BlackRock Inflation Protected Bond Portfolio:
Pay/Receive
Floating Rate | | | | Floating
Rate
Index | | Floating Rate
Index Payment
Frequency | | Counterparty | | Fixed
Rate | | | Fixed Rate
Payment
Frequency | | | Maturity
Date | | | Notional
Amount | | | Fair
Value | | | Upfront
Payments
Paid/
(Received) | | Unrealized
Appreciation/
(Depreciation) |
|---|
| Pay | | | | 7-day China Fixing Repo Rates | | Quarterly | | Citibank N.A. | | 2.630 | % | | Quarterly | | | 08/10/25 | | | CNH | 10,615,000 | | | $ | (461 | ) | | | $ — | | | | $(461 | ) |
| | | | | | | | | | | | | | | | | | | | | | | | $ | (461 | ) | | | $ — | | | | $(461 | ) |
See Accompanying Notes to Financial Statements
35
VY® BLACKROCK INFLATION
PROTECTED BOND PORTFOLIO | SUMMARY PORTFOLIO OF INVESTMENTS
AS OF DECEMBER 31, 2020 (CONTINUED) |
| | |
At December 31, 2020, the following centrally cleared inflation-linked swaps were outstanding for VY® BlackRock Inflation Protected Bond Portfolio:
Pay/Receive
Floating Rate | | | | Floating Rate Index | | Floating Rate
Index Payment
Frequency | | Fixed
Rate | | | Fixed Rate
Payment
Frequency | | | Maturity
Date | | | Notional Amount | | | Fair
Value | | | Unrealized
Appreciation/
(Depreciation) |
|---|
| Pay | | | | Eurostat Eurozone HICP ex Tobacco NSA (CPTFEMU) | | At Termination Date | | –0.429% | | | At Termination Date | | | 08/05/23 | | | EUR | 390,000 | | | $ | 813 | | | $ | 805 | |
| Pay | | | | Eurostat Eurozone HICP ex Tobacco NSA (CPTFEMU) | | At Termination Date | | 1.108 | | | At Termination Date | | | 12/15/30 | | | EUR | 1,065,000 | | | | (4,077 | ) | | | (4,130 | ) |
| Pay | | | | U.K. RPI All Items Monthly | | At Termination Date | | 3.490 | | | At Termination Date | | | 03/15/29 | | | GBP | 1,390,000 | | | | 85,549 | | | | 85,549 | |
| Pay | | | | U.K. RPI All Items Monthly | | At Termination Date | | 3.574 | | | At Termination Date | | | 10/15/30 | | | GBP | 1,415,000 | | | | 36,627 | | | | 35,172 | |
| Pay | | | | U.K. RPI All Items Monthly | | At Termination Date | | 3.510 | | | At Termination Date | | | 12/15/30 | | | GBP | 1,150,000 | | | | 19,146 | | | | 19,082 | |
| Pay | | | | U.K. RPI All Items Monthly | | At Termination Date | | 3.360 | | | At Termination Date | | | 10/15/39 | | | GBP | 2,025,000 | | | | 164,865 | | | | 164,865 | |
| Pay | | | | U.K. RPI All Items Monthly | | At Termination Date | | 3.310 | | | At Termination Date | | | 01/15/40 | | | GBP | 900,000 | | | | 38,357 | | | | 38,357 | |
| Pay | | | | U.K. RPI All Items Monthly | | At Termination Date | | 3.341 | | | At Termination Date | | | 01/15/40 | | | GBP | 800,000 | | | | 45,937 | | | | 45,937 | |
| Pay | | | | U.K. RPI All Items Monthly | | At Termination Date | | 3.336 | | | At Termination Date | | | 11/15/40 | | | GBP | 310,000 | | | | 3,919 | | | | 3,898 | |
| Pay | | | | U.K. RPI All Items Monthly | | At Termination Date | | 3.270 | | | At Termination Date | | | 10/15/44 | | | GBP | 1,560,000 | | | | 160,174 | | | | 160,174 | |
| Pay | | | | U.K. RPI All Items Monthly | | At Termination Date | | 3.220 | | | At Termination Date | | | 01/15/45 | | | GBP | 700,000 | | | | 38,393 | | | | 38,393 | |
| Pay | | | | U.K. RPI All Items Monthly | | At Termination Date | | 3.239 | | | At Termination Date | | | 01/15/45 | | | GBP | 600,000 | | | | 40,552 | | | | 40,552 | |
| Pay | | | | U.S. CPI Urban Consumers NSA (CPURNSA) | | At Termination Date | | 1.848 | | | At Termination Date | | | 08/10/30 | | | USD | 780,000 | | | | (37,505 | ) | | | (37,537 | ) |
| Pay | | | | U.S. CPI Urban Consumers NSA (CPURNSA) | | At Termination Date | | 2.008 | | | At Termination Date | | | 09/04/30 | | | USD | 360,000 | | | | (9,648 | ) | | | (9,663 | ) |
| Pay | | | | U.S. CPI Urban Consumers NSA (CPURNSA) | | At Termination Date | | 1.930 | | | At Termination Date | | | 09/10/30 | | | USD | 1,255,000 | | | | (43,333 | ) | | | (43,384 | ) |
| Pay | | | | U.S. CPI Urban Consumers NSA (CPURNSA) | | At Termination Date | | 1.949 | | | At Termination Date | | | 09/18/30 | | | USD | 625,000 | | | | (19,526 | ) | | | (19,552 | ) |
| Pay | | | | 1-day Overnight Fed Funds Effective Rate | | At Termination Date | | 0.555 | | | At Termination Date | | | 10/20/30 | | | USD | 1,250,000 | | | | (20,220 | ) | | | (20,220 | ) |
| Pay | | | | 1-day Overnight Fed Funds Effective Rate | | At Termination Date | | 0.562 | | | At Termination Date | | | 10/21/30 | | | USD | 21,996 | | | | 336 | | | | 336 | |
| Pay | | | | U.S. CPI Urban Consumers NSA (CPURNSA) | | At Termination Date | | 2.108 | | | At Termination Date | | | 12/07/30 | | | USD | 1,280,000 | | | | (12,655 | ) | | | (12,707 | ) |
| Pay | | | | U.S. CPI Urban Consumers NSA (CPURNSA) | | At Termination Date | | 2.169 | | | At Termination Date | | | 12/24/30 | | | USD | 1,290,000 | | | | (3,891 | ) | | | (3,943 | ) |
| Pay | | | | U.S. CPI Urban Consumers NSA (CPURNSA) | | At Termination Date | | 2.192 | | | At Termination Date | | | 12/31/30 | | | USD | 660,000 | | | | (181 | ) | | | (208 | ) |
| Receive | | | | Eurostat Eurozone HICP ex Tobacco NSA (CPTFEMU) | | At Termination Date | | 1.290 | | | At Termination Date | | | 03/15/29 | | | EUR | 1,980,000 | | | | (95,550 | ) | | | (95,550 | ) |
| Receive | | | | Eurostat Eurozone HICP ex Tobacco NSA (CPTFEMU) | | At Termination Date | | 0.920 | | | At Termination Date | | | 09/15/30 | | | EUR | 1,070,000 | | | | 19,141 | | | | 19,088 | |
| Receive | | | | Eurostat Eurozone HICP ex Tobacco NSA (CPTFEMU) | | At Termination Date | | 1.113 | | | At Termination Date | | | 12/15/30 | | | EUR | 1,055,000 | | | | 3,223 | | | | 3,170 | |
| Receive | | | | Eurostat Eurozone HICP ex Tobacco NSA (CPTFEMU) | | At Termination Date | | 1.124 | | | At Termination Date | | | 12/15/30 | | | EUR | 1,045,000 | | | | 1,574 | | | | 1,521 | |
| Receive | | | | U.K. RPI All Items Monthly | | At Termination Date | | 3.530 | | | At Termination Date | | | 10/15/25 | | | GBP | 1,415,000 | | | | (22,461 | ) | | | (23,023 | ) |
See Accompanying Notes to Financial Statements
36
VY® BLACKROCK INFLATION
PROTECTED BOND PORTFOLIO | SUMMARY PORTFOLIO OF INVESTMENTS
AS OF DECEMBER 31, 2020 (CONTINUED) |
| | |
Pay/Receive
Floating Rate | | | | Floating Rate Index | | Floating Rate
Index Payment
Frequency | | Fixed
Rate | | | Fixed Rate
Payment
Frequency | | | Maturity
Date | | | Notional Amount | | | Fair
Value | | | Unrealized
Appreciation/
(Depreciation) |
|---|
| Receive | | | | U.K. RPI All Items Monthly | | At Termination Date | | 3.384 | % | | At Termination Date | | | 12/15/30 | | | GBP | 415,000 | | | $ | 2,648 | | | $ | 2,625 | |
| Receive | | | | U.K. RPI All Items Monthly | | At Termination Date | | 3.420 | | | At Termination Date | | | 10/15/34 | | | GBP | 2,025,000 | | | | (145,361 | ) | | | (145,361 | ) |
| Receive | | | | U.K. RPI All Items Monthly | | At Termination Date | | 3.360 | | | At Termination Date | | | 01/15/35 | | | GBP | 900,000 | | | | (35,500 | ) | | | (35,500 | ) |
| Receive | | | | U.K. RPI All Items Monthly | | At Termination Date | | 3.390 | | | At Termination Date | | | 01/15/35 | | | GBP | 800,000 | | | | (39,120 | ) | | | (39,120 | ) |
| Receive | | | | U.K. RPI All Items Monthly | | At Termination Date | | 3.160 | | | At Termination Date | | | 10/15/49 | | | GBP | 1,560,000 | | | | (161,112 | ) | | | (161,112 | ) |
| Receive | | | | U.K. RPI All Items Monthly | | At Termination Date | | 3.111 | | | At Termination Date | | | 01/15/50 | | | GBP | 700,000 | | | | (31,110 | ) | | | (31,110 | ) |
| Receive | | | | U.K. RPI All Items Monthly | | At Termination Date | | 3.133 | | | At Termination Date | | | 01/15/50 | | | GBP | 600,000 | | | | (38,254 | ) | | | (38,254 | ) |
| Receive | | | | U.S. CPI Urban Consumers NSA (CPURNSA) | | At Termination Date | | 2.205 | | | At Termination Date | | | 03/21/22 | | | USD | 5,100,000 | | | | (87,573 | ) | | | (87,573 | ) |
| Receive | | | | U.S. CPI Urban Consumers NSA (CPURNSA) | | At Termination Date | | 1.890 | | | At Termination Date | | | 06/29/22 | | | USD | 6,700,000 | | | | 11,077 | | | | 11,077 | |
| Receive | | | | U.S. CPI Urban Consumers NSA (CPURNSA) | | At Termination Date | | 1.713 | | | At Termination Date | | | 08/21/22 | | | USD | 9,230,000 | | | | 133,049 | | | | 133,049 | |
| Receive | | | | U.S. CPI Urban Consumers NSA (CPURNSA) | | At Termination Date | | 2.260 | | | At Termination Date | | | 05/03/23 | | | USD | 9,000,000 | | | | (212,593 | ) | | | (212,593 | ) |
| Receive | | | | U.S. CPI Urban Consumers NSA (CPURNSA) | | At Termination Date | | 2.211 | | | At Termination Date | | | 10/26/23 | | | USD | 2,500,000 | | | | (49,699 | ) | | | (49,699 | ) |
| Receive | | | | U.S. CPI Urban Consumers NSA (CPURNSA) | | At Termination Date | | 1.957 | | | At Termination Date | | | 02/06/24 | | | USD | 12,000,000 | | | | (50,423 | ) | | | (50,423 | ) |
| Receive | | | | U.S. CPI Urban Consumers NSA (CPURNSA) | | At Termination Date | | 1.991 | | | At Termination Date | | | 03/04/24 | | | USD | 3,000,000 | | | | (11,871 | ) | | | (11,871 | ) |
| Receive | | | | U.S. CPI Urban Consumers NSA (CPURNSA) | | At Termination Date | | 2.248 | | | At Termination Date | | | 03/21/24 | | | USD | 4,900,000 | | | | (115,351 | ) | | | (115,351 | ) |
| Receive | | | | U.S. CPI Urban Consumers NSA (CPURNSA) | | At Termination Date | | 2.023 | | | At Termination Date | | | 05/02/24 | | | USD | 3,500,000 | | | | (16,709 | ) | | | (16,709 | ) |
| Receive | | | | U.S. CPI Urban Consumers NSA (CPURNSA) | | At Termination Date | | 1.829 | | | At Termination Date | | | 07/31/24 | | | USD | 600,000 | | | | 1,422 | | | | 1,422 | |
| Receive | | | | U.S. CPI Urban Consumers NSA (CPURNSA) | | At Termination Date | | 1.706 | | | At Termination Date | | | 08/12/24 | | | USD | 1,300,000 | | | | 12,430 | | | | 12,430 | |
| Receive | | | | U.S. CPI Urban Consumers NSA (CPURNSA) | | At Termination Date | | 2.351 | | | At Termination Date | | | 09/28/24 | | | USD | 7,400,000 | | | | (234,004 | ) | | | (234,004 | ) |
| Receive | | | | U.S. CPI Urban Consumers NSA (CPURNSA) | | At Termination Date | | 0.945 | | | At Termination Date | | | 03/12/25 | | | USD | 1,650,000 | | | | 81,131 | | | | 81,131 | |
| Receive | | | | U.S. CPI Urban Consumers NSA (CPURNSA) | | At Termination Date | | 1.908 | | | At Termination Date | | | 05/24/25 | | | USD | 4,500,000 | | | | 13,399 | | | | 13,399 | |
| Receive | | | | U.S. CPI Urban Consumers NSA (CPURNSA) | | At Termination Date | | 2.361 | | | At Termination Date | | | 09/28/25 | | | USD | 6,150,000 | | | | (216,951 | ) | | | (216,951 | ) |
| Receive | | | | U.S. CPI Urban Consumers NSA (CPURNSA) | | At Termination Date | | 1.783 | | | At Termination Date | | | 11/04/25 | | | USD | 1,300,000 | | | | 21,050 | | | | 21,003 | |
| Receive | | | | U.S. CPI Urban Consumers NSA (CPURNSA) | | At Termination Date | | 2.098 | | | At Termination Date | | | 11/29/25 | | | USD | 1,600,000 | | | | (20,825 | ) | | | (20,825 | ) |
See Accompanying Notes to Financial Statements
37
VY® BLACKROCK INFLATION
PROTECTED BOND PORTFOLIO | SUMMARY PORTFOLIO OF INVESTMENTS
AS OF DECEMBER 31, 2020 (CONTINUED) |
| | |
Pay/Receive
Floating Rate | | | | Floating Rate Index | | Floating Rate
Index Payment
Frequency | | Fixed
Rate | | | Fixed Rate
Payment
Frequency | | | Maturity
Date | | | Notional Amount | | | Fair
Value | | | Unrealized
Appreciation/
(Depreciation) |
|---|
| Receive | | | | U.S. CPI Urban Consumers NSA (CPURNSA) | | At Termination Date | | 1.853 | % | | At Termination Date | | | 06/28/26 | | | USD | 450,000 | | | $ | 3,524 | | | $ | 3,524 | |
| Receive | | | | U.S. CPI Urban Consumers NSA (CPURNSA) | | At Termination Date | | 2.249 | | | At Termination Date | | | 10/30/28 | | | USD | 1,195,000 | | | | (30,735 | ) | | | (30,735 | ) |
| Receive | | | | U.S. CPI Urban Consumers NSA (CPURNSA) | | At Termination Date | | 1.746 | | | At Termination Date | | | 09/06/29 | | | USD | 4,100,000 | | | | 151,550 | | | | 151,550 | |
| Receive | | | | U.S. CPI Urban Consumers NSA (CPURNSA) | | At Termination Date | | 1.504 | | | At Termination Date | | | 03/10/30 | | | USD | 3,840,000 | | | | 243,240 | | | | 243,240 | |
| Receive | | | | U.S. CPI Urban Consumers NSA (CPURNSA) | | At Termination Date | | 1.250 | | | At Termination Date | | | 03/11/30 | | | USD | 360,000 | | | | 32,490 | | | | 32,490 | |
| Receive | | | | U.S. CPI Urban Consumers NSA (CPURNSA) | | At Termination Date | | 1.268 | | | At Termination Date | | | 03/12/30 | | | USD | 2,575,000 | | | | 227,631 | | | | 227,631 | |
| Receive | | | | U.S. CPI Urban Consumers NSA (CPURNSA) | | At Termination Date | | 0.733 | | | At Termination Date | | | 03/23/30 | | | USD | 1,180,000 | | | | 169,434 | | | | 169,434 | |
| Receive | | | | U.S. CPI Urban Consumers NSA (CPURNSA) | | At Termination Date | | 0.835 | | | At Termination Date | | | 03/23/30 | | | USD | 655,000 | | | | 87,272 | | | | 87,272 | |
| Receive | | | | U.S. CPI Urban Consumers NSA (CPURNSA) | | At Termination Date | | 1.285 | | | At Termination Date | | | 05/05/30 | | | USD | 4,860,000 | | | | 430,811 | | | | 430,811 | |
| Receive | | | | U.S. CPI Urban Consumers NSA (CPURNSA) | | At Termination Date | | 1.983 | | | At Termination Date | | | 10/13/30 | | | USD | 1,430,000 | | | | 35,445 | | | | 35,387 | |
| Receive | | | | U.S. CPI Urban Consumers NSA (CPURNSA) | | At Termination Date | | 1.960 | | | At Termination Date | | | 12/12/49 | | | USD | 775,000 | | | | 64,753 | | | | 64,753 | |
| | | | | | | | | | | | | | | | | | | | | | $ | 614,724 | | | $ | 612,019 | |
At December 31, 2020, the following OTC inflation-linked swaps were outstanding for VY® BlackRock Inflation Protected Bond Portfolio:
| Counterparty | | | | Pay/Receive
Floating
Rate | | Floating
Rate Index | | Floating Rate
Index Payment
Frequency | | Fixed
Rate | | | Fixed Rate
Payment
Frequency | | | Maturity
Date | | | Notional
Amount | | | Fair
Value | | | Upfront
Payments
Paid/
(Received) | | Unrealized
Appreciation/
(Depreciation) |
|---|
| Citibank N.A. | | | | Receive | | U.S. CPI Urban Consumers NSA (CPURNSA) | | At Termination Date | | 1.515 | % | | At Termination Date | | | 01/15/22 | | | USD | 16,000,000 | | | $ | 365,555 | | | | $ — | | | | $365,555 | |
| Citibank N.A. | | | | Receive | | U.S. CPI Urban Consumers NSA (CPURNSA) | | At Termination Date | | 1.560 | | | At Termination Date | | | 01/15/23 | | | USD | 10,250,000 | | | | 266,062 | | | | — | | | | 266,062 | |
| Citibank N.A. | | | | Receive | | U.S. CPI Urban Consumers NSA (CPURNSA) | | At Termination Date | | 1.660 | | | At Termination Date | | | 09/22/23 | | | USD | 5,500,000 | | | | 129,250 | | | | — | | | | 129,250 | |
| | | | | | | | | | | | | | | | | | | | | | | | $ | 760,867 | | | | $ — | | | | $760,867 | |
At December 31, 2020, the following purchased exchange-traded options were outstanding for VY® BlackRock Inflation Protected Bond Portfolio:
| Description | | | | Put/Call | | Expiration
Date | | Exercise
Price | | Number of
Contracts | | Notional Amount | | Cost | | | Fair
Value | |
|---|
| 90-Day Eurodollar | | | | Call | | 12/13/21 | | 99.75 USD | | 92 | | 22,951,700 | | $ | 16,250 | | | $ | 16,100 | |
| U.S. Treasury 10-Year Note | | | | Put | | 01/22/21 | | 137.50 USD | | 22 | | 3,037,719 | | | 8,146 | | | | 6,187 | |
| | | | | | | | | | | | | | | $ | 24,396 | | | $ | 22,287 | |
See Accompanying Notes to Financial Statements
38
VY® BLACKROCK INFLATION
PROTECTED BOND PORTFOLIO | SUMMARY PORTFOLIO OF INVESTMENTS
AS OF DECEMBER 31, 2020 (CONTINUED) |
| | |
At December 31, 2020, the following exchange-traded written options were outstanding for VY® BlackRock Inflation Protected Bond Portfolio:
| Description | | | | Put/Call | | Expiration
Date | | Exercise
Price | | Number of
Contracts | | Notional Amount | | | Premiums
Received | | | Fair
Value | |
|---|
| 90-Day Eurodollar | | | | Call | | 12/13/21 | | 100.00 USD | | 27 | | USD | 6,735,825 | | | $ | 4,344 | | | $ | (844 | ) |
| 90-Day Eurodollar | | | | Call | | 12/13/21 | | 99.38 USD | | 53 | | USD | 13,222,175 | | | | 23,101 | | | | (55,981 | ) |
| U.S. Treasury 10-Year Note | | | | Put | | 01/22/21 | | 136.50 USD | | 22 | | USD | 3,037,719 | | | | 2,473 | | | | (1,719 | ) |
| | | | | | | | | | | | | | | | | $ | 29,918 | | | $ | (58,544 | ) |
At December 31, 2020, the following OTC purchased interest rate swaptions were outstanding for VY® BlackRock Inflation Protected Bond Portfolio:
| Description | | | | Counterparty | | Pay/
Receive
Exercise
Rate | | Exercise
Rate | | Floating Rate
Index | | Expiration
Date | | Notional Amount | | | Cost | | | Fair
Value |
|---|
Call on 10-Year Interest Rate Swap(1) | | | | Barclays Bank PLC | | Receive | | 2.950% | | 3-month USD-LIBOR | | 03/12/24 | | USD | 870,000 | | | $ | 39,215 | | | $ | 132,998 | |
Call on 10-Year Interest Rate Swap(1) | | | | Barclays Bank PLC | | Receive | | 2.978% | | 3-month USD-LIBOR | | 03/07/24 | | USD | 874,500 | | | | 40,205 | | | | 135,896 | |
Call on 10-Year Interest Rate Swap(1) | | | | Barclays Bank PLC | | Receive | | 3.052% | | 3-month USD-LIBOR | | 01/10/29 | | USD | 220,000 | | | | 12,430 | | | | 30,425 | |
Call on 10-Year Interest Rate Swap(1) | | | | Barclays Bank PLC | | Receive | | 3.083% | | 3-month USD-LIBOR | | 01/29/29 | | USD | 220,000 | | | | 12,496 | | | | 30,903 | |
Call on 10-Year Interest Rate Swap(1) | | | | Barclays Bank PLC | | Receive | | 3.088% | | 3-month USD-LIBOR | | 12/06/38 | | USD | 570,000 | | | | 26,505 | | | | 79,635 | |
Call on 10-Year Interest Rate Swap(1) | | | | Citibank N.A. | | Receive | | 1.460% | | 3-month USD-LIBOR | | 08/16/21 | | USD | 980,000 | | | | 35,072 | | | | 47,754 | |
Call on 10-Year Interest Rate Swap(1) | | | | Citibank N.A. | | Receive | | 1.492% | | 3-month USD-LIBOR | | 02/25/25 | | USD | 550,000 | | | | 28,889 | | | | 25,226 | |
Call on 10-Year Interest Rate Swap(1) | | | | Citibank N.A. | | Receive | | 2.824% | | 3-month USD-LIBOR | | 01/31/39 | | USD | 120,000 | | | | 6,149 | | | | 14,955 | |
Call on 10-Year Interest Rate Swap(1) | | | | Citibank N.A. | | Receive | | 2.978% | | 3-month USD-LIBOR | | 01/31/29 | | USD | 100,000 | | | | 5,780 | | | | 13,301 | |
Call on 10-Year Interest Rate Swap(1) | | | | Citibank N.A. | | Receive | | 2.985% | | 3-month USD-LIBOR | | 04/27/38 | | USD | 10,000 | | | | 493 | | | | 1,339 | |
Call on 10-Year Interest Rate Swap(1) | | | | Deutsche Bank AG | | Receive | | 0.890% | | 3-month USD-LIBOR | | 04/30/25 | | USD | 360,000 | | | | 19,422 | | | | 8,515 | |
Call on 10-Year Interest Rate Swap(1) | | | | Deutsche Bank AG | | Receive | | 1.423% | | 3-month USD-LIBOR | | 06/05/25 | | USD | 255,000 | | | | 13,668 | | | | 10,906 | |
Call on 10-Year Interest Rate Swap(1) | | | | Goldman Sachs International | | Receive | | 1.283% | | 3-month USD-LIBOR | | 06/04/25 | | USD | 255,000 | | | | 13,796 | | | | 9,418 | |
Call on 10-Year Interest Rate Swap(1) | | | | JPMorgan Chase Bank N.A. | | Receive | | 2.860% | | 3-month USD-LIBOR | | 02/22/39 | | USD | 232,500 | | | | 11,503 | | | | 29,437 | |
Call on 10-Year Interest Rate Swap(1) | | | | JPMorgan Chase Bank N.A. | | Receive | | 2.985% | | 3-month USD-LIBOR | | 04/27/38 | | USD | 200,000 | | | | 9,400 | | | | 26,789 | |
Call on 10-Year Interest Rate Swap(1) | | | | Morgan Stanley & Co. International PLC | | Receive | | 3.037% | | 3-month USD-LIBOR | | 01/11/29 | | USD | 220,000 | | | | 12,523 | | | | 30,185 | |
Call on 1-Year Interest Rate Swap(1) | | | | Barclays Bank PLC | | Receive | | 0.865% | | 3-month USD-LIBOR | | 12/02/24 | | USD | 2,860,000 | | | | 10,654 | | | | 11,714 | |
Call on 1-Year Interest Rate Swap(1) | | | | JPMorgan Chase Bank N.A. | | Receive | | 0.816% | | 3-month USD-LIBOR | | 11/25/24 | | USD | 2,860,000 | | | | 10,654 | | | | 10,991 | |
Call on 20-Year interest Rate Swap(2) | | | | JPMorgan Chase Bank N.A. | | Receive | | 0.780% | | 6-month JPY-LIBOR | | 04/16/21 | | JPY | 18,900,000 | | | | 5,916 | | | | 16,953 | |
Call on 20-Year Interest Rate Swap(2) | | | | Goldman Sachs International | | Receive | | 0.780% | | 6-month JPY-LIBOR | | 04/16/21 | | JPY | 1,670,000 | | | | 500 | | | | 1,528 | |
Put on 10-Year Interest Rate Swap(3) | | | | Barclays Bank PLC | | Pay | | 1.100% | | 6-month JPY-LIBOR | | 06/29/22 | | JPY | 692,890,000 | | | | 94,254 | | | | 340 | |
Put on 10-Year Interest Rate Swap(4) | | | | Barclays Bank PLC | | Pay | | 2.250% | | 3-month USD-LIBOR | | 08/08/22 | | USD | 960,000 | | | | 22,728 | | | | 4,834 | |
Put on 10-Year Interest Rate Swap(4) | | | | Barclays Bank PLC | | Pay | | 2.950% | | 3-month USD-LIBOR | | 03/12/24 | | USD | 870,000 | | | | 39,215 | | | | 5,797 | |
Put on 10-Year Interest Rate Swap(4) | | | | Barclays Bank PLC | | Pay | | 2.978% | | 3-month USD-LIBOR | | 03/07/24 | | USD | 874,500 | | | | 40,205 | | | | 5,604 | |
Put on 10-Year Interest Rate Swap(4) | | | | Barclays Bank PLC | | Pay | | 3.052% | | 3-month USD-LIBOR | | 01/10/29 | | USD | 220,000 | | | | 12,430 | | | | 4,774 | |
Put on 10-Year Interest Rate Swap(4) | | | | Barclays Bank PLC | | Pay | | 3.083% | | 3-month USD-LIBOR | | 01/29/29 | | USD | 220,000 | | | | 12,496 | | | | 4,685 | |
Put on 10-Year Interest Rate Swap(4) | | | | Barclays Bank PLC | | Pay | | 3.088% | | 3-month USD-LIBOR | | 12/06/38 | | USD | 570,000 | | | | 26,505 | | | | 17,839 | |
Put on 10-Year Interest Rate Swap(4) | | | | Citibank N.A. | | Pay | | 1.460% | | 3-month USD-LIBOR | | 08/16/21 | | USD | 980,000 | | | | 35,072 | | | | 5,837 | |
Put on 10-Year Interest Rate Swap(4) | | | | Citibank N.A. | | Pay | | 1.492% | | 3-month USD-LIBOR | | 02/25/25 | | USD | 550,000 | | | | 28,889 | | | | 26,534 | |
See Accompanying Notes to Financial Statements
39
VY® BLACKROCK INFLATION
PROTECTED BOND PORTFOLIO | SUMMARY PORTFOLIO OF INVESTMENTS
AS OF DECEMBER 31, 2020 (CONTINUED) |
| | |
| Description | | | | Counterparty | | Pay/
Receive
Exercise
Rate | | Exercise
Rate | | Floating Rate
Index | | Expiration
Date | | Notional Amount | | | Cost | | | Fair
Value |
|---|
Put on 10-Year Interest Rate Swap(4) | | | | Citibank N.A. | | Pay | | 2.824% | | 3-month USD-LIBOR | | 01/31/39 | | USD | 120,000 | | | $ | 6,025 | | | $ | 4,348 | |
Put on 10-Year Interest Rate Swap(4) | | | | Citibank N.A. | | Pay | | 2.978% | | 3-month USD-LIBOR | | 01/31/29 | | USD | 100,000 | | | | 5,778 | | | | 2,317 | |
Put on 10-Year Interest Rate Swap(4) | | | | Citibank N.A. | | Pay | | 2.985% | | 3-month USD-LIBOR | | 04/27/38 | | USD | 10,000 | | | | 461 | | | | 329 | |
Put on 10-Year Interest Rate Swap(4) | | | | Deutsche Bank AG | | Pay | | 0.890% | | 3-month USD-LIBOR | | 04/30/25 | | USD | 360,000 | | | | 19,422 | | | | 30,195 | |
Put on 10-Year Interest Rate Swap(4) | | | | Deutsche Bank AG | | Pay | | 1.423% | | 3-month USD-LIBOR | | 06/05/25 | | USD | 255,000 | | | | 13,668 | | | | 13,835 | |
Put on 10-Year Interest Rate Swap(4) | | | | Goldman Sachs International | | Pay | | 1.283% | | 3-month USD-LIBOR | | 06/04/25 | | USD | 255,000 | | | | 13,796 | | | | 15,652 | |
Put on 10-Year Interest Rate Swap(4) | | | | JPMorgan Chase Bank N.A. | | Pay | | 2.250% | | 3-month USD-LIBOR | | 08/02/22 | | USD | 950,000 | | | | 25,650 | | | | 4,703 | |
Put on 10-Year Interest Rate Swap(4) | | | | JPMorgan Chase Bank N.A. | | Pay | | 2.860% | | 3-month USD-LIBOR | | 02/22/39 | | USD | 232,500 | | | | 11,503 | | | | 8,262 | |
Put on 10-Year Interest Rate Swap(4) | | | | JPMorgan Chase Bank N.A. | | Pay | | 2.985% | | 3-month USD-LIBOR | | 04/27/38 | | USD | 200,000 | | | | 9,400 | | | | 6,588 | |
Put on 10-Year Interest Rate Swap(4) | | | | Morgan Stanley & Co. International PLC | | Pay | | 2.500% | | 3-month USD-LIBOR | | 06/13/24 | | USD | 930,000 | | | | 41,811 | | | | 12,024 | |
Put on 10-Year Interest Rate Swap(4) | | | | Morgan Stanley & Co. International PLC | | Pay | | 2.500% | | 3-month USD-LIBOR | | 06/20/24 | | USD | 930,000 | | | | 37,600 | | | | 12,129 | |
Put on 10-Year Interest Rate Swap(4) | | | | Morgan Stanley & Co. International PLC | | Pay | | 3.037% | | 3-month USD-LIBOR | | 01/11/29 | | USD | 220,000 | | | | 12,523 | | | | 4,836 | |
Put on 1-Year Interest Rate Swap(4) | | | | Barclays Bank PLC | | Pay | | 0.865% | | 3-month USD-LIBOR | | 12/02/24 | | USD | 2,860,000 | | | | 10,654 | | | | 10,439 | |
Put on 1-Year Interest Rate Swap(4) | | | | JPMorgan Chase Bank N.A. | | Pay | | 0.816% | | 3-month USD-LIBOR | | 11/25/24 | | USD | 2,860,000 | | | | 10,654 | | | | 10,951 | |
Put on 20-Year interest Rate Swap(3) | | | | JPMorgan Chase Bank N.A. | | Pay | | 0.780% | | 6-month JPY-LIBOR | | 04/16/21 | | JPY | 3,300,000 | | | | 521 | | | | 1 | |
Put on 20-Year interest Rate Swap(3) | | | | JPMorgan Chase Bank N.A. | | Pay | | 0.780% | | 6-month JPY-LIBOR | | 04/16/21 | | JPY | 3,300,000 | | | | 521 | | | | 1 | |
Put on 20-Year interest Rate Swap(3) | | | | JPMorgan Chase Bank N.A. | | Pay | | 0.780% | | 6-month JPY-LIBOR | | 04/16/21 | | JPY | 18,900,000 | | | | 5,916 | | | | 6 | |
Put on 20-Year Interest Rate Swap(3) | | | | Goldman Sachs International | | Pay | | 0.780% | | 6-month JPY-LIBOR | | 04/16/21 | | JPY | 1,670,000 | | | | 500 | | | | 1 | |
Put on 30-Year Interest Rate Swap(4) | | | | Barclays Bank PLC | | Pay | | 2.850% | | 3-month USD-LIBOR | | 05/09/22 | | USD | 1,170,000 | | | | 67,934 | | | | 7,937 | |
Put on 30-Year Interest Rate Swap(4) | | | | Barclays Bank PLC | | Pay | | 3.800% | | 3-month USD-LIBOR | | 06/07/21 | | USD | 830,000 | | | | 32,380 | | | | 107 | |
| | | | | | | | | | | | | | | | | | | $ | 953,781 | | | $ | 889,773 | |
At December 31, 2020, the following OTC written interest rate swaptions were outstanding for VY® BlackRock Inflation Protected Bond Portfolio:
| Description | | | | Counterparty | | Pay/
Receive
Exercise
Rate | | Exercise
Rate | | Floating Rate
Index | | Expiration
Date | | Notional Amount | | | Premiums
Received | | | Fair
Value |
|---|
Call on 10-Year interest Rate Swap(4) | | | | Barclays Bank PLC | | Pay | | 2.788% | | 3-month USD-LIBOR | | 03/08/21 | | USD | 1,312,000 | | | $ | 39,114 | | | $ | (235,153 | ) |
Call on 10-Year interest Rate Swap(4) | | | | Barclays Bank PLC | | Pay | | 3.050% | | 3-month USD-LIBOR | | 03/12/29 | | USD | 700,000 | | | | 37,135 | | | | (96,540 | ) |
Call on 10-Year Interest Rate Swap(4) | | | | Barclays Bank PLC | | Pay | | 1.225% | | 3-month USD-LIBOR | | 12/15/22 | | USD | 855,000 | | | | 27,959 | | | | (27,733 | ) |
Call on 10-Year Interest Rate Swap(4) | | | | BNP Paribas | | Pay | | 0.715% | | 3-month USD-LIBOR | | 06/29/21 | | USD | 555,000 | | | | 14,506 | | | | (3,532 | ) |
Call on 10-Year Interest Rate Swap(4) | | | | Citibank N.A. | | Pay | | 1.254% | | 3-month USD-LIBOR | | 12/30/22 | | USD | 470,000 | | | | 15,498 | | | | (15,915 | ) |
Call on 10-Year Interest Rate Swap(4) | | | | Deutsche Bank AG | | Pay | | 0.450% | | 3-month USD-LIBOR | | 09/30/21 | | USD | 540,000 | | | | 5,184 | | | | (2,089 | ) |
Call on 10-Year Interest Rate Swap(4) | | | | Deutsche Bank AG | | Pay | | 0.665% | | 3-month USD-LIBOR | | 07/14/21 | | USD | 560,000 | | | | 14,308 | | | | (3,177 | ) |
Call on 10-Year Interest Rate Swap(4) | | | | Deutsche Bank AG | | Pay | | 0.717% | | 3-month USD-LIBOR | | 04/16/21 | | USD | 255,000 | | | | 7,038 | | | | (1,073 | ) |
Call on 10-Year Interest Rate Swap(4) | | | | Deutsche Bank AG | | Pay | | 0.740% | | 3-month USD-LIBOR | | 05/02/22 | | USD | 550,000 | | | | 19,030 | | | | (6,739 | ) |
Call on 10-Year Interest Rate Swap(4) | | | | Deutsche Bank AG | | Pay | | 0.742% | | 3-month USD-LIBOR | | 06/25/21 | | USD | 555,000 | | | | 14,610 | | | | (3,831 | ) |
Call on 10-Year Interest Rate Swap(4) | | | | Deutsche Bank AG | | Pay | | 0.746% | | 3-month USD-LIBOR | | 06/02/21 | | USD | 1,090,000 | | | | 27,332 | | | | (6,989 | ) |
See Accompanying Notes to Financial Statements
40
VY® BLACKROCK INFLATION
PROTECTED BOND PORTFOLIO | SUMMARY PORTFOLIO OF INVESTMENTS
AS OF DECEMBER 31, 2020 (CONTINUED) |
| | |
| Description | | | | Counterparty | | Pay/
Receive
Exercise
Rate | | Exercise
Rate | | Floating Rate
Index | | Expiration
Date | | Notional Amount | | | Premiums
Received | | | Fair
Value |
|---|
Call on 10-Year Interest Rate Swap(4) | | | | Deutsche Bank AG | | Pay | | 0.765% | | 3-month USD-LIBOR | | 04/15/21 | | USD | 255,000 | | | $ | 6,993 | | | $ | (1,338 | ) |
Call on 10-Year Interest Rate Swap(4) | | | | Deutsche Bank AG | | Pay | | 0.930% | | 3-month USD-LIBOR | | 10/06/21 | | USD | 470,000 | | | | 11,327 | | | | (7,313 | ) |
Call on 10-Year Interest Rate Swap(4) | | | | Deutsche Bank AG | | Pay | | 1.064% | | 3-month USD-LIBOR | | 10/11/22 | | USD | 460,000 | | | | 15,473 | | | | (11,458 | ) |
Call on 10-Year Interest Rate Swap(4) | | | | Goldman Sachs International | | Pay | | 1.233% | | 3-month USD-LIBOR | | 12/16/22 | | USD | 427,500 | | | | 13,979 | | | | (14,025 | ) |
Call on 10-Year Interest Rate Swap(4) | | | | Goldman Sachs International | | Pay | | 1.245% | | 3-month USD-LIBOR | | 12/16/22 | | USD | 427,500 | | | | 13,979 | | | | (14,293 | ) |
Call on 10-Year Interest Rate Swap(4) | | | | Morgan Stanley & Co. International PLC | | Pay | | 0.743% | | 3-month USD-LIBOR | | 04/19/21 | | USD | 820,000 | | | | 22,776 | | | | (4,009 | ) |
Call on 1-Year Interest Rate Swap(4) | | | | Morgan Stanley & Co. International PLC | | Pay | | 0.410% | | 3-month USD-LIBOR | | 03/17/21 | | USD | 5,250,000 | | | | 8,925 | | | | (12,115 | ) |
Call on 2-Year interest Rate Swap(4) | | | | JPMorgan Chase Bank N.A. | | Pay | | 2.436% | | 3-month USD-LIBOR | | 02/01/21 | | USD | 3,300,000 | | | | 24,629 | | | | (148,169 | ) |
| Call on 5-Year Interest Rate Swap | | | | Barclays Bank PLC | | Pay | | –0.020% | | 6-month EUR-EURIBOR | | 04/07/22 | | EUR | 1,340,000 | | | | 17,169 | | | | (27,163 | ) |
| Call on 5-Year Interest Rate Swap | | | | Barclays Bank PLC | | Pay | | –0.035% | | 6-month EUR-EURIBOR | | 09/13/22 | | EUR | 600,000 | | | | 9,338 | | | | (14,664 | ) |
| Call on 5-Year Interest Rate Swap | | | | Barclays Bank PLC | | Pay | | –0.115% | | 6-month EUR-EURIBOR | | 04/04/22 | | EUR | 1,160,000 | | | | 14,671 | | | | (18,756 | ) |
| Call on 5-Year Interest Rate Swap | | | | Barclays Bank PLC | | Pay | | –0.138% | | 6-month EUR-EURIBOR | | 09/12/22 | | EUR | 600,000 | | | | 9,029 | | | | (11,590 | ) |
Call on 5-Year Interest Rate Swap(4) | | | | Deutsche Bank AG | | Pay | | 0.478% | | 3-month USD-LIBOR | | 01/19/21 | | USD | 1,280,000 | | | | 3,302 | | | | (3,708 | ) |
Put on 10-Year interest Rate Swap(1) | | | | Barclays Bank PLC | | Receive | | 2.788% | | 3-month USD-LIBOR | | 03/08/21 | | USD | 1,312,000 | | | | 39,114 | | | | (9 | ) |
Put on 10-Year interest Rate Swap(1) | | | | Barclays Bank PLC | | Receive | | 3.050% | | 3-month USD-LIBOR | | 03/12/29 | | USD | 700,000 | | | | 37,135 | | | | (15,490 | ) |
Put on 10-Year interest Rate Swap(1) | | | | Barclays Bank PLC | | Receive | | 3.870% | | 3-month USD-LIBOR | | 06/07/21 | | USD | 1,770,000 | | | | 34,676 | | | | (39 | ) |
Put on 10-Year Interest Rate Swap(1) | | | | Barclays Bank PLC | | Receive | | 0.950% | | 3-month USD-LIBOR | | 08/04/21 | | USD | 490,000 | | | | 5,439 | | | | (10,523 | ) |
Put on 10-Year Interest Rate Swap(1) | | | | Barclays Bank PLC | | Receive | | 1.000% | | 3-month USD-LIBOR | | 06/01/21 | | USD | 2,320,000 | | | | 34,974 | | | | (34,342 | ) |
Put on 10-Year Interest Rate Swap(1) | | | | Barclays Bank PLC | | Receive | | 1.050% | | 3-month USD-LIBOR | | 06/11/21 | | USD | 540,000 | | | | 7,695 | | | | (7,218 | ) |
Put on 10-Year Interest Rate Swap(1) | | | | Barclays Bank PLC | | Receive | | 1.225% | | 3-month USD-LIBOR | | 12/15/22 | | USD | 855,000 | | | | 27,959 | | | | (28,192 | ) |
Put on 10-Year Interest Rate Swap(1) | | | | Barclays Bank PLC | | Receive | | 1.600% | | 3-month USD-LIBOR | | 03/04/22 | | USD | 583,000 | | | | 9,620 | | | | (5,736 | ) |
Put on 10-Year Interest Rate Swap(1) | | | | Barclays Bank PLC | | Receive | | 1.850% | | 3-month USD-LIBOR | | 02/22/22 | | USD | 630,000 | | | | 10,836 | | | | (3,649 | ) |
Put on 10-Year Interest Rate Swap(1) | | | | Barclays Bank PLC | | Receive | | 1.850% | | 3-month USD-LIBOR | | 02/22/22 | | USD | 630,000 | | | | 11,088 | | | | (3,649 | ) |
Put on 10-Year Interest Rate Swap(1) | | | | Barclays Bank PLC | | Receive | | 2.100% | | 3-month USD-LIBOR | | 01/06/22 | | USD | 900,000 | | | | 20,644 | | | | (2,558 | ) |
Put on 10-Year Interest Rate Swap(1) | | | | Barclays Bank PLC | | Receive | | 2.150% | | 3-month USD-LIBOR | | 01/10/22 | | USD | 890,000 | | | | 20,693 | | | | (2,336 | ) |
Put on 10-Year Interest Rate Swap(1) | | | | Barclays Bank PLC | | Receive | | 2.750% | | 3-month USD-LIBOR | | 05/09/22 | | USD | 2,550,000 | | | | 73,975 | | | | (4,250 | ) |
Put on 10-Year Interest Rate Swap(1) | | | | Barclays Bank PLC | | Receive | | 2.750% | | 3-month USD-LIBOR | | 08/08/22 | | USD | 960,000 | | | | 11,568 | | | | (2,232 | ) |
Put on 10-Year Interest Rate Swap(1) | | | | Barclays Bank PLC | | Receive | | 3.250% | | 3-month USD-LIBOR | | 08/08/22 | | USD | 960,000 | | | | 5,712 | | | | (1,098 | ) |
Put on 10-Year Interest Rate Swap(1) | | | | BNP Paribas | | Receive | | 0.715% | | 3-month USD-LIBOR | | 06/29/21 | | USD | 555,000 | | | | 14,506 | | | | (18,903 | ) |
Put on 10-Year Interest Rate Swap(1) | | | | Citibank N.A. | | Receive | | 1.100% | | 3-month USD-LIBOR | | 07/14/21 | | USD | 350,000 | | | | 3,710 | | | | (4,681 | ) |
Put on 10-Year Interest Rate Swap(1) | | | | Citibank N.A. | | Receive | | 1.100% | | 3-month USD-LIBOR | | 07/16/21 | | USD | 360,000 | | | | 3,600 | | | | (4,874 | ) |
Put on 10-Year Interest Rate Swap(1) | | | | Citibank N.A. | | Receive | | 1.254% | | 3-month USD-LIBOR | | 12/30/22 | | USD | 470,000 | | | | 15,498 | | | | (15,161 | ) |
Put on 10-Year Interest Rate Swap(1) | | | | Deutsche Bank AG | | Receive | | 0.665% | | 3-month USD-LIBOR | | 07/14/21 | | USD | 560,000 | | | | 14,308 | | | | (21,750 | ) |
Put on 10-Year Interest Rate Swap(1) | | | | Deutsche Bank AG | | Receive | | 0.717% | | 3-month USD-LIBOR | | 04/16/21 | | USD | 255,000 | | | | 7,038 | | | | (7,323 | ) |
Put on 10-Year Interest Rate Swap(1) | | | | Deutsche Bank AG | | Receive | | 0.740% | | 3-month USD-LIBOR | | 05/02/22 | | USD | 550,000 | | | | 19,030 | | | | (27,552 | ) |
See Accompanying Notes to Financial Statements
41
VY® BLACKROCK INFLATION
PROTECTED BOND PORTFOLIO | SUMMARY PORTFOLIO OF INVESTMENTS
AS OF DECEMBER 31, 2020 (CONTINUED) |
| | |
| Description | | | | Counterparty | | Pay/
Receive
Exercise
Rate | | Exercise
Rate | | Floating Rate
Index | | Expiration
Date | | Notional Amount | | | Premiums
Received | | | Fair
Value |
|---|
Put on 10-Year Interest Rate Swap(1) | | | | Deutsche Bank AG | | Receive | | 0.742% | | 3-month USD-LIBOR | | 06/25/21 | | USD | 555,000 | | | $ | 14,610 | | | $ | (17,696 | ) |
Put on 10-Year Interest Rate Swap(1) | | | | Deutsche Bank AG | | Receive | | 0.746% | | 3-month USD-LIBOR | | 06/02/21 | | USD | 1,090,000 | | | | 27,332 | | | | (32,640 | ) |
Put on 10-Year Interest Rate Swap(1) | | | | Deutsche Bank AG | | Receive | | 0.765% | | 3-month USD-LIBOR | | 04/15/21 | | USD | 255,000 | | | | 6,993 | | | | (6,390 | ) |
Put on 10-Year Interest Rate Swap(1) | | | | Deutsche Bank AG | | Receive | | 0.930% | | 3-month USD-LIBOR | | 10/06/21 | | USD | 470,000 | | | | 11,327 | | | | (12,427 | ) |
Put on 10-Year Interest Rate Swap(1) | | | | Deutsche Bank AG | | Receive | | 0.950% | | 3-month USD-LIBOR | | 08/05/21 | | USD | 540,000 | | | | 6,183 | | | | (11,673 | ) |
Put on 10-Year Interest Rate Swap(1) | | | | Deutsche Bank AG | | Receive | | 1.064% | | 3-month USD-LIBOR | | 10/11/22 | | USD | 460,000 | | | | 15,473 | | | | (17,547 | ) |
Put on 10-Year Interest Rate Swap(1) | | | | Deutsche Bank AG | | Receive | | 1.150% | | 3-month USD-LIBOR | | 01/10/22 | | USD | 320,000 | | | | 4,832 | | | | (6,678 | ) |
Put on 10-Year Interest Rate Swap(1) | | | | Deutsche Bank AG | | Receive | | 1.450% | | 3-month USD-LIBOR | | 09/30/21 | | USD | 1,080,000 | | | | 7,712 | | | | (8,351 | ) |
Put on 10-Year Interest Rate Swap(1) | | | | Deutsche Bank AG | | Receive | | 1.600% | | 3-month USD-LIBOR | | 02/28/22 | | USD | 600,000 | | | | 10,950 | | | | (5,817 | ) |
Put on 10-Year Interest Rate Swap(1) | | | | Deutsche Bank AG | | Receive | | 1.600% | | 3-month USD-LIBOR | | 03/03/22 | | USD | 600,000 | | | | 10,680 | | | | (5,888 | ) |
Put on 10-Year Interest Rate Swap(1) | | | | Deutsche Bank AG | | Receive | | 1.600% | | 3-month USD-LIBOR | | 03/04/22 | | USD | 930,000 | | | | 15,624 | | | | (9,150 | ) |
Put on 10-Year Interest Rate Swap(1) | | | | Goldman Sachs International | | Receive | | 1.150% | | 3-month USD-LIBOR | | 11/04/21 | | USD | 1,223,000 | | | | 16,633 | | | | (21,619 | ) |
Put on 10-Year Interest Rate Swap(1) | | | | Goldman Sachs International | | Receive | | 1.233% | | 3-month USD-LIBOR | | 12/16/22 | | USD | 427,500 | | | | 13,979 | | | | (13,959 | ) |
Put on 10-Year Interest Rate Swap(1) | | | | Goldman Sachs International | | Receive | | 1.245% | | 3-month USD-LIBOR | | 12/16/22 | | USD | 427,500 | | | | 13,979 | | | | (13,714 | ) |
Put on 10-Year Interest Rate Swap(1) | | | | JPMorgan Chase Bank N.A. | | Receive | | 2.750% | | 3-month USD-LIBOR | | 08/02/22 | | USD | 950,000 | | | | 13,015 | | | | (2,167 | ) |
Put on 10-Year Interest Rate Swap(1) | | | | JPMorgan Chase Bank N.A. | | Receive | | 3.250% | | 3-month USD-LIBOR | | 08/02/22 | | USD | 950,000 | | | | 6,223 | | | | (1,065 | ) |
Put on 10-Year Interest Rate Swap(1) | | | | Morgan Stanley & Co. International PLC | | Receive | | 0.743% | | 3-month USD-LIBOR | | 04/19/21 | | USD | 820,000 | | | | 22,776 | | | | (22,081 | ) |
Put on 10-Year Interest Rate Swap(1) | | | | Morgan Stanley & Co. International PLC | | Receive | | 1.950% | | 3-month USD-LIBOR | | 01/28/22 | | USD | 880,000 | | | | 20,570 | | | | (3,768 | ) |
Put on 10-Year Interest Rate Swap(1) | | | | Morgan Stanley & Co. International PLC | | Receive | | 2.250% | | 3-month USD-LIBOR | | 08/20/24 | | USD | 980,000 | | | | 29,054 | | | | (18,251 | ) |
Put on 10-Year Interest Rate Swap(1) | | | | Morgan Stanley & Co. International PLC | | Receive | | 3.000% | | 3-month USD-LIBOR | | 06/13/24 | | USD | 930,000 | | | | 25,539 | | | | (6,755 | ) |
Put on 10-Year Interest Rate Swap(1) | | | | Morgan Stanley & Co. International PLC | | Receive | | 3.000% | | 3-month USD-LIBOR | | 06/20/24 | | USD | 930,000 | | | | 22,714 | | | | (6,824 | ) |
Put on 10-Year Interest Rate Swap(1) | | | | Morgan Stanley & Co. International PLC | | Receive | | 3.500% | | 3-month USD-LIBOR | | 06/13/24 | | USD | 930,000 | | | | 15,565 | | | | (3,874 | ) |
Put on 10-Year Interest Rate Swap(1) | | | | Morgan Stanley & Co. International PLC | | Receive | | 3.500% | | 3-month USD-LIBOR | | 06/20/24 | | USD | 930,000 | | | | 13,630 | | | | (3,918 | ) |
Put on 1-Year Interest Rate Swap(1) | | | | Barclays Bank PLC | | Receive | | 2.150% | | 3-month USD-LIBOR | | 05/28/21 | | USD | 14,860,000 | | | | 41,682 | | | | — | |
Put on 1-Year Interest Rate Swap(1) | | | | Citibank N.A. | | Receive | | 2.350% | | 3-month USD-LIBOR | | 05/17/21 | | USD | 10,930,000 | | | | 21,669 | | | | — | |
Put on 1-Year Interest Rate Swap(1) | | | | Morgan Stanley & Co. International PLC | | Receive | | 2.400% | | 3-month USD-LIBOR | | 06/01/21 | | USD | 18,400,000 | | | | 33,304 | | | | — | |
Put on 2-Year interest Rate Swap(5) | | | | Barclays Bank PLC | | Receive | | 0.000% | | 6-month EUR-EURIBOR | | 06/14/21 | | EUR | 1,010,000 | | | | 2,747 | | | | (18 | ) |
Put on 2-Year interest Rate Swap(5) | | | | Barclays Bank PLC | | Receive | | 0.000% | | 6-month EUR-EURIBOR | | 06/14/21 | | EUR | 1,040,000 | | | | 2,873 | | | | (19 | ) |
Put on 2-Year interest Rate Swap(5) | | | | Barclays Bank PLC | | Receive | | 0.000% | | 6-month EUR-EURIBOR | | 06/25/21 | | EUR | 1,140,000 | | | | 2,605 | | | | (24 | ) |
Put on 2-Year interest Rate Swap(5) | | | | Barclays Bank PLC | | Receive | | 0.050% | | 6-month EUR-EURIBOR | | 06/10/21 | | EUR | 2,310,000 | | | | 5,817 | | | | (31 | ) |
Put on 2-Year interest Rate Swap(5) | | | | Barclays Bank PLC | | Receive | | 0.100% | | 6-month EUR-EURIBOR | | 03/29/21 | | EUR | 4,470,000 | | | | 15,550 | | | | (5 | ) |
Put on 2-Year interest Rate Swap(5) | | | | Barclays Bank PLC | | Receive | | 0.110% | | 6-month EUR-EURIBOR | | 05/17/21 | | EUR | 2,262,400 | | | | 7,485 | | | | (14 | ) |
Put on 2-Year interest Rate Swap(5) | | | | Barclays Bank PLC | | Receive | | 0.120% | | 6-month EUR-EURIBOR | | 04/08/21 | | EUR | 6,960,000 | | | | 26,460 | | | | (11 | ) |
Put on 2-Year interest Rate Swap(5) | | | | Citibank N.A. | | Receive | | 0.000% | | 6-month EUR-EURIBOR | | 06/21/21 | | EUR | 1,220,000 | | | | 2,973 | | | | (24 | ) |
Put on 2-Year interest Rate Swap(5) | | | | Citibank N.A. | | Receive | | 0.100% | | 6-month EUR-EURIBOR | | 04/12/21 | | EUR | 3,490,000 | | | | 11,641 | | | | (6 | ) |
See Accompanying Notes to Financial Statements
42
VY® BLACKROCK INFLATION
PROTECTED BOND PORTFOLIO | SUMMARY PORTFOLIO OF INVESTMENTS
AS OF DECEMBER 31, 2020 (CONTINUED) |
| | |
| Description | | | | Counterparty | | Pay/
Receive
Exercise
Rate | | Exercise
Rate | | Floating Rate
Index | | Expiration
Date | | Notional Amount | | | Premiums
Received | | | Fair
Value |
|---|
Put on 2-Year interest Rate Swap(5) | | | | Goldman Sachs International | | Receive | | 0.000% | | 6-month EUR-EURIBOR | | 06/18/21 | | EUR | 1,040,000 | | | $ | 2,410 | | | $ | (21 | ) |
Put on 2-Year interest Rate Swap(5) | | | | Goldman Sachs International | | Receive | | 0.160% | | 6-month EUR-EURIBOR | | 04/12/21 | | EUR | 3,490,000 | | | | 11,750 | | | | (5 | ) |
Put on 2-Year interest Rate Swap(5) | | | | Morgan Stanley & Co. International PLC | | Receive | | 0.080% | | 6-month EUR-EURIBOR | | 05/31/21 | | EUR | 1,490,000 | | | | 4,347 | | | | (14 | ) |
Put on 2-Year interest Rate Swap(5) | | | | Morgan Stanley & Co. International PLC | | Receive | | 0.150% | | 6-month EUR-EURIBOR | | 04/19/21 | | EUR | 3,460,000 | | | | 12,434 | | | | (8 | ) |
Put on 2-Year interest Rate Swap(1) | | | | JPMorgan Chase Bank N.A. | | Receive | | 2.436% | | 3-month USD-LIBOR | | 02/01/21 | | USD | 3,300,000 | | | | 26,341 | | | | — | |
Put on 2-Year Interest Rate Swap(5) | | | | Barclays Bank PLC | | Receive | | 0.000% | | 6-month EUR-EURIBOR | | 07/01/21 | | EUR | 1,210,000 | | | | 2,499 | | | | (28 | ) |
Put on 2-Year Interest Rate Swap(5) | | | | Barclays Bank PLC | | Receive | | 0.000% | | 6-month EUR-EURIBOR | | 07/19/21 | | EUR | 1,240,000 | | | | 2,269 | | | | (38 | ) |
Put on 2-Year Interest Rate Swap(5) | | | | Barclays Bank PLC | | Receive | | –0.050% | | 6-month EUR-EURIBOR | | 07/02/21 | | EUR | 1,180,000 | | | | 2,489 | | | | (36 | ) |
Put on 2-Year Interest Rate Swap(5) | | | | Barclays Bank PLC | | Receive | | –0.150% | | 6-month EUR-EURIBOR | | 08/09/21 | | EUR | 1,570,000 | | | | 2,128 | | | | (139 | ) |
Put on 2-Year Interest Rate Swap(5) | | | | Barclays Bank PLC | | Receive | | –0.150% | | 6-month EUR-EURIBOR | | 08/09/21 | | EUR | 2,780,000 | | | | 3,847 | | | | (246 | ) |
Put on 2-Year Interest Rate Swap(5) | | | | Barclays Bank PLC | | Receive | | –0.250% | | 6-month EUR-EURIBOR | | 09/03/21 | | EUR | 5,030,000 | | | | 8,276 | | | | (963 | ) |
Put on 5-Year Interest Rate Swap(5) | | | | Barclays Bank PLC | | Receive | | –0.020% | | 6-month EUR-EURIBOR | | 04/07/22 | | EUR | 1,340,000 | | | | 17,169 | | | | (2,044 | ) |
Put on 5-Year Interest Rate Swap(5) | | | | Barclays Bank PLC | | Receive | | –0.035% | | 6-month EUR-EURIBOR | | 09/13/22 | | EUR | 600,000 | | | | 9,338 | | | | (2,119 | ) |
Put on 5-Year Interest Rate Swap(5) | | | | Barclays Bank PLC | | Receive | | –0.115% | | 6-month EUR-EURIBOR | | 04/04/22 | | EUR | 1,160,000 | | | | 14,671 | | | | (3,087 | ) |
Put on 5-Year Interest Rate Swap(5) | | | | Barclays Bank PLC | | Receive | | –0.138% | | 6-month EUR-EURIBOR | | 09/12/22 | | EUR | 600,000 | | | | 9,029 | | | | (2,894 | ) |
Put on 5-Year Interest Rate Swap(1) | | | | Deutsche Bank AG | | Receive | | 0.478% | | 3-month USD-LIBOR | | 01/19/21 | | USD | 1,280,000 | | | | 3,302 | | | | (949 | ) |
Put on 5-Year Interest Rate Swap(1) | | | | Deutsche Bank AG | | Receive | | 0.600% | | 3-month USD-LIBOR | | 09/03/21 | | USD | 1,700,000 | | | | 8,670 | | | | (9,555 | ) |
| | | | | | | | | | | | | | | | | | | $ | 1,483,290 | | | $ | (1,187,487 | ) |
At December 31, 2020, the following OTC purchased interest rate caps were outstanding for VY® BlackRock Inflation Protected Bond Portfolio:
| Description | | | | Counterparty | | Exercise Rate | | Pay/Receive
Exercise
Rate | | Expiration
Date | | Notional
Amount | | Cost | | | Fair Value | |
|---|
| Call Option-Max [0, 5-Year Constant Maturity Swap)-Exercise Rate] | | | | Citibank N.A. | | 0.300% | | Pay | | 02/14/22 | | USD 17,550,000 | | $ | 30,883 | | | $ | 106,572 | |
| | | | | | | | | | | | | | | $ | 30,883 | | | $ | 106,572 | |
At December 31, 2020, the following over-the-counter written inflation rate caps were outstanding for VY® BlackRock Inflation Protected Bond Portfolio:
| Reference Entity | | | | Counterparty | | Exercise
Inflation Rate | | Description | | | Expiration
Date | | | Notional Amount | | | Premiums
Received | | | Fair
Value |
|---|
| Call | | | | Citibank N.A. | | 0.550% | | Call Option-Max [0, 5-Year Constant
Maturity Swap)-Exercise Rate] | | | 02/14/22 | | | USD | 8,775,000 | | | $ | 7,459 | | | $ | (34,093 | ) |
| Call | | | | Citibank N.A. | | 0.550% | | Call Option-Max [0, 5-Year Constant
Maturity Swap)-Exercise Rate] | | | 02/14/22 | | | USD | 8,775,000 | | | | 9,038 | | | | (34,093 | ) |
| | | | | | | | | | | | | | | | | | | $ | 16,497 | | | $ | (68,186 | ) |
(1) | | Portfolio receives the exercise rate semi-annually and pays the floating rate index quarterly. |
(2) | | Portfolio receives the exercise rate semi-annually and pays the floating rate index semi-annually. |
(3) | | Portfolio pays the exercise rate semi-annually and receives the floating rate index semi-annually. |
(4) | | Portfolio pays the exercise rate semi-annually and receives the floating rate index quarterly. |
(5) | | Portfolio receives the exercise rate annually and pays the floating rate index semi-annually. |
See Accompanying Notes to Financial Statements
43
VY® BLACKROCK INFLATION
PROTECTED BOND PORTFOLIO | SUMMARY PORTFOLIO OF INVESTMENTS
AS OF DECEMBER 31, 2020 (CONTINUED) |
| | |
Currency Abbreviations
CAD — Canadian Dollar
CNH — Chinese Offshore Yuan
EUR — EU Euro
GBP — British Pound
JPY — Japanese Yen
NZD — New Zealand Dollar
USD — United States Dollar
A summary of derivative instruments by primary risk exposure is outlined in the following tables.
The fair value of derivative instruments as of December 31, 2020 was as follows:
Derivatives not accounted for as
hedging instruments | | Location on Statement
of Assets and Liabilities | | Fair Value | |
|---|
Asset Derivatives | | | | | | | | |
| Interest rate contracts | | Investments in securities at value* | | $ | 1,018,632 | |
| Foreign exchange contracts | | Unrealized appreciation on forward foreign currency contracts | | | 4,043 | |
| Interest rate contracts | | Net Assets — Unrealized appreciation** | | | 99,370 | |
| Interest rate contracts | | Net Assets — Unrealized appreciation*** | | | 4,273,102 | |
| Interest rate contracts | | Unrealized appreciation on OTC swap agreements | | | 760,867 | |
Total Asset Derivatives | | | | $ | 6,156,014 | |
Liability Derivatives | | | | | | |
| Foreign exchange contracts | | Unrealized depreciation on forward foreign currency contracts | | $ | 241,343 | |
| Interest rate contracts | | Net Assets — Unrealized depreciation** | | | 37,135 | |
| Interest rate contracts | | Net Assets — Unrealized depreciation*** | | | 3,091,607 | |
| Interest rate contracts | | Unrealized depreciation on OTC swap agreements | | | 461 | |
| Interest rate contracts | | Written options, at fair value | | | 1,314,217 | |
Total Liability Derivatives | | | | $ | 4,684,763 | |
| * | | Includes purchased options. |
| | | |
| ** | | Includes cumulative appreciation/depreciation of futures contracts as reported in the table within the Portfolio of Investments. |
| | | |
| *** | | Includes cumulative appreciation/depreciation of centrally cleared swaps as reported in the table within the Portfolio of Investments. Only current day’s variation margin receivable/payable is shown on the Statement of Assets and Liabiliites. |
The effect of derivative instruments on the Portfolio’s Statement of Operations for the year ended December 31, 2020 was as follows:
| | Amount of Realized Gain or (Loss) on Derivatives Recognized in Income |
Derivatives not accounted for as
hedging instruments | | Investments* | | Forward foreign
currency contracts | | Futures | | Swaps | | Written
options | | Total |
| Foreign exchange contracts | | | $ | 107,595 | | | | $ | (1,053,595 | ) | | | $ | — | | | | $ | — | | | | $ | 27,379 | | | | $ | (918,621 | ) |
| Interest rate contracts | | | | (375,766 | ) | | | | — | | | | | 909,161 | | | | | (800,441 | ) | | | | 766,006 | | | | | 498,960 | |
Total | | | $ | (268,171 | ) | | | $ | (1,053,595 | ) | | | $ | 909,161 | | | | $ | (800,441 | ) | | | $ | 793,385 | | | | $ | (419,661 | ) |
| | Change in Unrealized Appreciation or (Depreciation) on Derivatives Recognized in Income |
Derivatives not accounted for
as hedging instruments | | Investments* | | Forward foreign
currency contracts | | Futures | | Swaps | | Written
options | | Total |
| Foreign exchange contracts | | | $ | 16,346 | | | | $ | 20,127 | | | | $ | — | | | | $ | — | | | | $ | 3,699 | | | | $ | 40,172 | |
| Interest rate contracts | | | | (8,968 | ) | | | | — | | | | | 223,237 | | | | | 1,534,471 | | | | | (254,361 | ) | | | | 1,494,379 | |
Total | | | $ | 7,378 | | | | $ | 20,127 | | | | $ | 223,237 | | | | $ | 1,534,471 | | | | $ | (250,662 | ) | | | $ | 1,534,551 | |
| * | | Amounts recognized for purchased options are included in net realized gain (loss) on investments and net change in unrealized appreciation or depreciation on investments. |
See Accompanying Notes to Financial Statements
44
VY® BLACKROCK INFLATION
PROTECTED BOND PORTFOLIO | SUMMARY PORTFOLIO OF INVESTMENTS
AS OF DECEMBER 31, 2020 (CONTINUED) |
| | |
The following is a summary by counterparty of the fair value of OTC derivative instruments subject to Master Netting Agreements and collateral pledged (received), if any, at December 31, 2020:
| | | Barclays
Bank
PLC | | BNP
Paribas | | Citibank
N.A. | | Commonwealth
Bank of
Australia | | Deutsche
Bank AG | | Goldman
Sachs
International | | JPMorgan
Chase
Bank N.A. | | Morgan Stanley
& Co.
International PLC | | UBS
AG | | Totals |
Assets: | | | | | | | | | | | | | | | | | | | | | | | | | | | | | | | | | | | | | | | | | | | | | | | | | | |
| Purchased options | | | $ | 483,926 | | | | $ | — | | | | $ | 248,512 | | | | $ | — | | | | $ | 63,452 | | | | $ | 26,599 | | | | $ | 114,681 | | | | $ | 59,175 | | | | $ | — | | | | $ | 996,345 | |
| Forward foreign currency contracts | | | | — | | | | | — | | | | | 195 | | | | | — | | | | | — | | | | | — | | | | | — | | | | | — | | | | | 3,848 | | | | | 4,043 | |
| OTC Interest rate swaps | | | | — | | | | | — | | | | | 760,867 | | | | | — | | | | | — | | | | | — | | | | | — | | | | | — | | | | | — | | | | | 760,867 | |
Total Assets | | | $ | 483,926 | | | | $ | — | | | | $ | 1,009,574 | | | | | | | | | $ | 63,452 | | | | $ | 26,599 | | | | $ | 114,681 | | | | $ | 59,175 | | | | $ | 3,848 | | | | $ | 1,761,255 | |
Liabilities: | | | | | | | | | | | | | | | | | | | | | | | | | | | | | | | | | | | | | | | | | | | | | | | | | | |
| Forward foreign currency contracts | | | $ | — | | | | $ | — | | | | $ | 753 | | | | $ | 290 | | | | $ | 35,449 | | | | $ | 53,701 | | | | $ | — | | | | $ | — | | | | $ | 151,150 | | | | | 241,343 | |
| OTC Interest rate swaps | | | | — | | | | | — | | | | | 461 | | | | | — | | | | | — | | | | | — | | | | | — | | | | | — | | | | | — | | | | | 461 | |
| Written options | | | | 564,634 | | | | | 22,435 | | | | | 108,848 | | | | | | | | | | 230,537 | | | | | 96,200 | | | | | 151,402 | | | | | 81,617 | | | | | | | | | | 1,255,673 | |
Total Liabilities | | | $ | 564,634 | | | | $ | 22,435 | | | | $ | 110,062 | | | | $ | 290 | | | | $ | 265,986 | | | | $ | 149,901 | | | | $ | 151,402 | | | | $ | 81,617 | | | | $ | 151,150 | | | | $ | 1,497,477 | |
Net OTC derivative instruments by counterparty, at fair value | | | $ | (80,708 | ) | | | $ | (22,435 | ) | | | $ | 899,512 | | | | $ | (290 | ) | | | $ | (202,534 | ) | | | $ | (123,302 | ) | | | $ | (36,721 | ) | | | $ | (22,442 | ) | | | $ | (147,302 | ) | | | $ | 263,778 | |
Total collateral pledged by the Portfolio/(Received from counterparty) | | | $ | — | | | | $ | 22,435 | | | | $ | (899,512 | ) | | | $ | — | | | | $ | 190,000 | | | | $ | 50,000 | | | | $ | — | | | | $ | 22,442 | | | | $ | — | | | | $ | (614,635 | ) |
Net Exposure(1)(2) | | | $ | (80,708 | ) | | | $ | — | | | | $ | — | | | | $ | (290 | ) | | | $ | (12,534 | ) | | | $ | (73,302 | ) | | | $ | (36,721 | ) | | | $ | — | | | | $ | (147,302 | ) | | | $ | (350,857 | ) |
(1) | | Positive net exposure represents amounts due from each respective counterparty. Negative exposure represents amounts due from the Portfolio. Please refer to Note 2 for additional details regarding counterparty credit risk and credit related contingent features. |
(2) | | At December 31, 2020, the Portfolio had pledged $30,000 and $30,000, respectively, in cash collateral to BNP Paribas and Morgan Stanley & Co. International PLC, respectively. In addition, the Portfolio had received $910,000 in cash collateral from Citibank N.A.. Excess cash collateral is not shown for financial reporting purposes. |
At December 31, 2020, the aggregate cost of securities and other investments and the composition of unrealized appreciation and depreciation of securities and other investments on a tax basis were:
| Cost for federal income tax purposes was $267,287,254. | | | | | | |
| | | | | | | |
| Net unrealized appreciation consisted of: | | | | | | |
| Gross Unrealized Appreciation | | | | $ | 31,777,049 | |
| Gross Unrealized Depreciation | | | | | (4,383,099 | ) |
| Net Unrealized Appreciation | | | | $ | 27,393,950 | |
See Accompanying Notes to Financial Statements
45
VY® BrandywineGLOBAL —
Bond Portfolio | SUMMARY PORTFOLIO OF INVESTMENTS
AS OF DECEMBER 31, 2020 |
Principal
Amount† | | | | | | | Value | | | | Percentage
of Net
Assets | |
|---|
| | | | | | | | | | | | | |
|---|
CORPORATE BONDS/NOTES: 54.9% | |
| | | | | |
| 7,005,000 | | | | Freeport-McMoRan, Inc., 5.450%, 03/15/2043 | | $ | 8,734,254 | | | | 2.7 | |
| 2,895,000 | | | | Steel Dynamics, Inc., 3.250%, 10/15/2050 | | | 3,029,528 | | | | 1.0 | |
| | | | | | | | 11,763,782 | | | | 3.7 | |
| | | | | | | | | | | | | |
| | |
| 780,000 | | | | Walt Disney Co/The, 4.625%, 03/23/2040 | | | 1,042,437 | | | | 0.3 | |
| 1,370,000 | | | | Walt Disney Co/The, 4.700%, 03/23/2050 | | | 1,935,158 | | | | 0.6 | |
| | | | | | | | 2,977,595 | | | | 0.9 | |
| | | | | | | | | | | | | |
| | |
| 3,010,000 | | (1) | | Delta Air Lines, Inc. / SkyMiles IP Ltd., 4.750%, 10/20/2028 | | | 3,287,893 | | | | 1.0 | |
| 1,070,000 | | (1) | | Delta Air Lines, Inc., 7.000%, 05/01/2025 | | | 1,236,082 | | | | 0.4 | |
| 1,400,000 | | | | General Motors Co., 6.250%, 10/02/2043 | | | 1,888,625 | | | | 0.6 | |
| 920,000 | | | | General Motors Co., 6.800%, 10/01/2027 | | | 1,183,152 | | | | 0.4 | |
| 4,395,000 | | | | General Motors Financial Co., Inc., 1.285%, (SOFRRATE + 1.200%), 11/17/2023 | | | 4,405,665 | | | | 1.4 | |
| 6,050,000 | | | | Marriott International, Inc./MD, 3.500%,
10/15/2032 | | | 6,631,186 | | | | 2.1 | |
| 2,610,000 | | | | Southwest Airlines Co., 5.125%, 06/15/2027 | | | 3,107,114 | | | | 1.0 | |
| 3,015,000 | | | | Walgreens Boots Alliance, Inc., 4.100%, 04/15/2050 | | | 3,202,971 | | | | 1.0 | |
| 2,636,000 | | | | Walgreens Boots Alliance, Inc., 4.650%, 06/01/2046 | | | 2,945,495 | | | | 0.9 | |
| | | | | | | | 27,888,183 | | | | 8.8 | |
| | | | | | | | | | | | | |
| | Consumer, Non-cyclical: 3.2% |
| 7,585,000 | | | | Anheuser-Busch InBev Worldwide, Inc., 5.450%, 01/23/2039 | | | 10,253,215 | | | | 3.2 | |
| | | | | | | | | | | | | |
| | |
| 3,925,000 | | | | Apache Corp., 4.250%, 01/15/2044 | | | 3,882,335 | | | | 1.2 | |
| 2,570,000 | | | | Concho Resources, Inc., 4.875%, 10/01/2047 | | | 3,481,119 | | | | 1.1 | |
| 1,165,000 | | | | Devon Energy Corp., 4.750%–5.600%,
07/15/2041–06/15/2045 | | | 1,392,470 | | | | 0.4 | |
| 1,460,000 | | | | Exxon Mobil Corp., 3.452%, 04/15/2051 | | | 1,668,711 | | | | 0.5 | |
| 5,465,000 | | | | Hess Corp., 5.600%, 02/15/2041 | | | 6,669,477 | | | | 2.1 | |
| 5,710,000 | | | | Marathon Oil Corp., 6.600%, 10/01/2037 | | | 7,053,940 | | | | 2.2 | |
| 3,905,000 | | | | Occidental Petroleum Corp., 3.500%,
08/15/2029 | | | 3,579,987 | | | | 1.1 | |
| 720,000 | | | | Petroleos Mexicanos, 6.750%, 09/21/2047 | | | 676,156 | | | | 0.2 | |
| 6,160,000 | | | | Petroleos Mexicanos, 7.690%, 01/23/2050 | | | 6,221,600 | | | | 2.0 | |
Principal
Amount† | | | | | | | Value | | | | Percentage
of Net
Assets | |
|---|
| | | | | | | | | | | | | |
CORPORATE BONDS/NOTES: (continued) | |
| | |
| 1,825,000 | | (1) | | Saudi Arabian Oil Co., 3.250%, 11/24/2050 | | $ | 1,850,764 | | | | 0.6 | |
| 1,960,000 | | | | Total Capital International SA, 3.127%, 05/29/2050 | | | 2,126,335 | | | | 0.7 | |
| | | | | | | | 38,602,894 | | | | 12.1 | |
| | | | | | | | | | | | | |
| | |
| 2,880,000 | | (2) | | Bank of America Corp., 4.083%, 03/20/2051 | | | 3,641,217 | | | | 1.2 | |
| 5,380,000 | | | | Bank of Montreal, 0.768%, (SOFRRATE + 0.680%), 03/10/2023 | | | 5,427,996 | | | | 1.7 | |
| 7,100,000 | | | | Bank of Nova Scotia/The, 0.639%, (SOFRRATE + 0.550%), 09/15/2023 | | | 7,145,851 | | | | 2.3 | |
| 5,095,000 | | | | Canadian Imperial Bank of Commerce, 0.889%, (SOFRRATE + 0.800%), 03/17/2023 | | | 5,144,278 | | | | 1.6 | |
| 410,000 | | | | Intercontinental Exchange, Inc., 3.000%, 06/15/2050 | | | 434,114 | | | | 0.1 | |
| 6,425,000 | | (2) | | JPMorgan Chase & Co., 4.493%, 03/24/2031 | | | 7,911,767 | | | | 2.5 | |
| 3,300,000 | | (1) | | Metropolitan Life Global Funding I, 0.655%, (SOFRRATE + 0.570%), 01/13/2023 | | | 3,317,855 | | | | 1.0 | |
| 1,440,000 | | (1) | | Teachers Insurance & Annuity Association of America, 3.300%,
05/15/2050 | | | 1,569,279 | | | | 0.5 | |
| 2,930,000 | | | | Wells Fargo & Co., 1.240%, (US0003M + 1.025%), 07/26/2021 | | | 2,946,023 | | | | 0.9 | |
| | | | | | | | 37,538,380 | | | | 11.8 | |
| | | | | | | | | | | | | |
| | |
| 1,230,000 | | | | Boeing Co/The, 3.950%, 08/01/2059 | | | 1,316,486 | | | | 0.4 | |
| 800,000 | | | | Boeing Co/The, 5.705%, 05/01/2040 | | | 1,036,427 | | | | 0.3 | |
| 2,065,000 | | | | Boeing Co/The, 5.805%, 05/01/2050 | | | 2,852,756 | | | | 0.9 | |
| 1,225,000 | | | | Boeing Co/The, 5.930%, 05/01/2060 | | | 1,737,862 | | | | 0.6 | |
| 5,220,000 | | | | General Electric Co., 4.350%, 05/01/2050 | | | 6,348,585 | | | | 2.0 | |
| 2,085,000 | | | | Valmont Industries, Inc., 5.000%, 10/01/2044 | | | 2,419,714 | | | | 0.7 | |
| | | | | | | | 15,711,830 | | | | 4.9 | |
| | | | | | | | | | | | | |
| | |
| 5,360,000 | | (1) | | Dell International LLC / EMC Corp., 5.300%, 10/01/2029 | | | 6,568,869 | | | | 2.1 | |
| 160,000 | | | | Hewlett Packard Enterprise Co., 6.200%, 10/15/2035 | | | 206,731 | | | | 0.1 | |
| 1,920,000 | | | | Hewlett Packard Enterprise Co., 6.350%, 10/15/2045 | | | 2,530,801 | | | | 0.8 | |
| 6,105,000 | | | | International Business Machines Corp., 4.250%, 05/15/2049 | | | 8,017,058 | | | | 2.5 | |
See Accompanying Notes to Financial Statements
46
VY® BrandywineGLOBAL —
Bond Portfolio | SUMMARY PORTFOLIO OF INVESTMENTS
AS OF DECEMBER 31, 2020 (CONTINUED) |
Principal
Amount† | | | | | | | Value | | | | Percentage
of Net
Assets | |
|---|
| | | | | | | | | | | | | |
CORPORATE BONDS/NOTES: (continued) |
| | Technology: (continued) |
| 2,700,000 | | | | Oracle Corp., 3.600%, 04/01/2050 | | $ | 3,153,249 | | | | 1.0 | |
| 1,730,000 | | | | Oracle Corp., 3.850%, 04/01/2060 | | | 2,127,528 | | | | 0.6 | |
| | | | | | | | 22,604,236 | | | | 7.1 | |
| | | | | | | | | | | | | |
| | |
| 2,515,000 | | (1) | | AES Corp./The, 3.950%, 07/15/2030 | | | 2,847,697 | | | | 0.9 | |
| 2,530,000 | | (1) | | AES Panama Generation Holdings SRL, 4.375%, 05/31/2030 | | | 2,740,369 | | | | 0.9 | |
| 1,680,000 | | | | Consolidated Edison Co. of New York, Inc., 3.350%, 04/01/2030 | | | 1,927,177 | | | | 0.6 | |
| | | | | | | | 7,515,243 | | | | 2.4 | |
| | | | | | | | | | | | | |
| | | | | Total Corporate Bonds/Notes
(Cost $157,093,109) | | | 174,855,358 | | | | 54.9 | |
| | | | | | | | | | | | | |
COLLATERALIZED MORTGAGE OBLIGATIONS: 1.5% |
| 1,584,844 | | (1),(2) | | Angel Oak Mortgage Trust 2019-6 A1, 2.620%, 11/25/2059 | | | 1,610,444 | | | | 0.5 | |
| 850,652 | | (1),(2) | | Angel Oak Mortgage Trust I LLC 2019-2 A1, 3.628%, 03/25/2049 | | | 872,070 | | | | 0.3 | |
| 2,167,154 | | (1),(2) | | Residential Mortgage Loan Trust 2019-3 A1, 2.633%, 09/25/2059 | | | 2,208,048 | | | | 0.7 | |
| | | | | | | | | | | | | |
| | | | | Total Collateralized Mortgage Obligations
(Cost $4,543,050) | | | 4,690,562 | | | | 1.5 | |
| | | | | | | | | | | | | |
U.S. TREASURY OBLIGATIONS: 28.1% |
| | U.S. Treasury Floating Rate Notes: 28.1% |
| 31,520,000 | | | | 0.150%, (USBMMY3M + 0.055%),07/31/2022 | | | 31,523,763 | | | | 9.9 | |
| 21,755,000 | | | | 0.150%, (USBMMY3M + 0.055%),10/31/2022 | | | 21,754,949 | | | | 6.8 | |
| 36,350,000 | | | | 0.209%, (USBMMY3M + 0.114%),04/30/2022 | | | 36,383,591 | | | | 11.4 | |
| | | | | | | | | | | | | |
| | | | | Total U.S. Treasury Obligations
(Cost $89,663,884) | | | 89,662,303 | | | | 28.1 | |
| | | | | | | | | | | | | |
U.S. GOVERNMENT AGENCY OBLIGATIONS: 5.4% |
| | Federal Home Loan Bank: 3.1% |
| 9,800,000 | | | | 1.875%,07/07/2021 | | | 9,889,172 | | | | 3.1 | |
| | | | | | | | | | | | | |
| Federal Home Loan Mortgage Corporation: 2.3% |
| 7,300,000 | | | | 1.125%,08/12/2021 | | | 7,345,260 | | | | 2.3 | |
| | | | | | | | | | | | | |
| | | | | Total U.S. Government Agency Obligations
(Cost $17,096,378) | | | 17,234,432 | | | | 5.4 | |
| | | | | | | | | | | | | |
COMMERCIAL MORTGAGE-BACKED SECURITIES: 3.5% |
| 1,520,000 | | (1) | | Credit Suisse Mortgage Capital Certificates 2019-ICE4 A, 1.139%, (US0001M + 0.980%), 05/15/2036 | | | 1,525,083 | | | | 0.5 | |
| | | | | | | | | | | | | |
COMMERCIAL MORTGAGE-BACKED SECURITIES: (continued) |
| 9,370,000 | | (1),(2) | | FREMF 2012-K23 B Mortgage Trust, 3.656%, 10/25/2045 | | $ | 9,763,752 | | | | 3.0 | |
| | | | | | | | | | | | | |
| | | | | Total Commercial Mortgage-Backed Securities
(Cost $11,125,116) | | | 11,288,835 | | | | 3.5 | |
| | | | | | | | | | | | | |
ASSET-BACKED SECURITIES: 0.3% |
| | Other Asset-Backed Securities: 0.3% |
| 720,000 | | (1),(2) | | Towd Point Mortgage Trust 2018-3 A2, 3.875%, 05/25/2058 | | | 794,918 | | | | 0.3 | |
| | | | | | | | | | | | | |
| | | | | Total Asset-Backed Securities
(Cost $695,904) | | | 794,918 | | | | 0.3 | |
| | | | | | | | | | | | | |
| | | | | Total Long-Term Investments
(Cost $280,217,441) | | | 298,526,408 | | | | 93.7 | |
| Shares | | | | | | | Value | | | | Percentage
of Net
Assets | |
|---|
| | | | | | | | | | | | | |
SHORT-TERM INVESTMENTS: 0.6% |
| | Mutual Funds: 0.6% |
| 1,927,459 | | (3) | | BlackRock Liquidity Funds, FedFund, Institutional Class, 0.000%
(Cost $1,927,459) | | | 1,927,459 | | | | 0.6 | |
| | | | | | | | | | | | | |
| | | | | Total Short-Term Investments
(Cost $1,927,459) | | | 1,927,459 | | | | 0.6 | |
| | | | | | | | | | | | | |
| | | | | Total Investments in Securities
(Cost $282,144,900) | | $ | 300,453,867 | | | | 94.3 | |
| | | | | Assets in Excess of Other Liabilities | | | 18,211,505 | | | | 5.7 | |
| | | | | Net Assets | | $ | 318,665,372 | | | | 100.0 | |
| | “Other Securities” represents issues not identified as the top 50 holdings in terms of market value and issues or issuers not exceeding 1% of net assets individually or in aggregate respectively as of December 31, 2020.
The following footnotes apply to either the individual securities noted or one or more of the securities aggregated and listed as a single line item. |
| | | |
| † | | Unless otherwise indicated, principal amount is shown in USD. |
| | | |
| (1) | | Securities with purchases pursuant to Rule 144A or section 4(a)(2), under the Securities Act of 1933 and may not be resold subject to that rule except to qualified institutional buyers. |
| | | |
| (2) | | Variable rate security. Rate shown is the rate in effect as of December 31, 2020. |
| | | |
| (3) | | Rate shown is the 7-day yield as of December 31, 2020. |
| | | |
Reference Rate Abbreviations:
| SOFRRATE | | Secured Overnight Financing Rate |
| US0001M | | 1-month LIBOR |
| US0003M | | 3-month LIBOR |
| USBMMY3M | | U.S. Treasury 3-month Bill Money Market Yield |
See Accompanying Notes to Financial Statements
47
VY® BrandywineGLOBAL —
Bond Portfolio | SUMMARY PORTFOLIO OF INVESTMENTS
AS OF DECEMBER 31, 2020 (CONTINUED) |
Fair Value Measurementsˆ
The following is a summary of the fair valuations according to the inputs used as of December 31, 2020 in valuing the assets and liabilities:
| | Quoted Prices
in Active Markets
for Identical
Investments
(Level 1) | | Significant
Other
Observable
Inputs
(Level 2) | | Significant
Unobservable
Inputs
(Level 3) | | Fair Value
at
December 31, 2020 |
|---|
Asset Table | | | | | | | | | | | | | | | | | | | | |
Investments, at fair value | | | | | | | | | | | | | | | | | | | | |
| Corporate Bonds/Notes | | | $ | — | | | | $ | 174,855,358 | | | | $ | — | | | | $ | 174,855,358 | |
| Collateralized Mortgage Obligations | | | | — | | | | | 4,690,562 | | | | | — | | | | | 4,690,562 | |
| Commercial Mortgage-Backed Securities | | | | — | | | | | 11,288,835 | | | | | — | | | | | 11,288,835 | |
| U.S. Government Agency Obligations | | | | — | | | | | 17,234,432 | | | | | — | | | | | 17,234,432 | |
| Asset-Backed Securities | | | | — | | | | | 794,918 | | | | | — | | | | | 794,918 | |
| U.S. Treasury Obligations | | | | — | | | | | 89,662,303 | | | | | — | | | | | 89,662,303 | |
| Short-Term Investments | | | | 1,927,459 | | | | | — | | | �� | | — | | | | | 1,927,459 | |
| Total Investments, at fair value | | | $ | 1,927,459 | | | | $ | 298,526,408 | | | | $ | — | | | | $ | 300,453,867 | |
Other Financial Instruments+ | | | | | | | | | | | | | | | | | | | | |
| Futures | | | | 378,359 | | | | | — | | | | | — | | | | | 378,359 | |
| Total Assets | | | $ | 2,305,818 | | | | $ | 298,526,408 | | | | $ | — | | | | $ | 300,832,226 | |
| ˆ | | See Note 2, “Significant Accounting Policies” in the Notes to Financial Statements for additional information. |
| | | |
| + | | Other Financial Instruments may include open forward foreign currency contracts, futures, centrally cleared swaps, OTC swaps and written options. Forward foreign currency contracts, futures and centrally cleared swaps are fair valued at the unrealized appreciation (depreciation) on the instrument. OTC swaps and written options are valued at the fair value of the instrument. |
At December 31, 2020, the following futures contracts were outstanding for VY® BrandywineGLOBAL- Bond Portfolio:
| Description | | Number
of Contracts | | Expiration
Date | | Notional
Amount | | Unrealized
Appreciation/
(Depreciation) |
|---|
Short Contracts: | | | | | | | | | | | | | | | | | | |
| U.S. Treasury Ultra Long Bond | | | (263) | | | | 03/22/21 | | | | $ | (56,166,938 | ) | | | $ | 378,359 | |
| | | | | | | | | | | | $ | (56,166,938 | ) | | | $ | 378,359 | |
A summary of derivative instruments by primary risk exposure is outlined in the following tables.
The fair value of derivative instruments as of December 31, 2020 was as follows:
Derivatives not accounted for as
hedging instruments | | Location on Statement
of Assets and Liabilities | | Fair Value |
|---|
Asset Derivatives | | | | | | | |
| Interest rate contracts | | Net Assets- Unrealized appreciation* | | | $ | 378,359 | |
Total Asset Derivatives | | | | | $ | 378,359 | |
| * | | Includes cumulative appreciation/depreciation of futures contracts as reported in the table within the Portfolio of Investments. |
The effect of derivative instruments on the Portfolio’s Statement of Operations for the year ended December 31, 2020 was as follows:
| | Amount of Realized Gain or (Loss)
on Derivatives Recognized in Income |
|---|
Derivatives not accounted for as
hedging instruments | | Futures |
|---|
| Interest rate contracts | | | | $1,715,341 | |
Total | | | | $1,715,341 | |
| | | | | | |
| | Change in Unrealized Appreciation or (Depreciation)
on Derivatives Recognized in Income |
|---|
Derivatives not accounted for
as hedging instruments | | Futures |
|---|
| Interest rate contracts | | | | $ 378,359 | |
Total | | | | $ 378,359 | |
See Accompanying Notes to Financial Statements
48
VY® BrandywineGLOBAL —
Bond Portfolio | SUMMARY PORTFOLIO OF INVESTMENTS
AS OF DECEMBER 31, 2020 (CONTINUED) |
At December 31, 2020, the aggregate cost of securities and other investments and the composition of unrealized appreciation and depreciation of securities and other investments on a tax basis were:
| Cost for federal income tax purposes was $282,523,259. | | | | |
| Net unrealized appreciation consisted of: | | | | |
| Gross Unrealized Appreciation | | $ | 18,339,270 | |
| Gross Unrealized Depreciation | | | (30,303 | ) |
| Net Unrealized Appreciation | | $ | 18,308,967 | |
See Accompanying Notes to Financial Statements
49
TAX INFORMATION (Unaudited)
Dividends and distributions paid during the year ended December 31, 2020 were as follows:
| Portfolio Name | | Type | | Per Share Amount |
|---|
VY® BlackRock Inflation Protected Bond Portfolio | | | | | | | | |
| Class ADV | | NII | | | $0.0803 | |
| Class I | | NII | | | $0.1256 | |
| Class S | | NII | | | $0.0987 | |
| All Classes | | ROC
| | | $0.0561 | |
VY® BrandywineGLOBAL — Bond Portfolio | | NII | | | $0.2137 | |
| | | STCG
| | | $0.0847 | |
NII — Net investment income
STCG — Short-term capital gain
ROC — Return of capital
Above figures may differ from those cited elsewhere in this report due to differences in the calculation of income and gains under U.S. generally accepted accounting principles (book) purposes and Internal Revenue Service (tax) purposes.
Shareholders are strongly advised to consult their own tax advisers with respect to the tax consequences of their investments in the Portfolios. In January, shareholders, excluding corporate shareholders, receive an IRS 1099-DIV regarding the federal tax status of the dividends and distributions they received in the calendar year.
50
TRUSTEE AND OFFICER INFORMATION (Unaudited)
The business and affairs of each Trust are managed under the direction of the Board. A Trustee, who is not an interested person of a Trust, as defined in the 1940 Act, is an independent trustee (“Independent Trustee”). The Trustees and Officers of each Trust are listed below. The Statement of Additional Information includes additional information about trustees of the Trust and is available, without charge, upon request at (800) 992-0180 for Voya Variable Insurance Trust (“VVIT”) and (800) 366-0066 for Voya Investors Trust (“VIT”).
| Name, Address and Age | | Position(s)
Held with
the Trust | | Term of Office
and Length of
Time Served(1) | | Principal
Occupation(s) —
During the Past 5 Years | | Number of
funds in
Fund
Complex
Overseen by
Trustee(2) | | Other Board
Positions
Held by
Trustee |
|---|
| | | | | | | | | | | |
Independent Trustees: | | | | | | | | |
| | | | | | | | | | | |
Colleen D. Baldwin
7337 East Doubletree Ranch Rd.
Suite 100
Scottsdale, Arizona 85258
Age: 60 | | Trustee
Chairperson | | November
2007–Present
January
2020–Present | | President, Glantuam Partners, LLC, a business consulting firm (January 2009– Present). | | 133 | | Dentaquest (February
2014–Present); RSR Partners, Inc. (2016–Present). |
| | | | | | | | | | | |
John V. Boyer
7337 East Doubletree Ranch Rd.
Suite 100
Scottsdale, Arizona 85258
Age: 67 | | Trustee | | January
2005–Present | | Retired. Formerly, President and Chief Executive Officer, Bechtler Arts Foundation, an arts and education foundation (January 2008– December 2019). | | 133 | | None. |
| | | | | | | | | | | |
Patricia W. Chadwick
7337 East Doubletree Ranch Rd.
Suite 100
Scottsdale, Arizona 85258
Age: 72 | | Trustee | | January
2006–Present | | Consultant and President, Ravengate Partners LLC, a consulting firm that provides advice regarding financial markets and the global economy (January
2000–Present). | | 133 | | Wisconsin Energy Corporation (June 2006–Present); The Royce Funds (22 funds) (December 2009–Present); and AMICA Mutual Insurance Company (1992–Present). |
| | | | | | | | | | | |
Martin J. Gavin
7337 East Doubletree Ranch Rd.
Suite 100
Scottsdale, AZ 85258
Age: 70 | | Trustee | | August
2015–Present | | Retired. Formerly, President and Chief Executive Officer, Connecticut Children’s Medical Center (May 2006–November 2015). | | 133 | | None. |
| | | | | | | | | | | |
Joseph E. Obermeyer
7337 East Doubletree Ranch Rd.
Suite 100
Scottsdale, Arizona 85258
Age: 63 | | Trustee | | May
2013–Present | | President, Obermeyer & Associates, Inc., a provider of financial and economic consulting services (November 1999–Present). | | 133 | | None. |
| | | | | | | | | | | |
Sheryl K. Pressler
7337 East Doubletree Ranch Rd.
Suite 100
Scottsdale, Arizona 85258
Age: 70 | | Trustee | | January
2006–Present | | Consultant (May
2001– Present). | | 133 | | None. |
| | | | | | | | | | | |
Christopher P. Sullivan
7337 East Doubletree Ranch Rd.
Suite 100
Scottsdale, Arizona 85258
Age: 67 | | Trustee | | October
2015–Present | | Retired. | | 133 | | None. |
51
TRUSTEE AND OFFICER INFORMATION (Unaudited) (continued)
| Name, Address and Age | | Position(s)
Held with
the Trust | | Term of Office
and Length of
Time Served(1) | | Principal
Occupation(s) —
During the Past 5 Years | | Number of
funds in
Fund
Complex
Overseen by
Trustee(2) | | Other Board
Positions
Held by
Trustee |
|---|
| | | | | | | | | | | |
Trustee who is an “interested person”: | | | | | | |
| | | | | | | | | | | |
Dina Santoro
230 Park Avenue
New York, New York 10169
Age: 47 | | Trustee | | July
2018–Present | | President, Voya Investments, LLC and Voya Capital, LLC (March 2018–Present); Senior Vice President, Voya Investments Distributor, LLC (April 2018–Present); Senior Managing Director, Head of Product and Marketing Strategy, Voya Investment Management (September
2017–Present). Formerly, Managing Director, Quantitative Management Associates, LLC (January
2004–August 2017). | | 133 | | Voya Investments, LLC, Voya Capital, LLC, and Voya Funds Services, LLC (March
2018–Present); Voya Investments Distributor, LLC (April 2018–Present). |
(1) | | Trustees serve until their successors are duly elected and qualified. The tenure of each Trustee who is not an “interested person” as defined in the 1940 Act, of each Portfolio (“Independent Trustee”) is subject to the Board’s retirement policy which states that each duly elected or appointed Independent Trustee shall retire from and cease to be a member of the Board of Trustees at the close of business on December 31 of the calendar year in which the Independent Trustee attains the age of 75. A majority vote of the Board’s other Independent Trustees may extend the retirement date of an Independent Trustee if the retirement would trigger a requirement to hold a meeting of shareholders of the Trust under applicable law, whether for the purposes of appointing a successor to the Independent Trustee or otherwise comply under applicable law, in which case the extension would apply until such time as the shareholder meeting can be held or is no longer required (as determined by a vote of a majority of the other Independent Trustees). |
| | | |
(2) | | For the purposes of this table, “Fund Complex” means the Voya family of funds including the following investment companies: Voya Asia Pacific High Dividend Equity Income Fund; Voya Balanced Portfolio, Inc.; Voya Emerging Markets High Dividend Equity Fund; Voya Equity Trust; Voya Funds Trust; Voya Global Advantage and Premium Opportunity Fund; Voya Global Equity Dividend and Premium Opportunity Fund; Voya Government Money Market Portfolio; Voya Infrastructure, Industrials and Materials Fund; Voya Intermediate Bond Portfolio; Voya International High Dividend Equity Income Fund; Voya Investors Trust; Voya Mutual Funds; Voya Natural Resources Equity Income Fund; Voya Partners, Inc.; Voya Senior Income Fund; Voya Separate Portfolios Trust; Voya Strategic Allocation Portfolios, Inc.; Voya Variable Funds; Voya Variable Insurance Trust; Voya Variable Portfolios, Inc.; and Voya Variable Products Trust. The number of funds in the Fund Complex is as of January 31, 2021. |
52
TRUSTEE AND OFFICER INFORMATION (Unaudited) (continued)
| Name, Address and Age | | Position(s) Held
With the Trust | | Term of Office
and Length of
Time Served(1) | | Principal Occupation(s) —
During the Past 5 Years |
|---|
| | | | | | | |
Michael Bell
One Orange Way
Windsor, Connecticut 06095
Age: 52 | | Chief Executive Officer | | March
2018–Present | | Chief Executive Officer and Director, Voya Investments, LLC, Voya Capital, LLC, and Voya Funds Services, LLC (March 2018–Present); Senior Vice President and Chief Financial Officer, Voya Investments Distributor, LLC (September 2019–Present); Chief Financial Officer, Voya Investment Management (September 2014–Present). Formerly, Senior Vice President, Chief Financial Officer and Treasurer, Voya Investments, LLC (November 2015–March 2018). |
| | | | | | | |
Dina Santoro
230 Park Avenue
New York, New York 10169
Age: 47 | | President | | March
2018–Present | | President and Director, Voya Investments, LLC and Voya Capital, LLC (March 2018–Present); Director, Voya Funds Services, LLC (March 2018–Present); Director and Senior Vice President, Voya Investments Distributor, LLC (April 2018–Present); Senior Managing Director, Head of Product and Marketing Strategy, Voya Investment Management (September 2017–Present). Formerly, Managing Director, Quantitative Management Associates, LLC (January 2004–August 2017). |
| | | | | | | |
Jonathan Nash
230 Park Avenue
New York, New York 10169
Age: 53 | | Executive Vice President
Chief Investment Risk Officer | | March 2020–Present
March 2020–Present | | Senior Vice President, Investment Risk Management, Voya Investment Management (March 2017–Present); Formerly, Consultant, DA Capital LLC (January 2016–March 2017); Managing Director, Enterprise Risk, American International Group (AIG) (September
2014–March 2015). |
| | | | | | | |
James M. Fink
5780 Powers Ferry Road NW
Atlanta, Georgia 30327
Age: 62 | | Executive Vice President | | March
2018–Present | | Managing Director, Voya Investments, LLC, Voya Capital, LLC, and Voya Funds Services, LLC (March 2018–Present); Senior Vice President, Voya Investments Distributor, LLC (April 2018–Present); Chief Administrative Officer, Voya Investment Management (September 2017–Present). Formerly, Managing Director, Operations, Voya Investment Management (March 1999–September 2017). |
| | | | | | | |
Kevin M. Gleason
7337 East Doubletree Ranch Rd.
Suite 100
Scottsdale, Arizona 85258
Age: 54 | | Chief Compliance Officer | | February
2012–Present | | Senior Vice President, Voya Investment Management and Chief Compliance Officer, Voya Family of Funds (February 2012–Present). |
| | | | | | | |
Todd Modic
7337 East Doubletree Ranch Rd.
Suite 100
Scottsdale, Arizona 85258
Age: 53 | | Senior Vice President, Chief/Principal Financial Officer and Assistant Secretary | | March
2005–Present | | President, Voya Funds Services, LLC (March 2018–Present) and Senior Vice President, Voya Investments, LLC (April 2005–Present). |
| | | | | | | |
Kimberly A. Anderson
7337 East Doubletree Ranch Rd.
Suite 100
Scottsdale, Arizona 85258
Age: 56 | | Senior Vice President | | November
2003–Present | | Senior Vice President, Voya Investments, LLC (September 2003–Present). |
| | | | | | | |
Micheline S. Faver
7337 East Doubletree Ranch Rd.
Suite 100
Scottsdale, Arizona 85258
Age: 43 | | Senior Vice President | | September
2020–Present | | Vice President, Head of Fund Compliance and Chief Compliance Officer, Voya Investments, LLC (June 2016–Present). Formerly, Vice President, Mutual Fund Compliance (March 2014–June 2016). |
| | | | | | | |
Robert Terris
5780 Powers Ferry Road NW
Atlanta, Georgia 30327
Age: 50 | | Senior Vice President | | May
2006–Present | | Senior Vice President, Voya Investments Distributor, LLC (April 2018–Present); Senior Vice President, Head of Investment Services, Voya Investments, LLC (April 2018–Present) and Voya Funds Services, LLC (March 2006–Present). Formerly, Senior Vice President, Head of Division Operations, Voya Investments, LLC (October 2015–April 2018). |
53
TRUSTEE AND OFFICER INFORMATION (Unaudited) (continued)
| Name, Address and Age | | Position(s) Held
With the Trust | | Term of Office
and Length of
Time Served(1) | | Principal Occupation(s) —
During the Past 5 Years |
|---|
| | | | | | | |
Fred Bedoya
7337 East Doubletree Ranch Rd.
Suite 100
Scottsdale, Arizona 85258
Age: 48 | | Vice President and Treasurer | | September
2012–Present | | Vice President, Voya Investments, LLC (October 2015–Present) and Voya Funds Services, LLC (July 2012–Present). |
| | | | | | | |
Maria M. Anderson
7337 East Doubletree Ranch Rd.
Suite 100
Scottsdale, Arizona 85258
Age: 62 | | Vice President | | September
2004–Present | | Vice President, Voya Investments, LLC (October 2015–Present) and Voya Funds Services, LLC (September 2004–Present). |
| | | | | | | |
Sara M. Donaldson
7337 East Doubletree Ranch Rd.
Suite 100
Scottsdale, Arizona 85258
Age: 61 | | Vice President | | September
2014–Present | | Vice President, Voya Investments, LLC (October 2015–Present). |
| | | | | | | |
Robyn L. Ichilov
7337 East Doubletree Ranch Rd.
Suite 100
Scottsdale, Arizona 85258
Age: 53 | | Vice President | | VIT: November 1999–Present
VVIT: October 2000–Present | | Vice President, Voya Funds Services, LLC (November 1995–Present) and Voya Investments, LLC (August 1997–Present). |
| | | | | | | |
Jason Kadavy
7337 East Doubletree Ranch Rd.
Suite 100
Scottsdale, Arizona 85258
Age: 44 | | Vice President | | September
2012–Present | | Vice President, Voya Investments, LLC (October 2015–Present) and Voya Funds Services, LLC (July 2007–Present). |
| | | | | | | |
Andrew K. Schlueter
7337 East Doubletree Ranch Rd. Suite 100
Scottsdale, Arizona 85258
Age: 44 | | Vice President | | March
2018–Present | | Vice President, Voya Investments Distributor, LLC (April 2018–Present); Vice President, Voya Investments, LLC and Voya Funds Services, LLC (March 2018–Present); Vice President, Head of Mutual Fund Operations, Voya Investment Management (February 2018–Present). Formerly, Vice President, Voya Investment Management (March 2014–February 2018). |
| | | | | | | |
Craig Wheeler
7337 East Doubletree Ranch Rd.
Suite 100
Scottsdale, Arizona 85258
Age: 51 | | Vice President | | May
2013–Present | | Vice President — Director of Tax, Voya Investments, LLC (October 2015–Present). |
| | | | | | | |
Monia Piacenti
One Orange Way
Windsor, Connecticut 06095
Age: 44 | | Anti-Money Laundering Officer | | June
2018–Present | | Anti-Money Laundering Officer, Voya Investments Distributor, LLC, Voya Investment Management and Voya Investment Management Trust Co. (June 2018–Present); Compliance Consultant, Voya Financial, Inc. (January 2019–Present). Formerly, Senior Compliance Officer, Voya Investment Management (December 2009–December 2018). |
| | | | | | | |
Joanne F. Osberg
7337 East Doubletree Ranch Rd.
Suite 100
Scottsdale, Arizona 85258
Age: 39 | | Secretary | | September
2020–Present | | Vice President and Senior Counsel, Voya Investment Management — Mutual Fund Legal Department (September 2020–Present). Formerly, Vice President, Counsel II, Voya Investment Management — Mutual Fund Legal Department (January 2013–September 2020). |
| | | | | | | |
Paul A. Caldarelli
7337 East Doubletree Ranch Rd.
Suite 100
Scottsdale, Arizona 85258
Age: 69 | | Assistant Secretary | | June
2010–Present | | Vice President and Senior Counsel, Voya Investment Management — Mutual Fund Legal Department (March 2010–Present). |
(1) | | The Officers hold office until the next annual meeting of the Board of Trustees and until their successors shall have been elected and qualified. |
54
ADVISORY AND SUB-ADVISORY CONTRACT APPROVAL DISCUSSION (Unaudited)
BOARD CONSIDERATION AND APPROVAL OF INVESTMENT MANAGEMENT CONTRACTS AND SUB-ADVISORY CONTRACTS
At a meeting held on November 19, 2020, the Boards of Trustees (“Board”) of Voya Investors Trust (“VIT”) and Voya Variable Insurance Trust (“VVIT”) (together, the “Trusts”), including a majority of the Board members who have no direct or indirect interest in the management, sub-advisory, and sub-sub-advisory contracts, and who are not “interested persons” of VY® BlackRock Inflation Protected Bond Portfolio, a series of VIT, and VY® BrandywineGLOBAL — Bond Portfolio, a series of VVIT, (together, the “Portfolios”), as such term is defined under the Investment Company Act of 1940, as amended (the “Independent Trustees”), considered and approved the renewal of the investment management contracts (the “Management Contracts”) between Voya Investments, LLC (the “Manager”) and the Trusts, on behalf of the Portfolios, the sub-advisory contracts (the “Sub-Advisory Contracts”) with BlackRock Financial Management, Inc. and Brandywine Global Investment Management, LLC, the respective sub-advisers to the Portfolios, as relevant (the “Sub-Advisers”), and the sub-sub-advisory contract (the “Sub-Sub-Advisory Contract,” and together with the Management Contracts and Sub-Advisory Contracts, the “Contracts”) with BlackRock International Limited (the “Sub-Sub-Adviser”) for an additional one year period ending November 30, 2021.
In addition to the Board meeting on November 19, 2020, the Independent Trustees also held meetings outside the presence of personnel representing the Manager, Sub-Advisers or Sub-Sub-Adviser (collectively, such persons are referred to herein as “management”) on October 8, 2020, and November 17, 2020. At those meetings the Board reviewed and considered materials related to the proposed continuance of the Contracts that they had requested and believed to be relevant to the renewal of the Contracts in light of their own business judgment and the legal advice furnished to them by K&L Gates LLP, their independent legal counsel. The Board also considered information furnished to it throughout the year at meetings of the Board and its committees, including information regarding performance, expenses, and other matters. While the Board considered the renewal of the management contracts, sub-advisory contracts, and sub-sub-advisory contracts for all of the applicable investment companies in the Voya family of funds at the same meetings, the Board considered each Voya fund’s investment management, sub-advisory, and sub-sub-advisory relationships separately.
The Board has established a Contracts Committee and Investment Review Committees (the “IRCs”), each of which includes only Independent Trustees as members.
The Contracts Committee meets several times throughout the year to provide oversight with respect to the management, sub-advisory, and sub-sub-advisory contracts approval and renewal process for each Voya fund, among other functions, and each IRC meets several times throughout the year with respect to each Voya fund that is assigned to that IRC to provide oversight regarding the investment performance of the sub-advisers and sub-sub-advisers, as well as the Manager’s role in monitoring the sub-advisers and sub-sub-advisers.
The Contracts Committee oversees, and annually recommends Board approval of updates to, a methodology guide for the Voya funds (“Methodology Guide”), which sets out a framework pursuant to which the Independent Trustees request, and management provides, certain information that the Independent Trustees deem to be important or potentially relevant. The Independent Trustees retain the services of an independent consultant with experience in the mutual fund industry to assist the Contracts Committee in developing and recommending to the Board: (1) a selected peer group of investment companies for each Portfolio (“Selected Peer Group”) based on that Portfolio’s particular attributes, such as fund type and size, fund category (as determined by Morningstar, Inc., an independent provider of mutual fund data (“Morningstar”)), sales channels and structure and the Portfolio share class being compared to the Selected Peer Group; and (2) updates to the Methodology Guide with respect to the content and format of various data prepared in connection with the renewal process, including, but not limited to, investment performance, fee structure, and expense information. In addition, the Independent Trustees periodically have retained an independent firm to test and verify the accuracy of certain information presented to the Board for a representative sample of the Voya funds.
The Manager, Sub-Advisers or the Sub-Sub-Adviser may not have been able to, or opted not to, provide information in response to certain information requests, in which case the Board conducted its evaluation of the firm based on information that was provided. In such cases, the Board determined that the omission of any such information was not material to its considerations. Additionally, the Board considered the impact of significant market volatility that occurred during and after the period for which information was requested in conducting its evaluation of the Manager, Sub-Advisers and the Sub-Sub-Adviser.
Provided below is an overview of certain material factors that the Board considered at its meetings regarding the renewal of the Contracts and the compensation to be paid thereunder. The Board members did not identify any particular information or factor that was most relevant to its consideration, and each Board member may have
55
ADVISORY AND SUB-ADVISORY CONTRACT APPROVAL DISCUSSION (Unaudited) (continued)
accorded different weight to the various factors in reaching his or her conclusions with respect to each Portfolio’s investment management, sub-advisory and, as applicable, sub-sub-advisory arrangements.
Nature, Extent and Quality of Services
The Manager oversees, subject to the authority of the Board, and is responsible for the provision of, all investment advisory and portfolio management services for the Portfolios, but may delegate certain of these responsibilities to one or more sub-advisers and their sub-sub-advisers, if any. In addition, the Manager provides administrative services reasonably necessary for the operation of the Portfolios as set forth in the Management Contracts, including oversight of the Portfolios’ operations and risk management and the oversight of their various other service providers.
The Board considered the “manager-of-managers” platform of the Voya funds that has been developed by the Manager pursuant to which the Manager selects, subject to the Board’s approval, sub-advisers and their sub-sub-advisers, if any, to provide day-to-day management services to all or a portion of each Voya fund. The Board recognized that the Manager is responsible for monitoring the investment program, performance, developments, ongoing operations, and compliance with applicable regulations and investment policies and restrictions of the Sub-Advisers and Sub-Sub-Adviser with respect to the Portfolios under this manager-of-managers arrangement. The Board also considered the techniques and resources that the Manager has developed to provide this ongoing oversight and due diligence with respect to the sub-advisers and sub-sub-advisers and to advocate or recommend, when it believes appropriate, changes in investment strategies or investment sub-advisers and sub-sub-advisers designed to assist in improving a Voya fund’s performance. In connection with the Manager’s performance of these duties, the Board considered that the Manager has developed an oversight process formulated by its Manager Research & Selection Group that reviews, among other matters, performance data, each Sub-Adviser’s and the Sub-Sub-Adviser’s management team, portfolio data and attribution analysis related to each Sub-Adviser and the Sub-Sub-Adviser through various means, including, but not limited to, in-person meetings, on-site or virtual visits, and telephonic meetings with the Sub-Advisers and the Sub-Sub-Adviser.
Further, the Board considered periodic compliance reports it receives from the Trusts’ Chief Compliance Officer evaluating whether the regulatory compliance systems and procedures of the Manager, Sub-Advisers and the Sub-Sub-Adviser are reasonably designed to ensure compliance with the federal securities laws and whether the investment policies and restrictions for each Portfolio
are consistently complied with, and other periodic reports covering related matters.
The Board considered the portfolio management team assigned by the Sub-Advisers and Sub-Sub-Adviser to the Portfolios and the level of resources committed to the Portfolios (and other relevant funds in the Voya funds) by the Manager, Sub-Advisers and the Sub-Sub-Adviser, and whether those resources are sufficient to provide high-quality services to the Portfolios.
Based on their deliberations and the materials presented to them, the Board concluded that the nature, extent and quality of the overall services provided by the Manager, each Sub-Adviser and the Sub-Sub-Adviser under the Contracts were appropriate.
Portfolio Performance
In assessing the investment management, sub-advisory, and sub-sub-advisory relationships, the Board placed emphasis on the investment returns of each Portfolio, including its investment performance over certain time periods compared to the Portfolio’s Morningstar category and primary benchmark, a broad-based securities market index identified in the Portfolio’s prospectus. The Board also considered information from the Manager Research & Selection Group and received reports summarizing a separate analysis of each Portfolio’s performance and risk, including risk-adjusted investment return information, from the Trust’s Chief Investment Risk Officer.
Economies of Scale
When evaluating the reasonableness of the management fee schedules, the Board considered whether economies of scale have been or likely will be realized by the Manager, the Sub-Advisers, and the Sub-Sub-Adviser as a Portfolio grows larger and the extent to which any such economies are shared with the Portfolio. In this regard, the Board noted the breakpoints in management fee schedules that will result in a lower management fee rate when a Portfolio achieves sufficient asset levels to receive a breakpoint discount. The Board also considered that, in addition to the management fee breakpoints, the Portfolios have fee waiver and expense reimbursement arrangements. The Board considered the extent to which economies of scale realized by the Manager, Sub-Advisers, or the Sub-Sub-Adviser could be shared with each Portfolio through such fee waivers, expense reimbursements or other expense reductions. In evaluating these matters, the Board also considered periodic management reports, Selected Peer Group comparisons, and industry information regarding economies of scale. In the case of sub-advisory fees or sub-sub-advisory fees, the Board considered that breakpoints, if any, would inure to the benefit of the Manager or relevant Sub-Adviser, respectively.
56
ADVISORY AND SUB-ADVISORY CONTRACT APPROVAL DISCUSSION (Unaudited) (continued)
Information Regarding Services, Performance, and Fee Schedules Offered to Other Clients
The Board considered comparative information regarding the nature of services, performance, and fee schedules offered by the Manager, Sub-Advisers and the Sub-Sub-Adviser to other clients with similar investment objectives, if applicable, including other registered investment companies and relevant institutional accounts. When the fee schedules offered to or the performance of such other clients differed materially from a Portfolio, the Board took into account the underlying rationale provided by the Manager, Sub-Advisers or the Sub-Sub-Adviser, as applicable, for these differences. For the non-Voya-affiliated Sub-Advisers and the Sub-Sub-Adviser, the Board viewed the information related to any material differences in the fee schedules as not being a key factor in its deliberations because of the arm’s-length nature of negotiations between the Manager and non-Voya-affiliated Sub-Advisers and the Sub-Sub-Adviser with respect to sub-advisory and sub-sub-advisory fee schedules, and that the Manager is responsible for paying the fees of the Sub-Advisers and that the applicable Sub-Adviser is responsible for paying the fees of the Sub-Sub-Adviser.
Fee Schedules, Profitability, and Fall-out Benefits
The Board reviewed and considered the contractual management fee schedule and net management fee rate payable by each Portfolio to the Manager compared to the Portfolio’s Selected Peer Group. The Board also considered the compensation payable by the Manager to each Sub-Adviser for sub-advisory services for each Portfolio, including the portion of the contractual and net management fee rates that are paid to each Sub-Adviser, as compared to the compensation paid to the Manager, and the contractual sub-sub-advisory fee schedule payable to the Sub-Sub-Adviser by the relevant Sub-Adviser. In this regard, the Board considered that the Sub-Sub-Adviser is compensated by the relevant Sub-Adviser and not the Manager. In addition, the Board considered the fee waivers, expense limitations, and recoupment arrangements that apply to the fees payable by the Portfolios, including whether the Manager intends to propose any changes thereto. For each Portfolio, the Board separately determined that the fees payable to the Manager and the fee schedule payable to each Sub-Adviser and Sub-Sub-Adviser are reasonable for the services that each performs, which were considered in light of the nature, extent and quality of the services that each has performed and is expected to perform.
For each Portfolio, the Board considered information on revenues, costs and profits or losses realized by the Manager related to its services to the Portfolio. In analyzing the profitability of the Manager and its affiliated service providers in connection with services they render to a
Portfolio, the Board took into account the sub-advisory fee rate payable by the Manager to each Sub-Adviser. The Board also considered the profitability of the Manager attributable to servicing each Portfolio both with and without taking into account the profitability of the distributor of the Portfolios and any revenue sharing payments made by the Manager and both before and after giving effect to any expenses incurred by the Manager in making payments to affiliated insurance companies. The Board did not request profitability data from the Sub-Advisers or Sub-Sub-Adviser, which are not affiliated with the Manager because the Board did not view this data as a key factor to its deliberations given the arm’s-length nature of the relationship between the Manager and these non-Voya-affiliated Sub-Advisers and Sub-Sub-Adviser with respect to the negotiation of sub-advisory and sub-sub-advisory fee schedules. In addition, the Board noted that non-Voya-affiliated sub-advisers or sub-sub-advisers may not account for their profits on an account-by-account basis and those that do typically employ different methodologies in connection with these calculations.
Although the Methodology Guide establishes a framework for profit calculation, the Board recognized that there is no uniform methodology within the asset management industry for determining profitability for this purpose. The Board also recognized that the use of different reasonable methodologies can give rise to dramatically different reported profit and loss results with respect to the Manager, as well as other industry participants with whom the profits of the Manager could be compared. In addition, the Board recognized that management’s calculations regarding its costs incurred in establishing the infrastructure necessary for the Portfolios’ operations may not be fully reflected in the expenses allocated to each Portfolio in determining profitability, and that the information presented may not portray all of the costs borne by the Manager or reflect all risks, including entrepreneurial, regulatory, legal and operational risks, associated with offering and managing a mutual fund complex in the current regulatory and market environment.
The Board also considered that the Manager is entitled to earn a reasonable level of profits for the services that it provides to the Portfolios. The Board also considered information regarding the potential fall-out benefits to the Manager, Sub-Advisers, and Sub-Sub-Adviser and their respective affiliates from their association with the Portfolios, including their ability to engage in soft-dollar transactions on behalf of the Portfolios. Following its reviews, the Board determined that the Manager’s profitability with respect to its services to the Portfolios and the Manager, Sub-Advisers’ and Sub-Sub-Adviser’s potential fall-out benefits were not unreasonable.
57
ADVISORY AND SUB-ADVISORY CONTRACT APPROVAL DISCUSSION (Unaudited) (continued)
Portfolio-by-Portfolio Analysis
Set forth below are certain of the specific factors that the Board considered at its October 7, 2020, November 17, 2020, and/or November 19, 2020 meetings in relation to approving each Portfolio’s Contracts and the conclusions reached by the Board. These specific factors are in addition to those considerations discussed above. In each case, the Portfolio’s performance was compared to its Morningstar category, as well as its primary benchmark. The performance data provided to the Board primarily was for various periods ended March 31, 2020. In addition, the Board also considered at its October 7, 2020, November 17, 2020, and November 19, 2020 meetings certain additional data regarding each Portfolio’s more recent performance, asset levels and asset flows. Each Portfolio’s management fee rate and expense ratio were compared to the management fee rates and expense ratios of the funds in its Selected Peer Group. With respect to the quintile rankings noted below, the first quintile represents the range of funds with the highest performance or the lowest management fee rate or expense ratio, as applicable, and the fifth quintile represents the range of funds with the lowest performance or the highest management fee rate or expense ratio, as applicable.
VY® BlackRock Inflation Protected Bond Portfolio
In considering whether to approve the renewal of the Contracts for VY® BlackRock Inflation Protected Bond Portfolio, the Board considered that, based on performance data for the periods ended March 31, 2020: (1) the Portfolio is ranked in the third quintile of its Morningstar category for all periods presented; and (2) the Portfolio underperformed its primary benchmark for all periods presented.
In considering the fees payable under the Contracts for the Portfolio, the Board took into account the factors described above and also considered: (1) the economies of scale benefits to the Portfolio and its shareholders from breakpoint discounts applicable to the Portfolio’s management fee rate, which result in lower fees at higher asset levels; and (2) the pricing structure (including the net expense ratio to be borne by shareholders) of the Portfolio, as compared to its Selected Peer Group, including that: (a) the net management fee rate for the Portfolio is ranked in the second quintile of net management fee rates of the funds in its Selected Peer Group; (b) the contractual management fee rate for the Portfolio is ranked in the third quintile of contractual management fee rates of the funds in its Selected Peer Group; and (c) the net expense ratio for the Portfolio is ranked in the third quintile of net expense ratios of the funds in its Selected Peer Group.
After its deliberation, the Board reached the following conclusions: (1) the Portfolio’s management fee rate is reasonable in the context of all factors considered by the
Board; (2) the Portfolio’s net expense ratio is reasonable in the context of all factors considered by the Board; (3) the Portfolio’s performance is reasonable in the context of all factors considered by the Board; and (4) the sub-advisory fee rate payable by the Manager to the Sub-Adviser and the sub-sub-advisory fee rate payable by the Sub-Adviser to the Sub-Sub-Adviser, if any, are reasonable in the context of all factors considered by the Board. Based on these conclusions and other factors, the Board voted to renew the Contracts for the Portfolio for the year ending November 30, 2021. During this renewal process, different Board members may have given different weight to different individual factors and related conclusions.
VY® BrandywineGLOBAL — Bond Portfolio
In considering whether to approve the renewal of the Management Contract for VY® BrandywineGLOBAL — Bond Portfolio, the Board considered that, based on performance data for the periods ended March 31, 2020: (1) the Portfolio is ranked in the first quintile of its Morningstar category for the year-to-date and one-year periods, and the second quintile for the three-year and five-year periods; and (2) the Portfolio underperformed its primary benchmark for all periods presented.
In considering the fees payable under the Management Contract for the Portfolio, the Board took into account the factors described above and also considered: (1) the fairness of the compensation under a Management Contract with a breakpoint fee schedule where the asset level necessary to achieve a breakpoint discount had not been reached by the Portfolio; and (2) the pricing structure (including the net expense ratio to be borne by shareholders) of the Portfolio, as compared to its Selected Peer Group, including that: (a) the net management fee rate for the Portfolio is ranked in the third quintile of net management fee rates of the funds in its Selected Peer Group; (b) the contractual management fee rate for the Portfolio is ranked in the third quintile of contractual management fee rates of the funds in its Selected Peer Group; and (c) the net expense ratio for the Portfolio is ranked in the second quintile of net expense ratios of the funds in its Selected Peer Group.
After its deliberation, the Board reached the following conclusions: (1) the Portfolio’s management fee rate is reasonable in the context of all factors considered by the Board; (2) the Portfolio’s net expense ratio is reasonable in the context of all factors considered by the Board; and (3) the Portfolio’s performance is reasonable in the context of all factors considered by the Board. Based on these conclusions and other factors, the Board voted to renew the Management Contract for the Portfolio for the year ending November 30, 2021. During this renewal process, different Board members may have given different weight to different individual factors and related conclusions.
58
(THIS PAGE INTENTIONALLY LEFT BLANK)
Investment Adviser
Voya Investments, LLC
7337 East Doubletree Ranch Road, Suite 100
Scottsdale, Arizona 85258
Distributor
Voya Investments Distributor, LLC
7337 East Doubletree Ranch Road, Suite 100
Scottsdale, Arizona 85258
Transfer Agent
BNY Mellon Investment Servicing (U.S.) Inc.
301 Bellevue Parkway
Wilmington, Delaware 19809
Independent Registered Public Accounting Firm
Ernst & Young LLP
200 Clarendon Street
Boston, Massachusetts 02116
Custodian
The Bank of New York Mellon
225 Liberty Street
New York, New York 10286
Legal Counsel
Ropes & Gray LLP
Prudential Tower
800 Boylston Street
Boston, Massachusetts 02199
Before investing, carefully consider the investment objectives, risks, charges and expenses of the variable annuity contract or variable life insurance policy and the underlying variable investment options. This and other information is contained in the prospectus for the variable annuity contract or variable life insurance policy and the underlying variable investment options. Obtain these prospectuses from your agent/registered representative and read them carefully before investing.
RETIREMENT | INVESTMENTS | INSURANCE
voyainvestments.com | |
| | VPAR-VIT3AIS (1220-022321) |
Annual Report
December 31, 2020
Classes ADV, I and S
Voya Investors Trust
| n | | Voya Global Perspectives® Portfolio |
As permitted by regulations adopted by the U.S. Securities and Exchange Commission, paper copies of each Portfolio’s annual and semi-annual shareholder reports, like this annual report, ware not sent by mail, unless you specifically request paper copies of the reports. Instead, the reports will be made available on a website and you will be notified by mail each time a report is posted and provided with a website link to access the report.
If you already elected to receive shareholder reports electronically, you need not take any action. You may elect to receive shareholder reports and other communications from your insurance carrier electronically by contacting them directly.
You may elect to receive all future reports in paper free of charge. If you received this document in the mail, please follow the instructions provided to elect to continue receiving paper copies of your shareholder reports. You can inform us that you wish to continue receiving paper copies by calling 1-800-283-3427. Your election to receive reports in paper will apply to all the funds in which you invest. |
This report is submitted for general information to shareholders of the Voya mutual funds. It is not authorized for distribution to prospective shareholders unless accompanied or preceded by a prospectus which includes details regarding the fund’s investment objectives, risks, charges, expenses and other information. This information should be read carefully. |
| | |
| INVESTMENT MANAGEMENT | |
| voyainvestments.com | |
TABLE OF CONTENTS
| | 1 | |
| | 3 | |
| | 5 | |
| | 6 | |
| | 7 | |
| | 8 | |
| | 9 | |
| | 10 | |
| | 11 | |
| | 18 | |
| | 20 | |
| | 21 | |
| | 25 | |
PROXY VOTING INFORMATION
A description of the policies and procedures that the Portfolio uses to determine how to vote proxies related to portfolio securities is available: (1) without charge, upon request, by calling Shareholder Services toll-free at (800) 992-0180; (2) on the Portfolio’s website at www.voyainvestments.com; and (3) on the U.S. Securities and Exchange Commission’s (“SEC’s”) website at www.sec.gov. Information regarding how the Portfolio voted proxies related to portfolio securities during the most recent 12-month period ended June 30 is available without charge on the Portfolio’s website at www.voyainvestments.com and on the SEC’s website at www.sec.gov.
QUARTERLY PORTFOLIO HOLDINGS
The Portfolio files its complete schedule of portfolio holdings with the SEC for the first and third quarters of each fiscal year on Form NPORT-P. The Portfolio’s Forms NPORT-P are available on the SEC’s website at www.sec.gov. The Portfolio’s complete schedule of portfolio holdings, as filed on Form NPORT-P is available at: www.voyainvestments.com and without charge upon request from the Portfolio by calling Shareholder Services toll-free at (800) 992-0180.
(THIS PAGE INTENTIONALLY LEFT BLANK)
Beyond the Headlines, a Glimpse of Global Economic Recovery
Dear Shareholder,
For those of us hoping that 2021 would bring more encouraging headlines, it has been a rough start to the year: political turmoil, surging COVID-19 cases and a new, more virulent strain of the coronavirus. On the surface, economic news also has seemed disappointing: labor markets have cooled, manufacturing and services activity has slowed and consumer sentiment has dropped. Yet, the financial markets continue to march higher, begging the question: Where are the markets getting their news?
Voya investment strategists have written about the uneven pressures that have created a “two-speed” or “K-shaped” economic recovery. Consumers on the higher end of the income distribution have largely kept their jobs and adapted to the pandemic by working from home. By contrast, jobs in lower paying segments of the labor market such as leisure, lodging and retail have been eliminated or furloughed and have yet to return. For lower income consumers, the good news is that the fiscal response to help offset job losses has been enormous — and fiscal relief is expected to grow under a Democratic-controlled government. The initial rollout of the coronavirus vaccines, while slower than many had hoped, still represents a significant milestone as vaccines are the bridge that are expected to allow the economy to reopen fully.
In addition to fiscal support, the response from central banks has been extraordinary. The U.S. Federal Reserve Board (“Fed”) has adjusted its policy framework in ways that make the Fed more likely to remain accommodative longer than might otherwise be expected during economic recovery phases, a game changer for financial assets. We believe that analogous developments across the world should help reignite global economic growth in 2021 and breathe new life into struggling sectors. Despite today’s negative headlines, the data is telling us that the future is likely to be better. Looking broadly at the economic picture, in our opinion, it appears that a global synchronous expansion is underway.
Of course there are still risks, and we believe that one should not overlook the potential for episodic market stresses connected to the vaccine rollout or other global factors. As always, we glimpse the future “through a glass darkly,” and must allow for contingencies we can’t foresee. For this reason, we maintain that staying fully invested and broadly diversified is the most likely way to achieve one’s long-term investment goals. Should your goals change, discuss them thoroughly with your investment advisor before making any changes to your portfolio.
We remain humble and realistic in the face of the challenges ahead, but well prepared for and fully committed to serving our clients without disruption. We appreciate your continued confidence in us, and we look forward to serving your investment needs in the future.
Sincerely,
Dina Santoro
President
Voya Family of Funds
January 22, 2021
The views expressed in the President’s Letter reflect those of the President as of the date of the letter. Any such views are subject to change at any time based upon market or other conditions and the Voya mutual funds disclaim any responsibility to update such views. These views may not be relied on as investment advice and because investment decisions for a Voya mutual fund are based on numerous factors, may not be relied on as an indication of investment intent on behalf of any Voya mutual fund. Reference to specific company securities should not be construed as recommendations or investment advice.
1
BENCHMARK DESCRIPTIONS
| Index | Description |
|---|
| Bloomberg Barclays High Yield Bond — 2% Issuer Constrained Composite Index | An index that includes all fixed-income securities having a maximum quality rating of Ba1, a minimum amount outstanding of $150 million, and at least one year tomaturity. |
| Bloomberg Barclays U.S. 20+ Year Treasury Bond Index | Measures the performance of public obligations of the U.S. Treasury that have a remaining maturity of 20 or more years. The index includes all publicly-issued U.S. Treasury securities that have a remaining maturity of greater than or equal to 20 years, are rated investment grade and have $250 million or more of outstanding face value. |
| Bloomberg Barclays U.S. Corporate Investment Grade Bond Index | An index consisting of publicly issued, fixed rate, nonconvertible, investment grade debt securities. |
| Bloomberg Barclays Global Aggregate Index | Provides a broad-based measure of the global investment-grade fixed-rate debt markets. |
| FTSE ERPA Nareit Developed Index | The index is designed to track the performance of listed real estate companies and real-estate investment trusts (REITs) worldwide. Relevant activities are defined as the ownership, disposal and development of income-producing real estate. Constituents are classified into distinct property sectors based on gross invested book assets, as disclosed in the latest published financial statement. Index constituents are free-float adjusted, liquidity, size and revenue screened. |
MSCI Europe, Australasia and Far East®
(“MSCI EAFE”) Index | An index that measures the performance of securities listed on exchanges in Europe, Australasia and the Far East. It includes the reinvestment of dividends net of withholding taxes, but does not reflect fees, brokerage commissions or other expenses of investing. |
MSCI Emerging Markets IndexSM | An index that measures the performance of securities listed on exchanges in developing nations throughout the world. It includes the reinvestment of dividends and distributions net of withholding taxes, but does not reflect fees, brokerage commissions or other expenses of investing. |
S&P 500® Index | An index that measures the performance of securities of approximately 500 large-capitalization companies whose securities are traded on major U.S. stock markets. |
S&P MidCap 400® Index | An index that measures the performance of the mid-size company segment of the U.S. market. |
S&P SmallCap 600® Index | An index used to measure stock market performance composed of companies with a weighted average market value of approximately $630 million. |
S&P Target Risk® Growth Index | Seeks to measure the performance of an asset allocation strategy targeted to a growth focused risk profile. |
2
| PORTFOLIO MANAGERS’ REPORT | VOYA GLOBAL PERSPECTIVES® PORTFOLIO |
Target Allocations
as of December 31, 2020
(percent of net assets) |
| U.S. Large Cap Equities | | 5 | % |
| U.S. Mid Cap Equities | | 5 | % |
| U.S. Small Cap Equities | | 5 | % |
| Global Real Estate | | 5 | % |
| International Equities | | 5 | % |
| Emerging Market Equities | | 5 | % |
| U.S. Investment Grade Bonds | | 17.5 | % |
| U.S. Government Bonds | | 17.5 | % |
| Global Bonds | | 17.5 | % |
| U.S. High Yield Bonds | | 17.5 | % |
| Cash | | 0 | % |
Portfolio holdings are subject to change daily. |
Voya Global Perspectives® Portfolio (the “Portfolio”) seeks total return. Under normal conditions, the sub-adviser invests the assets of the Portfolio in a combination of underlying funds (“Underlying Funds”) that in turn, invest directly in securities such as stocks and bonds. The Portfolio is managed by Douglas Coté, CFA, Portfolio Manager of Voya Investment Management Co. LLC — the Sub-Adviser.
Under normal market conditions, approximately 60% of the Portfolio’s net assets are allocated to Underlying Funds that invest predominantly in equity securities, and approximately 40% of the Portfolio’s net assets are allocated to Underlying Funds that invest predominantly in debt instruments. These approximate weights are referred to as target allocations (“Target Allocations”). Depending upon the rules-based investment strategy, the equity target allocation may drop to approximately 30% and the debt target allocation may rise to approximately 70% — such weightings are called “defensive allocations.” No adjustments to the Target Allocations or defensive allocations will be made between quarterly allocation dates.
Performance: For the year ended December 31, 2020, the Portfolio’s Class S shares provided a total return of 15.79%, compared to the S&P Target Risk® Growth Index and the Portfolio’s composite index (“Composite Index”)(1), which returned 11.83% and 11.41%, respectively, for the same period.
Portfolio Specifics: The Portfolio outperformed the S&P Target Risk® Growth Index for the reporting period. The market in 2020 was defined by one of the sharpest bear markets in history followed by a V-shaped recovery that catapulted stocks and bonds to record highs. In our opinion, 2020 for decades to come will be the raison d’etre for diversification. The epic moment was during the first quarter bear market when the S&P 500® Index plummeted 19.6%, while the super-safe U.S. 20-Year Treasury bonds skyrocketed 21.5%. That was what we usually think of when talking about risk control — protect the downside. But after the carnage in the markets, in our view, unprecedented economic and monetary stimulus catapulted equities for the remainder of the year. While U.S. large cap and emerging markets equities led the way, it was U.S. small cap that stood out in the fourth quarter with a return in excess of thirty percent. This is referred to as “up-side” risk or being too conservative and missing out on stellar gains.
The Portfolio’s performance was strongly positive for the year, and significantly outperformed its benchmark, the S&P Target Risk® Growth Index, primarily due to its proprietary tactical positioning. The Portfolio positioned to “defensive” at the beginning of the year, we believe largely avoiding the first quarter bear market, and back to “base” in time to participate in the stimulus-induced rebound.
The Portfolio’s equity allocation had strongly positive absolute and benchmark-relative performance due to asset allocation positioning. The best absolute performance contributor was the Voya Midcap Opportunities Portfolio, while the worst was the VY® Clarion Global Portfolio. In fixed income, the Portfolio also had strong positive absolute and benchmark-relative performance due primarily to the Voya U.S. Bond Index Portfolio and the Voya Global Bond Fund.
Current Strategy and Outlook: We believe stocks are hot stoked by gargantuan Central Bank stimulus and government fiscal spending, in our opinion. The adage “don’t fight the Fed” is correct, in our opinion, and that means even a severely over-priced market can keep going up. In other words, we believe valuation cannot decide turning points like earnings growth can. There are two equally powerful risks in our view that we mentioned — “tail-risk” and “mean-reversion” — which simply means that when the sentiment switches, the rush for the exits is not orderly. Welcome 2021, but just remember that we believe “fundamentals drive markets.”
Despite our optimism for the full year 2021, for the first quarter of 2021 our tactical signal indicates a negative outlook, and accordingly, the Portfolio is positioned at its “defensive allocation”. This positioning is consistent with the Global Perspectives investment philosophy, and reflects the negative corporate earnings growth reported for the third quarter of 2020.
| (1) | | The Composite Index is composed of several indices that we believe provide an internal reference benchmark against which the actual performance of the Portfolio can be compared. As of December 31, 2020, the index allocation is approximately: 10% of the Bloomberg Barclays Global Aggregate Index, 10% of the Bloomberg Barclays High Yield Bond — 2% Issuer Constrained Composite Index, 10% of the Bloomberg Barclays U.S. Corporate Investment Grade Bond Index, 10% of the Bloomberg Barclays U.S. 20+ Year Treasury Bond Index, 10% of the FTSE ERPA Nareit Developed Index, 10% of the MSCI EAFE® Index, 10% of the MSCI Emerging Markets Index, 10% of the S&P 500® Index, 10% of the S&P MidCap 400® Index and 10% of the S&P SmallCap 600® Index. |
The views expressed in this commentary are informed opinions. They should not be considered promises or advice. The views expressed reflect those of the portfolio managers, only through the end of the period as stated on the cover. The portfolio managers’ views are subject to change at any time based on market and other conditions.
Portfolio holdings and characteristics are subject to change and may not be representative of current holdings and characteristics. Portfolio holdings are subject to change daily. The outlook for this Portfolio may differ from that presented for other Voya mutual funds. This report contains statements that may be “forward-looking” statements. Actual results may differ materially from those projected in the “forward-looking” statements. The Portfolio’s performance returns shown reflect applicable fee waivers and/or expense limits in effect during this period. Absent such fee waivers/expense limitations, if any, performance would have been lower. Performance for the different classes of shares will vary based on differences in fees associated with each class. An index has no cash in its portfolio and imposes no sales charges. An investor cannot invest directly in an index.
3
| VOYA GLOBAL PERSPECTIVES® PORTFOLIO | PORTFOLIO MANAGERS’ REPORT |
| | |
| | | Average Annual Total Returns for the Periods Ended December 31, 2020 | | |
|---|
| | | | | 1 Year | | 5 Year | | Since Inception
of Classes ADV, I and S
May 1, 2013 | | |
|---|
| | | Class ADV | | | 15.80 | % | | | 9.05 | % | | | 6.51 | % | | |
| | | Class I | | | 16.13 | % | | | 9.39 | % | | | 6.87 | % | | |
| | | Class S | | | 15.79 | % | | | 9.11 | % | | | 6.59 | % | | |
| | | S&P Target Risk ® Growth Index | | | 11.83 | % | | | 9.25 | % | | | 7.84 | % | | |
| | | Composite Index | | | 11.41 | % | | | 9.71 | % | | | 7.44 | % | | |
| | | | | | | | | | | | | | | | | |
Based on a $10,000 initial investment, the graph and table above illustrate the total return of the Voya Global Perspectives® Portfolio against the indices indicated. An index is unmanaged and has no cash in its portfolio and imposes no sales charges. An investor cannot invest directly in an index.
The Portfolio’s performance is shown without the imposition of any expenses or charges which are, or may be, imposed under your variable annuity contract or variable life insurance policy. Total returns would have been lower if such expenses or charges were included.
The performance graph and table do not reflect the deduction of taxes that a shareholder will pay on Portfolio distributions or the redemption of Portfolio shares.
The performance shown includes, if applicable, the effect of fee waivers and/or expense reimbursements by the Investment Adviser and/or other
service providers, which have the effect of increasing total return. Had all fees and expenses been considered, the total returns would have been lower.
The performance update illustrates performance for a variable investment option available through a variable annuity contract or a variable life insurance policy. The performance shown indicates past performance and is not a projection or prediction of future results. Actual investment returns and principal value will fluctuate so that shares and/or units, at redemption, may be worth more or less than their original cost. Please log on to www.voyainvestments.com or call (800) 366-0066 to get performance through the most recent month end.
Portfolio holdings are subject to change daily.
4
SHAREHOLDER EXPENSE EXAMPLE (Unaudited) As a shareholder of the Portfolio, you incur two types of costs: (1) transaction costs, including redemption fees and exchange fees; and (2) ongoing costs, including management fees, distribution and/or service (12b-1) fees, and other Portfolio expenses. These Examples are intended to help you understand your ongoing costs (in dollars) of investing in the Portfolio and to compare these costs with the ongoing costs of investing in other mutual funds.
The Examples are based on an investment of $1,000 invested at the beginning of the period and held for the entire period from July 1, 2020 to December 31, 2020. The Portfolio’s expenses are shown without the imposition of any charges which are, or may be, imposed under your variable annuity contract, variable life insurance policy, qualified pension, or retirement plan. Expenses would have been higher if such charges were included.
Actual Expenses
The left section of the table shown below, “Actual Portfolio Return,” provides information about actual account values and actual expenses. You may use the information in this section, together with the amount you invested, to estimate the expenses that you paid over the period. Simply divide your account value by $1,000 (for example, an $8,600 account value divided by $1,000 = 8.6), then multiply the result by the number in the first section under the heading entitled “Expenses Paid During the Period” to estimate the expenses you paid on your account during this period.
Hypothetical Example for Comparison Purposes
The right section of the table shown below, “Hypothetical (5% return before expenses)” provides information about hypothetical account values and hypothetical expenses based on the Portfolio’s actual expense ratio and an assumed rate of return of 5% per year before expenses, which is not the Portfolio’s actual return. The hypothetical account values and expenses may not be used to estimate the actual ending account balance or expenses you paid for the period. You may use this information to compare the ongoing costs of investing in the Portfolio and other mutual funds. To do so, compare this 5% hypothetical example with the 5% hypothetical examples that appear in the shareholder reports of the other mutual funds.
Please note that the expenses shown in the table are meant to highlight your ongoing costs only and do not reflect any transactional costs, such as redemption fees or exchange fees. Therefore, the hypothetical section of the table is useful in comparing ongoing costs only, and will not help you determine the relative total costs of owning different mutual funds. In addition, if these transactional costs were included, your costs would have been higher.
| | | | Actual Portfolio Return | | Hypothetical (5% return before expenses) | |
|---|
| | | | Beginning
Account
Value
July 1,
2020 | | Ending
Account
Value
December 31,
2020 | | Annualized
Expense
Ratio* | | Expenses Paid
During the
Period Ended
December 31,
2020** | | Beginning
Account
Value
July 1,
2020 | | Ending
Account
Value
December 31,
2020 | | Annualized
Expense
Ratio* | | Expenses Paid
During the
Period Ended
December 31,
2020** | |
|---|
| | Class ADV | | | $1,000.00 | | | | $1,115.00 | | | | 0.51 | % | | | $2.71 | | | | $1,000.00 | | | | $1,022.57 | | | | 0.51 | % | | | $2.59 | | |
| | Class I | | | 1,000.00 | | | | 1,116.70 | | | | 0.21 | | | | 1.12 | | | | 1,000.00 | | | | 1,024.08 | | | | 0.21 | | | | 1.07 | | |
| | Class S | | | 1,000.00 | | | | 1,115.00 | | | | 0.46 | | | | 2.45 | | | | 1,000.00 | | | | 1,022.82 | | | | 0.46 | | | | 2.34 | |
| * | | The annualized expense ratios do not include expenses of underlying funds. |
| ** | | Expenses are equal to the Portfolio’s respective annualized expense ratios multiplied by the average account value over the period, multiplied by 184/366 to reflect the most recent fiscal half-year. |
5
REPORT OF INDEPENDENT REGISTERED PUBLIC ACCOUNTING FIRM To the Shareholders of Voya Global Perspectives® Portfolio and the Board of Trustees of
Voya Investors Trust
Opinion on the Financial Statements
We have audited the accompanying statement of assets and liabilities of Voya Global Perspectives® Portfolio (the “Portfolio”) (one of the portfolios constituting Voya Investors Trust (the “Trust”)), including the portfolio of investments, as of December 31, 2020, and the related statements of operations and changes in net assets and the financial highlights for the year then ended and the related notes (collectively referred to as the “financial statements”). In our opinion, the financial statements present fairly, in all material respects, the financial position of the Portfolio (one of the portfolios constituting Voya Investors Trust) at December 31, 2020, the results of its operations, the changes in its net assets and its financial highlights for the year then ended, in conformity with U.S. generally accepted accounting principles.
The statement of changes in net assets for the year ended December 31, 2019, and the financial highlights for each of the years in the four-year period then ended, were audited by another independent registered public accounting firm whose report, dated February 26, 2020, expressed an unqualified opinion on that statement of changes in net assets and those financial highlights.
Basis for Opinion
These financial statements are the responsibility of the Trust’s management. Our responsibility is to express an opinion on the Portfolio’s financial statements based on our audit. We are a public accounting firm registered with the Public Company Accounting Oversight Board (United States) (“PCAOB”) and are required to be independent with respect to the Trust in accordance with the U.S. federal securities laws and the applicable rules and regulations of the Securities and Exchange Commission and the PCAOB.
We conducted our audit in accordance with the standards of the PCAOB. Those standards require that we plan and perform the audit to obtain reasonable assurance about whether the financial statements are free of material misstatement, whether due to error or fraud. The Trust is not required to have, nor were we engaged to perform, an audit of the Trust’s internal control over financial reporting. As part of our audit, we are required to obtain an understanding of internal control over financial reporting, but not for the purpose of expressing an opinion on the effectiveness of the Trust’s internal control over financial reporting. Accordingly, we express no such opinion.
Our audit included performing procedures to assess the risks of material misstatement of the financial statements, whether due to error or fraud, and performing procedures that respond to those risks. Such procedures included examining, on a test basis, evidence regarding the amounts and disclosures in the financial statements. Our procedures included confirmation of securities owned as of December 31, 2020, by correspondence with the custodian and others or by other appropriate auditing procedures where replies from others were not received. Our audit also included evaluating the accounting principles used and significant estimates made by management, as well as evaluating the overall presentation of the financial statements. We believe that our audit provides a reasonable basis for our opinion.
We have served as the auditor of one or more Voya investment companies since 2019.
Boston, Massachusetts
February 24, 2021
6
STATEMENT OF ASSETS AND LIABILITIES AS OF DECEMBER 31, 2020 ASSETS: | | | | |
| Investments in affiliated underlying funds at fair value* | | $ | 106,878,418 | |
| Cash | | | 6,983 | |
| Receivables: | | | | |
| Fund shares sold | | | 175,489 | |
| Prepaid expenses | | | 439 | |
| Reimbursement due from Investment Adviser | | | 5,693 | |
| Other assets | | | 9,866 | |
| Total assets | | | 107,076,888 | |
| | | | | |
LIABILITIES: | | | | |
| Payable for investments in affiliated underlying funds purchased | | | 175,467 | |
| Payable for fund shares redeemed | | | 52 | |
| Payable for investment management fees | | | 17,960 | |
| Payable for distribution and shareholder service fees | | | 24,580 | |
| Payable to trustees under the deferred compensation plan (Note 6) | | | 9,866 | |
| Payable for trustee fees | | | 504 | |
| Other accrued expenses and liabilities | | | 37,051 | |
| Total liabilities | | | 265,480 | |
NET ASSETS | | $ | 106,811,408 | |
| | | | | |
NET ASSETS WERE COMPRISED OF: | | | | |
| Paid-in capital | | $ | 88,768,374 | |
| Total distributable earnings | | | 18,043,034 | |
NET ASSETS | | $ | 106,811,408 | |
| | | | | |
* Cost of investments in affiliated underlying funds | | $ | 94,057,728 | |
| | | | | |
Class ADV | | | | |
| Net assets | | $ | 97,297,537 | |
| Shares authorized | | | unlimited | |
| Par value | | $ | 0.001 | |
| Shares outstanding | | | 8,022,089 | |
| Net asset value and redemption price per share | | $ | 12.13 | |
| | | | | |
Class I | | | | |
| Net assets | | $ | 9,436,878 | |
| Shares authorized | | | unlimited | |
| Par value | | $ | 0.001 | |
| Shares outstanding | | | 771,633 | |
| Net asset value and redemption price per share | | $ | 12.23 | |
| | | | | |
Class S | | | | |
| Net assets | | $ | 76,993 | |
| Shares authorized | | | unlimited | |
| Par value | | $ | 0.001 | |
| Shares outstanding | | | 6,346 | |
| Net asset value and redemption price per share | | $ | 12.13 | |
See Accompanying Notes to Financial Statements
7
STATEMENT OF OPERATIONS FOR THE YEAR ENDED DECEMBER 31, 2020
INVESTMENT INCOME: | | | | |
| Dividends from affiliated underlying funds | | $ | 3,551,167 | |
| Interest | | | 116 | |
| Total investment income | | | 3,551,283 | |
| | | | | |
EXPENSES: | | | | |
| Investment management fees | | | 201,357 | |
| Distribution and shareholder service fees: | | | | |
| Class ADV | | | 554,301 | |
| Class S | | | 166 | |
| Transfer agent fees: | | | | |
| Class ADV | | | 9,324 | |
| Class I | | | 830 | |
| Class S | | | 8 | |
| Shareholder reporting expense | | | 19,152 | |
| Professional fees | | | 24,275 | |
| Custody and accounting expense | | | 12,741 | |
| Trustee fees | | | 4,027 | |
| Miscellaneous expense | | | 11,623 | |
| Interest expense | | | 90 | |
| Total expenses | | | 837,894 | |
| Waived and reimbursed fees | | | (346,419 | ) |
| Net expenses | | | 491,475 | |
| Net investment income | | | 3,059,808 | |
| | | | | |
REALIZED AND UNREALIZED GAIN (LOSS): | | | | |
| Net realized gain (loss) on: | | | | |
| Sale of affiliated underlying funds | | | 2,341,801 | |
| Capital gain distributions from affiliated underlying funds | | | 2,223,062 | |
| Net realized gain | | | 4,564,863 | |
| Net change in unrealized appreciation (depreciation) on: | | | | |
| Affiliated underlying funds | | | 7,179,071 | |
| Net change in unrealized appreciation (depreciation) | | | 7,179,071 | |
| Net realized and unrealized gain | | | 11,743,934 | |
Increase in net assets resulting from operations | | $ | 14,803,742 | |
See Accompanying Notes to Financial Statements
8
STATEMENTS OF CHANGES IN NET ASSETS
| | Year Ended
December 31,
2020 | | Year Ended
December 31,
2019 |
|---|
FROM OPERATIONS: | | | | | | | | |
| Net investment income | | $ | 3,059,808 | | | $ | 2,202,850 | |
| Net realized gain | | | 4,564,863 | | | | 4,039,993 | |
| Net change in unrealized appreciation (depreciation) | | | 7,179,071 | | | | 11,208,477 | |
| Increase in net assets resulting from operations | | | 14,803,742 | | | | 17,451,320 | |
| | | | | | | | | |
FROM DISTRIBUTIONS TO SHAREHOLDERS: | | | | | | | | |
| Total distributions (excluding return of capital): | | | | | | | | |
| Class ADV | | | (5,772,190 | ) | | | (7,252,542 | ) |
| Class I | | | (552,917 | ) | | | (593,230 | ) |
| Class S | | | (4,152 | ) | | | (4,546 | ) |
| Total distributions | | | (6,329,259 | ) | | | (7,850,318 | ) |
| | | | | | | | | |
FROM CAPITAL SHARE TRANSACTIONS: | | | | | | | | |
| Net proceeds from sale of shares | | | 5,276,382 | | | | 3,178,856 | |
| Reinvestment of distributions | | | 6,329,259 | | | | 7,850,318 | |
| | | | 11,605,641 | | | | 11,029,174 | |
| Cost of shares redeemed | | | (16,868,995 | ) | | | (19,820,159 | ) |
| Net decrease in net assets resulting from capital share transactions | | | (5,263,354 | ) | | | (8,790,985 | ) |
| Net increase in net assets | | | 3,211,129 | | | | 810,017 | |
| | | | | | | | | |
NET ASSETS: | | | | | | | | |
| Beginning of year or period | | | 103,600,279 | | | | 102,790,262 | |
| End of year or period | | $ | 106,811,408 | | | $ | 103,600,279 |
See Accompanying Notes to Financial Statements
9
FINANCIAL HIGHLIGHTS
Selected data for a share of beneficial interest outstanding throughout each year or period.
| | | | | | | | Income (loss)
from
investment
operations | | | | | | | | Less distributions | | | | | | | | | | | | | | | | | | | | Ratios to average
net assets | | | | Supplemental
Data | |
Year or
period | | | Net asset value, beginning
of year or period | | | | Net investment income (loss) | | | | Net realized and unrealized
gain (loss) | | | | Total from investment operations | | | | From net investment income | | | | From net realized gains | | | | From return of capital | | | | Total distributions | | | | Payment by affiliate | | | | Net asset value,
end of year or period | | | | Total Return(1) | | | | Expenses before reductions/
additions
(2)(3)(4) | | | | Expenses net of fee waivers
and/or recoupments
if any(2)(3)(4) | | | | Expenses net of all
reductions/
additions
(2)(3)(4) | | | | Net investment income
(loss)(2)(3) | | | | Net assets, end of year or period | | | | Portfolio turnover rate | |
| ended | | | ($) | | | | ($) | | | | ($) | | | | ($) | | | | ($) | | | | ($) | | | | ($) | | | | ($) | | | | ($) | | | | ($) | | | | (%) | | | | (%) | | | | (%) | | | | (%) | | | | (%) | | | | ($000’s) | | | | (%) | |
| Class ADV |
| 12-31-20 | | | 11.17 | | | | 0.34 | • | | | 1.34 | | | | 1.68 | | | | 0.35 | | | | 0.37 | | | | — | | | | 0.72 | | | | — | | | | 12.13 | | | | 15.80 | | | | 0.88 | | | | 0.51 | | | | 0.51 | | | | 3.01 | | | | 97,298 | | | | 107 | |
| 12-31-19 | | | 10.21 | | | | 0.23 | • | | | 1.57 | | | | 1.80 | | | | 0.37 | | | | 0.47 | | | | — | | | | 0.84 | | | | — | | | | 11.17 | | | | 17.97 | | | | 0.87 | | | | 0.48 | | | | 0.48 | | | | 2.07 | | | | 95,446 | | | | 13 | |
| 12-31-18 | | | 11.46 | | | | 0.23 | • | | | (1.06 | ) | | | (0.83 | ) | | | 0.29 | | | | 0.13 | | | | — | | | | 0.42 | | | | — | | | | 10.21 | | | | (7.50 | ) | | | 0.87 | | | | 0.48 | | | | 0.48 | | | | 2.10 | | | | 94,684 | | | | 16 | |
| 12-31-17 | | | 10.26 | | | | 0.23 | • | | | 1.25 | | | | 1.48 | | | | 0.28 | | | | — | | | | — | | | | 0.28 | | | | — | | | | 11.46 | | | | 14.60 | | | | 0.86 | | | | 0.48 | | | | 0.48 | | | | 2.11 | | | | 122,258 | | | | 13 | |
| 12-31-16 | | | 9.87 | | | | 0.23 | • | | | 0.41 | | | | 0.64 | | | | 0.25 | | | | — | | | | — | | | | 0.25 | | | | — | | | | 10.26 | | | | 6.49 | | | | 0.89 | | | | 0.52 | | | | 0.52 | | | | 2.25 | | | | 139,474 | | | | 52 | |
| Class I |
| 12-31-20 | | | 11.26 | | | | 0.38 | • | | | 1.35 | | | | 1.73 | | | | 0.39 | | | | 0.37 | | | | — | | | | 0.76 | | | | — | | | | 12.23 | | | | 16.13 | | | | 0.28 | | | | 0.21 | | | | 0.21 | | | | 3.31 | | | | 9,437 | | | | 107 | |
| 12-31-19 | | | 10.29 | | | | 0.26 | • | | | 1.59 | | | | 1.85 | | | | 0.41 | | | | 0.47 | | | | — | | | | 0.88 | | | | — | | | | 11.26 | | | | 18.33 | | | | 0.27 | | | | 0.18 | | | | 0.18 | | | | 2.33 | | | | 8,090 | | | | 13 | |
| 12-31-18 | | | 11.55 | | | | 0.28 | • | | | (1.08 | ) | | | (0.80 | ) | | | 0.33 | | | | 0.13 | | | | — | | | | 0.46 | | | | — | | | | 10.29 | | | | (7.21 | ) | | | 0.27 | | | | 0.18 | | | | 0.18 | | | | 2.48 | | | | 8,051 | | | | 16 | |
| 12-31-17 | | | 10.34 | | | | 0.25 | • | | | 1.28 | | | | 1.53 | | | | 0.32 | | | | — | | | | — | | | | 0.32 | | | | — | | | | 11.55 | | | | 14.98 | | | | 0.26 | | | | 0.18 | | | | 0.18 | | | | 2.29 | | | | 8,755 | | | | 13 | |
| 12-31-16 | | | 9.95 | | | | 0.25 | • | | | 0.43 | | | | 0.68 | | | | 0.29 | | | | — | | | | — | | | | 0.29 | | | | — | | | | 10.34 | | | | 6.81 | | | | 0.24 | | | | 0.22 | | | | 0.22 | | | | 2.41 | | | | 14,747 | | | | 52 | |
| Class S |
| 12-31-20 | | | 11.18 | | | | 0.34 | • | | | 1.34 | | | | 1.68 | | | | 0.36 | | | | 0.37 | | | | — | | | | 0.73 | | | | — | | | | 12.13 | | | | 15.79 | | | | 0.53 | | | | 0.46 | | | | 0.46 | | | | 3.04 | | | | 77 | | | | 107 | |
| 12-31-19 | | | 10.22 | | | | 0.23 | | | | 1.58 | | | | 1.81 | | | | 0.38 | | | | 0.47 | | | | — | | | | 0.85 | | | | — | | | | 11.18 | | | | 18.08 | | | | 0.52 | | | | 0.43 | | | | 0.43 | | | | 2.10 | | | | 65 | | | | 13 | |
| 12-31-18 | | | 11.48 | | | | 0.23 | | | | (1.06 | ) | | | (0.83 | ) | | | 0.30 | | | | 0.13 | | | | — | | | | 0.43 | | | | — | | | | 10.22 | | | | (7.47 | ) | | | 0.52 | | | | 0.43 | | | | 0.43 | | | | 2.13 | | | | 55 | | | | 16 | |
| 12-31-17 | | | 10.28 | | | | 0.23 | | | | 1.27 | | | | 1.50 | | | | 0.30 | | | | — | | | | — | | | | 0.30 | | | | — | | | | 11.48 | | | | 14.71 | | | | 0.51 | | | | 0.43 | | | | 0.43 | | | | 2.14 | | | | 58 | | | | 13 | |
| 12-31-16 | | | 9.90 | | | | 0.23 | | | | 0.42 | | | | 0.65 | | | | 0.27 | | | | — | | | | — | | | | 0.27 | | | | — | | | | 10.28 | | | | 6.55 | | | | 0.49 | | | | 0.47 | | | | 0.47 | | | | 2.28 | | | | 50 | | | | 52 | |
(1) | | Total return is calculated assuming reinvestment of all dividends, capital gain distributions and return of capital distributions, if any, at net asset value and does not reflect the effect of insurance contract charges. Total return for periods less than one year is not annualized. |
(2) | | Annualized for periods less than one year. |
(3) | | Ratios reflect operating expenses of a Portfolio. Expenses before reductions/additions do not reflect amounts reimbursed or recouped by the Investment Adviser and/or Distributor or reductions from brokerage service arrangements or other expense offset arrangements and do not represent the amount paid by a Portfolio during periods when reimbursements or reductions occur. |
| | | Expenses net of fee waivers reflect expenses after reimbursement by the Investment Adviser and/or Distributor or recoupment of previously reimbursed fees by the Investment Adviser, but prior to reductions from brokerage service arrangements or other expense offset arrangements. Expenses net of all reductions/additions represent the net expenses paid by a Portfolio. Net investment income (loss) is net of all such additions or reductions. |
(4) | | Ratios do not include expenses of underlying funds and do not include fees and expenses charged under the variable annuity contract or variable life insurance policy. |
• | | Calculated using average number of shares outstanding throughout the year or period. |
See Accompanying Notes to Financial Statements
10
NOTES TO FINANCIAL STATEMENTS AS OF DECEMBER 31, 2020
NOTE 1 — ORGANIZATION
Voya Investors Trust (the “Trust”) is registered under the Investment Company Act of 1940, as amended (“1940 Act”), as an open-end management investment company. The Trust was organized as a Massachusetts business trust on August 3, 1988. The Trust consists of twenty-two active separate investment series. The series included in this report is Voya Global Perspectives® Portfolio (“Global Perspectives” or the “Portfolio”), a diversified series of the Trust. The investment objective of the Portfolio is described in the Portfolio’s Prospectus.
The classes of shares included in this report are: Adviser (“Class ADV”), Institutional (“Class I”) and Service (“Class S”). With the exception of class specific matters, each class has equal voting rights as to voting privileges. For class specific proposals, only the applicable class would have voting privileges. The classes differ principally in the applicable distribution and shareholder service fees. Generally, shareholders of each class also bear certain expenses that pertain to that particular class. All shareholders are allocated the common expenses of a portfolio and earn income and realized gains/losses from a portfolio pro rata based on the daily ending net assets of each class, without distinction between share classes. Expenses that are specific to a portfolio or a class are charged directly to that portfolio or class. Other operating expenses shared by several portfolios are generally allocated among those portfolios based on average net assets. Distributions are determined separately for each class based on income and expenses allocated to each class. Realized gain distributions are allocated to each class pro rata based on the shares outstanding of each class on the date of distribution. Differences in per share dividend rates generally result from differences in separate class expenses, including distribution and shareholder service fees, if any, as well as differences in the amount of waiver of fees and reimbursement of expenses between the separate classes, if any.
Voya Investments, LLC (“Voya Investments” or the “Investment Adviser”), an Arizona limited liability company, serves as the Investment Adviser to the Portfolio. Voya Investment Management Co. LLC (“Voya IM” or the “Sub-Adviser”), a Delaware limited liability company, serves as the Sub-Adviser to the Portfolio. Voya Investments Distributor, LLC (“VID” or the “Distributor”), a Delaware limited liability company, serves as the principal underwriter to the Portfolio.
The Portfolio seeks to achieve its investment objective by investing in affiliated investment companies that, in turn, invest directly in a wide range of portfolio securities (i.e., stocks and bonds). The investment companies in which the
Portfolio invests are collectively referred to as the “Underlying Funds.”
NOTE 2 — SIGNIFICANT ACCOUNTING POLICIES
The following significant accounting policies are consistently followed by the Portfolio in the preparation of its financial statements. The Portfolio is considered an investment company under U.S. generally accepted accounting principles (“GAAP”) and follows the accounting and reporting guidance applicable to investment companies.
A. Security Valuation. The Portfolio is open for business every day the New York Stock Exchange (“NYSE”) opens for regular trading (each such day, a “Business Day”). The net asset value (“NAV”) per share for each class of the Portfolio is determined each Business Day as of the close of the regular trading session (“Market Close”), as determined by the Consolidated Tape Association (“CTA”), the central distributor of transaction prices for exchange-traded securities (normally 4:00 p.m. Eastern time unless otherwise designated by the CTA). The data reflected on the consolidated tape provided by the CTA is generated by various market centers, including all securities exchanges, electronic communications networks, and third-market broker-dealers. The NAV per share of each class of the Portfolio is calculated by taking the value of the Portfolio’s assets attributable to that class, subtracting the Portfolio’s liabilities attributable to that class, and dividing by the number of shares of that class that are outstanding. On days when the Portfolio is closed for business, Portfolio shares will not be priced and the Portfolio does not transact purchase and redemption orders. To the extent the Portfolio’s assets are traded in other markets on days when the Portfolio does not price its shares, the value of the Portfolio’s assets will likely change and you will not be able to purchase or redeem shares of the Portfolio.
Assets for which market quotations are readily available are valued at market value. A security listed or traded on an exchange is valued at its last sales price or official closing price as of the close of the regular trading session on the exchange where the security is principally traded or, if such price is not available, at the last sale price as of the Market Close for such security provided by the CTA. Bank loans are valued at the average of the averages of the bid and ask prices provided to an independent loan pricing service by brokers. Futures contracts are valued at the final settlement price set by an exchange on which they are principally traded. Listed options are valued at the mean between the last bid and ask prices from the exchange on which they are principally traded. Investments in open-end registered investment companies that do not trade on an exchange are valued at the end of day NAV per share.
11
NOTES TO FINANCIAL STATEMENTS AS OF DECEMBER 31, 2020 (CONTINUED)
NOTE 2 — SIGNIFICANT ACCOUNTING POLICIES (continued)
Investments in registered investment companies that trade on an exchange are valued at the last sales price or official closing price as of the close of the regular trading session on the exchange where the security is principally traded.
When a market quotation is not readily available or is deemed unreliable, the Portfolio will determine a fair value for the relevant asset in accordance with procedures adopted by the Portfolio’s Board of Trustees (“Board”). Such procedures provide, for example, that: (a) Exchange-traded securities are valued at the mean of the closing bid and ask; (b) Debt obligations are valued using an evaluated price provided by an independent pricing service. Evaluated prices provided by the pricing service may be determined without exclusive reliance on quoted prices, and may reflect factors such as institution-size trading in similar groups of securities, developments related to specific securities, benchmark yield, quality, type of issue, coupon rate, maturity, individual trading characteristics and other market data; (c) Securities traded in the over-the-counter (“OTC”) market are valued based on prices provided by independent pricing services or market makers; (d) Options not listed on an exchange are valued by an independent source using an industry accepted model, such as Black-Scholes; (e) Centrally cleared swap agreements are valued using a price provided by the central counterparty clearinghouse; (f) OTC swap agreements are valued using a price provided by an independent pricing service; (g) Forward foreign currency exchange contracts are valued utilizing current and forward rates obtained from an independent pricing service. Such prices from the third party pricing service are for specific settlement periods and the Portfolio’s forward foreign currency exchange contracts are valued at an interpolated rate between the closest preceding and subsequent period reported by the independent pricing service; and (h) Securities for which market prices are not provided by any of the above methods may be valued based upon quotes furnished by brokers.
The prospectuses of the open-end registered investment companies in which the Portfolio may invest explain the circumstances under which they will use fair value pricing and the effects of using fair value pricing.
Foreign securities’ (including forward foreign currency exchange contracts) prices are converted into U.S. dollar amounts using the applicable exchange rates as of Market Close. If market quotations are available and believed to be reliable for foreign exchange-traded equity securities, the securities will be valued at the market quotations. Because trading hours for certain foreign securities end before Market Close, closing market quotations may become unreliable. An independent pricing service determines the
degree of certainty, based on historical data, that the closing price in the principal market where a foreign security trades is not the current value as of Market Close. Foreign securities’ prices meeting the approved degree of certainty that the price is not reflective of current value will be valued by the independent pricing service using pricing models designed to estimate likely changes in the values of those securities between the times in which the trading in those securities is substantially completed and Market Close. Multiple factors may be considered by the independent pricing service in determining the value of such securities and may include information relating to sector indices, American Depositary Receipts and domestic and foreign index futures.
All other assets for which market quotations are not readily available or became unreliable (or if the above fair valuation methods are unavailable or determined to be unreliable) are valued at fair value as determined in good faith by or under the supervision of the Board following procedures approved by the Board. The Board has delegated to the Investment Adviser responsibility for overseeing the implementation of the Portfolio’s valuation procedures; a “Pricing Committee” comprised of employees of the Investment Adviser or its affiliates has responsibility for applying the fair valuation methods set forth in the procedures and, if a fair valuation cannot be determined pursuant to the fair valuation methods, determining the fair value of assets held by the Portfolio. Issuer specific events, transaction price, position size, nature and duration of restrictions on disposition of the security, market trends, bid/ask quotes of brokers and other market data may be reviewed in the course of making a good faith determination of a security’s fair value. Valuations change in response to many factors including the historical and prospective earnings of the issuer, the value of the issuer’s assets, general economic conditions, interest rates, investor perceptions and market liquidity. Because of the inherent uncertainties of fair valuation, the values used to determine the Portfolio’s NAV may materially differ from the value received upon actual sale of those investments. Thus, fair valuation may have an unintended dilutive or accretive effect on the value of shareholders’ investments in the Portfolio.
Each investment asset or liability of the Portfolio is assigned a level at measurement date based on the significance and source of the inputs to its valuation. Quoted prices in active markets for identical securities are classified as “Level 1,” inputs other than quoted prices for an asset or liability that are observable are classified as “Level 2” and significant unobservable inputs, including the Sub-Adviser’s or Pricing Committee’s judgment about the assumptions that a market participant would use in pricing an asset or liability are classified as “Level 3.” The inputs
12
NOTES TO FINANCIAL STATEMENTS AS OF DECEMBER 31, 2020 (CONTINUED)
NOTE 2 — SIGNIFICANT ACCOUNTING POLICIES (continued)
used for valuing securities are not necessarily an indication of the risks associated with investing in those securities. Short-term securities of sufficient credit quality are generally considered to be Level 2 securities under applicable accounting rules. The Portfolio classifies each of its investments in the Underlying Funds as Level 1, without consideration as to the classification level of the specific investments held by the Underlying Funds. A table summarizing the Portfolio’s investments under these levels of classification is included within the Portfolio of Investments.
GAAP requires a reconciliation of the beginning to ending balances for reported fair values that presents changes attributable to total realized and unrealized gains or losses, purchases and sales, and transfers in or out of the Level 3 category during the period. A reconciliation of Level 3 investments within the Portfolio of Investments is presented only when the Portfolio has a significant amount of Level 3 investments.
B. Securities Transactions and Revenue Recognition. Securities transactions are accounted for on the trade date. Dividend income received from the Underlying Funds is recognized on the ex-dividend date and is recorded as income distributions in the Statement of Operations. Capital gain distributions received from the Underlying Funds are recognized on the ex-dividend date and are recorded on the Statement of Operations as such. Realized gains and losses are reported on the basis of identified cost of securities sold.
C. Foreign Currency Translation. The books and records of the Portfolio are maintained in U.S. dollars. Any foreign currency amounts are translated into U.S. dollars on the following basis:
| (1) | | Market value of investment securities, other assets and liabilities — at the exchange rates prevailing at Market Close. |
| (2) | | Purchases and sales of investment securities, income and expenses — at the rates of exchange prevailing on the respective dates of such transactions. |
Although the net assets and the market values are presented at the foreign exchange rates at Market Close, the Portfolio does not isolate the portion of the results of operations resulting from changes in foreign exchange rates on investments from the fluctuations arising from changes in market prices of securities held. Such fluctuations are included with the net realized and unrealized gains or losses from investments. For securities which are subject to foreign withholding tax upon
disposition, liabilities are recorded on the Statement of Assets and Liabilities for the estimated tax withholding based on the securities’ current market value. Upon disposition, realized gains or losses on such securities are recorded net of foreign withholding tax.
Reported net realized foreign exchange gains or losses arise from sales of foreign currencies, currency gains or losses realized between the trade and settlement dates on securities transactions, the difference between the amounts of dividends, interest, and foreign withholding tax reclaims recorded on each Portfolio’s books, and the U.S. dollar equivalent of the amounts actually received or paid. Net unrealized foreign exchange gains and losses arise from changes in the value of assets and liabilities other than investments in securities, resulting from changes in the exchange rate. Foreign security and currency transactions may involve certain considerations and risks not typically associated with investing in U.S. companies and U.S. government securities. These risks include, but are not limited to, revaluation of currencies and future adverse political and economic developments which could cause securities and their markets to be less liquid and prices more volatile than those of comparable U.S. companies and U.S. government securities. The foregoing risks are even greater with respect to securities of issuers in emerging markets.
D. Distributions to Shareholders. The Portfolio records distributions to its shareholders on the ex-dividend date. The Portfolio declares and pays dividends and capital gain distributions, if any, annually. The Portfolio may make distributions on a more frequent basis to comply with the distribution requirements of the Internal Revenue Code. The characteristics of income and gains to be distributed are determined in accordance with income tax regulations, which may differ from GAAP for investment companies.
E. Federal Income Taxes. It is the policy of the Portfolio to comply with the requirements of subchapter M of the Internal Revenue Code and related excise tax provisions applicable to regulated investment companies and to distribute substantially all of its net investment income and any net realized capital gains to its shareholders. Therefore, no federal income tax provision is required. Management has considered the sustainability of the Portfolio’s tax positions taken on federal income tax returns for all open tax years in making this determination. No capital gain distributions shall be made until any capital loss carryforwards have been fully utilized.
The Portfolio may utilize equalization accounting for tax purposes, whereby a portion of redemption payments are treated as distributions of income or gain.
13
NOTES TO FINANCIAL STATEMENTS AS OF DECEMBER 31, 2020 (CONTINUED)
NOTE 2 — SIGNIFICANT ACCOUNTING POLICIES (continued)
F. Use of Estimates. The preparation of financial statements in conformity with GAAP requires management to make estimates and assumptions that affect the reported amounts of assets and liabilities and disclosure of contingent assets and liabilities at the date of the financial statements and the reported amounts of increases and decreases in net assets from operations during the reporting period. Actual results could differ from those estimates.
G. Indemnifications. In the normal course of business, the Trust may enter into contracts that provide certain indemnifications. The Trust’s maximum exposure under these arrangements is dependent on future claims that may be made against the Portfolio and, therefore, cannot be estimated; however, based on experience, management considers the risk of loss from such claims remote.
NOTE 3 — INVESTMENTS IN UNDERLYING FUNDS
For the year ended December 31, 2020, the cost of purchases and the proceeds from the sales of the Underlying Funds were as follows:
| Purchases | | Sales |
|---|
| $107,740,019 | | $116,632,324 |
NOTE 4 — INVESTMENT MANAGEMENT FEES
The Portfolio has entered into an investment management agreement (“Management Agreement”) with the Investment Adviser. The Investment Adviser has overall responsibility for the management of the Portfolio. The Investment Adviser oversees all investment management and portfolio management services for the Portfolio and assists in managing and supervising all aspects of the general day-to-day business activities and operations of the Portfolio, including custodial, transfer agency, dividend disbursing, accounting, auditing, compliance and related services. This Management Agreement compensates the Investment Adviser with a management fee, computed daily and payable monthly, based on: 0.20% of average daily net assets invested in affiliated Underlying Funds and 0.40% of the average daily net assets invested in unaffiliated Underlying Funds and/or other direct investments.
The Investment Adviser has entered into a sub-advisory agreement with Voya IM. Voya IM provides investment advice for the Portfolio and is paid by the Investment Adviser based on the average daily net assets of the Portfolio. Subject to such policies as the Board or the Investment Adviser may determine, Voya IM manages the
Portfolio’s assets in accordance with the Portfolio’s investment objectives, policies, and limitations.
NOTE 5 — DISTRIBUTION AND SERVICE FEES
The Trust has entered into a shareholder service plan (the “Agreement”) for the Class S shares of the Portfolio. The Agreement compensates the Distributor for the provision of shareholder services and/or account maintenance services to direct or indirect beneficial owners of Class S. Under the Agreement, the Portfolio makes payments to the Distributor at an annual rate of 0.25% of the Portfolio’s average daily net assets attributable to Class S shares.
Class ADV shares have a shareholder service and distribution plan. Class ADV shares pay a shareholder service fee of 0.25% and a distribution fee of 0.35% of the Portfolio’s average daily net assets attributable to Class ADV shares. The Distributor has contractually agreed to waive 0.30% of the distribution fee for Class ADV shares of the Portfolio, so the actual fee paid by Class ADV shares is an annual rate of 0.05%. Termination or modification of this obligation requires approval by the Board.
NOTE 6 — OTHER TRANSACTIONS WITH AFFILIATES AND RELATED PARTIES
At December 31, 2020, the following direct or indirect, wholly-owned subsidiary of Voya Financial, Inc. owned more than 5% of the Portfolio:
| Subsidiary | | Percentage |
|---|
| Voya Retirement Insurance and Annuity Company | | 5.44% |
The Portfolio has adopted a deferred compensation plan (the “DC Plan”), which allows eligible independent trustees, as described in the DC Plan, to defer the receipt of all or a portion of the trustees’ fees that they are entitled to receive from the Portfolio. For purposes of determining the amount owed to the trustee under the DC Plan, the amounts deferred are invested in shares of the funds selected by the trustee (the “Notional Funds”). When the Portfolio purchases shares of the Notional Funds, which are all advised by Voya Investments, in amounts equal to the trustees’ deferred fees, this results in a Portfolio asset equal to the deferred compensation liability. Such assets, if applicable, are included as a component of “Other assets” on the accompanying Statement of Assets and Liabilities. Deferral of trustees’ fees under the DC Plan will not affect net assets of the Portfolio, and will not materially affect the Portfolio’s assets, liabilities or net investment income per share. Amounts will be deferred until distributed in accordance with the DC Plan.
Effective January 1, 2020, the Portfolio may pay per account fees to affiliates of Voya Investments for recordkeeping services provided on certain assets. For the
14
NOTES TO FINANCIAL STATEMENTS AS OF DECEMBER 31, 2020 (CONTINUED)
NOTE 6 — OTHER TRANSACTIONS WITH AFFILIATES AND RELATED PARTIES (continued)
year ended December 31, 2020, the per account fees for affiliated recordkeeping services paid by the Portfolio were $9,709.
NOTE 7 — EXPENSE LIMITATION AGREEMENTS
The Investment Adviser has entered into a written expense limitation agreement (“Expense Limitation Agreement”) with the Portfolio whereby the Investment Adviser has agreed to limit expenses, excluding interest, taxes, investment-related costs, leverage expenses, and extraordinary expenses to the levels listed below:
| Class ADV(1)(2) | | Class I(1)(2) | | Class S(1)(2) |
|---|
| 1.55% | | 0.95% | | 1.20% |
(1) | | The operating expense limits shown take into account the operating expenses incurred at the Underlying Fund level. The amount of fees and expenses of an Underlying Fund borne by the Portfolio will vary based on the Portfolio’s allocation of assets to, and the net expenses of, a particular Underlying Fund. |
(2) | | Pursuant to a side letter through May 1, 2021, the total expense limits including the operating expenses incurred at the Underlying Fund level are 1.09%, 0.83% and 1.08% for Class ADV, Class I, and Class S, respectively. Termination or modification of this obligation requires approval by the Board. |
The Investment Adviser may at a later date recoup from the Portfolio for fees waived and/or other expenses reimbursed by the Investment Adviser during the previous 36 months, but only if, after such recoupment, the Portfolio’s expense ratio does not exceed the percentage described above. Waived and reimbursed fees net of any recoupment by the Investment Adviser of such waived and reimbursed fees are reflected on the accompanying Statement of Operations. Amounts payable by the Investment Adviser are reflected on the accompanying Statement of Assets and Liabilities.
As of December 31, 2020, the amounts of waived and/or reimbursed fees that are subject to possible recoupment by the Investment Adviser and the related expiration dates are as follows:
| December 31, | | |
| | 2021 | | | | 2022 | | | | 2023 | | | | Total | |
| | $102,272 | | | | $97,079 | | | | $69,268 | | | | $268,619 | |
The Expense Limitation Agreement is contractual through May 1, 2021 and shall renew automatically for one-year terms. Termination or modification of this obligation requires approval by the Board.
NOTE 8 — LINE OF CREDIT
Effective May 15, 2020, the Portfolio, in addition to certain other funds managed by the Investment Adviser, has entered into a 364-day unsecured committed revolving line of credit agreement (the “Credit Agreement”) with The Bank of New York Mellon (“BNY”) for an aggregate amount of $400,000,000 through May 14, 2021. The proceeds may be used only to finance temporarily: (1) the purchase or sale of investment securities; or (2) the repurchase or redemption of shares of the Portfolio or certain other funds managed by the Investment Adviser. The funds to which the line of credit is available pay a commitment fee equal to 0.15% per annum on the daily unused portion of the committed line amount payable quarterly in arrears. Prior to May 15, 2020, the predecessor line of credit was for an aggregate amount of $400,000,000 and the funds to which the line of credit was available paid a commitment fee equal to 0.15% per annum on the daily unused portion of the committed line amount through May 15, 2020.
Borrowings under the Credit Agreement accrue interest at the federal funds rate plus a specified margin. Repayments generally must be made within 60 days after the date of a revolving credit advance.
The Portfolio utilized the line of credit during the year ended December 31, 2020 as follows:
Days
Utilized | | Approximate
Average
Daily
Balance For
Days
Utilized | | Approximate
Weighted
Average
Interest Rate
For Days
Utilized |
|---|
| | 4 | | | | $627,000 | | | | 1.29% | |
15
NOTES TO FINANCIAL STATEMENTS AS OF DECEMBER 31, 2020 (CONTINUED)
NOTE 9 — CAPITAL SHARES
Transactions in capital shares and dollars were as follows:
| | | | Shares
sold | | Shares
issued in
merger | | Reinvestment
of
distributions | | Shares
redeemed | | Net increase
(decrease)
in shares
outstanding | | Shares
sold | | Proceeds
from shares
issued in
merger | | Reinvestment
of
distributions | | Shares
redeemed | | Net increase
(decrease) |
|---|
Year or
period ended | | | | # | | # | | # | | # | | # | | ($) | | ($) | | ($) | | ($) | | ($) |
|---|
| Class ADV | | | | | | | | | | | | | | | | | | | | | | | | | | | | | | | | | | | | | | | | | | |
| 12/31/2020 | | | | | 205,940 | | | | — | | | | 526,180 | | | | (1,252,326 | ) | | | (520,206 | ) | | | 2,318,317 | | | | — | | | | 5,772,190 | | | | (13,966,694 | ) | | | (5,876,187 | ) |
| 12/31/2019 | | | | | 197,096 | | | | — | | | | 676,543 | | | | (1,604,598 | ) | | | (730,959 | ) | | | 2,170,458 | | | | — | | | | 7,252,542 | | | | (17,490,257 | ) | | | (8,067,257 | ) |
Class I | | | | | | | | | | | | | | | | | | | | | | | | | | | | | | | | | | | | | | | | | | |
| 12/31/2020 | | | | | 259,890 | | | | — | | | | 50,083 | | | | (256,584 | ) | | | 53,389 | | | | 2,953,946 | | | | — | | | | 552,917 | | | | (2,900,727 | ) | | | 606,136 | |
| 12/31/2019 | | | | | 92,317 | | | | — | | | | 54,979 | | | | (211,343 | ) | | | (64,047 | ) | | | 1,008,165 | | | | — | | | | 593,230 | | | | (2,329,337 | ) | | | (727,942 | ) |
Class S | | | | | | | | | | | | | | | | | | | | | | | | | | | | | | | | | | | | | | | | | | |
| 12/31/2020 | | | | | 353 | | | | — | | | | 379 | | | | (162 | ) | | | 570 | | | | 4,119 | | | | — | | | | 4,152 | | | | (1,574 | ) | | | 6,697 | |
| 12/31/2019 | | | | | 21 | | | | — | | | | 424 | | | | (51 | ) | | | 394 | | | | 233 | | | | — | | | | 4,546 | | | | (565 | ) | | | 4,214 | |
NOTE 10 — FEDERAL INCOME TAXES
The amount of distributions from net investment income and net realized capital gains are determined in accordance with federal income tax regulations, which may differ from GAAP for investment companies. These book/tax differences may be either temporary or permanent. Permanent differences are reclassified within the capital accounts based on their federal tax-basis treatment; temporary differences are not reclassified. Key differences include the treatment of short-term capital gains and wash sale deferrals.
Dividends paid by the Portfolio from net investment income and distributions of net realized short-term capital gains are, for federal income tax purposes, taxable as ordinary income to shareholders.
The tax composition of dividends and distributions to shareholders was as follows:
Year Ended
December 31,
2020 | | Year Ended
December 31,
2019 |
|---|
Ordinary
Income | | | | Long-term
Capital Gains | | Ordinary
Income | | Long-term
Capital Gains |
|---|
| $3,100,007 | | | | $3,229,252 | | $3,458,637 | | $4,391,681 |
The tax-basis components of distributable earnings as of December 31, 2020 were:
Undistributed
Ordinary
Income | | | | Undistributed
Long-term
Capital Gains | | Unrealized
Appreciation/
(Depreciation) | |
|---|
| $5,066,274 | | | | $ | 1,001,018 | | | $ | 11,982,013 | | |
At December 31, 2020, the Portfolio did not have any capital loss carryovers for U.S. federal income tax purposes.
The Portfolio’s major tax jurisdictions are U.S. federal, Arizona state, and Massachusetts state.
As of December 31, 2020, no provision for income tax is required in the Portfolio’s financial statements as a result of
tax positions taken on federal and state income tax returns for open tax years. The Portfolio’s federal and state income and federal excise tax returns for tax years for which the applicable statutes of limitations have not expired are subject to examination by the Internal Revenue Service and state department of revenue. Generally, the preceding four tax years remain subject to examination by these jurisdictions.
NOTE 11 — LONDON INTERBANK OFFERED RATE (“LIBOR”)
The U.K. Financial Conduct Authority has announced that it intends to stop persuading or compelling banks to submit LIBOR rates after 2021, and it remains unclear whether LIBOR will continue to exist after that date and, if so, in what form. Actions by regulators have resulted in the establishment of alternative reference rates to LIBOR in many major currencies. The U.S. Federal Reserve Board, based on the recommendations of the New York Federal Reserve’s Alternative Reference Rate Committee (comprised of major derivative market participants and their regulators), has begun publishing a Secured Overnight Funding Rate (“SOFR”) that is intended to replace U.S. dollar LIBOR. Proposals for alternative reference rates for other currencies have also been announced or have already begun publication.
Discontinuance of LIBOR and adoption/implementation of alternative rates pose a number of risks, including among others whether any substitute rate will experience the market participation and liquidity necessary to provide a workable substitute for LIBOR; the effect on parties’ existing contractual arrangements, hedging transactions, and investment strategies generally from a conversion from LIBOR to alternative rates; the effect on the Portfolio’s existing investments (including, for example, fixed-income investments; senior loans; CLOs and CDOs; and derivatives transactions), including the possibility that some of those investments may terminate or their terms
16
NOTES TO FINANCIAL STATEMENTS AS OF DECEMBER 31, 2020 (CONTINUED)
NOTE 11 — LONDON INTERBANK OFFERED RATE (“LIBOR”) (continued)
may be adjusted to the disadvantage of the Portfolio; and the risk of general market disruption during the period of the conversion. It is difficult to predict at this time the likely impact of the transition away from LIBOR on the Portfolio. On November 30, 2020, the administrator of LIBOR announced a delay in the phase out of a majority of the U.S. dollar LIBOR publications until June 30, 2023, with the remainder of LIBOR publications to still end at the end of 2021.
NOTE 12 — MARKET DISRUPTION
The Portfolio is subject to the risk that geopolitical events will disrupt securities markets and adversely affect global economies and markets. Due to the increasing interdependence among global economies and markets, conditions in one country, market, or region might adversely impact markets, issuers and/or foreign exchange rates in other countries, including the United States. War, terrorism, global health crises and pandemics, and other geopolitical events have led, and in the future may lead, to increased market volatility and may have adverse short- or long-term effects on U.S. and world economies and markets generally. For example, the COVID-19 pandemic has resulted, and may continue to result, in significant market volatility, exchange trading suspensions and closures, declines in global financial markets, higher default rates, and a substantial economic downturn in economies throughout the world. Natural and environmental disasters and systemic market dislocations are also highly disruptive to economies and markets. Those events as well as other changes in non-U.S. and domestic economic, social, and political conditions also could adversely affect individual issuers or related groups of issuers, securities markets, interest rates, credit ratings, inflation, investor sentiment, and other factors affecting the value of the investments of the portfolio and of the Portfolio. Any of these occurrences could disrupt the operations of the Portfolio and of the Portfolio’s service providers.
NOTE 13 — OTHER ACCOUNTING PRONOUNCEMENTS
The Portfolio has adopted the provisions of Financial Accounting Standards Board Accounting Standards Update 2018-13 (“ASU 2018-13”), Fair Value Measurement (Topic 820): Disclosure Framework — Changes to the Disclosure Requirements for Fair Value Measurement. ASU 2018-13 introduces new fair value disclosure requirements as well as provides guidance that eliminates, adds and modifies certain disclosure requirements for fair value measurements. The impact of the Portfolio’s adoption was limited to changes in the Portfolio’s financial statement disclosures regarding fair value, primarily those disclosures related to transfers between levels of the fair value hierarchy and disclosure of the range and weighted average used to develop significant unobservable inputs for Level 3 fair value measurements, when applicable. Upon evaluation, the Portfolio has concluded that the adoption of the new accounting standard does not materially impact the financial statement amounts.
In March 2020, the Financial Accounting Standards Board issued Accounting Standards Update No. 2020-04 (“ASU 2020-04”), Reference Rate Reform (Topic 848) — Facilitation of the Effects of Reference Rate Reform on Financial Reporting. The amendments in ASU 2020-04 provide optional temporary financial reporting relief from the effect of certain types of contract modifications due to the planned discontinuation of LIBOR and other interbank-offered based reference rates as of the end of 2021. ASU 2020-04 is effective for certain reference rate-related contract modifications that occur during the period March 12, 2020 through December 31, 2022. Management is currently evaluating the impact, if any, of applying ASU 2020-04.
NOTE 14 — SUBSEQUENT EVENTS
The Portfolio has evaluated events occurring after the Statement of Assets and Liabilities date through the date that the financials statements were issued (“subsequent events”) to determine whether any subsequent events necessitated adjustment to or disclosure in the financial statements. No such subsequent events were identified.
17
VOYA GLOBAL PERSPECTIVES® PORTFOLIO | PORTFOLIO OF INVESTMENTS
AS OF DECEMBER 31, 2020 |
| Shares | | | | | | Value | | | Percentage
of Net
Assets |
|---|
| | | | | | | | | | | | | |
|---|
MUTUAL FUNDS: 100.1% |
| | | | | Affiliated Investment Companies: 100.1% |
| 431,854 | | | | Voya Emerging Markets Index Portfolio — Class I | | $ | 5,968,219 | | | | 5.6 | |
| 1,795,407 | | | | Voya Global Bond Fund — Class R6 | | | 18,187,469 | | | | 17.0 | |
| 2,019,349 | | | | Voya GNMA Income Fund — Class R6 | | | 17,346,211 | | | | 16.2 | |
| 1,845,507 | | | | Voya High Yield Portfolio — Class I | | | 18,399,706 | | | | 17.2 | |
| 192,884 | | | | Voya Index Plus LargeCap Portfolio — Class I | | | 5,676,567 | | | | 5.3 | |
| 518,680 | | | | Voya International Index Portfolio — Class I | | | 5,752,163 | | | | 5.4 | |
| 326,932 | | | | Voya MidCap Opportunities Portfolio — Class R6 | | | 6,058,058 | | | | 5.7 | |
| Shares | | | | | | Value | | | Percentage
of Net
Assets |
|---|
| | | | | | | | | | | | | |
|---|
MUTUAL FUNDS: (continued) |
| | | | | Affiliated Investment Companies: (continued) |
| 353,576 | | | | Voya Small Company Portfolio — Class R6 | | $ | 6,576,518 | | | | 6.2 | |
| 1,526,969 | | | | Voya U.S. Bond Index Portfolio — Class I | | | 17,285,290 | | | | 16.2 | |
| 533,480 | | | | VY® Clarion Global Real Estate Portfolio — Class I | | | 5,628,217 | | | | 5.3 | |
| | | | | | | | | | | | | |
| | | | | Total Mutual Funds
(Cost $94,057,728) | | | 106,878,418 | | | | 100.1 | |
| | | | | Liabilities in Excess of Other Assets | | | (67,010 | ) | | | (0.1 | ) |
| | | | | Net Assets | | $ | 106,811,408 | | | | 100.0 | |
Fair Value Measurementsˆ
The following is a summary of the fair valuations according to the inputs used as of December 31, 2020 in valuing the assets and liabilities:
| | Quoted Prices
in Active Markets
for Identical
Investments
(Level 1) | | Significant
Other
Observable
Inputs
(Level 2) | | Significant
Unobservable
Inputs
(Level 3) | | Fair Value
at
December 31, 2020 |
|---|
Asset Table | | | | | | | | | | | | | | | | | | | | |
Investments, at fair value | | | | | | | | | | | | | | | | | | | | |
| Mutual Funds | | | $ | 106,878,418 | | | | $ | — | | | | $ | — | | | | $ | 106,878,418 | |
| Total Investments, at fair value | | | $ | 106,878,418 | | | | $ | — | | | | $ | — | | | | $ | 106,878,418 | |
ˆ See Note 2, “Significant Accounting Policies” in the Notes to Financial Statements for additional information.
Transactions with Affiliates
An investment of at least 5% of the voting securities of an issuer, or a company which is under common control with the issuer, results in that issuer becoming an affiliated person as defined by the 1940 Act.
The following table provides transactions during the year ended December 31, 2020, where the following issuers were considered an affiliate:
| Issuer | | | | Beginning
Fair Value
at 12/31/19 | | Purchases
at Cost | | Sales
at Cost | | Change in
Unrealized
Appreciation/
(Depreciation) | | Ending
Fair Value
at 12/31/20 | | Investment
Income | | Realized
Gains/
(Losses) | | Net
Capital Gain
Distributions |
|---|
| Voya Emerging Markets Index Portfolio — Class I | | | | $ | 10,939,364 | | | $ | 5,897,211.00 | | | $ | (11,232,536 | ) | | $ | 364,180 | | | $ | 5,968,219 | | | $ | 379,467 | | | $ | 1,315,150 | | | $ | — | |
| Voya Global Bond Fund —Class R6 | | | | | 9,969,103 | | | | 17,538,848 | | | | (10,228,286 | ) | | | 907,804 | | | | 18,187,469 | | | | 641,671 | | | | (412,680 | ) | | | — | |
| Voya GNMA Income Fund — Class I | | | | | 9,943,567 | | | | 18,036,468 | | | | (27,955,948 | ) | | | (24,087 | ) | | | — | | | | 239,410 | | | | 163,147 | | | | — | |
| Voya GNMA Income Fund — Class R6 | | | | | — | | | | 18,504,341 | | | | (1,212,360 | ) | | | 54,230 | | | | 17,346,211 | | | | 155,176 | | | | 12,124 | | | | — | |
| Voya High Yield Portfolio — Class I | | | | | 10,137,183 | | | | 17,665,223 | | | | (9,996,972 | ) | | | 594,272 | | | | 18,399,706 | | | | 863,110 | | | | (987,389 | ) | | | 1 | |
| Voya Index Plus LargeCap Portfolio — Class I | | | | | 10,729,830 | | | | 6,360,949 | | | | (11,461,126 | ) | | | 46,914 | | | | 5,676,567 | | | | 167,985 | | | | 902,433 | | | | 944,805 | |
| Voya International Index Portfolio — Class I | | | | | 10,624,045 | | | | 5,772,470 | | | | (10,805,341 | ) | | | 160,989 | | | | 5,752,163 | | | | 297,960 | | | | 963,931 | | | | — | |
| Voya MidCap Opportunities Portfolio — Class I | | | | | 10,544,892 | | | | 5,635,396 | | | | (15,387,833 | ) | | | (792,455 | ) | | | — | | | | 6,255 | | | | 1,283,220 | | | | 580,136 | |
| Voya MidCap Opportunities Portfolio — Class R6 | | | | | — | | | | 3,781,905 | | | | (23,808 | ) | | | 2,299,961 | | | | 6,058,058 | | | | — | | | | 15,698 | | | | — | |
See Accompanying Notes to Financial Statements
18
VOYA GLOBAL PERSPECTIVES® PORTFOLIO | PORTFOLIO OF INVESTMENTS
AS OF DECEMBER 31, 2020 (CONTINUED) |
| Issuer | | Beginning
Fair Value
at 12/31/19 | | Purchases
at Cost | | Sales
at Cost | | Change in
Unrealized
Appreciation/
(Depreciation) | | Ending
Fair Value
at 12/31/20 | | Investment
Income | | Realized
Gains/
(Losses) | | Net
Capital Gain
Distributions |
|---|
| Voya Small Company Portfolio — Class I | | | $ | 10,707,882 | | | | $ | 6,230,742 | | | | $ | (18,075,115 | ) | | | $ | 1,136,491 | | | | $ | — | | | | $ | 65,446 | | | | $ | (1,751,136 | ) | | | $ | 195,380 | |
| Voya Small Company Portfolio — Class R6 | | | | — | | | | | 3,958,636 | | | | | (23,406 | ) | | | | 2,641,288 | | | | | 6,576,518 | | | | | — | | | | | 16,100 | | | | | — | |
| Voya U.S. Bond Index Portfolio — Class I | | | | 9,903,706 | | | | | 18,274,575 | | | | | (10,870,084 | ) | | | | (22,907 | ) | | | | 17,285,290 | | | | | 409,923 | | | | | 550,373 | | | | | 50,035 | |
| VY® Clarion Global Real Estate Portfolio — Class I | | | | 10,134,388 | | | | | 6,276,015 | | | | | (10,594,577 | ) | | | | (187,609 | ) | | | | 5,628,217 | | | | | 324,764 | | | | | 270,830 | | | | | 452,705 | |
| | | | $ | 103,633,960 | | | | $ | 133,932,779 | | | | $ | (137,867,392 | ) | | | $ | 7,179,071 | | | | $ | 106,878,418 | | | | $ | 3,551,167 | | | | $ | 2,341,801 | | | | $ | 2,223,062 | |
The financial statements for the above mutual fund[s] can be found at www.sec.gov.
At December 31, 2020, the aggregate cost of securities and other investments and the composition of unrealized appreciation and depreciation of securities and other investments on a tax basis were:
| Cost for federal income tax purposes was $94,896,405. |
| Net unrealized appreciation consisted of: | | | | | | |
| Gross Unrealized Appreciation | | | | $ | 11,982,013 | |
| Gross Unrealized Depreciation | | | | | — | |
| Net Unrealized Appreciation | | | | $ | 11,982,013 | |
See Accompanying Notes to Financial Statements
19
TAX INFORMATION (UNAUDITED)
Dividends and distributions paid during the year ended December 31, 2020 were as follows:
| Portfolio Name | | Type | | Per Share Amount |
|---|
| Voya Global Perspectives® Portfolio | | | | | | |
| Class ADV | | NII | | $ | 0.3542 | |
| Class I | | NII | | $ | 0.3910 | |
| Class S | | NII | | $ | 0.3641 | |
| All Classes | | STCG | | $ | 0.0006 | |
| All Classes | | LTCG | | $ | 0.3728 | |
NII — Net investment income
STCG — Short-term capital gain
LTCG — Long-term capital gain
Of the ordinary distributions made during the year ended December 31, 2020, 11.51% qualifies for the dividends received deduction (DRD) available to corporate shareholders.
The Portfolio designates $3,229,252 of long-term capital gain distributions as 20% rate long-term capital gain dividends under Internal Revenue Code Section 852(b)(3)(C).
The Regulated Investment Company Modernization Act of 2010 allows qualified fund-of-funds to elect to pass through the ability to take foreign tax credits (or deductions) to the extent that foreign taxes are passed through from underlying funds. A qualified fund-of-funds is a regulated investment company that has at least 50% of the value of its total assets invested in other regulated investment companies at the end of each quarter of the taxable year. Pursuant to Section 853 of the Internal Revenue Code, the Portfolio designates the following amount as foreign taxes paid for the year ended December 31, 2020:
Creditable
Foreign
Taxes Paid | | Per Share
Amount | | Portion of Ordinary Income
Distribution Derived from
Foreign Sourced Income* |
|---|
| $18,048 | | $0.0021 | | 11.76% |
| * | | The Portfolio listed above did not derive any income from ineligible foreign sources as defined under Section 901(j) of the Internal Revenue Code. |
Foreign taxes paid or withheld must be included in taxable income with an offsetting deduction from gross income or as a credit for taxes paid to foreign governments. Shareholders are strongly advised to consult their own tax advisors regarding the appropriate treatment of foreign taxes paid.
Above figures may differ from those cited elsewhere in this report due to differences in the calculation of income and gains under U.S. generally accepted accounting principles (book) purposes and Internal Revenue Service (tax) purposes.
Shareholders are strongly advised to consult their own tax advisers with respect to the tax consequences of their investments in the Portfolio. In January, shareholders, excluding corporate shareholders, receive an IRS 1099-DIV regarding the federal tax status of the dividends and distributions they received in the calendar year.
20
TRUSTEE AND OFFICER INFORMATION (UNAUDITED)
The business and affairs of the Trust are managed under the direction of the Board. A Trustee, who is not an interested person of the Trust, as defined in the 1940 Act, is an independent trustee (“Independent Trustee”). The Trustees and Officers of the Trust are listed below. The Statement of Additional Information includes additional information about Trustees of the Trust and is available, without charge, upon request at (800) 366-0066.
| Name, Address and Age | | Position(s)
Held with
the Trust | | Term of Office
and Length of
Time Served(1) | | Principal Occupation(s) —
During the Past 5 Years | | Number of
funds in
Fund
Complex
Overseen by
Trustee(2) | | Other Board Positions
Held by Trustee |
|---|
| | | | | | | | | | | |
Independent Trustees: | | | | | | |
| | | | | | | | | | | |
Colleen D. Baldwin
7337 East Doubletree Ranch Rd.
Suite 100
Scottsdale, Arizona 85258
Age: 60 | | Trustee
Chairperson | | November
2007–Present
January
2020–Present | | President, Glantuam Partners, LLC, a business consulting firm (January
2009–Present). | | 133 | | Dentaquest (February 2014–Present); RSR Partners, Inc.
(2016–Present). |
| | | | | | | | | | | |
John V. Boyer
7337 East Doubletree Ranch Rd.
Suite 100
Scottsdale, Arizona 85258
Age: 67 | | Trustee | | January
2005–Present | | Retired. Formerly, President and Chief Executive Officer, Bechtler Arts Foundation, an arts and education foundation (January 2008– December 2019). | | 133 | | None. |
| | | | | | | | | | | |
Patricia W. Chadwick
7337 East Doubletree Ranch Rd.
Suite 100
Scottsdale, Arizona 85258
Age: 72 | | Trustee | | January
2006–Present | | Consultant and President, Ravengate Partners LLC, a consulting firm that provides advice regarding financial markets and the global economy (January 2000– Present). | | 133 | | Wisconsin Energy Corporation (June 2006–Present); The Royce Funds (22 funds) (December 2009– Present); and AMICA Mutual Insurance Company
(1992–Present). |
| | | | | | | | | | | |
Martin J. Gavin
7337 East Doubletree Ranch Rd. Suite 100
Scottsdale, AZ 85258
Age: 70 | | Trustee | | August
2015–Present | | Retired. Formerly, President and Chief Executive Officer, Connecticut Children’s Medical Center (May 2006– November 2015). | | 133 | | None. |
| | | | | | | | | | | |
Joseph E. Obermeyer
7337 East Doubletree Ranch Rd.
Suite 100
Scottsdale, Arizona 85258
Age: 63 | | Trustee | | May
2013–Present | | President, Obermeyer & Associates, Inc., a provider of financial and economic consulting services (November
1999–Present). | | 133 | | None. |
| | | | | | | | | | | |
Sheryl K. Pressler
7337 East Doubletree Ranch Rd.
Suite 100
Scottsdale, Arizona 85258
Age: 70 | | Trustee | | January
2006–Present | | Consultant (May
2001–Present). | | 133 | | None. |
| | | | | | | | | | | |
Christopher P. Sullivan
7337 East Doubletree Ranch Rd.
Suite 100
Scottsdale, Arizona 85258
Age: 67 | | Trustee | | October
2015–Present | | Retired. | | 133 | | None. |
21
TRUSTEE AND OFFICER INFORMATION (UNAUDITED) (CONTINUED)
| Name, Address and Age | | Position(s)
Held with
the Trust | | Term of Office
and Length of
Time Served(1) | | Principal Occupation(s) —
During the Past 5 Years | | Number of
funds in
Fund
Complex
Overseen by
Trustee(2) | | Other Board Positions
Held by Trustee |
|---|
| Trustee who is an “interested person”: | | | | | | |
| | | | | | | | | | | |
Dina Santoro
230 Park Avenue
New York, New York 10169
Age: 47 | | Trustee | | July
2018–Present | | President, Voya Investments, LLC and Voya Capital, LLC (March 2018–Present); Senior Vice President, Voya Investments Distributor, LLC (April 2018–Present); Senior Managing Director, Head of Product and Marketing Strategy, Voya Investment Management (September 2017–Present). Formerly, Managing Director, Quantitative Management Associates, LLC (January 2004–August 2017). | | 133 | | Voya Investments, LLC, Voya Capital, LLC, and Voya Funds Services, LLC (March 2018–Present); Voya Investments Distributor, LLC (April
2018–Present). |
(1) | | Trustees serve until their successors are duly elected and qualified. The tenure of each Trustee who is not an “interested person” as defined in the 1940 Act, of each Portfolio (“Independent Trustee”) is subject to the Board’s retirement policy which states that each duly elected or appointed Independent Trustee shall retire from and cease to be a member of the Board of Trustees at the close of business on December 31 of the calendar year in which the Independent Trustee attains the age of 75. A majority vote of the Board’s other Independent Trustees may extend the retirement date of an Independent Trustee if the retirement would trigger a requirement to hold a meeting of shareholders of the Trust under applicable law, whether for the purposes of appointing a successor to the Independent Trustee or otherwise comply under applicable law, in which case the extension would apply until such time as the shareholder meeting can be held or is no longer required (as determined by a vote of a majority of the other Independent Trustees). |
(2) | | For the purposes of this table, “Fund Complex” means the Voya family of funds including the following investment companies: Voya Asia Pacific High Dividend Equity Income Fund; Voya Balanced Portfolio, Inc.; Voya Emerging Markets High Dividend Equity Fund; Voya Equity Trust; Voya Funds Trust; Voya Global Advantage and Premium Opportunity Fund; Voya Global Equity Dividend and Premium Opportunity Fund; Voya Government Money Market Portfolio; Voya Infrastructure, Industrials and Materials Fund; Voya Intermediate Bond Portfolio; Voya International High Dividend Equity Income Fund; Voya Investors Trust; Voya Mutual Funds; Voya Natural Resources Equity Income Fund; Voya Partners, Inc.; Voya Senior Income Fund; Voya Separate Portfolios Trust; Voya Strategic Allocation Portfolios, Inc.; Voya Variable Funds; Voya Variable Insurance Trust; Voya Variable Portfolios, Inc.; and Voya Variable Products Trust. The number of funds in the Fund Complex is as of January 31, 2021. |
22
TRUSTEE AND OFFICER INFORMATION (UNAUDITED) (CONTINUED)
| Name, Address and Age | | Position(s)
Held With
the Trust | | Term of Office and Length
of Time Served(1) | | Principal Occupation(s) —
During the Past 5 Years |
|---|
| | | | | | | |
Michael Bell
One Orange Way
Windsor, Connecticut 06095
Age: 52 | | Chief Executive Officer | | March 2018–Present | | Chief Executive Officer and Director, Voya Investments, LLC, Voya Capital, LLC, and Voya Funds Services, LLC (March 2018–Present); Senior Vice President and Chief Financial Officer, Voya Investments Distributor, LLC (September 2019–Present); Chief Financial Officer, Voya Investment Management (September
2014–Present). Formerly, Senior Vice President, Chief Financial Officer and Treasurer, Voya Investments, LLC (November
2015–March 2018). |
| | | | | | | |
Dina Santoro
230 Park Avenue
New York, New York 10169
Age: 47 | | President | | March 2018–Present | | President and Director, Voya Investments, LLC and Voya Capital, LLC (March 2018–Present); Director, Voya Funds Services, LLC (March 2018–Present); Director and Senior Vice President, Voya Investments Distributor, LLC (April 2018–Present); Senior Managing Director, Head of Product and Marketing Strategy, Voya Investment Management (September 2017–Present). Formerly, Managing Director, Quantitative Management Associates, LLC (January
2004–August 2017). |
| | | | | | | |
Jonathan Nash
230 Park Avenue
New York, New York 10169
Age: 53 | | Executive Vice President
Chief Investment Risk Officer | | March 2020–Present
March 2020–Present | | Senior Vice President, Investment Risk Management, Voya Investment Management (March 2017–Present); Formerly, Consultant, DA Capital LLC (January 2016–March 2017); Managing Director, Enterprise Risk, American International Group (AIG) (September
2014–March 2015). |
| | | | | | | |
James M. Fink
5780 Powers Ferry Road NW
Atlanta, Georgia 30327
Age: 62 | | Executive Vice President | | March 2018–Present | | Managing Director, Voya Investments, LLC, Voya Capital, LLC, and Voya Funds Services, LLC (March 2018–Present); Senior Vice President, Voya Investments Distributor, LLC (April 2018–Present); Chief Administrative Officer, Voya Investment Management (September 2017–Present). Formerly, Managing Director, Operations, Voya Investment Management (March
1999–September 2017). |
| | | | | | | |
Kevin M. Gleason
7337 East Doubletree Ranch Rd.
Suite 100
Scottsdale, Arizona 85258
Age: 54 | | Chief Compliance Officer | | February 2012–Present | | Senior Vice President, Voya Investment Management and Chief Compliance Officer, Voya Family of Funds (February
2012–Present). |
| | | | | | | |
Todd Modic
7337 East Doubletree Ranch Rd.
Suite 100
Scottsdale, Arizona 85258
Age: 53 | | Senior Vice President, Chief/Principal Financial Officer and Assistant Secretary | | March 2005–Present | | President, Voya Funds Services, LLC (March 2018–Present) and Senior Vice President, Voya Investments, LLC (April
2005–Present). |
| | | | | | | |
Kimberly A. Anderson
7337 East Doubletree Ranch Rd.
Suite 100
Scottsdale, Arizona 85258
Age: 56 | | Senior Vice President | | November 2003–Present | | Senior Vice President, Voya Investments, LLC (September
2003 Present). |
| | | | | | | |
Micheline S. Faver
7337 East Doubletree Ranch Rd.
Suite 100
Scottsdale, Arizona 85258
Age: 43 | | Senior Vice President | | September 2020–Present | | Vice President, Head of Fund Compliance and Chief Compliance Officer, Voya Investments, LLC (June 2016–Present). Formerly, Vice President, Mutual Fund Compliance (March
2014–June 2016). |
| | | | | | | |
Robert Terris
5780 Powers Ferry Road NW
Atlanta, Georgia 30327
Age: 50 | | Senior Vice President | | May 2006–Present | | Senior Vice President, Voya Investments Distributor, LLC (April 2018–Present); Senior Vice President, Head of Investment Services, Voya Investments, LLC (April 2018–Present) and Voya Funds Services, LLC (March 2006 Present). Formerly, Senior Vice President, Head of Division Operations, Voya Investments, LLC (October
2015–April 2018). |
23
TRUSTEE AND OFFICER INFORMATION (UNAUDITED) (CONTINUED)
| Name, Address and Age | | Position(s)
Held With
the Trust | | Term of Office and Length
of Time Served(1) | | Principal Occupation(s) —
During the Past 5 Years |
|---|
| | | | | | | |
Fred Bedoya
7337 East Doubletree Ranch Rd.
Suite 100
Scottsdale, Arizona 85258
Age: 48 | | Vice President
and Treasurer | | September 2012–Present | | Vice President, Voya Investments, LLC (October
2015–Present) and Voya Funds Services, LLC (July
2012–Present). |
| | | | | | | |
Maria M. Anderson
7337 East Doubletree Ranch Rd.
Suite 100
Scottsdale, Arizona 85258
Age: 62 | | Vice President | | September 2004–Present | | Vice President, Voya Investments, LLC (October
2015–Present) and Voya Funds Services, LLC (September
2004–Present). |
| | | | | | | |
Sara M. Donaldson
7337 East Doubletree Ranch Rd.
Suite 100
Scottsdale, Arizona 85258
Age: 61 | | Vice President | | September 2014–Present | | Vice President, Voya Investments, LLC (October
2015–Present). |
| | | | | | | |
Robyn L. Ichilov
7337 East Doubletree Ranch Rd.
Suite 100
Scottsdale, Arizona 85258
Age: 53 | | Vice President | | November 1999–Present | | Vice President, Voya Funds Services, LLC (November
1995–Present) and Voya Investments, LLC (August
1997–Present). |
| | | | | | | |
Jason Kadavy
7337 East Doubletree Ranch Rd.
Suite 100
Scottsdale, Arizona 85258
Age: 44 | | Vice President | | September 2012–Present | | Vice President, Voya Investments, LLC (October
2015–Present) and Voya Funds Services, LLC (July
2007–Present). |
| | | | | | | |
Andrew K. Schlueter
7337 East Doubletree Ranch Rd.
Suite 100
Scottsdale, Arizona 85258
Age: 44 | | Vice President | | March 2018–Present | | Vice President, Voya Investments Distributor, LLC (April 2018–Present); Vice President, Voya Investments, LLC and Voya Funds Services, LLC (March 2018–Present); Vice President, Head of Mutual Fund Operations, Voya Investment Management (February
2018– Present). Formerly, Vice President, Voya Investment Management (March
2014– February 2018). |
| | | | | | | |
Craig Wheeler
7337 East Doubletree Ranch Rd.
Suite 100
Scottsdale, Arizona 85258
Age: 51 | | Vice President | | May 2013–Present | | Vice President–Director of Tax, Voya Investments, LLC (October 2015–Present). |
| | | | | | | |
Monia Piacenti
One Orange Way
Windsor, Connecticut 06095
Age: 44 | | Anti-Money Laundering Officer | | June 2018–Present | | Anti-Money Laundering Officer, Voya Investments Distributor, LLC, Voya Investment Management and Voya Investment Management Trust Co. (June 2018–Present); Compliance Consultant, Voya Financial, Inc. (January 2019–Present). Formerly, Senior Compliance Officer, Voya Investment Management (December 2009– December 2018). |
| | | | | | | |
Joanne F. Osberg
7337 East Doubletree Ranch Rd.
Suite 100
Scottsdale, Arizona 85258
Age: 39 | | Secretary | | September 2020–Present | | Vice President and Senior Counsel, Voya Investment Management — Mutual Fund Legal Department (September 2020–Present). Formerly, Vice President, Counsel II, Voya Investment Management — Mutual Fund Legal Department (January 2013–September 2020). |
| | | | | | | |
Paul A. Caldarelli
7337 East Doubletree Ranch Rd.
Suite 100
Scottsdale, Arizona 85258
Age: 69 | | Assistant Secretary | | June 2010–Present | | Vice President and Senior Counsel, Voya Investment Management — Mutual Fund Legal Department (March
2010–Present). |
(1) | | The Officers hold office until the next annual meeting of the Board of Trustees and until their successors shall have been elected and qualified. |
24
ADVISORY AND SUB-ADVISORY CONTRACT APPROVAL DISCUSSION (UNAUDITED)
BOARD CONSIDERATION AND APPROVAL OF INVESTMENT MANAGEMENT CONTRACTS AND SUB-ADVISORY CONTRACTS
At a meeting held on November 19, 2020, the Board of Trustees (“Board”) of Voya Investors Trust (the “Trust”), including a majority of the Board members who have no direct or indirect interest in the management and sub-advisory contracts, and who are not “interested persons” of Voya Global Perspectives® Portfolio, a series of the Trust (the “Portfolio”), as such term is defined under the Investment Company Act of 1940, as amended (the “Independent Trustees”), considered and approved the renewal of the investment management contract (the “Management Contract”) between Voya Investments, LLC (the “Manager”) and the Trust, on behalf of the Portfolio, and the sub-advisory contract (the “Sub-Advisory Contract,” and together with the Management Contract, the “Contracts”) with Voya Investment Management Co. LLC, the sub-adviser to the Portfolio (the “Sub-Adviser”) for an additional one year period ending November 30, 2021.
In addition to the Board meeting on November 19, 2020, the Independent Trustees also held meetings outside the presence of personnel representing the Manager or Sub-Adviser (collectively, such persons are referred to herein as “management”) on October 8, 2020, and November 17, 2020. At those meetings the Board reviewed and considered materials related to the proposed continuance of the Contracts that they had requested and believed to be relevant to the renewal of the Contracts in light of their own business judgment and the legal advice furnished to them by K&L Gates LLP, their independent legal counsel. The Board also considered information furnished to it throughout the year at meetings of the Board and its committees, including information regarding performance, expenses, and other matters. While the Board considered the renewal of the management contracts and sub-advisory contracts for all of the applicable investment companies in the Voya family of funds at the same meetings, the Board considered each Voya fund’s investment management and sub-advisory relationships separately.
The Board has established a Contracts Committee and Investment Review Committees (the “IRCs”), each of which includes only Independent Trustees as members. The Contracts Committee meets several times throughout the year to provide oversight with respect to the management and sub-advisory contracts approval and renewal process for each Voya fund, among other functions, and each IRC meets several times throughout the year with respect to each Voya fund that is assigned to that IRC to provide oversight regarding the investment performance of the sub-advisers, as well as the Manager’s role in monitoring the sub-advisers.
The Contracts Committee oversees, and annually recommends Board approval of updates to, a methodology guide for the Voya funds (“Methodology Guide”), which sets out a framework pursuant to which the Independent Trustees request, and management provides, certain information that the Independent Trustees deem to be important or potentially relevant. The Independent Trustees retain the services of an independent consultant with experience in the mutual fund industry to assist the Contracts Committee in developing and recommending to the Board: (1) a selected peer group of investment companies for the Portfolio (“Selected Peer Group”) based on the Portfolio’s particular attributes, such as fund type and size, fund category (as determined by Morningstar, Inc., an independent provider of mutual fund data (“Morningstar”)), sales channels and structure and the Portfolio share class being compared to the Selected Peer Group; and (2) updates to the Methodology Guide with respect to the content and format of various data prepared in connection with the renewal process, including, but not limited to, investment performance, fee structure, and expense information. In addition, the Independent Trustees periodically have retained an independent firm to test and verify the accuracy of certain information presented to the Board for a representative sample of the Voya funds.
The Manager or Sub-Adviser may not have been able to, or opted not to, provide information in response to certain information requests, in which case the Board conducted its evaluation of the firm based on information that was provided. In such cases, the Board determined that the omission of any such information was not material to its considerations. Additionally, the Board considered the impact of significant market volatility that occurred during and after the period for which information was requested in conducting its evaluation of the Manager and Sub-Adviser.
Provided below is an overview of certain material factors that the Board considered at its meetings regarding the renewal of the Contracts and the compensation to be paid thereunder. The Board members did not identify any particular information or factor that was most relevant to its consideration, and each Board member may have accorded different weight to the various factors in reaching his or her conclusions with respect to the Portfolio’s investment management and sub-advisory arrangements.
Nature, Extent and Quality of Services
The Manager oversees, subject to the authority of the Board, and is responsible for the provision of, all investment advisory and portfolio management services for the Portfolio but may delegate certain of these responsibilities to one or more sub-advisers. In addition, the Manager provides administrative services reasonably necessary for the operation of the Portfolio as set forth in the
25
ADVISORY AND SUB-ADVISORY CONTRACT APPROVAL DISCUSSION (UNAUDITED) (CONTINUED)
Management Contract, including oversight of the Portfolio’s operations and risk management and the oversight of its various other service providers.
The Board considered the “manager-of-managers” platform of the Voya funds that has been developed by the Manager pursuant to which the Manager selects, subject to the Board’s approval, sub-advisers to provide day-to-day management services to all or a portion of each Voya fund. The Board recognized that the Manager is responsible for monitoring the investment program, performance, developments, ongoing operations, and compliance with applicable regulations and investment policies and restrictions of the Sub-Adviser with respect to the Portfolio under this manager-of-managers arrangement. The Board also considered the techniques and resources that the Manager has developed to provide this ongoing oversight and due diligence with respect to the sub-advisers and to advocate or recommend, when it believes appropriate, changes in investment strategies or investment sub-advisers designed to assist in improving a Voya fund’s performance. In connection with the Manager’s performance of these duties, the Board considered that the Manager has developed an oversight process formulated by its Manager Research & Selection Group which reviews, among other matters, performance data, the Sub-Adviser’s management team, portfolio data and attribution analysis related to the Sub-Adviser through various means, including, but not limited to, in-person meetings, on-site or virtual visits, and telephonic meetings with the Sub-Adviser.
Further, the Board considered periodic compliance reports it receives from the Trust’s Chief Compliance Officer evaluating whether the regulatory compliance systems and procedures of the Manager and the Sub-Adviser are reasonably designed to ensure compliance with the federal securities laws and whether the investment policies and restrictions for the Portfolio are consistently complied with, and other periodic reports covering related matters.
The Board considered the portfolio management team assigned by the Sub-Adviser to the Portfolio and the level of resources committed to the Portfolio (and other relevant funds in the Voya funds) by the Manager and the Sub-Adviser, and whether those resources are sufficient to provide high-quality services to the Portfolio.
Based on their deliberations and the materials presented to them, the Board concluded that the nature, extent and quality of the overall services provided by the Manager and Sub-Adviser under the Contracts were appropriate.
Portfolio Performance
In assessing the investment management and sub-advisory relationships, the Board placed emphasis on the investment returns of the Portfolio, including its investment
performance over certain time periods compared to the Portfolio’s Morningstar category and primary benchmark, a broad-based securities market index identified in the Portfolio’s prospectus. The Board also considered information from the Manager Research & Selection Group and received reports summarizing a separate analysis of the Portfolio’s performance and risk, including risk-adjusted investment return information, from the Trust’s Chief Investment Risk Officer.
Economies of Scale
When evaluating the reasonableness of the management fee schedule, the Board considered whether economies of scale have been or likely will be realized by the Manager and Sub-Adviser as the Portfolio grows larger and the extent to which any such economies are shared with the Portfolio. The Board considered that, while the Portfolio does not have management fee breakpoints, it has fee waiver and expense reimbursement arrangements. The Board considered the extent to which economies of scale realized by the Manager could be shared with the Portfolio through such fee waivers, expense reimbursements or other expense reductions. The Board also considered the impact of fee waiver and expense reimbursement arrangements in instances where a share class of the Portfolio is operating such that its expense ratio is below the expense limit applicable to that share class. In evaluating these matters, the Board also considered periodic management reports, Selected Peer Group comparisons, and industry information regarding economies of scale.
Information Regarding Services, Performance, and Fee Schedules Offered to Other Clients
The Board considered comparative information regarding the nature of services, performance, and fee schedules offered by the Manager and Sub-Adviser to other clients with similar investment objectives, if applicable, including other registered investment companies and relevant institutional accounts. When the fee schedules offered to or the performance of such other clients differed materially from the Portfolio, the Board took into account the underlying rationale provided by the Manager or the Sub-Adviser, as applicable, for these differences.
Fee Schedules, Profitability, and Fall-out Benefits
The Board reviewed and considered the contractual management fee schedule and net management fee rate payable by the Portfolio to the Manager compared to the Portfolio’s Selected Peer Group. The Board also considered the compensation payable by the Manager to the Sub-Adviser for sub-advisory services for the Portfolio, including the portion of the contractual and net management fee rates that are paid to the Sub-Adviser, as compared to the compensation paid to the Manager. In addition, the Board considered the fee waivers, expense
26
ADVISORY AND SUB-ADVISORY CONTRACT APPROVAL DISCUSSION (UNAUDITED) (CONTINUED)
limitations, and recoupment arrangements that apply to the fees payable by the Portfolio, including whether the Manager intends to propose any changes thereto. The Board separately determined that the fees payable to the Manager and the fee schedule payable to the Sub-Adviser are reasonable for the services that each performs, which were considered in light of the nature, extent and quality of the services that each has performed and is expected to perform.
The Board considered information on revenues, costs and profits or losses realized by the Manager and the Voya-affiliated Sub-Adviser related to their services to the Portfolio. In analyzing the profitability of the Manager and its affiliated service providers in connection with services they render to a Portfolio, the Board took into account the sub-advisory fee rate payable by the Manager to the Sub-Adviser. The Board also considered the profitability of the Manager and its affiliated Sub-Adviser attributable to servicing the Portfolio both with and without taking into account the profitability of the distributor of the Portfolio and any revenue sharing payments made by the Manager and both before and after giving effect to any expenses incurred by the Manager or the affiliated Sub-Adviser in making payments to affiliated insurance companies.
Although the Methodology Guide establishes a framework for profit calculation, the Board recognized that there is no uniform methodology within the asset management industry for determining profitability for this purpose. The Board also recognized that the use of different reasonable methodologies can give rise to dramatically different reported profit and loss results with respect to the Manager and the Voya-affiliated Sub-Adviser, as well as other industry participants with whom the profits of the Manager and its affiliated Sub-Adviser could be compared. In addition, the Board recognized that management’s calculations regarding its costs incurred in establishing the infrastructure necessary for the Portfolio’s operations may not be fully reflected in the expenses allocated to the Portfolio in determining profitability, and that the information presented may not portray all of the costs borne by the Manager or reflect all risks, including entrepreneurial, regulatory, legal and operational risks, associated with offering and managing a mutual fund complex in the current regulatory and market environment.
The Board also considered that the Manager and the Voya-affiliated Sub-Adviser are entitled to earn a reasonable level of profits for the services that they provide to the Portfolio. The Board also considered information regarding the potential fall-out benefits to the Manager and Sub-Adviser and their respective affiliates from their association with the Portfolio, including their ability to engage in soft-dollar transactions on behalf of the Portfolio. Following its reviews, the Board determined that the Manager’s and the
Voya-affiliated Sub-Adviser’s profitability with respect to their services to the Portfolio and the Manager’s and Sub-Adviser’s potential fall-out benefits were not unreasonable.
Portfolio Analysis
Set forth below are certain of the specific factors that the Board considered at its October 7, 2020, November 17, 2020, and/or November 19, 2020 meetings in relation to approving the Portfolio’s Contracts and the conclusions reached by the Board. These specific factors are in addition to those considerations discussed above. The Portfolio’s performance was compared to its Morningstar category, as well as its primary benchmark. The performance data provided to the Board primarily was for various periods ended March 31, 2020. In addition, the Board also considered at its October 7, 2020, November 17, 2020, and November 19, 2020 meetings certain additional data regarding the Portfolio’s more recent performance, asset levels and asset flows. The Portfolio’s management fee rate and expense ratio were compared to the management fee rates and expense ratios of the funds in its Selected Peer Group. With respect to the quintile rankings noted below, the first quintile represents the range of funds with the highest performance or the lowest management fee rate or expense ratio, as applicable, and the fifth quintile represents the range of funds with the lowest performance or the highest management fee rate or expense ratio, as applicable.
In considering whether to approve the renewal of the Contracts for Voya Global Perspectives® Portfolio, the Board considered that, based on performance data for the periods ended March 31, 2020: (1) the Portfolio is ranked in the first quintile of its Morningstar category for all periods presented; and (2) the Portfolio outperformed its primary benchmark for the year-to-date, one-year and three-year periods and underperformed for the five-year period.
In considering the fees payable under the Contracts for the Portfolio, the Board took into account the factors described above and also considered: (1) the fairness of the compensation under a Management Contract with a level fee rate that does not include breakpoints; and (2) the pricing structure (including the net expense ratio to be borne by shareholders) of the Portfolio, as compared to its Selected Peer Group, including that: (a) the net management fee rate for the Portfolio is ranked in the second quintile of net management fee rates of the funds in its Selected Peer Group; (b) the contractual management fee rate for the Portfolio is ranked in the second quintile of contractual management fee rates of the funds in its Selected Peer Group; and (c) the all-in net expense ratio for the Portfolio, inclusive of the Acquired Fund Fees and Expenses (“AFFE”), is ranked in the first quintile of all-in net expense ratios of the funds in its Selected Peer Group, and the net expense ratio for the
27
ADVISORY AND SUB-ADVISORY CONTRACT APPROVAL DISCUSSION (UNAUDITED) (CONTINUED)
Portfolio, not inclusive of AFFE, is above the median of net expense ratios of the funds in its Selected Peer Group. In analyzing this fee data, the Board took into account that, as reflected in the AFFE, the Portfolio indirectly bears the fees payable by the underlying funds in which the Portfolio invests.
After its deliberation, the Board reached the following conclusions: (1) the Portfolio’s management fee rate is reasonable in the context of all factors considered by the Board; (2) the Portfolio’s net expense ratio is reasonable in the context of all factors considered by the Board; (3) the
Portfolio’s performance is reasonable in the context of all factors considered by the Board; and (4) the sub-advisory fee rate payable by the Manager to the Sub-Adviser is reasonable in the context of all factors considered by the Board. Based on these conclusions and other factors, the Board voted to renew the Contracts for the Portfolio for the year ending November 30, 2021. During this renewal process, different Board members may have given different weight to different individual factors and related conclusions.
28
(THIS PAGE INTENTIONALLY LEFT BLANK)
(THIS PAGE INTENTIONALLY LEFT BLANK)
(THIS PAGE INTENTIONALLY LEFT BLANK)
Investment Adviser
Voya Investments, LLC
7337 East Doubletree Ranch Road, Suite 100
Scottsdale, Arizona 85258
Distributor
Voya Investments Distributor, LLC
7337 East Doubletree Ranch Road, Suite 100
Scottsdale, Arizona 85258
Transfer Agent
BNY Mellon Investment Servicing (U.S.) Inc.
301 Bellevue Parkway
Wilmington, Delaware 19809
Independent Registered Public Accounting Firm
Ernst & Young LLP
200 Clarendon Street
Boston, Massachusetts 02116
Custodian
The Bank of New York Mellon
225 Liberty Street
New York, New York 10286
Legal Counsel
Ropes & Gray LLP
Prudential Tower
800 Boylston Street
Boston, Massachusetts 02199
Before investing, carefully consider the investment objectives, risks, charges and expenses of the variable annuity contract or variable life insurance policy and the underlying variable investment options. This and other information is contained in the prospectus for the variable annuity contract or variable life insurance policy and the underlying variable investment options. Obtain these prospectuses from your agent/registered representative and read them carefully before investing.
RETIREMENT | INVESTMENTS | INSURANCE
voyainvestments.com | |
| | VPAR-VITFOFAIS (1220-022221) |

Annual Report
December 31, 2020
Classes ADV and I
Voya Investors Trust |
| n | | Voya Retirement Conservative Portfolio |
| n | | Voya Retirement Growth Portfolio |
| n | | Voya Retirement Moderate Portfolio |
| n | | Voya Retirement Moderate Growth Portfolio |
As permitted by regulations adopted by the U.S. Securities and Exchange Commission, paper copies of each Portfolio’s annual and semi-annual shareholder reports, like this annual report, are not sent by mail, unless you specifically request paper copies of the reports. Instead, the reports will be made available on a website and you will be notified by mail each time a report is posted and provided with a website link to access the report.
If you already elected to receive shareholder reports electronically, you need not take any action. You may elect to receive shareholder reports and other communications from your insurance carrier electronically by contacting them directly.
You may elect to receive all future reports in paper free of charge. If you received this document in the mail, please follow the instructions provided to elect to continue receiving paper copies of your shareholder reports. You can inform us that you wish to continue receiving paper copies by calling 1-800-283-3427. Your election to receive reports in paper will apply to all the funds in which you invest. |
This report is submitted for general information to shareholders of the Voya mutual funds. It is not authorized for distribution to prospective shareholders unless accompanied or preceded by a prospectus which includes details regarding the fund’s investment objectives, risks, charges, expenses and other information. This information should be read carefully. |
| | |
| | |
| INVESTMENT MANAGEMENT voyainvestments.com | |
TABLE OF CONTENTS
| | | | | 1 | |
| | | | | 3 | |
| | | | | 9 | |
| | | | | 10 | |
| | | | | 11 | |
| | | | | 12 | |
| | | | | 13 | |
| | | | | 15 | |
| | | | | 17 | |
| | | | | 24 | |
| | | | | 32 | |
| | | | | 33 | |
| | | | | 37 | |
PROXY VOTING INFORMATION
A description of the policies and procedures that the Portfolios use to determine how to vote proxies related to portfolio securities is available: (1) without charge, upon request, by calling Shareholder Services toll-free at (800) 992-0180; (2) on the Portfolios’ website at www.voyainvestments.com; and (3) on the U.S. Securities and Exchange Commission’s (“SEC’s”) website at www.sec.gov. Information regarding how the Portfolios voted proxies related to portfolio securities during the most recent 12-month period ended June 30 is available without charge on the Portfolios’ website at www.voyainvestments.com and on the SEC’s website at www.sec.gov.
QUARTERLY PORTFOLIO HOLDINGS
The Portfolios file their complete schedule of portfolio holdings with the SEC for the first and third quarters of each fiscal year on Form NPORT-P. The Portfolios’ Forms NPORT-P are available on the SEC’s website at www.sec.gov. Each Portfolio’s complete schedule of portfolio holdings is available at: www.voyainvestments.com and without charge upon request from the Portfolio by calling Shareholder Services toll-free at (800) 992-0180.
(THIS PAGE INTENTIONALLY LEFT BLANK)
Beyond the Headlines, a Glimpse of Global Economic Recovery
Dear Shareholder,
For those of us hoping that 2021 would bring more encouraging headlines, it has been a rough start to the year: political turmoil, surging COVID-19 cases and a new, more virulent strain of the coronavirus. On the surface, economic news also has seemed disappointing: labor markets have cooled, manufacturing and services activity has slowed and consumer sentiment has dropped. Yet, the financial markets continue to march higher, begging the question: Where are the markets getting their news?
Voya investment strategists have written about the uneven pressures that have created a “two-speed” or “K-shaped” economic recovery. Consumers on the higher end of the income distribution have largely kept their jobs and adapted to the pandemic by working from home. By contrast, jobs in lower paying segments of the labor market such as leisure, lodging and retail have been eliminated or furloughed and have yet to return. For lower income consumers, the good news is that the fiscal response to help offset job losses has been enormous — and fiscal relief is expected to grow under a Democratic-controlled government. The initial rollout of the coronavirus vaccines, while slower than many had hoped, still represents a significant milestone as vaccines are the bridge that are expected to allow the economy to reopen fully.
In addition to fiscal support, the response from central banks has been extraordinary. The U.S. Federal Reserve Board (“Fed”) has adjusted its policy framework in ways that make the Fed more likely to remain accommodative longer than might otherwise be expected during economic recovery phases, a game changer for financial assets. We believe that analogous developments across the world should help reignite global economic growth in 2021 and breathe new life into struggling sectors. Despite today’s negative headlines, the data is telling us that the future is likely to be better. Looking broadly at the economic picture, in our opinion, it appears that a global synchronous expansion is underway.
Of course there are still risks, and we believe that one should not overlook the potential for episodic market stresses connected to the vaccine rollout or other global factors. As always, we glimpse the future “through a glass darkly,” and must allow for contingencies we can’t foresee. For this reason, we maintain that staying fully invested and broadly diversified is the most likely way to achieve one’s long-term investment goals. Should your goals change, discuss them thoroughly with your investment advisor before making any changes to your portfolio.
We remain humble and realistic in the face of the challenges ahead, but well prepared for and fully committed to serving our clients without disruption. We appreciate your continued confidence in us, and we look forward to serving your investment needs in the future.
Sincerely,

Dina Santoro
President
Voya Family of Funds
January 22, 2021
The views expressed in the President’s Letter reflect those of the President as of the date of the letter. Any such views are subject to change at any time based upon market or other conditions and the Voya mutual funds disclaim any responsibility to update such views. These views may not be relied on as investment advice and because investment decisions for a Voya mutual fund are based on numerous factors, may not be relied on as an indication of investment intent on behalf of any Voya mutual fund. Reference to specific company securities should not be construed as recommendations or investment advice.
International investing poses special risks including currency fluctuation, economic and political risks not found in investments that are solely domestic.
1
BENCHMARK DESCRIPTIONS
| Index | Description |
|---|
| Bloomberg Barclays U.S. Aggregate Bond Index | An index of publicly issued investment grade U.S. government, mortgage-backed, asset-backed and corporate debt securities. |
MSCI Europe, Australasia and Far East® (“MSCI EAFE”) Index | An index that measures the performance of securities listed on exchanges in Europe, Australasia and the Far East. It includes the reinvestment of dividends net of withholding taxes, but does not reflect fees, brokerage commissions or other expenses of investing. |
Russell 3000® Index | An index that measures the performance of the largest 3000 U.S. companies representing approximately 98% of the investable U.S. equity market. |
S&P Target Risk® Aggressive Index | Seeks to emphasize exposure to equity securities, maximizing opportunities for long-term capital accumulation. It may include small allocations in fixed-income securities to enhance portfolio efficiency. |
S&P Target Risk® Conservative Index | Seeks to emphasize exposure to fixed income securities in order to produce a current income stream and avoid excessive volatility of returns. Equity securities are included to protect long-term purchasing power. |
S&P Target Risk® Growth Index | Seeks to measure the performance of an asset allocation strategy targeted to a growth focused risk profile. |
S&P Target Risk® Moderate Index | Seeks to measure the performance of an asset allocation strategy targeted to a moderate risk profile. |
2
PORTFOLIO MANAGERS’ REPORT | VOYA RETIREMENT PORTFOLIOS |
Voya Retirement Portfolios consist of Voya Retirement Conservative Portfolio, Voya Retirement Growth Portfolio, Voya Retirement Moderate Portfolio and Voya Retirement Moderate Growth Portfolio (each a “Portfolio” or collectively, the “Portfolios” or the “Retirement Portfolios”). Each Portfolio seeks to achieve its investment objective by investing in a combination of underlying funds which are actively managed funds or passively managed funds (index funds).(1) The Portfolios are managed by Halvard Kvaale, CIMA, Paul Zemsky, CFA, and Barbara Reinhard, CFA, Portfolio Managers of Voya Investment Management Co. LLC (“Voya IM”) — the Sub-Adviser (“Sub-Adviser).*
Portfolio Specifics: Over the reporting period, the Portfolios met their performance objectives by minimizing performance deviation relative to their strategic asset allocation benchmarks. Due to the strategic nature of the Portfolios, no tactical asset allocation moves were made during the period. As part of the annual review, we made changes to the strategic asset allocations in the second to last week of June. Strategic changes included increasing U.S. large-cap equities across all Portfolios, funded by lowered allocations to domestic mid-cap, developed international and emerging market equities. In addition, we reduced domestic small-cap exposure in the Growth, Moderate Growth and Moderate Portfolios; and removed small-cap entirely from the Moderate Growth and Moderate Portfolios.
The underlying index funds performed as expected, minimizing performance deviation relative to their respective strategic allocation benchmarks, before the deduction of fees.
Current Strategy and Outlook: Despite historically weak, choppy economic data and unsettling, pandemic-related headlines, in our opinion risk assets have pushed higher on investor confidence that the future will be better than the present. With two Covid-19 vaccines in distribution and a new round of fiscal stimulus about to be deployed, we believe the U.S. economy is primed to accelerate in 2021. In our view, there is a clear bridge (vaccine) to post-Covid-19 normalcy and abutments (fiscal stimulus and prolonged, accommodative monetary policy) that should keep the recovery on track and absorb unexpected jolts along with way.
| * | | Each Portfolio’s relative performance versus its respective benchmarks can be found on page 5. |
(1) | | The investment objective of each Portfolio is described in the Portfolios’ prospectuses, each dated May 1, 2020. |
The views expressed in this commentary are informed opinions. They should not be considered promises or advice. The views expressed reflect those of the portfolio managers, only through the end of the period as stated on the cover. The portfolio managers’ views are subject to change at any time based on market and other conditions.
Portfolio holdings and characteristics are subject to change and may not be representative of current holdings and characteristics. Portfolio holdings are subject to change daily. The outlook for this Portfolio may differ from that presented for other Voya mutual funds. This report contains statements that may be ”forward-looking“ statements. Actual results may differ materially from those projected in the ”forward-looking“ statements. The Portfolio’s performance returns shown reflect applicable fee waivers and/or expense limits in effect during this period. Absent such fee waivers/expense limitations, if any, performance would have been lower. Performance for the different classes of shares will vary based on differences in fees associated with each class. An index has no cash in its portfolio and imposes no sales charges. An investor cannot invest directly in an index.
3
VOYA RETIREMENT PORTFOLIOS | PORTFOLIO MANAGERS’ REPORT |
| | Target Allocations as of 12/31/20
(as a percentage of net assets)(1) | |
|---|
| | Sub Asset Class | | Growth | | Moderate
Growth | | Moderate | | Conservative | |
|---|
| | US Large Blend | | | 50.00 | % | | | 50.00 | % | | | 39.00 | % | | | 23.00 | % | |
| | US Mid Cap Blend | | | 7.00 | % | | | 4.00 | % | | | 3.00 | % | | | 2.00 | % | |
| | US Small Cap | | | 2.00 | % | | | 0.00 | % | | | 0.00 | % | | | 0.00 | % | |
| | International | | | 11.00 | % | | | 7.00 | % | | | 5.00 | % | | | 3.00 | % | |
| | Emerging Markets | | | 5.00 | % | | | 4.00 | % | | | 3.00 | % | | | 2.00 | % | |
| | Core Fixed Income | | | 21.00 | % | | | 29.00 | % | | | 41.00 | % | | | 61.00 | % | |
| | TIPS | | | 4.00 | % | | | 6.00 | % | | | 9.00 | % | | | 9.00 | % | |
| | Equity | | | 75.00 | % | | | 65.00 | % | | | 50.00 | % | | | 30.00 | % | |
| | Fixed Income | | | 25.00 | % | | | 35.00 | % | | | 50.00 | % | | | 70.00 | % | |
| | Total | | | 100.00 | % | | | 100.00 | % | | | 100.00 | % | | | 100.00 | % | |
| | | | | | | | | | | | | | | | | | | |
(1) | | As these are target allocations, the actual allocations of each Portfolio’s assets may deviate from the percentages shown. Although the Retirement Portfolios expect to be fully invested at all times, they may maintain liquidity reserves to meet redemption requests. |
Portfolio holdings are subject to change.
| | Total Returns for the Period Ended December 31, 2020 | |
|---|
| | | | 1 Year | |
|---|
| | Voya Retirement Conservative Portfolio, Class I | | | 10.77 | % | |
| | S&P Target Risk® Conservative Index | | | 9.67 | % | |
| | Voya Retirement Growth Portfolio, Class I | | | 14.11 | % | |
| | S&P Target Risk Aggressive® Index | | | 13.09 | % | |
| | Russell 3000® Index | | | 20.89 | % | |
| | MSCI EAFE® Index | | | 7.82 | % | |
| | Bloomberg Barclays U.S. Aggregate Bond (“BCAB”) Index | | | 7.51 | % | |
| | Voya Retirement Moderate Portfolio, Class I | | | 12.51 | % | |
| | S&P Target Risk® Moderate Index | | | 10.42 | % | |
| | Russell 3000® Index | | | 20.89 | % | |
| | MSCI EAFE® Index | | | 7.82 | % | |
| | BCAB Index | | | 7.51 | % | |
| | Voya Retirement Moderate Growth Portfolio, Class I | | | 13.59 | % | |
| | S&P Target Risk® Growth Index | | | 11.83 | % | |
| | Russell 3000® Index | | | 20.89 | % | |
| | MSCI EAFE® Index | | | 7.82 | % | |
| | BCAB Index | | | 7.51 | % | |
4
PORTFOLIO MANAGERS’ REPORT | VOYA RETIREMENT CONSERVATIVE PORTFOLIO |

| | Average Annual Total Returns for the Periods Ended December 31, 2020 | |
|---|
| | | | 1 Year | | 5 Year | | 10 Year | |
|---|
| | Class ADV | | | 10.33 | % | | | 6.58 | % | | | 5.52 | % | |
| | Class I | | | 10.77 | % | | | 6.77 | % | | | 5.75 | % | |
| | S&P Target Risk® Conservative Index | | | 9.67 | % | | | 7.02 | % | | | 5.54 | % | |
| | | | | | | | | | | | | | | |
Based on a $10,000 initial investment, the graph and table above illustrate the total return of the Voya Retirement Conservative Portfolio against the index indicated. The index is unmanaged and has no cash in its portfolio and imposes no sales charges. An investor cannot invest directly in an index.
The Portfolio’s performance is shown without the imposition of any expenses or charges which are, or may be, imposed under your variable annuity contract or variable life insurance policy. Total returns would have been lower if such expenses or charges were included.
The performance graph and table do not reflect the deduction of taxes that a shareholder will pay on Portfolio distributions or the redemption of Portfolio shares.
The performance shown includes, if applicable, the effect of fee waivers and/or expense reimbursements by the Investment Adviser and/or other
service providers, which have the effect of increasing total return. Had all fees and expenses been considered, the total returns would have been lower.
The performance update illustrates performance for a variable investment option available through a variable annuity contract or a variable life insurance policy. The performance shown indicates past performance and is not a projection or prediction of future results. Actual investment returns and principal value will fluctuate so that shares and/or units, at redemption, may be worth more or less than their original cost. Please log on to www.voyainvestments.com or call (800) 366-0066 to get performance through the most recent month end.
Portfolio holdings are subject to change daily.
5
VOYA RETIREMENT GROWTH PORTFOLIO | PORTFOLIO MANAGERS’ REPORT |

| | Average Annual Total Returns for the Periods Ended December 31, 2020 | |
|---|
| | | | 1 Year | | 5 Year | | 10 Year | |
|---|
| | Class ADV | | | 13.64 | % | | | 9.86 | % | | | 8.14 | % | |
| | Class I | | | 14.11 | % | | | 10.33 | % | | | 8.60 | % | |
| | S&P Target Risk Aggressive® Index | | | 13.09 | % | | | 10.65 | % | | | 9.26 | % | |
| | Russell 3000® Index | | | 20.89 | % | | | 15.43 | % | | | 13.479 | % | |
| | MSCI EAFE® Index | | | 7.82 | % | | | 7.45 | % | | | 5.51 | % | |
| | BCAB Index | | | 7.51 | % | | | 4.44 | % | | | 3.84 | % | |
| | | | | | | | | | | | | | | |
Based on a $10,000 initial investment, the graph and table above illustrate the total return of the Voya Retirement Growth Portfolio against the indices indicated. An index is unmanaged and has no cash in its portfolio and imposes no sales charges. An investor cannot invest directly in an index.
The Portfolio’s performance is shown without the imposition of any expenses or charges which are, or may be, imposed under your variable annuity contract or variable life insurance policy. Total returns would have been lower if such expenses or charges were included.
The performance graph and table do not reflect the deduction of taxes that a shareholder will pay on Portfolio distributions or the redemption of Portfolio shares.
The performance shown includes, if applicable, the effect of fee waivers and/or expense reimbursements by the Investment Adviser and/or other
service providers, which have the effect of increasing total return. Had all fees and expenses been considered, the total returns would have been lower.
The performance update illustrates performance for a variable investment option available through a variable annuity contract or a variable life insurance policy. The performance shown indicates past performance and is not a projection or prediction of future results. Actual investment returns and principal value will fluctuate so that shares and/or units, at redemption, may be worth more or less than their original cost. Please log on to www.voyainvestments.com or call (800) 366-0066 to get performance through the most recent month end.
Portfolio holdings are subject to change daily.
6
PORTFOLIO MANAGERS’ REPORT | VOYA RETIREMENT MODERATE PORTFOLIO |

| | Average Annual Total Returns for the Periods Ended December 31, 2020 | |
|---|
| | | | 1 Year | | 5 Year | | 10 Year | |
|---|
| | Class ADV | | | 12.17 | % | | | 8.09 | % | | | 6.59 | % | |
| | Class I | | | 12.51 | % | | | 8.45 | % | | | 6.96 | % | |
| | S&P Target Risk® Moderate Index | | | 10.42 | % | | | 7.78 | % | | | 6.31 | % | |
| | Russell 3000® Index | | | 20.89 | % | | | 15.43 | % | | | 13.79 | % | |
| | MSCI EAFE® Index | | | 7.82 | % | | | 7.45 | % | | | 5.51 | % | |
| | BCAB Index | | | 7.51 | % | | | 4.44 | % | | | 3.84 | % | |
| | | | | | | | | | | | | | | |
Based on a $10,000 initial investment, the graph and table above illustrate the total return of the Voya Retirement Moderate Portfolio against the indices indicated. An index is unmanaged and has no cash in its portfolio and imposes no sales charges. An investor cannot invest directly in an index.
The Portfolio’s performance is shown without the imposition of any expenses or charges which are, or may be, imposed under your variable annuity contract or variable life insurance policy. Total returns would have been lower if such expenses or charges were included.
The performance graph and table do not reflect the deduction of taxes that a shareholder will pay on Portfolio distributions or the redemption of Portfolio shares.
The performance shown includes, if applicable, the effect of fee waivers and/or expense reimbursements by the Investment Adviser and/or other
service providers, which have the effect of increasing total return. Had all fees and expenses been considered, the total returns would have been lower.
The performance update illustrates performance for a variable investment option available through a variable annuity contract or a variable life insurance policy. The performance shown indicates past performance and is not a projection or prediction of future results. Actual investment returns and principal value will fluctuate so that shares and/or units, at redemption, may be worth more or less than their original cost. Please log on to www.voyainvestments.com or call (800) 366-0066 to get performance through the most recent month end.
Portfolio holdings are subject to change daily.
7
VOYA RETIREMENT MODERATE
GROWTH PORTFOLIO | PORTFOLIO MANAGERS’ REPORT |
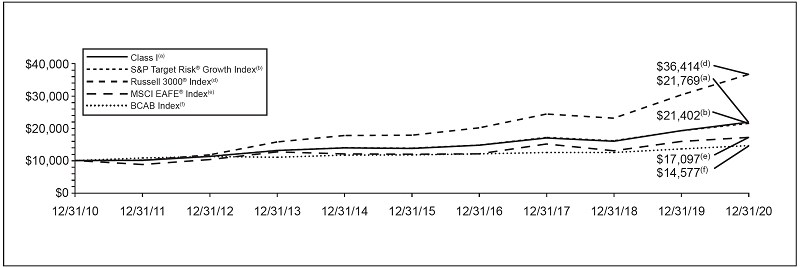
| | Average Annual Total Returns for the Periods Ended December 31, 2020 | |
|---|
| | | | 1 Year | | 5 Year | | 10 Year | |
|---|
| | Class ADV | | | 13.15 | % | | | 9.26 | % | | | 7.66 | % | |
| | Class I | | | 13.59 | % | | | 9.69 | % | | | 8.09 | % | |
| | S&P Target Risk® Growth Index | | | 11.83 | % | | | 9.25 | % | | | 7.94 | % | |
| | Russell 3000® Index | | | 20.89 | % | | | 15.43 | % | | | 13.79 | % | |
| | MSCI EAFE® Index | | | 7.82 | % | | | 7.45 | % | | | 5.51 | % | |
| | BCAB Index | | | 7.51 | % | | | 4.44 | % | | | 3.84 | % | |
| | | | | | | | | | | | | | | |
Based on a $10,000 initial investment, the graph and table above illustrate the total return of the Voya Retirement Moderate Growth Portfolio against the indices indicated. An index is unmanaged and has no cash in its portfolio and imposes no sales charges. An investor cannot invest directly in an index.
The Portfolio’s performance is shown without the imposition of any expenses or charges which are, or may be, imposed under your variable annuity contract or variable life insurance policy. Total returns would have been lower if such expenses or charges were included.
The performance graph and table do not reflect the deduction of taxes that a shareholder will pay on Portfolio distributions or the redemption of Portfolio shares.
The performance shown includes, if applicable, the effect of fee waivers and/or expense reimbursements by the Investment Adviser and/or other service providers, which have the effect of increasing total return. Had all fees and expenses been considered, the total returns would have been lower.
The performance update illustrates performance for a variable investment option available through a variable annuity contract or a variable life insurance policy. The performance shown indicates past performance and is not a projection or prediction of future results. Actual investment returns and principal value will fluctuate so that shares and/or units, at redemption, may be worth more or less than their original cost. Please log on to www.voyainvestments.com or call (800) 366-0066 to get performance through the most recent month end.
This report contains statements that may be “forward-looking” statements. Actual results may differ materially from those projected in the “forward-looking” statements.
The views expressed in this report reflect those of the portfolio managers, only through the end of the period as stated on the cover. The portfolio managers’ views are subject to change at any time based on market and other conditions.
Portfolio holdings are subject to change daily.
8
SHAREHOLDER EXPENSE EXAMPLES (UNAUDITED) As a shareholder of a Portfolio, you incur two types of costs: (1) transaction costs, including redemption fees and exchange fees; and (2) ongoing costs, including management fees, distribution and/or service (12b-1) fees, and other Portfolio expenses. These Examples are intended to help you understand your ongoing costs (in dollars) of investing in a Portfolio and to compare these costs with the ongoing costs of investing in other mutual funds.
The Examples are based on an investment of $1,000 invested at the beginning of the period and held for the entire period from July 1, 2020 to December 31, 2020. The Portfolios’ expenses are shown without the imposition of any charges which are, or may be, imposed under your variable annuity contract, variable life insurance policy, qualified pension or retirement plan. Expenses would have been higher if such charges were included.
Actual Expenses
The left section of the table shown below, “Actual Portfolio Return,” provides information about actual account values and actual expenses. You may use the information in this section, together with the amount you invested, to estimate the expenses that you paid over the period. Simply divide your account value by $1,000 (for example, an $8,600 account value divided by $1,000 = 8.6), then multiply the result by the number in the first section under the heading entitled ”Expenses Paid During the Period“ to estimate the expenses you paid on your account during this period.
Hypothetical Example for Comparison Purposes
The right section of the table shown below, “Hypothetical (5% return before expenses),” provides information about hypothetical account values and hypothetical expenses based on a Portfolio’s actual expense ratio and an assumed rate of return of 5% per year before expenses, which is not a Portfolio’s actual return. The hypothetical account values and expenses may not be used to estimate the actual ending account balance or expenses you paid for the period. You may use this information to compare the ongoing costs of investing in a Portfolio and other mutual funds. To do so, compare this 5% hypothetical example with the 5% hypothetical examples that appear in the shareholder reports of the other mutual funds.
Please note that the expenses shown in the table are meant to highlight your ongoing costs only and do not reflect any transactional costs, such as redemption fees or exchange fees. Therefore, the hypothetical section of the table is useful in comparing ongoing costs only, and will not help you determine the relative total costs of owning different mutual funds. In addition, if these transactional costs were included, your costs would have been higher.
| | | | Actual Portfolio Return | | Hypothetical (5% return before expenses) | |
|---|
| | | | Beginning
Account
Value
July 1,
2020 | | Ending
Account
Value
December 31,
2020 | | Annualized
Expense
Ratio* | | Expenses Paid
During the
Period Ended
December 31,
2020** | | Beginning
Account
Value
July 1,
2020 | | Ending
Account
Value
December 31,
2020 | | Annualized
Expense
Ratio* | | Expenses Paid
During the
Period Ended
December 31,
2020** | |
|---|
| | Voya Retirement Conservative Portfolio | | | | | | | | | | | | | | | | | | | | | | | | | | |
| | Class ADV | | $ | 1,000.00 | | | $ | 1,074.50 | | | | 0.52 | % | | $ | 2.71 | | | $ | 1,000.00 | | | $ | 1,022.52 | | | | 0.52 | % | | $ | 2.64 | | |
| | Class I | | | 1,000.00 | | | | 1,075.90 | | | | 0.27 | | | | 1.41 | | | $ | 1,000.00 | | | | 1,023.78 | | | | 0.27 | | | | 1.37 | | |
| | Voya Retirement Growth Portfolio | | | | | | | | | | | | | | | | | | | | | | | | | | |
| | Class ADV | | $ | 1,000.00 | | | $ | 1,174.40 | | | | 0.68 | % | | $ | 3.72 | | | $ | 1,000.00 | | | $ | 1,021.72 | | | | 0.68 | % | | $ | 3.46 | | |
| | Class I | | | 1,000.00 | | | | 1,177.10 | | | | 0.26 | | | | 1.42 | | | | 1,000.00 | | | | 1,023.83 | | | | 0.26 | | | | 1.32 | | |
| | Voya Retirement Moderate Portfolio | | | | | | | | | | | | | | | | | | | | | | | | | | |
| | Class ADV | | $ | 1,000.00 | | | $ | 1,117.80 | | | | 0.61 | % | | $ | 3.25 | | | $ | 1,000.00 | | | $ | 1,022.07 | | | | 0.61 | % | | $ | 3.10 | | |
| | Class I | | | 1,000.00 | | | | 1,119.30 | | | | 0.27 | | | | 1.44 | | | | 1,000.00 | | | | 1,023.78 | | | | 0.27 | | | | 1.37 | | |
| | Voya Retirement Moderate Growth Portfolio | | | | | | | | | | | | | | | | | | | | | | | | | | |
| | Class ADV | | $ | 1,000.00 | | | $ | 1,148.60 | | | | 0.65 | % | | $ | 3.51 | | | $ | 1,000.00 | | | $ | 1,021.87 | | | | 0.65 | % | | $ | 3.30 | | |
| | Class I | | | 1,000.00 | | | | 1,150.30 | | | | 0.26 | | | | 1.41 | | | | 1,000.00 | | | | 1,023.83 | | | | 0.26 | | | | 1.32 | | |
| * | | The annualized expense ratios do not include expenses of the underlying funds. |
| ** | | Expenses are equal to each Portfolios’ respective annualized expense ratios multiplied by the average account value over the period, multiplied by 184/366 to reflect the most recent fiscal half-year. |
9
REPORT OF INDEPENDENT REGISTERED PUBLIC ACCOUNTING FIRM To the Shareholders of Voya Retirement Conservative Portfolio, Voya Retirement Growth Portfolio, Voya Retirement Moderate Portfolio and Voya Retirement Moderate Growth Portfolio and the Board of Trustees of Voya Investors Trust
Opinion on the Financial Statements
We have audited the accompanying statements of assets and liabilities of Voya Retirement Conservative Portfolio, Voya Retirement Growth Portfolio, Voya Retirement Moderate Portfolio and Voya Retirement Moderate Growth Portfolio (collectively referred to as the “Portfolios”) (four of the portfolios constituting Voya Investors Trust (the “Trust”)), including the portfolios of investments, as of December 31, 2020, and the related statements of operations and changes in net assets and the financial highlights for the year then ended and the related notes (collectively referred to as the “financial statements”). In our opinion, the financial statements present fairly, in all material respects, the financial position of the Portfolios (four of the portfolios constituting Voya Investors Trust) at December 31, 2020, the results of their operations, the changes in their net assets and their financial highlights for the year then ended, in conformity with U.S. generally accepted accounting principles.
The statement of changes in net assets for the year ended December 31, 2019, and the financial highlights for each of the periods in the four-year period then ended, were audited by another independent registered public accounting firm whose report, dated February 26, 2020, expressed an unqualified opinion on that statement of changes in net assets and those financial highlights.
Basis for Opinion
These financial statements are the responsibility of the Trust’s management. Our responsibility is to express an opinion on the Portfolios’ financial statements based on our audits. We are a public accounting firm registered with the Public Company Accounting Oversight Board (United States) (“PCAOB”) and are required to be independent with respect to the Trust in accordance with the U.S. federal securities laws and the applicable rules and regulations of the Securities and Exchange Commission and the PCAOB.
We conducted our audits in accordance with the standards of the PCAOB. Those standards require that we plan and perform the audits to obtain reasonable assurance about whether the financial statements are free of material misstatement, whether due to error or fraud. The Trust is not required to have, nor were we engaged to perform, an audit of the Trust’s internal control over financial reporting. As part of our audits, we are required to obtain an understanding of internal control over financial reporting, but not for the purpose of expressing an opinion on the effectiveness of the Trust’s internal control over financial reporting. Accordingly, we express no such opinion.
Our audits included performing procedures to assess the risks of material misstatement of the financial statements, whether due to error or fraud, and performing procedures that respond to those risks. Such procedures included examining, on a test basis, evidence regarding the amounts and disclosures in the financial statements. Our procedures included confirmation of securities owned as of December 31, 2020, by correspondence with the custodian and others or by other appropriate auditing procedures where replies from others were not received. Our audits also included evaluating the accounting principles used and significant estimates made by management, as well as evaluating the overall presentation of the financial statements. We believe that our audits provide a reasonable basis for our opinion.

We have served as the auditor of one or more Voya investment companies since 2019.
Boston, Massachusetts
February 24, 2021
10
STATEMENTS OF ASSETS AND LIABILITIES AS OF DECEMBER 31, 2020
| | Voya
Retirement
Conservative
Portfolio | | Voya
Retirement
Growth
Portfolio | | Voya
Retirement
Moderate
Portfolio | | Voya
Retirement
Moderate
Growth
Portfolio |
|---|
ASSETS: | | | | | | | | | | | | | | | | |
| Investments in affiliated underlying funds at fair value* | | $ | 405,950,050 | | | $ | 2,449,348,459 | | | $ | 919,479,868 | | | $ | 1,655,491,119 | |
| Investments in unaffiliated underlying funds at fair value** | | | 40,151,792 | | | | 102,064,487 | | | | 91,347,057 | | | | 105,597,956 | |
| Cash | | | 372,635 | | | | 1,635,541 | | | | 843,861 | | | | 1,261,788 | |
| Receivables: | | | | | | | | | | | | | | | | |
| Investments in affiliated underlying funds sold | | | 42,522 | | | | 1,064,649 | | | | — | | | | 182,065 | |
| Fund shares sold | | | 274,241 | | | | 100,208 | | | | 305,203 | | | | 247,205 | |
| Interest | | | 354 | | | | 1,678 | | | | 893 | | | | 1,328 | |
| Prepaid expenses | | | 1,872 | | | | 10,712 | | | | 4,377 | | | | 7,494 | |
| Other assets | | | 16,165 | | | | 146,556 | | | | 57,581 | | | | 99,979 | |
| Total assets | | | 446,809,631 | | | | 2,554,372,290 | | | | 1,012,038,840 | | | | 1,762,888,934 | |
LIABILITIES: | | | | | | | | | | | | | | | | |
| Payable for investments in affiliated underlying funds purchased | | | — | | | | — | | | | 304,603 | | | | — | |
| Payable for fund shares redeemed | | | 316,763 | | | | 1,164,858 | | | | 600 | | | | 429,271 | |
| Payable for investment management fees | | | 93,487 | | | | 523,269 | | | | 212,109 | | | | 363,927 | |
| Payable for distribution and shareholder service fees | | | 94,298 | | | | 892,426 | | | | 283,991 | | | | 567,750 | |
| Payable to trustees under the deferred compensation plan (Note 6) | | | 16,165 | | | | 146,556 | | | | 57,581 | | | | 99,979 | |
| Payable for trustee fees | | | 2,134 | | | | 11,994 | | | | 4,886 | | | | 8,390 | |
| Other accrued expenses and liabilities | | | 65,931 | | | | 260,511 | | | | 115,724 | | | | 187,999 | |
| Total liabilities | | | 588,778 | | | | 2,999,614 | | | | 979,494 | | | | 1,657,316 | |
NET ASSETS | | $ | 446,220,853 | | | $ | 2,551,372,676 | | | $ | 1,011,059,346 | | | $ | 1,761,231,618 | |
NET ASSETS WERE COMPRISED OF: | | | | | | | | | | | | | | | | |
| Paid-in capital | | $ | 345,951,719 | | | $ | 2,056,641,981 | | | $ | 847,333,955 | | | $ | 1,444,370,612 | |
| Total distributable earnings | | | 100,269,134 | | | | 494,730,695 | | | | 163,725,391 | | | | 316,861,006 | |
NET ASSETS | | $ | 446,220,853 | | | $ | 2,551,372,676 | | | $ | 1,011,059,346 | | | $ | 1,761,231,618 | |
| | | | | | | | | | | | | | | | |
| * Cost of investments in affiliated underlying funds | | $ | 325,350,123 | | | $ | 2,085,561,725 | | | $ | 814,363,882 | | | $ | 1,434,762,260 | |
| ** Cost of investments in unaffiliated underlying funds | | $ | 34,755,554 | | | $ | 93,894,918 | | | $ | 81,494,163 | | | $ | 96,929,496 | |
| | | | | | | | | | | | | | | | | |
Class ADV | | $ | 444,944,477 | | | $ | 2,499,846,546 | | | $ | 988,152,908 | | | $ | 1,736,505,435 | |
| Net assets | | | unlimited | | | | unlimited | | | | unlimited | | | | unlimited | |
| Shares authorized | | $ | 0.001 | | | $ | 0.001 | | | $ | 0.001 | | | $ | 0.001 | |
| Par value | | | 45,212,432 | | | | 181,144,907 | | | | 80,761,834 | | | | 135,761,788 | |
| Shares outstanding | | $ | 9.84 | | | $ | 13.80 | | | $ | 12.24 | | | $ | 12.79 | |
| Net asset value and redemption price per share | | | | | | | | | | | | | | | | |
Class I | | $ | 1,276,376 | | | $ | 51,526,130 | | | $ | 22,906,438 | | | $ | 24,726,183 | |
| Net assets | | | unlimited | | | | unlimited | | | | unlimited | | | | unlimited | |
| Shares authorized | | $ | 0.001 | | | $ | 0.001 | | | $ | 0.001 | | | $ | 0.001 | |
| Par value | | | 127,516 | | | | 3,711,989 | | | | 1,847,868 | | | | 1,951,229 | |
| Shares outstanding | | $ | 10.01 | | | $ | 13.88 | | | $ | 12.40 | | | $ | 12.67 | |
| Net asset value and redemption price per share | | | | | | | | | | | | | | | | |
See Accompanying Notes to Financial Statements
11
STATEMENTS OF OPERATIONS FOR THE YEAR ENDED DECEMBER 31, 2020
| | Voya
Retirement
Conservative
Portfolio | | Voya
Retirement
Growth
Portfolio | | Voya
Retirement
Moderate
Portfolio | | Voya
Retirement
Moderate
Growth
Portfolio |
|---|
INVESTMENT INCOME: | | | | | | | | | | | | | | | | |
| Dividends from affiliated underlying funds | | $ | 9,922,396 | | | $ | 54,251,025 | | | $ | 21,867,420 | | | $ | 37,733,244 | |
| Dividends from unaffiliated underlying funds | | | 437,243 | | | | 1,082,029 | | | | 989,490 | | | | 1,134,075 | |
| Interest | | | 1,377 | | | | 8,683 | | | | 4,980 | | | | 7,654 | |
| Total investment income | | | 10,361,016 | | | | 55,341,737 | | | | 22,861,890 | | | | 38,874,973 | |
| |
EXPENSES: | | | | | | | | | | | | | | | | |
| Investment management fees | | | 1,020,691 | | | | 5,840,091 | | | | 2,379,927 | | | | 4,118,720 | |
| Distribution and shareholder service fees: | | | | | | | | | | | | | | | | |
| Class ADV | | | 2,132,163 | | | | 11,763,506 | | | | 4,778,090 | | | | 8,278,824 | |
| Transfer agent fees: | | | | | | | | | | | | | | | | |
| Class ADV | | | 50,951 | | | | 35,653 | | | | 50,619 | | | | 47,775 | |
| Class I | | | 64 | | | | 700 | | | | 1,137 | | | | 640 | |
| Shareholder reporting expense | | | 12,474 | | | | 53,624 | | | | 23,652 | | | | 44,316 | |
| Professional fees | | | 17,899 | | | | 84,498 | | | | 38,393 | | | | 53,938 | |
| Custody and accounting expense | | | 25,239 | | | | 91,448 | | | | 36,986 | | | | 47,427 | |
| Trustee fees | | | 17,079 | | | | 95,959 | | | | 39,085 | | | | 67,121 | |
| Miscellaneous expense | | | 21,912 | | | | 63,862 | | | | 32,035 | | | | 47,712 | |
| Interest expense | | | 313 | | | | — | | | | 1,294 | | | | 1,145 | |
| Total expenses | | | 3,298,785 | | | | 18,029,341 | | | | 7,381,218 | | | | 12,707,618 | |
| Waived and reimbursed fees | | | (1,057,560 | ) | | | (1,766,868 | ) | | | (1,516,578 | ) | | | (1,831,301 | ) |
| Net expenses | | | 2,241,225 | | | | 16,262,473 | | | | 5,864,640 | | | | 10,876,317 | |
| Net investment income | | | 8,119,791 | | | | 39,079,264 | | | | 16,997,250 | | | | 27,998,656 | |
| |
REALIZED AND UNREALIZED GAIN (LOSS): | | | | | | | | | | | | | | | | |
| Net realized gain (loss) on: | | | | | | | | | | | | | | | | |
| Sale of affiliated underlying funds | | | 2,249,657 | | | | 19,977,066 | | | | 18,231,577 | | | | 26,240,349 | |
| Sale of unaffiliated underlying funds | | | 234,420 | | | | 1,130,370 | | | | 1,660,195 | | | | 1,078,271 | |
| Capital gain distributions from affiliated underlying funds | | | 7,114,577 | | | | 84,241,747 | | | | 23,952,523 | | | | 50,614,001 | |
| Net realized gain | | | 9,598,654 | | | | 105,349,183 | | | | 43,844,295 | | | | 77,932,621 | |
| Net change in unrealized appreciation (depreciation) on: | | | | | | | | | | | | | | | | |
| Affiliated underlying funds | | | 21,787,467 | | | | 151,430,108 | | | | 42,975,981 | | | | 91,449,315 | |
| Unaffiliated underlying funds | | | 3,268,127 | | | | 7,662,803 | | | | 6,405,098 | | | | 8,137,774 | |
| Net change in unrealized appreciation (depreciation) | | | 25,055,594 | | | | 159,092,911 | | | | 49,381,079 | | | | 99,587,089 | |
| Net realized and unrealized gain | | | 34,654,248 | | | | 264,442,094 | | | | 93,225,374 | | | | 177,519,710 | |
Increase in net assets resulting from operations | | $ | 42,774,039 | | | $ | 303,521,358 | | | $ | 110,222,624 | | | $ | 205,518,366 | |
See Accompanying Notes to Financial Statements
12
STATEMENTS OF CHANGES IN NET ASSETS
| | Voya Retirement
Conservative Portfolio | | Voya Retirement
Growth Portfolio |
|---|
| | Year Ended
December 31,
2020 | | Year Ended
December 31,
2019 | | Year Ended
December 31,
2020 | | Year Ended
December 31,
2019 |
|---|
FROM OPERATIONS: | | | | | | | | | | | | | | | | |
| Net investment income | | $ | 8,119,791 | | | $ | 7,626,437 | | | $ | 39,079,264 | | | $ | 53,362,545 | |
| Net realized gain | | | 9,598,654 | | | | 10,820,540 | | | | 105,349,183 | | | | 133,568,784 | |
| Net change in unrealized appreciation (depreciation) | | | 25,055,594 | | | | 34,683,880 | | | | 159,092,911 | | | | 319,244,192 | |
| Increase in net assets resulting from operations | | | 42,774,039 | | | | 53,130,857 | | | | 303,521,358 | | | | 506,175,521 | |
| |
FROM DISTRIBUTIONS TO SHAREHOLDERS: | | | | | | | | | | | | | | | | |
| Total distributions (excluding return of capital): | | | | | | | | | | | | | | | | |
| Class ADV | | | (17,990,939 | ) | | | (18,553,699 | ) | | | (153,007,477 | ) | | | (232,360,607 | ) |
| Class I | | | (10,866 | ) | | | (3,535 | ) | | | (3,182,685 | ) | | | (4,625,627 | ) |
| Total distributions | | | (18,001,805 | ) | | | (18,557,234 | ) | | | (156,190,162 | ) | | | (236,986,234 | ) |
| |
FROM CAPITAL SHARE TRANSACTIONS: | | | | | | | | | | | | | | | | |
| Net proceeds from sale of shares | | | 40,843,106 | | | | 31,957,062 | | | | 5,729,227 | | | | 12,832,178 | |
| Reinvestment of distributions | | | 18,001,763 | | | | 18,557,191 | | | | 156,190,162 | | | | 236,986,234 | |
| | | | 58,844,869 | | | | 50,514,253 | | | | 161,919,389 | | | | 249,818,412 | |
| Cost of shares redeemed | | | (62,275,274 | ) | | | (60,509,716 | ) | | | (359,765,955 | ) | | | (410,938,244 | ) |
| Net decrease in net assets resulting from capital share transactions | | | (3,430,405 | ) | | | (9,995,463 | ) | | | (197,846,566 | ) | | | (161,119,832 | ) |
| Net increase (decrease) in net assets | | | 21,341,829 | | | | 24,578,160 | | | | (50,515,370 | ) | | | 108,069,455 | |
| |
NET ASSETS: | | | | | | | | | | | | | | | | |
| Beginning of year or period | | | 424,879,024 | | | | 400,300,864 | | | | 2,601,888,046 | | | | 2,493,818,591 | |
| End of year or period | | $ | 446,220,853 | | | $ | 424,879,024 | | | $ | 2,551,372,676 | | | $ | 2,601,888,046 | |
See Accompanying Notes to Financial Statements
13
STATEMENTS OF CHANGES IN NET ASSETS
| | Voya Retirement
Moderate Portfolio | | Voya Retirement
Moderate Growth Portfolio |
|---|
| | Year Ended
December 31,
2020 | | Year Ended
December 31,
2019 | | Year Ended
December 31,
2020 | | Year Ended
December 31,
2019 |
|---|
FROM OPERATIONS: | | | | | | | | | | | | | | | | |
| Net investment income | | $ | 16,997,250 | | | $ | 20,126,739 | | | $ | 27,998,656 | | | $ | 35,705,553 | |
| Net realized gain | | | 43,844,295 | | | | 40,364,426 | | | | 77,932,621 | | | | 92,751,119 | |
| Net change in unrealized appreciation (depreciation) | | | 49,381,079 | | | | 100,602,183 | | | | 99,587,089 | | | | 196,914,279 | |
| Increase in net assets resulting from operations | | | 110,222,624 | | | | 161,093,348 | | | | 205,518,366 | | | | 325,370,951 | |
| |
FROM DISTRIBUTIONS TO SHAREHOLDERS: | | | | | | | | | | | | | | | | |
| Total distributions (excluding return of capital): | | | | | | | | | | | | | | | | |
| Class ADV | | | (52,487,462 | ) | | | (62,980,933 | ) | | | (108,214,037 | ) | | | (146,075,017 | ) |
| Class I | | | (1,264,412 | ) | | | (1,264,979 | ) | | | (1,553,761 | ) | | | (1,883,900 | ) |
| Total distributions | | | (53,751,874 | ) | | | (64,245,912 | ) | | | (109,767,798 | ) | | | (147,958,917 | ) |
| |
FROM CAPITAL SHARE TRANSACTIONS: | | | | | | | | | | | | | | | | |
| Net proceeds from sale of shares | | | 17,324,081 | | | | 24,874,534 | | | | 12,142,256 | | | | 17,828,813 | |
| Reinvestment of distributions | | | 53,751,874 | | | | 64,245,912 | | | | 109,767,798 | | | | 147,958,917 | |
| | | | 71,075,955 | | | | 89,120,446 | | | | 121,910,054 | | | | 165,787,730 | |
| Cost of shares redeemed | | | (146,655,932 | ) | | | (145,338,094 | ) | | | (248,009,042 | ) | | | (287,935,946 | ) |
| Net decrease in net assets resulting from capital share transactions | | | (75,579,977 | ) | | | (56,217,648 | ) | | | (126,098,988 | ) | | | (122,148,216 | ) |
| Net increase (decrease) in net assets | | | (19,109,227 | ) | | | 40,629,788 | | | | (30,348,420 | ) | | | 55,263,818 | |
| |
NET ASSETS: | | | | | | | | | | | | | | | | |
| Beginning of year or period | | | 1,030,168,573 | | | | 989,538,785 | | | | 1,791,580,038 | | | | 1,736,316,220 | |
| End of year or period | | $ | 1,011,059,346 | | | $ | 1,030,168,573 | | | $ | 1,761,231,618 | | | $ | 1,791,580,038 | |
See Accompanying Notes to Financial Statements
14
Selected data for a share of beneficial interest outstanding throughout each year or period.
| | | | | Income (loss)
from investment
operations | | | | Less distributions | | | | | | | | | | Ratios to average
net assets | | Supplemental
data |
|---|
Year or
period | | Net asset
value,
beginning
of year or
period | | Net
investment
income (loss) | | Net
realized
and
unrealized
gain (loss) | | Total from
investment
operations | | From net
investment
income | | From net
realized
gains | | From
return of
capital | | Total
distributions | | Payment
by affiliate | | Net asset
value, end
of year or
period | | Total
Return(1) | | Expenses
before
reductions/
additions(2)(3)(4) | | Expenses
net of fee
waivers
and/or
recoupments
if any(2)(3)(4) | | Expenses
net of all
reductions/
additions(2)(3)(4) | | Net
investment
income
(loss)(2)(3) | | Net assets, end
of year or
period | | Portfolio
turnover
rate |
|---|
| ended | | ($) | | ($) | | ($) | | ($) | | ($) | | ($) | | ($) | | ($) | | ($) | | ($) | | (%) | | (%) | | (%) | | (%) | | (%) | | ($000’s) | | (%) |
Voya Retirement Conservative Portfolio | | | | | | | | | | | | | | | | | | | | | | | | | | | | | | | | | | | | | | | | | | | | | |
Class ADV | | | | | | | | | | | | | | | | | | | | | | | | | | | | | | | | | | | | | | | | | | | | | | | | | | | | | | | | | | | | | | | | | | | | |
12-31-20 | | | 9.31 | | | | 0.18 | | | | 0.75 | | | | 0.93 | | | | 0.17 | | | | 0.23 | | | | — | | | | 0.40 | | | | — | | | | 9.84 | | | | 10.33 | | | | 0.77 | | | | 0.52 | | | | 0.52 | | | | 1.90 | | | | 444,944 | | | | 27 | |
12-31-19 | | | 8.57 | | | | 0.17 | | | | 0.98 | | | | 1.15 | | | | 0.17 | | | | 0.24 | | | | — | | | | 0.41 | | | | — | | | | 9.31 | | | | 13.61 | | | | 0.78 | | | | 0.53 | | | | 0.53 | | | | 1.82 | | | | 424,756 | | | | 24 | |
12-31-18 | | | 9.24 | | | | 0.17 | | | | (0.41 | ) | | | (0.24 | ) | | | 0.17 | | | | 0.26 | | | | — | | | | 0.43 | | | | — | | | | 8.57 | | | | (2.74 | ) | | | 0.77 | | | | 0.52 | | | | 0.52 | | | | 1.74 | | | | 400,267 | | | | 33 | |
12-31-17 | | | 8.89 | | | | 0.14 | • | | | 0.54 | | | | 0.68 | | | | 0.13 | | | | 0.20 | | | | — | | | | 0.33 | | | | — | | | | 9.24 | | | | 7.76 | | | | 0.76 | | | | 0.51 | | | | 0.51 | | | | 1.57 | | | | 456,710 | | | | 15 | |
12-31-16 | | | 8.81 | | | | 0.09 | | | | 0.32 | | | | 0.41 | | | | 0.13 | | | | 0.20 | | | | — | | | | 0.33 | | | | — | | | | 8.89 | | | | 4.68 | | | | 0.76 | | | | 0.51 | | | | 0.51 | | | | 1.17 | | | | 507,585 | | | | 23 | |
Class I | | | | | | | | | | | | | | | | | | | | | | | | | | | | | | | | | | | | | | | | | | | | | | | | | | | | | | | | | | | | | | | | | | | | |
12-31-20 | | | 9.45 | | | | 0.24 | • | | | 0.75 | | | | 0.99 | | | | 0.20 | | | | 0.23 | | | | — | | | | 0.43 | | | | — | | | | 10.01 | | | | 10.77 | | | | 0.27 | | | | 0.27 | | | | 0.27 | | | | 2.47 | | | | 1,276 | | | | 27 | |
12-31-19 | | | 8.70 | | | | 0.21 | • | | | 0.98 | | | | 1.19 | | | | 0.20 | | | | 0.24 | | | | — | | | | 0.44 | | | | — | | | | 9.45 | | | | 13.81 | | | | 0.28 | | | | 0.28 | | | | 0.28 | | | | 2.31 | | | | 123 | | | | 24 | |
12-31-18 | | | 9.38 | | | | 0.19 | • | | | (0.41 | ) | | | (0.22 | ) | | | 0.20 | | | | 0.26 | | | | — | | | | 0.46 | | | | — | | | | 8.70 | | | | (2.54 | ) | | | 0.27 | | | | 0.27 | | | | 0.27 | | | | 2.11 | | | | 34 | | | | 33 | |
12-31-17 | | | 9.04 | | | | 0.31 | • | | | 0.39 | | | | 0.70 | | | | 0.16 | | | | 0.20 | | | | — | | | | 0.36 | | | | — | | | | 9.38 | | | | 7.81 | | | | 0.26 | | | | 0.26 | | | | 0.26 | | | | 3.44 | | | | 17 | | | | 15 | |
12-31-16 | | | 8.97 | | | | 0.14 | | | | 0.29 | | | | 0.43 | | | | 0.16 | | | | 0.20 | | | | — | | | | 0.36 | | | | — | | | | 9.04 | | | | 4.73 | | | | 0.26 | | | | 0.26 | | | | 0.26 | | | | 1.52 | | | | 1 | | | | 23 | |
Voya Retirement Growth Portfolio | | | | | | | | | | | | | | | | | | | | | | | | | | | | | | | | | | | | |
Class ADV | | | | | | | | | | | | | | | | | | | | | | | | | | | | | | | | | | | | | | | | | | | | | | | | | | | | | | | | | | | | | | | | | | | | |
12-31-20 | | | 13.00 | | | | 0.20 | • | | | 1.44 | | | | 1.64 | | | | 0.30 | | | | 0.54 | | | | — | | | | 0.84 | | | | — | | | | 13.80 | | | | 13.64 | | | | 0.76 | | | | 0.68 | | | | 0.68 | | | | 1.62 | | | | 2,499,847 | | | | 27 | |
12-31-19 | | | 11.74 | | | | 0.26 | • | | | 2.20 | | | | 2.46 | | | | 0.24 | | | | 0.96 | | | | — | | | | 1.20 | | | | — | | | | 13.00 | | | | 21.55 | | | | 0.76 | | | | 0.68 | | | | 0.68 | | | | 2.04 | | | | 2,553,927 | | | | 40 | |
12-31-18 | | | 13.99 | | | | 0.20 | • | | | (1.13 | ) | | | (0.93 | ) | | | 0.23 | | | | 1.09 | | | | — | | | | 1.32 | | | | — | | | | 11.74 | | | | (7.47 | ) | | | 0.76 | | | | 0.68 | | | | 0.68 | | | | 1.49 | | | | 2,449,356 | | | | 20 | |
12-31-17 | | | 13.10 | | | | 0.19 | • | | | 1.91 | | | | 2.10 | | | | 0.25 | | | | 0.96 | | | | — | | | | 1.21 | | | | — | | | | 13.99 | | | | 16.66 | | | | 0.76 | | | | 0.68 | | | | 0.68 | | | | 1.37 | | | | 3,018,225 | | | | 11 | |
12-31-16 | | | 13.14 | | | | 0.19 | • | | | 0.76 | | | | 0.95 | | | | 0.30 | | | | 0.69 | | | | — | | | | 0.99 | | | | — | | | | 13.10 | | | | 7.31 | | | | 0.76 | | | | 0.68 | | | | 0.68 | | | | 1.45 | | | | 3,275,638 | | | | 17 | |
Class I | | | | | | | | | | | | | | | | | | | | | | | | | | | | | | | | | | | | | | | | | | | | | | | | | | | | | | | | | | | | | | | | | | | | |
12-31-20 | | | 13.08 | | | | 0.27 | | | | 1.43 | | | | 1.70 | | | | 0.36 | | | | 0.54 | | | | — | | | | 0.90 | | | | — | | | | 13.88 | | | | 14.11 | | | | 0.26 | | | | 0.26 | | | | 0.26 | | | | 2.07 | | | | 51,526 | | | | 27 | |
12-31-19 | | | 11.81 | | | | 0.31 | • | | | 2.22 | | | | 2.53 | | | | 0.30 | | | | 0.96 | | | | — | | | | 1.26 | | | | — | | | | 13.08 | | | | 22.09 | | | | 0.26 | | | | 0.26 | | | | 0.26 | | | | 2.48 | | | | 47,961 | | | | 40 | |
12-31-18 | | | 14.07 | | | | 0.26 | | | | (1.13 | ) | | | (0.87 | ) | | | 0.30 | | | | 1.09 | | | | — | | | | 1.39 | | | | — | | | | 11.81 | | | | (7.05 | ) | | | 0.26 | | | | 0.26 | | | | 0.26 | | | | 1.94 | | | | 44,463 | | | | 20 | |
12-31-17 | | | 13.18 | | | | 0.25 | • | | | 1.91 | | | | 2.16 | | | | 0.31 | | | | 0.96 | | | | — | | | | 1.27 | | | | — | | | | 14.07 | | | | 17.11 | | | | 0.26 | | | | 0.26 | | | | 0.26 | | | | 1.84 | | | | 49,040 | | | | 11 | |
12-31-16 | | | 13.22 | | | | 0.25 | | | | 0.76 | | | | 1.01 | | | | 0.36 | | | | 0.69 | | | | — | | | | 1.05 | | | | — | | | | 13.18 | | | | 7.80 | | | | 0.26 | | | | 0.26 | | | | 0.26 | | | | 1.93 | | | | 47,460 | | | | 17 | |
Voya Retirement Moderate Portfolio | | | | | | | | | | | | | | | | | | | | | | | | | | | | | | | | | | | | | |
Class ADV | | | | | | | | | | | | | | | | | | | | | | | | | | | | | | | | | | | | | | | | | | | | | | | | | | | | | | | | | | | | | | | | | | | | |
12-31-20 | | | 11.55 | | | | 0.20 | • | | | 1.14 | | | | 1.34 | | | | 0.25 | | | | 0.40 | | | | — | | | | 0.65 | | | | — | | | | 12.24 | | | | 12.17 | | | | 0.77 | | | | 0.61 | | | | 0.61 | | | | 1.73 | | | | 988,153 | | | | 28 | |
12-31-19 | | | 10.51 | | | | 0.22 | • | | | 1.54 | | | | 1.76 | | | | 0.22 | | | | 0.50 | | | | — | | | | 0.72 | | | | — | | | | 11.55 | | | | 17.14 | | | | 0.77 | | | | 0.61 | | | | 0.61 | | | | 1.96 | | | | 1,008,727 | | | | 31 | |
12-31-18 | | | 11.79 | | | | 0.19 | • | | | (0.75 | ) | | | (0.56 | ) | | | 0.21 | | | | 0.51 | | | | — | | | | 0.72 | | | | — | | | | 10.51 | | | | (5.07 | ) | | | 0.77 | | | | 0.61 | | | | 0.61 | | | | 1.68 | | | | 972,232 | | | | 27 | |
12-31-17 | | | 11.35 | | | | 0.17 | • | | | 1.14 | | | | 1.31 | | | | 0.20 | | | | 0.67 | | | | — | | | | 0.87 | | | | — | | | | 11.79 | | | | 11.82 | | | | 0.76 | | | | 0.60 | | | | 0.60 | | | | 1.50 | | | | 1,170,685 | | | | 12 | |
12-31-16 | | | 11.49 | | | | 0.15 | • | | | 0.51 | | | | 0.66 | | | | 0.23 | | | | 0.57 | | | | — | | | | 0.80 | | | | — | | | | 11.35 | | | | 5.78 | | | | 0.76 | | | | 0.60 | | | | 0.60 | | | | 1.34 | | | | 1,257,324 | | | | 15 | |
Class I | | | | | | | | | | | | | | | | | | | | | | | | | | | | | | | | | | | | | | | | | | | | | | | | | | | | | | | | | | | | | | | | | | | | |
12-31-20 | | | 11.70 | | | | 0.24 | | | | 1.15 | | | | 1.39 | | | | 0.29 | | | | 0.40 | | | | — | | | | 0.69 | | | | — | | | | 12.40 | | | | 12.51 | | | | 0.27 | | | | 0.27 | | | | 0.27 | | | | 2.06 | | | | 22,906 | | | | 28 | |
12-31-19 | | | 10.64 | | | | 0.25 | | | | 1.58 | | | | 1.83 | | | | 0.27 | | | | 0.50 | | | | — | | | | 0.77 | | | | — | | | | 11.70 | | | | 17.56 | | | | 0.27 | | | | 0.27 | | | | 0.27 | | | | 2.35 | | | | 21,441 | | | | 31 | |
12-31-18 | | | 11.93 | | | | 0.24 | | | | (0.76 | ) | | | (0.52 | ) | | | 0.26 | | | | 0.51 | | | | — | | | | 0.77 | | | | — | | | | 10.64 | | | | (4.73 | ) | | | 0.27 | | | | 0.27 | | | | 0.27 | | | | 2.03 | | | | 17,307 | | | | 27 | |
12-31-17 | | | 11.48 | | | | 0.22 | | | | 1.14 | | | | 1.36 | | | | 0.24 | | | | 0.67 | | | | — | | | | 0.91 | | | | — | | | | 11.93 | | | | 12.21 | | | | 0.26 | | | | 0.26 | | | | 0.26 | | | | 1.86 | | | | 19,580 | | | | 12 | |
12-31-16 | | | 11.62 | | | | 0.20 | • | | | 0.51 | | | | 0.71 | | | | 0.28 | | | | 0.57 | | | | — | | | | 0.85 | | | | — | | | | 11.48 | | | | 6.12 | | | | 0.26 | | | | 0.26 | | | | 0.26 | | | | 1.68 | | | | 17,956 | | | | 15 | |
See Accompanying Notes to Financial Statements
15
FINANCIAL HIGHLIGHTS (CONTINUED)
Selected data for a share of beneficial interest outstanding throughout each year or period.
| | | | | Income (loss)
from investment
operations | | | | Less distributions | | | | | | | | | | Ratios to average
net assets | | Supplemental
data |
|---|
| | | Net asset
value,
beginning
of year or
period | | Net
investment
income (loss) | | Net
realized
and
unrealized
gain (loss) | | Total from
investment
operations | | From net
investment
income | | From net
realized
gains | | From
return of
capital | | Total
distributions | | Payment
by affiliate | | Net asset
value, end
of year or
period | | Total
Return(1) | | Expenses
before
reductions/
additions(2)(3)(4) | | Expenses
net of fee
waivers
and/or
recoupments
if any(2)(3)(4) | | Expenses
net of all
reductions/
additions(2)(3)(4) | | Net
investment
income
(loss)(2)(3) | | Net assets,
end of year or
period | | Portfolio
turnover
rate |
|---|
| Year or period ended | | ($) | | ($) | | ($) | | ($) | | ($) | | ($) | | ($) | | ($) | | ($) | | ($) | | (%) | | (%) | | (%) | | (%) | | (%) | | ($000’s) | | (%) |
Voya Retirement Moderate Growth Portfolio | | | | | | | | | | | | | | | | | | | | | | | | | | | | | | | | | | | | |
Class ADV | | | | | | | | | | | | | | | | | | | | | | | | | | | | | | | | | | | | | | | | | | | | | | | | | | | | | | | | | | | | | | | | | | | | |
| 12-31-20 | | | 12.10 | | | | 0.20 | • | | | 1.29 | | | | 1.49 | | | | 0.27 | | | | 0.53 | | | | — | | | | 0.80 | | | | — | | | | 12.79 | | | | 13.15 | | | | 0.76 | | | | 0.65 | | | | 0.65 | | | | 1.66 | | | | 1,736,505 | | | | 28 | |
| 12-31-19 | | | 10.97 | | | | 0.23 | • | | | 1.91 | | | | 2.14 | | | | 0.23 | | | | 0.78 | | | | — | | | | 1.01 | | | | — | | | | 12.10 | | | | 20.02 | | | | 0.76 | | | | 0.65 | | | | 0.65 | | | | 1.98 | | | | 1,769,060 | | | | 39 | |
| 12-31-18 | | | 12.80 | | | | 0.19 | • | | | (0.91 | ) | | | (0.72 | ) | | | 0.22 | | | | 0.89 | | | | — | | | | 1.11 | | | | — | | | | 10.97 | | | | (6.30 | ) | | | 0.76 | | | | 0.65 | | | | 0.65 | | | | 1.56 | | | | 1,716,501 | | | | 22 | |
| 12-31-17 | | | 12.23 | | | | 0.18 | • | | | 1.53 | | | | 1.71 | | | | 0.23 | | | | 0.91 | | | | — | | | | 1.14 | | | | — | | | | 12.80 | | | | 14.56 | | | | 0.76 | | | | 0.65 | | | | 0.65 | | | | 1.42 | | | | 2,111,439 | | | | 10 | |
| 12-31-16 | | | 12.76 | | | | 0.18 | • | | | 0.67 | | | | 0.85 | | | | 0.28 | | | | 1.10 | | | | — | | | | 1.38 | | | | — | | | | 12.23 | | | | 6.81 | | | | 0.76 | | | | 0.65 | | | | 0.65 | | | | 1.46 | | | | 2,275,963 | | | | 16 | |
Class I | | | | | | | | | | | | | | | | | | | | | | | | | | | | | | | | | | | | | | | | | | | | | | | | | | | | | | | | | | | | | | | | | | | | |
| 12-31-20 | | | 12.00 | | | | 0.25 | | | | 1.27 | | | | 1.52 | | | | 0.32 | | | | 0.53 | | | | — | | | | 0.85 | | | | — | | | | 12.67 | | | | 13.59 | | | | 0.26 | | | | 0.26 | | | | 0.26 | | | | 2.10 | | | | 24,726 | | | | 28 | |
| 12-31-19 | | | 10.90 | | | | 0.29 | | | | 1.87 | | | | 2.16 | | | | 0.28 | | | | 0.78 | | | | — | | | | 1.06 | | | | — | | | | 12.00 | | | | 20.40 | | | | 0.26 | | | | 0.26 | | | | 0.26 | | | | 2.41 | | | | 22,520 | | | | 39 | |
| 12-31-18 | | | 12.73 | | | | 0.24 | • | | | (0.90 | ) | | | (0.66 | ) | | | 0.28 | | | | 0.89 | | | | — | | | | 1.17 | | | | — | | | | 10.90 | | | | (5.90 | ) | | | 0.26 | | | | 0.26 | | | | 0.26 | | | | 1.97 | | | | 19,816 | | | | 22 | |
| 12-31-17 | | | 12.17 | | | | 0.24 | | | | 1.52 | | | | 1.76 | | | | 0.29 | | | | 0.91 | | | | — | | | | 1.20 | | | | — | | | | 12.73 | | | | 15.05 | | | | 0.26 | | | | 0.26 | | | | 0.26 | | | | 1.84 | | | | 24,017 | | | | 10 | |
| 12-31-16 | | | 12.71 | | | | 0.24 | | | | 0.66 | | | | 0.90 | | | | 0.34 | | | | 1.10 | | | | — | | | | 1.44 | | | | — | | | | 12.17 | | | | 7.25 | | | | 0.26 | | | | 0.26 | | | | 0.26 | | | | 1.86 | | | | 22,088 | | | | 16 | |
(1) | | Total return is calculated assuming reinvestment of all dividends, capital gain distributions and return of capital distributions, if any, at net asset value and does not reflect the effect of insurance contract charges. Total return for periods less than one year is not annualized. |
(2) | | Annualized for periods less than one year. |
(3) | | Ratios reflect operating expenses of a Portfolio. Expenses before reductions/additions do not reflect amounts reimbursed or recouped by the Investment Adviser and/or Distributor or reductions from brokerage service arrangements or other expense offset arrangements and do not represent the amount paid by a Portfolio during periods when reimbursements or reductions occur. |
| | | Expenses net of fee waivers reflect expenses after reimbursement by the Investment Adviser and/or Distributor or recoupment of previously reimbursed fees by the Investment Adviser, but prior to reductions from brokerage service arrangements or other expense offset arrangements. Expenses net of all reductions/additions represent the net expenses paid by a Portfolio. Net investment income (loss) is net of all such additions or reductions. |
(4) | | Ratios do not include expenses of underlying funds and do not include fees and expenses charged under the variable annuity contract or variable life insurance policy. |
• | | Calculated using average number of shares outstanding throughout the year or period. |
See Accompanying Notes to Financial Statements
16
NOTES TO FINANCIAL STATEMENTS AS OF DECEMBER 31, 2020
NOTE 1 — ORGANIZATION
Voya Investors Trust (the “Trust”) is registered under the Investment Company Act of 1940, as amended (“1940 Act”), as an open-end management investment company. The Trust was organized as a Massachusetts business trust on August 3, 1988. The Trust currently consists of twenty-two active separate investment series. The four series (each, a “Portfolio” and collectively, the “Portfolios”) included in this report are: Voya Retirement Conservative Portfolio (“Conservative”), Voya Retirement Growth Portfolio (Growth”), Voya Retirement Moderate Portfolio (“Moderate”) and Voya Retirement Moderate Growth Portfolio (“Moderate Growth”), each a diversified series of the Trust.
The classes of shares included in this report are: Adviser (“Class ADV”) and Institutional (“Class I”). With the exception of class specific matters, each class has equal voting rights as to voting privileges. For class specific proposals, only the applicable class would have voting privileges. The classes differ principally in the applicable distribution and shareholder service fees. Generally, shareholders of each class also bear certain expenses that pertain to that particular class. All shareholders are allocated the common expenses of a portfolio and earn income and realized gains/losses from a portfolio pro rata based on the daily ending net assets of each class, without distinction between share classes. Expenses that are specific to a portfolio or a class are charged directly to that portfolio or class. Other operating expenses shared by several portfolios are generally allocated among those portfolios based on average net assets. Distributions are determined separately for each class based on income and expenses allocated to each class. Realized gain distributions are allocated to each class pro rata based on the shares outstanding of each class on the date of distribution. Differences in per share dividend rates generally result from differences in separate class expenses, including distribution and shareholder service fees, if any, as well as differences in the amount of waiver of fees and reimbursement of expenses between the separate classes, if any.
Voya Investments, LLC (“Voya Investments” or the “Investment Adviser”), an Arizona limited liability company serves as the Investment Adviser to the Portfolios. Voya Investment Management Co. LLC (“Voya IM” or the “Sub-Adviser”), a Delaware limited liability company, serves as the Sub-Adviser to the Portfolios. Voya Investments Distributor, LLC (“VID” or the “Distributor”), a Delaware limited liability company, serves as the principal underwriter to the Portfolios.
Each Portfolio seeks to achieve its investment objective by investing in other investment companies (“Underlying
Funds”) and uses asset allocation strategies to determine how much to invest in the Underlying Funds. The investment objective of the Portfolios is described in the respective Portfolio’s Prospectus.
NOTE 2 — SIGNIFICANT ACCOUNTING POLICIES
The following significant accounting policies are consistently followed by the Portfolios in the preparation of their financial statements. Each Portfolio is considered an investment company under U.S. generally accepted accounting principles (“GAAP”) and follows the accounting and reporting guidance applicable to investment companies.
A. Security Valuation. Each Portfolio is open for business every day the New York Stock Exchange (“NYSE”) opens for regular trading (each such day, a “Business Day”). The net asset value (“NAV”) per share for each class of each Portfolio is determined each Business Day as of the close of the regular trading session (“Market Close”), as determined by the Consolidated Tape Association (“CTA”), the central distributor of transaction prices for exchange-traded securities (normally 4:00 p.m. Eastern time unless otherwise designated by the CTA). The data reflected on the consolidated tape provided by the CTA is generated by various market centers, including all securities exchanges, electronic communications networks, and third-market broker-dealers. The NAV per share of each class of each Portfolio is calculated by taking the value of the Portfolio’s assets attributable to that class, subtracting the Portfolio’s liabilities attributable to that class, and dividing by the number of shares of that class that are outstanding. On days when a Portfolio is closed for business, Portfolio shares will not be priced and a Portfolio does not transact purchase and redemption orders. To the extent a Portfolio’s assets are traded in other markets on days when a Portfolio does not price its shares, the value of a Portfolio’s assets will likely change and you will not be able to purchase or redeem shares of a Portfolio.
Assets for which market quotations are readily available are valued at market value. A security listed or traded on an exchange is valued at its last sales price or official closing price as of the close of the regular trading session on the exchange where the security is principally traded or, if such price is not available, at the last sale price as of the Market Close for such security provided by the CTA. Bank loans are valued at the average of the averages of the bid and ask prices provided to an independent loan pricing service by brokers. Futures contracts are valued at the final settlement price set by an exchange on which they are principally traded. Listed options are valued at the mean between the last bid and ask prices from the exchange on which they are principally traded. Investments in open-end
17
NOTES TO FINANCIAL STATEMENTS AS OF DECEMBER 31, 2020 (CONTINUED)
NOTE 2 — SIGNIFICANT ACCOUNTING POLICIES (continued)
registered investment companies that do not trade on an exchange are valued at the end of day NAV per share. Investments in registered investment companies that trade on an exchange are valued at the last sales price or official closing price as of the close of the regular trading session on the exchange where the security is principally traded.
When a market quotation is not readily available or is deemed unreliable, each Portfolio will determine a fair value for the relevant asset in accordance with procedures adopted by the Portfolios’ Board of Trustees (“Board”). Such procedures provide, for example, that: (a) Exchange-traded securities are valued at the mean of the closing bid and ask; (b) Debt obligations are valued using an evaluated price provided by an independent pricing service. Evaluated prices provided by the pricing service may be determined without exclusive reliance on quoted prices, and may reflect factors such as institution-size trading in similar groups of securities, developments related to specific securities, benchmark yield, quality, type of issue, coupon rate, maturity, individual trading characteristics and other market data; (c) Securities traded in the over-the-counter (“OTC”) market are valued based on prices provided by independent pricing services or market makers; (d) Options not listed on an exchange are valued by an independent source using an industry accepted model, such as Black-Scholes; (e) Centrally cleared swap agreements are valued using a price provided by the central counterparty clearinghouse; (f) OTC swap agreements are valued using a price provided by an independent pricing service; (g) Forward foreign currency exchange contracts are valued utilizing current and forward rates obtained from an independent pricing service. Such prices from the third party pricing service are for specific settlement periods and each Portfolio’s forward foreign currency exchange contracts are valued at an interpolated rate between the closest preceding and subsequent period reported by the independent pricing service; and (h) Securities for which market prices are not provided by any of the above methods may be valued based upon quotes furnished by brokers.
The prospectuses of the open-end registered investment companies in which each Portfolio may invest explain the circumstances under which they will use fair value pricing and the effects of using fair value pricing.
Foreign securities’ (including forward foreign currency exchange contracts) prices are converted into U.S. dollar amounts using the applicable exchange rates as of Market Close. If market quotations are available and believed to be reliable for foreign exchange-traded equity securities, the securities will be valued at the market quotations. Because trading hours for certain foreign securities end before
Market Close, closing market quotations may become unreliable. An independent pricing service determines the degree of certainty, based on historical data, that the closing price in the principal market where a foreign security trades is not the current value as of Market Close. Foreign securities’ prices meeting the approved degree of certainty that the price is not reflective of current value will be valued by the independent pricing service using pricing models designed to estimate likely changes in the values of those securities between the times in which the trading in those securities is substantially completed and Market Close. Multiple factors may be considered by the independent pricing service in determining the value of such securities and may include information relating to sector indices, American Depositary Receipts and domestic and foreign index futures.
All other assets for which market quotations are not readily available or became unreliable (or if the above fair valuation methods are unavailable or determined to be unreliable) are valued at fair value as determined in good faith by or under the supervision of the Board following procedures approved by the Board. The Board has delegated to the Investment Adviser responsibility for overseeing the implementation of the Portfolios’ valuation procedures; a ″Pricing Committee″ comprised of employees of the Investment Adviser or its affiliates has responsibility for applying the fair valuation methods set forth in the procedures and, if a fair valuation cannot be determined pursuant to the fair valuation methods, determining the fair value of assets held by the Portfolios. Issuer specific events, transaction price, position size, nature and duration of restrictions on disposition of the security, market trends, bid/ask quotes of brokers and other market data may be reviewed in the course of making a good faith determination of a security’s fair value. Valuations change in response to many factors including the historical and prospective earnings of the issuer, the value of the issuer’s assets, general economic conditions, interest rates, investor perceptions and market liquidity. Because of the inherent uncertainties of fair valuation, the values used to determine each Portfolio’s NAV may materially differ from the value received upon actual sale of those investments. Thus, fair valuation may have an unintended dilutive or accretive effect on the value of shareholders’ investments in each Portfolio.
Each investment asset or liability of the Portfolios is assigned a level at measurement date based on the significance and source of the inputs to its valuation. Quoted prices in active markets for identical securities are classified as “Level 1,” inputs other than quoted prices for an asset or liability that are observable are classified as ″Level 2″ and significant unobservable inputs, including the Sub-Adviser’s or Pricing Committee’s judgment about the
18
NOTES TO FINANCIAL STATEMENTS AS OF DECEMBER 31, 2020 (CONTINUED)
NOTE 2 — SIGNIFICANT ACCOUNTING POLICIES (continued)
assumptions that a market participant would use in pricing an asset or liability are classified as “Level 3.” The inputs used for valuing securities are not necessarily an indication of the risks associated with investing in those securities. Short-term securities of sufficient credit quality are generally considered to be Level 2 securities under applicable accounting rules. The Portfolios classify each of their investments in the Underlying Funds as Level 1, without consideration as to the classification level of the specific investments held by the Underlying Funds. A table summarizing the Portfolios’ investments under these levels of classification is included within the Portfolio of Investments.
GAAP requires a reconciliation of the beginning to ending balances for reported fair values that presents changes attributable to total realized and unrealized gains or losses, purchases and sales, and transfers in or out of the Level 3 category during the period. A reconciliation of Level 3 investments within the Portfolio of Investments is presented only when a Portfolio has a significant amount of Level 3 investments.
B. Securities Transactions and Revenue Recognition. Securities transactions are accounted for on the trade date. Dividend income received from the Underlying Funds is recognized on the ex-dividend date and is recorded as income distributions in the Statements of Operations. Capital gain distributions received from the Underlying Funds are recognized on the ex-dividend date and are recorded on the Statements of Operations as such. Realized gains and losses are reported on the basis of identified cost of securities sold.
C. Distributions to Shareholders. The Portfolios record distributions to their shareholders on the ex-dividend date. Each Portfolio declares and pays dividends and capital gain distributions, if any, annually. The Portfolios may make distributions on a more frequent basis to comply with the distribution requirements of the Internal Revenue Code. The characteristics of income and gains to be distributed are determined in accordance with income tax regulations, which may differ from GAAP for investment companies.
D. Federal Income Taxes. It is the policy of each Portfolio to comply with the requirements of subchapter M of the Internal Revenue Code that are applicable to regulated investment companies and to distribute substantially all of its net investment income and any net realized capital gains to its shareholders. Therefore, a federal income tax or excise tax provision is not required. Management has considered the sustainability of the Portfolios’ tax positions taken on federal income tax returns for all open tax years
in making this determination. No capital gain distributions shall be made until the capital loss carryforwards have been fully utilized.
The Portfolios may utilize equalization accounting for tax purposes, whereby a portion of redemption payments are treated as distributions of income or gain.
E. Use of Estimates. The preparation of financial statements in conformity with GAAP requires management to make estimates and assumptions that affect the reported amounts of assets and liabilities and disclosure of contingent assets and liabilities at the date of the financial statements and the reported amounts of increases and decreases in net assets from operations during the reporting period. Actual results could differ from those estimates.
F. Indemnifications. In the normal course of business, the Trust may enter into contracts that provide certain indemnifications. The Trust’s maximum exposure under these arrangements is dependent on future claims that may be made against the Portfolios and, therefore, cannot be estimated; however, based on experience, management considers the risk of loss from such claims remote.
NOTE 3 — INVESTMENTS IN UNDERLYING FUNDS
For the year ended December 31, 2020, the cost of purchases and the proceeds from the sales of the Underlying Funds were as follows:
| | | Purchases | | | Sales | |
|---|
| Conservative | | | $ | 116,141,099 | | | $ | 129,580,175 | |
| Growth | | | | 639,563,686 | | | | 953,994,078 | |
| Moderate | | | | 271,010,122 | | | | 383,555,374 | |
| Moderate Growth | | | | 468,245,576 | | | | 676,040,254 | |
NOTE 4 — INVESTMENT MANAGEMENT FEES
The Portfolios have entered into an investment management agreement (“Management Agreement”) with the Investment Adviser. The Investment Adviser has overall responsibility for the management of the Portfolios. The Investment Adviser oversees all investment management and portfolio management services for the Portfolios and assists in managing and supervising all aspects of the general day-to-day business activities and operations of the Portfolios, including custodial, transfer agency, dividend disbursing, accounting, auditing, compliance and related services. This Management Agreement compensates the Investment Adviser with a management fee, computed daily and payable monthly, based on: 0.24% of each Portfolio’s average daily net assets invested in affiliated Underlying Funds and 0.34% of each Portfolio’s average daily net assets invested in
19
NOTES TO FINANCIAL STATEMENTS AS OF DECEMBER 31, 2020 (CONTINUED)
NOTE 4 — INVESTMENT MANAGEMENT FEES (continued)
unaffiliated Underlying Funds and/or other direct investments.
The Investment Adviser has entered into a sub-advisory agreement with Voya IM with respect to each Portfolio. Voya IM provides investment advice for the Portfolios and is paid by the Investment Adviser based on the average daily net assets of each respective Portfolio. Subject to such policies as the Board or the Investment Adviser may determine, Voya IM manages the Portfolios’ assets in accordance with the Portfolios’ investment objectives, policies, and limitations.
NOTE 5 — DISTRIBUTION AND SERVICE FEES
The Trust has entered into a shareholder service and distribution plan (the “Agreement”) for the Class ADV shares of each Portfolio. The Agreement compensates the Distributor for the provision of shareholder services and/or account maintenance services and the distribution of shares to direct or indirect beneficial owners of Class ADV shares. Under the Agreement, each Portfolio makes payments to the Distributor a shareholder service fee of 0.25% and a distribution fee of 0.25% of each Portfolio’s average daily net assets attributable to Class ADV shares. The Distributor has contractually agreed to waive 0.2480%, 0.0751%, 0.1587% and 0.1106% of the distribution fee for the Class ADV shares of Conservative, Growth, Moderate and Moderate Growth, respectively. The actual distribution fee to be paid by Conservative, Growth, Moderate and Moderate Growth is at an annual rate of 0.002%, 0.1749%, 0.0913% and 0.1394%, respectively. Any fees waived are not subject to recoupment. Termination or modification of this obligation requires approval by the Board.
NOTE 6 — OTHER TRANSACTIONS WITH AFFILIATES AND RELATED PARTIES
At December 31, 2020, the following direct or indirect, wholly-owned subsidiary of Voya Financial, Inc. owned more than 5% of the following Portfolios:
| Subsidiary | | Portfolio | | Percentage |
|---|
| Voya Institutional Trust Company | | Conservative | | | 22.41 | % |
| | | Moderate | | | 8.87 | |
The Portfolios have adopted a deferred compensation plan (the “DC Plan”), which allows eligible independent trustees, as described in the DC Plan, to defer the receipt of all or a portion of the trustees’ fees that they are entitled to receive from the Portfolios. For purposes of determining the amount owed to the trustee under the DC Plan, the amounts deferred are invested in shares of the funds selected by the trustee (the “Notional Funds”). When the Portfolios purchase shares of the Notional Funds, which
are all advised by Voya Investments, in amounts equal to the trustees’ deferred fees, this results in a Portfolio asset equal to the deferred compensation liability. Such assets, if applicable, are included as a component of “Other assets” on the accompanying Statements of Assets and Liabilities. Deferral of trustees’ fees under the DC Plan will not affect net assets of the Portfolios, and will not materially affect the Portfolios’ assets, liabilities or net investment income per share. Amounts will be deferred until distributed in accordance with the DC Plan.
Effective January, 1, 2020, the Portfolios may pay per account fees to affiliates of Voya Investments for recordkeeping services provided on certain assets. For the year ended December 31, 2020, the per account fees for affiliated recordkeeping services paid by each Portfolio were as follows:
| Portfolio | | | | Amount |
|---|
| Conservative | | | | $ | 50,556 | |
| Growth | | | | | 34,241 | |
| Moderate | | | | | 50,655 | |
| Moderate Growth | | | | | 47,093 | |
NOTE 7 — EXPENSE LIMITATION AGREEMENT
The Investment Adviser has entered into a written expense limitation agreement (“Expense Limitation Agreement”) with each Portfolio whereby the Investment Adviser has agreed to limit expenses, excluding interest, taxes, investment-related costs, leverage expenses and extraordinary expenses to the levels listed below:
| Portfolio(1) | | | Class ADV | | Class I |
|---|
| Conservative | | | | 0.92% | | | 0.67% |
| Growth | | | | 1.07% | | | 0.82% |
| Moderate | | | | 1.00% | | | 0.75% |
| Moderate Growth | | | | 1.04% | | | 0.79% |
(1) | | The operating expense limits take into account the operating expenses incurred at the Underlying Fund level. The amount of fees and expenses of an Underlying Fund borne by each Portfolio will vary based on each Portfolio’s allocation of assets to, and the net expenses of, a particular Underlying Fund. |
The Investment Adviser may at a later date recoup from a Portfolio for fees waived and/or other expenses reimbursed by the Investment Adviser during the previous 36 months but only if, after such recoupment, a Portfolio’s expense ratio does not exceed the percentage described above. Waived and reimbursed fees net of any recoupment by the Investment Adviser of such waived and reimbursed fees are reflected on the accompanying Statements of Operations. Amounts payable by the Investment Adviser are reflected on the accompanying Statements of Assets and Liabilities.
As of December 31, 2020, the Portfolios did not have any amount of waived and/or reimbursed fees that would be subject to possible recoupment.
20
NOTES TO FINANCIAL STATEMENTS AS OF DECEMBER 31, 2020 (CONTINUED)
NOTE 7 — EXPENSE LIMITATION AGREEMENT (continued)
The Expense Limitation Agreement is contractual through May 1, 2021 and shall renew automatically for one-year terms. Termination or modification of this obligation requires approval by the Board.
NOTE 8 — LINE OF CREDIT
Effective May 15, 2020, each Portfolio, in addition to certain other funds managed by the Investment Adviser, has entered into a 364-day unsecured committed revolving line of credit agreement (the “Credit Agreement”) with The Bank of New York Mellon (“BNY”) for an aggregate amount of $400,000,000 through May 14, 2021. The proceeds may be used only to finance temporarily: (1) the purchase or sale of investment securities; or (2) the repurchase or redemption of shares of a Portfolio or certain other funds managed by the Investment Adviser. The funds to which the line of credit is available pay a commitment fee equal to 0.15% per annum on the daily unused portion of the
committed line amount payable quarterly in arrears. Prior to May 15, 2020, the predecessor line of credit was for an aggregate amount of $400,000,000 and the funds to which the line of credit was available paid a commitment fee equal to 0.15% per annum on the daily unused portion of the committed line amount through May 15, 2020.
Borrowings under the Credit Agreement accrue interest at the federal funds rate plus a specified margin. Repayments generally must be made within 60 days after the date of a revolving credit advance.
The following Portfolios utilized the line of credit during the year ended December 31, 2020:
| Portfolio | | | Days
Utilized | | Approximate
Average
Daily
Balance For
Days
Utilized | | Approximate
Weighted
Average
Interest Rate
For Days
Utilized |
| Conservative | | | | 8 | | | $ | 1,012,250 | | | | 1.39 | % |
| Moderate | | | | 10 | | | | 3,147,200 | | | | 1.48 | |
| Moderate Growth | | | | 7 | | | | 3,725,571 | | | | 1.58 | |
NOTE 9 — CAPITAL SHARES
Transactions in capital shares and dollars were as follows:
| | | Shares
sold | | Shares
issued in
merger | | Reinvestment
of
distributions | | Shares
redeemed | | Net
increase
(decrease)
in shares
outstanding | | Shares
sold | | Proceeds
from
shares
issued in
merger | | Reinvestment
of
distributions | | Shares
redeemed | | Net
increase
(decrease) |
| Year or period ended | | # | | # | | # | | # | | # | | ($) | | ($) | | ($) | | ($) | | ($) |
| Conservative | | | | | | | | | | | | | | | | | | | | | | | | | | | | | | | | | | | | | | | | |
| Class ADV | | | | | | | | | | | | | | | | | | | | | | | | | | | | | | | | | | | | | | | | |
| 12/31/2020 | | | 4,256,388 | | | | — | | | | 1,944,966 | | | | (6,634,142 | ) | | | (432,788 | ) | | | 39,635,918 | | | | — | | | | 17,990,939 | | | | (62,155,170 | ) | | | (4,528,313 | ) |
| 12/31/2019 | | | 3,536,081 | | | | — | | | | 2,070,725 | | | | (6,686,497 | ) | | | (1,079,691 | ) | | | 31,837,511 | | | | — | | | | 18,553,699 | | | | (60,469,570 | ) | | | (10,078,360 | ) |
| Class I | | | | | | | | | | | | | | | | | | | | | | | | | | | | | | | | | | | | | | | | |
| 12/31/2020 | | | 125,961 | | | | — | | | | 1,152 | | | | (12,611 | ) | | | 114,502 | | | | 1,207,188 | | | | — | | | | 10,824 | | | | (120,104 | ) | | | 1,097,908 | |
| 12/31/2019 | | | 12,992 | | | | — | | | | 384 | | | | (4,275 | ) | | | 9,101 | | | | 119,551 | | | | — | | | | 3,492 | | | | (40,146 | ) | | | 82,897 | |
| Growth | | | | | | | | | | | | | | | | | | | | | | | | | | | | | | | | | | | | | | | | |
| Class ADV | | | | | | | | | | | | | | | | | | | | | | | | | | | | | | | | | | | | | | | | |
| 12/31/2020 | | | 321,392 | | | | — | | | | 12,825,438 | | | | (28,472,537 | ) | | | (15,325,707 | ) | | | 4,052,122 | | | | — | | | | 153,007,477 | | | | (355,248,330 | ) | | | (198,188,731 | ) |
| 12/31/2019 | | | 863,657 | | | | — | | | | 18,906,477 | | | | (31,986,663 | ) | | | (12,216,529 | ) | | | 10,699,562 | | | | — | | | | 232,360,607 | | | | (402,854,268 | ) | | | (159,794,099 | ) |
| Class I | | | | | | | | | | | | | | | | | | | | | | | | | | | | | | | | | | | | | | | | |
| 12/31/2020 | | | 133,896 | | | | — | | | | 265,888 | | | | (355,170 | ) | | | 44,614 | | | | 1,677,105 | | | | — | | | | 3,182,685 | | | | (4,517,625 | ) | | | 342,165 | |
| 12/31/2019 | | | 167,795 | | | | — | | | | 374,848 | | | | (640,968 | ) | | | (98,325 | ) | | | 2,132,616 | | | | — | | | | 4,625,627 | | | | (8,083,976 | ) | | | (1,325,733 | ) |
| Moderate | | | | | | | | | | | | | | | | | | | | | | | | | | | | | | | | | | | | | | | | |
| Class ADV | | | | | | | | | | | | | | | | | | | | | | | | | | | | | | | | | | | | | | | | |
| 12/31/2020 | | | 1,301,983 | | | | — | | | | 4,732,864 | | | | (12,598,365 | ) | | | (6,563,518 | ) | | | 14,929,166 | | | | — | | | | 52,487,462 | | | | (143,122,779 | ) | | | (75,706,151 | ) |
| 12/31/2019 | | | 1,921,994 | | | | — | | | | 5,709,967 | | | | (12,776,626 | ) | | | (5,144,665 | ) | | | 21,377,716 | | | | �� | | | | 62,980,933 | | | | (142,891,944 | ) | | | (58,533,295 | ) |
| Class I | | | | | | | | | | | | | | | | | | | | | | | | | | | | | | | | | | | | | | | | |
| 12/31/2020 | | | 207,289 | | | | — | | | | 112,693 | | | | (305,055 | ) | | | 14,927 | | | | 2,394,915 | | | | — | | | | 1,264,412 | | | | (3,533,153 | ) | | | 126,174 | |
| 12/31/2019 | | | 308,962 | | | | — | | | | 113,451 | | | | (215,680 | ) | | | 206,733 | | | | 3,496,818 | | | | — | | | | 1,264,979 | | | | (2,446,150 | ) | | | 2,315,647 | |
| Moderate Growth | | | | | | | | | | | | | | | | | | | | | | | | | | | | | | | | | | | | | | | | |
| Class ADV | | | | | | | | | | | | | | | | | | | | | | | | | | | | | | | | | | | | | | | | |
| 12/31/2020 | | | 930,035 | | | | — | | | | 9,576,463 | | | | (20,975,881 | ) | | | (10,469,383 | ) | | | 11,039,280 | | | | — | | | | 108,214,036 | | | | (246,168,011 | ) | | | (126,914,695 | ) |
| 12/31/2019 | | | 1,344,775 | | | | — | | | | 12,735,398 | | | | (24,267,390 | ) | | | (10,187,217 | ) | | | 15,703,112 | | | | — | | | | 146,075,017 | | | | (284,531,681 | ) | | | (122,753,552 | ) |
| Class I | | | | | | | | | | | | | | | | | | | | | | | | | | | | | | | | | | | | | | | | |
| 12/31/2020 | | | 93,413 | | | | — | | | | 139,101 | | | | (158,133 | ) | | | 74,381 | | | | 1,102,976 | | | | — | | | | 1,553,762 | | | | (1,841,031 | ) | | | 815,707 | |
| 12/31/2019 | | | 183,304 | | | | — | | | | 165,836 | | | | (290,771 | ) | | | 58,369 | | | | 2,125,701 | | | | — | | | | 1,883,900 | | | | (3,404,265 | ) | | | 605,336 | |
21
NOTES TO FINANCIAL STATEMENTS AS OF DECEMBER 31, 2020 (CONTINUED)
NOTE 10 — FEDERAL INCOME TAXES
The amount of distributions from net investment income and net realized capital gains are determined in accordance with federal income tax regulations, which may differ from GAAP for investment companies. These book/tax differences may be either temporary or permanent. Permanent differences are reclassified within the capital accounts based on their federal tax-basis treatment; temporary differences are not reclassified. Key differences include the treatment of short-term capital gains and wash sale deferrals.
Dividends paid by the Portfolios from net investment income and distributions of net realized short-term capital gains are, for federal income tax purposes, taxable as ordinary income to shareholders.
The tax composition of dividends and distributions to shareholders was as follows:
| | | | Year Ended December 31, 2020 | | Year Ended December 31, 2019 |
|---|
| | | | Ordinary
Income | | Long-term
Capital Gains | | Ordinary
Income | | Long-term
Capital Gains Income |
|---|
| Conservative | | | | $ | 9,996,344 | | | $ | 8,005,461 | | | $ | 7,825,835 | | | $ | 10,731,399 | |
| Growth | | | | | 56,076,516 | | | | 100,113,646 | | | | 47,827,676 | | | | 189,158,558 | |
| Moderate | | | | | 21,827,057 | | | | 31,924,817 | | | | 19,898,150 | | | | 44,347,762 | |
| Moderate Growth | | | | | 37,863,570 | | | | 71,904,228 | | | | 33,939,686 | | | | 114,019,231 | |
The tax-basis components of distributable earnings as of December 31, 2020 were:
| | | | | Undistributed
Ordinary
Income | | Undistributed
Long-term
Capital Gains | | Unrealized
Appreciation/
(Depreciation) |
| Conservative | | | | $ | 10,972,829 | | | $ | 7,240,352 | | | $ | 82,065,311 | |
| Growth | | | | | 43,259,985 | | | | 105,152,952 | | | | 346,415,215 | |
| Moderate | | | | | 18,952,902 | | | | 40,539,619 | | | | 104,267,393 | |
| Moderate Growth | | | | | 31,041,311 | | | | 74,552,320 | | | | 211,327,847 | |
At December 31, 2020, the Portfolios did not have any capital loss carryovers for U.S. federal income tax purposes.
The Portfolios’ major tax jurisdictions are U.S. federal, Arizona state, and Massachusetts state.
As of December 31, 2020, no provision for income tax is required in the Portfolios’ financial statements as a result of tax positions taken on federal and state income tax returns for open tax years. The Portfolios’ federal and state income and federal excise tax returns for tax years for which the applicable statutes of limitations have not expired are subject to examination by the Internal Revenue Service and state department of revenue. Generally, the preceding four tax years remain subject to examination by these jurisdictions.
NOTE 11 — LONDON INTERBANK OFFERED RATE (“LIBOR”)
The U.K. Financial Conduct Authority has announced that it intends to stop persuading or compelling banks to submit LIBOR rates after 2021, and it remains unclear whether LIBOR will continue to exist after that date and, if so, in what form. Actions by regulators have resulted in the establishment of alternative reference rates to LIBOR in many major currencies. The U.S. Federal Reserve Board, based on the recommendations of the New York Federal Reserve’s Alternative Reference Rate Committee (comprised of major derivative market participants and their regulators), has begun publishing a Secured Overnight Funding Rate (“SOFR”) that is intended to replace U.S. dollar LIBOR. Proposals for alternative reference rates for other currencies have also been announced or have already begun publication.
Discontinuance of LIBOR and adoption/implementation of alternative rates pose a number of risks, including among others whether any substitute rate will experience the
market participation and liquidity necessary to provide a workable substitute for LIBOR; the effect on parties’ existing contractual arrangements, hedging transactions, and investment strategies generally from a conversion from LIBOR to alternative rates; the effect on a Portfolio’s existing investments (including, for example, fixed-income investments; senior loans; CLOs and CDOs; and derivatives transactions), including the possibility that some of those investments may terminate or their terms may be adjusted to the disadvantage of a Portfolio; and the risk of general market disruption during the period of the conversion. It is difficult to predict at this time the likely impact of the transition away from LIBOR on a Portfolio. On November 30, 2020, the administrator of LIBOR announced a delay in the phase out of a majority of the U.S. dollar LIBOR publications until June 30, 2023, with the remainder of LIBOR publications to still end at the end of 2021.
22
NOTES TO FINANCIAL STATEMENTS AS OF DECEMBER 31, 2020 (CONTINUED)
NOTE 12 — MARKET DISRUPTION
A Portfolio is subject to the risk that geopolitical events will disrupt securities markets and adversely affect global economies and markets. Due to the increasing interdependence among global economies and markets, conditions in one country, market, or region might adversely impact markets, issuers and/or foreign exchange rates in other countries, including the United States. War, terrorism, global health crises and pandemics, and other geopolitical events have led, and in the future may lead, to increased market volatility and may have adverse short- or long-term effects on U.S. and world economies and markets generally. For example, the COVID-19 pandemic has resulted, and may continue to result, in significant market volatility, exchange trading suspensions and closures, declines in global financial markets, higher default rates, and a substantial economic downturn in economies throughout the world. Natural and environmental disasters and systemic market dislocations are also highly disruptive to economies and markets. Those events as well as other changes in non-U.S. and domestic economic, social, and political conditions also could adversely affect individual issuers or related groups of issuers, securities markets, interest rates, credit ratings, inflation, investor sentiment, and other factors affecting the value of the investments of the portfolio and of the Portfolios. Any of these occurrences could disrupt the operations of a Portfolio and of the Portfolios’ service providers.
NOTE 13 — OTHER ACCOUNTING PRONOUNCEMENTS
The Portfolios have adopted the provisions of Financial Accounting Standards Board Accounting Standards
Update 2018-13 (“ASU 2018-13”), Fair Value Measurement (Topic 820): Disclosure Framework — Changes to the Disclosure Requirements for Fair Value
Measurement. ASU 2018-13 introduces new fair value disclosure requirements as well as provides guidance that eliminates, adds and modifies certain disclosure requirements for fair value measurements. The impact of the Portfolios’ adoption was limited to changes in the Portfolios’ financial statement disclosures regarding fair value, primarily those disclosures related to transfers between levels of the fair value hierarchy and disclosure of the range and weighted average used to develop significant unobservable inputs for Level 3 fair value measurements, when applicable. Upon evaluation, the Portfolios have concluded that the adoption of the new accounting standard does not materially impact the financial statement amounts.
In March 2020, the Financial Accounting Standards Board issued Accounting Standards Update No. 2020-04 (“ASU 2020-04”), Reference Rate Reform (Topic 848) — Facilitation of the Effects of Reference Rate Reform on Financial Reporting. The amendments in ASU 2020-04 provide optional temporary financial reporting relief from the effect of certain types of contract modifications due to the planned discontinuation of LIBOR and other interbank-offered based reference rates as of the end of 2021. ASU 2020-04 is effective for certain reference rate-related contract modifications that occur during the period March 12, 2020 through December 31, 2022. Management is currently evaluating the impact, if any, of applying ASU 2020-04.
NOTE 14 — SUBSEQUENT EVENTS
The Portfolios have evaluated events occurring after the Statements of Assets and Liabilities date through the date that the financial statements were issued (“subsequent events”) to determine whether any subsequent events necessitated adjustment to or disclosure in the financial statements. No such subsequent events were identified.
23
VOYA RETIREMENT
CONSERVATIVE PORTFOLIO | PORTFOLIO OF INVESTMENTS
AS OF DECEMBER 31, 2020 |
| | |
| Shares | | | | | | | | | Value | | | Percentage
of Net
Assets |
|---|
| |
EXCHANGE-TRADED FUNDS: 9.0% |
| 646,775 | | | | | | Schwab U.S. TIPS ETF | | $ | 40,151,792 | | | | 9.0 | |
| | | | | | | Total Exchange-Traded Funds
(Cost $34,755,554) | | | 40,151,792 | | | | 9.0 | |
| |
MUTUAL FUNDS: 91.0% |
| | | | | | | Affiliated Investment Companies: 91.0% |
| 671,556 | | | | | | Voya Emerging Markets Index Portfolio — Class I | | | 9,280,900 | | | | 2.1 | |
| 1,231,573 | | | | | | Voya International Index Portfolio — Class I | | | 13,658,141 | | | | 3.1 | |
| 691,361 | | | | | | Voya RussellTM Mid Cap Index Portfolio — Class I | | | 9,153,616 | | | | 2.0 | |
| Shares | | | | | | | | | Value | | | Percentage
of Net
Assets |
|---|
| |
MUTUAL FUNDS: (continued) |
| | | | | | | Affiliated Investment Companies: (continued) |
| 23,830,581 | | | | | | Voya U.S. Bond Index Portfolio — Class I | | $ | 269,762,180 | | | | 60.5 | |
| 5,496,051 | | | | | | Voya U.S. Stock Index Portfolio — Class I | | | 104,095,213 | | | | 23.3 | |
| | | | | | | Total Mutual Funds
(Cost $325,350,123) | | | 405,950,050 | | | | 91.0 | |
| | | | | | | Total Investments in Securities
(Cost $360,105,677) | | $ | 446,101,842 | | | | 100.0 | |
| | | | | | | Assets in Excess of Other Liabilities | | | 119,011 | | | | 0.0 | |
| | | | | | | Net Assets | | $ | 446,220,853 | | | | 100.0 | |
Fair Value Measurementsˆ
The following is a summary of the fair valuations according to the inputs used as of December 31, 2020 in valuing the assets and liabilities:
| | | Quoted Prices
in Active Markets
for Identical
Investments
(Level 1) | | Significant
Other
Observable
Inputs
(Level 2) | | Significant
Unobservable
Inputs
(Level 3) | | Fair Value
at
December 31, 2020 |
|---|
Asset Table | | | | | | | | | | | | | | | | | | | | | |
Investments, at fair value | | | | | | | | | | | | | | | | | | | | | |
| Exchange-Traded Funds | | | | $ | 40,151,792 | | | | $ | — | | | | $ | — | | | | $ | 40,151,792 | |
| Mutual Funds | | | | | 405,950,050 | | | | | — | | | | | — | | | | | 405,950,050 | |
| Total Investments, at fair value | | | | $ | 446,101,842 | | | | $ | — | | | | $ | — | | | | $ | 446,101,842 | |
| ˆ | | See Note 2, “Significant Accounting Policies” in the Notes to Financial Statements for additional information. |
Transactions with Affiliates
An investment of at least 5% of the voting securities of an issuer, or a company which is under common control with the issuer, results in that issuer becoming an affiliated person as defined by the 1940 Act.
The following table provides transactions during the year ended December 31, 2020, where the following issuers were considered an affiliate:
| Issuer | | | Beginning
Fair Value
at 12/31/2019 | | Purchases
at Cost | | Sales
at Cost | | Change in
Unrealized
Appreciation/
(Depreciation) | | Ending
Fair Value
at 12/31/2020 | | Investment
Income | | Realized
Gains/
(Losses) | | Net
Capital Gain
Distributions |
|---|
| Voya Emerging Markets Index Portfolio — Class I | | | $ | 13,326,416 | | | $ | 3,375,458 | | | $ | (9,027,328 | ) | | $ | 1,606,354 | | | $ | 9,280,900 | | | $ | 498,764 | | | $ | (694,073 | ) | | $ | — | |
| Voya International Index Portfolio — Class I | | | | 17,224,417 | | | | 5,093,205 | | | | (9,560,895 | ) | | | 901,414 | | | | 13,658,141 | | | | 522,190 | | | | (282,775 | ) | | | — | |
| Voya RussellTM Mid Cap Index Portfolio — Class I | | | | 12,906,139 | | | | 5,787,961 | | | | (8,464,700 | ) | | | (1,075,784 | ) | | | 9,153,616 | | | | 205,193 | | | | 465,234 | | | | 1,885,839 | |
| Voya U.S. Bond Index Portfolio — Class I | | | | 256,202,871 | | | | 62,563,573 | | | | (58,155,581 | ) | | | 9,151,317 | | | | 269,762,180 | | | | 6,880,382 | | | | 420,798 | | | | 1,369,405 | |
| Voya U.S. Stock Index Portfolio — Class I | | | | 86,755,352 | | | | 37,408,597 | | | | (31,272,902 | ) | | | 11,204,166 | | | | 104,095,213 | | | | 1,815,867 | | | | 2,340,473 | | | | 3,859,333 | |
| | | | $ | 386,415,195 | | | $ | 114,228,794 | | | $ | (116,481,406 | ) | | $ | 21,787,467 | | | $ | 405,950,050 | | | $ | 9,922,396 | | | $ | 2,249,657 | | | $ | 7,114,577 | |
The financial statements for the above mutual fund[s] can be found at www.sec.gov.
See Accompanying Notes to Financial Statements
24
VOYA RETIREMENT
CONSERVATIVE PORTFOLIO | PORTFOLIO OF INVESTMENTS
AS OF DECEMBER 31, 2020 (CONTINUED) |
| | |
At December 31, 2020, the aggregate cost of securities and other investments and the composition of unrealized appreciation and depreciation of securities and other investments on a tax basis were:
| Cost for federal income tax purposes was $364,036,531. | | | | | | |
| Net unrealized appreciation consisted of: | | | | | | |
| Gross Unrealized Appreciation | | | | $ | 82,065,311 | |
| Gross Unrealized Depreciation | | | | | — | |
| Net Unrealized Appreciation | | | | $ | 82,065,311 | |
See Accompanying Notes to Financial Statements
25
VOYA RETIREMENT
GROWTH PORTFOLIO | PORTFOLIO OF INVESTMENTS
AS OF DECEMBER 31, 2020 |
| | |
| Shares | | | | | | | Value | | Percentage
of Net
Assets |
|---|
| |
EXCHANGE-TRADED FUNDS: 4.0% |
| 1,644,080 | | | | | Schwab U.S. TIPS ETF | | | $ | 102,064,487 | | | | 4.0 | |
| | | | | | Total Exchange-Traded Funds
(Cost $93,894,918) | | | | 102,064,487 | | | | 4.0 | |
| | | | | | | | | | | | | | | |
| |
MUTUAL FUNDS: 96.0% |
| | | | | | Affiliated Investment Companies: 96.0% |
| 9,480,893 | | | | | Voya Emerging Markets Index Portfolio — Class I | | | | 131,025,942 | | | | 5.1 | |
| 25,499,498 | | | | | Voya International Index Portfolio — Class I | | | | 282,789,434 | | | | 11.1 | |
| 13,667,847 | | | | | Voya RussellTM Mid Cap Index Portfolio — Class I | | | | 180,962,300 | | | | 7.1 | |
| Shares | | | | | | | Value | | Percentage
of Net
Assets |
|---|
| | | | | | | | | |
|---|
MUTUAL FUNDS: (continued) |
| | | | | | Affiliated Investment Companies: (continued) |
3,445,176
| | | | | Voya RussellTM Small Cap Index Portfolio — Class I | | | $ | 53,641,387 | | | | 2.1 | |
| 46,214,779 | | | | | Voya U.S. Bond Index Portfolio — Class I | | | | 523,151,303 | | | | 20.5 | |
| 67,464,524 | | | | | Voya U.S. Stock Index Portfolio — Class I | | | | 1,277,778,093 | | | | 50.1 | |
| | | | | | Total Mutual Funds
(Cost $2,085,561,725) | | | | 2,449,348,459 | | | | 96.0 | |
| | | | | | Total Investments in Securities
(Cost $2,179,456,643) | | | $ | 2,551,412,946 | | | | 100.0 | |
| | | | | | Liabilities in Excess of Other Assets | | | | (40,270 | ) | | | — | |
| | | | | | Net Assets | | | $ | 2,551,372,676 | | | | 100.0 | |
Fair Value Measurementsˆ
The following is a summary of the fair valuations according to the inputs used as of December 31, 2020 in valuing the assets and liabilities:
| | | Quoted Prices
in Active Markets
for Identical
Investments
(Level 1) | | Significant
Other
Observable
Inputs
(Level 2) | | Significant
Unobservable
Inputs
(Level 3) | | Fair Value
at
December 31, 2020 |
|---|
Asset Table | | | | | | | | | | | | | | | | | | | | | |
Investments, at fair value | | | | | | | | | | | | | | | | | | | | | |
| Exchange-Traded Funds | | | | $ | 102,064,487 | | | | $ | — | | | | $ | — | | | | $ | 102,064,487 | |
| Mutual Funds | | | | | 2,449,348,459 | | | | | — | | | | | — | | | | | 2,449,348,459 | |
| Total Investments, at fair value | | | | $ | 2,551,412,946 | | | | $ | — | | | | $ | — | | | | $ | 2,551,412,946 | |
| ˆ | | See Note 2, “Significant Accounting Policies” in the Notes to Financial Statements for additional information. |
Transactions with Affiliates
An investment of at least 5% of the voting securities of an issuer, or a company which is under common control with the issuer, results in that issuer becoming an affiliated person as defined by the 1940 Act.
The following table provides transactions during the year ended December 31, 2020, where the following issuers were considered an affiliate:
| Issuer | | | Beginning
Fair Value
at 12/31/2019 | | | Purchases
at Cost | | | Sales
at Cost | | | Change in
Unrealized
Appreciation/
(Depreciation) | | | Ending
Fair Value
at 12/31/2020 | | | Investment
Income | | | Realized
Gains/
(Losses) | | | Net
Capital Gain
Distributions | |
|---|
| Voya Emerging Markets Index Portfolio — Class I | | | $ | 161,258,839 | | | $ | 19,475,380 | | | $ | (64,900,003 | ) | | $ | 15,191,726 | | | $ | 131,025,942 | | | $ | 5,334,986 | | | $ | (1,928,655 | ) | | $ | — | |
| Voya International Index Portfolio — Class I | | | | 338,490,510 | | | | 55,967,860 | | | | (124,281,433 | ) | | | 12,612,497 | | | | 282,789,434 | | | | 9,075,573 | | | | (2,753,922 | ) | | | — | |
| Voya RussellTM Mid Cap Index Portfolio — Class I | | | | 208,068,220 | | | | 51,964,531 | | | | (97,677,081 | ) | | | 18,606,630 | | | | 180,962,300 | | | | 2,926,211 | | | | (21,224,683 | ) | | | 26,893,574 | |
| Voya RussellTM Small Cap Index Portfolio — Class I | | | | 130,861,677 | | | | 29,463,180 | | | | (118,366,109 | ) | | | 11,682,639 | | | | 53,641,387 | | | | 1,484,839 | | | | (19,952,835 | ) | | | 8,387,223 | |
| Voya U.S. Bond Index Portfolio — Class I | | | | 531,106,717 | | | | 171,866,039 | | | | (190,302,381 | ) | | | 10,480,928 | | | | 523,151,303 | | | | 13,214,643 | | | | 8,668,226 | | | | 2,606,094 | |
| Voya U.S. Stock Index Portfolio — Class I | | | | 1,127,866,422 | | | | 295,209,786 | | | | (228,153,803 | ) | | | 82,855,688 | | | | 1,277,778,093 | | | | 22,214,773 | | | | 57,168,935 | | | | 46,354,856 | |
| | | | $ | 2,497,652,385 | | | $ | 623,946,776 | | | $ | (823,680,810 | ) | | $ | 151,430,108 | | | $ | 2,449,348,459 | | | $ | 54,251,025 | | | $ | 19,977,066 | | | $ | 84,241,747 | |
The financial statements for the above mutual fund[s] can be found at www.sec.gov.
See Accompanying Notes to Financial Statements
26
VOYA RETIREMENT
GROWTH PORTFOLIO | PORTFOLIO OF INVESTMENTS
AS OF DECEMBER 31, 2020 (CONTINUED) |
| | |
At December 31, 2020, the aggregate cost of securities and other investments and the composition of unrealized appreciation and depreciation of securities and other investments on a tax basis were:
| Cost for federal income tax purposes was $2,204,997,731. | | | | | | |
| Net unrealized appreciation consisted of: | | | | | | |
| Gross Unrealized Appreciation | | | | $ | 346,415,215 | |
| Gross Unrealized Depreciation | | | | | — | |
| Net Unrealized Appreciation | | | | $ | 346,415,215 | |
See Accompanying Notes to Financial Statements
27
VOYA RETIREMENT
MODERATE PORTFOLIO | PORTFOLIO OF INVESTMENTS
AS OF DECEMBER 31, 2020 |
| | |
| Shares | | | | | | | | Value | | | Percentage
of Net
Assets |
|---|
| |
EXCHANGE-TRADED FUNDS: 9.0% |
| 1,471,441 | | | | | | Schwab U.S. TIPS ETF | | $ | 91,347,057 | | | | 9.0 | |
| | | | | | | Total Exchange-Traded Funds
(Cost $81,494,163) | | | 91,347,057 | | | | 9.0 | |
| |
MUTUAL FUNDS: 91.0% |
| | Affiliated Investment Companies: 91.0% |
| 2,271,003 | | | | | | Voya Emerging Markets Index Portfolio — Class I | | | 31,385,258 | | | | 3.1 | |
| 4,627,294 | | | | | | Voya International Index Portfolio — Class I | | | 51,316,689 | | | | 5.1 | |
| 2,338,214 | | | | | | Voya RussellTM Mid Cap Index Portfolio — Class I | | | 30,957,952 | | | | 3.1 | |
| Shares | | | | | | | | Value | | | Percentage
of Net
Assets |
|---|
| |
MUTUAL FUNDS: (continued) |
| | Affiliated Investment Companies: (continued) |
| 36,035,648 | | | | | | Voya U.S. Bond Index Portfolio — Class I | | | 407,923,533 | | | | 40.3 | |
| 21,008,260 | | | | | | Voya U.S. Stock Index Portfolio — Class I | | | 397,896,436 | | | | 39.4 | |
| | | | | | | Total Mutual Funds
(Cost $814,363,882) | | | 919,479,868 | | | | 91.0 | |
| | | | | | | Total Investments in Securities
(Cost $895,858,045) | | $ | 1,010,826,925 | | | | 100.0 | |
| | | | | | | Assets in Excess of Other Liabilities | | | 232,421 | | | | 0.0 | |
| | | | | | | Net Assets | | $ | 1,011,059,346 | | | | 100.0 | |
Fair Value Measurementsˆ
The following is a summary of the fair valuations according to the inputs used as of December 31, 2020 in valuing the assets and liabilities:
| | | | Quoted Prices
in Active Markets
for Identical
Investments
(Level 1) | | Significant
Other
Observable
Inputs
(Level 2) | | Significant
Unobservable
Inputs
(Level 3) | | Fair Value
at
December 31, 2020 |
|---|
Asset Table | | | | | | | | | | | | | | | | | | | | | |
Investments, at fair value | | | | | | | | | | | | | | | | | | | | | |
| Exchange-Traded Funds | | | | $ | 91,347,057 | | | | $ | — | | | | $ | — | | | | $ | 91,347,057 | |
| Mutual Funds | | | | | 919,479,868 | | | | | — | | | | | — | | | | | 919,479,868 | |
| Total Investments, at fair value | | | | $ | 1,010,826,925 | | | | $ | — | | | | $ | — | | | | $ | 1,010,826,925 | |
| ˆ | | See Note 2, “Significant Accounting Policies” in the Notes to Financial Statements for additional information. |
Transactions with Affiliates
An investment of at least 5% of the voting securities of an issuer, or a company which is under common control with the issuer, results in that issuer becoming an affiliated person as defined by the 1940 Act.
The following table provides transactions during the year ended December 31, 2020, where the following issuers were considered an affiliate:
| Issuer | | | Beginning
Fair Value
at 12/31/2019 | | Purchases
at Cost | | Sales
at Cost | | Change in
Unrealized
Appreciation/
(Depreciation) | | Ending
Fair Value
at 12/31/2020 | | Investment
Income | | Realized
Gains/
(Losses) | | Net
Capital Gain
Distributions |
|---|
| Voya Emerging Markets Index Portfolio — Class I | | | $ | 42,837,528 | | | $ | 6,989,055 | | | $ | (21,475,977 | ) | | $ | 3,034,652 | | | $ | 31,385,258 | | | $ | 1,483,859 | | | $ | 8,888 | | | $ | — | |
| Voya International Index Portfolio — Class I | | | | 72,649,288 | | | | 14,839,199 | | | | (38,382,257 | ) | | | 2,210,459 | | | | 51,316,689 | | | | 2,038,899 | | | | (1,254,701 | ) | | | — | |
| Voya RussellTM Mid Cap Index Portfolio — Class I | | | | 41,471,573 | | | | 13,679,712 | | | | (29,992,321 | ) | | | 5,798,988 | | | | 30,957,952 | | | | 610,424 | | | | (7,364,179 | ) | | | 5,610,148 | |
| Voya RussellTM Small Cap Index Portfolio — Class I | | | | 20,863,928 | | | | 5,811,453 | | | | (25,724,220 | ) | | | (951,161 | ) | | | — | | | | 247,815 | | | | (2,893,556 | ) | | | 1,399,804 | |
| Voya U.S. Bond Index Portfolio — Class I | | | | 414,057,294 | | | | 103,294,075 | | | | (118,396,875 | ) | | | 8,969,039 | | | | 407,923,533 | | | | 10,542,651 | | | | 6,126,444 | | | | 2,088,768 | |
| Voya U.S. Stock Index Portfolio — Class I | | | | 345,012,032 | | | | 118,327,672 | | | | (89,357,272 | ) | | | 23,914,004 | | | | 397,896,436 | | | | 6,943,772 | | | | 23,608,681 | | | | 14,853,803 | |
| | | | $ | 936,891,643 | | | $ | 262,941,166 | | | $ | (323,328,922 | ) | | $ | 42,975,981 | | | $ | 919,479,868 | | | $ | 21,867,420 | | | $ | 18,231,577 | | | $ | 23,952,523 | |
The financial statements for the above mutual fund[s] can be found at www.sec.gov.
See Accompanying Notes to Financial Statements
28
VOYA RETIREMENT
MODERATE PORTFOLIO | PORTFOLIO OF INVESTMENTS
AS OF DECEMBER 31, 2020 (CONTINUED) |
| | |
At December 31, 2020, the aggregate cost of securities and other investments and the composition of unrealized appreciation and depreciation of securities and other investments on a tax basis were:
| Cost for federal income tax purposes was $906,559,532. | | | | | | |
| Net unrealized appreciation consisted of: | | | | | | |
| Gross Unrealized Appreciation | | | | $ | 104,267,393 | |
| Gross Unrealized Depreciation | | | | | — | |
| Net Unrealized Appreciation | | | | $ | 104,267,393 | |
See Accompanying Notes to Financial Statements
29
VOYA RETIREMENT MODERATE
GROWTH PORTFOLIO | PORTFOLIO OF INVESTMENTS
AS OF DECEMBER 31, 2020 |
| | |
| Shares | | | | | | | | Value | | | Percentage
of Net
Assets |
|---|
| |
EXCHANGE-TRADED FUNDS: 6.0% |
| 1,700,998 | | | | | | Schwab U.S. TIPS ETF | | $ | 105,597,956 | | | | 6.0 | |
| | | | | | | Total Exchange-Traded Funds
(Cost $96,929,496) | | | 105,597,956 | | | | 6.0 | |
| |
MUTUAL FUNDS: 94.0% |
| | Affiliated Investment Companies: 94.0% |
| 5,255,878 | | | | | | Voya Emerging Markets Index Portfolio — Class I | | | 72,636,240 | | | | 4.1 | |
| 11,244,864 | | | | | | Voya International Index Portfolio — Class I | | | 124,705,545 | | | | 7.1 | |
| 5,411,656 | | | | | | Voya RussellTM Mid Cap Index Portfolio — Class I | | | 71,650,321 | | | | 4.1 | |
| Shares | | | | | | | | Value | | | Percentage
of Net
Assets |
|---|
| |
MUTUAL FUNDS: (continued) |
| | Affiliated Investment Companies: (continued) |
| 44,260,344 | | | | | | Voya U.S. Bond Index Portfolio — Class I | | $ | 501,027,094 | | | | 28.4 | |
| 46,751,421 | | | | | | Voya U.S. Stock Index Portfolio — Class I | | | 885,471,919 | | | | 50.3 | |
| | | | | | | Total Mutual Funds
(Cost $1,434,762,260) | | | 1,655,491,119 | | | | 94.0 | |
| | | | | | | Total Investments in Securities
(Cost $1,531,691,756) | | $ | 1,761,089,075 | | | | 100.0 | |
| | | | | | | Assets in Excess of Other Liabilities | | | 142,543 | | | | 0.0 | |
| | | | | | | Net Assets | | $ | 1,761,231,618 | | | | 100.0 | |
Fair Value Measurementsˆ
The following is a summary of the fair valuations according to the inputs used as of December 31, 2020 in valuing the assets and liabilities:
| | | | Quoted Prices
in Active Markets
for Identical
Investments
(Level 1) | | Significant
Other
Observable
Inputs
(Level 2) | | Significant
Unobservable
Inputs
(Level 3) | | Fair Value
at
December 31, 2020 |
|---|
Asset Table | | | | | | | | | | | | | | | | | | | | | |
Investments, at fair value | | | | | | | | | | | | | | | | | | | | | |
| Exchange-Traded Funds | | | | $ | 105,597,956 | | | | $ | — | | | | $ | — | | | | $ | 105,597,956 | |
| Mutual Funds | | | | | 1,655,491,119 | | | | | — | | | | | — | | | | | 1,655,491,119 | |
| Total Investments, at fair value | | | | $ | 1,761,089,075 | | | | $ | — | | | | $ | — | | | | $ | 1,761,089,075 | |
| ˆ | | See Note 2, “Significant Accounting Policies” in the Notes to Financial Statements for additional information. |
Transactions with Affiliates
An investment of at least 5% of the voting securities of an issuer, or a company which is under common control with the issuer, results in that issuer becoming an affiliated person as defined by the 1940 Act.
The following table provides transactions during the year ended December 31, 2020, where the following issuers were considered an affiliate:
| Issuer | | | Beginning
Fair Value
at 12/31/2019 | | Purchases
at Cost | | Sales
at Cost | | Change in
Unrealized
Appreciation/
(Depreciation) | | Ending
Fair Value
at 12/31/2020 | | Investment
Income | | Realized
Gains/
(Losses) | | Net
Capital Gain
Distributions |
|---|
| Voya Emerging Markets Index Portfolio — Class I | | | $ | 92,745,944 | | | $ | 12,547,454 | | | $ | (44,396,024 | ) | | $ | 11,738,866 | | | $ | 72,636,240 | | | $ | 3,149,058 | | | $ | (4,406,824 | ) | | $ | — | |
| Voya International Index Portfolio — Class I | | | | 161,757,171 | | | | 29,645,463 | | | | (72,114,400 | ) | | | 5,417,311 | | | | 124,705,545 | | | | 4,450,521 | | | | (2,019,970 | ) | | | — | |
| Voya RussellTM Mid Cap Index Portfolio — Class I | | | | 89,767,314 | | | | 25,485,979 | | | | (54,886,991 | ) | | | 11,284,019 | | | | 71,650,321 | | | | 1,295,465 | | | | (13,785,405 | ) | | | 11,906,071 | |
| Voya RussellTM Small Cap Index Portfolio — Class I | | | | 54,196,817 | | | | 13,216,070 | | | | (65,141,597 | ) | | | (2,271,290 | ) | | | — | | | | 631,071 | | | | (7,792,968 | ) | | | 3,564,651 | |
| Voya U.S. Bond Index Portfolio — Class I | | | | 506,695,208 | | | | 150,230,881 | | | | (166,685,707 | ) | | | 10,786,712 | | | | 501,027,094 | | | | 12,779,976 | | | | 7,636,745 | | | | 2,530,588 | |
| Voya U.S. Stock Index Portfolio — Class I | | | | 778,517,305 | | | | 223,550,619 | | | | (171,089,702 | ) | | | 54,493,697 | | | | 885,471,919 | | | | 15,427,153 | | | | 46,608,772 | | | | 32,612,691 | |
| | | | $ | 1,683,679,759 | | | $ | 454,676,466 | | | $ | (574,314,421 | ) | | $ | 91,449,315 | | | $ | 1,655,491,119 | | | $ | 37,733,244 | | | $ | 26,240,349 | | | $ | 50,614,001 | |
The financial statements for the above mutual fund[s] can be found at www.sec.gov.
See Accompanying Notes to Financial Statements
30
VOYA RETIREMENT MODERATE
GROWTH PORTFOLIO | PORTFOLIO OF INVESTMENTS
AS OF DECEMBER 31, 2020 (CONTINUED) |
| | |
At December 31, 2020, the aggregate cost of securities and other investments and the composition of unrealized appreciation and depreciation of securities and other investments on a tax basis were:
| Cost for federal income tax purposes was $1,549,761,228. | | | | | | |
| Net unrealized appreciation consisted of: | | | | | | |
| Gross Unrealized Appreciation | | | | $ | 211,327,847 | |
| Gross Unrealized Depreciation | | | | | — | |
| Net Unrealized Appreciation | | | | $ | 211,327,847 | |
See Accompanying Notes to Financial Statements
31
TAX INFORMATION (UNAUDITED)
Dividends and distributions paid during the year ended December 31, 2020 were as follows:
| Portfolio Name | | | | Type | | Per Share Amount |
|---|
| Voya Retirement Conservative Portfolio | | | | | | | | | | |
| Class ADV | | | | NII | | $ | 0.1735 | |
| Class I | | | | NII | | $ | 0.1973 | |
| All Classes | | | | STCG | | $ | 0.0520 | |
| All Classes | | | | LTCG | | $ | 0.1806 | |
| Voya Retirement Growth Portfolio | | | | | | | | | | |
| Class ADV | | | | NII | | $ | 0.3015 | |
| Class I | | | | NII | | $ | 0.3612 | |
| All Classes | | | | LTCG | | $ | 0.5403 | |
| Portfolio Name | | | | Type | | Per Share Amount |
|---|
| Voya Retirement Moderate Portfolio | | | | | | | | | | |
| Class ADV | | | | NII | | $ | 0.2492 | |
| Class I | | | | NII | | $ | 0.2915 | |
| All Classes | | | | STCG | | $ | 0.0135 | |
| All Classes | | | | LTCG | | $ | 0.3856 | |
| Voya Retirement Moderate Growth Portfolio | | | | | | | | | | |
| Class ADV | | | | NII | | $ | 0.2687 | |
| Class I | | | | NII | | $ | 0.3195 | |
| All Classes | | | | STCG | | $ | 0.0055 | |
| All Classes | | | | LTCG | | $ | 0.5220 | |
NII — Net investment income
STCG — Short-term capital gain
LTCG — Long-term capital gain
Of the ordinary distributions made during the year ended December 31, 2020, the following percentages qualify for the dividends received deduction (DRD) available to corporate shareholders:
| Voya Retirement Conservative Portfolio | | | | | | | 13.98% | |
| Voya Retirement Growth Portfolio | | | | | | | 36.88% | |
| Voya Retirement Moderate Portfolio | | | | | | | 26.74% | |
| Voya Retirement Moderate Growth Portfolio | | | | | | | 35.24% | |
The Portfolios designate the following amounts of long-term capital gain distributions as 20% rate long-term capital gain dividends under Internal Revenue Code Section 852(b)(3)(C):
| Voya Retirement Conservative Portfolio | | | | | | $ | 8,005,461 | |
| Voya Retirement Growth Portfolio | | | | | | $ | 100,113,646 | |
| Voya Retirement Moderate Portfolio | | | | | | $ | 31,924,817 | |
| Voya Retirement Moderate Growth Portfolio | | | | | | $ | 71,904,228 | |
The Regulated Investment Company Modernization Act of 2010 allows qualified fund-of-funds to elect to pass through the ability to take foreign tax credits (or deductions) to the extent that foreign taxes are passed through from underlying funds. A qualified fund-of-funds is a regulated investment company that has at least 50% of the value of its total assets invested in other regulated investment companies at the end of each quarter of the taxable year. Pursuant to Section 853 of the Internal
Revenue Code, the Portfolios designate the following amounts as foreign taxes paid for the year ended December 31, 2020:
| | | | | Creditable
Foreign Taxes
Paid | | Per Share
Amount | | Portion of Ordinary Income
Distribution Derived from
Foreign Sourced Income* |
|---|
| Voya Retirement Conservative Portfolio | | | | $ | 34,359 | | | $ | 0.0008 | | | 7.51% | |
| Voya Retirement Growth Portfolio | | | | $ | 604,529 | | | $ | 0.0033 | | | 23.52% | |
| Voya Retirement Moderate Portfolio | | | | $ | 122,943 | | | $ | 0.0015 | | | 13.77% | |
| Voya Retirement Moderate Growth Portfolio | | | | $ | 292,521 | | | $ | 0.0021 | | | 17.61% | |
| * | | None of the Portfolios listed above derived any income from ineligible foreign sources as defined under Section 901(j) of the Internal Revenue Code. |
Foreign taxes paid or withheld should be included in taxable income with an offsetting deduction from gross income or as a credit for taxes paid to foreign governments. Shareholders are strongly advised to consult their own tax advisors regarding the appropriate treatment of foreign taxes paid.
Above figures may differ from those cited elsewhere in this report due to differences in the calculation of income and gains under U.S. generally accepted accounting principles (book) purposes and Internal Revenue Service (tax) purposes.
Shareholders are strongly advised to consult their own tax advisers with respect to the tax consequences of their investments in the Portfolios. In January, shareholders, excluding corporate shareholders, receive an IRS 1099-DIV regarding the federal tax status of the dividends and distributions they received in the calendar year.
32
TRUSTEE AND OFFICER INFORMATION (UNAUDITED)
The business and affairs of the Trust are managed under the direction of the Board. A Trustee, who is not an interested person of the Trust, as defined in the 1940 Act, is an independent trustee (“Independent Trustee”). The Trustees and Officers of the Trust are listed below. The Statement of Additional Information includes additional information about Trustees of the Trust and is available, without charge, upon request at (800) 366-0066.
| Name, Address and Age | | Position(s)
Held with
the Trust | | Term of Office
and Length of
Time Served(1) | | Principal Occupation(s) —
During the Past 5 Years | | Number of
funds in
Fund
Complex
Overseen by
Trustee(2) | | Other Board Positions
Held by Trustee |
|---|
| |
Independent Trustees: | | | | | | | | | | |
Colleen D. Baldwin
7337 East Doubletree Ranch Rd.
Suite 100
Scottsdale, Arizona 85258
Age: 60 | | Trustee
Chairperson | | November
2007–Present
January
2020–Present | | President, Glantuam Partners, LLC, a business consulting firm (January
2009–Present). | | 133 | | Dentaquest (February 2014–Present); RSR Partners, Inc.
(2016–Present). |
| |
John V. Boyer
7337 East Doubletree Ranch Rd.
Suite 100
Scottsdale, Arizona 85258
Age: 67 | | Trustee | | January
2005–Present | | Retired. Formerly, President and Chief Executive Officer, Bechtler Arts Foundation, an arts and education foundation (January 2008–December 2019). | | 133 | | None. |
| |
Patricia W. Chadwick
7337 East Doubletree Ranch Rd.
Suite 100
Scottsdale, Arizona 85258
Age: 72 | | Trustee | | January
2006–Present | | Consultant and President, Ravengate Partners LLC, a consulting firm that provides advice regarding financial markets and the global economy (January
2000–Present). | | 133 | | Wisconsin Energy Corporation (June
2006–Present); The Royce Funds (22 funds) (December
2009–Present); and AMICA Mutual Insurance Company
(1992–Present). |
| |
Martin J. Gavin
7337 East Doubletree Ranch Rd.
Suite 100
Scottsdale, AZ 85258
Age: 70 | | Trustee | | August
2015–Present | | Retired. Formerly, President and Chief Executive Officer, Connecticut Children’s Medical Center (May
2006–November 2015). | | 133 | | None. |
| |
Joseph E. Obermeyer
7337 East Doubletree Ranch Rd.
Suite 100
Scottsdale, Arizona 85258
Age: 63 | | Trustee | | May
2013–Present | | President, Obermeyer & Associates, Inc., a provider of financial and economic consulting services (November 1999–Present). | | 133 | | None. |
| |
Sheryl K. Pressler
7337 East Doubletree Ranch Rd.
Suite 100
Scottsdale, Arizona 85258
Age: 70 | | Trustee | | January
2006–Present | | Consultant (May
2001–Present). | | 133 | | None. |
| |
Christopher P. Sullivan
7337 East Doubletree Ranch Rd.
Suite 100
Scottsdale, Arizona 85258
Age: 67 | | Trustee | | October
2015–Present | | Retired. | | 133 | | None. |
33
TRUSTEE AND OFFICER INFORMATION (UNAUDITED) (CONTINUED)
| Name, Address and Age | | Position(s)
Held with
the Trust | | Term of Office
and Length of
Time Served(1) | | Principal Occupation(s) —
During the Past 5 Years | | Number of
funds in
Fund
Complex
Overseen by
Trustee(2) | | Other Board Positions
Held by Trustee |
|---|
| |
Trustee who is an “interested person”: |
| |
Dina Santoro
230 Park Avenue
New York, New York 10169
Age: 47 | | Trustee | | July
2018–Present | | President, Voya Investments, LLC and Voya Capital, LLC (March 2018–Present); Senior Vice President, Voya Investments Distributor, LLC (April 2018–Present); Senior Managing Director, Head of Product and Marketing Strategy, Voya Investment Management (September
2017–Present). Formerly, Managing Director, Quantitative Management Associates, LLC (January 2004–August 2017). | | 133 | | Voya Investments, LLC, Voya Capital, LLC, and Voya Funds Services, LLC (March 2018–Present); Voya Investments Distributor, LLC (April
2018–Present). |
(1) | | Trustees serve until their successors are duly elected and qualified. The tenure of each Trustee who is not an “interested person” as defined in the 1940 Act, of each Portfolio (“Independent Trustee”) is subject to the Board’s retirement policy which states that each duly elected or appointed Independent Trustee shall retire from and cease to be a member of the Board of Trustees at the close of business on December 31 of the calendar year in which the Independent Trustee attains the age of 75. A majority vote of the Board’s other Independent Trustees may extend the retirement date of an Independent Trustee if the retirement would trigger a requirement to hold a meeting of shareholders of the Trust under applicable law, whether for the purposes of appointing a successor to the Independent Trustee or otherwise comply under applicable law, in which case the extension would apply until such time as the shareholder meeting can be held or is no longer required (as determined by a vote of a majority of the other Independent Trustees). |
(2) | | For the purposes of this table, “Fund Complex” means the Voya family of funds including the following investment companies: Voya Asia Pacific High Dividend Equity Income Fund; Voya Balanced Portfolio, Inc.; Voya Emerging Markets High Dividend Equity Fund; Voya Equity Trust; Voya Funds Trust; Voya Global Advantage and Premium Opportunity Fund; Voya Global Equity Dividend and Premium Opportunity Fund; Voya Government Money Market Portfolio; Voya Infrastructure, Industrials and Materials Fund; Voya Intermediate Bond Portfolio; Voya International High Dividend Equity Income Fund; Voya Investors Trust; Voya Mutual Funds; Voya Natural Resources Equity Income Fund; Voya Partners, Inc.; Voya Senior Income Fund; Voya Separate Portfolios Trust; Voya Strategic Allocation Portfolios, Inc.; Voya Variable Funds; Voya Variable Insurance Trust; Voya Variable Portfolios, Inc.; and Voya Variable Products Trust. The number of funds in the Fund Complex is as of January 31, 2021. |
34
TRUSTEE AND OFFICER INFORMATION (UNAUDITED) (CONTINUED)
| Name, Address and Age | | Position(s)
Held With
the Trust | | Term of Office
and Length of
Time Served(1) | | Principal Occupation(s) —
During the Past 5 Years |
|---|
| |
Michael Bell
One Orange Way
Windsor, Connecticut 06095
Age: 52 | | Chief Executive Officer | | March
2018–Present | | Chief Executive Officer and Director, Voya Investments, LLC, Voya Capital, LLC, and Voya Funds Services, LLC (March 2018–Present); Senior Vice President and Chief Financial Officer, Voya Investments Distributor, LLC (September 2019–Present); Chief Financial Officer, Voya Investment Management (September 2014–Present). Formerly, Senior Vice President, Chief Financial Officer and Treasurer, Voya Investments, LLC (November 2015–March 2018). |
| |
Dina Santoro
230 Park Avenue
New York, New York 10169
Age: 47 | | President | | March
2018–Present | | President and Director, Voya Investments, LLC and Voya Capital, LLC (March 2018-Present); Director, Voya Funds Services, LLC (March 2018-Present); Director and Senior Vice President, Voya Investments Distributor, LLC (April 2018–Present); Senior Managing Director, Head of Product and Marketing Strategy, Voya Investment Management (September 2017–Present). Formerly, Managing Director, Quantitative Management Associates, LLC (January 2004–August 2017). |
| |
Jonathan Nash
230 Park Avenue
New York, New York 10169
Age: 53 | | Executive Vice President
Chief Investment Risk Officer | | March
2020–Present
March
2020–Present | | Senior Vice President, Investment Risk Management, Voya Investment Management (March 2017–Present); Formerly, Consultant, DA Capital LLC (January 2016–March 2017); Managing Director, Enterprise Risk, American International Group (AIG) (September 2014–March 2015). |
| |
James M. Fink
5780 Powers Ferry Road NW
Atlanta, Georgia 30327
Age: 62 | | Executive Vice President | | March
2018–Present | | Managing Director, Voya Investments, LLC, Voya Capital, LLC, and Voya Funds Services, LLC (March 2018-Present); Senior Vice President, Voya Investments Distributor, LLC (April 2018–Present); Chief Administrative Officer, Voya Investment Management (September 2017–Present). Formerly, Managing Director, Operations, Voya Investment Management (March 1999–September 2017). |
| |
Kevin M. Gleason
7337 East Doubletree Ranch Rd.
Suite 100
Scottsdale, Arizona 85258
Age: 54 | | Chief Compliance Officer | | February
2012–Present | | Senior Vice President, Voya Investment Management and Chief Compliance Officer, Voya Family of Funds (February 2012–Present). |
| |
Todd Modic
7337 East Doubletree Ranch Rd.
Suite 100
Scottsdale, Arizona 85258
Age: 53 | | Senior Vice President, Chief/Principal Financial Officer and Assistant Secretary | | March
2005–Present | | President, Voya Funds Services, LLC (March 2018–Present) and Senior Vice President, Voya Investments, LLC (April 2005–Present). |
| |
Kimberly A. Anderson
7337 East Doubletree Ranch Rd.
Suite 100
Scottsdale, Arizona 85258
Age: 56 | | Senior Vice President | | November
2003–Present | | Senior Vice President, Voya Investments, LLC (September 2003–Present). |
| |
Micheline S. Faver
7337 East Doubletree Ranch Rd.
Suite 100
Scottsdale, Arizona 85258
Age: 43 | | Senior Vice President | | September
2020–Present | | Vice President, Head of Fund Compliance and Chief Compliance Officer, Voya Investments, LLC (June 2016–Present). Formerly, Vice President, Mutual Fund Compliance (March 2014–June 2016). |
| |
Robert Terris
5780 Powers Ferry Road NW
Atlanta, Georgia 30327
Age: 50 | | Senior Vice President | | May
2006–Present | | Senior Vice President, Voya Investments Distributor, LLC (April 2018–Present); Senior Vice President, Head of Investment Services, Voya Investments, LLC (April 2018–Present) and Voya Funds Services, LLC (March 2006–Present). Formerly, Senior Vice President, Head of Division Operations, Voya Investments, LLC (October 2015–April 2018). |
35
TRUSTEE AND OFFICER INFORMATION (UNAUDITED) (CONTINUED)
| Name, Address and Age | | Position(s)
Held With
the Trust | | Term of Office
and Length of
Time Served(1) | | Principal Occupation(s) —
During the Past 5 Years |
|---|
| |
Fred Bedoya
7337 East Doubletree Ranch Rd.
Suite 100
Scottsdale, Arizona 85258
Age: 48 | | Vice President
and Treasurer | | September
2012–Present | | Vice President, Voya Investments, LLC (October 2015–Present) and Voya Funds Services, LLC (July 2012–Present). |
| |
Maria M. Anderson
7337 East Doubletree Ranch Rd.
Suite 100
Scottsdale, Arizona 85258
Age: 62 | | Vice President | | September
2004–Present | | Vice President, Voya Investments, LLC (October 2015–Present) and Voya Funds Services, LLC (September 2004–Present). |
| |
Sara M. Donaldson
7337 East Doubletree Ranch Rd.
Suite 100
Scottsdale, Arizona 85258
Age: 61 | | Vice President | | September
2014–Present | | Vice President, Voya Investments, LLC (October 2015–Present). |
| |
Robyn L. Ichilov
7337 East Doubletree Ranch Rd.
Suite 100
Scottsdale, Arizona 85258
Age: 53 | | Vice President | | November
1999–Present | | Vice President, Voya Funds Services, LLC (November 1995–Present) and Voya Investments, LLC (August 1997–Present). |
| |
Jason Kadavy
7337 East Doubletree Ranch Rd.
Suite 100
Scottsdale, Arizona 85258
Age: 44 | | Vice President | | September
2012–Present | | Vice President, Voya Investments, LLC (October 2015–Present) and Voya Funds Services, LLC (July 2007–Present). |
| |
Andrew K. Schlueter
7337 East Doubletree Ranch Rd.
Suite 100
Scottsdale, Arizona 85258
Age: 44 | | Vice President | | March
2018–Present | | Vice President, Voya Investments Distributor, LLC (April 2018–Present); Vice President, Voya Investments, LLC and Voya Funds Services, LLC (March 2018–Present); Vice President, Head of Mutual Fund Operations, Voya Investment Management (February 2018–Present). Formerly, Vice President, Voya Investment Management (March 2014–February 2018). |
| |
Craig Wheeler
7337 East Doubletree Ranch Rd.
Suite 100
Scottsdale, Arizona 85258
Age: 51 | | Vice President | | May
2013–Present | | Vice President — Director of Tax, Voya Investments, LLC (October 2015–Present). |
| |
Monia Piacenti
One Orange Way
Windsor, Connecticut 06095
Age: 44 | | Anti-Money Laundering Officer | | June
2018–Present | | Anti-Money Laundering Officer, Voya Investments Distributor, LLC, Voya Investment Management and Voya Investment Management Trust Co. (June 2018–Present); Compliance Consultant, Voya Financial, Inc. (January 2019–Present). Formerly, Senior Compliance Officer, Voya Investment Management (December 2009–December 2018). |
| |
Joanne F. Osberg
7337 East Doubletree Ranch Rd.
Suite 100
Scottsdale, Arizona 85258
Age: 39 | | Secretary | | September
2020–Present | | Vice President and Senior Counsel, Voya Investment Management — Mutual Fund Legal Department (September 2020–Present). Formerly, Vice President, Counsel II, Voya Investment Management — Mutual Fund Legal Department (January 2013–September 2020). |
| |
Paul A. Caldarelli
7337 East Doubletree Ranch Rd.
Suite 100
Scottsdale, Arizona 85258
Age: 69 | | Assistant Secretary | | June
2010–Present | | Vice President and Senior Counsel, Voya Investment Management — Mutual Fund Legal Department (March 2010–Present). |
(1) | | The Officers hold office until the next annual meeting of the Board of Trustees and until their successors shall have been elected and qualified. |
36
ADVISORY AND SUB-ADVISORY CONTRACT APPROVAL DISCUSSION (UNAUDITED)
BOARD CONSIDERATION AND APPROVAL OF INVESTMENT MANAGEMENT CONTRACTS AND SUB-ADVISORY CONTRACTS
At a meeting held on November 19, 2020, the Board of Trustees (“Board”) of Voya Investors Trust (the “Trust”), including a majority of the Board members who have no direct or indirect interest in the management and sub-advisory contracts, and who are not “interested persons” of Voya Retirement Conservative Portfolio, Voya Retirement Growth Portfolio, Voya Retirement Moderate Growth Portfolio, and Voya Retirement Moderate Portfolio, each a series of the Trust (the “Portfolios”), as such term is defined under the Investment Company Act of 1940, as amended (the “Independent Trustees”), considered and approved the renewal of the investment management contracts (the “Management Contracts”) between Voya Investments, LLC (the “Manager”) and the Trust, on behalf of the Portfolios, and the sub-advisory contracts (the “Sub-Advisory Contracts,” and together with the Management Contracts, the “Contracts”) with Voya Investment Management Co. LLC, the sub-adviser to each Portfolio (the “Sub-Adviser”) for an additional one year period ending November 30, 2021.
In addition to the Board meeting on November 19, 2020, the Independent Trustees also held meetings outside the presence of personnel representing the Manager or Sub-Adviser (collectively, such persons are referred to herein as “management”) on October 8, 2020, and November 17, 2020. At those meetings the Board reviewed and considered materials related to the proposed continuance of the Contracts that they had requested and believed to be relevant to the renewal of the Contracts in light of their own business judgment and the legal advice furnished to them by K&L Gates LLP, their independent legal counsel. The Board also considered information furnished to it throughout the year at meetings of the Board and its committees, including information regarding performance, expenses, and other matters. While the Board considered the renewal of the management contracts and sub-advisory contracts for all of the applicable investment companies in the Voya family of funds at the same meetings, the Board considered each Voya fund’s investment management and sub-advisory relationships separately.
The Board has established a Contracts Committee and Investment Review Committees (the “IRCs”), each of which includes only Independent Trustees as members. The Contracts Committee meets several times throughout the year to provide oversight with respect to the management and sub-advisory contracts approval and renewal process for each Voya fund, among other functions, and each IRC meets several times throughout the year with respect to each Voya fund that is assigned to
that IRC to provide oversight regarding the investment performance of the sub-advisers, as well as the Manager’s role in monitoring the sub-advisers.
The Contracts Committee oversees, and annually recommends Board approval of updates to, a methodology guide for the Voya funds (“Methodology Guide”), which sets out a framework pursuant to which the Independent Trustees request, and management provides, certain information that the Independent Trustees deem to be important or potentially relevant. The Independent Trustees retain the services of an independent consultant with experience in the mutual fund industry to assist the Contracts Committee in developing and recommending to the Board: (1) a selected peer group of investment companies for each Portfolio (“Selected Peer Group”) based on that Portfolio’s particular attributes, such as fund type and size, fund category (as determined by Morningstar, Inc., an independent provider of mutual fund data (“Morningstar”)), sales channels and structure and the Portfolio share class being compared to the Selected Peer Group; and (2) updates to the Methodology Guide with respect to the content and format of various data prepared in connection with the renewal process, including, but not limited to, investment performance, fee structure, and expense information. In addition, the Independent Trustees periodically have retained an independent firm to test and verify the accuracy of certain information presented to the Board for a representative sample of the Voya funds.
The Manager or Sub-Adviser may not have been able to, or opted not to, provide information in response to certain information requests, in which case the Board conducted its evaluation of the firm based on information that was provided. In such cases, the Board determined that the omission of any such information was not material to its considerations. Additionally, the Board considered the impact of significant market volatility that occurred during and after the period for which information was requested in conducting its evaluation of the Manager and Sub-Adviser.
Provided below is an overview of certain material factors that the Board considered at its meetings regarding the renewal of the Contracts and the compensation to be paid thereunder. The Board members did not identify any particular information or factor that was most relevant to its consideration, and each Board member may have accorded different weight to the various factors in reaching his or her conclusions with respect to each Portfolio’s investment management and sub-advisory arrangements.
Nature, Extent and Quality of Services
The Manager oversees, subject to the authority of the Board, and is responsible for the provision of, all investment advisory and portfolio management services for the
37
ADVISORY AND SUB-ADVISORY CONTRACT APPROVAL DISCUSSION (UNAUDITED) (CONTINUED)
Portfolios, but may delegate certain of these responsibilities to one or more sub-advisers. In addition, the Manager provides administrative services reasonably necessary for the operation of the Portfolios as set forth in the Management Contracts, including oversight of the Portfolios’ operations and risk management and the oversight of their various other service providers.
The Board considered the “manager-of-managers” platform of the Voya funds that has been developed by the Manager pursuant to which the Manager selects, subject to the Board’s approval, sub-advisers to provide day-to-day management services to all or a portion of each Voya fund. The Board recognized that the Manager is responsible for monitoring the investment program, performance, developments, ongoing operations, and compliance with applicable regulations and investment policies and restrictions of the Sub-Adviser with respect to the Portfolios under this manager-of-managers arrangement. The Board also considered the techniques and resources that the Manager has developed to provide this ongoing oversight and due diligence with respect to the sub-advisers and to advocate or recommend, when it believes appropriate, changes in investment strategies or investment sub-advisers designed to assist in improving a Voya fund’s performance. In connection with the Manager’s performance of these duties, the Board considered that the Manager has developed an oversight process formulated by its Manager Research & Selection Group which reviews, among other matters, performance data, the Sub-Adviser’s management team, portfolio data and attribution analysis related to the Sub-Adviser through various means, including, but not limited to, in-person meetings, on-site or virtual visits, and telephonic meetings with the Sub-Adviser.
Further, the Board considered periodic compliance reports it receives from the Trust’s Chief Compliance Officer evaluating whether the regulatory compliance systems and procedures of the Manager and the Sub-Adviser are reasonably designed to ensure compliance with the federal securities laws and whether the investment policies and restrictions for each Portfolio are consistently complied with, and other periodic reports covering related matters.
The Board considered the portfolio management team assigned by the Sub-Adviser to the Portfolios and the level of resources committed to the Portfolios (and other relevant funds in the Voya funds) by the Manager and Sub-Adviser, and whether those resources are sufficient to provide high-quality services to the Portfolios.
Based on their deliberations and the materials presented to them, the Board concluded that the nature, extent and quality of the overall services provided by the Manager and Sub-Adviser under the Contracts were appropriate.
Portfolio Performance
In assessing the investment management and sub-advisory relationships, the Board placed emphasis on the investment returns of each Portfolio, including its investment performance over certain time periods compared to the Portfolio’s Morningstar category and primary benchmark, a broad-based securities market index identified in the Portfolio’s prospectus. The Board also considered information from the Manager Research & Selection Group and received reports summarizing a separate analysis of each Portfolio’s performance and risk, including risk-adjusted investment return information, from the Trust’s Chief Investment Risk Officer.
Economies of Scale
When evaluating the reasonableness of the management fee schedules, the Board considered whether economies of scale have been or likely will be realized by the Manager and the Sub-Adviser as a Portfolio grows larger and the extent to which any such economies are shared with the Portfolio. The Board considered that, while the Portfolios do not have management fee breakpoints, the Portfolios have fee waiver and expense reimbursement arrangements. The Board considered the extent to which economies of scale realized by the Manager could be shared with each Portfolio through such fee waivers, expense reimbursements or other expense reductions. The Board also considered the impact of fee waiver and expense reimbursement arrangements in instances where a share class of a Portfolio is operating such that its expense ratio is below the expense limit applicable to that share class. In evaluating these matters, the Independent Trustees also considered periodic management reports, Selected Peer Group comparisons, and industry information regarding economies of scale.
Information Regarding Services, Performance, and Fee Schedules Offered to Other Clients
The Board considered comparative information regarding the nature of services, performance, and fee schedules offered by the Manager and the Sub-Adviser to other clients with similar investment objectives, if applicable, including other registered investment companies and relevant institutional accounts. When the fee schedules offered to or the performance of such other clients differed materially from a Portfolio, the Board took into account the underlying rationale provided by the Manager or the Sub-Adviser, as applicable, for these differences.
Fee Schedules, Profitability, and Fall-out Benefits
The Board reviewed and considered the contractual management fee schedule and net management fee rate payable by each Portfolio to the Manager compared to the Portfolio’s Selected Peer Group. The Board also
38
ADVISORY AND SUB-ADVISORY CONTRACT APPROVAL DISCUSSION (UNAUDITED) (CONTINUED)
considered the compensation payable by the Manager to the Sub-Adviser for sub-advisory services for each Portfolio, including the portion of the contractual and net management fee rates that are paid to the Sub-Adviser, as compared to the compensation paid to the Manager. In addition, the Board considered the fee waivers, expense limitations, and/or recoupment arrangements that apply to the fees payable by the Portfolios, including whether the Manager intends to propose any changes thereto. For each Portfolio, the Board separately determined that the fees payable to the Manager and the fee schedule payable to the Sub-Adviser are reasonable for the services that each performs, which were considered in light of the nature, extent and quality of the services that each has performed and is expected to perform.
For each Portfolio, the Board considered information on revenues, costs and profits or losses realized by the Manager and the Voya-affiliated Sub-Adviser related to their services to the Portfolio. In analyzing the profitability of the Manager and its affiliated service providers in connection with services they render to a Portfolio, the Board took into account the sub-advisory fee rate payable by the Manager to the Sub-Adviser. The Board also considered the profitability of the Manager and its affiliated Sub-Adviser attributable to servicing each Portfolio both with and without taking into account the profitability of the distributor of the Portfolios and any revenue sharing payments made by the Manager and both before and after giving effect to any expenses incurred by the Manager or the affiliated Sub-Adviser in making payments to affiliated insurance companies.
Although the Methodology Guide establishes a framework for profit calculation, the Board recognized that there is no uniform methodology within the asset management industry for determining profitability for this purpose. The Board also recognized that the use of different reasonable methodologies can give rise to dramatically different reported profit and loss results with respect to the Manager and the Voya-affiliated Sub-Adviser, as well as other industry participants with whom the profits of the Manager and its affiliated Sub-Adviser could be compared. In addition, the Board recognized that management’s calculations regarding its costs incurred in establishing the infrastructure necessary for the Portfolios’ operations may not be fully reflected in the expenses allocated to each Portfolio in determining profitability, and that the information presented may not portray all of the costs borne by the Manager or reflect all risks, including entrepreneurial, regulatory, legal and operational risks, associated with offering and managing a mutual fund complex in the current regulatory and market environment.
The Board also considered that the Manager and the Voya-affiliated Sub-Adviser are entitled to earn a reasonable
level of profits for the services that they provide to the Portfolios. The Board also considered information regarding the potential fall-out benefits to the Manager and Sub-Adviser and their respective affiliates from their association with the Portfolios, including their ability to engage in soft-dollar transactions on behalf of the Portfolios. Following its reviews, the Board determined that the Manager’s and the Voya-affiliated Sub-Adviser’s profitability with respect to their services to the Portfolios and the Manager’s and Sub-Adviser’s potential fall-out benefits were not unreasonable.
Portfolio-by-Portfolio Analysis
Set forth below are certain of the specific factors that the Board considered at its October 7, 2020, November 17, 2020, and/or November 19, 2020 meetings in relation to approving each Portfolio’s Contracts and the conclusions reached by the Board. These specific factors are in addition to those considerations discussed above. In each case, the Portfolio’s performance was compared to its Morningstar category, as well as its primary benchmark. The performance data provided to the Board primarily was for various periods ended March 31, 2020. In addition, the Board also considered at its October 7, 2020, November 17, 2020, and November 19, 2020 meetings certain additional data regarding each Portfolio’s more recent performance, asset levels and asset flows. Each Portfolio’s management fee rate and expense ratio were compared to the management fee rates and expense ratios of the funds in its Selected Peer Group. With respect to the quintile rankings noted below, the first quintile represents the range of funds with the highest performance or the lowest management fee rate or expense ratio, as applicable, and the fifth quintile represents the range of funds with the lowest performance or the highest management fee rate or expense ratio, as applicable.
Voya Retirement Conservative Portfolio
In considering whether to approve the renewal of the Contracts for Voya Retirement Conservative Portfolio, the Board considered that, based on performance data for the periods ended March 31, 2020: (1) the Portfolio is ranked in the first quintile of its Morningstar category for the year-to-date, one-year, three-year, five-year and ten-year periods; and (2) the Portfolio outperformed its primary benchmark for all periods presented, with the exception of the five-year period, during which it underperformed.
In considering the fees payable under the Contracts for the Portfolio, the Board took into account the factors described above and also considered: (1) the fairness of the compensation under a Management Contract with a level fee rate that does not include breakpoints; and (2) the pricing structure (including the net expense ratio to be borne by shareholders) of the Portfolio, as compared to its
39
ADVISORY AND SUB-ADVISORY CONTRACT APPROVAL DISCUSSION (UNAUDITED) (CONTINUED)
Selected Peer Group, including that: (a) the net management fee rate for the Portfolio is ranked in the fifth quintile of net management fee rates of the funds in its Selected Peer Group; (b) the contractual management fee rate for the Portfolio is ranked in the fifth quintile of contractual management fee rates of the funds in its Selected Peer Group; and (c) the all-in net expense ratio for the Portfolio, inclusive of the Acquired Fund Fees and Expenses (“AFFE”), is ranked in the third quintile of all-in net expense ratios of the funds in its Selected Peer Group, and the net expense ratio for the Portfolio, not inclusive of AFFE, is above the median of net expense ratios of the funds in its Selected Peer Group. In analyzing this fee data, the Board took into account: (1) that, as reflected in the AFFE, the Portfolio indirectly bears the fees payable by the underlying funds in which the Portfolio invests; (2) management’s representations regarding the effect that the limited size of its Selected Peer Group had on the Portfolio’s pricing relative to its Selected Peer Group; and (3) management’s representations regarding its belief that the Portfolio’s pricing is competitive.
After its deliberation, the Board reached the following conclusions: (1) the Portfolio’s management fee rate is reasonable in the context of all factors considered by the Board; (2) the Portfolio’s net expense ratio is reasonable in the context of all factors considered by the Board; (3) the Portfolio’s performance is reasonable in the context of all factors considered by the Board; and (4) the sub-advisory fee rate payable by the Manager to the Sub-Adviser is reasonable in the context of all factors considered by the Board. Based on these conclusions and other factors, the Board voted to renew the Contracts for the Portfolio for the year ending November 30, 2021. During this renewal process, different Board members may have given different weight to different individual factors and related conclusions.
Voya Retirement Growth Portfolio
In considering whether to approve the renewal of the Contracts for Voya Retirement Growth Portfolio, the Board considered that, based on performance data for the periods ended March 31, 2020: (1) the Portfolio is ranked in the first quintile of its Morningstar category for the year-to-date and one-year periods, the second quintile for the three-year and five-year periods, and the third quintile for the ten-year period; and (2) the Portfolio outperformed its primary benchmark for the year-to-date, one-year and three-year periods and underperformed for the five-year and ten-year periods.
In considering the fees payable under the Contracts for the Portfolio, the Board took into account the factors described above and also considered: (1) the fairness of the compensation under a Management Contract with a level fee rate that does not include breakpoints; and (2) the
pricing structure (including the net expense ratio to be borne by shareholders) of the Portfolio, as compared to its Selected Peer Group, including that: (a) the net management fee rate for the Portfolio is ranked in the fifth quintile of net management fee rates of the funds in its Selected Peer Group; (b) the contractual management fee rate for the Portfolio is ranked in the fifth quintile of contractual management fee rates of the funds in its Selected Peer Group; and (c) the all-in net expense ratio for the Portfolio, inclusive of the Acquired Fund Fees and Expenses (“AFFE”), is ranked in the fourth quintile of all-in net expense ratios of the funds in its Selected Peer Group, and the net expense ratio for the Portfolio, not inclusive of AFFE, is above the median of net expense ratios of the funds in its Selected Peer Group. In analyzing this fee data, the Board took into account: (1) that, as reflected in the AFFE, the Portfolio indirectly bears the fees payable by the underlying funds in which the Portfolio invests; (2) management’s representations regarding the effect that the limited size of its Selected Peer Group had on the Portfolio’s pricing relative to its Selected Peer Group; and (3) management’s representations regarding its belief that the Portfolio’s pricing is competitive.
After its deliberation, the Board reached the following conclusions: (1) the Portfolio’s management fee rate is reasonable in the context of all factors considered by the Board; (2) the Portfolio’s net expense ratio is reasonable in the context of all factors considered by the Board; (3) the Portfolio’s performance is reasonable in the context of all factors considered by the Board; and (4) the sub-advisory fee rate payable by the Manager to the Sub-Adviser is reasonable in the context of all factors considered by the Board. Based on these conclusions and other factors, the Board voted to renew the Contracts for the Portfolio for the year ending November 30, 2021. During this renewal process, different Board members may have given different weight to different individual factors and related conclusions.
Voya Retirement Moderate Growth Portfolio
In considering whether to approve the renewal of the Contracts for Voya Retirement Moderate Growth Portfolio, the Board considered that, based on performance data for the periods ended March 31, 2020: (1) the Portfolio is ranked in the second quintile of its Morningstar category for the year-to-date, one-year, three-year and five-year periods, and the third quintile for the ten-year period; and (2) the Portfolio outperformed its primary benchmark for the one-year and three-year periods and underperformed for the year-to-date, five-year and ten-year periods.
In considering the fees payable under the Contracts for the Portfolio, the Board took into account the factors described above and also considered: (1) the fairness of the compensation under a Management Contract with a level
40
ADVISORY AND SUB-ADVISORY CONTRACT APPROVAL DISCUSSION (UNAUDITED) (CONTINUED)
fee rate that does not include breakpoints; and (2) the pricing structure (including the net expense ratio to be borne by shareholders) of the Portfolio, as compared to its Selected Peer Group, including that: (a) the net management fee rate for the Portfolio is ranked in the fifth quintile of net management fee rates of the funds in its Selected Peer Group; (b) the contractual management fee rate for the Portfolio is ranked in the fifth quintile of contractual management fee rates of the funds in its Selected Peer Group; and (c) the all-in net expense ratio for the Portfolio, inclusive of the Acquired Fund Fees and Expenses (“AFFE”), is ranked in the fourth quintile of all-in net expense ratios of the funds in its Selected Peer Group, and the net expense ratio for the Portfolio, not inclusive of AFFE, is above the median of net expense ratios of the funds in its Selected Peer Group. In analyzing this fee data, the Board took into account: (1) that, as reflected in the AFFE, the Portfolio indirectly bears the fees payable by the underlying funds in which the Portfolio invests; (2) management’s representations regarding the effect that the limited size of its Selected Peer Group had on the Portfolio’s pricing relative to its Selected Peer Group; and (3) management’s representations regarding its belief that the Portfolio’s pricing is competitive.
After its deliberation, the Board reached the following conclusions: (1) the Portfolio’s management fee rate is reasonable in the context of all factors considered by the Board; (2) the Portfolio’s net expense ratio is reasonable in the context of all factors considered by the Board; (3) the Portfolio’s performance is reasonable in the context of all factors considered by the Board; and (4) the sub-advisory fee rate payable by the Manager to the Sub-Adviser is reasonable in the context of all factors considered by the Board. Based on these conclusions and other factors, the Board voted to renew the Contracts for the Portfolio for the year ending November 30, 2021. During this renewal process, different Board members may have given different weight to different individual factors and related conclusions.
Voya Retirement Moderate Portfolio
In considering whether to approve the renewal of the Contracts for Voya Retirement Moderate Portfolio, the Board considered that, based on performance data for the periods ended March 31, 2020: (1) the Portfolio is ranked in the first quintile of its Morningstar category for the one-year, three-year, five-year, and ten-year periods, and the second quintile for the year-to-date period; and (2) the
Portfolio underperformed its primary benchmark for all periods presented, with the exception of the ten-year period, during which it outperformed.
In considering the fees payable under the Contracts for the Portfolio, the Board took into account the factors described above and also considered: (1) the fairness of the compensation under a Management Contract with a level fee rate that does not include breakpoints; and (2) the pricing structure (including the net expense ratio to be borne by shareholders) of the Portfolio, as compared to its Selected Peer Group, including that: (a) the net management fee rate for the Portfolio is ranked in the fifth quintile of net management fee rates of the funds in its Selected Peer Group; (b) the contractual management fee rate for the Portfolio is ranked in the fifth quintile of contractual management fee rates of the funds in its Selected Peer Group; and (c) the all-in net expense ratio for the Portfolio, inclusive of the Acquired Fund Fees and Expenses (“AFFE”), is ranked in the third quintile of all-in net expense ratios of the funds in its Selected Peer Group, and the net expense ratio for the Portfolio, not inclusive of AFFE, is above the median of net expense ratios of the funds in its Selected Peer Group. In analyzing this fee data, the Board took into account: (1) that, as reflected in the AFFE, the Portfolio indirectly bears the fees payable by the underlying funds in which the Portfolio invests; (2) management’s representations regarding the effect that the limited size of its Selected Peer Group had on the Portfolio’s pricing relative to its Selected Peer Group; and (3) management’s representations regarding its belief that the Portfolio’s pricing is competitive.
After its deliberation, the Board reached the following conclusions: (1) the Portfolio’s management fee rate is reasonable in the context of all factors considered by the Board; (2) the Portfolio’s net expense ratio is reasonable in the context of all factors considered by the Board; (3) the Portfolio’s performance is reasonable in the context of all factors considered by the Board; and (4) the sub-advisory fee rate payable by the Manager to the Sub-Adviser is reasonable in the context of all factors considered by the Board. Based on these conclusions and other factors, the Board voted to renew the Contracts for the Portfolio for the year ending November 30, 2021. During this renewal process, different Board members may have given different weight to different individual factors and related conclusions.
41
(THIS PAGE INTENTIONALLY LEFT BLANK)
(THIS PAGE INTENTIONALLY LEFT BLANK)
Investment Adviser
Voya Investments, LLC
7337 East Doubletree Ranch Road, Suite 100
Scottsdale, Arizona 85258
Distributor
Voya Investments Distributor, LLC
7337 East Doubletree Ranch Road, Suite 100
Scottsdale, Arizona 85258
Transfer Agent
BNY Mellon Investment Servicing (U.S.) Inc.
301 Bellevue Parkway
Wilmington, Delaware 19809
Independent Registered Public Accounting Firm
Ernst & Young LLP
200 Clarendon Street
Boston, Massachusetts 02116
Custodian
The Bank of New York Mellon
225 Liberty Street
New York, New York 10286
Legal Counsel
Ropes & Gray LLP
Prudential Tower
800 Boylston Street
Boston, Massachusetts 02199
Before investing, carefully consider the investment objectives, risks, charges and expenses of the variable annuity contract or variable life insurance policy and the underlying variable investment options. This and other information is contained in the prospectus for the variable annuity contract or variable life insurance policy and the underlying variable investment options. Obtain these prospectuses from your agent/registered representative and read them carefully before investing.
| RETIREMENT | INVESTMENTS | INSURANCE | |
| |
| voyainvestments.com | VPAR-RETADVI (1220-022221) |
Item 2. Code of Ethics.
As of the end of the period covered by this report, Registrant had adopted a code of ethics, as defined in Item 2 of Form N-CSR, that applies to the Registrant’s principal executive officer and principal financial officer. There were no amendments to the Code during the period covered by the report. The Registrant did not grant any waivers, including implicit waivers, from any provisions of the Code during the period covered by this report. The code of ethics is filed herewith pursuant to Item 10(a)(1), Ex-99.CODE ETH.
Item 3. Audit Committee Financial Expert.
The Board of Trustees has determined that Colleen D. Baldwin, Martin J. Gavin, and Joseph E. Obermeyer are audit committee financial experts, as defined in Item 3 of Form N-CSR. Ms. Baldwin, Mr. Gavin, and Mr. Obermeyer are “independent” for purposes of Item 3 of Form N-CSR.
Item 4. Principal Accountant Fees and Services.
Below are the amount of fees that Ernst & Young LLP (“EY”), the Funds’ current Independent Registered Public Accounting Firm, billed to the Funds during the Funds’ fiscal year ended December 31, 2020 and the amount of fees that KPMG LLP (“KPMG”), the Funds’ prior Independent Registered Public Accounting Firm, billed to the Funds during the Funds’ fiscal year ended December 31, 2019.
| (a) | Audit Fees(1): The aggregate fees billed for each of the last two fiscal years for professional services rendered by EY and KPMG, the principal accountant for the audit of each respective registrant’s annual financial statements or services that are normally provided by the accountant in connection with statutory and regulatory filings or engagements for those fiscal years were $464,372 for the year ended December 31, 2020 and $556,585 for the year ended December 31, 2019. |
| (b) | Audit-Related Fees: The aggregate fees billed in each of the last two fiscal years for assurance and related services by EY and KPMG that are reasonably related to the performance of each respective audit of the registrant’s financial statements and are not reported under paragraph (a) of this Item were $0 for the year ended December 31, 2020 and $0 for the year ended December 31, 2019. |
| (c) | Tax Fees(2): The aggregate fees billed in each of the last two fiscal years for professional services rendered by EY and KPMG for tax compliance, tax advice, and tax planning were $46,126 for the year ended December 31, 2020 and $123,718 for the year ended December 31, 2019. Such services included review of excise distribution calculations (if applicable), preparation of the Funds’ federal, state, and excise tax returns, tax services related to mergers and routine consulting. |
| (d) | All Other Fees(3): The aggregate fees billed in each of the last two fiscal years for products and services provided by EY and KPMG, other than the services reported in paragraphs (a) through (c) of this Item were $0 for the year ended December 31, 2020 and $10,896 for the year ended December 31, 2019. |
(1) For the year ended December 31, 2020, KPMG billed $0 for Audit Fees.
(2) For the year ended December 31, 2020, KPMG billed $19,191 for Tax Fees.
(3) For the year ended December 31, 2020, KPMG billed $0 for All Other Fees.
| (e)(1) | Audit Committee Pre-Approval Policies and Procedures |
Appendix A
AUDIT AND NON-AUDIT SERVICES
PRE-APPROVAL POLICY
I. Statement of Principles
Under the Sarbanes-Oxley Act of 2002 (the “Act”), the Audit Committee of the Board of Directors or Trustees (the “Committee”) of the Voya funds (each a “Fund,” collectively, the “Funds”) set out on Exhibit A to this Audit and Non-Audit Services Pre-Approval Policy (“Policy”) is responsible for the oversight of the work of the Funds’ independent auditors. As part of its responsibilities, the Committee must pre-approve the audit and non-audit services performed by the auditors in order to assure that the provision of these services does not impair the auditors’ independence from the Funds. The Committee has adopted, and the Board has ratified, this Policy, which sets out the procedures and conditions under which the services of the independent auditors may be pre-approved.
Under Securities and Exchange Commission (“SEC”) rules promulgated in accordance with the Act, the Funds may establish two different approaches to pre-approving audit and non-audit services. The Committee may approve services without consideration of specific case-by-case services (“general pre-approval”) or it may pre-approve specific services (“specific pre-approval”). The Committee believes that the combination of these approaches contemplated in this Policy results in an effective and efficient method for pre-approving audit and non-audit services to be performed by the Funds’ independent auditors. Under this Policy, services that are not of a type that may receive general pre-approval require specific pre-approval by the Committee. Any proposed services that exceed pre-approved cost levels or budgeted amounts will also require the Committee’s specific pre-approval.
For both types of approval, the Committee considers whether the subject services are consistent with the SEC’s rules on auditor independence and that such services are compatible with maintaining the auditors independence. The Committee also considers whether a particular audit firm is in the best position to provide effective and efficient services to the Funds. Reasons that the auditors are in the best position include the auditors’ familiarity with the Funds’ business, personnel, culture, accounting systems, risk profile, and other factors, and whether the services will enhance the Funds’ ability to manage and control risk or improve audit quality. Such factors will be considered as a whole, with no one factor being determinative.
The appendices attached to this Policy describe the audit, audit-related, tax-related, and other services that have the Committee’s general pre-approval. For any service that has been approved through general pre-approval, the general pre-approval will remain in place for a period 12 months from the date of pre-approval, unless the Committee determines that a different period is appropriate. The Committee will annually review and pre-approve the services that may be provided by the independent auditors without specific pre-approval. The Committee will revise the list of services subject to general pre-approval as appropriate. This Policy does not serve as a delegation to Fund management of the Committee’s duty to pre-approve services performed by the Funds’ independent auditors.
II. Audit Services
The annual audit services engagement terms and fees are subject to the Committee’s specific pre-approval. Audit services are those services that are normally provided by auditors in connection with statutory and regulatory filings or engagements or those that generally only independent auditors can reasonably provide. They include the Funds’ annual financial statement audit and procedures that the independent auditors must perform in order to form an opinion on the Funds’ financial statements (e.g., information systems and procedural reviews and testing). The Committee will monitor the audit services engagement and approve any changes in terms, conditions or fees deemed by the Committee to be necessary or appropriate.
The Committee may grant general pre-approval to other audit services, such as statutory audits and services associated with SEC registration statements, periodic reports and other documents filed with the SEC or issued in connection with securities offerings.
The Committee has pre-approved the audit services listed on Appendix A. The Committee must specifically approve all audit services not listed on Appendix A.
III. Audit-related Services
Audit-related services are assurance and related services that are reasonably related to the performance of the audit or the review of the Funds’ financial statements or are traditionally performed by the independent auditors. The Committee believes that the provision of audit-related services will not impair the independent auditors’ independence, and therefore may grant pre-approval to audit-related services. Audit-related services include accounting consultations related to accounting, financial reporting or disclosure matters not classified as “audit services;” assistance with understanding and implementing new accounting and financial reporting guidance from rulemaking authorities; agreed-upon or expanded audit procedures relating to accounting and/or billing records required to respond to or comply with financial, accounting or regulatory reporting matters; and assistance with internal control reporting requirements under Form N-SAR or Form N-CSR.
The Committee has pre-approved the audit-related services listed on Appendix B. The Committee must specifically approve all audit-related services not listed on Appendix B.
IV. Tax Services
The Committee believes the independent auditors can provide tax services to the Funds, including tax compliance, tax planning, and tax advice, without compromising the auditors’ independence. Therefore, the Committee may grant general pre-approval with respect to tax services historically provided by the Funds’ independent auditors that do not, in the Committee’s view, impair auditor independence and that are consistent with the SEC’s rules on auditor independence.
The Committee will not grant pre-approval if the independent auditors initially recommends a transaction the sole business purpose of which is tax avoidance and the tax treatment of which may not be supported in the Internal Revenue Code and related regulations. The Committee may consult outside counsel to determine that tax planning and reporting positions are consistent with this Policy.
The Committee has pre-approved the tax-related services listed on Appendix C. The Committee must specifically approve all tax-related services not listed on Appendix C.
V. Other Services
The Committee believes it may grant approval of non-audit services that are permissible services for independent auditors to a Fund. The Committee has determined to grant general pre-approval to other services that it believes are routine and recurring, do not impair auditor independence, and are consistent with SEC rules on auditor independence.
The Committee has pre-approved the non-audit services listed on Appendix D. The Committee must specifically approve all non-audit services not listed on Appendix D.
A list of the SEC’s prohibited non-audit services is attached to this Policy as Appendix E. The SEC’s rules and relevant guidance should be consulted to determine the precise definitions of these impermissible services and the applicability of exceptions to certain of the SEC’s prohibitions.
VI. Pre-approval of Fee levels and Budgeted Amounts
The Committee will annually establish pre-approval fee levels or budgeted amounts for audit, audit-related, tax and non-audit services to be provided to the Funds by the independent auditors. Any proposed services exceeding these levels or amounts require the Committee’s specific pre-approval. The Committee considers fees for audit and non-audit services when deciding whether to pre-approve services. The Committee may determine, for a pre-approval period of 12 months, the appropriate ratio between the total amount of fees for the Fund’s audit, audit-related, and tax services (including fees for services provided to Fund affiliates that are subject to pre-approval), and the total amount of fees for certain permissible non-audit services for the Fund classified as other services (including any such services provided to Fund affiliates that are subject to pre-approval).
VII. Procedures
Requests or applications for services to be provided by the independent auditors will be submitted to management. If management determines that the services do not fall within those services generally pre-approved by the Committee and set out in the appendices to these procedures, management will submit the services to the Committee or its delagee. Any such submission will include a detailed description of the services to be rendered. Notwithstanding this paragraph, the Committee will, on a quarterly basis, receive from the independent auditors a list of services provided for the previous calendar quarter on a cumulative basis by the auditors during the Pre-Approval Period.
VIII. Delegation
The Committee may delegate pre-approval authority to one or more of the Committee’s members. Any member or members to whom such pre-approval authority is delegated must report any pre-approval decisions, including any pre-approved services, to the Committee at its next scheduled meeting. The Committee will identify any member to whom pre-approval authority is delegated in writing. The member will retain such authority for a period of 12 months from the date of pre-approval unless the Committee determines that a different period is appropriate. The period of delegated authority may be terminated by the Committee or at the option of the member.
IX. Additional Requirements
The Committee will take any measures the Committee deems necessary or appropriate to oversee the work of the independent auditors and to assure the auditors’ independence from the Funds. This may include reviewing a formal written statement from the independent auditors delineating all relationships between the auditors and the Funds, consistent with Independence Standards Board No. 1, and discussing with the auditors their methods and procedures for ensuring independence.
Last Approved: November 21, 2019
Appendix A
Pre-Approved Audit Services for the Pre-Approval Period January 1, 2020 through December 31, 2020
| Service |
| | The Fund(s) | Fee Range |
| Statutory audits or financial audits (including tax services associated with audit services) | √ | As presented to Audit Committee1 |
| Services associated with SEC registration statements, periodic reports and other documents filed with the SEC or other documents issued in connection with securities offerings (e.g., consents), and assistance in responding to SEC comment letters. | √ | Not to exceed $9,750 per filing |
| Consultations by Fund management with respect to accounting or disclosure treatment of transactions or events and/or the actual or potential effect of final or proposed rules, standards or interpretations by the SEC, Financial Accounting Standards Board, or other regulatory or standard setting bodies. | √ | Not to exceed $8,000 during the Pre-Approval Period |
| Seed capital audit and related review and issuance of consent on the N-2 registration statement | √ | Not to exceed $14,750 per audit |
| Audit of summary portfolio of investments | √ | Not to exceed $750 per fund |
| 1 | For new Funds launched during the Pre-Approval Period, the fee ranges pre-approved will be the same as those for existing Funds, pro-rated in accordance with inception dates as provided in the auditors’ Proposal or any Engagement Letter covering the period at issue. Fees in the Engagement Letter will be controlling. |
Appendix B
Pre-Approved Audit-Related Services for the Pre-Approval Period January 1, 2020 through December 31, 2020
| Service |
| | The Fund(s) | Fund Affiliates | Fee Range |
| Services related to Fund mergers (Excludes tax services - See Appendix C for tax services associated with Fund mergers) | √ | √ | Not to exceed $10,000 per merger |
| Consultations by Fund management with respect to accounting or disclosure treatment of transactions or events and/or the actual or potential effect of final or proposed rules, standards or interpretations by the SEC, Financial Accounting Standards Board, or other regulatory or standard setting bodies. [Note: Under SEC rules some consultations may be “audit” services and others may be “audit-related” services.] | √ | | Not to exceed $5,000 per occurrence during the Pre-Approval Period |
| Review of the Funds’ semi-annual and quarterly financial statements | √ | | Not to exceed $2,700 per set of financial statements per fund |
| Reports to regulatory or government agencies related to the annual engagement | √ | | Up to $5,000 per occurrence during the Pre-Approval Period |
| Regulatory compliance assistance | √ | √ | Not to exceed $5,000 per quarter |
| Training courses | | √ | Not to exceed $5,000 per course |
| For Prime Rate Trust, agreed upon procedures for quarterly reports to rating agencies | √ | | Not to exceed $9,450 per quarter |
Appendix C
Pre-Approved Tax Services for the Pre-Approval Period January 1, 2020 through December 31, 2020
| Service |
| | The Fund(s) | Fund Affiliates | Fee Range |
| Preparation of federal and state income tax returns and federal excise tax returns for the Funds including assistance and review with excise tax distributions | √ | | As presented to Audit Committee2 |
| Review of IRC Sections 851(b) and 817(h) diversification testing on a real-time basis | √ | | As presented to Audit Committee2 |
| Tax assistance and advice regarding statutory, regulatory or administrative developments | √ | √ | Not to exceed $5,000 for the Funds or for the Funds’ investment adviser during the Pre-Approval Period |
| 2 | For new Funds launched during the Pre-Approval Period, the fee ranges pre-approved will be the same as those for existing Funds, pro-rated in accordance with inception dates as provided in the auditors’ Proposal or any Engagement Letter covering the period at issue. Fees in the Engagement Letter will be controlling. |
Appendix C, continued
Pre-Approved Tax Services for the Pre-Approval Period January 1, 2020 through December 31, 2020
| Service |
| | The Fund(s) | Fund Affiliates | Fee Range |
| Tax and technology training sessions | | √ | Not to exceed $5,000 per course during the Pre-Approval Period |
| Tax services associated with Fund mergers | √ | √ | Not to exceed $4,000 per fund per merger during the Pre-Approval Period |
| Other tax-related assistance and consultation, including, without limitation, assistance in evaluating derivative financial instruments and international tax issues, qualification and distribution issues, year-end reporting for 1099’s, tax compliance services in foreign jurisdictions and similar routine tax consultations as requested. | √ | | Not to exceed $300,000 during the Pre-Approval Period |
Appendix D
Pre-Approved Other Services for the Pre-Approval Period January 1, 2020 through December 31, 2020
| Service |
| | The Fund(s) | Fund Affiliates | Fee Range |
| Agreed-upon procedures for Class B share 12b-1 programs | | √ | Not to exceed $60,000 during the Pre-Approval Period |
Security counts performed pursuant to Rule 17f-2 of the 1940 Act (i.e., counts for Funds holding securities with affiliated sub-custodians) Cost to be borne 50% by the Funds and 50% by Voya Investments, LLC. | √ | √ | Not to exceed $5,700 per Fund during the Pre-Approval Period |
| Agreed upon procedures for 15 (c) FACT Books | √ | | Not to exceed $50,000 during the Pre-Approval Period |
Appendix E
Prohibited Non-Audit Services
Dated: January 1, 2020 to December 31, 2020
| · | Bookkeeping or other services related to the accounting records or financial statements of the Funds |
| · | Financial information systems design and implementation |
| · | Appraisal or valuation services, fairness opinions, or contribution-in-kind reports |
| · | Internal audit outsourcing services |
| · | Broker-dealer, investment adviser, or investment banking services |
| · | Expert services unrelated to the audit |
| · | Any other service that the Public Company Accounting Oversight Board determines, by regulation, is impermissible |
EXHIBIT A
VOYA ASIA PACIFIC HIGH DIVIDEND EQUITY INCOME FUND
VOYA BALANCED PORTFOLIO, INC.
VOYA EMERGING MARKETS HIGH DIVIDEND EQUITY FUND
VOYA EQUITY TRUST
VOYA FUNDS TRUST
VOYA GLOBAL ADVANTAGE AND PREMIUM OPPORTUNITY FUND
VOYA GLOBAL EQUITY DIVIDEND AND PREMIUM OPPORTUNITY FUND
VOYA INFRASTRUCTURE, INDUSTRIALS, AND MATERIALS FUND
VOYA INTERMEDIATE BOND PORTFOLIO
VOYA INTERNATIONAL HIGH DIVIDEND EQUITY INCOME FUND
VOYA INVESTORS TRUST
VOYA GOVERNMENT MONEY MARKET PORTFOLIO
VOYA MUTUAL FUNDS
VOYA PARTNERS, INC.
VOYA NATURAL RESOURCES EQUITY INCOME FUND
VOYA SENIOR INCOME FUND
VOYA SEPARATE PORTFOLIOS TRUST
VOYA STRATEGIC ALLOCATIONS PORTFOLIOS, INC.
VOYA VARIABLE FUNDS
VOYA VARIABLE INSURANCE TRUST
VOYA VARIABLE PORTFOLIOS INC,
VOYA VARIABLE PRODUCTS TRUST
| (e)(2) | Percentage of services referred to in 4(b) – (4)(d) that were approved by the audit committee |
100% of the services were approved by the audit committee.
| (f) | Percentage of hours expended attributable to work performed by other than full time employees of EY if greater than 50% |
Not applicable.
| (g) | Non-Audit Fees: The following table presents (i) the aggregate non-audit fees (i.e., fees for audit-related, tax, and other services) billed to each Registrant by the independent registered public accounting firm for each Registrant’s fiscal years ended December 31, 2020 and December 31, 2019; and (ii) the aggregate non-audit fees billed to the investment adviser, or any of its affiliates that provide ongoing services to the registrant, by the independent registered public accounting firm for the same time periods. |
| Registrant/Investment Adviser | | | 2020(1) | | | | 2019 | |
| Voya Investors Trust | | | $46,126 | | | $ | 134,614 | |
| Voya Investments, LLC (2) | | $ | 14,804,511 | | | $ | 107,750 | |
(1) For the year ended December 31, 2020, KPMG billed the Registrant $19,191 for Non-Audit Fees.
(2) Each Registrant’s investment adviser and any of its affiliates, which are subsidiaries of Voya Financial, Inc..
| (h) | Principal Accountants Independence: The Registrant’s Audit committee has considered whether the provision of non-audit services that were rendered to the registrant’s investment adviser and any entity controlling, controlled by, or under common control with the investment adviser that provides ongoing services to the registrant that were not pre-approved pursuant to Rule 2-01(c)(7)(ii) of Regulation S-X is compatible with maintaining EY’s independence. |
Item 5. Audit Committee of Listed Registrants.
Not applicable.
Item 6. Schedule of Investments.
Complete schedule of investments, as applicable, is included as part of the report to shareholders filed under Item 1 of this Form and filed herein, as applicable.
Report of Independent Registered Public Accounting Firm
To the Shareholders of Voya Government Liquid Assets Portfolio, VY® Clarion Global Real Estate Portfolio, VY® Invesco Growth and Income Portfolio, VY® JPMorgan Emerging Markets Equity Portfolio, VY® Morgan Stanley Global Franchise Portfolio, VY® T. Rowe Price Capital Appreciation Portfolio, VY® T. Rowe Price Equity Income Portfolio and VY® T. Rowe Price International Stock Portfolio and the Board of Trustees of Voya Investors Trust
Opinion on the Financial Statements
We have audited the accompanying statements of assets and liabilities of Voya Government Liquid Assets Portfolio, VY® Clarion Global Real Estate Portfolio, VY® Invesco Growth and Income Portfolio, VY® JPMorgan Emerging Markets Equity Portfolio, VY® Morgan Stanley Global Franchise Portfolio, VY® T. Rowe Price Capital Appreciation Portfolio, VY® T. Rowe Price Equity Income Portfolio and VY® T. Rowe Price International Stock Portfolio (the “Portfolios”) (eight of the portfolios constituting Voya Investors Trust (the “Trust”)), including the portfolios of investments and summary portfolios of investments, as applicable, as of December 31, 2020, and the related statements of operations and changes in net assets and the financial highlights for the year then ended and the related notes (collectively referred to as the “financial statements”) (the financial statements are included in Item 1 of this Form N-CSR) and the portfolios of investments as of December 31, 2020 (included in Item 6 of this Form N-CSR). In our opinion, the financial statements and portfolios of investments present fairly, in all material respects, the financial position of the Portfolios (eight of the portfolios constituting Voya Investors Trust) at December 31, 2020, the results of their operations, the changes in their net assets and their financial highlights for the year then ended, in conformity with U.S. generally accepted accounting principles.
The statement of changes in net assets for the year ended December 31, 2019, and the financial highlights for each of the periods in the four-year period then ended, were audited by another independent registered public accounting firm whose report, dated February 21, 2020, expressed an unqualified opinion on that statement of changes in net assets and those financial highlights.
Basis for Opinion
These financial statements and portfolios of investments are the responsibility of the Trust’s management. Our responsibility is to express an opinion on the Portfolios’ financial statements and portfolios of investments based on our audits. We are a public accounting firm registered with the Public Company Accounting Oversight Board (United States) ("PCAOB") and are required to be independent with respect to the Trust in accordance with the U.S. federal securities laws and the applicable rules and regulations of the Securities and Exchange Commission and the PCAOB.
We conducted our audits in accordance with the standards of the PCAOB. Those standards require that we plan and perform the audits to obtain reasonable assurance about whether the financial statements and portfolios of investments are free of material misstatement, whether due to error or fraud. The Trust is not required to have, nor were we engaged to perform, an audit of the Trust’s internal control over financial reporting. As part of our audits, we are required to obtain an understanding of internal control over financial reporting, but not for the purpose of expressing an opinion on the effectiveness of the Trust’s internal control over financial reporting. Accordingly, we express no such opinion.
Our audits included performing procedures to assess the risks of material misstatement of the financial statements and portfolios of investments, whether due to error or fraud, and performing procedures that respond to those risks. Such procedures included examining, on a test basis, evidence regarding the amounts and disclosures in the financial statements and portfolios of investments. Our procedures included confirmation of securities owned as of December 31, 2020, by correspondence with the custodian and others or by other appropriate auditing procedures where replies from others were not received. Our audits also included evaluating the accounting principles used and significant estimates made by management, as well as evaluating the overall presentation of the financial statements and portfolios of investments. We believe that our audits provide a reasonable basis for our opinion.

We have served as the auditor of one or more Voya investment companies since 2019.
Boston, Massachusetts
February 24, 2021
Report of Independent Registered Public Accounting Firm
To the Shareholders of Voya Balanced Income Portfolio, Voya High Yield Portfolio, Voya Large Cap Growth Portfolio, Voya Large Cap Value Portfolio, Voya Limited Maturity Bond Portfolio, Voya U.S. Stock Index Portfolio, VY® Clarion Real Estate Portfolio and VY® JPMorgan Small Cap Core Equity Portfolio and the Board of Trustees of Voya Investors Trust
Opinion on the Financial Statements
We have audited the accompanying statements of assets and liabilities of Voya Balanced Income Portfolio, Voya High Yield Portfolio, Voya Large Cap Growth Portfolio, Voya Large Cap Value Portfolio, Voya Limited Maturity Bond Portfolio, Voya U.S. Stock Index Portfolio, VY® Clarion Real Estate Portfolio and VY® JPMorgan Small Cap Core Equity Portfolio (the “Portfolio”) (eight of the portfolios constituting Voya Investors Trust (the “Trust”)), including the portfolio of investments and summary portfolios of investments, as applicable, as of December 31, 2020, and the related statements of operations and changes in net assets and the financial highlights for the year then ended and the related notes (collectively referred to as the “financial statements”) (the financial statements are included in Item 1 of this Form N-CSR) and the portfolios of investments as of December 31, 2020 (included in Item 6 of this Form N-CSR). In our opinion, the financial statements and portfolios of investments present fairly, in all material respects, the financial position of the Portfolios (eight of the portfolios constituting Voya Investors Trust) at December 31, 2020, the results of their operations, the changes in their net assets and their financial highlights for the year then ended, in conformity with U.S. generally accepted accounting principles.
The statement of changes in net assets for the year ended December 31, 2019, and the financial highlights for each of the periods in the four-year period then ended, were audited by another independent registered public accounting firm whose report, dated February 21, 2020, expressed an unqualified opinion on that statement of changes in net assets and those financial highlights.
Basis for Opinion
These financial statements and portfolios of investments are the responsibility of the Trust’s management. Our responsibility is to express an opinion on the Portfolios’ financial statements and portfolios of investments based on our audits. We are a public accounting firm registered with the Public Company Accounting Oversight Board (United States) ("PCAOB") and are required to be independent with respect to the Trust in accordance with the U.S. federal securities laws and the applicable rules and regulations of the Securities and Exchange Commission and the PCAOB.
We conducted our audits in accordance with the standards of the PCAOB. Those standards require that we plan and perform the audits to obtain reasonable assurance about whether the financial statements and portfolios of investments are free of material misstatement, whether due to error or fraud. The Trust is not required to have, nor were we engaged to perform, an audit of the Trust’s internal control over financial reporting. As part of our audits, we are required to obtain an understanding of internal control over financial reporting, but not for the purpose of expressing an opinion on the effectiveness of the Trust’s internal control over financial reporting. Accordingly, we express no such opinion.
Our audits included performing procedures to assess the risks of material misstatement of the financial statements and portfolios of investments, whether due to error or fraud, and performing procedures that respond to those risks. Such procedures included examining, on a test basis, evidence regarding the amounts and disclosures in the financial statements and portfolios of investments. Our procedures included confirmation of securities owned as of December 31, 2020, by correspondence with the custodian and others or by other appropriate auditing procedures where replies from others were not received. Our audits also included evaluating the accounting principles used and significant estimates made by management, as well as evaluating the overall presentation of the financial statements and portfolios of investments. We believe that our audits provide a reasonable basis for our opinion.

We have served as the auditor of one or more Voya investment companies since 2019.
Boston, Massachusetts
February 24, 2021
Report of Independent Registered Public Accounting Firm
To the Shareholders of VY® BlackRock Inflation Protected Bond Portfolio and VY® BrandywineGLOBAL – Bond Portfolio and the Board of Trustees of Voya Investors Trust and Voya Variable Insurance Trust
Opinion on the Financial Statements
We have audited the accompanying statements of assets and liabilities of VY® BlackRock Inflation Protected Bond Portfolio and VY® BrandywineGLOBAL – Bond Portfolio (the “Portfolios”) (each a portfolio of Voya Investors Trust and Voya Variable Insurance Trust, respectively (collectively referred to as the “Trusts”)), including the portfolio of investments and summary portfolio of investments, as applicable, as of December 31, 2020, and the related statements of operations and changes in net assets and the financial highlights for the year then ended and the related notes (collectively referred to as the “financial statements”) (the financial statements are included in Item 1 of this Form N-CSR) and the portfolio of investments as of December 31, 2020 (included in Item 6 of this Form N-CSR). In our opinion, the financial statements and portfolio of investments present fairly, in all material respects, the financial position of the Portfolios at December 31, 2020, the results of their operations, the changes in their net assets and their financial highlights for the year then ended, in conformity with U.S. generally accepted accounting principles.
The statement of changes in net assets for the year ended December 31, 2019, and the financial highlights for each of the periods in the four-year period then ended, were audited by another independent registered public accounting firm whose report, dated February 21, 2020, expressed an unqualified opinion on that statement of changes in net assets and those financial highlights.
Basis for Opinion
These financial statements and portfolio of investments are the responsibility of the Trusts’ management. Our responsibility is to express an opinion on the Portfolios’ financial statements and portfolio of investments based on our audits. We are a public accounting firm registered with the Public Company Accounting Oversight Board (United States) ("PCAOB") and are required to be independent with respect to the Trusts in accordance with the U.S. federal securities laws and the applicable rules and regulations of the Securities and Exchange Commission and the PCAOB.
We conducted our audits in accordance with the standards of the PCAOB. Those standards require that we plan and perform the audits to obtain reasonable assurance about whether the financial statements and portfolio of investments are free of material misstatement, whether due to error or fraud. The Trusts are not required to have, nor were we engaged to perform, an audit of the Trusts’ internal control over financial reporting. As part of our audits, we are required to obtain an understanding of internal control over financial reporting, but not for the purpose of expressing an opinion on the effectiveness of the Trusts’ internal control over financial reporting. Accordingly, we express no such opinion.
Our audits included performing procedures to assess the risks of material misstatement of the financial statements and portfolio of investments, whether due to error or fraud, and performing procedures that respond to those risks. Such procedures included examining, on a test basis, evidence regarding the amounts and disclosures in the financial statements and portfolio of investments. Our procedures included confirmation of securities owned as of December 31, 2020, by correspondence with the custodian and others or by other appropriate auditing procedures where replies from others were not received. Our audits also included evaluating the accounting principles used and significant estimates made by management, as well as evaluating the overall presentation of the financial statements and portfolio of investments. We believe that our audits provide a reasonable basis for our opinion.

We have served as the auditor of one or more Voya investment companies since 2019.
Boston, Massachusetts
February 24, 2021
| VY® Clarion Global Real Estate Portfolio | PORTFOLIO OF INVESTMENTS
AS OF December 31, 2020 |
| | | | | | | | Percentage |
| | | | | | | | of Net |
| Shares | | | | Value | | | Assets |
| COMMON STOCK: 97.4% | | | | | | | |
| | | Australia: 3.7% | | | | | | | |
| 310,612 | | Dexus | | $ | 2,252,849 | | | | 1.2 |
| 281,734 | | Ingenia Communities Group | | | 1,066,568 | | | | 0.5 |
| 149,642 | (1) | Lifestyle Communities Ltd. | | | 1,475,806 | | | | 0.8 |
| 456,454 | | Stockland | | | 1,473,696 | | | | 0.7 |
| 755,985 | | Vicinity Centres | | | 934,754 | | | | 0.5 |
| | | | | | 7,203,673 | | | | 3.7 |
| | | | | | | | | | |
| | | Belgium: 1.3% | | | | | | | |
| 6,622 | | Montea C.V.A | | | 750,532 | | | | 0.4 |
| 23,065 | (1) | Shurgard Self Storage SA | | | 999,024 | | | | 0.5 |
| 22,396 | | Warehouses De Pauw CVA | | | 776,432 | | | | 0.4 |
| | | | | | 2,525,988 | | | | 1.3 |
| | | | | | | | | | |
| | | Canada: 2.8% | | | | | | | |
| 28,003 | | Boardwalk Real Estate Investment Trust | | | 742,259 | | | | 0.4 |
| 81,134 | | Canadian Apartment Properties REIT | | | 3,186,337 | | | | 1.7 |
| 136,176 | | H&R Real Estate Investment Trust | | | 1,421,776 | | | | 0.7 |
| | | | | | 5,350,372 | | | | 2.8 |
| | | | | | | | | | |
| | | Finland: 0.9% | | | | | | | |
| 79,330 | | Kojamo Oyj | | | 1,760,731 | | | | 0.9 |
| | | | | | | | | | |
| | | France: 1.0% | | | | | | | |
| 9,559 | | Covivio | | | 877,147 | | | | 0.5 |
| 117,115 | | Mercialys SA | | | 1,029,661 | | | | 0.5 |
| | | | | | 1,906,808 | | | | 1.0 |
| | | | | | | | | | |
| | | Germany: 7.8% | | | | | | | |
| 40,336 | (2),(3) | ADLER Group SA | | | 1,429,009 | | | | 0.7 |
| 222,552 | | Aroundtown SA | | | 1,659,323 | | | | 0.9 |
| 48,642 | (2) | Deutsche Euroshop AG | | | 1,101,229 | | | | 0.6 |
| 33,168 | | Deutsche Wohnen SE | | | 1,769,661 | | | | 0.9 |
| 13,666 | | LEG Immobilien AG | | | 2,120,197 | | | | 1.1 |
| 61,396 | | TAG Immobilien AG | | | 1,959,255 | | | | 1.0 |
| 70,386 | | Vonovia SE | | | 5,140,546 | | | | 2.6 |
| | | | | | 15,179,220 | | | | 7.8 |
| | | | | | | | | | |
| | | Hong Kong: 6.5% | | | | | | | |
| 263,000 | | Hongkong Land Holdings Ltd. - HKHGF | | | 1,086,234 | | | | 0.6 |
| 459,105 | | Link REIT | | | 4,169,489 | | | | 2.1 |
| 1,442,192 | | Sino Land Co. | | | 1,876,747 | | | | 1.0 |
| 290,195 | | Sun Hung Kai Properties Ltd. | | | 3,711,298 | | | | 1.9 |
| 636,000 | | Swire Properties Ltd. | | | 1,849,127 | | | | 0.9 |
| | | | | | 12,692,895 | | | | 6.5 |
| | | | | | | | | | |
| | | Ireland: 0.3% | | | | | | | |
| 385,733 | | Hibernia REIT plc | | | 532,487 | | | | 0.3 |
| | | | | | | | | | |
| | | Japan: 10.9% | | | | | | | |
| 802 | | AEON REIT Investment Corp. | | | 1,026,757 | | | | 0.5 |
| 230 | | Kenedix Office Investment Corp. | | | 1,561,561 | | | | 0.8 |
| 381 | | Kenedix Retail REIT Corp. | | | 929,749 | | | | 0.5 |
| 1,675 | | LaSalle Logiport REIT | | | 2,702,922 | | | | 1.4 |
| 1,660 | | MCUBS MidCity Investment Corp. | | | 1,513,521 | | | | 0.8 |
| 184,035 | | Mitsui Fudosan Co., Ltd. | | | 3,853,614 | | | | 2.0 |
| 210 | | Nippon Building Fund, Inc. | | | 1,217,937 | | | | 0.6 |
| 85,100 | | Nomura Real Estate Holdings, Inc. | | | 1,886,975 | | | | 1.0 |
| 1,894 | | Orix JREIT, Inc. | | | 3,133,299 | | | | 1.6 |
| 1,052 | | Sankei Real Estate, Inc. | | | 1,002,928 | | | | 0.5 |
| 159,811 | | Tokyo Tatemono Co., Ltd. | | | 2,194,116 | | | | 1.2 |
| | | | | | 21,023,379 | | | | 10.9 |
| | | | | | | | | | |
| | | Luxembourg: 0.6% | | | | | | | |
| 45,743 | | Grand City Properties SA | | | 1,181,877 | | | | 0.6 |
| | | | | | | | | | |
| | | Singapore: 3.5% | | | | | | | |
| 842,200 | | CapitaLand Integrated Commercial Trust | | | 1,377,358 | | | | 0.7 |
| 1,235,219 | | CapitaLand Ltd. | | | 3,064,913 | | | | 1.6 |
| 863,800 | | Mapletree Commercial Trust | | | 1,392,421 | | | | 0.7 |
| 630,400 | | Mapletree Logistics Trust | | | 959,447 | | | | 0.5 |
| | | | | | 6,794,139 | | | | 3.5 |
| | | | | | | | | | |
| | | Sweden: 1.8% | | | | | | | |
| 110,469 | | Castellum AB | | | 2,815,939 | | | | 1.4 |
| 15,915 | | Catena AB | | | 747,978 | | | | 0.4 |
| | | | | | 3,563,917 | | | | 1.8 |
| | | | | | | | | | |
| | | United Kingdom: 3.8% | | | | | | | |
| 83,156 | | Big Yellow Group PLC | | | 1,245,897 | | | | 0.7 |
| 41,021 | | Derwent London PLC | | | 1,743,360 | | | | 0.9 |
| 266,467 | | Grainger PLC | | | 1,036,482 | | | | 0.5 |
| 125,992 | | Land Securities Group PLC | | | 1,163,666 | | | | 0.6 |
| 100,126 | | Safestore Holdings PLC | | | 1,070,153 | | | | 0.6 |
| 78,408 | | Segro PLC | | | 1,017,405 | | | | 0.5 |
| | | | | | 7,276,963 | | | | 3.8 |
| | | | | | | | | | |
| | | United States: 52.5% | | | | | | | |
| 50,859 | | Acadia Realty Trust | | | 721,689 | | | | 0.4 |
| 26,074 | | Alexandria Real Estate Equities, Inc. | | | 4,646,908 | | | | 2.4 |
| 58,585 | | American Campus Communities, Inc. | | | 2,505,680 | | | | 1.3 |
| 10,825 | | American Tower Corp. | | | 2,429,779 | | | | 1.3 |
| 93,760 | (2) | Apartment Income REIT Corp. | | | 3,601,322 | | | | 1.9 |
| 86,102 | | Brandywine Realty Trust | | | 1,025,475 | | | | 0.5 |
| 110,429 | | Brixmor Property Group, Inc. | | | 1,827,600 | | | | 0.9 |
| 30,932 | | Camden Property Trust | | | 3,090,725 | | | | 1.6 |
| 49,025 | | Columbia Property Trust, Inc. | | | 703,018 | | | | 0.4 |
| 68,131 | | Cousins Properties, Inc. | | | 2,282,389 | | | | 1.2 |
| 7,308 | | Crown Castle International Corp. | | | 1,163,361 | | | | 0.6 |
| 111,726 | | CubeSmart | | | 3,755,111 | | | | 1.9 |
| 134,487 | | Duke Realty Corp. | | | 5,375,445 | | | | 2.8 |
| 32,533 | | Extra Space Storage, Inc. | | | 3,769,273 | | | | 1.9 |
See Accompanying Notes to Financial Statements
| VY® Clarion Global Real Estate Portfolio | PORTFOLIO OF INVESTMENTS
AS OF December 31, 2020 (Continued) |
| 110,987 | | Healthcare Trust of America, Inc. | | | 3,056,582 | | | | 1.6 |
| 74,552 | | Hudson Pacific Properties, Inc. | | | 1,790,739 | | | | 0.9 |
| 174,934 | | Invitation Homes, Inc. | | | 5,195,540 | | | | 2.7 |
| 22,815 | | Kilroy Realty Corp. | | | 1,309,581 | | | | 0.7 |
| 33,239 | | Life Storage, Inc. | | | 3,968,404 | | | | 2.1 |
| 63,218 | | MGM Growth Properties LLC | | | 1,978,723 | | | | 1.0 |
| 24,916 | | Mid-America Apartment Communities, Inc. | | | 3,156,608 | | | | 1.6 |
| 67,812 | | Piedmont Office Realty Trust, Inc. | | | 1,100,589 | | | | 0.6 |
| 105,061 | | ProLogis, Inc. | | | 10,470,379 | | | | 5.4 |
| 28,540 | | Regency Centers Corp. | | | 1,301,139 | | | | 0.7 |
| 117,876 | | Retail Properties of America, Inc. | | | 1,009,019 | | | | 0.5 |
| 103,131 | | Simon Property Group, Inc. | | | 8,795,012 | | | | 4.5 |
| 105,018 | | SITE Centers Corp. | | | 1,062,782 | | | | 0.5 |
| 50,765 | | Spirit Realty Capital, Inc. | | | 2,039,230 | | | | 1.1 |
| 115,622 | | STORE Capital Corp. | | | 3,928,836 | | | | 2.0 |
| 46,475 | | Ventas, Inc. | | | 2,279,134 | | | | 1.2 |
| 125,890 | | VEREIT, Inc. | | | 4,757,383 | | | | 2.5 |
| 138,289 | | VICI Properties, Inc. | | | 3,526,370 | | | | 1.8 |
| 60,600 | | Welltower, Inc. | | | 3,915,972 | | | | 2.0 |
| | | | | | 101,539,797 | | | | 52.5 |
| | Total Common Stock | | | | | | | |
| | (Cost $150,659,248) | | | 188,532,246 | | | | 97.4 |
| | | | | | | | | | |
| | | | | | | | | | Percentage |
| Principal | | | | | | | | | of Net |
| Amount† | | | | | Value | | | | Assets |
| SHORT-TERM INVESTMENTS: 0.9% | | | | | | | |
| | | Repurchase Agreements: 0.6% | | | | | | | |
| 47,089 | (4) | Bank of America Inc., Repurchase Agreement dated 12/31/20, 0.08%, due 01/04/21 (Repurchase Amount $47,089, collateralized by various U.S. Government Agency Obligations, 1.500%- 3.500%, Market Value plus accrued interest $48,031, due 02/01/48- 01/01/51) | | | 47,089 | | | | 0.1 |
| 1,000,000 | (4) | RBC Dominion Securities Inc., Repurchase Agreement dated 12/31/20, 0.08%, due 01/04/21 (Repurchase Amount $1,000,009, collateralized by various U.S. Government/U.S. Government Agency Obligations, 0.000%- 6.000%, Market Value plus accrued interest $1,020,000, due 01/05/21-12/20/50) | | | 1,000,000 | | | | 0.5 |
| | Total Repurchase Agreements
(Cost $1,047,089) | | | 1,047,089 | | | | 0.6 |
| | | | | | | | | | |
| | | | | | | | Percentage |
| | | | | | | | of Net |
| Shares | | | | Value | | | Assets |
| | | Mutual Funds: 0.3% | | | | | | | |
| 652,381 | (5) | BlackRock Liquidity Funds, FedFund, Institutional Class, 0.000%
(Cost $652,381) | | | 652,381 | | | | 0.3 |
| | | | | | | | | | |
| | Total Short-Term Investments
(Cost $1,699,470) | | | 1,699,470 | | | | 0.9 |
| | | | | | | | | | |
| | Total Investments in Securities
(Cost $152,358,718) | | $ | 190,231,716 | | | | 98.3 |
| | Assets in Excess of Other Liabilities | | | 3,299,312 | | | | 1.7 |
| | Net Assets | | $ | 193,531,028 | | | | 100.0 |
| | † | Unless otherwise indicated, principal amount is shown in USD. |
| | (1) | Security, or a portion of the security, is on loan. |
| | (2) | Non-income producing security. |
| | (3) | Securities with purchases pursuant to Rule 144A or section 4(a)(2), under the Securities Act of 1933 and may not be resold subject to that rule except to qualified institutional buyers. |
| | (4) | All or a portion of the security represents securities purchased with cash collateral received for securities on loan. |
| | (5) | Rate shown is the 7-day yield as of December 31, 2020. |
| VY® Invesco Growth and Income Portfolio | PORTFOLIO OF INVESTMENTS
AS OF December 31, 2020 |
| | | | | | | | Percentage |
| | | | | | | | of Net |
| Shares | | | | Value | | | Assets |
| COMMON STOCK: 98.1% | | | | | | | |
| | | Communication Services: 5.9% | | | | | | | |
| 6,824 | (1) | Charter Communications, Inc. | | $ | 4,514,417 | | | | 1.2 |
| 105,287 | | Comcast Corp. – Class A | | | 5,517,039 | | | | 1.4 |
| 3,355,082 | | Vodafone Group PLC | | | 5,510,692 | | | | 1.4 |
| 41,287 | (1) | Walt Disney Co. | | | 7,480,379 | | | | 1.9 |
| | | | | | 23,022,527 | | | | 5.9 |
| | | | | | | | | | |
| | | Consumer Discretionary: 7.5% | | | | | | | |
| 2,673 | (1) | Booking Holdings, Inc. | | | 5,953,493 | | | | 1.5 |
| 314,055 | | General Motors Co. | | | 13,077,250 | | | | 3.4 |
| 1,068,779 | (1) | Kingfisher PLC | | | 3,949,298 | | | | 1.0 |
| 90,325 | | TJX Cos., Inc. | | | 6,168,294 | | | | 1.6 |
| | | | | | 29,148,335 | | | | 7.5 |
| | | | | | | | | | |
| | | Consumer Staples: 5.9% | | | | | | | |
| 23,669 | | Mondelez International, Inc. | | | 1,383,926 | | | | 0.3 |
| 126,755 | | Philip Morris International, Inc. | | | 10,494,047 | | | | 2.7 |
| 77,440 | | Sysco Corp. | | | 5,750,694 | | | | 1.5 |
| 162,473 | (1) | US Foods Holding Corp. | | | 5,411,976 | | | | 1.4 |
| | | | | | 23,040,643 | | | | 5.9 |
| | | | | | | | | | |
| | | Energy: 5.3% | | | | | | | |
| 155,556 | | Canadian Natural Resources Ltd. | | | 3,738,281 | | | | 1.0 |
| 62,924 | | Chevron Corp. | | | 5,313,932 | | | | 1.4 |
| 58,186 | | Concho Resources, Inc./Midland TX | | | 3,395,153 | | | | 0.9 |
| 24,233 | | ConocoPhillips | | | 969,078 | | | | 0.2 |
| 209,840 | | Devon Energy Corp. | | | 3,317,570 | | | | 0.9 |
| 259,998 | | Parsley Energy, Inc. - Class A | | | 3,691,972 | | | | 0.9 |
| | | | | | 20,425,986 | | | | 5.3 |
| | | | | | | | | | |
| | | Financials: 22.6% | | | | | | | |
| 34,379 | | American Express Co. | | | 4,156,765 | | | | 1.1 |
| 225,801 | | American International Group, Inc. | | | 8,548,826 | | | | 2.2 |
| 161,784 | | Bank of America Corp. | | | 4,903,673 | | | | 1.3 |
| 60,950 | | Charles Schwab Corp. | | | 3,232,788 | | | | 0.8 |
| 89,638 | | Citigroup, Inc. | | | 5,527,079 | | | | 1.4 |
| 231,031 | | Citizens Financial Group, Inc. | | | 8,261,668 | | | | 2.1 |
| 133,881 | | Equitable Holdings, Inc. | | | 3,426,015 | | | | 0.9 |
| 36,897 | | Goldman Sachs Group, Inc. | | | 9,730,108 | | | | 2.5 |
| 154,021 | | Morgan Stanley | | | 10,555,059 | | | | 2.7 |
| 56,134 | | PNC Financial Services Group, Inc. | | | 8,363,966 | | | | 2.2 |
| 153,732 | | Truist Financial Corp. | | | 7,368,375 | | | | 1.9 |
| 329,123 | | Wells Fargo & Co. | | | 9,932,932 | | | | 2.6 |
| 16,906 | | Willis Towers Watson PLC | | | 3,561,756 | | | | 0.9 |
| | | | | | 87,569,010 | | | | 22.6 |
| | | | | | | | | | |
| | | Health Care: 15.7% | | | | | | | |
| 46,270 | (1) | Alcon, Inc. | | | 3,072,150 | | | | 0.8 |
| 27,027 | | Anthem, Inc. | | | 8,678,099 | | | | 2.2 |
| 113,968 | | Bristol-Myers Squibb Co. | | | 7,069,435 | | | | 1.8 |
| 21,245 | | Cigna Corp. | | | 4,422,784 | | | | 1.1 |
| 56,781 | | CVS Health Corp. | | | 3,878,142 | | | | 1.0 |
| 127,454 | | GlaxoSmithKline PLC | | | 2,332,153 | | | | 0.6 |
| 22,279 | | Johnson & Johnson | | | 3,506,269 | | | | 0.9 |
| 30,428 | | McKesson Corp. | | | 5,292,038 | | | | 1.4 |
| 62,566 | | Medtronic PLC | | | 7,328,981 | | | | 1.9 |
| 96,813 | | Pfizer, Inc. | | | 3,563,687 | | | | 0.9 |
| 51,997 | | Sanofi | | | 5,039,676 | | | | 1.3 |
| 21,369 | | Universal Health Services, Inc. | | | 2,938,238 | | | | 0.8 |
| 25,580 | | Zimmer Biomet Holdings, Inc. | | | 3,941,622 | | | | 1.0 |
| | | | | | 61,063,274 | | | | 15.7 |
| | | | | | | | | | |
| | | Industrials: 11.6% | | | | | | | |
| 43,535 | | Adecco Group AG | | | 2,899,578 | | | | 0.7 |
| 93,938 | | CSX Corp. | | | 8,524,873 | | | | 2.2 |
| 50,261 | | General Dynamics Corp. | | | 7,479,842 | | | | 1.9 |
| 175,374 | | Johnson Controls International plc | | | 8,170,675 | | | | 2.1 |
| 35,080 | | Quanta Services, Inc. | | | 2,526,462 | | | | 0.7 |
| 88,469 | | Raytheon Technologies Corp. | | | 6,326,418 | | | | 1.7 |
| 98,577 | | Textron, Inc. | | | 4,764,226 | | | | 1.2 |
| 30,212 | | Trane Technologies PLC | | | 4,385,574 | | | | 1.1 |
| | | | | | 45,077,648 | | | | 11.6 |
| | | | | | | | | | |
| | | Information Technology: 13.3% | | | | | | | |
| 28,816 | | Apple, Inc. | | | 3,823,595 | | | | 1.0 |
| 148,837 | | Cognizant Technology Solutions Corp. | | | 12,197,192 | | | | 3.1 |
| 109,190 | | Corning, Inc. | | | 3,930,840 | | | | 1.0 |
| 36,095 | (1) | Fiserv, Inc. | | | 4,109,777 | | | | 1.1 |
| 47,423 | (1) | Micron Technology, Inc. | | | 3,565,261 | | | | 0.9 |
| 32,707 | | NXP Semiconductor NV - NXPI - US | | | 5,200,740 | | | | 1.3 |
| 108,124 | | Oracle Corp. | | | 6,994,542 | | | | 1.8 |
| 49,741 | | Qualcomm, Inc. | | | 7,577,544 | | | | 2.0 |
| 34,318 | | TE Connectivity Ltd. | | | 4,154,880 | | | | 1.1 |
| | | | | | 51,554,371 | | | | 13.3 |
| | | | | | | | | | |
| | | Materials: 5.4% | | | | | | | |
| 232,133 | | Corteva, Inc. | | | 8,988,190 | | | | 2.3 |
| 77,331 | | Dow, Inc. | | | 4,291,871 | | | | 1.1 |
| 62,059 | | DuPont de Nemours, Inc. | | | 4,413,015 | | | | 1.1 |
| 69,483 | (2) | Nutrien Ltd. | | | 3,346,301 | | | | 0.9 |
| | | | | | 21,039,377 | | | | 5.4 |
| | | | | | | | | | |
| | | Real Estate: 2.2% | | | | | | | |
| 132,954 | (1) | CBRE Group, Inc. | | | 8,338,875 | | | | 2.2 |
| | | | | | | | | | |
| | | Utilities: 2.7% | | | | | | | |
| 34,892 | | Duke Energy Corp. | | | 3,194,711 | | | | 0.8 |
| 90,768 | | Exelon Corp. | | | 3,832,225 | | | | 1.0 |
| 109,077 | | FirstEnergy Corp. | | | 3,338,847 | | | | 0.9 |
| | | | | | 10,365,783 | | | | 2.7 |
| | | | | | | | | | |
| | Total Common Stock | | | | | | | |
| | (Cost $304,979,769) | | | 380,645,829 | | | | 98.1 |
See Accompanying Notes to Financial Statements
| VY® Invesco Growth and Income Portfolio | PORTFOLIO OF INVESTMENTS
AS OF December 31, 2020 (Continued) |
| | | | | | | | Percentage |
| Principal | | | | | | | of Net |
| Amount† | | | | Value | | | Assets |
| SHORT-TERM INVESTMENTS: 2.2% | | | | | | | |
| | | Repurchase Agreements: 0.4% | | | | | | | |
| 415,614 | (3) | Deutsche Bank Securities Inc., Repurchase Agreement dated 12/31/20, 0.06%, due 01/04/21 (Repurchase Amount $415,617, collateralized by various U.S. Government/U.S. Government Agency Obligations, 0.000%- 6.500%, Market Value plus accrued interest $423,926, due 01/15/21- 01/01/51) | | | 415,614 | | | | 0.1 |
| 1,000,000 | (3) | RBC Dominion Securities Inc., Repurchase Agreement dated 12/31/20, 0.08%, due 01/04/21 (Repurchase Amount $1,000,009, collateralized by various U.S. Government/U.S. Government Agency Obligations, 0.000%- 6.000%, Market Value plus accrued interest $1,020,000, due 01/05/21-12/20/50) | | | 1,000,000 | | | | 0.3 |
| | | | | | | | | | |
| | Total Repurchase Agreements
(Cost $1,415,614) | | | 1,415,614 | | | | 0.4 |
| | | | | | | | | | |
| | | | | | | | | | Percentage |
| | | | | | | | | | of Net |
| Shares | | | | | Value | | | | Assets |
| | | Mutual Funds: 1.8% | | | | | | | |
| 7,051,630 | (4) | BlackRock Liquidity Funds, FedFund, Institutional Class, 0.000%
(Cost $7,051,630) | | | 7,051,630 | | | | 1.8 |
| | | | | | | | | | |
| | Total Short-Term Investments
(Cost $8,467,244) | | | 8,467,244 | | | | 2.2 |
| | | | | | | | | | |
| | Total Investments in Securities
(Cost $313,447,013) | | $ | 389,113,073 | | | | 100.3 |
| | Liabilities in Excess of Other Assets | | | (972,946 | ) | | | (0.3) |
| | Net Assets | | $ | 388,140,127 | | | | 100.0 |
| | † | Unless otherwise indicated, principal amount is shown in USD. |
| | (1) | Non-income producing security. |
| | (2) | Security, or a portion of the security, is on loan. |
| | (3) | All or a portion of the security represents securities purchased with cash collateral received for securities on loan. |
| | (4) | Rate shown is the 7-day yield as of December 31, 2020. |
See Accompanying Notes to Financial Statements
| VY® JPMorgan Emerging Markets Equity Portfolio | PORTFOLIO OF INVESTMENTS
AS OF December 31, 2020 |
| | | | | | | | Percentage |
| | | | | | | | of Net |
| Shares | | | | Value | | | Assets |
| COMMON STOCK: 101.7% | | | | | | | |
| | | Argentina: 3.0% | | | | | | | |
| 10,423 | (1) | MercadoLibre, Inc. | | $ | 17,460,818 | | | | 3.0 |
| | | | | | | | | | |
| | | Brazil: 6.2% | | | | | | | |
| 540,488 | | B3 SA - Brasil Bolsa Balcao | | | 6,449,395 | | | | 1.1 |
| 390,185 | | Localiza Rent a Car SA | | | 5,179,480 | | | | 0.9 |
| 332,374 | | Lojas Renner SA | | | 2,786,101 | | | | 0.5 |
| 1,451,140 | | Magazine Luiza SA | | | 6,970,456 | | | | 1.2 |
| 133,830 | (1) | Pagseguro Digital Ltd. | | | 7,612,250 | | | | 1.3 |
| 517,575 | | Raia Drogasil SA | | | 2,495,106 | | | | 0.4 |
| 108,063 | (1) | XP, Inc. | | | 4,286,859 | | | | 0.8 |
| | | | | | 35,779,647 | | | | 6.2 |
| | | | | | | | | | |
| | | China: 38.6% | | | | | | | |
| 70,045 | (1) | Alibaba Group Holding Ltd. ADR | | | 16,301,573 | | | | 2.8 |
| 379,096 | (1) | Alibaba Group Holding Ltd. | | | 11,025,829 | | | | 1.9 |
| 2,302,800 | (2) | Budweiser Brewing Co. APAC Ltd. | | | 7,606,918 | | | | 1.3 |
| 1,450,600 | | China Gas Holdings Ltd. | | | 5,748,296 | | | | 1.0 |
| 106,393 | (1),(3) | Dada Nexus Ltd. ADR | | | 3,883,344 | | | | 0.7 |
| 361,011 | | Foshan Haitian Flavouring & Food Co. Ltd. - A Shares | | | 11,084,944 | | | | 1.9 |
| 298,780 | | Hundsun Technologies, Inc. - A Shares | | | 4,797,698 | | | | 0.8 |
| 55,644 | (1) | JD.com, inc. ADR | | | 4,891,108 | | | | 0.9 |
| 132,714 | (1) | JD.com, inc. - Class A | | | 5,845,046 | | | | 1.0 |
| 545,887 | | Jiangsu Hengli Hydraulic Co. Ltd. | | | 9,444,743 | | | | 1.7 |
| 22,400 | | Kweichow Moutai Co. Ltd. - A Shares (Shanghai) | | | 6,845,411 | | | | 1.2 |
| 397,877 | (1) | Meituan Class B | | | 14,977,466 | | | | 2.6 |
| 692,000 | | Midea Group Co. Ltd. - A Shares | | | 10,421,802 | | | | 1.8 |
| 291,500 | | NetEase, Inc. | | | 5,568,200 | | | | 1.0 |
| 54,161 | | NetEase, Inc. ADR | | | 5,186,999 | | | | 0.9 |
| 47,088 | (1) | New Oriental Education & Technology Group, Inc. ADR | | | 8,749,421 | | | | 1.5 |
| 3,340,675 | | Ping An Bank Co. Ltd. - A Shares | | | 9,885,477 | | | | 1.7 |
| 626,000 | | Ping An Insurance Group Co. of China Ltd. - H Shares | | | 7,618,180 | | | | 1.3 |
| 77,221 | | Shenzhen Mindray Bio- Medical Electronics Co. Ltd. - A Shares | | | 5,023,390 | | | | 0.9 |
| 349,300 | | Shenzhou International Group Holdings Ltd. | | | 6,845,669 | | | | 1.2 |
| 248,300 | | Sichuan Swellfun Co. Ltd. | | | 3,156,105 | | | | 0.6 |
| 318,200 | | Sunny Optical Technology Group Co. Ltd. | | | 6,952,189 | | | | 1.2 |
| 315,000 | | Tencent Holdings Ltd. | | | 22,665,447 | | | | 3.9 |
| 1,277,000 | (1),(2) | Wuxi Biologics Cayman, Inc. | | | 16,934,736 | | | | 2.9 |
| 1,586,000 | | Xinyi Solar Holdings Ltd. | | | 4,158,824 | | | | 0.7 |
| 120,806 | | Yum China Holdings, Inc. | | | 6,896,815 | | | | 1.2 |
| | | | | | 222,515,630 | | | | 38.6 |
| | | | | | | | | | �� |
| | | Egypt: 0.3% | | | | | | | |
| 419,408 | | Commercial International Bank Egypt SAE REG GDR | | | 1,573,256 | | | | 0.3 |
| | | | | | | | | | |
| | | Hong Kong: 5.7% | | | | | | | |
| 1,128,600 | | AIA Group Ltd. | | | 13,753,258 | | | | 2.4 |
| 105,200 | | Hong Kong Exchanges and Clearing Ltd. | | | 5,770,402 | | | | 1.0 |
| 920,500 | | Techtronic Industries Co., Ltd. | | | 13,157,098 | | | | 2.3 |
| | | | | | 32,680,758 | | | | 5.7 |
| | | | | | | | | | |
| | | Hungary: 0.6% | | | | | | | |
| 71,515 | (1) | OTP Bank Nyrt | | | 3,222,793 | | | | 0.6 |
| | | | | | | | | | |
| | | India: 18.0% | | | | | | | |
| 153,900 | | Asian Paints Ltd. | | | 5,829,473 | | | | 1.0 |
| 81,800 | | Britannia Industries Ltd. | | | 4,011,170 | | | | 0.7 |
| 324,399 | (1) | HDFC Bank Ltd. ADR | | | 23,441,072 | | | | 4.1 |
| 800,953 | (1),(2) | HDFC Life Insurance Co., Ltd. | | | 7,435,239 | | | | 1.3 |
| 162,230 | | Hindustan Unilever Ltd. | | | 5,325,856 | | | | 0.9 |
| 607,624 | | Housing Development Finance Corp. | | | 21,288,685 | | | | 3.7 |
| 217,402 | (1) | IndusInd Bank Ltd. | | | 2,667,844 | | | | 0.5 |
| 898,367 | | ITC Ltd. | | | 2,572,772 | | | | 0.5 |
| 410,367 | (1) | Kotak Mahindra Bank Ltd. | | | 11,215,602 | | | | 1.9 |
| 304,254 | | Reliance Industries Ltd. | | | 8,278,427 | | | | 1.4 |
| 294,018 | | Tata Consultancy Services Ltd. | | | 11,544,656 | | | | 2.0 |
| | | | | | 103,610,796 | | | | 18.0 |
| | | | | | | | | | |
| | | Indonesia: 2.0% | | | | | | | |
| 2,820,400 | | Bank Central Asia Tbk PT | | | 6,798,658 | | | | 1.2 |
| 16,362,900 | | Bank Rakyat Indonesia | | | 4,864,747 | | | | 0.8 |
| | | | | | 11,663,405 | | | | 2.0 |
| | | | | | | | | | |
| | | Macau: 0.9% | | | | | | | |
| 1,247,600 | | Sands China Ltd. | | | 5,448,768 | | | | 0.9 |
| | | | | | | | | | |
| | | Mexico: 1.2% | | | | | | | |
| 2,527,495 | | Wal-Mart de Mexico SAB de CV | | | 7,100,026 | | | | 1.2 |
| | | | | | | | | | |
| | | Panama: 0.6% | | | | | | | |
| 47,480 | | Copa Holdings S.A.- Class A | | | 3,666,880 | | | | 0.6 |
| | | | | | | | | | |
| | Poland: 0.8% | | | | | | | |
| 213,986 | (1),(2) | Allegro.eu SA | | | 4,851,732 | | | | 0.8 |
| | | | | | | | | | |
| | | Portugal: 1.0% | | | | | | | |
| 341,051 | | Jeronimo Martins SGPS SA | | | 5,732,938 | | | | 1.0 |
| | | | | | | | | | |
| | | Singapore: 3.3% | | | | | | | |
| 96,183 | (1) | Sea Ltd. ADR | | | 19,145,226 | | | | 3.3 |
| | | | | | | | | | |
| | | South Africa: 1.8% | | | | | | | |
| 345,043 | | Bid Corp. Ltd. | | | 6,200,589 | | | | 1.1 |
See Accompanying Notes to Financial Statements
| VY® JPMorgan Emerging Markets Equity Portfolio | PORTFOLIO OF INVESTMENTS
AS OF December 31, 2020 (Continued) |
| 39,656 | (1) | Capitec Bank Holdings Ltd. | | | 3,878,168 | | | | 0.7 |
| | | | | | 10,078,757 | | | | 1.8 |
| | | | | | | | | | |
| | | South Korea: 6.9% | | | | | | | |
| 9,270 | | NCSoft Corp. | | | 7,958,770 | | | | 1.4 |
| 427,622 | | Samsung Electronics Co., Ltd. | | | 31,932,896 | | | | 5.5 |
| | | | | | 39,891,666 | | | | 6.9 |
| | | | | | | | | | |
| | | Taiwan: 7.6% | | | | | | | |
| 255,822 | | Taiwan Semiconductor Manufacturing Co., Ltd. ADR | | | 27,894,831 | | | | 4.8 |
| 847,223 | | Taiwan Semiconductor Manufacturing Co., Ltd. | | | 16,027,318 | | | | 2.8 |
| | | | | | 43,922,149 | | | | 7.6 |
| | | | | | | | | | |
| | | Turkey: 0.6% | | | | | | | |
| 350,796 | | BIM Birlesik Magazalar AS | | | 3,548,127 | | | | 0.6 |
| | | | | | | | | | |
| | | United States: 2.6% | | | | | | | |
| 41,795 | (1) | EPAM Systems, Inc. | | | 14,977,238 | | | | 2.6 |
| | | | | | | | | | |
| | Total Common Stock | | | | | | | |
| | (Cost $308,479,159) | | | 586,870,610 | | | | 101.7 |
| | | | | | | | | | |
| | | | | | | | | | Percentage |
| Principal | | | | | | | | | of Net |
| Amount† | | | | | Value | | | | Assets |
| SHORT-TERM INVESTMENTS: 0.5% | | | | | | | |
| | | Repurchase Agreements: 0.5% | | | | | | | |
| 1,000,000 | (4) | Citigroup, Inc., Repurchase Agreement dated 12/31/20, 0.07%, due 01/04/21 (Repurchase Amount $1,000,008, collateralized by various U.S. Government/U.S. Government Agency Obligations, 0.000%- 4.000%, Market Value plus accrued interest $1,020,000, due 09/15/21-01/01/51) | | | 1,000,000 | | | | 0.2 |
| 601,075 | (4) | Daiwa Capital Markets, Repurchase Agreement dated 12/31/20, 0.07%, due 01/04/21 (Repurchase Amount $601,080, collateralized by various U.S. Government/U.S. Government Agency Obligations, 0.000%- 6.500%, Market Value plus accrued interest $613,097, due 01/26/21- 01/01/51) | | | 601,075 | | | | 0.1 |
| 1,000,000 | (4) | RBC Dominion Securities Inc., Repurchase Agreement dated 12/31/20, 0.08%, due 01/04/21 (Repurchase Amount $1,000,009, collateralized by various U.S. Government/U.S. Government Agency Obligations, 0.000%- 6.000%, Market Value plus accrued interest $1,020,000, due 01/05/21-12/20/50) | | | 1,000,000 | | | | 0.2 |
| | | | | | | | | | |
| | Total Repurchase Agreements
(Cost $2,601,075) | | | 2,601,075 | | | | 0.5 |
| | | | | | | | | | |
| | | | | | | | | | Percentage |
| | | | | | | | | | of Net |
| Shares | | | | | Value | | | | Assets |
| | | Mutual Funds: 0.0% | | | | | | | |
| 189,104 | (5) | BlackRock Liquidity Funds, FedFund, Institutional Class, 0.000%
(Cost $189,104) | | | 189,104 | | | | 0.0 |
| | | | | | | | | | |
| | Total Short-Term Investments
(Cost $2,790,179) | | | 2,790,179 | | | | 0.5 |
| | | | | | | | | | |
| | | | | | | | | | |
| | Total Investments in Securities
(Cost $311,269,338) | | $ | 589,660,789 | | | | 102.2 |
| | Liabilities in Excess of Other Assets | | | (12,532,382 | ) | | | (2.2) |
| | Net Assets | | $ | 577,128,407 | | | | 100.0 |
| † | Unless otherwise indicated, principal amount is shown in USD. |
| ADR | American Depositary Receipt |
| GDR | Global Depositary Receipt |
| (1) | Non-income producing security. |
| (2) | Securities with purchases pursuant to Rule 144A or section 4(a)(2), under the Securities Act of 1933 and may not be resold subject to that rule except to qualified institutional buyers. |
| (3) | Security, or a portion of the security, is on loan. |
| (4) | All or a portion of the security represents securities purchased with cash collateral received for securities on loan. |
| (5) | Rate shown is the 7-day yield as of December 31, 2020. |
| VY® T. Rowe Price Capital Appreciation Portfolio | PORTFOLIO OF INVESTMENTS
AS OF December 31, 2020 |
| | | | | | | | Percentage |
| | | | | | | | of Net |
| Shares | | | | Value | | | Assets |
| COMMON STOCK: 68.0% | | | | | |
| | | Communication Services: 4.5% | | | | | | | |
| 11,604 | (1) | Alphabet, Inc. - Class A | | $ | 20,337,634 | | | | 0.2 |
| 152,226 | (1),(2) | Alphabet, Inc. - Class C | | | 266,681,685 | | | | 3.4 |
| 251,635 | (1) | Facebook, Inc.- Class A | | | 68,736,617 | | | | 0.9 |
| | | | | | 355,755,936 | | | | 4.5 |
| | | | | | | | | | |
| | | Consumer Discretionary: 8.1% | | | | | | | |
| 89,750 | (1) | Amazon.com, Inc. | | | 292,309,467 | | | | 3.7 |
| 513,169 | (3) | Hilton Worldwide Holdings, Inc. | | | 57,095,183 | | | | 0.7 |
| 550,280 | | Marriott International, Inc. | | | 72,592,938 | | | | 0.9 |
| 452,749 | | Ross Stores, Inc. | | | 55,602,105 | | | | 0.7 |
| 1,472,472 | (2) | Yum! Brands, Inc. | | | 159,851,560 | | | | 2.1 |
| | | | | | 637,451,253 | | | | 8.1 |
| | | | | | | | | | |
| | | Consumer Staples: 1.6% | | | | | | | |
| 3,931,847 | (3) | Keurig Dr Pepper, Inc. | | | 125,819,104 | | | | 1.6 |
| | | | | | | | | | |
| | | Financials: 10.9% | | | | | | | |
| 350,502 | (3) | Arthur J. Gallagher & Co. | | | 43,360,603 | | | | 0.6 |
| 5,730,937 | | Bank of America Corp. | | | 173,704,701 | | | | 2.2 |
| 243,926 | | CME Group, Inc. | | | 44,406,728 | | | | 0.6 |
| 770,157 | | Huntington Bancshares, Inc. | | | 9,727,083 | | | | 0.1 |
| 695,039 | | Intercontinental Exchange, Inc. | | | 80,131,046 | | | | 1.0 |
| 2,032,529 | | Marsh & McLennan Cos., Inc. | | | 237,805,893 | | | | 3.0 |
| 1,797,649 | | PNC Financial Services Group, Inc. | | | 267,849,701 | | | | 3.4 |
| | | | | | 856,985,755 | | | | 10.9 |
| | | | | | | | | | |
| | | Health Care: 10.0% | | | | | | | |
| 108,600 | (2) | Becton Dickinson & Co. | | | 27,173,892 | | | | 0.3 |
| 719,129 | (1) | Boston Scientific Corp. | | | 25,852,688 | | | | 0.3 |
| 644,003 | | Danaher Corp. | | | 143,058,826 | | | | 1.8 |
| 2,111,116 | (1),(3) | Envista Holdings Corp. | | | 71,207,943 | | | | 0.9 |
| 511,182 | | Humana, Inc. | | | 209,722,639 | | | | 2.7 |
| 320,168 | | PerkinElmer, Inc. | | | 45,944,108 | | | | 0.6 |
| 219,172 | | Thermo Fisher Scientific, Inc. | | | 102,085,934 | | | | 1.3 |
| 468,878 | | UnitedHealth Group, Inc. | | | 164,426,137 | | | | 2.1 |
| | | | | | 789,472,167 | | | | 10.0 |
| | | | | | | | | | |
| | | Industrials: 6.4% | | | | | | | |
| 26,193,731 | | General Electric Co. | | | 282,892,295 | | | | 3.6 |
| 1,674,126 | (1) | Ingersoll Rand, Inc. | | | 76,273,181 | | | | 0.9 |
| 159,105 | (2) | Roper Technologies, Inc. | | | 68,588,574 | | | | 0.9 |
| 77,752 | (1) | Teledyne Technologies, Inc. | | | 30,477,229 | | | | 0.4 |
| 463,048 | | Waste Connections, Inc. | | | 47,494,833 | | | | 0.6 |
| | | | | | 505,726,112 | | | | 6.4 |
| | | | | | | | | | |
| | | Information Technology: 18.3% | | | | | | | |
| 2,050,649 | (1) | Fiserv, Inc. | | | 233,486,895 | | | | 3.0 |
| 918,922 | | Global Payments, Inc. | | | 197,954,177 | | | | 2.5 |
| 167,467 | (2) | Mastercard, Inc. - Class A | | | 59,775,671 | | | | 0.8 |
| 1,868,095 | | Microsoft Corp. | | | 415,501,690 | | | | 5.3 |
| 899,938 | | NXP Semiconductor NV - NXPI - US | | | 143,099,141 | | | | 1.8 |
| 252,937 | (1) | Salesforce.com, Inc. | | | 56,286,071 | | | | 0.7 |
| 915,702 | | TE Connectivity Ltd. | | | 110,864,041 | | | | 1.4 |
| 1,002,628 | (2) | Visa, Inc. - Class A | | | 219,304,823 | | | | 2.8 |
| | | | | | 1,436,272,509 | | | | 18.3 |
| | | | | | | | | | |
| | | Utilities: 8.2% | | | | | | | |
| 1,608,789 | (3) | Ameren Corp. | | | 125,582,069 | | | | 1.6 |
| 2,760,856 | | American Electric Power Co., Inc. | | | 229,896,479 | | | | 2.9 |
| 2,285,543 | | Exelon Corp. | | | 96,495,625 | | | | 1.2 |
| 3,936,307 | | NiSource, Inc. | | | 90,298,883 | | | | 1.2 |
| 1,805,933 | | Public Service Enterprise Group, Inc. | | | 105,285,894 | | | | 1.3 |
| | | | | | 647,558,950 | | | | 8.2 |
| | | | | | | | | | |
| | Total Common Stock | | | | | | | |
| | (Cost $4,074,397,282) | | | 5,355,041,786 | | | | 68.0 |
| | | | | | | | | | |
| PREFERRED STOCK: 2.8% | | | | | |
| | | Consumer Discretionary: 0.6% | | | | | | | |
| 576,340 | (1),(4),(5) | Aurora Innovation, Inc., - Series B | | | 11,328,979 | | | | 0.1 |
| 413,251 | (1),(4),(5) | Waymo LLC., Series A-2 | | | 35,484,706 | | | | 0.5 |
| | | | | | 46,813,685 | | | | 0.6 |
| | | | | | | | | | |
| | | Financials: 0.0% | | | | | | | |
| 23,000 | (1),(3),(6) | Charles Schwab Corp. - Series D | | | 598,920 | | | | 0.0 |
| | | | | | | | | | |
| | | Health Care: 0.7% | | | | | | | |
| 375,506 | (3) | Avantor, Inc. | | | 33,386,238 | | | | 0.4 |
| 227,135 | (1),(3) | Boston Scientific Corp. | | | 24,887,182 | | | | 0.3 |
| | | | | | 58,273,420 | | | | 0.7 |
| | | | | | | | | | |
| | | Utilities: 1.5% | | | | | | | |
| 91,994 | (1),(3),(6) | Alabama Power Co. | | | 2,571,232 | | | | 0.0 |
| 223,176 | (1),(3) | American Electric Power Co., Inc. | | | 11,181,118 | | | | 0.1 |
| 983,000 | (3),(6) | CMS Energy Corp. | | | 27,435,530 | | | | 0.3 |
| 736,056 | (3),(6) | CMS Energy Corp. | | | 20,903,990 | | | | 0.3 |
| 486,655 | (1),(3),(6) | DTE Energy Co. | | | 13,237,016 | | | | 0.2 |
| 423,704 | (1),(3),(6) | Duke Energy Corp. | | | 12,189,964 | | | | 0.2 |
| 525,000 | (1),(3),(6),(7) | NiSource, Inc. | | | 14,957,250 | | | | 0.2 |
| 16,757 | (1),(6),(7) | SCE Trust III | | | 410,547 | | | | 0.0 |
| 494,804 | (1),(3),(6),(7) | SCE Trust IV | | | 11,984,153 | | | | 0.2 |
| | | | | | 114,870,800 | | | | 1.5 |
| | | | | | | | | | |
| | Total Preferred Stock | | | | | | | |
| | (Cost $188,223,610) | | | 220,556,825 | | | | 2.8 |
See Accompanying Notes to Financial Statements
| VY® T. Rowe Price Capital Appreciation Portfolio | PORTFOLIO OF INVESTMENTS
AS OF December 31, 2020 (Continued) |
| | | | | | | | Percentage |
| Principal | | | | | | | of Net |
| Amount† | | | | Value | | | Assets |
| CORPORATE BONDS/NOTES: 9.3% | | | | | | | |
| | | Communications: 3.0% | | | | | | | |
| 8,415,000 | (8) | CCO Holdings LLC / CCO Holdings Capital Corp., 4.000%, 03/01/2023 | | | 8,483,372 | | | | 0.1 |
| 25,960,000 | (8) | CCO Holdings LLC / CCO Holdings Capital Corp., 5.125%, 05/01/2027 | | | 27,583,149 | | | | 0.4 |
| 38,178,000 | (8) | CCO Holdings LLC / CCO Holdings Capital Corp., 5.000%, 02/01/2028 | | | 40,411,413 | | | | 0.5 |
| 25,880,000 | | Netflix, Inc., 4.375%, 11/15/2026 | | | 28,742,975 | | | | 0.4 |
| 30,010,000 | | Netflix, Inc., 4.875%, 04/15/2028 | | | 33,891,193 | | | | 0.4 |
| 1,990,000 | | Netflix, Inc., 5.500%, 02/15/2022 | | | 2,085,769 | | | | 0.0 |
| 10,975,000 | (3) | Netflix, Inc., 5.875%, 02/15/2025 | | | 12,647,316 | | | | 0.2 |
| 38,795,000 | | Netflix, Inc., 5.875%, 11/15/2028 | | | 46,574,755 | | | | 0.6 |
| 23,355,000 | | Netflix, Inc., 6.375%, 05/15/2029 | | | 28,872,619 | | | | 0.4 |
| 1,070,000 | (8) | Sirius XM Radio, Inc., 3.875%, 08/01/2022 | | | 1,087,387 | | | | 0.0 |
| 2,870,000 | | T-Mobile USA, Inc., 6.000%, 03/01/2023 | | | 2,877,175 | | | | 0.0 |
| 1,410,000 | | T-Mobile USA, Inc., 6.500%, 01/15/2026 | | | 1,461,113 | | | | 0.0 |
| | | | | | 234,718,236 | | | | 3.0 |
| | | | | | | | | | |
| | | Consumer, Cyclical: 3.3% | | | | | | | |
| 12,920,000 | | Cedar Fair L.P. / Canada’s Wonderland Co. / Magnum Management Corp. / Millennium Op, 5.375%, 04/15/2027 | | | 13,234,925 | | | | 0.2 |
| 18,435,000 | (3) | Cedar Fair L.P. / Canada’s Wonderland Co. / Magnum Management Corp., 5.375%, 06/01/2024 | | | 18,527,175 | | | | 0.2 |
| 13,970,000 | (3) | Cedar Fair L.P., 5.250%, 07/15/2029 | | | 14,406,423 | | | | 0.2 |
| 640,000 | (8) | Cedar Fair L.P. / Canada’s Wonderland Co. / Magnum Management Corp. / Millennium Op, 5.500%, 05/01/2025 | | | 668,000 | | | | 0.0 |
| 10,835,000 | (3),(8) | Cedar Fair L.P. / Canada’s Wonderland Co. / Magnum Management Corp. / Millennium Op, 6.500%, 10/01/2028 | | | 11,769,790 | | | | 0.2 |
| 2,457,198 | | Continental Airlines 2012-1 Class A Pass Through Trust, 4.150%, 10/11/2025 | | | 2,478,341 | | | | 0.0 |
| 12,595,000 | (8) | Delta Air Lines, Inc. / SkyMiles IP Ltd., 4.500%, 10/20/2025 | | | 13,466,633 | | | | 0.2 |
| 7,010,000 | (8) | Delta Air Lines, Inc. / SkyMiles IP Ltd., 4.750%, 10/20/2028 | | | 7,657,187 | | | | 0.1 |
| 28,280,000 | (8) | KFC Holding Co/Pizza Hut Holdings LLC/Taco Bell of America LLC, 4.750%, 06/01/2027 | | | 29,946,116 | | | | 0.4 |
| 21,094,000 | (8) | KFC Holding Co/Pizza Hut Holdings LLC/Taco Bell of America LLC, 5.250%, 06/01/2026 | | | 21,924,576 | | | | 0.3 |
| 2,340,000 | | Marriott International, Inc./MD, 0.876%, (US0003M + 0.650%), 03/08/2021 | | | 2,340,948 | | | | 0.0 |
| 2,175,000 | | Marriott International, Inc./MD, 3.125%, 06/15/2026 | | | 2,321,770 | | | | 0.0 |
| 7,550,000 | (8) | Mileage Plus Holdings LLC / Mileage Plus Intellectual Property Assets Ltd., 6.500%, 06/20/2027 | | | 8,130,406 | | | | 0.1 |
| 23,709,000 | (8) | Six Flags Entertainment Corp., 4.875%, 07/31/2024 | | | 23,816,165 | | | | 0.3 |
| 18,612,000 | (3),(8) | Six Flags Entertainment Corp., 5.500%, 04/15/2027 | | | 19,147,095 | | | | 0.3 |
| 7,969,000 | (3),(8) | Six Flags Theme Parks, Inc., 7.000%, 07/01/2025 | | | 8,621,462 | | | | 0.1 |
| 1,618,288 | | US Airways 2010-1 Class A Pass Through Trust, 6.250%, 10/22/2024 | | | 1,547,997 | | | | 0.0 |
| 339,425 | | US Airways 2012-2 Class A Pass Through Trust, 4.625%, 12/03/2026 | | | 303,694 | | | | 0.0 |
| 600,827 | | US Airways 2012-2 Class B Pass Through Trust, 6.750%, 12/03/2022 | | | 584,529 | | | | 0.0 |
| 1,982,680 | | US Airways 2013-1 Class A Pass Through Trust, 3.950%, 05/15/2027 | | | 1,840,820 | | | | 0.0 |
| 690,796 | | US Airways 2013-1 Class B Pass Through Trust, 5.375%, 05/15/2023 | | | 658,684 | | | | 0.0 |
| 19,225,000 | (3) | Yum! Brands, Inc., 3.750%, 11/01/2021 | | | 19,486,941 | | | | 0.3 |
| 8,160,000 | (3) | Yum! Brands, Inc., 3.875%, 11/01/2023 | | | 8,567,143 | | | | 0.1 |
| 2,175,000 | (8) | Yum! Brands, Inc., 4.750%, 01/15/2030 | | | 2,388,150 | | | | 0.0 |
| 13,525,000 | | Yum! Brands, Inc., 5.350%, 11/01/2043 | | | 15,418,500 | | | | 0.2 |
| 5,885,000 | | Yum! Brands, Inc., 6.875%, 11/15/2037 | | | 7,587,501 | | | | 0.1 |
| | | | | | 256,840,971 | | | | 3.3 |
See Accompanying Notes to Financial Statements
| VY® T. Rowe Price Capital Appreciation Portfolio | PORTFOLIO OF INVESTMENTS
AS OF December 31, 2020 (Continued) |
| | | Consumer, Non-cyclical: 0.6% | | | | | | | |
| 7,855,000 | | Elanco Animal Health, Inc., 4.912%, 08/27/2021 | | | 8,046,465 | | | | 0.1 |
| 2,345,000 | (8) | Korn Ferry, 4.625%, 12/15/2027 | | | 2,447,594 | | | | 0.0 |
| 9,125,000 | (8) | Refinitiv US Holdings, Inc., 6.250%, 05/15/2026 | | | 9,758,047 | | | | 0.1 |
| 11,030,000 | (8) | Refinitiv US Holdings, Inc., 8.250%, 11/15/2026 | | | 12,050,275 | | | | 0.2 |
| 4,695,000 | | Teleflex, Inc., 4.625%, 11/15/2027 | | | 5,056,632 | | | | 0.1 |
| 7,275,000 | | Teleflex, Inc., 4.875%, 06/01/2026 | | | 7,601,284 | | | | 0.1 |
| | | | | | 44,960,297 | | | | 0.6 |
| | | | | | | | | | |
| | | Financial: 0.9% | | | | | | | |
| 555,000 | (8) | AmWINS Group, Inc., 7.750%, 07/01/2026 | | | 597,990 | | | | 0.0 |
| 8,400,000 | (7) | Bank of New York Mellon Corp., 3.659%, (US0003M + 3.420%), 12/31/2199 | | | 8,409,426 | | | | 0.1 |
| 16,343,000 | (8) | HUB International Ltd., 7.000%, 05/01/2026 | | | 17,107,771 | | | | 0.2 |
| 6,795,000 | (7) | PNC Financial Services Group, Inc./The, 5.000%, 12/31/2199 | | | 7,440,525 | | | | 0.1 |
| 3,510,000 | (8) | SBA Communications Corp., 3.875%, 02/15/2027 | | | 3,690,941 | | | | 0.0 |
| 13,150,000 | | SBA Communications Corp., 4.000%, 10/01/2022 | | | 13,306,156 | | | | 0.2 |
| 6,835,000 | | SBA Communications Corp., 4.875%, 09/01/2024 | | | 7,019,408 | | | | 0.1 |
| 6,640,000 | (7) | State Street Corp., 3.814%, 12/31/2199 | | | 6,623,400 | | | | 0.1 |
| 6,360,000 | (8) | USI, Inc./NY, 6.875%, 05/01/2025 | | | 6,538,812 | | | | 0.1 |
| | | | | | 70,734,429 | | | | 0.9 |
| | | | | | | | | | |
| | | Industrial: 0.8% | | | | | | | |
| 49,630,000 | (7) | General Electric Co., 5.000%, 12/31/2199 | | | 46,081,951 | | | | 0.6 |
| 1,500,000 | | Lennox International, Inc., 3.000%, 11/15/2023 | | | 1,582,535 | | | | 0.0 |
| 256,000 | (8) | Reynolds Group Issuer, Inc. / Reynolds Group Issuer LLC / Reynolds Group Issuer Lu, 5.125%, 07/15/2023 | | | 259,277 | | | | 0.0 |
| 4,220,000 | (8) | Sensata Technologies BV, 4.875%, 10/15/2023 | | | 4,562,875 | | | | 0.0 |
| 5,100,000 | (8) | Sensata Technologies BV, 5.000%, 10/01/2025 | | | 5,683,312 | | | | 0.1 |
| 1,430,000 | (8) | Sensata Technologies BV, 5.625%, 11/01/2024 | | | 1,602,551 | | | | 0.0 |
| 5,885,000 | (3) | Welbilt, Inc., 9.500%, 02/15/2024 | | | 6,093,417 | | | | 0.1 |
| 850,000 | | Xylem, Inc./NY, 4.875%, 10/01/2021 | | | 877,545 | | | | 0.0 |
| | | | | | 66,743,463 | | | | 0.8 |
| | | | | | | | | | |
| | | Technology: 0.6% | | | | | | | |
| 2,840,000 | (8) | Sensata Technologies UK Financing Co. PLC, 6.250%, 02/15/2026 | | | 2,957,150 | | | | 0.1 |
| 40,366,000 | (8) | Solera LLC / Solera Finance, Inc., 10.500%, 03/01/2024 | | | 41,879,725 | | | | 0.5 |
| | | | | | 44,836,875 | | | | 0.6 |
| | | | | | | | | | |
| | | Utilities: 0.1% | | | | | | | |
| 9,465,000 | (7) | NiSource, Inc., 5.650%, 12/31/2199 | | | 9,737,119 | | | | 0.1 |
| | | | | | | | | | |
| | Total Corporate Bonds/Notes | | | | | | | |
| | (Cost $673,394,103) | | | 728,571,390 | | | | 9.3 |
| | | | | | | | | | |
| BANK LOANS: 11.3% | | | | | | | |
| | | Aerospace & Defense: 0.2% | | | | | | | |
| 16,875,000 | | SkyMiles IP Ltd. 2020 Skymiles Term Loan B, 4.750%, (US0003M + 3.750%), 10/20/2027 | | | 17,531,016 | | | | 0.2 |
| | | | | | | | | | |
| | | Basic Materials: 0.0% | | | | | | | |
| 2,193,938 | | HB Fuller Co. 1st Lien Term Loan B, 2.152%, (US0001M + 2.000%), 10/20/2024 | | | 2,185,101 | | | | 0.0 |
| | | | | | | | | | |
| | | Communications: 0.0% | | | | | | | |
| 2,525,000 | | Mega Broadband Investments LLC TL B 1L, 3.144%, (US0001M + 3.000%), 10/19/2027 | | | 2,526,053 | | | | 0.0 |
| | | | | | | | | | |
| | | Consumer, Cyclical:1.3% | | | | | | | |
| 32,950,000 | | Formula One TL B3 1L, 3.500%, (US0003M + 2.500%), 02/01/2024 | | | 32,699,448 | | | | 0.4 |
| 5,171,594 | | Four Seasons Hotels Ltd. - TL B 1L, 2.254%, (US0003M + 2.000%), 11/30/2023 | | | 5,141,294 | | | | 0.1 |
| 15,071,701 | | Life Time, Inc. 2017 Term Loan B 1L, 3.750%, (US0003M + 2.750%), 06/10/2022 | | | 14,718,451 | | | | 0.2 |
| 38,690,000 | | Mileage Plus Holdings LLC 2020 Term Loan B, 6.250%, (US0003M + 5.250%), 06/25/2027 | | | 40,385,357 | | | | 0.5 |
| 4,224,028 | | SeaWorld Parks & Entertainment, Inc. - TL B5 1L, 3.750%, (US0003M + 3.000%), 04/01/2024 | | | 4,114,909 | | | | 0.1 |
| 2,825,000 | | WellPet - TL B 1L, 4.500%, (US0001M + 3.750%), 12/11/2027 | | | 2,828,531 | | | | 0.0 |
| | | | | | 99,887,990 | | | | 1.3 |
See Accompanying Notes to Financial Statements
| VY® T. Rowe Price Capital Appreciation Portfolio | PORTFOLIO OF INVESTMENTS
AS OF December 31, 2020 (Continued) |
| | | Consumer, Non-cyclical: 3.3% | | | | | | | |
| 7,610,000 | | Aspen Dental - TL B 1L, 4.144%, (US0001M + 4.000%), 12/15/2027 | | | 7,630,927 | | | | 0.1 |
| 1,855,243 | | Dentalcorp Health Services ULC - TL 1L, 4.750%, (US0003M + 3.750%), 06/06/2025 | | | 1,827,993 | | | | 0.0 |
| 11,112,818 | | Heartland Dental LLC - TL 1L, 3.966%, (US0003M + 3.750%), 04/30/2025 | | | 10,851,200 | | | | 0.2 |
| 1,037,360 | | Heartland Dental LLC - TL 1L, 4.739%, (US0003M + 3.750%), 04/30/2025 | | | 1,012,939 | | | | 0.0 |
| 20,875,231 | | Loire Finco Luxembourg Sarl - TL B 1L, 3.647%, (US0003M + 3.250%), 01/24/2027 | | | 20,588,197 | | | | 0.3 |
| 15,225,000 | | NVA Holdings Inc. - TL A-3 1L, 2.438%, (US0003M + 2.250%), 09/19/2022 | | | 15,072,750 | | | | 0.2 |
| 2,979,504 | | PetVet Care Centers LLC, 3.455%, (US0003M + 3.250%), 02/14/2025 | | | 2,921,776 | | | | 0.0 |
| 2,820,944 | | PetVet Care Centers LLC - TL B-DD 1L, 5.250%, (US0001M + 4.250%), 02/14/2025 | | | 2,835,049 | | | | 0.0 |
| 1,813,013 | | PetVet Care Centers LLC TL 1L, 2.897%, (US0003M + 2.750%), 02/14/2025 | | | 1,777,886 | | | | 0.0 |
| 311,016 | | Prestige Brands, Inc. Term Loan B4, 2.147%, (US0001M + 2.000%), 01/26/2024 | | | 312,020 | | | | 0.0 |
| 172,871,622 | | Refinitiv - TL B 1L, 3.397%, (US0001M + 3.750%), 10/01/2025 | | | 172,831,170 | | | | 2.2 |
| 23,470,419 | | Sunshine Luxembourg VII Sarl - TL B 1L, 4.254%, (US0003M + 4.250%), 07/17/2026 | | | 23,568,901 | | | | 0.3 |
| | | | | | 261,230,808 | | | | 3.3 |
| | | | | | | | | | |
| | | Financial: 2.7% | | | | | | | |
| 7,232,479 | | Alliant Holdings Intermediate, LLC Term Loan B 1L, 3.397%, (US0003M + 3.000%), 05/09/2025 | | | 7,118,466 | | | | 0.1 |
| 3,794,285 | | AmWINS Group, Inc. - TL B 1L, 3.750%, (US0003M + 2.750%), 01/25/2024 | | | 3,798,596 | | | | 0.0 |
| 43,717,112 | | HUB International Ltd. - TL B 1L, 5.000%, (US0001M + 4.000%), 04/25/2025 | | | 43,902,079 | | | | 0.6 |
| 105,281,965 | | HUB International Ltd. TL B 1L, 2.965%, (US0001M + 3.000%), 04/25/2025 | | | 103,535,232 | | | | 1.3 |
| 8,090,813 | | Hyperion Insurance - TL B-DD 1L, 4.750%, (US0001M + 3.750%), 10/22/2027 | | | 8,095,869 | | | | 0.1 |
| 4,344,113 | | Ryan Specialty Group, LLC TL B 1L, 4.000%, (US0001M + 3.250%), 07/23/2027 | | | 4,344,112 | | | | 0.1 |
| 32,212,294 | | USI Inc/NY - TL B 1L, 3.254%, (US0003M + 3.000%), 05/16/2024 | | | 31,806,290 | | | | 0.4 |
| 7,236,863 | | USI, Inc. Term Loan B 1L, 4.500%, (US0001M + 4.000%), 12/02/2026 | | | 7,240,481 | | | | 0.1 |
| | | | | | 209,841,125 | | | | 2.7 |
| | | | | | | | | | |
| | | Food Products: 0.1% | | | | | |
| 6,870,000 | | IRB Holding Corp 2020 Fourth Amendment Incremental Term Loan, 3.478%, (US0003M + 3.250%), 12/15/2027 | | | 6,879,446 | | | | 0.1 |
| | | | | | | | | | |
| | | Health Care: 0.0% | | | | | | | |
| 2,153,725 | | CPI Holdco, LLC 2019 TL 1L, 5.701%, (US0003M + 4.250%), 11/04/2026 | | | 2,160,455 | | | | 0.0 |
| | | | | | | | | | |
| | | Industrial: 0.6% | | | | | | | |
| EUR 9,450,000 | | Filtration Group - TL B 1L, 3.238%, (US0003M + 3.000%), 03/29/2025 | | | 11,486,800 | | | | 0.2 |
| 1,795,500 | | Filtration Group Corp. - TL B 1L, 4.500%, (US0001M + 3.750%), 03/29/2025 | | | 1,801,485 | | | | 0.0 |
| 2,807,487 | | Filtration Group Corp. 2018 1st Lien Term Loan, 3.147%, (US0003M + 3.000%), 03/31/2025 | | | 2,784,676 | | | | 0.0 |
| 27,880,000 | | Thyssenkrupp Elevator TL B 1L, 4.570%, (US0001M + 4.250%), 06/30/2027 | | | 28,043,349 | | | | 0.4 |
| 3,050,000 | | Welbilt, Inc. 2018 Term Loan B 1L, 2.645%, (US0003M + 2.500%), 10/23/2025 | | | 2,902,584 | | | | 0.0 |
| | | | | | 47,018,894 | | | | 0.6 |
| | | | | | | | | | |
| | | Industrial Equipment: 0.0% | | | | | | | |
| 2,069,600 | | Gardner Denver, Inc. 2020 USD Term Loan B, 2.897%, (US0001M + 2.750%), 03/01/2027 | | | 2,072,617 | | | | 0.0 |
| | | | | | | | | | |
| | | Insurance: 0.3% | | | | | | | |
| 8,208,078 | | Alliant Holdings Intermediate, LLC 2020 Term Loan B3, 4.250%, (US0003M + 3.750%), 10/08/2027 | | | 8,228,598 | | | | 0.1 |
See Accompanying Notes to Financial Statements
| VY® T. Rowe Price Capital Appreciation Portfolio | PORTFOLIO OF INVESTMENTS
AS OF December 31, 2020 (Continued) |
| 5,917,527 | | Alliant Holdings Intermediate, LLC Term Loan B, 3.397%, (US0003M + 3.250%), 05/09/2025 | | | 5,824,243 | | | | 0.1 |
| 9,187,829 | | USI, Inc. 2019 Incremental Term Loan B, 4.254%, (US0003M + 4.000%), 12/02/2026 | | | 9,192,422 | | | | 0.1 |
| | | | | | 23,245,263 | | | | 0.3 |
| | | | | | | | | | |
| | | Technology: 2.8% | | | | | | | |
| 3,622,226 | | Applied Systems, Inc. 2017 1st Lien Term Loan, 4.000%, (US0003M + 3.250%), 09/19/2024 | | | 3,626,754 | | | | 0.1 |
| 640,000 | | Ascend Learning LLC - TL B 1L, 3.238%, (US0003M + 3.000%), 07/12/2024 | | | 642,933 | | | | 0.0 |
| 3,320,000 | | Azalea Topco, Inc. - TL 1L, 4.750%, (US0001M + 4.000%), 07/25/2026 | | | 3,332,450 | | | | 0.1 |
| 17,725,000 | | Clarivate / Camelot Finance SA TL B 1L, 4.000%, (US0003M + 3.000%), 10/31/2026 | | | 17,721,313 | | | | 0.2 |
| 72,123,231 | | Cypress Intermediate Holdings III Inc TL B 1L, 4.000%, (US0001M + 3.000%), 04/29/2024 | | | 72,070,654 | | | | 0.9 |
| 20,280,140 | | Emerald TopCo Inc Term Loan, 3.656%, (US0001M + 3.500%), 07/24/2026 | | | 20,102,689 | | | | 0.3 |
| 2,839,063 | | Ultimate Software Group, Inc. - TL 1L, 3.897%, (US0003M + 3.750%), 05/04/2026 | | | 2,841,902 | | | | 0.0 |
| 92,283,738 | | Ultimate Software Group, Inc. TL 1L, 4.750%, (US0003M + 3.750%), 05/03/2026 | | | 92,941,259 | | | | 1.2 |
| 3,050,000 | | Ultimate Software Group, Inc. TL 2L, 7.500%, (US0001M + 6.750%), 05/03/2027 | | | 3,145,312 | | | | 0.0 |
| | | | | | 216,425,266 | | | | 2.8 |
| | | | | | | | | | |
| | Total Bank Loans | | | | | | | |
| | (Cost $879,845,116) | | | 891,004,034 | | | | 11.3 |
| | | | | | | | | | |
| ASSET-BACKED SECURITIES: 0.3% | | | | | | | |
| | | Other Asset-Backed Securities: 0.3% | | | | | | | |
| 7,927,810 | (8) | Domino’s Pizza Master Issuer LLC 2017-1A A23, 4.118%, 07/25/2047 | | | 8,522,542 | | | | 0.1 |
| 7,419,225 | (8) | Domino’s Pizza Master Issuer LLC 2018-1A A2I, 4.116%, 07/25/2048 | | | 7,821,390 | | | | 0.1 |
| 3,672,900 | (8) | Domino’s Pizza Master Issuer LLC 2019-1A A2, 3.668%, 10/25/2049 | | | 3,914,166 | | | | 0.0 |
| 5,011,990 | (8) | Wendys Funding LLC 2018-1A A2I, 3.573%, 03/15/2048 | | | 5,172,825 | | | | 0.1 |
| | | | | | | | | | |
| | Total Asset-Backed Securities | | | | | | | |
| | (Cost $23,827,660) | | | 25,430,923 | | | | 0.3 |
| | | | | | | | | | |
| CONVERTIBLE BONDS/NOTES: 0.0% | | | | | | | |
| | | Communications: 0.0% | | | | | | | |
| 3,459,000 | (8) | Liberty Broadband Corp., 2.750%, 09/30/2050 | | | 3,708,955 | | | | 0.0 |
| | | | | | | | | | |
| | Total Convertible Bonds/Notes | | | | | | | |
| | (Cost $3,459,000) | | | 3,708,955 | | | | 0.0 |
| | | | | | | | | | |
| | Total Long-Term Investments | | | | | | | |
| | (Cost $5,843,146,771) | | | 7,224,313,913 | | | | 91.7 |
| | | | | | | | | | |
| SHORT-TERM INVESTMENTS: 10.8% | | | | | | | |
| | | Repurchase Agreements: 1.3% | | | | | | | |
| 5,504,736 | (9) | Amherst Pierpoint Securities LLC, Repurchase Agreement dated 12/31/20, 0.10%, due 01/04/21 (Repurchase Amount $5,504,796, collateralized by various U.S. Government/U.S. Government Agency Obligations, 0.000%- 4.628%, Market Value plus accrued interest $5,614,831, due 02/03/21-11/20/70) | | | 5,504,736 | | | | 0.1 |
| 3,460,120 | (9) | Bethesda Securities LLC, Repurchase Agreement dated 12/31/20, 0.10%, due 01/04/21 (Repurchase Amount $3,460,158, collateralized by various U.S. Government Agency Obligations, 2.500%- 5.500%, Market Value plus accrued interest $3,529,322, due 07/01/24-10/01/50) | | | 3,460,120 | | | | 0.0 |
| 4,673,409 | (9) | BNP Paribas S.A., Repurchase Agreement dated 12/31/20, 0.24%, due 01/04/21 (Repurchase Amount $4,673,532, collateralized by various U.S. Government Securities, 0.750%- 8.750%, Market Value plus accrued interest $4,907,079, due 03/01/21-11/20/40) | | | 4,673,409 | | | | 0.1 |
See Accompanying Notes to Financial Statements
| VY® T. Rowe Price Capital Appreciation Portfolio | PORTFOLIO OF INVESTMENTS
AS OF December 31, 2020 (Continued) |
| 16,335,711 | (9) | Cantor Fitzgerald Securities, Repurchase Agreement dated 12/31/20, 0.07%, due 01/04/21 (Repurchase Amount $16,335,836, collateralized by various U.S. Government/U.S. Government Agency Obligations, 0.000%- 9.500%, Market Value plus accrued interest $16,662,425, due 01/25/21-10/15/62) | | | 16,335,711 | | | | 0.2 |
| 5,590,969 | (9) | CF Secured LLC, Repurchase Agreement dated 12/31/20, 0.07%, due 01/04/21 (Repurchase Amount $5,591,012, collateralized by various U.S. Government/U.S. Government Agency Obligations, 0.000%- 4.750%, Market Value plus accrued interest $5,702,789, due 01/14/21-01/20/69) | | | 5,590,969 | | | | 0.1 |
| 10,227,239 | (9) | Citadel Securities LLC, Repurchase Agreement dated 12/31/20, 0.13%, due 01/04/21 (Repurchase Amount $10,227,385, collateralized by various U.S. Government Securities, 0.000%- 7.875%, Market Value plus accrued interest $10,431,943, due 01/31/21-05/15/49) | | | 10,227,239 | | | | 0.1 |
| 14,547,880 | (9) | Daiwa Capital Markets, Repurchase Agreement dated 12/31/20, 0.07%, due 01/04/21 (Repurchase Amount $14,547,992, collateralized by various U.S. Government/U.S. Government Agency Obligations, 0.000%- 6.500%, Market Value plus accrued interest $14,838,837, due 01/26/21-01/01/51) | | | 14,547,880 | | | | 0.2 |
| 2,255,491 | (9) | Industrial & Comm. Bank of China, Repurchase Agreement dated 12/31/20, 0.07%, due 01/04/21 (Repurchase Amount $2,255,508, collateralized by various U.S. Government/U.S. Government Agency Obligations, 0.000%- 9.000%, Market Value plus accrued interest $2,300,601, due 01/04/21-12/01/50) | | | 2,255,491 | | | | 0.0 |
| 6,387,247 | (9) | JVB Financial Group LLC, Repurchase Agreement dated 12/31/20, 0.13%, due 01/04/21 (Repurchase Amount $6,387,338, collateralized by various U.S. Government/U.S. Government Agency Obligations, 0.125%- 7.000%, Market Value plus accrued interest $6,514,992, due 07/01/22-12/01/50) | | | 6,387,247 | | | | 0.1 |
| 7,298,162 | (9) | Mirae Asset Securities USA Inc., Repurchase Agreement dated 12/31/20, 0.13%, due 01/04/21 (Repurchase Amount $7,298,266, collateralized by various U.S. Government/U.S. Government Agency Obligations, 0.000%- 8.125%, Market Value plus accrued interest $7,444,233, due 02/18/21-01/15/62) | | | 7,298,162 | | | | 0.1 |
| 5,734,596 | (9) | Palafox Trading LLC, Repurchase Agreement dated 12/31/20, 0.13%, due 01/04/21 (Repurchase Amount $5,734,678, collateralized by various U.S. Government Securities, 0.250%- 1.125%, Market Value plus accrued interest $5,851,406, due 02/28/25-05/31/25) | | | 5,734,596 | | | | 0.1 |
See Accompanying Notes to Financial Statements
| VY® T. Rowe Price Capital Appreciation Portfolio | PORTFOLIO OF INVESTMENTS
AS OF December 31, 2020 (Continued) |
| 1,791,208 | (9) | Royal Bank of Canada, Repurchase Agreement dated 12/31/20, 0.21%, due 01/04/21 (Repurchase Amount $1,791,249, collateralized by various U.S. Government Securities, 0.379%- 10.200%, Market Value plus accrued interest $1,869,726, due 05/13/21- 11/01/40) | | | 1,791,208 | | | | 0.0 |
| 16,213,680 | (9) | State of Wisconsin Investment Board, Repurchase Agreement dated 12/31/20, 0.16%, due 01/04/21 (Repurchase Amount $16,213,964, collateralized by various U.S. Government Securities, 0.125%- 3.875%, Market Value plus accrued interest $16,579,174, due 07/15/22-02/15/47) | | | 16,213,680 | | | | 0.2 |
| | | | | | | | | |
| | Total Repurchase Agreements | | | | | | | |
| | (Cost $100,020,448) | | | 100,020,448 | | | | 1.3 |
| | | | | | | | Percentage |
| | | | | | | of Net |
| Shares | | | | Value | | | Assets |
| | | Mutual Funds: 9.5% | | | | | | | |
| 2,630,000 | (9),(10) | BlackRock Liquidity Funds, FedFund, Institutional Class, 0.000% | | | 2,630,000 | | | | 0.0 |
| 2,660,000 | (9),(10) | Goldman Sachs Financial Square Government Fund - Institutional Shares, 0.020% | | | 2,660,000 | | | | 0.0 |
| 3,010,000 | (9),(10) | Morgan Stanley Institutional Liquidity Funds - Government Portfolio (Institutional Share Class), 0.030% | | | 3,010,000 | | | | 0.1 |
| 738,802,367 | (10) | T. Rowe Price Government Reserve Fund, 0.080% | | | 738,802,367 | | | | 9.4 |
| | Total Mutual Funds | | | | | | | |
| | (Cost $747,102,367) | | | 747,102,367 | | | | 9.5 |
| | | | | | | | | | |
| | Total Short-Term Investments | | | | | | | |
| | (Cost $847,122,815) | | | 847,122,815 | | | | 10.8 |
| | Total Investments in Securities | | | | | |
| | (Cost $6,690,269,586) | | $ | 8,071,436,728 | | | | 102.5 |
| | Liabilities in Excess of Other Assets | | | (196,052,727 | ) | | | (2.5) |
| | Net Assets | | $ | 7,875,384,001 | | | | 100.0 |
| | † | Unless otherwise indicated, principal amount is shown in USD. |
| | (1) | Non-income producing security. |
| | (2) | All or a portion of this security is pledged to cover open written call options at December 31, 2020. |
| | (3) | Security, or a portion of the security, is on loan. |
| | (4) | For fair value measurement disclosure purposes, security is categorized as Level 3, whose value was determined using significant unobservable inputs. |
| | (5) | Restricted security as to resale, excluding Rule 144A securities. As of December 31, 2020, the Portfolio held restricted securities with a fair value of $46,813,685 or 0.6% of net assets. Please refer to the table below for additional details. |
| | (6) | Preferred Stock may be called prior to convertible date. |
| | (7) | Variable rate security. Rate shown is the rate in effect as of December 31, 2020. |
| | (8) | Securities with purchases pursuant to Rule 144A or section 4(a)(2), under the Securities Act of 1933 and may not be resold subject to that rule except to qualified institutional buyers. |
| | (9) | All or a portion of the security represents securities purchased with cash collateral received for securities on loan. |
| | (10) | Rate shown is the 7-day yield as of December 31, 2020. |
Currency Abbreviations:
EUR EU Euro
Reference Rate Abbreviations:
US0001M 1-month LIBOR
US0003M 3-month LIBOR
See Accompanying Notes to Financial Statements
| VY® T. Rowe Price Equity Income Portfolio | PORTFOLIO OF INVESTMENTS
AS OF December 31, 2020 |
| | | | | | | | Percentage |
| | | | | | | | of Net |
| Shares | | | | Value | | | Assets |
| COMMON STOCK: 96.6% | | | | | |
| Communication Services: 5.4% | | | | | |
| 35,501 | | AT&T, Inc. | | $ | 1,021,009 | | | | 0.3 |
| 116,983 | | Comcast Corp. – Class A | | | 6,129,909 | | | | 1.8 |
| 82,360 | | Fox Corp. - Class B | | | 2,378,557 | | | | 0.7 |
| 242,934 | | News Corp - Class A | | | 4,365,524 | | | | 1.2 |
| 20,175 | | Verizon Communications, Inc. | | | 1,185,281 | | | | 0.3 |
| 20,384 | (1) | Walt Disney Co. | | | 3,693,173 | | | | 1.1 |
| | | | | | 18,773,453 | | | | 5.4 |
| | | | | | | | | | |
| | | Consumer Discretionary: 4.1% | | | | | | | |
| 16,400 | | General Motors Co. | | | 682,896 | | | | 0.2 |
| 64,611 | | Kohl’s Corp. | | | 2,629,022 | | | | 0.8 |
| 59,423 | | Las Vegas Sands Corp. | | | 3,541,611 | | | | 1.0 |
| 7,000 | | Magna International, Inc. | | | 495,600 | | | | 0.2 |
| 145,416 | (1) | Mattel, Inc. | | | 2,537,509 | | | | 0.7 |
| 2,300 | | McDonald’s Corp. | | | 493,534 | | | | 0.1 |
| 16,300 | | TJX Cos., Inc. | | | 1,113,127 | | | | 0.3 |
| 150,917 | | Volkswagen AG ADR | | | 2,810,059 | | | | 0.8 |
| | | | | | 14,303,358 | | | | 4.1 |
| | | | | | | | | | |
| | | Consumer Staples: 7.4% | | | | | | | |
| 16,200 | | Altria Group, Inc. | | | 664,200 | | | | 0.2 |
| 15,938 | | Bunge Ltd. | | | 1,045,214 | | | | 0.3 |
| 38,400 | | Coca-Cola Co. | | | 2,105,856 | | | | 0.6 |
| 125,312 | | Conagra Brands, Inc. | | | 4,543,813 | | | | 1.3 |
| 24,540 | | Kimberly-Clark Corp. | | | 3,308,728 | | | | 1.0 |
| 2,800 | | Mondelez International, Inc. | | | 163,716 | | | | 0.0 |
| 74,828 | | Philip Morris International, Inc. | | | 6,195,010 | | | | 1.8 |
| 90,117 | | Tyson Foods, Inc. | | | 5,807,140 | | | | 1.7 |
| 11,711 | | Walmart, Inc. | | | 1,688,141 | | | | 0.5 |
| | | | | | 25,521,818 | | | | 7.4 |
| | | | | | | | | | |
| | | Energy: 6.5% | | | | | | | |
| 8,817 | | Chevron Corp. | | | 744,595 | | | | 0.2 |
| 11,000 | | ConocoPhillips | | | 439,890 | | | | 0.1 |
| 56,877 | | Enbridge, Inc. | | | 1,819,495 | | | | 0.5 |
| 52,700 | | EOG Resources, Inc. | | | 2,628,149 | | | | 0.8 |
| 62,227 | | Exxon Mobil Corp. | | | 2,564,997 | | | | 0.7 |
| 119,000 | | Halliburton Co. | | | 2,249,100 | | | | 0.7 |
| 11,231 | | Hess Corp. | | | 592,884 | | | | 0.2 |
| 27,083 | | Occidental Petroleum Corp. | | | 468,807 | | | | 0.1 |
| 73,718 | | Targa Resources Corp. | | | 1,944,681 | | | | 0.6 |
| 63,444 | | TC Energy Corp. | | | 2,583,440 | | | | 0.7 |
| 157,991 | | Total SE ADR | | | 6,621,403 | | | | 1.9 |
| | | | | | 22,657,441 | | | | 6.5 |
| | | | | | | | | | |
| | | Financials: 20.7% | | | | | | | |
| 172,421 | | American International Group, Inc. | | | 6,527,859 | | | | 1.9 |
| 37,618 | | Bank of America Corp. | | | 1,140,202 | | | | 0.3 |
| 25,600 | | Charles Schwab Corp. | | | 1,357,824 | | | | 0.4 |
| 51,475 | | Chubb Ltd. | | | 7,923,032 | | | | 2.3 |
| 106,998 | | Equitable Holdings, Inc. | | | 2,738,079 | | | | 0.8 |
| 184,260 | | Fifth Third Bancorp | | | 5,080,048 | | | | 1.5 |
| 44,460 | | Franklin Resources, Inc. | | | 1,111,055 | | | | 0.3 |
| 7,400 | | Goldman Sachs Group, Inc. | | | 1,951,454 | | | | 0.6 |
| 25,623 | | JPMorgan Chase & Co. | | | 3,255,915 | | | | 0.9 |
| 107,776 | | Loews Corp. | | | 4,852,075 | | | | 1.4 |
| 7,641 | | Marsh & McLennan Cos., Inc. | | | 893,997 | | | | 0.3 |
| 146,026 | | Metlife, Inc. | | | 6,855,921 | | | | 2.0 |
| 106,419 | | Morgan Stanley | | | 7,292,894 | | | | 2.1 |
| 23,832 | | PNC Financial Services Group, Inc. | | | 3,550,968 | | | | 1.0 |
| 22,160 | | Raymond James Financial, Inc. | | | 2,120,047 | | | | 0.6 |
| 61,951 | | State Street Corp. | | | 4,508,794 | | | | 1.3 |
| 320,733 | | Wells Fargo & Co. | | | 9,679,722 | | | | 2.8 |
| 3,491 | | Willis Towers Watson PLC | | | 735,484 | | | | 0.2 |
| | | | | | 71,575,370 | | | | 20.7 |
| | | | | | | | | | |
| | | Health Care: 12.8% | | | | | | | |
| 58,509 | | AbbVie, Inc. | | | 6,269,239 | | | | 1.8 |
| 17,950 | | Anthem, Inc. | | | 5,763,565 | | | | 1.7 |
| 18,545 | | Becton Dickinson & Co. | | | 4,640,330 | | | | 1.3 |
| 3,500 | (1) | Biogen, Inc. | | | 857,010 | | | | 0.3 |
| 66,451 | | CVS Health Corp. | | | 4,538,603 | | | | 1.3 |
| 25,320 | | Gilead Sciences, Inc. | | | 1,475,143 | | | | 0.4 |
| 63,380 | | GlaxoSmithKline PLC | | | 1,159,727 | | | | 0.3 |
| 18,800 | | GlaxoSmithKline PLC ADR | | | 691,840 | | | | 0.2 |
| 30,574 | | Johnson & Johnson | | | 4,811,736 | | | | 1.4 |
| 48,061 | | Medtronic PLC | | | 5,629,866 | | | | 1.6 |
| 18,000 | | Merck & Co., Inc. | | | 1,472,400 | | | | 0.4 |
| 111,755 | | Pfizer, Inc. | | | 4,113,702 | | | | 1.2 |
| 27,249 | (2) | Sanofi ADR | | | 1,324,029 | | | | 0.4 |
| 11,186 | | Zimmer Biomet Holdings, Inc. | | | 1,723,651 | | | | 0.5 |
| | | | | | 44,470,841 | | | | 12.8 |
| | | | | | | | | | |
| | | Industrials: 12.1% | | | | | | | |
| 22,539 | | Alaska Air Group, Inc. | | | 1,172,028 | | | | 0.3 |
| 20,964 | | Boeing Co. | | | 4,487,554 | | | | 1.3 |
| 11,100 | | Caterpillar, Inc. | | | 2,020,422 | | | | 0.6 |
| 2,000 | | Cummins, Inc. | | | 454,200 | | | | 0.1 |
| 13,345 | | Emerson Electric Co. | | | 1,072,538 | | | | 0.3 |
| 6,747 | | Flowserve Corp. | | | 248,627 | | | | 0.1 |
| 845,260 | | General Electric Co. | | | 9,128,808 | | | | 2.6 |
| 34,252 | | Johnson Controls International plc | | | 1,595,801 | | | | 0.5 |
| 26,631 | | L3Harris Technologies, Inc. | | | 5,033,792 | | | | 1.4 |
| 126,067 | | Nielsen Holdings PLC | | | 2,631,018 | | | | 0.8 |
| 15,960 | | Paccar, Inc. | | | 1,377,029 | | | | 0.4 |
| 12,427 | | Snap-On, Inc. | | | 2,126,757 | | | | 0.6 |
| 38,747 | (1) | Stericycle, Inc. | | | 2,686,329 | | | | 0.8 |
| 46,869 | | United Parcel Service, Inc. - Class B | | | 7,892,739 | | | | 2.3 |
| | | | | | 41,927,642 | | | | 12.1 |
| | | | | | | | | | |
| | | Information Technology: 9.5% | | | | | | | |
| 54,516 | | Applied Materials, Inc. | | | 4,704,731 | | | | 1.4 |
| 121,114 | | Cisco Systems, Inc. | | | 5,419,851 | | | | 1.6 |
| 9,400 | | Citrix Systems, Inc. | | | 1,222,940 | | | | 0.3 |
| 21,124 | | Microsoft Corp. | | | 4,698,400 | | | | 1.3 |
| 8,045 | | NXP Semiconductor NV - NXPI - US | | | 1,279,235 | | | | 0.4 |
| 70,737 | | Qualcomm, Inc. | | | 10,776,075 | | | | 3.1 |
| 7,800 | | TE Connectivity Ltd. | | | 944,346 | | | | 0.3 |
| 22,861 | | Texas Instruments, Inc. | | | 3,752,176 | | | | 1.1 |
| | | | | | 32,797,754 | | | | 9.5 |
See Accompanying Notes to Financial Statements
| VY® T. Rowe Price Equity Income Portfolio | PORTFOLIO OF INVESTMENTS
AS OF December 31, 2020 (Continued) |
| | | Materials: 6.1% | | | |
| 6,947 | | Akzo Nobel NV | | | 745,649 | | | | 0.2 |
| 138,543 | | CF Industries Holdings, Inc. | | | 5,363,000 | | | | 1.5 |
| 120,021 | | DuPont de Nemours, Inc. | | | 8,534,693 | | | | 2.5 |
| 117,418 | | International Paper Co. | | | 5,838,023 | | | | 1.7 |
| 5,491 | | PPG Industries, Inc. | | | 791,912 | | | | 0.2 |
| | | | | | 21,273,277 | | | | 6.1 |
| | | | | | | | | | |
| | | Real Estate: 4.5% | | | | | | | |
| 64,716 | | Equity Residential | | | 3,836,365 | | | | 1.1 |
| 96,860 | | Rayonier, Inc. | | | 2,845,747 | | | | 0.8 |
| 24,902 | | SL Green Realty Corp. | | | 1,483,661 | | | | 0.5 |
| 11,900 | | Welltower, Inc. | | | 768,978 | | | | 0.2 |
| 195,274 | | Weyerhaeuser Co. | | | 6,547,537 | | | | 1.9 |
| | | | | | 15,482,288 | | | | 4.5 |
| | | | | | | | | | |
| | | Utilities: 7.5% | | | | | | | |
| 26,700 | | Ameren Corp. | | | 2,084,202 | | | | 0.6 |
| 5,300 | | Duke Energy Corp. | | | 485,268 | | | | 0.1 |
| 54,250 | | Edison International | | | 3,407,985 | | | | 1.0 |
| 31,380 | | NextEra Energy, Inc. | | | 2,420,967 | | | | 0.7 |
| 244,253 | | NiSource, Inc. | | | 5,603,164 | | | | 1.6 |
| 21,450 | | Sempra Energy | | | 2,732,944 | | | | 0.8 |
| 151,728 | | Southern Co. | | | 9,320,651 | | | | 2.7 |
| | | | | | 26,055,181 | | | | 7.5 |
| | | | | | | | | | |
| | Total Common Stock | | | | | | | |
| | (Cost $270,453,640) | | | 334,838,423 | | | | 96.6 |
| | | | | | | | | | |
| PREFERRED STOCK: 1.9% | | | | | | | |
| | | Health Care: 0.4% | | | | | | | |
| 26,624 | (1),(2) | Becton Dickinson and Co. | | | 1,467,781 | | | | 0.4 |
| | | | | | | | | | |
| | | Utilities: 1.5% | | | | | | | |
| 23,003 | (1) | NextEra Energy, Inc. | | | 1,169,472 | | | | 0.3 |
| 17,784 | (1),(2) | Sempra Energy SRE A | | | 1,774,132 | | | | 0.5 |
| 5,385 | (1),(2) | Sempra Energy SRE B | | | 558,586 | | | | 0.2 |
| 30,331 | (1) | Southern Co/The | | | 1,574,179 | | | | 0.5 |
| | | | | | 5,076,369 | | | | 1.5 |
| | | | | | | | | | |
| | Total Preferred Stock | | | | | | | |
| | (Cost $6,297,815) | | | 6,544,150 | | | | 1.9 |
| WARRANTS: 0.0% | | | | | | | | |
| | | Energy: 0.0% | | | | | | | |
| 7,897 | (1) | Occidental Petroleum Corp. | | | 53,779 | | | | 0.0 |
| | | | | | | | | | |
| | Total Warrants | | | | | | | |
| | (Cost $39,086) | | | 53,779 | | | | 0.0 |
| | | | | | | | | Percentage |
| Principal | | | | | | | | of Net |
| Amount† | | | | Value | | | | Assets |
| CONVERTIBLE BONDS/NOTES: 0.3% | | | | | | |
| | | Financial: 0.3% | | | | | | |
| 772,000 | (3) | AXA SA, 7.250%, 05/15/2021 | | | 883,457 | | | | 0.3 |
| | | | | | | | | | |
| | Total Convertible Bonds/Notes | | | | | | | |
| | (Cost $772,000) | | | 883,457 | | | | 0.3 |
| | | | | | | | | | |
| | Total Long-Term Investments | | | | | | | |
| | (Cost $277,562,541) | | | 342,319,809 | | | | 98.8 |
| | | | | | | | | |
| SHORT-TERM INVESTMENTS: 1.3% | | | | | | | |
| | | Repurchase Agreements: 0.7% | | | | | | | |
| 1,000,000 | (4) | Citigroup, Inc., Repurchase Agreement dated 12/31/20, 0.07%, due 01/04/21 (Repurchase Amount $1,000,008, collateralized by various U.S. Government/U.S. Government Agency Obligations, 0.000%- 4.000%, Market Value plus accrued interest $1,020,000, due 09/15/21-01/01/51) | | | 1,000,000 | | | | 0.3 |
| 311,754 | (4) | Nomura Securities, Repurchase Agreement dated 12/31/20, 0.07%, due 01/04/21 (Repurchase Amount $311,756, collateralized by various U.S. Government/U.S. Government Agency Obligations, 0.000%- 8.500%, Market Value plus accrued interest $317,989, due 01/31/21- 01/15/56) | | | 311,754 | | | | 0.1 |
| 1,000,000 | (4) | RBC Dominion Securities Inc., Repurchase Agreement dated 12/31/20, 0.08%, due 01/04/21 (Repurchase Amount $1,000,009, collateralized by various U.S. Government/U.S. Government Agency Obligations, 0.000%- 6.000%, Market Value plus accrued interest $1,020,000, due 01/05/21-12/20/50) | | | 1,000,000 | | | | 0.3 |
| | | | | | | | | | |
| | Total Repurchase Agreements | | | | | | | |
| | (Cost $2,311,754) | | | 2,311,754 | | | | 0.7 |
See Accompanying Notes to Financial Statements
| VY® T. Rowe Price Equity Income Portfolio | PORTFOLIO OF INVESTMENTS
AS OF December 31, 2020 (Continued) |
| | | | | | | | | | Percentage |
| | | | | | | | | | of Net |
| Shares | | | | | Value | | | | Assets |
| | | Mutual Funds: 0.6% | | | | | | | |
| 2,187,729 | (5) | T. Rowe Price Government Reserve Fund, 0.080%
(Cost $2,187,729) | | | 2,187,729 | | | | 0.6 |
| | | | | | | | | | |
| | Total Short-Term Investments
(Cost $4,499,483) | | | 4,499,483 | | | | 1.3 |
| | | | | | | | | | |
| | Total Investments in Securities
(Cost $282,062,024) | | $ | 346,819,292 | | | | 100.1 |
| | Liabilities in Excess of Other Assets | | | (285,113 | ) | | | (0.1) |
| | Net Assets | | $ | 346,534,179 | | | | 100.0 |
| † | Unless otherwise indicated, principal amount is shown in USD. |
| | ADR | American Depositary Receipt |
| (1) | Non-income producing security. |
| (2) | Security, or a portion of the security, is on loan. |
| (3) | Securities with purchases pursuant to Rule 144A or section 4(a)(2), under the Securities Act of 1933 and may not be resold subject to that rule except to qualified institutional buyers. |
| (4) | All or a portion of the security represents securities purchased with cash collateral received for securities on loan. |
| (5) | Rate shown is the 7-day yield as of December 31, 2020. |
| VY® T. Rowe Price International Stock Portfolio | PORTFOLIO OF INVESTMENTS
AS OF December 31, 2020 |
| | | | | | | | Percentage |
| | | | | | | | of Net |
| Shares | | | | Value | | | Assets |
| COMMON STOCK: 96.2% | | | | | | | |
| | | Australia: 0.7% | | | | | | | |
| 132,819 | | Amcor PLC | | $ | 1,577,256 | | | | 0.7 |
| | | | | | | | | | |
| | | Austria: 0.8% | | | | | | | |
| 59,463 | (1) | Erste Group Bank AG | | | 1,811,395 | | | | 0.8 |
| | | | | | | | | | |
| | | Belgium: 0.0% | | | | | | | |
| 343 | (1) | Galapagos NV | | | 33,948 | | | | 0.0 |
| | | | | | | | | | |
| | | Brazil: 1.7% | | | | | | | |
| 156,000 | | Magazine Luiza SA | | | 749,336 | | | | 0.4 |
| 33,366 | (1) | Rede D’Or Sao Luiz SA | | | 438,739 | | | | 0.2 |
| 7,932 | (1) | StoneCo Ltd. | | | 665,653 | | | | 0.3 |
| 60,204 | (1) | Suzano SA | | | 678,515 | | | | 0.3 |
| 30,061 | (1) | XP, Inc. | | | 1,192,520 | | | | 0.5 |
| | | | | | 3,724,763 | | | | 1.7 |
| | | | | | | | | | |
| | | Canada: 3.8% | | | | | | | |
| 10,640 | (1) | Lightspeed POS, Inc. | | | 750,961 | | | | 0.4 |
| 100,894 | | Lundin Mining Corp. | | | 895,673 | | | | 0.4 |
| 29,176 | | Magna International, Inc. | | | 2,065,661 | | | | 0.9 |
| 264,251 | (1) | Seven Generations Energy Ltd. | | | 1,372,220 | | | | 0.6 |
| 22,807 | | TMX Group Ltd. | | | 2,278,012 | | | | 1.0 |
| 11,356 | | Waste Connections, Inc. | | | 1,164,785 | | | | 0.5 |
| | | | | | 8,527,312 | | | | 3.8 |
| | | | | | | | | | |
| | | China: 8.0% | | | | | | | |
| 25,338 | (1) | Alibaba Group Holding | | | | | | | |
| | | Ltd. ADR | | | 5,896,913 | | | | 2.6 |
| 10,507 | (1) | Baidu, Inc. ADR | | | 2,272,034 | | | | 1.0 |
| 229,400 | | BTG Hotels Group Co. Ltd. - A Shares | | | 745,835 | | | | 0.3 |
| 242,000 | | China Mengniu Dairy Co., Ltd. | | | 1,459,054 | | | | 0.7 |
| 220,100 | | Gree Electric Appliances, Inc. of Zhuhai - A Shares | | | 2,086,211 | | | | 0.9 |
| 6,600 | (1),(2) | JD Health International, Inc. | | | 127,701 | | | | 0.1 |
| 6,889 | | Kweichow Moutai Co. | | | | | | | |
| | | Ltd. - A Shares (Nth | | | | | | | |
| | | SSE-SEHK) | | | 2,105,270 | | | | 0.9 |
| 153,700 | | NARI Technology Co. | | | | | | | |
| | | Ltd. - A Shares | | | 625,589 | | | | 0.3 |
| 36,600 | | Tencent Holdings Ltd. | | | 2,633,509 | | | | 1.2 |
| | | | | | 17,952,116 | | | | 8.0 |
| | | | | | | | | | |
| | | France: 6.9% | | | | | | | |
| 7,088 | | Air Liquide SA | | | 1,162,048 | | | | 0.5 |
| 2,142 | (1) | Dassault Aviation SA | | | 2,332,461 | | | | 1.0 |
| 19,343 | | EssilorLuxottica SA | | | 3,014,287 | | | | 1.4 |
| 1,268 | | LVMH Moet Hennessy Louis Vuitton SE | | | 793,765 | | | | 0.4 |
| 31,462 | | Sanofi | | | 3,049,374 | | | | 1.4 |
| 53,951 | | Thales S.A. | | | 4,936,097 | | | | 2.2 |
| | | | | | 15,288,032 | | | | 6.9 |
| | | | | | | | | | |
| | | Germany: 4.2% | | | | | | | |
| 21,809 | | Bayer AG | | | 1,284,787 | | | | 0.6 |
| 5,346 | | Beiersdorf AG | | | 614,570 | | | | 0.3 |
| 48,022 | (1),(3) | Evotec AG | | | 1,774,493 | | | | 0.8 |
| 9,994 | | Knorr-Bremse AG | | | 1,363,512 | | | | 0.6 |
| 2,684 | | Merck KGaA | | | 460,342 | | | | 0.2 |
| 11,360 | (1) | Morphosys AG | | | 1,328,197 | | | | 0.6 |
| 5,443 | | SAP SE | | | 704,966 | | | | 0.3 |
| 20,149 | (1),(2) | TeamViewer AG | | | 1,082,346 | | | | 0.5 |
| 6,015 | (1),(2) | Zalando SE | | | 669,053 | | | | 0.3 |
| | | | | | 9,282,266 | | | | 4.2 |
| | | | | | | | | | |
| | | Hong Kong: 2.0% | | | | | | | |
| 364,200 | | AIA Group Ltd. | | | 4,438,186 | | | | 2.0 |
| | | | | | | | | | |
| | | India: 4.5% | | | | | | | |
| 234,082 | (1) | Axis Bank Ltd. | | | 1,992,489 | | | | 0.9 |
| 119,389 | | Housing Development Finance Corp. | | | 4,182,907 | | | | 1.9 |
| 29,237 | (1) | Kotak Mahindra Bank Ltd. | | | 799,067 | | | | 0.3 |
| 11,936 | | Maruti Suzuki India Ltd. | | | 1,252,308 | | | | 0.6 |
| 1,406,378 | | NTPC Ltd. | | | 1,914,940 | | | | 0.8 |
| | | | | | 10,141,711 | | | | 4.5 |
| | | | | | | | | | |
| | | Indonesia: 1.7% | | | | | | | |
| 1,052,200 | | Bank Central Asia Tbk PT | | | 2,536,360 | | | | 1.1 |
| 19,896,300 | | Sarana Menara Nusantara Tbk PT | | | 1,360,244 | | | | 0.6 |
| | | | | | 3,896,604 | | | | 1.7 |
| | | | | | | | | | |
| | | Italy: 1.4% | | | | | | | |
| 166,235 | | Banca Mediolanum SpA | | | 1,444,139 | | | | 0.6 |
| 6,198 | | DiaSorin SpA | | | 1,294,077 | | | | 0.6 |
| 57,904 | | Terna Rete Elettrica | | | | | | | |
| | | Nazionale SpA | | | 444,942 | | | | 0.2 |
| | | | | | 3,183,158 | | | | 1.4 |
| | | | | | | | | | |
| | | Japan: 15.2% | | | | | | | |
| 28,500 | | Daiichi Sankyo Co., Ltd. | | | 976,701 | | | | 0.4 |
| 3,000 | | Disco Corp. | | | 1,011,099 | | | | 0.5 |
| 11,400 | | en-japan, Inc. | | | 342,450 | | | | 0.2 |
| 69,400 | | Fujitsu General Ltd. | | | 1,882,089 | | | | 0.9 |
| 13,100 | (3) | Hoshizaki Corp. | | | 1,202,899 | | | | 0.5 |
| 35,400 | | Kansai Paint Co., Ltd. | | | 1,091,218 | | | | 0.5 |
| 12,700 | (3) | Kao Corp. | | | 981,154 | | | | 0.4 |
| 29,600 | | Murata Manufacturing Co., Ltd. | | | 2,679,675 | | | | 1.2 |
| 140,900 | | Nippon Telegraph & Telephone Corp. | | | 3,615,354 | | | | 1.6 |
| 27,300 | | ORIX Corp. | | | 419,986 | | | | 0.2 |
| 72,300 | (3) | Otsuka Holdings Co. Ltd. | | | 3,097,796 | | | | 1.4 |
| 77,400 | | Outsourcing, Inc. | | | 1,040,531 | | | | 0.5 |
| 48,500 | | Pan Pacific International Holdings Corp. | | | 1,120,530 | | | | 0.5 |
| 84,600 | | Persol Holdings Co. Ltd. | | | 1,528,445 | | | | 0.7 |
| 46,300 | | Seven & I Holdings Co., Ltd. | | | 1,639,511 | | | | 0.7 |
| 25,300 | | Shimadzu Corp. | | | 983,410 | | | | 0.4 |
| 13,000 | | Sony Corp. | | | 1,309,985 | | | | 0.6 |
| 46,600 | | Stanley Electric Co., Ltd. | | | 1,503,290 | | | | 0.7 |
| 19,500 | | Suzuki Motor Corp. | | | 903,933 | | | | 0.4 |
| 80,360 | | Takeda Pharmaceutical Co., Ltd. | | | 2,908,178 | | | | 1.3 |
| 12,500 | | Terumo Corp. | | | 523,078 | | | | 0.2 |
| 505,300 | | Z Holdings Corp. | | | 3,057,689 | | | | 1.4 |
| | | | | | 33,819,001 | | | | 15.2 |
See Accompanying Notes to Financial Statements
| VY® T. Rowe Price International Stock Portfolio | PORTFOLIO OF INVESTMENTS
AS OF December 31, 2020 (Continued) |
| | | Netherlands: 7.9% | | | | | |
| 378 | (1),(2) | Adyen NV | | | 878,293 | | | | 0.4 |
| 24,192 | | Akzo Nobel NV | | | 2,596,623 | | | | 1.2 |
| 7,659 | | ASML Holding NV | | | 3,708,291 | | | | 1.6 |
| 68,136 | (1) | Koninklijke Philips NV | | | 3,670,297 | | | | 1.6 |
| 17,832 | | NXP Semiconductor NV - NXPI - US | | | 2,835,467 | | | | 1.3 |
| 36,889 | | Prosus NV | | | 3,983,202 | | | | 1.8 |
| | | | | | 17,672,173 | | | | 7.9 |
| | | | | | | | | | |
| | | Peru: 0.5% | | | | | | | |
| 6,764 | | Credicorp Ltd. | | | 1,109,431 | | | | 0.5 |
| | | | | | | | | | |
| | | Philippines: 0.4% | | | | | | | |
| 36,995 | | SM Investments Corp. | | | 808,548 | | | | 0.4 |
| | | | | | | | | | |
| | | Poland: 0.7% | | | | | | | |
| 183,782 | (1) | Powszechny Zaklad Ubezpieczen SA | | | 1,596,659 | | | | 0.7 |
| | | | | | | | | | |
| | | Portugal: 2.2% | | | | | | | |
| 253,361 | | Galp Energia SGPS SA | | | 2,684,698 | | | | 1.2 |
| 134,307 | | Jeronimo Martins SGPS SA | | | 2,257,649 | | | | 1.0 |
| | | | | | 4,942,347 | | | | 2.2 |
| | | | | | | | | | |
| | | Russia: 0.5% | | | | | | | |
| 78,338 | | Sberbank PAO ADR | | | 1,135,901 | | | | 0.5 |
| | | | | | | | | | |
| | | South Africa: 3.0% | | | | | | | |
| 10,643 | (1) | Capitec Bank Holdings Ltd. | | | 1,040,835 | | | | 0.5 |
| 27,867 | | Naspers Ltd. | | | 5,706,456 | | | | 2.5 |
| | | | | | 6,747,291 | | | | 3.0 |
| | | | | | | | | | |
| | | South Korea: 5.7% | | | | | | | |
| 1,080 | | LG Household & Health Care Ltd. | | | 1,611,927 | | | | 0.7 |
| 18,618 | | NAVER Corp. | | | 5,018,841 | | | | 2.3 |
| 80,231 | | Samsung Electronics Co., Ltd. | | | 5,991,291 | | | | 2.7 |
| | | | | | 12,622,059 | | | | 5.7 |
| | | | | | | | | | |
| | | Spain: 0.4% | | | | | | | |
| 11,378 | | Amadeus IT Group SA | | | 839,888 | | | | 0.4 |
| | | | | | | | | | |
| | | Sweden: 1.7% | | | | | | | |
| 38,323 | | Assa Abloy AB | | | 947,038 | | | | 0.4 |
| 31,703 | | Essity AB | | | 1,021,445 | | | | 0.5 |
| 100,602 | (1) | Swedbank AB | | | 1,764,598 | | | | 0.8 |
| | | | | | 3,733,081 | | | | 1.7 |
| | | | | | | | | | |
| | | Switzerland: 6.8% | | | | | | | |
| 17,559 | (1) | Alcon, Inc. | | | 1,165,850 | | | | 0.5 |
| 51,691 | | Julius Baer Group Ltd. | | | 2,977,998 | | | | 1.3 |
| 5,915 | | Lonza Group AG | | | 3,810,247 | | | | 1.7 |
| 33,459 | | Nestle SA | | | 3,955,232 | | | | 1.8 |
| 6,213 | | Roche Holding AG | | | 2,163,979 | | | | 1.0 |
| 7,616 | | Temenos AG | | | 1,061,134 | | | | 0.5 |
| | | | | | 15,134,440 | | | | 6.8 |
| | | | | | | | | | |
| | | Taiwan: 3.4% | | | | | | | |
| 397,000 | | Taiwan Semiconductor | | | | | | | |
| | | Manufacturing Co., Ltd. | | | 7,510,237 | | | | 3.4 |
| | | | | | | | | | |
| | | Thailand: 0.5% | | | | | | | |
| 614,300 | (1) | CP ALL PCL (Foreign) | | | 1,193,874 | | | | 0.5 |
| | | | | | | | | | |
| | | United Arab Emirates: 0.7% | | | | | |
| 352,606 | (1),(2) | Network International | | | | | | | |
| | | Holdings PLC | | | 1,588,740 | | | | 0.7 |
| | | | | | | | | | |
| | | United Kingdom: 8.5% | | | | | | | |
| 246,294 | (1) | boohoo Group PLC | | | 1,156,177 | | | | 0.5 |
| 54,046 | (1) | Burberry Group PLC | | | 1,319,812 | | | | 0.6 |
| 77,390 | (1) | CNH Industrial NV | | | 972,819 | | | | 0.4 |
| 12,663 | (1) | Farfetch Ltd. - Class A | | | 808,026 | | | | 0.3 |
| 57,125 | (1) | Hiscox Ltd. | | | 777,916 | | | | 0.4 |
| 81,880 | | HomeServe PLC | | | 1,146,482 | | | | 0.5 |
| 11,306 | | Linde PLC | | | 2,981,109 | | | | 1.4 |
| 23,976 | | London Stock Exchange Group PLC | | | 2,959,520 | | | | 1.3 |
| 83,660 | | Smith & Nephew PLC | | | 1,737,828 | | | | 0.8 |
| 37,029 | (1) | THG Holdings Ltd. | | | 394,971 | | | | 0.2 |
| 76,929 | | Unilever PLC | | | 4,658,106 | | | | 2.1 |
| | | | | | 18,912,766 | | | | 8.5 |
| | | | | | | | | | |
| | | United States: 2.4% | | | | | | | |
| 41,459 | | Philip Morris | | | | | | | |
| | | International, Inc. | | | 3,432,390 | | | | 1.6 |
| 8,305 | | Visa, Inc. - Class A | | | 1,816,553 | | | | 0.8 |
| | | | | | 5,248,943 | | | | 2.4 |
| | | | | | | | | | |
| | Total Common Stock
(Cost $153,738,918) | | | 214,472,126 | | | | 96.2 |
| PREFERRED STOCK: 0.6% | | | | | | | |
| | | China: 0.2% | | | | | | | |
| 9,427 | (1),(4),(5) | Xiaoju Kuaizhi, Inc., Series A-17 (DiDi Chuxing, Inc.) | | | 395,934 | | | | 0.2 |
| | | | | | | | | | |
| | | Germany: 0.1% | | | | | | | |
| 802 | | Sartorius AG | | | 337,784 | | | | 0.1 |
| | | | | | | | | | |
| | | United Kingdom: 0.3% | | | | | | | |
| 990 | (1),(4),(5) | Roofoods Ltd. - Series G | | | 636,857 | | | | 0.3 |
| | | | | | | | | | |
| | | Total Preferred Stock
(Cost $774,002) | | | 1,370,575 | | | | 0.6 |
| | | | | | | | | | |
| | | | | | | | | | |
| | | Total Long-Term Investments
(Cost $154,512,920) | | | 215,842,701 | | | | 96.8 |
| | | | | | | | Percentage |
| Principal | | | | | | | of Net |
| Amount† | | | | Value | | | Assets |
| SHORT-TERM INVESTMENTS: 4.3% | | | | | |
| | | Repurchase Agreements: 1.9% | | | | | | | |
| 1,000,000 | (6) | Citigroup, Inc., Repurchase Agreement dated 12/31/20, 0.07%, due 01/04/21 (Repurchase Amount $1,000,008, collateralized by various U.S. Government/U.S. Government Agency Obligations, 0.000%- 4.000%, Market Value plus accrued interest $1,020,000, due 09/15/21-01/01/51) | | | 1,000,000 | | | | 0.5 |
See Accompanying Notes to Financial Statements
| VY® T. Rowe Price International Stock Portfolio | PORTFOLIO OF INVESTMENTS
AS OF December 31, 2020 (Continued) |
| 1,000,000 | (6) | Daiwa Capital Markets, Repurchase Agreement dated 12/31/20, 0.07%, due 01/04/21 (Repurchase Amount $1,000,008, collateralized by various U.S. Government/U.S. Government Agency Obligations, 0.000%- 6.500%, Market Value plus accrued interest $1,020,000, due 01/26/21-01/01/51) | | | 1,000,000 | | | | 0.4 |
| 1,000,000 | (6) | Deutsche Bank Securities Inc., Repurchase Agreement dated 12/31/20, 0.06%, due 01/04/21 (Repurchase Amount $1,000,007, collateralized by various U.S. Government/U.S. Government Agency Obligations, 0.000%- 6.500%, Market Value plus accrued interest $1,020,000, due 01/15/21-01/01/51) | | | 1,000,000 | | | | 0.4 |
| 249,056 | (6) | Nomura Securities, Repurchase Agreement dated 12/31/20, 0.07%, due 01/04/21 (Repurchase Amount $249,058, collateralized by various U.S. Government/U.S. Government Agency Obligations, 0.000%- 8.500%, Market Value plus accrued interest $254,037, due 01/31/21-01/15/56) | | | 249,056 | | | | 0.1 |
| 1,000,000 | (6) | RBC Dominion Securities Inc., Repurchase Agreement dated 12/31/20, 0.08%, due 01/04/21 (Repurchase Amount $1,000,009, collateralized by various U.S. Government/U.S. Government Agency Obligations, 0.000%- 6.000%, Market Value plus accrued interest $1,020,000, due 01/05/21-12/20/50) | | | 1,000,000 | | | | 0.5 |
| | | | | | | | | | |
| | Total Repurchase Agreements
(Cost $4,249,056) | | | 4,249,056 | | | | 1.9 |
| | | | | | | | | | Percentage |
| | | | | | | | | | of Net |
| Shares | | | | | Value | | | | Assets |
| | | Mutual Funds: 2.4% | | | | | | | |
| 5,344,692 | (7) | T. Rowe Price
Government Reserve
Fund, 0.080%
(Cost $5,344,692) | | | 5,344,692 | | | | 2.4 |
| | | | | | | | | | |
| Total Short-Term Investments
(Cost $9,593,748) | | | 9,593,748 | | | | 1.3 |
| | | | | | | | | | |
| | Total Investments in Securities
(Cost $164,106,668) | | $ | 225,436,449 | | | | 101.1 |
| | Liabilities in Excess of Other Assets | | | (2,473,943 | ) | | | (1.1) |
| | Net Assets | | $ | 222,962,506 | | | | 100.0 |
| † | Unless otherwise indicated, principal amount is shown in USD. |
| | ADR | American Depositary Receipt |
| (1) | Non-income producing security. |
| (2) | Securities with purchases pursuant to Rule 144A or section 4(a)(2), under the Securities Act of 1933 and may not be resold subject to that rule except to qualified institutional buyers. |
| (3) | Security, or a portion of the security, is on loan. |
| (4) | For fair value measurement disclosure purposes, security is categorized as Level 3, whose value was determined using significant unobservable inputs. |
| (5) | Restricted security as to resale, excluding Rule 144A securities. As of December 31, 2020, the Portfolio held restricted securities with a fair value of $1,032,791 or 0.5% of net assets. Please refer to the table below for additional details. |
| (6) | All or a portion of the security represents securities purchased with cash collateral received for securities on loan. |
| (7) | Rate shown is the 7-day yield as of December 31, 2020. |
| Voya Balanced Income Portfolio | PORTFOLIO OF INVESTMENTS
AS OF December 31, 2020 |
| | | | | | | | Percentage |
| | | | | | | | of Net |
| Shares | | | | Value | | | Assets |
| COMMON STOCK: 44.8% | | | | | | | |
| | | Communication Services: 2.7% | | | | | | | |
| 13,213 | | Activision Blizzard, Inc. | | $ | 1,226,827 | | | | 0.4 |
| 56,310 | | AT&T, Inc. | | | 1,619,476 | | | | 0.5 |
| 84,921 | | CenturyLink, Inc. | | | 827,980 | | | | 0.2 |
| 35,993 | | Comcast Corp. – Class A | | | 1,886,033 | | | | 0.5 |
| 9,600 | | Deutsche Telekom AG | | | 175,224 | | | | 0.1 |
| 1,299 | | Elisa OYJ | | | 71,210 | | | | 0.0 |
| 37,000 | | HKT Trust / HKT Ltd. | | | 47,986 | | | | 0.0 |
| 500 | | KDDI Corp. | | | 14,825 | | | | 0.0 |
| 2,500 | | Konami Holdings Corp. | | | 140,666 | | | | 0.1 |
| 8,990 | | Koninklijke KPN NV | | | 27,323 | | | | 0.0 |
| 8,220 | | New York Times Co. | | | 425,549 | | | | 0.1 |
| 300 | | Nintendo Co., Ltd. | | | 192,582 | | | | 0.1 |
| 3,700 | | Nippon Telegraph & Telephone Corp. | | | 94,938 | | | | 0.0 |
| 10,500 | | Orange SA | | | 125,002 | | | | 0.1 |
| 40,000 | | PCCW Ltd. | | | 24,088 | | | | 0.0 |
| 38,600 | | Singapore Telecommunications Ltd. | | | 67,401 | | | | 0.0 |
| 9,900 | | SoftBank Corp. | | | 124,265 | | | | 0.0 |
| 15,659 | | Spark New Zealand Ltd. | | | 53,041 | | | | 0.0 |
| 15,476 | | Telefonica Deutschland Holding AG | | | 42,625 | | | | 0.0 |
| 13,931 | | Telephone & Data Systems, Inc. | | | 258,699 | | | | 0.1 |
| 30,130 | | Verizon Communications, Inc. | | | 1,770,137 | | | | 0.5 |
| 18,245 | | Vodafone Group PLC | | | 29,967 | | | | 0.0 |
| | | | | | 9,245,844 | | | | 2.7 |
| | | | | | | | | | |
| | | Consumer Discretionary: 2.5% | | | | | | | |
| 500 | | ABC-Mart, Inc. | | | 27,801 | | | | 0.0 |
| 1,400 | | Benesse Holdings, Inc. | | | 27,351 | | | | 0.0 |
| 425 | | Cie Generale des Etablissements Michelin SCA | | | 54,721 | | | | 0.0 |
| 600 | | Denso Corp. | | | 35,712 | | | | 0.0 |
| 4,792 | | Dollar General Corp. | | | 1,007,758 | | | | 0.3 |
| 17,820 | | eBay, Inc. | | | 895,455 | | | | 0.3 |
| 274 | | Ferrari NV | | | 63,552 | | | | 0.0 |
| 1,355 | | Garmin Ltd. | | | 162,139 | | | | 0.0 |
| 27,558 | | Gentex Corp. | | | 935,043 | | | | 0.3 |
| 98 | | Hermes International | | | 105,377 | | | | 0.0 |
| 100 | | Hikari Tsushin, Inc. | | | 23,463 | | | | 0.0 |
| 2,855 | | Home Depot, Inc. | | | 758,345 | | | | 0.2 |
| 1,300 | (1) | McDonald’s Holdings Co. Japan Ltd. | | | 63,000 | | | | 0.0 |
| 500 | | Nitori Co., Ltd. | | | 104,551 | | | | 0.0 |
| 4,700 | | Pan Pacific International Holdings Corp. | | | 108,587 | | | | 0.0 |
| 429 | | Pandora A/S | | | 48,013 | | | | 0.0 |
| 2,879 | | Persimmon PLC | | | 108,662 | | | | 0.1 |
| 2,802 | | Pool Corp. | | | 1,043,745 | | | | 0.3 |
| 5,400 | | Sekisui House Ltd. | | | 110,008 | | | | 0.1 |
| 19,970 | | Service Corp. International | | | 980,527 | | | | 0.3 |
| 7,311 | | Target Corp. | | | 1,290,611 | | | | 0.4 |
| 2,901 | | Tractor Supply Co. | | | 407,822 | | | | 0.1 |
| 3,651 | | Wesfarmers Ltd. | | | 141,904 | | | | 0.1 |
| 4,100 | | Yamada Holdings Co. Ltd. | | | 21,783 | | | | 0.0 |
| | | | | | 8,525,930 | | | | 2.5 |
| | | | | | | | | | |
| | | Consumer Staples: 3.9% | | | | | | | |
| 5,300 | | Ajinomoto Co., Inc. | | | 120,097 | | | | 0.1 |
| 23,765 | | Altria Group, Inc. | | | 974,365 | | | | 0.3 |
| 240 | | Beiersdorf AG | | | 27,590 | | | | 0.0 |
| 1,692 | | British American Tobacco PLC | | | 62,836 | | | | 0.0 |
| 1,100 | | Calbee, Inc. | | | 33,159 | | | | 0.0 |
| 746 | | Carlsberg A/S | | | 119,593 | | | | 0.1 |
| 2,311 | | Coca-Cola Amatil Ltd. | | | 23,027 | | | | 0.0 |
| 1,466 | | Danone | | | 96,471 | | | | 0.0 |
| 2,133 | | Essity AB | | | 68,723 | | | | 0.0 |
| 967 | | Etablissements Franz Colruyt NV | | | 57,259 | | | | 0.0 |
| 21,165 | | Flowers Foods, Inc. | | | 478,964 | | | | 0.1 |
| 15,455 | | General Mills, Inc. | | | 908,754 | | | | 0.3 |
| 6,344 | | Hershey Co. | | | 966,382 | | | | 0.3 |
| 5,838 | | Imperial Brands PLC | | | 122,450 | | | | 0.1 |
| 13,050 | | J Sainsbury Plc | | | 40,112 | | | | 0.0 |
| 6,053 | | Kimberly-Clark Corp. | | | 816,126 | | | | 0.2 |
| 2,966 | | Koninklijke Ahold Delhaize NV | | | 83,674 | | | | 0.0 |
| 1,000 | | Lawson, Inc. | | | 46,536 | | | | 0.0 |
| 1,300 | | MEIJI Holdings Co., Ltd. | | | 91,494 | | | | 0.0 |
| 8,729 | | Mondelez International, Inc. | | | 510,385 | | | | 0.1 |
| 4,168 | | Nestle SA | | | 492,705 | | | | 0.2 |
| 5,945 | | Orkla ASA | | | 60,356 | | | | 0.0 |
| 8,994 | | PepsiCo, Inc. | | | 1,333,810 | | | | 0.4 |
| 16,880 | | Philip Morris International, Inc. | | | 1,397,495 | | | | 0.4 |
| 15,777 | | Procter & Gamble Co. | | | 2,195,212 | | | | 0.6 |
| 1,134 | | Reckitt Benckiser Group PLC | | | 101,214 | | | | 0.0 |
| 2,900 | | Seven & I Holdings Co., Ltd. | | | 102,691 | | | | 0.1 |
| 1,300 | | Sundrug Co., Ltd. | | | 51,957 | | | | 0.0 |
| 772 | | Swedish Match AB | | | 60,078 | | | | 0.0 |
| 900 | | Toyo Suisan Kaisha Ltd. | | | 43,800 | | | | 0.0 |
| 700 | | Tsuruha Holdings, Inc. | | | 99,543 | | | | 0.0 |
| 3,247 | | Unilever PLC | | | 196,608 | | | | 0.1 |
| 9,573 | | Walgreens Boots Alliance, Inc. | | | 381,771 | | | | 0.1 |
| 9,393 | | Walmart, Inc. | | | 1,354,001 | | | | 0.4 |
| 2,300 | | Welcia Holdings Co. Ltd. | | | 86,762 | | | | 0.0 |
| 33,991 | | WM Morrison Supermarkets PLC | | | 82,248 | | | | 0.0 |
| | | | | | 13,688,248 | | | | 3.9 |
| | | | | | | | | | |
| | | Energy: 1.1% | | | | | | | |
| 33,888 | | BP PLC | | | 116,939 | | | | 0.1 |
| 13,108 | | Chevron Corp. | | | 1,106,971 | | | | 0.3 |
| 6,054 | | ConocoPhillips | | | 242,099 | | | | 0.1 |
| 13,100 | | ENEOS Holdings, Inc. | | | 47,051 | | | | 0.0 |
| 9,184 | | ENI S.p.A. | | | 95,878 | | | | 0.0 |
| 93,888 | | Equitrans Midstream Corp. | | | 754,859 | | | | 0.2 |
| 38,576 | | Kinder Morgan, Inc. | | | 527,334 | | | | 0.2 |
| 2,302 | | Repsol SA | | | 23,191 | | | | 0.0 |
| 1,070 | (1) | Total SE | | | 46,183 | | | | 0.0 |
| 43,372 | | Williams Cos., Inc. | | | 869,609 | | | | 0.2 |
| | | | | | 3,830,114 | | | | 1.1 |
| | | | | | | | | | |
| | | Financials: 3.9% | | | | | | | |
| 8,586 | | 3i Group PLC | | | 135,804 | | | | 0.1 |
| 2,827 | | Admiral Group Plc | | | 111,785 | | | | 0.0 |
| 94 | | Allianz SE | | | 23,093 | | | | 0.0 |
| 6,717 | | Allstate Corp. | | | 738,400 | | | | 0.2 |
| 8,437 | | Assicurazioni Generali S.p.A. | | | 147,717 | | | | 0.1 |
See Accompanying Notes to Financial Statements
| Voya Balanced Income Portfolio | PORTFOLIO OF INVESTMENTS
AS OF December 31, 2020 (Continued) |
| 1,604 | | ASX Ltd. | | | 89,017 | | | | 0.0 |
| 10,660 | | Australia & New Zealand Banking Group Ltd. | | | 187,063 | | | | 0.1 |
| 13,765 | | Bank Leumi Le-Israel BM | | | 81,252 | | | | 0.0 |
| 1,074 | | Blackrock, Inc. | | | 774,934 | | | | 0.2 |
| 40,500 | | BOC Hong Kong Holdings Ltd. | | | 122,765 | | | | 0.0 |
| 751 | | Deutsche Boerse AG | | | 127,874 | | | | 0.1 |
| 18,537 | | Direct Line Insurance Group PLC | | | 81,076 | | | | 0.0 |
| 1,910 | | Erie Indemnity Co. | | | 469,096 | | | | 0.1 |
| 6,430 | (2) | FinecoBank Banca Fineco SpA | | | 106,043 | | | | 0.0 |
| 1,402 | | Hanover Insurance Group, Inc. | | | 163,922 | | | | 0.1 |
| 10,089 | | Intercontinental Exchange, Inc. | | | 1,163,161 | | | | 0.3 |
| 68,422 | (2) | Intesa Sanpaolo SpA | | | 161,729 | | | | 0.1 |
| 8,652 | | Israel Discount Bank Ltd. | | | 33,406 | | | | 0.0 |
| 11,046 | | JPMorgan Chase & Co. | | | 1,403,615 | | | | 0.4 |
| 1,086 | | London Stock Exchange Group PLC | | | 134,052 | | | | 0.1 |
| 768 | | Macquarie Group Ltd. | | | 81,976 | | | | 0.0 |
| 17,268 | | Mapfre SA | | | 33,747 | | | | 0.0 |
| 1,972 | | MarketAxess Holdings,Inc. | | | 1,125,144 | | | | 0.3 |
| 39,351 | | Medibank Pvt Ltd. | | | 91,143 | | | | 0.0 |
| 4,694 | | Mercury General Corp. | | | 245,074 | | | | 0.1 |
| 881 | | Mizrahi Tefahot Bank Ltd. | | | 20,437 | | | | 0.0 |
| 2,200 | | MS&AD Insurance Group Holdings, Inc. | | | 66,935 | | | | 0.0 |
| 1,718 | | MSCI, Inc. - Class A | | | 767,138 | | | | 0.2 |
| 283 | | Muenchener Rueckversicherungs- Gesellschaft AG | | | 84,086 | | | | 0.0 |
| 6,251 | | Nasdaq, Inc. | | | 829,758 | | | | 0.3 |
| 54,190 | (2) | Natwest Group PLC | | | 123,878 | | | | 0.0 |
| 10,993 | | Progressive Corp. | | | 1,086,988 | | | | 0.3 |
| 3,220 | | S&P Global, Inc. | | | 1,058,511 | | | | 0.3 |
| 2,329 | (2) | SCOR SE | | | 75,544 | | | | 0.0 |
| 11,900 | | Singapore Exchange Ltd. | | | 83,586 | | | | 0.0 |
| 4,100 | | Sumitomo Mitsui Financial Group, Inc. | | | 127,092 | | | | 0.0 |
| 7,373 | | T. Rowe Price Group, Inc. | | | 1,116,198 | | | | 0.3 |
| 1,190 | | Travelers Cos, Inc. | | | 167,040 | | | | 0.1 |
| 415 | | Zurich Insurance Group AG | | | 174,890 | | | | 0.1 |
| | | | | | 13,614,969 | | | | 3.9 |
| | | | | | | | | | |
| | | Health Care: 6.8% | | | | | | | |
| 16,331 | | AbbVie, Inc. | | | 1,749,867 | | | | 0.5 |
| 9,139 | | AmerisourceBergen Corp. | | | 893,429 | | | | 0.2 |
| 5,761 | | Amgen, Inc. | | | 1,324,569 | | | | 0.4 |
| 729 | | Anthem, Inc. | | | 234,075 | | | | 0.1 |
| 5,300 | | Astellas Pharma, Inc. | | | 82,064 | | | | 0.0 |
| 12,366 | | Baxter International, Inc. | | | 992,248 | | | | 0.3 |
| 22,526 | | Bristol-Myers Squibb Co. | | | 1,397,288 | | | | 0.4 |
| 16,341 | | Cardinal Health, Inc. | | | 875,224 | | | | 0.2 |
| 12,759 | | Cerner Corp. | | | 1,001,326 | | | | 0.3 |
| 1,083 | | Chemed Corp. | | | 576,817 | | | | 0.2 |
| 751 | | Coloplast A/S | | | 114,850 | | | | 0.0 |
| 8,848 | | Eli Lilly & Co. | | | 1,493,896 | | | | 0.4 |
| 749 | | Fisher & Paykel Healthcare Corp. Ltd. | | | 17,788 | | | | 0.0 |
| 17,934 | | Gilead Sciences, Inc. | | | 1,044,835 | | | | 0.3 |
| 10,375 | | GlaxoSmithKline PLC | | | 189,842 | | | | 0.1 |
| 2,376 | | Hikma Pharmaceuticals PLC | | | 81,665 | | | | 0.0 |
| 900 | | Hoya Corp. | | | 124,645 | | | | 0.1 |
| 704 | | Humana, Inc. | | | 288,830 | | | | 0.1 |
| 16,217 | | Johnson & Johnson | | | 2,552,231 | | | | 0.7 |
| 790 | (2) | Koninklijke Philips NV | | | 42,555 | | | | 0.0 |
| 4,188 | | McKesson Corp. | | | 728,377 | | | | 0.2 |
| 1,700 | | Medipal Holdings Corp. | | | 31,969 | | | | 0.0 |
| 8,384 | | Medtronic PLC | | | 982,102 | | | | 0.3 |
| 20,047 | | Merck & Co., Inc. | | | 1,639,844 | | | | 0.5 |
| 200 | | Nippon Shinyaku Co., Ltd. | | | 13,128 | | | | 0.0 |
| 3,001 | | Novartis AG | | | 282,568 | | | | 0.1 |
| 3,372 | | Novo Nordisk A/S | | | 235,228 | | | | 0.1 |
| 2,500 | | Olympus Corp. | | | 54,735 | | | | 0.0 |
| 1,314 | | Orion Oyj | | | 60,358 | | | | 0.0 |
| 45,000 | | Pfizer, Inc. | | | 1,656,450 | | | | 0.5 |
| 1,199 | | Recordati Industria Chimica e Farmaceutica SpA | | | 66,674 | | | | 0.0 |
| 1,055 | | Roche Holding AG | | | 367,455 | | | | 0.1 |
| 2,214 | | Sanofi | | | 214,586 | | | | 0.1 |
| 1,500 | | Santen Pharmaceutical Co., Ltd. | | | 24,362 | | | | 0.0 |
| 1,800 | | Shionogi & Co., Ltd. | | | 98,409 | | | | 0.0 |
| 5,751 | | Smith & Nephew PLC | | | 119,463 | | | | 0.1 |
| 700 | | Suzuken Co., Ltd. | | | 25,322 | | | | 0.0 |
| 743 | | UCB S.A. | | | 76,749 | | | | 0.0 |
| 1,842 | | UnitedHealth Group, Inc. | | | 645,952 | | | | 0.2 |
| 5,583 | (2) | Viatris, Inc. | | | 104,625 | | | | 0.0 |
| 6,462 | | Zoetis, Inc. | | | 1,069,461 | | | | 0.3 |
| | | | | | 23,575,861 | | | | 6.8 |
| | | | | | | | | | |
| | | Industrials: 4.4% | | | | | | | |
| 813 | | 3M Co. | | | 142,104 | | | | 0.1 |
| 32,367 | | Aurizon Holdings Ltd. | | | 97,244 | | | | 0.0 |
| 2,453 | | Bouygues SA | | | 100,886 | | | | 0.0 |
| 7,091 | | Brambles Ltd. | | | 58,163 | | | | 0.0 |
| 2,107 | | CH Robinson Worldwide, Inc. | | | 197,784 | | | | 0.1 |
| 6,500 | | CK Hutchison Holdings Ltd. | | | 45,382 | | | | 0.0 |
| 7,790 | | CSX Corp. | | | 706,942 | | | | 0.2 |
| 400 | | Daikin Industries Ltd. | | | 88,987 | | | | 0.0 |
| 3,339 | | Deutsche Post AG | | | 165,399 | | | | 0.1 |
| 863 | | DSV PANALPINA A/S | | | 145,037 | | | | 0.1 |
| 1,053 | (2) | Eiffage SA | | | 101,784 | | | | 0.0 |
| 3,390 | | Expeditors International Washington, Inc. | | | 322,423 | | | | 0.1 |
| 2,877 | | Fastenal Co. | | | 140,484 | | | | 0.1 |
| 4,185 | | Ferrovial SA - FERE | | | 115,717 | | | | 0.0 |
| 720 | | GEA Group AG | | | 25,752 | | | | 0.0 |
| 5,400 | | Itochu Corp. | | | 155,305 | | | | 0.1 |
| 1,000 | | Jardine Matheson Holdings Ltd. | | | 55,938 | | | | 0.0 |
| 1,700 | | Kamigumi Co., Ltd. | | | 31,056 | | | | 0.0 |
| 2,268 | | Kansas City Southern | | | 462,967 | | | | 0.1 |
| 3,154 | | Knight-Swift Transportation Holdings, Inc. | | | 131,900 | | | | 0.0 |
| 1,537 | | Kone Oyj | | | 125,234 | | | | 0.1 |
| 2,977 | | Landstar System, Inc. | | | 400,883 | | | | 0.1 |
| 737 | | Legrand S.A. | | | 65,929 | | | | 0.0 |
| 5,400 | | LIXIL Group Corp. | | | 117,108 | | | | 0.0 |
| 3,066 | | Lockheed Martin Corp. | | | 1,088,369 | | | | 0.3 |
| 4,700 | | Mitsubishi Corp. | | | 115,864 | | | | 0.0 |
| 3,300 | | Mitsubishi Heavy Industries Ltd. | | | 101,066 | | | | 0.0 |
| 900 | | Miura Co., Ltd. | | | 50,245 | | | | 0.0 |
See Accompanying Notes to Financial Statements
| Voya Balanced Income Portfolio | PORTFOLIO OF INVESTMENTS
AS OF December 31, 2020 (Continued) |
| 2,535 | | MSC Industrial Direct Co. | | | 213,929 | | | | 0.1 |
| 14,500 | | MTR Corp. | | | 81,093 | | | | 0.0 |
| 1,230 | | Old Dominion Freight Line | | | 240,071 | | | | 0.1 |
| 1,677 | (2) | Randstad NV | | | 108,556 | | | | 0.0 |
| 6,299 | | Relx PLC (GBP Exchange) | | | 154,121 | | | | 0.1 |
| 9,415 | | Republic Services, Inc. | | | 906,664 | | | | 0.3 |
| 23,994 | | Rollins, Inc. | | | 937,446 | | | | 0.3 |
| 2,495 | | Roper Technologies, Inc. | | | 1,075,570 | | | | 0.3 |
| 435 | | Schindler Holding AG - Part Cert | | | 117,641 | | | | 0.1 |
| 365 | | Schneider Electric SE | | | 52,752 | | | | 0.0 |
| 1,300 | | Secom Co., Ltd. | | | 119,927 | | | | 0.1 |
| 4,700 | | SG Holdings Co. Ltd. | | | 128,152 | | | | 0.1 |
| 620 | | Siemens AG | | | 89,308 | | | | 0.0 |
| 327 | (2) | Siemens Energy AG | | | 11,984 | | | | 0.0 |
| 700 | | Sohgo Security Services Co., Ltd. | | | 36,313 | | | | 0.0 |
| 7,700 | | Sumitomo Corp. | | | 102,048 | | | | 0.0 |
| 4,637 | | United Parcel Service, Inc. - Class B | | | 780,871 | | | | 0.2 |
| 5,010 | | Verisk Analytics, Inc. | | | 1,040,026 | | | | 0.3 |
| 245 | | Vinci SA | | | 24,404 | | | | 0.0 |
| 7,742 | | Waste Connections, Inc. | | | 794,097 | | | | 0.2 |
| 8,698 | | Waste Management, Inc. | | | 1,025,755 | | | | 0.3 |
| 3,646 | | Watsco, Inc. | | | 826,001 | | | | 0.2 |
| 17,893 | | Werner Enterprises, Inc. | | | 701,763 | | | | 0.2 |
| 1,488 | | Wolters Kluwer NV | | | 125,538 | | | | 0.0 |
| 2,800 | | Yamato Holdings Co., Ltd. | | | 71,492 | | | | 0.0 |
| | | | | | 15,121,474 | | | | 4.4 |
| | | | | | | | | | |
| | | Information Technology: 14.8% | | | | | | | |
| 6,015 | | Accenture PLC | | | 1,571,178 | | | | 0.5 |
| 14,581 | | Amdocs Ltd. | | | 1,034,230 | | | | 0.3 |
| 9,507 | | Applied Materials, Inc. | | | 820,454 | | | | 0.2 |
| 3,100 | | ASM Pacific Technology Ltd. | | | 40,941 | | | | 0.0 |
| 7,868 | | Automatic Data Processing, Inc. | | | 1,386,342 | | | | 0.4 |
| 16,837 | | Avnet, Inc. | | | 591,147 | | | | 0.2 |
| 9,868 | | Booz Allen Hamilton Holding Corp. | | | 860,292 | | | | 0.3 |
| 6,631 | | Broadridge Financial Solutions, Inc. ADR | | | 1,015,869 | | | | 0.3 |
| 5,500 | (1) | Canon, Inc. | | | 106,549 | | | | 0.0 |
| 10,511 | | CDK Global, Inc. | | | 544,785 | | | | 0.2 |
| 4,520 | | CDW Corp. | | | 595,691 | | | | 0.2 |
| 37,919 | | Cisco Systems, Inc. | | | 1,696,875 | | | | 0.5 |
| 6,435 | | Citrix Systems, Inc. | | | 837,194 | | | | 0.2 |
| 13,768 | | Cognex Corp. | | | 1,105,364 | | | | 0.3 |
| 14,121 | | Cognizant Technology Solutions Corp. | | | 1,157,216 | | | | 0.3 |
| 685 | | Dassault Systemes SE | | | 138,930 | | | | 0.1 |
| 11,881 | | Dolby Laboratories, Inc. | | | 1,154,002 | | | | 0.3 |
| 1,000 | | Fuji Film Holdings Corp. | | | 52,752 | | | | 0.0 |
| 20,353 | | Genpact Ltd. | | | 841,800 | | | | 0.2 |
| 1,700 | | Hitachi Ltd. | | | 67,098 | | | | 0.0 |
| 20,407 | | HP, Inc. | | | 501,808 | | | | 0.1 |
| 33,480 | | Intel Corp. | | | 1,667,974 | | | | 0.5 |
| 8,212 | | International Business Machines Corp. | | | 1,033,727 | | | | 0.3 |
| 3,529 | | Intuit, Inc. | | | 1,340,491 | | | | 0.4 |
| 4,600 | | Jack Henry & Associates, Inc. | | | 745,154 | | | | 0.2 |
| 35,836 | | Juniper Networks, Inc. | | | 806,668 | | | | 0.2 |
| 2,384 | | KLA Corp. | | | 617,241 | | | | 0.2 |
| 1,516 | | Logitech International SA | | | 147,196 | | | | 0.1 |
| 3,214 | | Mastercard, Inc. - Class A | | | 1,147,205 | | | | 0.3 |
| 7,716 | | MAXIMUS, Inc. | | | 564,734 | | | | 0.2 |
| 34,268 | | Microsoft Corp. | | | 7,621,889 | | | | 2.2 |
| 3,315 | | Monolithic Power Systems, Inc. | | | 1,214,052 | | | | 0.4 |
| 5,867 | | Motorola Solutions, Inc. | | | 997,742 | | | | 0.3 |
| 18,630 | | National Instruments Corp. | | | 818,602 | | | | 0.2 |
| 2,000 | | NEC Corp. | | | 107,419 | | | | 0.0 |
| 5,885 | | NetApp, Inc. | | | 389,822 | | | | 0.1 |
| 40,791 | | NortonLifeLock, Inc. | | | 847,637 | | | | 0.2 |
| 4,003 | | Nvidia Corp. | | | 2,090,367 | | | | 0.6 |
| 21,217 | | Oracle Corp. | | | 1,372,528 | | | | 0.4 |
| 500 | | Oracle Corp. Japan | | | 65,177 | | | | 0.0 |
| 11,990 | | Paychex, Inc. | | | 1,117,228 | | | | 0.3 |
| 6,904 | | Pegasystems, Inc. | | | 920,027 | | | | 0.3 |
| 11,715 | | Qualcomm, Inc. | | | 1,784,663 | | | | 0.5 |
| 11,801 | | Sage Group PLC/The | | | 93,703 | | | | 0.0 |
| 16,263 | | Seagate Technology | | | 1,010,908 | | | | 0.3 |
| 6,000 | (1) | Seiko Epson Corp. | | | 89,161 | | | | 0.0 |
| 14,232 | | SS&C Technologies Holdings, Inc. | | | 1,035,378 | | | | 0.3 |
| 44,060 | | Switch, Inc. | | | 721,262 | | | | 0.2 |
| 9,518 | | Telefonaktiebolaget LM Ericsson | | | 113,221 | | | | 0.1 |
| 9,594 | | Texas Instruments, Inc. | | | 1,574,663 | | | | 0.5 |
| 1,800 | (1) | Trend Micro, Inc. | | | 103,632 | | | | 0.0 |
| 3,877 | | Ubiquiti, Inc. | | | 1,079,783 | | | | 0.3 |
| 3,038 | | Visa, Inc. - Class A | | | 664,502 | | | | 0.2 |
| 8,793 | | Xilinx, Inc. | | | 1,246,584 | | | | 0.4 |
| | | | | | 51,270,857 | | | | 14.8 |
| | | | | | | | | | |
| | | Materials: 2.0% | | | | | | | |
| 3,670 | | Air Products & Chemicals, Inc. | | | 1,002,717 | | | | 0.3 |
| 708 | | Anglo American PLC | | | 23,380 | | | | 0.0 |
| 5,604 | | Aptargroup, Inc. | | | 767,131 | | | | 0.2 |
| 1,340 | | BASF SE | | | 105,916 | | | | 0.0 |
| 2,473 | | BHP Group Ltd. | | | 80,804 | | | | 0.0 |
| 14,213 | | Commercial Metals Co. | | | 291,935 | | | | 0.1 |
| 1,459 | | CRH PLC | | | 62,046 | | | | 0.0 |
| 1,257 | | Croda International PLC | | | 113,042 | | | | 0.0 |
| 92 | | EMS-Chemie Holding AG | | | 88,501 | | | | 0.0 |
| 12,193 | | Evraz PLC | | | 77,925 | | | | 0.0 |
| 10,615 | | Fortescue Metals Group Ltd. | | | 191,732 | | | | 0.1 |
| 6,878 | | ICL Group Ltd. | | | 35,110 | | | | 0.0 |
| 745 | | Koninklijke DSM NV | | | 128,118 | | | | 0.1 |
| 2,355 | | LafargeHolcim Ltd.-CHF | | | 129,261 | | | | 0.1 |
| 8,600 | | Mitsubishi Chemical Holdings Corp. | | | 52,102 | | | | 0.0 |
| 1,211 | | NewMarket Corp. | | | 482,329 | | | | 0.1 |
| 7,792 | | Packaging Corp. of America | | | 1,074,595 | | | | 0.3 |
| 2,835 | | Reliance Steel & Aluminum Co. | | | 339,491 | | | | 0.1 |
| 2,878 | | Rio Tinto Ltd. | | | 253,096 | | | | 0.1 |
| 1,772 | | Royal Gold, Inc. | | | 188,470 | | | | 0.1 |
| 2,506 | | Sensient Technologies Corp. | | | 184,868 | | | | 0.1 |
| 13,078 | | Silgan Holdings, Inc. | | | 484,932 | | | | 0.1 |
| 8,607 | | Sonoco Products Co. | | | 509,965 | | | | 0.1 |
| 679 | | Symrise AG | | | 90,268 | | | | 0.0 |
| 3,200 | | Teijin Ltd. | | | 60,218 | | | | 0.0 |
| 3,064 | | UPM-Kymmene OYJ | | | 114,261 | | | | 0.1 |
| | | | | | 6,932,213 | | | | 2.0 |
See Accompanying Notes to Financial Statements
| Voya Balanced Income Portfolio | PORTFOLIO OF INVESTMENTS
AS OF December 31, 2020 (Continued) |
| | | Real Estate: 0.5% | | | | | |
| 1,127 | | EastGroup Properties, Inc. | | | 155,594 | | | | 0.0 |
| 1,443 | | Equinix, Inc. | | | 1,030,562 | | | | 0.3 |
| 2,348 | | Equity Lifestyle Properties, Inc. | | | 148,769 | | | | 0.0 |
| 619 | | LEG Immobilien AG | | | 96,034 | | | | 0.1 |
| 1,535 | | Life Storage, Inc. | | | 183,264 | | | | 0.1 |
| 10,200 | | Link REIT | | | 92,634 | | | | 0.0 |
| | | | | | 1,706,857 | | | | 0.5 |
| | | | | | | | | | |
| | | Utilities: 2.2% | | | | | | | |
| 7,217 | | AGL Energy Ltd. | | | 66,616 | | | | 0.0 |
| 9,895 | | Ameren Corp. | | | 772,404 | | | | 0.2 |
| 6,472 | | American Water Works Co., Inc. | | | 993,258 | | | | 0.3 |
| 25,343 | (1) | AusNet Services | | | 34,347 | | | | 0.0 |
| 9,000 | | CK Infrastructure Holdings Ltd. | | | 48,334 | | | | 0.0 |
| 12,500 | | CLP Holdings Ltd. | | | 115,583 | | | | 0.1 |
| 12,825 | | Duke Energy Corp. | | | 1,174,257 | | | | 0.3 |
| 1,800 | | Electric Power Development Co., Ltd. | | | 24,840 | | | | 0.0 |
| 2,965 | | Enagas | | | 65,229 | | | | 0.0 |
| 4,103 | | Endesa S.A. | | | 112,540 | | | | 0.1 |
| 6,529 | | Enel S.p.A. | | | 66,430 | | | | 0.0 |
| 6,857 | (2) | Engie SA | | | 105,117 | | | | 0.0 |
| 13,107 | | Evergy, Inc. | | | 727,570 | | | | 0.2 |
| 19,641 | | Exelon Corp. | | | 829,243 | | | | 0.2 |
| 3,394 | | NorthWestern Corp. | | | 197,904 | | | | 0.1 |
| 2,574 | | ONE Gas, Inc. | | | 197,606 | | | | 0.1 |
| 4,441 | | PNM Resources, Inc. | | | 215,522 | | | | 0.1 |
| 12,000 | | Power Assets Holdings Ltd. | | | 64,988 | | | | 0.0 |
| 4,076 | | Red Electrica Corp. SA | | | 83,684 | | | | 0.0 |
| 20,676 | | Snam SpA | | | 116,769 | | | | 0.1 |
| 8,810 | | Southern Co. | | | 541,198 | | | | 0.2 |
| 7,888 | | Spire, Inc. | | | 505,147 | | | | 0.1 |
| 4,075 | | Terna Rete Elettrica Nazionale SpA | | | 31,313 | | | | 0.0 |
| 1,542 | | United Utilities Group PLC | | | 18,860 | | | | 0.0 |
| 19,745 | | Vistra Corp. | | | 388,187 | | | | 0.1 |
| 1,903 | | WEC Energy Group, Inc. | | | 175,133 | | | | 0.0 |
| | | | | | 7,672,079 | | | | 2.2 |
| | | | | | | | | | |
| | Total Common Stock
(Cost $123,224,404) | | | 155,184,446 | | | | 44.8 |
| EXCHANGE-TRADED FUNDS: 0.2% | | | | | |
| 1,704 | | iShares MSCI EAFE ETF | | | 124,324 | | | | 0.0 |
| 2,601 | | iShares Russell 1000 ETF | | | 550,996 | | | | 0.2 |
| | | | | | | | | | |
| | Total Exchange-Traded Funds | | | | | | | |
| | (Cost $622,394) | | | 675,320 | | | | 0.2 |
| | | | | | | | | | |
| MUTUAL FUNDS: 7.7% | | | | | | | |
| | | Affiliated Investment Companies: 7.7% | | | | | | | |
| 2,712,877 | | Voya Floating Rate Fund - Class P | | | 24,307,381 | | | | 7.0 |
| 280,943 | | Voya High Yield Bond Fund - Class P | | | 2,264,400 | | | | 0.7 |
| | | | | | | | | | |
| | Total Mutual Funds | | | | | | | |
| | (Cost $27,861,222) | | | 26,571,781 | | | | 7.7 |
| PREFERRED STOCK: 0.5% | | | | | | | |
| | | Consumer Staples: 0.0% | | | | | | | |
| 223 | | Henkel AG & Co. KGaA | | | 25,144 | | | | 0.0 |
| | | | | | | | | | |
| | | Financials: 0.5% | | | | | | | |
| 50 | (2),(3) | Fannie Mae | | | 1,562,500 | | | | 0.5 |
| | | | | | | | | | |
| | Total Preferred Stock | | | | | | | |
| | (Cost $4,117,533) | | | 1,587,644 | | | | 0.5 |
| | | | | | | | | | |
| RIGHTS: 0.0% | | | | | | | |
| | | Energy: 0.0% | | | | | | | |
| 2,302 | (2) | Repsol SA | | | 789 | | | | 0.0 |
| | | | | | | | | | |
| | Total Rights | | | | | | | |
| | (Cost $813) | | | 789 | | | | 0.0 |
| | | | | | | | | | |
| OTHER(4): –% | | | | | | | |
| | | Consumer Discretionary: –% | | | | | | | |
| 120,000 | (5),(6) | General Motors Co. Escrow | | | – | | | | – |
| | | | | | | | | | |
| | Total Other
(Cost $–) | | | – | | | | – |
| | | | | | | | | | |
| | | | | | | | Percentage |
| Principal | | | | | | | of Net |
| Amount† | | | | Value | | | Assets |
| CORPORATE BONDS/NOTES: 8.4% | | | | | | | |
| | | Basic Materials: 0.7% | | | | | | | |
| 200,000 | (7) | Celulosa Arauco y Constitucion SA, 4.250%, 04/30/2029 | | | 225,377 | | | | 0.1 |
| 70,000 | (7) | Cleveland-Cliffs, Inc., 6.750%, 03/15/2026 | | | 75,687 | | | | 0.0 |
| 200,000 | | CNAC HK Finbridge Co. Ltd., 5.125%, 03/14/2028 | | | 218,031 | | | | 0.1 |
| 70,000 | (7) | Compass Minerals International, Inc., 6.750%, 12/01/2027 | | | 76,007 | | | | 0.0 |
| 70,000 | (7) | Element Solutions, Inc., 3.875%, 09/01/2028 | | | 72,144 | | | | 0.0 |
| 250,000 | (7) | Evraz PLC, 5.250%, 04/02/2024 | | | 274,356 | | | | 0.1 |
| 70,000 | | Freeport-McMoRan, Inc., 4.125%, 03/01/2028 | | | 73,544 | | | | 0.0 |
| 200,000 | (7) | Gold Fields Orogen Holdings BVI Ltd., 5.125%, 05/15/2024 | | | 221,771 | | | | 0.1 |
| 70,000 | (7) | Hudbay Minerals, Inc., 6.125%, 04/01/2029 | | | 75,600 | | | | 0.0 |
| 70,000 | (7) | Illuminate Buyer LLC / Illuminate Holdings IV, Inc., 9.000%, 07/01/2028 | | | 77,087 | | | | 0.0 |
| 18,000 | (7) | Joseph T Ryerson & Son, Inc., 8.500%, 08/01/2028 | | | 20,419 | | | | 0.0 |
| 70,000 | (7) | Kraton Polymers LLC / Kraton Polymers Capital Corp., 4.250%, 12/15/2025 | | | 71,494 | | | | 0.0 |
| 225,000 | (7) | MMK International Capital DAC, 4.375%, 06/13/2024 | | | 243,077 | | | | 0.1 |
| 70,000 | (7) | Novelis Corp., 5.875%, 09/30/2026 | | | 73,238 | | | | 0.0 |
| 70,000 | | Olin Corp., 5.125%, 09/15/2027 | | | 73,317 | | | | 0.0 |
| 70,000 | (7) | Rayonier AM Products, Inc., 7.625%, 01/15/2026 | | | 73,080 | | | | 0.0 |
See Accompanying Notes to Financial Statements
| Voya Balanced Income Portfolio | PORTFOLIO OF INVESTMENTS
AS OF December 31, 2020 (Continued) |
| 70,000 | (7) | Schweitzer-Mauduit International, Inc., 6.875%, 10/01/2026 | | | 74,449 | | | | 0.0 |
| 60,000 | | Sherwin-Williams Co/The, 3.300%, 05/15/2050 | | | 66,464 | | | | 0.0 |
| 200,000 | | Suzano Austria GmbH, 5.000%, 01/15/2030 | | | 227,426 | | | | 0.1 |
| 70,000 | (7) | Trinseo Materials Operating SCA / Trinseo Materials Finance, Inc., 5.375%, 09/01/2025 | | | 71,619 | | | | 0.0 |
| 30,000 | (7) | Tronox, Inc., 6.500%, 04/15/2026 | | | 31,275 | | | | 0.0 |
| 115,000 | (7) | Venator Finance Sarl / Venator Materials LLC, 5.750%, 07/15/2025 | | | 107,741 | | | | 0.1 |
| 70,000 | (7) | WR Grace & Co-Conn, 4.875%, 06/15/2027 | | | 74,324 | | | | 0.0 |
| | | | | | 2,597,527 | | | | 0.7 |
| | | | | | | | | | |
| | | Communications: 0.7% | | | | | | | |
| 70,000 | (7) | ANGI Group LLC, 3.875%, 08/15/2028 | | | 71,373 | | | | 0.0 |
| 70,000 | (7) | CCO Holdings LLC / CCO Holdings Capital Corp., 5.125%, 05/01/2027 | | | 74,377 | | | | 0.0 |
| 70,000 | (7) | CommScope Technologies LLC, 5.000%, 03/15/2027 | | | 69,431 | | | | 0.0 |
| 70,000 | (7) | Consolidated Communications, Inc., 6.500%, 10/01/2028 | | | 75,005 | | | | 0.0 |
| 70,000 | | CSC Holdings LLC, 5.250%, 06/01/2024 | | | 75,899 | | | | 0.0 |
| 64,000 | (7) | Cumulus Media New Holdings, Inc., 6.750%, 07/01/2026 | | | 65,545 | | | | 0.0 |
| 35,000 | (7) | Diamond Sports Group LLC / Diamond Sports Finance Co., 5.375%, 08/15/2026 | | | 28,503 | | | | 0.0 |
| 35,000 | (1),(7) | Diamond Sports Group LLC / Diamond Sports Finance Co., 6.625%, 08/15/2027 | | | 21,219 | | | | 0.0 |
| 70,000 | | DISH DBS Corp., 5.875%, 11/15/2024 | | | 73,500 | | | | 0.0 |
| 70,000 | | Embarq Corp., 7.995%, 06/01/2036 | | | 86,473 | | | | 0.1 |
| 70,000 | (1),(7) | Entercom Media Corp., 7.250%, 11/01/2024 | | | 69,956 | | | | 0.0 |
| 70,000 | (7) | Frontier Communications Corp., 5.000%, 05/01/2028 | | | 73,106 | | | | 0.0 |
| 70,000 | (7) | GCI LLC, 4.750%, 10/15/2028 Hughes Satellite | | | 74,790 | | | | 0.0 |
| 70,000 | | Systems Corp., 6.625%, 08/01/2026 | | | 79,452 | | | | 0.1 |
| 70,000 | | iHeartCommunications, Inc., 8.375%, 05/01/2027 | | | 74,842 | | | | 0.0 |
| 70,000 | | Level 3 Financing, Inc., 5.250%, 03/15/2026 | | | 72,419 | | | | 0.0 |
| 70,000 | (7) | LogMeIn, Inc., 5.500%, 09/01/2027 | | | 73,413 | | | | 0.0 |
| 70,000 | (7) | Match Group Holdings II LLC, 4.125%, 08/01/2030 | | | 72,745 | | | | 0.0 |
| 70,000 | (7) | MDC Partners, Inc., 6.500%, 05/01/2024 | | | 71,068 | | | | 0.0 |
| 70,000 | | Meredith Corp., 6.875%, 02/01/2026 | | | 68,381 | | | | 0.0 |
| 70,000 | (7) | Midcontinent Communications / Midcontinent Finance Corp., 5.375%, 08/15/2027 | | | 73,399 | | | | 0.0 |
| 30,000 | (7) | National CineMedia LLC, 5.875%, 04/15/2028 | | | 25,500 | | | | 0.0 |
| 70,000 | | Netflix, Inc., 5.875%, 11/15/2028 | | | 84,038 | | | | 0.1 |
| 70,000 | (7) | Nexstar Broadcasting, Inc., 5.625%, 07/15/2027 | | | 75,097 | | | | 0.0 |
| 70,000 | (7) | Radiate Holdco LLC / Radiate Finance, Inc., 4.500%, 09/15/2026 | | | 72,363 | | | | 0.0 |
| 70,000 | (7) | Scripps Escrow II, Inc., 3.875%, 01/15/2029 | | | 73,106 | | | | 0.0 |
| 70,000 | (7) | Sinclair Television Group, Inc., 4.125%, 12/01/2030 | | | 71,820 | | | | 0.0 |
| 70,000 | (7) | Sirius XM Radio, Inc., 5.000%, 08/01/2027 | | | 74,478 | | | | 0.0 |
| 70,000 | | Sprint Corp., 7.625%, 03/01/2026 | | | 86,990 | | | | 0.1 |
| 70,000 | | TEGNA, Inc., 5.000%, 09/15/2029 | | | 74,015 | | | | 0.0 |
| 70,000 | | Telecom Italia Capital SA, 6.375%, 11/15/2033 | | | 86,262 | | | | 0.1 |
| 70,000 | (7) | Terrier Media Buyer, Inc., 8.875%, 12/15/2027 | | | 77,306 | | | | 0.1 |
| 70,000 | (7) | Univision Communications, Inc., 6.625%, 06/01/2027 | | | 75,304 | | | | 0.0 |
| 70,000 | (8) | ViacomCBS, Inc., 6.250%, 02/28/2057 | | | 78,741 | | | | 0.1 |
| 70,000 | (7) | ViaSat, Inc., 5.625%, 09/15/2025 | | | 71,684 | | | | 0.0 |
| 70,000 | (7) | Zayo Group Holdings, Inc., 6.125%, 03/01/2028 | | | 74,145 | | | | 0.0 |
| | | | | | 2,545,745 | | | | 0.7 |
| | | | | | | | | | |
| | | Consumer, Cyclical: 1.3% | | | | | | | |
| 70,000 | (7) | 1011778 BC ULC / New Red Finance, Inc., 4.000%, 10/15/2030 | | | 71,079 | | | | 0.0 |
| 70,000 | (7) | Academy Ltd., 6.000%, 11/15/2027 | | | 73,500 | | | | 0.0 |
| 70,000 | (7) | Adams Homes, Inc., 7.500%, 02/15/2025 | | | 73,544 | | | | 0.0 |
| 70,000 | (7) | Affinity Gaming, 6.875%, 12/15/2027 | | | 73,412 | | | | 0.0 |
| 70,000 | (7) | Allison Transmission, Inc., 5.875%, 06/01/2029 | | | 77,621 | | | | 0.1 |
| 47,394 | | American Airlines 2014-1 Class A Pass Through Trust, 3.700%, 10/01/2026 | | | 44,724 | | | | 0.0 |
| 70,000 | | American Axle & Manufacturing, Inc., 6.875%, 07/01/2028 | | | 75,559 | | | | 0.1 |
| 70,000 | | Asbury Automotive Group, Inc., 4.750%, 03/01/2030 | | | 75,162 | | | | 0.0 |
| 70,000 | (7) | Ashton Woods USA LLC / Ashton Woods Finance Co., 6.750%, 08/01/2025 | | | 73,055 | | | | 0.0 |
See Accompanying Notes to Financial Statements
| Voya Balanced Income Portfolio | PORTFOLIO OF INVESTMENTS
AS OF December 31, 2020 (Continued) |
| 70,000 | (7) | Beacon Roofing Supply, Inc., 4.875%, 11/01/2025 | | | 71,790 | | | | 0.0 |
| 70,000 | (7) | Boyd Gaming Corp., 8.625%, 06/01/2025 | | | 77,941 | | | | 0.1 |
| 70,000 | (7) | Caesars Entertainment, Inc., 6.250%, 07/01/2025 | | | 74,638 | | | | 0.0 |
| 70,000 | (7) | Caesars Resort Collection LLC / CRC Finco, Inc., 5.250%, 10/15/2025 | | | 70,833 | | | | 0.0 |
| 70,000 | (7) | CCM Merger, Inc., 6.375%, 05/01/2026 | | | 73,675 | | | | 0.0 |
| 70,000 | | Century Communities, Inc., 5.875%, 07/15/2025 | | | 73,055 | | | | 0.0 |
| 70,000 | (7) | Core & Main L.P., 6.125%, 08/15/2025 | | | 72,494 | | | | 0.0 |
| 70,000 | | Dana, Inc., 5.625%, 06/15/2028 | | | 75,486 | | | | 0.1 |
| 165,000 | (7) | Delta Air Lines, Inc. / SkyMiles IP Ltd., 4.750%, 10/20/2028 | | | 180,233 | | | | 0.1 |
| 70,000 | | Delta Air Lines, Inc., 2.900%, 10/28/2024 | | | 69,102 | | | | 0.0 |
| 70,000 | (7) | Golden Entertainment, Inc., 7.625%, 04/15/2026 | | | 75,370 | | | | 0.0 |
| 70,000 | (7) | H&E Equipment Services, Inc., 3.875%, 12/15/2028 | | | 70,615 | | | | 0.0 |
| 35,000 | (7) | Hilton Domestic Operating Co., Inc., 5.750%, 05/01/2028 | | | 38,128 | | | | 0.0 |
| 60,000 | | Home Depot, Inc./The, 3.125%, 12/15/2049 | | | 69,227 | | | | 0.0 |
| 70,000 | (7) | IAA, Inc., 5.500%, 06/15/2027 | | | 74,331 | | | | 0.0 |
| 70,000 | (7) | Installed Building Products, Inc., 5.750%, 02/01/2028 | | | 74,799 | | | | 0.0 |
| 70,000 | (7) | Interface, Inc., 5.500%, 12/01/2028 | | | 73,806 | | | | 0.0 |
| 70,000 | (7) | IRB Holding Corp., 7.000%, 06/15/2025 | | | 76,599 | | | | 0.1 |
| 70,000 | | L Brands, Inc., 6.750%, 07/01/2036 | | | 78,120 | | | | 0.1 |
| 70,000 | (7) | LBM Acquisition LLC, 6.250%, 01/15/2029 | | | 72,954 | | | | 0.0 |
| 70,000 | (7) | Lions Gate Capital Holdings LLC, 5.875%, 11/01/2024 | | | 71,305 | | | | 0.0 |
| 83,000 | | Lowe’s Cos, Inc., 4.050%, 05/03/2047 | | | 103,906 | | | | 0.1 |
| 70,000 | | M/I Homes, Inc., 4.950%, 02/01/2028 | | | 74,317 | | | | 0.0 |
| 50,000 | | McDonald’s Corp., 3.625%, 05/01/2043 | | | 57,662 | | | | 0.0 |
| 60,000 | | McDonald’s Corp., 3.625%, 09/01/2049 | | | 70,545 | | | | 0.0 |
| 70,000 | | Meritage Homes Corp., 5.125%, 06/06/2027 | | | 78,474 | | | | 0.1 |
| 70,000 | (7) | Meritor, Inc., 4.500%, 12/15/2028 | | | 71,881 | | | | 0.0 |
| 70,000 | | MGM Resorts International, 5.500%, 04/15/2027 | | | 78,113 | | | | 0.1 |
| 70,000 | (1),(7) | Michaels Stores, Inc., 8.000%, 07/15/2027 | | | 75,368 | | | | 0.0 |
| 70,000 | | Murphy Oil USA, Inc., 5.625%, 05/01/2027 | | | 74,274 | | | | 0.0 |
| 70,000 | (7) | Navistar International Corp., 6.625%, 11/01/2025 | | | 73,423 | | | | 0.0 |
| 70,000 | (7) | Penn National Gaming, Inc., 5.625%, 01/15/2027 | | | 73,157 | | | | 0.0 |
| 50,000 | (7) | PetSmart, Inc., 5.875%, 06/01/2025 | | | 51,469 | | | | 0.0 |
| 70,000 | (7) | Royal Caribbean Cruises Ltd., 9.125%, 06/15/2023 | | | 76,038 | | | | 0.1 |
| 35,000 | (7) | Scientific Games International, Inc., 5.000%, 10/15/2025 | | | 36,160 | | | | 0.0 |
| 35,000 | (7) | Scientific Games International, Inc., 8.250%, 03/15/2026 | | | 37,776 | | | | 0.0 |
| 70,000 | (7) | SeaWorld Parks & Entertainment, Inc., 9.500%, 08/01/2025 | | | 76,125 | | | | 0.1 |
| 70,000 | (7) | Sizzling Platter LLC / Sizzling Platter Finance Corp., 8.500%, 11/28/2025 | | | 72,989 | | | | 0.0 |
| 70,000 | | Sonic Automotive, Inc., 6.125%, 03/15/2027 | | | 73,894 | | | | 0.0 |
| 70,000 | (7) | Specialty Building Products Holdings LLC / SBP Finance Corp., 6.375%, 09/30/2026 | | | 74,269 | | | | 0.0 |
| 70,000 | (7) | Speedway Motorsports LLC / Speedway Funding II, Inc., 4.875%, 11/01/2027 | | | 69,475 | | | | 0.0 |
| 70,000 | (7) | Station Casinos LLC, 4.500%, 02/15/2028 | | | 70,656 | | | | 0.0 |
| 70,000 | (7) | STL Holding Co. LLC, 7.500%, 02/15/2026 | | | 72,625 | | | | 0.0 |
| 70,000 | | Tempur Sealy International, Inc., 5.500%, 06/15/2026 | | | 72,937 | | | | 0.0 |
| 35,000 | (1) | Tenneco, Inc., 5.000%, 07/15/2026 | | | 32,266 | | | | 0.0 |
| 35,000 | (7) | Tenneco, Inc., 7.875%, 01/15/2029 | | | 39,362 | | | | 0.0 |
| 70,000 | | TRI Pointe Group, Inc., 5.700%, 06/15/2028 | | | 79,205 | | | | 0.1 |
| 70,000 | | United Airlines Holdings, Inc., 4.250%, 10/01/2022 | | | 70,438 | | | | 0.0 |
| 70,000 | (7) | Univar Solutions USA, Inc./Washington, 5.125%, 12/01/2027 | | | 74,056 | | | | 0.0 |
| 35,000 | (7) | Viking Cruises Ltd., 5.875%, 09/15/2027 | | | 34,295 | | | | 0.0 |
| 35,000 | (7) | Viking Cruises Ltd., 13.000%, 05/15/2025 | | | 41,891 | | | | 0.0 |
| 70,000 | (7) | William Carter Co/The, 5.625%, 03/15/2027 | | | 73,806 | | | | 0.0 |
| 70,000 | (7) | Williams Scotsman International, Inc., 4.625%, 08/15/2028 | | | 72,581 | | | | 0.0 |
| 70,000 | (7) | Wolverine World Wide, Inc., 5.000%, 09/01/2026 | | | 71,619 | | | | 0.0 |
| 35,000 | (7) | Wyndham Hotels & Resorts, Inc., 4.375%, 08/15/2028 | | | 36,432 | | | | 0.0 |
| 35,000 | (7) | Wyndham Hotels & Resorts, Inc., 5.375%, 04/15/2026 | | | 36,291 | | | | 0.0 |
| | | | | | 4,529,932 | | | | 1.3 |
See Accompanying Notes to Financial Statements
| Voya Balanced Income Portfolio | PORTFOLIO OF INVESTMENTS
AS OF December 31, 2020 (Continued) |
| | | Consumer, Non-cyclical: 1.2% | | | | | | | |
| 70,000 | (7) | Acadia Healthcare Co., Inc., 5.500%, 07/01/2028 | | | 75,315 | | | | 0.0 |
| 200,000 | (7) | Adani Ports & Special Economic Zone Ltd., 4.375%, 07/03/2029 | | | 217,328 | | | | 0.1 |
| 70,000 | (7) | Albertsons Cos, Inc. / Safeway, Inc. / New Albertsons L.P. / Albertsons LLC, 3.500%, 03/15/2029 | | | 70,805 | | | | 0.0 |
| 25,000 | (7) | Allied Universal Holdco LLC / Allied Universal Finance Corp., 6.625%, 07/15/2026 | | | 26,689 | | | | 0.0 |
| 50,000 | (7) | Allied Universal Holdco LLC / Allied Universal Finance Corp., 9.750%, 07/15/2027 | | | 54,587 | | | | 0.0 |
| 245,000 | | Altria Group, Inc., 4.500%, 05/02/2043 | | | 281,332 | | | | 0.1 |
| 70,000 | (7) | AMN Healthcare, Inc., 4.625%, 10/01/2027 | | | 73,461 | | | | 0.0 |
| 70,000 | (7) | Avantor Funding, Inc., 4.625%, 07/15/2028 | | | 74,112 | | | | 0.0 |
| 35,000 | (7) | Bausch Health Cos, Inc., 5.250%, 01/30/2030 | | | 36,702 | | | | 0.0 |
| 70,000 | (7) | Cardtronics, Inc. / Cardtronics USA, Inc., 5.500%, 05/01/2025 | | | 72,618 | | | | 0.0 |
| 70,000 | (7) | Catalent Pharma Solutions, Inc., 5.000%, 07/15/2027 | | | 74,048 | | | | 0.0 |
| 70,000 | | Centene Corp., 4.625%, 12/15/2029 | | | 77,805 | | | | 0.1 |
| 25,000 | (7) | Chobani LLC / Chobani Finance Corp., Inc., 4.625%, 11/15/2028 | | | 25,437 | | | | 0.0 |
| 300,000 | | CVS Health Corp., 5.050%, 03/25/2048 | | | 406,619 | | | | 0.1 |
| 70,000 | (7) | DaVita, Inc., 4.625%, 06/01/2030 | | | 74,244 | | | | 0.0 |
| 225,000 | (1),(7) | DP World Crescent Ltd., 3.750%, 01/30/2030 | | | 245,418 | | | | 0.1 |
| 70,000 | (7) | Emergent BioSolutions, Inc., 3.875%, 08/15/2028 | | | 72,616 | | | | 0.0 |
| 45,000 | | Encompass Health Corp., 4.625%, 04/01/2031 | | | 48,206 | | | | 0.0 |
| 70,000 | (7) | Gartner, Inc., 4.500%, 07/01/2028 | | | 73,937 | | | | 0.0 |
| 70,000 | (7) | Graham Holdings Co., 5.750%, 06/01/2026 | | | 73,749 | | | | 0.0 |
| 70,000 | | HCA, Inc., 3.500%, 09/01/2030 | | | 74,400 | | | | 0.0 |
| 70,000 | (7) | Hill-Rom Holdings, Inc., 4.375%, 09/15/2027 | | | 74,126 | | | | 0.0 |
| 200,000 | (7) | Hutama Karya Persero PT, 3.750%, 05/11/2030 | | | 224,300 | | | | 0.1 |
| 70,000 | (7) | Jaguar Holding Co. II / PPD Development L.P., 5.000%, 06/15/2028 | | | 74,812 | | | | 0.0 |
| 70,000 | (7) | JBS USA LUX SA / JBS USA Finance, Inc., 6.750%, 02/15/2028 | | | 78,734 | | | | 0.1 |
| 70,000 | (7) | KeHE Distributors LLC / KeHE Finance Corp., 8.625%, 10/15/2026 | | | 78,739 | | | | 0.1 |
| 70,000 | | Kraft Heinz Foods Co., 5.000%, 07/15/2035 | | | 84,887 | | | | 0.1 |
| 70,000 | (7) | Legacy LifePoint Health LLC, 4.375%, 02/15/2027 | | | 71,225 | | | | 0.0 |
| 70,000 | (7) | Molina Healthcare, Inc., 3.875%, 11/15/2030 | | | 75,250 | | | | 0.0 |
| 70,000 | (7) | MPH Acquisition Holdings LLC, 5.750%, 11/01/2028 | | | 68,512 | | | | 0.0 |
| 70,000 | (7) | Nielsen Finance LLC / Nielsen Finance Co., 5.625%, 10/01/2028 | | | 76,190 | | | | 0.1 |
| 70,000 | (7) | Par Pharmaceutical, Inc., 7.500%, 04/01/2027 | | | 76,042 | | | | 0.1 |
| 70,000 | (7) | Pilgrim’s Pride Corp., 5.875%, 09/30/2027 | | | 76,010 | | | | 0.1 |
| 70,000 | (7) | Post Holdings, Inc., 4.625%, 04/15/2030 | | | 73,725 | | | | 0.0 |
| 70,000 | (7) | Primo Water Holdings, Inc., 5.500%, 04/01/2025 | | | 72,362 | | | | 0.0 |
| 70,000 | (7) | Select Medical Corp., 6.250%, 08/15/2026 | | | 75,492 | | | | 0.0 |
| 70,000 | | Spectrum Brands, Inc., 5.750%, 07/15/2025 | | | 72,370 | | | | 0.0 |
| 70,000 | (7) | Tenet Healthcare Corp., 6.125%, 10/01/2028 | | | 73,187 | | | | 0.0 |
| 70,000 | | TreeHouse Foods, Inc., 4.000%, 09/01/2028 | | | 72,538 | | | | 0.0 |
| 45,000 | (7) | United Natural Foods, Inc., 6.750%, 10/15/2028 | | | 47,137 | | | | 0.0 |
| 70,000 | | United Rentals North America, Inc., 4.875%, 01/15/2028 | | | 74,638 | | | | 0.0 |
| 70,000 | (7) | Vizient, Inc., 6.250%, 05/15/2027 | | | 75,499 | | | | 0.0 |
| 70,000 | (7) | West Street Merger Sub, Inc., 6.375%, 09/01/2025 | | | 71,881 | | | | 0.0 |
| | | | | | 3,997,084 | | | | 1.2 |
| | | | | | | | | | |
| | | Energy: 1.7% | | | | | | | |
| 70,000 | (1) | Antero Resources Corp., 5.000%, 03/01/2025 | | | 66,631 | | | | 0.0 |
| 70,000 | (1) | Apache Corp., 4.375%, 10/15/2028 | | | 72,974 | | | | 0.0 |
| 70,000 | (7) | Archrock Partners L.P. / Archrock Partners Finance Corp., 6.250%, 04/01/2028 | | | 73,042 | | | | 0.0 |
| 70,000 | (7) | Ascent Resources Utica Holdings LLC / ARU Finance Corp., 8.250%, 12/31/2028 | | | 70,000 | | | | 0.0 |
| 35,000 | (7) | Blue Racer Midstream LLC / Blue Racer Finance Corp., 6.625%, 07/15/2026 | | | 35,350 | | | | 0.0 |
| 250,000 | | CNOOC Finance 2013 Ltd., 2.875%, 09/30/2029 | | | 260,716 | | | | 0.1 |
| 70,000 | (7) | CNX Resources Corp., 7.250%, 03/14/2027 | | | 74,989 | | | | 0.0 |
| 75,000 | | Comstock Resources, Inc., 9.750%, 08/15/2026 | | | 80,550 | | | | 0.1 |
| 70,000 | | Crestwood Midstream Partners L.P. / Crestwood Midstream Finance Corp., 5.750%, 04/01/2025 | | | 71,400 | | | | 0.0 |
| 70,000 | | DCP Midstream Operating L.P., 5.625%, 07/15/2027 | | | 77,770 | | | | 0.0 |
See Accompanying Notes to Financial Statements
| Voya Balanced Income Portfolio | PORTFOLIO OF INVESTMENTS
AS OF December 31, 2020 (Continued) |
| 350,000 | | Empresa Nacional del Petroleo, 3.750%, 08/05/2026 | | | 383,000 | | | | 0.1 |
| 450,000 | (8) | Energy Transfer Operating L.P., 7.125%, 12/31/2199 | | | 428,625 | | | | 0.2 |
| 70,000 | | EnLink Midstream LLC, 5.375%, 06/01/2029 | | | 68,206 | | | | 0.0 |
| 70,000 | (7) | Enviva Partners L.P. / Enviva Partners Finance Corp., 6.500%, 01/15/2026 | | | 74,506 | | | | 0.0 |
| 60,000 | (7) | EQM Midstream Partners L.P., 6.000%, 07/01/2025 | | | 65,775 | | | | 0.0 |
| 146,000 | | Exxon Mobil Corp., 3.095%, 08/16/2049 | | | 157,607 | | | | 0.1 |
| 300,000 | | Gazprom PJSC Via Gaz Capital SA, 4.950%, 03/23/2027 | | | 340,500 | | | | 0.1 |
| 70,000 | (7) | Hess Midstream Operations L.P., 5.625%, 02/15/2026 | | | 72,931 | | | | 0.0 |
| 70,000 | (7) | Hilcorp Energy I L.P. / Hilcorp Finance Co., 5.000%, 12/01/2024 | | | 69,730 | | | | 0.0 |
| 70,000 | (7) | Indigo Natural Resources LLC, 6.875%, 02/15/2026 | | | 71,750 | | | | 0.0 |
| 350,000 | | KazMunayGas National Co. JSC, 5.375%, 04/24/2030 | | | 432,365 | | | | 0.2 |
| 70,000 | | Murphy Oil Corp., 5.750%, 08/15/2025 | | | 69,833 | | | | 0.0 |
| 70,000 | | Occidental Petroleum Corp., 6.625%, 09/01/2030 | | | 76,108 | | | | 0.0 |
| 70,000 | (7) | Parsley Energy LLC / Parsley Finance Corp., 5.625%, 10/15/2027 | | | 76,720 | | | | 0.0 |
| 70,000 | | PBF Logistics L.P. / PBF Logistics Finance Corp., 6.875%, 05/15/2023 | | | 67,200 | | | | 0.0 |
| 200,000 | | Petrobras Global Finance BV, 5.750%, 02/01/2029 | | | 233,450 | | | | 0.1 |
| 425,000 | | Petrobras Global Finance BV, 5.999%, 01/27/2028 | | | 498,005 | | | | 0.2 |
| 225,000 | | Petroleos del Peru SA, 4.750%, 06/19/2032 | | | 258,656 | | | | 0.1 |
| 425,000 | | Petroleos Mexicanos, 5.950%, 01/28/2031 | | | 424,681 | | | | 0.2 |
| 200,000 | | Petroleos Mexicanos, 6.500%, 03/13/2027 | | | 210,988 | | | | 0.1 |
| 70,000 | (7) | SunCoke Energy Partners L.P. / SunCoke Energy Partners Finance Corp., 7.500%, 06/15/2025 | | | 69,620 | | | | 0.0 |
| 70,000 | (7) | Sunoco L.P. / Sunoco Finance Corp., 4.500%, 05/15/2029 | | | 72,931 | | | | 0.0 |
| 70,000 | (7) | Tallgrass Energy Partners L.P. / Tallgrass Energy Finance Corp., 5.500%, 01/15/2028 | | | 71,691 | | | | 0.0 |
| 70,000 | (7) | Targa Resources Partners L.P. / Targa Resources Partners Finance Corp., 4.875%, 02/01/2031 | | | 76,055 | | | | 0.0 |
| 375,000 | (8) | Transcanada Trust, 5.500%, 09/15/2079 | | | 413,906 | | | | 0.1 |
| 70,000 | (7) | Viper Energy Partners L.P., 5.375%, 11/01/2027 | | | 73,268 | | | | 0.0 |
| 70,000 | | Western Midstream Operating L.P., 5.450%, 04/01/2044 | | | 70,920 | | | | 0.0 |
| 70,000 | | WPX Energy, Inc., 5.250%, 10/15/2027 | | | 74,292 | | | | 0.0 |
| | | | | | 5,886,741 | | | | 1.7 |
| | | | | | | | | | |
| | | Financial: 0.6% | | | | | | | |
| 70,000 | | Ally Financial, Inc., 5.750%, 11/20/2025 | | | 81,550 | | | | 0.0 |
| 100,000 | | American International Group, Inc., 4.375%, 01/15/2055 | | | 128,680 | | | | 0.1 |
| 200,000 | | Bancolombia SA, 3.000%, 01/29/2025 | | | 208,190 | | | | 0.1 |
| 95,000 | | Brookfield Finance LLC, 3.450%, 04/15/2050 | | | 100,946 | | | | 0.1 |
| 70,000 | (7) | Cushman & Wakefield US Borrower LLC, 6.750%, 05/15/2028 | | | 77,394 | | | | 0.0 |
| 70,000 | (7) | ESH Hospitality, Inc., 5.250%, 05/01/2025 | | | 71,853 | | | | 0.0 |
| 70,000 | (7) | Freedom Mortgage Corp., 8.250%, 04/15/2025 | | | 73,325 | | | | 0.0 |
| 70,000 | (7) | Iron Mountain, Inc., 5.250%, 07/15/2030 | | | 75,687 | | | | 0.0 |
| 530,000 | (8) | JPMorgan Chase & Co., 4.600%, 12/31/2199 | | | 547,888 | | | | 0.2 |
| 200,000 | (7),(8) | Kookmin Bank, 4.350%, 12/31/2199 | | | 211,341 | | | | 0.1 |
| 70,000 | (7) | LPL Holdings, Inc., 4.625%, 11/15/2027 | | | 72,669 | | | | 0.0 |
| 70,000 | (7) | MGM Growth Properties Operating Partnership L.P. / MGP Finance Co-Issuer, Inc., 3.875%, 02/15/2029 | | | 71,706 | | | | 0.0 |
| 70,000 | | MPT Operating Partnership L.P. / MPT Finance Corp., 3.500%, 03/15/2031 | | | 72,406 | | | | 0.0 |
| 35,000 | | Navient Corp., 5.000%, 03/15/2027 | | | 35,355 | | | | 0.0 |
| 70,000 | | OneMain Finance Corp., 6.625%, 01/15/2028 | | | 83,243 | | | | 0.0 |
| 70,000 | (7) | Quicken Loans LLC, 5.250%, 01/15/2028 | | | 74,856 | | | | 0.0 |
| 70,000 | (7) | SBA Communications Corp., 3.875%, 02/15/2027 | | | 73,609 | | | | 0.0 |
| 70,000 | | Service Properties Trust, 4.375%, 02/15/2030 | | | 68,381 | | | | 0.0 |
| | | | | | 2,129,079 | | | | 0.6 |
| | | | | | | | | | |
| | | Industrial: 0.7% | | | | | | | |
| 70,000 | | AECOM, 5.875%, 10/15/2024 | | | 78,245 | | | | 0.1 |
| 70,000 | (7) | Berry Global, Inc., 5.625%, 07/15/2027 | | | 75,403 | | | | 0.0 |
See Accompanying Notes to Financial Statements
| Voya Balanced Income Portfolio | PORTFOLIO OF INVESTMENTS
AS OF December 31, 2020 (Continued) |
| 276,000 | (8) | BNSF Funding Trust I, 6.613%, 12/15/2055 | | | 315,675 | | | | 0.1 |
| 70,000 | (7) | Builders FirstSource, Inc., 5.000%, 03/01/2030 | | | 75,338 | | | | 0.0 |
| 30,000 | | Burlington Northern Santa Fe LLC, 4.450%, 03/15/2043 | | | 40,420 | | | | 0.0 |
| 70,000 | (7) | Cargo Aircraft Management, Inc., 4.750%, 02/01/2028 | | | 72,319 | | | | 0.0 |
| 70,000 | (7) | Cascades, Inc./Cascades USA, Inc., 5.375%, 01/15/2028 | | | 74,528 | | | | 0.0 |
| 70,000 | (7) | Clark Equipment Co., 5.875%, 06/01/2025 | | | 74,069 | | | | 0.0 |
| 70,000 | (7) | Clean Harbors, Inc., 5.125%, 07/15/2029 | | | 76,680 | | | | 0.0 |
| 75,000 | | CSX Corp., 4.500%, 08/01/2054 | | | 99,621 | | | | 0.1 |
| 70,000 | (7) | GFL Environmental, Inc., 8.500%, 05/01/2027 | | | 77,831 | | | | 0.1 |
| 70,000 | (7) | GrafTech Finance, Inc., 4.625%, 12/15/2028 | | | 71,053 | | | | 0.0 |
| 70,000 | (7) | Graham Packaging Co., Inc., 7.125%, 08/15/2028 | | | 77,481 | | | | 0.0 |
| 70,000 | (7) | Granite US Holdings Corp., 11.000%, 10/01/2027 | | | 78,050 | | | | 0.1 |
| 70,000 | (7) | Intelligent Packaging Ltd. Finco, Inc. / Intelligent Packaging Ltd. Co-Issuer LLC, 6.000%, 09/15/2028 | | | 72,056 | | | | 0.0 |
| 200,000 | (1),(7) | Klabin Austria GmbH, 5.750%, 04/03/2029 | | | 232,852 | | | | 0.1 |
| 70,000 | (7) | Koppers, Inc., 6.000%, 02/15/2025 | | | 72,231 | | | | 0.0 |
| 70,000 | (7) | New Enterprise Stone & Lime Co., Inc., 9.750%, 07/15/2028 | | | 77,000 | | | | 0.0 |
| 70,000 | (7) | Norbord, Inc., 5.750%, 07/15/2027 | | | 75,501 | | | | 0.0 |
| 70,000 | | Park-Ohio Industries, Inc., 6.625%, 04/15/2027 | | | 72,625 | | | | 0.0 |
| 70,000 | (7) | PGT Innovations, Inc., 6.750%, 08/01/2026 | | | 74,712 | | | | 0.0 |
| 70,000 | (7) | Plastipak Holdings, Inc., 6.250%, 10/15/2025 | | | 72,231 | | | | 0.0 |
| 70,000 | | Silgan Holdings, Inc., 4.125%, 02/01/2028 | | | 72,888 | | | | 0.0 |
| 70,000 | (7) | SSL Robotics LLC, 9.750%, 12/31/2023 | | | 79,231 | | | | 0.1 |
| 55,000 | (7) | Standard Industries, Inc./NJ, 3.375%, 01/15/2031 | | | 55,344 | | | | 0.0 |
| 20,000 | (7) | Stericycle, Inc., 3.875%, 01/15/2029 | | | 20,575 | | | | 0.0 |
| 70,000 | (7) | Stevens Holding Co., Inc., 6.125%, 10/01/2026 | | | 75,849 | | | | 0.0 |
| 70,000 | (7) | Summit Materials LLC / Summit Materials Finance Corp., 5.125%, 06/01/2025 | | | 71,480 | | | | 0.0 |
| 70,000 | | TransDigm, Inc., 5.500%, 11/15/2027 | | | 73,696 | | | | 0.0 |
| 15,000 | (7) | Vertical Holdco GmbH, 7.625%, 07/15/2028 | | | 16,378 | | | | 0.0 |
| 70,000 | (7) | Weekley Homes LLC / Weekley Finance Corp., 4.875%, 09/15/2028 | | | 73,325 | | | | 0.0 |
| | | | | | 2,574,687 | | | | 0.7 |
| | | | | | | | | | |
| | | Technology: 0.4% | | | | | | | |
| 70,000 | (7) | Ascend Learning LLC, 6.875%, 08/01/2025 | | | 72,180 | | | | 0.0 |
| 70,000 | (7) | Austin BidCo, Inc., 7.125%, 12/15/2028 | | | 73,194 | | | | 0.0 |
| 70,000 | (7) | Booz Allen Hamilton, Inc., 3.875%, 09/01/2028 | | | 72,231 | | | | 0.0 |
| 70,000 | (7) | BY Crown Parent LLC / BY Bond Finance, Inc., 4.250%, 01/31/2026 | | | 71,837 | | | | 0.0 |
| 100,000 | (7) | Castle US Holding Corp., 9.500%, 02/15/2028 | | | 100,234 | | | | 0.1 |
| 70,000 | | CDW LLC / CDW Finance Corp., 3.250%, 02/15/2029 | | | 71,466 | | | | 0.0 |
| 70,000 | (7) | Change Healthcare Holdings LLC / Change Healthcare Finance, Inc., 5.750%, 03/01/2025 | | | 71,488 | | | | 0.0 |
| 70,000 | | Donnelley Financial Solutions, Inc., 8.250%, 10/15/2024 | | | 74,455 | | | | 0.0 |
| 70,000 | (7) | Entegris, Inc., 4.375%, 04/15/2028 | | | 74,725 | | | | 0.0 |
| 70,000 | (7) | Microchip Technology, Inc., 4.250%, 09/01/2025 | | | 74,074 | | | | 0.0 |
| 70,000 | (7) | MTS Systems Corp., 5.750%, 08/15/2027 | | | 76,183 | | | | 0.1 |
| 70,000 | (7) | ON Semiconductor Corp., 3.875%, 09/01/2028 | | | 72,363 | | | | 0.0 |
| 70,000 | (7) | Open Text Corp., 3.875%, 02/15/2028 | | | 72,745 | | | | 0.0 |
| 15,000 | (7) | Rackspace Technology Global, Inc., 5.375%, 12/01/2028 | | | 15,744 | | | | 0.0 |
| 70,000 | (7) | Science Applications International Corp., 4.875%, 04/01/2028 | | | 74,320 | | | | 0.0 |
| 40,000 | (7) | Tempo Acquisition LLC / Tempo Acquisition Finance Corp., 6.750%, 06/01/2025 | | | 41,392 | | | | 0.0 |
| 45,000 | | Texas Instruments, Inc., 3.875%, 03/15/2039 | | | 56,226 | | | | 0.0 |
| 70,000 | (7) | Unisys Corp., 6.875%, 11/01/2027 | | | 76,650 | | | | 0.1 |
| 75,000 | (7) | Veritas US, Inc. / Veritas Bermuda Ltd., 7.500%, 09/01/2025 | | | 77,063 | | | | 0.1 |
| | | | | | 1,318,570 | | | | 0.4 |
| | | | | | | | | | |
| | | Utilities: 1.1% | | | | | | | |
| 82,000 | | American Electric Power Co., Inc., 3.250%, 03/01/2050 | | | 87,313 | | | | 0.0 |
| 70,000 | (7) | Clearway Energy Operating LLC, 4.750%, 03/15/2028 | | | 75,141 | | | | 0.0 |
| 200,000 | (7) | Colbun SA, 3.150%, 03/06/2030 | | | 216,000 | | | | 0.1 |
| 475,000 | (8) | Dominion Energy, Inc., 4.650%, 12/31/2199 | | | 501,917 | | | | 0.2 |
| 380,000 | (8) | Duke Energy Corp., 4.875%, 12/31/2199 | | | 412,425 | | | | 0.1 |
See Accompanying Notes to Financial Statements
| Voya Balanced Income Portfolio | PORTFOLIO OF INVESTMENTS
AS OF December 31, 2020 (Continued) |
| 100,000 | | Duke Energy Indiana LLC, 3.750%, 05/15/2046 | | | 120,108 | | | | 0.0 |
| 46,000 | | Entergy Louisiana LLC, 2.900%, 03/15/2051 | | | 49,113 | | | | 0.0 |
| 200,000 | | Inkia Energy Ltd., 5.875%, 11/09/2027 | | | 217,062 | | | | 0.1 |
| 250,000 | | Kallpa Generacion SA, 4.125%, 08/16/2027 | | | 269,750 | | | | 0.1 |
| 290,000 | | Mississippi Power Co., 4.250%, 03/15/2042 | | | 351,034 | | | | 0.1 |
| 275,000 | (8) | NextEra Energy Capital Holdings, Inc., 5.650%, 05/01/2079 | | | 324,189 | | | | 0.1 |
| 70,000 | (7) | NRG Energy, Inc., 3.625%, 02/15/2031 | | | 72,147 | | | | 0.0 |
| 400,000 | | Perusahaan Listrik Negara PT, 5.450%, 05/21/2028 | | | 479,438 | | | | 0.2 |
| 70,000 | | PG&E Corp., 5.250%, 07/01/2030 | | | 77,087 | | | | 0.0 |
| 40,000 | | Southern California Edison Co., 3.650%, 02/01/2050 | | | 45,477 | | | | 0.0 |
| 275,000 | (8) | Southern Co/The, 4.000%, 01/15/2051 | | | 291,563 | | | | 0.1 |
| 70,000 | (7) | Vistra Operations Co. LLC, 5.625%, 02/15/2027 | | | 74,557 | | | | 0.0 |
| | | | | | 3,664,321 | | | | 1.1 |
| | | | | | | | | | |
| | Total Corporate Bonds/Notes | | | | | | | |
| | (Cost $27,453,761) | | | 29,243,686 | | | | 8.4 |
| | | | | | | | | | |
| COLLATERALIZED MORTGAGE OBLIGATIONS: 14.0% | | | | | | | |
| 780,872 | (7),(8) | Agate Bay Mortgage Trust 2015-1 B4, 3.793%, 01/25/2045 | | | 759,103 | | | | 0.2 |
| 500,000 | (7),(8) | Chase Home Lending Mortgage Trust 2019-ATR1 A5, 4.000%, 04/25/2049 | | | 524,843 | | | | 0.2 |
| 357,011 | (7),(8) | Chase Mortgage Finance Corp. 2016-SH1 M2, 3.750%, 04/25/2045 | | | 363,967 | | | | 0.1 |
| 803,249 | (7),(8) | CIM Trust 2019-INV2 A3, 4.000%, 05/25/2049 | | | 828,376 | | | | 0.2 |
| 479,792 | (7),(8) | CIM Trust 2019-J1 B2, 4.031%, 08/25/2049 | | | 502,838 | | | | 0.1 |
| 435,929 | (7),(8) | CIM Trust 2019-J2 A13, 3.500%, 10/25/2049 | | | 447,944 | | | | 0.1 |
| 1,000,000 | (7) | Connecticut Avenue Securities Trust 2020-R02 2M2, 2.148%, (US0001M + 2.000%), 01/25/2040 | | | 998,366 | | | | 0.3 |
| 1,000,000 | (7),(8) | Deephaven Residential Mortgage Trust 2018-1A M1, 3.939%, 12/25/2057 | | | 1,018,484 | | | | 0.3 |
| 800,000 | (7) | Deephaven Residential Mortgage Trust 2020-2 A2, 2.594%, 05/25/2065 | | | 821,345 | | | | 0.2 |
| 525,573 | | Fannie Mae Connecticut Avenue Securities 2017-C02 2M2, 3.798%, (US0001M + 3.650%), 09/25/2029 | | | 539,795 | | | | 0.2 |
| 297,782 | | Fannie Mae Connecticut Avenue Securities 2017-C06 1M2, 2.798%, (US0001M + 2.650%), 02/25/2030 | | | 299,804 | | | | 0.1 |
| 332,482 | | Fannie Mae Connecticut Avenue Securities 2017-CO6 2M2, 2.948%, (US0001M + 2.800%), 02/25/2030 | | | 336,484 | | | | 0.1 |
| 787,255 | | Fannie Mae Connecticut Avenue Securities 2018-C05 1M2, 2.498%, (US0001M + 2.350%), 01/25/2031 | | | 791,712 | | | | 0.2 |
| 676,704 | | Fannie Mae Connecticut Avenue Securities 2018-C06 1M2, 2.148%, (US0001M + 2.000%), 03/25/2031 | | | 674,992 | | | | 0.2 |
| 218,694 | | Fannie Mae Connecticut Avenue Securities 2018-CO1 1M2, 2.398%, (US0001M + 2.250%), 07/25/2030 | | | 218,515 | | | | 0.1 |
| 644,136 | (7) | Fannie Mae Connecticut Avenue Securities 2019-R02 1M2, 2.448%, (US0001M + 2.300%), 08/25/2031 | | | 645,833 | | | | 0.2 |
| 659,605 | (7) | Fannie Mae Connecticut Avenue Securities 2019-R04 2M2, 2.248%, (US0001M + 2.100%), 06/25/2039 | | | 660,510 | | | | 0.2 |
| 521,037 | (7) | Fannie Mae Connecticut Avenue Securities Trust 2018-R07 1M2, 2.548%, (US0001M + 2.400%), 04/25/2031 | | | 522,697 | | | | 0.2 |
| 464,679 | (7) | Fannie Mae Connecticut Avenue Securities Trust 2019-R06 2M2, 2.248%, (US0001M + 2.100%), 09/25/2039 | | | 465,702 | | | | 0.1 |
| 2,106,799 | (9) | Fannie Mae REMICS 2008-36 YI, 7.052%, (-1.000*US0001M + 7.200%), 07/25/2036 | | | 347,159 | | | | 0.1 |
| 936,263 | (9) | Fannie Mae REMICS 2010-59 NS, 5.622%, (-1.000*US0001M + 5.770%), 06/25/2040 | | | 177,476 | | | | 0.1 |
| 4,488,910 | (9) | Fannie Mae REMICS 2012-121 ID, 3.000%, 11/25/2027 | | | 301,398 | | | | 0.1 |
| 5,381,622 | (9) | Fannie Mae REMICS 2013-71 AI, 3.000%, 07/25/2028 | | | 374,670 | | | | 0.1 |
| 5,435,490 | (9) | Fannie Mae Interest Strip Series 367 2, 5.500%, 01/01/2036 | | | 1,074,872 | | | | 0.3 |
| 1,198,637 | (9) | Fannie Mae REMICS 2005-66 LS, 6.482%, (-1.000*US0001M + 6.630%), 07/25/2035 | | | 250,022 | | | | 0.1 |
| 4,553,804 | (9) | Fannie Mae REMICS 2012-144 SC, 5.952%, (-1.000*US0001M + 6.100%), 01/25/2043 | | | 1,037,560 | | | | 0.3 |
See Accompanying Notes to Financial Statements
| Voya Balanced Income Portfolio | PORTFOLIO OF INVESTMENTS AS OF December 31, 2020 (Continued) |
| 2,160,003 | (9) | Fannie Mae REMICS 2012-151 WS, 6.052%, (- 1.000*US0001M + 6.200%), 03/25/2042 | | | 383,371 | | | | 0.1 |
| 5,160,203 | (9) | Fannie Mae REMICS 2012-35 LS, 6.452%, (- 1.000*US0001M + 6.600%), 04/25/2041 | | | 771,287 | | | | 0.2 |
| 3,816,354 | (9) | Fannie Mae REMICS 2013-20 SK, 6.052%, (- 1.000*US0001M + 6.200%), 05/25/2041 | | | 486,431 | | | | 0.1 |
| 1,378,954 | (9) | Fannie Mae REMICS 2015-65 KI, 6.852%, (- 1.000*US0001M + 7.000%), 08/25/2035 | | | 291,649 | | | | 0.1 |
| 899,515 | (9) | Fannie Mae REMICS 2018-86 DS, 5.952%, (- 1.000*US0001M + 6.100%), 12/25/2048 | | | 136,368 | | | | 0.0 |
| 500,000 | (7),(8) | Flagstar Mortgage Trust 2017-1 1A7, 3.500%, 03/25/2047 | | | 516,039 | | | | 0.2 |
| 900,672 | (7),(8) | Flagstar Mortgage Trust 2017-1 B3, 3.677%, 03/25/2047 | | | 917,222 | | | | 0.3 |
| 1,216,786 | (7),(8) | Flagstar Mortgage Trust 2018-3INV A3, 4.000%, 05/25/2048 | | | 1,258,408 | | | | 0.4 |
| 1,200,000 | (7) | Freddie Mac STACR REMIC Trust 2020- HQA1 M2, 2.048%, (US0001M + 1.900%), 01/25/2050 | | | 1,200,706 | | | | 0.3 |
| 408,740 | | Freddie Mac Structured Agency Credit Risk Debt Notes 2015-DNA2 M3, 4.048%, (US0001M + 3.900%), 12/25/2027 | | | 415,927 | | | | 0.1 |
| 37,618 | | Freddie Mac Structured Agency Credit Risk Debt Notes 2015-HQ1 M3, 3.948%, (US0001M + 3.800%), 03/25/2025 | | | 37,680 | | | | 0.0 |
| 1,152,702 | (7) | Freddie Mac Structured Agency Credit Risk Debt Notes 2019-DNA1 M2, 2.798%, (US0001M + 2.650%), 01/25/2049 | | | 1,155,060 | | | | 0.3 |
| 837,933 | (7) | Freddie Mac Structured Agency Credit Risk Debt Notes 2019-HQA2 M2, 2.198%, (US0001M + 2.050%), 04/25/2049 | | | 829,626 | | | | 0.2 |
| 804,399 | (9) | Freddie Mac REMICS 3318 KS, 6.251%, (- 1.000*US0001M + 6.410%), 05/15/2037 | | | 111,332 | | | | 0.0 |
| 1,140,476 | (9) | Freddie Mac REMICS 3879 SL, 6.441%, (- 1.000*US0001M + 6.600%), 01/15/2041 | | | 165,995 | | | | 0.1 |
| 4,398,119 | (9) | Freddie Mac REMICS 4120 JS, 6.041%, (- 1.000*US0001M + 6.200%), 10/15/2032 | | | 760,396 | | | | 0.2 |
| 2,909,578 | (9) | Freddie Mac REMICS 4141 EI, 3.000%, 09/15/2027 | | | 148,048 | | | | 0.0 |
| 3,806,381 | (9) | Freddie Mac REMICS 4153 IB, 2.500%, 01/15/2028 | | | 208,294 | | | | 0.1 |
| 7,017,910 | (9) | Freddie Mac REMICS 4517 KI, 1.015%, (- 0.357*US0001M + 1.071%), 04/15/2043 | | | 134,405 | | | | 0.0 |
| 5,686,023 | (9) | Freddie Mac REMICS 4596 DI, 3.500%, 06/15/2046 | | | 670,918 | | | | 0.2 |
| 2,823,283 | (9) | Freddie Mac REMICS 4619 KS, 4.095%, (- 1.000*US0001M + 4.250%), 06/15/2039 | | | 435,930 | | | | 0.1 |
| 1,266,321 | (9) | Ginnie Mae Series 2013- 148 DS, 5.527%, (- 1.000*US0001M + 5.680%), 10/16/2043 | | | 272,394 | | | | 0.1 |
| 9,513,218 | (9) | Ginnie Mae Series 2015- 20 CI, 3.500%, 02/20/2030 | | | 833,470 | | | | 0.2 |
| 872,850 | (9) | Ginnie Mae Series 2015- 42 IY, 5.500%, 08/20/2039 | | | 88,802 | | | | 0.0 |
| 7,750,717 | (9) | Ginnie Mae Series 2019- 23 MT, 0.600%, (- 1.000*US0001M + 6.700%), 03/20/2042 | | | 146,502 | | | | 0.0 |
| 283,445 | (7),(8) | GS Mortgage-Backed Securities Corp. Trust 2019-PJ2 A1, 4.000%, 11/25/2049 | | | 287,514 | | | | 0.1 |
| 866,893 | (7),(8) | GS Mortgage-Backed Securities Trust 2020- NQM1 A2, 1.791%, 09/27/2060 | | | 872,760 | | | | 0.3 |
| 789,674 | (7),(8) | JP Morgan Mortgage Trust 2018-8 A13, 4.000%, 01/25/2049 | | | 813,192 | | | | 0.2 |
| 728,658 | (7),(8) | JP Morgan Mortgage Trust 2020-3 A15, 3.500%, 08/25/2050 | | | 748,719 | | | | 0.2 |
| 294,573 | (7),(8) | J.P. Morgan Mortgage Trust 2019-2 A15, 4.000%, 08/25/2049 | | | 302,868 | | | | 0.1 |
| 720,729 | (7),(8) | J.P. Morgan Mortgage Trust 2019-LTV1 A3, 4.000%, 06/25/2049 | | | 742,166 | | | | 0.2 |
| 1,325,304 | (7),(8) | JP Morgan Mortgage Trust 2016-4 A13, 3.500%, 10/25/2046 | | | 1,350,277 | | | | 0.4 |
| 867,002 | (7),(8) | JP Morgan Mortgage Trust 2017-5 B2, 3.128%, 10/26/2048 | | | 855,608 | | | | 0.2 |
| 1,129,472 | (7),(8) | JP Morgan Mortgage Trust 2018-3 B2, 3.753%, 09/25/2048 | | | 1,173,485 | | | | 0.3 |
| 733,123 | (7),(8) | JP Morgan Mortgage Trust 2018-4 B2, 3.750%, 10/25/2048 | | | 766,476 | | | | 0.2 |
| 951,610 | (7),(8) | JP Morgan Mortgage Trust 2018-5 A13, 3.500%, 10/25/2048 | | | 989,643 | | | | 0.3 |
| 311,420 | (7),(8) | JP Morgan Mortgage Trust 2019-1 A3, 4.000%, 05/25/2049 | | | 322,158 | | | | 0.1 |
| 337,530 | (7),(8) | JP Morgan Mortgage Trust 2019-5 A3, 4.000%, 11/25/2049 | | | 350,056 | | | | 0.1 |
See Accompanying Notes to Financial Statements
| Voya Balanced Income Portfolio | PORTFOLIO OF INVESTMENTS AS OF December 31, 2020 (Continued) |
| 97,178 | (7),(8) | JP Morgan Mortgage Trust 2019-8 A15, 3.500%, 03/25/2050 | | | 100,602 | | | | 0.0 |
| 973,563 | (7),(8) | JP Morgan Mortgage Trust 2019-INV1 B2, 5.083%, 10/25/2049 | | | 1,049,149 | | | | 0.3 |
| 607,053 | (7),(8) | JP Morgan Mortgage Trust 2019-LTV2 A18, 4.000%, 12/25/2049 | | | 626,005 | | | | 0.2 |
| 584,928 | (7),(8) | JP Morgan Mortgage Trust 2019-LTV2 B3, 4.809%, 12/25/2049 | | | 620,966 | | | | 0.2 |
| 477,078 | (7),(8) | Mello Mortgage Capital Acceptance 2018-MTG2 B1, 4.463%, 10/25/2048 | | | 515,515 | | | | 0.2 |
| 621,529 | (7),(8) | Mello Mortgage Capital Acceptance 2018-MTG2 A2, 4.000%, 10/25/2048 | | | 633,768 | | | | 0.2 |
| 893,086 | (7),(8) | New Residential Mortgage Loan Trust 2019-NQM3 A3, 3.086%, 07/25/2049 | | | 904,717 | | | | 0.3 |
| 506,313 | (7),(8) | OBX 2019-INV2 A25 Trust, 4.000%, 05/27/2049 | | | 519,066 | | | | 0.2 |
| 1,153,365 | (7),(8) | Sequoia Mortgage Trust 2019-2 B2, 4.252%, 06/25/2049 | | | 1,221,863 | | | | 0.4 |
| 1,155,063 | (7),(8) | Sequoia Mortgage Trust 2019-2 B3, 4.252%, 06/25/2049 | | | 1,195,187 | | | | 0.3 |
| 126,287 | (7),(8) | Sequoia Mortgage Trust 2019-3 A2, 3.500%, 09/25/2049 | | | 129,385 | | | | 0.0 |
| 360,930 | (7),(8) | Sequoia Mortgage Trust 2019-4 A19, 3.500%, 11/25/2049 | | | 368,274 | | | | 0.1 |
| 356,760 | (7),(8) | Sequoia Mortgage Trust 2019-CH2 A1, 4.500%, 08/25/2049 | | | 366,930 | | | | 0.1 |
| 1,096,654 | (7),(8) | Starwood Mortgage Residential Trust 2019-1 A3, 3.299%, 06/25/2049 | | | 1,112,111 | | | | 0.3 |
| 200,297 | (7),(8) | Verus Securitization Trust 2018-INV1 A1, 3.626%, 03/25/2058 | | | 202,341 | | | | 0.1 |
| 569,523 | (7),(8) | Verus Securitization Trust 2019-INV2 A2, 3.117%, 07/25/2059 | | | 585,772 | | | | 0.2 |
| 566,904 | (7),(8) | Wells Fargo Mortgage Backed Securities 2018- 1 B3, 3.688%, 07/25/2047 | | | 576,981 | | | | 0.2 |
| 859,819 | (7),(8) | Wells Fargo Mortgage Backed Securities 2020- 4 A17 Trust, 3.000%, 07/25/2050 | | | 876,710 | | | | 0.3 |
| | | | | | | | | | |
| | Total Collateralized Mortgage Obligations | | | | | | | |
| | (Cost $47,846,066) | | | 48,540,991 | | | | 14.0 |
| | | | | | | | | | |
| COMMERCIAL MORTGAGE-BACKED SECURITIES: 10.5% | | | | | | | |
| 330,000 | (7),(8) | BAMLL Re-REMIC Trust 2016-FRR16 B, 0.860%, 05/27/2021 | | | 325,081 | | | | 0.1 |
| 650,000 | (7) | BANK 2017-BNK4 D, 3.357%, 05/15/2050 | | | 576,116 | | | | 0.2 |
| 1,170,000 | (7) | BANK 2017-BNK8 D, 2.600%, 11/15/2050 | | | 985,465 | | | | 0.3 |
| 1,460,000 | (7) | BANK 2019-BNK17 D, 3.000%, 04/15/2052 | | | 1,386,796 | | | | 0.4 |
| 1,000,000 | (7),(8) | BENCHMARK 2018-B3 D Mortgage Trust, 3.056%, 04/10/2051 | | | 924,008 | | | | 0.3 |
| 12,389,183 | (8),(9) | BENCHMARK 2019-B10 XA Mortgage Trust, 1.229%, 03/15/2062 | | | 981,015 | | | | 0.3 |
| 180,000 | (7) | Benchmark 2020-B18 AGNE Mortgage Trust, 3.759%, 08/15/2053 | | | 184,353 | | | | 0.0 |
| 5,497,544 | (8),(9) | Benchmark 2020-B17 XA Mortgage Trust, 1.420%, 03/15/2053 | | | 509,792 | | | | 0.1 |
| 5,747,989 | (8),(9) | Benchmark 2020-B18 XA Mortgage Trust, 1.794%, 07/15/2053 | | | 690,516 | | | | 0.2 |
| 759,438 | (7) | BX Commercial Mortgage Trust 2019-XL J, 2.809%, (US0001M + 2.650%), 10/15/2036 | | | 749,318 | | | | 0.2 |
| 729,332 | (7) | BX Commercial Mortgage Trust 2020- BXLP G, 2.659%, (US0001M + 2.500%), 12/15/2029 | | | 716,080 | | | | 0.2 |
| 100,000 | (7) | BX Commercial Mortgage Trust 2020- VKNG E, 2.259%, (US0001M + 2.100%), 10/15/2037 | | | 100,085 | | | | 0.0 |
| 210,000 | (7),(8) | BX Trust 2019-OC11 E, 4.076%, 12/09/2041 | | | 214,083 | | | | 0.1 |
| 2,000,000 | (7),(8) | CALI Mortgage Trust 2019-101C E, 4.324%, 03/10/2039 | | | 2,024,841 | | | | 0.6 |
| 16,205,823 | (8),(9) | Citigroup Commercial Mortgage Trust 2019-C7 XA, 0.878%, 12/15/2072 | | | 1,079,442 | | | | 0.3 |
| 2,350,000 | (7),(8) | Citigroup Commercial Mortgage Trust 2013- GC15 D, 5.181%, 09/10/2046 | | | 2,288,787 | | | | 0.7 |
| 1,000,000 | (8) | Commercial Mortgage Pass Through Certificates 2016-CR28 D, 3.889%, 02/10/2049 | | | 977,173 | | | | 0.3 |
| 130,000 | (7),(8) | COMM 2013-CR10 E Mortgage Trust, 4.789%, 08/10/2046 | | | 116,353 | | | | 0.0 |
| 2,000,000 | (8) | COMM 2015-CCRE26 D Mortgage Trust, 3.480%, 10/10/2048 | | | 1,837,132 | | | | 0.5 |
| 520,000 | (7) | Credit Suisse Mortgage Capital Certificates 2019-ICE4 F, 2.809%, (US0001M + 2.650%), 05/15/2036 | | | 515,398 | | | | 0.1 |
| 100,000 | (7),(8) | Credit Suisse Mortgage Capital Certificates 2020-NET C, 3.526%, 08/15/2037 | | | 104,808 | | | | 0.0 |
| 2,000,000 | (8) | Csail 2015-C2 C Commercial Mortgage Trust, 4.190%, 06/15/2057 | | | 1,673,920 | | | | 0.5 |
| 320,000 | (8) | DBJPM 20-C9 C Mortgage Trust, 3.492%, 09/15/2053 | | | 340,750 | | | | 0.1 |
See Accompanying Notes to Financial Statements
| Voya Balanced Income Portfolio | PORTFOLIO OF INVESTMENTS AS OF December 31, 2020 (Continued) |
| 350,000 | (7) | DBUBS 2011-LC2A F Mortgage Trust, 3.805%, (US0001M + 3.650%), 07/10/2044 | | | 262,847 | | | | 0.1 |
| 190,000 | (7),(8) | DBUBS 2017-BRBK E Mortgage Trust, 3.530%, 10/10/2034 | | | 194,542 | | | | 0.1 |
| 1,458,953 | (8),(9) | Freddie Mac Multifamily Structured Pass Through Certificates K109 X1, 1.584%, 04/25/2030 | | | 184,697 | | | | 0.1 |
| 205,000 | (7),(8) | GRACE 2014-GRCE F Mortgage Trust, 3.590%, 06/10/2028 | | | 204,846 | | | | 0.1 |
| 293,000 | (7),(8) | Grace Trust 2020-GRCE E, 2.680%, 12/10/2040 | | | 276,478 | | | | 0.1 |
| 172,185 | (7),(8) | GS Mortgage Securities Trust 2011-GC3 B, 5.361%, 03/10/2044 | | | 172,124 | | | | 0.0 |
| 13,737,246 | (8),(9) | GS Mortgage Securities Trust 2019-GC39 XA, 1.139%, 05/10/2052 | | | 969,028 | | | | 0.3 |
| 200,000 | (7),(8) | JPMBB Commercial Mortgage Securities Trust 2013-C17 F, 3.867%, 01/15/2047 | | | 148,854 | | | | 0.0 |
| 370,000 | (7),(8) | JPMCC Re-REMIC Trust 2015-FRR2 AK36, 2.164%, 12/27/2046 | | | 367,381 | | | | 0.1 |
| 420,000 | (7),(8) | JP Morgan Chase Commercial Mortgage Securities Trust 2011-C5 B, 5.424%, 08/15/2046 | | | 423,650 | | | | 0.1 |
| 27,410,333 | (8),(9) | JPMDB Commercial Mortgage Securities Trust 2018-C8 XA, 0.641%, 06/15/2051 | | | 912,690 | | | | 0.3 |
| 2,000,000 | (7) | KNDL 2019-KNSQ E Mortgage Trust, 1.959%, (US0001M + 1.800%), 05/15/2036 | | | 1,995,345 | | | | 0.6 |
| 560,000 | (7) | Morgan Stanley Bank of America Merrill Lynch Trust 2013-C13 F, 3.707%, 11/15/2046 | | | 363,106 | | | | 0.1 |
| 530,000 | (7) | Morgan Stanley Capital I Trust 2011-C1 M, 4.193%, 09/15/2047 | | | 63,693 | | | | 0.0 |
| 1,955,000 | (7),(8) | Morgan Stanley Capital I Trust 2016-BNK2 D, 3.000%, 11/15/2049 | | | 1,603,258 | | | | 0.5 |
| 17,689,067 | (8),(9) | Morgan Stanley Capital I Trust 2019-L3 XA, 0.643%, 11/15/2029 | | | 876,856 | | | | 0.3 |
| 200,000 | (7) | MRCD 2019-PARK E Mortgage Trust, 2.718%, 12/15/2036 | | | 197,342 | | | | 0.1 |
| 140,000 | (7),(8) | UBS-Barclays Commercial Mortgage Trust 2012-C4 D, 4.470%, 12/10/2045 | | | 81,687 | | | | 0.0 |
| 240,000 | (7),(8) | UBS-Barclays Commercial Mortgage Trust 2012-C4 E, 4.470%, 12/10/2045 | | | 119,358 | | | | 0.0 |
| 2,240,000 | (7) | Wells Fargo Commercial Mortgage Trust 2019- C49 D, 3.000%, 03/15/2052 | | | 1,758,768 | | | | 0.5 |
| 1,920,000 | (8) | WFRBS Commercial Mortgage Trust 2014- C19 C, 4.646%, 03/15/2047 | | | 1,906,604 | | | | 0.5 |
| 420,000 | (7),(8) | WFRBS Commercial Mortgage Trust 2011-C5 B, 5.656%, 11/15/2044 | | | 428,379 | | | | 0.1 |
| 2,000,000 | (7),(8) | WFRBS Commercial Mortgage Trust 2011-C5 E, 5.656%, 11/15/2044 | | | 1,905,423 | | | | 0.5 |
| 2,210,000 | (7) | WFRBS Commercial Mortgage Trust 2013- C12 E, 3.500%, 03/15/2048 | | | 1,808,163 | | | | 0.5 |
| | | | | | | | | | |
| | Total Commercial Mortgage-Backed Securities | | | | | | | |
| | (Cost $37,903,081) | | | 36,526,431 | | | | 10.5 |
| | | | | | | | | |
| ASSET-BACKED SECURITIES: 9.6% | | | | | |
| | | Automobile Asset-Backed Securities: 1.7% | | | | | |
| 300,000 | | Americredit Automobile Receivables Trust 2018- 2 D, 4.010%, 07/18/2024 | | | 318,063 | | | | 0.1 |
| 450,000 | | Americredit Automobile Receivables Trust 2019- 2 D, 2.990%, 06/18/2025 | | | 471,259 | | | | 0.1 |
| 1,200,000 | | Carmax Auto Owner Trust 2019-3 D, 2.850%, 01/15/2026 | | | 1,242,040 | | | | 0.4 |
| 500,000 | | GM Financial Consumer Automobile Receivables Trust 2019-3 C, 2.620%, 01/16/2025 | | | 518,228 | | | | 0.1 |
| 550,000 | (7) | Oscar US Funding XI LLC 2019-2A A4, 2.680%, 09/10/2026 | | | 577,351 | | | | 0.2 |
| 550,000 | | Santander Drive Auto Receivables Trust 2019- 1 D, 3.650%, 04/15/2025 | | | 574,037 | | | | 0.2 |
| 1,000,000 | | Santander Drive Auto Receivables Trust 2019- 2 D, 3.220%, 07/15/2025 | | | 1,040,592 | | | | 0.3 |
| 150,000 | | Santander Drive Auto Receivables Trust 2019- 3 C, 2.490%, 10/15/2025 | | | 153,168 | | | | 0.0 |
| 350,000 | | Santander Drive Auto Receivables Trust 2019- 3 D, 2.680%, 10/15/2025 | | | 360,062 | | | | 0.1 |
| 600,000 | (7) | Santander Retail Auto Lease Trust 2019-B C, 2.770%, 08/21/2023 | | | 617,793 | | | | 0.2 |
| | | | | | 5,872,593 | | | | 1.7 |
| | | | | | | | | | |
| | | Home Equity Asset-Backed Securities:0.1% | | | | | | | |
| 586,611 | (7),(8),(10) | ACE Securities Corp. Mortgage Loan Trust Series 2007-D1 A2, 6.336%, 02/25/2038 | | | 582,967 | | | | 0.1 |
| | | | | | | | | | |
| | | Other Asset-Backed Securities: 7.6% | | | | | | | |
| 399,000 | (7) | Applebee’s Funding LLC / IHOP Funding LLC 2019-1A A2I, 4.194%, 06/07/2049 | | | 395,734 | | | | 0.1 |
| 149,625 | (7) | Applebee’s Funding LLC / IHOP Funding LLC 2019-1A A2II, 4.723%, 06/07/2049 | | | 146,370 | | | | 0.0 |
See Accompanying Notes to Financial Statements
| Voya Balanced Income Portfolio | PORTFOLIO OF INVESTMENTS AS OF December 31, 2020 (Continued) |
| 300,000 | (7) | Babson CLO Ltd. 2018- 3A C, 2.118%, (US0003M + 1.900%), 07/20/2029 | | | 296,489 | | | | 0.1 |
| 750,000 | (7) | Benefit Street Partners CLO II Ltd. 2013-IIA BR, 2.787%, (US0003M + 2.550%), 07/15/2029 | | | 737,255 | | | | 0.2 |
| 750,000 | (7) | Benefit Street Partners CLO X Ltd. 2016-10A BR, 2.637%, (US0003M + 2.400%), 01/15/2029 | | | 742,491 | | | | 0.2 |
| 500,000 | (7) | BlueMountain CLO XXV Ltd. 2019-25A C, 2.687%, (US0003M + 2.450%), 07/15/2032 | | | 497,254 | | | | 0.1 |
| 388,000 | (7) | Domino’s Pizza Master Issuer LLC 2017-1A A2II, 3.082%, 07/25/2047 | | | 391,977 | | | | 0.1 |
| 603,118 | (7) | Domino’s Pizza Master Issuer LLC 2018-1A A2I, 4.116%, 07/25/2048 | | | 635,810 | | | | 0.2 |
| 700,000 | (7) | Dryden 43 Senior Loan Fund 2016-43A CR, 2.618%, (US0003M + 2.400%), 07/20/2029 | | | 700,084 | | | | 0.2 |
| 500,000 | (7) | Dryden 75 CLO Ltd. 2019-75A CR, 2.637%, (US0003M + 2.400%), 07/15/2030 | | | 500,145 | | | | 0.2 |
| 423,914 | (7) | J.G. Wentworth XXXVIII LLC 2017-1A A, 3.990%, 08/16/2060 | | | 494,221 | | | | 0.1 |
| 750,000 | (7) | LCM XXII Ltd. 22A BR, 2.218%, (US0003M + 2.000%), 10/20/2028 | | | 732,580 | | | | 0.2 |
| 1,200,000 | (7) | LCM XXIV Ltd. 24A C, 2.468%, (US0003M + 2.250%), 03/20/2030 | | | 1,183,679 | | | | 0.3 |
| 750,000 | (7) | LCM XV L.P. 15A CR, 2.618%, (US0003M + 2.400%), 07/20/2030 | | | 737,925 | | | | 0.2 |
| 500,000 | (7) | Madison Park Funding XXI Ltd. 2016-21A BR, 3.087%, (US0003M + 2.850%), 10/15/2032 | | | 500,547 | | | | 0.2 |
| 650,000 | (7) | Marlette Funding Trust 2019-3A B, 3.070%, 09/17/2029 | | | 660,002 | | | | 0.2 |
| 444,495 | (7) | Mill City Solar Loan 2019-2GS A Ltd., 3.690%, 07/20/2043 | | | 469,674 | | | | 0.1 |
| 770,684 | (7) | Mosaic Solar Loans 2017-2A A LLC, 3.820%, 06/22/2043 | | | 831,656 | | | | 0.2 |
| 750,000 | (7) | Neuberger Berman CLO XVII Ltd. 2014-17A CR2, 2.216%, (US0003M + 2.000%), 04/22/2029 | | | 748,009 | | | | 0.2 |
| 1,000,000 | (7) | Neuberger Berman Loan Advisers CLO 25 Ltd. 2017-25A C, 2.368%, (US0003M + 2.150%), 10/18/2029 | | | 999,434 | | | | 0.3 |
| 750,000 | (7) | Neuberger Berman Loan Advisers CLO 33 Ltd. 2019-33A C, 2.680%, (US0003M + 2.450%), 10/16/2032 | | | 751,791 | | | | 0.2 |
| 750,000 | (7) | OCP Clo 2019-17A C1 Ltd., 2.768%, (US0003M + 2.550%), 07/20/2032 | | | 750,367 | | | | 0.2 |
| 250,000 | (7) | Octagon Loan Funding Ltd. 2014-1A CRR, 2.420%, (US0003M + 2.200%), 11/18/2031 | | | 246,750 | | | | 0.1 |
| 750,000 | (7) | OHA Credit Funding 3 Ltd. 2019-3A C, 2.668%, (US0003M + 2.450%), 07/20/2032 | | | 750,284 | | | | 0.2 |
| 1,000,000 | (7) | Palmer Square CLO 2015-1A BR2 Ltd., 2.463%, (US0003M + 2.250%), 05/21/2029 | | | 1,000,225 | | | | 0.3 |
| 800,000 | (7) | Palmer Square Loan Funding 2019-2A B Ltd., 2.468%, (US0003M + 2.250%), 04/20/2027 | | | 799,671 | | | | 0.2 |
| 750,000 | (7) | Palmer Square Loan Funding 2020-2A B Ltd., 2.468%, (US0003M + 2.250%), 04/20/2028 | | | 749,315 | | | | 0.2 |
| 500,000 | (7) | Shackleton CLO Ltd. 2019-15A C, 3.037%, (US0003M + 2.800%), 01/15/2030 | | | 500,035 | | | | 0.2 |
| 500,000 | (7) | Silver Creek CLO Ltd. 2014-1A CR, 2.518%, (US0003M + 2.300%), 07/20/2030 | | | 498,610 | | | | 0.2 |
| 150,000 | (7) | Sofi Consumer Loan Program 2018-2 B Trust, 3.790%, 04/26/2027 | | | 153,291 | | | | 0.1 |
| 150,000 | (7) | SoFi Consumer Loan Program 2018-4 B Trust, 3.960%, 11/26/2027 | | | 151,991 | | | | 0.1 |
| 1,000,000 | (7) | SoFi Consumer Loan Program 2019-3 D Trust, 3.890%, 05/25/2028 | | | 1,037,097 | | | | 0.3 |
| 200,000 | (7) | SoFi Consumer Loan Program 2019-4 C Trust, 2.840%, 08/25/2028 | | | 205,613 | | | | 0.1 |
| 100,000 | (7) | SoFi Consumer Loan Program 2019-4 D Trust, 3.480%, 08/25/2028 | | | 102,070 | | | | 0.0 |
| 400,000 | (7) | SoFi Consumer Loan Program 2020-1 C Trust, 2.500%, 01/25/2029 | | | 405,491 | | | | 0.1 |
| 349,526 | (7) | Sunrun Xanadu Issuer 2019-1A A LLC, 3.980%, 06/30/2054 | | | 369,597 | | | | 0.1 |
| 750,000 | (7) | THL Credit Wind River 2016-1A CR CLO Ltd., 2.337%, (US0003M + 2.100%), 07/15/2028 | | | 736,643 | | | | 0.2 |
| 2,000,000 | (7),(8) | Towd Point Mortgage Trust 2015-4 M2, 3.750%, 04/25/2055 | | | 2,163,742 | | | | 0.6 |
| 180,000 | (7),(8) | Towd Point Mortgage Trust 2015-6 M2, 3.750%, 04/25/2055 | | | 197,651 | | | | 0.1 |
| 1,164,000 | (7) | Wendy’s Funding LLC 2018-1A A2II, 3.884%, 03/15/2048 | | | 1,236,564 | | | | 0.4 |
| 241,250 | (7) | Wendy’s Funding LLC 2019-1A A2I, 3.783%, 06/15/2049 | | | 257,011 | | | | 0.1 |
See Accompanying Notes to Financial Statements
| Voya Balanced Income Portfolio | PORTFOLIO OF INVESTMENTS AS OF December 31, 2020 (Continued) |
| 780,000 | (7) | Westcott Park CLO Ltd. 2016-1A CR, 2.468%, (US0003M + 2.250%), 07/20/2028 | | | 780,120 | | | | 0.2 |
| | | | | | 26,245,265 | | | | 7.6 |
| | | | | | | | | | |
| | | Student Loan Asset-Backed Securities: 0.2% | | | | | | | |
| 600,000 | (7) | Sofi Professional Loan Program 2019-C BFX LLC, 3.050%, 11/16/2048 | | | 624,528 | | | | 0.2 |
| | | | | | | | | | |
| | Total Asset-Backed Securities | | | | | | | |
| | (Cost $32,654,561) | | | 33,325,353 | | | | 9.6 |
| | | | | | | | | | |
| U.S. TREASURY OBLIGATIONS: 0.7% | | | | | | | |
| | | U.S. Treasury Bonds: 0.2% | | | | | | | |
| 1,000 | | 1.250%,05/15/2050 | | | 905 | | | | 0.0 |
| 538,000 | | 1.375%,08/15/2050 | | | 502,862 | | | | 0.2 |
| | | | | | 503,767 | | | | 0.2 |
| | | | | | | | | | |
| | | U.S. Treasury Notes: 0.5% | | | | | | | |
| 1,800,000 | | 0.125%,12/15/2023 | | | 1,797,820 | | | | 0.5 |
| 90,000 | | 0.875%,11/15/2030 | | | 89,663 | | | | 0.0 |
| | | | | | 1,887,483 | | | | 0.5 |
| | | | | | | | | | |
| | Total U.S. Treasury Obligations | | | | | | | |
| | (Cost $2,390,668) | | | 2,391,250 | | | | 0.7 |
| | | | | | | | | | |
| SOVEREIGN BONDS: 1.6% | | | | | | | |
| 300,000 | | Brazilian Government International Bond, 3.875%, 06/12/2030 | | | 317,025 | | | | 0.1 |
| 450,000 | | Colombia Government International Bond, 3.875%, 04/25/2027 | | | 502,452 | | | | 0.1 |
| EUR 225,000 | | Croatia Government International Bond, 1.125%, 06/19/2029 | | | 289,673 | | | | 0.1 |
| 200,000 | | Croatia Government International Bond, 5.500%, 04/04/2023 | | | 220,605 | | | | 0.1 |
| 200,000 | (7) | Dominican Republic International Bond, 4.500%, 01/30/2030 | | | 217,750 | | | | 0.1 |
| 300,000 | | Dominican Republic International Bond, 6.875%, 01/29/2026 | | | 362,625 | | | | 0.1 |
| 350,000 | (1) | Egypt Government International Bond, 5.875%, 06/11/2025 | | | 380,787 | | | | 0.1 |
| 225,000 | | Egypt Government International Bond, 7.500%, 01/31/2027 | | | 260,818 | | | | 0.1 |
| 325,000 | (7) | Ghana Government International Bond, 6.375%, 02/11/2027 | | | 338,547 | | | | 0.1 |
| 166,000 | | Ivory Coast Government International Bond, 5.750%, 12/31/2032 | | | 167,978 | | | | 0.0 |
| 200,000 | | Mexico Government International Bond, 4.500%, 04/22/2029 | | | 235,175 | | | | 0.1 |
| 125,000 | | Panama Government International Bond, 9.375%, 04/01/2029 | | | 195,132 | | | | 0.1 |
| 200,000 | | Perusahaan Penerbit SBSN Indonesia III, 4.150%, 03/29/2027 | | | 229,634 | | | | 0.1 |
| 450,000 | | Republic of South Africa Government International Bond, 4.850%, 09/30/2029 | | | 478,999 | | | | 0.1 |
| 200,000 | | Russian Foreign Bond - Eurobond, 4.375%, 03/21/2029 | | | 233,741 | | | | 0.1 |
| 200,000 | | Sri Lanka Government International Bond, 6.350%, 06/28/2024 | | | 122,800 | | | | 0.0 |
| 475,000 | | Turkey Government International Bond, 4.875%, 10/09/2026 | | | 481,475 | | | | 0.1 |
| 350,000 | | Ukraine Government International Bond, 7.750%, 09/01/2025 | | | 393,304 | | | | 0.1 |
| | | | | | | | | | |
| | Total Sovereign Bonds | | | | | | | |
| | (Cost $5,130,111) | | | 5,428,520 | | | | 1.6 |
| | | | | | | | | | |
| | | | | | | | Percentage |
| | | | | | | | of Net |
| | | | | Value | | | Assets |
| PURCHASED OPTIONS (11): 0.0% | | | | | | |
| | Total Purchased Options | | | | | | | |
| | (Cost $184,426) | | | 74,743 | | | | 0.0 |
| | | | | | | | | |
| | Total Long-Term Investments | | | | | | | |
| | (Cost $309,389,040) | | | 339,550,954 | | | | 98.0 |
| | | | | | | | | | |
| | | | | | | | | | Percentage |
| Principal | | | | | | | | | of Net |
| Amount† | | | | | Value | | | | Assets |
| SHORT-TERM INVESTMENTS: 0.5% | | | | | | | |
| | | Repurchase Agreements: 0.5% | | | | | | | |
| 605,627 | (12) | Citigroup, Inc., Repurchase Agreement dated 12/31/20, 0.07%, due 01/04/21 (Repurchase Amount $605,632, collateralized by various U.S. Government/U.S. Government Agency Obligations, 0.000%- 4.000%, Market Value plus accrued interest $617,740, due 09/15/21- 01/01/51) | | | 605,627 | | | | 0.2 |
| 1,000,000 | (12) | RBC Dominion Securities Inc., Repurchase Agreement dated 12/31/20, 0.08%, due 01/04/21 (Repurchase Amount $1,000,009, collateralized by various U.S. Government/U.S. Government Agency Obligations, 0.000%- 6.000%, Market Value plus accrued interest $1,020,000, due 01/05/21-12/20/50) | | | 1,000,000 | | | | 0.3 |
| | | | | | | | | | |
| | Total Repurchase Agreements | | | | | | | |
| | | | | | | | | | |
| | Total Short-Term Investments | | | | | | | |
| | (Cost $1,605,627) | | | 1,605,627 | | | | 0.5 |
See Accompanying Notes to Financial Statements
| Voya Balanced Income Portfolio | PORTFOLIO OF INVESTMENTS
AS OF December 31, 2020 (Continued) |
| | Total Investments in Securities | | | | | |
| | (Cost $310,994,667) | | $ | 341,156,581 | | | | 98.5 |
| | Assets in Excess of Other Liabilities | | | 5,027,282 | | | | 1.5 |
| | Net Assets | | $ | 346,183,863 | | | | 100.0 |
| † | Unless otherwise indicated, principal amount is shown in USD. |
| ADR | American Depositary Receipt |
| (1) | Security, or a portion of the security, is on loan. |
| (2) | Non-income producing security. |
| (3) | Preferred Stock may be called prior to convertible date. |
| (4) | Represents an escrow position for future entitlements, if any, on the defaulted bond. The escrow position was received in exchange for the defaulted bond as part of the bankruptcy reorganization of the bond issuer. These holdings are non-income producing. |
| (5) | For fair value measurement disclosure purposes, security is categorized as Level 3, whose value was determined using significant unobservable inputs. |
| (6) | Restricted security as to resale, excluding Rule 144A securities. As of December 31, 2020, the Portfolio held restricted securities with a fair value of $– or 0.0% of net assets. Please refer to the table below for additional details. |
| (7) | Securities with purchases pursuant to Rule 144A or section 4(a)(2), under the Securities Act of 1933 and may not be resold subject to that rule except to qualified institutional buyers. |
| (8) | Variable rate security. Rate shown is the rate in effect as of December 31, 2020. |
| (9) | Interest only securities represent the right to receive the monthly interest payments on an underlying pool of mortgage loans. Principal amount shown represents the notional amount on which current interest is calculated. Payments of principal on the pool reduce the value of the interest only security. |
| (10) | Step-up bond that pays an initial coupon rate for the first period and then a higher coupon rate for the following periods. Rates shown reflect the current and next coupon rate as of December 31, 2020. |
| (11) | The tables within the Portfolio of Investments detail open purchased options which are non-income producing securities. |
| (12) | All or a portion of the security represents securities purchased with cash collateral received for securities on loan. |
Currency Abbreviations:
Reference Rate Abbreviations:
US0001M 1-month LIBOR
US0003M 3-month LIBOR
See Accompanying Notes to Financial Statements
| Voya High Yield Portfolio | PORTFOLIO OF INVESTMENTS
AS OF December 31, 2020 |
| | | | | | | | Percentage |
| Principal | | | | | | | of Net |
| Amount† | | | | Value | | | Assets |
| CORPORATE BONDS/NOTES: 94.3% | | | | | | | |
| | | Basic Materials: 6.4% | | | | | | | |
| 825,000 | | Cleveland-Cliffs, Inc., 5.750%, 03/01/2025 | | $ | 838,922 | | | | 0.2 |
| 75,000 | | Cleveland-Cliffs, Inc., 5.875%, 06/01/2027 | | | 76,565 | | | | 0.0 |
| 1,580,000 | (1) | Cleveland-Cliffs, Inc., 6.750%, 03/15/2026 | | | 1,708,375 | | | | 0.3 |
| 1,050,000 | (1) | Compass Minerals International, Inc., 6.750%, 12/01/2027 | | | 1,140,100 | | | | 0.2 |
| 1,150,000 | (1),(2) | Constellium SE, 5.625%, 06/15/2028 | | | 1,241,281 | | | | 0.2 |
| 850,000 | (1) | Constellium SE, 6.625%, 03/01/2025 | | | 869,656 | | | | 0.2 |
| 1,150,000 | (1) | Element Solutions, Inc., 3.875%, 09/01/2028 | | | 1,185,219 | | | | 0.2 |
| 1,500,000 | (1) | First Quantum Minerals Ltd., 6.875%, 10/15/2027 | | | 1,629,375 | | | | 0.3 |
| 2,825,000 | | Freeport-McMoRan, Inc., 4.125%, 03/01/2028 | | | 2,968,016 | | | | 0.6 |
| 200,000 | | Freeport-McMoRan, Inc., 4.250%, 03/01/2030 | | | 215,688 | | | | 0.0 |
| 575,000 | | Freeport-McMoRan, Inc., 4.550%, 11/14/2024 | | | 629,266 | | | | 0.1 |
| 585,000 | | Freeport-McMoRan, Inc., 4.625%, 08/01/2030 | | | 643,076 | | | | 0.1 |
| 1,175,000 | (1) | Hudbay Minerals, Inc., 6.125%, 04/01/2029 | | | 1,269,000 | | | | 0.2 |
| 1,150,000 | (1) | Illuminate Buyer LLC / Illuminate Holdings IV, Inc., 9.000%, 07/01/2028 | | | 1,266,437 | | | | 0.2 |
| 1,272,000 | (1) | Joseph T Ryerson & Son, Inc., 8.500%, 08/01/2028 | | | 1,442,925 | | | | 0.3 |
| 1,300,000 | (1) | Kraton Polymers LLC / Kraton Polymers Capital Corp., 4.250%, 12/15/2025 | | | 1,327,755 | | | | 0.3 |
| 2,000,000 | (1) | Novelis Corp., 5.875%, 09/30/2026 | | | 2,092,500 | | | | 0.4 |
| 635,000 | (1) | OCI NV, 4.625%, 10/15/2025 | | | 660,003 | | | | 0.1 |
| 750,000 | (1) | OCI NV, 5.250%, 11/01/2024 | | | 780,469 | | | | 0.1 |
| 850,000 | | Olin Corp., 5.125%, 09/15/2027 | | | 890,281 | | | | 0.2 |
| 175,000 | | Olin Corp., 5.000%, 02/01/2030 | | | 186,780 | | | | 0.0 |
| 1,300,000 | (1) | Rayonier AM Products, Inc., 7.625%, 01/15/2026 | | | 1,357,200 | | | | 0.3 |
| 1,500,000 | (1) | Schweitzer-Mauduit International, Inc., 6.875%, 10/01/2026 | | | 1,595,340 | | | | 0.3 |
| 1,215,000 | (1) | SPCM SA, 4.875%, 09/15/2025 | | | 1,254,487 | | | | 0.2 |
| 2,350,000 | (1) | Trinseo Materials Operating SCA / Trinseo Materials Finance, Inc., 5.375%, 09/01/2025 | | | 2,404,344 | | | | 0.4 |
| 1,875,000 | (1),(2) | Tronox, Inc., 6.500%, 04/15/2026 | | | 1,954,688 | | | | 0.4 |
| 1,450,000 | (1) | Venator Finance Sarl / Venator Materials LLC, 5.750%, 07/15/2025 | | | 1,358,469 | | | | 0.3 |
| 1,375,000 | (1) | WR Grace & Co-Conn, 4.875%, 06/15/2027 | | | 1,459,934 | | | | 0.3 |
| | | | | | 34,446,151 | | | | 6.4 |
| | | | | | | | | | |
| | | Communications: 16.9% | | | | | | | |
| 1,200,000 | (1) | Altice France Holding SA, 6.000%, 02/15/2028 | | | 1,217,502 | | | | 0.2 |
| 2,038,000 | (1) | Altice France Holding SA, 10.500%, 05/15/2027 | | | 2,291,476 | | | | 0.4 |
| 875,000 | (1) | Altice France SA/France, 5.125%, 01/15/2029 | | | 907,266 | | | | 0.2 |
| 1,225,000 | (1) | Altice France SA/France, 8.125%, 02/01/2027 | | | 1,351,977 | | | | 0.2 |
| 1,180,000 | (1) | ANGI Group LLC, 3.875%, 08/15/2028 | | | 1,203,146 | | | | 0.2 |
| 350,000 | (1) | Arches Buyer, Inc., 4.250%, 06/01/2028 | | | 355,101 | | | | 0.1 |
| 825,000 | (1) | Arches Buyer, Inc., 6.125%, 12/01/2028 | | | 853,524 | | | | 0.2 |
| 2,430,000 | (1) | CCO Holdings LLC / CCO Holdings Capital Corp., 4.500%, 05/01/2032 | | | 2,597,597 | | | | 0.5 |
| 2,250,000 | (1) | CCO Holdings LLC / CCO Holdings Capital Corp., 5.125%, 05/01/2027 | | | 2,390,681 | | | | 0.4 |
| 1,075,000 | (1) | CCO Holdings LLC / CCO Holdings Capital Corp., 5.000%, 02/01/2028 | | | 1,137,887 | | | | 0.2 |
| 450,000 | (1) | CCO Holdings LLC / CCO Holdings Capital Corp., 5.500%, 05/01/2026 | | | 466,945 | | | | 0.1 |
| 1,350,000 | | Clear Channel Worldwide Holdings, Inc., 9.250%, 02/15/2024 | | | 1,370,392 | | | | 0.3 |
| 1,790,000 | (1) | CommScope Tech Finance LLC, 6.000%, 06/15/2025 | | | 1,832,691 | | | | 0.3 |
| 175,000 | (1) | CommScope Technologies LLC, 5.000%, 03/15/2027 | | | 173,578 | | | | 0.0 |
| 890,000 | (1) | CommScope, Inc., 7.125%, 07/01/2028 | | | 949,372 | | | | 0.2 |
| 1,725,000 | (1) | Connect Finco SARL / Connect US Finco LLC, 6.750%, 10/01/2026 | | | 1,860,533 | | | | 0.3 |
| 1,225,000 | (1) | Consolidated Communications, Inc., 6.500%, 10/01/2028 | | | 1,312,587 | | | | 0.2 |
| 1,400,000 | (1) | CSC Holdings LLC, 4.625%, 12/01/2030 | | | 1,463,189 | | | | 0.3 |
| 1,485,000 | | CSC Holdings LLC, 5.250%, 06/01/2024 | | | 1,610,148 | | | | 0.3 |
| 1,125,000 | (1) | CSC Holdings LLC, 5.750%, 01/15/2030 | | | 1,234,693 | | | | 0.2 |
| 650,000 | (1) | CSC Holdings LLC, 7.500%, 04/01/2028 | | | 731,877 | | | | 0.1 |
| 1,400,000 | (1) | Cumulus Media New Holdings, Inc., 6.750%, 07/01/2026 | | | 1,433,789 | | | | 0.3 |
| 1,075,000 | (1) | Diamond Sports Group LLC / Diamond Sports Finance Co., 5.375%, 08/15/2026 | | | 875,453 | | | | 0.2 |
| 625,000 | (1),(2) | Diamond Sports Group LLC / Diamond Sports Finance Co., 6.625%, 08/15/2027 | | | 378,906 | | | | 0.1 |
| 525,000 | | DISH DBS Corp., 5.000%, 03/15/2023 | | | 542,719 | | | | 0.1 |
| 1,600,000 | | DISH DBS Corp., 5.875%, 11/15/2024 | | | 1,680,000 | | | | 0.3 |
| 1,685,000 | | DISH DBS Corp., 7.375%, 07/01/2028 | | | 1,796,631 | | | | 0.3 |
| 1,450,000 | | Embarq Corp., 7.995%, 06/01/2036 | | | 1,791,221 | | | | 0.3 |
| 1,600,000 | (1),(2) | Entercom Media Corp., 7.250%, 11/01/2024 | | | 1,599,000 | | | | 0.3 |
| 325,000 | (1) | Frontier Communications Corp., 5.000%, 05/01/2028 | | | 339,422 | | | | 0.1 |
| 1,350,000 | (1) | Frontier Communications Corp., 6.750%, 05/01/2029 | | | 1,447,031 | | | | 0.3 |
| 1,225,000 | (1) | GCI LLC, 4.750%, 10/15/2028 | | | 1,308,821 | | | | 0.2 |
See Accompanying Notes to Financial Statements
| Voya High Yield Portfolio | PORTFOLIO OF INVESTMENTS
AS OF December 31, 2020 (Continued) |
| 1,275,000 | | Hughes Satellite Systems Corp., 6.625%, 08/01/2026 | | | 1,447,163 | | | | 0.3 |
| 525,000 | (1) | iHeartCommunications, Inc., 5.250%, 08/15/2027 | | | 550,825 | | | | 0.1 |
| 1,875,000 | | iHeartCommunications, Inc., 8.375%, 05/01/2027 | | | 2,004,703 | | | | 0.4 |
| 1,600,000 | (1) | LCPR Senior Secured Financing DAC, 6.750%, 10/15/2027 | | | 1,724,000 | | | | 0.3 |
| 1,100,000 | | Level 3 Financing, Inc., 5.250%, 03/15/2026 | | | 1,138,005 | | | | 0.2 |
| 1,325,000 | (1) | LogMeIn, Inc., 5.500%, 09/01/2027 | | | 1,389,594 | | | | 0.3 |
| 650,000 | (1) | Match Group Holdings II LLC, 4.125%, 08/01/2030 | | | 675,493 | | | | 0.1 |
| 300,000 | (1) | Match Group Holdings II LLC, 4.625%, 06/01/2028 | | | 315,000 | | | | 0.1 |
| 1,000,000 | (1) | MDC Partners, Inc., 6.500%, 05/01/2024 | | | 1,015,260 | | | | 0.2 |
| 1,975,000 | (2) | Meredith Corp., 6.875%, 02/01/2026 | | | 1,929,328 | | | | 0.4 |
| 1,125,000 | (1) | Midcontinent Communications / Midcontinent Finance Corp., 5.375%, 08/15/2027 | | | 1,179,630 | | | | 0.2 |
| 540,000 | (1) | National CineMedia LLC, 5.875%, 04/15/2028 | | | 459,000 | | | | 0.1 |
| 850,000 | (1) | Netflix, Inc., 4.875%, 06/15/2030 | | | 979,094 | | | | 0.2 |
| 1,625,000 | | Netflix, Inc., 5.875%, 11/15/2028 | | | 1,950,869 | | | | 0.4 |
| 1,425,000 | (1) | Nexstar Broadcasting, Inc., 5.625%, 07/15/2027 | | | 1,528,761 | | | | 0.3 |
| 1,100,000 | | Northwestern Bell Telephone, 7.750%, 05/01/2030 | | | 1,315,246 | | | | 0.2 |
| 1,875,000 | (1) | Radiate Holdco LLC / Radiate Finance, Inc., 6.500%, 09/15/2028 | | | 1,972,266 | | | | 0.4 |
| 225,000 | (1),(2) | Scripps Escrow II, Inc., 3.875%, 01/15/2029 | | | 234,983 | | | | 0.0 |
| 300,000 | (1),(2) | Scripps Escrow II, Inc., 5.375%, 01/15/2031 | | | 316,044 | | | | 0.1 |
| 1,100,000 | (1) | Scripps Escrow, Inc., 5.875%, 07/15/2027 | | | 1,150,545 | | | | 0.2 |
| 1,700,000 | (1) | Sinclair Television Group, Inc., 4.125%, 12/01/2030 | | | 1,744,209 | | | | 0.3 |
| 1,775,000 | (1) | Sirius XM Radio, Inc., 5.000%, 08/01/2027 | | | 1,888,556 | | | | 0.3 |
| 925,000 | | Sprint Communications, Inc., 6.000%, 11/15/2022 | | | 1,002,469 | | | | 0.2 |
| 3,100,000 | | Sprint Corp., 7.125%, 06/15/2024 | | | 3,629,015 | | | | 0.7 |
| 1,100,000 | | Sprint Corp., 7.625%, 03/01/2026 | | | 1,366,981 | | | | 0.3 |
| 220,000 | (1) | TEGNA, Inc., 4.625%, 03/15/2028 | | | 225,363 | | | | 0.0 |
| 525,000 | (1) | TEGNA, Inc., 4.750%, 03/15/2026 | | | 561,251 | | | | 0.1 |
| 1,325,000 | | TEGNA, Inc., 5.000%, 09/15/2029 | | | 1,400,999 | | | | 0.3 |
| 825,000 | | Telecom Italia Capital SA, 6.000%, 09/30/2034 | | | 1,006,987 | | | | 0.2 |
| 1,050,000 | | Telecom Italia Capital SA, 6.375%, 11/15/2033 | | | 1,293,931 | | | | 0.2 |
| 1,700,000 | (1) | Terrier Media Buyer, Inc., 8.875%, 12/15/2027 | | | 1,877,438 | | | | 0.3 |
| 350,000 | (1) | Townsquare Media, Inc., 6.875%, 02/01/2026 | | | 367,596 | | | | 0.1 |
| 2,175,000 | (1) | Univision Communications, Inc., 6.625%, 06/01/2027 | | | 2,339,811 | | | | 0.4 |
| 425,000 | (1) | Univision Communications, Inc., 9.500%, 05/01/2025 | | | 474,938 | | | | 0.1 |
| 875,000 | (3) | ViacomCBS, Inc., 6.250%, 02/28/2057 | | | 984,261 | | | | 0.2 |
| 1,350,000 | (1) | ViaSat, Inc., 5.625%, 09/15/2025 | | | 1,382,468 | | | | 0.3 |
| 250,000 | (1) | ViaSat, Inc., 5.625%, 04/15/2027 | | | 262,969 | | | | 0.0 |
| 625,000 | (1),(2) | ViaSat, Inc., 6.500%, 07/15/2028 | | | 677,347 | | | | 0.1 |
| 400,000 | (1) | Virgin Media Finance PLC, 5.000%, 07/15/2030 | | | 415,500 | | | | 0.1 |
| 1,200,000 | (1) | Virgin Media Secured Finance PLC, 5.500%, 05/15/2029 | | | 1,302,408 | | | | 0.2 |
| 750,000 | (1) | Virgin Media Vendor Financing Notes IV DAC, 5.000%, 07/15/2028 | | | 780,750 | | | | 0.1 |
| 250,000 | (1) | VTR Comunicaciones SpA, 5.125%, 01/15/2028 | | | 266,650 | | | | 0.0 |
| 400,000 | (1) | VTR Finance NV, 6.375%, 07/15/2028 | | | 437,500 | | | | 0.1 |
| 1,850,000 | (1) | Zayo Group Holdings, Inc., 6.125%, 03/01/2028 | | | 1,959,557 | | | | 0.4 |
| | | | | | 91,429,918 | | | | 16.9 |
| | | | | | | | | | |
| | | Consumer, Cyclical: 20.8% | | | | | | | |
| 1,225,000 | (1) | 1011778 BC ULC / New Red Finance, Inc., 4.000%, 10/15/2030 | | | 1,243,877 | | | | 0.2 |
| 1,350,000 | (1) | Academy Ltd., 6.000%, 11/15/2027 | | | 1,417,500 | | | | 0.3 |
| 1,475,000 | (1) | Adams Homes, Inc., 7.500%, 02/15/2025 | | | 1,549,672 | | | | 0.3 |
| 1,775,000 | (1),(2) | Adient Global Holdings Ltd., 4.875%, 08/15/2026 | | | 1,826,031 | | | | 0.3 |
| 400,000 | (1) | Adient US LLC, 9.000%, 04/15/2025 | | | 446,500 | | | | 0.1 |
| 1,825,000 | (1) | Affinity Gaming, 6.875%, 12/15/2027 | | | 1,913,969 | | | | 0.3 |
| 1,575,000 | (1) | Allison Transmission, Inc., 5.875%, 06/01/2029 | | | 1,746,462 | | | | 0.3 |
| 1,029,117 | | American Airlines 2014-1 Class A Pass Through Trust, 3.700%, 10/01/2026 | | | 971,159 | | | | 0.2 |
| 519,329 | | American Airlines 2015-2 Class A Pass Through Trust, 4.000%, 09/22/2027 | | | 484,568 | | | | 0.1 |
| 625,000 | (1),(2) | American Airlines Group, Inc., 3.750%, 03/01/2025 | | | 484,375 | | | | 0.1 |
| 1,230,000 | (2) | American Axle & Manufacturing, Inc., 6.875%, 07/01/2028 | | | 1,327,687 | | | | 0.2 |
| 835,000 | | Asbury Automotive Group, Inc., 4.500%, 03/01/2028 | | | 874,662 | | | | 0.2 |
See Accompanying Notes to Financial Statements
| Voya High Yield Portfolio | PORTFOLIO OF INVESTMENTS
AS OF December 31, 2020 (Continued) |
| 690,000 | | Asbury Automotive Group, Inc., 4.750%, 03/01/2030 | | | 740,887 | | | | 0.1 |
| 800,000 | (1) | Ashton Woods USA LLC / Ashton Woods Finance Co., 6.625%, 01/15/2028 | | | 844,000 | | | | 0.2 |
| 625,000 | (1) | Ashton Woods USA LLC / Ashton Woods Finance Co., 6.750%, 08/01/2025 | | | 652,278 | | | | 0.1 |
| 1,675,000 | (1) | Beacon Roofing Supply, Inc., 4.875%, 11/01/2025 | | | 1,717,821 | | | | 0.3 |
| 1,225,000 | | Boyd Gaming Corp., 6.000%, 08/15/2026 | | | 1,274,000 | | | | 0.2 |
| 1,250,000 | (1) | Boyd Gaming Corp., 8.625%, 06/01/2025 | | | 1,391,800 | | | | 0.3 |
| 1,300,000 | (1) | Caesars Entertainment, Inc., 6.250%, 07/01/2025 | | | 1,386,131 | | | | 0.3 |
| 1,825,000 | (1) | Caesars Resort Collection LLC / CRC Finco, Inc., 5.250%, 10/15/2025 | | | 1,846,727 | | | | 0.3 |
| 1,250,000 | (1) | Carnival Corp., 7.625%, 03/01/2026 | | | 1,364,206 | | | | 0.2 |
| 700,000 | (1) | Carnival Corp., 9.875%, 08/01/2027 | | | 806,312 | | | | 0.1 |
| 1,400,000 | (1) | CCM Merger, Inc., 6.375%, 05/01/2026 | | | 1,473,500 | | | | 0.3 |
| 1,850,000 | | Century Communities, Inc., 5.875%, 07/15/2025 | | | 1,930,743 | | | | 0.4 |
| 1,225,000 | (1) | Cinemark USA, Inc., 8.750%, 05/01/2025 | | | 1,328,359 | | | | 0.2 |
| 325,000 | (1),(4) | Core & Main Holdings L.P., 8.625% (PIK Rate 9.375%, Cash Rate 8.625%), 09/15/2024 | | | 333,294 | | | | 0.1 |
| 1,875,000 | (1) | Core & Main L.P., 6.125%, 08/15/2025 | | | 1,941,797 | | | | 0.4 |
| 460,000 | | Dana, Inc., 5.625%, 06/15/2028 | | | 496,048 | | | | 0.1 |
| 700,000 | (1) | Delta Air Lines, Inc. / SkyMiles IP Ltd., 4.750%, 10/20/2028 | | | 764,626 | | | | 0.1 |
| 1,705,000 | | Delta Air Lines, Inc., 2.900%, 10/28/2024 | | | 1,683,120 | | | | 0.3 |
| 285,000 | | Delta Air Lines, Inc., 7.375%, 01/15/2026 | | | 325,764 | | | | 0.1 |
| 1,250,000 | | Ford Motor Co., 9.000%, 04/22/2025 | | | 1,537,669 | | | | 0.3 |
| 1,100,000 | | Ford Motor Credit Co. LLC, 4.125%, 08/17/2027 | | | 1,153,625 | | | | 0.2 |
| 1,775,000 | | Ford Motor Credit Co. LLC, 4.542%, 08/01/2026 | | | 1,897,031 | | | | 0.3 |
| 1,775,000 | | Ford Motor Credit Co. LLC, 5.113%, 05/03/2029 | | | 1,979,036 | | | | 0.4 |
| 2,100,000 | | Ford Motor Credit Co. LLC, 5.584%, 03/18/2024 | | | 2,268,000 | | | | 0.4 |
| 990,000 | (1),(2) | Golden Entertainment, Inc., 7.625%, 04/15/2026 | | | 1,065,948 | | | | 0.2 |
| 1,650,000 | (1) | H&E Equipment Services, Inc., 3.875%, 12/15/2028 | | | 1,664,487 | | | | 0.3 |
| 435,000 | (1) | Hilton Domestic Operating Co., Inc., 5.750%, 05/01/2028 | | | 473,878 | | | | 0.1 |
| 1,025,000 | (1) | IAA, Inc., 5.500%, 06/15/2027 | | | 1,088,422 | | | | 0.2 |
| 1,125,000 | (1) | Installed Building Products, Inc., 5.750%, 02/01/2028 | | | 1,202,130 | | | | 0.2 |
| 1,025,000 | (1) | Interface, Inc., 5.500%, 12/01/2028 | | | 1,080,734 | | | | 0.2 |
| 775,000 | (1) | IRB Holding Corp., 6.750%, 02/15/2026 | | | 800,846 | | | | 0.1 |
| 1,925,000 | | L Brands, Inc., 6.750%, 07/01/2036 | | | 2,148,300 | | | | 0.4 |
| 715,000 | (1) | L Brands, Inc., 6.875%, 07/01/2025 | | | 777,412 | | | | 0.1 |
| 325,000 | (1) | L Brands, Inc., 9.375%, 07/01/2025 | | | 400,156 | | | | 0.1 |
| 1,300,000 | (1) | LBM Acquisition LLC, 6.250%, 01/15/2029 | | | 1,354,866 | | | | 0.2 |
| 1,975,000 | (1) | Lions Gate Capital Holdings LLC, 5.875%, 11/01/2024 | | | 2,011,824 | | | | 0.4 |
| 1,225,000 | | M/I Homes, Inc., 4.950%, 02/01/2028 | | | 1,300,552 | | | | 0.2 |
| 500,000 | | M/I Homes, Inc., 5.625%, 08/01/2025 | | | 521,822 | | | | 0.1 |
| 675,000 | (2) | Macy's Retail Holdings LLC, 3.625%, 06/01/2024 | | | 643,545 | | | | 0.1 |
| 575,000 | | Macy's Retail Holdings LLC, 4.500%, 12/15/2034 | | | 443,256 | | | | 0.1 |
| 825,000 | | Mattel, Inc., 5.450%, 11/01/2041 | | | 911,332 | | | | 0.2 |
| 1,000,000 | | Meritage Homes Corp., 5.125%, 06/06/2027 | | | 1,121,060 | | | | 0.2 |
| 1,075,000 | | Meritage Homes Corp., 7.000%, 04/01/2022 | | | 1,145,966 | | | | 0.2 |
| 1,950,000 | (1) | Meritor, Inc., 4.500%, 12/15/2028 | | | 2,002,406 | | | | 0.4 |
| 300,000 | | MGM Resorts International, 5.500%, 04/15/2027 | | | 334,771 | | | | 0.1 |
| 725,000 | | MGM Resorts International, 6.000%, 03/15/2023 | | | 779,375 | | | | 0.1 |
| 1,400,000 | (1),(2) | Michaels Stores, Inc., 8.000%, 07/15/2027 | | | 1,507,366 | | | | 0.3 |
| 850,000 | (1) | Mileage Plus Holdings LLC / Mileage Plus Intellectual Property Assets Ltd., 6.500%, 06/20/2027 | | | 915,344 | | | | 0.2 |
| 1,400,000 | (1),(2) | Motion Bondco DAC, 6.625%, 11/15/2027 | | | 1,468,250 | | | | 0.3 |
| 1,100,000 | | Murphy Oil USA, Inc., 4.750%, 09/15/2029 | | | 1,172,671 | | | | 0.2 |
| 275,000 | | Murphy Oil USA, Inc., 5.625%, 05/01/2027 | | | 291,791 | | | | 0.1 |
| 1,225,000 | (1) | Navistar International Corp., 6.625%, 11/01/2025 | | | 1,284,902 | | | | 0.2 |
| 1,475,000 | (1),(2) | Penn National Gaming, Inc., 5.625%, 01/15/2027 | | | 1,541,522 | | | | 0.3 |
| 850,000 | (1) | PetSmart, Inc., 5.875%, 06/01/2025 | | | 874,969 | | | | 0.2 |
| 945,000 | (1) | PetSmart, Inc., 7.125%, 03/15/2023 | | | 945,850 | | | | 0.2 |
| 1,400,000 | (1) | Picasso Finance Sub, Inc., 6.125%, 06/15/2025 | | | 1,500,030 | | | | 0.3 |
| 355,000 | (1) | Royal Caribbean Cruises Ltd., 9.125%, 06/15/2023 | | | 385,619 | | | | 0.1 |
See Accompanying Notes to Financial Statements
| Voya High Yield Portfolio | PORTFOLIO OF INVESTMENTS
AS OF December 31, 2020 (Continued) |
| 1,225,000 | (1) | Royal Caribbean Cruises Ltd., 11.500%, 06/01/2025 | | | 1,433,618 | | | | 0.3 |
| 725,000 | (1) | Scientific Games International, Inc., 5.000%, 10/15/2025 | | | 749,027 | | | | 0.1 |
| 875,000 | (1) | Scientific Games International, Inc., 7.000%, 05/15/2028 | | | 942,288 | | | | 0.2 |
| 625,000 | (1) | Scientific Games International, Inc., 8.250%, 03/15/2026 | | | 674,566 | | | | 0.1 |
| 600,000 | (1) | Scientific Games International, Inc., 8.625%, 07/01/2025 | | | 657,750 | | | | 0.1 |
| 1,900,000 | (1) | SeaWorld Parks & Entertainment, Inc., 9.500%, 08/01/2025 | | | 2,066,250 | | | | 0.4 |
| 1,125,000 | (1) | Sizzling Platter LLC / Sizzling Platter Finance Corp., 8.500%, 11/28/2025 | | | 1,173,038 | | | | 0.2 |
| 1,550,000 | | Sonic Automotive, Inc., 6.125%, 03/15/2027 | | | 1,636,219 | | | | 0.3 |
| 1,575,000 | (1) | Specialty Building Products Holdings LLC / SBP Finance Corp., 6.375%, 09/30/2026 | | | 1,671,059 | | | | 0.3 |
| 1,140,000 | (1) | Speedway Motorsports LLC / Speedway Funding II, Inc., 4.875%, 11/01/2027 | | | 1,131,450 | | | | 0.2 |
| 425,000 | (1) | Station Casinos LLC, 4.500%, 02/15/2028 | | | 428,984 | | | | 0.1 |
| 1,275,000 | (1) | Station Casinos LLC, 5.000%, 10/01/2025 | | | 1,292,117 | | | | 0.2 |
| 1,375,000 | (1) | STL Holding Co. LLC, 7.500%, 02/15/2026 | | | 1,426,563 | | | | 0.3 |
| 1,650,000 | | Tempur Sealy International, Inc., 5.500%, 06/15/2026 | | | 1,719,218 | | | | 0.3 |
| 1,100,000 | (2) | Tenneco, Inc., 5.000%, 07/15/2026 | | | 1,014,063 | | | | 0.2 |
| 500,000 | (1) | Tenneco, Inc., 7.875%, 01/15/2029 | | | 562,318 | | | | 0.1 |
| 1,125,000 | | TRI Pointe Group, Inc., 5.700%, 06/15/2028 | | | 1,272,938 | | | | 0.2 |
| 950,000 | (2) | United Airlines Holdings, Inc., 4.250%, 10/01/2022 | | | 955,938 | | | | 0.2 |
| 950,000 | (2) | United Airlines Holdings, Inc., 4.875%, 01/15/2025 | | | 936,629 | | | | 0.2 |
| 1,500,000 | (1) | Univar Solutions USA, Inc./Washington, 5.125%, 12/01/2027 | | | 1,586,910 | | | | 0.3 |
| 1,200,000 | (1) | Viking Cruises Ltd., 5.875%, 09/15/2027 | | | 1,175,825 | | | | 0.2 |
| 830,000 | (1) | Viking Cruises Ltd., 13.000%, 05/15/2025 | | | 993,406 | | | | 0.2 |
| 1,200,000 | (1) | White Cap Buyer LLC, 6.875%, 10/15/2028 | | | 1,281,750 | | | | 0.2 |
| 1,175,000 | (1) | William Carter Co/The, 5.625%, 03/15/2027 | | | 1,238,891 | | | | 0.2 |
| 700,000 | (1) | Williams Scotsman International, Inc., 4.625%, 08/15/2028 | | | 725,813 | | | | 0.1 |
| 1,350,000 | (1) | Wolverine World Wide, Inc., 5.000%, 09/01/2026 | | | 1,381,219 | | | | 0.3 |
| 300,000 | (1) | Wolverine World Wide, Inc., 6.375%, 05/15/2025 | | | 320,813 | | | | 0.1 |
| 1,000,000 | (1) | Wyndham Hotels & Resorts, Inc., 4.375%, 08/15/2028 | | | 1,040,925 | | | | 0.2 |
| 690,000 | (1) | Wyndham Hotels & Resorts, Inc., 5.375%, 04/15/2026 | | | 715,444 | | | | 0.1 |
| | | | | | 112,789,667 | | | | 20.8 |
| | | | | | | | | | |
| | | Consumer, Non-cyclical: 16.4% | | | | | | | |
| 1,600,000 | (1) | Acadia Healthcare Co., Inc., 5.500%, 07/01/2028 | | | 1,721,480 | | | | 0.3 |
| 1,125,000 | (1) | Albertsons Cos, Inc. / Safeway, Inc. / New Albertsons L.P. / Albertsons LLC, 3.500%, 03/15/2029 | | | 1,137,937 | | | | 0.2 |
| 550,000 | (1) | Albertsons Cos, Inc. / Safeway, Inc. / New Albertsons L.P. / Albertsons LLC, 4.875%, 02/15/2030 | | | 606,584 | | | | 0.1 |
| 1,325,000 | (1) | Albertsons Cos, Inc. / Safeway, Inc. / New Albertsons L.P. / Albertsons LLC, 5.875%, 02/15/2028 | | | 1,444,091 | | | | 0.3 |
| 1,035,000 | (1) | Allied Universal Holdco LLC / Allied Universal Finance Corp., 6.625%, 07/15/2026 | | | 1,104,914 | | | | 0.2 |
| 1,525,000 | (1) | Allied Universal Holdco LLC / Allied Universal Finance Corp., 9.750%, 07/15/2027 | | | 1,664,903 | | | | 0.3 |
| 300,000 | (1) | AMN Healthcare, Inc., 4.000%, 04/15/2029 | | | 307,500 | | | | 0.1 |
| 1,485,000 | (1) | AMN Healthcare, Inc., 4.625%, 10/01/2027 | | | 1,558,426 | | | | 0.3 |
| 1,175,000 | (1) | Avantor Funding, Inc., 4.625%, 07/15/2028 | | | 1,244,031 | | | | 0.2 |
| 3,025,000 | (1) | Bausch Health Americas, Inc., 8.500%, 01/31/2027 | | | 3,368,595 | | | | 0.6 |
| 1,230,000 | (1) | Bausch Health Cos, Inc., 5.250%, 01/30/2030 | | | 1,289,803 | | | | 0.2 |
| 1,300,000 | (1) | Bausch Health Cos, Inc., 5.250%, 02/15/2031 | | | 1,360,573 | | | | 0.3 |
| 950,000 | (1) | Bausch Health Cos, Inc., 7.000%, 01/15/2028 | | | 1,045,845 | | | | 0.2 |
| 1,100,000 | (1),(2) | Cardtronics, Inc. / Cardtronics USA, Inc., 5.500%, 05/01/2025 | | | 1,141,134 | | | | 0.2 |
| 1,020,000 | (1) | Catalent Pharma Solutions, Inc., 5.000%, 07/15/2027 | | | 1,078,987 | | | | 0.2 |
| 800,000 | | Centene Corp., 3.375%, 02/15/2030 | | | 842,924 | | | | 0.2 |
| 2,025,000 | | Centene Corp., 4.625%, 12/15/2029 | | | 2,250,798 | | | | 0.4 |
| 550,000 | | Centene Corp., 4.750%, 01/15/2025 | | | 565,114 | | | | 0.1 |
| 550,000 | (1) | Centene Corp., 5.375%, 06/01/2026 | | | 580,778 | | | | 0.1 |
| 1,400,000 | (1) | Cheplapharm Arzneimittel GmbH, 5.500%, 01/15/2028 | | | 1,464,750 | | | | 0.3 |
| 505,000 | (1) | Chobani LLC / Chobani Finance Corp., Inc., 4.625%, 11/15/2028 | | | 513,838 | | | | 0.1 |
See Accompanying Notes to Financial Statements
| Voya High Yield Portfolio | PORTFOLIO OF INVESTMENTS
AS OF December 31, 2020 (Continued) |
| 1,550,000 | (1) | Chobani LLC / Chobani Finance Corp., Inc., 7.500%, 04/15/2025 | | | 1,630,158 | | | | 0.3 |
| 575,000 | (1) | CHS/Community Health Systems, Inc., 5.625%, 03/15/2027 | | | 618,987 | | | | 0.1 |
| 300,000 | (1),(2) | CHS/Community Health Systems, Inc., 6.000%, 01/15/2029 | | | 324,453 | | | | 0.1 |
| 1,585,000 | (1) | CHS/Community Health Systems, Inc., 6.625%, 02/15/2025 | | | 1,671,153 | | | | 0.3 |
| 450,000 | (1) | CHS/Community Health Systems, Inc., 8.125%, 06/30/2024 | | | 466,875 | | | | 0.1 |
| 600,000 | (1) | DaVita, Inc., 3.750%, 02/15/2031 | | | 610,341 | | | | 0.1 |
| 650,000 | (1) | DaVita, Inc., 4.625%, 06/01/2030 | | | 689,406 | | | | 0.1 |
| 1,225,000 | (1) | Emergent BioSolutions, Inc., 3.875%, 08/15/2028 | | | 1,270,784 | | | | 0.2 |
| 765,000 | | Encompass Health Corp., 4.625%, 04/01/2031 | | | 819,506 | | | | 0.2 |
| 497,000 | (1) | Endo Dac / Endo Finance LLC / Endo Finco, Inc., 6.000%, 06/30/2028 | | | 422,947 | | | | 0.1 |
| 331,000 | (1) | Endo Dac / Endo Finance LLC / Endo Finco, Inc., 9.500%, 07/31/2027 | | | 370,099 | | | | 0.1 |
| 525,000 | (1) | Gartner, Inc., 3.750%, 10/01/2030 | | | 551,906 | | | | 0.1 |
| 1,140,000 | (1) | Gartner, Inc., 4.500%, 07/01/2028 | | | 1,204,125 | | | | 0.2 |
| 1,225,000 | (1) | Graham Holdings Co., 5.750%, 06/01/2026 | | | 1,290,611 | | | | 0.2 |
| 1,125,000 | | HCA, Inc., 3.500%, 09/01/2030 | | | 1,195,712 | | | | 0.2 |
| 3,025,000 | | HCA, Inc., 5.375%, 02/01/2025 | | | 3,406,195 | | | | 0.6 |
| 725,000 | | HCA, Inc., 5.625%, 09/01/2028 | | | 857,693 | | | | 0.2 |
| 975,000 | (1) | Hill-Rom Holdings, Inc., 4.375%, 09/15/2027 | | | 1,032,471 | | | | 0.2 |
| 425,000 | (1) | Jaguar Holding Co. II / PPD Development L.P., 4.625%, 06/15/2025 | | | 448,902 | | | | 0.1 |
| 1,160,000 | (1) | Jaguar Holding Co. II / PPD Development L.P., 5.000%, 06/15/2028 | | | 1,239,750 | | | | 0.2 |
| 1,790,000 | (1) | JBS USA LUX SA / JBS USA Finance, Inc., 6.750%, 02/15/2028 | | | 2,013,338 | | | | 0.4 |
| 1,100,000 | (1) | JBS USA LUX SA / JBS USA Food Co. / JBS USA Finance, Inc., 5.500%, 01/15/2030 | | | 1,265,286 | | | | 0.2 |
| 1,575,000 | (1) | KeHE Distributors LLC / KeHE Finance Corp., 8.625%, 10/15/2026 | | | 1,771,631 | | | | 0.3 |
| 1,875,000 | | Kraft Heinz Foods Co., 4.375%, 06/01/2046 | | | 2,028,729 | | | | 0.4 |
| 2,750,000 | | Kraft Heinz Foods Co., 5.000%, 07/15/2035 | | | 3,334,836 | | | | 0.6 |
| 1,025,000 | (1) | Kraft Heinz Foods Co., 5.500%, 06/01/2050 | | | 1,294,403 | | | | 0.2 |
| 1,095,000 | (1) | Legacy LifePoint Health LLC, 4.375%, 02/15/2027 | | | 1,114,163 | | | | 0.2 |
| 425,000 | (1) | LifePoint Health, Inc., 5.375%, 01/15/2029 | | | 425,234 | | | | 0.1 |
| 200,000 | (1) | Molina Healthcare, Inc., 3.875%, 11/15/2030 | | | 215,000 | | | | 0.0 |
| 825,000 | (1) | Molina Healthcare, Inc., 4.375%, 06/15/2028 | | | 869,138 | | | | 0.2 |
| 755,000 | | Molina Healthcare, Inc., 5.375%, 11/15/2022 | | | 800,772 | | | | 0.2 |
| 1,200,000 | (1) | MPH Acquisition Holdings LLC, 5.750%, 11/01/2028 | | | 1,174,500 | | | | 0.2 |
| 850,000 | | New Albertsons L.P., 7.450%, 08/01/2029 | | | 1,009,213 | | | | 0.2 |
| 175,000 | (1) | Nielsen Finance LLC / Nielsen Finance Co., 5.625%, 10/01/2028 | | | 190,474 | | | | 0.0 |
| 1,175,000 | (1) | Nielsen Finance LLC / Nielsen Finance Co., 5.875%, 10/01/2030 | | | 1,331,422 | | | | 0.2 |
| 1,021,000 | (1) | Par Pharmaceutical, Inc., 7.500%, 04/01/2027 | | | 1,109,123 | | | | 0.2 |
| 1,275,000 | (1) | Pilgrim's Pride Corp., 5.750%, 03/15/2025 | | | 1,310,509 | | | | 0.2 |
| 1,325,000 | (1) | Pilgrim's Pride Corp., 5.875%, 09/30/2027 | | | 1,438,765 | | | | 0.3 |
| 625,000 | (1) | Post Holdings, Inc., 4.625%, 04/15/2030 | | | 658,256 | | | | 0.1 |
| 1,900,000 | (1) | Post Holdings, Inc., 5.625%, 01/15/2028 | | | 2,027,063 | | | | 0.4 |
| 1,575,000 | (1) | Primo Water Holdings, Inc., 5.500%, 04/01/2025 | | | 1,628,156 | | | | 0.3 |
| 1,850,000 | (1) | Select Medical Corp., 6.250%, 08/15/2026 | | | 1,995,151 | | | | 0.4 |
| 700,000 | (1) | Spectrum Brands, Inc., 5.500%, 07/15/2030 | | | 755,563 | | | | 0.1 |
| 700,000 | (1) | Syneos Health, Inc., 3.625%, 01/15/2029 | | | 703,248 | | | | 0.1 |
| 1,040,000 | | Tenet Healthcare Corp., 5.125%, 05/01/2025 | | | 1,061,570 | | | | 0.2 |
| 1,450,000 | (1) | Tenet Healthcare Corp., 6.125%, 10/01/2028 | | | 1,516,019 | | | | 0.3 |
| 2,425,000 | | Tenet Healthcare Corp., 6.750%, 06/15/2023 | | | 2,611,240 | | | | 0.5 |
| 1,055,000 | | TreeHouse Foods, Inc., 4.000%, 09/01/2028 | | | 1,093,244 | | | | 0.2 |
| 800,000 | (1),(2) | United Natural Foods, Inc., 6.750%, 10/15/2028 | | | 837,984 | | | | 0.2 |
| 290,000 | | United Rentals North America, Inc., 3.875%, 02/15/2031 | | | 304,768 | | | | 0.1 |
| 975,000 | | United Rentals North America, Inc., 4.875%, 01/15/2028 | | | 1,039,594 | | | | 0.2 |
| 475,000 | | United Rentals North America, Inc., 5.250%, 01/15/2030 | | | 528,141 | | | | 0.1 |
| 1,125,000 | (1) | Vizient, Inc., 6.250%, 05/15/2027 | | | 1,213,380 | | | | 0.2 |
| 1,375,000 | (1) | West Street Merger Sub, Inc., 6.375%, 09/01/2025 | | | 1,411,953 | | | | 0.3 |
| | | | | | 88,496,945 | | | | 16.4 |
| | | | | | | | | | |
| | | Energy: 11.7% | | | | | | | |
| 1,175,000 | (2) | Antero Resources Corp., 5.000%, 03/01/2025 | | | 1,118,453 | | | | 0.2 |
| 1,580,000 | | Apache Corp., 4.375%, 10/15/2028 | | | 1,647,118 | | | | 0.3 |
See Accompanying Notes to Financial Statements
| Voya High Yield Portfolio | PORTFOLIO OF INVESTMENTS
AS OF December 31, 2020 (Continued) |
| 1,600,000 | | Apache Corp., 5.100%, 09/01/2040 | | | 1,719,000 | | | | 0.3 |
| 795,000 | (1) | Archrock Partners L.P. / Archrock Partners Finance Corp., 6.250%, 04/01/2028 | | | 829,551 | | | | 0.2 |
| 400,000 | (1) | Archrock Partners L.P. / Archrock Partners Finance Corp., 6.875%, 04/01/2027 | | | 431,500 | | | | 0.1 |
| 1,300,000 | (1) | Ascent Resources Utica Holdings LLC / ARU Finance Corp., 8.250%, 12/31/2028 | | | 1,300,000 | | | | 0.2 |
| 1,300,000 | (1) | Blue Racer Midstream LLC / Blue Racer Finance Corp., 6.625%, 07/15/2026 | | | 1,313,000 | | | | 0.2 |
| 600,000 | (1) | Blue Racer Midstream LLC / Blue Racer Finance Corp., 7.625%, 12/15/2025 | | | 640,500 | | | | 0.1 |
| 475,000 | | Cenovus Energy, Inc., 3.800%, 09/15/2023 | | | 493,595 | | | | 0.1 |
| 125,000 | | Cenovus Energy, Inc., 5.250%, 06/15/2037 | | | 141,515 | | | | 0.0 |
| 350,000 | | Cenovus Energy, Inc., 5.375%, 07/15/2025 | | | 394,839 | | | | 0.1 |
| 675,000 | | Cenovus Energy, Inc., 5.400%, 06/15/2047 | | | 792,417 | | | | 0.1 |
| 350,000 | (1) | CNX Resources Corp., 6.000%, 01/15/2029 | | | 359,226 | | | | 0.1 |
| 1,550,000 | (1) | CNX Resources Corp., 7.250%, 03/14/2027 | | | 1,660,468 | | | | 0.3 |
| 1,600,000 | | Comstock Resources, Inc., 9.750%, 08/15/2026 | | | 1,718,400 | | | | 0.3 |
| 490,000 | | Comstock Resources, Inc., 9.750%, 08/15/2026 | | | 526,137 | | | | 0.1 |
| 300,000 | | Continental Resources, Inc., 4.900%, 06/01/2044 | | | 295,312 | | | | 0.1 |
| 375,000 | (1) | Continental Resources, Inc./OK, 5.750%, 01/15/2031 | | | 416,946 | | | | 0.1 |
| 1,130,000 | (2) | Crestwood Midstream Partners L.P. / Crestwood Midstream Finance Corp., 5.750%, 04/01/2025 | | | 1,152,600 | | | | 0.2 |
| 650,000 | | Crestwood Midstream Partners L.P. / Crestwood Midstream Finance Corp., 6.250%, 04/01/2023 | | | 652,844 | | | | 0.1 |
| 575,000 | | DCP Midstream Operating L.P., 5.125%, 05/15/2029 | | | 638,716 | | | | 0.1 |
| 595,000 | | DCP Midstream Operating L.P., 5.375%, 07/15/2025 | | | 654,914 | | | | 0.1 |
| 125,000 | | DCP Midstream Operating L.P., 5.600%, 04/01/2044 | | | 129,439 | | | | 0.0 |
| 1,175,000 | | DCP Midstream Operating L.P., 5.625%, 07/15/2027 | | | 1,305,425 | | | | 0.2 |
| 1,280,000 | | Delek Logistics Partners L.P. / Delek Logistics Finance Corp., 6.750%, 05/15/2025 | | | 1,246,266 | | | | 0.2 |
| 2,200,000 | | EnLink Midstream LLC, 5.375%, 06/01/2029 | | | 2,143,625 | | | | 0.4 |
| 2,285,000 | (1) | Enviva Partners L.P. / Enviva Partners Finance Corp., 6.500%, 01/15/2026 | | | 2,432,097 | | | | 0.5 |
| 555,000 | (2) | EQM Midstream Partners L.P., 5.500%, 07/15/2028 | | | 607,714 | | | | 0.1 |
| 725,000 | (1) | EQM Midstream Partners L.P., 6.000%, 07/01/2025 | | | 794,781 | | | | 0.1 |
| 310,000 | | EQM Midstream Partners L.P., 6.500%, 07/15/2048 | | | 322,110 | | | | 0.1 |
| 300,000 | | EQT Corp., 5.000%, 01/15/2029 | | | 317,046 | | | | 0.1 |
| 525,000 | (1) | Hess Midstream Operations L.P., 5.125%, 06/15/2028 | | | 549,281 | | | | 0.1 |
| 1,000,000 | (1) | Hess Midstream Operations L.P., 5.625%, 02/15/2026 | | | 1,041,875 | | | | 0.2 |
| 1,450,000 | (1) | Hilcorp Energy I L.P. / Hilcorp Finance Co., 5.750%, 10/01/2025 | | | 1,471,598 | | | | 0.3 |
| 650,000 | (1) | Hilcorp Energy I L.P. / Hilcorp Finance Co., 5.000%, 12/01/2024 | | | 647,494 | | | | 0.1 |
| 1,250,000 | (1) | Indigo Natural Resources LLC, 6.875%, 02/15/2026 | | | 1,281,250 | | | | 0.2 |
| 750,000 | (2) | Laredo Petroleum, Inc., 9.500%, 01/15/2025 | | | 653,205 | | | | 0.1 |
| 1,850,000 | (1) | Moss Creek Resources Holdings, Inc., 7.500%, 01/15/2026 | | | 1,410,625 | | | | 0.3 |
| 925,000 | | Murphy Oil Corp., 5.750%, 08/15/2025 | | | 922,785 | | | | 0.2 |
| 525,000 | | Murphy Oil Corp., 5.875%, 12/01/2027 | | | 517,618 | | | | 0.1 |
| 3,375,000 | | Occidental Petroleum Corp., 4.200%, 03/15/2048 | | | 2,750,625 | | | | 0.5 |
| 575,000 | | Occidental Petroleum Corp., 4.400%, 04/15/2046 | | | 502,073 | | | | 0.1 |
| 575,000 | | Occidental Petroleum Corp., 5.500%, 12/01/2025 | | | 600,579 | | | | 0.1 |
| 2,350,000 | | Occidental Petroleum Corp., 6.625%, 09/01/2030 | | | 2,555,037 | | | | 0.5 |
| 1,150,000 | | Occidental Petroleum Corp., 8.500%, 07/15/2027 | | | 1,329,314 | | | | 0.2 |
| 1,800,000 | | Ovintiv Exploration, Inc., 5.375%, 01/01/2026 | | | 1,932,894 | | | | 0.4 |
| 1,750,000 | (1) | Parsley Energy LLC / Parsley Finance Corp., 5.625%, 10/15/2027 | | | 1,918,000 | | | | 0.4 |
| 1,950,000 | | PBF Logistics L.P. / PBF Logistics Finance Corp., 6.875%, 05/15/2023 | | | 1,872,000 | | | | 0.3 |
| 1,425,000 | | QEP Resources, Inc., 5.250%, 05/01/2023 | | | 1,501,950 | | | | 0.3 |
| 2,100,000 | (1) | SunCoke Energy Partners L.P. / SunCoke Energy Partners Finance Corp., 7.500%, 06/15/2025 | | | 2,088,607 | | | | 0.4 |
See Accompanying Notes to Financial Statements
| Voya High Yield Portfolio | PORTFOLIO OF INVESTMENTS
AS OF December 31, 2020 (Continued) |
| 350,000 | (1) | Sunoco L.P. / Sunoco Finance Corp., 4.500%, 05/15/2029 | | | 364,656 | | | | 0.1 |
| 710,000 | | Sunoco L.P. / Sunoco Finance Corp., 6.000%, 04/15/2027 | | | 755,632 | | | | 0.1 |
| 675,000 | (1) | Tallgrass Energy Partners L.P. / Tallgrass Energy Finance Corp., 5.500%, 01/15/2028 | | | 691,305 | | | | 0.1 |
| 900,000 | (1) | Tallgrass Energy Partners L.P. / Tallgrass Energy Finance Corp., 7.500%, 10/01/2025 | | | 973,319 | | | | 0.2 |
| 1,325,000 | (1) | Targa Resources Partners L.P. / Targa Resources Partners Finance Corp., 4.875%, 02/01/2031 | | | 1,439,613 | | | | 0.3 |
| 825,000 | (1) | Viper Energy Partners L.P., 5.375%, 11/01/2027 | | | 863,519 | | | | 0.2 |
| 550,000 | | Western Midstream Operating L.P., 5.300%, 03/01/2048 | | | 547,778 | | | | 0.1 |
| 2,075,000 | | Western Midstream Operating L.P., 5.450%, 04/01/2044 | | | 2,102,276 | | | | 0.4 |
| 475,000 | | WPX Energy, Inc., 4.500%, 01/15/2030 | | | 504,213 | | | | 0.1 |
| 1,100,000 | | WPX Energy, Inc., 5.250%, 10/15/2027 | | | 1,167,441 | | | | 0.2 |
| | | | | | 63,152,116 | | | | 11.7 |
| | | | | | | | | | |
| | | Financial: 5.1% | | | | | | | |
| 1,100,000 | | Ally Financial, Inc., 5.750%, 11/20/2025 | | | 1,281,494 | | | | 0.2 |
| 1,050,000 | (1) | AssuredPartners, Inc., 5.625%, 01/15/2029 | | | 1,097,250 | | | | 0.2 |
| 1,125,000 | (1) | Cushman & Wakefield US Borrower LLC, 6.750%, 05/15/2028 | | | 1,243,828 | | | | 0.2 |
| 1,950,000 | (1) | ESH Hospitality, Inc., 5.250%, 05/01/2025 | | | 2,001,626 | | | | 0.4 |
| 775,000 | (1) | Freedom Mortgage Corp., 7.625%, 05/01/2026 | | | 820,686 | | | | 0.2 |
| 1,375,000 | (1) | Freedom Mortgage Corp., 8.250%, 04/15/2025 | | | 1,440,312 | | | | 0.3 |
| 420,000 | (1) | Iron Mountain, Inc., 5.000%, 07/15/2028 | | | 446,725 | | | | 0.1 |
| 690,000 | (1) | Iron Mountain, Inc., 5.250%, 07/15/2030 | | | 746,062 | | | | 0.1 |
| 560,000 | (1) | Iron Mountain, Inc., 5.625%, 07/15/2032 | | | 618,164 | | | | 0.1 |
| 940,000 | (3) | JPMorgan Chase & Co., 4.600%, 12/31/2199 | | | 971,725 | | | | 0.2 |
| 1,150,000 | (1) | LPL Holdings, Inc., 4.625%, 11/15/2027 | | | 1,193,844 | | | | 0.2 |
| 300,000 | (1) | MGM Growth Properties Operating Partnership L.P. / MGP Finance Co- Issuer, Inc., 3.875%, 02/15/2029 | | | 307,313 | | | | 0.1 |
| 665,000 | (1) | MGM Growth Properties Operating Partnership L.P. / MGP Finance Co- Issuer, Inc., 4.625%, 06/15/2025 | | | 712,880 | | | | 0.1 |
| 1,050,000 | | MGM Growth Properties Operating Partnership L.P. / MGP Finance Co- Issuer, Inc., 5.625%, 05/01/2024 | | | 1,142,426 | | | | 0.2 |
| 1,175,000 | | MPT Operating Partnership L.P. / MPT Finance Corp., 3.500%, 03/15/2031 | | | 1,215,391 | | | | 0.2 |
| 1,400,000 | | MPT Operating Partnership L.P. / MPT Finance Corp., 5.000%, 10/15/2027 | | | 1,491,735 | | | | 0.3 |
| 1,250,000 | (1) | Nationstar Mortgage Holdings, Inc., 5.125%, 12/15/2030 | | | 1,308,088 | | | | 0.2 |
| 1,100,000 | | Navient Corp., 5.000%, 03/15/2027 | | | 1,111,143 | | | | 0.2 |
| 550,000 | | Navient Corp., 7.250%, 09/25/2023 | | | 603,820 | | | | 0.1 |
| 275,000 | | OneMain Finance Corp., 4.000%, 09/15/2030 | | | 285,687 | | | | 0.1 |
| 2,100,000 | | OneMain Finance Corp., 5.375%, 11/15/2029 | | | 2,367,750 | | | | 0.4 |
| 1,575,000 | (1) | Quicken Loans LLC, 5.250%, 01/15/2028 | | | 1,684,266 | | | | 0.3 |
| 1,775,000 | (1) | SBA Communications Corp., 3.875%, 02/15/2027 | | | 1,866,501 | | | | 0.3 |
| 1,475,000 | | Service Properties Trust, 4.375%, 02/15/2030 | | | 1,440,891 | | | | 0.3 |
| 325,000 | | Service Properties Trust, 7.500%, 09/15/2025 | | | 374,722 | | | | 0.1 |
| | | | | | 27,774,329 | | | | 5.1 |
| | | | | | | | | | |
| | | Industrial: 9.4% | | | | | | | |
| 1,875,000 | | AECOM, 5.875%, 10/15/2024 | | | 2,095,837 | | | | 0.4 |
| 2,150,000 | (1),(4) | ARD Finance SA, 6.500% (PIK Rate 7.250%, Cash Rate 6.500%), 06/30/2027 | | | 2,297,812 | | | | 0.4 |
| 1,875,000 | (1),(2) | Berry Global, Inc., 5.625%, 07/15/2027 | | | 2,019,727 | | | | 0.4 |
| 400,000 | (1),(2) | Bombardier, Inc., 6.000%, 10/15/2022 | | | 393,660 | | | | 0.1 |
| 975,000 | (1) | Bombardier, Inc., 8.750%, 12/01/2021 | | | 1,015,623 | | | | 0.2 |
| 750,000 | (1) | Builders FirstSource, Inc., 5.000%, 03/01/2030 | | | 807,187 | | | | 0.2 |
| 725,000 | (1) | Builders FirstSource, Inc., 6.750%, 06/01/2027 | | | 787,321 | | | | 0.1 |
| 1,150,000 | (1) | Cargo Aircraft Management, Inc., 4.750%, 02/01/2028 | | | 1,188,094 | | | | 0.2 |
| 2,125,000 | (1) | Cascades, Inc./Cascades USA, Inc., 5.375%, 01/15/2028 | | | 2,262,461 | | | | 0.4 |
| 1,200,000 | (1) | Clark Equipment Co., 5.875%, 06/01/2025 | | | 1,269,750 | | | | 0.2 |
| 625,000 | (1) | Clean Harbors, Inc., 4.875%, 07/15/2027 | | | 653,125 | | | | 0.1 |
| 485,000 | (1) | Clean Harbors, Inc., 5.125%, 07/15/2029 | | | 531,286 | | | | 0.1 |
| 1,300,000 | (1) | CP Atlas Buyer, Inc., 7.000%, 12/01/2028 | | | 1,351,187 | | | | 0.3 |
| 625,000 | (1) | GFL Environmental, Inc., 4.000%, 08/01/2028 | | | 630,859 | | | | 0.1 |
| 375,000 | (1) | GFL Environmental, Inc., 4.250%, 06/01/2025 | | | 389,766 | | | | 0.1 |
See Accompanying Notes to Financial Statements
| Voya High Yield Portfolio | PORTFOLIO OF INVESTMENTS
AS OF December 31, 2020 (Continued) |
| 1,020,000 | (1) | GFL Environmental, Inc., 8.500%, 05/01/2027 | | | 1,134,112 | | | | 0.2 |
| 1,300,000 | (1) | GrafTech Finance, Inc., 4.625%, 12/15/2028 | | | 1,319,552 | | | | 0.2 |
| 1,175,000 | (1) | Graham Packaging Co., Inc., 7.125%, 08/15/2028 | | | 1,300,578 | | | | 0.2 |
| 1,275,000 | (1),(2) | Granite US Holdings Corp., 11.000%, 10/01/2027 | | | 1,421,625 | | | | 0.3 |
| 575,000 | (1),(4) | Intelligent Packaging Holdco Issuer L.P., 9.000% (PIK Rate 9.750%, Cash Rate 9.000%), 01/15/2026 | | | 578,594 | | | | 0.1 |
| 1,475,000 | (1) | Intelligent Packaging Ltd. Finco, Inc. / Intelligent Packaging Ltd. Co-Issuer LLC, 6.000%, 09/15/2028 | | | 1,518,328 | | | | 0.3 |
| 1,575,000 | (1) | Koppers, Inc., 6.000%, 02/15/2025 | | | 1,625,203 | | | | 0.3 |
| 1,665,000 | (1) | New Enterprise Stone & Lime Co., Inc., 9.750%, 07/15/2028 | | | 1,831,500 | | | | 0.3 |
| 1,375,000 | (1) | Norbord, Inc., 5.750%, 07/15/2027 | | | 1,483,047 | | | | 0.3 |
| 1,200,000 | | Park-Ohio Industries, Inc., 6.625%, 04/15/2027 | | | 1,245,000 | | | | 0.2 |
| 1,550,000 | (1) | PGT Innovations, Inc., 6.750%, 08/01/2026 | | | 1,654,330 | | | | 0.3 |
| 2,020,000 | (1),(2) | Plastipak Holdings, Inc., 6.250%, 10/15/2025 | | | 2,084,388 | | | | 0.4 |
| 1,300,000 | (1) | Rolls-Royce PLC, 5.750%, 10/15/2027 | | | 1,441,375 | | | | 0.3 |
| 1,255,000 | | Silgan Holdings, Inc., 4.125%, 02/01/2028 | | | 1,306,769 | | | | 0.2 |
| 1,400,000 | (1) | SSL Robotics LLC, 9.750%, 12/31/2023 | | | 1,584,625 | | | | 0.3 |
| 850,000 | (1) | Standard Industries, Inc./NJ, 3.375%, 01/15/2031 | | | 855,313 | | | | 0.2 |
| 350,000 | (1) | Stericycle, Inc., 3.875%, 01/15/2029 | | | 360,063 | | | | 0.1 |
| 1,325,000 | (1) | Stevens Holding Co., Inc., 6.125%, 10/01/2026 | | | 1,435,717 | | | | 0.3 |
| 375,000 | (1) | Summit Materials LLC / Summit Materials Finance Corp., 5.125%, 06/01/2025 | | | 382,929 | | | | 0.1 |
| 950,000 | (1) | Summit Materials LLC / Summit Materials Finance Corp., 5.250%, 01/15/2029 | | | 998,688 | | | | 0.2 |
| 1,125,000 | (1) | Summit Materials LLC / Summit Materials Finance Corp., 6.500%, 03/15/2027 | | | 1,199,318 | | | | 0.2 |
| 1,000,000 | | TransDigm, Inc., 5.500%, 11/15/2027 | | | 1,052,800 | | | | 0.2 |
| 1,200,000 | | TransDigm, Inc., 6.375%, 06/15/2026 | | | 1,244,250 | | | | 0.2 |
| 775,000 | | TransDigm, Inc., 6.500%, 05/15/2025 | | | 797,766 | | | | 0.1 |
| 1,625,000 | (1) | Vertical Holdco GmbH, 7.625%, 07/15/2028 | | | 1,774,297 | | | | 0.3 |
| 275,000 | (1) | Vertical US Newco, Inc., 5.250%, 07/15/2027 | | | 292,016 | | | | 0.1 |
| 1,250,000 | (1) | Weekley Homes LLC / Weekley Finance Corp., 4.875%, 09/15/2028 | | | 1,309,375 | | | | 0.2 |
| | | | | | 50,925,253 | | | | 9.4 |
| | | | | | | | | | |
| | | Technology: 5.5% | | | | | | | |
| 1,850,000 | (1) | Ascend Learning LLC, 6.875%, 08/01/2025 | | | 1,907,618 | | | | 0.4 |
| 1,305,000 | (1) | Austin BidCo, Inc., 7.125%, 12/15/2028 | | | 1,364,541 | | | | 0.3 |
| 1,175,000 | (1) | Booz Allen Hamilton, Inc., 3.875%, 09/01/2028 | | | 1,212,453 | | | | 0.2 |
| 420,000 | (1) | Boxer Parent Co., Inc., 7.125%, 10/02/2025 | | | 456,493 | | | | 0.1 |
| 420,000 | (1) | Boxer Parent Co., Inc., 9.125%, 03/01/2026 | | | 453,075 | | | | 0.1 |
| 465,000 | (1) | BY Crown Parent LLC / BY Bond Finance, Inc., 4.250%, 01/31/2026 | | | 477,206 | | | | 0.1 |
| 1,205,000 | (1) | BY Crown Parent LLC, 7.375%, 10/15/2024 | | | 1,230,480 | | | | 0.2 |
| 1,400,000 | (1) | Castle US Holding Corp., 9.500%, 02/15/2028 | | | 1,403,283 | | | | 0.3 |
| 845,000 | | CDW LLC / CDW Finance Corp., 3.250%, 02/15/2029 | | | 862,703 | | | | 0.2 |
| 625,000 | | CDW LLC / CDW Finance Corp., 4.125%, 05/01/2025 | | | 655,034 | | | | 0.1 |
| 1,000,000 | | CDW LLC / CDW Finance Corp., 5.500%, 12/01/2024 | | | 1,119,865 | | | | 0.2 |
| 2,825,000 | (1) | Change Healthcare Holdings LLC / Change Healthcare Finance, Inc., 5.750%, 03/01/2025 | | | 2,885,031 | | | | 0.5 |
| 1,250,000 | | Donnelley Financial Solutions, Inc., 8.250%, 10/15/2024 | | | 1,329,556 | | | | 0.2 |
| 795,000 | (1) | Entegris, Inc., 4.375%, 04/15/2028 | | | 848,663 | | | | 0.2 |
| 400,000 | (1) | Entegris, Inc., 4.625%, 02/10/2026 | | | 415,500 | | | | 0.1 |
| 1,705,000 | (1) | Microchip Technology, Inc., 4.250%, 09/01/2025 | | | 1,804,232 | | | | 0.3 |
| 1,225,000 | (1) | MTS Systems Corp., 5.750%, 08/15/2027 | | | 1,333,198 | | | | 0.2 |
| 1,125,000 | (1) | ON Semiconductor Corp., 3.875%, 09/01/2028 | | | 1,162,969 | | | | 0.2 |
| 225,000 | (1) | Open Text Corp., 3.875%, 02/15/2028 | | | 233,825 | | | | 0.0 |
| 685,000 | (1) | Open Text Corp., 5.875%, 06/01/2026 | | | 713,256 | | | | 0.1 |
| 1,225,000 | (1) | Open Text Holdings, Inc., 4.125%, 02/15/2030 | | | 1,305,409 | | | | 0.2 |
| 285,000 | (1) | Rackspace Technology Global, Inc., 5.375%, 12/01/2028 | | | 299,129 | | | | 0.1 |
| 1,070,000 | (1) | Science Applications International Corp., 4.875%, 04/01/2028 | | | 1,136,040 | | | | 0.2 |
| 1,280,000 | (1) | Tempo Acquisition LLC / Tempo Acquisition Finance Corp., 6.750%, 06/01/2025 | | | 1,324,544 | | | | 0.2 |
| 1,225,000 | (1) | Unisys Corp., 6.875%, 11/01/2027 | | | 1,341,375 | | | | 0.3 |
See Accompanying Notes to Financial Statements
| Voya High Yield Portfolio | PORTFOLIO OF INVESTMENTS
AS OF December 31, 2020 (Continued) |
| 1,025,000 | (1),(2) | Veritas US, Inc. / Veritas Bermuda Ltd.., 10.500%, 02/01/2024 | | | 1,046,182 | | | | 0.2 |
| 1,550,000 | (1) | Veritas US, Inc. / Veritas Bermuda Ltd., 7.500%, 09/01/2025 | | | 1,592,625 | | | | 0.3 |
| | | | | | 29,914,285 | | | | 5.5 |
| | | | | | | | | | |
| | | Utilities: 2.1% | | | | | | | |
| 1,300,000 | (1) | Clearway Energy Operating LLC, 4.750%, 03/15/2028 | | | 1,395,472 | | | | 0.3 |
| 1,750,000 | (1) | Drax Finco PLC, 6.625%, 11/01/2025 | | | 1,836,406 | | | | 0.3 |
| 1,550,000 | (1) | LBC Tank Terminals Holding Netherlands BV, 6.875%, 05/15/2023 | | | 1,554,844 | | | | 0.3 |
| 1,000,000 | (1) | NRG Energy, Inc., 3.375%, 02/15/2029 | | | 1,025,675 | | | | 0.2 |
| 950,000 | (1) | NRG Energy, Inc., 3.625%, 02/15/2031 | | | 979,141 | | | | 0.2 |
| 1,100,000 | | NRG Energy, Inc., 6.625%, 01/15/2027 | | | 1,163,250 | | | | 0.2 |
| 1,490,000 | | PG&E Corp., 5.250%, 07/01/2030 | | | 1,640,862 | | | | 0.3 |
| 775,000 | (1) | Vistra Operations Co. LLC, 5.500%, 09/01/2026 | | | 808,674 | | | | 0.1 |
| 1,025,000 | (1) | Vistra Operations Co. LLC, 5.625%, 02/15/2027 | | | 1,091,728 | | | | 0.2 |
| | | | | | 11,496,052 | | | | 2.1 |
| | | | | | | | | | |
| | Total Corporate Bonds/Notes | | | | | | | |
| | (Cost $476,074,071) | | | 510,424,716 | | | | 94.3 |
| | | | | | | | | | |
| BANK LOANS: 1.0% | | | | | | | | |
| | | Consumer, Cyclical: 0.5% | | | | | | | |
| 1,496,914 | | Golden Nugget LLC TL B 1L, 3.250%, (US0001M + 2.500%), 10/04/2023 | | | 1,450,759 | | | | 0.3 |
| 1,293,350 | | IRB Holding Corp - TL B 1L, 3.750%, (US0001M + 2.750%), 02/05/2025 | | | 1,284,782 | | | | 0.2 |
| | | | | | 2,735,541 | | | | 0.5 |
| | | | | | | | | | |
| | | Electronics/Electrical: 0.4% | | | | | | | |
| 1,901,270 | | Rackspace Hosting, Inc. 2017 Incremental 1st Lien Term Loan, 4.000%, (US0003M + 3.000%), 11/03/2023 | | | 1,902,063 | | | | 0.4 |
| | | | | | | | | | |
| | | Health Care: 0.1% | | | | | | | |
| 704,366 | | Bausch Health Companies, Inc. 2018 Term Loan B, 3.148%, (US0001M + 3.000%), 06/02/2025 | | | 702,495 | | | | 0.1 |
| | | | | | | | | | |
| | Total Bank Loans | | | | | | | |
| | (Cost $5,058,905) | | | 5,340,099 | | | | 1.0 |
| | | | | | | | | | |
| CONVERTIBLE BONDS/NOTES: 0.1% | | | | | | | |
| | | Communications: 0.1% | | | | | | | |
| 400,000 | | DISH Network Corp., 3.375%, 08/15/2026 | | | 382,292 | | | | 0.1 |
| | | | | | | | | | |
| | | Financial: 0.0% | | | | | | | |
| 499,200 | (1),(5) | Lehman Brothers Holdings, Inc., 8.160%, 05/30/2009 | | | 824 | | | | 0.0 |
| | | | | | | | | | |
| | Total Convertible Bonds/Notes | | | | | | | |
| | (Cost $844,544) | | | 383,116 | | | | 0.1 |
| | | | | | | | Percentage |
| | | | | | | | of Net |
| Shares | | | | Value | | | Assets |
| COMMON STOCK: 0.3% | | | | | | | | |
| | | Consumer Discretionary: 0.0% | | | | | | | |
| 474 | | Lear Corp. | | | 75,380 | | | | 0.0 |
| 1,476 | (1),(6),(7) | Perseus Holding Corp. | | | – | | | | – |
| | | | | | 75,380 | | | | 0.0 |
| | | | | | | | | | |
| | | Consumer Staples: 0.3% | | | | | | | |
| 24,842 | (6),(7) | Southeastern Grocers, Inc. | | | 1,751,361 | | | | 0.3 |
| | | | | | | | | | |
| | | Energy: 0.0% | | | | | | | |
| 2 | | Amplify Energy Corp. | | | 3 | | | | 0.0 |
| 424,441 | (6),(7) | Ascent Resources - Utica LLC | | | 5,093 | | | | 0.0 |
| | | | | | 5,096 | | | | 0.0 |
| | | | | | | | | | |
| | | Health Care: 0.0% | | | | | | | |
| 26 | (7) | Option Care Health, Inc. | | | 407 | | | | 0.0 |
| | | | | | | | | | |
| | | Information Technology: 0.0% | | | | | | | |
| 1 | (7) | Avaya Holdings Corp. | | | 19 | | | | 0.0 |
| | | | | | | | | | |
| | Total Common Stock | | | | | | | |
| | (Cost $824,718) | | | 1,832,263 | | | | 0.3 |
| | | | | | | | | | |
| PREFERRED STOCK: –% | | | | | | | |
| | | Consumer Discretionary: –% | | | | | | | |
| 775 | (1),(6),(7) | Perseus Holding Corp. | | | – | | | | – |
| | | | | | | | | | |
| | Total Preferred Stock | | | | | | | |
| | (Cost $–) | | | – | | | | – |
| | | | | | | | | | |
| WARRANTS: –% | | | | | | | | |
| | | Health Care: –% | | | | | | | |
| 126 | (6),(7) | Option Care Health, Inc. - Class A | | | – | | | | – |
| 126 | (6),(7) | Option Care Health, Inc. - Class B | | | – | | | | – |
| | | | | | | | | | |
| | Total Warrants | | | | | | | |
| | (Cost $–) | | | – | | | | – |
| | | | | | | | | | |
| OTHER(8): –% | | | | | | | | | |
| | | Communications: –% | | | | | | | |
| 1,445,000 | (6),(9) | Millicom International Cellular S.A. (Escrow) | | | – | | | | – |
| | | | | | | | | | |
| | | Energy: –% | | | | | | | |
| 2,000 | (6),(9) | Green Field Energy Services, Inc. (Escrow) | | | – | | | | – |
| | | | | | | | | | |
| | Total Other | | | | | | | |
| | (Cost $–) | | | – | | | | – |
| | | | | | | | | | |
| | Total Long-Term Investments | | | | | | | |
| | (Cost $482,802,238) | | | 517,980,194 | | | | 95.7 |
See Accompanying Notes to Financial Statements
| Voya High Yield Portfolio | PORTFOLIO OF INVESTMENTS
AS OF December 31, 2020 (Continued) |
| | | | | | | | Percentage |
| Principal | | | | | | | of Net |
| Amount† | | | | Value | | | Assets |
| SHORT-TERM INVESTMENTS: 5.2% | | | | | | | |
| | | Commercial Paper: 0.5% | | | | | | | |
| 2,500,000 | | American Electric Power Co., 0.230%, 02/03/2021 (Cost $2,499,473) | | | 2,499,469 | | | | 0.5 |
| | | | | | | | | | |
| | | U.S. Treasury Bills: 0.1% | | | | | | | |
| 850,000 | (10) | United States Treasury Bill, 0.030%, 02/09/2021 (Cost $849,883) | | | 849,970 | | | | 0.1 |
| | | | | | | | | | |
| | | Repurchase Agreements: 4.3% | | | | | | | |
| 1,298,691 | (11) | Amherst Pierpoint Securities LLC, Repurchase Agreement dated 12/31/20, 0.10%, due 01/04/21 (Repurchase Amount $1,298,705, collateralized by various U.S. Government/U.S. Government Agency Obligations, 0.000%- 4.628%, Market Value plus accrued interest $1,324,665, due 02/03/21-11/20/70) | | | 1,298,691 | | | | 0.2 |
| 1,082,346 | (11) | BNP Paribas S.A., Repurchase Agreement dated 12/31/20, 0.24%, due 01/04/21 (Repurchase Amount $1,082,374, collateralized by various U.S. Government Securities, 0.750%- 8.750%, Market Value plus accrued interest $1,136,463, due 03/01/21-11/20/40) | | | 1,082,346 | | | | 0.2 |
| 3,853,961 | (11) | Cantor Fitzgerald Securities, Repurchase Agreement dated 12/31/20, 0.07%, due 01/04/21 (Repurchase Amount $3,853,991, collateralized by various U.S. Government/U.S. Government Agency Obligations, 0.000%- 9.500%, Market Value plus accrued interest $3,931,040, due 01/25/21-10/15/62) | | | 3,853,961 | | | | 0.7 |
| 1,319,035 | (11) | CF Secured LLC, Repurchase Agreement dated 12/31/20, 0.07%, due 01/04/21 (Repurchase Amount $1,319,045, collateralized by various U.S. Government/U.S. Government Agency Obligations, 0.000%- 4.750%, Market Value plus accrued interest $1,345,416, due 01/14/21-01/20/69) | | | 1,319,035 | | | | 0.3 |
| 2,894,411 | (11) | Citadel Securities LLC, Repurchase Agreement dated 12/31/20, 0.13%, due 01/04/21 (Repurchase Amount $2,894,452, collateralized by various U.S. Government Securities, 0.000%- 7.875%, Market Value plus accrued interest $2,952,344, due 01/31/21-05/15/49) | | | 2,894,411 | | | | 0.5 |
| 4,185,399 | (11) | Citigroup, Inc., Repurchase Agreement dated 12/31/20, 0.07%, due 01/04/21 (Repurchase Amount $4,185,431, collateralized by various U.S. Government/U.S. Government Agency Obligations, 0.000%- 4.000%, Market Value plus accrued interest $4,269,107, due 09/15/21-01/01/51) | | | 4,185,399 | | | | 0.8 |
| 1,506,895 | (11) | JVB Financial Group LLC, Repurchase Agreement dated 12/31/20, 0.13%, due 01/04/21 (Repurchase Amount $1,506,916, collateralized by various U.S. Government/U.S. Government Agency Obligations, 0.125%- 7.000%, Market Value plus accrued interest $1,537,033, due 07/01/22-12/01/50) | | | 1,506,895 | | | | 0.3 |
| 1,721,800 | (11) | Mirae Asset Securities USA Inc., Repurchase Agreement dated 12/31/20, 0.13%, due 01/04/21 (Repurchase Amount $1,721,825, collateralized by various U.S. Government/U.S. Government Agency Obligations, 0.000%- 8.125%, Market Value plus accrued interest $1,756,261, due 02/18/21-01/15/62) | | | 1,721,800 | | | | 0.3 |
See Accompanying Notes to Financial Statements
| Voya High Yield Portfolio | PORTFOLIO OF INVESTMENTS
AS OF December 31, 2020 (Continued) |
| 1,622,950 | (11) | Palafox Trading LLC, Repurchase Agreement dated 12/31/20, 0.13%, due 01/04/21 (Repurchase Amount $1,622,973, collateralized by various U.S. Government Securities, 0.250%- 1.125%, Market Value plus accrued interest $1,656,009, due 02/28/25-05/31/25) | | | 1,622,950 | | | | 0.3 |
| 3,825,171 | (11) | State of Wisconsin Investment Board, Repurchase Agreement dated 12/31/20, 0.16%, due 01/04/21 (Repurchase Amount $3,825,238, collateralized by various U.S. Government Securities, 0.125%- 3.875%, Market Value plus accrued interest $3,911,399, due 07/15/22-02/15/47) | | | 3,825,171 | | | | 0.7 |
| | | | | | | | | | |
| | | Total Repurchase Agreements | | | | | | | |
| | | (Cost $23,310,659) | | | 23,310,659 | | | | 4.3 |
| | | | | | | | | | |
| | | | | | | | | | Percentage |
| | | | | | | | | | of Net |
| Shares | | | | | Value | | | | Assets |
| | | Mutual Funds(11): 0.3% | | | | | | | |
| 455,000 | (11),(12) | BlackRock Liquidity Funds, FedFund, Institutional Class, 0.000% | | | 455,000 | | | | 0.1 |
| 455,000 | (11),(12) | Goldman Sachs Financial Square Government Fund - Institutional Shares, 0.020% | | | 455,000 | | | | 0.1 |
| 600,000 | (11),(12) | Morgan Stanley Institutional Liquidity Funds - Government Portfolio (Institutional Share Class), 0.030% | | | 600,000 | | | | 0.1 |
| | Total Mutual Funds | | | | | | | |
| | (Cost $1,510,000) | | | 1,510,000 | | | | 0.3 |
| | | | | | | | | | |
| | Total Short-Term Investments | | | | | | | |
| | (Cost $28,170,015) | | | 28,170,098 | | | | 5.2 |
| | | | | | | | | | |
| | Total Investments in Securities | | | | | | | |
| | (Cost $510,972,253) | | $ | 546,150,292 | | | | 100.9 |
| | Liabilities in Excess of Other Assets | | | (5,119,381 | ) | | | (0.9) |
| | Net Assets | | $ | 541,030,911 | | | | 100.0 |
| † | Unless otherwise indicated, principal amount is shown in USD. |
| (1) | Securities with purchases pursuant to Rule 144A or section 4(a)(2), under the Securities Act of 1933 and may not be resold subject to that rule except to qualified institutional buyers. |
| (2) | Security, or a portion of the security, is on loan. |
| (3) | Variable rate security. Rate shown is the rate in effect as of December 31, 2020. |
| (4) | All or a portion of this security is payment-in-kind ("PIK") which may pay interest or additional principal at the issuer's discretion. Rates shown are the current rate and possible payment rates. |
| (6) | For fair value measurement disclosure purposes, security is categorized as Level 3, whose value was determined using significant unobservable inputs. |
| (7) | Non-income producing security. |
| (8) | Represents an escrow position for future entitlements, if any, on the defaulted bond. The escrow position was received in exchange for the defaulted bond as part of the bankruptcy reorganization of the bond issuer. These holdings are non-income producing. |
| (9) | Restricted security as to resale, excluding Rule 144A securities. As of December 31, 2020, the Portfolio held restricted securities with a fair value of $– or 0.0% of net assets. Please refer to the table below for additional details. |
| (10) | Represents a zero coupon bond. Rate shown reflects the effective yield as of December 31, 2020. |
| (11) | All or a portion of the security represents securities purchased with cash collateral received for securities on loan. |
| (12) | Rate shown is the 7-day yield as of December 31, 2020. |
Reference Rate Abbreviations:
| US0001M | 1-month LIBOR |
| US0003M | 3-month LIBOR |
See Accompanying Notes to Financial Statements
| Voya Large Cap Growth Portfolio | PORTFOLIO OF INVESTMENTS
AS OF December 31, 2020 |
| | | | | | | | Percentage |
| | | | | | | | of Net |
| Shares | | | | Value | | | Assets |
| COMMON STOCK: 99.8% | | | | | | | |
| | | Communication Services: 10.2% | | | | | | | |
| 17,314 | (1) | Alphabet, Inc. - Class A | | $ | 30,345,209 | | | | 0.5 |
| 1,287,605 | (1) | Altice USA, Inc. | | | 48,761,601 | | | | 0.7 |
| 1,108,450 | (1) | Facebook, Inc.- Class A | | | 302,784,202 | | | | 4.6 |
| 1,694,892 | (1),(2) | Snap, Inc. | | | 84,863,243 | | | | 1.3 |
| 244,288 | (1) | Spotify Technology SA | | | 76,867,662 | | | | 1.2 |
| 603,448 | (1) | Take-Two Interactive Software, Inc. | | | 125,390,460 | | | | 1.9 |
| | | | | | 669,012,377 | | | | 10.2 |
| | | | | | | | | | |
| | | Consumer Discretionary: 17.1% | | | | | | | |
| 199,532 | (1) | Amazon.com, Inc. | | | 649,861,757 | | | | 9.9 |
| 579,926 | | Darden Restaurants, Inc. | | | 69,080,785 | | | | 1.1 |
| 514,814 | | Expedia Group, Inc. | | | 68,161,373 | | | | 1.0 |
| 473,152 | (1),(2) | Five Below, Inc. | | | 82,792,137 | | | | 1.3 |
| 258,766 | (1) | O'Reilly Automotive, Inc. | | | 117,109,729 | | | | 1.8 |
| 1,039,210 | | Ross Stores, Inc. | | | 127,625,380 | | | | 2.0 |
| | | | | | 1,114,631,161 | | | | 17.1 |
| | | | | | | | | | |
| | | Consumer Staples: 4.5% | | | | | | | |
| 412,206 | | Church & Dwight Co., Inc. | | | 35,956,729 | | | | 0.5 |
| 488,892 | | Constellation Brands, Inc. | | | 107,091,793 | | | | 1.6 |
| 1,855,139 | | Philip Morris International, Inc. | | | 153,586,958 | | | | 2.4 |
| | | | | | 296,635,480 | | | | 4.5 |
| | | | | | | | | | |
| | | Financials: 2.1% | | | | | | | |
| 503,710 | | Progressive Corp. | | | 49,806,845 | | | | 0.8 |
| 259,311 | | S&P Global, Inc. | | | 85,243,305 | | | | 1.3 |
| | | | | | 135,050,150 | | | | 2.1 |
| | | | | | | | | | |
| | | Health Care: 12.9% | | | | | | | |
| 823,201 | | Agilent Technologies, Inc. | | | 97,541,087 | | | | 1.5 |
| 115,539 | (1) | Align Technology, Inc. | | | 61,741,731 | | | | 0.9 |
| 574,911 | | Danaher Corp. | | | 127,710,730 | | | | 2.0 |
| 220,777 | (1),(2) | DexCom, Inc. | | | 81,625,672 | | | | 1.2 |
| 1,192,294 | | Eli Lilly & Co. | | | 201,306,919 | | | | 3.1 |
| 483,774 | (1),(2) | Exact Sciences Corp. | | | 64,095,217 | | | | 1.0 |
| 708,371 | (1) | Horizon Therapeutics Plc | | | 51,817,339 | | | | 0.8 |
| 230,424 | | Humana, Inc. | | | 94,536,054 | | | | 1.4 |
| 332,011 | (1) | Tandem Diabetes Care, Inc. | | | 31,766,812 | | | | 0.5 |
| 112,868 | (1),(2) | Veeva Systems, Inc. | | | 30,728,313 | | | | 0.5 |
| | | | | | 842,869,874 | | | | 12.9 |
| | | | | | | | | | |
| | | Industrials: 4.7% | | | | | | | |
| 505,612 | | Ametek, Inc. | | | 61,148,715 | | | | 0.9 |
| 53,889 | (1) | CoStar Group, Inc. | | | 49,808,525 | | | | 0.8 |
| 1,201,019 | | CSX Corp. | | | 108,992,474 | | | | 1.7 |
| 188,462 | | Roper Technologies, Inc. | | | 81,244,083 | | | | 1.2 |
| 60,431 | | Waste Connections, Inc. | | | 6,198,408 | | | | 0.1 |
| | | | | | 307,392,205 | | | | 4.7 |
| | | | | | | | | | |
| | | Information Technology: 45.4% | | | | | | | |
| 1,456,710 | (1) | Advanced Micro Devices, Inc. | | | 133,594,874 | | | | 2.0 |
| 6,285,084 | | Apple, Inc. | | | 833,967,796 | | | | 12.8 |
| 360,928 | (1) | Autodesk, Inc. | | | 110,205,756 | | | | 1.7 |
| 534,117 | (1) | Cadence Design Systems, Inc. | | | 72,869,582 | | | | 1.1 |
| 317,334 | | Entegris, Inc. | | | 30,495,797 | | | | 0.5 |
| 339,216 | (1) | Five9, Inc. | | | 59,159,270 | | | | 0.9 |
| 364,722 | | Global Payments, Inc. | | | 78,568,413 | | | | 1.2 |
| 529,328 | | Intuit, Inc. | | | 201,065,241 | | | | 3.1 |
| 185,720 | | Lam Research Corp. | | | 87,709,984 | | | | 1.3 |
| 1,030,427 | | Microsoft Corp. | | | 229,187,573 | | | | 3.5 |
| 193,782 | | Monolithic Power Systems, Inc. | | | 70,968,782 | | | | 1.1 |
| 192,964 | (1) | Paycom Software, Inc. | | | 87,267,969 | | | | 1.3 |
| 696,257 | (1) | PayPal Holdings, Inc. | | | 163,063,389 | | | | 2.5 |
| 841,619 | | Qualcomm, Inc. | | | 128,212,239 | | | | 2.0 |
| 323,579 | (1),(2) | RingCentral, Inc. | | | 122,626,734 | | | | 1.9 |
| 193,163 | (1) | ServiceNow, Inc. | | | 106,322,710 | | | | 1.6 |
| 320,901 | (1),(2) | Twilio, Inc. | | | 108,624,989 | | | | 1.7 |
| 1,387,719 | | Visa, Inc. - Class A | | | 303,535,777 | | | | 4.7 |
| 91,403 | (1) | Zebra Technologies Corp. | | | 35,128,915 | | | | 0.5 |
| | | | | | 2,962,575,790 | | | | 45.4 |
| | | | | | | | | | |
| | | Materials: 1.6% | | | | | | | |
| 261,321 | | Avery Dennison Corp. | | | 40,533,500 | | | | 0.6 |
| 668,467 | (1) | Crown Holdings, Inc. | | | 66,980,394 | | | | 1.0 |
| | | | | | 107,513,894 | | | | 1.6 |
| | | | | | | | | | |
| | | Real Estate: 1.3% | | | | | | | |
| 300,217 | | SBA Communications Corp. | | | 84,700,222 | | | | 1.3 |
| | | | | | | | | | |
| | Total Common Stock | | | | | | | |
| | (Cost $4,881,110,469) | | | 6,520,381,153 | | | | 99.8 |
| | | | | | | | |
| | | | | | | | Percentage |
| Principal | | | | | | | of Net |
| Amount† | | | | Value | | | Assets |
| SHORT-TERM INVESTMENTS: 1.5% | | | | | | | |
| | Repurchase Agreements: 0.6% | | | | | | | |
| 2,222,417 | (3) | Amherst Pierpoint Securities LLC, Repurchase Agreement dated 12/31/20, 0.10%, due 01/04/21 (Repurchase Amount $2,222,441, collateralized by various U.S. Government/U.S. Government Agency Obligations, 0.000%-4.628%, Market Value plus accrued interest $2,266,865, due 02/03/21-11/20/70) | | | 2,222,417 | | | | 0.0 |
See Accompanying Notes to Financial Statements
| Voya Large Cap Growth Portfolio | PORTFOLIO OF INVESTMENTS
AS OF December 31, 2020 (Continued) |
| 1,396,946 | (3) | Bethesda Securities LLC, Repurchase Agreement dated 12/31/20, 0.10%, due 01/04/21 (Repurchase Amount $1,396,961, collateralized by various U.S. Government Agency Obligations, 2.500%-5.500%, Market Value plus accrued interest $1,424,885, due 07/01/24-10/01/50) | | | 1,396,946 | | | | 0.0 |
| 1,851,088 | (3) | BNP Paribas S.A., Repurchase Agreement dated 12/31/20, 0.24%, due 01/04/21 (Repurchase Amount $1,851,137, collateralized by various U.S. Government Securities, 0.750%- 8.750%, Market Value plus accrued interest $1,943,642, due 03/01/21-11/20/40) | | | 1,851,088 | | | | 0.0 |
| 6,595,181 | (3) | Cantor Fitzgerald Securities, Repurchase Agreement dated 12/31/20, 0.07%, due 01/04/21 (Repurchase Amount $6,595,232, collateralized by various U.S. Government/U.S. Government Agency Obligations, 0.000%- 9.500%, Market Value plus accrued interest $6,727,085, due 01/25/21-10/15/62) | | | 6,595,181 | | | | 0.1 |
| 2,257,230 | (3) | CF Secured LLC, Repurchase Agreement dated 12/31/20, 0.07%, due 01/04/21 (Repurchase Amount $2,257,247, collateralized by various U.S. Government/U.S. Government Agency Obligations, 0.000%- 4.750%, Market Value plus accrued interest $2,302,375, due 01/14/21-01/20/69) | | | 2,257,230 | | | | 0.0 |
| 4,452,521 | (3) | Citadel Securities LLC, Repurchase Agreement dated 12/31/20, 0.13%, due 01/04/21 (Repurchase Amount $4,452,584, collateralized by various U.S. Government Securities, 0.000%- 7.875%, Market Value plus accrued interest $4,541,641, due 01/31/21-05/15/49) | | | 4,452,521 | | | | 0.1 |
| 6,546,736 | (3) | Citigroup, Inc., Repurchase Agreement dated 12/31/20, 0.07%, due 01/04/21 (Repurchase Amount $6,546,786, collateralized by various U.S. Government/U.S. Government Agency Obligations, 0.000%- 4.000%, Market Value plus accrued interest $6,677,671, due 09/15/21-01/01/51) | | | 6,546,736 | | | | 0.1 |
| 2,578,709 | (3) | JVB Financial Group LLC, Repurchase Agreement dated 12/31/20, 0.13%, due 01/04/21 (Repurchase Amount $2,578,746, collateralized by various U.S. Government/U.S. Government Agency Obligations, 0.125%- 7.000%, Market Value plus accrued interest $2,630,283, due 07/01/22-12/01/50) | | | 2,578,709 | | | | 0.1 |
| 2,946,470 | (3) | Mirae Asset Securities USA Inc., Repurchase Agreement dated 12/31/20, 0.13%, due 01/04/21 (Repurchase Amount $2,946,512, collateralized by various U.S. Government/U.S. Government Agency Obligations, 0.000%- 8.125%, Market Value plus accrued interest $3,005,443, due 02/18/21-01/15/62) | | | 2,946,470 | | | | 0.1 |
| 2,496,610 | (3) | Palafox Trading LLC, Repurchase Agreement dated 12/31/20, 0.13%, due 01/04/21 (Repurchase Amount $2,496,646, collateralized by various U.S. Government Securities, 0.250%- 1.125%, Market Value plus accrued interest $2,547,464, due 02/28/25-05/31/25) | | | 2,496,610 | | | | 0.0 |
| 6,545,915 | (3) | State of Wisconsin Investment Board, Repurchase Agreement dated 12/31/20, 0.16%, due 01/04/21 (Repurchase Amount $6,546,030, collateralized by various U.S. Government Securities, 0.125%- 3.875%, Market Value plus accrued interest $6,693,475, due 07/15/22-02/15/47) | | | 6,545,915 | | | | 0.1 |
| | | | | | | | | | |
| | Total Repurchase Agreements | | | | | | |
| | Cost $39,889,823) | | 39,889,823 | | | | 0.6 |
See Accompanying Notes to Financial Statements
| Voya Large Cap Growth Portfolio | PORTFOLIO OF INVESTMENTS
AS OF December 31, 2020 (Continued) |
| | | | | | | | Percentage |
| | | | | | | | of Net |
| Shares | | | | Value | | | Assets |
| | | Mutual Funds(3): 0.9% | | | | | | | |
| 53,672,111 | (3),(4) | BlackRock Liquidity Funds, FedFund, Institutional Class, 0.000% | | | 53,672,111 | | | | 0.9 |
| 1,248,000 | (3),(4) | Goldman Sachs Financial Square Government Fund - Institutional Shares, 0.020% | | | 1,248,000 | | | | 0.0 |
| 1,248,000 | (3),(4) | Morgan Stanley Institutional Liquidity Funds - Government Portfolio (Institutional Share Class), 0.030% | | | 1,248,000 | | | | 0.0 |
| | Total Mutual Funds | | | | | | | |
| | (Cost $56,168,111) | | | 56,168,111 | | | | 0.9 |
| | | | | | | | | | |
| | Total Short-Term Investments | | | | | | | |
| | (Cost $96,057,934) | | | 96,057,934 | | | | 1.5 |
| | | | | | | | | |
| | Total Investments in Securities | | | | | | | |
| | (Cost $4,977,168,403) | | $ | 6,616,439,087 | | | | 101.3 |
| | Liabilities in Excess of Other Assets | | | (85,509,054 | ) | | | (1.3) |
| | Net Assets | | $ | 6,530,930,033 | | | | 100.0 |
| † | Unless otherwise indicated, principal amount is shown in USD. |
| (1) | Non-income producing security. |
| (2) | Security, or a portion of the security, is on loan. |
| (3) | All or a portion of the security represents securities purchased with cash collateral received for securities on loan. |
| (4) | Rate shown is the 7-day yield as of December 31, 2020. |
See Accompanying Notes to Financial Statements
| Voya Large Cap Value Portfolio | PORTFOLIO OF INVESTMENTS
AS OF December 31, 2020 |
| | | | | | | | Percentage |
| | | | | | | | of Net |
| Shares | | | | | Value | | | | Assets |
| COMMON STOCK: 99.6% | | | | | | | |
| | | Communication Services: 8.7% | | | | | | | |
| 135,198 | | Activision Blizzard, Inc. | | $ | 12,553,134 | | | | 1.3 |
| 505,820 | | Comcast Corp. – Class A | | | 26,504,968 | | | | 2.7 |
| 586,185 | | Interpublic Group of Cos., Inc. | | | 13,787,071 | | | | 1.4 |
| 182,325 | (1) | Walt Disney Co. | | | 33,033,644 | | | | 3.3 |
| | | | | | 85,878,817 | | | | 8.7 |
| | | | | | | | | | |
| | | Consumer Discretionary: 7.8% | | | | | | | |
| 87,192 | | Darden Restaurants, Inc. | | | 10,386,311 | | | | 1.1 |
| 89,877 | | Expedia Group, Inc. | | | 11,899,715 | | | | 1.2 |
| 135,499 | | Hasbro, Inc. | | | 12,674,576 | | | | 1.3 |
| 266,047 | | Las Vegas Sands Corp. | | | 15,856,401 | | | | 1.6 |
| 64,972 | | Nike, Inc. - Class B | | | 9,191,589 | | | | 0.9 |
| 106,618 | | Royal Caribbean Cruises Ltd. | | | 7,963,298 | | | | 0.8 |
| 183,097 | | Service Corp. International | | | 8,990,063 | | | | 0.9 |
| | | | | | 76,961,953 | | | | 7.8 |
| | | | | | | | | | |
| | | Consumer Staples: 7.4% | | | | | | | |
| 322,982 | | Coca-Cola Co. | | | 17,712,333 | | | | 1.8 |
| 56,388 | | Constellation Brands, Inc. | | | 12,351,791 | | | | 1.2 |
| 259,473 | | Philip Morris International, Inc. | | | 21,481,770 | | | | 2.2 |
| 153,640 | | Walmart, Inc. | | | 22,147,206 | | | | 2.2 |
| | | | | | 73,693,100 | | | | 7.4 |
| | | | | | | | | | |
| | | Energy: 4.6% | | | | | | | |
| 248,919 | | BP PLC ADR | | | 5,107,818 | | | | 0.5 |
| 184,968 | | Chevron Corp. | | | 15,620,548 | | | | 1.6 |
| 128,003 | | Concho Resources, Inc./Midland TX | | | 7,468,975 | | | | 0.7 |
| 196,946 | (2) | Diamondback Energy, Inc. | | | 9,532,186 | | | | 1.0 |
| 139,776 | | Valero Energy Corp. | | | 7,907,128 | | | | 0.8 |
| | | | | | 45,636,655 | | | | 4.6 |
| | | | | | | | | | |
| | | Financials: 20.0% | | | | | | | |
| 446,831 | | American International Group, Inc. | | | 16,917,022 | | | | 1.7 |
| 269,626 | (2) | Apollo Global Management, Inc. | | | 13,206,282 | | | | 1.3 |
| 95,792 | | Assurant, Inc. | | | 13,048,786 | | | | 1.3 |
| 812,123 | | Bank of America Corp. | | | 24,615,448 | | | | 2.5 |
| 399,564 | | Citigroup, Inc. | | | 24,637,116 | | | | 2.5 |
| 157,688 | | Discover Financial Services | | | 14,275,495 | | | | 1.4 |
| 69,264 | | Goldman Sachs Group, Inc. | | | 18,265,609 | | | | 1.9 |
| 385,499 | | Hartford Financial Services Group, Inc. | | | 18,881,741 | | | | 1.9 |
| 105,235 | | Intercontinental Exchange, Inc. | | | 12,132,543 | | | | 1.2 |
| 424,634 | | Truist Financial Corp. | | | 20,352,708 | | | | 2.1 |
| 469,616 | | US Bancorp | | | 21,879,409 | | | | 2.2 |
| | | | | | 198,212,159 | | | | 20.0 |
| | | | | | | | | | |
| | Health Care: 13.7% | | | | | | | |
| 146,586 | (1),(2) | Alcon, Inc. | | | 9,671,744 | | | | 1.0 |
| 6,263 | (1) | Biogen, Inc. | | | 1,533,558 | | | | 0.2 |
| 320,821 | | Bristol-Myers Squibb Co. | | | 19,900,527 | | | | 2.0 |
| 50,880 | | Cigna Corp. | | | 10,592,198 | | | | 1.1 |
| 45,881 | | Eli Lilly & Co. | | | 7,746,548 | | | | 0.8 |
| 170,433 | | Johnson & Johnson | | | 26,822,746 | | | | 2.7 |
| 219,828 | | Medtronic PLC | | | 25,750,652 | | | | 2.6 |
| 27,848 | | Thermo Fisher Scientific, Inc. | | | 12,971,042 | | | | 1.3 |
| 23,566 | | UnitedHealth Group, Inc. | | | 8,264,125 | | | | 0.8 |
| 76,715 | | Zimmer Biomet Holdings, Inc. | | | 11,821,014 | | | | 1.2 |
| | | | | | 135,074,154 | | | | 13.7 |
| | | | | | | | | | |
| | | Industrials: 12.9% | | | | | | | |
| 39,729 | | Cummins, Inc. | | | 9,022,456 | | | | 0.9 |
| 83,949 | | L3Harris Technologies,Inc. | | | 15,868,040 | | | | 1.6 |
| 98,577 | | Norfolk Southern Corp. | | | 23,422,881 | | | | 2.4 |
| 215,040 | | nVent Electric PLC | | | 5,008,282 | | | | 0.5 |
| 42,183 | | Old Dominion Freight Line | | | 8,233,278 | | | | 0.8 |
| 67,820 | | Parker Hannifin Corp. | | | 18,474,846 | | | | 1.9 |
| 328,035 | | Raytheon Technologies Corp. | | | 23,457,783 | | | | 2.4 |
| 137,282 | | Timken Co. | | | 10,620,135 | | | | 1.1 |
| 57,194 | (1) | United Rentals, Inc. | | | 13,263,861 | | | | 1.3 |
| | | | | | 127,371,562 | | | | 12.9 |
| | | | | | | | | | |
| | | Information Technology: 9.6% | | | | | | | |
| 29,323 | | Broadcom, Inc. | | | 12,839,076 | | | | 1.3 |
| 194,293 | (1) | Fiserv, Inc. | | | 22,122,201 | | | | 2.3 |
| 520,230 | | HP, Inc. | | | 12,792,456 | | | | 1.3 |
| 54,617 | | Microchip Technology, Inc. | | | 7,543,154 | | | | 0.8 |
| 81,191 | | MKS Instruments, Inc. | | | 12,215,186 | | | | 1.2 |
| 82,191 | | Motorola Solutions, Inc. | | | 13,977,401 | | | | 1.4 |
| 82,100 | (2) | NXP Semiconductor NV - NXPI - US | | | 13,054,721 | | | | 1.3 |
| | | | | | 94,544,195 | | | | 9.6 |
| | | | | | | | | | |
| | | Materials: 4.9% | | | | | | | |
| 40,379 | | Air Products & Chemicals, Inc. | | | 11,032,350 | | | | 1.1 |
| 318,183 | | CF Industries Holdings, Inc. | | | 12,316,864 | | | | 1.2 |
| 135,710 | | Eastman Chemical Co. | | | 13,608,999 | | | | 1.4 |
| 95,871 | | Reliance Steel & Aluminum Co. | | | 11,480,552 | | | | 1.2 |
| | | | | | 48,438,765 | | | | 4.9 |
| | | | | | | | | | |
| | | Real Estate: 4.6% | | | | | | | |
| 184,852 | | American Homes 4 Rent | | | 5,545,560 | | | | 0.6 |
| 182,127 | | MGM Growth Properties LLC | | | 5,700,575 | | | | 0.6 |
| 92,743 | | ProLogis, Inc. | | | 9,242,767 | | | | 0.9 |
| 91,725 | | Ryman Hospitality Properties | | | 6,215,286 | | | | 0.6 |
| 162,897 | | Spirit Realty Capital, Inc. | | | 6,543,573 | | | | 0.7 |
| 313,977 | | VEREIT, Inc. | | | 11,865,191 | | | | 1.2 |
| | | | | | 45,112,952 | | | | 4.6 |
See Accompanying Notes to Financial Statements
| Voya Large Cap Value Portfolio | PORTFOLIO OF INVESTMENTS
AS OF December 31, 2020 (Continued) |
| | Utilities: 5.4% | | | | | | | |
| 70,739 | | Ameren Corp. | | | 5,521,887 | | | | 0.5 |
| 113,805 | | Entergy Corp. | | | 11,362,291 | | | | 1.1 |
| 301,200 | | Exelon Corp. | | | 12,716,664 | | | | 1.3 |
| 201,774 | | NextEra Energy, Inc. | | | 15,566,864 | | | | 1.6 |
| 440,822 | (1),(3) | PRIME AET&D Holdings NO 1 | | | – | | | | – |
| 145,644 | | Public Service Enterprise Group, Inc. | | | 8,491,045 | | | | 0.9 |
| | | | | | 53,658,751 | | | | 5.4 |
| | | | | | | | | | |
| | Total Common Stock | | | | | | | |
| | (Cost $831,851,136) | | | 984,583,063 | | | | 99.6 |
| | | | | | | | | | |
| OTHER(4): –% | | | | | | | | | |
| | | Communications: –% | | | | | | | |
| 32,517 | (3),(5) | Tribune Co. (Escrow) | | | – | | | | – |
| | | | | | | | | | |
| | | Energy: –% | | | | | | | |
| 1,685,000 | (3),(5) | Samson Investment Co. | | | | | | | |
| | | (Escrow) | | | – | | | | – |
| | | | | | | | | | |
| Total Other
(Cost $30,842) | | | – | | | | – |
| | | | | | | | |
| | | | | | | | Percentage |
| Principal | | | | | | | of Net |
| Amount† | | | | | Value | | | | Assets |
| CORPORATE BONDS/NOTES: –% | | | | | | | |
| | | Financial: –% | | | | | | | |
| 1,216,000 | (3),(6) | Tropicana Entertainment LLC / Tropicana Finance Corp., 9.625%, 12/15/2015 | | | – | | | | – |
| | | | | | | | | | |
| | Total Corporate Bonds/Notes | | | | | | | |
| | (Cost $787,908) | | | – | | | | – |
| | | | | | | | | | |
| | Total Long-Term Investments | | | | | | | |
| | (Cost $832,669,886) | | | 984,583,063 | | | | 99.6 |
| | | | | | | | | | |
| SHORT-TERM INVESTMENTS: 2.1% | | | | | | | |
| | | Repurchase Agreements: 1.7% | | | | | | | |
| 61,975 | (7) | Bank of America Inc., Repurchase Agreement dated 12/31/20, 0.08%, due 01/04/21 (Repurchase Amount $61,976, collateralized by various U.S. Government Agency Obligations, 1.500%- 3.500%, Market Value plus accrued interest $63,215, due 02/01/48-01/01/51) | | | 61,975 | | | | 0.0 |
| 2,854,144 | (7) | Cantor Fitzgerald Securities, Repurchase Agreement dated 12/31/20, 0.07%, due 01/04/21 (Repurchase Amount $2,854,166, collateralized by various U.S. Government/U.S. Government Agency Obligations, 0.000%- 9.500%, Market Value plus accrued interest $2,911,227, due 01/25/21-10/15/62) | | | 2,854,144 | | | | 0.3 |
| 2,788,630 | (7) | Citadel Securities LLC, Repurchase Agreement dated 12/31/20, 0.13%, due 01/04/21 (Repurchase Amount $2,788,670, collateralized by various U.S. Government Securities, 0.000%- 7.875%, Market Value plus accrued interest $2,844,446, due 01/31/21-05/15/49) | | | 2,788,630 | | | | 0.3 |
| 1,241,680 | (7) | JVB Financial Group LLC, Repurchase Agreement dated 12/31/20, 0.13%, due 01/04/21 (Repurchase Amount $1,241,698, collateralized by various U.S. Government/U.S. Government Agency Obligations, 0.125%- 7.000%, Market Value plus accrued interest $1,266,514, due 07/01/22-12/01/50) | | | 1,241,680 | | | | 0.1 |
| 1,275,121 | (7) | Mirae Asset Securities USA Inc., Repurchase Agreement dated 12/31/20, 0.13%, due 01/04/21 (Repurchase Amount $1,275,139, collateralized by various U.S. Government/U.S. Government Agency Obligations, 0.000%- 8.125%, Market Value plus accrued interest $1,300,642, due 02/18/21-01/15/62) | | | 1,275,121 | | | | 0.1 |
| 1,309,370 | (7) | Palafox Trading LLC, Repurchase Agreement dated 12/31/20, 0.13%, due 01/04/21 (Repurchase Amount $1,309,389, collateralized by various U.S. Government Securities, 0.250%- 1.125%, Market Value plus accrued interest $1,336,041, due 02/28/25-05/31/25) | | | 1,309,370 | | | | 0.2 |
See Accompanying Notes to Financial Statements
| Voya Large Cap Value Portfolio | PORTFOLIO OF INVESTMENTS
AS OF December 31, 2020 (Continued) |
| 4,097,979 | (7) | RBC Dominion Securities Inc., Repurchase Agreement dated 12/31/20, 0.08%, due 01/04/21 (Repurchase Amount $4,098,015, collateralized by various U.S. Government/U.S. Government Agency Obligations, 0.000%-6.000%, Market Value plus accrued interest $4,179,939, due 01/05/21-12/20/50) | | | 4,097,979 | | | | 0.4 |
| 2,832,825 | (7) | State of Wisconsin Investment Board, Repurchase Agreement dated 12/31/20, 0.16%, due 01/04/21 (Repurchase Amount $2,832,875, collateralized by various U.S. Government Securities, 0.125%-3.875%, Market Value plus accrued interest $2,896,683, due 07/15/22-02/15/47) | | | 2,832,825 | | | | 0.3 |
| | | | | | | | | | |
| | Total Repurchase Agreements | | | | | | | |
| | (Cost $16,461,724) | | | 16,461,724 | | | | 1.7 |
| | | | | | | | Percentage |
| | | | | | | | of Net |
| Shares | | | | Value | | | Assets |
| | | Mutual Funds(7): 0.4% | | | | | | | |
| 3,513,013 | (7),(8) | BlackRock Liquidity Funds, FedFund, Institutional Class, 0.000% | | | 3,513,013 | | | | 0.4 |
| 331,000 | (7),(8) | Goldman Sachs Financial Square Government Fund - Institutional Shares, 0.020% | | | 331,000 | | | | 0.0 |
| 483,000 | (7),(8) | Morgan Stanley Institutional Liquidity Funds - Government Portfolio (Institutional Share Class), 0.030% | | | 483,000 | | | | 0.0 |
| | Total Mutual Funds | | | | | | | |
| | (Cost $4,327,013) | | | 4,327,013 | | | | 0.4 |
| | | | | | | | | | |
| | Total Short-Term Investments | | | | | | | |
| | (Cost $20,788,737) | | | 20,788,737 | | | | 2.1 |
| | | | | | | | | | |
| | Total Investments in Securities | | | | | | | |
| | (Cost $853,458,623) | | $ | 1,005,371,800 | | | | 101.7 |
| | Liabilities in Excess of Other Assets | | | (16,417,702 | ) | | | (1.7) |
| | Net Assets | | $ | 988,954,098 | | | | 100.0 |
| † | Unless otherwise indicated, principal amount is shown in USD. |
| ADR | American Depositary Receipt |
| (1) | Non-income producing security. |
| (2) | Security, or a portion of the security, is on loan. |
| (3) | For fair value measurement disclosure purposes, security is categorized as Level 3, whose value was determined using significant unobservable inputs. |
| (4) | Represents an escrow position for future entitlements, if any, on the defaulted bond. The escrow position was received in exchange for the defaulted bond as part of the bankruptcy reorganization of the bond issuer. These holdings are non-income producing. |
| (5) | Restricted security as to resale, excluding Rule 144A securities. As of December 31, 2020, the Portfolio held restricted securities with a fair value of $– or 0.0% of net assets. Please refer to the table below for additional details. |
| (7) | All or a portion of the security represents securities purchased with cash collateral received for securities on loan. |
| (8) | Rate shown is the 7-day yield as of December 31, 2020. |
See Accompanying Notes to Financial Statements
| Voya Limited Maturity Bond Portfolio | PORTFOLIO OF INVESTMENTS
AS OF December 31, 2020 |
| | | | | | | | | | Percentage |
| Principal | | | | | | | | | of Net |
| Amount † | | | | | Value | | | | Assets |
| CORPORATE BONDS/NOTES: 34.2% | | | | | | | |
| | | Basic Materials: 0.5% | | | | | | | |
| 200,000 | (1) | Anglo American Capital PLC, 4.125%, 04/15/2021 | | $ | 201,609 | | | | 0.0 |
| 430,000 | | Eastman Chemical Co., 3.500%, 12/01/2021 | | | 441,791 | | | | 0.1 |
| 500,000 | (1) | Georgia-Pacific LLC, 1.750%, 09/30/2025 | | | 522,990 | | | | 0.1 |
| 300,000 | | LYB International Finance III LLC, 2.875%, 05/01/2025 | | | 327,232 | | | | 0.1 |
| 280,000 | | Nucor Corp., 2.000%, 06/01/2025 | | | 296,774 | | | | 0.1 |
| 425,000 | | Nutrien Ltd., 3.150%, 10/01/2022 | | | 442,229 | | | | 0.1 |
| | | | | | 2,232,625 | | | | 0.5 |
| | | | | | | | | | |
| | | Communications: 1.8% | | | | | | | |
| 560,000 | | Alibaba Group Holding Ltd., 2.800%, 06/06/2023 | | | 589,482 | | | | 0.1 |
| 435,000 | | Alphabet, Inc., 0.450%, 08/15/2025 | | | 436,177 | | | | 0.1 |
| 335,000 | | AT&T, Inc., 4.050%, 12/15/2023 | | | 370,825 | | | | 0.1 |
| 375,000 | | Baidu, Inc., 3.875%, 09/29/2023 | | | 404,761 | | | | 0.1 |
| 684,000 | | Booking Holdings, Inc., 4.100%, 04/13/2025 | | | 776,328 | | | | 0.2 |
| 500,000 | | Charter Communications Operating LLC / Charter Communications Operating Capital, 4.464%, 07/23/2022 | | | 527,250 | | | | 0.1 |
| 599,000 | | Fox Corp., 4.030%, 01/25/2024 | | | 659,988 | | | | 0.2 |
| 280,000 | | Interpublic Group of Cos, Inc./The, 3.750%, 10/01/2021 | | | 287,055 | | | | 0.1 |
| 920,000 | | Omnicom Group, Inc. / Omnicom Capital, Inc., 3.625%, 05/01/2022 | | | 959,828 | | | | 0.2 |
| 185,000 | (1) | Sky Ltd., 3.125%, 11/26/2022 | | | 194,591 | | | | 0.0 |
| 408,000 | (1) | T-Mobile USA, Inc., 3.500%, 04/15/2025 | | | 451,240 | | | | 0.1 |
| 405,000 | | TWDC Enterprises 18 Corp., 2.125%, 09/13/2022 | | | 417,276 | | | | 0.1 |
| 600,000 | | TWDC Enterprises 18 Corp., 2.450%, 03/04/2022 | | | 615,640 | | | | 0.2 |
| 471,000 | | Verizon Communications, Inc., 0.850%, 11/20/2025 | | | 474,815 | | | | 0.1 |
| 500,000 | | Verizon Communications, Inc., 2.450%, 11/01/2022 | | | 516,801 | | | | 0.1 |
| | | | | | 7,682,057 | | | | 1.8 |
| | | | | | | | | | |
| | | Consumer, Cyclical: 2.2% | | | | | | | |
| 433,000 | | American Honda Finance Corp., 0.650%, 09/08/2023 | | | 435,879 | | | | 0.1 |
| 509,000 | | American Honda Finance Corp., 0.875%, 07/07/2023 | | | 515,354 | | | | 0.1 |
| 390,000 | | American Honda Finance Corp., 2.050%, 01/10/2023 | | | 403,396 | | | | 0.1 |
| 400,000 | (1) | BMW US Capital LLC, 3.400%, 08/13/2021 | | | 407,547 | | | | 0.1 |
| 431,000 | (1) | BMW US Capital LLC, 3.900%, 04/09/2025 | | | 485,414 | | | | 0.1 |
| 460,000 | (1) | Daimler Finance North America LLC, 3.400%, 02/22/2022 | | | 475,230 | | | | 0.1 |
| 250,000 | | Delta Air Lines 2019-1 Class A Pass Through Trust, 3.404%, 10/25/2025 | | | 246,715 | | | | 0.1 |
| 189,054 | | Delta Air Lines 2020-1 Class A Pass Through Trust, 2.500%, 12/10/2029 | | | 180,222 | | | | 0.0 |
| 256,000 | (1) | Delta Air Lines, Inc. / SkyMiles IP Ltd., 4.500%, 10/20/2025 | | | 273,716 | | | | 0.1 |
| 466,000 | | General Motors Financial Co., Inc., 1.700%, 08/18/2023 | | | 478,275 | | | | 0.1 |
| 446,000 | (1) | Nissan Motor Co. Ltd., 3.522%, 09/17/2025 | | | 478,545 | | | | 0.1 |
| 536,000 | | PACCAR Financial Corp., 0.350%, 08/11/2023 | | | 535,820 | | | | 0.1 |
| 450,000 | (1) | Panasonic Corp., 2.536%, 07/19/2022 | | | 462,702 | | | | 0.1 |
| 623,000 | | Ross Stores, Inc., 4.600%, 04/15/2025 | | | 719,259 | | | | 0.2 |
| 330,000 | (1) | Toyota Industries Corp., 3.110%, 03/12/2022 | | | 339,721 | | | | 0.1 |
| 815,000 | | Toyota Motor Credit Corp., 0.346%, (US0003M + 0.125%), 08/13/2021 | | | 815,445 | | | | 0.2 |
| 406,000 | | Toyota Motor Credit Corp., 0.450%, 07/22/2022 | | | 407,202 | | | | 0.1 |
| 742,000 | | Toyota Motor Credit Corp., 0.500%, 08/14/2023 | | | 745,933 | | | | 0.2 |
| 410,000 | | Toyota Motor Credit Corp., 0.350%, 10/14/2022 | | | 411,206 | | | | 0.1 |
| 276,000 | | WW Grainger, Inc., 1.850%, 02/15/2025 | | | 290,805 | | | | 0.1 |
| | | | | | 9,108,386 | | | | 2.2 |
| | | | | | | | | | |
| | | Consumer, Non-cyclical: 5.8% | | | | | | | |
| 680,000 | | AbbVie, Inc., 2.150%, 11/19/2021 | | | 691,047 | | | | 0.2 |
| 640,000 | | AbbVie, Inc., 2.300%, 11/21/2022 | | | 663,742 | | | | 0.2 |
| 165,000 | | AbbVie, Inc., 2.900%, 11/06/2022 | | | 172,659 | | | | 0.0 |
| 83,000 | | AbbVie, Inc., 3.375%, 11/14/2021 | | | 85,242 | | | | 0.0 |
| 850,000 | | AbbVie, Inc., 3.450%, 03/15/2022 | | | 876,844 | | | | 0.2 |
| 500,000 | | Altria Group, Inc., 2.350%, 05/06/2025 | | | 531,678 | | | | 0.1 |
| 450,000 | | Altria Group, Inc., 2.850%, 08/09/2022 | | | 467,448 | | | | 0.1 |
See Accompanying Notes to Financial Statements
| Voya Limited Maturity Bond Portfolio | PORTFOLIO OF INVESTMENTS
AS OF December 31, 2020 (Continued) |
| 405,000 | | Anheuser-Busch InBev Worldwide, Inc., 4.150%, 01/23/2025 | | | 461,318 | | | | 0.1 |
| 385,000 | | Anthem, Inc., 3.500%, 08/15/2024 | | | 422,571 | | | | 0.1 |
| 644,000 | | BAT International Finance PLC, 1.668%, 03/25/2026 | | | 659,541 | | | | 0.2 |
| 426,000 | | Becton Dickinson and Co., 2.894%, 06/06/2022 | | | 440,405 | | | | 0.1 |
| 386,000 | | Boston Scientific Corp., 1.900%, 06/01/2025 | | | 405,627 | | | | 0.1 |
| 506,000 | | Bristol-Myers Squibb Co., 0.750%, 11/13/2025 | | | 509,704 | | | | 0.1 |
| 405,000 | | Bristol-Myers Squibb Co., 2.250%, 08/15/2021 | | | 409,502 | | | | 0.1 |
| 405,000 | | Bristol-Myers Squibb Co., 2.550%, 05/14/2021 | | | 408,416 | | | | 0.1 |
| 355,000 | | Bristol-Myers Squibb Co., 2.600%, 05/16/2022 | | | 366,364 | | | | 0.1 |
| 587,000 | | Bunge Ltd. Finance Corp., 1.630%, 08/17/2025 | | | 606,943 | | | | 0.1 |
| 546,000 | | Cardinal Health, Inc., 2.616%, 06/15/2022 | | | 562,242 | | | | 0.1 |
| 219,000 | (1) | Cargill, Inc., 1.375%, 07/23/2023 | | | 224,537 | | | | 0.0 |
| 394,000 | | Constellation Brands, Inc., 3.200%, 02/15/2023 | | | 416,445 | | | | 0.1 |
| 187,000 | | CVS Health Corp., 3.700%, 03/09/2023 | | | 200,239 | | | | 0.0 |
| 685,000 | | DH Europe Finance II Sarl, 2.050%, 11/15/2022 | | | 706,817 | | | | 0.2 |
| 250,000 | | Diageo Capital PLC, 1.375%, 09/29/2025 | | | 257,350 | | | | 0.1 |
| 153,000 | | Evernorth Health, Inc., 3.900%, 02/15/2022 | | | 158,671 | | | | 0.0 |
| 900,000 | | General Mills, Inc., 3.150%, 12/15/2021 | | | 917,699 | | | | 0.2 |
| 411,000 | | Gilead Sciences, Inc., 0.750%, 09/29/2023 | | | 412,276 | | | | 0.1 |
| 770,000 | | Gilead Sciences, Inc., 1.950%, 03/01/2022 | | | 784,763 | | | | 0.2 |
| 575,000 | | GlaxoSmithKline Capital PLC, 0.534%, 10/01/2023 | | | 577,302 | | | | 0.1 |
| 226,000 | | GlaxoSmithKline Capital PLC, 2.875%, 06/01/2022 | | | 233,890 | | | | 0.0 |
| 417,000 | | Hershey Co/The, 0.900%, 06/01/2025 | | | 423,644 | | | | 0.1 |
| 370,000 | (1) | Imperial Brands Finance PLC, 3.750%, 07/21/2022 | | | 385,954 | | | | 0.1 |
| 330,000 | | Johnson & Johnson, 0.550%, 09/01/2025 | | | 331,572 | | | | 0.1 |
| 715,000 | | Keurig Dr Pepper, Inc., 3.551%, 05/25/2021 | | | 723,986 | | | | 0.2 |
| 278,000 | | Keurig Dr Pepper, Inc., 4.057%, 05/25/2023 | | | 302,235 | | | | 0.1 |
| 400,000 | | Laboratory Corp. of America Holdings, 3.600%, 02/01/2025 | | | 442,066 | | | | 0.1 |
| 440,000 | (1) | Mondelez International Holdings Netherlands BV, 2.125%, 09/19/2022 | | | 452,741 | | | | 0.1 |
| 633,000 | (1) | Mylan, Inc., 3.125%, 01/15/2023 | | | 664,855 | | | | 0.2 |
| 640,000 | | Novartis Capital Corp., 2.400%, 05/17/2022 | | | 657,854 | | | | 0.2 |
| 345,000 | | PayPal Holdings, Inc., 2.200%, 09/26/2022 | | | 356,547 | | | | 0.1 |
| 195,000 | | PepsiCo, Inc., 2.750%, 03/05/2022 | | | 200,756 | | | | 0.0 |
| 350,000 | | Pfizer, Inc., 2.800%, 03/11/2022 | | | 360,627 | | | | 0.1 |
| 340,000 | | Philip Morris International, Inc., 1.875%, 02/25/2021 | | | 339,923 | | | | 0.1 |
| 417,000 | (1) | Royalty Pharma PLC, 0.750%, 09/02/2023 | | | 419,239 | | | | 0.1 |
| 486,000 | (1) | Seven & i Holdings Co. Ltd., 3.350%, 09/17/2021 | | | 495,612 | | | | 0.1 |
| 242,000 | | Shire Acquisitions Investments Ireland DAC, 2.400%, 09/23/2021 | | | 245,185 | | | | 0.1 |
| 702,000 | | Stryker Corp., 0.600%, 12/01/2023 | | | 703,219 | | | | 0.2 |
| 270,000 | | Stryker Corp., 2.625%, 03/15/2021 | | | 270,500 | | | | 0.1 |
| 334,000 | (1) | Takeda Pharmaceutical Co. Ltd., 2.450%, 01/18/2022 | | | 340,616 | | | | 0.1 |
| 330,000 | | Takeda Pharmaceutical Co. Ltd., 4.000%, 11/26/2021 | | | 339,578 | | | | 0.1 |
| 284,000 | | Unilever Capital Corp., 0.375%, 09/14/2023 | | | 284,988 | | | | 0.1 |
| 495,000 | | Unilever Capital Corp., 3.000%, 03/07/2022 | | | 510,989 | | | | 0.1 |
| 165,000 | | UnitedHealth Group, Inc., 2.375%, 08/15/2024 | | | 175,885 | | | | 0.0 |
| 750,000 | (1) | Viatris, Inc., 1.650%, 06/22/2025 | | | 775,863 | | | | 0.2 |
| 555,000 | | Zoetis, Inc., 3.250%, 08/20/2021 | | | 565,373 | | | | 0.1 |
| | | | | | 24,401,089 | | | | 5.8 |
| | | | | | | | | | |
| | | Energy: 1.9% | | | | | | | |
| 210,000 | (1) | BG Energy Capital PLC, 4.000%, 10/15/2021 | | | 215,655 | | | | 0.1 |
| 569,000 | | BP Capital Markets America, Inc., 3.216%, 11/28/2023 | | | 610,575 | | | | 0.1 |
| 580,000 | | Canadian Natural Resources Ltd., 2.950%, 01/15/2023 | | | 606,752 | | | | 0.1 |
| 500,000 | | Chevron USA, Inc., 0.426%, 08/11/2023 | | | 502,669 | | | | 0.1 |
| 880,000 | | Energy Transfer Partners L.P. / Regency Energy Finance Corp., 5.875%, 03/01/2022 | | | 920,292 | | | | 0.2 |
| 280,000 | | Enterprise Products Operating LLC, 2.800%, 02/15/2021 | | | 280,794 | | | | 0.1 |
See Accompanying Notes to Financial Statements
| Voya Limited Maturity Bond Portfolio | PORTFOLIO OF INVESTMENTS
AS OF December 31, 2020 (Continued) |
| 690,000 | (2) | Enterprise Products Operating LLC, 2.850%, 04/15/2021 | | | 693,395 | | | | 0.2 |
| 469,000 | | Equinor ASA, 2.875%, 04/06/2025 | | | 512,552 | | | | 0.1 |
| 355,000 | | Exxon Mobil Corp., 2.992%, 03/19/2025 | | | 388,780 | | | | 0.1 |
| 350,000 | | Husky Energy, Inc., 3.950%, 04/15/2022 | | | 360,738 | | | | 0.1 |
| 770,000 | | Kinder Morgan Energy Partners L.P., 5.000%, 10/01/2021 | | | 786,765 | | | | 0.2 |
| 405,000 | | Marathon Petroleum Corp., 5.125%, 04/01/2024 | | | 412,050 | | | | 0.1 |
| 354,000 | | Phillips 66, 3.700%, 04/06/2023 | | | 379,312 | | | | 0.1 |
| 519,000 | | Shell International Finance BV, 0.375%, 09/15/2023 | | | 520,306 | | | | 0.1 |
| 433,000 | | Valero Energy Corp., 1.200%, 03/15/2024 | | | 437,277 | | | | 0.1 |
| 210,000 | | Valero Energy Corp., 2.850%, 04/15/2025 | | | 223,749 | | | | 0.1 |
| | | | | | 7,851,661 | | | | 1.9 |
| | | | | | | | | | |
| | | Financial: 14.3% | | | | | | | |
| 390,000 | (1) | ABN AMRO Bank NV, 3.400%, 08/27/2021 | | | 397,846 | | | | 0.1 |
| 525,000 | (1) | AIG Global Funding, 0.900%, 09/22/2025 | | | 526,184 | | | | 0.1 |
| 536,000 | | American Express Co., 2.500%, 07/30/2024 | | | 572,797 | | | | 0.1 |
| 1,000,000 | | American Express Co., 3.375%, 05/17/2021 | | | 1,008,702 | | | | 0.2 |
| 247,000 | | American International Group, Inc., 3.750%, 07/10/2025 | | | 277,726 | | | | 0.1 |
| 258,000 | | American Tower Corp., 3.500%, 01/31/2023 | | | 273,756 | | | | 0.1 |
| 234,000 | | Ameriprise Financial, Inc., 3.000%, 04/02/2025 | | | 255,101 | | | | 0.1 |
| 485,000 | | Ameriprise Financial, Inc., 4.000%, 10/15/2023 | | | 534,985 | | | | 0.1 |
| 440,000 | | Assurant, Inc., 4.200%, 09/27/2023 | | | 481,737 | | | | 0.1 |
| 284,000 | (1) | Athene Global Funding, 2.550%, 06/29/2025 | | | 299,957 | | | | 0.1 |
| 355,000 | | Australia & New Zealand Banking Group Ltd./New York NY, 2.050%, 11/21/2022 | | | 367,494 | | | | 0.1 |
| 294,000 | (1) | Aviation Capital Group LLC, 5.500%, 12/15/2024 | | | 325,708 | | | | 0.1 |
| 400,000 | | Banco Santander SA, 3.500%, 04/11/2022 | | | 415,423 | | | | 0.1 |
| 425,000 | (3) | Bank of America Corp., 0.981%, 09/25/2025 | | | 429,862 | | | | 0.1 |
| 496,000 | (3) | Bank of America Corp., 2.015%, 02/13/2026 | | | 520,037 | | | | 0.1 |
| 916,000 | (3) | Bank of America Corp., 3.004%, 12/20/2023 | | | 964,919 | | | | 0.2 |
| 405,000 | (3) | Bank of America Corp., 3.499%, 05/17/2022 | | | 409,811 | | | | 0.1 |
| 629,000 | (3) | Bank of America Corp., 0.810%, 10/24/2024 | | | 635,095 | | | | 0.2 |
| 280,000 | | Bank of New York Mellon Corp./The, 1.600%, 04/24/2025 | | | 292,915 | | | | 0.1 |
| 390,000 | | Bank of New York Mellon Corp./The, 1.950%, 08/23/2022 | | | 401,300 | | | | 0.1 |
| 180,000 | | Bank of New York Mellon Corp./The, 2.950%, 01/29/2023 | | | 189,381 | | | | 0.0 |
| 432,000 | | Bank of Nova Scotia/The, 0.550%, 09/15/2023 | | | 433,821 | | | | 0.1 |
| 335,000 | | Bank of Nova Scotia/The, 1.950%, 02/01/2023 | | | 346,054 | | | | 0.1 |
| 355,000 | (1) | Banque Federative du Credit Mutuel SA, 2.125%, 11/21/2022 | | | 366,709 | | | | 0.1 |
| 285,000 | (3) | Barclays PLC, 1.007%, 12/10/2024 | | | 287,072 | | | | 0.1 |
| 625,000 | | BBVA USA, 3.500%, 06/11/2021 | | | 632,104 | | | | 0.1 |
| 308,000 | | Berkshire Hathaway, Inc., 3.125%, 03/15/2026 | | | 344,212 | | | | 0.1 |
| 250,000 | (1) | BPCE SA, 2.750%, 01/11/2023 | | | 261,517 | | | | 0.1 |
| 350,000 | | Brookfield Finance, Inc., 4.000%, 04/01/2024 | | | 384,529 | | | | 0.1 |
| 503,000 | | Canadian Imperial Bank of Commerce, 0.500%, 12/14/2023 | | | 504,630 | | | | 0.1 |
| 386,000 | | Canadian Imperial Bank of Commerce, 0.950%, 06/23/2023 | | | 391,222 | | | | 0.1 |
| 270,000 | (3) | Canadian Imperial Bank of Commerce, 2.606%, 07/22/2023 | | | 279,379 | | | | 0.1 |
| 720,000 | | Capital One Financial Corp., 3.200%, 01/30/2023 | | | 758,995 | | | | 0.2 |
| 395,000 | | Charles Schwab Corp./The, 2.650%, 01/25/2023 | | | 414,045 | | | | 0.1 |
| 570,000 | | Chubb INA Holdings, Inc., 2.875%, 11/03/2022 | | | 594,497 | | | | 0.1 |
| 1,000,000 | | Citibank NA, 3.400%, 07/23/2021 | | | 1,014,795 | | | | 0.2 |
| 388,000 | (3) | Citigroup, Inc., 1.678%, 05/15/2024 | | | 399,890 | | | | 0.1 |
| 680,000 | (3) | Citigroup, Inc., 2.312%, 11/04/2022 | | | 691,006 | | | | 0.2 |
| 582,000 | | Citigroup, Inc., 2.900%, 12/08/2021 | | | 594,644 | | | | 0.1 |
| 107,000 | (3) | Citigroup, Inc., 3.106%, 04/08/2026 | | | 117,046 | | | | 0.0 |
| 480,000 | | Cooperatieve Rabobank UA/NY, 2.500%, 01/19/2021 | | | 480,405 | | | | 0.1 |
| 1,573,000 | | Cooperatieve Rabobank UA, 3.950%, 11/09/2022 | | | 1,672,419 | | | | 0.4 |
| 316,000 | | Cooperatieve Rabobank UA/NY, 2.750%, 01/10/2022 | | | 323,961 | | | | 0.1 |
| 233,000 | | Credit Suisse AG/New York NY, 2.950%, 04/09/2025 | | | 255,704 | | | | 0.1 |
See Accompanying Notes to Financial Statements
| Voya Limited Maturity Bond Portfolio | PORTFOLIO OF INVESTMENTS AS OF December 31, 2020 (Continued) |
| 1,246,000 | | Credit Suisse AG/New York NY, 3.625%, 09/09/2024 | | | 1,384,688 | | | | 0.3 |
| 355,000 | (1) | Danske Bank A/S, 2.000%, 09/08/2021 | | | 359,045 | | | | 0.1 |
| 425,000 | (1) | Danske Bank A/S, 2.800%, 03/10/2021 | | | 426,848 | | | | 0.1 |
| 455,000 | (1),(3) | Danske Bank A/S, 3.001%, 09/20/2022 | | | 462,320 | | | | 0.1 |
| 355,000 | (1) | DNB Bank ASA, 2.150%, 12/02/2022 | | | 367,730 | | | | 0.1 |
| 388,000 | | Federal Realty Investment Trust, 3.950%, 01/15/2024 | | | 422,221 | | | | 0.1 |
| 305,000 | (1) | Federation des Caisses Desjardins du Quebec, 2.050%, 02/10/2025 | | | 320,767 | | | | 0.1 |
| 531,000 | (3) | HSBC Holdings PLC, 1.645%, 04/18/2026 | | | 543,315 | | | | 0.1 |
| 287,000 | | ING Groep NV, 3.150%, 03/29/2022 | | | 296,859 | | | | 0.1 |
| 580,000 | | Intercontinental Exchange, Inc., 0.700%, 06/15/2023 | | | 583,917 | | | | 0.1 |
| 800,000 | | Intercontinental Exchange, Inc., 3.450%, 09/21/2023 | | | 861,924 | | | | 0.2 |
| 776,000 | (3) | JPMorgan Chase & Co., 0.653%, 09/16/2024 | | | 780,263 | | | | 0.2 |
| 389,000 | (3) | JPMorgan Chase & Co., 1.514%, 06/01/2024 | | | 399,501 | | | | 0.1 |
| 354,000 | (3) | JPMorgan Chase & Co., 2.083%, 04/22/2026 | | | 374,103 | | | | 0.1 |
| 460,000 | (3) | JPMorgan Chase & Co., 2.776%, 04/25/2023 | | | 475,045 | | | | 0.1 |
| 280,000 | | JPMorgan Chase & Co., 3.200%, 01/25/2023 | | | 296,485 | | | | 0.1 |
| 425,000 | | Lloyds Banking Group PLC, 3.000%, 01/11/2022 | | | 436,037 | | | | 0.1 |
| 176,000 | (3) | Lloyds Banking Group PLC, 3.870%, 07/09/2025 | | | 194,255 | | | | 0.0 |
| 460,000 | | Marsh & McLennan Cos, Inc., 4.050%, 10/15/2023 | | | 502,524 | | | | 0.1 |
| 330,000 | (1) | Metropolitan Life Global Funding I, 1.950%, 01/13/2023 | | | 340,557 | | | | 0.1 |
| 430,000 | (3) | Mitsubishi UFJ Financial Group, Inc., 0.848%, 09/15/2024 | | | 432,681 | | | | 0.1 |
| 323,000 | | Mitsubishi UFJ Financial Group, Inc., 1.412%, 07/17/2025 | | | 332,123 | | | | 0.1 |
| 464,000 | | Mitsubishi UFJ Financial Group, Inc., 2.190%, 09/13/2021 | | | 470,084 | | | | 0.1 |
| 200,000 | | Mitsubishi UFJ Financial Group, Inc., 2.623%, 07/18/2022 | | | 206,866 | | | | 0.0 |
| 820,000 | | Mizuho Financial Group, Inc., 0.837%, (US0003M + 0.630%), 05/25/2024 | | | 821,716 | | | | 0.2 |
| 392,000 | (3) | Mizuho Financial Group, Inc., 0.849%, 09/08/2024 | | | 394,383 | | | | 0.1 |
| 304,000 | (3) | Mizuho Financial Group, Inc., 2.555%, 09/13/2025 | | | 321,350 | | | | 0.1 |
| 320,000 | (1) | Mizuho Financial Group, Inc., 2.632%, 04/12/2021 | | | 322,028 | | | | 0.1 |
| 845,000 | | Morgan Stanley, 3.750%, 02/25/2023 | | | 906,217 | | | | 0.2 |
| 496,000 | | Morgan Stanley, 4.000%, 07/23/2025 | | | 567,984 | | | | 0.1 |
| 1,566,000 | | Morgan Stanley, 5.500%, 07/28/2021 | | | 1,612,219 | | | | 0.4 |
| 330,000 | | MUFG Union Bank NA, 2.100%, 12/09/2022 | | | 340,667 | | | | 0.1 |
| 250,000 | | MUFG Union Bank NA, 3.150%, 04/01/2022 | | | 258,247 | | | | 0.1 |
| 300,000 | | National Australia Bank Ltd./New York, 2.500%, 05/22/2022 | | | 309,271 | | | | 0.1 |
| 500,000 | | National Australia Bank Ltd./New York, 2.875%, 04/12/2023 | | | 528,867 | | | | 0.1 |
| 346,000 | (3) | National Bank of Canada, 0.550%, 11/15/2024 | | | 347,191 | | | | 0.1 |
| 350,000 | (1) | National Securities Clearing Corp., 1.200%, 04/23/2023 | | | 357,084 | | | | 0.1 |
| 250,000 | (1) | National Securities Clearing Corp., 1.500%, 04/23/2025 | | | 258,897 | | | | 0.1 |
| 399,000 | (1) | Nationwide Building Society, 2.000%, 01/27/2023 | | | 411,944 | | | | 0.1 |
| 380,000 | (1) | Nationwide Financial Services, Inc., 5.375%, 03/25/2021 | | | 384,137 | | | | 0.1 |
| 244,000 | | Natwest Group PLC, 3.875%, 09/12/2023 | | | 264,867 | | | | 0.1 |
| 293,000 | (1) | Nordea Bank Abp, 0.750%, 08/28/2025 | | | 292,921 | | | | 0.1 |
| 345,000 | (1) | Nordea Bank ABP, 4.875%, 05/13/2021 | | | 350,331 | | | | 0.1 |
| 498,000 | (1) | Pacific Life Global Funding II, 0.500%, 09/23/2023 | | | 499,490 | | | | 0.1 |
| 470,000 | | PNC Financial Services Group, Inc./The, 3.500%, 01/23/2024 | | | 512,458 | | | | 0.1 |
| 590,000 | | Reinsurance Group of America, Inc., 5.000%, 06/01/2021 | | | 600,977 | | | | 0.1 |
| 495,000 | (1) | Reliance Standard Life Global Funding II, 2.150%, 01/21/2023 | | | 507,730 | | | | 0.1 |
| 444,000 | | Royal Bank of Canada, 0.500%, 10/26/2023 | | | 446,606 | | | | 0.1 |
| 225,000 | | Royal Bank of Canada, 0.898%, (US0003M + 0.660%), 10/05/2023 | | | 227,366 | | | | 0.1 |
| 384,000 | | Royal Bank of Canada, 1.150%, 06/10/2025 | | | 392,572 | | | | 0.1 |
| 280,000 | | Royal Bank of Canada, 1.600%, 04/17/2023 | | | 288,018 | | | | 0.1 |
| 345,000 | | Royal Bank of Canada, 1.950%, 01/17/2023 | | | 356,477 | | | | 0.1 |
| 553,000 | | Royal Bank of Canada, 3.700%, 10/05/2023 | | | 603,222 | | | | 0.1 |
See Accompanying Notes to Financial Statements
| Voya Limited Maturity Bond Portfolio | PORTFOLIO OF INVESTMENTS AS OF December 31, 2020 (Continued) |
| 320,000 | | Santander Holdings USA, Inc., 4.450%, 12/03/2021 | | | 330,472 | | | | 0.1 |
| 396,000 | | Santander UK PLC, 2.100%, 01/13/2023 | | | 409,281 | | | | 0.1 |
| 324,000 | (1) | Scentre Group Trust 1 / Scentre Group Trust 2, 3.625%, 01/28/2026 | | | 356,671 | | | | 0.1 |
| 954,000 | (1) | Skandinaviska Enskilda Banken AB, 0.550%, 09/01/2023 | | | 956,228 | | | | 0.2 |
| 595,000 | | Skandinaviska Enskilda Banken AB, 1.875%, 09/13/2021 | | | 601,922 | | | | 0.1 |
| 340,000 | (3) | State Street Corp., 2.354%, 11/01/2025 | | | 363,021 | | | | 0.1 |
| 320,000 | | Sumitomo Mitsui Financial Group, Inc., 2.348%, 01/15/2025 | | | 339,686 | | | | 0.1 |
| 355,000 | | Sumitomo Mitsui Financial Group, Inc., 2.696%, 07/16/2024 | | | 379,146 | | | | 0.1 |
| 594,000 | | Sumitomo Mitsui Financial Group, Inc., 2.934%, 03/09/2021 | | | 596,858 | | | | 0.1 |
| 800,000 | (1) | Svenska Handelsbanken AB, 0.625%, 06/30/2023 | | | 805,789 | | | | 0.2 |
| 825,000 | | Svenska Handelsbanken AB, 3.350%, 05/24/2021 | | | 835,188 | | | | 0.2 |
| 425,000 | (1) | Swedbank AB, 0.600%, 09/25/2023 | | | 426,152 | | | | 0.1 |
| 525,000 | (1),(2) | Swiss Re Treasury US Corp., 2.875%, 12/06/2022 | | | 540,057 | | | | 0.1 |
| 701,000 | | Toronto-Dominion Bank/The, 0.450%, 09/11/2023 | | | 703,245 | | | | 0.2 |
| 821,000 | | Toronto-Dominion Bank/The, 1.150%, 06/12/2025 | | | 838,700 | | | | 0.2 |
| 799,000 | | Truist Bank, 1.250%, 03/09/2023 | | | 815,065 | | | | 0.2 |
| 351,000 | (1) | UBS AG/London, 1.750%, 04/21/2022 | | | 357,301 | | | | 0.1 |
| 600,000 | (1),(3) | UBS Group AG, 1.008%, 07/30/2024 | | | 606,145 | | | | 0.1 |
| 565,000 | (1),(3) | UBS Group AG, 2.859%, 08/15/2023 | | | 585,933 | | | | 0.1 |
| 280,000 | (1) | USAA Capital Corp., 1.500%, 05/01/2023 | | | 287,292 | | | | 0.1 |
| 444,000 | (3) | Wells Fargo & Co., 1.654%, 06/02/2024 | | | 456,224 | | | | 0.1 |
| 205,000 | (3) | Wells Fargo & Co., 2.406%, 10/30/2025 | | | 216,802 | | | | 0.1 |
| 880,000 | | Wells Fargo Bank NA, 3.625%, 10/22/2021 | | | 900,975 | | | | 0.2 |
| 500,000 | | Westpac Banking Corp., 2.100%, 05/13/2021 | | | 503,478 | | | | 0.1 |
| 555,000 | | XLIT Ltd., 4.450%, 03/31/2025 | | | 633,861 | | | | 0.1 |
| | | | | | 59,730,279 | | | | 14.3 |
| | | | | | | | | | |
| | | Industrial: 2.4% | | | | | | | |
| 388,000 | | Boeing Co/The, 4.875%, 05/01/2025 | | | 442,545 | | | | 0.1 |
| 405,000 | | Carrier Global Corp., 1.923%, 02/15/2023 | | | 417,405 | | | | 0.1 |
| 423,000 | | Caterpillar Financial Services Corp., 0.650%, 07/07/2023 | | | 426,675 | | | | 0.1 |
| 405,000 | | Caterpillar Financial Services Corp., 2.850%, 05/17/2024 | | | 436,404 | | | | 0.1 |
| 470,000 | | Caterpillar Financial Services Corp., 2.950%, 02/26/2022 | | | 484,693 | | | | 0.1 |
| 380,000 | | Caterpillar Financial Services Corp., 3.650%, 12/07/2023 | | | 417,037 | | | | 0.1 |
| 350,000 | | FedEx Corp., 3.400%, 01/14/2022 | | | 361,158 | | | | 0.1 |
| 175,000 | | FedEx Corp., 3.800%, 05/15/2025 | | | 197,709 | | | | 0.1 |
| 223,000 | | General Dynamics Corp., 3.250%, 04/01/2025 | | | 246,332 | | | | 0.1 |
| 579,000 | | Honeywell International, Inc., 0.483%, 08/19/2022 | | | 579,955 | | | | 0.1 |
| 386,000 | | Honeywell International, Inc., 1.350%, 06/01/2025 | | | 399,612 | | | | 0.1 |
| 389,000 | | John Deere Capital Corp., 0.400%, 10/10/2023 | | | 391,023 | | | | 0.1 |
| 335,000 | (2) | John Deere Capital Corp., 2.050%, 01/09/2025 | | | 355,374 | | | | 0.1 |
| 360,000 | | John Deere Capital Corp., 2.950%, 04/01/2022 | | | 372,053 | | | | 0.1 |
| 348,000 | (1) | Penske Truck Leasing Co. Lp / PTL Finance Corp., 3.650%, 07/29/2021 | | | 353,437 | | | | 0.1 |
| 500,000 | | Raytheon Technologies Corp., 3.200%, 03/15/2024 | | | 540,211 | | | | 0.1 |
| 435,000 | | Raytheon Technologies Corp., 3.700%, 12/15/2023 | | | 473,266 | | | | 0.1 |
| 400,000 | | Republic Services, Inc., 2.500%, 08/15/2024 | | | 427,299 | | | | 0.1 |
| 350,000 | | Roper Technologies, Inc., 0.450%, 08/15/2022 | | | 350,640 | | | | 0.1 |
| 430,000 | | Roper Technologies, Inc., 3.125%, 11/15/2022 | | | 449,802 | | | | 0.1 |
| 950,000 | | United Parcel Service, Inc., 2.050%, 04/01/2021 | | | 953,826 | | | | 0.2 |
| 506,000 | | WestRock RKT LLC, 4.000%, 03/01/2023 | | | 537,767 | | | | 0.1 |
| 480,000 | | WestRock RKT LLC, 4.900%, 03/01/2022 | | | 504,589 | | | | 0.1 |
| | | | | | 10,118,812 | | | | 2.4 |
| | | | | | | | | | |
| | | Technology: 1.7% | | | | | | | |
| 233,000 | | Analog Devices, Inc., 2.950%, 04/01/2025 | | | 254,509 | | | | 0.1 |
| 1,000,000 | | Apple, Inc., 1.800%, 09/11/2024 | | | 1,050,485 | | | | 0.3 |
| 500,000 | | Broadcom, Inc., 3.150%, 11/15/2025 | | | 546,167 | | | | 0.1 |
| 116,000 | | Electronic Arts, Inc., 3.700%, 03/01/2021 | | | 116,263 | | | | 0.0 |
See Accompanying Notes to Financial Statements
| Voya Limited Maturity Bond Portfolio | PORTFOLIO OF INVESTMENTS AS OF December 31, 2020 (Continued) |
| 445,000 | | Fiserv, Inc., 2.750%, 07/01/2024 | | | 477,997 | | | | 0.1 |
| 398,000 | | HP, Inc., 2.200%, 06/17/2025 | | | 421,733 | | | | 0.1 |
| 245,000 | | Intel Corp., 3.700%, 07/29/2025 | | | 277,339 | | | | 0.1 |
| 315,000 | | International Business Machines Corp., 2.850%, 05/13/2022 | | | 326,245 | | | | 0.1 |
| 500,000 | | International Business Machines Corp., 3.625%, 02/12/2024 | | | 548,185 | | | | 0.1 |
| 860,000 | | NVIDIA Corp., 2.200%, 09/16/2021 | | | 870,565 | | | | 0.2 |
| 288,000 | | Oracle Corp., 2.500%, 04/01/2025 | | | 309,470 | | | | 0.1 |
| 875,000 | | salesforce.com, Inc., 3.250%, 04/11/2023 | | | 932,389 | | | | 0.2 |
| 428,000 | | VMware, Inc., 2.950%, 08/21/2022 | | | 444,108 | | | | 0.1 |
| 424,000 | | VMware, Inc., 4.500%, 05/15/2025 | | | 485,644 | | | | 0.1 |
| | | | | | 7,061,099 | | | | 1.7 |
| | | | | | | | | | |
| | | Utilities: 3.6% | | | | | | | |
| 502,000 | | American Electric Power Co., Inc., 0.750%, 11/01/2023 | | | 503,224 | | | | 0.1 |
| 425,000 | | Arizona Public Service Co., 3.350%, 06/15/2024 | | | 460,647 | | | | 0.1 |
| 425,000 | | Avangrid, Inc., 3.200%, 04/15/2025 | | | 465,636 | | | | 0.1 |
| 574,000 | | Connecticut Light and Power Co/The, 0.750%, 12/01/2025 | | | 580,799 | | | | 0.1 |
| 375,000 | | Consumers Energy Co., 3.375%, 08/15/2023 | | | 401,949 | | | | 0.1 |
| 500,000 | (1) | Dominion Energy, Inc., 2.450%, 01/15/2023 | | | 520,550 | | | | 0.1 |
| 525,000 | (3) | Dominion Energy, Inc., 2.715%, 08/15/2021 | | | 531,604 | | | | 0.1 |
| 875,000 | | DTE Energy Co., 2.600%, 06/15/2022 | | | 902,558 | | | | 0.2 |
| 1,125,000 | | Duke Energy Corp., 1.800%, 09/01/2021 | | | 1,134,870 | | | | 0.3 |
| 385,000 | | Duke Energy Ohio, Inc., 3.800%, 09/01/2023 | | | 416,307 | | | | 0.1 |
| 290,000 | | Duke Energy Progress LLC, 3.375%, 09/01/2023 | | | 312,274 | | | | 0.1 |
| 329,000 | | Entergy Corp., 0.900%, 09/15/2025 | | | 329,193 | | | | 0.1 |
| 250,000 | | Entergy Louisiana LLC, 3.300%, 12/01/2022 | | | 262,211 | | | | 0.1 |
| 250,000 | | Entergy Louisiana LLC, 4.050%, 09/01/2023 | | | 271,776 | | | | 0.1 |
| 255,000 | | Evergy, Inc., 4.850%, 06/01/2021 | | | 256,750 | | | | 0.1 |
| 460,000 | | Eversource Energy, 2.500%, 03/15/2021 | | | 461,116 | | | | 0.1 |
| 380,000 | | FirstEnergy Corp., 4.250%, 03/15/2023 | | | 401,440 | | | | 0.1 |
| 72,000 | | IPALCO Enterprises, Inc., 3.700%, 09/01/2024 | | | 78,595 | | | | 0.0 |
| 835,000 | | National Rural Utilities Cooperative Finance Corp., 2.300%, 09/15/2022 | | | 861,853 | | | | 0.2 |
| 310,000 | | NextEra Energy Capital Holdings, Inc., 2.403%, 09/01/2021 | | | 314,302 | | | | 0.1 |
| 293,000 | | NextEra Energy Capital Holdings, Inc., 2.750%, 05/01/2025 | | | 317,233 | | | | 0.1 |
| 215,000 | | NextEra Energy Capital Holdings, Inc., 3.150%, 04/01/2024 | | | 232,485 | | | | 0.0 |
| 325,000 | (1) | Niagara Mohawk Power Corp., 2.721%, 11/28/2022 | | | 338,827 | | | | 0.1 |
| 524,000 | | PNM Resources, Inc., 3.250%, 03/09/2021 | | | 526,079 | | | | 0.1 |
| 485,000 | | Public Service Electric and Gas Co., 3.750%, 03/15/2024 | | | 527,832 | | | | 0.1 |
| 335,000 | | Public Service Enterprise Group, Inc., 0.800%, 08/15/2025 | | | 335,411 | | | | 0.1 |
| 365,000 | (2) | San Diego Gas & Electric Co., 3.000%, 08/15/2021 | | | 371,053 | | | | 0.1 |
| 369,000 | | Southern California Edison Co., 2.400%, 02/01/2022 | | | 375,312 | | | | 0.1 |
| 330,000 | | Southern Co. Gas Capital Corp., 2.450%, 10/01/2023 | | | 346,907 | | | | 0.1 |
| 384,000 | | Southern Co. Gas Capital Corp., 3.250%, 06/15/2026 | | | 431,425 | | | | 0.1 |
| 259,000 | | WEC Energy Group, Inc., 0.550%, 09/15/2023 | | | 260,451 | | | | 0.1 |
| 150,000 | | Wisconsin Power and Light Co., 2.250%, 11/15/2022 | | | 154,349 | | | | 0.0 |
| 610,000 | | Wisconsin Public Service Corp., 3.350%, 11/21/2021 | | | 625,945 | | | | 0.1 |
| 658,000 | | Xcel Energy, Inc., 0.500%, 10/15/2023 | | | 660,262 | | | | 0.2 |
| | | | | | 14,971,225 | | | | 3.6 |
| | | | | | | | | | |
| | Total Corporate Bonds/Notes | | | | | | |
| | (Cost $139,401,232) | | 143,157,233 | | | | 34.2 |
| | | | | | | | | | |
| COLLATERALIZED MORTGAGE OBLIGATIONS: 6.0% | | | | | | | |
| 1,477,636 | | Fannie Mae REMICS 2006-43-FJ, 0.558%, (US0001M + 0.410%), 06/25/2036 | | | 1,487,531 | | | | 0.4 |
| 1,013,775 | | Fannie Mae REMICS 2007-14 PF, 0.338%, (US0001M + 0.190%), 03/25/2037 | | | 1,012,117 | | | | 0.2 |
| 376,644 | | Fannie Mae REMICS 2010-123 FL, 0.578%, (US0001M + 0.430%), 11/25/2040 | | | 379,288 | | | | 0.1 |
| 1,518,591 | | Fannie Mae REMICS 2011-51 FM, 0.798%, (US0001M + 0.650%), 06/25/2041 | | | 1,542,668 | | | | 0.4 |
See Accompanying Notes to Financial Statements
| Voya Limited Maturity Bond Portfolio | PORTFOLIO OF INVESTMENTS AS OF December 31, 2020 (Continued) |
| 145,409 | | Fannie Mae REMICS 2011-96 FN, 0.648%, (US0001M + 0.500%), 10/25/2041 | | | 146,934 | | | | 0.0 |
| 1,120,982 | | Fannie Mae REMICS 2010-136 FG, 0.648%, (US0001M + 0.500%), 12/25/2030 | | | 1,116,434 | | | | 0.3 |
| 1,739,827 | | Fannie Mae REMICS 2011-68 F, 0.418%, (US0001M + 0.270%), 07/25/2031 | | | 1,733,448 | | | | 0.4 |
| 85,798 | (1),(3) | Flagstar Mortgage Trust 2017-2 A3, 3.500%, 10/25/2047 | | | 87,749 | | | | 0.0 |
| 847,299 | (1),(3) | Flagstar Mortgage Trust 2020-2 A2, 3.000%, 12/25/2049 | | | 875,472 | | | | 0.2 |
| 302,095 | (3) | Freddie Mac Whole Loan Securities Trust 2016-SC02 M1, 3.609%, 10/25/2046 | | | 306,216 | | | | 0.1 |
| 809,807 | | Freddie Mac REMICS 3626 FA, 0.809%, (US0001M + 0.650%), 05/15/2036 | | | 822,140 | | | | 0.2 |
| 487,337 | | Freddie Mac REMICS 4508 CF, 0.559%, (US0001M + 0.400%), 09/15/2045 | | | 490,925 | | | | 0.1 |
| 2,366,425 | | Ginnie Mae Series 2012-H31 FD, 0.480%, (US0001M + 0.340%), 12/20/2062 | | | 2,363,616 | | | | 0.6 |
| 1,428,548 | | Ginnie Mae Series 2014-H05 FB, 0.740%, (US0001M + 0.600%), 12/20/2063 | | | 1,435,017 | | | | 0.3 |
| 877,433 | | Ginnie Mae Series 2016-H08 FT, 0.860%, (US0001M + 0.720%), 02/20/2066 | | | 882,795 | | | | 0.2 |
| 3,094,646 | | Ginnie Mae Series 2016-H06 FD, 1.060%, (US0001M + 0.920%), 07/20/2065 | | | 3,146,995 | | | | 0.7 |
| 718,554 | | Ginnie Mae Series 2017-H09 FG, 0.610%, (US0001M + 0.470%), 03/20/2067 | | | 720,287 | | | | 0.2 |
| 772,574 | | Ginnie Mae Series 2018-H04 FM, 0.440%, (US0001M + 0.300%), 03/20/2068 | | | 770,726 | | | | 0.2 |
| 1,629,370 | | Ginnie Mae Series 2019-H02 FA, 0.590%, (US0001M + 0.450%), 01/20/2069 | | | 1,633,221 | | | | 0.4 |
| 145,228 | (1),(3) | GS Mortgage-Backed Securities Corp. Trust 2019-PJ3 A1, 3.500%, 03/25/2050 | | | 149,720 | | | | 0.0 |
| 713,190 | (1),(3) | JP Morgan Mortgage Trust 2019-INV3 A3, 3.500%, 05/25/2050 | | | 743,681 | | | | 0.2 |
| 900,000 | (1) | Mello Warehouse Securitization Trust 2020-1 A, 1.048%, (US0001M + 0.900%), 10/25/2053 | | | 901,951 | | | | 0.2 |
| 450,000 | (1) | Mello Warehouse Securitization Trust 2020-2 A, 0.953%, (US0001M + 0.800%), 11/25/2053 | | | 450,279 | | | | 0.1 |
| 336,863 | (1),(3) | Sequoia Mortgage Trust 2014-3 B3, 3.930%, 10/25/2044 | | | 348,225 | | | | 0.1 |
| 333,664 | (1),(3) | Sequoia Mortgage Trust 2014-4 B3, 3.873%, 11/25/2044 | | | 337,892 | | | | 0.1 |
| 379,727 | (1),(3) | Sequoia Mortgage Trust 2016-3 A11, 3.000%, 11/25/2046 | | | 385,734 | | | | 0.1 |
| 302,130 | (1),(3) | Sequoia Mortgage Trust 2018-CH1 A19, 4.000%, 02/25/2048 | | | 310,660 | | | | 0.1 |
| 154,483 | (3) | WaMu Mortgage Pass- Through Certificates Series 2004-AR4 A6 Trust, 2.951%, 06/25/2034 | | | 156,145 | | | | 0.0 |
| 588,550 | (1),(3) | Wells Fargo Mortgage Backed Securities 2020- 1 A17 Trust, 3.000%, 12/25/2049 | | | 601,040 | | | | 0.1 |
| | | | | | | | | | |
| | Total Collateralized Mortgage Obligations | | | | | | | |
| | (Cost $25,222,826) | | | 25,338,906 | | | | 6.0 |
| | | | | | | | | | |
| U.S. TREASURY OBLIGATIONS: 22.0% | | | | | | | |
| | | U.S. Treasury Notes: 22.0% | | | | | | | |
| 29,521,000 | | 0.125%,12/31/2022 | | | 29,523,306 | | | | 7.0 |
| 17,604,000 | | 0.125%,12/15/2023 | | | 17,582,683 | | | | 4.2 |
| 770,000 | | 0.625%,11/30/2027 | | | 769,639 | | | | 0.2 |
| 42,410,000 | | 1.500%,11/30/2021 | | | 42,943,994 | | | | 10.2 |
| 1,518,800 | | 1.625%,12/31/2021 | | | 1,541,734 | | | | 0.4 |
| | | | | | | | | | |
| | Total U.S. Treasury Obligations | | | | | | | |
| | (Cost $92,309,846) | | | 92,361,356 | | | | 22.0 |
| | | | | | | | | | |
| COMMERCIAL MORTGAGE-BACKED SECURITIES: 17.1% | | | | | | | |
| 350,000 | (1) | Austin Fairmont Hotel Trust 2019-FAIR C, 1.609%, (US0001M + 1.450%), 09/15/2032 | | | 337,565 | | | | 0.1 |
| 830,000 | (1) | BFLD 2019-DPLO A, 1.249%, (US0001M + 1.090%), 10/15/2034 | | | 823,734 | | | | 0.2 |
| 1,746,708 | (1) | BX Commercial Mortgage Trust 2019-XL D, 1.609%, (US0001M + 1.450%), 10/15/2036 | | | 1,750,631 | | | | 0.4 |
| 2,110,000 | (1) | BXMT 2020-FL2 AS Ltd., 1.303%, (US0001M + 1.150%), 02/16/2037 | | | 2,091,601 | | | | 0.5 |
| 200,000 | (3) | Citigroup Commercial Mortgage Trust 2013- GC17 C, 5.109%, 11/10/2046 | | | 203,278 | | | | 0.0 |
| 971,000 | (1),(3) | Citigroup Commercial Mortgage Trust 2014- GC19, 5.092%, 03/10/2047 | | | 1,020,958 | | | | 0.2 |
| 291,761 | | Citigroup Commercial Mortgage Trust 2015- GC27 AAB, 2.944%, 02/10/2048 | | | 304,558 | | | | 0.1 |
See Accompanying Notes to Financial Statements
| Voya Limited Maturity Bond Portfolio | PORTFOLIO OF INVESTMENTS AS OF December 31, 2020 (Continued) |
| 392,597 | | Citigroup/Deutsche Bank Commercial Mortgage Trust 2006- CD3 AM, 5.648%, 10/15/2048 | | | 404,151 | | | | 0.1 |
| 710,000 | (1) | CLNY Trust 2019-IKPR A, 1.288%, (US0001M + 1.227%), 11/15/2038 | | | 689,997 | | | | 0.2 |
| 1,178,831 | | COMM 2013-CCRE12 ASB Mortgage Trust, 3.623%, 10/10/2046 | | | 1,231,725 | | | | 0.3 |
| 1,700,000 | | COMM 2013-CCRE6 A4 Mortgage Trust, 3.101%, 03/10/2046 | | | 1,764,621 | | | | 0.4 |
| 955,000 | | COMM 2013-LC6 AM Mortgage Trust, 3.282%, 01/10/2046 | | | 994,531 | | | | 0.2 |
| 1,705,000 | (3) | COMM 2013-LC6 C Mortgage Trust, 4.242%, 01/10/2046 | | | 1,754,068 | | | | 0.4 |
| 792,251 | | COMM 2014-LC17 ASB Mortgage Trust, 3.620%, 10/10/2047 | | | 835,121 | | | | 0.2 |
| 876,539 | | COMM 2015-CR22 ASB Mortgage Trust, 3.144%, 03/10/2048 | | | 919,285 | | | | 0.2 |
| 1,287,957 | | COMM 2015-CR26 ASB Mortgage Trust, 3.373%, 10/10/2048 | | | 1,367,137 | | | | 0.3 |
| 360,000 | (1) | COMM 2012-CR2 A3 Mortgage Trust, 2.841%, 08/15/2045 | | | 368,368 | | | | 0.1 |
| 725,000 | | COMM 2012-CR5 A4 Mortgage Trust, 2.771%, 12/10/2045 | | | 750,286 | | | | 0.2 |
| 81,899 | | COMM 2012-LC4 A4, 3.288%, 12/10/2044 | | | 83,072 | | | | 0.0 |
| 1,663,000 | (1),(3) | COMM 2013-CR10 D Mortgage Trust, 4.789%, 08/10/2046 | | | 1,628,018 | | | | 0.4 |
| 1,690,000 | (1) | Credit Suisse Mortgage Capital Certificates 2019-ICE4 B, 1.389%, (US0001M + 1.230%), 05/15/2036 | | | 1,693,125 | | | | 0.4 |
| 256,000 | (1) | CSWF 2018-TOP C, 1.609%, (US0001M + 1.450%), 08/15/2035 | | | 249,972 | | | | 0.1 |
| 1,490,000 | (1),(3) | DBRR 2011-LC2 A4B Trust, 4.537%, 07/12/2044 | | | 1,497,507 | | | | 0.4 |
| 1,700,000 | (1),(3) | DBUBS 2011-LC1A E, 5.565%, 11/10/2046 | | | 1,700,502 | | | | 0.4 |
| 1,130,000 | (1),(3) | DBUBS 2011-LC2A B Mortgage Trust, 4.998%, 07/10/2044 | | | 1,135,816 | | | | 0.3 |
| 730,000 | (1),(3) | DBUBS 2011-LC2A D, 5.487%, 07/10/2044 | | | 699,170 | | | | 0.2 |
| 63,831 | (3) | Ginnie Mae 2011-53 B, 3.906%, 05/16/2051 | | | 65,708 | | | | 0.0 |
| 129,349 | | Ginnie Mae 2014-54 AC, 2.874%, 02/16/2049 | | | 132,340 | | | | 0.0 |
| 364,384 | | Ginnie Mae 2015-183 AC, 2.350%, 07/16/2056 | | | 373,933 | | | | 0.1 |
| 65,241 | (3) | Ginnie Mae 2015-21 AF, 2.108%, 07/16/2048 | | | 66,383 | | | | 0.0 |
| 262,912 | | Ginnie Mae 2016-110 AB, 2.000%, 05/16/2049 | | | 268,520 | | | | 0.1 |
| 85,049 | | Ginnie Mae 2016-86 AB, 2.500%, 09/16/2056 | | | 86,756 | | | | 0.0 |
| 448,417 | | Ginnie Mae 2017-51 AB, 2.350%, 04/16/2057 | | | 460,749 | | | | 0.1 |
| 152,490 | | Ginnie Mae 2017-69 AB, 2.350%, 05/16/2053 | | | 156,317 | | | | 0.0 |
| 254,072 | | Ginnie Mae 2017-70 A, 2.500%, 10/16/2057 | | | 261,311 | | | | 0.1 |
| 634,603 | | Ginnie Mae 2017-86 AB, 2.300%, 11/16/2051 | | | 652,373 | | | | 0.2 |
| 610,494 | | Ginnie Mae 2017-89 A, 2.500%, 08/16/2057 | | | 629,303 | | | | 0.2 |
| 1,000,000 | (1) | Great Wolf Trust 2019- WOLF A, 1.193%, (US0001M + 1.034%), 12/15/2029 | | | 980,218 | | | | 0.2 |
| 530,000 | (1) | GS Mortgage Securities Corp. Trust 2017-GPTX B, 3.104%, 05/10/2034 | | | 512,249 | | | | 0.1 |
| 1,420,000 | (1) | GS Mortgage Securities Corp. Trust 2019-70P C, 1.659%, (US0001M + 1.500%), 10/15/2036 | | | 1,354,164 | | | | 0.3 |
| 1,320,000 | (1),(3) | GS Mortgage Securities Trust 2011-GC3 D, 5.545%, 03/10/2044 | | | 1,309,048 | | | | 0.3 |
| 760,000 | (1),(3) | GS Mortgage Securities Trust 2012-GC6 C, 5.651%, 01/10/2045 | | | 747,671 | | | | 0.2 |
| 420,000 | (1) | GS Mortgage Securities Trust 2018-HART A, 1.249%, (US0001M + 1.090%), 10/15/2031 | | | 420,718 | | | | 0.1 |
| 583,811 | | GS Mortgage Securities Trust 2020-GC45 A1, 2.019%, 02/13/2053 | | | 604,623 | | | | 0.1 |
| 1,040,000 | (3) | GS Mortgage Securities Trust 2012-GCJ7 C, 5.628%, 05/10/2045 | | | 1,031,142 | | | | 0.2 |
| 344,371 | (1),(3) | GS Mortgage Securities Trust 2011-GC3 B, 5.361%, 03/10/2044 | | | 344,247 | | | | 0.1 |
| 1,330,000 | | GS Mortgage Securities Trust 2013-GCJ14 A5, 4.243%, 08/10/2046 | | | 1,442,378 | | | | 0.3 |
| 1,820,000 | (1),(3) | JPMBB Commercial Mortgage Securities Trust 2013-C15 D, 5.197%, 11/15/2045 | | | 1,753,750 | | | | 0.4 |
| 977,000 | (1),(3) | JP Morgan Chase Commercial Mortgage Securities Trust 2010- C2 C, 5.655%, 11/15/2043 | | | 932,028 | | | | 0.2 |
| 2,710,000 | (1),(3) | JP Morgan Chase Commercial Mortgage Securities Trust 2011- C5 B, 5.424%, 08/15/2046 | | | 2,733,551 | | | | 0.7 |
| 508,187 | | JP Morgan Chase Commercial Mortgage Securities Trust 2012- C8 A3, 2.829%, 10/15/2045 | | | 523,315 | | | | 0.1 |
| 2,700,000 | (3) | JP Morgan Chase Commercial Mortgage Securities Trust 2013- C10 B, 3.674%, 12/15/2047 | | | 2,797,351 | | | | 0.7 |
See Accompanying Notes to Financial Statements
| Voya Limited Maturity Bond Portfolio | PORTFOLIO OF INVESTMENTS
AS OF December 31, 2020 (Continued) |
| 680,000 | (1) | JP Morgan Chase Commercial Mortgage Securities Trust 2014- C20 A4A2, 3.538%, 07/15/2047 | | | 716,714 | | | | 0.2 |
| 4,526 | | JPMBB Commercial Mortgage Securities Trust 2 2014-C19 A2, 3.046%, 04/15/2047 | | | 4,528 | | | | 0.0 |
| 1,630,000 | (3) | JPMBB Commercial Mortgage Securities Trust 2013-C17 C, 4.888%, 01/15/2047 | | | 1,674,131 | | | | 0.4 |
| 417,674 | | JPMBB Commercial Mortgage Securities Trust 2015-C32 ASB, 3.358%, 11/15/2048 | | | 443,588 | | | | 0.1 |
| 400,000 | (1) | MF1 2020-FL3 A Ltd., 2.209%, (US0001M + 2.050%), 07/15/2035 | | | 403,088 | | | | 0.1 |
| 795,000 | | Morgan Stanley Bank of America Merrill Lynch Trust 2012-C5 A4, 3.176%, 08/15/2045 | | | 820,162 | | | | 0.2 |
| 950,000 | | Morgan Stanley Bank of America Merrill Lynch Trust 2013-C7 A4, 2.918%, 02/15/2046 | | | 988,068 | | | | 0.2 |
| 1,250,000 | | Morgan Stanley Bank of America Merrill Lynch Trust 2013-C8 A4 A4, 3.134%, 12/15/2048 | | | 1,305,443 | | | | 0.3 |
| 450,550 | | Morgan Stanley Bank of America Merrill Lynch Trust 2014 C19 ASB, 3.326%, 12/15/2047 | | | 474,349 | | | | 0.1 |
| 1,210,000 | (1),(3) | Morgan Stanley Capital I Trust 2011-C1 D, 5.563%, 09/15/2047 | | | 1,210,705 | | | | 0.3 |
| 1,730,000 | (1) | Morgan Stanley Capital I Trust 2011-C1 G, 4.193%, 09/15/2047 | | | 1,620,007 | | | | 0.4 |
| 960,000 | | Morgan Stanley Capital I Trust 2017-H1 A2, 3.089%, 06/15/2050 | | | 1,001,243 | | | | 0.2 |
| 1,220,000 | | Morgan Stanley Capital I Trust 2019-H6 A2, 3.228%, 06/15/2052 | | | 1,291,778 | | | | 0.3 |
| 1,250,000 | (3) | Morgan Stanley Bank of America Merrill Lynch Trust 2013-C10 A4, 4.082%, 07/15/2046 | | | 1,340,762 | | | | 0.3 |
| 1,929,980 | (1) | Ready Capital Mortgage Financing 2020-FL4 A LLC, 2.298%, (US0001M + 2.150%), 02/25/2035 | | | 1,937,229 | | | | 0.5 |
| 290,000 | | UBS Commercial Mortgage Trust 2018-C8 A2, 3.713%, 02/15/2051 | | | 304,242 | | | | 0.1 |
| 1,930,000 | (1) | UBS-Barclays Commercial Mortgage Trust 2012-C4 AS, 3.317%, 12/10/2045 | | | 2,007,166 | | | | 0.5 |
| 1,890,000 | (1),(3) | UBS-Barclays Commercial Mortgage Trust 2012-C4 B, 3.718%, 12/10/2045 | | | 1,953,181 | | | | 0.5 |
| 721,825 | (1) | West Town Mall Trust 2017-KNOX A, 3.823%, 07/05/2030 | | | 728,259 | | | | 0.2 |
| 1,510,286 | | WFRBS Commercial Mortgage Trust 2011-C5 A4, 3.667%, 11/15/2044 | | | 1,528,942 | | | | 0.4 |
| 840,000 | (1),(3) | WFRBS Commercial Mortgage Trust 2011-C5 B, 5.656%, 11/15/2044 | | | 856,757 | | | | 0.2 |
| 360,000 | (3) | WFRBS Commercial Mortgage Trust 2013- C18 A5, 4.162%, 12/15/2046 | | | 395,105 | | | | 0.1 |
| 1,720,000 | (3) | WFRBS Commercial Mortgage Trust 2013- C14 C, 3.973%, 06/15/2046 | | | 1,675,129 | | | | 0.4 |
| | | | | | | | | | |
| | Total Commercial Mortgage-Backed Securities
(Cost $72,445,147) | | | 71,619,519 | | | | 17.1 |
| | | | | | | | | | |
| ASSET-BACKED SECURITIES: 18.0% | | | | | | | |
| | | Automobile Asset-Backed Securities: 6.4% | | | | | | | |
| 600,000 | | Ally Auto Receivables Trust 2018-3 A4, 3.120%, 07/17/2023 | | | 615,558 | | | | 0.2 |
| 200,000 | | Ally Auto Receivables Trust 2019-1 A4, 3.020%, 04/15/2024 | | | 208,266 | | | | 0.1 |
| 750,000 | | Americredit Automobile Receivables Trust 2019- 1 B, 3.130%, 02/18/2025 | | | 776,577 | | | | 0.2 |
| 600,000 | | AmeriCredit Automobile Receivables Trust 2019- 3 B, 2.130%, 07/18/2025 | | | 616,919 | | | | 0.2 |
| 1,800,000 | | AmeriCredit Automobile Receivables Trust 2020- 1 A3, 1.110%, 08/19/2024 | | | 1,817,168 | | | | 0.4 |
| 900,000 | | AmeriCredit Automobile Receivables Trust 2020- 1 C, 1.590%, 10/20/2025 | | | 917,424 | | | | 0.2 |
| 1,350,000 | | AmeriCredit Automobile Receivables Trust 2020- 2 B, 0.970%, 02/18/2026 | | | 1,366,368 | | | | 0.3 |
| 950,000 | | BMW Vehicle Owner Trust 2020-A A3, 0.480%, 10/25/2024 | | | 954,223 | | | | 0.2 |
| 400,000 | | Capital One Prime Auto Receivables Trust 2019- 1 A4, 2.560%, 10/15/2024 | | | 415,717 | | | | 0.1 |
| 800,000 | | Capital One Prime Auto Receivables Trust 2020- 1 A4, 1.630%, 08/15/2025 | | | 823,807 | | | | 0.2 |
| 150,000 | | Carmax Auto Owner Trust 2019-3 A4, 2.300%, 04/15/2025 | | | 156,615 | | | | 0.0 |
| 800,000 | | Carmax Auto Owner Trust 2019-4 A4, 2.130%, 07/15/2025 | | | 840,708 | | | | 0.2 |
| 750,000 | | Drive Auto Receivables Trust 2020-2 A3, 0.830%, 05/15/2024 | | | 753,898 | | | | 0.2 |
| 650,000 | | Ford Credit Auto Lease Trust 2018-B A4, 3.300%, 02/15/2022 | | | 652,206 | | | | 0.2 |
See Accompanying Notes to Financial Statements
| Voya Limited Maturity Bond Portfolio | PORTFOLIO OF INVESTMENTS
AS OF December 31, 2020 (Continued) |
| 450,000 | | GM Financial Automobile Leasing Trust 2019-4 A4, 1.760%, 01/16/2025 | | | 463,511 | | | | 0.1 |
| 400,000 | | GM Financial Automobile Leasing Trust 2020-2 A3, 0.800%, 07/20/2023 | | | 403,114 | | | | 0.1 |
| 500,000 | | GM Financial Consumer Automobile Receivables Trust 2019-3 A3, 2.180%, 04/16/2024 | | | 508,221 | | | | 0.1 |
| 353,780 | | GM Financial Automobile Leasing Trust 2020-1 A2A, 1.670%, 04/20/2022 | | | 355,490 | | | | 0.1 |
| 1,050,000 | | GM Financial Automobile Leasing Trust 2020-1 A4, 1.700%, 12/20/2023 | | | 1,070,040 | | | | 0.3 |
| 650,000 | | Honda Auto Receivables 2018-4 A4 Owner Trust, 3.300%, 07/15/2025 | | | 675,775 | | | | 0.2 |
| 550,000 | | Honda Auto Receivables 2019-3 A3 Owner Trust, 1.780%, 08/15/2023 | | | 559,118 | | | | 0.1 |
| 900,000 | | Honda Auto Receivables 2020-2 A3 Owner Trust, 0.820%, 07/15/2024 | | | 908,935 | | | | 0.2 |
| 250,000 | (1) | Hyundai Auto Lease Securitization Trust 2019-B A4, 2.030%, 06/15/2023 | | | 254,241 | | | | 0.1 |
| 878,270 | | Hyundai Auto Receivables Trust 2017- B A4, 1.960%, 02/15/2023 | | | 882,364 | | | | 0.2 |
| 450,000 | | Mercedes-Benz Auto Receivables Trust 2018- 1 A4, 3.150%, 10/15/2024 | | | 465,816 | | | | 0.1 |
| 650,000 | | Nissan Auto Receivables 2017-C A4 Owner Trust, 2.280%, 02/15/2024 | | | 658,833 | | | | 0.2 |
| 500,000 | | Nissan Auto Receivables 2018-C A4 Owner Trust, 3.270%, 06/16/2025 | | | 524,462 | | | | 0.1 |
| 850,000 | | Santander Drive Auto Receivables Trust 2019- 2 B, 2.790%, 01/16/2024 | | | 858,368 | | | | 0.2 |
| 504,669 | | Santander Drive Auto Receivables Trust 2019- 3 A3, 2.160%, 11/15/2022 | | | 505,501 | | | | 0.1 |
| 1,800,000 | | Santander Drive Auto Receivables Trust 2020- 2 B, 0.960%, 11/15/2024 | | | 1,811,903 | | | | 0.4 |
| 1,250,000 | | Santander Drive Auto Receivables Trust 2020- 3 B, 0.690%, 03/17/2025 | | | 1,253,755 | | | | 0.3 |
| 21,339 | (1) | Santander Retail Auto Lease Trust 2019-A A2, 2.720%, 01/20/2022 | | | 21,381 | | | | 0.0 |
| 500,000 | (1) | Santander Retail Auto Lease Trust 2019-B A3, 2.300%, 01/20/2023 | | | 509,345 | | | | 0.1 |
| 500,000 | (1) | Santander Retail Auto Lease Trust 2019-B A4, 2.380%, 08/21/2023 | | | 512,834 | | | | 0.1 |
| 1,300,000 | (1) | Santander Retail Auto Lease Trust 2019-C A4, 1.930%, 11/20/2023 | | | 1,329,855 | | | | 0.3 |
| 425,697 | (1) | Tesla Auto Lease Trust 2018-B A, 3.710%, 08/20/2021 | | | 428,419 | | | | 0.1 |
| 950,000 | | Toyota Auto Receivables 2019-C A4 Owner Trust, 1.880%, 11/15/2024 | | | 981,221 | | | | 0.2 |
| | | | | | 26,857,956 | | | | 6.4 |
| | | | | | | | | | |
| | | Credit Card Asset-Backed Securities:0.9% | | | | | | | |
| 1,000,000 | | BA Credit Card Trust 2019-A1 A1, 1.740%, 01/15/2025 | | | 1,024,778 | | | | 0.2 |
| 1,150,000 | | Chase Issuance Trust 2020-1 A1, 1.530%, 01/15/2025 | | | 1,180,783 | | | | 0.3 |
| 1,550,000 | (1) | Evergreen Credit Card Trust Series 2018-1 A, 2.950%, 03/15/2023 | | | 1,560,140 | | | | 0.4 |
| | | | | | 3,765,701 | | | | 0.9 |
| | | | | | | | | | |
| | | Other Asset-Backed Securities: 10.2% | | | | | | | |
| 850,000 | (1) | Aimco CLO 11 Ltd. 2020-11A A1, 1.605%, (US0003M + 1.380%), 10/15/2031 | | | 850,999 | | | | 0.2 |
| 500,000 | (1) | Allegany Park CLO Ltd. 2019-1A A, 1.548%, (US0003M + 1.330%), 01/20/2033 | | | 500,741 | | | | 0.1 |
| 840,000 | (1) | Apidos Clo XXV 2016- 25A A1R, 1.388%, (US0003M + 1.170%), 10/20/2031 | | | 840,003 | | | | 0.2 |
| 560,000 | (1) | Arbor Realty Commercial Real Estate Notes 2019-FL2 A Ltd., 1.359%, (US0001M + 1.200%), 06/15/2034 | | | 556,693 | | | | 0.1 |
| 700,000 | (1) | ARES XLVI CLO Ltd. 2017-46A A2, 1.467%, (US0003M + 1.230%), 01/15/2030 | | | 692,952 | | | | 0.2 |
| 250,000 | (1) | Babson CLO Ltd. 2017- 1A A2, 1.568%, (US0003M + 1.350%), 07/18/2029 | | | 249,669 | | | | 0.1 |
| 250,000 | (1) | Bain Capital Credit CLO 2017-1A A2, 1.568%, (US0003M + 1.350%), 07/20/2030 | | | 249,444 | | | | 0.1 |
| 1,000,000 | (1) | Barings CLO Ltd. 2020- 1A A1, 1.630%, (US0003M + 1.400%), 10/15/2032 | | | 1,001,904 | | | | 0.2 |
| 579,691 | (1) | Benefit Street Partners CLO II Ltd. 2013-IIA A1R, 1.487%, (US0003M + 1.250%), 07/15/2029 | | | 579,699 | | | | 0.1 |
| 1,000,000 | (1) | Benefit Street Partners CLO XIX Ltd. 2019-19A A, 1.587%, (US0003M + 1.350%), 01/15/2033 | | | 1,001,896 | | | | 0.2 |
See Accompanying Notes to Financial Statements
| Voya Limited Maturity Bond Portfolio | PORTFOLIO OF INVESTMENTS
AS OF December 31, 2020 (Continued) |
| 250,000 | (1) | Carbone CLO Ltd. 2017- 1A A1, 1.358%, (US0003M + 1.140%), 01/20/2031 | | | 249,999 | | | | 0.1 |
| 492,818 | (1) | Carlyle Global Market Strategies CLO 2014- 2RA A1 Ltd., 1.271%, (US0003M + 1.050%), 05/15/2031 | | | 489,492 | | | | 0.1 |
| 620,000 | (1) | Cedar Funding VIII Clo Ltd. 2017-8A A1, 1.468%, (US0003M + 1.250%), 10/17/2030 | | | 620,008 | | | | 0.2 |
| 750,000 | (1) | CIFC Funding 2013-2A A1LR, 1.428%, (US0003M + 1.210%), 10/18/2030 | | | 749,065 | | | | 0.2 |
| 600,000 | (1) | CIFC Funding 2017-4 A1, 1.465%, (US0003M + 1.250%), 10/24/2030 | | | 600,023 | | | | 0.1 |
| 600,000 | (1) | CIFC Funding 2018-4A A1 Ltd., 1.368%, (US0003M + 1.150%), 10/17/2031 | | | 599,752 | | | | 0.1 |
| 900,000 | (1) | CIFC Funding 2020-2A A1 Ltd., 1.933%, (US0003M + 1.650%), 08/24/2032 | | | 903,850 | | | | 0.2 |
| 1,000,000 | (1) | CIFC Funding 2018-1A A Ltd., 1.218%, (US0003M + 1.000%), 04/18/2031 | | | 994,036 | | | | 0.2 |
| 600,000 | (1) | Clear Creek CLO Ltd. 2015-1A AR, 1.418%, (US0003M + 1.200%), 10/20/2030 | | | 599,408 | | | | 0.1 |
| 400,000 | | CNH Equipment Trust 2017-B A4, 2.170%, 04/17/2023 | | | 403,251 | | | | 0.1 |
| 250,000 | (1) | Deer Creek Clo Ltd. 2017-1A A, 1.398%, (US0003M + 1.180%), 10/20/2030 | | | 249,590 | | | | 0.1 |
| 680,000 | (1) | Dewolf Park Clo Ltd. 2017-1A A, 1.447%, (US0003M + 1.210%), 10/15/2030 | | | 680,001 | | | | 0.2 |
| 250,000 | (1) | Dryden 55 CLO Ltd. 2018-55A A1, 1.257%, (US0003M + 1.020%), 04/15/2031 | | | 249,015 | | | | 0.1 |
| 1,120,000 | (1) | Dryden Senior Loan Fund 2017-47A A2, 1.587%, (US0003M + 1.350%), 04/15/2028 | | | 1,117,633 | | | | 0.3 |
| 480,000 | (1) | Dryden XXVIII Senior Loan Fund 2013-28A A1LR, 1.421%, (US0003M + 1.200%), 08/15/2030 | | | 480,049 | | | | 0.1 |
| 1,000,000 | (1) | Dryden 78 CLO Ltd. 2020-78A A, 1.398%, (US0003M + 1.180%), 04/17/2033 | | | 999,446 | | | | 0.2 |
| 300,000 | (1) | Eaton Vance Clo 2015- 1A A2R Ltd., 1.468%, (US0003M + 1.250%), 01/20/2030 | | | 297,221 | | | | 0.1 |
| 700,000 | (1) | Elevation CLO 2014-2A A1R Ltd., 1.467%, (US0003M + 1.230%), 10/15/2029 | | | 699,861 | | | | 0.2 |
| 750,000 | (1) | Galaxy XIX CLO Ltd. 2015-19A A1R, 1.435%, (US0003M + 1.220%), 07/24/2030 | | | 749,998 | | | | 0.2 |
| 500,000 | (1) | Galaxy XV CLO Ltd. 2013-15A AR, 1.437%, (US0003M + 1.200%), 10/15/2030 | | | 499,506 | | | | 0.1 |
| 300,000 | (1) | Goldentree Loan Management US Clo 2 Ltd. 2017-2A A, 1.368%, (US0003M + 1.150%), 11/28/2030 | | | 299,894 | | | | 0.1 |
| 489,953 | (1) | Grand Avenue CRE 2020-FL2 A Ltd., 2.609%, (US0001M + 2.450%), 03/15/2035 | | | 493,998 | | | | 0.1 |
| 1,902,176 | (1) | Invitation Homes 2018- SFR3 A Trust, 1.153%, (US0001M + 1.000%), 07/17/2037 | | | 1,908,863 | | | | 0.5 |
| 400,107 | (1) | JGWPT XXXIII LLC 2014-3A A, 3.500%, 06/15/2077 | | | 446,403 | | | | 0.1 |
| 1,300,000 | (1) | Kayne CLO 6 Ltd. 2019- 6A A1, 1.598%, (US0003M + 1.380%), 01/20/2033 | | | 1,302,890 | | | | 0.3 |
| 1,000,000 | (1) | Kayne CLO 7 Ltd. 2020- 7A A1, 1.418%, (US0003M + 1.200%), 04/17/2033 | | | 1,000,257 | | | | 0.2 |
| 600,000 | (1) | LCM 26A A2 Ltd., 1.468%, (US0003M + 1.250%), 01/20/2031 | | | 594,917 | | | | 0.1 |
| 250,000 | (1) | LCM XXIV Ltd. 24A A, 1.528%, (US0003M + 1.310%), 03/20/2030 | | | 250,009 | | | | 0.1 |
| 480,000 | (1) | LoanCore 2019-CRE2 A Issuer Ltd., 1.289%, (US0001M + 1.130%), 05/09/2036 | | | 472,740 | | | | 0.1 |
| 700,000 | (1) | Madison Park Funding XXXV Ltd. 2019-35A A2A, 1.868%, (US0003M + 1.650%), 04/20/2031 | | | 700,487 | | | | 0.2 |
| 500,000 | (1) | Magnetite CLO Ltd. 2020-26A A, 1.987%, (US0003M + 1.750%), 07/15/2030 | | | 501,624 | | | | 0.1 |
| 700,000 | (1) | Magnetite XXII Ltd. 2019-22A A2, 1.887%, (US0003M + 1.650%), 04/15/2031 | | | 700,506 | | | | 0.2 |
| 1,500,000 | (1) | Magnetite XXVII Ltd. 2020-27A A1, 1.762%, (US0003M + 1.550%), 07/20/2033 | | | 1,503,909 | | | | 0.4 |
| 720,000 | (1) | Marble Point CLO XIV Ltd. 2018-2A A1, 1.548%, (US0003M + 1.330%), 01/20/2032 | | | 719,385 | | | | 0.2 |
| 800,000 | (1) | Marlette Funding Trust 2020-1A B, 2.380%, 03/15/2030 | | | 811,189 | | | | 0.2 |
See Accompanying Notes to Financial Statements
| Voya Limited Maturity Bond Portfolio | PORTFOLIO OF INVESTMENTS
AS OF December 31, 2020 (Continued) |
| 400,000 | (1) | Octagon Investment Partners 33 Ltd. 2017- 1A A1, 1.408%, (US0003M + 1.190%), 01/20/2031 | | | 400,001 | | | | 0.1 |
| 1,000,000 | (1) | Octagon Investment Partners 48 Ltd. 2020- 3A A, 1.732%, (US0003M + 1.500%), 10/20/2031 | | | 1,002,322 | | | | 0.2 |
| 500,000 | (1) | Octagon Investment Partners Ltd. 2017-1A A2, 1.587%, (US0003M + 1.350%), 07/15/2029 | | | 498,642 | | | | 0.1 |
| 500,000 | (1) | Octagon Investment Partners XIV Ltd. 2012- 1A A1BR, 1.612%, (US0003M + 1.375%), 07/15/2029 | | | 498,272 | | | | 0.1 |
| 400,000 | (1) | Octagon Investment Partners XV Ltd. 2013- 1A A2R, 1.568%, (US0003M + 1.350%), 07/19/2030 | | | 398,188 | | | | 0.1 |
| 500,000 | (1) | Palmer Square CLO 2013-2A AARR Ltd., 1.418%, (US0003M + 1.200%), 10/17/2031 | | | 500,010 | | | | 0.1 |
| 975,000 | (1) | Palmer Square CLO 2015-2A A1R2 Ltd., 1.318%, (US0003M + 1.100%), 07/20/2030 | | | 972,267 | | | | 0.2 |
| 900,000 | (1) | Palmer Square CLO 2020-2A A1A Ltd., 1.904%, (US0003M + 1.700%), 07/15/2031 | | | 902,775 | | | | 0.2 |
| 190,202 | (1) | SoFi Consumer Loan Program 2019-2 A Trust, 3.010%, 04/25/2028 | | | 192,354 | | | | 0.1 |
| 187,087 | (1) | SoFi Consumer Loan Program 2019-3 A Trust, 2.900%, 05/25/2028 | | | 189,085 | | | | 0.0 |
| 721,870 | (1) | SoFi Consumer Loan Program 2020-1 A Trust, 2.020%, 01/25/2029 | | | 729,603 | | | | 0.2 |
| 800,000 | (1) | SoFi Consumer Loan Program 2020-1 B Trust, 2.250%, 01/25/2029 | | | 809,247 | | | | 0.2 |
| 400,000 | (1) | TCI-Flatiron Clo 2017- 1A A Ltd., 1.422%, (US0003M + 1.200%), 11/18/2030 | | | 399,603 | | | | 0.1 |
| 500,000 | (1) | TCI-Symphony CLO 2017-1A A Ltd., 1.467%, (US0003M + 1.230%), 07/15/2030 | | | 500,005 | | | | 0.1 |
| 581,909 | (1) | THL Credit Wind River 2013-2A AR CLO Ltd., 1.448%, (US0003M + 1.230%), 10/18/2030 | | | 581,716 | | | | 0.1 |
| 570,000 | (1) | THL Credit Wind River 2017-2A A CLO Ltd., 1.448%, (US0003M + 1.230%), 07/20/2030 | | | 569,998 | | | | 0.1 |
| 850,000 | (1) | THL Credit Wind River 2018-2 A A2Clo Ltd., 1.687%, (US0003M + 1.450%), 07/15/2030 | | | 850,009 | | | | 0.2 |
| 850,000 | (1) | THL Credit Wind River 2019-2A A2 Clo Ltd., 1.887%, (US0003M + 1.650%), 01/15/2033 | | | 852,504 | | | | 0.2 |
| 800,000 | (1) | Trafigura Securitisation Finance PLC 2018-1A A2, 3.730%, 03/15/2022 | | | 816,779 | | | | 0.2 |
| 250,000 | (1) | Venture 34 CLO Ltd. 2018-34A A, 1.467%, (US0003M + 1.230%), 10/15/2031 | | | 250,000 | | | | 0.1 |
| 468,488 | | Verizon Owner Trust 2018-A A1A, 3.230%, 04/20/2023 | | | 474,757 | | | | 0.1 |
| | | | | | 42,850,412 | | | | 10.2 |
| | | | | | | | | | |
| | | Student Loan Asset-Backed Securities: 0.5% | | | | | | | |
| 850,000 | (1) | Navient Private Education Refi Loan Trust 2019-FA A2, 2.600%, 08/15/2068 | | | 878,491 | | | | 0.2 |
| 998,173 | (1) | Navient Private Education Refi Loan Trust 2020-GA A, 1.170%, 09/16/2069 | | | 1,006,182 | | | | 0.3 |
| | | | | | 1,884,673 | | | | 0.5 |
| | | | | | | | | | |
| | Total Asset-Backed Securities
(Cost $74,602,816) | | | 75,358,742 | | | | 18.0 |
| | | | | | | | | | |
| U.S. GOVERNMENT AGENCY OBLIGATIONS: 0.0% |
| | | Federal Home Loan Mortgage Corporation: 0.0%(4) | | | | | | | |
| 2 | | 3.500%, (H15T1Y + 1.997%),07/01/2024 | | | 2 | | | | 0.0 |
| | | | | | | | | | |
| | | Uniform Mortgage-Backed Securities: 0.0% | | | | | | | |
| 13,326 | | 6.500%,10/01/2022 | | | 14,936 | | | | 0.0 |
| 21,329 | | 6.500%,10/01/2032 | | | 24,732 | | | | 0.0 |
| 12,212 | | 7.000%,10/01/2032 | | | 12,356 | | | | 0.0 |
| | | | | | 52,024 | | | | 0.0 |
| | | | | | | | | | |
| | Total U.S. Government Agency Obligations
(Cost $47,702) | | | 52,026 | | | | 0.0 |
| | | | | | | | | | |
| | Total Long-Term Investments
(Cost $404,029,569) | | | 407,887,782 | | | | 97.3 |
| | | | | | | | | | |
| SHORT-TERM INVESTMENTS: 3.6% |
| | | Repurchase Agreements: 0.3% | | | | | | | |
| 212,194 | (5) | Nomura Securities, Repurchase Agreement dated 12/31/20, 0.07%, due 01/04/21 (Repurchase Amount $212,196, collateralized by various U.S. Government/U.S. Government Agency Obligations, 0.000%- 8.500%, Market Value plus accrued interest $216,438, due 01/31/21- 01/15/56) | | | 212,194 | | | | 0.1 |
See Accompanying Notes to Financial Statements
| Voya Limited Maturity Bond Portfolio | PORTFOLIO OF INVESTMENTS
AS OF December 31, 2020 (Continued) |
| 1,000,000 | (5) | RBC Dominion Securities Inc., Repurchase Agreement dated 12/31/20, 0.08%, due 01/04/21 (Repurchase Amount $1,000,009, collateralized by various U.S. Government/U.S. Government Agency Obligations, 0.000%- 6.000%, Market Value plus accrued interest $1,020,000, due 01/05/21-12/20/50) | | | 1,000,000 | | | | 0.2 |
| | | | | | | | | | |
| | Total Repurchase Agreements
(Cost $1,212,194) | | | 1,212,194 | | | | 0.3 |
| | | | | | | | | | |
| | | | | | | | | | Percentage |
| | | | | | | | | | of Net |
| Shares | | | | | Value | | | | Assets |
| | | Mutual Funds: 3.3% | | | | | | | |
| 13,873,030 | (6) | BlackRock Liquidity Funds, FedFund, Institutional Class, 0.000%
(Cost $13,873,030) | | | 13,873,030 | | | | 3.3 |
| | | | | | | | | | |
| | Total Short-Term Investments
(Cost $15,085,224) | | | 15,085,224 | | | | 3.6 |
| | | | | | | | | | |
| | Total Investments in Securities
(Cost $419,114,793) | | $ | 422,973,006 | | | | 100.9 |
| | Liabilities in Excess of Other Assets | | | (3,850,773 | ) | | | (0.9) |
| | Net Assets | | $ | 419,122,233 | | | | 100.0 |
| † | Unless otherwise indicated, principal amount is shown in USD. |
| (1) | Securities with purchases pursuant to Rule 144A or section 4(a)(2), under the Securities Act of 1933 and may not be resold subject to that rule except to qualified institutional buyers. |
| (2) | Security, or a portion of the security, is on loan. |
| (3) | Variable rate security. Rate shown is the rate in effect as of December 31, 2020. |
| (4) | The Federal Housing Finance Agency (“FHFA”) placed the Federal Home Loan Mortgage Corporation and Federal National Mortgage Association into conservatorship with FHFA as the conservator. As such, the FHFA oversees the continuing affairs of these companies. |
| (5) | All or a portion of the security represents securities purchased with cash collateral received for securities on loan. |
| (6) | Rate shown is the 7-day yield as of December 31, 2020. |
Reference Rate Abbreviations:
| H15T1Y | U.S. Treasury 1-Year Constant Maturity |
| US0001M | 1-month LIBOR |
| US0003M | 3-month LIBOR |
See Accompanying Notes to Financial Statements
| Voya U.S. Stock Index Portfolio | PORTFOLIO OF INVESTMENTS
AS OF December 31, 2020 |
| | | | | | | | Percentage |
| | | | | | | | of Net |
| Shares | | | | Value | | | Assets |
| COMMON STOCK: 97.1% | | |
| | | Communication Services: 10.5% | | | | | | | |
| 182,508 | | Activision Blizzard, Inc. | | $ | 16,945,868 | | | | 0.2 |
| 70,996 | (1) | Alphabet, Inc. - Class A | | | 124,430,430 | | | | 1.6 |
| 68,550 | (1) | Alphabet, Inc. - Class C | | | 120,091,374 | | | | 1.6 |
| 1,682,787 | | AT&T, Inc. | | | 48,396,954 | | | | 0.6 |
| 233,176 | (2) | CenturyLink, Inc. | | | 2,273,466 | | | | 0.0 |
| 34,456 | (1) | Charter Communications, Inc. | | | 22,794,367 | | | | 0.3 |
| 1,078,221 | | Comcast Corp. - Class A | | | 56,498,780 | | | | 0.8 |
| 37,859 | (1),(2) | Discovery Communications, Inc. - Class A | | | 1,139,177 | | | | 0.0 |
| 69,663 | (1) | Discovery Communications, Inc. - Class C | | | 1,824,474 | | | | 0.0 |
| 58,394 | (1) | Dish Network Corp. - Class A | | | 1,888,462 | | | | 0.0 |
| 68,501 | | Electronic Arts, Inc. | | | 9,836,744 | | | | 0.1 |
| 567,691 | (1) | Facebook, Inc.- Class A | | | 155,070,474 | | | | 2.0 |
| 79,710 | (2) | Fox Corp. - Class A | | | 2,321,155 | | | | 0.0 |
| 36,532 | | Fox Corp. - Class B | | | 1,055,044 | | | | 0.0 |
| 92,106 | | Interpublic Group of Cos., Inc. | | | 2,166,333 | | | | 0.0 |
| 33,767 | (1),(2) | Live Nation Entertainment, Inc. | | | 2,481,199 | | | | 0.0 |
| 104,329 | (1) | NetFlix, Inc. | | | 56,413,820 | | | | 0.8 |
| 92,323 | | News Corp - Class A | | | 1,659,044 | | | | 0.0 |
| 28,903 | | News Corp - Class B | | | 513,606 | | | | 0.0 |
| 50,765 | | Omnicom Group | | | 3,166,213 | | | | 0.1 |
| 27,162 | (1) | Take-Two Interactive Software, Inc. | | | 5,643,992 | | | | 0.1 |
| 137,759 | (1) | T-Mobile US, Inc. | | | 18,576,801 | | | | 0.3 |
| 187,820 | (1) | Twitter, Inc. | | | 10,170,453 | | | | 0.1 |
| 977,201 | | Verizon Communications, Inc. | | | 57,410,559 | | | | 0.8 |
| 133,419 | (2) | ViacomCBS, Inc. - Class B | | | 4,971,192 | | | | 0.1 |
| 427,542 | (1) | Walt Disney Co. | | | 77,462,060 | | | | 1.0 |
| | | | | | 805,202,041 | | | | 10.5 |
| | | | | | | | | | |
| | | Consumer Discretionary: 12.4% | | | | | | | |
| 16,024 | | Advance Auto Parts, Inc. | | | 2,523,940 | | | | 0.0 |
| 100,714 | (1) | Amazon.com, Inc. | | | 328,018,448 | | | | 4.3 |
| 63,766 | (1) | Aptiv PLC | | | 8,308,072 | | | | 0.1 |
| 5,473 | (1) | Autozone, Inc. | | | 6,487,913 | | | | 0.1 |
| 54,423 | | Best Buy Co., Inc. | | | 5,430,871 | | | | 0.1 |
| 9,671 | (1) | Booking Holdings, Inc. | | | 21,539,928 | | | | 0.3 |
| 57,743 | | BorgWarner, Inc. | | | 2,231,189 | | | | 0.0 |
| 38,749 | (1) | Carmax, Inc. | | | 3,660,231 | | | | 0.1 |
| 175,624 | (2) | Carnival Corp. | | | 3,804,016 | | | | 0.1 |
| 6,607 | (1) | Chipotle Mexican Grill, Inc. | | | 9,161,993 | | | | 0.1 |
| 30,746 | | Darden Restaurants, Inc. | | | 3,662,463 | | | | 0.1 |
| 57,856 | | Dollar General Corp. | | | 12,167,117 | | | | 0.2 |
| 55,540 | (1) | Dollar Tree, Inc. | | | 6,000,542 | | | | 0.1 |
| 9,304 | | Domino’s Pizza, Inc. | | | 3,567,712 | | | | 0.1 |
| 78,306 | | D.R. Horton, Inc. | | | 5,396,849 | | | | 0.1 |
| 154,646 | | eBay, Inc. | | | 7,770,961 | | | | 0.1 |
| 29,776 | (1) | Etsy, Inc. | | | 5,297,448 | | | | 0.1 |
| 32,101 | | Expedia Group, Inc. | | | 4,250,172 | | | | 0.1 |
| 922,764 | | Ford Motor Co. | | | 8,111,096 | | | | 0.1 |
| 48,579 | | Gap, Inc. | | | 980,810 | | | | 0.0 |
| 35,225 | | Garmin Ltd. | | | 4,215,023 | | | | 0.1 |
| 297,440 | | General Motors Co. | | | 12,385,402 | | | | 0.2 |
| 34,068 | | Genuine Parts Co. | | | 3,421,449 | | | | 0.0 |
| 82,256 | (2) | Hanesbrands, Inc. | | | 1,199,292 | | | | 0.0 |
| 30,094 | (2) | Hasbro, Inc. | | | 2,814,993 | | | | 0.0 |
| 65,518 | | Hilton Worldwide Holdings, Inc. | | | 7,289,533 | | | | 0.1 |
| 254,237 | | Home Depot, Inc. | | | 67,530,432 | | | | 0.9 |
| 55,167 | | L Brands, Inc. | | | 2,051,661 | | | | 0.0 |
| 77,562 | | Las Vegas Sands Corp. | | | 4,622,695 | | | | 0.1 |
| 31,290 | | Leggett & Platt, Inc. | | | 1,386,147 | | | | 0.0 |
| 64,968 | | Lennar Corp. - Class A | | | 4,952,511 | | | | 0.1 |
| 66,121 | (1) | LKQ Corp. | | | 2,330,104 | | | | 0.0 |
| 173,031 | | Lowe’s Cos, Inc. | | | 27,773,206 | | | | 0.4 |
| 62,804 | | Marriott International, Inc. | | | 8,285,104 | | | | 0.1 |
| 175,956 | | McDonald’s Corp. | | | 37,756,638 | | | | 0.5 |
| 96,813 | | MGM Resorts International | | | 3,050,578 | | | | 0.0 |
| 14,123 | (1) | Mohawk Industries, Inc. | | | 1,990,637 | | | | 0.0 |
| 89,176 | | Newell Brands, Inc. | | | 1,893,206 | | | | 0.0 |
| 296,320 | | Nike, Inc. - Class B | | | 41,920,390 | | | | 0.5 |
| 74,537 | (1),(2) | Norwegian Cruise Line Holdings Ltd. | | | 1,895,476 | | | | 0.0 |
| 826 | (1) | NVR, Inc. | | | 3,369,964 | | | | 0.0 |
| 17,108 | (1) | O’Reilly Automotive, Inc. | | | 7,742,568 | | | | 0.1 |
| 9,483 | | Pool Corp. | | | 3,532,417 | | | | 0.0 |
| 63,310 | | Pulte Group, Inc. | | | 2,729,927 | | | | 0.0 |
| 16,788 | | PVH Corp. | | | 1,576,225 | | | | 0.0 |
| 11,388 | | Ralph Lauren Corp. | | | 1,181,391 | | | | 0.0 |
| 84,070 | | Ross Stores, Inc. | | | 10,324,637 | | | | 0.1 |
| 43,971 | | Royal Caribbean Cruises Ltd. | | | 3,284,194 | | | | 0.0 |
| 277,166 | | Starbucks Corp. | | | 29,651,219 | | | | 0.4 |
| 65,509 | | Tapestry, Inc. | | | 2,036,020 | | | | 0.0 |
| 118,256 | | Target Corp. | | | 20,875,732 | | | | 0.3 |
| 179,076 | (1),(2) | Tesla, Inc. | | | 126,368,561 | | | | 1.6 |
| 25,518 | | Tiffany & Co. | | | 3,354,341 | | | | 0.0 |
| 283,526 | | TJX Cos., Inc. | | | 19,361,991 | | | | 0.3 |
| 27,510 | | Tractor Supply Co. | | | 3,867,356 | | | | 0.1 |
| 13,304 | (1) | Ulta Beauty, Inc. | | | 3,820,377 | | | | 0.1 |
| 44,522 | (1) | Under Armour, Inc. - Class A | | | 764,443 | | | | 0.0 |
| 45,958 | (1),(2) | Under Armour, Inc. - Class C | | | 683,855 | | | | 0.0 |
| 75,521 | | VF Corp. | | | 6,450,249 | | | | 0.1 |
| 14,770 | | Whirlpool Corp. | | | 2,665,837 | | | | 0.0 |
| 22,926 | (2) | Wynn Resorts Ltd. | | | 2,586,741 | | | | 0.0 |
| 71,238 | | Yum! Brands, Inc. | | | 7,733,597 | | | | 0.1 |
| | | | | | 951,097,890 | | | | 12.4 |
| | | | | | | | | | |
| | | Consumer Staples: 6.3% | | | | | | | |
| 438,861 | | Altria Group, Inc. | | | 17,993,301 | | | | 0.2 |
| 131,390 | | Archer-Daniels-Midland Co. | | | 6,623,370 | | | | 0.1 |
| 43,102 | (2) | Brown-Forman Corp. - Class B | | | 3,423,592 | | | | 0.0 |
| 47,825 | (2) | Campbell Soup Co. | | | 2,312,339 | | | | 0.0 |
| 58,671 | | Church & Dwight Co., Inc. | | | 5,117,871 | | | | 0.1 |
| 29,766 | | Clorox Co. | | | 6,010,351 | | | | 0.1 |
| 913,346 | | Coca-Cola Co. | | | 50,087,895 | | | | 0.7 |
| 202,418 | | Colgate-Palmolive Co. | | | 17,308,763 | | | | 0.2 |
| 115,362 | | Conagra Brands, Inc. | | | 4,183,026 | | | | 0.1 |
| 40,028 | | Constellation Brands, Inc. | | | 8,768,133 | | | | 0.1 |
| 104,195 | | Costco Wholesale Corp. | | | 39,258,592 | | | | 0.5 |
| 53,496 | | Estee Lauder Cos., Inc. | | | 14,240,100 | | | | 0.2 |
See Accompanying Notes to Financial Statements
| Voya U.S. Stock Index Portfolio | PORTFOLIO OF INVESTMENTS
AS OF December 31, 2020 (Continued) |
| 144,357 | | General Mills, Inc. | | | 8,488,191 | | | | 0.1 |
| 34,839 | | Hershey Co. | | | 5,307,025 | | | | 0.1 |
| 66,300 | (2) | Hormel Foods Corp. | | | 3,090,243 | | | | 0.0 |
| 26,943 | (2) | JM Smucker Co. | | | 3,114,611 | | | | 0.0 |
| 60,064 | | Kellogg Co. | | | 3,737,783 | | | | 0.0 |
| 80,323 | | Kimberly-Clark Corp. | | | 10,829,950 | | | | 0.1 |
| 153,021 | | Kraft Heinz Co. | | | 5,303,708 | | | | 0.1 |
| 182,855 | | Kroger Co. | | | 5,807,475 | | | | 0.1 |
| 34,558 | | Lamb Weston Holdings, Inc. | | | 2,721,097 | | | | 0.0 |
| 58,729 | | McCormick & Co., Inc. | | | 5,614,492 | | | | 0.1 |
| 44,430 | (2) | Molson Coors Beverage Co. | | | 2,007,792 | | | | 0.0 |
| 337,729 | | Mondelez International, Inc. | | | 19,747,015 | | | | 0.3 |
| 87,266 | (1) | Monster Beverage Corp. | | | 8,070,360 | | | | 0.1 |
| 326,346 | | PepsiCo, Inc. | | | 48,397,112 | | | | 0.6 |
| 367,756 | | Philip Morris International, Inc. | | | 30,446,519 | | | | 0.4 |
| 585,553 | | Procter & Gamble Co. | | | 81,473,844 | | | | 1.1 |
| 120,284 | | Sysco Corp. | | | 8,932,290 | | | | 0.1 |
| 69,457 | | Tyson Foods, Inc. | | | 4,475,809 | | | | 0.1 |
| 169,722 | | Walgreens Boots Alliance, Inc. | | | 6,768,513 | | | | 0.1 |
| 327,383 | | Walmart, Inc. | | | 47,192,259 | | | | 0.6 |
| | | | | | 486,853,421 | | | | 6.3 |
| | | | | | | | | | |
| | | Energy: 2.2% | | | | | | | |
| 89,141 | | Apache Corp. | | | 1,264,911 | | | | 0.0 |
| 161,954 | | Baker Hughes Co. | | | 3,376,741 | | | | 0.0 |
| 94,124 | (2) | Cabot Oil & Gas Corp. | | | 1,532,339 | | | | 0.0 |
| 454,596 | | Chevron Corp. | | | 38,390,632 | | | | 0.5 |
| 46,357 | | Concho Resources, Inc./Midland TX | | | 2,704,931 | | | | 0.0 |
| 252,195 | | ConocoPhillips | | | 10,085,278 | | | | 0.1 |
| 90,330 | | Devon Energy Corp. | | | 1,428,117 | | | | 0.0 |
| 37,305 | | Diamondback Energy, Inc. | | | 1,805,562 | | | | 0.0 |
| 137,763 | | EOG Resources, Inc. | | | 6,870,241 | | | | 0.1 |
| 998,487 | | Exxon Mobil Corp. | | | 41,157,634 | | | | 0.5 |
| 208,756 | | Halliburton Co. | | | 3,945,488 | | | | 0.1 |
| 64,539 | | Hess Corp. | | | 3,407,014 | | | | 0.0 |
| 35,199 | | HollyFrontier Corp. | | | 909,894 | | | | 0.0 |
| 459,747 | | Kinder Morgan, Inc. | | | 6,284,742 | | | | 0.1 |
| 186,413 | | Marathon Oil Corp. | | | 1,243,375 | | | | 0.0 |
| 153,650 | | Marathon Petroleum Corp. | | | 6,354,964 | | | | 0.1 |
| 91,688 | | National Oilwell Varco, Inc. | | | 1,258,876 | | | | 0.0 |
| 197,913 | | Occidental Petroleum Corp. | | | 3,425,874 | | | | 0.1 |
| 104,943 | | Oneok, Inc. | | | 4,027,712 | | | | 0.1 |
| 103,149 | | Phillips 66 | | | 7,214,241 | | | | 0.1 |
| 38,827 | | Pioneer Natural Resources Co. | | | 4,422,007 | | | | 0.1 |
| 328,724 | | Schlumberger NV | | | 7,176,045 | | | | 0.1 |
| 99,759 | | TechnipFMC PLC | | | 937,735 | | | | 0.0 |
| 96,298 | | Valero Energy Corp. | | | 5,447,578 | | | | 0.1 |
| 286,585 | | Williams Cos., Inc. | | | 5,746,029 | | | | 0.1 |
| | | | | | 170,417,960 | | | | 2.2 |
| | | | | | | | | | |
| | | Financials: 10.1% | | | | | | | |
| 154,269 | | Aflac, Inc. | | | 6,860,342 | | | | 0.1 |
| 71,805 | | Allstate Corp. | | | 7,893,524 | | | | 0.1 |
| 154,019 | | American Express Co. | | | 18,622,437 | | | | 0.2 |
| 203,447 | | American International Group, Inc. | | | 7,702,503 | | | | 0.1 |
| 27,860 | | Ameriprise Financial, Inc. | | | 5,414,034 | | | | 0.1 |
| 53,987 | (2) | Aon PLC | | | 11,405,833 | | | | 0.2 |
| 45,416 | | Arthur J. Gallagher & Co. | | | 5,618,413 | | | | 0.1 |
| 14,008 | | Assurant, Inc. | | | 1,908,170 | | | | 0.0 |
| 1,797,719 | | Bank of America Corp. | | | 54,488,863 | | | | 0.7 |
| 192,518 | | Bank of New York Mellon Corp. | | | 8,170,464 | | | | 0.1 |
| 459,572 | (1) | Berkshire Hathaway, Inc. – Class B | | | 106,560,960 | | | | 1.4 |
| 33,494 | | Blackrock, Inc. | | | 24,167,261 | | | | 0.3 |
| 108,013 | | Capital One Financial Corp. | | | 10,677,085 | | | | 0.1 |
| 25,514 | | Cboe Global Markets, Inc. | | | 2,375,864 | | | | 0.0 |
| 352,258 | | Charles Schwab Corp. | | | 18,683,764 | | | | 0.2 |
| 106,590 | | Chubb Ltd. | | | 16,406,333 | | | | 0.2 |
| 35,336 | (2) | Cincinnati Financial Corp. | | | 3,087,306 | | | | 0.0 |
| 491,650 | | Citigroup, Inc. | | | 30,315,139 | | | | 0.4 |
| 100,852 | | Citizens Financial Group, Inc. | | | 3,606,467 | | | | 0.1 |
| 84,774 | | CME Group, Inc. | | | 15,433,107 | | | | 0.2 |
| 32,845 | | Comerica, Inc. | | | 1,834,722 | | | | 0.0 |
| 72,378 | | Discover Financial Services | | | 6,552,380 | | | | 0.1 |
| 9,438 | | Everest Re Group Ltd. | | | 2,209,341 | | | | 0.0 |
| 168,236 | | Fifth Third Bancorp | | | 4,638,267 | | | | 0.1 |
| 41,076 | | First Republic Bank | | | 6,035,297 | | | | 0.1 |
| 64,345 | (2) | Franklin Resources, Inc. | | | 1,607,982 | | | | 0.0 |
| 22,738 | | Globe Life, Inc. | | | 2,159,200 | | | | 0.0 |
| 81,251 | | Goldman Sachs Group, Inc. | | | 21,426,701 | | | | 0.3 |
| 84,619 | | Hartford Financial Services Group, Inc. | | | 4,144,639 | | | | 0.1 |
| 240,235 | | Huntington Bancshares, Inc. | | | 3,034,168 | | | | 0.0 |
| 132,546 | | Intercontinental Exchange, Inc. | | | 15,281,228 | | | | 0.2 |
| 88,946 | (2) | Invesco Ltd. | | | 1,550,329 | | | | 0.0 |
| 719,826 | | JPMorgan Chase & Co. | | | 91,468,290 | | | | 1.2 |
| 230,592 | | Keycorp | | | 3,784,015 | | | | 0.1 |
| 42,901 | | Lincoln National Corp. | | | 2,158,349 | | | | 0.0 |
| 55,174 | | Loews Corp. | | | 2,483,933 | | | | 0.0 |
| 30,296 | | M&T Bank Corp. | | | 3,856,681 | | | | 0.1 |
| 8,965 | | MarketAxess Holdings, Inc. | | | 5,115,070 | | | | 0.1 |
| 119,772 | | Marsh & McLennan Cos., Inc. | | | 14,013,324 | | | | 0.2 |
| 180,643 | | Metlife, Inc. | | | 8,481,189 | | | | 0.1 |
| 38,140 | | Moody’s Corp. | | | 11,069,754 | | | | 0.1 |
| 337,518 | | Morgan Stanley | | | 23,130,109 | | | | 0.3 |
| 19,575 | | MSCI, Inc. - Class A | | | 8,740,825 | | | | 0.1 |
| 27,116 | | Nasdaq, Inc. | | | 3,599,378 | | | | 0.0 |
| 49,147 | | Northern Trust Corp. | | | 4,577,552 | | | | 0.1 |
| 100,331 | | People’s United Financial, Inc. | | | 1,297,280 | | | | 0.0 |
| 100,056 | | PNC Financial Services Group, Inc. | | | 14,908,344 | | | | 0.2 |
| 60,335 | | Principal Financial Group, Inc. | | | 2,993,219 | | | | 0.0 |
| 138,288 | | Progressive Corp. | | | 13,673,917 | | | | 0.2 |
| 93,514 | | Prudential Financial, Inc. | | | 7,300,638 | | | | 0.1 |
| 28,779 | | Raymond James Financial, Inc. | | | 2,753,287 | | | | 0.0 |
| 226,807 | | Regions Financial Corp. | | | 3,656,129 | | | | 0.1 |
| 56,817 | | S&P Global, Inc. | | | 18,677,452 | | | | 0.2 |
| 83,312 | | State Street Corp. | | | 6,063,447 | | | | 0.1 |
| 12,232 | (1) | SVB Financial Group | | | 4,743,937 | | | | 0.1 |
| 128,213 | | Synchrony Financial | | | 4,450,273 | | | | 0.1 |
See Accompanying Notes to Financial Statements
| Voya U.S. Stock Index Portfolio | PORTFOLIO OF INVESTMENTS
AS OF December 31, 2020 (Continued) |
| 53,472 | | T. Rowe Price Group, Inc. | | | 8,095,126 | | | | 0.1 |
| 59,818 | | Travelers Cos, Inc. | | | 8,396,653 | | | | 0.1 |
| 318,355 | | Truist Financial Corp. | | | 15,258,755 | | | | 0.2 |
| 48,094 | | Unum Group | | | 1,103,276 | | | | 0.0 |
| 323,725 | | US Bancorp | | | 15,082,348 | | | | 0.2 |
| 976,350 | | Wells Fargo & Co. | | | 29,466,243 | | | | 0.4 |
| 30,441 | | Willis Towers Watson PLC | | | 6,413,310 | | | | 0.1 |
| 33,248 | | WR Berkley Corp. | | | 2,208,332 | | | | 0.0 |
| 38,731 | | Zions Bancorp NA | | | 1,682,475 | | | | 0.0 |
| | | | | | 780,575,033 | | | | 10.1 |
| | | | | | | | | | |
| | | Health Care: 13.1% | | | | | | | |
| 418,539 | | Abbott Laboratories | | | 45,825,835 | | | | 0.6 |
| 416,912 | | AbbVie, Inc. | | | 44,672,121 | | | | 0.6 |
| 10,672 | (1) | Abiomed, Inc. | | | 3,459,862 | | | | 0.0 |
| 72,261 | | Agilent Technologies, Inc. | | | 8,562,206 | | | | 0.1 |
| 51,680 | (1) | Alexion Pharmaceuticals, Inc. | | | 8,074,483 | | | | 0.1 |
| 16,944 | (1) | Align Technology, Inc. | | | 9,054,535 | | | | 0.1 |
| 34,728 | | AmerisourceBergen Corp. | | | 3,395,009 | | | | 0.0 |
| 137,478 | | Amgen, Inc. | | | 31,608,942 | | | | 0.4 |
| 58,731 | | Anthem, Inc. | | | 18,857,937 | | | | 0.2 |
| 120,628 | | Baxter International, Inc. | | | 9,679,191 | | | | 0.1 |
| 68,490 | | Becton Dickinson & Co. | | | 17,137,568 | | | | 0.2 |
| 36,339 | (1) | Biogen, Inc. | | | 8,897,968 | | | | 0.1 |
| 5,083 | (1) | Bio-Rad Laboratories, Inc. | | | 2,963,084 | | | | 0.0 |
| 338,145 | (1) | Boston Scientific Corp. | | | 12,156,313 | | | | 0.2 |
| 533,635 | | Bristol-Myers Squibb Co. | | | 33,101,379 | | | | 0.4 |
| 69,291 | | Cardinal Health, Inc. | | | 3,711,226 | | | | 0.0 |
| 38,893 | (1) | Catalent, Inc. | | | 4,047,595 | | | | 0.1 |
| 136,918 | (1) | Centene Corp. | | | 8,219,188 | | | | 0.1 |
| 72,400 | | Cerner Corp. | | | 5,681,952 | | | | 0.1 |
| 85,312 | | Cigna Corp. | | | 17,760,252 | | | | 0.2 |
| 11,581 | | Cooper Cos., Inc. | | | 4,207,609 | | | | 0.1 |
| 309,097 | | CVS Health Corp. | | | 21,111,325 | | | | 0.3 |
| 149,301 | | Danaher Corp. | | | 33,165,724 | | | | 0.4 |
| 17,456 | (1) | DaVita, Inc. | | | 2,049,334 | | | | 0.0 |
| 51,611 | | Dentsply Sirona, Inc. | | | 2,702,352 | | | | 0.0 |
| 22,677 | (1) | DexCom, Inc. | | | 8,384,140 | | | | 0.1 |
| 147,178 | (1) | Edwards Lifesciences Corp. | | | 13,427,049 | | | | 0.2 |
| 187,492 | | Eli Lilly & Co. | | | 31,656,149 | | | | 0.4 |
| 296,018 | | Gilead Sciences, Inc. | | | 17,246,009 | | | | 0.2 |
| 62,327 | | HCA Healthcare, Inc. | | | 10,250,298 | | | | 0.1 |
| 33,716 | (1) | Henry Schein, Inc. | | | 2,254,252 | | | | 0.0 |
| 60,692 | (1) | Hologic, Inc. | | | 4,420,198 | | | | 0.1 |
| 31,252 | | Humana, Inc. | | | 12,821,758 | | | | 0.2 |
| 20,143 | (1) | Idexx Laboratories, Inc. | | | 10,068,881 | | | | 0.1 |
| 34,478 | (1) | Illumina, Inc. | | | 12,756,860 | | | | 0.2 |
| 43,958 | (1) | Incyte Corp., Ltd. | | | 3,823,467 | | | | 0.1 |
| 27,760 | (1) | Intuitive Surgical, Inc. | | | 22,710,456 | | | | 0.3 |
| 45,276 | (1) | IQVIA Holdings, Inc. | | | 8,112,101 | | | | 0.1 |
| 621,669 | | Johnson & Johnson | | | 97,838,267 | | | | 1.3 |
| 23,001 | (1) | Laboratory Corp. of America Holdings | | | 4,681,854 | | | | 0.1 |
| 37,917 | | McKesson Corp. | | | 6,594,525 | | | | 0.1 |
| 317,859 | | Medtronic PLC | | | 37,234,003 | | | | 0.5 |
| 597,461 | | Merck & Co., Inc. | | | 48,872,310 | | | | 0.6 |
| 5,619 | (1) | Mettler Toledo International, Inc. | | | 6,403,862 | | | | 0.1 |
| 26,442 | | PerkinElmer, Inc. | | | 3,794,427 | | | | 0.1 |
| 32,232 | | Perrigo Co. PLC | | | 1,441,415 | | | | 0.0 |
| 1,312,602 | | Pfizer, Inc. | | | 48,316,880 | | | | 0.6 |
| 31,825 | | Quest Diagnostics, Inc. | | | 3,792,585 | | | | 0.1 |
| 24,762 | (1) | Regeneron Pharmaceuticals, Inc. | | | 11,962,770 | | | | 0.2 |
| 34,221 | | Resmed, Inc. | | | 7,274,016 | | | | 0.1 |
| 20,149 | | STERIS Public Ltd. Co. | | | 3,819,041 | | | | 0.1 |
| 77,206 | | Stryker Corp. | | | 18,918,558 | | | | 0.2 |
| 10,997 | | Teleflex, Inc. | | | 4,526,035 | | | | 0.1 |
| 93,594 | | Thermo Fisher Scientific, Inc. | | | 43,594,213 | | | | 0.6 |
| 224,062 | | UnitedHealth Group, Inc. | | | 78,574,062 | | | | 1.0 |
| 18,354 | | Universal Health Services, Inc. | | | 2,523,675 | | | | 0.0 |
| 21,573 | (1) | Varian Medical Systems, Inc. | | | 3,775,491 | | | | 0.1 |
| 61,407 | (1) | Vertex Pharmaceuticals, Inc. | | | 14,512,930 | | | | 0.2 |
| 284,898 | (1) | Viatris, Inc. | | | 5,338,989 | | | | 0.1 |
| 14,652 | (1) | Waters Corp. | | | 3,625,198 | | | | 0.0 |
| 17,458 | | West Pharmaceutical Services, Inc. | | | 4,946,026 | | | | 0.1 |
| 48,948 | | Zimmer Biomet Holdings, Inc. | | | 7,542,397 | | | | 0.1 |
| 112,233 | | Zoetis, Inc. | | | 18,574,561 | | | | 0.2 |
| | | | | | 1,006,512,698 | | | | 13.1 |
| | | | | | | | | | |
| | | Industrials: 8.2% | | | | | | | |
| 136,215 | | 3M Co. | | | 23,809,020 | | | | 0.3 |
| 29,203 | | Alaska Air Group, Inc. | | | 1,518,556 | | | | 0.0 |
| 21,735 | | Allegion Public Ltd. | | | 2,529,519 | | | | 0.0 |
| 144,233 | (2) | American Airlines Group, Inc. | | | 2,274,554 | | | | 0.0 |
| 54,329 | | Ametek, Inc. | | | 6,570,549 | | | | 0.1 |
| 31,981 | | AO Smith Corp. | | | 1,753,198 | | | | 0.0 |
| 125,314 | | Boeing Co. | | | 26,824,715 | | | | 0.4 |
| 192,386 | | Carrier Global Corp. | | | 7,256,800 | | | | 0.1 |
| 128,289 | | Caterpillar, Inc. | | | 23,351,164 | | | | 0.3 |
| 32,103 | (2) | CH Robinson Worldwide, Inc. | | | 3,013,509 | | | | 0.0 |
| 20,754 | | Cintas Corp. | | | 7,335,709 | | | | 0.1 |
| 49,071 | (1) | Copart, Inc. | | | 6,244,285 | | | | 0.1 |
| 180,600 | | CSX Corp. | | | 16,389,450 | | | | 0.2 |
| 34,951 | | Cummins, Inc. | | | 7,937,372 | | | | 0.1 |
| 74,003 | | Deere & Co. | | | 19,910,507 | | | | 0.3 |
| 150,599 | | Delta Air Lines, Inc. | | | 6,055,586 | | | | 0.1 |
| 34,030 | | Dover Corp. | | | 4,296,287 | | | | 0.1 |
| 94,128 | | Eaton Corp. PLC | | | 11,308,538 | | | | 0.2 |
| 141,226 | | Emerson Electric Co. | | | 11,350,334 | | | | 0.2 |
| 28,726 | | Equifax, Inc. | | | 5,539,522 | | | | 0.1 |
| 39,972 | | Expeditors International Washington, Inc. | | | 3,801,737 | | | | 0.1 |
| 135,572 | | Fastenal Co. | | | 6,619,981 | | | | 0.1 |
| 57,050 | | FedEx Corp. | | | 14,811,321 | | | | 0.2 |
| 30,761 | (2) | Flowserve Corp. | | | 1,133,543 | | | | 0.0 |
| 79,628 | | Fortive Corp. | | | 5,639,255 | | | | 0.1 |
| 32,808 | | Fortune Brands Home & Security, Inc. | | | 2,812,302 | | | | 0.0 |
| 54,892 | | General Dynamics Corp. | | | 8,169,027 | | | | 0.1 |
| 2,068,623 | | General Electric Co. | | | 22,341,128 | | | | 0.3 |
| 165,701 | | Honeywell International, Inc. | | | 35,244,603 | | | | 0.5 |
| 92,155 | | Howmet Aerospace, Inc. | | | 2,630,104 | | | | 0.0 |
| 9,562 | | Huntington Ingalls Industries, Inc. | | | 1,630,130 | | | | 0.0 |
| 17,878 | | IDEX Corp. | | | 3,561,298 | | | | 0.1 |
| 88,011 | | IHS Markit Ltd. | | | 7,906,028 | | | | 0.1 |
| 68,018 | | Illinois Tool Works, Inc. | | | 13,867,510 | | | | 0.2 |
| 87,779 | (1) | Ingersoll Rand, Inc. | | | 3,999,211 | | | | 0.1 |
| 30,610 | | Jacobs Engineering Group, Inc. | | | 3,335,266 | | | | 0.0 |
See Accompanying Notes to Financial Statements
| Voya U.S. Stock Index Portfolio | PORTFOLIO OF INVESTMENTS
AS OF December 31, 2020 (Continued) |
| 19,715 | | JB Hunt Transport Services, Inc. | | | 2,694,055 | | | | 0.0 |
| 170,949 | | Johnson Controls International plc | | | 7,964,514 | | | | 0.1 |
| 22,104 | | Kansas City Southern | | | 4,512,089 | | | | 0.1 |
| 49,617 | | L3Harris Technologies, Inc. | | | 9,378,605 | | | | 0.1 |
| 58,142 | | Lockheed Martin Corp. | | | 20,639,247 | | | | 0.3 |
| 61,794 | | Masco Corp. | | | 3,394,344 | | | | 0.0 |
| 84,304 | (2) | Nielsen Holdings PLC | | | 1,759,424 | | | | 0.0 |
| 59,978 | | Norfolk Southern Corp. | | | 14,251,372 | | | | 0.2 |
| 36,614 | | Northrop Grumman Corp. | | | 11,157,018 | | | | 0.1 |
| 22,720 | | Old Dominion Freight Line | | | 4,434,490 | | | | 0.1 |
| 96,160 | | Otis Worldwide Corp. | | | 6,495,608 | | | | 0.1 |
| 81,811 | | Paccar, Inc. | | | 7,058,653 | | | | 0.1 |
| 30,416 | | Parker Hannifin Corp. | | | 8,285,622 | | | | 0.1 |
| 39,282 | | Pentair PLC | | | 2,085,481 | | | | 0.0 |
| 32,792 | | Quanta Services, Inc. | | | 2,361,680 | | | | 0.0 |
| 358,641 | | Raytheon Technologies Corp. | | | 25,646,418 | | | | 0.3 |
| 49,676 | | Republic Services, Inc. | | | 4,783,799 | | | | 0.1 |
| 26,916 | (2) | Robert Half International, Inc. | | | 1,681,712 | | | | 0.0 |
| 27,435 | | Rockwell Automation, Inc. | | | 6,880,972 | | | | 0.1 |
| 52,243 | (2) | Rollins, Inc. | | | 2,041,134 | | | | 0.0 |
| 24,765 | | Roper Technologies, Inc. | | | 10,675,944 | | | | 0.1 |
| 12,803 | (2) | Snap-On, Inc. | | | 2,191,105 | | | | 0.0 |
| 139,392 | | Southwest Airlines Co. | | | 6,497,061 | | | | 0.1 |
| 37,836 | | Stanley Black & Decker, Inc. | | | 6,755,996 | | | | 0.1 |
| 8,710 | (1) | Teledyne Technologies, Inc. | | | 3,414,146 | | | | 0.0 |
| 54,048 | | Textron, Inc. | | | 2,612,140 | | | | 0.0 |
| 56,705 | | Trane Technologies PLC | | | 8,231,298 | | | | 0.1 |
| 12,855 | (1) | TransDigm Group, Inc. | | | 7,955,317 | | | | 0.1 |
| 159,133 | | Union Pacific Corp. | | | 33,134,673 | | | | 0.4 |
| 69,111 | (1),(2) | United Airlines Holdings, Inc. | | | 2,989,051 | | | | 0.0 |
| 168,897 | | United Parcel Service, Inc. - Class B | | | 28,442,255 | | | | 0.4 |
| 17,035 | (1) | United Rentals, Inc. | | | 3,950,587 | | | | 0.1 |
| 38,395 | | Verisk Analytics, Inc. | | | 7,970,418 | | | | 0.1 |
| 91,814 | | Waste Management, Inc. | | | 10,827,625 | | | | 0.1 |
| 42,248 | | Westinghouse Air Brake Technologies Corp. | | | 3,092,554 | | | | 0.0 |
| 10,646 | | WW Grainger, Inc. | | | 4,347,188 | | | | 0.1 |
| 42,561 | | Xylem, Inc. | | | 4,332,284 | | | | 0.1 |
| | | | | | 627,697,497 | | | | 8.2 |
| | | | | | | | | | |
| | | Information Technology: 26.8% | | | | | | | |
| 149,615 | | Accenture PLC | | | 39,080,934 | | | | 0.5 |
| 113,284 | (1) | Adobe, Inc. | | | 56,655,594 | | | | 0.7 |
| 284,017 | (1) | Advanced Micro Devices, Inc. | | | 26,047,199 | | | | 0.3 |
| 38,443 | (1) | Akamai Technologies, Inc. | | | 4,036,131 | | | | 0.1 |
| 70,645 | | Amphenol Corp. | | | 9,238,247 | | | | 0.1 |
| 87,253 | | Analog Devices, Inc. | | | 12,889,886 | | | | 0.2 |
| 20,281 | (1) | ANSYS, Inc. | | | 7,378,228 | | | | 0.1 |
| 3,774,038 | | Apple, Inc. | | | 500,777,102 | | | | 6.5 |
| 215,670 | | Applied Materials, Inc. | | | 18,612,321 | | | | 0.2 |
| 12,864 | (1) | Arista Networks, Inc. | | | 3,737,892 | | | | 0.1 |
| 51,926 | (1) | Autodesk, Inc. | | | 15,855,085 | | | | 0.2 |
| 101,263 | | Automatic Data Processing, Inc. | | | 17,842,541 | | | | 0.2 |
| 95,522 | | Broadcom, Inc. | | | 41,824,308 | | | | 0.5 |
| 27,303 | | Broadridge Financial Solutions, Inc. ADR | | | 4,182,820 | | | | 0.1 |
| 65,869 | (1) | Cadence Design Systems, Inc. | | | 8,986,508 | | | | 0.1 |
| 33,766 | | CDW Corp. | | | 4,450,021 | | | | 0.1 |
| 997,845 | | Cisco Systems, Inc. | | | 44,653,564 | | | | 0.6 |
| 29,075 | | Citrix Systems, Inc. | | | 3,782,658 | | | | 0.1 |
| 126,254 | | Cognizant Technology Solutions Corp. | | | 10,346,515 | | | | 0.1 |
| 180,419 | | Corning, Inc. | | | 6,495,084 | | | | 0.1 |
| 60,079 | | DXC Technology Co. | | | 1,547,034 | | | | 0.0 |
| 14,547 | (1) | F5 Networks, Inc. | | | 2,559,399 | | | | 0.0 |
| 146,532 | | Fidelity National Information Services, Inc. | | | 20,728,417 | | | | 0.3 |
| 135,779 | (1) | Fiserv, Inc. | | | 15,459,797 | | | | 0.2 |
| 19,695 | (1) | FleetCor Technologies, Inc. | | | 5,373,387 | | | | 0.1 |
| 30,970 | | Flir Systems, Inc. | | | 1,357,415 | | | | 0.0 |
| 31,817 | (1) | Fortinet, Inc. | | | 4,725,779 | | | | 0.1 |
| 21,085 | (1) | Gartner, Inc. | | | 3,377,606 | | | | 0.0 |
| 70,688 | | Global Payments, Inc. | | | 15,227,609 | | | | 0.2 |
| 303,922 | | Hewlett Packard Enterprise Co. | | | 3,601,476 | | | | 0.1 |
| 324,348 | | HP, Inc. | | | 7,975,717 | | | | 0.1 |
| 967,733 | | Intel Corp. | | | 48,212,458 | | | | 0.6 |
| 210,421 | | International Business Machines Corp. | | | 26,487,795 | | | | 0.3 |
| 62,047 | | Intuit, Inc. | | | 23,568,553 | | | | 0.3 |
| 8,433 | (1) | IPG Photonics Corp. | | | 1,887,221 | | | | 0.0 |
| 18,022 | | Jack Henry & Associates, Inc. | | | 2,919,384 | | | | 0.0 |
| 77,866 | | Juniper Networks, Inc. | | | 1,752,764 | | | | 0.0 |
| 43,758 | (1) | Keysight Technologies, Inc. | | | 5,779,994 | | | | 0.1 |
| 36,475 | | KLA Corp. | | | 9,443,742 | | | | 0.1 |
| 34,007 | | Lam Research Corp. | | | 16,060,486 | | | | 0.2 |
| 31,592 | | Leidos Holdings, Inc. | | | 3,320,951 | | | | 0.0 |
| 207,748 | | Mastercard, Inc. - Class A | | | 74,153,571 | | | | 1.0 |
| 63,122 | | Maxim Integrated Products | | | 5,595,765 | | | | 0.1 |
| 61,487 | | Microchip Technology, Inc. | | | 8,491,970 | | | | 0.1 |
| 262,885 | (1) | Micron Technology, Inc. | | | 19,763,694 | | | | 0.3 |
| 1,785,393 | | Microsoft Corp. | | | 397,107,111 | | | | 5.2 |
| 40,032 | | Motorola Solutions, Inc. | | | 6,807,842 | | | | 0.1 |
| 52,752 | | NetApp, Inc. | | | 3,494,292 | | | | 0.0 |
| 139,769 | | NortonLifeLock, Inc. | | | 2,904,400 | | | | 0.0 |
| 146,175 | | Nvidia Corp. | | | 76,332,585 | | | | 1.0 |
| 447,939 | | Oracle Corp. | | | 28,977,174 | | | | 0.4 |
| 75,557 | | Paychex, Inc. | | | 7,040,401 | | | | 0.1 |
| 11,568 | (1) | Paycom Software, Inc. | | | 5,231,628 | | | | 0.1 |
| 276,692 | (1) | PayPal Holdings, Inc. | | | 64,801,266 | | | | 0.8 |
| 26,934 | (1) | Qorvo, Inc. | | | 4,478,316 | | | | 0.1 |
| 267,083 | | Qualcomm, Inc. | | | 40,687,424 | | | | 0.5 |
| 216,075 | (1) | Salesforce.com, Inc. | | | 48,083,170 | | | | 0.6 |
| 52,786 | (2) | Seagate Technology | | | 3,281,178 | | | | 0.0 |
| 46,072 | (1) | ServiceNow, Inc. | | | 25,359,411 | | | | 0.3 |
| 39,220 | | Skyworks Solutions, Inc. | | | 5,995,954 | | | | 0.1 |
| 36,040 | (1) | Synopsys, Inc. | | | 9,343,010 | | | | 0.1 |
| 78,104 | | TE Connectivity Ltd. | | | 9,456,051 | | | | 0.1 |
| 39,214 | | Teradyne, Inc. | | | 4,701,366 | | | | 0.1 |
| 216,770 | | Texas Instruments, Inc. | | | 35,578,460 | | | | 0.5 |
| 9,523 | (1) | Tyler Technologies, Inc. | | | 4,156,980 | | | | 0.1 |
| 23,713 | (1) | VeriSign, Inc. | | | 5,131,493 | | | | 0.1 |
| 400,430 | | Visa, Inc. - Class A | | | 87,586,054 | | | | 1.1 |
See Accompanying Notes to Financial Statements
| Voya U.S. Stock Index Portfolio | PORTFOLIO OF INVESTMENTS
AS OF December 31, 2020 (Continued) |
| 31,810 | (1) | Vontier Corp. | | | 1,062,454 | | | | 0.0 |
| 71,847 | | Western Digital Corp. | | | 3,979,605 | | | | 0.1 |
| 97,085 | (2) | Western Union Co. | | | 2,130,045 | | | | 0.0 |
| 39,352 | | Xerox Holdings Corp. | | | 912,573 | | | | 0.0 |
| 57,885 | | Xilinx, Inc. | | | 8,206,356 | | | | 0.1 |
| 12,590 | (1) | Zebra Technologies Corp. | | | 4,838,715 | | | | 0.1 |
| | | | | | 2,063,909,936 | | | | 26.8 |
| | | | | | | | | | |
| | | Materials: 2.5% | | | | | | | |
| 52,195 | | Air Products & Chemicals, Inc. | | | 14,260,718 | | | | 0.2 |
| 25,140 | (2) | Albemarle Corp. | | | 3,708,653 | | | | 0.1 |
| 370,393 | | Amcor PLC | | | 4,359,526 | | | | 0.1 |
| 19,699 | | Avery Dennison Corp. | | | 3,055,512 | | | | 0.0 |
| 77,247 | | Ball Corp. | | | 7,197,875 | | | | 0.1 |
| 27,604 | | Celanese Corp. - Series A | | | 3,586,864 | | | | 0.0 |
| 50,516 | | CF Industries Holdings, Inc. | | | 1,955,474 | | | | 0.0 |
| 175,934 | | Corteva, Inc. | | | 6,812,164 | | | | 0.1 |
| 175,163 | | Dow, Inc. | | | 9,721,546 | | | | 0.1 |
| 173,297 | | DuPont de Nemours, Inc. | | | 12,323,150 | | | | 0.2 |
| 31,990 | | Eastman Chemical Co. | | | 3,207,957 | | | | 0.0 |
| 58,644 | | Ecolab, Inc. | | | 12,688,216 | | | | 0.2 |
| 30,642 | | FMC Corp. | | | 3,521,685 | | | | 0.0 |
| 343,091 | | Freeport-McMoRan, Inc. | | | 8,927,228 | | | | 0.1 |
| 25,252 | (2) | International Flavors & Fragrances, Inc. | | | 2,748,428 | | | | 0.0 |
| 92,828 | | International Paper Co. | | | 4,615,408 | | | | 0.1 |
| 123,944 | | Linde PLC | | | 32,660,483 | | | | 0.4 |
| 60,718 | | LyondellBasell Industries NV - Class A | | | 5,565,412 | | | | 0.1 |
| 14,706 | | Martin Marietta Materials, Inc. | | | 4,176,063 | | | | 0.1 |
| 81,464 | | Mosaic Co. | | | 1,874,487 | | | | 0.0 |
| 189,711 | | Newmont Corp. | | | 11,361,792 | | | | 0.1 |
| 71,300 | | Nucor Corp. | | | 3,792,447 | | | | 0.1 |
| 22,394 | | Packaging Corp. of America | | | 3,088,357 | | | | 0.0 |
| 55,779 | | PPG Industries, Inc. | | | 8,044,447 | | | | 0.1 |
| 36,639 | | Sealed Air Corp. | | | 1,677,700 | | | | 0.0 |
| 19,303 | | Sherwin-Williams Co. | | | 14,185,968 | | | | 0.2 |
| 31,292 | | Vulcan Materials Co. | | | 4,640,916 | | | | 0.1 |
| 62,025 | | WestRock Co. | | | 2,699,948 | | | | 0.0 |
| | | | | | 196,458,424 | | | | 2.5 |
| | | | | | | | | | |
| | | Real Estate: 2.3% | | | | | | | |
| 29,241 | | Alexandria Real Estate Equities, Inc. | | | 5,211,331 | | | | 0.1 |
| 104,900 | | American Tower Corp. | | | 23,545,854 | | | | 0.3 |
| 32,968 | | AvalonBay Communities, Inc. | | | 5,289,056 | | | | 0.1 |
| 33,450 | | Boston Properties, Inc. | | | 3,162,028 | | | | 0.0 |
| 79,217 | (1) | CBRE Group, Inc. | | | 4,968,490 | | | | 0.1 |
| 101,850 | | Crown Castle International Corp. | | | 16,213,502 | | | | 0.2 |
| 66,160 | | Digital Realty Trust, Inc. | | | 9,229,982 | | | | 0.1 |
| 87,835 | | Duke Realty Corp. | | | 3,510,765 | | | | 0.0 |
| 21,041 | | Equinix, Inc. | | | 15,027,061 | | | | 0.2 |
| 80,874 | | Equity Residential | | | 4,794,211 | | | | 0.1 |
| 15,398 | | Essex Property Trust, Inc. | | | 3,655,793 | | | | 0.1 |
| 30,519 | | Extra Space Storage, Inc. | | | 3,535,931 | | | | 0.0 |
| 16,256 | | Federal Realty Investment Trust | | | 1,383,711 | | | | 0.0 |
| 127,133 | | Healthpeak Properties, Inc. | | | 3,843,231 | | | | 0.1 |
| 166,562 | | Host Hotels & Resorts, Inc. | | | 2,436,802 | | | | 0.0 |
| 68,051 | (2) | Iron Mountain, Inc. | | | 2,006,143 | | | | 0.0 |
| 102,134 | | Kimco Realty Corp. | | | 1,533,031 | | | | 0.0 |
| 27,008 | | Mid-America Apartment Communities, Inc. | | | 3,421,644 | | | | 0.0 |
| 174,566 | | ProLogis, Inc. | | | 17,397,248 | | | | 0.2 |
| 35,917 | | Public Storage, Inc. | | | 8,294,313 | | | | 0.1 |
| 82,885 | | Realty Income Corp. | | | 5,152,960 | | | | 0.1 |
| 37,265 | | Regency Centers Corp. | | | 1,698,911 | | | | 0.0 |
| 26,240 | | SBA Communications Corp. | | | 7,403,091 | | | | 0.1 |
| 77,431 | | Simon Property Group, Inc. | | | 6,603,316 | | | | 0.1 |
| 17,137 | (2) | SL Green Realty Corp. | | | 1,021,022 | | | | 0.0 |
| 69,541 | | UDR, Inc. | | | 2,672,461 | | | | 0.0 |
| 88,454 | | Ventas, Inc. | | | 4,337,784 | | | | 0.1 |
| 37,036 | | Vornado Realty Trust | | | 1,382,924 | | | | 0.0 |
| 98,546 | | Welltower, Inc. | | | 6,368,043 | | | | 0.1 |
| 176,266 | | Weyerhaeuser Co. | | | 5,910,199 | | | | 0.1 |
| | | | | | 181,010,838 | | | | 2.3 |
| | | | | | | | | | |
| | | Utilities: 2.7% | | | | | | | |
| 157,069 | | AES Corp. | | | 3,691,121 | | | | 0.0 |
| 58,980 | | Alliant Energy Corp. | | | 3,039,239 | | | | 0.0 |
| 58,377 | | Ameren Corp. | | | 4,556,909 | | | | 0.1 |
| 117,221 | | American Electric Power Co., Inc. | | | 9,760,993 | | | | 0.1 |
| 42,807 | | American Water Works Co., Inc. | | | 6,569,590 | | | | 0.1 |
| 29,728 | | Atmos Energy Corp. | | | 2,836,943 | | | | 0.0 |
| 128,658 | | Centerpoint Energy, Inc. | | | 2,784,159 | | | | 0.0 |
| 67,617 | | CMS Energy Corp. | | | 4,125,313 | | | | 0.1 |
| 80,790 | | Consolidated Edison, Inc. | | | 5,838,693 | | | | 0.1 |
| 192,654 | | Dominion Energy, Inc. | | | 14,487,581 | | | | 0.2 |
| 45,709 | | DTE Energy Co. | | | 5,549,530 | | | | 0.1 |
| 173,795 | | Duke Energy Corp. | | | 15,912,670 | | | | 0.2 |
| 89,385 | | Edison International | | | 5,615,166 | | | | 0.1 |
| 47,285 | | Entergy Corp. | | | 4,720,934 | | | | 0.1 |
| 53,566 | | Evergy, Inc. | | | 2,973,449 | | | | 0.0 |
| 80,957 | | Eversource Energy | | | 7,003,590 | | | | 0.1 |
| 230,379 | | Exelon Corp. | | | 9,726,601 | | | | 0.1 |
| 128,131 | | FirstEnergy Corp. | | | 3,922,090 | | | | 0.1 |
| 462,631 | | NextEra Energy, Inc. | | | 35,691,982 | | | | 0.5 |
| 90,495 | | NiSource, Inc. | | | 2,075,955 | | | | 0.0 |
| 57,672 | | NRG Energy, Inc. | | | 2,165,584 | | | | 0.0 |
| 26,590 | | Pinnacle West Capital Corp. | | | 2,125,870 | | | | 0.0 |
| 181,557 | | PPL Corp. | | | 5,119,907 | | | | 0.1 |
| 119,455 | | Public Service Enterprise Group, Inc. | | | 6,964,227 | | | | 0.1 |
| 68,121 | | Sempra Energy | | | 8,679,297 | | | | 0.1 |
| 249,429 | | Southern Co. | | | 15,322,423 | | | | 0.2 |
| 74,489 | | WEC Energy Group, Inc. | | | 6,855,223 | | | | 0.1 |
| 124,086 | | Xcel Energy, Inc. | | | 8,272,814 | | | | 0.1 |
| | | | | | 206,387,853 | | | | 2.7 |
| | | | | | | | | | |
| | Total Common Stock | | | | | | | |
| | (Cost $4,410,271,425) | | | 7,476,123,591 | | | | 97.1 |
See Accompanying Notes to Financial Statements
| Voya U.S. Stock Index Portfolio | PORTFOLIO OF INVESTMENTS
AS OF December 31, 2020 (Continued) |
| Principal | | | | | | | Percentage
of Net |
| Amount † | | | | | Value | | | | Assets |
| SHORT-TERM INVESTMENTS: 4.9% |
| | | Repurchase Agreements: 2.4% | | | | | | | |
| 10,105,480 | (3) | Amherst Pierpoint Securities LLC, Repurchase Agreement dated 12/31/20, 0.10%, due 01/04/21 (Repurchase Amount $10,105,591, collateralized by various U.S. Government/U.S. Government Agency Obligations, 0.000%- 4.628%, Market Value plus accrued interest $10,307,590, due 02/03/21-11/20/70) | | | 10,105,480 | | | | 0.1 |
| 6,352,016 | (3) | Bethesda Securities LLC, Repurchase Agreement dated 12/31/20, 0.10%, due 01/04/21 (Repurchase Amount $6,352,086, collateralized by various U.S. Government Agency Obligations, 2.500%-5.500%, Market Value plus accrued interest $6,479,056, due 07/01/24-10/01/50) | | | 6,352,016 | | | | 0.1 |
| 8,582,962 | (3) | BNP Paribas S.A., Repurchase Agreement dated 12/31/20, 0.24%, due 01/04/21 (Repurchase Amount $8,583,188, collateralized by various U.S. Government Securities, 0.750%- 8.750%, Market Value plus accrued interest $9,012,110, due 03/01/21-11/20/40) | | | 8,582,962 | | | | 0.1 |
| 29,988,753 | (3) | Cantor Fitzgerald Securities, Repurchase Agreement dated 12/31/20, 0.07%, due 01/04/21 (Repurchase Amount $29,988,983, collateralized by various U.S. Government/U.S. Government Agency Obligations, 0.000%- 9.500%, Market Value plus accrued interest $30,588,528, due 01/25/21-10/15/62) | | | 29,988,753 | | | | 0.4 |
| 10,263,781 | (3) | CF Secured LLC, Repurchase Agreement dated 12/31/20, 0.07%, due 01/04/21 (Repurchase Amount $10,263,860, collateralized by various U.S. Government/U.S. Government Agency Obligations, 0.000%- 4.750%, Market Value plus accrued interest $10,469,057, due 01/14/21-01/20/69) | | | 10,263,781 | | | | 0.1 |
| 18,141,196 | (3) | Citadel Securities LLC, Repurchase Agreement dated 12/31/20, 0.13%, due 01/04/21 (Repurchase Amount $18,141,454, collateralized by various U.S. Government Securities, 0.000%- 7.875%, Market Value plus accrued interest $18,504,302, due 01/31/21-05/15/49) | | | 18,141,196 | | | | 0.2 |
| 25,102,663 | (3) | Daiwa Capital Markets, Repurchase Agreement dated 12/31/20, 0.07%, due 01/04/21 (Repurchase Amount $25,102,856, collateralized by various U.S. Government/U.S. Government Agency Obligations, 0.000%- 6.500%, Market Value plus accrued interest $25,604,716, due 01/26/21-01/01/51) | | | 25,102,663 | | | | 0.3 |
| 4,140,582 | (3) | Industrial & Comm. Bank of China, Repurchase Agreement dated 12/31/20, 0.07%, due 01/04/21 (Repurchase Amount $4,140,614, collateralized by various U.S. Government/U.S. Government Agency Obligations, 0.000%- 9.000%, Market Value plus accrued interest $4,223,394, due 01/04/21-12/01/50) | | | 4,140,582 | | | | 0.1 |
| 1,942,254 | (3) | Jefferies LLC, Repurchase Agreement dated 12/31/20, 0.06%, due 01/04/21 (Repurchase Amount $1,942,267, collateralized by various U.S. Government Securities, 0.000%- 2.250%, Market Value plus accrued interest $1,981,099, due 03/02/21-08/15/29) | | | 1,942,254 | | | | 0.0 |
See Accompanying Notes to Financial Statements
| Voya U.S. Stock Index Portfolio | PORTFOLIO OF INVESTMENTS
AS OF December 31, 2020 (Continued) |
| 11,725,571 | (3) | JVB Financial Group LLC, Repurchase Agreement dated 12/31/20, 0.13%, due 01/04/21 (Repurchase Amount $11,725,738, collateralized by various U.S. Government/U.S. Government Agency Obligations, 0.125%- 7.000%, Market Value plus accrued interest $11,960,082, due 07/01/22-12/01/50) | | | 11,725,571 | | | | 0.2 |
| 13,397,811 | (3) | Mirae Asset Securities USA Inc., Repurchase Agreement dated 12/31/20, 0.13%, due 01/04/21 (Repurchase Amount $13,398,002, collateralized by various U.S. Government/U.S. Government Agency Obligations, 0.000%- 8.125%, Market Value plus accrued interest $13,665,966, due 02/18/21-01/15/62) | | | 13,397,811 | | | | 0.2 |
| 10,172,095 | (3) | Palafox Trading LLC, Repurchase Agreement dated 12/31/20, 0.13%, due 01/04/21 (Repurchase Amount $10,172,240, collateralized by various U.S. Government Securities, 0.250%- 1.125%, Market Value plus accrued interest $10,379,294, due 02/28/25-05/31/25) | | | 10,172,095 | | | | 0.1 |
| 3,289,648 | (3) | Royal Bank of Canada, Repurchase Agreement dated 12/31/20, 0.21%, due 01/04/21 (Repurchase Amount $3,289,724, collateralized by various U.S. Government Securities, 0.379%- 10.200%, Market Value plus accrued interest $3,433,851, due 05/13/21-11/01/40) | | | 3,289,648 | | | | 0.1 |
| 29,764,730 | (3) | State of Wisconsin Investment Board, Repurchase Agreement dated 12/31/20, 0.16%, due 01/04/21 (Repurchase Amount $29,765,252, collateralized by various U.S. Government Securities, 0.125%- 3.875%, Market Value plus accrued interest $30,435,696, due 07/15/22-02/15/47) | | | 29,764,730 | | | | 0.4 |
| 1,867,850 | (3) | Stonex Financial Inc., Repurchase Agreement dated 12/31/20, 0.14%, due 01/04/21 (Repurchase Amount $1,867,879, collateralized by various U.S. Government/U.S. Government Agency Obligations, 0.000%- 8.000%, Market Value plus accrued interest $1,905,210, due 06/17/21-11/20/70) | | | 1,867,850 | | | | 0.0 |
| | | | | | | | | | |
| | Total Repurchase Agreements | | | | | | | |
| | (Cost $184,837,392) | | | 184,837,392 | | | | 2.4 |
| | | | | | | | | | |
| | | | | | | | | Percentage |
| | | | | | | | | | of Net |
| Shares | | | | | Value | | | | Assets |
| | | Mutual Funds(3): 2.5% | | | | | | | |
| 182,313,233 | (3),(4) | BlackRock Liquidity Funds, FedFund, Institutional Class, 0.000% | | | 182,313,233 | | | | 2.4 |
| 4,954,000 | (3),(4) | Goldman Sachs Financial Square Government Fund - Institutional Shares, 0.020% | | | 4,954,000 | | | | 0.1 |
| 2,110,000 | (3),(4) | Morgan Stanley Institutional Liquidity Funds - Government Portfolio (Institutional Share Class), 0.030% | | | 2,110,000 | | | | 0.0 |
| | Total Mutual Funds
(Cost $189,377,233) | | | 189,377,233 | | | | 2.5 |
| | | | | | | | | | |
| | Total Short-Term Investments
(Cost $374,214,625) | | | 374,214,625 | | | | 4.9 |
| | | | | | | | | | |
| | Total Investments in Securities | | | | | | | |
| | (Cost $4,784,486,050) | | $ | 7,850,338,216 | | | | 102.0 |
| | Liabilities in Excess of Other Assets | | | (150,871,548 | ) | | | (2.0) |
| | Net Assets | | $ | 7,699,466,668 | | | | 100.0 |
| † | Unless otherwise indicated, principal amount is shown in USD. |
| ADR | American Depositary Receipt |
| (1) | Non-income producing security. |
| (2) | Security, or a portion of the security, is on loan. |
| (3) | All or a portion of the security represents securities purchased with cash collateral received for securities on loan. |
| (4) | Rate shown is the 7-day yield as of December 31, 2020. |
See Accompanying Notes to Financial Statements
| VY® JPMorgan Small Cap Core Equity Portfolio | PORTFOLIO OF INVESTMENTS
AS OF December 31, 2020 |
| | | | | | | | Percentage |
| | | | | | | | of Net |
| Shares | | | | | Value | | | | Assets |
| COMMON STOCK: 97.3% | | | | | | | |
| | | Communication Services: 2.3% | | | | | | | |
| 2,400 | | ATN International, Inc. | | $ | 100,224 | | | | 0.0 |
| 3,400 | (1) | Cardlytics, Inc. | | | 485,418 | | | | 0.1 |
| 36,100 | (1) | Cars.com, Inc. | | | 407,930 | | | | 0.1 |
| 115,300 | (2) | Cinemark Holdings, Inc. | | | 2,007,373 | | | | 0.3 |
| 22,600 | | Cogent Communications Holdings, Inc. | | | 1,353,062 | | | | 0.2 |
| 38,900 | | EW Scripps Co. | | | 594,781 | | | | 0.1 |
| 56,200 | (1) | Fluent, Inc. | | | 298,422 | | | | 0.0 |
| 30,400 | (1) | Gray Television, Inc. | | | 543,856 | | | | 0.1 |
| 98,900 | (1) | IDT Corp. | | | 1,222,404 | | | | 0.2 |
| 39,133 | (1) | Liberty Latin America Ltd. | | | 433,985 | | | | 0.1 |
| 43,100 | (1) | Liberty Latin America Ltd. - Class A | | | 479,703 | | | | 0.1 |
| 476,300 | (1) | Liberty TripAdvisor Holdings, Inc. | | | 2,067,142 | | | | 0.3 |
| 59,100 | | Meredith Corp. | | | 1,134,720 | | | | 0.2 |
| 24,500 | (1) | Ooma, Inc. | | | 352,800 | | | | 0.1 |
| 23,100 | (2) | Sinclair Broadcast Group, Inc. | | | 735,735 | | | | 0.1 |
| 38,600 | | Spok Holdings, Inc. | | | 429,618 | | | | 0.1 |
| 31,000 | (1) | Yelp, Inc. | | | 1,012,770 | | | | 0.2 |
| | | | | | 13,659,943 | | | | 2.3 |
| | | | | | | | | | |
| | | Consumer Discretionary: 10.1% | | | | | | | |
| 6,950 | (1) | Aaron’s Co., Inc./The | | | 131,772 | | | | 0.0 |
| 52,341 | | Acushnet Holdings Corp. | | | 2,121,904 | | | | 0.4 |
| 36,500 | (1) | Adient plc | | | 1,269,105 | | | | 0.2 |
| 73,200 | (1) | American Axle & Manufacturing Holdings, Inc. | | | 610,488 | | | | 0.1 |
| 6,300 | (1) | American Public Education, Inc. | | | 192,024 | | | | 0.0 |
| 14,900 | (2) | Bed Bath & Beyond, Inc. | | | 264,624 | | | | 0.0 |
| 11,600 | | Big Lots, Inc. | | | 497,988 | | | | 0.1 |
| 39,000 | | Bloomin Brands, Inc. | | | 757,380 | | | | 0.1 |
| 6,900 | | Boyd Gaming Corp. | | | 296,148 | | | | 0.1 |
| 16,781 | (1) | Bright Horizons Family Solutions, Inc. | | | 2,902,945 | | | | 0.5 |
| 19,000 | | Brinker International, Inc. | | | 1,074,830 | | | | 0.2 |
| 55,598 | | Brunswick Corp. | | | 4,238,792 | | | | 0.7 |
| 23,400 | (1) | Caesars Entertainment, Inc. | | | 1,737,918 | | | | 0.3 |
| 24,251 | | Carter’s, Inc. | | | 2,281,292 | | | | 0.4 |
| 22,900 | | Cooper Tire & Rubber Co. | | | 927,450 | | | | 0.2 |
| 29,600 | | Core-Mark Holding Co., Inc. | | | 869,352 | | | | 0.1 |
| 86,100 | | Dana, Inc. | | | 1,680,672 | | | | 0.3 |
| 11,850 | (1) | Deckers Outdoor Corp. | | | 3,398,343 | | | | 0.6 |
| 4,400 | (2) | Dillards, Inc. | | | 277,420 | | | | 0.0 |
| 8,800 | | Dine Brands Global, Inc. | | | 510,400 | | | | 0.1 |
| 14,100 | (1) | Genesco, Inc. | | | 424,269 | | | | 0.1 |
| 13,440 | (1) | Groupon, Inc. | | | 510,653 | | | | 0.1 |
| 38,800 | | Guess?, Inc. | | | 877,656 | | | | 0.1 |
| 2,800 | (1) | Helen of Troy Ltd. | | | 622,132 | | | | 0.1 |
| 22,400 | (1) | Hibbett Sports, Inc. | | | 1,034,432 | | | | 0.2 |
| 16,600 | | Hooker Furniture Corp. | | | 535,350 | | | | 0.1 |
| 203,300 | (1) | Houghton Mifflin Harcourt Co. | | | 676,989 | | | | 0.1 |
| 17,900 | | KB Home | | | 600,008 | | | | 0.1 |
| 27,236 | | LCI Industries | | | 3,531,964 | | | | 0.6 |
| 39,860 | (1) | Leslie’s, Inc. | | | 1,106,115 | | | | 0.2 |
| 43,000 | | Lifetime Brands, Inc. | | | 653,600 | | | | 0.1 |
| 27,200 | (2) | Macy’s, Inc. | | | 306,000 | | | | 0.1 |
| 13,100 | (1) | MarineMax, Inc. | | | 458,893 | | | | 0.1 |
| 8,600 | | Marriott Vacations Worldwide Corp. | | | 1,180,092 | | | | 0.2 |
| 9,600 | (1) | Meritage Homes Corp. | | | 795,072 | | | | 0.1 |
| 19,943 | (1)
| Monarch Casino & Resort, Inc. | | | 1,220,910 | | | | 0.2 |
| 23,800 | | Movado Group, Inc. | | | 395,556 | | | | 0.1 |
| 31,780 | (1)
| National Vision Holdings, Inc. | | | 1,439,316 | | | | 0.2 |
| 22,796 | | ODP Corp./The | | | 667,923 | | | | 0.1 |
| 5,400 | (1),(2) | Overstock.com, Inc. | | | 259,038 | | | | 0.0 |
| 17,192 | (1)
| Penn National Gaming, Inc. | | | 1,484,873 | | | | 0.3 |
| 29,606 | (1) | Planet Fitness, Inc. | | | 2,298,314 | | | | 0.4 |
| 6,860 | | Pool Corp. | | | 2,555,350 | | | | 0.4 |
| 44,400 | | Rent-A-Center, Inc. | | | 1,700,076 | | | | 0.3 |
| 10,100 | (1) | Scientific Games Corp. | | | 419,049 | | | | 0.1 |
| 26,900 | | Signet Jewelers Ltd. | | | 733,563 | | | | 0.1 |
| 32,600 | (1)
| Taylor Morrison Home Corp. | | | 836,190 | | | | 0.1 |
| 19,510 | | Thor Industries, Inc. | | | 1,814,235 | | | | 0.3 |
| 11,900 | (1)
| Tupperware Brands Corp. | | | 385,441 | | | | 0.1 |
| 13,700 | (1)
| Universal Electronics, Inc. | | | 718,702 | | | | 0.1 |
| 110,509 | | Wendy’s Company | | | 2,422,357 | | | | 0.4 |
| 13,400 | (1) | WW International, Inc. | | | 326,960 | | | | 0.1 |
| 17,100 | (1) | Zumiez, Inc. | | | 628,938 | | | | 0.1 |
| | | | | | 59,660,863 | | | | 10.1 |
| | | | | | | | | | |
| | | Consumer Staples: 3.6% | | | | | | | |
| 2,500 | | Andersons, Inc. | | | 61,275 | | | | 0.0 |
| 113,306 | (1) | BJ’s Wholesale Club Holdings, Inc. | | | 4,224,048 | | | | 0.7 |
| 6,800 | | Bunge Ltd. | | | 445,944 | | | | 0.1 |
| 14,733 | | Casey’s General Stores, Inc. | | | 2,631,608 | | | | 0.5 |
| 26,000 | (1) | Central Garden & Pet Co. - Class A - CENTA | | | 944,580 | | | | 0.2 |
| 600 | | Coca-Cola Consolidated, Inc. | | | 159,762 | | | | 0.0 |
| 25,900 | | Edgewell Personal Care Co. | | | 895,622 | | | | 0.2 |
| 2,900 | | Medifast, Inc. | | | 569,386 | | | | 0.1 |
| 150,873 | (1) | Performance Food Group Co. | | | 7,183,064 | | | | 1.2 |
| 7,800 | | Pricesmart, Inc. | | | 710,502 | | | | 0.1 |
| 171,462 | | Primo Water Corp. | | | 2,688,524 | | | | 0.5 |
| 1,800 | | Sanderson Farms, Inc. | | | 237,960 | | | | 0.0 |
| 4,900 | (1) | Seneca Foods Corp. | | | 195,510 | | | | 0.0 |
| | | | | | 20,947,785 | | | | 3.6 |
| | | | | | | | | | |
| | | Energy: 1.4% | | | | | | | |
| 9,800 | | Arch Resources, Inc. | | | 428,946 | | | | 0.1 |
| 62,100 | | Berry Corp. | | | 228,528 | | | | 0.0 |
| 6,400 | (1) | Bonanza Creek Energy, Inc. | | | 123,712 | | | | 0.0 |
| 18,400 | | Cactus, Inc. | | | 479,688 | | | | 0.1 |
| 4,500 | (1) | ChampionX Corp. | | | 68,850 | | | | 0.0 |
| 18,200 | (1) | CNX Resources Corp. | | | 196,560 | | | | 0.0 |
| 16,300 | | CVR Energy, Inc. | | | 242,870 | | | | 0.1 |
| 31,300 | (1) | Dorian L.P.G Ltd. | | | 381,547 | | | | 0.1 |
| 61,600 | | Falcon Minerals Corp. | | | 194,040 | | | | 0.0 |
| 13,100 | (1) | Green Plains, Inc. | | | 172,527 | | | | 0.0 |
See Accompanying Notes to Financial Statements
| VY® JPMorgan Small Cap Core Equity Portfolio | PORTFOLIO OF INVESTMENTS
AS OF December 31, 2020 (Continued) |
| 13,200 | (1) | Helix Energy Solutions Group, Inc. | | | 55,440 | | | | 0.0 |
| 71,600 | (1) | Magnolia Oil & Gas Corp. | | | 505,496 | | | | 0.1 |
| 35,700 | (1),(2) | Matador Resources Co. | | | 430,542 | | | | 0.1 |
| 17,600 | (1) | National Energy Services Reunited Corp. | | | 174,768 | | | | 0.0 |
| 48,400 | (1) | NexTier Oilfield Solutions, Inc. | | | 166,496 | | | | 0.0 |
| 32,800 | (1) | Oil States International, Inc. | | | 164,656 | | | | 0.0 |
| 23,700 | (1) | Par Pacific Holdings, Inc. | | | 331,326 | | | | 0.1 |
| 27,800 | | Patterson-UTI Energy, Inc. | | | 146,228 | | | | 0.0 |
| 29,300 | (1) | PDC Energy, Inc. | | | 601,529 | | | | 0.1 |
| 32,600 | (1) | Renewable Energy Group, Inc. | | | 2,308,732 | | | | 0.4 |
| 1,400 | (1) | REX American Resources Corp. | | | 102,858 | | | | 0.0 |
| 92,400 | (1) | Select Energy Services, Inc. | | | 378,840 | | | | 0.1 |
| 39,500 | | Solaris Oilfield Infrastructure, Inc. | | | 321,530 | | | | 0.1 |
| 5,300 | (1) | Talos Energy, Inc. | | | 43,672 | | | | 0.0 |
| | | | | | 8,249,381 | | | | 1.4 |
| | | | | | | | | | |
| | | Financials: 16.5% | | | | | | | |
| 11,700 | (1) | Ambac Financial Group, Inc. | | | 179,946 | | | | 0.0 |
| 14,400 | | American Equity Investment Life Holding Co. | | | 398,304 | | | | 0.1 |
| 8,782 | | Ameris Bancorp. | | | 334,331 | | | | 0.1 |
| 16,300 | | Apollo Commercial Real Estate Finance, Inc. | | | 182,071 | | | | 0.0 |
| 13,900 | | Ares Commercial Real Estate Corp. | | | 165,549 | | | | 0.0 |
| 8,300 | | Argo Group International Holdings Ltd. | | | 362,710 | | | | 0.1 |
| 3,500 | | Artisan Partners Asset Management, Inc. | | | 176,190 | | | | 0.0 |
| 62,183 | (1) | Assetmark Financial Holdings, Inc. | | | 1,504,829 | | | | 0.3 |
| 13,500 | | Associated Banc-Corp. | | | 230,175 | | | | 0.0 |
| 38,400 | (1) | Bancorp, Inc. | | | 524,160 | | | | 0.1 |
| 37,300 | | Bank of NT Butterfield & Son Ltd. | | | 1,162,268 | | | | 0.2 |
| 88,158 | | BankUnited, Inc. | | | 3,066,135 | | | | 0.5 |
| 5,800 | | Bar Harbor Bankshares | | | 131,022 | | | | 0.0 |
| 11,400 | | Blackstone Mortgage Trust, Inc. | | | 313,842 | | | | 0.1 |
| 54,300 | (1) | Blucora, Inc. | | | 863,913 | | | | 0.2 |
| 7,700 | | Brightsphere Investment Group, Inc. | | | 148,456 | | | | 0.0 |
| 7,700 | | Business First Bancshares, Inc. | | | 156,772 | | | | 0.0 |
| 2,400 | (1) | California BanCorp | | | 37,344 | | | | 0.0 |
| 2,900 | (1) | Capital Bancorp, Inc. | | | 40,397 | | | | 0.0 |
| 6,500 | | Capstar Financial Holdings, Inc. | | | 95,875 | | | | 0.0 |
| 6,500 | | Cathay General Bancorp. | | | 209,235 | | | | 0.0 |
| 1,400 | | CB Financial Services, Inc. | | | 28,014 | | | | 0.0 |
| – | | Central Valley Community Bancorp | | | – | | | | – |
| 29,100 | | CNO Financial Group, Inc. | | | 646,893 | | | | 0.1 |
| 2,900 | | Cohen & Steers, Inc. | | | 215,470 | | | | 0.0 |
| 8,800 | | Colony Credit Real Estate, Inc. | | | 66,000 | | | | 0.0 |
| 43,471 | | Commerce Bancshares, Inc. | | | 2,856,045 | | | | 0.5 |
| 1,247 | | Community Trust Bancorp, Inc. | | | 46,201 | | | | 0.0 |
| 62,200 | | ConnectOne Bancorp, Inc. | | | 1,230,938 | | | | 0.2 |
| 20,200 | | Cowen, Inc. | | | 524,998 | | | | 0.1 |
| 26,230 | | Cullen/Frost Bankers, Inc. | | | 2,288,043 | | | | 0.4 |
| 28,600 | (1) | Customers Bancorp, Inc. | | | 519,948 | | | | 0.1 |
| 16,240 | | Eaton Vance Corp. | | | 1,103,183 | | | | 0.2 |
| 1,600 | | Ellington Financial, Inc. | | | 23,744 | | | | 0.0 |
| 9,400 | (1) | Enova International, Inc. | | | 232,838 | | | | 0.0 |
| 1,300 | | Enterprise Financial Services Corp. | | | 45,435 | | | | 0.0 |
| 1,900 | | ESSA Bancorp, Inc. | | | 28,500 | | | | 0.0 |
| 29,000 | | Essent Group Ltd. | | | 1,252,800 | | | | 0.2 |
| 39,700 | | Federated Hermes, Inc. | | | 1,146,933 | | | | 0.2 |
| 7,200 | | FedNat Holding Co. | | | 42,624 | | | | 0.0 |
| 14,600 | | Financial Institutions, Inc. | | | 328,500 | | | | 0.1 |
| 142,700 | | First BanCorp. Puerto Rico | | | 1,315,694 | | | | 0.2 |
| 3,600 | | First Bank/Hamilton NJ | | | 33,768 | | | | 0.0 |
| 3,700 | | First Business Financial Services, Inc. | | | 68,117 | | | | 0.0 |
| 1,300 | | First Choice Bancorp | | | 24,037 | | | | 0.0 |
| 2,800 | | First Community Bancshares, Inc. | | | 60,424 | | | | 0.0 |
| 95,897 | | First Financial Bancorp. | | | 1,681,074 | | | | 0.3 |
| 105,887 | | First Hawaiian, Inc. | | | 2,496,815 | | | | 0.4 |
| 314,810 | | First Horizon Corp. | | | 4,016,976 | | | | 0.7 |
| 4,600 | | First Internet Bancorp | | | 132,204 | | | | 0.0 |
| 36,100 | | Flagstar Bancorp, Inc. | | | 1,471,436 | | | | 0.3 |
| 75,191 | (1) | Focus Financial Partners, Inc. | | | 3,270,808 | | | | 0.6 |
| 1,400 | | FS Bancorp, Inc. | | | 76,720 | | | | 0.0 |
| 6,700 | | Granite Point Mortgage Trust, Inc. | | | 66,933 | | | | 0.0 |
| 2,100 | | Great Ajax Corp. | | | 21,966 | | | | 0.0 |
| 5,300 | | Great Southern Bancorp., Inc. | | | 259,170 | | | | 0.1 |
| 16,900 | (1) | Green Dot Corp. | | | 943,020 | | | | 0.2 |
| 19,200 | | Hancock Whitney Corp. | | | 653,184 | | | | 0.1 |
| 27,050 | | Hanmi Financial Corp. | | | 306,747 | | | | 0.1 |
| 9,500 | | HBT Financial, Inc. | | | 143,925 | | | | 0.0 |
| 3,500 | | Heritage Insurance Holdings, Inc. | | | 35,455 | | | | 0.0 |
| 21,400 | | Hilltop Holdings, Inc. | | | 588,714 | | | | 0.1 |
| 7,600 | | HomeStreet, Inc. | | | 256,500 | | | | 0.1 |
| 1,900 | | Horace Mann Educators Corp. | | | 79,876 | | | | 0.0 |
| 7,100 | | Investar Holding Corp. | | | 117,434 | | | | 0.0 |
| 173,500 | | Investors Bancorp, Inc. | | | 1,832,160 | | | | 0.3 |
| 3,500 | | James River Group Holdings Ltd. | | | 172,025 | | | | 0.0 |
| 26,100 | | Kearny Financial Corp./MD | | | 275,616 | | | | 0.1 |
| 14,952 | | Kinsale Capital Group, Inc. | | | 2,992,344 | | | | 0.5 |
| 3,700 | | KKR Real Estate Finance Trust, Inc. | | | 66,304 | | | | 0.0 |
| 60,100 | | Ladder Capital Corp. | | | 587,778 | | | | 0.1 |
| 86,642 | | Lazard Ltd. | | | 3,664,957 | | | | 0.6 |
| 9,800 | | Luther Burbank Corp. | | | 96,040 | | | | 0.0 |
See Accompanying Notes to Financial Statements
| VY® JPMorgan Small Cap Core Equity Portfolio | PORTFOLIO OF INVESTMENTS
AS OF December 31, 2020 (Continued) |
| – | | Macatawa Bank Corp. | | | – | | | | – |
| 2,300 | | Meridian Corp. | | | 47,840 | | | | 0.0 |
| 3,000 | (1) | Metropolitan Bank Holding Corp. | | | 108,810 | | | | 0.0 |
| 43,200 | | MGIC Investment Corp. | | | 542,160 | | | | 0.1 |
| 2,500 | | Mid Penn Bancorp, Inc. | | | 54,750 | | | | 0.0 |
| 1,400 | (1) | MMA Capital Holdings, Inc. | | | 34,440 | | | | 0.0 |
| 64,501 | | Moelis & Co. | | | 3,016,067 | | | | 0.5 |
| 15,145 | | Morningstar, Inc. | | | 3,507,128 | | | | 0.6 |
| 33,300 | (1) | Mr Cooper Group, Inc. | | | 1,033,299 | | | | 0.2 |
| 9,900 | | Nelnet, Inc. | | | 705,276 | | | | 0.1 |
| 7,800 | | New York Mortgage Trust, Inc. | | | 28,782 | | | | 0.0 |
| 9,500 | (1) | NMI Holdings, Inc. | | | 215,175 | | | | 0.0 |
| 3,300 | | Northeast Bank | | | 74,316 | | | | 0.0 |
| 66,200 | | OceanFirst Financial Corp. | | | 1,233,306 | | | | 0.2 |
| 10,700 | | OP Bancorp | | | 82,390 | | | | 0.0 |
| 14,400 | (1) | Oportun Financial Corp. | | | 278,928 | | | | 0.1 |
| 19,525 | | PacWest Bancorp | | | 495,935 | | | | 0.1 |
| 6,200 | | Peapack-Gladstone Financial Corp. | | | 141,112 | | | | 0.0 |
| 11,000 | | PennyMac Financial Services, Inc. | | | 721,820 | | | | 0.1 |
| 47,700 | | PennyMac Mortgage Investment Trust | | | 839,043 | | | | 0.2 |
| 3,800 | | Piper Sandler Cos | | | 383,420 | | | | 0.1 |
| 24,600 | | Popular, Inc. | | | 1,385,472 | | | | 0.2 |
| 11,400 | | ProAssurance Corp. | | | 202,806 | | | | 0.0 |
| 13,900 | | PROG Holdings, Inc. | | | 748,793 | | | | 0.1 |
| 15,900 | (1) | ProSight Global, Inc. | | | 203,997 | | | | 0.0 |
| 20,300 | | Provident Bancorp, Inc. | | | 243,600 | | | | 0.1 |
| 62,900 | | Provident Financial Services, Inc. | | | 1,129,684 | | | | 0.2 |
| 49,700 | | Radian Group, Inc. | | | 1,006,425 | | | | 0.2 |
| 3,900 | | RBB Bancorp | | | 59,982 | | | | 0.0 |
| 56,600 | | Redwood Trust, Inc. | | | 496,948 | | | | 0.1 |
| 36,469 | | RLI Corp. | | | 3,798,246 | | | | 0.7 |
| 28,700 | (1) | Select Bancorp, Inc. | | | 271,789 | | | | 0.1 |
| 2,600 | | Selective Insurance Group | | | 174,148 | | | | 0.0 |
| 80,623 | (1) | Selectquote, Inc. | | | 1,672,927 | | | | 0.3 |
| 4,900 | | Shore Bancshares, Inc. | | | 71,540 | | | | 0.0 |
| 2,300 | | Sierra Bancorp. | | | 55,016 | | | | 0.0 |
| 30,971 | | Signature Bank | | | 4,190,067 | | | | 0.7 |
| 1,400 | | Standard AVB Financial Corp. | | | 45,626 | | | | 0.0 |
| 45,100 | (1),(2) | StepStone Group, Inc. | | | 1,794,980 | | | | 0.3 |
| 20,400 | | Sterling Bancorp | | | 366,792 | | | | 0.1 |
| 3,000 | | Stewart Information Services Corp. | | | 145,080 | | | | 0.0 |
| 22,750 | | Stifel Financial Corp. | | | 1,147,965 | | | | 0.2 |
| 18,100 | | Synovus Financial Corp. | | | 585,897 | | | | 0.1 |
| 21,100 | | TPG RE Finance Trust, Inc. | | | 224,082 | | | | 0.0 |
| 30,900 | | Two Harbors Investment Corp. | | | 196,833 | | | | 0.0 |
| 63,000 | | Umpqua Holdings Corp. | | | 953,820 | | | | 0.2 |
| 14,200 | | United Community Banks, Inc./GA | | | 403,848 | | | | 0.1 |
| 21,000 | | United Insurance Holdings Corp. | | | 120,120 | | | | 0.0 |
| 3,200 | | Virtus Investment Partners, Inc. | | | 694,400 | | | | 0.1 |
| 18,100 | | Walker & Dunlop, Inc. | | | 1,665,562 | | | | 0.3 |
| 60,639 | | Western Alliance Bancorp. | | | 3,635,308 | | | | 0.6 |
| 58,001 | | Wintrust Financial Corp. | | | 3,543,281 | | | | 0.6 |
| 33,200 | | Zions Bancorp NA | | | 1,442,208 | | | | 0.3 |
| | | | | | 96,940,091 | | | | 16.5 |
| | | | | | | | | | |
| | | Health Care: 16.6% | | | | | | | |
| 144,500 | (1) | Accuray, Inc. | | | 602,565 | | | | 0.1 |
| 64,000 | (1) | AdaptHealth Corp. | | | 2,403,840 | | | | 0.4 |
| 7,600 | (1) | Adaptive Biotechnologies Corp. | | | 449,388 | | | | 0.1 |
| 26,000 | (1) | Akebia Therapeutics, Inc. | | | 72,800 | | | | 0.0 |
| 21,900 | (1) | Alector, Inc. | | | 331,347 | | | | 0.1 |
| 21,100 | (1),(2) | Allogene Therapeutics, Inc. | | | 532,564 | | | | 0.1 |
| 57,900 | (1) | Alphatec Holdings, Inc. | | | 840,708 | | | | 0.1 |
| 40,500 | (1) | American Renal Associates Holdings, Inc. | | | 463,725 | | | | 0.1 |
| 44,000 | (1) | Amicus Therapeutics, Inc. | | | 1,015,960 | | | | 0.2 |
| 13,700 | (1) | AMN Healthcare Services, Inc. | | | 935,025 | | | | 0.2 |
| 37,500 | (1) | AnaptysBio, Inc. | | | 806,250 | | | | 0.1 |
| 16,900 | (1) | Apollo Medical Holdings, Inc. | | | 308,763 | | | | 0.1 |
| 67,900 | (1) | Apyx Medical Corp. | | | 488,880 | | | | 0.1 |
| 23,100 | (1) | Arrowhead Pharmaceuticals, Inc. | | | 1,772,463 | | | | 0.3 |
| 700 | (1) | Arvinas, Inc. | | | 59,451 | | | | 0.0 |
| 20,000 | (1) | Assembly Biosciences, Inc. | | | 121,000 | | | | 0.0 |
| 4,000 | (1) | Atara Biotherapeutics, Inc. | | | 78,520 | | | | 0.0 |
| 35,900 | (1) | AxoGen, Inc. | | | 642,610 | | | | 0.1 |
| 9,500 | (1),(2) | Berkeley Lights, Inc. | | | 849,395 | | | | 0.1 |
| 3,200 | (1) | Bluebird Bio, Inc. | | | 138,464 | | | | 0.0 |
| 9,400 | (1) | Blueprint Medicines Corp. | | | 1,054,210 | | | | 0.2 |
| 11,100 | (1),(2) | Bridgebio Pharma, Inc. | | | 789,321 | | | | 0.1 |
| 35,876 | | Cantel Medical Corp. | | | 2,829,181 | | | | 0.5 |
| 12,800 | (1) | Cara Therapeutics, Inc. | | | 193,664 | | | | 0.0 |
| 12,600 | (1) | CareDx, Inc. | | | 912,870 | | | | 0.2 |
| 24,666 | (1) | Catalent, Inc. | | | 2,566,991 | | | | 0.4 |
| 92,200 | (1) | Catalyst Pharmaceuticals, Inc. | | | 307,948 | | | | 0.1 |
| 42,557 | (1),(2) | Certara, Inc. | | | 1,435,022 | | | | 0.2 |
| 4,880 | | Chemed Corp. | | | 2,599,137 | | | | 0.4 |
| 28,160 | (1) | Chinook Therapeutics, Inc. | | | 446,618 | | | | 0.1 |
| 28,400 | (1) | Coherus Biosciences, Inc. | | | 493,592 | | | | 0.1 |
| 14,500 | (1) | Concert Pharmaceuticals, Inc. | | | 183,280 | | | | 0.0 |
| 900 | | Conmed Corp. | | | 100,800 | | | | 0.0 |
| 79,736 | (1) | Covetrus, Inc. | | | 2,291,613 | | | | 0.4 |
| 69,300 | (1) | Cross Country Healthcare, Inc. | | | 614,691 | | | | 0.1 |
| 37,100 | (1) | Cutera, Inc. | | | 894,481 | | | | 0.2 |
| 32,800 | (1) | Dicerna Pharmaceuticals, Inc. | | | 722,584 | | | | 0.1 |
| 62,079 | | Encompass Health Corp. | | | 5,133,313 | | | | 0.9 |
| 215,600 | (1) | Endo International PLC | | | 1,548,008 | | | | 0.3 |
| 66,079 | (1) | Envista Holdings Corp. | | | 2,228,845 | | | | 0.4 |
| 10,900 | (1),(2) | Esperion Therapeutics, Inc. | | | 283,400 | | | | 0.0 |
| 9,400 | (1) | FibroGen, Inc. | | | 348,646 | | | | 0.1 |
| 6,200 | (1) | Gritstone Oncology, Inc. | | | 24,428 | | | | 0.0 |
| 20,400 | (1) | Hanger, Inc. | | | 448,596 | | | | 0.1 |
| 44,732 | (1) | HealthEquity, Inc. | | | 3,118,268 | | | | 0.5 |
See Accompanying Notes to Financial Statements
| VY® JPMorgan Small Cap Core Equity Portfolio | PORTFOLIO OF INVESTMENTS
AS OF December 31, 2020 (Continued) |
| 46,600 | (1),(2) | Heron Therapeutics, Inc. | | | 986,289 | | | | 0.2 |
| 83,327 | (1) | HMS Holdings Corp. | | | 3,062,267 | | | | 0.5 |
| 16,900 | (1) | Homology Medicines, Inc. | | | 190,801 | | | | 0.0 |
| 29,300 | (1) | Horizon Therapeutics Plc | | | 2,143,295 | | | | 0.4 |
| 15,484 | (1) | ICU Medical, Inc. | | | 3,321,163 | | | | 0.6 |
| 19,700 | (1) | Inogen, Inc. | | | 880,196 | | | | 0.2 |
| 19,900 | (1) | Insmed, Inc. | | | 662,471 | | | | 0.1 |
| 3,500 | (1) | Integer Holdings Corp. | | | 284,165 | | | | 0.0 |
| 41,700 | (1) | Intersect ENT, Inc. | | | 954,930 | | | | 0.2 |
| 66,000 | | Invacare Corp. | | | 590,700 | | | | 0.1 |
| 17,900 | (1) | Jounce Therapeutics, Inc. | | | 125,300 | | | | 0.0 |
| 30,500 | (1),(2) | Kronos Bio, Inc. | | | 911,035 | | | | 0.2 |
| 2,800 | (1) | Kura Oncology, Inc. | | | 91,448 | | | | 0.0 |
| 175,700 | (1) | Lannett Co., Inc. | | | 1,145,564 | | | | 0.2 |
| 2,200 | (1) | LHC Group, Inc. | | | 469,304 | | | | 0.1 |
| 15,900 | (1) | Magellan Health, Inc. | | | 1,317,156 | | | | 0.2 |
| 8,800 | (1) | Mednax, Inc. | | | 215,952 | | | | 0.0 |
| 15,200 | (1) | MeiraGTx Holdings plc | | | 230,128 | | | | 0.0 |
| 20,512 | (1) | Molina Healthcare, Inc. | | | 4,362,492 | | | | 0.7 |
| 265,300 | (1) | Mustang Bio, Inc. | | | 1,004,160 | | | | 0.2 |
| 10,300 | (1) | Natera, Inc. | | | 1,025,056 | | | | 0.2 |
| 19,400 | | National Healthcare Corp. | | | 1,288,354 | | | | 0.2 |
| 17,000 | (1) | Natus Medical, Inc. | | | 340,680 | | | | 0.1 |
| 32,200 | (1) | NextGen Healthcare, Inc. | | | 587,328 | | | | 0.1 |
| 29,100 | (1) | NGM Biopharmaceuticals, Inc. | | | 881,584 | | | | 0.2 |
| 9,100 | (1) | NuVasive, Inc. | | | 512,603 | | | | 0.1 |
| 3,000 | (1) | Omnicell, Inc. | | | 360,060 | | | | 0.1 |
| 36,600 | (1) | Orthofix Medical, Inc. | | | 1,573,068 | | | | 0.3 |
| 10,000 | (1) | Outset Medical, Inc. | | | 568,400 | | | | 0.1 |
| 48,600 | | Owens & Minor, Inc. | | | 1,314,630 | | | | 0.2 |
| 40,300 | (1) | Personalis, Inc. | | | 1,475,383 | | | | 0.3 |
| 7,700 | | Phibro Animal Health Corp. | | | 149,534 | | | | 0.0 |
| 64,450 | | Premier, Inc. | | | 2,262,195 | | | | 0.4 |
| 5,107 | (1) | Progyny, Inc. | | | 216,486 | | | | 0.0 |
| 4,100 | (1) | Providence Service Corp. | | | 568,383 | | | | 0.1 |
| 2,300 | (1) | Radius Health, Inc. | | | 41,078 | | | | 0.0 |
| 3,900 | (1) | Revance Therapeutics, Inc. | | | 110,526 | | | | 0.0 |
| 6,800 | (1) | REVOLUTION Medicines, Inc. | | | 269,212 | | | | 0.0 |
| 11,300 | (1) | Rhythm Pharmaceuticals, Inc. | | | 335,949 | | | | 0.1 |
| 9,400 | (1) | Sage Therapeutics, Inc. | | | 813,194 | | | | 0.1 |
| 4,100 | (1) | Sarepta Therapeutics, Inc. | | | 699,009 | | | | 0.1 |
| 11,300 | (1) | Schrodinger, Inc./United States | | | 894,734 | | | | 0.2 |
| 14,908 | (1),(2) | Seer, Inc. | | | 836,935 | | | | 0.1 |
| 53,100 | (1) | Select Medical Holdings Corp. | | | 1,468,746 | | | | 0.2 |
| 27,500 | (1) | SI-BONE, Inc. | | | 822,250 | | | | 0.1 |
| 40,300 | (1) | Sientra, Inc. | | | 156,767 | | | | 0.0 |
| 28,633 | (1) | Spruce Biosciences, Inc. | | | 696,068 | | | | 0.1 |
| 28,100 | (1) | Surgery Partners, Inc. | | | 815,181 | | | | 0.1 |
| 5,200 | (1) | Sutro Biopharma, Inc. | | | 112,892 | | | | 0.0 |
| 51,426 | (1) | Syneos Health, Inc. | | | 3,503,653 | | | | 0.6 |
| 107,600 | (1) | Syros Pharmaceuticals, Inc. | | | 1,167,460 | | | | 0.2 |
| 10,600 | (1) | TCR2 Therapeutics, Inc. | | | 327,858 | | | | 0.1 |
| 74,200 | (1),(2) | TherapeuticsMD, Inc. | | | 89,782 | | | | 0.0 |
| 43,400 | (1) | Tivity Health, Inc. | | | 850,206 | | | | 0.1 |
| 42,000 | (1),(2) | Translate Bio, Inc. | | | 774,060 | | | | 0.1 |
| 3,300 | | Utah Medical Products, Inc. | | | 278,190 | | | | 0.0 |
| 13,400 | (1),(2) | Viela Bio, Inc. | | | 481,998 | | | | 0.1 |
| – | (1),(2) | ViewRay, Inc. | | | – | | | | – |
| 14,700 | (1),(2) | Vir Biotechnology, Inc. | | | 393,666 | | | | 0.1 |
| 39,300 | (1) | VYNE Therapeutics, Inc. | | | 62,094 | | | | 0.0 |
| 71,800 | (1) | WaVe Life Sciences Ltd. | | | 565,066 | | | | 0.1 |
| 8,500 | (1) | Xencor, Inc. | | | 370,855 | | | | 0.1 |
| 1,500 | (1) | Y-mAbs Therapeutics, Inc. | | | 74,265 | | | | 0.0 |
| 17,700 | (1) | Zogenix, Inc. | | | 353,823 | | | | 0.1 |
| 31,449 | (1),(2) | Zynerba Pharmaceuticals, Inc. | | | 103,782 | | | | 0.0 |
| | | | | | 98,025,084 | | | | 16.6 |
| | | | | | | | | | |
| | | Industrials: 18.5% | | | | | | | |
| 26,100 | | AAR Corp. | | | 945,342 | | | | 0.2 |
| 38,400 | | ABM Industries, Inc. | | | 1,453,056 | | | | 0.2 |
| 59,450 | | ACCO Brands Corp. | | | 502,352 | | | | 0.1 |
| 3,500 | | Advanced Drainage Systems, Inc. | | | 292,530 | | | | 0.0 |
| 2,900 | (1) | Aerojet Rocketdyne Holdings, Inc. | | | 153,265 | | | | 0.0 |
| 7,800 | | Alaska Air Group, Inc. | | | 405,600 | | | | 0.1 |
| 1,600 | | Albany International Corp. | | | 117,472 | | | | 0.0 |
| 5,100 | | Allegiant Travel Co. | | | 965,124 | | | | 0.2 |
| 59,965 | | Altra Industrial Motion Corp. | | | 3,323,860 | | | | 0.6 |
| 44,420 | | Applied Industrial Technologies, Inc. | | | 3,464,316 | | | | 0.6 |
| 62,900 | | ArcBest Corp. | | | 2,683,943 | | | | 0.5 |
| 44,100 | | Argan, Inc. | | | 1,962,009 | | | | 0.3 |
| 24,900 | (1) | Astronics Corp. | | | 329,427 | | | | 0.1 |
| 43,300 | (1) | Atkore International Group, Inc. | | | 1,780,063 | | | | 0.3 |
| 900 | (1) | Atlas Air Worldwide Holdings, Inc. | | | 49,086 | | | | 0.0 |
| 9,700 | | Barnes Group, Inc. | | | 491,693 | | | | 0.1 |
| 20,500 | | Barrett Business Services, Inc. | | | 1,398,305 | | | | 0.2 |
| 14,000 | (1) | Beacon Roofing Supply, Inc. | | | 562,660 | | | | 0.1 |
| 13,500 | (1) | BMC Stock Holdings, Inc. | | | 724,680 | | | | 0.1 |
| 13,600 | | Boise Cascade Co. | | | 650,080 | | | | 0.1 |
| 48,144 | | Brady Corp. | | | 2,542,966 | | | | 0.4 |
| 7,600 | | Brink’s Co. | | | 547,200 | | | | 0.1 |
| 40,800 | (1) | Builders FirstSource, Inc. | | | 1,665,048 | | | | 0.3 |
| 33,619 | (1) | Casella Waste Systems, Inc. | | | 2,082,697 | | | | 0.4 |
| 15,300 | (1) | CBIZ, Inc. | | | 407,133 | | | | 0.1 |
| 3,000 | (1) | CIRCOR International, Inc. | | | 115,320 | | | | 0.0 |
| 15,300 | | Columbus McKinnon Corp. | | | 588,132 | | | | 0.1 |
| 19,500 | | Comfort Systems USA, Inc. | | | 1,026,870 | | | | 0.2 |
| 26,441 | | CoreLogic, Inc. | | | 2,044,418 | | | | 0.3 |
| 33,500 | (1) | Cornerstone Building Brands, Inc. | | | 310,880 | | | | 0.1 |
| 71,200 | | Costamare, Inc. | | | 589,536 | | | | 0.1 |
| 35,072 | | Douglas Dynamics, Inc. | | | 1,500,029 | | | | 0.3 |
| 7,100 | (1) | Ducommun, Inc. | | | 381,270 | | | | 0.1 |
| 5,800 | (1) | Echo Global Logistics, Inc. | | | 155,556 | | | | 0.0 |
| 12,400 | | EMCOR Group, Inc. | | | 1,134,104 | | | | 0.2 |
See Accompanying Notes to Financial Statements
| VY® JPMorgan Small Cap Core Equity Portfolio | PORTFOLIO OF INVESTMENTS
AS OF December 31, 2020 (Continued) |
| 15,091 | | Fortune Brands Home & Security, Inc. | | | 1,293,600 | | | | 0.2 |
| 92,757 | (1) | Gates Industrial Corp. PLC | | | 1,183,579 | | | | 0.2 |
| 4,400 | (1) | Gencor Industries, Inc. | | | 54,120 | | | | 0.0 |
| 2,600 | (1) | Generac Holdings, Inc. | | | 591,266 | | | | 0.1 |
| 5,500 | (1) | Gibraltar Industries, Inc. | | | 395,670 | | | | 0.1 |
| 32,900 | (1) | GMS, Inc. | | | 1,002,792 | | | | 0.2 |
| 61,900 | (1) | Great Lakes Dredge & Dock Corp. | | | 815,223 | | | | 0.1 |
| 18,300 | | Heidrick & Struggles International, Inc. | | | 537,654 | | | | 0.1 |
| 12,900 | | Herman Miller, Inc. | | | 436,020 | | | | 0.1 |
| 12,100 | | HNI Corp. | | | 416,966 | | | | 0.1 |
| 25,700 | (1) | HUB Group, Inc. | | | 1,464,900 | | | | 0.2 |
| 65,681 | (1) | IAA, Inc. | | | 4,267,951 | | | | 0.7 |
| 4,700 | | Insperity, Inc. | | | 382,674 | | | | 0.1 |
| 12,900 | | KAR Auction Services, Inc. | | | 240,069 | | | | 0.0 |
| 22,700 | | Kelly Services, Inc. | | | 466,939 | | | | 0.1 |
| 13,100 | | Kforce, Inc. | | | 551,379 | | | | 0.1 |
| 62,291 | | Knight-Swift Transportation Holdings, Inc. | | | 2,605,010 | | | | 0.4 |
| 47,600 | | Knoll, Inc. | | | 698,768 | | | | 0.1 |
| 51,200 | | Korn Ferry | | | 2,227,200 | | | | 0.4 |
| 19,670 | | Landstar System, Inc. | | | 2,648,762 | | | | 0.4 |
| 39,832 | | Lincoln Electric Holdings, Inc. | | | 4,630,470 | | | | 0.8 |
| 23,400 | (1) | Manitowoc Co., Inc./The | | | 311,454 | | | | 0.1 |
| 22,900 | (1) | Mastec, Inc. | | | 1,561,322 | | | | 0.3 |
| 21,500 | (1) | Meritor, Inc. | | | 600,065 | | | | 0.1 |
| 2,800 | | Moog, Inc. | | | 222,040 | | | | 0.0 |
| 29,804 | | MSA Safety, Inc. | | | 4,452,420 | | | | 0.8 |
| 6,200 | | Mueller Industries, Inc. | | | 217,682 | | | | 0.0 |
| 6,836 | | Nordson Corp. | | | 1,373,694 | | | | 0.2 |
| 61,300 | (1) | NOW, Inc. | | | 440,134 | | | | 0.1 |
| 5,400 | | Park Aerospace Corp. | | | 72,414 | | | | 0.0 |
| 3,200 | | Park-Ohio Holdings Corp. | | | 98,880 | | | | 0.0 |
| 4,100 | | Powell Industries, Inc. | | | 120,909 | | | | 0.0 |
| 28,600 | | Primoris Services Corp. | | | 789,646 | | | | 0.1 |
| 51,000 | | Quad/Graphics, Inc. | | | 194,820 | | | | 0.0 |
| 15,900 | | Quanex Building Products Corp. | | | 352,503 | | | | 0.1 |
| 25,888 | (1) | RBC Bearings, Inc. | | | 4,634,988 | | | | 0.8 |
| 46,800 | | Steelcase, Inc. | | | 634,140 | | | | 0.1 |
| 31,881 | (1) | Stericycle, Inc. | | | 2,210,310 | | | | 0.4 |
| 38,800 | (1) | Sterling Construction Co., Inc. | | | 722,068 | | | | 0.1 |
| 11,200 | (1) | Team, Inc. | | | 122,080 | | | | 0.0 |
| 54,300 | | Terex Corp. | | | 1,894,527 | | | | 0.3 |
| 69,945 | | Toro Co. | | | 6,633,584 | | | | 1.1 |
| 12,400 | (1) | TriNet Group, Inc. | | | 999,440 | | | | 0.2 |
| 9,200 | | Triumph Group, Inc. | | | 115,552 | | | | 0.0 |
| 29,100 | (1) | TrueBlue, Inc. | | | 543,879 | | | | 0.1 |
| 25,900 | (1) | Tutor Perini Corp. | | | 335,405 | | | | 0.1 |
| 4,400 | | UFP Industries, Inc. | | | 244,420 | | | | 0.0 |
| 11,800 | (1) | Vectrus, Inc. | | | 586,696 | | | | 0.1 |
| 10,000 | (1) | Veritiv Corp. | | | 207,900 | | | | 0.0 |
| 167,873 | (1) | Welbilt, Inc. | | | 2,215,924 | | | | 0.4 |
| 38,200 | (1) | Wesco International, Inc. | | | 2,998,700 | | | | 0.5 |
| 202,017 | (1) | WillScot Mobile Mini Holdings Corp. | | | 4,680,734 | | | | 0.8 |
| 33,259 | | Woodward, Inc. | | | 4,041,966 | | | | 0.7 |
| | | | | | 108,887,330 | | | | 18.5 |
| | | | | | | | | | |
| | | Information Technology: 14.0% | | | | | | | |
| 3,800 | (1) | ACI Worldwide, Inc. | | | 146,034 | | | | 0.0 |
| 7,300 | (1) | Advanced Energy Industries, Inc. | | | 707,881 | | | | 0.1 |
| 53,395 | (1),(2) | Allegro MicroSystems, Inc. | | | 1,423,511 | | | | 0.2 |
| 37,700 | (1) | Alpha & Omega Co. | | | 891,228 | | | | 0.2 |
| 22,300 | | American Software, Inc. | | | 382,891 | | | | 0.1 |
| 39,500 | | Amkor Technology, Inc. | | | 595,660 | | | | 0.1 |
| 4,100 | (1),(2) | Appian Corp. | | | 664,569 | | | | 0.1 |
| 14,900 | (1) | Asana, Inc. | | | 440,295 | | | | 0.1 |
| 20,191 | (1) | Aspen Technology, Inc. | | | 2,629,878 | | | | 0.5 |
| 55,100 | (1) | Avaya Holdings Corp. | | | 1,055,165 | | | | 0.2 |
| 21,839 | | Badger Meter, Inc. | | | 2,054,176 | | | | 0.4 |
| 27,600 | | Bel Fuse, Inc. | | | 414,828 | | | | 0.1 |
| 61,800 | | Benchmark Electronics, Inc. | | | 1,669,218 | | | | 0.3 |
| 16,000 | (2) | Bentley Systems, Inc. | | | 648,160 | | | | 0.1 |
| 11,270 | (1) | Bill.com Holdings, Inc. | | | 1,538,355 | | | | 0.3 |
| 7,100 | (1) | Cerence, Inc. | | | 713,408 | | | | 0.1 |
| 4,700 | (1) | Ciena Corp. | | | 248,395 | | | | 0.0 |
| 25,263 | | CMC Materials, Inc. | | | 3,822,292 | | | | 0.7 |
| 51,100 | (1) | Cornerstone OnDemand, Inc. | | | 2,250,444 | | | | 0.4 |
| 57,100 | (1) | Diebold Nixdorf, Inc. | | | 608,686 | | | | 0.1 |
| 15,000 | (1) | Digital Turbine, Inc. | | | 848,400 | | | | 0.1 |
| 18,272 | (1) | Duck Creek Technologies, Inc. | | | 791,178 | | | | 0.1 |
| 119,200 | (1) | eGain Corp. | | | 1,407,752 | | | | 0.2 |
| 35,531 | (1) | Envestnet, Inc. | | | 2,923,846 | | | | 0.5 |
| 29,200 | (1) | Evo Payments, Inc. | | | 788,692 | | | | 0.1 |
| 115,500 | (1) | Extreme Networks, Inc. | | | 795,795 | | | | 0.1 |
| 13,900 | (1) | Fabrinet | | | 1,078,501 | | | | 0.2 |
| 36,500 | (1) | GSI Technology, Inc. | | | 270,100 | | | | 0.0 |
| 22,140 | (1) | Guidewire Software, Inc. | | | 2,850,082 | | | | 0.5 |
| 15,300 | (1) | Ichor Holdings Ltd. | | | 461,219 | | | | 0.1 |
| 3,400 | (1) | Itron, Inc. | | | 326,060 | | | | 0.1 |
| 14,600 | (1) | j2 Global, Inc. | | | 1,426,274 | | | | 0.2 |
| 4,600 | (1),(2) | JFrog Ltd. | | | 289,018 | | | | 0.1 |
| 52,200 | | KBR, Inc. | | | 1,614,546 | | | | 0.3 |
| 4,975 | (1) | Kimball Electronics, Inc. | | | 79,550 | | | | 0.0 |
| 63,264 | (1) | Medallia, Inc. | | | 2,101,630 | | | | 0.4 |
| 21,500 | | Methode Electronics, Inc. | | | 823,020 | | | | 0.1 |
| 6,200 | (1) | MicroStrategy, Inc. | | | 2,409,010 | | | | 0.4 |
| 4,100 | (1) | Model N, Inc. | | | 146,288 | | | | 0.0 |
| 10,762 | (1),(2) | nCino, Inc. | | | 779,276 | | | | 0.1 |
| 20,500 | | NIC, Inc. | | | 529,515 | | | | 0.1 |
| 70,919 | (1) | nLight, Inc. | | | 2,315,505 | | | | 0.4 |
| 17,497 | (1) | Novanta, Inc. | | | 2,068,495 | | | | 0.4 |
| 4,000 | | NVE Corp. | | | 224,720 | | | | 0.0 |
| 29,400 | | PCTEL, Inc. | | | 193,158 | | | | 0.0 |
| 11,600 | (1) | PDF Solutions, Inc. | | | 250,560 | | | | 0.0 |
| 24,800 | | Perspecta, Inc. | | | 597,184 | | | | 0.1 |
| 93,200 | (1) | Photronics, Inc. | | | 1,040,112 | | | | 0.2 |
| 50,580 | | Power Integrations, Inc. | | | 4,140,479 | | | | 0.7 |
| 14,412 | (1),(2) | PubMatic, Inc. | | | 402,960 | | | | 0.1 |
| 40,419 | (1) | Q2 Holdings, Inc. | | | 5,114,216 | | | | 0.9 |
| 9,000 | (1) | Rambus, Inc. | | | 157,140 | | | | 0.0 |
| 43,548 | (1),(2) | RealPage, Inc. | | | 3,799,128 | | | | 0.6 |
| 50,000 | (1) | Rimini Street, Inc. | | | 221,500 | | | | 0.0 |
| 65,300 | (1) | Sanmina Corp. | | | 2,082,417 | | | | 0.4 |
| 31,100 | (1) | Scansource, Inc. | | | 820,418 | | | | 0.1 |
| 10,800 | | Science Applications International Corp. | | | 1,022,112 | | | | 0.2 |
| 24,500 | (1) | SMART Global Holdings, Inc. | | | 921,935 | | | | 0.2 |
| 111,683 | (1) | Startek, Inc. | | | 839,856 | | | | 0.1 |
| 30,700 | | TTEC Holdings, Inc. | | | 2,238,951 | | | | 0.4 |
See Accompanying Notes to Financial Statements
| VY® JPMorgan Small Cap Core Equity Portfolio | PORTFOLIO OF INVESTMENTS
AS OF December 31, 2020 (Continued) |
| 17,700 | (1) | Ultra Clean Holdings, Inc. | | | 551,355 | | | | 0.1 |
| 17,000 | (1) | Verint Systems, Inc. | | | 1,142,060 | | | | 0.2 |
| 33,400 | | Vishay Intertechnology, Inc. | | | 691,714 | | | | 0.1 |
| 23,100 | (1) | Vishay Precision Group, Inc. | | | 727,188 | | | | 0.1 |
| 21,948 | (1) | WEX, Inc. | | | 4,467,076 | | | | 0.8 |
| 35,200 | (1) | Zuora, Inc. | | | 490,336 | | | | 0.1 |
| | | | | | 82,165,401 | | | | 14.0 |
| | | | | | | | | | |
| | | Materials: 5.8% | | | | | | | |
| 15,200 | (1) | Alcoa Corp. | | | 350,360 | | | | 0.1 |
| 31,900 | (1) | Allegheny Technologies, Inc. | | | 534,963 | | | | 0.1 |
| 51,446 | | Aptargroup, Inc. | | | 7,042,443 | | | | 1.2 |
| 16,200 | (1) | Arconic Corp. | | | 482,760 | | | | 0.1 |
| 30,800 | | Avient Corp. | | | 1,240,624 | | | | 0.2 |
| 5,400 | | Carpenter Technology Corp. | | | 157,248 | | | | 0.0 |
| 56,100 | | Cleveland-Cliffs, Inc. | | | 816,816 | | | | 0.1 |
| 72,300 | | Commercial Metals Co. | | | 1,485,042 | | | | 0.3 |
| 25,584 | (1) | Crown Holdings, Inc. | | | 2,563,517 | | | | 0.4 |
| 15,100 | | Domtar Corp. | | | 477,915 | | | | 0.1 |
| 14,500 | | FutureFuel Corp. | | | 184,150 | | | | 0.0 |
| 75,754 | (1) | GCP Applied Technologies, Inc. | | | 1,791,582 | | | | 0.3 |
| 5,000 | | Glatfelter Corp. | | | 81,900 | | | | 0.0 |
| 8,900 | (1) | Ingevity Corp. | | | 673,997 | | | | 0.1 |
| 3,100 | | Kaiser Aluminum Corp. | | | 306,590 | | | | 0.1 |
| 32,600 | (1) | Koppers Holdings, Inc. | | | 1,015,816 | | | | 0.2 |
| 3,300 | (1) | Kraton Corp. | | | 91,707 | | | | 0.0 |
| 24,600 | | Louisiana-Pacific Corp. | | | 914,382 | | | | 0.2 |
| 5,900 | | Minerals Technologies, Inc. | | | 366,508 | | | | 0.1 |
| 9,700 | | Myers Industries, Inc. | | | 201,566 | | | | 0.0 |
| 4,900 | | Neenah, Inc. | | | 271,068 | | | | 0.0 |
| 42,200 | | O-I Glass, Inc. | | | 502,180 | | | | 0.1 |
| 23,100 | | Orion Engineered Carbons SA | | | 395,934 | | | | 0.1 |
| 79,837 | (1) | Pactiv Evergreen, Inc. | | | 1,448,243 | | | | 0.2 |
| 106,073 | | PQ Group Holdings, Inc. | | | 1,512,601 | | | | 0.3 |
| 14,109 | | Quaker Chemical Corp. | | | 3,575,079 | | | | 0.6 |
| 41,100 | | Schweitzer-Mauduit International, Inc. | | | 1,652,631 | | | | 0.3 |
| 7,400 | (1) | Summit Materials, Inc. | | | 148,592 | | | | 0.0 |
| 99,900 | | SunCoke Energy, Inc. | | | 434,565 | | | | 0.1 |
| 11,200 | | Trinseo SA | | | 573,552 | | | | 0.1 |
| 66,600 | | Tronox Holdings PLC | | | 973,692 | | | | 0.2 |
| 14,400 | (1) | US Concrete, Inc. | | | 575,568 | | | | 0.1 |
| 23,300 | | Verso Corp. | | | 280,066 | | | | 0.0 |
| 36,300 | | Warrior Met Coal, Inc. | | | 773,916 | | | | 0.1 |
| 4,100 | | Worthington Industries, Inc. | | | 210,494 | | | | 0.0 |
| | | | | | 34,108,067 | | | | 5.8 |
| | | | | | | | | | |
| | | Real Estate: 6.3% | | | | | | | |
| 9,900 | | Acadia Realty Trust | | | 140,481 | | | | 0.0 |
| 2,400 | | Agree Realty Corp. | | | 159,792 | | | | 0.0 |
| 16,200 | | Alexander & Baldwin, Inc. | | | 278,316 | | | | 0.1 |
| 4,900 | | American Assets Trust, Inc. | | | 141,512 | | | | 0.0 |
| 46,752 | | American Campus Communities, Inc. | | | 1,999,583 | | | | 0.3 |
| 28,500 | | American Finance Trust, Inc. | | | 211,755 | | | | 0.0 |
| 54,900 | | Armada Hoffler Properties, Inc. | | | 615,978 | | | | 0.1 |
| 24,800 | | Broadstone Net Lease, Inc. | | | 485,584 | | | | 0.1 |
| 4,000 | | BRT Apartments Corp. | | | 60,800 | | | | 0.0 |
| 4,700 | | CareTrust REIT, Inc. | | | 104,246 | | | | 0.0 |
| 35,400 | | CatchMark Timber Trust, Inc. | | | 331,344 | | | | 0.1 |
| 4,800 | | Centerspace | | | 339,072 | | | | 0.1 |
| 4,900 | | Chatham Lodging Trust | | | 52,920 | | | | 0.0 |
| 57,700 | | City Office REIT, Inc. | | | 563,729 | | | | 0.1 |
| 12,700 | | Columbia Property Trust, Inc. | | | 182,118 | | | | 0.0 |
| 1,200 | | Community Healthcare Trust, Inc. | | | 56,532 | | | | 0.0 |
| 4,700 | | CorePoint Lodging, Inc. | | | 32,336 | | | | 0.0 |
| 14,556 | | Cousins Properties, Inc. | | | 487,626 | | | | 0.1 |
| 100,365 | | CubeSmart | | | 3,373,268 | | | | 0.6 |
| 169,385 | (1) | Cushman & Wakefield PLC | | | 2,511,979 | | | | 0.4 |
| 36,300 | | DiamondRock Hospitality Co. | | | 299,475 | | | | 0.1 |
| 31,751 | | EastGroup Properties, Inc. | | | 4,383,543 | | | | 0.8 |
| 17,200 | | Essential Properties Realty Trust, Inc. | | | 364,640 | | | | 0.1 |
| 14,975 | | First Industrial Realty Trust, Inc. | | | 630,897 | | | | 0.1 |
| 8,700 | | Four Corners Property Trust, Inc. | | | 258,999 | | | | 0.1 |
| 2,900 | | Getty Realty Corp. | | | 79,866 | | | | 0.0 |
| 31,200 | | Gladstone Commercial Corp. | | | 561,600 | | | | 0.1 |
| 3,500 | | Global Medical REIT, Inc. | | | 45,710 | | | | 0.0 |
| 58,700 | | Global Net Lease, Inc. | | | 1,006,118 | | | | 0.2 |
| 22,700 | | Healthcare Realty Trust, Inc. | | | 671,920 | | | | 0.1 |
| 2,200 | | Highwoods Properties, Inc. | | | 87,186 | | | | 0.0 |
| 8,500 | | Hudson Pacific Properties, Inc. | | | 204,170 | | | | 0.0 |
| 800 | | Innovative Industrial Properties, Inc. | | | 146,504 | | | | 0.0 |
| 1,353 | | Jones Lang LaSalle, Inc. | | | 200,744 | | | | 0.0 |
| 5,400 | | Kite Realty Group Trust | | | 80,784 | | | | 0.0 |
| 10,700 | | Monmouth Real Estate Investment Corp. | | | 185,324 | | | | 0.0 |
| 900 | | National Health Investors, Inc. | | | 62,253 | | | | 0.0 |
| 77,436 | | National Retail Properties, Inc. | | | 3,168,681 | | | | 0.5 |
| 57,800 | | New Senior Investment Group, Inc. | | | 299,404 | | | | 0.1 |
| 113,164 | | Outfront Media, Inc. | | | 2,213,488 | | | | 0.4 |
| 21,700 | | Physicians Realty Trust | | | 386,260 | | | | 0.1 |
| 14,500 | | Piedmont Office Realty Trust, Inc. | | | 235,335 | | | | 0.0 |
| 14,900 | | Plymouth Industrial REIT, Inc. | | | 223,500 | | | | 0.0 |
| 15,300 | | PotlatchDeltic Corp. | | | 765,306 | | | | 0.1 |
| 5,100 | | QTS Realty Trust, Inc. | | | 315,588 | | | | 0.1 |
| 84,665 | (1) | Realogy Holdings Corp. | | | 1,110,805 | | | | 0.2 |
| 60,300 | | Retail Properties of America, Inc. | | | 516,168 | | | | 0.1 |
| 8,900 | | Retail Value, Inc. | | | 132,343 | | | | 0.0 |
| 2,700 | | RMR Group, Inc. | | | 104,274 | | | | 0.0 |
| 27,518 | | Ryman Hospitality Properties | | | 1,864,620 | | | | 0.3 |
See Accompanying Notes to Financial Statements
| VY® JPMorgan Small Cap Core Equity Portfolio | PORTFOLIO OF INVESTMENTS
AS OF December 31, 2020 (Continued) |
| 31,700 | | Sabra Healthcare REIT, Inc. | | | 550,629 | | | | 0.1 |
| 8,700 | | Service Properties Trust | | | 99,963 | | | | 0.0 |
| 18,200 | | SITE Centers Corp. | | | 184,184 | | | | 0.0 |
| 36,700 | | STAG Industrial, Inc. | | | 1,149,444 | | | | 0.2 |
| 9,800 | | Summit Hotel Properties, Inc. | | | 88,298 | | | | 0.0 |
| 78,903 | | Sunstone Hotel Investors, Inc. | | | 893,971 | | | | 0.2 |
| 20,700 | | Urban Edge Properties | | | 267,858 | | | | 0.1 |
| 59,900 | | Xenia Hotels & Resorts, Inc. | | | 910,480 | | | | 0.2 |
| | | | | | 36,879,303 | | | | 6.3 |
| | | | | | | | | | |
| | | Utilities: 2.2% | | | | | | | |
| 10,400 | | ALLETE, Inc. | | | 644,176 | | | | 0.1 |
| 36,800 | (1) | Atlantic Power Corp. | | | 77,280 | | | | 0.0 |
| 6,300 | | Black Hills Corp. | | | 387,135 | | | | 0.1 |
| 4,600 | | Chesapeake Utilities Corp. | | | 497,766 | | | | 0.1 |
| 36,100 | | Clearway Energy, Inc.- Class A | | | 1,066,755 | | | | 0.2 |
| 32,300 | | Clearway Energy, Inc.- Class C | | | 1,031,339 | | | | 0.2 |
| 1,800 | | Consolidated Water Co., Ltd. | | | 21,690 | | | | 0.0 |
| 5,600 | | Genie Energy Ltd. | | | 40,376 | | | | 0.0 |
| 4,400 | | Idacorp, Inc. | | | 422,532 | | | | 0.1 |
| 9,300 | | New Jersey Resources Corp. | | | 330,615 | | | | 0.0 |
| 5,300 | | Northwest Natural Holding Co. | | | 243,747 | | | | 0.0 |
| 52,854 | | NorthWestern Corp. | | | 3,081,917 | | | | 0.5 |
| 76,657 | | Portland General Electric Co. | | | 3,278,620 | | | | 0.6 |
| 10,000 | | Southwest Gas Holdings, Inc. | | | 607,500 | | | | 0.1 |
| 67,900 | | Spark Energy, Inc. | | | 649,803 | | | | 0.1 |
| 7,800 | | Spire, Inc. | | | 499,512 | | | | 0.1 |
| 7,644 | | Vistra Corp. | | | 150,281 | | | | 0.0 |
| | | | | | 13,031,044 | | | | 2.2 |
| | | | | | | | | | |
| | Total Common Stock | | | | | | | |
| | (Cost $432,989,218) | | | 572,554,292 | | | | 97.3 |
| | | | | | | | | | |
| RIGHTS: –% | | | | | | | | | |
| | | Health Care: –% | | | | | | | |
| 28,260 | (1),(3),(4) | Aduro Biotech, Inc. - CVR | | | – | | | | – |
| | | | | | | | | | |
| | Total Rights | | | | | | | |
| | (Cost $–) | | | – | | | | – |
| | | | | | | | | | |
| | Total Long-Term Investments | | | | | | | |
| | (Cost $432,989,218) | | | 572,554,292 | | | | 97.3 |
| | | | | | | | | | |
| | | | | | | | | | Percentage |
| Principal | | | | | | | | | of Net |
| Amount† | | | | | Value | | | | Assets |
| SHORT-TERM INVESTMENTS: 5.2% | | | | | | | |
| | | Repurchase Agreements: 2.5% | | | | | | | |
| 2,582,314 | (5) | Cantor Fitzgerald Securities, Repurchase Agreement dated 12/31/20, 0.07%, due 01/04/21 (Repurchase Amount $2,582,334, collateralized by various U.S. Government/U.S. Government Agency Obligations, 0.000%- 9.500%, Market Value plus accrued interest $2,633,960, due 01/25/21-10/15/62) | | | 2,582,314 | | | | 0.5 |
| 2,530,176 | (5) | Citadel Securities LLC, Repurchase Agreement dated 12/31/20, 0.13%, due 01/04/21 (Repurchase Amount $2,530,212, collateralized by various U.S. Government Securities, 0.000%- 7.875%, Market Value plus accrued interest $2,580,819, due 01/31/21-05/15/49) | | | 2,530,176 | | | | 0.4 |
| 1,352,577 | (5) | Deutsche Bank Securities Inc., Repurchase Agreement dated 12/31/20, 0.06%, due 01/04/21 (Repurchase Amount $1,352,586, collateralized by various U.S. Government/U.S. Government Agency Obligations, 0.000%- 6.500%, Market Value plus accrued interest $1,379,629, due 01/15/21-01/01/51) | | | 1,352,577 | | | | 0.2 |
| 1,123,421 | (5) | JVB Financial Group LLC, Repurchase Agreement dated 12/31/20, 0.13%, due 01/04/21 (Repurchase Amount $1,123,437, collateralized by various U.S. Government/U.S. Government Agency Obligations, 0.125%- 7.000%, Market Value plus accrued interest $1,145,889, due 07/01/22-12/01/50) | | | 1,123,421 | | | | 0.2 |
See Accompanying Notes to Financial Statements
| VY® JPMorgan Small Cap Core Equity Portfolio | PORTFOLIO OF INVESTMENTS
AS OF December 31, 2020 (Continued) |
| 1,153,678 | (5) | Mirae Asset Securities USA Inc., Repurchase Agreement dated 12/31/20, 0.13%, due 01/04/21 (Repurchase Amount $1,153,694, collateralized by various U.S. Government/U.S. Government Agency Obligations, 0.000%- 8.125%, Market Value plus accrued interest $1,176,769, due 02/18/21-01/15/62) | | | 1,153,678 | | | | 0.2 |
| 3,429,520 | (5) | RBC Dominion Securities Inc., Repurchase Agreement dated 12/31/20, 0.08%, due 01/04/21 (Repurchase Amount $3,429,550, collateralized by various U.S. Government/U.S. Government Agency Obligations, 0.000%- 6.000%, Market Value plus accrued interest $3,498,110, due 01/05/21-12/20/50) | | | 3,429,520 | | | | 0.6 |
| 2,563,025 | (5) | State of Wisconsin Investment Board, Repurchase Agreement dated 12/31/20, 0.16%, due 01/04/21 (Repurchase Amount $2,563,070, collateralized by various U.S. Government Securities, 0.125%- 3.875%, Market Value plus accrued interest $2,620,802, due 07/15/22-02/15/47) | | | 2,563,025 | | | | 0.4 |
| | | | | | | | | | |
| | | Total Repurchase Agreements | | | | | | | |
| | | (Cost $14,734,711) | | | 14,734,711 | | | | 2.5 |
| | | | | | | | | | |
| | | | | | | | | | Percentage |
| | | | | | | | | | of Net |
| Shares | | | | | Value | | | | Assets |
| | | Mutual Funds: 2.7% | | | | | | | |
| 16,106,368 | (6) | BlackRock Liquidity Funds, FedFund, Institutional Class, 0.000% | | | | | | | |
| | | (Cost $16,106,368) | | | 16,106,368 | | | | 2.7 |
| | | | | | | | | | |
| | Total Short-Term Investments | | | | | | | |
| | (Cost $30,841,079) | | | 30,841,079 | | | | 5.2 |
| | | | | | | | | | |
| | Total Investments in Securities | | | | | | | |
| | (Cost $463,830,297) | | $ | 603,395,371 | | | | 102.5 |
| | Liabilities in Excess of Other Assets | | | (14,605,009 | ) | | | (2.5) |
| | Net Assets | | $ | 588,790,362 | | | | 100.0 |
| † | Unless otherwise indicated, principal amount is shown in USD. |
| (1) | Non-income producing security. |
| (2) | Security, or a portion of the security, is on loan. |
| (3) | For fair value measurement disclosure purposes, security is categorized as Level 3, whose value was determined using significant unobservable inputs. |
| (4) | Restricted security as to resale, excluding Rule 144A securities. As of December 31, 2020, the Portfolio held restricted securities with a fair value of $– or 0.0% of net assets. Please refer to the table below for additional details. |
| (5) | All or a portion of the security represents securities purchased with cash collateral received for securities on loan. |
| (6) | Rate shown is the 7-day yield as of December 31, 2020. |
See Accompanying Notes to Financial Statements
| VY® BlackRock Inflation Protected Bond Portfolio | PORTFOLIO OF INVESTMENTS
AS OF December 31, 2020 |
| | | | | | | | Percentage |
| Principal | | | | | | | of Net |
| Amount† | | | | Value | | | Assets |
| CORPORATE BONDS/NOTES: 24.9% | | | | | |
| | | Communications: 0.7% | | | | | |
| 1,000,000 | | Alibaba Group Holding Ltd., 3.125%, 11/28/2021 | | $ | 1,019,854 | | | | 0.4 |
| 73,000 | | Charter Communications Operating LLC / Charter Communications Operating Capital, 3.850%, 04/01/2061 | | | 73,567 | | | | 0.0 |
| 201,000 | | Comcast Corp., 3.950%, 10/15/2025 | | | 231,025 | | | | 0.1 |
| 616,000 | (1) | T-Mobile USA, Inc., 3.750%, 04/15/2027 | | | 702,117 | | | | 0.2 |
| 55,000 | | Verizon Communications, Inc., 2.625%, 08/15/2026 | | | 60,283 | | | | 0.0 |
| 30,000 | | Verizon Communications, Inc., 2.650%, 11/20/2040 | | | 30,341 | | | | 0.0 |
| 75,000 | | Verizon Communications, Inc., 4.329%, 09/21/2028 | | | 90,337 | | | | 0.0 |
| | | | | | 2,207,524 | | | | 0.7 |
| | | | | | | | | | |
| | | Consumer, Cyclical: 1.9% | | | | | | | |
| 750,000 | | American Honda Finance Corp., 0.650%, 09/08/2023 | | | 754,987 | | | | 0.3 |
| 1,000,000 | | American Honda Finance Corp., 2.600%, 11/16/2022 | | | 1,042,904 | | | | 0.3 |
| 3,000,000 | (1) | BMW US Capital LLC, 3.800%, 04/06/2023 | | | 3,222,859 | | | | 1.1 |
| 150,000 | (1) | Daimler Finance North America LLC, 2.125%, 03/10/2025 | | | 157,727 | | | | 0.1 |
| 135,000 | | General Motors Financial Co., Inc., 5.200%, 03/20/2023 | | | 148,080 | | | | 0.0 |
| 79,000 | | General Motors Financial Co., Inc., 2.750%, 06/20/2025 | | | 84,528 | | | | 0.0 |
| 356,000 | | PACCAR Financial Corp., 0.800%, 06/08/2023 | | | 359,920 | | | | 0.1 |
| | | | | | 5,771,005 | | | | 1.9 |
| | | | | | | | | | |
| | | Consumer, Non-cyclical: 1.1% | | | | | | | |
| 125,000 | | Altria Group, Inc., 3.800%, 02/14/2024 | | | 136,539 | | | | 0.1 |
| 2,500,000 | | Philip Morris International, Inc., 2.625%, 03/06/2023 | | | 2,625,950 | | | | 0.9 |
| 69,000 | | Shire Acquisitions Investments Ireland DAC, 3.200%, 09/23/2026 | | | 77,229 | | | | 0.0 |
| 250,000 | | Thermo Fisher Scientific, Inc., 4.133%, 03/25/2025 | | | 284,319 | | | | 0.1 |
| | | | | | 3,124,037 | | | | 1.1 |
| | | | | | | | | | |
| | Energy: 0.9% | | | | | | | |
| 1,550,000 | | BP Capital Markets PLC, 3.561%, 11/01/2021 | | | 1,591,715 | | | | 0.5 |
| 135,000 | | Sabine Pass Liquefaction LLC, 5.625%, 03/01/2025 | | | 157,510 | | | | 0.1 |
| 1,000,000 | (1) | Schlumberger Finance Canada Ltd., 2.650%, 11/20/2022 | | | 1,037,896 | | | | 0.3 |
| | | | | | 2,787,121 | | | | 0.9 |
| | | | | | | | | | |
| | Financial: 18.2% | | | | | | | |
| 1,885,000 | (1) | AIA Group Ltd., 0.759%, (US0003M + 0.520)%, 09/20/2021 | | | 1,884,755 | | | | 0.6 |
| 1,000,000 | (1) | AIG Global Funding, 0.450%, 12/08/2023 | | | 1,000,238 | | | | 0.3 |
| 200,000 | | American Express Co., 2.500%, 08/01/2022 | | | 206,424 | | | | 0.1 |
| 2,000,000 | | American Express Co., 3.700%, 08/03/2023 | | | 2,166,681 | | | | 0.7 |
| 30,000 | | Aon Corp., 2.800%, 05/15/2030 | | | 32,765 | | | | 0.0 |
| 25,000 | (2) | Bank of America Corp., 1.898%, 07/23/2031 | | | 25,266 | | | | 0.0 |
| 2,000,000 | (2) | Bank of America Corp., 2.738%, 01/23/2022 | | | 2,002,450 | | | | 0.7 |
| 2,000,000 | (2) | Bank of America Corp., 2.816%, 07/21/2023 | | | 2,077,429 | | | | 0.7 |
| 1,000,000 | (2) | Bank of America Corp., 3.004%, 12/20/2023 | | | 1,053,405 | | | | 0.4 |
| 1,500,000 | | Bank of America Corp., 3.300%, 01/11/2023 | | | 1,590,701 | | | | 0.5 |
| 199,000 | (2) | Bank of America Corp., 3.559%, 04/23/2027 | | | 224,750 | | | | 0.1 |
| 130,000 | (2) | Bank of America Corp., 3.705%, 04/24/2028 | | | 148,028 | | | | 0.0 |
| 1,300,000 | | Bank of Montreal, 0.450%, 12/08/2023 | | | 1,304,956 | | | | 0.4 |
| 1,250,000 | (2) | Bank of New York Mellon Corp./The, 2.661%, 05/16/2023 | | | 1,288,697 | | | | 0.4 |
| 740,000 | (1) | Banque Federative du Credit Mutuel SA, 0.650%, 02/27/2024 | | | 742,319 | | | | 0.2 |
| 760,000 | (1) | Banque Federative du Credit Mutuel SA, 2.125%, 11/21/2022 | | | 785,067 | | | | 0.3 |
| 2,500,000 | (2) | Citibank NA, 2.844%, 05/20/2022 | | | 2,524,057 | | | | 0.8 |
| 3,000,000 | (2) | Citigroup, Inc., 0.776%, 10/30/2024 | | | 3,020,921 | | | | 1.0 |
| 125,000 | (2) | Citigroup, Inc., 2.666%, 01/29/2031 | | | 134,190 | | | | 0.0 |
| 4,000,000 | | Credit Suisse AG/New York NY, 1.000%, 05/05/2023 | | | 4,061,664 | | | | 1.4 |
| 161,000 | | Crown Castle International Corp., 1.350%, 07/15/2025 | | | 164,489 | | | | 0.1 |
| 118,000 | | Crown Castle International Corp., 3.700%, 06/15/2026 | | | 133,038 | | | | 0.0 |
See Accompanying Notes to Financial Statements
| VY® BlackRock Inflation Protected Bond Portfolio | PORTFOLIO OF INVESTMENTS
AS OF December 31, 2020 (Continued) |
| 200,000 | (1),(2) | Danske Bank A/S, 1.171%, 12/08/2023 | | | 200,988 | | | | 0.1 |
| 200,000 | (1) | Danske Bank A/S, 1.226%, 06/22/2024 | | | 202,915 | | | | 0.1 |
| 1,000,000 | (2) | Goldman Sachs Group, Inc./The, 2.876%, 10/31/2022 | | | 1,020,402 | | | | 0.3 |
| 2,000,000 | (2) | Goldman Sachs Group, Inc./The, 0.627%, 11/17/2023 | | | 2,008,761 | | | | 0.7 |
| 3,500,000 | | JPMorgan Chase & Co., 3.200%, 01/25/2023 | | | 3,706,061 | | | | 1.2 |
| 1,000,000 | (2) | JPMorgan Chase & Co., 3.559%, 04/23/2024 | | | 1,072,101 | | | | 0.4 |
| 241,000 | | JPMorgan Chase & Co., 3.900%, 07/15/2025 | | | 273,934 | | | | 0.1 |
| 200,000 | (2) | JPMorgan Chase & Co., 4.493%, 03/24/2031 | | | 246,281 | | | | 0.1 |
| 870,000 | (2) | KeyBank NA/Cleveland OH, 0.423%, 01/03/2024 | | | 871,218 | | | | 0.3 |
| 1,614,000 | (1) | MassMutual Global Funding II, 0.850%, 06/09/2023 | | | 1,634,209 | | | | 0.5 |
| 1,170,000 | (1) | Metropolitan Life Global Funding I, 0.900%, 06/08/2023 | | | 1,185,041 | | | | 0.4 |
| 2,000,000 | | Mitsubishi UFJ Financial Group, Inc., 3.218%, 03/07/2022 | | | 2,068,269 | | | | 0.7 |
| 1,500,000 | (2) | Mizuho Financial Group, Inc., 1.241%, 07/10/2024 | | | 1,525,157 | | | | 0.5 |
| 200,000 | (2) | Mizuho Financial Group, Inc., 3.922%, 09/11/2024 | | | 217,615 | | | | 0.1 |
| 4,000,000 | | Morgan Stanley, 2.750%, 05/19/2022 | | | 4,131,619 | | | | 1.4 |
| 72,000 | (2) | Morgan Stanley, 3.772%, 01/24/2029 | | | 83,486 | | | | 0.0 |
| 167,000 | | Morgan Stanley, 4.000%, 07/23/2025 | | | 191,237 | | | | 0.1 |
| 1,000,000 | (1) | Nationwide Building Society, 2.000%, 01/27/2023 | | | 1,032,441 | | | | 0.3 |
| 800,000 | | Sumitomo Mitsui Financial Group, Inc., 2.846%, 01/11/2022 | | | 820,288 | | | | 0.3 |
| 1,000,000 | | Sumitomo Mitsui Financial Group, Inc., 3.936%, 10/16/2023 | | | 1,096,557 | | | | 0.4 |
| 1,400,000 | (1) | Swedbank AB, 0.600%, 09/25/2023 | | | 1,403,794 | | | | 0.5 |
| 500,000 | | Truist Bank, 2.625%, 01/15/2022 | | | 511,309 | | | | 0.2 |
| 104,000 | | Wells Fargo & Co., 3.000%, 10/23/2026 | | | 115,346 | | | | 0.0 |
| 2,100,000 | | Wells Fargo & Co., 3.500%, 03/08/2022 | | | 2,177,523 | | | | 0.7 |
| 199,000 | (2) | Wells Fargo & Co., 3.584%, 05/22/2028 | | | 225,628 | | | | 0.1 |
| | | | | | 54,594,470 | | | | 18.2 |
| | | | | | | | | | |
| | | Industrial: 0.2% | | | | | | | |
| 275,000 | | Raytheon Technologies Corp., 2.250%, 07/01/2030 | | | 292,307 | | | | 0.1 |
| 150,000 | | United Parcel Service, Inc., 4.450%, 04/01/2030 | | | 187,752 | | | | 0.1 |
| | | | | | 480,059 | | | | 0.2 |
| | | | | | | | | | |
| | | Technology: 1.8% | | | | | | | |
| 1,000,000 | | Broadcom Corp. / Broadcom Cayman Finance Ltd., 2.650%, 01/15/2023 | | | 1,040,672 | | | | 0.3 |
| 10,000 | | Broadcom, Inc., 4.150%, 11/15/2030 | | | 11,583 | | | | 0.0 |
| 157,000 | | Broadcom, Inc., 4.250%, 04/15/2026 | | | 179,968 | | | | 0.1 |
| 2,275,000 | | International Business Machines Corp., 2.850%, 05/13/2022 | | | 2,356,213 | | | | 0.8 |
| 146,000 | | NVIDIA Corp., 2.850%, 04/01/2030 | | | 164,284 | | | | 0.1 |
| 500,000 | (1) | NXP BV / NXP Funding LLC / NXP USA, Inc., 3.150%, 05/01/2027 | | | 551,526 | | | | 0.2 |
| 1,000,000 | | Oracle Corp., 2.500%, 05/15/2022 | | | 1,026,893 | | | | 0.3 |
| 55,000 | | Oracle Corp., 3.600%, 04/01/2050 | | | 64,233 | | | | 0.0 |
| | | | | | 5,395,372 | | | | 1.8 |
| | | | | | | | | | |
| | | Utilities: 0.1% | | | | | | | |
| 20,000 | | Baltimore Gas and Electric Co., 2.900%, 06/15/2050 | | | 21,557 | | | | 0.0 |
| 144,000 | | Baltimore Gas and Electric Co., 3.200%, 09/15/2049 | | | 161,131 | | | | 0.1 |
| 137,000 | | Duke Energy Florida LLC, 1.750%, 06/15/2030 | | | 140,182 | | | | 0.0 |
| | | | | | 322,870 | | | | 0.1 |
| | | | | | | | | | |
| | Total Corporate Bonds/Notes | | | | | | | |
| | (Cost $73,440,633) | | | 74,682,458 | | | | 24.9 |
| MUNICIPAL BONDS: 0.0% | | | | | | | |
| | | :0.0% | | | | | | | |
| 50,000 | | State of New Jersey, 5.000%, 06/01/2025 | | | 59,533 | | | | 0.0 |
| 35,000 | | State of New Jersey, 5.000%, 06/01/2029 | | | 45,364 | | | | 0.0 |
| | Total Municipal Bonds | | | | | | | |
| | (Cost $101,108) | | | 104,897 | | | | 0.0 |
| U.S. TREASURY OBLIGATIONS: 52.3% | | | | | | | |
| | | Treasury Inflation Indexed Protected Securities: 51.8% | | | | | | | |
| 274,155 | | 0.125%,07/15/2024 | | | 293,600 | | | | 0.1 |
| 4,648,242 | | 0.125%,10/15/2024 | | | 4,984,929 | | | | 1.7 |
| 3,903,771 | | 0.125%,10/15/2025 | | | 4,245,921 | | | | 1.4 |
| 6,371,150 | | 0.125%,07/15/2026 | | | 7,008,657 | | | | 2.3 |
| 1,983,657 | | 0.125%,01/15/2030 | | | 2,213,987 | | | | 0.7 |
| 8,124,720 | | 0.125%,07/15/2030 | | | 9,118,429 | | | | 3.0 |
| 120,930 | | 0.250%,01/15/2025 | | | 130,520 | | | | 0.0 |
See Accompanying Notes to Financial Statements
| VY® BlackRock Inflation Protected Bond Portfolio | PORTFOLIO OF INVESTMENTS
AS OF December 31, 2020 (Continued) |
| 2,427,835 | | 0.250%,07/15/2029 | | | 2,749,598 | | | | 0.9 |
| 2,790,292 | | 0.250%,02/15/2050 | | | 3,330,354 | | | | 1.1 |
| 11,189 | | 0.375%,07/15/2023 | | | 11,854 | | | | 0.0 |
| 2,992,105 | | 0.375%,07/15/2025 | | | 3,287,129 | | | | 1.1 |
| 8,492,845 | | 0.375%,01/15/2027 | | | 9,480,328 | | | | 3.2 |
| 9,346,047 | | 0.375%,07/15/2027 | | | 10,518,489 | | | | 3.5 |
| 8,674,428 | | 0.500%,01/15/2028 | | | 9,839,450 | | | | 3.3 |
| 22,224 | | 0.625%,04/15/2023 | | | 23,404 | | | | 0.0 |
| 8,137,308 | | 0.625%,01/15/2026 | | | 9,085,461 | | | | 3.0 |
| 3,539,250 | | 0.625%,02/15/2043 | | | 4,416,218 | | | | 1.5 |
| 8,381,626 | | 0.750%,07/15/2028 | | | 9,751,904 | | | | 3.3 |
| 4,683,998 | | 0.750%,02/15/2042 | | | 5,967,564 | | | | 2.0 |
| 5,086,542 | (3) | 0.750%,02/15/2045 | | | 6,566,646 | | | | 2.2 |
| 2,770,812 | | 0.875%,01/15/2029 | | | 3,257,646 | | | | 1.1 |
| 2,087,265 | | 0.875%,02/15/2047 | | | 2,809,471 | | | | 0.9 |
| 3,423,198 | | 1.000%,02/15/2046 | | | 4,673,593 | | | | 1.6 |
| 2,819,333 | | 1.000%,02/15/2048 | | | 3,929,478 | | | | 1.3 |
| 2,519,689 | | 1.000%,02/15/2049 | | | 3,552,364 | | | | 1.2 |
| 3,843,374 | | 1.375%,02/15/2044 | | | 5,539,994 | | | | 1.9 |
| 2,789,112 | (3) | 1.750%,01/15/2028 | | | 3,422,334 | | | | 1.1 |
| 3,896,432 | | 2.000%,01/15/2026 | | | 4,634,049 | | | | 1.6 |
| 1,892,977 | | 2.125%,02/15/2040 | | | 2,934,253 | | | | 1.0 |
| 2,514,820 | | 2.125%,02/15/2041 | | | 3,947,211 | | | | 1.3 |
| 3,663,106 | | 2.375%,01/15/2027 | | | 4,555,460 | | | | 1.5 |
| 2,146,656 | | 2.500%,01/15/2029 | | | 2,821,003 | | | | 0.9 |
| 1,863,052 | | 3.375%,04/15/2032 | | | 2,839,673 | | | | 1.0 |
| 986,881 | | 3.625%,04/15/2028 | | | 1,357,314 | | | | 0.5 |
| 1,153,101 | | 3.875%,04/15/2029 | | | 1,662,130 | | | | 0.6 |
| | | | | | 154,960,415 | | | | 51.8 |
| | | | | | | | | | |
| | | U.S. Treasury Bonds: 0.5% | | | | | | | |
| 430,000 | | 1.375%,11/15/2040 | | | 424,524 | | | | 0.1 |
| 345,000 | | 1.375%,08/15/2050 | | | 322,467 | | | | 0.1 |
| 790,000 | (3) | 1.125%,08/15/2040 | | | 746,921 | | | | 0.3 |
| | | | | | 1,493,912 | | | | 0.5 |
| | | | | | | | | | |
| | Total U.S. Treasury Obligations | | | | | | | |
| | (Cost $136,842,924) | | | 156,454,327 | | | | 52.3 |
| | | | | | | | | | |
| U.S. GOVERNMENT AGENCY OBLIGATIONS: 7.9% | | | | | | | |
| | | Federal Home Loan Bank: 2.5% | | | | | | | |
| 5,255,000 | | 2.875%,09/13/2024 | | | 5,764,486 | | | | 1.9 |
| 1,515,000 | | 3.250%,11/16/2028 | | | 1,812,179 | | | | 0.6 |
| | | | | | 7,576,665 | | | | 2.5 |
| | | | | | | | | | |
| | | Federal Home Loan Mortgage Corporation: 0.3%(4) | | | | | | | |
| | | | | | | | | | |
| 805,000 | | 2.375%,01/13/2022 | | | 823,662 | | | | 0.3 |
| | | | | | | | | | |
| | | Federal National Mortgage Association: 4.3%(4) | | | | | | | |
| 4,830,000 | | 1.875%,09/24/2026 | | | 5,223,936 | | | | 1.7 |
| 7,120,000 | | 2.625%,09/06/2024 | | | 7,744,950 | | | | 2.6 |
| | | | | | 12,968,886 | | | | 4.3 |
| | | | | | | | | | |
| | | Other U.S. Agency Obligations: 0.8% | | | | | | | |
| 2,190,000 | | 2.875%,12/21/2023 | | | 2,360,459 | | | | 0.8 |
| | | | | | | | | | |
| | Total U.S. Government Agency Obligations | | | | | | | |
| | (Cost $21,579,251) | | | 23,729,672 | | | | 7.9 |
| | | | | | | | | | |
| SOVEREIGN BONDS: 6.0% | | | | | | | |
| 170,000 | | Colombia Government International Bond,3.000%, 01/30/2030 | | | 178,481 | | | | 0.1 |
| 2,500,000 | | Israel Government AID Bond, 5.500%, 04/26/2024 | | | 2,919,424 | | | | 1.0 |
| EUR 1,736,933 | (1) | Italy Buoni Poliennali Del Tesoro, 1.300%, 05/15/2028 | | | 2,382,047 | | | | 0.8 |
| JPY 329,954,880 | | Japanese Government CPI Linked Bond, 0.100%, 03/10/2028 | | | 3,205,440 | | | | 1.1 |
| JPY 249,752,500 | | Japanese Government CPI Linked Bond, 0.100%, 03/10/2029 | | | 2,431,129 | | | | 0.8 |
| 200,000 | | Mexico Government International Bond, 2.659%, 05/24/2031 | | | 205,210 | | | | 0.1 |
| 135,000 | | Mexico Government International Bond, 4.500%, 04/22/2029 | | | 158,743 | | | | 0.0 |
| NZD 1,335,000 | | New Zealand Government Bond, 1.750%, 05/15/2041 | | | 947,519 | | | | 0.3 |
| NZD 2,055,000 | | New Zealand Government Inflation Linked Bond, 2.500%, 09/20/2035 | | | 2,223,883 | | | | 0.7 |
| NZD 1,158,000 | | New Zealand Government Inflation Linked Bond, 2.000%, 09/20/2025 | | | 1,036,109 | | | | 0.3 |
| 60,000 | | Panama Government International Bond, 4.500%, 04/01/2056 | | | 77,550 | | | | 0.0 |
| EUR 720,000 | (1) | Spain Government Bond, 0.500%, 04/30/2030 | | | 922,101 | | | | 0.3 |
| EUR 435,000 | (1) | Spain Government Bond, 1.000%, 10/31/2050 | | | 550,556 | | | | 0.2 |
| EUR 533,965 | (1) | Spain Government Inflation Linked Bond, 1.000%, 11/30/2030 | | | 783,645 | | | | 0.3 |
| | | | | | | | | | |
| | | Total Sovereign Bonds | | | | | | | |
| | | (Cost $16,136,655) | | | 18,021,837 | | | | 6.0 |
| | | | | | | | | | |
| COMMERCIAL MORTGAGE-BACKED SECURITIES: 1.5% | | | | | | | |
| 366,000 | | BANK 2019-BNK23 A3, 2.920%, 11/15/2029 | | | 409,326 | | | | 0.1 |
| 1,000,000 | | BENCHMARK 2018-B3 A5 Mortgage Trust, 4.025%, 04/10/2051 | | | 1,176,279 | | | | 0.4 |
| 350,000 | | Benchmark 2019-B15 A5 Mortgage Trust, 2.928%, 12/15/2072 | | | 390,479 | | | | 0.1 |
| 500,000 | | CD 2017-CD6 Mortgage Trust A5, 3.456%, 11/13/2050 | | | 570,017 | | | | 0.2 |
| 1,000,000 | | GS Mortgage Securities Trust 2017-GS7 A4, 3.430%, 08/10/2050 | | | 1,142,776 | | | | 0.4 |
| 700,000 | | Wells Fargo Commercial Mortgage Trust 2017-C39 A5, 3.418%, 09/15/2050 | | | 795,896 | | | | 0.3 |
| | | | | | | | | | |
| | Total Commercial Mortgage- Backed Securities | | | | | | | |
| | (Cost $3,957,294) | | | 4,484,773 | | | | 1.5 |
See Accompanying Notes to Financial Statements
| VY® BlackRock Inflation Protected Bond Portfolio | PORTFOLIO OF INVESTMENTS
AS OF December 31, 2020 (Continued) |
| ASSET-BACKED SECURITIES: 0.4% | | | | | | | |
| | | Student Loan Asset-Backed Securities: 0.4% | | | | | | | |
| 260,000 | (1) | Navient Student Loan Trust 2019-BA A2A, 3.390%, 12/15/2059 | | | 272,740 | | | | 0.1 |
| 800,000 | (1) | Sofi Professional Loan Program 2018-C A2FX Trust, 3.590%, 01/25/2048 | | | 830,883 | | | | 0.3 |
| | | | | | | | | | |
| | Total Asset-Backed Securities | | | | | | | |
| | (Cost $1,067,761) | | | 1,103,623 | | | | 0.4 |
| | | | | | | | | | |
| | | | | | | | | | Percentage |
| | | | | | | | | | of Net |
| | | | | | Value | | | | Assets |
| PURCHASED OPTIONS (5): 0.4% | | | | | | | |
| | Total Purchased Options | | | | | | | |
| | (Cost $1,009,060) | | | 1,018,633 | | | | 0.4 |
| | | | | | | | | | |
| | Total Long-Term Investments | | | | | | | |
| | (Cost $254,134,686) | | | 279,600,220 | | | | 93.4 |
| | | | | | | | | | |
| | | | | | | | | | Percentage |
| | | | | | | | | | of Net |
| Shares | | | | | Value | | | | Assets |
| SHORT-TERM INVESTMENTS: 4.8% | | | | | | | |
| | | Mutual Funds: 4.8% | | | | | | | |
| 14,416,461 | (6) | BlackRock Liquidity Funds, FedFund, Institutional Class, 0.000% | | | | | | | |
| | | (Cost $14,416,461) | | | 14,416,461 | | | | 4.8 |
| | | | | | | | | | |
| | Total Short-Term Investments | | | | | | | |
| | (Cost $14,416,461) | | | 14,416,461 | | | | 4.8 |
| | | | | | | | | |
| | Total Investments in Securities | | | | | | | |
| | (Cost $268,551,147) | | $ | 294,016,681 | | | | 98.2 |
| | Assets in Excess of Other Liabilities | | | 5,485,361 | | | | 1.8 |
| | Net Assets | | $ | 299,502,042 | | | | 100.0 |
| † | Unless otherwise indicated, principal amount is shown in USD. |
| (1) | Securities with purchases pursuant to Rule 144A or section 4(a)(2), under the Securities Act of 1933 and may not be resold subject to that rule except to qualified institutional buyers. |
| (2) | Variable rate security. Rate shown is the rate in effect as of December 31, 2020. |
| (3) | All or a portion of this security has been pledged as collateral in connection with open futures contracts. Please refer to Note 2 for additional details. |
| (4) | The Federal Housing Finance Agency (“FHFA”) placed the Federal Home Loan Mortgage Corporation and Federal National Mortgage Association into conservatorship with FHFA as the conservator. As such, the FHFA oversees the continuing affairs of these companies. |
| (5) | The tables within the Portfolio of Investments detail open purchased options which are non-income producing securities. |
| (6) | Rate shown is the 7-day yield as of December 31, 2020. |
Currency Abbreviations:
EUR EU Euro
JPY Japanese Yen
NZD New Zealand Dollar
Reference Rate Abbreviations:
US0003M 3-month LIBOR
See Accompanying Notes to Financial Statements
Item 7. Disclosure of Proxy Voting Policies and Procedures for Closed-End Management Investment Companies.
Not applicable.
Item 8. Portfolio Managers of Closed-End Management Investment Companies.
Not applicable.
Item 9. Purchases of Equity Securities by Closed-End Management Investment Company and Affiliated Purchasers.
Not applicable.
Item 10. Submission of Matters to a Vote of Security Holders.
Not applicable.
Item 11. Controls and Procedures.
| (a) | Based on our evaluation conducted within 90 days of the filing date, hereof, the design and operation of the registrant’s disclosure controls and procedures are effective to ensure that material information relating to the registrant is made known to the certifying officers by others within the appropriate entities, particularly during the period in which Forms N-CSR are being prepared, and the registrant’s disclosure controls and procedures allow timely preparation and review of the information for the registrant’s Form N-CSR and the officer certifications of such Form N-CSR. |
| (b) | There were no significant changes in the registrant’s internal controls that occurred during the second fiscal quarter of the period covered by this report that has materially affected, or is reasonably likely to materially affect, the registrant’s internal control over financial reporting. |
Item 12. Disclosure of Securities Lending Activities for Closed-End Management Investment Companies.
Not applicable.
Item 13. Exhibits.
SIGNATURES
Pursuant to the requirements of the Securities Exchange Act of 1934 and the Investment Company Act of 1940, the registrant has duly caused this report to be signed on its behalf by the undersigned, thereunto duly authorized.
(Registrant): Voya Investors Trust
| By | /s/ Michael Bell | |
| | Michael Bell | |
| | Chief Executive Officer | |
Date: March 10, 2021
Pursuant to the requirements of the Securities Exchange Act of 1934 and the Investment Company Act of 1940, this report has been signed below by the following persons on behalf of the registrant and in the capacities and on the dates indicated.
| By | /s/ Michael Bell | |
| | Michael Bell | |
| | Chief Executive Officer | |
Date: March 10, 2021
| By | /s/ Todd Modic | |
| | Todd Modic | |
| | Senior Vice President and Chief Financial Officer | |
Date: March 10, 2021


![[MISSING IMAGE: ing_cov.jpg]](https://capedge.com/proxy/N-CSR/0001104659-21-033960/ing_cov.jpg)
![[MISSING IMAGE: voya_covinvmgt.jpg]](https://capedge.com/proxy/N-CSR/0001104659-21-033960/voya_covinvmgt.jpg)
![[MISSING IMAGE: ph_dinasantoro-bw.jpg]](https://capedge.com/proxy/N-CSR/0001104659-21-033960/ph_dinasantoro-bw.jpg)
![[MISSING IMAGE: tm211583d1-lc_fibw.jpg]](https://capedge.com/proxy/N-CSR/0001104659-21-033960/tm211583d1-lc_fibw.jpg)
![[MISSING IMAGE: tm211583d1-lc_hybw.jpg]](https://capedge.com/proxy/N-CSR/0001104659-21-033960/tm211583d1-lc_hybw.jpg)
![[MISSING IMAGE: tm211583d1-lc_lcgbw.jpg]](https://capedge.com/proxy/N-CSR/0001104659-21-033960/tm211583d1-lc_lcgbw.jpg)
![[MISSING IMAGE: tm211583d1-lc_lcvbw.jpg]](https://capedge.com/proxy/N-CSR/0001104659-21-033960/tm211583d1-lc_lcvbw.jpg)
![[MISSING IMAGE: tm211583d8-lc_maturitybw.jpg]](https://capedge.com/proxy/N-CSR/0001104659-21-033960/tm211583d8-lc_maturitybw.jpg)
![[MISSING IMAGE: tm211583d1-lc_ussbw.jpg]](https://capedge.com/proxy/N-CSR/0001104659-21-033960/tm211583d1-lc_ussbw.jpg)
![[MISSING IMAGE: tm211583-lc_crepbw.jpg]](https://capedge.com/proxy/N-CSR/0001104659-21-033960/tm211583-lc_crepbw.jpg)
![[MISSING IMAGE: tm211583d1-lc_jpmscceqbw.jpg]](https://capedge.com/proxy/N-CSR/0001104659-21-033960/tm211583d1-lc_jpmscceqbw.jpg)