UNITED STATES
SECURITIES AND EXCHANGE COMMISSION
Washington, D.C. 20549
FORM N-CSR
CERTIFIED SHAREHOLDER REPORT OF REGISTERED
MANAGEMENT INVESTMENT COMPANIES
Investment Company Act file number 811-5639
Pacholder High Yield Fund, Inc
(Exact name of registrant as specified in charter)
| | |
| 8044 Montgomery Road, Ste. 555, Cincinnati, OH | | 45236 |
| (Address of principal executive offices) | | (Zip code) |
William J. Morgan
8044 Montgomery Road, Ste. 555
Cincinnati, OH 45236
(Name and address of agent for service)
Registrant’s telephone number, including area code: 513-985-3200
Date of fiscal year end: December 31, 2006
Date of reporting period: January 1, 2006 through June 30, 2006
| Item 1. | Reports to Stockholders. |
PACHOLDER HIGH YIELD FUND, INC. (Unaudited)
Dear Stockholders:
Second Quarter Review
The Pacholder High Yield Fund, Inc. (the “Fund”) carried over the momentum from the first quarter of 2006 with strong relative performance versus the high yield market in the second quarter of 2006. For the quarter ended June 30, 2006, the Fund returned +2.53% (net of expenses, preferred stock dividends and the effect of the Fund’s leveraged capital structure), and the Fund’s portfolio returned +2.60% (gross of leverage, fees and expenses). This compares favorably to the average total return of all closed-end high yield funds of -0.13%, as reported by Morningstar, and the +0.40% return of the Credit Suisse First Boston High Yield Index, Developed Countries Only (the “Index”) for the quarter. The Fund’s NAV performance for the first half of the year also compares favorably to the average total return of all closed-end high yield funds as reported by Morningstar (+8.70% versus +3.10%). The Fund’s portfolio return of +7.61% also outperformed the Index’s return of +3.44% for the six-month period ended June 30, 2006.
The drivers of the strong relative performance of the Fund’s portfolio in the second quarter were similar to the first quarter, namely the Fund’s underweight position in BB-rated securities (BB-rated securities provided lower returns than the high yield market as a whole during the quarter) and the very strong returns of several individual securities, primarily distressed securities that the Fund purchased for total return.
The solid performance from the first quarter of 2006 carried through the beginning of the second quarter as the Index posted a +0.67% return in April. This momentum noticeably slowed in May when the Index posted a +0.26% return as the high yield market reacted to tumbling equity markets and inflation news that raised the prospect of continued rate increases by the Fed. This slowdown turned into an outright decline in June as the Index posted its first negative monthly return of the year, -0.54%. Results for the high yield market in July and the first half of August have been positive as the market reacted to more benign inflation news that suggested that the Fed might be finished with its cycle of rate increases.
High yield issuers generally continue to report stable or improving results, and, with the consensus estimate of a 2006 GDP growth rate in the range of 3.0% to 3.5%, we expect this trend to continue for the balance of the year. Nevertheless, we do expect certain industries, such as auto suppliers, to continue to face more challenging conditions going forward and for more issuers to report negative surprises as the rate of economic growth slows. The trailing 12-month default rate for below-investment-grade issuers, as measured by Moody’s Investors Service, dropped from 1.8% at the end of 2005 to 1.7% in July 2006. Although Moody’s initially expected defaults to rise to 3.0% by the end of 2006, Moody’s has revised the expected 2006 default rate downward to 2.1%, well below the historical average. Continued economic growth, strong corporate profits, low relative interest rates and abundant liquidity available in the capital markets have combined to keep the default rate low thus far in this economic cycle.
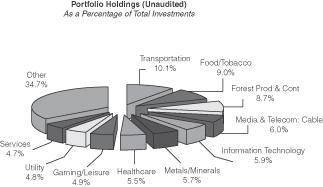
The second quarter showed mixed performance as 12 out of 19 of the Index’s industry sectors posted positive returns. Industry sectors that performed relatively well during the quarter were Transportation (Auto), Retail, Financial and Cable. Sectors that provided weak relative performance included Energy, Forest Products/Containers and Utility; the Energy and Utility sectors traditionally have had higher quality issuers, which are more interest rate sensitive and were affected more by the rising interest rates during the quarter. The Fund’s portfolio is well diversified, with investments in 172 issuers in 19 different industries. As of June 30, 2006, the Fund’s largest industry sector concentration was in Transportation (Auto), which accounted for 10.14% the portfolio’s market value as of that date (see Figure 1 — Portfolio Holdings). We increased our exposure in this sector over the past few quarters when the sector came under pressure in the market due to a number of downgrades of issuers from investment grade status, including General Motors, Ford and Lear.
The modest correction in the high yield market during the second quarter of 2006 was evident in the Index’s average price, yield and spread over Treasuries. For the quarter, the average price of the Index dropped 1.63 points from 97.66 to 96.03, the average yield rose 55 basis points from 8.17% to 8.72% and the spread over the comparable Treasury increased by 24 basis points from 335 to 359 basis points.
Except for February and July, the high yield market saw a steady supply of new issues in the first seven months of 2006, including a number of companies that sought to lock in long-term debt at relatively low interest rates to refinance existing debt with higher interest rates. Although this refinancing is fundamentally positive for the companies able to lower their cost of debt, it continued the trend towards refinancing high coupon bonds held by investors, including the Fund, and replacing them with lower coupon bonds or bank debt. Generally, issuers refinancing at lower yields lower the yield earned by the Fund and other high yield investors. In addition, the dividend rate on the Fund’s preferred stock has risen as the Fed has raised short-term interest rates at 17 consecutive meetings, which also reduces income available for dividends to common shareholders. The principal factors that determine the income available for common shares are the yield on the Fund’s investment portfolio, the cost of the preferred share dividends and the Fund’s expenses. It generally has been the Fund’s policy to maintain a level monthly dividend on the Fund’s common shares at approximately the level of net income estimated to be available to
PACHOLDER HIGH YIELD FUND, INC. (Unaudited)
common shareholders over the near-term time horizon (with the Fund’s investment advisory fee at the 0.90% midpoint of the “fulcrum fee”).
Second quarter returns for the broad equity indices were mostly negative. The Russell 2000 returned - -4.98%, the S&P 500 returned -1.44%, the NASDAQ Composite returned -7.01%, and the Dow returned +0.94%.
Portfolio Strategy and Outlook
The Fund continues to pursue the dual investment strategy of upgrading the credit profile of its portfolio while selectively investing in total return opportunities. In response to the rise in interest rates, we have increased the Fund’s allocation in 2005 and 2006 to investments whose coupons are variable and will rise in an increasing short-term rate environment, such as floating rate notes or bank loans. Looking ahead, we believe that the underlying fundamentals in the high yield market generally continue to be positive in the near term, although probably not as positive as they have been for the past three years. We believe that the near-term expectations for continued, although slowing, economic growth, moderate interest rates, moderate inflation and below-average default rates are likely to produce an environment that is favorable to high yield credit. As the rate of economic growth slows, the potential for negative surprises grows.
Although we retain a positive near term outlook, we think that it is prudent to continue to upgrade the credit quality of the portfolio and reduce exposure to securities that we think have a greater potential for credit volatility and do not offer commensurate return potential. Because the strength and duration of the economic expansion is not known, we will continue to adjust the composition of the portfolio gradually over time, predicated on bottom-up fundamental analysis of the individual issuers and securities available in the market.
As always, we appreciate your interest in the Fund and look forward to your continued support.
Sincerely,

William J. Morgan
President
August 16, 2006
Figure 1
PACHOLDER HIGH YIELD FUND, INC.
Statement of Net Assets Applicable to Common Stockholders
June 30, 2006 (Unaudited)
| | | | | | | |
| Description | | Par (000) | | Value | | Percent
of Net
Assets* | |
| | | | | | | | |
CORPORATE DEBT SECURITIES — 145.5% | | | | | |
AEROSPACE — 5.4% | | | | | |
American Airlines, Inc., Private Placement, Notes, 3.363%, 10/18/09 | | $989 | | $821,152 | | 0.7 | % |
American Airlines, Inc., Pass Thru Cert, 9.71%, 1/2/07 | | 214 | | 214,595 | | 0.2 | |
American Airlines, Inc., Collateral Trust Notes, 10.18%, 1/2/13 | | 300 | | 288,750 | | 0.2 | |
Continental Airlines, Inc., Series 01-1 Pass Thru Cert, 7.033%, 6/15/11 | | 194 | | 189,213 | | 0.2 | |
Continental Airlines, Inc., Pass Thru Cert, 9.798%, 4/1/21 | | 1,947 | | 2,034,688 | | 1.7 | |
DRS Technologies, Inc., Sr Nt, 6.625%, 2/1/16 | | 500 | | 483,750 | | 0.4 | |
Northwest Airlines Corp., Co Guar, 10%, 2/1/096 | | 800 | | 386,000 | | 0.3 | |
Northwest Airlines Corp., Bank Debt, 12.05%, 10/1/10 | | 1,000 | | 1,030,000 | | 0.9 | |
Wyle Laboratories, Inc., 1st Lien Bank Debt, 7.88%, 2/4/11 | | 474 | | 479,043 | | 0.4 | |
Wyle Laboratories, Inc., 2nd Lien Bank Debt, 11.63%, 8/4/11 | | 500 | | 505,000 | | 0.4 | |
| | | | |
| |
|
|
| | | | | 6,432,191 | | 5.4 | |
CHEMICALS — 3.5% | | | | | |
Basell Term Loan B, Bank Debt, 7.727%, 9/30/13 | | 482 | | 488,868 | | 0.4 | |
Basell Term Loan C, Bank Debt, 8.227%, 9/30/14 | | 482 | | 488,868 | | 0.4 | |
Koppers Industry, Inc., Sec’d Nt, 9.875%, 10/15/13 | | 119 | | 127,626 | | 0.1 | |
OM Group, Sr Sub Nt, 9.25%, 12/15/11 | | 1,000 | | 1,030,000 | | 0.9 | |
Tronox Worldwide/Finance, Sr Nt, 9.5%, 12/1/122 | | 2,000 | | 2,060,000 | | 1.7 | |
| | | | |
| |
|
|
| | | | | 4,195,362 | | 3.5 | |
CONSUMER PRODUCTS — 5.2% | | | | | |
Broder Bros. Co., Sr Nt, 11.25%, 10/15/10 | | 1,835 | | 1,706,550 | | 1.4 | |
Fedders NA, Sr Nt, 9.875%, 3/1/14 | | 1,250 | | 978,125 | | 0.8 | |
General Nutrition Center, Sr Sub Nt, 8.5%, 12/1/10 | | 875 | | 846,562 | | 0.7 | |
General Nutrition Center, Sr Nt, 8.625, 1/15/11 | | 250 | | 250,313 | | 0.2 | |
| | | | | | | |
| Description | | Par (000) | | Value | | Percent
of Net
Assets* | |
| | | | | | | | |
CONSUMER PRODUCTS (continued) | | | | | |
Gregg Appliances, Inc., Sr Nt, 9%, 2/1/13 | | $1,950 | | $1,798,875 | | 1.5 | % |
K2 Corp., Sr Nt, 7.375%, 7/1/14 | | 500 | | 480,000 | | 0.4 | |
Levi Straus and Co., FRN, Sr Nt, 9.74%, 4/1/12 | | 200 | | 203,500 | | 0.2 | |
Westpoint Stevens, Inc., Sr Nt, 7.875%, 6/15/051,4,9 | | 1,000 | | 100 | | 0.0 | |
| | | | |
| |
|
|
| | | | | 6,264,025 | | 5.2 | |
ENERGY — 6.5% | | | | | |
Chart Industries, Inc., Sr Sub Nt, 9.125%, 10/15/152 | | 1,400 | | 1,428,000 | | 1.2 | |
El Paso Corp., Sr Nt, 7.875%, 6/15/12 | | 1,250 | | 1,271,875 | | 1.1 | |
Hanover Compressor, Sr Nt, 7.5%, 4/15/13 | | 500 | | 490,000 | | 0.4 | |
Secunda Int’l, Ltd., FRN, Sec'd, 13.068%, 9/1/12 | | 1,500 | | 1,567,500 | | 1.3 | |
Targa Resources, Inc., L/C Commitment, 5.374%, 10/31/12 | | 145 | | 146,613 | | 0.1 | |
Targa Resources, Inc., Term Loan, 7.47%, 10/31/12 | | 600 | | 606,305 | | 0.5 | |
Transmontaigne, Inc., Sr Sub Nt,
9.125%, 6/1/10 | | 1,900 | | 2,023,500 | | 1.7 | |
Verasun Energy Corp., Sr Unsec’d Nt,
9.875%, 12/15/122 | | 250 | | 263,750 | | 0.2 | |
| | | | |
| |
|
|
| | | | | 7,797,543 | | 6.5 | |
FINANCE — 4.1% | | | | | | | |
Crum & Forster Holding, Inc., Sr Nt,
10.375%, 6/15/13 | | 1,410 | | 1,434,675 | | 1.2 | |
Fairfax Financial, Nt, Add-on 7.75%, 4/26/126 | | 1,750 | | 1,522,500 | | 1.3 | |
Swett & Crawford, 1st Lien Bank Debt,
7.827%, 11/16/11 | | 499 | | 498,750 | | 0.4 | |
Swett & Crawford, 2nd Lien Bank Debt,
11.827%, 11/16/12 | | 500 | | 500,000 | | 0.4 | |
Thornburg Mortgage, Sr Nt, 8%, 5/15/13 | | 1,000 | | 985,000 | | 0.8 | |
| | | | |
| |
|
|
| | | | | 4,940,925 | | 4.1 | |
FOOD & DRUG — 0.7% | | | | | | | |
Southern States Coop, Inc., Sr Nt,
10.5%, 10/15/102 | | 750 | | 783,750 | | 0.7 | |
| | | | |
| |
|
|
| | | | | 783,750 | | 0.7 | |
3
PACHOLDER HIGH YIELD FUND, INC.
Statement of Net Assets Applicable to Common Stockholders (continued)
June 30, 2006 (Unaudited)
| | | | | | | |
| Description | | Par (000) | | Value | | Percent
of Net
Assets* | |
| | | | | | | | |
FOOD & TOBACCO — 13.6% | | | | | | | |
Alliance One, Nt, 11%, 5/15/12 | | $2,400 | | $2,280,000 | | 1.9 | % |
Alliance One, Nt, 12.75%, 11/15/12 | | 150 | | 141,000 | | 0.1 | |
Chiquita Brands Int’l, Inc., Sr Nt,
8.875%, 12/1/156 | | 1,999 | | 1,769,115 | | 1.5 | |
Cosan SA Industria, Sr Nt, 9%, 11/1/092 | | 300 | | 313,500 | | 0.3 | |
Dole Foods Co., Sr Nt, 8.625%, 5/1/09 | | 1,000 | | 955,000 | | 0.8 | |
EPL Finance Corp., Sr Nt, 11.75%, 11/15/132 | | 750 | | 856,875 | | 0.7 | |
Eurofresh, Inc., Nt, 11.5%, 11/15/132 | | 1,500 | | 1,470,000 | | 1.2 | |
Gold Kist, Inc., Sr Nt, 10.25%, 3/15/14 | | 789 | | 822,532 | | 0.7 | |
Golden State Foods, Sr Sub Nt,
9.24%, 1/10/128,9 | | 1,250 | | 1,271,875 | | 1.1 | |
National Beef Packaging, Sr Nt, 10.5%, 8/1/11 | | 1,500 | | 1,515,000 | | 1.3 | |
National Wine & Spirits, Inc., Sr Nt,
10.125%, 1/15/09 | | 1,975 | | 1,975,000 | | 1.6 | |
Reynolds American, Inc., Nt, 7.625%, 6/1/162 | | 500 | | 488,750 | | 0.4 | |
Sbarro, Inc., Sr Nt, 11%, 9/15/096 | | 1,500 | | 1,528,125 | | 1.3 | |
Swift and Co., Sr Nt, 10.125%, 10/1/09 | | 250 | | 254,375 | | 0.2 | |
Swift and Co., Sr Sub Nt, 12.5%, 1/1/106 | | 530 | | 527,350 | | 0.4 | |
Tom’s Foods, Inc., Sr Nt, 10.5%, 11/1/041,3,4 | | 907 | | 79,345 | | 0.1 | |
| | | | |
| |
|
|
| | | | | 16,247,842 | | 13.6 | |
FOREST PRODUCTS & CONTAINERS — 13.0% | | | | | |
Abitibi-Consolidated Inc., Sr Nt,
8.375%, 4/1/156 | | 1,000 | | 912,500 | | 0.8 | |
Ainsworth Lumber, Sr Nt, 6.75%, 3/15/14 | | 1,000 | | 760,000 | | 0.6 | |
Ainsworth Lumber, Co Guar, 7.25%, 10/1/12 | | 750 | | 615,000 | | 0.5 | |
Ainsworth Lumber, FRN, Sr Nt,
9.499%, 4/1/132 | | 250 | | 227,500 | | 0.2 | |
Appleton Papers, Sr Sub Nt, 9.75%, 6/15/14 | | 500 | | 505,000 | | 0.4 | |
Buckeye Cellulose Corp., Sr Sub Nt,
9.25%, 9/15/08 | | 1,000 | | 997,500 | | 0.8 | |
Cascades, Inc., Sr Nt, 7.25%, 2/15/13 | | 1,500 | | 1,387,500 | | 1.2 | |
Constar International, FRN, Nt,
8.545%, 2/15/12 | | 750 | | 731,250 | | 0.6 | |
| | | | | | | |
| Description | | Par (000) | | Value | | Percent
of Net
Assets* | |
| | | | | | | | |
FOREST PRODUCTS & CONTAINERS (continued) | | | |
Constar International, Sr Sub Nt, 11%, 12/1/126 | | $1,725 | | $1,293,750 | | 1.1 | % |
Domtar, Inc., Nt, 7.875%, 10/15/11 | | 2,000 | | 1,880,000 | | 1.6 | |
Graphic Packaging Corp., Sr Sub Nt, 8.5%, 8/15/116 | | 500 | | 498,750 | | 0.4 | |
Graphic Packaging Corp., Sr Sub Nt, 9.5%, 8/15/136 | | 572 | | 566,280 | | 0.5 | |
Norske Skog, Sr Nt, 8.625%, 6/15/11 | | 1,000 | | 975,000 | | 0.8 | |
Plastipak Holdings, Inc., Sr Nt, 8.5%, 12/15/152 | | 200 | | 200,000 | | 0.2 | |
Portola Packaging Inc., Sr Nt, 8.25%, 2/1/126 | | 2,725 | | 2,302,625 | | 1.9 | |
Stone Container, Sr Nt, 9.75%, 2/1/11 | | 1,504 | | 1,545,360 | | 1.3 | |
Tembec Industries, Sr Unsec’d Nt, 8.625%, 6/30/096 | | 320 | | 175,200 | | 0.1 | |
| | | | |
| |
|
|
| | | | | 15,573,215 | | 13.0 | |
GAMING & LEISURE — 7.0% | | | | | |
Inn of the Mountain Gods, Sr Nt, 12%, 11/15/10 | | 2,175 | | 2,310,937 | | 1.9 | |
Venetian Macau Term Loan B, Bank Debt, 8.1%, 4/6/13 | | 1,333 | | 1,333,333 | | 1.1 | |
Venetian Macau Delayed Draw, Bank Debt, 1.375%, 4/6/11 | | 667 | | 663,333 | | 0.6 | |
Majestic Star Casino, Co Guar, 9.5%, 10/15/10 | | 500 | | 523,750 | | 0.4 | |
Pokagon Gaming Authority, Sr Nt, 10.375%, 6/15/142 | | 250 | | 258,438 | | 0.2 | |
Six Flags Entertainment Corp., Sr Nt, 9.75%, 4/15/13 | | 250 | | 229,688 | | 0.2 | |
Six Flags Entertainment Corp., Sr Nt, 9.625%, 6/1/14 | | 1,250 | | 1,137,500 | | 1.0 | |
True Temper Sports, Inc., Sr Sub Nt, 8.375%, 9/15/11 | | 1,050 | | 955,500 | | 0.8 | |
Trump Entertainment, Sec’d Nt, 8.5%, 6/1/15 | | 1,000 | | 961,250 | | 0.8 | |
| | | | |
| |
|
|
| | | | | 8,373,729 | | 7.0 | |
HEALTH CARE — 8.3% | | | | | |
Lifecare Holdings, Inc., Bank Debt, 7.6%, 8/11/12 | | 744 | | 710,878 | | 0.6 | |
Lifecare Holdings, Inc., Sr Sub Nt, 9.25%, 8/15/13 | | 1,200 | | 852,000 | | 0.7 | |
Multiplan, Inc., Sr Nt, 10.375%, 4/15/162 | | 750 | | 759,375 | | 0.6 | |
4
PACHOLDER HIGH YIELD FUND, INC.
Statement of Net Assets Applicable to Common Stockholders (continued)
June 30, 2006 (Unaudited)
| | | | | | | |
| Description | | Par (000) | | Value | | Percent
of Net
Assets* | |
| | | | | | | | |
HEALTH CARE (continued) | | | | | |
National Mentor, Inc., Sr Sub Nt, 11.25%, 7/1/142 | | $500 | | $508,750 | | 0.4 | % |
Psychiatric Solutions, Sr Sub Nt, 10.625%, 6/15/13 | | 333 | | 362,970 | | 0.3 | |
Team Health, Inc., Sr Sub Nt,
11.25% 12/1/13 | | 1,934 | | 2,021,030 | | 1.7 | |
Tenet Healthcare Corp., Sr Nt, 9.25%, 2/1/152 | | 250 | | 245,625 | | 0.2 | |
Tenet Healthcare Corp., Sr Nt, 9.875%, 7/1/14 | | 1,500 | | 1,500,000 | | 1.3 | |
US Oncology Inc, Co Guar, 10.75%, 8/15/14 | | 575 | | 623,875 | | 0.5 | |
US Oncology Inc, FRN, Sr Nt, 10.32%, 3/15/15 | | 630 | | 642,600 | | 0.5 | |
Vanguard Health Holdings II, Sr Sub Nt, 9%, 10/1/14 | | 1,400 | | 1,396,500 | | 1.2 | |
Vanguard Health Holdings I, Sr Disc Nt, 10.43%, 10/1/157 | | 500 | | 352,500 | | 0.3 | |
| | | | |
| |
|
|
| | | | | 9,976,103 | | 8.3 | |
HOUSING — 2.1% | | | | | |
Beazer Homes USA, Sr Nt, 8.125%, 6/15/162 | | 1,000 | | 961,250 | | 0.8 | |
Interface, Inc., Sr Nt, 10.375%, 2/1/10 | | 500 | | 546,875 | | 0.5 | |
Interface, Inc., Sr Sub Nt, 9.5%, 2/1/14 | | 535 | | 552,388 | | 0.5 | |
Interline Brands, Inc., Sr Sub Nt, 8.125%, 6/15/14 | | 350 | | 349,125 | | 0.3 | |
| | | | |
| |
|
|
| | | | | 2,409,638 | | 2.1 | |
INFORMATION TECHNOLOGY — 8.9% | | | | | |
Advanced Micro Devices, Sr Nt,
7.75%, 11/1/12 | | 260 | | 265,200 | | 0.2 | |
Amkor Technology, Inc., Sr Nt,
9.25%, 6/1/16 | | 1,000 | | 947,500 | | 0.8 | |
IKON Office Solutions, Sr Nt,
7.75%, 9/15/156 | | 500 | | 495,000 | | 0.4 | |
Intcomex, Inc., Sec'd Nt,
11.75%, 1/15/112 | | 750 | | 744,375 | | 0.6 | |
Magnachip Semiconductor, FRN, Sec’d Nt, 8.579%, 12/15/11 | | 1,000 | | 950,000 | | 0.8 | |
Magnachip Semiconductor, Sec'd Nt, 6.875%, 12/15/11 | | 750 | | 678,750 | | 0.6 | |
Magnachip Semiconductor, Sr Sub Nt, 8%, 12/15/14 | | 250 | | 207,500 | | 0.2 | |
| | | | | | | |
| Description | | Par (000) | | Value | | Percent
of Net
Assets* | |
| | | | | | | | |
INFORMATION TECHNOLOGY (continued) | | | | | |
Sanmina-SCI Corp., Sr Sub Nt,
8.125%, 3/1/16 | | $750 | | $731,250 | | 0.6 | % |
Smart Modular Tech, FRN, Sr Nt, 10.49%, 4/1/12 | | 423 | | 448,380 | | 0.4 | |
Spansion LLC, Sr Nt, 11.25%, 1/15/162 | | 1,000 | | 1,007,500 | | 0.8 | |
Stratus Technologies, Inc., 2nd Lien Bank Debt, 14.13%, 3/28/12 | | 1,000 | | 960,000 | | 0.8 | |
Sungard Data Systems, Inc., Sr Unsec'd Nt, 9.125%, 8/15/132 | | 400 | | 415,000 | | 0.3 | |
UGS Capital Corp., FRN, Sr Nt,
10.38%, 6/1/112 | | 1,000 | | 990,000 | | 0.8 | |
Unisys Corp., Sr Nt, 8%, 10/15/12 | | 1,500 | | 1,395,000 | | 1.2 | |
Unisys Corp., Sr Nt, 8.5%, 10/15/156 | | 500 | | 462,500 | | 0.4 | |
| | | | |
| |
|
|
| | | | | 10,697,955 | | 8.9 | |
MANUFACTURING — 6.6% | | | | | | | |
Case New Holland, Inc., Sr Nt,
9.25%, 8/1/11 | | 500 | | 526,250 | | 0.4 | |
Eagle-Picher, Inc., Sr Nt, 9.75%, 9/1/131,4,6 | | 1,250 | | 837,500 | | 0.7 | |
Eagle-Picher Industries, Inc., 1st Lien Bank Debt, 9.731%, 12/30/10 | | 750 | | 761,250 | | 0.6 | |
Eagle-Picher Industries, Inc., 2nd Lien Bank Debt, 13.812%, 12/30/11 | | 750 | | 765,000 | | 0.6 | |
Gardner Denver, Sr Sub Nt, 8%, 5/1/13 | | 500 | | 525,000 | | 0.4 | |
Greenbrier Companies, Inc., Sr Nt,
Add-on 8.375%, 5/15/15 | | 1,000 | | 1,021,250 | | 0.9 | |
Milacron Escrow Corp., Sec’d Nt,
11.5%, 5/15/11 | | 1,750 | | 1,623,125 | | 1.4 | |
Polypore, Inc., Sr Sub Nt,
8.75%, 5/15/12 | | 2,035 | | 1,925,619 | | 1.6 | |
| | | | |
| |
|
|
| | | | | 7,984,994 | | 6.6 | |
MEDIA & TELECOM: BROADCASTING — 1.6% | | | | | |
Fisher Communications, Inc., Sr Nt,
8.625%, 9/15/14 | | 500 | | 517,500 | | 0.4 | |
LBI Media, Inc., Sr Disc Nt,
11%, 10/15/137 | | 625 | | 506,250 | | 0.4 | |
Nexstar Fin Hldg LLC, Inc., Sr Disc Nt, 11.36%, 4/1/137 | | 250 | | 202,500 | | 0.2 | |
Nexstar Finance, Inc., Sr Sub Nt,
7%, 1/15/14 | | 725 | | 659,750 | | 0.6 | |
| | | | |
| |
|
|
| | | | | 1,886,000 | | 1.6 | |
5
PACHOLDER HIGH YIELD FUND, INC.
Statement of Net Assets Applicable to Common Stockholders (continued)
June 30, 2006 (Unaudited)
| | | | | | | |
| Description | | Par (000) | | Value | | Percent
of Net
Assets* | |
| | | | | | | | |
MEDIA & TELECOM: CABLE — 8.7% | | | | | | | |
Adelphia Communications Corp., Sr Nt,
9.375%, 11/15/091,4,6 | | $1,000 | | $560,000 | | 0.5 | % |
Adelphia Communications Corp., Sr Nt,
8.125%, 7/15/031,4 | | 750 | | 408,750 | | 0.3 | |
Adelphia Communications Corp., Sr Nt, 6%, 2/15/061,4 | | 125 | | 938 | | 0.0 | |
CCH I LLC, Sec’d Nt, 11%, 10/1/15 | | 2,305 | | 2,016,875 | | 1.7 | |
Charter Communications Hldgs II, Sr Nt,
10.25%, 9/15/10 | | 250 | | 250,625 | | 0.2 | |
Century Communications, Sr Nt,
9.5%, 3/1/051,4,6 | | 625 | | 625,000 | | 0.5 | |
Insight Communications, Inc., Sr Disc Nt, 12.21%, 2/15/117 | | 1,000 | | 1,057,500 | | 0.9 | |
Insight Midwest, Sr Nt, 10.5%, 11/1/10 | | 1,050 | | 1,094,625 | | 0.9 | |
Intelsat Bermuda Ltd., Sr Nt, 9.25%, 6/15/162 | | 500 | | 516,250 | | 0.4 | |
Intelsat Bermuda Ltd., Sr Nt,
11.25%, 6/15/162 | | 250 | | 256,250 | | 0.2 | |
Intelsat Bermuda Ltd., Sr Nt, 8.25%, 1/15/13 | | 500 | | 496,250 | | 0.4 | |
Mediacom LLC/Capital Corp., Sr Nt, 9.50%, 1/15/136 | | 2,000 | | 1,990,000 | | 1.7 | |
Panamsat Corp., Sr Nt, 9%, 8/15/14 | | 649 | | 658,735 | | 0.6 | |
Videotron Ltee, Sr Unsec’d Nt, 6.375%, 12/15/15 | | 500 | | 456,250 | | 0.4 | |
| | | | |
| |
|
|
| | | | | 10,388,048 | | 8.7 | |
MEDIA & TELECOM: FIXED COMMUNICATIONS — 5.4% | | | |
Level 3 Communications, Co Guar,
10.75%, 10/15/11 | | 500 | | 513,750 | | 0.4 | |
Mastec, Inc., Sr Sub Nt, 7.75%, 2/1/08 | | 500 | | 498,750 | | 0.4 | |
Primus Telecomm Group, Bank Debt,
11.61%, 2/18/11 | | 988 | | 997,375 | | 0.8 | |
Qwest Communications, Co Guar, 7.5%, 2/15/14 | | 200 | | 195,000 | | 0.2 | |
Qwest Communications, FRN, Sr Nt,
8.67%, 2/15/09 | | 1,001 | | 1,019,769 | | 0.8 | |
Qwest Communications, Sr Nt, 7.875%, 9/1/11 | | 100 | | 101,250 | | 0.1 | |
Qwest Communications, Sr Nt, 7.625%, 6/15/15 | | 250 | | 246,875 | | 0.2 | |
Qwest Communications, FRN, Sr Nt,
8.579%, 6/15/13 | | 1,000 | | 1,057,500 | | 0.9 | |
Stratos Global Corp., Sr Nt, 9.875%, 2/15/132 | | 75 | | 70,500 | | 0.1 | |
| | | | | | | |
| Description | | Par (000) | | Value | | Percent
of Net
Assets* | |
| | | | | | | | |
MEDIA & TELECOM: FIXED COMMUNICATIONS (continued) | | | |
Time Warner Communications, Sr Nt,
9.25%, 2/15/14 | | $1,250 | | $1,281,250 | | 1.1 | % |
Trilogy 1st Lien Term Loan, Bank Debt,
9.5%, 6/30/12 | | 500 | | 503,750 | | 0.4 | |
| | | | |
| |
|
|
| | | | | 6,485,769 | | 5.4 | |
MEDIA & TELECOM: WIRELESS COMMUNICATIONS — 3.6% | | | |
Cleveland Unlimited, Inc., FRN, Sr
Unsec’d Nt, 13.579%, 12/15/102 | | 1,000 | | 1,052,500 | | 0.9 | |
Dobson Cellular Systems, Sec’d, 9.875%, 11/1/12 | | 1,000 | | 1,055,000 | | 0.9 | |
Horizon PCS, Inc., Sr Nt, 11.375%, 7/15/12 | | 350 | | 393,313 | | 0.3 | |
Leap Wireless, Bank Debt, 8.249%, 6/16/13 | | 1,000 | | 1,005,000 | | 0.9 | |
Rogers Wireless, Inc., Sec’d Nt, 6.375%, 3/1/14 | | 250 | | 238,125 | | 0.2 | |
Rural Cellular, Sr Nt, 9.875%, 2/1/10 | | 500 | | 514,375 | | 0.4 | |
| | | | |
| |
|
|
| | | | | 4,258,313 | | 3.6 | |
MEDIA & TELECOM: DIVERSIFIED — 8.2% | | | |
DX III Holdings Corp., 1st Lien Term Loan, 9.249%, 1/27/11 | | 481 | | 484,122 | | 0.4 | |
HRP Myrtle Beach, FRN, Sec’d Nt,
9.818%, 4/1/122 | | 1,000 | | 990,000 | | 0.8 | |
IMAX Corp., Sr Nt, 9.625%, 12/1/10 | | 1,834 | | 1,879,850 | | 1.6 | |
London Arena & Waterfront Finance LLC, Bank Debt, 8.782%, 3/9/12 | | 499 | | 501,244 | | 0.4 | |
Cenveo Corp., Sr Sub Nt, 7.875%, 12/1/13 | | 2,000 | | 1,950,000 | | 1.6 | |
Phoenix Color Corp., Sr Sub Nt, 10.375%, 2/1/09 | | 1,930 | | 1,816,612 | | 1.5 | |
Primedia, Inc., Sr Nt, 8.875%, 5/15/11 | | 375 | | 360,000 | | 0.3 | |
Quebecor Media, Sr Nt, 7.75%, 3/15/162 | | 500 | | 490,000 | | 0.4 | |
Quebecor World Capital Corp., Sr Nt,
6.125%, 11/15/13 | | 850 | | 694,875 | | 0.6 | |
Quebecor World Capital Corp., Sr Nt,
8.75%, 3/15/162 | | 250 | | 228,125 | | 0.2 | |
RH Donnelley, Inc., Sr Disc Nt, 6.875%, 1/15/132 | | 250 | | 230,000 | | 0.2 | |
RH Donnelley, Inc., Sr Nt, 8.875%, 1/15/162 | | 250 | | 252,188 | | 0.2 | |
| | | | |
| |
|
|
| | | | | 9,877,016 | | 8.2 | |
6
PACHOLDER HIGH YIELD FUND, INC.
Statement of Net Assets Applicable to Common Stockholders (continued)
June 30, 2006 (Unaudited)
| | | | | | | |
| Description | | Par (000) | | Value | | Percent
of Net
Assets* | |
| | | | | | | | |
METALS & MINERALS — 4.2% | | | | | | | |
AK Steel Corp., Co Guar, 7.875%, 2/15/096 | | $1,705 | | $1,696,475 | | 1.4 | % |
AK Steel Corp., Co Guar, 7.75%, 6/15/12 | | 400 | | 392,000 | | 0.3 | |
Neenah Corp., Sr Sub Nt, 11%, 9/30/102 | | 200 | | 216,000 | | 0.2 | |
Oglebay Norton Co. Term Loan B, Bank Debt, 12.08%, 1/31/10 | | 842 | | 862,561 | | 0.7 | |
Trimas Corp., Co Guar, 9.875%, 6/15/12 | | 2,025 | | 1,852,875 | | 1.6 | |
| | | | |
| |
|
|
| | | | | 5,019,911 | | 4.2 | |
RETAIL — 1.9% | | | | | | | |
Brown Shoe Company, Inc., Sr Unsec’d Nt, 8.375%, 5/1/12 | | 750 | | 770,625 | | 0.6 | |
GSC Holdings Corp., FRN, Co Guar,
8.865%, 10/1/11 | | 550 | | 565,125 | | 0.5 | |
Linens ‘N Things, Inc., FRN, Sec’d Nt,
10.702%, 1/15/142 | | 1,000 | | 947,500 | | 0.8 | |
| | | | |
| |
|
|
| | | | | 2,283,250 | | 1.9 | |
SERVICES — 4.9% | | | | | | | |
Allied Waste NA, Co Guar, 9.25%, 9/1/12 | | 1,824 | | 1,933,440 | | 1.6 | |
Dycom Industries, Nt, 8.125%, 10/15/15 | | 500 | | 501,250 | | 0.4 | |
Knowledge Learning Center, Sr Sub Nt,
7.75%, 2/1/152 | | 750 | | 686,250 | | 0.6 | |
Mac-Gray Corp., Sr Nt, 7.625%, 8/15/15 | | 500 | | 505,000 | | 0.4 | |
Nationsrent, Inc., Sr Sec’d Nt, 9.5%, 10/15/10 | | 500 | | 532,500 | | 0.4 | |
Sac Holdings, Sr Nt, 8.5%, 3/15/14 | | 1,323 | | 1,279,857 | | 1.1 | |
Stewart Enterprises, Sr Nt, 7.75%, 2/15/13 | | 500 | | 455,625 | | 0.4 | |
| | | | |
| |
|
|
| | | | | 5,893,922 | | 4.9 | |
TRANSPORTATION — 15.4% | | | | | | | |
American Commercial Lines, Sr Nt, 9.50%, 2/15/15 | | 475 | | 520,125 | | 0.4 | |
Avis Budget Car Rental, Sr Nt, 7.625%, 5/15/142 | | 100 | | 97,000 | | 0.1 | |
| | | | | | | |
| Description | | Par (000) | | Value | | Percent
of Net
Assets* | |
TRANSPORTATION (continued) | | | | | | | |
| | | | | | | | |
Avis Budget Car Rental, Sr Nt, 7.75%, 5/15/162 | | $100 | | $96,250 | | 0.1 | % |
Avis Budget Car Rental, FRN, Sr Nt,
7.576%, 5/15/142 | | 250 | | 249,375 | | 0.2 | |
Autocam Corp., Sr Sub Nt, 10.875%, 6/15/14 | | 675 | | 415,125 | | 0.4 | |
Autocam Corp., Bank Debt, 14%, 12/22/11 | | 1,008 | | 1,007,936 | | 0.8 | |
Dura Operating Corp., Co Guar, 8.625%, 4/15/126 | | 150 | | 127,500 | | 0.1 | |
Ford Motor Co., Nt, 7.45%, 7/15/316 | | 1,425 | | 1,029,563 | | 0.9 | |
Ford Motor Credit Corp., FRN, Nt,
10.486%, 11/2/072 | | 460 | | 461,697 | | 0.4 | |
Ford Motor Credit Corp., Nt, 8.625%, 11/1/10 | | 750 | | 701,563 | | 0.6 | |
General Motors Acceptance Corp., Nt,
7.75%, 1/19/10 | | 1,000 | | 994,843 | | 0.8 | |
General Motors Acceptance Corp., Nt, 8%, 11/1/316 | | 1,300 | | 1,249,495 | | 1.0 | |
General Motors Acceptance Corp., Nt,
5.125%, 5/9/086 | | 750 | | 718,504 | | 0.6 | |
General Motors, Debentures, 8.1%, 6/15/24 | | 1,150 | | 868,250 | | 0.7 | |
General Motors, Debentures, 8.25%, 7/15/236 | | 1,525 | | 1,200,937 | | 1.0 | |
Goodyear Tire and Rubber, Sr Nt, 9%, 7/1/15 | | 1,725 | | 1,647,375 | | 1.4 | |
IdleAire Technologies Corp., Sr Disc Nt, 11.92%, 12/15/127 | | 1,250 | | 937,500 | | 0.8 | |
Lear Corp. Term Loan, Bank Debt,
7.999%, 4/25/12 | | 1,000 | | 991,250 | | 0.8 | |
Metaldyne Corp., Sr Nt, 10%, 11/1/136 | | 1,700 | | 1,644,750 | | 1.4 | |
Quality Distribution, Co Guar, 9%, 11/15/10 | | 1,150 | | 1,056,562 | | 0.9 | |
Quality Distribution, FRN, Co Guar,
9.568%, 1/15/12 | | 850 | | 842,562 | | 0.7 | |
TFM SA DE CV, Sr Nt, 12.5%, 6/15/12 | | 1,100 | | 1,212,750 | | 1.0 | |
Ultrapetrol (Bahamas) Ltd., 1st Mtg,
9%, 11/24/14 | | 450 | | 406,125 | | 0.3 | |
| | | | |
| |
|
|
| | | | | 18,477,037 | | 15.4 | |
7
PACHOLDER HIGH YIELD FUND, INC.
Statement of Net Assets Applicable to Common Stockholders (continued)
June 30, 2006 (Unaudited)
| | | | | | | |
| Description | | Par (000) | | Value | | Percent
of Net
Assets* | |
| | | | | | | | |
UTILITIES — 6.7% | | | | | | | |
Calpine Corp., Sr Nt, 8.5%, 5/1/081,4,6 | | $1,265 | | $790,625 | | 0.7 | % |
Calpine Corp., Sr Nt, 8.5%, 2/15/111,4,6 | | 985 | | 453,100 | | 0.4 | |
Calpine Corp., Sec’d Nt, 9.9%, 7/15/071,2,4 | | 904 | | 868,020 | | 0.7 | |
Calpine Corp., Sec’d Nt,
9.875%, 12/1/111,2,4,6 | | 250 | | 233,125 | | 0.2 | |
Calpine Generating Co.,
3rd FRN, Sec’d Nt,
14.12%, 4/1/11 | | 1,450 | | 1,518,875 | | 1.3 | |
Dynegy Holdings, Inc., Sr Unsec’d Nt,
8.375%, 5/1/162 | | 500 | | 492,500 | | 0.4 | |
Midwest Generation LLC, Sec’d Nt,
8.75%, 5/1/34 | | 500 | | 530,000 | | 0.4 | |
Mirant Americas, Sr Nt, 8.3%, 5/1/111,4 | | 250 | | 246,875 | | 0.2 | |
Mirant Americas Generation LLC, Sr Nt,
8.5%, 10/1/211,4 | | 500 | | 468,750 | | 0.4 | |
Dynegy/NGC Corp., Debentures,
7.125%, 5/15/18 | | 500 | | 437,500 | | 0.4 | |
NRG Energy, Inc., Term Loan B,
7.231%, 1/26/13 | | 499 | | 499,997 | | 0.4 | |
Northwest Pipeline Corp., Sr Nt,
7%, 6/15/162 | | 500 | | 496,875 | | 0.4 | |
Reliant Energy, Inc., Sec'd Nt,
6.75%, 12/15/14 | | 1,000 | | 920,000 | | 0.8 | |
Southern Energy, Inc., Escrow, Sr Nt,
7.9%, 7/15/09 | | 750 | | 12,187 | | 0.0 | |
| | | | |
| |
|
|
| | | | | 7,968,429 | | 6.7 | |
Total Corporate Debt Securities | | | | | | | |
(amortized cost $176,346,589) | | | | 174,214,967 | | 145.5 | |
| | | | |
| |
|
|
CORPORATE CONVERTIBLE DEBT SECURITIES — 0.2% | | | |
PACKAGING — 0.2% | | | | | | | |
Indesco International, Inc., Conv,
Sr Sub Nt, 10%, 3/15/083,9 | | 291 | | 232,423 | | 0.2 | |
| | | | |
| |
|
|
| | | | | 232,423 | | 0.2 | |
Total Convertible Corporate Debt Securities | | | | | | | |
(amortized cost $290,529) | | | | 232,423 | | 0.2 | |
| | | | |
| |
|
|
Total Debt Securities | | | | | | | |
(amortized cost $176,637,118) | | | | 174,447,390 | | 145.7 | |
| | | | |
| |
|
|
| | | | | | | |
| Description | | Shares/Par
(000) | | Value | | Percent
of Net
Assets* | |
| | | | | | | | |
PREFERRED STOCKS — 4.3% | | | | | |
Glasstech, Inc., Series C, Pfd1,3,9 | | $5 | | $0 | | 0.0 | % |
Oglebay Norton Company, Series A, Pfd, 14.8%1 | | 189,370 | | 4,734,250 | | 4.0 | |
Spanish Broadcasting Systems, Pfd,
10.75%, 10/15/13 | | 296 | | 328,560 | | 0.3 | |
| | | | |
| |
|
|
Total Preferred Stocks | | | | | | | |
(cost $2,189,700) | | | | 5,062,810 | | 4.3 | |
| | | | |
| |
|
|
COMMON STOCKS — 2.2% | | | | | | | |
Abovenet, Inc., Common Stock1 | | 1,702 | | 85,100 | | 0.1 | |
Avado Brands, Inc., Common Stock1,3 | | 9,063 | | 63,441 | | 0.1 | |
Bally Total Fitness Corp. Holding, Common Stock1,3,6,8,9 | | 5,880 | | 27,906 | | 0.0 | |
Glasstech, Inc., Class C, Common Stock1,3,9 | | 5 | | 0 | | 0.0 | |
Indesco International, Inc., Common Stock1,3,9 | | 60,345 | | 30,173 | | 0.0 | |
Kaiser Group Holdings, Inc., Common Stock1 | | 8,801 | | 299,234 | | 0.2 | |
Lexington Coal Company, Common Stock1 | | 25,311 | | 10,631 | | 0.0 | |
Mattress Discounters, Common Stock1,3,9 | | 8,329 | | 8,329 | | 0.0 | |
Mirant Corp. Common Equity, Common Stock1 | | 27,200 | | 728,960 | | 0.6 | |
Oglebay Norton Company, Common Stock1 | | 31,897 | | 647,509 | | 0.6 | |
Simonds Industries, Inc., Common Stock1,3,9 | | 8,236 | | 280,024 | | 0.2 | |
Westpoint Stevens, Inc., Common Stock1,3,9 | | 14,277 | | 283,113 | | 0.2 | |
Westpoint Stevens, Inc., Subscription Rights1,3,9 | | 12,745 | | 138,411 | | 0.1 | |
Westpoint Stevens, Inc., Rights1,3,9 | | 6,631 | | 72,013 | | 0.1 | |
XO Holdings, Inc., Common Stock1 | | 516 | | 2,270 | | 0.0 | |
| | | | |
| |
|
|
Total Common Stocks | | | | | | | |
(cost $10,324,740) | | | | 2,677,114 | | 2.2 | |
| | | | |
| |
|
|
8
PACHOLDER HIGH YIELD FUND, INC.
Statement of Net Assets Applicable to Common Stockholders (continued)
June 30, 2006 (Unaudited)
| | | | | | | | |
| Description | | Shares/Par
(000) | | Value | | | Percent
of Net
Assets* | |
| | | | | | | | | |
WARRANTS — 0.0% | | | | | | | | |
Abovenet, Inc., Warrants, 8/9/081,3,9 | | $584 | | $14,600 | | | 0.0 | % |
Abovenet, Inc., Warrants, 8/9/101,3,9 | | 687 | | 14,427 | | | 0.0 | |
XO Holdings, Inc., Series A Warrants1 | | 1,034 | | 889 | | | 0.0 | |
XO Holdings, Inc., Series B Warrants1 | | 775 | | 372 | | | 0.0 | |
XO Holdings, Inc., Series C Warrants1 | | 775 | | 271 | | | 0.0 | |
| | | | |
|
| |
|
|
Total Warrants | | | | | | | | |
(cost $417,200) | | | | 30,559 | | | 0.0 | |
| | | | |
|
| |
|
|
Total Equity Investments | | | | | | | | |
(cost $12,931,640) | | | | 7,770,483 | | | 6.5 | |
| | | | |
|
| |
|
|
INVESTMENTS OF CASH COLLATERAL FOR SECURITIES LOANED — 21.3% | |
Lehman Brothers, Inc. —
Repurchase Agreements5a
5.4625%, dated 6/30/06,
matures 7/3/06 repurchase
price $5,002,276 | | 5,000 | | 5,000,000 | | | 4.2 | |
Nomura Securities —
Repurchase Agreements5b 5.22%, dated 6/30/06, matures 7/3/06 repurchase
price $20,566,503 | | 20,558 | | 20,557,560 | | | 17.1 | |
| | | | |
|
| |
|
|
Total Investments of Cash Collateral for Securities Loaned | | | | | | |
(cost $25,557,560) | | | | 25,557,560 | | | 21.3 | |
| | | | |
|
| |
|
|
TOTAL INVESTMENTS | | | | | | | | |
(cost $215,126,318) | | | | 207,775,433 | | | 173.5 | |
| | | | |
|
| |
|
|
Payable Upon Return of Securities Loaned | | (25,557,560 | ) | | (21.3 | ) |
Payable to Advisor | | (423,425 | ) | | (0.4 | ) |
Payable to Administrator | | (15,350 | ) | | 0.0 | |
Accounting Fees Payable | | (3,124 | ) | | 0.0 | |
Custody Fees Payable | | (3,207 | ) | | 0.0 | |
Unrealized Appreciation on Swap Agreements | | 747,007 | | | 0.6 | |
Unrealized Depreciation on Swap Agreements | | (2,636 | ) | | 0.0 | |
Other Assets in Excess of Other Liabilities | | 3,200,988 | | | 2.7 | |
Less: Outstanding Preferred Stock (2,640 shares at $25,000 per share) at liquidation value. | | (66,000,000 | ) | | (55.1 | ) |
| | | | |
|
| |
|
|
| | | | | | | | |
| Description | | Shares/Par
(000) | | | Value | | Percent
of Net
Assets* | |
| | | | | | | | | |
Net Assets Applicable to Common Stockholders: | | | | | | | | |
Common Stock, $.01 par value; 49,996,320 shares authorized 12,928,800 shares issued and outstanding | | $129,288 | | | | | | |
Capital in excess of par value | | 179,777,883 | | | | | | |
Undistributed net investment income | | 530,685 | | | | | | |
Accumulated net realized loss from security transactions | | (54,108,771 | ) | | | | | |
Net unrealized depreciation on investments | | (6,610,959 | ) | | | | | |
Net Assets Applicable to Common Stockholders | | | | | $119,718,126 | | 100.0 | % |
| | | | | |
| |
|
|
Net Asset Value Per Common Share
($119,718,126 / 12,928,800) | | | $9.26 | | | |
| | | | | |
| | | |
| * | | Applicable to common stockholders. |
| 1 | | Non-income producing security. |
| 2 | | Security exempt from registration under Rule 144A of the Securities Act of 1933. These securities may be resold in transactions exempt from registration, normally to qualified institutional buyers. These securities amounted to $22,912,843. |
| 3 | | Fair valued security. These securities amounted to $1,244,205. |
| 5a | | Fully collateralized by non-investment grade corporate bonds with a fair market value of $5,251,605. |
| 5b | | Fully collateralized by GNMA notes with a fair market value of $20,706,000. |
| 6 | | All or a portion of the security is on loan. Securities on loan have a fair market value of $25,228,547. |
| 7 | | Step-up bond. Interest rate is effective rate. |
| 8 | | Restricted security. These securities amounted to $1,299,781. |
| 9 | | Security deemed to be illiquid. |
| FRN | | Floating Rate Note. Rate shown is rate in effect at June 30, 2006. |
See accompanying Notes to Financial Statements.
9
PACHOLDER HIGH YIELD FUND, INC.
Statement of Operations
For the Six Months Ended June 30, 2006 (Unaudited)
| | | | |
| | | | |
INVESTMENT INCOME: | | | | |
Interest | | $ | 8,597,400 | |
Dividends | | | 32,352 | |
Securities lending | | | 200,310 | |
| | |
|
|
|
Total Income | | | 8,830,062 | |
EXPENSES: | | | | |
Investment advisory fees (Note 6) | | | 1,479,625 | |
Administrative fees (Note 6) | | | 91,858 | |
Printing and other | | | 58,949 | |
Stock exchange listing fees | | | 12,397 | |
Accounting fees (Note 6) | | | 18,738 | |
Custodian fees (Note 6) | | | 9,186 | |
Transfer agent fees | | | 19,629 | |
Legal fees | | | 93,900 | |
Directors’ fees and expenses | | | 58,614 | |
Audit fee | | | 36,824 | |
Insurance | | | 16,923 | |
| | |
|
|
|
Operating Expenses | | | 1,896,643 | |
Commissions on auction rate preferred stock | | | 83,281 | |
| | |
|
|
|
Expenses Related to Leverage | | | 83,281 | |
| |
Total Expenses | | | 1,979,924 | |
| | |
|
|
|
Net Investment Income | | | 6,850,138 | |
NET REALIZED AND UNREALIZED GAIN/(LOSS) ON INVESTMENTS: | | | | |
Net realized gain/(loss): | | | | |
Investments | | | 2,164,608 | |
Swaps | | | 56,474 | |
| | |
|
|
|
Net realized gain/(loss) on investments | | | 2,221,082 | |
Net change in unrealized appreciation/(depreciation): | | | | |
Investments | | | 2,099,528 | |
Swaps | | | 352,837 | |
| | |
|
|
|
Net change in unrealized appreciation/(depreciation) on investments | | | 2,452,365 | |
| | |
|
|
|
Net realized and unrealized gain/(loss) on investments | | | 4,673,447 | |
| | |
|
|
|
Net Increase/(Decrease) Resulting from Operations | | | 11,523,585 | |
DISTRIBUTIONS TO PREFERRED STOCKHOLDERS FROM NET INVESTMENT INCOME | | | (1,517,068 | ) |
| | |
|
|
|
NET INCREASE/(DECREASE) IN NET ASSETS APPLICABLE TO COMMON STOCKHOLDERS RESULTING FROM OPERATIONS | | $ | 10,006,517 | |
| | |
|
|
|
See accompanying Notes to Financial Statements.
Statements of Changes in Net Assets Applicable to Common Stockholders
| | | | | | | | |
| | | For the Six
Months Ended
June 30, 2006
(Unaudited) | | | For the Year
Ended
December 31,
2005 | |
INCREASE/(DECREASE) IN NET ASSETS: | | | | | | | | |
Operations: | | | | | | | | |
Net investment income | | $ | 6,850,138 | | | $ | 14,442,694 | |
Net realized gain/(loss) on investments | | | 2,221,082 | | | | (8,453,201 | ) |
Net change in unrealized appreciation/(depreciation) on investments | | | 2,452,365 | | | | (177,142 | ) |
Distributions to preferred stockholders from net investment income | | | (1,517,068 | ) | | | (2,157,713 | ) |
| | |
|
|
| |
|
|
|
Net increase/(decrease) in net assets resulting from operations | | | 10,006,517 | | | | 3,654,638 | |
| | |
|
|
| |
|
|
|
DISTRIBUTIONS TO COMMON STOCKHOLDERS FROM: | | | | | | | | |
Net investment income | | | (5,815,609 | ) | | | (11,615,091 | ) |
| | |
|
|
| |
|
|
|
Total distributions to common stockholders | | | (5,815,609 | ) | | | (11,615,091 | ) |
| | |
|
|
| |
|
|
|
FUND SHARE TRANSACTIONS (NOTE 2): | | | | | | | | |
Value of 10,614 and 22,866 shares issued in reinvestment of dividends to common stockholders in 2006 and 2005, respectively | | | 98,521 | | | | 209,289 | |
| | |
|
|
| |
|
|
|
Total increase in net assets derived from fund share transactions | | | 98,521 | | | | 209,289 | |
| | |
|
|
| |
|
|
|
Total net increase/(decrease) in net assets applicable to common stockholders | | | 4,289,429 | | | | (7,751,164 | ) |
NET ASSETS APPLICABLE TO COMMON STOCKHOLDERS: | | | | | | | | |
Beginning of period | | | 115,428,697 | | | | 123,179,861 | |
| | |
|
|
| |
|
|
|
End of period | | $ | 119,718,126 | | | $ | 115,428,697 | |
| | |
|
|
| |
|
|
|
Undistributed Net Investment Income | | $ | 530,685 | | | $ | 1,013,224 | |
| | |
|
|
| |
|
|
|
See accompanying Notes to Financial Statements.
10
PACHOLDER HIGH YIELD FUND, INC.
Financial Highlights
(Contained below is per share operating performance data for a share of common stock outstanding, total return performance, ratios to average net assets and other supplemental data. This information has been derived from information provided in the financial statements and market price data for the Fund’s shares calculated using average shares outstanding.)
| | | | | | | | | | | | | | | | | | | | |
| | | For the Six
Months Ended June 30, 2006 (Unaudited)
| | | Year Ended December 31,
| |
| | | | 2005 | | | 2004 | | | 2003 | | | 2002 | |
Net asset value, beginning of period | | $ | 8.94 | | | $ | 9.55 | | | $ | 8.59 | | | $ | 5.73 | | | $ | 7.78 | |
| | |
|
|
| |
|
|
| |
|
|
| |
|
|
| |
|
|
|
Net investment income | | | 0.52 | | | | 1.12 | | | | 1.08 | | | | 1.10 | | | | 1.41 | |
Net realized and unrealized gain/(loss) on investments | | | 0.37 | | | | (0.67 | ) | | | 0.93 | | | | 2.77 | | | | (2.15 | ) |
Cumulative effect on change in fixed income valuation (Note 1) | | | — | | | | — | | | | (0.07 | ) | | | — | | | | — | |
Distributions to preferred stockholders from net investment income | | | (0.12 | ) | | | (0.16 | ) | | | (0.08 | ) | | | (0.07 | ) | | | (0.12 | ) |
| | |
|
|
| |
|
|
| |
|
|
| |
|
|
| |
|
|
|
Net increase/(decrease) in net asset value resulting from operations | | | 0.77 | | | | 0.29 | | | | 1.86 | | | | 3.80 | | | | (0.86 | ) |
| | |
|
|
| |
|
|
| |
|
|
| |
|
|
| |
|
|
|
Distributions to Common Stockholders from: | | | | | | | | | | | | | | | | | | | | |
Net investment income | | | (0.45 | ) | | | (0.90 | ) | | | (0.90 | ) | | | (0.89 | ) | | | (1.15 | ) |
Return of capital | | | — | | | | — | | | | — | | | | (0.05 | ) | | | (0.04 | ) |
| | |
|
|
| |
|
|
| |
|
|
| |
|
|
| |
|
|
|
Total distributions to common stockholders | | | (0.45 | ) | | | (0.90 | ) | | | (0.90 | ) | | | (0.94 | ) | | | (1.19 | ) |
| | |
|
|
| |
|
|
| |
|
|
| |
|
|
| |
|
|
|
Common and Preferred Shares Offering Costs Charged to Paid-In Capital: | | | | | | | | | | | | | | | | | | | | |
Common Shares | | | — | | | | — | | | | — | | | | — | | | | — | |
Preferred Shares | | | — | | | | — | | | | — | | | | — | | | | — | |
| | |
|
|
| |
|
|
| |
|
|
| |
|
|
| |
|
|
|
| | | | 0.00 | | | | 0.00 | | | | 0.00 | | | | 0.00 | | | | 0.00 | |
| | |
|
|
| |
|
|
| |
|
|
| |
|
|
| |
|
|
|
Net asset value, end of period | | $ | 9.26 | | | $ | 8.94 | | | $ | 9.55 | | | $ | 8.59 | | | $ | 5.73 | |
| | |
|
|
| |
|
|
| |
|
|
| |
|
|
| |
|
|
|
Market price per share, end of period | | $ | 9.62 | | | $ | 8.50 | | | $ | 9.82 | | | $ | 9.14 | | | $ | 6.16 | |
| | |
|
|
| |
|
|
| |
|
|
| |
|
|
| |
|
|
|
TOTAL INVESTMENT RETURN(1): | | | | | | | | | | | | | | | | | | | | |
Based on market price per common share(2) | | | 18.78 | % | | | (4.46 | %) | | | 18.67 | % | | | 67.19 | % | | | (19.91 | %) |
Based on net asset value per common share(3) | | | 8.70 | % | | | 3.33 | % | | | 22.79 | % | | | 68.92 | % | | | (13.05 | %) |
RATIOS TO AVERAGE NET ASSETS(4): | | | | | | | | | | | | | | | | | | | | |
Expenses (prior to expenses related to leverage)(5) | | | 2.07 | % | | | 1.50 | % | | | 1.83 | % | | | 1.80 | % | | | 0.83 | % |
Applicable to common stockholders only(6)(7) | | | 3.21 | % | | | 2.34 | % | | | 2.88 | % | | | 3.08 | % | | | 1.65 | % |
Expenses (including expenses related to leverage)(5) | | | 2.16 | % | | | 1.59 | % | | | 1.92 | % | | | 1.91 | % | | | 0.95 | % |
Applicable to common stockholders only(6)(7) | | | 3.35 | % | | | 2.48 | % | | | 3.03 | % | | | 3.26 | % | | | 1.90 | % |
Net investment income applicable to common stockholders only(6)(7) | | | 11.74 | % | | | 12.39 | % | | | 12.14 | % | | | 17.17 | % | | �� | 21.49 | % |
SUPPLEMENTAL DATA: | | | | | | | | | | | | | | | | | | | | |
Net assets at end of period, net of preferred stock (000) | | $ | 119,718 | | | $ | 115,429 | | | $ | 123,180 | | | $ | 110,476 | | | $ | 73,307 | |
Portfolio turnover rate | | | 35 | % | | | 95 | % | | | 73 | % | | | 51 | % | | | 40 | % |
SENIOR SECURITIES: | | | | | | | | | | | | | | | | | | | | |
Number of preferred shares outstanding at end of period | | | 2,640 | | | | 2,640 | | | | 2,640 | | | | 2,640 | | | | 2,640 | |
Asset coverage per share of preferred stock outstanding at end of period(8) | | $ | 70,348 | | | $ | 68,723 | | | $ | 71,660 | | | $ | 66,853 | | | $ | 52,768 | |
Involuntary liquidation preference and average market value per share of preferred stock | | $ | 25,000 | | | $ | 25,000 | | | $ | 25,000 | | | $ | 25,000 | | | $ | 25,000 | |
| 1 | | Total investment return excludes the effects of commissions. Dividends and distributions to common stockholders, if any, are assumed, for purposes of this calculation, to be reinvested at prices obtained under the Fund’s dividend reinvestment plan. Rights offerings, if any, are assumed, for purposes of this calculation, to be fully subscribed under the terms of the rights offering. |
| 2 | | Assumes an investment at the common share market value at the beginning of the period indicated and sale of all shares at the closing common share market value at the end of the period indicated. |
| 3 | | Assumes an investment at the common share net asset value at the beginning of the period indicated and sale of all shares at the closing common share net asset value at the end of the period indicated. |
| 4 | | Ratios calculated on an annualized basis of expenses and net investment income. Ratios do not include the effect of dividends to preferred stock. |
| 5 | | Ratios calculated relative to the average net assets of both common and preferred stockholders. |
| 6 | | Ratios calculated relative to the average net assets of common stockholders only. |
| 7 | | Information for the years 2002 through 2003 is not audited by previous auditors. Ratios have been derived from audited financial statements for the respective year. |
| 8 | | Calculated by subtracting the Fund’s total liabilities (not including the preferred stock) from the Fund’s total assets, and dividing this by the number of preferred shares outstanding. |
See accompanying Notes to Financial Statements.
11
PACHOLDER HIGH YIELD FUND, INC.
Notes to Financial Statements (Unaudited)
| 1. | | SIGNIFICANT ACCOUNTING POLICIES — Pacholder High Yield Fund, Inc. (the “Fund”) is a closed-end, diversified management investment company with a leveraged capital structure. The Fund’s investment objective is to provide a high level of total return through current income and capital appreciation. Under normal circumstances, the Fund invests at least 80% of the value of its assets in high yield securities. The Fund invests primarily in fixed income securities of domestic companies. The Fund was incorporated under the laws of the State of Maryland in August 1988. |
The following is a summary of significant accounting policies followed by the Fund in the preparation of its financial statements.
| | A. | | SECURITY VALUATIONS — Fixed income securities with a maturity of 61 days or more are valued at the bid side of the market by an independent pricing service or broker. Equity securities listed on an exchange are valued at the closing prices as determined by the primary exchange where the securities are traded. Restricted securities, portfolio securities not priced by the independent pricing service and other assets are valued at fair value as determined under procedures established and monitored by the Board of Directors. At June 30, 2006, there were fair-valued securities of $1,244,205. Original obligations with maturities of 60 days or less at the date of purchase are valued at amortized cost, which approximates market value. |
Prior to January 1, 2004, the Fund valued fixed income securities based on the mean of bid and asked prices. Effective January 1, 2004, the Fund changed its valuation policy to value fixed income securities based on bid prices, as bid prices are believed to be more representative of the price that could be obtained in sales transactions in the market for such securities. Bid prices generally are lower than those based on the mean of bid and asked prices. The cumulative effect of this accounting change on January 1, 2004 was to decrease the value of investments and net assets applicable to common stockholders by approximately $854,808 ($0.07 per common share). The financial highlights for periods prior to December 31, 2004 have not been restated to reflect this change in accounting policy.
| | B. | | REPURCHASE AGREEMENTS — Each repurchase agreement is valued at amortized cost. In connection with transactions in repurchase agreements, it is the Fund’s policy that a tri-party custodian take possession of the underlying collateral securities in a manner sufficient to enable the Fund to obtain collateral in the event of a counterparty default. If the counterparty defaults and the fair value of the collateral declines, realization of the collateral by the Fund may be delayed or limited. The repurchase agreements are fully collateralized by either or all of the following: U.S. Government agency securities, investment grade corporate bonds, and non-investment grade corporate bonds. |
| | C. | | FEDERAL TAXES — It is the Fund’s policy to make sufficient distributions to stockholders of net investment income and net realized capital gains to comply with the requirements of the Internal Revenue Code of 1986, as amended, applicable to regulated investment companies. |
The Fund intends to continue to qualify as a regulated investment company by complying with the appropriate provisions of the Internal Revenue Code and to distribute to stockholders each year substantially all of its taxable income, if any, and tax-exempt income, including realized gains on investments.
| | D. | | SECURITIES TRANSACTIONS AND INVESTMENT INCOME — Securities transactions are accounted for on the date the securities are purchased or sold (trade date). Realized gains and losses on securities transactions are determined on an identified cost basis. Interest income is recorded on an accrual basis. The Fund accretes discounts or amortizes premiums on all fixed income securities for financial reporting purposes. Dividend income is recorded on the ex-dividend date. |
| | E. | | SECURITIES LENDING — To generate additional income, the Fund lends its securities, through JPMorgan Chase Bank, NA as lending agent (an affiliate of the Advisor), to approved brokers and receives cash as collateral to secure the loans. The Fund receives payments from borrowers equivalent to the dividends and interest that would have been earned on securities lent while simultaneously seeking to earn income on the investment of collateral. Although the risk of lending is mitigated by the collateral, the Fund could experience a delay in recovering its securities and a possible loss of income or value if the borrower fails to return them. Loans are subject to termination by the Fund or the borrower at any time, and are, therefore, not considered to be illiquid investments. As of June 30, 2006, the Fund loaned securities having a value of $25,228,547. Collateral is marked to market daily to provide a level of collateral at not less than 102% of the value of loaned securities. The cash collateral received by the Fund at June 30, 2006 was invested in repurchase agreements (with interest rates ranging from 5.22% to |
12
PACHOLDER HIGH YIELD FUND, INC.
Notes to Financial Statements (Unaudited) (continued)
| | 5.4625% and maturity dates of July 3, 2006). Information on the investment of cash collateral is shown in the Statement of Net Assets Applicable to Common Stockholders. The Fund had received cash collateral of $25,557,560 for the loans and invested the collateral in repurchase agreements. |
Under the Securities Lending Agreement, JPMorgan Chase Bank, N.A. is entitled to a fee equal to: (i) 6 basis points (.06 of 1%) of the average Dollar value of Loans of U.S. Securities outstanding during a given month; and (ii) 11.42 basis points (.1142 of 1%) of the average Dollar value of Loans of non-U.S. Securities outstanding during a given month. JPMorgan Chase Bank, N.A. received $9,200 in fees for services rendered in lending of securities during the first six months of 2006.
| | F. | | EXPENSES AND DISTRIBUTIONS — Expenses are accrued as incurred. Dividends to common stockholders are paid from net investment income monthly, and distributions of net realized capital gains, if any, are paid at least annually. Dividends to preferred stockholders are accrued daily based on a variable interest rate set at weekly auctions and are paid weekly from net investment income. Distributions are determined in accordance with federal income tax regulations which may differ from generally accepted accounting principles. |
| | G. | | WHEN, AS AND IF ISSUED SECURITIES — The Fund may engage in “when-issued” or “delayed delivery” transactions. The Fund records when-issued securities on the trade date and maintains security positions such that sufficient liquid assets will be available to make payment for the securities purchased. Securities purchased on a when-issued or delayed delivery basis begin earning interest on the settlement date. |
The Fund had no when-issued or delayed-delivery purchase commitments as of June 30, 2006.
| | H. | | ESTIMATES — The preparation of financial statements in conformity with accounting principles generally accepted in the United States of America requires management to make estimates and assumptions that affect the reported amounts of assets and liabilities and disclosure of contingent assets and liabilities at the date of the financial statements and the reported amounts of revenues and expenses during the reporting period. Actual results could differ from these estimates. |
| | I. | | INTEREST RATE SWAPS — Unrealized gains are reported as an asset and unrealized losses are reported as a liability on the Statement of Net Assets Applicable to Common Stockholders. The change in value of swaps, including the periodic amounts of interest to be paid or received on swaps, is reported as unrealized gains or losses in the Statement of Operations. A realized gain or loss is recorded upon payment or receipt of a periodic payment or termination of swap agreements. Swap agreements are stated at fair value. |
| | J. | | INDEMNIFICATIONS — The Fund’s officers and directors are indemnified against certain liabilities arising out of the performance of their duties to the Fund. In addition, in the normal course of business, the Fund enters into contracts with its vendors and others that provide for general indemnifications. The Fund’s maximum exposure under these arrangements is unknown, as this would involve future claims that may be made against the Fund. However, based on experience, the Fund expects the risk of loss to be remote. |
| 2. | | COMMON STOCK — At June 30, 2006, there were 49,996,320 shares of common stock with a $.01 par value authorized and 12,928,800 shares outstanding. During the six months ended June 30, 2006 and the year ended December 31, 2005, the Fund issued 10,614 and 22,866 shares of common stock, respectively, in connection with its dividend reinvestment plan. |
| 3. | | PREFERRED STOCK — On June 29, 2001, the Fund issued 3,680 shares of Series W Auction Rate Cumulative Preferred Stock (ARPS) at an offering price of $25,000 per share. During 2002, the Fund redeemed a total of $26,000,000 or 1,040 shares of ARPS at various intervals and amounts. No redemptions have occurred since 2002. Dividends on these shares are paid weekly at an annual rate determined by a weekly auction. The Fund is required to maintain certain asset coverages as set forth in the Fund’s Articles Supplementary Creating and Fixing the Rights of Auction Rate Cumulative Preferred Stock. The ARPS is subject to mandatory redemption at a redemption price of $25,000 per share, plus accumulated and unpaid dividends, if the Fund is not in compliance with the required asset coverage (minimum 2 to 1) tests and restrictions. In general, the holders of the ARPS and the common stock vote together as a single class, except that the ARPS stockholders, as a separate class, vote to elect two members of the Board of Directors, and separate votes are required on certain matters that affect the respective interests of the ARPS and common stock. The ARPS has a liquidation preference of $25,000 per share, plus accumulated and unpaid dividends. At June 30, 2006, accrued ARPS dividends were $18,405. |
13
PACHOLDER HIGH YIELD FUND, INC.
Notes to Financial Statements (Unaudited) (continued)
| 4. | | INTEREST RATE SWAPS — The Fund entered into interest payment swap arrangements with Citibank, N. A. New York (Citibank) for the purpose of partially hedging its dividend payment obligations with respect to the ARPS. Pursuant to each of the swap arrangements, the Fund makes payments to Citibank on a monthly basis at fixed annual rates. In exchange for such payments Citibank makes payments to the Fund on a monthly basis at a variable rate determined with reference to the one month London Interbank Offered Rate (LIBOR). The variable rates ranged from 4.29% to 5.21% for the six months ended June 30, 2006. The effective date, notional amount, maturity and fixed rates of the swaps are as follows: |
| | | | | | | | | | | | | | | |
Effective Date
| | Notional Contract Amount
| | Maturity
| | Fixed Annual Rate
| | | Floating Annual Rate*
| | | Unrealized Appreciation/ (Depreciation)
| |
7/16/2001 | | $ | 10 million | | 7/17/2006 | | 5.52 | % | | 5.21 | % | | $ | (2,636 | ) |
11/13/2001 | | $ | 5 million | | 11/13/2006 | | 4.07 | % | | 5.18 | % | | | 28,539 | |
10/1/2004 | | $ | 10 million | | 10/1/2007 | | 3.30 | % | | 5.11 | % | | | 285,449 | |
6/1/2005 | | $ | 5 million | | 6/2/2008 | | 4.10 | % | | 5.11 | % | | | 131,572 | |
6/1/2005 | | $ | 5 million | | 6/1/2009 | | 4.15 | % | | 5.11 | % | | | 184,067 | |
12/1/2005 | | $ | 5 million | | 12/1/2009 | | 4.74 | % | | 5.11 | % | | | 117,380 | |
| * | | Represents rate in effect at June 30, 2006. |
Swap transactions, which involve future settlement, give rise to credit risk. Credit risk is the amount of loss the Fund would incur in the event counterparties failed to perform according to the terms of the contractual commitments. The Fund is exposed to credit loss in the event of nonperformance by the counterparty on interest rate swaps, but the Fund does not anticipate nonperformance by the counterparty. While notional contract amounts are used to express the volume of interest rate swap agreements, the amounts potentially subject to credit risk, in the event of nonperformance by counterparties, are substantially smaller.
For the six months ended June 30, 2006, the Fund’s receipts under the swap agreements were greater than the amount paid and accrued to Citibank by $56,474 and are included as realized gain in the accompanying Statement of Operations.
The estimated fair value of the interest rate swap agreements at June 30, 2006, amounted to approximately $744,371 in unrealized appreciation and is included in the accompanying Statement of Net Assets Applicable to Common Stockholders. Swap transactions present risk of loss in excess of the related amounts included in the Statement of Net Assets Applicable to Common Stockholders.
| 5. | | PURCHASES AND SALES OF SECURITIES — Purchases and sales of securities (excluding short-term securities) for the six months ended June 30, 2006 aggregated $63,471,413 and $64,055,167, respectively. |
| 6. | | TRANSACTIONS WITH INVESTMENT ADVISOR, ADMINISTRATOR, ACCOUNTING SERVICES AGENT AND CUSTODIAN — The Fund has an investment advisory agreement with Pacholder & Company, LLC (the “Advisor”), an Ohio limited liability company, which is wholly-owned by JPMorgan Investment Advisors, Inc. pursuant to which the Advisor serves as the Fund’s investment advisor. The Fund pays the Advisor an advisory fee that varies based on the total return investment performance of the Fund for the prior twelve-month period relative to the percentage change in the Credit Suisse First Boston High Yield Index, Developed Countries Only™. The fee, which is accrued at least weekly and paid monthly, ranges from a maximum of 1.40% to a minimum of 0.40% (on an annualized basis) of the Fund’s average net assets. For purposes of calculating the amount of the advisory fee, the Fund’s average net assets are determined by taking the average of all determinations of such net assets during the applicable 12-month period and the Fund’s net assets mean the total assets of the Fund minus accrued liabilities of the Fund other than the principal amount of any outstanding senior securities representing indebtedness (within the meaning of Section 18 of the 1940 Act). Notwithstanding the foregoing, during the 12-month period following March 1, 2005, the date on which the investment advisory agreement took effect, the Fund was obligated to pay the Advisor the minimum fee payable under the investment advisory agreement and any balance due based on the Fund’s investment performance during the period was paid to the Advisor upon completion of the 12-month period. For the twelve months ended June 30, 2006, the advisory fee was calculated based on 1.40% of average weekly net assets (as defined above) of the Fund, however, due to the cumulative nature of the calculation, the annualized expense charged in interim periods may exceed the maximum rate. At June 30, 2006, accrued advisory fees were $423,425. Certain officers and directors of the Fund are also members of the Executive Committee of the Advisor. |
The Fund has an administrative services agreement with JPMorgan Funds Management, Inc. (“JPMFM”) (an affiliate of the Advisor) pursuant to which JPMFM provides administrative services to the Fund. Under the agreement, JPMFM receives from the Fund a fee, accrued at least weekly and paid monthly, at the annual rate of 0.10% of the average weekly net assets of the Fund. At June 30, 2006, accrued administrative fees were $15,350.
14
PACHOLDER HIGH YIELD FUND, INC.
Notes to Financial Statements (Unaudited) (concluded)
The Fund also has an agreement with JPMFM to provide portfolio accounting and net asset value calculations for the Fund. Under the agreement, JPMFM receives from the Fund a fee, accrued at least weekly and paid monthly, at the annual rate of 0.025% of the first $100 million of the Fund’s average weekly net assets and 0.015% of such assets in excess of $100 million. At June 30, 2006, accrued accounting fees were $3,124.
The Fund has an agreement with Bank One Trust Company, N.A. (an affiliate of the Advisor) to provide custodial services for the Fund. Under the agreement, Bank One Trust Company, N.A. receives from the Fund a fee, accrued at least weekly and paid monthly, at the annual rate of 0.01% of the Fund’s average weekly net assets. At June 30, 2006, accrued custodial fees were $3,207.
As of June 30, 2006, liabilities for the Fund, other than those previously identified, included:
| | | |
Securities purchased payable | | $ | 3,458,994 |
Other liabilities | | | 1,041,425 |
| 7. | | TAX INFORMATION — At December 31, 2005, the Fund had available a capital loss carryforward of $54,892,304, of which $2,513,330 expires in 2006, $5,237,176 expires in 2007, $4,746,544 expires in 2008, $4,438,792 expires in 2009, $8,135,473 expires in 2010, $20,873,746 expires in 2011, $2,030,683 expires in 2012, and $6,916,560 expires in 2013, to offset any future net capital gains. |
| 8. | | SCHEDULE OF RESTRICTED SECURITIES — A restricted security is a security which has been purchased through a private offering and cannot be resold to the general public without prior registration under the Securities Act of 1933 (the “Act”) or pursuant to the resale limitations provided by Rule under the Act, or an exemption from the registration requirements of the Act. At June 30, 2006, the Fund held restricted securities representing 0.71% of the Fund’s long-term market value. The restricted securities held as of June 30, 2006 are identified below: |
| | | | | | | |
Security
| | Description
| | Acquisition
Date
| | Cost of
Security
|
Golden State Foods | | Bond | | 2/26/04 | | $ | 1,250,000 |
Bally Total Fitness | | Common Stock | | 12/30/05 | | | 26,830 |
| 9. | | OTHER MATTERS — In July 2006, the Financial Accounting Standards Board issued Interpretation No. 48, Accounting for Uncertainty in Income Taxes — an Interpretation of FASB Statement No. 109, (the “Interpretation”). The Interpretation prescribes for all entities, including pass-through entities, a recognition threshold and measurement attribute for financial statement recognition and measurement of a tax position taken or expected to be taken in a tax return, and requires certain expanded tax disclosures. The Interpretation is effective for fiscal years beginning after December 15, 2006, and is to be applied to all open tax years as of the date of effectiveness. Management is evaluating the Interpretation and the impact on the Fund’s financial statements, but has not at this time quantified the impact, if any, resulting from the adoption of the Interpretation. |
| 10. | | SUBSEQUENT EVENTS — At its August 2006 board meeting, the Board of Directors approved the appointment of JPMorgan Chase Bank, N.A. (an affiliate of the Advisor) as successor custodian and fund accountant effective October 20, 2006 or such later date as designated by the officers of the Fund (the “Effective Date”). On the Effective Date, JPMorgan Chase Bank, N.A. will replace Bank One Trust Company, N.A., as custodian and JPMorgan Funds Management, Inc. as fund accountant. |
15
PACHOLDER HIGH YIELD FUND, INC.
Annual Meeting Results (Unaudited)
The Fund held its 2006 annual meeting of shareholders on April 5, 2006, to elect directors of the Fund.
The results of voting were as follows (by number of shares):
| | |
| For nominees to the Board of Directors: | | |
| |
William J. Morgan1 | | |
In favor: | | 2,562 |
Withheld: | | 1 |
| |
George D. Woodard1 | | |
In favor: | | 2,562 |
Withheld: | | 1 |
| |
John F. Williamson2 | | |
In favor: | | 11,587,856 |
Withheld: | | 142,540 |
| |
Daniel A. Grant2 | | |
In favor: | | 11,588,316 |
Withheld: | | 142,080 |
| 1 | | Elected by holders of the Fund’s Auction Rate Preferred Stock voting separately as a class. |
| 2 | | Elected by holders of the Fund’s Auction Rate Preferred Stock and Common Stock voting together as a single class. |
16
PACHOLDER HIGH YIELD FUND, INC.
Supplemental Information (Unaudited)
Portfolio Holdings Information
The Fund files its complete schedule of portfolio holdings with the U.S. Securities and Exchange Commission (“SEC”) for the first and third quarters of each fiscal year on Form N-Q. The Fund’s Forms N-Q are available, without charge, on the SEC’s website at www.sec.gov. The Fund’s Forms N-Q may be reviewed and copied at the SEC’s Public Reference Room in Washington, DC. Information on the operation of the Public Reference Room may be obtained by calling 1-800-SEC-0330. The Fund’s website at www.phf-hy.com contains schedules of portfolio investments of the Fund.
Proxy Voting
A description of the policies and procedures used by the Fund to vote proxies relating to portfolio securities, as well as information regarding how the Fund voted proxies relating to portfolio securities during the most recent 12-month period ended June 30, is available (i) without charge, on the Fund’s website at www.phf-hy.com and (ii) on the SEC’s website at www.sec.gov.
Renewal of the Investment Advisory Contract
On May 22, 2006, the Fund’s Board of Directors (the “Board”) considered renewal of the investment advisory agreement between the Fund and the Advisor.
As discussed below, the Independent Directors relied upon comparisons of the advisory fee payable to the Advisor by the Fund to the investment advisory arrangements of other comparable closed-end funds. In addition, the Independent Directors considered that no change was being proposed in the terms of the advisory agreement. Because the Fund is a closed-end fund without daily inflows or outflows of new capital and because the investment advisory fee is a “fulcrum fee,” the Independent Directors did not give special consideration to whether economies of scale might be realized in managing the Fund’s assets.
The Independent Directors considered and found the following specific factors in support of approval of the continuation of the investment advisory agreement:
| | • | | The Advisor’s performance of its obligations under the agreement and the expectation that there would not be any significant change with respect to the Advisor’s personnel or day-to-day management of the Fund; |
| | • | | The expectation that the Advisor will continue to execute its obligations under the agreement consistently over time; |
| | • | | The Advisor has the requisite expertise and experience, as well as sufficient financial resources, to fulfill its commitments to the Fund under the agreement; |
| | • | | The Fund’s performance for the past 1, 3, 5 and 10-year periods was above average compared to other closed-end funds in the Fund’s Morningstar peer group; |
| | • | | The Fund’s average annual total returns between 1989 and 2005 were above the average annual total returns for other closed-end funds in the Fund’s Morningstar peer group; and |
| | • | | The Advisor’s estimated profitability in respect of the agreement has been reasonable and appears to be in line with general industry standards. |
The Independent Directors relied on comparisons of the advisory fee under the agreement to advisory fees paid by other closed-end high yield funds and found the following:
| | • | | The agreement’s 90 basis point fulcrum fee is somewhat higher than the average fixed advisory fee paid by other closed-end high yield funds, although the Fund’s overall expense ratio (at the fulcrum fee) has been slightly below the average expense ratio; |
| | • | | Although the Advisor earned the maximum 140 basis point fee in 2003 and 2004 and a 103 basis point fee in 2005, in 2001 and 2002 the Advisor earned the minimum 40 basis point fee, and the Fund’s actual advisory fee and expense ratio in those years were materially lower than most other closed-end high yield funds; and |
| | • | | The two largest closed-end high yield funds have fixed advisory fees of 90 basis points and 115 basis points, respectively. |
The Independent Directors recognized that it is difficult to make comparisons of profitability from the investment advisory arrangements of other comparable closed-end funds because comparative information is not generally publicly available and is affected by numerous factors, including the structure of the particular adviser, the types of funds it manages, its business mix, numerous assumptions regarding allocations, and the adviser’s capital structure and the cost of capital. The Independent Directors also recognized that the Advisor should be entitled to earn a reasonable level of profits for the services it provides to the Fund. Based on these considerations, the Independent Directors found the compensation to be paid to the Advisor under the investment advisory agreement to be fair and reasonable in relation to the services to be provided by the Advisor.
17
PACHOLDER HIGH YIELD FUND, INC.
Supplemental Information (Unaudited) (concluded)
Because the Advisor does not have any advisory clients other than the Fund, the Independent Directors did not compare the advisory services to be provided to the Fund under the contract to the investment advisory services being provided by the Advisor to other clients. However, they did consider the advisory fees charged by affiliates of the Advisor to other client accounts investing in high yield securities.
The Independent Directors considered the scope and quality of the services provided by the Advisor under the investment advisory agreement and noted that the scope of the services had expanded over time as a result of regulatory and other developments. The Independent Directors noted, for example, that the Advisor and its affiliates are responsible for maintaining and monitoring the Advisor’s and the Fund’s compliance programs, both of which have grown in scope and complexity as a result of new regulatory requirements that have been mandated over the past few years. As part of their deliberations, the Independent Directors also considered information concerning JPMorgan, including, among other matters, the nature and extent of its investment advisory businesses, its financial and other resources, its high yield assets under management, its investment company business, its fund support capabilities and any significant legal proceedings.
During the course of their deliberations, the Independent Directors reached the following conclusions, among others: (1) the Advisor is qualified to manage the assets of the Fund in accordance with the investment advisory agreement based in part on the Fund’s experience with the Advisor in the past; (2) the Fund’s performance over time has been above average compared to other closed-end funds in the Fund’s Morningstar peer group; and (3) the compensation to be paid to the Advisor under the investment advisory agreement is fair and reasonable in relation to the services to be provided by the Advisor and various industry averages for comparable funds. In their deliberations, the Independent Directors did not identify any particular information that was all important or controlling for purposes of making their decision.
After consideration of the foregoing, the Board, including all of the Independent Directors, resolved to renew the investment advisory agreement.
Dividend Reinvestment Plan
The Fund’s Dividend Reinvestment Plan offers you an automatic way to reinvest your dividends and capital gains distributions in additional shares of the Fund. For an enrollment form and detailed information about the Plan, please contact Computershare Investor Services, P.O. Box 1689, Chicago, IL 60690-1689, (888) 294-8217, and www.computershare.com.
18
[THIS PAGE INTENTIONALLY LEFT BLANK]
PACHOLDER HIGH YIELD FUND, INC.
Directors and Officers
| | |
William J. Morgan President and Director James P. Shanahan, Jr. Secretary James E. Gibson Treasurer David A. Groshoff, Esq. Chief Compliance Officer | | John F. Williamson Chairman and Director George D. Woodard Director Daniel A. Grant Director |
Investment Objective
A closed-end fund seeking a high level of total return through current income and capital appreciation by investing primarily in high-yield, fixed income securities of domestic companies.
Investment Advisor
Pacholder & Company, LLC
Administrator
JPMorgan Funds Management, Inc.
Custodian
Bank One Trust Company, N.A.
Transfer Agent
Computershare Investor Services, LLC
Legal Counsel
Kirkpatrick & Lockhart Nicholson Graham LLP
Independent Registered Public Accounting Firm
PricewaterhouseCoopers LLP
Executive Offices
Pacholder High Yield Fund, Inc.
8044 Montgomery Road
Suite 555
Cincinnati, Ohio 45236
(513) 985-3200
Please visit our web site, www.phf-hy.com, for information on the Fund’s NAV, share price, news releases, and SEC filings. We created this site to provide stockholders quick and easy access to the timeliest information available regarding the Fund.
This report is for the information of stockholders of Pacholder High Yield Fund, Inc. It is not a prospectus, offering circular or other representation intended for use in connection with the purchase or sale of shares of the Fund or any securities mentioned in this report.
PACHOLDER HIGH YIELD FUND, INC.
SEMI-ANNUAL REPORT
JUNE 30, 2006
Not applicable for semi-annual reports.
| Item 3. | Audit Committee Financial Expert. |
Not applicable for semi-annual reports.
| Item 4. | Principal Accountant Fees and Services. |
Not applicable for semi-annual reports.
| Item 5. | Audit Committee of Listed Registrants. |
Not applicable for semi-annual reports.
| Item 6. | Schedule of Investments. |
Included as part of the report to stockholders filed under Item 1 of this Form N-CSR.
| Item 7. | Disclosure of Proxy Voting Policies and Procedures for Closed-End Management Investment Companies. |
Not applicable for semi-annual reports.
| Item 8. | Portfolio Managers of Closed-End Management Investment Companies. |
There has been no change in the portfolio manager for the Fund since the annual report filed for the period ending December 31, 2005 on Form N-CSR.
| Item 9. | Purchases of Equity Securities by Closed-End Management Investment Company and Affiliated Purchasers. |
There were no purchases covered by this Item during the period covered by this report.
| Item 10. | Submission of Matters to a Vote of Security Holders. |
The Registrant has not made any material changes since the Registrant last provided disclosure in response to the requirements of Item 7(d)(2)(ii)(G) of Schedule 14A or this Item.
| Item 11. | Controls and Procedures. |
Registrant’s principal executive officer and principal financial officer have concluded, based on their evaluation of the Registrant’s disclosure controls and procedures as of a date within 90 days of the filing date of this Form N-CSR, that the Registrant’s disclosure controls and procedures are reasonably designed to ensure that information required to be disclosed by the Registrant on Form N-CSR is recorded,
processed, summarized and reported within the required time periods and that information required to be disclosed by the Registrant in the reports that it files or submits on Form N-CSR is accumulated and communicated to the Registrant’s management, including its principal executive and principal financial officers, as appropriate to allow timely decisions regarding required disclosure.
(a)(2a) Certification of principal executive and principal financial officer as required by Rule 30a-2(a) under the Investment Company Act of 1940 attached hereto as EX-99.
(a)(2b) Certification of principal executive and principal financial officer as required by Rule 30a-2(b) under the Investment Company Act of 1940 attached hereto as EX-99.906.
SIGNATURES
Pursuant to the requirements of the Securities Exchange Act of 1934 and the Investment Company Act of 1940, the Registrant has duly caused this report to be signed on its behalf by the undersigned, thereunto duly authorized.
| | | | |
Pacholder High Yield Fund, Inc. | | | | |
| | |
/s/ William J. Morgan | | | | September 7, 2006 |
William J. Morgan | | | | Date |
President (principal executive officer) | | | | |
Pursuant to the requirements of the Securities Exchange Act of 1934 and the Investment Company Act of 1940, this report has been signed below by the following persons on behalf of the Registrant and in the capacities and on the dates indicated.
| | | | |
| | |
/s/ William J. Morgan | | | | September 7, 2006 |
William J. Morgan | | | | Date |
President (principal executive officer) | | | | |
| | |
/s/ James E. Gibson | | | | September 7, 2006 |
James E. Gibson | | | | Date |
Treasurer (principal financial officer) | | | | |