UNITED STATES
SECURITIES AND EXCHANGE COMMISSION
Washington, D.C. 20549
FORM N-CSR
CERTIFIED SHAREHOLDER REPORT OF REGISTERED
MANAGEMENT INVESTMENT COMPANIES
| | |
| Investment Company Act file number: 811-05639 |
Pacholder High Yield Fund, Inc.
|
| (Exact name of registrant as specified in charter) |
| | |
| 8044 Montgomery Road, Ste. 555, Cincinnati, OH | | 45236 |
| (Address of principal executive offices) | | (Zip code) |
Gary J. Madich
8044 Montgomery Road, Ste. 555
Cincinnati, OH 45236
|
| (Name and Address of Agent for Service) |
Registrant’s telephone number, including area code: (513) 985-3200
Date of fiscal year end: December 31
Date of reporting period: January 1, 2007 through June 30, 2007
Form N-CSR is to be used by management investment companies to file reports with the Commission not later than 10 days after the transmission to stockholders of any report that is required to be transmitted to stockholders under Rule 30e-1 under the Investment Company Act of 1940 (17 CFR 270.30e-1). The Commission may use the information provided on Form N-CSR in its regulatory, disclosure review, inspection, and policymaking roles.
A registrant is required to disclose the information specified by Form N-CSR, and the Commission will make this information public. A registrant is not required to respond to the collection of information contained in Form N-CSR unless the Form displays a currently valid Office of Management and Budget (“OMB”) control number. Please direct comments concerning the accuracy of the information collection burden estimate and any suggestions for reducing the burden to Secretary, Securities and Exchange Commission, 450 Fifth Street, NW, Washington, DC 20549-0609. The OMB has reviewed this collection of information under the clearance requirements of 44 U.S.C. Section 3507.
| ITEM 1. | REPORTS TO STOCKHOLDERS. |
The following is a copy of the report transmitted to shareholders pursuant to Rule 30e-1 under the Investment Company Act of 1940 (17 CFR 270.30e-1).
PACHOLDER HIGH YIELD FUND, INC.
Directors and Officers
| | |
Gary J. Madich, CFA President Patricia A. Maleski Vice President and Chief Administrative Officer Stephanie J. Dorsey Treasurer Penny Grandominico Chief Compliance Officer Jessica K. Ditullio Secretary | | John F. Williamson Chairman and Director George D. Woodard Director Daniel A. Grant Director William J. Morgan Director |
Investment Objective
A closed-end fund seeking a high level of total return
through current income and capital appreciation by
investing primarily in high-yield, fixed income securities
of domestic companies.
Investment Advisor
J.P. Morgan Investment Management Inc.
Administrator
JPMorgan Funds Management, Inc.
Custodian
JPMorgan Chase Bank, N.A.
Transfer Agent
Computershare Investor Services, LLC
Legal Counsel
Kirkpatrick & Lockhart Preston Gates Ellis LLP
Independent Registered Public Accounting Firm
PricewaterhouseCoopers LLP
Executive Offices
Pacholder High Yield Fund, Inc.
8044 Montgomery Road
Suite 555
Cincinnati, Ohio 45236
Shareholder Services
(877) 217-9502
Please visit our website, www.phf-hy.com, for information on the Fund’s NAV, share price, news releases, and SEC filings. We created this site to provide stockholders quick and easy access to the timeliest information available regarding the Fund.
This report is for the information of stockholders of Pacholder High Yield Fund, Inc. It is not a prospectus, offering circular or other representation intended for use in connection with the purchase or sale of shares of the Fund or any securities mentioned in this report.
PACHOLDER HIGH YIELD FUND, INC.
SEMI-ANNUAL REPORT
JUNE 30, 2007
(UNAUDITED)
PACHOLDER HIGH YIELD FUND, INC.
(Unaudited)
Dear Stockholders:
Second Quarter Review
The Pacholder High Yield Fund, Inc. and the high-yield market continued the first-quarter’s pattern into the second quarter, with solid performance in the first two months followed by a sharp decline. For the quarter ended June 30, 2007, the Fund rendered a 1.74% net-of-fees return (i.e., net of fees and expenses, including preferred stock dividends and the effect of the Fund’s leveraged capital structure) and 2.05% gross-of-fees return (gross of leverage, fees and expenses), which compared favorably to the 0.14% return of the Morningstar Closed-End High Yield Category and the 0.65% return of the Credit Suisse First Boston High Yield Index, Developed Countries Only (the “Index”). The Fund’s net asset value (NAV) performance for the first half of the year also compared favorably to the average total return of all closed-end high-yield funds, as reported by Morningstar (6.11% versus 3.20%). The Fund’s gross-of-fees return of 5.93% also outperformed the Index’s return of 3.65% for the six-month period. The Fund’s strong relative performance for the second quarter and first half of 2007 was due primarily to an underweight in BB-rated securities — which provided lower returns than the high-yield market — and select holdings that were purchased primarily for total return.
The second quarter began on a strong note, as both the high-yield and equity markets rendered strong performance. This momentum carried through most of May, as demand for high-yield investments outpaced new supply. In June, the high-yield market relented due to a combination of factors, including a large supply of expected future offerings fueled by more speculative leveraged buyout (LBO) debt, renewed concerns over the effects of the sub-prime loan market on the economy, rising Treasury rates and concerns that tight spreads in the high-yield market were not compensating investors for the perceived risk.
On the fundamental side of the equation, high-yield issuers generally reported stable or improving results in the second quarter. Nevertheless, certain industries, such as auto suppliers, lumber and technology, may face challenging conditions. The trailing 12-month default rate for below-investment-grade issuers, as measured by Moody’s Investors Service, dropped from 1.7% at the end of 2006 to 1.4% in June 2007. Although Moody’s expects defaults to rise to 1.9% by the end of 2007, this estimate is still well below the historical average and has been revised downward from 2.7% at the end of March 2007. Continued economic growth, solid corporate profits, low relative interest rates and abundant liquidity in the capital markets have combined to keep the default rate low.
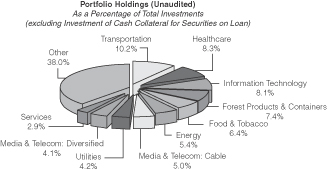
The second quarter showed mixed performance, as 12 of the Index’s 19 sectors posted positive returns. Sectors that performed relatively well were utilities, manufacturing and consumer products, while those that provided weak relative performance included information technology, aerospace (airlines) and retail. The Fund is well diversified, with investments in 190 issuers in 19 different industries. The Fund’s largest industry concentration was in transportation (auto), which accounted for 10.2% of the Fund. We have increased our exposure in this sector over the past few quarters because we believe that the industry is addressing overcapacity and legacy healthcare costs.
The effect of rising Treasury rates in the second quarter (the 10-year Treasury rose 38 basis points (bps) to close at 5.03%) and the market correction in June were apparent. As the average price of the Index dropped 1.34 bps from 100.55 to 99.21, the average yield rose 34 bps from 7.77% to 8.11% and the spread over the comparable Treasury remained flat at 316 bps.
Second-quarter returns for the broad equity indexes were very positive, despite a slight correction in June. The Russell 2000, S&P 500, NASDAQ and DJIA Indexes returned 4.42%, 6.28%, 7.70% and 9.11%, respectively. Positive momentum in the equity market may provide issuers with more financial flexibility and tends to reflect higher values for business assets to support leveraged capital structures, which is beneficial for high-yield investors.
Portfolio Strategy and Outlook
We have continued to see prices rise for a number of the Fund’s longer-term total return investments, as underlying fundamentals driving their markets remain favorable. In response, we have harvested some of these investments when they met our price and return objectives. The investment team identified a few more attractive higher return investments and, as a result, slightly increased the Fund’s exposure to improving credits currently rated CCC. We are continuing the Fund’s dual strategy of increasing positions with lower-credit volatility, such as senior secured loan participations and assignments (9.42% portfolio weighting), while also selectively investing in total return opportunities.
Because the strength and duration of the economic expansion is not known, we will continue to adjust the Fund’s composition gradually over time, predicated on bottom-up fundamental analysis of the individual issuers and securities available in the market.
PACHOLDER HIGH YIELD FUND, INC.
(Unaudited)
As always, we appreciate your interest in the Fund and look forward to your continued support.
Sincerely,

Gary J. Madich, CFA
President
July 23, 2007
Figure 1
The performance quoted is past performance and is not a guarantee of future results. Closed-end funds are subject to certain market risks. Investment returns and principal value of an investment will fluctuate so that an investor’s shares, when sold, may be worth more or less than their original cost. Current performance may be higher or lower than the performance data shown.
JPMorgan Asset Management is the marketing name for the asset management businesses of JPMorgan Chase & Co. Those businesses include, but are not limited to, J.P. Morgan Investment Management Inc., JPMorgan Investment Advisors, Inc., Security Capital Research & Management Incorporated and J.P. Morgan Alternative Asset Management, Inc.
Securities rated below investment grade are called “high-yield bonds,” “non-investment grade bonds,” “below investment-grade bonds,” or “junk bonds.” They generally are rated in the fifth or lower rating categories of Standard & Poor’s and Moody’s Investors Service. Although these securities tend to provide higher yields than higher rated securities, there is a greater risk that the Fund’s share value will decline. Because this Fund primarily invests in bonds, it is subject to interest rate risks. Bond prices generally fall when interest rates rise.
Opinions and estimates offered constitute our judgment and are subject to change without notice, as are statements of financial market trends, which are based on current market conditions. We believe the information provided here is reliable, but do not warrant its accuracy or completeness. This material is not intended as an offer or solicitation for the purchase or sale of any financial instrument. The views and strategies described may not be suitable for all investors. This material has been prepared for informational purposes only, and is not intended to provide, and should not be relied on for, accounting, legal or tax advice. References to future returns are not promises or even estimates of actual returns a client portfolio may achieve. Any forecasts contained herein are for illustrative purposes only and are not to be relied upon as advice or interpreted as a recommendation.
PACHOLDER HIGH YIELD FUND, INC.
Statement of Net Assets Applicable to Common Stockholders
June 30, 2007 (Unaudited)
| | | | | | | | | |
| Description | | Par
(000) | | Value | | Percent
of Net
Assets* | |
| | | | | | | | | |
CORPORATE DEBT SECURITIES — 128.6% | | | | | | |
AEROSPACE — 4.7% | | | | | | | | | |
American Airlines, Inc., Collateral Trust Notes, 10.18%, 1/2/13 | | $ | 1,300 | | $ | 1,352,000 | | 1.0 | % |
American Airlines, Inc., Pass Thru Cert, 7.379%, 5/23/16 | | | 590 | | | 551,551 | | 0.4 | |
American Airlines, Inc., Private Placement, Notes,
3.363%, 10/18/099 | | | 749 | | | 726,982 | | 0.6 | |
American Airlines, Inc., Private Placement, Notes, 10.32%, 7/30/142 | | | 750 | | | 768,750 | | 0.6 | |
Continental Airlines, Inc., Pass Thru Cert, 9.798%, 4/1/21 | | | 1,880 | | | 2,086,985 | | 1.6 | |
Continental Airlines, Inc., Unsubordinated, 8.75%, 12/1/116 | | | 250 | | | 245,000 | | 0.2 | |
Delta Air Lines, Inc., 8.30%, 12/15/291,4 | | | 1,500 | | | 105,000 | | 0.1 | |
Delta Air Lines, Inc., 10.125%, 5/15/101,4 | | | 500 | | | 34,375 | | 0.0 | |
United Air Lines, Inc., FRN, Private Placement, Nt, 7.54%, 7/2/142 | | | 200 | | | 198,000 | | 0.1 | |
United Air Lines, Inc., Private Placement, Nt, 7.336%, 7/2/192 | | | 100 | | | 99,000 | | 0.1 | |
| | | | | | | | | |
| | | | | | 6,167,643 | | 4.7 | |
CHEMICALS — 2.7% | | | | | | | | | |
MacDermid, Inc., Private Placement, 9.50%, 4/15/172 | | | 125 | | | 125,625 | | 0.1 | |
Mosaic Co., (The), Private Placement, Sr Nt, 7.375%, 12/1/142,6 | | | 125 | | | 126,250 | | 0.1 | |
Mosaic Co., (The), Private Placement, Sr Nt, 7.625%, 12/1/162 | | | 125 | | | 127,812 | | 0.1 | |
PolyOne Corp., Nt, 8.875%, 5/1/126 | | | 1,750 | | | 1,736,875 | | 1.3 | |
Sterling Chemicals, Inc., Private Placement, 10.25%, 4/1/152 | | | 850 | | | 879,750 | | 0.7 | |
Terra Capital, Inc., Series B, Sr Nt, 7.00%, 2/1/17 | | | 525 | | | 506,625 | | 0.4 | |
| | | | | | | | | |
| | | | | | 3,502,937 | | 2.7 | |
CONSUMER PRODUCTS — 2.9% | | | | | | | | | |
Broder Bros. Co., Series B, Sr Nt, 11.25%, 10/15/1010 | | | 1,835 | | | 1,809,769 | | 1.4 | |
Cooper Cos., Inc. (The), Private Placement, 7.125%, 2/15/152 | | | 500 | | | 495,000 | | 0.4 | |
Hanesbrands, Inc., FRN, Sr Nt,
8.784%, 12/15/146 | | | 500 | | | 507,500 | | 0.4 | |
| | | | | | | | |
| Description | | Par
(000) | | Value | | Percent
of Net
Assets* |
| | | | | | | | |
CONSUMER PRODUCTS (continued) | | | | | | | | |
Spectrum Brands, Inc., Sr Nt,
7.375%, 2/1/156 | | $ | 1,200 | | $ | 964,500 | | 0.7 |
Westpoint Stevens, Inc., Sr Nt,
7.875%, 6/15/051,3,4,9 | | | 1,000 | | | — | | 0.0 |
| | | | | | | | |
| | | | | | 3,776,769 | | 2.9 |
ENERGY — 8.2% | | | | | | | | |
Allis-Chalmers Energy, Inc., Sr Nt, 9.00%, 1/15/14 | | | 750 | | | 763,125 | | 0.6 |
Bristow Group, Inc., Co Guar,
6.125%, 6/15/13 | | | 250 | | | 235,625 | | 0.2 |
Chart Industries, Inc., Sr Sub Nt, 9.125%, 10/15/15 | | | 1,400 | | | 1,470,000 | | 1.1 |
El Paso Corp., Nt, 7.00%, 6/15/17 | | | 75 | | | 74,178 | | 0.1 |
El Paso Corp., Sr Nt, 6.875%, 6/15/146 | | | 75 | | | 74,625 | | 0.1 |
El Paso Performance-Linked Trust, Private Placement, Sr Nt,
7.75%, 7/15/112 | | | 500 | | | 515,000 | | 0.4 |
Encore Acquisition Co., Sr Nt,
6.00%, 7/15/156 | | | 1,000 | | | 882,500 | | 0.7 |
OPTI Canada, Inc. (Canada), Private Placement, Co Guar,
8.25%, 12/15/142 | | | 1,180 | | | 1,197,700 | | 0.9 |
Peabody Energy Corp., Co Guar, 7.375%, 11/1/166 | | | 500 | | | 510,000 | | 0.4 |
PHI, Inc., Co Guar, 7.125%, 4/15/13 | | | 783 | | | 747,765 | | 0.5 |
Pride International, Inc., Sr Nt,
7.375%, 7/15/15 | | | 200 | | | 200,500 | | 0.1 |
Range Resources Corp., Sr Sub Nt, 7.50%, 5/15/16 | | | 350 | | | 354,375 | | 0.3 |
Secunda International Ltd. (Canada), FRN, Sec’d, 13.36%, 9/1/1210 | | | 1,500 | | | 1,556,250 | | 1.2 |
Seitel, Inc., Private Placement,
9.75%, 2/15/142 | | | 400 | | | 396,000 | | 0.3 |
Swift Energy Co., Sr Nt, 7.125%, 6/1/17 | | | 1,010 | | | 962,025 | | 0.7 |
Williams Partners LP/Williams Partners Finance Corp., Sr Nt, 7.25%, 2/1/17 | | | 250 | | | 251,250 | | 0.2 |
W&T Offshore, Inc., Private Placement, Sr Nt, 8.25%, 6/15/142 | | | 500 | | | 493,750 | | 0.4 |
| | | | | | | | |
| | | | | | 10,684,668 | | 8.2 |
FINANCE — 3.7% | | | | | | | | |
ACE Cash Express, Inc., Private Placement, Sr Nt, 10.25%, 10/1/142 | | | 1,000 | | | 1,022,500 | | 0.8 |
3
PACHOLDER HIGH YIELD FUND, INC.
Statement of Net Assets Applicable to Common Stockholders (continued)
June 30, 2007 (Unaudited)
| | | | | | | | |
| Description | | Par
(000) | | Value | | Percent
of Net
Assets* |
| | | | | | | | |
FINANCE (continued) | | | | | | | | |
Crum & Forster Holdings Corp., Private Placement, 7.75%, 5/1/172 | | $ | 600 | | $ | 586,500 | | 0.4 |
GMAC LLC, 6.625%, 5/15/12 | | | 250 | | | 241,420 | | 0.2 |
Harland Clarke Holdings Corp., Private Placement, 9.50%, 5/15/152 | | | 250 | | | 240,000 | | 0.2 |
HUB International Holdings, Inc., Private Placement, 9.00%, 12/15/142 | | | 500 | | | 490,000 | | 0.4 |
HUB International Holdings, Inc., Private Placement, 10.25%, 6/15/152 | | | 500 | | | 481,250 | | 0.4 |
Realogy Corp., Private Placement, Sr Nt, 10.50%, 4/15/142 | | | 500 | | | 476,250 | | 0.3 |
Thornburg Mortgage, Inc., Sr Nt,
8.00%, 5/15/1310 | | | 1,300 | | | 1,303,250 | | 1.0 |
| | | | | | | | |
| | | | | | 4,841,170 | | 3.7 |
FOOD & DRUG — 0.6% | | | | | | | | |
Rite Aid Corp., Debentures,
7.50%, 3/1/17 | | | 100 | | | 96,500 | | 0.1 |
Rite Aid Corp., Debentures,
8.625%, 3/1/156 | | | 250 | | | 233,750 | | 0.2 |
Rite Aid Corp., Private Placement, 9.375%, 12/15/152,6 | | | 400 | | | 384,000 | | 0.3 |
| | | | | | | | |
| | | | | | 714,250 | | 0.6 |
FOOD & TOBACCO — 9.3% | | | | | | | | |
Alliance One International, Inc., Nt, 11.00%, 5/15/12 | | | 2,400 | | | 2,634,000 | | 2.0 |
Alliance One International, Inc., Nt, 12.75%, 11/15/126 | | | 150 | | | 167,250 | | 0.1 |
Buffets, Inc., Debentures,
12.50%, 11/1/14 | | | 200 | | | 191,500 | | 0.2 |
Chiquita Brands International, Inc., Sr Nt, 8.875%, 12/1/156 | | | 2,699 | | | 2,547,181 | | 2.0 |
Constellation Brands, Inc., Private Placement, Sr Nt, 7.25%, 5/15/172 | | | 250 | | | 243,750 | | 0.2 |
Cosan S.A. Industria e Comercio (Brazil), Private Placement, Sr Nt,
9.00%, 11/1/092 | | | 300 | | | 317,250 | | 0.2 |
Dean Foods Co., Sr Nt, 7.00%, 6/1/16 | | | 125 | | | 119,375 | | 0.1 |
Eurofresh, Inc., Private Placement, Nt, 11.50%, 1/15/132 | | | 2,750 | | | 2,736,250 | | 2.1 |
Golden State Foods Corp., Private Placement, Sr Sub Nt,
9.24%, 1/10/122,8,9 | | | 1,550 | | | 1,573,250 | | 1.2 |
| | | | | | | | |
| Description | | Par
(000) | | Value | | Percent
of Net
Assets* |
| | | | | | | | |
FOOD & TOBACCO (continued) | | | | | | | | |
National Beef Packaging Co. LLC/NB Finance Corp., Sr Nt,
10.50%, 8/1/1110 | | $ | 500 | | $ | 520,000 | | 0.4 |
OSI Restaurant Partners, Inc., Private Placement, 10.00%, 6/15/152,6 | | | 150 | | | 143,250 | | 0.1 |
Pilgrim’s Pride Corp., Debentures,
8.375%, 5/1/176 | | | 150 | | | 148,500 | | 0.1 |
Southern States Coop, Inc., Private Placement, Sr Nt, 10.50%, 11/1/102 | | | 750 | | | 791,250 | | 0.6 |
Tom’s Foods, Inc., Sr Nt,
10.50%, 11/1/041,4,9 | | | 907 | | | 11,335 | | 0.0 |
| | | | | | | | |
| | | | | | 12,144,141 | | 9.3 |
FOREST PRODUCTS & CONTAINERS — 11.1% | | | | | |
Abitibi-Consolidated Co. of Canada, Sr Nt, 8.375%, 4/1/156 | | | 1,170 | | | 1,023,750 | | 0.8 |
Ainsworth Lumber Co., Ltd. (Canada), Sr Nt, 6.75%, 3/15/146 | | | 1,265 | | | 940,844 | | 0.7 |
Ainsworth Lumber Co., Ltd. (Canada), Sr Nt, 6.75%, 3/15/146 | | | 895 | | | 662,300 | | 0.5 |
Appleton Papers, Inc., Series B, Sr Sub Nt, 9.75%, 6/15/1410 | | | 500 | | | 525,000 | | 0.4 |
Berry Plastics Holding Corp., Nt, 8.875%, 9/15/146 | | | 500 | | | 506,250 | | 0.4 |
Boise Cascade LLC, FRN,
8.23%, 10/15/12 | | | 250 | | | 250,000 | | 0.2 |
Buckeye Technologies, Inc., Sr Sub Nt, 9.25%, 9/15/0810 | | | 923 | | | 923,000 | | 0.7 |
Cascades, Inc. (Canada), Sr Nt,
7.25%, 2/15/13 | | | 200 | | | 194,500 | | 0.1 |
Constar International, Inc., FRN, Co Guar, 8.735%, 2/15/126 | | | 750 | | | 750,000 | | 0.6 |
Constar International, Inc., Sr Sub Nt, 11.00%, 12/1/126 | | | 2,680 | | | 2,438,800 | | 1.9 |
Georgia-Pacific Corp., Private Placement, Co Guar, 7.00%, 1/15/152 | | | 125 | | | 120,313 | | 0.1 |
Georgia-Pacific Corp., Private Placement, Co Guar, 7.125%, 1/15/172 | | | 125 | | | 120,000 | | 0.1 |
NewPage Corp., Sr Nt, 12.00%, 5/1/136 | | | 800 | | | 874,000 | | 0.7 |
Plastipak Holdings, Inc., Private Placement, Sr Nt, 8.50%, 12/15/152,6 | | | 300 | | | 310,500 | | 0.2 |
Portola Packaging, Inc., Sr Nt,
8.25%, 2/1/1210 | | | 1,260 | | | 1,146,600 | | 0.9 |
4
PACHOLDER HIGH YIELD FUND, INC.
Statement of Net Assets Applicable to Common Stockholders (continued)
June 30, 2007 (Unaudited)
| | | | | | | | |
| Description | | Par
(000) | | Value | | Percent
of Net
Assets* |
| | | | | | | | |
FOREST PRODUCTS & CONTAINERS (continued) | | |
Smurfit-Stone Container Enterprises, Inc., Sr Nt, 8.00%, 3/15/176 | | $ | 1,500 | | $ | 1,455,000 | | 1.1 |
Tembec Industries, Inc., (Canada), Sr Nt, 7.75%, 3/15/126 | | | 1,580 | | | 827,525 | | 0.6 |
Tembec Industries, Inc., (Canada), Sr Unsec’d Nt, 8.625%, 6/30/096 | | | 320 | | | 200,800 | | 0.1 |
Verso Paper Holdings LLC & Verson Paper, Inc., Private Placement, 11.375%, 8/1/162,6 | | | 725 | | | 773,938 | | 0.6 |
Vitro S.A. de C.V., Private Placement (Mexico), 8.625%, 2/1/122 | | | 500 | | | 507,500 | | 0.4 |
| | | | | | | | |
| | | | | | 14,550,620 | | 11.1 |
GAMING/LEISURE — 5.6% | | | | | | | | |
Harrah’s Operating Co., Inc., Sr Nt, 5.75%, 10/1/17 | | | 250 | | | 200,000 | | 0.1 |
Herbst Gaming, Inc., Nt,
7.00%, 11/15/14 | | | 500 | | | 468,750 | | 0.4 |
HRP Myrtle Beach Operations LLC/HRP Myrtle Beach Capital Corp., FRN, Private Placement,Sec’d Nt,
10.12%, 4/1/122 | | | 1,000 | | | 1,000,000 | | 0.8 |
MGM Mirage, Inc., Co Guar,
7.625%, 1/15/176 | | | 150 | | | 142,687 | | 0.1 |
MGM Mirage, Inc., Sr Nt, 7.50%, 6/1/16 | | | 250 | | | 237,188 | | 0.2 |
Pokagon Gaming Authority, Private Placement, Sr Nt, 10.375%, 6/15/142 | | | 1,000 | | | 1,102,500 | | 0.8 |
Shingle Springs Tribal Gaming Authority, Private Placement, Sr Nt,
9.375%, 6/15/152 | | | 1,000 | | | 1,008,750 | | 0.8 |
Six Flags, Inc., Sr Nt, 9.625%, 6/1/146 | | | 1,000 | | | 927,500 | | 0.7 |
True Temper Sports, Inc., Sr Nt, 8.375%, 9/15/11 | | | 990 | | | 866,250 | | 0.7 |
Venetian Macau, Term Loan B,
7.61%, 4/6/13 | | | 1,333 | | | 1,346,666 | | 1.0 |
| | | | | | | | |
| | | | | | 7,300,291 | | 5.6 |
HEALTHCARE — 11.7% | | | | | | | | |
Celtic Pharma Phinco B.V., Private Placement (Bermuda),
17.00%, 6/15/129 | | | 1,000 | | | 1,000,000 | | 0.8 |
Community Health Systems, Inc., Private Placement, 8.875%, 7/15/152 | | | 2,000 | | | 2,027,500 | | 1.5 |
HCA, Inc., Debentures, 6.30%, 10/1/12 | | | 250 | | | 231,250 | | 0.2 |
HCA, Inc., Debentures, 6.50%, 2/15/166 | | | 500 | | | 423,125 | | 0.3 |
| | | | | | | | |
| Description | | Par
(000) | | Value | | Percent
of Net
Assets* |
| | | | | | | | |
HEALTHCARE (continued) | | | | | | | | |
HCA, Inc., Private Placement, Sec’d Nt, 9.125%, 11/15/142 | | $ | 475 | | $ | 499,344 | | 0.4 |
HCA, Inc., Private Placement, Sec’d Nt, 9.25%, 11/15/162 | | | 1,000 | | | 1,065,000 | | 0.8 |
Medical Services Co., FRN, Co Guar, 12.86%, 10/15/1110 | | | 2,800 | | | 2,716,000 | | 2.1 |
TeamHealth, Inc., Sr Sub Nt,
11.25%, 12/1/1310 | | | 2,184 | | | 2,364,180 | | 1.8 |
Tenet Healthcare Corp., Sr Nt,
9.875%, 7/1/1410 | | | 2,250 | | | 2,227,500 | | 1.7 |
United Surgical Partners International, Inc., Private Placement, Nt,
8.875%, 5/1/17 2,6 | | | 150 | | | 150,375 | | 0.1 |
US Oncology, Inc., Co Guar,
10.75%, 8/15/14 | | | 575 | | | 615,250 | | 0.5 |
Vanguard Health Holding Co. II LLC, Sr Sub Nt, 9.00%, 10/1/1410 | | | 2,000 | | | 1,980,000 | | 1.5 |
| | | | | | | | |
| | | | | | 15,299,524 | | 11.7 |
HOUSING — 1.3% | | | | | | | | |
Associated Materials, Inc., Sr Nt, 11.25%, 3/1/147 | | | 150 | | | 111,750 | | 0.1 |
Associated Materials, Inc., Sr Sub Nt, 9.75%, 4/15/12 | | | 250 | | | 261,250 | | 0.2 |
Fedders North America, Inc., Co Guar, 9.875%, 3/1/146 | | | 479 | | | 158,070 | | 0.1 |
Interline Brands, Inc., Sr Sub Nt, 8.125%, 6/15/14 | | | 350 | | | 352,625 | | 0.2 |
KB Home, Sr Nt, 5.875%, 1/15/15 | | | 700 | | | 609,000 | | 0.5 |
Meritage Homes Corp., Sr Nt,
7.00%, 5/1/146 | | | 250 | | | 232,500 | | 0.2 |
| | | | | | | | |
| | | | | | 1,725,195 | | 1.3 |
INFORMATION TECHNOLOGY — 9.9% | | | | | |
CHR Intermediate Holding Corp., Private Placement, PIK, Sr Nt,
12.61%, 6/1/132 | | | 250 | | | 249,062 | | 0.2 |
Compucom Systems, Inc., Private Placement, Sr Nt, 12.00%, 11/1/142 | | | 1,000 | | | 1,075,000 | | 0.8 |
Freescale Semiconductor, Inc., FRN, Private Placement, Sr Nt,
9.23%, 12/15/142 | | | 250 | | | 241,250 | | 0.2 |
Freescale Semiconductor, Inc., Private Placement, Sr Nt,
8.875%, 12/15/142,6 | | | 1,000 | | | 955,000 | | 0.7 |
5
PACHOLDER HIGH YIELD FUND, INC.
Statement of Net Assets Applicable to Common Stockholders (continued)
June 30, 2007 (Unaudited)
| | | | | | | | |
| Description | | Par
(000) | | Value | | Percent
of Net
Assets* |
| | | | | | | | |
INFORMATION TECHNOLOGY (continued) | | | | | |
Intcomex, Inc., Sec’d Nt,
11.75%, 1/15/11 | | $ | 1,100 | | $ | 1,133,000 | | 0.9 |
MagnaChip Semiconductor SA/MagnaChip Semiconductor Finance Co. (Luxembourg), FRN, Sec’d Nt, 8.605%, 12/15/116 | | | 1,000 | | | 895,000 | | 0.7 |
MagnaChip Semiconductor SA/MagnaChip Semiconductor Finance Co. (Luxembourg), Sec’d Nt,
6.875%, 12/15/116 | | | 750 | | | 633,750 | | 0.5 |
MagnaChip Semiconductor SA/MagnaChip Semiconductor Finance Co. (Luxembourg), Sr Sub Nt,
8.00%, 12/15/146 | | | 1,990 | | | 1,452,700 | | 1.1 |
NXP BV/NXP Funding LLC (Netherlands), FRN, Sr Nt, 8.106%, 10/15/13 | | | 400 | | | 400,500 | | 0.3 |
NXP BV/NXP Funding LLC (Netherlands), Sr Nt, 7.875%, 10/15/14 | | | 200 | | | 197,000 | | 0.2 |
NXP BV/NXP Funding LLC (Netherlands), Sr Nt, 9.50%, 10/15/156 | | | 1,725 | | | 1,699,125 | | 1.3 |
Sanmina-SCI Corp., FRN, Private Placement, 8.11%, 6/15/102,6 | | | 300 | | | 300,750 | | 0.2 |
Sanmina-SCI Corp., FRN, Private Placement, Sr Nt, 8.11%, 6/15/142,6 | | | 300 | | | 300,000 | | 0.2 |
Smart Modular Technologies
(Cayman Islands), FRN, Sr Nt, 10.849%, 4/1/12 | | | 423 | | | 444,150 | | 0.3 |
Spansion, Inc., FRN, Private Placement, 8.485%, 6/1/132 | | | 850 | | | 848,937 | | 0.6 |
Unisys Corp., Sr Nt, 8.00%, 10/15/12 | | | 1,750 | | | 1,701,875 | | 1.3 |
Unisys Corp., Sr Nt, 8.50%, 10/15/156 | | | 500 | | | 492,500 | | 0.4 |
| | | | | | | | |
| | | | | | 13,019,599 | | 9.9 |
MANUFACTURING — 5.8% | | | | | | | | |
Baldor Electric Co., Sr Nt,
8.625%, 2/15/17 | | | 100 | | | 105,750 | | 0.1 |
General Cable Corp., FRN, Private Placement, 7.725%, 4/1/152 | | | 250 | | | 250,000 | | 0.2 |
Milacron Escrow Corp., Sec’d Nt, 11.50%, 5/15/11 | | | 1,750 | | | 1,693,125 | | 1.3 |
Polypore, Inc., Sr Sub Nt,
8.75%, 5/15/12 | | | 2,035 | | | 2,070,612 | | 1.6 |
Polypore International, Inc., Sr Disc Nt, 10.50%, 10/1/127 | | | 333 | | | 323,010 | | 0.3 |
| | | | | | | | |
| Description | | Par
(000) | | Value | | Percent
of Net
Assets* |
| | | | | | | | |
MANUFACTURING (continued) | | | | | | | | |
RBS Global, Inc. & Rexnord Corp., Sr Nt, 8.875%, 9/1/16 | | $ | 1,150 | | $ | 1,152,875 | | 0.9 |
RBS Global, Inc. & Rexnord Corp., Sr Sub Nt, 11.75%, 8/1/166 | | | 410 | | | 440,750 | | 0.3 |
Rental Services Corp., Private Placement, Sr Nt, 9.50%, 12/1/142 | | | 200 | | | 204,000 | | 0.1 |
Trimas Corp., Co Guar,
9.875%, 6/15/12 | | | 1,253 | | | 1,287,457 | | 1.0 |
| | | | | | | | |
| | | | | | 7,527,579 | | 5.8 |
MEDIA & TELECOM: BROADCASTING — 4.0% | | | | | |
Barrington Broadcasting Group LLC/Barrington Broadcasting Capital Corp., Private Placement, Sr Sub Nt, 10.50%, 8/15/142 | | | 700 | | | 729,750 | | 0.6 |
Fisher Communications, Inc., Sr Nt, 8.625%, 9/15/14 | | | 500 | | | 532,500 | | 0.4 |
LBI Media, Inc., Sr Disc Nt,
11.00%, 10/15/137 | | | 625 | | | 571,875 | | 0.4 |
Nexstar Finance Holdings LLC/Nexstar Finance Holdings, Inc., Sr Disc Nt, 11.67%, 4/1/136,7 | | | 750 | | | 736,875 | | 0.6 |
Nexstar Finance, Inc., Sr Sub Nt,
7.00%, 1/15/146 | | | 725 | | | 717,750 | | 0.5 |
Radio One, Inc., Sr Sub Nt,
6.375%, 2/15/13 | | | 500 | | | 470,000 | | 0.4 |
Univision Communications, Inc., Private Placement, PIK, 9.75%, 3/15/152,6 | | | 500 | | | 493,750 | | 0.4 |
XM Satellite Radio, Inc., Private Placement, 10.00%, 6/1/13 | | | 1,000 | | | 995,000 | | 0.7 |
| | | | | | | | |
| | | | | | 5,247,500 | | 4.0 |
MEDIA & TELECOM: CABLE — 7.6% | | | | | | | | |
Adelphia Communications Corp.,
6.00%, 2/15/061,4 | | | 125 | | | 13 | | 0.0 |
Adelphia Communications Corp., Sr Nt, 8.125%, 7/15/031,4 | | | 750 | | | 231,563 | | 0.2 |
Adelphia Communications Corp., Sr Nt, 9.375%, 11/15/091,4,6 | | | 560 | | | 179,200 | | 0.1 |
Adelphia Recovery Trust, Contingent Value, 0%, 12/31/491 | | | 1,297 | | | 121,584 | | 0.1 |
Block Communications, Inc., Private Placement, Sr Nt, 8.25%, 12/15/152 | | | 300 | | | 303,000 | | 0.2 |
CCH I Holdings LLC, Co Guar,
11.125%, 1/15/146 | | | 450 | | | 435,375 | | 0.3 |
6
PACHOLDER HIGH YIELD FUND, INC.
Statement of Net Assets Applicable to Common Stockholders (continued)
June 30, 2007 (Unaudited)
| | | | | | | | |
| Description | | Par
(000) | | Value | | Percent
of Net
Assets* |
| | | | | | | | |
MEDIA & TELECOM: CABLE (continued) | | | | | |
CCH I Holdings LLC/CCH I Holdings Capital Corp., Sec’d Nt,
11.00%, 10/1/15 | | $ | 2,305 | | $ | 2,405,844 | | 1.9 |
Charter Communications Holdings II LLC/Charter Communications Holdings II Cap Corp., Series B, Sr Nt,
10.25%, 9/15/106 | | | 500 | | | 521,875 | | 0.4 |
DirecTV Holdings LLC/DirecTV Financing Co., Sr Nt, 8.375%, 3/15/13 | | | 750 | | | 784,688 | | 0.6 |
Insight Communications Co., Inc., Nt, 12.25%, 2/15/117 | | | 500 | | | 522,500 | | 0.4 |
Intelsat Bermuda Ltd. (Bermuda), FRN, Debentures, 8.872%, 1/15/15 | | | 150 | | | 153,188 | | 0.1 |
Intelsat Bermuda Ltd. (Bermuda), Nt, 9.25%, 6/15/166 | | | 600 | | | 637,500 | | 0.5 |
Intelsat Bermuda Ltd. (Bermuda), Nt, 11.25%, 6/15/16 | | | 500 | | | 560,000 | | 0.4 |
Intelsat Corp., Sr Nt, 9.00%, 8/15/14 | | | 749 | | | 780,832 | | 0.6 |
Quebecor Media, Inc. (Canada), Sr Nt, 7.75%, 3/15/16 | | | 750 | | | 761,250 | | 0.6 |
Videotron Ltee (Canada), Co Guar, Sr Unsec’d Nt, 6.375%, 12/15/1510 | | | 500 | | | 475,000 | | 0.4 |
Virgin Media Finance plc (United Kingdom), Sr Nt, 9.125%, 8/15/166 | | | 1,000 | | | 1,047,500 | | 0.8 |
| | | | | | | | |
| | | | | | 9,920,912 | | 7.6 |
MEDIA & TELECOM: DIVERSIFIED — 6.2% | | | | | |
CanWest MediaWorks LP (Canada), Private Placement, Sr Nt,
9.25%, 8/1/152 | | | 750 | | | 751,875 | | 0.6 |
Cenveo Corp., Sr Sub Nt,
7.875%, 12/1/136 | | | 325 | | | 318,500 | | 0.2 |
Idearc, Inc., Sr Nt, 8.00%, 11/15/16 | | | 1,350 | | | 1,363,500 | | 1.0 |
Lamar Media Corp., Series B, Sr Sub Nt, 6.625%, 8/15/15 | | | 750 | | | 710,625 | | 0.5 |
Phoenix Color Corp., Sr Sub Nt,
13.00%, 2/1/09 | | | 2,030 | | | 2,040,150 | | 1.6 |
Quebecor World Capital Corp. (Canada), Sr Nt, 6.125%, 11/15/136 | | | 850 | | | 767,125 | | 0.6 |
Quebecor World Capital Corp. (Canada), Private Placement, Sr Nt,
8.75%, 3/15/162 | | | 250 | | | 246,250 | | 0.2 |
| | | | | | | | |
| Description | | Par
(000) | | Value | | Percent
of Net
Assets* |
| | | | | | | | |
MEDIA & TELECOM: DIVERSIFIED (continued) | | | | | |
Quebecor World, Inc. (Canada), Private Placement, Sr Nt, 9.75%, 1/15/152 | | $ | 500 | | $ | 506,250 | | 0.4 |
RH Donnelley Corp., Sr Disc Nt,
6.875%, 1/15/13 | | | 250 | | | 236,875 | | 0.2 |
RH Donnelley Corp., Sr Nt,
8.875%, 1/15/16 | | | 250 | | | 260,000 | | 0.2 |
Valassis Communications, Inc., Private Placement, 8.25%, 3/1/152,6 | | | 1,000 | | | 975,000 | | 0.7 |
| | | | | | | | |
| | | | | | 8,176,150 | | 6.2 |
MEDIA & TELECOM: FIXED COMMUNICATION — 3.7% | | |
Level 3 Financing, Inc., FRN, Private Placement, 9.15%, 2/15/152,6 | | | 250 | | | 250,000 | | 0.2 |
Level 3 Financing, Inc., Co. Guar, 9.25%, 11/1/14 | | | 1,500 | | | 1,515,000 | | 1.2 |
McLeod USA, Inc., Private Placement, Sec’d Nt, 10.50%, 10/1/112 | | | 433 | | | 462,228 | | 0.3 |
PAETEC Holding Corp., Private Placement, 9.5%, 7/15/132 | | | 400 | | | 400,500 | | 0.3 |
Qwest Corp., Sr Nt, 7.625%, 6/15/15 | | | 1,650 | | | 1,703,625 | | 1.3 |
Time Warner Telecom Holdings, Inc., Sr Nt, 9.25%, 2/15/1410 | | | 500 | | | 530,000 | | 0.4 |
| | | | | | | | |
| | | | | | 4,861,353 | | 3.7 |
MEDIA & TELECOM: WIRELESS COMMUNICATION — 2.7% | | |
Cricket Communications, Inc., Private Placement, Sr Nt, 9.375%, 11/1/142 | | | 500 | | | 516,250 | | 0.4 |
Cricket Communications, Inc., Sr Nt, 9.375%, 11/1/14 | | | 300 | | | 309,750 | | 0.2 |
iPCS, Inc., FRN, Private Placement, Sr Nt, 7.48%, 5/1/132 | | | 440 | | | 440,550 | | 0.3 |
MetroPCS Wireless, Inc., Private Placement, Sr Nt, 9.25%, 11/1/142,6 | | | 2,250 | | | 2,323,125 | | 1.8 |
| | | | | | | | |
| | | | | | 3,589,675 | | 2.7 |
METALS & MINERALS — 1.7% | | | | | | | | |
AK Steel Corp., Co Guar,
7.75%, 6/15/12 | | | 300 | | | 300,000 | | 0.2 |
AK Steel Corp., Co Guar,
7.875%, 2/15/096 | | | 505 | | | 503,737 | | 0.4 |
Aleris International, Inc., Private Placement, PIK, Sr Nt,
9.00%, 12/15/142,6 | | | 500 | | | 504,375 | | 0.4 |
7
PACHOLDER HIGH YIELD FUND, INC.
Statement of Net Assets Applicable to Common Stockholders (continued)
June 30, 2007 (Unaudited)
| | | | | | | | |
| Description | | Par
(000) | | Value | | Percent
of Net
Assets* |
| | | | | | | | |
METALS & MINERALS (continued) | | | | | | | | |
Wolverine Tube, Inc., Sr Nt,
10.50%, 4/1/096 | | $ | 945 | | $ | 942,637 | | 0.7 |
| | | | | | | | |
| | | | | | 2,250,749 | | 1.7 |
RETAIL — 1.9% | | | | | | | | |
Brown Shoe Co., Inc., Sr Unsec’d Nt, 8.75%, 5/1/1210 | | | 750 | | | 783,750 | | 0.6 |
Dollar General Corp., Private Placement, Sr Nt, 10.625%, 7/15/152 | | | 750 | | | 723,750 | | 0.5 |
Linens ‘N Things, Inc., FRN, Sec’d Nt, 10.985%, 1/15/146 | | | 1,335 | | | 989,569 | | 0.8 |
| | | | | | | | |
| | | | | | 2,497,069 | | 1.9 |
SERVICES — 4.3% | | | | | | | | |
Allied Waste North America, Inc., Sr Nt, 6.875%, 6/1/17 | | | 250 | | | 241,875 | | 0.2 |
Knowledge Learning Corp., Inc., Private Placement, Sr Sub Nt,
7.75%, 2/1/152 | | | 2,100 | | | 2,031,750 | | 1.5 |
Mac-Gray Corp., Sr Nt,
7.625%, 8/15/15 | | | 650 | | | 653,250 | | 0.5 |
Service Corp. International,
7.00%, 6/15/17 | | | 750 | | | 714,375 | | 0.5 |
Service Corp. International, Private Placement, 6.75%, 4/1/152 | | | 250 | | | 240,937 | | 0.2 |
Stewart Enterprises, Inc., Sr Nt,
6.25%, 2/15/13 | | | 1,084 | | | 1,043,350 | | 0.8 |
United Rentals North America, Inc., Co Guar, 6.50%, 2/15/12 | | | 750 | | | 736,875 | | 0.6 |
| | | | | | | | |
| | | | | | 5,662,412 | | 4.3 |
TRANSPORTATION — 12.7% | | | | | | | | |
American Tire Distributors, Inc., Nt, 10.75%, 4/1/136 | | | 500 | | | 507,500 | | 0.4 |
Ford Motor Co., Nt, 7.45%, 7/15/316 | | | 2,250 | | | 1,797,188 | | 1.4 |
Ford Motor Co., Nt, 9.98%, 2/15/476 | | | 750 | | | 688,125 | | 0.5 |
Ford Motor Credit Co., FRN, Nt,
8.11%, 1/13/12 | | | 300 | | | 299,239 | | 0.2 |
Ford Motor Credit Co., Nt,
8.00%, 12/15/166 | | | 1,400 | | | 1,340,987 | | 1.0 |
Ford Motor Credit Co., Nt,
8.625%, 11/1/1010 | | | 1,330 | | | 1,350,862 | | 1.0 |
General Motors Corp., Debentures, 8.10%, 6/15/2410 | | | 2,075 | | | 1,831,187 | | 1.4 |
| | | | | | | | | |
| Description | | Par
(000) | | | Value | | Percent
of Net
Assets* |
| | | | | | | | | |
TRANSPORTATION (continued) | | | | | | | | | |
General Motors Corp., Debentures, 8.375%, 7/15/336 | | $ | 2,000 | | | $ | 1,825,000 | | 1.4 |
Goodyear Tire & Rubber Co. (The), Private Placement, Sr Nt,
8.625%, 12/1/112 | | | 98 | | | | 103,145 | | 0.1 |
IdleAire Technologies Corp., Private Placement, Sr Disc Nt,
13.41%, 12/15/122,7 | | | 1,415 | a | | | 962,200 | | 0.8 |
J.B. Poindexter & Co., Inc., Co Guar, 8.75%, 3/15/146,10 | | | 2,584 | | | | 2,390,200 | | 1.8 |
Lear Corp., Series B, Sr Nt,
8.75%, 12/1/166 | | | 960 | | | | 914,400 | | 0.7 |
Quality Distribution LLC/QD Capital Corp., Co Guar, 9.00%, 11/15/10 | | | 1,250 | | | | 1,212,500 | | 0.9 |
Quality Distribution LLC/QD Capital Corp., FRN, Co Guar,
9.86%, 1/15/1210 | | | 850 | | | | 858,500 | | 0.7 |
Ultrapetrol Bahamas Ltd. (Bahamas), 1st Mtg, 9.00%, 11/24/14 | | | 450 | | | | 456,750 | | 0.4 |
| | | | | | | | | |
| | | | | | | 16,537,783 | | 12.7 |
UTILITIES — 6.3% | | | | | | | | | |
Calpine Corp., Private Placement, 8.50%, 7/15/101,2,4 | | | 1,000 | | | | 1,065,000 | | 0.8 |
Calpine Corp., Private Placement, Sec’d Nt, 9.875%, 12/1/111,2,4 | | | 250 | | | | 270,625 | | 0.2 |
Calpine Corp., Private Placement, Sr Sec’d Nt, 8.75%, 7/15/131,2,4 | | | 1,100 | | | | 1,188,000 | | 0.9 |
Calpine Generating Co. LLC, FRN, Sec’d Nt, 14.37%, 4/1/111,4,6 | | | 2,000 | | | | 646,300 | | 0.5 |
Dynegy Holdings, Inc., Sr Unsec’d Nt,
7.125%, 5/15/18 | | | 500 | | | | 445,000 | | 0.3 |
Mirant Americas Generation LLC, Sr Nt, 8.30%, 5/1/1110 | | | 1,250 | | | | 1,290,625 | | 1.0 |
Mirant Americas Generation LLC, Sr Nt, 8.50%, 10/1/21 | | | 1,000 | | | | 1,045,000 | | 0.8 |
Northwest Pipeline Corp., Sr Nt,
7.00%, 6/15/16 | | | 500 | | | | 521,250 | | 0.4 |
Reliant Energy, Inc., 7.625%, 6/15/14 | | | 750 | | | | 731,250 | | 0.6 |
Reliant Energy, Inc., Sec’d Nt,
6.75%, 12/15/1410 | | | 1,000 | | | | 1,020,000 | | 0.8 |
Southern Energy, Inc., Escrow, Sr Nt, 7.90%, 7/15/094 | | | 750 | | | | 48,750 | | 0.0 |
| | | | | | | | | |
| | | | | | | 8,271,800 | | 6.3 |
| | | | | | | | | |
8
PACHOLDER HIGH YIELD FUND, INC.
Statement of Net Assets Applicable to Common Stockholders (continued)
June 30, 2007 (Unaudited)
| | | | | | | | |
| Description | | Par
(000) | | Value | | Percent
of Net
Assets* |
| | | | | | | | |
Total Corporate Debt Securities | | | | | | | | |
(Cost $168,285,819) | | | | | $ | 168,269,789 | | 128.6 |
| | | | | | | | |
LOAN PARTICIPATIONS — 12.0% | | | | | | | | |
CHEMICALS — 0.8% | | | | | | | | |
Millenium Chemicals, Inc., 1st Lien Term Loan, 7.57%, 1/26/13 | | $ | 500 | | | 505,625 | | 0.4 |
Millenium Chemicals, Inc., 2nd Lien Term Loan, 11.07%, 1/26/13 | | | 500 | | | 501,250 | | 0.4 |
| | | | | | | | |
| | | | | | 1,006,875 | | 0.8 |
FINANCE — 2.3% | | | | | | | | |
Realogy Corp., Bank Loan,
8.32%, 9/1/14 | | | 424 | | | 420,000 | | 0.3 |
Realogy Corp., Bank Loan,
8.35%, 9/1/14 | | | 1,576 | | | 1,560,000 | | 1.2 |
Swett & Crawford, 1st Lien Bank Debt,
7.607%, 4/16/14 | | | 1,000 | | | 1,002,500 | | 0.8 |
| | | | | | | | |
| | | | | | 2,982,500 | | 2.3 |
FOOD & TOBACCO — 0.4% | | | | | | | | |
OSI Restaurant Partners, Inc., Term Loan, 5.36%, 6/14/14 | | | 5 | | | 5,404 | | 0.0 |
OSI Restaurant Partners, Inc., Term Loan, 7.625%, 09/14/07 | | | 495 | | | 497,721 | | 0.4 |
| | | | | | | | |
| | | | | | 503,125 | | 0.4 |
GAMING/LEISURE — 0.8% | | | | | | | | |
True Temper Sports, 1st Lien,
8.538%, 3/27/11 | | | 117 | | | 116,659 | | 0.1 |
True Temper Sports, 1st Lien,
8.61%, 3/27/11 | | | 883 | | | 883,341 | | 0.7 |
| | | | | | | | |
| | | | | | 1,000,000 | | 0.8 |
HEALTHCARE — 0.8% | | | | | | | | |
CareStream, 2nd Lien Bank Loan, 10.59%, 4/30/13 | | | 500 | | | 501,250 | | 0.4 |
HCA, Inc., Term Loan B,
7.61%, 11/14/13 | | | 498 | | | 498,122 | | 0.4 |
| | | | | | | | |
| | | | | | 999,372 | | 0.8 |
HOUSING — 0.7% | | | | | | | | |
Jacuzzi Brands, Inc., 2nd Lien, 11.348%, 8/7/14 | | | 667 | | | 616,667 | | 0.5 |
Jacuzzi Brands, Inc., 2nd Lien,
11.36%, 8/7/14 | | | 167 | | | 154,167 | | 0.1 |
Jacuzzi Brands, Inc., 2nd Lien, 11.379%, 8/20/14 | | | 167 | | | 154,167 | | 0.1 |
| | | | | | | | |
| | | | | | 925,001 | | 0.7 |
| | | | | | | | | |
| Description | | Par
(000) | | Value | | Percent
of Net
Assets* | |
| | | | | | | | | |
INFORMATION TECHNOLOGY — 2.2% | | | | | | | | | |
Isola Group S.A.R.L, 1st Lien Term Loan,
10.11%, 12/18/12 | | $ | 498 | | $ | 492,525 | | 0.4 | |
Isola Group S.A.R.L, 2nd Lien Term Loan, 13.07%, 12/18/13 | | | 250 | | | 248,750 | | 0.2 | |
Sirius Computer Solutions, 2nd Lien Bank Loan, 11.35%, 5/30/13 | | | 1,000 | | | 1,002,500 | | 0.7 | |
Stratus Technologies, Inc., 2nd Lien Term Loan, 14.36%, 3/28/12 | | | 1,000 | | | 900,000 | | 0.7 | |
TTM Technologies, Inc., Term Loan,
7.57%, 10/31/12 | | | 140 | | | 140,175 | | 0.1 | |
TTM Technologies, Inc., Term Loan,
7.61%, 10/31/12 | | | 160 | | | 160,200 | | 0.1 | |
| | | | | | | | | |
| | | | | | 2,944,150 | | 2.2 | |
MEDIA & TELECOM: BROADCASTING — 1.4% | | | | | | |
Univision, 1st Lien Term Loan,
7.605%, 7/30/07 | | | 940 | | | 920,805 | | 0.7 | |
Univision, 2nd Lien Term Loan,
7.82%, 3/1/09 | | | 1,000 | | | 991,250 | | 0.7 | |
| | | | | | | | | |
| | | | | | 1,912,055 | | 1.4 | |
TRANSPORTATION — 2.6% | | | | | | | | | |
Eagle-Picher Industries, Inc., 1st Lien,
9.84%, 12/20/10 | | | 710 | | | 710,156 | | 0.5 | |
Eagle-Picher Industries, Inc., 2nd Lien,
13.848%, 6/20/11 | | | 750 | | | 772,500 | | 0.6 | |
Ford Motor Co., Term Loan B,
8.36%, 12/15/13 | | | 995 | | | 997,487 | | 0.8 | |
Lear Corp., Term Loan, Bank Debt, 7.82%, 4/25/12 | | | 694 | | | 681,855 | | 0.5 | |
Lear Corp., Term Loan, Bank Debt, 7.86%, 4/25/12 | | | 300 | | | 294,750 | | 0.2 | |
| | | | | | | | | |
| | | | | | 3,456,748 | | 2.6 | |
| | | | | | | | | |
Total Loan Participations | | | | | | | | | |
(Cost $15,924,305) | | | | | | 15,729,826 | | 12.0 | |
| | | | | | | | | |
ASSET-BACKED SECURITIES — 0.6% | | | | | | | | | |
Citigroup Mortgage Loan Trust, Inc., | | | | | | | | | |
Series 2005-HE3, Class M12, FRN, 7.32%, 9/25/352,9 | | | 500 | | | 325,000 | | 0.2 | % |
Countrywide Asset-Backed Certificates, | | | | | | | | | |
Series 2004-13, Class MV8, FRN, 7.02%, 1/25/359 | | | 250 | | | 239,536 | | 0.2 | |
9
PACHOLDER HIGH YIELD FUND, INC.
Statement of Net Assets Applicable to Common Stockholders (continued)
June 30, 2007 (Unaudited)
| | | | | | | | | |
| Description | | Shares/
Par (000) | | | Value | | Percent
of Net
Assets* |
ASSET-BACKED SECURITIES (continued) | | | | | | |
Long Beach Mortgage Loan Trust, | | | | | | | | | |
Series 2004-5, Class M6, FRN,
7.82%, 9/25/34 | | $ | 250 | | | $ | 230,000 | | 0.2 |
| | | | | | | | | |
Total Asset-Backed Securities | | | | | | | | | |
(Cost $870,558) | | | | | | | 794,536 | | 0.6 |
| | | | | | | | | |
Total Fixed Income Investments | | | | | | | | | |
(Cost $185,080,682) | | | | | | | 184,794,151 | | 141.2 |
| | | | | | | | | |
| | | | | | | | | |
PREFERRED STOCKS — 0.3% | | | | | | | | | |
Glasstech, Inc., Series C, Pfd3,9 | | | — | 11 | | | — | | 0.0 |
Spanish Broadcasting System, Series B, Pfd, PIK, 10.75%, 10/15/13 | | | 3 | | | | 321,900 | | 0.3 |
| | | | | | | | | |
Total Preferred Stocks | | | | | | | | | |
(Cost $296,000) | | | | | | | 321,900 | | 0.3 |
| | | | | | | | | |
COMMON STOCKS — 5.6% | | | | | | | | | |
AboveNet, Inc.1 | | | 2 | | | | 103,822 | | 0.1 |
Adelphia Recovery Trust1,3 | | | 157 | | | | 2 | | 0.0 |
Avado Brands, Inc.1,9 | | | 9 | | | | 99,693 | | 0.1 |
Bally Total Fitness Holding Corp.1,9 | | | 2 | | | | 1,099 | | 0.0 |
Bally Total Fitness Holding Corp.1,3,6,8 | | | 4 | | | | 1,207 | | 0.0 |
Delta Air Lines, Inc.1 | | | 46 | | | | 907,244 | | 0.7 |
Glasstech, Inc., Class C1,3,9 | | | — | 11 | | | — | | 0.0 |
Lexington Coal Co.1 | | | 25 | | | | 35,435 | | 0.0 |
Mattress Discounters Corp.1,3,9 | | | 8 | | | | 27,736 | | 0.0 |
Oglebay Norton Co.1,8 | | | 202 | | | | 4,944,834 | | 3.8 |
Simonds Industries, Inc.1,3,9 | | | 8 | | | | 280,024 | | 0.2 |
Time Warner Cable, Inc., Class A1,6 | | | 20 | | | | 793,433 | | 0.6 |
Westpoint Stevens, Inc.1,3,9 | | | 14 | | | | 149,909 | | 0.1 |
XO Holdings, Inc.1 | | | 1 | | | | 2,301 | | 0.0 |
| | | | | | | | | |
Total Common Stocks | | | | | | | | | |
(Cost $10,325,627) | | | | | | | 7,346,739 | | 5.6 |
| | | | | | | | | |
RIGHTS — 0.0%12 | | | | | | | | | |
Westpoint Stevens, Inc.1,3,9,
Expiring 4/25/14 | | | | | | | | | |
(Cost $184,476) | | | 13 | | | | 22,049 | | 0.0 |
| | | | | | | | | |
WARRANTS — 0.0%12 | | | | | | | | | |
Abovenet, Inc., 9/8/081,9
(Strike Price $20.00) | | | 1 | | | | 23,944 | | 0.0 |
Abovenet, Inc., 9/8/101,9
(Strike Price $24.00) | | | 1 | | | | 25,419 | | 0.0 |
XO Holdings, Inc., Series A, 1/16/101
(Strike Price $6.25) | | | 1 | | | | 750 | | 0.0 |
XO Holdings, Inc., Series B, 1/16/101
(Strike Price $7.50) | | | 1 | | | | 326 | | 0.0 |
XO Holdings, Inc., Series C, 1/16/101
(Strike Price $10.00) | | | 1 | | | | 132 | | 0.0 |
| | | | | | | | | |
| | | | | | | | | | |
| Description | | Shares/ Par
(000) | | Value | | | Percent
of Net
Assets* | |
Total Warrants | | | | | | | | | | |
(Cost $417,200) | | | | | $ | 50,571 | | | 0.0 | |
| | | | | | | | | | |
Total Equity Investments | | | | | | | | | | |
(Cost $11,223,303) | | | | | | 7,741,259 | | | 5.9 | |
| | | | | | | | | | |
| | | | | | | | | | |
SHORT TERM INVESTMENT — 3.1% | | | | | | | | | | |
Federated Prime Obligations Fund | | | | | | | | | | |
(Cost $4,000,563) | | | 4,001 | | | 4,000,563 | | | 3.1 | |
| | | | | | | | | | |
INVESTMENTS OF CASH COLLATERAL FOR SECURITIES LOANED — 23.7% | |
Banc of America Securities LLC—Repurchase agreement, 5.39%, dated 06/29/07, matures 07/02/07, repurchase price $31,068,058, collateralized by U.S. Government Agency Mortgages
(Cost $31,054,122) | | $ | 31,054 | | | 31,054,122 | | | 23.7 | |
| | | | | | | | | | |
TOTAL INVESTMENTS | | | | | | | | | | |
(Cost $231,358,670) | | | | | | 227,590,095 | | | 173.9 | |
Payable Upon Return of Securities Loaned | | | (31,054,122 | ) | | (23.7 | ) |
Payable to Advisor | | | (143,424 | ) | | (0.1 | ) |
Payable to Administrator | | | (4,851 | ) | | 0.0 | |
Accounting Fees Payable | | | (8,083 | ) | | 0.0 | |
Custody Fees Payable | | | (2,579 | ) | | 0.0 | |
Unrealized Appreciation on Swap Agreements | | | 329,303 | | | 0.2 | |
Unrealized Depreciation on Swap Agreements | | | (2,990 | ) | | 0.0 | |
Other Assets in Excess of Other Liabilities | | | 153,945 | | | 0.1 | |
Less: Outstanding Preferred Stock
(2,640 shares at $25,000 per share) at liquidation value. | | | (66,000,000 | ) | | (50.4 | ) |
| | | | | | | | | | |
| | | | | | |
| | | | | | |
Net Assets Applicable to Common Stockholders | | $ | 130,857,294 | | | |
| | | | | | |
Net Assets Applicable to Common Stockholders: | | | | | | |
Common Stock, $.01 par value; 49,996,320 shares authorized 12,940,868 shares issued and outstanding | | $ | 129,409 | | | |
Capital in excess of par value | | | 180,113,036 | | | |
Distributions in excess of net investment income | | | (72,648 | ) | | |
Accumulated net realized loss from security transactions | | | (45,870,616 | ) | | |
Net unrealized depreciation on investments | | | (3,441,887 | ) | | |
| | | | | | |
Net Assets Applicable to Common Stockholders | | $ | 130,857,294 | | | |
| | | | | | |
Net Asset Value Per Common Share ($130,857,294/12,940,868) | | $ | 10.11 | | | |
| | | | | | |
10
PACHOLDER HIGH YIELD FUND, INC.
Statement of Net Assets Applicable to Common Stockholders (concluded)
June 30, 2007 (Unaudited)
| * | | Applicable to common stockholders. |
1 | | Non-income producing security. |
2 | | Security is a 144A or private placement security and can only be sold to qualified institutional buyers. Unless otherwise indicated, this security has been determined to be liquid under procedures established by the Board of Directors. These securities amounted to $43,831,166 and 33.5% of net assets applicable to common stockholders. |
3 | | Fair valued security. These securities amounted to $480,927 and 0.4% of net assets applicable to common stockholders. |
6 | | All or a portion of the security is on loan. Securities on loan have a fair market value of $29,180,522. |
7 | | Step-up bond. Interest rate is effective rate. |
8 | | Restricted security. These securities amounted to $6,519,291 and 5.0% of net assets applicable to common stockholders. |
9 | | Security deemed to be illiquid. These securities amounted to $4,505,976 and 3.4% of net assets applicable to common stockholders. |
10 | | All or a portion of the security is segregated for current or potential holdings of swaps, TBA, when-issued securities and delayed delivery securities. |
11 | | Amount rounds to less than 1,000 shares. |
12 | | Amount rounds to less than 0.1%. |
a | | Amount shown is whole number of units. |
| FRN | | Floating Rate Note. Rate shown is rate in effect as of June 30, 2007. |
11
PACHOLDER HIGH YIELD FUND, INC.
Statement of Operations
For the Six Months Ended June 30, 2007 (Unaudited)
| | | | |
| | | | |
INVESTMENT INCOME: | | | | |
Interest | | $ | 8,808,835 | |
Dividends | | | 79,528 | |
Securities lending (net) | | | 65,755 | |
| | | | |
Total Income | | | 8,954,118 | |
| | | | |
EXPENSES: | | | | |
Investment advisory fees (Note 6) | | | 1,278,897 | |
Administrative fees (Note 6) | | | 86,498 | |
Printing and other | | | 50,093 | |
Stock exchange listing fees | | | 8,606 | |
Custodian and accounting fees (Note 6) | | | 18,140 | |
Transfer agent fees | | | 15,374 | |
Legal fees | | | 103,484 | |
Directors’ fees and expenses | | | 55,485 | |
Audit fee | | | 35,141 | |
Insurance | | | 13,142 | |
Interest expense | | | 305 | |
| | | | |
Operating Expenses | | | 1,665,165 | |
Commissions on auction rate preferred stock | | | 138,533 | |
| | | | |
Total Expenses | | | 1,803,698 | |
Less earnings credits | | | (5,226 | ) |
| | | | |
Net Expenses | | | 1,798,472 | |
| | | | |
Net Investment Income | | | 7,155,646 | |
| | | | |
NET REALIZED AND UNREALIZED GAIN/(LOSS) ON INVESTMENTS: | |
Net realized gain/(loss): | | | | |
Investments | | | 3,683,416 | |
Swaps | | | 189,552 | |
| | | | |
Net realized gain/(loss) on investments | | | 3,872,968 | |
| | | | |
Net change in unrealized appreciation/(depreciation): | | | | |
Investments | | | (1,446,313 | ) |
Swaps | | | 21,320 | |
| | | | |
Net change in unrealized appreciation/(depreciation) on investments | | | (1,424,993 | ) |
| | | | |
Net realized and unrealized gain/(loss) on investments | | | 2,447,975 | |
| | | | |
Net Increase/(Decrease) Resulting from Operations | | | 9,603,621 | |
DISTRIBUTIONS TO PREFERRED STOCKHOLDERS FROM NET INVESTMENT INCOME | | | (1,773,341 | ) |
| | | | |
NET INCREASE/(DECREASE) IN NET ASSETS APPLICABLE TO COMMON STOCKHOLDERS RESULTING FROM OPERATIONS | | $ | 7,830,280 | |
| | | | |
See accompanying Notes to Financial Statements.
Statements of Changes in Net Assets Applicable to Common Stockholders
| | | | | | | | |
| | | For the Six
Months Ended
June 30, 2007
(Unaudited) | | | For the
Year Ended
December 31,
2006 | |
INCREASE/(DECREASE) IN NET ASSETS: | | | | | |
Operations: | | | | | | | | |
Net investment income | | $ | 7,155,646 | | | $ | 14,032,276 | |
Net realized gain/(loss) on investments | | | 3,872,968 | | | | 6,867,685 | |
Net change in unrealized appreciation/(depreciation) on investments | | | (1,424,993 | ) | | | 7,046,430 | |
Distributions to preferred stockholders from net investment income | | | (1,773,341 | ) | | | (3,239,730 | ) |
| | | | | | | | |
| | | | | | | | |
Net increase/(decrease) in net assets resulting from operations applicable to common stockholders | | | 7,830,280 | | | | 24,706,661 | |
| | | | | | | | |
DISTRIBUTIONS TO COMMON STOCKHOLDERS FROM: | | | | | | | | |
Net investment income | | | (5,684,857 | ) | | | (11,636,804 | ) |
| | | | | | | | |
Total distributions to common stockholders | | | (5,684,857 | ) | | | (11,636,804 | ) |
| | | | | | | | |
FUND SHARE TRANSACTIONS (NOTE 2): | | | | | |
Value of — and 22,682 shares issued in reinvestment of dividends to common stockholders in 2007 and 2006, respectively | | | — | | | | 213,317 | |
| | | | | | | | |
Total increase in net assets derived from fund share transactions | | | — | | | | 213,317 | |
| | | | | | | | |
Total net increase/(decrease) in net assets applicable to common stockholders | | | 2,145,423 | | | | 13,283,174 | |
NET ASSETS APPLICABLE TO
COMMON STOCKHOLDERS: | | | | | | | | |
Beginning of period | | | 128,711,871 | | | | 115,428,697 | |
| | | | | | | | |
End of period | | $ | 130,857,294 | | | $ | 128,711,871 | |
| | | | | | | | |
Accumulated Undistributed (Distributions in Excess of) Net Investment Income | | $ | (72,648 | ) | | $ | 229,904 | |
| | | | | | | | |
See accompanying Notes to Financial Statements.
12
PACHOLDER HIGH YIELD FUND, INC.
Financial Highlights
(Contained below is per share operating performance data for a share of common stock outstanding, total return performance, ratios to average net assets and other supplemental data. This information has been derived from information provided in the financial statements calculated using average shares outstanding and market price data for the Fund’s shares.)
| | | | | | | | | | | | | | | | | | | | | | | | |
| | | For the Six
Months Ended
June 30, 2007
(Unaudited) | | | For the Year Ended December 31, | |
| | | | 2006 | | | 2005 | | | 2004 | | | 2003 | | | 2002 | |
Net asset value, beginning of period | | $ | 9.95 | | | $ | 8.94 | | | $ | 9.55 | | | $ | 8.59 | | | $ | 5.73 | | | $ | 7.78 | |
| | | | | | | | | | | | | | | | | | | | | | | | |
Net investment income | | | 0.55 | | | | 1.09 | | | | 1.12 | | | | 1.08 | | | | 1.10 | | | | 1.41 | |
Net realized and unrealized gain/(loss) on investments | | | 0.19 | | | | 1.07 | | | | (0.67 | ) | | | 0.93 | | | | 2.77 | | | | (2.15 | ) |
Cumulative effect on change in fixed income valuation (Note 1) | | | — | | | | — | | | | — | | | | (0.07 | ) | | | — | | | | — | |
Distributions to preferred stockholders from net investment income | | | (0.14 | ) | | | (0.25 | ) | | | (0.16 | ) | | | (0.08 | ) | | | (0.07 | ) | | | (0.12 | ) |
| | | | | | | | | | | | | | | | | | | | | | | | |
Net increase/(decrease) in net asset value resulting from operations | | | 0.60 | | | | 1.91 | | | | 0.29 | | | | 1.86 | | | | 3.80 | | | | (0.86 | ) |
| | | | | | | | | | | | | | | | | | | | | | | | |
Distributions to Common Stockholders from: | | | | | | | | | | | | | | | | | | | | | | | | |
Net investment income | | | (0.44 | ) | | | (0.90 | ) | | | (0.90 | ) | | | (0.90 | ) | | | (0.89 | ) | | | (1.15 | ) |
Return of capital | | | — | | | | — | | | | — | | | | — | | | | (0.05 | ) | | | (0.04 | ) |
| | | | | | | | | | | | | | | | | | | | | | | | |
Total distributions to common stockholders | | | (0.44 | ) | | | (0.90 | ) | | | (0.90 | ) | | | (0.90 | ) | | | (0.94 | ) | | | (1.19 | ) |
| | | | | | | | | | | | | | | | | | | | | | | | |
Net asset value, end of period | | $ | 10.11 | | | $ | 9.95 | | | $ | 8.94 | | | $ | 9.55 | | | $ | 8.59 | | | $ | 5.73 | |
| | | | | | | | | | | | | | | | | | | | | | | | |
Market value per share, end of period | | $ | 10.03 | | | $ | 9.80 | | | $ | 8.50 | | | $ | 9.82 | | | $ | 9.14 | | | $ | 6.16 | |
| | | | | | | | | | | | | | | | | | | | | | | | |
TOTAL INVESTMENT RETURN(1): | | | | | | | | | | | | | | | | | | | | | | | | |
Based on market value per common share(2)(9) | | | 7.00 | % | | | 26.78 | % | | | (4.46 | %) | | | 18.67 | % | | | 67.19 | % | | | (19.91 | %) |
Based on net asset value per common share(3)(9) | | | 6.22 | % | | | 22.38 | % | | | 3.33 | % | | | 22.79 | % | | | 68.92 | % | | | (13.05 | %) |
RATIOS TO AVERAGE NET ASSETS(4): | | | | | | | | | | | | | | | | | | | | | | | | |
Expenses (prior to expenses related to leverage)(5)(10) | | | 1.69 | % | | | 1.86 | % | | | 1.50 | % | | | 1.83 | % | | | 1.80 | % | | | 0.83 | % |
Applicable to common stockholders only(6)(7)(10) | | | 2.53 | % | | | 2.87 | % | | | 2.34 | % | | | 2.88 | % | | | 3.08 | % | | | 1.65 | % |
Expenses (including expenses related to leverage)(5)(10) | | | 1.83 | % | | | 1.95 | % | | | 1.59 | % | | | 1.92 | % | | | 1.91 | % | | | 0.95 | % |
Applicable to common stockholders only(6)(7)(10) | | | 2.73 | % | | | 3.01 | % | | | 2.48 | % | | | 3.03 | % | | | 3.26 | % | | | 1.90 | % |
Net investment income(6)(7)(10) | | | 10.88 | % | | | 11.61 | % | | | 12.39 | % | | | 12.14 | % | | | 17.17 | % | | | 21.49 | % |
SUPPLEMENTAL DATA: | | | | | | | | | | | | | | | | | | | | | | | | |
Net assets at end of period, net of preferred stock (000) | | $ | 130,857 | | | $ | 128,712 | | | $ | 115,429 | | | $ | 123,180 | | | $ | 110,476 | | | $ | 73,307 | |
Portfolio turnover rate(9) | | | 46 | % | | | 75 | % | | | 95 | % | | | 73 | % | | | 51 | % | | | 40 | % |
SENIOR SECURITIES: | | | | | | | | | | | | | | | | | | | | | | | | |
Number of preferred shares outstanding at end of period | | | 2,640 | | | | 2,640 | | | | 2,640 | | | | 2,640 | | | | 2,640 | | | | 2,640 | |
Asset coverage per share of preferred stock outstanding at end of period(8) | | $ | 74,567 | | | $ | 73,755 | | | $ | 68,723 | | | $ | 71,660 | | | $ | 66,853 | | | $ | 52,768 | |
Involuntary liquidation preference and average market value per share of preferred stock | | $ | 25,000 | | | $ | 25,000 | | | $ | 25,000 | | | $ | 25,000 | | | $ | 25,000 | | | $ | 25,000 | |
1 | | Total investment return excludes the effects of commissions. Dividends and distributions to common stockholders, if any, are assumed, for purposes of this calculation, to be reinvested at prices obtained under the Fund’s dividend reinvestment plan. Rights offerings, if any, are assumed, for purposes of this calculation, to be fully subscribed under the terms of the rights offering. |
2 | | Assumes an investment at the common share market value at the beginning of the period indicated and sale of all shares at the closing common share market value at the end of the period indicated. Dividends and distributions are assumed, for purposes of this calculation, to be reinvested at prices obtained under the Fund’s dividend reinvestment plan. |
3 | | Assumes an investment at the common share net asset value at the beginning of the period indicated and sale of all shares at the closing common share net asset value at the end of the period indicated. Dividends and distributions are assumed, for purposes of this calculation, to be reinvested at prices obtained under the Fund’s dividend reinvestment plan. |
4 | | Ratios calculated on an annualized basis of expenses and net investment income. Ratios do not include the effect of dividends to preferred stock. |
5 | | Ratios calculated relative to the average net assets of both common and preferred stockholders. |
6 | | Ratios calculated relative to the average net assets of common stockholders only. |
7 | | Information for the years 2002 through 2003 is not audited by previous auditors. Ratios have been derived from audited financial statements for the respective year. |
8 | | Calculated by subtracting the Fund’s total liabilities (not including the preferred stock) from the Fund’s total assets, and dividing this by the number of preferred shares outstanding. |
9 | | Not annualized for periods less than one year. |
10 | | Annualized for periods less than one year. |
| See | | accompanying Notes to Financial Statements. |
13
PACHOLDER HIGH YIELD FUND, INC.
Notes to Financial Statements (Unaudited)
| 1. | | SIGNIFICANT ACCOUNTING POLICIES — Pacholder High Yield Fund, Inc. (the “Fund”) is a closed-end, diversified management investment company with a leveraged capital structure. The Fund’s investment objective is to provide a high level of total return through current income and capital appreciation. Under normal circumstances, the Fund invests at least 80% of the value of its assets in high yield debt securities. The Fund invests primarily in fixed income securities of domestic companies. The Fund was incorporated under the laws of the State of Maryland in August 1988. |
The following is a summary of significant accounting policies followed by the Fund in the preparation of its financial statements.
| | A. | | SECURITY VALUATIONS — Fixed income securities (other than short-term investments maturing in 60 days or less), are valued each day based on readily available market quotations received from third party broker-dealers of comparable securities or independent pricing services approved by the Board of Directors. Such pricing services and broker-dealers generally provide bid-side quotations. Short-term investments, other than certain distressed debt securities, with remaining maturities of 60 days or less are valued at amortized cost. Listed securities are valued at the last sale price on the exchange on which they are primarily traded. The value of National Market System equity securities quoted by the NASDAQ Stock Market shall generally be the NASDAQ Official Closing Price. Investments in other open-end investment companies are valued at such investment company’s current day closing net asset value per share. |
Equity securities listed on a North American, Central American, South American or Caribbean securities exchange shall generally be valued at the last sale price on the exchange on which the security is principally traded that is reported before the time when the net assets of the Funds are valued.
Swaps are priced generally by independent or affiliated pricing services (as a secondary source) or at an evaluated price provided by a counterparty or third party broker.
Securities or other assets for which market quotations are not readily available or for which market quotations do not represent the value at the time of pricing (including certain illiquid securities) are fair valued in accordance with procedures established and monitored by the Board of Directors. Valuations may be based upon current market prices of securities that are comparable in coupon, rating, maturity and industry. It is possible that the estimated values may differ significantly from the values that would have been used had a ready market for the investments existed, and such differences could have been material. At June 30, 2007, there were fair-valued securities of $480,927.
Prior to January 1, 2004, the Fund valued fixed income securities based on the mean of bid and asked prices. Effective January 1, 2004, the Fund changed its valuation policy to value fixed income securities based on bid prices, as bid prices are believed to be more representative of the price that could be obtained in sales transactions in the market for such securities. Bid prices generally are lower than those based on the mean of bid and asked prices. The cumulative effect of this accounting change on January 1, 2004 was to decrease the value of investments and net assets applicable to common stockholders by approximately $854,808 ($0.07 per common share). The financial highlights for periods prior to December 31, 2004 have not been restated to reflect this change in accounting policy.
| | B. | | REPURCHASE AGREEMENTS — Each repurchase agreement is valued at amortized cost. In connection with transactions in repurchase agreements, it is the Fund’s policy that a tri-party custodian take possession of the underlying collateral securities in a manner sufficient to enable the Fund to obtain collateral in the event of a counterparty default. If the counterparty defaults and the fair value of the collateral declines, realization of the collateral by the Fund may be delayed or limited. The repurchase agreements are fully collateralized by U.S. Government agency securities. |
| | C. | | FEDERAL TAXES — It is the Fund’s policy to make distributions to stockholders of net investment income and net realized capital gains to comply with the requirements of the Internal Revenue Code of 1986, as amended, applicable to regulated investment companies. |
The Fund intends to continue to qualify as a regulated investment company by complying with the appropriate provisions of the Internal Revenue Code and to distribute to stockholders each year substantially all of its taxable income, if any, including realized gains on investments.
The Fund seeks to maintain a level monthly dividend. Distributions paid by the Fund are subject to recharacterization for tax purposes. A portion of dividends paid may consist of net realized gains. To the extent that capital loss carryforwards are available to offset the distribution of capital gains but are not so utilized at the end of the Fund’s fiscal year, such capital gain distributions may be taxable to stockholders as ordinary income.
14
PACHOLDER HIGH YIELD FUND, INC.
Notes to Financial Statements (Unaudited) (continued)
The amount of dividends and distributions from net investment income and net realized capital gains is determined in accordance with Federal income tax regulations, which may differ from accounting principles generally accepted in the United States of America. To the extent these “book/tax” differences are permanent in nature (i.e., that they result from other than timing of recognition -“temporary differences”), such amounts are reclassified within the capital accounts based on their Federal tax-basis treatment.
| | D. | | SECURITIES TRANSACTIONS AND INVESTMENT INCOME — Securities transactions are accounted for on the date the securities are purchased or sold (trade date). Realized gains and losses on securities transactions are determined on an identified cost basis. Interest income is determined on the basis of coupon interest accrued using the effective interest method adjusted for amortization of premiums and accretion of discounts. Dividend income is recorded on the ex-dividend date. |
| | E. | | SECURITIES LENDING — To generate additional income, the Fund may lend its securities, through JPMorgan Chase Bank, N.A. (“JPMCB”) as lending agent (an affiliate of J.P. Morgan Investment Management Inc. (“JPMIM”)), to approved brokers and receives cash as collateral to secure the loans. The Fund receives payments from borrowers equivalent to the dividends and interest that would have been earned on securities lent while simultaneously seeking to earn income on the investment of collateral. Risks of delay in recovery of securities or even loss of rights in the securities may occur should the borrower of the securities fail financially. Risks may also arise to the extent that the value of the securities loaned increases above the value of the collateral received. JPMCB will indemnify the Fund from losses resulting from a borrower’s failure to return a loaned security when due. Such indemnification does not extend to losses associated with declines in the value of cash collateral investments. Loans are subject to termination by the Fund or the borrower at any time, and are, therefore, not considered to be illiquid investments. As of June 30, 2007, the Fund loaned securities having a value of $29,180,522. Collateral is marked to market daily to provide a level of collateral at not less than 100% of the value of loaned securities. The cash collateral of $31,054,122 received by the Fund at June 30, 2007 was invested in a repurchase agreement (with an interest rate of 5.39% and a maturity date of July 2, 2007). Information on the investment of |
| | cash collateral is shown in the Statement of Net Assets Applicable to Common Stockholders. |
Under the Securities Lending Agreement, JPMCB is entitled to a fee paid monthly in arrears equal to: (i) 0.06% of the average dollar value of loans of U.S. Securities outstanding during a given month; and (ii) 0.1142% of the average dollar value of loans of non-U.S. securities outstanding during a given month. For the six months ended June 30, 2007, the fees have been voluntarily reduced to 0.05% and 0.10%, respectively. JPMCB received $7,240 in fees for services rendered in lending of securities during the six months ended June 30, 2007.
| | F. | | EXPENSES AND DISTRIBUTIONS — Expenses are accrued as incurred. Dividends to common stockholders are paid from net investment income monthly and distributions of net realized capital gains, if any, are paid at least annually. Dividends to preferred stockholders are accrued daily based on a variable interest rate set at weekly auctions and are paid weekly from net investment income. Distributions are determined in accordance with federal income tax regulations which may differ from generally accepted accounting principles. |
| | G. | | WHEN, AS AND IF ISSUED SECURITIES — The Fund may engage in “when-issued” or “delayed delivery” transactions. The Fund records when-issued securities on the trade date and maintains security positions such that sufficient liquid assets will be available to make payment for the securities purchased. Securities purchased on a when-issued or delayed delivery basis begin earning interest on the settlement date. |
The Fund had no when-issued or delayed-delivery purchase commitments as of June 30, 2007.
| | H. | | LOAN PARTICIPATIONS AND ASSIGNMENTS — The Fund may invest in loan participations and assignments of all or a portion of loans. When the Fund purchases a loan participation, the Fund typically enters into a contractual relationship with the lender or third party selling such Participations (“Selling Participant”), but not the Borrower. In contrast, the Fund has direct rights against the Borrower on a loan when it purchases an assignment. As a result, the Fund assumes the credit risk of the Borrower, and with respect to loan participations, the Selling Participant and any other persons interpositioned between the Fund and the Borrower (“Intermediate Participants”). The Fund may not benefit directly from the collateral supporting the senior loan in which it has purchased the loan participation. |
15
PACHOLDER HIGH YIELD FUND, INC.
Notes to Financial Statements (Unaudited) (continued)
| | I. | | UNFUNDED COMMITMENTS — At June 30, 2007, the Fund had the following unfunded loan commitment which could be extended at the option of the borrower: |
| | | |
Borrower | | Unfunded Commitments |
Clarke American Corp., Term Loan | | $ | 500,000 |
| | J. | | ESTIMATES — The preparation of financial statements in conformity with accounting principles generally accepted in the United States of America requires management to make estimates and assumptions that affect the reported amounts of assets and liabilities at the date of the financial statements and the reported amounts of income and expenses during the reporting period. Actual results could differ from these estimates. |
| | K. | | INDEMNIFICATIONS — The Fund’s officers and directors are indemnified against certain liabilities arising out of the performance of their duties to the Fund. In addition, in the normal course of business, the Fund enters into contracts with its vendors and others that provide for general indemnifications. The Fund’s maximum exposure under these arrangements is unknown, as this would involve future claims that may be made against the Fund. However, based on experience, the Fund expects the risk of loss to be remote. |
| 2. | | COMMON STOCK — At June 30, 2007, there were 49,996,320 shares of common stock with a $.01 par value authorized and 12,940,868 shares outstanding. During the six months ended June 30, 2007, the Fund did not issue any shares of common stock. During the year ended December 31, 2006, the Fund issued 22,682 shares of common stock in connection with its dividend reinvestment plan. |
| 3. | | PREFERRED STOCK — On June 29, 2001, the Fund issued 3,680 shares of Series W Auction Rate Cumulative Preferred Stock (“ARPS”) at an offering price of $25,000 per share. During 2002, the Fund redeemed a total of $26,000,000 or 1,040 shares of ARPS at various intervals and amounts. No redemptions have occurred since 2002. Dividends on these shares are paid weekly at an annual rate determined by a weekly auction. The Fund is required to maintain certain asset coverages as set forth in the Fund’s Articles Supplementary Creating and Fixing the Rights of Auction Rate Cumulative Preferred Stock. The ARPS is subject to mandatory redemption at a redemption price of $25,000 per share, plus accumulated and unpaid dividends, if the Fund is not in compliance with the required asset coverage (minimum 2 to 1) tests and restrictions. In general, the holders of the ARPS and the common stock vote together as a single class, except that the ARPS stockholders, as a separate class, vote to elect two members of the Board of Directors, and separate votes are required on certain matters that affect the respective interests of the ARPS and common stock. The ARPS has a liquidation preference of $25,000 per share, plus accumulated and unpaid dividends. At June 30, 2007, accrued ARPS dividends were $29,983. |
| 4. | | INTEREST RATE SWAPS — Interest rate swap agreements involve the exchange by the Fund with another party of their respective commitments to pay or receive interest, e.g., an exchange of floating rate payments for fixed rate payments with respect to the notional amount of principal. Unrealized gains are reported as an asset and unrealized losses are reported as a liability on the Statement of Net Assets Applicable to Common Stockholders. The change in value of swaps, including the periodic amounts of interest to be paid or received on swaps, is reported as unrealized gains or losses in the Statement of Operations. A realized gain or loss is recorded upon payment or receipt of a periodic payment or termination of swap agreements. |
The Fund entered into interest payment swap arrangements with Citibank, N. A. New York (Citibank) for the purpose of partially hedging its dividend payment obligations with respect to the ARPS. Pursuant to each of the swap arrangements, the Fund makes payments to Citibank on a monthly basis at fixed annual rates. In exchange for such payments Citibank makes payments to the Fund on a monthly basis at a variable rate determined with reference to the one month London Interbank Offered Rate (LIBOR). The variable rates ranged from 5.33% to 5.36% for the six months ended June 30, 2007. The effective date, notional contract amount, maturity, fixed and floating annual rates and unrealized appreciation/depreciation of the swaps are as follows:
| | | | | | | | | | | | | | | |
Effective Date | | Notional
Contract
Amount | | Maturity | | Fixed
Annual
Rate | | | Floating
Annual
Rate * | | | Unrealized
Appreciation/
(Depreciation) | |
10/1/2004 | | $ | 10 million | | 10/1/2007 | | 3.30 | % | | 5.36 | % | | $ | 68,016 | |
6/1/2005 | | $ | 5 million | | 6/2/2008 | | 4.10 | % | | 5.36 | % | | | 57,422 | |
6/1/2005 | | $ | 5 million | | 6/1/2009 | | 4.15 | % | | 5.36 | % | | | 103,159 | |
12/1/2005 | | $ | 5 million | | 12/1/2009 | | 4.74 | % | | 5.36 | % | | | 58,360 | |
8/14/2006 | | $ | 5 million | | 12/1/2008 | | 5.26 | % | | 5.36 | % | | | (2,051 | ) |
8/14/2006 | | $ | 5 million | | 6/1/2010 | | 5.26 | % | | 5.36 | % | | | (939 | ) |
12/1/2006 | | $ | 5 million | | 12/1/2010 | | 5.01 | % | | 5.36 | % | | | 42,346 | |
| * | | Represents rate in effect at June 30, 2007. |
16
PACHOLDER HIGH YIELD FUND, INC.
Notes to Financial Statements (Unaudited) (continued)
Swap transactions, which involve future settlement, give rise to credit risk. Credit risk is the amount of loss the Fund would incur in the event counterparties failed to perform according to the terms of the contractual commitments. The Fund is exposed to credit loss in the event of nonperformance by the counterparty on interest rate swaps.
While notional contract amounts are used to express the volume of interest rate swap agreements, the amounts potentially subject to credit risk, in the event of nonperformance by counterparties, are substantially smaller.
For the six months ended June 30, 2007, the Fund’s receipts under the swap agreements were greater than the amount paid and accrued to Citibank by $189,552 and are included as realized gain/loss in the accompanying Statement of Operations.
The estimated fair value of the interest rate swap agreements at June 30, 2007, amounted to approximately $326,313 in net unrealized appreciation and is included in the accompanying Statement of Net Assets Applicable to Common Stockholders. Swap transactions present risk of loss in excess of the related amounts included in the Statement of Net Assets Applicable to Common Stockholders.
| 5. | | PURCHASES AND SALES OF SECURITIES — Purchases and sales of securities (excluding short-term securities) for the six months ended June 30, 2007 aggregated $88,927,980 and $89,770,582, respectively. During the six months ended June 30, 2007, there were no purchases or sales of U.S. Government securities. |
| 6. | | TRANSACTIONS WITH INVESTMENT ADVISOR, ADMINISTRATOR, ACCOUNTING SERVICES AGENT AND CUSTODIAN — J.P. Morgan Investment Management Inc., (“JPMIM”), an indirect, wholly owned subsidiary of JPMorgan Chase & Co. serves as investment advisor to the Fund under an investment advisory agreement effective as of January 1, 2007. Under the terms of the agreement, the Fund pays JPMIM an advisory fee that varies based on the total return investment performance of the Fund for the prior 12-month period relative to the percentage change in the Credit Suisse First Boston High Yield Index, Developed Countries Only™. The fee, which is accrued at least weekly and paid monthly, ranges from a maximum of 1.40% to a minimum of 0.40% (on an annualized basis) of the Fund’s average weekly net assets. For purposes of calculating the amount of the advisory fee, the Fund’s average weekly net assets is determined by taking the average of all determinations of such net assets is defined as the applicable 12-month period. The Fund’s net assets meant the total assets of the Fund minus accrued liabilities of the Fund other than the principal amount of any outstanding senior securities representing indebtedness including the ARPS. For the twelve months ended June 30, 2007, the advisory fee was calculated based on 1.40% of average weekly net assets (as defined above) of the Fund. At June 30, 2007, accrued advisory fees were $143,424. |
The Fund has an administrative services agreement with JPMorgan Funds Management, Inc. (the “Administrator”) (an affiliate of JPMIM) pursuant to which the Administrator provides administrative services to the Fund. Under the agreement, the Administrator receives from the Fund a fee, accrued at least weekly and paid monthly, at the annual rate of 0.10% of the average weekly net assets of the Fund. At June 30, 2007, accrued administrative fees were $4,851.
J.P. Morgan Investor Services, Co. (“JPMIS”), an indirect, wholly owned subsidiary of JPMorgan Chase & Co., began serving as the Fund’s sub-administrator effective October 20, 2006. For its services as sub-administrator, JPMIS receives a portion of the fees payable to the Administrator.
Effective October 20, 2006, the Fund entered into a Global Custody and Fund Accounting Agreement (the “Agreement”) with JPMCB. For providing custody services under the Agreement, JPMCB is entitled to a fee from the Fund, accrued weekly and paid monthly. The amounts paid directly to JPMCB by the Fund for custody and accounting services are included in custodian and accounting fees in the Statement of Operations. The custodian fees may be reduced by credits earned by the Fund, based on uninvested cash balances held by the custodian. Such earnings credits are presented separately in the Statement of Operations.
The amounts paid to JPMCB for the six months ended June 30, 2007, were $5,776 and $7,137 for custody and fund accounting fees, respectively, and the amounts are included in Custodian and accounting fees on the Statement of Operations.
At June 30, 2007, accrued custody and fund accounting fees were $2,579 and $8,083, respectively.
Interest expense, if any, paid to the custodian related to cash overdrafts is included in Interest expense in the Statement of Operations.
17
PACHOLDER HIGH YIELD FUND, INC.
Notes to Financial Statements (Unaudited) (concluded)
| 7. | | COMPONENTS OF ACCUMULATED EARNINGS (LOSSES) — At June 30, 2007, the components of net assets applicable to common stockholders (excluding paid in capital) on a tax basis were as follows: |
| | | | |
| | | June 30,
2007 | |
Gross unrealized appreciation on investments | | $ | 7,907,397 | |
Gross unrealized depreciation on investments | | $ | 11,675,972 | |
| | | | |
Net Unrealized appreciation/(depreciation) on investments | | $ | (3,768,575 | ) |
| | | | |
Cost of investments for Federal Tax purposes | | $ | 231,358,670 | |
| | | | |
The difference between the book-basis and tax basis unrealized appreciation/(depreciation) is attributable primarily to the difference between book and tax amortization methods for premium and market discount, and wash sale loss deferrals.
At December 31, 2006, the Fund had available a capital loss carryforward of $49,729,284, of which $2,587,486 expires in 2007, $4,746,544 expires in 2008, $4,438,792 expires in 2009, $8,135,473 expires in 2010, $20,873,746 expires in 2011, $2,030,683 expires in 2012, and $6,916,560 expires in 2013, to offset any future net capital gains.
| 8. | | SCHEDULE OF RESTRICTED SECURITIES — A restricted security is a security which has been purchased through a private offering and cannot be resold to the general public without prior registration under the Securities Act of 1933 (the “Act”) or pursuant to the resale limitations provided by rule under the Act, or an exemption from the registration requirements of the Act. At June 30, 2007, the Fund held restricted securities representing 5.0% of the Fund’s net assets. The restricted securities held as of June 30, 2007 are identified below: |
| | | | | | | |
| Security | | Description | | Acquisition
Date | | Cost of
Security |
Golden State Foods Corp. | | Bond | | 2/26/2004 | | $ | 1,556,198 |
Bally Total Fitness Holding Corp. | | Common
Stock | | 12/30/2005 | | | 24,275 |
Oglebay Norton Company | | Common
Stock | | 1/27/2005 | | | 1,675,797 |
| 9. | | ILLIQUID SECURITIES — The Fund may invest in securities that are subject to legal or contractual restrictions on resale or are illiquid. An illiquid security is a security which cannot be disposed of promptly (within seven days) and in the usual course of business at approximately its fair value and includes repurchase agreements maturing in excess of seven days, time deposits with a withdrawal penalty, non-negotiable instruments and instruments for which no market exists. Disposal of these securities may involve time-consuming negotiations and expense, and prompt sale at the current valuation may be difficult. At June 30, 2007, the Fund held illiquid securities representing 3.4% of net assets. |
| 10. | | OTHER MATTERS — In July 2006, the Financial Accounting Standards Board (the “FASB”) issued Interpretation No. 48, “Accounting for Uncertainty in Income Taxes — an Interpretation of FASB Statement No. 109” (the “Interpretation”). The Interpretation establishes for all entities, including pass-through entities such as the Fund, a minimum threshold for financial statement recognition of the benefit of positions taken in filing tax returns (including whether an entity is taxable in a particular jurisdiction), and requires certain expanded tax disclosures. The Interpretation is effective for fiscal years beginning after December 15, 2006, and is to be applied to all open tax years as of the date of effectiveness. Based on management’s analysis, the determination has been made that the adoption of the Interpretation did not have an impact to the Fund’s financial statements upon adoption. Management continually reviews the Fund’s tax positions and such conclusions under the Interpretation based on factors, including, but not limited to, ongoing analyses of tax laws, regulations and interpretations, thereof. |
In addition, in September 2006, Statement of Financial Accounting Standards No. 157, “Fair Value Measurements” (“SFAS 157”), was issued and is effective for fiscal years beginning after November 15, 2007. SFAS 157 defines fair value, establishes a framework for measuring fair value and expands disclosures about fair value measurements. Management continues to evaluate the impact the adoption of SFAS 157 will have on the Fund’s financial statement disclosures.
The Fund invests at least 80% of its assets in high yield debt securities. Investments in lower-rated securities or unrated securities of comparable quality tend to be more sensitive to economic conditions than higher rated securities. These securities involve a greater risk of default by the issuer because such securities are generally unsecured and are often subordinated to other creditors’ claims.
18
PACHOLDER HIGH YIELD FUND, INC.
Annual Meeting Results (Unaudited)
The Fund held its 2007 annual meeting of shareholders on April 5, 2007, to elect directors of the Fund.
The results of voting were as follows (by number of shares):
| | |
| For nominees to the Board of Directors: | | |
| |
William J. Morgan1 | | |
In favor: | | 2,485 |
Withheld: | | 1 |
| |
George D. Woodard1 | | |
In favor: | | 2,485 |
Withheld: | | 1 |
| |
John F. Williamson2 | | |
In favor: | | 11,488,825 |
Withheld: | | 104,187 |
| |
Daniel A. Grant2 | | |
In favor: | | 11,487,041 |
Withheld: | | 102,971 |
1 | | Elected by holders of the Fund’s Auction Rate Preferred Stock voting separately as a class. |
2 | | Elected by holders of the Fund’s Auction Rate Preferred Stock and Common Stock voting together as a single class. |
19
PACHOLDER HIGH YIELD FUND, INC.
Supplemental Information (Unaudited)
Portfolio Holdings Information
No sooner than 30 days after the end of each month, the Fund’s uncertified complete schedule of its portfolio holdings will be available on our website (www.phf-hy.com). In addition, the Fund files its certified, complete schedule of its portfolio holdings with the U.S. Securities and Exchange Commission (“SEC”) for the first and third quarters of each fiscal year on Form N-Q. The Fund’s Form N-Qs are available, without charge, on the SEC’s website at www.sec.gov. The Fund’s Form N-Qs may be reviewed and copied at the SEC’s Public Reference Room in Washington, DC. Information on the operation of the Public Reference Room may be obtained by calling 1-800-SEC-0330.
No sooner than 10 calendar days after the end of each month beginning no sooner than September 30, 2007, the Fund’s top ten holdings as of the last day of each month as well as certain other fund facts and statistical information will also be available on the Fund’s website.
Proxy Voting
A description of the policies and procedures used by the Fund to vote proxies relating to portfolio securities, as well as information regarding how the Fund voted proxies relating to portfolio securities during the most recent 12-month period ended June 30, is available (i) without charge, on the Fund’s website at www.phf-hy.com and (ii) on the SEC’s website at www.sec.gov.
Dividend Reinvestment Plan
The Fund’s Dividend Reinvestment Plan offers you an automatic way to reinvest your dividends and capital gains distributions in additional shares of the Fund. For an enrollment form and detailed information about the Plan, please contact Computershare Investor Services, P.O. Box 43036, Providence, RI 02940-3036, (888) 294-8217, and www.computershare.com.
20
PACHOLDER HIGH YIELD FUND, INC.
Supplemental Information (Unaudited) (continued)
Renewal of Investment Advisory Agreement
On May 21, 2007, the Fund’s Board of Directors (the “Board”) considered renewal of the investment advisory agreement (the “Advisory Agreement”) between the Fund and J.P. Morgan Investment Management Inc. (“JPMIM” or the “Adviser”).
The Independent Directors considered the nature and quality of the services provided and to be provided under the Advisory Agreement, the Fund’s investment performance, the fees and fee structure under the Advisory Agreement, the depth and breadth of the JPMorgan organization, and Fund expenses, among other matters.
The Independent Directors concluded that the portfolio manager and his team had provided the Fund with an appropriate and consistent level of high-quality services that had continued after the merger of Pacholder & Company, LLC (“P&C”) into JPMIM. The Independent Directors also considered relative performance and expense information for the Fund in a report prepared by Lipper. The Directors considered the total return performance information, which included the Fund’s ranking within a performance universe made up of funds with the same Lipper investment classification and objective (the “Universe Group”) by total return for one-year, three-year, five-year and ten-year periods. The Directors also considered the Fund’s performance in comparison to the performance results of a group (the “Peer Group”) of funds. The Directors reviewed a description of Lipper’s methodology for selecting funds in the Fund’s Peer Group and Universe Group. As part of this review, the Directors also reviewed the Fund’s performance against its benchmark and considered the performance information for the Fund provided at regular Board meetings.
The Independent Directors considered and found the following specific facts in support of approval of the Advisory Agreement:
| | • | | The Adviser’s performance of its obligations under the Advisory Agreement, the continuity of investment advisory personnel between P&C and JPMIM, and the expectation that there would not be any significant change with respect to the Adviser’s personnel or day-to-day management of the Fund; |
| | • | | The expectation that the Adviser will continue to execute its obligations under the Advisory Agreement consistently over time; |
| | • | | The Adviser has the requisite expertise and experience as well as sufficient financial resources to fulfill its commitments to the Fund under the Advisory Agreement; |
| | • | | The Fund’s performance was in the 1st Quintile for the one-, three-, five- and ten-year periods as compared to other closed-end funds in the Fund’s Universe Group; |
| | • | | The Adviser’s estimated profitability in respect of the Advisory Agreement is reasonable; |
| | • | | Due to the performance of the Fund and the Adviser’s receipt of the maximum advisory fee of 140 basis points in 2006, the Fund’s advisory fees were higher than the majority of its Peer Group and Universe Group, although the Fund’s advisory fees would have been lower than the majority of its Peer Group and Universe Group if the Adviser had received the minimum advisory fee of 40 basis points; |
| | • | | The total expenses relative to common and preferred shares for the Fund were 1.946% as compared with the median for the Universe Group of 1.964%; and |
| | • | | Although the Adviser earned the maximum 140 basis point fee in 2006, 2004 and 2003 and a 103 basis point fee in 2005, the Adviser earned the minimum 40 basis point fee in 2001 and 2002, and the Fund’s actual advisory fee and expense ratios in those years were materially lower than most other closed-end high yield funds. |
The Independent Directors recognized that it is difficult to make comparisons of profitability from the investment advisory arrangement of other comparable closed-end funds because comparative information is not generally publicly available and is affected by numerous factors, including the structure of the particular adviser, the types of funds it manages, its business mix, numerous assumptions regarding allocations, and the adviser’s capital and the cost of capital. The Independent Directors also recognized that the Adviser should be entitled to earn a reasonable level of profits for the services it provides to the Fund. The Independent Directors also considered the effectiveness of the Fund’s performance fee in aligning the Adviser’s interests with that of the Fund’s shareholders and providing a level of compensation commensurate with the value the Adviser has provided to the Fund. The Independent Directors also considered the advisory fees charged by the Adviser and its affiliates to other client accounts investing in high yield securities but noted that the Adviser did not manage other accounts in the same style as the Fund.
The Independent Directors considered the scope and quality of the services provided by the Adviser under the Advisory Agreement and noted that the scope of the services is continuing to expand over time as a result of regulatory and other developments. The Independent Directors noted, for example, that the Adviser and its affiliates continue to be responsible for maintaining and monitoring the Adviser’s and Fund’s compliance programs, both of which have grown in scope and complexity over time. As part of their deliberations, the Independent Directors also considered
21
PACHOLDER HIGH YIELD FUND, INC.
Supplemental Information (Unaudited) (continued)
information concerning JPMIM and its affiliates, including the depth of JPMorgan’s compliance program and compliance teams, the extent of JPMorgan’s investment advisory and investment company business, JPMorgan’s fund support capabilities, JPMIM’s financial and other resources, and legal proceedings related to management of other registered investment companies by JPMIM’s affiliates.
During the course of their deliberations, the Independent Directors reached the following conclusions, among others: (1) the Adviser was qualified to manage the assets of the Fund in accordance with the Advisory Agreement based on the Fund’s experience with the portfolio management team and the Adviser; (2) the Fund’s performance over time has been above average compared to other closed-end funds in the Fund’s Peer Group and Universe Group; and (3) the compensation to be paid to the Adviser under the Advisory Agreement is fair and reasonable in relation to the services provided by the Adviser and various industry averages for comparable funds. In their deliberations, the Independent Directors did not identify any particular information that was all important or controlling for purposes of making their decision.
After consideration of the foregoing, the Board, including all of the Independent Directors, resolved to renew the Advisory Agreement.
Portfolio Management Team
The portfolio management team for the Fund is led by William J. Morgan, Managing Director. Mr. Morgan has been the lead portfolio manager for the Fund since June 2000 and has been part of the team responsible for management of the Fund since its inception. Currently, Mr. Morgan is a high-yield team leader and the portfolio manager for accounts in the high yield, aggressive income high yield, and insurance asset BB styles. Mr. Morgan earned a B.A. from Kenyon College and an M.B.A. from Xavier University. James P. Shanahan, Jr., Managing Director, also serves as portfolio manager for the Fund focusing primarily on investments in distressed debt. Mr. Shanahan has been part of the team responsible for the management of the Fund since 1988. Mr. Shanahan holds a B.A. from Xavier University and a J.D. from the University of Cincinnati College of Law. James E. Gibson, Vice President, is primarily responsible for trading on behalf of the Fund and has been part of the portfolio management team for the Fund since 1988. Mr. Gibson is one of the principal high yield traders in the Adviser’s U.S. Fixed Income Group. Mr. Gibson holds a B.S from the University of Cincinnati College of Business Administration in finance. Mr. Morgan, Mr. Shanahan, and Mr. Gibson were officers of the Fund’s former adviser, P&C, since its inception in 1998 and have been officers of and/or associated with the Adviser since March 1, 2005.
22
PACHOLDER HIGH YIELD FUND, INC.
Supplemental Information (Unaudited) (concluded)
Privacy Policy
Respecting and protecting customer privacy is vital to the Pacholder High Yield Fund, Inc. This Policy explains what the Pacholder High Yield Fund, Inc. does to keep our customer information private and secure.
Q. Who is covered by the Privacy Policy
A. This Privacy Policy applies to consumers who are customers or former customers of Pacholder High Yield Fund, Inc. through record ownership of Fund shares. Our Privacy Policy is provided to customers when they open a new account. We also send it to current customers yearly. We may change our Policy. We will send you a new privacy policy if we broaden our information sharing practices about you.
Q. What information do you have about me?
A. To provide services and to help meet your needs, we collect information about you from various sources.
| | • | | We get information from you on applications or other forms, on our web site, or through other means. |
| | • | | We get information from transactions, correspondence, or other communications with us. |
Q. How do you safeguard information about me?
A. We take a number of steps to protect the privacy of information about you. Here are some examples:
| | • | | We keep information under physical, electronic and procedural controls that comply with or exceed governmental standards. |
| | • | | We authorize our employees, agents and contractors to get information about you only when they need it to do their work for us. |
| | • | | We require companies working for us to protect information. They agree to use it only to provide the services we ask them to perform for us. |
Q. Is information about me shared with others?
A. No, we do not share personally identifiable information about you except as noted below.
Q. Is information about me shared with service providers?
A. Yes, as permitted by law. We may share information about you with outside companies that work for us. These may include firms that help us maintain and service accounts. For instance, we will share information with the transfer agent for Pacholder High Yield Fund, Inc. The transfer agent needs this information to process your purchase and sale transactions, to pay dividends to you and to update your account.
Q. Is information about me shared in any other ways?
A. Yes. We may also share information about you in other ways, as required or permitted by law. Here are some examples of ways that we share information.
| | • | | To protect against fraud. |
| | • | | To respond to a subpoena. |
| | • | | To service your account. |
Special Notice for California Residents
In order to comply with California law, if your account has a California mailing address, we will not share information about you with third parties unless we first provide you with further privacy choices or unless otherwise permitted by law such as servicing your account.
Special Notice for Vermont Residents
In order to comply with Vermont law, if we disclose information about you to other financial institutions with which we have joint marketing agreements, we will only disclose your name, contact information and information about your transactions.
THE PACHOLDER HIGH YIELD FUND, INC.’s PRIVACY COMMITMENT The Pacholder High Yield Fund, Inc. is committed to protecting the privacy of our customers, but we understand that the best protection requires a partnership with you. We encourage you to find out how you can take steps to further protect your own privacy by visiting us online at www.phf-hy.com.
23
Disclose whether, as of the end of the period covered by the report, the registrant has adopted a code of ethics that applies to the registrant’s principal executive officer, principal financial officer, principal accounting officer or controller, or persons performing similar functions, regardless of whether these individuals are employed by the registrant or a third party. If the registrant has not adopted such a code of ethics, explain why it has not done so.
The registrant must briefly describe the nature of any amendment, during the period covered by the report, to a provision of its code of ethics that applies to the registrant’s principal executive officer, principal financial officer, principal accounting officer or controller, or persons performing similar functions, regardless of whether these individuals are employed by the registrant or a third party, and that relates to any element of the code of ethics definition enumerated in paragraph (b) of this Item. The registrant must file a copy of any such amendment as an exhibit pursuant to Item 12(a)(1), unless the registrant has elected to satisfy paragraph (f) of this Item by positing its code of ethics on its website pursuant to paragraph (f)(2) of this Item, or by undertaking to provide its code of ethics to any person without charge, upon request, pursuant to paragraph (f)(3) of this Item.
If the registrant has, during the period covered by the report, granted a waiver, including an implicit waiver, from a provision of the code of ethics that applies to the registrant’s principal executive officer, principal financial officer, principal accounting officer or controller, or persons performing similar functions, regardless of whether these individuals are employed by the registrant or third party, that relates to one or more items set forth in paragraph (b) of this Item, the registrant must briefly describe the nature of the waiver, the name of the person to whom the waiver was granted, and the date of the waiver.
Not applicable to a semi-annual report.
| ITEM 3. | AUDIT COMMITTEE FINANCIAL EXPERT. |
(a) (1) Disclose that the registrant’s board of directors has determined that the registrant either:
(i) Has at least one audit committee financial expert serving on its audit committee; or
(ii) Does not have an audit committee financial expert serving on its audit committee.
(2) If the registrant provides the disclosure required by paragraph (a)(1)(i) of this Item, it must disclose the name of the audit committee financial expert and whether that person is “independent.” In order to be considered “independent” for purposes of this Item, a member of an audit committee may not, other than in his or her capacity as a member of the audit committee, the board of directors, or any other board committee:
(i) Accept directly or indirectly any consulting, advisory, or other compensatory fee from the issuer; or
(ii) Be an “interested person” of the investment company as defined in Section 2(a)(19) of the Act (15 U.S.C. 80a-2(a)(19)).
(3) If the registrant provides the disclosure required by paragraph (a)(1)(ii) of this Item, it must explain why it does not have an audit committee financial expert.
Not applicable to a semi-annual report.
| ITEM 4. | PRINCIPAL ACCOUNTANT FEES AND SERVICES. |
(a) Disclose, under the caption Audit Fees, the aggregate fees billed for each of the last two fiscal years for professional
services rendered by the principal accountant for the audit of the registrant’s annual financial statements or services that are normally provided by the accountant in connection with statutory and regulatory filings or engagements for those fiscal years.
(b) Disclose, under the caption Audit-Related Fees, the aggregate fees billed in each of the last two fiscal years for assurance and related services by the principal accountant that are reasonably related to the performance of the audit of the registrant’s financial statements and are not reported under paragraph (a) of this Item. Registrants shall describe the nature of the services comprising the fees disclosed under this category.
(c) Disclose, under the caption Tax Fees, the aggregate fees billed in each of the last two fiscal years for professional services rendered by the principal accountant for tax compliance, tax advice, and tax planning. Registrants shall describe the nature of the services comprising the fees disclosed under this category.
(d) Disclose, under the caption All Other Fees, the aggregate fees billed in each of the last two fiscal years for products and services provided by the principal accountant, other than the services reported in paragraphs (a) through (c) of this Item. Registrants shall describe the nature of the services comprising the fees disclosed under this category.
(e) (1) Disclose the audit committee’s pre-approval policies and procedures described in paragraph (c)(7) of Rule 2-01 of Regulation S-X.
(2) Disclose the percentage of services described in each of paragraphs (b) through (d) of this Item that were approved by the audit committee pursuant to paragraph (c)(7)(i)(C) of Rule 2-01 of Regulation S-X.
(f) If greater than 50 percent, disclose the percentage of hours expended on the principal accountant’s engagement to audit the registrant’s financial statements for the most recent fiscal year that were attributed to work performed by persons other than the principal accountant’s full-time, permanent employees.
(g) Disclose the aggregate non-audit fees billed by the registrant’s accountant for services rendered to the registrant, and rendered to the registrant’s investment adviser (not including any sub-adviser whose role is primarily portfolio management and is subcontracted with or overseen by another investment adviser), and any entity controlling, controlled by, or under common control with the adviser that provides ongoing services to the registrant for each of the last two fiscal years of the registrant.
(h) Disclose whether the registrant’s audit committee of the board of directors has considered whether the provision of non-audit services that were rendered to the registrant’s investment adviser (not including any subadviser whose role is primarily portfolio management and is subcontracted with or overseen by another investment adviser), and any entity controlling, controlled by, or under common control with the investment adviser that provides ongoing services to the registrant that were not pre-approved pursuant to paragraph (c)(7)(ii) of Rule 2-01 of Regulation S-X is compatible with maintaining the principal accountant’s independence.
Not applicable to a semi-annual report.
| ITEM 5. | AUDIT COMMITTEE OF LISTED REGISTRANTS. |
(a) If the registrant is a listed issuer as defined in Rule 10A-3 under the Exchange Act (17CFR 240.10A-3), state whether or not the registrant has a separately-designated standing audit committee established in accordance with Section 3(a)(58)(A) of the Exchange Act (15 U.S.C. 78c(a)(58)(A)). If the registrant has such a committee, however designated, identify each committee member. If the entire board of directors is acting as the registrant’s audit committee as specified in Section 3(a)(58)(B) of the Exchange Act (15 U.S.C. 78c(a)(58)(B)), so state.
(b) If applicable, provide the disclosure required by Rule 10A-3(d) under the Exchange Act (17CFR 240.10A-3(d)) regarding an exemption from the listing standards for all audit committees.
Not applicable to a semi-annual report.
| ITEM 6. | SCHEDULE OF INVESTMENTS |
File Schedule I – Investments in securities of unaffiliated issuers as of the close of the reporting period as set forth in Section 210.12-12 of Regulation S-X, unless the schedule is included as part of the report to shareholders filed under Item 1 of this Form.
Included in Item 1.
| ITEM 7. | DISCLOSURE OF PROXY VOTING POLICIES AND PROCEDURES FOR CLOSED-END MANAGEMENT INVESTMENT COMPANIES. |
A closed-end management investment company that is filing an annual report on this Form N-CSR must, unless it invests exclusively in non-voting securities, describe the policies and procedures that it uses to determine how to vote proxies relating to portfolio securities, including the procedures that the company uses when a vote presents a conflict between the interests of its shareholders, on the one hand, and those of the company’s investment adviser; principal underwriter; or any affiliated person (as defined in Section 2(a)(3) of the Investment Company Act of 1940 (15 U.S.C. 80a-2(a)(3)) and the rules thereunder) of the company, its investment adviser, or its principal underwriter, on the other. Include any policies and procedures of the company’s investment adviser, or any other third party, that the company uses, or that are used on the company’s behalf, to determine how to vote proxies relating to portfolio securities.
Not applicable to a semi-annual report.
| ITEM 8. | PORTFOLIO MANAGERS OF CLOSED-END MANAGEMENT INVESTMENT COMPANIES. |
PORTFOLIO MANAGEMENT TEAM
William J. Morgan, a Director of the Registrant (the “Fund”) and a managing director of the Fund’s investment adviser (the “Adviser”) continues to be the lead portfolio manager of the Fund. In the semi-annual report, the Fund has also included biographical information for James P. Shanahan, Jr. and James E. Gibson as members of the portfolio management team due to their evolving responsibilities for the Fund. Mr. Shanahan, a managing director of the Adviser, is a portfolio manager for the Fund focusing primarily on investments in distressed debt. Mr. Shanahan has been part of the portfolio management team for the Fund since 1988. Mr. Gibson, a vice president of the Adviser, is primarily responsible for trading on behalf of the Fund and has been part of the portfolio management team since 1988.
Mr. Shanahan and Mr. Gibson have been associated with the Adviser or its predecessors in an investment management capacity for more than five years.
OTHER ACCOUNTS MANAGED
Information concerning other accounts managed by Mr. Morgan was included in the Fund’s Form N-CSR filed on March 13, 2007. As of July 31, 2007, Mr. Shanahan was part of the portfolio management team for three mutual funds with a total of approximately $1.4 billion in assets; eight pooled investment vehicles with a total of approximately $630.5 million in assets; and eight other accounts with a total of approximately $286.2 million in assets. As of July 31, 2007, Mr. Gibson was part of the portfolio management team for two mutual funds with a total of approximately $1.3 billion in assets. The Adviser is not paid a performance based fee in connection with the mutual funds and other accounts.
POTENTIAL CONFLICTS OF INTEREST
The potential for conflicts of interest exists when a portfolio manager manages other accounts with similar investment objectives and strategies as the Fund (“Similar Accounts”). Potential conflicts may include, for example, conflicts between investment strategies and conflicts in the allocation of investment opportunities.
Responsibility for managing the Adviser’s and its affiliates’ clients’ portfolios is organized according to investment strategies within asset classes. Generally, client portfolios with similar strategies are managed by portfolio managers in the same portfolio management group using the same objectives, approach and philosophy. Underlying sectors or strategy allocations within a larger portfolio are likewise managed by portfolio managers who use the same approach and philosophy as similarly managed portfolios. Therefore, portfolio holdings, relative position sizes and industry and sector exposures tend to be similar across similar portfolios and strategies, which minimizes the potential for conflicts of interest.
The Adviser and/or its affiliates may receive more compensation with respect to certain Similar Accounts than that received with respect to the Fund or may receive compensation based in part on the performance of certain Similar Accounts. This may create a potential conflict of interest for the Adviser and its affiliates or a portfolio manager by providing an incentive to favor these Similar Accounts when, for example, placing securities transactions. In addition, the Adviser or its affiliates could be viewed as having a conflict of interest to the extent that the Adviser or an affiliate has a proprietary investment in Similar Accounts, a portfolio manager has personal investments in Similar Accounts or the Similar Accounts are investment options in the Adviser’s or its affiliates’ employee benefit plans. Potential conflicts of interest may arise with both the aggregation and allocation of securities transactions and allocation of investment opportunities because of market factors or investment restrictions imposed upon the Adviser and its affiliates by law, regulation, contract or internal policies. Allocations of aggregated trades, particularly trade orders that were only partially completed due to limited availability and allocation of investment opportunities generally, could raise a potential conflict of interest, as the Adviser or its affiliates may have an incentive to allocate securities that are expected to increase in value to favored accounts. Initial public offerings, in particular, are frequently of very limited availability. The Adviser and its affiliates may be perceived as causing accounts they manage to participate in an offering to increase the Adviser’s and its affiliates’ overall allocation of securities in that offering. A potential conflict of interest also may be perceived to arise if transactions in one account closely follow related transactions in a different account, such as when a purchase increases the value of securities previously purchased by another account, or when a sale in one account lowers the sale price received in a sale by a second account. If the Adviser or its affiliates manage accounts that engage in short sales of securities of the type in which the Fund invests, the Adviser or its affiliates could be seen as harming the performance of the Fund for the benefit of the accounts engaging in short sales if the short sales cause the market value of the securities to fall.
As an internal policy matter, the Adviser or its affiliates may from time to time maintain certain overall investment limitations on the securities positions or positions in other financial instruments the Adviser or its affiliates will take on behalf of its various clients due to, among other things, liquidity concerns and regulatory restrictions. Such policies may preclude the Fund from purchasing particular securities or financial instruments, even if such securities or financial instruments would otherwise meet the Fund’s objectives.
The goal of the Adviser and its affiliates is to meet their fiduciary obligation with respect to all clients. The Adviser and its affiliates have policies and procedures that seek to manage conflicts. The Adviser and its affiliates monitor a variety of areas, including compliance with fund guidelines, review of allocation decisions and compliance with the Adviser’s Codes of Ethics and JPMorgan Chase & Co.’s Code of Conduct. With respect to the allocation of investment opportunities, the Adviser and its affiliates also have certain policies designed to achieve fair and equitable allocation of investment opportunities among its clients over time. For example:
Orders for the same equity security traded through a single trading desk or system are aggregated on a continual basis throughout each trading day consistent with the Adviser’s and its affiliates’ duty of best execution for its clients. If aggregated trades are fully executed, accounts participating in the trade will be allocated their pro rata share on an average price basis. Partially completed orders generally will be allocated among the participating accounts on a pro-rata average price basis, subject to certain limited exceptions. For example, accounts that would receive a de minimis allocation relative to their size may be excluded from the order. Another exception may occur when thin markets or price volatility require that an aggregated order be completed in multiple executions over several days. If partial completion of the order would result in an uneconomic allocation to an account due to fixed transaction or custody costs, the Adviser and its affiliates may exclude small orders until 50% of the total order is completed. Then the small orders will be executed. Following this procedure, small orders will lag in the early execution of the order, but will be completed before completion of the total order.
Purchases of money market instruments and fixed income securities cannot always be allocated pro-rata across the accounts with the same investment strategy and objective. However, the Adviser and its affiliates attempt to mitigate any potential unfairness by basing non-pro rata allocations traded through a single trading desk or system upon an objective predetermined
criteria for the selection of investments and a disciplined process for allocating securities with similar duration, credit quality and liquidity in the good faith judgment of the Adviser or its affiliates so that fair and equitable allocation will occur over time.
PORTFOLIO MANAGER COMPENSATION
The portfolio managers’ total compensation program includes a base salary fixed from year to year and a variable performance bonus consisting of cash incentives and restricted stock and may include mandatory notional investments (as described below) in selected funds advised by the Adviser or its affiliates. These elements reflect individual performance and the performance of the Adviser’s business as a whole.
The portfolio managers’ performance is formally evaluated annually based on a variety of factors including the aggregate size and blended performance of the portfolios a portfolio manager manages. Individual contribution relative to client goals carries the highest impact. Portfolio manager compensation is primarily driven by meeting or exceeding clients’ risk and return objectives, relative performance to competitors or competitive indices and compliance with firm policies and regulatory requirements. In evaluating a portfolio manager’s performance with respect to the funds he manages, the funds’ pre-tax performance is compared to the appropriate market peer group and to each fund’s benchmark over one, three and five year periods (or such shorter time as the portfolio manager has managed a fund). Investment performance is generally more heavily weighted to the long-term.
Awards of restricted stock are granted as part of an employee’s annual performance bonus and comprise from 0% to 35% of a portfolio manager’s total bonus. As the level of incentive compensation increases, the percentage of compensation awarded in restricted stock also increases. Up to 50% of the restricted stock portion of a portfolio manager’s bonus may instead be subject to mandatory notional investment in selected mutual funds advised by the Adviser or its affiliates. When these awards vest over time, the portfolio manager receives cash equal to the market value of the notional investment in the selected funds.
SECURITIES OWNERSHIP OF PORTFOLIO MANAGEMENT TEAM
Information concerning ownership of securities of the Fund owned by Mr. Morgan as of December 31, 2006 is included in the Form N-CSR filed on March 13, 2007. As of August 31, 2007, the dollar range of securities beneficially owned by the team members described above is shown below:
James P. Shanahan, Jr.: $100,001 - $500,000
James E. Gibson: $100,001 - $500,000
| ITEM 9. | PURCHASE OF EQUITY SECURITIES BY CLOSED-END MANAGEMENT INVESTMENT COMPANY AND AFFILIATED PURCHASERS. |
(a) If the registrant is a closed-end management investment company, provide the information specified in paragraph (b) of this Item with respect to any purchase made by or on behalf of the registrant or any “affiliated purchaser,” as defined in Rule 10b-18(a)(3) under the Exchange Act (17 CFR 240.10b-18(a)(3)), of shares or other units of any class of the registrant’s equity securities that is registered by the registrant pursuant to Section 12 of the Exchange Act (15 U.S.C. 781).
There were no purchases covered by this Item during the period covered by this report.
| ITEM 10. | SUBMISSION OF MATTERS TO A VOTE OF SECURITY HOLDERS. |
Describe any material changes to the procedures by which shareholders may recommend nominees to the registrant’s board of directors, where those changes were implemented after the registrant last provided disclosure in response to the requirements of Item 7(d)(2)(ii)(G) of Schedule 14A (17 CFR 240.14a-101), or this Item.
No material changes to report.
| ITEM 11. | CONTROLS AND PROCEDURES. |
(a) Disclose the conclusions of the registrant’s principal executive and principal financial officers, or persons performing similar functions, regarding the effectiveness of the registrant’s disclosure controls and procedures (as defined in Rule 30a-3(c) under the Act (17 CFR 270.30a-3(c))) as of a date within 90 days of the filing date of the report that includes the disclosure required by this paragraph, based on the evaluation of these controls and procedures required by Rule 30a-3(b) under the Act (17 CFR 270.30a-3(b)) and Rules 13a-15(b) or 15d-15(b) under the Exchange Act (17 CFR 240.13a-15(b) or 240.15d-15(b)).
The Registrant’s principal executive and principal financial officers have concluded, based on their evaluation of the Registrant’s disclosure controls and procedures as of a date within 90 days of the filing date of this report, that the Registrant’s disclosure controls and procedures are reasonably designed to ensure that information required to be disclosed by the Registrant on Form N-CSR is recorded, processed, summarized and reported within the required time periods and that information required to be disclosed by the Registrant in the reports that it files or submits on Form N-CSR is accumulated and communicated to the Registrant’s management, including its principal executive and principal financial officers, as appropriate to allow timely decisions regarding required disclosure.
(b) Disclose any change in the registrant’s internal control over financial reporting (as defined in Rule 30a-3(d) under the Act (17 CFR 270.30a-3(d)) that occurred during the registrant’s second fiscal quarter of the period covered by this report that has materially affected, or is reasonably likely to materially affect, the registrant’s internal control over financial reporting.
There were no changes in the Registrant’s internal control over financial reporting that occurred during the last fiscal quarter covered by this report that have materially affected, or are reasonably likely to materially affect, the Registrant’s internal control over financial reporting.
(a) File the exhibits listed below as part of this Form. Letter or number the exhibits in the sequence indicated.
(a)(1) Any code of ethics, or amendment thereto, that is the subject of the disclosure required by Item 2, to the extent that the registrant intends to satisfy the Item 2 requirements through filing of an exhibit.
Not applicable.
(a)(2) A separate certification for each principal executive officer and principal financial officer of the registrant as required by Rule 30a-2(a) under the Act (17 CFR 270.30a-2).
Certifications pursuant to Rule 30a-2(a) under the Investment Company Act of 1940 are attached hereto.
(a)(3) Any written solicitation to purchase securities under Rule 23c-1 under the Act (17 CFR 270.23c-1) sent or given during the period covered by the report by or on behalf of the registrant to 10 or more persons.
Not applicable.
(b) A separate or combined certification for each principal executive officer and principal officer of the registrant as required by Rule 30a-2(b) under the Act of 1940.
Certifications pursuant to Rule 30a-2(b) under the Investment Company Act of 1940 are attached hereto.
SIGNATURES
Pursuant to the requirements of the Securities Exchange Act of 1934 and the Investment Company Act of 1940, the registrant has duly caused this report to be signed on its behalf by the undersigned, thereunto duly authorized.
| | |
| Pacholder High Yield Fund, Inc. |
| |
| By: | | /s/ Gary J. Madich |
| | Gary J. Madich |
| | President and Principal Executive Officer |
| | September 7, 2007 |
Pursuant to the requirements of the Securities Exchange Act of 1934 and the Investment Company Act of 1940, this report has been signed below by the following persons on behalf of the registrant and in the capacities and on the dates indicated.
| | |
| |
| By: | | /s/ Gary J. Madich |
| | Gary J. Madich |
| | President and Principal Executive Officer |
| | September 7, 2007 |
| |
| By: | | /s/ Stephanie J. Dorsey |
| | Stephanie J. Dorsey |
| | Treasurer and Principal Financial Officer |
| | September 7, 2007 |