| |
Alpine Global Consumer Growth Fund | 
|
|
| | | | | | | | | | |
Comparative Annualized Returns as of 4/30/11 (Unaudited) |
| | 1 Month(1) | | 3 Months(1) | | Since Inception
(12/29/2010)(1) | |
|
|
|
|
|
|
|
|
|
|
|
Alpine Global Consumer Growth Fund | | 6.24 | % | | 8.32 | % | | 5.50 | % | |
|
|
|
|
|
|
|
|
|
|
|
MSCI All Country World Consumer Staples | | 6.16 | % | | 9.60 | % | | 6.77 | % | |
|
|
|
|
|
|
|
|
|
|
|
MSCI All Country World Consumer Discretionary | | 5.28 | % | | 7.04 | % | | 7.15 | % | |
|
|
|
|
|
|
|
|
|
|
|
Lipper Consumer Goods Funds Average(2) | | 5.39 | % | | 9.98 | % | | 25.25 | % | |
|
|
|
|
|
|
|
|
|
|
|
Gross Expense Ratio: 2.73%(3) | | | | | | | | | | |
|
|
|
|
|
|
|
|
|
|
|
Net Expense Ratio: 1.35%(3) | | | | | | | | | | |
| |
| | |
| | |
| (1) Not annualized. |
| (2) The since inception data represents the period beginning 12/31/2010. |
| (3) As disclosed in the prospectus dated March 1, 2011. |
Performance data quoted represents past performance and is not predictive of future results. Investment return and principal value of the Fund fluctuate, so that shares, when redeemed, may be worth more or less than their original cost. Performance current to the most recent month end may be lower or higher than the performance quoted and may be obtained by calling 1-888-785-5578. Performance data shown does not reflect the 1.00% redemption fee imposed on shares held for fewer than 60 days. If it did, total returns would be reduced.
The MSCI ACWI Consumer Staples Index is a free float adjusted market capitalization weighted index designed to measure the combined equity market performance of the consumer staples sector of developed and emerging markets countries. Component securities include those of food and drug retailers, food producers, tobacco companies and household products manufacturers. As of September 30, 2010, the Underlying Index consisted of companies in the following countries: Australia, Belgium, Brazil, Canada, Chile, China, Colombia, Denmark, Finland, France, Germany, Greece, India, Indonesia, Ireland, Italy, Japan, Malaysia, Mexico, the Netherlands, Poland, Portugal, Russia, Singapore, South Africa, South Korea, Sweden, Switzerland, Taiwan, Thailand, Turkey, United Kingdom, and the United States. The MSCI ACWI Consumer Discretionary Index is a free float adjusted market capitalization weighted index designed to measure the combined equity market performance of the consumer discretionary sector of developed and emerging markets countries. Component securities include those of manufacturers of automobiles and automotive components, consumer durables and apparel companies, consumer services companies, media producers and retailers. As of September 30, 2010, the Underlying Index consisted of companies in the following countries: Australia, Belgium, Brazil, Canada, Chile, China, Colombia, Denmark, Finland, France, Germany, Greece, India, Indonesia, Ireland, Italy, Japan, Malaysia, Mexico, the Netherlands, Poland, Portugal, Russia, Singapore, South Africa, South Korea, Sweden, Switzerland, Taiwan, Thailand, Turkey, United Kingdom, and the United States. The Lipper Consumer Goods Funds Average is an average of funds that invest primarily in the equity securities of domestic and foreign companies engaged in manufacturing and distributing consumer goods such as food, beverages, tobacco, and nondurable household goods and personal products. The MSCI All Country World Consumer Staples Index, the MSCI All Country World Consumer Discretionary Index and the Lipper Consumer Goods Funds Average are unmanaged and do not reflect direct fees associated with a mutual fund, such as investment adviser fees; however, the Lipper Consumer Goods Funds Average reflects fees charged by the underlying funds. The performance for the Global Consumer Growth Fund reflects the deduction of fees for these value-added services. Investors cannot directly invest in an index.
The adviser contractually agreed to waive a portion of its fees and to absorb certain fund expenses. This arrangement will remain in effect unless the Board of Trustees approves its modification or termination.
To the extent that the Fund’s historical performance resulted from gains derived from participation in initial public offerings (“IPOs”) and/or secondary offerings, there is no guarantee that these results can be replicated in future periods or that the Fund will be able to participate to the same degree in IPO/Secondary allocations in the future.
40
| |
Alpine Global Consumer Growth Fund | 
|
| |
| | | | | | | | | |
| |
| | | | | | | | | |
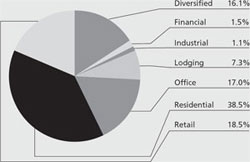
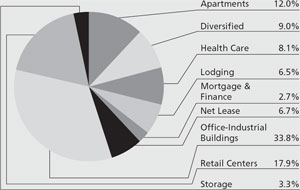
Portfolio Distributions* (Unaudited) | | | | | | | |
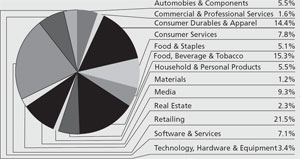
| | Top 10 Holdings* (Unaudited) | | | |
| 1. | | Anheuser-Busch InBev NV- | | | |
| | | ADR | | 3.15% | |
| 2. | | Nestle SA | | 3.06% | |
| 3. | | PepsiCo, Inc. | | 2.43% | |
| 4. | | Kabel Deutschland Holding | | | |
| | | AG | | 2.20% | |
| 5. | | Comcast Corp.-Class A | | 2.16% | |
| 6. | | Yum! Brands, Inc. | | 2.01% | |
| 7. | | VF Corp. | | 1.89% | |
| 8. | | SES SA | | 1.85% | |
| 9. | | McDonald’s Corp. | | 1.84% | |
| 10. | | Apple, Inc. | | 1.80% | |
| | | | | |
| | | | | |
| * | Portfolio holdings and sector distributions are as of 04/30/11 and are subject to change. Portfolio holdings are not recommendations to buy or sell any securities. Portfolio Distributions and Top 10 Holdings do not include short-term investments. Portfolio Distributions percentages are based on total investments less short-term investments and Top 10 Holdings percentages are based on total net assets. | |
| | | | | | | |
|
| |
|
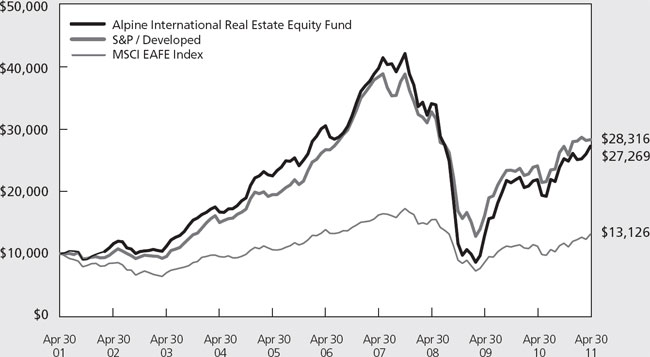
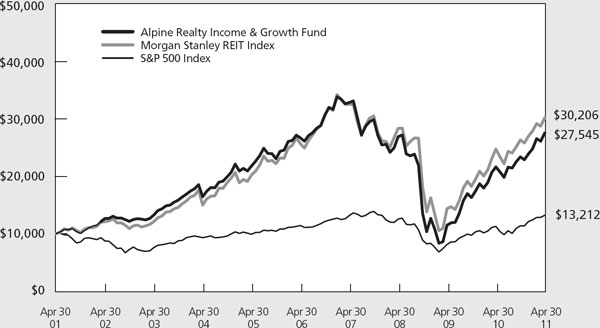
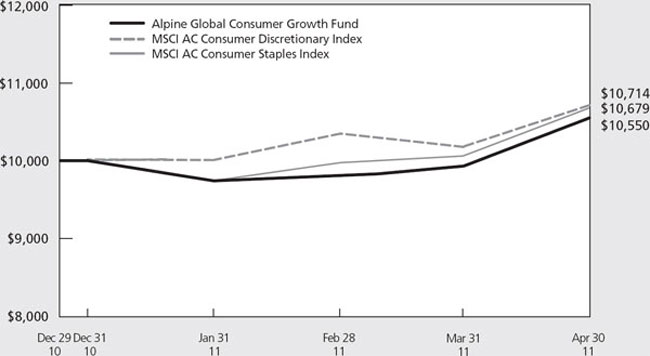
Value of a $10,000 Investment (Unaudited) |
|
|
|
This chart represents a comparison of a hypothetical $10,000 investment in the Fund versus a similar investment in the Fund’s benchmark. The graph and the table do not reflect the deduction of taxes that a shareholder would pay on Fund distributions or the redemption of Fund shares. Investment performance reflects the waiver and recovery of certain fees. Without the waiver and recovery of fees, the Fund’s total return would have differed.
41
| |
Alpine Global Consumer Growth Fund |
|
| |
|
Commentary |
| |
The Alpine Global Consumer Growth Fund launched on December 29, 2010. Over the first four months ending on April 29, 2011, the Fund provided a total return of 5.50%. The MSCI All Country World Consumer Staples and Consumer Discretionary Indices posted total returns of 6.77% and 7.15%, respectively. Our emerging market exposure contributed to the underperformance relative to the benchmarks during the period.
The Global Consumer Growth Fund seeks to invest in companies which have exposure to the rising purchasing power of the global consumer. The Fund aims to achieve diversification by investing primarily across consumer discretionary, consumer staples and technology sectors among both multi-national and local companies. In the developed world, we emphasis investment in consumer consumption trends, such as the rise in Internet spending and the usage of mobile devices, as well as in firms that have the ability to expand their brands domestically and abroad. Some examples that meet at least one of these criteria are: Yoox, an online retailer based in Italy; Apple, the maker of the iPhone and iPad among other consumer devices; and Abercrombie & Fitch, an increasingly global retailer. In emerging markets, the focus is on those businesses that stand to benefit from the demographic shifts that are taking place as disposable income levels rise over the next few years. As of April 29, 2011, the Fund held names such as Chinese online search company Baidu, CIA Hering (a Brazilian retailer), and Indofood CBP Sukses Makmur (a leading Indonesian food producer).
Portfolio Analysis
The top five contributors to the Fund’s performance since inception were Baidu (48.92% total return), Kabel Deutschland Holding (+34.53%), Mercado Libre (+30.50%), Comcast (+17.82%) and Yoox (+40.48%). Baidu is the largest search site in China. With the exit of Google in 2010, Baidu has captured market share over the past 12 months and we believe that they will continue to benefit from increased Internet usage in China as income levels rise. Kabel Deutschland is a German cable operator. After upgrading its network, the company has gained market share across its service offerings by providing a superior product than the incumbent. Mercado Libre, an online auction business in Latin America, benefits from the increased Internet penetration throughout the region. Comcast, the leading US cable operator, posted strong numbers in its cable operations, while the recent NBC Universal deal has positioned the combined company well in the content space. Finally, Yoox, an Italian online retailer, posted strong growth driven by the expansion of its
existing operations and the introduction of new business via opening new customer sites and entering new geographic regions.
Pandora A/S (-25.95%), Target (-17.77%), Daphne international Holdings (-22.57%), Li & Fung (-18.84%) and X5 Retail Group (-23.37%) were the bottom five contributors to the Fund’s performance through April 29, 2011. Pandora, a global jewelry manufacturer, posted disappointing results for the fourth quarter of 2010 resulting in the pullback in the shares. We continue to find the company’s growth prospects attractive and added to our position on the pullback. Thus far, discount retailer Target’s efforts to generate traffic growth through its Red card and P-Fresh initiatives have yet to bear fruit. As such, the shares have trailed the market over the first four months of the calendar year. We continue to look for signs of improvement and believe that the modest valuation reflects the company’s recent performance. Daphne is a footwear retailer in China. The company’s results have slowed a bit recently as the overall Chinese consumer sector has pulled back to begin the year. We find the company’s market position and the valuation of the shares attractive at current levels. Shares of Asian logistics provider Li & Fung have pulled back with the local consumer sector as well as due to fears about slowing spending in the developed world (Li & Fung provides the sourcing for many global customers, including Walmart). We continue to like the long term investment case for the company and would likely look to add on further weakness. Finally, Russian retailer X5 has pulled back on concerns about growing competition and little improvement in spending from the Russian consumer. However, we find the valuation of the shares attractive and believe that the long term Russian consumer consumption story remains intact.
Portfolio Construction
Since inception, we have diligently positioned the portfolio according to our investment thesis. Our top holdings include a variety of multi-national names, like Nestle, Pepsi and Yum! Brands. Meanwhile, we have ample direct exposure to emerging markets with 10.6% of the Fund in China and 11.6% in Brazil. The Fund’s overall emerging market exposure as of April 29, 2011 was 28.1%. Despite the near term macro economic concerns in several emerging economies, we continue to believe in the long-term growth trajectory of the developing market consumer as their income levels rise. We will likely use further weakness to add to our exposure.
42
| |
Alpine Global Consumer Growth Fund |
|
| |
The US represented 35.5% of the portfolio as of April 29, 2011. The Fund is invested in a wide variety of consumer industries such as media and cable (CBS, Comcast), global retail (Abercrombie, Guess?), global footwear and apparel (VF Corporation, Nike), leisure (Carnival Corp., Hasbro) and technology (Apple, Google). The Fund also holds a few smaller US oriented growth retailers, Lumber Liquidators and Rue21. Lumber Liquidators operates over 240 locations throughout the US and Canada offering flooring of all types. The company plans to increase its retailing space by 20% in 2011. Rue21 is a value-oriented fast-fashion retailer with almost 700 locations throughout the US, mainly in smaller towns and cities. Rue is growing its store base around 15% annually. We believe that both companies offer strong growth potential for years to come.
With concerns over the macro environment in Western Europe, the Fund has limited its exposure to the region to 26.0% of the portfolio. The focus has mainly been on names that are not completely reliant on Western Europe for growth, such as Nestle, Unilever and Swatch. Europe represented 20%, 27% and 39% of 2010 sales for each name respectively. AWCGX is also exposed to the global auto market through Bayerische Motoren Werke AG (BMW) and Renault SA. Two of our smaller holdings in the region are Pandora and Yoox. Pandora is a jewelry manufacturer that has grown rapidly with sales throughout the world. Yoox operates a number of multi-brand and mono-brand websites that offer luxury goods within Europe but the company has rapidly expanded its reach globally.
The Fund’s 28.1% emerging market exposure is concentrated in China and Brazil. The diversified holdings include: apparel retailers CIA Hering and Marisa Lojas; department store operators Springland and Golden Eagle; food retailers Cia Brasileira de Distribuicao Grupo Pao de Acucar and Lianhua Supermarket Holdings; as well as food producer Want Want China Holdings. The Fund also holds Indonesian food producer Indofood and food retailers X5 Retail Group (Russia) and Grupo Comercial Chedraui SA de CV (Mexico). We expect our emerging market exposure could grow over time as the consumers in these regions become an increasingly important percentage of global consumption.
Outlook
The macro economic picture for the consumer in the back half of 2011 is mixed. In the US, rising input costs appear set to squeeze margins for most consumer goods. Meanwhile, a slow but steadily improving job market and the tax cut enacted at the start of the year
are helping to offset the impact of higher gasoline prices. Retailers are testing select price increases, while consumer products companies and food manufactures are also looking to pass through cost increases. Thus far, there has been a limited impact on volumes. However, this bears monitoring as we move through the summer driving season and into the back half of the calendar year.
Outside of the US, we expect the subdued consumer spending environment in Western European to continue as governments enact austerity measures to reduce fiscal deficits. There are pockets of strength, such as Germany, but overall consumer spending growth is expected to remain modest for the next few quarters. As such, we continue to focus on consumer names with exposure outside of the region. Meanwhile, in emerging markets, the consumer growth trajectory remains on track. And we appear to be near the end of a tightening cycle that has had a short term impact on the performance of consumer names in many of these markets. This should bode well for emerging market performance over the next several quarters.
Looking further ahead, we have already begun to see some relief in commodity prices in the markets in recent weeks. Should this trend continue, most of our companies should benefit from reduced costs as we enter 2012. While some of the improvement will likely be passed onto the consumer, most likely in the form of discounts rather than price reductions, we believe that this should result in improving margins for the group as we look out 12-18 months. We would expect the market to begin to discount these gains in the coming months.
In closing, we are excited about the opportunities for the Global Consumer Growth Fund. We believe that the prospects for the long term global consumer story are attractive. Despite some near term headwinds, rising income levels and changing consumer consumption patterns across the globe should provide ample investment opportunities.
Sincerely,
Bryan Keane
Samuel A. Leiber
Co-Portfolio Managers
43
| |
Alpine Global Consumer Growth Fund |
|
| |
Mutual fund investing involves risk. Principal loss is possible. The Fund is subject to the following risks:
Emerging Market Securities Risk — The risks of investing in foreign securities can be intensified in the case of investments in issuers domiciled or operating in emerging market countries. These risks include lack of liquidity and greater price volatility, greater risks of expropriation, less developed legal systems and less reliable custodial services and settlement practices.
Equity Securities Risk — The stock or other security of a company may not perform as well as expected, and may decrease in value, because of factors related to the company (such as poorer than expected earnings or certain management decisions) or to the industry in which the company is engaged (such as a reduction in the demand for products or services in a particular industry).
Foreign Securities Risk — Public information available concerning foreign issuers may be more limited than would be with respect to domestic issuers. Different accounting standards may be used by foreign issuers, and foreign trading markets may not be as liquid as U.S. markets. Additionally, foreign securities also involve currency fluctuation risk, possible imposition of withholding or confiscatory taxes and adverse political or economic developments. These risks may be greater in emerging markets.
Growth Stock Risk — Growth stocks typically are very sensitive to market movements because their market prices tend to reflect future expectations. When it appears those expectations will not be met, the prices of growth stocks typically fall. Growth stocks as a group may be out of favor and underperform the overall equity market while the market concentrates on undervalued stocks.
Management Risk — The Adviser’s judgment about the quality, relative yield or value of, or market trends affecting, a particular security or sector, or about interest rates generally, may be incorrect. The Adviser’s security selections and other investment decisions might produce losses or cause the Fund to underperform when compared to other funds with similar investment objectives and strategies.
Market Risk — The price of a security held by the Fund may fall due to changing market, economic or political conditions.
Sector Risk — Significant problems may affect a particular sector, and returns from that sector may be lower than returns from the overall stock market. Events that affect the consumer products/services sector will have a greater effect on the Fund than they would on a fund that is more widely diversified among a number of unrelated industries. Daily fluctuations in specific market sectors are often more extreme than fluctuations in the overall market. Because the Fund invests a substantial amount of its assets in the consumer product/services sector, the Fund’s performance largely depends on the general condition of that sector. The consumer product/services sector could be adversely affected by overall economic conditions, interest rates, competition, consumer confidence, disposable income, changes in demographics and consumer tastes, and legislative or regulatory changes. The prices of the securities of those issuers also may fluctuate widely in response to such events.
Small and Medium Capitalization Company Risk — Securities of small or medium capitalization companies are more likely to experience sharper swings in market values, less liquid markets, in which it may be more difficult for the Adviser to sell at times and at prices that the Adviser believes appropriate and generally are more volatile than those of larger companies.
Please refer to page 5 for other important disclosures and definitions.
44
|
Alpine International Real Estate Equity Fund |
| |
Schedule of Portfolio Investments
April 30, 2011 (Unaudited)
| | | | | | | |
Shares | | Security
Description | | Value | |
| | | | | | |
| | | | | | | |
Common Stocks—102.6% | | | | |
Asia—25.1% | | | | |
China—4.7% | | | | |
| 6,177,873 | | C C Land Holdings, Ltd. | | $ | 2,378,476 | |
| 2,200,768 | | Evergrande Real Estate Group, Ltd. | | | 1,569,903 | |
| 10,528,960 | | Franshion Properties China, Ltd. | | | 3,280,873 | |
| 5,856,162 | | KWG Property Holding, Ltd. | | | 4,252,857 | |
| 286,110 | | New World China Land, Ltd. | | | 102,416 | |
| 4,286,926 | | Shui On Construction and
Materials, Ltd. | | | 5,762,821 | |
| 4,101,447 | | Soho China, Ltd. | | | 3,538,348 | |
| 298,237 | | Syswin, Inc.—ADR (a) | | | 1,792,404 | |
| 3,255,867 | | Yanlord Land Group, Ltd. | | | 3,856,875 | |
| | | | | | | |
| | | | | | 26,534,973 | |
| | | | |
Hong Kong—1.3% | | | | |
| 1,615,000 | | Mandarin Oriental International,
Ltd. | | | 3,423,800 | |
| 2,229,734 | | The Hongkong & Shanghai
Hotels, Ltd. | | | 3,927,605 | |
| | | | | | | |
| | | | | | 7,351,405 | |
| | | | | | | |
India—6.3% | | | | |
| 1,000,000 | | DB Realty, Ltd. (a) | | | 2,180,256 | |
| 2,295,373 | | Hirco PLC (a) | | | 2,218,971 | |
| 483,339 | | Ishaan Real Estate PLC (a) | | | 468,260 | |
| 2,000,000 | | South Asian Real Estate
PLC (a)(b)(c)(d) | | | 17,572,080 | |
| 7,240,153 | | Unitech Corporate Parks PLC (a) | | | 2,902,461 | |
| 1,491,800 | | Yatra Capital, Ltd. (a)(e) | | | 10,164,067 | |
| | | | | | | |
| | | | | | 35,506,095 | |
| | | | | | | |
Indonesia—2.5% | | | | |
| 316,462,031 | | PT Bakrieland Development TBK | | | 5,321,174 | |
| 57,796,865 | | PT Bumi Serpong Damai TBK | | | 6,208,911 | |
| 28,947,368 | | PT Lippo Karawaci TBK | | | 2,636,496 | |
| | | | | | | |
| | | | | | 14,166,581 | |
| | | | | | | |
Japan—3.2% | | | | |
| 50,900 | | Kenedix, Inc. (a) | | | 9,211,761 | |
| 128,000 | | Mitsui Fudosan Co., Ltd. | | | 2,185,539 | |
| 256,254 | | Sumitomo Realty & Development
Co., Ltd. | | | 5,247,339 | |
| 28,905 | | Tachihi Enterprise Co., Ltd. | | | 1,661,463 | |
| | | | | | | |
| | | | | | 18,306,102 | |
| | | | | | | |
Malaysia—0.5% | | | | |
| 5,506,000 | | Aseana Properties, Ltd. (a) | | | 2,890,650 | |
| | | | | | | |
Philippines—1.1% | | | | |
| 27,854,933 | | SM Development Corp. | | | 5,895,017 | |
| | | | | | | |
Singapore—2.8% | | | | |
| 6,979,000 | | Banyan Tree Holdings, Ltd. (a) | | | 5,387,978 | |
| 3,000,000 | | CapitaMalls Asia, Ltd. | | | 4,338,058 | |
| 4,001,420 | | Global Logistic Properties, Ltd. (a) | | | 6,309,171 | |
| | | | | | | |
| | | | | | 16,035,207 | |
| | | | | | | |
Thailand—2.7% | | | | |
| 7,242,300 | | Central Pattana PCL (b) | | | 7,157,382 | |
| 19,134,325 | | Minor International PCL (b) | | | 8,076,800 | |
| | | | | | | |
| | | | | | 15,234,182 | |
| | | | | | | |
| | | Total Asia (Cost $166,753,648) | | | 141,920,212 | |
| | | | | | | |
| | | | | | | |
Shares | | Security
Description | | Value | |
| | | | | | | | |
| | | | | | | |
Australia—1.1% | | | | |
| 2,368,550 | | Charter Hall Group | | $ | 6,412,531 | |
| | | | | | | |
| | | Total Australia (Cost $4,226,981) | | | 6,412,531 | |
| | | | | | | |
Europe—34.3% | | | | |
Austria—0.8% | | | | |
| 999,985 | | Immofinanz Immobilien Anlagen
AG (a) | | | 4,754,421 | |
| | | | | | | |
France—5.0% | | | | |
| 273,136 | | Club Mediterranee SA (a) | | | 6,365,680 | |
| 226,928 | | Kaufman & Broad SA (a) | | | 8,228,081 | |
| 166,193 | | Nexity SA | | | 9,033,954 | |
| 54,577 | | Pierre & Vacances SA | | | 4,868,796 | |
| | | | | | | |
| | | | | | 28,496,511 | |
| | | | | | | |
Germany—2.9% | | | | |
| 546,359 | | DIC Asset AG | | | 7,364,081 | |
| 7,642,900 | | Sirius Real Estate, Ltd. (a) | | | 3,947,949 | |
| 14,610,263 | | Treveria PLC (a) | | | 4,814,898 | |
| | | | | | | |
| | | | | | 16,126,928 | |
| | | | | | | |
Greece—0.0% * | | | | |
| 173,403 | | Babis Vovos International
Construction SA (a) | | | 143,828 | |
| | | | | | | |
Norway—2.7% | | | | |
| 1,981,700 | | BWG Homes ASA (a) | | | 9,253,926 | |
| 2,899,440 | | Norwegian Property ASA (a) | | | 5,857,901 | |
| | | | | | | |
| | | | | | 15,111,827 | |
| | | | | | | |
Poland—1.2% | | | | |
| 762,064 | | Globe Trade Centre SA (a) | | | 5,942,187 | |
| 3,265,000 | | Nanette Real Estate Group NV (d) | | | 967,190 | |
| | | | | | | |
| | | | | | 6,909,377 | |
| | | | | | | |
Russia—3.2% | | | | |
| 700,650 | | LSR Group—GDR (f) | | | 6,551,078 | |
| 835,805 | | Mirland Development Corp. PLC (a) | | | 3,800,846 | |
| 713,228 | | PIK Group—GDR (a)(d)(f) | | | 3,066,880 | |
| 1,724,911 | | RGI International, Ltd. (a) | | | 4,571,014 | |
| | | | | | | |
| | | | | | 17,989,818 | |
| | | | | | | |
Sweden—2.9% | | | | |
| 573,877 | | JM AB | | | 16,383,054 | |
| | | | | | | |
Turkey—3.7% | | | | |
| 10,577,522 | | Emlak Konut Gayrimenkul
Yatirim Ortakligi | | | 20,862,963 | |
| | | | | | | |
Ukraine—0.1% | | | | |
| 1,180,000 | | KDD Group NV (a) | | | 384,348 | |
| | | | | | | |
United Kingdom—11.8% | | | | |
| 674,280 | | Development Securities PLC | | | 2,449,667 | |
| 900,339 | | Great Portland Estates PLC | | | 6,332,843 | |
| 140,291 | | Helical Bar PLC | | | 611,614 | |
| 3,781,515 | | LXB Retail Properties PLC (a) | | | 7,011,263 | |
| 970,847 | | Metric Property Investments PLC (a) | | | 1,727,062 | |
| 3,265,000 | | Nanette Real Estate Group NV (d) | | | 967,190 | |
| 9,645,181 | | Quintain Estates & Development
PLC (a) | | | 7,531,811 | |
| 13,108,407 | | Regus PLC | | | 24,566,891 | |
| 606,537 | | Shaftesbury PLC | | | 5,197,352 | |
| 3,040,130 | | Songbird Estates PLC (a) | | | 7,718,682 | |
| 1,000,130 | | Unite Group PLC (a) | | | 3,586,707 | |
| | | | | | | |
| | | | | | 66,733,892 | |
| | | | | | | |
| | | Total Europe (Cost $234,181,170) | | | 193,896,967 | |
| | | | | | | |
45
|
Alpine International Real Estate Equity Fund |
| |
Schedule of Portfolio Investments—Continued
April 30, 2011 (Unaudited)
| | | | | | | |
Shares | | Security
Description | | Value | |
| | | | | | |
| | | | | | | |
Middle East/Africa—0.9% | | | | |
Egypt—0.9% | | | | |
| 8,355,079 | | Talaat Moustafa Group (a) | | $ | 5,212,266 | |
| | | | | | | |
| | | Total Middle East/Africa
(Cost $10,122,934) | | | 5,212,266 | |
| | | | | | | |
North & South America—41.2% | | | | |
Brazil—37.7% | | | | |
| 718,077 | | Aliansce Shopping Centers SA | | | 6,390,210 | |
| 702,380 | | BHG SA—Brazil Hospitality
Group (a) | | | 10,152,632 | |
| 90,758 | | BHG SA—Brazil Hospitality
Group (a) | | | 1,283,604 | |
| 2,002,200 | | BR Malls Participacoes SA | | | 21,075,789 | |
| 449,560 | | BR Properties SA | | | 5,400,892 | |
| 774,200 | | Brasil Brokers Participacoes SA | | | 4,256,821 | |
| 426,800 | | Brookfield Incorporacoes SA | | | 2,373,824 | |
| 2,629,810 | | Cyrela Commercial Properties SA
Empreendimentos e
Participacoes | | | 23,352,686 | |
| 2,712,208 | | Direcional Engenharia SA | | | 18,533,077 | |
| 1,782,684 | | Even Construtora e Incorporadora
SA (a) | | | 9,801,816 | |
| 934,132 | | General Shopping Brasil SA (a) | | | 7,416,291 | |
| 797,151 | | Iguatemi Empresa de Shopping
Centers SA | | | 20,521,622 | |
| 869,406 | | Inpar SA (a) | | | 1,646,853 | |
| 2,273,500 | | JHSF Participacoes SA | | | 6,185,215 | |
| 200,000 | | LPS Brasil Consultoria de Imoveis
SA (a) | | | 5,415,713 | |
| 1,197,600 | | MRV Engenharia e Participacoes SA | | | 10,353,013 | |
| 957,400 | | Multiplan Empreendimentos
Imobiliarios SA | | | 19,930,619 | |
| 3,760,610 | | PDG Realty SA Empreendimentos
e Participacoes | | | 22,087,488 | |
| 699,568 | | Rossi Residencial SA | | | 6,559,006 | |
| 475,394 | | Sao Carlos Empreendimentos e
Participacoes SA | | | 6,648,022 | |
| 503,227 | | Tecnisa SA | | | 3,947,255 | |
| | | | | | | |
| | | | | | 213,332,448 | |
| | | | | | | |
| Canada—1.4% | | | | | | |
| 366,500 | | Lakeview Hotel Real Estate
Investment Trust (a) | | | 198,521 | |
| 133,000 | | Lakeview Hotel Real Estate
Investment Trust (a)(f) | | | 72,042 | |
| 91,700 | | Mainstreet Equity Corp. (a) | | | 1,713,530 | |
| 300,000 | | Mainstreet Equity Corp. (a)(f) | | | 5,605,876 | |
| | | | | | | |
| | | | | | 7,589,969 | |
| | | | | | | |
United States—2.1% | | | | |
| 282,300 | | Sunrise Senior Living, Inc. (a) | | | 2,930,274 | |
| 519,696 | | Verde Realty Corp. (a)(b)(c)(d) | | | 8,834,832 | |
| | | | | | | |
| | | | | | 11,765,106 | |
| | | | | | | |
| | | Total North & South America
(Cost $164,422,502) | | | 232,687,523 | |
| | | | | | | |
| | | Total Common Stocks
(Cost $579,707,235) | | | 580,129,499 | |
| | | | | | | |
| | | | | | | |
Shares | | Security
Description | | | Value | |
| | | | | | | |
| | | | | | | |
Equity—Linked Structured Notes—1.9% | | | | |
Asia—1.9% | | | | |
India—1.9% | | | | |
| 1,189,900 | | Housing Development &
Infrastructure, Ltd.—Macquarie
Bank, Ltd. (a)(d) | | $ | 4,317,978 | |
| 180,695 | | Housing Development &
Infrastructure, Ltd.—Merrill
Lynch & Co., Inc. (a)(d) | | | 655,717 | |
| 1,190,000 | | Phoenix Mills, Ltd.—Merrill
Lynch & Co., Inc. (a)(d) | | | 5,610,211 | |
| | | | | | | |
| | | | | | 10,583,906 | |
| | | | | | | |
| | | Total Asia (Cost $10,837,487) | | | 10,583,906 | |
| | | | | | | |
| | | Total Equity—Linked Structured
Notes (Cost $10,837,487) | | | 10,583,906 | |
| | | | | | | |
Investment Companies—1.1% | | | | |
India—1.0% | | | | |
| 8,327,900 | | Trinity Capital PLC | | | 5,338,156 | |
| | | | | | | |
| | | Total India (Cost $14,721,942) | | | 5,338,156 | |
| | | | | | | |
Turkey—0.1% | | | | |
| 920,000 | | The Ottoman Fund, Ltd. (a) | | | 653,107 | |
| | | | | | | |
| | | Total Turkey (Cost $1,507,548) | | | 653,107 | |
| | | | | | | |
| | | Total Investment Companies
(Cost $16,229,490) | | | 5,991,263 | |
| | | | | | | |
Warrants—0.9% | | | | |
Asia—0.9% | | | | |
Malaysia—0.9% | | | | |
| 12,201,600 | | SP Setia BHD (a) | | | | |
| | | Expiration: January, 2013 | | | | |
| | | Exercise Price: MYR 4.480 | | | 5,066,836 | |
| | | | | | | |
Thailand—0.0% * | | | | |
| 2,569,584 | | Minor International PCL (a)(d) | | | | |
| | | Expiration: May, 2013 | | | | |
| | | Exercise Price: THB 13.000 | | | 246,198 | |
| | | | | | | |
| | | Total Asia (Cost $2,285,294) | | | 5,313,034 | |
| | | | | | | |
| | | Total Warrants (Cost $2,285,294) | | | 5,313,034 | |
| | | | | | | |
| | | Total Investments
(Cost $609,059,506)—106.5% (g) | | | 602,017,702 | |
| | | Liabilities in Excess of
Other Assets—(6.5)% | | | (36,625,309 | ) |
| | | | | | | |
| | | TOTAL NET ASSETS 100.0% | | $ | 565,392,393 | |
| | | | | | | |
The accompanying notes are an integral part of these financial statements.
46
|
Alpine International Real Estate Equity Fund |
| |
Schedule of Portfolio Investments—Continued
April 30, 2011 (Unaudited)
| | |
| | |
|
Percentages are stated as a percent of net assets. |
| | |
* | Amount is less than 0.05%. |
| | |
(a) | Non-income producing security. |
| | |
(b) | Illiquid security. |
| | |
(c) | Private placement. |
| | |
(d) | Security fair valued in accordance with procedures approved by the Board of Trustees. These securities comprised 7.3% of the Fund’s net assets. |
| | |
(e) | Affiliated issuer. See Note 6 in the Notes to Financial Statements. |
| | |
(f) | Restricted under Rule 144A of the Securities Act of 1933. These securities may be resold in transactions exempt from registration, normally to qualified institutional buyers. These securities have been determined to be liquid under guidelines established by the Board of Trustees. Liquid securities restricted under Rule 144A comprised 2.7% of the Fund’s net assets. |
| | |
(g) | Includes securities pledged as collateral for line of credit outstanding on April 30, 2011. |
|
AB—Aktiebolag is the Swedish equivalent of the term corporation.
ADR—American Depositary Receipt
|
AG—Aktiengesellschaft is a German term that refers to a corporation that is limited by shares, i.e., owned by shareholders.
|
AS—Aktieselskab is the Danish term for a stock-based corporation.
|
ASA—Allmennaksjeselskap is the Norwegian term for a public limited company.
|
GDR—Global Depositary Receipt
|
MYR—Malaysian Ringgit
|
NV—Naamloze Vennootschap is the Dutch term for a public limited liability corporation.
|
PCL—Public Company Limited
|
PLC—Public Limited Company
|
SA—Generally designates corporations in various countries, mostly those employing the civil law.
|
THB—Thailand Baht |
The accompanying notes are an integral part of these financial statements.
47
|
Alpine Realty Income & Growth Fund |
| |
Schedule of Portfolio Investments
April 30, 2011 (Unaudited)
| | | | | | | |
Shares | | Security
Description | | Value | |
| | | | | | |
| | | | |
Real Estate Investment Trusts—90.8% | | | | |
Apartments—12.4% | | | | |
| 18,000 | | Associated Estates Realty Corp. | | $ | 299,520 | |
| 10,125 | | AvalonBay Communities, Inc. | | | 1,281,927 | |
| 23,000 | | BRE Properties, Inc. | | | 1,166,560 | |
| 10,000 | | Camden Property Trust | | | 627,500 | |
| 59,900 | | Campus Crest Communities, Inc. | | | 708,018 | |
| 68,360 | | Equity Residential | | | 4,082,459 | |
| 24,065 | | Essex Property Trust, Inc. | | | 3,260,326 | |
| 45,200 | | Home Properties, Inc. | | | 2,865,680 | |
| 11,400 | | UDR, Inc. | | | 295,146 | |
| | | | | | | |
| | | | | | 14,587,136 | |
| | | | | | | |
Diversified—8.7% | | | | |
| 45,000 | | American Assets Trust, Inc. | | | 993,600 | |
| 118,700 | | Crombie Real Estate Investment
Trust (b) | | | 1,634,689 | |
| 86,364 | | Verde Realty Corp. (a)(c)(d)(e) | | | 1,468,188 | |
| 63,017 | | Vornado Realty Trust | | | 6,092,483 | |
| | | | | | | |
| | | | | | 10,188,960 | |
| | | | | | | |
Health Care—8.3% | | | | |
| 78,772 | | HCP, Inc. | | | 3,120,947 | |
| 15,000 | | Health Care REIT, Inc. | | | 806,550 | |
| 98,047 | | Omega Healthcare Investors, Inc. | | | 2,251,159 | |
| 20,000 | | Senior Housing Properties Trust | | | 474,400 | |
| 56,212 | | Ventas, Inc. | | | 3,143,937 | |
| | | | | | | |
| | | | | | 9,796,993 | |
| | | | | | | |
Lodging—4.2% | | | | |
| 164,692 | | Chatham Lodging Trust | | | 2,659,776 | |
| 72,003 | | Chesapeake Lodging Trust | | | 1,294,614 | |
| 100,463 | | FelCor Lodging Trust, Inc. (a) | | | 638,944 | |
| 12,000 | | LaSalle Hotel Properties | | | 337,680 | |
| | | | | | | |
| | | | | | 4,931,014 | |
| | | | | | | |
Mortgage & Finance—2.8% | | | | |
| 79,232 | | Apollo Commercial Real Estate
Finance, Inc. | | | 1,294,651 | |
| 100,000 | | Chimera Investment Corp. | | | 405,000 | |
| 40,400 | | Invesco Mortgage Capital, Inc. | | | 918,696 | |
| 30,000 | | Starwood Property Trust, Inc. | | | 683,700 | |
| | | | | | | |
| | | | | | 3,302,047 | |
| | | | | | | |
Net Lease—3.8% | | | | |
| 78,749 | | Entertainment Properties Trust | | | 3,749,240 | |
| 29,541 | | Getty Realty Corp. | | | 750,637 | |
| | | | | | | |
| | | | | | 4,499,877 | |
| | | | | | | |
Office-Industrial Buildings—31.1% | | | | |
| 51,528 | | Alexandria Real Estate Equities,
Inc. | | | 4,233,025 | |
| 59,271 | | AMB Property Corp. | | | 2,157,465 | |
| 64,611 | | Boston Properties, Inc. | | | 6,753,788 | |
| 28,571 | | Coresite Realty Corp. | | | 451,136 | |
| 24,153 | | Corporate Office Properties Trust | | | 850,427 | |
| 54,600 | | Digital Realty Trust, Inc. | | | 3,294,564 | |
| 146,509 | | Douglas Emmett, Inc. | | | 3,048,852 | |
| 120,352 | | DuPont Fabros Technology, Inc. | | | 2,943,810 | |
| 11,786 | | Hudson Pacific Properties, Inc. | | | 176,554 | |
| 60,973 | | Kilroy Realty Corp. | | | 2,557,208 | |
| 33,208 | | Liberty Property Trust | | | 1,167,925 | |
| 44,008 | | Mack—Cali Realty Corp. | | | 1,554,363 | |
| 251,497 | | MPG Office Trust, Inc. (a) | | | 837,485 | |
| 79,179 | | ProLogis | | | 1,289,826 | |
| 50,551 | | SL Green Realty Corp. | | | 4,171,974 | |
| | | | | | | |
Shares | | Security
Description | | Value | |
| | | | | | |
| | | | |
Real Estate Investment Trusts—continued | | | | |
Office-Industrial Buildings—continued | | | | |
| 80,000 | | STAG Industrial, Inc. (a) | | | 1,016,000 | |
| | | | | | | |
| | | | | | 36,504,402 | |
| | | | | | | |
Retail Centers—16.4% | | | | |
| 206,911 | | CBL & Associates Properties, Inc. | | | 3,842,337 | |
| 70,208 | | Excel Trust, Inc. | | | 835,475 | |
| 13,100 | | Federal Realty Investment Trust | | | 1,147,036 | |
| 45,000 | | Kimco Realty Corp. | | | 879,300 | |
| 68,595 | | Simon Property Group, Inc. | | | 7,856,872 | |
| 26,206 | | Taubman Centers, Inc. | | | 1,523,879 | |
| 60,428 | | The Macerich Co. | | | 3,191,807 | |
| | | | | | | |
| | | | | | 19,276,706 | |
| | | | | | | |
Storage—3.1% | | | | |
| 31,065 | | Public Storage | | | 3,644,235 | |
| | | | | | | |
| | | Total Real Estate Investment Trusts
(Cost $72,885,224) | | | 106,731,370 | |
| | | | | | | |
Common Stocks—2.3% | | | | |
Lodging—1.3% | | | | |
| 25,000 | | Starwood Hotels & Resorts
Worldwide, Inc. | | | 1,489,250 | |
| | | | | | | |
Office-Industrial Buildings—1.0% | | | | |
| 61,600 | | Brookfield Properties Corp. | | | 1,218,448 | |
| | | | | | | |
| | | Total Common Stocks
(Cost $1,971,997) | | | 2,707,698 | |
| | | | | | | |
Preferred Stocks—10.4% | | | | |
Diversified—0.6% | | | | |
| 17,400 | | Vornado Realty Trust—
Series G, 6.625% | | | 429,258 | |
| 13,354 | | Vornado Realty Trust—
Series I, 6.625% | | | 329,443 | |
| | | | | | | |
| | | | | | 758,701 | |
| | | | | | | |
Lodging—1.3% | | | | |
| 15,200 | | LaSalle Hotel Properties—
Series D, 7.500% | | | 375,288 | |
| 14,800 | | LaSalle Hotel Properties—
Series G, 7.250% | | | 357,716 | |
| 30,900 | | Sunstone Hotel Investors, Inc.—
Series A, 8.000% | | | 751,179 | |
| | | | | | | |
| | | | | | 1,484,183 | |
| | | | | | | |
Net Lease—3.1% | | | | |
| 27,000 | | CapLease, Inc.—Series A, 8.125% | | | 667,170 | |
| 124,500 | | Entertainment Properties Trust—
Series D, 7.375% | | | 3,017,880 | |
| | | | | | | |
| | | | | | 3,685,050 | |
| | | | | | | |
Office-Industrial Buildings—2.9% | | | | |
| 36,831 | | Kilroy Realty Corp.—
Series F, 7.500% | | | 917,092 | |
| 28,750 | | Prime Group Realty Trust—
Series B, 9.000% | | | 143,750 | |
| 33,128 | | PS Business Parks, Inc.—
Series H, 7.000% | | | 828,200 | |
| 59,600 | | SL Green Realty Corp.—
Series D, 7.875% | | | 1,504,900 | |
| | | | | | | |
| | | | | | 3,393,942 | |
| | | | | | | |
The accompanying notes are an integral part of these financial statements.
48
|
Alpine Realty Income & Growth Fund |
| |
Schedule of Portfolio Investments—Continued
April 30, 2011 (Unaudited)
| | | | | | | |
Shares | | Security
Description | | Value | |
| | | | | | |
| | | | |
Preferred Stocks—continued | | | | |
Retail Centers—2.1% | | | | |
| 89,558 | | CBL & Associates Properties,
Inc.—Series D, 7.375% | | | 2,177,155 | |
| 10,775 | | Cedar Shopping Centers, Inc.—
Series A, 8.875% | | | 273,577 | |
| | | | | | | |
| | | | | | 2,450,732 | |
| | | | | | | |
Storage—0.4% | | | | |
| 16,940 | | Public Storage—Series D, 6.180% | | | 417,571 | |
| | | | | | | |
| | | Total Preferred Stocks
(Cost $8,609,414) | | | 12,190,179 | |
| | | | | | | |
| | | Total Investments
(Cost $83,466,635)—103.5% (f) | | | 121,629,247 | |
| | | Liabilities in Excess of
Other Assets—(3.5)% | | | (4,059,547 | ) |
| | | | | | | |
| | | TOTAL NET ASSETS 100.0% | | $ | 117,569,700 | |
| | | | | | | |
| | |
| | |
| |
Percentages are stated as a percent of net assets. |
| |
(a) | Non-income producing security. |
| |
(b) | Restricted under Rule 144A of the Securities Act of 1933. These securities may be resold in transactions exempt from registration, normally to qualified institutional buyers. These securities have been determined to be liquid under guidelines established by the Board of Trustees. Securities restricted under Rule 144A comprised 1.4% of the Fund’s net assets. |
| |
(c) | Illiquid security. |
| |
(d) | Private placement. |
| |
(e) | Security fair valued in accordance with procedures approved by the Board of Trustees. This security comprised 1.2% of the Fund’s net assets. |
| |
(f) | Includes securities pledged as collateral for line of credit outstanding on April 30, 2011. |
| |
REIT—Real Estate Investment Trust |
The accompanying notes are an integral part of these financial statements.
49
|
Alpine Cyclical Advantage Property Fund |
| |
Schedule of Portfolio Investments
April 30, 2011 (Unaudited)
| | | | | | | |
Shares | | Security
Description | | Value | |
| | | | | | |
| | | | |
Common Stocks—90.8% | | | | |
Asia—22.6% | | | | |
China—5.1% | | | | |
| 415,705 | | C C Land Holdings, Ltd. | | $ | 160,046 | |
| 60,000 | | E-House China Holdings, Ltd.-ADR | | | 717,000 | |
| 190,526 | | Evergrande Real Estate Group, Ltd. | | | 135,911 | |
| 1,000,000 | | Kaisa Group Holdings, Ltd. (a) | | | 409,464 | |
| 421,501 | | KWG Property Holding, Ltd. | | | 306,102 | |
| 129,862 | | New World China Land, Ltd. | | | 46,485 | |
| 1,537,500 | | SPG Land Holdings, Ltd. | | | 688,943 | |
| 76,718 | | Syswin, Inc.-ADR (a) | | | 461,075 | |
| 352,745 | | Yanlord Land Group, Ltd. | | | 417,859 | |
| | | | | | | |
| | | | | | 3,342,885 | |
| | | | | | | |
Hong Kong—0.5% | | | | |
| 100,000 | | Great Eagle Holdings, Ltd. | | | 355,384 | |
| | | | | | | |
India—0.4% | | | | |
| 620,000 | | Unitech Corporate Parks PLC (a) | | | 248,548 | |
| | | | | | | |
Indonesia—4.9% | | | | |
| 43,204,016 | | PT Bakrieland Development TBK | | | 726,457 | |
| 8,264,823 | | PT Bumi Serpong Damai TBK | | | 887,860 | |
| 20,000,000 | | PT Ciputra Development TBK (a) | | | 910,789 | |
| 6,875,000 | | PT Lippo Karawaci TBK | | | 626,168 | |
| | | | | | | |
| | | | | | 3,151,274 | |
| | | | | | | |
Japan—3.5% | | | | |
| 60,000 | | Hulic Co., Ltd. | | | 499,291 | |
| 5,600 | | Kenedix, Inc. (a) | | | 1,013,475 | |
| 12,296 | | Mitsubishi Estate Co., Ltd. | | | 213,435 | |
| 25,635 | | Sumitomo Realty & Development
Co., Ltd. | | | 524,930 | |
| | | | | | | |
| | | | | | 2,251,131 | |
| | | | | | | |
Philippines—1.8% | | | | |
| 3,751,363 | | Robinsons Land Corp. | | | 1,165,455 | |
| | | | | | | |
Singapore—0.9% | | | | |
| 400,000 | | CapitaMalls Asia, Ltd. | | | 578,408 | |
| | | | | | | |
Thailand—5.5% | | | | |
| 300,000 | | Central Pattana PCL (b) | | | 296,482 | |
| 2,200,000 | | LPN Development PCL—NVDR | | | 788,610 | |
| 1,000,000 | | Minor International PCL (b) | | | 422,110 | |
| 1,500,000 | | Pruksa Real Estate PCL—NVDR (b) | | | 1,025,126 | |
| 1,400,000 | | Supalai PCL (b) | | | 562,814 | |
| 1,000,000 | | Ticon Industrial Connection PCL (b) | | | 462,312 | |
| | | | | | | |
| | | | | | 3,557,454 | |
| | | | | | | |
| | | Total Asia (Cost $13,869,630) | | | 14,650,539 | |
| | | | | | | |
Europe—11.4% | | | | |
Austria—0.6% | | | | | | |
| 81,242 | | Immofinanz Immobilien Anlagen
AG (a) | | | 386,265 | |
| | | | | | | |
| | | | | | 386,265 | |
| | | | | | | |
Germany—2.9% | | | | |
| 40,250 | | DIC Asset AG | | | 542,508 | |
| 125,000 | | TAG Immobilien AG (a) | | | 1,329,888 | |
| | | | | | | |
| | | | | | 1,872,396 | |
| | | | | | | |
Norway—0.7% | | | | |
| 100,000 | | BWG Homes ASA (a) | | | 466,969 | |
| | | | | | | |
Poland—1.3% | | | | |
| 40,000 | | Atrium European Real Estate, Ltd. | | | 273,716 | |
| 72,364 | | Globe Trade Centre SA (a) | | | 564,258 | |
| | | | | | | |
| | | | | | 837,974 | |
| | | | | | | |
| | | | | | | |
Shares | | Security
Description | | Value | |
| | | | | | |
| | | | |
Common Stocks—continued | | | | |
Russia—1.4% | | | | |
| 800,000 | | Raven Russia, Ltd. | | $ | 935,396 | |
| | | | | | | |
United Kingdom—4.5% | | | | |
| 488,831 | | LXB Retail Properties PLC (a) | | | 906,336 | |
| 964,231 | | Quintain Estates & Development
PLC (a) | | | 752,957 | |
| 341,253 | | Songbird Estates PLC (a) | | | 866,418 | |
| 100,014 | | Unite Group PLC (a) | | | 358,674 | |
| | | | | | | |
| | | | | | 2,884,385 | |
| | | | | | | |
| | | Total Europe (Cost $5,964,597) | | | 7,383,385 | |
| | | | | | | |
Middle East/Africa—1.3% | | | | |
Egypt—1.3% | | | | |
| 32,562 | | Six of October Development &
Investment Co. (a)(b) | | | 340,020 | |
| 835,775 | | Talaat Moustafa Group (a)(b) | | | 521,393 | |
| | | | | | | |
| | | | | | 861,413 | |
| | | | | | | |
| | | Total Middle East/Africa
(Cost $1,398,145) | | | 861,413 | |
| | | | | | | |
North & South America—55.5% | | | | |
Brazil—22.7% | | | | |
| 98,241 | | BHG SA—Brazil Hospitality
Group (a) | | | 1,416,534 | |
| 100,000 | | BR Malls Participacoes SA | | | 1,052,632 | |
| 60,806 | | BR Properties SA | | | 730,507 | |
| 320,700 | | Brookfield Incorporacoes SA | | | 1,783,705 | |
| 15,000 | | Cyrela Commercial Properties SA
Empreendimentos e
Participacoes-ADR (c) | | | 532,900 | |
| 7,500 | | Cyrela Commercial Properties SA
Empreendimentos e
Participacoes-ADR | | | 266,450 | |
| 231,571 | | Direcional Engenharia SA | | | 1,582,372 | |
| 100,526 | | Even Construtora e Incorporadora
SA (a) | | | 552,727 | |
| 72,140 | | Iguatemi Empresa de Shopping
Centers SA | | | 1,857,151 | |
| 76,489 | | Inpar SA (a) | | | 144,888 | |
| 28,000 | | LPS Brasil Consultoria de Imoveis
SA (a) | | | 758,200 | |
| 310,000 | | PDG Realty SA Empreendimentos
e Participacoes | | | 1,820,748 | |
| 190,000 | | Rossi Residencial SA | | | 1,781,401 | |
| 54,181 | | Tecnisa SA | | | 424,990 | |
| | | | | | | |
| | | | | | 14,705,205 | |
| | | | | | | |
United States—32.8% | | | | |
| 40,000 | | Altisource Portfolio Solutions
SA (a) | | | 1,299,200 | |
| 19,852 | | Apollo Commercial Real Estate
Finance, Inc. | | | 324,382 | |
| 100,000 | | Beazer Homes USA, Inc. (a) | | | 466,000 | |
| 50,000 | | Brookdale Senior Living, Inc. (a) | | | 1,362,000 | |
| 40,491 | | Brookfield Properties Corp. | | | 800,912 | |
| 90,000 | | CB Richard Ellis Group, Inc.—
Class A (a) | | | 2,403,900 | |
| 25,125 | | Chatham Lodging Trust | | | 405,769 | |
| 84,228 | | DiamondRock Hospitality Co. | | | 1,014,105 | |
| 28,571 | | DuPont Fabros Technology, Inc. | | | 698,846 | |
| 40,000 | | Excel Trust, Inc. | | | 476,000 | |
| 89,053 | | General Growth Properties, Inc. | | | 1,487,185 | |
| 4,910 | | Hudson Pacific Properties, Inc. | | | 73,552 | |
The accompanying notes are an integral part of these financial statements.
50
|
Alpine Cyclical Advantage Property Fund |
| |
Schedule of Portfolio Investments—Continued
April 30, 2011 (Unaudited)
| | | | | | | |
Shares | | Security
Description | | Value | |
| | | | | | |
| | | | |
Common Stocks—continued | | | | |
United States—continued | | | | |
| 55,500 | | KB Home | | | 655,455 | |
| 50,000 | | Lennar Corp.—Class A | | | 949,500 | |
| 700 | | NVR, Inc. (a) | | | 517,531 | |
| 136,771 | | Ocwen Financial Corp. (a) | | | 1,637,149 | |
| 15,303 | | ProLogis | | | 249,286 | |
| 200,000 | | Pulte Group, Inc. (a) | | | 1,626,000 | |
| 40,000 | | Sunrise Senior Living, Inc. (a) | | | 415,200 | |
| 8,533 | | The Howard Hughes Corp. (a) | | | 552,682 | |
| 20,000 | | Toll Brothers, Inc. (a) | | | 420,200 | |
| 143,940 | | Verde Realty Corp. (a)(b)(d)(e) | | | 2,446,980 | |
| 10,440 | | Vornado Realty Trust | | | 1,009,339 | |
| | | | | | | |
| | | | | | 21,291,173 | |
| | | | | | | |
| | | Total North & South America
(Cost $26,872,070) | | | 35,996,378 | |
| | | | | | | |
| | | Total Common Stocks
(Cost $48,104,442) | | | 58,891,715 | |
| | | | | | | |
Equity-Linked Structured Notes—4.7% | | | | |
Asia—4.7% | | | | |
China—0.5% | | | | |
| 250,000 | | China Vanke Co., Ltd.—Class A-
Citigroup Global Markets,
Inc. (a)(d) | | | 326,606 | |
| | | | | | | |
India—3.4% | | | | |
| 250,000 | | Anant Raj Industries, Ltd.—
Macquarie Bank, Ltd. (a)(d) | | | 508,029 | |
| 88,000 | | DB Realty, Ltd.—Macquarie Bank,
Ltd. (a)(d) | | | 191,862 | |
| 30,000 | | DLF, Ltd.—Macquarie Bank,
Ltd. (a)(d) | | | 150,967 | |
| 112,200 | | Housing Development &
Infrastructure, Ltd.—Macquarie
Bank, Ltd. (a)(d) | | | 407,158 | |
| | | | | | | |
Shares | | Security
Description | | Value | |
| | | | | | |
| | | | |
Equity-Linked Structured Notes—continued | | | | |
India—continued | | | | |
| 300,000 | | Peninsula Land, Ltd.—
Macquarie Bank, Ltd. (a)(d) | | | 391,835 | |
| 90,000 | | Sobha Developers, Ltd.—
Macquarie Bank, Ltd. (a)(d) | | | 576,456 | |
| | | | | | | |
| | | | | | 2,226,307 | |
| | | | | | | |
Vietnam—0.8% | | | | |
| 262,500 | | HAGL JSC-GDR—
Macquarie Bank, Ltd. (a)(d) | | | 537,773 | |
| | | | | | | |
| | | Total Asia (Cost $3,901,156) | | | 3,090,686 | |
| | | | | | | |
| | | Total Equity—Linked Structured
Notes (Cost $3,901,156) | | | 3,090,686 | |
| | | | | | | |
Rights—0.0%* | | | | |
Europe—0.0%* | | | | |
Germany—0.0%* | | | | |
| 125,000 | | TAG Immobilien AG
Expiration: May, 2011 (a) | | | 0 | |
| | | | | | | |
| | | Total Europe (Cost $0) | | | 0 | |
| | | | | | | |
| | | Total Rights (Cost $0) | | | 0 | |
| | | | | | | |
Warrants—0.0%* | | | | |
Asia—0.0%* | | | | |
Thailand—0.0%* | | | | |
| 100,000 | | Minor International PCL
Expiration: May 2013
Exercise Price: THB 13.00 (a)(d) | | | 9,582 | |
| | | | | | | |
| | | Total Asia (Cost $0) | | | 9,582 | |
| | | | | | | |
| | | Total Warrants (Cost $0) | | | 9,582 | |
| | | | | | | |
| | | Total Investments
(Cost $52,005,598)—95.5% (f) | | | 61,991,983 | |
| | | Other Assets in Excess of
Liabilities—4.5% | | | 2,887,398 | |
| | | | | | | |
| | | TOTAL NET ASSETS 100.0% | | $ | 64,879,381 | |
| | | | | | | |
| |
| | |
|
Percentages are stated as a percent of net assets. |
|
* Amount is less than 0.05%. |
|
(a) Non—income producing security. |
|
(b) Illiquid security. |
|
(c) Restricted under Rule 144A of the Securities Act of 1933. These securities may be resold in transactions exempt from registration, normally to qualified institutional buyers. These securities have been determined to be liquid under guidelines established by the Board of Trustees. Liquid securities restricted under Rule 144A comprised less than 0.8% of the Fund’s net assets. |
|
(d) Security fair valued in accordance with procedures approved by the Board of Trustees. These securities comprised 8.6% of the Fund’s net assets. |
|
(e) Private placement. |
|
(f) Includes securities pledged as collateral for line of credit outstanding as of April 30, 2011. |
|
ADR—American Depositary Receipt |
|
AG—Aktiengesellschaft is a German term that refers to a corporation that is limited by shares, i.e., owned by shareholders. |
|
ASA—Allmennaksjeselskap is the Norwegian term for a public limited company. |
|
GDR—Global Depositary Receipt |
|
NVDR—Non—Voting Depositary Receipts |
|
PCL—Public Company Limited |
|
PLC—Public Limited Company |
|
SA—Generally designates corporations in various countries, mostly those employing the civil law. |
|
THB—Thailand Baht |
The accompanying notes are an integral part of these financial statements.
51
|
Alpine Emerging Markets Real Estate Fund |
| |
Schedule of Portfolio Investments
April 30, 2011 (Unaudited)
| | | | | | | |
Shares | | Security
Description | | Value | |
| | | | | | |
|
Common Stocks—87.9% | | | | |
Asia—41.6% | | | | |
China—12.2% | | | | |
| 64,249 | | C C Land Holdings, Ltd. | | $ | 24,736 | |
| 35,000 | | China Overseas Grand Oceans
Group, Ltd. (a) | | | 49,573 | |
| 40,000 | | China Overseas Land & Investment,
Ltd. | | | 77,051 | |
| 40,000 | | China Resources Land, Ltd. | | | 68,708 | |
| 40,000 | | Country Garden Holdings Co. | | | 16,172 | |
| 48,267 | | Evergrande Real Estate Group, Ltd. | | | 34,431 | |
| 123,040 | | Franshion Properties China, Ltd. | | | 38,340 | |
| 63,000 | | Hopefluent Group Holdings, Ltd. | | | 37,883 | |
| 150,000 | | Kaisa Group Holdings, Ltd. (a) | | | 61,420 | |
| 64,385 | | KWG Property Holding, Ltd. | | | 46,758 | |
| 4,011 | | New World China Land, Ltd. | | | 1,436 | |
| 200,000 | | Powerlong Real Estate Holdings,
Ltd. | | | 62,321 | |
| 14,500 | | Shangri-La Asia, Ltd. | | | 40,422 | |
| 61,500 | | Soho China, Ltd. | | | 53,056 | |
| 82,000 | | SPG Land Holdings, Ltd. | | | 36,744 | |
| 1,537 | | Syswin, Inc.-ADR (a) | | | 9,237 | |
| 28,500 | | Yanlord Land Group, Ltd. | | | 33,761 | |
| | | | | | | |
| | | | | | 692,049 | |
| | | | | | | |
Hong Kong—1.5% | | | | |
| 10,000 | | Great Eagle Holdings, Ltd. | | | 35,539 | |
| 5,000 | | Mandarin Oriental International,
Ltd. | | | 10,600 | |
| 21,282 | | Sino Land Co., Ltd. | | | 37,542 | |
| | | | | | | |
| | | | | | 83,681 | |
| | | | | | | |
India—1.3% | | | | |
| 5,000 | | Hirco PLC (a) | | | 4,834 | |
| 110,000 | | Unitech Corporate Parks PLC (a) | | | 44,097 | |
| 4,000 | | Yatra Capital, Ltd. (a) | | | 27,253 | |
| | | | | | | |
| | | | | | 76,184 | |
| | | | | | | |
Indonesia—6.9% | | | | |
| 4,000,000 | | PT Alam Sutera Realty TBK | | | 137,786 | |
| 2,756,945 | | PT Bakrieland Development TBK | | | 46,357 | |
| 749,659 | | PT Bumi Serpong Damai TBK | | | 80,533 | |
| 600,000 | | PT Ciputra Development TBK (a) | | | 27,324 | |
| 750,000 | | PT Lippo Karawaci TBK | | | 68,309 | |
| 200,000 | | PT Summarecon Agung TBK | | | 29,425 | |
| | | | | | | |
| | | | | | 389,734 | |
| | | | | | | |
Israel—0.3% | | | | |
| 650 | | Azrieli Group | | | 19,074 | |
| | | | | | | |
Malaysia—2.6% | | | | |
| 100,000 | | Aseana Properties, Ltd. (a) | | | 52,500 | |
| 35,000 | | IJM Land BHD | | | 33,322 | |
| 70,000 | | UEM Land Holdings BHD (a) | | | 63,572 | |
| | | | | | | |
| | | | | | 149,394 | |
| | | | | | | |
Philippines—4.3% | | | | |
| 800,000 | | Megaworld Corp. | | | 43,541 | |
| 349,136 | | Robinsons Land Corp. (a) | | | 108,468 | |
| 233,333 | | SM Development Corp. | | | 49,381 | |
| 150,000 | | SM Prime Holdings, Inc. | | | 42,046 | |
| | | | | | | |
| | | | | | 243,436 | |
| | | | | | | |
Singapore—3.5% | | | | |
| 48,000 | | Banyan Tree Holdings, Ltd. (a) | | | 37,057 | |
| 35,000 | | CapitaMalls Asia, Ltd. | | | 50,611 | |
| 55,000 | | Global Logistic Properties, Ltd. (a) | | | 86,720 | |
| 25,000 | | Mapletree Industrial Trust | | | 22,058 | |
| | | | | | | |
| | | | | | 196,446 | |
| | | | | | | |
| | | | | | | |
Shares | | Security
Description | | Value | |
| | | | | | |
|
Common Stocks—continued | | | | |
Thailand—9.0% | | | | |
| 120,000 | | Amata Corp. PCL (b) | | $ | 63,518 | |
| 60,000 | | Central Pattana PCL (b) | | | 59,296 | |
| 155,000 | | LPN Development PCL—NVDR | | | 55,561 | |
| 225,000 | | Minor International PCL (b) | | | 94,975 | |
| 80,000 | | Pruksa Real Estate PCL—NVDR (b) | | | 54,673 | |
| 300,000 | | Supalai PCL (b) | | | 120,603 | |
| 140,000 | | The Erawan Group PCL (a)(b) | | | 12,007 | |
| 100,000 | | Ticon Industrial Connection PCL (b) | | | 46,231 | |
| | | | | | | |
| | | | | | 506,864 | |
| | | | | | | |
| | | Total Asia (Cost $1,914,731) | | | 2,356,862 | |
| | | | | | | |
Europe—12.4% | | | | |
Denmark—0.3% | | | | |
| 4,000 | | TK Development (a) | | | 18,510 | |
| | | | | | | |
Greece—0.4% | | | | |
| 7,437 | | Babis Vovos International
Construction SA (a) | | | 6,169 | |
| 10,000 | | J&P-Avax SA | | | 16,144 | |
| | | | | | | |
| | | | | | 22,313 | |
| | | | | | | |
Poland—2.5% | | | | |
| 11,636 | | Globe Trade Centre SA (a) | | | 90,732 | |
| 11,516 | | Warimpex Finanz und
Beteiligungs AG (a) | | | 47,240 | |
| | | | | | | |
| | | | | | 137,972 | |
| | | | | | | |
Russia—6.5% | | | | |
| 10,000 | | Etalon Group, Ltd.-GDR (a)(c)(d) | | | 70,000 | |
| 10,000 | | LSR Group-GDR (c) | | | 93,500 | |
| 11,074 | | Mirland Development Corp. PLC (a) | | | 50,360 | |
| 7,364 | | PIK Group-GDR (a)(c)(d) | | | 31,665 | |
| 70,000 | | Raven Russia, Ltd. | | | 81,847 | |
| 16,000 | | RGI International, Ltd. (a) | | | 42,400 | |
| | | | | | | |
| | | | | | 369,772 | |
| | | | | | | |
Turkey—2.6% | | | | |
| 75,000 | | Emlak Konut Gayrimenkul
Yatirim Ortakligi | | | 147,929 | |
| | | | | | | |
Ukraine—0.1% | | | | |
| 20,000 | | KDD Group NV (a) | | | 6,514 | |
| | | | | | | |
| | | Total Europe (Cost $516,254) | | | 703,010 | |
| | | | | | | |
Middle East/Africa—2.3% | | | | |
Egypt—2.3% | | | | |
| 900 | | Orascom Development Holding AG (a) | | | 38,289 | |
| 4,378 | | Six of October Development &
Investment Co. (a)(b) | | | 45,716 | |
| 71,871 | | Talaat Moustafa Group (a) | | | 44,837 | |
| | | | | | | |
| | | | | | 128,842 | |
| | | | | | | |
| | | Total Middle East/Africa
(Cost $175,959) | | | 128,842 | |
| | | | | | | |
North & South America—31.6% | | | | |
Argentina—1.1% | | | | |
| 2,000 | | IRSA Inversiones y Representaciones
SA-ADR | | | 25,340 | |
| 3,100 | | TGLT SA-ADR (d) | | | 36,171 | |
| | | | | | | |
| | | | | | 61,511 | |
| | | | | | | |
Brazil—29.0% | | | | |
| 6,500 | | Aliansce Shopping Centers SA | | | 57,844 | |
| 10,162 | | BHG SA—Brazil Hospitality
Group (a) | | | 146,526 | |
| 12,100 | | BR Malls Participacoes SA | | | 127,368 | |
| 4,083 | | BR Properties SA | | | 49,052 | |
| 20,000 | | Brasil Brokers Participacoes SA | | | 109,967 | |
The accompanying notes are an integral part of these financial statements.
52
|
Alpine Emerging Markets Real Estate Fund |
| |
Schedule of Portfolio Investments—Continued
April 30, 2011 (Unaudited)
| | | | | | | |
Shares | | Security
Description | | Value | |
| | | | | | |
|
Common Stocks—continued | | | | |
Brazil—continued | | | | |
| 15,100 | | Brookfield Incorporacoes SA | | | 83,985 | |
| 3,991 | | Cyrela Commercial Properties SA
Empreendimentos e Participacoes | | | 35,440 | |
| 19,124 | | Direcional Engenharia SA | | | 130,678 | |
| 18,895 | | Even Construtora e Incorporadora
SA (a) | | | 103,891 | |
| 9,338 | | General Shopping Brasil SA (a) | | | 74,137 | |
| 1,000 | | Helbor Empreendimentos SA | | | 13,158 | |
| 3,236 | | Iguatemi Empresa de Shopping
Centers SA | | | 83,307 | |
| 5,542 | | Inpar SA (a) | | | 10,498 | |
| 30,000 | | JHSF Participacoes SA | | | 81,617 | |
| 11,300 | | MRV Engenharia e Participacoes SA | | | 97,686 | |
| 3,000 | | Multiplan Empreendimentos
Imobiliarios SA | | | 62,452 | |
| 43,254 | | PDG Realty SA Empreendimentos
e Participacoes | | | 254,047 | |
| 9,677 | | Rossi Residencial SA | | | 90,730 | |
| 894 | | Sao Carlos Empreendimentos e
Participacoes SA | | | 12,502 | |
| 2,247 | | Tecnisa SA | | | 17,625 | |
| | | | | | | |
| | | | | | 1,642,510 | |
| | | | | | | |
Chile—1.5% | | | | |
| 22,000 | | Parque Arauco SA | | | 50,646 | |
| 50,000 | | Socovesa SA | | | 38,007 | |
| | | | | | | |
| | | | | | 88,653 | |
| | | | | | | |
| | | Total North & South America
(Cost $1,258,968) | | | 1,792,674 | |
| | | | | | | |
| | | Total Common Stocks
(Cost $3,865,912) | | | 4,981,388 | |
| | | | | | | |
Equity-Linked Structured Notes—5.2% | | | | |
Asia—5.2% | | | | |
India—3.8% | | | | |
| 20,699 | | DB Realty, Ltd.—Macquarie Bank,
Ltd. (a)(d) | | | 45,129 | |
| 3,667 | | DLF, Ltd.—Macquarie Bank,
Ltd. (a)(d) | | | 18,453 | |
| 4,000 | | Housing Development &
Infrastructure, Ltd.—Macquarie
Bank, Ltd. (a)(d) | | | 14,516 | |
| 805 | | Housing Development &
Infrastructure, Ltd.—
Merrill Lynch & Co., Inc. (a)(d) | | | 2,921 | |
| | | | | | | |
Shares | | Security
Description | | Value | |
| | | | | | |
|
Equity-Linked Structured Notes—continued | | | | |
India—continued | | | | |
| 20,013 | | Kolte—Patil Developers, Ltd.—
Merrill Lynch & Co. (a)(d) | | | 20,368 | |
| 20,000 | | Peninsula Land, Ltd.—Macquarie
Bank, Ltd. (a)(d) | | | 26,122 | |
| 5,000 | | Phoenix Mills, Ltd.—Merrill
Lynch & Co., Inc. (a)(d) | | | 23,572 | |
| 10,000 | | Sobha Developers, Ltd.—Macquarie
Bank, Ltd. (a)(d) | | | 64,051 | |
| | | | | | | |
| | | | | | 215,132 | |
| | | | | | | |
Vietnam—1.4% | | | | |
| 37,500 | | HAGL JSC-GDR—Macquarie Bank,
Ltd. (a)(d) | | | 76,825 | |
| | | | | | | |
| | | Total Asia (Cost $369,020) | | | 291,957 | |
| | | | | | | |
| | | Total Equity—Linked Structured Notes
(Cost $369,020) | | | 291,957 | |
| | | | | | | |
Investment Companies—0.3% | | | | |
| 20,000 | | Vinaland, Ltd. (a) | | | 18,325 | |
| | | | | | | |
| | | Total Investment Companies
(Cost $9,389) | | | 18,325 | |
| | | | | | | |
Warrants—0.9% | | | | |
Asia—0.9% | | | | |
Malaysia—0.9% | | | | |
| 120,000 | | SP Setia BHD (a)
Expiration: January, 2013
Exercise Price: MYR 4.480 | | | 49,831 | |
| | | | | | | |
Thailand—0.0% * | | | | |
| 7,500 | | Minor International PCL (a)(d)
Expiration: May, 2013
Exercise Price: THB 13.000 | | | 719 | |
| | | | | | | |
| | | Total Asia (Cost $11,422) | | | 50,550 | |
| | | | | | | |
| | | Total Warrants (Cost $11,422) | | | 50,550 | |
| | | | | | | |
| | | | | | | |
Principal
Amount | | | | | | |
| | | | | | | |
|
Short-Term Investments—7.9% | | | | |
| 450,000 | | State Street Eurodollar Time
Deposit, 0.01% | | | 450,000 | |
| | | | | | | |
| | | Total Short-Term Investments
(Cost $450,000) | | | 450,000 | |
| | | | | | | |
| | | Total Investments
(Cost $4,705,743)—102.2% | | | 5,792,220 | |
| | | Liabilities in Excess of
Other Assets—(2.2)% | | | (126,671 | ) |
| | | | | | | |
| | | TOTAL NET ASSETS 100.0% | | $ | 5,665,549 | |
| | | | | | | |
| | |
| | |
Percentages are stated as a percent of net assets. |
|
* | Amount is less than 0.05%. |
|
(a) | Non-income producing security. |
|
(b) | Illiquid security. |
|
(c) | Restricted under Rule 144A of the Securities Act of 1933. These securities may be resold in transactions exempt from registration, normally to qualified institutional buyers. These securities have been determined to be liquid under guidelines established by the Board of Trustees. Liquid securities restricted under Rule 144A comprised 3.4% of the Fund’s net assets. |
|
(d) | Security fair valued in accordance with procedures approved by the Board of Trustees. These securities comprised 7.6% of the Fund’s net assets. |
|
|
|
ADR—American Depositary Receipt |
|
AG—Aktiengesellschaft is a German term that refers to a corporation that is limited by shares, i.e., owned by shareholders. |
|
BHD—Malaysian equivalent to incorporated. |
|
GDR—Global Depositary Receipt |
|
MYR—Malaysian Ringgit |
|
NV—Naamloze Vennootschap is the Dutch term for a public limited liability corporation. |
|
NVDR—Non-Voting Depositary Receipts |
|
PCL—Public Company Limited |
|
PLC—Public Limited Company |
|
SA—Generally designates corporations in various countries, mostly those employing the civil law. |
|
THB—Thailand Baht |
The accompanying notes are an integral part of these financial statements.
53
|
Alpine Global Infrastructure Fund |
| |
Schedule of Portfolio Investments
April 30, 2011 (Unaudited)
| | | | | | | |
Shares | | Security
Description | | Value | |
| | | | | | |
|
Common Stocks—92.2% | | | | |
Asia—14.7% | | | | |
China—6.9% | | | | |
| 120,000 | | Anhui Expressway Co.—Class H | | $ | 100,434 | |
| 10,000 | | China Mobile, Ltd. | | | 92,065 | |
| 290,000 | | China Water Affairs Group, Ltd. | | | 109,783 | |
| 235,000 | | Guangshen Railway Co., Ltd. | | | 92,895 | |
| 190,000 | | GZI Transport, Ltd. | | | 105,199 | |
| 400,000 | | Tianjin Port Development
Holdings, Ltd. | | | 92,709 | |
| 16,890 | | ZTE Corp. | | | 60,677 | |
| | | | | | | |
| | | | | | 653,762 | |
| | | | | | | |
Hong Kong—2.7% | | | | |
| 87,000 | | China State Construction
International Holdings, Ltd. | | | 85,025 | |
| 55,000 | | COSCO Pacific, Ltd. | | | 113,594 | |
| 40,000 | | NWS Holdings, Ltd. | | | 58,819 | |
| | | | | | | |
| | | | | | 257,438 | |
| | | | | | | |
Indonesia—2.7% | | | | |
| 235,000 | | Jasa Marga | | | 90,553 | |
| 3,350,000 | | PT Bakrieland Development TBK | | | 56,329 | |
| 95,000 | | Semen Gresik Persero | | | 105,383 | |
| | | | | | | |
| | | | | | 252,265 | |
| | | | | | | |
Malaysia—0.4% | | | | |
| 27,500 | | PLUS Expressways BHD | | | 41,687 | |
| | | | | | | |
Philippines—2.0% | | | | |
| 80,000 | | International Container Terminal
Services, Inc. | | | 91,661 | |
| 220,000 | | Manila Water Co., Inc. | | | 92,502 | |
| | | | | | | |
| | | | | | 184,163 | |
| | | | | | | |
| | | | | | 1,389,315 | |
| | | | | | | |
Europe—33.8% | | | | |
Austria—1.3% | | | | |
| 6,500 | | EVN AG | | | 124,676 | |
| | | | | | | |
Finland—0.6% | | | | |
| 1,500 | | Fortum OYJ | | | 51,677 | |
| | | | | | | |
France—7.5% | | | | |
| 1,000 | | Aeroports de Paris | | | 95,830 | |
| 1,700 | | EDF SA | | | 71,573 | |
| 2,200 | | GDF Suez | | | 90,017 | |
| 4,500 | | SES SA | | | 118,173 | |
| 3,800 | | Veolia Environnement SA | | | 126,948 | |
| 3,100 | | Vinci SA | | | 207,080 | |
| | | | | | | |
| | | | | | 709,621 | |
| | | | | | | |
Germany—5.8% | | | | |
| 5,700 | | Deutsche Telekom AG | | | 94,683 | |
| 6,086 | | Elster Group SE-ADR (a) | | | 94,211 | |
| 1,600 | | Fraport AG Frankfurt Airport
Services Worldwide | | | 128,043 | |
| 2,000 | | Hamburger Hafen und Logistik AG | | | 97,015 | |
| 1,700 | | HeidelbergCement AG | | | 130,002 | |
| | | | | | | |
| | | | | | 543,954 | |
| | | | | | | |
Italy—2.8% | | | | |
| 6,600 | | Atlantia SpA | | | 162,373 | |
| 15,900 | | Snam Rete Gas SpA | | | 98,911 | |
| | | | | | | |
| | | | | | 261,284 | |
| | | | | | | |
| | | | | | | |
Shares | | Security
Description | | Value | |
| | | | | | |
|
Common Stocks—continued | | | | |
Netherlands—2.7% | | | | |
| 4,500 | | Koninklijke KPN NV | | | 71,418 | |
| 3,900 | | Koninklijke Vopak NV | | | 186,927 | |
| | | | | | | |
| | | | | | 258,345 | |
| | | | | | | |
Poland—1.2% | | | | |
| 50,000 | | Tauron Polska Energia SA (a) | | | 116,774 | |
| | | | | | | |
Spain—4.4% | | | | |
| 8,100 | | Abertis Infraestructuras SA | | | 191,897 | |
| 4,400 | | Enagas SA | | | 108,868 | |
| 3,800 | | Telvent GIT SA (a) | | | 117,002 | |
| | | | | | | |
| | | | | | 417,767 | |
| | | | | | | |
Sweden—1.2% | | | | |
| 4,600 | | Tele2 AB-B Shares | | | 115,486 | |
| | | | | | | |
United Kingdom—6.3% | | | | |
| 16,000 | | Centrica PLC | | | 85,762 | |
| 14,700 | | Ferrovial SA | | | 202,771 | |
| 20,500 | | International Power PLC | | | 113,205 | |
| 10,000 | | National Grid PLC | | | 102,559 | |
| 30,000 | | Vodafone Group PLC | | | 85,990 | |
| | | | | | | |
| | | | | | 590,287 | |
| | | | | | | |
| | | | | | 3,189,871 | |
| | | | | | | |
North & South America—43.7% | | | | |
Brazil—10.4% | | | | |
| 15,000 | | All America Latina Logistica SA | | | 123,951 | |
| 7,000 | | Cia de Concessoes Rodoviarias | | | 218,027 | |
| 1,600 | | Cia de Saneamento Basico do
Estado de Sao Paulo-ADR | | | 93,632 | |
| 23,000 | | EcoRodovias Infraestrutura e
Logistica SA | | | 202,485 | |
| 10,000 | | Mills Estruturas e Servicos de
Engenharia SA | | | 136,664 | |
| 5,500 | | Santos Brasil Participacoes SA | | | 105,406 | |
| 6,000 | | Tegma Gestao Logistica SA | | | 102,861 | |
| | | | | | | |
| | | | | | 983,026 | |
| | | | | | | |
Canada—2.6% | | | | |
| 1,600 | | Canadian National Railway Co. | | | 124,107 | |
| 1,800 | | Enbridge, Inc. | | | 117,001 | |
| | | | | | | |
| | | | | | 241,108 | |
| | | | | | | |
Chile—1.1% | | | | |
| 38,000 | | E-CL SA | | | 102,731 | |
| | | | | | | |
Colombia—1.0% | | | | |
| 900 | | Millicom International Cellular SA | | | 97,506 | |
| | | | | | | |
Mexico—3.6% | | | | |
| 21,500 | | Empresas ICA SAB de CV-ADR (a) | | | 212,205 | |
| 59,000 | | OHL Mexico SAB de CV (a) | | | 122,851 | |
| | | | | | | |
| | | | | | 335,056 | |
| | | | | | | |
United States—25.0% | | | | |
| 2,600 | | American Tower Corp.—Class A (a) | | | 136,006 | |
| 4,000 | | American Water Works Co., Inc. | | | 117,520 | |
| 3,000 | | AT&T, Inc. | | | 93,360 | |
| 3,000 | | Avista Corp. | | | 73,050 | |
| 5,600 | | Calpine Corp. (a) | | | 93,800 | |
| 6,700 | | Cisco Systems, Inc. | | | 117,652 | |
| 5,000 | | Comcast Corp.—Class A | | | 131,200 | |
| 5,000 | | El Paso Pipeline Partners LP | | | 185,200 | |
| 17,000 | | EnergySolutions, Inc. | | | 96,050 | |
| 7,500 | | IESI—BFC, Ltd. | | | 190,050 | |
| 2,000 | | ITC Holdings Corp. | | | 141,860 | |
The accompanying notes are an integral part of these financial statements.
54
|
Alpine Global Infrastructure Fund |
| |
Schedule of Portfolio Investments—Continued
April 30, 2011 (Unaudited)
| | | | | | | |
Shares | | Security
Description | | Value | |
| | | | | | |
|
Common Stocks—continued | | | | |
United States—continued | | | | |
| 1,700 | | Itron, Inc. (a) | | | 92,531 | |
| 6,900 | | MasTec, Inc. (a) | | | 156,492 | |
| 3,100 | | Northeast Utilities | | | 110,360 | |
| 900 | | NuStar Energy LP | | | 61,029 | |
| 5,400 | | The Geo Group, Inc. (a) | | | 144,072 | |
| 4,000 | | Tutor Perini Corp. | | | 106,640 | |
| 1,900 | | Union Pacific Corp. | | | 196,593 | |
| 3,000 | | World Fuel Services Corp. | | | 118,740 | |
| | | | | | | |
| | | | | | 2,362,205 | |
| | | | | | | |
| | | | | | 4,121,632 | |
| | | | | | | |
| | | Total Common Stocks
(Cost $7,417,676) | | | 8,700,818 | |
| | | | | | | |
Equity-Linked Structured Notes—1.7% | | | | |
Asia—1.7% | | | | |
India—1.7% | | | | |
| 31,500 | | IVRCL Infrastructures & Projects,
Ltd.—Macquarie Bank,
Ltd. (a)(b) | | | 56,282 | |
| 80,000 | | NHPC, Ltd.—Macquarie Bank,
Ltd. (a)(b) | | | 46,771 | |
| 23,500 | | Power Grid Corp. of India, Ltd.—
Macquarie Bank, Ltd. (a)(b) | | | 55,541 | |
| | | | | | | |
| | | | | | 158,594 | |
| | | | | | | |
| | | | | | 158,594 | |
| | | | | | | |
| | | Total Equity-Linked Structured
Notes (Cost $190,246) | | | 158,594 | |
| | | | | | | |
| | | | | | | |
Shares | | Security
Description | | Value | |
| | | | | | |
|
Rights—0.1% | | | | |
Asia—0.1% | | | | |
Hong Kong—0.1% | | | | |
| 17,400 | | China State Construction
International Holdings, Ltd. (a) | | | 3,495 | |
| | | | | | | |
| | | Total Rights (Cost $0) | | | 3,495 | |
| | | | | | | |
| | | | | | | |
Principal
Amount | | | | | | |
| | | | | | | |
Short-Term Investments—8.9% | | | | |
| 842,000 | | State Street Eurodollar Time
Deposit, 0.01% | | | 842,000 | |
| | | | | | | |
| | | Total Short-Term Investments
(Cost $842,000) | | | 842,000 | |
| | | | | | | |
| | | Total Investments
(Cost $8,449,922)—102.9% | | | 9,704,907 | |
| | | Liabilities in Excess of
Other Assets—(2.9)% | | | (271,247 | ) |
| | | | | | | |
| | | TOTAL NET ASSETS 100.0% | | $ | 9,433,660 | |
| | | | | | | |
| | |
| | |
Percentages are stated as a percent of net assets. |
|
(a) | Non-income producing security. |
|
(b) | Security fair valued in accordance with procedures approved by the Board of Trustees. These securities comprised 1.7% of the Fund’s net assets. |
|
| | |
AB—Aktiebolag is the Swedish equivalent of the term corporation. |
|
ADR—American Depositary Receipt |
|
AG—Aktiengesellschaft is a German term that refers to a corporation that is limited by shares, i.e., owned by shareholders. |
|
BHD—Malaysian equivalent to incorporated. |
|
NV—Naamloze Vennootschap is the Dutch term for a public limited liability corporation. |
|
OYJ—Osakeyhtio is the Finnish equivalent of a limited company. |
|
PLC—Public Limited Company |
|
SA—Generally designates corporations in various countries, mostly those employing the civil law. |
|
SAB de CV—Sociedad Anonima Bursátil de Capital Variable. Is the Spanish equivalent to Variable Capital Company. |
|
SE—SE Regulation. A European Company which can operate on a Europe—wide basis and be governed by Community law directly applicable in all Member States. |
|
SpA—Societa’ Per Azioni is an Italian shared company. |
The accompanying notes are an integral part of these financial statements.
55
|
Alpine Global Consumer Growth Fund |
| |
Schedule of Portfolio Investments
April 30, 2011 (Unaudited)
| | | | | | | |
Shares | | Security
Description | | Value | |
| | | | | | |
| | | | | | | |
Common Stocks—91.5% | | | | |
Asia—13.8% | | | | |
China—10.6% | | | | |
| 200 | | Baidu, Inc.—ADR (a) | | $ | 29,704 | |
| 26,000 | | Daphne International Holdings,
Ltd. | | | 20,790 | |
| 16,000 | | Dongfeng Motor Group Co., Ltd. | | | 24,928 | |
| 8,000 | | Golden Eagle Retail Group, Ltd. | | | 20,808 | |
| 6,000 | | Lianhua Supermarket Holdings
Co., Ltd. | | | 24,413 | |
| 200,000 | | REXLot Holdings, Ltd. | | | 20,345 | |
| 32,000 | | Springland International
Holdings, Ltd. (a) | | | 28,348 | |
| 500 | | Tencent Holdings, Ltd. | | | 14,293 | |
| 22,000 | | Want Want China Holdings, Ltd. | | | 19,744 | |
| 34,000 | | XTEP International Holdings | | | 23,466 | |
| | | | | | | |
| | | | | | 226,839 | |
| | | | | | | |
Hong Kong—1.0% | | | | |
| 4,000 | | Li & Fung, Ltd. | | | 20,499 | |
| | | | | | | |
Indonesia—1.2% | | | | |
| 40,000 | | PT Indofood CBP Sukses
Makmur TBK (a) | | | 25,222 | |
| | | | | | | |
Philippines—1.0% | | | | |
| 80,000 | | SM Prime Holdings, Inc. | | | 22,425 | |
| | | | | | | |
| | | | | | 294,985 | |
| | | | | | | |
Australia—0.9% | | | | |
Australia—0.9% | | | | |
| 5,500 | | Myer Holdings, Ltd. | | | 19,050 | |
| | | | | | | |
Europe—27.1% | | | | |
Belgium—3.2% | | | | |
| 1,050 | | Anheuser-Busch InBev NV-ADR | | | 67,168 | |
| | | | | | | |
Denmark—1.2% | | | | |
| 575 | | Pandora A/S | | | 25,900 | |
| | | | | | | |
France—3.0% | | | | |
| 400 | | Renault SA (a) | | | 24,374 | |
| 1,500 | | SES SA | | | 39,391 | |
| | | | | | | |
| | | | | | 63,765 | |
| | | | | | | |
Germany—5.4% | | | | |
| 450 | | Adidas AG | | | 33,499 | |
| 360 | | Bayerische Motoren Werke AG | | | 33,950 | |
| 750 | | Kabel Deutschland Holding AG (a) | | | 46,873 | |
| | | | | | | |
| | | | | | 114,322 | |
| | | | | | | |
Italy—1.3% | | | | |
| 1,550 | | Yoox SpA (a) | | | 28,169 | |
| | | | | | | |
Netherlands—3.2% | | | | |
| 600 | | Heineken NV | | | 35,917 | |
| 1,000 | | Unilever NV | | | 32,911 | |
| | | | | | | |
| | | | | | 68,828 | |
| | | | | | | |
Russia—1.1% | | | | |
| 650 | | X5 Retail Group NV-GDR (a)(b)(c) | | | 22,913 | |
| | | | | | | |
Spain—0.6% | | | | |
| 150 | | Inditex SA | | | 13,450 | |
| | | | | | | |
Sweden—0.4% | | | | |
| 250 | | Hennes & Mauritz AB—Class B | | | 8,833 | |
| | | | | | | |
Switzerland—6.3% | | | | |
| 250 | | Dufry Group (a) | | | 32,688 | |
| 1,050 | | Nestle SA | | | 65,185 | |
| 75 | | The Swatch Group AG | | | 36,893 | |
| | | | | | | |
| | | | | | 134,766 | |
| | | | | | | |
| | | | | | | |
Shares | | Security
Description | | Value | |
| | | | | | |
| | | | |
Common Stocks—continued | | | | |
United Kingdom—1.4% | | | | |
| 26,000 | | Debenhams PLC (a) | | | 29,575 | |
| | | | | | | |
| | | | | | 577,689 | |
| | | | | | | |
North & South America—49.7% | | | | |
Brazil—11.6% | | | | |
| 2,200 | | BR Malls Participacoes SA | | | 23,158 | |
| 500 | | Cia Brasileira de Distribuicao
Grupo Pao de Acucar-ADR | | | 22,730 | |
| 1,500 | | Cia Hering | | | 32,466 | |
| 1,800 | | Estacio Participacoes SA | | | 26,316 | |
| 2,000 | | Hypermarcas SA (a) | | | 26,824 | |
| 1,600 | | Marisa Lojas SA | | | 30,308 | |
| 320 | | MercadoLibre, Inc. | | | 29,248 | |
| 1,500 | | Multiplus SA | | | 30,797 | |
| 900 | | Natura Cosmeticos SA | | | 25,343 | |
| | | | | | | |
| | | | | | 247,190 | |
| | | | | | | |
Mexico—2.6% | | | | |
| 9,000 | | Grupo Comercial Chedraui SA
de CV | | | 30,373 | |
| 1,000 | | Grupo Televisa SA-ADR (a) | | | 23,720 | |
| | | | | | | |
| | | | | | 54,093 | |
| | | | | | | |
United States—35.5% | | | | |
| 400 | | Abercrombie & Fitch Co.—Class A | | | 28,320 | |
| 100 | | Amazon.com, Inc. (a) | | | 19,650 | |
| 110 | | Apple, Inc. (a) | | | 38,305 | |
| 600 | | Carnival Corp. | | | 22,842 | |
| 1,001 | | CBS Corp.—Class B | | | 25,245 | |
| 550 | | Coach, Inc. | | | 32,896 | |
| 300 | | Colgate-Palmolive Co. | | | 25,305 | |
| 1,750 | | Comcast Corp.—Class A | | | 45,920 | |
| 750 | | DG FastChannel, Inc. (a) | | | 27,443 | |
| 1,600 | | Ford Motor Co. (a) | | | 24,752 | |
| 60 | | Google, Inc.—Class A (a) | | | 32,646 | |
| 825 | | Guess?, Inc. | | | 35,467 | |
| 650 | | Hasbro, Inc. | | | 30,446 | |
| 800 | | Lumber Liquidators Holdings,
Inc. (a) | | | 20,760 | |
| 500 | | McDonald’s Corp. | | | 39,155 | |
| 450 | | NIKE, Inc.—Class B | | | 37,044 | |
| 750 | | PepsiCo, Inc. | | | 51,667 | |
| 775 | | Rue21, Inc. (a) | | | 23,343 | |
| 550 | | Target Corp. | | | 27,005 | |
| 450 | | The Procter & Gamble Co. | | | 29,205 | |
| 400 | | VF Corp. | | | 40,224 | |
| 425 | | Visa, Inc.—Class A | | | 33,201 | |
| 800 | | Yum! Brands, Inc. | | | 42,912 | |
| 2,700 | | Zagg, Inc. (a) | | | 23,976 | |
| | | | | | | |
| | | | | | 757,729 | |
| | | | | | | |
| | | | | | 1,059,012 | |
| | | | | | | |
| | | Total Common Stocks
(Cost $1,841,396) | | | 1,950,736 | |
| | | | | | | |
The accompanying notes are an integral part of these financial statements.
56
|
Alpine Global Consumer Growth Fund |
| |
Schedule of Portfolio Investments—Continued
April 30, 2011 (Unaudited)
| | | | | | | |
Principal
Amount | | Security
Description | | Value | |
| | | | | | |
| | | | | | | |
Short-Term Investments—7.5% | | | | |
| 159,000 | | State Street Eurodollar Time
Deposit, 0.01% | | $ | 159,000 | |
| | | | | | | |
| | Total Short-Term Investments
(Cost $159,000) | | | 159,000 | |
| | | | | | |
| | Total Investments
(Cost $2,000,396)—99.0% | | | 2,109,736 | |
| | Other Assets in Excess of
Liabilities—1.0% | | | 20,888 | |
| | | | | | |
| | | TOTAL NET ASSETS 100.0% | | $ | 2,130,624 | |
| | | | | | | |
| | |
| | |
| | |
Percentages are stated as a percent of net assets. |
| | |
(a) | Non-income producing security. |
| | |
(b) | Restricted under Rule 144A of the Securities Act of 1933. These securities may be resold in transactions exempt from registration, normally to qualified institutional buyers. These securities have been determined to be liquid under guidelines established by the Board of Trustees. Liquid securities restricted under Rule 144A comprised 1.1% of the Fund’s net assets. |
| | |
(c) | Security fair valued in accordance with procedures approved by the Board of Trustees. These securities comprised 1.1% of the Fund’s net assets. |
| | |
AB—Aktiebolag is the Swedish equivalent of the term corporation. |
|
ADR—American Depositary Receipt |
|
AG—Aktiengesellschaft is a German term that refers to a corporation that is limited by shares, i.e., owned by shareholders. |
|
A/S—Aktieselskab is the Danish term for a stock-based corporation. |
|
GDR—Global Depositary Receipt |
|
NV—Naamloze Vennootschap is the Dutch term for a public limited liability corporation. |
|
PLC—Public Limited Company |
|
SA—Generally designates corporations in various countries, mostly those employing the civil law. |
|
SA de CV—Sociedad Anonima de Capital Variable. Is the Spanish equivalent to Variable Capital Company. |
|
SpA—Societa’ Per Azioni is an Italian shared company. |
The accompanying notes are an integral part of these financial statements.
57
Statements of Assets and Liabilities
April 30, 2011 (Unaudited)
| | | | | | | | | | | | | | | | |
| | International
Real Estate
Equity Fund | | Realty
Income &
Growth Fund | | Cyclical
Advantage
Property Fund | |
| | | | | | | |
ASSETS: | | | | | | | | | | |
Investments, at value (1) | | | | | | | | | | |
Unaffiliated issuers | | | $ | 591,853,635 | | | | $ | 121,629,247 | | | | $ | 61,991,983 | | |
Affiliated issuers | | | | 10,164,067 | | | | | — | | | | | — | | |
Cash denominated in foreign currencies (2) | | | | 2,632,265 | | | | | — | | | | | 153,494 | | |
Receivable from capital shares issued | | | | 436,469 | | | | | 363,271 | | | | | 2,461 | | |
Receivable from investment securities sold | | | | 23,896,341 | | | | | 2,074,229 | | | | | 8,063,983 | | |
Dividends and interest receivable | | | | 2,840,853 | | | | | 152,749 | | | | | 164,689 | | |
Prepaid expenses and other assets | | | | 43,277 | | | | | 20,178 | | | | | 17,142 | | |
| | | | | | | | | | | | | | | | |
Total assets | | | | 631,866,907 | | | | | 124,239,674 | | | | | 70,393,752 | | |
| | | | | | | | | | | | | | | | |
| | | | | | | | | | | | | | | | |
LIABILITIES: | | | | | | | | | | | | | | | | |
Payable for capital shares redeemed | | | | 525,209 | | | | | 138,022 | | | | | 22,090 | | |
Interest on loan payable | | | | 5,122 | | | | | 592 | | | | | 235 | | |
Payable for investment securities purchased | | | | 2,643,977 | | | | | 172,311 | | | | | 2,638,547 | | |
Unrealized depreciation on forward currency contracts | | | | 3,886,731 | | | | | — | | | | | — | | |
Accrued expenses and other liabilities: | | | | | | | | | | | | | | | | |
Investment advisory fees | | | | 460,653 | | | | | 92,565 | | | | | 52,559 | | |
Line of credit | | | | 58,633,616 | | | | | 6,193,112 | | | | | 2,740,643 | | |
Other | | | | 319,206 | | | | | 73,372 | | | | | 60,297 | | |
| | | | | | | | | | | | | | | | |
Total liabilities | | | | 66,474,514 | | | | | 6,669,974 | | | | | 5,514,371 | | |
| | | | | | | | | | | | | | | | |
Net Assets | | | $ | 565,392,393 | | | | $ | 117,569,700 | | | | $ | 64,879,381 | | |
| | | | | | | | | | | | | | | | |
| | | | | | | | | | | | | | | | |
Net assets represented by: | | | | | | | | | | | | | | | | |
Capital stock | | | $ | 1,606,946,167 | | | | $ | 95,717,676 | | | | $ | 111,422,497 | | |
Accumulated net investment income (loss) | | | | (12,064,033 | ) | | | | 121,511 | | | | | (183,449 | ) | |
Accumulated net realized losses from investments, foreign currency translation and swap contracts | | | | (1,018,647,725 | ) | | | | (16,433,153 | ) | | | | (56,356,064 | ) | |
Net unrealized appreciation (deprecation) on: | | | | | | | | | | | | | | | | |
Investments | | | | (7,041,804 | ) | | | | 38,162,612 | | | | | 9,986,385 | | |
Foreign currency translations | | | | (3,800,212 | ) | | | | 1,054 | | | | | 10,012 | | |
| | | | | | | | | | | | | | | | |
Total Net Assets | | | $ | 565,392,393 | | | | $ | 117,569,700 | | | | $ | 64,879,381 | | |
| | | | | | | | | | | | | | | | |
| | | | | | | | | | | | | | | | |
Net asset value | | | | | | | | | | | | | | | | |
Net assets | | | $ | 565,392,393 | | | | $ | 117,569,700 | | | | $ | 64,879,381 | | |
Shares of beneficial interest issued and outstanding | | | | 20,869,296 | | | | | 6,908,809 | | | | | 2,875,795 | | |
Net asset value, offering price and redemption price per share* | | | $ | 27.09 | | | | $ | 17.02 | | | | $ | 22.56 | | |
| | | | | | | | | | | | | | | | |
| | | | | | | | | | | | | | | | |
(1) Cost of investments | | | | | | | | | | | | | | | | |
Unaffiliated issuers | | | $ | 588,415,090 | | | | $ | 83,466,635 | | | | $ | 52,005,598 | | |
Affiliated issuers | | | | 20,644,416 | | | | | — | | | | | — | | |
(2) Cost of cash denominated in foreign currencies | | | $ | 2,566,643 | | | | $ | — | | | | $ | 148,125 | | |
* If applicable, redemption price per share may be reduced by a redemption fee. |
The accompanying notes are an integral part of these financial statements.
58
Statements of Assets and Liabilities—Continued
April 30, 2011 (Unaudited)
| | | | | | | | | | | | | | | | |
| | Emerging
Markets Real
Estate Fund | | Global
Infrastructure
Fund | | Global
Consumer
Growth Fund | |
| | | | | | | |
ASSETS: | | | | | | | | | | |
Investments, at value (1) | | | $ | 5,792,220 | | | | $ | 9,704,907 | | | | $ | 2,109,736 | | |
Cash | | | | 879 | | | | | 676 | | | | | 806 | | |
Cash denominated in foreign currencies (2) | | | | 3,595 | | | | | 4,698 | | | | | 1,511 | | |
Receivable from capital shares issued | | | | 20,515 | | | | | 96,753 | | | | | — | | |
Receivable from investment securities sold | | | | 11,983 | | | | | 81,077 | | | | | 23,859 | | |
Due from Adviser | | | | 3,019 | | | | | 2,878 | | | | | 1,354 | | |
Dividends and interest receivable | | | | 18,406 | | | | | 24,542 | | | | | 5,439 | | |
Prepaid expenses and other assets | | | | 10,238 | | | | | 11,046 | | | | | 4,276 | | |
| | | | | | | | | | | | | | | | |
Total assets | | | | 5,860,855 | | | | | 9,926,577 | | | | | 2,146,981 | | |
| | | | | | | | | | | | | | | | |
| | | | | | | | | | | | | | | | |
LIABILITIES: | | | | | | | | | | | | | | | | |
Payable for investment securities purchased | | | | 176,977 | | | | | 470,029 | | | | | 6,738 | | |
Accrued expenses and other liabilities: | | | | | | | | | | | | | | | | |
Investment advisory fees | | | | 4,537 | | | | | 7,123 | | | | | 1,694 | | |
Other | | | | 13,792 | | | | | 15,765 | | | | | 7,925 | | |
| | | | | | | | | | | | | | | | |
Total liabilities | | | | 195,306 | | | | | 492,917 | | | | | 16,357 | | |
| | | | | | | | | | | | | | | | |
Net Assets | | | $ | 5,665,549 | | | | $ | 9,433,660 | | | | $ | 2,130,624 | | |
| | | | | | | | | | | | | | | | |
| | | | | | | | | | | | | | | | |
Net assets represented by: | | | | | | | | | | | | | | | | |
Capital stock | | | $ | 4,703,583 | | | | $ | 8,017,314 | | | | $ | 2,019,780 | | |
Accumulated net investment income (loss) | | | | (130,783 | ) | | | | 15,196 | | | | | 3,417 | | |
Accumulated net realized gains (losses) from investments, foreign currency transactions and swap contracts | | | | 5,727 | | | | | 145,834 | | | | | (1,983 | ) | |
Net unrealized appreciation on: | | | | | | | | | | | | | | | | |
Investments | | | | 1,086,477 | | | | | 1,254,985 | | | | | 109,340 | | |
Foreign currency translations | | | | 545 | | | | | 331 | | | | | 70 | | |
| | | | | | | | | | | | | | | | |
Total Net Assets | | | $ | 5,665,549 | | | | $ | 9,433,660 | | | | $ | 2,130,624 | | |
| | | | | | | | | | | | | | | | |
| | | | | | | | | | | | | | | | |
Net asset value | | | | | | | | | | | | | | | | |
Net assets | | | $ | 5,665,549 | | | | $ | 9,433,660 | | | | $ | 2,130,624 | | |
Shares of beneficial interest issued and outstanding | | | | 313,687 | | | | | 557,142 | | | | | 202,020 | | |
Net asset value, offering price and redemption price per share* | | | $ | 18.06 | | | | $ | 16.93 | | | | $ | 10.55 | | |
| | | | | | | | | | | | | | | | |
(1) Cost of investments | | | $ | 4,705,743 | | | | $ | 8,449,922 | | | | $ | 2,000,396 | | |
(2) Cost of cash denominated in foreign currencies | | | $ | 3,590 | | | | $ | 4,703 | | | | $ | 1,511 | | |
* If applicable, redemption price per share may be reduced by a redemption fee. | | | | | | | | | | | | | | | | |
The accompanying notes are an integral part of these financial statements.
59
Statements of Operations
For the six months ended April 30, 2011 (Unaudited)
| | | | | | | | | | | | | | | | |
| | International
Real Estate
Equity Fund | | Realty
Income &
Growth Fund | | Cyclical
Advantage
Property Fund | |
| | | | | | | |
INVESTMENT INCOME: | | | | | | | | | | |
Interest income | | | $ | 3,221 | | | | $ | 1 | | | | $ | — | | |
Dividends income* | | | | 10,861,163 | | | | | 3,330,863 | | | | | 473,295 | | |
| | | | | | | | | | | | | | | | |
Total investment income | | | | 10,864,384 | | | | | 3,330,864 | | | | | 473,295 | | |
| | | | | | | | | | | | | | | | |
| | | | | | | | | | | | | | | | |
EXPENSES: | | | | | | | | | | | | | | | | |
Investment advisory fees | | | | 2,829,836 | | | | | 539,962 | | | | | 313,034 | | |
Administration fees | | | | 89,930 | | | | | 14,775 | | | | | 9,346 | | |
Fund accounting fees | | | | 45,197 | | | | | 5,286 | | | | | 6,021 | | |
Audit and tax fees | | | | 16,988 | | | | | 13,656 | | | | | 14,705 | | |
Custodian fees | | | | 36,595 | | | | | 5,491 | | | | | 3,655 | | |
Legal fees | | | | 44,459 | | | | | 9,357 | | | | | 4,362 | | |
Registration and filing fees | | | | 21,672 | | | | | 11,918 | | | | | 10,830 | | |
Printing and mailing fees | | | | 91,066 | | | | | 19,763 | | | | | 14,577 | | |
Transfer agent fees | | | | 128,954 | | | | | 24,879 | | | | | 14,659 | | |
Trustee fees | | | | 6,272 | | | | | 1,914 | | | | | 1,852 | | |
Interest expense | | | | 325,577 | | | | | 49,427 | | | | | 10,332 | | |
Other fees | | | | 35,830 | | | | | 6,015 | | | | | 3,794 | | |
| | | | | | | | | | | | | | | | |
Total expenses before expense waiver by Adviser | | | | 3,672,376 | | | | | 702,443 | | | | | 407,167 | | |
Expense waiver by Adviser (Note 5) | | | | — | | | | | — | | | | | — | | |
| | | | | | | | | | | | | | | | |
Net expenses | | | | 3,672,376 | | | | | 702,443 | | | | | 407,167 | | |
| | | | | | | | | | | | | | | | |
Net investment income | | | | 7,192,008 | | | | | 2,628,421 | | | | | 66,128 | | |
| | | | | | | | | | | | | | | | |
| | | | | | | | | | | | | | | | |
REALIZED AND UNREALIZED GAIN (LOSS) ON INVESTMENTS: | | | | | | | | | | | | | | | | |
Net realized gain (loss) on: | | | | | | | | | | | | | | | | |
Investments | | | | (19,984,958 | ) | | | | 6,952,657 | | | | | 4,009,223 | | |
Foreign currency transactions | | | | (347,721 | ) | | | | (2,332 | ) | | | | (280,161 | ) | |
Swap contracts | | | | — | | | | | (2,858 | ) | | | | — | | |
| | | | | | | | | | | | | | | | |
Net realized gain (loss) | | | | (20,332,679 | ) | | | | 6,947,467 | | | | | 3,729,062 | | |
| | | | | | | | | | | | | | | | |
Change in unrealized appreciation (depreciation) on: | | | | | | | | | | | | | | | | |
Investments | | | | 59,830,342 | | | | | 8,405,734 | | | | | 3,220,824 | | |
Foreign currency translations | | | | (3,796,700 | ) | | | | (3,965 | ) | | | | (1,709 | ) | |
| | | | | | | | | | | | | | | | |
Net change in unrealized appreciation | | | | 56,033,642 | | | | | 8,401,769 | | | | | 3,219,115 | | |
| | | | | | | | | | | | | | | | |
Net realized and unrealized gain on investments | | | | 35,700,963 | | | | | 15,349,236 | | | | | 6,948,177 | | |
| | | | | | | | | | | | | | | | |
Change in net assets resulting from operations | | | $ | 42,892,971 | | | | $ | 17,977,657 | | | | $ | 7,014,305 | | |
| | | | | | | | | | | | | | | | |
| | | | | | | | | | | | | | | | |
* Net of foreign taxes withheld | | | $ | 181,553 | | | | $ | 38,011 | | | | $ | 11,192 | | |
| | | | | | | | | | | | | | | | |
The accompanying notes are an integral part of these financial statements.
60
Statements of Operations—Continued
For the six months ended April 30, 2011 (Unaudited)
| | | | | | | | | | | | | | | | |
| | Emerging
Markets Real
Estate Fund | | Global
Infrastructure
Fund | | Global
Consumer
Growth Fund | |
| | | | | | | |
INVESTMENT INCOME: | | | | | | | | | | |
Interest income | | | $ | — | | | | $ | 26 | | | | $ | 13 | | |
Dividends income* | | | | 29,796 | | | | | 114,655 | | | | | 12,493 | | |
| | | | | | | | | | | | | | | | |
Total investment income | | | | 29,796 | | | | | 114,681 | | | | | 12,506 | | |
| | | | | | | | | | | | | | | | |
| | | | | | | | | | | | | | | | |
EXPENSES: | | | | | | | | | | | | | | | | |
Investment advisory fees | | | | 20,320 | | | | | 26,550 | | | | | 6,677 | | |
Administration fees | | | | 615 | | | | | 697 | | | | | 128 | | |
Fund accounting fees | | | | 2,240 | | | | | 1,699 | | | | | 62 | | |
Audit and tax fees | | | | 9,866 | | | | | 9,878 | | | | | 6,736 | | |
Custodian fees | | | | 250 | | | | | 346 | | | | | 76 | | |
Legal fees | | | | 165 | | | | | 896 | | | | | 48 | | |
Registration and filing fees | | | | 2,808 | | | | | 3,052 | | | | | 2,374 | | |
Printing and mailing fees | | | | 933 | | | | | 758 | | | | | 513 | | |
Transfer agent fees | | | | 2,076 | | | | | 1,843 | | | | | 346 | | |
Trustee fees | | | | 110 | | | | | 135 | | | | | 48 | | |
Interest expense | | | | 143 | | | | | 3 | | | | | — | | |
Other fees | | | | 432 | | | | | 418 | | | | | 111 | | |
| | | | | | | | | | | | | | | | |
Total expenses before expense waiver by Adviser | | | | 39,958 | | | | | 46,275 | | | | | 17,119 | | |
Expense waiver by Adviser (Note 5) | | | | (12,384 | ) | | | | (10,429 | ) | | | | (8,030 | ) | |
| | | | | | | | | | | | | | | | |
Net expenses | | | | 27,574 | | | | | 35,846 | | | | | 9,089 | | |
| | | | | | | | | | | | | | | | |
Net investment income | | | | 2,222 | | | | | 78,835 | | | | | 3,417 | | |
| | | | | | | | | | | | | | | | |
|
REALIZED AND UNREALIZED GAIN (LOSS) ON INVESTMENTS: | | | | | | | | | | | | | | | | |
Net realized gain (loss) on: | | | | | | | | | | | | | | | | |
Investments | | | | 9,310 | | | | | 151,883 | | | | | (1,640 | ) | |
Foreign currency transactions | | | | 998 | | | | | (2,610 | ) | | | | (343 | ) | |
| | | | | | | | | | | | | | | | |
Net realized gain (loss) | | | | 10,308 | | | | | 149,273 | | | | | (1,983 | ) | |
| | | | | | | | | | | | | | | | |
Change in unrealized appreciation (depreciation) on: | | | | | | | | | | | | | | | | |
Investments | | | | 135,243 | | | | | 688,491 | | | | | 109,340 | | |
Foreign currency translations | | | | (1,165 | ) | | | | 240 | | | | | 70 | | |
| | | | | | | | | | | | | | | | |
Net change in unrealized appreciation | | | | 134,078 | | | | | 688,731 | | | | | 109,410 | | |
| | | | | | | | | | | | | | | | |
Net realized and unrealized gain on investments | | | | 144,386 | | | | | 838,004 | | | | | 107,427 | | |
| | | | | | | | | | | | | | | | |
Change in net assets resulting from operations | | | $ | 146,608 | | | | $ | 916,839 | | | | $ | 110,844 | | |
| | | | | | | | | | | | | | | | |
| | | | | | | | | | | | | | | | |
* Net of foreign taxes withheld | | | $ | 1,788 | | | | $ | 6,415 | | | | $ | 1,002 | | |
| | | | | | | | | | | | | | | | |
The accompanying notes are an integral part of these financial statements.
61
Statements of Changes in Net Assets
| | | | | | | | | | | |
| | International Real Estate Equity Fund | |
| | | |
| | Six Months Ended
April 30, 2011 | | Year Ended
October 31, 2010 | |
| | | | | |
| | (Unaudited) | | | |
OPERATIONS: | | | | | | | |
Net investment income | | | $ | 7,192,008 | | | | $ | 1,926,494 | | |
Net realized loss on: | | | | | | | | | | | |
Investments | | | | (19,984,958 | ) | | | | (46,829,759 | ) | |
Foreign currency transactions | | | | (347,721 | ) | | | | (146,277 | ) | |
Change in unrealized appreciation (depreciation) on: | | | | | | | | | | | |
Investments | | | | 59,830,342 | | | | | 136,943,968 | | |
Foreign currency translations | | | | (3,796,700 | ) | | | | 141,136 | | |
| | | | | | | | | | | |
Change in net assets resulting from operations | | | | 42,892,971 | | | | | 92,035,562 | | |
| | | | | | | | | | | |
| | | | | | | | | | | |
DISTRIBUTIONS TO SHAREHOLDERS: | | | | | | | | | | | |
From net investment income | | | | (15,264,706 | ) | | | | (24,044,819 | ) | |
From net realized gain on investments | | | | — | | | | | — | | |
| | | | | | | | | | | |
Change in net assets resulting from distributions to shareholders | | | | (15,264,706 | ) | | | | (24,044,819 | ) | |
| | | | | | | | | | | |
| | | | | | | | | | | |
CAPITAL SHARE TRANSACTIONS: | | | | | | | | | | | |
Proceeds from shares sold | | | | 37,700,626 | | | | | 131,323,773 | | |
Dividends reinvested | | | | 13,263,510 | | | | | 21,418,105 | | |
Redemption fees | | | | 11,365 | | | | | 107,464 | | |
Cost of shares redeemed | | | | (121,699,818 | ) | | | | (343,195,210 | ) | |
| | | | | | | | | | | |
Change in net assets from capital share transactions | | | | (70,724,317 | ) | | | | (190,345,868 | ) | |
| | | | | | | | | | | |
Total change in net assets | | | | (43,096,052 | ) | | | | (122,355,125 | ) | |
| | | | | | | | | | | |
| | | | | | | | | | | |
NET ASSETS: | | | | | | | | | | | |
Beginning of year | | | | 608,488,445 | | | | | 730,843,570 | | |
| | | | | | | | | | | |
End of period* | | | $ | 565,392,393 | | | | $ | 608,488,445 | | |
| | | | | | | | | | | |
**Including accumulated undistributed net investment loss of: | | | $ | (12,064,033 | ) | | | $ | (3,991,335 | ) | |
| | | | | | | | | | | |
The accompanying notes are an integral part of these financial statements.
62
Statements of Changes in Net Assets—Continued
| | | | | | | | | | | |
| | Realty Income & Growth Fund | |
| | | |
| | Six Months Ended
April 30, 2011 | | Year Ended
October 31, 2010 | |
| | | | | |
| | (Unaudited) | | | |
OPERATIONS: | | | | | | | |
Net investment income | | | $ | 2,628,421 | | | | $ | 4,284,144 | | |
Net realized gain (loss) on: | | | | | | | | | | | |
Investments | | | | 6,952,657 | | | | | 5,229,459 | | |
Foreign currency transactions | | | | (2,332 | ) | | | | 121,762 | | |
Swap contracts | | | | (2,858 | ) | | | | 32,576 | | |
Change in unrealized appreciation (depreciation) on: | | | | | | | | | | | |
Investments | | | | 8,405,734 | | | | | 25,633,205 | | |
Foreign currency translations | | | | (3,965 | ) | | | | 4,179 | | |
| | | | | | | | | | | |
Change in net assets resulting from operations | | | | 17,977,657 | | | | | 35,305,325 | | |
| | | | | | | | | | | |
| | | | | | | | | | | |
DISTRIBUTIONS TO SHAREHOLDERS: | | | | | | | | | | | |
From net investment income | | | | (2,506,910 | ) | | | | (4,981,461 | ) | |
From net realized gain on investments | | | | — | | | | | (517,638 | ) | |
| | | | | | | | | | | |
Change in net assets resulting from distributions to shareholders | | | | (2,506,910 | ) | | | | (5,499,099 | ) | |
| | | | | | | | | | | |
| | | | | | | | | | | |
CAPITAL SHARE TRANSACTIONS: | | | | | | | | | | | |
Proceeds from shares sold | | | | 6,248,623 | | | | | 16,374,720 | | |
Dividends reinvested | | | | 2,289,890 | | | | | 5,050,577 | | |
Redemption fees | | | | 3,629 | | | | | 13,275 | | |
Cost of shares redeemed | | | | (15,384,221 | ) | | | | (27,099,016 | ) | |
| | | | | | | | | | | |
Change in net assets from capital share transactions | | | | (6,842,079 | ) | | | | (5,660,444 | ) | |
| | | | | | | | | | | |
Total change in net assets | | | | 8,628,668 | | | | | 24,145,782 | | |
| | | | | | | | | | | |
| | | | | | | | | | | |
NET ASSETS: | | | | | | | | | | | |
Beginning of year | | | | 108,941,032 | | | | | 84,795,250 | | |
| | | | | | | | | | | |
End of period* | | | $ | 117,569,700 | | | | $ | 108,941,032 | | |
| | | | | | | | | | | |
* Including accumulated net investment income of: | | | $ | 121,511 | | | | $ | — | | |
| | | | | | | | | | | |
The accompanying notes are an integral part of these financial statements.
63
Statements of Changes in Net Assets—Continued
| | | | | | | | | | | | |
| | Cyclical Advantage Property Fund | |
| | | |
| | Six Months Ended
April 30, 2011 | | Year Ended
October 31, 2010 | |
| | | | | |
| | (Unaudited) | | | |
OPERATIONS: | | | | | | | | | | | |
Net investment income | | | $ | 66,128 | | | | $ | 300,096 | | |
Net realized gain (loss) on: | | | | | | | | | | | |
Investments | | | | 4,009,223 | | | | | (7,520,620 | ) | |
Foreign currency transactions | | | | (280,161 | ) | | | | 32,852 | | |
Change in unrealized appreciation (depreciation) on: | | | | | | | | | | | |
Investments | | | | 3,220,824 | | | | | 19,506,176 | | |
Foreign currency translations | | | | (1,709 | ) | | | | 9,807 | | |
| | | | | | | | | | | |
Change in net assets resulting from operations | | | | 7,014,305 | | | | | 12,328,311 | | |
| | | | | | | | | | | |
| | | | | | | | | | | |
DISTRIBUTIONS TO SHAREHOLDERS: | | | | | | | | | | | |
From net investment income | | | | (265,892 | ) | | | | (785,829 | ) | |
From net realized gain on investments | | | | — | | | | | — | | |
| | | | | | | | | | | |
Change in net assets resulting from distributions to shareholders | | | | (265,892 | ) | | | | (785,829 | ) | |
| | | | | | | | | | | |
| | | | | | | | | | | |
CAPITAL SHARE TRANSACTIONS: | | | | | | | | | | | |
Proceeds from shares sold | | | | 978,783 | | | | | 1,791,670 | | |
Dividends reinvested | | | | 256,450 | | | | | 752,822 | | |
Redemption fees | | | | 94 | | | | | 1,905 | | |
Cost of shares redeemed | | | | (5,148,473 | ) | | | | (7,109,123 | ) | |
| | | | | | | | | | | |
Change in net assets from capital share transactions | | | | (3,913,146 | ) | | | | (4,562,726 | ) | |
| | | | | | | | | | | |
Total change in net assets | | | | 2,835,267 | | | | | 6,979,756 | | |
| | | | | | | | | | | |
| | | | | | | | | | | |
NET ASSETS: | | | | | | | | | | | |
Beginning of year | | | | 62,044,114 | | | | | 55,064,358 | | |
| | | | | | | | | | | |
End of period* | | | $ | 64,879,381 | | | | $ | 62,044,114 | | |
| | | | | | | | | | | |
* | Including accumulated undistributed net investment income (loss) of: | | | $ | (183,449 | ) | | | $ | 16,315 | | |
| | | | | | | | | | | | |
The accompanying notes are an integral part of these financial statements.
64
Statements of Changes in Net Assets—Continued
| | | | | | | | | | | | |
| | Emerging Markets Real Estate Fund | |
| | | |
| | Six Months Ended
April 30, 2011 | | Period Ended
October 31, 2010 | |
| | | | | |
| | (Unaudited) | | | |
OPERATIONS: | | | | | | | | | | | |
Net investment income | | | $ | 2,222 | | | | $ | 3,179 | | |
Net realized gain (loss) on: | | | | | | | | | | | |
Investments | | | | 9,310 | | | | | 261,099 | | |
Foreign currency transactions | | | | 998 | | | | | (1,819 | ) | |
Change in unrealized appreciation (depreciation) on: | | | | | | | | | | | |
Investments | | | | 135,243 | | | | | 268,483 | | |
Foreign currency translations | | | | (1,165 | ) | | | | 2,079 | | |
| | | | | | | | | | | |
Change in net assets resulting from operations | | | | 146,608 | | | | | 533,021 | | |
| | | | | | | | | | | |
| | | | | | | | | | | |
DISTRIBUTIONS TO SHAREHOLDERS: | | | | | | | | | | | |
From net investment income | | | | (15,201 | ) | | | | (109,472 | ) | |
From net realized gain on investments | | | | (250,000 | ) | | | | (83,115 | ) | |
| | | | | | | | | | | |
Change in net assets resulting from distributions to shareholders | | | | (265,201 | ) | | | | (192,587 | ) | |
| | | | | | | | | | | |
| | | | | | | | | | | |
CAPITAL SHARE TRANSACTIONS: | | | | | | | | | | | |
Proceeds from shares sold | | | | 2,866,707 | | | | | 1,065,991 | | |
Dividends reinvested | | | | 256,293 | | | | | 185,773 | | |
Redemption fees | | | | 344 | | | | | 791 | | |
Cost of shares redeemed | | | | (607,718 | ) | | | | (371,652 | ) | |
| | | | | | | | | | | |
Change in net assets from capital share transactions | | | | 2,515,626 | | | | | 880,903 | | |
| | | | | | | | | | | |
Total change in net assets | | | | 2,397,033 | | | | | 1,221,337 | | |
| | | | | | | | | | | |
| | | | | | | | | | | |
NET ASSETS: | | | | | | | | | | | |
Beginning of year | | | | 3,268,516 | | | | | 2,047,179 | | |
| | | | | | | | | | | |
End of period* | | | $ | 5,665,549 | | | | $ | 3,268,516 | | |
| | | | | | | | | | | |
* | Including accumulated undistributed net investment loss of: | | | $ | (130,783 | ) | | | $ | (117,804 | ) | |
| | | | | | | | | | | | |
The accompanying notes are an integral part of these financial statements.
65
Statements of Changes in Net Assets—Continued
| | | | | | | | | | | | |
| | Global Infrastructure Fund | |
| | | |
| | Six Months Ended
April 30, 2011 | | Period Ended
October 31, 2010 | |
| | | | | |
| | (Unaudited) | | | |
OPERATIONS: | | | | | | | | | | | |
Net investment income | | | $ | 78,835 | | | | $ | 62,860 | | |
Net realized gain (loss) on: | | | | | | | | | | | |
Investments | | | | 151,883 | | | | | 76,631 | | |
Foreign currency transactions | | | | (2,610 | ) | | | | 713 | | |
Change in unrealized appreciation (depreciation) on: | | | | | | | | | | | |
Investments | | | | 688,491 | | | | | 342,495 | | |
Foreign currency translations | | | | 240 | | | | | (133 | ) | |
| | | | | | | | | | | |
Change in net assets resulting from operations | | | | 916,839 | | | | | 482,566 | | |
| | | | | | | | | | | |
| | | | | | | | | | | |
DISTRIBUTIONS TO SHAREHOLDERS: | | | | | | | | | | | |
From net investment income | | | | (122,317 | ) | | | | (24,399 | ) | |
From net realized gain on investments | | | | (75,954 | ) | | | | (124,645 | ) | |
| | | | | | | | | | | |
Change in net assets resulting from distributions to shareholders | | | | (198,271 | ) | | | | (149,044 | ) | |
| | | | | | | | | | | |
| | | | | | | | | | | |
CAPITAL SHARE TRANSACTIONS: | | | | | | | | | | | |
Proceeds from shares sold | | | | 6,406,233 | | | | | 356,108 | | |
Dividends reinvested | | | | 196,478 | | | | | 144,027 | | |
Redemption fees | | | | 422 | | | | | — | | |
Cost of shares redeemed | | | | (133,017 | ) | | | | (10,806 | ) | |
| | | | | | | | | | | |
Change in net assets from capital share transactions | | | | 6,470,116 | | | | | 489,329 | | |
| | | | | | | | | | | |
Total change in net assets | | | | 7,188,684 | | | | | 822,851 | | |
| | | | | | | | | | | |
| | | | | | | | | | | |
NET ASSETS: | | | | | | | | | | | |
Beginning of year | | | | 2,244,976 | | | | | 1,422,125 | | |
| | | | | | | | | | | |
End of period* | | | $ | 9,433,660 | | | | $ | 2,244,976 | | |
| | | | | | | | | | | |
* | Including accumulated net investment income of: | | | $ | 15,196 | | | | $ | 58,678 | | |
| | | | | | | | | | | | |
The accompanying notes are an integral part of these financial statements.
66
Statements of Changes in Net Assets—Continued
| | | | | | | |
| | Global Consumer
Growth Fund | |
| | | |
| | Period Ended
April 30, 2011 (1) | |
| | | |
| | (Unaudited) | |
OPERATIONS: | | | | | | |
Net investment income | | | $ | 3,417 | | |
Net realized loss on: | | | | | | |
Investments | | | | (1,640 | ) | |
Foreign currency transactions | | | | (343 | ) | |
Change in unrealized appreciation on: | | | | | | |
Investments | | | | 109,340 | | |
Foreign currency translations | | | | 70 | | |
| | | | | | |
Change in net assets resulting from operations | | | | 110,844 | | |
| | | | | | |
| | | | | | |
DISTRIBUTIONS TO SHAREHOLDERS: | | | | | | |
From net realized gain on investments | | | | — | | |
From net realized gain on investments | | | | — | | |
| | | | | | |
Change in net assets resulting from distributions to shareholders | | | | — | | |
| | | | | | |
| | | | | | |
CAPITAL SHARE TRANSACTIONS: | | | | | | |
Proceeds from shares sold | | | | 2,019,780 | | |
Dividends reinvested | | | | — | | |
Redemption fees | | | | — | | |
Cost of shares redeemed | | | | — | | |
| | | | | | |
Change in net assets from capital share transactions | | | | 2,019,780 | | |
| | | | | | |
Total change in net assets | | | | 2,130,624 | | |
| | | | | | |
| | | | | | |
NET ASSETS: | | | | | | |
Beginning of period | | | | — | | |
| | | | | | |
End of period* | | | $ | 2,130,624 | | |
| | | | | | |
* | Including accumulated net investment income of: | | | $ | 3,417 | | |
| | | | | | | |
| |
(1) | Fund commenced operations on December 29, 2010. |
The accompanying notes are an integral part of these financial statements.
67
Financial Highlights
(For a share outstanding throughout each period)
| | | | | | | | | | | | | | | | | | | | | |
| | | |
| | International Real Estate Equity Fund | |
| | | |
| | Six Months
Ended
April 30,
2011 | | Year Ended
October 31, | |
| | | | |
| | | 2010 | | 2009 | | 2008 | | 2007 | | 2006 | |
| | | | | | | | | | | | | |
| | (Unaudited) | | | | | | | | | | | | | | | | |
Per Share Data: | | | | | | | | | | | | | | | | | | | | | |
Net asset value per share, beginning of period | | | $ | 25.75 | | | $ | 22.59 | | $ | 12.26 | | $ | 47.58 | | $ | 37.56 | | $ | 28.89 | |
| | | | | | | | | | | | | | | | | | | | | |
Income from investment operations: | | | | | | | | | | | | | | | | | | | | | |
Net investment income (loss) | | | | 0.27 | | | | (0.08 | ) | | 0.20 | (a) | | 0.35 | (a) | | 0.63 | | | 0.50 | |
Net realized and unrealized gains
(losses) on investments | | | | 1.75 | | | | 4.03 | | | 10.12 | | | (33.05 | ) | | 10.78 | | | 8.90 | |
| | | | | | | | | | | | | | | | | | | | | |
Total from investment operations | | | | 2.02 | | | | 3.95 | | | 10.32 | | | (32.70 | ) | | 11.41 | | | 9.40 | |
| | | | | | | | | | | | | | | | | | | | | |
Redemption fees | | | | 0.00 | (b) | | | 0.00 | (b) | | 0.01 | | | 0.01 | | | 0.02 | | | 0.01 | |
Less distributions: | | | | | | | | | | | | | | | | | | | | | |
From net investment income | | | | (0.68 | ) | | | (0.79 | ) | | — | | | (0.45 | ) | | (0.63 | ) | | (0.39 | ) |
From net realized gains on investments | | | | — | | | | — | | | — | | | (2.10 | ) | | (0.78 | ) | | (0.35 | ) |
From tax return of capital | | | | — | | | | — | | | — | | | (0.08 | ) | | — | | | — | |
| | | | | | | | | | | | | | | | | | | | | |
Total distributions | | | | (0.68 | ) | | | (0.79 | ) | | — | | | (2.63 | ) | | (1.41 | ) | | (0.74 | ) |
| | | | | | | | | | | | | | | | | | | | | |
Net asset value per share, end of period | | | $ | 27.09 | | | $ | 25.75 | | $ | 22.59 | | $ | 12.26 | | $ | 47.58 | | $ | 37.56 | |
| | | | | | | | | | | | | | | | | | | | | |
Total return | | | | 7.98 | %(c) | | | 18.07 | % | | 84.26 | % | | –72.46 | % | | 31.16 | % | | 33.19 | % |
Ratios/Supplemental Data: | | | | | | | | | | | | | | | | | | | | | |
Net Assets at end of period (000) | | | $ | 565,392 | | | $ | 608,488 | | $ | 730,844 | | $ | 583,953 | | $ | 2,554,134 | | $ | 771,999 | |
Ratio of total expenses to average net assets | | | | 1.30 | %(d) | | | 1.28 | % | | 1.26 | % | | 1.22 | % | | 1.14 | % | | 1.17 | % |
Ratio of interest expense to average net assets | | | | 0.12 | %(d) | | | 0.08 | % | | 0.07 | % | | 0.06 | % | | 0.00 | % | | 0.02 | % |
Ratio of expenses to average net assets
excluding interest expense | | | | 1.18 | %(d) | | | 1.20 | % | | 1.19 | % | | 1.16 | % | | 1.14 | % | | 1.15 | % |
Ratio of net investment income to average net assets | | | | 2.54 | %(d) | | | 0.32 | % | | 1.13 | % | | 1.29 | % | | 1.08 | % | | 1.16 | % |
Portfolio turnover | | | | 12 | % | | | 34 | % | | 51 | % | | 42 | % | | 31 | % | | 30 | % |
| | |
| | |
(a) | Net investment income per share is calculated using ending balances after consideration of adjustments for permanent book and tax differences. |
| |
(b) | The amount is less than $0.005 per share. |
| |
(c) | Not annualized. |
| |
(d) | Annualized. |
The accompanying notes are an integral part of these financial statements.
68
Financial Highlights—Continued
(For a share outstanding throughout each period)
| | | | | | | | | | | | | | | | | | | | | |
| | | |
| | Realty Income & Growth Fund | |
| | | |
| | Six Months
Ended
April 30,
2011 | | Year Ended
October 31, | |
| | | | |
| | | 2010 | | 2009 | | 2008 | | 2007 | | 2006 | |
| | | | | | | | | | | | | |
| | (Unaudited) | | | | | | | | | | | | | | | | |
Per Share Data: | | | | | | | | | | | | | | | | | | | | | |
Net asset value per share, beginning of period | | | $ | 14.79 | | | $ | 10.89 | | $ | 9.95 | | $ | 25.12 | | $ | 27.75 | | $ | 21.92 | |
| | | | | | | | | | | | | | | | | | | | | |
Income from investment operations: | | | | | | | | | | | | | | | | | | | | | |
Net investment income (loss) | | | | 0.38 | | | | 0.56 | | | 0.79 | (a) | | 0.99 | (a) | | 0.91 | | | 0.65 | |
Net realized and unrealized gains
(losses) on investments | | | | 2.21 | | | | 4.06 | | | 0.94 | | | (13.46 | ) | | (1.54 | ) | | 6.35 | |
| | | | | | | | | | | | | | | | | | | | | |
Total from investment operations | | | | 2.59 | | | | 4.62 | | | 1.73 | | | (12.47 | ) | | (0.63 | ) | | 7.00 | |
| | | | | | | | | | | | | | | | | | | | | |
Redemption fees | | | | 0.00 | (b) | | | 0.00 | (b) | | 0.00 | (b) | | 0.00 | (b) | | 0.00 | (b) | | 0.00 | (b) |
Less distributions: | | | | | | | | | | | | | | | | | | | | | |
From net investment income | | | | (0.36 | ) | | | (0.65 | ) | | (0.62 | ) | | (0.99 | ) | | (0.95 | ) | | (0.87 | ) |
From net realized gains on investments | | | | — | | | | (0.07 | ) | | | | | (1.71 | ) | | (1.05 | ) | | (0.30 | ) |
From tax return of capital | | | | — | | | | — | | | (0.17 | ) | | — | | | — | | | — | |
| | | | | | | | | | | | | | | | | | | | | |
Total distributions | | | | (0.36 | ) | | | (0.72 | ) | | (0.79 | ) | | (2.70 | ) | | (2.00 | ) | | (1.17 | ) |
| | | | | | | | | | | | | | | | | | | | | |
Net asset value per share, end of period | | | $ | 17.02 | | | $ | 14.79 | | $ | 10.89 | | $ | 9.95 | | $ | 25.12 | | $ | 27.75 | |
| | | | | | | | | | | | | | | | | | | | | |
Total return | | | | 17.77 | %(c) | | | 43.51 | % | | 20.23 | % | | –54.62 | % | | –2.53 | % | | 32.91 | % |
Ratios/Supplemental Data: | | | | | | | | | | | | | | | | | | | | | |
Net Assets at end of period (000) | | | $ | 117,570 | | | $ | 108,941 | | $ | 84,795 | | $ | 95,270 | | $ | 532,443 | | $ | 850,075 | |
Ratio of total expenses to average net assets: | | | | | | | | | | | | | | | | | | | | | |
Before waivers | | | | 1.30 | %(d) | | | 1.34 | % | | 1.39 | % | | 1.56 | % | | 1.29 | % | | 1.17 | % |
After waivers | | | | 1.30 | %(d) | | | 1.34 | % | | 1.39 | % | | 1.43 | % | | 1.29 | % | | 1.17 | % |
Ratio of interest expense to average net assets | | | | 0.09 | %(d) | | | 0.10 | % | | 0.12 | % | | 0.40 | % | | 0.14 | % | | 0.01 | % |
Ratio of expenses to average net assets excluding interest expense: | | | | | | | | | | | | | | | | | | | | | |
Before waivers | | | | 1.21 | %(d) | | | 1.24 | % | | 1.27 | % | | 1.16 | % | | 1.15 | % | | 1.16 | % |
After waivers | | | | 1.21 | %(d) | | | 1.24 | % | | 1.27 | % | | 1.03 | % | | 1.15 | % | | 1.16 | % |
Ratio of net investment income to average net assets | | | | 4.87 | %(d) | | | 4.24 | % | | 8.57 | % | | 5.55 | % | | 3.34 | % | | 2.67 | % |
Portfolio turnover | | | | 30 | % | | | 70 | % | | 111 | % | | 23 | % | | 33 | % | | 33 | % |
| | |
| | |
(a) | Net investment income per share is calculated using ending balances after consideration of adjustments for permanent book and tax differences. |
| |
(b) | The amount is less than $0.005 per share. |
| |
(c) | Not annualized. |
| |
(d) | Annualized. |
The accompanying notes are an integral part of these financial statements.
69
Financial Highlights—Continued
(For a share outstanding throughout each period)
| | | | | | | | | | | | | | | | | | | | | |
| | | |
| | Cyclical Advantage Property Fund | |
| | | |
| | Six Months
Ended
April 30,
2011 | | Year Ended
October 31, | |
| | | | |
| | | 2010 | | 2009 | | 2008 | | 2007 | | 2006 | |
| | | | | | | | | | | | | |
| | (Unaudited) | | | | | | | | | | | | | | | | |
Per Share Data: | | | | | | | | | | | | | | | | | | | | | |
Net asset value per share, beginning of period | | | $ | 20.27 | | | $ | 16.65 | | $ | 13.86 | | $ | 34.97 | | $ | 38.27 | | $ | 39.45 | |
| | | | | | | | | | | | | | | | | | | | | |
Income from investment operations: | | | | | | | | | | | | | | | | | | | | | |
Net investment income (loss) | | | | 0.02 | | | | 0.09 | | | 0.26 | (a) | | 0.53 | (a) | | 0.15 | | | (0.20 | ) |
Net realized and unrealized gains
(losses) on investments | | | | 2.36 | | | | 3.77 | | | 2.65 | | | (21.11 | ) | | (0.28 | ) | | 0.62 | |
| | | | | | | | | | | | | | | | | | | | | |
Total from investment operations | | | | 2.38 | | | | 3.86 | | | 2.91 | | | (20.58 | ) | | (0.13 | ) | | 0.42 | |
| | | | | | | | | | | | | | | | | | | | | |
Redemption fees | | | | 0.00 | (b) | | | 0.00 | (b) | | 0.00 | (b) | | 0.00 | (b) | | 0.02 | | | 0.00 | (b) |
Less distributions: | | | | | | | | | | | | | | | | | | | | | |
From net investment income | | | | (0.09 | ) | | | (0.24 | ) | | (0.12 | ) | | (0.43 | ) | | (0.05 | ) | | (0.03 | ) |
From net realized gains on investments | | | | — | | | | — | | | — | | | — | | | (3.11 | ) | | (1.57 | ) |
From tax return of capital | | | | — | | | | — | | | — | | | (0.10 | ) | | (0.03 | ) | | — | |
| | | | | | | | | | | | | | | | | | | | | |
Total distributions | | | | (0.09 | ) | | | (0.24 | ) | | (0.12 | ) | | (0.53 | ) | | (3.19 | ) | | (1.60 | ) |
| | | | | | | | | | | | | | | | | | | | | |
Net asset value per share, end of period | | | $ | 22.56 | | | $ | 20.27 | | $ | 16.65 | | $ | 13.86 | | $ | 34.97 | | $ | 38.27 | |
| | | | | | | | | | | | | | | | | | | | | |
Total return | | | | 11.71 | %(c) | | | 23.36 | % | | 21.14 | % | | –59.54 | % | | –0.88 | % | | 0.74 | % |
Ratios/Supplemental Data: | | | | | | | | | | | | | | | | | | | | | |
Net Assets at end of period (000) | | | $ | 64,879 | | | $ | 62,044 | | $ | 55,064 | | $ | 47,405 | | $ | 148,631 | | $ | 269,414 | |
Ratio of total expenses to average net assets | | | | 1.30 | %(d) | | | 1.32 | % | | 1.45 | % | | 1.70 | % | | 1.58 | % | | 2.01 | % |
Ratio of interest expense to average net assets | | | | 0.03 | %(d) | | | 0.02 | % | | 0.11 | % | | 0.50 | % | | 0.39 | % | | 0.82 | % |
Ratio of expenses to average net assets excluding interest expense | | | | 1.27 | %(d) | | | 1.30 | % | | 1.34 | % | | 1.20 | % | | 1.19 | % | | 1.19 | % |
Ratio of net investment income to average net assets | | | | 0.21 | %(d) | | | 0.51 | % | | 2.28 | % | | 2.68 | % | | 0.42 | % | | (0.39 | )% |
Portfolio turnover | | | | 40 | % | | | 90 | % | | 135 | % | | 68 | % | | 49 | % | | 19 | % |
| | |
| | |
(a) | Net investment income per share is calculated using ending balances after consideration of adjustments for permanent book and tax differences. |
| |
(b) | The amount is less than $0.005 per share. |
| |
(c) | Not annualized. |
| |
(d) | Annualized. |
The accompanying notes are an integral part of these financial statements.
70
Financial Highlights—Continued
(For a share outstanding throughout each period)
| | | | | | | | | | | | | | | | |
| | | |
| | Emerging Markets Real Estate Fund | |
| | | |
| | Six Months
Ended
April 30, 2011 | | Year Ended
October 31,
2010 | | Period Ended
October 31,
2009 (a) | |
| | | | | | | |
| | (Unaudited) | | | | | | | |
Per Share Data: | | | | | | | | | | | | | | | | |
Net asset value per share, beginning of period | | | $ | 19.20 | | | | $ | 17.03 | | | | $ | 10.00 | | |
| | | | | | | | | | | | | | | | |
Income from investment operations: | | | | | | | | | | | | | | | | |
Net investment income (loss) | | | | 0.35 | | | | | 0.27 | | | | | (0.08 | )(b) | |
Net realized and unrealized gains (losses) on investments | | | | (0.05 | ) | | | | 3.43 | | | | | 7.10 | | |
| | | | | | | | | | | | | | | | |
Total from investment operations | | | | 0.30 | | | | | 3.70 | | | | | 7.02 | | |
| | | | | | | | | | | | | | | | |
Redemption fees | | | | 0.00 | (c) | | | | 0.00 | (c) | | | | 0.01 | | |
Less distributions: | | | | | | | | | | | | | | | | |
From net investment income | | | | (0.08 | ) | | | | (0.87 | ) | | | | — | | |
From net realized gains on investments | | | | (1.36 | ) | | | | (0.66 | ) | | | | — | | |
| | | | | | | | | | | | | | | | |
Total distributions | | | | (1.44 | ) | | | | (1.53 | ) | | | | — | | |
| | | | | | | | | | | | | | | | |
Net asset value per share, end of period | | | $ | 18.06 | | | | $ | 19.20 | | | | $ | 17.03 | | |
| | | | | | | | | | | | | | | | |
Total return | | | | 1.42 | %(d) | | | | 23.53 | % | | | | 70.30 | %(d) | |
Ratios/Supplemental Data: | | | | | | | | | | | | | | | | |
Net Assets at end of period (000) | | | $ | 5,666 | | | | $ | 3,269 | | | | $ | 2,047 | | |
Ratio of total expenses to average net assets: | | | | | | | | | | | | | | | | |
Before waivers | | | | 1.97 | %(e) | | | | 2.68 | % | | | | 4.36 | %(e) | |
After waivers | | | | 1.36 | %(e) | | | | 1.35 | % | | | | 1.35 | %(e) | |
Ratio of interest expense to average net assets | | | | 0.01 | %(e) | | | | — | % | | | | — | % | |
Ratio of expenses to average net assets excluding interest expense: | | | | | | | | | | | | | | | | |
Before waivers | | | | 1.96 | %(e) | | | | — | % | | | | — | % | |
After waivers | | | | 1.35 | %(e) | | | | — | % | | | | — | % | |
Ratio of net investment income to average net assets | | | | 0.11 | %(e) | | | | 0.13 | % | | | | (0.76 | )%(e) | |
Portfolio turnover | | | | 10 | % | | | | 77 | % | | | | 35 | %(d) | |
| | |
| | |
(a) | For the period from November 3, 2008 (inception of fund) to October 31, 2009. |
| |
(b) | Net investment income per share is calculated using ending balances after consideration of adjustments for permanent book and tax differences. |
| |
(c) | The amount is less than $0.005 per share. |
| |
(d) | Not annualized. |
| |
(e) | Annualized. |
The accompanying notes are an integral part of these financial statements.
71
Financial Highlights—Continued
(For a share outstanding throughout each period)
| | | | | | | | | | | | | | | | |
| | Global Infrastructure Fund | |
| | Six Months
Ended
April 30, 2011 | | Year Ended
October 31,
2010 | | Period Ended
October 31,
2009 (a) | |
| | | | | | | |
| | (Unaudited) | | | | | | | |
Per Share Data: | | | | | | | | | | | | | | | | |
Net asset value per share, beginning of period | | | $ | 15.98 | | | | $ | 13.38 | | | | $ | 10.00 | | |
| | | | | | | | | | | | | | | | |
Income from investment operations: | | | | | | | | | | | | | | | | |
Net investment income (loss) | | | | 0.29 | | | | | 0.43 | | | | | 0.19 | (b) | |
Net realized and unrealized gains (losses) on investments | | | | 1.89 | | | | | 3.40 | | | | | 3.19 | | |
| | | | | | | | | | | | | | | | |
Total from investment operations | | | | 2.18 | | | | | 3.83 | | | | | 3.38 | | |
| | | | | | | | | | | | | | | | |
Redemption fees | | | | 0.00 | (c) | | | | — | | | | | 0.00 | (c) | |
Less distributions: | | | | | | | | | | | | | | | | |
From net investment income | | | | (0.68 | ) | | | | (0.20 | ) | | | | — | | |
From net realized gains on investments | | | | (0.55 | ) | | | | (1.03 | ) | | | | — | | |
| | | | | | | | | | | | | | | | |
Total distributions | | | | (1.23 | ) | | | | (1.23 | ) | | | | — | | |
| | | | | | | | | | | | | | | | |
Net asset value per share, end of period | | | $ | 16.93 | | | | $ | 15.98 | | | | $ | 13.38 | | |
| | | | | | | | | | | | | | | | |
Total return | | | | 14.50 | %(d) | | | | 30.23 | % | | | | 33.80 | %(d) | |
Ratios/Supplemental Data: | | | | | | | | | | | | | | | | |
Net Assets at end of period (000) | | | $ | 9,434 | | | | $ | 2,245 | | | | $ | 1,422 | | |
Ratio of total expenses to average net assets: | | | | | | | | | | | | | | | | |
Before waivers | | | | 1.74 | %(e) | | | | 3.03 | % | | | | 4.42 | %(e) | |
After waivers | | | | 1.35 | %(e) | | | | 1.35 | % | | | | 1.35 | %(e) | |
Ratio of interest expense to average net assets | | | | 0.00 | %(c)(e) | | | | 0.00 | %(c) | | | | 0.00 | %(c)(e) | |
Ratio of expenses to average net assets excluding interest expense: | | | | | | | | | | | | | | | | |
Before waivers | | | | 1.74 | %(e) | | | | 3.03 | % | | | | 4.42 | %(e) | |
After waivers | | | | 1.35 | %(e) | | | | 1.35 | % | | | | 1.35 | %(e) | |
Ratio of net investment income to average net assets | | | | 2.97 | %(e) | | | | 3.40 | % | | | | 1.76 | %(e) | |
Portfolio turnover | | | | 142 | % | | | | 402 | % | | | | 258 | %(d) | |
| | |
| | |
(a) | For the period from November 3, 2008 (inception of fund) to October 31, 2009. |
| |
(b) | Net investment income per share is calculated using ending balances after consideration of adjustments for permanent book and tax differences. |
| |
(c) | The amount is less than $0.005 per share or 0.005%. |
| |
(d) | Not annualized. |
| |
(e) | Annualized. |
The accompanying notes are an integral part of these financial statements.
72
Financial Highlights—Continued
(For a share outstanding throughout each period)
| | | | | | |
| | Global
Consumer
Growth Fund | |
| | | |
| | Period Ended
December 29, 2010-
April 30, 2011 (a) | |
| | | |
| | (Unaudited) | |
Per Share Data: | | | | | | |
Net asset value per share, beginning of period | | | $ | 10.00 | | |
| | | | | | |
Income from investment operations: | | | | | | |
Net investment income (loss) | | | | 0.02 | | |
Net realized and unrealized gains (losses) on investments | | | | 0.53 | | |
| | | | | | |
Total from investment operations | | | | 0.55 | | |
| | | | | | |
Redemption fees | | | | 0.00 | (c) | |
Less distributions: | | | | | | |
From net investment income | | | | — | | |
From net realized gains on investments | | | | — | | |
| | | | | | |
Total distributions | | | | — | | |
| | | | | | |
Net asset value per share, end of period | | | $ | 10.55 | | |
| | | | | | |
Total return | | | | 5.50 | %(d) | |
Ratios/Supplemental Data: | | | | | | |
Net Assets at end of period (000) | | | $ | 2,131 | | |
Ratio of total expenses to average net assets: | | | | | | |
Before waivers | | | | 2.54 | %(e) | |
After waivers | | | | 1.35 | %(e) | |
Ratio of net investment income to average net assets | | | | 0.51 | %(e) | |
Portfolio turnover | | | | 4 | %(d) | |
| | |
| | |
(a) | Fund commenced operations on December 29, 2010. |
| |
(b) | Net investment income per share is calculated using ending balances after consideration of adjustments for permanent book and tax differences. |
| |
(c) | The amount is less than $0.005 per share. |
| |
(d) | Not annualized. |
| |
(e) | Annualized. |
The accompanying notes are an integral part of these financial statements.
73
Notes to Financial Statements
April 30, 2011 (Unaudited)
| |
1. | Organization: |
| |
| Alpine Equity Trust (the “Equity Trust”) was organized in 1988 as a Massachusetts Business Trust, and is registered under the Investment Company Act of 1940, as amended (the “1940 Act”), as an open-ended management investment company. The Alpine International Real Estate Equity Fund, Alpine Realty Income & Growth Fund, Alpine Cyclical Advantage Property Fund, Alpine Emerging Markets Real Estate Fund, Alpine Global Infrastructure Fund, and Alpine Global Consumer Growth Fund are six separate funds of the Equity Trust (individually referred to as a “Fund” and collectively, “the Funds”). Effective September 1, 2009, the Alpine U.S. Real Estate Equity Fund changed its name to the Alpine Cyclical Advantage Property Fund. The Alpine International Real Estate Equity Fund, Alpine Cyclical Advantage Property Fund, Alpine Emerging Markets Real Estate Fund, Alpine Global Infrastructure Fund and Alpine Global Consumer Growth Fund are diversified funds. The Alpine Realty Income & Growth Fund is a non-diversified fund. Alpine Woods Capital Investors, LLC (the “Adviser”) is a Delaware limited liability company and serves as the investment manager to the Funds. The Global Consumer Growth Fund commenced operations on December 29, 2010. |
| |
2. | Significant Accounting Policies: |
| |
| The following is a summary of significant accounting policies consistently followed by the Funds in the preparation of their financial statements. The policies are in conformity with accounting principles generally accepted in the United States of America (“GAAP”), which require management to make estimates and assumptions that affect amounts reported herein. Actual results could differ from those estimates. |
| |
| A. Valuation of Securities: |
| |
| The net asset value (“NAV”) of shares of the Funds are calculated by dividing the value of the Funds’ net assets by the number of outstanding shares. NAV is determined each day the NYSE is open as of the close of regular trading (normally, 4:00 p.m., Eastern time). In computing NAV, portfolio securities of the Funds are valued at their current market values determined on the basis of market quotations or if market quotations are not available or determined to be reliable, through procedures and/or guidelines established by the Board of Trustees. In computing the Funds’ net asset value, equity securities that are traded on a securities exchange in the United States are valued at the last reported sale price as of the time of valuation, or lacking any current reported sale at the time of valuation, at the mean between the most recent bid and asked quotations. Each option security traded on a securities exchange in the United States is valued at the last current reported sale price as of the time of valuation, or lacking any current reported sale at the time of valuation, the option is valued at the mid-point of the consolidated bid/ask quote for the option security. Each security traded in the over-the-counter market and quoted on the NASDAQ National Market System, is valued at the NASDAQ Official Closing Price (“NOCP”), as determined by NASDAQ, or lacking an NOCP, the last current reported sale price as of the time of valuation by NASDAQ, or lacking any current reported sale on NASDAQ at the time of valuation, at the mean between the most recent bid and asked quotations. Each over-the-counter option that is not traded through the Options Clearing Corporation is valued by the counterparty, or if the counterparty’s price is not readily available then by using the Black-Scholes method. Debt securities are valued based on an evaluated mean price as furnished by pricing services approved by the Board of Trustees, which may be based on market transactions for comparable securities and various relationships between securities that are generally recognized by institutional traders, a computerized matrix system, or appraisals derived from information concerning the securities or similar securities received from recognized dealers in those securities. Short-term securities with maturities of 60 days or less are valued at amortized cost, which approximates fair value. |
| |
| Equity securities that are principally traded in a foreign market are valued at the last current sale price at the time of valuation or lacking any current or reported sale at the time of valuation, at the mean between the most recent bid and asked quotations as of the close of the appropriate exchange or other designated time. Trading in securities on European and Far Eastern securities exchanges and over-the-counter markets is normally completed at various times before the close of business on each day on which the NYSE is open. Trading of these securities may not take place on every NYSE business day. In addition, trading may take place in various foreign markets on Saturdays or on other days when the NYSE is not open and on which the Fund’s net asset values are not calculated. If the market prices are not readily available or not reflective of the fair value of the security, as of the close of the regular trading on the NYSE (normally, 4:00 p.m., Eastern time), the security will be priced at fair value following procedures approved by the Board of Trustees. |
74
Notes to Financial Statements—Continued
April 30, 2011 (Unaudited)
| | |
| When market quotations are not readily available or when the valuation methods mentioned above are not reflective of a fair value of the security, the security is valued at fair value following procedures and/or guidelines approved by the Board of Trustees. The Board has approved the use of Interactive Data’s proprietary fair value pricing model to assist in determining current valuation for foreign securities traded in markets that close prior to the NYSE. When fair value pricing is employed, the value of the portfolio security used to calculate the Funds’ net asset values may differ from quoted or official closing prices. |
| | |
| As of April 30, 2011, the International Real Estate Equity Fund, Realty Income & Growth Fund, Cyclical Advantage Property Fund, Emerging Markets Real Estate Fund, Global Infrastructure Fund, and Global Consumer Growth Fund held securities that are fair valued, which comprised 7.3%, 1.2%, 8.6%, 7.6%, 1.7% and 1.1%, respectively, of each Fund’s net assets. |
| | |
| In accordance with GAAP, the Funds use a three-tier hierarchy to establish classification of fair value measurements for disclosure purposes. Inputs refer broadly to the assumptions that market participants would use in pricing the asset or liability, including assumptions about risk. Inputs may be observable or unobservable. Observable inputs are inputs that reflect the assumptions market participants would use in pricing the asset or liability that are developed based on market data obtained from sources independent of the reporting entity. Unobservable inputs are inputs that reflect the reporting entities own assumptions about the assumptions market participants would use in pricing the asset or liability that are developed based on the best information available. |
| | |
| Level 1 — | Unadjusted quoted prices in active markets for identical assets or liabilities that the Fund has the ability to access. |
| | |
| Level 2 — | Observable inputs other than quoted prices included in level 1 that are observable for the asset or liability, either directly or indirectly. These inputs may include quoted prices for the identical instrument on an inactive market, prices for similar instruments, interest rates, prepayment speeds, credit risk, yield curves, default rates and similar data. |
| | |
| Level 3 — | Unobservable inputs for the asset or liability, to the extent relevant observable inputs are not available; representing the Funds’ own assumptions about the assumptions a market participant would use in valuing the asset or liability, and would be based on the best information available. |
| | |
| The availability of observable inputs can vary from security to security and is affected by a wide variety of factors, including, for example, the type of security, whether the security is new and not yet established in the marketplace, the liquidity of markets, and other characteristics particular to the security. To the extent that valuation is based on models or inputs that are less observable or unobservable in the market, the determination of fair value requires more judgment. Accordingly, the degree of judgment exercised in determining fair value is greatest for instruments categorized in level 3. |
| | |
| The inputs used to measure fair value may fall into different levels of the fair value hierarchy. In such cases, for disclosure purposes, the level in the fair value hierarchy within which the fair value measurement falls in its entirety, is determined based on the lowest level input that is significant to the fair value measurement in its entirety. |
| | |
| Various inputs are used in determining the value of the Funds’ investments as of the reporting period end. The designated input levels are not necessarily an indication of the risk or liquidity associated with these investments. These inputs are categorized in the following hierarchy under applicable financial accounting standards. |
| | |
| The inputs or methodology used for valuing securities are not an indication of the risk associated with investing in those securities. |
75
Notes to Financial Statements—Continued
April 30, 2011 (Unaudited)
| |
| The following is a summary of the inputs used to value the Funds’ net assets as of April 30, 2011: |
| | | | | | | | | | | | | | |
| | Valuation Inputs | | | | |
| | | | | | |
International Real Estate Equity Fund* | | | Level 1** | | Level 2** | | Level 3 | | Total Value | |
| | | | | | | | | | |
Common Stocks | | | | | | | | | | | | | |
Asia | | $ | 109,113,950 | | $ | 15,234,182 | | $ | 17,572,080 | | $ | 141,920,212 | |
Australia | | | 6,412,531 | | | — | | | — | | | 6,412,531 | |
Europe | | | 183,311,819 | | | 9,617,958 | | | 967,190 | | | 193,896,967 | |
Middle East/Africa | | | 5,212,266 | | | — | | | — | | | 5,212,266 | |
North & South America | | | 223,852,691 | | | — | | | 8,834,832 | | | 232,687,523 | |
Equity-Linked Structured Notes | | | — | | | 10,583,906 | | | — | | | 10,583,906 | |
Investment Companies | | | 5,991,263 | | | — | | | — | | | 5,991,263 | |
Warrants | | | | | | | | | | | | | |
Asia | | | 5,313,034 | | | — | | | — | | | 5,313,034 | |
| | | | | | | | | | | | | |
Total | | $ | 539,207,554 | | $ | 35,436,046 | | $ | 27,374,102 | | $ | 602,017,702 | |
| | | | | | | | | | | | | |
| | | | | | | | | | | | | | |
| | Valuation Inputs | | | | |
| | | | | | |
Other Financial Instruments* | | | Level 1 | | Level 2 | | Level 3 | | Total Value | |
| | | | | | | | | | |
Liabilities | | | | | | | | | | | | | |
Forward Currency Contracts | | $ | — | | $ | (3,886,731 | ) | $ | — | | $ | (3,886,731 | ) |
| | | | | | | | | | | | | |
Total | | $ | — | | $ | (3,886,731 | ) | $ | — | | $ | (3,886,731 | ) |
| | | | | | | | | | | | | |
| | | | | | | | | | | | | | |
| | Valuation Inputs | | | | |
| | | | | | |
Realty Income and Growth Fund* | | | Level 1 ** | | Level 2 ** | | Level 3 | | Total Value | |
| | | | | | | | | | |
Real Estate Investment Trusts | | | | | | | | | | | | | |
Apartments | | $ | 14,587,136 | | $ | — | | $ | — | | $ | 14,587,136 | |
Diversified | | | 8,720,772 | | | — | | | 1,468,188 | | | 10,188,960 | |
Health Care | | | 9,796,993 | | | — | | | — | | | 9,796,993 | |
Lodging | | | 4,931,014 | | | — | | | — | | | 4,931,014 | |
Mortgage & Finance | | | 3,302,047 | | | — | | | — | | | 3,302,047 | |
Net Lease | | | 4,499,877 | | | — | | | — | | | 4,499,877 | |
Office-Industrial Buildings | | | 36,504,402 | | | — | | | — | | | 36,504,402 | |
Retail Centers | | | 19,276,706 | | | — | | | — | | | 19,276,706 | |
Storage | | | 3,644,235 | | | — | | | — | | | 3,644,235 | |
Common Stocks | | | 2,707,698 | | | — | | | — | | | 2,707,698 | |
Preferred Stocks | | | 12,190,179 | | | — | | | — | | | 12,190,179 | |
| | | | | | | | | | | | | |
Total | | $ | 120,161,059 | | $ | — | | $ | 1,468,188 | | $ | 121,629,247 | |
| | | | | | | | | | | | | |
76
Notes to Financial Statements—Continued
April 30, 2011 (Unaudited)
| | | | | | | | | | | | | | |
| | Valuation Inputs | | | | |
| | | | | | |
Cyclical Advantage Property Fund* | | | Level 1 ** | | Level 2 ** | | Level 3 | | Total Value | |
| | | | | | | | | | |
Common Stocks | | | | | | | | | | | | | |
Asia | | $ | 11,093,085 | | $ | 3,557,454 | | $ | — | | $ | 14,650,539 | |
Europe | | | 7,383,385 | | | — | | | — | | | 7,383,385 | |
Middle East/Africa | | | 861,413 | | | — | | | — | | | 861,413 | |
North & South America | | | 32,750,048 | | | 799,350 | | | 2,446,980 | | | 35,996,378 | |
Equity-Linked Structured Notes | | | — | | | 3,090,686 | | | — | | | 3,090,686 | |
Warrants | | | 9,582 | | | — | | | — | | | 9,582 | |
| | | | | | | | | | | | | |
Total | | $ | 52,097,513 | | $ | 7,447,490 | | $ | 2,446,980 | | $ | 61,991,983 | |
| | | | | | | | | | | | | |
| | | | | | | | | | | | | | |
| | Valuation Inputs | | | | |
| | | | | | |
Emerging Markets Real Estate Fund* | | | Level 1 ** | | Level 2 ** | | Level 3 | | Total Value | |
| | | | | | | | | | |
Common Stocks | | | | | | | | | | | | | |
Asia | | $ | 1,849,998 | | $ | 506,864 | | $ | — | | $ | 2,356,862 | |
Europe | | | 507,845 | | | 195,165 | | | — | | | 703,010 | |
Middle East/Africa | | | 128,842 | | | — | | | — | | | 128,842 | |
North & South America | | | 1,756,503 | | | 36,171 | | | — | | | 1,792,674 | |
Equity-Linked Structured Notes | | | — | | | 291,957 | | | — | | | 291,957 | |
Investment Companies | | | 18,325 | | | — | | | — | | | 18,325 | |
Warrants | | | 50,550 | | | — | | | — | | | 50,550 | |
Short-Term Investments | | | — | | | 450,000 | | | — | | | 450,000 | |
| | | | | | | | | | | | | |
Total | | $ | 4,312,063 | | $ | 1,480,157 | | $ | — | | $ | 5,792,220 | |
| | | | | | | | | | | | | |
| | | | | | | | | | | | | | |
| | | Valuation Inputs | | | | |
| | | | | | | |
Global Infrastructure Fund* | | | Level 1 ** | | Level 2 ** | | Level 3 | | Total Value | |
| | | | | | | | | | |
Common Stocks | | $ | 8,700,818 | | $ | — | | $ | — | | $ | 8,700,818 | |
Equity-Linked Structured Notes | | | — | | | 158,594 | | | — | | | 158,594 | |
Rights | | | 3,495 | | | — | | | — | | | 3,495 | |
Short-Term Investments | | | — | | | 842,000 | | | — | | | 842,000 | |
| | | | | | | | | | | | | |
Total | | $ | 8,704,313 | | $ | 1,000,594 | | $ | — | | $ | 9,704,907 | |
| | | | | | | | | | | | | |
77
Notes to Financial Statements—Continued
April 30, 2011 (Unaudited)
| | | | | | | | | | | | | | |
| | Valuation Inputs | | | | |
| | | | | | |
Global Consumer Growth Fund* | | | Level 1 ** | | Level 2 ** | | Level 3 | | Total Value | |
| | | | | | | | | | |
Common Stocks | | | | | | | | | | | | | |
Automobiles | | $ | 108,004 | | $ | — | | $ | — | | $ | 108,004 | |
Beverages | | | 154,752 | | | — | | | — | | | 154,752 | |
Chemicals | | | 23,976 | | | — | | | — | | | 23,976 | |
Commercial Services & Supplies | | | 30,797 | | | — | | | — | | | 30,797 | |
Communications Equipment | | | 27,443 | | | — | | | — | | | 27,443 | |
Computers & Peripherals | | | 38,305 | | | — | | | — | | | 38,305 | |
Distributors | | | 20,499 | | | — | | | — | | | 20,499 | |
Diversified Consumer Services | | | 26,316 | | | — | | | — | | | 26,316 | |
Food & Staples Retailing | | | 77,516 | | | 22,913 | | | — | | | 100,429 | |
Food Products | | | 143,062 | | | — | | | — | | | 143,062 | |
Hotels, Restaurants & Leisure | | | 125,254 | | | — | | | — | | | 125,254 | |
Household Products | | | 54,510 | | | — | | | — | | | 54,510 | |
Internet & Catalog Retail | | | 47,819 | | | — | | | — | | | 47,819 | |
Internet Software & Services | | | 105,891 | | | — | | | — | | | 105,891 | |
IT Services | | | 33,201 | | | — | | | — | | | 33,201 | |
Leisure Equipment & Products | | | 30,446 | | | — | | | — | | | 30,446 | |
Media | | | 181,149 | | | — | | | — | | | 181,149 | |
Multiline Retail | | | 155,094 | | | — | | | — | | | 155,094 | |
Personal Products | | | 52,168 | | | — | | | — | | | 52,168 | |
Real Estate Management & Development | | | 45,583 | | | — | | | — | | | 45,583 | |
Specialty Retail | | | 162,861 | | | — | | | — | | | 162,861 | |
Textiles, Apparel & Luxury Goods | | | 283,177 | | | — | | | — | | | 283,177 | |
Short-Term Investments | | | — | | | 159,000 | | | — | | | 159,000 | |
| | | | | | | | | | | | | |
Total | | $ | 1,927,823 | | $ | 181,913 | | $ | — | | $ | 2,109,736 | |
| | | | | | | | | | | | | |
| |
* | For detailed country and sector descriptions, see accompanying Schedule of Portfolio Investments |
| |
** | During the period ended April 30, 2011 there were no significant transfers between Level 1 and Level 2 securities. A security’s classification as Level 1 or Level 2 within the Fund can move on a daily basis throughout the year depending on whether or not the Fund has determined the value of securities principally traded in foreign markets has become stale between the close of the foreign exchanges and the time the funds calculate their NAV. If management determines the price has become stale, a fair value adjustment will be made to the impacted securities and these fair value adjusted securities are considered to be priced using Level 2 inputs. |
78
Notes to Financial Statements—Continued
April 30, 2011 (Unaudited)
| | |
| Following is a reconciliation of Level 3 assets for which significant unobservable inputs were used to determine fair value: |
| | | | | | | | | | | | | | | | | |
| | | International
Real Estate
Equity Fund | | Realty
Income &
Growth Fund | | Cyclical
Advantage
Property Fund | |
| | | | | | | | |
| | | | | | | | | | | | | | | |
| Balance as of October 31, 2010 | | | $ | 9,406,498 | | | | $ | 1,563,188 | | | | $ | 2,605,314 | | |
| Accrued discounts / premiums | | | | — | | | | | — | | | | | — | | |
| Realized gain (loss) | | | | — | | | | | — | | | | | — | | |
| Change in unrealized appreciation (depreciation) | | | | 1,191,931 | | | | | (95,000 | ) | | | | (158,334 | ) | |
| Purchases | | | | — | | | | | — | | | | | | | |
| Sales | | | | — | | | | | — | | | | | — | | |
| Transfers in to Level 3 | | | | 16,775,673 | | | | | — | | | | | — | | |
| Transfers out of Level 3 | | | | — | | | | | — | | | | | — | | |
| | | | | | | | | | | | | | | | | |
| Balance as of April 30, 2011 | | | $ | 27,374,102 | | | | $ | 1,468,188 | | | | $ | 2,446,980 | | |
| | | | | | | | | | | | | | | | | |
| | | | | | | | | | | | | | | | | |
| | | | | | | | | | | | | | | | | |
| Change in net unrealized depreciation on level 3 holdings held at period end | | | $ | 1,191,931 | | | | $ | (95,000 | ) | | | $ | (158,334 | ) | |
| | | | | | | | | | | | | | | | | |
| |
| B. Security Transactions and Investment Income: |
| |
| Securities transactions are recorded on the date a security is purchased or sold (i.e. on the trade date). Realized gains and losses are computed on the identified cost basis. Interest income is recorded on the accrual basis and includes accretion of discounts and amortization of premiums, where applicable. Dividend income is recorded on the ex-dividend date or in the case of some foreign securities, on the date thereafter when the Funds are made aware of the dividend. Foreign income may be subject to foreign withholding taxes, which are accrued as applicable. Capital gains realized on some foreign securities are subject to foreign taxes, which are accrued as applicable. |
| |
| Dividends and interest from non-U.S. sources received by the Funds are generally subject to non-U.S. withholding taxes at rates ranging up to 30%. Such withholding taxes may be reduced or eliminated under the terms of applicable U.S. income tax treaties, and the Funds intend to undertake any procedural steps required to claim the benefits of such treaties. |
| |
| C. Line of Credit: |
| |
| For the period from November 1, 2010 through November 30, 2010 each Fund had a line of credit with U.S. Bank N.A. On December 1, 2010 each Fund entered into a lending agreement with BNP Paribas through its New York branch. Loans in aggregate, whether to cover overdrafts or for investment purposes, may not exceed the maximum amount that is permitted under the 1940 Act. For the six months ended April 30, 2011, the average interest rate paid on outstanding borrowings under the line of credit was 1.12%, 1.14%, 1.13%, 1.13% and 1.22% for the International Real Estate Equity Fund, Realty Income & Growth Fund, Cyclical Advantage Property Fund, Emerging Markets Real Estate Fund and Global Infrastructure Fund, respectively. The Funds also incur interest expense on custody overdraft charges. |
79
| |
Alpine Mutual Funds |
| |
| |
Notes to Financial Statements—Continued
April 30, 2011 (Unaudited) |
| | | | | | | | | | | | | | | | | | | | |
| | | International
Real Estate
Equity Fund | | Realty
Income &
Growth
Fund | | Cyclical
Advantage
Property
Fund | | Emerging
Markets
Real Estate
Fund | | Global
Infrastructure
Fund | | Global
Consumer
Growth
Fund | |
| | | | | | | | | | | | | | |
| | | | | | | | | | | | | | | | | | | | |
| Total line of credit
amount available | | $ | 210,622,302 | | $ | 41,413,225 | | $ | 23,464,584 | | $ | 1,953,618 | | $ | 3,308,859 | | $ | 715,660 | |
| Line of credit outstanding
at April 30, 2011 | | | 58,633,616 | | | 6,193,112 | | | 2,740,643 | | | — | | | — | | | — | |
| Line of credit amount
unused at April 30, 2011 | | | 151,988,686 | | | 35,220,113 | | | 20,723,941 | | | 1,953,618 | | | 3,308,859 | | | 715,660 | |
| Average balance
outstanding during the
period | | | 58,040,266 | | | 8,645,493 | | | 1,818,185 | | | 25,089 | | | 2,112 | | | — | |
| Interest expense incurred
on line of credit during
the period | | | 325,576 | | | 49,427 | | | 10,332 | | | 143 | | | 13 | | | — | |
| Interest expense incurred
on custody overdrafts
during the period | | | — | | | 1 | | | 14 | | | 1 | | | — | | | — | |
| | |
| D. Income Taxes: |
| |
| It is each Fund’s policy to comply with the requirements of Subchapter M of the Internal Revenue Code applicable to regulated investment companies and to distribute timely, all of its investment company taxable income and net realized capital gains to shareholders. Therefore, no federal income tax provision is recorded. |
| |
| Under applicable foreign tax laws, a withholding tax may be imposed on interest, dividends, and capital gains earned on foreign investments. Where available, the Funds will file for claims on foreign taxes withheld. |
| |
| E. Dividends and Distributions: |
| |
| Each Fund intends to distribute substantially all of its net investment income and net realized capital gains, if any, throughout the year to its shareholders in the form of dividends. Distributions to shareholders are recorded at the close of business on the ex-dividend date. |
| |
| The amounts of dividends from net investment income and of distributions from net realized gains are determined in accordance with federal income tax regulations, which may differ from GAAP. These differences are either considered temporary or permanent in nature. To the extent these differences are permanent in nature, such amounts are reclassified within the composition of net assets based on their federal tax-basis treatment; temporary differences do not require reclassification. In the event dividends and distributions to shareholders exceed net investment income and net realized gains for tax purposes, they are reported as returns of capital. |
| |
| F. Foreign Currency Translation Transactions: |
| |
| The International Real Estate Equity Fund, Cyclical Advantage Property Fund, Emerging Markets Real Estate Fund, Global Infrastructure Fund, and Global Consumer Growth Fund may invest without limitation in foreign securities. The Realty Income & Growth Fund may invest up to 35% of the value of its net assets in foreign securities. The books and records of each Fund are maintained in U.S. dollars. Non-U.S. denominated amounts are translated into U.S. dollars as follows, with the resultant gains and losses recorded in the Statements of Operations: |
| |
| i) | market value of investment securities and other assets and liabilities at the exchange rate on the valuation date, |
| | |
| ii) | purchases and sales of investment securities, income and expenses at the exchange rate prevailing on the respective date of such transactions. |
| |
| G. Risk Associated With Foreign Securities and Currencies: |
| |
| Investments in securities of foreign issuers carry certain risks not ordinarily associated with investments in securities of domestic issuers. Such risks include future political and economic developments and the possible imposition of |
80
Notes to Financial Statements—Continued
April 30, 2011 (Unaudited)
| |
| exchange controls or other foreign governmental laws and restrictions. In addition, with respect to certain countries, there is a possibility of expropriation of assets, confiscatory taxation, political or social instability or diplomatic developments, which could adversely affect investments in those countries. |
| |
| Certain countries may also impose substantial restrictions on investments in their capital markets by foreign entities, including restrictions on investments in issuers or industries deemed sensitive to relevant national interests. These factors may limit the investment opportunities available to the Funds or result in a lack of liquidity and high price volatility with respect to securities of issuers from developing countries. |
| |
| H. Swap Contracts: |
| |
| The Funds are subject to equity price risk in the normal course of pursuing its investment objectives. The Funds may enter into long equity swap contracts with multiple brokers to manage or gain exposure to various securities or markets. A long equity swap contract entitles the Fund to receive from the counterparty any appreciation and dividends paid on an individual security, while obligating the Fund to pay the counterparty any depreciation on the security as well as interest on the notional amount of the contract. |
| |
| Fluctuations in the value of an open contract are recorded daily as a net unrealized gain or loss. The Fund will realize a gain or loss upon termination or reset of the contract. Either party, under certain conditions, may terminate the contract prior to the contract’s expiration date. |
| |
| Credit risk may arise as a result of the failure of the counterparty to comply with the terms of the contract. The Fund considers the creditworthiness of each counterparty to a contract in evaluating potential credit risk quarterly. The counterparty risk to the Fund is limited to the net unrealized gain, if any, on the contract, along with dividends receivable on long equity contracts. Additionally, risk may arise from unanticipated movements in interest rates or in the value of the underlying securities. During the six months ended April 30, 2011, the Realty Income & Growth Fund entered into one equity swap contract with a notional value of $187,876. |
| |
| The net realized gains or losses and change in unrealized appreciation or depreciation on swap contracts is included in the Statements of Operations. |
| |
| I. Equity-Linked Structured Notes: |
| |
| The Funds may invest in equity-linked structured notes. Equity-linked structured notes are securities which are specially designed to combine the characteristics of one or more underlying securities and their equity derivatives in a single note form. The return and/or yield or income component may be based on the performance of the underlying equity securities, and equity index, and/or option positions. Equity-linked structured notes are typically offered in limited transactions by financial institutions in either registered or non-registered form. An investment in equity-linked structured notes creates exposure to the credit risk of the issuing financial institution, as well as to the market risk of the underlying securities. There is no guaranteed return of principal with these securities and the appreciation potential of these securities may be limited by a maximum payment or call right. In certain cases, equity-linked structured notes may be more volatile and less liquid than less complex securities or other types of fixed income securities. Such securities may exhibit price behavior that does not correlate with other fixed-income securities. |
| |
| J. Forward Currency Contracts: |
| |
| The Funds are subject to foreign currency exchange rate risk in the normal course of pursuing its investment objectives. The Funds may use forward currency contracts to gain exposure to or hedge against changes in the value of foreign currencies. A forward currency contract (“forward”) is an agreement between two parties to buy and sell a currency at a set price on a future date. The market value of the forward contract fluctuates with changes in forward currency exchange rates. The forward contract is marked-to-market daily and the change in market value is recorded by each Fund as unrealized appreciation or depreciation. When the forward contract is closed, a Fund records a realized gain or loss equal to the fluctuation in value during the period the forward contract was open. A Fund could be exposed to risk if a counterparty is unable to meet the terms of a forward or if the value of the currency changes unfavorably. |
81
Notes to Financial Statements—Continued
April 30, 2011 (Unaudited)
| |
| The following forward currency contracts were held at April 30, 2011: |
| |
| International Real Estate Equity Fund |
| | | | | | | | | | | | | | | |
| Description | | Expiration
Date | | Contracts to
Deliver/Receive | | Settlement
Value | | Current
Value | | Unrealized
Loss | |
| | | | | | | | | | | | |
| Contracts Sold: | | | | | | | | | | | | | | |
| Euro | | 07/15/11 | | 21,315,790 (EUR) | | $ | 28,390,927 | | $ | 31,508,109 | | $ | (3,117,182 | ) |
| Euro | | 07/15/11 | | 9,212,500 (EUR) | | | 12,847,983 | | | 13,617,532 | | | (769,549 | ) |
| | | | | | | | | | | | | | | |
| | | | | | | | | | $ | 45,125,641 | | $ | (3,886,731 | ) |
| | | | | | | | | | | | | | | |
| |
| K. Derivatives |
| |
| The Funds have adopted authoritative standards regarding disclosure about derivatives and hedging activities and how they affect the Funds’ Statements of Assets and Liabilities and Statements of Operations. |
| |
| The affect of derivative instruments on the Statement of Assets and Liabilities as of April 30, 2011: |
| | | | | | | | | |
| International Real Estate Equity Fund | | | | | | | |
| | | | | | | | |
| | | | | | | | |
| Derivatives | | | Unrealized
Depreciation | | | | |
| | | | | | | | |
| Forward Currency Contracts | | | $(3,886,731) | | | | |
| | | | | | | | |
| The effect of derivative instruments on the Statements of Operations for the six months ended April 30, 2011: |
| | | | | | | | |
| International Real Estate Equity Fund | | | | | | | |
| | | | | | | | |
| Derivatives | | | Net Realized Gain | | Change in
Unrealized Depreciation | |
| | | | | | | |
| Forward Currency Contracts | | | $17,121 | | | $(3,886,731) | |
| | | | | | | | |
| Realty Income & Growth Fund | | | | | | | |
| | | | | | | | |
| Derivatives | | | Net Realized Gain | | Change in Unrealized
Appreciation (Depreciation) | |
| | | | | | | |
| Swap Contracts | | | $ 2,858 | | | $ — | |
| | | | | | | | |
| Cyclical Advantage Property Fund | | | | | | | |
| | | | | | | | |
| Derivatives | | | Net Realized Gain | | Change in Unrealized
Appreciation (Depreciation) | |
| | | | | | | |
| Forward Currency Contracts | | | $ 1,664 | | | $ — | |
| | | | | | | | |
| Emerging Markets Real Estate Fund | | | | | | | |
| | | | | | | | |
| Derivatives | | | Net Realized Gain | | Change in Unrealized
Appreciation (Depreciation) | |
| | | | | | | |
| Forward Currency Contracts | | | $ (702) | | | $ — | |
| |
3. | Capital Share Transactions: |
| |
| The Funds have an unlimited number of shares of beneficial interest, with $0.0001 par value, authorized. Transactions in shares and dollars of the Funds were as follows: |
| |
| International Real Estate Equity Fund |
| | | | | | | | | | | | | |
| | Six Months Ended
April 30, 2011 | | Year Ended
October 31, 2010 | |
| | | | | |
| | Shares | | Amount | | Shares | | Amount | |
| | | | | | | | | |
Shares sold | | | 1,465,480 | | $ | 37,700,626 | | | 5,832,345 | | $ | 131,323,773 | |
Shares issued in reinvestment of dividends | | | 511,118 | | | 13,263,510 | | | 965,649 | | | 21,418,105 | |
Redemption fees | | | — | | | 11,365 | | | — | | | 107,464 | |
Shares redeemed | | | (4,739,108 | ) | | (121,699,818 | ) | | (15,515,042 | ) | | (343,195,210 | ) |
| | | | | | | | | | | | | |
Total net change | | | (2,762,510 | ) | $ | (70,724,317 | ) | | (8,717,048 | ) | $ | (190,345,868 | ) |
| | | | | | | | | | | | | |
82
Notes to Financial Statements—Continued
April 30, 2011
| | | | | | | | | | | | | |
Realty Income & Growth Fund |
| | | | | | | | | | | | | |
| | Six Months Ended
April 30, 2011 | | Year Ended
October 31, 2010 | |
| | | | | |
| | Shares | | Amount | | Shares | | Amount | |
| | | | | | | | | |
Shares sold | | | 395,592 | | $ | 6,248,623 | | | 1,248,996 | | $ | 16,374,720 | |
Shares issued in reinvestment of dividends | | | 147,840 | | | 2,289,890 | | | 383,362 | | | 5,050,577 | |
Redemption fees | | | — | | | 3,629 | | | — | | | 13,275 | |
Shares redeemed | | | (998,625 | ) | | (15,384,221 | ) | | (2,058,126 | ) | | (27,099,016 | ) |
| | | | | | | | | | | | | |
Total net change | | | (455,193 | ) | $ | (6,842,079 | ) | | (425,768 | ) | $ | (5,660,444 | ) |
| | | | | | | | | | | | | |
| | | | | | | | | | | | | |
Cyclical Advantage Property Fund |
| | | | | |
| | Six Months Ended
April 30, 2011 | | Year Ended
October 31, 2010 | |
| | | | | |
| | Shares | | Amount | | Shares | | Amount | |
| | | | | | | | | |
Shares sold | | | 45,323 | | $ | 978,783 | | | 97,077 | | $ | 1,791,670 | |
Shares issued in reinvestment of dividends | | | 11,900 | | | 256,450 | | | 41,685 | | | 752,822 | |
Redemption fees | | | — | | | 94 | | | — | | | 1,905 | |
Shares redeemed | | | (242,419 | ) | | (5,148,473 | ) | | (385,222 | ) | | (7,109,123 | ) |
| | | | | | | | | | | | | |
Total net change | | | (185,196 | ) | $ | (3,913,146 | ) | | (246,460 | ) | $ | (4,562,726 | ) |
| | | | | | | | | | | | | |
| | | | | | | | | | | | | |
| | | | | | | | | | | | | |
Emerging Markets Real Estate Fund |
| | | | | | | | | | | | | |
| | Six Months Ended
April 30, 2011 | | Year Ended
October 31, 2010 | |
| | | | | |
| | Shares | | Amount | | Shares | | Amount | |
| | | | | | | | | |
Shares sold | | | 162,294 | | $ | 2,866,707 | | | 61,290 | | $ | 1,065,991 | |
Shares issued in reinvestment of dividends | | | 13,960 | | | 256,293 | | | 11,611 | | | 185,773 | |
Redemption fees | | | — | | | 344 | | | — | | | 791 | |
Shares redeemed | | | (32,761 | ) | | (607,718 | ) | | (22,908 | ) | | (371,652 | ) |
| | | | | | | | | | | | | |
Total net change | | | 143,493 | | $ | 2,515,626 | | | 49,993 | | $ | 880,903 | |
| | | | | | | | | | | | | |
| | | | | | | | | | | | | |
| | | | | | | | | | | | | |
Global Infrastructure Fund |
| | | | | | | | | | | | | |
| | Six Months Ended
April 30, 2011 | | Year Ended
October 31, 2010 | |
| | | | | |
| | Shares | | Amount | | Shares | | Amount | |
| | | | | | | | | |
Shares sold | | | 412,299 | | $ | 6,406,233 | | | 24,470 | | $ | 356,108 | |
Shares issued in reinvestment of dividends | | | 12,786 | | | 196,478 | | | 10,544 | | | 144,027 | |
Redemption fees | | | — | | | 422 | | | — | | | — | |
Shares redeemed | | | (8,446 | ) | | (133,017 | ) | | (762 | ) | | (10,806 | ) |
| | | | | | | | | | | | | |
Total net change | | | 416,639 | | $ | 6,470,116 | | | 34,252 | | $ | 489,329 | |
| | | | | | | | | | | | | |
| | | | | | | | | | | | | |
Global Consumer Growth Fund* |
| | | | | | | | | | | | | |
| | Six Months Ended
April 30, 2011 | | | |
| | | | | |
| | Shares | | Amount | | | | | |
| | | | | | | | | |
Shares sold | | | 202,020 | | $ | 2,019,780 | | | | | | | |
Shares issued in reinvestment of dividends | | | — | | | — | | | | | | | |
Redemption fees | | | — | | | — | | | | | | | |
Shares redeemed | | | — | | | — | | | | | | | |
| | | | | | | | | | | | | |
Total net change | | | 202,020 | | $ | 2,019,780 | | | | | | | |
| | | | | | | | | | | | | |
| | |
| * | Fund commenced on December 29, 2010. |
83
Notes to Financial Statements—Continued
April 30, 2011
| |
4. | Purchases and Sales of Securities: |
| |
| Purchases and sales of securities (excluding short-term securities) for the six months ended April 30, 2011 are as follows: |
| | | | | | | | | | | | | |
| | Non-U.S. Government | | U.S. Government | |
| | | | | |
| | Purchases | | Sales | | Purchases | | Sales | |
| | | | | | | | | |
International Real Estate Equity Fund | | $ | 73,705,277 | | $ | 132,084,682 | | $ | — | | $ | — | |
Realty Income & Growth Fund | | | 35,639,433 | | | 38,541,385 | | | — | | | — | |
Cyclical Advantage Property Fund | | | 25,298,863 | | | 32,107,480 | | | — | | | — | |
Emerging Markets Real Estate Fund | | | 2,927,687 | | | 363,711 | | | — | | | — | |
Global Infrastructure Fund | | | 13,049,645 | | | 7,257,587 | | | — | | | — | |
Global Consumer Growth Fund | | | 1,915,350 | | | 75,969 | | | — | | | — | |
| |
5. | Investment Advisory Agreement and Other Affiliated Transactions: |
| |
| Alpine Woods Capital Investors, LLC (“the Adviser”) provides investment advisory services to each of the Funds. Pursuant to the advisory agreements with the Realty Income & Growth Fund and the Cyclical Advantage Property Fund, the Adviser is entitled to an annual fee based on each Fund’s average daily net assets, in accordance with the following schedule: |
| | | | |
First $750 million | | | 1.00 | % |
Next $250 million | | | 0.90 | % |
Over $1 billion | | | 0.80 | % |
| |
| The Adviser is entitled to an annual fee based on 1.00% of each Fund’s average daily net assets for the International Real Estate Equity Fund, Emerging Markets Real Estate Fund and Global Infrastructure Fund. |
| |
| The Adviser agreed to reimburse the Realty Income & Growth Fund, Emerging Markets Real Estate Fund, Global Infrastructure Fund and Global Consumer Growth Fund to the extent necessary to ensure that each Fund’s annual total operating expenses (excluding interest, brokerage commissions and extraordinary expenses) does not exceed 1.50%, 1.35%, 1.35% and 1.35% of each Fund’s average daily net assets, respectively. The Adviser may recover expenses paid in excess of the cap on expenses for the three previous years, as long as the recovery does not cause the Funds to exceed such cap on expenses. For the six months ended April 30, 2011, the Adviser waived investment advisory fees and other expenses totaling $12,384, $10,429 and $8,030 for the Emerging Markets Real Estate Fund, Global Infrastructure Fund and Global Consumer Growth Fund, respectively. The expense limitations will remain in effect for the Funds unless and until the Board of Trustees of the Equity Trust approve its modification or termination with respect to the Funds. |
| |
| Waived expenses subject to potential recovery by year of expiration are as follows: |
| | | | | | | | | | | | | |
Year of Expiration | | Emerging Markets
Real Estate Fund | | Global
Infrastructure Fund | | Global Consumer
Growth Fund | |
| | | | | | | | |
| 10/31/2012 | | | $40,274 | | | $35,371 | | | $ | — | | |
| 10/31/2013 | | | $31,563 | | | $30,973 | | | $ | — | | |
| 10/31/2014 | | | $12,384 | | | $10,429 | | | $ | 8,030 | | |
| |
6. | Transactions with Affiliates |
| |
| The following issuers are affiliated with the International Real Estate Equity Fund; that is, the Fund held 5% or more of the outstanding voting securities during the six months ended April 30, 2011. As defined in Section (2)(a)(3) of the Investment Company Act of 1940, such issuers are: |
| | | | | | | | | | | | | | | | |
Fund | | Issuer Name | | Balance at
Oct. 31, 2010 | | Purchases | | Sales | | Balance at
April 30, 2011 | | Value at
April 30, 2011 | | Realized
Gains (Loss) | |
| | | | | | | | | | | | | | | | |
International Real | | Yatra | | | | | | | | | | | | | | |
Estate Equity Fund | | Capital, Ltd. | | 1,491,800 | | — | | — | | 1,491,800 | | | $10,164,067 | | — | |
84
Notes to Financial Statements—Continued
April 30, 2011
| |
7. | Concentration of Credit Risk: |
| |
| The Funds invest a substantial amount of their assets in the equity securities of issuers engaged in the real estate industry, including real estate investment trusts (REITs). As a result, the Funds may be more affected by economic developments in the real estate industry than would a general equity fund. |
| |
8. | Federal Income Tax Information |
| |
| At October 31, 2010, the components of accumulated earnings (losses) on a tax basis were as follows: |
| | | | | | | | | | | | | | | | |
| | International
Real Estate
Equity Fund | | Realty
Income &
Growth Fund | | Cyclical
Advantage
Property Fund | | Emerging
Markets Real
Estate Fund | | Global
Infrastructure
Fund | |
| | | | | | | | | | | |
Cost of investments | | $ | 705,626,631 | | $ | 86,749,494 | | $ | 54,049,079 | | $ | 2,718,862 | | $ | 1,695,122 | |
| | | | | | | | | | | | | | | | |
Gross unrealized appreciation | | | 142,316,902 | | | 37,840,553 | | | 13,152,726 | | | 1,003,304 | | | 586,594 | |
Gross unrealized depreciation | | | (230,658,897 | ) | | (12,208,144 | ) | | (6,672,758 | ) | | (189,656 | ) | | (23,386 | ) |
| | | | | | | | | | | | | | | | |
Net unrealized appreciation (depreciation) | | | (88,341,995 | ) | | 25,632,409 | | | 6,479,968 | | | 813,648 | | | 563,208 | |
| | | | | | | | | | | | | | | | |
Undistributed ordinary Income | | | 15,264,707 | | | — | | | 190,986 | | | 98,488 | | | 133,475 | |
Undistributed long-term capital gain | | | — | | | — | | | — | | | 166,713 | | | 1,004 | |
| | | | | | | | | | | | | | | | |
Total distributable earnings | | | 15,264,707 | | | — | | | 190,986 | | | 265,201 | | | 134,479 | |
| | | | | | | | | | | | | | | | |
Other accumulated gains (losses) | | | (996,104,751 | ) | | (19,251,132 | ) | | (59,962,483 | ) | | 1,710 | | | 91 | |
| | | | | | | | | | | | | | | | |
Total accumulated gains (losses) | | $ | (1,069,182,039 | ) | $ | 6,381,277 | | $ | (53,291,529 | ) | $ | 1,080,559 | | $ | 697,778 | |
| | | | | | | | | | | | | | | | |
| |
| The tax basis of investments for tax and financial reporting purposes differs principally due to the deferral of losses on wash sales, partnership tax adjustments, and mark-to-market cost basis adjustments for investments in passive foreign investment companies (PFICs) for tax purposes. |
| |
| The tax character of distributions paid during the years ended October 31, 2010 and 2009 were as follows: |
| | | | | | | |
| | 2010 | | 2009 | |
| | | | | |
| | | | | | | |
International Real Estate Equity Fund | | | | | | | |
Ordinary income | | $ | 4,044,819 | | $ | — | |
Long-term capital gain | | | — | | | — | |
| | | | | | | |
| | $ | 4,044,819 | | $ | — | |
| | | | | | | |
| | | | | | | |
Realty Income & Growth Fund | | | | | | | |
Ordinary income | | $ | 5,499,099 | | $ | 5,089,343 | |
Long-term capital gain | | | — | | | — | |
Return of capital | | | — | | | 1,391,340 | |
| | | | | | | |
| | $ | 5,499,099 | | $ | 6,480,683 | |
| | | | | | | |
| | | | | | | |
Cyclical Advantage Property Fund | | | | | | | |
Ordinary income | | $ | 785,829 | | $ | 411,286 | |
Long-term capital gain | | | — | | | — | |
| | | | | | | |
| | $ | 785,829 | | $ | 411,286 | |
| | | | | | | |
85
Notes to Financial Statements—Continued
April 30, 2011
| | | | | | | |
| | 2010 | | 2009 | |
| | | | | |
|
Emerging Markets Real Estate Fund | | | | | | | |
Ordinary income | | $ | 192,587 | | $ | — | |
Long-term capital gain | | | — | | | — | |
| | | | | | | |
| | $ | 192,587 | | $ | — | |
| | | | | | | |
| | | | | | | |
Global Infrastructure Fund | | | | | | | |
Ordinary income | | $ | 149,042 | | $ | — | |
Long-term capital gain | | | 2 | | | — | |
| | | | | | | |
| | $ | 149,044 | | $ | — | |
| | | | | | | |
During the year ended October 31, 2010, the Realty Income & Growth Fund utilized $4,822,514 of capital loss carryovers. Capital loss carryovers as of October 31, 2010 are as follows:
| | | | | | | | | | | | | | | |
Expiration Date | | | International
Real Estate
Equity Fund | | Realty
Income &
Growth Fund | | Cyclical
Advantage
Property Fund | |
| | | | | | | | | |
10/31/15 | | $ | — | | | $ | — | | | | $ | 5,568,140 | | �� |
10/31/16 | | $ | 384,892,332 | | | $ | — | | | | $ | 19,372,953 | | |
10/31/17 | | $ | 546,087,879 | | | $ | 19,256,151 | | | | $ | 26,502,747 | | |
10/31/18 | | $ | 65,121,028 | | | $ | — | | | | $ | 8,530,364 | | |
| |
| In accordance with U.S. GAAP, the Funds have previously adopted accounting standards related to the accounting for uncertain tax positions. In accordance with this guidance, the Funds analyzed all open tax years, as defined by the Statute of Limitations, for all major jurisdictions. Open tax years are those that are open for exam by taxing authorities. Major jurisdictions for the Funds included Federal and the state of New York. As of October 31, 2010, open Federal and New York tax years include the tax years ended October 31, 2007 through 2010. The Funds have no examinations in progress. |
| |
| The Funds have reviewed all open tax years and major jurisdictions and concluded that there is no impact on the Funds’ net assets and no tax liability resulting from unrecognized tax benefits relating to uncertain income tax positions taken in previous years or expected to be taken on the tax return for the fiscal year ended October 31, 2010. Also, the Funds have recognized no interest and penalties related to uncertain tax benefits. The Funds are also not aware of any tax positions for which it is reasonably possible that the total amounts of unrecognized tax benefits will significantly change in the next twelve months. |
| |
9. | Subsequent Events: |
| |
| In preparing these financial statements, the Funds have evaluated events and transactions for potential recognition or disclosure resulting from subsequent events through the date the financial statements were issued. |
| |
| Distributions: The Realty Income & Growth Fund and Global Infrastructure Fund declared distributions from net investment income of $0.18 and $0.16 per share, respectively, payable on June 29, 2011 to shareholders of record on June 28, 2011. |
86
Additional Information (Unaudited)
Expense Examples
April 30, 2011
As a shareholder of the International Real Estate Equity Fund, Realty Income & Growth Fund, Cyclical Advantage Property Fund, Emerging Markets Real Estate Fund Global Infrastructure Fund, and Alpine Global Consumer Growth Fund, you will incur two types of costs: (1) redemption fees and (2) ongoing costs, including management fees; distribution and/or service fees; and other Fund expenses. The examples below are intended to help you understand your ongoing costs (in dollars) of investing in the Funds and to compare these costs with the ongoing costs of investing in other mutual funds. The examples are based on an investment of $1,000 for the period 11/1/2010 - 4/30/2011.
Actual Expenses
The first line of the tables below provides information about actual account values and actual expenses. The Funds charge no sales load or transaction fees, but do assess shareholders for outgoing wire transfers, returned checks and stop payment orders at prevailing rates charged by Boston Financial Data Services, the Funds’ transfer agent. If you request a redemption by wire transfer, currently a $15.00 fee is charged by the Funds’ transfer agent. Shareholders in the Funds will be charged a redemption fee equal to 1.00% of the net amount of the redemption if they redeem their shares less than 2 months after purchase. IRA accounts will be charged a $15.00 annual maintenance fee. To the extent the Funds invest in shares of other investment companies as a part of their investment strategies, you will indirectly bear your proportionate share of any fees and expenses charged by the underlying funds in which the Funds invest in addition to the expenses of the Fund. These expenses are not included in the example below. The example below includes, but is not limited to, management fees, shareholder servicing fees, fund accounting, custody and transfer agent fees. You may use the information in this line, together with the amount you invested, to estimate the expenses that you paid over the period. Simply divide your account value by $1,000 (for example, an $8,600 account value divided by $1,000 = 8.6), then multiply the result by the number in the first line under the heading entitled “Expenses Paid During Period” to estimate the expenses you paid on your account during the period.
Hypothetical Example for Comparison Purposes
The second line of the table below provides information about hypothetical account values and hypothetical expenses based on the Funds’ actual expense ratios and an assumed rate of return of 5% per year before expenses, which does not represent the Funds’ actual returns. The hypothetical account values and expenses may not be used to estimate the actual ending account balance or expenses you paid for the period. You may use this information to compare the ongoing costs of investing in the Funds and other funds. To do so, compare this 5% hypothetical example with the 5% hypothetical examples that appear in the shareholder reports of other funds. Please note that the expenses shown in the table are meant to highlight your ongoing costs only and do not reflect any transactional costs, such as redemption fees. Therefore, the second line of the table is useful in comparing ongoing costs only, and will not help you determine the relative total costs of owning different funds. In addition, if these transactional costs were included, your costs would have been higher.
International Real Estate Equity Fund
| | | | | | | | | | | | | | | | |
| | Beginning
Account Value
11/1/2010 | | Ending
Account Value
4/30/2011 | | Expenses Paid
During Period
11/1/2010-4/30/2011(3)* | |
| | | | | | | |
Actual (1) | | | $ | 1,000.00 | | | | $ | 1,079.80 | | | | $ | 6.70 | | |
Hypothetical (2) | | | $ | 1,000.00 | | | | $ | 1,018.35 | | | | $ | 6.51 | | |
| | |
| | |
|
(1) | Ending account values and expenses paid during period based on a 7.98% return. The return is considered after expenses are deducted from the Fund. |
|
(2) | Ending account values and expenses paid during period based on a 5.00% annual return. The return is considered before expenses are deducted from the Fund. |
|
(3) | Excluding interest expense of 0.12%, the actual and hypothetical expenses paid during the period were $6.08 and $5.91, respectively. |
|
* | Expenses are equal to the Fund’s annualized expense ratio of 1.30%, multiplied by the average account value over the period, multiplied by 181/365 (to reflect the one-half year period). |
87
Additional Information (Unaudited)—Continued
Expense Examples
April 30, 2011
Realty Income & Growth Fund
| | | | | | | | | | | | | | | | |
| | Beginning
Account Value
11/1/2010 | | Ending
Account Value
4/30/2011 | | Expenses Paid
During Period
11/1/2010-4/30/2011(3)* | |
| | | | | | | |
Actual (1) | | | $ | 1,000.00 | | | | $ | 1,177.70 | | | | $ | 7.02 | | |
Hypothetical (2) | | | $ | 1,000.00 | | | | $ | 1,018.35 | | | | $ | 6.51 | | |
| | |
| | |
(1) | Ending account values and expenses paid during period based on a 17.77% return. The return is considered after expenses are deducted from the Fund. |
(2) | Ending account values and expenses paid during period based on a 5.00% annual return. The return is considered before expenses are deducted from the Fund. |
(3) | Excluding interest expense of 0.09%, the actual and hypothetical expenses paid during the period were $6.53 and $6.06, respectively. |
* | Expenses are equal to the Fund’s annualized expense ratio of 1.30%, multiplied by the average account value over the period, multiplied by 181/365 (to reflect the one-half year period). |
Cyclical Advantage Property Fund
| | | | | | | | | | | | | | | | |
| | Beginning
Account Value
11/1/2010 | | Ending
Account Value
4/30/2011 | | Expenses Paid
During Period
11/1/2010-4/30/2011(3)* | |
| | | | | | | |
Actual (1) | | | $ | 1,000.00 | | | | $ | 1,117.10 | | | | $ | 6.82 | | |
Hypothetical (2) | | | $ | 1,000.00 | | | | $ | 1,018.35 | | | | $ | 6.51 | | |
| | |
| | |
(1) | Ending account values and expenses paid during period based on a 11.71% return. The return is considered after expenses are deducted from the Fund. |
(2) | Ending account values and expenses paid during period based on a 5.00% annual return. The return is considered before expenses are deducted from the Fund. |
(3) | Excluding interest expense of 0.03%, the actual and hypothetical expenses paid during the period were $6.67 and $6.36, respectively. |
* | Expenses are equal to the Fund’s annualized expense ratio of 1.30%, multiplied by the average account value over the period, multiplied by 181/365 (to reflect the one-half year period). |
Emerging Markets Real Estate Fund
| | | | | | | | | | | | | | | | |
| | Beginning
Account Value
11/1/2010 | | Ending
Account Value
4/30/2011 | | Expenses Paid
During Period
11/1/2010-4/30/2011(3)* | |
| | | | | | | |
Actual (1) | | | $ | 1,000.00 | | | | $ | 1,014.20 | | | | $ | 6.79 | | |
Hypothetical (2) | | | $ | 1,000.00 | | | | $ | 1,018.05 | | | | $ | 6.81 | | |
| | |
| | |
(1) | Ending account values and expenses paid during period based on a 1.42% return. The return is considered after expenses are deducted from the Fund. |
(2) | Ending account values and expenses paid during period based on a 5.00% annual return. The return is considered before expenses are deducted from the Fund. |
(3) | Excluding interest expense of 0.01%, the actual and hypothetical expenses paid during the period were $6.74 and $6.76, respectively. |
* | Expenses are equal to the Fund’s annualized expense ratio of 1.36%, multiplied by the average account value over the period, multiplied by 181/365 (to reflect the one-half year period). |
88
Additional Information (Unaudited)—Continued
Expense Examples
April 30, 2011
Global Infrastructure Fund
| | | | | | | | | | | | | | | | |
| | Beginning
Account Value
11/1/2010 | | Ending
Account Value
4/30/2011 | | Expenses Paid
During Period
11/1/2010-4/30/2011* | |
| | | | | | | |
Actual (1) | | | $ | 1,000.00 | | | | $ | 1,145.00 | | | | $ | 7.18 | | |
Hypothetical (2) | | | $ | 1,000.00 | | | | $ | 1,018.10 | | | | $ | 6.76 | | |
| | |
| | |
(1) | Ending account values and expenses paid during period based on a 14.50% return. The return is considered after expenses are deducted from the Fund. |
(2) | Ending account values and expenses paid during period based on a 5.00% annual return. The return is considered before expenses are deducted from the Fund. |
* | Expenses are equal to the Fund’s annualized expense ratio of 1.35%, multiplied by the average account value over the period, multiplied by 181/365 (to reflect the one-half year period). |
Global Consumer Growth
| | | | | | | | | | | | | | | | |
| | Beginning
Account Value
11/1/2010 | | Ending
Account Value
4/30/2011 | | Expenses Paid
During Period
11/1/2010-4/30/2011* | |
| | | | | | | |
Actual (1) | | | $ | 1,000.00 | | | | $ | 1,055.00 | | | | $ | 4.67 | | |
Hypothetical (2) | | | $ | 1,000.00 | | | | $ | 1,018.10 | | | | $ | 6.76 | | |
| | |
| | |
(1) | Ending account values and expenses paid during period based on a 5.50% return. The return is considered after expenses are deducted from the Fund. |
(2) | Ending account values and expenses paid during period based on a 5.00% annual return. The return is considered before expenses are deducted from the Fund. |
* | Expenses are equal to the Fund’s annualized expense ratio of 1.35%, multiplied by the average account value over the period, multiplied by 123/365 (to reflect the period December 29, 2010-April 30, 2011, the Fund’s commencement of operations date to the end of the period). Hypothetical expenses are equal to the Fund’s annualized expense ratio of 1.35%, multiplied by the average account value over the period, multiplied by 181/365 (to reflect the one-half year period). |
89
Additional Information (Unaudited)—Continued
April 30, 2011
Investment Adviser and Advisory Contracts
On December 17, 2010 and on March 29, 2011, at meetings called for the purposes of voting on such approvals, the Boards of Trustees, including all of the Trustees who are not parties to the Advisory Contract or interested persons of any such party (the non-interested Trustees), approved the continuance of the Advisory Contract for the Fund. In so doing, the Board Members studied materials specifically relating to the Advisory Contracts provided by the Adviser, the Fund’s counsel. In deciding whether to renew the Agreements, the Independent Trustees considered various factors, including (i) the nature, extent and quality of the services provided by Adviser under the Agreements, (ii) the investment performance of the Funds, (iii) the costs to Adviser of its services and the profits realized by Adviser, from its relationship with the Funds, and (iv) the extent to which economies of scale would be realized if and as the Fund grows and whether the fee levels in the Agreements reflect these economies of scale. The December meeting considered these factors for the period ending October 31, 2010 and the March meeting considered these factors for the period ending December 31, 2010.
In considering the nature, extent and quality of the services provided by Adviser, the Independent Trustees relied on their prior experience as Independent Trustees of the Funds as well as on the materials provided at the meeting. They noted that under the Agreements, the Adviser is responsible for managing the Funds’ investments in accordance with the Fund’s investment objective and policies, applicable legal and regulatory requirements, and the instructions of the Independent Trustees, for providing necessary and appropriate reports and information to the Independent Trustees, and for furnishing the Funds with the assistance, cooperation, and information necessary for the Funds to meet various legal requirements regarding registration and reporting. They also noted the experience and expertise of Adviser as appropriate as an adviser to the Funds.
The Independent Trustees reviewed the background and experience of Adviser’s senior management, including those individuals responsible for the investment and compliance operations with respect to the Fund’s investments, and the responsibilities of the investment and compliance personnel with respect to the Fund. They also considered the resources, operational structures and practices of Adviser in managing the Funds’ portfolios, in monitoring and securing the Funds’ compliance with investment objectives and policies and with applicable laws and regulations, and in seeking best execution of portfolio transactions. Drawing upon the materials provided and their general knowledge of the business of Adviser, the Independent Trustees took into account that the Adviser’s experience, resources and strength in these areas are deep, extensive and of high quality. On the basis of this review, the Independent Trustees determined that the nature and extent of the services provided by Adviser to the Fund were appropriate, had been of high quality, and could be expected to remain so.
The Independent Trustees compared the Fund performance metrics provided by Morningstar with those internally generated by Alpine. It was observed that the last quarter of performance had been strong for several of the Funds. In assessing the quality of the portfolio management delivered by the Adviser, the Independent Trustees also compared the short-term and long-term performance of each Fund on both an absolute basis and in comparison to its peer group, as constructed by data provided by independent rating agencies. The Independent Trustees noted that the performance of a number of the Funds was strong. Of importance to the Independent Trustees was the extent to which the Funds achieved their objectives. They further concluded that the expense ratio of the Funds were appropriate and in line with competitors. Accordingly, the Independent Trustees concluded that the performance of the Funds was satisfactory.
The Independent Trustees considered the profitability of the advisory arrangement with the Adviser. The Independent Trustees had been provided with general data on the Funds’ profitability to Adviser. The Independent Trustees also examined the level of profits that could be expected to accrue to the Adviser from the fees payable under the Agreements and any expense subsidization undertaken by the Adviser, as well as each Fund’s brokerage and commissions. After discussion and analysis, they concluded that, to the extent that Adviser’s relationship with the Funds had been profitable, the profitability was in no case such as to render the advisory fee excessive.
The Independent Trustees discussed the other materials provided by Alpine, including expense information, organization charts, advisory fee breakpoints and profitability data. In reviewing breakpoints, the Independent Trustees recognized that breakpoints were more essential for open-end funds, where assets could continue to grow over time.
90
Additional Information (Unaudited)—Continued
April 30, 2011
In considering whether Adviser benefits in other ways from its relationship with the Funds, the Independent Trustees concluded that, to the extent that Adviser derives other benefits from its relationship with the Fund, those benefits are not so significant as to render the adviser’s fees excessive.
On the basis of their discussions with management and their analysis of information provided at the meeting, the Independent Trustees determined that the nature of the Fund and its operations is such that Adviser was likely to continue to realize economies of scale in the management of the Fund as it grows in size.
The Independent Trustees approved the continuance of the Fund’s Agreements with Adviser after weighing the foregoing factors. They reasoned that, considered in themselves, the nature and extent of the services provided by Adviser were appropriate, that the performance of the Funds had been satisfactory, and that Adviser could be expected to provide services of high quality. As to Adviser’s fees for the Funds, the Independent Trustees determined that the fees, considered in relation to the services provided, were fair and reasonable, that the Funds’ relationship with Adviser was not so profitable as to render the fees excessive, that any additional benefits to Adviser were not of a magnitude materially to affect the Independent Trustees’ deliberations, and that the fees adequately reflected shared economies of scale with the Fund.
91
Additional Information (Unaudited)—Continued
April 30, 2011
| | | | | | | | | | |
Independent Trustees |
|
| |
|
Name and Age | | Position(s)
Held with
the Trust | | Term of Office
and Length of
Time Served | | Principal Occupation During
Past Five Years | | # of
Portfolios in
Fund
Complex** | | Other Directorships
Held by Trustee |
| | | | | | | | | | |
Laurence B. Ashkin (83) | | Independent
Trustee | | Indefinite, since the Trust’s inception | | Real estate developer since 1980; Founder and President of Centrum Properties, Inc. since 1980. | | 17 | | Board of Trustees Chairman, Perspective Charter Schools, Chicago, IL; Director, Chicago Public Radio; Trustee of each of the Alpine Trusts.* |
| | | | | | | | | | |
| | | | | | | | | | | |
| | | | | | | | | | |
H. Guy Leibler (56) | | Independent
Trustee | | Indefinite, since the Trust’s inception | | Private investor, since 2007; Vice Chair & Chief Operating Officer of L&L Acquisitions, LLC (2004-2007); President, Skidmore, Owings & Merrill LLP (2001-2004). | | 17 | | Chairman Emeritus, White Plains Hospital Center; Trustee, each of the Alpine Trusts.* |
| | | | | | | | | | |
| | | | | | | | | | | |
| | | | | | | | | | |
Jeffrey E. Wacksman (50) | | Independent
Trustee | | Indefinite, since 2004 | | Partner, Loeb, Block & Partners LLP, since 1994. | | 17 | | Director, International Succession Planning Association; Trustee, Larchmont Manor Park Society; Director, Bondi Icebergs Inc. (Women’s Sportswear); Director, MH Properties, Inc.; Trustee, each of the Alpine Trusts.* |
| | | | | | | | | | |
| | | | | | | | | | | |
| | | | | | | | | | |
James A. Jacobson (66) | | Independent
Trustee | | Indefinite, since July 2009 | | Retired, since November 2008; Vice Chairman and Managing Director, Spear Leeds & Kellogg Specialists, LLC, January 2003 to November 2008. | | 17 | | Trustee, Allianz Global Investors Multi-Funds. Trustee, each of the Alpine Trusts.* |
| | |
| | | | | | | | | | | |
| |
* | The term “Fund Complex” refers to the Funds in the Alpine Equity Trust, Alpine Series Trust, and Alpine Income Trust, and Alpine Global Dynamic Dividend Fund, Alpine Total Dynamic Dividend Fund, and Alpine Global Premier Properties Fund (the “Alpine Trust”). |
92
Additional Information (Unaudited)—Continued
April 30, 2011
| | | | | | | | | | |
Interested Trustees & Officers |
|
| |
|
Name and Age | | Position(s)
Held with
the Trust | | Term of Office
and Length of
Time Served | | Principal Occupation During
Past Five Years | | # of
Portfolios in
Fund
Complex** | | Other Directorships
Held by Trustee |
| | | | | | | | | | |
Samuel A. Lieber* (54) | | Interested
Trustee,
President and
Portfolio
Manager | | Indefinite, since the Trust’s inception | | CEO of Alpine Woods Capital Investors, LLC since November 1997. President of Alpine Trusts since 1998. | | 17 | | Trustee, each of the Alpine Trusts. |
| | | | | | | | | | |
| | | | | | | | | | | |
| | | | | | | | | | |
Stephen A. Lieber*** (85) | | Vice President
and Portfolio
Manager | | Indefinite, since the Trust’s inception | | Chief Investment Officer, Alpine
Woods Capital Investors, LLC since 2003; Chairman and Senior Portfolio Manager, Saxon Woods Advisors, LLC since 1999. | | N/A | | None |
| | | | | | | | | | |
| | | | | | | | | | | |
| | | | | | | | | | |
John Megyesi (50) | | Chief
Compliance
Officer | | Indefinite, since January 2009 | | Chief Compliance Officer, Alpine
Woods Capital Investors, LLC since January 2009; Vice President and Manager, Trade Surveillance, Credit Suisse Asset Management, LLC (2006-2009); Manager, Trading and Surveillance, Allianz Global Investors (2004-2006). | | N/A | | None |
| | | | | | | | | | |
| | | | | | | | | | | |
| | | | | | | | | | |
Ronald Palmer (42) | | Chief Financial
Officer | | Indefinite, since January 2010 | | Chief Financial Officer, Alpine
Woods Capital Investors, LLC since January 2010; Independent Consultant (2008-2009); Vice President, Cash Management and Foreign Exchange, Macquarie Capital Investment Management, LLC (2007-2008); Chief Operating Officer, Macquarie Fund Adviser, LLC (2004-2007). | | N/A | | None |
| | | | | | | | | | |
| | | | | | | | | | | |
| | | | | | | | | | |
Meimei Li (47) | | Treasurer | | Indefinite, since March 2009 | | Controller, Alpine Woods Capital Investors, LLC since February 2007; Senior Accountant Pinnacle Group (2005-2007); Senior Auditor, Eisner & Lubin (2001-2005). | | N/A | | None |
| | | | | | | | | | |
| | | | | | | | | | | |
| | | | | | | | | | |
Andrew Pappert (31) | | Secretary | | Indefinite, since March
2009 | | Director of Fund Operations, Alpine Woods Capital Investors, LLC since September 2008; Assistant Vice President, Mutual Fund Operations, Credit Suisse Asset Management, LLC (2003-2008). | | N/A | | None |
| | |
| | | | | | | | | | | |
| | |
* | | Denotes Trustees who are “interested persons” of the Trust or Fund under the 1940 Act. |
| | |
** | | The term “Fund Complex” refers to the Funds in the Alpine Equity Trust, Alpine Series Trust, and Alpine Income Trust, and Alpine Global Dynamic Dividend Fund, Alpine Total Dynamic Dividend Fund, and Alpine Global Premier Properties Fund (the “Alpine Trust”). |
| | |
*** | | Stephen A. Lieber is the father of Samuel A. Lieber. |
93
Additional Information (Unaudited)—Continued
April 30, 2011
Tax Information
The Funds designated the following percentages of dividends declared from net investment income for the fiscal year ended October 31, 2010 as qualified dividend income under the Jobs & Growth Tax Relief Reconciliation Act of 2003.
| | | | |
International Real Estate Equity Fund | | | 24 | % |
Realty Income & Growth Fund | | | 18 | % |
Cyclical Advantage Property Fund | | | 56 | % |
Emerging Markets Real Estate Fund | | | 1 | % |
Global Infrastructure Fund | | | 27 | % |
The Funds designated the following percentages of dividends declared during the fiscal year ended October 31, 2010 as dividends qualifying for the dividends received deduction available to corporate shareholders.
| | | | |
International Real Estate Equity Fund | | | 0 | % |
Realty Income & Growth Fund | | | 14 | % |
Cyclical Advantage Property Fund | | | 20 | % |
Emerging Markets Real Estate Fund | | | 0 | % |
Global Infrastructure Fund | | | 8 | % |
The Funds designated the following percentages of taxable ordinary income distributions as short-term capital gain distributions under Internal Revenue Section 871(k)(2)(C).
| | | | |
International Real Estate Equity Fund | | | 0 | % |
Realty Income & Growth Fund | | | 12 | % |
Cyclical Advantage Property Fund | | | 0 | % |
Emerging Markets Real Estate Fund | | | 43 | % |
Global Infrastructure Fund | | | 84 | % |
The Funds designated as long-term capital gain dividend, pursuant to Internal Revenue Code Section 852(b)(3), the amount necessary to reduce the earnings and profits of the Funds related to net capital gain to zero for the tax year ended October 31, 2010.
Availability of Proxy Voting Information
Information regarding how each Fund votes proxies relating to portfolio securities is available without charge upon request by calling toll-free at 1-888-785-5578 and on the SEC’s website at www.sec.gov. Information regarding how each Fund voted proxies relating to portfolio securities during the most recent twelve month period ended June 30 is available on the SEC’s website at www.sec.gov or by calling the toll-free number listed above.
Availability of Quarterly Portfolio Schedule
Beginning with each Fund’s fiscal quarter ended July 31, 2004, each Fund filed its complete schedules of portfolio holdings on Form N-Q with the SEC. Going forward, each Fund will file Form N-Q for the first and third quarters of each fiscal year on Form N-Q. Each Fund’s Form N-Q is available on the SEC’s website at www.sec.gov and may be reviewed and copied at the SEC’s Public Reference Room in Washington, DC. Information on the operation of the Public Reference Room may be obtained by calling 1-202-551-8090.
94
Additional Information (Unaudited)—Continued
April 30, 2011
Privacy Policy
The Funds collect non-public information about you from the following sources:
| |
• | information we receive about you on applications or other forms; |
• | information you give us orally; and |
• | information about your transactions with others or us. |
The Funds do not disclose any non-public personal information about our customers or former customers without the customer’s authorization, except as required by law or in response to inquiries from governmental authorities. The Funds restrict access to your personal and account information to those employees who need to know that information to provide products and services to you. The Funds also may disclose that information to unaffiliated third parties (such as to brokers or custodians) only as permitted by law and only as needed for us to provide agreed services to you. The Funds maintain physical, electronic and procedural safeguards to guard your non-public personal information.
In the event that you hold shares of the Funds through a financial intermediary, including, but not limited to a broker dealer, bank or trust company, the privacy policy of your financial intermediary would govern how your non-public personal information would be shared with unaffiliated third parties.
95
|
TRUSTEES |
Samuel A. Lieber |
Laurence B. Ashkin |
James A. Jacobson |
H. Guy Leibler |
Jeffrey E. Wacksman |
|
CUSTODIAN & |
ADMINISTRATOR |
State Street Bank & Trust Company |
One Lincoln Street |
Boston, MA 02111 |
|
INDEPENDENT REGISTERED |
PUBLIC ACCOUNTING FIRM |
Deloitte & Touche LLP |
555 East Wells Street |
Milwaukee, WI 53202 |
|
FUND COUNSEL |
Wilkie Farr & Gallagher |
787 7th Avenue, 40th FL |
New York, NY 10019 |
|
DISTRIBUTOR |
Quasar Distributors, LLC |
615 East Michigan Street |
Milwaukee, WI 53202 |
|
INVESTMENT ADVISER |
Alpine Woods Capital Investors, LLC |
2500 Westchester Ave., Suite 215 |
Purchase, NY 10577 |
|
TRANSFER AGENT |
Boston Financial Data Services |
Two Heritage Drive |
North Quincy, MA 02171 |
|

|
|
SHAREHOLDER | INVESTOR INFORMATION |
|
1(888)785.5578 |
www.alpinefunds.com |
|
This material must be preceded or accompanied by a current prospectus. |
Item 2. Code of Ethics
Not applicable to semi-annual reports.
Item 3. Audit Committee Financial Expert
Not applicable to semi-annual reports.
Item 4. Principal Accountant Fees and Services
Not applicable to semi-annual reports.
Item 5. Audit Committee of Listed Registrants
Not applicable to registrants who are not listed issuers (as defined in Rule 10A-3 under the Securities Exchange Act of 1934).
Item 6. Schedule of Investments
| |
(a) | Schedule of Investments is included as part of Item 1 of the Form N-CSR. |
| |
(b) | Not applicable. |
Item 7. Disclosure of Proxy Voting Policies and Procedures for Closed-End Management Investment Companies.
Not applicable to open-end investment management companies.
Item 8. Portfolio Managers of Closed-End Management Investment Companies.
Not applicable to open-end investment management companies.
Item 9. Purchases of Equity Securities by Closed-End Management Investment Company and Affiliated Purchasers.
Not applicable to open-end investment management companies.
Item 10. Submission of Matters to a Vote of Security Holders.
There were no material changes to the procedures by which shareholders may recommend nominees to the Registrant’s Board of Trustees.
Item 11. Controls and Procedures.
| |
| (a) The Registrant’s principal executive officer and principal financial officer have evaluated the registrant’s disclosure controls and procedures (as defined in Rule 30a-3(c) under the Investment Company Act of 1940, as amended) within 90 days of this filing and have concluded that the Registrant’s disclosure controls and procedures were effective, as of that date. |
| |
| (b) There was no change in the Registrant’s internal control over financial reporting (as defined in Rule 30a-3(d) under the Investment Company Act of 1940, as amended) during the second fiscal quarter of the period covered by this report that has materially affected, or is reasonably likely to materially affect, the Registrant’s internal control over financial reporting. |
Item 12. Exhibits
(a)(1) Not applicable to semi-annual reports.
(a)(2) The certifications required by Rule 30a-2 of the Investment Company Act of 1940, as amended (the “1940 Act”) are attached hereto.
(a)(3) Not applicable to open-end investment management companies.
(b) The certifications required by Rule 30a-2(b) of the 1940 Act and Sections 906 of the Sarbanes-Oxley Act of 2002 are attached hereto.
SIGNATURES
Pursuant to the requirements of the Securities Exchange Act of 1934 and the Investment Company Act of 1940, the registrant has duly caused this report to be signed on its behalf by the undersigned, thereunto duly authorized.
Alpine Equity Trust
| | |
By: | /s/ Samuel A. Lieber | |
|
|
| Samuel A. Lieber | |
| Chief Executive Officer (Principal Executive Officer) |
| |
Date: | July 7, 2011 |
Pursuant to the requirements of the Securities Exchange Act of 1934 and the Investment Company Act of 1940, this report has been signed below by the following persons on behalf of the registrant and in the capacities and on the dates indicated.
| | |
By: | /s/ Samuel A. Lieber | |
|
|
| Samuel A. Lieber | |
| Chief Executive Officer (Principal Executive Officer) |
| | |
By: | /s/ Ronald G. Palmer, Jr. | |
|
|
| Ronald G. Palmer, Jr. | |
| Chief Financial Officer (Principal Financial Officer) |
| | |
Date: | July 7, 2011 | |