available to the Fund for investing. IPO and secondary offering shares frequently are volatile in price due to the absence of a prior public market, the small number of shares available for trading and limited information about the issuer. Therefore, the Fund may hold IPO and secondary offering shares for a very short period of time. This may increase the turnover of the Fund and may lead to increased expenses for the Fund, such as commissions and transaction costs. In addition, IPO and secondary offering shares can experience an immediate drop in value if the demand for the securities does not continue to support the offering price.
| | |
Alpine Global Consumer Growth Fund | 
| |
| | |
| | | | | | | | | |
| | | | | | | | | | |
|
Comparative Annualized Returns as of 4/30/12 (Unaudited) |
| | | | | | |
| | 6 Months(1) | | 1 Year | | Since Inception
(12/29/2010)(1) |
| | | | | | | |
Alpine Global Consumer Growth Fund — Institutional | | 11.22 | % | | 1.10 | % | | 4.93 | % |
| | | | | | | | | | |
MSCI World Index USD(2) | | 7.54 | % | | -4.63 | % | | 3.39 | % |
| | | | | | | | | | |
MSCI ACWI Consumer Discretionary Index USD | | 11.31 | % | | 1.51 | % | | 6.80 | % |
| | | | | | | | | | |
MSCI ACWI Consumer Staples Index USD | | 8.23 | % | | 5.18 | % | | 9.16 | % |
| | | | | | | | | | |
Lipper Consumer Goods Funds Average(3) | | 10.22 | % | | 5.07 | % | | 9.33 | % |
| | | | | | | | | | |
Lipper Consumer Goods Funds Ranking(3) | | N/A(4) | | 34/39 | | 34/38 |
| | | | | | | | | | |
Gross Expense Ratio: 2.96%(5) | | | | | | | | | |
| | | | | | | | | | |
Net Expense Ratio: 1.35%(5) | | | | | | | | | |
| | | | | | | | | | |
| | | |
| | |
| (1) | Not annualized. |
| (2) | Effective February 28, 2012, the Fund changed the primary benchmark against which it measures its performance to the MSCI World Index. The Adviser believes the MSCI World Index more accurately reflects the investment strategy of the Fund. |
| (3) | The since inception data represents the period beginning 12/31/2010. |
| (4) | FINRA does not recognize rankings for less than one year. |
| (5) | As disclosed in the prospectus dated February 28, 2012. |
Performance data quoted represents past performance and is not predictive of future results. Investment return and principal value of the Fund fluctuate, so that shares, when redeemed, may be worth more or less than their original cost. Performance current to the most recent month end may be lower or higher than the performance quoted and may be obtained by calling 1-888-785-5578. Performance data shown does not reflect the 1.00% redemption fee imposed on shares held for fewer than 60 days. If it did, total returns would be reduced.
Performance of Class A shares is not shown because this share class commenced operations on December 30, 2011.
The MSCI World Index USD is an unmanaged index considered representative of growth stocks of developed countries. Index performance is calculated with net dividends. The MSCI ACWI Consumer Staples Index USD is a free float adjusted market capitalization weighted index designed to measure the combined equity market performance of the consumer staples sector of developed and emerging markets countries. Component securities include those of food and drug retailers, food producers, tobacco companies and household products manufacturers. As of September 30, 2010, the Underlying Index consisted of companies in the following countries: Australia, Belgium, Brazil, Canada, Chile, China, Colombia, Denmark, Finland, France, Germany, Greece, India, Indonesia, Ireland, Italy, Japan, Malaysia, Mexico, the Netherlands, Poland, Portugal, Russia, Singapore, South Africa, South Korea, Sweden, Switzerland, Taiwan, Thailand, Turkey, United Kingdom, and the United States. The MSCI ACWI Consumer Discretionary Index USD is a free float adjusted market capitalization weighted index designed to measure the combined equity market performance of the consumer discretionary sector of developed and emerging markets countries. Component securities include those of manufacturers of automobiles and automotive components, consumer durables and apparel companies, consumer services companies, media producers and retailers. As of September 30, 2010, the Underlying Index consisted of companies in the following countries: Australia, Belgium, Brazil, Canada, Chile, China, Colombia, Denmark, Finland, France, Germany, Greece, India, Indonesia, Ireland, Italy, Japan, Malaysia, Mexico, the Netherlands, Poland, Portugal, Russia, Singapore, South Africa, South Korea, Sweden, Switzerland, Taiwan, Thailand, Turkey, United Kingdom, and the United States. The Lipper Consumer Goods Funds Average is an average of funds that invest primarily in the equity securities of domestic and foreign companies engaged in manufacturing and distributing consumer goods such as food, beverages, tobacco, and nondurable household goods and personal products. The MSCI ACWI Consumer Staples Index USD, the MSCI ACWI Consumer Discretionary Index USD and the Lipper Consumer Goods Funds Average are unmanaged and do not reflect direct fees associated with a mutual fund, such as investment adviser fees; however, the Lipper Consumer Goods Funds Average reflects fees charged by the underlying funds. The performance for the Global Consumer Growth Fund reflects the deduction of fees for these value-added services. Investors cannot directly invest in an index. Lipper rankings for the periods shown are based on Fund total returns with dividends and distributions reinvested and do not reflect sales charges.
Expense Ratios reflect the ratios reported in the Fund’s most recent prospectus. The Alpine Global Consumer Growth Fund has a contractual expense waiver that continues through February 28, 2013. Where a Fund’s gross and net expense ratio are the same for the period reported, the contractual expense reimbursement level was not reached as of the end of that period. To the extent the Fund’s expenses were reduced by waivers, the Fund’s total returns were increased. In these cases, in the absence of the expense waivers, the Fund’s total returns would have been lower.
To the extent that the Fund’s historical performance resulted from gains derived from participation in initial public offerings (“IPOs”) and/or secondary offerings, there is no guarantee that these results can be replicated in future periods or that the Fund will be able to participate to the same degree in IPO/Secondary allocations in the future.
38
| |
Alpine Global Consumer Growth Fund | 
|
| | |
| | | | | | | |
| | | | | | | | |
|
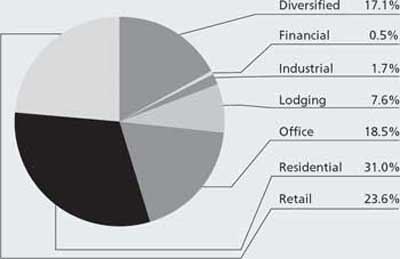
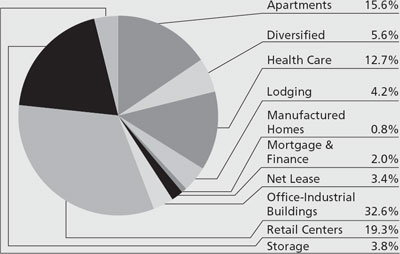
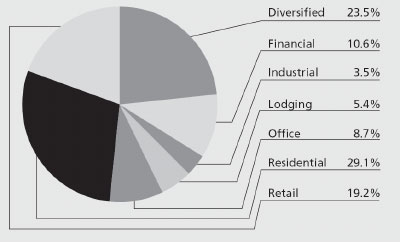
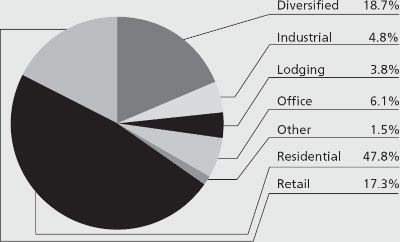
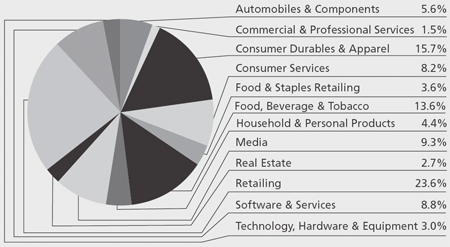
Portfolio Distributions* (Unaudited) | | Top 10 Holdings* (Unaudited) | |
| | 1. | | Anheuser-Busch InBev | | | |
| | | NV-ADR | | 2.99% | |
| 2. | | Nestle SA | | 2.79% | |
| 3. | | Apple, Inc. | | 2.79% | |
| 4. | | VF Corp. | | 2.64% | |
| 5. | | Yum! Brands, Inc. | | 2.52% | |
| 6. | | Comcast Corp.-Class A | | 2.30% | |
| 7. | | Visa, Inc.-Class A | | 2.27% | |
| 8. | | NIKE, Inc.-Class B | | 2.18% | |
| 9. | | PepsiCo, Inc. | | 2.15% | |
| 10. | | McDonald’s Corp. | | 2.11% | |
| | | | | | |
| |
| * | Top 10 Holdings do not include short-term investments and percentages are based on total net assets, Portfolio Distributions percentages are based on total investments. Portfolio holdings and sector distributions are as of 4/30/12 and are subject to change. Portfolio holdings are not recommendations to buy or sell any securities. |
| | | | | | | |
|
| |
|
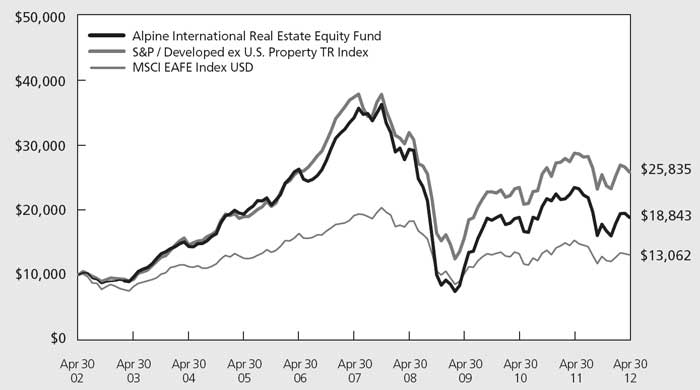
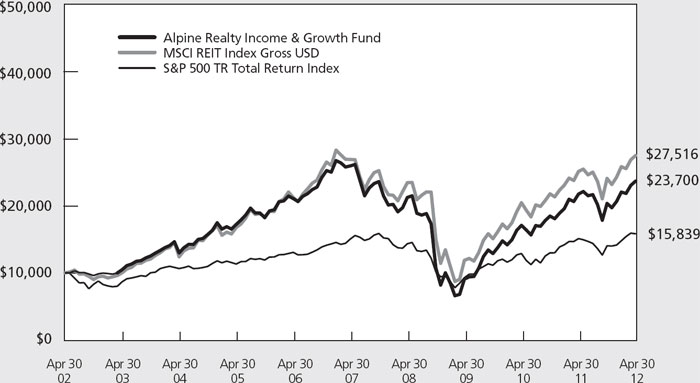
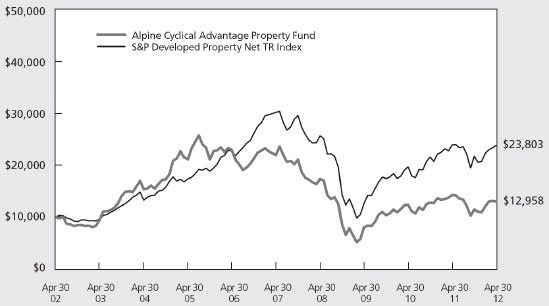
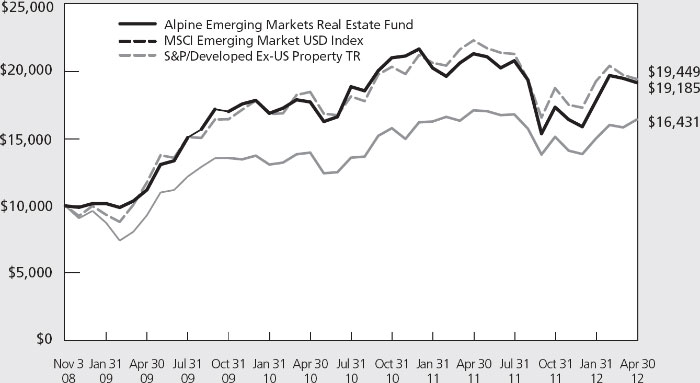
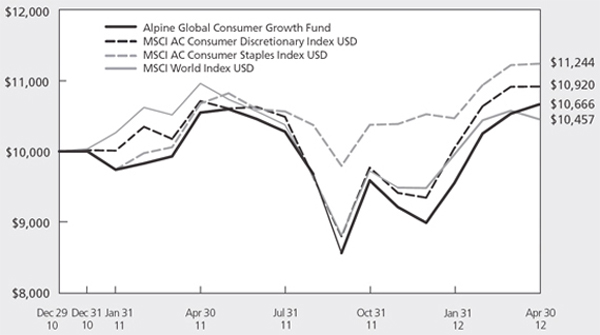
Value of a $10,000 Investment (Unaudited) |
|
|
|
This chart represents a comparison of a hypothetical $10,000 investment in the Fund versus a similar investment in the Fund’s benchmark. The graph and the table do not reflect the deduction of taxes that a shareholder would pay on Fund distributions or the redemption of Fund shares. Investment performance reflects the waiver and recovery of certain fees. Without the waiver and recovery of fees, the Fund’s total return would have differed.
39
| |
Alpine Global Consumer Growth Fund |
|
| | |
Through the first six months of the fiscal year, the Alpine Global Consumer Growth Fund generated a total return of 11.22%. Over the same period, the MSCI World Index and the MSCI All Country World Consumer Discretionary Indices posted total returns of 7.54% and 11.31%, respectively. The outperformance of the consumer discretionary and technology sectors aided the Fund’s strong relative performance to the MSCI World Index, while our emerging market exposure and being relatively underweight in automotives contributed to the Fund’s performance relative to the MSCI All Country World Consumer Discretionary Index.
Portfolio Drivers
After a difficult finish to fiscal 2011, market sentiment turned positive as we entered 2012 as the economic data in the US pointed to a bit of a recovery and the macro economic situation in the Euro zone stabilized. As such, the global markets recovered swiftly in the beginning of the calendar year, led by the more cyclical sectors.
| | |
| • | The country exposure of the Fund played a large part in the performance over the first six months of the fiscal year. China/Hong Kong (average weight 12.56%) and Brazil (9.64%) represented the Fund’s largest country exposures outside of the US (45.24%). Both of these markets experienced a strong recovery after difficult years in calendar 2011 despite some weakening in their respective economies. The US was the Fund’s top performing country, while Taiwan and Russia were the weakest. |
| | |
| • | From an industry standpoint, food, beverage and tobacco (average weight 13.85%) was the top performing segment. The more cyclical consumer durables & apparel and software & services industries were also among the top performers. Meanwhile, the market’s move toward higher beta over the last six months resulted in the underperformance of the less volatile food & staples retailing group. |
| | |
| • | As we entered the winter months, there were significant concerns about the pace of growth in emerging economies and for global consumer spending in particular. However, as December period results were released and macro economic data proved more resilient than expected, the focus of the market returned to the more cyclically oriented sectors of consumer discretionary and technology. As this event occurred, the Fund’s performance improved. |
Portfolio Analysis
The top five contributors to the Fund’s performance for the six months ended April 30, 2012 were Anheuser-Busch InBev N.V. (33.41%), Apple Inc (44.34%),Yum! Brands (36.98%), Lumber Liquidators Holdings, Inc (93.25%) and Visa Inc (32.42%).
| | |
| • | Anheuser Busch InBev N.V. (average weight 3.25%) was the top contributor to the Fund’s performance over the period as the company executed on its cost improvement plan and began to generate volume growth in many of its markets. |
| | |
| • | The success of Apple’s (average weight 2.56%) iPhone and iPad products contributed to the stock’s strong performance over the first half of the fiscal year. Earnings estimates have continued to trend higher over the past few quarters. The initiation of a dividend also introduced Apple stock to a new class of investors. |
| | |
| • | Yum! Brands (average weight 2.47%) posted strong results driven by its large and fast growing international business, particularly in China. Meanwhile, the US business has made strides in improving its performance. |
| | |
| • | After a difficult first nine months of 2011, Lumber Liquidators (average weight 1.15%) experienced some top-line improvement during the spring of 2012. Plus, management appears to have overcome the operational issues that hindered profitability in 2011. |
| | |
| • | Visa (average weight 2.23%) registered above plan financial results driven by strong global transaction volume growth. Near term, there may be some confusion in the numbers due to the changing regulatory landscape but as the world transitions to digital payments, Visa’s network is poised to benefit. |
| | |
| Abercrombie & Fitch Co (-32.08%), Digital Generation Inc (-50.21%), HTC Corp (-39.70%), Lianhua Supermarket Holdings Co (-35.07%) and Magazine Luiza S.A. (-22.98%) were the bottom five contributors to the Fund’s performance for the six months ended April 30, 2012. |
| | |
| • | Abercrombie & Fitch (average weight 1.29%) hit a few bumps in its growth path over the past few quarters. The company’s international growth engine has slowed a bit as the macro economic issues have dampened consumer enthusiasm throughout much of Europe. |
| | |
| • | Digital Generation (average weight 0.64%) made a series of acquisitions during 2011 that have |
40
| |
Alpine Global Consumer Growth Fund |
|
| | |
| | |
| | hampered their growth rate as they integrate the new businesses into the overall firm. In addition, the business has suffered from reduced pricing as a transition from standard definition to high definition content progresses. |
| | |
| • | HTC (average weight 0.15%) was slow to transition to the next generation of smart phones in the back half of 2011 and lost its technology edge. In addition, the company faced a lawsuit over patent infringement, which weighed on the shares. |
| | |
| • | Grocery store chain Lianhua (average weight 0.89%) is transitioning its operating model at a time when competition in the category is heating up and food inflation is slowing. As such, the expansion of net new stores has slowed and comparable store sales have weakened. |
| | |
| • | Hard goods retailer Magazine Luiza’s (average weight 0.88%) shares languished over the period as the Brazilian consumer slowed its spending patterns and as a result same store sales decelerated. In addition, since many of its higher cost items are sold via credit, concerns about the potential for rising delinquencies had an impact on the shares. |
Summary & Outlook
The Global Consumer Growth Fund seeks long-term capital appreciation by investing in companies which have exposure to the rising purchasing power of the global consumer. The Fund aims to achieve diversification by investing primarily across consumer discretionary, consumer staples and technology sectors among both multi-national and local companies. In the developed world, we emphasize investment in consumer consumption trends, such as the rise in Internet spending and the usage of mobile devices, as well as in firms that have the ability to expand their brands domestically and
abroad. In emerging markets, the focus is on those businesses that we believe stand to benefit from the demographic shifts that are taking place as disposable income levels rise over the next few years.
As we look ahead, consumer spending trends remain mixed. In the US, warm weather and an improving jobs picture helped boost consumer confidence levels, while high oil prices have had an impact on the lower income brackets. As we enter the back half of the year, we believe we are poised to benefit from the falling input costs that have been flowing through the cost structures over the past six months. In Europe, austerity measures and political and macro economic instability have hindered consumer confidence. But we are approaching the anniversary of many of the austerity measures in the coming months, which barring any large shocks to the economic system may result in an improving consumer spending environment as we exit 2012. Finally, we expect the emerging market consumers to continue their superior growth pace albeit at lower levels than in previous years. Discretionary spending should continue to benefit from strong wage growth and the growing middle class. Brazil and China remain the focus of our emerging market exposure but we are also looking at opportunities outside these two countries.
In closing, we are excited about the opportunities for the Global Consumer Growth Fund. We believe that the prospects for the long term global consumer story are attractive. Despite some near term headwinds, rising income levels and changing consumer consumption patterns across the globe should provide ample investment opportunities.
Sincerely,
Bryan Keane
Samuel A. Lieber
Co-Portfolio Managers
| |
| | |
Mutual fund investing involves risk. Principal loss is possible. The Fund is subject to the following risks: |
Concentration Risk – The Fund’s strategy of concentrating in companies in a specific industry means that its performance will be closely tied to the performance of a particular market segment. The Fund’s concentration in these companies may present more risks than if it were broadly diversified over numerous industries and sectors of the economy. A downturn in these companies would have a larger impact on the Fund than on a mutual fund that does not concentrate in such companies. At times, the performance of these companies will lag the performance of other industries or the broader market as a whole.
Consumer Products/Services Sector Risk – Significant problems may affect a particular sector, and returns from that sector may be lower than returns from the overall stock market. Events that affect the consumer products/services sector will have a greater effect on the Fund than they would on a fund that is more widely diversified among a number of unrelated industries. Daily fluctuations in specific market sectors are often more extreme than fluctuations in the overall market. Because the Fund invests a substantial amount of its assets in the consumer product/services sector, the Fund’s performance largely depends on the general condition of that sector. The consumer product/services
41
| |
Alpine Global Consumer Growth Fund |
|
| | |
sector could be adversely affected by overall economic conditions, interest rates, competition, consumer confidence, disposable income, changes in demographics and consumer tastes, and legislative or regulatory changes. The prices of the securities of those issuers also may fluctuate widely in response to such events.
Emerging Market Securities Risk – The risks of investing in foreign securities can be intensified in the case of investments in issuers domiciled or operating in emerging market countries. These risks include lack of liquidity and greater price volatility, greater risks of expropriation, less developed legal systems and less reliable custodial services and settlement practices.
Equity Securities Risk – The stock or other security of a company may not perform as well as expected, and may decrease in value, because of factors related to the company (such as poorer than expected earnings or certain management decisions) or to the industry in which the company is engaged (such as a reduction in the demand for products or services in a particular industry).
Foreign Currency Transactions – Foreign securities are often denominated in foreign currencies. As a result, the value of the Fund’s shares is affected by changes in exchange rates. A Fund may enter into foreign currency transactions to try to manage this risk. A Fund’s ability to use foreign currency transactions successfully depends on a number of factors, including the foreign currency transactions being available at prices that are not too costly, the availability of liquid markets and the ability of the portfolio managers to accurately predict the direction of changes in currency exchange rates.
Foreign Securities Risk – Public information available concerning foreign issuers may be more limited than would be with respect to domestic issuers. Different accounting standards may be used by foreign issuers, and foreign trading markets may not be as liquid as U.S. markets. Additionally, foreign securities also involve currency fluctuation risk, possible imposition of withholding or confiscatory taxes and adverse political or economic developments. These risks may be greater in emerging markets.
Growth Stock Risk – Growth stocks typically are very sensitive to market movements because their market prices tend to reflect future expectations. When it appears those expectations will not be met, the prices of growth stocks typically fall. Growth stocks as a group may be out of favor and underperform the overall equity market while the market concentrates on undervalued stocks.
Management Risk – The Adviser’s judgment about the quality, relative yield or value of, or market trends affecting, a particular security or sector, or about interest rates generally, may be incorrect. The Adviser’s security selections and other investment decisions might produce losses or cause the Fund to underperform when compared to other funds with similar investment objectives and strategies.
Market Risk – The price of a security held by the Fund may fall due to changing market, economic or political conditions.
Micro Capitalization Company Risk – Investments in micro-cap companies are associated with similar risks as investments in small and medium capitalization companies, but these risks may be even greater with respect to investments in micro-cap companies.
Small and Medium Capitalization Company Risk – Securities of small or medium capitalization companies are more likely to experience sharper swings in market values, less liquid markets, in which it may be more difficult for the Adviser to sell at times and at prices that the Adviser believes appropriate and generally are more volatile than those of larger companies.
Undervalued Stock Risk – The Fund may pursue strategies that may include investing in securities, which, in the opinion of the Adviser, are undervalued. The identification of investment opportunities in undervalued securities is a difficult task and there is no assurance that such opportunities will be successfully recognized or acquired. While investments in undervalued securities offer opportunities for above-average capital appreciation, these investments involve a high degree of financial risk and can result in substantial losses.
Please refer to pages 4-5 for other important disclosures and definitions
42
|
Alpine Mutual Funds |
| |
|
Information about your Funds Expenses (Unaudited)
April 30, 2012 |
Fund expenses (unaudited)
Example
As a shareholder of the Fund, you may incur two types of costs: (1) transaction costs, including front-end on purchase payments; and (2) ongoing costs, including management fees; service and/or distribution (12b-1) fees; and other Fund expenses. This example is intended to help you understand your ongoing costs (in dollars) of investing in the Fund and to compare these costs with the ongoing costs of investing in other mutual funds.
This example is based on an investment of $1,000 invested on November 1, 2011 and held for the six months ended April 30, 2012.
Actual Expenses
The table below titled “Based on Actual Total Return” provides information about actual account values and actual expenses. You may use the information provided in this table, together with the amount you invested, to estimate the expenses that you paid over the period. To estimate the expenses you paid on your account, divide your ending account value by $1,000 (for example, an $8,600 ending account value divided by $1,000 = 8.6), then multiply the result by the number under the heading entitled “Expenses Paid During the Period”.
Hypothetical Example for Comparison Purposes
The table below titled “Based on Hypothetical Total Return” provides information about hypothetical account values and hypothetical expenses based on the actual expense ratio and an assumed rate of return of 5.00% per year before expenses, which is not the Fund’s actual return. The hypothetical account values and expenses may not be used to estimate the actual ending account balance or expenses you paid for the period. You may use the information provided in this table to compare the ongoing costs of investing in the Fund and other funds. To do so, compare the 5.00% hypothetical example relating to the Fund with the 5.00% hypothetical examples that appear in the shareholder reports of the other funds.
Please note that the expenses shown in the table below are meant to highlight your ongoing costs only and do not reflect any transactional costs, such as front-end or back-end sales charges (loads). Therefore, the table is useful in comparing ongoing costs only, and will not help you determine the relative total costs of owning different funds. In addition, if these transaction costs were included, your costs would have been higher.
International Real Estate Equity Fund
Based on actual total return (1)
| | | | | | | | | | | | |
Class | | | Actual Total
Return Without
Sales Charges (2) | | Beginning
Account Value | | Ending
Account Value | | Annualized
Expense
Ratio | | Expenses
Paid During
the Period (3) | |
| | | | | | | | | | | | | |
| | | | | | | | | | | |
Class A | | 17.75% | | $1,000.00 | | $1,177.50 | | 1.68% | | $6.05 | |
| | | | | | | | | | | |
Institutional | | 6.00% | | $1,000.00 | | $1,060.00 | | 1.44% | | $7.38 | |
| | | | | | | | | | | |
Based on hypothetical total return (1) | | | | | | | | | | | |
| | | | | | | | | | | | |
Class | | | Hypothetical
Annualized
Total Return | | Beginning
Account Value | | Ending
Account Value | | Annualized
Expense
Ratio | | Expenses
Paid During
the Period (4) | |
| | | | | | | | | | | | | |
| | | | | | | | | | | |
Class A | | 5.00% | | $1,000.00 | | $1,016.51 | | 1.68% | | $8.42 | |
| | | | | | | | | | | |
Institutional | | 5.00% | | $1,000.00 | | $1,017.70 | | 1.44% | | $7.22 | |
43
|
Alpine Mutual Funds |
| |
|
Information about your Funds Expenses (Unaudited)—Continued
Expense Examples
April 30, 2012 |
|
Realty Income and Growth Fund |
| | | | | | | | | | | | |
Based on actual total return (1) | | | | | | | | | | | |
Class | | | Actual Total
Return Without
Sales Charges (2) | | Beginning
Account Value | | Ending
Account Value | | Annualized
Expense
Ratio | | Expenses
Paid During
the Period (3) | |
| | | | | | | | | | | | | |
| | | | | | | | | | | |
Class A | | 14.58% | | $1,000.00 | | $1,145.80 | | 1.59% | | $5.64 | |
| | | | | | | | | | | |
Institutional | | 16.26% | | $1,000.00 | | $1,162.60 | | 1.34% | | $7.21 | |
| | | | | | | | | | | |
Based on hypothetical total return (1) | | | | | | | | | | | |
Class | | | Hypothetical
Annualized
Total Return | | Beginning
Account Value | | Ending
Account Value | | Annualized
Expense
Ratio | | Expenses
Paid During
the Period (4) | |
| | | | | | | | | | | | | |
| | | | | | | | | | | |
Class A | | 5.00% | | $1,000.00 | | $1,016.96 | | 1.59% | | $7.97 | |
| | | | | | | | | | | |
Institutional | | 5.00% | | $1,000.00 | | $1,018.20 | | 1.34% | | $6.72 | |
| | | | | | | | | | | |
Cyclical Advantage Property Fund | | | | | | | | | | | |
| | | | | | | | | | | |
Based on actual total return (1) | | | | | | | | | | | |
Class | | | Actual Total
Return Without
Sales Charges (2) | | Beginning
Account Value | | Ending
Account Value | | Annualized
Expense
Ratio | | Expenses
Paid During
the Period (3) | |
| | | | | | | | | | | | | |
| | | | | | | | | | | |
Institutional | | 13.20% | | $1,000.00 | | $1,132.00 | | 1.48% | | $7.85 | |
| | | | | | | | | | | |
Based on hypothetical total return (1) | | | | | | | | | | | |
Class | | | Hypothetical
Annualized
Total Return | | Beginning
Account Value | | Ending
Account Value | | Annualized
Expense
Ratio | | Expenses
Paid During
the Period (3) | |
| | | | | | | | | | | | | |
| | | | | | | | | | | |
Institutional | | 5.00% | | $1,000.00 | | $1,017.50 | | 1.48% | | $7.42 | |
| | | | | | | | | | | |
| | | | | | | | | | | |
Emerging Markets Real Estate Fund | | | | | | | | | | | |
| | | | | | | | | | | |
Based on actual total return (1) | | | | | | | | | | | |
Class | | | Actual Total
Return Without
Sales Charges (2) | | Beginning
Account Value | | Ending
Account Value | | Annualized
Expense
Ratio | | Expenses
Paid During
the Period (3) | |
| | | | | | | | | | | | | |
| | | | | | | | | | | |
Class A | | 20.52% | | $1,000.00 | | $1,205.20 | | 1.61% | | $5.87 | |
| | | | | | | | | | | |
Institutional | | 10.56% | | $1,000.00 | | $1,105.60 | | 1.35% | | $7.07 | |
| | | | | | | | | | | |
Based on hypothetical total return (1) | | | | | | | | | | | |
Class | | | Hypothetical
Annualized
Total Return | | Beginning
Account Value | | Ending
Account Value | | Annualized
Expense
Ratio | | Expenses
Paid During
the Period (4) | |
| | | | | | | | | | | | | |
| | | | | | | | | | | |
Class A | | 5.00% | | $1,000.00 | | $1,016.86 | | 1.61% | | $8.07 | |
| | | | | | | | | | | |
Institutional | | 5.00% | | $1,000.00 | | $1,018.15 | | 1.35% | | $6.77 | |
44
|
Alpine Mutual Funds |
| |
|
Information about your Funds Expenses (Unaudited)—Continued
Expense Examples
April 30, 2012 |
| | | | | | | | | | | | |
Global Infrastructure Fund | | | | | | | | | | | |
| | | | | | | | | | | |
Based on actual total return (1) | | | | | | | | | | | |
Class | | | Actual Total
Return Without
Sales Charges (2) | | Beginning
Account Value | | Ending
Account Value | | Annualized
Expense
Ratio | | Expenses
Paid During
the Period (3) | |
| | | | | | | | | | | | | |
| | | | | | | | | | | |
Class A | | 13.16% | | $1,000.00 | | $1,131.60 | | 1.53% | | $5.39 | |
| | | | | | | | | | | |
Institutional | | 11.25% | | $1,000.00 | | $1,112.50 | | 1.28% | | $6.72 | |
| | | | | | | | | | | |
Based on hypothetical total return (1) | | | | | | | | | | | |
Class | | | Hypothetical
Annualized
Total Return | | Beginning
Account Value | | Ending
Account Value | | Annualized
Expense
Ratio | | Expenses
Paid During
the Period (4) | |
| | | | | | | | | | | | | |
| | | | | | | | | | | |
Class A | | 5.00% | | $1,000.00 | | $1,017.26 | | 1.53% | | $7.67 | |
| | | | | | | | | | | |
Institutional | | 5.00% | | $1,000.00 | | $1,018.50 | | 1.28% | | $6.42 | |
| | | | | | | | | | | |
Global Consumer Growth Fund | | | | | | | | | | | |
| | | | | | | | | | | |
Based on actual total return (1) | | | | | | | | | | | |
Class | | | Actual Total
Return Without
Sales Charges (2) | | Beginning
Account Value | | Ending
Account Value | | Annualized
Expense
Ratio | | Expenses
Paid During
the Period (3) | |
| | | | | | | | | | | | | |
| | | | | | | | | | | |
Class A | | 18.55% | | $1,000.00 | | $1,185.50 | | 1.60% | | $5.78 | |
| | | | | | | | | | | |
Institutional | | 11.22% | | $1,000.00 | | $1,112.20 | | 1.35% | | $7.09 | |
| | | | | | | | | | | |
Based on hypothetical total return (1) | | | | | | | | | | | |
Class | | | Hypothetical
Annualized
Total Return | | Beginning
Account Value | | Ending
Account Value | | Annualized
Expense
Ratio | | Expenses
Paid During
the Period (4) | |
| | | | | | | | | | | | | |
| | | | | | | | | | | |
Class A | | 5.00% | | $1,000.00 | | $1,016.91 | | 1.60% | | $8.02 | |
| | | | | | | | | | | |
Institutional | | 5.00% | | $1,000.00 | | $1,018.15 | | 1.35% | | $6.77 | |
| | |
| | |
(1) | For the six months ended April 30, 2012. |
(2) | Assumes the reinvestment of all distributions, including returns of capital, if any, at net asset value and does not reflect the deduction of the applicable sales charge. Total return is not annualized, as it may not be representative of the total return for the year. Performance figures may reflect fee waivers and/or expense reimbursements. In the absence of fee waivers and/or expense reimbursements, the total return would have been lower. Past performance is no guarantee of future results. |
(3) | Expenses (net of fee waivers and/or expense reimbursements) are equal to each class’ respective annualized expense ratio multiplied by the average account value over the period, multiplied by the number of days in the most recent fiscal half-year (121 and 182, for Class A and Institutional Shares, respectfully), then divided by 366. |
(4) | Class A Shares commenced operations on December 30, 2011. Hypothetical expense examples assume a 5% return over a hypothetical 182 day period. |
45
|
Alpine International Real Estate Equity Fund |
| |
Schedule of Portfolio Investments
April 30, 2012 (Unaudited)
| | | | | | | |
Shares | | Security
Description | | Value | |
| | | | | | |
|
Common Stocks—102.9% | | | | |
Asia—31.1% | | | | |
China—5.1% | | | | |
| 3,000,000 | | Evergrande Real Estate
Group, Ltd. | | $ | 1,736,127 | |
| 11,028,960 | | Franshion Properties China, Ltd. | | | 3,056,236 | |
| 1,500,000 | | Guangzhou R&F Properties
Co., Ltd. | | | 2,002,926 | |
| 6,000,000 | | Kaisa Group Holdings, Ltd. (a) | | | 1,268,262 | |
| 4,000,000 | | Poly Hong Kong Investments, Ltd. | | | 2,103,459 | |
| 3,991,373 | | SOCAM Development, Ltd. | | | 4,321,310 | |
| 2,199,515 | | Soho China, Ltd. | | | 1,709,456 | |
| | | | | | | |
| | | | | | 16,197,776 | |
| | | | | | | |
Hong Kong—1.7% | | | | |
| 1,615,000 | | Mandarin Oriental International,
Ltd. | | | 2,567,850 | |
| 176,522 | | Sun Hung Kai Properties, Ltd. | | | 2,131,829 | |
| 550,632 | | The Hongkong & Shanghai
Hotels, Ltd. | | | 722,475 | |
| | | | | | | |
| | | | | | 5,422,154 | |
| | | | | | | |
India—8.5% | | | | |
| 90,390 | | DB Realty, Ltd. (a) | | | 126,151 | |
| 2,290,373 | | Hirco PLC (a) | | | 2,137,301 | |
| 2,000,000 | | South Asian Real Estate PLC
(a)(b)(c)(d) | | | 15,287,716 | |
| 7,240,153 | | Unitech Corporate Parks PLC (a) | | | 3,760,014 | |
| 1,491,800 | | Yatra Capital, Ltd. (a)(e) | | | 5,825,354 | |
| | | | | | | |
| | | | | | 27,136,536 | |
| | | | | | | |
Indonesia—3.0% | | | | |
| 267,462,031 | | PT Bakrieland Development
TBK (a) | | | 3,404,935 | |
| 16,765,928 | | PT Bumi Serpong Damai TBK | | | 2,608,702 | |
| 37,288,857 | | PT Lippo Karawaci TBK | | | 3,367,581 | |
| | | | | | | |
| | | | | | 9,381,218 | |
| | | | | | | |
Japan—1.1% | | | | |
| 10,000 | | Kenedix, Inc. (a) | | | 1,814,880 | |
| 100,000 | | Nomura Real Estate Holdings, Inc. | | | 1,762,274 | |
| | | | | | | |
| | | | | | 3,577,154 | |
| | | | | | | |
Malaysia—0.4% | | | | |
| 3,100,591 | | Aseana Properties, Ltd. | | | 1,360,384 | |
| | | | | | | |
Philippines—2.3% | | | | |
| 40,000,000 | | Megaworld Corp. | | | 2,055,898 | |
| 32,035,959 | | SM Development Corp. | | | 5,319,092 | |
| | | | | | | |
| | | | | | 7,374,990 | |
| | | | | | | |
Singapore—3.9% | | | | |
| 6,979,000 | | Banyan Tree Holdings, Ltd. | | | 3,609,341 | |
| 1,250,000 | | CapitaMalls Asia, Ltd. | | | 1,555,556 | |
| 3,401,420 | | Global Logistic Properties, Ltd. (a) | | | 5,662,162 | |
| 625,000 | | Keppel Land, Ltd. | | | 1,601,010 | |
| | | | | | | |
| | | | | | 12,428,069 | |
| | | | | | | |
Thailand—5.1% | | | | |
| 4,702,300 | | Central Pattana PCL | | | 7,684,246 | |
| 18,920,357 | | Minor International PCL | | | 8,675,676 | |
| | | | | | | |
| | | | | | 16,359,922 | |
| | | | | | | |
| | | Total Asia (Cost $129,685,945) | | | 99,238,203 | |
| | | | | | | |
| | | | | | | |
Shares | | Security
Description | | Value | |
| | | | | | |
|
Europe—26.5% | | | | |
France—2.2% | | | | |
| 135,544 | | Kaufman & Broad SA (a) | | $ | 2,562,112 | |
| 154,193 | | Nexity SA | | | 4,396,429 | |
| | | | | | | |
| | | | | | 6,958,541 | |
| | | | | | | |
Germany—3.8% | | | | |
| 277,424 | | DIC Asset AG | | | 2,583,436 | |
| 1,099,999 | | IVG Immobilien AG (a) | | | 2,546,665 | |
| 1,100 | | Patrizia Immobilien AG (a) | | | 7,124 | |
| 7,642,900 | | Sirius Real Estate, Ltd. (a) | | | 2,377,474 | |
| 317,573 | | TAG Immobilien AG (a) | | | 3,152,786 | |
| 12,440,218 | | Treveria PLC (a) | | | 1,497,685 | |
| | | | | | | |
| | | | | | 12,165,170 | |
| | | | | | | |
Norway—0.5% | | | | |
| 697,582 | | BWG Homes ASA | | | 1,420,042 | |
| 207,485 | | Norwegian Property ASA | | | 308,167 | |
| | | | | | | |
| | | | | | 1,728,209 | |
| | | | | | | |
Poland—0.2% | | | | |
| 3,265,000 | | Nanette Real Estate Group NV
(a)(b)(d) | | | 757,889 | |
| | | | | | | |
Russia—1.7% | | | | |
| 799,367 | | Mirland Development Corp.
PLC (a) | | | 2,048,101 | |
| 1,724,911 | | RGI International, Ltd. (a) | | | 3,449,822 | |
| | | | | | | |
| | | | | | 5,497,923 | |
| | | | | | | |
Sweden—1.9% | | | | |
| 320,877 | | JM AB | | | 5,943,670 | |
| | | | | | | |
Turkey—3.1% | | | | |
| 6,100,522 | | Emlak Konut Gayrimenkul
Yatirim Ortakligi AS | | | 8,024,032 | |
| 2,471,294 | | Sinpas Gayrimenkul Yatirim
Ortakligi AS | | | 1,758,928 | |
| | | | | | | |
| | | | | | 9,782,960 | |
| | | | | | | |
United Kingdom—13.1% | | | | |
| 674,280 | | Development Securities PLC | | | 1,805,577 | |
| 700,339 | | Great Portland Estates PLC | | | 4,092,825 | |
| 5,000,713 | | LXB Retail Properties PLC (a) | | | 9,637,342 | |
| 1,161,792 | | Metric Property Investments PLC | | | 1,687,497 | |
| 5,218,398 | | Quintain Estates & Development
PLC (a) | | | 3,239,368 | |
| 7,808,407 | | Regus PLC | | | 13,521,303 | |
| 2,740,130 | | Songbird Estates PLC (a) | | | 5,202,939 | |
| 800,130 | | Unite Group PLC | | | 2,535,381 | |
| | | | | | | |
| | | | | | 41,722,232 | |
| | | | | | | |
| | | Total Europe (Cost $129,386,573) | | | 84,556,594 | |
| | | | | | | |
Middle East/Africa—0.2% | | | | |
Egypt—0.2% | | | | |
| 1,021,442 | | Talaat Moustafa Group (a) | | | 704,589 | |
| | | | | | | |
| | | Total Middle East/Africa
(Cost $749,574) | | | 704,589 | |
| | | | | | | |
The accompanying notes are an integral part of these financial statements.
46
|
Alpine International Real Estate Equity Fund |
| |
Schedule of Portfolio Investments—Continued
April 30, 2012 (Unaudited)
| | | | | | | |
Shares | | Security
Description | | Value | |
| | | | | | |
|
North & South America—45.1% | | | | |
Brazil—41.2% | | | | |
| 718,077 | | Aliansce Shopping Centers SA | | $ | 6,788,420 | |
| 793,138 | | BHG SA—Brazil Hospitality
Group (a) | | | 9,603,455 | |
| 950,037 | | BR Malls Participacoes SA | | | 11,802,259 | |
| 680,298 | | BR Properties SA | | | 8,440,599 | |
| 580,200 | | Brasil Brokers Participacoes SA | | | 1,984,578 | |
| 1,043,085 | | Cyrela Commercial Properties SA
Empreendimentos e
Participacoes | | | 11,491,638 | |
| 2,503,408 | | Direcional Engenharia SA | | | 12,844,388 | |
| 302,684 | | Even Construtora e
Incorporadora SA | | | 1,132,197 | |
| 1,207,100 | | Gafisa SA | | | 2,241,762 | |
| 912,132 | | General Shopping Brasil SA (a) | | | 5,531,698 | |
| 600,151 | | Iguatemi Empresa de Shopping
Centers SA | | | 13,185,911 | |
| 1,653,500 | | JHSF Participacoes SA | | | 5,187,383 | |
| 37,900 | | LPS Brasil Consultoria de
Imoveis SA | | | 654,151 | |
| 1,047,600 | | MRV Engenharia e
Participacoes SA | | | 6,094,947 | |
| 640,400 | | Multiplan Empreendimentos
Imobiliarios SA | | | 15,118,433 | |
| 3,040,610 | | PDG Realty SA Empreendimentos
e Participacoes | | | 7,178,210 | |
| 699,568 | | Rossi Residencial SA | | | 2,936,046 | |
| 475,394 | | Sao Carlos Empreendimentos e
Participacoes SA | | | 7,915,959 | |
| 303,227 | | Tecnisa SA | | | 1,364,891 | |
| | | | | | | |
| | | | | | 131,496,925 | |
| | | | | | | |
Canada—0.0%* | | | | |
| 320,000 | | Lakeview Hotel Real Estate
Investment Trust (a) | | | 90,702 | |
| | | | | | | |
Mexico—0.8% | | | | |
| 2,000,000 | | Corp. GEO SAB de CV—Series B (a) | | | 2,671,590 | |
| | | | | | | |
United States—3.1% | | | | |
| 282,300 | | Sunrise Senior Living, Inc. (a) | | | 1,772,844 | |
| 519,696 | | Verde Realty Corp. (a)(b)(c)(d) | | | 8,159,227 | |
| | | | | | | |
| | | | | | 9,932,071 | |
| | | | | | | |
| | | Total North & South America
(Cost $134,262,074) | | | 144,191,288 | |
| | | | | | | |
| | | Total Common Stocks
(Cost $394,084,166) | | | 328,690,674 | |
| | | | | | | |
| | | | | | | |
Shares | | Security
Description | | Value | |
| | | | | | |
|
Equity-Linked Structured Notes—1.5% | | | | |
Asia—1.5% | | | | |
India—1.5% | | | | |
| 1,190,000 | | Phoenix Mills, Ltd.—
Merrill Lynch & Co., Inc. | | $ | 4,735,161 | |
| | | | | | | |
| | | Total Asia (Cost $3,920,217) | | | 4,735,161 | |
| | | | | | | |
| | | Total Equity-Linked Structured
Notes (Cost $3,920,217) | | | 4,735,161 | |
| | | | | | | |
Investment Companies—0.8% | | | | |
Asia—0.6% | | | | |
India—0.6% | | | | |
| 7,497,900 | | Trinity Capital PLC (a) | | | 1,962,145 | |
| | | | | | | |
| | | Total Asia (Cost $12,613,773) | | | 1,962,145 | |
| | | | | | | |
Europe—0.2% | | | | |
Turkey—0.2% | | | | |
| 920,000 | | The Ottoman Fund, Ltd. (a) | | | 582,296 | |
| | | | | | | |
| | | Total Europe (Cost $1,507,548) | | | 582,296 | |
| | | | | | | |
| | | Total Investment Companies
(Cost $14,121,321) | | | 2,544,441 | |
| | | | | | | |
Warrants—0.1% | | | | |
Asia—0.1% | | | | |
Thailand—0.1% | | | | |
| 2,569,584 | | Minor International PCL (a)
Expiration: October, 2013
Exercise Price: THB 13.000 | | | 247,349 | |
| | | | | | | |
| | | Total Asia (Cost $0) | | | 247,349 | |
| | | | | | | |
| | | Total Warrants (Cost $0) | | | 247,349 | |
| | | | | | | |
| | | Total Investments
(Cost $412,125,704)—105.3% (f) | | | 336,217,625 | |
| | | Liabilities in Excess of
Other Assets—(5.3)% | | | (16,976,009 | ) |
| | | | | | | |
| | | TOTAL NET ASSETS 100.0% | | $ | 319,241,616 | |
| | | | | | | |
The accompanying notes are an integral part of these financial statements.
47
|
Alpine International Real Estate Equity Fund |
| |
Schedule of Portfolio Investments—Continued
April 30, 2012 (Unaudited)
| | |
| | |
Percentages are stated as a percent of net assets. |
|
* | Less than 0.05% of Net Assets. |
|
(a) | Non-income producing security. |
|
(b) | Illiquid security. |
|
(c) | Private placement. |
|
(d) | Security fair valued in accordance with procedures approved by the Board of Trustees. These securities comprised 7.6% of the Fund’s net assets. |
|
(e) | Affiliated issuer. See Note 6 in the Notes to Financial Statements. |
|
(f) | Includes securities pledged as collateral for line of credit outstanding on April 30, 2012. |
|
AB—Aktiebolag is the Swedish equivalent of the term corporation. |
|
AG—Aktiengesellschaft is a German term that refers to a corporation that is limited by shares, i.e., owned by shareholders. |
|
AS—Anonim Sirketi is the Turkish term for joint stock company. |
|
AAllmennaksjeselskap is the Norwegian term for a public limited company. |
|
NV—Naamloze Vennootschap is the Dutch term for a public limited liability corporation. |
|
PCL—Public Company Limited. |
|
PLC—Public Limited Company. |
|
SA—Generally designates corporations in various countries, mostly those employing the civil law. |
|
SAB de CV—Sociedad Anonima Bursátil de Capital Variable. Is the Spanish equivalent to Variable Capital Company. |
|
THB—Thailand Baht. |
The accompanying notes are an integral part of these financial statements.
48
|
Alpine Realty Income & Growth Fund |
| |
Schedule of Portfolio Investments
April 30, 2012 (Unaudited)
| | | | | | | |
Shares | | Security
Description | | Value | |
| | | | | | |
|
Real Estate Investment Trusts—96.6% | | | | |
Apartments—16.4% | | | | |
| 12,000 | | Associated Estates Realty Corp. | | $ | 203,160 | |
| 25,625 | | AvalonBay Communities, Inc. | | | 3,725,875 | |
| 34,900 | | BRE Properties, Inc. | | | 1,832,250 | |
| 10,000 | | Camden Property Trust | | | 676,700 | |
| 68,360 | | Equity Residential | | | 4,200,038 | |
| 23,665 | | Essex Property Trust, Inc. | | | 3,738,360 | |
| 50,200 | | Home Properties, Inc. | | | 3,064,710 | |
| 31,400 | | UDR, Inc. | | | 826,762 | |
| | | | | | | |
| | | | | | 18,267,855 | |
| | | | | | | |
Diversified—5.4% | | | | |
| 26,114 | | American Assets Trust, Inc. | | | 613,940 | |
| 88,700 | | Crombie Real Estate Investment
Trust | | | 1,275,032 | |
| 48,617 | | Vornado Realty Trust | | | 4,173,283 | |
| | | | | | | |
| | | | | | 6,062,255 | |
| | | | | | | |
Health Care—13.3% | | | | |
| 78,772 | | HCP, Inc. | | | 3,265,099 | |
| 44,546 | | Health Care REIT, Inc. | | | 2,523,976 | |
| 90,047 | | Omega Healthcare Investors, Inc. | | | 1,927,906 | |
| 126,200 | | Sabra Health Care REIT, Inc. | | | 2,112,588 | |
| 29,000 | | Senior Housing Properties Trust | | | 640,320 | |
| 74,212 | | Ventas, Inc. | | | 4,362,924 | |
| | | | | | | |
| | | | | | 14,832,813 | |
| | | | | | | |
Lodging—2.4% | | | | |
| 37,942 | | Chatham Lodging Trust | | | 493,246 | |
| 20,303 | | Chesapeake Lodging Trust | | | 367,484 | |
| 65,000 | | Host Hotels & Resorts, Inc. | | | 1,081,600 | |
| 12,000 | | LaSalle Hotel Properties | | | 352,920 | |
| 15,000 | | Pebblebrook Hotel Trust | | | 361,200 | |
| | | | | | | |
| | | | | | 2,656,450 | |
| | | | | | | |
Manufactured Homes—0.8% | | | | |
| 12,850 | | Equity Lifestyle Properties, Inc. | | | 898,729 | |
| | | | | | | |
Mortgage & Finance—2.1% | | | | |
| 79,232 | | Apollo Commercial Real Estate
Finance, Inc. | | | 1,278,012 | |
| 50,000 | | Starwood Property Trust, Inc. | | | 1,043,500 | |
| | | | | | | |
| | | | | | 2,321,512 | |
| | | | | | | |
Net Lease—0.9% | | | | |
| 22,112 | | Entertainment Properties Trust | | | 1,061,155 | |
| | | | | | | |
Office-Industrial Buildings—32.4% | | | | |
| 51,528 | | Alexandria Real Estate
Equities, Inc. | | | 3,860,478 | |
| 61,111 | | Boston Properties, Inc. | | | 6,615,266 | |
| 37,671 | | Coresite Realty Corp. | | | 938,385 | |
| 23,153 | | Corporate Office Properties
Trust | | | 545,253 | |
| 52,600 | | Digital Realty Trust, Inc. | | | 3,949,734 | |
| 139,509 | | Douglas Emmett, Inc. | | | 3,242,189 | |
| 40,352 | | DuPont Fabros Technology, Inc. (a) | | | 1,095,557 | |
| 54,473 | | Kilroy Realty Corp. | | | 2,584,744 | |
| 32,208 | | Liberty Property Trust | | | 1,173,982 | |
| 23,508 | | Mack—Cali Realty Corp. | | | 675,150 | |
| 38,581 | | Mission West Properties, Inc. | | | 338,741 | |
| 393,165 | | MPG Office Trust, Inc. (a) | | | 829,578 | |
| 104,700 | | ProLogis, Inc. | | | 3,746,166 | |
| 50,551 | | SL Green Realty Corp. | | | 4,167,424 | |
| | | | | | | |
Shares | | Security
Description | | Value | |
| | | | | | |
|
Real Estate Investment Trusts—continued | | | | |
Office-Industrial Buildings—continued | | | | |
| 51,271 | | STAG Industrial, Inc. | | $ | 713,692 | |
| 20,000 | | Terreno Realty Corp. | | | 286,000 | |
| 86,364 | | Verde Realty Corp. (a)(b)(c)(d) | | | 1,355,915 | |
| | | | | | | |
| | | | | | 36,118,254 | |
| | | | | | | |
Retail Centers—19.0% | | | | |
| 205,211 | | CBL & Associates Properties, Inc. | | | 3,823,081 | |
| 12,100 | | Federal Realty Investment Trust | | | 1,217,986 | |
| 60,000 | | General Growth Properties, Inc. | | | 1,068,000 | |
| 50,000 | | Kimco Realty Corp. | | | 970,500 | |
| 55,795 | | Simon Property Group, Inc. | | | 8,681,702 | |
| 24,706 | | Taubman Centers, Inc. | | | 1,906,809 | |
| 56,428 | | The Macerich Co. | | | 3,474,272 | |
| | | | | | | |
| | | | | | 21,142,350 | |
| | | | | | | |
Storage—3.9% | | | | |
| 30,765 | | Public Storage | | | 4,407,394 | |
| | | | | | | |
| | | Total Real Estate Investment Trusts
(Cost $73,695,799) | | | 107,768,767 | |
| | | | | | | |
Common Stocks—2.0% | | | | |
Lodging—1.1% | | | | | |
| 20,000 | | Starwood Hotels & Resorts
Worldwide, Inc. | | | 1,184,000 | |
| | | | | | | |
Office-Industrial Buildings—0.9% | | | | |
| 57,000 | | Brookfield Office Properties, Inc. | | | 1,035,120 | |
| | | | | | | |
| | | Total Common Stocks
(Cost $1,645,471) | | | 2,219,120 | |
| | | | | | | |
Preferred Stocks—6.3% | | | | |
Diversified—0.5% | | | | |
| 20,000 | | Winthrop Realty Trust—
Series D, 9.250% | | | 513,000 | |
| | | | | | | |
Lodging—1.0% | | | | | |
| 14,800 | | LaSalle Hotel Properties—
Series G, 7.250% | | | 371,184 | |
| 30,300 | | Sunstone Hotel Investors, Inc.—
Series A, 8.000% | | | | |
| | | | | | 745,380 | |
| | | | | | | |
| | | | | | 1,116,564 | |
| | | | | | | |
Net Lease—2.7% | | | | |
| 19,630 | | CapLease, Inc.—Series A, 8.125% | | | 490,750 | |
| 97,865 | | Entertainment Properties Trust—
Series D, 7.375% | | | 2,468,155 | |
| | | | | | | |
| | | | | | 2,958,905 | |
| | | | | | | |
Office-Industrial Buildings—0.9% | | | | |
| 41,360 | | SL Green Realty Corp.—
Series D, 7.875% | | | 1,060,057 | |
| | | | | | | |
Retail Centers—1.2% | | | | |
| 55,198 | | CBL & Associates Properties, Inc.—
Series D, 7.375% | | | 1,392,646 | |
| | | | | | | |
| | | Total Preferred Stocks
(Cost $4,361,825) | | | 7,041,172 | |
| | | | | | | |
| | | Total Investments
(Cost $79,703,095)—104.9% (e) | | | 117,029,059 | |
| | | Liabilities in Excess of
Other Assets—(4.9)% | | | (5,503,104 | ) |
| | | | | | | |
| | | TOTAL NET ASSETS 100.0% | | $ | 111,525,955 | |
| | | | | | | |
The accompanying notes are an integral part of these financial statements.
49
|
Alpine Realty Income & Growth Fund |
| |
Schedule of Portfolio Investments—Continued
April 30, 2012 (Unaudited)
| | |
| | |
Percentages are stated as a percent of net assets. |
|
(a) | Non-income producing security. |
| |
(b) | Illiquid security. |
| |
(c) | Private placement. |
| |
(d) | Security fair valued in accordance with procedures approved by the Board of Trustees. These securities comprised 1.2% of the Fund’s net assets. |
| |
(e) | Includes securities pledged as collateral for line of credit outstanding on April 30, 2012. |
| |
REIT—Real Estate Investment Trust |
The accompanying notes are an integral part of these financial statements.
50
|
Alpine Cyclical Advantage Property Fund |
| |
Schedule of Portfolio Investments
April 30, 2012 (Unaudited)
| | | | | | | |
Shares | | Security
Description | | Value | |
| | | | | | |
|
Common Stocks—100.6% | | | | |
Asia—20.8% | | | | |
China—3.8% | | | | |
| 500,000 | | Evergrande Real Estate
Group, Ltd. | | $ | 289,355 | |
| 2,500,000 | | Franshion Properties China, Ltd. | | | 692,775 | |
| 200,000 | | Guangzhou R&F Properties
Co., Ltd. | | | 267,057 | |
| 500,000 | | Hopson Development
Holdings, Ltd. | | | 301,599 | |
| 1,000,000 | | Kaisa Group Holdings, Ltd. (a) | | | 211,377 | |
| 500,000 | | Poly Hong Kong Investments, Ltd. | | | 262,932 | |
| | | | | | | |
| | | | | | 2,025,095 | |
| | | | | | | |
Hong Kong—0.7% | | | | |
| 29,420 | | Sun Hung Kai Properties, Ltd. | | | 355,301 | |
| | | | | | | |
India—0.6% | | | | |
| 620,000 | | Unitech Corporate Parks PLC (a) | | | 321,983 | |
| | | | | | | |
Indonesia—2.2% | | | | |
| 36,204,016 | | PT Bakrieland Development
TBK (a) | | | 460,897 | |
| 3,500,000 | | PT Ciputra Development TBK | | | 289,429 | |
| 4,513,514 | | PT Lippo Karawaci TBK | | | 407,618 | |
| | | | | | | |
| | | | | | 1,157,944 | |
| | | | | | | |
Japan—2.0% | | | | |
| 60,000 | | Hulic Co., Ltd. | | | 691,383 | |
| 1,000 | | Kenedix, Inc. (a) | | | 181,488 | |
| 10,000 | | Nomura Real Estate Holdings, Inc. | | | 176,227 | |
| | | | | | | |
| | | | | | 1,049,098 | |
| | | | | | | |
Philippines—3.4% | | | | |
| 5,000,000 | | Megaworld Corp. | | | 256,987 | |
| 3,751,363 | | Robinsons Land Corp. | | | 1,538,930 | |
| | | | | | | |
| | | | | | 1,795,917 | |
| | | | | | | |
Singapore—1.7% | | | | |
| 200,000 | | CapitaMalls Asia, Ltd. | | | 248,889 | |
| 250,000 | | Global Logistic Properties, Ltd. (a) | | | 416,161 | |
| 100,000 | | Keppel Land, Ltd. | | | 256,162 | |
| | | | | | | |
| | | | | | 921,212 | |
| | | | | | | |
Thailand—6.4% | | | | |
| 300,000 | | Central Pattana PCL | | | 490,244 | |
| 2,200,000 | | LPN Development PCL—NVDR | | | 1,237,724 | |
| 1,100,000 | | Minor International PCL | | | 504,390 | |
| 1,400,000 | | Supalai PCL | | | 746,667 | |
| 1,000,000 | | Ticon Industrial Connection PCL | | | 422,764 | |
| | | | | | | |
| | | | | | 3,401,789 | |
| | | | | | | |
| | | Total Asia (Cost $8,500,456) | | | 11,028,339 | |
| | | | | | | |
Europe—14.9% | | | | |
France—2.2% | | | | |
| 67,000 | | Affine SA | | | 1,160,038 | |
| | | | | | | |
Germany—4.9% | | | | |
| 39,904 | | DIC Asset AG | | | 371,595 | |
| 100,000 | | Patrizia Immobilien AG (a) | | | 647,687 | |
| 159,090 | | TAG Immobilien AG (a) | | | 1,579,406 | |
| | | | | | | |
| | | | | | 2,598,688 | |
| | | | | | | |
Norway—0.1% | | | | |
| 38,720 | | BWG Homes ASA | | | 78,821 | |
| | | | | | | |
Poland—0.4% | | | | |
| 40,000 | | Atrium European Real Estate, Ltd. | | | 194,848 | |
| | | | | | | |
| | | | | | | |
Shares | | Security
Description | | Value | |
| | | | | | |
|
Common Stocks—continued | | | | |
Russia—1.5% | | | | |
| 800,000 | | Raven Russia, Ltd. | | $ | 808,204 | |
| | | | | | | |
United Kingdom—5.8% | | | | |
| 778,923 | | LXB Retail Properties PLC (a) | | | 1,501,135 | |
| 964,231 | | Quintain Estates & Development
PLC (a) | | | 598,555 | |
| 341,253 | | Songbird Estates PLC (a) | | | 647,969 | |
| 100,014 | | Unite Group PLC | | | 316,916 | |
| | | | | | | |
| | | | | | 3,064,575 | |
| | | | | | | |
| | | Total Europe (Cost $7,598,973) | | | 7,905,174 | |
| | | | | | | |
Middle East/Africa—0.6% | | | | |
Egypt—0.6% | | | | |
| 81,405 | | Six of October Development &
Investment Co. | | | 214,378 | |
| 153,251 | | Talaat Moustafa Group (a) | | | 105,712 | |
| | | | | | | |
| | | | | | 320,090 | |
| | | | | | | |
| | | Total Middle East/Africa
(Cost $550,617) | | | 320,090 | |
| | | | | | | |
North & South America—64.3% | | | | |
Brazil—24.6% | | | | |
| 98,241 | | BHG SA—Brazil Hospitality
Group (a) | | | 1,189,519 | |
| 109,796 | | BR Malls Participacoes SA | | | 1,363,990 | |
| 95,538 | | BR Properties SA | | | 1,185,360 | |
| 7,500 | | Cyrela Commercial Properties SA
Empreendimentos e
Participacoes—ADR | | | 332,577 | |
| 15,000 | | Cyrela Commercial Properties SA
Empreendimentos e
Participacoes—ADR (b) | | | 665,154 | |
| 230,654 | | Direcional Engenharia SA | | | 1,183,430 | |
| 100,526 | | Even Construtora e
Incorporadora SA | | | 376,020 | |
| 180,100 | | Gafisa SA | | | 334,472 | |
| 40,000 | | General Shopping Brasil SA (a) | | | 242,583 | |
| 72,140 | | Iguatemi Empresa de Shopping
Centers SA | | | 1,584,987 | |
| 150,000 | | JHSF Participacoes SA | | | 470,582 | |
| 28,000 | | LPS Brasil Consultoria de
Imoveis SA | | | 483,278 | |
| 88,290 | | Multiplan Empreendimentos
Imobiliarios SA | | | 2,084,332 | |
| 310,000 | | PDG Realty SA Empreendimentos
e Participacoes | | | 731,842 | |
| 140,000 | | Rossi Residencial SA | | | 587,572 | |
| 54,181 | | Tecnisa SA | | | 243,881 | |
| | | | | | | |
| | | | | | 13,059,579 | |
| | | | | | | |
Canada—1.1% | | | | |
| 49,146 | | Brookfield Residential
Properties, Inc. (a) | | | 571,077 | |
| | | | | | | |
Mexico—0.7% | | | | |
| 254,825 | | Corp. GEO SAB de CV—Series B (a) | | | 340,394 | |
| | | | | | | |
United States—37.9% | | | | |
| 30,000 | | Altisource Portfolio Solutions
SA (a) | | | 1,794,900 | |
| 17,493 | | American Capital Agency Corp. | | | 546,481 | |
| 20,000 | | American Capital Mortgage
Investment Corp. | | | 454,600 | |
The accompanying notes are an integral part of these financial statements.
51
|
Alpine Cyclical Advantage Property Fund |
| |
Schedule of Portfolio Investments—Continued
April 30, 2012 (Unaudited)
| | | | | | | |
Shares | | Security
Description | | Value | |
| | | | | | |
|
Common Stocks—continued | | | | |
United States—continued | | | | |
| 19,852 | | Apollo Commercial Real Estate
Finance, Inc. | | $ | 320,213 | |
| 50,000 | | Brookdale Senior Living, Inc. (a) | | | 950,500 | |
| 40,491 | | Brookfield Office Properties, Inc. | | | 735,316 | |
| 45,000 | | CBRE Group, Inc.—Class A (a) | | | 846,450 | |
| 25,125 | | Chatham Lodging Trust | | | 326,625 | |
| 84,228 | | DiamondRock Hospitality Co. | | | 895,344 | |
| 40,000 | | Excel Trust, Inc. | | | 479,600 | |
| 89,053 | | General Growth Properties, Inc. | | | 1,585,143 | |
| 4,910 | | Hudson Pacific Properties, Inc. | | | 77,725 | |
| 5,000 | | Jones Lang LaSalle, Inc. | | | 399,700 | |
| 500 | | KB Home | | | 4,340 | |
| 25,000 | | Lennar Corp.—Class A | | | 693,500 | |
| 300 | | NVR, Inc. (a) | | | 235,182 | |
| 110,771 | | Ocwen Financial Corp. (a) | | | 1,651,596 | |
| 6,831 | | ProLogis, Inc. | | | 244,413 | |
| 100,000 | | PulteGroup, Inc. (a) | | | 984,000 | |
| 3,340 | | Rouse Properties, Inc. | | | 44,890 | |
| 1,923 | | Simon Property Group, Inc. | | | 299,219 | |
| 40,000 | | Starwood Property Trust, Inc. | | | 834,800 | |
| 40,000 | | Sunrise Senior Living, Inc. (a) | | | 251,200 | |
| 8,533 | | The Howard Hughes Corp. (a) | | | 572,650 | |
| 20,000 | | Toll Brothers, Inc. (a) | | | 508,000 | |
| 48,200 | | TravelCenters of America LLC (a) | | | 303,660 | |
| 87,912 | | Two Harbors Investment Corp. | | | 919,559 | |
| 143,940 | | Verde Realty Corp. (a)(c)(d)(e) | | | 2,259,858 | |
| 10,440 | | Vornado Realty Trust | | | 896,170 | |
| | | | | | | |
| | | | | | 20,115,634 | |
| | | | | | | |
| | | Total North & South America
(Cost $29,644,457) | | | 34,086,684 | |
| | | | | | | |
| | | Total Common Stocks
(Cost $46,294,503) | | | 53,340,287 | |
| | | | | | | |
| | | | | | | |
Shares | | Security
Description | | Value | |
| | | | | | |
|
Equity-Linked Structured Notes—1.7% | | | | |
Asia—1.7% | | | | |
India—0.9% | | | | |
| 300,000 | | Peninsula Land, Ltd.—
Macquarie Bank, Ltd. (a) | | $ | 179,886 | |
| 50,000 | | Sobha Developers, Ltd.—
Macquarie Bank, Ltd. (a) | | | 311,432 | |
| | | | | | | |
| | | | | | 491,318 | |
| | | | | | | |
Vietnam—0.8% | | | | |
| 301,875 | | HAGL JSC—GDR—
Macquarie Bank, Ltd. (a) | | | 412,932 | |
| | | | | | | |
| | | Total Asia (Cost $1,542,321) | | | 904,250 | |
| | | | | | | |
| | | Total Equity-Linked Structured
Notes (Cost $1,542,321) | | | 904,250 | |
| | | | | | | |
Warrants—0.0%* | | | | |
Asia—0.0%* | | | | |
Thailand—0.0%* | | | | |
| 100,000 | | Minor International PLC
Expiration: May, 2013 | | | | |
| | | Exercise Price: THB 13.00 (a) | | | 9,626 | |
| | | | | | | |
| | | Total Asia (Cost $0) | | | 9,626 | |
| | | | | | | |
| | | Total Warrants (Cost $0) | | | 9,626 | |
| | | | | | | |
| | | Total Investments
(Cost $47,836,824)—102.3% (f) | | | 54,254,163 | |
| | | Liabilities in Excess of
Other Assets—(2.3)% | | | (1,224,340 | ) |
| | | | | | | |
| | | TOTAL NET ASSETS 100.0% | | $ | 53,029,823 | |
| | | | | | | |
| | |
| | |
|
Percentages are stated as a percent of net assets. |
|
* Amount is less than 0.05%. |
| |
(a) | Non-income producing security. |
| |
(b) | Restricted under Rule 144A of the Securities Act of 1933. These securities may be resold in transactions exempt from registration, normally to qualified institutional buyers. These securities have been determined to be liquid under guidelines established by the Board of Trustees. Liquid securities restricted under Rule 144A comprised 1.3% of the Fund’s net assets. |
| |
(c) | Security fair valued in accordance with procedures approved by the Board of Trustees. These securities comprised 4.3% of the Fund’s net assets. |
| |
(d) | Illiquid security. |
| |
(e) | Private placement. |
| |
(f) | Includes securities pledged as collateral for line of credit outstanding on April 30, 2012. |
ADR—American Depositary Receipt.
AG—Aktiengesellschaft is a German term that refers to a corporation that is limited by shares, i.e., owned by shareholders.
ASA—Allmennaksjeselskap is the Norwegian term for a public limited company.
GDR—Global Depositary Receipt.
JSC—Joint Stock Company.
NVDR—Non-Voting Depositary Receipts.
PCL—Public Company Limited.
PLC—Public Limited Company.
SA—Generally designates corporations in various countries, mostly those employing the civil law.
SAB de CV—Sociedad Anonima Bursátil de Capital Variable. Is the Spanish equivalent to Variable Capital Company.
THB—Thailand Baht.
The accompanying notes are an integral part of these financial statements.
52
|
Alpine Emerging Markets Real Estate Fund |
| |
Schedule of Portfolio Investments
April 30, 2012 (Unaudited)
| | | | | | | |
Shares | | Security
Description | | Value | |
| | | | | | |
| | | | |
Common Stocks—93.6% | | | | |
Asia—49.7% | | | | |
China—13.4% | | | | |
| 100,000 | | C C Land Holdings, Ltd. | | $ | 21,396 | |
| 74,000 | | China Overseas Grand Oceans
Group, Ltd. | | | 99,574 | |
| 27,000 | | China Overseas Land &
Investment, Ltd. | | | 58,603 | |
| 31,000 | | China Resources Land, Ltd. | | | 59,693 | |
| 70,000 | | China State Construction
International Holdings, Ltd. | | | 64,689 | |
| 150,000 | | Evergrande Real Estate Group,
Ltd. | | | 86,806 | |
| 26,000 | | Franshion Properties China, Ltd. | | | 7,205 | |
| 27,000 | | Guangzhou R&F Properties Co.,
Ltd. | | | 36,053 | |
| 125,000 | | Kaisa Group Holdings, Ltd. (a) | | | 26,422 | |
| 20,000 | | KWG Property Holding, Ltd. | | | 13,224 | |
| 82,000 | | Poly Hong Kong Investments,
Ltd. (a) | | | 43,121 | |
| 58,500 | | Soho China, Ltd. | | | 45,466 | |
| | | | | | | |
| | | | | | 562,252 | |
| | | | | | | |
Hong Kong—3.2% | | | | |
| 3,000 | | Cheung Kong Holdings, Ltd. | | | 39,981 | |
| 11,000 | | Mandarin Oriental International,
Ltd. | | | 17,490 | |
| 3,500 | | Sun Hung Kai Properties, Ltd. | | | 42,269 | |
| 6,000 | | Wharf Holdings, Ltd. | | | 35,805 | |
| | | | | | | |
| | | | | | 135,545 | |
| | | | | | | |
India—0.8% | | | | |
| 65,000 | | Unitech Corporate Parks PLC (a) | | | 33,756 | |
| | | | | | | |
Indonesia—11.5% | | | | |
| 52,000 | | First Real Estate Investment Trust | | | 37,608 | |
| 149,000 | | Lippo Malls Indonesia Retail Trust | | | 49,366 | |
| 330,000 | | PT Agung Podomoro Land TBK (a) | | | 13,465 | |
| 1,700,000 | | PT Alam Sutera Realty TBK | | | 110,984 | |
| 1,006,945 | | PT Bakrieland Development
TBK (a) | | | 12,819 | |
| 524,659 | | PT Bumi Serpong Damai TBK | | | 81,635 | |
| 400,000 | | PT Ciputra Development TBK | | | 33,078 | |
| 100,000 | | PT Ciputra Property TBK | | | 8,596 | |
| 170,000 | | PT Ciputra Surya TBK | | | 38,844 | |
| 450,000 | | PT Lippo Karawaci TBK | | | 40,640 | |
| 300,000 | | PT Summarecon Agung TBK | | | 56,471 | |
| | | | | | | |
| | | | | | 483,506 | |
| | | | | | | |
Malaysia—1.6% | | | | |
| 50,000 | | Aseana Properties, Ltd. | | | 21,937 | |
| 23,000 | | IJM Land BHD | | | 16,798 | |
| 40,000 | | UEM Land Holdings BHD (a) | | | 26,570 | |
| | | | | | | |
| | | | | | 65,305 | |
| | | | | | | |
Philippines—6.4% | | | | |
| 140,000 | | Ayala Land, Inc. | | | 71,128 | |
| 700,000 | | Megaworld Corp. | | | 35,978 | |
| 145,136 | | Robinsons Land Corp. | | | 59,540 | |
| 93,356 | | SM Development Corp. | | | 15,500 | |
| 225,000 | | SM Prime Holdings, Inc. | | | 88,998 | |
| | | | | | | |
| | | | | | 271,144 | |
| | | | | | | |
Singapore—1.0% | | | | |
| 26,500 | | Global Logistic Properties,
Ltd. (a) | | | 44,113 | |
| | | | | | | |
| | | | | | | |
Shares | | Security
Description | | Value | |
| | | | | | |
| | | | |
Common Stocks—continued | | | | |
Thailand—11.8% | | | | |
| 120,000 | | Amata Corp. PCL | | $ | 69,854 | |
| 205,000 | | Asian Property Development PCL | | | 45,667 | |
| 45,000 | | Central Pattana PCL | | | 73,536 | |
| 170,000 | | LPN Development PCL—NVDR | | | 95,642 | |
| 204,500 | | Minor International PCL | | | 93,771 | |
| 180,000 | | Supalai PCL | | | 96,000 | |
| 50,000 | | Ticon Industrial Connection PCL | | | 21,138 | |
| | | | | | | |
| | | | | | 495,608 | |
| | | | | | | |
| | | Total Asia (Cost $1,605,262) | | | 2,091,229 | |
| | | | | | | |
Europe—6.3% | | | | |
Russia—4.3% | | | | |
| 11,500 | | Etalon Group, Ltd.—GDR (a)(b) | | | 76,245 | |
| 6,074 | | Mirland Development Corp.
PLC (a) | | | 15,562 | |
| 65,000 | | Raven Russia, Ltd. | | | 65,667 | |
| 11,000 | | RGI International, Ltd. (a) | | | 22,000 | |
| | | | | | | |
| | | | | | 179,474 | |
| | | | | | | |
Turkey—2.0% | | | | |
| 47,000 | | Emlak Konut Gayrimenkul
Yatirim Ortakligi AS | | | 61,819 | |
| 30,000 | | Sinpas Gayrimenkul Yatirim
Ortakligi AS | | | 21,352 | |
| | | | | | | |
| | | | | | 83,171 | |
| | | | | | | |
| | | Total Europe (Cost $220,946) | | | 262,645 | |
| | | | | | | |
Middle East/Africa—0.5% | | | | |
UAE—0.5% | | | | |
| 25,000 | | Emaar Properties PJSC | | | 22,257 | |
| | | | | | | �� |
| | | Total Middle East/Africa
(Cost $20,735) | | | 22,257 | |
| | | | | | | |
North & South America—37.1% | | | | |
Argentina—1.0% | | | | |
| 3,100 | | TGLT SA—ADR (a) | | | 40,203 | |
| | | | | | | |
Brazil—34.4% | | | | |
| 4,500 | | Aliansce Shopping Centers SA | | | 42,541 | |
| 3,762 | | BHG SA—Brazil Hospitality
Group (a) | | | 45,551 | |
| 17,049 | | BR Malls Participacoes SA | | | 211,799 | |
| 10,056 | | BR Properties SA | | | 124,767 | |
| 10,500 | | Brasil Brokers Participacoes SA | | | 35,915 | |
| 3,791 | | Cyrela Commercial Properties SA
Empreendimentos e
Participacoes | | | 41,765 | |
| 19,124 | | Direcional Engenharia SA | | | 98,121 | |
| 16,895 | | Even Construtora e
Incorporadora SA | | | 63,196 | |
| 8,000 | | Ez Tec Empreendimentos e
Participacoes SA | | | 88,346 | |
| 14,838 | | General Shopping Brasil SA (a) | | | 89,986 | |
| 6,000 | | Helbor Empreendimentos SA | | | 29,683 | |
| 1,000 | | Iguatemi Empresa de Shopping
Centers SA | | | 21,971 | |
| 35,000 | | JHSF Participacoes SA | | | 109,803 | |
| 2,250 | | LPS Brasil Consultoria de
Imoveis SA | | | 38,835 | |
| 18,050 | | MRV Engenharia e
Participacoes SA | | | 105,015 | |
| 2,000 | | Multiplan Empreendimentos
Imobiliarios SA | | | 47,216 | |
The accompanying notes are an integral part of these financial statements.
53
|
Alpine Emerging Markets Real Estate Fund |
| |
Schedule of Portfolio Investments—Continued
April 30, 2012 (Unaudited)
| | | | | | | |
Shares | | Security
Description | | Value | |
| | | | | | |
| | | | | | |
Common Stocks—continued | | | | |
Brazil—continued | | | | |
| 81,754 | | PDG Realty SA Empreendimentos
e Participacoes | | $ | 193,003 | |
| 6,677 | | Rossi Residencial SA | | | 28,023 | |
| 894 | | Sao Carlos Empreendimentos e
Participacoes SA | | | 14,886 | |
| 3,500 | | Tecnisa SA | | | 15,754 | |
| | | | | | | |
| | | | | | 1,446,176 | |
| | | | | | | |
Chile—0.8% | | | | |
| 12,000 | | Parque Arauco SA | | | 23,315 | |
| 20,000 | | Socovesa SA | | | 10,060 | |
| | | | | | | |
| | | | | | 33,375 | |
| | | | | | | |
Mexico—0.9% | | | | |
| 30,000 | | Corp. GEO SAB de CV—
Series B (a) | | | 40,074 | |
| | | | | | | |
| | | Total North & South America
(Cost $1,591,876) | | | 1,559,828 | |
| | | | | | | |
| | | Total Common Stocks
(Cost $3,438,819) | | | 3,935,959 | |
| | | | | | | |
Equity-Linked Structured Notes—5.2% | | | | |
Asia—5.2% | | | | |
India—3.8% | | | | |
| 10,000 | | Anant Raj Industries, Ltd.—
Macquarie Bank, Ltd. | | | 11,091 | |
| 8,667 | | DLF, Ltd.—Macquarie Bank, Ltd. | | | 30,820 | |
| 25,000 | | Peninsula Land, Ltd.—
Macquarie Bank, Ltd. | | | 14,990 | |
| 12,310 | | Phoenix Mills, Ltd.—
Macquarie Bank, Ltd. | | | 48,983 | |
| 5,000 | | Phoenix Mills, Ltd.—
Merrill Lynch & Co., Inc. | | | 19,896 | |
| 15,500 | | Prestige Estates Projects, Ltd.—
Macqarie Bank, Ltd. | | | 32,353 | |
| | | | | | | |
| | | | | | 158,133 | |
| | | | | | | |
| | | | | | | |
Shares | | Security
Description | | Value | |
| | | | | | |
| | | | | |
Equity-Linked Structured Notes—continued | | | | |
Vietnam—1.4% | | | | |
| 43,125 | | HAGL JSC—GDR—
Macquarie Bank, Ltd. (a) | | $ | 58,990 | |
| | | | | | | |
| | | Total Asia (Cost $253,055) | | | 217,123 | |
| | | | | | | |
| | | Total Equity-Linked Structured
Notes (Cost $253,055) | | | 217,123 | |
| | | | | | | |
Investment Companies—0.1% | | | | |
| 10,000 | | Vinaland, Ltd. (a) | | | 5,638 | |
| | | | | | | |
| | | Total Investment Companies
(Cost $4,857) | | | 5,638 | |
| | | | | | | |
Warrants—0.0%* | | | | |
Asia—0.0%* | | | | |
Thailand—0.0%* | | | | |
| 14,000 | | The Erawan Group PCL (a)
Expiration: December, 2013
Exercise Price: THB 2.80 | | | 278 | |
| 7,500 | | Minor International PCL (a)
Expiration: May, 2013
Exercise Price: THB 13.00 | | | 722 | |
| | | | | | | |
| | | | | | 1,000 | |
| | | | | | | |
| | | Total Asia (Cost $0) | | | 1,000 | |
| | | | | | | |
| | | Total Warrants (Cost $0) | | | 1,000 | |
| | | | | | | |
| | | Total Investments
(Cost $3,696,731)—98.9% (c) | | | 4,159,720 | |
| | | Other Assets in Excess of
Liabilities—1.1% | | | 45,307 | |
| | | | | | | |
| | | TOTAL NET ASSETS 100.0% | | $ | 4,205,027 | |
| | | | | | | |
| | |
| | |
|
Percentages are stated as a percent of net assets. |
|
* Amount is less than 0.05%. |
|
(a) | Non-income producing security. |
| |
(b) | Restricted under Rule 144A of the Securities Act of 1933. These securities may be resold in transactions exempt from registration, normally to qualified institutional buyers. These securities have been determined to be liquid under guidelines established by the Board of Trustees. Liquid securities restricted under Rule 144A comprised 1.8% of the Fund’s net assets. |
| |
(c) | Includes securities pledged as collateral for line of credit outstanding on April 30, 2012. |
|
ADR—American Depositary Receipt. |
|
AS—Anonim Sirketi is the Turkish term for joint stock company. |
|
BHD—Malaysian equivalent to incorporated. |
|
GDR—Global Depositary Receipt. |
|
JSC—Joint Stock Company. |
|
NVDR—Non-Voting Depositary Receipts. |
|
PCL—Public Company Limited. |
|
PJSC—Public Joint Stock Company. |
|
PLC—Public Limited Company. |
|
SA—Generally designates corporations in various countries, mostly those employing the civil law. |
|
SAB de CV—Sociedad Anonima Bursátil de Capital Variable. Is the Spanish equivalent to Variable Capital Company. |
|
THB—Thailand Baht. |
The accompanying notes are an integral part of these financial statements.
54
|
Alpine Global Infrastructure Fund |
| |
Schedule of Portfolio Investments
April 30, 2012 (Unaudited)
| | | | | | | |
Shares | | Security
Description | | Value | |
| | | | | | |
| | | | |
Common Stocks—93.1% | | | | |
Asia—15.1% | | | | |
China—9.3% | | | | |
| 1,050,000 | | Anhui Expressway Co.—Class H (a) | | $ | 596,818 | |
| 35,000 | | China Mobile, Ltd. | | | 387,954 | |
| 350,000 | | China Railway Construction Corp.,
Ltd.—Class H | | | 279,237 | |
| 460,400 | | China State Construction
International Holdings, Ltd. | | | 425,469 | |
| 440,000 | | COSCO Pacific, Ltd. | | | 640,833 | |
| 1,200,000 | | Guangshen Railway Co., Ltd.—
Class H (a) | | | 445,438 | |
| 150,000 | | NWS Holdings, Ltd. | | | 226,586 | |
| 2,591,000 | | Tianjin Port Development
Holdings, Ltd. | | | 350,647 | |
| 1,050,000 | | Yuexiu Transport Infrastructure,
Ltd. | | | 507,498 | |
| 125,890 | | ZTE Corp.—Class H (a) | | | 305,369 | |
| | | | | | | |
| | | | | | 4,165,849 | |
| | | | | | | |
Indonesia—2.3% | | | | |
| 17,500,000 | | PT Bakrieland Development
TBK (a) | | | 222,785 | |
| 1,470,000 | | PT Citra Marga Nusaphala
Persada TBK | | | 351,885 | |
| 800,000 | | PT Jasa Marga TBK | | | 465,698 | |
| | | | | | | |
| | | | | | 1,040,368 | |
| | | | | | | |
Japan—1.3% | | | | |
| 9,500 | | East Japan Railway Co. | | | 592,560 | |
| | | | | | | |
Philippines—2.2% | | | | |
| 320,000 | | International Container Terminal
Services, Inc. | | | 515,395 | |
| 800,000 | | Manila Water Co., Inc. | | | 468,025 | |
| | | | | | | |
| | | | | | 983,420 | |
| | | | | | | |
| | | Total Asia (Cost $6,371,867) | | | 6,782,197 | |
| | | | | | | |
Europe—29.0% | | | | |
Austria—0.8% | | | | |
| 4,000 | | Kapsch TrafficCom AG | | | 357,399 | |
| | | | | | | |
France—6.6% | | | | |
| 5,200 | | Aeroports de Paris | | | 437,499 | |
| 29,000 | | France Telecom SA | | | 396,733 | |
| 23,000 | | SES SA | | | 550,752 | |
| 31,000 | | Suez Environnement Co. | | | 437,225 | |
| 16,000 | | Veolia Environnement SA | | | 234,348 | |
| 19,500 | | Vinci SA | | | 903,425 | |
| | | | | | | |
| | | | | | 2,959,982 | |
| | | | | | | |
Germany—6.3% | | | | |
| 27,500 | | Deutsche Telekom AG | | | 310,034 | |
| 7,500 | | Fraport AG Frankfurt Airport
Services Worldwide | | | 487,353 | |
| 16,500 | | Hamburger Hafen und Logistik AG | | | 547,119 | |
| 10,500 | | HeidelbergCement AG | | | 577,289 | |
| 6,000 | | Hochtief AG | | | 351,760 | |
| 9,000 | | Kabel Deutschland Holding AG (a) | | | 567,073 | |
| | | | | | | |
| | | | | | 2,840,628 | |
| | | | | | | |
Italy—1.7% | | | | |
| 31,000 | | Atlantia SpA | | | 469,847 | |
| 60,000 | | Snam Rete Gas SpA | | | 285,443 | |
| | | | | | | |
| | | | | | 755,290 | |
| | | | | | | |
| | | | | | | |
Shares | | Security
Description | | Value | |
| | | | | | |
| | | | | |
Common Stocks—continued | | | | |
Netherlands—2.8% | | | | |
| 14,500 | | Koninklijke Vopak NV | | $ | 934,635 | |
| 10,000 | | Ziggo NV (a) | | | 314,511 | |
| | | | | | | |
| | | | | | 1,249,146 | |
| | | | | | | |
Spain—2.8% | | | | |
| 57,500 | | Abertis Infraestructuras SA | | | 889,758 | |
| 20,000 | | Enagas SA | | | 351,443 | |
| | | | | | | |
| | | | | | 1,241,201 | |
| | | | | | | |
Sweden—1.2% | | | | |
| 79,422 | | TeliaSonera AB | | | 530,914 | |
| | | | | | | |
Turkey—1.1% | | | | |
| 95,000 | | TAV Havalimanlari Holding (a) | | | 499,815 | |
| | | | | | | |
United Kingdom—5.7% | | | | |
| 100,000 | | Centrica PLC | | | 498,068 | |
| 85,000 | | Ferrovial SA | | | 946,472 | |
| 57,500 | | National Grid PLC | | | 621,023 | |
| 185,000 | | Vodafone Group PLC | | | 511,903 | |
| | | | | | | |
| | | | | | 2,577,466 | |
| | | | | | | |
| | | Total Europe (Cost $12,986,943) | | | 13,011,841 | |
| | | | | | | |
North & South America—49.0% | | | | |
Brazil—9.9% | | | | |
| 125,000 | | All America Latina Logistica SA | | | 569,210 | |
| 112,500 | | CCR SA | | | 873,489 | |
| 8,000 | | Cia de Saneamento Basico do
Estado de Sao Paulo—ADR | | | 633,280 | |
| 72,500 | | EcoRodovias Infraestrutura e
Logistica SA | | | 604,753 | |
| 60,000 | | EDP — Energias do Brasil SA | | | 419,589 | |
| 45,000 | | Mills Estruturas e Servicos de
Engenharia SA | | | 585,237 | |
| 20,000 | | Santos Brasil Participacoes SA | | | 348,346 | |
| 27,000 | | Tegma Gestao Logistica SA | | | 410,776 | |
| | | | | | | |
| | | | | | 4,444,680 | |
| | | | | | | |
Canada—2.6% | | | | |
| 7,000 | | Canadian National Railway Co. | | | 597,358 | |
| 14,000 | | Enbridge, Inc. | | | 586,587 | |
| | | | | | | |
| | | | | | 1,183,945 | |
| | | | | | | |
Chile—0.8% | | | | |
| 130,000 | | E.CL SA | | | 347,739 | |
| | | | | | | |
Colombia—1.2% | | | | |
| 5,000 | | Millicom International
Cellular SA—SDR | | | 531,147 | |
| | | | | | | |
Mexico—3.8% | | | | |
| 130,000 | | Empresas ICA SAB de CV—
ADR (a) | | | 939,900 | |
| 500,000 | | OHL Mexico SAB de CV (a) | | | 790,729 | |
| | | | | | | |
| | | | | | 1,730,629 | |
| | | | | | | |
Peru—0.5% | | | | |
| 20,000 | | Cementos Pacasmayo SAA—
ADR (a) | | | 243,200 | |
| | | | | | | |
United States—30.2% | | | | |
| 13,500 | | American Tower Corp.—Class A | | | 885,330 | |
| 13,000 | | American Water Works Co., Inc. | | | 445,120 | |
| 17,000 | | AT&T, Inc. | | | 559,470 | |
| 15,000 | | Atmos Energy Corp. | | | 488,700 | |
| 39,000 | | Calpine Corp. (a) | | | 731,250 | |
| 29,000 | | Cisco Systems, Inc. | | | 584,350 | |
The accompanying notes are an integral part of these financial statements.
55
|
Alpine Global Infrastructure Fund |
| |
Schedule of Portfolio Investments—Continued
April 30, 2012 (Unaudited)
| | | | | | | |
Shares | | Security
Description | | Value | |
| | | | | | |
| | | | |
Common Stocks—continued | | | | |
United States—continued | | | | |
| 21,000 | | Comcast Corp.—Class A | | $ | 636,930 | |
| 21,000 | | DISH Network Corp. | | | 671,370 | |
| 11,000 | | El Paso Pipeline Partners LP | | | 372,570 | |
| 145,000 | | EnergySolutions, Inc. (a) | | | 610,450 | |
| 7,500 | | ITC Holdings Corp. | | | 580,950 | |
| 15,000 | | Itron, Inc. (a) | | | 612,000 | |
| 33,000 | | MasTec, Inc. (a) | | | 573,870 | |
| 14,000 | | Northeast Utilities | | | 514,780 | |
| 5,800 | | NuStar Energy LP | | | 318,942 | |
| 38,000 | | Progressive Waste Solutions, Ltd. | | | 823,080 | |
| 29,000 | | RailAmerica, Inc. (a) | | | 672,220 | |
| 43,000 | | The Geo Group, Inc. (a) | | | 890,530 | |
| 115,000 | | TravelCenters of America LLC (a) | | | 724,500 | |
| 16,500 | | UGI Corp. | | | 481,470 | |
| 2,500 | | Union Pacific Corp. | | | 281,100 | |
| 15,000 | | World Fuel Services Corp. | | | 660,900 | |
| 16,500 | | Xcel Energy, Inc. | | | 446,490 | |
| | | | | | | |
| | | | | | 13,566,372 | |
| | | | | | | |
| | | Total North & South America
(Cost $19,717,427) | | | 22,047,712 | |
| | | | | | | |
| | | Total Common Stocks
(Cost $39,076,237) | | | 41,841,750 | |
| | | | | | | |
| | | | | | | |
Shares | | Security
Description | | Value | |
| | | | | | |
| | | |
Equity-Linked Structured Notes—1.0% | | | | |
Asia—1.0% | | | | |
India—1.0% | | | | |
| 550,000 | | NHPC, Ltd.—
Macquarie Bank, Ltd. (a) | | $ | 197,770 | |
| 120,000 | | Power Grid Corp. of India, Ltd.—
Macquarie Bank, Ltd. (a) | | | 254,801 | |
| | | | | | | |
| | | | | | 452,571 | |
| | | | | | | |
| | | Total Asia (Cost $536,588) | | | 452,571 | |
| | | | | | | |
| | | Total Equity-Linked Structured
Notes (Cost $536,588) | | | 452,571 | |
| | | | | | | |
| | | | | | | |
Principal Amount | | | | | | |
| | | | | | | |
|
Short-Term Investments—5.3% | | | | |
$ | 2,401,000 | | State Street Eurodollar Time
Deposit, 0.01% | | | 2,401,000 | |
| | | | | | | |
| | | Total Short-Term Investments
(Cost $2,401,000) | | | 2,401,000 | |
| | | | | | | |
| | | Total Investments
(Cost $42,013,825)—99.4% (b) | | | 44,695,321 | |
| | | Other Assets in Excess of
Liabilities—0.6% | | | 263,185 | |
| | | | | | | |
| | | TOTAL NET ASSETS 100.0% | | $ | 44,958,506 | |
| | | | | | | |
| | |
| | |
|
Percentages are stated as a percent of net assets. |
|
(a) | Non-income producing security. |
| |
(b) | Includes securities pledged as collateral for line of credit outstanding on April 30, 2012. |
|
AB—Aktiebolag is the Swedish equivalent of the term corporation. |
|
ADR—American Depositary Receipt. |
|
AG—Aktiengesellschaft is a German term that refers to a corporation that is limited by shares, i.e., owned by shareholders. |
|
NV—Naamloze Vennootschap is the Dutch term for a public limited liability corporation. |
|
PLC—Public Limited Company. |
|
SA—Generally designates corporations in various countries, mostly those employing the civil law. |
|
SAA—Open Corporations (Sociedades Anonimas Abiertas). |
|
SAB de CV—Sociedad Anonima Bursátil de Capital Variable. Is the Spanish equivalent to Variable Capital Company. |
|
SDR—Swedish Depositary Receipt. |
|
SpA—Societa’ Per Azioni is an Italian shared company. |
The accompanying notes are an integral part of these financial statements.
56
|
Alpine Global Consumer Growth Fund |
| |
Schedule of Portfolio Investments
April 30, 2012 (Unaudited)
| | | | | | | |
Shares | | Security
Description | | Value | |
| | | | | | |
| | | | | | | |
Common Stocks—93.5% | | | | |
Asia—18.0% | | | | |
China—10.8% | | | | |
| 240 | | Baidu, Inc.—ADR (a) | | $ | 31,848 | |
| 20,000 | | Daphne International Holdings, Ltd. | | | 28,562 | |
| 16,000 | | Dongfeng Motor Group Co., Ltd. | | | 31,593 | |
| 11,000 | | Golden Eagle Retail Group, Ltd. | | | 29,064 | |
| 14,800 | | Lianhua Supermarket Holdings
Co., Ltd. | | | 15,470 | |
| 38,000 | | Springland International
Holdings, Ltd. | | | 28,113 | |
| 1,200 | | Tencent Holdings, Ltd. | | | 37,739 | |
| 22,000 | | Want Want China Holdings, Ltd. | | | 27,108 | |
| 46,000 | | XTEP International Holdings | | | 20,810 | |
| | | | | | | |
| | | | | | 250,307 | |
| | | | | | | |
Hong Kong—3.1% | | | | |
| 56,000 | | Hengdeli Holdings, Ltd. | | | 22,447 | |
| 12,000 | | Li & Fung, Ltd. | | | 25,675 | |
| 250,000 | | REXLot Holdings, Ltd. | | | 22,555 | |
| | | | | | | |
| | | | | | 70,677 | |
| | | | | | | |
Indonesia—1.1% | | | | |
| 40,000 | | PT Indofood CBP Sukses Makmur
TBK | | | 24,591 | |
| | | | | | | |
Philippines—1.4% | | | | |
| 80,000 | | SM Prime Holdings, Inc. | | | 31,644 | |
| | | | | | | |
South Korea—1.6% | | | | |
| 500 | | Kia Motors Corp. | | | 36,898 | |
| | | | | | | |
| | | Total Asia (Cost $394,138) | | | 414,117 | |
| | | | | | | |
Europe—22.3% | | | | |
Belgium—3.0% | | | | |
| 950 | | Anheuser-Busch InBev NV—ADR | | | 68,989 | |
| | | | | | | |
France—1.5% | | | | |
| 1,500 | | SES SA | | | 35,919 | |
| | | | | | | |
Germany—5.2% | | | | |
| 450 | | Adidas AG | | | 37,527 | |
| 360 | | Bayerische Motoren Werke AG | | | 34,220 | |
| 750 | | Kabel Deutschland Holding AG (a) | | | 47,256 | |
| | | | | | | |
| | | | | | 119,003 | |
| | | | | | | |
Italy—1.0% | | | | |
| 1,550 | | Yoox SpA (a) | | | 22,159 | |
| | | | | | | |
Netherlands—2.5% | | | | |
| 450 | | Heineken NV | | | 24,610 | |
| 1,000 | | Unilever NV | | | 34,244 | |
| | | | | | | |
| | | | | | 58,854 | |
| | | | | | | |
Russia—0.9% | | | | |
| 825 | | X5 Retail Group NV—GDR (a)(b) | | | 20,856 | |
| | | | | | | |
Spain—0.6% | | | | |
| 150 | | Inditex SA | | | 13,492 | |
| | | | | | | |
Sweden—0.4% | | | | |
| 250 | | Hennes & Mauritz AB—Class B | | | 8,588 | |
| | | | | | | |
Switzerland—5.7% | | | | |
| 250 | | Dufry Group (a) | | | 33,906 | |
| 1,050 | | Nestle SA | | | 64,320 | |
| 75 | | The Swatch Group AG | | | 34,589 | |
| | | | | | | |
| | | | | | 132,815 | |
| | | | | | | |
United Kingdom—1.5% | | | | |
| 26,000 | | Debenhams PLC | | | 34,853 | |
| | | | | | | |
| | | Total Europe (Cost $468,169) | | | 515,528 | |
| | | | | | | |
| | | | | | | |
Shares | | Security
Description | | Value | |
| | | | | | |
| | | | |
Common Stocks—continued | | | | |
North & South America—53.2% | | | | |
Brazil—9.4% | | | | |
| 2,200 | | BR Malls Participacoes SA | | $ | 27,330 | |
| 375 | | Cia Brasileira de Distribuicao
Grupo Pao de Acucar—ADR | | | 17,636 | |
| 1,200 | | Cia Hering | | | 29,777 | |
| 2,200 | | Estacio Participacoes SA | | | 27,469 | |
| 2,600 | | Hypermarcas SA | | | 16,682 | |
| 3,400 | | Magazine Luiza SA (a) | | | 20,299 | |
| 2,050 | | Marisa Lojas SA | | | 24,252 | |
| 1,500 | | Multiplus SA | | | 32,500 | |
| 900 | | Natura Cosmeticos SA | | | 20,657 | |
| | | | | | | |
| | | | | | 216,602 | |
| | | | | | | |
Mexico—2.0% | | | | |
| 9,000 | | Grupo Comercial Chedraui SA
de CV | | | 23,409 | |
| 1,000 | | Grupo Televisa SA—ADR | | | 21,970 | |
| | | | | | | |
| | | | | | 45,379 | |
| | | | | | | |
United States—41.8% | | | | |
| 575 | | Abercrombie & Fitch Co.—Class A | | | 28,848 | |
| 100 | | Amazon.com, Inc. (a) | | | 23,190 | |
| 110 | | Apple, Inc. (a) | | | 64,266 | |
| 600 | | Carnival Corp. | | | 19,494 | |
| 1,001 | | CBS Corp.—Class B | | | 33,383 | |
| 550 | | Coach, Inc. | | | 40,238 | |
| 300 | | Colgate—Palmolive Co. | | | 29,682 | |
| 1,750 | | Comcast Corp.—Class A | | | 53,077 | |
| 550 | | Dick’s Sporting Goods, Inc. | | | 27,830 | |
| 1,050 | | Digital Generation, Inc. (a) | | | 9,744 | |
| 1,600 | | Ford Motor Co. | | | 18,048 | |
| 549 | | Francesca’s Holdings Corp. (a) | | | 17,211 | |
| 60 | | Google, Inc.—Class A (a) | | | 36,314 | |
| 825 | | Guess?, Inc. | | | 24,156 | |
| 775 | | Hasbro, Inc. | | | 28,474 | |
| 1,150 | | Lumber Liquidators Holdings,
Inc. (a) | | | 33,270 | |
| 500 | | McDonald’s Corp. | | | 48,725 | |
| 320 | | MercadoLibre, Inc. | | | 30,957 | |
| 450 | | NIKE, Inc.—Class B | | | 50,342 | |
| 750 | | PepsiCo, Inc. | | | 49,500 | |
| 975 | | Rue21, Inc. (a) | | | 29,591 | |
| 550 | | Target Corp. | | | 31,867 | |
| 450 | | The Procter & Gamble Co. | | | 28,638 | |
| 400 | | VF Corp. | | | 60,820 | |
| 425 | | Visa, Inc.—Class A | | | 52,266 | |
| 800 | | Yum! Brands, Inc. | | | 58,184 | |
| 2,800 | | Zagg, Inc. (a) | | | 36,484 | |
| | | | | | | |
| | | | | | 964,599 | |
| | | | | | | |
| | | Total North & South America
(Cost $1,096,101) | | | 1,226,580 | |
| | | | | | | |
| | | Total Common Stocks
(Cost $1,958,408) | | | 2,156,225 | |
| | | | | | | |
| | | Total Investments
(Cost $1,958,408)—93.5% | | | 2,156,225 | |
| | | Other Assets in Excess of
Liabilities—6.5% | | | 149,367 | |
| | | | | | | |
| | | TOTAL NET ASSETS 100.0% | | $ | 2,305,592 | |
| | | | | | | |
The accompanying notes are an integral part of these financial statements.
57
|
Alpine Global Consumer Growth Fund |
| |
Schedule of Portfolio Investments—Continued
April 30, 2012 (Unaudited)
| | |
| | |
|
Percentages are stated as a percent of net assets. |
| |
(a) | Non-income producing security. |
| |
(b) | Restricted under Rule 144A of the Securities Act of 1933. These securities may be resold in transactions exempt from registration, normally to qualified institutional buyers. These securities have been determined to be liquid under guidelines established by the Board of Trustees. Liquid securities restricted under Rule 144A comprised 0.9% of the Fund’s net assets. |
AB—Aktiebolag is the Swedish equivalent of the term corporation.
ADR—American Depositary Receipt.
AG—Aktiengesellschaft is a German term that refers to a corporation that is limited by shares, i.e., owned by shareholders.
GDR—Global Depositary Receipt.
NV—Naamloze Vennootschap is the Dutch term for a public limited liability corporation.
PLC—Public Limited Company.
SA—Generally designates corporations in various countries, mostly those employing the civil law.
SA de CV—Sociedad Anonima de Capital Variable. Is the Spanish equivalent to Variable Capital Company.
SpA—Societa’ Per Azioni is an Italian shared company.
The accompanying notes are an integral part of these financial statements.
58
Statements of Assets and Liabilities
April 30, 2012 (Unaudited)
| | | | | | | | | | | | |
| | International
Real Estate
Equity Fund | | Realty
Income &
Growth Fund | | Cyclical
Advantage
Property Fund | |
| | | | | | | |
ASSETS: | | | | | | | | | | | | |
Investments, at value | | | | | | | | | | | | |
Unaffiliated issuers (Cost—$391,481,287, $79,703,095 and $47,836,824) | | $ | 330,392,271 | | $ | 117,029,059 | | | $ | 54,254,163 | | |
Affiliated issuers (Cost—$20,644,417, $— and $—) | | | 5,825,354 | | | — | | | | — | | |
Foreign currencies, at value (Cost—$750,144, $— and $118,038) | | | 750,057 | | | — | | | | 117,950 | | |
Dividends and interest receivable | | | 2,582,759 | | | 72,579 | | | | 150,754 | | |
Receivable from investment securities sold | | | 1,560,690 | | | 735,453 | | | | 850,675 | | |
Receivable from capital shares issued | | | 161,737 | | | 205,583 | | | | 118,934 | | |
Prepaid expenses and other assets | | | 39,423 | | | 7,888 | | | | 4,686 | | |
| | | | | | | | | | | | |
Total assets | | | 341,312,291 | | | 118,050,562 | | | | 55,497,162 | | |
| | | | | | | | | | | | |
| | | | | | | | | | | | |
LIABILITIES: | | | | | | | | | | | | |
Payable for capital shares redeemed | | | 396,361 | | | 47,497 | | | | 331,532 | | |
Payable for investment securities purchased | | | — | | | 40,315 | | | | — | | |
Accrued expenses and other liabilities: | | | | | | | | | | | | |
Investment advisory fees (Note 6) | | | 264,757 | | | 88,546 | | | | 43,491 | | |
Line of credit (Note 2) | | | 21,150,061 | | | 6,308,032 | | | | 2,043,808 | | |
Distribution fees (Note 5) | | | 96 | | | 89 | | | | — | | |
Other | | | 259,400 | | | 40,128 | | | | 48,508 | | |
| | | | | | | | | | | | |
Total liabilities | | | 22,070,675 | | | 6,524,607 | | | | 2,467,339 | | |
| | | | | | | | | | | | |
Net Assets | | $ | 319,241,616 | | $ | 111,525,955 | | | $ | 53,029,823 | | |
| | | | | | | | | | | | |
| | | | | | | | | | | | |
Net assets represented by: | | | | | | | | | | | | |
Capital stock | | $ | 1,484,153,738 | | $ | 85,077,380 | | | $ | 106,087,920 | | |
Accumulated net investment income (loss) | | | (7,630,758 | ) | | (31,681 | ) | | | (40,879 | ) | |
Accumulated net realized losses from investments and foreign currency transactions | | | (1,081,307,606 | ) | | (10,845,686 | ) | | | (59,430,830 | ) | |
Net unrealized appreciation (depreciation) on: | | | | | | | | | | | | |
Investments | | | (75,908,079 | ) | | 37,325,964 | | | | 6,417,339 | | |
Foreign currency translations | | | (65,679 | ) | | (22 | ) | | | (3,727 | ) | |
| | | | | | | | | | | | |
Total Net Assets | | $ | 319,241,616 | | $ | 111,525,955 | | | $ | 53,029,823 | | |
| | | | | | | | | | | | |
| | | | | | | | | | | | |
Net asset value | | | | | | | | | | | | |
Class A Shares | | | | | | | | | | | | |
Net assets | | $ | 117,749 | | $ | 114,551 | | | $ | — | | |
Shares outstanding | | | 5,580 | | | 6,473 | | | | — | | |
Net asset value per share | | $ | 21.10 | | $ | 17.70 | | | $ | — | | |
Maximum offering price per share (net asset value plus sales charge of 5.50%) | | $ | 22.33 | | $ | 18.73 | | | $ | — | | |
Institutional Class Shares | | | | | | | | | | | | |
Net assets | | $ | 319,123,867 | | $ | 111,411,404 | | | $ | 53,029,823 | | |
Shares outstanding | | | 15,112,689 | | | 6,293,980 | | | | 2,598,021 | | |
Net asset value, offering price and redemption price per share* | | $ | 21.12 | | $ | 17.70 | | | $ | 20.41 | | |
| | | | | | | | | | | | |
* If applicable, redemption price per share may be reduced by a redemption fee. |
The accompanying notes are an integral part of these financial statements.
59
Statements of Assets and Liabilities—Continued
April 30, 2012 (Unaudited)
| | | | | | | | | | | | | | | | |
| | Emerging
Markets Real
Estate Fund | | Global
Infrastructure
Fund | | Global
Consumer
Growth Fund | |
| | | | | | | |
ASSETS: | | | | | | | | | | | | | | | | |
Investments, at value (Cost—$3,696,731, $42,013,825 and $1,958,408) | | | $ | 4,159,720 | | | | $ | 44,695,321 | | | | $ | 2,156,225 | | |
Cash | | | | — | | | | | 841 | | | | | 87,670 | | |
Foreign currencies, at value (Cost—$12,276, $24,249 and $1,485) | | | | 12,263 | | | | | 24,232 | | | | | 1,485 | | |
Receivable from investment securities sold | | | | 108,612 | | | | | 236,350 | | | | | — | | |
Receivable from capital shares issued | | | | 27,000 | | | | | 159,438 | | | | | 23,050 | | |
Dividends and interest receivable | | | | 16,080 | | | | | 116,808 | | | | | 4,971 | | |
Unrealized appreciation on forward currency contracts | | | | — | | | | | 659 | | | | | — | | |
Due from Adviser | | | | 7,546 | | | | | — | | | | | 29,964 | | |
Prepaid expenses and other assets | | | | 2,027 | | | | | 5,554 | | | | | 6,047 | | |
| | | | | | | | | | | | | | | | |
Total assets | | | | 4,333,248 | | | | | 45,239,203 | | | | | 2,309,412 | | |
| | | | | | | | | | | | | | | | |
| | | | | | | | | | | | | | | | |
LIABILITIES: | | | | | | | | | | | | | | | | |
Payable for investment securities purchased | | | | 88,178 | | | | | 238,670 | | | | | — | | |
Unrealized depreciation on forward currency contracts | | | | — | | | | | 1,416 | | | | | — | | |
Payable for capital shares redeemed | | | | — | | | | | 420 | | | | | — | | |
Accrued expenses and other liabilities: | | | | | | | | | | | | | | | | |
Investment advisory fees (Note 6) | | | | 3,541 | | | | | 37,011 | | | | | 1,838 | | |
Line of credit (Note 2) | | | | 7,695 | | | | | — | | | | | — | | |
Distribution fees (Note 5) | | | | 98 | | | | | 94 | | | | | 92 | | |
Other | | | | 28,709 | | | | | 3,086 | | | | | 1,890 | | |
| | | | | | | | | | | | | | | | |
Total liabilities | | | | 128,221 | | | | | 280,697 | | | | | 3,820 | | |
| | | | | | | | | | | | | | | | |
Net Assets | | | $ | 4,205,027 | | | | $ | 44,958,506 | | | | $ | 2,305,592 | | |
| | | | | | | | | | | | | | | | |
| | | | | | | | | | | | | | | | |
Net assets represented by: | | | | | | | | | | | | | | | | |
Capital stock | | | $ | 3,894,725 | | | | $ | 43,068,634 | | | | $ | 2,158,942 | | |
Accumulated net investment income (loss) | | | | (62,636 | ) | | | | 107,459 | | | | | 2,856 | | |
Accumulated net realized losses from investments and foreign currency transactions | | | | (89,487 | ) | | | | (898,132 | ) | | | | (53,990 | ) | |
Net unrealized appreciation (depreciation) on: | | | | | | | | | | | | | | | | |
Investments | | | | 462,989 | | | | | 2,681,496 | | | | | 197,817 | | |
Foreign currency translations | | | | (564 | ) | | | | (951 | ) | | | | (33 | ) | |
| | | | | | | | | | | | | | | | |
Total Net Assets | | | $ | 4,205,027 | | | | $ | 44,958,506 | | | | $ | 2,305,592 | | |
| | | | | | | | | | | | | | | | |
| | | | | | | | | | | | | | | | |
Net asset value: | | | | | | | | | | | | | | | | |
Class A Shares | | | | | | | | | | | | | | | | |
Net assets | | | $ | 120,569 | | | | $ | 277,168 | | | | $ | 118,549 | | |
Shares outstanding | | | | 7,435 | | | | | 17,781 | | | | | 11,173 | | |
Net asset value per share | | | $ | 16.22 | | | | $ | 15.59 | | | | $ | 10.61 | | |
Maximum offering price per share (net asset value plus sales charge of 5.50%) | | | $ | 17.16 | | | | $ | 16.50 | | | | $ | 11.23 | | |
Institutional Class Shares | | | | | | | | | | | | | | | | |
Net assets | | | $ | 4,084,458 | | | | $ | 44,681,338 | | | | $ | 2,187,043 | | |
Shares outstanding | | | | 251,677 | | | | | 2,866,220 | | | | | 205,922 | | |
Net asset value, offering price and redemption price per share* | | | $ | 16.23 | | | | $ | 15.59 | | | | $ | 10.62 | | |
| | | | | | | | | | | | | | | | |
* If applicable, redemption price per share may be reduced by a redemption fee. |
The accompanying notes are an integral part of these financial statements.
60
Statements of Operations
For the six months ended April 30, 2012 (Unaudited)
| | | | | | | | | | | | | | | | |
| | International
Real Estate
Equity Fund | | Realty
Income &
Growth Fund | | Cyclical
Advantage
Property Fund | |
| | | | | | | |
INVESTMENT INCOME: | | | | | | | | | | | | | | | | |
Interest income | | | $ | 19,570 | | | | $ | 42,282 | | | | $ | 109,342 | | |
Dividends income | | | | 2,972,213 | | | | | 2,913,771 | | | | | 508,215 | | |
Less: Foreign taxes withheld | | | | (151,758 | ) | | | | (8,475 | ) | | | | (11,966 | ) | |
| | | | | | | | | | | | | | | | |
Total investment income | | | | 2,840,025 | | | | | 2,947,578 | | | | | 605,591 | | |
| | | | | | | | | | | | | | | | |
| | | | | | | | | | | | | | | | |
EXPENSES: | | | | | | | | | | | | | | | | |
Investment advisory fee (Note 6) | | | | 1,615,485 | | | | | 515,251 | | | | | 249,030 | | |
Administration fee (Note 6) | | | | 34,617 | | | | | 10,988 | | | | | 4,975 | | |
Distribution fees — Class A (Note 5) | | | | 96 | | | | | 89 | | | | | — | | |
Transfer agent fees | | | | 148,104 | | | | | 44,518 | | | | | 31,813 | | |
Interest on line of credit expense (Note 2) | | | | 142,496 | | | | | 43,231 | | | | | 2,953 | | |
Fund accounting and custody fees | | | | 122,307 | | | | | 4,374 | | | | | 14,187 | | |
Printing and mailing fees | | | | 96,715 | | | | | 22,938 | | | | | 16,942 | | |
Legal fees | | | | 40,592 | | | | | 12,398 | | | | | 19,535 | | |
Audit and tax fees | | | | 40,306 | | | | | 10,227 | | | | | 6,381 | | |
Trustee fees | | | | 18,694 | | | | | 5,098 | | | | | 2,491 | | |
Registration and filing fees | | | | 18,493 | | | | | 17,806 | | | | | 14,687 | | |
Other fees | | | | 40,909 | | | | | 4,633 | | | | | 5,292 | | |
| | | | | | | | | | | | | | | | |
Total expenses | | | | 2,318,814 | | | | | 691,551 | | | | | 368,286 | | |
| | | | | | | | | | | | | | | | |
Net investment income | | | | 521,211 | | | | | 2,256,027 | | | | | 237,305 | | |
| | | | | | | | | | | | | | | | |
| | | | | | | | | | | | | | | | |
NET REALIZED AND UNREALIZED GAIN (LOSS) ON INVESTMENTS AND FOREIGN CURRENCY: | | | | | | | | | | | | | | | | |
Net realized gain (loss) on: | | | | | | | | | | | | | | | | |
Securities transactions | | | | (21,033,877 | ) | | | | 4,498,627 | | | | | 216,495 | | |
Foreign currency transactions | | | | 487,605 | | | | | (621 | ) | | | | 2,869 | | |
| | | | | | | | | | | | | | | | |
Net realized gain (loss) | | | | (20,546,272 | ) | | | | 4,498,006 | | | | | 219,364 | | |
| | | | | | | | | | | | | | | | |
Change in net unrealized appreciation (depreciation) on: | | | | | | | | | | | | | | | | |
Investments | | | | 36,966,700 | | | | | 9,224,919 | | | | | 5,779,102 | | |
Foreign currency translations | | | | (92,076 | ) | | | | 41 | | | | | (4,252 | ) | |
| | | | | | | | | | | | | | | | |
Net change in unrealized appreciation (depreciation) | | | | 36,874,624 | | | | | 9,224,960 | | | | | 5,774,850 | | |
| | | | | | | | | | | | | | | | |
Net gain on investments and foreign currency | | | | 16,328,352 | | | | | 13,722,966 | | | | | 5,994,214 | | |
| | | | | | | | | | | | | | | | |
Increase in net assets from operations | | | $ | 16,849,563 | | | | $ | 15,978,993 | | | | $ | 6,231,519 | | |
| | | | | | | | | | | | | | | | |
The accompanying notes are an integral part of these financial statements.
61
Statements of Operations—Continued
For the six months ended April 30, 2012 (Unaudited)
| | | | | | | | | | | | | | | | |
| | Emerging
Markets Real
Estate Fund | | Global
Infrastructure
Fund | | Global
Consumer
Growth Fund | |
| | | | | | | |
INVESTMENT INCOME: | | | | | | | | | | |
Interest income | | | $ | 15 | | | | $ | 121 | | | | $ | 4 | | |
Dividends income | | | | 32,512 | | | | | 1,192,393 | | | | | 17,689 | | |
Less: Foreign taxes withheld | | | | (1,113 | ) | | | | (46,850 | ) | | | | (1,016 | ) | |
| | | | | | | | | | | | | | | | |
Total investment income | | | | 31,414 | | | | | 1,145,664 | | | | | 16,677 | | |
| | | | | | | | | | | | | | | | |
| | | | | | | | | | | | | | | | |
EXPENSES: | | | | | | | | | | | | | | | | |
Investment advisory fee (Note 6) | | | | 20,928 | | | | | 183,912 | | | | | 10,170 | | |
Administration fee (Note 6) | | | | 416 | | | | | 3,634 | | | | | 201 | | |
Distribution fees — Class A (Note 5) | | | | 97 | | | | | 95 | | | | | 92 | | |
Registration and filing fees | | | | 12,571 | | | | | 16,349 | | | | | 3,770 | | |
Fund accounting and custody fees | | | | 17,375 | | | | | 8,657 | | | | | 4,402 | | |
Audit and tax fees | | | | 8,708 | | | | | 5,626 | | | | | 1,155 | | |
Transfer agent fees | | | | 11,381 | | | | | 4,818 | | | | | 2,606 | | |
Legal fees | | | | 566 | | | | | 3,667 | | | | | 4,289 | | |
Printing and mailing fees | | | | 2,358 | | | | | 3,161 | | | | | 28,422 | | |
Trustee fees | | | | 268 | | | | | 1,463 | | | | | 91 | | |
Interest on line of credit expense (Note 2) | | | | 78 | | | | | — | | | | | — | | |
Other fees | | | | 1,134 | | | | | 3,661 | | | | | 889 | | |
| | | | | | | | | | | | | | | | |
Total expenses | | | | 75,880 | | | | | 235,043 | | | | | 56,087 | | |
Less: Fee waivers and/or expense reimbursements (Note 6) | | | | (47,592 | ) | | | | — | | | | | (42,266 | ) | |
| | | | | | | | | | | | | | | | |
Net expenses | | | | 28,288 | | | | | 235,043 | | | | | 13,821 | | |
| | | | | | | | | | | | | | | | |
Net investment income | | | | 3,126 | | | | | 910,621 | | | | | 2,856 | | |
| | | | | | | | | | | | | | | | |
| | | | | | | | | | | | | | | | |
NET REALIZED AND UNREALIZED GAIN (LOSS) ON INVESTMENTS AND FOREIGN CURRENCY: | | | | | | | | | | | | | | | | |
Net realized gain (loss) on: | | | | | | | | | | | | | | | | |
Securities transactions* | | | | 116,781 | | | | | (241,260 | ) | | | | (8,314 | ) | |
Foreign currency transactions | | | | (2,619 | ) | | | | (5,930 | ) | | | | (174 | ) | |
| | | | | | | | | | | | | | | | |
Net realized gain (loss) | | | | 114,162 | | | | | (247,190 | ) | | | | (8,488 | ) | |
| | | | | | | | | | | | | | | | |
Change in net unrealized appreciation (depreciation) on: | | | | | | | | | | | | | | | | |
Investments | | | | 327,619 | | | | | 3,562,573 | | | | | 242,993 | | |
Foreign currency translations | | | | 309 | | | | | 2,637 | | | | | (40 | ) | |
| | | | | | | | | | | | | | | | |
Net change in unrealized appreciation (depreciation) | | | | 327,928 | | | | | 3,565,210 | | | | | 242,953 | | |
| | | | | | | | | | | | | | | | |
Net gain on investments and foreign currency | | | | 442,090 | | | | | 3,318,020 | | | | | 234,465 | | |
| | | | | | | | | | | | | | | | |
Increase in net assets from operations | | | $ | 445,216 | | | | $ | 4,228,641 | | | | $ | 237,321 | | |
| | | | | | | | | | | | | | | | |
| | | | | | | | | | | | | | | | |
* Net of foreign capital gains taxes | | | $ | 884 | | | | $ | 10,106 | | | | $ | — | | |
The accompanying notes are an integral part of these financial statements.
62
Statements of Changes in Net Assets
| | | | | | | | | | | |
| | International Real Estate Equity Fund | |
| | | |
| | Six Months Ended
April 30, 2012 | | Year Ended
October 31, 2011 | |
| | | | | |
| | (Unaudited) | | | |
OPERATIONS: | | | | | | | |
Net investment income | | | $ | 521,211 | | | | $ | 9,706,575 | | |
Net realized gain (loss) on: | | | | | | | | | | | |
Securities transactions | | | | (21,033,877 | ) | | | | (50,053,818 | ) | |
Foreign currency transactions | | | | 487,605 | | | | | (2,102,194 | ) | |
Change in net unrealized appreciation (depreciation) on: | | | | | | | | | | | |
Investments | | | | 36,966,700 | | | | | (46,002,633 | ) | |
Foreign currency translations | | | | (92,076 | ) | | | | 29,909 | | |
| | | | | | | | | | | |
Increase (Decrease) in net assets from operations | | | | 16,849,563 | | | | | (88,422,161 | ) | |
| | | | | | | | | | | |
| | | | | | | | | | | |
DISTRIBUTIONS TO SHAREHOLDERS: | | | | | | | | | | | |
Distributions to Class A Shareholders: | | | | | | | | | | | |
From net investment income | | | | — | | | | | — | | |
From net realized gain on investments | | | | — | | | | | — | | |
Distributions to Institutional Class Shareholders: | | | | | | | | | | | |
From net investment income | | | | (8,892,777 | ) | | | | (15,264,706 | ) | |
From net realized gain on investments | | | | — | | | | | — | | |
| | | | | | | | | | | |
Decrease in net assets from distributions to shareholders | | | | (8,892,777 | ) | | | | (15,264,706 | ) | |
| | | | | | | | | | | |
| | | | | | | | | | | |
CAPITAL SHARE TRANSACTIONS (NOTE 3): | | | | | | | | | | | |
Net proceeds from shares sold | | | | 17,841,907 | | | | | 54,635,072 | | |
Dividends reinvested | | | | 7,845,139 | | | | | 13,263,510 | | |
Redemption fees | | | | 3,560 | | | | | 17,897 | | |
Cost of shares repurchased | | | | (69,838,363 | ) | | | | (217,285,470 | ) | |
| | | | | | | | | | | |
Decrease in net assets from capital share transactions | | | | (44,147,757 | ) | | | | (149,368,991 | ) | |
| | | | | | | | | | | |
Total decrease in net assets | | | | (36,190,971 | ) | | | | (253,055,858 | ) | |
| | | | | | | | | | | |
| | | | | | | | | | | |
NET ASSETS: | | | | | | | | | | | |
Beginning of period | | | | 355,432,587 | | | | | 608,488,445 | | |
| | | | | | | | | | | |
End of period* | | | $ | 319,241,616 | | | | $ | 355,432,587 | | |
| | | | | | | | | | | |
* Including accumulated/undistributed net investment income (loss) of: | | | $ | (7,630,758 | ) | | | $ | 740,808 | | |
| | | | | | | | | | | |
The accompanying notes are an integral part of these financial statements.
63
Statements of Changes in Net Assets—Continued
| | | | | | | | | | | |
| | Realty Income & Growth Fund | |
| | | |
| | Six Months Ended
April 30, 2012 | | Year Ended
October 31, 2011 | |
| | | | | |
| | (Unaudited) | | | |
OPERATIONS: | | | | | | | |
Net investment income | | | $ | 2,256,027 | | | | $ | 3,344,712 | | |
Net realized gain (loss) on: | | | | | | | | | | | |
Securities transactions | | | | 4,498,627 | | | | | 8,048,128 | | |
Foreign currency transactions | | | | (621 | ) | | | | 2,249 | | |
Swap contracts | | | | — | | | | | (2,858 | ) | |
Change in net unrealized appreciation (depreciation) on: | | | | | | | | | | | |
Investments | | | | 9,224,919 | | | | | (1,655,833 | ) | |
Foreign currency translations | | | | 41 | | | | | (5,082 | ) | |
| | | | | | | | | | | |
Increase in net assets from operations | | | | 15,978,993 | | | | | 9,731,316 | | |
| | | | | | | | | | | |
| | | | | | | | | | | |
DISTRIBUTIONS TO SHAREHOLDERS: | | | | | | | | | | | |
Distributions to Class A Shareholders: | | | | | | | | | | | |
From net investment income | | | | (1,089 | ) | | | | — | | |
From net realized gain on investments | | | | — | | | | | — | | |
Distributions to Institutional Class Shareholders: | | | | | | | | | | | |
From net investment income | | | | (2,286,619 | ) | | | | (4,932,978 | ) | |
From net realized gain on investments | | | | — | | | | | — | | |
| | | | | | | | | | | |
Decrease in net assets from distributions to shareholders | | | | (2,287,708 | ) | | | | (4,932,978 | ) | |
| | | | | | | | | | | |
| | | | | | | | | | | |
CAPITAL SHARE TRANSACTIONS (NOTE 3): | | | | | | | | | | | |
Net proceeds from shares sold | | | | 6,045,347 | | | | | 13,192,635 | | |
Dividends reinvested | | | | 2,075,402 | | | | | 4,499,252 | | |
Redemption fees | | | | 1,364 | | | | | 16,325 | | |
Cost of shares repurchased | | | | (11,609,159 | ) | | | | (30,125,866 | ) | |
| | | | | | | | | | | |
Decrease in net assets from capital share transactions | | | | (3,487,046 | ) | | | | (12,417,654 | ) | |
| | | | | | | | | | | |
Total increase (decrease) in net assets | | | | 10,204,239 | | | | | (7,619,316 | ) | |
| | | | | | | | | | | |
| | | | | | | | | | | |
NET ASSETS: | | | | | | | | | | | |
Beginning of period | | | | 101,321,716 | | | | | 108,941,032 | | |
| | | | | | | | | | | |
End of period* | | | $ | 111,525,955 | | | | $ | 101,321,716 | | |
| | | | | | | | | | | |
* Including accumulated/undistributed net investment loss of: | | | $ | (31,681 | ) | | | $ | — | | |
| | | | | | | | | | | |
The accompanying notes are an integral part of these financial statements.
64
Statements of Changes in Net Assets—Continued
| | | | | | | | | | | |
| | Cyclical Advantage Property Fund | |
| | | |
| | Six Months Ended
April 30, 2012 | | Year Ended
October 31, 2011 | |
| | | | | |
| | (Unaudited) | | | |
OPERATIONS: | | | | | | | |
Net investment income | | | $ | 237,305 | | | | $ | 215,210 | | |
Net realized gain on: | | | | | | | | | | | |
Securities transactions | | | | 216,495 | | | | | 419,803 | | |
Foreign currency transactions | | | | 2,869 | | | | | 22,772 | | |
Change in net unrealized appreciation (depreciation) on: | | | | | | | | | | | |
Investments | | | | 5,779,102 | | | | | (6,127,324 | ) | |
Foreign currency translations | | | | (4,252 | ) | | | | (11,196 | ) | |
| | | | | | | | | | | |
Increase (Decrease) in net assets from operations | | | | 6,231,519 | | | | | (5,480,735 | ) | |
| | | | | | | | | | | |
DISTRIBUTIONS TO SHAREHOLDERS: | | | | | | | | | | | |
From net investment income | | | | (251,458 | ) | | | | (265,892 | ) | |
From net realized gain on investments | | | | — | | | | | — | | |
| | | | | | | | | | | |
Decrease in net assets from distributions to shareholders | | | | (251,458 | ) | | | | (265,892 | ) | |
| | | | | | | | | | | |
CAPITAL SHARE TRANSACTIONS (NOTE 3): | | | | | | | | | | | |
Net proceeds from shares sold | | | | 933,316 | | | | | 1,267,115 | | |
Dividends reinvested | | | | 244,257 | | | | | 256,450 | | |
Redemption fees | | | | 229 | | | | | 109 | | |
Cost of shares repurchased | | | | (3,217,635 | ) | | | | (8,731,566 | ) | |
| | | | | | | | | | | |
Decrease in net assets from capital share transactions | | | | (2,039,833 | ) | | | | (7,207,892 | ) | |
| | | | | | | | | | | |
Total increase (decrease) in net assets | | | | 3,940,228 | | | | | (12,954,519 | ) | |
| | | | | | | | | | | |
NET ASSETS: | | | | | | | | | | | |
Beginning of period | | | | 49,089,595 | | | | | 62,044,114 | | |
| | | | | | | | | | | |
End of period* | | | $ | 53,029,823 | | | | $ | 49,089,595 | | |
| | | | | | | | | | | |
* Including accumulated/undistributed net investment loss of: | | | $ | (40,879 | ) | | | $ | (26,726 | ) | |
| | | | | | | | | | | |
The accompanying notes are an integral part of these financial statements.
65
Statements of Changes in Net Assets—Continued
| | | | | | | | | | | |
| | Emerging Markets Real Estate Fund | |
| | | |
| | Six Months Ended
April 30, 2012 | | Year Ended
October 31, 2011 | |
| | | | | |
| | (Unaudited) | | | |
OPERATIONS: | | | | | | | | | | | |
Net investment income | | | $ | 3,126 | | | | $ | 24,617 | | |
Net realized gain (loss) on: | | | | | | | | | | | |
Securities transactions | | | | 116,781 | | | | | (173,308 | ) | |
Foreign currency transactions | | | | (2,619 | ) | | | | (5,340 | ) | |
Change in net unrealized appreciation (depreciation) on: | | | | | | | | | | | |
Investments | | | | 327,619 | | | | | (815,864 | ) | |
Foreign currency translations | | | | 309 | | | | | (2,583 | ) | |
| | | | | | | | | | | |
Increase (Decrease) in net assets from operations | | | | 445,216 | | | | | (972,478 | ) | |
| | | | | | | | | | | |
| | | | | | | | | | | |
DISTRIBUTIONS TO SHAREHOLDERS: | | | | | | | | | | | |
Distributions to Class A Shareholders: | | | | | | | | | | | |
From net investment income | | | | — | | | | | — | | |
From net realized gain on investments | | | | — | | | | | — | | |
Distributions to Institutional Class Shareholders: | | | | | | | | | | | |
From net investment income | | | | — | | | | | (15,201 | ) | |
From net realized gain on investments | | | | — | | | | | (250,000 | ) | |
| | | | | | | | | | | |
Decrease in net assets from distributions to shareholders | | | | — | | | | | (265,201 | ) | |
| | | | | | | | | | | |
| | | | | | | | | | | |
CAPITAL SHARE TRANSACTIONS (NOTE 3) | | | | | | | | | | | |
Net proceeds from shares sold | | | | 401,083 | | | | | 3,315,249 | | |
Dividends reinvested | | | | — | | | | | 256,293 | | |
Redemption fees | | | | 497 | | | | | 569 | | |
Cost of shares repurchased | | | | (930,648 | ) | | | | (1,314,069 | ) | |
| | | | | | | | | | | |
Increase (Decrease) in net assets from capital share transactions | | | | (529,068 | ) | | | | 2,258,042 | | |
| | | | | | | | | | | |
Total increase (decrease) in net assets | | | | (83,852 | ) | | | | 1,020,363 | | |
| | | | | | | | | | | |
| | | | | | | | | | | |
NET ASSETS: | | | | | | | | | | | |
Beginning of period | | | | 4,288,879 | | | | | 3,268,516 | | |
| | | | | | | | | | | |
End of period* | | | $ | 4,205,027 | | | | $ | 4,288,879 | | |
| | | | | | | | | | | |
* Including accumulated/undistributed net investment loss of: | | | $ | (62,636 | ) | | | $ | (65,762 | ) | |
| | | | | | | | | | | |
The accompanying notes are an integral part of these financial statements.
66
Statements of Changes in Net Assets—Continued
| | | | | | | | | | | |
| | Global Infrastructure Fund | |
| | | |
| | Six Months Ended April 30, 2012 | | Year Ended
October 31, 2011 | |
| | | | | |
| | (Unaudited) | | | |
OPERATIONS: | | | | | | | | | | | |
Net investment income | | | $ | 910,621 | | | | $ | 474,566 | | |
Net realized loss on: | | | | | | | | | | | |
Securities transactions | | | | (241,260 | ) | | | | (712,139 | ) | |
Foreign currency transactions | | | | (5,930 | ) | | | | (10,847 | ) | |
Change in net unrealized appreciation (depreciation) on: | | | | | | | | | | | |
Investments | | | | 3,562,573 | | | | | (1,447,571 | ) | |
Foreign currency translations | | | | 2,637 | | | | | (3,679 | ) | |
| | | | | | | | | | | |
Increase (Decrease) in net assets from operations | | | | 4,228,641 | | | | | (1,699,670 | ) | |
| | | | | | | | | | | |
| | | | | | | | | | | |
DISTRIBUTIONS TO SHAREHOLDERS: | | | | | | | | | | | |
Distributions to Class A Shareholders: | | | | | | | | | | | |
From net investment income | | | | (1,085 | ) | | | | — | | |
From net realized gain on investments | | | | — | | | | | — | | |
Distributions to Institutional Class Shareholders: | | | | | | | | | | | |
From net investment income | | | | (799,115 | ) | | | | (460,750 | ) | |
From net realized gain on investments | | | | — | | | | | (75,954 | ) | |
From tax return of capital | | | | — | | | | | (8,682 | ) | |
| | | | | | | | | | | |
Decrease in net assets from distributions to shareholders | | | | (800,200 | ) | | | | (545,386 | ) | |
| | | | | | | | | | | |
| | | | | | | | | | | |
CAPITAL SHARE TRANSACTIONS (NOTE 3): | | | | | | | | | | | |
Net proceeds from shares sold | | | | 13,235,636 | | | | | 33,763,890 | | |
Dividends reinvested | | | | 605,614 | | | | | 498,618 | | |
Redemption fees | | | | 1,268 | | | | | 1,381 | | |
Cost of shares repurchased | | | | (1,340,853 | ) | | | | (5,235,409 | ) | |
| | | | | | | | | | | |
Increase in net assets from capital share transactions | | | | 12,501,665 | | | | | 29,028,480 | | |
| | | | | | | | | | | |
Total increase in net assets | | | | 15,930,106 | | | | | 26,783,424 | | |
| | | | | | | | | | | |
| | | | | | | | | | | |
NET ASSETS: | | | | | | | | | | | |
Beginning of period | | | | 29,028,400 | | | | | 2,244,976 | | |
| | | | | | | | | | | |
End of period* | | | $ | 44,958,506 | | | | $ | 29,028,400 | | |
| | | | | | | | | | | |
* Including accumulated/undistributed net investment income (loss) of: | | | $ | 107,459 | | | | $ | (2,962 | ) | |
| | | | | | | | | | | |
The accompanying notes are an integral part of these financial statements.
67
Statements of Changes in Net Assets—Continued
| | | | | | | | | | | |
| | Global Consumer Growth Fund | |
| | | |
| | Six Months Ended
April 30, 2012 | | Period Ended
October 31, 2011 (1) | |
| | | | | |
| | (Unaudited) | | | |
OPERATIONS: | | | | | | | | | | | |
Net investment income | | | $ | 2,856 | | | | $ | 9,005 | | |
Net realized loss on: | | | | | | | | | | | |
Securities transactions | | | | (8,314 | ) | | | | (46,230 | ) | |
Foreign currency transactions | | | | (174 | ) | | | | (415 | ) | |
Change in net unrealized appreciation (depreciation) on: | | | | | | | | | | | |
Investments | | | | 242,993 | | | | | (45,176 | ) | |
Foreign currency translations | | | | (40 | ) | | | | 7 | | |
| | | | | | | | | | | |
Increase (Decrease) in net assets from operations | | | | 237,321 | | | | | (82,809 | ) | |
| | | | | | | | | | | |
| | | | | | | | | | | |
DISTRIBUTIONS TO SHAREHOLDERS: | | | | | | | | | | | |
Distributions to Class A Shareholders: | | | | | | | | | | | |
From net investment income | | | | — | | | | | — | | |
From net realized gain on investments | | | | — | | | | | — | | |
Distributions to Institutional Class Shareholders: | | | | | | | | | | | |
From net investment income | | | | (7,862 | ) | | | | — | | |
From net realized gain on investments | | | | — | | | | | — | | |
| | | | | | | | | | | |
Decrease in net assets from distributions to shareholders | | | | (7,862 | ) | | | | — | | |
| | | | | | | | | | | |
| | | | | | | | | | | |
CAPITAL SHARE TRANSACTIONS (NOTE 3): | | | | | | | | | | | |
Net proceeds from shares sold | | | | 123,600 | | | | | 2,027,480 | | |
Dividends reinvested | | | | 7,862 | | | | | — | | |
| | | | | | | | | | | |
Increase in net assets from capital share transactions | | | | 131,462 | | | | | 2,027,480 | | |
| | | | | | | | | | | |
Total increase in net assets | | | | 360,921 | | | | | 1,944,671 | | |
| | | | | | | | | | | |
| | | | | | | | | | | |
NET ASSETS: | | | | | | | | | | | |
Beginning of period | | | | 1,944,671 | | | | | — | | |
| | | | | | | | | | | |
End of period* | | | $ | 2,305,592 | | | | $ | 1,944,671 | | |
| | | | | | | | | | | |
* Including accumulated net investment income of: | | | $ | 2,856 | | | | $ | 7,862 | | |
| | | | | | | | | | | |
(1) Fund commenced operations on December 29, 2010. | | | | | | | | | | | |
The accompanying notes are an integral part of these financial statements.
68
Financial Highlights
(For a share outstanding throughout each period)
| | | | | | |
| | International
Real Estate
Equity Fund | |
| | | |
| | Period
Ended
April 30,
2012 (a) | |
| | | |
| | (Unaudited) | |
Class A Shares: | | | | | | |
Net asset value per share, beginning of period | | | $ | 17.92 | | |
| | | | | | |
Income from investment operations: | | | | | | |
Net investment income | | | | 0.04 | | |
Net realized and unrealized gain on investments | | | | 3.14 | | |
| | | | | | |
Total from investment operations | | | | 3.18 | | |
| | | | | | |
Redemption fees | | | | — | | |
Less distributions from: | | | | | | |
Net investment income | | | | — | | |
Net realized gains on investments | | | | — | | |
| | | | | | |
Total distributions | | | | — | | |
| | | | | | |
Net asset value per share, end of period | | | $ | 21.10 | | |
| | | | | | |
Total return | | | | 17.75 | (b) | |
Ratios/Supplemental Data: | | | | | | |
Net Assets at end of period (000) | | | $ | 118 | | |
Ratio of total expenses to average net assets | | | | 1.68 | %(c) | |
Ratio of interest expense to average net assets | | | | 0.09 | %(c) | |
Ratio of expenses to average net assets excluding interest expense | | | | 1.59 | %(c) | |
Ratio of net investment income to average net assets | | | | 0.52 | %(c) | |
Portfolio turnover rate (d) | | | | 7 | %(b) | |
| | |
| | |
| |
(a) | Class A commenced operations on December 30, 2011. |
| |
(b) | Not annualized. |
| |
(c) | Annualized. |
| |
(d) | Portfolio turnover is calculated on the basis of the Fund as a whole, without distinguishing between classes of shares issued. |
The accompanying notes are an integral part of these financial statements.
69
Financial Highlights—Continued
(For a share outstanding throughout each period)
| | | | | | | | | | | | | | | | | | | | | |
| | | |
| | International Real Estate Equity Fund | |
| | | |
| | Six Months
Ended
April 30,
2012 | | Year Ended
October 31, | |
| | | | |
| | | 2011 | | 2010 | | 2009 | | 2008 | | 2007 | |
| | | | | | | | | | | | | |
| | (Unaudited) | | | | | | | | | | | |
Institutional Class Shares: | | | | | | | | | | | | | | | | | | | | | |
Net asset value per share, beginning of period | | | $ | 20.53 | | | $ | 25.75 | | $ | 22.59 | | $ | 12.26 | | $ | 47.58 | | $ | 37.56 | |
| | | | | | | | | | | | | | | | | | | | | |
Income from investment operations: | | | | | | | | | | | | | | | | | | | | | |
Net investment income (loss) | | | | (0.01 | ) | | | 0.30 | | | (0.08 | ) | | 0.20 | (a) | | 0.35 | (a) | | 0.63 | |
Net realized and unrealized gains (losses) on investments | | | | 1.14 | | | | (4.84 | ) | | 4.03 | | | 10.12 | | | (33.05 | ) | | 10.78 | |
| | | | | | | | | | | | | | | | | | | | | |
Total from investment operations | | | | 1.13 | | | | (4.54 | ) | | 3.95 | | | 10.32 | | | (32.70 | ) | | 11.41 | |
| | | | | | | | | | | | | | | | | | | | | |
Redemption fees | | | | 0.00 | (b) | | | 0.00 | (b) | | 0.00 | (b) | | 0.01 | | | 0.01 | | | 0.02 | |
Less distributions from: | | | | | | | | | | | | | | | | | | | | | |
Net investment income | | | | (0.54 | ) | | | (0.68 | ) | | (0.79 | ) | | — | | | (0.45 | ) | | (0.63 | ) |
Net realized gains on investments | | | | — | | | | — | | | — | | | — | | | (2.10 | ) | | (0.78 | ) |
Tax return of capital | | | | — | | | | — | | | — | | | — | | | (0.08 | ) | | — | |
| | | | | | | | | | | | | | | | | | | | | |
Total distributions | | | | (0.54 | ) | | | (0.68 | ) | | (0.79 | ) | | — | | | (2.63 | ) | | (1.41 | ) |
| | | | | | | | | | | | | | | | | | | | | |
Net asset value per share, end of period | | | $ | 21.12 | | | $ | 20.53 | | $ | 25.75 | | $ | 22.59 | | $ | 12.26 | | $ | 47.58 | |
| | | | | | | | | | | | | | | | | | | | | |
Total return | | | | 6.00 | %(c) | | | –18.17 | % | | 18.07 | % | | 84.26 | % | | –72.46 | % | | 31.16 | % |
Ratios/Supplemental Data: | | | | | | | | | | | | | | | | | | | | | |
Net Assets at end of period (000) | | | $ | 319,124 | | | $ | 355,433 | | $ | 608,488 | | $ | 730,844 | | $ | 583,953 | | $ | 2,554,134 | |
Ratio of total expenses to average net assets | | | | 1.44 | %(d) | | | 1.37 | % | | 1.28 | % | | 1.26 | % | | 1.22 | % | | 1.14 | % |
Ratio of interest expense to average net assets | | | | 0.09 | %(d) | | | 0.11 | % | | 0.08 | % | | 0.07 | % | | 0.06 | % | | 0.00 | % |
Ratio of expenses to average net assets excluding interest expense | | | | 1.35 | %(d) | | | 1.26 | % | | 1.20 | % | | 1.19 | % | | 1.16 | % | | 1.14 | % |
Ratio of net investment income to average net assets | | | | 0.32 | %(d) | | | 1.89 | % | | 0.32 | % | | 1.13 | % | | 1.29 | % | | 1.08 | % |
Portfolio turnover (e) | | | | 7 | %(c) | | | 20 | % | | 34 | % | | 51 | % | | 42 | % | | 31 | % |
| | |
| | |
| |
(a) | Net investment income per share is calculated using ending balances after consideration of adjustments for permanent book and tax differences. |
| |
(b) | The amount is less than $0.005 per share. |
| |
(c) | Not annualized. |
| |
(d) | Annualized. |
| |
(e) | Portfolio turnover is calculated on the basis of the Fund as a whole, without distinguishing between classes of shares issued. |
The accompanying notes are an integral part of these financial statements.
70
Financial Highlights—Continued
(For a share outstanding throughout each period)
| | | | | | |
| | Realty Income
& Growth Fund | |
| | | |
| | Period
Ended
April 30,
2012 (a) | |
| | | |
| | (Unaudited) | |
Class A Shares: | | | | | | |
Net asset value per share, beginning of period | | | $ | 15.60 | | |
| | | | | | |
Income from investment operations: | | | | | | |
Net investment income | | | | 0.18 | | |
Net realized and unrealized gain on investments | | | | 2.09 | | |
| | | | | | |
Total from investment operations | | | | 2.27 | | |
| | | | | | |
Redemption fees | | | | — | | |
Less distributions from: | | | | | | |
Net investment income | | | | (0.17 | ) | |
Net realized gains on investments | | | | — | | |
| | | | | | |
Total distributions | | | | (0.17 | ) | |
| | | | | | |
Net asset value per share, end of period | | | $ | 17.70 | | |
| | | | | | |
Total return | | | | 14.58 | %(b) | |
Ratios/Supplemental Data: | | | | | | |
Net Assets at end of period (000) | | | $ | 115 | | |
Ratio of total expenses to average net assets | | | | 1.59 | %(c) | |
Ratio of interest expense to average net assets | | | | 0.09 | %(c) | |
Ratio of expenses to average net assets excluding interest expense | | | | 1.50 | %(c) | |
Ratio of net investment income to average net assets | | | | 3.34 | %(c) | |
Portfolio turnover rate (d) | | | | 16 | %(b) | |
| | |
| | |
| |
(a) | Class A commenced operations on December 30, 2011. |
| |
(b) | Not annualized. |
| |
(c) | Annualized. |
| |
(d) | Portfolio turnover is calculated on the basis of the Fund as a whole, without distinguishing between classes of shares issued. |
The accompanying notes are an integral part of these financial statements.
71
|
Alpine Mutual Funds |
| |
|
Financial Highlights—Continued |
(For a share outstanding throughout each period) |
| | | | | | | | | | | | | | | | | | | | | |
| | | |
| | Realty Income & Growth Fund | |
| | | |
| | Six Months
Ended
April 30,
2012 | | Year Ended
October 31, | |
| | | |
| | | | |
| | | 2011 | | 2010 | | 2009 | | 2008 | | 2007 | |
| | | | | | | | | | | | | | | | | | |
| | (Unaudited) | | | | | | | | | | | | | | | | |
Institutional Class Shares: | | | | | | | | | | | | | | | | | | |
Net asset value per share, beginning of period | | | $ | 15.56 | | | $ | 14.79 | | $ | 10.89 | | $ | 9.95 | | $ | 25.12 | | $ | 27.75 | |
| | | | | | | | | | | | | | | | | | | | | |
Income from investment operations: | | | | | | | | | | | | | | | | | | | | | |
Net investment income | | | | 0.36 | | | | 0.48 | | | 0.56 | | | 0.79 | (a) | | 0.99 | (a) | | 0.91 | |
Net realized and unrealized gains (losses) on investments | | | | 2.14 | | | | 1.01 | | | 4.06 | | | 0.94 | | | (13.46 | ) | | (1.54 | ) |
| | | | | | | | | | | | | | | | | | | | | |
Total from investment operations | | | | 2.50 | | | | 1.49 | | | 4.62 | | | 1.73 | | | (12.47 | ) | | (0.63 | ) |
| | | | | | | | | | | | | | | | | | | | | |
Redemption fees | | | | 0.00 | (b) | | | 0.00 | (b) | | 0.00 | (b) | | 0.00 | (b) | | 0.00 | (b) | | 0.00 | (b) |
Less distributions from: | | | | | | | | | | | | | | | | | | | | | |
Net investment income | | | | (0.36 | ) | | | (0.72 | ) | | (0.65 | ) | | (0.62 | ) | | (0.99 | ) | | (0.95 | ) |
Net realized gains on investments | | | | — | | | | — | | | (0.07 | ) | | — | | | (1.71 | ) | | (1.05 | ) |
Tax return of capital | | | | — | | | | — | | | — | | | (0.17 | ) | | — | | | — | |
| | | | | | | | | | | | | | | | | | | | | |
Total distributions | | | | (0.36 | ) | | | (0.72 | ) | | (0.72 | ) | | (0.79 | ) | | (2.70 | ) | | (2.00 | ) |
| | | | | | | | | | | | | | | | | | | | | |
Net asset value per share, end of period | | | $ | 17.70 | | | $ | 15.56 | | $ | 14.79 | | $ | 10.89 | | $ | 9.95 | | $ | 25.12 | |
| | | | | | | | | | | | | | | | | | | | | |
Total return | | | | 16.26 | %(c) | | | 10.23 | % | | 43.51 | % | | 20.23 | % | | –54.62 | % | | –2.53 | % |
Ratios/Supplemental Data: | | | | | | | | | | | | | | | | | | | | | |
Net Assets at end of period (000) | | | $ | 111,411 | | | $ | 101,322 | | $ | 108,941 | | $ | 84,795 | | $ | 95,270 | | $ | 532,443 | |
Ratio of total expenses to average net assets: | | | | | | | | | | | | | | | | | | | | | |
Before waivers | | | | 1.34 | %(d) | | | 1.32 | % | | 1.34 | % | | 1.39 | % | | 1.56 | % | | 1.29 | % |
After waivers | | | | 1.34 | %(d) | | | 1.32 | % | | 1.34 | % | | 1.39 | % | | 1.43 | % | | 1.29 | % |
Ratio of interest expense to average net assets | | | | 0.08 | %(d) | | | 0.09 | % | | 0.10 | % | | 0.12 | % | | 0.40 | % | | 0.14 | % |
Ratio of expenses to average net assets excluding interest expense: | | | | | | | | | | | | | | | | | | | | | |
Before waivers | | | | 1.26 | %(d) | | | 1.23 | % | | 1.24 | % | | 1.27 | % | | 1.16 | % | | 1.15 | % |
After waivers | | | | 1.26 | %(d) | | | 1.23 | % | | 1.24 | % | | 1.27 | % | | 1.03 | % | | 1.15 | % |
Ratio of net investment income to average net assets | | | | 4.38 | %(d) | | | 3.09 | % | | 4.24 | % | | 8.57 | % | | 5.55 | % | | 3.34 | % |
Portfolio turnover(e) | | | | 16 | %(c) | | | 59 | % | | 70 | % | | 111 | % | | 23 | % | | 33 | % |
| | |
| | |
|
(a) | Net investment income per share is calculated using ending balances after consideration of adjustments for permanent book and tax differences. |
|
(b) | The amount is less than $0.005 per share. |
|
(c) | Not annualized. |
|
(d) | Annualized. |
|
(e) | Portfolio turnover is calculated on the basis of the Fund as a whole, without distinguishing between classes of shares issued. |
The accompanying notes are an integral part of these financial statements.
72
|
Alpine Mutual Funds |
| |
|
Financial Highlights—Continued |
(For a share outstanding throughout each period) |
| | | | | | | | | | | | | | | | | | | | | |
| | | |
| | Cyclical Advantage Property Fund | |
| | | |
| | Six Months
Ended
April 30,
2012 | | Year Ended
October 31, | |
| | | |
| | | | |
| | | 2011 | | 2010 | | 2009 | | 2008 | | 2007 | |
| | | | | | | | | | | | | |
| | (Unaudited) | | | | | | | | | | | | | | | | |
Institutional Class Shares: | | | | | | | | | | | | | | | | | | | |
Net asset value per share, beginning of period | | | $ | 18.13 | | | $ | 20.27 | | $ | 16.65 | | $ | 13.86 | | $ | 34.97 | | $ | 38.27 | |
| | | | | | | | | | | | | | | | | | | | | |
Income from investment operations: | | | | | | | | | | | | | | | | | | | | | |
Net investment income | | | | 0.09 | | | | 0.07 | | | 0.09 | | | 0.26 | (a) | | 0.53 | (a) | | 0.15 | |
Net realized and unrealized gains (losses) on investments | | | | 2.28 | | | | (2.12 | ) | | 3.77 | | | 2.65 | | | (21.11 | ) | | (0.28 | ) |
| | | | | | | | | | | | | | | | | | | | | |
Total from investment operations | | | | 2.37 | | | | (2.05 | ) | | 3.86 | | | 2.91 | | | (20.58 | ) | | (0.13 | ) |
| | | | | | | | | | | | | | | | | | | | | |
Redemption fees | | | | 0.00 | (b) | | | 0.00 | (b) | | 0.00 | (b) | | 0.00 | (b) | | 0.00 | (b) | | 0.02 | |
Less distributions from: | | | | | | | | | | | | | | | | | | | | | |
Net investment income | | | | (0.09 | ) | | | (0.09 | ) | | (0.24 | ) | | (0.12 | ) | | (0.43 | ) | | (0.05 | ) |
Net realized gains on investments | | | | — | | | | — | | | — | | | — | | | — | | | (3.11 | ) |
Tax return of capital | | | | — | | | | — | | | — | | | — | | | (0.10 | ) | | (0.03 | ) |
| | | | | | | | | | | | | | | | | | | | | |
Total distributions | | | | (0.09 | ) | | | (0.09 | ) | | (0.24 | ) | | (0.12 | ) | | (0.53 | ) | | (3.19 | ) |
| | | | | | | | | | | | | | | | | | | | | |
Net asset value per share, end of period | | | $ | 20.41 | | | $ | 18.13 | | $ | 20.27 | | $ | 16.65 | | $ | 13.86 | | $ | 34.97 | |
| | | | | | | | | | | | | | | | | | | | | |
Total return | | | �� | 13.20 | %(c) | | | –10.19 | % | | 23.36 | % | | 21.14 | % | | –59.54 | % | | –0.88 | % |
Ratios/Supplemental Data: | | | | | | | | | | | | | | | | | | | | | |
Net Assets at end of period (000) | | | $ | 53,030 | | | $ | 49,090 | | $ | 62,044 | | $ | 55,064 | | $ | 47,405 | | $ | 148,631 | |
Ratio of total expenses to average net assets | | | | 1.48 | %(d) | | | 1.38 | % | | 1.32 | % | | 1.45 | % | | 1.70 | % | | 1.58 | % |
Ratio of interest expense to average net assets | | | | 0.01 | %(d) | | | 0.03 | % | | 0.02 | % | | 0.11 | % | | 0.50 | % | | 0.39 | % |
Ratio of expenses to average net assets excluding interest expense | | | | 1.47 | %(d) | | | 1.35 | % | | 1.30 | % | | 1.34 | % | | 1.20 | % | | 1.19 | % |
Ratio of net investment income to average net assets | | | | 0.95 | %(d) | | | 0.36 | % | | 0.51 | % | | 2.28 | % | | 2.68 | % | | 0.42 | % |
Portfolio turnover | | | | 12 | %(c) | | | 59 | % | | 90 | % | | 135 | % | | 68 | % | | 49 | % |
| | |
| | | |
|
(a) | Net investment income per share is calculated using ending balances after consideration of adjustments for permanent book and tax differences. |
|
(b) | The amount is less than $0.005 per share. |
|
(c) | Not annualized. |
|
(d) | Annualized. |
The accompanying notes are an integral part of these financial statements.
73
|
Alpine Mutual Funds |
| |
|
Financial Highlights—Continued |
(For a share outstanding throughout each period) |
| | | | | | |
| | Emerging
Markets
Real Estate Fund | |
�� | | | |
| | Period
Ended
April 30,
2012 (a) | |
| | | |
| | (Unaudited) | |
Class A Shares: | | | | |
Net asset value per share, beginning of period | | | $ | 13.45 | | |
| | | | | | |
Income from investment operations: | | | | | | |
Net investment income | | | | 0.02 | | |
Net realized and unrealized gain on investments | | | | 2.75 | | |
| | | | | | |
Total from investment operations | | | | 2.77 | | |
| | | | | | |
Redemption fees | | | | — | | |
Less distributions from: | | | | | | |
Net investment income | | | | — | | |
Net realized gains on investments | | | | — | | |
| | | | | | |
Total distributions | | | | — | | |
| | | | | | |
Net asset value per share, end of period | | | $ | 16.22 | | |
| | | | | | |
Total return | | | | 20.59 | %(b) | |
Ratios/Supplemental Data: | | | | | | |
Net Assets at end of period (000) | | | $ | 121 | | |
Ratio of total expenses to average net assets: | | | | | | |
Before waivers | | | | 3.73 | %(c) | |
After waivers | | | | 1.61 | %(c) | |
Ratio of interest expense to average net assets | | | | 0.01 | %(c) | |
Ratio of expenses to average net assets excluding interest expense: | | | | | | |
Before waivers | | | | 3.72 | %(c) | |
After waivers | | | | 1.60 | %(c) | |
Ratio of net investment income to average net assets | | | | 0.32 | %(c) | |
Portfolio turnover rate (d) | | | | 37 | %(b) | |
| | |
| | | |
|
(a) | Class A commenced operations on December 30, 2011. |
|
(b) | Not annualized. |
|
(c) | Annualized. |
|
(d) | Portfolio turnover is calculated on the basis of the Fund as a whole, without distinguishing between classes of shares issued. |
The accompanying notes are an integral part of these financial statements.
74
|
Alpine Mutual Funds |
| |
|
Financial Highlights—Continued |
(For a share outstanding throughout each period) |
| | | | | | | | | | | | | | | | | |
| | | |
| | Emerging Markets Real Estate Fund | |
| | | |
| | Six Months
Ended
April 30,
2012 | | Year Ended
October 31, | | Period
Ended
October 31,
2009 (a) | |
| | | | |
| | | | | |
| | | 2011 | | 2010 | | |
| | | | | | | | | |
| | (Unaudited) | | | | | | | |
Institutional Class Shares: | | | | | | | | | | | | | |
Net asset value per share, beginning of period | | | $ | 14.68 | | | $ | 19.20 | | $ | 17.03 | | | $ | 10.00 | | |
| | | | | | | | | | | | | | | | | |
Income from investment operations: | | | | | | | | | | | | | | | | | |
Net investment income (loss) | | | | (0.02 | ) | | | 0.40 | | | 0.27 | | | | (0.08 | )(b) | |
Net realized and unrealized gains (losses) on investments | | | | 1.57 | | | | (3.47 | ) | | 3.43 | | | | 7.10 | | |
| | | | | | | | | | | | | | | | | |
Total from investment operations | | | | 1.55 | | | | (3.07 | ) | | 3.70 | | | | 7.02 | | |
| | | | | | | | | | | | | | | | | |
Redemption fees | | | | 0.00 | (c) | | | 0.00 | (c) | | 0.00 | (c) | | | 0.01 | | |
Less distributions from: | | | | | | | | | | | | | | | | | |
Net investment income | | | | — | | | | (0.08 | ) | | (0.87 | ) | | | — | | |
Net realized gains on investments | | | | — | | | | (1.37 | ) | | (0.66 | ) | | | — | | |
| | | | | | | | | | | | | | | | | |
Total distributions | | | | — | | | | (1.45 | ) | | (1.53 | ) | | | — | | |
| | | | | | | | | | | | | | | | | |
Net asset value per share, end of period | | | $ | 16.23 | | | $ | 14.68 | | $ | 19.20 | | | $ | 17.03 | | |
| | | | | | | | | | | | | | | | | |
Total return | | | | 10.56 | %(d) | | | –17.52 | % | | 23.53 | % | | | 70.30 | %(d) | |
Ratios/Supplemental Data: | | | | | | | | | | | | | | | | | |
Net Assets at end of period (000) | | | $ | 4,084 | | | $ | 4,289 | | $ | 3,269 | | | $ | 2,047 | | |
Ratio of total expenses to average net assets: | | | | | | | | | | | | | | | | | |
Before waivers | | | | 3.62 | %(e) | | | 2.42 | % | | 2.68 | % | | | 4.36 | %(e) | |
After waivers | | | | 1.35 | %(e) | | | 1.35 | % | | 1.35 | % | | | 1.35 | %(e) | |
Ratio of interest expense to average net assets | | | | 0.00 | %(c)(e) | | | 0.00 | %(c) | | 0.00 | % | | | 0.00 | % | |
Ratio of expenses to average net assets excluding interest expense: | | | | | | | | | | | | | | | | | |
Before waivers | | | | 3.62 | %(e) | | | 2.42 | % | | 2.68 | % | | | 4.36 | %(e) | |
After waivers | | | | 1.35 | %(e) | | | 1.35 | % | | 1.35 | % | | | 1.35 | %(e) | |
Ratio of net investment income to average net assets | | | | 0.15 | %(e) | | | 0.54 | % | | 0.13 | % | | | (0.76 | )%(e) | |
Portfolio turnover(f) | | | | 37 | %(d) | | | 58 | % | | 77 | % | | | 35 | %(d) | |
| | |
| | | |
|
(a) | For the period from November 3, 2008 (inception of fund) to October 31, 2009. |
|
(b) | Net investment income per share is calculated using ending balances after consideration of adjustments for permanent book and tax differences. |
|
(c) | The amount is less than $0.005 per share or 0.005%. |
|
(d) | Not annualized. |
|
(e) | Annualized. |
|
(f) | Portfolio turnover is calculated on the basis of the Fund as a whole, without distinguishing between classes of shares issued. |
The accompanying notes are an integral part of these financial statements.
75
|
Alpine Mutual Funds |
| |
|
Financial Highlights—Continued |
(For a share outstanding throughout each period) |
| | | | | | |
| | Global
Infrastructure
Fund | |
| | | |
| | Period
Ended
April 30,
2012 (a) | |
| | | |
| | (Unaudited) | |
Class A Shares: | | | | |
Net asset value per share, beginning of period | | | $ | 13.91 | | |
| | | | | | |
Income from investment operations: | | | | | | |
Net investment income | | | | 0.18 | | |
Net realized and unrealized gain on investments | | | | 1.65 | | |
| | | | | | |
Total from investment operations | | | | 1.83 | | |
| | | | | | |
Redemption fees | | | | — | | |
Less distributions from: | | | | | | |
Net investment income | | | | (0.15 | ) | |
Net realized gains on investments | | | | — | | |
| | | | | | |
Total distributions | | | | (0.15 | ) | |
| | | | | | |
Net asset value per share, end of period | | | $ | 15.59 | | |
| | | | | | |
Total return | | | | 13.16 | %(b) | |
Ratios/Supplemental Data: | | | | | | |
Net Assets at end of period (000) | | | $ | 277 | | |
Ratio of total expenses to average net assets | | | | 1.53 | %(c) | |
Ratio of net investment income to average net assets | | | | 4.15 | %(c) | |
Portfolio turnover rate(d) | | | | 75 | %(b) | |
| | |
| | | |
|
(a) | Class A commenced operations on December 30, 2011. |
|
(b) | Not annualized. |
|
(c) | Annualized. |
|
(d) | Portfolio turnover is calculated on the basis of the Fund as a whole, without distinguishing between classes of shares issued. |
The accompanying notes are an integral part of these financial statements.
76
|
Alpine Mutual Funds |
| |
|
Financial Highlights—Continued |
(For a share outstanding throughout each period) |
| | | | | | | | | | | | | | | | | |
| | | |
| | Global Infrastructure Fund | |
| | | |
| | Six Months
Ended
April 30,
2012 | | Year Ended
October 31, | | Period
Ended
October 31,
2009 (a) | |
| | | | |
| | | | | |
| | | 2011 | | 2010 | | |
| | | | | | | | | |
| | (Unaudited) | | | | | | | |
Institutional Class Shares: | | | | | | | | | | | | | |
Net asset value per share, beginning of period | | | $ | 14.32 | | | $ | 15.98 | | $ | 13.38 | | | $ | 10.00 | | |
| | | | | | | | | | | | | | | | | |
Income from investment operations: | | | | | | | | | | | | | | | | | |
Net investment income | | | | 0.36 | | | | 0.61 | | | 0.43 | | | | 0.19 | (b) | |
Net realized and unrealized gains (losses) on investments | | | | 1.23 | | | | (0.72 | ) | | 3.40 | | | | 3.19 | | |
| | | | | | | | | | | | | | | | | |
Total from investment operations | | | | 1.59 | | | | (0.11 | ) | | 3.83 | | | | 3.38 | | |
| | | | | | | | | | | | | | | | | |
Redemption fees | | | | 0.00 | (c) | | | 0.00 | (c) | | — | | | | 0.00 | (c) | |
Less distributions from: | | | | | | | | | | | | | | | | | |
Net investment income | | | | (0.32 | ) | | | (0.99 | ) | | (0.20 | ) | | | — | | |
Net realized gains on investments | | | | — | | | | (0.55 | ) | | (1.03 | ) | | | — | | |
Tax return of capital | | | | — | | | | (0.01 | ) | | — | | | | — | | |
| | | | | | | | | | | | | | | | | |
Total distributions | | | | (0.32 | ) | | | (1.55 | ) | | (1.23 | ) | | | — | | |
| | | | | | | | | | | | | | | | | |
Net asset value per share, end of period | | | $ | 15.59 | | | $ | 14.32 | | $ | 15.98 | | | $ | 13.38 | | |
| | | | | | | | | | | | | | | | | |
Total return | | | | 11.25 | %(d) | | | –1.03 | % | | 30.23 | % | | | 33.80 | %(d) | |
Ratios/Supplemental Data: | | | | | | | | | | | | | | | | | |
Net Assets at end of period (000) | | | $ | 44,682 | | | $ | 29,028 | | $ | 2,245 | | | $ | 1,422 | | |
Ratio of total expenses to average net assets: | | | | | | | | | | | | | | | | | |
Before waivers | | | | 1.28 | %(e) | | | 1.59 | % | | 3.03 | % | | | 4.42 | %(e) | |
After waivers | | | | 1.28 | %(e) | | | 1.35 | % | | 1.35 | % | | | 1.35 | %(e) | |
Ratio of interest expense to average net assets | | | | 0.00 | % | | | 0.00 | %(c) | | 0.00 | %(c) | | | 0.00 | %(c)(e) | |
Ratio of expenses to average net assets excluding interest expense: | | | | | | | | | | | | | | | | | |
Before waivers | | | | 1.28 | %(e) | | | 1.59 | % | | 3.03 | % | | | 4.42 | %(e) | |
After waivers | | | | 1.28 | %(e) | | | 1.35 | % | | 1.35 | % | | | 1.35 | %(e) | |
Ratio of net investment income to average net assets | | | | 4.95 | %(e) | | | 4.17 | % | | 3.40 | % | | | 1.76 | %(e) | |
Portfolio turnover(f) | | | | 75 | %(d) | | | 189 | % | | 402 | % | | | 258 | %(d) | |
| | |
| | | |
|
(a) | For the period from November 3, 2008 (inception of fund) to October 31, 2009. |
|
(b) | Net investment income per share is calculated using ending balances after consideration of adjustments for permanent book and tax differences. |
|
(c) | The amount is less than $0.005 per share or 0.005%. |
|
(d) | Not annualized. |
|
(e) | Annualized. |
|
(f) | Portfolio turnover is calculated on the basis of the Fund as a whole, without distinguishing between classes of shares issued. |
The accompanying notes are an integral part of these financial statements.
77
|
Alpine Mutual Funds |
| |
|
Financial Highlights—Continued |
(For a share outstanding throughout each period) |
| | | | | | |
| | Global
Consumer
Growth Fund | |
| | | |
| | Period Ended
April 30,
2012 (a) | |
| | | |
| | (Unaudited) | |
Class A Shares: | | | | |
Net asset value per share, beginning of period | | | $ | 8.95 | | |
| | | | | | |
Income from investment operations: | | | | | | |
Net investment income | | | | 0.01 | | |
Net realized and unrealized gain on investments | | | | 1.65 | | |
| | | | | | |
Total from investment operations | | | | 1.66 | | |
| | | | | | |
Redemption fees | | | | — | | |
Less distributions from: | | | | | | |
Net investment income | | | | — | | |
Net realized gains on investments | | | | — | | |
| | | | | | |
Total distributions | | | | — | | |
| | | | | | |
Net asset value per share, end of period | | | $ | 10.61 | | |
| | | | | | |
Total return | | | | 18.55 | %(b) | |
Ratios/Supplemental Data: | | | | | | |
Net Assets at end of period (000) | | | $ | 119 | | |
Ratio of total expenses to average net assets: | | | | | | |
Before waivers | | | | 6.85 | %(c) | |
After waivers | | | | 1.60 | %(c) | |
Ratio of net investment income to average net assets | | | | 0.23 | %(c) | |
Portfolio turnover rate(d) | | | | 2 | %(b) | |
| | |
| | | |
|
(a) | Class A commenced operations on December 30, 2011. |
|
(b) | Not annualized. |
|
(c) | Annualized. |
|
(d) | Portfolio turnover is calculated on the basis of the Fund as a whole, without distinguishing between classes of shares issued. |
The accompanying notes are an integral part of these financial statements.
78
|
Alpine Mutual Funds |
| |
|
Financial Highlights—Continued |
(For a share outstanding throughout each period) |
| | | | | | | | | | | |
| | | |
| | Global Consumer Growth Fund | |
| | | |
| | Six Months
Ended
April 30,
2012 | | Period
Ended
October 31,
2011 (a) | |
| | | | | |
| | (Unaudited) | | | | |
Institutional Class Shares: | | | | | | | |
Net asset value per share, beginning of period | | | $ | 9.59 | | | | $ | 10.00 | | |
| | | | | | | | | | | |
Income from investment operations: | | | | | | | | | | | |
Net investment income | | | | 0.01 | | | | | 0.04 | | |
Net realized and unrealized gains (losses) on investments | | | | 1.06 | | | | | (0.45 | ) | |
| | | | | | | | | | | |
Total from investment operations | | | | 1.07 | | | | | (0.41 | ) | |
| | | | | | | | | | | |
Redemption fees | | | | — | | | | | — | | |
Less distributions from: | | | | | | | | | | | |
Net investment income | | | | (0.04 | ) | | | | — | | |
Net realized gains on investments | | | | — | | | | | — | | |
| | | | | | | | | | | |
Total distributions | | | | (0.04 | ) | | | | — | | |
| | | | | | | | | | | |
Net asset value per share, end of period | | | $ | 10.62 | | | | $ | 9.59 | | |
| | | | | | | | | | | |
Total return | | | | 11.22 | %(b) | | | | –4.10 | %(b) | |
Ratios/Supplemental Data: | | | | | | | | | | | |
Net Assets at end of period (000) | | | $ | 2,187 | | | | $ | 1,945 | | |
Ratio of total expenses to average net assets: | | | | | | | | | | | |
Before waivers | | | | 5.46 | %(c) | | | | 2.96 | %(c) | |
After waivers | | | | 1.35 | %(c) | | | | 1.35 | %(c) | |
Ratio of net investment income to average net assets | | | | 0.28 | %(c) | | | | 0.54 | %(c) | |
Portfolio turnover(d) | | | | 2 | %(b) | | | | 7 | %(b) | |
| | |
| | | |
|
(a) | For the period from December 29, 2010 (inception of fund) to October 31, 2011. |
|
(b) | Not annualized. |
|
(c) | Annualized. |
|
(d) | Portfolio turnover is calculated on the basis of the Fund as a whole, without distinguishing between classes of shares issued. |
The accompanying notes are an integral part of these financial statements.
79
Notes to Financial Statements
April 30, 2012 (Unaudited)
| |
1. | Organization: |
| |
| Alpine Equity Trust (the “Equity Trust”) was organized in 1988 as a Massachusetts Business Trust, and is registered under the Investment Company Act of 1940, as amended (the “1940 Act”), as an open-ended management investment company. The Alpine International Real Estate Equity Fund, Alpine Realty Income & Growth Fund, Alpine Cyclical Advantage Property Fund, Alpine Emerging Markets Real Estate Fund, Alpine Global Infrastructure Fund, and Alpine Global Consumer Growth Fund are six separate funds of the Equity Trust (individually referred to as a “Fund” and collectively, “the Funds”). Effective September 1, 2009, the Alpine U.S. Real Estate Equity Fund changed its name to the Alpine Cyclical Advantage Property Fund. The Alpine International Real Estate Equity Fund, Alpine Cyclical Advantage Property Fund, Alpine Emerging Markets Real Estate Fund, Alpine Global Infrastructure Fund and Alpine Global Consumer Growth Fund are diversified funds. The Alpine Realty Income & Growth Fund is a non-diversified fund. Alpine Woods Capital Investors, LLC (the “Adviser”) is a Delaware limited liability company and serves as the investment manager to the Funds. |
| |
2. | Significant Accounting Policies: |
| |
| The following is a summary of significant accounting policies consistently followed by the Funds in the preparation of their financial statements. The policies are in conformity with accounting principles generally accepted in the United States of America (“GAAP”), which require management to make estimates and assumptions that affect amounts reported herein. Actual results could differ from those estimates. Changes in the economic environment financial markets and any other parameters used in determining these estimates could cause actual results to differ. Subsequent events have been evaluated through the date the financial statements were issued. |
| |
| A. Valuation of Securities: |
| |
| The net asset value (“NAV”) of shares of the Funds are calculated by dividing the value of the Funds’ net assets by the number of outstanding shares. NAV is determined each day the NYSE is open as of the close of regular trading (normally, 4:00 p.m., Eastern time). In computing NAV, portfolio securities of the Funds are valued at their current market values determined on the basis of market quotations or if market quotations are not available or determined to be reliable, through procedures and/or guidelines established by the Board of Trustees. In computing the Funds’ net asset value, equity securities that are traded on a securities exchange in the United States are valued at the last reported sale price as of the time of valuation, or lacking any current reported sale at the time of valuation, at the mean between the most recent bid and asked quotations. Each option security traded on a securities exchange in the United States is valued at the last current reported sale price as of the time of valuation, or lacking any current reported sale at the time of valuation, the option is valued at the mid-point of the consolidated bid/ask quote for the option security. Each security traded in the over-the-counter market and quoted on the NASDAQ National Market System, is valued at the NASDAQ Official Closing Price (“NOCP”), as determined by NASDAQ, or lacking an NOCP, the last current reported sale price as of the time of valuation by NASDAQ, or lacking any current reported sale on NASDAQ at the time of valuation, at the mean between the most recent bid and asked quotations. Each over-the-counter option that is not traded through the Options Clearing Corporation is valued by the counterparty, or if the counterparty’s price is not readily available then by using the Black-Scholes method. Debt securities are valued based on an evaluated mean price as furnished by pricing services approved by the Board of Trustees, which may be based on market transactions for comparable securities and various relationships between securities that are generally recognized by institutional traders, a computerized matrix system, or appraisals derived from information concerning the securities or similar securities received from recognized dealers in those securities. Short-term securities with maturities of 60 days or less are valued at amortized cost, which approximates fair value. |
| |
| Equity securities that are principally traded in a foreign market are valued at the last current sale price at the time of valuation or lacking any current or reported sale at the time of valuation, at the mean between the most recent bid and asked quotations as of the close of the appropriate exchange or other designated time. Trading in securities on European and Far Eastern securities exchanges and over-the-counter markets is normally completed at various times before the close of business on each day on which the NYSE is open. Trading of these securities may not take place on every NYSE business day. In addition, trading may take place in various foreign markets on Saturdays or on other days when the NYSE is not open and on which the Fund’s net asset values are not calculated. If the market prices are not readily available or not reflective of the fair value of the security, as of the close of the |
80
Notes to Financial Statements—Continued
April 30, 2012 (Unaudited)
|
regular trading on the NYSE (normally, 4:00 p.m., Eastern time), the security will be priced at fair value following procedures approved by the Board of Trustees. |
|
When market quotations are not readily available or when the valuation methods mentioned above are not reflective of a fair value of the security, the security is valued at fair value following procedures and/or guidelines approved by the Board of Trustees. The Board has approved the use of Interactive Data’s proprietary fair value pricing model to assist in determining current valuation for foreign securities traded in markets that close prior to the NYSE. When fair value pricing is employed, the value of the portfolio security used to calculate the Funds’ net asset values may differ from quoted or official closing prices. |
|
As of April 30, 2012, the International Real Estate Equity Fund, Realty Income & Growth Fund, and Cyclical Advantage Property Fund held securities that are fair valued, which comprised 7.6%, 1.2%, and 4.3%, respectively, of each Fund’s net assets. |
|
Fair Value Measurement: The Fund’s have adopted Financial Accounting Standards Board Codification Topic 820 (“ASC Topic 820”). ASC Topic 820 establishes a single definition of fair value, creates a three-tier hierarchy as a framework for measuring fair value based on inputs used to value the Fund’s investments, and requires additional disclosure about fair value. The hierarchy of inputs is summarized below. |
| | |
| Level 1 — | quoted prices in active markets for identical investments. |
| | |
| Level 2 — | other significant observable inputs (including quoted prices for similar investments, interest rates, prepayment speeds, credit risk, yield curves, default rates, etc.). |
| | |
| Level 3 — | significant unobservable inputs (including the Funds’ own assumptions in determining the fair value of investments). |
The inputs or methodology used for valuing securities are not necessarily an indication of the risk associated with investing in those securities.
The Fund uses valuation techniques to measure fair value that are consistent with the market approach and/or income approach, depending on the type of security and the particular circumstance. The market approach uses prices and other relevant information generated by market transactions involving identical or comparable securities. The income approach uses valuation techniques to discount estimated future cash flows to present value.
The following is a summary of the inputs used in valuing the Fund’s assets and liabilities carried at fair value:
| | | | | | | | | | | | | | |
| | | Valuation Inputs | | | |
| | | | | | |
International Real Estate Equity Fund* | | | Level 1 ** | | Level 2 ** | | Level 3 | | Total Value | |
| | | | | | | | | | | |
Common Stocks | | | | | | | | | | | | | |
Asia | | $ | 67,590,565 | | $ | 16,359,922 | | $ | 15,287,716 | | $ | 99,238,203 | |
Europe | | | 83,798,705 | | | — | | | 757,889 | | | 84,556,594 | |
Middle East/Africa | | | 704,589 | | | — | | | — | | | 704,589 | |
North & South America | | | 136,032,061 | | | — | | | 8,159,227 | | | 144,191,288 | |
Equity-Linked Structured Notes | | | — | | | 4,735,161 | | | — | | | 4,735,161 | |
Investment Companies | | | 2,544,441 | | | — | | | — | | | 2,544,441 | |
Warrants | | | 247,349 | | | — | | | — | | | 247,349 | |
| | | | | | | | | | | | | |
Total | | $ | 290,917,710 | | $ | 21,095,083 | | $ | 24,204,832 | | $ | 336,217,625 | |
| | | | | | | | | | | | | |
81
Notes to Financial Statements—Continued
April 30, 2012 (Unaudited)
| | | | | | | | | | | | | | |
| | | Valuation Inputs | | | | |
| | | | | | | |
Realty Income and Growth Fund* | | | Level 1 ** | | Level 2 ** | | Level 3 | | Total Value | |
| | | | | | | | | | | |
Real Estate Investment Trusts | | | | | | | | | | | | | |
Apartments | | $ | 18,267,855 | | $ | — | | $ | — | | $ | 18,267,855 | |
Diversified | | | 6,062,255 | | | — | | | — | | | 6,062,255 | |
Health Care | | | 14,832,813 | | | — | | | — | | | 14,832,813 | |
Lodging | | | 2,656,450 | | | — | | | — | | | 2,656,450 | |
Manufactured Homes | | | 898,729 | | | — | | | — | | | 898,729 | |
Mortgage & Finance | | | 2,321,512 | | | — | | | — | | | 2,321,512 | |
Net Lease | | | 1,061,155 | | | — | | | — | | | 1,061,155 | |
Office-Industrial Buildings | | | 34,762,339 | | | — | | | 1,355,915 | | | 36,118,254 | |
Retail Centers | | | 21,142,350 | | | — | | | — | | | 21,142,350 | |
Storage | | | 4,407,394 | | | — | | | — | | | 4,407,394 | |
Common Stocks | | | 2,219,120 | | | — | | | — | | | 2,219,120 | |
Preferred Stocks | | | 7,041,172 | | | — | | | — | | | 7,041,172 | |
| | | | | | | | | | | | | |
Total | | $ | 115,673,144 | | $ | — | | $ | 1,355,915 | | $ | 117,029,059 | |
| | | | | | | | | | | | | |
| | | | | | | | | | | | | |
| | Valuation Inputs | | | | |
| | | | | | |
Cyclical Advantage Property Fund* | | | Level 1 ** | | Level 2 ** | | Level 3 | | Total Value | |
| | | | | | | | | | | |
Common Stocks | | | | | | | | | | | | | |
Asia | | $ | 7,626,550 | | $ | 3,401,789 | | $ | — | | $ | 11,028,339 | |
Europe | | | 7,905,174 | | | — | | | — | | | 7,905,174 | |
Middle East/Africa | | | 320,090 | | | — | | | — | | | 320,090 | |
North & South America | | | 30,829,095 | | | 997,731 | | | 2,259,858 | | | 34,086,684 | |
Equity-Linked Structured Notes | | | — | | | 904,250 | | | — | | | 904,250 | |
Warrants | | | 9,626 | | | — | | | — | | | 9,626 | |
| | | | | | | | | | | | | |
Total | | $ | 46,690,535 | | $ | 5,303,770 | | $ | 2,259,858 | | $ | 54,254,163 | |
| | | | | | | | | | | | | |
| | | | | | | | | | | | | |
| | Valuation Inputs | | | | |
| | | | | | |
Emerging Markets Real Estate Fund* | | | Level 1 ** | | Level 2 ** | | Level 3 | | Total Value | |
| | | | | | | | | | | |
Common Stocks | | | | | | | | | | | | | |
Asia | | $ | 1,595,621 | | $ | 495,608 | | $ | — | | $ | 2,091,229 | |
Europe | | | 186400 | | | 76,245 | | | — | | | 262,645 | |
Middle East/Africa | | | 22,257 | | | — | | | — | | | 22,257 | |
North & South America | | | 1,519,625 | | | 40,203 | | | — | | | 1,559,828 | |
Equity-Linked Structured Notes | | | — | | | 217,123 | | | — | | | 217,123 | |
Investment Companies | | | 5,638 | | | — | | | — | | | 5,638 | |
Warrants | | | 722 | | | 278 | | | — | | | 1,000 | |
| | | | | | | | | | | | | |
Total | | $ | 3,330,263 | | $ | 829,457 | | $ | — | | $ | 4,159,720 | |
| | | | | | | | | | | | | |
82
Notes to Financial Statements—Continued
April 30, 2012 (Unaudited)
| | | | | | | | | | | | | | |
| | | Valuation Inputs | | | | |
| | | | | | | |
Global Infrastructure Fund* | | | Level 1 ** | | Level 2 ** | | Level 3 | | Total Value | |
| | | | | | | | | | | |
Common Stocks | | $ | 41,841,750 | | $ | — | | $ | — | | $ | 41,841,750 | |
Equity-Linked Structured Notes | | | — | | | 452,571 | | | — | | | 452,571 | |
Short-Term Investments | | | — | | | 2,401,000 | | | — | | | 2,401,000 | |
| | | | | | | | | | | | | |
Total | | $ | 41,841,750 | | $ | 2,853,571 | | $ | — | | $ | 44,695,321 | |
| | | | | | | | | | | | | |
| | | | | | | | | | | | | |
| | Valuation Inputs | | | | |
| | | | | | |
Other Financial Instruments | | | Level 1 | | Level 2 | | Level 3 | | Total Value | |
| | | | | | | | | | | |
Assets | | | | | | | | | | | | | |
Forward Currency Contracts | | $ | — | | $ | 659 | | $ | — | | $ | 659 | |
Liabilities | | | | | | | | | | | | | |
Forward Currency Contracts | | | — | | | (1,416 | ) | | — | | | (1,416 | ) |
| | | | | | | | | | | | | |
Total | | $ | — | | $ | (757 | ) | $ | — | | $ | (757 | ) |
| | | | | | | | | | | | | |
| | | | | | | | | | | | | |
| | Valuation Inputs | | | | |
| | | | | | |
Global Consumer Growth Fund* | | | Level 1 ** | | Level 2 ** | | Level 3 | | Total Value | |
| | | | | | | | | | | |
Common Stocks | | | | | | | | | | | | | |
Asia | | $ | 414,117 | | $ | — | | $ | — | | $ | 414,117 | |
Europe | | | 494,672 | | | 20,856 | | | — | | | 515,528 | |
North & South America | | | 1,226,580 | | | — | | | — | | | 1,226,580 | |
| | | | | | | | | | | | | |
Total | | $ | 2,135,369 | | $ | 20,856 | | $ | — | | $ | 2,156,225 | |
| | | | | | | | | | | | | |
| |
* | For detailed country and sector descriptions, see accompanying Schedule of Portfolio Investments |
** | During the six months ended April 30, 2012 there were significant transfers between Level 1 and Level 2 securities. A security’s classification as Level 1 or Level 2 within the Fund can move on a daily basis throughout the period depending on whether or not the Fund has determined the value of securities principally traded in foreign markets has become stale between the close of the foreign exchanges and the time the funds calculate their NAV. If management determines the price has become stale, a fair value adjustment will be made to the impacted securities and these fair value adjusted securities are considered to be priced using Level 2 inputs. As a result, it is not practicable to disclose transfers between Level 1 and Level 2 within the fair value hierarchy for the period ended April 30, 2012. |
Following is a reconciliation of Level 3 assets for which significant unobservable inputs were used to determine fair value:
| | | | | | | | | | | | | | | | |
| | International
Real Estate
Equity Fund | | Realty
Income &
Growth Fund | | Cyclical
Advantage
Property Fund | |
| | | | | | | |
Balance as of October 31, 2011 | | | $ | 24,716,446 | | | | $ | 1,459,551 | | | | $ | 2,432,586 | | |
Accrued discounts / premiums | | | | — | | | | | — | | | | | — | | |
Realized gain (loss) | | | | — | | | | | — | | | | | — | | |
Change in unrealized appreciation (depreciation) | | | | (511,614 | ) | | | | (103,636 | ) | | | | (172,728 | ) | |
Purchases | | | | — | | | | | — | | | | | — | | |
Sales | | | | — | | | | | — | | | | | — | | |
Transfers in to Level 3 | | | | — | | | | | — | | | | | — | | |
Transfers out of Level 3 | | | | — | | | | | — | | | | | — | | |
| | | | | | | | | | | | | | | | |
Balance as of April 30, 2012 | | | $ | 24,204,832 | | | | $ | 1,355,915 | | | | $ | 2,259,858 | | |
| | | | | | | | | | | | | | | | |
| | | | | | | | | | |
Change in net unrealized depreciation on level 3
holdings held at period end | | | $ | (511,614 | ) | | | $ | (103,636 | ) | | | $ | (172,728 | ) | |
| | | | | | | | | | | | | | | | |
83
Notes to Financial Statements—Continued
April 30, 2012 (Unaudited)
B. Security Transactions and Investment Income:
Securities transactions are accounted for on a trade date basis. Realized gains and losses are computed on the identified cost basis. Interest income is recorded on the accrual basis and includes accretion of discounts and amortization of premiums, where applicable. To the extent any issuer defaults or a credit event occurs that impacts the issuer, the Funds’ may halt any additional interest income accruals and consider the realizability of interest accrued up to the date of default or credit event. Dividend income is recorded on the ex-dividend date or in the case of some foreign securities, on the date thereafter when the Funds are made aware of the dividend. Foreign income may be subject to foreign withholding taxes, which are accrued as applicable. Capital gains realized on some foreign securities are subject to foreign taxes, which are accrued as applicable.
Dividends and interest from non-U.S. sources received by the Funds are generally subject to non-U.S. withholding taxes at rates ranging up to 30%. Such withholding taxes may be reduced or eliminated under the terms of applicable U.S. income tax treaties, and the Funds intend to undertake any procedural steps required to claim the benefits of such treaties.
C. Line of Credit:
On December 1, 2010 each Trust entered into a lending agreement with BNP Paribas through its New York branch. Loans in aggregate, whether to cover overdrafts or for investment purposes, may not exceed the maximum amount that is permitted under the 1940 Act. For the six months ended April 30, 2012, the average interest rate paid on outstanding borrowings under the line of credit was 1.05%, 1.05%, 1.08% and 1.05% for the International Real Estate Equity Fund, Realty Income & Growth Fund, Cyclical Advantage Property Fund and Emerging Markets Real Estate Fund, respectively. The Funds also incur interest expense on custody overdraft charges.
| | | | | | | | | | | | | | | | | | | |
| | International
Real Estate
Equity Fund | | Realty
Income &
Growth
Fund | | Cyclical
Advantage
Property
Fund | | Emerging
Markets
Real Estate
Fund | | Global
Infrastructure
Fund | | Global
Consumer
Growth
Fund | |
| | | | | | | | | | | | | |
Total line of credit
amount available
at April 30, 2012 | | $ | 113,770,764 | | $ | 39,350,187 | | $ | 18,499,054 | | $ | 1,444,416 | | $ | 15,079,734 | | $ | 769,804 | |
Line of credit outstanding
at April 30, 2012 | | | 21,150,061 | | | 6,308,032 | | | 2,043,808 | | | 7,695 | | | — | | | — | |
Line of credit
amount unused
at April 30, 2012 | | | 92,620,703 | | | 33,042,155 | | | 16,455,246 | | | 1,436,721 | | | 15,079,734 | | | 769,804 | |
Average balance
outstanding during
the period | | | 26,927,283 | | | 8,107,492 | | | 540,914 | | | 14,727 | | | — | | | — | |
Interest expense incurred
on line of credit during
the period | | | 142,496 | | | 43,231 | | | 2,953 | | | 78 | | | — | | | — | |
Interest expense incurred
on custody overdrafts
during the period | | | — | | | — | | | — | | | — | | | — | | | — | |
D. Federal and Other Income Taxes:
It is each Fund’s policy to comply with the Federal income and excise tax requirements of the Internal Revenue Code of 1986 (the “Code”), as amended applicable to regulated investment companies and to distribute timely, all of its investment company taxable income and net realized capital gains to shareholders in accordance with the timing requirements imposed by the Code. Therefore, no federal income tax provision is recorded. Under applicable foreign tax laws, a withholding tax may be imposed on interest, dividends, and capital gains earned on foreign investments. Where available, the Funds will file for claims on foreign taxes withheld.
Management has analyzed the Fund’s tax positions taken on income tax returns for all open tax years and has concluded that as of April 30, 2012, no provision for income tax is required in the Fund’s financial statements. The Fund’s federal and state income and federal excise tax returns for tax years for which the applicable statutes of
84
Notes to Financial Statements—Continued
April 30, 2012 (Unaudited)
limitations have not expired are subject to examination by Internal Revenue Service and state departments of revenue.
Under the applicable foreign tax laws, a withholding tax may be imposed on interest, dividends and capital gains at various rates.
GAAP requires that certain components of net assets be reclassified to reflect permanent differences between financial and tax reporting. These reclassifications have no effect on net assets or net asset value per share.
E. Distributions to Shareholders:
Each Fund intends to distribute substantially all of its net investment income and net realized capital gains, if any, throughout the year to its shareholders in the form of dividends. Distributions to shareholders are recorded at the close of business on the ex-dividend date.
The amounts of dividends from net investment income and of distributions from net realized gains are determined in accordance with federal income tax regulations, which may differ from GAAP. These differences are either considered temporary or permanent in nature. To the extent these differences are permanent in nature, such amounts are reclassified within the composition of net assets based on their federal tax-basis treatment; temporary differences do not require reclassification. In the event dividends and distributions to shareholders exceed net investment income and net realized gains for tax purposes, they are reported as returns of capital.
F. Class Allocations:
Income, expenses (other than class specific expenses) and realized and unrealized gains and losses are allocated among the classes of the International Real Estate Fund, Realty & Income Growth Fund, Emerging Markets Real Estate Fund, Global Infrastructure Fund, and Global Consumer Growth Fund based on the relative net assets of each class. Class specific expenses are allocated to the class to which they relate. Currently, class specific expenses are limited to those incurred under the Distribution Plan for Class A shares.
G. Foreign Currency Translation Transactions:
The International Real Estate Equity Fund, Cyclical Advantage Property Fund, Emerging Markets Real Estate Fund, Global Infrastructure Fund, and Global Consumer Growth Fund may invest without limitation in foreign securities. The Realty Income & Growth Fund may invest up to 35% of the value of its net assets in foreign securities. The books and records of each Fund are maintained in U.S. dollars. Non-U.S. denominated amounts are translated into U.S. dollars as follows, with the resultant gains and losses recorded in the Statements of Operations:
| | |
| i) | market value of investment securities and other assets and liabilities at the exchange rate on the valuation date, |
| | |
| ii) | purchases and sales of investment securities, income and expenses at the exchange rate prevailing on the respective date of such transactions. |
H. Risk Associated With Foreign Securities and Currencies:
Investments in securities of foreign issuers carry certain risks not ordinarily associated with investments in securities of domestic issuers. Such risks include future political and economic developments and the possible imposition of exchange controls or other foreign governmental laws and restrictions. In addition, with respect to certain countries, there is a possibility of expropriation of assets, confiscatory taxation, political or social instability or diplomatic developments, which could adversely affect investments in those countries.
Certain countries may also impose substantial restrictions on investments in their capital markets by foreign entities, including restrictions on investments in issuers or industries deemed sensitive to relevant national interests. These factors may limit the investment opportunities available to the Funds or result in a lack of liquidity and high price volatility with respect to securities of issuers from developing countries.
I. Equity-Linked Structured Notes:
The Funds may invest in equity-linked structured notes. Equity-linked structured notes are securities which are specially designed to combine the characteristics of one or more underlying securities and their equity derivatives in a single note form. The return and/or yield or income component may be based on the performance of the
85
Notes to Financial Statements—Continued
April 30, 2012 (Unaudited)
underlying equity securities, and equity index, and/or option positions. Equity-linked structured notes are typically offered in limited transactions by financial institutions in either registered or non-registered form. An investment in equity-linked structured notes creates exposure to the credit risk of the issuing financial institution, as well as to the market risk of the underlying securities. There is no guaranteed return of principal with these securities and the appreciation potential of these securities may be limited by a maximum payment or call right. In certain cases, equity-linked structured notes may be more volatile and less liquid than less complex securities or other types of fixed income securities. Such securities may exhibit price behavior that does not correlate with other fixed-income securities. International Real Estate Equity Fund, Cyclical Advantage Property Fund, Emerging Markets Real Estate Fund and Global Infrastructure Fund held 1, 3, 7 and 2 equity-linked structured notes, respectively, at April 30, 2012.
J. Forward Currency Contracts:
The Funds are subject to foreign currency exchange rate risk in the normal course of pursuing its investment objectives. The Funds may use forward currency contracts to gain exposure to or hedge against changes in the value of foreign currencies. A forward currency contract (“forward”) is an agreement between two parties to buy and sell a currency at a set price on a future date. The market value of the forward contract fluctuates with changes in forward currency exchange rates. The forward contract is marked-to-market daily and the change in market value is recorded by each Fund as unrealized appreciation or depreciation. When the forward contract is closed, a Fund records a realized gain or loss equal to the fluctuation in value during the period the forward contract was open. A Fund could be exposed to risk if a counterparty is unable to meet the terms of a forward or if the value of the currency changes unfavorably.
The following forward currency contracts were held at April 30, 2012:
Global Infrastructure Fund
| | | | | | | | | | | | | | | | | | | |
Description | | | Expiration
Date | | Contracts to
Deliver/Receive | | Settlement
Value | | Current
Value | | Unrealized
Gain (Loss) | |
| | | | | | | | | | | | | |
Contracts Sold: | | | | | | | | | | | | | | | | | | |
Euro | | | 08/08/12 | | 2,000,000 (EUR) | | $ | 2,649,640 | | $ | 2,648,981 | | | $ | 659 | | |
Euro | | | 08/08/12 | | | 600,000 (EUR) | | | 793,278 | | | 794,694 | | | | (1,416 | ) | |
| | | | | | | | | | | | | | | | | | |
| | | | | | | | | | | $ | 3,443,675 | | | $ | (757 | ) | |
| | | | | | | | | | | | | | | | | | |
K. Derivative instruments and hedging activities:
Financial Accounting Standards Board Codification Topic 815 requires enhanced disclosure about an entity’s derivative and hedging activities.
The following tables provide information about the effect of derivatives and hedging activities on the Fund’s Statement of Operations for the six months ended April 30, 2012. The first table provides additional detail about the amounts and sources of gains (losses) realized on derivatives during the period. The second table provides additional information about the change in unrealized appreciation (depreciation) resulting from the Fund’s derivatives and hedging activities during the period.
The affect of derivative instruments on the Statement of Assets and Liabilities as of April 30, 2012:
Global Infrastructure Fund
| | | | | |
Derivatives | | | Statement of Assets
and Liabilities Location | | Unrealized Appreciation
(Depreciation) |
| | | | | | |
Forward Currency Contracts | | Unrealized appreciation on
forward currency contracts | | $ 659 |
| | | | |
Forward Currency Contracts | | Unrealized depreciation on
forward currency contracts | | $(1,416) |
86
Notes to Financial Statements—Continued
April 30, 2012 (Unaudited)
The effect of derivative instruments on the Statements of Operations for the six months ended April 30, 2012:
International Real Estate Equity Fund
| | | | | | | |
Derivatives | | | Statement of
Operations Location | | Net Realized Gain | | Change in
Unrealized Depreciation |
| | | | | | | | |
Forward Currency Contracts | | Net realized loss on foreign currency translations / Change in unrealized appreciation on foreign currency translations | | $544,840 | | $(40,457) |
| | | | | | |
Global Infrastructure Fund | | | | | | |
Derivatives | | | Statement of
Operations Location | | Net Realized
Gain (Loss) | | Change in
Unrealized Depreciation |
| | | | | | | | |
Forward Currency Contracts | | Change in unrealized depreciation on foreign currency translations | | $— | | $(757) |
| |
3. | Capital Share Transactions: |
| |
| The Funds have an unlimited number of shares of beneficial interest, with $0.0001 par value, authorized. Transactions in shares and dollars of the Funds were as follows: |
| |
| International Real Estate Equity Fund |
| | | | | | | | | | | | | |
| | Period Ended
April 30, 2012* | | Year Ended
October 31, 2011* | |
| | | | | |
| | Shares | | Amount | | Shares | | Amount | |
| | | | | | | | | |
Class A | | | | | | | | | | | | | |
Shares sold | | | 5,580 | | $ | 100,000 | | | N/A | | | N/A | |
Shares issued in reinvestment of dividends | | | — | | | — | | | N/A | | | N/A | |
Redemption fees | | | — | | | — | | | N/A | | | N/A | |
Shares redeemed | | | — | | | — | | | N/A | | | N/A | |
| | | | | | | | | | | | | |
Total net change | | | 5,580 | | $ | 100,000 | | | N/A | | | N/A | |
| | | | | | | | | | | | | |
| | | | | | | | | | | | | |
Institutional Class | | | | | | | | | | | | | |
Shares sold | | | 858,679 | | $ | 17,741,907 | | | 2,195,037 | | $ | 54,635,072 | |
Shares issued in reinvestment of dividends | | | 439,750 | | | 7,845,139 | | | 511,118 | | | 13,263,510 | |
Redemption fees | | | — | | | 3,560 | | | — | | | 17,897 | |
Shares redeemed | | | (3,500,424 | ) | | (69,838,363 | ) | | (9,023,277 | ) | | (217,285,470 | ) |
| | | | | | | | | | | | | |
Total net change | | | (2,201,995 | ) | $ | (44,247,757 | ) | | (6,317,122 | ) | $ | (149,368,991 | ) |
| | | | | | | | | | | | | |
87
Notes to Financial Statements—Continued
April 30, 2012 (Unaudited)
| | | | | | | | | | | | | |
Realty Income & Growth Fund | | | | | | | | | | | | | |
| | Period Ended
April 30, 2012* | | Year Ended
October 31, 2011* | |
| | | | | |
| | Shares | | Amount | | Shares | | Amount | |
| | | | | | | | | |
Class A | | | | | | | | | | | | | |
Shares sold | | | 6,410 | | $ | 100,000 | | | N/A | | | N/A | |
Shares issued in reinvestment of dividends | | | 63 | | | 1,089 | | | N/A | | | N/A | |
Redemption fees | | | — | | | — | | | N/A | | | N/A | |
Shares redeemed | | | — | | | — | | | N/A | | | N/A | |
| | | | | | | | | | | | | |
Total net change | | | 6,473 | | $ | 101,089 | | | N/A | | | N/A | |
| | | | | | | | | | | | | |
| | | | | | | | | | | | | |
Institutional Class | | | | | | | | | | | | | |
Shares sold | | | 368,364 | | $ | 5,945,347 | | | 827,759 | | $ | 13,192,635 | |
Shares issued in reinvestment of dividends | | | 126,558 | | | 2,074,313 | | | 292,882 | | | 4,499,252 | |
Redemption fees | | | — | | | 1,364 | | | — | | | 16,325 | |
Shares redeemed | | | (712,273 | ) | | (11,609,159 | ) | | (1,973,312 | ) | | (30,125,866 | ) |
| | | | | | | | | | | | | |
Total net change | | | (217,351 | ) | $ | (3,588,135 | ) | | (852,671 | ) | $ | (12,417,654 | ) |
| | | | | | | | | | | | | |
| | | | | | | | | | | | | |
Cyclical Advantage Property Fund | | | | | | | | | | | | | |
| | Six Months Ended
April 30, 2012* | | Year Ended
October 31, 2011* | |
| | | | | |
| | Shares | | Amount | | Shares | | Amount | |
| | | | | | | | | |
Shares sold | | | 47,275 | | $ | 933,316 | | | 60,571 | | $ | 1,267,115 | |
Shares issued in reinvestment of dividends | | | 14,259 | | | 244,257 | | | 11,900 | | | 256,450 | |
Redemption fees | | | — | | | 229 | | | — | | | 109 | |
Shares redeemed | | | (170,624 | ) | | (3,217,635 | ) | | (426,350 | ) | | (8,731,566 | ) |
| | | | | | | | | | | | | |
Total net change | | | (109,090 | ) | $ | (2,039,833 | ) | | (353,879 | ) | $ | (7,207,892 | ) |
| | | | | | | | | | | | | |
| | | | | | | | | | | | | |
Emerging Markets Real Estate Fund | | | | | | | | | | | | | |
| | Period Ended
April 30, 2012* | | Year Ended
October 31, 2011* | |
| | | | | |
| | Shares | | Amount | | Shares | | Amount | |
| | | | | | | | | |
Class A | | | | | | | | | | | | | |
Shares sold | | | 7,435 | | $ | 100,000 | | | N/A | | | N/A | |
Shares issued in reinvestment of dividends | | | — | | | — | | | N/A | | | N/A | |
Redemption fees | | | — | | | — | | | N/A | | | N/A | |
Shares redeemed | | | — | | | — | | | N/A | | | N/A | |
| | | | | | | | | | | | | |
Total net change | | | 7,435 | | $ | 100,000 | | | N/A | | | N/A | |
| | | | | | | | | | | | | |
| | | | | | | | | | | | | |
Institutional Class | | | | | | | | | | | | | |
Shares sold | | | 19,911 | | $ | 301,083 | | | 189,308 | | $ | 3,315,249 | |
Shares issued in reinvestment of dividends | | | — | | | — | | | 13,959 | | | 256,293 | |
Redemption fees | | | — | | | 497 | | | — | | | 569 | |
Shares redeemed | | | (60,296 | ) | | (930,648 | ) | | (81,399 | ) | | (1,314,069 | ) |
| | | | | | | | | | | | | |
Total net change | | | (40,385 | ) | $ | (629,068 | ) | | 121,868 | | $ | 2,258,042 | |
| | | | | | | | | | | | | |
88
Notes to Financial Statements—Continued
April 30, 2012 (Unaudited)
| | | | | | | | | | | | | |
Global Infrastructure Fund | | | | | | | | | | | | | |
| | | | | | | | | | | | | |
| | Period Ended
April 30, 2012* | | Year Ended
October 31, 2011* | |
| | | | | |
| | Shares | | Amount | | Shares | | Amount | |
| | | | | | | | | |
Class A | | | | | | | | | | | | | |
Shares sold | | | 17,712 | | $ | 262,767 | | | N/A | | | N/A | |
Shares issued in reinvestment of dividends | | | 69 | | | 1,085 | | | N/A | | | N/A | |
Redemption fees | | | — | | | — | | | N/A | | | N/A | |
Shares redeemed | | | — | | | — | | | N/A | | | N/A | |
| | | | | | | | | | | | | |
Total net change | | | 17,781 | | $ | 263,852 | | | N/A | | | N/A | |
| | | | | | | | | | | | | |
| | | | | | | | | | | | | |
Institutional Class | | | | | | | | | | | | | |
Shares sold | | | 888,384 | | $ | 12,972,869 | | | 2,247,714 | | $ | 33,763,890 | |
Shares issued in reinvestment of dividends | | | 40,985 | | | 604,529 | | | 34,028 | | | 498,618 | |
Redemption fees | | | — | | | 1,268 | | | — | | | 1,381 | |
Shares redeemed | | | (89,962 | ) | | (1,340,853 | ) | | (395,432 | ) | | (5,235,409 | ) |
| | | | | | | | | | | | | |
Total net change | | | 839,407 | | $ | 12,237,813 | | | 1,886,310 | | $ | 29,028,480 | |
| | | | | | | | | | | | | |
| | | | | | | | | | | | | |
Global Consumer Growth Fund | | | | | | | | | | | | | |
| | Period Ended
April 30, 2012* | | Year Ended
October 31, 2011* | |
| | | | | |
| | Shares | | Amount | | Shares | | Amount | |
| | | | | | | | | |
Class A | | | | | | | | | | | | | |
Shares sold | | | 11,173 | | $ | 100,000 | | | N/A | | | N/A | |
Shares issued in reinvestment of dividends | | | — | | | — | | | N/A | | | N/A | |
Redemption fees | | | — | | | — | | | N/A | | | N/A | |
Shares redeemed | | | — | | | — | | | N/A | | | N/A | |
| | | | | | | | | | | | | |
Total net change | | | 11,173 | | $ | 100,000 | | | N/A | | | N/A | |
| | | | | | | | | | | | | |
| | | | | | | | | | | | | |
Institutional Class | | | | | | | | | | | | | |
Shares sold | | | 2,227 | | $ | 23,600 | | | 202,816 | | $ | 2,027,480 | |
Shares issued in reinvestment of dividends | | | 879 | | | 7,862 | | | — | | | — | |
Redemption fees | | | — | | | — | | | — | | | — | |
Shares redeemed | | | — | | | — | | | — | | | — | |
| | | | | | | | | | | | | |
Total net change | | | 3,106 | | $ | 31,462 | | | 202,816 | | $ | 2,027,480 | |
| | | | | | | | | | | | | |
* Class A commenced operations on December 30, 2011. |
| |
4. | Purchases and Sales of Securities: |
| |
| Purchases and sales of securities (excluding short-term securities) for the six months ended April 30, 2012 are as follows: |
| | | | | | | |
| | Non-U.S. Government | |
| | | |
| | Purchases | | Sales | |
| | | | | |
International Real Estate Equity Fund | | $ | 25,490,202 | | $ | 84,141,384 | |
Realty Income & Growth Fund | | | 17,462,820 | | | 21,779,650 | |
Cyclical Advantage Property Fund | | | 5,919,854 | | | 7,028,783 | |
Emerging Markets Real Estate Fund | | | 1,541,854 | | | 2,009,509 | |
Global Infrastructure Fund | | | 38,983,281 | | | 25,991,090 | |
Global Consumer Growth Fund | | | 130,494 | | | 48,453 | |
| |
| The Funds did not have purchases and sales of U.S. Government obligations for the six months ended April 30, 2012. |
89
Notes to Financial Statements—Continued
April 30, 2012 (Unaudited)
| |
5. | Distribution Plans: |
| |
| Quasar Distributors, LLC (“Quasar”) serves as each Fund’s distributor. Certain of the Funds have adopted distribution and servicing plans (the “Plans”) for their Class A shares as allowed by Rule 12b-1 under the 1940 Act. The Plans authorize payments by the Funds in connection with the distribution and servicing of its shares at an annual rate, as determined from time to time by the Board of Trustees, of up to 0.25% of the Fund’s average daily net assets. Amounts paid under the Plans by the Funds may be spent by the Funds on any activities or expenses primarily intended to result in the sale of shares of the Fund, including but not limited to advertising, compensation for sales and marketing activities of financial institutions and others such as dealers and distributors, shareholder account servicing, the printing and mailing of prospectuses to other than current shareholders and the printing and mailing of sales literature. |
| |
| International Real Estate Equity Fund, Realty Income and Growth Fund, Emerging Markets Real Estate Fund, Global Infrastructure Fund and Global Consumer Growth Fund incurred $96, $89, $98, $95 and $92, respectively, pursuant to the Plans for the six months ended April 30, 2012. |
| |
| The Plans for the Funds may be terminated at any time by vote of the Trustees of the Equity Trust who are not “interested persons”, as defined by the 1940 Act, of the Equity Trust, or by vote of a majority of the outstanding voting shares of the respective class. |
| |
| Alpine Woods Capital Investors, LLC (the “Adviser”) makes payments to intermediaries that provide omnibus account services, sub-accounting services and/or networking services with respect to the Funds. On February 2nd, the Board approved, subject to certain limitations, that the reimbursement of such fees paid by the Adviser, to intermediaries that provide omnibus account services or sub-accounting, are charged back to the appropriate Fund. |
| |
| For the six months ended April 30, 2012, The Adviser did not charge back any amounts to the Funds, however, it intends to submit such charges incurred in the period for approval by the Board at its next regularly scheduled meeting and will continue to submit such charges for approval at each regularly scheduled Board meeting occurring in the next quarter after such charges have been paid by the Adviser. These charges will be included in the transfer agent fees and expenses in the Statement of Operations. |
| |
6. | Investment Advisory Agreement, Administration Agreement and Other Affiliated Transactions: |
| |
| Alpine Woods Capital Investors, LLC (“the Adviser”) provides investment advisory services to each of the Funds. Pursuant to the advisory agreements with the Realty Income & Growth Fund and the Cyclical Advantage Property Fund, the Adviser is entitled to an annual fee based on each Fund’s average daily net assets, in accordance with the following schedule: |
| |
First $750 million | 1.00% |
Next $250 million | 0.90% |
Over $1 billion | 0.80% |
| |
| The Adviser is entitled to an annual fee based on 1.00% of each Fund’s average daily net assets for the International Real Estate Equity Fund, Emerging Markets Real Estate Fund, Global Infrastructure Fund and Global Consumer Growth Fund. |
| |
| The Adviser agreed to reimburse the Realty Income & Growth Fund, Emerging Markets Real Estate Fund, Global Infrastructure Fund and Global Consumer Growth Fund to the extent necessary to ensure that each Fund’s annual total operating expenses (excluding 12-b1 fees, interest, brokerage commissions and extraordinary expenses) does not exceed 1.50%, 1.35%, 1.35% and 1.35% of each Fund’s average daily net assets, respectively. The Adviser may recover expenses paid in excess of the cap on expenses for the three previous years, as long as the recovery does not cause the Funds to exceed such cap on expenses. For the six months ended April 30, 2012, the Adviser waived investment advisory fees and other expenses totaling $47,592 and $42,266 for the Emerging Markets Real Estate Fund and Global Consumer Growth Fund, respectively. The expense limitations will remain in effect for the Funds unless and until the Board of Trustees of the Equity Trust approve its modification or termination with respect to the Funds. |
90
Notes to Financial Statements—Continued
April 30, 2012 (Unaudited)
Waived expenses subject to potential recovery by year of expiration are as follows:
| | | | | | | | | | | | | | | | | |
Year of Expiration | | | Emerging Markets
Real Estate Fund | | Global
Infrastructure Fund | | Global Consumer
Growth Fund | |
| | | | | | | | | |
10/31/2012 | | | $ | 40,274 | | | | $ | 35,371 | | | | $ | — | | |
10/31/2013 | | | $ | 31,563 | | | | $ | 30,973 | | | | $ | — | | |
10/31/2014 | | | $ | 48,844 | | | | $ | 27,165 | | | | $ | 26,927 | | |
| |
| State Street Bank and Trust Company (“SSBT”) serves as the Fund’s administrator pursuant to an Administration, Bookkeeping and Pricing Services Agreement with the Fund. As compensation for its services to the Fund, SSBT receives an annual administration fee of 0.02% of total net assets on the first $5 billion and 0.015% on total net assets exceeding $5 billion, computed daily and payable monthly. |
| |
7. | Transactions with Affiliates |
| |
| The following issuers are affiliated with the International Real Estate Equity Fund; that is, the Fund held 5% or more of the outstanding voting securities during the six months ended April 30, 2012. As defined in Section (2)(a)(3) of the Investment Company Act of 1940, such issuers are: |
| | | | | | | | | | | | | | |
Fund | | Issuer Name | | Balance at
Oct. 31, 2011 | | Purchases | | Sales | | Balance at
April 30, 2012 | | Value at
April 30, 2012 | | Realized
Gain (Loss) |
| | | | | | | | | | | | | | | |
International Real Estate Fund | | Yatra
Capital, Ltd. | | 1,491,800 | | — | | — | | 1,491,800 | | $5,825,354 | | — |
| |
8. | Concentration of Risk: |
| |
| The Funds invest a substantial amount of their assets in the equity securities of issuers engaged in the real estate industry, including real estate investment trusts (REITs). As a result, the Funds may be more affected by economic developments in the real estate industry than would a general equity fund. |
| |
9. | Federal Income Tax Information |
| |
| At October 31, 2011, the components of accumulated earnings (losses) on a tax basis were as follows: |
| | | | | | | | | | | | | | | | |
| | International
Real Estate
Equity Fund | | Realty
Income &
Growth Fund | | Cyclical
Advantage
Property Fund | |
| | | | | | | |
Cost of investments | | | $ | 499,660,770 | | | | $ | 83,813,977 | | | | $ | 49,322,262 | | |
| | | | | | | | | | | | | | | | |
Gross unrealized appreciation | | | | 62,086,801 | | | | | 28,156,462 | | | | | 8,086,364 | | |
Gross unrealized depreciation | | | | (183,748,183 | ) | | | | (4,348,091 | ) | | | | (8,041,126 | ) | |
| | | | | | | | | | | | | | | | |
Net unrealized appreciation (depreciation) | | | | (121,661,382 | ) | | | | 23,808,371 | | | | | 45,238 | | |
| | | | | | | | | | | | | | | | |
|
Undistributed ordinary Income | | | | 8,892,777 | | | | | — | | | | | 127,514 | | |
Undistributed long-term capital gain | | | | — | | | | | — | | | | | — | | |
| | | | | | | | | | | | | | | | |
Total distributable earnings | | | | 8,892,777 | | | | | — | | | | | 127,514 | | |
| | | | | | | | | | | | | | | | |
Other accumulated gains (losses) | | | | (1,060,100,303 | ) | | | | (11,051,081 | ) | | | | (59,210,910 | ) | |
| | | | | | | | | | | | | | | | |
Total accumulated gains (losses) | | | $ | (1,172,868,908 | ) | | | $ | 12,757,290 | | | | $ | (59,038,158 | ) | |
| | | | | | | | | | | | | | | | |
91
Notes to Financial Statements—Continued
April 30, 2012 (Unaudited)
| | | | | | | | | | | | | | | | |
| | | | | | | | | | | | | | | | |
| | Emerging
Markets Real
Estate Fund | | Global
Infrastructure
Fund | | Global
Consumer
Growth Fund | |
| | | | | | | |
Cost of investments | | | $ | 4,299,976 | | | | $ | 31,738,851 | | | | $ | 2,007,681 | | |
| | | | | | | | | | | | | | | | |
| | | | | | | | | | | | | | | | |
Gross unrealized appreciation | | | | 379,963 | | | | | 822,829 | | | | | 141,577 | | |
Gross unrealized depreciation | | | | (337,847 | ) | | | | (1,852,417 | ) | | | | (186,753 | ) | |
| | | | | | | | | | | | | | | | |
Net unrealized appreciation (depreciation) | | | | 42,116 | | | | | (1,029,588 | ) | | | | (45,176 | ) | |
| | | | | | | | | | | | | | | | |
| | | | | | | | | | | | | | | | |
Undistributed ordinary Income | | | | — | | | | | — | | | | | 7,862 | | |
Undistributed long-term capital gain | | | | — | | | | | — | | | | | — | | |
| | | | | | | | | | | | | | | | |
Total distributable earnings | | | | — | | | | | — | | | | | 7,862 | | |
| | | | | | | | | | | | | | | | |
| | | | | | | | | | | | | | | | |
Other accumulated gains (losses) | | | | (177,030 | ) | | | | (508,981 | ) | | | | (45,495 | ) | |
| | | | | | | | | | | | | | | | |
Total accumulated gains (losses) | | | $ | (134,914 | ) | | | $ | (1,538,569 | ) | | | $ | (82,809 | ) | |
| | | | | | | | | | | | | | | | |
| |
| The tax basis of investments for tax and financial reporting purposes differs principally due to the deferral of losses on wash sales, partnership tax adjustments, and mark-to-market cost basis adjustments for investments in passive foreign investment companies (PFICs) for tax purposes. |
| |
| The tax character of distributions paid during the years ended October 31, 2011 and 2010 were as follows: |
| | | | | | | |
| | 2011 | | 2010 | |
| | | | | |
International Real Estate Equity Fund | | | | | | | |
Ordinary income | | $ | 15,264,706 | | $ | 24,044,819 | |
Long-term capital gain | | | — | | | — | |
| | | | | | | |
| | $ | 15,264,706 | | $ | 24,044,819 | |
| | | | | | | |
| | | | | | | |
Realty Income & Growth Fund | | | | | | | |
Ordinary income | | $ | 4,932,978 | | $ | 5,499,099 | |
Long-term capital gain | | | — | | | — | |
| | | | | | | |
| | $ | 4,932,978 | | $ | 5,499,099 | |
| | | | | | | |
| | | | | | | |
Cyclical Advantage Property Fund | | | | | | | |
Ordinary income | | $ | 265,892 | | $ | 785,829 | |
Long-term capital gain | | | — | | | — | |
| | | | | | | |
| | $ | 265,892 | | $ | 785,829 | |
| | | | | | | |
| | | | | | | |
Emerging Markets Real Estate Fund | | | | | | | |
Ordinary income | | $ | 98,488 | | $ | 192,587 | |
Long-term capital gain | | | 166,713 | | | — | |
| | | | | | | |
| | $ | 265,201 | | $ | 192,587 | |
| | | | | | | |
| | | | | | | |
Global Infrastructure Fund | | | | | | | |
Ordinary income | | $ | 535,700 | | $ | 149,042 | |
Long-term capital gain | | | 1,004 | | | 2 | |
Return of capital | | | 8,682 | | | — | |
| | | | | | | |
| | $ | 545,386 | | $ | 149,044 | |
| | | | | | | |
| | | | | | | |
Global Consumer Growth Fund | | | | | | | |
Ordinary income | | $ | — | | | | |
Long-term capital gain | | | — | | | | |
| | | | | | | |
| | $ | — | | | | |
| | | | | | | |
92
Notes to Financial Statements—Continued
April 30, 2012 (Unaudited)
| |
| During the year ended October 31, 2011, the Realty Income & Growth Fund and Cyclical Advantage Property Fund utilized $8,011,518 and $754,254 of capital loss carryovers, respectively. |
| |
| Capital loss carryovers as of October 31, 2011 are as follows: |
| | | | | | | | | | | | | | | |
Expiration Date | | | International
Real Estate
Equity Fund | | Realty
Income &
Growth Fund | | Cyclical
Advantage
Property Fund | |
| | | | | | | | | |
10/31/15 | | $ | — | | | $ | — | | | | $ | 4,813,886 | | |
10/31/16 | | $ | 384,892,332 | | | $ | — | | | | $ | 19,372,953 | | |
10/31/17 | | $ | 546,087,879 | | | $ | 11,051,018 | | | | $ | 26,502,747 | | |
10/31/18 | | $ | 65,121,028 | | | $ | — | | | | $ | 8,521,849 | | |
10/31/19 | | $ | 63,938,162 | | | $ | — | | | | $ | — | | |
| | | | | | | | | | | | | | |
Expiration Date | | | Emerging
Markets Real
Estate Fund | | Global
Infrastructure
Fund | | Global
Consumer
Growth Fund | |
| | | | | | | | | |
10/31/15 | | $ | — | | | $ | — | | | | $ | — | | |
10/31/16 | | $ | — | | | $ | — | | | | $ | — | | |
10/31/17 | | $ | — | | | $ | — | | | | $ | — | | |
10/31/18 | | $ | — | | | $ | — | | | | $ | — | | |
10/31/19 | | $ | 176,152 | | | $ | 518,201 | | | | $ | — | | |
| |
| The Regulated Investment Company (“RIC”) Modernization Act of 2010 (the “Modernization Act”) modernizes several of the federal income and excise tax provisions related to RICs. The Modernization Act contains simplification provisions effective for taxable years beginning after December 22, 2010, which are aimed at preventing disqualification of a RIC for “inadvertent” failures of the asset diversification and/or qualifying income tests. Additionally, the Modernization Act allows capital losses to be carried forward indefinitely, and retain the character of the original loss, exempts RICs from the preferential dividend rule and repealed the 60-day designation requirement for certain types of pay-through income and gains. |
| |
| Under the Modernization Act, post-enactment capital losses that are carried forward will retain their character as either short-term or long-term capital losses rather than being considered all short-term as under previous law. However, any losses incurred during those future taxable years will be required to be utilized prior to the losses incurred in pre-enactment taxable years, which carry an expiration date. As a result of this ordering rule, pre-enactment capital loss carryforwards may be more likely to expire unused. |
| |
| Capital loss carryforwards as of October 31, 2011 with no expiration are as follows: |
| | | |
Fund | | | Short Term |
| | | | |
Global Consumer Growth Fund | | $45,502 |
| |
| In accordance with U.S. GAAP, the Funds have previously adopted accounting standards related to the accounting for uncertain tax positions. In accordance with this guidance, the Funds analyzed all open tax years, as defined by the Statute of Limitations, for all major jurisdictions. Open tax years are those that are open for exam by taxing authorities. Major jurisdictions for the Funds included Federal and the state of New York. As of October 31, 2011, open Federal and New York tax years include the tax years ended October 31, 2008 through 2011. The Funds have no examinations in progress. |
| |
| The Funds have reviewed all open tax years and major jurisdictions and concluded that there is no impact on the Funds’ net assets and no tax liability resulting from unrecognized tax benefits relating to uncertain income tax positions taken in previous years or expected to be taken on the tax return for the fiscal year ended October 31, 2011. Also, the Funds have recognized no interest and penalties related to uncertain tax benefits. The Funds are also not aware of any tax positions for which it is reasonably possible that the total amounts of unrecognized tax benefits will significantly change in the next twelve months. |
93
Notes to Financial Statements—Continued
April 30, 2012 (Unaudited)
| |
10. | New Accounting Pronouncement: |
| |
| In May 2011, the FASB issued ASU No. 2011-04, “Fair Value Measurement: Amendments to Achieve Common Fair Value Measurement and Disclosure Requirements in U.S. GAAP and IFRS” (“ASU 2011-04”), modifying ASC 820. At the same time, the International Accounting Standards Board (“IASB”) issued International Financial Reporting Standard (“IFRS”) 13, “Fair Value Measurement”. The objective by the FASB and IASB is convergence of their guidance on fair value measurements and disclosures. Specifically, ASU 2011-04 requires reporting entities to disclose: (1) the amounts and reasons for any transfers between Level 1 and Level 2, and (2) for Level 3 fair value measurements: (a) quantitative information about significant unobservable inputs used, (b) a description of the valuation procedures used by the reporting entity, and (c) a narrative description of the sensitivity of the fair value measurement to changes in unobservable inputs if a change in those inputs might result in a significantly higher or lower fair value measurement. The effective date of ASU 2011-04 is for interim and annual periods beginning after December 15, 2011. At this time, management is evaluating the implications of this requirement and the impact it will have to the Fund’s financial statement disclosures. |
94
Additional Information (Unaudited)
April 30, 2012
Investment Advisor and Advisory Contracts
In the weeks leading up to the Meeting, of the Board on March 28th, 2012, the Board Members reviewed materials specifically relating to the Advisory Contracts provided by the Adviser. The Board members had the opportunity to, and did, ask specific questions of the Adviser relating to the materials provided. In deciding whether to renew the Agreements, the Independent Trustees considered various factors, including (i) the nature, extent and quality of the services provided by Adviser under the Agreements, (ii) the investment performance of the Funds, (iii) the costs to the Adviser of its services and the profits realized by the Adviser, from its relationship with the Funds, and (iv) the extent to which economies of scale would be realized if and as a Fund grows and whether the fee levels in the Agreements reflect these economies of scale.
In considering the nature, extent and quality of the services provided by Adviser, the Independent Trustees relied on their prior experience as Independent Trustees of the Funds as well as on the materials provided at and prior to the meeting. They noted that under the Agreements, the Adviser is responsible for managing the Funds’ investments in accordance with the Fund’s investment objectives and policies, applicable legal and regulatory requirements, and the instructions of the Independent Trustees, for providing necessary and appropriate reports and information to the Independent Trustees, and for furnishing the Funds with the assistance, cooperation, and information necessary for the Funds to meet various legal requirements regarding registration and reporting. They also noted the experience and expertise of the Adviser as appropriate as an adviser to the Funds.
The Independent Trustees reviewed the background and experience of the Adviser’s senior management, including those individuals responsible for the investment and compliance operations with respect to the Funds’ investments, and the responsibilities of the investment and compliance personnel with respect to the Fund. They also considered the resources, operational structures and practices of the Adviser in managing the Funds’ portfolios, in monitoring and securing the Funds’ compliance with investment objectives and policies and with applicable laws and regulations, and in seeking best execution of portfolio transactions. Drawing upon the materials provided and their general knowledge of the business of the Adviser, the Independent Trustees took into account that the Adviser’s experience, resources and strength in these areas are deep, extensive and of high quality. On the basis of this review, the Independent Trustees determined that the nature and extent of the services provided by the Adviser to the Fund were appropriate, had been of high quality, and could be expected to remain so.
The Independent Trustees discussed the Fund performance metrics compiled from Morningstar data and those internally generated by Alpine. It was observed that the last quarter of performance had been strong for several of the Funds. In assessing the quality of the portfolio management delivered by the Adviser, the Independent Trustees also compared the short-term and long-term performance of each Fund on both an absolute basis and in comparison to its peer group, as constructed by data provided by independent rating agencies. The Independent Trustees noted that the performance of a number of the Funds was strong. Of importance to the Independent Trustees was the extent to which the Funds achieved their objectives. They further concluded that the expense ratios of the Funds were appropriate and in line with competitors. Accordingly, the Independent Trustees concluded that the performance of the Funds was satisfactory.
The Independent Trustees considered the profitability of the advisory arrangement with the Adviser. The Independent Trustees had been provided with general data on the Funds’ profitability with respect to the advisory arrangement with the Adviser. The Independent Trustees also examined the level of profits that could be expected to accrue to the Adviser from the fees payable under the Agreements and any expense subsidization undertaken by the Adviser, as well as each Funds’ brokerage and commissions. After discussion and analysis, they concluded that, to the extent that the Adviser’s relationship with the Funds had been profitable, the profitability was in no case such as to render the advisory fee excessive.
The Independent Trustees discussed the other materials provided by Alpine, including expense information, organization charts, advisory fee breakpoints and profitability data. In reviewing breakpoints, the Independent Trustees recognized that breakpoints were more relevent for open-end funds, where assets could continue to grow over time.
In considering whether the Adviser benefits in other ways from its relationship with the Funds, the Independent Trustees concluded that, to the extent that Adviser derives other benefits from its relationship with the Funds, those benefits are not so significant as to render the Adviser’s fees excessive.
95
Additional Information (Unaudited)—Continued
April 30, 2012
On the basis of their discussions with management and their analysis of information provided at the meeting, the Independent Trustees determined that the nature of the Funds and their operations is such that the Adviser may realize economies of scale in the management of certain Funds as they grow in size.
The Independent Trustees approved the continuance of the Funds’ Agreements with Adviser after weighing the foregoing factors. They reasoned that the nature and extent of the services provided by the Adviser were appropriate, that the performance of the Funds had been satisfactory, and that Adviser could be expected to provide services of high quality. As to the Adviser’s fees for the Funds, the Independent Trustees determined that the fees, considered in relation to the services provided, were fair and reasonable, that the Funds’ relationship with the Adviser was not so profitable as to render the fees excessive, that any additional benefits to the Adviser were not of a magnitude that materially affected the Independent Trustees’ deliberations, and that the fees adequately reflected shared economies of scale with the Funds.
After reconvening, the Trustees, including a majority of the Independent Trustees, agreed to approve the continuation of the Agreements for one year.
96
Additional Information (Unaudited)—Continued
April 30, 2012
Tax Information
The Funds designated the following percentages of dividends declared from net investment income for the fiscal year ended October 31, 2011 as qualified dividend income under the Jobs & Growth Tax Relief Reconciliation Act of 2003.
| | | | |
International Real Estate Equity Fund | | | 23 | % |
Realty Income & Growth Fund | | | 5 | % |
Cyclical Advantage Property Fund | | | 100 | % |
Emerging Markets Real Estate Fund | | | 19 | % |
Global Infrastructure Fund | | | 72 | % |
Global Consumer Growth Fund | | | 0 | % |
| | | | |
The Funds designated the following percentages of dividends declared during the fiscal year ended October 31, 2011 as dividends qualifying for the dividends received deduction available to corporate shareholders. |
| | | | |
International Real Estate Equity Fund | | | 0 | % |
Realty Income & Growth Fund | | | 5 | % |
Cyclical Advantage Property Fund | | | 32 | % |
Emerging Markets Real Estate Fund | | | 4 | % |
Global Infrastructure Fund | | | 14 | % |
Global Consumer Growth Fund | | | 0 | % |
| | | | |
The Funds designated the following percentages of taxable ordinary income distributions as short-term capital gain distributions under Internal Revenue Section 871(k)(2)(C). |
| | | | |
International Real Estate Equity Fund | | | 0 | % |
Realty Income & Growth Fund | | | 0 | % |
Cyclical Advantage Property Fund | | | 0 | % |
Emerging Markets Real Estate Fund | | | 0 | % |
Global Infrastructure Fund | | | 0 | % |
Global Consumer Growth Fund | | | 0 | % |
The Funds designated as long-term capital gain dividend, pursuant to Internal Revenue Code Section 852(b)(3), the amount necessary to reduce the earnings and profits of the Funds related to net capital gain to zero for the tax year ended October 31, 2011.
Availability of Proxy Voting Information
Information regarding how each Fund votes proxies relating to portfolio securities is available without charge upon request by calling toll-free at 1-888-785-5578 and on the SEC’s website at www.sec.gov. Information regarding how each Fund voted proxies relating to portfolio securities during the most recent twelve month period ended June 30 is available on the SEC’s website at www.sec.gov or by calling the toll-free number listed above.
Availability of Quarterly Portfolio Schedule
Beginning with each Fund’s fiscal quarter ended July 31, 2004, each Fund filed its complete schedules of portfolio holdings on Form N-Q with the SEC. Going forward, each Fund will file Form N-Q for the first and third quarters of each fiscal year on Form N-Q. Each Fund’s Form N-Q is available on the SEC’s website at www.sec.gov and may be reviewed and copied at the SEC’s Public Reference Room in Washington, DC. Information on the operation of the Public Reference Room may be obtained by calling 1-202-551-8090.
97
Additional Information (Unaudited)—Continued
April 30, 2012
Privacy Policy
The Funds collect non-public information about you from the following sources:
| |
| • information we receive about you on applications or other forms; |
| • information you give us orally; and |
| • information about your transactions with others or us. |
The Funds do not disclose any non-public personal information about our customers or former customers without the customer’s authorization, except as required by law or in response to inquiries from governmental authorities. The Funds restrict access to your personal and account information to those employees who need to know that information to provide products and services to you. The Funds also may disclose that information to unaffiliated third parties (such as to brokers or custodians) only as permitted by law and only as needed for us to provide agreed services to you. The Funds maintain physical, electronic and procedural safeguards to guard your non-public personal information.
In the event that you hold shares of the Funds through a financial intermediary, including, but not limited to a broker dealer, bank or trust company, the privacy policy of your financial intermediary would govern how your non-public personal information would be shared with unaffiliated third parties.
98
Additional Information (Unaudited)—Continued
April 30, 2012
SHAREHOLDER MEETING
On June 8, 2012, the Trusts held their Annual Meeting of Shareholders (the “Meeting”) for the purpose of voting on proposals below. The results stated as a percentage of the shares voted are as follows:
Proposal 1: To elect H. Guy Leibler, James A. Jacobson, Jeffrey E. Wacksman, and Samuel A. Lieber as Trustee to the Board of Trustees for an indefinite term or until his successor has been duly elected and qualified.
| | | | | |
| | For | | Withheld | |
H. Guy Leibler | | 95.47% | | 4.53% | |
James A. Jacobson | | 95.57% | | 4.43% | |
Jeffrey E. Wacksman | | 95.48% | | 4.52% | |
Samuel A. Lieber | | 95.48% | | 4.52% | |
Proposal 2: To transact such other business as may properly come before the meeting or any adjournments or postponements thereof.
| |
For | 82.90% |
Against | 15.03% |
Abstain | 2.07% |
99
|
TRUSTEES |
Samuel A. Lieber |
James A. Jacobson |
H. Guy Leibler |
Jeffrey E. Wacksman |
|
CUSTODIAN & |
ADMINISTRATOR |
State Street Bank & Trust Company |
One Lincoln Street |
Boston, MA 02111 |
|
INDEPENDENT REGISTERED |
PUBLIC ACCOUNTING FIRM |
Deloitte & Touche LLP |
555 East Wells Street |
Milwaukee, WI 53202 |
|
FUND COUNSEL |
Wilkie Farr & Gallagher |
787 7th Avenue, 40th FL |
New York, NY 10019 |
|
DISTRIBUTOR |
Quasar Distributors, LLC |
615 East Michigan Street |
Milwaukee, WI 53202 |
|
INVESTMENT ADVISER |
Alpine Woods Capital Investors, LLC |
2500 Westchester Ave., Suite 215 |
Purchase, NY 10577 |
|
TRANSFER AGENT |
Boston Financial Data Services |
Two Heritage Drive |
North Quincy, MA 02171 |
|

|
|
SHAREHOLDER | INVESTOR INFORMATION |
|
1(888)785.5578 |
www.alpinefunds.com |
|
This material must be preceded or accompanied by a current prospectus. |
Item 2. Code of Ethics
Not applicable to semi-annual reports.
Item 3. Audit Committee Financial Expert
Not applicable to semi-annual reports.
Item 4. Principal Accountant Fees and Services
Not applicable to semi-annual reports.
Item 5. Audit Committee of Listed Registrants
Not applicable to registrants who are not listed issuers (as defined in Rule 10A-3 under the Securities Exchange Act of 1934).
Item 6. Schedule of Investments
| |
(a) | Schedule of Investments is included as part of Item 1 of the Form N-CSR. |
| |
(b) | Not applicable. |
Item 7. Disclosure of Proxy Voting Policies and Procedures for Closed-End Management Investment Companies.
Not applicable to open-end investment management companies.
Item 8. Portfolio Managers of Closed-End Management Investment Companies.
Not applicable to open-end investment management companies.
Item 9. Purchases of Equity Securities by Closed-End Management Investment Company and Affiliated Purchasers.
Not applicable to open-end investment management companies.
Item 10. Submission of Matters to a Vote of Security Holders.
There were no material changes to the procedures by which shareholders may recommend nominees to the Registrant’s Board of Trustees.
Item 11. Controls and Procedures.
(a) The Registrant’s principal executive officer and principal financial officer have evaluated the registrant’s disclosure controls and procedures (as defined in Rule 30a-3(c) under the Investment Company Act of 1940, as amended) within 90 days of this filing and have concluded that the Registrant’s disclosure controls and procedures were effective, as of that date.
(b) There was no change in the Registrant’s internal control over financial reporting (as defined in Rule 30a-3(d) under the Investment Company Act of 1940, as amended) during the second fiscal quarter of the period covered by this report that has materially affected, or is reasonably likely to materially affect, the Registrant’s internal control over financial reporting.
Item 12. Exhibits
| |
(a)(1) Not applicable to semi-annual reports. |
| |
(a)(2) The certifications required by Rule 30a-2(a) of the Investment Company Act of 1940, as amended, and Section 302 of the Sarbanes-Oxley Act of 2002 are attached hereto as Ex99.Cert. |
| |
(a)(3) Not applicable. |
| |
(b) The certifications by the Registrant’s Principal Executive Officer and Principal Financial Officer, as required by Rule 30a-2(b) of the Investment Company Act of 1940, as amended, and Section 906 of the Sarbanes-Oxley Act of 2002 are attached hereto as Ex99.906Cert. |
SIGNATURES
Pursuant to the requirements of the Securities Exchange Act of 1934 and the Investment Company Act of 1940, the registrant has duly caused this report to be signed on its behalf by the undersigned, thereunto duly authorized.
| | |
Alpine Equity Trust | |
| |
By: | /s/ Samuel A. Lieber | |
|
| |
| Samuel A. Lieber | |
| Chief Executive Officer (Principal Executive Officer) |
| |
Date: | July 9, 2012 | |
Pursuant to the requirements of the Securities Exchange Act of 1934 and the Investment Company Act of 1940, this report has been signed below by the following persons on behalf of the registrant and in the capacities and on the dates indicated.
| | |
By: | /s/ Samuel A. Lieber | |
|
| |
| Samuel A. Lieber |
| Chief Executive Officer (Principal Executive Officer) |
| | |
By: | /s/ Ronald G. Palmer, Jr. | |
|
| |
| Ronald G. Palmer, Jr. |
| Chief Financial Officer (Principal Financial Officer) |
| |
Date: | July 9, 2012 | |