UNITED STATES
SECURITIES AND EXCHANGE COMMISSION
Washington, D.C. 20549
FORM N-CSR
CERTIFIED SHAREHOLDER REPORT OF REGISTERED
MANAGEMENT INVESTMENT COMPANIES
Investment Company Act file number: 811-05684
Alpine Equity Trust
(Exact name of registrant as specified in charter)
2500 Westchester Avenue, Suite 215
Purchase, New York 10577
(Address of principal executive offices)(Zip code)
(Name and Address of Agent for
Service) | | Copy to: |
| | | |
Samuel A. Lieber
Alpine Woods Capital Investors, LLC
2500 Westchester Avenue, Suite 215
Purchase, New York 10577 | | Rose DiMartino
Attorney at Law
Willkie Farr & Gallagher
787 7th Avenue, 40th Floor New York, New York 10019 |
Registrant’s telephone number, including area code: (914) 251-0880
Date of fiscal year end: October 31
Date of reporting period: November 1, 2012 - April 30, 2013
Item 1: Shareholder Report

Real Estate Funds
Alpine International Real Estate Equity Fund
Institutional Class (EGLRX)
Class A (EGALX) Alpine Realty Income & Growth Fund
Institutional Class (AIGYX)
Class A (AIAGX) | Alpine Cyclical Advantage Property Fund
Institutional Class (EUEYX) Alpine Emerging Markets Real Estate Fund
Institutional Class (AEMEX)
Class A (AEAMX) Alpine Global Infrastructure Fund
Institutional Class (AIFRX)
Class A (AIAFX) Alpine Global Consumer Growth Fund
Institutional Class (AWCGX)
Class A (AWCAX) |
Semi-Annual Report
Table of Contents
Additional Alpine Funds are offered in the Alpine Series Trust and Alpine Income Trust. These Funds include:
| Alpine Dynamic Dividend Fund | Alpine Transformations Fund |
| | |
| Alpine Accelerating Dividend Fund | Alpine Foundation Fund |
| | |
| Alpine Financial Services Fund | Alpine Municipal Money Market Fund |
| | |
| Alpine Innovators Fund | Alpine Ultra Short Tax Optimized Income Fund |
Alpine’s Series and Income Funds’ investment objectives, risks, charges and expenses must be considered carefully before investing in funds of the Alpine Series Trust and Alpine Income Trust. The statutory and summary prospectuses contain this and other important information about the investment company, and it may be obtained by calling 1-888-785-5578, or visiting www.alpinefunds.com. Read it carefully before investing.
Mutual fund investing involves risk. Principal loss is possible.

Alpine’s Investment Outlook
Dear Shareholders:
Over the past six months, capital markets have been induced by cheap money into following the “hope” trade. The ‘hope’ is that global central bank stimuli will continue to drive demand for stocks, bonds and alternative investments, allowing for continued balance sheet recapitalization and debt cost reduction until the onset of meaningful job and income growth kicks in. Nevertheless, if the markets are broadly heeding the call of ‘don’t fight the Fed (Federal Reserve)’, an increasing number of market participants are focusing on the potential impact of an eventual unwinding of this global pump priming with considerable trepidation. For example, if the Fed ‘tapers’ the amount of its asset buying program known as quantitative easing (QE), will this be akin to setting a raft adrift in mid-ocean, or will they only do so when land is visible, when employment and economic growth have been sustained? We just learned that the Fed will keep some assets bought under QE ($3.5 trillion to date) on its balance sheet until the bonds mature. While speculating on when, how quickly, and on what scale, the Fed divests fills considerable time on CNBC, it is really just another set of data points in setting investment policy.
These as yet uncertain outcomes are already being partly discounted by the market, potentially years in advance. Perhaps such concerns will continue to create a waltz-like pattern of returns, advancing two steps forward for each move sideways or back, a pattern some call “climbing a wall of worry”. This typically occurs when the market has yet to embrace a trend, despite overall positive sentiment. While at times the ensuing volatility is unsettling, this trend limits excess exuberance.
Alpine believes that all of the world’s major central banks will gradually join the fight against potential deflation, brought on by debt repayment and deleveraging at a time of slow growth which is characterized by moderating consumer demand. However, without the conventional push of fiscal stimulus working in tandem with monetary easing, the recovery from the Great Recession has been anemic. This has been reflected in the velocity of global monetary growth, which already slow,
has been declining over the past year. Instead, global growth has moderated while we hope for a job creating economic recovery fueled by pent up consumer demand and expansionary corporate capex. Over time, such a rise in activity would hopefully launch a self-sustaining surge in corporate profits and equity market expansion which would offset the negative impact of rising bond yields. If this occurs, it is more likely that other factors or even global events, financial or otherwise, would temper such an optimistic scenario. Nonetheless, we should be able to bank on the Fed’s own statement “...that a highly accommodative stance ... will remain appropriate for a considerable time after the asset purchase program ends and the economic recovery strengthens.” The Fed has stated that the Fed-Funds rate is not projected to rise until 2015, leading us to project limited increases in long rates for the next few years with 10-year U.S. Treasury yields fluctuating around the average of the past five years centered at 2.78%. Some fear that this could prove inflationary over time, and we believe this is precisely what the Fed is in fact targeting.
Historical Precedents for Stimulus
Historically, government intervention via monetary and fiscal policy tools has induced both economic slowdowns and surges. Former Fed Governor Paul Volker squeezed inflationary expectations and pressures out of the U.S. financial system, inducing the recession of 1981-82 through a highly restrictive monetary policy. The subsequent “Reagan recovery” used massive tax and fiscal stimulus to drive the economy forward. However, lax regulation and continued monetary stimulus following 1987’s “Black Monday” stock market crash led to the excesses and bust of the Savings & Loan (“S&L”) industry in 1989-90.
After the S&L crisis of 1990, our economy was rebooted and rallied in the aftermath of the “Desert Storm” campaign to contain Iraq. By mid-decade, we enjoyed a great surge in growth, job expansion and family wealth creation throughout the U.S., pulling along much of the world over a prolonged recovery. Innovation and internet expansion were further fueled by easy money (leading up
to Y2K), which ended with the collapse of the internet bubble in 2000. After the tragedy of “9/11”, this millennium’s first decade endured a bad experience of “guns and butter” stimulus through draining wars, tax cuts and uncontrolled financial excesses. This set up a roller coaster ride, first down and then way up, without functional brakes, before crashing in 2008.
Alas, this near systemic meltdown has required an extended period of adjustment, absorption, and/or rationalization of excesses, in the form of jobs, businesses, corporate spending, and inevitably, government tax receipts and spending. In essence, the credit based capital delivery system was broken, perhaps beyond repair, but the collective response has not been to redesign and build anew. Instead, we cut back the weak branches but have not fed or fertilized the plant, providing only a steady drip for life support. This period of downsizing has been supported by central bankers around the world who have pumped capital into the global financial system in order to stabilize markets, support weak bank balance sheets until they can become healthy, and moderate the impact of slow economic growth on unemployment.
Must There be An Era of Austerity?
The product of monetary stimulus over the past four and one-half years is a modest recovery in the U.S., new hope for recovery in Japan, a stable if somewhat slower China, and a still weak, if not further receding European economy. Notably, all of the major global economies withdrew or significantly reduced their fiscal stimulus following the initial stabilization efforts after the desperate days of 2008 and 2009. This is in contrast with the historic patterns of prior recessionary periods in the U.S., such as 1981-1982, or 1990-1991, when there were rising levels of aggregate fiscal stimulus for extended periods of two to three years. That is, historically our Government either extended tax relief, program support and/or made direct investments to foster economic activity over a sustained period of time. This time, substantial monetary and fiscal stimulus during 2009 was not extended amidst fears that higher Government debt would further strain weak GDP levels in an economy already straining against an aging demographic profile with higher future costs. The prospect of higher debt burdens just as many faced retirement was not politically palatable. However, unlike past recoveries which typically took hold a few years after recession ended, the significant short term erosion of tax receipts due to lower taxable sales and earnings, had made annual fiscal deficits appear much higher than the long term trend.
Now, it appears that prospective deficits are smaller than some feared, just as fiscal policy paralysis set in, compounded by election cycles around the world. In fact, the confluence of strong current positions of politically and fiscally conservative parties in power across many key countries led to the imposition of virtual, if not outright, austerity beginning in 2010 and extending throughout Europe and North America. Many believe that the impact of sequestration in the U.S. will slow our economy, notably in the second quarter, limiting the prior period’s buildup. However, we now see an alternative emerging, perhaps out of desperation. A very bold, and potentially very powerful economic experiment is underway in Japan. If Japan’s experiment fails, it will become yet another drag to economic growth (albeit at 7% of global GDP, no longer large enough to be catastrophic). If it succeeds in fostering a dynamic level of economic activity, however, the rest of the world may follow suit.
Japan can be viewed as the progenitor of the recent decade’s debt fueled bubble economics and, perhaps, is an example of how bad things can get if they are not handled correctly. Japan has muddled through a period of extended wealth depreciation, asset deflation and debt expansion since its stock market peaked in 1990. This predicament has evolved by alternating between ineffectual austerity programs and inadequate stimulus packages. The recently elected President, Shinzaro Abe, has reshuffled the Bank of Japan and the Finance Ministry to push quantitative easing on a relative scale of three-fold what our Fed has done. Of perhaps greater impact, Abe will seek a parliamentary victory this summer as a mandate for creating fiscal and structural economic reforms. If indeed there are material reforms, there is a possibility that Japan can restart a new period of economic growth with a more dynamic economy. This could happen despite demographic constraints, the world’s highest government debt to GDP ratio (in excess of 200% or over 400% when corporate and household debt are included) and a history of negative consumer and investor sentiment.
Our View: Fiscal Stimulus Has Already Had Success Here
In October 2008, President Bush signed the legislation creating the $700 billion Troubled Asset Relief Program (TARP), which was used initially to help keep AIG, Citigroup and Bank of America afloat, and later provided much needed assistance (which President Obama augmented) to Chrysler and General Motors (GM). On June 6, both GM and AIG rejoined the S&P 500, a triumphant (if symbolic) victory since their near collapse some five years ago. And as unthinkable as it was five years ago, the taxpayers have
2
turned a profit on the AIG deal. Later, the Obama administration provided stimulus via loans through the Department of Energy to green tech entrepreneurs like Solyndra and Tesla Motors. And while the Solyndra bankruptcy was a politically embarrassing poor investment, it turns out that Tesla was a pretty good one, having recently raised capital to pay the government back - nine years ahead of schedule. It’s worth noting that cars being made in the U.S., relative to foreign competitors, are now widely judged as comparable in terms of quality and value for the first time in a generation. Also, it is significant that Consumer Reports gave the Tesla ‘S’ its highest score of any car since a top of the line Lexus in 2008. Pretty impressive for a new company!
Obama’s 2009 stimulus package also offered investments beyond “shovel-ready” projects, such as advanced manufacturing tax credits for clean energy that went to approximately 200 U.S. factories, with significant results. To provide one example, in 2008, approximately 80% of the average U.S. wind turbine was made of imported parts. But after the stimulus created these factories that make one or several of the 8,000 parts that go into a turbine, the percentage of imported parts has dropped to 40%. In some ways, this is not very different than when the government subsidizes oil well drilling, or private equity investments by allowing deferred payback of gains or carrying losses on poor investments to offset future gains from productive ones. All of this suggests that stimulus investing could be beneficial in retaining jobs for the short run and aiding the growth of new businesses in the medium to long run.
What Should We Do Next?
In the U.S., we can take pride not only in the quality of our new cars but also in the fact that we still have the most significant economy in the world. Over time, our banks’ balance sheets and business models have become more stable, while economic output and household and corporate balance sheets are stronger than they were before the bust. As a result, the U.S. consumer is recovering confidence and household net worth is again growing now that housing prices are returning to long term trend levels. It does not hurt that the potential realization of huge oil and gas reserves through improved extraction technology promises energy cost advantages for the U.S. over the next generation, although its initial benefits have yet been barely realized. Indeed, in 2008 “drill baby drill” became a rallying cry that ultimately was more political inspiration than economic necessity. Perhaps today a more beneficial and promising slogan should be “build baby build”. To realize this energy wealth, we believe we need to build pipelines
and transportation systems that are secure from storms, hackers or other forms of attack. We also believe that we need refineries, fertilizer plants, and environmental control procedures that are state of the art. Pressure is intensifying to rebuild those under- maintained bridges and roads upon which our interstate commerce is dependent and rebuild or expand regional rail networks for commuters. It is our opinion that we need to enhance our water treatment and distribution plants, and to take our above-ground electric and telephone utility wires underground before too many hurricanes, tornados or mudslides force us to continually rebuild them. Major ports of entry into the country, be they by air or sea, for people or freight, should be upgraded to a level commensurate with the stature of our economy. We feel these efforts would not only create much needed engineering and construction jobs now, but would be investments that could have meaningful returns over many years. That is just what we did with the interstate highway system and the GPS navigation system, both of which were created by government, and have dramatically aided industry, consumption, and individual use. The myriad of benefits over the years, including job creation and a generation of strong returns, probably sounds like a good investment to most people.
It is often said that the 1944 GI bill, with its low cost mortgages, business loans and tuition assistance, created the middle class. Well, another level of investment that should be made is for our soldiers returning from active deployment and desirous of further service, training or perhaps advanced education, but who are unable to access these for various reasons. The payback as illustrated by the unemployment data is quite stark in the disparity between those with a college degree (-3.9%) versus those without a secondary degree (-11.65%). So beyond further assistance, perhaps we should strengthen an independent Coast Guard, rebuild the Park Service, expand the Job Corps, and institutionalize technical training more broadly. Here the payback will not be as quick and the monetary returns will be partially indirect, but it is a worthy undertaking if we can lower prison populations, reduce alcoholism or drug dependency, and host fewer homeless people in emergency rooms.
What Could This Mean for Markets?
So what does this mean for stock investing? Money is still flowing into the U.S. to invest, which should strengthen the dollar over time and keep inflation in this country low while also supporting our bond and equity markets. The U.S., U.K. and Japan have all adopted quantitative easing strategies and it is likely that the Europeans will probably do so within the next three to six months, depending
3
upon unemployment rates and contested German elections in September. In recent months, European equities and bonds have traded well in response to stabilization efforts, and in anticipation of funds flowing out of Japanese debt markets in a global search of higher yields. While Italian and Spanish 10-year debt trades at yields of 3.88% and 4.11% respectively, this is a big spread over Japanese bonds at 0.88%, or even U.S. bonds at 1.64% (Bloomberg, May 1st). If the European Central Bank (ECB) also undertakes quantitative easing before year end, we believe that the global equity rally may continue and sustain current trends well into 2014.
The big test will be whether the global economy shows increased prospects for gradual expansion into 2015. We believe a major wild card will be whether Japan undertakes meaningful fiscal and structural reforms as well as direct stimulus of the economy to help boost business and consumer demand. This means no more bridges to nowhere, but practical and impactful investments which create jobs and provide a return on invested capital that appeals to global investors. It will require streamlining regulations and revamping or redefining bureaucracies. It is possible that Japan could become a model for other countries to follow. Such a scenario suggests a meaningful and robust economic climate could unfold for an extended period of time. While prudence suggests that one should rarely bet on the most optimistic scenario, it has often been the case that great challenges set the stage for positive change and new opportunity.
Alpine believes that the forces for change are stronger than those of complacency and the status quo. High unemployment led to the street riots in Tunisia, which set off the Jasmine Revolution in the Middle East two years ago, and today we find youth unemployment in Spain and Greece is over 55%, over 30% in Ireland, 33% in Italy, 26% in France, and even 20% in the U.K. Historically, civilizations either adapt and survive when one crisis begets another, or they perish.
The globalization of labor, ideas and capital has dramatically shifted the landscape over the past 50 years, yet the organization and operational structure of many of our institutions often dates back 50 years. In that time, demographic profiles have changed dramatically within countries and between regions. In similar fashion, economic powers are shifting as industries expand and contract across countries and regions. Now, with the advent of rapid mass mobile communications, more people know what they want and have the means to figure out how to get it. All of this increases the odds that the flashpoint which unleashes change could come from unlikely places.
Could the last ‘Bubble Economy’ of the Twentieth Century be the first economy to shift from deflation to inflation and show the rest of us how to reignite growth? We are hopeful that if Japan sets a successful model for fiscal and structural reform and stimulus, other countries will follow. If not Japan, we firmly believe that another protagonist will emerge.
We thank you for your support and interest.
Sincerely,

Samuel A. Lieber
President
Past performance is not a guarantee of future results. The specific market, sector or investment conditions that contribute to a Fund’s performance may not be replicated in future periods.
Mutual fund investing involves risk. Principal loss is possible. Please refer to the individual fund letters for risks specific to that fund.
This letter and the letters that follow represent the opinions of the Fund’s management and are subject to change, are not guaranteed and should not be considered recommendations to buy or sell any security. The information provided is not intended to be, and is not, a forecast of future events, a guarantee of future results, or investment advice.
4
| Disclosures and Definitions |  |
Real Estate Funds Disclosures
The specific market, sector or investment conditions that contributed to a Fund’s performance may not be replicated in future periods.
Please refer to the Schedule of Portfolio Investments for Fund holdings information. Fund holdings and sector allocations are subject to change and should not be considered a recommendation to buy or sell any security.
Current and future portfolio holdings are subject to risk.
Diversification does not assure a profit or protect against loss in a declining market.
Favorable tax treatment of Fund distributions may be adversely affected, changed or repealed by future changes in tax laws. Alpine may not be able to anticipate the level of dividends that companies will pay in any given timeframe.
A portion of the Fund’s distributions may be comprised of return-of-capital or short-term or long-term capital gains. To the extent that the distribution is from a source other than net investment income, a 19a-1 notice will be provided and is available on our website.
Neither the Fund nor any of its representatives may give tax advice. Investors should consult their tax advisor for information concerning their particular situation.
Must be preceded or accompanied by a prospectus.
Quasar Distributors, LLC, distributor.
Real Estate Funds - Definitions
Capex (aka Capitalization Expenditure) are funds used by a company to acquire or upgrade physical assets such as property, industrial buildings or equipment. This type of outlay is made by companies to maintain or increase the scope of their operations.
Cap Rate (aka Capitalization Rate) is a rate of return on a real estate investment property based on the expected income that the property will generate. Capitalization rate is used to estimate the investor’s potential return on his or her investment by dividing the income the property will generate (after fixed costs and variable costs) by the total value of the property.
Cash Burn is the rate at which a new company uses up its venture capital to finance overhead before generating positive cash flow from operations. Also used as a measure of negative cash flow.
Cash Flow measures the cash generating capability of a company by adding non-cash charges (e.g. depreciation) and interest expense to pretax income.
Correlations are statistical measures of how two securities move in relation to each other.
Developing Markets (“DM”) operate in a country with a relatively high level of economic growth and security and are therefore less risky.
EBITDA (Earnings Before Interest, Taxes, Depreciation and Amortization) is essentially Net Income with Interest, Taxes, Depreciation, and Amortization added back to it. EBITDA can be used to analyze and compare profitability between companies and industries because it eliminates the effects of financing and accounting decisions.
Emerging Markets (“EM”) generally do not have the level of market efficiency and strict standards in accounting and securities regulation to be on par with advanced economies (such as the United States, Europe and Japan), but emerging markets will typically have a physical financial infrastructure including banks, a stock exchange and a unified currency.
FTSE EPRA/NAREIT® Emerging Index is an unmanaged index designed to track the performance of listed real estate securities companies in emerging countries worldwide.
FTSE EPRA/NAREIT® Global ex U.S. Real Estate Index is an unmanaged index designed to track the performance of publicly traded companies engaged in the real estate business outside the United States. The funds or securities referred to herein are not sponsored, endorsed, or promoted by the index providers, and the index providers bear no liability with respect to any such funds or securities or any index on which such funds or securities are based. The prospectus contains a more detailed description of the limited relationship the index providers have with the licensee and any related funds.
Funds From Operations is a figure used by real estate investment trusts (REITs) to define the cash flow from their operations. It is calculated by adding depreciation and amortization expenses to earnings, and sometimes quoted on a per share basis.
Hedge involves making an investment to reduce the risk of adverse price movements in an asset. Normally, a hedge consists of taking an offsetting position in a related security, such as a futures contract.
Lipper Real Estate Funds Average is an average of funds that invest at least 80% of their portfolio in equity securities of domestic and foreign companies engaged in the real estate industry.
MSCI All Country World Index Gross USD* is a free float-adjusted market capitalization-weighted index that is
5
| Disclosures and Definitions (Continued) | |
designed to measure the equity market performance of developed and emerging markets. Source: MSCI.
MSCI All Country World Consumer Discretionary Index* is a free float-adjusted market capitalization-weighted index that is designed to measure the equity market performance of developed and emerging markets for the Consumer Discretionary GICS(r) sector. Source: MSCI.
MSCI Emerging Markets Index USD* is a free float-adjusted market cap-weighted index that is designed to measure equity market performance in the global emerging markets. Source: MSCI.
MSCI US REIT Index* is a free float-adjusted market capitalization-weighted index that is comprised of the most actively-traded equity REITs that are of reasonable size in terms of full- and free-float-adjusted market capitalization. Source: MSCI.
MSCI World Index* is a free-float weighted equity index which includes developed world markets, and does not include emerging markets. Source: MSCI.
*MSCI makes no express or implied warranties or representations and shall have no liability whatsoever with respect to any MSCI data contained herein. The MSCI data may not be further redistributed or used as a basis for other indices or any securities or financial products. This report is not approved, reviewed or produced by MSCI.
Net Operating Income is a company’s operating income after operating expenses are deducted, but before income taxes and interest are deducted. If this is a positive value, it is referred to as net operating income, while a negative value is called a net operating loss.
Return on Equity (ROE) is the amount of net income returned as a percentage of shareholders’ equity. Return on equity measures a corporation’s profitability by revealing how much profit a company generates with the money shareholders have invested.
Risk Premium is the return in excess of the risk-free rate of return that an investment is expected to yield. An asset’s risk premium is a form of compensation for investors who tolerate the extra risk - compared to that of a risk-free asset - in a given investment.
S&P 500® Index is float-adjusted, market capitalization-weighted index of 500 common stocks chosen for market size, liquidity, and industry group representation to represent U.S. equity performance.
S&P Developed BMI Property Net Total Return is an unmanaged market-weighted total return index available on a monthly basis. The index consists of many companies from developed markets whose floats are
larger than $100 million and derive more than half of their revenue from property-related activities. Net total returns include cash dividends reinvested in the index but adjusted for country specific withholding taxes based on the highest tax rate possible.
S&P Developed Ex-U.S. Property Total Return Index defines and measures the investable universe of publicly-traded real estate companies domiciled in developed countries outside of the United States. The companies in the Index are engaged in real estate-related activities such as property ownership, management, development, rental and investment.
S&P Global Infrastructure Index is comprised of 75 of the largest publicly-listed infrastructure companies that meet specific investability requirements. The Index is designed to provide liquid exposure to the leading publicly-listed companies in the global infrastructure industry, from both developed markets and emerging markets.
Tokyo Stock Exchange REIT Index is a capitalization-weighted index of all Real Estate Investment Trusts listed on the Tokyo Stock Exchange, and is a price return index.
TOPIX Real Estate Index (also known as the Tokyo Stock Price Index), is a capitalization-weighted index of all companies listed on the First Section of the Tokyo Stock Exchange. The index calculation excludes temporary issues and preferred stocks
6
Equity Manager Reports

| | Alpine International Real Estate |
| | Equity Fund |
| | |
| | Alpine Realty Income & Growth Fund |
| | |
| | Alpine Cyclical Advantage Property Fund |
| | |
| | Alpine Emerging Markets Real Estate Fund |
| | |
| | Alpine Global Infrastructure Fund |
| | |
| | Alpine Global Consumer Growth Fund |
| Alpine International Real Estate Equity Fund |  |
| | | | | | | | | | | | | | | | | | | |
| Comparative Annualized Returns as of 4/30/13 (Unaudited) | |
| | | | | | | | | | | | | | | | | | | |
| | | 6 Months(1) | | 1 Year | | 3 Years | | 5 Years | | 10 Years | | Since Inception(2) |
| Alpine International Real Estate Equity Fund — Institutional Class | | | 13.88 | % | | | 19.87 | % | | | 6.25 | % | | | -5.10 | % | | | 8.88 | % | | | 5.87 | % |
| Alpine International Real Estate Equity Fund — Class A (Without Load) | | | 13.72 | % | | | 19.60 | % | | | N/A | | | | N/A | | | | N/A | | | | 29.25 | % |
| Alpine International Real Estate Equity Fund — Class A (With Load) | | | 7.47 | % | | | 13.01 | % | | | N/A | | | | N/A | | | | N/A | | | | 23.90 | % |
| FTSE EPRA/NAREIT® Global Ex-U.S. Real Estate Index(3) | | | 19.48 | % | | | 32.32 | % | | | 14.07 | % | | | N/A | | | | N/A | | | | N/A | |
| MSCI EAFE Index | | | 16.90 | % | | | 19.39 | % | | | 7.44 | % | | | -0.93 | % | | | 9.23 | % | | | 4.57 | % |
| S&P Developed Ex-U.S. Property Total Return Index(4) | | | 21.26 | % | | | 36.68 | % | | | 16.23 | % | | | 2.91 | % | | | 14.28 | % | | | N/A | |
| Lipper International Real Estate Funds Average(5) | | | 18.65 | % | | | 31.96 | % | | | 13.79 | % | | | 0.89 | % | | | 11.36 | % | | | 5.87 | % |
| Lipper International Real Estate Funds Ranking(5) | | | N/A(6) | | | | 57/58 | | | | 44/44 | | | | 43/43 | | | | 3/3 | | | | 1/1 | |
| Gross Expense Ratio (Institutional Class): 1.51%(7) | | | | | | | | | | | | | | | | | | | | | | | | |
| Net Expense Ratio (Institutional Class): 1.51%(7) | | | | | | | | | | | | | | | | | | | | | | | | |
| Gross Expense Ratio (Class A): 1.76%(7) | | | | | | | | | | | | | | | | | | | | | | | | |
| Net Expense Ratio (Class A): 1.76%(7) | | | | | | | | | | | | | | | | | | | | | | | | |
| (1) | Not annualized. |
| (2) | Institutional Class shares commenced on February 1, 1989 and Class A shares commenced on December 30, 2011. Returns for indices are since February 1, 1989. |
| (3) | Index commenced on October 31, 2008. Effective February 28, 2012, the Fund changed the benchmark against which it measures its performance from the S&P Developed Property Total Return Index to the FTSE EPRA/NAREIT® Global ex-U.S. Real Estate Index. The Adviser believes the FTSE EPRA/NAREIT® Global Ex-U.S. Real Estate Index more accurately reflects the investment strategy of the Fund. |
| (4) | Index commenced on July 31, 1989. |
| (5) | The since inception data represents the period beginning February 2, 1989 (Institutional Class only). |
| (6) | FINRA does not recognize rankings for less than one year. |
| (7) | As disclosed in the prospectus dated February 28, 2013. |
Performance data quoted represents past performance and is not predictive of future results. Investment return and principal value of the Fund fluctuate, so that shares, when redeemed, may be worth more or less than their original cost. Performance current to the most recent month end may be lower or higher than the performance quoted and may be obtained by calling 1-888-785-5578. Performance data shown does not reflect the 1.00% redemption fee imposed on shares held for fewer than 60 days. If it did, total returns would be reduced. Returns for the Class A shares with sales charge reflect a maximum sales charge of 5.50%. Performance for the Class A shares without sales charges does not reflect this load.
The FTSE EPRA/NAREIT® Global Real Estate Index Series is designed to represent general trends in eligible real estate equities worldwide. The funds or securities referred to herein are not sponsored, endorsed, or promoted by the index providers, and the index providers bear no liability with respect to any such funds or securities or any index on which such funds or securities are based. The prospectus contains a more detailed description of the limited relationship the index providers have with the licensee and any related funds. MSCI EAFE (Europe, Australasia, Far East) Index is a free float-adjusted market-cap-weighted index designed to measure developed market equity performance. Source: MSCI. MSCI data may not be reproduced or used for any other purpose. MSCI makes no express or implied warranties or representations and shall have no liability whatsoever with respect to any MSCI data contained herein. The MSCI data may not be further redistributed or used as a basis for other indices or any securities or financial products. This report is not approved, reviewed or produced by MSCI. The S&P Developed Ex-U.S. Property Total Return Index defines and measures the investable universe of publicly-traded real estate companies domiciled in developed countries outside of the United States. The companies in the Index are engaged in real estate-related activities such as property ownership, management, development, rental and investment. The Lipper International Real Estate Funds Average is an average of funds that invest at least 80% of their portfolio in equity securities of domestic and foreign companies engaged in the real estate industry. Lipper rankings for the periods shown are based on fund total returns with dividends and distributions reinvested and do not reflect sales charges. The FTSE EPRA/NAREIT® Global Ex-U.S. Real Estate Index, the MSCI EAFE Index, the S&P Developed Ex-U.S. Property Total Return Index and the Lipper International Real Estate Funds Average are unmanaged and do not reflect direct fees associated with a mutual fund, such as investment adviser fees; however, the Lipper International Real Estate Funds Average reflects fees charged by the underlying funds. The performance for the Alpine International Real Estate Equity Fund reflects the deduction of fees for these value-added services. Investors cannot directly invest in an index.
To the extent that the Fund’s historical performance resulted from gains derived from participation in Initial Public Offerings (“IPOs”) and/or Secondary Offerings, there is no guarantee that these results can be replicated in future periods or that the Fund will be able to participate to the same degree in IPO/Secondary Offerings in the future.
8
| Alpine International Real Estate Equity Fund (Continued) | |
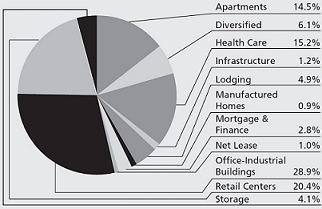
Portfolio Distributions* (Unaudited)

Top 10 Holdings* (Unaudited)
| 1. | | South Asian Real Estate PLC | 5.99% |
| 2. | | Regus PLC | 5.75% |
| 3. | | Direcional Engenharia SA | 5.14% |
| 4. | | Central Pattana PCL | 4.87% |
| 5. | | Multiplan Empreendimentos Imobiliarios SA | 4.33% |
| 6. | | Sao Carlos Empreendimentos e Participacoes SA | 4.20% |
| 7. | | Iguatemi Empresa de Shopping Centers SA | 3.56% |
| 8. | | LXB Retail Properties PLC | 3.41% |
| 9. | | Hulic Co., Ltd. | 2.98% |
| 10. | | SM Development Corp. | 2.76% |
| | | |
| * | Top 10 Holdings do not include short-term investments and percentages are based on total net assets. Portfolio Distributions percentages are based on total investments. Portfolio holdings and sector distributions are as of 4/30/2013 and are subject to change. Portfolio holdings are not recommendations to buy or sell any securities. |
| Value of a $10,000 Investment (Unaudited) |
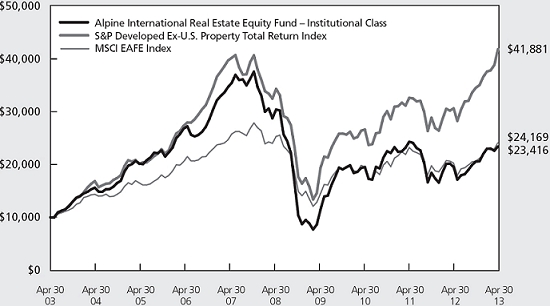 |
This chart represents a comparison of a hypothetical $10,000 investment in the Fund versus a similar investment in the Fund’s benchmark. The graph and the table do not reflect the deduction of taxes that a shareholder would pay on Fund distributions or the redemption of Fund shares. Investment performance reflects the waiver and recovery of certain fees, if applicable. Without the waiver and recovery of fees, the Fund’s total return would have differed.
Performance data quoted represents past performance and is not predictive of future results. Investment return and principal value of the Fund fluctuate, so that shares, when redeemed, may be worth more or less than their original cost.
9
| Alpine International Real Estate Equity Fund (Continued) | |
Commentary
Dear Investor:
We are pleased to present the 2013 Semi-Annual Report of the Alpine International Real Estate Equity Fund. For the six-month period ended April 30, 2013, the net asset value per share increased from $22.23 to $25.21, which, in combination with the distribution in December, produced a total return of 13.88%. This compares with the total return for our benchmark indices the FTSE/EPRA NAREIT® Global ex U.S. Index of 19.48% for the six months under review and the S&P Developed Ex-U.S. Property Index of 21.26% for the same period. All references in this letter to the Fund’s performance relate to the performance of the Fund’s Institutional Class.
One of the distinguishing performance attributes of the Fund in comparison with the FTSE/EPRA NAREIT® Global ex US Index over the past six months has been the Fund’s relatively low representation of Japanese holdings in the portfolio. The index positioned 22% of assets weighted towards Japan. In contrast, the Fund had a position of roughly7% weighted towards Japan at the end of the fiscal period. During the period under review, the Tokyo Stock Exchange REIT Index and the TOPIX Real Estate Index returned 55% and more than 104%, respectively. While the Fund’s Japanese holdings generated an aggregate return of over 178%, our fractional relative weighting constrained the overall returns of the Fund. Thus, while we believe our stock picking in the Japanese market was good, the Fund was too far out of line with these indices during this period of its underperformance.
Real Estate Stocks in Review
Real estate stocks outperformed their broader benchmark indices in twelve of the twenty countries we follow most carefully, and only materially underperformed in six. Overall, the strongest markets were Japan, Thailand, Indonesia, the Philippines, and Dubai. We believe that to a large measure this level of outperformance was driven by declining interest rates in most of the world’s markets, although the strongest returns were not in REIT-specific indices, which suggests that real estate is being sought as an alternative growth beneficiary of bond market capital appreciation, but not necessarily as a yield proxy. Indeed, cap rate compression, or lower initial investment yields for income-producing property, has been a dominant feature of real estate markets around the world over the past decade.
We believe the concern over how real estate stocks will perform when the interest rate cycle changes direction
will mitigate over time as such a transition draws closer. The initial reaction may well be a knee-jerk reflexive sell-off. However, we believe that the medium to long-term returns will be fundamentally dependent upon the underlying user demand for property that drives the growth outlook for rents and prices. Accordingly, our long-term focus is on markets where rental growth can more than offset prospective cap-rate expansion or higher debt funding costs which might affect long term valuations. Typically, this occurs in economies where real estate supply and demand fundamentals are balanced in favor of the landlord, as well as experiencing greater than average Gross Domestic Product (“GDP”) growth, which drives business expansion and job creation. While real estate equities tend to be more responsive to capital market activity than private real estate investment trends, the stocks’ ultimate valuation and performance reflect those longer-term trends. Thus, we view real estate equities as something of a hybrid between the broader equity markets and the direct real estate investment markets.
Across the globe, real estate equities have evolved to represent many of the largest and highest quality property operators in their respective regions, who have chosen public ownership in order to achieve lower cost of capital, more diverse funding opportunities, greater public profile and liquidity for themselves, their employees and their investors. For these reasons, we see the globalization of real estate equities continuing to expand along with the overall ebb and flow of the capital markets. In addition to breadth and depth of their operations, public companies often utilize less leverage than their private counterparts due to the preferences of public investors.
During the period under review, we believe the most significant change in the universe of real estate equities has been the extraordinary performance of Japanese REITs and, even more notably, Japanese real estate developers, in response to the shift in government and central bank policy aimed at reflating the domestic economy. While we believe this strategy holds great risk, it also holds unusual promise. Over the short-term, the markets have responded to that potential for improvement, driving shares to valuations which will only be justified under optimistic circumstances. That said, we believe a pull-back in share prices could provide attractive entry or re-entry points which may still provide meaningful prospective returns. Unlike prior periods when U.S. quantitative easing (“QE”) led to expansion of
10
| Alpine International Real Estate Equity Fund (Continued) | |
capital flowing into emerging markets, this later surge in liquidity coming from Japan after the introduction of QE has been directed towards developed economies. Thus, in the global context, broad European equity and bond indices performed rather well during this fiscal period despite the meager prospects with most of the region largely in recession. Notably, most European real estate sub-indices still underperformed the broader market indices, perhaps reflecting the prospect of declining demand impacting prospective rents for many properties.
Contributors to Portfolio Performance
The Fund’s top ten holdings as of the end of fiscal semi-annual period made up 42.99% of the portfolio. There were two new names in the top ten arising in the ninth and tenth positions, Hulic from Japan and SM Development Corp. from the Philippines. The Fund’s largest holding continued to be South Asian Real Estate, which is an Indian homebuilder1 The second largest holding, Regus PLC rose from the fifth spot due to very strong returns which contributed approximately 2% to the Fund’s 13.88% overall aggregate return.. Direcional fell from second to third spot despite solid performance, contributing over 1.5% to the Fund. Another notable outperformer was Central Pattana, the dominant Thai shopping mall developer, which rose from the tenth position to number four, providing approximately 1.4% of the Fund’s total return. Brazilian shopping mall leader, Multiplan, fell from fourth to fifth spot with a slight negative performance, while Sao Carlos, the specialist office owner focused on Rio de Janeiro and Sao Paulo remained in sixth place with a modest contribution. Iguatemi, the Brazilian high-end mall developer fell from third to seventh position despite only modest negative contribution, reflecting a modest reduction in the Fund’s holdings. LXB Retail Properties in the UK also had a slight negative return and fell to number eight. The Fund’s long term holding in Hulic, the Japanese office redevelopment specialist gained 90.41%, providing over one percent contribution to the Fund’s total return. Finally, SM Development Corp., a long term holding specializing in condominiums, also had a strong performance during the period.
The top five contributors to performance, accounting for an aggregate average weight of 15.60% for the six-month period ending April 30, 2013, included Kenedix
Inc. (average weight 1.88%) that gained 466.31%, as the prospects for this asset manager of Japanese REITs and investment funds make it a prime beneficiary of reflation in the Japanese real estate market. That said, the Fund began selling shares during April as we believed the stock became overvalued. We may look for opportunities to buy it back if stock becomes less expensive. Regus PLC (average weight 4.16%), which gained 57.75%, is the world’s largest operator of temporary office space to both individuals and corporations. It continues to expand its global network of locations while demonstrating solid performance for its established facilities. Direcional Engenharia (average weight 4.80%), which gained 32.61%, is the largest developer of low-income subsidized housing in Brazil. It has continued to expand its sales backlog at attractive margins. Central Pattana Public Co. (average weight 3.54%), which gained 47.08%, is Thailand’s dominant shopping mall developer and continues to expand its national footprint, and Hulic Co Ltd (average weight 1.22%), which gained 90.41%, is a specialist in renovating medium-sized office buildings in prime Tokyo locations and could also benefit from the reflation theme.
The five stocks which had the largest negative contribution to the portfolio and which had an 8.63% aggregate average weight during the period included Desarrolladora Homex (average weight 1.12%), which declined by 63.64%, as incoming Mexican President Pena Nieto’s administration limited the availability of low-income mortgages. Ongoing discussions of the government’s future role in supporting the housing market may lead to a modified business plan, so we have retained the holding in the portfolio. IVG Immobilien AG (average weight 0.77%), which declined by 59.28% announced that utilities were not exercising options to rent its underground salt domes for oil and gas storage in response to the expanding availability of natural gas at lower prices in Germany. This greatly altered the cash flow prospects for IVG, forcing it to pursue a restructuring of its balance sheet and causing the manager to sell the Fund’s shares. PDG Realty (average weight 1.56%) declined by 34.04%. The Brazilian homebuilder continues to restructure its building program after the installation of a new management team has not brought clarity to the company’s medium-term prospects for growth. BR Properties (average weight
| 1 | The Fund purchased South Asian Real Estate through a private placement in 2007. There is no public market for the holding and we have valued it based upon discounting both its current and projected adjusted book value, as well as taking into consideration the potential for a public offering of the shares in the future. As of April 30, 2013, the position has increased to approximately 6% of the Fund’s net assets as a result of net outflows from the Fund during the period. |
11
| Alpine International Real Estate Equity Fund (Continued) | |
2.63%) declined by 15.42%, as rising interest rates in Brazil have cooled the near-term prospects for this pre-eminent office landlord. Brazil Hospitality Group (average weight 2.56%) declined by 12.11%, as rising interest rates may diminish near-term growth prospects for one of Brazil’s largest hoteliers. We believe the prospects for next year appear more promising with Brazil hosting the World Cup.
While the Fund has benefited from strong contribution from its holdings in Japan, we are aware that the Bank of Japan’s aggressive stimulus policy is designed to put significant downward pressure on the Japanese Yen, and as a result have hedged a portion of Japanese Yen exposure. We have also continued to employ leverage both in the execution of the Fund’s investment strategy and to manage significant unexpected net outflows from the Fund during the period.
Fund’s Contributors by Country
The Fund’s top contributors by country constituted an average weighting of 32.9%, while the bottom contributors constituted about 43.0% of the portfolio. The top five country contributors produced almost the entire return of the Fund’s 13.88% total return for the six months. Japanese stocks were the main drivers adding over 6% while UK stocks contributed over 3% to the total return. This was followed by Thailand with approximately 2% return, the Philippines at over 1% and Hong Kong at approximately 0.8%. Four countries that had negative returns constituted 43.01% average weight and contributed -2.02%, including Germany, Mexico and Russia all with less than 1/2% negative return, however, the significant underperformer was Brazil, which while only contributing a -0.43% return was a significant drag due to its average weighting of over 36%. That said, over the course of the period, a number of Brazilian positions were reduced, lowering the Fund’s gross exposure to Brazil down from 37.2% to 29.5% at the end of the period.
While many of the world’s stock markets benefited from falling interest rates during this period, Brazil in fact gradually raised interest rates providing a headwind to overall returns. Despite a rising interest rate climate in Brazil, we believe that the share prices may be approaching a low level, although the timing is uncertain and, hence, the Fund might further consider its exposure over the next several months. With that said, we believe interest rates will come down over the next twelve months, which makes us positive on the prospects for the shopping mall sector from the long term perspective.
To better understand our keen focus on Brazilian shopping malls, it might be instructive to compare two mall companies which arguably represent the “best in class” from the U.S. and Brazil; both Simon Properties Group (SPG) and Multiplan (MULT3) are holdings of the Fund. Analyzing year-over-year data as of the end of the first calendar quarter of the year, we start with the basics, examining retail productivity metrics. Retail sales per square foot across Simon’s portfolio were $575 while Multiplan’s properties produced $723. Looking at tenant sales growth, Simon exceeded national averages as mall sales grew an impressive 5.3%, while Multiplan also grew faster than industry comparables, up 11.4%. Since sales performance can influence a store’s profitability and, hence, ability to pay rent, we compare annual base rents for Simon Properties which grew by 3.0%, while same store rents at Multiplan grew by 11.4%. Portfolio expansion through acquisition and development can influence corporate top line gross rental income which grew by 9.9% at Simon and 28% at Multiplan. This in turn influenced net operating income, which grew by 10.4% for Simon and 29.1% for Multiplan. Finally, Simon’s funds from operations (“FFO”) per share as a beneficiary of very strong financial management increased by 12.6%, while Multiplan temporarily took on expensive debt to fund new developments, growing FFO by 15.8%.
When valuing real estate stocks, investors look beyond growth in determining underlying asset value. While both companies have a strong balance sheet and cash flow coverage, it is relevant that Simon was leveraged 76% debt-to-market capitalization in contrast with 24% for Multiplan. Net debt relative to EBITDA is a solid 5.9 times for Simon, while Multiplan is a very conservative 1.8 times. The enterprise value (net debt + market cap) divided by EBITDA for Simon is a multiple of over 21 times compared with Multiplan at 16.8 times. This multiple, when inverted is similar to the implicit cap rate of Simon at 4.8% and for Multiplan at 6.7%. Note that both relate to their respective market valuations for real estate, with Simon at a moderate premium and Multiplan at a modest discount.
In many ways, these companies represent the best in class and we believe they highlight the different opportunities between the developing Brazil retail sector and what we view as the relatively stable, but more moderate U.S. growth profile. Perhaps the most notable difference is that Multiplan is projected to expand its shopping mall area almost 50% through new developments by 2016, while Simon has limited opportunities due to both its scale and mature markets. This underscores Simon’s continuing emphasis on global expansion over recent years.
12
| Alpine International Real Estate Equity Fund (Continued) | |
Despite all of the aforementioned data points depicting Brazil’s exceptional consumer growth trend, this should be understood in the context that, during the fiscal period under review, rising interest rates in Brazil undermined the performance of stocks while declining interest rates in the U.S. have boosted REIT prices here.
Prospects and Portfolio Positioning for the Balance of 2013 (and Beyond?)
Real estate equities performed well over the past year, in part because of falling interest rates in response to the anemic economic recovery throughout the world. We would expect them to benefit from any significant cyclical expansion. If the prospects of a more rapid European recovery are present, we believe that almost all global sectors and regions will benefit. The potential for European quantitative easing could become a significant growth driver not just for that region but much of the world, and in particular global real estate companies. A strong Japanese fiscal program, which in combination with their significant monetary easing, could lead to a powerful recovery - able to sustain rising real estate rents and prices, even in the face of higher interest rates.
In general, we believe that over time, potential job growth, business formation and ultimately GDP expansion
should outweigh the short-erm impact of rising interest rates if the global recovery continues to pick up pace. On the other hand, events out of “left field” or so-called “tail risk” could negatively impact prospective returns. The potential for conflict, be it with Iran, North Korea, China and maybe even Russia, remains present. Accordingly, Alpine believes it is important to maintain a diversified portfolio in terms of geography, business type, property type mix and income distribution potential. Our focus will continue to be on seeking long-term growth of capital with a secondary emphasis on current income.
We very much appreciate your continued support and interest in the Alpine International Real Estate Equity Fund.
Sincerely,
Samuel Lieber
Portfolio Manager
This letter represents the opinions of the Fund’s management and is subject to change, is not guaranteed and should not be considered recommendations to buy or sell any security. The information provided is not intended to be, and is not, a forecast of future events, a guarantee of future results, or investment advice. Views expressed may vary from those of the firm as a whole.
Mutual fund investing involves. Principal loss is possible. The Fund is subject to risks, including the following:
Concentration Risk – The Fund’s strategy of concentrating in companies in a specific industry means that its performance will be closely tied to the performance of a particular market segment. The Fund’s concentration in these companies may present more risks than if it were broadly diversified over numerous industries and sectors of the economy. A downturn in these companies would have a larger impact on the Fund than on a mutual fund that does not concentrate in such companies. At times, the performance of these companies will lag the performance of other industries or the broader market as a whole.
Emerging Market Securities Risk – The risks of foreign investments are heightened when investing in issuers in emerging market countries. Emerging market countries tend to have economic, political and legal systems that are less fully developed and are less stable than those of more developed countries. They are often particularly sensitive to market movements because their market prices tend to reflect speculative expectations. Low trading volumes may result in a lack of liquidity and in extreme price volatility.
Equity Securities Risk – The stock or other security of a company may not perform as well as expected, and may decrease in value, because of factors related to the company (such as poorer than expected earnings or certain management decisions) or to the industry in which the company is engaged (such as a reduction in the demand for products or services in a particular industry).
Foreign Currency Transactions Risk – Foreign securities are often denominated in foreign currencies. As a result, the value of the Fund’s shares is affected by changes in exchange rates. The Fund may enter into foreign currency transactions to try to manage this risk. The Fund’s ability to use foreign currency transactions successfully depends on a number of factors, including the foreign currency transactions being available at prices that are not too costly, the availability of liquid markets and the ability of the Adviser to accurately predict the direction of changes in currency exchange rates.
13
| Alpine International Real Estate Equity Fund (Continued) | |
Foreign Securities Risk – The Fund’s investments in securities of foreign issuers or issuers with significant exposure to foreign markets involve additional risk. Foreign countries in which the Fund may invest may have markets that are less liquid, less regulated and more volatile than U.S. markets. The value of the Fund’s investments may decline because of factors affecting the particular issuer as well as foreign markets and issuers generally, such as unfavorable government actions, and political or financial instability. Lack of information may also affect the value of these securities. The risks of foreign investment are heightened when investing in issuers of emerging market countries.
Growth Stock Risk – Growth stocks typically are very sensitive to market movements because their market prices tend to reflect future expectations. When it appears those expectations will not be met, the prices of growth stocks typically fall. Growth stocks as a group may be out of favor and underperform the overall equity market while the market concentrates on undervalued stocks.
Initial Public Offerings and Secondary Offerings Risk – The Fund may invest a portion of its assets in shares of IPOs or secondary offerings of an issuer. IPOs and secondary offerings may have a magnified impact on the performance of a Fund with a small asset base. The impact of IPOs and secondary offerings on a Fund’s performance likely will decrease as the Fund’s asset size increases, which could reduce a Fund’s returns. IPOs and secondary offerings may not be consistently available to the Fund for investing. IPO and secondary offering shares frequently are volatile in price due to the absence of a prior public market, the small number of shares available for trading and limited information about the issuer. Therefore, the Fund may hold IPO and secondary offering shares for a very short period of time. This may increase the turnover of the Fund and may lead to increased expenses for the Fund, such as commissions and transaction costs. In addition, IPO and secondary offering shares can experience an immediate drop in value if the demand for the securities does not continue to support the offering price.
Leverage Risk – The Fund may use leverage to purchase securities. Increases and decreases in the value of the Fund’s portfolio will be magnified when the Fund uses leverage.
Liquidity Risk – Some securities held by the Fund may be difficult to sell, or illiquid, particularly during times of market turmoil. Illiquid securities may also be difficult to value. If the Fund is forced to sell an illiquid asset to meet redemption requests or other cash needs, the Fund may be forced to sell at a loss.
Management Risk – The Adviser’s judgment about the quality, relative yield or value of, or market trends affecting, a particular security or sector, or about interest rates generally, may be incorrect. The Adviser’s security selections and other investment decisions might produce losses or cause the Fund to underperform when compared to other funds with similar investment objectives and strategies.
Market Risk – The price of a security held by the Fund may fall due to changing market, economic or political conditions.
Micro Capitalization Company Risk – Stock prices of micro capitalization companies are significantly more volatile, and more vulnerable to adverse business and economic developments than those of larger companies. Micro capitalization companies often have narrower markets for their goods and/or services and more limited managerial and financial resources than larger, more established companies, including small or medium capitalization companies.
Real Estate Investment Trusts (“REITs”) Risk – REITs’ share prices may decline because of adverse developments affecting the real estate industry including changes in interest rates. The returns from REITs may trail returns from the overall market. Additionally, there is always a risk that a given REIT will fail to qualify for favorable tax treatment.
Real Estate Securities Risk – Risks associated with investment in securities of companies in the real estate industry include: declines in the value of real estate; risks related to local economic conditions, overbuilding and increased competition; increases in property taxes and operating expenses; changes in zoning laws; casualty or condemnation losses; variations in rental income, neighborhood values or the appeal of properties to tenants; changes in interest rates and changes in general economic and market conditions.
Small and Medium Capitalization Company Risk – Securities of small or medium capitalization companies are more likely to experience sharper swings in market values, less liquid markets, in which it may be more difficult for the Adviser to sell at times and at prices that the Adviser believes appropriate and generally are more volatile than those of larger companies.
14
| Alpine International Real Estate Equity Fund (Continued) | |
Undervalued Stock Risk – The Fund may pursue strategies that may include investing in securities, which, in the opinion of the Adviser, are undervalued. The identification of investment opportunities in undervalued securities is a difficult task and there is no assurance that such opportunities will be successfully recognized or acquired. While investments in undervalued securities offer opportunities for above-average capital appreciation, these investments involve a high degree of financial risk and can result in substantial losses.
Please refer to pages 5-6 for other important disclosures and definitions.
15
| Alpine Realty Income & Growth Fund |  |
| Comparative Annualized Returns as of 4/30/13 (Unaudited) | |
| | |
| | 6 Months(1) | | | 1 Year | | 3 Years | | 5 Years | | 10 Years | | Since Inception(2) | |
| Alpine Realty Income & Growth Fund — Institutional Class | 17.87% | | | 18.05% | | 17.84% | | 5.64% | | 10.32% | | 12.04% | |
| Alpine Realty Income & Growth Fund — Class A (Without Load) | 17.77% | | | 17.71% | | N/A | | N/A | | N/A | | 25.14% | |
| Alpine Realty Income & Growth Fund — Class A (With Load) | 11.29% | | | 11.24% | | N/A | | N/A | | N/A | | 19.93% | |
| MSCI US REIT Index | 19.20% | | | 19.21% | | 17.19% | | 6.92% | | 12.59% | | 11.86% | |
| S&P 500® Index | 14.42% | | | 16.89% | | 12.80% | | 5.21% | | 7.88% | | 3.75% | |
| Lipper Real Estate Funds Average(3) | 16.56% | | | 17.36% | | 16.07% | | 6.19% | | 11.62% | | 11.15% | |
| Lipper Real Estate Funds Ranking(3) | N/A(4) | | | 61/236 | | 15/195 | | 110/175 | | 90/105 | | 15/58 | |
| Gross Expense Ratio (Institutional Class): 1.41%(5) | | | | | | | | | | | | | |
| Net Expense Ratio (Institutional Class): 1.41%(5) | | | | | | | | | | | | | |
| Gross Expense Ratio (Class A): 1.66%(5) | | | | | | | | | | | | | |
| Net Expense Ratio (Class A): 1.66%(5) | | | | | | | | | | | | | |
| (1) | Not annualized. |
| (2) | Institutional Class shares commenced on December 29, 1998 and Class A shares commenced on December 30, 2011. Returns for indices are since December 29, 1998. |
| (3) | The since inception data represents the period beginning December 31, 1998 (Institutional Class only). (4) FINRA does not recognize rankings for less than one year. |
| (5) | As disclosed in the prospectus dated February 28, 2013. |
Performance data quoted represents past performance and is not predictive of future results. Investment return and principal value of the Fund fluctuate, so that shares, when redeemed, may be worth more or less than their original cost. Performance current to the most recent month end may be lower or higher than the performance quoted and may be obtained by calling 1-888-785-5578. Performance data shown does not reflect the 1.00% redemption fee imposed on shares held for fewer than 60 days. If it did, total returns would be reduced. Returns for the Class A shares with sales charge reflect a maximum sales charge of 5.50%. Performance for the Class A shares without sales charges does not reflect this load.
MSCI US REIT Index is a free float-adjusted market capitalization-weighted index that is comprised of the most actively-traded equity REITs that are of reasonable size in terms of full- and free-float-adjusted market capitalization. Source: MSCI. MSCI makes no express or implied warranties or representations and shall have no liability whatsoever with respect to any MSCI data contained herein. The MSCI data may not be further redistributed or used as a basis for other indices or any securities or financial products. This report is not approved, reviewed or produced by MSCI. The S&P 500® Index is a float-adjusted market capitalization-weighted index of 500 common stocks chosen for market size, liquidity, and industry group representation to represent U.S. equity performance. The Lipper Real Estate Funds Average is an average of funds that invest at least 80% of their portfolio in equity securities of domestic and foreign companies engaged in the real estate industry. Lipper rankings for the periods shown are based on fund total returns with dividends and distributions reinvested and do not reflect sales charges. The MSCI US REIT Index, the S&P 500® Index and the Lipper Real Estate Funds Average are unmanaged and do not reflect direct fees associated with a mutual fund, such as investment adviser fees; however, the Lipper Real Estate Funds Average reflects fees charged by the underlying funds. The performance for the Alpine Realty Income & Growth Fund reflects the deduction of fees for these value-added services. Investors cannot directly invest in an index.
Expense ratios reflect the ratios reported in the Fund’s most recent prospectus. The Alpine Realty Income & Growth Fund has a contractual expense waiver that continues through February 28, 2014. Where a Fund’s gross and net expense ratio are the same for the period reported, the contractual expense reimbursement level was not reached as of the end of that period. To the extent the Fund’s expenses were reduced by waivers, the Fund’s total returns were increased. In these cases, in the absence of the expense waivers, the Fund’s total returns would have been lower.
To the extent that the Fund’s historical performance resulted from gains derived from participation in Initial Public Offerings (“IPOs”) and/or Secondary Offerings, there is no guarantee that these results can be replicated in future periods or that the Fund will be able to participate to the same degree in IPO/Secondary Offerings in the future.
16
| Alpine Realty Income & Growth Fund (Continued) | |
Portfolio Distributions*(Unaudited)
| Top 10 Holdings*(Unaudited) | |
| 1. | | Simon Property Group, Inc. | 8.65% |
| 2. | | Boston Properties, Inc. | 5.44% |
| 3. | | Ventas, Inc. | 4.87% |
| 4. | | Public Storage | 4.30% |
| 5. | | SL Green Realty Corp. | 3.89% |
| 6. | | ProLogis, Inc. | 3.72% |
| 7. | | Health Care REIT, Inc. | 3.62% |
| 8. | | Vornado Realty Trust | 3.61% |
| 9. | | HCP, Inc. | 3.56% |
| 10. | | Equity Residential | 3.36% |
| * | Top 10 Holdings do not include short-term investments and percentages are based on total net assets. Portfolio Distributions percentages are based on total investments. Portfolio holdings and sector distributions are as of 04/30/13 and are subject to change. Portfolio holdings are not recommendations to buy or sell any securities. |
| Value of a $10,000 Investment (Unaudited) |
| |
 |
This chart represents a comparison of a hypothetical $10,000 investment in the Fund versus a similar investment in the Fund’s benchmark. The graph and the table do not reflect the deduction of taxes that a shareholder would pay on Fund distributions or the redemption of Fund shares. Investment performance reflects the waiver and recovery of certain fees, if applicable. Without the waiver and recovery of fees, the Fund’s total return would have differed.
Performance data quoted represents past performance and is not predictive of future results. Investment return and principal value of the Fund fluctuate, so that shares, when redeemed, may be worth more or less than their original cost.
17
| Alpine Realty Income & Growth Fund (Continued) | |
Commentary
Dear Investor:
We are pleased to report the results of the Alpine Realty Income & Growth Fund for the fiscal semi-annual period that ended April 30, 2013. During this period, the Fund produced a total return of 17.87% which compares to the 16.56% return of the Lipper Real Estate Funds Average, the 19.20% return of the MSCI REIT Index (the “RMS Index”), and the 14.42% return of the S&P 500® Index (the “S&P”). All references in this letter to the Fund’s performance relate to the performance of the Fund’s Institutional Class.
At April 30, 2013, the Fund’s net asset value per share had increased to $20.06 from $17.37 six months prior. During this timeframe, the Fund paid two quarterly distributions of $0.1875 per share totaling $0.375 per share for the fiscal period. Since its inception on December 29, 1998 through April 30, 2013, the Fund has delivered an annualized total return to shareholders of 12.04% including cumulative distributions of $15.11. The performance chart on page 16 presents the Fund’s returns for the current period, one-year, three-year, five-year, ten-year, and since inception periods.
Returns for the broader equity market and real estate securities exceeded our expectations for the latest six-month fiscal period and were seemingly advanced by continued evidence of economic recovery domestically; mitigation of fiscal issue uncertainties both in the Eurozone and at home; and the search for yield and total return in a low interest rate environment. Indeed, both the S&P and the RMS Index broke through their respective previous high water marks during the period, closed at all-time highs on April 30th, and continued to advance in May.
While the pace of this cycle’s economic rebound has been historically weak, it remains on a positive trajectory. This trend has been the market’s friend with improvements in employment and in housing buoying investor confidence. During the latest fiscal period, the official unemployment rate decreased from 7.9% to 7.5%, its lowest level since December 2008, while continuing claims for unemployment insurance are currently threatening to fall below 3 million for the first time since May 2008. Meanwhile, a significant component of the U.S. economy, housing, shows long-awaited positive signs of improvement with existing home sales and housing starts reaching respective levels of 4.97 million and 5.57 million on an annualized basis, which though significantly below their peak levels are nonetheless at the highest levels in years.
Investor confidence has also been strengthened by the diminishment of issues that previously dominated the public discussion and contributed mightily to risk-aversion in the equity markets, namely political and fiscal issue uncertainties in the Eurozone and domestically. The U.S. Presidential election was decided. Central bank action, austerity measures, and forceful intervention helped alleviate concerns temporarily about the health of the banking systems and government finances in Greece, Spain, and Italy. And in the U.S., band-aid solutions were cobbled together to avoid the predicted hazards of the “fiscal cliff” though achievement of an appropriate mix of revenue increases and budget cuts remains illusory.
Tepid economic growth and central bank intervention have kept interest rates low and pushed investors to seek yield-oriented opportunities in alternative areas such as real estate, benefitting the U.S. REIT securities market. While the current average REIT dividend yield at approximately 3.25% is historically low, such a return appears attractive relative to traditional fixed income alternatives and holds out the prospect of growth as the economy and real estate markets continue to recover. In fact, the 72% average payout ratio for REIT dividends as a percentage of Adjusted Funds From Operations (a REIT measure of cash earnings) stands below the sector’s 81% long-term average according to Citi research, implying room for potential future dividend growth within the group. The Fund experienced strong individual company common dividend increases during the latest six-month fiscal period, enabling an increase in the quarterly distribution rate and a further reduction in higher yielding preferred equity holdings The table on the next page depicts dividend increases experienced within the Fund’s top 20 positions.
18
| Alpine Realty Income & Growth Fund (Continued) | |
| Individual Company Dividend Increases |
| (10/31/12 — 4/30/13) |
| 1) | Simon Property Group | +4.5% |
| 2) | Boston Properties | +18.2% |
| 3) | Ventas | +8.1% |
| 4) | Public Storage | +13.6% |
| 5) | SL Green Realty | +32.0% |
| 6) | Prologis | 0% |
| 7) | HealthCare REIT | +3.4% |
| 8) | Vornado Realty Trust | +5.8% |
| 9) | HCP Inc. | +5.0% |
| 10) | Equity Residential | +18.5% |
| 12) | Alexandria Real Estate | +13.2% |
| 11) | Digital Realty | +6.8% |
| 13) | Essex Property Trust | +10.0% |
| 14) | CBL & Associates | +4.5% |
| 15) | Macerich | 0% |
| 16) | Avalon Bay | +10.3% |
| 17) | Kilroy Realty Corp. | 0% |
| 18) | Home Properties | +6.1% |
| 19) | Taubman Centers, Inc. | +8.1% |
| 20) | Omega Healthcare | +4.5% |
For the Fund, among the top contributors to its 17.87% performance during the fiscal period were healthcare REITs, lodging companies, and industrial warehouse owners. Healthcare REITs attracted investors seeking both yield and stability from demographically driven need-based demand and, as a result, posted some of the highest returns within the sector. All of the Fund’s healthcare holdings outperformed the overall REIT averages led by Omega Healthcare Investors (47.77%, average weight 1.89%), Sabra Health Care (38.85%, average weight 2.04%), Senior Housing Properties (33.63%, average weight 0.80%), Health Care REIT (29.31%, average weight 3.40%), Ventas (28.29%, average weight 4.54%), and HCP, Inc. (22.94%. average weight 3.40%). Lodging company investments, while not a significant percentage of the portfolio, also provided attractive returns as business and leisure travel helped drive above average revenue growth against a backdrop of historically limited supply additions. For the Fund, leading returns were generated by Chatham Lodging Trust (45.67%, average weight 0.55%), Chesapeake Lodging (32.96%, average weight 0.58%), Pebblebrook Hotel Trust (29.46%, average weight 0.32%), and Host Hotels & Resorts (27.82%, average weight 1.26%). With economic indicators such as inventory levels, global trade, and port activity showing improvement, industrial REITs attracted investor attention and performed well during the fiscal period. Within the Fund, top returns were delivered by holdings in STAG Industrial (31.02%, average weight 0.98%), Terreno Realty (25.99%, average weight
0.34%), and ProLogis (24.20%, average weight 3.62%). Also noteworthy was the 61.96% total return produced by the Fund’s investment in data center owner Coresite Realty (average weight 1.03%).
Holdings that underperformed REIT average returns and detracted from relative performance included the Fund’s apartment companies, its remaining preferred equity positions, and several office and life science related REIT investments. Though companies within the apartment sector continued to produce strong rental increases and solid net operating income improvement, stock performances reflected investor concerns regarding potential new supply threats, a rebounding single family home market, and a slight deceleration in the revenue growth trajectory compared to the earlier recovery years. Lagging returns included those delivered by AvalonBay Communities (-0.33%, average weight 3.09%), Equity Residential (3.28%, average weight 3.53%), Essex Property Trust (6.34%, average weight 3.22%), Home Properties (8.43%, average weight 2.76%), and BRE Properties (6.09%, average weight 1.59%). The Fund’s preferred stock investments, while generating positive returns during the period, considerably lagged the total return performance of their common REIT brethren. Returns ranged from 8.90% for the Fund’s holding in Winthrop Realty Trust’s 9.25% Series D (average weight 0.50%) to 0.89% for LaSalle Hotel Properties 7.25% Series G (average weight 0.32%). As discussed in previous shareholder letters, it has been a Fund goal to reduce its preferred equity investments and as of the end of the latest fiscal period, such holdings now account for only 2.5% of total investments. Finally, the Fund experienced below average relative returns during the latest six-month period from its significant holdings in the CBD office owner and developer Boston Properties (4.25%, average weight 5.72%) and lab/office landlord Alexandria Real Estate Equities (5.04%, average weight 3.33%).
One year ago in our April 30th 2012 report we stated our belief that the largest threats to the performance of real estate securities resided at the extremes, namely unexpected strength in the economy with rising long term interest rates at one end of the spectrum and instability and uncertainty caused by Eurozone or U.S. budget failures on the other. Since that point, the U.S. economy’s moderate growth has provided an environment for real estate landlords to slowly regain occupancies lost in the downturn and, in a growing number of markets, achieve various degrees of pricing power. As a result, the recovery in revenues for apartments and for select retail centers and lodging markets has reached or even surpassed pre-recession
19
| Alpine Realty Income & Growth Fund (Continued) | |
levels, though many markets and property types, particularly office, remain well below prior peak. And all of this has occurred against a backdrop of limited new supply and low interest rates which have enabled historically cheap borrowing costs and increased the valuations of real estate cash flows. REITs have benefited during this time by decreasing their borrowing costs, locking in historically low long term interest rates that have provided (and should continue to provide) a boost to current and future earnings. Certain REIT subsectors, particularly the triple-net and healthcare groups, have also generated above trend earnings growth and healthy dividend increases through accretive acquisitions abetted by low cost financings and seen the equity markets reward them for such activity.
Our prior stated thesis about the threats to real estate securities performance remains intact today. We continue to believe that in the current low interest rate environment that there are enough attractive opportunities in the real estate sector to employ leverage both in the execution of the Fund’s investment strategy and to manage unexpected Fund flows. Yet we are becoming more biased and sensitive to the prospects of higher long-term interest rates as the economy recovers further and believe our portfolio construction must be consistent with such concerns and remain focused on prospects for the best fundamental improvements. As a result, we have greatly reduced the fixed income portion of the Fund’s holdings, namely our preferred stock
investments, and have underweighted business models dependent upon financial arbitrage while overweighting areas such as office and industrial real estate which still remain well below prior peak profitability. That discipline impacted our performance relative to the RMS Index during the latest six-month period as subsectors such as triple-net companies soared and many office entities lagged. However, we continue to believe that demand driven cash flow improvements will prove more valuable than acquisition derived growth in a potentially rising interest rate environment. And we believe the best demand driven organic growth will result from knowledge-based economies supporting technological innovations and above average employment growth. We look forward to providing an update on Fund performance after the end of the fiscal period in October 2013.
Sincerely,
Robert W. Gadsden
Portfolio Manager
This letter represents the opinions of the Fund’s management and is subject to change, is not guaranteed and should not be considered recommendations to buy or sell any security. The information provided is not intended to be, and is not, a forecast of future events, a guarantee of future results, or investment advice. Views expressed may vary from those of the firm as a whole.
Mutual fund investing involves risk. Principal loss is possible. The Fund is subject to risks, including the following:
Concentration Risk – The Fund’s strategy of concentrating in companies in a specific industry means that its performance will be closely tied to the performance of a particular market segment. The Fund’s concentration in these companies may present more risks than if it were broadly diversified over numerous industries and sectors of the economy. A downturn in these companies would have a larger impact on the Fund than on a mutual fund that does not concentrate in such companies. At times, the performance of these companies will lag the performance of other industries or the broader market as a whole.
Convertible Securities Risk – The Fund can invest in securities that can be exercised for or converted into common stocks (such as warrants or convertible preferred stock). While offering greater potential for long-term growth, common stocks and similar equity securities are more volatile and more risky than some other forms of investment. Therefore, the value of your investment in the Fund may sometimes decrease instead of increase. Convertible securities include other securities, such as warrants, that provide an opportunity for equity participation. Because convertible securities can be converted into equity securities, their values will normally increase or decrease as the values of the underlying equity securities increase or decrease. The movements in the prices of convertible securities, however, may be smaller than the movements in the value of the underlying equity securities.
Credit Risk – Credit risk refers to the possibility that the issuer of a security will not be able to make payments of interest and principal when due. Changes in an issuer’s credit rating or the market’s perception of an issuer’s creditworthiness may also affect the value of the Fund’s investment in that issuer. The degree of credit risk depends on both the financial condition of the issuer and the terms of the obligation.
20
| Alpine Realty Income & Growth Fund (Continued) | |
Dividend Strategy Risk – The Fund’s strategy of investing in dividend-paying stocks involves the risk that such stocks may fall out favor with investors and underperform the market. Companies that issue dividend paying-stocks are not required to continue to pay dividends on such stocks. Therefore, there is the possibility that such companies could reduce or eliminate the payment of dividends in the future.
Equity Securities Risk – The stock or other security of a company may not perform as well as expected, and may decrease in value, because of factors related to the company (such as poorer than expected earnings or certain management decisions) or to the industry in which the company is engaged (such as a reduction in the demand for products or services in a particular industry).
Fixed Income Securities Risk – Fixed income securities are subject to issuer risk, interest rate risk and market risk.
Growth Stock Risk – Growth stocks typically are very sensitive to market movements because their market prices tend to reflect future expectations. When it appears those expectations will not be met, the prices of growth stocks typically fall. Growth stocks as a group may be out of favor and underperform the overall equity market while the market concentrates on undervalued stocks.
Initial Public Offerings and Secondary Offerings Risk – The Fund may invest a portion of its assets in shares of IPOs or secondary offerings of an issuer. IPOs and secondary offerings may have a magnified impact on the performance of a Fund with a small asset base. The impact of IPOs and secondary offerings on a Fund’s performance likely will decrease as the Fund’s asset size increases, which could reduce a Fund’s returns. IPOs and secondary offerings may not be consistently available to the Fund for investing. IPO and secondary offering shares frequently are volatile in price due to the absence of a prior public market, the small number of shares available for trading and limited information about the issuer. Therefore, the Fund may hold IPO and secondary offering shares for a very short period of time. This may increase the turnover of the Fund and may lead to increased expenses for the Fund, such as commissions and transaction costs. In addition, IPO and secondary offering shares can experience an immediate drop in value if the demand for the securities does not continue to support the offering price.
Interest Rate Risk – Interest rates may rise resulting in a decrease in the value of securities held by the Fund, or may fall resulting in an increase in the value of such securities. Securities having longer maturities generally involve a greater risk of fluctuations in the value resulting from changes in interest rates.
Leverage Risk – The Fund may use leverage to purchase securities. Increases and decreases in the value of the Fund’s portfolio will be magnified when the Fund uses leverage.
Management Risk – The Adviser’s judgment about the quality, relative yield or value of, or market trends affecting, a particular security or sector, or about interest rates generally, may be incorrect. The Adviser’s security selections and other investment decisions might produce losses or cause the Fund to underperform when compared to other funds with similar investment objectives and strategies.
Market Risk – The price of a security held by the Fund may fall due to changing market, economic or political conditions.
Non-Diversified Fund Risk – Performance of a non-diversified fund may be more volatile than a diversified fund because a non-diversified fund may invest a greater percentage of its total assets in the securities of a single issuer.
Preferred Stock Risk – Preferred stock represents an interest in a company that generally entitles the holder to receive, in preference to the holders of common stock, dividends and a fixed share of the proceeds resulting from a liquidation of the company. Preferred stocks may pay fixed or adjustable rates of return. Preferred stock has investment characteristics of both fixed income and equity securities. However, the value of these securities tends to vary more with fluctuations in the underlying common stock and less with fluctuations in interest rates and tends to exhibit greater volatility.
Real Estate Investment Trusts (“REITs”) Risk – REITs’ share prices may decline because of adverse developments affecting the real estate industry including changes in interest rates. The returns from REITs may trail returns from the overall market. Additionally, there is always a risk that a given REIT will fail to qualify for favorable tax treatment.
21
| Alpine Realty Income & Growth Fund (Continued) | |
Real Estate Securities Risk – Risks associated with investment in securities of companies in the real estate industry include: declines in the value of real estate; risks related to local economic conditions, overbuilding and increased competition; increases in property taxes and operating expenses; changes in zoning laws; casualty or condemnation losses; variations in rental income, neighborhood values or the appeal of properties to tenants; changes in interest rates and changes in general economic and market conditions.
Small and Medium Capitalization Company Risk – Securities of small or medium capitalization companies are more likely to experience sharper swings in market values, less liquid markets, in which it may be more difficult for the Adviser to sell at times and at prices that the Adviser believes appropriate and generally are more volatile than those of larger companies.
Undervalued Stock Risk – The Fund may pursue strategies that may include investing in securities, which, in the opinion of the Adviser, are undervalued. The identification of investment opportunities in undervalued securities is a difficult task and there is no assurance that such opportunities will be successfully recognized or acquired. While investments in undervalued securities offer opportunities for above-average capital appreciation, these investments involve a high degree of financial risk and can result in substantial losses.
Please refer to pages 5-6 for other important disclosures and definitions.
22
| Alpine Cyclical Advantage Property Fund | |
| Comparative Annualized Returns as of 4/30/13 (Unaudited) |
| | | | | | | | | | | | | Since Inception |
| | | 6 Months(1) | | 1 Year | | 3 Years | | 5 Years | | 10 Years | | (9/1/1993) |
| Alpine Cyclical Advantage Property Fund — Institutional Class | | | 13.86 | % | | | 31.88 | % | | | 11.45 | % | | | -0.27 | % | | | 6.12 | % | | | 8.79 | % |
| FTSE EPRA/NAREIT® Global Index(2) | | | 19.38 | % | | | 26.78 | % | | | 15.23 | % | | | 3.40 | % | | | N/A | | | | N/A | |
S&P Developed BMI Property Net
Total Return Index(3) | | | 19.90 | % | | | 27.47 | % | | | 15.55 | % | | | 3.39 | % | | | 12.25 | % | | | N/A | |
| Lipper Global Real Estate Funds Average(4) | | | 17.65 | % | | | 24.83 | % | | | 13.92 | % | | | 3.25 | % | | | 11.30 | % | | | 9.74 | % |
| Lipper Global Real Estate Funds Ranking(4) | | | N/A | (5) | | | 1/111 | | | | 90/96 | | | | 68/69 | | | | 19/19 | | | | 2/2 | |
| Gross Expense Ratio: 1.51%(6) | | | | | | | | | | | | | | | | | | | | | | | | |
| Net Expense Ratio: 1.51%(6) | | | | | | | | | | | | | | | | | | | | | | | | |
| (1) | Not annualized. |
| (2) | Index commenced on February 18, 2005. |
| (3) | Index commenced on December 29, 2000. |
| (4) | The since inception data represents the period beginning September 2, 1993. |
| (5) | FINRA does not recognize rankings for less than one year. |
| (6) | As disclosed in the prospectus dated February 28, 2013. |
Performance data quoted represents past performance and is not predictive of future results. Investment return and principal value of the Fund fluctuate, so that shares, when redeemed, may be worth more or less than their original cost. Performance current to the most recent month end may be lower or higher than the performance quoted and may be obtained by calling 1-888-785-5578. Performance data shown does not reflect the 1.00% redemption fee imposed on shares held for fewer than 60 days. If it did, total returns would be reduced.
The FTSE EPRA/NAREIT® Global Index is an unmanaged index designed to track the performance of publicly-traded companies engaged in the real estate business in developed and emerging real estate markets/regions around the world. The funds or securities referred to herein are not sponsored, endorsed, or promoted by the index providers, and the index providers bear no liability with respect to any such funds or securities or any index on which such funds or securities are based. The prospectus contains a more detailed description of the limited relationship the index providers have with the licensee and any related funds. The S&P Developed BMI Property Net Total Return Index is an unmanaged market-weighted total return index available on a monthly basis. The index consists of many companies from developed markets whose floats are larger than $100 million and derive more than half of their revenue from property-related activities. The Lipper Global Real Estate Funds Average is an average of funds that invest at least 25% of their equity portfolio in shares of companies engaged in the real estate industry that are strictly outside of the U.S. or whose securities are principally traded outside of the U.S. Lipper rankings for the periods shown are based on fund total returns with dividends and distributions reinvested and do not reflect sales charges. The FTSE EPRA/NAREIT® Global Index, the S&P Developed Property Net Total Return Index and the Lipper Global Real Estate Funds Average are unmanaged and do not reflect direct fees associated with a mutual fund, such as investment adviser fees; however, the Lipper Global Real Estate Funds Average reflects fees charged by the underlying funds. The performance for the Alpine Cyclical Advantage Property Fund reflects the deduction of fees for these value-added services. Investors cannot directly invest in an index.
To the extent that the Fund’s historical performance resulted from gains derived from participation in Initial Public Offerings (“IPOs”) and/or Secondary Offerings, there is no guarantee that these results can be replicated in future periods or that the Fund will be able to participate to the same degree in IPO/Secondary Offerings in the future.
23
| Alpine Cyclical Advantage Property Fund (Continued) | |
Portfolio Distributions* (Unaudited)
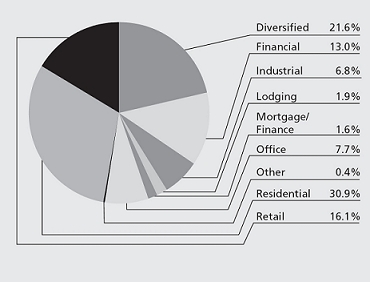
Top 10 Holdings* (Unaudited)
| 1. | | Hulic Co., Ltd. | | 4.60% |
| 2. | | Starwood Property Trust, Inc. | | 3.44% |
| 3. | | Multiplan Empreendimentos Imobiliarios SA | | 3.39% |
| 4. | | Ocwen Financial Corp. | | 3.29% |
| 5. | | TAG Immobilien AG | | 2.85% |
| 6. | | Direcional Engenharia SA | | 2.72% |
| 7. | | LPN Development PCL-NVDR | | 2.65% |
| 8. | | Iguatemi Empresa de Shopping Centers SA | | 2.57% |
| 9. | | Global Logistic Properties, Ltd. | | 2.49% |
| 10. | | Altisource Residential Corp. | | 2.44% |
| * | Top 10 Holdings do not include short-term investments percentages and are based on total net assets. Portfolio Distributions percentages are based on total investments. Portfolio holdings and sector distributions are as of 04/30/13 and are subject to change. Portfolio holdings are not recommendations to buy or sell any securities. |
Value of a $10,000 Investment (Unaudited)
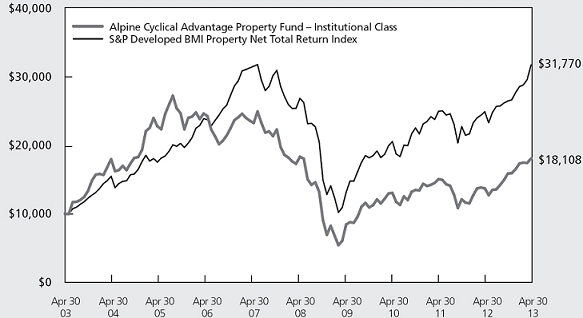
This chart represents a comparison of a hypothetical $10,000 investment in the Fund versus a similar investment in the Fund’s benchmark. The graph and the table do not reflect the deduction of taxes that a shareholder would pay on Fund distributions or the redemption of Fund shares. Investment performance reflects the waiver and recovery of certain fees, if applicable. Without the waiver and recovery of fees, the Fund’s total return would have differed.
Performance data quoted represents past performance and is not predictive of future results. Investment return and principal value of the Fund fluctuate, so that shares, when redeemed, may be worth more or less than their original cost.
24
| Alpine Cyclical Advantage Property Fund (Continued) | |
Commentary
Dear Investor:
We are pleased to present the 2013 semi-annual report for the Alpine Cyclical Advantage Property Fund. For the six-month period ended April 30, 2013, the net asset value per share increased from $23.64 to $26.69, which in combination with total distributions of $.207 produced a total return of 13.86%. This compares with the total return for our benchmark indices, with the FTSE EPRA/NAREIT® Global Index producing 19.38% for the six months under review and the S&P Developed BMI Property Net Total Return Index producing 19.90% for the same period.
Real Estate Stocks in Review
Real estate stocks outperformed their broader benchmark indices in twelve of the twenty countries we follow most carefully, and only materially underperformed in six. Overall, the strongest markets were Japan, Thailand, Indonesia, the Philippines, and Dubai. We believe that to a large measure this level of outperformance was driven by declining interest rates in most of the world’s markets, although the strongest returns were not in REIT-specific indices, which suggests that real estate is being sought as an alternative growth beneficiary of bond market capital appreciation, but not necessarily as a yield proxy. Indeed, cap rate compression, or lower initial investment yields for income-producing property has been a dominant feature of real estate markets around the world over the past decade.
We believe the concern over how real estate stocks will perform when the interest rate cycle changes direction will mitigate over time as such a transition draws closer. The initial reaction may well be a knee-jerk reflexive sell-off. However, we believe that the medium to long-term returns will be fundamentally dependent upon the underlying user demand for property that drives the growth outlook for rents and prices. Accordingly, our long-term focus is on markets where rental growth can more than offset prospective cap-rate expansion or higher debt funding costs which might affect long-term valuations. Typically, this occurs in economies where real estate supply and demand fundamentals are balanced in favor of the landlord, as well as experiencing greater than average Gross Domestic Product (“GDP”) growth, which drives business expansion and job creation. While real estate equities tend to be more responsive to capital market activity than private real estate investment trends, the stocks’ ultimate valuation and performance
reflect those longer-term trends. Thus, we view real estate equities as something of a hybrid between the broader equity markets and the direct real estate investment markets.
Across the globe, real estate equities have evolved to represent many of the largest and highest quality property operators in their respective regions who have chosen public ownership in order to achieve lower cost of capital, more diverse funding opportunities, greater public profile and liquidity for themselves, their employees and their investors. For these reasons, we see the globalization of real estate equities continuing to expand along with the overall ebb and flow of the capital markets. In addition to breadth and depth of their operations, public companies often utilize less leverage than their private counterparts due to the preferences of public investors.
During the period under review, we believe the most significant change in the universe of real estate equities has been the extraordinary performance of Japanese REITs and, even more notably, Japanese real estate developers, in response to the shift in government and central bank policy aimed at reflating the domestic economy. While we believe this strategy holds great risk, it also holds unusual promise. Over the short term, the markets have responded to that potential for improvement, driving shares to valuations which will only be justified under optimistic circumstances. That said we believe a pull-back in share prices could provide attractive entry or re-entry points which may still provide meaningful prospective returns. Unlike prior periods when U.S. quantitative easing (“QE”) led to expansion of capital flowing into emerging markets, this later surge in liquidity coming from Japan after the introduction of QE has been directed towards developed economies. Thus, in the global context, broad European equity and bond indices performed rather well during this fiscal period despite the meager prospects with most of the region largely in recession. Notably, most European real estate sub-indices still underperformed the broader market indices, perhaps reflecting the prospect of declining demand impacting prospective rents for many properties.
Contributors to Portfolio Performance
The Fund’s top ten holdings at the fiscal semi-annual period made up 30.4% of the Portfolio. Three new names entered the top ten list with Starwood Property Trust moving into the second position, Global Logistic
25
| Alpine Cyclical Advantage Property Fund (Continued) | |
Properties into the ninth slot and Altisource Residential Corp. joining in the tenth spot. Hulic Corp. of Japan moved into the top spot after gaining almost 41% during the period. Hulic owns and refurbishes mid-sized office buildings in prime districts of Tokyo. Starwood Property Trust has become one of the largest commercial mortgage lenders in the U.S. Brazilian shopping mall leader, Multiplan, fell from the first position last October with a slight negative performance. Ocwen Financial Corp. fell from the second spot after last year’s 130% gain, to the fourth due to -5.2% return. The fifth largest holding was TAG Immobilien, a German apartment owner, followed by Direcional Engenharia, the leading Brazilian low income homebuilder which added over 32% total return for the period moved up to sixth. Another homebuilder, LPN Development of Thailand, gained over 40% and also moved up from the ninth position. Iguatemi, the high-end Brazilian shopping mall company, declined almost 4% and had a modest reduction in shares held as it dropped from the fifth position to number eight. New to the portfolio in the ninth spot, Global Logistic Properties, had a relatively modest 5% return, despite a successful IPO of its Japanese subsidiary, while Altisource Residential Corp. took up the tenth position after it was spun off from parent Altisource Portfolio Solutions and expanded with a public offering. Altisource Residential specializes in single-family homes for rent.
The top five contributors to performance accounting for an aggregate average weight of 11.18% for the six-month period ending April 30, 2013 included Kenedix Inc. (average weight 1.00%) which gained 461.99% as the prospects for this asset manager of Japanese REITs and investment funds make it a prime beneficiary of reflation in the Japanese real estate market. That said, the Fund began selling shares during April as the manager believed the stock became overvalued. We may look for opportunities to buy it back if the stock becomes less expensive. Hulic Co. Ltd. (average weight 3.02%) gained 40.94%, as this specialist in renovating medium-sized office buildings in prime Tokyo locations could also benefit from the reflation theme. LPN Development (average weight 2.44%) gained 40.56% as this Thai developer of condominiums continued to enjoy strong demand. Directional Egenharia SA (average weight 2.62%) gained 32.84% as the largest developer of low-income subsidized housing in Brazil continued to expand their sales backlog at attractive margins, and Robinsons Land Corp. (average weight 2.10%) gained 34.18% as the Philippine economy continued to support consumers for Robinsons shopping malls.
The five stocks which had the largest negative contribution to the portfolio, equal to 5.2% aggregate average weight included Desarrolladora Homex (average weight 1.12%) which declined by 63.57%, was a casualty of the new policies of Mexican President Pena Nieto’s incoming government which limited the availability of mortgages for low-end housing. Ongoing discussions of the government’s future role in supporting the housing market may lead to a modified business plan, so we have retained the holding in the portfolio. Altisource Portfolio Solutions SA (average weight 1.40%) declined by 17.14%, In December, Altisource spun off Altisource Residential Corp. which specializes in single-family rental properties and Altisource Asset Management which manages a range of investment funds for Altisource. BR Properties SA (average weight 1.83%) declined by 14.88%, as the threat of rising interest rates in Brazil has dampened growth expectations for this pre-eminent office owner. Corporacion Geo (average weight 0.38%) declined by 66.30%, for the same reasons as Homex as the Mexican government limited funding low-income mortgages. The Fund sold this position due to concerns over its financial strength subsequent to the new measures, and Peninsula Land (average weight 0.48%) which declined by 44.17%, suffered from an overall weak environment with stubbornly high interest rates in India, yet the company’s quality office parks are performing satisfactorily while residential sales volume has slowed for this Mumbai-centric developer.
The Fund’s top contributors by country constituted 47.4% of the average weight of the portfolio and contributed over 12% of the Fund’s overall 13.86% total return. The leader in this category was Japan, which grew from an average weight of 3.7% last October to 10.1% of the portfolio and contributed 5% of the Fund’s overall total return. The U.S. ending weight moved from 27.3% to 24.4% and contributed over 2.4% of the return, while Thailand grew from 5.8% to just under 8% and contributed 2.3% of the overall return. The Philippines saw reduction in the share size of our holdings from 3.4% to 3.0% while adding 1.4% to the return and China declined from 5.3% to 3.5% and added 1.3%.
The countries with the largest negative contribution constituted 24% of the portfolio and had a negative contribution to the return of slightly more than 1%. The main protagonist was Brazil which constituted over 21% of the portfolio last October and ended at 18.4% as of April 30. Overall, the returns of the Brazilian holdings were -2.6% in aggregate which contributed a -0.48% impact on the Fund’s total return. The other negative countries were smaller both in weight and negative
26
| Alpine Cyclical Advantage Property Fund (Continued) | |
contribution were Mexico, India, Turkey and Vietnam, which in aggregate constituted 4.2% of the portfolio. While the Brazilian portion of the portfolio had an overall negative impact in this fiscal period, this reflected in part the gradual trend of rising interest rates there, in sharp contrast with the rest of the world where rates have been coming down. While we are still very positive on the shopping mall sector from a real estate perspective, the Brazilian overweighting might be further reduced over the second half.
To better understand our keen focus on Brazilian shopping malls, it might be instructive to compare two mall companies which arguably represent the “best in class” from the U.S. and Brazil; both Simon Properties Group (SPG) and Multiplan (MULT3) are holdings of the Fund. Analyzing year-over-year data as of the end of the first calendar quarter of the year, we start with the basics, examining retail productivity metrics. Retail sales per square foot across Simon’s portfolio were $575 while Multiplan’s properties produced $723. Looking at tenant sales growth, Simon exceeded national averages as mall sales grew an impressive 5.3%, while Multiplan also grew faster than industry comparables, up 11.4%. Since sales performance can influence a store’s profitability and, hence, ability to pay rent, we compare annual base rents for Simon Properties which grew by 3.0%, while same store rents at Multiplan grew by 11.4%. Portfolio expansion through acquisition and development can influence corporate top line gross rental income which grew by 9.9% at Simon and 28% at Multiplan. This in turn influenced net operating income, which grew by 10.4% for Simon and 29.1% for Multiplan. Finally, Simon’s funds from operations (“FFO”) per share as a beneficiary of very strong financial management increased by 12.6%, while Multiplan temporarily took on expensive debt to fund new developments, growing FFO by 15.8%.
When valuing real estate stocks, investors look beyond growth in determining underlying asset value. While both companies have a strong balance sheet and cash flow coverage, it is relevant that Simon was leveraged 76% debt-to-market capitalization in contrast with 24% for Multiplan. Net debt relative to EBITDA is a solid 5.9 times for Simon, while Multiplan is a very conservative 1.8 times. The enterprise value (net debt + market cap) divided by EBITDA for Simon is a multiple of over 21 times compared with Multiplan at 16.8 times. This multiple, when inverted is similar to the implicit cap rate of Simon at 4.8% and for Multiplan at 6.7%. Note that both relate to their respective market valuations for real estate, with Simon at a moderate premium and Multiplan at a modest discount.
In many ways, these companies represent the “best in class” and we believe they highlight the different opportunities between the developing Brazil retail sector and what we view as the relatively stable, but more moderate U.S. growth profile. Perhaps the most notable difference is that Multiplan is projected to expand its shopping mall area almost 50% through new developments by 2016, while Simon has limited opportunities due to both its scale and mature markets. This underscores Simon’s continuing emphasis on global expansion over recent years.
Despite all of the aforementioned data points depicting Brazil’s exceptional consumer growth trend, this should be understood in the context that, during the fiscal period under review, rising interest rates in Brazil undermined the performance of stocks while declining interest rates in the U.S. have boosted REIT prices here.
Prospects and Portfolio Positioning for the Balance of 2013 (and Beyond?)
Real estate equities performed well over the past year, in part because of falling interest rates in response to the anemic economic recovery throughout the world. We would expect them to benefit from any significant cyclical expansion. If the prospects of a more rapid European recovery are present, we believe that almost all global sectors and regions will benefit. The potential for European quantitative easing could become a significant growth driver not just for that region but much of the world, and in particular global real estate companies. A strong Japanese fiscal program, which, in combination with their significant monetary easing, could lead to a powerful recovery able to sustain rising real estate rents and prices even in the face of higher interest rates.
In general, we believe that over time, potential job growth, business formation and ultimately GDP expansion should outweigh the short-term impact of rising interest rates if the global recovery continues to pick up pace. On the other hand, events out of “left field” or so-called “tail risk” could negatively impact prospective returns. The potential for conflict, be it with Iran, North Korea, China and maybe even Russia, remains present. Accordingly, Alpine believes it is important to maintain a diversified portfolio in terms of geography, business type, property type mix and income distribution potential. Our focus will continue to be on seeking to grow net asset value while potentially providing dividend paying capacity.
27
| Alpine Cyclical Advantage Property Fund (Continued) | |
We very much appreciate your continued support and interest in the Alpine Cyclical Advantage Property Fund.
Sincerely,
Samuel Lieber
Portfolio Manager
This letter represents the opinions of the Fund’s management and is subject to change, is not guaranteed and should not be considered recommendations to buy or sell any security. The information provided is not intended to be, and is not, a forecast of future events, a guarantee of future results, or investment advice. Views expressed may vary from those of the firm as a whole.
Mutual fund investing involves. Principal loss is possible. The Fund is subject to risks, including the following:
Concentration Risk – The Fund’s strategy of concentrating in companies in a specific industry means that its performance will be closely tied to the performance of a particular market segment. The Fund’s concentration in these companies may present more risks than if it were broadly diversified over numerous industries and sectors of the economy. A downturn in these companies would have a larger impact on the Fund than on a mutual fund that does not concentrate in such companies. At times, the performance of these companies will lag the performance of other industries or the broader market as a whole.
Equity Securities Risk – The stock or other security of a company may not perform as well as expected, and may decrease in value, because of factors related to the company (such as poorer than expected earnings or certain management decisions) or to the industry in which the company is engaged (such as a reduction in the demand for products or services in a particular industry).
Foreign Currency Transactions Risk – Foreign securities are often denominated in foreign currencies. As a result, the value of the Fund’s shares is affected by changes in exchange rates. The Fund may enter into foreign currency transactions to try to manage this risk. The Fund’s ability to use foreign currency transactions successfully depends on a number of factors, including the foreign currency transactions being available at prices that are not too costly, the availability of liquid markets and the ability of the Adviser to accurately predict the direction of changes in currency exchange rates.
Foreign Securities Risk – The Fund’s investments in securities of foreign issuers or issuers with significant exposure to foreign markets involve additional risk. Foreign countries in which the Fund may invest may have markets that are less liquid, less regulated and more volatile than U.S. markets. The value of the Fund’s investments may decline because of factors affecting the particular issuer as well as foreign markets and issuers generally, such as unfavorable government actions, and political or financial instability. Lack of information may also affect the value of these securities. The risks of foreign investments are heightened when investing in issuers in emerging market countries.
Growth Stock Risk – Growth stocks are stocks of companies believed to have above-average potential for growth in revenue and earnings. Growth stocks typically are very sensitive to market movements because their market prices tend to reflect future expectations. When it appears those expectations will not be met, the prices of growth stocks typically fall. Growth stocks as a group may be out of favor and underperform the overall equity market while the market concentrates on undervalued stocks.
Initial Public Offerings and Secondary Offerings Risk – The Fund may invest a portion of its assets in shares of IPOs or secondary offerings of an issuer. IPOs and secondary offerings may have a magnified impact on the performance of a Fund with a small asset base. The impact of IPOs and secondary offerings on a Fund’s performance likely will decrease as the Fund’s asset size increases, which could reduce a Fund’s returns. IPOs and secondary offerings may not be consistently available to the Fund for investing. IPO and secondary offering shares frequently are volatile in price due to the absence of a prior public market, the small number of shares available for trading and limited information about the issuer. Therefore, the Fund may hold IPO and secondary offering shares for a very short period of time. This may increase the turnover of the Fund and may lead to increased expenses for the Fund, such as commissions and transaction costs. In addition, IPO and secondary offering shares can experience an immediate drop in value if the demand for the securities does not continue to support the offering price.
Liquidity Risk – Some securities held by a Fund may be difficult to sell, or illiquid, particularly during times of market turmoil. Illiquid securities may also be difficult to value. If a Fund is forced to sell an illiquid asset to meet redemption requests or other cash needs, the Fund may be forced to sell at a loss.
28
| Alpine Cyclical Advantage Property Fund (Continued) | |
Management Risk – The Adviser’s judgment about the quality, relative yield or value of, or market trends affecting, a particular security or sector, or about interest rates generally, may be incorrect. The Adviser’s security selections and other investment decisions might produce losses or cause the Fund to underperform when compared to other funds with similar investment objectives and strategies.
Market Risk – The price of a security held by the Fund may fall due to changing market, economic or political conditions.
Micro Capitalization Company Risk – Stock prices of micro capitalization companies are significantly more volatile, and more vulnerable to adverse business and economic developments than those of larger companies. Micro capitalization companies often have narrower markets for their goods and/or services and more limited managerial and financial resources than larger, more established companies, including small or medium capitalization companies.
Real Estate Investment Trusts (“REITs”) Risk – REITs’ share prices may decline because of adverse developments affecting the real estate industry including changes in interest rates. The returns from REITs may trail returns from the overall market. Additionally, there is always a risk that a given REIT will fail to qualify for favorable tax treatment.
Real Estate Securities Risk – Risks associated with investment in securities of companies in the real estate industry include: declines in the value of real estate; risks related to local economic conditions, overbuilding and increased competition; increases in property taxes and operating expenses; changes in zoning laws; casualty or condemnation losses; variations in rental income, neighborhood values or the appeal of properties to tenants; changes in interest rates and changes in general economic and market conditions.
Small and Medium Capitalization Company Risk – Securities of small or medium capitalization companies are more likely to experience sharper swings in market values, less liquid markets, in which it may be more difficult for the Adviser to sell at times and at prices that the Adviser believes appropriate and generally are more volatile than those of larger companies.
Undervalued Stock Risk – The Fund may pursue strategies that may include investing in securities, which, in the opinion of the Adviser, are undervalued. The identification of investment opportunities in undervalued securities is a difficult task and there is no assurance that such opportunities will be successfully recognized or acquired. While investments in undervalued securities offer opportunities for above-average capital appreciation, these investments involve a high degree of financial risk and can result in substantial losses.
Please refer to pages 5-6 for other important disclosures and definitions.
29
| Alpine Emerging Markets Real Estate Fund | |
| Comparative Annualized Returns as of 4/30/13 (Unaudited) | |
| | |
| | | 6 Months(1) | | 1 Year | | 3 Years | | Since Inception(2) |
| Alpine Emerging Markets Real Estate Fund — Institutional Class | | | 18.92 | % | | | 25.74 | % | | | 10.79 | % | | | 21.66 | % |
| Alpine Emerging Markets Real Estate Fund — Class A (Without Load) | | | 18.78 | % | | | 25.52 | % | | | N/A | | | | 36.38 | % |
| Alpine Emerging Markets Real Estate Fund — Class A (With Load) | | | 12.23 | % | | | 18.64 | % | | | N/A | | | | 30.74 | % |
| FTSE EPRA/NAREIT® Emerging Index(3) | | | 16.32 | % | | | 21.59 | % | | | 5.26 | % | | | N/A | |
| S&P Developed Ex-U.S. Total Return Property Index | | | 21.26 | % | | | 36.68 | % | | | 16.23 | % | | | 19.74 | % |
| MSCI Emerging Markets Index USD | | | 5.29 | % | | | 3.97 | % | | | 3.12 | % | | | 16.98 | % |
| Lipper Global Real Estate Funds Average(4) | | | 17.65 | % | | | 24.83 | % | | | 13.92 | % | | | 18.46 | % |
| Lipper Global Real Estate Funds Ranking(4) | | | N/A | (5) | | | 42/111 | | | | 95/96 | | | | 4/81 | |
| Gross Expense Ratio (Institutional Class): 2.96%(6) | | | | | | | | | | | | | | | | |
| Net Expense Ratio (Institutional Class): 1.36%(6) | | | | | | | | | | | | | | | | |
| Gross Expense Ratio (Class A): 3.21%(6) | | | | | | | | | | | | | | | | |
| Net Expense Ratio (Class A): 1.61%(6) | | | | | | | | | | | | | | | | |
| (1) | Not annualized. |
| (2) | Institutional Class shares commenced on November 3, 2008 and Class A shares commenced on December 30, 2011. Returns for indices are since November 3, 2008. |
| (3) | Index commenced on January 2, 2009. |
| (4) | The since inception data represents the period beginning November 6, 2008 (Institutional Class only). |
| (5) | FINRA does not recognize rankings for less than one year. |
| (6) | As disclosed in the prospectus dated Feburary 28, 2013. |
Performance data quoted represents past performance and is not predictive of future results. Investment return and principal value of the Fund fluctuate, so that shares, when redeemed, may be worth more or less than their original cost. Performance current to the most recent month end may be lower or higher than the performance quoted and may be obtained by calling 1-888-785-5578. Performance data shown does not reflect the 1.00% redemption fee imposed on shares held for fewer than 60 days. If it did, total returns would be reduced. Returns for the Class A shares with sales charge reflect a maximum sales charge of 5.50%. Performance for the Class A shares without sales charges does not reflect this load.
The FTSE EPRA/NAREIT® Emerging Index is an unmanaged index designed to track the performance of listed real estate securities companies in emerging countries worldwide. The funds or securities referred to herein are not sponsored, endorsed, or promoted by the index providers, and the index providers bear no liability with respect to any such funds or securities or any index on which such funds or securities are based. The prospectus contains a more detailed description of the limited relationship the index providers have with the licensee and any related funds. The S&P Developed Ex-U.S. Total Return Property Index defines and measures the investable universe of publicly-traded real estate companies domiciled in developed countries outside of the United States. The companies in the Index are engaged in real estate-related activities such as property ownership, management, development, rental and investment. MSCI Emerging Markets Index USD is a free float-adjusted market cap-weighted index that is designed to measure equity market performance in the global emerging markets. Source: MSCI. MSCI makes no express or implied warranties or representations and shall have no liability whatsoever with respect to any MSCI data contained herein. The MSCI data may not be further redistributed or used as a basis for other indices or any securities or financial products. This report is not approved, reviewed or produced by MSCI. The Lipper Global Real Estate Funds Average is an average of funds that invest at least 25% of their equity portfolio in shares of companies engaged in the real estate industry that are strictly outside of the U.S. or whose securities are principally traded outside of the U.S. Lipper rankings for the periods shown are based on fund total returns with dividends and distributions reinvested and do not reflect sales charges. The FTSE EPRA/NAREIT® Emerging Index, the S&P Developed Ex-US Total Return Property Index, the MSCI Emerging Markets Index USD and the Lipper Global Real Estate Funds Average are unmanaged and do not reflect direct fees associated with a mutual fund, such as investment adviser fees; however, the Lipper Global Real Estate Funds Average reflects fees charged by the underlying funds. The performance for the Alpine Emerging Markets Real Estate Fund reflects the deduction of fees for these value-added services. Investors cannot directly invest in an index.
Expense ratios reflect the ratios reported in the Fund’s most recent prospectus. The Alpine Emerging Markets Real Estate Fund has a contractual expense waiver that continues through February 28, 2014. Where a Fund’s gross and net expense ratio are the same for the period reported, the contractual expense reimbursement level was not reached as of the end of that period. To the extent the Fund’s expenses were reduced by waivers, the Fund’s total returns were increased. In these cases, in the absence of the expense waivers, the Fund’s total returns would have been lower.
To the extent that the Fund’s historical performance resulted from gains derived from participation in Initial Public Offerings (“IPOs”) and/or Secondary Offerings, there is no guarantee that these results can be replicated in future periods or that the Fund will be able to participate to the same degree in IPO/Secondary Offerings in the future.
30
| Alpine Emerging Markets Real Estate Fund (Continued) | |
Portfolio Distributions*(Unaudited)
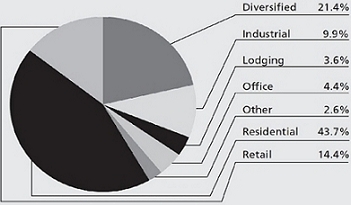
Top 10 Holdings* (Unaudited)
| 1. | | China Resources Land, Ltd. | | 3.63 | % |
| 2. | | Shimao Property Holdings, Ltd. | | 3.01 | % |
| 3. | | BR Properties SA | | 2.87 | % |
| 4. | | China Overseas Land & Investment, Ltd. | | 2.74 | % |
| 5. | | BR Malls Participacoes SA | | 2.73 | % |
| 6. | | China Vanke Co., Ltd.-Class B | | 2.72 | % |
| 7. | | China Overseas Grand Oceans Group, Ltd. | | 2.46 | % |
| 8. | | Ayala Land, Inc. | | 2.45 | % |
| 9. | | PT Ciputra Development TBK | | 1.90 | % |
| 10. | | Emaar Properties PJSC | | 1.79 | % |
| | | | | | | |
| * | Top 10 Holdings do not include short-term investments and percentages are based on total net assets. Portfolio Distributions percentages are based on total investments. Portfolio holdings and sector distributions are as of 04/30/13 and are subject to change. Portfolio holdings are not recommendations to buy or sell any securities. |
| | |
| Value of a $10,000 Investment (Unaudited) |
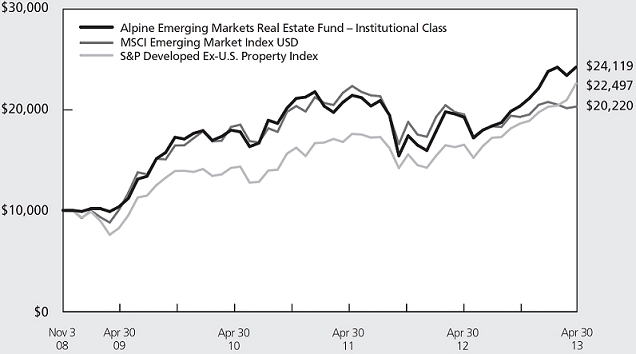
This chart represents a comparison of a hypothetical $10,000 investment in the Fund versus a similar investment in the Fund’s benchmark. The graph and the table do not reflect the deduction of taxes that a shareholder would pay on Fund distributions or the redemption of Fund shares. Investment performance reflects the waiver and recovery of certain fees, if applicable. Without the waiver and recovery of fees, the Fund’s total return would have differed.
Performance data quoted represents past performance and is not predictive of future results. Investment return and principal value of the Fund fluctuate, so that shares, when redeemed, may be worth more or less than their original cost.
31
| Alpine Emerging Markets Real Estate Fund (Continued) | |
Commentary
We are pleased to report the semi-annual results for the Alpine Emerging Markets Real Estate Fund. For the six-month period ending April 30, 2013, the closing NAV was $20.18 per share, representing a total return of 18.92% for the period. The Fund’s benchmark index, the FTSE EPRA/NAREIT Emerging Index returned 16.32% adjusted in U.S. dollar terms over the same period. Over that same time frame the MSCI Emerging Market Index finished with a total return of 5.29% and the S&P Developed Ex-U.S. Property Total Return Index returned 21.26%. All references in this letter to the Fund’s performance relate to the performance of the Fund’s Institutional Class.
Performance Drivers
Emerging Market (“EM”) real estate equity returns saw positive divergence from the broader EM universe, but lagged Developed Market (“DM”) performance as cyclical growth prospects appeared to lose some traction in the face of softening economic data. Despite investors’ cautious growth outlook, the unbridled wave of liquidity provided by central banks guided markets in the developed world toward fresh highs. While somewhat paradoxically, broader EM performance diverged from DM trends due, in no small part, to deepening anxiety regarding the ongoing structural shift in EM growth models, weakening commodity prices and increased uncertainty with respect to policy direction in select Developing Markets (primarily Brazil, Russia, India and China). This level of dislocation was not as pronounced for EM real estate returns which continued to benefit from an environment marked by resilient domestic demand, supportive credit conditions, and subdued inflation trends.
| • | Synchronized Easing. During the period the inclination for policymakers to stimulate demand continued unabated, with monetary policy remaining the primary transmission mechanism. With the Bank of Japan (“BoJ”) joining the quantitative easing (“QE”) party by committing $1.2 trillion of liquidity to the financial system over the next two years and the vast majority of central banks supporting an easing bias, the global conversation has once again shifted its focus to the impact of unprecedented liquidity on asset markets. Indeed, while there is scant evidence that unorthodox policy is underpinning growth in the respective real economies (or encouraging meaningful balance sheet repair and/or structural adjustments), it could be debated that with the growth of the Federal |
Reserve and BoJ’s balance sheets alone by up to $160 billion/month, that reflation of asset markets could continue, absent a sustainable recovery in underlying fundamentals. Furthermore, up until now, the magnitude of policy measures has not been symmetric across the G7 economies. With the merits of austerity now under intense critical review, it is gradually becoming the consensus view that the European Central Bank and Bank of England might not be far behind in relaxing fiscal targets and pursuing additional accommodative policies.
| • | Cyclical vs. Structural. As many EM economies continue to adapt their growth models to the evolving demand landscape and are confronting an increasingly sclerotic response to countercyclical measures, investors have been forced to reexamine whether the faltering recovery in some of these economies is merely cyclical, or in fact, an indication of endemic, structural problems. Improvements in various macroeconomic indicators in Q4 2012, particularly in China, gave reason for optimism and markets began to reflect greater visibility of a cyclical inflection point in margin recovery/earnings erosion along with the growing expectation of a tentative rebound to trend Gross Domestic Product (GDP) growth in major EM economies. However such optimism proved premature and the “jury is still out” as to the trajectory of the current recovery. |
| • | Portfolio Allocation. As we continue to expect a growing dispersion of equity returns across countries and asset classes, it is our conviction that active management of portfolios in EM is critical. The Fund’s tactical exposure to China/Hong Kong (25.62% average weighting) drove positive relative returns despite the policy headwinds and uncertainty surrounding the government transition. While investor sentiment toward Brazil has deteriorated due to the pending tightening cycle and weakening fiscal accounts, we remained selectively constructive on the market. Even though most of the negative contributors during the period on an absolute basis were in Brazil (see below), stock selection and the underweight to the larger cap residential developers underpinned positive relative returns in Brazil (20.91% average weighting). The allocation to India (5.27% weighted average) was increased on the back of (albeit slow) reform momentum and a potential inflection point in the macro recovery. Exposure to the Association of Southeast Asian Nations |
32
| Alpine Emerging Markets Real Estate Fund (Continued) | |
(“ASEAN”) markets provided a mixed contribution relative to the benchmark. Returns in Thailand (10.89% average weighting) were supported by the expanding consumer class and benign inflation underpinning property demand while the relative underweight in Malaysia (1.76%) in advance of the election uncertainty further supported outperformance during the period. Modest relative underperformance in Indonesia (7.24% average weight) and the Philippines (4.82% average weighting) was largely due to their relative underweight position in the portfolio. The position in Mexico (1.34%) positively contributed to relative returns, driven by the absence of homebuilders in favor of exposure to the recently listed REIT-like structures. The underweight position to United Arab Emirates (1.3%) and South Africa (0.9%) had a negative impact on the Fund’s overall performance.
Portfolio Analysis
The top five contributors to the Fund’s absolute performance over the six months ending April 30, 2013, based on contribution to total return, were China Resources Land (+29.50%), Amata (+60.44%), China Overseas Grand Oceans (+49.17%), Ciputra Development (+99.81%), and Ayala Land (+39.14%).
| • | China Resources Land, a leading developer focused on residential and mixed-use developments in China, represented a 3.41% average weighted position in the portfolio and was the top contributor to the Fund’s performance over the time period. Its solid balance sheet, low borrowing costs and growing contribution from income properties have proven resilient in the face of policy uncertainty. |
| • | Amata Corp, a real estate developer focusing on large-scale industrial estates in Chonburi and Rayon, Thailand as well as Vietnam, represented an average portfolio weighting of 1.71% during the period. The company is seeing strong pre-sales and price increases as the up cycle in foreign direct investment (FDI) continues. |
| • | China Overseas Grand Oceans (COGO) is a residential builder targeting developments in the Tier 2-3 markets in China and Mongolia. The company is able to leverage the expertise, balance sheet, brand and land acquisition capabilities of its parent, China Overseas Land. COGO represents 2.08% average weight in the portfolio. |
| • | Ciputra Development, one of the most geographically diversified developers in Indonesia, represented a 1.05% average weighted position in |
the portfolio. The company and its listed subsidiaries are focused on integrated developments across the major centers of Indonesia. The expanding investment portfolio and joint operation strategy provide a buffer to short-term earning volatility and reduces exposure to development risk.
| • | Ayala Land is the largest diversified property company in the Philippines. The company, which represents a 2.41% average weighted position in the portfolio, is potentially well-positioned to benefit from the secular demand for housing, the expansion of the BPO (business process outsourcing) business and the incipient growth of resort demand. |
The top five negative contributors to the Fund’s performance over six months ending April 30, 2013 based on contribution to total return, were BR Properties (-14.77%), PDG Realty (-32.25%), BR Malls (-9.91%), TGLT (-30.92%) and JHSF Participacoes (-15.25%).
| • | BR Properties, one of the major developers/operators of commercial properties in Brazil, represented an average portfolio weighting of 2.45% during the period and had the overall largest negative effect on performance. Market perception of slowing absorption in the rental market, expectations for increased supply and the potential impact of rising rates all conspired to weigh on the shares. |
| • | PDG Realty, a pan-Brazilian residential developer, represented a 1.04% average weighting in the portfolio. The company is in the midst of a restructuring after a change in ownership and management. The repositioning effort has been marked by continued downward pressure on operating margins and profitability (ROE) along with increased cash burn and leverage due in part to the execution and delivery of legacy units launched in 2007. |
| • | BR Malls, the largest shopping mall operator/developer in Brazil, represented an average portfolio weighting of 3.34% during the period. While operating trends and the development pipeline have continued to show strength, they did not offset concerns over macro weakness in Brazil and the impact of a rising rate environment on cap rate expansion. |
| • | TGLT, a residential developer active in Argentina and Uruguay, represented a 0.47% average weighting. Results have been negatively affected by foreign exchange impact of dollar-denominated client advances and the subsequent imposition of restrictions on foreign currency purchases. |
33
| Alpine Emerging Markets Real Estate Fund (Continued) | |
| • | JHSF Participações, a Brazilian real estate developer focusing on large-scale, mixed-use (residential, office, retail and hotel) projects mainly targeted at the medium/high-end segments, represented an average portfolio weighting of 1.43% during the period. The tougher approval environment in Sao Paulo, weakening margins due to temporary product mix issues and uncertainty surrounding the airport project, have had a negative impact on stock performance. |
Outlook
The Alpine Emerging Markets Real Estate Fund focuses on real estate investments primarily in developing economies that we believe are positioned to be at the forefront of global growth. The Fund seeks out opportunities with solid demographic and urbanization trends, increasing availability and access to credit, and strengthening macro-economic fundamentals, consistent with our structural view that superior risk-adjusted returns can be achieved in markets with broadening domestic consumption fueled by a growing middle class.
The magnitude and efficacy of further counter-cyclical measures by policy makers, the timing and implementation of structural reforms, and the direction of the growth/inflation dynamic in Developing Markets remain some of the critical signposts for Alpine’s assessment of the re-acceleration of demand in both EM and DM and the overall sustainability of the global recovery. On balance, we believe that the soft economic data is transitory and we confirm our expectation for a re-acceleration of growth in the coming quarters. In light of this, we will be closely monitoring the impact from lower commodity prices and subdued inflation and the extent to which these factors are transmitted into policy and the real economy over time. Since accommodative measures have supported asset price reflation to a large extent, the market’s sensitivity to the timing and method of the Fed tapering its QE plans could test investor appetite for risk and overshadow the expectations for a cyclical recovery in the near-term. Indeed, the mechanics of the eventual normalization of monetary conditions in the U.S. (and eventually across all countries) could likely be one of the dominant drivers of asset markets for some time to come. However, it is Alpine’s view that once the uncertainty gives way to more confidence in the growth outlook that it could trigger continued reduction in risk premiums and correlations across geographies and asset classes.
Despite a faltering revival in near-term growth prospects, our longer-term outlook for many emerging economies remains constructive with respect to both growth and the markets. While we are acutely aware of the unique set of idiosyncratic challenges intrinsic to the recovery across EM, particularly in the more leveraged and imbalanced economies, we do not see any convincing arguments leading us to stray materially from our thesis that the key emerging economies are expected to continue to be a strong source of demand, exhibit market resilience, and realign with their long-term growth trends. As the developing countries strive to become deeper and more integrated, it is Alpine’s view that over time the emerging equity markets could increase substantially in absolute terms as more companies come public and eventually even surpass developed equity markets in terms of market capitalization. Perhaps the next inflection point looming on the horizon is whether investors who have been crowding into yield trades will look to transition toward a more tactical posture predicated on a constructive medium-term view as to the normalization of growth, risk appetite and rates. At the same time we expect growth differentials between EM and DM to remain stable over the next 12-18 months, which could support further structural reallocation to EM equities.
Alpine’s Real Estate team is ever evaluating the risk/reward proposition of each position in the portfolio and carefully monitoring volatility. The managers continue to be extremely selective in our approach to the markets and deploying capital. We thank our shareholders for their support and look forward to seeking continued success over the remainder of the year.
Sincerely,
Joel E.D. Wells
Samuel A. Lieber
Co-Portfolio Managers
This letter represents the opinions of the Fund’s management and is subject to change, is not guaranteed and should not be considered recommendations to buy or sell any security. The information provided is not intended to be, and is not, a forecast of future events, a guarantee of future results, or investment advice. Views expressed may vary from those of the firm as a whole.
34
| Alpine Emerging Markets Real Estate Fund (Continued) | |
Mutual fund investing involves risk. Principal loss is possible. The Fund is subject to risks, including the following:
Concentration Risk – The Fund’s strategy of concentrating in companies in a specific industry means that its performance will be closely tied to the performance of a particular market segment. The Fund’s concentration in these companies may present more risks than if it were broadly diversified over numerous industries and sectors of the economy. A downturn in these companies would have a larger impact on the Fund than on a mutual fund that does not concentrate in such companies. At times, the performance of these companies will lag the performance of other industries or the broader market as a whole.
Emerging Market Securities Risk – The risks of foreign investments are heightened when investing in issuers in emerging market countries. Emerging market countries tend to have economic, political and legal systems that are less fully developed and are less stable than those of more developed countries. They are often particularly sensitive to market movements because their market prices tend to reflect speculative expectations. Low trading volumes may result in a lack of liquidity and in extreme price volatility.
Equity Securities Risk – The stock or other security of a company may not perform as well as expected, and may decrease in value, because of factors related to the company (such as poorer than expected earnings or certain management decisions) or to the industry in which the company is engaged (such as a reduction in the demand for products or services in a particular industry).
Foreign Currency Transactions Risk – Foreign securities are often denominated in foreign currencies. As a result, the value of the Fund’s shares is affected by changes in exchange rates. The Fund may enter into foreign currency transactions to try to manage this risk. The Fund’s ability to use foreign currency transactions successfully depends on a number of factors, including the foreign currency transactions being available at prices that are not too costly, the availability of liquid markets and the ability of the Adviser to accurately predict the direction of changes in currency exchange rates.
Foreign Securities Risk – The Fund’s investments in securities of foreign issuers or issuers with significant exposure to foreign markets involve additional risk. Foreign countries in which the Fund may invest may have markets that are less liquid, less regulated and more volatile than U.S. markets. The value of the Fund’s investments may decline because of factors affecting the particular issuer as well as foreign markets and issuers generally, such as unfavorable government actions, and political or financial instability. Lack of information may also affect the value of these securities. The risks of foreign investment are heightened when investing in issuers of emerging market countries.
Growth Stock Risk – Growth stocks typically are very sensitive to market movements because their market prices tend to reflect future expectations. When it appears those expectations will not be met, the prices of growth stocks typically fall. Growth stocks as a group may be out of favor and underperform the overall equity market while the market concentrates on undervalued stocks.
Initial Public Offerings and Secondary Offerings Risk – The Fund may invest a portion of its assets in shares of IPOs or secondary offerings of an issuer. IPOs and secondary offerings may have a magnified impact on the performance of a Fund with a small asset base. The impact of IPOs and secondary offerings on a Fund’s performance likely will decrease as the Fund’s asset size increases, which could reduce a Fund’s returns. IPOs and secondary offerings may not be consistently available to the Fund for investing. IPO and secondary offering shares frequently are volatile in price due to the absence of a prior public market, the small number of shares available for trading and limited information about the issuer. Therefore, the Fund may hold IPO and secondary offering shares for a very short period of time. This may increase the turnover of the Fund and may lead to increased expenses for the Fund, such as commissions and transaction costs. In addition, IPO and secondary offering shares can experience an immediate drop in value if the demand for the securities does not continue to support the offering price.
Liquidity Risk – Some securities held by the Fund may be difficult to sell, or illiquid, particularly during times of market turmoil. Illiquid securities may also be difficult to value. If the Fund is forced to sell an illiquid asset to meet redemption requests or other cash needs, the Fund may be forced to sell at a loss.
Management Risk – The Adviser’s judgment about the quality, relative yield or value of, or market trends affecting, a particular security or sector, or about interest rates generally, may be incorrect. The Adviser’s security selections and other investment decisions might produce losses or cause the Fund to underperform when compared to other funds with similar investment objectives and strategies.
35
| Alpine Emerging Markets Real Estate Fund (Continued) | |
Market Risk – The price of a security held by the Fund may fall due to changing market, economic or political conditions.
Micro Capitalization Company Risk – Stock prices of micro capitalization companies are significantly more volatile, and more vulnerable to adverse business and economic developments than those of larger companies. Micro capitalization companies often have narrower markets for their goods and/or services and more limited managerial and financial resources than larger, more established companies, including small or medium capitalization companies.
Real Estate Investment Trusts (“REITs”) Risk – REITs’ share prices may decline because of adverse developments affecting the real estate industry including changes in interest rates. The returns from REITs may trail returns from the overall market. Additionally, there is always a risk that a given REIT will fail to qualify for favorable tax treatment.
Real Estate Securities Risk – Risks associated with investment in securities of companies in the real estate industry include: declines in the value of real estate; risks related to local economic conditions, overbuilding and increased competition; increases in property taxes and operating expenses; changes in zoning laws; casualty or condemnation losses; variations in rental income, neighborhood values or the appeal of properties to tenants; changes in interest rates and changes in general economic and market conditions.
Small and Medium Capitalization Company Risk – Securities of small or medium capitalization companies are more likely to experience sharper swings in market values, less liquid markets, in which it may be more difficult for the Adviser to sell at times and at prices that the Adviser believes appropriate and generally are more volatile than those of larger companies.
Undervalued Stock Risk – The Fund may pursue strategies that may include investing in securities, which, in the opinion of the Adviser, are undervalued. The identification of investment opportunities in undervalued securities is a difficult task and there is no assurance that such opportunities will be successfully recognized or acquired. While investments in undervalued securities offer opportunities for above-average capital appreciation, these investments involve a high degree of financial risk and can result in substantial losses.
Please refer to pages 5-6 for other important disclosures and definitions.
36
| Alpine Global Infrastructure Fund | |
| Comparative Annualized Returns as of 4/30/13 (Unaudited) | | |
| | | 6 Months(1) | 1 Year | 3 Years | Since Inception(2) |
| Alpine Global Infrastructure Fund — Institutional Class | | 18.22% | | 23.36% | | 15.36% | | 21.15% | |
| Alpine Global Infrastructure Fund — Class A (Without Load) | | 18.01% | | 23.00% | | N/A | | 28.12% | |
| Alpine Global Infrastructure Fund — Class A (With Load) | | 11.50% | | 16.21% | | N/A | | 22.80% | |
| S&P Global Infrastructure Index | | 11.13% | | 15.16% | | 9.78% | | 11.72% | |
| Lipper Specialty/Miscellaneous Funds Average(3) | | 5.99% | | 6.80% | | 8.86% | | 16.15% | |
| Lipper Specialty/Miscellaneous Funds Ranking(3) | | N/A(4) | | 21/94 | | 13/63 | | 1/37 | |
| Gross Expense Ratio (Institutional Class): 1.33%(5) | | | | | | | | | |
| Net Expense Ratio (Institutional Class): 1.33%(5) | | | | | | | | | |
| Gross Expense Ratio (Class A): 1.58%(5) | | | | | | | | | |
| Net Expense Ratio (Class A): 1.58%(5) | | | | | | | | | |
| (1) | Not annualized. |
| (2) | Institutional Class shares commenced on November 3, 2008 and Class A shares commenced on December 30, 2011. Returns for indices are since November 3, 2008. |
| (3) | The since inception data represents the period beginning November 6, 2008 (Institutional Class only). |
| (4) | FINRA does not recognize rankings for less than one year. |
| (5) | As disclosed in the prospectus dated February 28, 2013. |
Performance data quoted represents past performance and is not predictive of future results. Investment return and principal value of the Fund fluctuate, so that shares, when redeemed, may be worth more or less than their original cost. Performance current to the most recent month end may be lower or higher than the performance quoted and may be obtained by calling 1-888-785-5578. Performance data shown does not reflect the 1.00% redemption fee imposed on shares held for fewer than 60 days. If it did, total returns would be reduced. Returns for the Class A shares with sales charge reflect a maximum sales charge of 5.50%. Performance for the Class A shares without sales charges does not reflect this load.
The S&P Global Infrastructure Index is comprised of 75 of the largest publicly-listed infrastructure companies that meet specific investability requirements. The Index is designed to provide liquid exposure to the leading publicly-listed companies in the global infrastructure industry, from both developed markets and emerging markets. The Lipper Specialty/Miscellaneous Funds Average is an average of funds that limit their investments to a specific industry (e.g. transportation, retailing, or paper, etc.) or ones that have not been classified into an existing investment classification. To create diversified exposure across the global listed infrastructure market, the index has balanced weights across three distinct infrastructure clusters: utilities, transportation, and energy. The S&P Global Infrastructure Index and the Lipper Specialty/Miscellaneous Funds Average are unmanaged and do not reflect direct fees associated with a mutual fund, such as investment adviser fees; however, the Lipper Specialty/Miscellaneous Funds Average reflects fees charged by the underlying funds. The performance for the Alpine Global Infrastructure Fund reflects the deduction of fees for these value-added services. Lipper rankings for the periods shown are based on fund total returns with dividends and distributions reinvested and do not reflect sales charges. Investors cannot directly invest in an index.
Expense ratios reflect the ratios reported in the Fund’s most recent prospectus. The Alpine Global Infrastructure Fund has a contractual expense waiver that continues through February 28, 2014. Where a Fund’s gross and net expense ratio are the same for the period reported, the contractual expense reimbursement level was not reached as of the end of that period. To the extent the Fund’s expenses were reduced by waivers, the Fund’s total returns were increased. In these cases, in the absence of the expense waivers, the Fund’s total returns would have been lower.
The Fund’s past performance benefited significantly from Secondary Offerings of certain issuers, and Initial Public Offerings (“IPOs”) contributed to performance. There is no assurance that the Fund can replicate this performance in the future. Additionally, there is no guarantee that the Fund will be able to participate to the same degree in IPO/Secondary Offerings in the future.
37
| Alpine Global Infrastructure Fund (Continued) | |
Portfolio Distributions* (Unaudited)
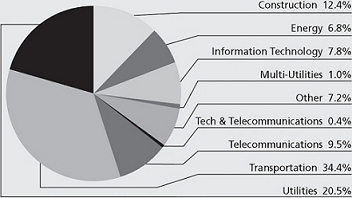
Top 10 Holdings* (Unaudited)
| 1. | Vinci SA | 2.13% |
| 2. | Corrections Corp. of America | 1.93% |
| 3. | Ferrovial SA | 1.87% |
| 4. | Progressive Waste Solutions, Ltd. | 1.82% |
| 5. | All America Latina Logistica SA | 1.78% |
| 6. | EcoRodovias Infraestrutura e Logistica SA | 1.73% |
| 7. | Canadian Pacific Railway, Ltd. | 1.72% |
| 8. | Koninklijke Vopak NV | 1.68% |
| 9. | Abertis Infraestructuras SA | 1.63% |
| 10. | American Tower Corp. | 1.63% |
| * | Portfolio holdings and sector distributions are as of 04/30/13 and are subject to change. Portfolio holdings are not recommendations to buy or sell any securities. Top 10 Holdings do not include short-term investments. Portfolio Distributions percentages are based on total investments less short-term investments and Top 10 Holdings percentages are based on total net assets. |
Value of a $10,000 Investment (Unaudited)

This chart represents a comparison of a hypothetical $10,000 investment in the Fund versus a similar investment in the Fund’s benchmark. The graph and the table do not reflect the deduction of taxes that a shareholder would pay on Fund distributions or the redemption of Fund shares. Investment performance reflects the waiver and recovery of certain fees, if applicable. Without the waiver and recovery of fees, the Fund’s total return would have differed.
Performance data quoted represents past performance and is not predictive of future results. Investment return and principal value of the Fund fluctuate, so that shares, when redeemed, may be worth more or less than their original cost.
38
| Alpine Global Infrastructure Fund (Continued) | |
Commentary
Dear Investor:
We are pleased to report the results for the Alpine Global Infrastructure Fund for the six- month period ending April 30, 2013. For this period, the Fund reported an 18.22% total return versus the S&P Global Infrastructure Index which had a total return of 11.13%. All references in this letter to the Fund’s performance relate to the performance of the Fund’s Institutional Class.
Performance Drivers
Over the past six months, the stock market has marched higher due to a number of factors including highly accommodative global monetary policy, improving macroeconomic indicators, bullish sentiment and inflows into equity-oriented mutual funds and exchange traded funds. Although economic growth is slow by historical standards, the central banks’ policies have helped the stock market rally. Government interventions such as quantitative easing in the United States, the launch of the long-term refinancing operations (“LTRO”) in Europe by the European Central Bank and the Bank of Japan’s aggressive stimulus policy have led to low yields on fixed-income investments. As a result, we believe that equities may become the favored asset class among market participants. We invest in infrastructure stocks that we believe have stable and predictable cash flows. In the long term, we believe our portfolio of companies is poised to grow from continued government and private spending on infrastructure.
The Fund has also participated in a number of Initial Public Offerings (“IPO”), both inside and outside of the infrastructure sector, that have contributed to the Fund’s total return. We cannot predict how long, if at all, these opportunities will continue to exist, but to the extent we consider IPO’s to be attractively priced and available, the Fund may continue to participate in them.
Emerging Market Exposure: We believe that the urbanization of emerging market countries will be an important driver of infrastructure development and spending. During this period, our exposure to emerging markets was a contributor to the outperformance of the fund versus its benchmark. In Mexico, both OHL Mexico and Empresas ICA benefited from investors’ belief that Mexico will increase infrastructure spending when President Pena Nieto announces the 2013-2018 National Infrastructure Program. Our investments in Brazil were a laggard in emerging markets as growth was below expectations. We still believe there will be significant spending on infrastructure in Brazil as it is now the
seventh largest economy by Gross Domestic Product (“GDP”); but, according to the Global Competitiveness Report by the World Economic Forum, Brazil ranks 104th in its overall quality of infrastructure. We believe that infrastructure spending in emerging markets will continue to increase and thus we maintain an overweight position compared to the benchmark in those markets.
In our view, the need to invest in infrastructure and the desire of pension funds and other asset owners to own infrastructure assets make this sector an attractive investment. During this six-month reporting period, several of the companies that we own were involved in merger and acquisition activity. Energy Solutions, a company in which we own shares in, has agreed to be acquired by Energy Capital Partners. This transaction is pending. In addition, Manchester Airport Group, which is partially owned by Ferrovial, sold Stansted Airport. Vinci acquired the concession to manage Portugal’s 10 main airports for a period of 50 years. Also in February 2013, Hochtief announced the sale of its airports and subsequently found a buyer in May.
Portfolio Analysis
The top five contributors to the Fund’s performance for the period ending April 30, 2013 based on contribution to total return were The Geo Group (“GEO”) (65.04%), TravelCenters of America (“TA”) (135.68%), OHL Mexico (84.80%), , ICA (27.38%), and Ferrovial (26.06%).
| • | GEO (average weight 2.0%) operates private correctional facilities. We believe GEO’s stock has benefited from converting to a REIT, paying a special dividend during the conversion process, and from a large potential pipeline of opportunities. |
| • | TravelCenters of America (average weight 1.2%) operates a network of fuel service areas mainly along the U.S. interstate highway system. We believe TA’s earnings and EBITDA have increased due to better margins on both fuel and merchandise sales. TA and Shell finalized an agreement to build liquefied natural gas fueling lanes at up to 100 of TA’s centers. We do not expect this to materially increase earnings in the foreseeable future. |
| • | OHL Mexico (average weight 1.2%) builds and operates toll roads in Mexico and many of its concessions have a minimum return guarantee from the government. OHL Mexico’s toll roads reported traffic growth above analysts’ expectations and thus the stock has outperformed. |
39
| Alpine Global Infrastructure Fund (Continued) | |
| | • | ICA (average weight 1.9%) is a large construction company specializing in infrastructure projects in Mexico. ICA started operations of several concessions in the fourth quarter of 2012. In addition, we expect ICA to begin operations on two additional concessions in 2013. |
| | | |
| | • | Ferrovial (2.0%) is a developer and owner of infrastructure assets globally. The stock outperformed as they have recently monetized several assets. One of the assets that they sold at a price that was above our expectations was the Stansted Airport. They also paid a special dividend in December. |
The following companies had the largest adverse impact on the performance of the Fund based on contribution to return for the six-month period ending April 30, 2013: Vopak (-19.04%), Tegma Gestao Logistica (-21.53%), Oi S.A. (-29.44%), Citra Marga Nusaphala Persada (-22.44%), and Hamburger Hafen and Logistik (-11.32%).
| | • | Vopak (average weight 1.9%) is the world’s largest independent bulk liquid storage company serving the oil and chemical industries. Vopak was an underperformer due to higher pension costs and its occupancy rate falling to 89%, partially resulting from the backwardation of the oil market. We believe that 2014 will be a strong year for the company as new capacity is planned to come online. |
| | | |
| | • | Tegma (average weight 1.0%) is a Brazilian logistics supplier. Tegma has two main business lines: automotive transportation and integrated logistics. The automotive transportation is an asset-light business in which Tegma delivers automobiles from the factory to dealers. Tegma currently holds a 33% market share in its core business. We believe that while the results in the integrated logistics business have been disappointing and have hurt the overall margins of Tegma, the business is in its early phases of growth. |
| | • | Oi (average weight 0.2%) is one of the largest integrated telecommunication companies in Brazil. Oi underperformed due to concerns in the market that it has committed to pay a high dividend despite debt of approximately 3 times EBITDA. In the first quarter of 2013, the company experienced negative free cash flow due to an elevated level of capex. We have reduced our position in Oi. |
| | • | Citra Marga (average weight 0.8%) is a toll road operator in Indonesia. The stock has underperformed because the company has not announced any new toll road projects that will aid higher growth. In |
| | | |
| | | |
| | | addition, the company is considering the purchase of a bank. We view this as a negative for the company as we prefer it to focus on its core toll road business. |
| | | |
| | • | Hamburger Hafen und Logistik AG (average weight 1.2%) is a large container terminal operator at the Port of Hamburg. It was an underperformer due to the continued delays in the dredging of the river Elbe. If the dredging project is approved, it will allow larger vessels to navigate the channel leading to the Port of Hamburg. We believe that the project will be approved and thus we continue to own the stock. |
Summary and Outlook
We launched the Alpine Global Infrastructure Fund because we believe that there are special opportunities to benefit from global spending in infrastructure over the next several decades. Even before the financial crisis began to wreak havoc on the budgets of governments and municipalities, the privatization of infrastructure assets began to take place. Now, even more so, we believe there will be an accelerated effort to privatize these assets as public entities will not have the funds to maintain their current infrastructure assets nor to build new infrastructure assets to meet the needs of a growing population. Throughout the world, the owners of infrastructure are primarily government entities. However, over the last several decades, due to the large cost of building and maintaining these facilities, there has been a movement towards privatization of infrastructure assets. In Canada, Australia, the United Kingdom, and throughout Europe and Asia, roads, airports, and seaports have been privatized.
Since the launch of our Fund, the equity markets have been volatile as the world’s economies suffered from the effects of the financial crisis. The amount of debt that governments have on their balance sheets and the austerity measures that have been enacted will likely lead to slower growth for years to come. The uncertainty over the European debt crisis along with the questionable growth prospects of China has led to extremely volatile markets and, as a result, we continued to hedge a portion of our Euro currency exposure during the period to partially offset the Euro’s impact on the value of the Fund’s Euro- denominated holdings. We believe that this may create many new opportunities for investors in infrastructure stocks that have the potential for more stable and predictable cash flows. Our portfolio of companies is not immune to swings in share prices, but volatile markets may provide an opportunity to continue buying what we believe are high-quality companies with solid balance sheets and good growth prospects at what we believe are inexpensive valuations.
40
| Alpine Global Infrastructure Fund (Continued) | |
In the future, governments may be compelled to sell off infrastructure assets and utilize public/private funds using build/operate/transfer models to finance new projects.
We are pleased with the structure of our portfolio and the outperformance of the Fund during the six- month period ending April 30th 2013. We believe the Fund is positioned to take advantage of the anticipated increase in global infrastructure spending. We continue to believe that the combination of urbanization, rising standards of living and population growth will propel infrastructure spending for decades to come. We will continue to adapt our investment approach as economic conditions change
and look forward to discussing the portfolio and the prospects for the Fund in future communications.
Sincerely,
Joshua E. Duitz
Samuel A. Lieber
Co-Portfolio Managers
This letter represents the opinions of the Fund’s management and is subject to change, is not guaranteed and should not be considered recommendations to buy or sell any security. The information provided is not intended to be, and is not, a forecast of future events, a guarantee of future results, or investment advice. Views expressed may vary from those of the firm as a whole.
Mutual fund investing involves risk. Principal loss is possible. The Fund is subject to risks including the following:
Concentration Risk – The Fund’s strategy of concentrating in companies in a specific industry means that its performance will be closely tied to the performance of a particular market segment. The Fund’s concentration in these companies may present more risks than if it were broadly diversified over numerous industries and sectors of the economy. A downturn in these companies would have a larger impact on the Fund than on a mutual fund that does not concentrate in such companies. At times, the performance of these companies will lag the performance of other industries or the broader market as a whole.
Dividend Strategy Risk – The Fund’s strategy of investing in dividend-paying stocks involves the risk that such stocks may fall out of favor with investors and underperform the market. Companies that issue dividend paying-stocks are not required to continue to pay dividends on such stocks. Therefore, there is the possibility that such companies could reduce or eliminate the payment of dividends in the future.
Emerging Market Securities Risk – The risks of foreign investments are heightened when investing in issuers in emerging market countries. Emerging market countries tend to have economic, political and legal systems that are less fully developed and are less stable than those of more developed countries. They are often particularly sensitive to market movements because their market prices tend to reflect speculative expectations. Low trading volumes may result in a lack of liquidity and in extreme price volatility.
Equity Securities Risk – The stock or other security of a company may not perform as well as expected, and may decrease in value, because of factors related to the company (such as poorer than expected earnings or certain management decisions) or to the industry in which the company is engaged (such as a reduction in the demand for products or services in a particular industry).
Foreign Currency Transactions Risk – Foreign securities are often denominated in foreign currencies. As a result, the value of the Fund’s shares is affected by changes in exchange rates. The Fund may enter into foreign currency transactions to try to manage this risk. The Fund’s ability to use foreign currency transactions successfully depends on a number of factors, including the foreign currency transactions being available at prices that are not too costly, the availability of liquid markets and the ability of the Adviser to accurately predict the direction of changes in currency exchange rates.
Foreign Securities Risk – The Fund’s investments in securities of foreign issuers or issuers with significant exposure to foreign markets involve additional risk. Foreign countries in which the Fund may invest may have markets that are less liquid, less regulated and more volatile than U.S. markets. The value of the Fund’s investments may decline because of factors affecting the particular issuer as well as foreign markets and issuers generally, such as unfavorable government actions, and political or financial instability. Lack of information may also affect the value of these securities. The risks of foreign investment are heightened when investing in issuers of emerging market countries.
41
| Alpine Global Infrastructure Fund (Continued) | |
Growth Stock Risk – Growth stocks are stocks of companies believed to have above-average potential for growth in revenue and earnings. Growth stocks typically are very sensitive to market movements because their market prices tend to reflect future expectations. When it appears those expectations will not be met, the prices of growth stocks typically fall. Growth stocks as a group may be out of favor and underperform the overall equity market while the market concentrates on undervalued stocks.
Infrastructure-Related Investment Risk – Because the Fund concentrates its investments in infrastructure-related entities, the Fund has greater exposure to the potential adverse economic, regulatory, political and other changes affecting such entities. Infrastructure-related entities are subject to a variety of factors that may adversely affect their business or operations, including high interest costs in connection with capital construction programs, costs associated with environmental and other regulations, the effects of economic slowdown and surplus capacity, increased competition from other providers of services, uncertainties concerning the availability of fuel at reasonable prices, the effects of energy conservation policies and other factors. Additionally, infrastructure-related entities may be subject to regulation by various governmental authorities and may also be affected by governmental regulation of rates charged to customers, service interruption due to environmental, operational or other mishaps and the imposition of special tariffs and changes in tax laws, regulatory policies and accounting standards.
Initial Public Offerings and Secondary Offerings Risk – The Fund may invest a portion of its assets in shares of IPOs or secondary offerings of an issuer. IPOs and secondary offerings may have a magnified impact on the performance of a Fund with a small asset base. The impact of IPOs and secondary offerings on a Fund’s performance likely will decrease as the Fund’s asset size increases, which could reduce a Fund’s returns. IPOs and secondary offerings may not be consistently available to the Fund for investing. IPO and secondary offering shares frequently are volatile in price due to the absence of a prior public market, the small number of shares available for trading and limited information about the issuer. Therefore, the Fund may hold IPO and secondary offering shares for a very short period of time. This may increase the turnover of the Fund and may lead to increased expenses for the Fund, such as commissions and transaction costs. In addition, IPO and secondary offering shares can experience an immediate drop in value if the demand for the securities does not continue to support the offering price.
Management Risk – The Adviser’s judgment about the quality, relative yield or value of, or market trends affecting, a particular security or sector, or about interest rates generally, may be incorrect. The Adviser’s security selections and other investment decisions might produce losses or cause the Fund to underperform when compared to other funds with similar investment objectives and strategies.
Market Risk – The price of a security held by the Fund may fall due to changing market, economic or political conditions.
Portfolio Turnover Risk – High portfolio turnover necessarily results in greater transaction costs which may reduce Fund performance.
Small and Medium Capitalization Company Risk – Securities of small or medium capitalization companies are more likely to experience sharper swings in market values, less liquid markets, in which it may be more difficult for the Adviser to sell at times and at prices that the Adviser believes appropriate and generally are more volatile than those of larger companies.
Undervalued Stock Risk – The Fund may pursue strategies that may include investing in securities, which, in the opinion of the Adviser, are undervalued. The identification of investment opportunities in undervalued securities is a difficult task and there is no assurance that such opportunities will be successfully recognized or acquired. While investments in undervalued securities offer opportunities for above-average capital appreciation, these investments involve a high degree of financial risk and can result in substantial losses.
Please refer to pages 5-6 for other important disclosures and definitions.
42
| Alpine Global Consumer Growth Fund | |
| Comparative Annualized Returns as of 4/30/13 (Unaudited) | | |
| | | 6 Months(1) | | 1 Year | | Since Inception(2) |
| Alpine Global Consumer Growth Fund — Institutional Class | | | 8.64 | % | | | 9.87 | % | | | 7.02 | % |
| Alpine Global Consumer Growth Fund — Class A (Without Load) | | | 8.51 | % | | | 9.53 | % | | | 21.62 | % |
| Alpine Global Consumer Growth Fund — Class A (With Load) | | | 2.57 | % | | | 3.48 | % | | | 16.58 | % |
| MSCI World Index USD(3) | | | 14.67 | % | | | 16.70 | % | | | 8.89 | % |
| MSCI ACWI Consumer Discretionary Index USD | | | 18.68 | % | | | 16.88 | % | | | 11.01 | % |
| MSCI ACWI Consumer Staples Index USD | | | 15.49 | % | | | 19.51 | % | | | 13.48 | % |
| Lipper Consumer Goods Funds Average(4) | | | 16.49 | % | | | 18.14 | % | | | 13.59 | % |
| Lipper Consumer Goods Funds Ranking(4) | | | N/A | (5) | | | 39/44 | | | | 35/38 | |
| Gross Expense Ratio (Institutional Class): 5.31%(6) | | | | | | | | | | | | |
| Net Expense Ratio (Institutional Class): 1.35%(6) | | | | | | | | | | | | |
| Gross Expense Ratio (Class A): 5.56% | | | | | | | | | | | | |
| Net Expense Ratio (Class A): 1.60% | | | | | | | | | | | | |
| (1) | Not annualized. |
| (2) | Institutional Class shares commenced on December 29, 2010 and Class A shares commenced on December 30, 2011. Returns for indices are since December 29, 2010. |
| (3) | Effective February 28, 2012, the Fund changed the primary benchmark against which it measures its performance to the MSCI World Index USD. The Adviser believes the MSCI World Index USD more accurately reflects the investment strategy of the Fund. |
| (4) | The since inception data represents the period beginning December 31, 2010 (Institutional Class only). |
| (5) | FINRA does not recognize rankings for less than one year. |
| (6) | As disclosed in the prospectus dated February 28, 2013. |
Performance data quoted represents past performance and is not predictive of future results. Investment return and principal value of the Fund fluctuate, so that shares, when redeemed, may be worth more or less than their original cost. Performance current to the most recent month end may be lower or higher than the performance quoted and may be obtained by calling 1-888-785-5578. Performance data shown does not reflect the 1.00% redemption fee imposed on shares held for fewer than 60 days. If it did, total returns would be reduced. Returns for the Class A shares with sales charge reflect a maximum sales charge of 5.50%. Performance for the Class A shares without sales charges does not reflect this load.
The MSCI World Index USD is a free float-adjusted market capitalization-weighted index that is designed to measure the equity market performance of developed markets. Source: MSCI. MSCI data may not be reproduced or used for any other purpose. The Lipper Consumer Goods Funds Average is an average of funds that invest primarily in the equity securities of domestic and foreign companies engaged in manufacturing and distributing consumer goods such as food, beverages, tobacco, and nondurable household goods and personal products. MSCI ACWI Consumer Staples Index USD is a market capitalization-weighted index that is designed to measure the equity market performance of developed and emerging markets for the Consumer Staples GICS® sector. Source: MSCI. MSCI makes no express or implied warranties or representations and shall have no liability whatsoever with respect to any MSCI data contained herein. The MSCI data may not be further redistributed or used as a basis for other indices or any securities or financial products. This report is not approved, reviewed or produced by MSCI. MSCI ACWI Consumer Discretionary Index USD is a free float-adjusted market capitalization-weighted index that is designed to measure the equity market performance of developed and emerging markets for the Consumer Discretionary GICS® sector. Source: MSCI. The MSCI ACWI Consumer Staples Index USD, the MSCI ACWI Consumer Discretionary Index USD and the Lipper Consumer Goods Funds Average are unmanaged and do not reflect direct fees associated with a mutual fund, such as investment adviser fees; however, the Lipper Consumer Goods Funds Average reflects fees charged by the underlying funds. The performance for the Alpine Global Consumer Growth Fund reflects the deduction of fees for these value-added services. Investors cannot directly invest in an index. Lipper rankings for the periods shown are based on fund total returns with dividends and distributions reinvested and do not reflect sales charges.
Expense ratios reflect the ratios reported in the Fund’s most recent prospectus. The Alpine Global Consumer Growth Fund has a contractual expense waiver that continues through February 28, 2014. Where a Fund’s gross and net expense ratio are the same for the period reported, the contractual expense reimbursement level was not reached as of the end of that period. To the extent the Fund’s expenses were reduced by waivers, the Fund’s total returns were increased. In these cases, in the absence of the expense waivers, the Fund’s total returns would have been lower.
To the extent that the Fund’s historical performance resulted from gains derived from participation in Initial Public Offerings (“IPOs”) and/or Secondary Offerings, there is no guarantee that these results can be replicated in future periods or that the Fund will be able to participate to the same degree in IPO/Secondary Offerings in the future.
43
| Alpine Global Consumer Growth Fund (Continued) | |
Portfolio Distributions*(Unaudited)
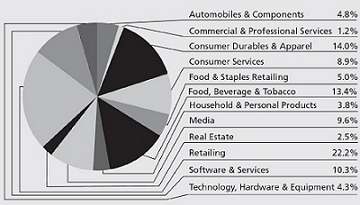
Top 10 Holdings*(Unaudited)
| 1. | | Anheuser-Busch InBev NV-ADR | | 2.79% |
| 2. | | Nestle SA | | 2.74% |
| 3. | | Comcast Corp.-Class A | | 2.64% |
| 4. | | VF Corp. | | 2.60% |
| 5. | | Kabel Deutschland Holding AG | | 2.34% |
| 6. | | Apple, Inc. | | 2.26% |
| 7. | | PepsiCo, Inc. | | 2.26% |
| 8. | | Google, Inc.-Class A | | 2.26% |
| 9. | | Visa, Inc.-Class A | | 2.15% |
| 10. | | Coach, Inc. | | 2.15% |
| * | Top 10 Holdings do not include short-term investments and percentages are based on total net assets. Portfolio Distributions percentages are based on total investments. Portfolio holdings and sector distributions are as of 04/30/13 and are subject to change. Portfolio holdings are not recommendations to buy or sell any securities. |
| |
|---|
| Value of a $10,000 Investment (Unaudited) |
|---|
| |
|---|
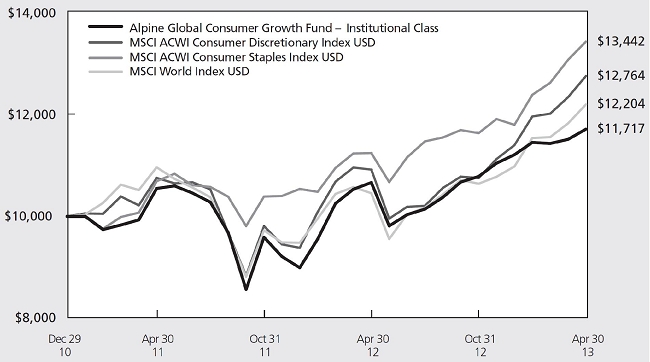 |
This chart represents a comparison of a hypothetical $10,000 investment in the Fund versus a similar investment in the Fund’s benchmark. The graph and the table do not reflect the deduction of taxes that a shareholder would pay on Fund distributions or the redemption of Fund shares. Investment performance reflects the waiver and recovery of certain fees, if applicable. Without the waiver and recovery of fees, the Fund’s total return would have differed.
Performance data quoted represents past performance and is not predictive of future results. Investment return and principal value of the Fund fluctuate, so that shares, when redeemed, may be worth more or less than their original cost.
44
| Alpine Global Consumer Growth Fund (Continued) | |
Commentary
Through the first six months of the fiscal year, the Alpine Global Consumer Growth Fund generated a total return of 8.64%. Over the same period, the MSCI World Index and the MSCI All Country World Consumer Discretionary Index posted total returns of 14.67% and 18.68%, respectively. The underperformance of the Fund versus the aforementioned benchmarks can be primarily attributed to the Fund’s technology sector and country exposure. All references in this letter to the Fund’s performance relate to the performance of the Fund’s Institutional Class.
Portfolio Drivers
The market rally continued over the first six months of the fiscal year as investors looked past issues such as the macro economic situation in the Euro zone and the threat of sequestration in the U.S. and focused instead on steady economic data in the U.S. and the government’s efforts to stimulate growth in that market.
| • | The emerging market country exposure of the Fund played a significant part in the performance versus the benchmark over the first six months of the fiscal year. China/Hong Kong (average weight 13.0%) and Brazil (average weight 8.9%) represented the Fund’s largest country exposures outside of the U.S. (average weight 40.9%). Both of these emerging markets greatly underperformed the global indices as economic growth slowed and the governments failed to act to stimulate activity. Although relatively small in size, the Philippines (average weight 1.5%) and Indonesia (average weight 3.3%) were the top performing emerging markets countries in the portfolio. |
| • | From an industry standpoint, on an absolute basis, Media (average weight 10.4%) was the top performing segment. Textiles, Apparel & Luxury Goods (average weight 11.7%) and Specialty Retail (average weight 11.6%) were also among the top performers as the consumer discretionary sector, as a whole, performed well. Meanwhile, the Computer & Peripheral group (average weight 2.4%) was one of the few detractors to the overall performance of the Fund as the overall technology sector lagged the overall market. |
| • | Throughout the period, the consumer discretionary and consumer staple sectors benefitted from solid spending trends on a global basis. This was somewhat offset by the underperformance of the technology sector as concerns over slowing spending growth weighed on the group. |
Portfolio Analysis
The top five contributors to the Fund’s performance for the six months ended April 30, 2013 were Kabel Deutschland Holding AG (31.93%), Abercrombie & Fitch Co. (63.07%), Lumber Liquidators Holdings Inc. (46.42%), CBS Corp. (42.15%) and Nike Inc. (38.17%).
| • | Kabel Deutschland Holding (average weight 2.4%) was the top contributor to the Fund’s performance over the period as the company posted solid results and discussion of a potential take out drove the shares higher. |
| • | Abercrombie & Fitch Co. (average weight 1.3%) experienced a rebound in its shares as the company’s financial results stabilized and management announced plans to evaluate the business in an effort to better streamline its expense structure. |
| • | Lumber Liquidators (average weight 1.4%) continued its strong run in the period. We believe management has done an excellent job of adding to its product portfolio, improving in-store execution and refining its sourcing structure while the improvement in the U.S. housing market has driven strong demand for flooring products. |
| • | CBS Corp. (average weight 1.6%) shares continue to outperform the market for several reasons. Management has improved the visibility of the business by reducing its exposure to the advertising market and the company has made several moves to improve shareholder returns, such as increasing its buyback program and its dividend payout. |
| • | Nike (average weight 1.6%) Despite concerns about slowing in the important Chinese footwear market, Nike has been able to outperform by posting strong results in the U.S. market. We believe the outlook for the athletic footwear cycle remains strong for the back half of the year. |
Apple Inc. (-25.11%), Debenhams (-31.90%), Magazine Luiza S.A (-36.08%), Li & Fung Ltd.(-21.31%) and Multiplus S/A (-27.35%) were the bottom five contributors to the Fund’s performance through April 30, 2013.
| • | Apple (average weight 2.4%) shares tumbled as the company appeared to reach maturity in its product line and competition began to take a technology lead. In addition, concerns about margins have increased as newer products (such as the iPad Mini) carry margins lower than the corporate average. |
45
| Alpine Global Consumer Growth Fund (Continued) | |
| • | After a very strong re-rating for the shares of Debenhams (average weight 1.2%) during 2012, the company stumbled exiting the year as adverse weather led to an increase in markdowns at the beginning of the year. As such, management was forced to take down margin expectations. |
| • | Hard goods retailer Magazine Luiza’s (average weight 0.9%) shares languished over the period as the Brazilian consumer slowed its spending patterns and as a result same store sales decelerated. In addition, rising inflation levels have led to fears that the government will be forced to increase interest rates, which may have an adverse impact on the company’s credit business. |
| • | Lackluster consumer demand in Europe and an economic slowdown in China led Li & Fung (average weight 0.7%) management to temper its long term outlook. The company’s business model remains in a state of flux as more of its developed world customer’s source product directly from Asian suppliers. |
| • | At the beginning of 2013, one of Multiplus’ (average weight 1.1%) financial customers changed the terms of its loyalty plan, which will likely result in lower growth from that partner on an ongoing basis. This led to concern that other customers may follow suit and drove the shares lower. |
Summary & Outlook
The objective of the Alpine Global Consumer Growth Fund is to seek capital appreciation. The Fund seeks to invest in companies which have exposure to the rising purchasing power of the global consumer. The Fund aims to achieve diversification by investing primarily across consumer discretionary, consumer staples and technology sectors among both multi-national and local companies. In the developed world, we emphasize investment in consumer consumption trends, such as the rise in Internet spending and the usage of mobile devices, as well as in firms that have the ability to expand their brands domestically and abroad. In emerging markets, the focus
is on those businesses that stand to benefit from the demographic shifts that are taking place as disposable income levels rise over the next few years.
As we look ahead, consumer spending trends remain mixed. In the U.S., consumer confidence and spending levels have held up relatively well despite higher taxes, difficult comparisons from a year ago and poor weather conditions. As we enter the back half of the year, comparisons ease but there is some uncertainty over the impact that higher taxes and sequestration will ultimately have on consumer sentiment. In Europe, austerity measures and political and macro-economic instability continue to rule the day. But as we are another year into the spending cycle, barring any large shocks to the economic system, we may be in line to see some moderate improvement in consumer spending in the back half of the year. Finally, while the emerging market consumer continues to drive global consumption, growth in the larger Brazil, Russia, India and China (“BRIC”) markets has moderated. We have diversified our emerging market holdings somewhat, increasing our exposure to those regions and/or industries we believe can outperform over the back half of 2013. Discretionary spending may benefit from strong wage growth and the growing middle class across all emerging markets.
Despite some near term headwinds, we believe rising income levels and changing consumer consumption patterns across the globe should provide long-term investment opportunities.
Sincerely,
Bryan Keane
Samuel Lieber
Co-Portfolio Managers
This letter represents the opinions of the Fund’s management and is subject to change, is not guaranteed and should not be considered recommendations to buy or sell any security. The information provided is not intended to be, and is not, a forecast of future events, a guarantee of future results, or investment advice. Views expressed may vary from those of the firm as a whole.
46
| Alpine Global Consumer Growth Fund (Continued) | |
Mutual fund investing involves risk. Principal loss is possible. The Fund is subject to risks, including the following:
Concentration Risk – The Fund’s strategy of concentrating in companies in a specific industry means that its performance will be closely tied to the performance of a particular market segment. The Fund’s concentration in these companies may present more risks than if it were broadly diversified over numerous industries and sectors of the economy. A downturn in these companies would have a larger impact on the Fund than on a mutual fund that does not concentrate in such companies. At times, the performance of these companies will lag the performance of other industries or the broader market as a whole.
Consumer Products/Services Sector Risk – Because the Fund’s investments are concentrated in the consumer products/services sector, the value of its shares will be affected by factors particular to this sector and may fluctuate more widely than that of a fund which invests in a broad range of industries. The Fund’s performance largely depends on the general condition of the consumer product/services sector. The consumer product/services sector could be adversely affected by overall economic conditions, interest rates, competition, consumer confidence, disposable income, changes in demographics and consumer tastes, and legislative or regulatory changes. The prices of the securities of those issuers also may fluctuate widely in response to such events.
Emerging Market Securities Risk – The risks of foreign investments are heightened when investing in issuers in emerging market countries. Emerging market countries tend to have economic, political and legal systems that are less fully developed and are less stable than those of more developed countries. They are often particularly sensitive to market movements because their market prices tend to reflect speculative expectations. Low trading volumes may result in a lack of liquidity and in extreme price volatility.
Equity Securities Risk – The stock or other security of a company may not perform as well as expected, and may decrease in value, because of factors related to the company (such as poorer than expected earnings or certain management decisions) or to the industry in which the company is engaged (such as a reduction in the demand for products or services in a particular industry).
Foreign Currency Transactions Risk – Foreign securities are often denominated in foreign currencies. As a result, the value of the Fund’s shares is affected by changes in exchange rates. The Fund may enter into foreign currency transactions to try to manage this risk. The Fund’s ability to use foreign currency transactions successfully depends on a number of factors, including the foreign currency transactions being available at prices that are not too costly, the availability of liquid markets and the ability of the Adviser to accurately predict the direction of changes in currency exchange rates.
Foreign Securities Risk – The Fund’s investments in securities of foreign issuers or issuers with significant exposure to foreign markets involve additional risk. Foreign countries in which the Fund may invest may have markets that are less liquid, less regulated and more volatile than U.S. markets. The value of the Fund’s investments may decline because of factors affecting the particular issuer as well as foreign markets and issuers generally, such as unfavorable government actions, and political or financial instability. Lack of information may also affect the value of these securities. The risks of foreign investment are heightened when investing in issuers of emerging market countries.
Growth Stock Risk – Growth stocks typically are very sensitive to market movements because their market prices tend to reflect future expectations. When it appears those expectations will not be met, the prices of growth stocks typically fall. Growth stocks as a group may be out of favor and underperform the overall equity market while the market concentrates on undervalued stocks.
Initial Public Offerings and Secondary Offerings Risk – The Fund may invest a portion of its assets in shares of IPOs or secondary offerings of an issuer. IPOs and secondary offerings may have a magnified impact on the performance of a Fund with a small asset base. The impact of IPOs and secondary offerings on a Fund’s performance likely will decrease as the Fund’s asset size increases, which could reduce a Fund’s returns. IPOs and secondary offerings may not be consistently available to the Fund for investing. IPO and secondary offering shares frequently are volatile in price due to the absence of a prior public market, the small number of shares available for trading and limited information about the issuer. Therefore, the Fund may hold IPO and secondary offering shares for a very short period of time. This may increase the turnover of the Fund and may lead to increased expenses for the Fund, such as commissions and transaction costs. In addition, IPO and secondary offering shares can experience an immediate drop in value if the demand for the securities does not continue to support the offering price.
47
| Alpine Global Consumer Growth Fund (Continued) | |
Management Risk – The Adviser’s judgment about the quality, relative yield or value of, or market trends affecting, a particular security or sector, or about interest rates generally, may be incorrect. The Adviser’s security selections and other investment decisions might produce losses or cause the Fund to underperform when compared to other funds with similar investment objectives and strategies.
Market Risk – The price of a security held by the Fund may fall due to changing market, economic or political conditions.
Micro Capitalization Company Risk – Stock prices of micro capitalization companies are significantly more volatile, and more vulnerable to adverse business and economic developments than those of larger companies. Micro capitalization companies often have narrower markets for their goods and/or services and more limited managerial and financial resources than larger, more established companies, including small or medium capitalization companies.
Small and Medium Capitalization Company Risk – Securities of small or medium capitalization companies are more likely to experience sharper swings in market values, less liquid markets, in which it may be more difficult for the Adviser to sell at times and at prices that the Adviser believes appropriate and generally are more volatile than those of larger companies.
Undervalued Stock Risk – The Fund may pursue strategies that may include investing in securities, which, in the opinion of the Adviser, are undervalued. The identification of investment opportunities in undervalued securities is a difficult task and there is no assurance that such opportunities will be successfully recognized or acquired. While investments in undervalued securities offer opportunities for above-average capital appreciation, these investments involve a high degree of financial risk and can result in substantial losses.
Please refer to pages 5-6 for other important disclosures and definitions.
48
Alpine International Real Estate Equity Fund
Schedule of Portfolio Investments
April 30, 2013 (Unaudited)
| | | | Security | | | | |
| Shares | | | Description | | Value | |
| | | | | | | | |
| Common Stocks—96.9% | | | | |
| Asia—38.6% | | | | |
| China—2.4% | | | | |
| 400,000 | | | China Overseas Land &
Investment, Ltd. | | $ | 1,224,203 | |
| 8,800,960 | | | Franshion Properties China, Ltd. | | | 3,005,425 | |
| 4,527,587 | | | Kaisa Group Holdings, Ltd. (a) | | | 1,423,595 | |
| 900,000 | | | Sunac China Holdings, Ltd. | | | 726,017 | |
| | | | | | | 6,379,240 | |
| Hong Kong—1.1% | |
| 33,002,031 | | | CSI Properties, Ltd. | | | 1,552,256 | |
| 160,000 | | | Wharf Holdings, Ltd. | | | 1,429,869 | |
| | | | | | | 2,982,125 | |
| India—10.3% | | | | |
| 2,290,373 | | | Hirco PLC (b) | | | 1,049,537 | |
| 2,000,000 | | | South Asian Real Estate PLC
(a)(c)(d)(e) | | | 15,782,034 | |
| 7,240,153 | | | Unitech Corporate Parks PLC (a) | | | 4,161,201 | |
| 1,325,831 | | | Yatra Capital, Ltd. (b)(f) | | | 6,006,425 | |
| | | | | | | 26,999,197 | |
| Indonesia—1.6% | | | | |
| 246,285,560 | | | PT Bakrieland Development TBK (a) | | | 1,317,238 | |
| 16,765,928 | | | PT Bumi Serpong Damai TBK | | | 2,983,292 | |
| | | | | | | 4,300,530 | |
| Japan—6.5% | | | | |
| 15,000 | | | Daito Trust Construction Co., Ltd. (b) | | | 1,452,531 | |
| 707,691 | | | Hulic Co., Ltd. (b) | | | 7,854,764 | |
| 4,000 | | | Kenedix, Inc. (a) | | | 2,892,753 | |
| 50,000 | | | Mitsubishi Estate Co., Ltd. (b) | | | 1,623,326 | |
| 100,000 | | | Nomura Real Estate Holdings, Inc. (b) | | | 2,682,464 | |
| 399 | | | NTT Urban Development Corp. | | | 589,383 | |
| | | | | | | 17,095,221 | |
| Malaysia—0.9% | | | | |
| 3,100,591 | | | Aseana Properties, Ltd. (a) | | | 1,224,734 | |
| 1,035,715 | | | SP Setia BHD | | | 1,167,626 | |
| | | | | | | 2,392,360 | |
| Philippines—5.0% | | | | |
| 2,357,077 | | | Ayala Land, Inc. | | | 1,858,288 | |
| 40,000,000 | | | Megaworld Corp. | | | 4,033,042 | |
| 35,239,555 | | | SM Development Corp. | | | 7,277,362 | |
| | | | | | | 13,168,692 | |
| Singapore—3.3% | | | | |
| 5,155,000 | | | Banyan Tree Holdings, Ltd. (b) | | | 2,573,943 | |
| 2,701,420 | | | Global Logistic Properties, Ltd. (b) | | | 6,053,356 | |
| | | | | | | 8,627,299 | |
| Thailand—7.5% | | | | |
| 6,000,000 | | | Ananda Development PCL (a) | | | 891,312 | |
| 3,762,300 | | | Central Pattana PCL | | | 12,818,740 | |
| 5,000,000 | | | Hemaraj Land and Development PCL | | | 732,538 | |
| 6,320,357 | | | Minor International PCL | | | 5,297,471 | |
| | | | | | | 19,740,061 | |
| | | | Total Asia (Cost $106,983,946) | | | 101,684,725 | |
| | | | | | | | |
| Europe—27.6% | | | | |
| France—2.1% | | | | |
| 154,193 | | | Nexity SA (b) | | | 5,543,662 | |
| | | | Security | | | | |
| Shares | | | Description | | Value | |
| | | | | | | | |
| Germany—3.2% | | | | |
| 250,424 | | | DIC Asset AG (b) | | $ | 2,815,798 | |
| 7,642,900 | | | Sirius Real Estate, Ltd. (a)(b) | | | 1,899,829 | |
| 317,573 | | | TAG Immobilien AG (b) | | | 3,847,697 | |
| | | | | | | 8,563,324 | |
| Italy—0.1% | | | | |
| 600,000 | | | Beni Stabili SpA | | | 422,741 | |
| Norway—0.6% | | | | |
| 693,067 | | | BWG Homes ASA (a)(b) | | | 1,598,507 | |
| Poland—0.3% | | | | |
| 3,265,000 | | | Nanette Real Estate Group NV (a)(c)(e) | | | 812,670 | |
| Russia—0.6% | | | | |
| 799,367 | | | Mirland Development Corp. PLC (a)(b) | | | 1,490,036 | |
| Sweden—1.3% | | | | |
| 150,877 | | | JM AB (b) | | | 3,398,838 | |
| Turkey—2.7% | | | | |
| 3,000,522 | | | Emlak Konut Gayrimenkul Yatirim
Ortakligi AS (b) | | | 5,138,253 | |
| 2,471,294 | | | Sinpas Gayrimenkul Yatirim
Ortakligi AS (b) | | | 1,916,106 | |
| | | | | | | 7,054,359 | |
| United Kingdom—16.7% | | | | |
| 257,125 | | | Development Securities PLC (b) | | | 579,138 | |
| 536,270 | | | Great Portland Estates PLC (b) | | | 4,431,639 | |
| 1,092,084 | | | Londonmetric Property PLC | | | 1,942,365 | |
| 5,000,713 | | | LXB Retail Properties PLC (a)(b) | | | 8,991,294 | |
| 5,004,118 | | | Quintain Estates & Development
PLC (a)(b) | | | 5,033,112 | |
| 5,948,407 | | | Regus PLC (b) | | | 15,135,049 | |
| 1,600,130 | | | Songbird Estates PLC (b) | | | 3,479,786 | |
| 800,130 | | | Unite Group PLC (b) | | | 4,322,743 | |
| | | | | | | 43,915,126 | |
| | | | Total Europe (Cost $79,489,906) | | | 72,799,263 | |
| | | | | | | | |
| North & South America—30.7% | | | | |
| Brazil—29.5% | | | | |
| 307,551 | | | Aliansce Shopping Centers SA | | | 3,472,486 | |
| 793,138 | | | BHG SA-Brazil Hospitality Group (a) | | | 6,897,714 | |
| 580,200 | | | Brasil Brokers Participacoes SA | | | 2,044,438 | |
| 299,335 | | | Cyrela Commercial Properties SA
Empreendimentos e Participacoes | | | 3,515,868 | |
| 1,703,408 | | | Direcional Engenharia SA | | | 13,545,531 | |
| 912,132 | | | General Shopping Brasil SA (a) | | | 5,625,745 | |
| 780,102 | | | Iguatemi Empresa de Shopping
Centers SA | | | 9,369,412 | |
| 1,488,500 | | | JHSF Participacoes SA | | | 5,423,549 | |
| 599,277 | | | MRV Engenharia e Participacoes SA | | | 2,575,925 | |
| 400,400 | | | Multiplan Empreendimentos
Imobiliarios SA | | | 11,407,122 | |
| 475,394 | | | Sao Carlos Empreendimentos e
Participacoes SA | | | 11,048,767 | |
| 200,000 | | | Sonae Sierra Brasil SA | | | 2,798,951 | |
| | | | | | | 77,725,508 | |
| Canada—0.0% * | | | | |
| 133,000 | | | Lakeview Hotel Investment Corp. (a) | | | 30,364 | |
The accompanying notes are an integral part of these financial statements.
49
Alpine International Real Estate Equity Fund
Schedule of Portfolio Investments—Continued
April 30, 2013 (Unaudited)
| | | | Security | | | |
| Shares | | | Description | | Value | |
| | | | | | | | |
| Common Stocks—continued | | | | |
| Mexico—1.2% | | | | |
| 267,600 | | | Desarrolladora Homex SAB de
CV-ADR (a)(b) | | $ | 1,305,888 | |
| 700,000 | | | TF Administradora Industrial S de
RL de CV (a) | | | 1,668,959 | |
| | | | | | | 2,974,847 | |
| | | | Total North & South America
(Cost $59,588,464) | | | 80,730,719 | |
| | | | Total Common Stocks
(Cost $246,062,316) | | | 255,214,707 | |
| Equity-Linked Structured Notes—1.1% | | | | |
| Asia—1.1% | | | | |
| India—1.1% | | | | |
| 590,000 | | | Phoenix Mills, Ltd.-Merrill Lynch
& Co., Inc. | | | 2,967,795 | |
| | | | Total Asia (Cost $1,943,637) | | | 2,967,795 | |
| | | | Total Equity-Linked Structured
Notes (Cost $1,943,637) | | | 2,967,795 | |
| | | | Security | | | | |
| Shares | | | Description | | | Value | |
| | | | | | | | |
| Investment Companies—0.7% | | | | |
| Asia—0.5% | | | | |
| India—0.5% | | | | |
| 7,497,900 | | | Trinity Capital PLC (a)(b) | | $ | 1,310,272 | |
| | | | Total Asia (Cost $11,924,297) | | | 1,310,272 | |
| Europe—0.2% | | | | |
| Turkey—0.2% | | | | |
| 920,000 | | | The Ottoman Fund, Ltd. (a)(b) | | | 507,324 | |
| | | | Total Europe (Cost $1,507,548) | | | 507,324 | |
| | | | Total Investment Companies
(Cost $13,431,845) | | | 1,817,596 | |
Total Investments
(Cost $261,437,798)—98.7% | | | 260,000,098 | |
| Other Assets in Excess of Liabilities—1.3% | | | 3,302,720 | |
| TOTAL NET ASSETS 100.0% | | $ | 263,302,818 | |
Percentages are stated as a percent of net assets.
| * | Less than 0.05% of Net Assets. |
| | |
| (a) | Non-income producing security. |
| | |
| (b) | All or a portion of the security is available to serve as collateral on the outstanding loans. |
| | |
| (c) | Illiquid security. |
| | |
| (d) | Private placement. |
| | |
| (e) | Security fair valued in accordance with procedures approved by the Board of Trustees. These securities comprised 6.3% of the Fund’s net assets. |
| | |
| (f) | Affiliated issuer. |
AB—Aktiebolag is the Swedish equivalent of a corporation.
ADR—American Depositary Receipt
AG—Aktiengesellschaft is a German term that refers to a corporation that is limited by shares, i.e., owned by shareholders.
AS—Anonim Sirketi is the Turkish term for joint stock company.
ASA—Allmennaksjeselskap is the Norwegian term for a public limited company.
BHD—Malaysian equivalent to incorporated.
NV—Naamloze Vennootschap is the Dutch term for a public limited liability corporation.
PCL—Public Company Limited
PLC—Public Limited Company
S de RL de CV—Sociedad de Responsabilidad Limitada de Capital Variable is the Spanish equivalent to Limited Liability Company.
SA—Generally designates corporations in various countries, mostly those employing the civil law.
SAB de CV—Sociedad Anonima Bursátil de Capital Variable is the Spanish equivalent to Variable Capital Company.
SpA—Societa’ Per Azioni is an Italian shared company.
The accompanying notes are an integral part of these financial statements.
50
Alpine Realty Income & Growth Fund
Schedule of Portfolio Investments
April 30, 2013 (Unaudited)
| | | | Security | | | |
| Shares | | | Description | | Value | |
| | | | | | | | |
| Real Estate Investment Trusts—100.5% | | | | |
| Apartments—15.1% | | | | |
| 31,445 | | | Associated Estates Realty Corp. | | $ | 561,922 | |
| 25,625 | | | AvalonBay Communities, Inc. | | | 3,409,150 | |
| 34,900 | | | BRE Properties, Inc. | | | 1,761,752 | |
| 10,000 | | | Camden Property Trust | | | 723,400 | |
| 68,360 | | | Equity Residential (a) | | | 3,968,982 | |
| 23,665 | | | Essex Property Trust, Inc. (a) | | | 3,716,588 | |
| 45,200 | | | Home Properties, Inc. (a) | | | 2,913,592 | |
| 31,400 | | | UDR, Inc. | | | 771,812 | |
| | | | | | | 17,827,198 | |
| Diversified—5.5% | | | | |
| 26,114 | | | American Assets Trust, Inc. | | | 881,609 | |
| 88,700 | | | Crombie Real Estate
Investment Trust | | | 1,372,607 | |
| 48,617 | | | Vornado Realty Trust (a) | | | 4,256,904 | |
| | | | | | | 6,511,120 | |
| Health Care—15.9% | | | | |
| 78,772 | | | HCP, Inc. | | | 4,198,548 | |
| 56,903 | | | Health Care REIT, Inc. | | | 4,266,018 | |
| 60,047 | | | Omega Healthcare Investors, Inc. | | | 1,973,745 | |
| 51,340 | | | Sabra Health Care REIT, Inc. | | | 1,530,959 | |
| 34,333 | | | Senior Housing Properties Trust | | | 976,087 | |
| 72,212 | | | Ventas, Inc. (a) | | | 5,750,241 | |
| | | | | | | 18,695,598 | |
| Infrastructure—1.3% | | | | |
| 18,500 | | | American Tower Corp. | | | 1,553,815 | |
| Lodging—3.9% | | | | |
| 37,842 | | | Chatham Lodging Trust | | | 692,887 | |
| 39,658 | | | Chesapeake Lodging Trust | | | 938,308 | |
| 70,000 | | | DiamondRock Hospitality Co. | | | 698,600 | |
| 85,000 | | | Host Hotels & Resorts, Inc. | | | 1,552,950 | |
| 12,000 | | | LaSalle Hotel Properties (a) | | | 311,160 | |
| 15,000 | | | Pebblebrook Hotel Trust | | | 407,400 | |
| | | | | | | 4,601,305 | |
| Manufactured Homes—1.0% | | | | |
| 14,450 | | | Equity Lifestyle Properties, Inc. | | | 1,174,063 | |
| Mortgage & Finance—2.4% | | | | |
| 79,232 | | | Apollo Commercial Real Estate
Finance, Inc. | | | 1,405,576 | |
| 50,000 | | | Starwood Property Trust, Inc. | | | 1,374,500 | |
| | | | | | | 2,780,076 | |
| Net Lease—0.8% | | | | |
| 17,012 | | | EPR Properties | | | 961,858 | |
| Office-Industrial Buildings—30.2% | | | | |
| 51,528 | | | Alexandria Real Estate Equities,
Inc. (a) | | | 3,749,693 | |
| 58,611 | | | Boston Properties, Inc. | | | 6,413,802 | |
| 16,618 | | | CommonWealth REIT | | | 371,080 | |
| 37,671 | | | Coresite Realty Corp. | | | 1,362,937 | |
| 18,153 | | | Corporate Office Properties Trust (a) | | | 526,255 | |
| 55,100 | | | Digital Realty Trust, Inc. | | | 3,885,652 | |
| 64,509 | | | Douglas Emmett, Inc. | | | 1,688,201 | |
| 40,352 | | | DuPont Fabros Technology, Inc. | | | 1,014,449 | |
| 54,473 | | | Kilroy Realty Corp. (a) | | | 3,082,627 | |
| 29,208 | | | Liberty Property Trust | | | 1,255,652 | |
| 23,508 | | | Mack-Cali Realty Corp. | | | 652,817 | |
| 306,220 | | | MPG Office Trust, Inc. (b) | | | 955,406 | |
| | | | Security | | | | |
| Shares | | | Description | | Value | |
| | | | | | | | |
| Office-Industrial Buildings—continued | | | | |
| 104,700 | | | ProLogis, Inc. | | $ | 4,392,165 | |
| 50,551 | | | SL Green Realty Corp. (a) | | | 4,584,976 | |
| 54,537 | | | STAG Industrial, Inc. | | | 1,201,995 | |
| 24,766 | | | Terreno Realty Corp. | | | 466,096 | |
| | | | | | | 35,603,803 | |
| Retail Centers—20.1% | | | | |
| 148,191 | | | CBL & Associates Properties, Inc. | | | 3,577,331 | |
| 12,100 | | | Federal Realty Investment Trust (a) | | | 1,415,821 | |
| 76,000 | | | General Growth Properties, Inc. | | | 1,726,720 | |
| 50,000 | | | Kimco Realty Corp. | | | 1,189,000 | |
| 57,295 | | | Simon Property Group, Inc. (a) | | | 10,202,521 | |
| 24,706 | | | Taubman Centers, Inc. (a) | | | 2,112,610 | |
| 50,428 | | | The Macerich Co. (a) | | | 3,532,481 | |
| | | | | | | 23,756,484 | |
| Storage—4.3% | | | | |
| 30,765 | | | Public Storage (a) | | | 5,076,225 | |
| | | | Total Real Estate Investment
Trusts (Cost $70,585,270) | | | 118,541,545 | |
| | | | | | | | |
| Common Stocks—1.5% | | | | |
| Diversified—0.4% | | | | |
| 1,600 | | | Cofinimmo | | | 192,696 | |
| 22,034 | | | Cousins Properties, Inc. | | | 240,611 | |
| | | | | | | 433,307 | |
| Lodging—1.1% | | | | |
| 20,000 | | | Starwood Hotels & Resorts
Worldwide, Inc. (a) | | | 1,290,400 | |
| | | | Total Common Stocks
(Cost $1,318,830) | | | 1,723,707 | |
| | | | | | | | |
| Preferred Stocks—2.5% | | | | |
| Diversified—0.5% | | | | |
| 20,000 | | | Winthrop Realty Trust-
Series D, 9.250% | | | 558,200 | |
| Lodging—0.1% | | | | |
| 5,475 | | | LaSalle Hotel Properties-
Series G, 7.250% | | | 137,423 | |
| Mortgage & Finance—0.5% | | | | |
| 25,200 | | | NorthStar Realty Finance Corp.-
Series B, 8.250% | | | 633,024 | |
| Net Lease—0.2% | | | | |
| 10,432 | | | CapLease, Inc.-Series A, 8.125% | | | 264,451 | |
| Retail Centers—1.2% | | | | |
| 55,198 | | | CBL & Associates Properties, Inc.-
Series D, 7.375% | | | 1,402,581 | |
| | | | Total Preferred Stocks
(Cost $2,287,384) | | | 2,995,679 | |
Total Investments
(Cost $74,191,484)—104.5% | | | 123,260,931 | |
| Liabilities in Excess of Other Assets—(4.5)% | | | (5,273,514 | ) |
| TOTAL NET ASSETS 100.0% | | $ | 117,987,417 | |
The accompanying notes are an integral part of these financial statements.
51
Alpine Realty Income & Growth Fund
Schedule of Portfolio Investments—Continued
April 30, 2013 (Unaudited)
Percentages are stated as a percent of net assets.
| (a) | All or a portion of the security is available to serve as collateral on the outstanding loans. |
| | |
| (b) | Non-income producing security. |
REIT—Real Estate Investment Trust
The accompanying notes are an integral part of these financial statements.
52
Alpine Cyclical Advantage Property Fund
Schedule of Portfolio Investments
April 30, 2013 (Unaudited)
| Shares | | | Security
Description | | Value |
| | | | | | | | |
| Common Stocks—94.2% | | | | |
| Asia—31.2% | | | | |
| China—3.5% | | | | |
| 300,000 | | | China Overseas Land &
Investment, Ltd. | | $ | 918,152 | |
| 172,857 | | | China State Construction
International Holdings, Ltd. | | | 251,707 | |
| 2,000,000 | | | Franshion Properties China, Ltd. | | | 682,976 | |
| 897,931 | | | Kaisa Group Holdings, Ltd. (a) | | | 282,334 | |
| 300,000 | | | Sunac China Holdings, Ltd. | | | 242,006 | |
| | | | | | | 2,377,175 | |
| Hong Kong—1.8% | | | | |
| 6,967,005 | | | CSI Properties, Ltd. | | | 327,694 | |
| 60,000 | | | Hongkong Land Holdings, Ltd. | | | 435,600 | |
| 50,000 | | | Wharf Holdings, Ltd. | | | 446,834 | |
| | | | | | | 1,210,128 | |
| India—0.9% | | | | |
| 389,105 | | | Ascendas India Trust | | | 259,045 | |
| 620,000 | | | Unitech Corporate Parks PLC (a) | | | 356,339 | |
| | | | | | | 615,384 | |
| Indonesia—1.0% | | | | |
| 33,380,487 | | | PT Bakrieland Development TBK (a) | | | 178,533 | |
| 3,500,000 | | | PT Ciputra Development TBK | | | 496,786 | |
| | | | | | | 675,319 | |
| Japan—10.1% | | | | |
| 2,500 | | | Daito Trust Construction Co., Ltd. | | | 242,088 | |
| 400,000 | | | Haseko Corp. (a) | | | 582,654 | |
| 280,000 | | | Hulic Co., Ltd. | | | 3,107,760 | |
| 1,000 | | | Kenedix, Inc. (a) | | | 723,188 | |
| 20,000 | | | Mitsubishi Estate Co., Ltd. | | | 649,331 | |
| 16,000 | | | Nomura Real Estate Holdings, Inc. | | | 429,194 | |
| 199 | | | NTT Urban Development Corp. | | | 293,953 | |
| 100,000 | | | TOC Co., Ltd. | | | 785,762 | |
| | | | | | | 6,813,930 | |
| Malaysia—0.5% | | | | |
| 285,714 | | | SP Setia BHD | | | 322,103 | |
| Philippines—3.0% | | | | |
| 866,539 | | | Ayala Land, Inc. | | | 683,168 | |
| 5,000,000 | | | Megaworld Corp. | | | 504,130 | |
| 1,401,363 | | | Robinsons Land Corp. | | | 875,001 | |
| | | | | | | 2,062,299 | |
| Singapore—2.5% | | | | |
| 750,000 | | | Global Logistic Properties, Ltd. | | | 1,680,604 | |
| Thailand—7.9% | | | | |
| 1,500,000 | | | Ananda Development PCL (a) | | | 222,828 | |
| 300,000 | | | Central Pattana PCL | | | 1,022,147 | |
3,000,000
|
|
| Hemaraj Land and
Development PCL |
|
|
439,523 |
|
| 2,200,000 | | | LPN Development PCL-NVDR | | | 1,791,482 | |
| 500,000 | | | Minor International PCL | | | 419,080 | |
| 1,400,000 | | | Supalai PCL | | | 977,853 | |
| 569,550 | | | Ticon Industrial Connection PCL | | | 479,315 | |
| | | | | | | 5,352,228 | |
| | | | Total Asia (Cost $12,738,328) | | | 21,109,170 | |
| Shares | | | Security
Description | | Value | |
| | | | | | | |
| Europe—17.0% | | | | |
| France—1.8% | | | | |
| 67,000 | | | Affine SA | | $ | 1,199,123 | |
| Germany—5.2% | | | | |
| 39,904 | | | DIC Asset AG | | | 448,685 | |
| 110,000 | | | Patrizia Immobilien AG (a) | | | 1,113,864 | |
| 159,090 | | | TAG Immobilien AG | | | 1,927,526 | |
| | | | | | | 3,490,075 | |
| Italy—0.4% | | | | |
| 400,000 | | | Beni Stabili SpA | | | 281,827 | |
| Norway—0.1% | | | | |
| 38,469 | | | BWG Homes ASA (a) | | | 88,726 | |
| Poland—0.4% | | | | |
| 40,000 | | | Atrium European Real Estate, Ltd. | | | 238,737 | |
| Russia—1.3% | | | | |
| 783,674 | | | Raven Russia, Ltd. | | | 888,643 | |
| Turkey—2.4% | | | | |
| 500,000 | | | Emlak Konut Gayrimenkul Yatirim
Ortakligi AS | | | 856,227 | |
| 1,000,000 | | | Sinpas Gayrimenkul Yatirim
Ortakligi AS | | | 775,345 | |
| | | | | | | 1,631,572 | |
| United Kingdom—5.4% | | | | |
| 778,923 | | | LXB Retail Properties PLC (a) | | | 1,400,505 | |
| 950,924 | | | Quintain Estates &
Development PLC (a) | | | 956,434 | |
| 341,253 | | | Songbird Estates PLC | | | 742,119 | |
| 100,014 | | | Unite Group PLC | | | 540,331 | |
| | | | | | | 3,639,389 | |
| | | | Total Europe (Cost $9,527,133) | | | 11,458,092 | |
| | | | | | | | |
| North & South America—46.0% | | | | |
| Brazil—18.4% | | | | |
| 23,684 | | | Aliansce Shopping Centers SA | | | 267,411 | |
| 98,241 | | | BHG SA-Brazil Hospitality
Group (a) | | | 854,376 | |
| 84,796 | | | BR Malls Participacoes SA | | | 1,006,575 | |
| 95,538 | | | BR Properties SA | | | 1,064,849 | |
| 40,000 | | | Cyrela Brazil Realty SA
Empreendimentos
e Participacoes | | | 363,464 | |
| 15,000 | | | Cyrela Commercial Properties
SA Empreendimentos
e Participacoes-ADR (b)(c) | | | 703,076 | |
| 230,654 | | | Direcional Engenharia SA | | | 1,834,165 | |
| 50,000 | | | Gafisa SA (a) | | | 101,212 | |
| 40,000 | | | General Shopping Brasil SA (a) | | | 246,707 | |
| 144,280 | | | Iguatemi Empresa de Shopping
Centers SA | | | 1,732,874 | |
| 150,000 | | | JHSF Participacoes SA | | | 546,545 | |
| 91,805 | | | MRV Engenharia
e Participacoes SA | | | 394,614 | |
| 80,290 | | | Multiplan Empreendimentos
Imobiliarios SA | | | 2,287,407 | |
| 70,127 | | | Sonae Sierra Brasil SA | | | 981,410 | |
| | | | | | | 12,384,685 | |
The accompanying notes are an integral part of these financial statements.
53
Alpine Cyclical Advantage Property Fund
Schedule of Portfolio Investments—Continued
April 30, 2013 (Unaudited)
| Shares | | | Security
Description | | | Value | |
| | | | | | | | |
| North & South America—continued | | | | |
| Canada—1.7% | | | | |
| 49,146 | | | Brookfield Residential
Properties, Inc. (a)(c) | | $ | 1,174,098 | |
| Mexico—1.5% | | | | |
62,500
|
|
| Desarrolladora Homex SAB
de CV-ADR (a) |
|
|
305,000 |
|
300,000
|
|
| TF Administradora Industrial
S de RL de CV (a) |
|
| 715,268 | |
| | | | | | | 1,020,268 | |
| United States—24.4% | | | | |
| 1,000 | | | Altisource Asset Management
Corp. (a) | | | 200,000 | |
| 10,000 | | | Altisource Portfolio
Solutions SA (a)(c) | | | 825,400 | |
| 86,667 | | | Altisource Residential Corp. (a) | | | 1,646,673 | |
| 22,493 | | | American Capital Agency Corp. (c) | | | 749,242 | |
| 25,000 | | | American Capital Mortgage
Investment Corp. | | | 664,000 | |
| 19,852 | | | Apollo Commercial Real Estate
Finance, Inc. (c) | | | 352,175 | |
| 50,000 | | | Brookdale Senior Living, Inc. (a)(c) | | | 1,289,500 | |
| 40,000 | | | Cousins Properties, Inc. | | | 436,800 | |
| 90,000 | | | Newcastle Investment Corp. | | | 1,019,700 | |
| 60,771 | | | Ocwen Financial Corp. (a) | | | 2,223,003 | |
| 6,831 | | | ProLogis, Inc. | | | 286,560 | |
| 20,000 | | | Ryland Group, Inc. | | | 901,200 | |
| 1,923 | | | Simon Property Group, Inc. | | | 342,436 | |
| 84,445 | | | Starwood Property Trust, Inc. | | | 2,321,393 | |
| 5,000 | | | The Howard Hughes Corp. (a) | | | 471,900 | |
| 48,200 | | | TravelCenters of America LLC (a) | | | 555,264 | |
| 87,912 | | | Two Harbors Investment Corp. | | | 1,053,186 | |
| 10,440 | | | Vornado Realty Trust (c) | | | 914,126 | |
| 10,000 | | | Western Asset Mortgage
Capital Corp. | | | 224,000 | |
| | | | | | | 16,476,558 | |
| | | | Total North & South America
(Cost $23,409,947) | | | 31,055,609 | |
| | | | Total Common Stocks
(Cost $45,675,408) | | | 63,622,871 | |
| Shares | | | Security
Description | | | Value | |
| | | | | | | | |
| Real Estate Investment Trusts—1.9% | | | | |
| North & South America—1.9% | | | | |
| United States—1.9% | | | | |
| 3,000 | | | AvalonBay Communities, Inc. | | $ | 399,120 | |
| 5,000 | | | Camden Property Trust | | | 361,700 | |
| 5,783 | | | Taubman Centers, Inc. | | | 494,504 | |
| | | | | | | 1,255,324 | |
| | | | Total North & South America
(Cost $1,246,370) | | | 1,255,324 | |
| | | | Total Real Estate Investment Trusts
(Cost $1,246,370) | | | 1,255,324 | |
| | | | | | | | |
| Equity-Linked Structured Notes—1.1% | | | | |
| Asia—1.1% | | | | |
| India—0.6% | | | | |
| 50,000 | | | Sobha Developers, Ltd.-Macquarie
Bank, Ltd. | | | 386,450 | |
| Vietnam—0.5% | | | | |
| 301,875 | | | HAGL JSC-GDR-Macquarie
Bank, Ltd. (a)(d) | | | 326,040 | |
| | | | Total Asia (Cost $1,003,512) | | | 712,490 | |
| | | | Total Equity-Linked Structured
Notes (Cost $1,003,512) | | | 712,490 | |
| | | | | | | | |
| Principal | | | | | | | |
| Amount | | | | | | | |
| | | | | | | | |
| Short-Term Investments—4.6% | | | | |
$ 3,133,000
|
|
| State Street Eurodollar Time
Deposit, 0.01% |
|
|
3,133,000 |
|
| | | | Total Short-Term Investments
(Cost $3,133,000) | | | 3,133,000 | |
Total Investments
(Cost $51,058,290)—101.8% |
|
|
68,723,685 |
|
| Liabilities in Excess of Other Assets—(1.8)% | | | (1,207,832 | ) |
| TOTAL NET ASSETS 100.0% | | $ | 67,515,853 | |
The accompanying notes are an integral part of these financial statements.
54
Alpine Cyclical Advantage Property Fund
Schedule of Portfolio Investments—Continued
April 30, 2013 (Unaudited)
Percentages are stated as a percent of net assets.
| (a) | Non-income producing security. |
| | |
| (b) | Restricted under Rule 144A of the Securities Act of 1933. These securities may be resold in transactions exempt from registration, normally to qualified institutional buyers. These securities have been determined to be liquid under guidelines established by the Board of Trustees. Liquid securities restricted under Rule 144A comprised 1.0% of the Fund’s net assets. |
| | |
| (c) | All or a portion of the security is available to serve as collateral on the outstanding loans. |
| | |
| (d) | Reg S—Security exempt from registration under Regulation S of the Securities Act of 1933, which exempts from registration securities offered and sold outside the United States. Security may not be offered or sold in the United States except pursuant to an exemption from, or in a transaction not subject to, the registration requirements of the Securities Act of 1933. As of April 30, 2013, these securities amounted to a total value of $326,040 which comprised 0.5% of the Fund’s net assets. |
| | |
| ADR—American Depositary Receipt |
| |
| AG—Aktiengesellschaft is a German term that refers to a corporation that is limited by shares, i.e., owned by shareholders. |
| |
| AS—Anonim Sirketi is the Turkish term for joint stock company. |
| |
| ASA—Allmennaksjeselskap is the Norwegian term for a public limited company. |
| |
| BHD—Malaysian equivalent to incorporated. |
| |
| GDR—Global Depositary Receipt |
| |
| JSC—Joint Stock Company |
| |
| NVDR—Non-Voting Depositary Receipts |
| |
| PCL—Public Company Limited |
| |
| PLC—Public Limited Company |
| |
| S de RL de CV—Sociedad de Responsabilidad Limitada de Capital Variable is the Spanish equivalent to Limited Liability Company. |
| |
| SA—Generally designates corporations in various countries, mostly those employing the civil law. |
| |
| SAB de CV—Sociedad Anonima Bursátil de Capital Variable is the Spanish equivalent to Variable Capital Company. |
| |
| SpA—Societa’ Per Azioni is an Italian shared company. |
The accompanying notes are an integral part of these financial statements.
55
Alpine Emerging Markets Real Estate Fund
Schedule of Portfolio Investments
April 30, 2013 (Unaudited)
| Shares | | | Security
Description | | Value | |
| | | | | | | | |
| Common Stocks—86.2% | | | | |
| Asia—60.3% | | | | |
| China—23.7% | | | | |
| 200,000 | | | Central China Real Estate, Ltd. | | $ | 68,555 | |
| 140,000 | | | China Overseas Grand Oceans
Group, Ltd. | | | 220,099 | |
| 80,000 | | | China Overseas Land &
Investment, Ltd. | | | 244,841 | |
| 107,500 | | | China Resources Land, Ltd. | | | 324,849 | |
| 98,857 | | | China State Construction
International Holdings, Ltd. | | | 143,951 | |
| 120,000 | | | China Vanke Co., Ltd.-Class B | | | 243,088 | |
| 75,000 | | | Country Garden Holdings Co.,
Ltd. (a) | | | 42,621 | |
| 300,000 | | | Franshion Properties China, Ltd. | | | 102,446 | |
| 400,000 | | | Kaisa Group Holdings, Ltd. (a) | | | 125,771 | |
| 150,000 | | | KWG Property Holding, Ltd. | | | 103,606 | |
| 125,000 | | | Shimao Property Holdings, Ltd. | | | 269,647 | |
| 125,000 | | | Sunac China Holdings, Ltd. | | | 100,836 | |
| 450,000 | | | Yuexiu Property Co., Ltd. | | | 133,374 | |
| | | | | | | 2,123,684 | |
| Hong Kong—3.3% | | | | |
| 6,000 | | | Cheung Kong Holdings, Ltd. | | | 90,462 | |
| 1,393,401 | | | CSI Properties, Ltd. | | | 65,539 | |
| 45,000 | | | New World Development Co., Ltd. | | | 78,168 | |
| 7,000 | | | Wharf Holdings, Ltd. | | | 62,557 | |
| | | | | | | 296,726 | |
| India—0.3% | | | | |
| 50,000 | | | Unitech Corporate Parks PLC (a)(b) | | | 28,737 | |
| Indonesia—9.4% | | | | |
| 800,000 | | | PT Alam Sutera Realty TBK (b) | | | 86,398 | |
| 900,000 | | | PT Bekasi Fajar Industrial Estate
TBK (a) | | | 92,569 | |
| 699,659 | | | PT Bumi Serpong Damai TBK (b) | | | 124,496 | |
| 1,200,000 | | | PT Ciputra Development TBK | | | 170,327 | |
| 100,000 | | | PT Lippo Karawaci TBK | | | 13,885 | |
| 1,200,000 | | | PT Modernland Realty TBK (a) | | | 119,722 | |
| 500,000 | | | PT Summarecon Agung TBK | | | 133,710 | |
| 600,000 | | | PT Surya Semesta Internusa TBK | | | 97,506 | |
| | | | | | | 838,613 | |
| Malaysia—2.5% | | | | |
| 100,000 | | | CapitaMalls Malaysia Trust | | | 61,791 | |
| 60,000 | | | Pavilion Real Estate Investment
Trust | | | 31,553 | |
| 117,142 | | | SP Setia BHD | | | 132,062 | |
| | | | | | | 225,406 | |
| Philippines—5.5% | | | | |
| 278,307 | | | Ayala Land, Inc. | | | 219,414 | |
| 700,000 | | | Megaworld Corp. | | | 70,578 | |
| 200,000 | | | SM Development Corp. | | | 41,302 | |
| 328,850 | | | SM Prime Holdings, Inc. | | | 159,791 | |
| | | | | | | 491,085 | |
| Singapore—2.1% | | | | |
| 35,000 | | | CapitaLand, Ltd. | | | 106,276 | |
| 35,000 | | | Global Logistic Properties, Ltd. | | | 78,428 | |
| | | | | | | 184,704 | |
| Shares | | | Security
Description | | Value | |
| | | | | | | | |
| Thailand—11.7% | | | | |
| 200,000 | | | Amata Corp. PCL | | $ | 156,729 | |
| 700,000 | | | Ananda Development PCL (a) | | | 103,986 | |
| 270,000 | | | Asian Property Development PCL | | | 86,474 | |
| 35,000 | | | Central Pattana PCL | | | 119,250 | |
| 120,000 | | | CPN Retail Growth Leasehold
Property Fund | | | 80,545 | |
| 600,000 | | | Hemaraj Land and Development PCL | | | 87,905 | |
| 120,000 | | | LPN Development PCL—NVDR | | | 97,717 | |
| 100,000 | | | Major Cineplex Group PCL | | | 75,639 | |
| 120,000 | | | Minor International PCL | | | 100,579 | |
| 75,000 | | | Pruksa Real Estate PCL | | | 74,745 | |
| 80,125 | | | Ticon Industrial Connection PCL | | | 67,431 | |
| | | | | | | 1,051,000 | |
| United Arab Emirates—1.8% | | | | |
| 105,000 | | | Emaar Properties PJSC | | | 160,373 | |
| | | | Total Asia (Cost $4,317,650) | | | 5,400,328 | |
| Europe—2.4% | | | | |
| Russia—0.7% | | | | |
| 56,902 | | | Raven Russia, Ltd. (b) | | | 64,524 | |
| Turkey—1.7% | | | | |
| 40,000 | | | Emlak Konut Gayrimenkul Yatirim
Ortakligi AS | | | 68,498 | |
| 100,000 | | | Sinpas Gayrimenkul Yatirim
Ortakligi AS | | | 77,534 | |
| | | | | | | 146,032 | |
| | | | Total Europe (Cost $183,228) | | | 210,556 | |
| Middle East/Africa—0.4% | | | | |
| South Africa—0.4% | | | | |
| 30,000 | | | Capital Property Fund | | | 39,450 | |
| | | | Total Middle East/Africa
(Cost $37,555) | | | 39,450 | |
| North & South America—23.1% | | | | |
| Argentina—0.3% | | | | |
| 3,100 | | | TGLT SA—ADR (c) | | | 24,301 | |
| Brazil—18.1% | | | | |
| 7,763 | | | Aliansce Shopping Centers SA | | | 87,650 | |
| 8,962 | | | BHG SA—Brazil Hospitality
Group (a) | | | 77,940 | |
| 20,549 | | | BR Malls Participacoes SA (b) | | | 243,928 | |
| 23,056 | | | BR Properties SA | | | 256,978 | |
| 4,091 | | | Cyrela Commercial Properties SA
Empreendimentos e Participacoes | | | 48,051 | |
| 13,624 | | | Direcional Engenharia SA | | | 108,338 | |
| 16,895 | | | Even Construtora e Incorporadora SA | | | 79,799 | |
| 6,000 | | | Ez Tec Empreendimentos e
Participacoes SA | | | 82,469 | |
| 40,000 | | | Gafisa SA (a) | | | 80,970 | |
| 20,838 | | | General Shopping Brasil SA (a) | | | 128,522 | |
| 14,300 | | | Helbor Empreendimentos SA | | | 71,045 | |
| 6,000 | | | Iguatemi Empresa de Shopping
Centers SA | | | 72,063 | |
| 22,000 | | | JHSF Participacoes SA | | | 80,160 | |
| 4,050 | | | MRV Engenharia e Participacoes SA | | | 17,409 | |
| 1,842 | | | Multiplan Empreendimentos
Imobiliarios SA | | | 52,477 | |
| 1,894 | | | Sao Carlos Empreendimentos e
Participacoes SA | | | 44,019 | |
| 6,500 | | | Sonae Sierra Brasil SA | | | 90,966 | |
| | | | | | | 1,622,784 | |
The accompanying notes are an integral part of these financial statements.
56
Alpine Emerging Markets Real Estate Fund
Schedule of Portfolio Investments—Continued
April 30, 2013 (Unaudited)
| Shares | | | Security
Description | | | Value | |
| | | | | | | | |
| North & South America—continued | | | | |
| Chile—0.6% | | | | |
| 20,000 | | | Parque Arauco SA | | $ | 51,721 | |
| Mexico—4.1% | | | | |
| 40,000 | | | Concentradora Fibra Hotelera
Mexicana SA de CV | | | 81,533 | |
| 30,000 | | | Corp. Inmobiliaria Vesta SAB de CV | | | 69,155 | |
| 25,000 | | | Fibra Uno Administracion SA de CV | | | 96,069 | |
| 50,000 | | | TF Administradora Industrial S de
RL de CV (a) | | | 119,211 | |
| | | | | | | 365,968 | |
| | | | Total North & South America
(Cost $1,920,238) | | | 2,064,774 | |
| | | | Total Common Stocks
(Cost $6,458,671) | | | 7,715,108 | |
| Preferred Stocks—0.8% | | | | |
| Europe—0.8% | | | | |
| Russia—0.8% | | | | |
| 30,000 | | | Raven Russia, Ltd., 12.000% (b) | | | 70,250 | |
| | | | Total Europe (Cost $63,178) | | | 70,250 | |
| | | | Total Preferred Stocks
(Cost $63,178) | | | 70,250 | |
| Equity—Linked Structured Notes—6.0% | | | | |
| Asia—6.0% | | | | |
| China—1.0% | | | | |
| 50,000 | | | China Vanke Co., Ltd.—Class A—
Citigroup Global Markets, Inc. | | | 89,456 | |
| India—4.5% | | | | |
45,000
|
|
| Housing Development &
Infrastructure, Ltd.—Macquarie
Bank, Ltd. (a) |
|
|
44,186 |
|
| 10,000 | | | Oberoi Realty, Ltd.—Macquarie
Bank, Ltd. | | | 45,160 | |
| 80,000 | | | Peninsula Land, Ltd.—Macquarie
Bank, Ltd. | | | 70,608 | |
| 8,310 | | | Phoenix Mills, Ltd.—Macquarie
Bank, Ltd. | | | 41,801 | |
| 8,000 | | | Phoenix Mills, Ltd.—Merrill Lynch
& Co., Inc. | | | 40,241 | |
| 17,500 | | | Prestige Estates Projects, Ltd.— Macqarie
Bank, Ltd. | | | 54,733 | |
| 14,000 | | | Sobha Developers, Ltd.—Macquarie
Bank, Ltd. | | | 108,206 | |
| | | | | | | 404,935 | |
| Vietnam—0.5% | | | | |
| 43,125 | | | HAGL JSC—GDR—Macquarie Bank,
Ltd. (a)(d) | | | 46,577 | |
| | | | Total Asia (Cost $544,549) | | | 540,968 | |
| | | | Total Equity—Linked Structured
Notes (Cost $544,549) | | | 540,968 | |
Principal
Amount | | | Security
Description | | | Value | |
| | | | | | | | | |
| Convertible Bonds—0.2% | | | | |
| North & South America—0.2% | | | | |
| Brazil—0.2% | | | | |
| $ | 80,000 | | | PDG Realty SA Empreendimentos
e Participacoes—Series 8, 0.000%,
9/19/16 (Brazilian Real) (e) | | | | |
| | | | | | | $ | 17,793 | |
| | | | | Total Convertible Bonds
(Cost $28,699) | | | 17,793 | |
| | | | | | | | | |
| Shares | | | | | | | |
| | | | | |
| Warrants—2.4% | | | | |
| Asia—2.4% | | | | |
| Malaysia—0.4% | | | | |
| 100,000
|
|
| IJM Land BHD (a)
Expiration: September, 2013
Exercise Price: MYR 1.35 |
|
|
38,455 |
|
| Thailand—2.0% | | | | |
| 514,000
|
|
| The Erawan Group PCL (a)
Expiration: December, 2013
Exercise Price: THB 2.80 |
|
|
45,533 |
|
| 250,000
|
|
| Ticon Industrial Connection PCL (a)
Expiration: January, 2014
Exercise Price: THB 19.342 |
|
|
45,145 |
|
| 700,000
|
|
| Sansiri PCL (a)
Expiration: January, 2015
Exercise Price: THB 1.114 |
|
|
85,384 |
|
| | | | | | | | 176,062 | |
| | | | | Total Asia (Cost $198,780) | | | 214,517 | |
| | | | | Total Warrants (Cost $198,780) | | | 214,517 | |
| | | | | | | | | |
| Principal | | | | | | | |
| Amount | | | | | | | |
| | | | | | | | |
| Short-Term Investments—5.3% | | | | |
$
| 471,000
|
|
| State Street Eurodollar Time
Deposit, 0.01% |
|
|
471,000 |
|
| | | | | Total Short-Term Investments
(Cost $471,000) | | | 471,000 | |
Total Investments
(Cost $7,764,877)—100.9% | | | 9,029,636 | |
| Liabilities in Excess of Other Assets—(0.9)% | | | (80,377 | ) |
| TOTAL NET ASSETS 100.0% | | $ | 8,949,259 | |
The accompanying notes are an integral part of these financial statements.
57
Alpine Emerging Markets Real Estate Fund
Schedule of Portfolio Investments—Continued
April 30, 2013 (Unaudited)
Percentages are stated as a percent of net assets.
| (a) | Non-income producing security. |
| | |
| (b) | All or a portion of the security is available to serve as collateral on the outstanding loans. |
| | |
| (c) | Illiquid security. |
| | |
| (d) | Reg S—Security exempt from registration under Regulation S of the Securities Act of 1933, which exempts from registration securities offered and sold outside the United States. Security may not be offered or sold in the United States except pursuant to an exemption from, or in a transaction not subject to, the registration requirements of the Securities Act of 1933. As of April 30, 2013, these securities amounted to a total value of $46,577 which comprised 0.5% of the Fund’s net assets. |
| | |
| (e) Represents a zero-coupon bond. Rate shown reflects the current yield as of the report date. |
| |
| ADR—American Depositary Receipt |
| |
| AS—Anonim Sirketi is the Turkish term for joint stock company. |
| |
| BHD—Malaysian equivalent to incorporated. |
| |
| GDR—Global Depositary Receipt |
| |
| JSC—Joint Stock Company |
| |
| MYR—Malaysian Ringgit |
| |
| NVDR—Non-Voting Depositary Receipts |
| |
| PCL—Public Company Limited |
| |
| PJSC—Public Joint Stock Company |
| |
| PLC—Public Limited Company |
| |
| S de RL de CV—Sociedad de Responsabilidad Limitada de Capital Variable is the Spanish equivalent to Limited Liability Company. |
| |
| SA—Generally designates corporations in various countries, mostly those employing the civil law. |
| |
| SA de CV—Sociedad Anonima de Capital Variable is the Spanish equivalent to Variable Capital Company. |
| |
| SAB de CV—Sociedad Anonima Bursátil de Capital Variable is the Spanish equivalent to Variable Capital Company. |
| |
| THB—Thailand Baht |
The accompanying notes are an integral part of these financial statements.
58
Alpine Global Infrastructure Fund
Schedule of Portfolio Investments
April 30, 2013 (Unaudited)
| | | | Security | | | |
| Shares | | | Description | | Value | |
| | | | | | | | | |
| Common Stocks—89.7% |
| Asia—16.2% |
| China—9.6% |
| | 1,250,000 | | | Anhui Expressway Co.-Class H | | $ | 689,420 | |
| | 3,700,000 | | | Beijing Enterprises Water
Group, Ltd. | | | 1,125,236 | |
| | 950,000 | | | China Everbright
International, Ltd. | | | 734,522 | |
| | 105,000 | | | China Mobile, Ltd. | | | 1,150,107 | |
| | 1,400,000 | | | China Railway Construction
Corp., Ltd.-Class H | | | 1,412,601 | |
| | 806,972 | | | China State Construction
International Holdings, Ltd. | | | 1,175,078 | |
| | 1,073,000 | | | COSCO Pacific, Ltd. | | | 1,421,421 | |
| | 2,650,000 | | | Guangshen Railway Co.,
Ltd.-Class H | | | 1,335,219 | |
| | 5,291,000 | | | Tianjin Port Development
Holdings, Ltd. | | | 756,817 | |
| | 1,300,000 | | | Yuexiu Transport
Infrastructure, Ltd. | | | 665,064 | |
| | | | | | | | 10,465,485 | |
| Indonesia—2.1% |
| | 48,500,000 | | | PT Bakrieland Development TBK (a) | | | 259,398 | |
| | 4,400,000 | | | PT Citra Marga Nusaphala
Persada TBK | | | 832,707 | |
| | 1,800,000 | | | PT Jasa Marga TBK | | | 1,240,422 | |
| | | | | | | | 2,332,527 | |
| Japan—2.4% | | | | | | | |
| | 13,500 | | | East Japan Railway Co. | | | 1,138,329 | |
| | 29,000 | | | Japan Airlines Co., Ltd. (b) | | | 1,469,559 | |
| | | | | | | | 2,607,888 | |
| Philippines—1.7% |
| | 350,000 | | | International Container Terminal
Services, Inc. | | | 782,313 | |
| | 1,075,000 | | | Manila Water Co., Inc. | | | 1,043,398 | |
| | | | | | | | 1,825,711 | |
| Thailand—0.4% |
| | 1,000,000 | | | BTS Rail Mass Transit Growth
Infrastructure Fund (a) | | | 412,266 | |
| | | | | Total Asia (Cost $15,273,501) | | | 17,643,877 | |
| Europe-26.6% |
| Austria—0.7% |
| | 14,500 | | | Kapsch TrafficCom AG | | | 712,272 | |
| France—6.8% |
| | 12,500 | | | Aeroports de Paris | | | 1,131,425 | |
| | 38,500 | | | Eutelsat Communications SA | | | 1,390,012 | |
| | 87,500 | | | Suez Environnement Co. | | | 1,256,618 | |
| | 92,500 | | | Veolia Environnement SA | | | 1,274,824 | |
| | 48,000 | | | Vinci SA | | | 2,311,090 | |
| | | | | | | | 7,363,969 | |
| Germany—6.1% |
| | 19,000 | | | Fraport AG Frankfurt Airport
Services Worldwide | | | 1,135,501 | |
| | 60,000 | | | Hamburger Hafen und Logistik AG | | | 1,291,138 | |
| | 22,500 | | | HeidelbergCement AG | | | 1,619,948 | |
| | 19,000 | | | Hochtief AG (a) | | | 1,318,663 | |
| | 13,500 | | | Kabel Deutschland Holding AG | | | 1,283,098 | |
| | | | | | | | 6,648,348 | |
| | | | Security | | | |
| Shares | | | Description | | Value | |
| | | | | | | | | |
| Italy—2.0% | | | | |
| | 65,000 | | | Atlantia SpA | | $ | 1,161,616 | |
| | 200,000 | | | Snam Rete Gas SpA | | | 983,499 | |
| | | | | | | | 2,145,115 | |
| Netherlands—3.1% |
| | 33,000 | | | Koninklijke Vopak NV | | | 1,827,901 | |
| | 42,000 | | | Ziggo NV | | | 1,505,314 | |
| | | | | | | | 3,333,215 | |
| Spain—1.6% | | | | |
| | 95,000 | | | Abertis Infraestructuras SA | | | 1,774,064 | |
| Turkey—1.4% | | | | |
| | 215,000 | | | TAV Havalimanlari Holding AS | | | 1,517,083 | |
| United Kingdom—4.9% | | | | |
| | 190,000 | | | Centrica PLC | | | 1,094,956 | |
| | 122,500 | | | Ferrovial SA | | | 2,027,067 | |
| | 15,500 | | | National Grid PLC-ADR | | | 988,590 | |
| | 40,000 | | | Vodafone Group PLC-ADR | | | 1,223,600 | |
| | | | | | | | 5,334,213 | |
| | | | | Total Europe (Cost $26,390,271) | | | 28,828,279 | |
| North & South America—46.9% | | | | |
| Brazil—10.9% | | | | |
| | 380,000 | | | All America Latina Logistica SA | | | 1,935,374 | |
| | 152,500 | | | CCR SA | | | 1,507,660 | |
| | 100,000 | | | Cia de Saneamento Basico do
Estado de Sao Paulo-ADR (b) | | | 1,430,000 | |
| | 215,000 | | | EcoRodovias Infraestrutura
e Logistica SA | | | 1,881,619 | |
| | 180,000 | | | EDP – Energias do Brasil SA | | | 1,103,886 | |
| | 94,999 | | | Equatorial Energia SA | | | 1,011,360 | |
| | 82,500 | | | Mills Estruturas e Servicos
de Engenharia SA | | | 1,354,555 | |
| | 168,500 | | | Oi SA-ADR | | | 402,715 | |
| | 90,000 | | | Tegma Gestao Logistica SA | | | 1,214,994 | |
| | | | | | | | 11,842,163 | |
| Canada—3.2% | | | | |
| | 15,000 | | | Canadian Pacific Railway, Ltd. | | | 1,869,300 | |
| | 34,000 | | | Enbridge, Inc. | | | 1,617,907 | |
| | | | | | | | 3,487,207 | |
| Chile—0.8% | | | | |
| | 420,000 | | | E.CL SA | | | 876,654 | |
| Colombia—1.1% |
| | 14,000 | | | Millicom International
Cellular SA-SDR | | | 1,144,876 | |
| Mexico—2.7% | | | | |
| | 142,500 | | | Empresas ICA SAB de CV-ADR (a)(b) | | | 1,568,925 | |
| | 150,000 | | | Infraestructura Energetica Nova
SAB de CV (a) | | | 512,547 | |
| | 290,000 | | | OHL Mexico SAB de CV (a) | | | 897,540 | |
| | | | | | | | 2,979,012 | |
| United States—28.2% | | | | |
| | 21,000 | | | American Tower Corp. | | | 1,763,790 | |
| | 31,000 | | | American Water Works Co., Inc. (b) | | | 1,298,280 | |
| | 33,500 | | | AT&T, Inc. (b) | | | 1,254,910 | |
| | 24,500 | | | Atmos Energy Corp. | | | 1,087,065 | |
| | 55,000 | | | Calpine Corp. (a)(b) | | | 1,195,150 | |
| | 70,000 | | | Cisco Systems, Inc. (b) | | | 1,464,400 | |
| | 36,000 | | | CMS Energy Corp. | | | 1,077,840 | |
| | 35,000 | | | Comcast Corp.-Class A (b) | | | 1,445,500 | |
The accompanying notes are an integral part of these financial statements.
59
Alpine Global Infrastructure Fund
Schedule of Portfolio Investments—Continued
April 30, 2013 (Unaudited)
| | | | Security | | | |
| Shares | | | Description | | Value | |
| | | | | | | | | |
| North & South America—continued |
| United States—continued |
| | 58,000 | | | Corrections Corp. of America | | $ | 2,099,600 | |
| | 36,500 | | | DISH Network Corp.-Class A | | | 1,430,435 | |
| | 140,000 | | | EnergySolutions, Inc. (a)(b) | | | 578,200 | |
| | 14,000 | | | ITC Holdings Corp. (b) | | | 1,291,080 | |
| | 32,000 | | | Itron, Inc. (a)(b) | | | 1,268,800 | |
| | 53,000 | | | MasTec, Inc. (a)(b) | | | 1,473,400 | |
| | 23,000 | | | Northeast Utilities (b) | | | 1,042,590 | |
| | 88,500 | | | Progressive Waste
Solutions, Ltd. (b) | | | 1,970,010 | |
| | 41,776 | | | The Geo Group, Inc. (b) | | | 1,564,517 | |
| | 43,000 | | | The Williams Cos., Inc. | | | 1,639,590 | |
| | 105,000 | | | TravelCenters of America LLC (a)(b) | | | 1,209,600 | |
| | 14,500 | | | UGI Corp. | | | 594,210 | |
| | 10,500 | | | Union Pacific Corp. (b) | | | 1,553,580 | |
| | 34,000 | | | World Fuel Services Corp. (b) | | | 1,378,700 | |
| | 28,000 | | | Xcel Energy, Inc. | | | 890,120 | |
| | | | | | | | 30,571,367 | |
| | | | | Total North & South America
(Cost $42,884,973) | | | 50,901,279 | |
| | | | | Total Common Stocks
(Cost $84,548,745) | | | 97,373,435 | |
| | | | Security | | | |
| Shares | | | Description | | Value | |
| | | | | | | | | |
| Equity-Linked Structured Notes—1.2% | | | | |
| Asia—1.2% | | | | |
| India-1.2% | | | | |
| | 175,000 | | | Adani Ports and Special Economic
Zone-Macquarie Bank, Ltd. | | $ | 470,510 | |
| | 400,000 | | | Power Grid Corp. of India, Ltd.-
Macquarie Bank, Ltd. | | | 830,441 | |
| | | | | | | | 1,300,951 | |
| | | | | Total Asia (Cost $1,276,274) | | | 1,300,951 | |
| | | | | Total Equity-Linked Structured
Notes (Cost $1,276,274) | | | 1,300,951 | |
| | | | | | | | | |
Principal
Amount | | | | | | | |
| Short-Term Investments—13.5% | | | | |
| $ | 14,614,000 | | | State Street Eurodollar Time
Deposit, 0.01% | | | 14,614,000 | |
| | | | | Total Short-Term Investments
(Cost $14,614,000) | | | 14,614,000 | |
Total Investments
(Cost $100,439,019)—104.4% | | | 113,288,386 | |
| Liabilities in Excess of Other Assets—(4.4)% | | | (4,755,283 | ) |
| TOTAL NET ASSETS 100.0% | | $ | 108,533,103 | |
Percentages are stated as a percent of net assets.
| (a) | Non-income producing security. |
| | |
| (b) | All or a portion of the security is available to serve as collateral on the outstanding loans. |
ADR—American Depositary Receipt
AG—Aktiengesellschaft is a German term that refers to a corporation that is limited by shares, i.e., owned by shareholders.
AS—Anonim Sirketi is the Turkish term for joint stock company.
NV—Naamloze Vennootschap is the Dutch term for a public limited liability corporation.
PLC—Public Limited Company
SA—Generally designates corporations in various countries, mostly those employing the civil law.
SAB de CV—Sociedad Anonima Bursátil de Capital Variable is the Spanish equivalent to Variable Capital Company.
SDR—Swedish Depositary Receipt
SpA—Societa’ Per Azioni is an Italian shared company.
The accompanying notes are an integral part of these financial statements.
60
Alpine Global Consumer Growth Fund
Schedule of Portfolio Investments
April 30, 2013 (Unaudited)
| | | | Security | | | |
| Shares | | | Description | | Value | |
| | | | | | | | | |
| Common Stocks—96.3% |
| Asia—19.1% |
| China—8.3% |
| | 450 | | | Baidu, Inc.-ADR (a) | | $ | 38,633 | |
| | 26,000 | | | Daphne International
Holdings, Ltd. | | | 27,038 | |
| | 20,000 | | | Dongfeng Motor Group Co., Ltd. | | | 29,896 | |
| | 14,000 | | | Golden Eagle Retail Group, Ltd. | | | 24,536 | |
| | 48,000 | | | Springland International
Holdings, Ltd. | | | 24,989 | |
| | 1,400 | | | Tencent Holdings, Ltd. | | | 47,989 | |
| | 22,000 | | | Want Want China Holdings, Ltd. | | | 34,870 | |
| | | | | | | | 227,951 | |
| Hong Kong—2.1% |
| | 96,000 | | | Hengdeli Holdings, Ltd. | | | 28,082 | |
| | 350,000 | | | REXLot Holdings, Ltd. | | | 28,865 | |
| | | | | | | | 56,947 | |
| Indonesia—3.6% |
| | 100,000 | | | PT Erajaya Swasembada TBK (a) | | | 32,142 | |
| | 27,500 | | | PT Indofood CBP Sukses
Makmur TBK | | | 32,386 | |
| | 40,000 | | | PT Mitra Adiperkasa TBK | | | 33,942 | |
| | | | | | | | 98,470 | |
| Japan—2.6% |
| | 3,000 | | | Nissan Motor Co., Ltd. | | | 31,266 | |
| | 1,000 | | | Seven & I Holdings Co., Ltd. | | | 38,365 | |
| | | | | | | | 69,631 | |
| Philippines—1.4% |
| | 80,000 | | | SM Prime Holdings, Inc. | | | 38,873 | |
| South Korea—1.1% |
| | 625 | | | Kia Motors Corp. | | | 31,100 | |
| | | | | Total Asia (Cost $484,982) | | | 522,972 | |
| Europe—24.3% |
| Belgium—2.8% |
| | 800 | | | Anheuser-Busch InBev NV-ADR | | | 76,496 | |
| France—2.5% |
| | 100 | | | PPR | | | 22,000 | |
| | 1,500 | | | SES SA | | | 46,837 | |
| | | | | | | | 68,837 | |
| Germany—5.3% |
| | 450 | | | Adidas AG | | | 46,995 | |
| | 360 | | | Bayerische Motoren Werke AG | | | 33,211 | |
| | 675 | | | Kabel Deutschland Holding AG | | | 64,155 | |
| | | | | | | | 144,361 | |
| Italy—1.2% |
| | 1,800 | | | Yoox SpA (a) | | | 33,803 | |
| Netherlands—3.6% |
| | 450 | | | Heineken NV | | | 31,777 | |
| | 1,000 | | | Unilever NV | | | 42,564 | |
| | 900 | | | Yandex NV-Class A (a) | | | 23,166 | |
| | | | | | | | 97,507 | |
| Russia—1.0% |
| | 1,525 | | | X5 Retail Group NV-GDR (a)(b) | | | 26,749 | |
| Spain—0.7% |
| | 150 | | | Inditex SA | | | 20,159 | |
| Sweden—0.8% |
| | 4,000 | | | Fingerprint Cards AB (a) | | | 20,737 | |
| | | | Security | | | |
| Shares | | | Description | | Value | |
| | | | | | | | | |
| Switzerland—5.4% | | | | |
| | 300 | | | Dufry Group (a) | | $ | 39,976 | |
| | 1,050 | | | Nestle SA | | | 74,984 | |
| | 60 | | | The Swatch Group AG | | | 34,362 | |
| | | | | | | | 149,322 | |
| United Kingdom—1.0% | | | | |
| | 22,000 | | | Debenhams PLC | | | 28,433 | |
| | | | | Total Europe (Cost $518,846) | | | 666,404 | |
| | | | | | | | | |
| North & South America—52.9% | | | | |
| Brazil—7.8% | | | | |
| | 2,500 | | | Anhanguera Educaciona
Participacoes SA | | | 44,983 | |
| | 2,200 | | | BR Malls Participacoes SA | | | 26,115 | |
| | 575 | | | Cia Brasileira de Distribuicao
Grupo Pao de Acucar | | | 31,947 | |
| | 3,600 | | | Hypermarcas SA (a) | | | 28,807 | |
| | 2,400 | | | International Meal Co. Holdings SA | | | 30,349 | |
| | 5,900 | | | Magazine Luiza SA | | | 21,114 | |
| | 1,900 | | | Multiplus SA | | | 31,187 | |
| | | | | | | | 214,502 | |
| Mexico—2.2% | | | | |
| | 9,000 | | | Grupo Comercial Chedraui
SA de CV | | | 34,303 | |
| | 1,000 | | | Grupo Televisa SA-ADR | | | 25,320 | |
| | | | | | | | 59,623 | |
| United States—42.9% | | | | |
| | 775 | | | Abercrombie & Fitch Co.-Class A | | | 38,409 | |
| | 175 | | | Amazon.com, Inc. (a) | | | 44,417 | |
| | 140 | | | Apple, Inc. | | | 61,985 | |
| | 750 | | | Carnival Corp. | | | 25,883 | |
| | 1,001 | | | CBS Corp.-Class B | | | 45,826 | |
| | 1,000 | | | Coach, Inc. | | | 58,860 | |
| | 300 | | | Colgate-Palmolive Co. | | | 35,823 | |
| | 1,750 | | | Comcast Corp.-Class A | | | 72,275 | |
| | 900 | | | Dick’s Sporting Goods, Inc. | | | 43,290 | |
| | 1,250 | | | Francesca’s Holdings Corp. (a) | | | 35,700 | |
| | 75 | | | Google, Inc.-Class A (a) | | | 61,843 | |
| | 825 | | | Guess?, Inc. | | | 22,836 | |
| | 500 | | | Lumber Liquidators
Holdings, Inc. (a) | | | 40,980 | |
| | 500 | | | McDonald’s Corp. | | | 51,070 | |
| | 420 | | | MercadoLibre, Inc. | | | 42,248 | |
| | 996 | | | Michael Kors Holdings, Ltd. (a) | | | 56,712 | |
| | 700 | | | NIKE, Inc.-Class B | | | 44,520 | |
| | 750 | | | PepsiCo, Inc. | | | 61,852 | |
| | 550 | | | Target Corp. | | | 38,808 | |
| | 450 | | | The Procter & Gamble Co. | | | 34,546 | |
| | 500 | | | Ulta Salon Cosmetics &
Fragrance, Inc. | | | 43,825 | |
| | 400 | | | VF Corp. | | | 71,288 | |
| | 350 | | | Visa, Inc.-Class A | | | 58,961 | |
| | 800 | | | Yum! Brands, Inc. | | | 54,496 | |
| | 4,400 | | | Zagg, Inc. (a) | | | 29,788 | |
| | | | | | | | 1,176,241 | |
| | | | | Total North & South America
(Cost $1,179,243) | | | 1,450,366 | |
| | | | | Total Common Stocks
(Cost $2,183,071) | | | 2,639,742 | |
The accompanying notes are an integral part of these financial statements.
61
Alpine Global Consumer Growth Fund
Schedule of Portfolio Investments—Continued
April 30, 2013 (Unaudited)
| Principal | | | Security | | | |
| Amount | | | Description | | Value | |
| | | | | | | | | |
| Short-Term Investments—3.8% | | | | |
| $ | 103,000 | | | State Street Eurodollar Time
Deposit, 0.01% | | $ | 103,000 | |
| | | | | Total Short-Term Investments
(Cost $103,000) | | | 103,000 | |
Total Investments
(Cost $2,286,071)-100.1% | | | 2,742,742 | |
| Liabilities in Excess of Other Assets—(0.1)% | | | (1,958 | ) |
| TOTAL NET ASSETS 100.0% | | $ | 2,740,784 | |
Percentages are stated as a percent of net assets.
| (a) | Non-income producing security. |
| (b) | Restricted under Rule 144A of the Securities Act of 1933. These securities may be resold in transactions exempt from registration, normally to qualified institutional buyers. These securities have been determined to be liquid under guidelines established by the Board of Trustees. Liquid securities restricted under Rule 144A comprised 1.0% of the Fund’s net assets. |
AB—Aktiebolag is the Swedish equivalent of a corporation.
ADR—American Depositary Receipt
AG—Aktiengesellschaft is a German term that refers to a corporation that is limited by shares, i.e., owned by shareholders.
GDR—Global Depositary Receipt
NV—Naamloze Vennootschap is the Dutch term for a public limited liability corporation.
PLC—Public Limited Company
SA—Generally designates corporations in various countries, mostly those employing the civil law.
SA de CV—Sociedad Anonima de Capital Variable is the Spanish equivalent to Variable Capital Company.
SpA—Societa’ Per Azioni is an Italian shared company.
The accompanying notes are an integral part of these financial statements.
62
Alpine Mutual Funds
Statements of Assets and Liabilities
April 30, 2013 (Unaudited)
| | | | International
Real Estate
Equity Fund | | | | Realty
Income &
Growth Fund | | | | Cyclical
Advantage
Property Fund | |
| ASSETS: | | | | | | | | | | | | | | | |
| Investments, at value(1) | | | | | | | | | | | | | | | |
| Unaffiliated issuers | | | $ | 253,993,673 | | | | $ | 123,260,931 | | | | $ | 68,723,685 | |
| Affiliated issuers | | | | 6,006,425 | | | | | — | | | | | — | |
| Total Investments, at value | | | | 260,000,098 | | | | | 123,260,931 | | | | | 68,723,685 | |
| Foreign currencies, at value(2) | | | | — | | | | | — | | | | | 53 | |
| Cash | | | | — | | | | | — | | | | | 464 | |
| Receivable from investment securities sold | | | | 18,050,850 | | | | | 323,762 | | | | | 3,284,541 | |
| Dividends and interest receivable | | | | 985,061 | | | | | 195,863 | | | | | 235,529 | |
| Receivable from capital shares issued | | | | 82,870 | | | | | 25,218 | | | | | 41 | |
| Due from Adviser | | | | — | | | | | 5,013 | | | | | — | |
| Prepaid expenses and other assets | | | | 98,434 | | | | | 11,822 | | | | | 6,371 | |
| Total assets | | | | 279,217,313 | | | | | 123,822,609 | | | | | 72,250,684 | |
| | | | | | | | | | | | | | | | |
| LIABILITIES: | | | | | | | | | | | | | | | |
| Payable for investment securities purchased | | | | 302,662 | | | | | 1,404 | | | | | 4,601,349 | |
| Unrealized depreciation on forward currency contracts | | | | 10,107 | | | | | — | | | | | 4,043 | |
| Payable for capital shares redeemed | | | | 1,836,953 | | | | | 74,302 | | | | | 6,640 | |
| Accrued expenses and other liabilities: | | | | | | | | | | | | | | | |
| Investment advisory fees (Note 6) | | | | 239,148 | | | | | 94,704 | | | | | 53,983 | |
| Line of credit (Note 2) | | | | 13,212,669 | | | | | 5,603,668 | | | | | — | |
| Distribution fees (Note 5) | | | | 418 | | | | | 398 | | | | | — | |
| Other | | | | 312,538 | | | | | 60,716 | | | | | 68,816 | |
| Total liabilities | | | | 15,914,495 | | | | | 5,835,192 | | | | | 4,734,831 | |
| Net Assets | | | $ | 263,302,818 | | | | $ | 117,987,417 | | | | $ | 67,515,853 | |
| | | | | | | | | | | | | | | | |
| Net assets represented by: | | | | | | | | | | | | | | | |
| Capital stock | | | $ | 1,376,835,264 | | | | $ | 75,880,119 | | | | $ | 104,694,714 | |
| Accumulated net investment income (loss) | | | | (7,970,141 | ) | | | | 52,956 | | | | | (255,277 | ) |
| Accumulated net realized losses from investments and foreign currency transactions | | | | (1,104,096,312 | ) | | | | (7,015,498 | ) | | | | (54,583,225 | ) |
| Net unrealized appreciation/depreciation on: | | | | | | | | | | | | | | | |
| Investments | | | | (1,437,700 | ) | | | | 49,069,447 | | | | | 17,665,395 | |
| Foreign currency translations | | | | (28,293 | ) | | | | 393 | | | | | (5,754 | ) |
| Total Net Assets | | | $ | 263,302,818 | | | | $ | 117,987,417 | | | | $ | 67,515,853 | |
| | | | | | | | | | | | | | | | |
| Net asset value | | | | | | | | | | | | | | | |
| Class A | | | | | | | | | | | | | | | |
| Net assets | | | $ | 152,754 | | | | $ | 206,145 | | | | | | |
| Shares outstanding | | | | 6,066 | | | | | 10,288 | | | | | | |
| Net asset value per share | | | $ | 25.18 | | | | $ | 20.04 | | | | | | |
| Maximum offering price per share (net asset value plus sales charge of 5.50% of offering price) | | | $ | 26.65 | | | | $ | 21.21 | | | | | | |
| Institutional Class | | | | | | | | | | | | | | | |
| Net assets | | | $ | 263,150,064 | | | | $ | 117,781,272 | | | | $ | 67,515,853 | |
| Shares outstanding | | | | 10,438,173 | | | | | 5,872,025 | | | | | 2,529,681 | |
| Net asset value, offering price and redemption price per share* | | | $ | 25.21 | | | | $ | 20.06 | | | | $ | 26.69 | |
| * If applicable, redemption price per share may be reduced by a redemption fee. | | | | | | | | | | | | | | | |
| (1) Total cost of investments | | | | | | | | | | | | | | | |
| Unaffiliated issuers | | | $ | 242,983,674 | | | | $ | 74,191,484 | | | | $ | 51,058,290 | |
| Affiliated issuers | | | $ | 18,454,124 | | | | $ | — | | | | $ | — | |
| (2) Cost of foreign currencies | | | $ | — | | | | $ | — | | | | $ | 61 | |
The accompanying notes are an integral part of these financial statements.
63
Alpine Mutual Funds
Statements of Assets and Liabilities—Continued
April 30, 2013 (Unaudited)
| | | | Emerging
Markets Real
Estate Fund | | | | Global
Infrastructure
Fund | | | | Global
Consumer
Growth Fund | |
| ASSETS: | | | | | | | | | | | | | | | |
| Investments, at value(1) | | | $ | 9,029,636 | | | | $ | 113,288,386 | | | | $ | 2,742,742 | |
| Foreign currencies, at value(2) | | | | 24 | | | | | 9,744 | | | | | 17 | |
| Cash | | | | 359 | | | | | 490 | | | | | 99 | |
| Receivable from investment securities sold | | | | 163,377 | | | | | 5,376,770 | | | | | 8,332 | |
| Dividends and interest receivable | | | | 24,836 | | | | | 702,008 | | | | | 3,723 | |
| Receivable from capital shares issued | | | | 57,445 | | | | | 109,739 | | | | | 50 | |
| Unrealized appreciation on forward currency contracts | | | | — | | | | | 187,705 | | | | | — | |
| Due from Adviser | | | | 2,751 | | | | | — | | | | | 3,570 | |
| Prepaid expenses and other assets | | | | 8,544 | | | | | 14,825 | | | | | 7,362 | |
| Total assets | | | | 9,286,972 | | | | | 119,689,667 | | | | | 2,765,895 | |
| | | | | | | | | | | | | | | | |
| LIABILITIES: | | | | | | | | | | | | | | | |
| Payable for investment securities purchased | | | | 309,715 | | | | | 11,040,285 | | | | | — | |
| Unrealized depreciation on forward currency contracts | | | | — | | | | | 14,657 | | | | | — | |
| Payable for capital shares redeemed | | | | — | | | | | 3,324 | | | | | 3,600 | |
| Accrued expenses and other liabilities: | | | | | | | | | | | | | | | |
| Investment advisory fees (Note 6) | | | | 6,533 | | | | | 77,698 | | | | | 2,209 | |
| Distribution fees (Note 5) | | | | 813 | | | | | 4,251 | | | | | 428 | |
| Other | | | | 20,652 | | | | | 16,349 | | | | | 18,874 | |
| Total liabilities | | | | 337,713 | | | | | 11,156,564 | | | | | 25,111 | |
| Net Assets | | | $ | 8,949,259 | | | | $ | 108,533,103 | | | | $ | 2,740,784 | |
| | | | | | | | | | | | | | | | |
| Net assets represented by: | | | | | | | | | | | | | | | |
| Capital stock | | | $ | 7,441,118 | | | | $ | 95,184,680 | | | | $ | 2,374,034 | |
| Accumulated net investment income (loss) | | | | (49,514 | ) | | | | 503,126 | | | | | (237 | ) |
| Accumulated net realized gains (losses) from investments and foreign currency transactions | | | | 292,878 | | | | | (174,570 | ) | | | | (89,680 | ) |
| Net unrealized appreciation/depreciation on: | | | | | | | | | | | | | | | |
| Investments | | | | 1,264,759 | | | | | 12,849,367 | | | | | 456,671 | |
| Foreign currency translations | | | | 18 | | | | | 170,500 | | | | | (4 | ) |
| Total Net Assets | | | $ | 8,949,259 | | | | $ | 108,533,103 | | | | $ | 2,740,784 | |
| | | | | | | | | | | | | | | | |
| Net asset value | | | | | | | | | | | | | | | |
| Class A | | | | | | | | | | | | | | | |
| Net assets | | | $ | 913,849 | | | | $ | 14,184,461 | | | | $ | 331,947 | |
| Shares outstanding | | | | 45,353 | | | | | 768,224 | | | | | 28,606 | |
| Net asset value per share | | | $ | 20.15 | | | | $ | 18.46 | | | | $ | 11.60 | |
| Maximum offering price per share (net asset value plus sales charge of 5.50% of offering price) | | | $ | 21.32 | | | | $ | 19.53 | | | | $ | 12.28 | |
| Institutional Class | | | | | | | | | | | | | | | |
| Net assets | | | $ | 8,035,410 | | | | $ | 94,348,642 | | | | $ | 2,408,837 | |
| Shares outstanding | | | | 398,135 | | | | | 5,103,551 | | | | | 207,345 | |
| Net asset value, offering price and redemption price per share* | | | $ | 20.18 | | | | $ | 18.49 | | | | $ | 11.62 | |
| * If applicable, redemption price per share may be reduced by a redemption fee. | | | | | | | | | | | | | | | |
| (1) Total cost of investments | | | $ | 7,764,877 | | | | $ | 100,439,019 | | | | $ | 2,286,071 | |
| (2) Cost of foreign currencies | | | $ | 24 | | | | $ | 9,746 | | | | $ | 17 | |
The accompanying notes are an integral part of these financial statements.
64
Alpine Mutual Funds
Statements of Operations
For the six months ended April 30, 2013 (Unaudited)
| | | | International
Real Estate
Equity Fund | | | | Realty
Income &
Growth Fund | | | | Cyclical
Advantage
Property Fund | |
| INVESTMENT INCOME: | | | | | | | | | | | | | | | |
| Dividend income | | | $ | 619,209 | | | | $ | 3,091,137 | | | | $ | 794,163 | |
| Less: Foreign taxes withheld | | | | (93,071 | ) | | | | (40,613 | ) | | | | (33,830 | ) |
| Interest income | | | | 21 | | | | | 1,752 | | | | | 239 | |
| Total investment income | | | | 526,159 | | | | | 3,052,276 | | | | | 760,572 | |
| | | | | | | | | | | | | | | | |
| EXPENSES: | | | | | | | | | | | | | | | |
| Investment advisory fee (Note 6) | | | | 1,506,576 | | | | | 541,767 | | | | | 314,156 | |
| Transfer agent fees | | | | 243,966 | | | | | 93,011 | | | | | 48,326 | |
| Accounting and custody fees | | | | 110,841 | | | | | 7,140 | | | | | 21,907 | |
| Printing and mailing fees | | | | 81,379 | | | | | 23,481 | | | | | 14,015 | |
| Interest (Note 2) | | | | 68,386 | | | | | 40,058 | | | | | — | |
| Legal fees | | | | 59,985 | | | | | 18,152 | | | | | 11,276 | |
| Registration and filing fees | | | | 17,452 | | | | | 14,617 | | | | | 9,398 | |
| Audit and tax fees | | | | 29,087 | | | | | 12,606 | | | | | 8,320 | |
| Administrative fee (Note 6) | | | | 31,361 | | | | | 11,549 | | | | | 6,283 | |
| Trustee fees | | | | 21,800 | | | | | 7,676 | | | | | 4,309 | |
| Distribution fees - Class A (Note 5) | | | | 181 | | | | | 197 | | | | | — | |
| Other fees | | | | 33,103 | | | | | 12,255 | | | | | 6,386 | |
| Total expenses | | | | 2,204,117 | | | | | 782,509 | | | | | 444,376 | |
| Less: Fee waivers and/or expense reimbursements (Note 6) | | | | — | | | | | (7,633 | ) | | | | — | |
| Net expenses | | | | 2,204,117 | | | | | 774,876 | | | | | 444,376 | |
| Net investment income (loss) | | | | (1,677,958 | ) | | | | 2,277,400 | | | | | 316,196 | |
| | | | | | | | | | | | | | | | |
| REALIZED AND UNREALIZED GAIN (LOSS) ON INVESTMENTS AND FOREIGN CURRENCY: | | | | | | | | | | | | | | | |
| Net realized gain (loss) on: | | | | | | | | | | | | | | | |
| Investments | | | | (3,783,839 | ) | | | | 1,924,765 | | | | | 65,231 | |
| Foreign currency transactions | | | | (19,759 | ) | | | | 690 | | | | | (12,845 | ) |
| Net realized gain (loss) on investments and foreign currency | | | | (3,803,598 | ) | | | | 1,925,455 | | | | | 52,386 | |
| Change in net unrealized appreciation/depreciation on: | | | | | | | | | | | | | | | |
| Investments | | | | 44,478,703 | | | | | 14,048,741 | | | | | 7,909,021 | |
| Foreign currency translations | | | | (17,950 | ) | | | | 384 | | | | | (5,620 | ) |
| Net change in unrealized appreciation/depreciation of investments and foreign currency | | | | 44,460,753 | | | | | 14,049,125 | | | | | 7,903,401 | |
| Net gain on investments and foreign currency | | | | 40,657,155 | | | | | 15,974,580 | | | | | 7,955,787 | |
| Increase in net assets from operations | | | $ | 38,979,197 | | | | $ | 18,251,980 | | | | $ | 8,271,983 | |
The accompanying notes are an integral part of these financial statements.
65
Alpine Mutual Funds
Statements of Operations—Continued
For the six months ended April 30, 2013 (Unaudited)
| | | | Emerging
Markets Real
Estate Fund | | | | Global
Infrastructure
Fund | | | | Global
Consumer
Growth Fund | |
| INVESTMENT INCOME: | | | | | | | | | | | | | | | |
| Dividend income | | | $ | 41,975 | | | | $ | 2,265,423 | | | | $ | 20,182 | |
| Less: Foreign taxes withheld | | | | (2,293 | ) | | | | (90,575 | ) | | | | (1,197 | ) |
| Interest income | | | | 35 | | | | | 272 | | | | | 40 | |
| Total investment income | | | | 39,717 | | | | | 2,175,120 | | | | | 19,025 | |
| | | | | | | | | | | | | | | | |
| EXPENSES: | | | | | | | | | | | | | | | |
| Investment advisory fee (Note 6) | | | | 30,380 | | | | | 331,897 | | | | | 12,333 | |
| Transfer agent fees | | | | 4,855 | | | | | 11,761 | | | | | 2,738 | |
| Accounting and custody fees | | | | 13,788 | | | | | 16,165 | | | | | 6,521 | |
| Printing and mailing fees | | | | 1,875 | | | | | 4,436 | | | | | 2,935 | |
| Interest (Note 2) | | | | 40 | | | | | — | | | | | — | |
| Legal fees | | | | 735 | | | | | 6,024 | | | | | 1,137 | |
| Registration and filing fees | | | | 15,260 | | | | | 16,711 | | | | | 14,509 | |
| Audit and tax fees | | | | 3,878 | | | | | 7,563 | | | | | 3,687 | |
| Administrative fee (Note 6) | | | | 609 | | | | | 6,638 | | | | | 247 | |
| Trustee fees | | | | 346 | | | | | 3,749 | | | | | 169 | |
| Distribution fees - Class A (Note 5) | | | | 733 | | | | | 7,651 | | | | | 211 | |
| Other fees | | | | 799 | | | | | 5,483 | | | | | 495 | |
| Total expenses | | | | 73,298 | | | | | 418,078 | | | | | 44,982 | |
| Less: Fee waivers and/or expense reimbursements (Note 6) | | | | (31,513 | ) | | | | — | | | | | (28,122 | ) |
| Net expenses | | | | 41,785 | | | | | 418,078 | | | | | 16,860 | |
| Net investment income (loss) | | | | (2,068 | ) | | | | 1,757,042 | | | | | 2,165 | |
| | | | | | | | | | | | | | | | |
| REALIZED AND UNREALIZED GAIN (LOSS) ON INVESTMENTS AND FOREIGN CURRENCY: | | | | | | | | | | | | | | | |
| Net realized gain (loss) on: | | | | | | | | | | | | | | | |
| Investments | | | | 459,144 | | | | | 624,096 | | | | | (42,204 | ) |
| Foreign currency transactions | | | | (4,222 | ) | | | | (336,071 | ) | | | | 80 | |
| Net realized gain (loss) on investments and foreign currency | | | | 454,922 | | | | | 288,025 | | | | | (42,124 | ) |
| Change in net unrealized appreciation/depreciation on: | | | | | | | | | | | | | | | |
| Investments | | | | 563,008 | | | | | 8,944,941 | | | | | 244,922 | |
| Foreign currency translations | | | | 50 | | | | | 311,019 | | | | | — | |
| Net change in unrealized appreciation/depreciation of investments and foreign currency | | | | 563,058 | | | | | 9,255,960 | | | | | 244,922 | |
| Net gain on investments and foreign currency | | | | 1,017,980 | | | | | 9,543,985 | | | | | 202,798 | |
| Increase in net assets from operations | | | $ | 1,015,912 | | | | $ | 11,301,027 | | | | $ | 204,963 | |
The accompanying notes are an integral part of these financial statements.
66
Alpine Mutual Funds
Statements of Changes in Net Assets
| | | International Real Estate Equity Fund |
| | | Six Months Ended
April 30, 2013 | | Year Ended
October 31, 2012 |
| | | | (Unaudited) | | | | | |
| OPERATIONS: | | | | | | | | | | |
| Net investment income (loss) | | | $ | (1,677,958 | ) | | | $ | 1,572,515 | |
| Net realized gain (loss) on: | | | | | | | | | | |
| Investments | | | | (3,783,839 | ) | | | | (38,257,364 | ) |
| Foreign currency transactions | | | | (19,759 | ) | | | | 308,893 | |
| Change in unrealized appreciation/(depreciation) on: | | | | | | | | | | |
| Investments | | | | 44,478,703 | | | | | 66,958,376 | |
| Foreign currency translations | | | | (17,950 | ) | | | | (36,740 | ) |
| Increase in net assets from operations | | | | 38,979,197 | | | | | 30,545,680 | |
| | | | | | | | | | | |
| DISTRIBUTIONS TO SHAREHOLDERS: | | | | | | | | | | |
| Distributions to Class A Shareholders: | | | | | | | | | | |
| From net investment income | | | | (317 | ) | | | | — | |
| From net realized gain on investments | | | | — | | | | | — | |
| Distributions to Institutional Class Shareholders: | | | | | | | | | | |
| From net investment income | | | | (1,295,320 | ) | | | | (8,892,777 | ) |
| From net realized gain on investments | | | | — | | | | | — | |
| Decrease in net assets from distributions to shareholders | | | | (1,295,637 | ) | | | | (8,892,777 | ) |
| | | | | | | | | | | |
| CAPITAL SHARE TRANSACTIONS (NOTE 3): | | | | | | | | | | |
| Net proceeds from shares sold | | | | 8,356,609 | | | | | 26,097,570 | |
| Dividends reinvested | | | | 1,150,945 | | | | | 7,845,139 | |
| Redemption fees | | | | 3,537 | | | | | 7,621 | |
| Cost of shares redeemed | | | | (83,985,200 | ) | | | | (110,942,453 | ) |
| Decrease in net assets from capital share transactions | | | | (74,474,109 | ) | | | | (76,992,123 | ) |
| Total decrease in net assets | | | | (36,790,549 | ) | | | | (55,339,220 | ) |
| | | | | | | | | | | |
| NET ASSETS: | | | | | | | | | | |
| Beginning of period | | | | 300,093,367 | | | | | 355,432,587 | |
| End of period* | | | $ | 263,302,818 | | | | $ | 300,093,367 | |
| * Including accumulated net investment loss of: | | | $ | (7,970,141 | ) | | | $ | (4,996,546 | ) |
The accompanying notes are an integral part of these financial statements.
67
Alpine Mutual Funds
Statements of Changes in Net Assets—Continued
| | | Realty Income & Growth Fund |
| | | Six Months Ended
April 30, 2013 | | Year Ended
October 31, 2012 |
| | | (Unaudited) | | | | | |
| OPERATIONS: | | | | | | | | | | |
| Net investment income | | | $ | 2,277,400 | | | | $ | 2,924,382 | |
| Net realized gain on: | | | | | | | | | | |
| Investments | | | | 1,924,765 | | | | | 6,402,733 | |
| Foreign currency transactions | | | | 690 | | | | | 1,850 | |
| Change in unrealized appreciation on: | | | | | | | | | | |
| Investments | | | | 14,048,741 | | | | | 6,919,661 | |
| Foreign currency translations | | | | 384 | | | | | 72 | |
| Increase in net assets from operations | | | | 18,251,980 | | | | | 16,248,698 | |
| | | | | | | | | | | |
| DISTRIBUTIONS TO SHAREHOLDERS: | | | | | | | | | | |
| Distributions to Class A Shareholders: | | | | | | | | | | |
| From net investment income | | | | (3,319 | ) | | | | (3,340 | ) |
| From net realized gain on investments | | | | — | | | | | — | |
| Distributions to Institutional Class Shareholders: | | | | | | | | | | |
| From net investment income | | | | (2,221,125 | ) | | | | (4,523,288 | ) |
| From net realized gain on investments | | | | — | | | | | — | |
| Decrease in net assets from distributions to shareholders | | | | (2,224,444 | ) | | | | (4,526,628 | ) |
| | | | | | | | | | | |
| CAPITAL SHARE TRANSACTIONS (NOTE 3): | | | | | | | | | | |
| Net proceeds from shares sold | | | | 3,493,664 | | | | | 10,733,752 | |
| Dividends reinvested | | | | 1,994,944 | | | | | 4,090,369 | |
| Redemption fees | | | | 716 | | | | | 3,613 | |
| Cost of shares redeemed | | | | (9,948,182 | ) | | | | (21,452,781 | ) |
| Decrease in net assets from capital share transactions | | | | (4,458,858 | ) | | | | (6,625,047 | ) |
| Total increase in net assets | | | | 11,568,678 | | | | | 5,097,023 | |
| | | | | | | | | | | |
| NET ASSETS: | | | | | | | | | | |
| Beginning of period | | | | 106,418,739 | | | | | 101,321,716 | |
| End of period* | | | $ | 117,987,417 | | | | $ | 106,418,739 | |
| * Including undistributed net investment income of: | | | $ | 52,956 | | | | $ | — | |
The accompanying notes are an integral part of these financial statements.
68
Alpine Mutual Funds
Statements of Changes in Net Assets—Continued
| | | Cyclical Advantage Property Fund |
| | | Six Months Ended
April 30, 2013 | | Year Ended
October 31, 2012 |
| | | (Unaudited) | | | | |
| OPERATIONS: | | | | | | | | | | |
| Net investment income | | | $ | 316,196 | | | | $ | 213,057 | |
| Net realized gain (loss) on: | | | | | | | | | | |
| Investments | | | | 65,231 | | | | | 5,047,499 | |
| Foreign currency transactions | | | | (12,845 | ) | | | | (16,081 | ) |
| Change in unrealized appreciation/(depreciation) on: | | | | | | | | | | |
| Investments | | | | 7,909,021 | | | | | 9,118,137 | |
| Foreign currency translations | | | | (5,620 | ) | | | | (659 | ) |
| Increase in net assets from operations | | | | 8,271,983 | | | | | 14,361,953 | |
| | | | | | | | | | | |
| DISTRIBUTIONS TO SHAREHOLDERS: | | | | | | | | | | |
| Distributions to Institutional Class Shareholders: | | | | | | | | | | |
| From net investment income | | | | (523,183 | ) | | | | (251,458 | ) |
| From net realized gain on investments | | | | — | | | | | — | |
| Decrease in net assets from distributions to shareholders | | | | (523,183 | ) | | | | (251,458 | ) |
| | | | | | | | | | | |
| CAPITAL SHARE TRANSACTIONS (NOTE 3): | | | | | | | | | | |
| Net proceeds from shares sold | | | | 2,240,506 | | | | | 1,522,677 | |
| Dividends reinvested | | | | 510,363 | | | | | 244,257 | |
| Redemption fees | | | | 719 | | | | | 77 | |
| Cost of shares redeemed | | | | (2,608,198 | ) | | | | (5,343,438 | ) |
| Increase (decrease) in net assets from capital share transactions | | | | 143,390 | | | | | (3,576,427 | ) |
| Total increase in net assets | | | | 7,892,190 | | | | | 10,534,068 | |
| | | | | | | | | | | |
| NET ASSETS: | | | | | | | | | | |
| Beginning of period | | | | 59,623,663 | | | | | 49,089,595 | |
| End of period* | | | $ | 67,515,853 | | | | $ | 59,623,663 | |
| * Including accumulated net investment loss of: | | | $ | (255,277 | ) | | | $ | (48,290 | ) |
The accompanying notes are an integral part of these financial statements.
69
Alpine Mutual Funds
Statements of Changes in Net Assets—Continued
| | | Emerging Markets Real Estate Fund |
| | | Six Months Ended
April 30, 2013 | | Year Ended
October 31, 2012 |
| | | (Unaudited) | | | | | |
| OPERATIONS: | | | | | | | | | | |
| Net investment income (loss) | | | $ | (2,068 | ) | | | $ | 40,025 | |
| Net realized gain (loss) on: | | | | | | | | | | |
| Investments | | | | 459,144 | | | | | 87,667 | |
| Foreign currency transactions | | | | (4,222 | ) | | | | (8,889 | ) |
| Change in unrealized appreciation on: | | | | | | | | | | |
| Investments | | | | 563,008 | | | | | 566,381 | |
| Foreign currency translations | | | | 50 | | | | | 841 | |
| Increase in net assets from operations | | | | 1,015,912 | | | | | 686,025 | |
| | | | | | | | | | | |
| DISTRIBUTIONS TO SHAREHOLDERS: | | | | | | | | | | |
| Distributions to Class A Shareholders: | | | | | | | | | | |
| From net investment income | | | | (2,120 | ) | | | | — | |
| From net realized gain on investments | | | | — | | | | | — | |
| Distributions to Institutional Class Shareholders: | | | | | | | | | | |
| From net investment income | | | | (56,765 | ) | | | | — | |
| From net realized gain on investments | | | | — | | | | | — | |
| Decrease in net assets from distributions to shareholders | | | | (58,885 | ) | | | | — | |
| | | | | | | | | | | |
| CAPITAL SHARE TRANSACTIONS (NOTE 3): | | | | | | | | | | |
| Net proceeds from shares sold | | | | 3,868,091 | | | | | 505,557 | |
| Dividends reinvested | | | | 57,509 | | | | | — | |
| Redemption fees | | | | 518 | | | | | 560 | |
| Cost of shares redeemed | | | | (361,866 | ) | | | | (1,053,041 | ) |
| Increase (decrease) in net assets from capital share transactions | | | | 3,564,252 | | | | | (546,924 | ) |
| Total increase in net assets | | | | 4,521,279 | | | | | 139,101 | |
| | | | | | | | | | | |
| NET ASSETS: | | | | | | | | | | |
| Beginning of period | | | | 4,427,980 | | | | | 4,288,879 | |
| End of period* | | | $ | 8,949,259 | | | | $ | 4,427,980 | |
| * Including (accumulated) undistributed net investment (loss) income of: | | | $ | (49,514 | ) | | | $ | 11,439 | |
The accompanying notes are an integral part of these financial statements.
70
Alpine Mutual Funds
Statements of Changes in Net Assets—Continued
| | | Global Infrastructure Fund |
| | | Six Months Ended
April 30, 2013 | | Year Ended
October 31, 2012 |
| | | (Unaudited) | | | | |
| OPERATIONS: | | | | | | | | | | |
| Net investment income | | | $ | 1,757,042 | | | | $ | 1,794,009 | |
| Net realized gain (loss) on: | | | | | | | | | | |
| Investments | | | | 624,096 | | | | | (57,563 | ) |
| Foreign currency transactions | | | | (336,071 | ) | | | | 205,242 | |
| Change in unrealized appreciation/(depreciation) on: | | | | | | | | | | |
| Investments | | | | 8,944,941 | | | | | 4,785,503 | |
| Foreign currency translations | | | | 311,019 | | | | | (136,931 | ) |
| Increase in net assets from operations | | | | 11,301,027 | | | | | 6,590,260 | |
| | | | | | | | | | | |
| DISTRIBUTIONS TO SHAREHOLDERS: | | | | | | | | | | |
| Distributions to Class A Shareholders: | | | | | | | | | | |
| From net investment income | | | | (114,904 | ) | | | | (21,335 | ) |
| From net realized gain on investments | | | | — | | | | | — | |
| Distributions to Institutional Class Shareholders: | | | | | | | | | | |
| From net investment income | | | | (1,139,012 | ) | | | | (1,754,166 | ) |
| From net realized gain on investments | | | | — | | | | | — | |
| Decrease in net assets from distributions to shareholders | | | | (1,253,916 | ) | | | | (1,775,501 | ) |
| | | | | | | | | | | |
| CAPITAL SHARE TRANSACTIONS (NOTE 3): | | | | | | | | | | |
| Net proceeds from shares sold | | | | 51,743,808 | | | | | 23,939,376 | |
| Dividends reinvested | | | | 941,026 | | | | | 1,358,204 | |
| Redemption fees | | | | 8,947 | | | | | 2,368 | |
| Cost of shares redeemed | | | | (2,926,835 | ) | | | | (10,424,061 | ) |
| Increase in net assets from capital share transactions | | | | 49,766,946 | | | | | 14,875,887 | |
| Total increase in net assets | | | | 59,814,057 | | | | | 19,690,646 | |
| | | | | | | | | | | |
| NET ASSETS: | | | | | | | | | | |
| Beginning of period | | | | 48,719,046 | | | | | 29,028,400 | |
| End of period* | | | $ | 108,533,103 | | | | $ | 48,719,046 | |
| * Including undistributed net investment income of: | | | $ | 503,126 | | | | $ | — | |
The accompanying notes are an integral part of these financial statements.
71
Alpine Mutual Funds
Statements of Changes in Net Assets—Continued
| | | Global Consumer Growth Fund |
| | | Six Months Ended
April 30, 2013 | | Year Ended
October 31, 2012 |
| | | (Unaudited) | | | | |
| OPERATIONS: | | | | | | | | | | |
| Net investment income | | | $ | 2,165 | | | | $ | 7,626 | |
| Net realized gain (loss) on: | | | | | | | | | | |
| Investments | | | | (42,204 | ) | | | | (2,054 | ) |
| Foreign currency transactions | | | | 80 | | | | | (325 | ) |
| Change in unrealized appreciation/(depreciation) on: | | | | | | | | | | |
| Investments | | | | 244,922 | | | | | 256,925 | |
| Foreign currency translations | | | | — | | | | | (11 | ) |
| Increase in net assets from operations | | | | 204,963 | | | | | 262,161 | |
| | | | | | | | | | | |
| DISTRIBUTIONS TO SHAREHOLDERS: | | | | | | | | | | |
| Distributions to Class A Shareholders: | | | | | | | | | | |
| From net investment income | | | | (227 | ) | | | | — | |
| From net realized gain on investments | | | | — | | | | | — | |
| Distributions to Institutional Class Shareholders: | | | | | | | | | | |
| From net investment income | | | | (9,476 | ) | | | | (7,862 | ) |
| From net realized gain on investments | | | | — | | | | | — | |
| Decrease in net assets from distributions to shareholders | | | | (9,703 | ) | | | | (7,862 | ) |
| | | | | | | | | | | |
| CAPITAL SHARE TRANSACTIONS (NOTE 3): | | | | | | | | | | |
| Net proceeds from shares sold | | | | 208,480 | | | | | 124,200 | |
| Dividends reinvested | | | | 9,612 | | | | | 7,862 | |
| Cost of shares redeemed | | | | (3,600 | ) | | | | — | |
| Increase in net assets from capital share transactions | | | | 214,492 | | | | | 132,062 | |
| Total increase in net assets | | | | 409,752 | | | | | 386,361 | |
| | | | | | | | | | | |
| NET ASSETS: | | | | | | | | | | |
| Beginning of period | | | | 2,331,032 | | | | | 1,944,671 | |
| End of period* | | | $ | 2,740,784 | | | | $ | 2,331,032 | |
| * Including (accumulated) undistributed net investment (loss) income of: | | | $ | (237 | ) | | | $ | 7,301 | |
The accompanying notes are an integral part of these financial statements.
72
Alpine Mutual Funds
Financial Highlights
(For a share outstanding throughout each period)
| | | International Real Estate
Equity Fund |
| | | Six Months Ended
April 30, 2013 | | Period Ended
October 31, 2012 (a) |
| | | (Unaudited) | | | | | |
| Class A: | | | | | | | | | | |
| Net asset value per share, beginning of period | | | $ | 22.19 | | | | $ | 17.92 | |
| Income from investment operations: | | | | | | | | | | |
| Net investment income (loss) | | | | (0.17 | ) | | | | 0.08 | |
| Net realized and unrealized gain on investments | | | | 3.21 | | | | | 4.19 | |
| Total from investment operations | | | | 3.04 | | | | | 4.27 | |
| Redemption fees | | | | 0.00 | (b) | | | | — | |
| Less distributions: | | | | | | | | | | |
| From net investment income | | | | (0.05 | ) | | | | — | |
| Total distributions | | | | (0.05 | ) | | | | — | |
| Net asset value per share, end of period | | | $ | 25.18 | | | | $ | 22.19 | |
| Total return | | | | 13.72 | %(c) | | | | 23.83 | %(c) |
| Ratios/Supplemental Data | | | | | | | | | | |
| Net Assets at end of period (000) | | | $ | 153 | | | | $ | 128 | |
| Ratio of total expenses to average net assets (d) | | | | 1.71 | %(e) | | | | 1.72 | %(e) |
| Ratio of net investment income (loss) to average net assets | | | | (1.30 | )%(e) | | | | 0.48 | %(e) |
| Portfolio turnover (f) | | | | 8 | %(c) | | | | 12 | % |
| (a) | Class A commenced operations on December 30, 2011. |
| | |
| (b) | The amount is less than $0.005 per share. |
| | |
| (c) | Not annualized. |
| | |
| (d) | Ratio of total expenses to average net assets excluding interest expense was 1.67% for the six months ended April 30, 2013, and 1.64% for the period ended October 31, 2012. |
| | |
| (e) | Annualized. |
| | |
| (f) | Portfolio turnover is calculated on the basis of the Fund as a whole, without distinguishing between classes of shares issued. |
The accompanying notes are an integral part of these financial statements.
73
Alpine Mutual Funds
Financial Highlights—Continued
(For a share outstanding throughout each period)
| | | | International Real Estate Equity Fund | |
| | | | Six Months | | | | | | | | | | | | | | | | |
| | | | Ended | | | Year Ended | |
| | | | April 30, | | | October 31, | |
| | | | 2013 | | | 2012 | | | 2011 | | | 2010 | | | 2009 | | | 2008 | |
| | | | (Unaudited) | | | | | | | | | | | | | | | | |
| Institutional Class: | | | | | | | | | | | | | | | | | | | | | | | | | |
| Net asset value per share, beginning of period | | | $ | 22.23 | | | $ | 20.53 | | | $ | 25.75 | | | $ | 22.59 | | | $ | 12.26 | | | $ | 47.58 | |
| Income from investment operations: | | | | | | | | | | | | | | | | | | | | | | | | | |
| Net investment income (loss) | | | | (0.29 | ) | | | 0.01 | | | | 0.30 | | | | (0.08 | ) | | | 0.20 | (a) | | | 0.35 | (a) |
| Net realized and unrealized gains (losses) on investments | | | | 3.37 | | | | 2.23 | | | | (4.84 | ) | | | 4.03 | | | | 10.12 | | | | (33.05 | ) |
| Total from investment operations | | | | 3.08 | | | | 2.24 | | | | (4.54 | ) | | | 3.95 | | | | 10.32 | | | | (32.70 | ) |
| Redemption fees | | | | 0.00 | (b) | | | 0.00 | (b) | | | 0.00 | (b) | | | 0.00 | (b) | | | 0.01 | | | | 0.01 | |
| Less distributions: | | | | | | | | | | | | | | | | | | | | | | | | | |
| From net investment income | | | | (0.10 | ) | | | (0.54 | ) | | | (0.68 | ) | | | (0.79 | ) | | | — | | | | (0.45 | ) |
| From net realized gains on investments | | | | — | | | | — | | | | — | | | | — | | | | — | | | | (2.10 | ) |
| From tax return of capital | | | | — | | | | — | | | | — | | | | — | | | | — | | | | (0.08 | ) |
| Total distributions | | | | (0.10 | ) | | | (0.54 | ) | | | (0.68 | ) | | | (0.79 | ) | | | — | | | | (2.63 | ) |
| Net asset value per share, end of period | | | $ | 25.21 | | | $ | 22.23 | | | $ | 20.53 | | | $ | 25.75 | | | $ | 22.59 | | | $ | 12.26 | |
| Total return | | | | 13.88 | %(c) | | | 11.57 | % | | | –18.17 | % | | | 18.07 | % | | | 84.26 | % | | | –72.46 | % |
| Ratios/Supplemental Data: | | | | | | | | | | | | | | | | | | | | | | | | | |
| Net Assets at end of period (000) | | | $ | 263,150 | | | $ | 299,965 | | | $ | 355,433 | | | $ | 608,488 | | | $ | 730,844 | | | $ | 583,953 | |
| Ratio of total expenses to average net assets (d) | | | | 1.46 | %(e) | | | 1.47 | % | | | 1.37 | % | | | 1.28 | % | | | 1.26 | % | | | 1.22 | % |
| Ratio of net investment income (loss) to average net assets | | | | (1.11 | )%(e) | | | 0.51 | % | | | 1.89 | % | | | 0.32 | % | | | 1.13 | % | | | 1.29 | % |
| Portfolio turnover (f) | | | | 8 | %(c) | | | 12 | % | | | 20 | % | | | 34 | % | | | 51 | % | | | 42 | % |
| (a) | Net investment income (loss) per share is calculated using ending balances after consideration of adjustments for permanent book and tax differences. |
| | |
| (b) | The amount is less than $0.005 per share. |
| | |
| (c) | Not annualized. |
| | |
| (d) | Ratio of total expenses to average net assets excluding interest expense was 1.42% for the six months ended April 30, 2013 and, 1.39%, 1.26%, 1.20%, 1.19% and 1.16% for the years ended October 31, 2012, 2011, 2010, 2009, and 2008 respectively. |
| | |
| (e) | Annualized. |
| | |
| (f) | Portfolio turnover is calculated on the basis of the Fund as a whole, without distinguishing between classes of shares issued. |
The accompanying notes are an integral part of these financial statements.
74
Alpine Mutual Funds
Financial Highlights—Continued
(For a share outstanding throughout each period)
| | | Realty Income & Growth Fund |
| | | Six Months | | Period |
| | | Ended | | Ended |
| | | April 30, 2013 | | October 31, 2012 (a) |
| | | (Unaudited) | | |
| Class A: | | | | | | | | | | |
| Net asset value per share, beginning of period | | | $ | 17.35 | | | | $ | 15.60 | |
| Income from investment operations: | | | | | | | | | | |
| Net investment income | | | | 0.34 | | | | | 0.32 | |
| Net realized and unrealized gain on investments | | | | 2.71 | | | | | 1.95 | |
| Total from investment operations | | | | 3.05 | | | | | 2.27 | |
| Redemption fees | | | | 0.00 | (b) | | | | 0.00 | (b) |
| Less distributions: | | | | | | | | | | |
| From net investment income | | | | (0.36 | ) | | | | (0.52 | ) |
| From net realized gains on investments | | | | — | | | | | — | |
| From tax return of capital | | | | — | | | | | — | |
| Total distributions | | | | (0.36 | ) | | | | (0.52 | ) |
| Net asset value per share, end of period | | | $ | 20.04 | | | | $ | 17.35 | |
| Total return | | | | 17.77 | %(c) | | | | 14.53 | %(c) |
| Ratios/Supplemental Data: | | | | | | | | | | |
| Net Assets at end of period (000) | | | $ | 206 | | | | $ | 115 | |
| Ratio of total expenses to average net assets: | | | | | | | | | | |
| Before waivers and/or expense reimbursements (d) | | | | 1.70 | %(e) | | | | 1.66 | %(e) |
| After waivers and/or expense reimbursements (f) | | | | 1.68 | %(e) | | | | 1.66 | %(e) |
| Ratio of net investment income to average net assets | | | | 3.90 | %(e) | | | | 2.18 | %(e) |
| Portfolio turnover (g) | | | | 15 | %(c) | | | | 28 | % |
| (a) | Class A commenced operations on December 30, 2011. |
| (b) | The amount is less than $0.005 per share. |
| (d) | Ratio of total expenses to average net assets excluding interest expense before waivers and/or expense reimbursements was 1.62% for the six months ended April 30, 2013 and 1.58% for the period ended October 31, 2012. |
| (f) | Ratio of total expenses to average net assets excluding interest expense after waivers and/or expense reimbursements was 1.61% for the six months ended April 30, 2013 and 1.58% for the period ended October 31, 2012. |
| (g) | Portfolio turnover is calculated on the basis of the Fund as a whole, without distinguishing between classes of shares issued. |
The accompanying notes are an integral part of these financial statements.
75
Alpine Mutual Funds
Financial Highlights—Continued
(For a share outstanding throughout each period)
| | | Realty Income & Growth Fund | |
| | | Six Months | | | |
| | | Ended | | Year Ended | |
| | | April 30, | | October 31, | |
| | | 2013 | | 2012 | | | 2011 | | | 2010 | | | 2009 | | | 2008 | |
| | | (Unaudited) | | | | | | | | | | | | | | | |
| Institutional Class: | | | | | | | | | | | | | | | | | | | | | | | | | |
| Net asset value per share, beginning of period | | | $ | 17.37 | | | $ | 15.56 | | | $ | 14.79 | | | $ | 10.89 | | | $ | 9.95 | | | $ | 25.12 | |
| Income from investment operations: | | | | | | | | | | | | | | | | | | | | | | | | | |
| Net investment income | | | | 0.39 | | | | 0.46 | | | | 0.48 | | | | 0.56 | | | | 0.79 | (a) | | | 0.99 | (a) |
| Net realized and unrealized gains (losses) on investments | | | | 2.68 | | | | 2.07 | | | | 1.01 | | | | 4.06 | | | | 0.94 | | | | (13.46 | ) |
| Total from investment operations | | | | 3.07 | | | | 2.53 | | | | 1.49 | | | | 4.62 | | | | 1.73 | | | | (12.47 | ) |
| Redemption fees | | | | 0.00 | (b) | | | 0.00 | (b) | | | 0.00 | (b) | | | 0.00 | (b) | | | 0.00 | (b) | | | 0.00 | (b) |
| Less distributions: | | | | | | | | | | | | | | | | | | | | | | | | | |
| Net investment income | | | | (0.38 | ) | | | (0.72 | ) | | | (0.72 | ) | | | (0.65 | ) | | | (0.62 | ) | | | (0.99 | ) |
| From net realized gains on investments | | | | — | | | | — | | | | — | | | | (0.07 | ) | | | — | | | | (1.71 | ) |
| From tax return of capital | | | | — | | | | — | | | | — | | | | — | | | | (0.17 | ) | | | — | |
| Total distributions | | | | (0.38 | ) | | | (0.72 | ) | | | (0.72 | ) | | | (0.72 | ) | | | (0.79 | ) | | | (2.70 | ) |
| Net asset value per share, end of period | | | $ | 20.06 | | | $ | 17.37 | | | $ | 15.56 | | | $ | 14.79 | | | $ | 10.89 | | | $ | 9.95 | |
| Total return | | | | 17.87 | %(c) | | | 16.44 | % | | | 10.23 | % | | | 43.51 | % | | | 20.23 | % | | | -54.62 | % |
| Ratios/Supplemental Data: | | | | | | | | | | | | | | | | | | | | | | | | | |
| Net Assets at end of period (000) | | | $ | 117,781 | | | $ | 106,304 | | | $ | 101,322 | | | $ | 108,941 | | | $ | 84,795 | | | $ | 95,270 | |
| Ratio of total expenses to average net assets: | | | | | | | | | | | | | | | | | | | | | | | | | |
| Before waivers and/or expense reimbursements (d) | | | | 1.44 | %(e) | | | 1.41 | % | | | 1.32 | % | | | 1.34 | % | | | 1.39 | % | | | 1.56 | % |
| After waivers and/or expense reimbursements (f) | | | | 1.43 | %(e) | | | 1.41 | % | | | 1.32 | % | | | 1.34 | % | | | 1.39 | % | | | 1.43 | % |
| Ratio of net investment income to average net assets | | | | 4.20 | %(e) | | | 2.73 | % | | | 3.09 | % | | | 4.24 | % | | | 8.57 | % | | | 5.55 | % |
| Portfolio turnover (g) | | | | 15 | %(c) | | | 28 | % | | | 59 | % | | | 70 | % | | | 111 | % | | | 23 | % |
| (a) | Net investment income per share is calculated using ending balances after consideration of adjustments for permanent book and tax differences |
| (b) | The amount is less than $0.005 per share. |
| (d) | Ratio of total expenses to average net assets excluding interest expense before waivers and/or expense reimbursements was 1.37% for the six months ended April 30, 2013, and 1.33%, 1.23%, 1.24%, 1.27% and 1.16% for the years ended October 31, 2012, 2011, 2010, 2009, and 2008 respectively. |
| (f) | Ratio of total expenses to average net assets excluding interest expense after waivers and/or expense reimbursements was 1.36% for the six months ended April 30, 2013, and 1.33%, 1.23%, 1.24%, 1.27% and 1.03% for the years ended October 31, 2012, 2011, 2010, 2009, and 2008 respectively. |
| (g) | Portfolio turnover is calculated on the basis of the Fund as a whole, without distinguishing between classes of shares issued. |
The accompanying notes are an integral part of these financial statements.
76
Alpine Mutual Funds
Financial Highlights—Continued
(For a share outstanding throughout each period)
| | Cyclical Advantage Property Fund | |
| | Six Months | | | | | | | | | | | | | | | |
| | Ended | | Year Ended | |
| | April 30, | | October 31, | |
| | 2013 | | 2012 | | | 2011 | | | 2010 | | | 2009 | | | 2008 | |
| | (Unaudited) | | | | | | | | | | | | | | | |
| Institutional Class: | | | | | | | | | | | | | | | | | | | | | | | | |
| Net asset value per share, beginning of period | | $ | 23.64 | | | $ | 18.13 | | | $ | 20.27 | | | $ | 16.65 | | | $ | 13.86 | | | $ | 34.97 | |
| Income from investment operations: | | | | | | | | | | | | | | | | | | | | | | | | |
| Net investment income | | | 0.13 | | | | 0.07 | | | | 0.07 | | | | 0.09 | | | | 0.26 | (a) | | | 0.53 | (a) |
| Net realized and unrealized gains (losses) on investments | | | 3.13 | | | | 5.53 | | | | (2.12 | ) | | | 3.77 | | | | 2.65 | | | | (21.11 | ) |
| Total from investment operations | | | 3.26 | | | | 5.60 | | | | (2.05 | ) | | | 3.86 | | | | 2.91 | | | | (20.58 | ) |
| Redemption fees | | | 0.00 | (b) | | | 0.00 | (b) | | | 0.00 | (b) | | | 0.00 | (b) | | | 0.00 | (b) | | | 0.00 | (b) |
| Less distributions: | | | | | | | | | | | | | | | | | | | | | | | | |
| From net investment income | | | (0.21 | ) | | | (0.09 | ) | | | (0.09 | ) | | | (0.24 | ) | | | (0.12 | ) | | | (0.43 | ) |
| From tax return of capital | | | — | | | | — | | | | — | | | | — | | | | — | | | | (0.10 | ) |
| Total distributions | | | (0.21 | ) | | | (0.09 | ) | | | (0.09 | ) | | | (0.24 | ) | | | (0.12 | ) | | | (0.53 | ) |
| Net asset value per share, end of period | | $ | 26.69 | | | $ | 23.64 | | | $ | 18.13 | | | $ | 20.27 | | | $ | 16.65 | | | $ | 13.86 | |
| Total return | | | 13.86 | %(c) | | | 31.11 | % | | | –10.19 | % | | | 23.36 | % | | | 21.14 | % | | | –59.54 | % |
| Ratios/Supplemental Data: | | | | | | | | | | | | | | | | | | | | | | | | |
| Net Assets at end of period (000) | | $ | 67,516 | | | $ | 59,624 | | | $ | 49,090 | | | $ | 62,044 | | | $ | 55,064 | | | $ | 47,405 | |
| Ratio of total expenses to average net assets (d) | | | 1.41 | %(e) | | | 1.51 | % | | | 1.38 | % | | | 1.32 | % | | | 1.45 | % | | | 1.70 | % |
| Ratio of net investment income to average net assets | | | 1.01 | %(e) | | | 0.41 | % | | | 0.36 | % | | | 0.51 | % | | | 2.28 | % | | | 2.68 | % |
| Portfolio turnover | | | 27 | %(c) | | | 24 | % | | | 59 | % | | | 90 | % | | | 135 | % | | | 68 | % |
| (a) | Net investment income per share is calculated using ending balances after consideration of adjustments for permanent book and tax differences. |
| (b) | The amount is less than $0.005 per share. |
| (d) | Ratio of total expenses to average net assets excluding interest expense was 1.50%, 1.35%, 1.30%, 1.34% and 1.20% for the years ended October 31, 2012, 2011, 2010, 2009, and 2008 respectively. |
The accompanying notes are an integral part of these financial statements.
77
Alpine Mutual Funds
Financial Highlights—Continued
(For a share outstanding throughout each period)
| | | Emerging Markets |
| | | Real Estate Fund |
| | | Six Months | | Period |
| | | Ended | | Ended |
| | | April 30, 2013 | | October 31, 2012 (a) |
| | | (Unaudited) | | | |
| Class A: | | | | | | | | | | |
| Net asset value per share, beginning of period | | | $ | 17.13 | | | | $ | 13.45 | |
| Income from investment operations: | | | | | | | | | | |
| Net investment income (loss) | | | | (0.09 | ) | | | | 0.13 | |
| Net realized and unrealized gain on investments | | | | 3.29 | | | | | 3.55 | |
| Total from investment operations | | | | 3.20 | | | | | 3.68 | |
| Redemption fees | | | | 0.00 | (b) | | | | — | |
| Less distributions: | | | | | | | | | | |
| From Net investment income | | | | (0.18 | ) | | | | — | |
| Total distributions | | | | (0.18 | ) | | | | — | |
| Net asset value per share, end of period | | | $ | 20.15 | | | | $ | 17.13 | |
| Total return | | | | 18.78 | %(c) | | | | 27.36 | %(c) |
| Ratios/Supplemental Data | | | | | | | | | | |
| Net Assets at end of period (000) | | | $ | 914 | | | | $ | 140 | |
| Ratio of total expenses to average net assets | | | | | | | | | | |
| Before waivers and/or expense reimbursements (d) | | | | 2.64 | %(f) | | | | 3.01 | %(f) |
| After waivers and/or expense reimbursements (e) | | | | 1.60 | %(f) | | | | 1.61 | %(f) |
| Ratio of net investment income (loss) to average net assets | | | | (0.18 | )%(f) | | | | 1.05 | %(f) |
| Portfolio turnover (g) | | | | 56 | %(c) | | | | 102 | % |
| (a) | Class A commenced operations on December 30, 2011. |
| (b) | The amount is less than $0.005 per share. |
| (d) | Ratio of total expenses to average net assets excluding interest expense before waivers and/or expense reimbursements was 2.64% for the six months ended April 30, 2013, and 3.01% for the period ended October 31, 2012. |
| (e) | Ratio of total expenses to average net assets excluding interest expense after waivers and/or expense reimbursements was 1.60% for the six months ended April 30, 2013, and 1.61% for the period ended October 31, 2012. |
| (g) | Portfolio turnover is calculated on the basis of the Fund as a whole, without distinguishing between classes of shares issued. |
The accompanying notes are an integral part of these financial statements.
78
Alpine Mutual Funds
Financial Highlights—Continued
(For a share outstanding throughout each period)
| | | Emerging Markets Real Estate Fund |
| | | Six Months | | | | | | | | | | | Period |
| | | Ended | | | | | | | | | | | Ended |
| | | April 30, | | Year Ended October 31, | | | October 31, |
| | | 2013 | | 2012 | | | 2011 | | | 2010 | | | 2009 (a) |
| | | (Unaudited) | | | | | | | | | | | | | |
| Institutional Class: | | | | | | | | | | | | | | | | | | | | | | |
| Net asset value per share, beginning of period | | | $ | 17.16 | | | $ | 14.68 | | | $ | 19.20 | | | $ | 17.03 | | | | $ | 10.00 | |
| Income from investment operations: | | | | | | | | | | | | | | | | | | | | | | |
| Net investment income (loss) | | | | 0.05 | | | | 0.12 | | | | 0.40 | | | | 0.27 | | | | | (0.08 | )(b) |
| Net realized and unrealized gains (losses) on investments | | | | 3.18 | | | | 2.36 | | | | (3.47 | ) | | | 3.43 | | | | | 7.10 | |
| Total from investment operations | | | | 3.23 | | | | 2.48 | | | | (3.07 | ) | | | 3.70 | | | | | 7.02 | |
| Redemption fees | | | | 0.00 | (c) | | | 0.00 | (c) | | | 0.00 | (c) | | | 0.00 | (c) | | | | 0.01 | |
| Less distributions: | | | | | | | | | | | | | | | | | | | | | | |
| From Net investment income | | | | (0.21 | ) | | | — | | | | (0.08 | ) | | | (0.87 | ) | | | | — | |
| From net realized gains on investments | | | | — | | | | — | | | | (1.37 | ) | | | (0.66 | ) | | | | — | |
| Total distributions | | | | (0.21 | ) | | | — | | | | (1.45 | ) | | | (1.53 | ) | | | | — | |
| Net asset value per share, end of period | | | $ | 20.18 | | | $ | 17.16 | | | $ | 14.68 | | | $ | 19.20 | | | | $ | 17.03 | |
| Total return | | | | 18.92 | %(d) | | | 16.89 | % | | | (17.52 | )% | | | 23.53 | % | | | | 70.30 | %(d) |
| Ratios/Supplemental Data: | | | | | | | | | | | | | | | | | | | | | | |
| Net Assets at end of period (000) | | | $ | 8,035 | | | $ | 4,288 | | | $ | 4,289 | | | $ | 3,269 | | | | $ | 2,047 | |
| Ratio of total expenses to average net assets | | | | | | | | | | | | | | | | | | | | | | |
| Before waivers and/or expense reimbursements (e) | | | | 2.39 | %(g) | | | 2.95 | % | | | 2.42 | % | | | 2.68 | % | | | | 4.36 | %(g) |
| After waivers and/or expense reimbursements (f) | | | | 1.35 | %(g) | | | 1.35 | % | | | 1.35 | % | | | 1.35 | % | | | | 1.35 | %(g) |
| Ratio of net investment income to average net assets | | | | (0.06 | )%(g) | | | 0.97 | % | | | 0.54 | % | | | 0.13 | % | | | | (0.76 | )%(g) |
| Portfolio turnover (h) | | | | 56 | %(d) | | | 102 | % | | | 58 | % | | | 77 | % | | | | 35 | %(d) |
| (a) | For the period from November 3, 2008 (inception of fund) to October 31, 2009. |
| (b) | Net investment income per share is calculated using ending balances after consideration of adjustments for permanent book and tax differences. |
| | | |
| | (c) | The amount is less than $0.005 per share. |
| (e) | Ratio of total expenses to average net assets excluding interest expense before waivers and/or expense reimbursements was 2.39% for the six months ended April 30, 2013, and 2.95%, 2.42%, 2.68% and 4.36% for the periods ended October 31, 2012, 2011, 2010 and 2009 respectively. |
| (f) | Ratio of total expenses to average net assets excluding interest expense after waivers and/or expense reimbursements was 1.35% for the six months ended April 30, 2013, and 1.35%, 1.35%, 1.35% and 1.35% for the periods ended October 31, 2012, 2011, 2010 and 2009 respectively. |
| (h) | Portfolio turnover is calculated on the basis of the Fund as a whole, without distinguishing between classes of shares issued. |
The accompanying notes are an integral part of these financial statements.
79
Alpine Mutual Funds
Financial Highlights—Continued
(For a share outstanding throughout each period)
| | | Global Infrastructure Fund |
| | | Six Months | | Period |
| | | Ended | | Ended |
| | | April 30, 2013 | | October 31, 2012 (a) |
| | | (Unaudited) | | | | |
| Class A: | | | | | | | | | | |
| Net asset value per share, beginning of period | | | $ | 15.92 | | | | $ | 13.91 | |
| Income from investment operations: | | | | | | | | | | |
| Net investment income | | | | 0.40 | | | | | 0.43 | |
| Net realized and unrealized gain on investments | | | | 2.45 | | | | | 2.04 | |
| Total from investment operations | | | | 2.85 | | | | | 2.47 | |
| Redemption fees | | | | 0.00 | (b) | | | | 0.00 | (b) |
| Less distributions: | | | | | | | | | | |
| Net investment income | | | | (0.31 | ) | | | | (0.46 | ) |
| Net realized gains on investments | | | | — | | | | | — | |
| Total distributions | | | | (0.31 | ) | | | | (0.46 | ) |
| Net asset value per share, end of period | | | $ | 18.46 | | | | $ | 15.92 | |
| Total return | | | | 18.01 | %(c) | | | | 17.94 | %(c) |
| Net Assets at end of period (000) | | | $ | 14,184 | | | | $ | 1,721 | |
| Ratio of total expenses to average net assets | | | | | | | | | | |
| Before waivers and/or expense reimbursements | | | | 1.49 | %(d) | | | | 1.67 | %(d) |
| After waivers and/or expense reimbursements | | | | 1.49 | %(d) | | | | 1.60 | %(d) |
| Ratio of net investment income to average net assets | | | | 5.19 | %(d) | | | | 3.67 | %(d) |
| Portfolio turnover (e) | | | | 79 | %(c) | | | | 148 | % |
| (a) | Class A commenced operations on December 30, 2011. |
| (b) | The amount is less than $0.005 per share. |
| (e) | Portfolio turnover is calculated on the basis of the Fund as a whole, without distinguishing between classes of shares issued. |
The accompanying notes are an integral part of these financial statements.
80
Alpine Mutual Funds
Financial Highlights—Continued
(For a share outstanding throughout each period)
| | | Global Infrastructure Fund |
| | | Six Months | | | | | | | | | | | Period |
| | | Ended | | | | | Ended |
| | | April 30, | | Year Ended October 31, | | | October 31, |
| | | 2013 | | 2012 | | | 2011 | | | 2010 | | | 2009 (a) |
| | | (Unaudited) | | | | | | | | | | | | | |
| Institutional Class: | | | | | | | | | | | | | | | | | | | | | | |
| Net asset value per share, beginning of period | | | $ | 15.93 | | | $ | 14.32 | | | $ | 15.98 | | | $ | 13.38 | | | | $ | 10.00 | |
| Income from investment operations: | | | | | | | | | | | | | | | | | | | | | | |
| Net investment income | | | | 0.41 | | | | 0.65 | | | | 0.61 | | | | 0.43 | | | | | 0.19 | (b) |
| Net realized and unrealized gains (losses) on investments | | | | 2.47 | | | | 1.60 | | | | (0.72 | ) | | | 3.40 | | | | | 3.19 | |
| Total from investment operations | | | | 2.88 | | | | 2.25 | | | | (0.11 | ) | | | 3.83 | | | | | 3.38 | |
| Redemption fees | | | | 0.00 | (c) | | | 0.00 | (c) | | | 0.00 | (c) | | | — | | | | | 0.00 | (c) |
| Less distributions: | | | | | | | | | | | | | | | | | | | | | | |
| From net investment income | | | | (0.32 | ) | | | (0.64 | ) | | | (0.99 | ) | | | (0.20 | ) | | | | — | |
| From net realized gains on investments | | | | — | | | | — | | | | (0.55 | ) | | | (1.03 | ) | | | | — | |
| From tax return of capital | | | | — | | | | — | | | | (0.01 | ) | | | — | | | | | — | |
| Total distributions | | | | (0.32 | ) | | | (0.64 | ) | | | (1.55 | ) | | | (1.23 | ) | | | | — | |
| Net asset value per share, end of period | | | $ | 18.49 | | | $ | 15.93 | | | $ | 14.32 | | | $ | 15.98 | | | | $ | 13.38 | |
| | | | | | | | | | | | | | | | | | | | | | | |
| Total return | | | | 18.22 | %(d) | | | 16.09 | % | | | –1.03 | % | | | 30.23 | % | | | | 33.80 | %(d) |
| Ratios/Supplemental Data | | | | | | | | | | | | | | | | | | | | | | |
| Net Assets at end of period (000) | | | $ | 94,349 | | | $ | 46,998 | | | $ | 29,028 | | | $ | 2,245 | | | | $ | 1,422 | |
| Ratio of total expenses to average net assets: | | | | | | | | | | | | | | | | | | | | | | |
| Before waivers and/or expense reimbursements (e) | | | | 1.24 | %(f) | | | 1.33 | % | | | 1.59 | % | | | 3.03 | % | | | | 4.42 | %(f) |
| After waivers and/or expense reimbursements (g) | | | | 1.24 | %(f) | | | 1.33 | % | | | 1.35 | % | | | 1.35 | % | | | | 1.35 | %(f) |
| Ratio of net investment income to average net assets | | | | 5.30 | %(f) | | | 4.30 | % | | | 4.17 | % | | | 3.40 | % | | | | 1.76 | %(f) |
| Portfolio turnover (h) | | | | 79 | %(d) | | | 148 | % | | | 189 | % | | | 402 | % | | | | 258 | %(d) |
| (a) | For the period from November 3, 2008 (inception of fund) to October 31, 2009. |
| (b) | Net investment income per share is calculated using ending balances after consideration of adjustments for permanent book and tax differences. |
| (c) | The amount is less than $0.005 per share. |
| (e) | Ratio of total expenses to average net assets excluding interest expense before waivers and/or expense reimbursements was 1.24% for the six months ended April 30, 2013, and 1.33%, 1.59%, 3.03% and 4.42% for the periods ended October 31, 2012, 2011, 2010 and 2009 respectively. |
| (g) | Ratio of total expenses to average net assets excluding interest expense after waivers and/or expense reimbursements was 1.24% for the six months ended April 30, 2013, and 1.33%, 1.35%, 1.35% and 1.35% for the periods ended October 31, 2012, 2011, 2010 and 2009 respectively. |
| (h) | Portfolio turnover is calculated on the basis of the Fund as a whole, without distinguishing between classes of shares issued. |
The accompanying notes are an integral part of these financial statements.
81
Alpine Mutual Funds
Financial Highlights—Continued
(For a share outstanding throughout each period)
| | | Global Consumer |
| | | Growth Fund |
| | | Six Months | | Period |
| | | Ended | | Ended |
| | | April 30, 2013 | | October 31, 2012 (a) |
| | | (Unaudited) | | |
| Class A: | | | | | | | | | | |
| Net asset value per share, beginning of period | | | $ | 10.71 | | | | $ | 8.95 | |
| Income from investment operations: | | | | | | | | | | |
| Net investment income | | | | 0.01 | | | | | 0.02 | |
| Net realized and unrealized gain on investments | | | | 0.90 | | | | | 1.74 | |
| Total from investment operations | | | | 0.91 | | | | | 1.76 | |
| Redemption fees | | | | — | | | | | — | |
| Less distributions: | | | | | | | | | | |
| From net investment income | | | | (0.02 | ) | | | | — | |
| Total distributions | | | | (0.02 | ) | | | | — | |
| Net asset value per share, end of period | | | $ | 11.60 | | | | $ | 10.71 | |
| Total return | | | | 8.51 | %(b) | | | | 19.66 | %(b) |
| Ratios/Supplemental Data: | | | | | | | | | | |
| Net Assets at end of period (000) | | | $ | 332 | | | | $ | 120 | |
| Ratio of total expenses to average net assets: | | | | | | | | | | |
| Before waivers and/or expense reimbursements | | | | 3.89 | %(c) | | | | 5.98 | %(c) |
| After waivers and/or expense reimbursements | | | | 1.60 | %(c) | | | | 1.60 | %(c) |
| Ratio of net investment income to average net assets | | | | 0.13 | %(c) | | | | 0.20 | %(c) |
| Portfolio turnover (d) | | | | 11 | %(b) | | | | 13 | % |
| (a) | Class A commenced operations on December 30, 2011. |
| (d) | Portfolio turnover is calculated on the basis of the Fund as a whole, without distinguishing between classes of shares issued. |
The accompanying notes are an integral part of these financial statements.
82
Alpine Mutual Funds
Financial Highlights—Continued
(For a share outstanding throughout each period)
| | | Global Consumer Growth Fund |
| | | Six Months | | Year | | Period |
| | | Ended | | Ended | | Ended |
| | | April 30, 2013 | | October 31, 2012 | | October 31, 2011 (a) |
| | | (Unaudited) | | | | | | |
| Institutional Class: | | | | | | | | | | | | |
| Net asset value per share, beginning of period | | | $ | 10.74 | | | | $ | 9.59 | | | | $ | 10.00 | |
| Income from investment operations: | | | | | | | | | | | | | | | |
| Net investment income | | | | 0.01 | | | | | 0.04 | | | | | 0.04 | |
| Net realized and unrealized gains (losses) on investments | | | | 0.92 | | | | | 1.15 | | | | | (0.45 | ) |
| Total from investment operations | | | | 0.93 | | | | | 1.19 | | | | | (0.41 | ) |
| Redemption fees | | | | — | | | | | — | | | | | — | |
| Less distributions: | | | | | | | | | | | | | | | |
| From net investment income | | | | (0.05 | ) | | | | (0.04 | ) | | | | — | |
| Total distributions | | | | (0.05 | ) | | | | (0.04 | ) | | | | — | |
| Net asset value per share, end of period | | | $ | 11.62 | | | | $ | 10.74 | | | | $ | 9.59 | |
| Ratios/Supplemental Data: | | | | | | | | | | | | | | | |
| Total return | | | | 8.64 | %(b) | | | | 12.48 | % | | | | (4.10 | )%(b) |
| Net Assets at end of period (000) | | | $ | 2,409 | | | | $ | 2,211 | | | | $ | 1,945 | |
| Ratio of total expenses to average net assets: | | | | | | | | | | | | | | | |
| Before waivers and/or expense reimbursements | | | | 3.64 | %(c) | | | | 5.31 | % | | | | 2.96 | %(c) |
| After waivers and/or expense reimbursements | | | | 1.35 | %(c) | | | | 1.35 | % | | | | 1.35 | %(c) |
| Ratio of net investment income to average net assets | | | | 0.18 | %(c) | | | | 0.36 | % | | | | 0.54 | %(c) |
| Portfolio turnover (d) | | | | 11 | %(b) | | | | 13 | % | | | | 7 | %(b) |
| (a) | For the period from December 29, 2010 (commencement of operations) to October 31, 2011. |
| (d) | Portfolio turnover is calculated on the basis of the Fund as a whole, without distinguishing between classes of shares issued. |
The accompanying notes are an integral part of these financial statements.
83
Alpine Mutual Funds
Notes to Financial Statements
April 30, 2013 (Unaudited)
Alpine Equity Trust (the “Equity Trust”) was organized in 1988 as a Massachusetts Business Trust, and is registered under the Investment Company Act of 1940, as amended (the “1940 Act”), as an open-end management investment company. The Alpine International Real Estate Equity Fund, Alpine Realty Income & Growth Fund, Alpine Cyclical Advantage Property Fund, Alpine Emerging Markets Real Estate Fund, Alpine Global Infrastructure Fund, and Alpine Global Consumer Growth Fund are six separate funds of the Equity Trust (individually referred to as a “Fund” and collectively, “the Funds”). The Alpine International Real Estate Equity Fund, Alpine Cyclical Advantage Property Fund, Alpine Emerging Markets Real Estate Fund, Alpine Global Infrastructure Fund and Alpine Global Consumer Growth Fund are diversified funds. The Alpine Realty Income & Growth Fund is a non-diversified fund. Alpine Woods Capital Investors, LLC (the “Adviser”) is a Delaware limited liability company and serves as the investment manager to the Funds.
| 2. | Significant Accounting Policies: |
The following is a summary of significant accounting policies consistently followed by the Funds in the preparation of their financial statements. The policies are in conformity with accounting principles generally accepted in the United States of America (“GAAP”), which require management to make estimates and assumptions that affect amounts reported herein. Actual results could differ from those estimates. Changes in the economic environment, financial markets and any other parameters used in determining these estimates could cause actual results to differ.
A. Valuation of Securities:
The net asset value (“NAV”) of shares of the Funds are calculated by dividing the value of the Funds’ net assets by the number of outstanding shares. NAV is determined each day the New York Stock Exchange (“NYSE”) is open as of the close of regular trading (normally, 4:00 p.m., Eastern time). In computing NAV, portfolio securities of the Funds are valued at their current market values determined on the basis of market quotations or if market quotations are not available or determined to be reliable, through procedures and/or guidelines established by the Board of Trustees. In computing the Funds’ net asset values, equity securities that are traded on a securities exchange in the United States are valued at the last reported sale price as of the time of valuation, or lacking any current reported sale at the time of valuation, at the mean between the most recent bid and asked quotations. Each option security traded on a securities exchange in the United States is valued at the last current reported sale price as of the time of valuation, or lacking any current reported sale at the time of valuation, the option is valued at the mid-point of the consolidated bid/ask quote for the option security. Forward currency contracts are valued based on third-party vendor quotations. Each security traded in the over-the-counter market and quoted on the NASDAQ National Market System, is valued at the NASDAQ Official Closing Price (“NOCP”), as determined by NASDAQ, or lacking an NOCP, the last current reported sale price as of the time of valuation by NASDAQ, or lacking any current reported sale on NASDAQ at the time of valuation, at the mean between the most recent bid and asked quotations. Each over-the-counter option that is not traded through the Options Clearing Corporation is valued by the counterparty, or if the counterparty’s price is not readily available, then by using the Black-Scholes method. Debt securities are valued based on an evaluated mean price as furnished by pricing services approved by the Board of Trustees, which may be based on market transactions for comparable securities and various relationships between securities that are generally recognized by institutional traders, a computerized matrix system, or appraisals derived from information concerning the securities or similar securities received from recognized dealers in those securities. Short-term securities with maturities of 60 days or less are valued at amortized cost, which approximates fair value.
Equity securities that are principally traded in a foreign market are valued at the last current sale price at the time of valuation or lacking any current or reported sale at the time of valuation, at the mean between the most recent bid and asked quotations as of the close of the appropriate exchange or other designated time. Trading in securities on European and Far Eastern securities exchanges and over-the-counter markets is normally completed at various times before the close of business on each day on which the NYSE is open. Trading of these securities may not take place on every NYSE business day. In addition, trading may take place in various foreign markets on Saturdays or on other days when the NYSE is not open and on which the Funds’ net asset values are not calculated. If the market prices are not readily available or not reflective of the fair value of the security, as of the close of the regular trading on the NYSE, the security will be priced at fair value following procedures approved by the Board of Trustees.
When market quotations are not readily available or when the valuation methods mentioned above are not reflective of a fair value of the security, the security is valued at fair value following procedures and/or guidelines approved by the Board of Trustees. The Board has approved the use of Interactive Data’s proprietary fair value pricing
84
Alpine Mutual Funds
Notes to Financial Statements—Continued
April 30, 2013 (Unaudited)
model to assist in determining current valuation for foreign securities traded in markets that close prior to the NYSE. When fair value pricing is employed, the value of the portfolio security used to calculate the Funds’ net asset values may differ from quoted or official closing prices.
As of April 30, 2013, the International Real Estate Equity Fund held securities that are fair valued, which comprised 6.3% of the Fund’s net assets.
Fair Value Measurement: The Fund’s have adopted Financial Accounting Standards Board (“FASB”) Codification Topic 820 (“ASC Topic 820”). ASC Topic 820 establishes a single definition of fair value, creates a three-tier hierarchy as a framework for measuring fair value based on inputs used to value the Funds’ investments, and requires additional disclosure about fair value. The hierarchy of inputs is summarized below.
| • Level 1 | — | quoted prices in active markets for identical investments. |
| • Level 2 | — | other significant observable inputs (including quoted prices for similar investments, interest rates, prepayment speeds, credit risk, yield curves, default rates, etc.). |
| • Level 3 | — | significant unobservable inputs (including the Funds’ own assumptions in determining the fair value of investments). |
The inputs or methodology used for valuing securities are not necessarily an indication of the risk associated with investing in those securities.
The Funds use valuation techniques to measure fair value that are consistent with the market approach and/or income approach, depending on the type of security and the particular circumstance. The market approach uses prices and other relevant information generated by market transactions involving identical or comparable securities. The income approach uses valuation techniques to discount estimated future cash flows to present value.
The following is a summary of the inputs used in valuing the Funds’ assets and liabilities carried at fair value:
| | | Valuation Inputs | | | | |
| International Real Estate Equity Fund * | | Level 1 | | | Level 2 | | | Level 3 | | | Total Value | |
| Common Stocks | | | | | | | | | | | | | | | | |
| Asia | | $ | 66,162,630 | | | $ | 19,740,061 | | | $ | 15,782,034 | | | $ | 101,684,725 | |
| Europe | | | 71,986,593 | | | | — | | | | 812,670 | | | | 72,799,263 | |
| North & South America | | | 80,730,719 | | | | — | | | | — | | | | 80,730,719 | |
| Equity-Linked Structured Notes | | | — | | | | 2,967,795 | | | | — | | | | 2,967,795 | |
| Investment Companies | | | 1,817,596 | | | | — | | | | — | | | | 1,817,596 | |
| Total | | $ | 220,697,538 | | | $ | 22,707,856 | | | $ | 16,594,704 | | | $ | 260,000,098 | |
| | | Valuation Inputs | | | | |
| Other Financial Instruments | | Level 1 | | | Level 2 | | | Level 3 | | | Total Value | |
| Liabilities | | | | | | | | | | | | | | | | |
| Forward Currency Contracts | | $ | — | | | $ | (10,107 | ) | | | — | | | | (10,107 | ) |
| Total | | $ | — | | | $ | (10,107 | ) | | $ | — | | | $ | (10,107 | ) |
| | | Valuation Inputs | | | | |
| Realty Income & Growth Fund * | | Level 1 | | | Level 2 | | | Level 3 | | | Total Value | |
| Real Estate Investment Trusts | | $ | 118,541,545 | | | $ | — | | | $ | — | | | $ | 118,541,545 | |
| Common Stocks | | | 1,723,707 | | | | — | | | | — | | | | 1,723,707 | |
| Preferred Stocks | | | 2,995,679 | | | | — | | | | — | | | | 2,995,679 | |
| Total | | $ | 123,260,931 | | | $ | — | | | $ | — | | | $ | 123,260,931 | |
85
Alpine Mutual Funds
Notes to Financial Statements—Continued
April 30, 2013 (Unaudited)
| | | Valuation Inputs | | | | |
| Cyclical Advantage Property Fund * | | Level 1 | | | Level 2 | | | Level 3 | | | Total Value | |
| Common Stocks | | | | | | | | | | | | | | | | |
| Asia | | $ | 15,756,942 | | | $ | 5,352,228 | | | $ | — | | | $ | 21,109,170 | |
| Europe | | | 11,458,092 | | | | — | | | | — | | | | 11,458,092 | |
| North & South America | | | 30,352,533 | | | | 703,076 | | | | — | | | | 31,055,609 | |
| Real Estate Investment Trusts | | | 1,255,324 | | | | — | | | | — | | | | 1,255,324 | |
| Equity-Linked Structured Notes | | | — | | | | 712,490 | | | | — | | | | 712,490 | |
| Short-Term Investments | | | — | | | | 3,133,000 | | | | — | | | | 3,133,000 | |
| Total | | $ | 58,822,891 | | | $ | 9,900,794 | | | $ | — | | | $ | 68,723,685 | |
| | | Valuation Inputs | | | | |
| Other Financial Instruments | | Level 1 | | | Level 2 | | | Level 3 | | | Total Value | |
| Liabilities | | | | | | | | | | | | | | | | |
| Forward Currency Contracts | | $ | — | | | $ | (4,043 | ) | | $ | — | | | $ | (4,043 | ) |
| Total | | $ | — | | | $ | (4,043 | ) | | $ | — | | | $ | (4,043 | ) |
| | | Valuation Inputs | | | | |
| Emerging Markets Real Estate Fund * | | Level 1 | | | Level 2 | | | Level 3 | | | Total Value | |
| Common Stocks | | | | | | | | | | | | | | | | |
| Asia | | $ | 4,349,328 | | | $ | 1,051,000 | | | $ | — | | | $ | 5,400,328 | |
| Europe | | | 210,556 | | | | — | | | | — | | | | 210,556 | |
| Middle East/Africa | | | 39,450 | | | | — | | | | — | | | | 39,450 | |
| North & South America | | | 2,040,473 | | | | 24,301 | | | | — | | | | 2,064,774 | |
| Preferred Stocks | | | 70,250 | | | | — | | | | — | | | | 70,250 | |
| Equity-Linked Structured Notes | | | — | | | | 540,968 | | | | — | | | | 540,968 | |
| Convertible Bonds | | | — | | | | 17,793 | | | | — | | | | 17,793 | |
| Warrants | | | — | | | | 214,517 | | | | — | | | | 214,517 | |
| Short-Term Investments | | | — | | | | 471,000 | | | | — | | | | 471,000 | |
| Total | | $ | 6,710,057 | | | $ | 2,319,579 | | | $ | — | | | $ | 9,029,636 | |
| | | Valuation Inputs | | | | |
| Global Infrastructure Fund * | | Level 1 | | | Level 2 | | | Level 3 | | | Total Value | |
| Common Stocks | | | | | | | | | | | | | | | | |
| Asia | | $ | 17,231,611 | | | $ | 412,266 | | | $ | — | | | $ | 17,643,877 | |
| Europe | | | 28,828,279 | | | | — | | | | — | | | | 28,828,279 | |
| North & South America | | | 50,901,279 | | | | — | | | | — | | | | 50,901,279 | |
| Equity-Linked Structured Notes | | | — | | | | 1,300,951 | | | | — | | | | 1,300,951 | |
| Short-Term Investments | | | — | | | | 14,614,000 | | | | — | | | | 14,614,000 | |
| Total | | $ | 96,961,169 | | | $ | 16,327,217 | | | $ | — | | | $ | 113,288,386 | |
| | | Valuation Inputs | | | | |
| Other Financial Instruments | | Level 1 | | | Level 2 | | | Level 3 | | | Total Value | |
| Assets | | | | | | | | | | | | | | | | |
| Forward Currency Contracts | | $ | — | | | $ | 187,705 | | | $ | — | | | $ | 187,705 | |
| Liabilities | | | | | | | | | | | | | | | | |
| Forward Currency Contracts | | | — | | | | (14,657 | ) | | | — | | | | (14,657 | ) |
| Total | | $ | — | | | $ | 173,048 | | | $ | — | | | $ | 173,048 | |
86
Notes to Financial Statements—Continued
April 30, 2013 (Unaudited)
| | | Valuation Inputs | | | | |
| Global Consumer Growth Fund * | | Level 1 | | | Level 2 | | | Level 3 | | | Total Value | |
| Common Stocks | | | | | | | | | | | | | | | | |
| Asia | | $ | 522,972 | | | $ | — | | | $ | — | | | $ | 522,972 | |
| Europe | | | 639,655 | | | | 26,749 | | | | — | | | | 666,404 | |
| North & South America | | | 1,450,366 | | | | — | | | | — | | | | 1,450,366 | |
| Short-Term Investments | | | — | | | | 103,000 | | | | — | | | | 103,000 | |
| Total | | $ | 2,612,993 | | | $ | 129,749 | | | $ | — | | | $ | 2,742,742 | |
| * | For detailed country and sector descriptions, see accompanying Schedule of Portfolio Investments. |
For the period ended April 30, 2013, the Funds had no transfers between Level 1, Level 2 and Level 3.
Following is a reconciliation of Level 3 assets for which significant unobservable inputs were used to determine fair value:
| | | International
Real Estate
Equity Fund | |
| Balance as of October 31, 2012 | | $ | 16,621,460 | |
| Realized gain (loss) | | | — | |
| Change in unrealized depreciation* | | | (26,756 | ) |
| Purchases | | | — | |
| Sales | | | — | |
| Transfers in to Level 3** | | | — | |
| Transfers out of Level 3** | | | — | |
| Balance as of April 30, 2013 | | $ | 16,594,704 | |
| Change in net unrealized depreciation on Level 3 holdings held at year end | | $ | (26,756 | ) |
| * | Statements of Operations Location: Change in net unrealized appreciation/depreciation on investments |
| | |
| ** | The Funds recognize transfers as of the beginning of the year. |
The following table shows the valuation techniques and significant amounts of unobservable inputs used in the fair value measurement of the Fund’s Level 3 investments, as of April 30, 2013:
International Real Estate Equity Fund
| Asset | | Fair Value
at 4/30/13 | | | Valuation
Technique (s) | | Significant
Unobservable
Input (s) | | Range of
Values | | Weighted
Average | | Relationship
Between Fair
Value and
Input: If
Input Value
Increases Then: |
| Common Stocks | | $ | 15,782,034 | * | | Average of terminal
value and price to
book value | | Liquidity Discount | | 15% | | 15% | | Fair Value would Decrease |
| | | | | | | | | Adjusted Weighted
Average Cost of Capital | | 13% | | 13% | | Fair Value would Decrease |
| | | | | | | | | Terminal Value Discount | | 21% | | 21% | | Fair Value would Decrease |
| Common Stocks | | $ | 812,670 | * | | Adjusted Book Value | | Discount to NAV | | 50% | | 50% | | Fair Value would Decrease |
| * | Represents a single security, as of April 30, 2013. As a result, the range of values and weighted average for each unobservable input refer to a single value. |
The significant unobservable inputs used in the fair value measurement of common stocks and real estate investment trusts are liquidity discounts, market risk and private quotes. Other market indicators are also considered. Changes in any of those inputs would result in lower or higher fair value measurement.
87
Notes to Financial Statements—Continued
April 30, 2013 (Unaudited)
B. Security Transactions and Investment Income:
Securities transactions are accounted for on a trade date basis. Realized gains and losses are computed on the identified cost basis. Dividend income is recorded on the ex-dividend date or in the case of some foreign securities, on the date thereafter when the Funds are made aware of the dividend. Foreign income may be subject to foreign withholding taxes, which are accrued as applicable. Capital gains realized on some foreign securities are subject to foreign taxes, which are accrued as applicable. Interest income is recorded on the accrual basis and includes accretion of discounts and amortization of premiums, where applicable. To the extent any issuer defaults or a credit event occurs that impacts the issuer, the Funds’ may halt any additional interest income accruals and consider the realizability of interest accrued up to the date of default or credit event.
Dividends and interest from non-U.S. sources received by the Funds are generally subject to non-U.S. withholding taxes at rates ranging up to 30%. Such withholding taxes may be reduced or eliminated under the terms of applicable
U.S. income tax treaties, and the Funds intend to undertake procedural steps to claim the benefits of such treaties.
C. Line of Credit and Custody Overdrafts:
On December 1, 2010 the Trust entered into a lending agreement with BNP Paribas through its New York branch (“BNPP NY”). Loans in aggregate, whether to cover overdrafts or for investment purposes, may not exceed the maximum amount that is permitted under the 1940 Act. The terms of the lending agreement indicate the rate to be the Fed Funds rate plus 0.95% per annum on amounts borrowed. The BNP Paribas Facility provides for secured, uncommitted lines of credit for the Funds where selected Funds’ assets are pledged against advances made to the respective Fund. Each Fund is permitted to borrow up to 33.33% of its total assets for extraordinary or emergency purposes. Additionally the Funds are permitted to borrow up to 10% of their respective total assets for investment purposes but in no case shall any Fund’s total outstanding borrowings exceed 33.33% of its total assets. Either BNPP NY or the Funds may terminate this agreement upon delivery of written notice. For the period ended April 30, 2013, the average interest rate paid on outstanding borrowings under the line of credit was 1.11%, 1.11% and 1.12% for the International Real Estate Equity Fund, Realty Income & Growth Fund and Emerging Markets Real Estate Fund, respectively. The Funds may also incur interest expense on custody overdraft charges.
| | | International
Real Estate
Equity Fund | | | Realty
Income &
Growth
Fund | | | Cyclical
Advantage
Property
Fund | | | Emerging
Markets
Real Estate
Fund | | | Global
Infrastructure
Fund | | | Global
Consumer
Growth
Fund | |
| Total line of credit amount available for investment purposes at April 30, 2013 | | $ | 27,921,731 | | | $ | 12,382,261 | | | $ | 7,225,068 | | | $ | 928,697 | | | $ | 11,968,967 | | | $ | 276,590 | |
| Line of credit outstanding at April 30, 2013 | | | 13,212,669 | | | | 5,603,668 | | | | — | | | | — | | | | — | | | | — | |
| Line of credit amount unused at April 30, 2013 | | | 14,709,063 | | | | 6,778,593 | | | | 7,225,068 | | | | 928,697 | | | | 11,968,967 | | | | 276,590 | |
| Average balance outstanding during the year | | | 12,243,354 | | | | 7,168,023 | | | | — | | | | 7,078 | | | | — | | | | — | |
| Interest expense incurred on line of credit during the year | | | 68,386 | | | | 40,058 | | | | — | | | | 40 | | | | — | | | | — | |
| Interest expense incurred on custody overdrafts during the period | | | 1,293 | | | | 75 | | | | 120 | | | | 11 | | | | 47 | | | | — | |
The line of credit outstanding as of April 30, 2013 approximates its fair value and would be categorized at Level 2.
88
Notes to Financial Statements—Continued
April 30, 2013 (Unaudited)
D. Federal and Other Income Taxes:
It is each Fund’s policy to comply with the Federal income and excise tax requirements of the Internal Revenue Code of 1986 (the “Code”), as amended applicable to regulated investment companies and to distribute timely, all of its investment company taxable income and net realized capital gains to shareholders in accordance with the timing requirements imposed by the Code. Therefore, no Federal income tax provision is recorded. Under applicable foreign tax laws, a withholding tax may be imposed on interest, dividends, and capital gains earned on foreign investments. Where available, the Funds will file refund claims for foreign taxes withheld.
Management has analyzed the Funds’ tax positions taken on income tax returns for all open tax years and has concluded that as of April 30, 2013, no provision for income tax is required in the Funds’ financial statements. The Funds’ Federal and state income and Federal excise tax returns for tax years for which the applicable statutes of limitations have not expired are subject to examination by Internal Revenue Service and state departments of revenue.
GAAP requires that certain components of net assets be reclassified to reflect permanent differences between financial and tax reporting. These reclassifications have no effect on net assets or net asset values per share.
E. Distributions to Shareholders:
Each Fund intends to distribute all of its net investment income and net realized capital gains, if any, throughout the year to its shareholders in the form of dividends. Distributions to shareholders are recorded at the close of business on the ex-dividend date.
The amounts of dividends from net investment income and of distributions from net realized gains are determined in accordance with Federal income tax regulations, which may differ from GAAP. These differences are either considered temporary or permanent in nature. To the extent these differences are permanent in nature, such amounts are reclassified within the composition of net assets based on their Federal tax-basis treatment; temporary differences do not require reclassification. In the event dividends and distributions to shareholders exceed net investment income and net realized gains for tax purposes, they are reported as returns of capital.
F. Class Allocations:
Income, expenses (other than class specific expenses) and realized and unrealized gains and losses are allocated among the classes of the International Real Estate Fund, Realty & Income Growth Fund, Emerging Markets Real Estate Fund, Global Infrastructure Fund, and Global Consumer Growth Fund based on the relative net assets of each class. Class specific expenses are allocated to the class to which they relate. Currently, class specific expenses are limited to those incurred under the Distribution Plan for Class A shares.
G. Foreign Currency Translation Transactions:
The International Real Estate Equity Fund, Cyclical Advantage Property Fund, Emerging Markets Real Estate Fund, Global Infrastructure Fund, and Global Consumer Growth Fund may invest without limitation in foreign securities. The Realty Income & Growth Fund may invest up to 35% of its net assets in foreign securities. The books and records of each Fund are maintained in U.S. dollars. Non-U.S. dollar-denominated amounts are translated into U.S. dollars as follows, with the resultant gains and losses recorded in the Statements of Operations:
| | i) | market value of investment securities and other assets and liabilities at the exchange rate on the valuation date, |
| | | |
| | ii) | purchases and sales of investment securities, income and expenses at the exchange rate prevailing on the respective date of such transactions. |
H. Risk Associated with Foreign Securities and Currencies:
Investments in securities of foreign issuers carry certain risks not ordinarily associated with investments in securities of domestic issuers. Such risks include future political and economic developments and the possible imposition of exchange controls or other foreign governmental laws and restrictions. In addition, with respect to certain countries, there is a possibility of expropriation of assets, confiscatory taxation, political or social instability or diplomatic developments, which could adversely affect investments in those countries.
89
Notes to Financial Statements—Continued
April 30, 2013 (Unaudited)
Certain countries may also impose substantial restrictions on investments in their capital markets by foreign entities, including restrictions on investments in issuers or industries deemed sensitive to relevant national interests. These factors may limit the investment opportunities available to the Funds or result in a lack of liquidity and high price volatility with respect to securities of issuers from developing countries.
I. Equity-Linked Structured Notes:
The Funds may invest in equity-linked structured notes. Equity-linked structured notes are securities which are specially designed to combine the characteristics of one or more underlying securities and their equity derivatives in a single note form. The return and/or yield or income component may be based on the performance of the underlying equity securities, and equity index, and/or option positions. Equity-linked structured notes are typically offered in limited transactions by financial institutions in either registered or non-registered form. An investment in equity-linked structured notes creates exposure to the credit risk of the issuing financial institution, as well as to the market risk of the underlying securities. There is no guaranteed return of principal with these securities and the appreciation potential of these securities may be limited by a maximum payment or call right. In certain cases, equity-linked structured notes may be more volatile and less liquid than less complex securities or other types of fixed income securities. Such securities may exhibit price behavior that does not correlate with other fixed income securities. International Real Estate Equity Fund, Cyclical Advantage Property Fund, Emerging Markets Real Estate Fund and Global Infrastructure Fund held 1, 2, 9 and 2 equity-linked structured notes, respectively, at April 30, 2013.
J. Forward Currency Contracts:
The Funds are subject to foreign currency exchange rate risk in the normal course of pursuing their investment objectives. The Funds may use forward currency contracts to gain exposure to or economically hedge against changes in the value of foreign currencies. A forward currency contract (“forward”) is an agreement between two parties to buy and sell a currency at a set price on a future date. The market value of the forward contract fluctuates with changes in forward currency exchange rates. The forward contract is marked-to-market daily and the change in market value is recorded by each Fund as unrealized appreciation or depreciation. When the forward contract is closed, a Fund records a realized gain or loss equal to the fluctuation in value during the period the forward contract was open. A Fund could be exposed to risk if a counterparty is unable to meet the terms of a forward or if the value of the currency changes unfavorably. During the six months ended April 30, 2013, the International Real Estate Equity Fund, Cyclical Advantage Property Fund and Global Infrastructure Fund entered into 1, 1 and 6 forward currency contracts, respectively.
The following forward currency contracts were held at April 30, 2013:
International Real Estate Equity Fund
| | | Settlement | | | | | | Settlement | | | Current | | | Unrealized | |
| Description | | Date | | | Currency | | | Value | | | Value | | | Loss | |
| Contracts Sold: | | | | | | | | | | | | | | | |
| Japanese Yen | | | 08/07/13 | | | | 828,750,000 JPY | | | $ | 8,495,425 | | | $ | 8,505,532 | | | | $(10,107 | ) |
| | | | | | | | | | | | | | | $ | 8,505,532 | | | | $(10,107 | ) |
Cyclical Advantage Property Fund
| | | Settlement | | | | | | Settlement | | | Current | | | Unrealized | |
| Description | | Date | | | Currency | | | Value | | | Value | | | Loss | |
| Contracts Sold: | | | | | | | | | | | | | | | |
| Japanese Yen | | | 07/30/13 | | | | 331,500,000 JPY | | | $ | 3,398,170 | | | $ | 3,402,213 | | | | $(4,043 | ) |
| | | | | | | | | | | | | | | $ | 3,402,213 | | | | $(4,043 | ) |
90
Notes to Financial Statements—Continued
April 30, 2013 (Unaudited)
Global Infrastructure Fund
| | | Settlement | | | | Settlement | | | Current | | | Unrealized | |
| Description | | Date | | Currency | | Value | | | Value | | | Gain/(Loss) | |
| Contracts Sold: | | | | | | | | | | | | | | | | |
| Euro | | 08/07/13 | | 5,500,000 EUR | | $ | 7,435,670 | | | $ | 7,247,965 | | | $ | 187,705 | |
| Euro | | 08/07/13 | | 1,700,000 EUR | | | 2,225,623 | | | | 2,240,280 | | | | (14,657 | ) |
| | | | | | | | | | | $ | 9,488,245 | | | $ | 173,048 | |
K. Derivative Instruments and Hedging Activities:
The following tables provide information about the effect of derivatives and hedging activities on the Funds’ Statements of Assets and Liabilities and Statements of Operations as of and for the six months ended April 30, 2013. The first table provides additional detail about the amounts and sources of unrealized appreciation/depreciation on derivatives at the end of the period. The second table provides additional information about the amounts and sources of net realized gain and the change in unrealized appreciation/depreciation resulting from the Funds’ derivatives and hedging activities during the period.
The effect of derivative instruments on the Statements of Assets and Liabilities as of April 30, 2013:
International Real Estate Equity Fund
| Derivatives | | Statements of Assets
and Liabilities Location | | Unrealized
Depreciation |
| Foreign exchange risk | | Unrealized depreciation on
forward currency contracts | | $(10,107) |
| Total | | | | $(10,107) |
Cyclical Advantage Property Fund
| Derivatives | | Statements of Assets
and Liabilities Location | | Unrealized
Depreciation |
| Foreign exchange risk | | Unrealized depreciation on
forward currency contracts | | $(4,043) |
| Total | | | | $(4,043) |
Global Infrastructure Fund
| Derivatives | | Statements of Assets
and Liabilities Location | | Unrealized Appreciation/
Depreciation |
| Foreign exchange risk | | Unrealized appreciation on
forward currency contracts | | $187,705 |
| Foreign exchange risk | | Unrealized depreciation on
forward currency contracts | | (14,657) |
| Total | | | | $173,048 |
The effect of derivative instruments on the Statements of Operations for the six months ended April 30, 2013:
International Real Estate Equity Fund
| Derivatives | | Statements of
Operations Location | | Net Realized Gain | | Change in
Unrealized Depreciation |
| Foreign exchange risk | | Change in unrealized
appreciation/depreciation on
foreign currency translations | | $— | | $(10,107) |
91
Alpine Mutual Funds
Notes to Financial Statements—Continued
April 30, 2013 (Unaudited)
| Cyclical Advantage Property Fund | | | | |
| | | | | |
| | | Statements of | | | | Change in |
| Derivatives | | Operations Location | | Net Realized Gain | | Unrealized Depreciation |
Foreign exchange risk
|
| Change in unrealized
appreciation/depreciation on
foreign currency translations |
|
$— |
|
$(4,043) |
| Global Infrastructure Fund | | | | |
| | | Statements of | | | | Change in |
| Derivatives | | Operations Location | | Net Realized Gain | | Unrealized Appreciation |
| Foreign exchange risk | | Net realized gain (loss) on
foreign currency transactions/
Change in unrealized
appreciation/depreciation on
foreign currency translations | | $(354,493) | | $313,395 |
3. Capital Share Transactions:
The Funds have an unlimited number of shares of beneficial interest, with $0.0001 par value, authorized. Transactions in shares and dollars of the Funds were as follows:
| International Real Estate Equity Fund |
| | | Period Ended
April 30, 2013 | | | Year Ended
October 31, 2012* | |
| | | Shares | | | Amount | | | Shares | | | Amount | |
| Class A | | | | | | | | | | | | | | | | |
| Shares sold | | | 779 | | | $ | 18,362 | | | | 5,775 | | | $ | 104,301 | |
| Shares issued in reinvestment of dividends | | | 13 | | | | 318 | | | | — | | | | — | |
| Redemption fees | | | — | | | | 2 | | | | — | | | | 2 | |
| Shares redeemed | | | (498 | ) | | | (12,165 | ) | | | (3 | ) | | | (68 | ) |
| Total net change | | | 294 | | | $ | 6,517 | | | | 5,772 | | | | 104,235 | |
| | | | | | | | | | | | | | | | | |
| Institutional Class | | | | | | | | | | | | | | | | |
| Shares sold | | | 346,530 | | | $ | 8,338,247 | | | | 1,267,230 | | | $ | 25,993,269 | |
| Shares issued in reinvestment of dividends | | | 48,570 | | | | 1,150,627 | | | | 439,750 | | | | 7,845,139 | |
| Redemption fees | | | — | | | | 3,535 | | | | — | | | | 7,619 | |
| Shares redeemed | | | (3,447,683 | ) | | $ | (83,973,035 | ) | | | (5,530,908 | ) | | | (110,942,385 | ) |
| Total net change | | | (3,052,583 | ) | | $ | (74,480,626 | ) | | | (3,823,928 | ) | | $ | (77,096,358 | ) |
92
Alpine Mutual Funds
Notes to Financial Statements—Continued
April 30, 2013 (Unaudited)
| Realty Income & Growth Fund |
| | | Period Ended
April 30, 2013 | | | Year Ended
October 31, 2012* | |
| | | Shares | | | Amount | | | Shares | | | Amount | |
| Class A | | | | | | | | | | | | | | | | |
| Shares sold | | | 3,557 | | | $ | 63,753 | | | | 6,414 | | | $ | 100,066 | |
| Shares issued in reinvestment of dividends | | | 130 | | | | 2,359 | | | | 191 | | | | 3,339 | |
| Redemption fees | | | — | | | | — | | | | — | | | | 3 | |
| Shares redeemed | | | — | | | | — | | | | (4 | ) | | | (64 | ) |
| Total net change | | | 3,687 | | | $ | 66,112 | | | | 6,601 | | | | 103,344 | |
| | | | | | | | | | | | | | | | | |
| Institutional Class | | | | | | | | | | | | | | | | |
| Shares sold | | | 187,161 | | | $ | 3,429,912 | | | | 636,722 | | | $ | 10,633,686 | |
| Shares issued in reinvestment of dividends | | | 109,180 | | | | 1,992,585 | | | | 240,721 | | | | 4,087,030 | |
| Redemption fees | | | — | | | | 715 | | | | — | | | | 3,610 | |
| Shares redeemed | | | (545,586 | ) | | | (9,948,182 | ) | | | (1,267,504 | ) | | | (21,452,717 | ) |
| Total net change | | | (249,245 | ) | | $ | (4,524,970 | ) | | | (390,061 | ) | | $ | (6,728,391 | ) |
| Cyclical Advantage Property Fund |
| | | Period Ended
April 30, 2013 | | | Year Ended
October 31, 2012* | |
| | | Shares | | | Amount | | | Shares | | | Amount | |
| Institutional Class | | | | | | | | | | | | | | | | |
| Shares sold | | | 90,976 | | | $ | 2,240,506 | | | | 73,565 | | | $ | 1,522,677 | |
| Shares issued in reinvestment of dividends | | | 20,925 | | | | 510,363 | | | | 14,259 | | | | 244,257 | |
| Redemption fees | | | — | | | | 719 | | | | — | | | | 77 | |
| Shares redeemed | | | (104,655 | ) | | | (2,608,198 | ) | | | (272,500 | ) | | | (5,343,438 | ) |
| Total net change | | | 7,246 | | | $ | 143,390 | | | | (184,676 | ) | | $ | (3,576,427 | ) |
| Emerging Markets Real Estate Fund |
| | | Period Ended
April 30, 2013 | | | Year Ended
October 31, 2012* | |
| | | Shares | | | Amount | | | Shares | | | Amount | |
| Class A | | | | | | | | | | | | | | | | |
| Shares sold | | | 41,282 | | | $ | 788,719 | | | | 8,184 | | | $ | 111,813 | |
| Shares issued in reinvestment of dividends | | | 88 | | | | 1,633 | | | | — | | | | — | |
| Redemption fees | | | — | | | | 52 | | | | — | | | | — | |
| Shares redeemed | | | (4,201 | ) | | | (81,908 | ) | | | — | | | | — | |
| Total net change | | | 37,169 | | | $ | 708,496 | | | | 8,184 | | | | 111,813 | |
| | | | | | | | | | | | | | | | | |
| Institutional Class | | | | | | | | | | | | | | | | |
| Shares sold | | | 159,929 | | | $ | 3,079,372 | | | | 25,841 | | | $ | 393,744 | |
| Shares issued in reinvestment of dividends | | | 3,029 | | | | 55,876 | | | | — | | | | — | |
| Redemption fees | | | — | | | | 466 | | | | — | | | | 560 | |
| Shares redeemed | | | (14,652 | ) | | | (279,958 | ) | | | (68,074 | ) | | | (1,053,041 | ) |
| Total net change | | | 148,306 | | | $ | 2,855,756 | | | | (42,233 | ) | | $ | (658,737 | ) |
93
Alpine Mutual Funds
Notes to Financial Statements—Continued
April 30, 2013 (Unaudited)
| Global Infrastructure Fund |
| | | Period Ended
April 30, 2013 | | | Year Ended
October 31, 2012* | |
| | | Shares | | | Amount | | | Shares | | | Amount | |
| Class A | | | | | | | | | | | | | | | | |
| Shares sold | | | 664,902 | | | $ | 11,642,781 | | | | 107,333 | | | $ | 1,627,209 | |
| Shares issued in reinvestment of dividends | | | 5,247 | | | | 91,804 | | | | 1,338 | | | | 20,570 | |
| Redemption fees | | | — | | | | 1,624 | | | | — | | | | 18 | |
| Shares redeemed | | | (10,055 | ) | | | (180,717 | ) | | | (541 | ) | | | (7,742 | ) |
| Total net change | | | 660,094 | | | $ | 11,555,492 | | | | 108,130 | | | $ | 1,640,055 | |
| | | | | | | | | | | | | | | | | |
| Institutional Class | | | | | | | | | | | | | | | | |
| Shares sold | | | 2,263,925 | | | $ | 40,101,027 | | | | 1,517,961 | | | $ | 22,312,167 | |
| Shares issued in reinvestment of dividends | | | 48,780 | | | | 849,222 | | | | 89,244 | | | | 1,337,634 | |
| Redemption fees | | | — | | | | 7,323 | | | | — | | | | 2,350 | |
| Shares redeemed | | | (159,500 | ) | | | (2,746,118 | ) | | | (683,673 | ) | | | (10,416,319 | ) |
| Total net change | | | 2,153,205 | | | $ | 38,211,454 | | | | 923,532 | | | $ | 13,235,832 | |
| Global Consumer Growth Fund |
| | | Period Ended
April 30, 2013 | | | Year Ended
October 31, 2012* | |
| | | Shares | | | Amount | | | Shares | | | Amount | |
| Class A | | | | | | | | | | | | | | | | |
| Shares sold | | | 17,413 | | | $ | 199,082 | | | | 11,173 | | | $ | 100,000 | |
| Shares issued in reinvestment of dividends | | | 20 | | | | 227 | | | | — | | | | — | |
| Redemption fees | | | — | | | | — | | | | — | | | | — | |
| Shares redeemed | | | — | | | | — | | | | — | | | | — | |
| Total net change | | | 17,433 | | | $ | 199,309 | | | | 11,173 | | | $ | 100,000 | |
| | | | | | | | | | | | | | | | | |
| Institutional Class | | | | | | | | | | | | | | | | |
| Shares sold | | | 830 | | | $ | 9,398 | | | | 2,286 | | | $ | 24,200 | |
| Shares issued in reinvestment of dividends | | | 844 | | | | 9,385 | | | | 878 | | | | 7,862 | |
| Redemption fees | | | — | | | | — | | | | — | | | | — | |
| Shares redeemed | | | (309 | ) | | | (3,600 | ) | | | — | | | | — | |
| Total net change | | | 1,365 | | | $ | 15,183 | | | | 3,164 | | | $ | 32,062 | |
| * | Class A commenced operations on December 30, 2011. |
4. Purchases and Sales of Securities:
Purchases and sales of securities (excluding short-term securities) for the period ended April 30, 2013 are as follows:
| | | Purchases | | Sales |
| International Real Estate Equity Fund | | $23,640,437 | | $108,754,238 |
| Realty Income & Growth Fund | | 17,203,568 | | 25,655,258 |
| Cyclical Advantage Property Fund | | 19,156,116 | | 15,788,030 |
| Emerging Markets Real Estate Fund | | 6,486,477 | | 3,331,646 |
| Global Infrastructure Fund | | 92,866,951 | | 49,901,867 |
| Global Consumer Growth Fund | | 477,487 | | 273,158 |
The Funds did not have purchases and sales of U.S. Government obligations for the six months ended April 30, 2013.
94
Alpine Mutual Funds
Notes to Financial Statements—Continued
April 30, 2013 (Unaudited)
| 5. | Distribution Plans: Quasar Distributors, LLC (“Quasar”) serves as each Fund’s distributor. Each of the Funds, except for the Cyclical Advantage Property Fund, has adopted distribution and servicing plans (the “Plans”) for their Class A shares as allowed by Rule 12b-1 under the 1940 Act. The Plans authorize payments by the Funds in connection with the distribution and servicing of their Class A shares at an annual rate, as determined from time to time by the Board of Trustees, of up to 0.25% of the average daily net assets of the Class A shares of the Funds. Amounts paid under the Plans by the Funds may be spent by the Funds on any activities or expenses primarily intended to result in the sale of Class A shares of the Fund, including but not limited to advertising, compensation for sales and marketing activities of financial institutions and others such as dealers and distributors, shareholder account servicing, the printing and mailing of prospectuses to other than current shareholders and the printing and mailing of sales literature. International Real Estate Equity Fund, Realty Income & Growth Fund, Emerging Markets Real Estate Fund, Global Infrastructure Fund and Global Consumer Growth Fund incurred $181, $197, $733, $7,651 and $211, respectively, pursuant to the Plans for the six months ended April 30, 2013. The Plans for the Funds may be terminated at any time by vote of the Board of Trustees of the Equity Trust who are not “interested persons,” as defined by the 1940 Act, of the Equity Trust, or by vote of a majority of the outstanding voting shares of the respective class. Alpine Woods Capital Investors, LLC (the “Adviser”) makes payments to intermediaries that provide omnibus account services, sub-accounting services and/or networking services with respect to the Funds. The Board of Trustees approved, subject to certain limitations, the reimbursement to the Adviser by the appropriate Fund, of up to a certain percentage of such fees paid by the Adviser to intermediaries that provide omnibus account services, sub-accounting services, and/or networking services. Reimbursement of these fees are subject to review by the Board of Trustees and are included in the transfer agent fees in the Statements of Operations. |
| 6. | Investment Advisory Agreement, Administration Agreement and Other Affiliated Transactions: The Adviser provides investment advisory services to each of the Funds. Pursuant to the advisory agreements with the Realty Income & Growth Fund and the Cyclical Advantage Property Fund, the Adviser is entitled to an annual fee based on each Fund’s average daily net assets, in accordance with the following schedule: |
| First $750 million | | 1.00 | % |
| Next $250 million | | 0.90 | % |
| Over $1 billion | | 0.80 | % |
| | The Adviser is entitled to an annual fee based on 1.00% of each Fund’s average daily net assets for the International Real Estate Equity Fund, Emerging Markets Real Estate Fund, Global Infrastructure Fund and Global Consumer Growth Fund. The Adviser agreed to reimburse the Realty Income & Growth Fund, Emerging Markets Real Estate Fund, Global Infrastructure Fund and Global Consumer Growth Fund to the extent necessary to ensure that ordinary operating expenses (including 12b-1 fees, but excluding interest, brokerage commissions, acquired fund fees and extraordinary expenses) do not exceed annually 1.60% of the Fund’s Class A Shares average daily net assets, and 1.35% of each Fund’s Institutional Class Shares average daily net assets. The Adviser may recover expenses paid in excess of the cap on expenses for the three previous years, as long as the recovery does not cause the Funds to exceed such cap on expenses. For the six months ended April 30, 2013, the Adviser waived investment advisory fees and other expenses totaling $7,633, $31,513 and $28,122 for the Realty Income & Growth Fund, Emerging Markets Real Estate Fund and Global Consumer Growth Fund, respectively. The expense limitations will remain in effect for the Funds through February 28, 2014 unless and until the Board of Trustees of the Equity Trust approves their modification or termination with respect to the Funds. |
95
Alpine Mutual Funds
Notes to Financial Statements—Continued
April 30, 2013 (Unaudited)
Waived expenses subject to potential recovery by year of expiration are as follows:
| Years of Expiration | | Realty Income &
Growth Fund | | Emerging Markets
Real Estate Fund | | Global
Infrastructure Fund | | Global Consumer
Growth Fund |
| 10/31/2013 | | $ | — | | | $ | 31,563 | | | $ | 30,973 | | | $ | — | |
| 10/31/2014 | | $ | — | | | $ | 48,844 | | | $ | 27,165 | | | $ | 26,927 | |
| 10/31/2015 | | $ | — | | | $ | 65,965 | | | $ | — | | | $ | 84,997 | |
| 10/31/2016 | | $ | 7,633 | | | $ | 31,513 | | | $ | — | | | $ | 28,122 | |
State Street Bank and Trust Company (“SSBT”) serves as the Funds’ administrator pursuant to an Administration Agreement with the Funds. As compensation for its services to the Funds, SSBT receives an annual administration fee of 0.02% of total net assets on the first $5 billion and 0.015% on total net assets exceeding $5 billion, computed daily and payable monthly.
| 7. | Transactions with Affiliates: |
The following issuers are affiliated with the International Real Estate Equity Fund; that is, the Fund held 5% or more of the outstanding voting securities during the six months ended April 30, 2013. As defined in Section (2)(a)(3) of the Investment Company Act of 1940, such issuers are:
| | | Shares at | | | | | | | | Shares at | | Value at | | Realized | | Dividend |
| Issuer Name | | October 31, 2012 | | Purchases | | Sales | | April 30, 2013 | | April 30, 2013 | | Loss | | Income |
| Yatra Capital, Ltd. | | | 1,443,695 | | | | — | | | | 117,864 | | | | 1,325,831 | | | | $6,006,425 | | | | $(770,373) | | | | $— | |
Certain of the Funds invest a substantial amount of their assets in the equity securities of issuers engaged in the real estate industry, including real estate investment trusts (REITs). As a result, these Funds may be more affected by economic developments in the real estate industry than would a general equity fund.
| 9. | Federal Income Tax Information: |
At October 31, 2012, the components of distributable earnings on a tax basis were as follows:
| | | | International Real | | | | Realty Income & | | | | Cyclical Advantage | |
| | | | Estate Equity Fund | | | | Growth Fund | | | | Property Fund | |
| Undistributed ordinary Income | | | $ | 1,897,548 | | | | $ | — | | | | $ | 276,013 | |
| Accumulated capital loss | | | | (1,099,421,435 | ) | | | | (4,663,247 | ) | | | | (54,626,492 | ) |
| Unrealized appreciation/depreciation | | | | (53,692,119 | ) | | | | 30,743,009 | | | | | 9,422,818 | |
| Total | | | $ | (1,151,216,006 | ) | | | $ | 26,079,762 | | | | $ | (44,927,661 | ) |
| | | | | | | | | | | | | | | | |
| | | | Emerging Markets | | | | Global | | | | Global Consumer | |
| | | | Real Estate Fund | | | | Infrastructure Fund | | | | Growth Fund | |
| Undistributed ordinary Income | | | $ | 58,098 | | | | $ | — | | | | $ | 7,301 | |
| Accumulated capital loss | | | | (113,559 | ) | | | | (459,887 | ) | | | | (44,895 | ) |
| Unrealized appreciation/depreciation | | | | 606,575 | | | | | 3,761,199 | | | | | 209,084 | |
| Total | | | $ | 551,114 | | | | $ | 3,301,312 | | | | $ | 171,490 | |
96
Alpine Mutual Funds
Notes to Financial Statements—Continued
April 30, 2013 (Unaudited)
Tax components of distributable earnings are determined in accordance with income tax regulations which may differ from the composition of net assets reported under GAAP. Accordingly, for the year ended October 31, 2012, the effects of certain differences were reclassified as follows:
| | | | | | Accumulated | | | Accumulated | |
| | | | | | net investment | | | net realized | |
| | | Capital stock | | | income (loss) | | | gains (losses) | |
| International Real Estate Equity Fund | | $ | 1 | | | | $ | 1,582,908 | | | | $ | (1,582,909 | ) |
| Realty Income & Growth Fund | | | (1,600,402 | ) | | | 1,602,246 | | | | (1,844 | ) |
| Cyclical Advantage Property Fund | | | (2 | ) | | | 16,837 | | | | (16,835 | ) |
| Emerging Markets Real Estate Fund | | | (3 | ) | | | 37,176 | | | | (37,173 | ) |
| Global Infrastructure Fund | | | (25,122 | ) | | | (15,546 | ) | | | 40,668 | |
| Global Consumer Growth Fund | | | — | | | | (325 | ) | | | 325 | |
As of April 30, 2013, the net unrealized appreciation/depreciation of investments, excluding foreign currency, based on Federal tax costs was as follows:
| | | International Real | | | Realty Income & | | | Cyclical Advantage | |
| | | Estate Equity Fund | | | Growth Fund | | | Property Fund | |
| Cost of investments | | $ | 261,437,798 | | | $ | 74,191,484 | | | $ | 51,058,290 | |
| Gross unrealized appreciation | | | 84,925,084 | | | | 49,222,812 | | | | 19,627,222 | |
| Gross unrealized depreciation | | | (86,362,784 | ) | | | (153,365 | ) | | | (1,961,827 | ) |
| Net unrealized appreciation (depreciation) | | | (1,437,700 | ) | | | 49,069,447 | | | | 17,665,395 | |
| | | | | | | | | | | | | |
| | | Emerging Markets | | | Global | | | Global Consumer | |
| | | Real Estate Fund | | | Infrastructure Fund | | | Growth Fund | |
| Cost of investments | | $ | 7,764,877 | | | $ | 100,439,019 | | | $ | 2,286,071 | |
| Gross unrealized appreciation | | | 1,395,920 | | | | 14,596,115 | | | | 591,704 | |
| Gross unrealized depreciation | | | (131,161 | ) | | | (1,746,748 | ) | | | (135,033 | ) |
| Net unrealized appreciation (depreciation) | | | 1,264,759 | | | | 12,849,367 | | | | 456,671 | |
The tax basis of investments for tax and financial reporting purposes differs principally due to the deferral of losses on wash sales, partnership tax adjustments, and mark-to-market cost basis adjustments for investments in passive foreign investment companies (PFICs) for tax purposes.
The tax character of distributions paid during the year ended October 31, 2012 were as follows:
| | | 2012 | |
| International Real Estate Equity Fund | | | | |
| Ordinary income | | $ | 8,892,777 | |
| Long-term capital gain | | | — | |
| | | $ | 8,892,777 | |
| Realty Income & Growth Fund | | | | |
| Ordinary income | | $ | 4,526,628 | |
| Long-term capital gain | | | — | |
| | | $ | 4,526,628 | |
| Cyclical Advantage Property Fund | | | | |
| Ordinary income | | $ | 251,458 | |
| Long-term capital gain | | | — | |
| | | $ | 251,458 | |
97
Alpine Mutual Funds
Notes to Financial Statements—Continued
April 30, 2013 (Unaudited)
| | | 2012 | |
| Emerging Markets Real Estate Fund | | | | |
| Ordinary income | | $ | — | |
| Long-term capital gain | | | — | |
| | | $ | — | |
| Global Infrastructure Fund | | | | |
| Ordinary income | | $ | 1,775,501 | |
| Long-term capital gain | | | — | |
| Return of capital | | | — | |
| | | $ | 1,775,501 | |
| Global Consumer Growth Fund | | | | |
| Ordinary income | | $ | 7,862 | |
| Long-term capital gain | | | — | |
| | | $ | 7,862 | |
During the year ended October 31, 2012, the Realty Income & Growth Fund, Cyclical Advantage Property Fund, Emerging Markets Real Estate Fund, Global Infrastructure Fund and Global Consumer Growth Fund utilized $6,287,395, $4,570,317, $62,593, $58,397 and $607 of capital loss carryovers, respectively.
Capital loss carryovers as of October 31, 2012 are as follows:
| Expiration Date | | International Real
Estate Equity Fund | | | Realty Income &
Growth Fund | | | Cyclical Advantage
Property Fund | |
| 10/31/2015 | | | $ | — | | | | | $ | — | | | | | $ | 228,943 | | |
| 10/31/2016 | | | $ | 384,892,332 | | | | | $ | — | | | | | $ | 19,372,953 | | |
| 10/31/2017 | | | $ | 546,087,879 | | | | | $ | 4,663,247 | | | | | $ | 26,502,747 | | |
| 10/31/2018 | | | $ | 65,121,028 | | | | | $ | — | | | | | $ | 8,521,849 | | |
| 10/31/2019 | | | $ | 63,938,162 | | | | | $ | — | | | | | $ | — | | |
| Expiration Date | | Emerging Markets
Real Estate Fund | | | Global
Infrastructure
Fund | | | Global
Consumer
Growth Fund | |
| 10/31/2015 | | | $ | — | | | | | $ | — | | | | | $ | — | | |
| 10/31/2016 | | | $ | — | | | | | $ | — | | | | | $ | — | | |
| 10/31/2017 | | | $ | — | | | | | $ | — | | | | | $ | — | | |
| 10/31/2018 | | | $ | — | | | | | $ | — | | | | | $ | — | | |
| 10/31/2019 | | | $ | 113,559 | | | | | $ | 459,887 | | | | | $ | — | | |
Under the Regulated Investment Company (“RIC”) Modernization Act of 2010 (“the Modernization Act”), post-enactment capital losses that are carried forward will retain their character as either short-term or long-term capital losses rather than being considered all short-term as under previous law. However, any losses incurred during those future taxable years will be required to be utilized prior to the losses incurred in pre-enactment taxable years, which carry an expiration date. As a result of this ordering rule, pre-enactment capital loss carryovers may be more likely to expire unused.
Capital loss carryover as of October 31, 2012 with no expiration are as follows:
| Fund | | Short Term | | | Long Term | |
| International Real Estate Equity Fund | | $ | 3,599,589 | | | $ | 35,782,445 | |
| Global Consumer Growth Fund | | | 44,895 | | | | — | |
98
Alpine Mutual Funds
Notes to Financial Statements—Continued
April 30, 2013 (Unaudited)
In accordance with U.S. GAAP, the Funds have previously adopted accounting standards related to the accounting for uncertain tax positions. In accordance with this guidance, the Funds analyzed all open tax years, as defined by the Statute of Limitations, for all major jurisdictions. Open tax years are those that are open for examination by taxing authorities. Major jurisdictions for the Funds included Federal and the state of New York. As of April 30, 2013, open Federal and New York tax years include the tax years ended October 31, 2009 through 2012. The Funds have no examinations in progress.
The Funds have reviewed all open tax years and major jurisdictions and concluded that there is no impact on the Funds’ net assets and no tax liability resulting from unrecognized tax benefits relating to uncertain income tax positions taken in previous years or expected to be taken on the tax return for the fiscal year ended October 31, 2012 or 2013. Also, the Funds have recognized no interest and penalties related to uncertain tax benefits. The Funds are also not aware of any tax positions for which it is reasonably possible that the total amounts of unrecognized tax benefits will significantly change in the next twelve months.
| 10. | Recent Accounting Pronouncement: On December 16, 2011, the Financial Accounting Standards Board (“FASB”) issued Accounting Standards Update No. 2011-11, “Disclosures about Offsetting Assets and Liabilities” (“ASU 2011-11”), as clarified with ASU 2013-01 “Clarifying the Scope of Disclosures about Offsetting Assets and Liabilities” issued in January 2013. ASU 2011-11 amends FASB Accounting Standards Codification Topic 210, specifically requiring an entity to disclose information about offsetting and related arrangements and the effect those arrangements have on the financial position. ASU 2011-11 is effective in annual reporting periods beginning on or after January 1, 2013, and for interim periods within those annual reporting periods. Management is currently evaluating the implications of these changes and their impact on the financial statements. |
99
Alpine Mutual Funds
Information about your Funds Expenses (unaudited)
April 30, 2013
Fund expenses
Example
As a shareholder of the Fund, you may incur two types of costs: (1) transaction costs, including front-end on purchase payments; and (2) ongoing costs, including management fees; service and/or distribution (12b-1) fees; and other Fund expenses. This example is intended to help you understand your ongoing costs (in dollars) of investing in the Fund and to compare these costs with the ongoing costs of investing in other mutual funds.
This example is based on an investment of $1,000 invested on November 1, 2012 and held for the six months ended April 30, 2013.
Actual Expenses
The table below titled “Based on Actual Total Return” provides information about actual account values and actual expenses. You may use the information provided in this table, together with the amount you invested, to estimate the expenses that you paid over the period. To estimate the expenses you paid on your account, divide your ending account value by $1,000 (for example, an $8,600 ending account value divided by $1,000 = 8.6), then multiply the result by the number under the heading entitled “Expenses Paid During the Period”.
Hypothetical Example for Comparison Purposes
The table below titled “Based on Hypothetical Total Return” provides information about hypothetical account values and hypothetical expenses based on the actual expense ratio and an assumed rate of return of 5.00% per year before expenses, which is not the Fund’s actual return. The hypothetical account values and expenses may not be used to estimate the actual ending account balance or expenses you paid for the period. You may use the information provided in this table to compare the ongoing costs of investing in the Fund and other funds. To do so, compare the 5.00% hypothetical example relating to the Fund with the 5.00% hypothetical examples that appear in the shareholder reports of the other funds.
Please note that the expenses shown in the table below are meant to highlight your ongoing costs only and do not reflect any transactional costs, such as front-end or back-end sales charges (loads). Therefore, the table is useful in comparing ongoing costs only, and will not help you determine the relative total costs of owning different funds. In addition, if these transaction costs were included, your costs would have been higher.
Alpine International Real Estate Equity Fund
Based on actual total return (1)
| Class | | Actual Total
Return Without
Sales Charges (2) | | Beginning
Account Value | | Ending
Account Value | | Annualized
Expense
Ratio | | Expenses
Paid During
the Period (3) |
| Class A | | | 13.72% | | | | $1,000.00 | | | | $1,137.20 | | | | 1.71% | | | | $9.06 | |
| Institutional | | | 13.88% | | | | $1,000.00 | | | | $1,138.80 | | | | 1.46% | | | | $7.74 | |
Based on hypothetical total return (1)
| Class | | Hypothetical
Annualized
Total Return | | Beginning
Account Value | | Ending
Account Value | | Annualized
Expense
Ratio | | Expenses
Paid During
the Period (4) |
| Class A | | | 5.00% | | | | $1,000.00 | | | | $1,016.32 | | | | 1.71% | | | | $8.55 | |
| Institutional | | | 5.00% | | | | $1,000.00 | | | | $1,017.56 | | | | 1.46% | | | | $7.30 | |
100
Alpine Mutual Funds
Information about your Funds Expenses (unaudited)—Continued
April 30, 2013
Alpine Realty Income & Growth Fund
Based on actual total return (1)
| Class | | Actual Total
Return Without
Sales Charges (2) | | Beginning
Account Value | | Ending
Account Value | | Annualized
Expense
Ratio | | Expenses
Paid During
the Period (3) |
| | | | | | | | | | | |
| Class A | | 17.77% | | $1,000.00 | | $1,177.70 | | 1.68% | | $9.07 |
| | | | | | | | | | | |
| Institutional | | 17.87% | | $1,000.00 | | $1,178.70 | | 1.43% | | $7.72 |
Based on hypothetical total return (1)
| Class | | Hypothetical
Annualized
Total Return | | Beginning
Account Value | | Ending
Account Value | | Annualized
Expense
Ratio | | Expenses
Paid During
the Period (4) |
| | | | | | | | | | | |
| Class A | | 5.00% | | $1,000.00 | | $1,016.46 | | 1.68% | | $8.40 |
| | | | | | | | | | | |
| Institutional | | 5.00% | | $1,000.00 | | $1,017.70 | | 1.43% | | $7.15 |
Alpine Cyclical Advantage Property Fund
Based on actual total return (1)
| Class | | Actual Total
Return Without
Sales Charges (2) | | Beginning
Account Value | | Ending
Account Value | | Annualized
Expense
Ratio | | Expenses
Paid During
the Period (3) |
| | | | | | | | | | | |
| Institutional | | 13.86% | | $1,000.00 | | $1,138.60 | | 1.41% | | $7.47 |
Based on hypothetical total return (1)
| Class | | Hypothetical
Annualized
Total Return | | Beginning
Account Value | | Ending
Account Value | | Annualized
Expense
Ratio | | Expenses
Paid During
the Period (4) |
| | | | | | | | | | | |
| Institutional | | 5.00% | | $1,000.00 | | $1,017.80 | | 1.41% | | $7.05 |
Alpine Emerging Markets Real Estate Fund
Based on actual total return (1)
| Class | | Actual Total
Return Without
Sales Charges (2) | | Beginning
Account Value | | Ending
Account Value | | Annualized
Expense
Ratio | | Expenses
Paid During
the Period (3) |
| | | | | | | | | | | |
| Class A | | 18.78% | | $1,000.00 | | $1,187.80 | | 1.60% | | $8.69 |
| | | | | | | | | | | |
| Institutional | | 18.92% | | $1,000.00 | | $1,189.20 | | 1.35% | | $7.33 |
Based on hypothetical total return (1)
| Class | | Hypothetical
Annualized
Total Return | | Beginning
Account Value | | Ending
Account Value | | Annualized
Expense
Ratio | | Expenses
Paid During
the Period (4) |
| | | | | | | | | | | |
| Class A | | 5.00% | | $1,000.00 | | $1,016.85 | | 1.60% | | $8.00 |
| | | | | | | | | | | |
| Institutional | | 5.00% | | $1,000.00 | | $1,018.09 | | 1.35% | | $6.76 |
101
Alpine Mutual Funds
Information about your Funds Expenses (unaudited)—Continued
April 30, 2013
Alpine Global Infrastructure Fund
Based on actual total return (1)
| Class | | Actual Total
Return Without
Sales Charges (2) | | Beginning
Account Value | | Ending
Account Value | | Annualized
Expense
Ratio | | Expenses
Paid During
the Period (3) |
| | | | | | | | | | | |
| Class A | | 18.01% | | $1,000.00 | | $1,180.10 | | 1.49% | | $8.05 |
| | | | | | | | | | | |
| Institutional | | 18.22% | | $1,000.00 | | $1,182.20 | | 1.24% | | $6.71 |
Based on hypothetical total return (1)
| Class | | Hypothetical
Annualized
Total Return | | Beginning
Account Value | | Ending
Account Value | | Annualized
Expense
Ratio | | Expenses
Paid During
the Period (4) |
| | | | | | | | | | | |
| Class A | | 5.00% | | $1,000.00 | | $1,017.41 | | 1.49% | | $7.45 |
| | | | | | | | | | | |
| Institutional | | 5.00% | | $1,000.00 | | $1,018.65 | | 1.24% | | $6.21 |
Alpine Global Consumer Growth Fund
Based on actual total return (1)
| Class | | Actual Total
Return Without
Sales Charges (2) | | Beginning
Account Value | | Ending
Account Value | | Annualized
Expense
Ratio | | Expenses
Paid During
the Period (3) |
| | | | | | | | | | | |
| Class A | | 8.51% | | $1,000.00 | | $1,085.10 | | 1.60% | | $8.27 |
| | | | | | | | | | | |
| Institutional | | 8.64% | | $1,000.00 | | $1,086.40 | | 1.35% | | $6.98 |
Based on hypothetical total return (1)
| Class | | Hypothetical
Annualized
Total Return | | Beginning
Account Value | | Ending
Account Value | | Annualized
Expense
Ratio | | Expenses
Paid During
the Period (4) |
| Class A | | 5.00% | | $1,000.00 | | $1,016.86 | | 1.60% | | $8.00 |
| | | | | | | | | | | |
| Institutional | | 5.00% | | $1,000.00 | | $1,018.10 | | 1.35% | | $6.76 |
| (1) | For the six months ended April 30, 2013. |
| | |
| (2) | Assumes the reinvestment of all distributions, including returns of capital, if any, at net asset value and does not reflect the deduction of the applicable sales charge. Total return is not annualized, as it may not be representative of the total return for the year. Performance figures may reflect fee waivers and/or expense reimbursements. In the absence of fee waivers and/or expense reimbursements, the total return would have been lower. Past performance is no guarantee of future results. |
| | |
| (3) | Expenses (net of fee waivers and/or expense reimbursements) are equal to each class’ respective annualized expense ratio multiplied by the average account value over the period, multiplied by the number of days in the most recent fiscal half-year, then divided by 365. |
| | |
| (4) | Hypothetical expense examples assume a 5% return over a hypothetical 181 day period. |
102
Alpine Mutual Funds
Additional Information (unaudited)
April 30, 2013
Approval of Investment Management Agreements
In the weeks leading up to the Meeting of the Board of Trustees on March 12-13, 2013, the Independent Trustees reviewed materials (“15(c) Materials”) provided by the Adviser relating to the Advisory Contracts. The 15(c) Materials responded to information requested by the Independent Trustees, through independent legal counsel, which the Trustees discussed with the Adviser at the meeting. In reviewing the Agreements, the Independent Trustees considered various factors, including among other things (i) the nature, extent and quality of the services provided by the Adviser under the Agreements, (ii) the investment performance of the Funds, (iii) the costs to the Adviser of its services and the profits realized by the Adviser, from its relationship with the Funds, and (iv) the extent to which economies of scale would be realized if and as a Fund grows and whether the fee levels in the Agreements reflect these economies of scale.
In considering the nature, extent and quality of the services provided by the Adviser, the Independent Trustees relied on their prior experience as Independent Trustees of the Funds, the 15(c) Materials provided at and prior to the meeting, as well as on materials and updates provided at Board meetings throughout the year. They noted that under the Agreements, the Adviser is responsible for managing the Funds’ investments in accordance with each Fund’s investment objectives and policies, applicable legal and regulatory requirements, and the oversight of the Independent Trustees, for providing necessary and appropriate reports and information to the Independent Trustees, and for furnishing the Funds with the assistance, cooperation, and information necessary for the Funds to meet various legal requirements regarding registration and reporting. They also noted the experience and expertise of the Adviser as appropriate as an adviser to the Funds.
The Independent Trustees reviewed the background and experience of the Adviser’s Senior Management, including those individuals responsible for the investment, operations and compliance with respect to the Funds’ investments, and the responsibilities of the investment, operations and compliance personnel with respect to the Funds. They also considered the resources, operational structures and practices of the Adviser in managing the Funds’ portfolios, in monitoring and securing the Funds’ compliance with investment objectives and policies and with applicable laws and regulations, and in seeking best execution of portfolio transactions. Drawing upon all the materials provided throughout the year, including the 15(c) Materials, and their knowledge of the business of the Adviser formed through meetings with Portfolio Managers among others, the Independent Trustees took into account that the Adviser’s experience, resources and strength in these areas are deep, extensive and of high quality. On the basis of this review, the Independent Trustees determined that the nature and extent of the services provided by the Adviser to the Fund were appropriate, had been of high quality, and could be expected to remain so.
The Independent Trustees discussed the Fund performance metrics in the 15(c) Materials that were compiled by Morningstar. The Chief Financial Officer directed the Trustees to the summary of the Morningstar Report and noted the performance and expense highlights of the Funds. In assessing the quality of the portfolio management, the Independent Trustees were able to compare the short-term and long-term performance of each Fund on both an absolute basis and in comparison to its peer group, as set forth in the Morningstar Report. The Board recognized the steps that management has taken over the past year with respect to the performance of the Funds and specifically to address the bottom quartile performance of certain of the Funds for the three and five years ended December 31, 2012, including, depending on the Fund, changes to the portfolio management team, increased investment in analytical, investment and research tools for portfolio management and enhancements to the risk management process. The Independent Trustees noted that the performance of certain of these Funds had recently improved, but acknowledged that they will continue to closely monitor these Funds for further improvement. The Independent Trustees also reviewed a summary of certain Fund expenses against those of peer and category groups. For certain of the Funds, they noted that higher expenses relative to peer and category groups were due to the small size of a Fund or its decline in assets. In other instances, the net expenses exceeded the peer group and category medians largely due to an advisory fee higher than the category median. The Independent Trustees considered the use of Adviser assets to potentially benefit shareholders over time through the hiring of additional analysts, operations and compliance staff over the past five years, enhancements to portfolio management and research teams and provision of additional risk and analytic tools for portfolio management. The Independent Trustees concluded on balance that the fees to the Adviser were fair and equitable.
The Independent Trustees also considered the profitability of the advisory arrangements with the Adviser. The Independent Trustees were provided with data on the Funds’ profitability generally and on the profitability of each Fund. The Independent Trustees also examined the expense limitation agreements in place and any other expense subsidization undertaken by the Adviser, as well as each Funds’ brokerage and commissions, commission sharing
103
Alpine Mutual Funds
Additional Information (unaudited)
April 30, 2013
agreements and the open-end Funds’ payments to intermediaries whose customers invest in the Funds. After discussion and analysis, the Independent Trustees concluded that the profitability was in no instance such as to render any advisory fee excessive.
The Independent Trustees also had an opportunity to review and discuss the other 15(c) Materials provided by Alpine in response to the request of their Counsel, including, among others, expense information, organization charts and advisory fee breakpoints. Further, the Independent Trustees had the opportunity to consider whether the management of the Funds resulted in any “fall-out” benefits to the Adviser. In considering whether the Adviser benefits in other ways from its relationship with the Funds, the Independent Trustees concluded that, to the extent that Adviser derives other benefits from its relationship with the Funds, those benefits are not so significant as to render the Adviser’s fees excessive.
On the basis of their ongoing discussions with Management and their analysis of information provided prior to and at the meeting, the Independent Trustees determined that the nature of the Funds and their operations, particularly the open-end Funds, is such that economies of scale may be realized as the Funds grow in size.
The Independent Trustees approved the continuance of the Funds’ Agreements with Adviser after weighing the foregoing factors. They reasoned that the nature and extent of the services provided by the Adviser were appropriate and that the Adviser had and was taking appropriate steps to address performance issues affecting certain Funds. As to the Adviser’s fees, the Independent Trustees determined that the fees, considered in relation to the services provided, were fair and reasonable. Accordingly, the Trustees, including a majority of the Independent Trustees, agreed to approve the continuation of the Agreements for one year.
Availability of Proxy Voting Information
Information regarding how each Fund votes proxies relating to portfolio securities is available without charge upon request by calling toll-free at 1-888-785-5578 and on the SEC’s website at www.sec.gov. Information regarding how each Fund voted proxies relating to portfolio securities during the most recent twelve month period ended June 30 is available on the SEC’s website at www.sec.gov or by calling the toll-free number listed above.
Availability of Quarterly Portfolio Schedule
The Funds file Form N-Q for the first and third quarters of each fiscal year on Form N-Q. Each Fund’s Form N-Q is available on the SEC’s website at www.sec.gov and may be reviewed and copied at the SEC’s Public Reference Room in Washington, DC. Information on the operation of the Public Reference Room may be obtained by calling 1-202-551-8090.
Privacy Policy
The Funds collect non-public information about you from the following sources:
| | · | information we receive about you on applications or other forms; |
| | · | information you give us orally; and |
| | · | information about your transactions with others or us. |
The Funds do not disclose any non-public personal information about our customers or former customers without the customer’s authorization, except as required by law or in response to inquiries from governmental authorities. The Funds restrict access to your personal and account information to those employees who need to know that information to provide products and services to you. The Funds also may disclose that information to unaffiliated third parties (such as to brokers or custodians) only as permitted by law and only as needed for us to provide agreed services to you. The Funds maintain physical, electronic and procedural safeguards to guard your non-public personal information.
In the event that you hold shares of the Funds through a financial intermediary, including, but not limited to a broker dealer, bank or trust company, the privacy policy of your financial intermediary would govern how your non-public personal information would be shared with unaffiliated third parties.
104
TRUSTEES
Samuel A. Lieber
Eleanor T.M. Hoagland
James A. Jacobson
H. Guy Leibler
Jeffrey E. Wacksman
CUSTODIAN &
ADMINISTRATOR
State Street Bank & Trust Company
One Lincoln Street
Boston, MA 02111
INDEPENDENT REGISTERED
PUBLIC ACCOUNTING FIRM
Deloitte & Touche LLP
500 College Road East
Princeton, NJ 08540
FUND COUNSEL
Wilkie Farr & Gallagher LLP
787 7th Avenue
New York, NY 10019
DISTRIBUTOR
Quasar Distributors, LLC
615 East Michigan Street
Milwaukee, WI 53202
INVESTMENT ADVISER
Alpine Woods Capital Investors, LLC
2500 Westchester Ave., Suite 215
Purchase, NY 10577
TRANSFER AGENT
Boston Financial Data Services
Two Heritage Drive
North Quincy, MA 02171

SHAREHOLDER | INVESTOR INFORMATION
1(888)785.5578
www.alpinefunds.com
This material must be preceded or accompanied by a current prospectus.
Item 2. Code of Ethics
Not applicable to semi-annual reports.
Item 3. Audit Committee Financial Expert
Not applicable to semi-annual reports.
Item 4. Principal Accountant Fees and Services
Not applicable to semi-annual reports.
Item 5. Audit Committee of Listed Registrants
Not applicable to registrants who are not listed issuers (as defined in Rule 10A-3 under the Securities Exchange Act of 1934).
Item 6. Schedule of Investments
| (a) | Schedule of Investments is included as part of Item 1 of the Form N-CSR. |
Item 7. Disclosure of Proxy Voting Policies and Procedures for Closed-End Management Investment Companies.
Not applicable to open-end investment management companies.
Item 8. Portfolio Managers of Closed-End Management Investment Companies.
Not applicable to open-end investment management companies.
Item 9. Purchases of Equity Securities by Closed-End Management Investment Company and Affiliated Purchasers.
Not applicable to open-end investment management companies.
Item 10. Submission of Matters to a Vote of Security Holders.
There were no material changes to the procedures by which shareholders may recommend nominees to the Registrant’s Board of Trustees.
Item 11. Controls and Procedures.
(a) The Registrant’s principal executive officer and principal financial officer have evaluated the registrant’s disclosure controls and procedures (as defined in Rule 30a-3(c) under the Investment Company Act of 1940, as amended) within 90 days of this filing and have concluded that the Registrant’s disclosure controls and procedures were effective, as of that date.
(b) There was no change in the Registrant’s internal control over financial reporting (as defined in Rule 30a-3(d) under the Investment Company Act of 1940, as amended) during the second fiscal quarter of the period covered by this report that has materially affected, or is reasonably likely to materially affect, the Registrant’s internal control over financial reporting.
Item 12. Exhibits
| (a)(1) | Not applicable to semi-annual reports. |
| (a)(2) | The certifications required by Rule 30a-2(a) of the Investment Company Act of 1940, as amended, and Section 302 of the Sarbanes-Oxley Act of 2002 are attached hereto as Ex99.Cert. |
(b) The certifications by the Registrant’s Principal Executive Officer and Principal Financial Officer, as required by Rule 30a-2(b) of the Investment Company Act of 1940, as amended, and Section 906 of the Sarbanes-Oxley Act of 2002 are attached hereto as Ex99.906Cert.
SIGNATURES
Pursuant to the requirements of the Securities Exchange Act of 1934 and the Investment Company Act of 1940, the registrant has duly caused this report to be signed on its behalf by the undersigned, thereunto duly authorized.
Alpine Equity Trust
| By: | /s/ Samuel A. Lieber | |
| | Samuel A. Lieber | |
| | Chief Executive Officer (Principal Executive Officer) |
| | | |
| Date: | July 1, 2013 | |
Pursuant to the requirements of the Securities Exchange Act of 1934 and the Investment Company Act of 1940, this report has been signed below by the following persons on behalf of the registrant and in the capacities and on the dates indicated.
| By: | /s/ Samuel A. Lieber | |
| | Samuel A. Lieber | |
| | Chief Executive Officer (Principal Executive Officer) |
| By: | /s/ Ronald G. Palmer, Jr. | |
| | Ronald G. Palmer, Jr. | |
| | Chief Financial Officer (Principal Financial Officer) | |
| | | |
| Date: | July 1, 2013 | |