UNITED STATES
SECURITIES AND EXCHANGE COMMISSION
Washington, D.C. 20549
FORM N-CSR
CERTIFIED SHAREHOLDER REPORT OF REGISTERED
MANAGEMENT INVESTMENT COMPANIES
Investment Company Act file number: 811-05684
Alpine Equity Trust
(Exact name of registrant as specified in charter)
2500 Westchester Avenue, Suite 215
Purchase, New York 10577
(Address of principal executive offices)(Zip code)
(Name and Address of Agent for
Service) | | Copy to: |
| | | |
| Samuel A. Lieber | | Rose DiMartino |
| Alpine Woods Capital Investors, LLC | | Attorney at Law |
| 2500 Westchester Avenue, Suite 215 | | Willkie Farr & Gallagher |
| Purchase, New York 10577 | | 787 7th Avenue, 40th Floor |
| | | New York, New York 10019 |
Registrant’s telephone number, including area code: (914) 251-0880
Date of fiscal year end: October 31
Date of reporting period: November 1, 2013 - April 30, 2014
Item 1: Shareholder Report

Table of Contents
Additional Alpine Funds are offered in the Alpine Series Trust and Alpine Income Trust. These Funds include:
| Alpine Dynamic Dividend Fund | Alpine Transformations Fund |
| Alpine Accelerating Dividend Fund | Alpine Foundation Fund |
| Alpine Financial Services Fund | Alpine Ultra Short Tax Optimized Income Fund |
| Alpine Small Cap Fund | Alpine Municipal Money Market Fund |
| | Alpine High Yield Managed Duration Municipal Fund |
Alpine’s Series and Income Funds’ investment objectives, risks, charges and expenses must be considered carefully before investing in funds of the Alpine Series Trust and Alpine Income Trust. The statutory and summary prospectuses contain this and other important information about the investment company, and it may be obtained by calling 1-888-785-5578, or visiting www.alpinefunds.com. Read it carefully before investing.
Mutual fund investing involves risk. Principal loss is possible.
Alpine’s Investment Outlook

The President’s Letter
Are We There Yet?
Over the past five years and two months since the S&P 500® Index intraday low of just under 667, the Index appreciated to 1,884 on April 30, 2014. Indeed, new highs subsequent to April 30 have extended the strong gains of 2013. During the past five years, we have seen a gradual, if not steady, improvement in global economic and financial market conditions, most notably in the U.S. This has been reflected in the outperformance of the U.S. equity indices over broad global and emerging market indices (MSCI World Index and MSCI Emerging Market Index) since mid-2011 but in particular for 2013 through April 30, 2014. On a cumulative basis, the U.S. market has finally recouped the lost jobs which occurred during the 2008-2009 recession and we have seen improvements in unemployment rates of other countries although, broadly speaking, Europe is a notable laggard.
This painfully slow recovery has been accomplished not by economic strategy or fiscal policy but rather on the backs of the world’s major Central Banks. Japan has been a notable exception to this pattern of constrained action, albeit they too are relying upon flexible Central Bank policy. Fundamentally, quantitative easing (QE) in the U.S., via buying bonds related to treasuries and mortgages, is currently being reduced by “tapering” the amount. It is expected that the U.K. may continue its QE program for a little longer and that the European Central Bank (ECB) may also adopt a modified QE program. Japan will continue its QE program and will likely add more fiscal stimulus over the coming year in the form of tax cuts or financial incentives for targeted businesses and investments. Even the few countries which have been tightening monetary policies over the past year including India, China and Brazil, are expected to be nearly done. We may see further loosening of monetary policy in China imminently, followed by India and Brazil over the next year. The ultimate impact of these Central Bank policies is how commercial banks and/or capital markets provide additional funding for their clients. Differing banking/corporate/retail clientele relationships require varying mechanisms to transmit downstream the impact
of monetary policies in different countries. Suffice it to say, some countries have seen financial liquidity support the residential or retail capital sector via mortgages and car loans, while others have emphasized the corporate sector. For example, mortgage rates in the U.K. are almost exclusively ‘floating rate,’ which, in combination with the government’s “help to buy” 95% loan to value program means that a lot of capital has been injected into the household sector. In contrast, the U.S. where tight credit standards and banks’ continued caution on accepting high loan to value mortgages has, in fact, constrained the household sector. This, in turn, has dampened retail sales in the U.S. leading many marginal store chains to either contract or restructure operations, while in the U.K., retail sales were up 4% year over year.
Indeed, the big impact of financial liquidity in the U.S. has been the appreciation of stock and bond prices. This has created an ongoing surge in refinancing of corporate debt, which has significantly increased the earnings potential of many companies over the last number of years. Today’s historic low lending rates in Europe and near historic low rates in the U.S. might normally have been expected to fuel a resurgence in capital expenditures (capex) on new or improved production facilities or research activity by corporations. However, the continued poor utilization of superfluous or inefficient plants and machinery has, in combination with slow demand growth, limited corporate capital expenditures. Either demand must grow or such capacity must be eliminated before capex resumes.
Instead, corporations have been using their low cost of debt to fund either mergers and acquisitions (M&A), or return cash to shareholders via dividends or share buybacks. We have recently witnessed the largest overall aggregate dividend in history as Vodafone distributed $23.9 billion to shareholders while Apple distributed $30 billion in the form of share buybacks over 2013 in addition to their substantial dividend payouts. While the U.S. is the center of such activity, we believe it may spread increasingly across the globe. The U.S. has also been the center of the M&A activity as businesses seek to increase market share or expand to new products by acquiring them from other companies using inexpensive capital.
1
While this may work in positive fashion for both the acquirer and the seller in terms of delivering value for shareholders and growth going forward, it is not adding positive investment in new facilities or increased employment. Often “Merger Synergies” are derived from eliminating redundant jobs and production facilities. That said, we believe that over time, facilities expansion will take place if demand continues to recover and inefficient productive capacity is rationalized. Thus, eventually, the pace of job growth and then wages should accelerate.
Another effect of this significant flood of financial liquidity is that the financial markets have experienced rather low volatility, which many investors have viewed in recent years as a measure of reduced risk. Witness the CBOE SPX Volatility Index (VIX Index) which peaked in 2008 at a level of 80 and has averaged just over 20 for the past ten years. The historic low in January 2007 was at 9.9, while the level at the end of April 2014 was 13.4 and has subsequently dropped below 12 during the month of May. This does not mean that there is no volatility in the stock market as significant rotation has occurred among sectors such as biotech, software and mobile technologies which offer the prospect of great long term growth and, thus, command very high price to earnings ratios. By comparison, the best performing stocks on a year to date basis are interest sensitive stocks such as utilities and real estate investment trusts (REITs) which reflect the strong performance of U.S. Treasury bonds, which rallied from over 3.00% yield on December 31, 2013 to the April close of 2.65% and in May to levels below last July’s 2.48%.
Interest rates are still near historic lows. Further easing in Europe along with recent weak U.S. gross domestic product (GDP) performance and depressed retail sales in the U.S. are factors contributing to the current low rate environment, as is the uncertainty over broad global economic recovery. However, when economic activity picks up, possibly in the fall, and more likely next year as excess capacity continues to be absorbed, we would expect to see another reversal in bonds. We do not expect such a reversal would be as violent as last May’s spike in yields, when many leveraged participants utilizing similar carry trades or other forms of financing were forced to
reduce positions and take losses. Over the medium term, we expect that sustained moderate growth in the U.S. with continued recapitalization of European banks in a pattern following the past several years’ recovery in the U.S. may unfold. We expect limited price pressure over the medium term but that eventual demand growth resulting in new orders will collide with reduced industrial capacity to gradually create modest upward pressure for prices and wages.
During the interim period though, we would expect politics to intrude on the global economy in different fashions as unhappy or dissatisfied electorates work to remove or change the existing regimes and bring in new or at least different political perspectives. While their promises may prove empty, many politicians will attempt to solve some of the pressing issues related to quality of life. We suspect this will precipitate increased spending on infrastructure, housing and healthcare. We believe that many politicians will not utilize taxation, nor print more debt to fund such activity. Instead an emphasis of government oversight utilizing corporate management and private investment capital, or so called public private partnerships (PPP) could become a larger component of delivering services to meet the needs of expanding global population centers. In other words, we expect that the major drivers of long-term economic activity, which include developed as well as emerging markets, will continue to be an underlying theme over coming quarters as well as years. That, combined with new technologies used to access, communicate and transact business, pleasure or daily needs, will continue to be significant factors as we strive to maintain efficiency and security in our daily lives. This will continue to drive the prospects for stock performance even when interest rates return to historically “normal” levels.
Thank you for your interest and support.
Sincerely,

Samuel A. Lieber
President
Past performance is not a guarantee of future results. The specific market, sector or investment conditions that contribute to a Fund’s performance may not be replicated in future periods.
Mutual fund investing involves risk. Principal loss is possible. Please refer to individual fund letters for risks specific to that fund.
This letter and the letters that follow represent the opinions of the Funds’ management and are subject to change, are not guaranteed and should not be considered recommendations to buy or sell any security. The information provided is not intended to be, and is not, a forecast of future events, a guarantee of future results, or investment advice.
2
| Disclosures and Definitions |  |
Real Estate Funds Disclosures
The specific market, sector or investment conditions that contributed to a Fund’s performance may not be replicated in future periods.
Please refer to the Schedule of Portfolio Investments for Fund holding information. Fund holdings and sector allocations are subject to change and should not be considered a recommendation to buy or sell any security.
Diversification does not assure a profit or protect against loss in a declining market.
Favorable tax treatment of Fund distributions may be adversely affected, changed or repealed by future changes in tax laws. Alpine may not be able to anticipate the level of dividends that companies will pay in any given timeframe.
The Funds’ monthly distributions may consist of net investment income, net realized capital gains and/or a return of capital. If a distribution includes anything other than net investment income, the Funds will provide a notice of the best estimate of its distribution sources when distributed, which will be posted on the Funds’ website: www.alpinefunds.com, or can be obtained by calling 1-800-617-7616. We estimate that the Alpine Equity Trust did not pay any distributions during the fiscal semi-annual period ending April 30, 2014 through a return of capital. A return of capital distribution does not necessarily reflect the Funds’ performance and should not be confused with “yield” or “income.” Final determination of the Federal income tax characteristics of distributions paid during the calendar year will be provided on U.S. Form 1099-DIV, which will be mailed to shareholders. Please consult your tax advisor for further information.
Neither the Fund nor any of its representatives may give tax advice. Investors should consult their tax advisor for information concerning their particular situation.
All investments involve risk. Principal loss is possible. A small portion of the S&P 500 yield may include return of capital; the 10-year Treasury yield does not include return of capital; Corporate bonds and High Yield bonds generally do not have return of capital; a portion of the dividend paid by REITs and REIT preferred stock may be deemed a return of capital for tax purposes in the event the company pays a dividend greater than its taxable income. A stock may trade with more or less liquidity than a bond depending on the number of shares and bonds outstanding, the size of the company, and the demand for the securities. The REIT and REIT preferred stock market are smaller than the broader equity and bond markets and often trade with less liquidity than these markets depending upon the size of the individual
issue and the demand of the securities. Treasury notes are guaranteed by the U.S. Government and thus they are considered to be safer than other asset classes. Tax features of a Treasury Note, Corporate bond, Stock, High Yield bond, REITs and REIT preferred stock may vary based on an individual’s circumstances. Consult a tax professional for additional information.
Earnings Growth & EPS Growth are not measures of the Funds’ future performance.
Must be preceded or accompanied by a prospectus.
Quasar Distributors, LLC, distributor.
Real Estate Funds – Definitions
Capex (aka Capitalization Expenditure) are funds used by a company to acquire or upgrade physical assets such as property, industrial buildings or equipment. This type of outlay is made by companies to maintain or increase the scope of their operations.
CBOE Volatility Index (VIX Index) Chicago Board Options Exchange SPX Volatility Index reflects a market estimate of future volatility, based on the weighted average of the implied volatilities for a wide range of strikes.
FICO is an American public company that provides analytics software and services-including credit scoring-intended to help financial services companies make complex, high-volume decisions. FICO also has clients outside of the financial services sector.
FTSE EPRA/NAREIT® Emerging Index is an unmanaged index designed to track the performance of listed real estate securities companies in emerging countries worldwide.
FTSE EPRA/NAREIT® Global Index is an unmanaged index designed to track the performance of publicly-traded companies engaged in the real estate business in developed and emerging real estate markets/regions around the world.
FTSE EPRA/NAREIT® Global ex U.S. Real Estate Index is an unmanaged index designed to track the performance of publicly-traded companies engaged in the real estate business outside the United States.
Hang Seng Index is a free-float capitalization-weighted index of a selection of companies from the Stock Exchange of Hong Kong. The components of the index are divided into four sub-indexes: Commerce and Industry, Finance, Utilities, and Properties. The index was developed with a base level of 100 as of July 31, 1964.
Ibovespa Index is a total return index weighted by traded volume and is comprised of the most liquid stocks traded on the Sao Paulo Stock Exchange.
3
| Disclosures and Definitions (Continued) | |
Lipper Real Estate Funds Average is an average of funds that invest at least 80% of their portfolio in equity securities of domestic and foreign companies engaged in the real estate industry.
Market Capitalization (market cap) is the total value of a company’s outstanding shares and is calculated by multiplying the company’s outstanding shares by the current market price of one share.
MSCI ACWI Consumer Discretionary Index is a free float-adjusted market capitalization-weighted index that is designed to measure the equity market performance of developed and emerging markets for the Consumer Discretionary GICS(r) sector. Source: MSCI. MSCI makes no express or implied warranties or representations and shall have no liability whatsoever with respect to any MSCI data contained herein. The MSCI data may not be further redistributed or used as a basis for other indices or any securities or financial products. This report is not approved, reviewed or produced by MSCI.
MSCI ACWI Consumer Staples Index USD is a market capitalization-weighted index that is designed to measure the equity market performance of developed and emerging markets for the Consumer Staples GICS(r) sector. Source: MSCI. MSCI makes no express or implied warranties or representations and shall have no liability whatsoever with respect to any MSCI data contained herein. The MSCI data may not be further redistributed or used as a basis for other indices or any securities or financial products. This report is not approved, reviewed or produced by MSCI.
MSCI All Country World Index USD is a free float-adjusted market capitalization-weighted index that is designed to measure the equity market performance of developed and emerging markets. Source: MSCI. MSCI makes no express or implied warranties or representations and shall have no liability whatsoever with respect to any MSCI data contained herein. The MSCI data may not be further redistributed or used as a basis for other indices or any securities or financial products. This report is not approved, reviewed or produced by MSCI.
MSCI Daily TR Net EAFE Index USD is a free float adjusted market cap weighted index designed to measure developed market equity performance, excluding the U.S. and Canada. MSCI makes no express or implied warranties or representations and shall have no liability whatsoever with respect to any MSCI data contained herein. The MSCI data may not be further redistributed or used as a basis for other indices or any securities or financial products. This report is not approved, reviewed or produced by MSCI.
MSCI Emerging Markets Index USD is a free float adjusted market cap-weighted index that is designed to measure equity market performance in the global emerging markets. Source: MSCI.MSCI Emerging Market Index. Source: MSCI. MSCI makes no express or implied warranties or representations and shall have no liability whatsoever with respect to any MSCI data contained herein. The MSCI data may not be further redistributed or used as a basis for other indices or any securities or financial products. This report is not approved, reviewed or produced by MSCI.
MSCI Europe Index is a free float-adjusted market capitalization weighted index that is designed to measure the equity market performance of the developed markets in Europe. The MSCI Europe Index consists of the following 15 developed market country indexes: Austria, Belgium, Denmark, Finland, France, Germany, Ireland, Italy, the Netherlands, Norway, Portugal, Spain, Sweden, Switzerland, and the United Kingdom. Source: MSCI. MSCI makes no express or implied warranties or representations and shall have no liability whatsoever with respect to any MSCI data contained herein. The MSCI data may not be further redistributed or used as a basis for other indices or any securities or financial products. This report is not approved, reviewed or produced by MSCI.
MSCI US REIT Index is a free float-adjusted market capitalization-weighted index that is comprised of the most actively-traded equity REITs that are of reasonable size in terms of full- and free-float-adjusted market capitalization. Source: MSCI. MSCI makes no express or implied warranties or representations and shall have no liability whatsoever with respect to any MSCI data contained herein. The MSCI data may not be further redistributed or used as a basis for other indices or any securities or financial products. This report is not approved, reviewed or produced by MSCI.
MSCI World Index is a free-float weighted equity index which includes developed world markets, and does not include emerging markets. Source: MSCI. MSCI makes no express or implied warranties or representations and shall have no liability whatsoever with respect to any MSCI data contained herein. The MSCI data may not be further redistributed or used as a basis for other indices or any securities or financial products. This report is not approved, reviewed or produced by MSCI.
Price/Earnings Ratio (P/E) is a valuation ratio of a company’s current share price compared to its per-share earnings. Normalized earnings - earnings metric that shows you what earnings look like smoothed out in the
4
| Disclosures and Definitions (Continued) | |
long run, taking into account the cyclical changes in an economy or stock.
S&P 500® Utilities Index comprises those companies included in the S&P 500® that are classified as members of the GICS(r) utilities sector.
S&P 500® Utilities Sector provides investors with a benchmark that represents U.S. traded securities that are classified under the GICS® utilities and telecommunication services sectors.
S&P 500® Index is a float-adjusted, market capitalization-weighted index of 500 common stocks chosen for market size, liquidity, and industry group representation to represent U.S. equity performance.
S&P Developed Property Net Total Return Index(TM) is an unmanaged market-weighted total return index available on a monthly basis. The index consists of many companies from developed markets whose floats are larger than $100 million and derive more than half of their revenue from property-related activities. Net total returns include cash dividends reinvested in the index but adjusted for country specific withholding taxes based on the highest tax rate possible.
S&P Developed Ex-U.S. Property Total Return Index(TM) defines and measures the investable universe of publicly traded real estate companies domiciled in developed countries outside of the United States. The companies in the Index are engaged in real estate-related activities such as property ownership, management, development, rental and investment.
S&P Global Infrastructure Index(TM) is comprised of 75 of the largest publicly-listed infrastructure companies that meet specific investability requirements. The Index is designed to provide liquid exposure to the leading publicly-listed companies in the global infrastructure industry, from both developed markets and emerging markets.
STOXX 600 Utilities Index is a capitalization-weighted index which includes European companies that are involved in the utility sector.
STOXX Europe 600 (Price) Index is a broad based capitalization-weighted index of European stocks designed to provide a broad yet liquid representation of companies in the European region. The equities use free float shares in the index calculation. The index was developed with a base value of 100 as of December 31, 1991. This index uses float shares.
Source: FTSE - The funds or securities referred to herein are not sponsored, endorsed, or promoted by the index providers, and the index providers bear no liability with respect to any such funds or securities or any index on which such funds or securities are based. The prospectus contains a more detailed description of the limited relationship the index providers have with the licensee and any related funds.
The S&P 500® Index, the S&P Developed Property Net TR Index(TM), the S&P Developed (ex. U.S.) Property Net TR Index(TM), and the S&P Global Infrastructure Index(TM) (the “Indices”) are products of S&P Dow Jones Indices LLC and have been licensed for use by Alpine Woods Capital Investors, LLC. Copyright© 2014 by S&P Dow Jones Indices LLC. All rights reserved. Redistribution or reproduction in whole or in part are prohibited without written the permission of S&P Dow Jones Indices LLC. S&P Dow Jones Indices LLC, its affiliates, and third party licensors make no representation or warranty, express or implied, with respect to the Index and none of such parties shall have any liability for any errors, omissions, or interruptions in the Index or the data included therein.
An investor cannot invest directly in an index.
5
Equity Manager Reports

| | Alpine International Real Estate Equity Fund |
| | Alpine Realty Income & Growth Fund |
| | Alpine Cyclical Advantage Property Fund |
| | Alpine Emerging Markets Real Estate Fund |
| | Alpine Global Infrastructure Fund |
| | Alpine Global Consumer Growth Fund |
| Alpine International Real Estate Equity Fund |  |
| Comparative Annualized Returns as of 4/30/14 (Unaudited) |
| | | 6 Months(1) | | 1 Year | | 3 Years | | 5 Years | 10 Years | | Since Inception(2) |
| Alpine International Real Estate Equity Fund — Institutional Class | | -1.26 | % | | -6.51 | % | | -3.44 | % | | 13.86 | % | | 3.94 | % | | 5.35% | |
| Alpine International Real Estate Equity Fund — Class A (Without Load) | | -1.47 | % | | -6.83 | % | | N/A | | N/A | | N/A | | 12.34% | |
| Alpine International Real Estate Equity Fund — Class A (With Load) | | -6.90 | % | | -11.97 | % | | N/A | | N/A | | N/A | | 9.66% | |
| FTSE EPRA/NAREIT® Global Ex-U.S. Real Estate Index(3) | | -1.23 | % | | -6.79 | % | | 4.75 | % | | 15.53 | % | | N/A | | N/A | |
| MSCI EAFE Index | | 4.44 | % | | 13.35 | % | | 5.66 | % | | 13.58 | % | | 6.93 | % | | 4.90% | |
| Lipper International Real Estate Funds Average(4) | | -0.16 | % | | -4.85 | % | | 5.07 | % | | 15.40 | % | | 6.19 | % | | 5.35% | |
| Lipper International Real Estate Funds Ranking(4) | | N/A | (5) | | 41/55 | | | 49/49 | | | 34/41 | | | 3/3 | | | 1/1 | |
| Gross Expense Ratio (Institutional Class): 1.49%(6) | | | | | | | | | | | | | | | | | | |
| Net Expense Ratio (Institutional Class): 1.49%(6) | | | | | | | | | | | | | | | | | | |
| Gross Expense Ratio (Class A): 1.74%(6) | | | | | | | | | | | | | | | | | | |
| Net Expense Ratio (Class A): 1.74%(6) | | | | | | | | | | | | | | | | | | |
| | (1) | Not annualized. |
| | (2) | Institutional Class shares commenced on February 1, 1989 and Class A shares commenced on December 30, 2011. Returns for indices are since February 1, 1989. |
| | (3) | Index commenced on October 31, 2008. |
| | (4) | The since inception data represents the period beginning February 2, 1989 (Institutional Class only). |
| | (5) | FINRA does not recognize rankings for less than one year. |
| | (6) | As disclosed in the prospectus dated February 28, 2014. |
Performance data quoted represents past performance and is not predictive of future results. Investment return and principal value of the Fund fluctuate, so that shares, when redeemed, may be worth more or less than their original cost. Performance current to the most recent month end may be lower or higher than the performance quoted and may be obtained by calling 1-888-785-5578. Performance data shown does not reflect the 1.00% redemption fee imposed on shares held for fewer than 60 days. If it did, total returns would be reduced. Returns for the Class A shares with sales charge reflect a maximum sales charge of 5.50%. Performance for the Class A shares without sales charges does not reflect this load.
FTSE EPRA/NAREIT® Global ex-U.S. Real Estate Index is an unmanaged index designed to track the performance of publicly traded companies engaged in the real estate business outside the United States. The funds or securities referred to herein are not sponsored, endorsed, or promoted by the index providers, and the index providers bear no liability with respect to any such funds or securities or any index on which such funds or securities are based. MSCI EAFE (Europe, Australasia, Far East) Index is a free float-adjusted market-cap-weighted index designed to measure developed market equity performance. Source: MSCI. MSCI data may not be reproduced or used for any other purpose. MSCI makes no express or implied warranties or representations and shall have no liability whatsoever with respect to any MSCI data contained herein. The MSCI data may not be further redistributed or used as a basis for other indices or any securities or financial products. This report is not approved, reviewed or produced by MSCI. The Lipper International Real Estate Funds Average is an average of funds that invest at least 80% of their portfolio in equity securities of domestic and foreign companies engaged in the real estate industry. Lipper rankings for the periods shown are based on fund total returns with dividends and distributions reinvested and do not reflect sales charges. The FTSE EPRA/NAREIT® Global ex-U.S. Real Estate Index, the MSCI EAFE Index, and the Lipper International Real Estate Funds Average are unmanaged and do not reflect direct fees associated with a mutual fund, such as investment adviser fees; however, the Lipper International Real Estate Funds Average reflects fees charged by the underlying funds. The performance for the Alpine International Real Estate Equity Fund reflects the deduction of fees for these value-added services. Investors cannot directly invest in an index.
To the extent that the Fund’s historical performance resulted from gains derived from participation in Initial Public Offerings (“IPOs”) and/or Secondary Offerings, there is no guarantee that these results can be replicated in future periods or that the Fund will be able to participate to the same degree in IPO/Secondary Offerings in the future.
7
| Alpine International Real Estate Equity Fund (Continued) | |
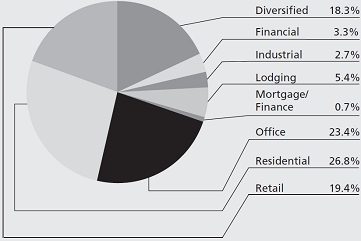
Portfolio Distributions* (Unaudited)
| Top 10 Holdings* (Unaudited) |
| |
| 1. | | Regus PLC | 7.70 | % |
| 2. | | South Asian Real Estate PLC | 6.89 | % |
| 3. | | LXB Retail Properties PLC | 4.53 | % |
| 4. | | Central Pattana PCL | 3.82 | % |
| 5. | | Songbird Estates PLC | 3.63 | % |
| 6. | | Nexity SA | 3.39 | % |
| 7. | | SM Prime Holdings, Inc. | 3.33 | % |
| 8. | | Kenedix, Inc. | 3.28 | % |
| 9. | | Great Portland Estates PLC | 3.11 | % |
| 10. | | Direcional Engenharia SA | 3.10 | % |
| * | Portfolio Distributions percentages are based on total investments. Top 10 Holdings do not include short-term investments and percentages are based on total net assets. Portfolio holdings and sector distributions are as of 04/30/14 and are subject to change. Portfolio holdings are not recommendations to buy or sell any securities. |
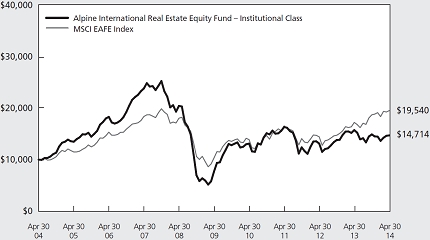
| Value of a $10,000 Investment (Unaudited) |
 |
| |
This chart represents a comparison of a hypothetical $10,000 investment in the Fund versus a similar investment in the Fund’s benchmarks. The graph and the table do not reflect the deduction of taxes that a shareholder would pay on Fund distributions or the redemption of Fund shares. Investment performance reflects the waiver and recovery of certain fees, if applicable. Without the waiver and recovery of fees, the Fund’s total return would have differed.
Performance data quoted represents past performance and is not predictive of future results. Investment return and principal value of the Fund fluctuate, so that shares, when redeemed, may be worth more or less than their original cost.
8
| Alpine International Real Estate Equity Fund (Continued) | |
Commentary
We are pleased to present the 2014 semi-annual report for the Alpine International Real Estate Equity Fund. For the six months ended April 30, 2014, the Fund generated a total return of -1.26%. This compares with the total return of the Fund’s primary benchmark, the FTSE EPRA/NAREIT® Global Ex-U.S. Real Estate Index of -1.23%. In general, international real estate stocks underperformed the broader global real estate equity indices as represented by the MSCI Daily TR Net EAFE Index USD which produced a 4.44% return. All references in this letter to the Fund’s performance relate to the performance of the Fund’s Institutional Class.
The Fund’s positions in emerging markets and Japan negatively impacted the Fund. The most notable decline in emerging markets was the Fund’s position in Brazil. The Fund’s holdings in Brazil have decreased from 21.3% in October 2013 to 14.6% as of April 30, 2014. In contrast, the Fund’s significant overweight position in the U.K. positively contributed to the Fund’s return. The Japan, Brazil and U.K. markets reflect three ongoing themes in the property sector, all of which are related to the cyclical nature of real estate. For example, the U.K. has been a major beneficiary of significant quantitative easing over the past few years and specific government programs such as ‘Help to Buy’ home buyer assistance plans, which have contributed to improved consumption patterns and acceleration of business activity. Thus, the U.K. may even be ahead of the U.S. at this stage of the business cycle and has been enjoying particularly strong demand versus supply balance which has led to rising rents, particularly in London. Brazil, on the other hand, is facing a difficult election season and has been hurt by a populist, anti-business government regime whose policies have slowed the economy and promoted inflation and inefficiency. The resulting high interest rates and weak currency have hurt the near term business prospects over the medium term. The recovery in Japan is in between the advanced cyclical pace of the U.K. and the bottoming cyclical pace of Brazil. The Bank of Japan has embarked on quantitative easing and the government is attempting to bring about further fiscal and structural reforms. Japanese Prime Minister Abe’s honeymoon with investors has ended as the government’s economic roadmap has met some short-term speed bumps with the imposition of a new value added tax (VAT). We suspect that market negativity may be short-lived.
Real Estate and the Real Economy
In the past we have highlighted Alpine’s premise that real estate equities share certain characteristics of both stocks and bonds. We believe that this could have both positive and negative implications for real estate equities, including potential under/over valuation relative to intrinsic market value of real estate for varying periods of time. Judging the effects in terms of “growth” or “yield” relative to potential total return is an ongoing process.
Alpine continues to believe that many real estate stock prices are generally still well below their 2007 peak, although some countries and companies have been able to surpass prior historic highs. We believe that, with selectivity, we can find relatively attractive valuation opportunities with the prospect for future growth which is not priced into the shares despite today’s historically low interest rate environment. The complexity of investing in stocks which have benefited from low rates is that any reversal might offset the growth prospects for income in dividends. Thus, we believe Alpine’s focus on not only companies with large market cap, but also smaller cap and non-traditional real estate or non-classified index companies may benefit the portfolio.
It is Alpine’s belief that we are in the middle of a protracted economic cycle characterized by strong investment demand which has pushed prices of property up while slow economic activity has hampered new supply. This suggests that if economic activity continues to gradually strengthen, the potential increase in jobs and requirements for new property, plant and equipment may push rents higher until the demand can be met by new properties. We believe that the potential for rent spikes in selected markets could be significant in cities or countries where the combination of economic demand, unbalanced supply and demand conditions, and cautious capital availability for development prevails. Alpine considers this mix of capital markets forces, economic fundamentals, real estate conditions and local characteristics and combines it with Alpine’s assessment of corporate capabilities, property location and competitiveness in the portfolio selection criteria of the Alpine International Real Estate Equity Fund.
9
| Alpine International Real Estate Equity Fund (Continued) | |
Portfolio Review
The portfolio shifted slightly in specific ways in response to both portfolio adjustments and share price movements. As a result, seven out of the top ten holdings from last period continue with the additions of Songbird Estates from the U.K., Nexity from France and Great Portland Estates also from the U.K. The overall representation of Asian companies in the portfolio remains relatively stable, however, there have been some notable changes, in particular with regard to India which rose from 10.4% to 15.7% of the portfolio in large measure due to new acquisitions following a recent trip to the country. Japanese real estate equities fell from 11.5% to 8.1% of the portfolio as a result of both portfolio sales and the significant price depreciation. The only other major change in Asia was the decline in Thai property shares, which in combination with a couple of notable profit taking events and overall price weakness, was certainly a factor as the Thai holdings dropped from 6.4% to 4.6% of the portfolio. New to the portfolio were shares listed in the United Arab Emirates, as the Fund bought positions in two companies following a recent fact finding trip to Dubai. We believe that fundamentals can continue to generate growth over the next few years. The most significant changes in the portfolio took place in Europe which grew from 33% of the portfolio in October 2013 to 40.4% on April 30, 2014. Most major countries, such as France and Germany, saw portfolio increases and we added new positions in Ireland where the Fund started buying two recent real estate investment trust (REIT) initial public offerings (IPOs). The biggest change in Europe, however, was in the U.K. where strong performance led to an increase from 22.1% to 25.9% of the portfolio. In Latin America, the Fund’s Mexican exposure grew modestly from 2.1% to 3.2% as we added two specific positions. However, the Fund’s Brazilian holdings declined from 21.3% to 14.6% of the portfolio through a combination of share dispositions and share price depreciation. We have continued to hedge a portion of Japanese Yen exposure. We have also continued to employ leverage both in the execution of the Fund’s investment strategy and to manage unexpected net outflows from the Fund during the period.
Stock Contributors
The greatest positive contribution to the portfolio came from Songbird Estates, a U.K. owner/developer of Class A
office buildings in Canary Wharf, a major London sub-market. This long term holding gained as the market responded to significant growth in underlying net asset value and the company’s growing appeal to so called dotcom tenants, combined with significant residential development plans. Our overweight position in Regus, PLC was the largest individual portfolio holding making its contribution significant. This long term holding is the world’s largest provider of temporary and flexible office accommodation. South Asian Real Estate Ltd.* is an emerging pan India Home builder private placement. JM gained as this long term holding in the Fund continued to demonstrate the strength of the Stockholm residential condominium market. Sirius Real Estate produced a positive return as its German industrial parks have seen improving economic conditions leading to higher rents. In aggregate, these five companies represent 22.90% of the portfolio.
By comparison, the five stocks detracting the most from total return were 16.00% of the total portfolio. They were Kenedix Inc., the Japanese REIT and pension fund asset manager and Hulic, the emerging Tokyo real estate office owner, which declined due to concerns of the prospect of Japanese recovery. Direcional from Brazil fell as concerns over future economic activity developed despite the fact that it is the largest beneficiary of low income housing funds, which has proven to be the incumbent political party’s strongest social success. SM Prime Holdings, declined after consolidating a sister company, SM Development, which the fund had previously held. Central Pattana of Thailand fell as this leading mall company was impacted by the economic uncertainty produced by the political stalemate and subsequent coup.
Expectations for 2014...and Beyond?
For the balance of 2014 we expect the world’s property markets to continue to be dominated by improving financial liquidity and low cost capital emanating from the capital markets. We also believe this may underpin a continued stabilization of banks, most notably in Europe, and over time should be supportive of new investment in plants, equipment and jobs. Ultimately, we believe job growth and rising household incomes can support a resumption of consumption of both large and small ticket items, most notably autos and homes. Over the past 18 months, there has been resumed strength in the U.S., and we believe that other countries will follow the lead of the U.S., albeit at a different pace and pattern of recovery. Thus,
*The Fund purchased South Asian Real Estate through a private placement in 2007. There is no public market for the holding and we have valued it based upon discounting both its current and projected adjusted book value, as well as taking into consideration the potential for a public offering of the shares in the future. As of April 30, 2014, the position has increased to approximately 7% of the Fund’s net assets as a result of net outflows from the Fund during the period.
10
| Alpine International Real Estate Equity Fund (Continued) | |
the pattern of continuing low interest rates and modest growth in the U.S., a similar recovery in the U.K., followed by the broader European zone and varying patterns in different Asian economies should provide evolving opportunities over time. Alpine remains positive on the potential of global real estate stocks over the balance of this year, and increasingly so over the longer term.
Thank you for your interest and support.
Sincerely,
Samuel A. Lieber
Portfolio Manager
11
| Alpine International Real Estate Equity Fund (Continued) | |
This letter represents the opinions of the Fund’s management and is subject to change, is not guaranteed and should not be considered a recommendation to buy or sell any security. The information provided is not intended to be, and is not, a forecast of future events, a guarantee of future results, or investment advice. Views expressed may vary from those of the firm as a whole. Past performance is no guarantee of future results.
Mutual fund investing involves risk. Principal loss is possible. The Fund is subject to risks, including the following:
Concentration Risk – The Fund’s strategy of concentrating in companies in a specific industry means that its performance will be closely tied to the performance of a particular market segment. The Fund’s concentration in these companies may present more risks than if it were broadly diversified over numerous industries and sectors of the economy. A downturn in these companies would have a larger impact on the Fund than on a mutual fund that does not concentrate in such companies. At times, the performance of these companies will lag the performance of other industries or the broader market as a whole.
Currency Risk – The value of investments in securities denominated in foreign currencies increases or decreases as the rates of exchange between those currencies and the U.S. dollar change. Currency conversion costs and currency fluctuations could erase investment gains or add to investment losses. Currency exchange rates can be volatile, and are affected by factors such as general economic conditions, the actions of the U.S. and foreign governments or central banks, the imposition of currency controls and speculation.
Emerging Market Securities Risk – The risks of foreign investments are heightened when investing in issuers in emerging market countries. Emerging market countries tend to have economic, political and legal systems that are less fully developed and are less stable than those of more developed countries. They are often particularly sensitive to market movements because their market prices tend to reflect speculative expectations. Low trading volumes may result in a lack of liquidity and in extreme price volatility.
Equity Securities Risk – The stock or other security of a company may not perform as well as expected, and may decrease in value, because of factors related to the company (such as poorer than expected earnings or certain management decisions) or to the industry in which the company is engaged (such as a reduction in the demand for products or services in a particular industry).
Foreign Currency Transactions Risk – Foreign securities are often denominated in foreign currencies. As a result, the value of the Fund’s shares is affected by changes in exchange rates. The Fund may enter into foreign currency transactions to try to manage this risk. The Fund’s ability to use foreign currency transactions successfully depends on a number of factors, including the foreign currency transactions being available at prices that are not too costly, the availability of liquid markets and the ability of the Adviser to accurately predict the direction of changes in currency exchange rates.
Foreign Securities Risk – The Fund’s investments in securities of foreign issuers or issuers with significant exposure to foreign markets involve additional risk. Foreign countries in which the Fund may invest may have markets that are less liquid, less regulated and more volatile than U.S. markets. The value of the Fund’s investments may decline because of factors affecting the particular issuer as well as foreign markets and issuers generally, such as unfavorable government actions, and political or financial instability. Lack of information may also affect the value of these securities. The risks of foreign investment are heightened when investing in issuers of emerging market countries.
Growth Stock Risk – Growth stocks typically are very sensitive to market movements because their market prices tend to reflect future expectations. When it appears those expectations will not be met, the prices of growth stocks typically fall. Growth stocks as a group may be out of favor and underperform the overall equity market while the market concentrates on undervalued stocks.
Initial Public Offerings and Secondary Offerings Risk – The Fund may invest a portion of its assets in shares of IPOs or secondary offerings of an issuer. IPOs and secondary offerings may have a magnified impact on the performance of a Fund with a small asset base. The impact of IPOs and secondary offerings on a Fund’s performance likely will decrease as the Fund’s asset size increases, which could reduce a Fund’s returns. IPOs and secondary offerings may not be consistently available to the Fund for investing. IPO and secondary offering shares frequently are volatile in price due to the absence of a prior public market, the small number of shares available for trading and limited information about the issuer. Therefore, the Fund may hold IPO and secondary offering shares for a very short period of time. This may increase the turnover of the Fund and may lead to increased expenses for the Fund, such as commissions and transaction costs. In addition, IPO and
12
| Alpine International Real Estate Equity Fund (Continued) | |
secondary offering shares can experience an immediate drop in value if the demand for the securities does not continue to support the offering price.
Interest Rate Risk – Interest rates may rise resulting in a decrease in the value of securities held by the Fund, or may fall resulting in an increase in the value of such securities. Securities having longer maturities generally involve a greater risk of fluctuations in the value resulting from changes in interest rates.
Leverage Risk – The Fund may use leverage to purchase securities. Increases and decreases in the value of the Fund’s portfolio will be magnified when the Fund uses leverage.
Liquidity Risk – Some securities held by the Fund may be difficult to sell, or illiquid, particularly during times of market turmoil. Illiquid securities may also be difficult to value. If the Fund is forced to sell an illiquid asset to meet redemption requests or other cash needs, the Fund may be forced to sell at a loss.
Management Risk – The Adviser’s judgment about the quality, relative yield or value of, or market trends affecting, a particular security or sector, or about interest rates generally, may be incorrect. The Adviser’s security selections and other investment decisions might produce losses or cause the Fund to underperform when compared to other funds with similar investment objectives and strategies.
Market Risk – The price of a security held by the Fund may fall due to changing market, economic or political conditions.
Micro Capitalization Company Risk – Stock prices of micro capitalization companies are significantly more volatile, and more vulnerable to adverse business and economic developments than those of larger companies. Micro capitalization companies often have narrower markets for their goods and/or services and more limited managerial and financial resources than larger, more established companies, including small or medium capitalization companies.
Real Estate Investment Trusts (“REITs”) Risk – REITs’ share prices may decline because of adverse developments affecting the real estate industry including changes in interest rates. The returns from REITs may trail returns from the overall market. Additionally, there is always a risk that a given REIT will fail to qualify for favorable tax treatment.
Real Estate Securities Risk – Risks associated with investment in securities of companies in the real estate industry include: declines in the value of real estate; risks related to local economic conditions, overbuilding and increased competition; increases in property taxes and operating expenses; changes in zoning laws; casualty or condemnation losses; variations in rental income, neighborhood values or the appeal of properties to tenants; changes in interest rates and changes in general economic and market conditions.
Small and Medium Capitalization Company Risk – Securities of small or medium capitalization companies are more likely to experience sharper swings in market values, less liquid markets, in which it may be more difficult for the Adviser to sell at times and at prices that the Adviser believes appropriate and generally are more volatile than those of larger companies.
Undervalued Stock Risk – The Fund may pursue strategies that may include investing in securities, which, in the opinion of the Adviser, are undervalued. The identification of investment opportunities in undervalued securities is a difficult task and there is no assurance that such opportunities will be successfully recognized or acquired. While investments in undervalued securities offer opportunities for above-average capital appreciation, these investments involve a high degree of financial risk and can result in substantial losses.
Please refer to pages 3-5 for other important disclosures and definitions.
13
| Alpine Realty Income & Growth Fund | |
| Comparative Annualized Returns as of 4/30/14 (Unaudited) | |
| | | | | | | | | | | | | | | |
| | | 6 Months(1) | | 1 Year | | 3 Years | | 5 Years | | 10 Years | | | Since Inception(2) | |
| Alpine Realty Income & Growth Fund — Institutional Class | | 9.95 | % | | 1.69 | % | | 9.31 | % | | 25.68 | % | | 8.15 | % | | 11.33 | % | | |
| Alpine Realty Income & Growth Fund — Class A (Without Load) | | 9.78 | % | | 1.46 | % | | N/A | | N/A | | N/A | | 14.38 | % | | |
| Alpine Realty Income & Growth Fund — Class A (With Load) | | 3.72 | % | | -4.14 | % | | N/A | | N/A | | N/A | | 11.64 | % | | |
| MSCI US REIT Index | | 8.03 | % | | 0.98 | % | | 9.82 | % | | 22.73 | % | | 10.31 | % | | 11.11 | % | | |
| S&P 500® Index | | 8.35 | % | | 20.43 | % | | 13.82 | % | | 19.13 | % | | 7.67 | % | | 4.77 | % | | |
| Lipper Real Estate Funds Average(3) | | 7.98 | % | | 0.93 | % | | 8.95 | % | | 21.69 | % | | 9.47 | % | | 10.47 | % | | |
| Lipper Real Estate Funds Ranking(3) | | N/A | (4) | | 76/241 | | 63/204 | | 7/173 | | 102/124 | | 15/55 | | |
| Gross Expense Ratio (Institutional Class): 1.50%(5) | | | | | | | | | | | | | | | | | | | | |
| Net Expense Ratio (Institutional Class): 1.43%(5) | | | | | | | | | | | | | | | | | | | | |
| Gross Expense Ratio (Class A): 1.75%(5) | | | | | | | | | | | | | | | | | | | | |
| Net Expense Ratio (Class A): 1.68%(5) | | | | | | | | | | | | | | | | | | | | |
| | (1) | Not annualized. |
| | (2) | Institutional Class shares commenced on December 29, 1998 and Class A shares commenced on December 30, 2011. Returns for indices are since December 29, 1998. |
| | (3) | The since inception data represents the period beginning December 31, 1998 (Institutional Class only). |
| | (4) | FINRA does not recognize rankings for less than one year. |
| | (5) | As disclosed in the prospectus dated February 28, 2014. |
Performance data quoted represents past performance and is not predictive of future results. Investment return and principal value of the Fund fluctuate, so that shares, when redeemed, may be worth more or less than their original cost. Performance current to the most recent month end may be lower or higher than the performance quoted and may be obtained by calling 1-888-785-5578. Performance data shown does not reflect the 1.00% redemption fee imposed on shares held for fewer than 60 days. If it did, total returns would be reduced. Returns for the Class A shares with sales charge reflect a maximum sales charge of 5.50%. Performance for the Class A shares without sales charges does not reflect this load.
MSCI US REIT Index is a free float-adjusted market capitalization-weighted index that is comprised of the most actively-traded equity REITs that are of reasonable size in terms of full- and free-float-adjusted market capitalization. Source: MSCI. MSCI makes no express or implied warranties or representations and shall have no liability whatsoever with respect to any MSCI data contained herein. The MSCI data may not be further redistributed or used as a basis for other indices or any securities or financial products. This report is not approved, reviewed or produced by MSCI. The S&P 500® Index is a float-adjusted market capitalization-weighted index of 500 common stocks chosen for market size, liquidity, and industry group representation to represent U.S. equity performance. The Lipper Real Estate Funds Average is an average of funds that invest at least 80% of their portfolio in equity securities of domestic and foreign companies engaged in the real estate industry. Lipper rankings for the periods shown are based on fund total returns with dividends and distributions reinvested and do not reflect sales charges. The MSCI US REIT Index, the S&P 500® Index and the Lipper Real Estate Funds Average are unmanaged and do not reflect direct fees associated with a mutual fund, such as investment adviser fees; however, the Lipper Real Estate Funds Average reflects fees charged by the underlying funds. The performance for the Alpine Realty Income & Growth Fund reflects the deduction of fees for these value-added services. Investors cannot directly invest in an index.
Expense Ratios reflect the ratios reported in the Fund’s most recent prospectus. The Alpine Realty Income & Growth Fund has a contractual expense waiver that continues through February 28, 2015. Where a Fund’s gross and net expense ratios are the same for the period reported, the contractual expense reimbursement level was not reached as of the end of that period. To the extent the Fund’s expenses were reduced by waivers, the Fund’s total returns were increased. In these cases, in the absence of the expense waivers, the Fund’s total returns would have been lower.
To the extent that the Fund’s historical performance resulted from gains derived from participation in Initial Public Offerings (“IPOs”) and/or Secondary Offerings, there is no guarantee that these results can be replicated in future periods or that the Fund will be able to participate to the same degree in IPO/Secondary Offerings in the future.
14
| Alpine Realty Income & Growth Fund (Continued) | |
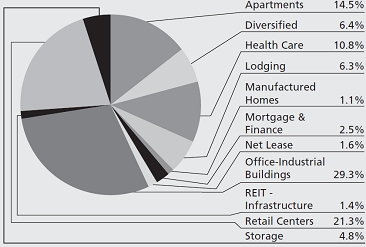
Portfolio Distributions* (Unaudited)
| Top 10 Holdings* (Unaudited) |
| 1 | . | Simon Property Group, Inc. | 9.22 | % |
| 2 | . | Boston Properties, Inc. | 5.40 | % |
| 3 | . | SL Green Realty Corp. | 4.80 | % |
| 4 | . | Public Storage | 4.61 | % |
| 5 | . | Vornado Realty Trust | 4.49 | % |
| 6 | . | Prologis, Inc. | 3.95 | % |
| 7 | . | Essex Property Trust, Inc. | 3.81 | % |
| 8 | . | Equity Residential | 3.78 | % |
| 9 | . | Ventas, Inc. | 3.70 | % |
| 10 | . | Alexandria Real Estate Equities, Inc. | 3.53 | % |
| * | Portfolio Distributions percentages are based on total investments. Top 10 Holdings do not include short-term investments and percentages are based on total net assets. Portfolio holdings and sector distributions are as of 04/30/14 and are subject to change. Portfolio holdings are not recommendations to buy or sell any securities. |
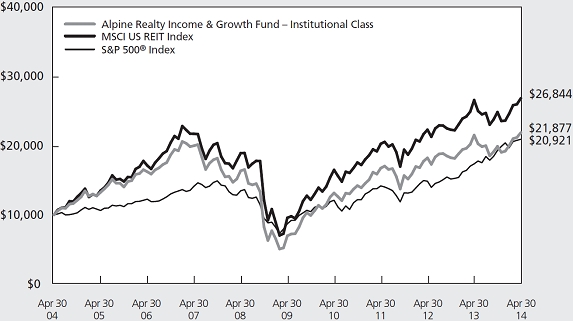
| Value of a $10,000 Investment (Unaudited) |
 |
| |
This chart represents a comparison of a hypothetical $10,000 investment in the Fund versus a similar investment in the Fund’s benchmarks. The graph and the table do not reflect the deduction of taxes that a shareholder would pay on Fund distributions or the redemption of Fund shares. Investment performance reflects the waiver and recovery of certain fees, if applicable. Without the waiver and recovery of fees, the Fund’s total return would have differed.
Performance data quoted represents past performance and is not predictive of future results. Investment return and principal value of the Fund fluctuate, so that shares, when redeemed, may be worth more or less than their original cost.
15
| Alpine Realty Income & Growth Fund (Continued) | |
Commentary
We are pleased to report the results of the Alpine Realty Income & Growth Fund for the fiscal semi-annual period that ended April 30, 2014. During this period, the Fund produced a total return of 9.95% which compares to the 7.98% return of the Lipper Real Estate Funds Average, the 8.03% return of the MSCI U.S. REIT Index Gross USD (the “RMS Index”), and the 8.35% return of the S&P 500® Index (the “S&P”). All references in this letter to the Fund’s performance relate to the performance of the Fund’s Institutional Class.
At April 30, 2014, the Fund’s net asset value per share had increased to $19.57 from $18.17 six months prior. During this timeframe, the Fund paid two quarterly distributions of $0.1875 per share totaling $0.375 per share for the fiscal period. Additionally, in March the Fund was honored with the 2014 Lipper Award for the “Best Real Estate Fund over the Five Year period” that ended November 30, 2013 among 55 funds, based on historical risk-adjusted returns. Since its inception on December 29, 1998 through April 30, 2014, the Fund has delivered an annualized total return to shareholders of 11.33% including cumulative distributions of $15.86. The performance chart on page 14 presents the Fund’s returns for the current period, one-year, three-year, five-year, ten-year, and since inception periods.
In our view, returns for real estate securities during the period were impacted by (i) movements in long term interest rates, (ii) slow and steady improvements in economic conditions and real estate fundamentals, and (iii) perhaps from an increased allocation to the real estate asset class, viewed as defensive by investors, given uncertainties in Ukraine and in the overall economy. Particularly since the beginning of 2014, investors have seemingly resumed their search for yield and total return in a low interest rate environment and, in our opinion, found relative value in the real estate investment trust (REIT) sector. The REIT sector had greatly underperformed the broader equity markets in 2013, having delivered a calendar year return of only 2.47% as represented by the RMS Index versus the 32.38% gain in the S&P.
In our last report for the fiscal year that ended October 31, 2013, we stated our belief that the performance of REIT securities in the near term would likely continue to be highly correlated with the direction of long term interest rates and, in fact, that relationship remained in force during the last six month fiscal period. As the Ten-Year Treasury rate rose from 2.56% on October 31, 2013 to 3.03% on December 31, 2013, the RMS Index
decreased -4.95%, lagging the S&P which increased 5.65%. However, since the beginning of 2014, long term rates have decreased, ending April 30, 2014 at 2.65% and the RMS has outperformed, rising 13.65% versus the 2.56% increase of the S&P. With lower interest rates perhaps signaling slower than previously anticipated economic growth, investors apparently were intrigued by the REIT sector’s average dividend yield and consensus projections for earnings growth in the 6-8% range for the next few years.
The expectations for positive REIT earnings growth in the 6-8% range are based on the belief of continued employment growth and business investment which have been enabling landlords to continue chipping away at their vacancies and reach levels of occupancy that provide stronger pricing power and thereby enhanced top-line growth. While overall economic growth remains somewhat anemic compared to past recoveries, the national unemployment rate has nevertheless decreased to 6.3% as of April 2014, down from 7.5% one year ago, and is now at the lowest level since September 2008 when it stood at 6.1%. Job gains have not been equally distributed across the nation however. As a result, we continue to bias the Fund’s holdings to those entities with assets and business plans that are tied to the knowledge-based economies of the east and west coasts where employment trends are more attractive. Our belief is that those areas experiencing better employment trends should witness stronger real estate space demand, as well as improving consumer confidence and spending, and those factors should, in turn, improve the prospects for company earnings growth and dividend increases. As we discuss next in the report, some of the Fund’s best performers during the fiscal period were, in fact, some of those companies that fit that thesis.
The Fund’s significant overweight position in office owning REITs, particularly companies with assets on the east and west coasts, provided some of the top contributions to its 9.95% return during fiscal semi-annual period. Boston Properties, an owner and developer of office properties in the Boston/Cambridge, New York, Washington, D.C., and San Francisco metropolitan areas and the Fund’s second largest holding, demonstrated strength in building shareholder value with announced progress in its $3.2 billion development pipeline. Above average returns were also produced by two of the Fund’s other top ten holdings, SL Green, a New York City focused office landlord, and Vornado Realty Trust, a diversified REIT with significant
16
| Alpine Realty Income & Growth Fund (Continued) | |
office holdings in New York and Washington, D.C. Meanwhile, Kilroy Realty, a west coast-focused office owner and developer with assets from San Diego to Seattle, and Alexandria Real Equities, a lab/office landlord and developer with assets clustered primarily in the life science markets of San Francisco, San Diego, Seattle, Maryland, New York, and Cambridge, Massachusetts, experienced strength in their local submarkets and achieved leasing successes in their new projects under construction. Additionally, Simon Property, the largest regional mall and individual REIT, and Equity Residential, the largest multi-family residential REIT and owner of a national apartment portfolio, both delivered above average returns. Relative to the overall return of the RMS Index, the Fund’s most positive attribution was produced by our overweight positions in Boston Properties and Alexandria and our holdings in Starwood Property Trust, an originator and investor in commercial mortgage debt and mortgage securities.
Holdings that underperformed REIT average returns and detracted from performance included the regional mall owning company, CBL & Associates; a data center entity, CoreSite Realty; a residential homes-for-rent landlord, Starwood Waypoint Residential Trust; a net lease company, American Realty Capital Properties; and an investor in seniors housing and health care properties, Health Care REIT. CBL & Associates, an operator of middle-market retail shopping malls, lagged its peers as investors reacted to slower than anticipated net operating income growth and concerns about the health of anchor tenants Sears and JC Penney. CoreSite Realty declined given concerns on data center pricing trends and leasing volumes. Starwood Waypoint was spun off from the Fund’s holding in Starwood Property Trust, fell in price from its initial trading level, and was subsequently sold by the Fund. American Realty Capital produced a negative return for the Fund as the market reacted negatively to its announced plan to spin-off rather than sell its retail shopping center assets and Health Care REIT underperformed its peers over the six months. Relative to the overall returns of the RMS Index, the securities that created the most impactful negative attribution to performance were our overweight positions in CBL, CoreSite, a Canadian shopping center REIT, Crombie REIT, and our underweight position in Host Hotels & Resorts which outperformed the RMS Index as group business recovered.
We believe the current environment of slow and steady economic growth, low interest rates, and below historic levels of new supply additions nationally is supportive of positive real estate fundamentals and real estate securities performance. Though the economic and resultant commercial real estate market recovery is
several years in duration, it is our view that improvements in job growth, capital investment, and consumer spending can continue a slow and steady pace, particularly if global economies that have lagged the U.S. experience gain further health. While higher levels of long-term interest rates reflecting an improved economic outlook and potential inflationary pressures may cause a short term reaction and consolidation of real estate securities pricing, such underlying economic strength should manifest itself in tighter real estate market conditions and growth in revenues from improving rents for landlords. We also believe the Federal Reserve will not increase the Fed funds rate in the near term and short-term rates will remain historically low. Consequently, we anticipate that we will continue to employ leverage both in the execution of the Fund’s strategy and to manage unexpected Fund flows.
At this point in the cycle, we continue to favor those areas of commercial real estate, particularly office and industrial real estate, which remain below prior peak profitability. We also favor those entities with proven strength and opportunities in creating shareholder value through development and redevelopment activities and portfolio recycling efforts. We look forward to providing an update on Fund performance after the end of the fiscal year in October 2014.
Sincerely,
Robert W. Gadsden
Portfolio Manager
Earnings growth is not representative of the funds future performance.
Lipper Awards are based on historical risk-adjusted returns relative to their peers. The Alpine Realty Income & Growth Fund (AIGYX) received the award for best Real Estate Fund for the five year period ending November 30, 2013, among 55 funds. The award is specific to Institutional shares and does not apply to other share classes of the Fund. The Lipper Fund Awards are part of the Thomson Reuters Awards for Excellence, a global family of awards that celebrate exceptional performance throughout the professional investment community. Individual fund classification awards extend over 3, 5, and 10 years. Lipper Awards are granted annually to the funds in each Lipper classification that achieve the highest score for Consistent Return, a measure of fund’s historical risk-adjusted returns. Lipper, a Thomson Reuters company, is a leading global provider of mutual fund information and analysis to fund companies, financial intermediaries and media organizations.
17
| Alpine Realty Income & Growth Fund (Continued) | |
This letter represents the opinions of the Fund’s management and is subject to change, is not guaranteed and should not be considered a recommendation to buy or sell any security. The information provided is not intended to be, and is not, a forecast of future events, a guarantee of future results, or investment advice. Views expressed may vary from those of the firm as a whole. Past performance is no guarantee of future results.
Mutual fund investing involves risk. Principal loss is possible. The Fund is subject to risks, including the following:
Concentration Risk – The Fund’s strategy of concentrating in companies in a specific industry means that its performance will be closely tied to the performance of a particular market segment. The Fund’s concentration in these companies may present more risks than if it were broadly diversified over numerous industries and sectors of the economy. A downturn in these companies would have a larger impact on the Fund than on a mutual fund that does not concentrate in such companies. At times, the performance of these companies will lag the performance of other industries or the broader market as a whole.
Convertible Securities Risk – The Fund can invest in securities that can be exercised for or converted into common stocks (such as warrants or convertible preferred stock). While offering greater potential for long-term growth, common stocks and similar equity securities are more volatile and more risky than some other forms of investment. Therefore, the value of your investment in the Fund may sometimes decrease instead of increase. Convertible securities include other securities, such as warrants, that provide an opportunity for equity participation. Because convertible securities can be converted into equity securities, their values will normally increase or decrease as the values of the underlying equity securities increase or decrease. The movements in the prices of convertible securities, however, may be smaller than the movements in the value of the underlying equity securities.
Credit Risk – Credit risk refers to the possibility that the issuer of a security will not be able to make payments of interest and principal when due. Changes in an issuer’s credit rating or the market’s perception of an issuer’s creditworthiness may also affect the value of the Fund’s investment in that issuer. The degree of credit risk depends on both the financial condition of the issuer and the terms of the obligation.
Dividend Strategy Risk – The Fund’s strategy of investing in dividend-paying stocks involves the risk that such stocks may fall out favor with investors and underperform the market. Companies that issue dividend paying-stocks are not required to continue to pay dividends on such stocks. Therefore, there is the possibility that such companies could reduce or eliminate the payment of dividends in the future.
Equity Securities Risk – The stock or other security of a company may not perform as well as expected, and may decrease in value, because of factors related to the company (such as poorer than expected earnings or certain management decisions) or to the industry in which the company is engaged (such as a reduction in the demand for products or services in a particular industry).
Fixed Income Securities Risk – Fixed income securities are subject to issuer risk, interest rate risk and market risk.
Growth Stock Risk – Growth stocks typically are very sensitive to market movements because their market prices tend to reflect future expectations. When it appears those expectations will not be met, the prices of growth stocks typically fall. Growth stocks as a group may be out of favor and underperform the overall equity market while the market concentrates on undervalued stocks.
Initial Public Offerings and Secondary Offerings Risk – The Fund may invest a portion of its assets in shares of IPOs or secondary offerings of an issuer. IPOs and secondary offerings may have a magnified impact on the performance of a Fund with a small asset base. The impact of IPOs and secondary offerings on a Fund’s performance likely will decrease as the Fund’s asset size increases, which could reduce a Fund’s returns. IPOs and secondary offerings may not be consistently available to the Fund for investing. IPO and secondary offering shares frequently are volatile in price due to the absence of a prior public market, the small number of shares available for trading and limited information about the issuer. Therefore, the Fund may hold IPO and secondary offering shares for a very short period of time. This may increase the turnover of the Fund and may lead to increased expenses for the Fund, such as commissions and transaction costs. In addition, IPO and secondary offering shares can experience an immediate drop in value if the demand for the securities does not continue to support the offering price.
18
| Alpine Realty Income & Growth Fund (Continued) | |
Interest Rate Risk –Interest rates may rise resulting in a decrease in the value of securities held by the Fund, or may fall resulting in an increase in the value of such securities. Securities having longer maturities generally involve a greater risk of fluctuations in the value resulting from changes in interest rates.
Leverage Risk – The Fund may use leverage to purchase securities. Increases and decreases in the value of the Fund’s portfolio will be magnified when the Fund uses leverage.
Management Risk – The Adviser’s judgment about the quality, relative yield or value of, or market trends affecting, a particular security or sector, or about interest rates generally, may be incorrect. The Adviser’s security selections and other investment decisions might produce losses or cause the Fund to underperform when compared to other funds with similar investment objectives and strategies.
Market Risk – The price of a security held by the Fund may fall due to changing market, economic or political conditions.
Non-Diversified Fund Risk – Performance of a non-diversified fund may be more volatile than a diversified fund because a non-diversified fund may invest a greater percentage of its total assets in the securities of a single issuer.
Preferred Stock Risk – Preferred stock represents an interest in a company that generally entitles the holder to receive, in preference to the holders of common stock, dividends and a fixed share of the proceeds resulting from a liquidation of the company. Preferred stocks may pay fixed or adjustable rates of return. Preferred stock has investment characteristics of both fixed income and equity securities. However, the value of these securities tends to vary more with fluctuations in the underlying common stock and less with fluctuations in interest rates and tends to exhibit greater volatility.
Real Estate Investment Trusts (“REITs”) Risk – REITs’ share prices may decline because of adverse developments affecting the real estate industry including changes in interest rates. The returns from REITs may trail returns from the overall market. Additionally, there is always a risk that a given REIT will fail to qualify for favorable tax treatment.
Real Estate Securities Risk – Risks associated with investment in securities of companies in the real estate industry include: declines in the value of real estate; risks related to local economic conditions, overbuilding and increased competition; increases in property taxes and operating expenses; changes in zoning laws; casualty or condemnation losses; variations in rental income, neighborhood values or the appeal of properties to tenants; changes in interest rates and changes in general economic and market conditions.
Small and Medium Capitalization Company Risk – Securities of small or medium capitalization companies are more likely to experience sharper swings in market values, less liquid markets, in which it may be more difficult for the Adviser to sell at times and at prices that the Adviser believes appropriate and generally are more volatile than those of larger companies.
Undervalued Stock Risk – The Fund may pursue strategies that may include investing in securities, which, in the opinion of the Adviser, are undervalued. The identification of investment opportunities in undervalued securities is a difficult task and there is no assurance that such opportunities will be successfully recognized or acquired. While investments in undervalued securities offer opportunities for above-average capital appreciation, these investments involve a high degree of financial risk and can result in substantial losses.
Please refer to pages 3-5 for other important disclosures and definitions.
19
| Alpine Cyclical Advantage Property Fund |  |
| Comparative Annualized Returns as of 4/30/14 (Unaudited) | | | | | | |
| | | | | | | | | | | | | Since Inception | |
| | | 6 Months(1) | | 1 Year | 3 Years | 5 Years | 10 Years | (9/1/1993) | |
| Alpine Cyclical Advantage Property Fund — Institutional Class | | -2.60% | | -3.91 | % | 4.87 | % | 15.54 | % | 0.69% | | 8.14% | | |
| FTSE EPRA/NAREIT® Global Index(2) | | 2.67% | | -3.46 | % | 6.78 | % | 18.23 | % | N/A | | N/A | | |
| S&P Developed Property Net Total Return Index(3) | | 3.25% | | -2.25 | % | 7.45 | % | 18.72 | % | 8.42% | | N/A | | |
| Lipper Global Real Estate Funds Average(4) | | 3.86% | | -1.73 | % | 6.67 | % | 17.30 | % | 8.01% | | 9.09% | | |
| Lipper Global Real Estate Funds Ranking(4) | | N/A | (5) | 124/133 | 98/102 | 81/88 | 21/21 | | 2/2 | | |
| Gross Expense Ratio: 1.43%(6) | | | | | | | | | | | | | | |
| Net Expense Ratio: 1.43%(6) | | | | | | | | | | | | | | |
| (2) | Index commenced on February 18, 2005. |
| (3) | Index commenced on December 29, 2000. |
| (4) | The since inception data represents the period beginning September 2, 1993. |
| (5) | FINRA does not recognize rankings for less than one year. |
| (6) | As disclosed in the prospectus dated February 28, 2014. |
Performance data quoted represents past performance and is not predictive of future results. Investment return and principal value of the Fund fluctuate, so that shares, when redeemed, may be worth more or less than their original cost. Performance current to the most recent month end may be lower or higher than the performance quoted and may be obtained by calling 1-888-785-5578. Performance data shown does not reflect the 1.00% redemption fee imposed on shares held for fewer than 60 days. If it did, total returns would be reduced.
The FTSE EPRA/NAREIT® Global Index is an unmanaged index designed to track the performance of publicly-traded companies engaged in the real estate business in developed and emerging real estate markets/regions around the world. The funds or securities referred to herein are not sponsored, endorsed, or promoted by the index providers, and the index providers bear no liability with respect to any such funds or securities or any index on which such funds or securities are based. The S&P Developed Property Net Total Return Index is an unmanaged market-weighted total return index available on a monthly basis. The index consists of many companies from developed markets whose floats are larger than $100 million and derive more than half of their revenue from property-related activities. The Lipper Global Real Estate Funds Average is an average of funds that invest at least 25% of their equity portfolio in shares of companies engaged in the real estate industry that are strictly outside of the U.S. or whose securities are principally traded outside of the U.S. Lipper rankings for the periods shown are based on fund total returns with dividends and distributions reinvested and do not reflect sales charges. The FTSE EPRA/NAREIT® Global Index, the S&P Developed Property Net Total Return Index and the Lipper Global Real Estate Funds Average are unmanaged and do not reflect direct fees associated with a mutual fund, such as investment adviser fees; however, the Lipper Global Real Estate Funds Average reflects fees charged by the underlying funds. The performance for the Alpine Cyclical Advantage Property Fund reflects the deduction of fees for these value-added services. Investors cannot directly invest in an index.
To the extent that the Fund’s historical performance resulted from gains derived from participation in Initial Public Offerings (“IPOs”) and/or Secondary Offerings, there is no guarantee that these results can be replicated in future periods or that the Fund will be able to participate to the same degree in IPO/Secondary Offerings in the future.
| Alpine Cyclical Advantage Property Fund (Continued) | |
Portfolio Distributions* (Unaudited)

| Top 10 Holdings* (Unaudited) |
| 1. | | Altisource Residential Corp. | 3.20 | % |
| 2. | | Kenedix, Inc. | 3.19 | % |
| 3. | | Starwood Property Trust, Inc. | 3.13 | % |
| 4. | | LXB Retail Properties PLC | 2.80 | % |
| 5. | | Quintain Estates & Development PLC | 2.69 | % |
| 6. | | Ocwen Financial Corp. | 2.68 | % |
| 7. | | Colony Financial, Inc. | 2.64 | % |
| 8. | | Hulic Co., Ltd. | 2.56 | % |
| 9. | | Patrizia Immobilien AG | 2.48 | % |
| 10. | | Songbird Estates PLC | 2.45 | % |
| * | Portfolio Distributions percentages are based on total investments. Top 10 Holdings do not include short-term investments and percentages are based on total net assets. Portfolio holdings and sector distributions are as of 04/30/14 and are subject to change. Portfolio holdings are not recommendations to buy or sell any securities. |
| Value of a $10,000 Investment (Unaudited) |
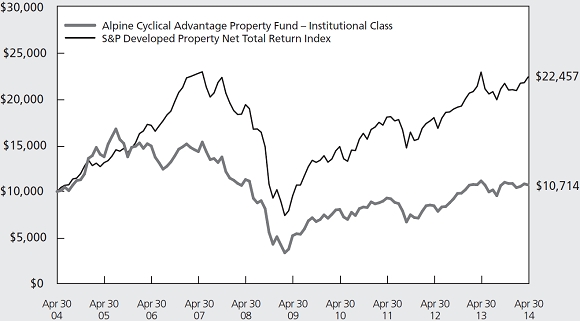 |
| |
This chart represents a comparison of a hypothetical $10,000 investment in the Fund versus a similar investment in the Fund’s benchmarks. The graph and the table do not reflect the deduction of taxes that a shareholder would pay on Fund distributions or the redemption of Fund shares. Investment performance reflects the waiver and recovery of certain fees, if applicable. Without the waiver and recovery of fees, the Fund’s total return would have differed.
Performance data quoted represents past performance and is not predictive of future results. Investment return and principal value of the Fund fluctuate, so that shares, when redeemed, may be worth more or less than their original cost.
21
| Alpine Cyclical Advantage Property Fund (Continued) | |
We are pleased to present the 2014 semi-annual report for the Alpine Cyclical Advantage Property Fund. For the six months ended April 30, 2014, the fund generated a total return of -2.60%. This compares with the total return for the Fund’s primary benchmark index, the FTSE EPRA/NAREIT® Global Real Estate Index of 2.67% and the return of its secondary benchmark, the S&P Developed Property Net TR Index(TM) which generated 3.25%.
The Fund’s absolute performance for the six months period ending April 30, 2014 reflects the transition in market sentiment from euphoria to caution. There was continued volatility in emerging market returns, particularly those impacted by political uncertainty like Brazil and Thailand. In addition, many real estate stocks in Japan declined in advance of an increase in the value added consumption tax in March, combined with some diminished optimism for the nation’s recovery prospects. However, we continue to remain positive on the potential for Japan’s stimulus, and based on historical precedent, believe the impact of the value added tax increase should be over in one quarter. Nevertheless, Japan accounted for a negative contribution to portfolio returns. These specific situations offset the generally positive tone of moderately growing mid-cycle real estate returns in most of the world’s local economies. This has been amplified by the continued availability of historically low cost investment which has firmly underpinned the prices of most publicly traded property companies.
Real Estate and the Real Economy
In the past we have highlighted Alpine’s premise that real estate equities share certain characteristics of both stocks and bonds. We believe that this could have both positive and negative implications for real estate equities, including potential under/over valuation relative to intrinsic market value of real estate for varying periods of time. Judging the effects in terms of “growth” or “yield” relative to potential total return is an ongoing process.
Alpine continues to believe that many real estate stock values are generally still well below their 2007 peak, although some countries and companies have been able to surpass prior historic highs. We believe that, with selectivity, we can find relatively attractive valuation opportunities with the prospect for future growth which is not priced into the shares despite today’s historically low interest rate environment. The complexity of investing in stocks which have benefited from low rates is
that any reversal might offset the growth prospects for income in dividends. Thus, we believe Alpine’s focus on not only companies with large market cap, but also smaller cap and non-traditional real estate or non-classified index companies may benefit the portfolio.
It is Alpine’s assessment that we are in the middle of a protracted economic cycle characterized by strong investment demand which has pushed prices of property up while slow economic activity has hampered new supply. This suggests that if economic activity continues to gradually strengthen the potential increase in jobs and requirements for new property, plant and equipment may push rents higher until the demand can be met by new properties. We believe that the potential for rent spikes in selected markets could be significant in cities or countries where the combination of economic demand, unbalanced supply and demand conditions, and cautious capital availability for development prevails. Alpine considers this mix of capital markets forces, economic fundamentals, real estate conditions and local characteristics and combine it with Alpine’s assessment of corporate capabilities, property location and competitiveness in the portfolio selection criteria of the Alpine Cyclical Advantage Property Fund.
Portfolio Overview
Six of the prior period’s top ten holdings continue as such with four new companies Quintain Estates and Development in the U.K., Colony Financial in the U.S., Patrizia Immobilien in Germany, and Songbird Estates from the U.K., joining the portfolio’s ten largest holdings. These shifts reflect both portfolio adjustments as well changes in share prices. Notable changes in the portfolio include a decrease in exposure to Asia as a whole from 33.8% to 31.5%. This was driven primarily by a decline in Japanese holdings from 15.6% to 10.3%, which was the result of selected share sales as well as poor returns. Notably, the largest other change in Asia was an increase in the Fund’s exposure to Indian equities and equity linked certificates, up from 1.7% to 4.2%. This contrasted with Europe where the portfolio’s exposure rose from 19.6% to 25.1%, most notably reflected in the increase in U.K. exposure to 11.4% from 8.6% last October. While the portfolio’s exposure to the U.S. increased only modestly to 36.2%, exposure south of the border in Mexico was increased from 3% to 4.1%, primarily through additional share purchases. We maintained the Fund’s position in Brazil at 11.6%.
| Alpine Cyclical Advantage Property Fund (Continued) | |
Major Stock Contributors
The greatest positive contribution to the portfolio came from Songbird Estates, a U.K. owner/developer of Class A office buildings in Canary Wharf, a major London sub-market. This long term holding gained as the market responded to significant growth in underlying net asset value and the company’s growing appeal to so called ‘dotcom’ tenants, combined with significant residential development plans. Starwood Property Trust, the largest commercial mortgage real estate investment trust (REIT) continued to grow its dividends while diversifying its broad book of business across different property subsectors and increasingly geographies including Europe. Altisource Asset Management Corp. is a subsidiary of Ocwen Financial Corp. that manages asset ownership entities most notably the fast growing Altisource Residential Corp., an investor in single family homes for rent. Patrizia Immobilien manages residential property funds for German institutional investors. And finally we have Altisource Residential Corp. This single family home REIT has a unique business model which incorporates non-performing loans which have been fixed and either sold or used to source attractively priced homes for rent. In aggregate, these five companies constituted an ending weight of 12.93% of the portfolio.
Negative contributors included Kenedix Inc., a Japanese manager of REITs and pension funds which declined due to concerns of the prospect of a Japanese recovery. Ocwen Financial Corp. is the nation’s leading independent mortgage servicing corporation, which has been actively buying mortgage servicing rights (MSRs) from banks and other financial institutions over the past several years in response to capital allocation constraints of banks and Ocwen’s highly efficient business model. After very strong year in 2013, the company’s shares have declined significantly due to ongoing investigations into the company’s business practices. Altisource Portfolio Solutions is the primary operating subsidiary of Ocwen Financial Corp., and in similar fashion declined following last year’s strong performance. As the principal operating
subsidiary of Ocwen, Altisource is dependent upon the portfolio growth of its parent for the majority of its earnings growth potential. Hulic declined in line with many of its Japanese peers. This second tier Tokyo-based office developer is emerging as quality contender for strong cyclical returns amongst leading property investors. LPN Development Company fell as the political upheaval in Thailand has led to something of a re-pricing amongst home builders on fears that the period following the recent coup will lead to slower economic growth. In aggregate these five companies accounted for 11.23% of the portfolio.
Expectations for 2014...and Beyond?
For the balance of 2014 we expect the world’s property markets to continue to be dominated by improving financial liquidity and low cost capital emanating from the capital markets. We also believe this may underpin a continued stabilization of banks, most notably in Europe, and over time should be supportive of new investment in plants, equipment and jobs. Ultimately, we believe job growth and rising household incomes can support a resumption of consumption of both large and small ticket items, most notably autos and homes. Over the past 18 months, there has been resumed strength in the U.S., and we believe that other countries will follow the lead of the U.S., albeit at a different pace and pattern of recovery. Thus, the pattern of continuing low interest rates and modest growth in the U.S., a similar recovery in the U.K., followed by the broader European zone and varying patterns in different Asian economies should provide evolving opportunities over time. Alpine remains positive on the potential of global real estate stocks over the balance of this year, and increasingly so over the longer term.
Thank you for your interest and support.
Sincerely,
Samuel A. Lieber
Portfolio Manager
| Alpine Cyclical Advantage Property Fund (Continued) | |
This letter represents the opinions of the Fund’s management and is subject to change, is not guaranteed and should not be considered a recommendation to buy or sell any security. The information provided is not intended to be, and is not, a forecast of future events, a guarantee of future results, or investment advice. Views expressed may vary from those of the firm as a whole. Past performance is no guarantee of future results.
Mutual fund investing involves risk. Principal loss is possible. The Fund is subject to risks, including the following:
Concentration Risk – The Fund’s strategy of concentrating in companies in a specific industry means that its performance will be closely tied to the performance of a particular market segment. The Fund’s concentration in these companies may present more risks than if it were broadly diversified over numerous industries and sectors of the economy. A downturn in these companies would have a larger impact on the Fund than on a mutual fund that does not concentrate in such companies. At times, the performance of these companies will lag the performance of other industries or the broader market as a whole.
Currency Risk – The value of investments in securities denominated in foreign currencies increases or decreases as the rates of exchange between those currencies and the U.S. dollar change. Currency conversion costs and currency fluctuations could erase investment gains or add to investment losses. Currency exchange rates can be volatile, and are affected by factors such as general economic conditions, the actions of the U.S. and foreign governments or central banks, the imposition of currency controls and speculation.
Equity Securities Risk – The stock or other security of a company may not perform as well as expected, and may decrease in value, because of factors related to the company (such as poorer than expected earnings or certain management decisions) or to the industry in which the company is engaged (such as a reduction in the demand for products or services in a particular industry).
Foreign Currency Transactions Risk – Foreign securities are often denominated in foreign currencies. As a result, the value of the Fund’s shares is affected by changes in exchange rates. The Fund may enter into foreign currency transactions to try to manage this risk. The Fund’s ability to use foreign currency transactions successfully depends on a number of factors, including the foreign currency transactions being available at prices that are not too costly, the availability of liquid markets and the ability of the Adviser to accurately predict the direction of changes in currency exchange rates.
Foreign Securities Risk – The Fund’s investments in securities of foreign issuers or issuers with significant exposure to foreign markets involve additional risk. Foreign countries in which the Fund may invest may have markets that are less liquid, less regulated and more volatile than U.S. markets. The value of the Fund’s investments may decline because of factors affecting the particular issuer as well as foreign markets and issuers generally, such as unfavorable government actions, and political or financial instability. Lack of information may also affect the value of these securities. The risks of foreign investments are heightened when investing in issuers in emerging market countries.
Growth Stock Risk – Growth stocks are stocks of companies believed to have above-average potential for growth in revenue and earnings. Growth stocks typically are very sensitive to market movements because their market prices tend to reflect future expectations. When it appears those expectations will not be met, the prices of growth stocks typically fall. Growth stocks as a group may be out of favor and underperform the overall equity market while the market concentrates on undervalued stocks.
Initial Public Offerings and Secondary Offerings Risk – The Fund may invest a portion of its assets in shares of IPOs or secondary offerings of an issuer. IPOs and secondary offerings may have a magnified impact on the performance of a Fund with a small asset base. The impact of IPOs and secondary offerings on a Fund’s performance likely will decrease as the Fund’s asset size increases, which could reduce a Fund’s returns. IPOs and secondary offerings may not be consistently available to the Fund for investing. IPO and secondary offering shares frequently are volatile in price due to the absence of a prior public market, the small number of shares available for trading and limited information about the issuer. Therefore, the Fund may hold IPO and secondary offering shares for a very short period of time. This may increase the turnover of the Fund and may lead to increased expenses for the Fund, such as commissions and transaction costs. In addition, IPO and secondary offering shares can experience an immediate drop in value if the demand for the securities does not continue to support the offering price.
| Alpine Cyclical Advantage Property Fund (Continued) | |
Interest Rate Risk – Interest rates may rise resulting in a decrease in the value of securities held by the Fund, or may fall resulting in an increase in the value of such securities. Securities having longer maturities generally involve a greater risk of fluctuations in the value resulting from changes in interest rates.
Liquidity Risk – Some securities held by a Fund may be difficult to sell, or illiquid, particularly during times of market turmoil. Illiquid securities may also be difficult to value. If a Fund is forced to sell an illiquid asset to meet redemption requests or other cash needs, the Fund may be forced to sell at a loss.
Management Risk – The Adviser’s judgment about the quality, relative yield or value of, or market trends affecting, a particular security or sector, or about interest rates generally, may be incorrect. The Adviser’s security selections and other investment decisions might produce losses or cause the Fund to underperform when compared to other funds with similar investment objectives and strategies.
Market Risk – The price of a security held by the Fund may fall due to changing market, economic or political conditions.
Micro Capitalization Company Risk – Stock prices of micro capitalization companies are significantly more volatile, and more vulnerable to adverse business and economic developments than those of larger companies. Micro capitalization companies often have narrower markets for their goods and/or services and more limited managerial and financial resources than larger, more established companies, including small or medium capitalization companies.
Real Estate Investment Trusts (“REITs”) Risk – REITs’ share prices may decline because of adverse developments affecting the real estate industry including changes in interest rates. The returns from REITs may trail returns from the overall market. Additionally, there is always a risk that a given REIT will fail to qualify for favorable tax treatment.
Real Estate Securities Risk – Risks associated with investment in securities of companies in the real estate industry include: declines in the value of real estate; risks related to local economic conditions, overbuilding and increased competition; increases in property taxes and operating expenses; changes in zoning laws; casualty or condemnation losses; variations in rental income, neighborhood values or the appeal of properties to tenants; changes in interest rates and changes in general economic and market conditions.
Small and Medium Capitalization Company Risk – Securities of small or medium capitalization companies are more likely to experience sharper swings in market values, less liquid markets, in which it may be more difficult for the Adviser to sell at times and at prices that the Adviser believes appropriate and generally are more volatile than those of larger companies.
Undervalued Stock Risk – The Fund may pursue strategies that may include investing in securities, which, in the opinion of the Adviser, are undervalued. The identification of investment opportunities in undervalued securities is a difficult task and there is no assurance that such opportunities will be successfully recognized or acquired. While investments in undervalued securities offer opportunities for above-average capital appreciation, these investments involve a high degree of financial risk and can result in substantial losses.
Please refer to pages 3-5 for other important disclosures and definitions.
| Alpine Emerging Markets Real Estate Fund | |
| Comparative Annualized Returns as of 4/30/14 (Unaudited) |
| | | | | 6 Months(1) | | | 1 Year | | | 3 Years | | | | 5 Years | | | | Since Inception(2) |
| | Alpine Emerging Markets Real Estate Fund — Institutional Class | | | -4.75 | % | | | -18.01% | | | -2.50% | | | | 12.06% | | | | 13.23% | |
| | Alpine Emerging Markets Real Estate Fund — Class A (Without Load) | | | -4.85 | % | | | -18.21% | | | N/A | | | | N/A | | | | 9.55% | |
| | Alpine Emerging Markets Real Estate Fund — Class A (With Load) | | | -10.09 | % | | | -22.70% | | | N/A | | | | N/A | | | | 6.93% | |
| | FTSE EPRA/NAREIT® Emerging Total Return Index(3) | | | -6.07 | % | | | -16.28% | | | -1.95% | | | | 10.09% | | | | N/A | |
| | S&P Developed Ex-U.S. Total Return Property Index | | | 0.31 | % | | | -3.58% | | | 7.30% | | | | 17.86% | | | | 15.11% | |
| | MSCI Emerging Markets Index USD | | | -2.98 | % | | | -1.84% | | | -3.74% | | | | 11.08% | | | | 13.30% | |
| | Lipper Global Real Estate Funds Average(4) | | | 3.86 | % | | | -1.73% | | | 6.67% | | | | 17.30% | | | | 14.45% | |
| | Lipper Global Real Estate Funds Ranking(4) | | | N/A | (5) | | | 132/133 | | | 102/102 | | | | 88/88 | | | | 68/81 | |
| | Gross Expense Ratio (Institutional Class): 2.35%(6) | | | | | | | | | | | | | | | | | | | |
| | Net Expense Ratio (Institutional Class): 1.35%(6) | | | | | | | | | | | | | | | | | | | |
| | Gross Expense Ratio (Class A): 2.60%(6) | | | | | | | | | | | | | | | | | | | |
| | Net Expense Ratio (Class A): 1.60%(6) | | | | | | | | | | | | | | | | | | | | |
| | (1) | Not annualized. |
| | (2) | Institutional Class shares commenced on November 3, 2008 and Class A shares commenced on December 30, 2011. Returns for indices are since November 3, 2008. |
| | (3) | Index commenced on January 2, 2009. |
| | (4) | The since inception data represents the period beginning November 6, 2008 (Institutional Class only). |
| | (5) | FINRA does not recognize rankings for less than one year. |
| | (6) | As disclosed in the prospectus dated February 28, 2014. |
Performance data quoted represents past performance and is not predictive of future results. Investment return and principal value of the Fund fluctuate, so that shares, when redeemed, may be worth more or less than their original cost. Performance current to the most recent month end may be lower or higher than the performance quoted and may be obtained by calling 1-888-785-5578. Performance data shown does not reflect the 1.00% redemption fee imposed on shares held for fewer than 60 days. If it did, total returns would be reduced. Returns for the Class A shares with sales charge reflect a maximum sales charge of 5.50%. Performance for the Class A shares without sales charges does not reflect this load.
The FTSE EPRA/NAREIT® Emerging Total Return Index is an unmanaged index designed to track the performance of listed real estate securities companies in emerging countries worldwide. The funds or securities referred to herein are not sponsored, endorsed, or promoted by the index providers, and the index providers bear no liability with respect to any such funds or securities or any index on which such funds or securities are based. The S&P Developed Ex-U.S. Total Return Property Index defines and measures the investable universe of publicly-traded real estate companies domiciled in developed countries outside of the United States. The companies in the Index are engaged in real estate-related activities such as property ownership, management, development, rental and investment. MSCI Emerging Markets Index USD is a free float-adjusted market cap-weighted index that is designed to measure equity market performance in the global emerging markets. Source: MSCI. MSCI makes no express or implied warranties or representations and shall have no liability whatsoever with respect to any MSCI data contained herein. The MSCI data may not be further redistributed or used as a basis for other indices or any securities or financial products. This report is not approved, reviewed or produced by MSCI. The Lipper Global Real Estate Funds Average is an average of funds that invest at least 25% of their equity portfolio in shares of companies engaged in the real estate industry that are strictly outside of the U.S. or whose securities are principally traded outside of the U.S. Lipper rankings for the periods shown are based on fund total returns with dividends and distributions reinvested and do not reflect sales charges. The FTSE EPRA/NAREIT® Emerging Total Return Index, the S&P Developed Ex-U.S. Total Return Property Index, the MSCI Emerging Markets Index USD and the Lipper Global Real Estate Funds Average are unmanaged and do not reflect direct fees associated with a mutual fund, such as investment adviser fees; however, the Lipper Global Real Estate Funds Average reflects fees charged by the underlying funds. The performance for the Alpine Emerging Markets Real Estate Fund reflects the deduction of fees for these value-added services. Investors cannot directly invest in an index.
Expense Ratios reflect the ratios reported in the Fund’s most recent prospectus. The Alpine Emerging Markets Real Estate Fund has a contractual expense waiver that continues through February 28, 2015. Where a Fund’s gross and net expense ratios are the same for the period reported, the contractual expense reimbursement level was not reached as of the end of that period. To the extent the Fund’s expenses were reduced by waivers, the Fund’s total returns were increased. In these cases, in the absence of the expense waivers, the Fund’s total returns would have been lower.
To the extent that the Fund’s historical performance resulted from gains derived from participation in Initial Public Offerings (“IPOs”) and/or Secondary Offerings, there is no guarantee that these results can be replicated in future periods or that the Fund will be able to participate to the same degree in IPO/Secondary Offerings in the future.
26
| Alpine Emerging Markets Real Estate Fund (Continued) |  |
Portfolio Distributions* (Unaudited)
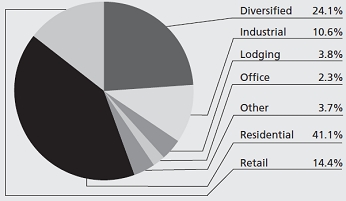
| Top 10 Holdings* (Unaudited) | |
| 1. | | Emaar Properties PJSC | 8.84 | % |
| 2. | | China Overseas Land & Investment, Ltd. | 7.73 | % |
| 3. | | Ayala Land, Inc. | 3.88 | % |
| 4. | | China State Construction International Holdings, Ltd. | 3.67 | % |
| 5. | | Global Logistic Properties, Ltd. | 2.99 | % |
| 6. | | Central Pattana PCL | 2.94 | % |
| 7. | | China Vanke Co., Ltd.-Class B | 2.92 | % |
| 8. | | SM Prime Holdings, Inc. | 2.89 | % |
| 9. | | Cheung Kong Holdings, Ltd. | 2.68 | % |
| 10. | | Shimao Property Holdings, Ltd. | 2.59 | % |
| * | Portfolio Distributions percentages are based on total investments. Top 10 Holdings do not include short-term investments and percentages are based on total net assets. Portfolio holdings and sector distributions are as of 04/30/14 and are subject to change. Portfolio holdings are not recommendations to buy or sell any securities. |
| Value of a $10,000 Investment (Unaudited) |
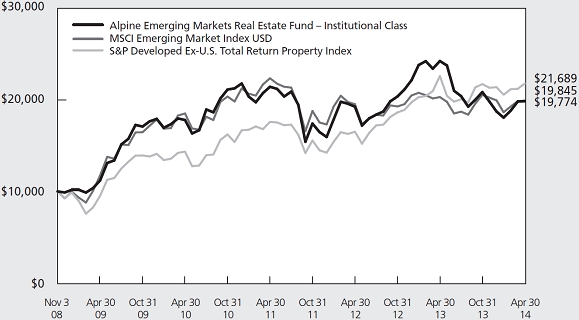 |
| |
This chart represents a comparison of a hypothetical $10,000 investment in the Fund versus a similar investment in the Fund’s benchmarks. The graph and the table do not reflect the deduction of taxes that a shareholder would pay on Fund distributions or the redemption of Fund shares. Investment performance reflects the waiver and recovery of certain fees, if applicable. Without the waiver and recovery of fees, the Fund’s total return would have differed.
Performance data quoted represents past performance and is not predictive of future results. Investment return and principal value of the Fund fluctuate, so that shares, when redeemed, may be worth more or less than their original cost.
27
| Alpine Emerging Markets Real Estate Fund (Continued) |  |
Commentary
We present below the semi-annual results for the Alpine Emerging Markets Real Estate Fund. For the six-month period ending April 30, 2014, the closing net asset value was $16.11 per share, representing a total return of -4.75% for the period. The Fund’s benchmark index, the FTSE EPRA/NAREIT® Emerging TR Index returned -6.07% adjusted in U.S. dollar terms over the same period. Over that same time frame the MSCI Emerging Market Index finished with a total return of -2.98% and the S&P Developed Ex-U.S. Property Total ReturnTM Index returned 0.31%. All references in this letter to the Fund’s performance relate to the performance of the Fund’s Institutional Class.
Performance Drivers
Emerging Market (EM) real estate equity returns lagged the broader EM universe as well as developed markets (DM), though relative performance during the period could best be described as a “tale of two halves.” The period under review witnessed investor positioning across EM equities approaching record levels of pessimism. Such sentiment prevailed for the majority of Q1 2014 as fund flows hit historically depressed levels. Market volatility was elevated as geopolitical tensions, in particular the threat of Russian aggression in the Ukraine, escalated. Defining Q2 2014 was a rebound in relative returns driven by the suspicion that EM equities had experienced an overcorrection in valuation in the face of an increasingly benign interest rate environment in the U.S. Optimism for electoral outcomes and reform agendas in certain EM economies, as well as rising expectations for targeted counter-cyclical policy action in China in order to stabilize aggregate demand further supported a modest recovery toward the end of the period.
| | • | Bond Market Signals. One of the most interesting developments for the constantly evolving rebalancing act of EM economies was an apparent disconnect between investor expectations for a growth recovery in the U.S. contemporaneous to downward pressure on the yield curve. As weather-affected Q1 economic data from the U.S. began to hit investors’ radar screens, the underlying driver of interest rate normalization seemingly shifted away from Fed policy pronouncements (which generally anchor short rates) towards evidence of sustainable improvements in U.S. macro factors (which generally exhibit influence on long yields). Though it was not only a benign U.S. rate environment which saw markets become gradually more supportive of EM |
| | | assets. The sharp rise in China CDS (credit default swaps) also reversed during the period, accentuating a global interest rate environment remaining supportive for riskier assets in general. |
| | | |
| | • | Fund Flows. Going in to the period the consensus outlook was that imminent monetary tightening in the U.S. would draw capital away from EMs. Indeed, through the period ending March 26, 2014 EM equities weathered an unprecedented 22 consecutive weeks of outflows according to EPFR Global. Increasing concerns over China’s poor sequential economic data, as well as the Chinese government’s structural challenge of tightening liquidity amidst a cyclical deceleration, disengaged investor interest even further. However, underweight positioning and a spike in short interest in EM ultimately hit an inflection point as the outlook for China growth bottomed out, global yields remained depressed and election momentum anticipated further credibility for reform agendas in certain developing economies. As flows began to recover so too did relative equity performance. |
| | | |
| | • | Portfolio Composition. Active management of the portfolio again played a critical role in the overall performance of the Fund, underpinning our long-held expectation for a growing dispersion of equity returns across countries and asset classes as the global recovery achieves greater momentum and risk premia compress. Allocation and stock selection in Mexico was the largest contributor to relative performance followed by stock selection in Egypt, India, Indonesia and the Philippines. While the overweight in Thailand, the off-index position in Japan and underweight positioning in Austria and South Africa detracted from relative performance. Additionally, the Fund maintained cash positions and/or borrowed to manage unexpected outflows during the semi-annual period. |
| | | |
| | | At period end the top 10 positions accounted for 41.13% of the portfolio versus 36.79% at fiscal year-end 2013. The weighting in China/Hong Kong was pared back significantly due to uncertainty in the growth outlook and liquidity tightening by the People’s Bank of China (PBOC) as mentioned above. Another meaningful portfolio adjustment was in Thailand where political unrest and weakening domestic consumption trends were the main consideration in reducing exposure to that market. |
28
| Alpine Emerging Markets Real Estate Fund (Continued) |  |
| | | Country allocations which benefited from this shift included: Egypt, India, the United Arab Emirates (UAE) and Mexico. The Egyptian market has been buoyed by expectations that a new election cycle will finally bring some stability and reform to the region. A similar dynamic exists in India and was confirmed by our team on the ground during extensive site visits and management meetings in country. The UAE has benefitted from its status as a safe-haven in the Middle East which has underpinned a broad recovery in the real estate market. Finally, the position in Mexico was increased due to the enactment of an ambitious reform agenda and its unique position as a beneficiary of the U.S. recovery. |
Portfolio Analysis
The top five stocks contributing to the Fund’s total return over the six months ending April 30, 2014, were Emaar Properties, Medinet Nasr Housing, Megaworld, Sobha Developers, and Talaat Moustafa Group.
| | • | Emaar Properties, a UAE based real estate developer focusing on large-scale, mixed use (primarily residential, retail and hotel) projects across the Middle East and North Africa (MENA) region, was the top contributor to the Fund’s performance. The main beneficiary of the real estate recovery in Dubai and the strong growth of tourism in the region, its solid balance sheet, low borrowing costs and steady contribution from income properties such as the Dubai Mall have proven resilient. |
| | | |
| | • | Medinet Nasr Housing is an Egyptian residential builder targeting developments in the middle segment of the Cairo home market. The company, which was formerly owned by the Egyptian government, has benefited from its clear land title over its landbank, versus some of its peers which are still disputing land ownership rights. Its strong balance sheet and robust sales momentum in an environment of political reconciliation has further supported the share recovery. |
| | | |
| | • | Megaworld is a Philippine property company engaged in the development of mixed-use projects in metro Manila as well as the provinces. Its prime landbank in Fort Bonifacio and proven track record appears ideally positioned to potentially benefit from the secular demand for the BPO (business process outsourcing) segment of the market. |
| | | |
| | • | Sobha Developers is a Bangalore-based, fully-integrated Indian developer. Its premium positioning, execution capabilities and strong cashflow generation are some key differentiators. |
| | • | Talaat Moustafa Group (TMG) is the largest developer in Egypt. The company develops large-scale integrated townships and operates hotels. Strong underlying fundamentals and expectations for a positive political outcome have driven outperformance. A final settlement of the protracted land dispute could provide a further tailwind to the shares. |
The top five stocks that detracted from the Fund’s total return for the six months ending April 30, 2014 were China Resources Land, China Overseas Land, Shimao Property, Country Garden and SM Prime.
| | • | China Resources Land is one of the leading landlords and developers in China focused on mixed use projects. Performance of the Chinese developers across the board has become more macro driven. Fears over the growth outlook for China as a whole and less favorable supply/demand outlook driving weakening property fundamentals in select markets has weighed indiscriminately on sector performance. Reform agenda implementation has hit the shadow banking and trust finance systems placing further pressure on the balance sheet outlook for many developers. |
| | | |
| | • | China Overseas Land is one of the largest listed residential developers in China. |
| | | |
| | • | Shimao Property is a residential builder targeting integrated development projects in tier 1-2 markets in China. |
| | | |
| | • | Country Garden is one of the leading mass-residential developers in China focused on large-scale community projects in tier-three cities. |
| | | |
| | • | SM Prime, the dominant mall developer and operator in the Philippines, has recently transformed into an integrated property company through a consolidation of certain subsidiary companies. The shift in risk profile due to the increased exposure to cash flows from development projects and the overhang of a possible equity issuance had an impact on share performance during the period. |
Outlook
The Alpine Emerging Markets Real Estate Fund focuses on real estate investments primarily in developing economies that we believe are positioned to be at the forefront of global growth. The Fund seeks out opportunities with solid demographic and urbanization trends, deepening credit markets, and resilient macroeconomic fundamentals, consistent with our structural view that superior risk-adjusted returns can be achieved in markets with broadening domestic consumption fueled by a growing middle class.
29
| Alpine Emerging Markets Real Estate Fund (Continued) |  |
The recovery in developed markets has yet to fulfill expectations and there remains significant slack in aggregate demand overall. Despite a far-from-spectacular recovery in the growth outlook, our longer-term view toward many EM economies remains constructive. Uncertainties about imbalances and the rising rate environment present near-term structural hurdles for specific EM countries, but investor fears of a systemic crisis or even a disorderly exit are severely misplaced in our view. Given the ongoing sensitivity surrounding the self-imposed deceleration of China’s growth and the necessary adjustments to its banking system, investors are likely to maintain a highly cautious stance toward EM until there is more clarity on the reform agenda and clearer sequential evidence of a recovery in corporate margins and earnings. While we are acutely aware of the unique set of idiosyncratic challenges intrinsic to the recovery across EM, particularly in the more leveraged and imbalanced economies, we do not see any convincing arguments leading us to stray materially from our thesis that the key emerging economies are expected to continue to be a strong source of demand, exhibit market resilience, and realign with their long-term growth trends. As the developing countries strive to become deeper and more integrated, it is Alpine’s view that over time the emerging equity markets could increase substantially in absolute terms as more companies come public and eventually even surpass developed markets in terms of market capitalization. At the same time we expect growth differentials between EMs and DMs to stabilize over the next 12-18 months, which could support a structural reallocation to EM equities.
While the current outlook could challenge investor appetite for risk and entrench skepticism toward a bottoming out of the EM earning cycle in the near term, it remains clear to us that the global monetary policy is likely to remain extremely supportive in absolute terms. Some of the critical signposts for Alpine’s assessment of the reacceleration of demand in EM include: the magnitude and implementation of structural reforms, the geopolitical landscape and election calendar across many EMs, the vulnerability to external funding of selective countries, as well as the direction of the growth/inflation dynamic. Over the medium-term, many EM economies could continue to underpin global growth based on the recovery of domestic demand, as well as urbanization and positive demographic trends. Alpine continues to believe that the spillover effects of divergent monetary policies could likely remain one of the dominant drivers of asset market volatility and returns for the foreseeable future. Indeed, it would not be beyond the realm of consideration if the prevailing low yield environment did not begin to trigger investor concerns that the bond markets are merely foreshadowing further risks to aggregate demand on the horizon.
Alpine’s Real Estate team is ever evaluating the risk/reward proposition of each position in the portfolio and monitors volatility carefully. The managers remain extremely selective in our approach to the markets and deploying capital. We thank our shareholders for their support.
Sincerely,
Joel E.D. Wells
Samuel A. Lieber
Portfolio Managers
This letter represents the opinions of the Fund’s management and is subject to change, is not guaranteed and should not be considered a recommendation to buy or sell any security. The information provided is not intended to be, and is not, a forecast of future events, a guarantee of future results, or investment advice. Views expressed may vary from those of the firm as a whole. Past performance is no guarantee of future results.
Mutual fund investing involves risk. Principal loss is possible. The Fund is subject to risks, including the following:
Concentration Risk – The Fund’s strategy of concentrating in companies in a specific industry means that its performance will be closely tied to the performance of a particular market segment. The Fund’s concentration in these companies may present more risks than if it were broadly diversified over numerous industries and sectors of the economy. A downturn in these companies would have a larger impact on the Fund than on a mutual fund that does not concentrate in such companies. At times, the performance of these companies will lag the performance of other industries or the broader market as a whole.
Currency Risk – The value of investments in securities denominated in foreign currencies increases or decreases as the rates of exchange between those currencies and the U.S. dollar change. Currency conversion costs and currency fluctuations could erase investment gains or add to investment losses. Currency exchange rates can be volatile, and are affected by factors such as general economic conditions, the actions of the U.S. and foreign governments or central banks, the imposition of currency controls and speculation.
30
| Alpine Emerging Markets Real Estate Fund (Continued) |  |
Emerging Market Securities Risk – The risks of foreign investments are heightened when investing in issuers in emerging market countries. Emerging market countries tend to have economic, political and legal systems that are less fully developed and are less stable than those of more developed countries. They are often particularly sensitive to market movements because their market prices tend to reflect speculative expectations. Low trading volumes may result in a lack of liquidity and in extreme price volatility.
Equity Securities Risk – The stock or other security of a company may not perform as well as expected, and may decrease in value, because of factors related to the company (such as poorer than expected earnings or certain management decisions) or to the industry in which the company is engaged (such as a reduction in the demand for products or services in a particular industry).
Foreign Currency Transactions Risk – Foreign securities are often denominated in foreign currencies. As a result, the value of the Fund’s shares is affected by changes in exchange rates. The Fund may enter into foreign currency transactions to try to manage this risk. The Fund’s ability to use foreign currency transactions successfully depends on a number of factors, including the foreign currency transactions being available at prices that are not too costly, the availability of liquid markets and the ability of the Adviser to accurately predict the direction of changes in currency exchange rates.
Foreign Securities Risk – The Fund’s investments in securities of foreign issuers or issuers with significant exposure to foreign markets involve additional risk. Foreign countries in which the Fund may invest may have markets that are less liquid, less regulated and more volatile than U.S. markets. The value of the Fund’s investments may decline because of factors affecting the particular issuer as well as foreign markets and issuers generally, such as unfavorable government actions, and political or financial instability. Lack of information may also affect the value of these securities. The risks of foreign investment are heightened when investing in issuers of emerging market countries.
Growth Stock Risk – Growth stocks typically are very sensitive to market movements because their market prices tend to reflect future expectations. When it appears those expectations will not be met, the prices of growth stocks typically fall. Growth stocks as a group may be out of favor and underperform the overall equity market while the market concentrates on undervalued stocks.
Initial Public Offerings and Secondary Offerings Risk – The Fund may invest a portion of its assets in shares of IPOs or secondary offerings of an issuer. IPOs and secondary offerings may have a magnified impact on the performance of a Fund with a small asset base. The impact of IPOs and secondary offerings on a Fund’s performance likely will decrease as the Fund’s asset size increases, which could reduce a Fund’s returns. IPOs and secondary offerings may not be consistently available to the Fund for investing. IPO and secondary offering shares frequently are volatile in price due to the absence of a prior public market, the small number of shares available for trading and limited information about the issuer. Therefore, the Fund may hold IPO and secondary offering shares for a very short period of time. This may increase the turnover of the Fund and may lead to increased expenses for the Fund, such as commissions and transaction costs. In addition, IPO and secondary offering shares can experience an immediate drop in value if the demand for the securities does not continue to support the offering price.
Interest Rate Risk – Interest rates may rise resulting in a decrease in the value of securities held by the Fund, or may fall resulting in an increase in the value of such securities. Securities having longer maturities generally involve a greater risk of fluctuations in the value resulting from changes in interest rates.
Liquidity Risk – Some securities held by the Fund may be difficult to sell, or illiquid, particularly during times of market turmoil. Illiquid securities may also be difficult to value. If the Fund is forced to sell an illiquid asset to meet redemption requests or other cash needs, the Fund may be forced to sell at a loss.
Management Risk – The Adviser’s judgment about the quality, relative yield or value of, or market trends affecting, a particular security or sector, or about interest rates generally, may be incorrect. The Adviser’s security selections and other investment decisions might produce losses or cause the Fund to underperform when compared to other funds with similar investment objectives and strategies.
Market Risk – The price of a security held by the Fund may fall due to changing market, economic or political conditions.
31
| Alpine Emerging Markets Real Estate Fund (Continued) | |
Micro Capitalization Company Risk – Stock prices of micro capitalization companies are significantly more volatile, and more vulnerable to adverse business and economic developments than those of larger companies. Micro capitalization companies often have narrower markets for their goods and/or services and more limited managerial and financial resources than larger, more established companies, including small or medium capitalization companies.
Real Estate Investment Trusts (“REITs”) Risk – REITs’ share prices may decline because of adverse developments affecting the real estate industry including changes in interest rates. The returns from REITs may trail returns from the overall market. Additionally, there is always a risk that a given REIT will fail to qualify for favorable tax treatment.
Real Estate Securities Risk – Risks associated with investment in securities of companies in the real estate industry include: declines in the value of real estate; risks related to local economic conditions, overbuilding and increased competition; increases in property taxes and operating expenses; changes in zoning laws; casualty or condemnation losses; variations in rental income, neighborhood values or the appeal of properties to tenants; changes in interest rates and changes in general economic and market conditions.
Small and Medium Capitalization Company Risk – Securities of small or medium capitalization companies are more likely to experience sharper swings in market values, less liquid markets, in which it may be more difficult for the Adviser to sell at times and at prices that the Adviser believes appropriate and generally are more volatile than those of larger companies.
Undervalued Stock Risk – The Fund may pursue strategies that may include investing in securities, which, in the opinion of the Adviser, are undervalued. The identification of investment opportunities in undervalued securities is a difficult task and there is no assurance that such opportunities will be successfully recognized or acquired. While investments in undervalued securities offer opportunities for above-average capital appreciation, these investments involve a high degree of financial risk and can result in substantial losses.
Please refer to pages 3-5 for other important disclosures and definitions.
32
| Alpine Global Infrastructure Fund | |
| Comparative Annualized Returns as of 4/30/14 (Unaudited) |
| | | 6 Months(1) | | 1 Year | | 3 Years | | 5 Years | | Since Inception(2) |
| Alpine Global Infrastructure Fund — Institutional Class | | 5.89 | % | | 12.27 | % | | 10.03 | % | | 20.80 | % | | 19.48% | |
| Alpine Global Infrastructure Fund — Class A (Without Load) | | 5.73 | % | | 12.02 | % | | N/A | | N/A | | 20.96% | |
| Alpine Global Infrastructure Fund — Class A (With Load) | | -0.10 | % | | 5.89 | % | | N/A | | N/A | | 18.06% | |
| S&P Global Infrastructure Index | | 9.68 | % | | 13.79 | % | | 8.04 | % | | 15.36 | % | | 12.09% | |
| MSCI All Country World Index | | 5.48 | % | | 14.91 | % | | 7.94 | % | | 15.91 | % | | 13.78% | |
| Lipper Specialty/Miscellaneous Funds Average(3) | | 4.21 | % | | 5.89 | % | | 0.66 | % | | 14.53 | % | | 15.09% | |
| Lipper Specialty/Miscellaneous Funds Ranking(3) | | N/A | (4) | | 40/88 | | 25/73 | | 11/39 | | 2/30 | |
| Gross Expense Ratio (Institutional Class): 1.25%(5) | | | | | | | | | | | | | | | |
| Net Expense Ratio (Institutional Class): 1.25%(5) | | | | | | | | | | | | | | | |
| Gross Expense Ratio (Class A): 1.50%(5) | | | | | | | | | | | | | | | |
| Net Expense Ratio (Class A): 1.50%(5) | | | | | | | | | | | | | | | |
| | (1) | Not annualized. |
| | (2) | Institutional Class shares commenced on November 3, 2008 and Class A shares commenced on December 30, 2011. Returns for indices are since November 3, 2008. |
| | (3) | The since inception data represents the period beginning November 6, 2008 (Institutional Class only). |
| | (4) | FINRA does not recognize rankings for less than one year. |
| | (5) | As disclosed in the prospectus dated February 28, 2014. |
Performance data quoted represents past performance and is not predictive of future results. Investment return and principal value of the Fund fluctuate, so that shares, when redeemed, may be worth more or less than their original cost. Performance current to the most recent month end may be lower or higher than the performance quoted and may be obtained by calling 1-888-785-5578. Performance data shown does not reflect the 1.00% redemption fee imposed on shares held for fewer than 60 days. If it did, total returns would be reduced. Returns for the Class A shares with sales charge reflect a maximum sales charge of 5.50%. Performance for the Class A shares without sales charges does not reflect this load.
The S&P Global Infrastructure Index is comprised of 75 of the largest publicly-listed infrastructure companies that meet specific investability requirements. The Index is designed to provide liquid exposure to the leading publicly-listed companies in the global infrastructure industry, from both developed markets and emerging markets. To create diversified exposure across the global listed infrastructure market, the index has balanced weights across three distinct infrastructure clusters: utilities, transportation, and energy. The Lipper Specialty/Miscellaneous Funds Average is an average of funds that limit their investments to a specific industry (e.g. transportation, retailing, or paper, etc.) or ones that have not been classified into an existing investment classification. The MSCI All Country World Index is a free float-adjusted market capitalization-weighted index that is designed to measure the equity market performance of developed and emerging markets. Source: MSCI. MSCI data may not be reproduced or used for any other purpose. The S&P Global Infrastructure Index, the MSCI All Country World Index and the Lipper Specialty/Miscellaneous Funds Average are unmanaged and do not reflect direct fees associated with a mutual fund, such as investment adviser fees; however, the Lipper Specialty/Miscellaneous Funds Average reflects fees charged by the underlying funds. The performance for the Alpine Global Infrastructure Fund reflects the deduction of fees for these value-added services. Lipper rankings for the periods shown are based on fund total returns with dividends and distributions reinvested and do not reflect sales charges. Investors cannot directly invest in an index.
Expense Ratios reflect the ratios reported in the Fund’s most recent prospectus. The Alpine Global Infrastructure Fund has a contractual expense waiver that continues through February 28, 2015. Where a Fund’s gross and net expense ratios are the same for the period reported, the contractual expense reimbursement level was not reached as of the end of that period. To the extent the Fund’s expenses were reduced by waivers, the Fund’s total returns were increased. In these cases, in the absence of the expense waivers, the Fund’s total returns would have been lower.
The Fund’s past performance benefited significantly from Initial Public Offerings (“IPOs”) and Secondary Offerings of certain issuers. There is no assurance that the Fund can replicate this performance in the future. Additionally, there is no guarantee that the Fund will be able to participate to the same degree in IPO/Secondary Offerings in the future.
33
| Alpine Global Infrastructure Fund (Continued) | |
Portfolio Distributions* (Unaudited)
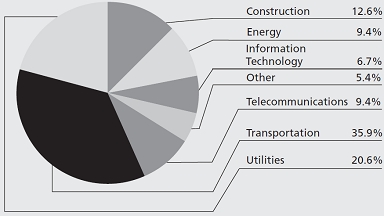
| Top 10 Holdings* (Unaudited) | | |
| 1. | | Vinci SA | 2.26 | % |
| 2. | | Ferrovial SA | 1.96 | % |
| 3. | | American Tower Corp. | 1.92 | % |
| 4. | | MasTec, Inc. | 1.86 | % |
| 5. | | Enbridge, Inc. | 1.81 | % |
| 6. | | Canadian Pacific Railway, Ltd. | 1.79 | % |
| 7. | | Union Pacific Corp. | 1.70 | % |
| 8. | | Abertis Infraestructuras SA | 1.62 | % |
| 9. | | CCR SA | 1.60 | % |
| 10. | | Eutelsat Communications SA | 1.57 | % |
| * | Portfolio Distributions percentages are based on total investments. Top 10 Holdings do not include short-term investments and percentages are based on total net assets. Portfolio holdings and sector distributions are as of 04/30/14 and are subject to change. Portfolio holdings are not recommendations to buy or sell any securities. |
| Value of a $10,000 Investment (Unaudited) |
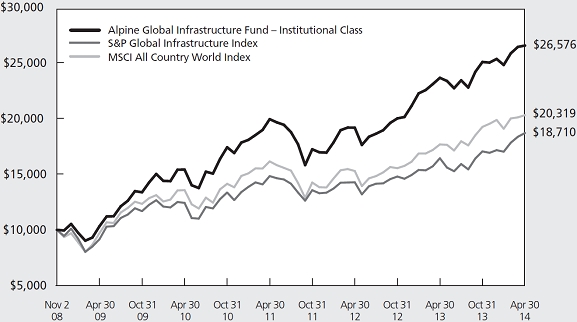 |
| |
This chart represents a comparison of a hypothetical $10,000 investment in the Fund versus a similar investment in the Fund’s benchmarks. The graph and the table do not reflect the deduction of taxes that a shareholder would pay on Fund distributions or the redemption of Fund shares. Investment performance reflects the waiver and recovery of certain fees, if applicable. Without the waiver and recovery of fees, the Fund’s total return would have differed.
Performance data quoted represents past performance and is not predictive of future results. Investment return and principal value of the Fund fluctuate, so that shares, when redeemed, may be worth more or less than their original cost.
34
| Alpine Global Infrastructure Fund (Continued) | |
Commentary
For the six month period ending April 30, 2014, the Alpine Global Infrastructure Fund reported a 5.89% total return versus the S&P Global Infrastructure IndexTM which had a total return of 9.68%. All references in this letter to the Fund’s performance relate to the performance of the Fund’s Institutional Class.
Economic Analysis
Although stocks in most developed markets advanced during the six month period ending April 30, 2014, it was a volatile period characterized by a sell-off in emerging markets, increased geopolitical tensions and uncertainty in the United States amidst a transition in leadership at the Federal Reserve (the “Fed”). Economic data were mixed, with extremely cold weather affecting spending patterns in the United States this winter, and sluggish growth in Europe bringing a fresh round of deflation worries. That said, macroeconomic conditions in the United States and in the Eurozone continued to be broadly supportive of a moderate recovery.
We believe the slow recovery is the result of 1) the reluctance of U.S. banks to lend at the same levels as they did prior to the global financial crisis, 2) a less accommodative fiscal policy in the United States, and 3) a still sluggish U.S. housing market plagued by historically low mortgage originations. Bond yields in the United States remained low as the Fed reassured investors that despite the tapering of quantitative easing, interest rates would remain low for an extended period. Consequently, interest rate-sensitive sectors in the U.S. outperformed more cyclical sectors, with U.S. utilities up 13.63% as measured by the S&P 500® Utilities Index in the period. European sovereign yields decreased with both the Italian and Spanish ten-year yields dropping to multi-year lows, driving a similar rally with European utilities up 13.79% (in USD) as measured by the MSCI Europe Utilities Index. Emerging markets continued to lag behind developed markets in the period, with the MSCI Emerging Markets Index posting a total return of -2.98% vs. 8.59% for the MSCI Europe Index, 8.35% for the S&P 500 Index, and 5.48% for the MSCI All Country World Index. In Brazil, potential risk of power rationing was complicated by election politics. In China, the tightening of credit conditions and the consequent slowing of growth weighed on sectors dependent on government spending. Finally, the Russian annexation of Crimea brought investor concern about further aggression and the resulting economic impacts.
Performance Drivers
The S&P 500 Utility Index was up 13.63% and the STOXX 600 Utilities Index was up 13.51% compared to the S&P 500® Index which gained 8.35% and the STOXX 600 Index which gained 8.59%. Our underweight in utilities
compared to our benchmark, the S&P Global Infrastructure Index, contributed to our underperformance. We believe that utilities as a group are expensive relative to their historical valuations and other sectors in which we may invest. We are focused on specific opportunities within the utility sector such as water. In addition, we underperformed in the transportation sector due to our exposure to companies within the emerging markets.
The Fund has also participated in a number of Initial Public Offerings (“IPO”) and Secondary Offerings, both inside and outside of the infrastructure sector, that have contributed to the Fund’s total return. We cannot predict how long, if at all, these opportunities will continue to exist, but to the extent we consider IPO’s to be attractively priced and available, the Fund may continue to participate in them.
Sector outperformance:
We were underweight in the energy sector but outperformed the benchmark due to stock selection. One example of this is our investment in Infraestructura Energetica Nova, a company that develops energy infrastructure in Mexico. We also outperformed our benchmark in the construction sector.
Emerging Market Exposure:
We believe that the urbanization of emerging market countries will be an important driver of infrastructure development and spending. The MSCI Emerging Market Index, the Ibovespa Index (Brazil) and the Hang Seng Index (Hong Kong) all underperformed both the S&P 500® Index and the STOXX 600 Index during the six month period ending April 30, 2014. During this period, our exposure to emerging markets was overweight versus our benchmark. Emerging markets were a negative contributor to our overall return. We believe that infrastructure spending in emerging markets may continue to increase and thus we are currently maintaining an overweight position compared to the benchmark in those markets. Our investments in Brazil were a laggard in emerging markets as growth was below expectations. We still believe there may be significant spending on infrastructure in Brazil as it is now the seventh largest economy in the world by Gross Domestic Product (“GDP”); but, according to the Global Competitiveness Report by the World Economic Forum, Brazil ranks 104th in its overall quality of infrastructure.
Portfolio Analysis
The top five stocks contributing to the Fund’s performance for the six month period ending April 30, 2014 based on contribution to total return were Abengoa, Vinci, Beijing Enterprises Water Group Limited (“BEW”), MasTec, and Union Pacific Corporation.
35
| Alpine Global Infrastructure Fund (Continued) | |
Abengoa is an engineering and construction company that focuses on the energy and water sectors. Abengoa also owns concessions in these sectors. The company continued to execute on its turnaround plan announcing new projects awards, further asset sales and additional debt reduction. In addition, it announced the plan to form a “yield co”, which would allow it to sell concessions from the parent company to the newly formed company, potentially allowing Abengoa to unlock the value of the concessions that they own more quickly.
Vinci is a world-leading concession and construction company. It operates motorway concessions in France and car parks across Europe. We believe the shares have risen during the period due to a recovery in the traffic on their motorways and at their airports. Contracting revenues increased in the first quarter due to mild winter weather in Europe.
BEW is a diversified water company in China and the largest wastewater treatment operator in China. BEW made several acquisitions during 2013, which we believe will contribute to its earnings in 2014. In March 2014, they reported that earnings for 2013 increased over 40%. In addition, the central government’s policies focusing on improving the efficiency and operation of water projects through privatization has led to a positive sentiment towards the stock. We believe BEW will participate and potentially benefit from additional opportunities to further consolidate the market.
MasTec is a contractor specializing in infrastructure construction projects. MasTec’s stock outperformed, as investors believe that they can continue to benefit from positive growth in their end-markets such as wireless and wireline build-out, pipeline construction, and transmission growth. In addition, MasTec benefitted from a new large contract with AT&T.
Union Pacific Corporation is a rail transportation company located in the western two-thirds of the United States. The company continued to benefit from solid end-market demand due to an improving U.S. economy. Union Pacific has continued to improve its margins and reported a record first quarter operating ratio in 2014.
The following companies had the largest adverse impact on the performance of the Fund based on contribution to return for the six month period ending April 30, 2014: Guangshen Railway, China Railway Construction Corporation, Royal Vopak, Energias Do Brasil, and Corrections Corporation of America.
Guangshen Railway is a railway operator in the Guangdong province of China. The company underperformed due to the negative impact from the adoption by the railway transportation sector of the new tax system.
China Railway Construction Corporation is one of the two largest railway construction contractors in China. The company’s share price was negatively impacted by fears
of a slowdown in China’s fixed asset investment in rail. We believe that the Chinese government will continue to invest in the rail network, and it has recently announced an acceleration of its spending plan.
Vopak is the world’s largest independent bulk liquid storage company serving the oil and chemical industries. Vopak’s share price has underperformed due to a weak oil products market in Europe and a declining occupancy rate. These conditions led to a profit warning in the first quarter.
Energias Do Brasil is a utility company located in Brazil. The company’s share price was hurt by below average returns expected for its Sao Manoel hydro project and fears of energy rationing driven by severe drought conditions in Brazil. The Fund no longer owns the stock.
Shares of Corrections Corp of America (CXW), an operator of prisons for state and federal government, suffered from uncertainty about the future of the California corrections market, one of its largest markets. A string of delays throughout 2013 eventually ended with a disappointing judicial decision in February 2014 that granted the state an additional two years to comply with laws meant to reduce overcrowding in prisons. With the ruling, CXW lost the opportunity to fill out-of-state beds with California inmates.
Summary and Outlook
We launched the Alpine Global Infrastructure Fund because we believe that there are special opportunities to benefit from global spending in infrastructure over the next several decades. Even before the financial crisis began to wreak havoc on the budgets of governments and municipalities, the privatization of infrastructure assets began to take place. Now, even more so, we believe there will be an accelerated effort to privatize these assets as public entities will not have the funds to maintain their current infrastructure assets nor to build new infrastructure assets to meet the needs of a growing population. Throughout the world, the owners of infrastructure are primarily government entities. However, over the last several decades, due to the large cost of building and maintaining these facilities, there has been a movement towards privatization of infrastructure assets. In Canada, Australia, the United Kingdom, and throughout Europe and Asia, roads, airports, and seaports have been privatized. Currently, The Port Authority of New York and New Jersey have issued a request for proposal to the prequalified consortia bidding for the LaGuardia Airport Central Terminal Building Replacement Project. The proposals and selection of the winning bid is expected to take place in 2014. We believe that this may be the beginning of local airport authorities in the United States utilizing the expertise, experience, and innovation of private owners of airports to rehabilitate their aging airports.
36
| Alpine Global Infrastructure Fund (Continued) | |
Since the launch of our Fund, the equity markets have been volatile as the world’s economies suffered from the effects of the financial crisis. The amount of debt that governments have on their balance sheets and the austerity measures that have been enacted will likely lead to slower growth for years to come. The uncertainty over the European debt crisis along with the questionable growth prospects of China has led to extremely volatile markets and, as a result, we continued to hedge a portion of our Euro currency exposure during the period to partially help offset the Euro’s impact on the value of the Fund’s Euro-denominated holdings. We believe that these market conditions may create many new opportunities for investors in infrastructure stocks that have the potential for more stable and predictable cash flows. Our portfolio of companies is not immune to swings in share prices, but volatile markets may provide an opportunity to continue buying what we believe are high-quality companies with solid balance sheets and good growth prospects at what we believe are inexpensive valuations. In the future, governments may
be compelled to sell off infrastructure assets and utilize public/private funds using build/operate/transfer models to finance new projects.
We are pleased with the structure of our portfolio. We believe the Fund should be well positioned to take advantage of the anticipated increase in global infrastructure spending. We continue to believe that the combination of urbanization, rising standards of living and population growth can propel infrastructure spending for decades to come. We will continue to adapt our investment approach as economic conditions change and look forward to discussing the portfolio and the prospects for the Fund in future communications. We appreciate your trust and investment in the Fund.
Sincerely,
Joshua E. Duitz
Samuel A. Lieber
Portfolio Managers
This letter represents the opinions of the Fund’s management and is subject to change, is not guaranteed and should not be considered a recommendation to buy or sell any security. The information provided is not intended to be, and is not, a forecast of future events, a guarantee of future results, or investment advice. Views expressed may vary from those of the firm as a whole.
Past performance is no guarantee of future results.
Mutual fund investing involves risk. Principal loss is possible. The Fund is subject to risks including the following:
Concentration Risk – The Fund’s strategy of concentrating in companies in a specific industry means that its performance will be closely tied to the performance of a particular market segment. The Fund’s concentration in these companies may present more risks than if it were broadly diversified over numerous industries and sectors of the economy. A downturn in these companies would have a larger impact on the Fund than on a mutual fund that does not concentrate in such companies. At times, the performance of these companies will lag the performance of other industries or the broader market as a whole.
Currency Risk – The value of investments in securities denominated in foreign currencies increases or decreases as the rates of exchange between those currencies and the U.S. dollar change. Currency conversion costs and currency fluctuations could erase investment gains or add to investment losses. Currency exchange rates can be volatile, and are affected by factors such as general economic conditions, the actions of the U.S. and foreign governments or central banks, the imposition of currency controls and speculation.
Dividend Strategy Risk – The Fund’s strategy of investing in dividend-paying stocks involves the risk that such stocks may fall out of favor with investors and underperform the market. Companies that issue dividend paying-stocks are not required to continue to pay dividends on such stocks. Therefore, there is the possibility that such companies could reduce or eliminate the payment of dividends in the future.
Emerging Market Securities Risk – The risks of foreign investments are heightened when investing in issuers in emerging market countries. Emerging market countries tend to have economic, political and legal systems that are less fully developed and are less stable than those of more developed countries. They are often particularly sensitive to market movements because their market prices tend to reflect speculative expectations. Low trading volumes may result in a lack of liquidity and in extreme price volatility.
Equity Securities Risk – The stock or other security of a company may not perform as well as expected, and may decrease in value, because of factors related to the company (such as poorer than expected earnings or certain management decisions) or to the industry in which the company is engaged (such as a reduction in the demand for products or services in a particular industry).
37
| Alpine Global Infrastructure Fund (Continued) | |
Foreign Currency Transactions Risk – Foreign securities are often denominated in foreign currencies. As a result, the value of the Fund’s shares is affected by changes in exchange rates. The Fund may enter into foreign currency transactions to try to manage this risk. The Fund’s ability to use foreign currency transactions successfully depends on a number of factors, including the foreign currency transactions being available at prices that are not too costly, the availability of liquid markets and the ability of the Adviser to accurately predict the direction of changes in currency exchange rates.
Foreign Securities Risk – The Fund’s investments in securities of foreign issuers or issuers with significant exposure to foreign markets involve additional risk. Foreign countries in which the Fund may invest may have markets that are less liquid, less regulated and more volatile than U.S. markets. The value of the Fund’s investments may decline because of factors affecting the particular issuer as well as foreign markets and issuers generally, such as unfavorable government actions, and political or financial instability. Lack of information may also affect the value of these securities. The risks of foreign investment are heightened when investing in issuers of emerging market countries.
Growth Stock Risk – Growth stocks are stocks of companies believed to have above-average potential for growth in revenue and earnings. Growth stocks typically are very sensitive to market movements because their market prices tend to reflect future expectations. When it appears those expectations will not be met, the prices of growth stocks typically fall. Growth stocks as a group may be out of favor and underperform the overall equity market while the market concentrates on undervalued stocks.
Infrastructure-Related Investment Risk – Because the Fund concentrates its investments in infrastructure-related entities, the Fund has greater exposure to the potential adverse economic, regulatory, political and other changes affecting such entities. Infrastructure-related entities are subject to a variety of factors that may adversely affect their business or operations, including high interest costs in connection with capital construction programs, costs associated with environmental and other regulations, the effects of economic slowdown and surplus capacity, increased competition from other providers of services, uncertainties concerning the availability of fuel at reasonable prices, the effects of energy conservation policies and other factors. Additionally, infrastructure-related entities may be subject to regulation by various governmental authorities and may also be affected by governmental regulation of rates charged to customers, service interruption due to environmental, operational or other mishaps and the imposition of special tariffs and changes in tax laws, regulatory policies and accounting standards.
Initial Public Offerings and Secondary Offerings Risk – The Fund may invest a portion of its assets in shares of IPOs or secondary offerings of an issuer. IPOs and secondary offerings may have a magnified impact on the performance of a Fund with a small asset base. The impact of IPOs and secondary offerings on a Fund’s performance likely will decrease as the Fund’s asset size increases, which could reduce a Fund’s returns. IPOs and secondary offerings may not be consistently available to the Fund for investing. IPO and secondary offering shares frequently are volatile in price due to the absence of a prior public market, the small number of shares available for trading and limited information about the issuer. Therefore, the Fund may hold IPO and secondary offering shares for a very short period of time. This may increase the turnover of the Fund and may lead to increased expenses for the Fund, such as commissions and transaction costs. In addition, IPO and secondary offering shares can experience an immediate drop in value if the demand for the securities does not continue to support the offering price.
Management Risk – The Adviser’s judgment about the quality, relative yield or value of, or market trends affecting, a particular security or sector, or about interest rates generally, may be incorrect. The Adviser’s security selections and other investment decisions might produce losses or cause the Fund to underperform when compared to other funds with similar investment objectives and strategies.
Market Risk – The price of a security held by the Fund may fall due to changing market, economic or political conditions.
Portfolio Turnover Risk – High portfolio turnover necessarily results in greater transaction costs which may reduce Fund performance.
Small and Medium Capitalization Company Risk – Securities of small or medium capitalization companies are more likely to experience sharper swings in market values, less liquid markets, in which it may be more difficult for the Adviser to sell at times and at prices that the Adviser believes appropriate and generally are more volatile than those of larger companies.
Undervalued Stock Risk – The Fund may pursue strategies that may include investing in securities, which, in the opinion of the Adviser, are undervalued. The identification of investment opportunities in undervalued securities is a difficult task and there is no assurance that such opportunities will be successfully recognized or acquired. While investments in undervalued securities offer opportunities for above-average capital appreciation, these investments involve a high degree of financial risk and can result in substantial losses.
Please refer to pages 3-5 for other important disclosures and definitions.
38
| Alpine Global Consumer Growth Fund | |
| Comparative Annualized Returns as of 4/30/14 (Unaudited) | |
| | | 6 Months(1) | | 1 Year | | 3 Years | | Since Inception(2) | |
| Alpine Global Consumer Growth Fund — Institutional Class | | -0.22 | % | | 8.20 | % | | 6.32 | % | | 7.37 | % | | |
| Alpine Global Consumer Growth Fund — Class A (Without Load) | | -0.39 | % | | 7.94 | % | | N/A | | 15.56 | % | | |
| Alpine Global Consumer Growth Fund — Class A (With Load) | | -5.86 | % | | 1.96 | % | | N/A | | 12.80 | % | | |
| MSCI World Index USD | | 6.32 | % | | 16.62 | % | | 9.08 | % | | 11.15 | % | | |
| MSCI ACWI Consumer Discretionary Index USD | | 0.36 | % | | 15.77 | % | | 11.16 | % | | 12.41 | % | | |
| MSCI ACWI Consumer Staples Index USD | | 2.90 | % | | 4.14 | % | | 9.39 | % | | 10.59 | % | | |
| Lipper Consumer Goods Funds Average(3) | | 3.42 | % | | 11.79 | % | | 11.80 | % | | 12.95 | % | | |
| Lipper Consumer Goods Funds Ranking(3) | | N/A | (4) | | 34/41 | | 33/36 | | 33/36 | | |
| Gross Expense Ratio (Institutional Class): 3.80%(5) | | | | | | | | | | | | | | |
| Net Expense Ratio (Institutional Class): 1.35%(5) | | | | | | | | | | | | | | |
| Gross Expense Ratio (Class A): 4.05%(5) | | | | | | | | | | | | | | |
| Net Expense Ratio (Class A): 1.60%(5) | | | | | | | | | | | | | | |
| | (1) | Not annualized. |
| | (2) | Institutional Class shares commenced on December 29, 2010 and Class A shares commenced on December 30, 2011. Returns for indices are since December 29, 2010. |
| | (3) | The since inception data represents the period beginning December 31, 2010 (Institutional Class only). |
| | (4) | FINRA does not recognize rankings for less than one year. |
| | (5) | As disclosed in the prospectus dated February 28, 2014. |
Performance data quoted represents past performance and is not predictive of future results. Investment return and principal value of the Fund fluctuate, so that shares, when redeemed, may be worth more or less than their original cost. Performance current to the most recent month end may be lower or higher than the performance quoted and may be obtained by calling 1-888-785-5578. Performance data shown does not reflect the 1.00% redemption fee imposed on shares held for fewer than 60 days. If it did, total returns would be reduced. Returns for the Class A shares with sales charge reflect a maximum sales charge of 5.50%. Performance for the Class A shares without sales charges does not reflect this load.
The MSCI World Index USD is a free float-adjusted market capitalization-weighted index that is designed to measure the equity market performance of developed markets. MSCI ACWI Consumer Discretionary Index USD is a free float-adjusted market capitalization-weighted index that is designed to measure the equity market performance of developed and emerging markets for the Consumer Discretionary GICS® sector. MSCI ACWI Consumer Staples Index USD is a market capitalization-weighted index that is designed to measure the equity market performance of developed and emerging markets for the Consumer Staples GICS® sector. MSCI makes no express or implied warranties or representations and shall have no liability whatsoever with respect to any MSCI data contained herein. The MSCI data may not be further redistributed or used as a basis for other indices or any securities or financial products. This report is not approved, reviewed or produced by MSCI. The Lipper Consumer Goods Funds Average is an average of funds that invest primarily in the equity securities of domestic and foreign companies engaged in manufacturing and distributing consumer goods such as food, beverages, tobacco, and nondurable household goods and personal products. The MSCI ACWI Consumer Discretionary Index USD, the MSCI ACWI Consumer Staples Index USD, and the Lipper Consumer Goods Funds Average are unmanaged and do not reflect direct fees associated with a mutual fund, such as investment adviser fees; however, the Lipper Consumer Goods Funds Average reflects fees charged by the underlying funds. The performance for the Alpine Global Consumer Growth Fund reflects the deduction of fees for these value-added services. Investors cannot directly invest in an index. Lipper rankings for the periods shown are based on fund total returns with dividends and distributions reinvested and do not reflect sales charges.
Expense Ratios reflect the ratios reported in the Fund’s most recent prospectus. The Alpine Global Consumer Growth Fund has a contractual expense waiver that continues through February 28, 2015. Where a Fund’s gross and net expense ratios are the same for the period reported, the contractual expense reimbursement level was not reached as of the end of that period. To the extent the Fund’s expenses were reduced by waivers, the Fund’s total returns were increased. In these cases, in the absence of the expense waivers, the Fund’s total returns would have been lower.
To the extent that the Fund’s historical performance resulted from gains derived from participation in Initial Public Offerings (“IPOs”) and/or Secondary Offerings, there is no guarantee that these results can be replicated in future periods or that the Fund will be able to participate to the same degree in IPO/Secondary Offerings in the future.
39
| Alpine Global Consumer Growth Fund (Continued) | |
Portfolio Distributions* (Unaudited)

| Top 10 Holdings* (Unaudited) |
| 1. | | Comcast Corp.-Class A | 3.18 | % |
| 2. | | Apple, Inc. | 3.11 | % |
| 3. | | Anheuser-Busch InBev NV-ADR | 2.98 | % |
| 4. | | VF Corp. | 2.83 | % |
| 5. | | Michael Kors Holdings, Ltd. | 2.79 | % |
| 6. | | Visa, Inc.-Class A | 2.49 | % |
| 7. | | Nestle SA | 2.44 | % |
| 8. | | Baidu, Inc.-ADR | 2.43 | % |
| 9. | | Tencent Holdings, Ltd. | 2.41 | % |
| 10. | | Kering | 2.33 | % |
| * | Portfolio Distributions percentages are based on total investments. Top 10 Holdings do not include short-term investments and percentages are based on total net assets. Portfolio holdings and sector distributions are as of 04/30/14 and are subject to change. Portfolio holdings are not recommendations to buy or sell any securities. |
| Value of a $10,000 Investment (Unaudited) |
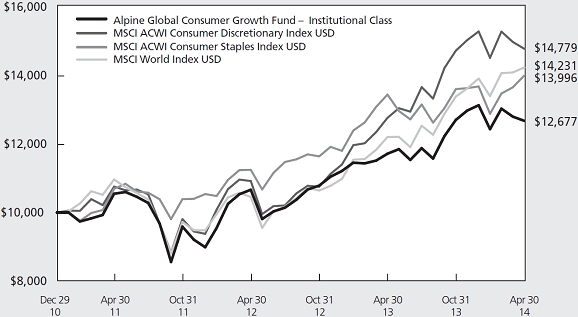 |
| |
This chart represents a comparison of a hypothetical $10,000 investment in the Fund versus a similar investment in the Fund’s benchmarks. The graph and the table do not reflect the deduction of taxes that a shareholder would pay on Fund distributions or the redemption of Fund shares. Investment performance reflects the waiver and recovery of certain fees, if applicable. Without the waiver and recovery of fees, the Fund’s total return would have differed.
Performance data quoted represents past performance and is not predictive of future results. Investment return and principal value of the Fund fluctuate, so that shares, when redeemed, may be worth more or less than their original cost.
40
| Alpine Global Consumer Growth Fund (Continued) | |
Commentary
For the six months ended April 30, 2014, the Alpine Global Consumer Growth Fund had a total return of -0.22%. The MSCI World Index posted a total return of 6.32% while the MSCI All Country World Consumer Staples and Consumer Discretionary Indices posted total returns of 2.90% and 0.36%, respectively. All references in this letter to the Fund’s performance relate to the performance of the Fund’s Institutional Class.
Portfolio Drivers
After a strong finish to calendar 2013, the global markets were choppy in the first few months of 2014 as investors tried to process the potential impact of the end of quantitative easing (QE3) in the U.S. on economies around the world. Global indices retreated in late January before rallying less than a month later as investor optimism rose post fourth-quarter earnings season and commentary from European Union leaders suggested that the group would be more accommodative, if needed, to keep European Union countries moving in the right direction.
| | • | Geographic exposure played a large part in the performance of the Fund versus the MSCI All Country World Consumer Discretionary Index. Due to the global nature of the portfolio, the United States represented a 45.20% average weight during the fiscal year versus 53.14% in the benchmark. Conversely, the Fund had a large relative overweight in emerging markets versus the benchmark. |
| | | |
| | • | The Fund carried an average cash balance of 5.05% over the past six months as we became more cautious following a very strong 2013 market performance. Given the positive direction of the overall global markets during the past six months, this balance created a significant drag on the portfolio during the period. |
| | | |
| | • | From an industry standpoint, despite the Fund’s relative underweight in retailing, the segment was the largest negative contributor through April 30, 2014. Software & services also played a role in the relative underperformance. Meanwhile, consumer durables & apparel and consumer services had the largest positive relative impact on the Fund’s performance. |
| | | |
| | • | Sector performance was a major factor during the first six months of the fiscal year. Despite the underperformance of global consumer stocks in the broader indices in the period and a relative |
| | | underweight position, the consumer discretionary sector was the largest detractor from performance. The Fund’s information technology exposure was also a negative contributor through April 30, 2014. Meanwhile, the consumer staples segment kept pace with the benchmark. |
Portfolio Analysis
The top five stocks contributing to the Fund’s performance during the period ending April 30, 2014 were SES SA, Michael Kors Holdings, Tencent Holdings, Future Bright Holdings and Apple Inc.
| | • | European satellite operator SES SA was the largest contributor to the Fund during this period. The company benefited from a bounce back in performance as investors were a bit more defensive at the beginning of 2014 after a strong run in discretionary stocks the previous year. SES is poised to have a return to normalized growth over the next 12 months and offers a defensive business model for uncertain times. |
| | | |
| | • | The shares of Michael Kors Holdings remained strong over the past six months as the company’s fundamental results exceeded expectations. While many apparel names experienced a weather-related slowdown toward the end of 2013 and into 2014, the Michael Kors brand remained resilient. Plus, its international expansion added to the performance. |
| | | |
| | • | Chinese Internet player Tencent is another company that continued to outperform this period. The company benefitted from rising Internet usage in China as well as the shift from desktop to mobile. Management has done an excellent job navigating the transition to mobile while diversifying its revenue streams from instant messaging into gaming, chat and e-commerce. |
| | | |
| | • | Macau restaurant operator Future Bright Holdings posted strong results in the period and the shares rallied nicely. The company has benefitted from the bustling traffic to casinos in Macau from Mainland China. Future Bright’s restaurants are largely located in the casinos. |
| | | |
| | • | Apple shares rallied late in 2013 on the back of the strength of sales of its newest iPhone, the 5s. The stock price outperformance continued in 2014 due to a number of factors - strong first quarter results, an 8% increase in the dividend and the announcement of a 7-for-1 stock split. |
41
| Alpine Global Consumer Growth Fund (Continued) | |
Ulta Salon, Cosmetics & Fragrance, Inc., Mercadolibre SA, Amazon Inc., Lumber Liquidators Holdings and Yandex NV were the bottom five stocks contributing to the Fund’s performance through April 30, 2014.
| | • | Ulta Salon was the worst performer in the portfolio this period. Most of the decline in the shares occurred after the company revised its outlook for the fourth quarter in mid-December. The miss capped off a difficult year at Ulta, with slower sales than expected and a change in leadership. Thus far in 2014, results have been in line with the difficult start that many in the retail world have experienced due to poor weather conditions throughout much of the U.S. |
| | | |
| | • | Internet retailer Mercadolibre shares performed well for most of 2013 before a series of issues weighed on the stock despite solid results. The actions surrounding the local economy in Argentina and the nation’s exchange rate had an impact on the company. The company’s exposure to the consumer slowdown in Brazil was another factor. Finally, global Internet shares have suffered thus far in 2014 as investors became more focused on valuations. |
| | | |
| | • | Amazon shares have also fallen victim to the sell-off in Internet names in 2014. Making matters a bit worse, Amazon’s recent results suggested that the company’s spending levels will remain high in the short term. Given the stock’s high valuation, this led to a pullback in the shares. |
| | | |
| | • | Lumber Liquidators has been a high flying stock over the past few years as earnings have exceeded expectations. Over the last six months, like many retailers, the company’s shares have pulled back as investors took some profits. Meanwhile, near term results have been hit by the previously mentioned weather issues in the U.S. |
| | | |
| | • | Russian search engine Yandex was another victim of the Internet-related sell off during the beginning of 2014 after a strong 2013 price performance. In addition, Russia’s ongoing dispute with other countries about governance in the Ukraine and President Putin’s comments about potentially restricting the Internet in Russia have added pressure to this holding. |
Summary & Outlook
The investment objective of the Fund is to seek long-term capital appreciation. In the developed world, we emphasize investment in consumer consumption trends, such as the rise in Internet spending and the usage of mobile devices, as well as in firms that have the ability to expand their brands domestically and abroad. In emerging markets, the focus is on those businesses that may stand to benefit from the demographic shifts that are taking place if disposable income levels rise over the next few years.
We continue to monitor global consumer spending trends. In the near term, spending trends in the U.S. have been solid despite the impact of harsh winter weather to start the year. Job growth remains modest but is trending in the right direction. That said there is some uncertainty as the Federal Reserve slows its quantitative easing policy. In Europe, investors have turned a bit more positive on the region but the macroeconomic situation remains meager at best with high unemployment in many countries. The European Union appears to be ready to step in to support the continent should growth begin to falter. Finally, the emerging world is struggling to come to grips with the impact of the aforementioned slowing of the U.S. Federal Reserve’s quantitative easing program will have on their local economies. Tighter policies may result in less economic activity and therefore may result in a slowdown in the growth of consumer purchasing power in these areas. While we expect the emerging economies to continue to expand at a faster pace than developed markets, we appear to be going through an adjustment period at the present time. Longer term, we believe wage growth and the growing middle class should remain the key drivers to discretionary spending at the local level.
Sincerely,
Bryan Keane
Samuel A. Lieber
Portfolio Managers
42
| Alpine Global Consumer Growth Fund (Continued) | |
This letter represents the opinions of the Fund’s management and is subject to change, is not guaranteed and should not be considered a recommendation to buy or sell any security. The information provided is not intended to be, and is not, a forecast of future events, a guarantee of future results, or investment advice. Views expressed may vary from those of the firm as a whole. Past performance is no guarantee of future results.
Diversification does not assure a profit nor protect against loss in a declining market.
Mutual fund investing involves risk. Principal loss is possible. The Fund is subject to risks, including the following:
Concentration Risk – The Fund’s strategy of concentrating in companies in a specific industry means that its performance will be closely tied to the performance of a particular market segment. The Fund’s concentration in these companies may present more risks than if it were broadly diversified over numerous industries and sectors of the economy. A downturn in these companies would have a larger impact on the Fund than on a mutual fund that does not concentrate in such companies. At times, the performance of these companies will lag the performance of other industries or the broader market as a whole.
Consumer Products/Services Sector Risk – Because the Fund’s investments are concentrated in the consumer products/services sector, the value of its shares will be affected by factors particular to this sector and may fluctuate more widely than that of a fund which invests in a broad range of industries. The Fund’s performance largely depends on the general condition of the consumer product/services sector. The consumer product/services sector could be adversely affected by overall economic conditions, interest rates, competition, consumer confidence, disposable income, changes in demographics and consumer tastes, and legislative or regulatory changes. The prices of the securities of those issuers also may fluctuate widely in response to such events.
Currency Risk – The value of investments in securities denominated in foreign currencies increases or decreases as the rates of exchange between those currencies and the U.S. dollar change. Currency conversion costs and currency fluctuations could erase investment gains or add to investment losses. Currency exchange rates can be volatile, and are affected by factors such as general economic conditions, the actions of the U.S. and foreign governments or central banks, the imposition of currency controls and speculation.
Emerging Market Securities Risk – The risks of foreign investments are heightened when investing in issuers in emerging market countries. Emerging market countries tend to have economic, political and legal systems that are less fully developed and are less stable than those of more developed countries. They are often particularly sensitive to market movements because their market prices tend to reflect speculative expectations. Low trading volumes may result in a lack of liquidity and in extreme price volatility.
Equity Securities Risk – The stock or other security of a company may not perform as well as expected, and may decrease in value, because of factors related to the company (such as poorer than expected earnings or certain management decisions) or to the industry in which the company is engaged (such as a reduction in the demand for products or services in a particular industry).
Foreign Currency Transactions Risk – Foreign securities are often denominated in foreign currencies. As a result, the value of the Fund’s shares is affected by changes in exchange rates. The Fund may enter into foreign currency transactions to try to manage this risk. The Fund’s ability to use foreign currency transactions successfully depends on a number of factors, including the foreign currency transactions being available at prices that are not too costly, the availability of liquid markets and the ability of the Adviser to accurately predict the direction of changes in currency exchange rates.
Foreign Securities Risk – The Fund’s investments in securities of foreign issuers or issuers with significant exposure to foreign markets involve additional risk. Foreign countries in which the Fund may invest may have markets that are less liquid, less regulated and more volatile than U.S. markets. The value of the Fund’s investments may decline because of factors affecting the particular issuer as well as foreign markets and issuers generally, such as unfavorable government actions, and political or financial instability. Lack of information may also affect the value of these securities. The risks of foreign investment are heightened when investing in issuers of emerging market countries.
Growth Stock Risk – Growth stocks typically are very sensitive to market movements because their market prices tend to reflect future expectations. When it appears those expectations will not be met, the prices of growth stocks typically fall. Growth stocks as a group may be out of favor and underperform the overall equity market while the market concentrates on undervalued stocks.
43
| Alpine Global Consumer Growth Fund (Continued) | |
Initial Public Offerings and Secondary Offerings Risk – The Fund may invest a portion of its assets in shares of IPOs or secondary offerings of an issuer. IPOs and secondary offerings may have a magnified impact on the performance of a Fund with a small asset base. The impact of IPOs and secondary offerings on a Fund’s performance likely will decrease as the Fund’s asset size increases, which could reduce a Fund’s returns. IPOs and secondary offerings may not be consistently available to the Fund for investing. IPO and secondary offering shares frequently are volatile in price due to the absence of a prior public market, the small number of shares available for trading and limited information about the issuer. Therefore, the Fund may hold IPO and secondary offering shares for a very short period of time. This may increase the turnover of the Fund and may lead to increased expenses for the Fund, such as commissions and transaction costs. In addition, IPO and secondary offering shares can experience an immediate drop in value if the demand for the securities does not continue to support the offering price.
Management Risk – The Adviser’s judgment about the quality, relative yield or value of, or market trends affecting, a particular security or sector, or about interest rates generally, may be incorrect. The Adviser’s security selections and other investment decisions might produce losses or cause the Fund to underperform when compared to other funds with similar investment objectives and strategies.
Market Risk – The price of a security held by the Fund may fall due to changing market, economic or political conditions.
Micro Capitalization Company Risk – Stock prices of micro capitalization companies are significantly more volatile, and more vulnerable to adverse business and economic developments than those of larger companies. Micro capitalization companies often have narrower markets for their goods and/or services and more limited managerial and financial resources than larger, more established companies, including small or medium capitalization companies.
Small and Medium Capitalization Company Risk – Securities of small or medium capitalization companies are more likely to experience sharper swings in market values, less liquid markets, in which it may be more difficult for the Adviser to sell at times and at prices that the Adviser believes appropriate and generally are more volatile than those of larger companies.
Undervalued Stock Risk – The Fund may pursue strategies that may include investing in securities, which, in the opinion of the Adviser, are undervalued. The identification of investment opportunities in undervalued securities is a difficult task and there is no assurance that such opportunities will be successfully recognized or acquired. While investments in undervalued securities offer opportunities for above-average capital appreciation, these investments involve a high degree of financial risk and can result in substantial losses.
Please refer to pages 3-5 for other important disclosures and definitions.
44
| Alpine International Real Estate Equity Fund |
Schedule of Portfolio Investments
April 30, 2014 (Unaudited)
| | | | | Security | | | | |
| Shares | | | Description | | Value | |
| | | | | | | | |
| Common Stocks—98.3% | | | | |
| Asia —40.1% | | | | |
| China —2.3% | | | | |
| | 400,000 | | | China Overseas Land & Investment, Ltd. | | $ | 980,272 | |
| | 200,000 | | | E-House China Holdings, Ltd.–ADR | | | 1,740,000 | |
| | 1,300,960 | | | Franshion Properties China, Ltd. | | | 406,081 | |
| | 3,527,587 | | | Kaisa Group Holdings, Ltd. | | | 1,114,748 | |
| | | | | | | | 4,241,101 | |
| Hong Kong—0.5% | | | | |
| | 24,002,031 | | | CSI Properties, Ltd. | | | 835,882 | |
| India — 13.2% | | | | |
| | 701,983 | | | DB Realty, Ltd. (a) | | | 810,047 | |
| | 2,290,373 | | | Hirco PLC (a)(b)(c)(d) | | | 154,683 | |
| | 245,430 | | | Prestige Estates Projects, Ltd. | | | 693,788 | |
| | 84,007 | | | Sobha Developers, Ltd. | | | 518,123 | |
| | | | | | | | | |
| | 2,000,000 | | | South Asian Real Estate PLC (a)(b)(c)(e) | | | 12,605,588 | |
| | 7,240,153 | | | Unitech Corporate Parks PLC (a) | | | 4,920,268 | |
| | 1,097,824 | | | Yatra Capital, Ltd. (a)(f) | | | 4,416,890 | |
| | | | | | | | 24,119,387 | |
| Indonesia—1.1% | | | | |
| | 246,285,560 | | | PT Bakrieland Development TBK (a) | | | 1,065,110 | |
| | 10,000,000 | | | PT Ciputra Development TBK | | | 877,914 | |
| | | | | | | | 1,943,024 | |
| Japan—8.1% | | | | |
| | 10,000 | | | Daito Trust Construction Co., Ltd. (d) | | | 1,016,286 | |
| | 375,691 | | | Hulic Co., Ltd. (d) | | | 4,516,303 | |
| | 1,742,312 | | | Kenedix, Inc. (a) | | | 5,998,863 | |
| | 100,000 | | | Mitsubishi Estate Co., Ltd. (d) | | | 2,263,413 | |
| | 19,900 | | | NTT Urban Development Corp. | | | 174,795 | |
| | 20,000 | | | Sumitomo Realty & Development Co., Ltd. | | | 774,686 | |
| | | | | | | | 14,744,346 | |
| Malaysia—0.4% | | | | |
| | 1,600,591 | | | Aseana Properties, Ltd. (a) | | | 652,241 | |
| | 137,592 | | | SP Setia BHD | | | 127,248 | |
| | | | | | | | 779,489 | |
| Philippines—6.9% | | | | |
| | 2,847,077 | | | Ayala Land, Inc. | | | 1,922,320 | |
| | 45,000,000 | | | Megaworld Corp. | | | 4,693,809 | |
| | 16,633,070 | | | SM Prime Holdings, Inc. | | | 6,089,091 | |
| | | | | | | | 12,705,220 | |
| Singapore—2.0% | | | | |
| | 2,919,931 | | | Banyan Tree Holdings, Ltd. | | | 1,467,302 | |
| | 1,001,420 | | | Global Logistic Properties, Ltd. | | | 2,276,499 | |
| | | | | | | | 3,743,801 | |
| Thailand—4.6% | | | | |
| | 6,000,000 | | | Ananda Development PCL | | | 426,452 | |
| | 4,999,600 | | | Central Pattana PCL | | | 6,991,097 | |
| | 1,250,357 | | | Minor International PCL | | | 950,519 | |
| | | | | | | | 8,368,068 | |
| | | | | Security | | | | |
| Shares | | | Description | | Value | |
| | | | | | | | | |
| United Arab Emirates—1.0% | | | | |
| | 60,000 | | | DAMAC Real Estate Development, Ltd.–GDR (a)(g) | | $ | 942,000 | |
| | 1,153,654 | | | Emaar Properties PJSC | | | 890,293 | |
| | | | | | | | 1,832,293 | |
| | | | | Total Asia (Cost $102,060,746) | | | 73,312,611 | |
| Europe—40.4% | | | | |
| France—3.4% | | | | |
| | 138,193 | | | Nexity SA (d) | | | 6,192,619 | |
| Germany—5.7% | | | | |
| | 184,669 | | | DIC Asset AG | | | 1,816,973 | |
| | 100,000 | | | GAGFAH SA (a) | | | 1,578,804 | |
| | 7,642,900 | | | Sirius Real Estate, Ltd. (a)(d) | | | 3,472,604 | |
| | 280,573 | | | TAG Immobilien AG (d) | | | 3,562,831 | |
| | | | | | | | 10,431,212 | |
| Ireland—0.7% | | | | |
| | 518,484 | | | Green REIT PLC (a) | | | 863,182 | |
| | 300,000 | | | Hibernia REIT PLC (a) | | | 416,205 | |
| | | | | | | | 1,279,387 | |
| Italy—0.3% | | | | |
| | 600,000 | | | Beni Stabili SpA | | | 535,656 | |
| Norway—0.5% | | | | |
| | 519,771 | | | BWG Homes ASA (a)(d) | | | 1,023,051 | |
| Poland—0.3% | | | | |
| | 3,265,000 | | | Nanette Real Estate Group NV (a)(b)(c) | | | 498,266 | |
| Russia—0.8% | | | | |
| | 359,137 | | | Mirland Development Corp. PLC (a)(d) | | | 1,414,350 | |
| Sweden—2.8% | | | | |
| | 150,877 | | | JM AB (d) | | | 5,104,878 | |
| United Kingdom—25.9% | | | | |
| | 82,758 | | | Countrywide PLC | | | 826,494 | |
| | 100,000 | | | Foxtons Group PLC | | | 537,080 | |
| | 536,270 | | | Great Portland Estates PLC (d) | | | 5,677,095 | |
| | 512,795 | | | Londonmetric Property PLC | | | 1,197,405 | |
| | 4,000,713 | | | LXB Retail Properties PLC (a)(d) | | | 8,283,074 | |
| | 3,170,350 | | | Quintain Estates & Development PLC (a)(d) | | | 5,433,109 | |
| | 3,988,052 | | | Regus PLC (d) | | | 14,072,856 | |
| | 120,000 | | | Savills PLC | | | 1,215,647 | |
| | 1,600,130 | | | Songbird Estates PLC (a)(d) | | | 6,639,325 | |
| | 477,416 | | | The Unite Group PLC (d) | | | 3,405,641 | |
| | | | | | | | 47,287,726 | |
| | | | | Total Europe (Cost $63,412,414) | | | 73,767,145 | |
| North & South America—17.8% | | | | |
| Brazil—14.6% | | | | |
| | 70,051 | | | Aliansce Shopping Centers SA | | | 578,064 | |
| | 713,138 | | | BHG SA—Brazil Hospitality Group (a) | | | 4,445,618 | |
| | 220,535 | | | Cyrela Commercial Properties SA Empreendimentos e Participacoes | | | 1,767,445 | |
| | 1,161,829 | | | Direcional Engenharia SA | | | 5,669,111 | |
| | 912,132 | | | General Shopping Brasil SA (a) | | | 2,826,699 | |
The accompanying notes are an integral part of these financial statements.
| Alpine International Real Estate Equity Fund |
Schedule of Portfolio Investments—Continued
April 30, 2014 (Unaudited)
| | | | | Security | | | | |
| Shares | | | Description | | Value | |
| | | |
| Common Stocks—continued | | | | |
| North & South America—continued | | | | |
| Brazil—continued | | | | |
| | 275,826 | | | Iguatemi Empresa de Shopping Centers SA | | $ | 2,742,488 | |
| | 1,085,500 | | | JHSF Participacoes SA | | | 1,767,178 | |
| | 194,959 | | | Multiplan Empreendimentos Imobiliarios SA | | | 4,308,815 | |
| | 155,394 | | | Sao Carlos Empreendimentos e Participacoes SA | | | 2,439,193 | |
| | 24,282 | | | Sonae Sierra Brasil SA | | | 195,693 | |
| | | | | | | | 26,740,304 | |
| Mexico—3.2% | | | | |
| | 500,000 | | | Concentradora Fibra Hotelera Mexicana SA de CV | | | 825,897 | |
| | 671,429 | | | Corp. Inmobiliaria Vesta SAB de CV | | | 1,365,157 | |
| | 1,257,643 | | | Hoteles City Express SAB de CV (a) | | | 2,235,019 | |
| | 700,000 | | | TF Administradora Industrial | | | | |
| | | | | S de RL de CV | | | 1,406,662 | |
| | | | | | | | 5,832,735 | |
| | | | | Total North & South America
(Cost $36,009,804) | | | 32,573,039 | |
| | | | | Total Common Stocks
(Cost $201,482,964) | | | 179,652,795 | |
| | | | | Security | | | | |
| Shares | | | Description | | Value | |
| |
| Equity-Linked Structured Notes—2.0% | | | | |
| Asia—2.0% | | | | |
| India—2.0% | | | | |
| | 185,910 | | | Kolte-Patil Developers, Ltd.– Merrill Lynch & Co. | | $ | 307,153 | |
| | 590,000 | | | Phoenix Mills, Ltd.– Merrill Lynch & Co., Inc. | | | 2,450,385 | |
| | 724,560 | | | Puravankara Projects, Ltd.– Macquarie Bank, Ltd. | | | 871,538 | |
| | | | | Total Asia (Cost $3,743,483) | | | 3,629,076 | |
| | | | | Total Equity-Linked Structured Notes (Cost $3,743,483) | | | 3,629,076 | |
| |
| Investment Companies—0.5% | | | | |
| Asia —0.5% | | | | |
| India —0.5% | | | | |
| | 7,076,577 | | | Trinity Capital PLC (a)(d) | | | 925,977 | |
| | | | | Total Asia (Cost $10,503,012) | | | 925,977 | |
| | | | | Total Investment Companies | | | | |
| | | | | (Cost $10,503,012) | | | 925,977 | |
| | | | | | |
| | Total Investments
(Cost $215,729,459)—100.8% | | | 184,207,848 | |
| | Liabilities in Excess of Other Assets—(0.8)% | | | (1,380,229 | ) |
| | TOTAL NET ASSETS 100.0% | | $ | 182,827,619 | |
Percentages are stated as a percent of net assets.
| (a) | Non—income producing security. |
| | |
| (c) | Security fair valued in accordance with procedures approved by the Board of Trustees. These securities comprised 7.3% of the Fund’s net assets. |
| | |
| (d) | All or a portion of the security has been designated as collateral for the line of credit. |
| | |
| (e) | Private placement. |
| | |
| (f) | Affiliated issuer. See Note 7 in the Notes to Financial Statements. |
| | |
| (g) | Restricted under Rule 144A of the Securities Act of 1933. These securities may be resold in transactions exempt from registration, normally to qualified institutional buyers. These securities have been determined to be liquid under guidelines established by the Board of Trustees. Liquid securities restricted under Rule 144A comprised 0.5% of the Fund’s net assets. |
AB—Aktiebolag is the Swedish equivalent of a corporation.
ADR—American Depositary Receipt
AG—Aktiengesellschaft is a German term that refers to a corporation that is limited by shares, i.e., owned by shareholders.
ASA—Allmennaksjeselskap is the Norwegian term for a public limited company.
BHD—Malaysian equivalent to incorporated.
GDR—Global Depositary Receipt
NV—Naamloze Vennootschap is the Dutch term for a public limited liability corporation.
PCL—Public Company Limited
PJSC—Public Joint Stock Company
PLC—Public Limited Company
REIT—Real Estate Investment Trust
S de RL de CV—Socieded de Responsabilidad Limitada de Capital Variable is the Spanish equivalent to Limited Liability Company.
SA—Generally designates corporations in various countries, mostly those employing the civil law.
SA de CV—Sociedad Anonima de Capital Variable is the Spanish equivalent to Variable Capital Company.
SAB de CV—Sociedad Anonima Bursátil de Capital Variable is the Spanish equivalent to Variable Capital Company.
SpA—Societa’ Per Azioni is an Italian shared company.
The accompanying notes are an integral part of these financial statements.
| Alpine Reality Income & Growth Fund |
Schedule of Portfolio Investments
April 30, 2014 (Unaudited)
| | | | | Security | | | | |
| Shares | | | Description | | Value | |
| | | |
| Real Estate Investment Trusts—102.1% | | | | |
| Apartments—15.3% | | | | |
| | 15,000 | | | American Campus Communities, Inc. | | $ | 573,000 | |
| | 25,625 | | | AvalonBay Communities, Inc. (a) | | | 3,499,094 | |
| | 18,000 | | | Camden Property Trust | | | 1,232,820 | |
| | 68,360 | | | Equity Residential (a) | | | 4,063,318 | |
| | 23,665 | | | Essex Property Trust, Inc. (a) | | | 4,100,198 | |
| | 35,200 | | | Home Properties, Inc. (a) | | | 2,168,320 | |
| | 31,400 | | | UDR, Inc. | | | 812,004 | |
| | | | | | | | 16,448,754 | |
| Diversified—6.7% | | | | |
| | 26,114 | | | American Assets Trust, Inc. (a) | | | 886,570 | |
| | 37,087 | | | Cousins Properties, Inc. | | | 431,322 | |
| | 88,700 | | | Crombie Real Estate Investment Trust | | | 1,088,468 | |
| | 47,117 | | | Vornado Realty Trust (a) | | | 4,834,204 | |
| | | | | | | | 7,240,564 | |
| Health Care—11.3% | | | | |
| | 75,772 | | | HCP, Inc. | | | 3,171,816 | |
| | 25,403 | | | Health Care REIT, Inc. | | | 1,602,675 | |
| | 55,047 | | | Omega Healthcare Investors, Inc. | | | 1,914,535 | |
| | 51,340 | | | Sabra Health Care REIT, Inc. | | | 1,538,660 | |
| | 60,212 | | | Ventas, Inc. (a) | | | 3,978,809 | |
| | | | | | | | 12,206,495 | |
| Lodging—5.1% | | | | |
| | 37,842 | | | Chatham Lodging Trust | | | 769,328 | |
| | 39,658 | | | Chesapeake Lodging Trust | | | 1,070,369 | |
| | 70,000 | | | DiamondRock Hospitality Co. | | | 858,900 | |
| | 85,000 | | | Host Hotels & Resorts, Inc. | | | 1,823,250 | |
| | 12,000 | | | LaSalle Hotel Properties (a) | | | 396,960 | |
| | 15,000 | | | Pebblebrook Hotel Trust | | | 516,600 | |
| | | | | | | | 5,435,407 | |
| Manufactured Homes—1.1% | | | | |
| | 28,900 | | | Equity Lifestyle Properties, Inc. | | | 1,210,043 | |
| Mortgage & Finance—2.1% | | | | |
| | 63,032 | | | Apollo Commercial Real Estate Finance, Inc. | | | 1,072,174 | |
| | 50,000 | | | Starwood Property Trust, Inc. | | | 1,202,500 | |
| | | | | | | | 2,274,674 | |
| Net Lease—1.7% | | | | |
| | 45,000 | | | American Realty Capital Properties, Inc. | | | 589,050 | |
| | 17,012 | | | EPR Properties | | | 912,014 | |
| | 6,154 | | | Realty Income Corp. | | | 267,391 | |
| | | | | | | | 1,768,455 | |
| Office—Industrial Buildings—30.9% | | | | |
| | 51,528 | | | Alexandria Real Estate Equities, Inc. (a) | | | 3,803,797 | |
| | 49,611 | | | Boston Properties, Inc. | | | 5,811,432 | |
| | 37,671 | | | CoreSite Realty Corp. | | | 1,145,952 | |
| | 18,153 | | | Corporate Office Properties Trust (a) | | | 485,593 | |
| | 55,100 | | | Digital Realty Trust, Inc. | | | 2,942,340 | |
| | | | | Security | | |
| Shares | | | Description | | Value | |
| |
| Office—Industrial Buildings—continued | | | | |
| | 64,509 | | | Douglas Emmett, Inc. | | $ | 1,780,448 | |
| | 40,352 | | | DuPont Fabros Technology, Inc. | | | 977,729 | |
| | 45,455 | | | Empire State Realty Trust, Inc.–Class A | | | 695,461 | |
| | 10,714 | | | Hudson Pacific Properties, Inc. | | | 252,315 | |
| | 54,473 | | | Kilroy Realty Corp. (a) | | | 3,244,957 | |
| | 23,708 | | | Liberty Property Trust | | | 889,050 | |
| | 104,700 | | | Prologis, Inc. | | | 4,253,961 | |
| | 49,351 | | | SL Green Realty Corp. (a) | | | 5,167,543 | |
| | 54,537 | | | STAG Industrial, Inc. | | | 1,283,256 | |
| | 27,528 | | | Terreno Realty Corp. | | | 502,937 | |
| | | | | | | | 33,236,771 | |
| REIT—Infrastructure—1.4% | | | | |
| | 18,500 | | | American Tower Corp. | | | 1,545,120 | |
| Retail Centers—21.4% | | | | |
| | 16,889 | | | Brixmor Property Group, Inc. | | | 370,882 | |
| | 168,191 | | | CBL & Associates Properties, Inc. | | | 3,056,030 | |
| | 23,475 | | | DDR Corp. | | | 403,066 | |
| | 10,200 | | | Equity One, Inc. | | | 229,806 | |
| | 12,100 | | | Federal Realty Investment Trust (a) | | | 1,422,234 | |
| | 76,000 | | | General Growth Properties, Inc. | | | 1,745,720 | |
| | 50,000 | | | Kimco Realty Corp. | | | 1,146,000 | |
| | 57,295 | | | Simon Property Group, Inc. (a) | | | 9,923,494 | |
| | 19,706 | | | Taubman Centers, Inc. (a) | | | 1,435,385 | |
| | 50,428 | | | The Macerich Co. (a) | | | 3,273,282 | |
| | | | | | | | 23,005,899 | |
| Storage—5.1% | | | | |
| | 10,000 | | | Extra Space Storage, Inc. | | | 523,300 | |
| | 28,265 | | | Public Storage (a) | | | 4,960,790 | |
| | | | | | | | 5,484,090 | |
| | | | | Total Real Estate Investment Trusts
(Cost $67,620,476) | | | 109,856,272 | |
| Common Stocks—1.5% | | | | |
| Lodging—1.5% | | | | |
| | 22,000 | | | Starwood Hotels & Resorts | | | | |
| | | | | Worldwide, Inc. (a) | | | 1,686,300 | |
| | | | | Total Common Stocks
(Cost $1,122,842) | | | 1,686,300 | |
| Preferred Stocks—1.6% | | | | |
| Mortgage & Finance—0.5% | | | | |
| | 22,004 | | | NorthStar Realty Finance Corp.– Series B, 8.250% | | | 551,420 | |
| Retail Centers—1.1% | | | | |
| | 44,942 | | | CBL & Associates Properties, Inc.– | | | | |
| | | | | Series D, 7.375% | | | 1,143,774 | |
| | | | | Total Preferred Stocks
(Cost $1,277,867) | | | 1,695,194 | |
Total Investments
(Cost $70,021,185)—105.2% | | | 113,237,766 | |
| Liabilities in Excess of Other Assets—(5.2)% | | | (5,621,231 | ) |
| TOTAL NET ASSETS 100.0% | | $ | 107,616,535 | |
Percentages are stated as a percent of net assets.
| (a) | All or a portion of the security has been designated as collateral for the line of credit. |
REIT—Real Estate Investment Trust
The accompanying notes are an integral part of these financial statements.
Alpine Cyclical Advantage Property Fund
Schedule of Portfolio Investments
April 30, 2014 (Unaudited)
| | Shares | | | Security
Description | | Value | |
| | | | | | | | | |
| Common Stocks—105.0% | | | | |
| Asia—28.0% | | | | |
| China—2.6% | | | | |
| | 150,000 | | | China Overseas Land & Investment, Ltd. | | $ | 367,602 | |
| | 100,000 | | | E-House China Holdings, Ltd.–ADR | | | 870,000 | |
| | 897,931 | | | Kaisa Group Holdings, Ltd. | | | 283,754 | |
| | | | | | | | 1,521,356 | |
| Hong Kong—0.4% | | | | |
| | 6,967,005 | | | CSI Properties, Ltd. | | | 242,629 | |
| India—0.7% | | | |
| | 620,000 | | | Unitech Corporate Parks PLC (a) | | | 421,340 | |
| Indonesia—0.8% | | | | |
| | 33,380,487 | | | PT Bakrieland Development TBK (a) | | | 144,360 | |
| | 3,500,000 | | | PT Ciputra Development TBK | | | 307,270 | |
| | | | | | | | 451,630 | |
| Japan—10.3% | | | | |
| | 2,500 | | | Daito Trust Construction Co., Ltd. | | | 254,072 | |
| | 123,000 | | | Hulic Co., Ltd. | | | 1,478,623 | |
| | 534,573 | | | Kenedix, Inc. | | | 1,840,560 | |
| | 40,000 | | | Mitsubishi Estate Co., Ltd. | | | 905,365 | |
| | 9,900 | | | NTT Urban Development Corp. | | | 86,959 | |
| | 18,000 | | | Sumitomo Realty & Development Co., Ltd. | | | 697,217 | |
| | 100,000 | | | TOC Co., Ltd. | | | 679,806 | |
| | | | | | | | 5,942,602 | |
| Malaysia—0.1% | | | | |
| | 37,960 | | | SP Setia BHD | | | 35,106 | |
| Philippines—5.2% | | | | |
| | 746,539 | | | Ayala Land, Inc. | | | 504,056 | |
| | 10,000,000 | | | Megaworld Corp. | | | 1,043,069 | |
| | 1,401,363 | | | Robinsons Land Corp. | | | 700,996 | |
| | 2,000,000 | | | SM Prime Holdings, Inc. | | | 732,167 | |
| | | | | | | | 2,980,288 | |
| Singapore—1.4% | | | | |
| | 350,000 | | | Global Logistic Properties, Ltd. | | | 795,645 | |
| Thailand—5.4% | | | | |
| | 3,000,000 | | | Ananda Development PCL | | | 213,226 | |
| | 680,000 | | | Central Pattana PCL | | | 950,866 | |
| | 1,100,000 | | | LPN Development PCL–NVDR | | | 591,471 | |
| | 350,000 | | | Minor International PCL | | | 266,069 | |
| | 1,400,000 | | | Supalai PCL | | | 843,634 | |
| | 569,550 | | | TICON Industrial Connection PCL | | | 281,607 | |
| | | | | | | | 3,146,873 | |
| United Arab Emirates—1.1% | | | | |
| | 20,000 | | | DAMAC Real Estate Development, Ltd.–GDR (a)(b) | | | 314,000 | |
| | 169,121 | | | Emaar Properties PJSC | | | 296,764 | |
| | | | | | | | 610,764 | |
| | | | | Total Asia (Cost $15,183,350) | | | 16,148,233 | |
| Europe—25.1% | | | | |
| France—4.0% | | | | |
| | 46,000 | | | Affine SA | | | 961,738 | |
| | 30,000 | | | Nexity SA | | | 1,344,342 | |
| | | | | | | | 2,306,080 | |
| Germany—6.3% | | | | |
| | 54,414 | | | DIC Asset AG | | | 535,384 | |
| | 40,000 | | | GAGFAH SA (a) | | | 631,521 | |
| Shares | | | Security
Description | | Value | |
| | | | | | | | | |
| Germany—continued | | | | |
| | 121,000 | | | Patrizia Immobilien AG (a) | | $ | 1,428,568 | |
| | 79,090 | | | TAG Immobilien AG | | | 1,004,317 | |
| | | | | | | | 3,599,790 | |
| Ireland—1.2% | | | | |
| | 259,242 | | | Green REIT PLC (a) | | | 431,591 | |
| | 200,000 | | | Hibernia REIT PLC (a) | | | 277,470 | |
| | | | | | | | 709,061 | |
| Italy—0.6% | | | | |
| | 400,000 | | | Beni Stabili SpA | | | 357,103 | |
| Norway—0.1% | | | | |
| | 38,166 | | | BWG Homes ASA (a) | | | 75,121 | |
| Poland—0.4% | | | | |
| | 40,000 | | | Atrium European Real Estate, Ltd. (a) | | | 230,300 | |
| Russia—1.1% | | | | |
| | 587,878 | | | Raven Russia, Ltd. (a) | | | 645,172 | |
| United Kingdom—11.4% | | | | |
| | 41,379 | | | Countrywide PLC | | | 413,247 | |
| | 30,000 | | | Foxtons Group PLC | | | 161,124 | |
| | 30,000 | | | Londonmetric Property PLC | | | 70,052 | |
| | 778,923 | | | LXB Retail Properties PLC (a) | | | 1,612,682 | |
| | 905,853 | | | Quintain Estates & Development PLC (a) | | | 1,552,383 | |
| | 50,000 | | | Savills PLC | | | 506,520 | |
| | 341,253 | | | Songbird Estates PLC (a) | | | 1,415,941 | |
| | 119,064 | | | The Unite Group PLC | | | 849,341 | |
| | | | | | | | 6,581,290 | |
| | | | | Total Europe (Cost $10,549,783) | | | 14,503,917 | |
| North & South America—51.9% | | | | |
| Brazil—11.6% | | | | |
| | 98,241 | | | BHG SA–Brazil Hospitality Group (a) | | | 612,423 | |
| | 50,796 | | | BR Malls Participacoes SA | | | 437,168 | |
| | 50,000 | | | BR Properties SA | | | 399,372 | |
| | 15,000 | | | Cyrela Commercial Properties SA Empreendimentos e Participacoes–ADR (b)(c) | | | 468,198 | |
| | 201,912 | | | Direcional Engenharia SA | | | 985,224 | |
| | 40,000 | | | General Shopping Brasil SA (a) | | | 123,960 | |
| | 90,284 | | | Iguatemi Empresa de Shopping Centers SA | | | 897,677 | |
| | 150,000 | | | JHSF Participacoes SA | | | 244,198 | |
| | 55,082 | | | Multiplan Empreendimentos Imobiliarios SA | | | 1,217,374 | |
| | 80,000 | | | Sao Carlos Empreendimentos e Participacoes SA | | | 1,255,746 | |
| | 7,596 | | | Sonae Sierra Brasil SA | | | 61,218 | |
| | | | | | | | 6,702,558 | |
| Mexico—4.1% | | | | |
| | 300,000 | | | Concentradora Fibra Hotelera Mexicana SA de CV | | | 495,538 | |
| | 273,469 | | | Corp. Inmobiliaria Vesta SAB de CV | | | 556,021 | |
| | 399,212 | | | Hoteles City Express SAB de CV (a) | | | 709,459 | |
| | 300,000 | | | TF Administradora Industrial S de RL de CV | | | 602,855 | |
| | | | | | | | 2,363,873 | |
| United States—36.2% | | | | |
| | 1,000 | | | Altisource Asset Management Corp. (a)(c) | | | 978,250 | |
| | 10,000 | | | Altisource Portfolio Solutions SA (a)(c) | | | 1,037,100 | |
The accompanying notes are an integral part of these financial statements.
48
Alpine Cyclical Advantage Property Fund
Schedule of Portfolio Investments—Continued
April 30, 2014 (Unaudited)
| Shares | | | Security
Description | | Value | |
| | | | | | | | | |
| Common Stocks—continued | | | | |
| North & South America—continued | | | | |
| United States—continued | | | | |
| | 65,667 | | | Altisource Residential Corp. (c) | | $ | 1,846,556 | |
| | 25,000 | | | American Capital Mortgage Investment Corp. (c) | | | 495,000 | |
| | 70,000 | | | American Homes 4 Rent–Class A (c) | | | 1,123,500 | |
| | 5,000 | | | AvalonBay Communities, Inc. (c) | | | 682,750 | |
| | 40,146 | | | Brookfield Residential Properties, Inc. (a)(c) | | | 787,263 | |
| | 70,000 | | | Colony Financial, Inc. (c) | | | 1,522,500 | |
| | 62,581 | | | Cousins Properties, Inc. (c) | | | 727,817 | |
| | 50,000 | | | DR Horton, Inc. (c) | | | 1,114,000 | |
| | 10,000 | | | Equity Lifestyle Properties, Inc. (c) | | | 418,700 | |
| | 15,000 | | | Lennar Corp.–Class A (c) | | | 578,850 | |
| | 28,666 | | | Meritage Homes Corp. (a)(c) | | | 1,105,934 | |
| | 6,497 | | | New Media Investment Group, Inc. (a)(c) | | | 92,712 | |
| | 90,000 | | | New Residential Investment Corp. (c) | | | 549,000 | |
| | 90,000 | | | Newcastle Investment Corp. (c) | | | 404,100 | |
| | 40,771 | | | Ocwen Financial Corp. (a)(c) | | | 1,545,221 | |
| | 24,901 | | | Ryland Group, Inc. (c) | | | 955,950 | |
| | 1,923 | | | Simon Property Group, Inc. (c) | | | 333,064 | |
| | 75,045 | | | Starwood Property Trust, Inc. (c) | | | 1,804,832 | |
| | 2,290 | | | Starwood Waypoint Residential Trust (a)(c) | | | 62,219 | |
| | 5,000 | | | The Howard Hughes Corp. (a)(c) | | | 713,800 | |
| | 117,912 | | | Two Harbors Investment Corp. (c) | | | 1,223,927 | |
| | 40,000 | | | WCI Communities, Inc. (a)(c) | | | 766,800 | |
| | | | | | | | 20,869,845 | |
| | | | | Total North & South America
(Cost $26,622,365) | | | 29,936,276 | |
| | | | | Total Common Stocks
(Cost $52,355,498) | | | 60,588,426 | |
| Shares | | | Security
Description | | Value | |
| | | | | | | | | |
| Equity-Linked Structured Notes—3.5% | | | | |
| Asia—3.5% | | | | |
| India—3.5% | | | | |
| | 200,000 | | | DB Realty, Ltd.– Macquarie Bank, Ltd. (a) | | $ | 230,788 | |
| | 193,000 | | | Kolte—Patil Developers, Ltd.– Macquarie Bank, Ltd. | | | 318,867 | |
| | 120,000 | | | Prestige Estates Projects, Ltd.– Macqarie Bank, Ltd. | | | 339,219 | |
| | 362,280 | | | Puravankara Projects, Ltd.– Macquarie Bank, Ltd. | | | 435,769 | |
| | 110,000 | | | Sobha Developers, Ltd.– Macquarie Bank, Ltd. | | | 678,438 | |
| | | | | Total Asia (Cost $2,019,511) | | | 2,003,081 | |
| | | | | Total Equity-Linked Structured Notes (Cost $2,019,511) | | | 2,003,081 | |
| Rights—0.0% (d) | | | | |
| Asia—0.0% (d) | | | | |
| Thailand—0.0% (d) | | | | |
| | 113,910 | | | Ticon Industrial Connection PCL (a) | | | | |
| | | | | Expiration: June, 2014 | | | | |
| | | | | Exercise Price: THB 15.00 | | | 3,520 | |
| | | | | Total Rights (Cost $0) | | | 3,520 | |
| | Total Investments
(Cost $54,375,009)—108.5% | | | 62,595,027 | |
| Liabilities in Excess of Other Assets—(8.5)% | | | (4,917,397 | ) |
| TOTAL NET ASSETS 100.0% | | $ | 57,677,630 | |
Percentages are stated as a percent of net assets.
| (a) | Non—income producing security. |
| | |
| (b) | Restricted under Rule 144A of the Securities Act of 1933. These securities may be resold in transactions exempt from registration, normally to qualified institutional buyers. These securities have been determined to be liquid under guidelines established by the Board of Trustees. Liquid securities restricted under Rule 144A comprised 1.4% of the Fund’s net assets. |
| | |
| (c) | All or a portion of the security has been designated as collateral for the line of credit. |
| | |
| (d) | Amount is less than 0.05%. |
| | |
ADR—American Depositary Receipt
AG—Aktiengesellschaft is a German term that refers to a corporation that is limited by shares, i.e., owned by shareholders.
ASA—Allmennaksjeselskap is the Norwegian term for a public limited company.
BHD—Malaysian equivalent to incorporated.
GDR—Global Depositary Receipt
NVDR—Non—Voting Depositary Receipts
PCL—Public Company Limited
PJSC—Public Joint Stock Company
PLC—Public Limited Company
REIT—Real Estate Investment Trust
S de RL de CV—Socieded de Responsabilidad Limitada de Capital Variable is the Spanish equivalent to Limited Liability Company.
SA—Generally designates corporations in various countries, mostly those employing the civil law.
SA de CV—Sociedad Anonima de Capital Variable is the Spanish equivalent to Variable Capital Company.
SAB de CV—Sociedad Anonima Bursátil de Capital Variable is the Spanish equivalent to Variable Capital Company.
SpA—Societa’ Per Azioni is an Italian shared company.
The accompanying notes are an integral part of these financial statements.
49
Alpine Emerging Markets Real Estate Fund
Schedule of Portfolio Investments
April 30, 2014 (Unaudited)
| Shares | | | Security
Description | | Value | |
| | | | | | | | | |
| Common Stocks—90.5% | | | | |
| Asia—60.8% | | | | |
| China—22.2% | | | | |
| | 180,000 | | | China Overseas Land & Investment, Ltd. | | $ | 441,122 | |
| | 52,500 | | | China Resources Land, Ltd. | | | 107,940 | |
| | 125,857 | | | China State Construction International Holdings, Ltd. | | | 209,411 | |
| | 100,000 | | | China Vanke Co., Ltd.–Class B | | | 166,775 | |
| | 220,000 | | | Franshion Properties China, Ltd. | | | 68,671 | |
| | 80,000 | | | Greenland Hong Kong Holdings, Ltd. | | | 36,528 | |
| | 25,000 | | | Greentown China Holdings, Ltd. | | | 25,152 | |
| | 210,000 | | | Kaisa Group Holdings, Ltd. | | | 66,362 | |
| | 75,000 | | | Shimao Property Holdings, Ltd. | | | 147,621 | |
| | | | | | | | 1,269,582 | |
| Hong Kong—2.7% | | | | |
| | 9,000 | | | Cheung Kong Holdings, Ltd. | | | 153,000 | |
| Indonesia—4.1% | | | | |
| | 332,159 | | | PT Bumi Serpong Damai TBK | | | 44,818 | |
| | 450,500 | | | PT Ciputra Development TBK | | | 39,550 | |
| | 270,000 | | | PT Ciputra Surya TBK | | | 53,129 | |
| | 400,000 | | | PT Pakuwon Jati TBK | | | 12,178 | |
| | 900,000 | | | PT Summarecon Agung TBK | | | 86,408 | |
| | | | | | | | 236,083 | |
| Malaysia—1.5% | | | | |
| | 90,000 | | | IJM Land BHD | | | 83,234 | |
| Philippines—11.4% | | | | |
| | 328,307 | | | Ayala Land, Inc. | | | 221,670 | |
| | 1,000,000 | | | Megaworld Corp. | | | 104,307 | |
| | 200,000 | | | Robinsons Land Corp. | | | 100,045 | |
| | 450,000 | | | SM Prime Holdings, Inc. | | | 164,737 | |
| | 450,000 | | | Vista Land & Lifescapes, Inc. | | | 60,868 | |
| | | | | | | | 651,627 | |
| Singapore—3.0% | | | | |
| | 75,000 | | | Global Logistic Properties, Ltd. | | | 170,495 | |
| Thailand—6.5% | | | | |
| | 200,000 | | | Ananda Development PCL | | | 14,215 | |
| | 75,000 | | | AP Thailand PCL | | | 13,211 | |
| | 120,000 | | | Central Pattana PCL | | | 167,800 | |
| | 400,000 | | | Hemaraj Land and Development PCL | | | 44,005 | |
| | 40,000 | | | Pruksa Real Estate PCL | | | 27,688 | |
| | 90,000 | | | Supalai PCL | | | 54,234 | |
| | 105,125 | | | TICON Industrial Connection PCL | | | 51,978 | |
| | | | 373,131 | |
| United Arab Emirates—9.4% | | | | |
| | 2,000 | | | DAMAC Real Estate Development, Ltd.–GDR (a)(b) | | | 31,400 | |
| | 170,000 | | | Emaar Properties PJSC | | | 504,499 | |
| | | | | | | | 535,899 | |
| | | | | Total Asia (Cost $3,323,384) | | | 3,473,051 | |
| Europe—4.5% | | | | |
| Austria—1.2% | | | | |
| | 700 | | | BUWOG AG (c) | | | 12,853 | |
| | 14,000 | | | Immofinanz AG | | | 51,898 | |
| | | | | | | | 64,751 | |
| France—1.0% | | | | |
| | 800 | | | Orpea (c) | | | 58,136 | |
| Shares | | | Security
Description | | Value | |
| | | | | | | | | |
| Greece—0.6% | | | | |
| | 3,000 | | | Eurobank Properties Real Estate Investment Co. | | $ | 34,712 | |
| Russia—1.0% | | | | |
| | 10,000 | | | LSR Group—GDR (a)(c) | | | 29,900 | |
| | 25,492 | | | Raven Russia, Ltd. (c) | | | 27,976 | |
| | | | | | | | 57,876 | |
| Turkey—0.7% | | | | |
| | 30,809 | | | Emlak Konut Gayrimenkul Yatirim Ortakligi AS | | | 40,270 | |
| | | | | Total Europe (Cost $245,485) | | | 255,745 | |
| Middle East/Africa—3.9% | | | | |
| Egypt—3.9% | | | | |
| | 16,074 | | | Medinet Nasr Housing (c) | | | 72,026 | |
| | 100,000 | | | Palm Hills Developments SAE (c) | | | 58,508 | |
| | 7,000 | | | Six of October Development & Investment (a) | | | 26,102 | |
| | 50,000 | | | Talaat Moustafa Group | | | 64,216 | |
| | | | | Total Middle East/Africa
(Cost $166,585) | | | 220,852 | |
| North & South America—21.3% | | | | |
| Argentina—0.3% | | | | |
| | 3,100 | | | TGLT SA–ADR (b) | | | 18,597 | |
| Brazil—11.6% | | | | |
| | 5,962 | | | BHG SA–Brazil Hospitality Group (c) | | | 37,166 | |
| | 16,549 | | | BR Malls Participacoes SA | | | 142,426 | |
| | 12,056 | | | BR Properties SA | | | 96,297 | |
| | 6,724 | | | Direcional Engenharia SA | | | 32,810 | |
| | 17,000 | | | Even Construtora e Incorporadora SA | | | 54,742 | |
| | 3,500 | | | Ez Tec Empreendimentos e Participacoes SA | | | 42,962 | |
| | 24,538 | | | General Shopping Brasil SA (c) | | | 76,043 | |
| | 17,000 | | | Helbor Empreendimentos SA | | | 57,944 | |
| | 4,342 | | | Multiplan Empreendimentos Imobiliarios SA | | | 95,963 | |
| | 8,000 | | | Tecnisa SA | | | 24,864 | |
| Chile—1.0% | | | 661,217 | |
| | 33,000 | | | Parque Arauco SA | | | 59,063 | |
| Mexico—8.4% | | | | |
| | 70,000 | | | Concentradora Fibra Hotelera Mexicana SA de CV | | | 115,625 | |
| | 65,244 | | | Corp. Inmobiliaria Vesta SAB de CV | | | 132,655 | |
| | 28,000 | | | Fibra Shop Portafolios Inmobiliarios SAPI de CV | | | 36,619 | |
| | 35,000 | | | Hoteles City Express SAB de CV (c) | | | 62,200 | |
| | 65,000 | | | TF Administradora Industrial S de RL de CV | | | 130,619 | |
| | | | | | | | 477,718 | |
| | | | | Total North & South America
(Cost $1,293,585) | | | 1,216,595 | |
| | | | | Total Common Stocks
(Cost $5,029,039) | | | 5,166,243 | |
The accompanying notes are an integral part of these financial statements.
50
Alpine Emerging Markets Real Estate Fund
Schedule of Portfolio Investments—Continued
April 30, 2014 (Unaudited)
| | | | | Security | | | | |
| Shares | | | Description | | Value | |
| | |
| Preferred Stocks—0.7% | | | | |
| Europe—0.7% | | | |
| Russia—0.7% | | | |
| | 18,000 | | | Raven Russia, Ltd., 12.000% | | $ | 42,433 | |
| | | | | Total Europe (Cost $41,146) | | | 42,433 | |
| | | | | Total Preferred Stocks | | | | |
| | | | | (Cost $41,146) | | | 42,433 | |
| | |
| Equity-Linked Structured Notes—8.2% | | | | |
| Asia—8.2% | | |
| India—7.2% | | |
| | 40,000 | | | DB Realty, Ltd.– | | | | |
| | | | | Macquarie Bank, Ltd. (c) | | | 46,158 | |
| | 10,000 | | | DFL Ltd. – Macquarie Bank, Ltd. | | | 23,120 | |
| | 18,000 | | | Oberoi Realty, Ltd.– | | | | |
| | | | | Macquarie Bank, Ltd. | | | 61,910 | |
| | 18,310 | | | Phoenix Mills, Ltd.– | | | | |
| | | | | Macquarie Bank, Ltd. | | | 76,045 | |
| | 20,500 | | | Prestige Estates Projects, Ltd.– | | | | |
| | | | | Macqarie Bank, Ltd. | | | 57,950 | |
| | 40,070 | | | Puravankara Projects, Ltd.– | | | | |
| | | | | Macquarie Bank, Ltd. | | | 48,198 | |
| | 16,000 | | | Sobha Developers, Ltd.– | | | | |
| | | | | Macquarie Bank, Ltd. | | | 98,682 | |
| | | | | | | | 412,063 | |
| Vietnam—1.0% | | | | |
| | 43,125 | | | HAGL JSC—GDR– | | | | |
| | | | | Macquarie Bank, Ltd. (b) | | | 53,228 | |
| | | | | Total Asia (Cost $495,822) | | | 465,291 | |
| | | | | Total Equity-Linked Structured Notes | |
| | | | | (Cost $495,822) | | | 465,291 | |
| Principal | | | Security | | | | |
| Amount | | | Description | | Value | |
| | |
| Convertible Bonds—0.0% (d) | | | | |
| North & South America—0.0% (d) | | | | |
| Brazil—0.0% (d) | | | | |
| $ | 80,000 | | | PDG Realty SA Empreendimentos e Participacoes–Series 8, 0.000%,9/19/16 (Brazilian Real) (e) | | $ | 359 | |
| | | | | Total Convertible Bonds
(Cost $28,699) | | | 359 | |
| | Shares | | | | | | | |
| Rights—0.0% (d) | | | | |
| Asia—0.0% (d) | | | | |
| Thailand—0.0% (d) | | | | |
| | 21,025 | | | Ticon Industrial Connection PCL | | | | |
| | | | | Expiration: June, 2014 | | | | |
| | | | | Exercise Price: THB 15.00 | | | 650 | |
| | | | | Total Rights (Cost $0) | | | 650 | |
| | Principal
Amount | | | | | | | |
| Short-Term Investments—1.8% | | | | |
| $ | 105,000 | | | State Street Eurodollar
Time Deposit, 0.01% | | | 105,000 | |
| | | | | Total Short-Term Investments
(Cost $105,000) | | | 105,000 | |
Total Investments
(Cost $5,699,706)—101.2% | | | 5,779,976 | |
| Liabilities in Excess of Other Assets—(1.2)% | | | (70,184 | ) |
| TOTAL NET ASSETS 100.0% | | $ | 5,709,792 | |
Percentages are stated as a percent of net assets.
| (a) | Restricted under Rule 144A of the Securities Act of 1933. These securities may be resold in transactions exempt from registration, normally to qualified institutional buyers. These securities have been determined to be liquid under guidelines established by the Board of Trustees. Liquid securities restricted under Rule 144A comprised 1.1% of the Fund’s net assets. |
| | |
| (b) | Reg S—Security exempt from registration under Regulation S of the Securities Act of 1933, which exempts from registration securities offered and sold outside the United States. Security may not be offered or sold in the United States except pursuant to an exemption from, or in a transaction not subject to, the registration requirements of the Securities Act of 1933. As of April 30, 2014, these securities amounted to a total value of $71,825 which comprised 1.3% of the Fund’s net assets. |
(c) Non-income producing security.
(d) Amount is less than 0.05%.
(e) Represents a zero-coupon bond. Rate shown reflects the current yield as of the report date.
ADR—American Depositary Receipt
AG—Aktiengesellschaft is a German term that refers to a corporation that is limited by shares, i.e., owned by shareholders.
AS—Anonim Sirketi is the Turkish term for joint stock company.
BHD—Malaysian equivalent to incorporated.
GDR—Global Depositary Receipt
JSC—Joint Stock Company
PCL—Public Company Limited
PJSC—Public Joint Stock Company
S de RL de CV—Socieded de Responsabilidad Limitada de Capital Variable is the Spanish equivalent to Limited Liability Company.
SA—Generally designates corporations in various countries, mostly those employing the civil law.
SA de CV—Sociedad Anonima de Capital Variable is the Spanish equivalent to Variable Capital Company.
The accompanying notes are an integral part of these financial statements.
51
Alpine Emerging Markets Real Estate Fund
Schedule of Portfolio Investments—Continued
April 30, 2014 (Unaudited)
SAB de CV—Sociedad Anonima Bursátil de Capital Variable is the Spanish equivalent to Variable Capital Company.
SAE—Societe Anonyme Egyptienne.
SAPI de CV—Sociedad Anonima Promotora de Inversion de Capital Variable is the Spanish equivalent to Variable Capital Corporation.
The accompanying notes are an integral part of these financial statements.
52
| Alpine Global Infrastructure Fund |
Schedule of Portfolio Investments
April 30, 2014 (Unaudited)
| Shares | | | Security
Description | | Value | |
| | | | | | | |
| Common Stocks—92.5% | | | |
| Asia—17.3% | | | | |
| China—11.0% | | | | |
| | 1,600,000 | | | Anhui Expressway Co., Ltd.–Class H | | $ | 875,022 | |
| | 2,770,000 | | | Beijing Enterprises Water Group, Ltd. | | | 1,750,688 | |
| | 830,000 | | | China Everbright International, Ltd. | | | 1,037,373 | |
| | 425,000 | | | China Merchants Holdings International Co., Ltd. | | | 1,323,851 | |
| | 2,130,000 | | | China Railway Construction Corp., Ltd.–Class H | | | 1,747,309 | |
| | 588,000 | | | China Resources Power Holdings Co., Ltd. | | | 1,478,921 | |
| | 1,092,972 | | | China State Construction International Holdings, Ltd. | | | 1,818,577 | |
| | 1,525,000 | | | COSCO Pacific, Ltd. | | | 2,041,739 | |
| | 250,000 | | | ENN Energy Holdings, Ltd. | | | 1,742,885 | |
| | 4,024,000 | | | Guangshen Railway Co., Ltd.– Class H | | | 1,515,562 | |
| | 1,802,000 | | | Qinhuangdao Port Co., Ltd.– Class H (a) | | | 973,872 | |
| | 6,341,000 | | | Tianjin Port Development Holdings, Ltd. | | | 989,638 | |
| | 1,500,000 | | | Yuexiu Transport Infrastructure, Ltd. | | | 768,095 | |
| | 1,790,000 | | | Zhejiang Expressway Co., Ltd.– Class H | | | 1,549,204 | |
| | | | | | | | 19,612,736 | |
| Indonesia—2.7% |
| | 63,500,000 | | | PT Bakrieland Development TBK (a) | | | 274,618 | |
| | 5,175,000 | | | PT Jasa Marga Persero TBK | | | 2,640,877 | |
| | 3,380,000 | | | PT Tower Bersama Infrastructure TBK | | | 1,900,273 | |
| | | | | | | | 4,815,768 | |
| Japan—2.1% | | | |
| | 26,000 | | | East Japan Railway Co. | | | 1,895,417 | |
| | 36,000 | | | Japan Airlines Co., Ltd. | | | 1,862,767 | |
| | | | | | | | 3,758,184 | |
| Philippines—0.8% | | | |
| | 605,000 | | | International Container Terminal Services, Inc. | | | 1,467,037 | |
| Thailand—0.7% | | | |
| | 4,100,000 | | | BTS Rail Mass Transit Growth Infrastructure Fund | | | 1,222,651 | |
| | | | | Total Asia (Cost $28,243,497) | | | 30,876,376 | |
| Europe—24.7% | | | |
| Austria—0.5% | | | |
| | 15,500 | | | Kapsch TrafficCom AG | | | 860,049 | |
| France—7.8% | | | |
| | 17,500 | | | Aeroports de Paris | | | 2,176,092 | |
| | 82,000 | | | Eutelsat Communications SA | | | 2,813,350 | |
| | 110,000 | | | Suez Environnement Co. | | | 2,159,409 | |
| | 147,000 | | | Veolia Environnement SA | | | 2,740,959 | |
| | 53,500 | | | Vinci SA | | | 4,033,288 | |
| | | | | | | | 13,923,098 | |
| Germany—3.5% | | | |
| | 28,000 | | | Fraport AG Frankfurt Airport Services Worldwide | | | 2,066,207 | |
| | 80,000 | | | Hamburger Hafen und Logistik AG | | | 1,936,740 | |
| | 27,000 | | | HeidelbergCement AG | | | 2,341,901 | |
| | | | | | | | 6,344,848 | |
| | Shares | | | Security
Description | | Value | |
| | | | | | | |
| Italy—2.3% | | | |
| | 83,000 | | | Atlantia SpA | | $ | 2,159,062 | |
| | 310,000 | | | Snam SpA | | | 1,863,099 | |
| | | | | | | | 4,022,161 | |
| Netherlands—2.2% | | | |
| | 40,500 | | | Koninklijke Vopak NV | | | 2,016,294 | |
| | 46,000 | | | Ziggo NV (a) | | | 1,996,229 | |
| | | | | | | | 4,012,523 | |
| Spain—2.7% | | | |
| | 430,000 | | | Abengoa SA–B Shares | | | 1,915,555 | |
| | 128,500 | | | Abertis Infraestructuras SA | | | 2,888,936 | |
| | | | | | | | 4,804,491 | |
| Turkey—0.5% | | | |
| | 113,500 | | | TAV Havalimanlari Holding AS | | | 908,409 | |
| United Kingdom—5.2% |
| | 175,000 | | | Drax Group PLC | | | 1,956,011 | |
| | 157,500 | | | Ferrovial SA | | | 3,496,120 | |
| | 26,000 | | | National Grid PLC–ADR | | | 1,847,560 | |
| | 52,500 | | | Vodafone Group PLC–ADR | | | 1,992,900 | |
| | | | | | | | 9,292,591 | |
| | | | | Total Europe (Cost $36,898,006) . | | | 44,168,170 | |
| North & South America—50.5% | | | |
| Brazil—8.0% | | | |
| | 645,000 | | | All America Latina Logistica SA | | | 2,554,255 | |
| | 365,000 | | | CCR SA | | | 2,856,486 | |
| | 262,000 | | | Cia de Saneamento Basico do Estado de Sao Paulo–ADR | | | 2,483,760 | |
| | 425,000 | | | EcoRodovias Infraestrutura e Logistica SA | | | 2,540,756 | |
| | 132,000 | | | Mills Estruturas e Servicos de Engenharia SA | | | 1,664,689 | |
| | | | | | | | | |
| | 260,000 | | | Tegma Gestao Logistica | | | 2,174,683 | |
| | | | | | | | 14,274,629 | |
| Canada—3.6% | | | |
| | 20,500 | | | Canadian Pacific Railway, Ltd. | | | 3,197,385 | |
| | 67,000 | | | Enbridge, Inc. | | | 3,233,091 | |
| | | | | | | | 6,430,476 | |
| Chile—1.2% | | | |
| | 135,000 | | | Enersis SA–ADR | | | 2,173,500 | |
| Colombia—1.1% | | | |
| | 21,000 | | | Millicom International Cellular SA–SDR | | | 2,076,682 | |
| Mexico—4.5% | | | |
| | 330,000 | | | Empresas ICA SAB de CV–ADR (a) | | | 2,379,300 | |
| | 13,500 | | | Grupo Aeroportuario del Sureste SAB de CV–ADR | | | 1,650,375 | |
| | 407,500 | | | Infraestructura Energetica Nova SAB de CV | | | 2,131,761 | |
| | 690,000 | | | OHL Mexico SAB de CV (a) | | | 1,835,394 | |
| | | | | | | | 7,996,830 | |
| Peru—1.2% | | | |
| | 122,500 | | | Grana y Montero SA–ADR | | | 2,133,950 | |
| United States—30.9% | | |
| | 41,000 | | | American Tower Corp. | | | 3,424,320 | |
| | 52,000 | | | American Water Works Co., Inc. | | | 2,367,560 | |
| | 64,000 | | | AT&T, Inc. | | | 2,284,800 | |
| | 47,000 | | | Atmos Energy Corp. | | | 2,398,880 | |
| | 88,000 | | | Cisco Systems, Inc. | | | 2,033,680 | |
| | 80,000 | | | CMS Energy Corp. | | | 2,424,800 | |
The accompanying notes are an integral part of these financial statements.
53
| Alpine Global Infrastructure Fund |
Schedule of Portfolio Investments—Continued
April 30, 2014 (Unaudited)
| | Shares | | | Security
Description | | Value | |
| | | | | | | |
| Common Stocks—continued | | | |
| North & South America—continued | | | |
| United States—continued | | | |
| | 43,000 | | | Comcast Corp.–Class A | | $ | 2,225,680 | |
| | 66,000 | | | Corrections Corp. of America | | | 2,164,800 | |
| | 31,000 | | | Crown Castle International Corp. | | | 2,254,630 | |
| | 39,000 | | | DISH Network Corp.–Class A (a) | | | 2,217,540 | |
| | 12,500 | | | Dominion Resources, Inc. | | | 906,750 | |
| | 18,500 | | | Genesee & Wyoming, Inc.–Class A (a) | | | 1,831,685 | |
| | 49,000 | | | ITC Holdings Corp. | | | 1,811,530 | |
| | 30,000 | | | Itron, Inc. (a) | | | 1,140,000 | |
| | 84,000 | | | MasTec, Inc. (a) | | | 3,324,720 | |
| | 50,500 | | | Northeast Utilities | | | 2,386,630 | |
| | 50,500 | | | NRG Energy, Inc. | | | 1,652,360 | |
| | 108,000 | | | Progressive Waste Solutions, Ltd. | | | 2,631,960 | |
| | 34,000 | | | SemGroup Corp.–Class A | | | 2,171,920 | |
| | 75,000 | | | The Geo Group, Inc. | | | 2,514,750 | |
| | 64,000 | | | The Williams Cos., Inc. | | | 2,698,880 | |
| | 220,000 | | | TravelCenters of America LLC (a) | | | 1,665,400 | |
| | 33,000 | | | UGI Corp. | | | 1,540,770 | |
| | 16,000 | | | Union Pacific Corp. | | | 3,046,880 | |
| | 46,000 | | | World Fuel Services Corp. | | | 2,094,840 | |
| | | | | | | | 55,215,765 | |
| | | | | Total North & South America
(Cost $80,263,593) | | | 90,301,832 | |
| | | | | Total Common Stocks
(Cost $145,405,096) | | | 165,346,378 | |
| Shares | | | Security
Description | | Value | |
| | | | | | | |
| Equity-Linked Structured Notes—2.4% | | | |
| Asia—2.4% | | | |
| India—2.4% | | | |
| | 800,000 | | | Adani Ports and Special Economic Zone–Macquarie Bank, Ltd. | | $ | 2,516,787 | |
| | 1,026,800 | | | Power Grid Corp. of India, Ltd.–Macquarie Bank, Ltd. | | | 1,804,539 | |
| | | | | Total Asia (Cost $3,784,997) | | | 4,321,326 | |
| | | | | Total Equity-Linked Structured Notes
(Cost $3,784,997) | | | 4,321,326 | |
| | Principal
Amount | | | | | | | |
| Short-Term Investments—5.6% | | | | |
| $ | 10,052,000 | | | State Street Eurodollar
Time Deposit, 0.01% | | | 10,052,000 | |
| | | | | Total Short-Term Investments
(Cost $10,052,000) | | | 10,052,000 | |
Total Investments
(Cost $159,242,093)—100.5% | | | 179,719,704 | |
| Liabilities in Excess of Other Assets—(0.5)% | | | (957,835 | ) |
| TOTAL NET ASSETS 100.0% | | $ | 178,761,869 | |
Percentages are stated as a percent of net assets.
(a) Non-income producing security.
ADR—American Depositary Receipt
AG—Aktiengesellschaft is a German term that refers to a corporation that is limited by shares, i.e., owned by shareholders.
AS—Anonim Sirketi is the Turkish term for joint stock company.
NV—Naamloze Vennootschap is the Dutch term for a public limited liability corporation.
PLC—Public Limited Company
SA—Generally designates corporations in various countries, mostly those employing the civil law.
SAB de CV—Sociedad Anonima Bursátil de Capital Variable is the Spanish equivalent to Variable Capital Company.
SDR—Swedish Depositary Receipt
SpA—Societa’ Per Azioni is an Italian shared company.
The accompanying notes are an integral part of these financial statements.
54
| Alpine Global Consumer Growth Fund |
Schedule of Portfolio Investments
April 30, 2014 (Unaudited)
| | | | | Security | | | | |
| Shares | | | Description | | | Value | |
| | |
| Common Stocks—94.7% | | | | |
| Asia—17.3% | | | | |
| China—7.6% | | | | |
| | 450 | | | Baidu, Inc.–ADR (a) | | $ | 69,232 | |
| | 20,000 | | | Dongfeng Motor Group Co., Ltd.– | | | |
| | | | | Class H | | | 26,622 | |
| | 48,000 | | | Springland International | | | | |
| | | | | Holdings, Ltd. | | | 18,883 | |
| | 1,100 | | | Tencent Holdings, Ltd. | | | 68,586 | |
| | 22,000 | | | Want Want China Holdings, Ltd. | | 34,392 | |
| | | | | | | | 217,715 | |
| Hong Kong—2.2% | | | | |
| | 66,000 | | | Future Bright Holdings, Ltd. | | | 31,583 | |
| | 300,000 | | | REXLot Holdings, Ltd. | | | 31,343 | |
| | | | | | | | 62,926 | |
| Indonesia—2.5% | | | | |
| | 180,000 | | | PT Erajaya Swasembada TBK (a) | | | 18,682 | |
| | 27,500 | | | PT Indofood CBP Sukses | | | | |
| | | | | Makmur TBK | | | 23,786 | |
| | 50,000 | | | PT Mitra Adiperkasa TBK | | | 27,570 | |
| | | | | | | | 70,038 | |
| Japan—2.6% | | | |
| | 4,000 | | | Nissan Motor Co., Ltd. | | | 34,313 | |
| | 1,000 | | | Seven & I Holdings Co., Ltd. | | | 39,429 | |
| | | | | | | | 73,742 | |
| Philippines—1.0% | | | | |
| | 80,000 | | | SM Prime Holdings, Inc. | | | 29,287 | |
| South Korea—1.4% | | | | |
| | 725 | | | Kia Motors Corp. | | | 40,204 | |
| | | | | Total Asia (Cost $425,747) | | | 493,912 | |
| Europe—23.5% | | | | |
| Belgium—3.0% | | | | |
| | 800 | | | Anheuser-Busch InBev NV–ADR | | | 84,656 | |
| France—4.2% | | | | |
| | 300 | | | Kering | | | 66,343 | |
| | 1,400 | | | SES SA | | | 52,724 | |
| | | | | | | | 119,067 | |
| Germany—3.3% | | | | |
| | 450 | | | Adidas AG | | | 48,028 | |
| | 360 | | | Bayerische Motoren Werke AG | | | 45,040 | |
| | | | | | | | 93,068 | |
| Italy—1.1% | | | |
| | 850 | | | Yoox SpA (a) | | | 30,472 | |
| Netherlands—1.2% | | | | |
| | 800 | | | Unilever NV | | | 34,279 | |
| Russia—0.5% | | | | |
| | 600 | | | Yandex NV–Class A (a) | | | 15,900 | |
| Spain—0.9% | | | |
| | 175 | | | Inditex SA | | | 26,257 | |
| Sweden—0.7% | | | | |
| | 2,500 | | | Fingerprint Cards AB–Class B (a) | | | 20,089 | |
| Switzerland—5.8% | | | | |
| | 300 | | | Dufry Group (a) | | | 49,563 | |
| | 900 | | | Nestle SA | | | 69,486 | |
| | 70 | | | The Swatch Group AG | | | 44,898 | |
| | | | | | | | 163,947 | |
| | | | | Security | | | | |
| Shares | | | Description | | | Value | |
| | | |
| United Kingdom—2.8% | | | | |
| | 22,000 | | | Debenhams PLC | | $ | 29,790 | |
| | 700 | | | Liberty Global PLC–Class A (a) | | | 27,874 | |
| | 600 | | | Liberty Global PLC–Series C (a) | | | 23,058 | |
| | | | | | | | 80,722 | |
| | | | | Total Europe (Cost $480,481) | | | 668,457 | |
| North & South America—53.9% | | | | |
| Argentina—1.0% | | | | |
| | 300 | | | MercadoLibre, Inc. | | | 27,981 | |
| Brazil—6.3% | | | | |
| | 6,500 | | | Anhanguera Educacional | | | | |
| | | | | Participacoes SA | | | 40,229 | |
| | 3,200 | | | BR Malls Participacoes SA | | | 27,540 | |
| | 575 | | | Cia Brasileira de Distribuicao | | | | |
| | | | | Grupo Pao de Acucar | | | 27,347 | |
| | 3,600 | | | Hypermarcas SA | | | 26,527 | |
| | 3,400 | | | International Meal Co. Holdings SA | | | 26,913 | |
| | 2,500 | | | Multiplus SA | | | 31,988 | |
| | | | | | | | 180,544 | |
| Mexico—1.2% | | | | |
| | 1,000 | | | Grupo Televisa SA–ADR | | | 32,810 | |
| United States—45.4% | | | | |
| | 850 | | | Abercrombie & Fitch Co.–Class A | | | 31,246 | |
| | 175 | | | Amazon.com, Inc. (a) | | | 53,223 | |
| | 1,750 | | | AMC Entertainment Holdings, Inc.– | | | | |
| | | | | Class A (a) | | | 40,495 | |
| | 150 | | | Apple, Inc. | | | 88,513 | |
| | 750 | | | Carnival Corp. | | | 29,483 | |
| | 1,001 | | | CBS Corp.–Class B | | | 57,818 | |
| | 450 | | | Coach, Inc. | | | 20,093 | |
| | 600 | | | Colgate–Palmolive Co. | | | 40,380 | |
| | 1,750 | | | Comcast Corp.–Class A | | | 90,580 | |
| | 900 | | | Dick’s Sporting Goods, Inc. | | | 47,394 | |
| | 2,500 | | | Francesca’s Holdings Corp. (a) | | | 40,900 | |
| | 1,300 | | | GameStop Corp.–Class A | | | 51,584 | |
| | 75 | | | Google, Inc.–Class A (a) | | | 40,116 | |
| | 75 | | | Google, Inc.–Class C (a) | | | 39,499 | |
| | 500 | | | Guess?, Inc. | | | 13,455 | |
| | 375 | | | Lumber Liquidators | | | | |
| | | | | Holdings, Inc. (a) | | | 32,685 | |
| | 500 | | | McDonald’s Corp. | | | 50,690 | |
| | 870 | | | Michael Kors Holdings, Ltd. (a) | | | 79,344 | |
| | 650 | | | NIKE, Inc.–Class B | | | 47,417 | |
| | 675 | | | PepsiCo, Inc. | | | 57,976 | |
| | 2,400 | | | Pier 1 Imports, Inc. | | | 43,824 | |
| | 550 | | | The Procter & Gamble Co. | | | 45,402 | |
| | 475 | | | Ulta Salon Cosmetics & | | | | |
| | | | | Fragrance, Inc. (a) | | | 41,662 | |
| | 1,320 | | | VF Corp. | | | 80,639 | |
| | 350 | | | Visa, Inc.–Class A | | | 70,913 | |
| | 725 | | | Yum! Brands, Inc. | | | 55,818 | |
| | | | | | | | 1,291,149 | |
| | | | | Total North & South America | | | | |
| | | | | (Cost $1,159,116) | | | 1,532,484 | |
| | | | | Total Common Stocks | | | | |
| | | | | (Cost $2,065,344) | | | 2,694,853 | |
The accompanying notes are an integral part of these financial statements.
| Alpine Global Consumer Growth Fund |
Schedule of Portfolio Investments—Continued
April 30, 2014 (Unaudited)
| Principal Amount | | | Security
Description | | | Value | |
| | | | | |
| Short -Term Investments-5.9% | | | | |
| $ | 166,000 | | | State Street Eurodollar Time
Deposit, 0.01% | | $ | 166,000 | |
| | | | | Total Short-Term Investments
(Cost $166,000) | | | 166,000 | |
Total Investments
(Cost $2,231,344)—100.6% | | | 2,860,853 | |
| Liabilities in Excess of Other Assets—(0.6)% | | | (16,225 | ) |
| TOTAL NET ASSETS 100.0% | | $ | 2,844,628 | |
Percentages are stated as a percent of net assets.
| (a) | Non-income producing security. |
AB—Aktiebolag is the Swedish equivalent of a corporation.
ADR—American Depositary Receipt
AG—Aktiengesellschaft is a German term that refers to a corporation that is limited by shares, i.e., owned by shareholders.
NV—Naamloze Vennootschap is the Dutch term for a public limited liability corporation.
PLC—Public Limited Company
SA—Generally designates corporations in various countries, mostly those employing the civil law.
SpA—Societa’ Per Azioni is an Italian shared company.
The accompanying notes are an integral part of these financial statements.
Alpine Mutual Funds
Statements of Assets and Liabilities
April 30, 2014 (Unaudited)
| | | International
Real Estate
Equity Fund | | | Realty
Income &
Growth Fund | | Cyclical
Advantage
Property Fund |
| ASSETS: | | | | | | | | | | | | | | |
| Investments, at value(1) | | | | | | | | | | | | | | |
| Unaffiliated issuers | | $ | 179,790,958 | | | | $ | 113,237,766 | | | | $ | 62,595,027 | |
| Affiliated issuers | | | 4,416,890 | | | | | — | | | | | — | |
| Total investments, at value | | | 184,207,848 | | | | | 113,237,766 | | | | | 62,595,027 | |
| Foreign currencies, at value(2) | | | 52,305 | | | | | — | | | | | 3,407 | |
| Receivable from investment securities sold | | | 2,238,772 | | | | | 400,609 | | | | | 845,591 | |
| Dividends and interest receivable | | | 724,381 | | | | | 48,904 | | | | | 143,532 | |
| Receivable from capital shares issued | | | 3,175 | | | | | 54,600 | | | | | 724 | |
| Due from Adviser | | | — | | | | | 4,820 | | | | | — | |
| Prepaid expenses and other assets | | | 83,152 | | | | | 12,743 | | | | | 6,464 | |
| Total assets | | | 187,309,633 | | | | | 113,759,442 | | | | | 63,594,745 | |
| | | | | | | | | | | | | | | |
| LIABILITIES: | | | | | | | | | | | | | | |
| Payable for investment securities purchased | | | 881,415 | | | | | — | | | | | 403,922 | |
| Unrealized depreciation on forward currency contracts | | | 95,782 | | | | | — | | | | | 46,677 | |
| Payable for capital shares redeemed | | | 22,556 | | | | | 22,570 | | | | | 2,189 | |
| Accrued expenses and other liabilities: | | | | | | | | | | | | | | |
| Investment advisory fees (Note 6) | | | 151,570 | | | | | 87,134 | | | | | 47,877 | |
| Line of credit (Note 2) | | | 2,895,729 | | | | | 5,855,240 | | | | | 5,329,049 | |
| Distribution fees (Note 5) | | | 771 | | | | | 3,495 | | | | | — | |
| Other | | | 434,191 | | | | | 174,468 | | | | | 87,401 | |
| Total liabilities | | | 4,482,014 | | | | | 6,142,907 | | | | | 5,917,115 | |
| Net Assets | | $ | 182,827,619 | | | | $ | 107,616,535 | | | | $ | 57,677,630 | |
| | | | | | | | | | | | | | | |
| NET ASSETS REPRESENTED BY: | | | | | | | | | | | | | | |
| Paid-in-capital | | $ | 1,313,631,521 | | | | $ | 68,304,866 | | | | $ | 98,875,675 | |
| Undistributed (accumulated) net investment income (loss) | | | (6,468,679 | ) | | | | 100,451 | | | | | 97,590 | |
| Accumulated net realized loss from investments and foreign currency transactions | | | (1,092,708,398 | ) | | | | (4,005,397 | ) | | | | (49,468,731 | ) |
| Net unrealized appreciation/(depreciation) on: | | | | | | | | | | | | | | |
| Investments | | | (31,521,611 | ) | | | | 43,216,581 | | | | | 8,220,018 | |
| Foreign currency translations | | | (105,214 | ) | | | | 34 | | | | | (46,922 | ) |
| Net Assets | | $ | 182,827,619 | | | | $ | 107,616,535 | | | | $ | 57,677,630 | |
| | | | | | | | | | | | | | | |
| Net asset value | | | | | | | | | | | | | | |
| Institutional Class | | | | | | | | | | | | | | |
| Net assets | | $ | 182,683,711 | | | | $ | 105,282,543 | | | | $ | 57,677,630 | |
| Shares outstanding | | | 7,767,303 | | | | | 5,379,701 | | | | | 2,295,853 | |
| Net asset value, offering price and redemption price per share* | | $ | 23.52 | | | | $ | 19.57 | | | | $ | 25.12 | |
| Class A | | | | | | | | | | | | | | |
| Net assets | | $ | 143,908 | | | | $ | 2,333,992 | | | | $ | — | |
| Shares outstanding | | | 6,134 | | | | | 119,408 | | | | | — | |
| Net asset value per share | | $ | 23.46 | | | | $ | 19.55 | | | | $ | — | |
| Maximum offering price per share (net asset value plus sales charge of 5.50% of offering price) | | $ | 24.83 | | | | $ | 20.69 | | | | $ | — | |
| * | If applicable, redemption price per share may be reduced by a redemption fee. | | | | | | | | | | | | | | |
| (1) | Total cost of investments | | | | | | | | | | | | | | |
| | Unaffiliated issuers | | $ | 204,494,414 | | | | $ | 70,021,185 | | | | $ | 54,375,009 | |
| | Affiliated issuers | | $ | 11,235,045 | | | | $ | — | | | | $ | — | |
| (2) | Cost of foreign currencies | | $ | 52,305 | | | | $ | — | | | | $ | 3,407 | |
The accompanying notes are an integral part of these financial statements.
57
Alpine Mutual Funds
Statements of Assets and Liabilities—Continued
April 30, 2014 (Unaudited)
| | | Emerging
Markets Real
Estate Fund | | Global
Infrastructure
Fund | | Global
Consumer
Growth Fund |
| ASSETS: | | | | | | | | | | | | | | | |
| Investments, at value(1) | | | $ | 5,779,976 | | | | $ | 179,719,704 | | | | $ | 2,860,853 | |
| Foreign currencies, at value(2) | | | | 39 | | | | | 101,395 | | | | | — | |
| Cash | | | | 85 | | | | | 856 | | | | | 128 | |
| Receivable from investment securities sold | | | | 82,536 | | | | | 682 | | | | | 16 | |
| Dividends and interest receivable | | | | 14,770 | | | | | 651,624 | | | | | 4,707 | |
| Receivable from capital shares issued | | | | — | | | | | 70,512 | | | | | 50 | |
| Due from Adviser | | | | 2,917 | | | | | — | | | | | 3,582 | |
| Prepaid expenses and other assets | | | | 2,670 | | | | | 9,279 | | | | | 2,315 | |
| Total assets | | | | 5,882,993 | | | | | 180,554,052 | | | | | 2,871,651 | |
| | | | | | | | | | | | | | | | |
| LIABILITIES: | | | | | | | | | | | | | | | |
| Payable for investment securities purchased | | | | 95,000 | | | | | 1,245,572 | | | | | 9,382 | |
| Unrealized depreciation on forward currency contracts | | | | — | | | | | 335,132 | | | | | — | |
| Payable for capital shares redeemed | | | | 46,589 | | | | | 12,322 | | | | | — | |
| Accrued expenses and other liabilities: | | | | | | | | | | | | | | | |
| Investment advisory fees (Note 6) | | | | 3,178 | | | | | 145,781 | | | | | 270 | |
| Distribution fees (Note 5) | | | | 1,207 | | | | | 13,089 | | | | | 738 | |
| Other | | | | 27,227 | | | | | 40,287 | | | | | 16,633 | |
| Total liabilities | | | | 173,201 | | | | | 1,792,183 | | | | | 27,023 | |
| Net Assets | | | $ | 5,709,792 | | | | $ | 178,761,869 | | | | $ | 2,844,628 | |
| | | | | | | | | | | | | | | | |
| NET ASSETS REPRESENTED BY: | | | | | | | | | | | | | | | |
| Paid-in-capital | | | $ | 6,500,569 | | | | $ | 155,620,835 | | | | $ | 2,277,472 | |
| Undistributed (accumulated) net investment income (loss) | | | | 651 | | | | | 1,334,470 | | | | | (72 | ) |
| Accumulated net realized gain (loss) from investments and foreign currency transactions | | | | (871,672 | ) | | | | 1,662,381 | | | | | (62,333 | ) |
| Net unrealized appreciation/(depreciation) on: | | | | | | | | | | | | | | | |
| Investments | | | | 80,270 | | | | | 20,477,611 | | | | | 629,509 | |
| Foreign currency translations | | | | (26 | ) | | | | (333,428 | ) | | | | 52 | |
| Net Assets | | | $ | 5,709,792 | | | | $ | 178,761,869 | | | | $ | 2,844,628 | |
| | | | | | | | | | | | | | | | |
| Net asset value | | | | | | | | | | | | | | | |
| Institutional Class | | | | | | | | | | | | | | | |
| Net assets | | | $ | 5,007,545 | | | | $ | 154,874,748 | | | | $ | 2,673,802 | |
| Shares outstanding | | | | 310,769 | | | | | 7,884,870 | | | | | 213,278 | |
| Net asset value, offering price and redemption price per share* | | | $ | 16.11 | | | | $ | 19.64 | | | | $ | 12.54 | |
| Class A | | | | | | | | | | | | | | | |
| Net assets | | | $ | 702,247 | | | | $ | 23,887,121 | | | | $ | 170,826 | |
| Shares outstanding | | | | 43,644 | | | | | 1,218,081 | | | | | 13,641 | |
| Net asset value per share | | | $ | 16.09 | | | | $ | 19.61 | | | | $ | 12.52 | |
| Maximum offering price per share (net asset value plus sales charge of 5.50% of offering price) | | | $ | 17.03 | | | | $ | 20.75 | | | | $ | 13.25 | |
| * | If applicable, redemption price per share may be reduced by a redemption fee | | | | | | | | | | | | | | | |
| (1) | Total cost of investments | | | $ | 5,699,706 | | | | $ | 159,242,093 | | | | $ | 2,231,344 | |
| (2) | Cost of foreign currencies | | | $ | 39 | | | | $ | 101,395 | | | | $ | — | |
The accompanying notes are an integral part of these financial statements.
58
Alpine Mutual Funds
Statements of Operations
For the six months ended April 30, 2014 (Unaudited)
| | | International
Real Estate
Equity Fund | | | Realty
Income &
Growth Fund | | Cyclical
Advantage
Property Fund |
| INVESTMENT INCOME: | | | | | | | | | | | | | | | |
| Dividend income | | | $ | 1,032,822 | | | | $ | 2,856,812 | | | | $ | 1,166,103 | |
| Less: Foreign taxes withheld | | | | (63,560 | ) | | | | (13,377 | ) | | | | (10,940 | ) |
| Interest income | | | | 16 | | | | | — | | | | | — | |
| Total investment income | | | | 969,278 | | | | | 2,843,435 | | | | | 1,155,163 | |
| | | | | | | | | | | | | | | | |
| EXPENSES: | | | | | | | | | | | | | | | |
| Investment advisory fee (Note 6) | | | | 928,039 | | | | | 494,578 | | | | | 290,323 | |
| Transfer agent fees | | | | 243,988 | | | | | 106,102 | | | | | 51,257 | |
| Accounting and custody fees | | | | 55,137 | | | | | 6,969 | | | | | 20,253 | |
| Registration and filing fees | | | | 18,354 | | | | | 16,482 | | | | | 11,432 | |
| Audit and tax fees | | | | 40,800 | | | | | 17,726 | | | | | 12,979 | |
| Printing and mailing fees | | | | 51,245 | | | | | 20,283 | | | | | 11,810 | |
| Interest (Note 2) | | | | 16,550 | | | | | 32,416 | | | | | 19,817 | |
| Administration fee (Note 6) | | | | 18,880 | | | | | 10,513 | | | | | 6,188 | |
| Trustee fees | | | | 21,312 | | | | | 8,887 | | | | | 5,126 | |
| Legal fees | | | | 13,676 | | | | | 7,141 | | | | | 3,672 | |
| Distribution fees - Class A (Note 5) | | | | 174 | | | | | 2,408 | | | | | — | |
| Other fees | | | | 27,498 | | | | | 11,049 | | | | | 6,477 | |
| Total expenses | | | | 1,435,653 | | | | | 734,554 | | | | | 439,334 | |
| Less: Fee waivers and/or expense reimbursements (Note 6) | | | | — | | | | | (32,083 | ) | | | | — | |
| Net expenses | | | | 1,435,653 | | | | | 702,471 | | | | | 439,334 | |
| Net investment income (loss) | | | | (466,375 | ) | | | | 2,140,964 | | | | | 715,829 | |
| | | | | | | | | | | | | | | | |
| NET REALIZED AND UNREALIZED GAIN (LOSS) ON INVESTMENTS AND FOREIGN CURRENCY: | | | | | | | | | | | | | | | |
| Net realized gain (loss) from: | | | | | | | | | | | | | | | |
| Investments | | | | 4,006,413 | | | | | 192,797 | | | | | 3,144,063 | |
| Foreign currency transactions | | | | 821,994 | | | | | (4,020 | ) | | | | 393,355 | |
| Net realized gain from investments and foreign currency | | | | 4,828,407 | | | | | 188,777 | | | | | 3,537,418 | |
| Change in net unrealized appreciation/(depreciation) on: | | | | | | | | | | | | | | | |
| Investments | | | | (7,528,451 | ) | | | | 7,310,067 | | | | | (5,805,332 | ) |
| Foreign currency translations | | | | (109,233 | ) | | | | 24 | | | | | (64,085 | ) |
| Change in net unrealized appreciation/(depreciation) on investments and foreign currency | | | | (7,637,684 | ) | | | | 7,310,091 | | | | | (5,869,417 | ) |
| Net gain (loss) on investments and foreign currency | | | | (2,809,277 | ) | | | | 7,498,868 | | | | | (2,331,999 | ) |
| Increase (decrease) in net assets from operations | | | $ | (3,275,652 | ) | | | $ | 9,639,832 | | | | $ | (1,616,170 | ) |
The accompanying notes are an integral part of these financial statements.
59
Alpine Mutual Funds
Statements of Operations—Continued
For the six months ended April 30, 2014 (Unaudited)
| | | Emerging
Markets Real
Estate Fund | | Global
Infrastructure
Fund | | Global
Consumer
Growth Fund |
| INVESTMENT INCOME: | | | | | | | | | | | | | | | |
| Dividend income | | | $ | 55,875 | | | | $ | 4,997,458 | | | | $ | 20,831 | |
| Less: Foreign taxes withheld | | | | (1,838 | ) | | | | (173,380 | ) | | | | (1,390 | ) |
| Interest income | | | | — | | | | | 328 | | | | | 6 | |
| Total investment income | | | | 54,037 | | | | | 4,824,406 | | | | | 19,447 | |
| | | | | | | | | | | | | | | | |
| EXPENSES: | | | | | | | | | | | | | | | |
| Investment advisory fee (Note 6) | | | | 32,397 | | | | | 809,716 | | | | | 14,268 | |
| Transfer agent fees | | | | 7,933 | | | | | 33,470 | | | | | 5,866 | |
| Accounting and custody fees | | | | 13,720 | | | | | 29,533 | | | | | 5,316 | |
| Registration and filing fees | | | | 16,965 | | | | | 24,444 | | | | | 15,769 | |
| Audit and tax fees | | | | 7,299 | | | | | 17,636 | | | | | 6,825 | |
| Printing and mailing fees | | | | 1,034 | | | | | 10,869 | | | | | — | |
| Interest (Note 2) | | | | 492 | | | | | 153 | | | | | — | |
| Administration fee (Note 6) | | | | 658 | | | | | 16,195 | | | | | 285 | |
| Trustee fees | | | | 644 | | | | | 7,986 | | | | | 216 | |
| Legal fees | | | | 338 | | | | | 5,453 | | | | | 693 | |
| Distribution fees - Class A (Note 5) | | | | 838 | | | | | 27,230 | | | | | 257 | |
| Other fees | | | | 2,511 | | | | | 11,799 | | | | | 1,300 | |
| Total expenses | | | | 84,829 | | | | | 994,484 | | | | | 50,795 | |
| Less: Fee waivers and/or expense reimbursements (Note 6) | | | | (39,766 | ) | | | | — | | | | | (31,281 | ) |
| Net expenses | | | | 45,063 | | | | | 994,484 | | | | | 19,514 | |
| Net investment income (loss) | | | | 8,974 | | | | | 3,829,922 | | | | | (67 | ) |
| | | | | | | | | | | | | | | | |
| NET REALIZED AND UNREALIZED GAIN (LOSS) ON INVESTMENTS AND FOREIGN CURRENCY: | | | | | | | | | | | | | | | |
| Net realized gain (loss) from: | | | | | | | | | | | | | | | |
| Investments | | | | (705,091 | ) | | | | 2,112,824 | | | | | (6,351 | ) |
| Foreign currency transactions | | | | (4,045 | ) | | | | (303,792 | ) | | | | (55 | ) |
| Net realized gain (loss) from investments and foreign currency | | | | (709,136 | ) | | | | 1,809,032 | | | | | (6,406 | ) |
| Change in net unrealized appreciation/(depreciation) on: | | | | | | | | | | | | | | | |
| Investments | | | | 90,919 | | | | | 4,230,198 | | | | | (3,401 | ) |
| Foreign currency translations | | | | (245 | ) | | | | (41,495 | ) | | | | 24 | |
| Change in net unrealized appreciation/(depreciation) on investments and foreign currency | | | | 90,674 | | | | | 4,188,703 | | | | | (3,377 | ) |
| Net gain (loss) on investments and foreign currency | | | | (618,462 | ) | | | | 5,997,735 | | | | | (9,783 | ) |
| Increase (decrease) in net assets from operations | | | $ | (609,488 | ) | | | $ | 9,827,657 | | | | $ | (9,850 | ) |
The accompanying notes are an integral part of these financial statements.
60
Alpine Mutual Funds
Statements of Changes in Net Assets
| | | International Real Estate Equity Fund |
| | | Six Months Ended
April 30, 2014 | | Year Ended
October 31, 2013 |
| | | (Unaudited) | | | |
| OPERATIONS: | | | | | | | | | | |
| Net investment loss | | | $ | (466,375 | ) | | | $ | (837,291 | ) |
| Net realized gain (loss) from: | | | | | | | | | | |
| Investments | | | | 4,006,413 | | | | | 4,386,247 | |
| Foreign currency transactions | | | | 821,994 | | | | | (103,441 | ) |
| Change in net unrealized appreciation/(depreciation) on: | | | | | | | | | | |
| Investments | | | | (7,528,451 | ) | | | | 21,923,243 | |
| Foreign currency translations | | | | (109,233 | ) | | | | 14,362 | |
| Increase (decrease) in net assets from operations | | | | (3,275,652 | ) | | | | 25,383,120 | |
| | | | | | | | | | | |
| DISTRIBUTIONS TO SHAREHOLDERS: | | | | | | | | | | |
| Distributions to Institutional Class Shareholders: | | | | | | | | | | |
| From net investment income | | | | (399,726 | ) | | | | (1,295,320 | ) |
| Distributions to Class A Shareholders: | | | | | | | | | | |
| From net investment income | | | | — | | | | | (318 | ) |
| Decrease in net assets from distributions to shareholders | | | | (399,726 | ) | | | | (1,295,638 | ) |
| | | | | | | | | | | |
| CAPITAL SHARE TRANSACTIONS (NOTE 3): | | | | | | | | | | |
| Net proceeds from shares sold | | | | 2,208,313 | | | | | 11,145,146 | |
| Dividends reinvested | | | | 366,356 | | | | | 1,150,945 | |
| Redemption fees | | | | 14,547 | | | | | 6,920 | |
| Cost of shares redeemed | | | | (22,811,827 | ) | | | | (129,758,252 | ) |
| Decrease in net assets from capital share transactions | | | | (20,222,611 | ) | | | | (117,455,241 | ) |
| Net decrease in net assets | | | | (23,897,989 | ) | | | | (93,367,759 | ) |
| | | | | | | | | | | |
| NET ASSETS: | | | | | | | | | | |
| Beginning of period | | | | 206,725,608 | | | | | 300,093,367 | |
| End of period* | | | $ | 182,827,619 | | | | $ | 206,725,608 | |
| * Including accumulated net investment loss of: | | | $ | (6,468,679 | ) | | | $ | (5,602,578 | ) |
The accompanying notes are an integral part of these financial statements.
61
Alpine Mutual Funds
Statements of Changes in Net Assets—Continued
| | | Realty Income & Growth Fund |
| | | Six Months Ended
April 30, 2014 | | Year Ended
October 31, 2013 |
| | | (Unaudited) | | |
| OPERATIONS: | | | | | | | | | | |
| Net investment income | | | $ | 2,140,964 | | | | $ | 3,202,397 | |
| Net realized gain (loss) from: | | | | | | | | | | |
| Investments | | | | 192,797 | | | | | 5,295,486 | |
| Foreign currency transactions | | | | (4,020 | ) | | | | (796 | ) |
| Change in net unrealized appreciation/(depreciation) on: | | | | | | | | | | |
| Investments | | | | 7,310,067 | | | | | 885,808 | |
| Foreign currency translations | | | | 24 | | | | | 1 | |
| Increase in net assets from operations | | | | 9,639,832 | | | | | 9,382,896 | |
| | | | | | | | | | | |
| DISTRIBUTIONS TO SHAREHOLDERS: | | | | | | | | | | |
| Distributions to Institutional Class Shareholders: | | | | | | | | | | |
| From net investment income | | | | (2,001,813 | ) | | | | (3,751,100 | ) |
| From net realized gain on investments | | | | — | | | | | (557,236 | ) |
| Distributions to Class A Shareholders: | | | | | | | | | | |
| From net investment income | | | | (38,700 | ) | | | | (14,332 | ) |
| From net realized gain on investments | | | | — | | | | | (2,192 | ) |
| Decrease in net assets from distributions to shareholders | | | | (2,040,513 | ) | | | | (4,324,860 | ) |
| | | | | | | | | | | |
| CAPITAL SHARE TRANSACTIONS (NOTE 3): | | | | | | | | | | |
| Net proceeds from shares sold | | | | 5,778,593 | | | | | 8,416,187 | |
| Dividends reinvested | | | | 1,816,273 | | | | | 3,880,515 | |
| Redemption fees | | | | 76 | | | | | 5,559 | |
| Cost of shares redeemed | | | | (7,543,764 | ) | | | | (23,812,998 | ) |
| Increase (decrease) in net assets from capital share transactions | | | | 51,178 | | | | | (11,510,737 | ) |
| Net increase (decrease) in net assets | | | | 7,650,497 | | | | | (6,452,701 | ) |
| | | | | | | | | | | |
| NET ASSETS: | | | | | | | | | | |
| Beginning of period | | | | 99,966,038 | | | | | 106,418,739 | |
| End of period* | | | $ | 107,616,535 | | | | $ | 99,966,038 | |
| * Including undistributed net investment income of: | | | $ | 100,451 | | | | $ | — | |
The accompanying notes are an integral part of these financial statements.
62
Alpine Mutual Funds
Statements of Changes in Net Assets—Continued
| | | Cyclical Advantage Property Fund |
| | | Six Months Ended
April 30, 2014 | | Year Ended
October 31, 2013 |
| | | (Unaudited) | | |
| OPERATIONS: | | | | | | | | | | |
| Net investment income | | | $ | 715,829 | | | | $ | 1,179,984 | |
| Net realized gain (loss) from: | | | | | | | | | | |
| Investments | | | | 3,144,063 | | | | | 1,644,699 | |
| Foreign currency transactions | | | | 393,355 | | | | | (10,618 | ) |
| Change in net unrealized appreciation/(depreciation) on: | | | | | | | | | | |
| Investments | | | | (5,805,332 | ) | | | | 4,268,975 | |
| Foreign currency translations | | | | (64,085 | ) | | | | 17,297 | |
| Increase (decrease) in net assets from operations | | | | (1,616,170 | ) | | | | 7,100,337 | |
| | | | | | | | | | | |
| DISTRIBUTIONS TO SHAREHOLDERS: | | | | | | | | | | |
| Distributions to Institutional Class Shareholders: | | | | | | | | | | |
| From net investment income | | | | (1,232,961 | ) | | | | (523,183 | ) |
| Decrease in net assets from distributions to shareholders | | | | (1,232,961 | ) | | | | (523,183 | ) |
| | | | | | | | | | | |
| CAPITAL SHARE TRANSACTIONS (NOTE 3): | | | | | | | | | | |
| Net proceeds from shares sold | | | | 333,359 | | | | | 2,535,452 | |
| Dividends reinvested | | | | 1,210,311 | | | | | 510,363 | |
| Redemption fees | | | | 42 | | | | | 2,260 | |
| Cost of shares redeemed | | | | (2,825,305 | ) | | | | (7,440,538 | ) |
| Decrease in net assets from capital share transactions | | | | (1,281,593 | ) | | | | (4,392,463 | ) |
| Net increase (decrease) in net assets | | | | (4,130,724 | ) | | | | 2,184,691 | |
| | | | | | | | | | | |
| NET ASSETS: | | | | | | | | | | |
| Beginning of period | | | | 61,808,354 | | | | | 59,623,663 | |
| End of period* | | | $ | 57,677,630 | | | | $ | 61,808,354 | |
| * Including undistributed net investment income of: | | | $ | 97,590 | | | | $ | 614,722 | |
The accompanying notes are an integral part of these financial statements.
63
Alpine Mutual Funds
Statements of Changes in Net Assets—Continued
| | | Emerging Markets Real Estate Fund |
| | | Six Months Ended
April 30, 2014 | | Year Ended
October 31, 2013 |
| | | (Unaudited) | | |
| OPERATIONS: | | | | | | | | | | |
| Net investment income | | | $ | 8,974 | | | | $ | 92,136 | |
| Net realized gain (loss) from: | | | | | | | | | | |
| Investments | | | | (705,091 | ) | | | | 141,417 | |
| Foreign currency transactions | | | | (4,045 | ) | | | | (20,910 | ) |
| Change in net unrealized appreciation/(depreciation) on: | | | | | | | | | | |
| Investments | | | | 90,919 | | | | | (712,400 | ) |
| Foreign currency translations | | | | (245 | ) | | | | 251 | |
| Decrease in net assets from operations | | | | (609,488 | ) | | | | (499,506 | ) |
| | | | | | | | | | | |
| DISTRIBUTIONS TO SHAREHOLDERS: | | | | | | | | | | |
| Distributions to Institutional Class Shareholders: | | | | | | | | | | |
| From net investment income | | | | (102,180 | ) | | | | (56,766 | ) |
| From net realized gain on investments | | | | (57,017 | ) | | | | — | |
| Distributions to Class A Shareholders: | | | | | | | | | | |
| From net investment income | | | | (8,880 | ) | | | | (2,120 | ) |
| From net realized gain on investments | | | | (5,934 | ) | | | | — | |
| Decrease in net assets from distributions to shareholders | | | | (174,011 | ) | | | | (58,886 | ) |
| | | | | | | | | | | |
| CAPITAL SHARE TRANSACTIONS (NOTE 3): | | | | | | | | | | |
| Net proceeds from shares sold | | | | 1,037,556 | | | | | 9,526,277 | |
| Dividends reinvested | | | | 170,729 | | | | | 57,510 | |
| Redemption fees | | | | 9,528 | | | | | 15,254 | |
| Cost of shares redeemed | | | | (4,483,587 | ) | | | | (3,709,564 | ) |
| Increase (decrease) in net assets from capital share transactions | | | | (3,265,774 | ) | | | | 5,889,477 | |
| Net increase (decrease) in net assets | | | | (4,049,273 | ) | | | | 5,331,085 | |
| | | | | | | | | | | |
| NET ASSETS: | | | | | | | | | | |
| Beginning of period | | | | 9,759,065 | | | | | 4,427,980 | |
| End of period* | | | $ | 5,709,792 | | | | $ | 9,759,065 | |
| * Including undistributed net investment income of: | | | $ | 651 | | | | $ | 102,737 | |
The accompanying notes are an integral part of these financial statements.
64
Alpine Mutual Funds
Statements of Changes in Net Assets—Continued
| | | Global Infrastructure Fund |
| | | Six Months Ended
April 30, 2014 | | Year Ended
October 31, 2013 |
| | | (Unaudited) | | |
| OPERATIONS: | | | | | | | | | | |
| Net investment income | | | $ | 3,829,922 | | | | $ | 3,918,078 | |
| Net realized gain (loss) from: | | | | | | | | | | |
| Investments | | | | 2,112,824 | | | | | 3,581,109 | |
| Foreign currency transactions | | | | (303,792 | ) | | | | (279,152 | ) |
| Change in net unrealized appreciation/(depreciation) on: | | | | | | | | | | |
| Investments | | | | 4,230,198 | | | | | 12,342,987 | |
| Foreign currency translations | | | | (41,495 | ) | | | | (151,414 | ) |
| Increase in net assets from operations | | | | 9,827,657 | | | | | 19,411,608 | |
| | | | | | | | | | | |
| DISTRIBUTIONS TO SHAREHOLDERS: | | | | | | | | | | |
| Distributions to Institutional Class Shareholders: | | | | | | | | | | |
| From net investment income | | | | (2,664,762 | ) | | | | (3,113,199 | ) |
| From net realized gain on investments | | | | (2,409,615 | ) | | | | — | |
| Distributions to Class A Shareholders: | | | | | | | | | | |
| From net investment income | | | | (385,618 | ) | | | | (413,051 | ) |
| From net realized gain on investments | | | | (388,294 | ) | | | | — | |
| Decrease in net assets from distributions to shareholders | | | | (5,848,289 | ) | | | | (3,526,250 | ) |
| | | | | | | | | | | |
| CAPITAL SHARE TRANSACTIONS (NOTE 3): | | | | | | | | | | |
| Net proceeds from shares sold | | | | 54,049,915 | | | | | 97,147,550 | |
| Dividends reinvested | | | | 3,806,864 | | | | | 2,394,461 | |
| Redemption fees | | | | 7,450 | | | | | 30,630 | |
| Cost of shares redeemed | | | | (28,299,699 | ) | | | | (18,959,074 | ) |
| Increase in net assets from capital share transactions | | | | 29,564,530 | | | | | 80,613,567 | |
| Net increase in net assets | | | | 33,543,898 | | | | | 96,498,925 | |
| | | | | | | | | | | |
| NET ASSETS: | | | | | | | | | | |
| Beginning of period | | | | 145,217,971 | | | | | 48,719,046 | |
| End of period* | | | $ | 178,761,869 | | | | $ | 145,217,971 | |
| * Including undistributed net investment income of: | | | $ | 1,334,470 | | | | $ | 554,928 | |
The accompanying notes are an integral part of these financial statements.
65
Alpine Mutual Funds
Statements of Changes in Net Assets—Continued
| | | Global Consumer Growth Fund |
| | | Six Months Ended
April 30, 2014 | | Year Ended
October 31, 2013 |
| | | (Unaudited) | | |
| OPERATIONS: | | | | | | | | | | |
| Net investment income (loss) | | | $ | (67 | ) | | | $ | 7,311 | |
| Net realized gain (loss) from: | | | | | | | | | | |
| Investments | | | | (6,351 | ) | | | | (6,978 | ) |
| Foreign currency transactions | | | | (55 | ) | | | | 726 | |
| Change in net unrealized appreciation/(depreciation) on: | | | | | | | | | | |
| Investments | | | | (3,401 | ) | | | | 421,161 | |
| Foreign currency translations | | | | 24 | | | | | 32 | |
| Increase (decrease) in net assets from operations | | | | (9,850 | ) | | | | 422,252 | |
| | | | | | | | | | | |
| DISTRIBUTIONS TO SHAREHOLDERS: | | | | | | | | | | |
| Distributions to Institutional Class Shareholders: | | | | | | | | | | |
| From net investment income | | | | (7,024 | ) | | | | (9,476 | ) |
| Distributions to Class A Shareholders: | | | | | | | | | | |
| From net investment income | | | | (9 | ) | | | | (227 | ) |
| Decrease in net assets from distributions to shareholders | | | | (7,033 | ) | | | | (9,703 | ) |
| | | | | | | | | | | |
| CAPITAL SHARE TRANSACTIONS (NOTE 3): | | | | | | | | | | |
| Net proceeds from shares sold | | | | 63,651 | | | | | 304,035 | |
| Dividends reinvested | | | | 6,966 | | | | | 9,612 | |
| Cost of shares redeemed | | | | (59,206 | ) | | | | (207,128 | ) |
| Increase in net assets from capital share transactions | | | | 11,411 | | | | | 106,519 | |
| Net increase (decrease) in net assets | | | | (5,472 | ) | | | | 519,068 | |
| | | | | | | | | | | |
| NET ASSETS: | | | | | | | | | | |
| Beginning of period | | | | 2,850,100 | | | | | 2,331,032 | |
| End of period* | | | $ | 2,844,628 | | | | $ | 2,850,100 | |
| * Including undistributed (accumulated) net investment income (loss) of: | | | $ | (72 | ) | | | $ | 7,028 | |
The accompanying notes are an integral part of these financial statements.
66
Alpine Mutual Funds
Financial Highlights
(For a share outstanding throughout each period)
| | | International Real Estate Equity Fund | |
| | | Six Months | | | | | | | | | | | | | | | |
| | | Ended | | Year Ended | |
| | | April 30, | | October 31, | |
| | | 2014 | | 2013 | | | 2012 | | | 2011 | | | 2010 | | | 2009 | |
| | | (Unaudited) | | | | | | | | | | | | | | | |
| Institutional Class: | | | | | | | | | | | | | | | | | | | | | | | | | |
| Net asset value per share, beginning of period | | | $ | 23.87 | | | $ | 22.23 | | | $ | 20.53 | | | $ | 25.75 | | | $ | 22.59 | | | $ | 12.26 | |
| Income from investment operations: | | | | | | | | | | | | | | | | | | | | | | | | | |
| Net investment income (loss) | | | | (0.14 | ) | | | (0.35 | ) | | | 0.01 | | | | 0.30 | | | | (0.08 | ) | | | 0.20 | (a) |
| Net realized and unrealized gain (loss) | | | | (0.16 | ) | | | 2.09 | | | | 2.23 | | | | (4.84 | ) | | | 4.03 | | | | 10.12 | |
| Total from investment operations | | | | (0.30 | ) | | | 1.74 | | | | 2.24 | | | | (4.54 | ) | | | 3.95 | | | | 10.32 | |
| Redemption fees | | | | 0.00 | (b) | | | 0.00 | (b) | | | 0.00 | (b) | | | 0.00 | (b) | | | 0.00 | (b) | | | 0.01 | |
| Less distributions: | | | | | | | | | | | | | | | | | | | | | | | | | |
| From net investment income | | | | (0.05 | ) | | | (0.10 | ) | | | (0.54 | ) | | | (0.68 | ) | | | (0.79 | ) | | | — | |
| Total distributions | | | | (0.05 | ) | | | (0.10 | ) | | | (0.54 | ) | | | (0.68 | ) | | | (0.79 | ) | | | — | |
| Net asset value per share, end of period | | | $ | 23.52 | | | $ | 23.87 | | | $ | 22.23 | | | $ | 20.53 | | | $ | 25.75 | | | $ | 22.59 | |
| Total return | | | | (1.26 | )%(c) | | | 7.83 | % | | | 11.57 | % | | | (18.17 | )% | | | 18.07 | % | | | 84.26 | % |
| Ratios/Supplemental Data: | | | | | | | | | | | | | | | | | | | | | | | | | |
| Net Assets at end of period (000) | | | $ | 182,684 | | | $ | 206,580 | | | $ | 299,965 | | | $ | 355,433 | | | $ | 608,488 | | | $ | 730,844 | |
| Ratio of total expenses to average net assets (d) | | | | 1.55 | %(e) | | | 1.48 | % | | | 1.47 | % | | | 1.37 | % | | | 1.28 | % | | | 1.26 | % |
| Ratio of net investment income (loss) to average net assets | | | | (0.50 | )%(e) | | | (0.32 | )% | | | 0.51 | % | | | 1.89 | % | | | 0.32 | % | | | 1.13 | % |
| Portfolio turnover (f) | | | | 6 | %(c) | | | 19 | % | | | 12 | % | | | 20 | % | | | 34 | % | | | 51 | % |
| (a) | Net investment income per share is calculated using ending balances after consideration of adjustments for permanent book and tax differences. |
| | |
| (b) | The amount is less than $0.005 per share. |
| | |
| (c) | Not annualized. |
| | |
| (d) | Ratio of total expenses to average net assets excluding interest expense was 1.53% for the six months ended April 30, 2014, and 1.44%, 1.39%, 1.26%, 1.20%, and 1.19% for the years ended October 31, 2013, 2012, 2011, 2010 and 2009, respectively. |
| | |
| (e) | Annualized. |
| | |
| (f) | Portfolio turnover is calculated on the basis of the Fund as a whole, without distinguishing between classes of shares issued. |
The accompanying notes are an integral part of these financial statements.
67
Alpine Mutual Funds
Financial Highlights—Continued
(For a share outstanding throughout each period)
| | | International Real Estate Equity Fund |
| | | Six Months | | Year | | Period |
| | | Ended | | Ended | | Ended |
| | | April 30, 2014 | | October 31, 2013 | | October 31, 2012 (a) |
| | | (Unaudited) | | | | | | | | |
| Class A: | | | | | | | | | | | | |
| Net asset value per share, beginning of period | | | $ | 23.81 | | | | $ | 22.19 | | | | $ | 17.92 | |
| Income from investment operations: | | | | | | | | | | | | | | | |
| Net investment income (loss) | | | | (0.08 | ) | | | | (0.12 | ) | | | | 0.08 | |
| Net realized and unrealized gain (loss) | | | | (0.27 | ) | | | | 1.79 | | | | | 4.19 | |
| Total from investment operations | | | | (0.35 | ) | | | | 1.67 | | | | | 4.27 | |
| Redemption fees | | | | 0.00 | (b) | | | | 0.00 | (b) | | | | — | |
| Less distributions: | | | | | | | | | | | | | | | |
| From net investment income | | | | — | | | | | (0.05 | ) | | | | — | |
| Total distributions | | | | — | | | | | (0.05 | ) | | | | — | |
| Net asset value per share, end of period | | | $ | 23.46 | | | | $ | 23.81 | | | | $ | 22.19 | |
| Total return | | | | (1.47 | )%(c) | | | | 7.53 | % | | | | 23.83 | %(c) |
| Ratios/Supplemental Data | | | | | | | | | | | | | | | |
| Net Assets at end of period (000) | | | $ | 144 | | | | $ | 146 | | | | $ | 128 | |
| Ratio of total expenses to average net assets (d) | | | | 1.80 | %(e) | | | | 1.73 | % | | | | 1.72 | %(e) |
| Ratio of net investment income (loss) to average net assets | | | | (0.73 | )%(e) | | | | (0.46 | )% | | | | 0.48 | %(e) |
| Portfolio turnover (f) | | | | 6 | %(c) | | | | 19 | % | | | | 12 | % |
| (a) | Class A commenced operations on December 30, 2011. |
| | |
| (b) | The amount is less than $0.005 per share. |
| | |
| (c) | Not annualized. |
| | |
| (d) | Ratio of total expenses to average net assets excluding interest expense was 1.78% for the six months ended April 30, 2014, 1.69% for the year ended October 31, 2013, and 1.64% for the period ended October 31, 2012. |
| | |
| (e) | Annualized. |
| | |
| (f) | Portfolio turnover is calculated on the basis of the Fund as a whole, without distinguishing between classes of shares issued. |
The accompanying notes are an integral part of these financial statements.
68
Alpine Mutual Funds
Financial Highlights—Continued
(For a share outstanding throughout each period)
| | | Realty Income & Growth Fund | |
| | | Six Months | | | | | | | | | | | | | | | |
| | | Ended | | Year Ended | |
| | | April 30, | | October 31, | |
| | | 2014 | | 2013 | | | 2012 | | | 2011 | | | 2010 | | | 2009 | |
| | | (Unaudited) | | | | | | | | | | | | | | | |
| Institutional Class: | | | | | | | | | | | | | | | | | | | | | | | | | |
| Net asset value per share, beginning of period | | | $ | 18.17 | | | $ | 17.37 | | | $ | 15.56 | | | $ | 14.79 | | | $ | 10.89 | | | $ | 9.95 | |
| Income from investment operations: | | | | | | | | | | | | | | | | | | | | | | | | | |
| Net investment income | | | | 0.40 | | | | 0.54 | | | | 0.46 | | | | 0.48 | | | | 0.56 | | | | 0.79 | (a) |
| Net realized and unrealized gain | | | | 1.38 | | | | 1.01 | | | | 2.07 | | | | 1.01 | | | | 4.06 | | | | 0.94 | |
| Total from investment operations | | | | 1.78 | | | | 1.55 | | | | 2.53 | | | | 1.49 | | | | 4.62 | | | | 1.73 | |
| Redemption fees | | | | 0.00 | (b) | | | 0.00 | (b) | | | 0.00 | (b) | | | 0.00 | (b) | | | 0.00 | (b) | | | 0.00 | (b) |
| Less distributions: | | | | | | | | | | | | | | | | | | | | | | | | | |
| From net investment income | | | | (0.38 | ) | | | (0.65 | ) | | | (0.72 | ) | | | (0.72 | ) | | | (0.65 | ) | | | (0.62 | ) |
| From net realized gains | | | | — | | | | (0.10 | ) | | | — | | | | — | | | | (0.07 | ) | | | — | |
| Tax return of capital | | | | — | | | | — | | | | — | | | | — | | | | — | | | | (0.17 | ) |
| Total distributions | | | | (0.38 | ) | | | (0.75 | ) | | | (0.72 | ) | | | (0.72 | ) | | | (0.72 | ) | | | (0.79 | ) |
| Net asset value per share, end of period | | | $ | 19.57 | | | $ | 18.17 | | | $ | 17.37 | | | $ | 15.56 | | | $ | 14.79 | | | $ | 10.89 | |
| Total return | | | | 9.95 | %(c) | | | 9.02 | % | | | 16.44 | % | | | 10.23 | % | | | 43.51 | % | | | 20.23 | % |
| Ratios/Supplemental Data: | | | | | | | | | | | | | | | | | | | | | | | | | |
| Net Assets at end of period (000) | | | $ | 105,283 | | | $ | 98,798 | | | $ | 106,304 | | | $ | 101,322 | | | $ | 108,941 | | | $ | 84,795 | |
| Ratio of total expenses to average net assets: | | | | | | | | | | | | | | | | | | | | | | | | | |
| Before waivers and/or expense reimbursements (d) | | | | 1.48 | %(e) | | | 1.50 | % | | | 1.41 | % | | | 1.32 | % | | | 1.34 | % | | | 1.39 | % |
| After waivers and/or expense reimbursements (f) | | | | 1.42 | %(e) | | | 1.43 | % | | | 1.41 | % | | | 1.32 | % | | | 1.34 | % | | | 1.39 | % |
| Ratio of net investment income to average net assets | | | | 4.33 | %(e) | | | 2.99 | % | | | 2.73 | % | | | 3.09 | % | | | 4.24 | % | | | 8.57 | % |
| Portfolio turnover (g) | | | | 12 | %(c) | | | 33 | % | | | 28 | % | | | 59 | % | | | 70 | % | | | 111 | % |
| (a) | Net investment income per share is calculated using ending balances after consideration of adjustments for permanent book and tax differences. |
| | |
| (b) | The amount is less than $0.005 per share. |
| | |
| (c) | Not annualized. |
| | |
| (d) | Ratio of total expenses to average net assets excluding interest expense before waivers and/or expense reimbursements was 1.41% for the six months ended April 30, 2014, and 1.42%, 1.33%, 1.23%, 1.24%, and 1.27% for the years ended October 31, 2013, 2012, 2011, 2010 and 2009, respectively. |
| | |
| (e) | Annualized. |
| | |
| (f) | Ratio of total expenses to average net assets excluding interest expense after waivers and/or expense reimbursements was 1.35% for the six months ended April 30, 2014, and 1.35%, 1.33%, 1.23%, 1.24%, and 1.27% for the years ended October 31, 2013, 2012, 2011, 2010 and 2009, respectively. |
| | |
| (g) | Portfolio turnover is calculated on the basis of the Fund as a whole, without distinguishing between classes of shares issued. |
The accompanying notes are an integral part of these financial statements.
69
Alpine Mutual Funds
Financial Highlights—Continued
(For a share outstanding throughout each period)
| | | Realty Income & Growth Fund |
| | | Six Months | | Year | | Period |
| | | Ended | | Ended | | Ended |
| | | April 30, 2014 | | October 31, 2013 | | October 31, 2012 (a) |
| | | (Unaudited) | | | | | | | | |
| Class A: | | | | | | | | | | | | | | | |
| Net asset value per share, beginning of period | | | $ | 18.16 | | | | $ | 17.35 | | | | $ | 15.60 | |
| Income from investment operations: | | | | | | | | | | | | | | | |
| Net investment income | | | | 0.36 | | | | | 0.59 | | | | | 0.32 | |
| Net realized and unrealized gain | | | | 1.38 | | | | | 0.93 | | | | | 1.95 | |
| Total from investment operations | | | | 1.74 | | | | | 1.52 | | | | | 2.27 | |
| Redemption fees | | | | 0.00 | (b) | | | | 0.00 | (b) | | | | 0.00 | (b) |
| Less distributions: | | | | | | | | | | | | | | | |
| From net investment income | | | | (0.35 | ) | | | | (0.61 | ) | | | | (0.52 | ) |
| From net realized gains | | | | — | | | | | (0.10 | ) | | | | — | |
| Total distributions | | | | (0.35 | ) | | | | (0.71 | ) | | | | (0.52 | ) |
| Net asset value per share, end of period | | | $ | 19.55 | | | | $ | 18.16 | | | | $ | 17.35 | |
| Total return | | | | 9.78 | %(c) | | | | 8.85 | % | | | | 14.53 | %(c) |
| Ratios/Supplemental Data | | | | | | | | | | | | | | | |
| Net Assets at end of period (000) | | | $ | 2,334 | | | | $ | 1,168 | | | | $ | 115 | |
| Ratio of total expenses to average net assets: | | | | | | | | | | | | | | | |
| Before waivers and/or expense reimbursements (d) | | | | 1.73 | %(e) | | | | 1.75 | % | | | | 1.66 | %(e) |
| After waivers and/or expense reimbursements (f) | | | | 1.67 | %(e) | | | | 1.67 | % | | | | 1.66 | %(e) |
| Ratio of net investment income to average net assets | | | | 4.08 | %(e) | | | | 3.00 | % | | | | 2.18 | %(e) |
| Portfolio turnover (g) | | | | 12 | %(c) | | | | 33 | % | | | | 28 | % |
| (a) | Class A commenced operations on December 30, 2011. |
| | |
| (b) | The amount is less than $0.005 per share. |
| | |
| (c) | Not annualized. |
| | |
| (d) | Ratio of total expenses to average net assets excluding interest expense before waivers and/or expense reimbursements was 1.67% for the six months ended April 30, 2014, 1.67% for the year ended October 31, 2013, and 1.58% for the period ended October 31, 2012. |
| | |
| (e) | Annualized. |
| | |
| (f) | Ratio of total expenses to average net assets excluding interest expense after waivers and/or expense reimbursements was 1.60% for the six months ended April 30, 2014, 1.59% for the year ended October 31, 2013, and 1.58% for the period ended October 31, 2012. |
| | |
| (g) | Portfolio turnover is calculated on the basis of the Fund as a whole, without distinguishing between classes of shares issued. |
The accompanying notes are an integral part of these financial statements.
70
Alpine Mutual Funds
Financial Highlights—Continued
(For a share outstanding throughout each period)
| | | Cyclical Advantage Property Fund | |
| | | Six Months | | | | | | | | | | | | | | | |
| | | Ended | | Year Ended | |
| | | April 30, | | October 31, | |
| | | 2014 | | 2013 | | | 2012 | | | 2011 | | | 2010 | | | 2009 | |
| | | (Unaudited) | | | | | | | | | | | | | | | |
| Institutional Class: | | | | | | | | | | | | | | | | | | | | | | | | | |
| Net asset value per share, beginning of period | | | $ | 26.33 | | | $ | 23.64 | | | $ | 18.13 | | | $ | 20.27 | | | $ | 16.65 | | | $ | 13.86 | |
| Income from investment operations: | | | | | | | | | | | | | | | | | | | | | | | | | |
| Net investment income | | | | 0.31 | | | | 0.49 | | | | 0.07 | | | | 0.07 | | | | 0.09 | | | | 0.26 | (a) |
| Net realized and unrealized gain (loss) | | | | (0.99 | ) | | | 2.41 | | | | 5.53 | | | | (2.12 | ) | | | 3.77 | | | | 2.65 | |
| Total from investment operations | | | | (0.68 | ) | | | 2.90 | | | | 5.60 | | | | (2.05 | ) | | | 3.86 | | | | 2.91 | |
| Redemption fees | | | | 0.00 | (b) | | | 0.00 | (b) | | | 0.00 | (b) | | | 0.00 | (b) | | | 0.00 | (b) | | | 0.00 | (b) |
| Less distributions: | | | | | | | | | | | | | | | | | | | | | | | | | |
| From net investment income | | | | (0.53 | ) | | | (0.21 | ) | | | (0.09 | ) | | | (0.09 | ) | | | (0.24 | ) | | | (0.12 | ) |
| Total distributions | | | | (0.53 | ) | | | (0.21 | ) | | | (0.09 | ) | | | (0.09 | ) | | | (0.24 | ) | | | (0.12 | ) |
| Net asset value per share, end of period | | | $ | 25.12 | | | $ | 26.33 | | | $ | 23.64 | | | $ | 18.13 | | | $ | 20.27 | | | $ | 16.65 | |
| Total return | | | | (2.60 | )%(c) | | | 12.33 | % | | | 31.11 | % | | | (10.19 | )% | | | 23.36 | % | | | 21.14 | % |
| Ratios/Supplemental Data: | | | | | | | | | | | | | | | | | | | | | | | | | |
| Net Assets at end of period (000) | | | $ | 57,678 | | | $ | 61,808 | | | $ | 59,624 | | | $ | 49,090 | | | $ | 62,044 | | | $ | 55,064 | |
| Ratio of total expenses to average net assets (d) | | | | 1.51 | %(e) | | | 1.43 | % | | | 1.51 | % | | | 1.38 | % | | | 1.32 | % | | | 1.45 | % |
| Ratio of net investment income to average net assets | | | | 2.47 | %(e) | | | 1.90 | % | | | 0.41 | % | | | 0.36 | % | | | 0.51 | % | | | 2.28 | % |
| Portfolio turnover | | | | 16 | %(c) | | | 60 | % | | | 24 | % | | | 59 | % | | | 90 | % | | | 135 | % |
| (a) | Net investment income per share is calculated using ending balances after consideration of adjustments for permanent book and tax differences. |
| | |
| (b) | The amount is less than $0.005 per share. |
| | |
| (c) | Not annualized. |
| | |
| (d) | Ratio of total expenses to average net assets excluding interest expense was 1.44% for the six months ended April 30, 2014, and 1.41%, 1.50%, 1.35%, 1.30%, and 1.34% for the years ended October 31, 2013, 2012, 2011, 2010 and 2009, respectively. |
| | |
| (e) | Annualized. |
The accompanying notes are an integral part of these financial statements.
71
Alpine Mutual Funds
Financial Highlights—Continued
(For a share outstanding throughout each period)
| | | Emerging Markets Real Estate Fund | |
| | | Six Months | | | | | | | | | | | | | | | | | | Period | |
| | | Ended | | | Year Ended | | Ended | |
| | | April 30, | | | October 31, | | October 31, | |
| | | 2014 | | | 2013 | | | | 2012 | | | | 2011 | | | | 2010 | | | 2009 (a) | |
| | | (Unaudited) | | | | | | | | | | | | | | | | | | | | | | | | | |
| Institutional Class: | | | | | | | | | | | | | | | | | | | | | | | | | | | | | | |
| Net asset value per share, beginning of period | | | $ | 17.37 | | | | $ | 17.16 | | | | $ | 14.68 | | | | $ | 19.20 | | | | $ | 17.03 | | | | $ | 10.00 | |
| Income from investment operations: | | | | | | | | | | | | | | | | | | | | | | | | | | | | | | |
| Net investment income (loss) | | | | 0.09 | | | | | 0.25 | | | | | 0.12 | | | | | 0.40 | | | | | 0.27 | | | | | (0.08 | )(b) |
| Net realized and unrealized gain (loss) | | | | (0.95 | ) | | | | 0.13 | | | | | 2.36 | | | | | (3.47 | ) | | | | 3.43 | | | | | 7.10 | |
| Total from investment operations | | | | (0.86 | ) | | | | 0.38 | | | | | 2.48 | | | | | (3.07 | ) | | | | 3.70 | | | | | 7.02 | |
| Redemption fees | | | | 0.02 | | | | | 0.04 | | | | | 0.00 | (c) | | | | 0.00 | (c) | | | | 0.00 | (c) | | | | 0.01 | |
| Less distributions: | | | | | | | | | | | | | | | | | | | | | | | | | | | | | | |
| From net investment income | | | | (0.27 | ) | | | | (0.21 | ) | | | | — | | | | | (0.08 | ) | | | | (0.87 | ) | | | | — | |
| From net realized gains | | | | (0.15 | ) | | | | — | | | | | — | | | | | (1.37 | ) | | | | (0.66 | ) | | | | — | |
| Total distributions | | | | (0.42 | ) | | | | (0.21 | ) | | | | — | | | | | (1.45 | ) | | | | (1.53 | ) | | | | — | |
| Net asset value per share, end of period | | | $ | 16.11 | | | | $ | 17.37 | | | | $ | 17.16 | | | | $ | 14.68 | | | | $ | 19.20 | | | | $ | 17.03 | |
| Total return | | | | (4.75 | )%(d) | | | | 2.36 | % | | | | 16.89 | % | | | | (17.52 | )% | | | | 23.53 | % | | | | 70.30 | %(d) |
| Ratios/Supplemental Data: | | | | | | | | | | | | | | | | | | | | | | | | | | | | | | |
| Net Assets at end of period (000) | | | $ | 5,008 | | | | $ | 9,051 | | | | $ | 4,288 | | | | $ | 4,289 | | | | $ | 3,269 | | | | $ | 2,047 | |
| Ratio of total expenses to average net assets: | | | | | | | | | | | | | | | | | | | | | | | | | | | | | | |
| Before waivers and/or expense reimbursements (e) | | | | 2.59 | %(f) | | | | 2.35 | % | | | | 2.95 | % | | | | 2.42 | % | | | | 2.68 | % | | | | 4.36 | %(f) |
| After waivers and/or expense reimbursements (g) | | | | 1.36 | %(f) | | | | 1.35 | % | | | | 1.35 | % | | | | 1.35 | % | | | | 1.35 | % | | | | 1.35 | %(f) |
| Ratio of net investment income (loss) to average net assets | | | | 0.27 | %(f) | | | | 1.22 | % | | | | 0.97 | % | | | | 0.54 | % | | | | 0.13 | % | | | | (0.76 | )%(f) |
| Portfolio turnover (h) | | | | 42 | %(d) | | | | 120 | % | | | | 102 | % | | | | 58 | % | | | | 77 | % | | | | 35 | % |
| (a) | For the period from November 3, 2008 (inception of Fund) to October 31, 2009. |
| | |
| (b) | Net investment loss per share is calculated using ending balances after consideration of adjustments for permanent book and tax differences. |
| | |
| (c) | The amount is less than $0.005 per share. |
| | |
| (d) | Not annualized. |
| | |
| (e) | Ratio of total expenses to average net assets excluding interest expense before waivers and/or expense reimbursements was 2.58% for the six months ended April 30, 2014, 2.35%, 2.95%, 2.42%, and 2.68% for the years ended October 31, 2013, 2012, 2011 and 2010, respectively, and 4.36% for the period ended October 31, 2009. |
| | |
| (f) | Annualized. |
| | |
| (g) | Ratio of total expenses to average net assets excluding interest expense after waivers and/or expense reimbursements was 1.35% for the six months ended April 30, 2014, 1.35%, 1.35%, 1.35%, and 1.35% for the years ended October 31, 2013, 2012, 2011 and 2010, respectively, and 1.35% for the period ended October 31, 2009. |
| | |
| (h) | Portfolio turnover is calculated on the basis of the Fund as a whole, without distinguishing between classes of shares issued. |
The accompanying notes are an integral part of these financial statements.
72
Alpine Mutual Funds
Financial Highlights—Continued
(For a share outstanding throughout each period)
| | | Emerging Markets Real Estate Fund |
| | | Six Months | | Year | | Period |
| | | Ended | | Ended | | Ended |
| | | April 30, 2014 | | October 31, 2013 | | October 31, 2012 (a) |
| | | (Unaudited) | | | | | | | | |
| Class A: | | | | | | | | | | | | | | | |
| Net asset value per share, beginning of period | | | $ | 17.32 | | | | $ | 17.13 | | | | $ | 13.45 | |
| Income from investment operations: | | | | | | | | | | | | | | | |
| Net investment income | | | | 0.02 | | | | | 0.05 | | | | | 0.13 | |
| Net realized and unrealized gain (loss) | | | | (0.90 | ) | | | | 0.29 | | | | | 3.55 | |
| Total from investment operations | | | | (0.88 | ) | | | | 0.34 | | | | | 3.68 | |
| Redemption fees | | | | 0.02 | | | | | 0.03 | | | | | — | |
| Less distributions: | | | | | | | | | | | | | | | |
| From net investment income | | | | (0.22 | ) | | | | (0.18 | ) | | | | — | |
| From net realized gains | | | | (0.15 | ) | | | | — | | | | | — | |
| Total distributions | | | | (0.37 | ) | | | | (0.18 | ) | | | | — | |
| Net asset value per share, end of period | | | $ | 16.09 | | | | $ | 17.32 | | | | $ | 17.13 | |
| Total return | | | | (4.85 | )%(b) | | | | 2.10 | % | | | | 27.36 | %(b) |
| Ratios/Supplemental Data | | | | | | | | | | | | | | | |
| Net Assets at end of period (000) | | | $ | 702 | | | | $ | 708 | | | | $ | 140 | |
| Ratio of total expenses to average net assets: | | | | | | | | | | | | | | | |
| Before waivers and/or expense reimbursements (c) | | | | 2.84 | %(d) | | | | 2.60 | % | | | | 3.01 | %(d) |
| After waivers and/or expense reimbursements (e) | | | | 1.62 | %(d) | | | | 1.60 | % | | | | 1.61 | %(d) |
| Ratio of net investment income to average net assets | | | | 0.31 | %(d) | | | | 0.93 | % | | | | 1.05 | %(d) |
| Portfolio turnover (f) | | | | 42 | %(b) | | | | 120 | % | | | | 102 | % |
| (a) | Class A commenced operations on December 30, 2011. |
| | |
| (b) | Not annualized. |
| | |
| (c) | Ratio of total expenses to average net assets excluding interest expense before waivers and/or expense reimbursements was 2.82% for the six months ended April 30, 2014, 2.60% for the year ended October 31, 2013, and 3.01% for the period ended October 31, 2012. |
| | |
| (d) | Annualized. |
| | |
| (e) | Ratio of total expenses to average net assets excluding interest expense after waivers and/or expense reimbursements was 1.60% for the six months ended April 30, 2014, 1.60% for the year ended October 31, 2013, and 1.61% for the period ended October 31, 2012. |
| | |
| (f) | Portfolio turnover is calculated on the basis of the Fund as a whole, without distinguishing between classes of shares issued. |
The accompanying notes are an integral part of these financial statements.
73
Alpine Mutual Funds
Financial Highlights—Continued
(For a share outstanding throughout each period)
| | | Global Infrastructure Fund | |
| | | Six Months | | | | | | | | | | | | | | | | | | Period | |
| | | Ended | | | Year Ended | | Ended | |
| | | April 30, | | | October 31, | | October 31, | |
| | | 2014 | | | 2013 | | | | 2012 | | | | 2011 | | | | 2010 | | | 2009 (a) | |
| | | (Unaudited) | | | | | | | | | | | | | | | | | | | | |
| Institutional Class: | | | | | | | | | | | | | | | | | | | | | | | | | | | | | | |
| Net asset value per share, beginning of period | | | $ | 19.24 | | | | $ | 15.93 | | | | $ | 14.32 | | | | $ | 15.98 | | | | $ | 13.38 | | | | $ | 10.00 | |
| Income from investment operations: | | | | | | | | | | | | | | | | | | | | | | | | | | | | | | |
| Net investment income | | | | 0.42 | | | | | 0.71 | | | | | 0.65 | | | | | 0.61 | | | | | 0.43 | | | | | 0.19 | (b) |
| Net realized and unrealized gain (loss) | | | | 0.68 | | | | | 3.25 | | | | | 1.60 | | | | | (0.72 | ) | | | | 3.40 | | | | | 3.19 | |
| Total from investment operations | | | | 1.10 | | | | | 3.96 | | | | | 2.25 | | | | | (0.11 | ) | | | | 3.83 | | | | | 3.38 | |
| Redemption fees | | | | 0.00 | (c) | | | | 0.01 | | | | | 0.00 | (c) | | | | 0.00 | (c) | | | | 0.00 | (c) | | | | 0.00 | (c) |
| Less distributions: | | | | | | | | | | | | | | | | | | | | | | | | | | | | | | |
| From net investment income | | | | (0.35 | ) | | | | (0.66 | ) | | | | (0.64 | ) | | | | (0.99 | ) | | | | (0.20 | ) | | | | — | |
| From net realized gains | | | | (0.35 | ) | | | | — | | | | | — | | | | | (0.55 | ) | | | | (1.03 | ) | | | | — | |
| Tax return of capital | | | | — | | | | | — | | | | | — | | | | | (0.01 | ) | | | | — | | | | | — | |
| Total distributions | | | | (0.70 | ) | | | | (0.66 | ) | | | | (0.64 | ) | | | | (1.55 | ) | | | | (1.23 | ) | | | | — | |
| Net asset value per share, end of period | | | $ | 19.64 | | | | $ | 19.24 | | | | $ | 15.93 | | | | $ | 14.32 | | | | $ | 15.98 | | | | $ | 13.38 | |
| Total return | | | | 5.89 | %(d) | | | | 25.35 | % | | | | 16.09 | % | | | | (1.03 | )% | | | | 30.23 | % | | | | 33.80 | %(d) |
| Ratios/Supplemental Data: | | | | | | | | | | | | | | | | | | | | | | | | | | | | | | |
| Net Assets at end of period (000) | | | $ | 154,875 | | | | $ | 125,277 | | | | $ | 46,998 | | | | $ | 29,028 | | | | $ | 2,245 | | | | $ | 1,422 | |
| Ratio of total expenses to average net assets: | | | | | | | | | | | | | | | | | | | | | | | | | | | | | | |
| Before waivers and/or expense reimbursements (e) | | | | 1.19 | %(f) | | | | 1.24 | % | | | | 1.33 | % | | | | 1.59 | % | | | | 3.03 | % | | | | 4.42 | %(f) |
| After waivers and/or expense reimbursements (g) | | | | 1.19 | %(f) | | | | 1.24 | % | | | | 1.33 | % | | | | 1.35 | % | | | | 1.35 | % | | | | 1.35 | %(f) |
| Ratio of net investment income to average net assets | | | | 4.77 | %(f) | | | | 4.18 | % | | | | 4.30 | % | | | | 4.17 | % | | | | 3.40 | % | | | | 1.76 | %(f) |
| Portfolio turnover (h) | | | | 63 | %(d) | | | | 147 | % | | | | 148 | % | | | | 189 | % | | | | 402 | % | | | | 258 | % |
| (a) | For the period from November 3, 2008 (inception of Fund) to October 31, 2009. |
| | |
| (b) | Net investment income per share is calculated using ending balances after consideration of adjustments for permanent book and tax differences. |
| | |
| (c) | The amount is less than $0.005 per share. |
| | |
| (d) | Not annualized. |
| | |
| (e) | Ratio of total expenses to average net assets excluding interest expense before waivers and/or expense reimbursements was 1.19% for the six months ended April 30, 2014, 1.24%, 1.33%, 1.59%, and 3.03% for the years ended October 31, 2013, 2012, 2011 and 2010, respectively, and 4.42% for the period ended October 31, 2009. |
| | |
| (f) | Annualized. |
| | |
| (g) | Ratio of total expenses to average net assets excluding interest expense after waivers and/or expense reimbursements was 1.19% for the six months ended April 30, 2014, 1.24%, 1.33%, 1.35%, and 1.35% for the years ended October 31, 2013, 2012, 2011 and 2010, respectively, and 1.35% for the period ended October 31, 2009. |
| | |
| (h) | Portfolio turnover is calculated on the basis of the Fund as a whole, without distinguishing between classes of shares issued. |
The accompanying notes are an integral part of these financial statements.
74
Alpine Mutual Funds
Financial Highlights—Continued
(For a share outstanding throughout each period)
| | | Global Infrastructure Fund |
| | | Six Months | | Year | | Period |
| | | Ended | | Ended | | Ended |
| | | April 30, 2014 | | October 31, 2013 | | October 31, 2012 (a) |
| | | (Unaudited) | | | | | | | | |
| Class A: | | | | | | | | | | | | | | | |
| Net asset value per share, beginning of period | | | $ | 19.22 | | | | $ | 15.92 | | | | $ | 13.91 | |
| Income from investment operations: | | | | | | | | | | | | | | | |
| Net investment income | | | | 0.41 | | | | | 0.69 | | | | | 0.43 | |
| Net realized and unrealized gain | | | | 0.66 | | | | | 3.22 | | | | | 2.04 | |
| Total from investment operations | | | | 1.07 | | | | | 3.91 | | | | | 2.47 | |
| Redemption fees | | | | 0.00 | (b) | | | | 0.01 | | | | | 0.00 | (b) |
| Less distributions: | | | | | | | | | | | | | | | |
| From net investment income | | | | (0.33 | ) | | | | (0.62 | ) | | | | (0.46 | ) |
| From net realized gains | | | | (0.35 | ) | | | | — | | | | | — | |
| Total distributions | | | | (0.68 | ) | | | | (0.62 | ) | | | | (0.46 | ) |
| Net asset value per share, end of period | | | $ | 19.61 | | | | $ | 19.22 | | | | $ | 15.92 | |
| Total return | | | | 5.73 | %(c) | | | | 25.04 | % | | | | 17.94 | %(c) |
| Ratios/Supplemental Data | | | | | | | | | | | | | | | |
| Net Assets at end of period (000) | | | $ | 23,887 | | | | $ | 19,941 | | | | $ | 1,721 | |
| Ratio of total expenses to average net assets: | | | | | | | | | | | | | | | |
| Before waivers and/or expense reimbursements | | | | 1.44 | %(d) | | | | 1.49 | % | | | | 1.67 | %(d) |
| After waivers and/or expense reimbursements | | | | 1.44 | %(d) | | | | 1.49 | % | | | | 1.60 | %(d) |
| Ratio of net investment income to average net assets | | | | 4.50 | %(d) | | | | 3.67 | % | | | | 3.67 | %(d) |
| Portfolio turnover (e) | | | | 63 | %(c) | | | | 147 | % | | | | 148 | % |
| (a) | Class A commenced operations on December 30, 2011. |
| | |
| (b) | The amount is less than $0.005 per share. |
| | |
| (c) | Not annualized. |
| | |
| (d) | Annualized. |
| | |
| (e) | Portfolio turnover is calculated on the basis of the Fund as a whole, without distinguishing between classes of shares issued. |
The accompanying notes are an integral part of these financial statements.
75
Alpine Mutual Funds
Financial Highlights—Continued
(For a share outstanding throughout each period)
| | | Global Consumer Growth Fund | |
| | | Six Months | | | | | | | | | | Period | |
| | | Ended | | Year Ended | | Ended | |
| | | April 30, | | October 31, | | October 31, | |
| | | 2014 | | 2013 | | 2012 | | 2011 (a) | |
| | | (Unaudited) | | | | | | | | | | | | |
| Institutional Class: | | | | | | | | | | | | | | | | | | | | |
| Net asset value per share, beginning of period | | | $ | 12.60 | | | | $ | 10.74 | | | | $ | 9.59 | | | | $ | 10.00 | |
| Income from investment operations: | | | | | | | | | | | | | | | | | | | | |
| Net investment income | | | | 0.00 | (b) | | | | 0.03 | | | | | 0.04 | | | | | 0.04 | |
| Net realized and unrealized gain (loss) | | | | (0.03 | ) | | | | 1.88 | | | | | 1.15 | | | | | (0.45 | ) |
| Total from investment operations | | | | (0.03 | ) | | | | 1.91 | | | | | 1.19 | | | | | (0.41 | ) |
| Less distributions: | | | | | | | | | | | | | | | | | | | | |
| From net investment income | | | | (0.03 | ) | | | | (0.05 | ) | | | | (0.04 | ) | | | | — | |
| Total distributions | | | | (0.03 | ) | | | | (0.05 | ) | | | | (0.04 | ) | | | | — | |
| Net asset value per share, end of period | | | $ | 12.54 | | | | $ | 12.60 | | | | $ | 10.74 | | | | $ | 9.59 | |
| Total return | | | | (0.22 | )%(c) | | | | 17.80 | % | | | | 12.48 | % | | | | (4.10 | )%(c) |
| Ratios/Supplemental Data: | | | | | | | | | | | | | | | | | | | | |
| Net Assets at end of period (000) | | | $ | 2,674 | | | | $ | 2,621 | | | | $ | 2,211 | | | | $ | 1,945 | |
| Ratio of total expenses to average net assets: | | | | | | | | | | | | | | | | | | | | |
| Before waivers and/or expense reimbursements | | | | 3.54 | %(d) | | | | 3.80 | % | | | | 5.31 | % | | | | 2.96 | %(d) |
| After waivers and/or expense reimbursements | | | | 1.35 | %(d) | | | | 1.35 | % | | | | 1.35 | % | | | | 1.35 | %(d) |
| Ratio of net investment income to average net assets | | | | 0.02 | %(d) | | | | 0.29 | % | | | | 0.36 | % | | | | 0.54 | %(d) |
| Portfolio turnover (e) | | | | 8 | %(c) | | | | 24 | % | | | | 13 | % | | | | 7 | % |
| (a) | For the period from December 29, 2010 (commencement of operations) to October 31, 2011. |
| | |
| (b) | The amount is less than $0.005 per share. |
| | |
| (c) | Not annualized. |
| | |
| (d) | Annualized. |
| | |
| (e) | Portfolio turnover is calculated on the basis of the Fund as a whole, without distinguishing between classes of shares issued. |
The accompanying notes are an integral part of these financial statements.
76
Alpine Mutual Funds
Financial Highlights—Continued
(For a share outstanding throughout each period)
| | | Global Consumer Growth Fund |
| | | Six Months | | Year | | Period |
| | | Ended | | Ended | | Ended |
| | | April 30, 2014 | | October 31, 2013 | | October 31, 2012 (a) |
| | | (Unaudited) | | | | | | | | |
| Class A: | | | | | | | | | | | | | | | |
| Net asset value per share, beginning of period | | | $ | 12.57 | | | | $ | 10.71 | | | | $ | 8.95 | |
| Income from investment operations: | | | | | | | | | | | | | | | |
| Net investment income (loss) | | | | (0.01 | ) | | | | 0.03 | | | | | 0.02 | |
| Net realized and unrealized gain (loss) | | | | (0.04 | ) | | | | 1.85 | | | | | 1.74 | |
| Total from investment operations | | | | (0.05 | ) | | | | 1.88 | | | | | 1.76 | |
| Less distributions: | | | | | | | | | | | | | | | |
| From net investment income | | | | — | | | | | (0.02 | ) | | | | — | |
| Total distributions | | | | — | | | | | (0.02 | ) | | | | — | |
| Net asset value per share, end of period | | | $ | 12.52 | | | | $ | 12.57 | | | | $ | 10.71 | |
| Total return | | | | (0.39 | )%(b) | | | | 17.58 | % | | | | 19.66 | %(b) |
| Ratios/Supplemental Data | | | | | | | | | | | | | | | |
| Net Assets at end of period (000) | | | $ | 171 | | | | $ | 229 | | | | $ | 120 | |
| Ratio of total expenses to average net assets: | | | | | | | | | | | | | | | |
| Before waivers and/or expense reimbursements | | | | 3.79 | %(c) | | | | 4.05 | % | | | | 5.98 | %(c) |
| After waivers and/or expense reimbursements | | | | 1.60 | %(c) | | | | 1.60 | % | | | | 1.60 | %(c) |
| Ratio of net investment income (loss) to average net assets | | | | (0.29 | )%(c) | | | | 0.20 | % | | | | 0.20 | %(c) |
| Portfolio turnover (d) | | | | 8 | %(b) | | | | 24 | % | | | | 13 | % |
| (a) | Class A commenced operations on December 30, 2011. |
| | |
| (b) | Not annualized. |
| | |
| (c) | Annualized. |
| | |
| (d) | Portfolio turnover is calculated on the basis of the Fund as a whole, without distinguishing between classes of shares issued. |
The accompanying notes are an integral part of these financial statements.
77
Alpine Mutual Funds
Notes to Financial Statements
April 30, 2014 (Unaudited)
Alpine Equity Trust (the “Equity Trust”) was organized in 1988 as a Massachusetts Business Trust, and is registered under the Investment Company Act of 1940, as amended (the “1940 Act”), as an open-end management investment company. The Alpine International Real Estate Equity Fund, Alpine Realty Income & Growth Fund, Alpine Cyclical Advantage Property Fund, Alpine Emerging Markets Real Estate Fund, Alpine Global Infrastructure Fund, and Alpine Global Consumer Growth Fund are six separate series of the Equity Trust (individually referred to as a “Fund” and collectively, “the Funds”). The Alpine International Real Estate Equity Fund, Alpine Cyclical Advantage Property Fund, Alpine Emerging Markets Real Estate Fund, Alpine Global Infrastructure Fund and Alpine Global Consumer Growth Fund are diversified funds. The Alpine Realty Income & Growth Fund is a non-diversified fund. Alpine Woods Capital Investors, LLC (the “Adviser”) is a Delaware limited liability company and serves as the investment manager to the Funds. The Funds offer Institutional Class and Class A shares, except for Cyclical Advantage Property Fund which has only the Institutional Class shares. Institutional Class and Investor Class shares are sold without a sales charge. Class A shares have an initial sales charge which may be waived under certain conditions as described in the Funds’ prospectus. Class A shares may be subject to a Contingent Deferred Sales Charges (“CDSC”) for certain redemptions where no initial sales charge was paid at the time of purchase. All shares of the Funds have equal rights and privileges. Each share of a Fund is entitled to one vote on all matters as to which shares are entitled to vote, to participate equally with other shares in dividends and distributions declared by the Funds and on liquidation to their proportionate share of the assets remaining after satisfaction of outstanding liabilities, except that Class A shares bear certain expenses related to the distribution fee of such shares. Each class has exclusive voting rights with respect to matters relating to its shareholder servicing and distribution expenditures.
| 2. | Significant Accounting Policies: |
The following is a summary of significant accounting policies consistently followed by the Funds in the preparation of their financial statements. The policies are in conformity with accounting principles generally accepted in the United States of America (“GAAP”), which require management to make estimates and assumptions that affect amounts reported herein. Actual results could differ from those estimates. Changes in the economic environment, financial markets and any other parameters used in determining these estimates could cause actual results to differ.
A. Valuation of Securities:
The net asset value (“NAV”) of shares of the Funds are calculated by dividing the value of the Funds’ net assets by the number of outstanding shares. NAV is determined each day the New York Stock Exchange (“NYSE”) is open as of the close of regular trading (normally, 4:00 p.m., Eastern time). In computing NAV, portfolio securities of the Funds are valued at their current market values determined on the basis of market quotations or if market quotations are not available or determined to be unreliable, through procedures and/or guidelines established by the Board of Trustees (“Board”). In computing the Funds’ NAV, equity securities that are traded on a securities exchange in the United States, except for option securities, are valued at the last reported sale price as of the time of valuation or lacking any current reported sale at the time of valuation, at the mean between the most recent bid and asked quotations. Each option security traded on a securities exchange in the United States is valued at the last current reported sale price as of the time of valuation, or lacking any current reported sale at the time of valuation, the option is valued at the mid-point of the consolidated bid/ask quote for the option security. Forward currency contracts are valued based on third-party vendor quotations, or if market quotations are not available or determined to be unreliable, through procedures and/or guidelines established by the Board. Each security traded in the over-the-counter market and quoted on the NASDAQ National Market System, is valued at the NASDAQ Official Closing Price (“NOCP”), as determined by NASDAQ, or lacking an NOCP, the last current reported sale price as of the time of valuation by NASDAQ, or lacking any current reported sale on NASDAQ at the time of valuation, at the mean between the most recent bid and asked quotations. Each over-the-counter option that is not traded through the Options Clearing Corporation is valued by the counterparty, or if the counterparty’s price is not readily available, then by using the Black-Scholes method. Debt securities are valued based on an evaluated mean price as furnished by pricing services approved by the Board, which may be based on market transactions for comparable securities and various relationships between securities that are generally recognized by institutional traders, a computerized matrix system, or appraisals derived from information concerning the securities or similar securities received from recognized dealers in those securities. Each other security traded over-the-counter is valued at the mean between the most recent bid and asked quotations. Short-term securities with maturities of 60 days or less are valued at amortized cost, which approximates fair value.
78
Alpine Mutual Funds
Notes to Financial Statements—Continued
April 30, 2014 (Unaudited)
Equity securities that are principally traded in a foreign market are valued at the last current sale price at the time of valuation or lacking any current or reported sale, at the time of valuation, at the mean between the most recent bid and asked quotations as of the close of the appropriate exchange or other designated time. Trading in securities on European and Far Eastern securities exchanges and over-the-counter markets is normally completed at various times before the close of business on each day on which the NYSE is open. Trading of these securities may not take place on every NYSE business day. In addition, trading may take place in various foreign markets on Saturdays or on other days when the NYSE is not open and on which the Funds’ NAV is not calculated. As stated above, if the market prices are not readily available or not reflective of the fair value of the security, as of the close of the regular trading on the NYSE, the security will be priced at fair value following procedures approved by the Board.
When market quotations are not readily available or when the valuation methods mentioned above are not reflective of a fair value of the security, the security is valued at fair value following procedures and/or guidelines approved by the Board. The Funds may also use fair value pricing, if the value of a security it holds is, pursuant to the Board guidelines, materially affected by events occurring before the Funds’ pricing time but after the close of the primary market or market transactions for comparable securities and various relationships between securities that are generally recognized by institutional traders, a computerized matrix system, or appraisals derived from information concerning the securities or similar securities received from recognized dealers in those securities. The Board has approved the use of a third-party pricing vendor’s proprietary fair value pricing model to assist in determining current valuation for foreign securities traded in markets that close prior to the NYSE. When fair value pricing is employed, the value of the portfolio security used to calculate the Funds’ NAV may differ from quoted or official closing prices.
As of April 30, 2014, the International Real Estate Equity Fund held securities that are fair valued, which comprised 7.3% of the Fund’s net assets.
Fair Value Measurement:
In accordance with GAAP, the Funds use a three-tier hierarchy to establish classification of fair value measurements for disclosure purposes. Inputs refer broadly to the assumptions that market participants would use in pricing the asset or liability, including assumptions about risk. Inputs may be observable or unobservable. Observable inputs are inputs that reflect the assumptions market participants would use in pricing the asset or liability that are developed based on market data obtained from sources independent of the reporting entity. Unobservable inputs are inputs that reflect the reporting entities’ own assumptions about the assumptions market participants would use in pricing the asset or liability that are developed based on the best information available.
| • | | Level 1 — | Quoted prices in active markets for identical investments. |
| | | | |
| • | | Level 2 — | Other significant observable inputs (including quoted prices for similar instruments, interest rates, prepayment speeds, credit risk, yield curves, default rates, etc.). |
| | | | |
| • | | Level 3 — | Significant unobservable inputs (including the Funds’ own assumptions in determining the fair value of investments). |
The availability of observable inputs can vary from security to security and is affected by a wide variety of factors, including, for example, the type of security, whether the security is new and not yet established in the marketplace, the liquidity of markets, and other characteristics particular to the security. To the extent that valuation is based on models or inputs that are less observable or unobservable in the market, the determination of fair value requires more judgment. Accordingly, the degree of judgment exercised in determining fair value is greatest for instruments categorized in Level 3.
The inputs used to measure fair value may fall into different levels of the fair value hierarchy. In such cases, for disclosure purposes, the level in the fair value hierarchy within which the fair value measurement falls in its entirety, is determined based on the lowest level input that is significant to the fair value measurement in its entirety.
Various inputs are used in determining the value of the Funds’ investments as of the reporting period end. The designated input levels are not necessarily an indication of the risk or liquidity associated with these investments. These inputs are categorized in the following hierarchy under GAAP.
The Funds use valuation techniques to measure fair value that are consistent with the market approach and/or income approach, depending on the type of security and the particular circumstance. The market approach uses
79
Alpine Mutual Funds
Notes to Financial Statements—Continued
April 30, 2014 (Unaudited)
prices and other relevant information generated by market transactions involving identical or comparable securities. The income approach uses valuation techniques to discount estimated future cash flows to present value.
The following is a summary of the inputs used to value the Funds’ assets and liabilities carried at fair value as of April 30, 2014:
| | | | Valuation Inputs | | | | |
| | International Real Estate Equity Fund * | | Level 1 | | | Level 2 | | | Level 3 | | | Total Value | |
| | Common Stocks | | | | | | | | | | | | | | | | |
| | Asia | | $ | 51,242,272 | | | $ | 9,310,068 | | | $ | 12,760,271 | | | $ | 73,312,611 | |
| | Europe | | | 73,268,879 | | | | — | | | | 498,266 | | | | 73,767,145 | |
| | North & South America | | | 32,573,039 | | | | — | | | | — | | | | 32,573,039 | |
| | Equity-Linked Structured Notes | | | — | | | | 3,629,076 | | | | — | | | | 3,629,076 | |
| | Investment Company | | | 925,977 | | | | — | | | | — | | | | 925,977 | |
| | Total | | $ | 158,010,167 | | | $ | 12,939,144 | | | $ | 13,258,537 | | | $ | 184,207,848 | |
| | | | | | | | | | | | | | | | | | |
| | | | Valuation Inputs | | | | | |
| | Other Financial Instruments | | | Level 1 | | | | Level 2 | | | | Level 3 | | | | Total Value | |
| | Liabilities | | | | | | | | | | | | | | | | |
| | Forward Currency Contracts | | $ | — | | | $ | (95,782 | ) | | $ | — | | | $ | (95,782 | ) |
| | Total | | $ | — | | | $ | (95,782 | ) | | $ | — | | | $ | (95,782 | ) |
| | | | | | | | | | | | | | | | | | |
| | | | Valuation Inputs | | | | | |
| | Realty Income & Growth Fund * | | | Level 1 | | | | Level 2 | | | | Level 3 | | | | Total Value | |
| | Real Estate Investment Trusts | | $ | 109,856,272 | | | $ | — | | | $ | — | | | $ | 109,856,272 | |
| | Common Stocks | | | 1,686,300 | | | | — | | | | — | | | | 1,686,300 | |
| | Preferred Stocks | | | 1,695,194 | | | | — | | | | — | | | | 1,695,194 | |
| | Total | | $ | 113,237,766 | | | $ | — | | | $ | — | | | $ | 113,237,766 | |
| | | | | | | | | | | | | | | | | | |
| | | | Valuation Inputs | | | | | |
| | Cyclical Advantage Property Fund * | | | Level 1 | | | | Level 2 | | | | Level 3 | | | | Total Value | |
| | Common Stocks | | | | | | | | | | | | | | | | |
| | Asia | | $ | 12,687,360 | | | $ | 3,460,873 | | | $ | — | | | $ | 16,148,233 | |
| | Europe | | | 14,503,917 | | | | — | | | | — | | | | 14,503,917 | |
| | North & South America | | | 29,468,078 | | | | 468,198 | | | | — | | | | 29,936,276 | |
| | Equity-Linked Structured Notes | | | — | | | | 2,003,081 | | | | — | | | | 2,003,081 | |
| | Rights | | | — | | | | 3,520 | | | | — | | | | 3,520 | |
| | Total | | $ | 56,659,355 | | | $ | 5,935,672 | | | $ | — | | | $ | 62,595,027 | |
| | | | | | | | | | | | | | | | | | |
| | | | Valuation Inputs | | | | | |
| | Other Financial Instruments | | | Level 1 | | | | Level 2 | | | | Level 3 | | | | Total Value | |
| | Liabilities | | | | | | | | | | | | | | | | |
| | Forward Currency Contracts | | $ | — | | | $ | (46,677 | ) | | $ | — | | | $ | (46,677 | ) |
| | Total | | $ | — | | | $ | (46,677 | ) | | $ | — | | | $ | (46,677 | ) |
80
Alpine Mutual Funds
Notes to Financial Statements—Continued
April 30, 2014 (Unaudited)
| | | | Valuation Inputs | | | | |
| | Emerging Markets Real Estate Fund * | | | Level 1 | | | | Level 2 | | | | Level 3 | | | | Total Value | |
| | Common Stocks | | | | | | | | | | | | | | | | |
| | Asia | | $ | 3,068,520 | | | $ | 404,531 | | | $ | — | | | $ | 3,473,051 | |
| | Europe | | | 225,845 | | | | 29,900 | | | | — | | | | 255,745 | |
| | Middle East/Africa | | | 220,852 | | | | — | | | | — | | | | 220,852 | |
| | North & South America | | | 1,197,998 | | | | 18,597 | | | | — | | | | 1,216,595 | |
| | Preferred Stocks | | | 42,433 | | | | — | | | | — | | | | 42,433 | |
| | Equity-Linked Structured Notes | | | — | | | | 465,291 | | | | — | | | | 465,291 | |
| | Convertible Bonds | | | — | | | | 359 | | | | — | | | | 359 | |
| | Rights | | | — | | | | 650 | | | | — | | | | 650 | |
| | Short-Term Investments | | | — | | | | 105,000 | | | | — | | | | 105,000 | |
| | Total | | $ | 4,755,648 | | | $ | 1,024,328 | | | $ | — | | | $ | 5,779,976 | |
| | | | | | | | | | | | | | | | | | |
| | | | Valuation Inputs | | | | | |
| | Global Infrastructure Fund * | | | Level 1 | | | | Level 2 | | | | Level 3 | | | | Total Value | |
| | Common Stocks | | | | | | | | | | | | | | | | |
| | Asia | | $ | 29,653,725 | | | $ | 1,222,651 | | | $ | — | | | $ | 30,876,376 | |
| | Europe | | | 44,168,170 | | | | — | | | | — | | | | 44,168,170 | |
| | North & South America | | | 90,301,832 | | | | — | | | | — | | | | 90,301,832 | |
| | Equity-Linked Structured Notes | | | — | | | | 4,321,326 | | | | — | | | | 4,321,326 | |
| | Short-Term Investments | | | — | | | | 10,052,000 | | | | — | | | | 10,052,000 | |
| | Total | | $ | 164,123,727 | | | $ | 15,595,977 | | | $ | — | | | $ | 179,719,704 | |
| | | | | | | | | | | | | | | | | | |
| | | | Valuation Inputs | | | | | |
| | Other Financial Instruments | | | Level 1 | | | | Level 2 | | | | Level 3 | | | | Total Value | |
| | Liabilities | | | | | | | | | | | | | | | | |
| | Forward Currency Contracts | | $ | — | | | $ | (335,132 | ) | | $ | — | | | $ | (335,132 | ) |
| | Total | | $ | — | | | $ | (335,132 | ) | | $ | — | | | $ | (335,132 | ) |
| | | | | | | | | | | | | | | | | | |
| | | | Valuation Inputs | | | | | |
| | Global Consumer Growth Fund * | | | Level 1 | | | | Level 2 | | | | Level 3 | | | | Total Value | |
| | Common Stocks | | $ | 2,694,853 | | | $ | — | | | $ | — | | | $ | 2,694,853 | |
| | Short-Term Investments | | | — | | | | 166,000 | | | | — | | | | 166,000 | |
| | Total | | $ | 2,694,853 | | | $ | 166,000 | | | $ | — | | | $ | 2,860,853 | |
* For detailed country and sector descriptions, see accompanying Schedule of Portfolio Investments.
For the period ended April 30, 2014, there were no transfers between Level 1, Level 2 and Level 3.
81
Alpine Mutual Funds
Notes to Financial Statements—Continued
April 30, 2014 (Unaudited)
The following is a reconciliation of Level 3 assets for which significant unobservable inputs were used to determine fair value:
| | | | International
Real Estate
Equity Fund | |
| Balance as of October 31, 2013 | | $ | 12,710,485 | |
| Realized gain (loss) | | | — | |
| Change in unrealized appreciation* | | | 548,052 | |
| Purchases | | | — | |
| Sales | | | — | |
| Transfers in to Level 3** | | | — | |
| Transfers out of Level 3 ** | | | — | |
| Balance as of April 30, 2014 | | $ | 13,258,537 | |
| Change in net unrealized appreciation on Level 3 holdings held at period end | | $ | 548,052 | |
| | |
| * | Statements of Operations Location: Change in net unrealized appreciation/(depreciation) on investments. |
| ** | The Funds recognize transfers as of the beginning of the year. |
The following table shows the valuation techniques and significant amounts of unobservable inputs used in the fair value measurement of the Fund’s Level 3 investments, as of April 30, 2014:
International Real Estate Equity Fund
| Asset | | Fair Value
at 4/30/14 | | Valuation
Technique (s) | | Significant
Unobservable
Input (s) | | Range of
Values | | Weighted
Average | | Relationship
Between Fair
Value and
Input: If
Input Value
Increases Then: |
| Common Stocks | | $12,605,588 | * | | Average of terminal | | Liquidity Discount | | 3%-15% | | 10% | | Fair Value would |
| | | | | | value and price to | | | | | | | | Decrease |
| | | | | | book value | | Adjusted Weighted | | 14%-16% | | 15% | | Fair Value would |
| | | | | | | | Average Cost of Capital | | | | | | Decrease |
| | | | | | | | Company Risk | | 4%-16% | | 9% | | Fair Value would |
| | | | | | | | | | | | | | Decrease |
| | | | | | | | Currency Risk | | 3%-4% | | 4% | | Fair Value would |
| | | | | | | | | | | | | | Decrease |
| | | | | | | | Terminal Value Discount | | 27%-39% | | 32% | | Fair Value would |
| | | | | | | | | | | | | | Decrease |
| Common Stocks | | $498,266 | * | | Adjusted Book Value | | Liquidity Discount | | 80% | | 80% | | Fair Value would |
| | | | | | | | | | | | | | Decrease |
| Common Stocks | | $154,683 | * | | Adjusted Book Value | | Discount to NAV | | 50% | | 50% | | Fair Value would |
| | | | | | | | | | | | | | Decrease |
| * | Represents a single security, as of April 30, 2014. As a result, the range of values and weighted average for each unobservable input refer to a single value. |
The significant unobservable inputs used in the fair value measurement of common stocks are liquidity discounts, adjusted weighted average cost of capital, company risk, currency risk, terminal value discount, and discount to NAV. Other market indicators are also considered. Changes in any of those inputs would result in lower or higher fair value measurement.
B. Security Transactions and Investment Income:
Security transactions are accounted for on a trade date basis. Realized gains and losses are computed on the identified cost basis. Dividend income is recorded on the ex-dividend date or in the case of some foreign securities, on the date thereafter when the Funds are made aware of the dividend. Interest income is recorded on the accrual basis and includes accretion of discounts and amortization of premiums, where applicable. To the extent any issuer
Alpine Mutual Funds
Notes to Financial Statements—Continued
April 30, 2014 (Unaudited)
defaults or a credit event occurs that impacts the issuer, the Funds may halt any additional interest income accruals and consider the realizability of interest accrued up to the date of default or credit event.
C. Line of Credit and Custody Overdrafts:
On December 1, 2010 the Trust entered into a lending agreement with BNP Paribas through its New York branch (“BNPP NY”). Loans in aggregate, whether to cover overdrafts or for investment purposes, may not exceed the maximum amount that is permitted under the 1940 Act. The terms of the lending agreement indicate the rate to be the Fed Funds rate plus 0.95% per annum on amounts borrowed. The BNP Paribas Facility provides for secured, uncommitted lines of credit for the Funds where selected Funds assets are pledged against advances made to the respective Fund. Each Fund is permitted to borrow up to 33.33% of its total assets for extraordinary or emergency purposes. Additionally, each of the following Funds are permitted to borrow up to 10% of their respective total assets for investment purposes but in no case shall any Fund’s total outstanding borrowings exceed 33.33% of its total assets. Either BNPP NY or the Funds may terminate this agreement upon delivery of written notice. For the period ended April 30, 2014, the average interest rate paid on outstanding borrowings under the line of credit was 1.03%, 1.03%, 1.03%, 1.05% and 1.05% for the International Real Estate Equity Fund, Realty Income & Growth Fund, Cyclical Advantage Property Fund, Global Infrastructure Fund and Emerging Markets Real Estate Fund, respectively. The Funds may also incur interest expense on custody overdraft charges.
| | | International
Real Estate
Equity Fund | | | Realty
Income &
Growth
Fund | | | Cyclical
Advantage
Property
Fund | | | Emerging
Markets
Real Estate
Fund | | | Global
Infrastructure
Fund | | | Global
Consumer
Growth
Fund | |
| Total line of credit amount available for investment purposes at April 30, 2014 | | | $18,730,963 | | | | $11,375,944 | | | | $6,359,475 | | | | $588,299 | | | | $18,055,405 | | | | $287,165 | |
| Line of credit outstanding at April 30, 2014 | | | 2,895,729 | | | | 5,855,240 | | | | 5,329,049 | | | | — | | | | — | | | | — | |
| Line of credit amount unused at April 30, 2014 | | | 15,835,234 | | | | 5,520,704 | | | | 1,030,426 | | | | 588,299 | | | | 18,055,405 | | | | 287,165 | |
| Average balance outstanding during the period | | | 3,198,426 | | | | 6,287,983 | | | | 3,842,074 | | | | 93,537 | | | | 29,016 | | | | — | |
| Maximum balance outstanding during the period | | | 9,958,086 | | | | 9,015,900 | | | | 6,498,923 | | | | 1,243,755 | | | | 1,653,435 | | | | — | |
| Interest expense incurred on line of credit during the period | | | 16,550 | | | | 32,416 | | | | 19,817 | | | | 492 | | | | 153 | | | | — | |
| Interest expense incurred on custody overdrafts during the period | | | — | | | | — | | | | — | | | | — | | | | — | | | | — | |
The line of credit outstanding as of April 30, 2014 approximates its fair value and would be categorized at Level 2.
D. Federal and Other Income Taxes:
It is each Fund’s policy to comply with the Federal income and excise tax requirements of the Internal Revenue Code of 1986 (the “Code”), as amended, applicable to regulated investment companies and to timely distribute, all of its investment company taxable income and net realized capital gains to shareholders in accordance with the timing requirements imposed by the Code. Therefore, no Federal income tax provision is required. Capital gains realized on some foreign securities are subject to foreign taxes. Dividends and interest from non-U.S. sources received by the Funds are generally subject to non-U.S. withholding taxes at rates ranging up to 30%. Such capital gains and withholding taxes may be reduced or eliminated under the terms of applicable U.S. income tax treaties, and the Funds intend to undertake procedural steps to claim the benefits of such treaties. Where available, the Funds will file refund claims for foreign taxes withheld.
Alpine Mutual Funds
Notes to Financial Statements—Continued
April 30, 2014 (Unaudited)
Management has analyzed the Funds’ tax positions taken on income tax returns for all open tax years and has concluded that as of April 30, 2014, no provision for income tax is required in the Funds’ financial statements. The Funds’ Federal and state income and Federal excise tax returns for tax years for which the applicable statutes of limitations have not expired are subject to examination by the Internal Revenue Service and state departments of revenue. As of April 30, 2014, open Federal and New York tax years include the tax years ended October 31, 2010 through 2013.
GAAP requires that certain components of net assets be reclassified to reflect permanent differences between financial and tax reporting. These reclassifications have no effect on net assets or net asset values per share.
E. Distributions to Shareholders:
Each Fund intends to distribute all of its net investment income and net realized capital gains, if any, throughout the year to its shareholders in the form of dividends. Distributions to shareholders are recorded at the close of business on the ex-dividend date.
The amounts of dividends from net investment income and of distributions from net realized gains are determined in accordance with Federal income tax regulations, which may differ from GAAP. These differences are either considered temporary or permanent in nature. To the extent these differences are permanent in nature, such amounts are reclassified within the composition of net assets based on their Federal tax-basis treatment; temporary differences do not require reclassification. In the event dividends and distributions to shareholders exceed net investment income and net realized gains for tax purposes, they are reported as returns of capital.
F. Class Allocations:
Income, expenses (other than class specific expenses) and realized and unrealized gains and losses are allocated among the classes of the Funds based on the relative net assets of each class. Class specific expenses are allocated to the class to which they relate. Currently, class specific expenses are limited to those incurred under the Distribution Plan for Class A shares.
G. Foreign Currency Translation Transactions:
The International Real Estate Equity Fund, Cyclical Advantage Property Fund, Emerging Markets Real Estate Fund, Global Infrastructure Fund, and Global Consumer Growth Fund may invest without limitation in foreign securities. The Realty Income & Growth Fund may invest up to 35% of its net assets in foreign securities. The books and records of each Fund are maintained in U.S. dollars. Non-U.S. dollar-denominated amounts are translated into U.S. dollars as follows, with the resultant translations gains and losses recorded in the Statements of Operations:
| | i) | market value of investment securities and other assets and liabilities at the exchange rate on the valuation date, |
| | | |
| | ii) | purchases and sales of investment securities, income and expenses at the exchange rate prevailing on the respective date of such transactions. |
H. Risks Associated with Foreign Securities and Currencies:
Investments in securities of foreign issuers carry certain risks not ordinarily associated with investments in securities of domestic issuers. Such risks include future political and economic developments and the possible imposition of exchange controls or other foreign governmental laws and restrictions. In addition, with respect to certain countries, there is a possibility of expropriation of assets, confiscatory taxation, political or social instability or diplomatic developments, which could adversely affect investments in those countries.
Certain countries may also impose substantial restrictions on investments in their capital markets by foreign entities, including restrictions on investments in issuers or industries deemed sensitive to relevant national interests. These factors may limit the investment opportunities available to the Funds or result in a lack of liquidity and high price volatility with respect to securities of issuers from developing countries.
I. Equity-Linked Structured Notes:
The Funds may invest in equity-linked structured notes. Equity-linked structured notes are securities which are specially designed to combine the characteristics of one or more underlying securities and their equity derivatives in a single note form. The return and/or yield or income component may be based on the performance of the
Alpine Mutual Funds
Notes to Financial Statements—Continued
April 30, 2014 (Unaudited)
underlying equity securities, and equity index, and/or option positions. Equity-linked structured notes are typically offered in limited transactions by financial institutions in either registered or non-registered form. An investment in equity-linked structured notes creates exposure to the credit risk of the issuing financial institution, as well as to the market risk of the underlying securities. There is no guaranteed return of principal with these securities and the appreciation potential of these securities may be limited by a maximum payment or call right. In certain cases, equity-linked structured notes may be more volatile and less liquid than less complex securities or other types of fixed-income securities. Such securities may exhibit price behavior that does not correlate with other fixed income securities. International Real Estate Equity Fund, Cyclical Advantage Property Fund, Emerging Markets Real Estate Fund and Global Infrastructure Fund held 3, 5, 8 and 2 equity-linked structured notes, respectively, at April 30, 2014.
J. Forward Currency Contracts:
The Funds are subject to foreign currency exchange rate risk in the normal course of pursuing their investment objectives. The Funds may use forward currency contracts to gain exposure to or economically hedge against changes in the value of foreign currencies. A forward currency contract (“forward”) is an agreement between two parties to buy and sell a currency at a set price on a future date. The market value of the forward contract fluctuates with changes in forward currency exchange rates. The forward contract is marked-to-market daily and the change in market value is recorded by each Fund as unrealized appreciation or depreciation. When the forward contract is closed, a Fund records a realized gain or loss equal to the fluctuation in value during the period the forward contract was open. A Fund could be exposed to risk if a counterparty is unable to meet the terms of a forward or if the value of the currency changes unfavorably. During the period ended April 30, 2014, the International Real Estate Equity Fund, Cyclical Advantage Property Fund and Global Infrastructure Fund entered into 4, 8 and 1 forward currency contracts, respectively.
The following forward currency contracts were held at April 30, 2014:
International Real Estate Equity Fund
| Description | | Settlement
Date | | Currency | | Settlement
Value | | Current
Value | | Unrealized
Loss | |
| Contracts Purchased: | | | | | | | | | | | | | | | |
| Japanese Yen | | 07/30/14 | | 125,000,000 | JPY | | $ | 1,223,463 | | $ | 1,223,314 | | $ | (149 | ) |
| Japanese Yen | | 07/30/14 | | 90,000,000 | JPY | | | 888,219 | | | 880,786 | | | (7,433 | ) |
| Japanese Yen | | 07/30/14 | | 35,000,000 | JPY | | | 344,465 | | | 342,528 | | | (1,937 | ) |
| | | | | | | | | | | $ | 2,446,628 | | $ | (9,519 | ) |
| Contracts Sold: | | | | | | | | | | | | | | | |
| Japanese Yen | | 07/30/14 | | 1,600,000,000 | JPY | | $ | 15,572,155 | | $ | 15,658,418 | | $ | (86,263 | ) |
| | | | | | | | | | | $ | 15,658,418 | | $ | (86,263 | ) |
| Cyclical Advantage Property Fund | | | | | | | | | | | | | | | |
| | | Settlement | | | | | Settlement | | Current | | Unrealized | |
| Description | | Date | | Currency | | Value | | Value | | Loss | |
| Contracts Purchased: | | | | | | | | | | | | | | | |
| Japanese Yen | | 07/30/14 | | 53,000,000 | JPY | | $ | 518,748 | | $ | 518,685 | | $ | (63 | ) |
| Japanese Yen | | 07/30/14 | | 52,000,000 | JPY | | | 511,776 | | | 508,899 | | | (2,877 | ) |
| Japanese Yen | | 07/30/14 | | 40,000,000 | JPY | | | 394,764 | | | 391,460 | | | (3,304 | ) |
| Japanese Yen | | 07/30/14 | | 30,000,000 | JPY | | | 295,479 | | | 293,595 | | | (1,884 | ) |
| | | | | | | | | | | $ | 1,712,639 | | $ | (8,128 | ) |
| Contracts Sold: | | | | | | | | | | | | | | | |
| Japanese Yen | | 07/30/14 | | 715,000,000 | JPY | | $ | 6,958,807 | | $ | 6,997,356 | | $ | (38,549 | ) |
| | | | | | | | | | | $ | 6,997,356 | | $ | (38,549 | ) |
Alpine Mutual Funds
Notes to Financial Statements—Continued
April 30, 2014 (Unaudited)
| Global Infrastructure Fund | | | | | | | | | | | | | | | |
| | | Settlement | | | | | | Settlement | | | Current | | Unrealized | |
| Description | | Date | | | Currency | | | Value | | | Value | | Loss | |
| Contracts Sold: | | | | | | | | | | | | | | | |
| Euro | | | 07/09/14 | | | | 12,500,000 EUR | | | $ | 17,003,950 | | | $ | 17,339,082 | | | $ | (335,132 | ) |
| | | | | | | | | | | | | | | $ | 17,339,082 | | | $ | (335,132 | ) |
K. Derivative Instruments and Hedging Activities:
The following tables provide information about the effect of derivatives and hedging activities on the Funds’ Statements of Assets and Liabilities and Statements of Operations as of and for the period ended April 30, 2014. The first table provides additional detail about the amounts and sources of unrealized appreciation/(depreciation) on derivatives at the end of the period. The second table provides additional information about the amounts and sources of net realized gain (loss) and the change in net unrealized appreciation/(depreciation) resulting from the Funds’ derivatives and hedging activities during the period.
The effect of derivative instruments on the Statements of Assets and Liabilities as of April 30, 2014:
| International Real Estate Equity Fund |
| | | Statements of Assets | | Unrealized |
| Derivatives | | and Liabilities Location | | Depreciation |
| Foreign exchange risk | | Unrealized depreciation on forward currency contracts | | | $(95,782) | |
| Cyclical Advantage Property Fund |
| | | Statements of Assets | | Unrealized |
| Derivatives | | and Liabilities Location | | Depreciation |
| Foreign exchange risk | | Unrealized depreciation on forward currency contracts | | | $(46,677) | |
| Global Infrastructure Fund |
| | | Statements of Assets | | Unrealized |
| Derivatives | | and Liabilities Location | | Depreciation |
| Foreign exchange risk | | Unrealized depreciation on forward currency contracts | | | $(335,132) | |
The effect of derivative instruments on the Statements of Operations for the period ended April 30, 2014:
| International Real Estate Equity Fund |
| | | Statements of | | | | | | | | |
| Derivatives | | Operations Location | | Net Realized Gain | | Unrealized Depreciation |
| Foreign exchange risk | | Net realized gain (loss) from foreign currency transactions/ Change in net unrealized appreciation/(depreciation) on foreign currency translations | | | $960,658 | | | | $(135,402) | |
| Cyclical Advantage Property Fund |
| | | Statements of | | | | | | |
| Derivatives | | Operations Location | | Net Realized Gain | | Unrealized Depreciation |
| Foreign exchange risk | | Net realized gain (loss) from foreign currency transactions/ Change in net unrealized appreciation/(depreciation) on foreign currency translations | | | $376,822 | | | | $(62,327) | |
86
Alpine Mutual Funds
Notes to Financial Statements—Continued
April 30, 2014 (Unaudited)
| Global Infrastructure Fund | | | | | | | | |
| | | | | | | | | |
| Derivatives | | Statements of
Operations Location | | Net Realized Loss | | | Unrealized Depreciation | |
| Foreign exchange risk | | Net realized gain (loss) from foreign currency transactions/ Change in net unrealized appreciation/(depreciation) on foreign currency translations | | | $(321,405) | | | | $(38,535) | |
L. Redemption Fees:
The Funds of the Alpine Equity Trust impose a redemption fee of 1% of the total redemption amount on all Fund shares redeemed or exchanged within 60 days of buying them, either by purchase or exchange. This fee is assessed and retained by the Funds for the benefit of the remaining shareholders. The redemption fee is accounted for as an increase to paid-in-capital.
| 3. | Capital Share Transactions: |
The Funds have an unlimited number of shares of beneficial interest, with $0.0001 par value, authorized. Transactions in shares and dollars of the Funds were as follows:
International Real Estate Equity Fund
| | | Six Months Ended | | Year Ended |
| | | April 30, 2014 | | October 31, 2013 |
| | | Shares | | | Amount | | | Shares | | | Amount | |
| Institutional Class | | | | | | | | | | | | | | | | |
| Shares sold | | | 96,824 | | | $ | 2,207,968 | | | | 465,270 | | | $ | 11,120,278 | |
| Shares issued in reinvestment of dividends | | | 15,832 | | | | 366,356 | | | | 48,570 | | | | 1,150,627 | |
| Redemption fees | | | — | | | | 14,547 | | | | — | | | | 6,916 | |
| Shares redeemed | | | (999,519 | ) | | | (22,811,827 | ) | | | (5,350,431 | ) | | | (129,741,173 | ) |
| Total net change | | | (886,863 | ) | | $ | (20,222,956 | ) | | | (4,836,591 | ) | | $ | (117,463,352 | ) |
| Class A | | | | | | | | | | | | | | | | |
| Shares sold | | | 15 | | | $ | 345 | | | | 1,040 | | | $ | 24,868 | |
| Shares issued in reinvestment of dividends | | | — | | | | — | | | | 13 | | | | 318 | |
| Redemption fees | | | — | | | | — | | | | — | | | | 4 | |
| Shares redeemed | | | — | | | | — | | | | (706 | ) | | | (17,079 | ) |
| Total net change | | | 15 | | | $ | 345 | | | | 347 | | | $ | 8,111 | |
87
Alpine Mutual Funds
Notes to Financial Statements—Continued
April 30, 2014 (Unaudited)
| Realty Income & Growth Fund |
| | | Six Months Ended | | Year Ended |
| | | April 30, 2014 | | October 31, 2013 |
| | | Shares | | | Amount | | | Shares | | | Amount | |
| Institutional Class | | | | | | | | | | | | | | | | |
| Shares sold | | | 261,798 | | | $ | 4,811,311 | | | | 396,879 | | | $ | 7,333,676 | |
| Shares issued in reinvestment of dividends | | | 98,189 | | | | 1,778,347 | | | | 213,883 | | | | 3,866,099 | |
| Redemption fees | | | — | | | | 74 | | | | — | | | | 5,518 | |
| Shares redeemed | | | (416,285 | ) | | | (7,523,870 | ) | | | (1,296,033 | ) | | | (23,806,742 | ) |
| Total net change | | | (56,298 | ) | | $ | (934,138 | ) | | | (685,271 | ) | | $ | (12,601,449 | ) |
| Class A | | | | | | | | | | | | | | | | |
| Shares sold | | | 54,130 | | | $ | 967,282 | | | | 57,263 | | | $ | 1,082,511 | |
| Shares issued in reinvestment of dividends | | | 2,093 | | | | 37,926 | | | | 817 | | | | 14,416 | |
| Redemption fees | | | — | | | | 2 | | | | — | | | | 41 | |
| Shares redeemed | | | (1,154 | ) | | | (19,894 | ) | | | (342 | ) | | | (6,256 | ) |
| Total net change | | | 55,069 | | | $ | 985,316 | | | | 57,738 | | | $ | 1,090,712 | |
| Cyclical Advantage Property Fund |
| | | Six Months Ended | | Year Ended |
| | | April 30, 2014 | | October 31, 2013 |
| | | Shares | | | Amount | | | Shares | | | Amount | |
| Institutional Class | | | | | | | | | | | | | | | | |
| Shares sold | | | 12,976 | | | $ | 333,359 | | | | 102,636 | | | $ | 2,535,452 | |
| Shares issued in reinvestment of dividends | | | 47,482 | | | | 1,210,311 | | | | 20,925 | | | | 510,363 | |
| Redemption fees | | | — | | | | 42 | | | | — | | | | 2,260 | |
| Shares redeemed | | | (112,079 | ) | | | (2,825,305 | ) | | | (298,522 | ) | | | (7,440,538 | ) |
| Total net change | | | (51,621 | ) | | $ | (1,281,593 | ) | | | (174,961 | ) | | $ | (4,392,463 | ) |
| Emerging Markets Real Estate Fund |
| | | Six Months Ended | | Year Ended |
| | | April 30, 2014 | | October 31, 2013 |
| | | Shares | | | Amount | | | Shares | | | Amount | |
| Institutional Class | | | | | | | | | | | | | | | | |
| Shares sold | | | 57,900 | | | $ | 910,596 | | | | 452,465 | | | $ | 8,462,630 | |
| Shares issued in reinvestment of dividends | | | 10,210 | | | | 157,788 | | | | 3,029 | | | | 55,877 | |
| Redemption fees | | | — | | | | 8,759 | | | | — | | | | 14,297 | |
| Shares redeemed | | | (278,401 | ) | | | (4,381,452 | ) | | | (184,263 | ) | | | (3,237,097 | ) |
| Total net change | | | (210,291 | ) | | $ | (3,304,309 | ) | | | 271,231 | | | $ | 5,295,707 | |
| Class A | | | | | | | | | | | | | | | | |
| Shares sold | | | 8,398 | | | $ | 126,960 | | | | 56,958 | | | $ | 1,063,647 | |
| Shares issued in reinvestment of dividends | | | 837 | | | | 12,941 | | | | 89 | | | | 1,633 | |
| Redemption fees | | | — | | | | 769 | | | | — | | | | 957 | |
| Shares redeemed | | | (6,449 | ) | | | (102,135 | ) | | | (24,373 | ) | | | (472,467 | ) |
| Total net change | | | 2,786 | | | $ | 38,535 | | | | 32,674 | | | $ | 593,770 | |
88
Alpine Mutual Funds
Notes to Financial Statements—Continued
April 30, 2014 (Unaudited)
| Global Infrastructure Fund |
| | | Six Months Ended | | Year Ended |
| | | April 30, 2014 | | October 31, 2013 |
| | | Shares | | | Amount | | | Shares | | | Amount | |
| Institutional Class | | | | | | | | | | | | | | | | |
| Shares sold | | | 2,639,403 | | | $ | 50,134,853 | | | | 4,137,898 | | | $ | 74,738,705 | |
| Shares issued in reinvestment of dividends | | | 168,436 | | | | 3,197,889 | | | | 117,131 | | | | 2,085,515 | |
| Redemption fees | | | — | | | | 6,457 | | | | — | | | | 26,140 | |
| Shares redeemed | | | (1,432,660 | ) | | | (27,204,998 | ) | | | (695,683 | ) | | | (12,708,600 | ) |
| Total net change | | | 1,375,179 | | | $ | 26,134,201 | | | | 3,559,346 | | | $ | 64,141,760 | |
| Class A | | | | | | | | | | | | | | | | |
| Shares sold | | | 205,433 | | | $ | 3,915,062 | | | | 1,246,168 | | | $ | 22,408,845 | |
| Shares issued in reinvestment of dividends | | | 32,160 | | | | 608,975 | | | | 17,256 | | | | 308,946 | |
| Redemption fees | | | — | | | | 993 | | | | — | | | | 4,490 | |
| Shares redeemed | | | (57,103 | ) | | | (1,094,701 | ) | | | (333,963 | ) | | | (6,250,474 | ) |
| Total net change | | | 180,490 | | | $ | 3,430,329 | | | | 929,461 | | | $ | 16,471,807 | |
| Global Consumer Growth Fund |
| | | Six Months Ended | | Year Ended |
| | | April 30, 2014 | | October 31, 2013 |
| | | Shares | | | Amount | | | Shares | | | Amount | |
| Institutional Class | | | | | | | | | | | | | | | | |
| Shares sold | | | 4,958 | | | $ | 63,651 | | | | 1,877 | | | $ | 22,131 | |
| Shares issued in reinvestment of dividends | | | 536 | | | | 6,957 | | | | 844 | | | | 9,385 | |
| Shares redeemed | | | (167 | ) | | | (2,133 | ) | | | (750 | ) | | | (8,697 | ) |
| Total net change | | | 5,327 | | | $ | 68,475 | | | | 1,971 | | | $ | 22,819 | |
| Class A | | | | | | | | | | | | | | | | |
| Shares sold | | | — | | | $ | — | | | | 24,428 | | | $ | 281,904 | |
| Shares issued in reinvestment of dividends | | | 1 | | | | 9 | | | | 20 | | | | 227 | |
| Shares redeemed | | | (4,568 | ) | | | (57,073 | ) | | | (17,413 | ) | | | (198,431 | ) |
| Total net change | | | (4,567 | ) | | $ | (57,064 | ) | | | 7,035 | | | $ | 83,700 | |
| 4. | Purchases and Sales of Securities: |
Purchases and sales of securities (excluding short-term securities) for the period ended April 30, 2014 are as follows:
| | | Purchases | | | Sales | |
| International Real Estate Equity | | $ | 11,890,380 | | | $ | 31,972,048 | |
| Realty Income & Growth Fund | | | 12,778,094 | | | | 12,556,485 | |
| Cyclical Advantage Property Fund | | | 11,349,340 | | | | 10,077,481 | |
| Emerging Markets Real Estate Fund | | | 2,753,750 | | | | 5,948,393 | |
| Global Infrastructure Fund | | | 124,156,359 | | | | 97,546,736 | |
| Global Consumer Growth Fund | | | 214,037 | | | | 258,617 | |
The Funds did not have purchases and sales of U.S. Government Obligations during the period ended April 30, 2014.
Quasar Distributors, LLC (“Quasar”) serves as each Fund’s distributor. Each of the Funds, except for the Cyclical Advantage Property Fund, has adopted distribution and servicing plans (the “Plans”) for their Class A shares as
89
Alpine Mutual Funds
Notes to Financial Statements—Continued
April 30, 2014 (Unaudited)
allowed by Rule 12b-1 under the 1940 Act. The Plans authorize payments by the Funds in connection with the distribution and servicing of their Class A shares at an annual rate, as determined from time to time by the Board, of up to 0.25% of the average daily net assets of the Class A shares of the Funds. Amounts paid under the Plans by the Funds may be spent by the Funds on any activities or expenses primarily intended to result in the sale of Class A shares of the Fund, including but not limited to advertising, compensation for sales and marketing activities of financial institutions and others such as dealers and distributors, shareholder account servicing, the printing and mailing of prospectuses to other than current shareholders and the printing and mailing of sales literature. International Real Estate Equity Fund, Realty Income & Growth Fund, Emerging Markets Real Estate Fund, Global Infrastructure Fund and Global Consumer Growth Fund incurred $174, $2,408, $838, $27,230 and $257, respectively, pursuant to the Plans for the period ended April 30, 2014.
The Plans for the Funds may be terminated at any time by vote of the members of the Board of the Equity Trust who are not “interested persons,” as defined by the 1940 Act, or by vote of a majority of the outstanding voting shares of the respective class.
| 6. | Investment Advisory Agreement, Administration Agreement and Other Affiliated Transactions: |
The Adviser provides investment advisory services to each of the Funds. Pursuant to the advisory agreements with the Realty Income & Growth Fund and the Cyclical Advantage Property Fund, the Adviser is entitled to an annual fee based on each Fund’s average daily net assets, in accordance with the following schedule:
| First $750 million | 1.00 | % |
| Next $250 million | 0.90 | % |
| Over $1 billion | 0.80 | % |
The Adviser is entitled to an annual fee based on 1.00% of each Fund’s average daily net assets for the International Real Estate Equity Fund, Emerging Markets Real Estate Fund, Global Infrastructure Fund and Global Consumer Growth Fund.
The Adviser agreed to reimburse the Realty Income & Growth Fund, Emerging Markets Real Estate Fund, Global Infrastructure Fund and Global Consumer Growth Fund to the extent necessary to ensure that ordinary operating expenses (including 12b-1 fees, where applicable, but excluding interest, brokerage commissions, acquired fund fees and extraordinary expenses) do not exceed annually 1.60%, of the respective Fund’s Class A shares average daily net assets, and 1.35% of the respective Fund’s Institutional Class shares average daily net assets. The Adviser may recover expenses paid in excess of the cap on expenses for the three previous years, as long as the recovery does not cause the Funds to exceed such cap on expenses. For the period ended April 30, 2014, the Adviser waived investment advisory fees and other expenses totaling $32,083, $39,766 and $31,281 for the Realty Income & Growth Fund, Emerging Markets Real Estate Fund and Global Consumer Growth Fund, respectively. The expense limitations will remain in effect for the Funds through February 28, 2015 unless and until the Board of the Equity Trust approves their modification or termination with respect to the Funds. Waived expenses subject to potential recovery by year of expiration are as follows:
| | | Realty Income & | | Emerging Markets | | Global | | Global Consumer |
| Years of Expiration | | Growth Fund | | Real Estate Fund | | Infrastructure Fund | | Growth Fund |
| 10/31/2014 | | $ | — | | | $ | 48,844 | | | $ | 27,165 | | | $ | 26,927 | |
| 10/31/2015 | | | — | | | | 65,965 | | | | — | | | | 84,997 | |
| 10/31/2016 | | | 69,202 | | | | 76,551 | | | | — | | | | 63,885 | |
| 10/31/2017 | | | 32,083 | | | | 39,766 | | | | — | | | | 31,281 | |
90
Alpine Mutual Funds
Notes to Financial Statements—Continued
April 30, 2014 (Unaudited)
The Adviser makes payments to intermediaries that provide omnibus account services, sub-accounting services and/or networking services with respect to the Funds. On February 2, 2012, the Board approved, subject to certain limitations, the reimbursement to the Adviser by the appropriate Fund, of up to a certain percentage of such fees paid by the Adviser to intermediaries that provide omnibus account services, sub-accounting services, and/or networking services. Reimbursement of these fees are subject to review by the Board and are included in the transfer agent fees in the Statements of Operations. The International Real Estate Fund, Realty Income & Growth Fund, Cyclical Advantage Property Fund, Emerging Markets Real Estate Fund and Global Infrastructure Fund incurred $151,526, $56,722, $21,018, $894 and $7,408 respectively, in reimbursements to the Adviser.
State Street Bank and Trust Company (“SSBT”) serves as the Funds’ administrator pursuant to an Administration Agreement with the Funds. As compensation for its services to the Funds, SSBT receives an annual administration fee of 0.02% of total net assets on the first $5 billion and 0.015% on total net assets exceeding $5 billion, computed daily and payable monthly.
| 7. | Transactions with Affiliates: |
The following issuers are affiliated with the International Real Estate Equity Fund; that is, the Fund held 5% or more of the outstanding voting securities during the period ended April 30, 2014. As defined in Section (2)(a)(3) of the Investment Company Act of 1940, such issuers are:
| | | Shares at | | | | | | | | | Shares at | | Value at | | Realized | | | Dividend | |
| Issuer Name | | October 31, 2013 | | | Purchases | | | Sales | | | April 30, 2014 | | April 30, 2014 | | Loss | | | Income | |
| Yatra Capital, Ltd. | | | 1,325,831 | | | | — | | | | (228,007) | | | | 1,097,824 | | | | $4,416,890 | | | | $(1,907,651) | | | | $— | |
The Funds invest a substantial amount of their assets in the equity securities of issuers engaged in the real estate industry, including real estate investment trusts (REITs). As a result, the Funds may be more affected by economic developments in the real estate industry than would a general equity fund.
| 9. | Federal Income Tax Information: |
At October 31, 2013, the components of distributable earnings on a tax basis were as follows:
| | | International Real | | Realty Income & | | Cyclical Advantage |
| | | Estate Equity Fund | | Growth Fund | | Property Fund |
| Undistributed ordinary income | | | $ | 399,345 | | | | $ | — | | | | $ | 1,075,650 | |
| Accumulated capital loss | | | | (1,097,008,705 | ) | | | | — | | | | | (53,000,137 | ) |
| Unrealized appreciation/(depreciation) | | | | (30,358,824 | ) | | | | 31,712,350 | | | | | 13,575,573 | |
| Total | | | $ | (1,126,968,184 | ) | | | $ | 31,712,350 | | | | $ | (38,348,914 | ) |
| | | | | | | | | | | | | | | | |
| | | Emerging Markets | | Global | | Global Consumer |
| | | Real Estate Fund | | Infrastructure Fund | | Growth Fund |
| Undistributed ordinary income | | | $ | 111,032 | | | | $ | 1,781,502 | | | | $ | 7,028 | |
| Accumulated capital gain/(loss) | | | | 62,929 | | | | | 1,570,778 | | | | | (53,266 | ) |
| Unrealized appreciation/(depreciation) | | | | (181,237 | ) | | | | 15,809,386 | | | | | 630,277 | |
| Total | | | $ | (7,276 | ) | | | $ | 19,161,666 | | | | $ | 584,039 | |
91
Alpine Mutual Funds
Notes to Financial Statements—Continued
April 30, 2014 (Unaudited)
Tax components of distributable earnings are determined in accordance with income tax regulations which may differ from the composition of net assets reported under GAAP. Accordingly, for the year ended October 31, 2013, the effects of certain differences were reclassified as follows:
| | | | | Accumulated | | Accumulated |
| | | | | net investment | | net realized |
| | | Capital stock | | income (loss) | | gains (losses) |
| International Real Estate Equity Fund | | $ | — | | | $ | 1,526,897 | | | $ | (1,526,897 | ) |
| Realty Income & Growth Fund | | | (574,552 | ) | | | 1,122,463 | | | | (547,911 | ) |
| Cyclical Advantage Property Fund | | | (1,593 | ) | | | 6,210 | | | | (4,617 | ) |
| Emerging Markets Real Estate Fund | | | — | | | | 58,048 | | | | (58,048 | ) |
| Global Infrastructure Fund | | | 25,004 | | | | 163,100 | | | | (188,104 | ) |
| Global Consumer Growth Fund | | | — | | | | 2,119 | | | | (2,119 | ) |
As of April 30, 2014, net unrealized appreciation/(depreciation) of investments, excluding foreign currency, based on Federal tax costs was as follows:
| | International Real | | Realty Income & | | Cyclical Advantage |
| | Estate Equity Fund | | Growth Fund | | Property Fund |
| Cost of investments | | $ | 215,729,459 | | | | $ | 70,021,185 | | | | $ | 54,375,009 | |
| Gross unrealized appreciation | | | 48,513,954 | | | | | 44,021,754 | | | | | 13,123,662 | |
| Gross unrealized depreciation | | | (80,035,565 | ) | | | | (805,173 | ) | | | | (4,903,644 | ) |
| Net unrealized appreciation/(depreciation) | | | (31,521,611 | ) | | | | 43,216,581 | | | | | 8,220,018 | |
| | | | | | | | | | | | | | | |
| | Emerging Markets | | Global | | Global Consumer |
| | Real Estate Fund | | Infrastructure Fund | | Growth Fund |
| Cost of investments | | $ | 5,699,706 | | | | $ | 159,242,093 | | | | $ | 2,231,344 | |
| Gross unrealized appreciation | | | 456,408 | | | | | 26,676,826 | | | | | 768,951 | |
| Gross unrealized depreciation | | | (376,138 | ) | | | | (6,199,215 | ) | | | | (139,442 | ) |
| Net unrealized appreciation | | | 80,270 | | | | | 20,477,611 | | | | | 629,509 | |
The tax basis of investments for tax and financial reporting purposes differs principally due to the deferral of losses on wash sales, partnership tax adjustments, and marked-to-market cost basis adjustments for investments in passive foreign investment companies (PFICs) for tax purposes.
The tax character of distributions paid during the year ended October 31, 2013 were as follows:
| | | 2013 | | | | | | | | | |
| International Real Estate Equity Fund | | | | | | | | | | | | |
| Ordinary income | | $ | 1,295,638 | | | | | | | | | |
| Long-term capital gain | | | — | | | | | | | | | |
| | | $ | 1,295,638 | | | | | | | | | |
| | | | | | | | | | | | | |
| Realty Income & Growth Fund | | | | | | | | | | | | |
| Ordinary income | | $ | 3,765,432 | | | | | | | | | |
| Long-term capital gain | | | 559,428 | | | | | | | | | |
| | | $ | 4,324,860 | | | | | | | | | |
| | | | | | | | | | | | | |
| Cyclical Advantage Property Fund | | | | | | | | | | | | |
| Ordinary income | | $ | 523,183 | | | | | | | | | |
| Long-term capital gain | | | — | | | | | | | | | |
| | | $ | 523,183 | | | | | | | | | |
92
Alpine Mutual Funds
Notes to Financial Statements—Continued
April 30, 2014 (Unaudited)
| | | 2013 | | | | | | | | |
| Emerging Markets Real Estate Fund | | | | | | | | | | | |
| Ordinary income | | $ | 58,886 | | | | | | | | |
| Long-term capital gain | | | — | | | | | | | | |
| | | $ | 58,886 | | | | | | | | |
| Global Infrastructure Fund | | | | | | | | | | | |
| Ordinary income | | $ | 3,526,250 | | | | | | | | |
| Long-term capital gain | | | — | | | | | | | | |
| | | $ | 3,526,250 | | | | | | | | |
| Global Consumer Growth Fund | | | | | | | | | | | |
| Ordinary income | | $ | 9,703 | | | | | | | | |
| Long-term capital gain | | | — | | | | | | | | |
| | | $ | 9,703 | | | | | | | | |
During the year ended October 31, 2013, the International Real Estate Equity Fund, Realty Income & Growth Fund, Cyclical Advantage Property Fund, Emerging Markets Real Estate Fund and Global Infrastructure Fund utilized $2,412,730, $4,603,113, $1,621,372, $113,560 and $504,403 of capital loss carryovers, respectively. Capital loss carryovers as of October 31, 2013 are as follows:
| | | International Real | | Realty Income & | | Cyclical Advantage |
| Expiration Date | | Estate Equity Fund | | Growth Fund | | Property Fund |
| 10/31/2016 | | $ | 384,892,332 | | | $ | — | | | $ | 17,975,541 | |
| 10/31/2017 | | $ | 546,087,879 | | | $ | — | | | $ | 26,502,747 | |
| 10/31/2018 | | $ | 65,121,028 | | | $ | — | | | $ | 8,521,849 | |
| 10/31/2019 | | $ | 63,938,162 | | | $ | — | | | $ | — | |
| | | | | | | | | | | | | |
| | | | | Global | | Global |
| | | Emerging Markets | | Infrastructure | | Consumer |
| Expiration Date | | Real Estate Fund | | Fund | | Growth Fund |
| 10/31/2016 | | $ | — | | | $ | — | | | $ | — | |
| 10/31/2017 | | $ | — | | | $ | — | | | $ | — | |
| 10/31/2018 | | $ | — | | | $ | — | | | $ | — | |
| 10/31/2019 | | $ | — | | | $ | — | | | $ | — | |
Under the Regulated Investment Company (“RIC”) Modernization Act of 2010 (“the Modernization Act”), post-enactment capital losses that are carried forward will retain their character as either short-term or long-term capital losses rather than being considered all short-term as under previous law. However, any losses incurred during those future taxable years will be required to be utilized prior to the losses incurred in pre-enactment taxable years, which carry an expiration date. As a result of this ordering rule, pre-enactment capital loss carryovers may be more likely to expire unused. Capital loss carryover as of October 31, 2013 with no expiration are as follows:
| Fund | | Short Term | | | Long Term | |
| International Real Estate Equity Fund | | $ | — | | | $ | 36,969,304 | |
| Global Consumer Growth Fund | | | 53,266 | | | | — | |
In accordance with U.S. GAAP, the Funds have previously adopted accounting standards related to the accounting for uncertain tax positions. In accordance with this guidance, the Funds analyzed all open tax years, as defined by the Statute of Limitations, for all major jurisdiction. Open tax years are those that are open for exam by taxing authorities. Major jurisdictions for the Funds included Federal and the state of New York. As of April 30, 2014, open Federal and New York tax years include the tax years ended October 31, 2010 through 2013. The Funds have no examinations in progress.
93
Alpine Mutual Funds
Notes to Financial Statements—Continued
April 30, 2014 (Unaudited)
The Funds have reviewed all open tax years and major jurisdictions and concluded that there is no impact on the Funds’ net assets and no tax liability resulting from unrecognized tax benefits relating to uncertain income tax positions taken in previous years or expected to be taken on the tax return for the fiscal year ended October 31, 2013 or 2014. Also, the Funds have recognized no interest and penalties related to uncertain tax benefits. The Funds are also not aware of any tax positions for which it is reasonably possible that the total amounts of unrecognized tax benefits will significantly change in the next twelve months.
94
Alpine Mutual Funds
Information about your Funds Expenses (Unaudited)
April 30, 2014
Fund expenses
Example
As a shareholder of the Fund, you may incur two types of costs: (1) transaction costs, including front-end on purchase payments; and (2) ongoing costs, including management fees; service and/or distribution 12b-1 fees; and other Fund expenses. This example is intended to help you understand your ongoing costs (in dollars) of investing in the Fund and to compare these costs with the ongoing costs of investing in other mutual funds. This example is based on an investment of $1,000 invested on November 1, 2013 and held for the six months ended April 30, 2014.
Actual Expenses
The table below titled “Based on Actual Total Return” provides information about actual account values and actual expenses. You may use the information provided in this table, together with the amount you invested, to estimate the expenses that you paid over the period. To estimate the expenses you paid on your account, divide your ending account value by $1,000 (for example, an $8,600 ending account value divided by $1,000 = 8.6), then multiply the result by the number under the heading entitled “Expenses Paid During the Period.”
Hypothetical Example for Comparison Purposes
The table below titled “Based on Hypothetical Total Return” provides information about hypothetical account values and hypothetical expenses based on the actual expense ratio and an assumed rate of return of 5.00% per year before expenses, which is not the Fund’s actual return. The hypothetical account values and expenses may not be used to estimate the actual ending account balance or expenses you paid for the period. You may use the information provided in this table to compare the ongoing costs of investing in the Fund and other funds. To do so, compare the 5.00% hypothetical example relating to the Fund with the 5.00% hypothetical examples that appear in the shareholder reports of the other funds.
Please note that the expenses shown in the table below are meant to highlight your ongoing costs only and do not reflect any transactional costs, such as front-end or back-end sales charges (loads). Therefore, the table is useful in comparing ongoing costs only, and will not help you determine the relative total costs of owning different funds. In addition, if these transaction costs were included, your costs would have been higher.
International Real Estate Equity Fund
Based on actual total return (1)
| | | Actual Total | | | | | | Annualized | | Expenses |
| | | Return Without | | Beginning | | Ending | | Expense | | Paid During |
| Class | | Sales Charges (2) | | Account Value | | Account Value | | Ratio | | the Period (3) |
| | | | | | | | | | | |
| Institutional | | (1.26)% | | $1,000.00 | | $987.40 | | 1.55% | | $7.64 |
| Class A | | (1.47)% | | $1,000.00 | | $985.30 | | 1.80% | | $8.86 |
Based on hypothetical total return (1)
| | | Hypothetical | | | | | | Annualized | | Expenses |
| | | Annualized | | Beginning | | Ending | | Expense | | Paid During |
| Class | | Total Return | | Account Value | | Account Value | | Ratio | | the Period (4) |
| | | | | | | | | | | |
| Institutional | | 5.00% | | $1,000.00 | | $1,017.11 | | 1.55% | | $7.75 |
| Class A | | 5.00% | | $1,000.00 | | $1,015.87 | | 1.80% | | $9.00 |
95
Alpine Mutual Funds
Information about your Funds Expenses (Unaudited)—Continued
April 30, 2014
Realty Income & Growth Fund
Based on actual total return (1)
| | | Actual Total | | | | | | Annualized | | Expenses |
| | | Return Without | | Beginning | | Ending | | Expense | | Paid During |
| Class | | Sales Charges (2) | | Account Value | | Account Value | | Ratio | | the Period (3) |
| | | | | | | | | | | |
| Institutional | | 9.95% | | $1,000.00 | | $1,099.50 | | 1.42% | | $7.39 |
| Class A | | 9.78% | | $1,000.00 | | $1,097.80 | | 1.67% | | $8.69 |
Based on hypothetical total return (1)
| | | Hypothetical | | | | | | Annualized | | Expenses |
| | | Annualized | | Beginning | | Ending | | Expense | | Paid During |
| Class | | Total Return | | Account Value | | Account Value | | Ratio | | the Period (4) |
| | | | | | | | | | | |
| Institutional | | 5.00% | | $1,000.00 | | $1,017.75 | | 1.42% | | $7.10 |
| Class A | | 5.00% | | $1,000.00 | | $1,016.51 | | 1.67% | | $8.35 |
Cyclical Advantage Property Fund
Based on actual total return (1)
| | | Actual Total | | | | | | Annualized | | Expenses |
| | | Return Without | | Beginning | | Ending | | Expense | | Paid During |
| Class | | Sales Charges (2) | | Account Value | | Account Value | | Ratio | | the Period (3) |
| | | | | | | | | | | |
| Institutional | | (2.60)% | | $1,000.00 | | $974.00 | | 1.51% | | $7.39 |
Based on hypothetical total return (1)
| | | Hypothetical | | | | | | Annualized | | Expenses |
| | | Annualized | | Beginning | | Ending | | Expense | | Paid During |
| Class | | Total Return | | Account Value | | Account Value | | Ratio | | the Period (4) |
| | | | | | | | | | | |
| Institutional | | 5.00% | | $1,000.00 | | $1,017.31 | | 1.51% | | $7.55 |
Emerging Markets Real Estate Fund
Based on actual total return (1)
| | | Actual Total | | | | | | Annualized | | Expenses |
| | | Return Without | | Beginning | | Ending | | Expense | | Paid During |
| Class | | Sales Charges (2) | | Account Value | | Account Value | | Ratio | | the Period (3) |
| | | | | | | | | | | |
| Institutional | | (4.75)% | | $1,000.00 | | $952.50 | | 1.36% | | $6.58 |
| Class A | | (4.85)% | | $1,000.00 | | $951.50 | | 1.62% | | $7.84 |
Based on hypothetical total return (1)
| | | Hypothetical | | | | | | Annualized | | Expenses |
| | | Annualized | | Beginning | | Ending | | Expense | | Paid During |
| Class | | Total Return | | Account Value | | Account Value | | Ratio | | the Period (4) |
| | | | | | | | | | | |
| Institutional | | 5.00% | | $1,000.00 | | $1,018.05 | | 1.36% | | $6.81 |
| Class A | | 5.00% | | $1,000.00 | | $1,016.76 | | 1.62% | | $8.10 |
96
Alpine Mutual Funds
Information about your Funds Expenses (Unaudited)—Continued
April 30, 2014
Global Infrastructure Fund
Based on actual total return (1)
| | | Actual Total | | | | | | Annualized | | Expenses |
| | | Return Without | | Beginning | | Ending | | Expense | | Paid During |
| Class | | Sales Charges (2) | | Account Value | | Account Value | | Ratio | | the Period (3) |
| | | | | | | | | | | |
| Institutional | | 5.89% | | $1,000.00 | | $1,058.90 | | 1.19% | | $6.07 |
| Class A | | 5.73% | | $1,000.00 | | $1,057.30 | | 1.44% | | $7.35 |
Based on hypothetical total return (1)
| | | Hypothetical | | | | | | Annualized | | Expenses |
| | | Annualized | | Beginning | | Ending | | Expense | | Paid During |
| Class | | Total Return | | Account Value | | Account Value | | Ratio | | the Period (4) |
| | | | | | | | | | | |
| Institutional | | 5.00% | | $1,000.00 | | $1,018.89 | | 1.19% | | $5.96 |
| Class A | | 5.00% | | $1,000.00 | | $1,017.65 | | 1.44% | | $7.20 |
Global Consumer Growth Fund
Based on actual total return (1)
| | | Actual Total | | | | | | Annualized | | Expenses |
| | | Return Without | | Beginning | | Ending | | Expense | | Paid During |
| Class | | Sales Charges (2) | | Account Value | | Account Value | | Ratio | | the Period (3) |
| | | | | | | | | | | |
| Institutional | | (0.22)% | | $1,000.00 | | $997.80 | | 1.35% | | $6.69 |
| Class A | | (0.39)% | | $1,000.00 | | $996.10 | | 1.60% | | $7.92 |
Based on hypothetical total return (1)
| | | Hypothetical | | | | | | Annualized | | Expenses |
| | | Annualized | | Beginning | | Ending | | Expense | | Paid During |
| Class | | Total Return | | Account Value | | Account Value | | Ratio | | the Period (4) |
| | | | | | | | | | | |
| Institutional | | 5.00% | | $1,000.00 | | $1,018.10 | | 1.35% | | $6.76 |
| Class A | | 5.00% | | $1,000.00 | | $1,016.86 | | 1.60% | | $8.00 |
| (1) | For the six months ended April 30, 2014. |
| (2) | Assumes the reinvestment of all distributions, including returns of capital, if any, at net asset value and does not reflect the deduction of the applicable sales charge. Total return is not annualized, as it may not be representative of the total return for the year. Performance figures may reflect fee waivers and/or expense reimbursements. In the absence of fee waivers and/or expense reimbursements, the total return would have been lower. Past performance is no guarantee of future results. |
| (3) | Expenses (net of fee waivers and/or expense reimbursements) are equal to each class’ respective annualized expense ratio multiplied by the average account value over the period, multiplied by the number of days in the most recent fiscal half-year then divided by 365. |
| (4) | Hypothetical expense examples assume a 5% return over a hypothetical 181 day period. |
97
Alpine Mutual Funds
Additional Information (Unaudited)
April 30, 2014
Approval of Investment Management Agreements
In the weeks leading up to the Meeting of the Board of Trustees on March 26-27, 2014, the Independent Trustees reviewed materials (“15(c) Materials”) provided by the Adviser relating to the Advisory Contracts. The 15(c) Materials responded to information requested by the Independent Trustees, through independent legal counsel, which the Independent Trustees discussed prior to the meeting and with the Adviser at the meeting. In reviewing the Agreements, the Independent Trustees considered various factors, including among other things (i) the nature, extent and quality of the services provided by the Adviser under the Agreement, (ii) the investment performance of the Funds, (iii) the costs to the Adviser of its services and the profits realized by the Adviser, from its relationship with the Funds, and (iv) the extent to which economies of scale would be realized if and as a Fund grows and whether the fee levels in the Agreements reflect these economies of scale. The Independent Trustees evaluated a variety of information they deemed relevant on a Fund by Fund basis. No one particular factor was identified as determinative, but rather it was a combination of all the factors and conclusions that formed the basis for the determinations made by the Independent Trustees, and different Independent Trustees may have placed greater weight on certain factors than did other Independent Trustees.
In considering the nature, extent and quality of the services provided by the Adviser, the Independent Trustees relied on their prior experience as Independent Trustees of the Funds, the 15(c) Materials provided at and prior to the meeting, as well as on materials and updates provided at Board meetings throughout the year. They noted that under the Agreements, the Adviser is responsible for managing the Funds’ investments in accordance with each Fund’s investment objectives and policies, applicable legal and regulatory requirements, and the oversight of the Independent Trustees, for providing necessary and appropriate reports and information to the Independent Trustees, and for furnishing the Funds with the assistance, cooperation, and information necessary for the Funds to meet various legal requirements regarding registration and reporting. They also noted the experience and expertise of the Adviser as appropriate as an adviser to the Funds.
The Independent Trustees reviewed the background and experience of the Adviser’s Senior Management, including those individuals responsible for the investment, operations and compliance with respect to the Funds’ investments, and the responsibilities of the investment, operations and compliance personnel with respect to the Funds. They also considered the resources, operational structures and practices of the Adviser in managing the Funds’ portfolios, in monitoring and securing the Funds’ compliance with investment objectives and policies and with applicable laws and regulations, and in seeking best execution of portfolio transactions. Drawing upon all the materials provided throughout the year, including the 15(c) Materials, and their knowledge of the business of the Adviser formed through meetings with Portfolio Managers among others, the Independent Trustees took into account that the Adviser’s experience, resources and strength in these areas are deep, extensive and of high quality. On the basis of this review, the Independent Trustees determined that the nature and extent of the services provided by the Adviser to the Funds were appropriate, had been of high quality, and could be expected to remain so.
The Independent Trustees discussed the Fund performance metrics in the 15(c) Materials that were compiled by Morningstar. In assessing the quality of the portfolio management, the Independent Trustees were able to compare the short-term and long-term performance of each Fund on both an absolute basis and in comparison to its peer group, as set forth in the Morningstar Report. The Board recognized the steps that management has taken over the past year with respect to the performance of the Funds, including additions to the portfolio management and research teams and the continued development of a more team-based approach. The Independent Trustees noted that the performance of certain of these funds had recently improved but that the Board acknowledged that they will continue to closely monitor these funds for improvement of performance. The Independent Trustees also considered the formation of the Senior Investment Committee to serve as the Office of the CIO, the Adviser’s explanation of how the Committee would operate and the potential impact this could be expected to have on performance. Additionally, the Independent Trustees noted the Adviser’s expanded use of performance attribution and risk reporting. The Independent Trustees also reviewed a summary of certain Fund expenses against those of peer and category groups. For certain of the Funds, they noted that higher expenses relative to peer and category groups were due to the small size of a Fund or its decline in assets. In other instances, the net expenses exceeded the peer group and category medians largely due to an advisory fee higher than the category median. The Board considered the use of Adviser profits to potentially benefit shareholders over time through the addition of certain employees over the past several years, enhancements to portfolio management and research teams and investment in additional risk and analytic tools to aid in portfolio management. The Board also considered the infrastructure and technology services provided by the Adviser. The Independent Trustees concluded on balance that the fees to the Adviser were fair and equitable.
The Independent Trustees also considered the profitability of the advisory agreements with the Adviser. The Independent Trustees were provided with data on the Funds’ profitability generally and on the profitability of each Fund. The Independent Trustees also examined the expense limitation agreements in place and any other expense subsidization
98
Alpine Mutual Funds
Additional Information (Unaudited)—Continued
April 30, 2014
undertaken by the Adviser, as well as each Funds’ brokerage and commissions, commission sharing agreements and the open-end Funds’ payments to intermediaries whose customers invest in the Funds. After discussion and analysis, including regarding plans and potential plans for modification or enhancement of existing products, the Independent Trustees concluded that, to the extent that the Adviser’s relationship with the Funds has been profitable, the profitability was in no instance such as to render any advisory fee excessive.
The Independent Trustees also had an opportunity to review and discuss the other 15(c) Materials provided by Alpine in response to the request of their Counsel, including, among others, comparative performance expense information, organization charts, advisory fee breakpoints, and profitability. Further, the Independent Trustees had the opportunity to consider whether the management of the Funds resulted in any “fall-out” benefits to the Adviser. In considering whether the Adviser benefits in other ways from its relationship with the Funds, the Independent Trustees concluded that, to the extent that Adviser derives other benefits from its relationship with the Funds, those benefits are not so significant as to render the Adviser’s fees excessive.
On the basis of their ongoing discussions with Management and their analysis of information provided prior to and at the meeting, the Independent Trustees determined that the nature of the Funds and their operations, particularly the open-end Funds, is such that the Adviser may realize economies of scale in the management of certain Funds as they grow in size.
The Independent Trustees approved the continuance of the Funds’ Agreements with the Adviser after weighing, among others, the foregoing factors. They reasoned that the nature and extent of the services provided by the Adviser were appropriate and that the Adviser had and was taking appropriate steps to address performance issues affecting certain Funds. As to the Adviser’s fees for the Funds, the Independent Trustees determined that the fees, considered in relation to the services provided, were fair and reasonable, that the Funds’ relationship with the Adviser was not so profitable as to render the fees excessive, any additional benefits to the Adviser were not of a magnitude that resulted in excessive fees, and that the fees adequately reflected shared economies of scale with the Funds. Accordingly, the Trustees, including a majority of the Independent Trustees, agreed to approve the continuation of the Agreements for one year.
Availability of Proxy Voting Information
Information regarding how each Fund votes proxies relating to portfolio securities is available without charge upon request by calling toll-free at 1-888-785-5578 and on the SEC’s website at www.sec.gov. Information regarding how each Fund voted proxies relating to portfolio securities during the most recent twelve month period ended June 30 is available on the SEC’s website at www.sec.gov or by calling the toll-free number listed above.
Availability of Quarterly Portfolio Schedule
The Funds file Form N-Q for the first and third quarters of each fiscal year on Form N-Q. Each Fund’s Form N-Q is available on the SEC’s website at www.sec.gov and may be reviewed and copied at the SEC’s Public Reference Room in Washington, DC. Information on the operation of the Public Reference Room may be obtained by calling 1-202-551-8090.
Privacy Policy
The Funds collect non-public information about you from the following sources:
| | • | information we receive about you on applications or other forms; |
| | • | information you give us orally; and |
| | • | information about your transactions with others or us. |
The Funds do not disclose any non-public personal information about our customers or former customers without the customer’s authorization, except as required by law or in response to inquiries from governmental authorities. The Funds restrict access to your personal and account information to those employees who need to know that information to provide products and services to you. The Funds also may disclose that information to unaffiliated third parties (such as to brokers or custodians) only as permitted by law and only as needed for us to provide agreed services to you. The Funds maintain physical, electronic and procedural safeguards to guard your non-public personal information.
In the event that you hold shares of the Funds through a financial intermediary, including, but not limited to a broker dealer, bank or trust company, the privacy policy of your financial intermediary would govern how your non-public personal information would be shared with unaffiliated third parties.
99
[THIS PAGE INTENTIONALLY LEFT BLANK]
TRUSTEES
Samuel A. Lieber
Eleanor T.M. Hoagland
James A. Jacobson
H. Guy Leibler
Jeffrey E. Wacksman
CUSTODIAN &
ADMINISTRATOR
State Street Bank & Trust Company
One Lincoln Street
Boston, MA 02111
INDEPENDENT REGISTERED
PUBLIC ACCOUNTING FIRM
Deloitte & Touche LLP
500 College Road East
Princeton, NJ 08540
FUND COUNSEL
Willkie Farr & Gallagher LLP
787 7th Avenue
NewYork, NY 10019
DISTRIBUTOR
Quasar Distributors, LLC
615 East Michigan Street
Milwaukee, WI 53202
INVESTMENT Adviser
Alpine Woods Capital Investors, LLC
2500 Westchester Ave., Suite 215
Purchase, NY 10577
TRANSFER AGENT
Boston Financial Data Services
2000 Crown Colony Drive
Quincy, MA 02169

SHAREHOLDER | INVESTOR INFORMATION
1(888)785.5578
www.alpinefunds.com
This material must be preceded or accompanied by a current prospectus.
Item 2. Code of Ethics
Not applicable to semi-annual reports.
Item 3. Audit Committee Financial Expert
Not applicable to semi-annual reports.
Item 4. Principal Accountant Fees and Services
Not applicable to semi-annual reports.
Item 5. Audit Committee of Listed Registrants
Not applicable to registrants who are not listed issuers (as defined in Rule 10A-3 under the Securities Exchange Act of 1934).
Item 6. Schedule of Investments
| (a) | Schedule of Investments is included as part of Item 1 of the Form N-CSR. |
Item 7. Disclosure of Proxy Voting Policies and Procedures for Closed-End Management Investment Companies.
Not applicable to open-end investment management companies.
Item 8. Portfolio Managers of Closed-End Management Investment Companies.
Not applicable to open-end investment management companies.
Item 9. Purchases of Equity Securities by Closed-End Management Investment Company and Affiliated Purchasers.
Not applicable to open-end investment management companies.
Item 10. Submission of Matters to a Vote of Security Holders.
There were no material changes to the procedures by which shareholders may recommend nominees to the Registrant’s Board of Trustees.
Item 11. Controls and Procedures.
(a) The Registrant’s principal executive officer and principal financial officer have evaluated the registrant’s disclosure controls and procedures (as defined in Rule 30a-3(c) under the Investment Company Act of 1940, as amended) within 90 days of this filing and have concluded that the Registrant’s disclosure controls and procedures were effective, as of that date.
(b) There was no change in the Registrant’s internal control over financial reporting (as defined in Rule 30a-3(d) under the Investment Company Act of 1940, as amended) during the second fiscal quarter of the period covered by this report that has materially affected, or is reasonably likely to materially affect, the Registrant’s internal control over financial reporting.
Item 12. Exhibits
(a)(1) Not applicable to semi-annual reports.
(a)(2) The certifications required by Rule 30a-2(a) of the Investment Company Act of 1940, as amended, and Section 302 of the Sarbanes-Oxley Act of 2002 are attached hereto as Ex99.Cert.
(a)(3) Not applicable.
(b) The certifications by the Registrant’s Principal Executive Officer and Principal Financial Officer, as required by Rule 30a-2(b) of the Investment Company Act of 1940, as amended, and Section 906 of the Sarbanes-Oxley Act of 2002 are attached hereto as Ex99.906Cert.
SIGNATURES
Pursuant to the requirements of the Securities Exchange Act of 1934 and the Investment Company Act of 1940, the registrant has duly caused this report to be signed on its behalf by the undersigned, thereunto duly authorized.
Alpine Equity Trust
| By: | /s/ Samuel A. Lieber | |
| | Samuel A. Lieber |
| | Chief Executive Officer (Principal Executive Officer) |
| | | |
| Date: | July 2, 2014 | |
Pursuant to the requirements of the Securities Exchange Act of 1934 and the Investment Company Act of 1940, this report has been signed below by the following persons on behalf of the registrant and in the capacities and on the dates indicated.
| By: | /s/ Samuel A. Lieber | |
| | Samuel A. Lieber |
| | Chief Executive Officer (Principal Executive Officer) |
| By: | /s/ Ronald G. Palmer, Jr. | |
| | Ronald G. Palmer, Jr. |
| | Chief Financial Officer (Principal Financial Officer) |