UNITED STATES
SECURITIES AND EXCHANGE COMMISSION
Washington, D.C. 20549
FORM N-CSR
CERTIFIED SHAREHOLDER REPORT OF REGISTERED
MANAGEMENT INVESTMENT COMPANIES
Investment Company Act File number: 811-05684
Alpine Equity Trust
(Exact name of registrant as specified in charter)
2500 Westchester Avenue, Suite 215
Purchase, New York 10577
(Address of principal executive offices)(Zip code)
(Name and Address of Agent for
Service) | Copy to: |
| | |
Samuel A. Lieber
Alpine Woods Capital Investors, LLC
2500 Westchester Avenue, Suite 215
Purchase, New York 10577 | Rose DiMartino
Attorney at Law
Willkie Farr & Gallagher
787 7th Avenue, 40th Floor
New York, New York 10019 |
Registrant’s telephone number, including area code: (914) 251-0880
Date of fiscal year end: October 31, 2013
Date of reporting period: November 1, 2012 – October 31, 2013
Item 1. Shareholder Report.

Real Estate Funds
Annual Report
Table of Contents
Additional Alpine Funds are offered in the Alpine Series Trust and Alpine Income Trust. These Funds include:
| Alpine Dynamic Dividend Fund | Alpine Transformations Fund |
| | |
| Alpine Accelerating Dividend Fund | Alpine Foundation Fund |
| | |
| Alpine Financial Services Fund | Alpine Ultra Short Tax Optimized Income Fund |
| | |
| Alpine Innovators Fund | Alpine Municipal Money Market Fund |
| | |
| | Alpine High Yield Managed Duration Municipal Fund |
Alpine’s Series and Income Funds’ investment objectives, risks, charges and expenses must be considered carefully before investing in funds of the Alpine Series Trust and Alpine Income Trust. The statutory and summary prospectuses contain this and other important information about the investment company, and it may be obtained by calling 1-888-785-5578, or visiting www.alpinefunds.com. Read it carefully before investing.
Mutual fund investing involves risk. Principal loss is possible.
Alpine’s Investment Outlook

President’s Letter
Dear Investors:
The fiscal year ended October 31, 2013 presented a difficult and complex year for investors across capital markets. However, like 2012, it has produced positive returns as economic and business momentum remain favorable. We are nearly five years past the trough of the global financial crisis which occurred from November, 2008 through early March, 2009. The positive performance of stocks since that time may appear to have moved ahead of the economic recovery in the real economy, however, this must be considered in the context of the extreme trough of valuations after the 2008 financial crisis. Generally, the price of many equities today, as measured against typical parameters such as price to earnings multiples, earnings yield relative to treasury yields, share price to cash flow, discounted cash flows, or EV/EBITDA (enterprise value divided by earnings before interest taxes depreciation and amortization), are typically less expensive than during the 2007 peak. Thus, in the context of a normalized business cycle we believe that the most relevant question becomes where are corporate earnings and overall business activity trending? Given the slow pace of recovery, Alpine believes that we are only in the middle of a protracted economic cycle.
The slow pace of recovery as measured by job creation, business capital expenditures, per capita income growth, new business formation, the pace of car and home sales, as well as retail consumption patterns amongst other components of gross domestic product (GDP), suggests that the tepid economy is far from testing the limits of capacity or productivity. This has contributed to the continued lack of material goods inflation, despite the sustained efforts of the global central bankers to provide inexpensive financial liquidity. The lack of growth is evident from the recent earnings reports of the S&P 500® Index companies, which in many cases reflected positive earnings growth with minimal or even declining top line revenue trends. Companies have wrung productivity gains through technological streamlining, enhanced production processes, cost containment and reducing costs of capital through refinancing or restructuring debt. Increasingly,
market participants are concerned that companies may be approaching the limits of such profit margin enhancements. Going forward, we believe the market’s focus may turn to macro factors underpinning the prospects for economic growth which, if positive, should stimulate incremental demand for goods and services, boost aggregate revenues, and ultimately drive returns.
The year began with the traditional economic concerns as it became increasingly evident that the more than thirty-year trend of declining interest rates was nearing an end. The tug-of-war between inflation and deflation seemed to be tilting in the direction of the former as 2012 rolled into 2013, but swung abruptly in the second calendar quarter back to worries over U.S. economic slowing due to reduced government spending as sequestration cuts were implemented. Then the Federal Reserve (Fed) upset the capital markets shortly after interest rates hit record lows at the end of April when Fed Chairman Bernanke announced a process through which the economy would be weaned off the current Quantitative Easing (QE) program, the mechanism by which the Federal Reserve is making $85 billion of monthly purchases of treasury and mortgage backed securities in order to keep interest rates low. The Fed proposed that they would ‘taper’ down QE from $85 billion to $0 in the coming year contingent on the domestic economy showing signs of recovery. Thus, two new words entered the economists’ lexicon this year: ‘sequestration’ and ‘taper’.
Due to the inability of the President and Congress to find common ground between ideology and political opportunism, there has been limited fiscal stimulus deployed towards economic recovery over the past three years. This is in stark contrast to historical precedent where economic stimulus typically extended for two to three years after a recession. Since some lawmakers, investors and economists believed that more stimulus would only inflate the existing debt position, they argued for austerity measures, which precluded more fiscal deficit spending. Sequestration came into play earlier this year as a force majeure created by Congress in anticipation of their inability to come to terms with both current and future fiscal responsibilities. Most economists forecasted that the sequestration process, which
1
indiscriminately reduced spending across the U.S. government, would impact the economy by over a half percent of GDP. In effect, Congress chose to impose the burden of deficit reduction now, rather than waiting until a future date, even if the economy might be on a more stable footing then. It is clear that uncertainty surrounding government policy has significantly dampened business investment sentiment.
In the wake of the financial crisis the Fed was left as the only entity which could provide economic stimulus in the form of cheap money. However, low interest rates alone would not been enough to stimulate economic activity because the lending operations of many domestic financial institutions were significantly impaired by the near collapse of 2008. Since the onset of the crisis the Fed has utilized numerous tools in order to repair the credit mechanism in the economy. In 2012, the Fed acknowledged the potential of a deflationary effect from diminished fiscal spending combined with restricted bank lending practices, and launched the current wave of its QE program which targeted the open-ended purchase of mortgage and treasury bonds from the banks at a profit. We believe the program almost certainly has helped to stabilize the U.S. banking system, to raise the value of financial assets, and even to stimulate modest job growth. Unfortunately, the liquidity introduced into global markets through the latest QE measures also introduced distortions into the economy including excess leverage and speculation in some segments of the capital markets. Thus in our opinion, the limitless duration of open-ended easing could not go on indefinitely without causing more problems. The market became both concerned that the taper would undermine the renewed strength of our banking system and feared the unknown potential level where unsupported interest rates might settle (presumably higher). This forced many investors holding positions in interest sensitive investments to sell, hedge or otherwise reduce much of their interest rate exposure. As a result of the sudden unwinding of these positions, prices fell sharply in May and June of this year. Bond yields, foreign sovereign yields and mortgage yields rose precipitously as the market began discounting the potential impact of Fed tapering.
The market’s knee-jerk reaction to the May taper announcement proved to be premature as the Fed, in fact, did not begin tapering in September as most expected. In fact, since the sell-off in May, the Fed has gone to great lengths to communicate its decision making parameters and to strengthen the credibility of its forward guidance on interest rates. Indeed, in recent comments by prospective Fed Governor Janet Yellen, after the close of our Funds’ fiscal year, she emphasized
that when tapering does occur it will be done in accordance with improvement in economic data and will be at a very gradual pace. Thus, bonds have rallied somewhat as we enter a new phase in the seemingly never ending dance of the capital markets.
Despite tapering concerns, which have at times had traders responding to changes in sentiment on what often seems to be a daily basis, the overall direction and tone of the markets has been positive. Indeed, the S&P 500® Index, as well as other indices, surpassed the price levels of 2007 in April of this year, establishing new highs through the end of the fiscal year. As we reported in the past, the equity markets continue to climb a ‘wall of worry’, two steps forward, one step back, looking over a shoulder both to see how far we have advanced as well as whether danger lurks in our shadow. This could be a very positive stance for investment markets, provided that the fundamentals are supportive. In this light, let us return to the story of limited top-line revenue growth as opposed to bottom-line earnings growth.
Without broad economic growth, revenue growth is dependent upon market share gains or an expanding demand for specific goods and services. For most economies to grow there has to be job creation first and foremost, followed by income growth which should be sustained by enhanced productive capacity. As we closely monitor business trends and capital flows it is becoming increasingly apparent that the world’s more robust economies, notably the developed economies of North America and Asia, are at the nascent stages of a durable recovery, even if broad growth has yet to be sustained. Specifically, the United States and Japan are showing positive, if not consistent, trends in new orders and capital investment. While such investment is not as broad based as we would like to see across different segments of the economy, automobile sales, new building starts (both commercial and residential), as well as selective capital goods hold the potential for a sustained capital goods cycle.
Outside the United States, the traditional engines of global economic growth appear to be aligning in part due to significant monetary easing utilizing QE type policies in both Japan and Great Britain as well as, to a limited degree, the Eurozone. This is providing scope for these countries domestic banking sectors to heal and for capital markets to begin re-pricing risk more favorably in terms of higher stock prices and increasing money flows moving along the capital stack toward a higher risk/reward profile. Japan is riding the wave of ‘Abenomics’, pushing both aggressive monetary loosening and increasing fiscal reforms into the economy. If both the business and consumer segments of the
2
economy can be kick started, then markets could continue pricing in a reflation of growth expectations across the economy, which in turn could create a virtuous cycle across other countries given Japan’s oversized role in the global economy. While the overall economic picture in Europe remains difficult due to continued high unemployment and a weak banking system, particularly in Southern Europe, the economies in Germany and Great Britain continue to motor along. Emblematic of this stage of recovery in Europe is Ireland, which was arguably one of the major beneficiaries of the prior period of excess capital in the early part of last decade. Following a period of fiscal austerity and recapitalization of its banking system, there is strong evidence for recovery as property prices rise and investment capital begins to flow into new business formation ultimately leading to job growth.
With respect to the larger emerging markets we can look to continued solid growth out of China, in spite of the fact that China faces challenges of its own in terms of its banking structure and lending channels. Nonetheless, China’s current account surpluses and foreign capital reserves provide significant support for them to maintain stability as the economy continues its transformation from a pure low priced exporter towards a higher value added producer with a growing consumer base. We note that a number of trends of internet retail demand are globally led by the Chinese consumer, both in terms of the double-digit growth rate of retail sales to the single day record for sales volume ($5.75 billion of sales were recorded by Alibaba.com on November 11 of this year). We believe that the business cycle in many other emerging markets will remain a bit choppy over the first half of next year, however, to a certain extent, the developing economies have been able to take advantage of the delay in Fed tapering, to implement agendas to address the uncertain growth outlook and the expected rise in bond yields. We expect such adjustments could drive business capital expenditure to offset fading governmental economic support (be it fiscal or monetary) to set the stage for the next phase of global economic activity.
While we believe that as economies begin to pick up steam over the next two to three years there will be greater consumer demand for goods and services which may again lead to an excess rate of expansion in prices as well as activity, none of this appears to be present in traditional measures of inflation. The price of gold fell by 23.11% over the fiscal year, while silver declined by 32.03%. As uncertainties over China’s growth trajectory worked through the global economy, resource-based countries saw their currencies decline, notably the Australian Dollar was down 8.87%, Brazilian Real down
9.33%, South African Rand down 10.73% and Indonesian Rupiah down 12.49%. It’s worth noting that Japan was able to depreciate what many believed was an overvalued Yen, leading to an 18.9% fall, which corresponded with significant monetary stimulus and Quantitative Easing in an effort to raise equity prices and jumpstart inflation in its economy. Just to emphasize that currency markets are especially sensitive to global flows of capital, it is worth noting that the largest currency declines during the fiscal year occurred in the Syrian Pound and the Iranian Rial, both of which dropped by over 50% as those countries endured the hardships of civil war and economic blockade respectively.
In summary, we believe the current data suggest that establishing a new trend in global inflation, economic activity and capital availability could be a few years away. Interest rates could remain low relative to history, with the prospect for the yield curve tilting higher over time. This implies relatively appealing prospects for equities, assuming valuations remain sensible. At this time current equity valuations appear reasonable, notwithstanding the selective exuberance of the crowd searching for “the next new thing”, be it web retailers, new energy technology or social media related stocks.
In our view other issues that the capital markets would look at favorably include Congress providing a modicum of current fiscal stimulus over the next twelve to twenty-four months via appropriate tax incentives combined with enacting a program to tackle the long term entitlement pressures before they become more corrosive in 2020. In the meantime, the prospect of reasonable earnings growth, moderate top line expansion, rising corporate capex and gradual strengthening of the employment market could lead to a more traditional balance between the corporate sector, government and public expenditures and thereby provide a sustained basis for equity total returns over the next few years.
We appreciate your interest and support.
Sincerely,

Samuel A. Lieber
President
3
Past performance is not a guarantee of future results. The specific market, sector or investment conditions that contribute to a Fund’s performance may not be replicated in future periods.
Mutual fund investing involves risk. Principal loss is possible. Please refer to individual fund letters for risks specific to that fund.
This letter and the letters that follow represent the opinions of the Funds’ management and are subject to change, are not guaranteed and should not be considered recommendations to buy or sell any security. The information provided is not intended to be, and is not, a forecast of future events, a guarantee of future results, or investment advice.
4
| Disclosures and Definitions |  |
Real Estate Funds Disclosures
The specific market, sector or investment conditions that contributed to a Fund’s performance may not be replicated in future periods.
Please refer to the Schedule of Portfolio Investments for Fund holdings information. Fund holdings and sector allocations are subject to change and should not be considered a recommendation to buy or sell any security.
Current and future portfolio holdings are subject to risk.
Diversification does not assure a profit or protect against loss in a declining market.
Favorable tax treatment of Fund distributions may be adversely affected, changed or repealed by future changes in tax laws. Alpine may not be able to anticipate the level of dividends that companies will pay in any given timeframe.
The Funds’ monthly distributions may consist of net investment income, net realized capital gains and / or a return of capital. If a distribution includes anything other than net investment income, the Funds will provide a notice of the best estimate of its distribution sources when distributed, which will be posted on the Funds’ website, www.alpinefunds.com. A return of capital distribution does not necessarily reflect the funds’ investment performance and should not be confused with “yield” or “income.” Final determination of the federal income tax characteristics of distributions paid during calendar year 2013 will be provided on U.S. Form 1099-DIV, which will be mailed to shareholders.
Neither the Fund nor any of its representatives may give tax advice. Investors should consult their tax advisor for information concerning their particular situation.
All investments involve risk. Principal loss is possible. A small portion of the S&P 500 yield may include return of capital; the 10-year Treasury yield does not include return of capital; Corporate Bonds and High Yield Bonds generally do not have return of capital; a portion of the dividend paid by REITs and REIT preferred stock may be deemed a return of capital for tax purposes in the event the company pays a dividend greater than its taxable income. A stock may trade with more or less liquidity than a bond depending on the number of shares and bonds outstanding, the size of the company, and the demand for the securities. The REIT and REIT preferred stock market are smaller than the broader equity and bond markets and often trade with less liquidity than these markets depending upon the size of the individual issue and the demand of the securities. Treasury notes are guaranteed by the U.S. government and thus they are
considered to be safer than other asset classes. Tax features of a Treasury Note, Corporate Bond, Stock, High Yield Bond, REITs and REIT preferred stock may vary based on an individual’s circumstances. Consult a tax professional for additional information.
Earnings Growth & EPS Growth are not measures of the Funds’ future performance.
Must be preceded or accompanied by a prospectus.
Quasar Distributors, LLC, distributor.
Real Estate Funds – Definitions
Adjusted Funds From Operations (AFFO) is generally equal to a trust’s funds from operation with adjustments made for recurring capital expenditures.
Average Weight refers to the average weight of the holding in the portfolio during the reporting period.
Capex (aka Capitalization Expenditure) are funds used by a company to acquire or upgrade physical assets such as property, industrial buildings or equipment. This type of outlay is made by companies to maintain or increase the scope of their operations.
Cap Rate (aka Capitalization Rate) is a rate of return on a real estate investment property based on the expected income that the property will generate. Capitalization rate is used to estimate the investor’s potential return on his or her investment by dividing the income the property will generate (after fixed costs and variable costs) by the total value of the property.
Cash Flow measures the cash generating capability of a company by adding non-cash charges (e.g. depreciation) and interest expense to pretax income.
Correlations are statistical measures of how two securities move in relation to each other.
Developing Markets (“DM”) operate in a country with a relatively high level of economic growth and security and are therefore less risky.
EBITDA (Earnings Before Interest, Taxes, Depreciation and Amortization) is essentially Net Income with Interest, Taxes, Depreciation, and Amortization added back to it. EBITDA can be used to analyze and compare profitability between companies and industries because it eliminates the effects of financing and accounting decisions.
Earnings Growth is a measure of a company’s net income over a specific period, generally one year, is a key indicator for measuring a company’s success, and the driving force behind stock price appreciation.
5
| Disclosures and Definitions (Continued) | |
Earnings Per Share Growth is a measure of a company’s net income over a specific period, generally one year, is a key indicator for measuring a company’s success, and the driving force behind stock price appreciation.
Emerging Markets (“EM”) generally do not have the level of market efficiency and strict standards in accounting and securities regulation to be on par with advanced economies (such as the United States, Europe and Japan), but emerging markets will typically have a physical financial infrastructure including banks, a stock exchange and a unified currency.
EV (Enterprise Value) is a measure of a company’s value.
Free cash flow is a measure of financial performance calculated as operating cash flow minus capital expenditures. Free cash flow (FCF) represents the cash that a company is able to generate after laying out the money required to maintain or expand its asset base. Free cash flow is important because it allows a company to pursue opportunities that enhance shareholder value.
FTSE EPRA/NAREIT® Emerging Index is an unmanaged index designed to track the performance of listed real estate securities companies in emerging countries worldwide.
FTSE EPRA/NAREIT® Global Index is an unmanaged index designed to track the performance of publicly traded companies engaged in the real estate business in developed and emerging real estate markets/regions around the world.
FTSE EPRA/NAREIT® Global ex U.S. Real Estate Index is an unmanaged index designed to track the performance of publicly traded companies engaged in the real estate business outside the United States. The funds or securities referred to herein are not sponsored, endorsed, or promoted by the index providers, and the index providers bear no liability with respect to any such funds or securities or any index on which such funds or securities are based. The prospectus contains a more detailed description of the limited relationship the index providers have with the licensee and any related funds.
Funds From Operations is a figure used by real estate investment trusts (REITs) to define the cash flow from their operations. It is calculated by adding depreciation and amortization expenses to earnings, and sometimes quoted on a per share basis.
Hedge involves making an investment to reduce the risk of adverse price movements in an asset. Normally, a hedge consists of taking an offsetting position in a related security, such as a futures contract.
Hang Seng Index is a free-float capitalization-weighted index of selection of companies from the Stock Exchange of Hong Kong. The components of the index are divided into four subindexes: Commerce and Industry, Finance, Utilities, and properties. The index was developed with a base level of 100 as of July 31, 1964.
Ibovespa Index is a total return index weighted by traded volume and is comprised of the most liquid stocks traded on the Sao Paulo Stock Exchange.
Lipper Real Estate Funds Average is an average of funds that invest at least 80% of their portfolio in equity securities of domestic and foreign companies engaged in the real estate industry.
MSCI All Country World Index USD* is a free float-adjusted market capitalization-weighted index that is designed to measure the equity market performance of developed and emerging markets. Source: MSCI.
MSCI ACWI Consumer Discretionary Index* is a free float-adjusted market capitalization-weighted index that is designed to measure the equity market performance of developed and emerging markets for the Consumer Discretionary GICS® sector. Source: MSCI.
MSCI ACWI Consumer Staples Index USD is a market capitalization-weighted index that is designed to measure the equity market performance of developed and emerging markets for the Consumer Staples GICS® sector. Source: MSCI.
MSCI Emerging Markets Index USD* is a free float-adjusted market cap-weighted index that is designed to measure equity market performance in the global emerging markets. Source: MSCI.
MSCI US REIT Index* is a free float-adjusted market capitalization-weighted index that is comprised of the most actively-traded equity REITs that are of reasonable size in terms of full- and free-float-adjusted market capitalization. Source: MSCI.
MSCI World Index* is a free-float weighted equity index which includes developed world markets, and does not include emerging markets. Source: MSCI.
*MSCI makes no express or implied warranties or representations and shall have no liability whatsoever with respect to any MSCI data contained herein. The MSCI data may not be further redistributed or used as a basis for other indices or any securities or financial products. This report is not approved, reviewed or produced by MSCI.
Net Operating Income is a company’s operating income after operating expenses are deducted, but before income taxes and interest are deducted. If this is a
6
| Disclosures and Definitions (Continued) | |
positive value, it is referred to as net operating income, while a negative value is called a net operating loss.
Price/Earnings Ratio (P/E) is a valuation ratio of a company’s current share price compared to its per-share earnings. Normalized earnings — earnings metric that shows you want earnings look like smoothed out in the long run, taking into account the cyclical changes in an economy or stock.
Return on Equity (ROE) is the amount of net income returned as a percentage of shareholders’ equity. Return on equity measures a corporation’s profitability by revealing how much profit a company generates with the money shareholders have invested.
Risk Premium is the return in excess of the risk-free rate of return that an investment is expected to yield. An asset’s risk premium is a form of compensation for investors who tolerate the extra risk - compared to that of a risk-free asset - in a given investment.
S&P 500® Index is a float-adjusted, market capitalization-weighted index of 500 common stocks chosen for market size, liquidity, and industry group representation to represent U.S. equity performance.
S&P Developed BMI Property Net Total Return Index is an unmanaged market-weighted total return index available on a monthly basis. The index consists of many companies from developed markets whose floats are larger than $100 million and derive more than half of their revenue from property-related activities. Net total returns include cash dividends reinvested in the index but adjusted for
country specific withholding taxes based on the highest tax rate possible.
S&P Developed Ex-U.S. Property Total Return Index defines and measures the investable universe of publicly-traded real estate companies domiciled in developed countries outside of the United States. The companies in the Index are engaged in real estate-related activities such as property ownership, management, development, rental and investment.
S&P Global Infrastructure Index is comprised of 75 of the largest publicly-listed infrastructure companies that meet specific investability requirements. The Index is designed to provide liquid exposure to the leading publicly-listed companies in the global infrastructure industry, from both developed markets and emerging markets.
S&P 500® Utilities Index comprises those companies included in the S&P 500 that are classified as members of the GICS® utilities sector.
STOXX Europe 600 (Price) Index is a broad based capitalization-weighted index of European stocks designed to provide a broad yet liquid representation of companies in the European region. The equities use free float shares in the index calculation. The index was developed with a base value of 100 as of December 31, 1991. This index uses float shares.
STOXX 600 Utilities Index is a capitalization-weighted index which includes European companies that are involved in the utility sector.
An investor cannot invest directly in an index.
7
Equity Manager Reports

| | Alpine International Real Estate
Equity Fund | |
| | | |
| | Alpine Realty Income & Growth Fund | |
| | | |
| | Alpine Cyclical Advantage Property Fund | |
| | | |
| | Alpine Emerging Markets Real Estate Fund | |
| | | |
| | Alpine Global Infrastructure Fund | |
| | | |
| | Alpine Global Consumer Growth Fund | |
| Alpine International Real Estate Equity Fund |  |
| Comparative Annualized Returns as of 10/31/13 (Unaudited) | | |
| | | 1 Year | | 3 Years | | 5 Years | | 10 Years | | Since Inception(1) |
Alpine International Real Estate Equity Fund —
Institutional Class | | | 7.83% | | | | -0.52% | | | | 16.45% | | | | 4.92% | | | | 5.51% | |
Alpine International Real Estate Equity Fund —
Class A (Without Load) | | | 7.53% | | | | N/A | | | | N/A | | | | N/A | | | | 16.86% | |
Alpine International Real Estate Equity Fund —
Class A (With Load) | | | 1.63% | | | | N/A | | | | N/A | | | | N/A | | | | 13.32% | |
| FTSE EPRA/NAREIT® Global Ex-U.S. Real Estate Index(2) | | | 12.76% | | | | 6.84% | | | | 15.46% | | | | N/A | | | | N/A | |
| MSCI EAFE Index | | | 26.88% | | | | 8.38% | | | | 11.99% | | | | 7.71% | | | | 4.82% | |
| S&P Developed Ex-U.S. Property Total Return Index(3) | | | 16.55% | | | | 10.11% | | | | 16.64% | | | | 10.34% | | | | N/A | |
| Lipper International Real Estate Funds Average(4) | | | 12.59% | | | | 7.18% | | | | 13.23% | | | | 8.04% | | | | 5.53% | |
| Lipper International Real Estate Funds Ranking(4) | | | 46/58 | | | | 44/44 | | | | 3/43 | | | | 3/3 | | | | 1/1 | |
| Gross Expense Ratio (Institutional Class): 1.51%(5) | | | | | | | | | | | | | | | | | | | | |
| Net Expense Ratio (Institutional Class): 1.51%(5) | | | | | | | | | | | | | | | | | | | | |
| Gross Expense Ratio (Class A): 1.76%(5) | | | | | | | | | | | | | | | | | | | | |
| Net Expense Ratio (Class A): 1.76%(5) | | | | | | | | | | | | | | | | | | | | |
| | (1) | Institutional Class shares commenced on February 1, 1989 and Class A shares commenced on December 30, 2011. Returns for indices are since February 1, 1989. |
| | (2) | Index commenced on October 31, 2008. |
| | (3) | Index commenced on July 31, 1989. |
| | (4) | The since inception data represents the period beginning February 2, 1989 (Institutional Class only). |
| | (5) | As disclosed in the prospectus dated February 28, 2013. |
Performance data quoted represents past performance and is not predictive of future results. Investment return and principal value of the Fund fluctuate, so that shares, when redeemed, may be worth more or less than their original cost. Performance current to the most recent month end may be lower or higher than the performance quoted and may be obtained by calling 1-888-785-5578. Performance data shown does not reflect the 1.00% redemption fee imposed on shares held for fewer than 60 days. If it did, total returns would be reduced. Returns for the Class A shares with sales charge reflect a maximum sales charge of 5.50%. Performance for the Class A shares without sales charges does not reflect this load.
FTSE EPRA/NAREIT® Global ex-U.S. Real Estate Index is an unmanaged index designed to track the performance of publicly traded companies engaged in the real estate business outside the United States. The funds or securities referred to herein are not sponsored, endorsed, or promoted by the index providers, and the index providers bear no liability with respect to any such funds or securities or any index on which such funds or securities are based. The prospectus contains a more detailed description of the limited relationship the index providers have with the licensee and any related funds. MSCI EAFE (Europe, Australasia, Far East) Index is a free float-adjusted market-cap-weighted index designed to measure developed market equity performance. Source: MSCI. MSCI data may not be reproduced or used for any other purpose. MSCI makes no express or implied warranties or representations and shall have no liability whatsoever with respect to any MSCI data contained herein. The MSCI data may not be further redistributed or used as a basis for other indices or any securities or financial products. This report is not approved, reviewed or produced by MSCI. The S&P Developed Ex-U.S. Property Total Return Index defines and measures the investable universe of publicly-traded real estate companies domiciled in developed countries outside of the United States. The companies in the Index are engaged in real estate-related activities such as property ownership, management, development, rental and investment. The Lipper International Real Estate Funds Average is an average of funds that invest at least 80% of their portfolio in equity securities of domestic and foreign companies engaged in the real estate industry. Lipper rankings for the periods shown are based on fund total returns with dividends and distributions reinvested and do not reflect sales charges. The FTSE EPRA/NAREIT® Global ex-U.S. Real Estate Index, the MSCI EAFE Index, the S&P Developed Ex-U.S. Property Total Return Index and the Lipper International Real Estate Funds Average are unmanaged and do not reflect direct fees associated with a mutual fund, such as investment adviser fees; however, the Lipper International Real Estate Funds Average reflects fees charged by the underlying funds. The performance for the Alpine International Real Estate Equity Fund reflects the deduction of fees for these value-added services. Investors cannot directly invest in an index.
To the extent that the Fund’s historical performance resulted from gains derived from participation in Initial Public Offerings (“IPOs”) and/or Secondary Offerings, there is no guarantee that these results can be replicated in future periods or that the Fund will be able to participate to the same degree in IPO/Secondary Offerings in the future.
9
| Alpine International Real Estate Equity Fund (Continued) | |
Portfolio Distributions* (Unaudited)
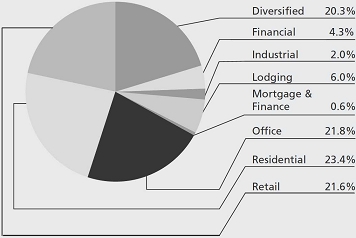
| Top 10 Holdings* (Unaudited) |
| 1. | | Regus PLC | 7.93 | % |
| 2. | | South Asian Real Estate PLC | 5.51 | % |
| 3. | | Central Pattana PCL | 5.02 | % |
| 4. | | Hulic Co., Ltd. | 4.33 | % |
| 5. | | Kenedix, Inc. | 4.32 | % |
| 6. | | Direcional Engenharia SA | 4.04 | % |
| 7. | | Sao Carlos Empreendimentos e Participacoes SA | 4.03 | % |
| 8. | | LXB Retail Properties PLC | 3.74 | % |
| 9. | | SM Prime Holdings, Inc. | 3.56 | % |
| 10. | | Iguatemi Empresa de Shopping Centers SA | 3.14 | % |
| * | Portfolio Distributions percentages are based on total investments. Top 10 Holdings do not include short-term investments and percentages are based on total net assets. Portfolio holdings and sector distributions are as of 10/31/13 and are subject to change. Portfolio holdings are not recommendations to buy or sell any securities. |
| Value of a $10,000 Investment (Unaudited) |
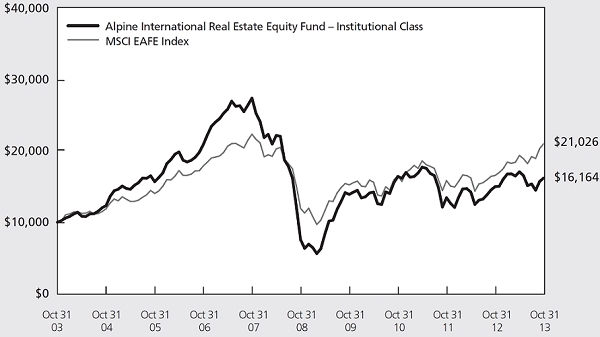 |
| |
This chart represents a comparison of a hypothetical $10,000 investment in the Fund versus a similar investment in the Fund’s benchmarks. The graph and the table do not reflect the deduction of taxes that a shareholder would pay on Fund distributions or the redemption of Fund shares. Investment performance reflects the waiver and recovery of certain fees, if applicable. Without the waiver and recovery of fees, the Fund’s total return would have differed.
Performance data quoted represents past performance and is not predictive of future results. Investment return and principal value of the Fund fluctuate, so that shares, when redeemed, may be worth more or less than their original cost.
10
| Alpine International Real Estate Equity Fund (Continued) | |
Commentary
Dear Investors:
We are pleased to present the 2013 annual report for the Alpine International Real Estate Equity Fund. For the twelve months ended October 31, 2013, the Fund generated a total return of 7.83%. This compares with the total return of the Fund’s primary benchmark, the FTSE EPRA/NAREIT® Global Ex-US Real Estate Index of 12.76% and the return of its secondary benchmark, the S&P Developed Ex-US Property Total Return Index, of 16.55%. The Fund’s relative performance for the year reflects primarily the impact of an acute shift in capital flows out of emerging markets. The largely indiscriminate exodus in the second half of the fiscal year was motivated in large part by investor concerns that the Federal Reserve’s (Fed) decision to taper its Quantitative Easing (QE) program would remove the monetary stimulus that has been supporting global economic growth. Emerging market economies, which have been the primary driver of global GDP growth since the financial crisis, were the most exposed to a pull back in Fed liquidity. All references in this letter to the Fund’s performance relate to the performance of the Fund’s Institutional Class.
Big Picture for Real Estate in 2013/2014
Since real estate asset pricing typically recovers later in the economic cycle, while stocks generally move in anticipation of economic earnings, real estate equities overall tend to perform in a hybrid fashion. As interest rates were falling in the period after the financial crisis, rate-sensitive sectors such as real estate, and particularly REITs which pay much of their income out in the form of dividends, outperformed the broader equity market and saw strong demand consistent with other income-producing assets. However, this year as interest rates have started to move higher, real estate stock returns have been positive but have lagged the broader market indices. While the S&P 500 finally moved above levels achieved in 2007, during this fiscal year, price-only real estate stock indices are generally well below their prior peak levels. Our analysis has led us to believe that real estate stock price indices are approximately 30% below their 2007 peak. Thus we believe the moderate pace of economic expansion will underpin real estate stock valuations in 2014, as global growth offsets rising interest rate trends.
With weak economic activity suggesting lower levels of demand for goods and services, the construction of new supply of real estate has been limited to specific geographies or subsectors. Thus, the supply and demand balance for many segments of the real estate market is
generally supportive, with limited new supply while demand remains flat to modestly higher. We believe that this gap between demand and supply could widen and translate into stable or rising rents and capital values over the next 12 to 24 months. We expect that if rents increase in ensuing years then dividend growth should follow. Such a scenario would provide a landscape in which real estate equities could sustain current price levels or perhaps move higher even as interest rates rise, because their income and dividend growth could potentially offset the impact of higher relative yields and costs. Of course, this is more likely in an environment where rates are rising at a moderate pace, as opposed to when rates are fluctuating rapidly, such as this summer, when talk of the Fed tapering consumed the market.
Assuming that our assessment of the economic recovery is correct-that we are in the middle of a protracted economic cycle — and given that real estate rents and values tend to perform better in the latter stages of the business cycle-then one might expect positive returns from real estate securities over the next few years. By and large, capital values have moved ahead of rents, due to still low interest rates, but if rents grow appreciably, then development returns could become significant for well capitalized property companies. In our view this could drive the next phase of real estate value creation for property stocks. It is Alpine’s view that selectivity, by stock, sector and geography will be significantly influenced by our analysis of competitive business models.
2013 Portfolio Overview
During the period the Fund reduced its significant overweight position in Brazil from 37.2% down to 21.3% at fiscal year-end. This year end position was surpassed by the Fund’s weight in the U.K. which rose from 13.3% last year to 22.1% this past October. India’s position grew marginally from 10.5% to 12.4%, while the exposure to Japan was increased from 2.2% to 11.5% at year end. The Fund’s next largest positions were in the Philippines which expanded from 3.0% to 6.4% and Thailand which grew from 4.4% to 6.4%. We have continued to hedge a portion of Japanese Yen exposure. We have also continued to employ leverage both in the execution of the Fund’s investment strategy and to manage significant unexpected net outflows from the Fund during the period.
The drivers of portfolio performance in terms of stock selection were generally quite positive, while the macro calls which effect country allocations were decidedly mixed at best. This is perhaps best illustrated by comparing the
11
| Alpine International Real Estate Equity Fund (Continued) | |
benchmark FTSE EPRA/NAREIT® Global Ex-US Real Estate Index (EPRA Index) with the portfolio returns for the same countries. Japan was the largest weighting in the EPRA Index with an average weight of 19.34% and the stocks in the index produced a 43.23% return. By comparison, the Fund had a much smaller 6.93% average weighting in Japan and despite the lower weighting the Fund generated a comparable contribution from Japan because of the 204.73% return from its holdings. Hong Kong was the second highest weighting in the benchmark with an average weight of 14.72% and generated a total return of 0.92% resulting in a negligible contribution to the Index return, while the Fund’s average weighting of 1.88% generated an 11.28% total return for a comparable portfolio impact. The Index’s third largest weighting was Australia with an average weight of 11.43%, which generated a 2.77% total return compared with a zero exposure in the Fund’s portfolio. The fourth largest index weighting was in the U.K. where an average weight of 7.77% of the index generated a 27.69% total return. This compares with the Fund’s larger 17.64% average U.K. weighting which generated a 49.71% total return. The index’s fifth largest country’s average weight was Singapore with 7.20% which generated a 2.78% total return which compared with the Fund’s 3.40% average weighting and 11.85% total return. In aggregate, the top five country weightings accounted for 60.46% of the index and generated 10.09% of the index’s 12.76% total return. By comparison, the Fund had 29.85% of its portfolio invested in these same five countries, generating a contribution of over 15%. Stock selection in these countries played a key role in the Fund’s generating more than a 50% higher return with 50% less invested in the index’s top 5 countries.
Unfortunately, some of these gains were offset by some other country allocations in the Fund’s portfolio, which dragged down the Fund’s overall return. Specifically, the Fund had an average weighting of 30.26% in Brazil which produced a -20.87% return compared with the Index average weighting of 3.2%, which generated a -22.81% return. Add to this India at an 11.96% average weight, generating a -15.59% return compared with the benchmark’s small 0.41% average weight generating -33.71% total return. While the Fund’s stock selection in Brazil and India were positive contributors relative to the index selection, the Fund’s performance suffered severely from the overweight allocations to these countries. Specifically the Fund’s weighting to Brazil and India
averaged 42.22% during the period and contributed -9.21%, versus a benchmark average exposure of 3.61% for the period which contributed -0.85%.
The Fund’s primary exposure in Brazil was to shopping mall owners and developers and, in fact, the six publically traded Brazilian mall companies have continued to fare quite well, posting aggregate robust third quarter same store sales growth of 9.3% and same store rental growth of 11.13%. Nonetheless, the macro conditions weighed heavily on Brazilian equity returns. While our holdings in these countries may be fundamentally inexpensive and may prove to be attractive investments over a longer period of time, the outsized position in Brazil during this period exposed the Fund to considerable currency volatility as well as poor share performance. This is why exposure has been reduced from 37.2% to 21.2% and we will continue to monitor this level of exposure closely.
Top Ten Largest Holdings
The largest holding at year end was in U.K-based Regus PLC which moved up from fifth position last year with a total return of 107.90%. This reflects a continued strong demand for flexible office accommodation of which Regus is the world’s leading provider. South Asian Real Estate*, which oversees residential development in India, fell from top position last year to second this year with a decline of -27.90% as a slowdown in new orders for homes and continued weakness in the macro environment impaired the probability for an IPO in 2015. Central Pattana, Thailand’s largest shopping mall owner added 33.76% as it rose from tenth position to third, primarily due to the Fund’s purchase of additional shares during the year. Hulic Co., a Japanese office owner specializing in renovating older medium-sized buildings in prime locations gained 172.92% for the Fund. Kenedix, Inc., a Japanese manager of REITs and private real estate funds is very well positioned to benefit from the potential reflationary trend and rose 318.26%. The Fund’s sixth largest holding, Direcional Engenharia S.A. from Brazil, fell from the second position last year and had a relatively flat return of -0.03%. The company is the sole home builder focused on the very low income, subsidized apartment construction upon which it is executing its business plan profitably. The Brazilian office investor Sao Carlos fell from sixth to seventh position, losing -19.65% despite recording excellent cash flow growth over the year. LXB Retail Properties in the eighth slot is a U.K. developer of supermarket anchored shopping centers and generated
*The Fund purchased South Asian Real Estate through a private placement in 2007. There is no public market for the holding and we have valued it based upon discounting both its current and projected adjusted book value, as well as taking into consideration the potential for a public offering of the shares in the future. As of October 31, 2013, the position has increased to approximately 6% of the Fund’s net assets as a result of net outflows from the Fund during the period.
12
| Alpine International Real Estate Equity Fund (Continued) | |
4.88% total return. SM Prime Holdings, in the ninth position, generated a return of 5.95%. SM Prime is the parent of SM Development Corp. a long term holding which was acquired by the Philippines largest shopping mall company. Iguatemi, a Brazilian developer of premier shopping malls fell from third place to tenth after the stock posted a -7.51% total return, despite the successful open of the JK Shopping Mall in Sao Paolo.
Top Five Positive/Negative Impact
From the top ten holdings come the three top contributors as well as two with negative impact. In aggregrate, the relative importance of these positive/negative contributors by average weighting and returns, respectively, were 13.97% of holdings adding a contribution of over 12% versus 14.88% detracting over 5%.
The top contributor was Regus PLC (+107.90%, average weight 5.61%), followed by Kenedix (+318.26, average weight 2.11%) and Hulic (+172.92%, average weight 2.62%) from the Fund’s top ten. All three are long term holdings, although we added shares to Japanese positions this year. Quintain Estates (+80.62%, average weight 2.08%) owns developments in London on the Greenwich Peninsula across the Thames River from Canary Wharf and surrounding Wembley Stadium. Progress in redesigning its potential value and paying back debt were catalysts for this long term holding. JM AB, Stockholm’s leading condo developer, continued to perform for the Fund (+65.20%, average weight 1.56%).
Negative contributors include South Asian Real Estate Limited, a non-traded Indian homebuilder whose valuation was impacted (-27.90%, average weight 6.12%) by rising interest rates and cyclically soft demand in the greater Delhi (NCR) area and in Chennai. Homex, a Mexican homebuilder suffered (-86.23%, average weight 0.66%) after the new Federal government eliminated decade old mortgage subsidy programs. The weakening Brazilian macro picture hurt our holdings in retail mall/condo builder JHSF (-40.65%, average weight 1.79%), office owner Sao Carlos (-19.65%, average weight 3.76%) despite strong growth in both cash flow and underlying net asset value, as well as hotelier BHG (-25.53%, average weight 2.55%) which is attempting to become a nationwide consolidator.
Real Estate Cycle
Earlier in this report, we stated that real estate equities had benefited from falling interest rates and by their nature tend to be forward looking incorporating some measure of future growth into current valuations. This raises the question as to what extent do valuations of real estate equities today reflect future prices and valuations three to five years from now. While there is uncertainty with respect
to the duration of the business cycle, the rate of inflation, interest rates and prospective supply vs. demand for property, among other factors that could adversely impact the Fund’s holdings, it might be constructive to develop a context in which to understand the relative prices of real estate equities.
In the year end 2008 shareholder report we provided a table showing the performance of nine separate indices for select countries and major regions covering historical cyclical performance. We noted when the previous cyclical rally had started how much they gained to their peak in 2007 and then how large a fall there had been through the post-Lehman debacle. We also showed average historic returns for these different indices with both positive and negative ranges during the 1980’s and 1990’s. Suffice it to say that the decline through November of 2008 from the previous peaks was far larger than the average historic cyclical decline. In fact, many indices continued to decline until March of 2009.
Real estate stock cycles are usually a bit like a waltz, two steps forward, then one step back. During the 1980’s and 1990’s the S&P Developed Property Index (Global Price Only) averaged 87% cyclical increases, followed by 31% average decline. Notably, the prior cycle from 1998 through 2007 showed a gain of 225% and the subsequent 2008/09 financial crisis decline was -74%. Since the cycle began March, 2009, the index regained 211% to the peak on May 8, 2013, before concerns over ‘taper’-talk induced retracement through the end of October, 2013. What is relevant is that at the end of the fiscal year, this real estate index had only regained 75% of their prior peaks before the great financial crisis of 2008. Other indices are even further behind, notably U.S. Homebuilder (-59%) and Euro Zone Real Estate (-46%). The implication here is that even if there were no inflation in real estate values or rents over the next few years, the potential for real estate equities to catch up with broad stock indices, which have already surpassed 2007 levels, seems plausible. If we are correct that the typical late cycle period of expansion takes hold, there could be additional uplift in real estate prices and activity, and with it the potential for further share price appreciation.
Currently, we expect that 2014 could be less volatile than prior years and we hope to see a gradual uptick in global growth towards the latter half of the year. As we begin the next fiscal year we remain steadfast in our belief that real estate should continue to be a store of value that is sought after for both its income potential and its ability to capture economic growth and inflation in terms of rents and prices.
Sincerely,
Samuel A. Lieber
Portfolio Manager
13
| Alpine International Real Estate Equity Fund (Continued) | |
This letter represents the opinions of the Fund’s management and is subject to change, is not guaranteed and should not be considered a recommendation to buy or sell any security. The information provided is not intended to be, and is not, a forecast of future events, a guarantee of future results, or investment advice. Views expressed may vary from those of the firm as a whole. Past performance is no guarantee of future results.
Mutual fund investing involves risk. Principal loss is possible. The Fund is subject to risks, including the following:
Concentration Risk – The Fund’s strategy of concentrating in companies in a specific industry means that its performance will be closely tied to the performance of a particular market segment. The Fund’s concentration in these companies may present more risks than if it were broadly diversified over numerous industries and sectors of the economy. A downturn in these companies would have a larger impact on the Fund than on a mutual fund that does not concentrate in such companies. At times, the performance of these companies will lag the performance of other industries or the broader market as a whole.
Emerging Market Securities Risk – The risks of foreign investments are heightened when investing in issuers in emerging market countries. Emerging market countries tend to have economic, political and legal systems that are less fully developed and are less stable than those of more developed countries. They are often particularly sensitive to market movements because their market prices tend to reflect speculative expectations. Low trading volumes may result in a lack of liquidity and in extreme price volatility.
Equity Securities Risk – The stock or other security of a company may not perform as well as expected, and may decrease in value, because of factors related to the company (such as poorer than expected earnings or certain management decisions) or to the industry in which the company is engaged (such as a reduction in the demand for products or services in a particular industry).
Foreign Currency Transactions Risk – Foreign securities are often denominated in foreign currencies. As a result, the value of the Fund’s shares is affected by changes in exchange rates. The Fund may enter into foreign currency transactions to try to manage this risk. The Fund’s ability to use foreign currency transactions successfully depends on a number of factors, including the foreign currency transactions being available at prices that are not too costly, the availability of liquid markets and the ability of the Adviser to accurately predict the direction of changes in currency exchange rates.
Foreign Securities Risk – The Fund’s investments in securities of foreign issuers or issuers with significant exposure to foreign markets involve additional risk. Foreign countries in which the Fund may invest may have markets that are less liquid, less regulated and more volatile than U.S. markets. The value of the Fund’s investments may decline because of factors affecting the particular issuer as well as foreign markets and issuers generally, such as unfavorable government actions, and political or financial instability. Lack of information may also affect the value of these securities. The risks of foreign investment are heightened when investing in issuers of emerging market countries.
Growth Stock Risk – Growth stocks typically are very sensitive to market movements because their market prices tend to reflect future expectations. When it appears those expectations will not be met, the prices of growth stocks typically fall. Growth stocks as a group may be out of favor and underperform the overall equity market while the market concentrates on undervalued stocks.
Initial Public Offerings (IPO) and Secondary Offerings Risk – The Fund may invest a portion of its assets in shares of IPOs or secondary offerings of an issuer. IPOs and secondary offerings may have a magnified impact on the performance of a Fund with a small asset base. The impact of IPOs and secondary offerings on a Fund’s performance likely will decrease as the Fund’s asset size increases, which could reduce a Fund’s returns. IPOs and secondary offerings may not be consistently available to the Fund for investing. IPO and secondary offering shares frequently are volatile in price due to the absence of a prior public market, the small number of shares available for trading and limited information about the issuer. Therefore, the Fund may hold IPO and secondary offering shares for a very short period of time. This may increase the turnover of the Fund and may lead to increased expenses for the Fund, such as commissions and transaction costs. In addition, IPO and secondary offering shares can experience an immediate drop in value if the demand for the securities does not continue to support the offering price.
Leverage Risk – The Fund may use leverage to purchase securities. Increases and decreases in the value of the Fund’s portfolio will be magnified when the Fund uses leverage.
14
| Alpine International Real Estate Equity Fund (Continued) | |
Liquidity Risk – Some securities held by the Fund may be difficult to sell, or illiquid, particularly during times of market turmoil. Illiquid securities may also be difficult to value. If the Fund is forced to sell an illiquid asset to meet redemption requests or other cash needs, the Fund may be forced to sell at a loss.
Management Risk – The Adviser’s judgment about the quality, relative yield or value of, or market trends affecting, a particular security or sector, or about interest rates generally, may be incorrect. The Adviser’s security selections and other investment decisions might produce losses or cause the Fund to underperform when compared to other funds with similar investment objectives and strategies.
Market Risk – The price of a security held by the Fund may fall due to changing market, economic or political conditions.
Micro Capitalization Company Risk – Stock prices of micro capitalization companies are significantly more volatile, and more vulnerable to adverse business and economic developments than those of larger companies. Micro capitalization companies often have narrower markets for their goods and/or services and more limited managerial and financial resources than larger, more established companies, including small or medium capitalization companies.
Real Estate Investment Trusts (REITs) Risk – REITs’ share prices may decline because of adverse developments affecting the real estate industry including changes in interest rates. The returns from REITs may trail returns from the overall market. Additionally, there is always a risk that a given REIT will fail to qualify for favorable tax treatment.
Real Estate Securities Risk – Risks associated with investment in securities of companies in the real estate industry include: declines in the value of real estate; risks related to local economic conditions, overbuilding and increased competition; increases in property taxes and operating expenses; changes in zoning laws; casualty or condemnation losses; variations in rental income, neighborhood values or the appeal of properties to tenants; changes in interest rates and changes in general economic and market conditions.
Small- and Medium-Capitalization Company Risk – Securities of small- or medium-capitalization companies are more likely to experience sharper swings in market values, and may be less liquid, in which case it may be more difficult for the Adviser to sell at times and at prices that the Adviser believes appropriate and generally are more volatile than those of larger companies.
Undervalued Stock Risk – The Fund may pursue strategies that may include investing in securities, which, in the opinion of the Adviser, are undervalued. The identification of investment opportunities in undervalued securities is a difficult task and there is no assurance that such opportunities will be successfully recognized or acquired. While investments in undervalued securities offer opportunities for above-average capital appreciation, these investments involve a high degree of financial risk and can result in substantial losses.
Please refer to page 5-7 for other important disclosures and definitions.
15
| Alpine Realty Income & Growth Fund | |
| Comparative Annualized Returns as of 10/31/13 (Unaudited) |
| | | 1 Year | | 3 Years | | 5 Years | | 10 Years | | Since Inception(1) |
Alpine Realty Income & Growth Fund —
Institutional Class | | | 9.02% | | | | 11.85% | | | | 19.28% | | | | 7.52% | | | | 11.02% | |
Alpine Realty Income & Growth Fund —
Class A (Without Load) | | | 8.85% | | | | N/A | | | | N/A | | | | N/A | | | | 12.74% | |
Alpine Realty Income & Growth Fund —
Class A (With Load) | | | 2.86% | | | | N/A | | | | N/A | | | | N/A | | | | 9.32% | |
| MSCI US REIT Index | | | 11.42% | | | | 12.26% | | | | 15.30% | | | | 9.77% | | | | 10.93% | |
| S&P 500® Index | | | 27.18% | | | | 16.56% | | | | 15.17% | | | | 7.46% | | | | 4.37% | |
| Lipper Real Estate Funds Average(2) | | | 8.96% | | | | 11.19% | | | | 14.77% | | | | 9.09% | | | | 10.26% | |
| Lipper Real Estate Funds Ranking(2) | | | 131/242 | | | | 47/204 | | | | 13/179 | | | | 105/120 | | | | 17/58 | |
| Gross Expense Ratio (Institutional Class): 1.41%(3) | | | | | | | | | | | | | | | | | | | | |
| Net Expense Ratio (Institutional Class): 1.41%(3) | | | | | | | | | | | | | | | | | | | | |
| Gross Expense Ratio (Class A): 1.66%(3) | | | | | | | | | | | | | | | | | | | | |
| Net Expense Ratio (Class A): 1.66%(3) | | | | | | | | | | | | | | | | | | | | |
| (1) | Institutional Class shares commenced on December 29, 1998 and Class A shares commenced on December 30, 2011. Returns for indices are since December 29, 1998. |
| | (2) | The since inception data represents the period beginning December 31, 1998 (Institutional Class only). |
| | (3) | As disclosed in the prospectus dated February 28, 2013. |
Performance data quoted represents past performance and is not predictive of future results. Investment return and principal value of the Fund fluctuate, so that shares, when redeemed, may be worth more or less than their original cost. Performance current to the most recent month end may be lower or higher than the performance quoted and may be obtained by calling 1-888-785-5578. Performance data shown does not reflect the 1.00% redemption fee imposed on shares held for fewer than 60 days. If it did, total returns would be reduced. Returns for the Class A shares with sales charge reflect a maximum sales charge of 5.50%. Performance for the Class A shares without sales charges does not reflect this load.
MSCI US REIT Index is a free float-adjusted market capitalization-weighted index that is comprised of the most actively-traded equity REITs that are of reasonable size in terms of full- and free-float-adjusted market capitalization. Source: MSCI. MSCI makes no express or implied warranties or representations and shall have no liability whatsoever with respect to any MSCI data contained herein. The MSCI data may not be further redistributed or used as a basis for other indices or any securities or financial products. This report is not approved, reviewed or produced by MSCI. The S&P 500® Index is a float-adjusted market capitalization-weighted index of 500 common stocks chosen for market size, liquidity, and industry group representation to represent U.S. equity performance. The Lipper Real Estate Funds Average is an average of funds that invest at least 80% of their portfolio in equity securities of domestic and foreign companies engaged in the real estate industry. Lipper rankings for the periods shown are based on fund total returns with dividends and distributions reinvested and do not reflect sales charges. The MSCI US REIT Index, the S&P 500® Index and the Lipper Real Estate Funds Average are unmanaged and do not reflect direct fees associated with a mutual fund, such as investment adviser fees; however, the Lipper Real Estate Funds Average reflects fees charged by the underlying funds. The performance for the Alpine Realty Income & Growth Fund reflects the deduction of fees for these value-added services. Investors cannot directly invest in an index.
Expense Ratios reflect the ratios reported in the Fund’s most recent prospectus. The Alpine Realty Income & Growth Fund has a contractual expense waiver that continues through February 28, 2014. Where a Fund’s gross and net expense ratios are the same for the period reported, the contractual expense reimbursement level was not reached as of the end of that period. To the extent the Fund’s expenses were reduced by waivers, the Fund’s total returns were increased. In these cases, in the absence of the expense waivers, the Fund’s total returns would have been lower.
To the extent that the Fund’s historical performance resulted from gains derived from participation in Initial Public Offerings (“IPOs”) and/or Secondary Offerings, there is no guarantee that these results can be replicated in future periods or that the Fund will be able to participate to the same degree in IPO/Secondary Offerings in the future.
16
| Alpine Realty Income & Growth Fund (Continued) | |
Portfolio Distributions* (Unaudited)

| Top 10 Holdings* (Unaudited) |
| 1 | . | Simon Property Group, Inc. | 8.86 | % |
| 2 | . | Boston Properties, Inc. | 5.14 | % |
| 3 | . | Public Storage | 4.89 | % |
| 4 | . | SL Green Realty Corp. | 4.67 | % |
| 5 | . | Vornado Realty Trust | 4.20 | % |
| 6 | . | Prologis, Inc. | 4.18 | % |
| 7 | . | Ventas, Inc. | 4.16 | % |
| 8 | . | Essex Property Trust, Inc. | 3.81 | % |
| 9 | . | Equity Residential | 3.58 | % |
| 10 | . | Alexandria Real Estate Equities, Inc. | 3.39 | % |
| * | Portfolio Distributions percentages are based on total investments. Top 10 Holdings do not include short-term investments and percentages are based on total net assets. Portfolio holdings and sector distributions are as of 10/31/13 and are subject to change. Portfolio holdings are not recommendations to buy or sell any securities. |
| Value of a $10,000 Investment (Unaudited) |
 |
| |
This chart represents a comparison of a hypothetical $10,000 investment in the Fund versus a similar investment in the Fund’s benchmarks. The graph and the table do not reflect the deduction of taxes that a shareholder would pay on Fund distributions or the redemption of Fund shares. Investment performance reflects the waiver and recovery of certain fees, if applicable. Without the waiver and recovery of fees, the Fund’s total return would have differed.
Performance data quoted represents past performance and is not predictive of future results. Investment return and principal value of the Fund fluctuate, so that shares, when redeemed, may be worth more or less than their original cost.
17
| Alpine Realty Income & Growth Fund (Continued) | |
Commentary
We welcome the opportunity to report the results of the Alpine Realty Income & Growth Fund for the fiscal year that ended October 31, 2013. During the fiscal year, the Fund produced a total return of 9.02% which compares to the 8.96% return of the Lipper Real Estate Funds Average, the 11.42% return of the MSCI REIT Index (the “RMS Index”), and the 27.18% return of the S&P 500® Index (the “S&P”). All references in this letter to the Fund’s performance relate to the performance of the Fund’s Institutional Class.
At October 31, 2013, the Fund’s net asset value had increased to $18.17 from $17.37 twelve months prior. During this timeframe, the Fund paid four quarterly distributions of $0.1875 per share totaling $0.75 per share for the fiscal period, which represented a 4.2% increase over the Fund’s distributions in the prior fiscal year. Since its inception on December 29, 1998 through October 31, 2013, the Fund has delivered an annualized total return to shareholders of 11.02% which includes cumulative distributions of $15.48. The performance chart on page 16 presents the Fund’s returns for the latest one-year, three-year, five year, ten year, and since inception periods.
The most impactful factor influencing returns for REIT securities during the fiscal year was the volatile upward trend in long-term interest rates. During the fiscal year, the 10 year Treasury rate increased from 1.69% on October 31, 2012 to 2.55% on October 31, 2013, but nearly reached 3.00% in early September.
Prior to May 21, 2013, the 10 year rate remained within a relatively narrow band, averaging approximately 1.81%, and the RMS Index broke through its previous high water marks reaching an all-time high on May 21st. On that date, however, the Federal Reserve indicated an intention to taper its purchases of government bonds as signs of an improving economy are achieved. Following that announcement, the 10 year Treasury rate increased quickly, reaching a high for the period of 2.995% on September 5th and the RMS Index fell -17.64% during that timeframe. REIT securities recovered part of those losses before the end of the Fund’s fiscal year, rising 9.27% from September 5th through October 31st and in fact the RMS Index had its biggest one day move of 2013 (+3.41%) on September 18th, the day the Federal Reserve surprised the market by not beginning to taper. Nevertheless, prevailing market sentiment appears to be that REIT valuations cannot advance in the face of rising long-term rates, and, as a result, REIT stock price movements have been highly correlated recently with changes in the 10 year Treasury rate.
It is our view, based on historical data, that how REITs will perform in a rising interest rate environment is dependent upon numerous factors, including the cause of the rate increase, the speed or pace of that increase, the underlying fundamentals of real estate markets, the relative valuations for REIT securities, and what other attractive investment alternatives exist for investors. REIT cash flows are able to grow in a recovering economy and REIT management teams have the ability to create value through improving rents and occupancies, renovating assets, and developing new properties when it is appropriate to do so. If rates are rising because of underlying strength in the economy leading to inflationary pressures, then that underlying strength may also manifest itself in tighter real estate market conditions and growth in revenues from improving rents for landlords. That growth in cash flows may in turn translate into rising dividend yields which combined with likely rising material costs for the underlying assets may allow real estate to potentially provide some level of inflation protection.
The history of REIT stock performance during periods of rises in the 10 year Treasury rate is mixed but dispels, in our view, the notion that REITs cannot perform with a rising rate headwind. In a study recently published by Citigroup1, REIT performance was tracked during 8 periods of rising rates with the first period occurring between October 1993 and December 1994 and the last period occurring between October 2010 and April 2011. The average rise in 10 year Treasury yields over these eight periods was 170 basis points. During those periods, REITs outperformed the S&P five times and underperformed 3 times and on average produced total returns of 13.5% which lagged the average returns of the S&P during those periods of 15.9%. Significantly impacting those average period returns was the October 1998 through February 2000 period when the S&P increased 41.8%, and REITs, which were viewed as relatively unattractive defensive investments, delivered a negative 6.5% return. So, in conclusion, while the history of REIT performance in a rising rate environment is somewhat mixed, it seems apparent that (1) rising rates have not necessarily precluded positive REIT returns, and (2) numerous factors have come into play including the cause of the rate increase, the conditions of real estate markets, and whether other attractive investment alternatives exist. Nevertheless, in the past fiscal year, the rapid pace of the rise in long term interest rates occurring at a point when the RMS Index had reached an all-time high created a large discrepancy between REIT stock returns and that of broader market indices such as the S&P.
1 Citi Research, 1 July 2013
18
| Alpine Realty Income & Growth Fund (Continued) | |
For the Fund, among the top contributors to its 9.02% return during the fiscal year were a large-capitalization self-storage owning company, a global owner of industrial warehouse properties, two companies with office property investments in central business districts, two healthcare REITs focused on skilled nursing facilities, and our lodging company investments as a group. Public Storage (average weight 4.43%), the largest self-storage facility owner, and Prologis (average weight 3.74%), the largest global industrial warehouse REIT, both top ten holdings for the Fund, produced returns of 24.39% and 20.02%, respectively. Within the healthcare REIT sector, Omega Healthcare Investors (average weight 1.84%) and Sabra Healthcare (average weight 1.65%) delivered strong returns of 53.77% and 28.33%, respectively, while above average performances were also produced by two of the Fund’s other top ten investments, SL Green (27.58%, average weight 4.03%), a New York City focused office landlord, and Vornado Realty Trust (16.42%, average weight 3.76%), a diversified REIT with significant office holdings in New York and Washington, D.C. Additionally, our lodging company investments, while not a significant percentage of the portfolio, also provided attractive returns as business and leisure travel continued to drive above average revenue growth against a backdrop of historically limited supply additions. For the Fund, leading returns were generated by Chesapeake Lodging Trust (35.44%, average weight 0.72%), Pebblebrook Hotel Trust (45.63%, average weight 0.36%), Starwood Hotels and Resorts (45.12%, average weight 1.15%), Diamondrock Hospitality (39.18%, average weight 0.63%), LaSalle Hotel Properties (34.16%, average weight 0.30%), and Host Hotels & Resorts (31.52%, average weight 1.35%). Relative to the overall returns of the RMS Index, the Fund’s most positive attribution was provided by our overweight positions in Omega Healthcare, SL Green, Sabra, and Starwood and our underweight/non-ownership of American Campus Communities (average index weight 0.90%), an owner and developer of student housing facilities which significantly underperformed the RMS Index with a -21.19% return.
Holdings that underperformed REIT average returns and detracted from performance included the data center owner and developer, Digital Realty, the regional mall owning companies, CBL & Associates and Taubman Centers, two apartment landlords, Equity Residential and AvalonBay Communities, and a Canadian shopping center and office company, Crombie REIT. Digital Realty (-18.46%, average weight 3.22%) disappointed investors during 2013 by missing earnings guidance for its leasing results and lowering near term growth expectations. The two regional mall entities, CBL & Associates (-7.60%, average weight 3.08%), whose low operating income and
retail sales growth lagged peer results, and Taubman Centers (-14.01%, average weight 1.76%), which experienced slowing sales trends and challenges on new development projects, both underperformed overall REIT averages. Equity Residential (-5.49%, average weight 3.57%) and AvalonBay Communities (-4.79%, average weight 3.16%) each produced healthy revenue growth yet underperformed in part from investor concerns about decelerating rent growth trends and exposure to the Washington, D.C. market. Crombie REIT (average weight 1.15%) declined 11.21% during the period from both a weakening of the Canadian currency relative to the dollar and the overall decline in Canadian REIT pricing as interest rates increased in the latter half of the fiscal period. Relative to the overall returns of the RMS Index, the most impactful securities that attributed to underperformance were our overweight positions in CBL, Digital, Crombie, Alexandria Real Estate Equities (-3.08%, average weight 3.31%), and an underweight/non-ownership of Cole Real Estate Investments (average index weight 0.36%), a net lease REIT that outperformed overall REIT results with a 24.65% return.
We believe the performance of REIT securities in the near term will likely continue to be highly correlated with the direction of long term interest rates and until the market reaches a higher confidence level on where long term interest rate will settle out, we expect the REIT equity markets may experience increased volatility. Underlying the expected tapering targets of the Federal Reserve, however, are assumptions for improved economic conditions including employment growth and business investment, factors which may be positive drivers for real estate operating fundamentals and growth in revenues for landlords. Such growth, in turn, has the potential to translate into higher dividend yields particularly since REITs continue to operate at near historically low payout ratios of approximately 73% for dividends as a percentage of Adjusted Funds From Operations (a REIT measure of cash earnings) according to Citi research. Even in the absence of economic growth in excess of the somewhat anemic recovery we have been experiencing, we believe landlords should be able to continue chipping away at their vacancies and reach levels of occupancy that provide stronger pricing power and relatively attractive earnings expansion.
We continue to favor those companies capable of prospective demand driven cash flow improvements which we believe will prove more valuable in a potentially rising interest rate environment than acquisition driven growth. While we anticipate that long-term interest rates are likely to rise somewhat from current levels, we also believe that the Federal Reserve will not increase the Fed funds rate in the near-term and short-term rates will remain historically
19
| Alpine Realty Income & Growth Fund (Continued) | |
low. We will continue to employ leverage both in the execution of the Fund’s strategy and to manage unexpected Fund flows. We remain overweighted in areas such as office and industrial real estate, two real estate subsectors which are still below prior peak profitability, and underweighted in business models more dependent
upon financial arbitrage and spread investing. We look forward to providing an update on Fund performance after the end of the semi-annual period in April, 2014.
Sincerely,
Robert W. Gadsden
Portfolio Manager
This letter represents the opinions of the Fund’s management and is subject to change, is not guaranteed and should not be considered a recommendation to buy or sell any security. The information provided is not intended to be, and is not, a forecast of future events, a guarantee of future results, or investment advice. Views expressed may vary from those of the firm as a whole. Past performance is no guarantee of future results.
Mutual fund investing involves risk. Principal loss is possible. The Fund is subject to risks, including the following:
Concentration Risk – The Fund’s strategy of concentrating in companies in a specific industry means that its performance will be closely tied to the performance of a particular market segment. The Fund’s concentration in these companies may present more risks than if it were broadly diversified over numerous industries and sectors of the economy. A downturn in these companies would have a larger impact on the Fund than on a mutual fund that does not concentrate in such companies. At times, the performance of these companies will lag the performance of other industries or the broader market as a whole.
Convertible Securities Risk – The Fund can invest in securities that can be exercised for or converted into common stocks (such as warrants or convertible preferred stock). While offering greater potential for long-term growth, common stocks and similar equity securities are more volatile and more risky than some other forms of investment. Therefore, the value of your investment in the Fund may sometimes decrease instead of increase. Convertible securities include other securities, such as warrants, that provide an opportunity for equity participation. Because convertible securities can be converted into equity securities, their values will normally increase or decrease as the values of the underlying equity securities increase or decrease. The movements in the prices of convertible securities, however, may be smaller than the movements in the value of the underlying equity securities.
Credit Risk – Credit risk refers to the possibility that the issuer of a security will not be able to make payments of interest and principal when due. Changes in an issuer’s credit rating or the market’s perception of an issuer’s creditworthiness may also affect the value of the Fund’s investment in that issuer. The degree of credit risk depends on both the financial condition of the issuer and the terms of the obligation.
Dividend Strategy Risk – The Fund’s strategy of investing in dividend-paying stocks involves the risk that such stocks may fall out favor with investors and underperform the market. Companies that issue dividend paying-stocks are not required to continue to pay dividends on such stocks. Therefore, there is the possibility that such companies could reduce or eliminate the payment of dividends in the future.
Equity Securities Risk – The stock or other security of a company may not perform as well as expected, and may decrease in value, because of factors related to the company (such as poorer than expected earnings or certain management decisions) or to the industry in which the company is engaged (such as a reduction in the demand for products or services in a particular industry).
Fixed Income Securities Risk – Fixed income securities are subject to issuer risk, interest rate risk and market risk.
Growth Stock Risk – Growth stocks typically are very sensitive to market movements because their market prices tend to reflect future expectations. When it appears those expectations will not be met, the prices of growth stocks typically fall. Growth stocks as a group may be out of favor and underperform the overall equity market while the market concentrates on undervalued stocks.
Initial Public Offerings (“IPO”) and Secondary Offerings Risk – The Fund may invest a portion of its assets in shares of IPOs or secondary offerings of an issuer. IPOs and secondary offerings may have a magnified impact on the performance of a Fund with a small asset base. The impact of IPOs and secondary offerings on a Fund’s performance likely will decrease as the Fund’s asset size increases, which could reduce a Fund’s returns. IPOs and secondary offerings may not be consistently available to the Fund for investing. IPO and secondary offering shares frequently are volatile in price due to the absence of
20
| Alpine Realty Income & Growth Fund (Continued) | |
a prior public market, the small number of shares available for trading and limited information about the issuer. Therefore, the Fund may hold IPO and secondary offering shares for a very short period of time. This may increase the turnover of the Fund and may lead to increased expenses for the Fund, such as commissions and transaction costs. In addition, IPO and secondary offering shares can experience an immediate drop in value if the demand for the securities does not continue to support the offering price.
Interest Rate Risk – Interest rates may rise resulting in a decrease in the value of securities held by the Fund, or may fall resulting in an increase in the value of such securities. Securities having longer maturities generally involve a greater risk of fluctuations in the value resulting from changes in interest rates.
Leverage Risk – The Fund may use leverage to purchase securities. Increases and decreases in the value of the Fund’s portfolio will be magnified when the Fund uses leverage.
Management Risk – The Adviser’s judgment about the quality, relative yield or value of, or market trends affecting, a particular security or sector, or about interest rates generally, may be incorrect. The Adviser’s security selections and other investment decisions might produce losses or cause the Fund to underperform when compared to other funds with similar investment objectives and strategies.
Market Risk – The price of a security held by the Fund may fall due to changing market, economic or political conditions.
Non-Diversified Fund Risk – Performance of a non-diversified fund may be more volatile than a diversified fund because a non-diversified fund may invest a greater percentage of its total assets in the securities of a single issuer.
Preferred Stock Risk – Preferred stock represents an interest in a company that generally entitles the holder to receive, in preference to the holders of common stock, dividends and a fixed share of the proceeds resulting from a liquidation of the company. Preferred stocks may pay fixed or adjustable rates of return. Preferred stock has investment characteristics of both fixed income and equity securities. However, the value of these securities tends to vary more with fluctuations in the underlying common stock and less with fluctuations in interest rates and tends to exhibit greater volatility.
Real Estate Investment Trusts (“REITs”) Risk – REITs’ share prices may decline because of adverse developments affecting the real estate industry including changes in interest rates. The returns from REITs may trail returns from the overall market. Additionally, there is always a risk that a given REIT will fail to qualify for favorable tax treatment.
Real Estate Securities Risk – Risks associated with investment in securities of companies in the real estate industry include: declines in the value of real estate; risks related to local economic conditions, overbuilding and increased competition; increases in property taxes and operating expenses; changes in zoning laws; casualty or condemnation losses; variations in rental income, neighborhood values or the appeal of properties to tenants; changes in interest rates and changes in general economic and market conditions.
Small- and Medium-Capitalization Company Risk – Securities of small- or medium-capitalization companies are more likely to experience sharper swings in market values, and may be less liquid, in which case it may be more difficult for the Adviser to sell at times and at prices that the Adviser believes appropriate and generally are more volatile than those of larger companies.
Undervalued Stock Risk – The Fund may pursue strategies that may include investing in securities, which, in the opinion of the Adviser, are undervalued. The identification of investment opportunities in undervalued securities is a difficult task and there is no assurance that such opportunities will be successfully recognized or acquired. While investments in undervalued securities offer opportunities for above-average capital appreciation, these investments involve a high degree of financial risk and can result in substantial losses.
Please refer to page 5-7 for other important disclosures and definitions.
21
| Alpine Cyclical Advantage Property Fund | |
| Comparative Annualized Returns as of 10/31/13 (Unaudited) |
| | | 1 Year | | 3 Years | | 5 Years | | 10 Years | | Since Inception
(9/1/1993) |
Alpine Cyclical Advantage Property Fund —
Institutional Class | | 12.33% | | 9.77% | | 14.60% | | 1.85% | | | 8.49% | |
| FTSE EPRA/NAREIT® Global Index(1) | | 12.25% | | 8.81% | | 15.27% | | N/A | | | N/A | |
| S&P Developed BMI Property Net Total Return Index(2) | | 13.51% | | 10.01% | | 15.05% | | 8.96% | | | N/A | |
| Lipper Global Real Estate Funds Average(3) | | 11.54% | | 8.60% | | 13.35% | | 8.40% | | | 9.30% | |
| Lipper Global Real Estate Funds Ranking(3) | | 41/114 | | 13/95 | | 14/79 | | 19/19 | | | 2/2 | |
| Gross Expense Ratio: 1.51%(4) | | | | | | | | | | | | |
| Net Expense Ratio: 1.51%(4) | | | | | | | | | | | | |
| | (1) | Index commenced on February 18, 2005. |
| | (2) | Index commenced on December 29, 2000. |
| | (3) | The since inception data represents the period beginning September 2, 1993. |
| | (4) | As disclosed in the prospectus dated February 28, 2013. |
Performance data quoted represents past performance and is not predictive of future results. Investment return and principal value of the Fund fluctuate, so that shares, when redeemed, may be worth more or less than their original cost. Performance current to the most recent month end may be lower or higher than the performance quoted and may be obtained by calling 1-888-785-5578. Performance data shown does not reflect the 1.00% redemption fee imposed on shares held for fewer than 60 days. If it did, total returns would be reduced.
The FTSE EPRA/NAREIT® Global Index is an unmanaged index designed to track the performance of publicly-traded companies engaged in the real estate business in developed and emerging real estate markets/regions around the world. The funds or securities referred to herein are not sponsored, endorsed, or promoted by the index providers, and the index providers bear no liability with respect to any such funds or securities or any index on which such funds or securities are based. The prospectus contains a more detailed description of the limited relationship the index providers have with the licensee and any related funds. The S&P Developed BMI Property Net Total Return Index is an unmanaged market-weighted total return index available on a monthly basis. The index consists of many companies from developed markets whose floats are larger than $100 million and derive more than half of their revenue from property-related activities. The Lipper Global Real Estate Funds Average is an average of funds that invest at least 25% of their equity portfolio in shares of companies engaged in the real estate industry that are strictly outside of the U.S. or whose securities are principally traded outside of the U.S. Lipper rankings for the periods shown are based on fund total returns with dividends and distributions reinvested and do not reflect sales charges. The FTSE EPRA/NAREIT® Global Index, the S&P Developed BMI Property Net Total Return Index and the Lipper Global Real Estate Funds Average are unmanaged and do not reflect direct fees associated with a mutual fund, such as investment adviser fees; however, the Lipper Global Real Estate Funds Average reflects fees charged by the underlying funds. The performance for the Alpine Cyclical Advantage Property Fund reflects the deduction of fees for these value-added services. Investors cannot directly invest in an index.
To the extent that the Fund’s historical performance resulted from gains derived from participation in Initial Public Offerings (“IPOs”) and/or Secondary Offerings, there is no guarantee that these results can be replicated in future periods or that the Fund will be able to participate to the same degree in IPO/Secondary Offerings in the future.
22
| Alpine Cyclical Advantage Property Fund (Continued) | |
Portfolio Distributions* (Unaudited)
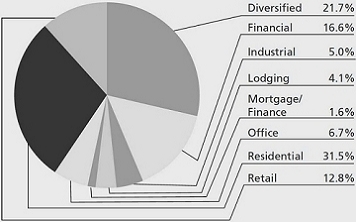
Top 10 Holdings* (Unaudited)
| 1. | | Ocwen Financial Corp. | 5.53 | % |
| 2. | | Hulic Co., Ltd. | 5.38 | % |
| 3. | | Kenedix, Inc. | 4.45 | % |
| 4. | | Altisource Residential Corp. | 3.73 | % |
| 5. | | Ryland Group, Inc. | 3.25 | % |
| 6. | | Starwood Property Trust, Inc. | 2.60 | % |
| 7. | | Altisource Portfolio Solutions SA | 2.54 | % |
| 8. | | Iguatemi Empresa de Shopping Centers SA | 2.53 | % |
| 9. | | LPN Development PCL-NVDR | 2.50 | % |
| 10. | | LXB Retail Properties PLC | 2.44 | % |
| * | Portfolio Distributions percentages are based on total investments. Top 10 Holdings do not include short-term investments and percentages are based on total net assets. Portfolio holdings and sector distributions are as of 10/31/13 and are subject to change. Portfolio holdings are not recommendations to buy or sell any securities. |
| Value of a $10,000 Investment (Unaudited) |
 |
| |
This chart represents a comparison of a hypothetical $10,000 investment in the Fund versus a similar investment in the Fund’s benchmarks. The graph and the table do not reflect the deduction of taxes that a shareholder would pay on Fund distributions or the redemption of Fund shares. Investment performance reflects the waiver and recovery of certain fees, if applicable. Without the waiver and recovery of fees, the Fund’s total return would have differed.
Performance data quoted represents past performance and is not predictive of future results. Investment return and principal value of the Fund fluctuate, so that shares, when redeemed, may be worth more or less than their original cost.
23
| Alpine Cyclical Advantage Property Fund (Continued) | |
Commentary
Dear Investor:
We are pleased to present the 2013 annual report for the Alpine Cyclical Advantage Property Fund. For the twelve months ended October 31, 2013, the Fund generated a total return of 12.33%. This compares with the FTSE EPRA/NAREIT® Global Index return of 12.25% and the S&P Developed Property Net Total Return Index of 13.51%.
Big Picture for Real Estate in 2013/2014
Since real estate asset pricing typically recovers later in the economic cycle, while stocks generally move in anticipation of economic earnings, real estate equities overall tend to perform in a hybrid fashion. As interest rates fell in the period after the financial crisis, rate-sensitive sectors such as real estate, and particularly REITs which pay much of their income out in the form of dividends, outperformed the broader equity market and saw strong demand consistent with other income-producing assets. However, this year as interest rates have started to move higher, real estate stock returns have been positive but have lagged the broader market indices. While the S&P 500 finally moved above levels achieved in 2007, during this fiscal year, price-only real estate stock indices are generally well below their prior peak levels. Our analysis has led us to believe that real estate stock price indices are approximately 30% below their 2007 peak. Thus, we believe the moderate pace of economic expansion will underpin real estate stock valuations in 2014, as global growth offsets rising interest rate trends.
With weak economic activity suggesting lower levels of demand for goods and services, the construction of new supply of real estate has been limited to specific geographies or subsectors. Thus, the supply and demand balance for many segments of the real estate market is generally supportive, with limited new supply while demand remains flat to modestly higher. We believe that this gap between demand and supply could widen and translate into stable or rising rents and capital values over the next 12 to 24 months. We expect that if rents increase in ensuing years then dividend growth should follow. Such a scenario would provide a landscape in which real estate equities could sustain current price levels or perhaps move higher even as interest rates rise, because their income and dividend growth could potentially offset the impact of higher relative yields and costs. Of course, this is more likely in an environment where rates are rising at a moderate pace, as opposed to when rates are fluctuating rapidly, such as this summer, when talk of the Fed tapering consumed the market.
Assuming that our assessment of the economic recovery is correct — that we are in the middle of a protracted economic cycle — and given that real estate rents and values tend to perform better in the latter stages of the
business cycle, then one might expect positive returns from real estate securities over the next few years. By and large, capital values have moved ahead of rents, due to still low interest rates, but if rents grow appreciably, then development returns could become significant for well capitalized property companies. In our view this could drive the next phase of real estate value creation for property stocks. It is Alpine’s view that selectivity, by stock, sector and geography will be significantly influenced by our analysis of competitive business models.
2013 Portfolio Overview
The Alpine Cyclical Advantage Property Fund provides exposure to small cap real estate companies and focuses more on the growth potential of individual companies rather than the income component of their total return. Historically the Fund has a higher emerging market exposure than would be typical, which is generally consistent with the size and growth characteristics of companies in which it invests. That said, over the course of fiscal 2013, the Fund’s exposure to the United States increased from 27.3% to 35.4% of the portfolio. Japan started the fiscal year at a 3.7% weighting in the Fund, growing to 15.6% by October, 2013, making Japan the second largest country weighting in the Fund. The Fund’s exposure to the United Kingdom also grew, although more moderately, from 5.6% last year to 8.8% this year. Thailand rose from 5.8% to finish the year at 7.1%, while Germany remained flat at 5%. Brazil, which had been 21.1% of the portfolio a year ago, was reduced to 11.7%.
The biggest contributor to performance over the fiscal year was Japan. The holdings in Japan rose by 101.82% contributing over half the Fund’s total return in spite of its 9.15% portfolio average weight. By comparison, the FTSE EPRA/NAREIT® Global Index’s 11.3% average weight in Japan over the fiscal year gained 43.23%. The U.S. was the second major contributor, where the Fund’s 28.66% average weighting produced an aggregate total return of 27.94%. This contrasted with the benchmark’s 41% average weighting in the U.S. which added 11.42% total return. The United Kingdom had an average portfolio exposure of 6.1% and produced a 33.81% total return versus the benchmark’s 4.57% weighting which grew by 27.69%. A comparison of the three largest contributing countries to both the portfolio and the index shows that 43.91% of the Fund’s portfolio generated 16.74% of return, which exceeded the Fund’s 12.33% total return. By comparison, the benchmark’s exposure to the same three countries comprised 56.91% of the index’s portfolio and generated 9.91% of its 12.25% total return. The major detractor to the portfolio’s performance was its 19.01% average exposure to Brazil which returned -22.18%; in comparison, the benchmark’s weighting in Brazil was
24
| Alpine Cyclical Advantage Property Fund (Continued) | |
1.89% and so its return of a comparable -22.81% minimally impacted the benchmark’s returns.
Brazil’s deteriorating macro trends led us to reduce the portfolio’s exposure from over 21% to under 12% over the course of the year. This reflected our concern about deteriorating macroeconomic fundamentals and rising uncertainty over forthcoming elections. That said, shopping mall owners, which represent the bulk of the Fund’s investment in Brazil produced very strong annual same store sales data in the third quarter, averaging a 9.3% increase. Similarly, the average same store rent figures for the six companies under analysis averaged an 11.13% increase, which remain stellar by global standards. However, the macro economic conditions weighed heavily on equity returns, reflecting either the prospect of significant future deterioration of operating performance at these malls or the potential for a sharp recovery once the storm clouds pass.
During the period the Fund increased its exposure to residential holdings in Germany and the U.S. Shares of homebuilding companies in the U.S. fell precipitously during the second calendar quarter as mortgage rates began to rise, which induced us to start buying homebuilding stocks once again, notably D.R. Horton, Lennar, Meritage Homes, Ryland Group and WCI Communities. During the second half of the fiscal year, the Fund began to invest in companies focused on the acquisition of single family homes for rent, specifically American Homes 4 Rent and Altisource Residential Corp. which, along with its sister company, Altisource Asset Management, was initially a spinoff from Altisource Portfolio Solutions. We decreased portfolio exposure to Mexican residential companies that suffered from a sudden government withdrawal of subsidized mortgages following many years of promoting such stimulus. The exposure to Mexico was maintained at 3% however, shifting to investments in both hotel owners and industrial property companies, as we believe these sectors are poised to benefit from the widespread economic reforms undertaken by the Nieto administration.
Top Ten Largest Holdings
Ocwen Financial rose from the Fund’s second largest holding a year ago at 3.93% to its largest at 5.34% with a 45.79% total return. Ocwen is amongst the country’s largest and most efficient servicer of mortgages and has been able to take advantage of the large banks selling mortgage servicing rights over the past year. Hulic Co. rose from the seventh spot last year to second with a gain of 100.54%. Hulic’s focus on renovating medium-sized older office buildings in prime locations in central Tokyo positions it very well for a potential reflationary cycle in Japan. The Fund’s third largest holding, Kenedix Inc., is also a Japanese business which manages both public and private real estate portfolios. The stock gained 314.56% on the year and we believe the company would be a prime
beneficiary of real estate reflation. Altisource Residential Corp. is the fourth largest position and has been the top performing stock across the group of acquirers of single family homes for rent. The portfolio’s initial position was seeded through a spinoff of shares from its parent, Altisource Portfolio Solutions, and the holding was substantially increased over the summer. During the year the Fund acquired shares of Ryland Group, making it the fifth largest holding; it has returned 7.47% so far. Starwood Property Trust has emerged as an important lender to commercial real estate owners and developers, utilizing several key corporate acquisitions to opportunistically expand its scope. It produced a 20.16% total return this year. Iguatemi in eighth position is one of the premier shopping mall owner and developers in Brazil, and it fell from fifth position last year with of a decline of -7.38%, despite opening the highly successful J.K. Mall in Sao Paolo this year. Altisource Portfolio Solutions specializes in managing and servicing subprime and poorly performing residential mortgages; it gained 57.28% this year. Continuing in the ninth position is L.P.N. Development, a major Thai condominium developer which gained 22.82% over the past year. The tenth largest holding in the portfolio is LXB Retail Properties which fell from the sixth spot last year due to its relative underperformance with a 4.93% total return. LXB is developing supermarket anchored shopping centers in a number of markets throughout the U.K.
Top Five Positive/Negative Impact
Four of the portfolio’s top five contributors and one of the bottom detractors were discussed in the top ten holdings. The relative weight and impact of the top/bottom were 13.45% of holdings, adding 10.49% return vs. 7.71%, detracting -3.65%.
The aforementioned Hulic Corp. (average weight 4.34%) was the top contributor, followed by Kenedix (average weight 1.75%), Ocwen (average weight 4.20%) and Altisource Residential (average weight 1.69%). The fifth was long term holding, Quintain Estates (average weight 1.69%), a London based developer which has been working to realize the potential value of large land holdings on the Greenwich Peninsula, across the river Thames from Canary Wharf, and surrounding Wembley Stadium, while reducing an historic debt burden. The interim success of new management produced an 80.79% gain for the Fund.
The stocks with the greatest negative impact were Homex which lost -86.13% on a 0.65% (average weight) holding as the new Mexican government abruptly discontinued decades old mortgage subsidy policies. Sonae Sierra (-26.46% , average weight 1.32%), Gafisa (-46.31%, average weight 0.88%), BR Properties (-32.97%, average weight 1.76%) and Multiplan (-17.39%, average weight 3.10%) were all impacted by negative market conditions in Brazil.
25
| Alpine Cyclical Advantage Property Fund (Continued) | |
Real Estate Cycle
Earlier in this report, we stated that real estate equities had benefited from falling interest rates and by their nature tend to be forward looking incorporating some measure of future growth into current valuations. This raises the question as to what extent do valuations of real estate equities today reflect future prices and valuations three to five years from now. While there is uncertainty with respect to the duration of the business cycle, the rate of inflation, interest rates and prospective supply vs. demand for property, among other factors that could adversely impact the Fund’s holdings, it might be constructive to develop a context in which to understand the relative prices of real estate equities.
In the year-end 2008 shareholder report we provided a table showing the performance of nine separate indices for select countries and major regions covering historical cyclical performance. We noted when the previous cyclical rally had started how much they gained to their peak in 2007 and then how large a fall there had been through the post-Lehman debacle. We also showed average historic returns for these different indices with both positive and negative ranges during the 1980’s and 1990’s. Suffice it to say that the decline through November of 2008 from the previous peaks was far larger than the average historic cyclical decline. In fact, many indices continued to decline until March of 2009.
Real estate stock cycles are usually a bit like a waltz, two steps forward, then one step back. During the 1980’s and 1990’s the S&P Developed Property Index (Global Price
Only) averaged 87% cyclical increases, followed by 31% average decline. Notably, the prior cycle from 1998 through 2007 showed a gain of 225% and the subsequent 2008/09 financial crisis decline was -74%. Since this cycle began in March, 2009, the index regained 211% to the peak on May 8, 2013, before concerns over ‘taper’-talk induced retracement through the end of October, 2013. What is relevant is that at the end of the fiscal year, this real estate index had only regained 75% of its prior peak before the great financial crisis of 2008. Other indices are even further behind, notably U.S. Homebuilder (-59%) and Euro Zone Real Estate (-46%). The implication here is that even if there were no inflation in real estate values or rents over the next few years, the potential for real estate equities to catch up with broad stock indices, which have already surpassed 2007 levels, seems plausible. If we are correct that the typical late cycle period of expansion takes hold, there could be additional uplift in real estate prices and activity, and with it the potential for further share price appreciation.
Currently, we expect that 2014 could be less volatile than prior years and we hope to see a gradual uptick in global growth towards the latter half of the year. As we begin the next fiscal year we remain steadfast in our belief that real estate should continue to be a store of value that is sought after for both its income potential and its ability to capture economic growth and inflation in terms of rents and prices.
Sincerely,
Samuel A. Lieber
Portfolio Manager
This letter represents the opinions of the Fund’s management and is subject to change, is not guaranteed and should not be considered a recommendation to buy or sell any security. The information provided is not intended to be, and is not, a forecast of future events, a guarantee of future results, or investment advice. Views expressed may vary from those of the firm as a whole. Past performance is no guarantee of future results.
Mutual fund investing involves risk. Principal loss is possible. The Fund is subject to risks, including the following:
Concentration Risk – The Fund’s strategy of concentrating in companies in a specific industry means that its performance will be closely tied to the performance of a particular market segment. The Fund’s concentration in these companies may present more risks than if it were broadly diversified over numerous industries and sectors of the economy. A downturn in these companies would have a larger impact on the Fund than on a mutual fund that does not concentrate in such companies. At times, the performance of these companies will lag the performance of other industries or the broader market as a whole.
Equity Securities Risk – The stock or other security of a company may not perform as well as expected, and may decrease in value, because of factors related to the company (such as poorer than expected earnings or certain management decisions) or to the industry in which the company is engaged (such as a reduction in the demand for products or services in a particular industry).
Foreign Currency Transactions Risk – Foreign securities are often denominated in foreign currencies. As a result, the value of the Fund’s shares is affected by changes in exchange rates. The Fund may enter into foreign currency transactions to try to manage this risk. The Fund’s ability to use foreign currency transactions successfully depends on a number of factors, including the foreign currency transactions being available at prices that are not too costly, the availability of liquid markets and the ability of the Adviser to accurately predict the direction of changes in currency exchange rates.
Foreign Securities Risk – The Fund’s investments in securities of foreign issuers or issuers with significant exposure to foreign markets involve additional risk. Foreign countries in which the Fund may invest may have markets that are less liquid, less regulated and more volatile than U.S. markets. The value of the Fund’s investments may decline because of factors affecting
26
| Alpine Cyclical Advantage Property Fund (Continued) | |
the particular issuer as well as foreign markets and issuers generally, such as unfavorable government actions, and political or financial instability. Lack of information may also affect the value of these securities. The risks of foreign investments are heightened when investing in issuers in emerging market countries.
Growth Stock Risk – Growth stocks are stocks of companies believed to have above-average potential for growth in revenue and earnings. Growth stocks typically are very sensitive to market movements because their market prices tend to reflect future expectations. When it appears those expectations will not be met, the prices of growth stocks typically fall. Growth stocks as a group may be out of favor and underperform the overall equity market while the market concentrates on undervalued stocks.
Initial Public Offerings (IPO) and Secondary Offerings Risk – The Fund may invest a portion of its assets in shares of IPOs or secondary offerings of an issuer. IPOs and secondary offerings may have a magnified impact on the performance of a Fund with a small asset base. The impact of IPOs and secondary offerings on a Fund’s performance likely will decrease as the Fund’s asset size increases, which could reduce a Fund’s returns. IPOs and secondary offerings may not be consistently available to the Fund for investing. IPO and secondary offering shares frequently are volatile in price due to the absence of a prior public market, the small number of shares available for trading and limited information about the issuer. Therefore, the Fund may hold IPO and secondary offering shares for a very short period of time. This may increase the turnover of the Fund and may lead to increased expenses for the Fund, such as commissions and transaction costs. In addition, IPO and secondary offering shares can experience an immediate drop in value if the demand for the securities does not continue to support the offering price.
Liquidity Risk – Some securities held by a Fund may be difficult to sell, or illiquid, particularly during times of market turmoil. Illiquid securities may also be difficult to value. If a Fund is forced to sell an illiquid asset to meet redemption requests or other cash needs, the Fund may be forced to sell at a loss.
Management Risk – The Adviser’s judgment about the quality, relative yield or value of, or market trends affecting, a particular security or sector, or about interest rates generally, may be incorrect. The Adviser’s security selections and other investment decisions might produce losses or cause the Fund to underperform when compared to other funds with similar investment objectives and strategies.
Market Risk – The price of a security held by the Fund may fall due to changing market, economic or political conditions.
Micro Capitalization Company Risk – Stock prices of micro capitalization companies are significantly more volatile, and more vulnerable to adverse business and economic developments than those of larger companies. Micro capitalization companies often have narrower markets for their goods and/or services and more limited managerial and financial resources than larger, more established companies, including small or medium capitalization companies.
Real Estate Investment Trusts (REITs) Risk – REITs’ share prices may decline because of adverse developments affecting the real estate industry including changes in interest rates. The returns from REITs may trail returns from the overall market. Additionally, there is always a risk that a given REIT will fail to qualify for favorable tax treatment.
Real Estate Securities Risk – Risks associated with investment in securities of companies in the real estate industry include: declines in the value of real estate; risks related to local economic conditions, overbuilding and increased competition; increases in property taxes and operating expenses; changes in zoning laws; casualty or condemnation losses; variations in rental income, neighborhood values or the appeal of properties to tenants; changes in interest rates and changes in general economic and market conditions.
Small- and Medium-Capitalization Company Risk – Securities of small- or medium-capitalization companies are more likely to experience sharper swings in market values, and may be less liquid, in which case it may be more difficult for the Adviser to sell at times and at prices that the Adviser believes appropriate and generally are more volatile than those of larger companies.
Undervalued Stock Risk – The Fund may pursue strategies that may include investing in securities, which, in the opinion of the Adviser, are undervalued. The identification of investment opportunities in undervalued securities is a difficult task and there is no assurance that such opportunities will be successfully recognized or acquired. While investments in undervalued securities offer opportunities for above-average capital appreciation, these investments involve a high degree of financial risk and can result in substantial losses.
Please refer to page 5-7 for other important disclosures and definitions.
27
| Alpine Emerging Markets Real Estate Fund | |
| Comparative Annualized Returns as of 10/31/13 (Unaudited) |
| | | 1 Year | | 3 Years | | Since Inception(1) |
| Alpine Emerging Markets Real Estate Fund — Institutional Class | | 2.36% | | -0.44% | | | 15.75% | |
| Alpine Emerging Markets Real Estate Fund — Class A (Without Load) | | 2.10% | | N/A | | | 15.36% | |
| Alpine Emerging Markets Real Estate Fund — Class A (With Load) | | -3.53% | | N/A | | | 11.87% | |
| FTSE EPRA/NAREIT® Emerging Total Return Index(2) | | 4.81% | | -2.03% | | | N/A | |
| S&P Developed Ex-U.S. Total Return Property Index | | 16.55% | | 10.11% | | | 16.66% | |
| MSCI Emerging Markets Index USD | | 6.53% | | 0.30% | | | 15.41% | |
| Lipper Global Real Estate Funds Average(3) | | 11.54% | | 8.60% | | | 15.19% | |
| Lipper Global Real Estate Funds Ranking(3) | | 113/114 | | 95/95 | | | 24/80 | |
| Gross Expense Ratio (Institutional Class): 2.96%(4) | | | | | | | | |
| Net Expense Ratio (Institutional Class): 1.36%(4) | | | | | | | | |
| Gross Expense Ratio (Class A): 3.21%(4) | | | | | | | | |
| Net Expense Ratio (Class A): 1.61%(4) | | | | | | | | |
| | (1) | Institutional Class shares commenced on November 3, 2008 and Class A shares commenced on December 30, 2011. Returns for indices are since November 3, 2008. |
| | (2) | Index commenced on January 2, 2009. |
| | (3) | The since inception data represents the period beginning November 6, 2008 (Institutional Class only). |
| | (4) | As disclosed in the prospectus dated February 28, 2013. |
Performance data quoted represents past performance and is not predictive of future results. Investment return and principal value of the Fund fluctuate, so that shares, when redeemed, may be worth more or less than their original cost. Performance current to the most recent month end may be lower or higher than the performance quoted and may be obtained by calling 1-888-785-5578. Performance data shown does not reflect the 1.00% redemption fee imposed on shares held for fewer than 60 days. If it did, total returns would be reduced. Returns for the Class A shares with sales charge reflect a maximum sales charge of 5.50%. Performance for the Class A shares without sales charges does not reflect this load.
The FTSE EPRA/NAREIT® Emerging Index is an unmanaged index designed to track the performance of listed real estate securities companies in emerging countries worldwide. The funds or securities referred to herein are not sponsored, endorsed, or promoted by the index providers, and the index providers bear no liability with respect to any such funds or securities or any index on which such funds or securities are based. The prospectus contains a more detailed description of the limited relationship the index providers have with the licensee and any related funds. The S&P Developed Ex-U.S. Total Return Property Index defines and measures the investable universe of publicly-traded real estate companies domiciled in developed countries outside of the United States. The companies in the Index are engaged in real estate-related activities such as property ownership, management, development, rental and investment. MSCI Emerging Markets Index USD is a free float-adjusted market cap-weighted index that is designed to measure equity market performance in the global emerging markets. Source: MSCI. MSCI makes no express or implied warranties or representations and shall have no liability whatsoever with respect to any MSCI data contained herein. The MSCI data may not be further redistributed or used as a basis for other indices or any securities or financial products. This report is not approved, reviewed or produced by MSCI. The Lipper Global Real Estate Funds Average is an average of funds that invest at least 25% of their equity portfolio in shares of companies engaged in the real estate industry that are strictly outside of the U.S. or whose securities are principally traded outside of the U.S. Lipper rankings for the periods shown are based on fund total returns with dividends and distributions reinvested and do not reflect sales charges. The FTSE EPRA/NAREIT® Emerging Index, the S&P Developed Ex-US Total Return Property Index, the MSCI Emerging Markets Index USD and the Lipper Global Real Estate Funds Average are unmanaged and do not reflect direct fees associated with a mutual fund, such as investment adviser fees; however, the Lipper Global Real Estate Funds Average reflects fees charged by the underlying funds. The performance for the Alpine Emerging Markets Real Estate Fund reflects the deduction of fees for these value-added services. Investors cannot directly invest in an index.
Expense Ratios reflect the ratios reported in the Fund’s most recent prospectus. The Alpine Emerging Markets Real Estate Fund has a contractual expense waiver that continues through February 28, 2014. Where a Fund’s gross and net expense ratios are the same for the period reported, the contractual expense reimbursement level was not reached as of the end of that period. To the extent the Fund’s expenses were reduced by waivers, the Fund’s total returns were increased. In these cases, in the absence of the expense waivers, the Fund’s total returns would have been lower.
To the extent that the Fund’s historical performance resulted from gains derived from participation in Initial Public Offerings (“IPOs”) and/or Secondary Offerings, there is no guarantee that these results can be replicated in future periods or that the Fund will be able to participate to the same degree in IPO/Secondary Offerings in the future.
28
| Alpine Emerging Markets Real Estate Fund (Continued) | |
Portfolio Distributions* (Unaudited)

| Top 10 Holdings* (Unaudited) |
| 1. | | China Resources Land, Ltd. | 4.82 | % |
| 2. | | China Overseas Land & Investment, Ltd. | 4.75 | % |
| 3. | | Shimao Property Holdings, Ltd. | 4.63 | % |
| 4. | | Emaar Properties PJSC | 4.24 | % |
| 5. | | SM Prime Holdings, Inc. | 4.19 | % |
| 6. | | China Vanke Co., Ltd.-Class B | 3.82 | % |
| 7. | | BR Malls Participacoes SA | 3.33 | % |
| 8. | | Ayala Land, Inc. | 3.13 | % |
| 9. | | TF Administradora Industrial S de RL de CV | 2.23 | % |
| 10. | | Central Pattana PCL | 2.21 | % |
| * | Portfolio Distributions percentages are based on total investments. Top 10 Holdings do not include short-term investments and percentages are based on total net assets. Portfolio holdings and sector distributions are as of 10/31/13 and are subject to change. Portfolio holdings are not recommendations to buy or sell any securities. |
| Value of a $10,000 Investment (Unaudited) |
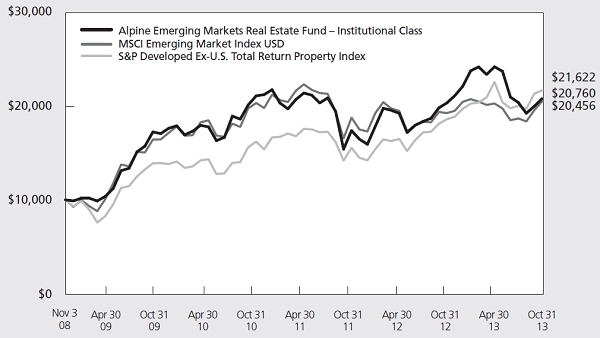 |
| |
This chart represents a comparison of a hypothetical $10,000 investment in the Fund versus a similar investment in the Fund’s benchmarks. The graph and the table do not reflect the deduction of taxes that a shareholder would pay on Fund distributions or the redemption of Fund shares. Investment performance reflects the waiver and recovery of certain fees, if applicable. Without the waiver and recovery of fees, the Fund’s total return would have differed.
Performance data quoted represents past performance and is not predictive of future results. Investment return and principal value of the Fund fluctuate, so that shares, when redeemed, may be worth more or less than their original cost.
29
| Alpine Emerging Markets Real Estate Fund (Continued) | |
Commentary
We present the annual report for the Alpine Emerging Markets Real Estate Fund. The closing NAV on October 31, 2013 was $17.37 per share, representing a total return of 2.36% for the twelve-month period. The Fund’s benchmark index, the FTSE EPRA/NAREIT® Emerging Index (“FENEI”) returned 4.81%, adjusted in U.S. dollar terms over the same period. The MSCI Emerging Markets Index USD finished with a total return of 6.53% and the S&P Developed Ex-U.S. Total Return Property Index returning 16.55% during the period. All references in this letter to the Fund’s performance relate to the performance of the Fund’s Institutional Class.
Performance Drivers
Fiscal 2013 turned out to be a year in which investor sentiment, capital flows and equity returns across emerging markets (EM) experienced dramatic swings. It is more than five years post the global financial crisis and despite unprecedented liquidity provided by central banks, investors still do not have confidence that global growth has entered a sustainable recovery phase. Indeed, the International Monetary Fund (IMF) recently revised its growth projections for 2013 to 2.9%, the lowest reading since the crisis in 2008. Such uncertainty, coincided by fears of a deceleration in China (as well as a liquidity scare with the Shanghai Interbank Offered Rate (SHIBOR) shock), the knee-jerk reaction to the Federal Reserve (Fed) tapering language and certain geopolitical events, in Brazil and Turkey among others, compounded in Q2 2013 and provided an inflection point for underperformance of emerging market real estate shares. Broader EM equities experienced substantial volatility as spikes in US interest rates, combined with weakening domestic consumption and continued softness in external demand, drove a reflexive withdrawal of capital flows, a steepening of local yield curves and currency depreciation relative to the USD. The market’s reaction to the Fed’s proposed taper has raised the debate anew as to the efficacy of liquidity and the credit cycle in underpinning economic growth and driving asset returns.
| • | Pavlovian Economics. By almost any measure the trend and tone of global markets since the crisis in 2008 has been largely dictated by the monetary policy of central banks in the developed world. The frequently invoked bromide “Don’t fight the Fed” has long been a market mantra that can often drive binary investment outcomes (risk on/risk off) and tightening asset correlations, particularly in the absence of growth. In such an environment, the |
| | repercussions of macro data for the growth and policy outlook have, to a great degree, become distorted. Over this time period the unprecedented scale of central bank liquidity operations and the reliance on forward guidance have conspired to elicit a conditioned response from investors where as far as the read through of macroeconomic data to equity markets has been concerned “what’s good is bad, what’s bad is good.” This dynamic became glaringly evident at the onset of the tapering discussion in May, into the deferred expectations in September, and remains in full effect into the end of the year. To be sure, the Fed inadvertently provoked this investor impulse when it assigned data thresholds to the ultimate implementation of its tapering plans. Unless and until growth achieves a velocity closer to trend free from the training wheels of Fed support it is likely that the daily divination of economic minutiae and its anticipated impact on the timing and quantum of monetary intervention could continue to drive reflexive responses from investors as to the direction of so-called risk assets, rates and bond yields. |
| • | Emerging Market Growth Models. Broader EMs have been flirting with a cyclical slowdown for some time, concomitant with the transitioning growth models in the developing world, the lack of recovery in commodity and export markets, as well as imbalances in certain economies aggravated by the unintended consequences of loose monetary policy. The Fed’s taper announcement merely served to reinvigorate the debate over whether the faltering momentum in broad EM growth is cyclical or in fact a symptom of endemic, structural problems in selective growth models. Given the reflexive sell-off following the announcement, it’s clear that the market’s hair trigger conclusion was that EM growth models and fiscal stances would not suffice if real rates were re-priced and FX vulnerabilities were exposed contemporaneous to a cyclical slowdown. Compounding this reaction was the creeping realization that the solutions, i.e., monetary and fiscal reforms, would likely result in a further softening of domestic demand and place a ceiling on Gross Domestic Product (GDP) growth in the short term. The respite of Fed tapering expectations in September offered a window for many developing economies to reduce the magnitude of their vulnerability, but they have yet to address market concerns regarding their reliance on cyclical policy stimulus rather than credible structural reform initiatives to support their evolving growth models. |
30
| Alpine Emerging Markets Real Estate Fund (Continued) | |
| • | Portfolio Allocation. As we continue to expect a more pronounced dispersion of equity returns across countries and asset classes in the face of a differentiated growth environment and Fed tapering expectations, it is Alpine’s view that active management of EM portfolios remains critical. Positive contributors to relative returns include the overweight to Mexico (average weight 3.54%), highlighted by the absence of homebuilders in favor of exposure to the recently listed REIT-like structures. Additionally the overweight position in Russia (average weight 1.93%), specifically the warehouse/ logistics sector and the out of index position in Japan (average weight 0.60%) were net positive contributors to performance. Finally, the underweight positions to Malaysia (average weight 2.42%) and South Africa (average weight 0.74%) had a positive impact on returns as well. By comparison, the negative contributors to performance include the overweight to India (average weight 4.69%) and Thailand (average weight 11.31%) which both experienced a sharp sell off post the Fed taper talk as well as steeply depreciating currencies. The structural underweight to the UAE market (average weight 2.00%) and no allocation to the Austrian market dampened the Fund’s overall performance. |
Despite the policy headwinds and uncertainty surrounding the government transition the Fund maintained its tactical exposure to China/Hong Kong (29.82% average weighting) throughout the period. Investor sentiment toward Brazil continued to deteriorate due to the ongoing monetary tightening, the weak fiscal accounts and uncertainty surrounding the upcoming election cycle. While the Fund pared back some of its exposure, specifically to the homebuilders, we remained constructive on certain pockets of the market in Brazil (18.22% average weighting), specifically the mall owner/operators. The overweight in India (4.69% average weight) was maintained based on relative valuation and the expectation of an inflection point in the macro environment. Exposure across the Association of Southeast Asian Nations (ASEAN) markets modestly grew in aggregate with increased weightings in the Philippines (7.71% average weight) and Thailand offset by a notable reduction in Indonesia (6.73% average weight) and an underweight in Malaysia (average weight 2.42%). During the period under review the composition and weightings of the benchmark index (FENEI) continued to evolve, with the index dropping 21 component members and adding 24 new constituents.
Portfolio Analysis
The top five contributors to the Fund’s performance over the past twelve months based on contribution to total return were Shimao Property (+27.60%), China Resources Land (+23.88%), China Overseas Land (+16.57%), Emaar Properties (+66.07%), and Country Garden (+56.83%).
| • | Shimao Property, a residential builder targeting integrated development projects in tier 1-2 markets in China represented a 2.83% average weighted position in the portfolio and was the top contributor to the Fund’s performance. Strong underlying sales performance and accelerated asset turns resulted in a ramp up of project deliveries and expansion of development margins during the period. |
| • | China Resources Land, one of the leading landlords and developers in China focused on mixed use projects, represented a 3.97% average position in the portfolio. Its solid balance sheet, low borrowing costs and growing contribution from income properties have exhibited stability in the face of economic and policy uncertainty. |
| • | China Overseas Land, which represented a 3.16% average weight in the portfolio, is one of the largest listed residential developers in China. Potential future asset injections from the parent company could offer greater saleable resources and increased visibility on future earnings. |
| • | Emaar Properties, a UAE based real estate developer focusing on large-scale, mixed use (primarily residential, retail and hotel) projects across the MENA region, represented an average portfolio weighting of 2.01% during the period. The main beneficiary of the real estate recovery in Dubai and the strong growth of tourism in the region. |
| • | Country Garden, one of the leading mass-residential developers in China focused on large-scale community projects in tier-three cities, represented a 1.27% average weighted position in the portfolio. The company has experienced prodigious growth in sales and deliveries while improving its asset turns and land bank management. Sales were bolstered by the launch of projects in Malaysia. |
The five positions which weighed on the Fund’s performance over the past twelve months based on contribution to total return were BR Properties (-32.98%), Ananda Development (-50.22%), Vanke (-16.20%), PT Surya Semesta (-60.31%) and BR Malls (-24.63%).
31
| Alpine Emerging Markets Real Estate Fund (Continued) | |
| • | BR Properties, a leading commercial owner/developer in Brazil, represented a 2.61% average weighting in the portfolio and was the overall largest drag on performance. Market perception of a grinding slowdown in net absorption in the office rental market, expectations for increased supply coming on line in Sao Paulo and Rio, and the prevailing interest rate environment continued to weigh on share performance. |
| • | Ananda Development, a Thai residential company primarily developing condo units in close proximity to the developing mass transit lines in Bangkok, represented an average portfolio weighting of 0.67% during the period. Weak operating performance shortly after its IPO eroded investor confidence in near-term earnings and underlying book value. Political uncertainty surrounding the status of the infrastructure bill and the impact of a pending yuan-denominated bond further weighted on the shares. The recent announcement of a share buyback, the delivery of certain units ahead of schedule and strong sales launches have served to support the shares. |
| • | Vanke B Shares, one of the largest residential developers in China, represented a 2.25% average weighting in the portfolio. Performance has been dampened by weakening margin and profitability trends, as well as government delays in approving the listing of the company on the Hong Kong Exchange. In our view these issues are transitory as high visibility on sales volumes and pricing, as well as early signs of a margin recovery could fuel earnings expansion and support performance in the shares as the discount to NAV narrows. |
| • | PT Surya Semesta is an Indonesian property conglomerate with business interests in industrial estates, construction and hospitality investments. Caution surrounding the near-term impact of Fed tapering has tempered foreign multinational demand for industrial estate land and raised concerns over the timing of delivery of key infrastructure projects. Surya Semesta represented a 0.85% weighted average position in the portfolio. |
| • | BR Malls, the largest mall operator/developer in Brazil, represented an average portfolio weighting of 3.23% during the period. While operating trends and the development pipeline have continued to show resilience, they did not offset concerns over macro strains in Brazil, the impact of a rising rate environment on cap rate expansion and uncertainty surrounding the political landscape in the face of mounting social unrest. |
Outlook
Notwithstanding consensus expectations for a modest recovery across most developed economies, the global growth outlook remains tentative. Given the potential implications of Fed policy going forward and uncertainty surrounding China’s growth prospects, investors are likely to show heightened sensitivity to EM vulnerabilities which could enhance the transmission of negative feedback loops between technical weakness in EM equities and the underlying longer-term fundamentals of the respective real economies. The market’s sensitivity to the timing and method of the Fed tapering its QE program could test investor appetite for risk and overshadow the expectations for a cyclical recovery in the near term. Indeed, the mechanics of the eventual normalization of monetary conditions in the US (and eventually across all countries) could likely be one of the dominant drivers of asset markets for the foreseeable future. Despite the timing and magnitude of rate normalization, the global monetary stance is likely to remain extremely supportive in absolute terms. While uncertainties about the durability of growth models and the rising rate environment present near-term structural hurdles for specific EM countries, investor fears of a systemic crisis or even a disorderly exit are severely misplaced in our view. From an historic valuation perspective the teething pains associated with a withdrawal of liquidity in the US and China are well advanced across developing markets.
Until the recovery shows signs of stabilizing, markets could be whiplashed by each successive Fed announcement and US macro data point. Broadly speaking, the rise in bond yields could drive the cost of capital as well as the equity discount rate higher, applying further pressure to valuations in the current environment of subdued positive earnings revisions. However, it is Alpine’s view that once the uncertainty gives way to more confidence in the growth outlook that it could trigger continued reduction in risk premia and correlations across geographies and asset classes. Outflows from EM could then reverse as better growth prospects would likely feed into positive earnings expectations. Many EM economies will continue to drive global growth based on the expansion of the middle class, long-term themes of urbanization, and positive demographic trends. The magnitude and efficacy of further counter-cyclical measures by policy makers, the timing and implementation of structural reforms including investment in public infrastructure, and the direction of the growth/inflation dynamic remain some of the critical signposts for Alpine’s assessment of the reacceleration of demand in both EM and DM. Alpine continues to expect that the dispersion of equity returns across developing economies could demonstrate above-trend variance based
32
| Alpine Emerging Markets Real Estate Fund (Continued) | |
on relative growth dynamics, diverging macro/micro fundamentals, relative valuations, implementation of structural reforms and fund flows.
The Fund focuses on real estate investments primarily in developing economies that we believe are positioned to be at the forefront of global growth. The manager seeks out opportunities with solid demographic and urbanization trends, increasing availability and access to credit, and strengthening macroeconomic fundamentals, consistent with our structural view that superior risk-adjusted returns can be achieved in markets with broadening domestic consumption fueled by a growing middle class. While the adaptability of select EM growth models is likely to be put to the test in face of Fed tapering, we do not see any convincing arguments leading us to stray materially from our thesis that the key emerging economies are expected to continue to be a strong source of global demand, exhibit market resilience, and realign with their long-term
growth trends. As the developing countries strive to become more integrated, it is Alpine’s view that over time the emerging equity markets could deepen substantially in absolute terms as more companies come public and institutional allocations shift toward GDP weighted methodologies.
The Real Estate team at Alpine carefully monitors volatility and evaluates the risk/reward proposition of each position in the portfolio. As always we will continue to be extremely selective in our approach to the markets and deploying assets. We thank our shareholders for their support and look forward to renewed success in the year ahead.
Sincerely,
Joel E.D. Wells
Samuel A. Lieber
Co-Portfolio Managers
This letter represents the opinions of the Fund’s management and is subject to change, is not guaranteed and should not be considered a recommendation to buy or sell any security. The information provided is not intended to be, and is not, a forecast of future events, a guarantee of future results, or investment advice. Views expressed may vary from those of the firm as a whole. Past performance is no guarantee of future results.
Mutual fund investing involves risk. Principal loss is possible. The Fund is subject to risks, including the following:
Concentration Risk – The Fund’s strategy of concentrating in companies in a specific industry means that its performance will be closely tied to the performance of a particular market segment. The Fund’s concentration in these companies may present more risks than if it were broadly diversified over numerous industries and sectors of the economy. A downturn in these companies would have a larger impact on the Fund than on a mutual fund that does not concentrate in such companies. At times, the performance of these companies will lag the performance of other industries or the broader market as a whole.
Emerging Market Securities Risk – The risks of foreign investments are heightened when investing in issuers in emerging market countries. Emerging market countries tend to have economic, political and legal systems that are less fully developed and are less stable than those of more developed countries. They are often particularly sensitive to market movements because their market prices tend to reflect speculative expectations. Low trading volumes may result in a lack of liquidity and in extreme price volatility.
Equity Securities Risk – The stock or other security of a company may not perform as well as expected, and may decrease in value, because of factors related to the company (such as poorer than expected earnings or certain management decisions) or to the industry in which the company is engaged (such as a reduction in the demand for products or services in a particular industry).
Foreign Currency Transactions Risk – Foreign securities are often denominated in foreign currencies. As a result, the value of the Fund’s shares is affected by changes in exchange rates. The Fund may enter into foreign currency transactions to try to manage this risk. The Fund’s ability to use foreign currency transactions successfully depends on a number of factors, including the foreign currency transactions being available at prices that are not too costly, the availability of liquid markets and the ability of the Adviser to accurately predict the direction of changes in currency exchange rates.
Foreign Securities Risk – The Fund’s investments in securities of foreign issuers or issuers with significant exposure to foreign markets involve additional risk. Foreign countries in which the Fund may invest may have markets that are less liquid, less regulated and more volatile than U.S. markets. The value of the Fund’s investments may decline because of factors affecting the particular issuer as well as foreign markets and issuers generally, such as unfavorable government actions, and political or financial instability. Lack of information may also affect the value of these securities. The risks of foreign investment are heightened when investing in issuers of emerging market countries.
33
| Alpine Emerging Markets Real Estate Fund (Continued) | |
Growth Stock Risk – Growth stocks typically are very sensitive to market movements because their market prices tend to reflect future expectations. When it appears those expectations will not be met, the prices of growth stocks typically fall. Growth stocks as a group may be out of favor and underperform the overall equity market while the market concentrates on undervalued stocks.
Initial Public Offerings (IPO) and Secondary Offerings Risk – The Fund may invest a portion of its assets in shares of IPOs or secondary offerings of an issuer. IPOs and secondary offerings may have a magnified impact on the performance of a Fund with a small asset base. The impact of IPOs and secondary offerings on a Fund’s performance likely will decrease as the Fund’s asset size increases, which could reduce a Fund’s returns. IPOs and secondary offerings may not be consistently available to the Fund for investing. IPO and secondary offering shares frequently are volatile in price due to the absence of a prior public market, the small number of shares available for trading and limited information about the issuer. Therefore, the Fund may hold IPO and secondary offering shares for a very short period of time. This may increase the turnover of the Fund and may lead to increased expenses for the Fund, such as commissions and transaction costs. In addition, IPO and secondary offering shares can experience an immediate drop in value if the demand for the securities does not continue to support the offering price.
Liquidity Risk – Some securities held by the Fund may be difficult to sell, or illiquid, particularly during times of market turmoil. Illiquid securities may also be difficult to value. If the Fund is forced to sell an illiquid asset to meet redemption requests or other cash needs, the Fund may be forced to sell at a loss.
Management Risk – The Adviser’s judgment about the quality, relative yield or value of, or market trends affecting, a particular security or sector, or about interest rates generally, may be incorrect. The Adviser’s security selections and other investment decisions might produce losses or cause the Fund to underperform when compared to other funds with similar investment objectives and strategies.
Market Risk – The price of a security held by the Fund may fall due to changing market, economic or political conditions.
Micro Capitalization Company Risk – Stock prices of micro capitalization companies are significantly more volatile, and more vulnerable to adverse business and economic developments than those of larger companies. Micro capitalization companies often have narrower markets for their goods and/or services and more limited managerial and financial resources than larger, more established companies, including small or medium capitalization companies.
Real Estate Investment Trusts (“REITs”) Risk – REITs’ share prices may decline because of adverse developments affecting the real estate industry including changes in interest rates. The returns from REITs may trail returns from the overall market. Additionally, there is always a risk that a given REIT will fail to qualify for favorable tax treatment.
Real Estate Securities Risk – Risks associated with investment in securities of companies in the real estate industry include: declines in the value of real estate; risks related to local economic conditions, overbuilding and increased competition; increases in property taxes and operating expenses; changes in zoning laws; casualty or condemnation losses; variations in rental income, neighborhood values or the appeal of properties to tenants; changes in interest rates and changes in general economic and market conditions.
Small- and Medium-Capitalization Company Risk – Securities of small- or medium-capitalization companies are more likely to experience sharper swings in market values, and may be less liquid, in which case it may be more difficult for the Adviser to sell at times and at prices that the Adviser believes appropriate and generally are more volatile than those of larger companies.
Undervalued Stock Risk – The Fund may pursue strategies that may include investing in securities, which, in the opinion of the Adviser, are undervalued. The identification of investment opportunities in undervalued securities is a difficult task and there is no assurance that such opportunities will be successfully recognized or acquired. While investments in undervalued securities offer opportunities for above-average capital appreciation, these investments involve a high degree of financial risk and can result in substantial losses.
Please refer to page 5-7 for other important disclosures and definitions.
34
| Alpine Global Infrastructure Fund | |
| Comparative Annualized Returns as of 10/31/13 (Unaudited) | | |
| | | 1 Year | | | 3 Years | | | Since Inception(1) |
| Alpine Global Infrastructure Fund — Institutional Class | | | 25.35% | | | | 12.93% | | | | 20.23% | |
| Alpine Global Infrastructure Fund — Class A (Without Load) | | | 25.04% | | | | N/A | | | | 23.53% | |
| Alpine Global Infrastructure Fund — Class A (With Load) | | | 18.14% | | | | N/A | | | | 19.79% | |
| S&P Global Infrastructure Index | | | 15.29% | | | | 8.48% | | | | 11.29% | |
| Lipper Specialty/Miscellaneous Funds Average(2) | | | 8.70% | | | | 8.16% | | | | 15.01% | |
| Lipper Specialty/Miscellaneous Funds Ranking(2) | | | 15/91 | | | | 28/67 | | | | 3/31 | |
| Gross Expense Ratio (Institutional Class): 1.33%(3) | | | | | | | | | | | | |
| Net Expense Ratio (Institutional Class): 1.33%(3) | | | | | | | | | | | | |
| Gross Expense Ratio (Class A): 1.58%(3) | | | | | | | | | | | | |
| Net Expense Ratio (Class A): 1.58%(3) | | | | | | | | | | | | |
| (1) | Institutional Class shares commenced on November 3, 2008 and Class A shares commenced on December 30, 2011. Returns for indices are since November 3, 2008. |
| | (2) | The since inception data represents the period beginning November 6, 2008 (Institutional Class only). |
| | (3) | As disclosed in the prospectus dated February 28, 2013. |
Performance data quoted represents past performance and is not predictive of future results. Investment return and principal value of the Fund fluctuate, so that shares, when redeemed, may be worth more or less than their original cost. Performance current to the most recent month end may be lower or higher than the performance quoted and may be obtained by calling 1-888-785-5578. Performance data shown does not reflect the 1.00% redemption fee imposed on shares held for fewer than 60 days. If it did, total returns would be reduced. Returns for the Class A shares with sales charge reflect a maximum sales charge of 5.50%. Performance for the Class A shares without sales charges does not reflect this load.
The S&P Global Infrastructure Index is comprised of 75 of the largest publicly-listed infrastructure companies that meet specific investability requirements. The Index is designed to provide liquid exposure to the leading publicly-listed companies in the global infrastructure industry, from both developed markets and emerging markets. The Lipper Specialty/Miscellaneous Funds Average is an average of funds that limit their investments to a specific industry (e.g. transportation, retailing, or paper, etc.) or ones that have not been classified into an existing investment classification. To create diversified exposure across the global listed infrastructure market, the index has balanced weights across three distinct infrastructure clusters: utilities, transportation, and energy. The S&P Global Infrastructure Index and the Lipper Specialty/Miscellaneous Funds Average are unmanaged and do not reflect direct fees associated with a mutual fund, such as investment adviser fees; however, the Lipper Specialty/Miscellaneous Funds Average reflects fees charged by the underlying funds. The performance for the Alpine Global Infrastructure Fund reflects the deduction of fees for these value-added services. Lipper rankings for the periods shown are based on fund total returns with dividends and distributions reinvested and do not reflect sales charges. Investors cannot directly invest in an index.
Expense Ratios reflect the ratios reported in the Fund’s most recent prospectus. The Alpine Global Infrastructure Fund has a contractual expense waiver that continues through February 28, 2014. Where a Fund’s gross and net expense ratios are the same for the period reported, the contractual expense reimbursement level was not reached as of the end of that period. To the extent the Fund’s expenses were reduced by waivers, the Fund’s total returns were increased. In these cases, in the absence of the expense waivers, the Fund’s total returns would have been lower.
The Fund’s past performance benefited significantly from Initial Public Offerings (“IPOs”) and Secondary Offerings of certain issuers. There is no assurance that the Fund can replicate this performance in the future. Additionally, there is no guarantee that the Fund will be able to participate to the same degree in IPO/Secondary Offerings in the future.
35
| Alpine Global Infrastructure Fund (Continued) | |
Portfolio Distributions* (Unaudited)

| Top 10 Holdings* (Unaudited) |
| 1. | | Vinci SA | 2.36 | % |
| 2. | | Corrections Corp. of America | 2.17 | % |
| 3. | | Ferrovial SA | 2.04 | % |
| 4. | | American Tower Corp. | 1.91 | % |
| 5. | | Canadian Pacific Railway, Ltd. | 1.77 | % |
| 6. | | Abertis Infraestructuras SA | 1.74 | % |
| 7. | | Progressive Waste Solutions, Ltd. | 1.66 | % |
| 8. | | CCR SA | 1.66 | % |
| 9. | | Cia de Saneamento Basico do Estado de Sao Paulo-ADR | 1.61 | % |
| 10. | | Koninklijke Vopak NV | 1.59 | % |
| * | Portfolio Distributions percentages are based on total investments. Top 10 Holdings do not include short-term investments and percentages are based on total net assets. Portfolio holdings and sector distributions are as of 10/31/13 and are subject to change. Portfolio holdings are not recommendations to buy or sell any securities. |
| Value of a $10,000 Investment (Unaudited) |
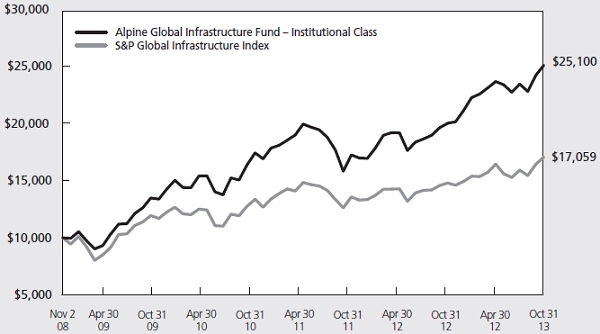 |
| |
This chart represents a comparison of a hypothetical $10,000 investment in the Fund versus a similar investment in the Fund’s benchmarks. The graph and the table do not reflect the deduction of taxes that a shareholder would pay on Fund distributions or the redemption of Fund shares. Investment performance reflects the waiver and recovery of certain fees, if applicable. Without the waiver and recovery of fees, the Fund’s total return would have differed.
Performance data quoted represents past performance and is not predictive of future results. Investment return and principal value of the Fund fluctuate, so that shares, when redeemed, may be worth more or less than their original cost.
36
| Alpine Global Infrastructure Fund (Continued) | |
Commentary
We are pleased to report the results for the Alpine Global Infrastructure Fund for the fiscal year ending October 31, 2013. For this year, the Fund reported a 25.35% total return versus the S&P Global Infrastructure Index, which had a total return of 15.29%. All references in this letter to the Fund’s performance relate to the performance of the Fund’s Institutional Class.
Performance Drivers
Over the past twelve months, the stock market has marched higher due to a number of factors including highly accommodative global monetary policy, improving macroeconomic indicators, bullish sentiment and inflows into equity-oriented mutual funds and exchange traded funds. Although economic growth is slow by historical standards, the central banks’ policies have helped the stock market rally. Government interventions such as quantitative easing in the United States, the long-term refinancing operations (“LTRO”) in Europe by the European Central Bank and the Bank of Japan’s aggressive stimulus policy have led to low yields on fixed-income investments. The markets have been highly sensitive to potential changes in monetary policy, as seen when the equity market started to sell off in May due to speculation that the Federal Reserve (Fed) might reduce its bond purchases. The 10 year Treasury yield rose from a low of 1.6% in early May to 3.0% by September 2013 as Fed Chairman Bernanke confirmed that the Fed would likely begin tapering its quantitative easing program by the end of the year. Stocks have since resumed their upward climb as the Fed backed away from its earlier inclination to taper its bond-buying program. We invest in infrastructure stocks that we believe have stable and predictable and inflation-protected cash flows. In the long term, we believe our portfolio of companies is poised to grow from continued government and private spending on infrastructure.
The Fund has also participated in a number of Initial Public Offerings (“IPO”), both inside and outside of the infrastructure sector, that have contributed to the Fund’s total return. We cannot predict how long, if at all, these opportunities will continue to exist, but to the extent we consider IPO’s to be attractively priced and available, the Fund may continue to participate in them.
Utilities: The S&P 500 Utility Index was up 9.51% and the STOXX 600 Utilities Index was up 15.94% compared to the S&P 500® Index which gained 27.18% and the STOXX Europe 600 Index which gained 29.50%. Our underweight in this sector compared to our benchmark and our outperformance in the companies that we owned in this sector contributed to our outperformance of our
benchmark. We have invested in water companies globally such as Beijing Enterprises Water Group Limited, Veolia Environnement, and Suez Environnement. These investments have contributed to our outperformance in the utility sector.
Emerging Market Exposure: We believe that the urbanization of emerging market countries will be an important driver of infrastructure development and spending. The MSCI Emerging Market Index gained 6.90% while the Ibovespa Index was down 13.64% and the Hang Seng Index was up 11.07%. All three indices underperformed both the S&P 500® Index and the STOXX 600 index. During this period, our exposure to emerging markets was overweight versus our benchmark. Emerging markets was a positive contributor to our overall return despite having an overweight position. We believe that infrastructure spending in emerging markets will continue to increase and thus we are maintaining an overweight position compared to the benchmark in those markets. Our investments in Brazil were a laggard in emerging markets as growth was below expectations. We still believe there will be significant spending on infrastructure in Brazil as it is now the seventh largest economy by Gross Domestic Product (“GDP”); but, according to the Global Competitiveness Report by the World Economic Forum (2011 – 2012), Brazil ranks 104th in its overall quality of infrastructure. On November 22, 2013, Brazil completed the auction of two airports at a price significantly above the minimum bid requirements.
In our view, the need to invest in infrastructure and the desire of pension funds and other asset owners to own infrastructure assets make this sector an attractive investment. Several of the companies that we owned during the period, were involved in merger and acquisition activity. Energy Solutions, a company in which we owned shares, agreed to be acquired by Energy Capital Partners. Kabel Deutschland Holding, another company in which we owned shares, was acquired by Vodafone Group. In addition, Manchester Airport Group, which is partially owned by Ferrovial, sold Stansted Airport. Vinci acquired the concession to manage Portugal’s 10 main airports for a period of 50 years. Also in February 2013, Hochtief announced the sale of its airports, for which it subsequently found a buyer in May.
Portfolio Analysis
The top five contributors to the Fund’s performance for the fiscal year ending October 31, 2013 based on contribution to total return were The Geo Group (“GEO”) (63.05%), Vinci (51.72%), TravelCenters of America (“TA”)
37
| Alpine Global Infrastructure Fund (Continued) | |
(72.85%), Ferrovial (47.68%), and Beijing Enterprises Water Group Limited (“BEW”) (97.29%).
| | • | GEO (average weight 1.71%) operates private correctional facilities. We believe GEO’s stock has benefited from converting to a real estate investment trust (“REIT”), paying a special dividend during the conversion process, and from a large potential pipeline of opportunities. |
| | • | Vinci (average weight 2.07%) is a world-leading concession and construction company. It operates motorway concessions in France and car parks across Europe. We believe the shares have risen during the fiscal year due to a recovery in the traffic on their motorways and the purchase of Portuguese airport operator ANA-Aeroportos de Portugal SA ANA. We believe that the shares of Vinci would benefit from the sale of the car park division. |
| | • | TravelCenters of America (average weight 1.03%) operates a network of fuel service areas mainly along the U.S. interstate highway system. We believe the 26 sites that TA has acquired over the past three years will positively contribute to EBITDA over the next several years. In addition, TA and Shell finalized an agreement to build liquefied natural gas fueling lanes at up to 100 of TA’s centers. Installations of these lanes may begin in the first half of 2014. |
| | • | Ferrovial (average weight 1.98%) is a developer and owner of infrastructure assets globally. The stock outperformed as they have recently monetized several assets. One of the assets that they sold at a price that was above our expectations was the Stansted Airport. In addition, the traffic on Ferrovial’s most valuable concession, the Canadian 407 Express Toll Route, continues to be very resilient. They also paid a special dividend in December 2012. |
| | • | Beijing Enterprises Water Group Limited (average weight 1.15%) is a diversified water company in China. It is the largest wastewater treatment operator in China. BEW made several acquisitions during 2013, which we believe will contribute to its earnings in 2014. In addition, the central government’s policies focusing on improving the efficiency and operation of water projects through privatization has led to a positive sentiment towards the stock. We believe BEW will participate and benefit from additional opportunities to further consolidate the market. |
The following companies had the largest adverse impact on the performance of the Fund based on contribution to return for the fiscal year ending October 31, 2013: E-CL S.A. (-39.40%), Oi S.A. (-48.44%), Ecorodovias Infraestrutura e Logistica S.A (“ECOR”)
(-18.35%), Companhia de Saneamento Basico do Estado de Sao Paulo (“Sabesp”) (-22.30%) and All America Latina Logistica (“ALL”) (-19.97%).
| | • | E-CL (average weight 0.65%) is an electricity generation company in Chile. E-CL underperformed as it reported lower than expected earnings as it was forced to purchase energy in the spot market. E-CL also reduced its payout ratio. We no longer have a position in E-CL. |
| | • | Oi (average weight 0.14%) is one of the largest integrated telecommunication companies in Brazil. Oi underperformed due to concerns in the market that it has committed to pay a high dividend despite debt of approximately three times EBITDA. In the first quarter of 2013, the company experienced negative free cash flow due to an elevated level of capex. We no longer have a position in Oi. |
| | • | ECOR (average weight 1.42%) is an owner of infrastructure concessions in Brazil. ECOR’s road concessions have performed well but the port and logistics businesses have underperformed due to increased competition at the Port of Santos. We continue to own ECOR as we believe there will be opportunities for growth through buying new concessions over the next several years in Brazil. |
| | • | Sabesp (average weight 1.33%) is a water company in Brazil. Sabesp’s stock underperformed during the fiscal period due to regulatory risk as its tariff review process was delayed. The tariff review and decision on a regulatory framework is now scheduled to take place in 2014. |
| | • | ALL (average weight 1.57%) is a rail operator in Brazil. Although Brazil experienced a strong winter harvest, ALL’s volumes on its rails disappointed due to bottlenecks at Santos port. In addition, ALL is attempting to renegotiate the unfavorable Rumo contract. |
Summary and Outlook
We launched the Fund because we believe that there are special opportunities to benefit from global spending in infrastructure over the next several decades. Even before the financial crisis began to wreak havoc on the budgets of governments and municipalities, the privatization of infrastructure assets began to take place. Now, even more so, we believe there will be an accelerated effort to privatize these assets as public entities will not have the funds to maintain their current infrastructure assets nor to build new infrastructure assets to meet the needs of a growing population. Throughout the world, the owners of infrastructure are primarily government entities. However, over the last several decades, due to the large cost of building and maintaining these facilities, there has been a
38
| Alpine Global Infrastructure Fund (Continued) | |
movement towards privatization of infrastructure assets. In Canada, Australia, the United Kingdom, and throughout Europe and Asia, roads, airports, and seaports have been privatized. Currently, The Port Authority of New York and New Jersey have issued a request for proposal to four prequalified consortia bidding for the LaGuardia Airport Central Terminal Building Replacement Project. The proposals and selection of the winning bid is expected to take place in 2014. We believe that this may be the beginning of local airport authorities in the United States utilizing the expertise, experience, and innovation of private owners of airports to rehabilitate their aging airports.
Since the launch of our Fund, the equity markets have been volatile as the world’s economies suffered from the effects of the financial crisis. The amount of debt that governments have on their balance sheets and the austerity measures that have been enacted will likely lead to slower growth for years to come. The uncertainty over the European debt crisis along with the questionable growth prospects of China has led to extremely volatile markets and, as a result, we continued to hedge a portion of our euro currency exposure during the period to partially offset the euro’s impact on the value of the Fund’s euro-denominated holdings. We believe that this volatility may create many new opportunities for investors in infrastructure stocks that have the potential for more
stable and predictable cash flows. Our portfolio of companies is not immune to swings in share prices, but volatile markets may provide an opportunity to continue buying what we believe are high-quality companies with solid balance sheets and good growth prospects at what we believe are inexpensive valuations. In the future, governments may be compelled to sell off infrastructure assets and utilize public or private funds using build, operate or transfer models to finance new projects.
We are pleased with the structure of our portfolio and the outperformance of the Fund during the fiscal year ending October 31, 2013. We believe the Fund is positioned to take advantage of the anticipated increase in global infrastructure spending. We continue to believe that the combination of urbanization, rising standards of living and population growth will propel infrastructure spending for decades to come. We will continue to adapt our investment approach as economic conditions change and look forward to discussing the portfolio and the prospects for the Fund in future communications. We appreciate your trust and investment in the Fund.
Sincerely,
Joshua E. Duitz
Samuel A. Lieber
Co-Portfolio Managers
This letter represents the opinions of the Fund’s management and is subject to change, is not guaranteed and should not be considered a recommendation to buy or sell any security. The information provided is not intended to be, and is not, a forecast of future events, a guarantee of future results, or investment advice. Views expressed may vary from those of the firm as a whole. Past performance does not guarantee future results.
Mutual fund investing involves risk. Principal loss is possible. The Fund is subject to risks including the following:
Concentration Risk – The Fund’s strategy of concentrating in companies in a specific industry means that its performance will be closely tied to the performance of a particular market segment. The Fund’s concentration in these companies may present more risks than if it were broadly diversified over numerous industries and sectors of the economy. A downturn in these companies would have a larger impact on the Fund than on a fund that does not concentrate in such companies. At times, the performance of these companies will lag the performance of other industries or the broader market as a whole.
Dividend Strategy Risk – The Fund’s strategy of investing in dividend-paying stocks involves the risk that such stocks may fall out of favor with investors and underperform the market. Companies that issue dividend-paying stocks are not required to continue to pay dividends on such stocks. Therefore, there is the possibility that such companies could reduce or eliminate the payment of dividends in the future.
Emerging Market Securities Risk – The risks of foreign investments are heightened when investing in issuers in emerging market countries. Emerging market countries tend to have economic, political and legal systems that are less fully developed and are less stable than those of more developed countries. They are often particularly sensitive to market movements because their market prices tend to reflect speculative expectations. Low trading volumes may result in a lack of liquidity and in extreme price volatility.
Equity Securities Risk – The stock or other security of a company may not perform as well as expected, and may decrease in value, because of factors related to the company (such as poorer–than-expected earnings or certain management decisions) or to the industry in which the company is engaged (such as a reduction in the demand for products or services in a particular industry).
Foreign Currency Transactions Risk – Foreign securities are often denominated in foreign currencies. As a result, the value of the Fund’s shares is affected by changes in exchange rates. The Fund may enter into foreign currency transactions to try
39
| Alpine Global Infrastructure Fund (Continued) | |
to manage this risk. The Fund’s ability to use foreign currency transactions successfully depends on a number of factors, including the foreign currency transactions being available at prices that are not too costly, the availability of liquid markets and the ability of the Adviser to accurately predict the direction of changes in currency exchange rates.
Foreign Securities Risk – The Fund’s investments in securities of foreign issuers or issuers with significant exposure to foreign markets involve additional risk. Foreign countries in which the Fund may invest may have markets that are less liquid, less regulated and more volatile than U.S. markets. The value of the Fund’s investments may decline because of factors affecting the particular issuer as well as foreign markets and issuers generally, such as unfavorable government actions, and political or financial instability. Lack of information may also affect the value of these securities. The risks of foreign investment are heightened when investing in issuers of emerging market countries.
Growth Stock Risk – Growth stocks are stocks of companies believed to have above-average potential for growth in revenue and earnings. Growth stocks typically are very sensitive to market movements because their market prices tend to reflect future expectations. When it appears those expectations will not be met, the prices of growth stocks typically fall. Growth stocks as a group may be out of favor and underperform the overall equity market while the market concentrates on undervalued stocks.
Infrastructure-Related Investment Risk – Because the Fund concentrates its investments in infrastructure-related entities, the Fund has greater exposure to potential adverse economic, regulatory, political and other changes affecting such entities. Infrastructure-related entities are subject to a variety of factors that may adversely affect their business or operations, including high interest costs in connection with capital construction programs, costs associated with environmental and other regulations, the effects of economic slowdown and surplus capacity, increased competition from other providers of services, uncertainties concerning the availability of fuel at reasonable prices, the effects of energy conservation policies and other factors. Additionally, infrastructure-related entities may be subject to regulation by various governmental authorities and may also be affected by governmental regulation of rates charged to customers, service interruption due to environmental, operational or other mishaps and the imposition of special tariffs and changes in tax laws, regulatory policies and accounting standards.
Initial Public Offerings (IPO) and Secondary Offerings Risk – The Fund may invest a portion of its assets in shares of IPOs or Secondary Offerings of an issuer. IPOs and Secondary Offerings may have a magnified impact on the performance of a Fund with a small asset base. The impact of IPOs and Secondary Offerings on a Fund’s performance likely will decrease as the Fund’s asset size increases, which could reduce a Fund’s returns. IPOs and Secondary Offerings may not be consistently available to the Fund for investing. IPO and Secondary Offering shares frequently are volatile in price due to the absence of a prior public market, the small number of shares available for trading and limited information about the issuer. Therefore, the Fund may hold IPO and Secondary Offering shares for a very short period of time. This may increase the turnover of the Fund and may lead to increased expenses for the Fund, such as commissions and transaction costs. In addition, IPO and Secondary Offering shares can an immediate drop in value if the demand for the securities does not continue to support the offering price.
Management Risk – The Adviser’s judgment about the quality, relative yield or value of, or market trends affecting a particular security or sector, or about interest rates generally, may be incorrect. The Adviser’s security selections and other investment decisions might produce losses or cause the Fund to underperform when compared to other funds with similar investment objectives and strategies.
Market Risk – The price of a security held by the Fund may fall due to changing market, economic or political conditions.
Portfolio Turnover Risk – High portfolio turnover necessarily results in greater transaction costs which may reduce Fund performance.
Small- and Medium-Capitalization Company Risk – Securities of small- or medium-capitalization companies are more likely to experience sharper swings in market values, and may be less liquid, in which case it may be more difficult for the Adviser to sell at times and at prices that the Adviser believes appropriate and generally are more volatile than those of larger companies.
Undervalued Stock Risk – The Fund may pursue strategies that may include investing in securities, which, in the opinion of the Adviser, are undervalued. The identification of investment opportunities in undervalued securities is a difficult task and there is no assurance that such opportunities will be successfully recognized or acquired. While investments in undervalued securities offer opportunities for above-average capital appreciation, these investments involve a high degree of financial risk and can result in substantial losses.
Please refer to page 5-7 for other important disclosures and definitions.
40
| Alpine Global Consumer Growth Fund | |
| Comparative Annualized Returns as of 10/31/13 (Unaudited) | | |
| | | | 1 Year | | | Since Inception(1) |
| Alpine Global Consumer Growth Fund — Institutional Class | | | 17.80% | | | | 8.80% | |
| Alpine Global Consumer Growth Fund — Class A (Without Load) | | | 17.58% | | | | 20.41% | |
| Alpine Global Consumer Growth Fund — Class A (With Load) | | | 11.15% | | | | 16.77% | |
| MSCI World Index USD | | | 25.77% | | | | 10.81% | |
| MSCI ACWI Consumer Discretionary Index USD | | | 36.91% | | | | 14.59% | |
| MSCI ACWI Consumer Staples Index USD | | | 16.88% | | | | 11.43% | |
| Lipper Consumer Goods Funds Average(2) | | | 26.21% | | | | 13.92% | |
| Lipper Consumer Goods Funds Ranking(2) | | | 36/43 | | | | 35/38 | |
| Gross Expense Ratio (Institutional Class): 5.31%(3) | | | | | | | | |
| Net Expense Ratio (Institutional Class): 1.35%(3) | | | | | | | | |
| Gross Expense Ratio (Class A): 5.56%(3) | | | | | | | | |
| Net Expense Ratio (Class A): 1.60%(3) | | | | | | | | |
| (1) | Institutional Class shares commenced on December 29, 2010 and Class A shares commenced on December 30, 2011. Returns for indices are since December 29, 2010. |
| | (2) | The since inception data represents the period beginning December 31, 2010 (Institutional Class only). |
| | (3) | As disclosed in the prospectus dated February 28, 2013. |
Performance data quoted represents past performance and is not predictive of future results. Investment return and principal value of the Fund fluctuate, so that shares, when redeemed, may be worth more or less than their original cost. Performance current to the most recent month end may be lower or higher than the performance quoted and may be obtained by calling 1-888-785-5578. Performance data shown does not reflect the 1.00% redemption fee imposed on shares held for fewer than 60 days. If it did, total returns would be reduced. Returns for the Class A shares with sales charge reflect a maximum sales charge of 5.50%. Performance for the Class A shares without sales charges does not reflect this load.
The MSCI World Index USD is a free float-adjusted market capitalization-weighted index that is designed to measure the equity market performance of developed markets. Source: MSCI. MSCI data may not be reproduced or used for any other purpose. The Lipper Consumer Goods Funds Average is an average of funds that invest primarily in the equity securities of domestic and foreign companies engaged in manufacturing and distributing consumer goods such as food, beverages, tobacco, and nondurable household goods and personal products. MSCI ACWI Consumer Staples Index USD is a market capitalization-weighted index that is designed to measure the equity market performance of developed and emerging markets for the Consumer Staples GICS® sector. Source: MSCI. MSCI makes no express or implied warranties or representations and shall have no liability whatsoever with respect to any MSCI data contained herein. The MSCI data may not be further redistributed or used as a basis for other indices or any securities or financial products. This report is not approved, reviewed or produced by MSCI. MSCI ACWI Consumer Discretionary Index USD is a free float-adjusted market capitalization-weighted index that is designed to measure the equity market performance of developed and emerging markets for the Consumer Discretionary GICS® sector. Source: MSCI. The MSCI ACWI Consumer Staples Index USD, the MSCI ACWI Consumer Discretionary Index USD and the Lipper Consumer Goods Funds Average are unmanaged and do not reflect direct fees associated with a mutual fund, such as investment adviser fees; however, the Lipper Consumer Goods Funds Average reflects fees charged by the underlying funds. The performance for the Alpine Global Consumer Growth Fund reflects the deduction of fees for these value-added services. Investors cannot directly invest in an index. Lipper rankings for the periods shown are based on fund total returns with dividends and distributions reinvested and do not reflect sales charges.
Expense Ratios reflect the ratios reported in the Fund’s most recent prospectus. The Alpine Global Consumer Growth Fund has a contractual expense waiver that continues through February 28, 2014. Where a Fund’s gross and net expense ratios are the same for the period reported, the contractual expense reimbursement level was not reached as of the end of that period. To the extent the Fund’s expenses were reduced by waivers, the Fund’s total returns were increased. In these cases, in the absence of the expense waivers, the Fund’s total returns would have been lower.
The Fund’s past performance benefited significantly from Secondary Offerings of certain issuers, and Initial Public Offerings (“IPOs”) contributed to performance. There is no assurance that the Fund can replicate this performance in the future. Additionally, there is no guarantee that the Fund will be able to participate to the same degree in IPO/Secondary Offerings in the future.
41
| Alpine Global Consumer Growth Fund (Continued) | |
Portfolio Distributions* (Unaudited)
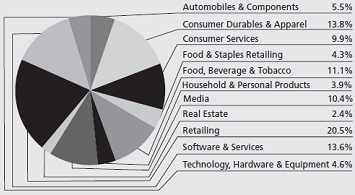
| Top 10 Holdings* (Unaudited) |
| 1. | | Comcast Corp.-Class A | 2.92 | % |
| 2. | | Anheuser-Busch InBev NV-ADR | 2.91 | % |
| 3. | | Tencent Holdings, Ltd. | 2.87 | % |
| 4. | | Apple, Inc. | 2.75 | % |
| 5. | | Google, Inc.-Class A | 2.71 | % |
| 6. | | Baidu, Inc.-ADR | 2.54 | % |
| 7. | | VF Corp. | 2.49 | % |
| 8. | | Visa, Inc.-Class A | 2.42 | % |
| 9. | | Michael Kors Holdings, Ltd. | 2.35 | % |
| 10. | | Nestle SA | 2.28 | % |
| * | Portfolio Distributions percentages are based on total investments. Top 10 Holdings do not include short-term investments and percentages are based on total net assets. Portfolio holdings and sector distributions are as of 10/31/13 and are subject to change. Portfolio holdings are not recommendations to buy or sell any securities. |
| Value of a $10,000 Investment (Unaudited) |
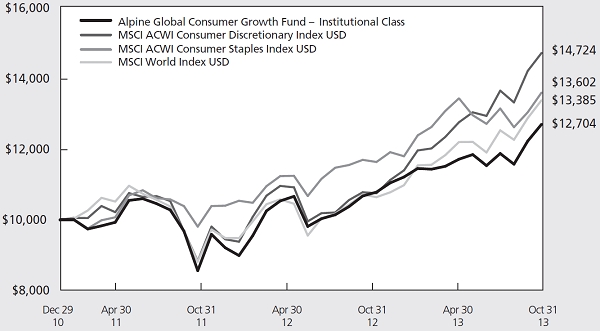 |
| |
This chart represents a comparison of a hypothetical $10,000 investment in the Fund versus a similar investment in the Fund’s benchmarks. The graph and the table do not reflect the deduction of taxes that a shareholder would pay on Fund distributions or the redemption of Fund shares. Investment performance reflects the waiver and recovery of certain fees, if applicable. Without the waiver and recovery of fees, the Fund’s total return would have differed.
Performance data quoted represents past performance and is not predictive of future results. Investment return and principal value of the Fund fluctuate, so that shares, when redeemed, may be worth more or less than their original cost.
42
| Alpine Global Consumer Growth Fund (Continued) | |
Commentary
In the fiscal year ended October 31, 2013, the Alpine Global Consumer Growth Fund provided a total return of 17.80%. The MSCI World Index posted a total return of 25.77% while the MSCI ACWI Consumer Staples and MSCI ACWI Consumer Discretionary Indices posted total returns of 16.88% and 36.91%, respectively. All references in this letter to the Fund’s performance relate to the performance of the Fund’s Institutional Class.
Portfolio Drivers
The global markets trended higher throughout fiscal 2013. During the first six months of the fiscal year, the markets rallied as several potential roadblocks in the United States were passed, namely the U.S. Presidential election and the impact of the sequester, and economic data around the globe signaled continued improvement. After a sharp pullback after comments from the Federal Reserve Chairman with regard to the potential for tapering, markets rallied through fiscal year end.
| • | Geographic exposure played a large part in the performance of the Fund versus the benchmark. Due to the global nature of the portfolio, the United States represented a 41.45% average weight during the fiscal year versus 52.47% in the benchmark. Conversely, the Fund had a large relative overweight versus the benchmark in emerging markets (29.51% versus 10.07%). The large outperformance of the markets in the United States versus the emerging market countries played a large part in the results during the fiscal year. |
| • | The Fund carried an average cash balance of 3.74% over the past twelve months. Given the strength of the markets during the fiscal year, this balance created a significant drag on performance in the period. |
| • | From an industry standpoint, the Fund’s relative underweight in retailing and automobiles & components contributed to the shortfall versus the benchmark. Meanwhile, an overweight in software & services had the largest positive contribution to performance. |
| • | Sector performance was also a major factor during the year. Global consumer discretionary stocks outperformed in the period and were a relative underweight in the Fund (56.67% average weight versus 99.70% for the benchmark). The Fund’s other major sector exposures, consumer staples (20.50%) and information technology (14.75%), were positive |
contributors in fiscal 2013 but didn’t keep pace with the discretionary sector.
Portfolio Analysis
The top five contributors to the Fund’s performance for the fiscal year ended October 31, 2013 were YOOX S.p.A. (138.03%), Kabel Deutschland Holding (57.58%), Lumber Liquidators Holdings (105.57%), CBS Corporation (84.49%) and Tencent Holdings (54.53%).
| • | Italian on-line retailer YOOX (average weight 1.38%) was the top contributor to the Fund’s performance for the fiscal year. The company launched several new e-commerce sites under a variety of high-end apparel and accessory designers that enabled the company to exceed expectations on both the top and the bottom line, which also led to P/E multiple expansion. |
| • | Kabel Deutschland (average weight 2.13%) became an acquisition target during 2013. After rumors surfaced earlier in the year, the company reached an agreement to be acquired by Vodafone in an all cash offer for a significant premium compared to the price of the shares at the beginning of the fiscal year. |
| • | Lumber Liquidators (average weight 1.49%) had another stellar year in 2013. An improving housing market drove solid demand for the flooring category. In addition, management’s efforts to improve its supply chain and its product mix resulted in further expansion of the company’s operating margins. |
| • | CBS Corporation (average weight 1.77%) had an exceptional year as the company continued to monetize the strong ratings at its namesake broadcast network, driving advertising revenue higher. In addition, the results benefited from increased re-transmission fees and content agreements with digital providers. The shares also experienced P/E multiple expansion along with most of the media sector. |
| • | Tencent Holdings (average weight 2.05%) solidified its position as a leader in the Chinese internet space with a strong performance in fiscal 2013. The company expanded its platform beyond instant messaging into areas such as gaming, chat and e-commerce. More importantly, Tencent has been able to transition from the desktop environment to the mobile world seamlessly. |
43
| Alpine Global Consumer Growth Fund (Continued) | |
Magazine Luiza S.A. (-61.38%), Daphne International Holdings (-54.88%), Erajaya Swamsembada (-50.19%), Multiplus S.A. (-43.38%) and Francesca’s Holdings Corporation (-39.42%) were the bottom five contributors to the Fund’s performance for the fiscal year ended October 31, 2013.
| • | Magazine Luiza (average weight 0.62%) experienced a slowdown in sales as spending in the Brazilian market faltered during the year. As a smaller market cap stock, the shares also experienced P/E multiple contraction as investors fled the Brazilian market. |
| • | As a retailer in smaller Chinese cities, Daphne (average weight 1.08%) suffered from slowing sales and higher inventory levels during the year. The company is in the process of clearing the excess inventory, which has had a negative impact on margins in the near term. |
| • | Mobile phone distributor Erajaya’s (average weight 0.97%) results suffered due to its exposure to Blackberry phones in Indonesia. The company has seen some recovery in sales but faces tough Blackberry comparisons as it shifts away from the troubled device maker. |
| • | Brazilian loyalty plan operator Multiplus (average weight 1.07%) entered 2013 performing extremely well. At the beginning of the year one of its bank partners changed the terms of its agreement with the company, which led to fears that other partners would follow suit and the shares dropped. While that has not been the case to date, the shares have yet to fully recover. |
| • | Francesca’s Holdings (average weight 1.22%) is a high growth apparel retailer in the United States. Its shares underperformed as consumer mall traffic dropped mid-way through the year. This resulted in weakness in the apparel retail group in general due to lower sales and led to multiple compression. |
Summary & Outlook
The investment objective of the Fund is to seek long-term capital appreciation. The Fund seeks to invest in companies which have exposure to the rising purchasing
power of the global consumer. The Fund aims to achieve diversification by investing primarily across the consumer discretionary, consumer staples and technology sectors among both multi-national and local companies. In the developed world, we emphasize investment in consumer consumption trends, such as the rise in Internet spending and the usage of mobile devices, as well as in firms that have the ability to expand their brands domestically and abroad. In emerging markets, the focus is on those businesses that may stand to benefit from the demographic shifts that are taking place as disposable income levels rise over the next few years.
We continue to monitor global consumer spending. There are several potential risks to spending in the United States, the lack of job growth and the threat of tapering by the Federal Reserve may weigh on the markets and the consumer. Thus far, consumer spending has held up relatively well in an uncertain environment. We expect the moderate spending environment to continue as we move into 2014. In Europe, investors have turned a bit more positive on the region but the macroeconomic situation remains meager at best with high unemployment in many countries. Finally, the biggest change we have seen over the past year is in emerging markets. While growth is still superior to the developed world, we have seen economic activity slow in the emerging world. There is the added risk that if the United States economy begins to tighten, these emerging market economies may see further slowing as capital becomes more expensive to attain. On the positive side, wage growth and the growing middle class should remain the key drivers to discretionary spending at the local level.
In closing, we are excited about the opportunities for the Fund. We believe that the prospects for the long term global consumer story are attractive. Despite some near term headwinds, we believe rising income levels and changing consumer consumption patterns across the globe should provide long-term investment opportunities.
Sincerely,
Bryan Keane
Samuel A. Lieber
Co-Portfolio Managers
44
| Alpine Global Consumer Growth Fund (Continued) | |
This letter represents the opinions of the Fund’s management and is subject to change, is not guaranteed and should not be considered a recommendation to buy or sell any security. The information provided is not intended to be, and is not, a forecast of future events, a guarantee of future results, or investment advice. Actual results could differ materially from those anticipated due to various risks and uncertainties. Views expressed may vary from those of the firm as a whole. Past performance is no guarantee of future results.
Diversification does not assure a profit or protect against market loss.
Mutual fund investing involves risk. Principal loss is possible. The Fund is subject to risks, including the following:
Concentration Risk – The Fund’s strategy of concentrating in companies in a specific industry means that its performance will be closely tied to the performance of a particular market segment. The Fund’s concentration in these companies may present more risks than if it were broadly diversified over numerous industries and sectors of the economy. A downturn in these companies would have a larger impact on the Fund than on a fund that does not concentrate in such companies. At times, the performance of these companies will lag the performance of other industries or the broader market as a whole.
Consumer Products/Services Sector Risk – Because the Fund’s investments are concentrated in the consumer products/services sector, the value of its shares will be affected by factors particular to this sector and may fluctuate more widely than that of a fund which invests in a broad range of industries. The Fund’s performance largely depends on the general condition of the consumer product/services sector. The consumer product/services sector could be adversely affected by overall economic conditions, interest rates, competition, consumer confidence, disposable income, changes in demographics and consumer tastes, and legislative or regulatory changes. The prices of the securities of those issuers also may fluctuate widely in response to such events.
Emerging Market Securities Risk – The risks of foreign investments are heightened when investing in issuers in emerging market countries. Emerging market countries tend to have economic, political and legal systems that are less fully developed and are less stable than those of more developed countries. They are often particularly sensitive to market movements because their market prices tend to reflect speculative expectations. Low trading volumes may result in a lack of liquidity and in extreme price volatility.
Equity Securities Risk – The stock or other security of a company may not perform as well as expected, and may decrease in value, because of factors related to the company (such as poorer–than-expected earnings or certain management decisions) or to the industry in which the company is engaged (such as a reduction in the demand for products or services in a particular industry).
Foreign Currency Transactions Risk – Foreign securities are often denominated in foreign currencies. As a result, the value of the Fund’s shares is affected by changes in exchange rates. The Fund may enter into foreign currency transactions to try to manage this risk. The Fund’s ability to use foreign currency transactions successfully depends on a number of factors, including the foreign currency transactions being available at prices that are not too costly, the availability of liquid markets and the ability of the Adviser to accurately predict the direction of changes in currency exchange rates.
Foreign Securities Risk – The Fund’s investments in securities of foreign issuers or issuers with significant exposure to foreign markets involve additional risk. Foreign countries in which the Fund may invest may have markets that are less liquid, less regulated and more volatile than U.S. markets. The value of the Fund’s investments may decline because of factors affecting the particular issuer as well as foreign markets and issuers generally, such as unfavorable government actions, and political or financial instability. Lack of information may also affect the value of these securities. The risks of foreign investment are heightened when investing in issuers of emerging market countries.
Growth Stock Risk – Growth stocks typically are very sensitive to market movements because their market prices tend to reflect future expectations. When it appears those expectations will not be met, the prices of growth stocks typically fall. Growth stocks as a group may be out of favor and underperform the overall equity market while the market concentrates on undervalued stocks.
Initial Public Offerings (IPO) and Secondary Offerings Risk – The Fund may invest a portion of its assets in shares of IPOs or Secondary Offerings of an issuer. IPOs and Secondary Offerings may have a magnified impact on the performance of a Fund with a small asset base. The impact of IPOs and Secondary Offerings on a Fund’s performance likely will decrease as the Fund’s asset size increases, which could reduce a Fund’s returns. IPOs and Secondary Offerings may not be
45
| Alpine Global Consumer Growth Fund (Continued) | |
consistently available to the Fund for investing. IPO and Secondary Offering shares frequently are volatile in price due to the absence of a prior public market, the small number of shares available for trading and limited information about the issuer. Therefore, the Fund may hold IPO and Secondary Offering shares for a very short period of time. This may increase the turnover of the Fund and may lead to increased expenses for the Fund, such as commissions and transaction costs. In addition, IPO and Secondary Offering shares can experience an immediate drop in value if the demand for the securities does not continue to support the offering price.
Management Risk – The Adviser’s judgment about the quality, relative yield or value of, or market trends affecting a particular security or sector, or about interest rates generally, may be incorrect. The Adviser’s security selections and other investment decisions might produce losses or cause the Fund to underperform when compared to other funds with similar investment objectives and strategies.
Market Risk – The price of a security held by the Fund may fall due to changing market, economic or political conditions.
Micro-Capitalization Company Risk – Stock prices of micro-capitalization companies are significantly more volatile, and more vulnerable to adverse business and economic developments than those of larger companies. Micro-capitalization companies often have narrower markets for their goods and/or services and more limited managerial and financial resources than larger, more established companies, including small- or medium-capitalization companies.
Small- and Medium-Capitalization Company Risk – Securities of small- or medium-capitalization companies are more likely to experience sharper swings in market values, and may be less liquid, in which case it may be more difficult for the Adviser to sell at times and at prices that the Adviser believes appropriate and generally are more volatile than those of larger companies.
Undervalued Stock Risk – The Fund may pursue strategies that may include investing in securities, which, in the opinion of the Adviser, are undervalued. The identification of investment opportunities in undervalued securities is a difficult task and there is no assurance that such opportunities will be successfully recognized or acquired. While investments in undervalued securities offer opportunities for above-average capital appreciation, these investments involve a high degree of financial risk and can result in substantial losses.
Please refer to page 5-7 for other important disclosures and definitions.
46
Alpine International Real Estate Equity Fund
Schedule of Portfolio Investments
October 31, 2013
| Shares | | Security
Description | | Value | |
| | | | | | |
| Common Stocks—98.3% | | | | |
| Asia—41.4% | | | | |
| China—1.7% | | | | |
| 400,000 | | China Overseas Land & Investment, Ltd. | | $ | 1,235,650 | |
| 2,800,960 | | Franshion Properties China, Ltd. | | | 975,441 | |
| 4,527,587 | | Kaisa Group Holdings, Ltd. (a) | | | 1,378,190 | |
| | | | | | 3,589,281 | |
| Hong Kong—0.6% | | | | |
| 33,002,031 | | CSI Properties, Ltd. | | | 1,149,303 | |
| India—10.4% | | | | |
| 2,290,373 | | Hirco PLC (a)(b)(d) | | | 351,080 | |
| 2,000,000 | | South Asian Real Estate PLC (a)(b)(d)(e) | | | 11,384,134 | |
| 7,240,153 | | Unitech Corporate Parks PLC (a) | | | 4,179,188 | |
| 1,325,831 | | Yatra Capital, Ltd. (a)(f) | | | 5,625,456 | |
| | | | | | 21,539,858 | |
| Indonesia—1.0% | | | | |
| 246,285,560 | | PT Bakrieland Development TBK (a) | | | 1,092,418 | |
| 10,000,000 | | PT Ciputra Development TBK | | | 913,728 | |
| | | | | | 2,006,146 | |
| Japan—11.5% | | | | |
| 15,000 | | Daito Trust Construction Co., Ltd. | | | 1,527,001 | |
| 567,691 | | Hulic Co., Ltd. | | | 8,983,293 | |
| 1,742,312 | | Kenedix, Inc. (a) | | | 8,965,828 | |
| 100,000 | | Mitsubishi Estate Co., Ltd. | | | 2,844,503 | |
| 39,900 | | NTT Urban Development Corp. | | | 506,003 | |
| 20,000 | | Sumitomo Realty & Development Co., Ltd. | | | 940,710 | |
| | | | | | 23,767,338 | |
| Malaysia—1.1% | | | | |
| 3,100,591 | | Aseana Properties, Ltd. (a) | | | 1,302,248 | |
| 1,035,715 | | SP Setia BHD | | | 1,007,636 | |
| | | | | | 2,309,884 | |
| Philippines—6.4% | | | | |
| 2,847,077 | | Ayala Land, Inc. | | | 1,940,440 | |
| 45,000,000 | | Megaworld Corp. | | | 3,999,075 | |
| 16,633,070 | | SM Prime Holdings, Inc. | | | 7,383,066 | |
| | | | | | 13,322,581 | |
| Singapore—2.3% | | | | |
| 4,756,991 | | Banyan Tree Holdings, Ltd. | | | 2,280,068 | |
| 1,001,420 | | Global Logistic Properties, Ltd. | | | 2,491,054 | |
| | | | | | 4,771,122 | |
| Thailand—6.4% | | | | |
| 6,000,000 | | Ananda Development PCL (a) | | | 493,494 | |
| 7,042,263 | | Central Pattana PCL | | | 10,409,022 | |
| 2,500,357 | | Minor International PCL | | | 2,229,234 | |
| | | | | | 13,131,750 | |
| | | Total Asia (Cost $106,165,312) | | | 85,587,263 | |
| Europe—33.0% | | | | |
| France—2.6% | | | | |
| 138,193 | | Nexity SA | | | 5,422,549 | |
| Germany—4.3% | | | | |
| 135,424 | | DIC Asset AG | | | 1,498,555 | |
| 100,000 | | GAGFAH SA (a) | | | 1,421,564 | |
| 7,642,900 | | Sirius Real Estate, Ltd. (a) | | | 2,542,400 | |
| 280,573 | | TAG Immobilien AG | | | 3,390,435 | |
| | | | | | 8,852,954 | |
| Shares | | Security
Description | | Value | |
| | | | | | |
| Italy—0.2% | | | | |
| 600,000 | | Beni Stabili SpA | | $ | 412,213 | |
| Norway—0.5% | | | | |
| 547,992 | | BWG Homes ASA (a) | | | 1,021,781 | |
| Poland—0.5% | | | | |
| 3,265,000 | | Nanette Real Estate Group NV (a)(b)(d) | | | 975,271 | |
| Russia—0.7% | | | | |
| 504,367 | | Mirland Development Corp. PLC (a) | | | 1,532,489 | |
| Sweden—2.1% | | | | |
| 150,877 | | JM AB | | | 4,307,412 | |
| United Kingdom—22.1% | | | | |
| 82,758 | | Countrywide PLC | | | 740,433 | |
| 100,000 | | Foxtons Group PLC (a) | | | 511,084 | |
| 536,270 | | Great Portland Estates PLC | | | 4,926,969 | |
| 1,092,084 | | Londonmetric Property PLC | | | 2,258,850 | |
| 4,000,713 | | LXB Retail Properties PLC (a) | | | 7,761,835 | |
| 3,470,059 | | Quintain Estates & Development PLC (a) | | | 5,396,973 | |
| 4,998,407 | | Regus PLC | | | 16,437,620 | |
| 90,956 | | Savills PLC | | | 947,952 | |
| 1,600,130 | | Songbird Estates PLC (a) | | | 4,105,036 | |
| 401,030 | | Unite Group PLC | | | 2,546,324 | |
| | | | | | 45,633,076 | |
| | | Total Europe (Cost $64,993,828) . | | | 68,157,745 | |
| | | | | | | |
| North & South America—23.9% | | | | |
| Brazil—21.3% | | | | |
| 140,051 | | Aliansce Shopping Centers SA | | | 1,354,747 | |
| 713,138 | | BHG SA-Brazil Hospitality Group (a) | | | 5,220,723 | |
| 220,535 | | Cyrela Commercial Properties SA Empreendimentos e Participacoes | | | 1,985,622 | |
| 1,441,829 | | Direcional Engenharia SA | | | 8,367,011 | |
| 912,132 | | General Shopping Brasil SA (a) | | | 3,908,788 | |
| 565,826 | | Iguatemi Empresa de Shopping Centers SA | | | 6,503,892 | |
| 1,085,500 | | JHSF Participacoes SA | | | 2,703,817 | |
| 194,959 | | Multiplan Empreendimentos Imobiliarios SA | | | 4,576,776 | |
| 475,394 | | Sao Carlos Empreendimentos e Participacoes SA | | | 8,350,484 | |
| 98,856 | | Sonae Sierra Brasil SA | | | 992,885 | |
| | | | | | 43,964,745 | |
| Canada—0.0% (g) | | | | |
| 133,000 | | Lakeview Hotel Investment Corp. (a) | | | 29,976 | |
| Mexico—2.1% | | | | |
| 500,000 | | Concentradora Fibra Hotelera Mexicana SA de CV | | | 777,559 | |
| 171,429 | | Corp. Inmobiliaria Vesta SAB de CV | | | 328,477 | |
| 1,250,851 | | Hoteles City Express SAB de CV (a) | | | 1,956,724 | |
| 700,000 | | TF Administradora Industrial S de RL de CV | | | 1,384,200 | |
| | | | | | 4,446,960 | |
| United States—0.5% | | | | |
| 29,520 | | Lennar Corp.-Class A (c) | | | 1,049,436 | |
| | | Total North & South America (Cost $44,708,874) | | | 49,491,117 | |
| | | Total Common Stocks (Cost $215,868,014) | | | 203,236,125 | |
The accompanying notes are an integral part of these financial statements.
47
Alpine International Real Estate Equity Fund
Schedule of Portfolio Investments—Continued
October 31, 2013
| Shares | | Security
Description | | Value | |
| | | | | | |
| Equity-Linked Structured Notes—1.5% | | | | |
| Asia—1.5% | | | | |
| India—1.5% | | | | |
| 590,000 | | Phoenix Mills, Ltd.-Merrill Lynch & Co., Inc. | | $ | 2,245,561 | |
| 724,560 | | Puravankara Projects, Ltd.–Macquarie Bank, Ltd. | | | 910,195 | |
| | | Total Asia (Cost $3,454,397) | | | 3,155,756 | |
| | | Total Equity-Linked Structured Notes
(Cost $3,454,397) | | | 3,155,756 | |
| Shares | | Security
Description | | Value | |
| | | | | | |
| Investment Companies—0.7% | | | | |
| Asia—0.5% | | | | |
| India—0.5% | | | | |
| 7,386,447 | | Trinity Capital PLC (a) | | $ | 991,886 | |
| | | Total Asia (Cost $10,974,755) | | | 991,886 | |
| Europe—0.2% | | | | |
| Turkey—0.2% | | | | |
| 920,000 | | The Ottoman Fund, Ltd. (a) | | | 427,787 | |
| | | Total Europe (Cost $1,507,548) | | | 427,787 | |
| | | Total Investment Companies (Cost $12,482,303) | | | 1,419,673 | |
Total Investments
(Cost $231,804,714)—100.5% | | | 207,811,554 | |
| Liabilities in Excess of Other Assets—(0.5)% | | | (1,085,946 | ) |
| TOTAL NET ASSETS 100.0% | | $ | 206,725,608 | |
Percentages are stated as a percent of net assets.
| (a) | Non-income producing security. |
| | |
| (b) | Illiquid security. |
| | |
| (c) | All or a portion of the security has been designated as collateral for the line of credit. |
| | |
| (d) | Security fair valued in accordance with procedures approved by the Board of Trustees. These securities comprised 6.1% of the Fund’s net assets. |
| | |
| (e) | Private placement. |
| | |
| (f) | Affiliated issuer. |
| | |
| (g) | Less than 0.05% of Net Assets. |
AB—Aktiebolag is the Swedish equivalent of a corporation.
AG—Aktiengesellschaft is a German term that refers to a corporation that is limited by shares, i.e., owned by shareholders.
ASA—Allmennaksjeselskap is the Norwegian term for a public limited company.
BHD—Malaysian equivalent to incorporated.
NV—Naamloze Vennootschap is the Dutch term for a public limited liability corporation.
PCL—Public Company Limited
PLC—Public Limited Company
S de RL de CV—Socieded de Responsabilidad Limitada de Capital Variable is the Spanish equivalent to Limited Liability Company.
SA—Generally designates corporations in various countries, mostly those employing the civil law
SA de CV—Sociedad Anonima de Capital Variable is the Spanish equivalent to Variable Capital Company.
SAB de CV—Sociedad Anonima Bursátil de Capital Variable is the Spanish equivalent to Variable Capital Company.
SpA—Societa’ Per Azioni is an Italian shared company.
The accompanying notes are an integral part of these financial statements.
48
Alpine Realty Income & Growth Fund
Schedule of Portfolio Investments
October 31, 2013
| Shares | | Security
Description | | Value | |
| | | | | | | |
| Real Estate Investment Trusts—102.4% | | | | |
| Apartments—15.7% | | | | |
| 25,625 | | AvalonBay Communities, Inc. (a) | | $ | 3,204,406 | |
| 19,400 | | BRE Properties, Inc. | | | 1,059,434 | |
| 18,000 | | Camden Property Trust | | | 1,155,600 | |
| 68,360 | | Equity Residential (a) | | | 3,579,330 | |
| 23,665 | | Essex Property Trust, Inc. (a) | | | 3,810,065 | |
| 35,200 | | Home Properties, Inc. (a) | | | 2,122,912 | |
| 31,400 | | UDR, Inc. | | | 779,034 | |
| | | | | | 15,710,781 | |
| Diversified—6.6% | | | | |
| 26,114 | | American Assets Trust, Inc. (a) | | | 869,335 | |
| 37,087 | | Cousins Properties, Inc. | | | 420,196 | |
| 88,700 | | Crombie Real Estate Investment Trust | | | 1,127,200 | |
| 47,117 | | Vornado Realty Trust (a) | | | 4,196,240 | |
| | | | | | 6,612,971 | |
| Health Care—12.5% | | | | |
| 78,772 | | HCP, Inc. | | | 3,269,038 | |
| 25,403 | | Health Care REIT, Inc. | | | 1,647,385 | |
| 60,047 | | Omega Healthcare Investors, Inc. | | | 1,995,962 | |
| 51,340 | | Sabra Health Care REIT, Inc. | | | 1,381,046 | |
| 63,712 | | Ventas, Inc. (a) | | | 4,156,571 | |
| | | | | | 12,450,002 | |
| Infrastructure—1.5% | | | | |
| 18,500 | | American Tower Corp. | | | 1,467,975 | |
| Lodging—4.8% | | | | |
| 37,842 | | Chatham Lodging Trust | | | 713,700 | |
| 39,658 | | Chesapeake Lodging Trust | | | 934,739 | |
| 70,000 | | DiamondRock Hospitality Co. | | | 797,300 | |
| 85,000 | | Host Hotels & Resorts, Inc. | | | 1,576,750 | |
| 12,000 | | LaSalle Hotel Properties (a) | | | 372,600 | |
| 15,000 | | Pebblebrook Hotel Trust | | | 453,000 | |
| | | | | | 4,848,089 | |
| Manufactured Homes—1.1% | | | | |
| 28,900 | | Equity Lifestyle Properties, Inc. | | | 1,097,911 | |
| Mortgage & Finance—2.3% | | | | |
| 63,032 | | Apollo Commercial Real Estate Finance, Inc. | | | 1,015,445 | |
| 50,000 | | Starwood Property Trust, Inc. | | | 1,284,500 | |
| | | | | | 2,299,945 | |
| Net Lease—0.9% | | | | |
| 17,012 | | EPR Properties | | | 873,906 | |
| Office-Industrial Buildings—30.8% | | | | |
| 51,528 | | Alexandria Real Estate Equities, Inc. (a) | | | 3,389,512 | |
| 49,611 | | Boston Properties, Inc. | | | 5,134,738 | |
| 37,671 | | CoreSite Realty Corp. | | | 1,222,047 | |
| 18,153 | | Corporate Office Properties Trust (a) | | | 446,564 | |
| 55,100 | | Digital Realty Trust, Inc. | | | 2,626,066 | |
| 64,509 | | Douglas Emmett, Inc. | | | 1,608,209 | |
| Shares | | Security
Description | | Value | |
| | | | | | | |
| Office-Industrial Buildings—continued | | | | |
| 40,352 | | DuPont Fabros Technology, Inc. | | $ | 1,002,747 | |
| 45,455 | | Empire State Realty Trust, Inc. (b) | | | 643,188 | |
| 54,473 | | Kilroy Realty Corp. (a) | | | 2,895,785 | |
| 23,708 | | Liberty Property Trust | | | 881,701 | |
| 23,508 | | Mack-Cali Realty Corp. | | | 483,324 | |
| 104,700 | | Prologis, Inc. | | | 4,182,765 | |
| 49,351 | | SL Green Realty Corp. (a) | | | 4,667,124 | |
| 54,537 | | STAG Industrial, Inc. | | | 1,140,369 | |
| 27,528 | | Terreno Realty Corp. | | | 489,448 | |
| | | | | | 30,813,587 | |
| Retail Centers—21.3% | | | | |
| 16,889 | | Brixmor Property Group, Inc. (b) | | | 348,758 | |
| 148,191 | | CBL & Associates Properties, Inc. | | | 2,935,664 | |
| 23,475 | | DDR Corp. | | | 397,901 | |
| 10,200 | | Equity One, Inc. | | | 245,922 | |
| 12,100 | | Federal Realty Investment Trust (a) | | | 1,253,560 | |
| 76,000 | | General Growth Properties, Inc. | | | 1,613,480 | |
| 50,000 | | Kimco Realty Corp. | | | 1,074,000 | |
| 57,295 | | Simon Property Group, Inc. (a) | | | 8,854,942 | |
| 23,706 | | Taubman Centers, Inc. (a) | | | 1,559,618 | |
| 50,428 | | The Macerich Co. (a) | | | 2,985,842 | |
| | | | | | 21,269,687 | |
| Storage—4.9% | | | | |
| 29,265 | | Public Storage (a) | | | 4,886,377 | |
| | | Total Real Estate Investment Trusts
(Cost $67,304,091) | | | 102,331,231 | |
| | | | | | | |
| Common Stock—1.2% | | | | |
| Lodging—1.2% | | | | |
| 17,000 | | Starwood Hotels & Resorts Worldwide, Inc. (a) | | | 1,251,540 | |
| | | Total Common Stock (Cost $753,606) | | | 1,251,540 | |
| | | | | | | |
| Preferred Stocks—2.0% | | | | |
| Diversified—0.5% | | | | |
| 17,170 | | Winthrop Realty Trust-Series D, 9.250% | | | 456,550 | |
| Mortgage & Finance—0.5% | | | | |
| 22,004 | | NorthStar Realty Finance Corp.-Series B, 8.250% | | | 522,595 | |
| Retail Centers—1.0% | | | | |
| 42,142 | | CBL & Associates Properties, Inc.-Series D, 7.375% | | | 1,043,015 | |
| | | Total Preferred Stocks (Cost $1,640,720) | | | 2,022,160 | |
Total Investments
(Cost $69,698,417)—105.6% | | | 105,604,931 | |
| Liabilities in Excess of Other Assets—(5.6)% | | | (5,638,893 | ) |
| TOTAL NET ASSETS 100.0% | | $ | 99,966,038 | |
Percentages are stated as a percent of net assets.
| (a) | All or a portion of the security has been designated as collateral for the line of credit. |
| | |
| (b) | Non-income producing security. |
| | |
REIT—Real Estate Investment Trust
The accompanying notes are an integral part of these financial statements.
49
Alpine Cyclical Advantage Property Fund
Schedule of Portfolio Investments
October 31, 2013
| Shares | | Security
Description | | Value | |
| | | | | | |
| Common Stocks—102.4% | | | | |
| Asia—32.7% | | | | |
| China—1.5% | | | | |
| 150,000 | | China Overseas Land & Investment, Ltd. | | $ | 463,369 | |
| 500,000 | | Franshion Properties China, Ltd. | | | 174,126 | |
| 897,931 | | Kaisa Group Holdings, Ltd. (a) | | | 273,329 | |
| | | | | | 910,824 | |
| Hong Kong—0.4% | | | | |
| 6,967,005 | | CSI Properties, Ltd. | | | 242,627 | |
| India—0.6% | | | | |
| 620,000 | | Unitech Corporate Parks PLC (a) | | | 357,879 | |
| Indonesia—0.8% | | | | |
| 33,380,487 | | PT Bakrieland Development TBK (a) | | | 148,061 | |
| 3,500,000 | | PT Ciputra Development TBK | | | 319,805 | |
| | | | | | 467,866 | |
| Japan—15.6% | | | | |
| 2,500 | | Daito Trust Construction Co., Ltd. | | | 254,500 | |
| 210,000 | | Hulic Co., Ltd. | | | 3,323,096 | |
| 534,573 | | Kenedix, Inc. (a) | | | 2,750,879 | |
| 40,000 | | Mitsubishi Estate Co., Ltd. | | | 1,137,801 | |
| 28 | | Nippon Prologis REIT, Inc. | | | 279,060 | |
| 19,900 | | NTT Urban Development Corp. | | | 252,368 | |
| 18,000 | | Sumitomo Realty & Development Co., Ltd. | | | 846,639 | |
| 100,000 | | TOC Co., Ltd. | | | 807,485 | |
| | | | | | 9,651,828 | |
| Malaysia—0.4% | | | | |
| 285,714 | | SP Setia BHD | | | 277,968 | |
| Philippines—4.9% | | | | |
| 746,539 | | Ayala Land, Inc. | | | 508,808 | |
| 10,000,000 | | Megaworld Corp. | | | 888,683 | |
| 1,401,363 | | Robinsons Land Corp. | | | 736,194 | |
| 2,000,000 | | SM Prime Holdings, Inc. | | | 887,757 | |
| | | | | | 3,021,442 | |
| Singapore—1.4% | | | | |
| 350,000 | | Global Logistic Properties, Ltd. | | | 870,633 | |
| Thailand—7.1% | | | | |
| 3,024,242 | | Ananda Development PCL (a) | | | 246,747 | |
| 724,879 | | Central Pattana PCL | | | 1,048,675 | |
| 2,200,000 | | LPN Development PCL-NVDR | | | 1,547,952 | |
| 500,000 | | Minor International PCL | | | 445,783 | |
| 1,400,000 | | Supalai PCL | | | 796,145 | |
| 569,550 | | TICON Industrial Connection PCL | | | 325,718 | |
| | | | | | 4,411,020 | |
| | | Total Asia (Cost $14,418,427) | | | 20,212,087 | |
| | | | | | | |
| Europe—19.6% | | | | |
| France—3.4% | | | | |
| 46,000 | | Affine SA | | | 893,127 | |
| 30,000 | | Nexity SA | | | 1,177,169 | |
| | | | | | 2,070,296 | |
| Germany—5.0% | | | | |
| 39,904 | | DIC Asset AG | | | 441,564 | |
| 40,000 | | GAGFAH SA (a) | | | 568,625 | |
| 121,000 | | Patrizia Immobilien AG (a) | | | 1,136,871 | |
| 79,090 | | TAG Immobilien AG | | | 955,721 | |
| | | | | | 3,102,781 | |
| Shares | | Security
Description | | Value | |
| | | | | | |
| Italy—0.4% | | | | |
| 400,000 | | Beni Stabili SpA | | $ | 274,808 | |
| Norway—0.1% | | | | |
| 38,166 | | BWG Homes ASA (a) | | | 71,164 | |
| Poland—0.4% | | | | |
| 40,000 | | Atrium European Real Estate, Ltd. | | | 239,290 | |
| Russia—1.5% | | | | |
| 759,927 | | Raven Russia, Ltd. | | | 956,496 | |
| United Kingdom—8.8% | | | | |
| 41,379 | | Countrywide PLC | | | 370,216 | |
| 30,000 | | Foxtons Group PLC (a) | | | 153,325 | |
| 30,000 | | Londonmetric Property PLC | | | 62,051 | |
| 778,923 | | LXB Retail Properties PLC (a) | | | 1,511,199 | |
| 905,853 | | Quintain Estates & Development PLC (a) | | | 1,408,871 | |
| 37,896 | | Savills PLC | | | 394,956 | |
| 341,253 | | Songbird Estates PLC (a) | | | 875,464 | |
| 100,014 | | Unite Group PLC | | | 635,035 | |
| | | | | | 5,411,117 | |
| | | Total Europe (Cost $9,557,954) | | | 12,125,952 | |
| | | | | | | |
| North & South America—50.1% | | | | |
| Brazil—11.7% | | | | |
| 98,241 | | BHG SA-Brazil Hospitality Group (a) | | | 719,200 | |
| 50,796 | | BR Malls Participacoes SA | | | 492,042 | |
| 70,538 | | BR Properties SA | | | 598,260 | |
| 15,000 | | Cyrela Commercial Properties SA Empreendimentos e Participacoes-ADR (c)(d) | | | 544,314 | |
| 201,912 | | Direcional Engenharia SA | | | 1,171,706 | |
| 40,000 | | General Shopping Brasil SA (a) | | | 171,413 | |
| 136,284 | | Iguatemi Empresa de Shopping Centers SA | | | 1,566,518 | |
| 150,000 | | JHSF Participacoes SA | | | 373,628 | |
| 55,082 | | Multiplan Empreendimentos Imobiliarios SA | | | 1,293,082 | |
| 30,900 | | Sonae Sierra Brasil SA | | | 310,352 | |
| | | | | | 7,240,515 | |
| Mexico—3.0% | | | | |
| 300,000 | | Concentradora Fibra Hotelera Mexicana SA de CV | | | 466,535 | |
| 73,469 | | Corp. Inmobiliaria Vesta SAB de CV | | | 140,775 | |
| 396,949 | | Hoteles City Express SAB de CV (a) | | | 620,953 | |
| 300,000 | | TF Administradora Industrial S de RL de CV | | | 593,228 | |
| | | | | | 1,821,491 | |
| United States—35.4% | | | | |
| 1,000 | | Altisource Asset Management Corp. (a)(d) | | | 639,680 | |
| 10,000 | | Altisource Portfolio Solutions SA (a)(d) | | | 1,572,800 | |
| 86,667 | | Altisource Residential Corp. (d) | | | 2,302,742 | |
| 25,000 | | American Capital Mortgage Investment Corp. (d) | | | 477,750 | |
| 30,000 | | American Homes 4 Rent-Class A (a) | | | 464,400 | |
| 5,000 | | AvalonBay Communities, Inc. (d) | | | 625,250 | |
| 40,146 | | Brookfield Residential Properties, Inc. (a)(d) | | | 886,424 | |
| 62,581 | | Cousins Properties, Inc. (d) | | | 709,043 | |
| 20,000 | | DR Horton, Inc. (d) | | | 379,000 | |
| 10,000 | | Equity Lifestyle Properties, Inc. | | | 379,900 | |
The accompanying notes are an integral part of these financial statements.
50
Alpine Cyclical Advantage Property Fund
Schedule of Portfolio Investments—Continued
October 31, 2013
| Shares | | Security
Description | | Value | |
| | | | | | |
| Common Stocks—continued | | | | |
| North & South America—continued | | | | |
| United States—continued | | | | |
| 60,000 | | Invesco Mortgage Capital, REIT Inc. | | $ | 927,000 | |
| 15,000 | | Lennar Corp.-Class A (d) | | | 533,250 | |
| 15,000 | | Meritage Homes Corp. (a)(d) | | | 680,850 | |
| 140,000 | | New Residential Investment Corp. (d) | | | 925,400 | |
| 90,000 | | Newcastle Investment Corp. (d) | | | 516,600 | |
| 60,771 | | Ocwen Financial Corp. (a)(d) | | | 3,417,153 | |
| 50,000 | | Ryland Group, Inc. (d) | | | 2,010,000 | |
| 1,923 | | Simon Property Group, Inc. (d) | | | 297,200 | |
| 62,445 | | Starwood Property Trust, Inc. (d) | | | 1,604,212 | |
| 5,000 | | The Howard Hughes Corp. (a)(d) | | | 585,250 | |
| 48,200 | | TravelCenters of America LLC (a)(d) | | | 400,542 | |
| 87,912 | | Two Harbors Investment Corp. (d) | | | 820,219 | |
| 40,000 | | WCI Communities, Inc. (a)(d) | | | 721,600 | |
| | | | | | 21,876,265 | |
| | | Total North & South America (Cost $25,100,332) | | | 30,938,271 | |
| | | Total Common Stocks (Cost $49,076,713) | | | 63,276,310 | |
| Shares | | Security
Description | | Value | |
| | | | | | | |
| Equity-Linked Structured Notes—1.1% | | | | |
| Asia—1.1% | | | | |
| India—1.1% | | | | |
| 362,280 | | Puravankara Projects, Ltd.-Macquarie Bank, Ltd. | | $ | 455,097 | |
| 50,000 | | Sobha Developers, Ltd.-Macquarie Bank, Ltd. | | | 253,031 | |
| | | Total Asia (Cost $882,376) | | | 708,128 | |
| | | Total Equity-Linked Structured Notes
(Cost $882,376) | | | 708,128 | |
Total Investments
(Cost $49,959,089)—103.5% | | | 63,984,438 | |
| Liabilities in Excess of Other Assets—(3.5)% | | | (2,176,084 | ) |
| TOTAL NET ASSETS 100.0% | | $ | 61,808,354 | |
Percentages are stated as a percent of net assets.
| (a) | Non-income producing security. |
| | |
| (b) | Illiquid security. |
| | |
| (c) | Restricted under Rule 144A of the Securities Act of 1933. These securities may be resold in transactions exempt from registration, normally to qualified institutional buyers. These securities have been determined to be liquid under guidelines established by the Board of Trustees. Liquid securities restricted under Rule 144A comprised 0.9% of the Fund’s net assets. |
| | |
| (d) | All or a portion of the security has been designated as collateral for the line of credit. |
ADR—American Depositary Receipt
AG—Aktiengesellschaft is a German term that refers to a corporation that is limited by shares, i.e., owned by shareholders.
ASA—Allmennaksjeselskap is the Norwegian term for a public limited company.
BHD—Malaysian equivalent to incorporated.
NVDR—Non-Voting Depositary Receipts
PCL—Public Company Limited
PLC—Public Limited Company
REIT—Real Estate Investment Trust
S de RL de CV—Socieded de Responsabilidad Limitada de Capital Variable is the Spanish equivalent to Limited Liability Company.
SA—Generally designates corporations in various countries, mostly those employing the civil law
SA de CV—Sociedad Anonima de Capital Variable is the Spanish equivalent to Variable Capital Company.
SAB de CV—Sociedad Anonima Bursátil de Capital Variable is the Spanish equivalent to Variable Capital Company.
SpA—Societa’ Per Azioni is an Italian shared company.
The accompanying notes are an integral part of these financial statements.
51
Alpine Emerging Markets Real Estate Fund
Schedule of Portfolio Investments
October 31, 2013
| Shares | | Security
Description | | Value | |
| | | | | | | |
| Common Stocks—92.2% | | | | |
| Asia—71.9% | | | | |
| China—32.8% | | | | |
| 60,000 | | CapitaRetail China Trust | | $ | 67,380 | |
| 80,000 | | China Overseas Grand Oceans Group, Ltd. | | | 95,137 | |
| 150,000 | | China Overseas Land & Investment, Ltd. | | | 463,369 | |
| 162,500 | | China Resources Land, Ltd. | | | 470,544 | |
| 123,857 | | China State Construction International Holdings, Ltd. | | | 208,319 | |
| 220,000 | | China Vanke Co., Ltd.-Class B | | | 372,578 | |
| 290,000 | | Country Garden Holdings Co., Ltd. | | | 198,994 | |
| 430,000 | | Franshion Properties China, Ltd. | | | 149,749 | |
| 85,000 | | Greentown China Holdings, Ltd. | | | 164,452 | |
| 420,000 | | Kaisa Group Holdings, Ltd. (a) | | | 127,847 | |
| 210,000 | | KWG Property Holding, Ltd. | | | 136,786 | |
| 150,000 | | Shenzhen Investment, Ltd. | | | 59,977 | |
| 180,000 | | Shimao Property Holdings, Ltd. | | | 451,799 | |
| 185,000 | | Sunac China Holdings, Ltd. | | | 128,376 | |
| 370,000 | | Yuexiu Property Co., Ltd. | | | 103,083 | |
| | | | | | 3,198,390 | |
| Hong Kong—2.7% | | | | |
| 10,000 | | Cheung Kong Holdings, Ltd. | | | 156,585 | |
| 693,401 | | CSI Properties, Ltd. | | | 24,148 | |
| 10,000 | | Wharf Holdings, Ltd. | | | 84,612 | |
| | | | | | 265,345 | |
| India—0.2% | | | | |
| 26,000 | | Unitech Corporate Parks PLC (a) | | | 15,008 | |
| Indonesia—5.1% | | | | |
| 621,500 | | PT Alam Sutera Realty TBK | | | 33,632 | |
| 602,159 | | PT Bumi Serpong Damai TBK | | | 83,867 | |
| 1,070,500 | | PT Ciputra Development TBK | | | 97,815 | |
| 297,000 | | PT Lippo Karawaci TBK (a) | | | 29,772 | |
| 3,250,000 | | PT Pakuwon Jati TBK | | | 89,377 | |
| 1,000,000 | | PT Summarecon Agung TBK | | | 93,147 | |
| 1,000,000 | | PT Surya Semesta Internusa TBK | | | 70,969 | |
| | | | | | 498,579 | |
| Japan—1.0% | | | | |
| 19,396 | | Kenedix, Inc. (a) | | | 99,811 | |
| Malaysia—2.6% | | | | |
| 80,000 | | Glomac BHD | | | 28,648 | |
| 170,000 | | IJM Land BHD | | | 150,845 | |
| 55,000 | | Tebrau Teguh BHD (a) | | | 23,530 | |
| 70,000 | | UEM Sunrise BHD | | | 51,909 | |
| | | | | | 254,932 | |
| Philippines—11.6% | | | | |
| 448,307 | | Ayala Land, Inc. | | | 305,546 | |
| 1,500,000 | | Megaworld Corp. | | | 133,303 | |
| 300,000 | | Robinsons Land Corp. | | | 157,602 | |
| 922,250 | | SM Prime Holdings, Inc. | | | 409,367 | |
| 1,000,000 | | Vista Land & Lifescapes, Inc. | | | 127,748 | |
| | | | | | 1,133,566 | |
| Singapore—1.2% | | | | |
| 45,000 | | Global Logistic Properties, Ltd. | | | 111,938 | |
| Shares | | Security
Description | | Value | |
| | | | | | |
| Thailand—10.5% | | | | |
| 1,300,000 | | Ananda Development PCL (a) | | $ | 106,924 | |
| 140,000 | | Central Pattana PCL | | | 215,904 | |
| 700,000 | | Hemaraj Land and Development PCL | | | 78,265 | |
| 183,900 | | Land and Houses PCL—NVDR | | | 64,993 | |
| 200,000 | | LPN Development PCL—NVDR | | | 140,723 | |
| 160,000 | | Minor International PCL | | | 142,651 | |
| 160,000 | | Pruksa Real Estate PCL | | | 114,634 | |
| 100,000 | | Supalai PCL | | | 56,867 | |
| 180,125 | | TICON Industrial Connection PCL | | | 103,011 | |
| | | | | | 1,023,972 | |
| United Arab Emirates—4.2% | | | | |
| 250,000 | | Emaar Properties PJSC | | | 413,831 | |
| | | Total Asia (Cost $6,758,015) | | | 7,015,372 | |
| | | | | | | |
| Europe—0.9% | | | | |
| Russia—0.7% | | | | |
| 52,692 | | Raven Russia, Ltd. | | | 66,322 | |
| Turkey—0.2% | | | | |
| 40,000 | | Sinpas Gayrimenkul Yatirim Ortakligi AS | | | 22,041 | |
| | | Total Europe (Cost $73,597) | | | 88,363 | |
| | | | | | | |
| Middle East/Africa—0.5% | | | | |
| Egypt—0.2% | | | | |
| 30,000 | | Talaat Moustafa Group (a) | | | 24,171 | |
| South Africa—0.3% | | | | |
| 10,000 | | Growthpoint Properties, Ltd. | | | 25,402 | |
| | | Total Middle East/Africa (Cost $44,030) | | | 49,573 | |
| | | | | | | |
| North & South America—18.9% | | | | |
| Argentina—0.2% | | | | |
| 3,100 | | TGLT SA—ADR (b) | | | 22,933 | |
| Brazil—12.7% | | | | |
| 8,962 | | BHG SA—Brazil Hospitality Group (a) | | | 65,609 | |
| 33,549 | | BR Malls Participacoes SA | | | 324,977 | |
| 23,056 | | BR Properties SA | | | 195,547 | |
| 15,624 | | Direcional Engenharia SA | | | 90,667 | |
| 20,000 | | Even Construtora e Incorporadora SA | | | 74,547 | |
| 4,000 | | Ez Tec Empreendimentos e Participacoes SA | | | 58,834 | |
| 31,838 | | General Shopping Brasil SA (a) | | | 136,436 | |
| 16,300 | | Helbor Empreendimentos SA | | | 64,976 | |
| 6,000 | | Iguatemi Empresa de Shopping Centers SA | | | 68,967 | |
| 6,842 | | Multiplan Empreendimentos Imobiliarios SA | | | 160,620 | |
| | | | | | 1,241,180 | |
The accompanying notes are an integral part of these financial statements.
52
Alpine Emerging Markets Real Estate Fund
Schedule of Portfolio Investments—Continued
October 31, 2013
| Shares | | Security
Description | | Value | |
| | | | | | |
| Common Stocks—continued | | | | |
| North & South America—continued | | | | |
| Mexico—6.0% | | | | |
| 87,000 | | Concentradora Fibra Hotelera Mexicana SA de CV | | $ | 135,295 | |
| 72,244 | | Corp. Inmobiliaria Vesta SAB de CV | | | 138,427 | |
| 20,000 | | Fibra Shop Portafolios Inmobiliarios
SAPI de CV (a) | | | 24,220 | |
| 44,000 | | Hoteles City Express SAB de CV (a) | | | 68,830 | |
| 110,000 | | TF Administradora Industrial S de RL de CV | | | 217,517 | |
| | | | | | 584,289 | |
| | | Total North & South America (Cost $2,037,001) | | | 1,848,402 | |
| | | Total Common Stocks (Cost $8,912,643) | | | 9,001,710 | |
| | | | | | | |
| Preferred Stocks—1.0% | | | | |
| Europe—1.0% | | | | |
| Russia-1.0% | | | | |
| 40,000 | | Raven Russia, Ltd., 12.000% | | | 95,402 | |
| | | Total Europe (Cost $86,213) | | | 95,402 | |
| | | Total Preferred Stocks (Cost $86,213) | | | 95,402 | |
| | | | | | | |
| Equity-Linked Structured Notes—3.9% | | | | |
| Asia—3.9% | | | | |
| China—0.7% | | | | |
| 50,000 | | China Vanke Co., Ltd.-Class A-Citigroup Global Markets, Inc. (a) | | | 75,560 | |
| India—2.7% | | | | |
| 19,310 | | Phoenix Mills, Ltd.—Macquarie Bank, Ltd. (a) | | | 73,495 | |
| 3,000 | | Phoenix Mills, Ltd.—Merrill Lynch & Co., Inc. | | | 11,418 | |
| 21,500 | | Prestige Estates Projects, Ltd.—Macqarie Bank, Ltd. (a) | | | 50,203 | |
| 58,070 | | Puravankara Projects, Ltd.—Macquarie Bank, Ltd. | | | 72,948 | |
| 11,000 | | Sobha Developers, Ltd.—Macquarie Bank, Ltd. | | | 55,667 | |
| | | | | | 263,731 | |
| Vietnam—0.5% | | | | |
| 43,125 | | HAGL JSC—GDR—Macquarie Bank, Ltd. (a)(b) | | | 46,399 | |
| | | Total Asia (Cost $466,886) | | | 385,690 | |
| | | Total Equity-Linked Structured Notes
(Cost $466,886) | | | 385,690 | |
Principal
Amount | | Security
Description | | Value | |
| | | | | | |
| Convertible Bonds—0.0% (d) | | | | |
| North & South America—0.0% (d) | | | | |
| Brazil—0.0% (d) | | | | |
| 80,000 | | PDG Realty SA Empreendimentos e Participacoes—Series 8, 0.000%, 9/19/16 (Brazilian Real) (c) | | $ | 714 | |
| | | Total Convertible Bonds (Cost $28,699) | | | 714 | |
| | | | | | |
| Shares | | | | | |
| Rights—0.0% (d) | | | | |
| 3,600 | | CapitaRetail China Trust (a)
Expiration: November, 2013
Exercise Price:1.30 | | | 276 | |
| | | Total Rights (Cost $0) | | | 276 | |
| | | | | | | |
| Short-Term Investments—2.8% | | | | |
| $269,000 | | State Street Eurodollar Time Deposit, 0.01% | | | 269,000 | |
| | | Total Short-Term Investments (Cost $269,000) | | | 269,000 | |
Total Investments
(Cost $9,763,441)—99.9% | | | 9,752,792 | |
| Other Assets in Excess of Liabilities—0.1% | | | 6,273 | |
| TOTAL NET ASSETS 100.0% | | $ | 9,759,065 | |
The accompanying notes are an integral part of these financial statements.
53
Alpine Emerging Markets Real Estate Fund
Schedule of Portfolio Investments—Continued
October 31, 2013
Percentages are stated as a percent of net assets.
| (a) | Non-income producing security. |
| | |
| (b) | Reg S—Security exempt from registration under Regulation S of the Securities Act of 1933, which exempts from registration securities offered and sold outside the United States. Security may not be offered or sold in the United States except pursuant to an exemption from, or in a transaction not subject to, the registration requirements of the Securities Act of 1933. As of October 31, 2013, these securities amounted to a total value of $69,332 which comprised 0.7% of the Fund’s net assets. |
| | |
| (c) | Represents a zero-coupon bond. Rate shown reflects the current yield as of the report date. |
| | |
| (d) | Less than 0.05% of Net Assets. |
AB—Aktiebolag is the Swedish equivalent of a corporation.
ADR—American Depositary Receipt
AS—Anonim Sirketi is the Turkish term for joint stock company.
BHD—Malaysian equivalent to incorporated.
GDR—Global Depositary Receipt
JSC—Joint Stock Company
NVDR—Non-Voting Depositary Receipts
PCL—Public Company Limited
PJSC—Public Joint Stock Company
PLC—Public Limited Company
S de RL de CV—Socieded de Responsabilidad Limitada de Capital Variable is the Spanish equivalent to Limited Liability Company.
SA—Generally designates corporations in various countries, mostly those employing the civil law
SA de CV—Sociedad Anonima de Capital Variable is the Spanish equivalent to Variable Capital Company.
SAB de CV—Sociedad Anonima Bursátil de Capital Variable is the Spanish equivalent to Variable Capital Company.
SAPI de CV—Sociedad Anonima Promotora de Inversion de Capital Variable is the Spanish equivalent to Variable Capital Corporation.
The accompanying notes are an integral part of these financial statements.
54
Alpine Global Infrastructure Fund
Schedule of Portfolio Investments
October 31, 2013
| Shares | | Security
Description | | Value | |
| | | | | | |
| Common Stocks—92.4% | | | | |
| Asia—17.0% | | | | |
| China—11.3% | | | | |
| 1,600,000 | | Anhui Expressway Co.-Class H | | $ | 897,717 | |
| 3,700,000 | | Beijing Enterprises Water Group, Ltd. | | | 1,646,460 | |
| 1,000,000 | | China Everbright International, Ltd. | | | 999,613 | |
| 130,000 | | China Mobile, Ltd. | | | 1,364,891 | |
| 1,700,000 | | China Railway Construction Corp., Ltd.-Class H | | | 1,859,409 | |
| 932,972 | | China State Construction International Holdings, Ltd. | | | 1,569,193 | |
| 1,175,000 | | COSCO Pacific, Ltd. | | | 1,706,501 | |
| 250,000 | | ENN Energy Holdings, Ltd. | | | 1,473,623 | |
| 3,400,000 | | Guangshen Railway Co., Ltd.-Class H | | | 1,793,628 | |
| 6,041,000 | | Tianjin Port Development Holdings, Ltd. | | | 1,051,896 | |
| 1,500,000 | | Yuexiu Transport Infrastructure, Ltd. | | | 787,437 | |
| 1,361,000 | | Zhejiang Expressway Co., Ltd.-Class H | | | 1,241,103 | |
| | | | | | 16,391,471 | |
| Indonesia—1.9% | | | | |
| 63,500,000 | | PT Bakrieland Development TBK (a)(b) | | | 281,659 | |
| 3,300,000 | | PT Jasa Marga TBK | | | 1,536,926 | |
| 1,850,000 | | PT Tower Bersama Infrastructure TBK (a) | | | 935,462 | |
| | | | | | 2,754,047 | |
| Japan—2.0% | | | | |
| 17,500 | | East Japan Railway Co. | | | 1,514,543 | |
| 25,000 | | Japan Airlines Co., Ltd. (c) | | | 1,456,829 | |
| | | | | | 2,971,372 | |
| Philippines—1.1% | | | | |
| 400,000 | | International Container Terminal Services, Inc. | | | 962,740 | |
| 1,000,000 | | Manila Water Co., Inc. | | | 578,570 | |
| | | | | | 1,541,310 | |
| Thailand—0.7% | | | | |
| 3,100,000 | | BTS Rail Mass Transit Growth Infrastructure Fund | | | 961,125 | |
| | | Total Asia (Cost $21,162,541) | | | 24,619,325 | |
| | | | | | | |
| Europe—25.1% | | | | |
| Austria—0.5% | | | | |
| 14,500 | | Kapsch TrafficCom AG | | | 782,967 | |
| France—7.6% | | | | |
| 15,000 | | Aeroports de Paris | | | 1,602,823 | |
| 70,000 | | Eutelsat Communications SA | | | 2,218,766 | |
| 102,000 | | Suez Environnement Co. | | | 1,780,294 | |
| 120,000 | | Veolia Environnement SA | | | 2,056,176 | |
| 53,500 | | Vinci SA | | | 3,431,857 | |
| | | | | | 11,089,916 | |
| Germany—3.6% | | | | |
| 19,000 | | Fraport AG Frankfurt Airport Services Worldwide | | | 1,472,249 | |
| 72,500 | | Hamburger Hafen und Logistik AG | | | 1,821,081 | |
| 25,000 | | HeidelbergCement AG | | | 1,970,773 | |
| | | | | | 5,264,103 | |
| Shares | | Security
Description | | Value | |
| | | | | | |
| Italy—2.2% | | | | |
| 83,000 | | Atlantia SpA | | $ | 1,819,995 | |
| 270,000 | | Snam SpA | | | 1,391,584 | |
| | | | | | 3,211,579 | |
| Netherlands—3.0% | | | | |
| 37,500 | | Koninklijke Vopak NV | | | 2,308,768 | |
| 46,000 | | Ziggo NV | | | 1,973,936 | |
| | | | | | 4,282,704 | |
| Spain—3.1% | | | | |
| 810,000 | | Abengoa SA-B Shares | | | 1,965,301 | |
| 117,500 | | Abertis Infraestructuras SA | | | 2,520,662 | |
| | | | | | 4,485,963 | |
| Turkey—0.8% | | | | |
| 160,000 | | TAV Havalimanlari Holding AS | | | 1,162,179 | |
| United Kingdom—4.3% | | | | |
| 155,000 | | Ferrovial SA | | | 2,955,786 | |
| 23,000 | | National Grid PLC-ADR | | | 1,447,390 | |
| 50,000 | | Vodafone Group PLC-ADR | | | 1,841,000 | |
| | | | | | 6,244,176 | |
| | | Total Europe (Cost $30,327,726) | | | 36,523,587 | |
| | | | | |
| North & South America—50.3% | | | | |
| Brazil—10.1% | | | | |
| 590,000 | | All America Latina Logistica SA | | | 2,112,222 | |
| 290,000 | | CCR SA | | | 2,411,704 | |
| 220,000 | | Cia de Saneamento Basico do Estado de Sao Paulo-ADR | | | 2,334,200 | |
| 300,000 | | EcoRodovias Infraestrutura e Logistica SA | | | 2,035,533 | |
| 225,000 | | EDP — Energias do Brasil SA | | | 1,285,599 | |
| 94,999 | | Equatorial Energia SA | | | 983,830 | |
| 137,500 | | Mills Estruturas e Servicos de Engenharia SA | | | 1,908,870 | |
| 160,000 | | Tegma Gestao Logistica SA | | | 1,589,144 | |
| | | | | | 14,661,102 | |
| Canada—3.4% | | | | |
| 18,000 | | Canadian Pacific Railway, Ltd. | | | 2,575,260 | |
| 53,000 | | Enbridge, Inc. | | | 2,297,607 | |
| | | | | | 4,872,867 | |
| Chile—1.1% | | | | |
| 95,000 | | Enersis SA-ADR | | | 1,567,500 | |
| Colombia—1.3% | | | | |
| 20,500 | | Millicom International Cellular SA-SDR | | | 1,890,225 | |
| Mexico—2.6% | | | | |
| 258,200 | | Empresas ICA SAB de CV-ADR (a) | | | 1,964,902 | |
| 285,000 | | Infraestructura Energetica Nova SAB de CV | | | 1,128,226 | |
| 290,000 | | OHL Mexico SAB de CV (a) | | | 744,157 | |
| | | | | | 3,837,285 | |
| United States—31.8% | | | | |
| 35,000 | | American Tower Corp. | | | 2,777,250 | |
| 44,000 | | American Water Works Co., Inc. | | | 1,886,280 | |
| 54,000 | | AT&T, Inc. | | | 1,954,800 | |
| 30,000 | | Atmos Energy Corp. | | | 1,328,100 | |
| 109,500 | | Calpine Corp. (a) | | | 2,208,615 | |
| 86,000 | | Cisco Systems, Inc. | | | 1,935,000 | |
| 68,000 | | CMS Energy Corp. | | | 1,867,280 | |
| 41,000 | | Comcast Corp.-Class A | | | 1,950,780 | |
| 85,000 | | Corrections Corp. of America | | | 3,145,000 | |
The accompanying notes are an integral part of these financial statements.
55
Alpine Global Infrastructure Fund
Schedule of Portfolio Investments—Continued
October 31, 2013
| Shares | | Security
Description | | Value | |
| | | | | | | |
| Common Stocks—continued | | | | |
| North & South America—continued | | | | |
| United States—continued | | | | |
| 19,300 | | Crown Castle International Corp. (a) | | $ | 1,467,186 | |
| 44,000 | | DISH Network Corp.-Class A | | | 2,120,800 | |
| 16,000 | | ITC Holdings Corp. | | | 1,609,440 | |
| 43,000 | | Itron, Inc. (a) | | | 1,834,810 | |
| 67,000 | | MasTec, Inc. (a) | | | 2,141,990 | |
| 42,500 | | Northeast Utilities | | | 1,822,825 | |
| 60,000 | | Portland General Electric Co. | | | 1,722,000 | |
| 90,000 | | Progressive Waste Solutions, Ltd. (c) | | | 2,416,500 | |
| 31,000 | | SemGroup Corp.-Class A | | | 1,872,090 | |
| 62,500 | | The Geo Group, Inc. | | | 2,204,375 | |
| 58,000 | | The Williams Cos., Inc. | | | 2,071,180 | |
| 132,500 | | TravelCenters of America LLC (a) | | | 1,101,075 | |
| 23,000 | | UGI Corp. | | | 951,510 | |
| 14,000 | | Union Pacific Corp. | | | 2,119,600 | |
| 45,000 | | World Fuel Services Corp. | | | 1,716,750 | |
| | | | | | 46,225,236 | |
| | | Total North & South America (Cost $66,225,392) | | | 73,054,215 | |
| | | Total Common Stocks (Cost $117,715,659) | | | 134,197,127 | |
| Shares | | Security
Description | | Value | |
| | | | | | | |
| Equity-Linked Structured Notes—1.7% | | | | |
| Asia—1.7% | | | | |
| India—1.7% | | | | |
| 710,000 | | Adani Ports and Special Economic Zone—Macquarie Bank, Ltd. | | $ | 1,678,098 | |
| 510,000 | | Power Grid Corp. of India, Ltd.—Macquarie Bank, Ltd. | | | 839,834 | |
| | | Total Asia (Cost $2,751,987) | | | 2,517,932 | |
| | | Total Equity-Linked Structured Notes
(Cost $2,751,987) | | | 2,517,932 | |
| | | | | | | |
Principal
Amount | | | | | | |
| Short-Term Investments—6.7% | | | | |
| $9,722,000 | | State Street Eurodollar Time Deposit, 0.01% | | | 9,722,000 | |
| | | Total Short-Term Investments (Cost $9,722,000) | | | 9,722,000 | |
Total Investments
(Cost $130,189,646)—100.8% | | | 146,437,059 | |
| Liabilities in Excess of Other Assets—(0.8)% | | | (1,219,088 | ) |
| TOTAL NET ASSETS 100.0% | | $ | 145,217,971 | |
Percentages are stated as a percent of net assets.
| (a) | Non-income producing security. |
| | |
| (b) | Illiquid security. |
ADR—American Depositary Receipt
AG—Aktiengesellschaft is a German term that refers to a corporation that is limited by shares, i.e., owned by shareholders.
AS—Anonim Sirketi is the Turkish term for joint stock company.
NV—Naamloze Vennootschap is the Dutch term for a public limited liability corporation.
PLC—Public Limited Company
SA—Generally designates corporations in various countries, mostly those employing the civil law
SAB de CV—Sociedad Anonima Bursátil de Capital Variable is the Spanish equivalent to Variable Capital Company.
SDR—Swedish Depositary Receipt
SpA—Societa’ Per Azioni is an Italian shared company.
The accompanying notes are an integral part of these financial statements.
56
Alpine Global Consumer Growth Fund
Schedule of Portfolio Investments
October 31, 2013
| Shares | | Security
Description | | Value | |
| | | | | | |
| Common Stocks—96.5% | | | | |
| Asia—20.5% | | | | |
| China—9.8% | | | | |
| 450 | | Baidu, Inc.-ADR (a) | | $ | 72,405 | |
| 32,000 | | Daphne International Holdings, Ltd. | | | 17,046 | |
| 20,000 | | Dongfeng Motor Group Co., Ltd.-Class H | | | 28,170 | |
| 14,000 | | Golden Eagle Retail Group, Ltd. | | | 20,766 | |
| 48,000 | | Springland International Holdings, Ltd. | | | 26,250 | |
| 1,500 | | Tencent Holdings, Ltd. | | | 81,917 | |
| 22,000 | | Want Want China Holdings, Ltd. | | | 33,711 | |
| | | | | | 280,265 | |
| Hong Kong—2.7% | | | | |
| 108,000 | | Future Bright Holdings, Ltd. | | | 41,790 | |
| 400,000 | | REXLot Holdings, Ltd. | | | 35,083 | |
| | | | | | 76,873 | |
| Indonesia—2.6% | | | | |
| 180,000 | | PT Erajaya Swasembada TBK (a) | | | 21,717 | |
| 27,500 | | PT Indofood CBP Sukses Makmur TBK | | | 27,323 | |
| 50,000 | | PT Mitra Adiperkasa TBK | | | 23,952 | |
| | | | | | 72,992 | |
| Japan—2.7% | | | | |
| 4,000 | | Nissan Motor Co., Ltd. | | | 39,947 | |
| 1,000 | | Seven & I Holdings Co., Ltd. | | | 36,815 | |
| | | | | | 76,762 | |
| Philippines—1.2% | | | | |
| 80,000 | | SM Prime Holdings, Inc. | | | 35,510 | |
| South Korea—1.5% | | | | |
| 725 | | Kia Motors Corp. | | | 42,171 | |
| | | Total Asia (Cost $523,389) | | | 584,573 | |
| | | | | | | |
| Europe—23.7% | | | | |
| Belgium—2.9% | | | | |
| 800 | | Anheuser-Busch InBev NV-ADR | | | 82,984 | |
| France—2.9% | | | | |
| 1 | | Groupe FNAC SA (a) | | | 28 | |
| 175 | | Kering | | | 39,764 | |
| 1,500 | | SES SA | | | 43,665 | |
| | | | | | 83,457 | |
| Germany—3.2% | | | | |
| 450 | | Adidas AG | | | 51,372 | |
| 360 | | Bayerische Motoren Werke AG | | | 40,833 | |
| | | | | | 92,205 | |
| Italy—1.5% | | | | |
| 1,200 | | Yoox SpA (a) | | | 43,176 | |
| Netherlands—2.6% | | | | |
| 1,000 | | Unilever NV | | | 39,606 | |
| 900 | | Yandex NV-Class A (a) | | | 33,174 | |
| | | | | | 72,780 | |
| Russia—0.9% | | | | |
| 1,525 | | X5 Retail Group NV-GDR (a)(b) | | | 24,705 | |
| Spain—0.9% | | | | |
| 150 | | Inditex SA | | | 24,643 | |
| Sweden—0.9% | | | | |
| 3,000 | | Fingerprint Cards AB-Class B (a) | | | 24,884 | |
| Shares | | Security
Description | | Value | |
| | | | | | |
| Switzerland—5.3% | | | | |
| 300 | | Dufry Group (a) | | $ | 48,504 | |
| 900 | | Nestle SA | | | 64,969 | |
| 60 | | The Swatch Group AG | | | 38,387 | |
| | | | | | 151,860 | |
| United Kingdom—2.6% | | | | |
| 22,000 | | Debenhams PLC | | | 35,945 | |
| 500 | | Liberty Global PLC-Class A (a) | | | 39,185 | |
| | | | | | 75,130 | |
| | | Total Europe (Cost $494,454) | | | 675,824 | |
| | | | | |
| North & South America—52.3% | | | | |
| Brazil—6.8% | | | | |
| 6,500 | | Anhanguera Educacional Participacoes SA | | | 38,880 | |
| 3,200 | | BR Malls Participacoes SA | | | 30,997 | |
| 575 | | Cia Brasileira de Distribuicao Grupo Pao de Acucar | | | 28,992 | |
| 3,600 | | Hypermarcas SA | | | 31,417 | |
| 3,400 | | International Meal Co. Holdings SA (a) | | | 33,618 | |
| 2,500 | | Multiplus SA | | | 30,968 | |
| | | | | | 194,872 | |
| Mexico—2.1% | | | | |
| 9,000 | | Grupo Comercial Chedraui SA de CV | | | 28,047 | |
| 1,000 | | Grupo Televisa SA-ADR | | | 30,440 | |
| | | | | | 58,487 | |
| United States—43.4% | | | | |
| 850 | | Abercrombie & Fitch Co.-Class A | | | 31,858 | |
| 175 | | Amazon.com, Inc. (a) | | | 63,705 | |
| 150 | | Apple, Inc. | | | 78,352 | |
| 750 | | Carnival Corp. | | | 25,988 | |
| 1,001 | | CBS Corp.-Class B | | | 59,199 | |
| 1,000 | | Coach, Inc. | | | 50,680 | |
| 600 | | Colgate-Palmolive Co. | | | 38,838 | |
| 1,750 | | Comcast Corp.-Class A | | | 83,265 | |
| 900 | | Dick’s Sporting Goods, Inc. | | | 47,889 | |
| 2,000 | | Francesca’s Holdings Corp. (a) | | | 35,980 | |
| 75 | | Google, Inc.-Class A (a) | | | 77,293 | |
| 1,000 | | Guess?, Inc. | | | 31,250 | |
| 425 | | Lumber Liquidators Holdings, Inc. (a) | | | 48,531 | |
| 500 | | McDonald’s Corp. | | | 48,260 | |
| 300 | | MercadoLibre, Inc. | | | 40,391 | |
| 870 | | Michael Kors Holdings, Ltd. (a) | | | 66,946 | |
| 600 | | NIKE, Inc.-Class B | | | 45,456 | |
| 675 | | PepsiCo, Inc. | | | 56,761 | |
| 1,500 | | Pier 1 Imports, Inc. | | | 31,320 | |
| 450 | | The Procter & Gamble Co. | | | 36,338 | |
| 375 | | Ulta Salon Cosmetics & Fragrance, Inc. (a) | | | 48,319 | |
| 330 | | VF Corp. | | | 70,950 | |
| 350 | | Visa, Inc.-Class A | | | 68,834 | |
| 725 | | Yum! Brands, Inc. | | | 49,025 | |
| | | | | | 1,235,428 | |
| | | Total North & South America (Cost $1,098,431) | | | 1,488,787 | |
| | | Total Common Stocks (Cost $2,116,274) | | | 2,749,184 | |
The accompanying notes are an integral part of these financial statements.
57
Alpine Global Consumer Growth Fund
Schedule of Portfolio Investments—Continued
October 31, 2013
Principal
Amount | | Security
Description | | Value | |
| | | | | | |
| Short-Term Investments—4.2% | | | | |
| $120,000 | | State Street Eurodollar Time Deposit, 0.01% | | $ | 120,000 | |
| | | Total Short-Term Investments (Cost $120,000) | | | 120,000 | |
Total Investments
(Cost $2,236,274)—100.7% | | | 2,869,184 | |
| Liabilities in Excess of Other Assets—(0.7)% | | | (19,084 | ) |
| TOTAL NET ASSETS 100.0% | | $ | 2,850,100 | |
Percentages are stated as a percent of net assets.
| (a) | Non-income producing security. |
| | |
| (b) | Restricted under Rule 144A of the Securities Act of 1933. These securities may be resold in transactions exempt from registration, normally to qualified institutional buyers. These securities have been determined to be liquid under guidelines established by the Board of Trustees. Liquid securities restricted under Rule 144A comprised 0.9% of the Fund’s net assets. |
AB—Aktiebolag is the Swedish equivalent of a corporation.
ADR—American Depositary Receipt
AG—Aktiengesellschaft is a German term that refers to a corporation that is limited by shares, i.e., owned by shareholders.
GDR—Global Depositary Receipt
NV—Naamloze Vennootschap is the Dutch term for a public limited liability corporation.
PLC—Public Limited Company
SA—Generally designates corporations in various countries, mostly those employing the civil law
SA de CV—Sociedad Anonima de Capital Variable is the Spanish equivalent to Variable Capital Company.
SpA—Societa’ Per Azioni is an Italian shared company.
The accompanying notes are an integral part of these financial statements.
58
Alpine Mutual Funds
Statements of Assets and Liabilities
October 31, 2013
| | | International
Real Estate
Equity Fund | | Realty
Income &
Growth Fund | | Cyclical
Advantage
Property Fund |
| ASSETS: | | | | | | | | | | | | | | | |
| Investments, at value(1) | | | | | | | | | | | | | | | |
| Unaffiliated issuers | | | $ | 202,186,098 | | | | $ | 105,604,931 | | | | $ | 63,984,438 | |
| Affiliated issuers | | | | 5,625,456 | | | | | — | | | | | — | |
| Total investments, at value | | | | 207,811,554 | | | | | 105,604,931 | | | | | 63,984,438 | |
| Foreign currencies, at value(2) | | | | 8,886 | | | | | — | | | | | 5,342 | |
| Receivable from investment securities sold | | | | 11,270,961 | | | | | — | | | | | 5,174,159 | |
| Dividends and interest receivable | | | | 156,702 | | | | | 131,365 | | | | | 24,541 | |
| Receivable from capital shares issued | | | | 3,752 | | | | | 44,565 | | | | | 152 | |
| Unrealized appreciation on forward currency contracts | | | | 39,620 | | | | | — | | | | | 15,650 | |
| Due from Adviser | | | | — | | | | | 23,705 | | | | | — | |
| Prepaid expenses and other assets | | | | 47,336 | | | | | 9,429 | | | | | 6,078 | |
| Total assets | | | | 219,338,811 | | | | | 105,813,995 | | | | | 69,210,360 | |
| | | | | | | | | | | | | | | | |
| LIABILITIES: | | | | | | | | | | | | | | | |
| Payable for investment securities purchased | | | | 4,332,698 | | | | | 337,780 | | | | | 5,402,216 | |
| Payable for capital shares redeemed | | | | 101,940 | | | | | 43,138 | | | | | 29,118 | |
| Accrued expenses and other liabilities: | | | | | | | | | | | | | | | |
| Investment advisory fees (Note 6) | | | | 178,428 | | | | | 84,877 | | | | | 52,263 | |
| Line of credit (Note 2) | | | | 7,734,153 | | | | | 5,276,539 | | | | | 1,854,678 | |
| Distribution fees (Note 5) | | | | 599 | | | | | 1,175 | | | | | — | |
| Other | | | | 265,385 | | | | | 104,448 | | | | | 63,731 | |
| Total liabilities | | | | 12,613,203 | | | | | 5,847,957 | | | | | 7,402,006 | |
| Net Assets | | | $ | 206,725,608 | | | | $ | 99,966,038 | | | | $ | 61,808,354 | |
| | | | | | | | | | | | | | | | |
| Net assets represented by: | | | | | | | | | | | | | | | |
| Paid-in-capital | | | $ | 1,333,854,132 | | | | $ | 68,253,688 | | | | $ | 100,157,268 | |
| Accumulated net investment income (loss) | | | | (5,602,578 | ) | | | | — | | | | | 614,722 | |
| Accumulated net realized loss from investments and foreign currency transactions | | | | (1,097,536,805 | ) | | | | (4,194,174 | ) | | | | (53,006,149 | ) |
| Net unrealized appreciation/(depreciation) on: | | | | | | | | | | | | | | | |
| Investments | | | | (23,993,160 | ) | | | | 35,906,514 | | | | | 14,025,350 | |
| Foreign currency translations | | | | 4,019 | | | | | 10 | | | | | 17,163 | |
| Net Assets | | | $ | 206,725,608 | | | | $ | 99,966,038 | | | | $ | 61,808,354 | |
| | | | | | | | | | | | | | | | |
| Net asset value | | | | | | | | | | | | | | | |
| Class A | | | | | | | | | | | | | | | |
| Net assets | | | $ | 145,705 | | | | $ | 1,168,146 | | | | $ | — | |
| Shares outstanding | | | | 6,119 | | | | | 64,339 | | | | | — | |
| Net asset value per share | | | $ | 23.81 | | | | $ | 18.16 | | | | $ | — | |
| Maximum offering price per share (net asset value plus sales charge of 5.50% of offering price) | | | $ | 25.20 | | | | $ | 19.22 | | | | $ | — | |
| Institutional Class | | | | | | | | | | | | | | | |
| Net assets | | | $ | 206,579,903 | | | | $ | 98,797,892 | | | | $ | 61,808,354 | |
| Shares outstanding | | | | 8,654,166 | | | | | 5,435,999 | | | | | 2,347,474 | |
| Net asset value, offering price and redemption price per share* | | | $ | 23.87 | | | | $ | 18.17 | | | | $ | 26.33 | |
| * If applicable, redemption price per share may be reduced by a redemption fee. | |
| (1) Total cost of investments | | | | | | | | | | | | | | | |
| Unaffiliated issuers | | | $ | 213,350,590 | | | | $ | 69,698,417 | | | | $ | 49,959,089 | |
| Affiliated issuers | | | $ | 18,454,124 | | | | $ | — | | | | $ | — | |
| (2) Cost of foreign currencies | | | $ | 8,886 | | | | $ | — | | | | $ | 5,342 | |
The accompanying notes are an integral part of these financial statements.
59
Alpine Mutual Funds
Statements of Assets and Liabilities—Continued
October 31, 2013
| | | Emerging
Markets Real
Estate Fund | | Global
Infrastructure
Fund | | Global
Consumer
Growth Fund |
| ASSETS: | | | | | | | | | | | | | | | |
| Investments, at value(1) | | | $ | 9,752,792 | | | | $ | 146,437,059 | | | | $ | 2,869,184 | |
| Foreign currencies, at value(2) | | | | 4,737 | | | | | 84,990 | | | | | — | |
| Cash | | | | — | | | | | 482 | | | | | 518 | |
| Receivable from investment securities sold | | | | 303,225 | | | | | 2,203,859 | | | | | 20,481 | |
| Dividends and interest receivable | | | | 6,750 | | | | | 186,481 | | | | | 3,179 | |
| Receivable from capital shares issued | | | | 1,545 | | | | | 786,332 | | | | | — | |
| Due from Adviser | | | | 22,895 | | | | | — | | | | | 4,898 | |
| Prepaid expenses and other assets | | | | 1,703 | | | | | 6,186 | | | | | 763 | |
| Total assets | | | | 10,093,647 | | | | | 149,705,389 | | | | | 2,899,023 | |
| | | | | | | | | | | | | | | | |
| LIABILITIES: | | | | | | | | | | | | | | | |
| Payable for investment securities purchased | | | | 156,516 | | | | | 4,011,078 | | | | | 29,114 | |
| Unrealized depreciation on forward currency contracts | | | | — | | | | | 296,596 | | | | | — | |
| Payable for capital shares redeemed | | | | 140,637 | | | | | 11,798 | | | | | — | |
| Accrued expenses and other liabilities: | | | | | | | | | | | | | | | |
| Investment advisory fees (Note 6) | | | | 6,799 | | | | | 117,638 | | | | | 294 | |
| Distribution fees (Note 5) | | | | 1,032 | | | | | 10,863 | | | | | 574 | |
| Other | | | | 29,598 | | | | | 39,445 | | | | | 18,941 | |
| Total liabilities | | | | 334,582 | | | | | 4,487,418 | | | | | 48,923 | |
| Net Assets | | | $ | 9,759,065 | | | | $ | 145,217,971 | | | | $ | 2,850,100 | |
| | | | | | | | | | | | | | | | |
| Net assets represented by: | | | | | | | | | | | | | | | |
| Paid-in-capital | | | $ | 9,766,343 | | | | $ | 126,056,305 | | | | $ | 2,266,061 | |
| Accumulated net investment income | | | | 102,737 | | | | | 554,928 | | | | | 7,028 | |
| Accumulated net realized gain (loss) from investments and foreign currency transactions | | | | (99,585 | ) | | | | 2,651,258 | | | | | (55,927 | ) |
| Net unrealized appreciation/(depreciation) on: | | | | | | | | | | | | | | | |
| Investments | | | | (10,649 | ) | | | | 16,247,413 | | | | | 632,910 | |
| Foreign currency translations | | | | 219 | | | | | (291,933 | ) | | | | 28 | |
| Net Assets | | | $ | 9,759,065 | | | | $ | 145,217,971 | | | | $ | 2,850,100 | |
| | | | | | | | | | | | | | | | |
| Net asset value | | | | | | | | | | | | | | | |
| Class A | | | | | | | | | | | | | | | |
| Net assets | | | $ | 707,659 | | | | $ | 19,940,815 | | | | $ | 228,959 | |
| Shares outstanding | | | | 40,858 | | | | | 1,037,591 | | | | | 18,208 | |
| Net asset value per share | | | $ | 17.32 | | | | $ | 19.22 | | | | $ | 12.57 | |
| Maximum offering price per share (net asset value plus sales charge of 5.50% of offering price) | | | $ | 18.33 | | | | $ | 20.34 | | | | $ | 13.30 | |
| Institutional Class | | | | | | | | | | | | | | | |
| Net assets | | | $ | 9,051,406 | | | | $ | 125,277,156 | | | | $ | 2,621,141 | |
| Shares outstanding | | | | 521,060 | | | | | 6,509,691 | | | | | 207,951 | |
| Net asset value, offering price and redemption price per share* | | | $ | 17.37 | | | | $ | 19.24 | | | | $ | 12.60 | |
| * If applicable, redemption price per share may be reduced by a redemption fee. | | | | | | | | | | | |
| (1) Total cost of investments | | | $ | 9,763,441 | | | | $ | 130,189,646 | | | | $ | 2,236,274 | |
| (2) Cost of foreign currencies | | | $ | 4,772 | | | | $ | 86,926 | | | | $ | — | |
The accompanying notes are an integral part of these financial statements.
60
Alpine Mutual Funds
Statements of Operations
For the year ended October 31, 2013
| | | International
Real Estate
Equity Fund | | Realty
Income &
Growth Fund | | Cyclical
Advantage
Property Fund |
| INVESTMENT INCOME: | | | | | | | | | | | | | | | |
| Dividend income | | | $ | 3,250,154 | | | | $ | 4,797,694 | | | | $ | 2,124,663 | |
| Less: Foreign taxes withheld | | | | (235,823 | ) | | | | (61,031 | ) | | | | (55,895 | ) |
| Interest income | | | | — | | | | | 1,695 | | | | | 249 | |
| Total investment income | | | | 3,014,331 | | | | | 4,738,358 | | | | | 2,069,017 | |
| | | | | | | | | | | | | | | | |
| EXPENSES: | | | | | | | | | | | | | | | |
| Investment advisory fee (Note 6) | | | | 2,608,355 | | | | | 1,072,438 | | | | | 620,756 | |
| Transfer agent fees | | | | 512,562 | | | | | 224,149 | | | | | 102,769 | |
| Accounting and custody fees | | | | 181,707 | | | | | 14,719 | | | | | 42,656 | |
| Audit and tax fees | | | | 103,960 | | | | | 45,426 | | | | | 29,856 | |
| Registration and filing fees | | | | 39,930 | | | | | 32,984 | | | | | 16,680 | |
| Interest (Note 2) | | | | 107,283 | | | | | 84,021 | | | | | 10,769 | |
| Printing and mailing fees | | | | 83,914 | | | | | 48,030 | | | | | 17,942 | |
| Administration fee (Note 6) | | | | 54,143 | | | | | 22,994 | | | | | 12,621 | |
| Legal fees | | | | 58,699 | | | | | 23,515 | | | | | 7,229 | |
| Trustee fees | | | | 51,455 | | | | | 19,163 | | | | | 10,957 | |
| Distribution fees - Class A (Note 5) | | | | 365 | | | | | 1,051 | | | | | — | |
| Other fees | | | | 49,249 | | | | | 16,673 | | | | | 16,798 | |
| Total expenses | | | | 3,851,622 | | | | | 1,605,163 | | | | | 889,033 | |
| Less: Fee waivers and/or expense reimbursements (Note 6) | | | | — | | | | | (69,202 | ) | | | | — | |
| Net expenses | | | | 3,851,622 | | | | | 1,535,961 | | | | | 889,033 | |
| Net investment income (loss) | | | | (837,291 | ) | | | | 3,202,397 | | | | | 1,179,984 | |
| | | | | | | | | | | | | | | | |
| NET REALIZED AND UNREALIZED GAIN (LOSS) ON INVESTMENTS AND FOREIGN CURRENCY: | | | | | | | | | | | | | | | |
| Net realized gain (loss) from: | | | | | | | | | | | | | | | |
| Investments | | | | 4,386,247 | | | | | 5,295,486 | | | | | 1,644,699 | |
| Foreign currency transactions | | | | (103,441 | ) | | | | (796 | ) | | | | (10,618 | ) |
| Net realized gain from investments and foreign currency | | | | 4,282,806 | | | | | 5,294,690 | | | | | 1,634,081 | |
| Change in net unrealized appreciation on: | | | | | | | | | | | | | | | |
| Investments | | | | 21,923,243 | | | | | 885,808 | | | | | 4,268,975 | |
| Foreign currency translations | | | | 14,362 | | | | | 1 | | | | | 17,297 | |
| Change in net unrealized appreciation on investments and foreign currency | | | | 21,937,605 | | | | | 885,809 | | | | | 4,286,272 | |
| Net gain on investments and foreign currency | | | | 26,220,411 | | | | | 6,180,499 | | | | | 5,920,353 | |
| Increase in net assets from operations | | | $ | 25,383,120 | | | | $ | 9,382,896 | | | | $ | 7,100,337 | |
The accompanying notes are an integral part of these financial statements.
61
Alpine Mutual Funds
Statements of Operations—Continued
For the year ended October 31, 2013
| | | Emerging
Markets Real
Estate Fund | | Global
Infrastructure
Fund | | Global
Consumer
Growth Fund |
| INVESTMENT INCOME: | | | | | | | | | | | | | | | |
| Dividend income | | | $ | 207,035 | | | | $ | 5,370,570 | | | | $ | 45,420 | |
| Less: Foreign taxes withheld | | | | (9,717 | ) | | | | (238,200 | ) | | | | (2,338 | ) |
| Interest income | | | | 202 | | | | | 457 | | | | | 43 | |
| Total investment income | | | | 197,520 | | | | | 5,132,827 | | | | | 43,125 | |
| | | | | | | | | | | | | | | | |
| EXPENSES: | | | | | | | | | | | | | | | |
| Investment advisory fee (Note 6) | | | | 76,911 | | | | | 952,068 | | | | | 26,114 | |
| Transfer agent fees | | | | 12,478 | | | | | 35,567 | | | | | 7,823 | |
| Accounting and custody fees | | | | 24,792 | | | | | 40,370 | | | | | 10,937 | |
| Audit and tax fees | | | | 15,238 | | | | | 32,191 | | | | | 14,356 | |
| Registration and filing fees | | | | 42,846 | | | | | 46,616 | | | | | 34,477 | |
| Interest (Note 2) | | | | 65 | | | | | — | | | | | — | |
| Printing and mailing fees | | | | 1,811 | | | | | 23,219 | | | | | 100 | |
| Administration fee (Note 6) | | | | 1,540 | | | | | 19,041 | | | | | 522 | |
| Legal fees | | | | 952 | | | | | 10,583 | | | | | 765 | |
| Trustee fees | | | | 1,078 | | | | | 11,977 | | | | | 442 | |
| Distribution fees - Class A (Note 5) | | | | 1,492 | | | | | 30,308 | | | | | 561 | |
| Other fees | | | | 2,732 | | | | | 12,809 | | | | | 3,602 | |
| Total expenses | | | | 181,935 | | | | | 1,214,749 | | | | | 99,699 | |
| Less: Fee waivers and/or expense reimbursements (Note 6) | | | | (76,551 | ) | | | | — | | | | | (63,885 | ) |
| Net expenses | | | | 105,384 | | | | | 1,214,749 | | | | | 35,814 | |
| Net investment income | | | | 92,136 | | | | | 3,918,078 | | | | | 7,311 | |
| | | | | | | | | | | | | | | |
| NET REALIZED AND UNREALIZED GAIN (LOSS) ON INVESTMENTS AND FOREIGN CURRENCY: | | | | | | | | | | | | | | | |
| Net realized gain (loss) from: | | | | | | | | | | | | | | | |
| Investments | | | | 141,417 | | | | | 3,581,109 | | | | | (6,978 | ) |
| Foreign currency transactions | | | | (20,910 | ) | | | | (279,152 | ) | | | | 726 | |
| Net realized gain (loss) from investments and foreign currency | | | | 120,507 | | | | | 3,301,957 | | | | | (6,252 | ) |
| Change in net unrealized appreciation/(depreciation) on: | | | | | | | | | | | | | | | |
| Investments | | | | (712,400 | ) | | | | 12,342,987 | | | | | 421,161 | |
| Foreign currency translations | | | | 251 | | | | | (151,414 | ) | | | | 32 | |
| Change in net unrealized appreciation/(depreciation) on investments and foreign currency | | | | (712,149 | ) | | | | 12,191,573 | | | | | 421,193 | |
| Net gain (loss) on investments and foreign currency | | | | (591,642 | ) | | | | 15,493,530 | | | | | 414,941 | |
| Increase (decrease) in net assets from operations | | | $ | (499,506 | ) | | | $ | 19,411,608 | | | | $ | 422,252 | |
The accompanying notes are an integral part of these financial statements.
62
Alpine Mutual Funds
Statements of Changes in Net Assets
| | | International Real Estate Equity Fund | |
| | | Year Ended
October 31, 2013 | | Year Ended
October 31, 2012 |
| OPERATIONS: | | | | | | | | | | |
| Net investment income (loss) | | | $ | (837,291 | ) | | | $ | 1,572,515 | |
| Net realized gain (loss) from: | | | | | | | | | | |
| Investments | | | | 4,386,247 | | | | | (38,257,364 | ) |
| Foreign currency transactions | | | | (103,441 | ) | | | | 308,893 | |
| Change in net unrealized appreciation/(depreciation) on: | | | | | | | | | | |
| Investments | | | | 21,923,243 | | | | | 66,958,376 | |
| Foreign currency translations | | | | 14,362 | | | | | (36,740 | ) |
| Increase in net assets from operations | | | | 25,383,120 | | | | | 30,545,680 | |
| | | | | | | | | | | |
| DISTRIBUTIONS TO SHAREHOLDERS: | | | | | | | | | | |
| Distributions to Class A Shareholders: | | | | | | | | | | |
| From net investment income | | | | (318 | ) | | | | — | |
| Distributions to Institutional Class Shareholders: | | | | | | | | | | |
| From net investment income | | | | (1,295,320 | ) | | | | (8,892,777 | ) |
| From net realized gain on investments | | | | — | | | | | — | |
| Decrease in net assets from distributions to shareholders | | | | (1,295,638 | ) | | | | (8,892,777 | ) |
| | | | | | | | | | | |
| CAPITAL SHARE TRANSACTIONS (NOTE 3): | | | | | | | | | | |
| Net proceeds from shares sold | | | | 11,145,146 | | | | | 26,097,570 | |
| Dividends reinvested | | | | 1,150,945 | | | | | 7,845,139 | |
| Redemption fees | | | | 6,920 | | | | | 7,621 | |
| Cost of shares redeemed | | | | (129,758,252 | ) | | | | (110,942,453 | ) |
| Decrease in net assets from capital share transactions | | | | (117,455,241 | ) | | | | (76,992,123 | ) |
| Net decrease in net assets | | | | (93,367,759 | ) | | | | (55,339,220 | ) |
| | | | | | | | | | | |
| NET ASSETS: | | | | | | | | | | |
| Beginning of year | | | | 300,093,367 | | | | | 355,432,587 | |
| End of year* | | | $ | 206,725,608 | | | | $ | 300,093,367 | |
| * Including accumulated net investment loss of: | | | $ | (5,602,578 | ) | | | $ | (4,996,546 | ) |
The accompanying notes are an integral part of these financial statements.
63
Alpine Mutual Funds
Statements of Changes in Net Assets—Continued
| | | Realty Income & Growth Fund | |
| | | Year Ended
October 31, 2013 | | Year Ended
October 31, 2012 |
| OPERATIONS: | | | | | | | | | | |
| Net investment income | | | $ | 3,202,397 | | | | $ | 2,924,382 | |
| Net realized gain (loss) from: | | | | | | | | | | |
| Investments | | | | 5,295,486 | | | | | 6,402,733 | |
| Foreign currency transactions | | | | (796 | ) | | | | 1,850 | |
| Change in net unrealized appreciation on: | | | | | | | | | | |
| Investments | | | | 885,808 | | | | | 6,919,661 | |
| Foreign currency translations | | | | 1 | | | | | 72 | |
| Increase in net assets from operations | | | | 9,382,896 | | | | | 16,248,698 | |
| | | | | | | | | | | |
| DISTRIBUTIONS TO SHAREHOLDERS: | | | | | | | | | | |
| Distributions to Class A Shareholders: | | | | | | | | | | |
| From net investment income | | | | (14,332 | ) | | | | (3,340 | ) |
| From net realized gain on investments | | | | (2,192 | ) | | | | — | |
| Distributions to Institutional Class Shareholders: | | | | | | | | | | |
| From net investment income | | | | (3,751,100 | ) | | | | (4,523,288 | ) |
| From net realized gain on investments | | | | (557,236 | ) | | | | — | |
| Decrease in net assets from distributions to shareholders | | | | (4,324,860 | ) | | | | (4,526,628 | ) |
| | | | | | | | | | | |
| CAPITAL SHARE TRANSACTIONS (NOTE 3): | | | | | | | | | | |
| Net proceeds from shares sold | | | | 8,416,187 | | | | | 10,733,752 | |
| Dividends reinvested | | | | 3,880,515 | | | | | 4,090,369 | |
| Redemption fees | | | | 5,559 | | | | | 3,613 | |
| Cost of shares redeemed | | | | (23,812,998 | ) | | | | (21,452,781 | ) |
| Decrease in net assets from capital share transactions | | �� | | (11,510,737 | ) | | | | (6,625,047 | ) |
| Net increase (decrease) in net assets | | | | (6,452,701 | ) | | | | 5,097,023 | |
| | | | | | | | | | | |
| NET ASSETS: | | | | | | | | | | |
| Beginning of year | | | | 106,418,739 | | | | | 101,321,716 | |
| End of year* | | | $ | 99,966,038 | | | | $ | 106,418,739 | |
| * Including undistributed (accumulated) net investment income (loss) of: | | | $ | — | | | | $ | — | |
The accompanying notes are an integral part of these financial statements.
64
Alpine Mutual Funds
Statements of Changes in Net Assets—Continued
| | | Cyclical Advantage Property Fund | |
| | | Year Ended
October 31, 2013 | | Year Ended
October 31, 2012 |
| OPERATIONS: | | | | | | | | | | |
| Net investment income | | | $ | 1,179,984 | | | | $ | 213,057 | |
| Net realized gain (loss) from: | | | | | | | | | | |
| Investments | | | | 1,644,699 | | | | | 5,047,499 | |
| Foreign currency transactions | | | | (10,618 | ) | | | | (16,081 | ) |
| Change in net unrealized appreciation/(depreciation) on: | | | | | | | | | | |
| Investments | | | | 4,268,975 | | | | | 9,118,137 | |
| Foreign currency translations | | | | 17,297 | | | | | (659 | ) |
| Increase in net assets from operations | | | | 7,100,337 | | | | | 14,361,953 | |
| | | | | | | | | | | |
| DISTRIBUTIONS TO SHAREHOLDERS: | | | | | | | | | | |
| Distributions to Institutional Class Shareholders: | | | | | | | | | | |
| From net investment income | | | | (523,183 | ) | | | | (251,458 | ) |
| Decrease in net assets from distributions to shareholders | | | | (523,183 | ) | | | | (251,458 | ) |
| | | | | | | | | | | |
| CAPITAL SHARE TRANSACTIONS (NOTE 3): | | | | | | | | | | |
| Net proceeds from shares sold | | | | 2,535,452 | | | | | 1,522,677 | |
| Dividends reinvested | | | | 510,363 | | | | | 244,257 | |
| Redemption fees | | | | 2,260 | | | | | 77 | |
| Cost of shares redeemed | | | | (7,440,538 | ) | | | | (5,343,438 | ) |
| Decrease in net assets from capital share transactions | | | | (4,392,463 | ) | | | | (3,576,427 | ) |
| Net increase in net assets | | | | 2,184,691 | | | | | 10,534,068 | |
| | | | | | | | | | | |
| NET ASSETS: | | | | | | | | | | |
| Beginning of year | | | | 59,623,663 | | | | | 49,089,595 | |
| End of year* | | | $ | 61,808,354 | | | | $ | 59,623,663 | |
| * Including undistributed (accumulated) net investment income (loss) of: | | | $ | 614,722 | | | | $ | (48,290 | ) |
The accompanying notes are an integral part of these financial statements.
65
Alpine Mutual Funds
Statements of Changes in Net Assets—Continued
| | | Emerging Markets Real Estate Fund | |
| | | Year Ended
October 31, 2013 | | Year Ended
October 31, 2012 |
| OPERATIONS: | | | | | | | | | | |
| Net investment income | | | $ | 92,136 | | | | $ | 40,025 | |
| Net realized gain (loss) from: | | | | | | | | | | |
| Investments | | | | 141,417 | | | | | 87,667 | |
| Foreign currency transactions | | | | (20,910 | ) | | | | (8,889 | ) |
| Change in net unrealized appreciation/(depreciation) on: | | | | | | | | | | |
| Investments | | | | (712,400 | ) | | | | 566,381 | |
| Foreign currency translations | | | | 251 | | | | | 841 | |
| Increase (decrease) in net assets from operations | | | | (499,506 | ) | | | | 686,025 | |
| | | | | | | | | | | |
| DISTRIBUTIONS TO SHAREHOLDERS: | | | | | | | | | | |
| Distributions to Class A Shareholders: | | | | | | | | | | |
| From net investment income | | | | (2,120 | ) | | | | — | |
| Distributions to Institutional Class Shareholders: | | | | | | | | | | |
| From net investment income | | | | (56,766 | ) | | | | — | |
| Decrease in net assets from distributions to shareholders | | | | (58,886 | ) | | | | — | |
| | | | | | | | | | | |
| CAPITAL SHARE TRANSACTIONS (NOTE 3): | | | | | | | | | | |
| Net proceeds from shares sold | | | | 9,526,277 | | | | | 505,557 | |
| Dividends reinvested | | | | 57,510 | | | | | — | |
| Redemption fees | | | | 15,254 | | | | | 560 | |
| Cost of shares redeemed | | | | (3,709,564 | ) | | | | (1,053,041 | ) |
| Increase (decrease) in net assets from capital share transactions | | | | 5,889,477 | | | | | (546,924 | ) |
| Total increase in net assets | | | | 5,331,085 | | | | | 139,101 | |
| | | | | | | | | | | |
| NET ASSETS: | | | | | | | | | | |
| Beginning of year | | | | 4,427,980 | | | | | 4,288,879 | |
| End of year* | | | $ | 9,759,065 | | | | $ | 4,427,980 | |
| * Including undistributed net investment income of: | | | $ | 102,737 | | | | $ | 11,439 | |
The accompanying notes are an integral part of these financial statements.
66
Alpine Mutual Funds
Statements of Changes in Net Assets—Continued
| | | Global Infrastructure Fund | |
| | | Year Ended
October 31, 2013 | | Year Ended
October 31, 2012 |
| OPERATIONS: | | | | | | | | | | |
| Net investment income | | | $ | 3,918,078 | | | | $ | 1,794,009 | |
| Net realized gain (loss) on: | | | | | | | | | | |
| Investments | | | | 3,581,109 | | | | | (57,563 | ) |
| Foreign currency transactions | | | | (279,152 | ) | | | | 205,242 | |
| Change in net unrealized appreciation/(deprecation) on: | | | | | | | | | | |
| Investments | | | | 12,342,987 | | | | | 4,785,503 | |
| Foreign currency translations | | | | (151,414 | ) | | | | (136,931 | ) |
| Increase in net assets from operations | | | | 19,411,608 | | | | | 6,590,260 | |
| | | | | | | | | | | |
| DISTRIBUTIONS TO SHAREHOLDERS: | | | | | | | | | | |
| Distributions to Class A Shareholders: | | | | | | | | | | |
| From net investment income | | | | (413,051 | ) | | | | (21,335 | ) |
| Distributions to Institutional Class Shareholders: | | | | | | | | | | |
| From net investment income | | | | (3,113,199 | ) | | | | (1,754,166 | ) |
| Decrease in net assets from distributions to shareholders | | | | (3,526,250 | ) | | | | (1,775,501 | ) |
| | | | | | | | | | | |
| CAPITAL SHARE TRANSACTIONS (NOTE 3): | | | | | | | | | | |
| Net proceeds from shares sold | | | | 97,147,550 | | | | | 23,939,376 | |
| Dividends reinvested | | | | 2,394,461 | | | | | 1,358,204 | |
| Redemption fees | | | | 30,630 | | | | | 2,368 | |
| Cost of shares redeemed | | | | (18,959,074 | ) | | | | (10,424,061 | ) |
| Increase in net assets from capital share transactions | | | | 80,613,567 | | | | | 14,875,887 | |
| Total increase in net assets | | | | 96,498,925 | | | | | 19,690,646 | |
| | | | | | | | | | | |
| NET ASSETS: | | | | | | | | | | |
| Beginning of year | | | | 48,719,046 | | | | | 29,028,400 | |
| End of year* | | | $ | 145,217,971 | | | | $ | 48,719,046 | |
| * Including undistributed net investment income of: | | | $ | 554,928 | | | | $ | — | |
The accompanying notes are an integral part of these financial statements.
67
Alpine Mutual Funds
Statements of Changes in Net Assets—Continued
| | | Global Consumer Growth Fund | |
| | | Year Ended
October 31, 2013 | | Year Ended
October 31, 2012 |
| OPERATIONS: | | | | | | | | | | |
| Net investment income | | | $ | 7,311 | | | | $ | 7,626 | |
| Net realized gain (loss) from: | | | | | | | | | | |
| Investments | | | | (6,978 | ) | | | | (2,054 | ) |
| Foreign currency transactions | | | | 726 | | | | | (325 | ) |
| Change in net unrealized appreciation/(depreciation) on: | | | | | | | | | | |
| Investments | | | | 421,161 | | | | | 256,925 | |
| Foreign currency translations | | | | 32 | | | | | (11 | ) |
| Increase in net assets from operations | | | | 422,252 | | | | | 262,161 | |
| | | | | | | | | | | |
| DISTRIBUTIONS TO SHAREHOLDERS: | | | | | | | | | | |
| Distributions to Class A Shareholders: | | | | | | | | | | |
| From net investment income | | | | (227 | ) | | | | — | |
| Distributions to Institutional Class Shareholders: | | | | | | | | | | |
| From net investment income | | | | (9,476 | ) | | | | (7,862 | ) |
| Decrease in net assets from distributions to shareholders | | | | (9,703 | ) | | | | (7,862 | ) |
| | | | | | | | | | | |
| CAPITAL SHARE TRANSACTIONS (NOTE 3): | | | | | | | | | | |
| Net proceeds from shares sold | | | | 304,035 | | | | | 124,200 | |
| Dividends reinvested | | | | 9,612 | | | | | 7,862 | |
| Cost of shares redeemed | | | | (207,128 | ) | | | | — | |
| Increase in net assets from capital share transactions | | | | 106,519 | | | | | 132,062 | |
| Total increase in net assets | | | | 519,068 | | | | | 386,361 | |
| | | | | | | | | | | |
| NET ASSETS: | | | | | | | | | | |
| Beginning of year | | | | 2,331,032 | | | | | 1,944,671 | |
| End of year* | | | $ | 2,850,100 | | | | $ | 2,331,032 | |
| * Including undistributed net investment income of: | | | $ | 7,028 | | | | $ | 7,301 | |
The accompanying notes are an integral part of these financial statements.
68
Alpine Mutual Funds
Financial Highlights
(For a share outstanding throughout each period)
| | | International Real Estate Equity Fund |
| | | Year Ended | | Period Ended |
| | | October 31, 2013 | | October 31, 2012 (a) |
| Class A Shares: | | | | | | | | | | |
| Net asset value per share, beginning of period | | | $ | 22.19 | | | | $ | 17.92 | |
| Income from investment operations: | | | | | | | | | | |
| Net investment income (loss) | | | | (0.12 | ) | | | | 0.08 | |
| Net realized and unrealized gain on investments | | | | 1.79 | | | | | 4.19 | |
| Total from investment operations | | | | 1.67 | | | | | 4.27 | |
| Redemption fees | | | | 0.00 | (b) | | | | — | |
| Less distributions: | | | | | | | | | | |
| From net investment income | | | | (0.05 | ) | | | | — | |
| Total distributions | | | | (0.05 | ) | | | | — | |
| Net asset value per share, end of period | | | $ | 23.81 | | | | $ | 22.19 | |
| Total return | | | | 7.53 | % | | | | 23.83 | %(c) |
| Ratios/Supplemental Data | | | | | | | | | | |
| Net Assets at end of period (000) | | | $ | 146 | | | | $ | 128 | |
| Ratio of total expenses to average net assets (d) | | | | 1.73 | % | | | | 1.72 | %(e) |
| Ratio of net investment income (loss) to average net assets | | | | (0.46 | )% | | | | 0.48 | %(e) |
| Portfolio turnover (f) | | | | 19 | % | | | | 12 | % |
| (a) | Class A commenced operations on December 30, 2011. |
| (b) | The amount is less than $0.005. |
| (c) | Not annualized. |
| (d) | Ratio of total expenses to average net assets excluding interest expense was 1.69% for the year ended October 31, 2013, and 1.64% for the period ended October 31, 2012. |
| (e) | Annualized. |
| (f) | Portfolio turnover is calculated on the basis of the Fund as a whole, without distinguishing between classes of shares issued. |
The accompanying notes are an integral part of these financial statements.
69
Alpine Mutual Funds
Financial Highlights—Continued
(For a share outstanding throughout each year)
| | | International Real Estate Equity Fund | |
| | | Year Ended October 31, | |
| | | 2013 | | | 2012 | | | 2011 | | | 2010 | | | 2009 | |
| Institutional Class: | | | | | | | | | | | | | | | | | | | | |
| Net asset value per share, beginning of year | | $ | 22.23 | | | $ | 20.53 | | | $ | 25.75 | | | $ | 22.59 | | | $ | 12.26 | |
| Income from investment operations: | | | | | | | | | | | | | | | | | | | | |
| Net investment income (loss) | | | (0.35 | ) | | | 0.01 | | | | 0.30 | | | | (0.08 | ) | | | 0.20 | (a) |
| Net realized and unrealized gain (loss) on investments | | | 2.09 | | | | 2.23 | | | | (4.84 | ) | | | 4.03 | | | | 10.12 | |
| Total from investment operations | | | 1.74 | | | | 2.24 | | | | (4.54 | ) | | | 3.95 | | | | 10.32 | |
| Redemption fees | | | 0.00 | (b) | | | 0.00 | (b) | | | 0.00 | (b) | | | 0.00 | (b) | | | 0.01 | |
| Less distributions: | | | | | | | | | | | | | | | | | | | | |
| From net investment income | | | (0.10 | ) | | | (0.54 | ) | | | (0.68 | ) | | | (0.79 | ) | | | — | |
| Total distributions | | | (0.10 | ) | | | (0.54 | ) | | | (0.68 | ) | | | (0.79 | ) | | | — | |
| Net asset value per share, end of year | | $ | 23.87 | | | $ | 22.23 | | | $ | 20.53 | | | $ | 25.75 | | | $ | 22.59 | |
| Total return | | | 7.83 | % | | | 11.57 | % | | | (18.17 | )% | | | 18.07 | % | | | 84.26 | % |
| Ratios/Supplemental Data: | | | | | | | | | | | | | | | | | | | | |
| Net Assets at end of year (000) | | $ | 206,580 | | | $ | 299,965 | | | $ | 355,433 | | | $ | 608,488 | | | $ | 730,844 | |
| Ratio of total expenses to average net assets (c) | | | 1.48 | % | | | 1.47 | % | | | 1.37 | % | | | 1.28 | % | | | 1.26 | % |
| Ratio of net investment income (loss) to average net assets | | | (0.32 | )% | | | 0.51 | % | | | 1.89 | % | | | 0.32 | % | | | 1.13 | % |
| Portfolio turnover (d) | | | 19 | % | | | 12 | % | | | 20 | % | | | 34 | % | | | 51 | % |
| (a) | Net investment income (loss) per share is calculated using ending balances after consideration of adjustments for permanent book and tax differences. |
| (b) | The amount is less than $0.005. |
| (c) | Ratio of total expenses to average net assets excluding interest expense was 1.44%, 1.39%, 1.26%, 1.20% and 1.19% for the years ended October 31, 2013, 2012, 2011, 2010 and 2009, respectively. |
| (d) | Portfolio turnover is calculated on the basis of the Fund as a whole, without distinguishing between classes of shares issued. |
The accompanying notes are an integral part of these financial statements.
70
Alpine Mutual Funds
Financial Highlights—Continued
(For a share outstanding throughout each period)
| | | Realty Income & Growth Fund |
| | | Year Ended | | Period Ended |
| | | October 31, 2013 | | October 31, 2012 (a) |
| Class A Shares: | | | | | | | | | | |
| Net asset value per share, beginning of period | | | $ | 17.35 | | | | $ | 15.60 | |
| Income from investment operations: | | | | | | | | | | |
| Net investment income | | | | 0.59 | | | | | 0.32 | |
| Net realized and unrealized gain on investments | | | | 0.93 | | | | | 1.95 | |
| Total from investment operations | | | | 1.52 | | | | | 2.27 | |
| Redemption fees | | | | 0.00 | (b) | | | | 0.00 | (b) |
| Less distributions: | | | | | | | | | | |
| From net investment income | | | | (0.61 | ) | | | | (0.52 | ) |
| Net realized gains on investments | | | | (0.10 | ) | | | | — | |
| Tax return of capital | | | | — | | | | | — | |
| Total distributions | | | | (0.71 | ) | | | | (0.52 | ) |
| Net asset value per share, end of period | | | $ | 18.16 | | | | $ | 17.35 | |
| Total return | | | | 8.85 | % | | | | 14.53 | %(c) |
| Ratios/Supplemental Data | | | | | | | | | | |
| Net Assets at end of period (000) | | | $ | 1,168 | | | | $ | 115 | |
| Ratio of total expenses to average net assets: | | | | | | | | | | |
| Before waivers and/or expense reimbursements (d) | | | | 1.75 | % | | | | 1.66 | %(e) |
| After waivers and/or expense reimbursements (f) | | | | 1.67 | % | | | | 1.66 | %(e) |
| Ratio of net investment income to average net assets | | | | 3.00 | % | | | | 2.18 | %(e) |
| Portfolio turnover (g) | | | | 33 | % | | | | 28 | % |
| (a) | Class A commenced operations on December 30, 2011. |
| (b) | The amount is less than $0.005 per share. |
| (c) | Not annualized. |
| (d) | Ratio of total expenses to average net assets excluding interest expense before waivers and/or expense reimbursements was 1.67% for the year ended October 31, 2013, and 1.58% for the period ended October 31, 2012. |
| (e) | Annualized. |
| (f) | Ratio of total expenses to average net assets excluding interest expense after waivers and/or expense reimbursements was 1.59% for the year ended October 31, 2013, and 1.58% for the period ended October 31, 2012. |
| (g) | Portfolio turnover is calculated on the basis of the Fund as a whole, without distinguishing between classes of shares issued. |
The accompanying notes are an integral part of these financial statements.
71
Alpine Mutual Funds
Financial Highlights—Continued
(For a share outstanding throughout each year)
| | | Realty Income & Growth Fund | |
| | | Year Ended October 31, | |
| | | 2013 | | | 2012 | | | 2011 | | | 2010 | | | 2009 | |
| Institutional Class: | | | | | | | | | | | | | | | | | | | | |
| Net asset value per share, beginning of year | | $ | 17.37 | | | $ | 15.56 | | | $ | 14.79 | | | $ | 10.89 | | | $ | 9.95 | |
| Income from investment operations: | | | | | | | | | | | | | | | | | | | | |
| Net investment income | | | 0.54 | | | | 0.46 | | | | 0.48 | | | | 0.56 | | | | 0.79 | (a) |
| Net realized and unrealized gain on investments | | | 1.01 | | | | 2.07 | | | | 1.01 | | | | 4.06 | | | | 0.94 | |
| Total from investment operations | | | 1.55 | | | | 2.53 | | | | 1.49 | | | | 4.62 | | | | 1.73 | |
| Redemption fees | | | 0.00 | (b) | | | 0.00 | (b) | | | 0.00 | (b) | | | 0.00 | (b) | | | 0.00 | (b) |
| Less distributions: | | | | | | | | | | | | | | | | | | | | |
| From net investment income | | | (0.65 | ) | | | (0.72 | ) | | | (0.72 | ) | | | (0.65 | ) | | | (0.62 | ) |
| From net realized gains on investments | | | (0.10 | ) | | | — | | | | — | | | | (0.07 | ) | | | — | |
| Tax return of capital | | | — | | | | — | | | | — | | | | — | | | | (0.17 | ) |
| Total distributions | | | (0.75 | ) | | | (0.72 | ) | | | (0.72 | ) | | | (0.72 | ) | | | (0.79 | ) |
| Net asset value per share, end of year | | $ | 18.17 | | | $ | 17.37 | | | $ | 15.56 | | | $ | 14.79 | | | $ | 10.89 | |
| Total return | | | 9.02 | % | | | 16.44 | % | | | 10.23 | % | | | 43.51 | % | | | 20.23 | % |
| Ratios/Supplemental Data: | | | | | | | | | | | | | | | | | | | | |
| Net Assets at end of year (000) | | $ | 98,798 | | | $ | 106,304 | | | $ | 101,322 | | | $ | 108,941 | | | $ | 84,795 | |
| Ratio of total expenses to average net assets: | | | | | | | | | | | | | | | | | | | | |
| Before waivers and/or expense reimbursements (c) | | | 1.50 | % | | | 1.41 | % | | | 1.32 | % | | | 1.34 | % | | | 1.39 | % |
| After waivers and/or expense reimbursements (d) | | | 1.43 | % | | | 1.41 | % | | | 1.32 | % | | | 1.34 | % | | | 1.39 | % |
| Ratio of net investment income to average net assets | | | 2.99 | % | | | 2.73 | % | | | 3.09 | % | | | 4.24 | % | | | 8.57 | % |
| Portfolio turnover (e) | | | 33 | % | | | 28 | % | | | 59 | % | | | 70 | % | | | 111 | % |
| (a) | Net investment income per share is calculated using ending balances after consideration of adjustments for permanent book and tax differences. |
| (b) | The amount is less than $0.005 per share. |
| (c) | Ratio of total expenses to average net assets excluding interest expense before waivers and/or expense reimbursements was 1.42%, 1.33%, 1.23%, 1.24% and 1.27% for the years ended October 31, 2013, 2012, 2011, 2010 and 2009, respectively. |
| (d) | Ratio of total expenses to average net assets excluding interest expense after waivers and/or expense reimbursements was 1.35%, 1.33%, 1.23%, 1.24% and 1.27% for the years ended October 31, 2013, 2012, 2011, 2010 and 2009, respectively. |
| (e) | Portfolio turnover is calculated on the basis of the Fund as a whole, without distinguishing between classes of shares issued. |
The accompanying notes are an integral part of these financial statements.
72
Alpine Mutual Funds
Financial Highlights—Continued
(For a share outstanding throughout each year)
| | | Cyclical Advantage Property Fund | |
| | | Year Ended October 31, | |
| | | 2013 | | | 2012 | | | 2011 | | | 2010 | | | 2009 | |
| Institutional Class: | | | | | | | | | | | | | | | | | | | | |
| Net asset value per share, beginning of year | | $ | 23.64 | | | $ | 18.13 | | | $ | 20.27 | | | $ | 16.65 | | | $ | 13.86 | |
| Income from investment operations: | | | | | | | | | | | | | | | | | | | | |
| Net investment income | | | 0.49 | | | | 0.07 | | | | 0.07 | | | | 0.09 | | | | 0.26 | (a) |
| Net realized and unrealized gain (loss) on investments | | | 2.41 | | | | 5.53 | | | | (2.12 | ) | | | 3.77 | | | | 2.65 | |
| Total from investment operations | | | 2.90 | | | | 5.60 | | | | (2.05 | ) | | | 3.86 | | | | 2.91 | |
| Redemption fees | | | 0.00 | (b) | | | 0.00 | (b) | | | 0.00 | (b) | | | 0.00 | (b) | | | 0.00 | (b) |
| Less distributions: | | | | | | | | | | | | | | | | | | | | |
| From net investment income | | | (0.21 | ) | | | (0.09 | ) | | | (0.09 | ) | | | (0.24 | ) | | | (0.12 | ) |
| Total distributions | | | (0.21 | ) | | | (0.09 | ) | | | (0.09 | ) | | | (0.24 | ) | | | (0.12 | ) |
| Net asset value per share, end of year | | $ | 26.33 | | | $ | 23.64 | | | $ | 18.13 | | | $ | 20.27 | | | $ | 16.65 | |
| Total return | | | 12.33 | % | | | 31.11 | % | | | (10.19 | )% | | | 23.36 | % | | | 21.14 | % |
| Ratios/Supplemental Data: | | | | | | | | | | | | | | | | | | | | |
| Net Assets at end of year (000) | | $ | 61,808 | | | $ | 59,624 | | | $ | 49,090 | | | $ | 62,044 | | | $ | 55,064 | |
| Ratio of total expenses to average net assets (c) | | | 1.43 | % | | | 1.51 | % | | | 1.38 | % | | | 1.32 | % | | | 1.45 | % |
| Ratio of net investment income to average net assets | | | 1.90 | % | | | 0.41 | % | | | 0.36 | % | | | 0.51 | % | | | 2.28 | % |
| Portfolio turnover | | | 60 | % | | | 24 | % | | | 59 | % | | | 90 | % | | | 135 | % |
| (a) | Net investment income per share is calculated using ending balances after consideration of adjustments for permanent book and tax differences. |
| (b) | The amount is less than $0.005 per share. |
| (c) | Ratio of total expenses to average net assets excluding interest expense was 1.41%, 1.50%, 1.35%, 1.30% and 1.34% for the years ended October 31, 2013, 2012, 2011, 2010 and 2009, respectively. |
The accompanying notes are an integral part of these financial statements.
73
Alpine Mutual Funds
Financial Highlights—Continued
(For a share outstanding throughout each period)
| | | Emerging Markets Real Estate Fund |
| | | Year Ended | | Period Ended |
| | | October 31, 2013 | | October 31, 2012 (a) |
| Class A Shares: | | | | | | | | | | |
| Net asset value per share, beginning of period | | | $ | 17.13 | | | | $ | 13.45 | |
| Income from investment operations: | | �� | | | | | | | | |
| Net investment income | | | | 0.05 | | | | | 0.13 | |
| Net realized and unrealized gain on investments | | | | 0.29 | | | | | 3.55 | |
| Total from investment operations | | | | 0.34 | | | | | 3.68 | |
| Redemption fees | | | | 0.03 | | | | | — | |
| Less distributions: | | | | | | | | | | |
| Net investment income | | | | (0.18 | ) | | | | — | |
| Total distributions | | | | (0.18 | ) | | | | — | |
| Net asset value per share, end of period | | | $ | 17.32 | | | | $ | 17.13 | |
| Total return | | | | 2.10 | % | | | | 27.36 | %(b) |
| Ratios/Supplemental Data | | | | | | | | | | |
| Net Assets at end of period (000) | | | $ | 708 | | | | $ | 140 | |
| Ratio of total expenses to average net assets: | | | | | | | | | | |
| Before waivers and/or expense reimbursements (c) | | | | 2.60 | % | | | | 3.01 | %(d) |
| After waivers and/or expense reimbursements (e) | | | | 1.60 | % | | | | 1.61 | %(d) |
| Ratio of net investment income to average net assets | | | | 0.93 | % | | | | 1.05 | %(d) |
| Portfolio turnover (f) | | | | 120 | % | | | | 102 | % |
| (a) | Class A commenced operations on December 30, 2011. |
| (b) | Not annualized. |
| (c) | Ratio of total expenses to average net assets excluding interest expense before waivers and/or expense reimbursement was 2.60% for the year ended October 31, 2013, and 3.01% for the period ended October 31, 2012. |
| (d) | Annualized. |
| (e) | Ratio of total expenses to average net assets excluding interest expense after waivers and/or expense reimbursement was 1.60% for the year ended October 31, 2013, and 1.61% for the period ended October 31, 2012. |
| (f) | Portfolio turnover is calculated on the basis of the Fund as a whole, without distinguishing between classes of shares issued. |
The accompanying notes are an integral part of these financial statements.
74
Alpine Mutual Funds
Financial Highlights—Continued
(For a share outstanding throughout each period)
| | | | Emerging Markets Real Estate Fund |
| | | | | | | | | | | | | | | | Period
Ended |
| | | | Year Ended October 31, | | | October 31, |
| | | | 2013 | | | | 2012 | | | | 2011 | | | | 2010 | | | 2009 (a) |
| Institutional Class: | | | | | | | | | | | | | | | | | | | | | | | | | |
| Net asset value per share, beginning of period | | | $ | 17.16 | | | | $ | 14.68 | | | | $ | 19.20 | | | | $ | 17.03 | | | | $ | 10.00 | |
| Income from investment operations: | | | | | | | | | | | | | | | | | | | | | | | | | |
| Net investment income (loss) | | | | 0.25 | | | | | 0.12 | | | | | 0.40 | | | | | 0.27 | | | | | (0.08 | )(b) |
| Net realized and unrealized gain (loss) on investments | | | | 0.13 | | | | | 2.36 | | | | | (3.47 | ) | | | | 3.43 | | | | | 7.10 | |
| Total from investment operations | | | | 0.38 | | | | | 2.48 | | | | | (3.07 | ) | | | | 3.70 | | | | | 7.02 | |
| Redemption fees | | | | 0.04 | | | | | 0.00 | (c) | | | | 0.00 | (c) | | | | 0.00 | (c) | | | | 0.01 | |
| Less distributions: | | | | | | | | | | | | | | | | | | | | | | | | | |
| Net investment income | | | | (0.21 | ) | | | | — | | | | | (0.08 | ) | | | | (0.87 | ) | | | | — | |
| Net realized gains on investments | | | | — | | | | | — | | | | | (1.37 | ) | | | | (0.66 | ) | | | | — | |
| Total distributions | | | | (0.21 | ) | | | | — | | | | | (1.45 | ) | | | | (1.53 | ) | | | | — | |
| Net asset value per share, end of period | | | $ | 17.37 | | | | $ | 17.16 | | | | $ | 14.68 | | | | $ | 19.20 | | | | $ | 17.03 | |
| Total return | | | | 2.36 | % | | | | 16.89 | % | | | | (17.52 | )% | | | | 23.53 | % | | | | 70.30 | %(d) |
| Ratios/Supplemental Data: | | | | | | | | | | | | | | | | | | | | | | | | | |
| Net Assets at end of period (000) | | | $ | 9,051 | | | | $ | 4,288 | | | | $ | 4,289 | | | | $ | 3,269 | | | | $ | 2,047 | |
| Ratio of total expenses to average net assets: | | | | | | | | | | | | | | | | | | | | | | | | | |
| Before waivers and/or expense reimbursements (f) | | | | 2.35 | % | | | | 2.95 | % | | | | 2.42 | % | | | | 2.68 | % | | | | 4.36 | %(e) |
| After waivers and/or expense reimbursements (g) | | | | 1.35 | % | | | | 1.35 | % | | | | 1.35 | % | | | | 1.35 | % | | | | 1.35 | %(e) |
| Ratio of net investment income (loss) to average net assets | | | | 1.22 | % | | | | 0.97 | % | | | | 0.54 | % | | | | 0.13 | % | | | | (0.76 | )%(e) |
| Portfolio turnover (h) | | | | 120 | % | | | | 102 | % | | | | 58 | % | | | | 77 | % | | | | 35 | %(d) |
| (a) | For the period from November 3, 2008 (inception of fund) to October 31, 2009. |
| (b) | Net investment income (loss) per share is calculated using ending balances after consideration of adjustments for permanent book and tax differences. |
| (c) | The amount is less than $0.005 per share. |
| (d) | Not annualized. |
| (e) | Annualized. |
| (f) | Ratio of total expenses to average net assets excluding interest expense before waivers and/or expense reimbursement was 2.35%, 2.95%, 2.42% and 2.68% for the years ended October 31, 2013, 2012, 2011 and 2010, respectively, and 4.36% for the period ended October 31, 2009. |
| (g) | Ratio of total expenses to average net assets excluding interest expense after waivers and/or expense reimbursement was 1.35%, 1.35%, 1.35% and 1.35% for the years ended October 31, 2013, 2012, 2011 and 2010, respectively, and 1.35% for the period ended October 31, 2009. |
| (h) | Portfolio turnover is calculated on the basis of the Fund as a whole, without distinguishing between classes of shares issued. |
The accompanying notes are an integral part of these financial statements.
75
Alpine Mutual Funds
Financial Highlights—Continued
(For a share outstanding throughout each period)
| | | Global Infrastructure Fund |
| | | Year Ended
October 31, 2013 | | Period Ended
October 31, 2012 (a) |
| Class A Shares: | | | | | | | | | | |
| Net asset value per share, beginning of period | | | $ | 15.92 | | | | $ | 13.91 | |
| Income from investment operations: | | | | | | | | | | |
| Net investment income | | | | 0.69 | | | | | 0.43 | |
| Net realized and unrealized gain on investments | | | | 3.22 | | | | | 2.04 | |
| Total from investment operations | | | | 3.91 | | | | | 2.47 | |
| Redemption fees | | | | 0.01 | | | | | 0.00 | (b) |
| Less distributions: | | | | | | | | | | |
| Net investment income | | | | (0.62 | ) | | | | (0.46 | ) |
| Total distributions | | | | (0.62 | ) | | | | (0.46 | ) |
| Net asset value per share, end of period | | | $ | 19.22 | | | | $ | 15.92 | |
| Total return | | | | 25.04 | % | | | | 17.94 | %(c) |
| Ratios/Supplemental Data | | | | | | | | | | |
| Net Assets at end of period (000) | | | $ | 19,941 | | | | $ | 1,721 | |
| Ratio of total expenses to average net assets: | | | | | | | | | | |
| Before waivers and/or expense reimbursements | | | | 1.49 | % | | | | 1.67 | %(d) |
| After waivers and/or expense reimbursements | | | | 1.49 | % | | | | 1.60 | %(d) |
| Ratio of net investment income to average net assets | | | | 3.67 | % | | | | 3.67 | %(d) |
| Portfolio turnover (e) | | | | 147 | % | | | | 148 | % |
| (a) | Class A commenced operations on December 30, 2011. |
| (b) | The amount is less than $0.005 per share. |
| (c) | Not annualized. |
| (d) | Annualized. |
| (e) | Portfolio turnover is calculated on the basis of the Fund as a whole, without distinguishing between classes of shares issued. |
The accompanying notes are an integral part of these financial statements.
76
Alpine Mutual Funds
Financial Highlights—Continued
(For a share outstanding throughout each period)
| | | | Global Infrastructure Fund |
| | | | | | | | | | | | | | | Period
Ended |
| | | | Year Ended October 31, | | | October 31, |
| | | | 2013 | | | | 2012 | | | | 2011 | | | | 2010 | | | 2009 (a) |
| Institutional Class: | | | | | | | | | | | | | | | | | | | | | | | | | |
| Net asset value per share, beginning of period | | | $ | 15.93 | | | | $ | 14.32 | | | | $ | 15.98 | | | | $ | 13.38 | | | | $ | 10.00 | |
| Income from investment operations: | | | | | | | | | | | | | | | | | | | | | | | | | |
| Net investment income | | | | 0.71 | | | | | 0.65 | | | | | 0.61 | | | | | 0.43 | | | | | 0.19 | (b) |
| Net realized and unrealized gain (loss) on investments | | | | 3.25 | | | | | 1.60 | | | | | (0.72 | ) | | | | 3.40 | | | | | 3.19 | |
| Total from investment operations | | | | 3.96 | | | | | 2.25 | | | | | (0.11 | ) | | | | 3.83 | | | | | 3.38 | |
| Redemption fees | | | | 0.01 | | | | | 0.00 | (c) | | | | 0.00 | (c) | | | | 0.00 | | | | | 0.00 | (c) |
| Less distributions: | | | | | | | | | | | | | | | | | | | | | | | | | |
| Net investment income | | | | (0.66 | ) | | | | (0.64 | ) | | | | (0.99 | ) | | | | (0.20 | ) | | | | — | |
| Net realized gains on investments | | | | — | | | | | — | | | | | (0.55 | ) | | | | (1.03 | ) | | | | — | |
| Tax return of capital | | | | — | | | | | — | | | | | (0.01 | ) | | | | — | | | | | — | |
| Total distributions | | | | (0.66 | ) | | | | (0.64 | ) | | | | (1.55 | ) | | | | (1.23 | ) | | | | — | |
| Net asset value per share, end of period | | | $ | 19.24 | | | | $ | 15.93 | | | | $ | 14.32 | | | | $ | 15.98 | | | | $ | 13.38 | |
| Total return | | | | 25.35 | % | | | | 16.09 | % | | | | (1.03 | )% | | | | 30.23 | % | | | | 33.80 | %(d) |
| Ratios/Supplemental Data: | | | | | | | | | | | | | | | | | | | | | | | | | |
| Net Assets at end of period (000) | | | $ | 125,277 | | | | $ | 46,998 | | | | $ | 29,028 | | | | $ | 2,245 | | | | $ | 1,422 | |
| Ratio of total expenses to average net assets: | | | | | | | | | | | | | | | | | | | | | | | | | |
| Before waivers and/or expense reimbursements (e) | | | | 1.24 | % | | | | 1.33 | % | | | | 1.59 | % | | | | 3.03 | % | | | | 4.42 | %(f) |
| After waivers and/or expense reimbursements (g) | | | | 1.24 | % | | | | 1.33 | % | | | | 1.35 | % | | | | 1.35 | % | | | | 1.35 | %(f) |
| Ratio of net investment income to average net assets | | | | 4.18 | % | | | | 4.30 | % | | | | 4.17 | % | | | | 3.40 | % | | | | 1.76 | %(f) |
| Portfolio turnover (h) | | | | 147 | % | | | | 148 | % | | | | 189 | % | | | | 402 | % | | | | 258 | %(d) |
| (a) | For the period from November 3, 2008 (inception of fund) to October 31, 2009. |
| (b) | Net investment income per share is calculated using ending balances after consideration of adjustments for permanent book and tax differences. |
| (c) | The amount is less than $0.005 per share. |
| (d) | Not annualized. |
| (e) | Ratio of total expenses to average net assets excluding interest expense before waivers and/or expense reimbursement was 1.24%, 1.33%, 1.59%, 3.03% for the years ended October 31, 2013, 2012, 2011, and 2010, respectively, and 4.42% for the period ended October 31, 2009. |
| (f) | Annualized. |
| (g) | Ratio of total expenses to average net assets excluding interest expense after waivers and/or expense reimbursement was 1.24%, 1.33%, 1.35%, 1.35% for the years ended October 31, 2013, 2012, 2011, and 2010, respectively, and 1.35% for the period ended October 31, 2009. |
| (h) | Portfolio turnover is calculated on the basis of the Fund as a whole, without distinguishing between classes of shares issued. |
The accompanying notes are an integral part of these financial statements.
77
Alpine Mutual Funds
Financial Highlights—Continued
(For a share outstanding throughout each period)
| | | Global Consumer Growth Fund |
| | | Year Ended
October 31, 2013 | | Period Ended
October 31, 2012 (a) |
| Class A Shares: | | | | | | | | | | |
| Net asset value per share, beginning of period | | | $ | 10.71 | | | | $ | 8.95 | |
| Income from investment operations: | | | | | | | | | | |
| Net investment income | | | | 0.03 | | | | | 0.02 | |
| Net realized and unrealized gain on investments | | | | 1.85 | | | | | 1.74 | |
| Total from investment operations | | | | 1.88 | | | | | 1.76 | |
| Redemption fees | | | | — | | | | | — | |
| Less distributions: | | | | | | | | | | |
| Net investment income | | | | (0.02 | ) | | | | — | |
| Total distributions | | | | (0.02 | ) | | | | — | |
| Net asset value per share, end of period | | | $ | 12.57 | | | | $ | 10.71 | |
| Total return | | | | 17.58 | % | | | | 19.66 | %(b) |
| Ratios/Supplemental Data: | | | | | | | | | | |
| Net Assets at end of period (000) | | | $ | 229 | | | | $ | 120 | |
| Ratio of total expenses to average net assets: | | | | | | | | | | |
| Before waivers and/or expense reimbursements | | | | 4.05 | % | | | | 5.98 | %(c) |
| After waivers and/or expense reimbursements | | | | 1.60 | % | | | | 1.60 | %(c) |
| Ratio of net investment income to average net assets | | | | 0.20 | % | | | | 0.20 | %(c) |
| Portfolio turnover (d) | | | | 24 | % | | | | 13 | % |
| (a) | Class A commenced operations on December 30, 2011. |
| (b) | Not annualized. |
| (c) | Annualized. |
| (d) | Portfolio turnover is calculated on the basis of the Fund as a whole, without distinguishing between classes of shares issued. |
The accompanying notes are an integral part of these financial statements.
78
Alpine Mutual Funds
Financial Highlights—Continued
(For a share outstanding throughout each period)
| | | | Global Consumer Growth Fund |
| | | | | | | | | | Period
Ended |
| | | | Year Ended October 31, | | | October 31, |
| | | | 2013 | | | | 2012 | | | 2011 (a) |
| Institutional Class: | | | | | | | | | | | | | | | |
| Net asset value per share, beginning of period | | | $ | 10.74 | | | | $ | 9.59 | | | | $ | 10.00 | |
| Income from investment operations: | | | | | | | | | | | | | | | |
| Net investment income | | | | 0.03 | | | | | 0.04 | | | | | 0.04 | |
| Net realized and unrealized gain (loss) on investments | | | | 1.88 | | | | | 1.15 | | | | | (0.45 | ) |
| Total from investment operations | | | | 1.91 | | | | | 1.19 | | | | | (0.41 | ) |
| Redemption fees | | | | — | | | | | — | | | | | — | |
| Less distributions: | | | | | | | | | | | | | | | |
| Net investment income | | | | (0.05 | ) | | | | (0.04 | ) | | | | — | |
| Total distributions | | | | (0.05 | ) | | | | (0.04 | ) | | | | — | |
| Net asset value per share, end of period | | | $ | 12.60 | | | | $ | 10.74 | | | | $ | 9.59 | |
| Total return | | | | 17.80 | % | | | | 12.48 | % | | | | (4.10 | )%(b) |
| Ratios/Supplemental Data: | | | | | | | | | | | | | | | |
| Net Assets at end of period (000) | | | $ | 2,621 | | | | $ | 2,211 | | | | $ | 1,945 | |
| Ratio of total expenses to average net assets: | | | | | | | | | | | | | | | |
| Before waivers and/or expense reimbursements | | | | 3.80 | % | | | | 5.31 | % | | | | 2.96 | %(c) |
| After waivers and/or expense reimbursements | | | | 1.35 | % | | | | 1.35 | % | | | | 1.35 | %(c) |
| Ratio of net investment income to average net assets | | | | 0.29 | % | | | | 0.36 | % | | | | 0.54 | %(c) |
| Portfolio turnover (d) | | | | 24 | % | | | | 13 | % | | | | 7 | %(b) |
| (a) | For the period from December 29, 2010 (commencement of operations) to October 31, 2011. |
| (b) | Not annualized. |
| (c) | Annualized. |
| (d) | Portfolio turnover is calculated on the basis of the Fund as a whole, without distinguishing between classes of shares issued. |
The accompanying notes are an integral part of these financial statements.
79
Alpine Mutual Funds
Notes to Financial Statements
October 31, 2013
| 1. | Organization: |
| | |
| | Alpine Equity Trust (the “Equity Trust”) was organized in 1988 as a Massachusetts Business Trust, and is registered under the Investment Company Act of 1940, as amended (the “1940 Act”), as an open-end management investment company. The Alpine International Real Estate Equity Fund, Alpine Realty Income & Growth Fund, Alpine Cyclical Advantage Property Fund, Alpine Emerging Markets Real Estate Fund, Alpine Global Infrastructure Fund, and Alpine Global Consumer Growth Fund are six separate funds of the Equity Trust (individually referred to as a “Fund” and collectively, “the Funds”). The Alpine International Real Estate Equity Fund, Alpine Cyclical Advantage Property Fund, Alpine Emerging Markets Real Estate Fund, Alpine Global Infrastructure Fund and Alpine Global Consumer Growth Fund are diversified funds. The Alpine Realty Income & Growth Fund is a non-diversified fund. Alpine Woods Capital Investors, LLC (the “Adviser”) is a Delaware limited liability company and serves as the investment manager to the Funds. |
| | |
| 2. | Significant Accounting Policies: |
| | |
| | The following is a summary of significant accounting policies consistently followed by the Funds in the preparation of their financial statements. The policies are in conformity with accounting principles generally accepted in the United States of America (“GAAP”), which require management to make estimates and assumptions that affect amounts reported herein. Actual results could differ from those estimates. Changes in the economic environment, financial markets and any other parameters used in determining these estimates could cause actual results to differ. |
| | |
| | A. Valuation of Securities: |
| | |
| | The net asset value (“NAV”) of shares of the Funds are calculated by dividing the value of the Funds’ net assets by the number of outstanding shares. NAV is determined each day the New York Stock Exchange (“NYSE”) is open as of the close of regular trading (normally, 4:00 p.m., Eastern time). In computing NAV, portfolio securities of the Funds are valued at their current market values determined on the basis of market quotations or if market quotations are not available or determined to be unreliable, through procedures and/or guidelines established by the Board of Trustees (“Board”). In computing the Funds’ NAV, equity securities that are traded on a securities exchange in the United States, except for option securities, are valued at the last reported sale price as of the time of valuation, or lacking any current reported sale at the time of valuation, at the mean between the most recent bid and asked quotations, or if market quotations are not available or determined to be unreliable, through procedures and/or guidelines established by the Board. Each option security traded on a securities exchange in the United States is valued at the last current reported sale price as of the time of valuation, or lacking any current reported sale at the time of valuation, the option is valued at the mid-point of the consolidated bid/ask quote for the option security. Forward currency contracts are valued based on third-party vendor quotations. Each security traded in the over-the-counter market and quoted on the NASDAQ National Market System, is valued at the NASDAQ Official Closing Price (“NOCP”), as determined by NASDAQ, or lacking an NOCP, the last current reported sale price as of the time of valuation by NASDAQ, or lacking any current reported sale on NASDAQ at the time of valuation, at the mean between the most recent bid and asked quotations. Each over-the-counter option that is not traded through the Options Clearing Corporation is valued by the counterparty, or if the counterparty’s price is not readily available, then by using the Black-Scholes method. Debt securities are valued based on an evaluated mean price as furnished by pricing services approved by the Board, which may be based on market transactions for comparable securities and various relationships between securities that are generally recognized by institutional traders, a computerized matrix system, or appraisals derived from information concerning the securities or similar securities received from recognized dealers in those securities. Each other security traded over-the-counter is valued at the mean between the most recent bid and asked quotations. Short-term securities with maturities of 60 days or less are valued at amortized cost, which approximates fair value. |
| | |
| | Equity securities that are principally traded in a foreign market are valued at the last current sale price at the time of valuation or lacking any current or reported sale, at the time of valuation, at the mean between the most recent bid and asked quotations as of the close of the appropriate exchange or other designated time. Trading in securities on European and Far Eastern securities exchanges and over-the-counter markets is normally completed at various times before the close of business on each day on which the NYSE is open. Trading of these securities may not take place on every NYSE business day. In addition, trading may take place in various foreign markets on Saturdays or on other days when the NYSE is not open and on which the Funds’ NAVs are not calculated. As stated above, if the market prices are not readily available or not reflective of the fair value of the security, as of the close of the regular trading on the NYSE, the security will be priced at fair value following procedures approved by the Board. |
80
Alpine Mutual Funds
Notes to Financial Statements—Continued
October 31, 2013
| | When market quotations are not readily available or when the valuation methods mentioned above are not reflective of a fair value of the security, the security is valued at fair value following procedures and/or guidelines approved by the Board. The Funds may also use fair value pricing, if the value of a security it holds is, pursuant to the Board guidelines, materially affected by events occurring before the Funds’ pricing time but after the close of the primary market or market transactions for comparable securities and various relationships between securities that are generally recognized by institutional traders, a computerized matrix system, or appraisals derived from information concerning the securities or similar securities received from recognized dealers in those securities. The Board has approved the use of a third-party pricing vendor’s proprietary fair value pricing model to assist in determining current valuation for foreign securities traded in markets that close prior to the NYSE. When fair value pricing is employed, the value of the portfolio security used to calculate the Funds’ NAVs may differ from quoted or official closing prices. |
| | |
| | As of October 31, 2013, the International Real Estate Equity Fund held securities that are fair valued, which comprised 6.1% of the Fund’s net assets. |
| | |
| | Fair Value Measurement: In accordance with GAAP, the Fund uses a three-tier hierarchy to establish classification of fair value measurements for disclosure purposes. Inputs refer broadly to the assumptions that market participants would use in pricing the asset or liability, including assumptions about risk. Inputs may be observable or unobservable. Observable inputs are inputs that reflect the assumptions market participants would use in pricing the asset or liability that are developed based on market data obtained from sources independent of the reporting entity. Unobservable inputs are inputs that reflect the reporting entities’ own assumptions about the assumptions market participants would use in pricing the asset or liability that are developed based on the best information available. |
| | |
| | | • Level 1 — | Quoted prices in active markets for identical investments. |
| | | | |
| | | • Level 2 — | Other significant observable inputs (including quoted prices for similar instruments, interest rates, prepayment speeds, credit risk, yield curves, default rates, etc.). |
| | | | |
| | | • Level 3 — | Significant unobservable inputs (including the Funds’ own assumptions in determining the fair value of investments). |
| | | | |
| | The availability of observable inputs can vary from security to security and is affected by a wide variety of factors, including, for example, the type of security, whether the security is new and not yet established in the marketplace, the liquidity of markets, and other characteristics particular to the security. To the extent that valuation is based on models or inputs that are less observable or unobservable in the market, the determination of fair value requires more judgment. Accordingly, the degree of judgment exercised in determining fair value is greatest for instruments categorized in Level 3. |
| | |
| | The inputs used to measure fair value may fall into different levels of the fair value hierarchy. In such cases, for disclosure purposes, the level in the fair value hierarchy within which the fair value measurement falls in its entirety, is determined based on the lowest level input that is significant to the fair value measurement in its entirety. |
| | |
| | Various inputs are used in determining the value of the Funds’ investments as of the reporting period end. The designated input levels are not necessarily an indication of the risk or liquidity associated with these investments. These inputs are categorized in the following hierarchy under GAAP. |
| | |
| | The Funds use valuation techniques to measure fair value that are consistent with the market approach and/or income approach, depending on the type of security and the particular circumstance. The market approach uses prices and other relevant information generated by market transactions involving identical or comparable securities. The income approach uses valuation techniques to discount estimated future cash flows to present value. |
81
Alpine Mutual Funds
Notes to Financial Statements—Continued
October 31, 2013
| | The following is a summary of the inputs used to value the Funds’ assets and liabilities carried at fair value as of October 31, 2013: |
| | | | Valuation Inputs | | | | |
| | International Real Estate Equity Fund * | | Level 1 | | | Level 2 | | | Level 3 | | | Total Value | |
| | Common Stocks | | | | | | | | | | | | | | | | |
| | Asia | | $ | 60,720,299 | | | $ | 13,131,750 | | | $ | 11,735,214 | | | $ | 85,587,263 | |
| | Europe | | | 67,182,474 | | | | — | | | | 975,271 | | | | 68,157,745 | |
| | North & South America | | | 49,491,117 | | | | — | | | | — | | | | 49,491,117 | |
| | Equity-Linked Structured Notes | | | — | | | | 3,155,756 | | | | — | | | | 3,155,756 | |
| | Investment Companies | | | 1,419,673 | | | | — | | | | — | | | | 1,419,673 | |
| | Total | | $ | 178,813,563 | | | $ | 16,287,506 | | | $ | 12,710,485 | | | $ | 207,811,554 | |
| | | | Valuation Inputs | | | | |
| | Other Financial Instruments | | Level 1 | | | Level 2 | | | Level 3 | | | Total Value | |
| | Assets | | | | | | | | | | | | | | | | |
| | Forward Currency Contracts | | $ | — | | | $ | 39,620 | | | $ | — | | | $ | 39,620 | |
| | Total | | $ | — | | | $ | 39,620 | | | $ | — | | | $ | 39,620 | |
| | | | Valuation Inputs | | | | |
| | Realty Income & Growth Fund * | | Level 1 | | | Level 2 | | | Level 3 | | | Total Value | |
| | Real Estate Investment Trusts | | $ | 102,331,231 | | | $ | — | | | $ | — | | | $ | 102,331,231 | |
| | Common Stock | | | 1,251,540 | | | | — | | | | — | | | | 1,251,540 | |
| | Preferred Stocks | | | 2,022,160 | | | | — | | | | — | | | | 2,022,160 | |
| | Total | | $ | 105,604,931 | | | $ | — | | | $ | — | | | $ | 105,604,931 | |
| | | | Valuation Inputs | | | | |
| | Cyclical Advantage Property Fund * | | Level 1 | | | Level 2 | | | Level 3 | | | Total Value | |
| | Common Stocks | | | | | | | | | | | | | | | | |
| | Asia | | $ | 15,801,067 | | | $ | 4,411,020 | | | $ | — | | | $ | 20,212,087 | |
| | Europe | | | 12,125,952 | | | | — | | | | — | | | | 12,125,952 | |
| | North & South America | | | 30,393,957 | | | | 544,314 | | | | — | | | | 30,938,271 | |
| | Equity-Linked Structured Notes | | | — | | | | 708,128 | | | | — | | | | 708,128 | |
| | Total | | $ | 58,320,976 | | | $ | 5,663,462 | | | $ | — | | | $ | 63,984,438 | |
| | | | Valuation Inputs | | | | |
| | Other Financial Instruments | | Level 1 | | | Level 2 | | | Level 3 | | | Total Value | |
| | Assets | | | | | | | | | | | | | | | | |
| | Forward Currency Contracts | | $ | — | | | $ | 15,650 | | | $ | — | | | $ | 15,650 | |
| | Total | | $ | — | | | $ | 15,650 | | | $ | — | | | $ | 15,650 | |
82
Alpine Mutual Funds
Notes to Financial Statements—Continued
October 31, 2013
| | | | Valuation Inputs | | | | |
| | Emerging Markets Real Estate Fund * | | Level 1 | | | Level 2 | | | Level 3 | | | Total Value | |
| | Common Stocks | | | | | | | | | | | | | | | | |
| | Asia | | $ | 5,991,400 | | | $ | 1,023,972 | | | $ | — | | | $ | 7,015,372 | |
| | Europe | | | 88,363 | | | | — | | | | — | | | | 88,363 | |
| | Middle East/Africa | | | 49,573 | | | | — | | | | — | | | | 49,573 | |
| | North & South America | | | 1,825,469 | | | | 22,933 | | | | — | | | | 1,848,402 | |
| | Preferred Stock | | | 95,402 | | | | — | | | | — | | | | 95,402 | |
| | Equity-Linked Structured Notes | | | — | | | | 385,690 | | | | — | | | | 385,690 | |
| | Convertible Bond | | | — | | | | 714 | | | | — | | | | 714 | |
| | Right | | | — | | | | 276 | | | | — | | | | 276 | |
| | Short-Term Investment | | | — | | | | 269,000 | | | | — | | | | 269,000 | |
| | Total | | $ | 8,050,207 | | | $ | 1,702,585 | | | $ | — | | | $ | 9,752,792 | |
| | | | Valuation Inputs | | | | |
| | Global Infrastructure Fund * | | Level 1 | | | Level 2 | | | Level 3 | | | Total Value | |
| | Common Stocks | | | | | | | | | | | | | | | | |
| | Asia | | $ | 23,658,200 | | | $ | 961,125 | | | $ | — | | | $ | 24,619,325 | |
| | Europe | | | 36,523,587 | | | | — | | | | — | | | | 36,523,587 | |
| | North & South America | | | 73,054,215 | | | | — | | | | — | | | | 73,054,215 | |
| | Equity-Linked Structured Notes | | | — | | | | 2,517,932 | | | | — | | | | 2,517,932 | |
| | Short-Term Investment | | | — | | | | 9,722,000 | | | | — | | | | 9,722,000 | |
| | Total | | $ | 133,236,002 | | | $ | 13,201,057 | | | $ | — | | | $ | 146,437,059 | |
| | | | Valuation Inputs | | | | |
| | Other Financial Instruments | | Level 1 | | | Level 2 | | | Level 3 | | | Total Value | |
| | Liabilities | | | | | | | | | | | | | | | | |
| | Forward Currency Contracts | | $ | — | | | $ | (296,596 | ) | | $ | — | | | | (296,596 | ) |
| | Total | | $ | — | | | $ | (296,596 | ) | | $ | — | | | $ | (296,596 | ) |
| | | | Valuation Inputs | | | | |
| | Global Consumer Growth Fund * | | Level 1 | | | Level 2 | | | Level 3 | | | Total Value | |
| | Common Stocks | | | | | | | | | | | | | | | | |
| | Asia | | $ | 584,573 | | | $ | — | | | $ | — | | | $ | 584,573 | |
| | Europe | | | 651,119 | | | | 24,705 | | | | — | | | | 675,824 | |
| | North & South America | | | 1,488,787 | | | | — | | | | — | | | | 1,488,787 | |
| | Short-Term Investment | | | — | | | | 120,000 | | | | — | | | | 120,000 | |
| | Total | | $ | 2,724,479 | | | $ | 144,705 | | | $ | — | | | $ | 2,869,184 | |
| | |
| | * For detailed country and sector descriptions, see accompanying Schedule of Portfolio Investments. |
| | |
| | For the year ended October 31, 2013, there were no transfers between Level 1 and Level 2. |
83
Alpine Mutual Funds
Notes to Financial Statements—Continued
October 31, 2013
| | The following is a reconciliation of Level 3 assets for which significant unobservable inputs were used to determine fair value: |
| | |
| | | International
Real Estate
Equity Fund | |
| Balance as of October 31, 2012 | | | $ | 16,621,460 | |
| Realized gain (loss) | | | | — | |
| Change in unrealized depreciation* | | | | (5,329,348 | ) |
| Purchases | | | | — | |
| Sales | | | | — | |
| Transfers in to Level 3** | | | | 1,418,373 | |
| Transfers out of Level 3** | | | | — | |
| Balance as of October 31, 2013 | | | $ | 12,710,485 | |
| Change in net unrealized appreciation/(depreciation) on Level 3 holdings held at year end | | | $ | (5,329,348 | ) |
| | | |
| | * | Statements of Operations Location: Change in net unrealized appreciation/(depreciation) on investments |
| | ** | The Funds recognize transfers as of the beginning of the year. |
| | |
| | The following table shows the valuation techniques and significant amounts of unobservable inputs used in the fair value measurement of the Fund’s Level 3 investments, as of October 31, 2013: |
| | |
| | International Real Estate Equity Fund |
| | Asset | | Fair Value
at 10/31/13 | | | Valuation
Technique (s) | | Significant
Unobservable
Input (s) | | Range of
Values | | Weighted
Average | | Relationship
Between Fair
Value and
Input: If
Input Value
Increases Then: |
| | Common Stocks | | | $11,384,134 | * | | Average of terminal value and price to book value | | Liquidity Discount | | 3%-15% | | 10% | | Fair Value would Decrease |
| | | | | | | | | | Adjusted Weighted Average Cost of Capital | | 14%-16% | | 15% | | Fair Value would Decrease |
| | | | | | | | | | Company Risk | | 4%-16% | | 9.3% | | Fair Value would Decrease |
| | | | | | | | | | Currency Risk | | 3%-4% | | 4% | | Fair Value would Decrease |
| | | | | | | | | | Terminal Value Discount | | 27%-39% | | 32% | | Fair Value would Decrease |
| | Common Stocks | | | $975,271 | * | | Adjusted Book Value | | Liquidity Discount | | 35% | | 35% | | Fair Value would Decrease |
| | Common Stocks | | | $351,080 | * | | Adjusted Book Value | | Discount to NAV | | 90% | | 90% | | Fair Value would Decrease |
| | | |
| | * | Represents a single security, as of October 31, 2013. As a result, the range of values and weighted average for each unobservable input refer to a single value. |
| | |
| | The significant unobservable inputs used in the fair value measurement of common stocks are liquidity discounts, adjusted weighted average cost of capital, company risk, currency risk, terminal value discount and discount to NAV. Other market indicators are also considered. Changes in any of those inputs would result in lower or higher fair value measurement. |
| | |
| | B. Security Transactions and Investment Income: |
| | |
| | Security transactions are accounted for on a trade date basis. Realized gains and losses are computed on the identified cost basis. Dividend income is recorded on the ex-dividend date or in the case of some foreign securities, on the date thereafter when the Funds are made aware of the dividend. Interest income is recorded on the accrual basis and includes accretion of discounts and amortization of premiums, where applicable. To the extent any issuer defaults or a credit event occurs that impacts the issuer, the Funds may halt any additional interest income accruals and consider the realizability of interest accrued up to the date of default or credit event. |
84
Alpine Mutual Funds
Notes to Financial Statements—Continued
October 31, 2013
| | C. Line of Credit and Custody Overdrafts: |
| | |
| | On December 1, 2010 the Trust entered into a lending agreement with BNP Paribas through its New York branch (“BNPP NY”). Loans in aggregate, whether to cover overdrafts or for investment purposes, may not exceed the maximum amount that is permitted under the 1940 Act. The terms of the lending agreement indicate the rate to be the Fed Funds rate plus 0.95% per annum on amounts borrowed. The BNP Paribas Facility provides for secured, uncommitted lines of credit for the Funds where selected Funds’ assets are pledged against advances made to the respective Fund. Each Fund is permitted to borrow up to 33.33% of its total assets for extraordinary or emergency purposes. Additionally, each of the following Funds are permitted to borrow up to 10% of their respective total assets for investment purposes but in no case shall any Fund’s total outstanding borrowings exceed 33.33% of its total assets. Either BNPP NY or the Funds may terminate this agreement upon delivery of written notice. For the year ended October 31, 2013, the average interest rate paid on outstanding borrowings under the line of credit was 1.09%, 1.08%, 1.04% and 1.09% for the International Real Estate Equity Fund, Realty Income & Growth Fund, Cyclical Advantage Property Fund and Emerging Markets Real Estate Fund, respectively. The Funds may also incur interest expense on custody overdraft charges. |
| | |
| | | | International
Real Estate
Equity Fund | | Realty
Income &
Growth
Fund | | Cyclical
Advantage
Property
Fund | | Emerging
Markets
Real Estate
Fund | | Global
Infrastructure
Fund | | Global
Consumer
Growth
Fund |
| | Total line of credit amount available for investment purposes at October 31, 2013 | | | $21,991,604 | | | | $10,581,400 | | | | $6,921,036 | | | | $1,009,365 | | | | $14,970,258 | | | | $289,902 | |
| | Line of credit outstanding at October 31, 2013 | | | 7,734,153 | | | | 5,276,539 | | | | 1,854,678 | | | | — | | | | — | | | | — | |
| | Line of credit amount unused at October 31, 2013 | | | 14,257,451 | | | | 5,304,861 | | | | 5,066,358 | | | | 1,009,365 | | | | 14,970,258 | | | | 289,902 | |
| | Average balance outstanding during the year | | | 9,744,647 | | | | 7,704,128 | | | | 1,018,530 | | | | 5,833 | | | | — | | | | — | |
| | Maximum balance outstanding during the year | | | 22,504,445 | | | | 10,862,668 | | | | 5,152,564 | | | | 316,130 | | | | — | | | | — | |
| | Interest expense incurred on line of credit during the year | | | 107,283 | | | | 84,021 | | | | 10,769 | | | | 65 | | | | — | | | | — | |
| | Interest expense incurred on custody overdrafts during the year | | | 1,294 | | | | 76 | | | | 120 | | | | 12 | | | | 66 | | | | 7 | |
| | |
| | The line of credit outstanding as of October 31, 2013 approximates its fair value and would be categorized at Level 2. |
| | |
| | D. Federal and Other Income Taxes: |
| | |
| | It is each Fund’s policy to comply with the Federal income and excise tax requirements of the Internal Revenue Code of 1986 (the “Code”), as amended, applicable to regulated investment companies and to distribute timely, all of its investment company taxable income and net realized capital gains to shareholders in accordance with the timing requirements imposed by the Code. Therefore, no Federal income tax provision is required. Capital gains realized on some foreign securities are subject to foreign taxes, which are accrued as applicable. Dividends and interest from non-U.S. sources received by the Funds are generally subject to non-U.S. withholding taxes at rates ranging up to 30%. Such capital gains and withholding taxes, which are accrued as applicable, may be reduced or eliminated under the terms of applicable U.S. income tax treaties, and the Funds intend to undertake procedural steps to claim the benefits of such treaties. Where available, the Funds will file refund claims for foreign taxes withheld. |
| | |
| | Management has analyzed the Funds’ tax positions taken on income tax returns for all open tax years and has concluded that as of October 31, 2013, no provision for income tax is required in the Funds’ financial statements. The Funds’ Federal |
85
Alpine Mutual Funds
Notes to Financial Statements—Continued
October 31, 2013
| | and state income and Federal excise tax returns for tax years for which the applicable statutes of limitations have not expired are subject to examination by the Internal Revenue Service and state departments of revenue. As of October 31, 2013, open Federal and New York tax years include the tax years ended October 31, 2010 through 2013. |
| | |
| | GAAP requires that certain components of net assets be reclassified to reflect permanent differences between financial and tax reporting. These reclassifications have no effect on net assets or net asset values per share. |
| | |
| | E. Distributions to Shareholders: |
| | |
| | Each Fund intends to distribute all of its net investment income and net realized capital gains, if any, throughout the year to its shareholders in the form of dividends. Distributions to shareholders are recorded at the close of business on the ex-dividend date. |
| | |
| | The amounts of dividends from net investment income and of distributions from net realized gains are determined in accordance with Federal income tax regulations, which may differ from GAAP. These differences are either considered temporary or permanent in nature. To the extent these differences are permanent in nature, such amounts are reclassified within the composition of net assets based on their Federal tax-basis treatment; temporary differences do not require reclassification. In the event dividends and distributions to shareholders exceed net investment income and net realized gains for tax purposes, they are reported as returns of capital. |
| | |
| | F. Class Allocations: |
| | |
| | Income, expenses (other than class specific expenses) and realized and unrealized gains and losses are allocated among the classes of the Funds based on the relative net assets of each class. Class specific expenses are allocated to the class to which they relate. Currently, class specific expenses are limited to those incurred under the Distribution Plan for Class A shares. |
| | |
| | G. Foreign Currency Translation Transactions: |
| | |
| | The International Real Estate Equity Fund, Cyclical Advantage Property Fund, Emerging Markets Real Estate Fund, Global Infrastructure Fund, and Global Consumer Growth Fund may invest without limitation in foreign securities. The Realty Income & Growth Fund may invest up to 35% of its net assets in foreign securities. The books and records of each Fund are maintained in U.S. dollars. Non-U.S. dollar-denominated amounts are translated into U.S. dollars as follows, with the resultant translations gains and losses recorded in the Statements of Operations: |
| | | | |
| | | i) | market value of investment securities and other assets and liabilities at the exchange rate on the valuation date, |
| | | | |
| | | ii) | purchases and sales of investment securities, income and expenses at the exchange rate prevailing on the respective date of such transactions. |
| | |
| | H. Risks Associated with Foreign Securities and Currencies: |
| | |
| | Investments in securities of foreign issuers carry certain risks not ordinarily associated with investments in securities of domestic issuers. Such risks include future political and economic developments and the possible imposition of exchange controls or other foreign governmental laws and restrictions. In addition, with respect to certain countries, there is a possibility of expropriation of assets, confiscatory taxation, political or social instability or diplomatic developments, which could adversely affect investments in those countries. |
| | |
| | Certain countries may also impose substantial restrictions on investments in their capital markets by foreign entities, including restrictions on investments in issuers or industries deemed sensitive to relevant national interests. These factors may limit the investment opportunities available to the Funds are or result in a lack of liquidity and high price volatility with respect to securities of issuers from developing countries. |
| | |
| | I. Equity-Linked Structured Notes: |
| | |
| | The Funds may invest in equity-linked structured notes. Equity-linked structured notes are securities which are specially designed to combine the characteristics of one or more underlying securities and their equity derivatives in a single note form. The return and/or yield or income component may be based on the performance of the underlying equity securities, and equity index, and/or option positions. Equity-linked structured notes are typically offered in limited transactions by financial institutions in either registered or non-registered form. An investment in equity-linked structured notes creates exposure to the credit risk of the issuing financial institution, as well as to the market risk of |
86
Alpine Mutual Funds
Notes to Financial Statements—Continued
October 31, 2013
| | the underlying securities. There is no guaranteed return of principal with these securities and the appreciation potential of these securities may be limited by a maximum payment or call right. In certain cases, equity-linked structured notes may be more volatile and less liquid than less complex securities or other types of fixed-income securities. Such securities may exhibit price behavior that does not correlate with other fixed-income securities. International Real Estate Equity Fund, Cyclical Advantage Property Fund, Emerging Markets Real Estate Fund and Global Infrastructure Fund held 2, 2, 7 and 2 equity-linked structured notes, respectively, at October 31, 2013. |
| | |
| | J. Forward Currency Contracts: |
| | |
| | The Funds are subject to foreign currency exchange rate risk in the normal course of pursuing their investment objectives. The Funds may use forward currency contracts to gain exposure to or economically hedge against changes in the value of foreign currencies. A forward currency contract (“forward”) is an agreement between two parties to buy and sell a currency at a set price on a future date. The market value of the forward contract fluctuates with changes in forward currency exchange rates. The forward contract is marked-to-market daily and the change in market value is recorded by each Fund as unrealized appreciation or depreciation. When the forward contract is closed, a Fund records a realized gain or loss equal to the fluctuation in value during the period the forward contract was open. A Fund could be exposed to risk if a counterparty is unable to meet the terms of a forward or if the value of the currency changes unfavorably. During the year ended October 31, 2013, the International Real Estate Equity Fund, Cyclical Advantage Property Fund and Global Infrastructure Fund entered into 2, 3 and 2 forward currency contracts, respectively. |
| | |
| | The following forward currency contracts were held at October 31, 2013: |
| | |
| | International Real Estate Equity Fund |
| | Description | | Settlement Date | | | Currency | | Settlement Value | | | Current
Value | | | Unrealized Gain | |
| | Contracts Sold: | | | | | | | | | | | | | | | | | | |
| | Japanese Yen | | 01/29/14 | | | 2,000,000,000 | JPY | | $ | 20,390,893 | | | $ | 20,351,273 | | | $ | 39,620 | |
| | | | | | | | | | | | | | $ | 20,351,273 | | | $ | 39,620 | |
| | | | | | | | | | | | | | | | | | | | |
| | Cyclical Advantage Property Fund | |
| | Description | | Settlement Date | | | Currency | | Settlement
Value | | | Current
Value | | | Unrealized
Gain | |
| | Contracts Sold: | | | | | | | | | | | | | | | | | | |
| | Japanese Yen | | 01/29/14 | | | 790,000,000 | JPY | | $ | 8,054,403 | | | $ | 8,038,753 | | | $ | 15,650 | |
| | | | | | | | | | | | | | $ | 8,038,753 | | | $ | 15,650 | |
| | | | | | | | | | | | | | | | | | | | |
| | Global Infrastructure Fund | |
| | Description | | Settlement
Date | | | Currency | | Settlement
Value | | | Current
Value | | | Unrealized
Loss | |
| | Contracts Sold: | | | | | | | | | | | | | | | | | | |
| | Euro | | 02/07/14 | | | 10,500,000 | EUR | | $ | 13,961,850 | | | $ | 14,258,446 | | | $ | (296,596 | ) |
| | | | | | | | | | | | | | $ | 14,258,446 | | | $ | (296,596 | ) |
| | K. Derivative Instruments and Hedging Activities: |
| | |
| | The following tables provide information about the effect of derivatives and hedging activities on the Funds’ Statements of Assets and Liabilities and Statements of Operations as of and for the year ended October 31, 2013. The first table provides additional detail about the amounts and sources of unrealized appreciation/(depreciation) on derivatives at the end of the period. The second table provides additional information about the amounts and sources of net realized gain (loss) and the change in net unrealized appreciation/(depreciation) resulting from the Funds’ derivatives and hedging activities during the period. |
87
Alpine Mutual Funds
Notes to Financial Statements—Continued
October 31, 2013
| | The effect of derivative instruments on the Statements of Assets and Liabilities as of October 31, 2013: |
| | |
| | International Real Estate Equity Fund |
| | Derivatives | | Statement of Assets
and Liabilities Location | | Unrealized
Appreciation | |
| | Foreign exchange risk | | Unrealized appreciation on forward currency contracts | | | $39,620 | |
| | | | | | | | |
| | Cyclical Advantage Property Fund | | | | |
| | Derivatives | | Statement of Assets
and Liabilities Location | | | Unrealized
Appreciation | |
| | Foreign exchange risk | | Unrealized appreciation on forward currency contracts | | | $15,650 | |
| | | | | | | | |
| | Global Infrastructure Fund | | | | |
| | Derivatives | | Statement of Assets
and Liabilities Location | | | Unrealized
Depreciation | |
| | Foreign exchange risk | | Unrealized depreciation on
forward currency contracts | | | $(296,596) | |
| | The effect of derivative instruments on the Statements of Operations for the year ended October 31, 2013: |
| | |
| | International Real Estate Equity Fund |
| | Derivatives | | Statement of
Operations Location | | Net Realized Gain | | Change in Net
Unrealized Appreciation | |
| | Foreign exchange risk | | Net realized gain (loss) from foreign currency transactions / Change in net unrealized appreciation/(depreciation) on foreign currency translations | | $50,457 | | $39,620 | |
| | | | | | | | | |
| | Cyclical Advantage Property Fund | | | | | |
| | Derivatives | | Statement of
Operations Location | | Net Realized Gain | | Change in Net
Unrealized Appreciation | |
| | Foreign exchange risk | | Net realized gain (loss) from foreign currency transactions / Change in net unrealized appreciation/(depreciation) on foreign currency translations | | $19,426 | | $15,650 | |
| | | | | | | | | |
| | Global Infrastructure Fund | | | | | |
| | Derivatives | | Statement of
Operations Location | | Net Realized Loss | | Change in Net
Unrealized Depreciation | |
| | Foreign exchange risk | | Net realized gain (loss) from foreign currency transactions / Change in net unrealized appreciation/(depreciation) on foreign currency translations | | $(305,788) | | $(156,249) | |
| | J. Redemption Fees |
| | |
| | The Funds of the Alpine Equity Trust impose a redemption fee of 1% of the total redemption amount on all Fund shares redeemed or exchanged within 60 days of buying them, either by purchase or exchange. This fee is assessed and retained by the Funds for the benefit of the remaining shareholders. The redemption fee is accounted for as an increase to paid-in-capital. |
88
Alpine Mutual Funds
Notes to Financial Statements—Continued
October 31, 2013
| 3. | Capital Share Transactions: |
| | |
| | The Funds have an unlimited number of shares of beneficial interest, with $0.0001 par value, authorized. Transactions in shares and dollars of the Funds were as follows: |
| | International Real Estate Equity Fund | | | | | | | | | | | | |
| | | | | Year Ended
October 31, 2013 | | | | Year Ended
October 31, 2012* | |
| | | | | Shares | | | Amount | | | | Shares | | | Amount | |
| | Class A | | | | | | | | | | | | | | | | |
| | Shares sold | | | 1,040 | | | $ | 24,868 | | | | 5,775 | | | $ | 104,301 | |
| | Shares issued in reinvestment of dividends | | | 13 | | | | 318 | | | | — | | | | — | |
| | Redemption fees | | | — | | | | 4 | | | | — | | | | 2 | |
| | Shares redeemed | | | (706 | ) | | | (17,079 | ) | | | (3 | ) | | | (68 | ) |
| | Total net change | | | 347 | | | $ | 8,111 | | | | 5,772 | | | $ | 104,235 | |
| | Institutional Class | | | | | | | | | | | | | | | | |
| | Shares sold | | | 465,270 | | | $ | 11,120,278 | | | | 1,267,230 | | | $ | 25,993,269 | |
| | Shares issued in reinvestment of dividends | | | 48,570 | | | | 1,150,627 | | | | 439,750 | | | | 7,845,139 | |
| | Redemption fees | | | — | | | | 6,916 | | | | — | | | | 7,619 | |
| | Shares redeemed | | | (5,350,431 | ) | | | (129,741,173 | ) | | | (5,530,908 | ) | | | (110,942,385 | ) |
| | Total net change | | | (4,836,591 | ) | | $ | (117,463,352 | ) | | | (3,823,928 | ) | | $ | (77,096,358 | ) |
| | | | | | | | | | | | | | | | | | |
| | Realty Income & Growth Fund | | | | | | | | | | | | | | | | |
| | | | | Year Ended
October 31, 2013 | | | | Year Ended
October 31, 2012* | |
| | | | | Shares | | | Amount | | | | Shares | | | Amount | |
| | Class A | | | | | | | | | | | | | | | | |
| | Shares sold | | | 57,263 | | | $ | 1,082,511 | | | | 6,414 | | | $ | 100,066 | |
| | Shares issued in reinvestment of dividends | | | 817 | | | | 14,416 | | | | 191 | | | | 3,339 | |
| | Redemption fees | | | — | | | | 41 | | | | — | | | | 3 | |
| | Shares redeemed | | | (342 | ) | | | (6,256 | ) | | | (4 | ) | | | (64 | ) |
| | Total net change | | | 57,738 | | | $ | 1,090,712 | | | | 6,601 | | | $ | 103,344 | |
| | Institutional Class | | | | | | | | | | | | | | | | |
| | Shares sold | | | 396,879 | | | $ | 7,333,676 | | | | 636,722 | | | $ | 10,633,686 | |
| | Shares issued in reinvestment of dividends | | | 213,883 | | | | 3,866,099 | | | | 240,721 | | | | 4,087,030 | |
| | Redemption fees | | | — | | | | 5,518 | | | | — | | | | 3,610 | |
| | Shares redeemed | | | (1,296,033 | ) | | | (23,806,742 | ) | | | (1,267,504 | ) | | | (21,452,717 | ) |
| | Total net change | | | (685,271 | ) | | $ | (12,601,449 | ) | | | (390,061 | ) | | $ | (6,728,391 | ) |
| | | | | | | | | | | | | | | | | | |
| | Cyclical Advantage Property Fund | | | | | | | | | | | | | | | | |
| | | | | Year Ended
October 31, 2013 | | | | Year Ended
October 31, 2012 | |
| | | | | Shares | | | Amount | | | | Shares | | | Amount | |
| | Institutional Class | | | | | | | | | | | | | | | | |
| | Shares sold | | | 102,636 | | | $ | 2,535,452 | | | | 73,565 | | | $ | 1,522,677 | |
| | Shares issued in reinvestment of dividends | | | 20,925 | | | | 510,363 | | | | 14,259 | | | | 244,257 | |
| | Redemption fees | | | — | | | | 2,260 | | | | — | | | | 77 | |
| | Shares redeemed | | | (298,522 | ) | | | (7,440,538 | ) | | | (272,500 | ) | | | (5,343,438 | ) |
| | Total net change | | | (174,961 | ) | | $ | (4,392,463 | ) | | | (184,676 | ) | | $ | (3,576,427 | ) |
89
Alpine Mutual Funds
Notes to Financial Statements—Continued
October 31, 2013
| | Emerging Markets Real Estate Fund | | | | | | | | | | | | |
| | | | Year Ended
October 31, 2013 | | | Year Ended
October 31, 2012* | |
| | | | Shares | | | Amount | | | Shares | | | Amount | |
| | Class A | | | | | | | | | | | | | | | | |
| | Shares sold | | | 56,958 | | | $ | 1,063,647 | | | | 8,184 | | | $ | 111,813 | |
| | Shares issued in reinvestment of dividends | | | 89 | | | | 1,633 | | | | — | | | | — | |
| | Redemption fees | | | — | | | | 957 | | | | — | | | | — | |
| | Shares redeemed | | | (24,373 | ) | | | (472,467 | ) | | | — | | | | — | |
| | Total net change | | | 32,674 | | | $ | 593,770 | | | | 8,184 | | | $ | 111,813 | |
| | Institutional Class | | | | | | | | | | | | | | | | |
| | Shares sold | | | 452,465 | | | $ | 8,462,630 | | | | 25,841 | | | $ | 393,744 | |
| | Shares issued in reinvestment of dividends | | | 3,029 | | | | 55,877 | | | | — | | | | — | |
| | Redemption fees | | | — | | | | 14,297 | | | | — | | | | 560 | |
| | Shares redeemed | | | (184,263 | ) | | | (3,237,097 | ) | | | (68,074 | ) | | | (1,053,041 | ) |
| | Total net change | | | 271,231 | | | $ | 5,295,707 | | | | (42,233 | ) | | $ | (658,737 | ) |
| | | | | | | | | | | | | | | | | | |
| | Global Infrastructure Fund | | | | | | | | | | | | |
| | | | Year Ended
October 31, 2013 | | | Year Ended
October 31, 2012* | |
| | | | Shares | | | Amount | | | Shares | | | Amount | |
| | Class A | | | | | | | | | | | | | | | | |
| | Shares sold | | | 1,246,168 | | | $ | 22,408,845 | | | | 107,333 | | | $ | 1,627,209 | |
| | Shares issued in reinvestment of dividends | | | 17,256 | | | | 308,946 | | | | 1,338 | | | | 20,570 | |
| | Redemption fees | | | — | | | | 4,490 | | | | — | | | | 18 | |
| | Shares redeemed | | | (333,963 | ) | | | (6,250,474 | ) | | | (541 | ) | | | (7,742 | ) |
| | Total net change | | | 929,461 | | | $ | 16,471,807 | | | | 108,130 | | | $ | 1,640,055 | |
| | Institutional Class | | | | | | | | | | | | | | | | |
| | Shares sold | | | 4,137,898 | | | $ | 74,738,705 | | | | 1,517,961 | | | $ | 22,312,167 | |
| | Shares issued in reinvestment of dividends | | | 117,131 | | | | 2,085,515 | | | | 89,244 | | | | 1,337,634 | |
| | Redemption fees | | | — | | | | 26,140 | | | | — | | | | 2,350 | |
| | Shares redeemed | | | (695,683 | ) | | | (12,708,600 | ) | | | (683,673 | ) | | | (10,416,319 | ) |
| | Total net change | | | 3,559,346 | | | $ | 64,141,760 | | | | 923,532 | | | $ | 13,235,832 | |
90
Alpine Mutual Funds
Notes to Financial Statements—Continued
October 31, 2013
| | Global Consumer Growth Fund | | | | | | | | |
| | | | Year Ended
October 31, 2013 | | | Year Ended
October 31, 2012* | |
| | | | Shares | | | Amount | | | Shares | | | Amount | |
| | Class A | | | | | | | | | | | | | | | | |
| | Shares sold | | | 24,428 | | | $ | 281,904 | | | | 11,173 | | | $ | 100,000 | |
| | Shares issued in reinvestment of dividends | | | 20 | | | | 227 | | | | — | | | | — | |
| | Redemption fees | | | — | | | | — | | | | — | | | | — | |
| | Shares redeemed | | | (17,413 | ) | | | (198,431 | ) | | | — | | | | — | |
| | Total net change | | | 7,035 | | | $ | 83,700 | | | | 11,173 | | | $ | 100,000 | |
| | Institutional Class | | | | | | | | | | | | | | | | |
| | Shares sold | | | 1,877 | | | $ | 22,131 | | | | 2,286 | | | $ | 24,200 | |
| | Shares issued in reinvestment of dividends | | | 844 | | | | 9,385 | | | | 878 | | | | 7,862 | |
| | Redemption fees | | | — | | | | — | | | | — | | | | — | |
| | Shares redeemed | | | (750 | ) | | | (8,697 | ) | | | — | | | | — | |
| | Total net change | | | 1,971 | | | $ | 22,819 | | | | 3,164 | | | $ | 32,062 | |
| | * Class A commenced operations on December 30, 2011. | | | | | | | |
| 4. | Purchase and Sales of Securities: |
| | |
| | Purchases and sales of securities (excluding short-term securities) for the year ended October 31, 2013 are as follows: |
| | | | Purchases | | | Sales | |
| | International Real Estate Equity | | $ | 49,517,177 | | | $ | 173,890,180 | |
| | Realty Income & Growth Fund | | | 37,712,271 | | | | 52,918,186 | |
| | Cyclical Advantage Property Fund | | | 39,224,554 | | | | 35,924,894 | |
| | Emerging Markets Real Estate Fund | | | 14,326,058 | | | | 8,726,716 | |
| | Global Infrastructure Fund | | | 206,652,621 | | | | 129,338,387 | |
| | Global Consumer Growth Fund | | | 697,763 | | | | 595,454 | |
| | The Funds did not have purchases and sales of U.S. Government Obligations during the year ended October 31, 2013. |
| | |
| 5. | Distribution Plans: |
| | |
| | Quasar Distributors, LLC (“Quasar”) serves as each Fund’s distributor. Each of the Funds, except for the Cyclical Advantage Property Fund, has adopted distribution and servicing plans (the “Plans”) for their Class A shares as allowed by Rule 12b-1 under the 1940 Act. The Plans authorize payments by the Funds in connection with the distribution and servicing of their Class A shares at an annual rate, as determined from time to time by the Board, of up to 0.25% of the average daily net assets of the Class A shares of the Funds. Amounts paid under the Plans by the Funds may be spent by the Funds on any activities or expenses primarily intended to result in the sale of Class A shares of the Fund, including but not limited to advertising, compensation for sales and marketing activities of financial institutions and others such as dealers and distributors, shareholder account servicing, the printing and mailing of prospectuses to other than current shareholders and the printing and mailing of sales literature. International Real Estate Equity Fund, Realty Income & Growth Fund, Emerging Markets Real Estate Fund, Global Infrastructure Fund and Global Consumer Growth Fund incurred $365, $1,051, $1,492, $30,308 and $561, respectively, pursuant to the Plans for the year ended October 31, 2013. |
| | |
| | The Plans for the Funds may be terminated at any time by vote of the Board of the Equity Trust who are not “interested persons,” as defined by the 1940 Act, of the Equity Trust, or by vote of a majority of the outstanding voting shares of the respective class. |
91
Alpine Mutual Funds
Notes to Financial Statements—Continued
October 31, 2013
| 6. | Investment Advisory Agreement, Administration Agreement and Other Affiliated Transactions: |
The Adviser provides investment advisory services to each of the Funds. Pursuant to the advisory agreements with the Realty Income & Growth Fund and the Cyclical Advantage Property Fund, the Adviser is entitled to an annual fee based on each Fund’s average daily net assets, in accordance with the following schedule:
| First $750 million | | | 1.00 | % |
| Next $250 million | | | 0.90 | % |
| Over $1 billion | | | 0.80 | % |
The Adviser is entitled to an annual fee based on 1.00% of each Fund’s average daily net assets for the International Real Estate Equity Fund, Emerging Markets Real Estate Fund, Global Infrastructure Fund and Global Consumer Growth Fund.
The Adviser agreed to reimburse the Realty Income & Growth Fund, Emerging Markets Real Estate Fund, Global Infrastructure Fund and Global Consumer Growth Fund to the extent necessary to ensure that ordinary operating expenses (including 12b-1 fees, where applicable, but excluding interest, brokerage commissions, acquired fund fees and extraordinary expenses) do not exceed annually 1.60%, of the respective Fund’s Class A Shares average daily net assets, and 1.35% of the respective Fund’s Institutional Class Shares average daily net assets. Additionally, the Adviser may recover expenses paid in excess of the cap on expenses for the three previous years, as long as the recovery does not cause the Funds to exceed such cap on expenses. For the year ended October 31, 2013, the Adviser waived investment advisory fees and other expenses totaling $69,202, $76,551 and $63,885 for the Realty Income and Growth Fund, Emerging Markets Real Estate Fund and Global Consumer Growth Fund, respectively. The expense limitations will remain in effect for the Funds through February 28, 2014 unless and until the Board of the Equity Trust approves their modification or termination with respect to the Funds. Waived expenses subject to potential recovery by year of expiration are as follows:
| | | | Realty Income & | | Emerging Markets | | Global | | Global Consumer |
| | Years of Expiration | | Growth Fund | | Real Estate Fund | | Infrastructure Fund | | Growth Fund |
| | 10/31/2014 | | | $ | — | | | | $ | 48,844 | | | | $ | 27,165 | | | | $ | 26,927 | |
| | 10/31/2015 | | | | — | | | | | 65,965 | | | | | — | | | | | 84,997 | |
| | 10/31/2016 | | | | 69,202 | | | | | 76,551 | | | | | — | | | | | 63,885 | |
The Adviser makes payments to intermediaries that provide omnibus account services, sub-accounting services and/or networking services with respect to the Funds. On February 2, 2012, the Board approved, subject to certain limitations, the reimbursement to the Adviser by the appropriate Fund, of up to a certain percentage of such fees paid by the Adviser to intermediaries that provide omnibus account services, sub-accounting services, and/or networking services. Reimbursement of these fees are subject to review by the Board and are included in the transfer agent fees in the Statements of Operations. The International Real Estate Fund, Realty Income and Growth Fund, Cyclical Advantage Property Fund, Emerging Markets Real Estate Fund and Global Infrastructure Fund incurred $400,905, $158,955, $54,621, $1,646 and $17,460 respectively, in reimbursements to the Adviser.
State Street Bank and Trust Company (“SSBT”) serves as the Funds’ administrator pursuant to an Administration Agreement with the Funds. As compensation for its services to the Funds, SSBT receives an annual administration fee of 0.02% of total net assets on the first $5 billion and 0.015% on total net assets exceeding $5 billion, computed daily and payable monthly.
During the year ended October 31, 2013, the Funds engaged in purchase and sale transactions with funds that have a common investment adviser (or affiliated investment advisers), common Directors/Trustees and/or common Officers. These purchase and sale transactions complied with Rule 17a-7 under the 1940 Act and were as follows:
| | | | Purchases | | Sales |
| | International Real Estate Equity Fund | | $— | | $4,631,355 |
| 7. | Transactions with Affiliates: |
The following issuers are affiliated with the International Real Estate Equity Fund; that is, the Fund held 5% or more of the outstanding voting securities during the year ended October 31, 2013. As defined in Section (2)(a)(3) of the Investment Company Act of 1940, such issuers are:
| | Issuer Name | | Shares at
October 31, 2012 | | Purchases | | Sales | | Shares at
October 31, 2013 | | Value at
October 31, 2013 | | Realized
Loss |
| | Yatra Capital, Ltd. | | 1,443,695 | | — | | 117,864 | | 1,325,831 | | $5,625,456 | | $(1,025,080) |
92
Alpine Mutual Funds
Notes to Financial Statements—Continued
October 31, 2013
| 8. | Concentration of Risk: |
| | |
| | The Funds invest a substantial amount of their assets in the equity securities of issuers engaged in the real estate industry, including real estate investment trusts (REITs). As a result, the Funds may be more affected by economic developments in the real estate industry than would a general equity fund. |
| | |
| 9. | Federal Income Tax Information: |
| | |
| | At October 31, 2013, the components of distributable earnings on a tax basis were as follows: |
| | | | International Real
Estate Equity Fund | | Realty Income &
Growth Fund | | Cyclical Advantage
Property Fund |
| | Undistributed ordinary income | | | $ | 399,345 | | | | $ | — | | | | $ | 1,075,650 | |
| | Accumulated capital gain/(loss) | | | | (1,097,008,705 | ) | | | | — | | | | | (53,000,137 | ) |
| | Unrealized appreciation/(depreciation) | | | | (30,358,824 | ) | | | | 31,712,350 | | | | | 13,575,573 | |
| | Total | | | $ | (1,126,968,184 | ) | | | $ | 31,712,350 | | | | $ | (38,348,914 | ) |
| | | | | | | | | | | | | | | | | |
| | | | Emerging Markets
Real Estate Fund | | Global
Infrastructure Fund | | Global Consumer
Growth Fund |
| | Undistributed ordinary income | | | $ | 111,032 | | | | $ | 1,781,502 | | | | $ | 7,028 | |
| | Accumulated capital gain/(loss) | | | | 62,929 | | | | | 1,570,778 | | | | | (53,266 | ) |
| | Unrealized appreciation/(depreciation) | | | | (181,237 | ) | | | | 15,809,386 | | | | | 630,277 | |
| | Total | | | $ | (7,276 | ) | | | $ | 19,161,666 | | | | $ | 584,039 | |
| | | | | | | | | | | | | | | | | |
| | Tax components of distributable earnings are determined in accordance with income tax regulations which may differ from the composition of net assets reported under GAAP. Accordingly, for the year ended October 31, 2013, the effects of certain differences were reclassified as follows: |
| | |
| | Fund | | Capital Stock | | Accumulated
net investment
income (loss) | | Accumulated
net realized
gains (losses) |
| | International Real Estate Equity Fund | | | $ | — | | | | $ | 1,526,897 | | | | $ | (1,526,897 | ) |
| | Realty Income & Growth Fund | | | | (574,552 | ) | | | | 1,122,463 | | | | | (547,911 | ) |
| | Cyclical Advantage Property Fund | | | | (1,593 | ) | | | | 6,210 | | | | | (4,617 | ) |
| | Emerging Markets Real Estate Fund | | | | — | | | | | 58,048 | | | | | (58,048 | ) |
| | Global Infrastructure Fund | | | | 25,004 | | | | | 163,100 | | | | | (188,104 | ) |
| | Global Consumer Growth Fund | | | | — | | | | | 2,119 | | | | | (2,119 | ) |
| | | | | | | | | | | | | | | | | |
| | As of October 31, 2013, net unrealized appreciation/(depreciation) of investments, excluding foreign currency, based on Federal tax costs was as follows: |
| | |
| | | | International Real
Estate Equity Fund | | Realty Income &
Growth Fund | | Cyclical Advantage
Property Fund |
| | Cost of investments | | | $ | 238,334,737 | | | | $ | 73,892,591 | | | | $ | 50,420,018 | |
| | Gross unrealized appreciation | | | | 58,560,384 | | | | | 32,656,953 | | | | | 16,133,654 | |
| | Gross unrealized depreciation | | | | (88,083,567 | ) | | | | (944,613 | ) | | | | (2,569,234 | ) |
| | Net unrealized appreciation (depreciation) | | | | (29,523,183 | ) | | | | 31,712,340 | | | | | 13,564,420 | |
| | | | | | | | | | | | | | | | | |
| | | | Emerging Markets
Real Estate Fund | | Global
Infrastructure Fund | | Global Consumer
Growth Fund |
| | Cost of investments | | | $ | 9,934,248 | | | | $ | 130,335,740 | | | | $ | 2,238,935 | |
| | Gross unrealized appreciation | | | | 580,665 | | | | | 18,996,680 | | | | | 782,739 | |
| | Gross unrealized depreciation | | | | (762,121 | ) | | | | (2,895,361 | ) | | | | (152,490 | ) |
| | Net unrealized appreciation (depreciation) | | | | (181,456 | ) | | | | 16,101,319 | | | | | 630,249 | |
93
Alpine Mutual Funds
Notes to Financial Statements—Continued
October 31, 2013
| | The tax basis of investments for tax and financial reporting purposes differs principally due to the deferral of losses on wash sales, partnership tax adjustments, and mark-to-market cost basis adjustments for investments in passive foreign investment companies (PFICs) for tax purposes. |
| | |
| | The tax character of distributions paid during the years ended October 31, 2013 and 2012 were as follows: |
| | | | 2013 | | | 2012 | | |
| | International Real Estate Equity Fund | | | | | | | | | |
| | Ordinary income | | $ | 1,295,638 | | | $ | 8,892,777 | | |
| | Long-term capital gain | | | — | | | | — | | |
| | | | $ | 1,295,638 | | | $ | 8,892,777 | | |
| | Realty Income & Growth Fund | | | | | | | | | |
| | Ordinary income | | $ | 3,765,432 | | | $ | 4,526,628 | | |
| | Long-term capital gain | | | 559,428 | | | | — | | |
| | | | $ | 4,324,860 | | | $ | 4,526,628 | | |
| | Cyclical Advantage Property Fund | | | | | | | | | |
| | Ordinary income | | $ | 523,183 | | | $ | 251,458 | | |
| | Long-term capital gain | | | — | | | | — | | |
| | | | $ | 523,183 | | | $ | 251,458 | | |
| | Emerging Markets Real Estate Fund | | | | | | | | | |
| | Ordinary income | | $ | 58,886 | | | $ | — | | |
| | Long-term capital gain | | | — | | | | — | | |
| | | | $ | 58,886 | | | $ | — | | |
| | Global Infrastructure Fund | | | | | | | | | |
| | Ordinary income | | $ | 3,526,250 | | | $ | 1,775,501 | | |
| | Long-term capital gain | | | — | | | | — | | |
| | | | $ | 3,526,250 | | | $ | 1,775,501 | | |
| | Global Consumer Growth Fund | | | | | | | | | |
| | Ordinary income | | $ | 9,703 | | | $ | 7,862 | | |
| | Long-term capital gain | | | — | | | | — | | |
| | | | $ | 9,703 | | | $ | 7,862 | | |
| | During the year ended October 31, 2013, the International Real Estate Equity Fund, Realty Income & Growth Fund, Cyclical Advantage Property Fund, Emerging Markets Real Estate Fund and Global Infrastructure Fund utilized $2,412,730, $4,603,113, $1,621,372, $113,560 and $504,403 of capital loss carryovers, respectively. Capital loss carryovers as of October 31, 2013 are as follows: |
| | Expiration Date | | International Real
Estate Equity Fund | | Realty Income &
Growth Fund | | Cyclical Advantage
Property Fund | |
| | 10/31/2015 | | | $ | — | | | | $ | — | | | | $ | — | | |
| | 10/31/2016 | | | $ | 384,892,332 | | | | $ | — | | | | $ | 17,975,541 | | |
| | 10/31/2017 | | | $ | 546,087,879 | | | | $ | — | | | | $ | 26,502,747 | | |
| | 10/31/2018 | | | $ | 65,121,028 | | | | $ | — | | | | $ | 8,521,849 | | |
| | 10/31/2019 | | | $ | 63,938,162 | | | | $ | — | | | | $ | — | | |
94
Alpine Mutual Funds
Notes to Financial Statements—Continued
October 31, 2013
| | Expiration Date | | Emerging Markets
Real Estate Fund | | Global
Infrastructure
Fund | | Global
Consumer
Growth Fund | |
| | 10/31/2015 | | | $ | — | | | | $ | — | | | | $ | — | | |
| | 10/31/2016 | | | $ | — | | | | $ | — | | | | $ | — | | |
| | 10/31/2017 | | | $ | — | | | | $ | — | | | | $ | — | | |
| | 10/31/2018 | | | $ | — | | | | $ | — | | | | $ | — | | |
| | 10/31/2019 | | | $ | — | | | | $ | — | | | | $ | — | | |
Under the Regulated Investment Company (“RIC”) Modernization Act of 2010 (“the Modernization Act”), post-enactment capital losses that are carried forward will retain their character as either short-term or long-term capital losses rather than being considered all short-term as under previous law. However, any losses incurred during those future taxable years will be required to be utilized prior to the losses incurred in pre-enactment taxable years, which carry an expiration date. As a result of this ordering rule, pre-enactment capital loss carryovers may be more likely to expire unused. Capital loss carryover as of October 31, 2013 with no expiration are as follows:
| | Fund | | Short Term | | Long Term | |
| | International Real Estate Equity Fund | | | $ | — | | | | $ | 36,969,304 | | |
| | Global Consumer Growth Fund | | | $ | 53,266 | | | | $ | — | | |
In accordance with U.S. GAAP, the Funds have previously adopted accounting standards related to the accounting for uncertain tax positions. In accordance with this guidance, the Funds analyzed all open tax years, as defined by the Statute of Limitations, for all major jurisdictions. Open tax years are those that are open for exam by taxing authorities. Major jurisdictions for the Funds included Federal and the state of New York.
The Funds have reviewed all open tax years and major jurisdictions and concluded that there is no impact on the Funds’ net assets and no tax liability resulting from unrecognized tax benefits relating to uncertain income tax positions taken in previous years or expected to be taken on the tax return for the fiscal year-end October 31, 2013. Also, the Funds have recognized no interest and penalties related to uncertain tax benefits. The Funds are also not aware of any tax positions for which it is reasonably possible that the total amounts of unrecognized tax benefits will significantly change in the next twelve months.
| 10. | Recent Accounting Pronouncement: |
On December 16, 2011, the Financial Accounting Standards Board (“FASB”) issued Accounting Standards Update No. 2011-11, “Disclosures about Offsetting Assets and Liabilities” (“ASU 2011-11”), as clarified with ASU 2013-01 “Clarifying the Scope of Disclosures about Offsetting Assets and Liabilities” issued in January 2013. ASU 2011-11 amends FASB Accounting Standards Codification Topic 210, specifically requiring an entity to disclose information about offsetting and related arrangements and the effect those arrangements have on the financial position. ASU 2011-11 is effective in annual reporting beginning on or after January 1, 2013, and for interim periods within those annual reporting periods. Management is currently evaluating the implications of these changes and their impact on the financial statements.
Distributions: The Emerging Markets Real Estate Fund — Institutional Class and Class A paid a distribution from long-term capital gains of $0.1497 on December 6, 2013 to shareholders of record on December 5, 2013. The Global Infrastructure Fund — Institutional Class and Class A paid a distribution from short-term capital gains of $0.1525 and from long-term capital gains of $0.1953 on December 6, 2013 to shareholders of record on December 5, 2013.
95
Alpine Mutual Funds
Report of Independent Registered Public Accounting Firm
To the Shareholders and Board of Trustees of
Alpine Equity Trust:
We have audited the accompanying statements of assets and liabilities, including the schedules of portfolio investments, of Alpine Equity Trust (the “Funds”), comprising the Alpine International Real Estate Equity Fund, Alpine Realty Income & Growth Fund, Alpine Cyclical Advantage Property Fund, Alpine Emerging Markets Real Estate Fund, Alpine Global Infrastructure Fund, and Alpine Global Consumer Growth Fund as of October 31, 2013, and the related statements of operations for the year then ended, the statements of changes in net assets for each of the two years in the period then ended, and the financial highlights for each of the periods presented. These financial statements and financial highlights are the responsibility of the Funds’ management. Our responsibility is to express an opinion on these financial statements and financial highlights based on our audits.
We conducted our audits in accordance with the standards of the Public Company Accounting Oversight Board (United States). Those standards require that we plan and perform the audit to obtain reasonable assurance about whether the financial statements and financial highlights are free of material misstatement. The Funds are not required to have, nor were we engaged to perform, an audit of their internal control over financial reporting. Our audits included consideration of internal control over financial reporting as a basis for designing audit procedures that are appropriate in the circumstances, but not for the purpose of expressing an opinion on the effectiveness of the Funds’ internal control over financial reporting. Accordingly, we express no such opinion. An audit also includes examining, on a test basis, evidence supporting the amounts and disclosures in the financial statements, assessing the accounting principles used and significant estimates made by management, as well as evaluating the overall financial statement presentation. Our procedures included confirmation of securities owned as of October 31, 2013, by correspondence with the custodian and brokers; where replies were not received from brokers, we performed other auditing procedures. We believe that our audits provide a reasonable basis for our opinion.
In our opinion, the financial statements and financial highlights referred to above present fairly, in all material respects, the financial positions of Alpine International Real Estate Equity Fund, Alpine Realty Income & Growth Fund, Alpine Cyclical Advantage Property Fund, Alpine Emerging Markets Real Estate Fund, Alpine Global Infrastructure Fund, and Alpine Global Consumer Growth Fund of Alpine Equity Trust, as of October 31, 2013, the results of their operations for the year then ended, the changes in their net assets for each of the two years in the period then ended, and the financial highlights for each of the periods presented, in conformity with accounting principles generally accepted in the United States of America.

Princeton, New Jersey
December 30, 2013
96
Alpine Mutual Funds
Information about your Funds Expenses (unaudited)
October 31, 2013
Fund expenses (unaudited)
Example
As a shareholder of the Fund, you may incur two types of costs: (1) transaction costs, including front-end on purchase payments; and (2) ongoing costs, including management fees; service and/or distribution (12b-1) fees; and other Fund expenses. This example is intended to help you understand your ongoing costs (in dollars) of investing in the Fund and to compare these costs with the ongoing costs of investing in other mutual funds. This example is based on an investment of $1,000 invested on May 1, 2013 and held for the six months ended October 31, 2013.
Actual Expenses
The table below titled “Based on Actual Total Return” provides information about actual account values and actual expenses. You may use the information provided in this table, together with the amount you invested, to estimate the expenses that you paid over the period. To estimate the expenses you paid on your account, divide your ending account value by $1,000 (for example, an $8,600 ending account value divided by $1,000 = 8.6), then multiply the result by the number under the heading entitled “Expenses Paid During the Period”.
Hypothetical Example for Comparison Purposes
The table below titled “Based on Hypothetical Total Return” provides information about hypothetical account values and hypothetical expenses based on the actual expense ratio and an assumed rate of return of 5.00% per year before expenses, which is not the Fund’s actual return. The hypothetical account values and expenses may not be used to estimate the actual ending account balance or expenses you paid for the period. You may use the information provided in this table to compare the ongoing costs of investing in the Fund and other funds. To do so, compare the 5.00% hypothetical example relating to the Fund with the 5.00% hypothetical examples that appear in the shareholder reports of the other funds.
Please note that the expenses shown in the table below are meant to highlight your ongoing costs only and do not reflect any transactional costs, such as front-end or back-end sales charges (loads). Therefore, the table is useful in comparing ongoing costs only, and will not help you determine the relative total costs of owning different funds. In addition, if these transaction costs were included, your costs would have been higher.
International Real Estate Equity Fund
| Based on actual total return(1) | | | | |
| | | Actual Total | | | | | | Annualized | | Expenses |
| | | Return Without | | Beginning | | Ending | | Expense | | Paid During |
| Class | | Sales Charges (2) | | Account Value | | Account Value | | Ratio | | the Period (3) |
| | | | | | | | | | | |
| Class A | | (10.39)% | | $1,000.00 | | $896.10 | | 1.74% | | $8.32 |
| Institutional | | (5.04)% | | $1,000.00 | | $949.60 | | 1.50% | | $7.37 |
| | | | | | | | | | | |
| Based on hypothetical total return (1) | | | | |
| | | Hypothetical | | | | | | Annualized | | Expenses |
| | | Annualized | | Beginning | | Ending | | Expense | | Paid During |
| Class | | Total Return | | Account Value | | Account Value | | Ratio | | the Period (4) |
| | | | | | | | | | | |
| Class A | | 5.00% | | $1,000.00 | | $1,016.43 | | 1.74% | | $8.84 |
| Institutional | | 5.00% | | $1,000.00 | | $1,017.64 | | 1.50% | | $7.63 |
| | | | | | | | | | | |
| Realty Income & Growth Fund | | | | |
| | | | | | | | | | | |
| Based on actual total return (1) | | | | |
| | | Actual Total | | | | | | Annualized | | Expenses |
| | | Return Without | | Beginning | | Ending | | Expense | | Paid During |
| Class | | Sales Charges (2) | | Account Value | | Account Value | | Ratio | | the Period (3) |
| | | | | | | | | | | |
| Class A | | (7.57)% | | $1,000.00 | | $924.30 | | 1.67% | | $8.10 |
| Institutional | | (7.51)% | | $1,000.00 | | $924.90 | | 1.43% | | $6.94 |
97
Alpine Mutual Funds
Information about your Funds Expenses (unaudited)—Continued
October 31, 2013
| Based on hypothetical total return (1) | | | | |
| | | Hypothetical | | | | | | Annualized | | Expenses |
| | | Annualized | | Beginning | | Ending | | Expense | | Paid During |
| Class | | Total Return | | Account Value | | Account Value | | Ratio | | the Period (4) |
| | | | | | | | | | | |
| Class A | | 5.00% | | $1,000.00 | | $1,016.79 | | 1.67% | | $8.49 |
| Institutional | | 5.00% | | $1,000.00 | | $1,018.00 | | 1.43% | | $7.27 |
| | | | | | | | | | | |
| Cyclical Advantage Property Fund | | | | |
| | | | | | | | | | | |
| Based on actual total return (1) | | | | |
| | | Actual Total | | | | | | Annualized | | Expenses |
| | | Return Without | | Beginning | | Ending | | Expense | | Paid During |
| Class | | Sales Charges (2) | | Account Value | | Account Value | | Ratio | | the Period (3) |
| | | | | | | | | | | |
| Institutional | | (1.35)% | | $1,000.00 | | $986.50 | | 1.45% | | $7.26 |
| | | | | | | | | | | |
| Based on hypothetical total return (1) | | | | |
| | | Hypothetical | | | | | | Annualized | | Expenses |
| | | Annualized | | Beginning | | Ending | | Expense | | Paid During |
| Class | | Total Return | | Account Value | | Account Value | | Ratio | | the Period (4) |
| | | | | | | | | | | |
| Institutional | | 5.00% | | $1,000.00 | | $1,017.90 | | 1.45% | | $7.38 |
| | | | | | | | | | | |
| Emerging Markets Real Estate Fund | | | | |
| | | | | | | | | | | |
| Based on actual total return (1) | | | | |
| | | Actual Total | | | | | | Annualized | | Expenses |
| | | Return Without | | Beginning | | Ending | | Expense | | Paid During |
| Class | | Sales Charges (2) | | Account Value | | Account Value | | Ratio | | the Period (3) |
| | | | | | | | | | | |
| Class A | | (14.04)% | | $1,000.00 | | $859.60 | | 1.60% | | $7.50 |
| Institutional | | (13.92)% | | $1,000.00 | | $860.80 | | 1.35% | | $6.33 |
| | | | | | | | | | | |
| Based on hypothetical total return (1) | | | | |
| | | Hypothetical | | | | | | Annualized | | Expenses |
| | | Annualized | | Beginning | | Ending | | Expense | | Paid During |
| Class | | Total Return | | Account Value | | Account Value | | Ratio | | the Period (4) |
| | | | | | | | | | | |
| Class A | | 5.00% | | $1,000.00 | | $1,017.14 | | 1.60% | | $8.13 |
| Institutional | | 5.00% | | $1,000.00 | | $1,018.40 | | 1.35% | | $6.87 |
| | | | | | | | | | | |
| Global Infrastructure Fund | | | | |
| | | | | | | | | | | |
| Based on actual total return (1) | | | | |
| | | Actual Total | | | | | | Annualized | | Expenses |
| | | Return Without | | Beginning | | Ending | | Expense | | Paid During |
| Class | | Sales Charges (2) | | Account Value | | Account Value | | Ratio | | the Period (3) |
| | | | | | | | | | | |
| Class A | | 5.96% | | $1,000.00 | | $1,059.60 | | 1.50% | | $7.79 |
| Institutional | | 6.02% | | $1,000.00 | | $1,060.20 | | 1.25% | | $6.49 |
| | | | | | | | | | | |
| Based on hypothetical total return (1) | | | | |
| | | Hypothetical | | | | | | Annualized | | Expenses |
| | | Annualized | | Beginning | | Ending | | Expense | | Paid During |
| Class | | Total Return | | Account Value | | Account Value | | Ratio | | the Period (4) |
| | | | | | | | | | | |
| Class A | | 5.00% | | $1,000.00 | | $1,017.64 | | 1.50% | | $7.63 |
| Institutional | | 5.00% | | $1,000.00 | | $1,018.90 | | 1.25% | | $6.36 |
98
Alpine Mutual Funds
Information about your Funds Expenses (unaudited)—Continued
October 31, 2013
| Global Consumer Growth Fund | | | | |
| | | | | | | | | | | |
| Based on actual total return (1) | | | | |
| | | Actual Total | | | | | | Annualized | | Expenses |
| | | Return Without | | Beginning | | Ending | | Expense | | Paid During |
| Class | | Sales Charges (2) | | Account Value | | Account Value | | Ratio | | the Period (3) |
| | | | | | | | | | | |
| Class A | | 8.36% | | $1,000.00 | | $1,083.60 | | 1.60% | | $8.40 |
| Institutional | | 8.43% | | $1,000.00 | | $1,084.30 | | 1.35% | | $7.09 |
| | | | | | | | | | | |
| Based on hypothetical total return (1) | | | | |
| | | Hypothetical | | | | | | Annualized | | Expenses |
| | | Annualized | | Beginning | | Ending | | Expense | | Paid During |
| Class | | Total Return | | Account Value | | Account Value | | Ratio | | the Period (4) |
| | | | | | | | | | | |
| Class A | | 5.00% | | $1,000.00 | | $1,017.14 | | 1.60% | | $8.13 |
| Institutional | | 5.00% | | $1,000.00 | | $1,018.40 | | 1.35% | | $6.87 |
| (1) | For the six months ended October 31, 2013. |
| (2) | Assumes the reinvestment of all distributions, including returns of capital, if any, at net asset value and does not reflect the deduction of the applicable sales charge. Total return is not annualized, as it may not be representative of the total return for the year. Performance figures may reflect fee waivers and/or expense reimbursements. In the absence of fee waivers and/or expense reimbursements, the total return would have been lower. Past performance is no guarantee of future results. |
| (3) | Expenses (net of fee waivers and/or expense reimbursements) are equal to each class’ respective annualized expense ratio multiplied by the average account value over the period, multiplied by the number of days in the most recent fiscal half-year then divided by 365. |
| (4) | Hypothetical expense examples assume a 5% return return over a hypothetical 365 day period. |
99
Alpine Mutual Funds
Additional Information (unaudited)
October 31, 2013
Independent Trustees
| Name and Age | | Position(s)
Held with
the Trust | | Term of Office
and Length of
Time Served | | Principal Occupation During
Past Five Years | | | # of
Portfolios in
Fund
Complex* | | | Other Directorships
Held by Trustee |
| | | | | | | | | | | | | |
| H. Guy Leibler (59) | | Independent Trustee | | Indefinite, since the Trust’s inception | | Private investor, since 2007; Vice Chair & Chief Operating Officer of L&L Acquisitions, LLC (2004-2007); President, Skidmore, Owings & Merrill LLP (2001-2004). | | | 18 | | | Chairman Emeritus, White Plains Hospital Center; Trustee, each of the Alpine Trusts. |
| Jeffrey E. Wacksman (53) | | Independent Trustee | | Indefinite, since 2004 | | Partner, Loeb, Block & Partners LLP, since 1994. | | | 18 | | | Director, International Succession Planning Association; Director, Bondi Icebergs Inc. (Women’s Sports- wear); Director, MH Properties, Inc.; Trustee, each of the Alpine Trusts. |
| James A. Jacobson (68) | | Independent Trustee | | Indefinite, since July 2009 | | Retired, since November 2008; Vice Chairman and Managing Director, Spear Leeds & Kellogg Specialists, LLC, January 2003 to November 2008. | | | 18 | | | Trustee, Allianz Global Investors Multi-Funds. Trustee, each of the Alpine Trusts. |
| Eleanor T.M. Hoagland (62) | | Independent Trustee | | Indefinite, since October 2012 | | Principal, VCS Advisory, LLC (since 2011); Chief Compliance Officer and Senior Managing Director of Magni Asset Management LLC (since 2011) and Park Fifth Capital Management LLC (2011-2013); Vice President (2008-2010) and CCO (2009-2010), Ameriprise Financial Inc.; Managing Director (2000-2008) and CCO (2004-2008), J. & W. Seligman & Co. Incorporated. | | | 18 | | | Trustee of each of the Alpine Trusts. |
| * | | The term “Fund Complex” refers to the Funds in the Alpine Equity Trust, Alpine Series Trust, and Alpine Income Trust, and Alpine Global Dynamic Dividend Fund, Alpine Total Dynamic Dividend Fund, and Alpine Global Premier Properties Fund (the “Alpine Trusts”). |
100
Alpine Mutual Funds
Additional Information (unaudited)—Continued
October 31, 2013
Interested Trustees & Officers
| Name and Age | | Position(s)
Held with
the Trust | | Term of Office
and Length of
Time Served | | Principal Occupation During
Past Five Years | | # of
Portfolios in
Fund
Complex** | | | Other Directorships
Held by Trustee |
| Samuel A. Lieber* (57) | | Interested Trustee, President and Portfolio Manager | | Indefinite, since the Trust’s inception | | CEO of Alpine Woods Capital Investors, LLC since November 1997. President of Alpine Trusts since 1998. | | | 18 | | | Trustee, each of the Alpine Trusts. |
| Stephen A. Lieber*** (88) | | Vice President and Portfolio Manager | | Indefinite, since the Trust’s inception | | Chief Investment Officer, Alpine Woods Capital Investors, LLC since 2003; Chairman and Senior Portfolio Manager, Saxon Woods Advisors, LLC since 1999. | | | 18 | | | None |
| Kenneth Corrado (49) | | Chief Compliance Officer | | Indefinite, since July 2013 | | Chief Compliance Officer, Alpine Woods Capital Investors, LLC since July 2013; Independent Compliance Consultant (2012-2013); Vice President and Deputy Chief Compliance Officer, Artio Global Management, LLC (2007- 2012); Vice President and Chief Compliance Officer, BNY Asset Management (2000-2007), Compliance Officer, Prudential Insurance Company of America (1995-2000), Operations Manager, Prudential Insurance Company of America (1988-1995). | | | 18 | | | None |
| Ronald Palmer (45) | | Chief Financial Officer and Treasurer | | Indefinite, since January 2010 | | Chief Financial Officer, Alpine Woods Capital Investors, LLC since January 2010; Independent Consultant (2008-2009); Vice President, Cash Management and Foreign Exchange, Macquarie Capital Investment Management, LLC (2007-2008); Chief Operating Officer, Macquarie Fund Adviser, LLC (2004-2007). | | | 18 | | | None |
| Andrew Pappert (33) | | Secretary | | Indefinite, since March 2009 | | Director of Fund Operations, Alpine Woods Capital Investors, LLC since September 2008; Assistant Vice President, Mutual Fund Operations, Credit Suisse Asset Management, LLC (2003-2008). | | | 18 | | | None |
| * | | Denotes Trustees who are “interested persons” of the Trust or Fund under the 1940 Act. |
| ** | | The term “Fund Complex” refers to the Funds in the Alpine Equity Trust, Alpine Series Trust, and Alpine Income Trust, and Alpine Global Dynamic Dividend Fund, Alpine Total Dynamic Dividend Fund, and Alpine Global Premier Properties Fund (the “Alpine Trusts”). |
| *** | | Stephen A. Lieber is the father of Samuel A. Lieber. |
Further information regarding the Funds’ Trustees is also available in the Funds’ Statement of Additional Information, which can be obtained without charge by calling 1-888-785-5578.
101
Alpine Mutual Funds
Additional Information (unaudited)—Continued
October 31, 2013
Tax Information
The Funds designated the following percentages of dividends declared from net investment income for the fiscal year ended October 31, 2013 as qualified dividend income under the Jobs & Growth Tax Relief Reconciliation Act of 2003.
| International Real Estate Equity Fund | | | 100 | % |
| Realty Income & Growth Fund | | | 1 | % |
| Cyclical Advantage Property Fund | | | 47 | % |
| Emerging Markets Real Estate Fund | | | 39 | % |
| Global Infrastructure Fund | | | 48 | % |
| Global Consumer Growth Fund | | | 100 | % |
The Funds designated the following percentages of dividends declared during the fiscal year ended October 31, 2013 as dividends qualifying for the dividends received deduction available to corporate shareholders.
| International Real Estate Equity Fund | | | 0 | % |
| Realty Income & Growth Fund | | | 2 | % |
| Cyclical Advantage Property Fund | | | 1 | % |
| Emerging Markets Real Estate Fund | | | 0 | % |
| Global Infrastructure Fund | | | 20 | % |
| Global Consumer Growth Fund | | | 100 | % |
The Funds designated the following percentages of taxable ordinary income distributions as short-term capital gain distributions under Internal Revenue Section 871(k)(2)(C).
| International Real Estate Equity Fund | | | 0 | % |
| Realty Income & Growth Fund | | | 0 | % |
| Cyclical Advantage Property Fund | | | 0 | % |
| Emerging Markets Real Estate Fund | | | 0 | % |
| Global Infrastructure Fund | | | 0 | % |
| Global Consumer Growth Fund | | | 0 | % |
The Funds designated as long-term capital gain dividend, pursuant to Internal Revenue Code Section 852(b)(3), the amount necessary to reduce the earnings and profits of the Funds related to net capital gain to zero for the tax year ended October 31, 2013.
Availability of Proxy Voting Information
Information regarding how each Fund votes proxies relating to portfolio securities is available without charge upon request by calling toll-free at 1-888-785-5578 and on the SEC’s website at www.sec.gov. Information regarding how each Fund voted proxies relating to portfolio securities during the most recent twelve month period ended June 30 is available on the SEC’s website at www.sec.gov or by calling the toll-free number listed above.
Availability of Quarterly Portfolio Schedule
Beginning with each Fund’s fiscal quarter ended July 31, 2004, each Fund filed its complete schedules of portfolio holdings on Form N-Q with the SEC. Going forward, each Fund will file Form N-Q for the first and third quarters of each fiscal year on Form N-Q. Each Fund’s Form N-Q is available on the SEC’s website at www.sec.gov and may be reviewed and copied at the SEC’s Public Reference Room in Washington, DC. Information on the operation of the Public Reference Room may be obtained by calling 1-202-551-8090.
102
Alpine Mutual Funds
Additional Information (unaudited)—Continued
October 31, 2013
Privacy Policy
The Funds collect non-public information about you from the following sources:
| | • | information we receive about you on applications or other forms; |
| | • | information you give us orally; and |
| | • | information about your transactions with others or us. |
The Funds do not disclose any non-public personal information about our customers or former customers without the customer’s authorization, except as required by law or in response to inquiries from governmental authorities. The Funds restrict access to your personal and account information to those employees who need to know that information to provide products and services to you. The Funds also may disclose that information to unaffiliated third parties (such as to brokers or custodians) only as permitted by law and only as needed for us to provide agreed services to you. The Funds maintain physical, electronic and procedural safeguards to guard your non-public personal information.
In the event that you hold shares of the Funds through a financial intermediary, including, but not limited to a broker dealer, bank or trust company, the privacy policy of your financial intermediary would govern how your non-public personal information would be shared with unaffiliated third parties.
103
TRUSTEES
Samuel A. Lieber
Eleanor T.M. Hoagland
James A. Jacobson
H. Guy Leibler
Jeffrey E. Wacksman
CUSTODIAN &
ADMINISTRATOR
State Street Bank & Trust Company
One Lincoln Street
Boston, MA 02111
INDEPENDENT REGISTERED
PUBLIC ACCOUNTING FIRM
Deloitte & Touche LLP
500 College Road East
Princeton, NJ 08540
FUND COUNSEL
Willkie Farr & Gallagher LLP
787 7th Avenue
New York, NY 10019
DISTRIBUTOR
Quasar Distributors, LLC
615 East Michigan Street
Milwaukee, WI 53202
INVESTMENT ADVISER
Alpine Woods Capital Investors, LLC
2500 Westchester Ave., Suite 215
Purchase, NY 10577
TRANSFER AGENT
Boston Financial Data Services
Two Heritage Drive
North Quincy, MA 02171

SHAREHOLDER | INVESTOR INFORMATION
1(888)785.5578
www.alpinefunds.com
This material must be preceded or accompanied by a current prospectus.
Item 2. Code of Ethics.
(a) The Registrant, as of the end of the period covered by the report, has adopted a code of ethics that applies to the Registrant’s principal executive officer, principal financial officer, principal accounting officer or controller or persons performing similar functions.
(b) Not applicable.
(c) There have been no amendments, during the period covered by this report, to a provision of the code of ethics that applies to the Registrant’s principal executive officer, principal financial officer, principal accounting officer or controller, or persons performing similar functions and that relates to any element of the code of ethics described in Item 2(b) of Form N-CSR.
(d) The Registrant has not granted any waivers, including an implicit waiver, from a provision of the code of ethics that applies to the registrant’s principal executive officer, principal financial officer, principal accounting officer or controller, or persons performing similar functions that relates to any element of the code of ethics described in Item 2(b) of Form N-CSR.
(e) Not applicable.
(f) The Registrant’s Code of Ethics is attached as Exhibit 12(A)(1) hereto.
Item 3. Audit Committee Financial Expert.
(a)(1) The Board of Trustees of the Registrant has determined that the Registrant has at least one audit committee financial expert serving on its audit committee.
(a)(2) The Board of Trustees has determined that James A. Jacobson and H. Guy Leibler are audit committee financial experts. Messrs. Jacobson and Leibler are “independent” as defined in paragraph (a)(2) of Item 3 to Form N-CSR. It has been determined that Mr. Jacobson qualifies as an audit committee financial expert based on his extensive experience in the financial services industry, including serving for more than 15 years as a senior executive at a New York Stock Exchange (“NYSE”) specialist firm and as a member of the NYSE Board of Directors (including terms as Vice Chair), his other board service, as well as his educational background. It has been determined that Mr. Leibler qualifies as an audit committee financial expert based on his substantial experience as a senior executive of an operating company actively supervising principal financial officers in the preparation of financial statements, other board service, as well as his educational background.
(a)(3) Not applicable.
Item 4. Principal Accountant Fees and Services.
(a) Audit Fees: The aggregate fees billed for each of the last two fiscal years for professional services rendered by the principal accountant for the audit of the registrant’s annual financial statements or services that are normally provided by the accountant in connection with statutory and regulatory filings or engagements for fiscal year 2012 was $89,390 and for fiscal year 2013 was $200,774.
(b) Audit-Related Fees: The aggregate fees billed in each of the last two fiscal years for assurance and related services by the principal accountant that are reasonably related to the performance of the audit of the registrant’s financial statements and are not reported under paragraph (a) of this Item was $0 in fiscal year 2012 and $0 in fiscal year 2013.
(c) Tax Fees: The aggregate fees billed in each of the last two fiscal years for professional services rendered by the principal accountant for tax compliance, tax advice, and tax planning was $20,357 in fiscal year 2012 and $15,631 in fiscal year 2013.
(d) All Other Fees: The aggregate fees billed in each of the last two fiscal years for products and services provided by the principal accountant, other than the services reported in paragraphs (a) through (c) of this Item is $10,947 in fiscal year 2012 and $19,029 in fiscal year 2013. The fees were for consulting and advisory services regarding enterprise risk management.
(e)(1) Audit Committee Pre-Approval Policies and Procedures: All services to be performed by the Registrant’s principal auditors must be pre-approved by the Registrant’s audit committee, which may include the approval of certain services up to an amount determined by the audit committee. Any services that would exceed that amount would require additional approval of the audit committee.
(e)(2) No services described in paragraphs (b) through (d) were approved pursuant to paragraph (c)(7)(i)(C) of Rule 2-01 of Regulation S-X.
(f) Not applicable.
(g) The aggregate non-audit fees billed by the registrant’s accountant for services rendered to the registrant, and the registrant’s investment adviser, and any entity controlling, controlled by, or under common control with the adviser that provides ongoing services to the registrant was $109,474 in fiscal year 2012 and $190,297 in fiscal year 2013. The fees were for consulting and advisory services regarding enterprise risk management.
(h) Not applicable
Item 5. Audit Committee of Listed Registrants.
Not applicable to registrants who are not listed issuers (as defined in Rule 10A-3 under the Securities Exchange Act of 1934).
Item 6. Schedule of Investments.
| (a) | Schedule of Investments is included as part of Item 1 of the Form N-CSR. |
Item 7. Disclosure of Proxy Voting Policies and Procedures for Closed-End Management Investment Companies.
Not applicable to open-end investment management companies.
Item 8. Portfolio Managers of Closed-End Management Investment Companies.
Not applicable to open-end investment management companies.
Item 9. Purchases of Equity Securities by Closed-End Management Investment Company and Affiliated Purchasers.
Not applicable to open-end investment management companies.
Item 10. Submission of Matters to a Vote of Security Holders.
There were no material changes to the procedures by which shareholders may recommend nominees to the Registrant’s Board of Trustees.
Item 11. Controls and Procedures.
(a) The Registrant’s principal executive officer and principal financial officer have evaluated the Registrant’s disclosure controls and procedures (as defined in Rule 30a-3(c) under the Investment Company Act of 1940, as amended) within 90 days of this filing and have concluded that the registrant’s disclosure controls and procedures were effective, as of that date.
(b) There was no change in the Registrant’s internal control over financial reporting (as defined in Rule 30a-3(d) under the Investment Company Act of 1940, as amended) during the second fiscal quarter of the period covered by this report that has materially affected, or is reasonably likely to materially affect, the Registrant’s internal control over financial reporting.
Item 12. Exhibits.
(a)(1) The Code of Ethics that applies to the Registrant’s principal executive officer and principal financial officer is attached hereto as Exhibit 12.A.1.
(a)(2) The certifications required by Rule 30a-2(a) of the Investment Company Act of 1940, as amended, and Section 302 of the Sarbanes-Oxley Act of 2002 are attached hereto as Ex99.Cert.
(a)(3) Not applicable.
(b) The certifications by the Registrant’s Principal Executive Officer and Principal Financial Officer, as required by Rule 30a-2(b) of the Investment Company Act of 1940, as amended, and Section 906 of the Sarbanes-Oxley Act of 2002 are attached hereto as Ex99.906Cert.
SIGNATURES
Pursuant to the requirements of the Securities Exchange Act of 1934 and the Investment Company Act of 1940, the registrant has duly caused this report to be signed on its behalf by the undersigned, thereunto duly authorized.
Alpine Equity Trust
| By: | /s/ Samuel A. Lieber | |
| | Samuel A. Lieber | |
| | Chief Executive Officer (Principal Executive Officer) | |
Date: January 7, 2014
Pursuant to the requirements of the Securities Exchange Act of 1934 and the Investment Company Act of 1940, this report has been signed below by the following persons on behalf of the registrant and in the capacities and on the dates indicated.
| By: | /s/ Samuel A. Lieber | |
| | Samuel A. Lieber | |
| | Chief Executive Officer (Principal Executive Officer) | |
| By: | /s/ Ronald G. Palmer, Jr. | |
| | Ronald G. Palmer, Jr. | |
| | Chief Financial Officer (Principal Financial Officer) | |
Date: January 7, 2014