UNITED STATES
SECURITIES AND EXCHANGE COMMISSION
Washington, D.C. 20549
FORM N-CSR
CERTIFIED SHAREHOLDER REPORT OF REGISTERED
MANAGEMENT INVESTMENT COMPANIES
Investment Company Act file number: 811-05684
Alpine Equity Trust
(Exact name of registrant as specified in charter)
2500 Westchester Avenue, Suite 215
Purchase, New York 10577
(Address of principal executive offices)(Zip code)
| | (Name and Address of Agent for Service) | Copy to: | |
| | | | |
| | Samuel A. Lieber
Alpine Woods Capital Investors, LLC
2500 Westchester Avenue, Suite 215
Purchase, New York 10577 | Rose DiMartino
Attorney at Law
Willkie Farr & Gallagher
787 7th Avenue, 40th Floor
New York, New York 10019 | |
Registrant’s telephone number, including area code: (914) 251-0880
Date of fiscal year end: October 31
Date of reporting period: November 1, 2014 - October 31, 2015
Item 1: Shareholder Report

Real Estate Funds
Alpine International Real Estate Equity Fund
Institutional Class (EGLRX)
Class A (EGALX) | | Alpine Emerging Markets Real Estate Fund
Institutional Class (AEMEX)
Class A (AEAMX) |
| | | |
Alpine Realty Income & Growth Fund
Institutional Class (AIGYX)
Class A (AIAGX) | | Alpine Global Infrastructure Fund
Institutional Class (AIFRX)
Class A (AIAFX) |
October 31,
2015
Annual Report
Table of Contents
Additional Alpine Funds are offered in the Alpine Series Trust and Alpine Income Trust. These Funds include:
| Alpine Dynamic Dividend Fund | Alpine Small Cap Fund |
| | |
| Alpine Rising Dividend Fund | Alpine Ultra Short Municipal Income Fund |
| | |
| Alpine Financial Services Fund | Alpine High Yield Managed Duration Municipal Fund |
Alpine’s Series and Income Funds’ investment objectives, risks, charges and expenses must be considered carefully before investing in funds of the Alpine Series Trust and Alpine Income Trust. The statutory and summary prospectuses contain this and other important information about the investment company, and it may be obtained by calling 1-888-785-5578, or visiting www.alpinefunds.com. Read it carefully before investing.
Mutual fund investing involves risk. Principal loss is possible.
Alpine’s Investment Outlook

Dear Shareholders:
A few of the watchwords for financial markets over the past year included excess liquidity, unicorn valuations, risk-on/risk-off, deflation, income inequality and, unfortunately, terrorism. Perhaps there is another way to describe the overarching themes driving the markets as we enter the eighth year of recovery since the Great Financial Recession. The markets are still captive to the complexity and contradiction of fundamental data. Alpine believes that this condition stems from the unfocused, weak economic expansion. Atypically, the markets are dependent not upon the leadership of governments or industry but from central banks. Historically, economic leadership has not been the role of central banks. However, corporate spending has been limited and government stimulus has been constrained by either ideology (austerity) or weak tax revenues. This has placed an unusual burden on central banks, worldwide, which are designed and staffed to balance or neutralize unfavorable economic forces. Perhaps that is why both consumer and business confidence has been weak during this cycle as central banks have, by default, become the primary source of both economic stimulus and direction during the past six years, yet by their nature, they can only provide monetary leadership.
As we look back on fiscal year 2015, and prepare for 2016, the slow recovery of both global economies and evolving capital markets is very clear. Nonetheless, this has been an eventful year filled with notable shifts and even dramatic reversals leading to periods of increased volatility. The dominant factors have been the anticipated emergence of divergent interest rate trends between cyclically advancing countries and those which lag behind. At the start of 2015, it was clear to the markets that the Federal Reserve was done with quantitative easing (QE), — after first signaling this intention back in May 2013 — to the point where the Fed was about to raise interest rates. Also, at the beginning of the year it was clear that the European Central Bank (ECB) was about to embark upon a program of quantitative easing trailing the Fed’s lead by over five years.
As we embark upon 2016, the Fed seems likely to finally raise interest rates, if only by a quarter percent, while the ECB has announced an extension of QE into 2017. Long-term trends remain in place, so we believe that this divergence between slowly strengthening economies and still weak, lagging countries, may continue for another two to three years, taking us into 2018. It is conceivable that even more time will be required before another global
super cycle of demand exceeding supply emerges. At minimum, any major global upswing of demand for goods and services may take three to five years to emerge. This suggests that inflation may not become a significant threat for such a period of time. The upshot is that we may see U.S. interest rates gradually increase over several years by 100 to 250 basis points towards normalized historical levels. We believe the ECB is at least three years behind the Fed. This also suggests that we may be experiencing an historically extended period of economic growth without recession that could last into the next decade.
Members of our Investment team, with respect to their areas of expertise, have made the following observations covering both the past year and the new year. Bruce Ebnother, a member of our real estate investment team noted that “Unlike typical recovery cycles ... only a moderate amount of new supply has come online.” Mark Austin, who covers global housing stocks, commented that “wages (in the U.S.) have grown faster over the past year than at any other point during this recovery since 2008 and unemployment has dropped to its lowest level since then. Despite this, industry fundamentals continue to point to merely another year of slow but steady growth”. He is, however, more optimistic because in 2018 “40 million millennials will turn 25, an age when historically increased numbers begin looking for new homes. Already, we are experiencing a pick-up in household formation.” So, it appears that both commercial and residential real estate in the U.S., among other countries, is undersupplied from a cyclical perspective and demand is underpinned by solid fundamentals.
In contrast, the energy and mining sectors have only recently experienced a significant downdraft in demand at a time where productive capacity hit a new peak. Thus, over the past year, we have only begun to see a modest reduction of output despite a significant collapse in prices due to the excesses of the commodity sector. Sarah Hunt, who follows industrial companies and the oil sector, in particular, as part of our commodities team, observed that the old oil industry adage that “low prices cure low prices” (where supplies typically reduce production in the face of falling prices only when the cost of extraction is higher than the sales price) did not hold true as “large fiscal inventories ... and current future strip pricing is not predicting a quick fix for low oil prices”. Thus, we believe consumers and certain industries should continue to benefit from the lowest oil prices since 2004, roughly 60% below peak levels. This could last well into 2016, before gradually moving higher.
1
Supply-side issues have generally not been such a factor in the healthcare sector as demand growth continues. Jonathan Gelb, who follows the healthcare sector for us, notes that “companies that produce clinically different drugs that create cost savings will remain insulated from pricing pressure, however, companies whose models depend on aggressive pricing actions without significant innovation are likely to see growth impacted as soon as 2016.” No doubt his comments apply to both Turing Pharmaceutical and Valent Pharmaceuticals, which relied upon repackaging acquired medication at higher prices for a captive marketplace. With limited innovation, he believes that consolidation “is a theme that will likely continue into 2016, since nearly $265 billion worth of mergers or acquisitions (M&As) were announced during 2015.
Another area where acquisitions have been on the rise, creating revenue and hopefully, earnings growth, has been the financial sector. Peter Kovalski, who follows regional banks and financial services for us, noted that M&A activity in the U.S. for 2015 to date has totaled 243 announced deals. What’s notable is that this volume is only slightly behind last year’s level of 284 deals, the most since 2006 when 299 transactions took place. The difference is one of scale as the aggregate deal value in 2006 was $109 billion compared to only $19 billion in 2014. Thus, the typical transaction was less than a fifth of the size of previous transactions in 2006, suggesting that “the main driver behind these small bank deals is the rising cost of regulatory compliance ... a burden which is not going away.” The implication of this trend is that small local banks may not be as competitive in their local markets as larger, regional players. This may accelerate the underlying consolidation trend in which the number of banks in the U.S. has fallen from 14,907 in 1984 to 5,410 in 2015.
In a world where the pie is only growing slowly or for just a few, where their industry or market share is shrinking due to regulations, technological change or better-capitalized competition, the best business alternative may be a merger or acquisition. Indeed, Brian Hennessey, who follows commodity-related businesses in the mining and industrial materials companies for us, described 2015 as “the year of the mega mergers.” He expects this to continue in 2016 as “many forces driving consolidation across the developed world with low interest rates and high uncertainty with respect to the regulatory and macro-economic backdrop.” Naturally such consolidation can create opportunities for both astute and opportunistic acquirers as well as for companies whose shares have been undervalued by the market place. The broad economic implications of strategic or complementary consolidation is that it encourages buyers to shut the least effective operators or least efficient
producers, which curtails excess production, permitting supply and demand to find equilibrium levels faster than they might otherwise. Companies structured merely to grow through acquisitions, however, may lose their luster if they cannot innovate or continue to find M&A opportunities for expansion. Such risks have driven the market to place of particularly high earnings multiples on technological leaders including Facebook, Amazon, Netflix and Google (now known as Alphabet), among others which are expanding geographically, across platforms and market segments, while both making acquisitions and pushing innovation in ways that portend an extended period of revenue expansion.
As we look forward to 2016 and beyond, we should note that a key fundamental driver of growth is in fact demographic. That is, continual global population growth and the trending evolution of agrarian populations moving to urban industrial lifestyles, transitioning from subsistence to higher levels of productivity. This ongoing shift has not only been true of emerging countries but even here at home where many recent college graduates have chosen to live in urban settings, leading to a rebirth of a number of downtowns throughout the U.S. This has put extra demands upon infrastructure while creating new nodes for consumer activity, which, of course, has led to rising real estate values in many places. The rapidly expanding capacity to make the world our “oyster,” no longer depending upon local merchants or service providers to enhance our lifestyle, may prove to be an affirmation of our technological prowess even though there might be a range of social consequences. That said, the increased access to information, as well as goods and services, is opening up new avenues for creativity on both personal and societal levels. Those companies that can benefit from these different trends — old and new, small and large-should be able to generate attractive growth. As the global economy gradually returns to normalized levels of expansion, we would anticipate that the period of corporate consolidation through M&A will evolve towards a new period of capital investment and innovation. Even though this recent period of economic recovery has been quite extended, we are optimistic that the longer-term dynamic for continued expansion will become more apparent in the months and quarters ahead of us.
Thank you for your interest and support.
Sincerely,

Samuel A. Lieber
President
Past performance is not a guarantee of future results. The specific market, sector or investment conditions that contribute to a Fund’s performance may not be replicated in future periods.
Mutual fund investing involves risk. Principal loss is possible. Please refer to individual fund letters for risks specific to that fund.
This letter and the letters that follow represent the opinions of the Funds’ management and are subject to change, are not guaranteed and should not be considered recommendations to buy or sell any security. The information provided is not intended to be, and is not, a forecast of future events, a guarantee of future results, or investment advice.
2
| Disclosures and Definitions |  |
Real Estate Funds Disclosures
The specific market, sector or investment conditions that contributed to a Fund’s performance may not be replicated in future periods.
Please refer to the Schedule of Portfolio Investments for Fund holdings information. Fund holdings and sector allocations are subject to change and should not be considered a recommendation to buy or sell any security.
Diversification does not assure a profit or protect against loss in a declining market.
Favorable tax treatment of Fund distributions may be adversely affected, changed or repealed by future changes in tax laws. Alpine may not be able to anticipate the level of dividends that companies will pay in any given timeframe.
The Funds’ monthly distributions may consist of net investment income, net realized capital gains and/or a return of capital. If a distribution includes anything other than net investment income, the Funds will provide a notice of the best estimate of its distribution sources when distributed, which will be posted on the Funds’ website; www.alpinefunds.com, or can be obtained by calling 1-800-617-7616. We estimate Alpine Global Infrastructure Fund paid a portion of the 2015 distributions (approximately 7.5%) through a return of capital and Alpine International Real Estate Equity Fund, Alpine Realty Income & Growth Fund and Alpine Emerging Markets Real Estate Fund did not pay any distribution through a return of capital during the fiscal annual period ending October 31, 2015 through a return of capital. A return of capital distribution does not necessarily reflect the Funds’ performance and should not be confused with “yield” or “income.” Final determination of the federal income tax characteristics of distributions paid during the calendar year will be provided on U.S. Form 1099-DIV, which will be mailed to shareholders. Please consult your tax advisor for further information.
Neither the Fund nor any of its representatives may give tax advice. Investors should consult their tax advisor for information concerning their particular situation.
All investments involve risk. Principal loss is possible. A small portion of the S&P 500 yield may include return of capital; the 10-year Treasury yield does not include return of capital; Corporate Bonds and High Yield Bonds generally do not have return of capital; a portion of the dividend paid by REITs and REIT preferred stock may be deemed a return of capital for tax purposes in the event the company pays a dividend greater than its taxable income. A stock may trade with more or less liquidity than a bond depending on the number of shares and bonds outstanding, the size of the company, and the demand for the securities. The REIT and REIT preferred stock market are smaller than the broader equity and bond markets and often trade with less liquidity than
these markets depending upon the size of the individual issue and the demand of the securities. Treasury notes are guaranteed by the U.S. government and thus they are considered to be safer than other asset classes. Tax features of a Treasury Note, Corporate Bond, Stock, High Yield Bond, REITs and REIT preferred stock may vary based on an individual’s circumstances. Consult a tax professional for additional information.
Earnings Growth & EPS Growth are not measures of the Funds’ future performance.
Must be preceded or accompanied by a prospectus.
Quasar Distributors, LLC, distributor.
Real Estate Funds – Definitions
Alerian MLP Index is a composite of the 50 most prominent energy master limited partnerships calculated by Standard & Poor’s using a float-adjusted market capitalization methodology. The index is disseminated by the New York Stock Exchange real-time on a price return basis (NYSE: AMZ).
Basis point is a value equaling one one-hundredth of a percent (1/100 of 1%).
Cash flow measures the cash generating capability of a company by adding non-cash charges (e.g. depreciation) and interest expense to pretax income.
Chicago Board Options Exchange Volatility Index (VIX) reflects a market estimate of future volatility, based on the weighted average of the implied volatilities for a wide range of strikes.
Fibra is a real estate investment trust structured according to Mexican law.
Free cash flow is a measure of financial performance calculated as operating cash flow minus capital expenditures. Free cash flow (FCF) represents the cash that a company is able to generate after laying out the money required to maintain or expand its asset base. Free cash flow is important because it allows a company to pursue opportunities that enhance shareholder value.
FTSE EPRA/NAREIT Emerging Index is a total return index, designed to track the performance of listed real estate companies and REITS in emerging markets.
FTSE EPRA/NAREIT Global ex US Index is a total return index that is designed to represent general trends in eligible real estate equities outside the United States.
Source: FTSE the funds or securities referred to herein are not sponsored, endorsed, or promoted by the index providers, and the index providers bear no liability with respect to any such funds or securities or any index on which such funds or securities are based. The prospectus contains a more detailed description of the limited relationship the index providers have with the licensee and any related funds.
3
| Disclosures and Definitions (continued) | |
Lipper Real Estate Funds Average is an average of funds that invest at least 80% of their portfolio in equity securities of domestic and foreign companies engaged in the real estate industry.
Markit Index of Manufacturing measures the performance of the manufacturing sector and is derived from a survey of 600 industrial companies.
MSCI EAFE Index is a total return, free-float adjusted market capitalization weighted index that measures the performance of stocks from Europe, Asia, and the Far East. This is one of the most widely used measures of international stock performance. Source: MSCI. MSCI data may not be reproduced or used for any other purpose. MSCI provides no warranties, has not prepared or approved this report, and has no liability hereunder.
MSCI Emerging Markets Index is a total return, free-float adjusted market capitalization weighted index that is designed to measure the equity market performance in the global emerging markets. Source: MSCI. MSCI data may not be reproduced or used for any other purpose. MSCI provides no warranties, has not prepared or approved this report, and has no liability hereunder.
MSCI Europe Index is a free float-adjusted market capitalization weighted index that is designed to measure the equity market performance of the developed markets in Europe. The MSCI Europe Index consists of the following 15 developed market country indexes: Austria, Belgium, Denmark, Finland, France, Germany, Ireland, Italy, the Netherlands, Norway, Portugal, Spain, Sweden, Switzerland, and the United Kingdom*. Source: MSCI. MSCI makes no express or implied warranties or representations and shall have no liability whatsoever with respect to any MSCI data contained herein. The MSCI data may not be further redistributed or used as a basis for other indices or any securities or financial products. This report is not approved, reviewed or produced by MSCI.
MSCI US REIT Index is a gross, total return, free float-adjusted market capitalization index that is comprised of equity REITs. The index is based on MSCI USA Investable Market Index (IMI) its parent index which captures large, mid and small caps securities. With 144 constituents, it represents about 99% of the US REIT universe and securities are classified in the REIT sector according to the Global Industry Classification Standard (GICS®). It however excludes Mortgage REIT and selected Specialized REITs. This index reinvests as much as possible of a company’s dividend distributions. The reinvested amount is equal to the total dividend amount distributed to persons residing in the country of the dividend-paying company. Gross total return indexes do not, however, include any tax credits. Source: MSCI. MSCI data may not be reproduced or used for any other purpose. MSCI
provides no warranties, has not prepared or approved this report, and has no liability hereunder.
Return on Equity (ROE) is the amount of net income returned as a percentage of shareholders equity. Return on equity measures a corporation’s profitability by revealing how much profit a company generates with the money shareholders have invested.
Risk on/Risk off refers to changes in investment activity in response to global economic patterns. When risk is perceived as low, investors tend to engage in higher-risk investments. When risk is perceive as high, investors tend to engage in lower-risk investments.
S&P 500® Index is a total return, float-adjusted market capitalization-weighted index of 500 common stocks chosen for market size, liquidity, and industry group representation to represent U.S. equity performance. Total return indexes include reinvestments of all dividends
S&P Developed Ex-US Property Index is a total return index that defines and measures the investable universe of publicly traded property companies domiciled in developed countries outside of the U.S. The companies included are engaged in real estate related activities, such as property ownership, management, development, rental and investment. Total return indexes include reinvestments of all dividends.
S&P Global Infrastructure Index is a total return index that is designed to track 75 companies from around the world chosen to represent the listed infrastructure industry while maintaining liquidity and tradability. To create diversified exposure, the index includes three distinct infrastructure clusters: energy, transportation, and utilities. Net Total Return (NTR) indexes include reinvestments of all dividends minus taxes.
The S&P 500® Index, the S&P Developed ex. U.S. Property Index, and the S&P Global Infrastructure Index (the “Indices”) are products of S&P Dow Jones Indices LLC and have been licensed for use by Alpine Woods Capital Investors, LLC. Copyright © 2015 by S&P Dow Jones Indices LLC. All rights reserved. Redistribution or reproduction in whole or in part are prohibited without written the permission of S&P Dow Jones Indices LLC. S&P Dow Jones Indices LLC, its affiliates, and third party licensors make no representation or warranty, express or implied, with respect to the Index and none of such parties shall have any liability for any errors, omissions, or interruptions in the Index or the data included therein.
Unicorn valuations is a term which denotes a start-up company whose valuation has exceeded $1 billion.
US trade-weighted dollar index, also known as the broad index, is a measure of the value of the United States dollar relative to other world currencies.
An investor cannot invest directly in an index.
4
Equity Manager Reports

| | Alpine International Real Estate
Equity Fund |
| | |
| | Alpine Realty Income & Growth Fund |
| | |
| | Alpine Emerging Markets Real Estate Fund |
| | |
| | Alpine Global Infrastructure Fund |
5
| Alpine International Real Estate Equity Fund |  |
| Comparative Annualized Returns as of 10/31/15 (Unaudited) |
| | | 1 Year | | 3 Years | | 5 Years | | 10 Years | | Since Inception(1) | |
| Alpine International Real Estate Equity Fund — Institutional Class | | | -8.05% | | | | -0.26% | | | | -1.96% | | | | -0.53% | | | | 4.76% | | | |
| Alpine International Real Estate Equity Fund — Class A (Without Load) | | | -8.25% | | | | -0.53% | | | | N/A | | | | N/A | | | | 5.28% | | | |
| Alpine International Real Estate Equity Fund — Class A (With Load) | | | -13.29% | | | | -2.39% | | | | N/A | | | | N/A | | | | 3.75% | | | |
| FTSE EPRA/NAREIT Global Ex-U.S. Index(2) | | | -2.07% | | | | 4.13% | | | | 4.08% | | | | N/A | | | | N/A | | | |
| MSCI EAFE Index | | | -0.07% | | | | 8.02% | | | | 4.81% | | | | 4.05% | | | | 4.43% | | | |
| Lipper International Real Estate Funds Average(3) | | | -0.12% | | | | 5.26% | | | | 5.39% | | | | 3.61% | | | | 4.76% | | | |
| Lipper International Real Estate Funds Ranking(3) | | | 52/53 | | | | 49/50 | | | | 36/36 | | | | 8/8 | | | | 1/1 | | | |
| Gross Expense Ratio (Institutional Class): 1.62%(4) | | | | | | | | | | | | | | | | | | | | | | |
| Net Expense Ratio (Institutional Class): 1.62%(4) | | | | | | | | | | | | | | | | | | | | | | |
| Gross Expense Ratio (Class A): 1.87%(4) | | | | | | | | | | | | | | | | | | | | | | |
| Net Expense Ratio (Class A): 1.87%(4) | | | | | | | | | | | | | | | | | | | | | | |
| | (1) | Institutional Class shares commenced on February 1, 1989 and Class A shares commenced on December 30, 2011. Returns for indices are since February 1, 1989. |
| | (2) | Index commenced on October 31, 2008. |
| | (3) | The since inception data represents the period beginning February 2, 1989 (Institutional Class only). |
| | (4) | As disclosed in the prospectus dated February 27, 2015. |
Performance data quoted represents past performance and is not predictive of future results. Investment return and principal value of the Fund fluctuate, so that shares, when redeemed, may be worth more or less than their original cost. Performance current to the most recent month end may be lower or higher than the performance quoted and may be obtained by calling 1-888-785-5578. Performance data shown does not reflect the 1.00% redemption fee imposed on shares held for fewer than 60 days. If it did, total returns would be reduced. Returns for the Class A shares with sales charge reflect a maximum sales charge of 5.50%. Performance for the Class A shares without sales charges does not reflect this load.
FTSE EPRA/NAREIT Global ex US Index is a total return index that is designed to represent general trends in eligible real estate equities outside the United States. MSCI EAFE Index is a total return, free-float adjusted market capitalization weighted index that measures the performance of stocks from Europe, Asia, and the Far East. This is one of the most widely used measures of international stock performance. Source: MSCI. MSCI data may not be reproduced or used for any other purpose. MSCI provides no warranties, has not prepared or approved this report, and has no liability hereunder. The Lipper International Real Estate Funds Average is an average of funds that invest at least 80% of their portfolio in equity securities of domestic and foreign companies engaged in the real estate industry. Lipper rankings for the periods shown are based on fund total returns with dividends and distributions reinvested and do not reflect sales charges. The FTSE EPRA/NAREIT Global ex-U.S. Index, the MSCI EAFE Index and the Lipper International Real Estate Funds Average are unmanaged and do not reflect direct fees associated with a mutual fund, such as investment adviser fees; however, the Lipper International Real Estate Funds Average reflects fees charged by the underlying funds. The performance for the Alpine International Real Estate Equity Fund reflects the deduction of fees for these value-added services. Investors cannot directly invest in an index.
To the extent that the Fund’s historical performance resulted from gains derived from participation in Initial Public Offerings (“IPOs”) and/or Secondary Offerings, there is no guarantee that these results can be replicated in future periods or that the Fund will be able to participate to the same degree in IPO/Secondary Offerings in the future.
6
| Alpine International Real Estate Equity Fund (Continued) |  |
Portfolio Distributions* (Unaudited)

| Top 10 Holdings* (Unaudited) |
| 1. | | Regus PLC | 6.39% |
| 2. | | Mitsui Fudosan Co., Ltd. | 3.54% |
| 3. | | Great Portland Estates PLC | 3.40% |
| 4. | | Mitsubishi Estate Co., Ltd. | 3.34% |
| 5. | | Dalata Hotel Group PLC | 3.19% |
| 6. | | Invincible Investment Corp. | 3.02% |
| 7. | | South Asian Real Estate PLC | 2.98% |
| 8. | | China Resources Land, Ltd. | 2.93% |
| 9. | | LXB Retail Properties PLC | 2.59% |
| 10. | | Kenedix, Inc. | 2.46% |
| * | Portfolio Distributions percentages are based on total investments. Top 10 Holdings do not include short-term investments and percentages are based on total net assets. Portfolio holdings and sector distributions are as of 10/31/15 and are subject to change. Portfolio holdings are not recommendations to buy or sell any securities. |
Value of a $10,000 Investment (Unaudited)

This chart represents a comparison of a hypothetical $10,000 investment in the Fund versus a similar investment in the Fund’s benchmarks. The graph and the table do not reflect the deduction of taxes that a shareholder would pay on Fund distributions or the redemption of Fund shares. Investment performance reflects the waiver and recovery of certain fees, if applicable. Without the waiver and recovery of fees, the Fund’s total return would have differed.
Performance data quoted represents past performance and is not predictive of future results. Investment return and principal value of the Fund fluctuate, so that shares, when redeemed, may be worth more or less than their original cost.
7
| Alpine International Real Estate Equity Fund (Continued) | |
Commentary
Dear Shareholders:
We present below the annual results for the Alpine International Real Estate Equity Fund. For the period ended October 31, 2015, the closing NAV was $21.92 per share, representing a total return of -8.05%. The Fund’s benchmark index, the FTSE EPRA/NAREIT Global Ex-U.S. Index returned -2.07% over the same period. In the context of broader equity markets, the MSCI EAFE Index produced a total return of -0.07%. All references in this letter to the Fund’s performance relate to the performance of the Fund’s Institutional Class.
Performance Drivers
Broadly speaking, international equity performance for the year was a story of contrasts with strength in the first half of the year giving way to uncertainty in the second half. The broad themes driving the momentum of returns were the slow-motion global recovery, expectations for the timing and pace of Fed policy, and questions surrounding China and its ability to manage its economy through a pronounced cyclical downturn. During the first half of the period markets took a constructive view of these variables and as such the risk on trade was firmly established. Adding to this was the Chinese government’s use of moral suasion to encourage equity market speculation seemingly as a means for promoting mainland IPO activity and acting as a pressure valve for over-indebted corporates. The bubble in the China A-share market that followed shortly thereafter was the inflection point for the risk trade in global markets. Downward pressure on equities gathered further momentum in August when China embarked on a managed depreciation of its currency, which was communicated poorly and subsequently sent markets into a tailspin. Concerns were amplified by foreign exchange (FX) volatility (USD strength), persistent commodity weakness and a seemingly endless list of geopolitical flare ups ranging from Greece to Russia to the constantly evolving situation in the Middle East.
Nevertheless, the risk off environment in the second half did nothing to dampen transaction volumes in the listed and physical property markets. According to Jones Lang LaSalle (JLL), transaction volumes through Q3 2015 were $497bn, up 13% from 2014 in local currency terms, while UBS calculates $154bn in listed real estate mergers and acquisitions (M&A) during the period which lags only 2007 values in aggregate. The Fund’s largest position was in the UK whose economy continued to muddle along and real estate equities handily outperformed despite
the lingering threat of a rate hike as rental growth in London offices continued to surge higher. In Japan both the developers and the Japanese REITs (JREITs) lagged the broader market despite robust evidence of a recovery in operational markets, especially in Tokyo. Market focus has shifted toward expectations for further Bank of Japan (BoJ) easing as the macroeconomic data follows a prolonged downtrend. European real estate outperformed by a wide margin due largely to the European Central Bank (ECB) launching its quantitative easing (QE) program. Smaller markets including Ireland and Spain saw strong returns. The data in Europe have been lackluster and there remain downside risks to growth and inflation which could prompt the ECB to consider further measures to support the recovery. The deterioration in the macroeconomic and currency outlook in Australia continued to weigh on the Australian REIT (AREIT) market on an absolute basis but it nevertheless outperformed on a relative basis due to reasonable valuations, stable fundamentals and yield support. Emerging markets (EM) generally tracked the momentum in China which ultimately was a significant drag on returns as EMs took the brunt of the impact from the Renminbi devaluation, via FX channels as well as the equities.
Portfolio Analysis
At the headline level, the relative underperformance of the Fund during the period was driven primarily by stock selection, however this aggregate perspective masks the wide variance of contributions across geographies as economic and policy divergence became increasingly more pronounced for international investors. For example, the Fund saw relative outperformance across the majority of developed markets due to both stock selection and allocation (i.e., the UK, Japan and many European countries including Ireland, France and Spain) or due to allocation decisions entirely (i.e., Canada and Australia). By contrast the primary detractors to relative performance during the past year could largely be attributed to select emerging markets countries, specifically the overweight allocations to India, Brazil and Mexico or stock selection in Indonesia weighing on performance.
At quarter end the top 10 positions accounted for 33.84% of the portfolio versus 37.30% twelve months ago and the composition shifted considerably due to M&A and corporate actions. There were six companies falling out of the top 10: three of them including Songbird Estates in the UK, Unitech Corporate Parks in India and BHG in
8
| Alpine International Real Estate Equity Fund (Continued) | |
Brazil were taken private; one of them, Yatra Capital in India, was reduced through a tender offer and two, SM Prime in the Philippines and Nexity in France, were bumped out due to an increased allocation to Japan. During the period under review, the aggregate weightings in India and Brazil were pared back due to a lack of recovery in fundamentals in the residential markets in the former and a deteriorating macroeconomic position in the latter. However the portfolio is significantly overweight India and we remain very constructive on the long term prospects for the overall economy as well as its real estate sector. The weakness of select EM currencies versus the USD further guided portfolio weighting considerations. The overweight allocation to the UK was reduced due primarily to M&A activity in Songbird and Quintain Estates. Japan positioning was increased due to continued evidence of robust rental dynamics in commercial assets in prime Tokyo. The European positions were buoyed by the introduction of QE by the ECB. Positioning in Germany shifted slightly as the Fund established positions in the commercial real estate operator TLG and the Berlin residential developer ADO Properties. Finally, the position in China/HK was increased due to a growing focus on policy tools to reinvigorate the economy and mounting evidence of diminishing inventory levels and stabilizing demand across many tier one and two residential markets. The Philippines remains one of the strongest macroeconomic stories in EMs. The Fund maintained large underweights to the Australian, Canadian and South African markets due to a weakening macroeconomic outlook, specifically commodity pricing, as well as instability in the currencies.
The Fund hedged a portion of its currency exposures to the Euro, the Japanese Yen and the British Pound. The currency hedging mitigated a portion of the overall negative impact of currency in the portfolio. We have also used leverage both in the execution of the strategy of the Fund and to manage outflows during the period.
The top five contributors to the Fund’s absolute performance over the period under discussion based on contribution to total return were Regus, Nexity, Songbird Estates, Invincible Investment, and Dalata Hotel Group.
| • | Regus PLC, which is the world’s largest operator of business centers offering temporary office rental space, is a long-term holding of the Fund. The stock saw a re-rating during the year based on its robust |
| | growth outlook, strong cash flow generation and private market transactions in the space that reinforced its relative value. |
| | |
| • | Nexity is one of the largest residential developers in France and has been a perceived beneficiary of government housing incentives as well as early evidence of a recovery in Europe. |
| | |
| • | Songbird Estates was a UK owner and manager of, among other assets, Canary Wharf in the East of London. The company was taken private by an existing shareholder, the Qatari Investment Authority, and Brookfield in the largest UK property transaction this decade. |
| | |
| • | Invincible Investment, a Japanese REIT, enjoyed strong share price appreciation during the period as it aggressively expanded its property portfolio and added hotels to its diversified mix of property assets. |
| | |
| • | Dalata Hotel Group, Ireland’s largest hotel operator, benefitted from its game-changing €455 million acquisition of Moran Bewley, continued robust economic growth in Ireland and a record numbers of overseas visitors. |
The top five negative contributors to the Fund’s absolute performance for the year ended October 31 based on contribution to total return were South Asian Real Estate, Direcional Engenharia, General Shopping, Sao Carlos and Bakrieland Development.
| • | South Asian Real Estate (SARE)* is a residential developer in India. |
| | |
| • | Direcional Engenharia S.A. is a Brazilian homebuilder whose operating results were negatively impacted by the challenging macroeconomic environment in Brazil. In addition, the weakness in the Brazilian currency negatively impacted the value of the Fund’s position. |
| | |
| • | General Shopping is a niche Brazilian shopping mall and outlet operator. The company has exhibited resilient operating performance but has not been able to recover from a suboptimal capital structure in a time of rising interest rates and depreciating currency. |
| | |
| • | Sao Carlos, a Brazilian developer and operator of commercial properties, struggled with its operating performance as a weak Brazilian macroeconomic environment coupled with an increase in new office supply caused vacancy levels to rise. |
*The Fund purchased South Asian Real Estate PLC (“SARE”) through a private placement in 2007. There is no public market for the holding. As of October 31, 2015, the holding was valued based upon an equal weighting of an income approach and a market approach.
9
| Alpine International Real Estate Equity Fund (Continued) | |
| • | Bakrieland Development, a large land-owner and residential developer majority owned by a political family in Indonesia, saw its performance suffer as it continues its protracted efforts to restructure its bonds. |
Outlook
Modest levels of growth, a measured pace of inflation, and a benign real interest rate environment are generally supportive for real estate returns on a historical basis. The JLL report referenced above supports Alpine’s long-held bias for continued demand for real estate assets, which could continue to drive cap rate compression and capital values globally, albeit at a slower pace. As markets enter the middle innings of the real estate cycle we would expect the breadth of bids slowly to narrow over time. As we have outlined frequently in our discussions with shareholders, the next leg of the equity story would almost certainly require an inflection point in cash earnings whereby the drivers underpinning demand for real estate begin shifting away from yield spreads and safe haven characteristics to the prospects for rising net absorption trends as well as heightened rental tension across occupational markets. In this respect we are encouraged to note that across many markets we are seeing traction in the rental markets and, perhaps more importantly, there has not been a significant supply response that is typically seen as cycles mature. The JLL report goes on to conclude that, “major commercial real estate markets are now on sounder footing than at any time since the Global Financial Crisis.” We would tend to agree and see clear evidence of this second leg of growth in select markets in the US, the UK and to a lesser degree Japan and Europe, but downside risks still remain.
The Fed’s tentative approach to raising rates underscores the fragility of the economic recovery, and when it comes to monetary policy, investors are becoming increasingly sensitive to the fine line between prudence and indecisiveness. It is important to reiterate that divergent monetary policies and their spillover effects could likely remain one of the dominant drivers of asset market volatility and returns for the foreseeable future. While markets are now pricing in a Fed lift off in December, monetary policy will nonetheless be tethered to growth prospects and could remain exceptionally accommodative by any historic measure. The global monetary environment remains extremely supportive and markets are expecting further stimulus from the ECB and BoJ in the weeks to come. Accordingly we remain cautiously optimistic on the growth outlook while recognizing that movements of the yield curve post the Fed’s first rate hike could prompt intervals of reflexive risk aversion across
asset classes. Some are even calling for a replay of the taper tantrum of May 2013. Indeed, the first move off of the zero bound in close to seven years – no matter how well it is signaled – could undoubtedly create air pockets of uncertainty. In any case, we firmly believe that the true risks to a sustainable global recovery are likely entrenched prospects of weak growth and disinflation rather than fears of measured rate tightening due to a recovery in aggregate demand.
As we parse uneven economic data and try to identify long-term trends, we acknowledge that prolonged uncertainty could further unnerve risk/reward dynamics, intensify volatility and galvanize fears of secular stagnation. A fifth consecutive year of deteriorating fundamentals in EMs has certainly dragged down global growth expectations. Lower commodity prices present both challenges and opportunities to the overall outlook. FX could continue to represent a more relevant component of total return as US yields drift higher and currency depreciation becomes an important macroeconomic adjustment mechanism. Additionally, M&A should continue to be a major investment theme as divergent valuations, cheap financing and the market’s emphasis on growth could drive consolidation. It will be interesting to see whether developed market corporates, particularly in Europe, follow the US road map since 2008 and take up cheap debt in order to facilitate increasing dividends and to buy back shares. Although it requires some patience, we would expect China to stabilize its economy through a balanced mix of monetary and fiscal measures which should help to assuage fears over a raft of potential problems including devaluation of the currency, corporate debt levels and a possible balance of payments crisis. Finally, as always, investors should keep a close eye on geopolitical concerns.
Differentiation – whether in markets, asset types or growth models – should remain a dominant theme in portfolio construction. Alpine’s Real Estate team carefully evaluates the risk/reward proposition of each position in the portfolio and monitors volatility carefully. The managers remain extremely selective in our approach to the markets and deploying capital. We thank our shareholders for their interest and support.
Sincerely,
Samuel A. Lieber
Portfolio Manager
10
| Alpine International Real Estate Equity Fund (Continued) | |
This letter represents the opinions of the Fund’s management and is subject to change, is not guaranteed and should not be considered a recommendation to buy or sell any security. The information provided is not intended to be, and is not, a forecast of future events, a guarantee of future results, or investment advice. Views expressed may vary from those of the firm as a whole.
Past performance is no guarantee of future results.
Mutual fund investing involves risk. Principal loss is possible. The Fund is subject to risks, including the following:
Concentration Risk – The Fund’s strategy of concentrating in companies in a specific industry means that its performance will be closely tied to the performance of a particular market segment. The Fund’s concentration in these companies may present more risks than if it were broadly diversified over numerous industries and sectors of the economy. A downturn in these companies would have a larger impact on the Fund than on a mutual fund that does not concentrate in such companies. At times, the performance of these companies will lag the performance of other industries or the broader market as a whole.
Currency Risk – The value of investments in securities denominated in foreign currencies increases or decreases as the rates of exchange between those currencies and the U.S. dollar change. Currency conversion costs and currency fluctuations could erase investment gains or add to investment losses. Currency exchange rates can be volatile, and are affected by factors such as general economic conditions, the actions of the U.S. and foreign governments or central banks, the imposition of currency controls and speculation.
Emerging Market Securities Risk – The risks of foreign investments are heightened when investing in issuers in emerging market countries. Emerging market countries tend to have economic, political and legal systems that are less fully developed and are less stable than those of more developed countries. They are often particularly sensitive to market movements because their market prices tend to reflect speculative expectations. Low trading volumes may result in a lack of liquidity and in extreme price volatility.
Equity Securities Risk – The stock or other security of a company may not perform as well as expected, and may decrease in value, because of factors related to the company (such as poorer than expected earnings or certain management decisions) or to the industry in which the company is engaged (such as a reduction in the demand for products or services in a particular industry).
Foreign Currency Transactions Risk – Foreign securities are often denominated in foreign currencies. As a result, the value of the Fund’s shares is affected by changes in exchange rates. The Fund may enter into foreign currency transactions to try to manage this risk. The Fund’s ability to use foreign currency transactions successfully depends on a number of factors, including the foreign currency transactions being available at prices that are not too costly, the availability of liquid markets and the ability of the Adviser to accurately predict the direction of changes in currency exchange rates.
Foreign Securities Risk – The Fund’s investments in securities of foreign issuers or issuers with significant exposure to foreign markets involve additional risk. Foreign countries in which the Fund may invest may have markets that are less liquid, less regulated and more volatile than U.S. markets. The value of the Fund’s investments may decline because of factors affecting the particular issuer as well as foreign markets and issuers generally, such as unfavorable government actions, and political or financial instability. Lack of information may also affect the value of these securities. The risks of foreign investment are heightened when investing in issuers of emerging market countries.
Growth Stock Risk – Growth stocks typically are very sensitive to market movements because their market prices tend to reflect future expectations. When it appears those expectations will not be met, the prices of growth stocks typically fall. Growth stocks as a group may be out of favor and underperform the overall equity market while the market concentrates on undervalued stocks.
Initial Public Offerings and Secondary Offerings Risk – The Fund may invest a portion of its assets in shares of IPOs or secondary offerings of an issuer. IPOs and secondary offerings may have a magnified impact on the performance of a Fund with a small asset base. The impact of IPOs and secondary offerings on a Fund’s performance likely will decrease as the Fund’s asset size increases, which could reduce a Fund’s returns. IPOs and secondary offerings may not be consistently available to the Fund for investing. IPO and secondary offering shares frequently are volatile in price due to the absence of a prior public market, the small number of shares available for trading and limited information about the issuer. Therefore, the Fund may hold IPO and secondary offering shares for a very short period of time. This may increase the
11
| Alpine International Real Estate Equity Fund (Continued) | |
turnover of the Fund and may lead to increased expenses for the Fund, such as commissions and transaction costs. In addition, IPO and secondary offering shares can experience an immediate drop in value if the demand for the securities does not continue to support the offering price.
Interest Rate Risk – Interest rates may rise resulting in a decrease in the value of securities held by the Fund, or may fall resulting in an increase in the value of such securities. Securities having longer maturities generally involve a greater risk of fluctuations in the value resulting from changes in interest rates.
Leverage Risk – The Fund may use leverage to purchase securities. Increases and decreases in the value of the Fund’s portfolio will be magnified when the Fund uses leverage.
Liquidity Risk – Some securities held by the Fund may be difficult to sell, or illiquid, particularly during times of market turmoil. Illiquid securities may also be difficult to value. If the Fund is forced to sell an illiquid asset to meet redemption requests or other cash needs, the Fund may be forced to sell at a loss.
Management Risk – The Adviser’s judgment about the quality, relative yield or value of, or market trends affecting, a particular security or sector, or about interest rates generally, may be incorrect. The Adviser’s security selections and other investment decisions might produce losses or cause the Fund to underperform when compared to other funds with similar investment objectives and strategies.
Market Risk – The price of a security held by the Fund may fall due to changing market, economic or political conditions.
Micro Capitalization Company Risk – Stock prices of micro capitalization companies are significantly more volatile, and more vulnerable to adverse business and economic developments than those of larger companies. Micro capitalization companies often have narrower markets for their goods and/or services and more limited managerial and financial resources than larger, more established companies, including small or medium capitalization companies.
Real Estate Investment Trusts (“REITs”) Risk – REITs’ share prices may decline because of adverse developments affecting the real estate industry including changes in interest rates. The returns from REITs may trail returns from the overall market. Additionally, there is always a risk that a given REIT will fail to qualify for favorable tax treatment.
Real Estate Securities Risk – Risks associated with investment in securities of companies in the real estate industry include: declines in the value of real estate; risks related to local economic conditions, overbuilding and increased competition; increases in property taxes and operating expenses; changes in zoning laws; casualty or condemnation losses; variations in rental income, neighborhood values or the appeal of properties to tenants; changes in interest rates and changes in general economic and market conditions.
Small and Medium Capitalization Company Risk – Securities of small or medium capitalization companies are more likely to experience sharper swings in market values, less liquid markets, in which it may be more difficult for the Adviser to sell at times and at prices that the Adviser believes appropriate and generally are more volatile than those of larger companies.
Undervalued Stock Risk – The Fund may pursue strategies that may include investing in securities, which, in the opinion of the Adviser, are undervalued. The identification of investment opportunities in undervalued securities is a difficult task and there is no assurance that such opportunities will be successfully recognized or acquired. While investments in undervalued securities offer opportunities for above-average capital appreciation, these investments involve a high degree of financial risk and can result in substantial losses.
Please refer to pages 3-4 for other important disclosures and definitions.
12
| Alpine Realty Income & Growth Fund | |
| Comparative Annualized Returns as of 10/31/15 (Unaudited) | | |
| | | 1 Year | | 3 Years | | 5 Years | | 10 Years | | Since Inception(1) | |
| Alpine Realty Income & Growth Fund — Institutional Class | | | 6.98% | | | | 12.44% | | | | 12.78% | | | | 6.35% | | | | 11.39% | | | |
| Alpine Realty Income & Growth Fund — Class A (Without Load) | | | 6.72% | | | | 12.17% | | | | N/A | | | | N/A | | | | 13.32% | | | |
| Alpine Realty Income & Growth Fund — Class A (With Load) | | | 0.84% | | | | 10.08% | | | | N/A | | | | N/A | | | | 11.66% | | | |
| MSCI US REIT Index | | | 5.32% | | | | 11.83% | | | | 12.17% | | | | 7.66% | | | | 11.06% | | | |
| S&P 500® Index | | | 5.20% | | | | 16.20% | | | | 14.33% | | | | 7.85% | | | | 5.14% | | | |
| Lipper Real Estate Funds Average(2) | | | 4.92% | | | | 10.75% | | | | 11.46% | | | | 7.02% | | | | 10.56% | | | |
| Lipper Real Estate Funds Ranking(2) | | | 36/261 | | | | 24/220 | | | | 18/182 | | | | 102/130 | | | | 12/49 | | | |
| Gross Expense Ratio (Institutional Class): 1.47%(3) | | | | | | | | | | | | | | | | | | | | | | |
| Net Expense Ratio (Institutional Class): 1.42%(3) | | | | | | | | | | | | | | | | | | | | | | |
| Gross Expense Ratio (Class A): 1.72%(3) | | | | | | | | | | | | | | | | | | | | | | |
| Net Expense Ratio (Class A): 1.67%(3) | | | | | | | | | | | | | | | | | | | | | | |
| | (1) | Institutional Class shares commenced on December 29, 1998 and Class A shares commenced on December 30, 2011. Returns for indices are since December 29, 1998. |
| | (2) | The since inception data represents the period beginning December 31, 1998 (Institutional Class only). |
| | (3) | As disclosed in the prospectus dated February 27, 2015. |
Performance data quoted represents past performance and is not predictive of future results. Investment return and principal value of the Fund fluctuate, so that shares, when redeemed, may be worth more or less than their original cost. Performance current to the most recent month end may be lower or higher than the performance quoted and may be obtained by calling 1-888-785-5578. Performance data shown does not reflect the 1.00% redemption fee imposed on shares held for fewer than 60 days. If it did, total returns would be reduced. Returns for the Class A shares with sales charge reflect a maximum sales charge of 5.50%. Performance for the Class A shares without sales charges does not reflect this load.
MSCI US REIT Index is a gross, total return, free float-adjusted market capitalization index that is comprised of equity REITs. The index is based on MSCI USA Investable Market Index (IMI) its parent index which captures large, mid and small caps securities. With 144 constituents, it represents about 99% of the US REIT universe and securities are classified in the REIT sector according to the Global Industry Classification Standard (GICS®). It however excludes Mortgage REIT and selected Specialized REITs. This index reinvests as much as possible of a company’s dividend distributions. The reinvested amount is equal to the total dividend amount distributed to persons residing in the country of the dividend-paying company. Gross total return indexes do not, however, include any tax credits. Source: MSCI. MSCI data may not be reproduced or used for any other purpose. MSCI provides no warranties, has not prepared or approved this report, and has no liability hereunder. S&P 500® Index is a total return, float-adjusted market capitalization-weighted index of 500 common stocks chosen for market size, liquidity, and industry group representation to represent U.S. equity performance. Total return indexes include reinvestments of all dividends. Lipper rankings for the periods shown are based on fund total returns with dividends and distributions reinvested and do not reflect sales charges. The MSCI US REIT Index, the S&P 500® Index and the Lipper Real Estate Funds Average are unmanaged and do not reflect direct fees associated with a mutual fund, such as investment adviser fees; however, the Lipper Real Estate Funds Average reflects fees charged by the underlying funds. The performance for the Alpine Realty Income & Growth Fund reflects the deduction of fees for these value-added services. Investors cannot directly invest in an index.
Expense Ratios reflect the ratios reported in the Fund’s most recent prospectus. The Alpine Realty Income & Growth Fund has a contractual expense waiver that continues through March 1, 2016. Where a Fund’s gross and net expense ratios are the same for the period reported, the contractual expense reimbursement level was not reached as of the end of that period. To the extent the Fund’s expenses were reduced by waivers, the Fund’s total returns were increased. In these cases, in the absence of the expense waivers, the Fund’s total returns would have been lower.
To the extent that the Fund’s historical performance resulted from gains derived from participation in Initial Public Offerings (“IPOs”) and/or Secondary Offerings, there is no guarantee that these results can be replicated in future periods or that the Fund will be able to participate to the same degree in IPO/Secondary Offerings in the future.
13
| Alpine Realty Income & Growth Fund (Continued) | |
Portfolio Distributions* (Unaudited)
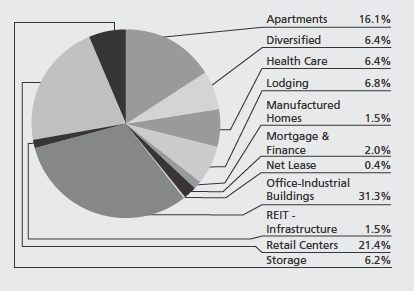
| Top 10 Holdings* (Unaudited) |
| 1. | | Simon Property Group, Inc. | 9.79% |
| 2. | | Boston Properties, Inc. | 5.39% |
| 3. | | Public Storage | 5.20% |
| 4. | | Equity Residential | 4.56% |
| 5. | | Essex Property Trust, Inc. | 4.50% |
| 6. | | Vornado Realty Trust | 4.00% |
| 7. | | Alexandria Real Estate Equities, Inc. | 3.99% |
| 8. | | AvalonBay Communities, Inc. | 3.87% |
| 9. | | Prologis, Inc. | 3.67% |
| 10. | | SL Green Realty Corp. | 3.58% |
| * | Portfolio Distributions percentages are based on total investments. Top 10 Holdings do not include short-term investments and percentages are based on total net assets. Portfolio holdings and sector distributions are as of 10/31/15 and are subject to change. Portfolio holdings are not recommendations to buy or sell any securities. |
Value of a $10,000 Investment (Unaudited)
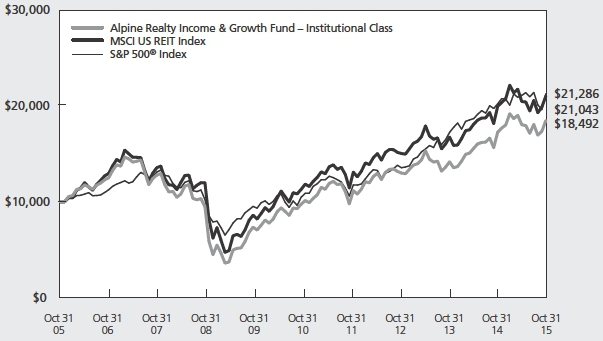
This chart represents a comparison of a hypothetical $10,000 investment in the Fund versus a similar investment in the Fund’s benchmarks. The graph and the table do not reflect the deduction of taxes that a shareholder would pay on Fund distributions or the redemption of Fund shares. Investment performance reflects the waiver and recovery of certain fees, if applicable. Without the waiver and recovery of fees, the Fund’s total return would have differed.
Performance data quoted represents past performance and is not predictive of future results. Investment return and principal value of the Fund fluctuate, so that shares, when redeemed, may be worth more or less than their original cost.
14
| Alpine Realty Income & Growth Fund (Continued) | |
Commentary
Dear Shareholders:
We are pleased to report the results of the Alpine Realty Income & Growth Fund for the fiscal year that ended October 31, 2015. During this past fiscal year, the Fund produced a total return of 6.98% which compares to the 4.92% return of the Lipper Real Estate Funds Average, the 5.32% return of the MSCI US REIT Index (the “RMS Index”), and the 5.20% return of the S&P 500® Index (the “S&P”). All references in this letter to the Fund’s performance relate to the performance of the Fund’s Institutional Class.
At October 31, 2015, the Fund’s net asset value had increased to $22.00 from $21.29 twelve months prior. During this timeframe, the Fund paid four quarterly distributions of $0.1875 per share totaling $0.75 per share for the fiscal year. Since its inception at $10.00 per share on December 29, 1998 through October 31, 2015, the Fund has delivered an annualized total return to shareholders of 11.39% which includes cumulative distributions of $16.98. The performance chart on page 13 presents the Fund’s returns for the latest one-year, three-year, five year, ten-year, and since inception periods.
In our view, the most impactful factors influencing returns for REIT securities during the fiscal year, consistent with the last few years, were (i) the level and direction of long term interest rates, specifically that of the Ten-Year US Treasury obligation; (ii) continued improvement in real estate property fundamentals nationally with particular strength in those coastal markets with notably higher than average job growth trends; and (iii) steady demand by both domestic and foreign capital for direct property investment in the private market and for debt investments in both the private and public markets.
The Ten-Year Treasury rate remained historically low during the fiscal year, even decreasing 0.20% over the twelve-month period to 2.14% as of October 31, 2015, and providing, in our view, a positive tailwind for public real estate securities valuations. Yet fluctuations in that rate – a fiscal year low of 1.64% on January 30th to a high of 2.49% on June 10th – caused above average volatility in REIT pricing, in our opinion, as investors remained concerned that significant rate increases would negatively impact underlying real estate valuations. In contrast to public market participants, private capital remained seemingly more confident in the continuance of economic growth and the real estate cycle; in the relative stability of US real estate cash flow prospects; and
in the ability to generate attractive returns on equity relative to other alternative investments. That conviction in ongoing improvement in real estate operating fundamentals has, in our opinion, increased transactional and merger and acquisition activity including privatizations of REIT entities perceived to be trading at discounts to their underlying net asset value. We believe this trend could continue and even accelerate in the upcoming year if US economic growth continues at a slow and steady pace, long term interest rates remain historically subdued, and discounts to private market valuations continue in REIT securities pricing.
For the Fund, the top contributors to its positive performance during the latest fiscal year included companies within the self-storage and apartment sectors as well as those within the segment of the regional mall category with the highest tenant sales productivity. Self-storage companies, including the Fund’s third largest holding, Public Storage, a national owner and developer of storage facilities, produced strong yearly growth in earnings from occupancy and rental increases and were rewarded with some of the top total returns within the REIT group. Apartment companies, including Essex Properties Trust, Equity Residential, and AvalonBay Communities, all top ten holdings for the Fund, demonstrated continued strength in achieving high occupancies and rates of rental increases, particularly in the western coastal markets from southern California to Seattle, Washington. Within the regional mall sector, there was a definitive bifurcation of fundamental operating performance and stock price appreciation between Class A malls achieving higher rents, sales productivity, and occupancies and their Class B brethren who struggled to maintain stable tenancy levels in the face of higher than average retailer bankruptcies and store closures during the period. Both retail landlords, Simon Property Group and The Macerich Company, whom Simon unsuccessfully targeted as an acquisition earlier in the year, produced above average returns for the Fund. Relative to the overall return of the RMS Index, some of the greatest positive attribution was produced by our overweight positions in CoreSite Realty, a data center owner and developer who experienced strong demand from network service, cloud, and information technology providers; Home Properties, an apartment properties owner that was acquired by a private equity entity; the aforementioned Macerich; and by our underweight position in the healthcare REIT, HCP, Inc.
15
| Alpine Realty Income & Growth Fund (Continued) | |
Holdings that underperformed REIT average returns and detracted from performance included companies within the lodging and healthcare sectors as well as those within the Class B segment of the regional mall category. Lodging companies experienced a deceleration in revenue growth, albeit from historically high levels, from a combination of slowing international travel due to the strength in the dollar, less robust business transient business, and new supply pressures in certain markets such as New York City. For the Fund, all of its lodging REIT holdings, except for Strategic Hotels and Resorts which is subject to a privatization bid from private equity funds controlled by The Blackstone Group, L.P., produced negative returns during the period with Host Hotels and Resorts and Chesapeake Lodging Trust accounting for the largest detractions from overall portfolio results. Healthcare REITs, including the Fund’s holdings in Ventas Inc., Welltower Inc., and Sabra Health Care REIT, produced weak stock performances as investors demonstrated concerns about signs of new supply additions of senior housing facilities and the impact of potentially rising interest rates on healthcare REIT valuations. Finally, the Fund’s holding in CBL & Associates Properties, an operator of middle-market shopping malls with essentially flat growth in net operating income impacted by retailer bankruptcies, detracted from overall results. Relative to the return of the RMS Index, the securities that created the most impactful negative attribution to performance were our overweight positions in the aforementioned Ventas, Sabra, and CBL & Associates, and Emaar Properties, a diversified Dubai-based developer of housing and commercial properties, which declined on investor concerns regarding potential slowing economic conditions as a result of declining oil prices and was sold by the Fund during the period.
Prospects for continued positive trends in real estate operating performance, in our view, remain tied to domestic economic growth including gains in employment and to muted supply additions. We remain most constructive on investing in companies that we believe have the highest likelihood for above average internal growth supported by strong local economies and for shareholder valuation potential from development and redevelopment activities. We believe concerns about the impact of potential rises in long term interest rates on REIT valuations have been creating above average volatility in REIT pricing and a potential headwind to advancement in share price appreciation resulting in somewhat of a dislocation between how real estate is priced in the public arena versus the private market. As a result, over the past year, we witnessed an increase in privatizations and merger and acquisition activity among the publicly traded real estate companies that affected a number of Fund holdings including Home Properties, Strategic Hotels and Resorts, Campus Crest Communities and most recently Starwood Hotels & Resorts which agreed to a merger with Marriott International. We believe this trend could continue and even accelerate in the upcoming year if discounts to private market valuations persist in REIT securities’ pricing. Additionally, we anticipate that we will continue to employ low levels of leverage both in the execution of the Fund’s strategy and to manage unexpected Fund flows. We look forward to providing an update on real estate trends and Fund performance at the end of the semi-annual period in April 2016.
Sincerely,
Robert W. Gadsden
Portfolio Manager
16
| Alpine Realty Income & Growth Fund (Continued) | |
This letter represents the opinions of the Fund’s management and is subject to change, is not guaranteed and should not be considered a recommendation to buy or sell any security. The information provided is not intended to be, and is not, a forecast of future events, a guarantee of future results, or investment advice. Views expressed may vary from those of the firm as a whole.
Past performance is no guarantee of future results.
Mutual fund investing involves risk. Principal loss is possible. The Fund is subject to risks, including the following:
Concentration Risk – The Fund’s strategy of concentrating in companies in a specific industry means that its performance will be closely tied to the performance of a particular market segment. The Fund’s concentration in these companies may present more risks than if it were broadly diversified over numerous industries and sectors of the economy. A downturn in these companies would have a larger impact on the Fund than on a mutual fund that does not concentrate in such companies. At times, the performance of these companies will lag the performance of other industries or the broader market as a whole.
Credit Risk – Credit risk refers to the possibility that the issuer of a security will not be able to make payments of interest and principal when due. Changes in an issuer’s credit rating or the market’s perception of an issuer’s creditworthiness may also affect the value of the Fund’s investment in that issuer. The degree of credit risk depends on both the financial condition of the issuer and the terms of the obligation.
Dividend Strategy Risk – The Fund’s strategy of investing in dividend-paying stocks involves the risk that such stocks may fall out favor with investors and underperform the market. Companies that issue dividend paying-stocks are not required to continue to pay dividends on such stocks. Therefore, there is the possibility that such companies could reduce or eliminate the payment of dividends in the future.
Equity Securities Risk – The stock or other security of a company may not perform as well as expected, and may decrease in value, because of factors related to the company (such as poorer than expected earnings or certain management decisions) or to the industry in which the company is engaged (such as a reduction in the demand for products or services in a particular industry).
Fixed Income Securities Risk – Fixed income securities are subject to issuer risk, interest rate risk and market risk.
Growth Stock Risk – Growth stocks typically are very sensitive to market movements because their market prices tend to reflect future expectations. When it appears those expectations will not be met, the prices of growth stocks typically fall. Growth stocks as a group may be out of favor and underperform the overall equity market while the market concentrates on undervalued stocks.
Initial Public Offerings and Secondary Offerings Risk – The Fund may invest a portion of its assets in shares of IPOs or secondary offerings of an issuer. IPOs and secondary offerings may have a magnified impact on the performance of a Fund with a small asset base. The impact of IPOs and secondary offerings on a Fund’s performance likely will decrease as the Fund’s asset size increases, which could reduce a Fund’s returns. IPOs and secondary offerings may not be consistently available to the Fund for investing. IPO and secondary offering shares frequently are volatile in price due to the absence of a prior public market, the small number of shares available for trading and limited information about the issuer. Therefore, the Fund may hold IPO and secondary offering shares for a very short period of time. This may increase the turnover of the Fund and may lead to increased expenses for the Fund, such as commissions and transaction costs. In addition, IPO and secondary offering shares can experience an immediate drop in value if the demand for the securities does not continue to support the offering price.
Interest Rate Risk – Interest rates may rise resulting in a decrease in the value of securities held by the Fund, or may fall resulting in an increase in the value of such securities. Securities having longer maturities generally involve a greater risk of fluctuations in the value resulting from changes in interest rates.
Leverage Risk – The Fund may use leverage to purchase securities. Increases and decreases in the value of the Fund’s portfolio will be magnified when the Fund uses leverage.
Management Risk – The Adviser’s judgment about the quality, relative yield or value of, or market trends affecting, a particular security or sector, or about interest rates generally, may be incorrect. The Adviser’s security selections and other
17
| Alpine Realty Income & Growth Fund (Continued) | |
investment decisions might produce losses or cause the Fund to underperform when compared to other funds with similar investment objectives and strategies.
Market Risk – The price of a security held by the Fund may fall due to changing market, economic or political conditions.
Non-Diversified Fund Risk – Performance of a non-diversified fund may be more volatile than a diversified fund because a non-diversified fund may invest a greater percentage of its total assets in the securities of a single issuer.
Preferred Stock Risk – Preferred stock represents an interest in a company that generally entitles the holder to receive, in preference to the holders of common stock, dividends and a fixed share of the proceeds resulting from a liquidation of the company. Preferred stocks may pay fixed or adjustable rates of return. Preferred stock has investment characteristics of both fixed income and equity securities. However, the value of these securities tends to vary more with fluctuations in the underlying common stock and less with fluctuations in interest rates and tends to exhibit greater volatility.
Real Estate Investment Trusts (“REITs”) Risk – REITs’ share prices may decline because of adverse developments affecting the real estate industry including changes in interest rates. The returns from REITs may trail returns from the overall market. Additionally, there is always a risk that a given REIT will fail to qualify for favorable tax treatment.
Real Estate Securities Risk – Risks associated with investment in securities of companies in the real estate industry include: declines in the value of real estate; risks related to local economic conditions, overbuilding and increased competition; increases in property taxes and operating expenses; changes in zoning laws; casualty or condemnation losses; variations in rental income, neighborhood values or the appeal of properties to tenants; changes in interest rates and changes in general economic and market conditions.
Small and Medium Capitalization Company Risk – Securities of small or medium capitalization companies are more likely to experience sharper swings in market values, less liquid markets, in which it may be more difficult for the Adviser to sell at times and at prices that the Adviser believes appropriate and generally are more volatile than those of larger companies.
Undervalued Stock Risk – The Fund may pursue strategies that may include investing in securities, which, in the opinion of the Adviser, are undervalued. The identification of investment opportunities in undervalued securities is a difficult task and there is no assurance that such opportunities will be successfully recognized or acquired. While investments in undervalued securities offer opportunities for above-average capital appreciation, these investments involve a high degree of financial risk and can result in substantial losses.
Please refer to pages 3-4 for other important disclosures and definitions.
18
| Alpine Emerging Markets Real Estate Fund | |
| Comparative Annualized Returns as of 10/31/15 (Unaudited) |
| | | 1 Year | | 3 Years | | 5 Years | | Since Inception(1) |
| Alpine Emerging Markets Real Estate Fund — Institutional Class | | -12.59% | | | -2.91% | | | -2.47% | | | 9.25% | |
| Alpine Emerging Markets Real Estate Fund — Class A (Without Load) | | -12.80% | | | -3.16% | | | N/A | | | 3.86% | |
| Alpine Emerging Markets Real Estate Fund — Class A (With Load) | | -17.58% | | | -4.97% | | | N/A | | | 2.35% | |
| S&P Developed Ex-U.S. Property Index | | 1.01% | | | 6.90% | | | 6.95% | | | 12.38% | |
| FTSE EPRA/NAREIT Emerging Index | | -8.83% | | | -1.94% | | | -3.29% | | | N/A | |
| MSCI Emerging Markets Index | | -14.53% | | | -2.87% | | | -2.80% | | | 8.42% | |
| Lipper Global Real Estate Funds Average(3) | | 1.55% | | | 7.77% | | | 7.58% | | | 12.45% | |
| Lipper Global Real Estate Funds Ranking(3) | | 151/152 | | | 112/113 | | | 94/94 | | | 79/79 | |
| Gross Expense Ratio (Institutional Class): 2.38%(4) | | | | | | | | | | | | |
| Net Expense Ratio (Institutional Class): 1.36%(4) | | | | | | | | | | | | |
| Gross Expense Ratio (Class A): 2.63%(4) | | | | | | | | | | | | |
| Net Expense Ratio (Class A): 1.61%(4) | | | | | | | | | | | | |
| | (1) | Institutional Class shares commenced on November 3, 2008 and Class A shares commenced on December 30, 2011. Returns for indices are since November 3, 2008. |
| | (2) | Index commenced on January 2, 2009. |
| | (3) | The since inception data represents the period beginning November 6, 2008 (Institutional Class only). |
| | (4) | As disclosed in the prospectus dated February 27, 2015. |
Performance data quoted represents past performance and is not predictive of future results. Investment return and principal value of the Fund fluctuate, so that shares, when redeemed, may be worth more or less than their original cost. Performance current to the most recent month end may be lower or higher than the performance quoted and may be obtained by calling 1-888-785-5578. Performance data shown does not reflect the 1.00% redemption fee imposed on shares held for fewer than 60 days. If it did, total returns would be reduced. Returns for the Class A shares with sales charge reflect a maximum sales charge of 5.50%. Performance for the Class A shares without sales charges does not reflect this load.
S&P Developed Ex-US Property Index is a total return index that defines and measures the investable universe of publicly traded property companies domiciled in developed countries outside of the U.S. The companies included are engaged in real estate related activities, such as property ownership, management, development, rental and investment. Total return indexes include reinvestments of all dividends. FTSE EPRA/NAREIT Emerging Index is a total return index, designed to track the performance of listed real estate companies and REITS in emerging markets. MSCI Emerging Markets Index is a total return, free-float adjusted market capitalization weighted index that is designed to measure the equity market performance in the global emerging markets. Source: MSCI. MSCI data may not be reproduced or used for any other purpose. MSCI provides no warranties, has not prepared or approved this report, and has no liability hereunder. The Lipper Global Real Estate Funds Average is an average of funds that invest at least 25% of their equity portfolio in shares of companies engaged in the real estate industry that are strictly outside of the U.S. or whose securities are principally traded outside of the U.S. Lipper rankings for the periods shown are based on fund total returns with dividends and distributions reinvested and do not reflect sales charges. The FTSE EPRA/NAREIT Emerging Index, the S&P Developed Ex-U.S. Property Index, the MSCI Emerging Markets Index and the Lipper Global Real Estate Funds Average are unmanaged and do not reflect direct fees associated with a mutual fund, such as investment adviser fees; however, the Lipper Global Real Estate Funds Average reflects fees charged by the underlying funds. The performance for the Alpine Emerging Markets Real Estate Fund reflects the deduction of fees for these value added services. Investors cannot directly invest in an index.
Expense Ratios reflect the ratios reported in the Fund’s most recent prospectus. The Alpine Emerging Markets Real Estate Fund has a contractual expense waiver that continues through March 1, 2016. Where a Fund’s gross and net expense ratios are the same for the period reported, the contractual expense reimbursement level was not reached as of the end of that period. To the extent the Fund’s expenses were reduced by waivers, the Fund’s total returns were increased. In these cases, in the absence of the expense waivers, the Fund’s total returns would have been lower.
To the extent that the Fund’s historical performance resulted from gains derived from participation in Initial Public Offerings (“IPOs”) and/or Secondary Offerings, there is no guarantee that these results can be replicated in future periods or that the Fund will be able to participate to the same degree in IPO/Secondary Offerings in the future.
19
| Alpine Emerging Markets Real Estate Fund (Continued) | |
Portfolio Distributions* (Unaudited)

| Top 10 Holdings* (Unaudited) |
| 1. | | China Overseas Land & Investment, Ltd. | 10.80% |
| 2. | | China Resources Land, Ltd. | 7.02% |
| 3. | | Emaar Properties PJSC | 4.78% |
| 4. | | China Vanke Co., Ltd.-Class H | 4.23% |
| 5. | | Ayala Land, Inc. | 3.37% |
| 6. | | Dalian Wanda Commercial Properties Co., Ltd.-Class H | 3.16% |
| 7. | | SM Prime Holdings, Inc. | 2.77% |
| 8. | | Growthpoint Properties, Ltd. | 2.16% |
| 9. | | Evergrande Real Estate Group, Ltd. | 2.08% |
| 10. | | Fibra Uno Administracion SA de CV | 1.97% |
| * | Portfolio Distributions percentages are based on total investments. Top 10 Holdings do not include short-term investments and percentages are based on total net assets. Portfolio holdings and sector distributions are as of 10/31/15 and are subject to change. Portfolio holdings are not recommendations to buy or sell any securities. |
Value of a $10,000 Investment (Unaudited)

This chart represents a comparison of a hypothetical $10,000 investment in the Fund versus a similar investment in the Fund’s benchmarks. The graph and the table do not reflect the deduction of taxes that a shareholder would pay on Fund distributions or the redemption of Fund shares. Investment performance reflects the waiver and recovery of certain fees, if applicable. Without the waiver and recovery of fees, the Fund’s total return would have differed.
Performance data quoted represents past performance and is not predictive of future results. Investment return and principal value of the Fund fluctuate, so that shares, when redeemed, may be worth more or less than their original cost.
20
| Alpine Emerging Markets Real Estate Fund (Continued) | |
Commentary
Dear Shareholders:
We present below the annual results for the Alpine Emerging Markets Real Estate Fund. For the period ended October 31, 2015, the closing NAV was $14.54 per share, representing a total return of -12.59% for the period. The Fund’s benchmark index, the FTSE EPRA/NAREIT Emerging Index returned -8.83% adjusted in U.S. dollar terms over the same period. Over that same time frame the MSCI Emerging Markets Index finished with a total return of -14.53% and the S&P Developed Ex-U.S. Property Index returned 1.01%. All references in this letter to the Fund’s performance relate to the performance of the Fund’s Institutional Class.
Performance Drivers
Broadly speaking, Emerging Market (EM) real estate equity performance for the year was a story of contrasts with strength in the first half of the year giving way to heightened volatility in the second half. The broad themes driving the momentum of returns were shifting expectations for the timing and pace of Fed policy, questions surrounding China and its ability to manage its economy through a pronounced cyclical downturn were at the epicenter of concerns, as well as the overall slow-motion global recovery. Indeed, the International Monetary Fund (IMF) once again revised its growth outlook for the global economy from 3.8% to 3.1% and for EMs from 5.0% to 4.0%, though its projection for 2016 currently stands at 4.5%. Macro market gyrations seized many of the headlines over the past twelve months – whether it was sharp commodity price fluctuations, currency market agitation, or global bond markets and the signaling of negative yields – and exacerbated volatility across assets. During the first half of the period markets took a constructive view of these variables and as such the risk on trade was firmly established. Adding to this was the Chinese government’s use of moral suasion to encourage equity market speculation seemingly as a means for promoting mainland initial public offering (IPO) activity and acting as a pressure valve for over-indebted corporates. The bubble in the China A-share market that followed shortly thereafter was the inflection point for the risk trade across EMs. Downward pressure on developing markets evolved into indiscriminate selling in August as China embarked on a managed depreciation of its currency, which was communicated poorly and subsequently sent EMs into a tailspin over fears of deflationary feedback loops. Concerns were amplified by foreign exchange (FX) volatility (USD strength), persistent commodity weakness
and a seemingly endless list of geopolitical flare ups including Greece, Turkey and Russia as well as the constantly evolving situation in the Middle East. As a result, EM mutual funds experienced combined portfolio outflows of $45bn in August and September, which greatly exceeded the amount seen post the 2013 taper tantrum.
Portfolio Analysis
Stock selection was the dominant factor in the overall performance of the Fund during the period. Stock picking in China and Hong Kong along with the underweight allocation to South Africa and the overweight in Egypt and Mexico were the most significant detractors from relative performance. The underperformance in China was due largely to the strong performance of Evergrande Real Estate, which the Fund was underweight. The underweight allocation to Brazil and Malaysia as well as the weighting in Argentina and Spain provided the largest positive contributions to relative performance.
At year end the top 10 positions accounted for 42.34% of the portfolio versus 42.42% a year ago. The composition shifted slightly with Dalian Wanda and Evergrande replacing BR Malls and Shimao. During the twelve-month period under review, the aggregate weightings in Brazil and Thailand were pared back significantly due to a deteriorating macroeconomic position in the former and political unrest and weakening domestic consumption trends in the latter. The exposure to China/HK was increased due to growing focus on policy tools to reinvigorate the economy and clear evidence of a volume recovery in Tier 1 residential markets. The large underweight in South Africa was reduced, yet the Fund maintained a significant underweight to the market due to a weak macro outlook and instability in the currency as well as the underweight to Malaysia due to geopolitical risk and deteriorating macro on the back of export weakness and oil prices. Additionally, the Fund hedged its currency exposure to the Euro in the first half of the fiscal year. The currency hedging mitigated some of the negative impact of currency in the portfolio.
The top five contributors to the Fund’s absolute performance over the period under discussion based on contribution to total return were China Overseas Land, China Vanke, China Resources Land, SM Prime, and Evergrande.
| • | China Overseas Land, one of the largest developers in China, was the top contributor to the Fund’s performance on an absolute basis. The Chinese |
21
| Alpine Emerging Markets Real Estate Fund (Continued) | |
| | developers across the board have been beneficiaries of government policies to support the economy as well as targeted measures for the real estate sector specifically including easing of mortgage restrictions. Volumes are recovering in a stable pricing environment resulting in significant inventory reduction in Tier 1 and select Tier 2 markets. |
| | |
| • | China Vanke, is one of the largest residential developers in China. The company is more concentrated on end user demand, which allows it to focus on quicker asset turns, shorter landbank duration and maintaining higher return on equities (RoEs) versus peers. |
| | |
| • | China Resources Land is one of the leading landlords and developers in China focused on mixed use projects. Expected acquisitions from its parent company are expected to underpin continued sales, margin and profit growth over the near term. |
| | |
| • | SM Prime is the largest mall owner/operator in the Philippines and following a consolidation with SM Development is also a residential developer. The local economy has performed well over the past year driving consumer spending and same store sales growth. |
| | |
| • | Evergrande is a highly geared Chinese residential developer focused on lower tier markets. The company has diversified its revenue stream by branching out into a variety of other business initiatives. The shares have been supported by a strong contracted sales momentum, a substantial share buyback plan and an extremely generous dividend payout. |
The top five negative contributors to the Fund’s absolute performance for the fiscal year ended October 31, based on contribution to total return were Emaar Properties, Fibra Uno, BR Malls, Sixth of October Development and Greenland Hong Kong.
| • | Emaar Properties, a UAE based real estate developer focusing on large-scale, mixed use (primarily residential, retail and hotel) projects across the Middle East and North Africa (MENA) region and represented the largest detractor of performance for the period. Operations of the company remain robust but the pace of sales in the region has slowed and the weakness in the oil price has dampened sentiment for the shares. |
| | |
| • | Fibra Uno, the largest and most liquid Fibra in Mexico holds a resilient and broadly diversified portfolio and has an aggressive development pipeline. Macroeconomic weakness in Mexico and the fear of rate increases in the US have weighed on the shares. |
| • | BR Malls is the largest shopping center company in Brazil. While operating metrics such as leasing spreads and occupancy levels have outpaced the weakness in the broader economy, the combination of weakening consumer confidence, weak credit and wage data and ongoing macro economic headwinds have dampened investor interest in the sector’s defensive characteristics. |
| | |
| • | Sixth of October Development is a residential developer based in Cairo. Sales momentum and pricing remained strong through the period however, geopolitical issues, commodity prices and currency depreciation affected returns. |
| | |
| • | Greenland Hong Kong is a Chinese residential developer which recently diversified its business lines into real estate internet finance and a real estate fund management arm. The company is effectively the offshore capital platform for its parent the Greenland Group and is still in the early stages of integrating back-ended project injections, expanding its business platform and smoothing out its shareholding structure to promote a more efficient capital structure. |
Outlook
On the surface it would appear that a broad recovery of equity returns across EMs in general could still face headwinds and a challenging year ahead. Indeed, expectations for a continued slowdown in China, the potential for higher US interest rates, the surge in corporate credit, sticky lower commodity prices and ongoing deterioration of global trade (just to name a few) do not augur well for the developing market narrative in the near term. The first move off of the zero bound in close to seven years – no matter how well it is signaled – could potentially heighten the risk of negative spillovers. As we look through transitory economic data and try to identify underlying trends, we acknowledge that such lingering uncertainties could likely skew short term risk/reward dynamics, intensify volatility and fuel debate concerning secular stagnation. As a result, investors are likely to maintain a defensive stance toward EM until signs of a reversal of six years of sequential declines in growth prospects become apparent. While we would expect the trajectory of growth to remain well below trend in the short term we do see early signs that the pace of contraction in select markets has decelerated and that net margins and thus earning prospects for EM corporates could be bottoming, which could offer tactical as well as longer term opportunities in developing markets over the next twelve months and beyond.
22
| Alpine Emerging Markets Real Estate Fund (Continued) | |
The Fed’s tentative approach to rate normalization underscores the fragility of the global macro economic landscape. Market attention has shifted away from lift off timing to the path of the policy rate and the implied neutral rate. While markets are now pricing in a Fed lift off in December, monetary policy should nonetheless be tethered to growth prospects and could remain exceptionally accommodative by any historic measure. The global monetary environment remains extremely supportive and markets are expecting further monetary support from the Bank of Japan (BoJ) and the European Central Bank (ECB), even if it results in more pressure on negative nominal yields and widening interest rate differentials. Accordingly we remain cautiously optimistic on the growth outlook while recognizing that unexpected movements of the yield curve post the Fed’s first rate hike could prompt intervals of risk aversion across asset classes. It is important to reiterate that divergent monetary policies and their spillover effects could likely remain one of the dominant drivers of asset market volatility and returns for the foreseeable future. Though in our view, fears of a replay of the taper tantrum of May 2013 are overstated in terms of both severity and duration. In any case, we believe that the true risks to a sustainable global recovery are likely entrenched prospects of weak growth and disinflation rather than fears of measured rate tightening due to a recovery in aggregate demand.
As markets digest the Fed outlook for rates we would expect to see clear winners and losers emerge as these adjustments are transmitted through the real economy. Lower commodity prices and USD strength are further highlighting the differences in monetary and fiscal policy flexibility between domestic and export-based economies. Inflation could tick higher on base effects alone while FX adjustments could continue to be an extremely important transmission channel for addressing imbalances in certain countries. China should remain a focus of EM investor concern, especially as it recorded its lowest growth rate in Q3 (6.9% annualized) since the crisis in 2009. Of particular interest will be China’s success in liberalizing its capital account, managing the process of market pricing for its currency and interest rates and gaining inclusion of its locally traded shares into global indices. Although it requires some patience, we would
expect China to stabilize its economy through a balanced mix of monetary and fiscal measures which should help to assuage fears over a raft of potential problems including devaluation of the currency, corporate debt levels and a possible balance of payments crisis. A managed growth deceleration should not be equated with a hard landing in our view.
Some of the critical elements for Alpine’s assessment of EM include: the scope and implementation of structural reforms, the vulnerability to external funding, the geopolitical landscape and crucially the growth/inflation dynamic. Over the medium-term, many EM economies could continue to underpin global growth based on the stabilization of domestic demand trends, as well as urbanization and positive demographics. As the developing countries strive to become deeper and more integrated, it is Alpine’s view that over time the emerging equity markets could increase substantially in absolute terms as more companies come public and eventually even surpass developed markets (DMs) in terms of market capitalization. At the same time we expect growth differentials between EMs and DMs to stabilize over the medium term, which could support a structural reallocation to EM equities. Dispersion of EM real estate equity returns across geographies and asset types could remain elevated, which is consistent with Alpine’s long-term view that the current macroeconomic climate could provide attractive opportunities for active management and stock selection. Differentiation – whether in markets, asset types or growth models – should remain a dominant theme in our portfolio construction methodology.
Alpine’s Real Estate team carefully evaluates the risk/reward proposition of each position in the portfolio and monitors volatility carefully. The managers remain extremely selective in our approach to the markets and deploying capital. We thank our shareholders for their support and look forward to the coming year.
Sincerely,
Joel E.D. Wells
Samuel A. Lieber
Portfolio Managers
23
| Alpine Emerging Markets Real Estate Fund (Continued) | |
This letter represents the opinions of the Fund’s management and is subject to change, is not guaranteed and should not be considered a recommendation to buy or sell any security. The information provided is not intended to be, and is not, a forecast of future events, a guarantee of future results, or investment advice. Views expressed may vary from those of the firm as a whole.
Past performance is no guarantee of future results.
Mutual fund investing involves risk. Principal loss is possible. The Fund is subject to risks, including the following:
Concentration Risk – The Fund’s strategy of concentrating in companies in a specific industry means that its performance will be closely tied to the performance of a particular market segment. The Fund’s concentration in these companies may present more risks than if it were broadly diversified over numerous industries and sectors of the economy. A downturn in these companies would have a larger impact on the Fund than on a mutual fund that does not concentrate in such companies. At times, the performance of these companies will lag the performance of other industries or the broader market as a whole.
Currency Risk – The value of investments in securities denominated in foreign currencies increases or decreases as the rates of exchange between those currencies and the U.S. dollar change. Currency conversion costs and currency fluctuations could erase investment gains or add to investment losses. Currency exchange rates can be volatile, and are affected by factors such as general economic conditions, the actions of the U.S. and foreign governments or central banks, the imposition of currency controls and speculation.
Emerging Market Securities Risk – The risks of foreign investments are heightened when investing in issuers in emerging market countries. Emerging market countries tend to have economic, political and legal systems that are less fully developed and are less stable than those of more developed countries. They are often particularly sensitive to market movements because their market prices tend to reflect speculative expectations. Low trading volumes may result in a lack of liquidity and in extreme price volatility.
Equity Securities Risk – The stock or other security of a company may not perform as well as expected, and may decrease in value, because of factors related to the company (such as poorer than expected earnings or certain management decisions) or to the industry in which the company is engaged (such as a reduction in the demand for products or services in a particular industry).
Foreign Currency Transactions Risk – Foreign securities are often denominated in foreign currencies. As a result, the value of the Fund’s shares is affected by changes in exchange rates. The Fund may enter into foreign currency transactions to try to manage this risk. The Fund’s ability to use foreign currency transactions successfully depends on a number of factors, including the foreign currency transactions being available at prices that are not too costly, the availability of liquid markets and the ability of the Adviser to accurately predict the direction of changes in currency exchange rates.
Foreign Securities Risk – The Fund’s investments in securities of foreign issuers or issuers with significant exposure to foreign markets involve additional risk. Foreign countries in which the Fund may invest may have markets that are less liquid, less regulated and more volatile than U.S. markets. The value of the Fund’s investments may decline because of factors affecting the particular issuer as well as foreign markets and issuers generally, such as unfavorable government actions, and political or financial instability. Lack of information may also affect the value of these securities. The risks of foreign investment are heightened when investing in issuers of emerging market countries.
Growth Stock Risk – Growth stocks typically are very sensitive to market movements because their market prices tend to reflect future expectations. When it appears those expectations will not be met, the prices of growth stocks typically fall. Growth stocks as a group may be out of favor and underperform the overall equity market while the market concentrates on undervalued stocks.
Initial Public Offerings and Secondary Offerings Risk – The Fund may invest a portion of its assets in shares of IPOs or secondary offerings of an issuer. IPOs and secondary offerings may have a magnified impact on the performance of a Fund with a small asset base. The impact of IPOs and secondary offerings on a Fund’s performance likely will decrease as the Fund’s asset size increases, which could reduce a Fund’s returns. IPOs and secondary offerings may not be consistently available to the Fund for investing. IPO and secondary offering shares frequently are volatile in price due to the absence of a prior public market, the small number of shares available for trading and limited information about the issuer. Therefore, the Fund may hold IPO and secondary offering shares for a very short period of time. This may increase the
24
| Alpine Emerging Markets Real Estate Fund (Continued) | |
turnover of the Fund and may lead to increased expenses for the Fund, such as commissions and transaction costs. In addition, IPO and secondary offering shares can experience an immediate drop in value if the demand for the securities does not continue to support the offering price.
Interest Rate Risk – Interest rates may rise resulting in a decrease in the value of securities held by the Fund, or may fall resulting in an increase in the value of such securities. Securities having longer maturities generally involve a greater risk of fluctuations in the value resulting from changes in interest rates.
Liquidity Risk – Some securities held by the Fund may be difficult to sell, or illiquid, particularly during times of market turmoil. Illiquid securities may also be difficult to value. If the Fund is forced to sell an illiquid asset to meet redemption requests or other cash needs, the Fund may be forced to sell at a loss.
Management Risk – The Adviser’s judgment about the quality, relative yield or value of, or market trends affecting, a particular security or sector, or about interest rates generally, may be incorrect. The Adviser’s security selections and other investment decisions might produce losses or cause the Fund to underperform when compared to other funds with similar investment objectives and strategies.
Market Risk – The price of a security held by the Fund may fall due to changing market, economic or political conditions.
Micro Capitalization Company Risk – Stock prices of micro capitalization companies are significantly more volatile, and more vulnerable to adverse business and economic developments than those of larger companies. Micro capitalization companies often have narrower markets for their goods and/or services and more limited managerial and financial resources than larger, more established companies, including small or medium capitalization companies.
Real Estate Investment Trusts (“REITs”) Risk – REITs’ share prices may decline because of adverse developments affecting the real estate industry including changes in interest rates. The returns from REITs may trail returns from the overall market. Additionally, there is always a risk that a given REIT will fail to qualify for favorable tax treatment.
Real Estate Securities Risk – Risks associated with investment in securities of companies in the real estate industry include: declines in the value of real estate; risks related to local economic conditions, overbuilding and increased competition; increases in property taxes and operating expenses; changes in zoning laws; casualty or condemnation losses; variations in rental income, neighborhood values or the appeal of properties to tenants; changes in interest rates and changes in general economic and market conditions.
Small and Medium Capitalization Company Risk – Securities of small or medium capitalization companies are more likely to experience sharper swings in market values, less liquid markets, in which it may be more difficult for the Adviser to sell at times and at prices that the Adviser believes appropriate and generally are more volatile than those of larger companies.
Undervalued Stock Risk – The Fund may pursue strategies that may include investing in securities, which, in the opinion of the Adviser, are undervalued. The identification of investment opportunities in undervalued securities is a difficult task and there is no assurance that such opportunities will be successfully recognized or acquired. While investments in undervalued securities offer opportunities for above-average capital appreciation, these investments involve a high degree of financial risk and can result in substantial losses.
Please refer to pages 3-4 for other important disclosures and definitions.
25
| Alpine Global Infrastructure Fund | |
| Comparative Annualized Returns as of 10/31/15 (Unaudited) |
| | | 1 Year | | 3 Years | | 5 Years | | Since Inception(1) |
| Alpine Global Infrastructure Fund — Institutional Class | | -7.90% | | | 8.46% | | | 7.95% | | | 14.35% | |
| Alpine Global Infrastructure Fund — Class A (Without Load) | | -8.15% | | | 8.18% | | | N/A | | | 11.00% | |
| Alpine Global Infrastructure Fund — Class A (With Load) | | -13.20% | | | 6.15% | | | N/A | | | 9.38% | |
| S&P Global Infrastructure Index | | -5.54% | | | 7.56% | | | 6.62% | | | 9.12% | |
| MSCI All Country World Index | | -0.03% | | | 9.92% | | | 7.68% | | | 10.62% | |
| Lipper Global Infrastructure Funds Average(2) | | -6.00% | | | 8.58% | | | 7.46% | | | 10.91% | |
| Lipper Global Infrastructure Funds Ranking(2) | | 59/78 | | | 23/51 | | | 25/44 | | | 4/22 | |
| Gross Expense Ratio (Institutional Class): 1.21%(3) | | | | | | | | | | | | |
| Net Expense Ratio (Institutional Class): 1.21%(3) | | | | | | | | | | | | |
| Gross Expense Ratio (Class A): 1.46%(3) | | | | | | | | | | | | |
| Net Expense Ratio (Class A): 1.46%(3) | | | | | | | | | | | | |
| | (1) | Institutional Class shares commenced on November 3, 2008 and Class A shares commenced on December 30, 2011. Returns for indices are since November 3, 2008. |
| | (2) | The since inception data represents the period beginning November 6, 2008 (Institutional Class only). |
| | (3) | As disclosed in the prospectus dated February 27, 2015. |
Performance data quoted represents past performance and is not predictive of future results. Investment return and principal value of the Fund fluctuate, so that shares, when redeemed, may be worth more or less than their original cost. Performance current to the most recent month end may be lower or higher than the performance quoted and may be obtained by calling 1-888-785-5578. Performance data shown does not reflect the 1.00% redemption fee imposed on shares held for fewer than 60 days. If it did, total returns would be reduced. Returns for the Class A shares with sales charge reflect a maximum sales charge of 5.50%. Performance for the Class A shares without sales charges does not reflect this load.
S&P Global Infrastructure Index is a total return index that is designed to track 75 companies from around the world chosen to represent the listed infrastructure industry while maintaining liquidity and tradability. To create diversified exposure, the index includes three distinct infrastructure clusters: energy, transportation, and utilities. Net Total Return (NTR) indexes include reinvestments of all dividends minus taxes. MSCI All Country World Index is a total return, free-float adjusted market capitalization weighted index that captures large and mid-cap representation across 24 Developed and 21 Emerging Markets countries. With 2,483 constituents, the index covers approximately 85% of the global investable equity opportunity set. Net total return indices reinvest dividends after the deduction of withholding taxes, using (for international indices) a tax rate applicable to non-resident institutional investors who do not benefit from double taxation treaties. Source: MSCI. MSCI data may not be reproduced or used for any other purpose. MSCI provides no warranties, has not prepared or approved this report, and has no liability hereunder. The Lipper Global Infrastructure Funds Average is an average of funds that limit their investments to a specific industry (e.g. transportation, retailing, or paper, etc.) or ones that have not been classified into an existing investment classification. To create diversified exposure across the global listed infrastructure market, the index has balanced weights across three distinct infrastructure clusters: utilities, transportation, and energy. The S&P Global Infrastructure Index, MSCI All Country World Index and the Lipper Global Infrastructure Funds Average are unmanaged and do not reflect direct fees associated with a mutual fund, such as investment adviser fees; however, the Lipper Global Infrastructure Funds Average reflects fees charged by the underlying funds. The performance for the Alpine Global Infrastructure Fund reflects the deduction of fees for these value-added services. Lipper rankings for the periods shown are based on fund total returns with dividends and distributions reinvested and do not reflect sales charges. Investors cannot directly invest in an index.
Expense Ratios reflect the ratios reported in the Fund’s most recent prospectus. The Alpine Global Infrastructure Fund has a contractual expense waiver that continues through March 1, 2017. Where a Fund’s gross and net expense ratios are the same for the period reported, the contractual expense reimbursement level was not reached as of the end of that period. To the extent the Fund’s expenses were reduced by waivers, the Fund’s total returns were increased. In these cases, in the absence of the expense waivers, the Fund’s total returns would have been lower.
The Fund’s past performance benefited significantly from Initial Public Offerings (“IPOs”) and Secondary Offerings of certain issuers. There is no assurance that the Fund can replicate this performance in the future. Additionally, there is no guarantee that the Fund will be able to participate to the same degree in IPO/Secondary Offerings in the future.
26
| Alpine Global Infrastructure Fund (Continued) | |
Portfolio Distributions* (Unaudited)

| Top 10 Holdings* (Unaudited) |
| 1. | | Crown Castle International Corp. | 2.58% |
| 2. | | The Geo Group, Inc. | 2.47% |
| 3. | | Enbridge, Inc. | 2.43% |
| 4. | | Ferrovial SA | 2.39% |
| 5. | | Vinci SA | 2.38% |
| 6. | | T-Mobile U.S., Inc. | 2.13% |
| 7. | | American Tower Corp. | 2.08% |
| 8. | | Eutelsat Communications SA | 2.06% |
| 9. | | Union Pacific Corp. | 2.05% |
| 10. | | Pattern Energy Group, Inc. | 2.03% |
| * | Portfolio Distributions percentages are based on total investments. Top 10 Holdings do not include short-term investments and percentages are based on total net assets. Portfolio holdings and sector distributions are as of 10/31/15 and are subject to change. Portfolio holdings are not recommendations to buy or sell any securities. |
Value of a $10,000 Investment (Unaudited)
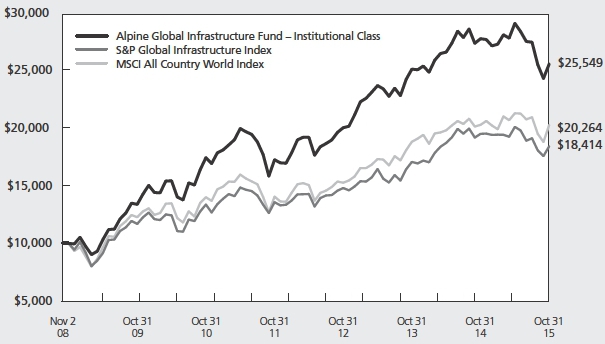
This chart represents a comparison of a hypothetical $10,000 investment in the Fund versus a similar investment in the Fund’s benchmarks. The graph and the table do not reflect the deduction of taxes that a shareholder would pay on Fund distributions or the redemption of Fund shares. Investment performance reflects the waiver and recovery of certain fees, if applicable. Without the waiver and recovery of fees, the Fund’s total return would have differed.
Performance data quoted represents past performance and is not predictive of future results. Investment return and principal value of the Fund fluctuate, so that shares, when redeemed, may be worth more or less than their original cost.
27
| Alpine Global Infrastructure Fund (Continued) | |
Commentary
Dear Shareholders:
For the fiscal year ended October 31, 2015, the Alpine Global Infrastructure Fund reported a -7.90% total return versus the S&P Global Infrastructure Index, which had a total return of -5.54%. All references in this letter to the Fund’s performance relate to the performance of the Fund’s Institutional Class.
Performance Drivers
Despite a bout of turbulence, global equities managed to eke out a modest gain during the 12 month period ended October 31, 2015. During the month of August 2015, the Chicago Board Options Exchange Volatility Index (VIX) spiked by over 200% from its trough to its peak, in a vivid reminder of the heightened volatility witnessed in 2011. There were a number of factors that increased investor unease, including the devaluation of the Chinese Renminbi, general weakness in emerging market economies, the uncertainty of when the Federal Reserve Bank would begin increasing interest rates, commodity weakness, and concerns over the potential for new drug price regulations in the United States. While the volatility did subside as autumn wore on, the dispersion in the performance of stocks worldwide remained stark. The total return of the S&P 500® Index, at 5.20% contrasted sharply with that of the MSCI Europe Index (up 0.17% in U.S. Dollar terms) and the MSCI Emerging Market Index (down 14.53%). With economic prospects in the US remaining relatively sanguine as compared to most other countries, particularly in Europe, the US trade-weighted Dollar Index rose by about 13% during the period, driven largely by the 12% depreciation in the Euro.
On a relative basis, the Fund outperformed in the energy sector due to its underweighting in the sector and the stocks within the sector outperforming the S&P Global Infrastructure Index. The energy sector was the worst performing sector in the index as MLPs declined. This was due to the drop in oil and natural gas prices and the market’s anticipation of an increase in interest rates by the Federal Reserve Bank. The Alerian MLP Index declined 30.08% over the fiscal year. The Fund underperformed in the transportation sector due to stock selection. The overweight in railroads hurt the performance as rail volumes declined during 2015.
We believe that the urbanization of emerging market countries will be an important driver of infrastructure development and spending. During the period, the Fund’s exposure to emerging markets continues to be
overweight versus its benchmark but we have reduced the position to below 20% of our total assets.
The Fund also participated in a number of initial public offerings (IPOs) both inside and outside of the infrastructure sector, that have contributed to the Fund’s total return. We cannot predict how long, if at all, these opportunities will continue to exist, but to the extent we consider IPOs to be attractively priced and available, the Fund will continue to participate in them.
Portfolio Analysis
The top five stocks contributing to the Fund’s absolute performance for the 12-month period ended October 31, 2015, based on contribution to total return were CRRC Corp. (“CRRC”), China Railway Construction Corp. (“CRCC”), Ferrovial (“FER”), Veolia Environment (“VIE”) and Vinci (“DG”).
| • | CRRC Corp, formerly known as China CNR, is China’s only railway equipment manufacturer. At the end of 2014, the Chinese government merged China CNR and China CSR to form CRRC, which has a monopoly on domestic railway equipment manufacturing in China. We expect CRRC to continue to benefit from favorable government policy supporting domestic railway fixed asset investment and promoting the overseas export of China’s railway expertise via its “One Belt, One Road” program. |
| | |
| • | China Railway Construction Corp. is a diversified engineering and construction company in China. The stock’s outperformance was driven by China’s “One Belt, One Road” program, which promotes overseas railway and road construction by Chinese companies. In 2015, CRCC was involved in project awards in Nigeria, Saudi Arabia, Dhaka and Indonesia, with potential future awards in Thailand, Poland, India, Latin America and the United States. A potential merger with China Railway Group, similar to China CNR and China CSR, could be an additional catalyst. |
| | |
| • | Ferrovial is a global transportation infrastructure company based in Spain. The stock performed well as vehicle traffic recovered in Spain. FER’s key asset, the 407 toll road in Canada, continued to grow revenues as traffic remained inelastic to increases in tariffs. The company’s new “managed lane” toll roads in Texas have also been ramping up in line with expectations. The decision to build a third runway at Heathrow airport in the UK could be a positive catalyst. |
28
| Alpine Global Infrastructure Fund (Continued) | |
| • | Veolia Environment is a global water and waste-water company based in France. VIE is in the midst of a turnaround and is nearing the completion of three-year cost reduction plan. In addition, the company has made progress reducing its debt, improving free cash flow and selling its non-core assets. VIE is expected to present a new three-year cost cutting plan in December 2015. We continue to believe that the company will have operational leverage to a recovery in European waste volumes. |
| | |
| • | Vinci is a global transportation infrastructure and engineering and construction company based in France. DG’s French toll road assets benefited from improved vehicle traffic and the motorway stimulus plan approved by the French government in early 2015. The company’s Portugal airport performed well and it also won new airport concessions in Chile and Japan during the year. We continue to wait for a recovery in French construction but believe that Vinci has optimized its cost base for the current environment. |
The following companies had the largest adverse impact on the performance of the Fund based on contribution to return for the fiscal year ended October 31, 2015: OHL Mexico (“OHLMEX”), Empresas ICA (“ICA”), Cosan Logistica (“RLOG”), Abengoa (“ABG”) and Grana y Montero (“GRAM”).
| • | OHL Mexico is a transportation infrastructure company in Mexico. The company suffered from allegations of impropriety involving government officials. Numerous audits, including an investigation by the Mexican National Banking and Securities Commission, did not produce any evidence of illegal activity. As a result, we continue to believe that confidence in the company will be restored after all investigations are finalized. Earlier in 2015, OHLMEX sold a 24.99% stake in its largest toll road asset, Conmex, to IFM Investors, a global fund manager, providing a positive valuation marker for the stock. In addition, vehicle traffic for its Mexico road portfolio has been exceptionally strong, up 14% year-over-year through the first nine months of 2015. |
| | |
| • | ICA is a construction and concession company focused on Mexico but also with assets in Latin America. The company underperformed over fears of contract cancellations and slowdown of new contract awards, given the contraction in public spending with lower oil prices. In addition, the appreciation of the US dollar relative to the Mexican Peso also had a negative translation effect on its US-dollar denominated debt. |
| • | Cosan Logistica is a railway concession operator in Brazil, formed through the merger of America Latina Logistica and Rumo Logistica Operadora Multimodal. Stock performance suffered as financial results continued to deteriorate, partly as a result of the Brazilian economy slowing. New management has laid out short- and long-term plans to optimize costs and deploy new capital. |
| | |
| • | Abengoa is a global engineering & construction company based in Spain. ABG underperformed as a result of liquidity concerns that surfaced in November 2014 but became more apparent in the July 2015. We have fully divested our position in the stock. |
| | |
| • | Grana y Montero is a Peruvian construction company. The company continued to underperform on weakness in new contract opportunities given weak public and private investment levels in Peru. |
Summary and Outlook
As we look toward 2016, we see a market environment that remains fairly uncertain. While the U.S. economy appears to be in a sustained growth trajectory, it is challenged by a partisan environment in Washington D.C. and numerous external headwinds including soft export markets and geopolitical uncertainties relating to key trading partners. It is entirely plausible that the U.S. stock market will be stuck in a holding pattern, supported on the one hand by a benign macro environment and solid corporate earnings growth, but at the same time wrestling with the prospect of the first Federal Funds rate hike in many years.
The setting in Europe appears a bit more favorable. Europe is benefiting from multiple tailwinds: growth is picking up, as evidenced by the persistent strength of the Markit Index of Manufacturing in the Eurozone, the exchange rate has remained far lower than in 2014, and corporate profits are improving. And in contrast to the Fed’s pulling back of the monetary punch bowl, the party is just getting started in Europe, with its own version of quantitative easing now under way.
The Asia-Pacific region is mixed, but there are some bright spots. Prime Minister Shinzo Abe’s ‘Abenomics’ appears to be gaining traction in Japan, with the labor market strengthening and corporate earnings growth amongst the most buoyant in the world. And while China’s transition to a consumer-led economy has been a bumpy ride, policy-makers are taking full advantage of their formidable array of tools, including monetary, fiscal and exchange-rate policy, and we are beginning to see some green shoots.
29
| Alpine Global Infrastructure Fund (Continued) | |
We launched the Alpine Global Infrastructure Fund because we believe that there may be special opportunities to benefit from global spending in infrastructure over the next several decades. Even before the financial crisis began to wreak havoc on the budgets of governments and municipalities, the privatization of infrastructure assets began to take place. Now, even more so, we believe there will be an accelerated effort to privatize these assets as public entities will not have the funds to maintain their current infrastructure assets nor to build new infrastructure assets to meet the needs of a growing population. Throughout the world, the owners of infrastructure are primarily government entities. However, over the last several decades, due to the large cost of building and maintaining these facilities, there has been a movement towards privatization of infrastructure assets. In Canada, Australia, the United Kingdom, and throughout Europe and Asia, roads, airports, and seaports have been privatized.
Since the launch of our Fund, the equity markets have been volatile as the world’s economies suffered from the effects of the financial crisis. We believe the amount of debt that governments have on their balance sheets and the austerity measures that have been enacted will likely lead to slower growth for years to come. The uncertainty over the European debt crisis along with the questionable growth prospects of China has led to extremely volatile markets and, as a result, we have continued to hedge a portion of our Euro currency exposure during the period to partially help offset the
Euro’s impact on the value of the Fund’s Euro-denominated holdings. We believe that these market conditions may create many new opportunities for investors in infrastructure stocks that have the potential for more stable and predictable cash flows. Our portfolio of companies is not immune to swings in share prices, but volatile markets may provide an opportunity to continue buying what we believe are high-quality companies with solid balance sheets and good growth prospects at what we believe are inexpensive valuations. In the future, governments may be compelled to sell off infrastructure assets and utilize public/private funds using build/operate/transfer models to finance new projects.
We recently completed a merger. The merger did not affect the strategy of the Fund. We are pleased with the structure of our portfolio. We believe the Fund should be well positioned to take advantage of any increase in global infrastructure spending. We continue to believe that the combination of urbanization, rising standards of living and population growth can propel infrastructure spending for decades to come. We will continue to adapt our investment approach as economic conditions change and look forward to discussing the portfolio and the prospects for the Fund in future communications. We appreciate your trust and investment in the Fund.
Sincerely,
Joshua E. Duitz
Samuel A. Lieber
Portfolio Managers
This letter represents the opinions of the Fund’s management and is subject to change, is not guaranteed and should not be considered a recommendation to buy or sell any security. The information provided is not intended to be, and is not, a forecast of future events, a guarantee of future results, or investment advice. Views expressed may vary from those of the firm as a whole.
Past performance is no guarantee of future results.
Mutual fund investing involves risk. Principal loss is possible. The Fund is subject to risks including the following:
Concentration Risk – The Fund’s strategy of concentrating in companies in a specific industry means that its performance will be closely tied to the performance of a particular market segment. The Fund’s concentration in these companies may present more risks than if it were broadly diversified over numerous industries and sectors of the economy. A downturn in these companies would have a larger impact on the Fund than on a mutual fund that does not concentrate in such companies. At times, the performance of these companies will lag the performance of other industries or the broader market as a whole.
Currency Risk – The value of investments in securities denominated in foreign currencies increases or decreases as the rates of exchange between those currencies and the U.S. dollar change. Currency conversion costs and currency fluctuations could erase investment gains or add to investment losses. Currency exchange rates can be volatile, and are affected by factors such as general economic conditions, the actions of the U.S. and foreign governments or central banks, the imposition of currency controls and speculation.
Dividend Strategy Risk – The Fund’s strategy of investing in dividend-paying stocks involves the risk that such stocks may fall out of favor with investors and underperform the market. Companies that issue dividend paying-stocks are not
30
| Alpine Global Infrastructure Fund (Continued) | |
required to continue to pay dividends on such stocks. Therefore, there is the possibility that such companies could reduce or eliminate the payment of dividends in the future.
Emerging Market Securities Risk – The risks of foreign investments are heightened when investing in issuers in emerging market countries. Emerging market countries tend to have economic, political and legal systems that are less fully developed and are less stable than those of more developed countries. They are often particularly sensitive to market movements because their market prices tend to reflect speculative expectations. Low trading volumes may result in a lack of liquidity and in extreme price volatility.
Equity Securities Risk – The stock or other security of a company may not perform as well as expected, and may decrease in value, because of factors related to the company (such as poorer than expected earnings or certain management decisions) or to the industry in which the company is engaged (such as a reduction in the demand for products or services in a particular industry).
Foreign Currency Transactions Risk – Foreign securities are often denominated in foreign currencies. As a result, the value of the Fund’s shares is affected by changes in exchange rates. The Fund may enter into foreign currency transactions to try to manage this risk. The Fund’s ability to use foreign currency transactions successfully depends on a number of factors, including the foreign currency transactions being available at prices that are not too costly, the availability of liquid markets and the ability of the Adviser to accurately predict the direction of changes in currency exchange rates.
Foreign Securities Risk – The Fund’s investments in securities of foreign issuers or issuers with significant exposure to foreign markets involve additional risk. Foreign countries in which the Fund may invest may have markets that are less liquid, less regulated and more volatile than U.S. markets. The value of the Fund’s investments may decline because of factors affecting the particular issuer as well as foreign markets and issuers generally, such as unfavorable government actions, and political or financial instability. Lack of information may also affect the value of these securities. The risks of foreign investment are heightened when investing in issuers of emerging market countries.
Growth Stock Risk – Growth stocks are stocks of companies believed to have above-average potential for growth in revenue and earnings. Growth stocks typically are very sensitive to market movements because their market prices tend to reflect future expectations. When it appears those expectations will not be met, the prices of growth stocks typically fall. Growth stocks as a group may be out of favor and underperform the overall equity market while the market concentrates on undervalued stocks.
Infrastructure-Related Investment Risk – Because the Fund concentrates its investments in infrastructure-related entities, the Fund has greater exposure to the potential adverse economic, regulatory, political and other changes affecting such entities. Infrastructure-related entities are subject to a variety of factors that may adversely affect their business or operations, including high interest costs in connection with capital construction programs, costs associated with environmental and other regulations, the effects of economic slowdown and surplus capacity, increased competition from other providers of services, uncertainties concerning the availability of fuel at reasonable prices, the effects of energy conservation policies and other factors. Additionally, infrastructure-related entities may be subject to regulation by various governmental authorities and may also be affected by governmental regulation of rates charged to customers, service interruption due to environmental, operational or other mishaps and the imposition of special tariffs and changes in tax laws, regulatory policies and accounting standards.
Initial Public Offerings and Secondary Offerings Risk – The Fund may invest a portion of its assets in shares of IPOs or secondary offerings of an issuer. IPOs and secondary offerings may have a magnified impact on the performance of a Fund with a small asset base. The impact of IPOs and secondary offerings on a Fund’s performance likely will decrease as the Fund’s asset size increases, which could reduce a Fund’s returns. IPOs and secondary offerings may not be consistently available to the Fund for investing. IPO and secondary offering shares frequently are volatile in price due to the absence of a prior public market, the small number of shares available for trading and limited information about the issuer. Therefore, the Fund may hold IPO and secondary offering shares for a very short period of time. This may increase the turnover of the Fund and may lead to increased expenses for the Fund, such as commissions and transaction costs. In addition, IPO and secondary offering shares can experience an immediate drop in value if the demand for the securities does not continue to support the offering price.
Management Risk – The Adviser’s judgment about the quality, relative yield or value of, or market trends affecting, a particular security or sector, or about interest rates generally, may be incorrect. The Adviser’s security selections and other
31
| Alpine Global Infrastructure Fund (Continued) | |
investment decisions might produce losses or cause the Fund to underperform when compared to other funds with similar investment objectives and strategies.
Market Risk – The price of a security held by the Fund may fall due to changing market, economic or political conditions.
Portfolio Turnover Risk – High portfolio turnover necessarily results in greater transaction costs which may reduce Fund performance.
Small and Medium Capitalization Company Risk – Securities of small or medium capitalization companies are more likely to experience sharper swings in market values, less liquid markets, in which it may be more difficult for the Adviser to sell at times and at prices that the Adviser believes appropriate and generally are more volatile than those of larger companies.
Undervalued Stock Risk – The Fund may pursue strategies that may include investing in securities, which, in the opinion of the Adviser, are undervalued. The identification of investment opportunities in undervalued securities is a difficult task and there is no assurance that such opportunities will be successfully recognized or acquired. While investments in undervalued securities offer opportunities for above-average capital appreciation, these investments involve a high degree of financial risk and can result in substantial losses.
Please refer to pages 3-4 for other important disclosures and definitions.
32
Alpine International Real Estate Equity Fund
Schedule of Portfolio Investments
October 31, 2015
| | | | Security | | | |
| Shares | | | Description | | Value | |
| | | | | | | | |
| Common Stocks—91.0% | | | | |
| Asia—47.7% | | | | |
| China—9.0% | | | | |
| | 380,000 | | | China Overseas Land & Investment, Ltd. | | $ | 1,235,517 | |
| | 1,448,261 | | | China Resources Land, Ltd. | | | 3,783,873 | |
| | 755,096 | | | China State Construction International Holdings, Ltd. | | | 1,149,606 | |
| | 240,000 | | | Dalian Wanda Commercial Properties Co., Ltd.-Class H (a) | | | 1,607,101 | |
| | 200,000 | | | E-House China Holdings, Ltd.- ADR (b) | | | 1,240,000 | |
| | 1,656,667 | | | Greenland Hong Kong Holdings, Ltd. (c) | | | 703,227 | |
| | 700,000 | | | Longfor Properties Co., Ltd. | | | 942,895 | |
| | 250,000 | | | Shimao Property Holdings, Ltd. | | | 439,321 | |
| | 1,958,227 | | | Shui On Land, Ltd. | | | 540,682 | |
| | | | | | | | 11,642,222 | |
| India—8.9% | | | | |
| | 1,947,083 | | | DB Realty, Ltd. (c) | | | 1,851,882 | |
| | 1,000,000 | | | DLF, Ltd. | | | 1,776,724 | |
| | 2,290,373 | | | Hirco PLC (c)(d)(e) | | | 176,542 | |
| | 500,000 | | | Housing Development & Infrastructure, Ltd. (c) | | | 550,922 | |
| | 185,910 | | | Kolte-Patil Developers, Ltd. | | | 498,453 | |
| | 228,000 | | | Oberoi Realty, Ltd. | | | 991,972 | |
| | 374,877 | | | Prestige Estates Projects, Ltd. | | | 1,162,581 | |
| | 111,902 | | | Sobha, Ltd. | | | 558,268 | |
| | 2,000,000 | | | South Asian Real Estate PLC (c)(d)(e)(f) | | | 3,853,998 | |
| | 8,955 | | | Yatra Capital, Ltd. (c) | | | 54,259 | |
| | | | | | | | 11,475,601 | |
| Japan—18.0% | | | | |
| | 15,000 | | | Daito Trust Construction Co., Ltd. (b) | | | 1,633,380 | |
| | 496 | | | GLP J-REIT | | | 494,890 | |
| | 330,691 | | | Hulic Co., Ltd. (b) | | | 3,113,160 | |
| | 800,000 | | | Ichigo, Inc. | | | 2,081,711 | |
| | 6,538 | | | Invincible Investment Corp. | | | 3,895,601 | |
| | 872,312 | | | Kenedix, Inc. | | | 3,180,718 | |
| | 200,000 | | | Mitsubishi Estate Co., Ltd. (b) | | | 4,320,875 | |
| | 166,725 | | | Mitsui Fudosan Co., Ltd. | | | 4,573,297 | |
| | | | | | | | 23,293,632 | |
| Philippines—5.2% | | | | |
| | 2,097,077 | | | Ayala Land, Inc. | | | 1,605,729 | |
| | 30,000,000 | | | Megaworld Corp. | | | 3,005,126 | |
| | 4,500,070 | | | SM Prime Holdings, Inc. | | | 2,076,068 | |
| | | | | | | | 6,686,923 | |
| Singapore—2.8% | | | | |
| | 2,479,000 | | | Banyan Tree Holdings, Ltd. | | | 884,788 | |
| | 1,701,420 | | | Global Logistic Properties, Ltd. | | | 2,720,523 | |
| | | | | | | | 3,605,311 | |
| Thailand—1.5% | | | | |
| | 1,114,600 | | | Central Pattana PCL | | | 1,441,529 | |
| | 550,392 | | | Minor International PCL | | | 471,975 | |
| | | | | | | | 1,913,504 | |
| | | | Security | | | |
| Shares | | | Description | | Value | |
| | | | | | | | |
| United Arab Emirates—2.3% | | | | |
| | 1,345,383 | | | DAMAC Properties Dubai Co. PJSC | | $ | 1,087,881 | |
| | 181,820 | | | Emaar Malls Group PJSC (c) | | | 154,940 | |
| | 1,000,000 | | | Emaar Properties PJSC | | | 1,756,058 | |
| | | | | | | | 2,998,879 | |
| | | | | Total Asia (Cost $85,757,033) | | | 61,616,072 | |
| Europe—34.8% | | | | |
| France—2.4% | | | | |
| | 70,193 | | | Nexity SA (b) | | | 3,109,895 | |
| Germany—2.6% | | | | |
| | 40,000 | | | ADO Properties SA (a)(c) | | | 1,022,675 | |
| | 28,000 | | | DIC Asset AG | | | 275,634 | |
| | 2,047,900 | | | Sirius Real Estate, Ltd. (b) | | | 1,171,026 | |
| | 5,000 | | | TAG Immobilien AG | | | 64,742 | |
| | 43,548 | | | TLG Immobilien AG | | | 819,835 | |
| | | | | | | | 3,353,912 | |
| Greece—0.0% (g) | | | | |
| | 100,000 | | | Dolphin Capital Investors, Ltd. (c) | | | 26,785 | |
| Ireland—5.1% | | | | |
| | 828,000 | | | Dalata Hotel Group PLC (b)(c) | | | 4,115,508 | |
| | 518,484 | | | Green REIT PLC (b) | | | 897,988 | |
| | 166,666 | | | Hibernia REIT PLC (b) | | | 246,687 | |
| | 1,022,471 | | | Irish Residential Properties REIT PLC | | | 1,259,284 | |
| | | | | | | | 6,519,467 | |
| Poland—0.0% | | | | |
| | 3,265,000 | | | Nanette Real Estate Group NV (c)(d)(e) | | | 11,489 | |
| Spain—3.3% | | | | |
| | 75,000 | | | Hispania Activos Inmobiliarios SA (c) | | | 1,129,891 | |
| | 111,632 | | | Lar Espana Real Estate Socimi SA | | | 1,178,459 | |
| | 150,000 | | | Merlin Properties Socimi SA | | | 1,923,288 | |
| | | | | | | | 4,231,638 | |
| Sweden—2.2% | | | | |
| | 100,877 | | | JM AB (b) | | | 2,855,026 | |
| United Kingdom—19.2% | | | | |
| | 320,270 | | | Great Portland Estates PLC (b) | | | 4,391,711 | |
| | 45,688 | | | Kennedy Wilson Europe Real Estate PLC | | | 842,374 | |
| | 90,000 | | | Land Securities Group PLC (b) | | | 1,857,781 | |
| | 252,084 | | | Londonmetric Property PLC (b) | | | 657,532 | |
| | 2,356,215 | | | LXB Retail Properties PLC (b) | | | 3,341,752 | |
| | 1,600,756 | | | Regus PLC (b) | | | 8,257,006 | |
| | 120,000 | | | Savills PLC (b) | | | 1,694,526 | |
| | 150,000 | | | The British Land Co. PLC (b) | | | 2,012,943 | |
| | 167,416 | | | The Unite Group PLC (b) | | | 1,716,288 | |
| | | | | | | | 24,771,913 | |
| | | | | Total Europe (Cost $36,538,860) | | | 44,880,125 | |
The accompanying notes are an integral part of these financial statements.
33
Alpine International Real Estate Equity Fund
Schedule of Portfolio Investments—Continued
October 31, 2015
| | | | Security | | | |
| Shares | | | Description | | Value | |
| | | | | | | | |
| Common Stocks—continued | | | | |
| North & South America—8.5% | | | | |
| Brazil—2.5% | | | | |
| | 45,717 | | | BR Malls Participacoes SA | | $ | 132,769 | |
| | 220,535 | | | Cyrela Commercial Properties SA Empreendimentos e Participacoes | | | 542,395 | |
| | 986,829 | | | Direcional Engenharia SA | | | 905,829 | |
| | 912,132 | | | General Shopping Brasil SA (c) | | | 588,923 | |
| | 251,300 | | | JHSF Participacoes SA | | | 114,033 | |
| | 155,394 | | | Sao Carlos Empreendimentos e Participacoes SA | | | 926,751 | |
| | | | | | | | 3,210,700 | |
| Mexico—4.4% | | | | |
| | 500,000 | | | Concentradora Fibra Hotelera Mexicana SA de CV | | | 484,326 | |
| | 766,024 | | | Corp. Inmobiliaria Vesta SAB de CV | | | 1,255,853 | |
| | 600,979 | | | Fibra Uno Administracion SA de CV | | | 1,317,818 | |
| | 1,000,000 | | | Grupo GICSA SA de CV (c) | | | 984,393 | |
| | 1,257,643 | | | Hoteles City Express SAB de CV (c) | | | 1,698,653 | |
| | | | | | | | 5,741,043 | |
| United States—1.6% | | | | |
| | 74,984 | | | Extended Stay America, Inc. (b) | | | 1,439,693 | |
| | 77,750 | | | VEREIT, Inc. | | | 642,215 | |
| | | | | | | | 2,081,908 | |
| | | | | Total North & South America
(Cost $25,934,992) | | | 11,033,651 | |
| | | | | Total Common Stocks
(Cost $148,230,885) | | | 117,529,848 | |
| | | | Security | | | |
| Shares | | | Description | | Value | |
| | | | | | | | |
| Equity-Linked Structured Notes—3.0% | | | | |
| Asia—3.0% | | | | |
| India—3.0% | | | | |
| | 240,454 | | | Dewan Housing Finance Corp.- Macquarie Bank, Ltd. | | $ | 826,106 | |
| | 540,000 | | | Phoenix Mills, Ltd.-Macquarie Bank, Ltd. | | | 2,743,591 | |
| | 60,000 | | | Prestige Estates Projects, Ltd.- Macquarie Bank, Ltd. | | | 186,074 | |
| | 30,000 | | | Sobha, Ltd.-Macquarie Bank, Ltd. | | | 149,667 | |
| | | | | | | | 3,905,438 | |
| | | | | Total Asia (Cost $4,004,825) | | | 3,905,438 | |
| | | | | Total Equity-Linked Structured Notes
(Cost $4,004,825) | | | 3,905,438 | |
| Investment Companies—0.6% | | |
| Asia—0.6% | | | | |
| India—0.6% | | | | |
| | 6,976,577 | | | Trinity Capital PLC (b)(c) | | | 752,856 | |
| | | | | Total Asia (Cost $10,032,091) | | | 752,856 | |
| | | | | Total Investment Companies
(Cost $10,032,091) | | | 752,856 | |
| Warrants—0.0% (g) | | | | |
| Asia—0.0% (g) | | | | |
| Thailand—0.0% (g) | | | | |
| | 25,018 | | | | | | | |
| | | | | Minor International PCL
Expiration: November 03, 2017
Exercise Price: THB 36.36 (c) | | | 2,251 | |
| | | | | Total Asia (Cost $0) | | | 2,251 | |
| | | | | Total Warrants (Cost $0) | | | 2,251 | |
Total Investments
(Cost $162,267,801) (h)—94.6% | | | 122,190,393 | |
| Other Assets in Excess of Liabilities—5.4% | | | 6,989,406 | |
| TOTAL NET ASSETS 100.0% | | $ | 129,179,799 | |
The accompanying notes are an integral part of these financial statements.
34
Alpine International Real Estate Equity Fund
Schedule of Portfolio Investments—Continued
October 31, 2015
Percentages are stated as a percent of net assets.
| (a) | Restricted under Rule 144A of the Securities Act of 1933. These securities may be resold in transactions exempt from registration, normally to qualified institutional buyers. These securities have been determined to be liquid under guidelines established by the Board of Trustees. Liquid securities restricted under Rule 144A comprised 2.0% of the Fund’s net assets. |
| (b) | All or a portion of the security has been designated as collateral for the line of credit. |
| (c) | Non-income producing security. |
| (d) | Illiquid security. |
| (e) | Security fair valued in accordance with procedures approved by the Board of Trustees. These securities comprised 3.1% of the Fund’s net assets. |
| (f) | Private placement. |
| (g) | Amount is less than 0.05%. |
| (h) | See Note 9 for the cost of investments for federal tax purposes. |
AB—Aktiebolag is the Swedish equivalent of a corporation.
ADR—American Depositary Receipt
AG—Aktiengesellschaft is a German term that refers to a corporation that is limited by shares, i.e., owned by shareholders.
NV—Naamloze Vennootschap is the Dutch term for a public limited liability corporation.
PCL—Public Company Limited
PJSC—Public Joint Stock Company
PLC—Public Limited Company
REIT—Real Estate Investment Trust
SA—Generally designates corporations in various countries, mostly those employing the civil law.
SA de CV—Sociedad Anonima de Capital Variable is the Spanish equivalent to Variable Capital Company.
SAB de CV—Sociedad Anonima Bursátil de Capital Variable is the Spanish equivalent to Variable Capital Company.
THB—Thailand Baht
The accompanying notes are an integral part of these financial statements.
35
Alpine Realty Income & Growth Fund
Schedule of Portfolio Investments
October 31, 2015
| | | | Security | | | |
| Shares | | | Description | | Value | |
| | | | | | | | |
| Real Estate Investment Trusts—98.3% | | | | |
| Apartments—16.4% | | | | |
| | 15,000 | | | American Campus Communities, Inc. | | $ | 608,550 | |
| | 25,625 | | | AvalonBay Communities, Inc. | | | 4,480,019 | |
| | 21,000 | | | Camden Property Trust | | | 1,549,590 | |
| | 85,023 | | | Campus Crest Communities, Inc. | | | 563,702 | |
| | 68,360 | | | Equity Residential (a) | | | 5,285,595 | |
| | 23,665 | | | Essex Property Trust, Inc. (a) | | | 5,216,713 | |
| | 36,900 | | | UDR, Inc. | | | 1,271,574 | |
| | | | | | | | 18,975,743 | |
| Diversified—6.0% | | | | |
| | 26,114 | | | American Assets Trust, Inc. | | | 1,100,966 | |
| | 37,087 | | | Cousins Properties, Inc. | | | 372,354 | |
| | 88,700 | | | Crombie Real Estate Investment Trust | | | 881,166 | |
| | 46,117 | | | Vornado Realty Trust (a) | | | 4,637,064 | |
| | | | | | | | 6,991,550 | |
| Health Care—6.5% | | | | |
| | 23,928 | | | Care Capital Properties, Inc. | | | 788,427 | |
| | 30,413 | | | Omega Healthcare Investors, Inc. | | | 1,049,857 | |
| | 47,344 | | | Sabra Health Care REIT, Inc. | | | 1,073,762 | |
| | 55,712 | | | Ventas, Inc. (a) | | | 2,992,849 | |
| | 24,803 | | | Welltower, Inc. | | | 1,608,971 | |
| | | | | | | | 7,513,866 | |
| Lodging—5.4% | | | | |
| | 37,842 | | | Chatham Lodging Trust | | | 866,204 | |
| | 39,658 | | | Chesapeake Lodging Trust | | | 1,092,181 | |
| | 70,000 | | | DiamondRock Hospitality Co. | | | 817,600 | |
| | 16,000 | | | Hospitality Properties Trust | | | 429,440 | |
| | 105,000 | | | Host Hotels & Resorts, Inc. | | | 1,819,650 | |
| | 12,000 | | | LaSalle Hotel Properties (a) | | | 352,920 | |
| | 15,300 | | | Pebblebrook Hotel Trust | | | 522,954 | |
| | 25,000 | | | Strategic Hotels & Resorts, Inc. (b) | | | 352,500 | |
| | | | | | | | 6,253,449 | |
| Manufactured Homes—1.5% | | | | |
| | 28,900 | | | Equity LifeStyle Properties, Inc. | | | 1,747,872 | |
| Mortgage & Finance—1.5% | | | | |
| | 46,944 | | | Apollo Commercial Real Estate Finance, Inc. | | | 779,740 | |
| | 50,000 | | | Starwood Property Trust, Inc. | | | 1,004,500 | |
| | | | | | | | 1,784,240 | |
| Net Lease—0.4% | | | | |
| | 9,012 | | | EPR Properties | | | 511,972 | |
| Office-Industrial Buildings—31.8% | | | | |
| | 51,528 | | | Alexandria Real Estate Equities, Inc. (a) | | | 4,624,123 | |
| | 49,611 | | | Boston Properties, Inc. | | | 6,243,544 | |
| | 37,671 | | | CoreSite Realty Corp. | | | 2,070,022 | |
| | 18,169 | | | CyrusOne, Inc. | | | 641,002 | |
| | 52,600 | | | Digital Realty Trust, Inc. | | | 3,890,296 | |
| | 59,509 | | | Douglas Emmett, Inc. | | | 1,818,000 | |
| | 17,000 | | | Duke Realty Corp. | | | 351,900 | |
| | 40,352 | | | DuPont Fabros Technology, Inc. | | | 1,294,896 | |
| | 45,455 | | | Empire State Realty Trust, Inc.- Class A | | | 810,008 | |
| | | | Security | | | |
| Shares | | | Description | | Value | |
| | | | | | | | | |
| Office-Industrial Buildings—continued | | | | |
| | 10,714 | | | Hudson Pacific Properties, Inc. | | $ | 306,099 | |
| | 38,773 | | | Kilroy Realty Corp. (a) | | | 2,552,814 | |
| | 23,708 | | | Liberty Property Trust | | | 806,546 | |
| | 15,000 | | | Mack-Cali Realty Corp. | | | 326,400 | |
| | 35,608 | | | Paramount Group, Inc. | | | 632,754 | |
| | 99,400 | | | Prologis, Inc. | | | 4,247,362 | |
| | 35,000 | | | SL Green Realty Corp. (a) | | | 4,151,700 | |
| | 44,537 | | | STAG Industrial, Inc. | | | 913,899 | |
| | 51,058 | | | Terreno Realty Corp. | | | 1,142,678 | |
| | | | | | | | 36,824,043 | |
| REIT - Infrastructure—1.6% | | | | |
| | 17,500 | | | American Tower Corp. | | | 1,789,025 | |
| Retail Centers—20.9% | | | | |
| | 78,191 | | | CBL & Associates Properties, Inc. | | | 1,140,025 | |
| | 25,075 | | | DDR Corp. | | | 421,260 | |
| | 12,100 | | | Federal Realty Investment Trust (a) | | | 1,736,229 | |
| | 76,000 | | | General Growth Properties, Inc. | | | 2,200,200 | |
| | 50,000 | | | Kimco Realty Corp. | | | 1,338,500 | |
| | 56,295 | | | Simon Property Group, Inc. (a) | | | 11,341,190 | |
| | 19,106 | | | Taubman Centers, Inc. (a) | | | 1,470,780 | |
| | 30,928 | | | The Macerich Co. (a) | | | 2,620,839 | |
| | 23,058 | | | Urban Edge Properties | | | 547,397 | |
| | 29,670 | | | Weingarten Realty Investors | | | 1,060,999 | |
| | 22,897 | | | WP GLIMCHER, Inc. | | | 266,063 | |
| | | | | | | | 24,143,482 | |
| Storage—6.3% | | | | |
| | 16,000 | | | Extra Space Storage, Inc. | | | 1,267,840 | |
| | 26,265 | | | Public Storage (a) | | | 6,026,767 | |
| | | | | | | | 7,294,607 | |
| | | | | Total Real Estate Investment Trusts
(Cost $56,891,339) | | | 113,829,849 | |
| Common Stocks—2.0% | | | | |
| Diversified—0.5% | | | | |
| | 25,000 | | | Forest City Enterprises, Inc.- Class A (b) | | | 552,500 | |
| Lodging—1.5% | | | | |
| | 22,000 | | | Starwood Hotels & Resorts Worldwide, Inc. (a) | | | 1,757,140 | |
| | | | | Total Common Stocks
(Cost $1,684,241) | | | 2,309,640 | |
| Preferred Stocks—1.3% | | | | |
| Mortgage & Finance—0.5% | | | | |
| | 22,167 | | | NorthStar Realty Finance Corp.- Series B, 8.250% | | | 523,584 | |
| Retail Centers—0.8% | | | | |
| | 37,843 | | | CBL & Associates Properties, Inc.- Series D, 7.375% | | | 958,185 | |
| | | | | Total Preferred Stocks
(Cost $1,166,419) | | | 1,481,769 | |
| Total Investments (Cost $59,741,999) (c)—101.6% | | | 117,621,258 | |
| Liabilities in Excess of Other Assets—(1.6)% | | | (1,808,775 | ) |
| TOTAL NET ASSETS 100.0% | | $ | 115,812,483 | |
Percentages are stated as a percent of net assets.
| (a) | All or a portion of the security has been designated as collateral for the line of credit. |
| (b) | Non-income producing security. |
| (c) | See Note 9 for the cost of investments for federal tax purposes. |
REIT—Real Estate Investment Trust
The accompanying notes are an integral part of these financial statements.
36
Alpine Emerging Markets Real Estate Fund
Schedule of Portfolio Investments
October 31, 2015
| | | | Security | | | |
| Shares | | | Description | | Value | |
| | | | | | | | |
| Common Stocks—88.8% | | | | |
| Asia—71.4% | | | | |
| China—43.3% | | | | |
| | 160,000 | | | China Jinmao Holdings Group, Ltd. | | $ | 44,177 | |
| | 155,000 | | | China Overseas Land & Investment, Ltd. | | | 503,961 | |
| | 125,357 | | | China Resources Land, Ltd. | | | 327,520 | |
| | 20,000 | | | China State Construction International Holdings, Ltd. | | | 30,449 | |
| | 84,000 | | | China Vanke Co., Ltd.-Class H | | | 197,466 | |
| | 108,000 | | | CIFI Holdings Group Co., Ltd. | | | 23,131 | |
| | 130,333 | | | Country Garden Holdings Co., Ltd. | | | 49,775 | |
| | 22,000 | | | Dalian Wanda Commercial Properties Co., Ltd.-Class H (a) | | | 147,318 | |
| | 12,000 | | | E-House China Holdings, Ltd.-ADR | | | 74,400 | |
| | 127,000 | | | Evergrande Real Estate Group, Ltd. | | | 96,840 | |
| | 150,000 | | | Fantasia Holdings Group Co., Ltd. | | | 17,805 | |
| | 98,904 | | | Greenland Hong Kong Holdings, Ltd. (b) | | | 41,983 | |
| | 15,000 | | | Greentown China Holdings, Ltd. (b) | | | 13,122 | |
| | 20,000 | | | Guangzhou R&F Properties Co., Ltd.-Class H | | | 19,895 | |
| | 110,000 | | | KWG Property Holding, Ltd. | | | 79,478 | |
| | 60,000 | | | Longfor Properties Co., Ltd. | | | 80,819 | |
| | 54,000 | | | Shenzhen Investment, Ltd. | | | 21,947 | |
| | 46,000 | | | Shimao Property Holdings, Ltd. | | | 80,835 | |
| | 121,000 | | | Shui On Land, Ltd. | | | 33,409 | |
| | 125,000 | | | Sino-Ocean Land Holdings, Ltd. | | | 72,575 | |
| | 66,000 | | | Sunac China Holdings, Ltd. | | | 40,789 | |
| | 140,000 | | | Yuexiu Property Co., Ltd. | | | 24,205 | |
| | | | | | | | 2,021,899 | |
| Hong Kong—0.6% | | | | |
| | 3,800 | | | Cheung Kong Property Holdings, Ltd. | | | 26,770 | |
| Indonesia—4.4% | | | | |
| | 20,000 | | | First Real Estate Investment Trust | | | 17,703 | |
| | 500,000 | | | PT Alam Sutera Realty TBK | | | 14,210 | |
| | 260,159 | | | PT Bumi Serpong Damai TBK | | | 30,792 | |
| | 100,649 | | | PT Ciputra Surya TBK | | | 16,655 | |
| | 90,000 | | | PT Lippo Cikarang TBK (b) | | | 52,603 | |
| | 1,005,714 | | | PT Pakuwon Jati TBK | | | 31,301 | |
| | 400,000 | | | PT Summarecon Agung TBK | | | 40,767 | |
| | | | | | | | 204,031 | |
| Malaysia—0.2% | | | | |
| | 15,000 | | | SP Setia BHD Group | | | 11,522 | |
| Philippines—9.4% | | | | |
| | 205,307 | | | Ayala Land, Inc. | | | 157,203 | |
| | 500,000 | | | Megaworld Corp. | | | 50,086 | |
| | 120,000 | | | Robinsons Land Corp. | | | 78,428 | |
| | 280,000 | | | SM Prime Holdings, Inc. | | | 129,176 | |
| | 200,000 | | | Vista Land & Lifescapes, Inc. | | | 23,793 | |
| | | | | | | | 438,686 | |
| Singapore—1.9% | | | | |
| | 55,000 | | | Global Logistic Properties, Ltd. | | | 87,943 | |
| Thailand—3.6% | | | | |
| | 40,000 | | | Amata Corp. PCL | | | 15,407 | |
| | 90,000 | | | AP Thailand PCL | | | 15,183 | |
| | 88,000 | | | BTS Group Holdings PCL-NVDR | | | 23,876 | |
| | | | Security | | | |
| Shares | | | Description | | Value | |
| | | | | | | | |
| Thailand—continued | | | | |
| | 42,000 | | | Central Pattana PCL | | $ | 54,319 | |
| | 50,000 | | | Land & Houses PCL | | | 12,019 | |
| | 30,000 | | | Minor International PCL | | | 25,726 | |
| | 25,000 | | | Pruksa Real Estate PCL | | | 19,681 | |
| | | | | | | | 166,211 | |
| United Arab Emirates—8.0% | | | | |
| | 110,000 | | | Aldar Properties PJSC | | | 68,282 | |
| | 38,354 | | | DAMAC Properties Dubai Co. PJSC | | | 31,013 | |
| | 60,611 | | | Emaar Malls Group PJSC (b) | | | 51,651 | |
| | 127,000 | | | Emaar Properties PJSC | | | 223,019 | |
| | | | | | | | 373,965 | |
| | | | | Total Asia (Cost $3,279,497) | | | 3,331,027 | |
| Europe—2.9% | | | | |
| Greece—0.2% | | | | |
| | 1,000 | | | Grivalia Properties REIC AE | | | 9,094 | |
| Spain—1.3% | | | | |
| | 4,000 | | | Melia Hotels International SA | | | 57,885 | |
| Turkey—1.4% | | | | |
| | 52,809 | | | Emlak Konut Gayrimenkul Yatirim Ortakligi AS | | | 51,262 | |
| | 29,338 | | | Is Gayrimenkul Yatirim Ortakligi AS | | | 15,095 | |
| | | | | | | | 66,357 | |
| | | | | Total Europe (Cost $135,266) | | | 133,336 | |
| Middle East/Africa—6.0% | | | | |
| Egypt—1.3% | | | | |
| | 4,183 | | | Medinet Nasr Housing (b) | | | 12,476 | |
| | 10,000 | | | Orascom Hotels & Development (b) | | | 9,340 | |
| | 15,355 | | | Six of October Development & Investment (b) | | | 17,114 | |
| | 26,000 | | | Talaat Moustafa Group | | | 21,726 | |
| | | | | | | | 60,656 | |
| South Africa—4.7% | | | | |
| | 20,000 | | | Capital Property Fund | | | 23,325 | |
| | 10,000 | | | Emira Property Fund, Ltd. | | | 13,296 | |
| | 55,000 | | | Growthpoint Properties, Ltd. | | | 100,827 | |
| | 65,000 | | | Redefine Properties, Ltd. | | | 54,296 | |
| | 20,000 | | | Vukile Property Fund, Ltd. | | | 27,676 | |
| | | | | | | | 219,420 | |
| | | | | Total Middle East/Africa
(Cost $337,510) | | | 280,076 | |
| North & South America—8.5% | | | | |
| Argentina—0.5% | | | | |
| | 3,100 | | | TGLT SA-ADR (c) | | | 24,468 | |
| Brazil—1.3% | | | | |
| | 10,049 | | | BR Malls Participacoes SA | | | 29,184 | |
| | 5,724 | | | Direcional Engenharia SA | | | 5,254 | |
| | 6,000 | | | Even Construtora e Incorporadora SA | | | 6,223 | |
| | 2,011 | | | Ez Tec Empreendimentos e Participacoes SA | | | 6,622 | |
| | 4,538 | | | General Shopping Brasil SA (b) | | | 2,930 | |
| | 6,000 | | | MRV Engenharia e Participacoes SA | | | 11,544 | |
| | | | | | | | 61,757 | |
| Chile—0.7% | | | | |
| | 19,000 | | | Parque Arauco SA | | | 31,821 | |
The accompanying notes are an integral part of these financial statements.
37
Alpine Emerging Markets Real Estate Fund
Schedule of Portfolio Investments—Continued
October 31, 2015
| | | | Security | | | |
| Shares | | | Description | | Value | |
| | | | | | | | |
| North & South America—continued | | | | |
| Mexico—6.0% | | | | |
| | 23,937 | | | Concentradora Fibra Hotelera Mexicana SA de CV | | $ | 23,187 | |
| | 40,244 | | | Corp. Inmobiliaria Vesta SAB de CV | | | 65,978 | |
| | 15,582 | | | Fibra Shop Portafolios Inmobiliarios SAPI de CV | | | 15,971 | |
| | 42,000 | | | Fibra Uno Administracion SA de CV | | | 92,097 | |
| | 20,000 | | | Grupo GICSA SA de CV (b) | | | 19,688 | |
| | 25,000 | | | Hoteles City Express SAB de CV (b) | | | 33,766 | |
| | 17,000 | | | Prologis Property Mexico SA de CV | | | 28,282 | |
| | | | | | | | 278,969 | |
| | | | | Total North & South America
(Cost $538,295) | | | 397,015 | |
| | | | | Total Common Stocks
(Cost $4,290,568) | | | 4,141,454 | |
| Equity-Linked Structured Notes—8.0% | | | | |
| Asia—8.0% | | | | |
| India—7.4% | | | | |
| | 30,000 | | | DB Realty, Ltd.-Macquarie Bank, Ltd. (b) | | | 28,533 | |
| | 16,978 | | | Dewan Housing Finance Corp.- Macquarie Bank, Ltd. | | | 58,330 | |
| | 44,000 | | | Housing Development & Infrastructure, Ltd.-Macquarie Bank, Ltd. (b) | | | 48,481 | |
| | 14,000 | | | Kolte-Patil Developers, Ltd.- Macquarie Bank, Ltd. | | | 37,536 | |
| | 15,000 | | | Oberoi Realty, Ltd.-Macquarie Bank, Ltd. | | | 65,261 | |
| | 9,310 | | | Phoenix Mills, Ltd.-Macquarie Bank, Ltd. | | | 47,302 | |
| | 8,000 | | | Prestige Estates Projects, Ltd.- Macquarie Bank, Ltd. | | | 24,810 | |
| | 7,000 | | | Sobha, Ltd.-Macquarie Bank, Ltd. | | | 34,922 | |
| | | | | | | | 345,175 | |
| | | | Security | | | |
| Shares | | | Description | | Value | |
| | | | | | | | |
| Vietnam—0.6% | | | | |
| | 47,437 | | | HAGL JSC-GDR-Macquarie Bank, Ltd. (b) | | $ | 29,946 | |
| | | | | Total Asia (Cost $462,844) | | | 375,121 | |
| | | | | Total Equity-Linked Structured Notes (Cost $462,844) | | | 375,121 | |
| | | | | | | | | |
Principal
Amount | | | | | | | |
| | | | | | | | | |
| Convertible Foreign Bonds—0.0% (d) | | | | |
| North & South America—0.0% (d) | | | | |
| Brazil—0.0% (d) | | | | |
| | $80,000 | | | PDG Realty SA Empreendimentos e Participacoes-Series 8, 0.000%, 9/19/16 (Brazilian Real) (e)(f) | | | 208 | |
| | | | | Total North & South America
(Cost $28,699) | | | 208 | |
| | | | | Total Convertible Foreign Bonds
(Cost $28,699) | | | 208 | |
Total Investments
(Cost $4,782,111) (g)—96.8% | | | 4,516,783 | |
| Other Assets in Excess of Liabilities—3.2% | | | 149,866 | |
| TOTAL NET ASSETS 100.0% | | $ | 4,666,649 | |
The accompanying notes are an integral part of these financial statements.
38
Alpine Emerging Markets Real Estate Fund
Schedule of Portfolio Investments—Continued
October 31, 2015
Percentages are stated as a percent of net assets.
| (a) | Restricted under Rule 144A of the Securities Act of 1933. These securities may be resold in transactions exempt from registration, normally to qualified institutional buyers. These securities have been determined to be liquid under guidelines established by the Board of Trustees. Liquid securities restricted under Rule 144A comprised 3.2% of the Fund’s net assets. |
| (b) | Non-income producing security. |
| (c) | Reg S—Security exempt from registration under Regulation S of the Securities Act of 1933, which exempts from registration securities offered and sold outside the United States. Security may not be offered or sold in the United States except pursuant to an exemption from, or in a transaction not subject to, the registration requirements of the Securities Act of 1933. As of October 31, 2015, these securities amounted to a total value of $24,468 which comprised 0.5% of the Fund’s net assets. |
| (d) | Amount is less than 0.05%. |
| (e) | Represents a zero-coupon bond. |
| (f) | Security fair valued in accordance with procedures approved by the Board of Trustees. These securities comprised 0.0% of the Fund’s net assets. |
| (g) | See Note 9 for the cost of investments for federal tax purposes. |
ADR—American Depositary Receipt
AS—Anonim Sirketi is the Turkish term for joint stock company.
BHD—Malaysian equivalent to incorporated.
NVDR—Non-Voting Depositary Receipts
PCL—Public Company Limited
PJSC—Public Joint Stock Company
SA—Generally designates corporations in various countries, mostly those employing the civil law.
SA de CV—Sociedad Anonima de Capital Variable is the Spanish equivalent to Variable Capital Company.
SAB de CV—Sociedad Anonima Bursátil de Capital Variable is the Spanish equivalent to Variable Capital Company.
SAPI de CV—Sociedad Anonima Promotora de Inversion de Capital Variable is the Spanish equivalent to Variable Capital Corporation.
The accompanying notes are an integral part of these financial statements.
39
Alpine Global Infrastructure Fund
Schedule of Portfolio Investments
October 31, 2015
| | | | Security | | | |
| Shares | | | Description | | Value | |
| | | | | | | | |
| Common Stocks—91.8% | | | | |
| Asia—11.0% | | | | |
| China—6.4% | | | | |
| | 1,966,000 | | | Beijing Enterprises Water Group, Ltd. | | $ | 1,565,068 | |
| | 781,000 | | | China Everbright International, Ltd. | | | 1,263,611 | |
| | 505,000 | | | China Merchants Holdings International Co., Ltd. | | | 1,681,031 | |
| | 839,000 | | | China Railway Construction Corp., Ltd.-Class H | | | 1,262,191 | |
| | 1,218,771 | | | China State Construction International Holdings, Ltd. | | | 1,855,533 | |
| | 1,305,000 | | | COSCO Pacific, Ltd. | | | 1,481,692 | |
| | 974,200 | | | CRRC Corp., Ltd.-Class H | | | 1,249,393 | |
| | 472,000 | | | ENN Energy Holdings, Ltd. | | | 2,700,849 | |
| | 1,342,100 | | | Zhejiang Expressway Co., Ltd.- Class H | | | 1,662,344 | |
| | | | | | | | 14,721,712 | |
| Indonesia—1.3% | | | | |
| | 5,016,200 | | | PT Jasa Marga Persero TBK | | | 1,773,765 | |
| | 2,166,700 | | | PT Tower Bersama Infrastructure TBK (a) | | | 1,131,829 | |
| | | | | | | | 2,905,594 | |
| Japan—1.8% | | | | |
| | 42,300 | | | East Japan Railway Co. | | | 4,055,780 | |
| Philippines—0.9% | | | | |
| | 1,162,700 | | | International Container Terminal Services, Inc. | | | 2,048,756 | |
| Thailand—0.6% | | | | |
| | 5,115,000 | | | BTS Rail Mass Transit Growth Infrastructure Fund | | | 1,452,492 | |
| | | | | Total Asia (Cost $23,921,098) | | | 25,184,334 | |
| Europe—31.3% | | | |
| France—10.4% | | | | |
| | 26,000 | | | Aeroports de Paris | | | 3,269,370 | |
| | 142,800 | | | Eutelsat Communications SA | | | 4,712,472 | |
| | 252,600 | | | Groupe Eurotunnel SE | | | 3,540,200 | |
| | 179,100 | | | Suez Environnement Co. | | | 3,409,159 | |
| | 146,700 | | | Veolia Environnement SA | | | 3,415,924 | |
| | 80,600 | | | Vinci SA | | | 5,440,221 | |
| | | | | | | | 23,787,346 | |
| Germany—2.5% | | | | |
| | 51,800 | | | Fraport AG Frankfurt Airport Services Worldwide | | | 3,286,701 | |
| | 32,800 | | | HeidelbergCement AG | | | 2,444,725 | |
| | | | | | | | 5,731,426 | |
| Italy—4.3% | | | | |
| | 125,000 | | | Atlantia SpA | | | 3,463,899 | |
| | 736,300 | | | Enel SpA | | | 3,397,386 | |
| | 265,149 | | | Societa Iniziative Autostradali e Servizi SpA | | | 3,041,087 | |
| | | | | | | | 9,902,372 | |
| Netherlands—3.1% | | | | |
| | 879,800 | | | Koninklijke KPN NV | | | 3,231,358 | |
| | 98,300 | | | Koninklijke Vopak NV | | | 3,953,597 | |
| | | | | | | | 7,184,955 | |
| Portugal—1.2% | | | | |
| | 330,100 | | | NOS SGPS | | | 2,743,876 | |
| | | | Security | | | |
| Shares | | | Description | | Value | |
| | | | | | | | |
| Spain—5.0% | | | | |
| | 237,170 | | | Abertis Infraestructuras SA | | $ | 3,940,749 | |
| | 220,000 | | | Cellnex Telecom SAU (a)(b) | | | 3,817,546 | |
| | 75,299 | | | Obrascon Huarte Lain SA | | | 603,962 | |
| | 314,300 | | | Saeta Yield SA | | | 3,114,037 | |
| | | | | | | | 11,476,294 | |
| United Kingdom—4.8% | | | | |
| | 124,800 | | | Abengoa Yield PLC | | | 2,312,544 | |
| | 43,900 | | | BT Group PLC-SP ADR | | | 3,146,313 | |
| | 216,300 | | | Ferrovial SA | | | 5,461,136 | |
| | | | | | | | 10,919,993 | |
| | | | | Total Europe
(Cost $67,331,651) | | | 71,746,262 | |
| North & South America—49.5% | | | | |
| Brazil—2.0% | | | | |
| | 754,000 | | | CCR SA | | | 2,369,600 | |
| | 341,900 | | | Cia de Saneamento Basico do Estado de Sao Paulo-ADR | | | 1,500,941 | |
| | 2,150,100 | | | Cosan Logistica SA | | | 724,775 | |
| | | | | | | | 4,595,316 | |
| Canada—4.5% | | | | |
| | 33,000 | | | Canadian Pacific Railway, Ltd. | | | 4,636,500 | |
| | 130,300 | | | Enbridge, Inc. | | | 5,569,338 | |
| | | | | | | | 10,205,838 | |
| Mexico—3.5% | | | | |
| | 500,000 | | | Empresas ICA SAB de CV-SP ADR (a) | | | 770,000 | |
| | 3,188,844 | | | OHL Mexico SAB de CV (a) | | | 4,214,391 | |
| | 246,000 | | | Promotora y Operadora de Infraestructura SAB de CV (a) | | | 3,092,834 | |
| | | | | | | | 8,077,225 | |
| Peru—0.3% | | | | |
| | 183,371 | | | Grana y Montero SA-SP ADR | | | 753,655 | |
| United States—39.2% | | | | |
| | 46,500 | | | American Tower Corp. | | | 4,753,695 | |
| | 96,400 | | | AT&T, Inc. | | | 3,230,364 | |
| | 84,200 | | | CMS Energy Corp. | | | 3,037,094 | |
| | 39,000 | | | Comcast Corp.-Class A | | | 2,442,180 | |
| | 80,100 | | | Corrections Corp. of America | | | 2,282,850 | |
| | 69,200 | | | Crown Castle International Corp. | | | 5,913,832 | |
| | 56,000 | | | DISH Network Corp.-Class A (a) | | | 3,526,320 | |
| | 46,600 | | | Dominion Resources, Inc. | | | 3,328,638 | |
| | 35,400 | | | DTE Energy Co. | | | 2,888,286 | |
| | 44,900 | | | Eversource Energy | | | 2,287,206 | |
| | 92,400 | | | Exelon Corp. | | | 2,579,808 | |
| | 52,200 | | | Genesee & Wyoming, Inc.- Class A (a) | | | 3,502,620 | |
| | 77,100 | | | ITC Holdings Corp. | | | 2,522,712 | |
| | 41,500 | | | Kansas City Southern | | | 3,434,540 | |
| | 172,000 | | | MasTec, Inc. (a) | | | 2,884,440 | |
| | 34,800 | | | NextEra Energy, Inc. | | | 3,572,568 | |
| | 141,900 | | | NRG Energy, Inc. | | | 1,829,091 | |
| | 240,000 | | | NRG Yield, Inc.-Class A | | | 3,295,200 | |
| | 199,000 | | | Pattern Energy Group, Inc. | | | 4,654,610 | |
| | 127,000 | | | Progressive Waste Solutions, Ltd. | | | 3,054,350 | |
| | 46,800 | | | SemGroup Corp.-Class A | | | 2,131,740 | |
| | 128,800 | | | T-Mobile U.S., Inc. (a) | | | 4,880,232 | |
| | 175,500 | | | The Geo Group, Inc. | | | 5,663,385 | |
| | 117,600 | | | The Williams Cos., Inc. | | | 4,638,144 | |
The accompanying notes are an integral part of these financial statements.
40
Alpine Global Infrastructure Fund
Schedule of Portfolio Investments—Continued
October 31, 2015
| Shares | | | Security
Description | | Value | |
| | | | | | | | |
| Common Stocks—continued | | | | |
| North & South America—continued | | | | |
| United States—continued | | | | |
| | 230,200 | | | TravelCenters of America LLC (a) | | $ | 2,651,904 | |
| | 52,600 | | | Union Pacific Corp. | | | 4,699,810 | |
| | | | | | | | 89,685,619 | |
| | | | | Total North & South America
(Cost $122,979,133) | | | 113,317,653 | |
| | | | | Total Common Stocks
(Cost $214,231,882) | | | 210,248,249 | |
| Equity-Linked Structured Notes—1.2% | | | | |
| Asia—1.2% | | | | |
| India—1.2% | | | | |
| | 600,000 | | | Adani Ports and Special Economic Zone-Macquarie Bank, Ltd. | | | 2,713,291 | |
| | | | | Total Equity-Linked Structured Notes (Cost $1,413,287) | | | 2,713,291 | |
Principal
Amount | | | Security
Description | | Value | |
| | | | | | | | |
| Short-Term Investment—1.4% | | | | |
| | $3,184,000 | | | State Street Eurodollar Time Deposit, 0.01% | | $ | 3,184,000 | |
| | | | | Total Short-Term Investment
(Cost $3,184,000) | | | 3,184,000 | |
| Total Investments (Cost $218,829,169) (c) —94.4% | | | 216,145,540 | |
| Other Assets in Excess of Liabilities—5.6% | | | 12,710,294 | |
| TOTAL NET ASSETS 100.0% | | $ | 228,855,834 | |
Percentages are stated as a percent of net assets.
| (a) | Non-income producing security. |
| (b) | Restricted under Rule 144A of the Securities Act of 1933. These securities may be resold in transactions exempt from registration, normally to qualified institutional buyers. These securities have been determined to be liquid under guidelines established by the Board of Trustees. Liquid securities restricted under Rule 144A comprised 1.7% of the Fund’s net assets. |
| (c) | See Note 9 for the cost of investments for federal tax purposes. |
ADR—American Depositary Receipt
AG—Aktiengesellschaft is a German term that refers to a corporation that is limited by shares, i.e., owned by shareholders.
NV—Naamloze Vennootschap is the Dutch term for a public limited liability corporation.
PLC—Public Limited Company
SA—Generally designates corporations in various countries, mostly those employing the civil law.
SAB de CV—Sociedad Anonima Bursátil de Capital Variable is the Spanish equivalent to Variable Capital Company.
SAU—Sociedad Anonima Unipersonal
SE—SE Regulation. A European Company which can operate on a Europe-wide basis and be governed by Community law directly applicable in all Member States.
SP ADR—Sponsored American Depositary Receipt
SpA—Societa’ Per Azioni is an Italian shared company.
The accompanying notes are an integral part of these financial statements.
41
Alpine Mutual Funds
Statements of Assets and Liabilities
October 31, 2015
| | | International | | Realty |
| | | Real Estate | | Income & |
| | | Equity Fund | | Growth Fund |
| ASSETS: | | | | | | | | | | |
| Investments, at value(1) | | | $ | 122,190,393 | | | | $ | 117,621,258 | |
| Foreign currencies, at value(2) | | | | 61,555 | | | | | — | |
| Receivable from investment securities sold | | | | 14,965,457 | | | | | 2,188,058 | |
| Dividends and interest receivable | | | | 154,429 | | | | | 83,489 | |
| Receivable from capital shares issued | | | | 1,090 | | | | | 6,350 | |
| Unrealized appreciation on forward currency contracts | | | | 409,087 | | | | | — | |
| Prepaid expenses and other assets | | | | 14,636 | | | | | 13,316 | |
| Total assets | | | | 137,796,647 | | | | | 119,912,471 | |
| | | | | | | | | | | |
| LIABILITIES: | | | | | | | | | | |
| Payable for investment securities purchased | | | | 6,582,282 | | | | | — | |
| Unrealized depreciation on forward currency contracts | | | | 257,436 | | | | | — | |
| Payable for capital shares redeemed | | | | 212,644 | | | | | 25,617 | |
| Payable for line of credit (Note 2) | | | | 1,182,026 | | | | | 3,785,166 | |
| Accrued expenses and other liabilities: | | | | | | | | | | |
| Investment advisory fees (Note 6) | | | | 109,305 | | | | | 97,350 | |
| Distribution fees (Note 5) | | | | 1,286 | | | | | 12,191 | |
| Trustee fees | | | | 4,746 | | | | | 3,866 | |
| Other | | | | 267,123 | | | | | 175,798 | |
| Total liabilities | | | | 8,616,848 | | | | | 4,099,988 | |
| Net Assets | | | $ | 129,179,799 | | | | $ | 115,812,483 | |
| | | | | | | | | | | |
| NET ASSETS REPRESENTED BY: | | | | | | | | | | |
| Paid-in-capital | | | $ | 1,267,719,875 | | | | $ | 61,072,208 | |
| Undistributed (accumulated) net investment income (loss) | | | | 5,739,895 | | | | | — | |
| Accumulated net realized loss from investments and foreign currency transactions | | | | (1,104,342,257 | ) | | | | (3,138,598 | ) |
| Net unrealized depreciation on: | | | | | | | | | | |
| Investments | | | | (40,077,408 | ) | | | | 57,879,259 | |
| Foreign currency translations | | | | 139,694 | | | | | (386 | ) |
| Net Assets | | | $ | 129,179,799 | | | | $ | 115,812,483 | |
| | | | | | | | | | | |
| Net asset value | | | | | | | | | | |
| Institutional Class | | | | | | | | | | |
| Net assets | | | $ | 129,048,187 | | | | $ | 112,926,592 | |
| Shares outstanding | | | | 5,885,911 | | | | | 5,133,283 | |
| Net asset value, offering price and redemption price per share* | | | $ | 21.92 | | | | $ | 22.00 | |
| Class A | | | | | | | | | | |
| Net assets | | | $ | 131,612 | | | | $ | 2,885,891 | |
| Shares outstanding | | | | 6,041 | | | | | 131,349 | |
| Net asset value per share | | | $ | 21.79 | | | | $ | 21.97 | |
| Maximum offering price per share (net asset value plus sales charge of 5.50% of offering price) | | | $ | 23.06 | | | | $ | 23.25 | |
| * If applicable, redemption price per share may be reduced by a redemption fee. | | | | | | | | | | |
| (1) Total cost of investments | | | $ | 162,267,801 | | | | $ | 59,741,999 | |
| (2) Total cost of foreign currencies | | | $ | 61,555 | | | | $ | — | |
The accompanying notes are an integral part of these financial statements.
42
Alpine Mutual Funds
Statements of Assets and Liabilities—Continued
October 31, 2015
| | | Emerging
Markets Real
Estate Fund | | Global
Infrastructure
Fund |
| | | | | | | | | |
| ASSETS: | | | | | | | | | | |
| Investments, at value(1) | | | $ | 4,516,783 | | | | $ | 216,145,540 | |
| Foreign currencies, at value(2) | | | | 1,826 | | | | | 7,755,846 | |
| Cash | | | | 96,546 | | | | | 763 | |
| Receivable from investment securities sold | | | | 78,648 | | | | | 7,209,932 | |
| Dividends and interest receivable | | | | 3,604 | | | | | 251,041 | |
| Receivable from capital shares issued | | | | 451 | | | | | 905,424 | |
| Unrealized appreciation on forward currency contracts | | | | — | | | | | 473,119 | |
| Due from Adviser | | | | 13,592 | | | | | 43,020 | |
| Prepaid expenses and other assets | | | | 364 | | | | | 155,091 | |
| Total assets | | | | 4,711,814 | | | | | 232,939,776 | |
| | | | | | | | | | | |
| LIABILITIES: | | | | | | | | | | |
| Payable for investment securities purchased | | | | 2,169 | | | | | 2,555,469 | |
| Unrealized depreciation on forward currency contracts | | | | — | | | | | 143,415 | |
| Payable for capital shares redeemed | | | | — | | | | | 875,598 | |
| Accrued expenses and other liabilities: | | | | | | | | | | |
| Investment advisory fees (Note 6) | | | | 3,972 | | | | | 204,266 | |
| Distribution fees (Note 5) | | | | 1,673 | | | | | 19,521 | |
| Trustee fees | | | | 190 | | | | | 9,735 | |
| Audit fees | | | | 16,687 | | | | | — | |
| Custody fees | | | | 8,723 | | | | | — | |
| Other | | | | 11,751 | | | | | 275,938 | |
| Total liabilities | | | | 45,165 | | | | | 4,083,942 | |
| Net Assets | | | $ | 4,666,649 | | | | $ | 228,855,834 | |
| | | | | | | | | | | |
| NET ASSETS REPRESENTED BY: | | | | | | | | | | |
| Paid-in-capital | | | $ | 5,972,825 | | | | $ | 239,402,426 | |
| Undistributed (accumulated) net investment income (loss) | | | | 86,251 | | | | | (5,825 | ) |
| Accumulated net realized loss from investments and foreign currency transactions | | | | (1,126,731 | ) | | | | (8,151,002 | ) |
| Net unrealized depreciation on: | | | | | | | | | | |
| Investments | | | | (265,328 | ) | | | | (2,683,629 | ) |
| Foreign currency translations | | | | (368 | ) | | | | 293,864 | |
| Net Assets | | | $ | 4,666,649 | | | | $ | 228,855,834 | |
| | | | | | | | | | | |
| Net asset value | | | | | | | | | | |
| Institutional Class | | | | | | | | | | |
| Net assets | | | $ | 4,263,554 | | | | $ | 207,034,267 | |
| Shares outstanding | | | | 293,282 | | | | | 11,726,457 | |
| Net asset value, offering price and redemption price per share* | | | $ | 14.54 | | | | $ | 17.66 | |
| Class A | | | | | | | | | | |
| Net assets | | | $ | 403,095 | | | | $ | 21,821,567 | |
| Shares outstanding | | | | 27,802 | | | | | 1,237,954 | |
| Net asset value per share | | | $ | 14.50 | | | | $ | 17.63 | |
| Maximum offering price per share (net asset value plus sales charge of 5.50% of offering price) | | | $ | 15.34 | | | | $ | 18.66 | |
| * If applicable, redemption price per share may be reduced by a redemption fee. | | | | | | | | | | |
| (1) Total cost of investments | | | $ | 4,782,111 | | | | $ | 218,829,169 | |
| (2) Total cost of foreign currencies | | | $ | 1,825 | | | | $ | 7,787,832 | |
The accompanying notes are an integral part of these financial statements.
43
Alpine Mutual Funds
Statements of Operations
For the year ended October 31, 2015
| | | International | | Realty |
| | | Real Estate | | Income & |
| | | Equity Fund | | Growth Fund |
| INVESTMENT INCOME: | | | | | | | | | | |
| Dividend income | | | $ | 11,461,587 | | | | $ | 3,937,032 | |
| Less: Foreign taxes withheld | | | | (145,608 | ) | | | | (11,241 | ) |
| Total investment income | | | | 11,315,979 | | | | | 3,925,791 | |
| | | | | | | | | | | |
| EXPENSES: | | | | | | | | | | |
| Investment advisory fee (Note 6) | | | | 1,433,335 | | | | | 1,170,897 | |
| Transfer agent fees | | | | 99,926 | | | | | 171,447 | |
| Accounting and custody fees | | | | 132,177 | | | | | 25,844 | |
| Audit and tax fees | | | | 71,092 | | | | | 35,743 | |
| Interest (Note 2) | | | | 37,582 | | | | | 46,137 | |
| Registration and filing fees | | | | 35,898 | | | | | 41,067 | |
| Administration fee (Note 6) | | | | 36,055 | | | | | 29,363 | |
| Printing and mailing fees | | | | 31,025 | | | | | 32,033 | |
| Legal fees | | | | 47,646 | | | | | 8,846 | |
| Trustee fees | | | | 13,754 | | | | | 13,926 | |
| Distribution fees - Class A (Note 5) | | | | 336 | | | | | 7,044 | |
| Other fees | | | | 113,505 | | | | | 7,831 | |
| Total expenses | | | | 2,052,331 | | | | | 1,590,178 | |
| Net investment income | | | | 9,263,648 | | | | | 2,335,613 | |
| | | | | | | | | | | |
| NET REALIZED AND UNREALIZED GAIN/(LOSS) ON INVESTMENTS AND FOREIGN CURRENCY: | | | | | | | | | | |
| Net realized gain/(loss) from: | | | | | | | | | | |
| Investments | | | | (15,315,166 | ) | | | | 2,753,414 | |
| Foreign currency transactions | | | | 791,686 | | | | | (4,833 | ) |
| Net realized gain/(loss) from investments and foreign currency | | | | (14,523,480 | ) | | | | 2,748,581 | |
| Change in net unrealized appreciation/(depreciation) on: | | | | | | | | | | |
| Investments | | | | (6,431,766 | ) | | | | 2,939,428 | |
| Foreign currency translations | | | | (1,075,712 | ) | | | | 688 | |
| Change in net unrealized appreciation/(depreciation) on investments and foreign currency | | | | (7,507,478 | ) | | | | 2,940,116 | |
| Net gain/(loss) on investments and foreign currency | | | | (22,030,958 | ) | | | | 5,688,697 | |
| Increase (decrease) in net assets from operations | | | $ | (12,767,310 | ) | | | $ | 8,024,310 | |
The accompanying notes are an integral part of these financial statements.
44
Alpine Mutual Funds
Statements of Operations—Continued
For the year ended October 31, 2015
| | | Emerging
Markets Real
Estate Fund | | Global
Infrastructure
Fund |
| INVESTMENT INCOME: | | | | | | | | | | |
| Dividend income | | | $ | 221,475 | | | | $ | 10,874,397 | |
| Less: Foreign taxes withheld | | | | (9,592 | ) | | | | (312,096 | ) |
| Interest income | | | | 21 | | | | | 418 | |
| Total investment income | | | | 211,904 | | | | | 10,562,719 | |
| | | | | | | | | | | |
| EXPENSES: | | | | | | | | | | |
| Investment advisory fee (Note 6) | | | | 54,202 | | | | | 2,168,645 | |
| Transfer agent fees | | | | 12,618 | | | | | 248,329 | |
| Accounting and custody fees | | | | 21,817 | | | | | 71,460 | |
| Audit and tax fees | | | | 31,822 | | | | | 41,655 | |
| Distribution fees - Class A (Note 5) | | | | 1,475 | | | | | 63,897 | |
| Printing and mailing fees | | | | 2,181 | | | | | 62,056 | |
| Registration and filing fees | | | | 32,467 | | | | | 31,292 | |
| Administration fee (Note 6) | | | | 1,336 | | | | | 53,423 | |
| Legal fees | | | | 3,862 | | | | | 33,925 | |
| Trustee fees | | | | 466 | | | | | 27,867 | |
| Interest (Note 2) | | | | 50 | | | | | 5,048 | |
| Other fees | | | | 168 | | | | | 24,247 | |
| Total expenses | | | | 162,464 | | | | | 2,831,844 | |
| Less: Fee waivers and/or expense reimbursements (Note 6) | | | | (87,769 | ) | | | | (43,020 | ) |
| Net expenses | | | | 74,695 | | | | | 2,788,824 | |
| Net investment income | | | | 137,209 | | | | | 7,773,895 | |
| | | | | | | | | | | |
| NET REALIZED AND UNREALIZED GAIN/(LOSS) ON INVESTMENTS AND FOREIGN CURRENCY: | | | | | | | | | | |
| Net realized gain/(loss) from: | | | | | | | | | | |
| Investments | | | | (199,695 | ) | | | | (6,924,183 | ) |
| Foreign currency transactions | | | | 5,827 | | | | | 3,417,088 | |
| Net realized loss from investments and foreign currency | | | | (193,868 | ) | | | | (3,507,095 | ) |
| Change in net unrealized depreciation on: | | | | | | | | | | |
| Investments | | | | (649,578 | ) | | | | (22,913,458 | ) |
| Foreign currency translations | | | | (5,635 | ) | | | | (1,137,512 | ) |
| Change in net unrealized depreciation on investments and foreign currency | | | | (655,213 | ) | | | | (24,050,970 | ) |
| Net loss on investments and foreign currency | | | | (849,081 | ) | | | | (27,558,065 | ) |
| Decrease in net assets from operations | | | $ | (711,872 | ) | | | $ | (19,784,170 | ) |
The accompanying notes are an integral part of these financial statements.
45
Alpine Mutual Funds
Statements of Changes in Net Assets
| | | International Real Estate Equity Fund |
| | | Year Ended
October 31, 2015 | | Year Ended
October 31, 2014† |
| OPERATIONS: | | | | | | | | | | |
| Net investment income | | | $ | 9,263,648 | | | | $ | 423,309 | |
| Net realized gain (loss) from: | | | | | | | | | | |
| Investments | | | | (15,315,166 | ) | | | | 6,896,920 | |
| Foreign currency transactions | | | | 791,686 | | | | | 644,958 | |
| Change in net unrealized appreciation/(depreciation) on: | | | | | | | | | | |
| Investments | | | | (6,431,766 | ) | | | | (9,652,482 | ) |
| Foreign currency translations | | | | (1,075,712 | ) | | | | 1,211,387 | |
| Decrease in net assets from operations | | | | (12,767,310 | ) | | | | (475,908 | ) |
| | | | | | | | | | | |
| DISTRIBUTIONS TO SHAREHOLDERS: | | | | | | | | | | |
| Distributions to Institutional Class Shareholders: | | | | | | | | | | |
| From net investment income | | | | — | | | | | (399,726 | ) |
| Decrease in net assets from distributions to shareholders | | | | — | | | | | (399,726 | ) |
| | | | | | | | | | | |
| CAPITAL SHARE TRANSACTIONS (NOTE 3): | | | | | | | | | | |
| Net proceeds from shares sold | | | | 1,203,520 | | | | | 3,002,371 | |
| Dividends reinvested | | | | — | | | | | 366,356 | |
| Redemption fees (Note 2) | | | | 406 | | | | | 1,764 | |
| Cost of shares redeemed | | | | (28,628,334 | ) | | | | (39,848,948 | ) |
| Decrease in net assets from capital share transactions | | | | (27,424,408 | ) | | | | (36,478,457 | ) |
| Net decrease in net assets | | | | (40,191,718 | ) | | | | (37,354,091 | ) |
| | | | | | | | | | | |
| NET ASSETS: | | | | | | | | | | |
| Beginning of year | | | | 169,371,517 | | | | | 206,725,608 | |
| End of year* | | | $ | 129,179,799 | | | | $ | 169,371,517 | |
| * Including undistributed (accumulated) net investment income (loss) of: | | | $ | 5,739,895 | | | | $ | (3,336,449 | ) |
| † | Beginning with the year ended October 31, 2015, the Fund was audited by Ernst & Young LLP. The previous year was audited by another independent registered public accounting firm. |
The accompanying notes are an integral part of these financial statements.
46
Alpine Mutual Funds
Statements of Changes in Net Assets—Continued
| | | Realty Income & Growth Fund |
| | | Year Ended
October 31, 2015 | | Year Ended
October 31, 2014† |
| OPERATIONS: | | | | | | | | | | |
| Net investment income | | | $ | 2,335,613 | | | | $ | 2,843,684 | |
| Net realized gain (loss) from: | | | | | | | | | | |
| Investments | | | | 2,753,414 | | | | | 1,804,409 | |
| Foreign currency transactions | | | | (4,833 | ) | | | | (4,613 | ) |
| Change in net unrealized appreciation/(depreciation) on: | | | | | | | | | | |
| Investments | | | | 2,939,428 | | | | | 16,359,773 | |
| Foreign currency translations | | | | 688 | | | | | (1,084 | ) |
| Increase in net assets from operations | | | | 8,024,310 | | | | | 21,002,169 | |
| | | | | | | | | | | |
| DISTRIBUTIONS TO SHAREHOLDERS: | | | | | | | | | | |
| Distributions to Institutional Class Shareholders: | | | | | | | | | | |
| From net investment income | | | | (2,476,035 | ) | | | | (2,652,918 | ) |
| From net realized gain on investments | | | | (1,393,428 | ) | | | | (1,345,262 | ) |
| Distributions to Class A Shareholders: | | | | | | | | | | |
| From net investment income | | | | (61,047 | ) | | | | (51,895 | ) |
| From net realized gain on investments | | | | (34,355 | ) | | | | (28,558 | ) |
| Decrease in net assets from distributions to shareholders | | | | (3,964,865 | ) | | | | (4,078,633 | ) |
| | | | | | | | | | | |
| CAPITAL SHARE TRANSACTIONS (NOTE 3): | | | | | | | | | | |
| Net proceeds from shares sold | | | | 8,702,292 | | | | | 10,147,042 | |
| Dividends reinvested | | | | 3,504,090 | | | | | 3,629,157 | |
| Redemption fees (Note 2) | | | | 1,823 | | | | | 6,982 | |
| Cost of shares redeemed | | | | (15,880,024 | ) | | | | (15,247,898 | ) |
| Decrease in net assets from capital share transactions | | | | (3,671,819 | ) | | | | (1,464,717 | ) |
| Net increase in net assets | | | | 387,626 | | | | | 15,458,819 | |
| | | | | | | | | | | |
| NET ASSETS: | | | | | | | | | | |
| Beginning of year | | | | 115,424,857 | | | | | 99,966,038 | |
| End of year* | | | $ | 115,812,483 | | | | $ | 115,424,857 | |
| * Including undistributed (accumulated) net investment income (loss) of: | | | $ | — | | | | $ | 127,290 | |
| † | Beginning with the year ended October 31, 2015, the Fund was audited by Ernst & Young LLP. The previous year was audited by another independent registered public accounting firm. |
The accompanying notes are an integral part of these financial statements.
47
Alpine Mutual Funds
Statements of Changes in Net Assets—Continued
| | | Emerging Markets Real Estate Fund |
| | | Year Ended | | Year Ended |
| | | October 31, 2015 | | October 31, 2014† |
| OPERATIONS: | | | | | | | | | | |
| Net investment income | | | $ | 137,209 | | | | $ | 151,766 | |
| Net realized gain (loss) from: | | | | | | | | | | |
| Investments | | | | (199,695 | ) | | | | (742,405 | ) |
| Foreign currency transactions | | | | 5,827 | | | | | (5,486 | ) |
| Change in net unrealized appreciation/(depreciation) on: | | | | | | | | | | |
| Investments | | | | (649,578 | ) | | | | 394,899 | |
| Foreign currency translations | | | | (5,635 | ) | | | | 5,048 | |
| Decrease in net assets from operations | | | | (711,872 | ) | | | | (196,178 | ) |
| | | | | | | | | | | |
| DISTRIBUTIONS TO SHAREHOLDERS: | | | | | | | | | | |
| Distributions to Institutional Class Shareholders: | | | | | | | | | | |
| From net investment income | | | | (190,847 | ) | | | | (102,193 | ) |
| From net realized gain on investments | | | | — | | | | | (57,004 | ) |
| Distributions to Class A Shareholders: | | | | | | | | | | |
| From net investment income | | | | (25,990 | ) | | | | (8,882 | ) |
| From net realized gain on investments | | | | — | | | | | (5,932 | ) |
| Decrease in net assets from distributions to shareholders | | | | (216,837 | ) | | | | (174,011 | ) |
| | | | | | | | | | | |
| CAPITAL SHARE TRANSACTIONS (NOTE 3): | | | | | | | | | | |
| Net proceeds from shares sold | | | | 486,774 | | | | | 1,485,628 | |
| Dividends reinvested | | | | 189,793 | | | | | 170,729 | |
| Redemption fees (Note 2) | | | | 42 | | | | | 9,658 | |
| Cost of shares redeemed | | | | (1,198,244 | ) | | | | (4,937,898 | ) |
| Decrease in net assets from capital share transactions | | | | (521,635 | ) | | | | (3,271,883 | ) |
| Net decrease in net assets | | | | (1,450,344 | ) | | | | (3,642,072 | ) |
| | | | | | | | | | | |
| NET ASSETS: | | | | | | | | | | |
| Beginning of year | | | | 6,116,993 | | | | | 9,759,065 | |
| End of year* | | | $ | 4,666,649 | | | | $ | 6,116,993 | |
| * Including undistributed net investment income of: | | | $ | 86,251 | | | | $ | 156,831 | |
| † | Beginning with the year ended October 31, 2015, the Fund was audited by Ernst & Young LLP. The previous year was audited by another independent registered public accounting firm. |
The accompanying notes are an integral part of these financial statements.
48
Alpine Mutual Funds
Statements of Changes in Net Assets—Continued
| | | Global Infrastructure Fund |
| | | Year Ended
October 31, 2015 | | Year Ended
October 31, 2014† |
| OPERATIONS: | | | | | | | | | | |
| Net investment income | | | $ | 7,773,895 | | | | $ | 5,668,445 | |
| Net realized gain (loss) from: | | | | | | | | | | |
| Investments | | | | (6,924,183 | ) | | | | 1,241,283 | |
| Foreign currency transactions | | | | 3,417,088 | | | | | (330,059 | ) |
| Change in net unrealized appreciation/(depreciation) on: | | | | | | | | | | |
| Investments | | | | (22,913,458 | ) | | | | 9,101,302 | |
| Foreign currency translations | | | | (1,137,512 | ) | | | | 1,777,090 | |
| Increase (decrease) in net assets from operations | | | | (19,784,170 | ) | | | | 17,458,061 | |
| | | | | | | | | | | |
| DISTRIBUTIONS TO SHAREHOLDERS: | | | | | | | | | | |
| Distributions to Institutional Class Shareholders: | | | | | | | | | | |
| From net investment income | | | | (6,786,261 | ) | | | | (5,793,200 | ) |
| From net realized gain on investments | | | | (1,788,105 | ) | | | | (2,409,615 | ) |
| From tax return of capital | | | | (416,438 | ) | | | | — | |
| Distributions to Class A Shareholders: | | | | | | | | | | |
| From net investment income | | | | (910,486 | ) | | | | (811,945 | ) |
| From net realized gain on investments | | | | (239,611 | ) | | | | (388,294 | ) |
| From tax return of capital | | | | (51,090 | ) | | | | — | |
| Decrease in net assets from distributions to shareholders | | | | (10,191,991 | ) | | | | (9,403,054 | ) |
| | | | | | | | | | | |
| CAPITAL SHARE TRANSACTIONS (NOTE 3): | | | | | | | | | | |
| Net proceeds from shares sold | | | | 95,574,887 | | | | | 97,805,598 | |
| Proceeds from shares issued in connection with the tax-free transfer of assets from Alpine Cyclical Advantage Property Fund (Note 10) | | | | 53,861,934 | | | | | — | |
| Dividends reinvested | | | | 6,479,854 | | | | | 6,081,424 | |
| Redemption fees (Note 2) | | | | 29,502 | | | | | 14,500 | |
| Cost of shares redeemed | | | | (110,218,226 | ) | | | | (44,070,456 | ) |
| Increase in net assets from capital share transactions | | | | 45,727,951 | | | | | 59,831,066 | |
| Net increase in net assets | | | | 15,751,790 | | | | | 67,886,073 | |
| | | | | | | | | | | |
| NET ASSETS: | | | | | | | | | | |
| Beginning of year | | | | 213,104,044 | | | | | 145,217,971 | |
| End of year* | | | $ | 228,855,834 | | | | $ | 213,104,044 | |
| * Including accumulated net investment loss of: | | | $ | (5,825 | ) | | | $ | (24,624 | ) |
| † | Beginning with the year ended October 31, 2015, the Fund was audited by Ernst & Young LLP. The previous year was audited by another independent registered public accounting firm. |
The accompanying notes are an integral part of these financial statements.
49
Alpine Mutual Funds
Financial Highlights
(For a share outstanding throughout each year)
| | | International Real Estate Equity Fund | |
| | | Years Ended October 31, | |
| | | 2015 | | | 2014† | | | 2013† | | | 2012† | | | 2011† | |
| Institutional Class: | | | | | | | | | | | | | | | | | | | | |
| Net asset value per share, beginning of year | | $ | 23.84 | | | $ | 23.87 | | | $ | 22.23 | | | $ | 20.53 | | | $ | 25.75 | |
| Income from investment operations: | | | | | | | | | | | | | | | | | | | | |
| Net investment income (loss) | | | 1.48 | | | | (0.09 | ) | | | (0.35 | ) | | | 0.01 | | | | 0.30 | |
| Net realized and unrealized gain (loss) | | | (3.40 | ) | | | 0.11 | | | | 2.09 | | | | 2.23 | | | | (4.84 | ) |
| Total from investment operations | | | (1.92 | ) | | | 0.02 | | | | 1.74 | | | | 2.24 | | | | (4.54 | ) |
| Redemption fees | | | 0.00 | (a) | | | 0.00 | (a) | | | 0.00 | (a) | | | 0.00 | (a) | | | 0.00 | (a) |
| Less distributions: | | | | | | | | | | | | | | | | | | | | |
| From net investment income | | | — | | | | (0.05 | ) | | | (0.10 | ) | | | (0.54 | ) | | | (0.68 | ) |
| Total distributions | | | — | | | | (0.05 | ) | | | (0.10 | ) | | | (0.54 | ) | | | (0.68 | ) |
| Net asset value per share, end of year | | $ | 21.92 | | | $ | 23.84 | | | $ | 23.87 | | | $ | 22.23 | | | $ | 20.53 | |
| Total return | | | (8.05 | )% | | | 0.08 | % | | | 7.83 | % | | | 11.57 | % | | | (18.17 | )% |
| Ratios/Supplemental Data: | | | | | | | | | | | | | | | | | | | | |
| Net Assets at end of year (000) | | $129,048 | | | $169,226 | | | $206,580 | | | $299,965 | | | $355,433 | |
| Ratio of total expenses to average net assets (b) | | | 1.43 | % | | | 1.60 | % | | | 1.48 | % | | | 1.47 | % | | | 1.37 | % |
| Ratio of net investment income (loss) to average net assets | | | 6.46 | % | | | 0.23 | % | | | (0.32 | )% | | | 0.51 | % | | | 1.89 | % |
| Portfolio turnover (c) | | | 28 | % | | | 23 | % | | | 19 | % | | | 12 | % | | | 20 | % |
| † | Beginning with the year ended October 31, 2015, the Fund was audited by Ernst & Young LLP. The previous years were audited by another independent registered public accounting firm. |
| (a) | The amount is less than $0.005 per share. |
| (b) | Ratio of total expenses to average net assets excluding interest expense was 1.41%, 1.57%, 1.44%, 1.39% and 1.26% for the years ended October 31, 2015, 2014, 2013, 2012 and 2011, respectively. |
| (c) | Portfolio turnover is calculated on the basis of the Fund as a whole, without distinguishing between classes of shares issued. |
The accompanying notes are an integral part of these financial statements.
50
Alpine Mutual Funds
Financial Highlights—Continued
(For a share outstanding throughout each period)
| | | International Real Estate Equity Fund | |
| | | | | | | | | | | | Period | |
| | | | | | | | | | | | Ended | |
| | | Years Ended October 31, | | | October 31, | |
| | | 2015 | | | 2014† | | | 2013† | | | 2012†(a) | |
| Class A: | | | | | | | | | | | | | | | | |
| Net asset value per share, beginning of period | | $ | 23.75 | | | $ | 23.81 | | | $ | 22.19 | | | $ | 17.92 | |
| Income from investment operations: | | | | | | | | | | | | | | | | |
| Net investment income (loss) | | | 1.34 | | | | (0.00 | )(b) | | | (0.12 | ) | | | 0.08 | |
| Net realized and unrealized gain (loss) | | | (3.30 | ) | | | (0.06 | ) | | | 1.79 | | | | 4.19 | |
| Total from investment operations | | | (1.96 | ) | | | (0.06 | ) | | | 1.67 | | | | 4.27 | |
| Redemption fees | | | — | | | | 0.00 | (b) | | | 0.00 | (b) | | | — | |
| Less distributions: | | | | | | | | | | | | | | | | |
| From net investment income | | | — | | | | — | | | | (0.05 | ) | | | — | |
| Total distributions | | | — | | | | — | | | | (0.05 | ) | | | — | |
| Net asset value per share, end of period | | $ | 21.79 | | | $ | 23.75 | | | $ | 23.81 | | | $ | 22.19 | |
| Total return | | | (8.25 | )% | | | (0.25 | )% | | | 7.53 | % | | | 23.83 | %(c) |
| Ratios/Supplemental Data | | | | | | | | | | | | | | | | |
| Net Assets at end of period (000) | | $132 | | | $146 | | | $146 | | | $128 | |
| Ratio of total expenses to average net assets (d) | | | 1.68 | % | | | 1.85 | % | | | 1.73 | % | | | 1.72 | %(e) |
| Ratio of net investment income (loss) to average net assets | | | 6.00 | % | | | — | % | | | (0.46 | )% | | | 0.48 | %(e) |
| Portfolio turnover (f) | | | 28 | % | | | 23 | % | | | 19 | % | | | 12 | % |
| † | Beginning with the year ended October 31, 2015, the Fund was audited by Ernst & Young LLP. The previous years were audited by another independent registered public accounting firm. |
| (a) | Class A commenced operations on December 30, 2011. |
| (b) | The amount is less than $0.005 per share. |
| (c) | Not annualized. |
| (d) | Ratio of total expenses to average net assets excluding interest expense was 1.66%, 1.82% and 1.69% for the years ended October 31, 2015, 2014 and 2013, respectively, and 1.64% for the period ended October 31, 2012. |
| (e) | Annualized. |
| (f) | Portfolio turnover is calculated on the basis of the Fund as a whole, without distinguishing between classes of shares issued. |
The accompanying notes are an integral part of these financial statements.
51
Alpine Mutual Funds
Financial Highlights—Continued
(For a share outstanding throughout each year)
| | | Realty Income & Growth Fund | |
| | | Years Ended October 31, | |
| | | 2015 | | | 2014† | | | 2013† | | | 2012† | | | 2011† | |
| Institutional Class: | | | | | | | | | | | | | | | | | | | | |
| Net asset value per share, beginning of year | | $ | 21.29 | | | $ | 18.17 | | | $ | 17.37 | | | $ | 15.56 | | | $ | 14.79 | |
| Income from investment operations: | | | | | | | | | | | | | | | | | | | | |
| Net investment income | | | 0.44 | | | | 0.52 | | | | 0.54 | | | | 0.46 | | | | 0.48 | |
| Net realized and unrealized gain | | | 1.02 | | | | 3.35 | | | | 1.01 | | | | 2.07 | | | | 1.01 | |
| Total from investment operations | | | 1.46 | | | | 3.87 | | | | 1.55 | | | | 2.53 | | | | 1.49 | |
| Redemption fees | | | 0.00 | (a) | | | 0.00 | (a) | | | 0.00 | (a) | | | 0.00 | (a) | | | 0.00 | (a) |
| Less distributions: | | | | | | | | | | | | | | | | | | | | |
| From net investment income | | | (0.48 | ) | | | (0.50 | ) | | | (0.65 | ) | | | (0.72 | ) | | | (0.72 | ) |
| From net realized gains | | | (0.27 | ) | | | (0.25 | ) | | | (0.10 | ) | | | — | | | | — | |
| Total distributions | | | (0.75 | ) | | | (0.75 | ) | | | (0.75 | ) | | | (0.72 | ) | | | (0.72 | ) |
| Net asset value per share, end of year | | $ | 22.00 | | | $ | 21.29 | | | $ | 18.17 | | | $ | 17.37 | | | $ | 15.56 | |
| Total return | | | 6.98 | % | | | 21.90 | % | | | 9.02 | % | | | 16.44 | % | | | 10.23 | % |
| Ratios/Supplemental Data: | | | | | | | | | | | | | | | | | | | | |
| Net Assets at end of year (000) | | $112,927 | | | $112,984 | | | $98,798 | | | $106,304 | | | $101,322 | |
| Ratio of total expenses to average net assets: | | | | | | | | | | | | | | | | | | | | |
| Before waivers and/or expense reimbursements (b) | | | 1.35 | % | | | 1.47 | % | | | 1.50 | % | | | 1.41 | % | | | 1.32 | % |
| After waivers and/or expense reimbursements (c) | | | 1.35 | % | | | 1.42 | % | | | 1.43 | % | | | 1.41 | % | | | 1.32 | % |
| Ratio of net investment income to average net assets | | | 2.00 | % | | | 2.71 | % | | | 2.99 | % | | | 2.73 | % | | | 3.09 | % |
| Portfolio turnover (d) | | | 32 | % | | | 32 | % | | | 33 | % | | | 28 | % | | | 59 | % |
| † | Beginning with the year ended October 31, 2015, the Fund was audited by Ernst & Young LLP. The previous years were audited by another independent registered public accounting firm. |
| (a) | The amount is less than $0.005 per share. |
| (b) | Ratio of total expenses to average net assets excluding interest expense before waivers and/or expense reimbursements was 1.31%, 1.40%, 1.42%, 1.33% and 1.23% for the years ended October 31, 2015, 2014, 2013, 2012 and 2011, respectively. |
| (c) | Ratio of total expenses to average net assets excluding interest expense after waivers and/or expense reimbursements was 1.31%, 1.35%, 1.35%, 1.33% and 1.23% for the years ended October 31, 2015, 2014, 2013, 2012 and 2011, respectively. |
| (d) | Portfolio turnover is calculated on the basis of the Fund as a whole, without distinguishing between classes of shares issued. |
The accompanying notes are an integral part of these financial statements.
52
Alpine Mutual Funds
Financial Highlights—Continued
(For a share outstanding throughout each period)
| | | Realty Income & Growth Fund | |
| | | | | | | | | | | | Period | |
| | | | | | | | | | | | Ended | |
| | | Years Ended October 31, | | | October 31, | |
| | | 2015 | | | 2014† | | | 2013† | | | 2012†(a) | |
| Class A: | | | | | | | | | | | | | | | | |
| Net asset value per share, beginning of period | | $ | 21.26 | | | $ | 18.16 | | | $ | 17.35 | | | $ | 15.60 | |
| Income from investment operations: | | | | | | | | | | | | | | | | |
| Net investment income | | | 0.33 | | | | 0.46 | | | | 0.59 | | | | 0.32 | |
| Net realized and unrealized gain | | | 1.08 | | | | 3.34 | | | | 0.93 | | | | 1.95 | |
| Total from investment operations | | | 1.41 | | | | 3.80 | | | | 1.52 | | | | 2.27 | |
| Redemption fees | | | 0.00 | (b) | | | 0.00 | (b) | | | 0.00 | (b) | | | 0.00 | (b) |
| Less distributions: | | | | | | | | | | | | | | | | |
| From net investment income | | | (0.43 | ) | | | (0.45 | ) | | | (0.61 | ) | | | (0.52 | ) |
| From net realized gains | | | (0.27 | ) | | | (0.25 | ) | | | (0.10 | ) | | | — | |
| Total distributions | | | (0.70 | ) | | | (0.70 | ) | | | (0.71 | ) | | | (0.52 | ) |
| Net asset value per share, end of period | | $ | 21.97 | | | $ | 21.26 | | | $ | 18.16 | | | $ | 17.35 | |
| Total return | | | 6.72 | % | | | 21.51 | % | | | 8.85 | % | | | 14.53 | %(c) |
| Ratios/Supplemental Data | | | | | | | | | | | | | | | | |
| Net Assets at end of period (000) | | $2,886 | | | $2,441 | | | $1,168 | | | $115 | |
| Ratio of total expenses to average net assets: | | | | | | | | | | | | | | | | |
| Before waivers and/or expense reimbursements (d) | | | 1.60 | % | | | 1.72 | % | | | 1.75 | % | | | 1.66 | %(e) |
| After waivers and/or expense reimbursements (f) | | | 1.60 | % | | | 1.67 | % | | | 1.67 | % | | | 1.66 | %(e) |
| Ratio of net investment income to average net assets | | | 1.72 | % | | | 2.42 | % | | | 3.00 | % | | | 2.18 | %(e) |
| Portfolio turnover (g) | | | 32 | % | | | 32 | % | | | 33 | % | | | 28 | % |
| † | Beginning with the year ended October 31, 2015, the Fund was audited by Ernst & Young LLP. The previous years were audited by another independent registered public accounting firm. |
| (a) | Class A commenced operations on December 30, 2011. |
| (b) | The amount is less than $0.005 per share. |
| (c) | Not annualized. |
| (d) | Ratio of total expenses to average net assets excluding interest expense before waivers and/or expense reimbursements was 1.56%, 1.65% and 1.67% for the years ended October 31, 2015, 2014 and 2013, respectively, and 1.58% for the period ended October 31, 2012. |
| (e) | Annualized. |
| (f) | Ratio of total expenses to average net assets excluding interest expense after waivers and/or expense reimbursements was 1.56%, 1.60% and 1.59% for the years ended October 31, 2015, 2014 and 2013, respectively, and 1.58% for the period ended October 31, 2012. |
| (g) | Portfolio turnover is calculated on the basis of the Fund as a whole, without distinguishing between classes of shares issued. |
The accompanying notes are an integral part of these financial statements.
53
Alpine Mutual Funds
Financial Highlights—Continued
(For a share outstanding throughout each year)
| | | Emerging Markets Real Estate Fund | |
| | | Years Ended October 31, | |
| | | 2015 | | | 2014† | | | 2013† | | | 2012† | | | 2011† | |
| Institutional Class: | | | | | | | | | | | | | | | | | | | | |
| Net asset value per share, beginning of year | | $ | 17.30 | | | $ | 17.37 | | | $ | 17.16 | | | $ | 14.68 | | | $ | 19.20 | |
| Income from investment operations: | | | | | | | | | | | | | | | | | | | | |
| Net investment income | | | 0.43 | | | | 0.50 | | | | 0.25 | | | | 0.12 | | | | 0.40 | |
| Net realized and unrealized gain (loss) | | | (2.55 | ) | | | (0.18 | ) | | | 0.13 | | | | 2.36 | | | | (3.47 | ) |
| Total from investment operations | | | (2.12 | ) | | | 0.32 | | | | 0.38 | | | | 2.48 | | | | (3.07 | ) |
| Redemption fees | | | 0.00 | (a) | | | 0.03 | | | | 0.04 | | | | 0.00 | (a) | | | 0.00 | (a) |
| Less distributions: | | | | | | | | | | | | | | | | | | | | |
| From net investment income | | | (0.64 | ) | | | (0.27 | ) | | | (0.21 | ) | | | — | | | | (0.08 | ) |
| From net realized gains | | | — | | | | (0.15 | ) | | | — | | | | — | | | | (1.37 | ) |
| Total distributions | | | (0.64 | ) | | | (0.42 | ) | | | (0.21 | ) | | | — | | | | (1.45 | ) |
| Net asset value per share, end of year | | $ | 14.54 | | | $ | 17.30 | | | $ | 17.37 | | | $ | 17.16 | | | $ | 14.68 | |
| Total return | | | (12.59 | )% | | | 2.29 | % | | | 2.36 | % | | | 16.89 | % | | | (17.52 | )% |
| Ratios/Supplemental Data: | | | | | | | | | | | | | | | | | | | | |
| Net Assets at end of year (000) | | $4,264 | | | $5,332 | | | $9,051 | | | $4,288 | | | $4,289 | |
| Ratio of total expenses to average net assets: | | | | | | | | | | | | | | | | | | | | |
| Before waivers and/or expense reimbursements (b) | | | 2.97 | % | | | 2.38 | % | | | 2.35 | % | | | 2.95 | % | | | 2.42 | % |
| After waivers and/or expense reimbursements (c) | | | 1.35 | % | | | 1.36 | % | | | 1.35 | % | | | 1.35 | % | | | 1.35 | % |
| Ratio of net investment income to average net assets | | | 2.54 | % | | | 2.39 | % | | | 1.22 | % | | | 0.97 | % | | | 0.54 | % |
| Portfolio turnover (d) | | | 78 | % | | | 117 | % | | | 120 | % | | | 102 | % | | | 58 | % |
| † | Beginning with the year ended October 31, 2015, the Fund was audited by Ernst & Young LLP. The previous years were audited by another independent registered public accounting firm. |
| (a) | The amount is less than $0.005 per share. |
| (b) | Ratio of total expenses to average net assets excluding interest expense before waivers and/or expense reimbursements was 2.97%, 2.37%, 2.35%, 2.95% and 2.42% for the years ended October 31, 2015, 2014, 2013, 2012 and 2011, respectively. |
| (c) | Ratio of total expenses to average net assets excluding interest expense after waivers and/or expense reimbursements was 1.35%, 1.35%, 1.35%, 1.35% and 1.35% for the years ended October 31, 2015, 2014, 2013, 2012 and 2011, respectively. |
| (d) | Portfolio turnover is calculated on the basis of the Fund as a whole, without distinguishing between classes of shares issued. |
The accompanying notes are an integral part of these financial statements.
54
Alpine Mutual Funds
Financial Highlights—Continued
(For a share outstanding throughout each period)
| | | Emerging Markets Real Estate Fund | |
| | | | | | | | | | | | Period | |
| | | | | | | | | | | | Ended | |
| | | Years Ended October 31, | | | October 31, | |
| | | 2015 | | | 2014† | | | 2013† | | | 2012†(a) | |
| Class A: | | | | | | | | | | | | | | | | |
| Net asset value per share, beginning of period | | $ | 17.25 | | | $ | 17.32 | | | $ | 17.13 | | | $ | 13.45 | |
| Income from investment operations: | | | | | | | | | | | | | | | | |
| Net investment income | | | 0.46 | | | | 0.39 | | | | 0.05 | | | | 0.13 | |
| Net realized and unrealized gain (loss) | | | (2.61 | ) | | | (0.11 | ) | | | 0.29 | | | | 3.55 | |
| Total from investment operations | | | (2.15 | ) | | | 0.28 | | | | 0.34 | | | | 3.68 | |
| Redemption fees | | | 0.00 | (b) | | | 0.02 | | | | 0.03 | | | | 0.00 | (b) |
| Less distributions: | | | | | | | | | | | | | | | | |
| From net investment income | | | (0.60 | ) | | | (0.22 | ) | | | (0.18 | ) | | | — | |
| From net realized gains | | | — | | | | (0.15 | ) | | | — | | | | — | |
| Total distributions | | | (0.60 | ) | | | (0.37 | ) | | | (0.18 | ) | | | — | |
| Net asset value per share, end of period | | $ | 14.50 | | | $ | 17.25 | | | $ | 17.32 | | | $ | 17.13 | |
| Total return | | | (12.80 | )% | | | 2.01 | % | | | 2.10 | % | | | 27.36 | %(c) |
| Ratios/Supplemental Data | | | | | | | | | | | | | | | | |
| Net Assets at end of period (000) | | $403 | | | $785 | | | $708 | | | $140 | |
| Ratio of total expenses to average net assets: | | | | | | | | | | | | | | | | |
| Before waivers and/or expense reimbursements (d) | | | 3.22 | % | | | 2.63 | % | | | 2.60 | % | | | 3.01 | %(e) |
| After waivers and/or expense reimbursements (f) | | | 1.60 | % | | | 1.61 | % | | | 1.60 | % | | | 1.61 | %(e) |
| Ratio of net investment income to average net assets | | | 2.42 | % | | | 2.49 | % | | | 0.93 | % | | | 1.05 | %(e) |
| Portfolio turnover (g) | | | 78 | % | | | 117 | % | | | 120 | % | | | 102 | % |
| † | Beginning with the year ended October 31, 2015, the Fund was audited by Ernst & Young LLP. The previous years were audited by another independent registered public accounting firm. |
| (a) | Class A commenced operations on December 30, 2011. |
| (b) | The amount is less than $0.005 per share. |
| (c) | Not annualized. |
| (d) | Ratio of total expenses to average net assets excluding interest expense before waivers and/or expense reimbursements was 3.22%, 2.63% and 2.60% for the years ended October 31, 2015, 2014 and 2013, respectively, and 3.01% for the period ended October 31, 2012. |
| (e) | Annualized. |
| (f) | Ratio of total expenses to average net assets excluding interest expense after waivers and/or expense reimbursements was 1.60%, 1.60% and 1.60% for the years ended October 31, 2015, 2014 and 2013, respectively, and 1.61% for the period ended October 31, 2012. |
| (g) | Portfolio turnover is calculated on the basis of the Fund as a whole, without distinguishing between classes of shares issued. |
The accompanying notes are an integral part of these financial statements.
55
Alpine Mutual Funds
Financial Highlights—Continued
(For a share outstanding throughout each year)
| | | Global Infrastructure Fund | |
| | | Years Ended October 31, | |
| | | 2015 | | | 2014† | | | 2013† | | | 2012† | | | 2011† | |
| Institutional Class: | | | | | | | | | | | | | | | | | | | | |
| Net asset value per share, beginning of year | | $ | 20.14 | | | $ | 19.24 | | | $ | 15.93 | | | $ | 14.32 | | | $ | 15.98 | |
| Income from investment operations: | | | | | | | | | | | | | | | | | | | | |
| Net investment income | | | 0.71 | | | | 0.60 | | | | 0.71 | | | | 0.65 | | | | 0.61 | |
| Net realized and unrealized gain (loss) | | | (2.25 | ) | | | 1.36 | | | | 3.25 | | | | 1.60 | | | | (0.72 | ) |
| Total from investment operations | | | (1.54 | ) | | | 1.96 | | | | 3.96 | | | | 2.25 | | | | (0.11 | ) |
| Redemption fees | | | 0.00 | (a) | | | 0.00 | (a) | | | 0.01 | | | | 0.00 | (a) | | | 0.00 | (a) |
| Less distributions: | | | | | | | | | | | | | | | | | | | | |
| From net investment income | | | (0.71 | ) | | | (0.71 | ) | | | (0.66 | ) | | | (0.64 | ) | | | (0.99 | ) |
| From net realized gains | | | (0.19 | ) | | | (0.35 | ) | | | — | | | | — | | | | (0.55 | ) |
| Tax return of capital | | | (0.04 | ) | | | — | | | | — | | | | — | | | | (0.01 | ) |
| Total distributions | | | (0.94 | ) | | | (1.06 | ) | | | (0.66 | ) | | | (0.64 | ) | | | (1.55 | ) |
| Net asset value per share, end of year | | $ | 17.66 | | | $ | 20.14 | | | $ | 19.24 | | | $ | 15.93 | | | $ | 14.32 | |
| Total return | | | (7.90 | )% | | | 10.52 | % | | | 25.35 | % | | | 16.09 | % | | | (1.03 | )% |
| Ratios/Supplemental Data: | | | | | | | | | | | | | | | | | | | | |
| Net Assets at end of year (000) | | $207,034 | | | $185,904 | | | $125,277 | | | $46,998 | | | $29,028 | |
| Ratio of total expenses to average net assets: | | | | | | | | | | | | | | | | | | | | |
| Before waivers and/or expense reimbursements (b) | | | 1.28 | % | | | 1.21 | % | | | 1.24 | % | | | 1.33 | % | | | 1.59 | % |
| After waivers and/or expense reimbursements (c) | | | 1.26 | % | | | 1.21 | % | | | 1.24 | % | | | 1.33 | % | | | 1.35 | % |
| Ratio of net investment income to average net assets | | | 3.60 | % | | | 3.14 | % | | | 4.18 | % | | | 4.30 | % | | | 4.17 | % |
| Portfolio turnover (d) | | | 116 | % | | | 109 | % | | | 147 | % | | | 148 | % | | | 189 | % |
| † | Beginning with the year ended October 31, 2015, the Fund was audited by Ernst & Young LLP. The previous years were audited by another independent registered public accounting firm. |
| (a) | The amount is less than $0.005 per share. |
| (b) | Ratio of total expenses to average net assets excluding interest expense before waivers and/or expense reimbursements was 1.27%, 1.21%, 1.24%, 1.33% and 1.59% for the years ended October 31, 2015, 2014, 2013, 2012 and 2011, respectively. |
| (c) | Ratio of total expenses to average net assets excluding interest expense after waivers and/or expense reimbursements was 1.25%, 1.21%, 1.24%, 1.33% and 1.35% for the years ended October 31, 2015, 2014, 2013, 2012 and 2011, respectively. |
| (d) | Portfolio turnover is calculated on the basis of the Fund as a whole, without distinguishing between classes of shares issued. |
The accompanying notes are an integral part of these financial statements.
56
Alpine Mutual Funds
Financial Highlights—Continued
(For a share outstanding throughout each period)
| | | Global Infrastructure Fund | |
| | | | | | | | | | | | Period | |
| | | | | | | | | | | | Ended | |
| | | Years Ended October 31, | | | October 31, | |
| | | 2015 | | | 2014† | | | 2013† | | | 2012†(a) | |
| Class A: | | | | | | | | | | | | | | | | |
| Net asset value per share, beginning of period | | $ | 20.11 | | | $ | 19.22 | | | $ | 15.92 | | | $ | 13.91 | |
| Income from investment operations: | | | | | | | | | | | | | | | | |
| Net investment income | | | 0.61 | | | | 0.57 | | | | 0.69 | | | | 0.43 | |
| Net realized and unrealized gain (loss) | | | (2,21 | ) | | | 1.34 | | | | 3.22 | | | | 2.04 | |
| Total from investment operations | | | (1.60 | ) | | | 1.91 | | | | 3.91 | | | | 2.47 | |
| Redemption fees | | | 0.00 | (b) | | | 0.00 | (b) | | | 0.01 | | | | 0.00 | (b) |
| Less distributions: | | | | | | | | | | | | | | | | |
| From net investment income | | | (0.63 | ) | | | (0.67 | ) | | | (0.62 | ) | | | (0.46 | ) |
| From net realized gains | | | (0.21 | ) | | | (0.35 | ) | | | — | | | | — | |
| Tax return of capital | | | (0.04 | ) | | | — | | | | — | | | | — | |
| Total distributions | | | (0.88 | ) | | | (1.02 | ) | | | (0.62 | ) | | | (0.46 | ) |
| Net asset value per share, end of period | | $ | 17.63 | | | $ | 20.11 | | | $ | 19.22 | | | $ | 15.92 | |
| Total return | | | (8.15 | )% | | | 10.22 | % | | | 25.04 | % | | | 17.94 | %(c) |
| Ratios/Supplemental Data | | | | | | | | | | | | | | | | |
| Net Assets at end of period (000) | | $21,822 | | | $27,200 | | | $19,941 | | | $1,721 | |
| Ratio of total expenses to average net assets: | | | | | | | | | | | | | | | | |
| Before waivers and/or expense reimbursements (d) | | | 1.52 | % | | | 1.46 | % | | | 1.49 | % | | | 1.67 | %(e) |
| After waivers and/or expense reimbursements (f) | | | 1.50 | % | | | 1.46 | % | | | 1.49 | % | | | 1.60 | %(e) |
| Ratio of net investment income to average net assets | | | 3.47 | % | | | 2.92 | % | | | 3.67 | % | | | 3.67 | %(e) |
| Portfolio turnover (g) | | | 116 | % | | | 109 | % | | | 147 | % | | | 148 | % |
| † | Beginning with the year ended October 31, 2015, the Fund was audited by Ernst & Young LLP. The previous years were audited by another independent registered public accounting firm. |
| (a) | Class A commenced operations on December 30, 2011. |
| (b) | The amount is less than $0.005 per share. |
| (c) | Not annualized. |
| (d) | Ratio of total expenses to average net assets excluding interest expense before waivers and/or expense reimbursements was 1.52%, 1.46% and 1.49% for the years ended October 31, 2015, 2014 and 2013, respectively, and 1.67% for the period ended October 31, 2012. |
| (e) | Annualized. |
| (f) | Ratio of total expenses to average net assets excluding interest expense after waivers and/or expense reimbursements was 1.50%, 1.46% and 1.49% for the years ended October 31, 2015, 2014 and 2013, respectively, and 1.60% for the period ended October 31, 2012. |
| (g) | Portfolio turnover is calculated on the basis of the Fund as a whole, without distinguishing between classes of shares issued. |
The accompanying notes are an integral part of these financial statements.
57
Alpine Mutual Funds
Notes to Financial Statements
October 31, 2015
Alpine Equity Trust (the “Equity Trust”) was organized in 1988 as a Massachusetts Business Trust, and is registered under the Investment Company Act of 1940, as amended (the “1940 Act”), as an open-end management investment company. The Alpine International Real Estate Equity Fund, Alpine Realty Income & Growth Fund, Alpine Emerging Markets Real Estate Fund and Alpine Global Infrastructure Fund are four separate series of the Equity Trust (individually referred to as a “Fund” and collectively, “the Funds”). The Alpine International Real Estate Equity Fund, Alpine Emerging Markets Real Estate Fund and Alpine Global Infrastructure Fund are diversified funds. The Alpine Realty Income & Growth Fund is a nondiversified fund. Alpine International Real Estate Equity Fund seeks long-term capital growth. Current income is a secondary objective. Alpine Realty Income & Growth Fund seeks a high level of current income. Capital appreciation is a secondary objective. Alpine Emerging Markets Real Estate Fund seeks capital appreciation. Current income is a secondary objective. Alpine Global Infrastructure Fund seeks capital appreciation. Current income is a secondary objective.
Alpine Woods Capital Investors, LLC (the “Adviser”) is a Delaware limited liability company and serves as the investment manager to the Funds. The Funds offer Institutional Class and Class A shares. Institutional Class shares are sold without a sales charge. Class A shares have an initial sales charge which may be waived under certain conditions as described in the Funds’ prospectus. Class A shares may be subject to Contingent Deferred Sales Charges (“CDSC”) for certain redemptions where no initial sales charge was paid at the time of purchase. All shares of the Funds have equal rights and privileges. Each share of a Fund is entitled to one vote on all matters as to which shares are entitled to vote, to participate equally with other shares in dividends and distributions declared by the Funds and on liquidation to their proportionate share of the assets remaining after satisfaction of outstanding liabilities, except that Class A shares bear certain expenses related to the distribution fee of such shares. Each class has exclusive voting rights with respect to matters relating to its shareholder servicing and distribution expenditures.
The Funds are each an investment company and accordingly follow the investment company accounting and reporting guidance of the Financial Accounting Standards Board (“FASB”) Accounting Standards Codification Topic (“ASC”) 946 Financial Services – Investment Companies.
| 2. | Significant Accounting Policies: |
The following is a summary of significant accounting policies consistently followed by the Funds in the preparation of their financial statements. The policies are in conformity with accounting principles generally accepted in the United States of America (“GAAP”), which require management to make estimates and assumptions that affect amounts reported herein. Actual results could differ from those estimates. Changes in the economic environment, financial markets and any other parameters used in determining these estimates could cause actual results to differ.
A. Valuation of Securities:
The net asset value (“NAV”) of shares of the Funds are calculated by dividing the value of the Funds’ net assets by the number of outstanding shares. NAV is determined each day the New York Stock Exchange (“NYSE”) is open as of the close of regular trading (normally, 4:00 p.m., Eastern Time). In computing NAV, portfolio securities of the Funds are valued at their current fair values determined on the basis of market quotations or if market quotations are not readily available or determined to be unreliable, through procedures and/or guidelines established by the Board. In computing the Funds’ NAV, equity securities that are traded on a securities exchange in the United States, except for those listed on NASDAQ Global Market, NASDAQ Global Select Market and NASDAQ Capital Market exchanges (collectively, “NASDAQ”) and option securities are valued at the last reported sale price as of the time of valuation. Securities traded on NASDAQ will be valued at the NASDAQ Official Closing Prices (“NOCP”). If, on a particular day, an exchange traded or NASDAQ security does not trade, then the mean between the most recent quoted bid and asked prices will be used. For equity investments traded on more than one exchange, the last reported sale price on the exchange where the stock is primarily traded is used. Equity-linked structured notes are valued by referencing the last reported sale or settlement price of the underlying security on the day of valuation. Foreign exchange adjustments are applied to the last reported price to convert the underlying security’s trading currency to the equity-linked structured note’s settlement currency. Each option security traded on a securities exchange in the United States is valued at the last current reported sales price as of the time of valuation if the last current reported sales price falls within the consolidated bid/ask quote. If the last current reported sale price does not fall within the consolidated bid/ask quote, the security is valued at the mid-point of the consolidated bid/ask quote for the option security. Forward currency contracts are valued based on third-party vendor quotations. Each security traded in the over-the-counter market and
58
Alpine Mutual Funds
Notes to Financial Statements—Continued
October 31, 2015
quoted on the NASDAQ National Market System is valued at the NOCP, as determined by NASDAQ, or lacking an NOCP, the last current reported sale price as of the time of valuation by NASDAQ, or lacking any current reported sale on NASDAQ at the time of valuation, at the mean between the most recent bid and asked quotations. Each over-the-counter option that is not traded through the Options Clearing Corporation is valued by the counterparty of the option, or if the counterparty’s price is not readily available, then by using the Black-Scholes method. Debt and short-term securities are valued based on an evaluated bid price as furnished by pricing services approved by the Board, which may be based on market transactions for comparable securities and various relationships between securities that are generally recognized by institutional traders, a computerized matrix system, or appraisals derived from information concerning the securities or similar securities received from recognized dealers in those securities. Each other security traded over-the-counter is valued at the mean between the most recent bid and asked quotations.
Securities that are principally traded in a foreign market are valued at the last current sale price at the time of valuation or lacking any current or reported sale, at the time of valuation, at the mean between the most recent bid and asked quotations as of the close of the appropriate exchange or other designated time. Trading in securities on European and Far Eastern securities exchanges and over-the-counter markets is normally completed at various times before the close of business on each day on which the NYSE is open. Trading of these securities may not take place on every NYSE business day. In addition, trading may take place in various foreign markets on Saturdays or on other days when the NYSE is not open and on which the Funds’ NAVs are not calculated.
When market quotations are not readily available or when the valuation methods mentioned above are not reflective of a fair value of the security, the security is valued at fair value following procedures and/or guidelines approved by the Board. The Funds may also use fair value pricing, if the value of a security it holds is, pursuant to the Board guidelines, materially affected by events occurring before the Funds’ NAVs are calculated but after the close of the primary market or market transactions for comparable securities and various relationships between securities that are generally recognized by institutional traders, a computerized matrix system, or appraisals derived from information concerning the securities or similar securities received from recognized dealers in those securities. The Board has approved the use of a third-party pricing vendor’s proprietary fair value pricing model to assist in determining current valuation for foreign equities and OTC derivatives traded in markets that close prior to the NYSE. When fair value pricing is employed, the value of the portfolio security used to calculate the Funds’ NAVs may differ from quoted or official closing prices. The Fund may also fair value a security if the Fund or Adviser believes that the market price is stale. Other types of securities that the Funds may hold for which fair value pricing might be required include illiquid securities including restricted securities and private placements for which there is no public market.
For securities valued by the Funds, valuation techniques are used to measure fair value that are consistent with the market approach and/or income approach, depending on the type of security and the particular circumstance. The market approach uses prices and other relevant information generated by market transactions involving identical or comparable securities. The income approach uses valuation techniques to discount estimated future cash flows to present value.
The Board of Trustees adopted procedures which utilize fair value procedures when any assets for which reliable market quotations are not readily available or for which the Funds’ pricing service does not provide a valuation or provides a valuation that in the judgment of the Adviser does not represent fair value. The Board of Trustees has established a Valuation Committee which is responsible for (1) monitoring the valuation of Fund securities and other investments; and (2) as required, when the Board of Trustees is not in session, reviewing and approving the fair value of illiquid and other holdings after consideration of all relevant factors, which determinations are reported to the Board of Trustees.
Fair Value Measurement:
In accordance with FASB ASC, “Fair Value Measurement” (“ASC 820”), defines fair value as the value that the Funds would receive to sell an investment or pay to transfer a liability in a timely transaction with an independent buyer in the principal market, or in the absence of a principal market the most advantageous market for the investment or liability. ASC 820 uses a three-tier hierarchy to establish classification of fair value measurements for disclosure purposes. Inputs refer broadly to the assumptions that market participants would use in pricing the asset or liability, including assumptions about risk. Inputs may be observable or unobservable. Observable inputs are inputs that reflect the assumptions market participants would use in pricing the asset or liability that are developed based on market data obtained from sources independent of the reporting entity. Unobservable inputs are inputs that reflect
59
Alpine Mutual Funds
Notes to Financial Statements—Continued
October 31, 2015
the reporting entities’ own assumptions about the assumptions market participants would use in pricing the asset or liability that are developed based on the best information available.
| | • Level 1 — | Unadjusted quoted prices in active markets for identical investments. |
| | | |
| | • Level 2 — | Other significant observable inputs (including quoted prices for similar instruments, interest rates, prepayment speeds, credit risk, yield curves, default rates, etc.). |
| | | |
| | • Level 3 — | Significant unobservable inputs (including the Funds’ own assumptions in determining the fair value of investments). |
The availability of observable inputs can vary from security to security and is affected by a wide variety of factors, including, for example, the type of security, whether the security is new and not yet established in the marketplace, the liquidity of markets, and other characteristics particular to the security. To the extent that valuation is based on models or inputs that are less observable or unobservable in the market, the determination of fair value requires more judgment. Accordingly, the degree of judgment exercised in determining fair value is greatest for instruments categorized in Level 3.
The inputs used to measure fair value may fall into different levels of the fair value hierarchy. In such cases, for disclosure purposes, the level in the fair value hierarchy within which the fair value measurement falls, is determined based on the lowest level input that is significant to the fair value measurement in its entirety.
Various inputs are used in determining the value of the Funds’ investments as of the reporting year end. The designated input levels are not necessarily an indication of the risk or liquidity associated with these investments. These inputs are categorized in the following hierarchy under ASC 820.
For certain Level 3 investments the Adviser may perform due diligence that may include visiting a company’s largest projects, meeting with the company’s management team, and having discussions with company management regarding the operation of its business. The Adviser considers all of this information in the determination of fair value. International Real Estate Equity Fund has retained a third-party independent valuation firm to provide input on the methodology to value a particular investment and the range of its values.
The following is a summary of the inputs used to value the Funds’ assets and liabilities carried at fair value as of October 31, 2015:
| | | Valuation Inputs | | | | |
| International Real Estate Equity Fund* | | Level 1 | | | Level 2 | | | Level 3 | | | Total Value | |
| Common Stocks | | | | | | | | | | | | | | | | |
| Asia | | $ | 55,672,028 | | | $ | 2,090,046 | | | $ | 3,853,998 | | | $ | 61,616,072 | |
| Europe | | | 44,868,636 | | | | — | | | | 11,489 | | | | 44,880,125 | |
| North & South America | | | 11,033,651 | | | | — | | | | — | | | | 11,033,651 | |
| Equity-Linked Structured Notes | | | — | | | | 3,905,438 | | | | — | | | | 3,905,438 | |
| Investment Companies | | | 752,856 | | | | — | | | | — | | | | 752,856 | |
| Warrants | | | — | | | | 2,251 | | | | — | | | | 2,251 | |
| Total | | $ | 112,327,171 | | | $ | 5,997,735 | | | $ | 3,865,487 | | | $ | 122,190,393 | |
60
Alpine Mutual Funds
Notes to Financial Statements—Continued
October 31, 2015
| | | Valuation Inputs | | | | |
| Other Financial Instruments | | Level 1 | | | Level 2 | | | Level 3 | | | Total Value | |
| Assets | | | | | | | | | | | | | | | | |
| Forward Currency Contracts | | $ | — | | | $ | 409,087 | | | $ | — | | | $ | 409,087 | |
| Liabilities | | | | | | | | | | | | | | | | |
| Forward Currency Contracts | | | — | | | | (257,436 | ) | | | — | | | | (257,436 | ) |
| Total | | $ | — | | | $ | 151,651 | | | $ | — | | | $ | 151,651 | |
| | | | | | | | | | | | | | | | | |
| | | Valuation Inputs | | | | |
| Realty Income & Growth Fund* | | Level 1 | | | Level 2 | | | Level 3 | | | Total Value | |
| Real Estate Investment Trusts | | $ | 113,829,849 | | | $ | — | | | $ | — | | | $ | 113,829,849 | |
| Common Stocks | | | 2,309,640 | | | | — | | | | — | | | | 2,309,640 | |
| Preferred Stocks | | | 1,481,769 | | | | — | | | | — | | | | 1,481,769 | |
| Total | | $ | 117,621,258 | | | $ | — | | | $ | — | | | $ | 117,621,258 | |
| | | | | | | | | | | | | | | | | |
| | | Valuation Inputs | | | | |
| Emerging Markets Real Estate Fund* | | Level 1 | | | Level 2 | | | Level 3 | | | Total Value | |
| Common Stocks | | | | | | | | | | | | | | | | |
| Asia | | $ | 3,164,816 | | | $ | 166,211 | | | $ | — | | | $ | 3,331,027 | |
| Europe | | | 133,336 | | | | — | | | | — | | | | 133,336 | |
| Middle East/Africa | | | 280,076 | | | | — | | | | — | | | | 280,076 | |
| North & South America | | | 372,547 | | | | 24,468 | | | | — | | | | 397,015 | |
| Equity-Linked Structured Notes | | | — | | | | 375,121 | | | | — | | | | 375,121 | |
| Convertible Foreign Bonds | | | — | | | | 208 | | | | — | | | | 208 | |
| Total | | $ | 3,950,775 | | | $ | 566,008 | | | $ | — | | | $ | 4,516,783 | |
| | | | | | | | | | | | | | | | | |
| | | Valuation Inputs | | | | |
| Global Infrastructure Fund* | | Level 1 | | | Level 2 | | | Level 3 | | | Total Value | |
| Common Stocks | | | | | | | | | | | | | | | | |
| Asia | | $ | 22,250,150 | | | $ | 2,934,184 | | | $ | — | | | $ | 25,184,334 | |
| Europe | | | 71,746,262 | | | | — | | | | — | | | | 71,746,262 | |
| North & South America | | | 113,317,653 | | | | — | | | | — | | | | 113,317,653 | |
| Equity-Linked Structured Notes | | | — | | | | 2,713,291 | | | | — | | | | 2,713,291 | |
| Short-Term Investments | | | — | | | | 3,184,000 | | | | — | | | | 3,184,000 | |
| Total | | $ | 207,314,065 | | | $ | 8,831,475 | | | $ | — | | | $ | 216,145,540 | |
| | | | | | | | | | | | | | | | | |
| | | Valuation Inputs | | | | |
| Other Financial Instruments | | Level 1 | | | Level 2 | | | Level 3 | | | Total Value | |
| Assets | | | | | | | | | | | | | | | | |
| Forward Currency Contracts | | $ | — | | | $ | 473,119 | | | $ | — | | | $ | 473,119 | |
| Liabilities | | | | | | | | | | | | | | | | |
| Forward Currency Contracts | | | — | | | | (143,415 | ) | | | — | | | | (143,415 | ) |
| Total | | $ | — | | | $ | 329,704 | | | $ | — | | | $ | 329,704 | |
| * | For detailed country and sector descriptions, see accompanying Schedule of Portfolio Investments. |
For the year ended October 31, 2015, there were no transfers between Level 1 and Level 2. As of October 31, 2015, securities valued at $146,556 were transferred from Level 3 to Level 2 for International Real Estate Equity Fund.
61
Alpine Mutual Funds
Notes to Financial Statements—Continued
October 31, 2015
The following is a reconciliation of Level 3 assets for which significant unobservable inputs were used to determine fair value:
| | | International | |
| | | Real Estate | |
| | | Equity Fund | |
| Balance as of October 31, 2014 | | $ | 12,451,624 | |
| Realized gain (loss) | | | — | |
| Change in net unrealized depreciation* | | | (8,586,137 | ) |
| Purchases | | | — | |
| Sales | | | — | |
| Transfers in to Level 3** | | | — | |
| Transfers out of Level 3 ** | | | — | |
| Balance as of October 31, 2015 | | $ | 3,865,487 | |
Change in net unrealized appreciation/(depreciation) on
Level 3 assets held at year end | | $ | (8,586,137 | ) |
| * | Statements of Operations Location: Change in net unrealized appreciation/(depreciation) on investments and foreign currency. |
| ** | The Funds recognize transfers as of the beginning of the year. |
The following table shows the valuation techniques and significant amounts of unobservable inputs used in the fair value measurement of the Fund’s Level 3 investments, as of October 31, 2015:
| International Real Estate Equity Fund | | | | | | | | |
| | | | | | | | | | | | | Relationship |
| | | | | | | | | | | | | Between Fair |
| | | | | | | | | | | | | Value and |
| | | | | Significant | | Significant | | | | | | Input: If |
| | | Fair Value | | Valuation | | Unobservable | | Range of | | Weighted | | Input Value |
| Asset | | at 10/31/15 | | Technique | | Input | | Values | | Average | | Increases Then: |
| Common Stock | | | $3,853,998* | + | | Market Approach | | Liquidity Discount | | 20% | | 20% | | Fair Value would Decrease |
| | | | | | | | | Total Enterprise
Value / Revenue | | 1.75 x to
2.25 x | | 2.00x | | Fair Value would Increase |
| | | | | | | | | Price / Book | | 0.90 x to
1.30 x | | 1.10x | | Fair Value would Increase |
| | | | | | | Income Approach | | Adjusted Weighted
Average Cost of Capital | | 16.5%-
17.5% | | 17% | | Fair Value would Decrease |
| | | | | | | | | Terminal Growth Rate | | 3%-5% | | 4% | | Fair Value would Decrease |
| Common Stock | | | $11,489* | | | Adjusted Book Value | | Discount to NAV | | 50% | | 50% | | Fair Value would Decrease |
| * | Represents a single security, as of October 31, 2015. As a result, the range of values and weighted average for each unobservable input refer to a single value. |
The significant unobservable inputs used in the fair value measurement of common stocks is liquidity discounts, total enterprise value/revenue, total enterprise value/earnings before interest & taxes, price/book, adjusted weighted average cost of capital and discount to NAV. Other market indicators are also considered. Changes in any of those inputs would result in lower or higher fair value measurement.
B. Security Transactions and Investment Income:
Security transactions are accounted for on a trade date basis. Realized gains and losses are computed on the identified cost basis. Dividend income is recorded on the ex-dividend date or in the case of some foreign securities, on the date thereafter when the Funds are made aware of the dividend. Upon notification from issuers, some of the dividend income received from a real estate investment trust may be redesignated as a reduction of cost of the related investment and/or realized gain. Interest income is recorded on the accrual basis and includes accretion of
62
Alpine Mutual Funds
Notes to Financial Statements—Continued
October 31, 2015
discounts and amortization of premiums, where applicable. To the extent any issuer defaults or a credit event occurs that impacts the issuer, the Funds may halt any additional interest income accruals and consider the realizability of interest accrued up to the date of default or credit event.
C. Line of Credit and Custody Overdrafts:
On December 1, 2010, the Trust entered into a lending agreement with BNP Paribas through its New York branch (“BNPP NY”). Loans in aggregate, whether to cover overdrafts or for investment purposes, may not exceed the maximum amount that is permitted under the 1940 Act. The terms of the lending agreement indicate the rate to be the Federal Funds rate plus 0.95% per annum on amounts borrowed. The BNPP NY facility provides secured, uncommitted lines of credit for the Funds where selected Funds assets are pledged against advances made to the respective Fund. Each Fund has granted a security interest in all pledged assets used as collateral to the BNPP NY facility. Each Fund is permitted to borrow up to 33.33% of its total assets for extraordinary or emergency purposes. Additionally, each of the following Funds is permitted to borrow up to 10% of its respective total assets for investment purposes but in no case shall any Fund’s total outstanding borrowings exceed 33.33% of its total assets. Either BNPP NY or the Funds may terminate this agreement upon delivery of written notice. For the year ended October 31, 2015, the average interest rate paid on outstanding borrowings under the line of credit was 1.06%, 1.09%, 1.06% and 1.13% for the International Real Estate Equity Fund, Realty Income & Growth Fund, Emerging Markets Real Estate Fund and Global Infrastructure Fund, respectively. The Funds may also incur interest expense on custody overdraft charges.
| | | | | Realty | | Emerging | | |
| | | International | | Income & | | Markets | | Global |
| | | Real Estate | | Growth | | Real Estate | | Infrastructure |
| | | Equity Fund | | Fund | | Fund | | Fund |
| Total line of credit amount available for investment purposes at October 31, 2015 | | $ | 13,779,666 | | | $ | 11,991,247 | | | | $471,181 | | | | $23,293,978 | |
| Line of credit outstanding at October 31, 2015 | | | 1,182,026 | | | | 3,785,166 | | | | — | | | | — | |
| Line of credit amount unused at October 31, 2015 | | | 12,597,640 | | | | 11,606,081 | | | | 471,181 | | | | 23,293,978 | |
| Average balance outstanding during the period | | | 3,484,082 | | | | 4,167,115 | | | | 4,646 | | | | 438,884 | |
| Maximum balance outstanding during the period | | | 16,613,217 | | | | 8,673,584 | | | | 153,328 | | | | 13,152,468 | |
| Interest expense incurred on line of credit during the period | | | 37,582 | | | | 46,137 | | | | 50 | | | | 5,048 | |
| Interest expense incurred on custody overdrafts during the period | | | — | | | | 9 | | | | — | | | | 236 | |
D. Federal and Other Income Taxes:
It is each Fund’s policy to comply with the Federal income and excise tax requirements of the Internal Revenue Code of 1986 (the “Code”), as amended, applicable to regulated investment companies and to timely distribute all of its investment company taxable income and net realized capital gains to shareholders in accordance with the timing requirements imposed by the Code. Therefore, no Federal income tax provision is required. Capital gains realized on some foreign securities are subject to foreign taxes. Dividends and interest from non-U.S. sources received by the Funds are generally subject to non-U.S. withholding taxes at rates ranging up to 30%. Such capital gains and withholding taxes, which are accrued as applicable, may be reduced or eliminated under the terms of applicable U.S. income tax treaties, and the Funds intend to undertake procedural steps to claim the benefits of such treaties. Where available, the Funds will file refund claims for foreign taxes withheld.
FASB ASC 740-10 Income Taxes – Overall sets forth a minimum threshold for financial statement recognition of the benefit of a tax position taken or expected to be taken in a tax return. Management has analyzed the Funds’ tax positions taken on income tax returns for all open tax years and has concluded that as of October 31, 2015, no provision for income tax is required in the Funds’ financial statements. The Funds’ Federal and state income and Federal excise tax returns for tax years for which the applicable statutes of limitations have not expired are subject to examination by the Internal Revenue Service and state departments of revenue. As of October 31, 2015, open Federal and New York tax years include the tax years ended October 31, 2012 through 2015. Also, the Funds have recognized no interest and penalties related to uncertain tax benefits. The Funds are also not aware of any tax positions for which it is reasonably possible that the total amounts of unrecognized tax benefits will significantly change in the next twelve months.
63
Alpine Mutual Funds
Notes to Financial Statements—Continued
October 31, 2015
E. Distributions to Shareholders:
Each Fund intends to distribute all of its net investment income and net realized capital gains, if any, throughout the year to its shareholders in the form of dividends. Distributions to shareholders are recorded at the close of business on the ex-dividend date.
The amounts of dividends from net investment income and of distributions from net realized gains are determined in accordance with Federal income tax regulations, which may differ from GAAP. These differences are either considered temporary or permanent in nature. To the extent these differences are permanent in nature, such amounts are reclassified within the composition of net assets based on their Federal tax-basis treatment; temporary differences do not require reclassification. In the event dividends and distributions to shareholders exceed net investment income and net realized gains for tax purposes, they are reported as returns of capital.
F. Class Allocations:
Income, expenses (other than class specific expenses) and realized and unrealized gains and losses are allocated among the classes of the Funds based on the relative net assets of each class. Class specific expenses are allocated to the class to which they relate. Currently, class specific expenses are limited to those incurred under the Distribution Plan for Class A shares (See Note 5).
G. Foreign Currency Translation Transactions:
The International Real Estate Equity Fund, Emerging Markets Real Estate Fund and Global Infrastructure Fund may invest without limitation in foreign securities. The Realty Income & Growth Fund may invest up to 35% of its net assets in foreign securities. The books and records of each Fund are maintained in U.S. dollars. Non-U.S. dollar-denominated amounts are translated into U.S. dollars as follows, with the resultant translations gains and losses recorded in the Statements of Operations:
| | i) | fair value of investment securities and other assets and liabilities at the exchange rate on the valuation date, |
| | | |
| | ii) | purchases and sales of investment securities, income and expenses at the exchange rate prevailing on the respective date of such transactions. |
H. Risks Associated with Foreign Securities and Currencies:
Investments in securities of foreign issuers carry certain risks not ordinarily associated with investments in securities of domestic issuers. Such risks include future political and economic developments and the possible imposition of exchange controls or other foreign governmental laws and restrictions. In addition, with respect to certain countries, there is a possibility of expropriation of assets, confiscatory taxation, political or social instability or diplomatic developments, which could adversely affect investments in those countries. Generally, when the U.S. dollar rises in value against a foreign currency, the Funds’ investments denominated in that currency will lose value because that currency is worth fewer U.S. dollars; the opposite effect occurs if the U.S. dollar falls in relative value.
Certain countries may also impose substantial restrictions on investments in their capital markets by foreign entities, including restrictions on investments in issuers or industries deemed sensitive to relevant national interests. These factors may limit the investment opportunities available to the Funds or result in a lack of liquidity and high price volatility with respect to securities of issuers from developing countries.
I. Equity-Linked Structured Notes:
The Funds may invest in equity-linked structured notes. Equity-linked structured notes are securities which are specially designed to combine the characteristics of one or more underlying securities and their equity derivatives in a single note form. The return and/or yield or income component may be based on the performance of the underlying equity securities, and equity index, and/or option positions. Equity-linked structured notes are typically offered in limited transactions by financial institutions in either registered or non-registered form. An investment in equity-linked structured notes creates exposure to the credit risk of the issuing financial institution, as well as to the market risk of the underlying securities. There is no guaranteed return of principal with these securities and the appreciation potential of these securities may be limited by a maximum payment or call right. In certain cases, equity-linked structured notes may be more volatile and less liquid than less complex securities or other types of fixed-income securities. Such securities may exhibit price behavior that does not correlate with other fixed income securities. International Real Estate Equity Fund, Emerging Markets Real Estate Fund and Global Infrastructure Fund held four, nine and one equity-linked structured notes, respectively, as of October 31, 2015.
64
Alpine Mutual Funds
Notes to Financial Statements—Continued
October 31, 2015
J. Forward Currency Contracts:
The Funds are subject to foreign currency exchange rate risk in the normal course of pursuing their investment objectives. The Funds may use forward currency contracts to gain exposure to or economically hedge against changes in the value of foreign currencies. A forward currency contract (“forward”) is an agreement between two parties to buy and sell a currency at a set price on a future date. The market value of the forward contract fluctuates with changes in forward currency exchange rates. The forward contract is marked-to-market daily and the change in market value is recorded by each Fund as unrealized appreciation or depreciation. When the forward contract is closed, a Fund records a realized gain or loss equal to the fluctuation in value during the period the forward contract was open. A Fund could be exposed to risk if a counterparty is unable to meet the terms of a forward or if the value of the currency changes unfavorably. The Funds’ forward contracts are not subject to a master netting agreement or similar agreement. During the year ended October 31, 2015, the International Real Estate Equity Fund, Emerging Markets Real Estate Fund and Global Infrastructure Fund entered into nine, five and nine forward contracts, respectively. The average monthly principal amount for forward contracts held by the International Real Estate Equity Fund, Emerging Markets Real Estate Fund and Global Infrastructure Fund throughout the period was $28,069,518, $59,709 and $20,081,828, respectively. This is based on amounts held as of each month-end throughout the fiscal year.
The following forward currency contracts were held as of October 31, 2015:
International Real Estate Equity Fund
| | | | | | | | | | | | | | | Unrealized | |
| | | | | Settlement | | | | Settlement | | | Current | | | Appreciation/ | |
| Description | | Counterparty | | Date | | Currency | | Value | | | Value | | | (Depreciation) | |
| Contracts Sold: | | | | | | | | | | | | | | | | | |
| Euro | | State Street Bank and Trust Company | | 12/16/15 | | 7,400,000 EUR | | $ | 8,351,048 | | | $ | 8,142,970 | | | $ | 208,078 | |
| British Pound | | State Street Bank and Trust Company | | 12/16/15 | | 7,700,000 GBP | | | 12,068,980 | | | | 11,867,971 | | | | 201,009 | |
| Japanese Yen | | State Street Bank and Trust Company | | 12/16/15 | | 1,310,000,000 JPY | | | 10,605,742 | | | | 10,863,178 | | | | (257,436 | ) |
| | | | | | | | | | | | | $ | 30,874,119 | | | $ | 151,651 | |
Global Infrastructure Fund
| | | | | | | | | | | | | | | Unrealized | |
| | | | | Settlement | | | | Settlement | | | Current | | | Appreciation/ | |
| Description | | Counterparty | | Date | | Currency | | Value | | | Value | | | (Depreciation) | |
| Contracts Purchased: | | | | | | | | | | | | | | | | |
| British Pound | | State Street Bank and Trust Company | | 12/16/15 | | 1,275,000 GBP | | $ | 1,967,822 | | | $ | 1,965,151 | | | $ | (2,671 | ) |
| Japanese Yen | | State Street Bank and Trust Company | | 12/16/15 | | 560,000,000 JPY | | | 4,674,496 | | | | 4,643,801 | | | | (30,695 | ) |
| | | | | | | | | | | | | $ | 6,608,952 | | | $ | (33,366 | ) |
| | | | | | | | | | | | | | | | | | | |
| Contracts Sold: | | | | | | | | | | | | | | | | | |
| Euro | | State Street Bank and Trust Company | | 12/16/15 | | 1,950,000 EUR | | $ | 2,200,614 | | | $ | 2,145,783 | | | $ | 54,831 | |
| Euro | | State Street Bank and Trust Company | | 12/09/15 | | 17,000,000 EUR | | | 19,088,705 | | | | 18,703,701 | | | | 385,004 | |
| British Pound | | State Street Bank and Trust Company | | 12/16/15 | | 1,275,000 GBP | | | 1,998,435 | | | | 1,965,151 | | | | 33,284 | |
| Japanese Yen | | State Street Bank and Trust Company | | 12/16/15 | | 560,000,000 JPY | | | 4,533,752 | | | | 4,643,801 | | | | (110,049 | ) |
| | | | | | | | | | | | | $ | 27,458,436 | | | $ | 363,070 | |
65
Alpine Mutual Funds
Notes to Financial Statements—Continued
October 31, 2015
K. Derivative Instruments:
The following tables provide information about the effect of derivatives on the Funds’ Statements of Assets and Liabilities and Statements of Operations as of and for the year ended October 31, 2015. The first table provides additional detail about the amounts and sources of unrealized appreciation/(depreciation) on derivatives at the end of the period. The second table provides additional information about the amounts and sources of net realized gain/(loss) and the change in net unrealized appreciation/(depreciation) resulting from the Funds’ derivatives during the year.
The effect of derivative instruments in the Statements of Assets and Liabilities as of October 31, 2015:
International Real Estate Equity Fund
| | | Statements of Assets | | Unrealized |
| Derivatives | | and Liabilities Location | | Appreciation/(Depreciation) |
| | | | | |
| Foreign exchange risk | | Unrealized appreciation on forward currency contracts | | | $ | 409,087 | |
| | | | | | | | |
| Foreign exchange risk | | Unrealized depreciation on forward currency contracts | | | | (257,436 | ) |
| | | | | | $ | 151,651 | |
| | | | | | | | |
| Global Infrastructure Fund | | | | | |
| | | | | |
| | | Statements of Assets | | Unrealized |
| Derivatives | | and Liabilities Location | | Appreciation/(Depreciation) |
| | | | | |
| Foreign exchange risk | | Unrealized appreciation on forward currency contracts | | | $ | 473,119 | |
| | | | | | | | |
| Foreign exchange risk | | Unrealized depreciation on forward currency contracts | | | | (143,415 | ) |
| | | | | | $ | 329,704 | |
The effect of derivative instruments in the Statements of Operations for the year ended October 31, 2015:
International Real Estate Equity Fund
| | | Statements of | | | | | Change in Net |
| Derivatives | | Operations Location | | Net Realized Gain | | | Unrealized Depreciation |
| | | | | | | | | |
| Foreign exchange risk | | Net realized gain/(loss) from foreign currency transactions | | | $824,772 | | | |
| | | | | | | | | |
| | | Change in net unrealized appreciation/(depreciation) on foreign currency translations | | | | | | $(1,061,126) |
| | | | | | | | | |
| Emerging Markets Real Estate Fund | | | | | | |
| | | | | | | |
| | | Statements of | | | | | | Change in Net |
| Derivatives | | Operations Location | | Net Realized Gain | | | Unrealized Appreciation |
| | | | | | | | | |
| Foreign exchange risk | | Net realized gain/(loss) from foreign currency transactions | | | $ 6,225 | | | |
| | | | | | | | | |
| | | Change in net unrealized appreciation/(depreciation) on foreign currency translations | | | | | | $— |
66
Alpine Mutual Funds
Notes to Financial Statements—Continued
October 31, 2015
Global Infrastructure Fund
| | | Statements of | | | | | Change in Net |
| Derivatives | | Operations Location | | Net Realized Gain | | | Unrealized Depreciation |
| | | | | | | | | |
| Foreign exchange risk | | Net realized gain/(loss) from foreign currency transactions | | | $3,471,864 | | | |
| | | | | | | | | |
| | | Change in net unrealized appreciation/(depreciation) on foreign currency translations | | | | | | $(1,158,672) |
L. Redemption Fees:
The Funds of the Alpine Equity Trust impose a redemption fee of 1% of the total redemption amount on all Fund shares redeemed or exchanged within 60 days of buying them, either by purchase or exchange. This fee is assessed and retained by the Funds for the benefit of the remaining shareholders. The redemption fee is accounted for as an increase to paid-in-capital.
| 3. | Capital Share Transactions: |
The Funds have an unlimited number of shares of beneficial interest, with $0.0001 par value, authorized. Transactions in shares and dollars of the Funds were as follows:
International Real Estate Equity Fund
| | | Year Ended | | | Year Ended | |
| | | October 31, 2015 | | | October 31, 2014 | |
| | | Shares | | | Amount | | | Shares | | | Amount | |
| Institutional Class | | | | | | | | | | | | | | | | |
| Shares sold | | | 53,473 | | | $ | 1,198,922 | | | | 129,030 | | | $ | 3,001,722 | |
| Shares issued in reinvestment of dividends | | | — | | | | — | | | | 15,832 | | | | 366,356 | |
| Redemption fees | | | — | | | | 406 | | | | — | | | | 1,764 | |
| Shares redeemed | | | (1,265,361 | ) | | | (28,620,909 | ) | | | (1,701,229 | ) | | | (39,848,948 | ) |
| Total net change | | | (1,211,888 | ) | | $ | (27,421,581 | ) | | | (1,556,367 | ) | | $ | (36,479,106 | ) |
| Class A | | | | | | | | | | | | | | | | |
| Shares sold | | | 206 | | | $ | 4,598 | | | | 27 | | | $ | 649 | |
| Shares issued in reinvestment of dividends | | | — | | | | — | | | | — | | | | — | |
| Redemption fees | | | — | | | | — | | | | — | | | | — | |
| Shares redeemed | | | (311 | ) | | | (7,425 | ) | | | — | | | | — | |
| Total net change | | | (105 | ) | | $ | (2,827 | ) | | | 27 | | | $ | 649 | |
67
Alpine Mutual Funds
Notes to Financial Statements—Continued
October 31, 2015
Realty Income & Growth Fund
| | | Year Ended | | | Year Ended | |
| | | October 31, 2015 | | | October 31, 2014 | |
| | | Shares | | | Amount | | | Shares | | | Amount | |
| Institutional Class | | | | | | | | | | | | | | | | |
| Shares sold | | | 371,174 | | | $ | 8,214,277 | | | | 470,247 | | | $ | 9,049,768 | |
| Shares issued in reinvestment of dividends | | | 158,946 | | | | 3,423,333 | | | | 188,120 | | | | 3,551,116 | |
| Redemption fees | | | — | | | | 1,778 | | | | — | | | | 6,834 | |
| Shares redeemed | | | (703,966 | ) | | | (15,694,022 | ) | | | (787,237 | ) | | | (14,956,430 | ) |
| Total net change | | | (173,846 | ) | | $ | (4,054,634 | ) | | | (128,870 | ) | | $ | (2,348,712 | ) |
| Class A | | | | | | | | | | | | | | | | |
| Shares sold | | | 21,367 | | | $ | 488,015 | | | | 60,631 | | | $ | 1,097,274 | |
| Shares issued in reinvestment of dividends | | | 3,756 | | | | 80,757 | | | | 4,128 | | | | 78,041 | |
| Redemption fees | | | — | | | | 45 | | | | — | | | | 148 | |
| Shares redeemed | | | (8,556 | ) | | | (186,002 | ) | | | (14,316 | ) | | | (291,468 | ) |
| Total net change | | | 16,567 | | | $ | 382,815 | | | | 50,443 | | | $ | 883,995 | |
| | | | | | | | | | | | | | | | | |
| Emerging Markets Real Estate Fund | | | | | | | | | | | | | | | | |
| | | Year Ended | | | Year Ended | |
| | | October 31, 2015 | | | October 31, 2014 | |
| | | Shares | | | Amount | | | Shares | | | Amount | |
| Institutional Class | | | | | | | | | | | | | | | | |
| Shares sold | | | 23,257 | | | $ | 384,088 | | | | 77,503 | | | $ | 1,256,776 | |
| Shares issued in reinvestment of dividends | | | 10,277 | | | | 164,328 | | | | 10,210 | | | | 157,788 | |
| Redemption fees | | | — | | | | 37 | | | | — | | | | 8,873 | |
| Shares redeemed | | | (48,495 | ) | | | (786,485 | ) | | | (300,530 | ) | | | (4,765,455 | ) |
| Total net change | | | (14,961 | ) | | $ | (238,032 | ) | | | (212,817 | ) | | $ | (3,342,018 | ) |
| Class A | | | | | | | | | | | | | | | | |
| Shares sold | | | 6,268 | | | $ | 102,686 | | | | 14,160 | | | $ | 228,852 | |
| Shares issued in reinvestment of dividends | | | 1,594 | | | | 25,465 | | | | 837 | | | | 12,941 | |
| Redemption fees | | | — | | | | 5 | | | | — | | | | 785 | |
| Shares redeemed | | | (25,576 | ) | | | (411,759 | ) | | | (10,339 | ) | | | (172,443 | ) |
| Total net change | | | (17,714 | ) | | $ | (283,603 | ) | | | 4,658 | | | $ | 70,135 | |
68
Alpine Mutual Funds
Notes to Financial Statements—Continued
October 31, 2015
Global Infrastructure Fund
| | | Year Ended | | | Year Ended | |
| | | October 31, 2015 | | | October 31, 2014 | |
| | | Shares | | | Amount | | | Shares | | | Amount | |
| Institutional Class | | | | | | | | | | | | | | | | |
| Shares sold | | | 4,576,136 | | | $ | 90,037,024 | | | | 4,515,044 | | | $ | 88,313,233 | |
| Proceeds from shares issued in connection with the tax-free transfer of assets from Alpine Cyclical Advantage Property Fund (Note 10) | | | 3,005,684 | | | | 53,861,934 | | | | — | | | | — | |
| Shares issued in reinvestment of dividends | | | 295,985 | | | | 5,582,396 | | | | 264,123 | | | | 5,139,124 | |
| Redemption fees | | | — | | | | 26,103 | | | | — | | | | 12,604 | |
| Shares redeemed | | | (5,381,408 | ) | | | (101,670,374 | ) | | | (2,058,798 | ) | | | (39,830,494 | ) |
| Total net change | | | 2,496,397 | | | $ | 47,837,083 | | | | 2,720,369 | | | $ | 53,634,467 | |
| Class A | | | | | | | | | | | | | | | | |
| Shares sold | | | 286,451 | | | $ | 5,537,863 | | | | 479,034 | | | $ | 9,492,365 | |
| Shares issued in reinvestment of dividends | | | 47,620 | | | | 897,458 | | | | 48,609 | | | | 942,300 | |
| Redemption fees | | | — | | | | 3,399 | | | | — | | | | 1,896 | |
| Shares redeemed | | | (448,870 | ) | | | (8,547,852 | ) | | | (212,481 | ) | | | (4,239,962 | ) |
| Total net change | | | (114,799 | ) | | $ | (2,109,132 | ) | | | 315,162 | | | $ | 6,196,599 | |
| 4. | Purchases and Sales of Securities: |
Purchases and sales of securities (excluding short-term securities) for the year ended October 31, 2015 are as follows:
| | | Purchases | | | Sales | |
| International Real Estate Equity Fund | | $ | 41,088,682 | | | $ | 77,573,365 | |
| Realty Income & Growth Fund | | | 38,360,019 | | | | 42,570,781 | |
| Emerging Markets Real Estate Fund | | | 4,042,570 | | | | 4,935,106 | |
| Global Infrastructure Fund | | | 239,663,085 | | | | 239,662,738 | |
The Funds did not have purchases and sales of U.S. Government Obligations during the year ended October 31, 2015.
Quasar Distributors, LLC (“Quasar”) serves as each Fund’s distributor. Each of the Funds has adopted a distribution and servicing plan (the “Plan”) for their Class A shares as allowed by Rule 12b-1 under the 1940 Act. The Plan authorizes payments by the Funds in connection with the distribution and servicing of their Class A shares at an annual rate, as determined from time to time by the Board, of up to 0.25% of the average daily net assets of the Class A shares of the Funds. Amounts paid under the Plan by the Funds may be spent by the Funds on any activities or expenses primarily intended to result in the sale of Class A shares of the Funds, including but not limited to advertising, compensation for sales and marketing activities of financial institutions and others such as dealers and distributors, shareholder account servicing, the printing and mailing of prospectuses to other than current shareholders and the printing and mailing of sales literature. International Real Estate Equity Fund, Realty Income & Growth Fund, Emerging Markets Real Estate Fund and Global Infrastructure Fund incurred $336, $7,044, $1,475 and $63,897, respectively, pursuant to the Plan for the year ended October 31, 2015.
The Plan for the Funds may be terminated at any time by a majority vote of the members of the Board of the Equity Trust who are not “interested persons,” as defined by the 1940 Act, or by vote of a majority of the outstanding voting shares of the respective Fund.
69
Alpine Mutual Funds
Notes to Financial Statements—Continued
October 31, 2015
| 6. | Investment Advisory Agreement, Administration Agreement and Other Affiliated Transactions: |
The Adviser provides investment advisory services to each of the Funds. Pursuant to the advisory agreement with the Realty Income & Growth Fund and Global Infrastructure Fund the Adviser is entitled to an annual fee based on the Funds’ average daily net assets, in accordance with the following schedule:
| First $750 million | 1.00% |
| Next $250 million | 0.90% |
| Over $1 billion | 0.80% |
The Adviser is entitled to an annual fee based on 1.00% of each Fund’s average daily net assets for the International Real Estate Equity Fund and Emerging Markets Real Estate Fund.
The Adviser agreed to reimburse the Realty Income & Growth Fund, Emerging Markets Real Estate Fund and Global Infrastructure Fund (until October 23, 2015) to the extent necessary to ensure that ordinary operating expenses (including 12b-1 fees, where applicable, but excluding interest, brokerage commissions, acquired fund fees and extraordinary expenses) do not exceed annually 1.60%, of the respective Fund’s Class A shares average daily net assets, and 1.35% of the respective Fund’s Institutional Class shares average daily net assets. Effective October 23, 2015 the advisor agreed to reimburse the Global Infrastructure Fund to the extent necessary to ensure that ordinary operating expenses (including 12b-1 fees, where applicable, but excluding interest, broker commissions, acquired fund fees and extraordinary expenses) do not exceed annually 1.45% of the average daily net assets of Class A shares and 1.20% of the average daily net assets of the Institutional Class shares. The Adviser may recover expenses paid in excess of the cap on expenses for the three previous years, as long as the recovery does not cause the Funds to exceed such cap on expenses. For the year ended October 31, 2015, the Adviser waived investment advisory fees and other expenses totaling $87,769 and $43,020 for the Emerging Markets Real Estate Fund and Global Infrastructure Fund, respectively. The expense limitations will remain in effect for the Funds through March 1, 2016 (March 1, 2017 for Global Infrastructure Fund) unless and until the Board of the Equity Trust approves their modification or termination with respect to the Funds. Waived expenses subject to potential recovery by year of expiration are as follows:
| | | Realty Income & | | Emerging Markets | | Global |
| Years of Expiration | | Growth Fund | | Real Estate Fund | | Infrastructure Fund |
| 10/31/2016 | | $69,202 | | | $76,551 | | | $ — | |
| 10/31/2017 | | 55,466 | | | 64,614 | | | — | |
| 10/31/2018 | | — | | | 87,769 | | | 43,020 | |
The Adviser makes payments to intermediaries that provide omnibus account services, sub-accounting services and/or networking services with respect to the Funds. On February 2, 2012, the Board approved, subject to certain limitations, the reimbursement to the Adviser by the appropriate Fund, of up to a certain percentage of such fees paid by the Adviser to intermediaries that provide omnibus account services, sub-accounting services, and/or networking services. Reimbursement of these fees are subject to review by the Board and are included in the transfer agent fees in the Statements of Operations. The International Real Estate Fund, Realty Income & Growth Fund, Emerging Markets Real Estate Fund and Global Infrastructure Fund incurred $138,351, $105,833, $2,851 and $85,077, respectively, in reimbursements to the Adviser.
State Street Bank and Trust Company (“SSBT”) serves as the fund accounting agent and custodian. The custodian is responsible for the safekeeping of the assets of the Funds and the fund accounting agent is responsible for calculating the Funds’ NAVs. SSBT, as the Funds’ custodian and fund accounting agent, is paid on the basis of net assets and transaction costs of the Funds. SSBT also serves as the administrator for the Equity Trust. SSBT, as the Funds’ administrator, is paid on the basis of net assets of the Funds which are allocated among the series of the Equity Trust, on the basis of relative net assets.
Boston Financial Data Services, Inc. (“BFDS”) serves as the transfer agent to the Equity Trust. BFDS is paid on the basis of net assets, per account fees and certain transaction costs.
During the year ended October 31, 2015, the Funds engaged in purchase and sale transactions with funds that have a common investment adviser (or affiliated investment advisers), common Directors/Trustees and/or common Officers. These purchase and sale transactions complied with Rule 17a-7 under the 1940 Act and were as follows:
70
Alpine Mutual Funds
Notes to Financial Statements—Continued
October 31, 2015
| | | Purchases | | | Sales | |
| International Real Estate Equity Fund | | $ | 431,120 | | | $ | — | |
| Global Infrastructure Fund | | $ | — | | | $ | 1,094,246 | |
| 7. | Transactions with Affiliates: |
The following issuers are affiliated with the International Real Estate Equity Fund; that is, the Fund held 5% or more of the outstanding voting securities during the year ended October 31, 2015. As defined in Section (2)(a)(3) of the Investment Company Act of 1940, such issuers are:
| | | Shares at | | | | | | Shares at | | Value at | | Realized | | Dividend |
| Issuer Name | | October 31, 2014 | | Purchases | | Sales | | October 31, 2015 | | October 31, 2015 | | Loss | | Income |
| | | | | | | | | | | | | | | |
| Yatra Capital Ltd.* | | 5,090,232 | | — | | (5,081,277) | | 8,955 | | $54,259 | | $(9,734,629) | | $— |
* This security was not affiliated at October 31, 2015.
The Funds invest a substantial amount of their assets in the equity securities of issuers engaged in the real estate industry, including real estate investment trusts (REITs). As a result, the Funds may be more affected by economic developments in the real estate industry than would a general equity fund.
| 9. | Federal Income Tax Information: |
GAAP requires that certain components of net assets be reclassified to reflect permanent differences between financial and tax reporting. These reclassifications have no effect on net assets or net asset values per share of the Funds.
As of October 31, 2015, the components of distributable earnings on a tax basis were as follows:
| | | | | | | | | | | | Global |
| | | International Real | | | Realty Income & | | Emerging Markets | | Infrastructure |
| | | Estate Equity Fund | | | Growth Fund | | Real Estate Fund | | Fund |
| Undistributed ordinary income | | $ | 8,432,627 | | | $ | — | | | $ | 86,441 | | | $ | — | |
| Undistributed capital gains | | | — | | | | 848,562 | | | | — | | | | — | |
| Accumulated capital loss | | | (1,104,089,927 | ) | | | — | | | | (993,237 | ) | | | (6,709,792 | ) |
| Unrealized appreciation/(depreciation) | | | (42,882,776 | ) | | | 53,891,713 | | | | (399,381 | ) | | | (3,836,802 | ) |
| Total | | $ | (1,138,540,076 | ) | | $ | 54,740,275 | | | $ | (1,306,177 | ) | | $ | (10,546,594 | ) |
Tax components of distributable earnings are determined in accordance with income tax regulations which may differ from the composition of net assets reported under GAAP. These permanent differences are primarily due to the differing treatment of gains (losses) related to foreign currency transactions, basis adjustments on certain equity securities designated as passive foreign investment companies, acquired capital loss carryforwards, and distribution redesignations. Accordingly, for the year ended October 31, 2015, the effects of certain differences were reclassified as follows:
| | | | | | Accumulated | | Accumulated |
| | | | | | net investment | | net realized |
| Fund | | Capital stock | | | income (loss) | | gains / (losses) |
| International Real Estate Equity Fund | | $ | (6,353 | ) | | $ | (187,304 | ) | | $ | 193,657 | |
| Realty Income & Growth Fund | | | 434,429 | | | | 74,179 | | | | (508,608 | ) |
| Emerging Markets Real Estate Fund | | | — | | | | 9,048 | | | | (9,048 | ) |
| Global Infrastructure Fund | | | 3,081,965 | | | | (58,349 | ) | | | (3,023,616 | ) |
71
Alpine Mutual Funds
Notes to Financial Statements—Continued
October 31, 2015
As of October 31, 2015, net unrealized appreciation/(depreciation) of investments, excluding foreign currency, based on Federal tax costs was as follows:
| | | Cost of | | Gross unrealized | | Gross unrealized | | Net unrealized
appreciation/ |
| Fund | | investments | | appreciation | | depreciation | | (depreciation) |
| International Real Estate Equity Fund | | $ | 165,063,488 | | | $ | 23,977,089 | | | $ | (66,850,184 | ) | | $ | (42,873,095 | ) |
| Realty Income & Growth Fund | | | 63,729,159 | | | | 53,957,797 | | | | (65,698 | ) | | | 53,892,099 | |
| Emerging Markets Real Estate Fund | | | 4,915,782 | | | | 317,598 | | | | (716,597 | ) | | | (398,999 | ) |
| Global Infrastructure Fund | | | 219,947,574 | | | | 19,315,882 | | | | (23,117,916 | ) | | | (3,802,034 | ) |
The tax basis of investments for tax and financial reporting purposes differs principally due to the deferral of losses on wash sales, partnership tax adjustments, and mark-to-market cost basis adjustments for investments in passive foreign investment companies (PFICs) for tax purposes.
The tax character of distributions paid during the years ended October 31, 2015 and 2014 were as follows:
| | | 2015 | | | 2014 | |
| International Real Estate Equity Fund | | | | |
| Ordinary income | | $ | — | | | $ | 399,726 | |
| Total | | $ | — | | | $ | 399,726 | |
| Realty Income & Growth Fund | | | | | | | | |
| Ordinary income | | $ | 2,537,082 | | | $ | 2,704,813 | |
| Long-term capital gain | | | 1,427,783 | | | | 1,373,820 | |
| Total | | $ | 3,964,865 | | | $ | 4,078,633 | |
| Emerging Markets Real Estate Fund | | | | | | | | |
| Ordinary income | | $ | 216,837 | | | $ | 111,075 | |
| Long-term capital gain | | | — | | | | 62,936 | |
| Total | | $ | 216,837 | | | $ | 174,011 | |
| Global Infrastructure Fund | | | | | | | | |
| Ordinary income | | $ | 9,121,877 | | | $ | 7,831,945 | |
| Long-term capital gain | | | 602,585 | | | | 1,571,109 | |
| Return of capital | | $ | 467,529 | | | | — | |
| Total | | $ | 10,191,991 | | | $ | 9,403,054 | |
Capital loss carryovers as of October 31, 2015 are as follows:
| | | International Real | | Realty Income & |
| Expiration Date | | Estate Equity Fund | | Growth Fund |
| 10/31/2016 | | $ | 384,892,332 | | | | $— | |
| 10/31/2017 | | $ | 546,087,879 | | | | $— | |
| 10/31/2018 | | $ | 65,121,028 | | | | $— | |
| 10/31/2019 | | $ | 63,938,162 | | | | $— | |
| | | | | | | | | |
| | | | | | | Global |
| | | Emerging Markets | | Infrastructure |
| Expiration Date | | Real Estate Fund | | Fund* |
| 10/31/2016 | | $ | — | | | $ | — | |
| 10/31/2017 | | $ | — | | | $ | 3,075,266 | |
| 10/31/2018 | | $ | — | | | $ | — | |
| 10/31/2019 | | $ | — | | | $ | — | |
| * | Global Infrastructure Fund acquired $35,024,596 of capital losses from Cyclical Advantage Property Fund due to the reorganization on October 23, 2015. $31,949,330 has been written off due to IRS Section 382 limitations. |
72
Alpine Mutual Funds
Notes to Financial Statements—Continued
October 31, 2015
Under the Regulated Investment Company (“RIC”) Modernization Act of 2010 (“the Modernization Act”), post-enactment capital losses that are carried forward will retain their character as either short-term or long-term capital losses rather than being considered all short-term as under previous law. However, any losses incurred during those future taxable years will be required to be utilized prior to the losses incurred in pre-enactment taxable years, which carry an expiration date. As a result of this ordering rule, pre-enactment capital loss carryovers may be more likely to expire unused. Capital loss carryover as of October 31, 2015 with no expiration are as follows:
| Fund | | Short-Term | | Long-Term |
| International Real Estate Equity Fund | | $ | 2,464,698 | | | $ | 41,585,828 | |
| Emerging Markets Real Estate Fund | | $ | 930,364 | | | $ | 62,873 | |
| Global Infrastructure Fund | | $ | 3,634,526 | | | $ | — | |
At a meeting held on July 31, 2015, the Board, unanimously approved the tax free reorganization of the Alpine Cyclical Advantage Properties Fund (the “Target Fund”) into the Alpine Global Infrastructure Fund (the “Acquiring Fund”), a separate series of the Trust. On October 23, 2015, the Acquiring Fund acquired all of the net assets of the Target Fund in a tax-free exchange of shares pursuant to an Agreement and Plan of Reorganization approved by the Target Fund shareholders. The purpose of the transaction was to combine two portfolios with comparable investment objectives and strategies.
| | | | | Shares Issued by | | |
| | | Shares Prior to | | the Acquiring | | Net Assets Prior |
| Target Fund | | Reorganization | | Fund | | to Reorganization |
| Institutional Class | | 2,261,459 | | 3,005,684 | | $53,861,934 |
The depreciation of the Target Fund was $5,172,667 as of the date of the reorganization. The combined net assets of the Acquiring Fund immediately after the reorganization were $243,281,168.
Assuming the acquisition had been completed on November 1, 2014, the beginning of the reporting period of the Acquiring Fund, the Acquiring Fund’s pro forma results of operations for the period ended October 31, 2015, were as follows:
| Net Investment Income (Loss) | | $ | 9,750,384 | |
| Net Realized and Unrealized Losses on Investments and Foreign Currency Transactions | | $ | (30,040,529 | ) |
| Net Decrease in Net Assets resulting from Operations | | $ | (20,290,145 | ) |
Because the combined investment portfolios have been managed as a single integrated portfolio since the reorganization was completed, it is not practicable to separate the amounts of revenue and earnings of the Target Fund that has been included in the Acquiring Fund’s Statement of Operations as of October 31, 2015.
73
Alpine Mutual Funds
Report of Independent Registered Public Accounting Firm
To the Shareholders and Board of Trustees of
Alpine Equity Trust:
We have audited the accompanying statements of assets and liabilities, including the schedules of portfolio investments, of Alpine Equity Trust, (comprising, respectively, Alpine International Real Estate Equity Fund, Alpine Income & Growth Fund, Alpine Emerging Markets Real Estate Fund and Alpine Global Infrastructure Fund) (collectively the “Funds”) as of October 31, 2015, and the related statements of operations, changes in net assets and the financial highlights for the year then ended. These financial statements and financial highlights are the responsibility of the Funds’ management. Our responsibility is to express an opinion on these financial statements and financial highlights based on our audits. The statement of changes in net assets for the year ended October 31, 2014 and the financial highlights for the periods ended prior to November 1, 2014 were audited by another independent registered public accounting firm whose report, dated December 29, 2014, expressed an unqualified opinion on those financial statements and financial highlights.
We conducted our audits in accordance with the standards of the Public Company Accounting Oversight Board (United States). Those standards require that we plan and perform the audit to obtain reasonable assurance about whether the financial statements and financial highlights are free of material misstatement. We were not engaged to perform an audit of the Funds’ internal control over financial reporting. Our audits included consideration of internal control over financial reporting as a basis for designing audit procedures that are appropriate in the circumstances, but not for the purpose of expressing an opinion on the effectiveness of the Funds’ internal control over financial reporting. Accordingly, we express no such opinion. An audit also includes examining, on a test basis, evidence supporting the amounts and disclosures in the financial statements and financial highlights, assessing the accounting principles used and significant estimates made by management, and evaluating the overall financial statement presentation. Our procedures included confirmation of securities owned as of October 31, 2015, by correspondence with the custodian and others or by other appropriate auditing procedures where replies from others were not received. We believe that our audits provide a reasonable basis for our opinion.
In our opinion, the financial statements and financial highlights referred to above present fairly, in all material respects, the financial position of each of the respective portfolios constituting Alpine Equity Trust at October 31, 2015, the results of their operations, changes in their net assets and the financial highlights for the year then ended in conformity with U.S. generally accepted accounting principles.

New York, NY
December 24, 2015
74
Alpine Mutual Funds
Information about your Funds’ Expenses
October 31, 2015
Fund expenses (Unaudited)
Example
As a shareholder of the Fund, you may incur two types of costs: (1) transaction costs, including front-end on purchase payments; and (2) ongoing costs, including management fees; service and/or distribution (12b-1) fees; and other Fund expenses. This example is intended to help you understand your ongoing costs (in dollars) of investing in the Fund and to compare these costs with the ongoing costs of investing in other mutual funds. This example is based on an investment of $1,000 invested on May 1, 2015 and held for the six months ended October 31, 2015.
Actual Expenses
The table below titled “Based on Actual Total Return” provides information about actual account values and actual expenses. You may use the information provided in this table, together with the amount you invested, to estimate the expenses that you paid over the period. To estimate the expenses you paid on your account, divide your ending account value by $1,000 (for example, an $8,600 ending account value divided by $1,000 = 8.6), then multiply the result by the number under the heading entitled “Expenses Paid During the Period”.
Hypothetical Example for Comparison Purposes
The table below titled “Based on Hypothetical Total Return” provides information about hypothetical account values and hypothetical expenses based on the actual expense ratio and an assumed rate of return of 5.00% per year before expenses, which is not the Fund’s actual return. The hypothetical account values and expenses may not be used to estimate the actual ending account balance or expenses you paid for the period. You may use the information provided in this table to compare the ongoing costs of investing in the Fund and other funds. To do so, compare the 5.00% hypothetical example relating to the Fund with the 5.00% hypothetical examples that appear in the shareholder reports of the other funds.
Please note that the expenses shown in the table below are meant to highlight your ongoing costs only and do not reflect any transactional costs, such as front-end or back-end sales charges (loads). Therefore, the table is useful in comparing ongoing costs only, and will not help you determine the relative total costs of owning different funds. In addition, if these transaction costs were included, your costs would have been higher.
International Real Estate Equity Fund
Based on actual total return(1)
| Class | | Actual Total
Return Without
Sales Charges (2) | | Beginning
Account Value | | Ending
Account Value | | Annualized
Expense
Ratio | | Expenses
Paid During
the Period (3) |
| | | | | | | | | | | |
| Institutional | | (6.56)% | | $1,000.00 | | $934.40 | | | 1.27 | % | | | $6.19 | |
| | | | | | | | | | | | | | | | | | | | | |
| Class A | | (6.68)% | | $1,000.00 | | $933.20 | | | 1.53 | % | | | $7.46 | |
Based on hypothetical total return(1)
| Class | | Hypothetical
Annualized
Total Return | | Beginning
Account Value | | Ending
Account Value | | Annualized
Expense
Ratio | | Expenses
Paid During
the Period (4) |
| | | | | | | | | | | |
| Institutional | | (6.56)% | | $1,000.00 | | $934.40 | | | 1.27 | % | | | $6.19 | |
| | | | | | | | | | | | | | | | | | | | | |
| Class A | | (6.68)% | | $1,000.00 | | $933.20 | | | 1.53 | % | | | $7.46 | |
75
Alpine Mutual Funds
Information about your Funds’ Expenses (Unaudited)—Continued
October 31, 2015
Realty Income & Growth Fund
Based on actual total return (1)
| Class | | Actual Total
Return Without
Sales Charges (2) | | Beginning
Account Value | | Ending
Account Value | | Annualized
Expense
Ratio | | Expenses
Paid During
the Period (3) |
| | | | | | | | | | | |
| Institutional | | | 2.43 | % | | | $1,000.00 | | | | $1,024.30 | | | | 1.38 | % | | | $7.04 | |
| | | | | | | | | | | | | | | | | | | | | |
| Class A | | | 2.30 | % | | | $1,000.00 | | | | $1,023.00 | | | | 1.63 | % | | | $8.31 | |
Based on hypothetical total return (1)
| Class | | Hypothetical
Annualized
Total Return | | Beginning
Account Value | | Ending
Account Value | | Annualized
Expense
Ratio | | Expenses
Paid During
the Period (4) |
| | | | | | | | | | | |
| Institutional | | | 5.00 | % | | $ | 1,000.00 | | | $ | 1,018.25 | | | | 1.38 | % | | | $7.02 | |
| | | | | | | | | | | | | | | | | | | | | |
| Class A | | | 5.00 | % | | $ | 1,000.00 | | | $ | 1,016.99 | | | | 1.63 | % | | | $8.29 | |
Emerging Markets Real Estate Fund
Based on actual total return (1)
| Class | | Actual Total
Return Without
Sales Charges (2) | | Beginning
Account Value | | Ending
Account Value | | Annualized
Expense
Ratio | | Expenses
Paid During
the Period (3) |
| | | | | | | | | | | |
| Institutional | | | (17.67 | )% | | $ | 1,000.00 | | | $ | 823.30 | | | | 1.35 | % | | | $6.20 | |
| | | | | | | | | | | | | | | | | | | | | |
| Class A | | | (17.80 | )% | | $ | 1,000.00 | | | $ | 822.00 | | | | 1.60 | % | | | $7.35 | |
Based on hypothetical total return (1)
| Class | | Hypothetical
Annualized
Total Return | | Beginning
Account Value | | Ending
Account Value | | Annualized
Expense
Ratio | | Expenses
Paid During
the Period (4) |
| | | | | | | | | | | |
| Institutional | | | 5.00 | % | | $ | 1,000.00 | | | $ | 1,018.40 | | | | 1.35 | % | | | $6.87 | |
| | | | | | | | | | | | | | | | | | | | | |
| Class A | | | 5.00 | % | | $ | 1,000.00 | | | $ | 1,017.14 | | | | 1.60 | % | | | $8.13 | |
Global Infrastructure Fund
Based on actual total return (1)
| Class | | Actual Total
Return Without
Sales Charges (2) | | Beginning
Account Value | | Ending
Account Value | | Annualized
Expense
Ratio | | Expenses
Paid During
the Period (3) |
| | | | | | | | | | | |
| Institutional | | | (12.10 | )% | | $ | 1,000.00 | | | $ | 879.00 | | | | 1.34 | % | | | $6.35 | |
| | | | | | | | | | | | | | | | | | | | | |
| Class A | | | (12.24 | )% | | $ | 1,000.00 | | | $ | 877.60 | | | | 1.59 | % | | | $7.52 | |
Based on hypothetical total return (1)
| Class | | Hypothetical
Annualized
Total Return | | Beginning
Account Value | | Ending
Account Value | | Annualized
Expense
Ratio | | Expenses
Paid During
the Period (4) |
| | | | | | | | | | | |
| Institutional | | | 5.00 | % | | $ | 1,000.00 | | | $ | 1,018.45 | | | | 1.34 | % | | | $6.82 | |
| | | | | | | | | | | | | | | | | | | | | |
| Class A | | | 5.00 | % | | $ | 1,000.00 | | | $ | 1,017.19 | | | | 1.59 | % | | | $8.08 | |
| | | | | | | | | | | | | | | | | | | | | |
| (1) | For the six months ended October 31, 2015. |
| (2) | Assumes the reinvestment of all distributions, including returns of capital, if any, at net asset value and does not reflect the deduction of the applicable sales charge. Total return is not annualized, as it may not be representative of the total return for the year. Performance figures may reflect fee waivers and/or expense reimbursements. In the absence of fee waivers and/or expense reimbursements, the total return would have been lower. Past performance is no guarantee of future results. |
| (3) | Expenses (net of fee waivers and/or expense reimbursements) are equal to each class’ respective annualized expense ratio multiplied by the average account value over the period, multiplied by the number of days in the most recent fiscal half-year then divided by 365. |
| (4) | Hypothetical expense examples assume a 5% return over a hypothetical 184 day period. |
76
Alpine Mutual Funds
Additional Information (Unaudited)
October 31, 2015
The Fund’s Statement of Additional Information includes additional information about Trust Trustees and is available, without charge and upon request, by visiting www.alpinefunds.com.
Independent Trustees
The Fund’s Statement of Additional Information includes additional information about Trust Trustees and is available, without charge and upon request, by visiting www.alpinefunds.com.
Name, Address
and Year of Birth | | Position(s)
Held with
the Trusts | | Term of Office
and Length of
Time Served | | Principal Occupation During
Past Five Years | | Number of
Portfolios in
Fund
Complex
Overseen
by Trustee* | | Other Directorships
Held by Trustee |
| H. Guy Leibler (1954) | | Independent Trustee | | Indefinite, since the Trust’s inception | | President, Simone Healthcare development (since 2013); Private investor (since 2007). | | 13 | | Chairman Emeritus, White Plains Hospital Center (1988 to Present); Trustee of each of the Alpine Trusts (1996 to Present).** |
Jeffrey E. Wacksman
(1960) | | Independent Trustee | | Indefinite, since 2004 | | Partner, Loeb, Block & Partners LLP, (law firm) (since 1994). | | 13 | | Director, International Succession Planning Association; Director, Bondi Icebergs Inc. (women’s sports- wear); Director, MH Properties, Inc. (a real estate holding company); Trustee of each of the Alpine Trusts.** |
James A. Jacobson
(1945) | | Independent Trustee | | Indefinite, since 2009 | | Retired, (since 2008); Vice Chairman and Managing Director, Spear Leeds & Kellogg Specialists, LLC (sales and trading firm) (2003 to 2008). | | 13 | | Trustee of Allianz Global Investors Multi-Funds (2009 to Present); Trustee of PIMCO Closed-End Funds (since 2014); Trustee of PIMCO Managed Accounts Trust (since 2014); Trustee of each of the Alpine Trusts.** |
Eleanor T.M. Hoagland
(1951) | | Independent Trustee | | Indefinite, since October 2012 | | Principal, VCS Advisory, LLC (since 2011); Chief Compliance Officer and Senior Managing Director of Magni Asset Management LLC (since 2011) and Park Fifth Capital Management LLC (2011-2013); Vice President (2008 to 2010) and CCO (2009 to 2010), Ameriprise Financial Inc. | | 13 | | Trustee of each of the Alpine Trusts.** |
| * | The term “Fund Complex” refers to the Funds in the Alpine Equity Trust, Alpine Series Trust, Alpine Income Trust, Alpine Global Dynamic Dividend Fund, Alpine Total Dynamic Dividend Fund and Alpine Global Premier Properties Fund (the “Alpine Trusts”). |
77
Alpine Mutual Funds
Additional Information (Unaudited)—Continued
October 31, 2015
Interested Trustees & Officers
Name, Address
and Year of Birth | | Position(s)
Held with
the Trusts | | Term of Office
and Length of
Time Served | | Principal Occupation During
Past Five Years | | # of
Portfolios in
Fund
Complex
Overseen
by Trustee* | | Other Directorships
Held by Trustee |
Samuel A. Lieber***
(1956) | | Interested Trustee and
President | | Indefinite, since the Trust’s inception | | Chief Executive Officer, Alpine Woods Capital Investors, LLC (since 1997); President of Alpine Trusts (since 1998). | | 13 | | Trustee of each of the Alpine Trusts.** |
Stephen A. Lieber****
(1925) | | Vice President | | Indefinite, since the Trust’s inception | | Chairman and Senior Portfolio Manager, Saxon Woods Advisors, LLC (since 1999). | | 13 | | N/A |
| Kenneth Corrado (1964) | | Chief Compliance Officer | | Indefinite, since July 2013 | | Chief Compliance Officer, Alpine Woods Capital Investors, LLC (since July 2013); Independent Compliance Consultant (2012 to 2013); Vice President and Deputy Chief Compliance Officer, Artio Global Management, LLC (2007 to 2012). | | 13 | | N/A |
| Ronald G. Palmer, Jr. (1968) | | Chief Financial Officer | | Indefinite, since 2010 | | Chief Financial Officer, Alpine Woods Capital Investors, LLC (since January 2010). | | 13 | | N/A |
| Joe C. Caruso (1971) | | Treasurer | | Indefinite, since July 2013 | | Fund Accountant, Alpine Woods Capital Investors, LLC since 2011; Independent Tax Consultant (2010 to 2011); Assistant Vice President Global Fund Services, Deutsche Bank AG (2009 to 2010). | | 13 | | N/A |
| Andrew Pappert (1980) | | Secretary | | Indefinite, since 2009 | | Director of Fund Operations, Alpine Woods Capital Investors, LLC (since September 2008). | | 13 | | N/A |
| * | As of October 31, 2015, Alpine Woods Capital Investors, LLC manages thirteen portfolios within the six investment companies that comprise the Alpine Trusts. The Alpine Equity Trust, Alpine Series Trust and Alpine Income Trust are each registered as an open-end management investment company. The Alpine Global Dynamic Dividend Fund, Alpine Total Dynamic Dividend Fund and Alpine Global Premier Properties Fund are each registered as a closed-end management investment company. As of October 31, 2015, the Trustees oversee thirteen portfolios within the six Alpine Trusts. |
| ** | The Trustees are members of the Board of Trustees for each of the Alpine Equity Trust, Alpine Income Trust, Alpine Series Trust, Alpine Global Dynamic Dividend Fund, Alpine Total Dynamic Dividend Fund and Alpine Global Premier Properties Fund (the “Alpine Trusts”). Shareholders may contact the Trustee at c/o Alpine Woods Capital Investors, LLC, 2500 Westchester Ave., Suite 215, Purchase NY, 10577. Each Trust’s Statement of Additional Information (“SAI”) includes additional information about the Trustees and is available, without charge, by calling 1-888-785-5578. |
| *** | Denotes Trustees who are “interested persons” of the Trust or Fund under the 1940 Act. |
| **** | Stephen A. Lieber is the father of Samuel A. Lieber. |
78
Alpine Mutual Funds
Additional Information (Unaudited)—Continued
October 31, 2015
Tax Information
The Funds designated the following percentages of dividends declared from net investment income for the fiscal year ended October 31, 2015 as qualified dividend income under the Jobs & Growth Tax Relief Reconciliation Act of 2003.
| International Real Estate Equity Fund | | | 0 | % |
| Realty Income & Growth Fund | | | 4 | % |
| Emerging Markets Real Estate Fund | | | 31 | % |
| Global Infrastructure Fund | | | 57 | % |
The Funds designated the following percentages of dividends declared during the fiscal year ended October 31, 2015 as dividends qualifying for the dividends received deduction available to corporate shareholders.
| International Real Estate Equity Fund | | | 0 | % |
| Realty Income & Growth Fund | | | 2 | % |
| Emerging Markets Real Estate Fund | | | 0 | % |
| Global Infrastructure Fund | | | 17 | % |
The Funds designated the following percentages of taxable ordinary income distributions as short-term capital gain distributions under Internal Revenue Section 871(k)(2)(C).
| International Real Estate Equity Fund | | | 0 | % |
| Realty Income & Growth Fund | | | 0 | % |
| Emerging Markets Real Estate Fund | | | 0 | % |
| Global Infrastructure Fund | | | 0 | % |
The Funds designated as long-term capital gain dividend, pursuant to Internal Revenue Code Section 852(b)(3), the amount necessary to reduce the earnings and profits of the Funds related to net capital gain to zero for the tax year ended October 31, 2015.
Change in Independent Registered Public Accounting Firm
Effective June 25, 2015, Deloitte & Touche LLP (“D&T”) was replaced as the independent registered public accounting firm to each series (the “Funds”) of the following trusts: Alpine Series Trust (on behalf of its series, Alpine Dynamic Dividend Fund, Alpine Rising Dividend Fund, Alpine Financial Services Fund and Alpine Small Cap Fund); Alpine Equity Trust (on behalf of its series, Alpine International Real Estate Equity Fund, Alpine Realty Income & Growth Fund, Alpine Emerging Markets Real Estate Fund and Alpine Global Infrastructure Fund); and Alpine Income Trust (on behalf of its series, Alpine Ultra Short Municipal Income Fund, and Alpine High Yield Managed Duration Municipal Fund) (the “Trusts”). The Board of Trustees of each Trust approved the dismissal upon recommendation by the Audit Committee of each Board.
D&T’s reports on the Funds’ financial statements for the fiscal years ended October 31, 2014 and October 31, 2013 contained no adverse opinion or disclaimer of opinion nor were they qualified or modified as to uncertainty, audit scope or accounting principles.
During the Funds’ fiscal years ended October 31, 2014 and October 31, 2013 and during the period from November 1, 2014 through the date of this semi-annual report, (i) there were no disagreements with D&T on any matter of accounting principles or practices, financial statement disclosure or auditing scope or procedure, which disagreements, if not resolved to the satisfaction of D&T, would have caused them to make reference to the subject matter of the disagreements in connection with their reports on the Funds’ financial statements for such periods, and (ii) there were no “reportable events” of the kind described in Item 304(a)(1)(v) of Regulation S-K under the Securities Exchange Act of 1934, as amended.
On June 25, 2015, upon recommendation of the Audit Committee of each Trust’s Board of Trustees, each Trust’s Board of Trustees approved the engagement of Ernst & Young LLP (“E&Y”) as each Fund’s independent registered public accounting firm for the fiscal year ended October 31, 2015. The selection of E&Y does not reflect any disagreements with or dissatisfaction by the Trusts or the Boards of Trustees with the performance of the Funds’ prior independent registered public accounting firm, D&T.
79
Alpine Mutual Funds
Additional Information (Unaudited)—Continued
October 31, 2015
During the Funds’ fiscal years ended October 31, 2014 and October 31, 2013, and during the period from November 1, 2014 through the date of this semi-annual report neither the Funds, nor anyone on their behalf, consulted with E&Y on items which: (i) concerned the application of accounting principles to a specified transaction, either completed or proposed, or the type of audit opinion that might be rendered on the Funds’ financial statements; or (ii) concerned the subject of a “disagreement” (as defined in paragraph (a)(1)(iv) of Item 304 of Regulation S-K) or a “reportable event” (as described in paragraph (a)(1)(v) of said Item 304).
Availability of Proxy Voting Information
The policies and procedures used in determining how to vote proxies relating to portfolio securities are available without a charge, upon request, by contacting the Funds at 1(800) 617.7616 and on the SEC’s web site at http://www.sec.gov.
Information regarding how the Funds voted proxies relating to portfolio securities during the most recent twelve-month period ended June 30 is available without charge, upon request, by contacting the Fund at 1(800) 617.7616 and on the SEC’s web site at http://www.sec.gov.
Availability of Quarterly Portfolio Schedule
Beginning with each Fund’s fiscal quarter ended July 31, 2004, each Fund filed its complete schedules of portfolio holdings on Form N-Q with the SEC. Going forward, each Fund will file Form N-Q for the first and third quarters of each fiscal year on Form N-Q. Each Fund’s Form N-Q is available on the SEC’s website at www.sec.gov and may be reviewed and copied at the SEC’s Public Reference Room in Washington, DC. Information on the operation of the Public Reference Room may be obtained by calling 1-202-551-8090.
Privacy Policy
The Funds collect non-public information about you from the following sources:
| | • | information we receive about you on applications or other forms; |
| | • | information you give us orally; and |
| | • | information about your transactions with others or us. |
The Funds do not disclose any non-public personal information about our customers or former customers without the customer’s authorization, except as required by law or in response to inquiries from governmental authorities. The Funds restrict access to your personal and account information to those employees who need to know that information to provide products and services to you. The Funds also may disclose that information to unaffiliated third parties (such as to brokers or custodians) only as permitted by law and only as needed for us to provide agreed services to you. The Funds maintain physical, electronic and procedural safeguards to guard your non-public personal information.
In the event that you hold shares of the Funds through a financial intermediary, including, but not limited to a broker dealer, bank or trust company, the privacy policy of your financial intermediary would govern how your non-public personal information would be shared with unaffiliated third parties.
Shareholder Meeting
On October 16, 2015, a Special Meeting of Shareholders of the Alpine Cyclical Advantage Property Fund (the “Fund”), a series of Alpine Equity Trust (the “Trust”), met to vote to approve an Agreement and Plan of Reorganization, providing for: (i) the acquisition of all of the assets of the Alpine Cyclical Advantage Property Fund by the Alpine Global Infrastructure Fund (the “Acquiring Fund”), in exchange for the assumption of all of the liabilities of the Alpine Cyclical Advantage Property Fund for shares of the Acquiring Fund to be distributed to the shareholders of the Alpine Cyclical Advantage Property Fund; and (ii) the subsequent termination of the Alpine Cyclical Advantage Property Fund as a series of the Trust:
Proposal 1: to approve an Agreement and Plan of Reorganization for the Alpine Cyclical Advantage Property Fund.
| For | | | 97.95 | % |
| Against | | | 1.16 | % |
| Abstain | | | 0.89 | % |
80
TRUSTEES
Samuel A. Lieber
Eleanor T.M. Hoagland
James A. Jacobson
H. Guy Leibler
Jeffrey E. Wacksman
CUSTODIAN &
ADMINISTRATOR
State Street Bank & Trust Company
One Lincoln Street
Boston, MA 02111
INDEPENDENT REGISTERED
PUBLIC ACCOUNTING FIRM
Ernst & Young
5 Times Square
New York, NY 10019
FUND COUNSEL
Willkie Farr & Gallagher LLP
787 7th Avenue
New York, NY 10019
DISTRIBUTOR
Quasar Distributors, LLC
615 East Michigan Street
Milwaukee, WI 53202
INVESTMENT ADVISER
Alpine Woods Capital Investors, LLC
2500 Westchester Ave., Suite 215
Purchase, NY 10577
TRANSFER AGENT
Boston Financial Data Services
2000 Crown Colony Drive
Quincy, MA 02169

SHAREHOLDER | INVESTOR INFORMATION
1(888)785.5578
www.alpinefunds.com
This material must be preceded or accompanied by a current prospectus.
Item 2. Code of Ethics
| (a) | The Registrant, as of the end of the period covered by the report, has adopted a code of ethics that applies to the Registrant’s principal executive officer, principal financial officer, principal accounting officer or controller or persons performing similar functions. |
| (c) | There have been no amendments, during the period covered by this report, to a provision of the code of ethics that applies to the Registrant’s principal executive officer, principal financial officer, principal accounting officer or controller, or persons performing similar functions and that relates to any element of the code of ethics described in Item 2(b) of Form N-CSR. |
| (d) | The Registrant has not granted any waivers, including an implicit waiver, from a provision of the code of ethics that applies to the Registrant’s principal executive officer, principal financial officer, principal accounting officer or controller, or persons performing similar functions that relates to any element of the code of ethics described in Item 2(b) of Form N-CSR. |
| (f) | The Registrant’s Code of Ethics is attached as EX-99.CODEETH hereto. |
Item 3. Audit Committee Financial Expert
| (a)(1) | The Board of Trustees of the Registrant has determined that the Registrant has at least one audit committee financial expert serving on its audit committee. |
| (a)(2) | The Board of Trustees has determined that James A. Jacobson and H. Guy Leibler are audit committee financial experts. Messrs. Jacobson and Leibler are “independent” as defined in paragraph (a)(2) of Item 3 to Form N-CSR. It has been determined that Mr. Jacobson qualifies as an audit committee financial expert based on his extensive experience in the financial services industry, including serving for more than 15 years as a senior executive at a New York Stock Exchange (“NYSE”) specialist firm and as a member of the NYSE Board of Directors (including terms as Vice Chair), his other board service, as well as his educational background. It has been determined that Mr. Leibler qualifies as an audit committee financial expert based on his substantial experience as a senior executive of an operating company actively supervising principal financial officers in the preparation of financial statements, other board service, as well as his educational background. |
Item 4. Principal Accountant Fees and Services
| (a) | Audit Fees: The aggregate fees billed for each of the last two fiscal years for professional services rendered by the principal accountant for the audit of the Registrant’s annual financial statements or services that are normally provided by the accountant in connection with statutory and regulatory filings or engagements for fiscal year 2014 was $213,030 and for fiscal year 2015 was $209,268. |
| (b) | Audit-Related Fees: The aggregate fees billed in each of the last two fiscal years for assurance and related services by the principal accountant that are reasonably related to the performance of the audit of the Registrant’s financial statements and are not reported under paragraph (a) of this Item was $0 in fiscal year 2014 and $479 in fiscal year 2015. The fees in fiscal year 2015 were for professional services for auditor transition. |
| (c) | Tax Fees: The aggregate fees billed in each of the last two fiscal years for professional services rendered by the principal accountant for tax compliance, tax advice, and tax planning was $42,945 in fiscal year 2014 and $29,839 in fiscal year 2015. |
| (d) | All Other Fees: The aggregate fees billed in each of the last two fiscal years for products and services provided by the principal accountant, other than the services reported in paragraphs (a) through (c) of this Item was $6,725 in fiscal year 2014 and $0 in fiscal year 2015. The fees in fiscal year 2014 were for consulting and advisory services regarding enterprise risk management. |
| (e)(1) | Audit Committee Pre-Approval Policies and Procedures: All services to be performed by the Registrant’s principal auditors must be pre-approved by the Registrant’s audit committee, which may include the approval of certain services up to an amount determined by the audit committee. Any services that would exceed that amount would require additional approval of the audit committee. |
| (e)(2) | No services described in paragraphs (b) through (d) were approved pursuant to paragraph (c)(7)(i)(C) of Rule 2-01 of Regulation S-X. |
| (g) | The aggregate non-audit fees billed by the Registrant’s accountant for services rendered to the Registrant, and the Registrant’s investment adviser, and any entity controlling, controlled by, or under common control with the adviser that provides ongoing services to the Registrant was $67,250 in fiscal year 2014 and $0 in fiscal year 2015. The in fiscal year 2014 fees were for consulting and advisory services regarding enterprise risk management. |
Item 5. Audit Committee of Listed Registrants
Not applicable to registrants who are not listed issuers (as defined in Rule 10A-3 under the Securities Exchange Act of 1934).
Item 6. Schedule of Investments
| (a) | Schedule of Investments is included as part of Item 1 of the Form N-CSR. |
Item 7. Disclosure of Proxy Voting Policies and Procedures for Closed-End Management Investment Companies.
Not applicable to open-end investment management companies.
Item 8. Portfolio Managers of Closed-End Management Investment Companies.
Not applicable to open-end investment management companies.
Item 9. Purchases of Equity Securities by Closed-End Management Investment Company and Affiliated Purchasers.
Not applicable to open-end investment management companies.
Item 10. Submission of Matters to a Vote of Security Holders.
There were no material changes to the procedures by which shareholders may recommend nominees to the Registrant’s Board of Trustees.
Item 11. Controls and Procedures.
| (a) | The Registrant’s principal executive officer and principal financial officer have evaluated the registrant’s disclosure controls and procedures (as defined in Rule 30a-3(c) under the Investment Company Act of 1940, as amended) within 90 days of this filing and have concluded that the Registrant’s disclosure controls and procedures were effective, as of that date. |
| (b) | There was no change in the Registrant’s internal control over financial reporting (as defined in Rule 30a-3(d) under the Investment Company Act of 1940, as amended) during the second fiscal quarter of the period covered by this report that has materially affected, or is reasonably likely to materially affect, the Registrant’s internal control over financial reporting. |
Item 12. Exhibits
| (a)(1) | The Code of Ethics that applies to the Registrant’s principal executive officer and principal financial officer is attached hereto as EX-99.CODE ETH |
| (a)(2) | The certifications required by Rule 30a-2(a) of the Investment Company Act of 1940, as amended, and Section 302 of the Sarbanes-Oxley Act of 2002 are attached hereto as Ex-99.Cert. |
| (b) | The certifications by the Registrant’s Principal Executive Officer and Principal Financial Officer, as required by Rule 30a-2(b) of the Investment Company Act of 1940, as amended, and Section 906 of the Sarbanes-Oxley Act of 2002 are attached hereto as Ex-99.906Cert. |
SIGNATURES
Pursuant to the requirements of the Securities Exchange Act of 1934 and the Investment Company Act of 1940, the registrant has duly caused this report to be signed on its behalf by the undersigned, thereunto duly authorized.
Alpine Equity Trust
| By: | /s/ Samuel A. Lieber | |
| | Samuel A. Lieber | |
| | Chief Executive Officer (Principal Executive Officer) |
| | | |
| Date: | December 31, 2015 | |
Pursuant to the requirements of the Securities Exchange Act of 1934 and the Investment Company Act of 1940, this report has been signed below by the following persons on behalf of the registrant and in the capacities and on the dates indicated.
| By: | /s/ Samuel A. Lieber | |
| | Samuel A. Lieber | |
| | Chief Executive Officer (Principal Executive Officer) |
| | | |
| By: | /s/ Ronald G. Palmer, Jr. | |
| | Ronald G. Palmer, Jr. | |
| | Chief Financial Officer (Principal Financial Officer) |
| | | |
| Date: | December 31, 2015 | |