UNITED STATES
SECURITIES AND EXCHANGE COMMISSION
Washington, D.C. 20549
FORM N-CSR
CERTIFIED SHAREHOLDER REPORT OF REGISTERED
MANAGEMENT INVESTMENT COMPANIES
Investment Company Act File number: 811-05684
Alpine Equity Trust
(Exact name of registrant as specified in charter)
2500 Westchester Avenue, Suite 215
Purchase, New York 10577
(Address of principal executive offices)(Zip code)
| | (Name and Address of Agent for Service) | | Copy to: | |
| | | | | |
| | Samuel A. Lieber
Alpine Woods Capital Investors, LLC
2500 Westchester Avenue, Suite 215
Purchase, New York 10577 | | Rose DiMartino
Attorney at Law
Willkie Farr & Gallagher
787 7th Avenue, 40th Floor
New York, New York 10019 | |
Registrant’s telephone number, including area code: (914) 251-0880
Date of fiscal year end: October 31, 2014
Date of reporting period: November 1, 2013 – October 31, 2014
Item 1. Shareholder Report.

Real Estate Funds
October 31,
2014
Annual Report
Table of Contents
Additional Alpine Funds are offered in the Alpine Series Trust and Alpine Income Trust. These Funds include:
Alpine Dynamic Dividend Fund Alpine Accelerating Dividend Fund Alpine Financial Services Fund Alpine Small Cap Fund | Alpine Transformations Fund Alpine Equity Income Fund Alpine Ultra Short Municipal Income Fund Alpine Municipal Money Market Fund Alpine High Yield Managed Duration Municipal Fund |
Alpine’s Series and Income Funds’ investment objectives, risks, charges and expenses must be considered carefully before investing in funds of the Alpine Series Trust and Alpine Income Trust. The statutory and summary prospectuses contain this and other important information about the investment company, and it may be obtained by calling 1-888-785-5578, or visiting www.alpinefunds.com. Read it carefully before investing.
Mutual fund investing involves risk. Principal loss is possible.
Alpine’s Investment Outlook

Dear Shareholder:
“Interest Rates: How Low, For How Long?”
Alpine believes that over the next year, investors will be rewarded if they focus on long-term trends. This strategy has worked well for the extended period since the Great Financial Collapse of 2008. Despite news of distressing events, traumas, coups and even wars which have had short lived impacts, the positive long-term trend of capital markets around the world has been sustained by low interest rates and modest economic growth. Another factor has been the U.S. dollar, which reversed a nine and one-half year decline in mid-2011, with notable appreciation from August of 2014. The principle factor underpinning these trends has been Central Bank monetary policy, led by the U.S. Federal Reserve. In October of 2014, the Fed concluded its quantitative easing program while other countries have adopted similar supportive policies. On top of these measures, the price of oil and most raw material commodities have seen notable declines, lowering many production costs and enhancing potential profitability.
One can argue that Central Bank policy has been the primary force for economic recovery and growth in the absence of fiscal stimulus from most governments. Indeed, many believe that fiscal austerity around the world, most notably in Europe, has limited opportunities for job creation and reduced economic growth. Increasingly, the world’s central banks are adopting tools to increase money supply, but instead of boosting bank lending, much of the liquidity has flowed into capital markets. The Federal Reserve has completed its tapering of quantitative easing by phasing out the purchase of financial securities, making the U.S. the leader in normalizing this cycle. It should be noted that the Fed has accumulated a $4 trillion balance sheet which will not dramatically decline over the near term, so stimulus will not yet be reduced. Add to this expanded Japanese quantitative easing and the prospect of some form of European quantitative easing next year should more than make up for our Fed’s reduced level of monetary support. After the close of the fiscal year in October, the financial markets received an early Thanksgiving gift from China
via a reduction in China’s mortgage loan rates and a likely follow up of decreased reserve requirements for some of its banks, which should push increased liquidity into the capital markets. However, since China is not as open an economy (unlike other major nations), the flow of funds into the global liquidity pool will be more gradual. Nonetheless, the trend is clear, “do not fear, your friendly central banker will be here”.
Europe faces a prospect of continued GDP growth of less than 1% with inflation at similar low levels. This suggests that the possibility of a long-term (i.e., secular) period of minimal growth or possibly even stagnation could occur. Thus, the current Eurozone unemployment rate of 11.5% (Spain and Greece are more than two times that number) may not improve materially for some time. The International Monetary Fund (IMF) has suggested that countries should adopt more stimulative fiscal policies, such as significant infrastructure spending, but we think that is not enough. Indeed, outgoing European Council President Von Rompuy stated that “without jobs and growth, the European idea itself is in danger”. Clearly the political consequences of stagnant or even deflationary economies can create social upheavals, as Europe itself has witnessed over the past several hundred years. Just two years ago, the so called “Jasmine Revolution” spread political upheaval throughout the Arab world. This was largely the product of high unemployment rates and disenfranchised populations.
Japan is currently the only major country utilizing both monetary and fiscal stimulus. Indeed, their so called ‘three arrows’ approach of aggressive monetary policy, expansionary fiscal stimulus combined with structural reforms to the economy are key products of the political situation in Japan, brought on by over 20 years of substandard economic performance. In addition to Japan, there are a few emerging market economies, most notably India, which are in a position to reduce interest rates and expand domestic demand as well as utilize appropriate fiscal spending and structural reforms to spur growth. However, most countries are taking the politically more expedient path of devaluing their currency in order to make exports cheaper and, hence, more competitive. Such currency devaluation can create
1
inflation over time and cause long term problems if growth in output and wages does not increase materially.
The one country that is not in this position, of course, is the U.S.A. Indeed, the U.S. currency has been ascending over the past year, the U.S. banking sector is in a better position than those of most other countries, and larger companies are generally well capitalized by both the equity and debt markets. However, small companies in this country are not fully enjoying the benefits of the modest economic recovery we have enjoyed over the past few years. This is holding back the U.S. recovery, sustaining only moderate job growth over time. Thus, median real wages are in fact lower today than they were in 2007. Nonetheless, the prospects for small U.S. businesses are improving. However, Alpine believes productivity enhancements created by investments in new technology, production capabilities, and communication and physical infrastructure are still required for economic growth to accelerate.
In addition to the push for greater global liquidity, the other major driver of economic prospects and, hence, the markets, has been the continued expansion of U.S. oil and gas reserves. This has helped to bring about lower oil and gas prices at a time when global economic activity and demand for energy is slowing. Fundamentally, cheaper energy means the cost of economic activity has not only declined, but the transfer of economic wealth from goods producers and transporters to energy producers has also shifted. Countries whose economies are dependent on high oil prices, notably Russia and Iran, and to a lesser degree, Brazil, Canada, Mexico and Norway, may be hurt by an extended decline. On the other hand, Japan and much of Europe could be big beneficiaries. The resultant increase in many industries’ profitability due to lower fuel prices provides the possibility that some of the enhanced margins might be distributed to workers and some of the savings may also be distributed to consumers in the form of price stability. In other words, a major inflationary input has been limited, and this may stimulate economic activity. Alpine believes there will be minimal inflationary impulses
globally over the next year or two until global aggregate demand starts to rise.
For 2015, Alpine believes that the prospects for modest economic growth supported by abundant cheap global liquidity, combined with lower energy costs, will continue to favor capital markets and global equities more broadly. We still expect significant regional differences in terms of growth, and individual companies may see their prospects and share prices rise or decline based on management’s ability to utilize the capital markets during this period. This suggests continued expansion of mergers and acquisitions activities on a global basis. It could also lead to an increased number of IPOs in different industries, seeking both to capitalize on high historic valuations as well as position themselves to utilize capital markets for future growth.
Just as the U.S. stock market outperformed much of the world during 2014 as a result of the combination of cheap money and improving economic fundamentals, we believe that 2015 will see a global broadening of market performance to include small cap stocks in the U.S. as well as increased international opportunities. Finally, we should note that the extended period of low volatility, including 2013 and much of 2014, may not be fully over, but political and economic risks remain, as few of this year’s conflicts have resolved and more may surface. The market appears to be increasingly open to more risk if returns are commensurate. Fundamentally, the Fed is still our friend, even though many market participants have been waiting over a year for the proverbial ‘punch bowl’ to be removed and the party to end. Markets may well continue to climb a “wall of worry” as we enter 2015.
We appreciate your interest and support as we enter what appears to be a seventh year of economic and equity market recoveries.
Sincerely,

Samuel A. Lieber
President
Past performance is not a guarantee of future results. The specific market, sector or investment conditions that contribute to a Fund’s performance may not be replicated in future periods.
Mutual fund investing involves risk. Principal loss is possible. Please refer to individual fund letters for risks specific to that fund.
This letter and the letters that follow represent the opinions of the Funds’ management and are subject to change, are not guaranteed and should not be considered recommendations to buy or sell any security. The information provided is not intended to be, and is not, a forecast of future events, a guarantee of future results, or investment advice.
2
| Disclosures and Definitions |  |
Real Estate Funds Disclosures
The specific market, sector or investment conditions that contributed to a Fund’s performance may not be replicated in future periods.
Please refer to the Schedule of Portfolio Investments for Fund holdings information. Fund holdings and sector allocations are subject to change and should not be considered a recommendation to buy or sell any security.
Diversification does not assure a profit or protect against loss in a declining market.
Favorable tax treatment of Fund distributions may be adversely affected, changed or repealed by future changes in tax laws. Alpine may not be able to anticipate the level of dividends that companies will pay in any given timeframe.
The Funds’ monthly distributions may consist of net investment income, net realized capital gains and/or a return of capital. If a distribution includes anything other than net investment income, the Funds will provide a notice of the best estimate of its distribution sources when distributed, which will be posted on the Funds’ website; www.alpinefunds.com, or can be obtained by calling 1-800-617-7616. We estimate that the Alpine Equity Trust did not pay any distributions during the fiscal annual period ending October 31, 2014 through a return of capital. A return of capital distribution does not necessarily reflect the Funds’ performance and should not be confused with “yield” or “income.” Final determination of the federal income tax characteristics of distributions paid during the calendar year will be provided on U.S. Form 1099-DIV, which will be mailed to shareholders. Please consult your tax advisor for further information.
Neither the Fund nor any of its representatives may give tax advice. Investors should consult their tax advisor for information concerning their particular situation.
All investments involve risk. Principal loss is possible. A small portion of the S&P 500 yield may include return of capital; the 10-year Treasury yield does not include return of capital; Corporate Bonds and High Yield Bonds generally do not have return of capital; a portion of the dividend paid by REITs and REIT preferred stock may be deemed a return of capital for tax purposes in the event the company pays a dividend greater than its taxable income. A stock may trade with more or less liquidity than a bond depending on the number of shares and bonds outstanding, the size of the company, and the demand for the securities. The REIT and REIT preferred stock market are smaller than the broader equity and bond markets and often trade with less liquidity than these markets depending upon the size of the individual
issue and the demand of the securities. Treasury notes are guaranteed by the U.S. government and thus they are considered to be safer than other asset classes. Tax features of a Treasury Note, Corporate Bond, Stock, High Yield Bond, REITs and REIT preferred stock may vary based on an individual’s circumstances. Consult a tax professional for additional information.
Earnings Growth & EPS Growth are not measures of the Funds’ future performance.
Must be preceded or accompanied by a prospectus.
Quasar Distributors, LLC, distributor.
Real Estate Funds – Definitions
Alpha – A measure of performance vs. a benchmark on a risk-adjusted basis. A positive alpha of 1.0 means the portfolio has outperformed its benchmark index by 1%. Correspondingly, a similar negative alpha would indicate an underperformance of 1%.
FTSE EPRA/NAREIT® Emerging Index* is an unmanaged index designed to track the performance of listed real estate securities companies in emerging countries worldwide.
FTSE EPRA/NAREIT® Global Real Estate Index* is an unmanaged index designed to track the performance of publicly traded companies engaged in the real estate business in developed and emerging real estate markets/regions around the world.
FTSE EPRA/NAREIT® Global ex U.S. Real Estate Index* is an unmanaged index designed to track the performance of publicly traded companies engaged in the real estate business outside the United States. The funds or securities referred to herein are not sponsored, endorsed, or promoted by the index providers, and the index providers bear no liability with respect to any such funds or securities or any index on which such funds or securities are based. The prospectus contains a more detailed description of the limited relationship the index providers have with the licensee and any related funds.
Hang Seng Index is a free-float capitalization-weighted index of selection of companies from the Stock Exchange of Hong Kong. The components of the index are divided into four sub-indexes: Commerce and Industry, Finance, Utilities, and properties. The index was developed with a base level of 100 as of July 31, 1964.
Ibovespa Index is a total return index weighted by traded volume and is comprised of the most liquid stocks traded on the Sao Paulo Stock Exchange.
Lipper Real Estate Funds Average is an average of funds that invest at least 80% of their portfolio in equity
3
| Disclosures and Definitions (Continued) | |
securities of domestic and foreign companies engaged in the real estate industry.
Market Capitalization (market cap) is the total value of a company’s outstanding shares and is calculated by multiplying the company’s outstanding shares by the current market price of one share.
MSCI ACWI Consumer Discretionary Index** is a free float-adjusted market capitalization-weighted index that is designed to measure the equity market performance of developed and emerging markets for the Consumer Discretionary GICS® sector.
MSCI ACWI Consumer Staples Index USD** is a market capitalization-weighted index that is designed to measure the equity market performance of developed and emerging markets for the Consumer Staples GICS® sector.
MSCI All Country World Index USD** is a free float-adjusted market capitalization-weighted index that is designed to measure the equity market performance of developed and emerging markets.
MSCI Daily TR Net EAFE Index USD** is a free float adjusted market cap weighted index designed to measure developed market equity performance, excluding the U.S. and Canada.
MSCI Emerging Markets Index USD** is a free float adjusted market cap-weighted index that is designed to measure equity market performance in the global emerging markets. Source: MSCI.MSCI Emerging Market Index
MSCI Europe Index** is a free float-adjusted market capitalization weighted index that is designed to measure the equity market performance of the developed markets in Europe. The MSCI Europe Index consists of the following 15 developed market country indexes: Austria, Belgium, Denmark, Finland, France, Germany, Ireland, Italy, the Netherlands, Norway, Portugal, Spain, Sweden, Switzerland, and the United Kingdom.
MSCI US REIT Index** is a free float-adjusted market capitalization-weighted index that is comprised of the most actively-traded equity REITs that are of reasonable size in terms of full- and free-float-adjusted market capitalization.
MSCI World Index** is a free-float weighted equity index which includes developed world markets, and does not include emerging markets.
Price/Earnings Ratio (P/E) is a valuation ratio of a company’s current share price compared to its per-share
earnings. Normalized earnings - earnings metric that shows you want earnings look like smoothed out in the long run, taking into account the cyclical changes in an economy or stock.
S&P 500® Utilities Index*** provides investors with a benchmark that represents U.S. traded securities that are classified under the GICS® utilities and telecommunication services sectors.
S&P 500® Index*** is a float-adjusted, market capitalization-weighted index of 500 common stocks chosen for market size, liquidity, and industry group representation to represent U.S. equity performance.
S&P Developed Property Net Total Return Index(TM)*** is an unmanaged market-weighted total return index available on a monthly basis. The index consists of many companies from developed markets whose floats are larger than $100 million and derive more than half of their revenue from property-related activities. Net total returns include cash dividends reinvested in the index but adjusted for country specific withholding taxes based on the highest tax rate possible.
S&P Developed Ex-U.S. Property Total Return Index(TM)*** defines and measures the investable universe of publicly traded real estate companies domiciled in developed countries outside of the United States. The companies in the Index are engaged in real estate-related activities such as property ownership, management, development, rental and investment.
S&P Global Infrastructure Index(TM)*** is comprised of 75 of the largest publicly-listed infrastructure companies that meet specific invest ability requirements. The Index is designed to provide liquid exposure to the leading publicly-listed companies in the global infrastructure industry, from both developed markets and emerging markets.
STOXX 600 Utilities Index is a capitalization-weighted index which includes European companies that are involved in the utility sector.
STOXX Europe 600 (Price) Index is a broad based capitalization-weighted index of European stocks designed to provide a broad yet liquid representation of companies in the European region. The equities use free float shares in the index calculation. The index was developed with a base value of 100 as of December 31, 1991. This index uses float shares.
* Source: FTSE. The funds or securities referred to herein are not sponsored, endorsed, or promoted by the index providers, and the index providers bear no liability with respect to any such funds or securities or any index on
4
| Disclosures and Definitions (Continued) | |
which such funds or securities are based. The prospectus contains a more detailed description of the limited relationship the index providers have with the licensee and any related funds.
| ** | Source: MSCI. MSCI makes no express or implied warranties or representations and shall have no liability whatsoever with respect to any MSCI data contained herein. The MSCI data may not be further redistributed or used as a basis for other indices or any securities or financial products. This report is not approved, reviewed or produced by MSCI. |
| *** | The S&P 500® Index, the S&P Developed Property Net TR Index(TM), the S&P Developed (ex. U.S.) Property Net TR Index(TM), and the S&P Global Infrastructure Index(TM) (the “Indices”) are products of S&P Dow Jones Indices LLC and have been licensed for use by Alpine Woods Capital Investors, LLC. Copyright © 2014 by S&P Dow Jones Indices LLC. All rights reserved. Redistribution or reproduction in whole or in part are prohibited without written the permission of S&P Dow Jones Indices LLC. S&P Dow Jones Indices LLC, its affiliates, and third party licensors make no representation or warranty, express or implied, with respect to the Index and none of such parties shall have any liability for any errors, omissions, or interruptions in the Index or the data included therein. |
An investor cannot invest directly in an index.
5
Equity Manager Reports

| | Alpine International Real Estate Equity Fund |
| | |
| | Alpine Realty Income & Growth Fund |
| | |
| | Alpine Cyclical Advantage Property Fund |
| | |
| | Alpine Emerging Markets Real Estate Fund |
| | |
| | Alpine Global Infrastructure Fund |
| | |
| | Alpine Global Consumer Growth Fund |
| Alpine International Real Estate Equity Fund |  |
| Comparative Annualized Returns as of 10/31/14 (Unaudited) |
| | | 1 Year | | | 3 Years | | | 5 Years | | | 10 Years | | Since Inception(1) |
| Alpine International Real Estate Equity Fund — Institutional Class | | | 0.08% | | | | 6.38% | | | | 3.07% | | | | 2.76% | | | | 5.30% | |
| Alpine International Real Estate Equity Fund — Class A (Without Load) | | | -0.25% | | | | N/A | | | | N/A | | | | N/A | | | | 10.52% | |
| Alpine International Real Estate Equity Fund — Class A (With Load) | | | -5.75% | | | | N/A | | | | N/A | | | | N/A | | | | 8.34% | |
| FTSE EPRA/NAREIT® Global Ex-U.S. Index(2) | | | 2.24% | | | | 10.82% | | | | 7.75% | | | | N/A | | | | N/A | |
| MSCI EAFE Index | | | -0.60% | | | | 9.68% | | | | 6.52% | | | | 5.81% | | | | 4.60% | |
| Lipper International Real Estate Funds Average(3) | | | 3.53% | | | | 12.32% | | | | 8.25% | | | | 5.86% | | | | 5.30% | |
| Lipper International Real Estate Funds Ranking(3) | | | 50/52 | | | | 48/48 | | | | 37/37 | | | | 5/5 | | | | 1/1 | |
| Gross Expense Ratio (Institutional Class): 1.49%(4) | | | | | | | | | | | | | | | | | | | | |
| Net Expense Ratio (Institutional Class): 1.49%(4) | | | | | | | | | | | | | | | | | | | | |
| Gross Expense Ratio (Class A): 1.74%(4) | | | | | | | | | | | | | | | | | | | | |
| Net Expense Ratio (Class A): 1.74%(4) | | | | | | | | | | | | | | | | | | | | |
| | (1) | Institutional Class shares commenced on February 1, 1989 and Class A shares commenced on December 30, 2011. Returns for indices are since February 1, 1989. |
| | (2) | Index commenced on October 31, 2008. |
| | (3) | The since inception data represents the period beginning February 2, 1989 (Institutional Class only). |
| | (4) | As disclosed in the prospectus dated February 28, 2014. |
Performance data quoted represents past performance and is not predictive of future results. Investment return and principal value of the Fund fluctuate, so that shares, when redeemed, may be worth more or less than their original cost. Performance current to the most recent month end may be lower or higher than the performance quoted and may be obtained by calling 1-888-785-5578. Performance data shown does not reflect the 1.00% redemption fee imposed on shares held for fewer than 60 days. If it did, total returns would be reduced. Returns for the Class A shares with sales charge reflect a maximum sales charge of 5.50%. Performance for the Class A shares without sales charges does not reflect this load.
FTSE EPRA/NAREIT® Global ex-U.S. Index is an unmanaged index designed to track the performance of publicly traded companies engaged in the real estate business outside the United States. The funds or securities referred to herein are not sponsored, endorsed, or promoted by the index providers, and the index providers bear no liability with respect to any such funds or securities or any index on which such funds or securities are based. The prospectus contains a more detailed description of the limited relationship the index providers have with the licensee and any related funds. MSCI EAFE (Europe, Australasia, Far East) Index is a free float-adjusted market-cap-weighted index designed to measure developed market equity performance. Source: MSCI. MSCI data may not be reproduced or used for any other purpose. MSCI makes no express or implied warranties or representations and shall have no liability whatsoever with respect to any MSCI data contained herein. The MSCI data may not be further redistributed or used as a basis for other indices or any securities or financial products. This report is not approved, reviewed or produced by MSCI. The Lipper International Real Estate Funds Average is an average of funds that invest at least 80% of their portfolio in equity securities of domestic and foreign companies engaged in the real estate industry. Lipper rankings for the periods shown are based on fund total returns with dividends and distributions reinvested and do not reflect sales charges. The FTSE EPRA/NAREIT® Global ex-U.S. Index, the MSCI EAFE Index and the Lipper International Real Estate Funds Average are unmanaged and do not reflect direct fees associated with a mutual fund, such as investment adviser fees; however, the Lipper International Real Estate Funds Average reflects fees charged by the underlying funds. The performance for the Alpine International Real Estate Equity Fund reflects the deduction of fees for these value-added services. Investors cannot directly invest in an index.
To the extent that the Fund’s historical performance resulted from gains derived from participation in Initial Public Offerings (“IPOs”) and/or Secondary Offerings, there is no guarantee that these results can be replicated in future periods or that the Fund will be able to participate to the same degree in IPO/Secondary Offerings in the future.
7
| Alpine International Real Estate Equity Fund (Continued) | |
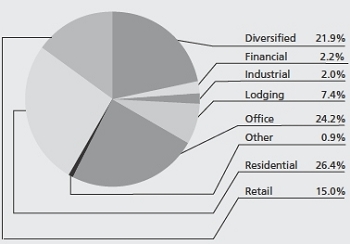
Portfolio Distributions* (Unaudited)
| Top 10 Holdings* (Unaudited) | |
| 1. | | Regus PLC | 7.37 | % |
| 2. | | South Asian Real Estate PLC | 7.09 | % |
| 3. | | LXB Retail Properties PLC | 5.21 | % |
| 4. | | Songbird Estates PLC | 3.68 | % |
| 5. | | Unitech Corporate Parks PLC | 3.49 | % |
| 6. | | Yatra Capital, Ltd. | 3.01 | % |
| 7. | | SM Prime Holdings, Inc. | 2.99 | % |
| 8. | | Nexity SA | 2.93 | % |
| 9. | | BHG SA-Brazil Hospitality Group | 2.73 | % |
| 10. | | Great Portland Estates PLC | 2.60 | % |
| * | Portfolio Distributions percentages are based on total investments. Top 10 Holdings do not include short-term investments and percentages are based on total net assets. Portfolio holdings and sector distributions are as of 10/31/14 and are subject to change. Portfolio holdings are not recommendations to buy or sell any securities. |
Value of a $10,000 Investment (Unaudited)
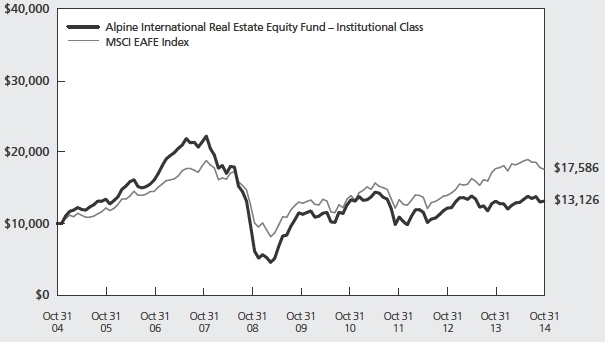
This chart represents a comparison of a hypothetical $10,000 investment in the Fund versus a similar investment in the Fund’s benchmarks. The graph and the table do not reflect the deduction of taxes that a shareholder would pay on Fund distributions or the redemption of Fund shares. Investment performance reflects the waiver and recovery of certain fees, if applicable. Without the waiver and recovery of fees, the Fund’s total return would have differed.
Performance data quoted represents past performance and is not predictive of future results. Investment return and principal value of the Fund fluctuate, so that shares, when redeemed, may be worth more or less than their original cost.
8
| Alpine International Real Estate Equity Fund (Continued) | |
Commentary
Dear Shareholder:
We are pleased to present the 2014 annual report for the Alpine International Real Estate Equity Fund. For the twelve months ended October 31, 2014, the Fund generated a total return of 0.08%. This compares with the total return of the Fund’s primary benchmark the FTSE EPRA/NAREIT® Global Ex-U.S. Real Estate Index of 2.24%. In the context of broader equity markets, the MSCI Daily TR Net EAFE Index USD produced a total return of -0.60%. All references in this letter to the Fund’s performance relate to the performance of the Fund’s Institutional Class.
As we noted in the President’s letter, broadly speaking, US equities outperformed international or non-US equities this year. We believe this reflects America’s faster return to normalized economic levels than much of the rest of the world. Related to this, the US Dollar has been strengthening over the past year, particularly in the final three months of the fiscal year. It’s been a period characterized by significant currency volatility, with the Japanese Yen, Swedish Krona, Brazilian Real, the Euro and the Australian Dollar all weakening relative to the US Dollar by 7% to 12%. The Indian Rupee gained a bit over 1% and was one of the few currencies in the portfolio to strengthen in the period.
The Fund hedged a portion of its Yen exposure for most of its fiscal year. The currency hedging mitigated the overall negative impact of currency in the portfolio. We have also used leverage both in the execution of the strategy of the Fund and to manage inflows and outflows during the fiscal year.
The portfolio continues to be focused on both growth situations and undervalued opportunities. This is reflected in both the geographic distribution of the portfolio, as well as individual stock holdings. Increasingly, this reflects the widening divergence among countries experiencing improving economic conditions, countries that appear to be bottoming and should
benefit from aggressive monetary and/or fiscal stimulus, and those countries that are still suffering from severe structural and/or fiscal deficits leading to weak demand and/or high unemployment. In the first category, the U.S. and U.K. stand out. In the second category, China and India are promising, as is Japan. Europe is a bit more questionable and varied, although Ireland looks very promising and Spain has potential. In the third category, several emerging market countries, notably across commodity driven economies in Latin America and Asia, may be in for a rocky ride, although their valuations may support potential upside appreciation.
Portfolio Composition
Reflecting both economic and equity market conditions, as well as real estate fundamentals, we have made some notable shifts in the portfolio over the past year. The largest change occurred in the increased weighting of Asian holdings, from 43.4% to 50.7% of the portfolio. Europe increased from 33.2% to 38.9%, and North and South America fell from 23.9% to 15% of the portfolio. While the Fund’s largest country exposure is to the United Kingdom, which rose from 22.1% at the end of last year to a relatively constant 25.9% for much of the year, India has seen an increase from 12.4% to 18.5%. In the opposite direction, Brazil has dropped from 21.3% to 11% of holdings. Japan’s position was reduced from 11.5% at previous fiscal year end to just over 8% at mid-year and closed out this fiscal year at 9.8%. Other smaller, but notable changes, are a significant increase in our exposure to China from 1.7% to 6.5% at fiscal year-end. This contrasts with Thailand where we reduced positions from 6.4% to 2.8%. Finally, it’s worth noting that last year the Fund had no exposure to the United Arab Emirates, while at mid-year it had 1% and concluded the year at 1.8%. The Fund also took advantage of new opportunities to invest in Ireland, where, we see a promising dynamic for property recovery so we initiated positions by mid-year at 0.7%, leading up to 1.9% at the end of the year.
9
| Alpine International Real Estate Equity Fund (Continued) | |
Top Ten Holdings
While portfolio wide shifts are notable, three of last year’s top ten holdings remained amongst the largest positions in the Fund as of the end of the fiscal year.. Regus PLC, the global leader in flexible or temporary office space remains the largest holding. This is followed by South Asian Real Estate PLC*, the Indian homebuilder private placement. LXB Retail Properties PLC rose to the third largest holding as the company makes progress towards completing its development pipeline. Over the past year Songbird Estates PLC moved up to the number four slot. Songbird owns and controls the Canary Wharf financial center in the east end of London and received a takeover proposal from major shareholders, Brookfield Properties and the Qatari Investment Fund, subsequent to fiscal year end. Unitech Corporate Parks PLC is a significant owner of large office buildings, which has already accepted an acquisition offer from Brookfield Properties. The Fund’s sixth largest position, Yatra Capital is another Indian investment fund which has chosen to liquidate its investments and return capital to shareholders over a period of time. SM Prime Holdings, Inc. in the Philippines continues to be the seventh largest holding of the Fund. It is the largest owner of shopping malls in the Philippines. Nexity SA remains a top holding and is France’s largest residential developer. The company’s strong capital resources have enabled it to be a significant dividend payer over the last several years. BHG (Brazil Hospitality Group) the ninth largest holding, received a buyout proposal. Great Portland Estates continues to benefit from rising rents in London’s West End.
We note that three of the top ten holdings are subject to acquisition proposals, which serves to illustrate some of the undervalued opportunities we believe underpin long term holdings for the Fund.
Contributors to Performance
Among the top five positive contributors to performance, Songbird Estates rose prior to receiving the aforementioned acquisition proposal. Unitech Corporate Parks benefited from the previously mentioned accepted acquisition offer. Phoenix Mills is another Indian holding
which primarily develops urban shopping malls. Great Portland Estate is a London based developer focused on West End properties and Megaworld is an office and condominium developer in Manila.
Negative contributors were led by companies from Japan and Brazil where negative currency trends contributed to the poor returns. Hulic, which is a rising Japanese office owner, declined after the IPO of its first REIT in January. Direcional, the Brazilian low income homebuilder dropped despite positive short term cash flow and dividend prospects as sentiment towards the Brazilian housing market has deteriorated. In Japan, Kenedix Inc., a sponsor of REITs and funds, declined. General Shopping from Brazil had good underlying performance although certain redeemable debt is priced in U.S. dollars, which impacts short term cash flows. Therefore, the stock declined. Finally, Sao Carlos, the Brazilian office owner, declined during this period under review.
In sum, the top contributors to overall performance during the past year came from the U.K., followed closely by India with notable contributions from Sweden, Mexico and Germany. The principal negative contributions came most notably from holdings in Brazil, as well as Japan, with modest impacts from other markets.
Prospects for Real Estate Equities
We believe the past several years have been an atypical cycle for investing in real estate equities, especially abroad. In our opinion, this is not only due to the strong relative outperformance of U.S. equities and especially real estate stocks, but also due to the near global unidirectional trend in interest rates. Many property companies, particularly the larger ones, have benefited from the low interest rate regime which has allowed them to reduce borrowing costs during a period of stagnant rental growth. Low rates also encouraged income oriented investors seeking higher yields to push share prices to levels in excess of underlying property values. This has been beneficial for companies that embraced consolidation and were able to acquire other companies and/or properties with a combination of inexpensive debt and equity at premium valuations,
*The Fund purchased South Asian Real Estate PLC (“SARE”) through a private placement in 2007. There is no public market for the holding. As of October 31, 2014, the holding was valued based upon an equal weighting of an income approach and a market approach. This represents a change in valuation methodology from the prior period. As of October 31, 2014, the position had increased to approximately 7% of the Fund’s net assets primarily as a result of net outflows from the Fund during the period. Subsequent to period end, the Adviser received updated information from SARE that negatively impacted the Adviser’s view of SARE’s value. Because the nature of the updated information only supported the use of the market approach, the valuation methodology was modified to use only that approach until additional information becomes available. As a result of this updated information, the value of SARE was reduced by approximately 58% and this change is reflected in the net asset value on December 12, 2014.
10
| Alpine International Real Estate Equity Fund (Continued) | |
which enabled earnings accretion and helped push both property and REIT share prices higher. Institutional investors in real estate, including many of the world’s sovereign funds, have contributed to the trend of cap rate compression (which equates to higher property prices) as they pursued real estate acquisitions, in many cases in order to fulfill recently increased real estate allocations. This is a global phenomenon, but is particularly pronounced in North America and Europe, where the upward revaluation of assets is well in advance of top line earnings or rental growth. Needless to say, this is characteristic of the broad equity markets, which are forward looking. The challenge for real estate equities over the near term is that top line rental growth usually lags economic growth.
Since the U.S., and to a lesser degree the U.K., are leading the developed world in the pace of economic recovery and normalization, we suspect that the issue of top line growth at the time when interest rates start to reverse
their 32 year trend of decline could create headwinds for some stocks. We see the growing divergence of the pace of economic normalization around the world as creating opportunities for international investors to outperform - which could well accrue to real estate equities in similar fashion. That said, real estate fundamentals will invariably determine the course of potential returns and, accordingly, we believe that some markets will benefit from rising demand and little or no new property supply. A good example is the Central Business District office market in Dublin, Ireland which experienced a two-thirds fall in rents from 2007, but has begun to recover over the past year. It has benefited from 50% rental growth for the 12-months through September 2014.
Thank you for your interest and support.
Sincerely,
Samuel A. Lieber
Portfolio Manager
11
| Alpine International Real Estate Equity Fund (Continued) | |
This letter represents the opinions of the Fund’s management and is subject to change, is not guaranteed and should not be considered a recommendation to buy or sell any security. The information provided is not intended to be, and is not, a forecast of future events, a guarantee of future results, or investment advice. Views expressed may vary from those of the firm as a whole. Past performance is no guarantee of future results.
Mutual fund investing involves risk. Principal loss is possible. The Fund is subject to risks, including the following:
Concentration Risk – The Fund’s strategy of concentrating in companies in a specific industry means that its performance will be closely tied to the performance of a particular market segment. The Fund’s concentration in these companies may present more risks than if it were broadly diversified over numerous industries and sectors of the economy. A downturn in these companies would have a larger impact on the Fund than on a mutual fund that does not concentrate in such companies. At times, the performance of these companies will lag the performance of other industries or the broader market as a whole.
Currency Risk – The value of investments in securities denominated in foreign currencies increases or decreases as the rates of exchange between those currencies and the U.S. dollar change. Currency conversion costs and currency fluctuations could erase investment gains or add to investment losses. Currency exchange rates can be volatile, and are affected by factors such as general economic conditions, the actions of the U.S. and foreign governments or central banks, the imposition of currency controls and speculation.
Emerging Market Securities Risk – The risks of foreign investments are heightened when investing in issuers in emerging market countries. Emerging market countries tend to have economic, political and legal systems that are less fully developed and are less stable than those of more developed countries. They are often particularly sensitive to market movements because their market prices tend to reflect speculative expectations. Low trading volumes may result in a lack of liquidity and in extreme price volatility.
Equity Securities Risk – The stock or other security of a company may not perform as well as expected, and may decrease in value, because of factors related to the company (such as poorer than expected earnings or certain management decisions) or to the industry in which the company is engaged (such as a reduction in the demand for products or services in a particular industry).
Foreign Currency Transactions Risk – Foreign securities are often denominated in foreign currencies. As a result, the value of the Fund’s shares is affected by changes in exchange rates. The Fund may enter into foreign currency transactions to try to manage this risk. The Fund’s ability to use foreign currency transactions successfully depends on a number of factors, including the foreign currency transactions being available at prices that are not too costly, the availability of liquid markets and the ability of the Adviser to accurately predict the direction of changes in currency exchange rates.
Foreign Securities Risk – The Fund’s investments in securities of foreign issuers or issuers with significant exposure to foreign markets involve additional risk. Foreign countries in which the Fund may invest may have markets that are less liquid, less regulated and more volatile than U.S. markets. The value of the Fund’s investments may decline because of factors affecting the particular issuer as well as foreign markets and issuers generally, such as unfavorable government actions, and political or financial instability. Lack of information may also affect the value of these securities. The risks of foreign investment are heightened when investing in issuers of emerging market countries.
Growth Stock Risk – Growth stocks typically are very sensitive to market movements because their market prices tend to reflect future expectations. When it appears those expectations will not be met, the prices of growth stocks typically fall. Growth stocks as a group may be out of favor and underperform the overall equity market while the market concentrates on undervalued stocks.
Initial Public Offerings and Secondary Offerings Risk – The Fund may invest a portion of its assets in shares of IPOs or secondary offerings of an issuer. IPOs and secondary offerings may have a magnified impact on the performance of a Fund with a small asset base. The impact of IPOs and secondary offerings on a Fund’s performance likely will decrease as the Fund’s asset size increases, which could reduce a Fund’s returns. IPOs and secondary offerings may not be consistently
12
| Alpine International Real Estate Equity Fund (Continued) | |
available to the Fund for investing. IPO and secondary offering shares frequently are volatile in price due to the absence of a prior public market, the small number of shares available for trading and limited information about the issuer. Therefore, the Fund may hold IPO and secondary offering shares for a very short period of time. This may increase the turnover of the Fund and may lead to increased expenses for the Fund, such as commissions and transaction costs. In addition, IPO and secondary offering shares can experience an immediate drop in value if the demand for the securities does not continue to support the offering price.
Interest Rate Risk – Interest rates may rise resulting in a decrease in the value of securities held by the Fund, or may fall resulting in an increase in the value of such securities. Securities having longer maturities generally involve a greater risk of fluctuations in the value resulting from changes in interest rates.
Leverage Risk – The Fund may use leverage to purchase securities. Increases and decreases in the value of the Fund’s portfolio will be magnified when the Fund uses leverage.
Liquidity Risk – Some securities held by the Fund may be difficult to sell, or illiquid, particularly during times of market turmoil. Illiquid securities may also be difficult to value. If the Fund is forced to sell an illiquid asset to meet redemption requests or other cash needs, the Fund may be forced to sell at a loss.
Management Risk – The Adviser’s judgment about the quality, relative yield or value of, or market trends affecting, a particular security or sector, or about interest rates generally, may be incorrect. The Adviser’s security selections and other investment decisions might produce losses or cause the Fund to underperform when compared to other funds with similar investment objectives and strategies.
Market Risk – The price of a security held by the Fund may fall due to changing market, economic or political conditions.
Micro Capitalization Company Risk – Stock prices of micro capitalization companies are significantly more volatile, and more vulnerable to adverse business and economic developments than those of larger companies. Micro capitalization companies often have narrower markets for their goods and/or services and more limited managerial and financial resources than larger, more established companies, including small or medium capitalization companies.
Real Estate Investment Trusts (“REITs”) Risk – REITs’ share prices may decline because of adverse developments affecting the real estate industry including changes in interest rates. The returns from REITs may trail returns from the overall market. Additionally, there is always a risk that a given REIT will fail to qualify for favorable tax treatment.
Real Estate Securities Risk – Risks associated with investment in securities of companies in the real estate industry include: declines in the value of real estate; risks related to local economic conditions, overbuilding and increased competition; increases in property taxes and operating expenses; changes in zoning laws; casualty or condemnation losses; variations in rental income, neighborhood values or the appeal of properties to tenants; changes in interest rates and changes in general economic and market conditions.
Small and Medium Capitalization Company Risk – Securities of small or medium capitalization companies are more likely to experience sharper swings in market values, less liquid markets, in which it may be more difficult for the Adviser to sell at times and at prices that the Adviser believes appropriate and generally are more volatile than those of larger companies.
Undervalued Stock Risk – The Fund may pursue strategies that may include investing in securities, which, in the opinion of the Adviser, are undervalued. The identification of investment opportunities in undervalued securities is a difficult task and there is no assurance that such opportunities will be successfully recognized or acquired. While investments in undervalued securities offer opportunities for above-average capital appreciation, these investments involve a high degree of financial risk and can result in substantial losses.
Please refer to page 3-5 for other important disclosures and definitions.
13
| Alpine Realty Income & Growth Fund | |
| Comparative Annualized Returns as of 10/31/14 (Unaudited) |
| | | 1 Year | | 3 Years | | 5 Years | | 10 Years | | Since Inception(1) | |
| Alpine Realty Income & Growth Fund — Institutional Class | | | 21.90% | | | | 15.66% | | | | 19.61% | | | | 7.21% | | | | 11.68% | | | |
| Alpine Realty Income & Growth Fund — Class A (Without Load) | | | 21.51% | | | | N/A | | | | N/A | | | | N/A | | | | 15.75% | | | |
| Alpine Realty Income & Growth Fund — Class A (With Load) | | | 14.80% | | | | N/A | | | | N/A | | | | N/A | | | | 13.46% | | | |
| MSCI US REIT Index Gross USD | | | 19.19% | | | | 15.10% | | | | 19.31% | | | | 8.86% | | | | 11.43% | | | |
| S&P 500® Index | | | 17.26% | | | | 19.77% | | | | 16.69% | | | | 8.20% | | | | 5.14% | | | |
| Lipper Real Estate Funds Average(2) | | | 18.48% | | | | 14.19% | | | | 18.27% | | | | 8.16% | | | | 10.81% | | | |
| Lipper Real Estate Funds Ranking(2) | | | 7/246 | | | | 14/218 | | | | 13/170 | | | | 100/127 | | | | 14/52 | | | |
| Gross Expense Ratio (Institutional Class): 1.50%(3) | | | | | | | | | | | | | | | | | | | | | | |
| Net Expense Ratio (Institutional Class): 1.43%(3) | | | | | | | | | | | | | | | | | | | | | | |
| Gross Expense Ratio (Class A): 1.75%(3) | | | | | | | | | | | | | | | | | | | | | | |
| Net Expense Ratio (Class A): 1.68%(3) | | | | | | | | | | | | | | | | | | | | | | |
| | (1) | Institutional Class shares commenced on December 29, 1998 and Class A shares commenced on December 30, 2011. Returns for indices are since December 29, 1998. |
| | (2) | The since inception data represents the period beginning December 31, 1998 (Institutional Class only). |
| | (3) | As disclosed in the prospectus dated February 28, 2014. |
Performance data quoted represents past performance and is not predictive of future results. Investment return and principal value of the Fund fluctuate, so that shares, when redeemed, may be worth more or less than their original cost. Performance current to the most recent month end may be lower or higher than the performance quoted and may be obtained by calling 1-888-785-5578. Performance data shown does not reflect the 1.00% redemption fee imposed on shares held for fewer than 60 days. If it did, total returns would be reduced. Returns for the Class A shares with sales charge reflect a maximum sales charge of 5.50%. Performance for the Class A shares without sales charges does not reflect this load.
MSCI US REIT Index Gross USD is a free float-adjusted market capitalization-weighted index that is comprised of the most actively-traded equity REITs that are of reasonable size in terms of full- and free-float-adjusted market capitalization. Source: MSCI. MSCI makes no express or implied warranties or representations and shall have no liability whatsoever with respect to any MSCI data contained herein. The MSCI data may not be further redistributed or used as a basis for other indices or any securities or financial products. This report is not approved, reviewed or produced by MSCI. The S&P 500® Index is a float-adjusted market capitalization-weighted index of 500 common stocks chosen for market size, liquidity, and industry group representation to represent U.S. equity performance. The Lipper Real Estate Funds Average is an average of funds that invest at least 80% of their portfolio in equity securities of domestic and foreign companies engaged in the real estate industry. Lipper rankings for the periods shown are based on fund total returns with dividends and distributions reinvested and do not reflect sales charges. The MSCI US REIT Index, the S&P 500® Index and the Lipper Real Estate Funds Average are unmanaged and do not reflect direct fees associated with a mutual fund, such as investment adviser fees; however, the Lipper Real Estate Funds Average reflects fees charged by the underlying funds. The performance for the Alpine Realty Income & Growth Fund reflects the deduction of fees for these value-added services. Investors cannot directly invest in an index.
Expense Ratios reflect the ratios reported in the Fund’s most recent prospectus. The Alpine Realty Income & Growth Fund has a contractual expense waiver that continues through February 28, 2015. Where a Fund’s gross and net expense ratios are the same for the period reported, the contractual expense reimbursement level was not reached as of the end of that period. To the extent the Fund’s expenses were reduced by waivers, the Fund’s total returns were increased. In these cases, in the absence of the expense waivers, the Fund’s total returns would have been lower.
To the extent that the Fund’s historical performance resulted from gains derived from participation in Initial Public Offerings (“IPOs”) and/or Secondary Offerings, there is no guarantee that these results can be replicated in future periods or that the Fund will be able to participate to the same degree in IPO/Secondary Offerings in the future.
14
| Alpine Realty Income & Growth Fund (Continued) | |
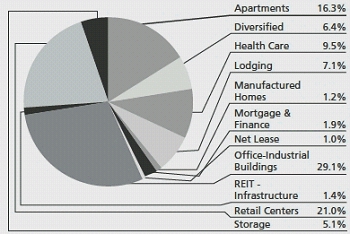
Portfolio Distributions* (Unaudited)
| Top 10 Holdings* (Unaudited) |
| 1. | | Simon Property Group, Inc. | | 8.74% |
| 2. | | Boston Properties, Inc. | | 5.45% |
| 3. | | Vornado Realty Trust | | 4.37% |
| 4. | | Public Storage | | 4.35% |
| 5. | | SL Green Realty Corp. | | 4.14% |
| 6. | | Essex Property Trust, Inc. | | 4.14% |
| 7. | | Equity Residential | | 4.12% |
| 8. | | Prologis, Inc. | | 3.78% |
| 9. | | Alexandria Real Estate Equities, Inc. | | 3.71% |
| 10. | | AvalonBay Communities, Inc. | | 3.46% |
| * | Portfolio Distributions percentages are based on total investments. Top 10 Holdings do not include short-term investments and percentages are based on total net assets. Portfolio holdings and sector distributions are as of 10/31/14 and are subject to change. Portfolio holdings are not recommendations to buy or sell any securities. |
Value of a $10,000 Investment (Unaudited)

This chart represents a comparison of a hypothetical $10,000 investment in the Fund versus a similar investment in the Fund’s benchmarks. The graph and the table do not reflect the deduction of taxes that a shareholder would pay on Fund distributions or the redemption of Fund shares. Investment performance reflects the waiver and recovery of certain fees, if applicable. Without the waiver and recovery of fees, the Fund’s total return would have differed.
Performance data quoted represents past performance and is not predictive of future results. Investment return and principal value of the Fund fluctuate, so that shares, when redeemed, may be worth more or less than their original cost.
15
| Alpine Realty Income & Growth Fund (Continued) | |
Commentary
We are pleased to report the results of the Alpine Realty Income & Growth Fund for the fiscal year that ended October 31, 2014. During this period, the Fund produced a total return of 21.90% which compares to the 18.48% return of the Lipper Real Estate Funds Average, the 19.19% return of the MSCI US REIT Index Gross USD (the “RMS Index”), and the 17.26% return of the S&P 500® Index (the “S&P”). All references in this letter to the Fund’s performance relate to the performance of the Fund’s Institutional Class.
At October 31, 2014, the Fund’s net asset value had increased to $21.29 from $18.17 twelve months prior. During this timeframe, the Fund paid four quarterly distributions of $0.1875 per share totaling $0.75 per share for the fiscal period. Since its inception at $10.00 per share on December 29, 1998 through October 31, 2014, the Fund has delivered an annualized total return to shareholders of 11.68% which includes cumulative distributions of $16.23. The performance chart on page 14 presents the Fund’s returns for the latest one-year, three-year, five year, ten-year, and since inception periods.
In our view, the most impactful factors influencing returns for REIT securities during the fiscal period were (i) low long term interest rates highlighted by the Ten-Year U.S Treasury rate which stood at 2.34% at the end of the period; (ii) continued improvement in real estate property fundamentals; (iii) relatively benign levels of new supply additions; and (iv) an abundance of investor appetite for both direct property investment in the private market and for debt instruments in both the public and private markets. Though REIT securities decreased in value during the first two months of the fiscal period as the Ten-Year Treasury rate increased to 3.03%, by December 31, 2013 the RMS Index rebounded strongly and produced a total return of 25.40% during the next ten months through October 31, 2014, as the Ten-Year Treasury rate decreased to a low of 2.14% in mid-October before increasing to its 2.34% level at the end of the month. We believe these historically low rates increased investor demand for yield investments such as REIT securities and direct real estate ownership that hold out the prospect of rising dividend yields and property cash flow as the economy improves. In the private market, such demand from investors, including U.S. and foreign pension plans and sovereign wealth funds, was exemplified by some very large transactions announced during the period, including the $1.95 billion purchase of the Waldorf Astoria Hotel in New York by the China-based Anbang Insurance Group, the $1.827 billion purchase of a 45% interest in three properties from Boston
Properties by Norges Bank Investment Management, and the $2.25 billion agreement to purchase a single office tower, 1095 Avenue of Americas in New York, by a venture led by Ivanhoe Cambridge, the real estate division of Canadian pension plan Caisse de depot et placement du Quebec. Meanwhile, in the public market, reflecting investor demand for REIT securities investment, the RMS Index closed out the fiscal period at an all-time high. In our opinion, investor confidence in U.S commercial real estate has been buoyed by signs of continued economic improvement, including a decrease in the unemployment rate from 7.2% at October 31, 2013 to 5.8% on October 31, 2014; an increase in the Conference Board’s Index of Consumer Confidence which rose from 72.38 at the beginning of the fiscal period to 94.10at the end, the highest reading since October 2007; and consensus forecast for GDP (Gross Domestic Product) growth of 3.0% for 2015.
For the Fund, the top contributors to its 21.90% total return were a combination of large capitalization REITs with dominant market positions and companies with business strategies and assets serving those regional centers with the highest levels of innovation, economic growth, and corresponding job creation. Simon Property Group, the largest owner of regional malls and outlet centers and the Fund’s largest individual holding, delivered strong earnings growth despite relatively flat retail tenant sales, producing the biggest positive contribution to the Fund’s return. In the office sector, where we have significantly overweighted companies operating on the east and west coasts, our holdings in Boston Properties, Vornado Realty Trust, SL Green Realty, Alexandria Real Estate Equities, and Kilroy Realty were all top contributors. Within the residential apartment sector, the Fund experienced strong performances by Equity Residential, AvalonBay Communities, and Essex Property Trust, all of which benefitted from above-average occupancy and revenue growth in the west coast markets from southern California north to Seattle. Finally, Digital Realty Trust, the preeminent owner and developer of data centers, improved its operations and communications with the Street and produced the highest individual return for the Fund. Relative to the overall return of the RMS Index, the Fund’s most positive attribution was produced by our overweight positions in Digital Realty, Alexandria Real Estate, Kilroy, Essex, and Boston Properties and our underweight position in American Realty Capital Properties, a net lease REIT which fell sharply at the end of the fiscal period after announcing accounting irregularities.
16
| Alpine Realty Income & Growth Fund (Continued) | |
Holdings that underperformed REIT average returns and detracted from performance included the aforementioned American Realty Capital Properties; Washington Prime Group, a retail shopping center owner; Crombie Real Estate Investment Trust, a Canadian owner of primarily convenience-based retail properties; Starwood Waypoint Residential Trust, an owner of single family homes for rent; and Campus Crest Communities, an owner and developer of student housing projects. Washington Prime, spun out of Simon Property Group in May 2014, saw its share price decline after announcing its proposed acquisition of another REIT, Glimcher Realty, in September. Crombie was impacted by both below average earnings growth and an approximate 7.5% decline in the Canadian dollar relative to U.S. currency. Starwood Waypoint, which was spun off from the Fund’s holding in Starwood Property Trust, fell in price from its initial trading level, and was subsequently sold by the Fund. Campus Crest, purchased by the Fund in late September, disappointed the Street with its below average leasing results but subsequently in early November announced changes in leadership and business strategy and has rebounded above the Fund’s basis in this holding. Relative to the overall returns of the RMS Index, the securities that created the most impactful negative attribution to performance were overweight positions in CBL & Associates, an operator of middle-market shopping malls with lagging growth in net operating income; Crombie; Starwood Hotels, a non-REIT lodging company, whose international exposure to Europe and Asia concerned investors; and Home Properties, whose ownership of apartment communities in the sluggish Washington, D.C. metropolitan area served as a drag on performance, and our underweight position in Host Hotels, a lodging REIT that saw its results benefitted from the rebound in group business.
As we look forward, it is our view that the push-and-pull between the direction of long term interest rates and the performance of REIT securities will continue in the 2015 fiscal year. Despite improving economic conditions in the United States, it seems that central banks in Europe and Asia are motivated to maintain low interest rates in an attempt to stimulate economic growth and, in some instances, avoid recession. As a result, while we believe that directionally the long term trend in interest rates is upwards from current levels, depressed yields on foreign obligations may keep U.S Treasury rates somewhat subdued.
Predicting when rates will rise and potentially impact disproportionately the valuations of those REITs with slower growth prospects is problematic. Yet we nevertheless believe it remains prudent to underweight such entities within the Fund and favor those companies that have proven strength and opportunities for creating shareholder value through development and redevelopment activities and that operate in regional markets which are experiencing the strongest economic growth. Additionally, we anticipate that we will continue to employ low levels of leverage both in the execution of the Fund’s strategy and to manage unexpected Fund flows. We look forward to providing an update on Fund performance after the end of semi-annual period in April, 2015.
Sincerely,
Robert W. Gadsden
Portfolio Manager
17
| Alpine Realty Income & Growth Fund (Continued) | |
Earnings growth is not representative of the funds future performance.
This letter represents the opinions of the Fund’s management and is subject to change, is not guaranteed and should not be considered a recommendation to buy or sell any security. The information provided is not intended to be, and is not, a forecast of future events, a guarantee of future results, or investment advice. Views expressed may vary from those of the firm as a whole. Past performance is no guarantee of future results.
Mutual fund investing involves risk. Principal loss is possible. The Fund is subject to risks, including the following:
Concentration Risk – The Fund’s strategy of concentrating in companies in a specific industry means that its performance will be closely tied to the performance of a particular market segment. The Fund’s concentration in these companies may present more risks than if it were broadly diversified over numerous industries and sectors of the economy. A downturn in these companies would have a larger impact on the Fund than on a mutual fund that does not concentrate in such companies. At times, the performance of these companies will lag the performance of other industries or the broader market as a whole.
Convertible Securities Risk – The Fund can invest in securities that can be exercised for or converted into common stocks (such as warrants or convertible preferred stock). While offering greater potential for long-term growth, common stocks and similar equity securities are more volatile and more risky than some other forms of investment. Therefore, the value of your investment in the Fund may sometimes decrease instead of increase. Convertible securities include other securities, such as warrants, that provide an opportunity for equity participation. Because convertible securities can be converted into equity securities, their values will normally increase or decrease as the values of the underlying equity securities increase or decrease. The movements in the prices of convertible securities, however, may be smaller than the movements in the value of the underlying equity securities.
Credit Risk – Credit risk refers to the possibility that the issuer of a security will not be able to make payments of interest and principal when due. Changes in an issuer’s credit rating or the market’s perception of an issuer’s creditworthiness may also affect the value of the Fund’s investment in that issuer. The degree of credit risk depends on both the financial condition of the issuer and the terms of the obligation.
Dividend Strategy Risk – The Fund’s strategy of investing in dividend-paying stocks involves the risk that such stocks may fall out favor with investors and underperform the market. Companies that issue dividend paying-stocks are not required to continue to pay dividends on such stocks. Therefore, there is the possibility that such companies could reduce or eliminate the payment of dividends in the future.
Equity Securities Risk – The stock or other security of a company may not perform as well as expected, and may decrease in value, because of factors related to the company (such as poorer than expected earnings or certain management decisions) or to the industry in which the company is engaged (such as a reduction in the demand for products or services in a particular industry).
Fixed Income Securities Risk – Fixed income securities are subject to issuer risk, interest rate risk and market risk.
Growth Stock Risk – Growth stocks typically are very sensitive to market movements because their market prices tend to reflect future expectations. When it appears those expectations will not be met, the prices of growth stocks typically fall. Growth stocks as a group may be out of favor and underperform the overall equity market while the market concentrates on undervalued stocks.
Initial Public Offerings and Secondary Offerings Risk – The Fund may invest a portion of its assets in shares of IPOs or secondary offerings of an issuer. IPOs and secondary offerings may have a magnified impact on the performance of a Fund with a small asset base. The impact of IPOs and secondary offerings on a Fund’s performance likely will decrease as the Fund’s asset size increases, which could reduce a Fund’s returns. IPOs and secondary offerings may not be consistently available to the Fund for investing. IPO and secondary offering shares frequently are volatile in price due to the absence of a prior public market, the small number of shares available for trading and limited information about the issuer. Therefore, the Fund may hold IPO and secondary offering shares for a very short period of time. This may increase the turnover of the Fund and may lead to increased expenses for the Fund, such as commissions and transaction costs. In addition, IPO and secondary offering shares can experience an immediate drop in value if the demand for the securities does not continue to support the offering price.
18
| Alpine Realty Income & Growth Fund (Continued) | |
Interest Rate Risk – Interest rates may rise resulting in a decrease in the value of securities held by the Fund, or may fall resulting in an increase in the value of such securities. Securities having longer maturities generally involve a greater risk of fluctuations in the value resulting from changes in interest rates.
Leverage Risk – The Fund may use leverage to purchase securities. Increases and decreases in the value of the Fund’s portfolio will be magnified when the Fund uses leverage.
Management Risk – The Adviser’s judgment about the quality, relative yield or value of, or market trends affecting, a particular security or sector, or about interest rates generally, may be incorrect. The Adviser’s security selections and other investment decisions might produce losses or cause the Fund to underperform when compared to other funds with similar investment objectives and strategies.
Market Risk – The price of a security held by the Fund may fall due to changing market, economic or political conditions.
Non-Diversified Fund Risk – Performance of a non-diversified fund may be more volatile than a diversified fund because a non-diversified fund may invest a greater percentage of its total assets in the securities of a single issuer.
Preferred Stock Risk – Preferred stock represents an interest in a company that generally entitles the holder to receive, in preference to the holders of common stock, dividends and a fixed share of the proceeds resulting from a liquidation of the company. Preferred stocks may pay fixed or adjustable rates of return. Preferred stock has investment characteristics of both fixed income and equity securities. However, the value of these securities tends to vary more with fluctuations in the underlying common stock and less with fluctuations in interest rates and tends to exhibit greater volatility.
Real Estate Investment Trusts (“REITs”) Risk – REITs’ share prices may decline because of adverse developments affecting the real estate industry including changes in interest rates. The returns from REITs may trail returns from the overall market. Additionally, there is always a risk that a given REIT will fail to qualify for favorable tax treatment.
Real Estate Securities Risk – Risks associated with investment in securities of companies in the real estate industry include: declines in the value of real estate; risks related to local economic conditions, overbuilding and increased competition; increases in property taxes and operating expenses; changes in zoning laws; casualty or condemnation losses; variations in rental income, neighborhood values or the appeal of properties to tenants; changes in interest rates and changes in general economic and market conditions.
Small and Medium Capitalization Company Risk – Securities of small or medium capitalization companies are more likely to experience sharper swings in market values, less liquid markets, in which it may be more difficult for the Adviser to sell at times and at prices that the Adviser believes appropriate and generally are more volatile than those of larger companies.
Undervalued Stock Risk – The Fund may pursue strategies that may include investing in securities, which, in the opinion of the Adviser, are undervalued. The identification of investment opportunities in undervalued securities is a difficult task and there is no assurance that such opportunities will be successfully recognized or acquired. While investments in undervalued securities offer opportunities for above-average capital appreciation, these investments involve a high degree of financial risk and can result in substantial losses.
Please refer to pages 3-5 for other important disclosures and definitions.
19
| Alpine Cyclical Advantage Property Fund |  |
| Comparative Annualized Returns as of 10/31/14 (Unaudited) | | | |
| | | 1 Year | | 3 Years | | 5 Years | | 10 Years | | Since Inception
(9/1/1993) | |
| Alpine Cyclical Advantage Property Fund — Institutional Class | | | -0.70% | | | | 13.51% | | | | 10.13% | | | | -0.31% | | | | 8.04% | | | |
| FTSE EPRA/NAREIT® Global Index(1) | | | 9.35% | | | | 12.72% | | | | 11.94% | | | | N/A | | | | N/A | | | |
| S&P Developed Property Net Total Return Index(2) | | | 9.59% | | | | 13.12% | | | | 12.58% | | | | 7.16% | | | | N/A | | | |
| Lipper Global Real Estate Funds Average(3) | | | 10.87% | | | | 12.93% | | | | 12.18% | | | | 6.18% | | | | 9.08% | | | |
| Lipper Global Real Estate Funds Ranking(3) | | | 138/138 | | | | 35/104 | | | | 94/95 | | | | 24/24 | | | | 2/2 | | | |
| Gross Expense Ratio: 1.43%(4) | | | | | | | | | | | | | | | | | | | | | | |
| Net Expense Ratio: 1.43%(4) | | | | | | | | | | | | | | | | | | | | | | |
| | (1) | Index commenced on February 18, 2005. |
| | (2) | Index commenced on December 29, 2000. |
| | (3) | The since inception data represents the period beginning September 2, 1993. |
| | (4) | As disclosed in the prospectus dated February 28, 2014. |
Performance data quoted represents past performance and is not predictive of future results. Investment return and principal value of the Fund fluctuate, so that shares, when redeemed, may be worth more or less than their original cost. Performance current to the most recent month end may be lower or higher than the performance quoted and may be obtained by calling 1-888-785-5578. Performance data shown does not reflect the 1.00% redemption fee imposed on shares held for fewer than 60 days. If it did, total returns would be reduced.
The FTSE EPRA/NAREIT® Global Index is an unmanaged index designed to track the performance of publicly-traded companies engaged in the real estate business in developed and emerging real estate markets/regions around the world. The funds or securities referred to herein are not sponsored, endorsed, or promoted by the index providers, and the index providers bear no liability with respect to any such funds or securities or any index on which such funds or securities are based. The prospectus contains a more detailed description of the limited relationship the index providers have with the licensee and any related funds. The S&P Developed Property Net Total Return Index is an unmanaged market-weighted total return index available on a monthly basis. The index consists of many companies from developed markets whose floats are larger than $100 million and derive more than half of their revenue from property-related activities. The Lipper Global Real Estate Funds Average is an average of funds that invest at least 25% of their equity portfolio in shares of companies engaged in the real estate industry that are strictly outside of the U.S. or whose securities are principally traded outside of the U.S. Lipper rankings for the periods shown are based on fund total returns with dividends and distributions reinvested and do not reflect sales charges. The FTSE EPRA/NAREIT® Global Index, the S&P Developed Property Net Total Return Index and the Lipper Global Real Estate Funds Average are unmanaged and do not reflect direct fees associated with a mutual fund, such as investment adviser fees; however, the Lipper Global Real Estate Funds Average reflects fees charged by the underlying funds. The performance for the Alpine Cyclical Advantage Property Fund reflects the deduction of fees for these value-added services. Investors cannot directly invest in an index.
To the extent that the Fund’s historical performance resulted from gains derived from participation in Initial Public Offerings (“IPOs”) and/or Secondary Offerings, there is no guarantee that these results can be replicated in future periods or that the Fund will be able to participate to the same degree in IPO/Secondary Offerings in the future.
20
| Alpine Cyclical Advantage Property Fund (Continued) |  |
Portfolio Distributions* (Unaudited)
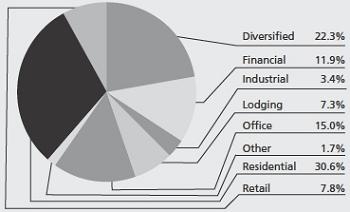
| Top 10 Holdings* (Unaudited) | | |
| 1. | | LXB Retail Properties PLC | 3.00 | % |
| 2. | | Starwood Property Trust, Inc. | 2.96 | % |
| 3. | | Kenedix, Inc. | 2.80 | % |
| 4. | | Colony Financial, Inc. | 2.72 | % |
| 5. | | Songbird Estates PLC | 2.50 | % |
| 6. | | Hulic Co., Ltd. | 2.31 | % |
| 7. | | Two Harbors Investment Corp. | 2.09 | % |
| 8. | | DR Horton, Inc. | 1.99 | % |
| 9. | | Megaworld Corp. | 1.93 | % |
| 10. | | Sao Carlos Empreendimentos | | |
| | | e Participacoes SA | 1.88 | % |
| * | Portfolio Distributions percentages are based on total investments. Top 10 Holdings do not include short-term investments and percentages are based on total net assets. Portfolio holdings and sector distributions are as of 10/31/14 and are subject to change. Portfolio holdings are not recommendations to buy or sell any securities. |
Value of a $10,000 Investment (Unaudited)
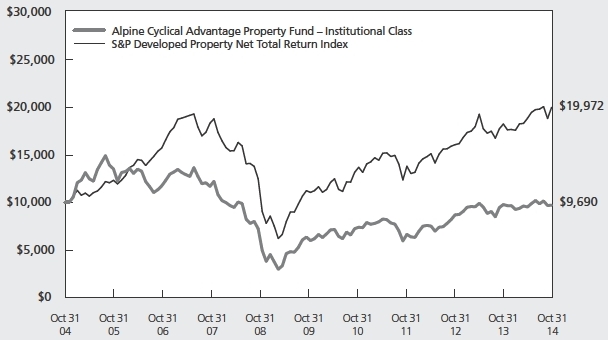
This chart represents a comparison of a hypothetical $10,000 investment in the Fund versus a similar investment in the Fund’s benchmarks. The graph and the table do not reflect the deduction of taxes that a shareholder would pay on Fund distributions or the redemption of Fund shares. Investment performance reflects the waiver and recovery of certain fees, if applicable. Without the waiver and recovery of fees, the Fund’s total return would have differed.
Performance data quoted represents past performance and is not predictive of future results. Investment return and principal value of the Fund fluctuate, so that shares, when redeemed, may be worth more or less than their original cost.
21
| Alpine Cyclical Advantage Property Fund (Continued) | |
Commentary
Dear Shareholders:
We are pleased to present the 2014 annual report for the Alpine Cyclical Advantage Property Fund. For the twelve months ended October 31, 2014, the Fund generated a total return of -0.70%. This compares with the total return for the Fund’s primary benchmark index, the FTSE EPRA/NAREIT® Global Real Estate Index of 9.35%. The Fund’s secondary benchmark, the S&P Developed Property Net TR IndexTM, generated a total return of 9.59%.
As we noted in the President’s letter, broadly speaking, US equities generally outperformed international or non-US equities this year. We believe this reflects America’s faster return to normalized economic levels than much of the rest of the world. Related to this, the US Dollar has been strengthening over the past year, particularly in the final three months of the fiscal year. It’s been a period characterized by significant currency volatility, with the Japanese Yen, Swedish Krona, Brazilian Real, the Euro and the Australian Dollar all weakening relative to the US Dollar by 7% to 12%. The Indian Rupee gained a bit over 1% and was one of the few currencies in the portfolio to strengthen in the period. The Fund hedged a portion of its Yen exposure for most of its fiscal year. The currency hedging mitigated the overall negative impact of currency in the portfolio. We have also used leverage both in the execution of the strategy of the Fund and to manage inflows and outflows during the fiscal year.
In addition to currencies, it is noteworthy that the dramatic disparity in performance of real estate equity returns favored U.S. REITs. For the twelve months ended October 31, 2014, the MSCI U.S. REIT Total Return Index gained 19.19%. This outperformed all global and country real estate indices with the exception of the United Arab Emirates and Sweden. As we will discuss in the following section on portfolio composition, the Fund was underweight U.S. equities. The portfolio continues to be focused on both growth situations and undervalued opportunities. This is reflected in both the geographic distribution of the portfolio, as well as individual stock holdings. Increasingly, this reflects the widening divergence among countries experiencing improving economic conditions, countries that appear to be bottoming and should benefit from aggressive monetary and/or fiscal stimulus, and those countries that are still suffering from severe structural and/or fiscal deficits leading to weak demand and/or high unemployment. In the first category, the U.S. and U.K. stand out. In the second category, China and India are promising, as is Japan. Europe is a bit more questionable and varied, although Ireland looks very
promising and Spain has potential. In the third category, several emerging market countries, notably across commodity driven economies in Latin America and Asia, may be in for a rocky ride, although their valuations may support potential upside appreciation.
Portfolio Positioning
In comparing fiscal year end 2013 with fiscal year end 2014, the major change in composition of the Fund is the decline in North and South American holdings from 50.1% to 40% of the portfolio. Asian exposure went from 33.8% to 37.9% and European exposure was increased somewhat from 19.6% to just about 26% of the portfolio. The main impact on performance, however, was a decline in U.S. exposure from 35.4% to 28.6% of the portfolio. Brazil was also reduced from 11.7% to 7.6%, while Mexico remained stable for the balance. Other significant holdings are the U.K., which rose from 8.8% to 13.6%, and Japan which declined from 15.6% to 12.9% for the fiscal year end. Notable changes also occurred in China/Hong Kong, which had a combined weight of 1.9% last year and we increased to 8% by the end of this fiscal year. In similar fashion, India grew from 1.7% to 4.8% of the portfolio. Notably, other countries were added, specifically, the United Arab Emirates which rose from no representation to 2.2% this year, Spain which grew from 0% to 1.4% and Ireland where we grew from 0% to 2% of the portfolio.
Top Ten Holdings
The Fund’s top ten holdings also changed materially, with only four companies surviving from last year’s top ten to the end of this fiscal year. The largest holding in the Fund is LXB Retail Property Trust. This developer of retail power centers throughout England is in the process of completing its pipeline of projects. Starwood Property Trust was also in last year’s top ten. This commercial mortgage lender has been expanding its portfolio to Europe as well as related asset classes. Also from last year, Kenedix Inc., declined even though this manager and sponsor of REITs and private equity funds launched new projects. New to the top ten but not the Fund is Colony Financial, an entrepreneurial lender of multi real estate asset classes. Songbird Estates of the U.K. grew into a top ten position. It controls the Canary Wharf financial center in London’s East End, along the Thames, and received a takeover bid from its major shareholder after the end of the 2014 fiscal year. Next, Hulic, formerly the Fund’s second largest holding, experienced a share price decline following the IPO launch of its first REIT. Two Harbors
22
| Alpine Cyclical Advantage Property Fund (Continued) | |
Investment Corp. is the Fund’s seventh largest holding. It expanded the scope of its residential mortgage portfolios. Domestic homebuilder, D.R. Horton announced new brands at both the top and bottom of its price range to expand market share. Megaworld is the largest developer of call center offices, as well as major condominium builder in Manila. Finally, the tenth largest holding by ending weight is Sao Carlos, the Brazilian office developer.
Contributors To Performance
The portfolio’s top contributor for the year was a German company, Patrizia Immobilien, which manages and sponsors real estate investment funds for institutions. Songbird Estates and Starwood Property Trust, discussed above, were also top contributors to performance. Supalai, a Thai condo developer, contributed to the Fund’s total return. Kolte-Patil Development gained for the portfolio as it continues to expand its range of offerings in Pune and Mumbai, India. Notably, companies that had significant deleterious effect on the portfolio were from countries with notable currency depreciation, such as Japan, where the number three decliner Hulic, previously mentioned, declined in value during the fiscal period, as did Kenedix. Direcional, the Brazilian low income homebuilder, dropped despite positive short term cash flow and dividend prospects as sentiment towards the Brazilian housing market has deteriorated.
The most notable detractors were Ocwen Financial Corp. and related company, Altisource Portfolio Solutions. These were both strong contributors to the portfolio for the prior fiscal year. Ocwen Financial Corp. is the country’s largest investor in mortgage servicing rights, which they have typically acquired from large banks. However, Ocwen’s shares have declined significantly due to ongoing investigations into the company’s business practices.
In sum, the top contributors to overall performance during the past year came from the U.K., followed closely by India with notable contributions from Sweden, Mexico and Germany. The principal negative contributions came most notably from the Fund’s U.S. and Brazil holdings, as well as from Japan.
Prospects for Real Estate Equities
We believe the past several years have been an atypical cycle for investing in real estate equities, especially abroad. In our opinion, this is not only due to the strong relative outperformance of U.S. equities and especially real estate stocks, but also due to the near global unidirectional trend in interest rates. Many property companies, particularly the larger ones, have benefited
from the low interest rate regime which has allowed them to reduce borrowing costs during a period of stagnant rental growth. Low rates also encouraged income oriented investors seeking higher yields to push share prices to levels in excess of underlying property values. This has been beneficial for companies that embraced consolidation and were able to acquire other companies and/or properties with a combination of inexpensive debt and equity at premium valuations, which enabled earnings accretion and helped push both property and REIT share prices higher. Institutional investors in real estate, including many of the world’s sovereign funds, have contributed to the trend of cap rate compression (which equates to higher property prices) as they pursued real estate acquisitions, in many cases in order to fulfill recently increased real estate allocations. This is a global phenomenon, but is particularly pronounced in North America and Europe, where the upward revaluation of assets is well in advance of top line earnings or rental growth. Needless to say, this is characteristic of the broad equity markets, which are forward looking. The challenge for real estate equities over the near term is that top line rental growth usually lags economic growth.
Since the U.S., and to a lesser degree the U.K., are leading the developed world in the pace of economic recovery and normalization, we suspect that the issue of top line growth at the time when interest rates start to reverse their 32 year trend of decline could create headwinds for some stocks. We see the growing divergence of the pace of economic normalization around the world as creating opportunities for international investors to outperform –which could well accrue to real estate equities in similar fashion. That said, real estate fundamentals will invariably determine the course of potential returns and, accordingly, we believe that some markets will benefit from rising demand and little or no new property supply. A good example is the Central Business District office market in Dublin, Ireland which experienced a two-thirds fall in rents from 2007, but has begun to recover over the past year. It has benefited from 50% rental growth for the 12-months through September 2014.
Thank you for your interest and support.
Sincerely,
Samuel A. Lieber
Portfolio Manager
23
| Alpine Cyclical Advantage Property Fund (Continued) | |
This letter represents the opinions of the Fund’s management and is subject to change, is not guaranteed and should not be considered a recommendation to buy or sell any security. The information provided is not intended to be, and is not, a forecast of future events, a guarantee of future results, or investment advice. Views expressed may vary from those of the firm as a whole. Past performance is no guarantee of future results.
Mutual fund investing involves risk. Principal loss is possible. The Fund is subject to risks, including the following:
Concentration Risk – The Fund’s strategy of concentrating in companies in a specific industry means that its performance will be closely tied to the performance of a particular market segment. The Fund’s concentration in these companies may present more risks than if it were broadly diversified over numerous industries and sectors of the economy. A downturn in these companies would have a larger impact on the Fund than on a mutual fund that does not concentrate in such companies. At times, the performance of these companies will lag the performance of other industries or the broader market as a whole.
Currency Risk – The value of investments in securities denominated in foreign currencies increases or decreases as the rates of exchange between those currencies and the U.S. dollar change. Currency conversion costs and currency fluctuations could erase investment gains or add to investment losses. Currency exchange rates can be volatile, and are affected by factors such as general economic conditions, the actions of the U.S. and foreign governments or central banks, the imposition of currency controls and speculation.
Equity Securities Risk – The stock or other security of a company may not perform as well as expected, and may decrease in value, because of factors related to the company (such as poorer than expected earnings or certain management decisions) or to the industry in which the company is engaged (such as a reduction in the demand for products or services in a particular industry).
Foreign Currency Transactions Risk – Foreign securities are often denominated in foreign currencies. As a result, the value of the Fund’s shares is affected by changes in exchange rates. The Fund may enter into foreign currency transactions to try to manage this risk. The Fund’s ability to use foreign currency transactions successfully depends on a number of factors, including the foreign currency transactions being available at prices that are not too costly, the availability of liquid markets and the ability of the Adviser to accurately predict the direction of changes in currency exchange rates.
Foreign Securities Risk – The Fund’s investments in securities of foreign issuers or issuers with significant exposure to foreign markets involve additional risk. Foreign countries in which the Fund may invest may have markets that are less liquid, less regulated and more volatile than U.S. markets. The value of the Fund’s investments may decline because of factors affecting the particular issuer as well as foreign markets and issuers generally, such as unfavorable government actions, and political or financial instability. Lack of information may also affect the value of these securities. The risks of foreign investments are heightened when investing in issuers in emerging market countries.
Growth Stock Risk – Growth stocks are stocks of companies believed to have above-average potential for growth in revenue and earnings. Growth stocks typically are very sensitive to market movements because their market prices tend to reflect future expectations. When it appears those expectations will not be met, the prices of growth stocks typically fall. Growth stocks as a group may be out of favor and underperform the overall equity market while the market concentrates on undervalued stocks.
Initial Public Offerings and Secondary Offerings Risk – The Fund may invest a portion of its assets in shares of IPOs or secondary offerings of an issuer. IPOs and secondary offerings may have a magnified impact on the performance of a Fund with a small asset base. The impact of IPOs and secondary offerings on a Fund’s performance likely will decrease as the Fund’s asset size increases, which could reduce a Fund’s returns. IPOs and secondary offerings may not be consistently available to the Fund for investing. IPO and secondary offering shares frequently are volatile in price due to the absence of a prior public market, the small number of shares available for trading and limited information about the issuer. Therefore, the Fund may hold IPO and secondary offering shares for a very short period of time. This may increase the turnover of the Fund and may lead to increased expenses for the Fund, such as commissions and transaction costs. In addition, IPO and secondary offering shares can experience an immediate drop in value if the demand for the securities does not continue to support the offering price.
Interest Rate Risk – Interest rates may rise resulting in a decrease in the value of securities held by the Fund, or may fall resulting in an increase in the value of such securities. Securities having longer maturities generally involve a greater risk of fluctuations in the value resulting from changes in interest rates.
24
| Alpine Cyclical Advantage Property Fund (Continued) | |
Liquidity Risk – Some securities held by a Fund may be difficult to sell, or illiquid, particularly during times of market turmoil. Illiquid securities may also be difficult to value. If a Fund is forced to sell an illiquid asset to meet redemption requests or other cash needs, the Fund may be forced to sell at a loss.
Management Risk – The Adviser’s judgment about the quality, relative yield or value of, or market trends affecting, a particular security or sector, or about interest rates generally, may be incorrect. The Adviser’s security selections and other investment decisions might produce losses or cause the Fund to underperform when compared to other funds with similar investment objectives and strategies.
Market Risk – The price of a security held by the Fund may fall due to changing market, economic or political conditions.
Micro Capitalization Company Risk – Stock prices of micro capitalization companies are significantly more volatile, and more vulnerable to adverse business and economic developments than those of larger companies. Micro capitalization companies often have narrower markets for their goods and/or services and more limited managerial and financial resources than larger, more established companies, including small or medium capitalization companies.
Real Estate Investment Trusts (“REITs”) Risk – REITs’ share prices may decline because of adverse developments affecting the real estate industry including changes in interest rates. The returns from REITs may trail returns from the overall market. Additionally, there is always a risk that a given REIT will fail to qualify for favorable tax treatment.
Real Estate Securities Risk – Risks associated with investment in securities of companies in the real estate industry include: declines in the value of real estate; risks related to local economic conditions, overbuilding and increased competition; increases in property taxes and operating expenses; changes in zoning laws; casualty or condemnation losses; variations in rental income, neighborhood values or the appeal of properties to tenants; changes in interest rates and changes in general economic and market conditions.
Small and Medium Capitalization Company Risk – Securities of small or medium capitalization companies are more likely to experience sharper swings in market values, less liquid markets, in which it may be more difficult for the Adviser to sell at times and at prices that the Adviser believes appropriate and generally are more volatile than those of larger companies.
Undervalued Stock Risk – The Fund may pursue strategies that may include investing in securities, which, in the opinion of the Adviser, are undervalued. The identification of investment opportunities in undervalued securities is a difficult task and there is no assurance that such opportunities will be successfully recognized or acquired. While investments in undervalued securities offer opportunities for above-average capital appreciation, these investments involve a high degree of financial risk and can result in substantial losses.
Please refer to page 3-5 for other important disclosures and definitions.
25
| Alpine Emerging Markets Real Estate Fund | |
| Comparative Annualized Returns as of 10/31/14 (Unaudited) | | | |
| | | 1 Year | | 3 Years | | 5 Years | | Since Inception(1) | |
| Alpine Emerging Markets Real Estate Fund — Institutional Class | | | 2.29% | | | | 6.97% | | | | 4.52% | | | | 13.39% | | |
| Alpine Emerging Markets Real Estate Fund — Class A (Without Load) | | | 2.01% | | | | N/A | | | | N/A | | | | 10.47% | | |
| Alpine Emerging Markets Real Estate Fund — Class A (With Load) | | | -3.61% | | | | N/A | | | | N/A | | | | 8.29% | | |
| FTSE EPRA/NAREIT® Emerging Total Return Index(2) | | | -1.32% | | | | 6.08% | | | | 2.71% | | | | N/A | | |
| S&P Developed Ex-U.S. Property Total Return Index | | | 3.78% | | | | 13.04% | | | | 10.03% | | | | 14.40% | | |
| MSCI Emerging Markets Index USD | | | 0.64% | | | | 3.24% | | | | 4.64% | | | | 12.81% | | |
| Lipper Global Real Estate Funds Average(3) | | | 10.84% | | | | 12.93% | | | | 12.18% | | | | 14.39% | | |
| Lipper Global Real Estate Funds Ranking(3) | | | 136/138 | | | | 104/104 | | | | 95/95 | | | | 65/81 | | |
| Gross Expense Ratio (Institutional Class): 2.35%(4) | | | | | | | | | | | | | | | | | |
| Net Expense Ratio (Institutional Class): 1.35%(4) | | | | | | | | | | | | | | | | | |
| Gross Expense Ratio (Class A): 2.60%(4) | | | | | | | | | | | | | | | | | |
| Net Expense Ratio (Class A): 1.60%(4) | | | | | | | | | | | | | | | | | |
| | (1) | Institutional Class shares commenced on November 3, 2008 and Class A shares commenced on December 30, 2011. Returns for indices are since November 3, 2008. |
| | (2) | Index commenced on January 2, 2009. |
| | (3) | The since inception data represents the period beginning November 6, 2008 (Institutional Class only). |
| | (4) | As disclosed in the prospectus dated February 28, 2014. |
Performance data quoted represents past performance and is not predictive of future results. Investment return and principal value of the Fund fluctuate, so that shares, when redeemed, may be worth more or less than their original cost. Performance current to the most recent month end may be lower or higher than the performance quoted and may be obtained by calling 1-888-785-5578. Performance data shown does not reflect the 1.00% redemption fee imposed on shares held for fewer than 60 days. If it did, total returns would be reduced. Returns for the Class A shares with sales charge reflect a maximum sales charge of 5.50%. Performance for the Class A shares without sales charges does not reflect this load.
The FTSE EPRA/NAREIT® Emerging Index is an unmanaged index designed to track the performance of listed real estate securities companies in emerging countries worldwide. The funds or securities referred to herein are not sponsored, endorsed, or promoted by the index providers, and the index providers bear no liability with respect to any such funds or securities or any index on which such funds or securities are based. The prospectus contains a more detailed description of the limited relationship the index providers have with the licensee and any related funds. The S&P Developed Ex-U.S. Property Total Return Index defines and measures the investable universe of publicly-traded real estate companies domiciled in developed countries outside of the United States. The companies in the Index are engaged in real estate-related activities such as property ownership, management, development, rental and investment. MSCI Emerging Markets Index USD is a free float-adjusted market cap-weighted index that is designed to measure equity market performance in the global emerging markets. Source: MSCI. MSCI makes no express or implied warranties or representations and shall have no liability whatsoever with respect to any MSCI data contained herein. The MSCI data may not be further redistributed or used as a basis for other indices or any securities or financial products. This report is not approved, reviewed or produced by MSCI. The Lipper Global Real Estate Funds Average is an average of funds that invest at least 25% of their equity portfolio in shares of companies engaged in the real estate industry that are strictly outside of the U.S. or whose securities are principally traded outside of the U.S. Lipper rankings for the periods shown are based on fund total returns with dividends and distributions reinvested and do not reflect sales charges. The FTSE EPRA/NAREIT® Emerging Index, the S&P Developed Ex-US Property Total Return Index, the MSCI Emerging Markets Index USD and the Lipper Global Real Estate Funds Average are unmanaged and do not reflect direct fees associated with a mutual fund, such as investment adviser fees; however, the Lipper Global Real Estate Funds Average reflects fees charged by the underlying funds. The performance for the Alpine Emerging Markets Real Estate Fund reflects the deduction of fees for these value-added services. Investors cannot directly invest in an index.
Expense Ratios reflect the ratios reported in the Fund’s most recent prospectus. The Alpine Emerging Markets Real Estate Fund has a contractual expense waiver that continues through February 28, 2015. Where a Fund’s gross and net expense ratios are the same for the period reported, the contractual expense reimbursement level was not reached as of the end of that period. To the extent the Fund’s expenses were reduced by waivers, the Fund’s total returns were increased. In these cases, in the absence of the expense waivers, the Fund’s total returns would have been lower.
To the extent that the Fund’s historical performance resulted from gains derived from participation in Initial Public Offerings (“IPOs”) and/or Secondary Offerings, there is no guarantee that these results can be replicated in future periods or that the Fund will be able to participate to the same degree in IPO/Secondary Offerings in the future.
26
| Alpine Emerging Markets Real Estate Fund (Continued) | |
Portfolio Distributions* (Unaudited)
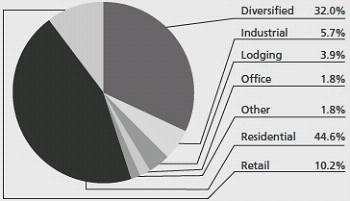
| Top 10 Holdings* (Unaudited) |
| 1. | | China Overseas Land & Investment, Ltd. | | 9.17% |
| 2. | | Emaar Properties PJSC | | 7.17% |
| 3. | | China Vanke Co., Ltd.-Class H | | 4.31% |
| 4. | | China Resources Land, Ltd. | | 4.27% |
| 5. | | Shimao Property Holdings, Ltd. | | 3.89% |
| 6. | | Fibra Uno Administracion SA de CV | | 3.69% |
| 7. | | Ayala Land, Inc. | | 2.93% |
| 8. | | Growthpoint Properties, Ltd. | | 2.78% |
| 9. | | BR Malls Participacoes SA | | 2.11% |
| 10. | | SM Prime Holdings, Inc. | | 2.10% |
| * | Portfolio Distributions percentages are based on total investments. Top 10 Holdings do not include short-term investments and percentages are based on total net assets. Portfolio holdings and sector distributions are as of 10/31/14 and are subject to change. Portfolio holdings are not recommendations to buy or sell any securities. |
Value of a $10,000 Investment (Unaudited)
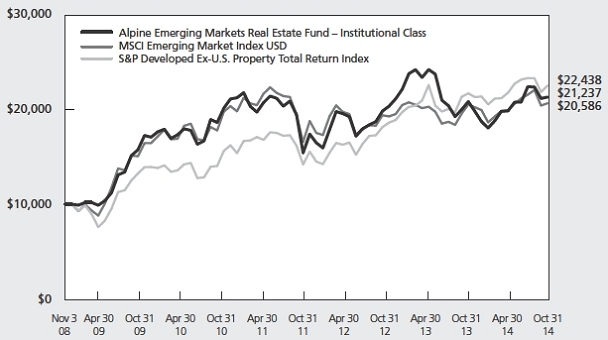
This chart represents a comparison of a hypothetical $10,000 investment in the Fund versus a similar investment in the Fund’s benchmarks. The graph and the table do not reflect the deduction of taxes that a shareholder would pay on Fund distributions or the redemption of Fund shares. Investment performance reflects the waiver and recovery of certain fees, if applicable. Without the waiver and recovery of fees, the Fund’s total return would have differed.
Performance data quoted represents past performance and is not predictive of future results. Investment return and principal value of the Fund fluctuate, so that shares, when redeemed, may be worth more or less than their original cost.
27
| Alpine Emerging Markets Real Estate Fund (Continued) | |
Commentary
We present below the annual results for the Alpine Emerging Markets Real Estate Fund. For the 12-month period ended October 31, 2014, the closing NAV was $17.30 per share, representing a total return of 2.29% for the period. The Fund’s benchmark index, the FTSE EPRA/NAREIT® Emerging Index returned -1.32% adjusted in U.S. dollar terms over the same period. Over that same time frame the MSCI Emerging Markets Index finished with a total return of 0.64% and the S&P Developed Ex-U.S. Property Total ReturnTM Index returned 3.78%. All references in this letter to the Fund’s performance relate to the performance of the Fund’s Institutional Class.
Performance Drivers
Emerging Market (EM) real estate equity returns lagged the broader EM universe and significantly under-performed developed market real estate. Concerns over the timing and magnitude of U.S. monetary policy, weakening outlook for Chinese growth and uncertainty about political reforms weighed on flows into the space as well as relative share performance. Market volatility was elevated as geopolitical tensions, in particular the threat of Russian aggression in the Ukraine, escalating tensions in the Middle East and the imposition of martial law in Thailand, spiked. Weakening commodity markets, in particular the price of oil, and further evidence of disinflation in Europe prompted a rethink on the outlook for global demand in general. With this backdrop, sentiment for riskier assets was uneven at best. Tactical enthusiasm for EM waned as optimism over reform policies exited the honeymoon phase, while skepticism resurfaced over China’s ability to balance reform while preserving a politically acceptable level of growth and social stability. Reform agendas in select EM economies, ample global liquidity despite the Fed’s taper program, as well as the implementation of targeted counter-cyclical policy action in China put a floor under performance but could not stoke a sustainable recovery. As a result, dispersion of EM real estate equity returns across geographies and asset types remained pronounced, which is consistent with Alpine’s view that the current macroeconomic climate could provide interesting opportunities for active management and stock selection.
Portfolio Analysis
Active management of the portfolio again played a pivotal role in the overall performance of the fund, underpinning our long-held expectation for a growing dispersion of equity returns across countries and asset classes as the global recovery slowly gains traction. The overweight
allocation in Egypt as well as the weighting and stock selection in India and Mexico provided the largest contributions to relative performance. While the underweight in South Africa, stock selection in Singapore and the off-index positions in Japan and Greece detracted from relative performance.
At period end the top 10 positions accounted for 42.42% of the portfolio versus 37.35% twelve months ago. Portfolio construction reflected our top down views. During the year the weightings in Brazil and Thailand were pared back significantly due to a deteriorating fiscal position in the former and political unrest and weakening domestic consumption trends in the latter. Country allocations which benefited from this shift included: the United Arab Emirates (UAE), Mexico, Egypt and the Philippines. The UAE has benefitted from its status as a safe-haven in the Middle East which has underpinned a broad recovery in the real estate market. The exposure to Mexico was increased due to the enactment of an ambitious reform agenda and its unique position as a beneficiary of the US recovery. The Egyptian market has been buoyed by expectations for a stable polictical landscape and reform to the region while the Philippines remains one of the strongest macro stories. The Fund maintained its significant underweight to the South African market due to a weak macro outlook and instability in the currency.
The top five contributors to the Fund’s absolute performance over the period under discussion based on contribution to total return were Emaar Properties, Sixth of October, China Vanke, Phoenix Mills, and Sobha Developers.
| • | Emaar Properties, a UAE based real estate developer focusing on large-scale, mixed use (primarily residential, retail and hotel) projects across the Middle East and North Africa region was the top contributor to the Fund’s performance. The company has been the main beneficiary of the real estate recovery in Dubai and the strong growth of tourism in the region. |
| | |
| • | Sixth of October is an Egyptian property developer targeting the middle and high end segments of the Cairo home market. Its strong balance sheet, recent landbank expansion and robust sales momentum in an environment of political reconciliation supported strength in the shares. The Fund’s participation in a steeply discounted rights issue significantly enhanced returns. |
28
| Alpine Emerging Markets Real Estate Fund (Continued) | |
| • | China Vanke, is one of the largest residential developers in China. The company is more concentrated on end user demand, which allows it to focus on quicker asset turns, shorter landbank duration and maintaining higher RoEs versus peers. |
| | |
| • | Sobha Developers is a Bangalore-based, fully-integrated Indian developer. Its premium positioning, superior execution capabilities and strong cashflow generation are some key differentiators. |
| | |
| • | Phoenix Mills is India’s larger owner/developer of iconic integrated retail projects. The company is positioned to benefit from strong underlying fundamentals, continued delivery of its development pipeline and the ongoing deleveraging of its balance sheet. |
The top five negative contributors to the Fund’s absolute performance for the year ended October 31, 2014 based on contribution to total return were China Resources Land, BR Malls, Country Garden, Kenedix and Shimao Property.
| • | China Resources Land is one of the leading landlords and developers in China focused on mixed use projects. Performance of the Chinese developers across the board is quite sensitive to policy announcements and liquidity support. Fears over the growth outlook for China as a whole and less favorable supply/demand outlook driving weakening property fundamentals in select markets has weighed on sector performance. Reform agenda implementation has hit the shadow banking and trust finance systems placing further pressure on the balance sheet outlook for many developers. |
| | |
| • | BR Malls is the largest owner/operator of malls in Brazil. The challenging macro environment, expectations for a weak operating environment and election uncertainty weighed on the shares. |
| | |
| • | Country Garden is one of the leading mass-residential developers in China focused on large-scale community projects in tier-three cities. |
| | |
| • | Kenedix is a real estate investment fund providing real estate advisory, asset management services and principal investment in Japan. Weakness in the period was driven by a deteriorating outlook in Japan. |
| | |
| • | Shimao Property, a residential builder targeting integrated development projects in tier 1-2 markets in China. |
Outlook
The Alpine Emerging Markets Real Estate Fund focuses on real estate investments primarily in developing economies
that we believe are positioned to be at the forefront of global growth. The Fund seeks out opportunities with solid demographic and urbanization trends, robust credit markets, and resilient macro-economic fundamentals, consistent with our structural view that superior risk-adjusted returns can be achieved in markets with broadening domestic consumption fueled by a growing middle class.
The uneven recovery of global growth and the significant slack in aggregate demand overall remains at the forefront of investor fears of a growth scare. However the scope of caution should be kept in proportion as the International Monetary Fund’s (IMF) downward Gross Domestic Product (GDP) forecast revisions mask very disparate economic potentials and trajectories. According to most of the sequential data, the US economy finally appears to be reaching escape velocity. While the 5% growth expectation for EM economies in 2015 is below historical trend, it nevertheless implies a doubling of total output in less than 15 years. The current outlook, while marginally below potential, does not appear consistent with lingering fears of stagnation.
Now that the U.S. exit from quantitative easing (QE) is behind us, the market is re-training its gaze on the transformative event of monetary policy normalization by the Fed and how it plans to navigate a rather protracted period of diverging global monetary policies. Spillover effects of divergent monetary policies could likely remain one of the dominant drivers of asset market volatility and returns for the foreseeable future. Indeed, it would not be beyond the realm of consideration that the prevailing low yield environment could trigger investor concerns that the bond markets are merely foreshadowing further risks to aggregate demand on the horizon. Futures markets currently suggest that the timing of the Fed starting to raise rates has been pushed to the second half of 2015, with a measured pace of tightening thereafter. While a prolonged transition period could likely skew short term risk/reward dynamics, intensify volatility and test fiscal imbalances in certain developing economies, we believe that as reforms gain more traction and Fed policy direction firms up that confidence in this recovery (now six years in the making) could finally take hold in earnest. In the interim, the monetary environment is expected to remain extremely accommodative with the European Central Bank (ECB) edging closer to implementing its own version of quantitative easing and Japan surprising the market with further plans to expand its monetary base. Weak underlying inflation trends could provide flexibility for certain EM central banks to ease policy as commodity disinflation filters through to the real economy.
29
| Alpine Emerging Markets Real Estate Fund (Continued) | |
Global growth, below trend inflation and low real interest rates have generally supported EM real estate returns historically, however sensitivity to macro imbalances as well as the slope and velocity of expected yield curve adjustments could prompt reflexive flashes of risk aversion. Notably, FX could become a more relevant component of total return as US yields drift higher and currency depreciation remains an important macro adjustment mechanism. As a result, investors are likely to maintain a tactical stance toward EM overall until there is more clarity on the actual execution of reforms and clearer evidence of a recovery in corporate margins and earnings. While we are acutely aware of the challenges weighing on the recovery across EM, particularly in the more imbalanced economies, we do not see any convincing arguments leading us to stray materially from our thesis that the key emerging economies are expected to continue to be a strong source of demand, exhibit market resilience, and realign with their long-term growth trends. Ultimately, we could expect the drivers underpinning demand for EM in general and for real estate equities specifically such as urbanization trends, demographics and the growth of the aspirational middle class to support positive net absorption trends as well as rent/occupancy gains. Differentiation - whether in markets, asset types or growth models - should remain a dominant theme in portfolio construction.
Some of the critical signposts for Alpine’s assessment of the reacceleration of demand in EM include: the magnitude and implementation of structural reforms, the geopolitical landscape, the vulnerability to external funding of selective countries, and crucially perhaps is the direction of the growth/inflation dynamic. Over the medium-term, we believe many EM economies could continue to underpin global growth based on the recovery of domestic demand, as well as urbanization and positive demographic trends. As the developing countries strive to become deeper and more integrated, it is Alpine’s view that over time the emerging equity markets could increase substantially in absolute terms as more companies come public and eventually even surpass developed markets in terms of market capitalization. At the same time we expect growth differentials between EMs and DMs to stabilize over the medium term, which could support a structural reallocation to EM equities.
Alpine’s Real Estate team seeks to carefully evaluate the risk/reward proposition of each position in the portfolio and monitors volatility. The managers remain extremely selective in our approach to the markets and deploying capital. We thank our shareholders for their support.
Sincerely,
Joel E.D. Wells
Sam Lieber
Portfolio Managers
This letter represents the opinions of the Fund’s management and is subject to change, is not guaranteed and should not be considered a recommendation to buy or sell any security. The information provided is not intended to be, and is not, a forecast of future events, a guarantee of future results, or investment advice. Views expressed may vary from those of the firm as a whole. Past performance is no guarantee of future results.
Mutual fund investing involves risk. Principal loss is possible. The Fund is subject to risks, including the following:
Concentration Risk – The Fund’s strategy of concentrating in companies in a specific industry means that its performance will be closely tied to the performance of a particular market segment. The Fund’s concentration in these companies may present more risks than if it were broadly diversified over numerous industries and sectors of the economy. A downturn in these companies would have a larger impact on the Fund than on a mutual fund that does not concentrate in such companies. At times, the performance of these companies will lag the performance of other industries or the broader market as a whole.
Currency Risk – The value of investments in securities denominated in foreign currencies increases or decreases as the rates of exchange between those currencies and the U.S. dollar change. Currency conversion costs and currency fluctuations could erase investment gains or add to investment losses. Currency exchange rates can be volatile, and are affected by factors such as general economic conditions, the actions of the U.S. and foreign governments or central banks, the imposition of currency controls and speculation.
Emerging Market Securities Risk – The risks of foreign investments are heightened when investing in issuers in emerging market countries. Emerging market countries tend to have economic, political and legal systems that are less fully developed and are less stable than those of more developed countries. They are often particularly sensitive to market movements because their market prices tend to reflect speculative expectations. Low trading volumes may result in a lack of liquidity and in extreme price volatility.
30
| Alpine Emerging Markets Real Estate Fund (Continued) | |
Equity Securities Risk – The stock or other security of a company may not perform as well as expected, and may decrease in value, because of factors related to the company (such as poorer than expected earnings or certain management decisions) or to the industry in which the company is engaged (such as a reduction in the demand for products or services in a particular industry).
Foreign Currency Transactions Risk – Foreign securities are often denominated in foreign currencies. As a result, the value of the Fund’s shares is affected by changes in exchange rates. The Fund may enter into foreign currency transactions to try to manage this risk. The Fund’s ability to use foreign currency transactions successfully depends on a number of factors, including the foreign currency transactions being available at prices that are not too costly, the availability of liquid markets and the ability of the Adviser to accurately predict the direction of changes in currency exchange rates.
Foreign Securities Risk – The Fund’s investments in securities of foreign issuers or issuers with significant exposure to foreign markets involve additional risk. Foreign countries in which the Fund may invest may have markets that are less liquid, less regulated and more volatile than U.S. markets. The value of the Fund’s investments may decline because of factors affecting the particular issuer as well as foreign markets and issuers generally, such as unfavorable government actions, and political or financial instability. Lack of information may also affect the value of these securities. The risks of foreign investment are heightened when investing in issuers of emerging market countries.
Growth Stock Risk – Growth stocks typically are very sensitive to market movements because their market prices tend to reflect future expectations. When it appears those expectations will not be met, the prices of growth stocks typically fall. Growth stocks as a group may be out of favor and underperform the overall equity market while the market concentrates on undervalued stocks.
Initial Public Offerings and Secondary Offerings Risk – The Fund may invest a portion of its assets in shares of IPOs or secondary offerings of an issuer. IPOs and secondary offerings may have a magnified impact on the performance of a Fund with a small asset base. The impact of IPOs and secondary offerings on a Fund’s performance likely will decrease as the Fund’s asset size increases, which could reduce a Fund’s returns. IPOs and secondary offerings may not be consistently available to the Fund for investing. IPO and secondary offering shares frequently are volatile in price due to the absence of a prior public market, the small number of shares available for trading and limited information about the issuer. Therefore, the Fund may hold IPO and secondary offering shares for a very short period of time. This may increase the turnover of the Fund and may lead to increased expenses for the Fund, such as commissions and transaction costs. In addition, IPO and secondary offering shares can experience an immediate drop in value if the demand for the securities does not continue to support the offering price.
Interest Rate Risk – Interest rates may rise resulting in a decrease in the value of securities held by the Fund, or may fall resulting in an increase in the value of such securities. Securities having longer maturities generally involve a greater risk of fluctuations in the value resulting from changes in interest rates.
Liquidity Risk – Some securities held by the Fund may be difficult to sell, or illiquid, particularly during times of market turmoil. Illiquid securities may also be difficult to value. If the Fund is forced to sell an illiquid asset to meet redemption requests or other cash needs, the Fund may be forced to sell at a loss.
Management Risk – The Adviser’s judgment about the quality, relative yield or value of, or market trends affecting, a particular security or sector, or about interest rates generally, may be incorrect. The Adviser’s security selections and other investment decisions might produce losses or cause the Fund to underperform when compared to other funds with similar investment objectives and strategies.
Market Risk – The price of a security held by the Fund may fall due to changing market, economic or political conditions.
Micro Capitalization Company Risk – Stock prices of micro capitalization companies are significantly more volatile, and more vulnerable to adverse business and economic developments than those of larger companies. Micro capitalization companies often have narrower markets for their goods and/or services and more limited managerial and financial resources than larger, more established companies, including small or medium capitalization companies.
Real Estate Investment Trusts (“REITs”) Risk – REITs’ share prices may decline because of adverse developments affecting the real estate industry including changes in interest rates. The returns from REITs may trail returns from the overall market. Additionally, there is always a risk that a given REIT will fail to qualify for favorable tax treatment.
31
| Alpine Emerging Markets Real Estate Fund (Continued) | |
Real Estate Securities Risk – Risks associated with investment in securities of companies in the real estate industry include: declines in the value of real estate; risks related to local economic conditions, overbuilding and increased competition; increases in property taxes and operating expenses; changes in zoning laws; casualty or condemnation losses; variations in rental income, neighborhood values or the appeal of properties to tenants; changes in interest rates and changes in general economic and market conditions.
Small and Medium Capitalization Company Risk – Securities of small or medium capitalization companies are more likely to experience sharper swings in market values, less liquid markets, in which it may be more difficult for the Adviser to sell at times and at prices that the Adviser believes appropriate and generally are more volatile than those of larger companies.
Undervalued Stock Risk – The Fund may pursue strategies that may include investing in securities, which, in the opinion of the Adviser, are undervalued. The identification of investment opportunities in undervalued securities is a difficult task and there is no assurance that such opportunities will be successfully recognized or acquired. While investments in undervalued securities offer opportunities for above-average capital appreciation, these investments involve a high degree of financial risk and can result in substantial losses.
Please refer to pages 3-5 for other important disclosures and definitions.
32
| Alpine Global Infrastructure Fund |  |
| Comparative Annualized Returns as of 10/31/14 (Unaudited) |
| | | 1 Year | | 3 Years | | 5 Years | | Since Inception(1) | |
| Alpine Global Infrastructure Fund — Institutional Class | | | 10.52% | | | | 17.16% | | | | 15.70% | | | | 18.55% | | |
| Alpine Global Infrastructure Fund — Class A (Without Load) | | | 10.22% | | | | N/A | | | | N/A | | | | 18.67% | | |
| Alpine Global Infrastructure Fund — Class A (With Load) | | | 4.15% | | | | N/A | | | | N/A | | | | 16.32% | | |
| S&P Global Infrastructure IndexTM | | | 14.26% | | | | 12.83% | | | | 10.78% | | | | 11.78% | | |
| MSCI All Country World Daily Total Return Index (Net Div) | | | 7.77% | | | | 12.98% | | | | 10.57% | | | | 12.51% | | |
| Lipper Global Infrastructure Funds Average(2) | | | 14.29% | | | | 14.39% | | | | 13.52% | | | | 14.42% | | |
| Lipper Global Infrastructure Funds Ranking(2) | | | 56/67 | | | | 23/49 | | | | 15/33 | | | | 4/25 | | |
| Gross Expense Ratio (Institutional Class): 1.25%(3) | | | | | | | | | | | | | | | | | |
| Net Expense Ratio (Institutional Class): 1.25%(3) | | | | | | | | | | | | | | | | | |
| Gross Expense Ratio (Class A): 1.50%(3) | | | | | | | | | | | | | | | | | |
| Net Expense Ratio (Class A): 1.50%(3) | | | | | | | | | | | | | | | | | |
| | (1) | Institutional Class shares commenced on November 3, 2008 and Class A shares commenced on December 30, 2011. Returns for indices are since November 3, 2008. |
| | (2) | The since inception data represents the period beginning November 6, 2008 (Institutional Class only). |
| | (3) | As disclosed in the prospectus dated February 28, 2014. |
Performance data quoted represents past performance and is not predictive of future results. Investment return and principal value of the Fund fluctuate, so that shares, when redeemed, may be worth more or less than their original cost. Performance current to the most recent month end may be lower or higher than the performance quoted and may be obtained by calling 1-888-785-5578. Performance data shown does not reflect the 1.00% redemption fee imposed on shares held for fewer than 60 days. If it did, total returns would be reduced. Returns for the Class A shares with sales charge reflect a maximum sales charge of 5.50%. Performance for the Class A shares without sales charges does not reflect this load.
The S&P Global Infrastructure IndexTM is comprised of 75 of the largest publicly-listed infrastructure companies that meet specific investability requirements. The Index is designed to provide liquid exposure to the leading publicly-listed companies in the global infrastructure industry, from both developed markets and emerging markets. The MSCI All Country World Daily Total Return Index (NetDiv) is a free float-adjusted market capitalization-weighted index that is designed to measure the equity market performance of developed and emerging markets. Source: MSCI. MSCI data may not be reproduced or used for any other purpose. The Lipper Specialty/Miscellaneous Funds Average is an average of funds that limit their investments to a specific industry (e.g. transportation, retailing, or paper, etc.) or ones that have not been classified into an existing investment classification. To create diversified exposure across the global listed infrastructure market, the index has balanced weights across three distinct infrastructure clusters: utilities, transportation, and energy. The S&P Global Infrastructure IndexTM, MSCI All Country World TR Index (Net Div) and the Lipper Specialty/Miscellaneous Global Infrastructure Funds Average are unmanaged and do not reflect direct fees associated with a mutual fund, such as investment adviser fees; however, the Lipper Global Infrastructure Funds Average reflects fees charged by the underlying funds. The performance for the Alpine Global Infrastructure Fund reflects the deduction of fees for these value-added services. Lipper rankings for the periods shown are based on fund total returns with dividends and distributions reinvested and do not reflect sales charges. Investors cannot directly invest in an index.
Expense Ratios reflect the ratios reported in the Fund’s most recent prospectus. The Alpine Global Infrastructure Fund has a contractual expense waiver that continues through February 28, 2015. Where a Fund’s gross and net expense ratios are the same for the period reported, the contractual expense reimbursement level was not reached as of the end of that period. To the extent the Fund’s expenses were reduced by waivers, the Fund’s total returns were increased. In these cases, in the absence of the expense waivers, the Fund’s total returns would have been lower.
The Fund’s past performance benefited significantly from Initial Public Offerings (“IPOs”) and Secondary Offerings of certain issuers. There is no assurance that the Fund can replicate this performance in the future. Additionally, there is no guarantee that the Fund will be able to participate to the same degree in IPO/Secondary Offerings in the future.
33
| Alpine Global Infrastructure Fund (Continued) |  |
Portfolio Distributions* (Unaudited)
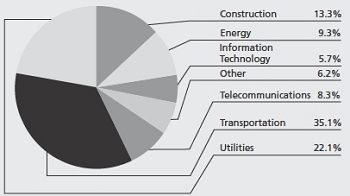
| Top 10 Holdings* (Unaudited) | | |
| 1. | | Canadian Pacific Railway, Ltd. | | 2.17% |
| 2. | | Union Pacific Corp. | | 2.11% |
| 3. | | Ferrovial SA | | 1.99% |
| 4. | | Enbridge, Inc. | | 1.97% |
| 5. | | American Tower Corp. | | 1.96% |
| 6. | | Vinci SA | | 1.91% |
| 7. | | The Williams Cos., Inc. | | 1.90% |
| 8. | | The Geo Group, Inc. | | 1.88% |
| 9. | | Obrascon Huarte Lain SA | | 1.63% |
| 10. | | Genesee & Wyoming, Inc.-Class A | | 1.63% |
| * | Portfolio Distributions percentages are based on total investments. Top 10 Holdings do not include short-term investments and percentages are based on total net assets. Portfolio holdings and sector distributions are as of 10/31/14 and are subject to change. Portfolio holdings are not recommendations to buy or sell any securities. |
Value of a $10,000 Investment (Unaudited)
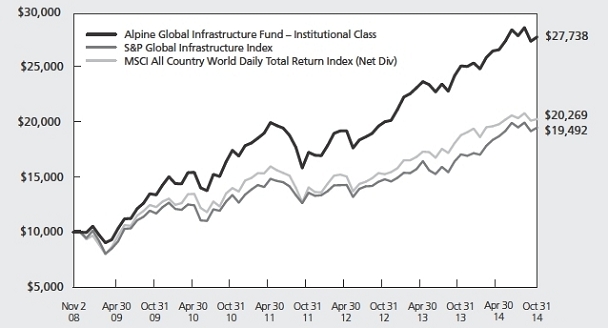
This chart represents a comparison of a hypothetical $10,000 investment in the Fund versus a similar investment in the Fund’s benchmarks. The graph and the table do not reflect the deduction of taxes that a shareholder would pay on Fund distributions or the redemption of Fund shares. Investment performance reflects the waiver and recovery of certain fees, if applicable. Without the waiver and recovery of fees, the Fund’s total return would have differed.
Performance data quoted represents past performance and is not predictive of future results. Investment return and principal value of the Fund fluctuate, so that shares, when redeemed, may be worth more or less than their original cost.
34
| Alpine Global Infrastructure Fund (Continued) | |
Commentary
Dear Investor
For the fiscal year ended October 31, 2014, the Alpine Global Infrastructure Fund reported a 10.52% total return versus the S&P Global Infrastructure IndexTM, which had a total return of 14.26%. All references in this letter to the Fund’s performance relate to the performance of the Fund’s Institutional Class.
Performance Drivers
Global equities continued their impressive ascent during the 12-month period ended October 31, 2014, but the dispersion of returns among different geographic regions was striking. The total return of the S&P 500® Index, at 17.26%, contrasted sharply with that of the MSCI Europe Index (down 0.52% in U.S. Dollar terms) and the MSCI Emerging Markets Index (up 0.64%). With economic prospects in the U.S. remaining relatively sanguine as compared to most other countries, particularly in Europe, the U.S. trade-weighted Dollar Index rose by about 8% during the period, driven largely by the 8% depreciation in the Euro and the 14% depreciation in the Japanese Yen against the Dollar.
The S&P 500 Utilities Index was up 21.89% and the STOXX 600 Utilities Index was up 11.89% compared to the S&P 500® Index, which gained 17.26%, and the STOXX 600 Index, which was down 0.49%. Our underweight in utilities compared to our benchmark, the S&P Global Infrastructure IndexTM, contributed to the Fund’s underperformance. We believe that utilities as a group are expensive relative to their historical valuations and other sectors in which we may invest. We are focused on specific opportunities within the utility sector such as water. In addition, the Fund underperformed in the construction sector due to our exposure to companies with emerging markets exposure.
The Fund outperformed in the transportation sector due to its exposure to the railway sector both in North America and in China. The North American railroads have outperformed due to industry trends such as the shale revolution, improving domestic output, and a shortage of truck drivers. Certain companies within this sector have made operational improvements. For example, Hunter Harrison, the CEO of Canadian Pacific, improved the efficiency of the company’s rail operations.
The Fund has also participated in a number of Initial Public Offerings (“IPO”) and Secondary Offerings, both inside and outside of the infrastructure sector, that have contributed to the Fund’s total return. We cannot predict
how long, if at all, these opportunities will continue to exist, but to the extent we consider IPO’s to be attractively priced and available, the Fund may continue to participate in them.
A significant portion of the Fund’s holdings were held outside the U.S. and denominated in foreign currencies. As a result of a strengthening dollar, these currencies had a negative impact on the Fund’s performance.
Emerging Market Exposure
We believe that the urbanization of emerging market countries will be an important driver of infrastructure development and spending. The MSCI Emerging Markets Index, the Ibovespa Index (Brazil) and the Hang Seng Index (Hong Kong) all underperformed both the S&P 500® Index and the STOXX 600 Index during the 12-month period ended October 31, 2014. During this period, the Fund’s exposure to emerging markets was overweight versus its benchmark. Emerging markets were a negative contributor to the Fund’s overall return. We believe that infrastructure spending in emerging markets may continue to increase. Therefore, we continue to maintain an overweight position as compared to the benchmark in those markets. The Fund’s investments in Brazil lagged in emerging markets as growth was below expectations and the anticipation of Dilma Rousseff winning re-election hurt the stock market.
Portfolio Analysis
The top five stocks contributing to the Fund’s performance for the 12-month period ended October 31, 2014, based on contribution to total return were Adani Ports & Special Economic Zone (“ADSEZ”), Abengoa (“ABG”), The Williams Companies (“WMB”), Union Pacific Corporation (“UNP”), and Canadian Pacific Railway (“CP”).
Adani Ports & Special Economic Zone is the largest private port operator in India. The election of new Prime Minister, Narendra Modi, improved business sentiment in India and raised expectations for policy reform. ADSEZ’s port business experienced strong volume growth, with its largest port growing 15% from calendar year 2013 to calendar year 2014. The acquisition of Dhamra Port was also positive given its strategic value.
Abengoa is a global integrated engineering & construction and concessions company based in Spain. ABG benefited from the successful initial public offering of Abengoa Yield (“ABY”) in the United States. ABY is a dividend-oriented company with a portfolio of long-term
35
| Alpine Global Infrastructure Fund (Continued) | |
contracted assets. Abengoa holds an approximately 65% stake in ABY and plans to sell additional assets to ABY in the future, as part of its asset rotation strategy.
The Williams Companies is a diversified natural gas company in the United States. In June, WMB announced a transaction that had the effect of merging Access Midstream L.P. and Williams Partners L.P. The result of the transaction restored financial flexibility at Williams Partners L.P. and also created a higher and more visible distribution growth.
Union Pacific is a Class 1 transcontinental railway in the United States. UNP was able to leverage volume growth, raise prices and lower its operating costs – all driving earnings growth. It also gained market share as its Western competitor struggled with congestion issues. UNP set a new operating ratio goal of 60% by FY19, as it is on track to achieve its prior goal of 65% in 2017 by the end of FY14.
Canadian Pacific Railway is a Class 1 transcontinental railway serving Canada and the United States. CP is in the midst of its impressive turnaround story achieving a mid-60s (percent) operating ratio goal. At its analyst day in October 2014, the company positioned itself as a structural growth story targeting 10% revenue growth, low 60s operating ratio, and approximately doubling its earnings per share (EPS) by 2018. We believe CP should benefit from themes such as the energy renaissance, industrial resurgence, and tight trucking capacity in the US.
The following companies had the largest adverse impact on the performance of the Fund based on contribution to return for the fiscal year ended October 31, 2014: Mills Estruturas E Servicos De Engenharia (“MILLS”), All America Latina Logistica (“ALL”), Obrascon Huarte Lain (“OHL”), Ecorodovias Infraestrutura e Logistica S.A (“ECOR”) and Grana y Montero (“GRAM”).
Mills Estruturas E Servicos De Engenharia is an engineering & construction, industrial services and real estate company in Brazil. Mills suffered as the Brazilian economy slipped into recession and economic activity dipped ahead of October Presidential elections. We believe the company could rebound as infrastructure project activity recovers post-elections.
All America Latina Logistica (ALL) is a rail operator in Brazil. ALL continued to suffer from uncertainty from a contract dispute with its customer Rumo. A proposal to merge ALL and Rumo was announced in mid-February and is currently awaiting regulatory approval. We believe the merger may resolve the contract dispute and may generate cost and operational synergies.
Obrascon Huarte Lain (OHL) is a global engineering & construction and concessions company based in Spain. OHL debt levels increased as it had a seasonal working capital outflow. Its stakes in listed-companies, Abertis Infraestructuras and OHL Mexico, declined in value as the underlying companies experienced volatility. We believe that the company may recover as working capital seasonality reverses, allowing it to repay debt and its listed stakes recover.
Ecorodovias Infraestrustura e Logistica is a transportation company with road, port and logistics assets in Brazil. ECOR suffered as the Brazilian economy fell into recession and traffic levels were negatively impacted by the World Cup and Presidential elections. The company failed to win new concessions as a result of a competitive bidding environment, and its port and logistics operations were weak. Looking ahead, we believe that the company should be positioned to win new road concession projects and its port and logistics operations should stabilize.
Grana y Montero is an engineering & construction company in Peru. GRAM’s new order activity has declined along with Peruvian mining-related industries. The new finance minister may use infrastructure spending to fill the gap, which may benefit GRAM.
Summary and Outlook
We launched the Alpine Global Infrastructure Fund because we believe that there are special opportunities to benefit from global spending in infrastructure over the next several decades. Even before the financial crisis began to wreak havoc on the budgets of governments and municipalities, the privatization of infrastructure assets began to take place. Now, even more so, we believe there will be an accelerated effort to privatize these assets as public entities will not have the funds to maintain their current infrastructure assets nor to build new infrastructure assets to meet the needs of a growing population. Throughout the world, the owners of infrastructure are primarily government entities. However, over the last several decades, due to the large cost of building and maintaining these facilities, there has been a movement towards privatization of infrastructure assets. In Canada, Australia, the United Kingdom, and throughout Europe and Asia, roads, airports, and seaports have been privatized. Currently, The Port Authority of New York and New Jersey has issued a request for proposal to the prequalified consortia bidding for the LaGuardia Airport Central Terminal Building Replacement Project. We believe that this may be the beginning of local airport authorities in the United States utilizing the expertise, experience, and innovation of private owners of airports to rehabilitate their aging airports.
36
| Alpine Global Infrastructure Fund (Continued) | |
Since the launch of our Fund, the equity markets have been volatile as the world’s economies suffered from the effects of the financial crisis. The amount of debt that governments have on their balance sheets and the austerity measures that have been enacted will likely lead to slower growth for years to come. The uncertainty over the European debt crisis along with the questionable growth prospects of China has led to extremely volatile markets and, as a result, we continued to hedge a portion of our Euro currency exposure during the period to partially help offset the Euro’s impact on the value of the Fund’s Euro-denominated holdings. We believe that these market conditions may create many new opportunities for investors in infrastructure stocks that have the potential for more stable and predictable cash flows. Our portfolio of companies is not immune to swings in share prices, but volatile markets may provide an opportunity to continue buying what we believe are high-quality companies with solid balance sheets and good growth prospects at what we believe are inexpensive valuations.
In the future, governments may be compelled to sell off infrastructure assets and utilize public/private funds using build/operate/transfer models to finance new projects.
We are pleased with the structure of our portfolio. We believe the Fund should be well positioned to take advantage of increases in global infrastructure spending. We continue to believe that the combination of urbanization, rising standards of living and population growth can propel infrastructure spending for decades to come. We will continue to adapt our investment approach as economic conditions change and look forward to discussing the portfolio and the prospects for the Fund in future communications. We appreciate your trust and investment in the Fund.
Sincerely,
Joshua E. Duitz
Samuel A. Lieber
Portfolio Managers
This letter represents the opinions of the Fund’s management and is subject to change, is not guaranteed and should not be considered a recommendation to buy or sell any security. The information provided is not intended to be, and is not, a forecast of future events, a guarantee of future results, or investment advice. Views expressed may vary from those of the firm as a whole.
Past performance is no guarantee of future results.
Mutual fund investing involves risk. Principal loss is possible. The Fund is subject to risks including the following:
Concentration Risk – The Fund’s strategy of concentrating in companies in a specific industry means that its performance will be closely tied to the performance of a particular market segment. The Fund’s concentration in these companies may present more risks than if it were broadly diversified over numerous industries and sectors of the economy. A downturn in these companies would have a larger impact on the Fund than on a mutual fund that does not concentrate in such companies. At times, the performance of these companies will lag the performance of other industries or the broader market as a whole.
Currency Risk – The value of investments in securities denominated in foreign currencies increases or decreases as the rates of exchange between those currencies and the U.S. dollar change. Currency conversion costs and currency fluctuations could erase investment gains or add to investment losses. Currency exchange rates can be volatile, and are affected by factors such as general economic conditions, the actions of the U.S. and foreign governments or central banks, the imposition of currency controls and speculation.
Dividend Strategy Risk – The Fund’s strategy of investing in dividend-paying stocks involves the risk that such stocks may fall out of favor with investors and underperform the market. Companies that issue dividend paying-stocks are not required to continue to pay dividends on such stocks. Therefore, there is the possibility that such companies could reduce or eliminate the payment of dividends in the future.
Emerging Market Securities Risk – The risks of foreign investments are heightened when investing in issuers in emerging market countries. Emerging market countries tend to have economic, political and legal systems that are less fully developed and are less stable than those of more developed countries. They are often particularly sensitive to market movements because their market prices tend to reflect speculative expectations. Low trading volumes may result in a lack of liquidity and in extreme price volatility.
Equity Securities Risk – The stock or other security of a company may not perform as well as expected, and may decrease in value, because of factors related to the company (such as poorer than expected earnings or certain management decisions) or to the industry in which the company is engaged (such as a reduction in the demand for products or services in a particular industry).
37
| Alpine Global Infrastructure Fund (Continued) | |
Foreign Currency Transactions Risk – Foreign securities are often denominated in foreign currencies. As a result, the value of the Fund’s shares is affected by changes in exchange rates. The Fund may enter into foreign currency transactions to try to manage this risk. The Fund’s ability to use foreign currency transactions successfully depends on a number of factors, including the foreign currency transactions being available at prices that are not too costly, the availability of liquid markets and the ability of the Adviser to accurately predict the direction of changes in currency exchange rates.
Foreign Securities Risk – The Fund’s investments in securities of foreign issuers or issuers with significant exposure to foreign markets involve additional risk. Foreign countries in which the Fund may invest may have markets that are less liquid, less regulated and more volatile than U.S. markets. The value of the Fund’s investments may decline because of factors affecting the particular issuer as well as foreign markets and issuers generally, such as unfavorable government actions, and political or financial instability. Lack of information may also affect the value of these securities. The risks of foreign investment are heightened when investing in issuers of emerging market countries.
Growth Stock Risk – Growth stocks are stocks of companies believed to have above-average potential for growth in revenue and earnings. Growth stocks typically are very sensitive to market movements because their market prices tend to reflect future expectations. When it appears those expectations will not be met, the prices of growth stocks typically fall. Growth stocks as a group may be out of favor and underperform the overall equity market while the market concentrates on undervalued stocks.
Infrastructure-Related Investment Risk – Because the Fund concentrates its investments in infrastructure-related entities, the Fund has greater exposure to the potential adverse economic, regulatory, political and other changes affecting such entities. Infrastructure-related entities are subject to a variety of factors that may adversely affect their business or operations, including high interest costs in connection with capital construction programs, costs associated with environmental and other regulations, the effects of economic slowdown and surplus capacity, increased competition from other providers of services, uncertainties concerning the availability of fuel at reasonable prices, the effects of energy conservation policies and other factors. Additionally, infrastructure-related entities may be subject to regulation by various governmental authorities and may also be affected by governmental regulation of rates charged to customers, service interruption due to environmental, operational or other mishaps and the imposition of special tariffs and changes in tax laws, regulatory policies and accounting standards.
Initial Public Offerings and Secondary Offerings Risk – The Fund may invest a portion of its assets in shares of IPOs or secondary offerings of an issuer. IPOs and secondary offerings may have a magnified impact on the performance of a Fund with a small asset base. The impact of IPOs and secondary offerings on a Fund’s performance likely will decrease as the Fund’s asset size increases, which could reduce a Fund’s returns. IPOs and secondary offerings may not be consistently available to the Fund for investing. IPO and secondary offering shares frequently are volatile in price due to the absence of a prior public market, the small number of shares available for trading and limited information about the issuer. Therefore, the Fund may hold IPO and secondary offering shares for a very short period of time. This may increase the turnover of the Fund and may lead to increased expenses for the Fund, such as commissions and transaction costs. In addition, IPO and secondary offering shares can experience an immediate drop in value if the demand for the securities does not continue to support the offering price.
Management Risk – The Adviser’s judgment about the quality, relative yield or value of, or market trends affecting, a particular security or sector, or about interest rates generally, may be incorrect. The Adviser’s security selections and other investment decisions might produce losses or cause the Fund to underperform when compared to other funds with similar investment objectives and strategies.
Market Risk – The price of a security held by the Fund may fall due to changing market, economic or political conditions.
Portfolio Turnover Risk – High portfolio turnover necessarily results in greater transaction costs which may reduce Fund performance.
Small and Medium Capitalization Company Risk – Securities of small or medium capitalization companies are more likely to experience sharper swings in market values, less liquid markets, in which it may be more difficult for the Adviser to sell at times and at prices that the Adviser believes appropriate and generally are more volatile than those of larger companies.
Undervalued Stock Risk – The Fund may pursue strategies that may include investing in securities, which, in the opinion of the Adviser, are undervalued. The identification of investment opportunities in undervalued securities is a difficult task and there is no assurance that such opportunities will be successfully recognized or acquired. While investments in undervalued securities offer opportunities for above-average capital appreciation, these investments involve a high degree of financial risk and can result in substantial losses.
Please refer to pages 3-5 for other important disclosures and definitions.
38
| Alpine Global Consumer Growth Fund | |
| Comparative Annualized Returns as of 10/31/14 (Unaudited) |
| | | 1 Year | | | 3 Years | | | Since Inception(1) |
| Alpine Global Consumer Growth Fund — Institutional Class | | | 0.34 | % | | | 9.96 | % | | | | 6.53% | |
| Alpine Global Consumer Growth Fund — Class A (Without Load) | | | 0.08 | % | | | N/A | | | | 12.82% | |
| Alpine Global Consumer Growth Fund — Class A (With Load) | | | -5.41 | % | | | N/A | | | | 10.60% | |
| MSCI World Index USD | | | 8.67 | % | | | 14.37 | % | | | | 10.25% | |
| MSCI ACWI Consumer Discretionary Index USD | | | 1.62 | % | | | 15.11 | % | | | | 11.06% | |
| MSCI ACWI Consumer Staples Index USD | | | 3.63 | % | | | 10.70 | % | | | | 9.34% | |
| Lipper Consumer Goods Funds Average(2) | | | 9.02 | % | | | 15.65 | % | | | | 12.59% | |
| Lipper Consumer Goods Funds Ranking(2) | | | 38/42 | | | 33/37 | | | | 33/36 | |
| Gross Expense Ratio (Institutional Class): 3.80%(3) | | | | | | | | | | | | | |
| Net Expense Ratio (Institutional Class): 1.35%(3) | | | | | | | | | | | | | |
| Gross Expense Ratio (Class A): 4.05%(3) | | | | | | | | | | | | | |
| Net Expense Ratio (Class A): 1.60%(3) | | | | | | | | | | | | | |
| | (1) | Institutional Class shares commenced on December 29, 2010 and Class A shares commenced on December 30, 2011. Returns for indices are since December 29, 2010. |
| | (2) | The since inception data represents the period beginning December 31, 2010 (Institutional Class only). |
| | (3) | As disclosed in the prospectus dated February 28, 2014. |
Performance data quoted represents past performance and is not predictive of future results. Investment return and principal value of the Fund fluctuate, so that shares, when redeemed, may be worth more or less than their original cost. Performance current to the most recent month end may be lower or higher than the performance quoted and may be obtained by calling 1-888-785-5578. Performance data shown does not reflect the 1.00% redemption fee imposed on shares held for fewer than 60 days. If it did, total returns would be reduced. Returns for the Class A shares with sales charge reflect a maximum sales charge of 5.50%. Performance for the Class A shares without sales charges does not reflect this load.
The MSCI World Index USD is a free float-adjusted market capitalization-weighted index that is designed to measure the equity market performance of developed markets. Source: MSCI. MSCI data may not be reproduced or used for any other purpose. The Lipper Consumer Goods Funds Average is an average of funds that invest primarily in the equity securities of domestic and foreign companies engaged in manufacturing and distributing consumer goods such as food, beverages, tobacco, and nondurable household goods and personal products. MSCI ACWI Consumer Staples Index USD is a market capitalization-weighted index that is designed to measure the equity market performance of developed and emerging markets for the Consumer Staples GICS® sector. Source: MSCI. MSCI makes no express or implied warranties or representations and shall have no liability whatsoever with respect to any MSCI data contained herein. The MSCI data may not be further redistributed or used as a basis for other indices or any securities or financial products. This report is not approved, reviewed or produced by MSCI. MSCI ACWI Consumer Discretionary Index USD is a free float-adjusted market capitalization-weighted index that is designed to measure the equity market performance of developed and emerging markets for the Consumer Discretionary GICS® sector. Source: MSCI. The MSCI ACWI Consumer Staples Index USD, the MSCI ACWI Consumer Discretionary Index USD and the Lipper Consumer Goods Funds Average are unmanaged and do not reflect direct fees associated with a mutual fund, such as investment adviser fees; however, the Lipper Consumer Goods Funds Average reflects fees charged by the underlying funds. The performance for the Alpine Global Consumer Growth Fund reflects the deduction of fees for these value-added services. Investors cannot directly invest in an index. Lipper rankings for the periods shown are based on fund total returns with dividends and distributions reinvested and do not reflect sales charges.
Expense Ratios reflect the ratios reported in the Fund’s most recent prospectus. The Alpine Global Consumer Growth Fund has a contractual expense waiver that continues through February 28, 2015. Where a Fund’s gross and net expense ratios are the same for the period reported, the contractual expense reimbursement level was not reached as of the end of that period. To the extent the Fund’s expenses were reduced by waivers, the Fund’s total returns were increased. In these cases, in the absence of the expense waivers, the Fund’s total returns would have been lower.
To the extent that the Fund’s historical performance resulted from gains derived from participation in Initial Public Offerings (“IPOs”) and/or Secondary Offerings, there is no guarantee that these results can be replicated in future periods or that the Fund will be able to participate to the same degree in IPO/Secondary Offerings in the future.
39
| Alpine Global Consumer Growth Fund (Continued) | |
Portfolio Distributions* (Unaudited)
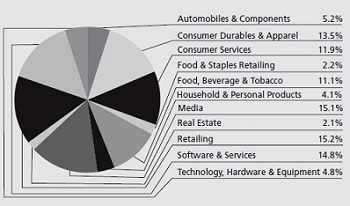
| Top 10 Holdings* (Unaudited) | |
| 1. | | Apple, Inc. | 3.96 | % |
| 2. | | Comcast Corp.-Class A | 3.38 | % |
| 3. | | Baidu, Inc.-ADR | 3.33 | % |
| 4. | | VF Corp. | 3.12 | % |
| 5. | | Anheuser-Busch InBev NV-ADR | 3.10 | % |
| 6. | | Visa, Inc.-Class A | 2.95 | % |
| 7. | | Tencent Holdings, Ltd. | 2.78 | % |
| 8. | | Michael Kors Holdings, Ltd. | 2.39 | % |
| 9. | | Nestle SA | 2.30 | % |
| 10. | | PepsiCo, Inc. | 2.27 | % |
| * | Portfolio Distributions percentages are based on total net investments. Top 10 Holdings do not include short-term investments and percentages are based on total net assets. Portfolio holdings sector distributions are as of 10/31/14 and are subject to change. Portfolio holdings are not recommendations to buy or sell any securities. |
Value of a $10,000 Investment (Unaudited)
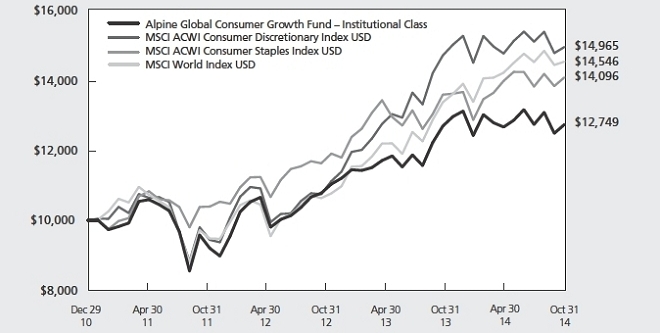
This chart represents a comparison of a hypothetical $10,000 investment in the Fund versus a similar investment in the Fund’s benchmarks. The graph and the table do not reflect the deduction of taxes that a shareholder would pay on Fund distributions or the redemption of Fund shares. Investment performance reflects the waiver and recovery of certain fees, if applicable. Without the waiver and recovery of fees, the Fund’s total return would have differed.
Performance data quoted represents past performance and is not predictive of future results. Investment return and principal value of the Fund fluctuate, so that shares, when redeemed, may be worth more or less than their original cost.
40
| Alpine Global Consumer Growth Fund (Continued) | |
Commentary
For the twelve months ended October 31, 2014, the Alpine Global Consumer Growth Fund had a total return of 0.34%. The MSCI World Index posted a total return of 8.67% while the MSCI All Country World Consumer Staples and Consumer Discretionary Indices posted total returns of 3.63% and 1.62%, respectively. All references in this letter to the Fund’s performance relate to the performance of the Fund’s Institutional Class.
Portfolio Drivers
During the twelve months ended October 31, 2014, the global markets have experienced a number of fits and starts driven by a variety of factors. Investors began the year grappling with the potential impact of the end of quantitative easing in the U.S. on global economies. This was followed by encouraging commentary from European Union leaders suggesting that the group would be more accommodative, if needed, to keep the European markets moving in the right direction. The threat of Ebola spreading throughout Africa and slowing macro economic data to end the summer also drove healthy market corrections during the year before stocks bounced back to reach new highs each time.
| • | Geographic exposure played a large part in the performance of the Fund versus the MSCI All Country World Consumer Discretionary Index. Due to the global nature of the portfolio, the United States represented a 46.28% average weight during the fiscal year versus 53.15% in the benchmark. This underweight detracted from the Fund’s overall performance. Meanwhile, the Fund’s relative overweight in China and relative underweight in Japan generated positive relative returns. |
| | |
| • | The Fund carried an average cash balance of 4.85% during the twelve months ended October 31, 2014. Given the positive direction of the overall global markets during the time period, this balance created a significant drag on the portfolio relative to the benchmark. Additionally, a significant portion of the Fund’s holdings were held outside the U.S. and denominated in foreign currencies. As a result of a strengthening dollar, these currencies had a negative impact on the Fund’s performance. |
| | |
| • | From a sector perspective, the underperformance of the consumer discretionary segment was the main detractor from the Fund relative to the MSCI All Country World Consumer Discretionary index. Exposure to the consumer staples sector and |
| | financials also contributed to the shortfall. This was partially offset by the strong performance of the technology sector. |
Portfolio Analysis
The top five stocks contributing to the Fund’s performance during the twelve months ending October 31, 2014 were Apple, Inc., Baidu, Inc., Tencent Corporation, V.F. Corporation and Visa, Inc.
| • | Apple shares had a strong performance during the fiscal year for several reasons. Most importantly, earnings surpassed expectations throughout the period as iPhone sales and gross margins topped forecasts. In addition, the company increased its dividend and had a 7-for-1 stock split. |
| | |
| • | Chinese online search company Baidu rode the wave of Internet growth in its home country. After a year of investment in 2013, the company’s bottom line reaccelerated throughout 2014 as the search provider successfully navigated the transition to more mobile advertising sales versus the traditional desktop model. |
| | |
| • | Tencent, another Chinese mobile Internet company, also benefitted from the strength of Internet growth in China during the period. The company continued to make investments to diversify its business and was still able to grow its earnings over 50% over the past twelve months. |
| | |
| • | Apparel maker V.F. Corporation continues to execute its model efficiently. Earnings have remained consistent in an uncertain consumer environment. The outdoor segment remains the driving force behind the performance due to strong growth in the North Face and Vans brands. In addition, speculation in the market about the potential for an accretive acquisition has helped the shares. |
| | |
| • | Credit card processor Visa was one of the main beneficiaries of the move away from cash transactions around the world. The firm’s results were strong again this year due to this payment trend. In addition, Visa shares experienced a boost from Apple and the introduction of ApplePay. The potential use of smart phones to digitally conduct transactions with an added sense of security when compared to traditional credit card usage may help speed up the transition away from cash payments. |
41
| Alpine Global Consumer Growth Fund (Continued) | |
Lumber Liquidators Holdings, Pier 1 Imports, Adidas AG, Francesca’s Holdings Corp. and YOOX S.p.A were the bottom five stocks contributing to the Fund’s performance through October 31, 2014.
| • | After several years of outperformance, Lumber Liquidators’ 2014 results were disappointing. The business slowed early in 2014 and has yet to pick back up. Management has continued to improve the efficiency of its model but the benefits haven’t translated into better results as of yet. At this point, it is difficult to know whether the performance has been due to a relatively weak consumer environment or if competition has had a bigger impact on the business. |
| | |
| • | Pier 1 Imports began the year by reducing financial guidance three times in the first three months of 2014 due to weather issues in the United States. However, the problems have proven to be more than just weather related as traffic has yet to pick up in the stores. In addition, management stepped up investments in the retailer’s Internet business, which has had a negative impact on margins. The e-commerce segment has been a bright spot for Pier 1 but it has been too small of a portion of sales to overcome the weakness in store traffic. |
| | |
| • | Adidas has had a variety of issues to deal with in 2014, some of which were out of their control. Foreign exchange has been a large overhang on the business for the past twelve months. In addition, the unrest in Eastern Europe resulted in a sharp decline in the profitability of its Russian unit. And a global slowdown in the golf sector led to aggressive markdowns in its Taylormade product lines in order to work down inventories. |
| | |
| • | Apparel retailer Francesca’s has been a victim of the malaise in U.S. apparel retailing this year. Despite strong square footage growth and positive comparable store sales for much of the period, margins have been under pressure as markdowns have reigned supreme in the industry. Management also experienced some missteps in its assortment and has made several changes to address the difficulties. |
* Luxury e-commerce player YOOX continued to post solid numbers in 2014. Unfortunately, the company has fallen victim to a slowing luxury market and a high valuation. After the successful launch of several new brand websites in 2013, this year has been about improving efficiency. Many investors would like to see YOOX add more new customers to its mono-brand business given the long-term opportunity but thus far we have yet to see any major additions. As such, the valuation has come down to a more normalized level.
Summary & Outlook
The investment objective of the Fund is to seek long-term capital appreciation. In the developed world, we emphasize investment in consumer consumption trends, such as the rise in Internet spending and the usage of mobile devices, as well as in firms that have the ability to expand their brands domestically and abroad. In emerging markets, the focus is on those businesses that may stand to benefit from the demographic shifts that are taking place if disposable income levels rise over the next few years.
We continue to monitor global consumer spending trends. In the U.S., spending remains modest although we have seen improvements in consumer confidence throughout the year, particularly as oil prices began to decline just in time for the important holiday season. That said there remains a divide in confidence between lower and higher income groups throughout the country. In Europe, the macro situation continues to scrape along the bottom with only pockets of improvement throughout the region. The situation has made it difficult for consumer confidence to materially improve in the near term. Finally, the lackluster economic activity in most of the developed world has had an impact on emerging market economies as well. While growth in these regions remains superior to more mature economies, they are no longer growing at the high levels once achieved a few years ago.
Sincerely,
Bryan Keane
Samuel Lieber
Portfolio Managers
On December 18, 2014, the Board of Trustees of the Alpine Global Consumer Growth Fund (the “Fund”), determined that it is in the best interests of the Fund and its respective shareholders to terminate and wind up the Fund. Consummation of the termination and winding up of the Fund will be subject to receipt of approval, at a meeting of shareholders called for the purpose of voting thereon (the “Special Meeting”), by the affirmative vote of a “majority of the outstanding voting securities” of the Fund. The Special Meeting is expected to occur in the first quarter of 2015. If approved by shareholders, the Fund is expected to cease operations shortly after the Special Meeting.
Effective December 19, 2014, the Fund will no longer sell shares to new investors or existing shareholders, including through exchanges into the Fund from other Alpine mutual funds.
42
| Alpine Global Consumer Growth Fund (Continued) | |
This letter represents the opinions of the Fund’s management and is subject to change, is not guaranteed and should not be considered a recommendation to buy or sell any security. The information provided is not intended to be, and is not, a forecast of future events, a guarantee of future results, or investment advice. Views expressed may vary from those of the firm as a whole. Past performance is no guarantee of future results.
Diversification does not assure a profit nor protect against loss in a declining market.
Mutual fund investing involves risk. Principal loss is possible. The Fund is subject to risks, including the following:
Concentration Risk – The Fund’s strategy of concentrating in companies in a specific industry means that its performance will be closely tied to the performance of a particular market segment. The Fund’s concentration in these companies may present more risks than if it were broadly diversified over numerous industries and sectors of the economy. A downturn in these companies would have a larger impact on the Fund than on a mutual fund that does not concentrate in such companies. At times, the performance of these companies will lag the performance of other industries or the broader market as a whole.
Consumer Products/Services Sector Risk – Because the Fund’s investments are concentrated in the consumer products/services sector, the value of its shares will be affected by factors particular to this sector and may fluctuate more widely than that of a fund which invests in a broad range of industries. The Fund’s performance largely depends on the general condition of the consumer product/services sector. The consumer product/services sector could be adversely affected by overall economic conditions, interest rates, competition, consumer confidence, disposable income, changes in demographics and consumer tastes, and legislative or regulatory changes. The prices of the securities of those issuers also may fluctuate widely in response to such events.
Currency Risk – The value of investments in securities denominated in foreign currencies increases or decreases as the rates of exchange between those currencies and the U.S. dollar change. Currency conversion costs and currency fluctuations could erase investment gains or add to investment losses. Currency exchange rates can be volatile, and are affected by factors such as general economic conditions, the actions of the U.S. and foreign governments or central banks, the imposition of currency controls and speculation.
Emerging Market Securities Risk – The risks of foreign investments are heightened when investing in issuers in emerging market countries. Emerging market countries tend to have economic, political and legal systems that are less fully developed and are less stable than those of more developed countries. They are often particularly sensitive to market movements because their market prices tend to reflect speculative expectations. Low trading volumes may result in a lack of liquidity and in extreme price volatility.
Equity Securities Risk – The stock or other security of a company may not perform as well as expected, and may decrease in value, because of factors related to the company (such as poorer than expected earnings or certain management decisions) or to the industry in which the company is engaged (such as a reduction in the demand for products or services in a particular industry).
Foreign Currency Transactions Risk – Foreign securities are often denominated in foreign currencies. As a result, the value of the Fund’s shares is affected by changes in exchange rates. The Fund may enter into foreign currency transactions to try to manage this risk. The Fund’s ability to use foreign currency transactions successfully depends on a number of factors, including the foreign currency transactions being available at prices that are not too costly, the availability of liquid markets and the ability of the Adviser to accurately predict the direction of changes in currency exchange rates.
Foreign Securities Risk – The Fund’s investments in securities of foreign issuers or issuers with significant exposure to foreign markets involve additional risk. Foreign countries in which the Fund may invest may have markets that are less liquid, less regulated and more volatile than U.S. markets. The value of the Fund’s investments may decline because of factors affecting the particular issuer as well as foreign markets and issuers generally, such as unfavorable government actions, and political or financial instability. Lack of information may also affect the value of these securities. The risks of foreign investment are heightened when investing in issuers of emerging market countries.
Growth Stock Risk – Growth stocks typically are very sensitive to market movements because their market prices tend to reflect future expectations. When it appears those expectations will not be met, the prices of growth stocks typically fall. Growth stocks as a group may be out of favor and underperform the overall equity market while the market concentrates on undervalued stocks.
43
| Alpine Global Consumer Growth Fund (Continued) | |
Initial Public Offerings and Secondary Offerings Risk – The Fund may invest a portion of its assets in shares of IPOs or secondary offerings of an issuer. IPOs and secondary offerings may have a magnified impact on the performance of a Fund with a small asset base. The impact of IPOs and secondary offerings on a Fund’s performance likely will decrease as the Fund’s asset size increases, which could reduce a Fund’s returns. IPOs and secondary offerings may not be consistently available to the Fund for investing. IPO and secondary offering shares frequently are volatile in price due to the absence of a prior public market, the small number of shares available for trading and limited information about the issuer. Therefore, the Fund may hold IPO and secondary offering shares for a very short period of time. This may increase the turnover of the Fund and may lead to increased expenses for the Fund, such as commissions and transaction costs. In addition, IPO and secondary offering shares can experience an immediate drop in value if the demand for the securities does not continue to support the offering price.
Management Risk – The Adviser’s judgment about the quality, relative yield or value of, or market trends affecting, a particular security or sector, or about interest rates generally, may be incorrect. The Adviser’s security selections and other investment decisions might produce losses or cause the Fund to underperform when compared to other funds with similar investment objectives and strategies.
Market Risk – The price of a security held by the Fund may fall due to changing market, economic or political conditions.
Micro Capitalization Company Risk – Stock prices of micro capitalization companies are significantly more volatile, and more vulnerable to adverse business and economic developments than those of larger companies. Micro capitalization companies often have narrower markets for their goods and/or services and more limited managerial and financial resources than larger, more established companies, including small or medium capitalization companies.
Small and Medium Capitalization Company Risk – Securities of small or medium capitalization companies are more likely to experience sharper swings in market values, less liquid markets, in which it may be more difficult for the Adviser to sell at times and at prices that the Adviser believes appropriate and generally are more volatile than those of larger companies.
Undervalued Stock Risk – The Fund may pursue strategies that may include investing in securities, which, in the opinion of the Adviser, are undervalued. The identification of investment opportunities in undervalued securities is a difficult task and there is no assurance that such opportunities will be successfully recognized or acquired. While investments in undervalued securities offer opportunities for above-average capital appreciation, these investments involve a high degree of financial risk and can result in substantial losses.
Please refer to pages 3-5 for other important disclosures and definitions.
44
Alpine International Real Estate Equity Fund
Schedule of Portfolio Investments
October 31, 2014
| Shares | | | Security
Description | | Value | |
| | | | | | | | | |
| Common Stocks—101.3% | | | | |
| Asia—47.4% | | | | |
| China—6.5% | | | | |
| | 730,000 | | | China Overseas Land & Investment, Ltd. | | $ | 2,122,654 | |
| | 646,377 | | | China State Construction International Holdings, Ltd. | | | 1,000,177 | |
| | 1,500,000 | | | Country Garden Holdings Co., Ltd. | | | 589,931 | |
| | 200,000 | | | E-House China Holdings, Ltd.-ADR (a) | | | 1,998,000 | |
| | 926,492 | | | Franshion Properties China, Ltd. | | | 219,821 | |
| | 800,000 | | | Greentown China Holdings, Ltd. | | | 832,479 | |
| | 3,527,587 | | | Kaisa Group Holdings, Ltd. | | | 1,305,478 | |
| | 700,000 | | | Longfor Properties Co., Ltd. | | | 812,363 | |
| | 450,000 | | | Shimao Property Holdings, Ltd. | | | 969,033 | |
| | 1,350,000 | | | Sunac China Holdings, Ltd. | | | 1,171,544 | |
| | | | | | | | 11,021,480 | |
| Hong Kong—1.7% | | | | |
| | 32,002,031 | | | CSI Properties, Ltd. | | | 1,382,395 | |
| | 240,480 | | | Sands China, Ltd. | | | 1,499,289 | |
| | | | | | | | 2,881,684 | |
| India—15.2% | | | | |
| | 991,872 | | | DB Realty, Ltd. (b) | | | 1,098,490 | |
| | 2,290,373 | | | Hirco PLC (a)(b)(c)(d) | | | 146,556 | |
| | 249,877 | | | Prestige Estates Projects, Ltd. | | | 915,877 | |
| | 84,007 | | | Sobha Developers, Ltd. | | | 590,170 | |
| | 2,000,000 | | | South Asian Real Estate PLC (b)(c)(d)(e) | | | 12,013,751 | |
| | 7,240,153 | | | Unitech Corporate Parks PLC (a)(b) | | | 5,906,859 | |
| | 1,097,824 | | | Yatra Capital, Ltd. (b)(f) | | | 5,090,232 | |
| | | | | | | | 25,761,935 | |
| Indonesia—1.0% | | | | |
| | 246,285,560 | | | PT Bakrieland Development TBK (b) | | | 1,018,972 | |
| | 16,071,429 | | | PT Pakuwon Jati TBK | | | 598,440 | |
| | | | | | | | 1,617,412 | |
| Japan—9.8% | | | | |
| | 15,000 | | | Daito Trust Construction Co., Ltd. (a) | | | 1,846,205 | |
| | 496 | | | GLP J-REIT | | | 554,619 | |
| | 375,691 | | | Hulic Co., Ltd. (a) | | | 4,033,682 | |
| | 3,538 | | | Invincible Investment Corp. | | | 1,196,920 | |
| | 872,312 | | | Kenedix, Inc. | | | 3,937,344 | |
| | 100,000 | | | Mitsubishi Estate Co., Ltd. (a) | | | 2,488,760 | |
| | 51,725 | | | Mitsui Fudosan Co., Ltd. | | | 1,615,183 | |
| | 112 | | | Nippon Prologis REIT, Inc. | | | 257,952 | |
| | 20,000 | | | Sumitomo Realty & Development Co., Ltd. | | | 729,045 | |
| | | | | | | | 16,659,710 | |
| Malaysia—0.3% | | | | |
| | 1,000,591 | | | Aseana Properties, Ltd. (a)(b) | | | 450,266 | |
| Philippines—6.6% | | | | |
| | 2,847,077 | | | Ayala Land, Inc. | | | 2,125,395 | |
| | 36,533,000 | | | Megaworld Corp. | | | 4,037,965 | |
| | 13,000,070 | | | SM Prime Holdings, Inc. | | | 5,063,871 | |
| | | | | | | | 11,227,231 | |
| Singapore—1.7% | | | | |
| | 2,479,000 | | | Banyan Tree Holdings, Ltd. | | | 1,196,373 | |
| | 801,420 | | | Global Logistic Properties, Ltd. | | | 1,715,501 | |
| | | | | | | | 2,911,874 | |
| Shares | | | Security
Description | | Value | |
| | | | |
| Thailand—2.8% | | | | |
| | 3,933,333 | | | Ananda Development PCL | | $ | 458,909 | |
| | 2,499,600 | | | Central Pattana PCL | | | 3,702,969 | |
| | 500,357 | | | Minor International PCL | | | 533,847 | |
| | | | | | | | 4,695,725 | |
| United Arab Emirates—1.8% | | | | |
| | 60,000 | | | DAMAC Real Estate Development, Ltd.-GDR (g) | | | 1,179,000 | |
| | 18,333 | | | Emaar Malls Group PJSC (b) | | | 16,022 | |
| | 660,000 | | | Emaar Properties PJSC | | | 1,796,896 | |
| | | | | | | | 2,991,918 | |
| | | | | Total Asia (Cost $107,600,497) | | | 80,219,235 | |
| Europe—38.9% | | | | |
| France—2.9% | | | | |
| | 138,193 | | | Nexity SA (a) | | | 4,959,777 | |
| Germany—3.6% | | | | |
| | 132,383 | | | DIC Asset AG | | | 1,114,156 | |
| | 100,000 | | | GAGFAH SA (b) | | | 1,867,194 | |
| | 4,642,900 | | | Sirius Real Estate, Ltd. (a) | | | 1,810,930 | |
| | 113,933 | | | TAG Immobilien AG | | | 1,332,378 | |
| | | | | | | | 6,124,658 | |
| Ireland—1.9% | | | | |
| | 600,000 | | | Dalata Hotel Group PLC (a)(b) | | | 2,180,481 | |
| | 518,484 | | | Green REIT PLC (a) | | | 818,670 | |
| | 166,666 | | | Hibernia REIT PLC (a)(b) | | | 229,744 | |
| | | | | | | | 3,228,895 | |
| Norway—0.5% | | | | |
| | 72,000 | | | Entra ASA (b)(g) | | | 795,262 | |
| Poland—0.2% | | | | |
| | 3,265,000 | | | Nanette Real Estate Group NV (b)(c)(d) | | | 291,317 | |
| Russia—0.6% | | | | |
| | 359,137 | | | Mirland Development Corp. PLC (a)(b) | | | 1,127,479 | |
| Spain—1.4% | | | | |
| | 75,000 | | | Hispania Activos Inmobiliarios SAU (b) | | | 921,065 | |
| | 60,000 | | | Lar Espana Real Estate Socimi SA (b) | | | 691,739 | |
| | 60,000 | | | Merlin Properties Socimi SA (b) | | | 710,536 | |
| | | | | | | | 2,323,340 | |
| Sweden—1.9% | | | | |
| | 100,877 | | | JM AB (a) | | | 3,252,753 | |
| United Kingdom—25.9% | | | | |
| | 400,270 | | | Great Portland Estates PLC (a) | | | 4,395,743 | |
| | 150,000 | | | Land Securities Group PLC (a) | | | 2,656,303 | |
| | 502,084 | | | Londonmetric Property PLC (a) | | | 1,183,893 | |
| | 4,000,713 | | | LXB Retail Properties PLC (a)(b) | | | 8,831,921 | |
| | 2,225,350 | | | Quintain Estates & Development PLC (a)(b) | | | 2,919,113 | |
| | 3,955,756 | | | Regus PLC (a) | | | 12,485,193 | |
| | 120,000 | | | Savills PLC | | | 1,236,248 | |
| | 1,485,112 | | | Songbird Estates PLC (a)(b) | | | 6,236,303 | |
| | 150,000 | | | The British Land Co. PLC (a) | | | 1,748,073 | |
| | 317,416 | | | The Unite Group PLC (a) | | | 2,168,180 | |
| | | | | | | | 43,860,970 | |
| | | | | Total Europe (Cost $58,191,992) | | | 65,964,451 | |
The accompanying notes are an integral part of these financial statements.
45
Alpine International Real Estate Equity Fund
Schedule of Portfolio Investments—Continued
October 31, 2014
| Shares | | | Security
Description | | Value | |
| | | | | | | | | |
| Common Stocks—continued | | | | |
| North & South America—15.0% | | | | |
| Brazil—11.0% | | | | |
| | 640,138 | | | BHG SA-Brazil Hospitality Group (b) | | $ | 4,624,267 | |
| | 80,661 | | | BR Properties SA | | | 407,553 | |
| | 220,535 | | | Cyrela Commercial Properties SA Empreendimentos e Participacoes | | | 1,397,312 | |
| | 986,829 | | | Direcional Engenharia SA | | | 4,062,172 | |
| | 912,132 | | | General Shopping Brasil SA (b) | | | 2,484,721 | |
| | 39,921 | | | Iguatemi Empresa de Shopping Centers SA | | | 404,382 | |
| | 790,500 | | | JHSF Participacoes SA | | | 1,004,913 | |
| | 66,655 | | | Multiplan Empreendimentos Imobiliarios SA | | | 1,378,614 | |
| | 1,500,000 | | | PDG Realty SA Empreendimentos e Participacoes (b) | | | 738,529 | |
| | 155,394 | | | Sao Carlos Empreendimentos e Participacoes SA | | | 2,094,580 | |
| | | | | | | | 18,597,043 | |
| Mexico—3.5% | | | | |
| | 500,000 | | | Concentradora Fibra Hotelera Mexicana SA de CV | | | 840,991 | |
| | 671,429 | | | Corp. Inmobiliaria Vesta SAB de CV | | | 1,475,860 | |
| | 382,979 | | | Fibra Uno Administracion SA de CV | | | 1,329,282 | |
| | 1,257,643 | | | Hoteles City Express SAB de CV (b) | | | 2,278,770 | |
| | | | | | | | 5,924,903 | |
| United States—0.5% | | | | |
| | 93,750 | | | American Realty Capital Properties, Inc. (a) | | | 831,563 | |
| | | | | Total North & South America (Cost $31,614,239) | | | 25,353,509 | |
| | | | | Total Common Stocks (Cost $197,406,728) | | | 171,537,195 | |
| | | | | | | | | |
| Shares | | | Security
Description | | Value | |
| | | | | | | | | |
| Equity-Linked Structured Notes—2.8% | | | | |
| Asia—2.8% | | | | |
| India—2.8% | | | | |
| | 185,910 | | | Kolte-Patil Developers, Ltd.-Merrill Lynch & Co., Inc. | | $ | 569,236 | |
| | 590,000 | | | Phoenix Mills, Ltd.-Merrill Lynch & Co., Inc. | | | 3,668,281 | |
| | 360,560 | | | Puravankara Projects, Ltd.- Macquarie Bank, Ltd. | | | 588,112 | |
| | | | | | | | 4,825,629 | |
| | | | | Total Asia (Cost $3,214,287) | | | 4,825,629 | |
| | | | | Total Equity-Linked Structured
Notes (Cost $3,214,287) | | | 4,825,629 | |
| Investment Companies—0.5% | | | | |
| Asia—0.5% | | | | |
| India—0.5% | | | | |
| | 7,076,577 | | | Trinity Capital PLC (a)(b) | | | 792,428 | |
| | | | | Total Asia (Cost $10,179,879) | | | 792,428 | |
| | | | | Total Investment Companies
(Cost $10,179,879) | | | 792,428 | |
| Warrants—0.0% (h) | | | | |
| Asia—0.0% (h) | | | | |
| Thailand—0.0% (h) | | | | |
| | 25,018 | | | Minor International PCL | | | | |
| | | | | Expiration: November 25, 2014 | | | | |
| | | | | Exercise Price: THB 40.00 | | | 0 | |
| | | | | Total Asia (Cost $0) | | | 0 | |
| | | | | Total Warrants (Cost $0) | | | 0 | |
Total Investments
(Cost $210,800,894)—104.6% | | | 177,155,252 | |
| Liabilities in Excess of Other Assets—(4.6)% | | | (7,783,735 | ) |
| TOTAL NET ASSETS 100.0% | | $ | 169,371,517 | |
The accompanying notes are an integral part of these financial statements.
46
Alpine International Real Estate Equity Fund
Schedule of Portfolio Investments—Continued
October 31, 2014
Percentages are stated as a percent of net assets.
| (a) | All or a portion of the security has been designated as collateral for the line of credit. |
| (b) | Non-income producing security. |
| (c) | Illiquid security. |
| (d) | Security fair valued in accordance with procedures approved by the Board of Trustees. These securities comprised 7.4% of the Fund’s net assets. |
| (e) | Private placement. |
| (f) | Affiliated issuer. See Note 7 in the Notes to Financial Statements. |
| (g) | Restricted under Rule 144A of the Securities Act of 1933. These securities may be resold in transactions exempt from registration, normally to qualified institutional buyers. These securities have been determined to be liquid under guidelines established by the Board of Trustees. Liquid securities restricted under Rule 144A comprised 0.7% of the Fund’s net assets. |
| (h) | Amount is less than 0.05%. |
AB—Aktiebolag is the Swedish equivalent of a corporation.
ADR—American Depositary Receipt
AG—Aktiengesellschaft is a German term that refers to a corporation that is limited by shares, i.e., owned by shareholders.
ASA—Allmennaksjeselskap is the Norwegian term for a public limited company.
GDR—Global Depositary Receipt
NV—Naamloze Vennootschap is the Dutch term for a public limited liability corporation.
PCL—Public Company Limited
PJSC—Public Joint Stock Company
PLC—Public Limited Company
REIT—Real Estate Investment Trust
SA—Generally designates corporations in various countries, mostly those employing the civil law.
SA de CV—Sociedad Anonima de Capital Variable is the Spanish equivalent to Variable Capital Company.
SAB de CV—Sociedad Anonima Bursátil de Capital Variable is the Spanish equivalent to Variable Capital Company.
SAU—Sociedad Anónima Unipersonal
TBK—Indonesian city of Tanjung Balai Karimun
THB—Thailand Baht
The accompanying notes are an integral part of these financial statements.
47
Alpine Realty Income & Growth Fund
Schedule of Portfolio Investments
October 31, 2014
| Shares | | | Security
Description | | Value | |
| | | | | | | |
| Real Estate Investment Trusts—99.1% | | | | |
| Apartments—16.6% | | | | |
| | 15,000 | | | American Campus Communities, Inc. | | $ | 589,050 | |
| | 25,625 | | | AvalonBay Communities, Inc. (a) | | | 3,993,400 | |
| | 18,000 | | | Camden Property Trust | | | 1,380,060 | |
| | 38,000 | | | Campus Crest Communities, Inc. | | | 240,920 | |
| | 68,360 | | | Equity Residential (a) | | | 4,755,122 | |
| | 23,665 | | | Essex Property Trust, Inc. (a) | | | 4,774,650 | |
| | 35,200 | | | Home Properties, Inc. (a) | | | 2,263,712 | |
| | 36,900 | | | UDR, Inc. | | | 1,115,487 | |
| | | | | | | | 19,112,401 | |
| Diversified—6.5% | | | | |
| | 26,114 | | | American Assets Trust, Inc. (a) | | | 1,001,211 | |
| | 37,087 | | | Cousins Properties, Inc. | | | 482,502 | |
| | 88,700 | | | Crombie Real Estate Investment Trust | | | 1,028,622 | |
| | 46,117 | | | Vornado Realty Trust (a) | | | 5,048,889 | |
| | | | | | | | 7,561,224 | |
| Health Care—9.7% | | | | |
| | 69,372 | | | HCP, Inc. | | | 3,050,287 | |
| | 24,803 | | | Health Care REIT, Inc. | | | 1,763,742 | |
| | 30,413 | | | Omega Healthcare Investors, Inc. | | | 1,160,560 | |
| | 47,344 | | | Sabra Health Care REIT, Inc. | | | 1,352,618 | |
| | 55,712 | | | Ventas, Inc. (a) | | | 3,816,829 | |
| | | | | | | | 11,144,036 | |
| Lodging—5.8% | | | | |
| | 37,842 | | | Chatham Lodging Trust | | | 969,512 | |
| | 39,658 | | | Chesapeake Lodging Trust | | | 1,310,301 | |
| | 70,000 | | | DiamondRock Hospitality Co. | | | 1,004,500 | |
| | 85,000 | | | Host Hotels & Resorts, Inc. | | | 1,981,350 | |
| | 12,000 | | | LaSalle Hotel Properties (a) | | | 470,520 | |
| | 15,000 | | | Pebblebrook Hotel Trust | | | 639,000 | |
| | 25,000 | | | Strategic Hotels & Resorts, Inc. (b) | | | 321,250 | |
| | | | | | | | 6,696,433 | |
| Manufactured Homes—1.2% | | | | |
| | 28,900 | | | Equity LifeStyle Properties, Inc. | | | 1,418,990 | |
| Mortgage & Finance—1.5% | | | | |
| | 34,775 | | | Apollo Commercial Real Estate Finance, Inc. | | | 571,701 | |
| | 50,000 | | | Starwood Property Trust, Inc. | | | 1,128,000 | |
| | | | | | | | 1,699,701 | |
| Net Lease—1.0% | | | | |
| | 67,500 | | | American Realty Capital Properties, Inc. | | | 598,725 | |
| | 11,012 | | | EPR Properties | | | 617,773 | |
| | | | | | | | 1,216,498 | |
| Office-Industrial Buildings—29.6% | | | | |
| | 51,528 | | | Alexandria Real Estate Equities, Inc. (a) | | | 4,276,824 | |
| | 49,611 | | | Boston Properties, Inc. | | | 6,288,194 | |
| | 37,671 | | | CoreSite Realty Corp. | | | 1,394,580 | |
| | 52,600 | | | Digital Realty Trust, Inc. | | | 3,628,874 | |
| Shares | | | Security
Description | | Value | |
| | | | | | | |
| Office-Industrial Buildings—continued | | | | |
| | 64,509 | | | Douglas Emmett, Inc. | | $ | 1,814,638 | |
| | 40,352 | | | DuPont Fabros Technology, Inc. | | | 1,249,702 | |
| | 45,455 | | | Empire State Realty Trust, Inc.-Class A | | | 725,462 | |
| | 10,714 | | | Hudson Pacific Properties, Inc. | | | 292,599 | |
| | 42,473 | | | Kilroy Realty Corp. (a) | | | 2,877,121 | |
| | 23,708 | | | Liberty Property Trust | | | 824,327 | |
| | 104,700 | | | Prologis, Inc. | | | 4,360,755 | |
| | 41,351 | | | SL Green Realty Corp. (a) | | | 4,784,311 | |
| | 44,537 | | | STAG Industrial, Inc. | | | 1,086,703 | |
| | 27,528 | | | Terreno Realty Corp. | | | 579,740 | |
| | | | | | | | 34,183,830 | |
| REIT - Infrastructure—1.5% | | | | |
| | 17,500 | | | American Tower Corp. | | | 1,706,250 | |
| Retail Centers—20.5% | | | | |
| | 158,191 | | | CBL & Associates Properties, Inc. | | | 3,026,194 | |
| | 20,075 | | | DDR Corp. | | | 364,160 | |
| | 12,100 | | | Federal Realty Investment Trust (a) | | | 1,594,780 | |
| | 76,000 | | | General Growth Properties, Inc. | | | 1,969,160 | |
| | 50,000 | | | Kimco Realty Corp. | | | 1,247,500 | |
| | 56,295 | | | Simon Property Group, Inc. (a) | | | 10,088,627 | |
| | 19,106 | | | Taubman Centers, Inc. (a) | | | 1,453,011 | |
| | 48,928 | | | The Macerich Co. (a) | | | 3,449,424 | |
| | 28,647 | | | Washington Prime Group, Inc. | | | 505,047 | |
| | | | | | | | 23,697,903 | |
| Storage—5.2% | | | | |
| | 16,000 | | | Extra Space Storage, Inc. | | | 930,560 | |
| | 27,265 | | | Public Storage (a) | | | 5,026,030 | |
| | | | | | | | 5,956,590 | |
| | | | | Total Real Estate Investment Trusts
(Cost $63,063,926) | | | 114,393,856 | |
| Common Stocks—1.5% | | | | |
| Lodging—1.5% | | | | |
| | 22,000 | | | Starwood Hotels & Resorts Worldwide, Inc. (a) | | | 1,686,520 | |
| | | | | Total Common Stocks
(Cost $1,122,842) | | | 1,686,520 | |
| Preferred Stocks—1.3% | | | | |
| Mortgage & Finance—0.4% | | | | |
| | 20,567 | | | NorthStar Realty Finance Corp.-Series B, 8.250% | | | 515,615 | |
| Retail Centers—0.9% | | | | |
| | 39,333 | | | CBL & Associates Properties, Inc.-Series D, 7.375% | | | 995,911 | |
| | | | | Total Preferred Stocks
(Cost $1,138,847) | | | 1,511,526 | |
Total Investments
(Cost $65,325,615)—101.9% | | | 117,591,902 | |
| Liabilities in Excess of Other Assets—(1.9)% | | | (2,167,045 | ) |
| TOTAL NET ASSETS 100.0% | | $ | 115,424,857 | |
Percentages are stated as a percent of net assets.
| (a) | All or a portion of the security has been designated as collateral for the line of credit. |
| | |
| (b) | Non-income producing security. |
REIT—Real Estate Investment Trust
The accompanying notes are an integral part of these financial statements.
48
Alpine Cyclical Advantage Property Fund
Schedule of Portfolio Investments—Continued
October 31, 2014
| Shares | | | Security
Description | | Value | |
| | | | | | | |
| Common Stocks—99.9% | | | | |
| Asia—34.0% | | | | |
| China—8.0% | | | | |
| | 260,000 | | | China Overseas Land & Investment, Ltd. | | $ | 756,014 | |
| | 226,231 | | | China State Construction International Holdings, Ltd. | | | 350,060 | |
| | 500,000 | | | Country Garden Holdings Co., Ltd. | | | 196,643 | |
| | 10,967,005 | | | CSI Properties, Ltd. | | | 473,743 | |
| | 80,000 | | | E-House China Holdings, Ltd.-ADR (a) | | | 799,200 | |
| | 270,000 | | | Greentown China Holdings, Ltd. | | | 280,962 | |
| | 897,931 | | | Kaisa Group Holdings, Ltd. | | | 332,303 | |
| | 300,000 | | | Longfor Properties Co., Ltd. | | | 348,156 | |
| | 50,100 | | | Sands China, Ltd. | | | 312,352 | |
| | 150,000 | | | Shimao Property Holdings, Ltd. | | | 323,011 | |
| | 450,000 | | | Sunac China Holdings, Ltd. | | | 390,515 | |
| | | | | | | | 4,562,959 | |
| India—0.9% | | | | |
| | 620,000 | | | Unitech Corporate Parks PLC (b) | | | 505,825 | |
| Indonesia—0.9% | | | | |
| | 33,380,487 | | | PT Bakrieland Development TBK (b) | | | 138,107 | |
| | 9,642,857 | | | PT Pakuwon Jati TBK | | | 359,064 | |
| | | | | | | | 497,171 | |
| Japan—12.9% | | | | |
| | 5,000 | | | Daito Trust Construction Co., Ltd. | | | 615,402 | |
| | 158 | | | GLP J-REIT | | | 176,673 | |
| | 123,000 | | | Hulic Co., Ltd. | | | 1,320,614 | |
| | 1,768 | | | Invincible Investment Corp. | | | 598,121 | |
| | 354,573 | | | Kenedix, Inc. | | | 1,600,432 | |
| | 40,000 | | | Mitsubishi Estate Co., Ltd. | | | 995,504 | |
| | 19,396 | | | Mitsui Fudosan Co., Ltd. | | | 605,666 | |
| | 36 | | | Nippon Prologis REIT, Inc. | | | 82,913 | |
| | 18,000 | | | Sumitomo Realty & Development Co., Ltd. | | | 656,141 | |
| | 100,000 | | | TOC Co., Ltd. | | | 708,658 | |
| | | | | | | | 7,360,124 | |
| Philippines—5.3% | | | | |
| | 746,539 | | | Ayala Land, Inc. | | | 557,305 | |
| | 10,000,000 | | | Megaworld Corp. | | | 1,105,293 | |
| | 1,401,363 | | | Robinsons Land Corp. | | | 766,651 | |
| | 1,600,000 | | | SM Prime Holdings, Inc. | | | 623,242 | |
| | | | | | | | 3,052,491 | |
| Singapore—1.0% | | | | |
| | 280,000 | | | Global Logistic Properties, Ltd. | | | 599,362 | |
| Thailand—2.8% | | | | |
| | 1,966,667 | | | Ananda Development PCL | | | 229,455 | |
| | 550,000 | | | Central Pattana PCL | | | 814,784 | |
| | 230,000 | | | Minor International PCL | | | 245,394 | |
| | 569,550 | | | TICON Industrial Connection PCL | | | 325,257 | |
| | | | | | | | 1,614,890 | |
| United Arab Emirates—2.2% | | | | |
| | 20,000 | | | DAMAC Real Estate Development, Ltd.-GDR (c) | | | 393,000 | |
| | 8,889 | | | Emaar Malls Group PJSC (b) | | | 7,769 | |
| Shares | | | Security
Description | | Value | |
| | | | | | | |
| United Arab Emirates—continued | | | | |
| | 320,000 | | | Emaar Properties PJSC | | $ | 871,222 | |
| | | | | | | | 1,271,991 | |
| | | | | Total Asia (Cost $17,709,862) | | | 19,464,813 | |
| Europe—25.9% | | | | |
| France—3.1% | | | | |
| | 39,715 | | | Affine SA | | | 704,229 | |
| | 30,000 | | | Nexity SA | | | 1,076,707 | |
| | | | | | | | 1,780,936 | |
| Germany—4.5% | | | | |
| | 38,729 | | | DIC Asset AG | | | 325,949 | |
| | 40,000 | | | GAGFAH SA (b) | | | 746,877 | |
| | 70,100 | | | Patrizia Immobilien AG (b) | | | 946,100 | |
| | 26,110 | | | TAG Immobilien AG | | | 305,341 | |
| | 20,000 | | | TLG Immobilien AG (b) | | | 273,187 | |
| | | | | | | | 2,597,454 | |
| Ireland—2.0% | | | | |
| | 200,000 | | | Dalata Hotel Group PLC (b) | | | 726,827 | |
| | 259,242 | | | Green REIT PLC | | | 409,335 | |
| | | | | | | | 1,136,162 | |
| Norway—0.5% | | | | |
| | 26,000 | | | Entra ASA (b)(c) | | | 287,178 | |
| Russia—0.8% | | | | |
| | 444,709 | | | Raven Russia, Ltd. (b) | | | 441,069 | |
| Spain—1.4% | | | | |
| | 25,000 | | | Hispania Activos Inmobiliarios SAU (b) | | | 307,022 | |
| | 20,000 | | | Lar Espana Real Estate Socimi SA (b) | | | 230,580 | |
| | 24,000 | | | Merlin Properties Socimi SA (b) | | | 284,214 | |
| | | | | | | | 821,816 | |
| United Kingdom—13.6% | | | | |
| | 23,000 | | | Great Portland Estates PLC | | | 252,585 | |
| | 55,000 | | | Land Securities Group PLC | | | 973,978 | |
| | 60,000 | | | Londonmetric Property PLC | | | 141,477 | |
| | 778,923 | | | LXB Retail Properties PLC (b) | | | 1,719,540 | |
| | 600,853 | | | Quintain Estates & Development PLC (b) | | | 788,172 | |
| | 175,000 | | | Regus PLC | | | 552,336 | |
| | 50,000 | | | Savills PLC | | | 515,103 | |
| | 341,253 | | | Songbird Estates PLC (b) | | | 1,432,994 | |
| | 50,000 | | | The British Land Co. PLC | | | 582,691 | |
| | 119,064 | | | The Unite Group PLC | | | 813,293 | |
| | | | | | | | 7,772,169 | |
| | | | | Total Europe (Cost $12,332,481) | | | 14,836,784 | |
| North & South America—40.0% | | | | |
| Brazil—7.6% | | | | |
| | 98,241 | | | BHG SA-Brazil Hospitality Group (b) | | | 709,679 | |
| | 35,851 | | | BR Properties SA | | | 181,143 | |
| | 15,000 | | | Cyrela Commercial Properties SA Empreendimentos e Participacoes-ADR (a)(c) | | | 383,949 | |
| | 201,912 | | | Direcional Engenharia SA | | | 831,148 | |
| | 40,000 | | | General Shopping Brasil SA (b) | | | 108,963 | |
| | 12,887 | | | Iguatemi Empresa de Shopping Centers SA | | | 130,540 | |
| | 150,000 | | | JHSF Participacoes SA | | | 190,686 | |
| | 22,256 | | | Multiplan Empreendimentos Imobiliarios SA | | | 460,317 | |
The accompanying notes are an integral part of these financial statements.
49
Alpine Cyclical Advantage Property Fund
Schedule of Portfolio Investments—Continued
October 31, 2014
| Shares | | | Security
Description | | Value | |
| | | | | | | |
| Common Stocks—continued | | | | |
| North & South America—continued | | | | |
| Brazil—(continued) | | | | |
| | 500,000 | | | PDG Realty SA Empreendimentos e Participacoes (b) | | $ | 246,176 | |
| | 80,000 | | | Sao Carlos Empreendimentos e Participacoes SA | | | 1,078,333 | |
| | | | | | | | 4,320,934 | |
| Mexico—3.8% | | | | |
| | 300,000 | | | Concentradora Fibra Hotelera Mexicana SA de CV | | | 504,595 | |
| | 273,469 | | | Corp. Inmobiliaria Vesta SAB de CV | | | 601,109 | |
| | 106,383 | | | Fibra Uno Administracion SA de CV | | | 369,245 | |
| | 399,212 | | | Hoteles City Express SAB de CV (b) | | | 723,347 | |
| | | | | | | | 2,198,296 | |
| United States—28.6% | | | | |
| | 1,000 | | | Altisource Asset Management Corp. (a)(b) | | | 540,000 | |
| | 45,667 | | | Altisource Residential Corp. (a) | | | 1,060,388 | |
| | 25,000 | | | American Capital Mortgage Investment Corp. (a) | | | 489,750 | |
| | 35,000 | | | American Homes 4 Rent-Class A (a) | | | 613,550 | |
| | 43,750 | | | American Realty Capital Properties, Inc. (a) | | | 388,062 | |
| | 5,000 | | | AvalonBay Communities, Inc. (a) | | | 779,200 | |
| | 4,000 | | | Boston Properties, Inc. (a) | | | 507,000 | |
| | 70,000 | | | Colony Financial, Inc. (a) | | | 1,559,600 | |
| | 50,000 | | | DR Horton, Inc. (a) | | | 1,139,500 | |
| | 10,000 | | | Hilton Worldwide Holdings, Inc. (b) | | | 252,400 | |
| | 9,000 | | | Kilroy Realty Corp. | | | 609,660 | |
| | 15,000 | | | La Quinta Holdings, Inc. (a)(b) | | | 306,150 | |
| | 15,000 | | | Lennar Corp.-Class A (a) | | | 646,200 | |
| | 14,666 | | | Meritage Homes Corp. (a)(b) | | | 539,562 | |
| | 30,904 | | | RCS Capital Corp.-Class A (a) | | | 507,135 | |
| | 15,000 | | | Ryland Group, Inc. (a) | | | 537,150 | |
| | 1,923 | | | Simon Property Group, Inc. (a) | | | 344,621 | |
| | 7,000 | | | Starwood Hotels & Resorts Worldwide, Inc. (a) | | | 536,620 | |
| | 75,045 | | | Starwood Property Trust, Inc. (a) | | | 1,693,015 | |
| | 25,009 | | | Starwood Waypoint Residential Trust (a) | | | 654,736 | |
| Shares | | | Security
Description | | Value | |
| | | | | | | |
| United States—continued | | | | |
| | 5,000 | | | The Howard Hughes Corp. (a)(b) | | $ | 736,900 | |
| | 117,912 | | | Two Harbors Investment Corp. (a) | | | 1,194,448 | |
| | 40,000 | | | WCI Communities, Inc. (a)(b) | | | 750,400 | |
| | | | | | | | 16,386,047 | |
| | | | | Total North & South America
(Cost $22,850,641) | | | 22,905,277 | |
| | | | | Total Common Stocks
(Cost $52,892,984) | | | 57,206,874 | |
| Equity-Linked Structured Notes—3.9% | | | | |
| Asia—3.9% | | | |
| India—3.9% | | | | |
| | 200,000 | | | DB Realty, Ltd.-Macquarie Bank, Ltd. (b) | | | 221,498 | |
| | 193,000 | | | Kolte-Patil Developers, Ltd.-Macquarie Bank, Ltd. | | | 590,944 | |
| | 120,000 | | | Prestige Estates Projects, Ltd.-Macqarie Bank, Ltd. | | | 439,837 | |
| | 130,280 | | | Puravankara Projects, Ltd.-Macquarie Bank, Ltd. | | | 212,501 | |
| | 110,000 | | | Sobha Developers, Ltd.-Macquarie Bank, Ltd. | | | 772,777 | |
| | | | | | | | 2,237,557 | |
| | | | | Total Asia (Cost $1,682,220) | | | 2,237,557 | |
| | | | | Total Equity-Linked Structured Notes
(Cost $1,682,220) | | | 2,237,557 | |
| Warrants—0.0% (d) | | | | |
| Asia—0.0% (d) | | | | |
| Thailand—0.0% (d) | | | | |
| | 11,500 | | | Minor International PCL | | | | |
| | | | | Expiration: November 25, 2014 | | | | |
| | | | | Exercise Price: THB 40.00 | | | 0 | |
| | | | | Total Asia (Cost $0) | | | 0 | |
| | | | | Total Warrants (Cost $0) | | | 0 | |
Total Investments
(Cost $54,575,204)—103.8% | | | 59,444,431 | |
| Liabilities in Excess of Other Assets—(3.8)% | | | (2,189,945 | ) |
| TOTAL NET ASSETS 100.0% | | $ | 57,254,486 | |
Percentages are stated as a percent of net assets.
| (a) | All or a portion of the security has been designated as collateral for the line of credit. |
| | |
| (b) | Non-income producing security. |
| | |
| (c) | Restricted under Rule 144A of the Securities Act of 1933. These securities may be resold in transactions exempt from registration, normally to qualified institutional buyers. These securities have been determined to be liquid under guidelines established by the Board of Trustees. Liquid securities restricted under Rule 144A comprised 1.9% of the Fund’s net assets. |
| | |
| (d) | Amount is less than 0.05%. |
ADR—American Depositary Receipt
AG—Aktiengesellschaft is a German term that refers to a corporation that is limited by shares, i.e., owned by shareholders.
ASA—Allmennaksjeselskap is the Norwegian term for a public limited company.
GDR—Global Depositary Receipt
PCL—Public Company Limited
PJSC—Public Joint Stock Company
PLC—Public Limited Company
REIT—Real Estate Investment Trust
SA—Generally designates corporations in various countries, mostly those employing the civil law.
SA de CV—Sociedad Anonima de Capital Variable is the Spanish equivalent to Variable Capital Company.
SAB de CV—Sociedad Anonima Bursátil de Capital Variable is the Spanish equivalent to Variable Capital Company.
SAU—Sociedad Anónima Unipersonal
THB—Thailand Baht
The accompanying notes are an integral part of these financial statements.
50
Alpine Emerging Markets Real Estate Fund
Schedule of Portfolio Investments
October 31, 2014
| Shares | | | Security
Description | | Value | |
| | | | | | | |
| Common Stocks—92.9% | | | | |
| Asia—63.5% | | | | |
| China—28.8% | | | | |
| | 193,000 | | | China Overseas Land & Investment, Ltd. | | $ | 561,195 | |
| | 110,000 | | | China Resources Land, Ltd. | | | 261,271 | |
| | 135,000 | | | China South City Holdings, Ltd. | | | 61,449 | |
| | 30,857 | | | China State Construction | | | | |
| | | | | International Holdings, Ltd. | | | 47,747 | |
| | 140,000 | | | China Vanke Co., Ltd.-Class H (a) | | | 263,567 | |
| | 28,333 | | | Country Garden Holdings Co., Ltd. | | | 11,143 | |
| | 5,000 | | | E-House China Holdings, Ltd.-ADR | | | 49,950 | |
| | 32,000 | | | Greentown China Holdings, Ltd. | | | 33,299 | |
| | 120,000 | | | Kaisa Group Holdings, Ltd. | | | 44,409 | |
| | 81,000 | | | KWG Property Holding, Ltd. | | | 56,192 | |
| | 54,000 | | | Longfor Properties Co., Ltd. | | | 62,668 | |
| | 110,500 | | | Shimao Property Holdings, Ltd. | | | 237,952 | |
| | 81,000 | | | Sunac China Holdings, Ltd. | | | 70,293 | |
| | | | | | | | 1,761,135 | |
| Hong Kong—2.7% | | | | |
| | 6,800 | | | Cheung Kong Holdings, Ltd. | | | 120,916 | |
| | 1,000,000 | | | CSI Properties, Ltd. | | | 43,197 | |
| | | | | | | | 164,113 | |
| India—0.3% | | | | |
| | 30,000 | | | Ascendas India Trust | | | 19,149 | |
| Indonesia—4.7% | | | | |
| | 20,000 | | | First Real Estate Investment Trust | | | 19,149 | |
| | 500,000 | | | PT Alam Sutera Realty TBK | | | 19,197 | |
| | 322,159 | | | PT Bumi Serpong Damai TBK | | | 42,786 | |
| | 480,500 | | | PT Ciputra Development TBK | | | 45,525 | |
| | 100,000 | | | PT Ciputra Surya TBK | | | 20,066 | |
| | 1,535,714 | | | PT Pakuwon Jati TBK | | | 57,184 | |
| | 800,000 | | | PT Summarecon Agung TBK | | | 83,409 | |
| | | | | | | | 287,316 | |
| Malaysia—3.7% | | | | |
| | 120,000 | | | IJM Land BHD | | | 125,500 | |
| | 70,000 | | | Mah Sing Group BHD | | | 50,650 | |
| | 50,000 | | | MKH BHD | | | 51,075 | |
| | | | | | | | 227,225 | |
| Philippines—7.6% | | | | |
| | 240,307 | | | Ayala Land, Inc. | | | 179,393 | |
| | 520,000 | | | Megaworld Corp. | | | 57,475 | |
| | 140,000 | | | Robinsons Land Corp. | | | 76,591 | |
| | 330,000 | | | SM Prime Holdings, Inc. | | | 128,544 | |
| | 150,000 | | | Vista Land & Lifescapes, Inc. | | | 20,557 | |
| | | | | | | | 462,560 | |
| Singapore—0.9% | | | | |
| | 27,000 | | | Global Logistic Properties, Ltd. | | | 57,796 | |
| Thailand—6.1% | | | | |
| | 231,000 | | | AP Thailand PCL | | | 47,165 | |
| | 200,000 | | | BTS Group Holdings PCL-NVDR | | | 63,248 | |
| | 72,000 | | | Central Pattana PCL | | | 106,663 | |
| | 100,000 | | | Hemaraj Land and Development PCL | | | 14,676 | |
| | 60,000 | | | Land & Houses PCL | | | 18,790 | |
| | 45,000 | | | LPN Development PCL-NVDR | | | 34,403 | |
| | 10,000 | | | Pruksa Real Estate PCL | | | 10,286 | |
| | 45,000 | | | Supalai PCL | | | 35,577 | |
| | 70,150 | | | TICON Industrial Connection PCL | | | 40,061 | |
| | | | | | | | 370,869 | |
| Shares | | | Security
Description | | Value | |
| | | | | | | |
| United Arab Emirates—8.7% | | |
| | 2,000 | | | DAMAC Real Estate Development, Ltd.-GDR (b) | | $ | 39,300 | |
| | 64,611 | | | Emaar Malls Group PJSC | | | 56,466 | |
| | 161,000 | | | Emaar Properties PJSC | | | 438,334 | |
| | | | | | | | 534,100 | |
| | | | | Total Asia (Cost $3,505,919) | | | 3,884,263 | |
| Europe—3.0% | | | | |
| Austria—1.7% | | | | |
| | 2,000 | | | CA Immobilien Anlagen AG (a) | | | 38,284 | |
| | 22,000 | | | Immofinanz AG (a) | | | 66,497 | |
| | | | | | | | 104,781 | |
| Turkey—1.3% | | | | |
| | 72,809 | | | Emlak Konut Gayrimenkul Yatirim Ortakligi AS | | | 81,894 | |
| | | | | Total Europe (Cost $198,358) | | | 186,675 | |
| Middle East/Africa—8.4% | | | | |
| Egypt—2.9% | | | | |
| | 5,074 | | | Medinet Nasr Housing (a) | | | 29,096 | |
| | 50,000 | | | Palm Hills Developments SAE (a) | | | 28,601 | |
| | 41,355 | | | Six of October Development & Investment (a) | | | 91,617 | |
| | 20,000 | | | Talaat Moustafa Group | | | 29,398 | |
| | | | | | | | 178,712 | |
| South Africa—5.5% | | | | |
| | 40,000 | | | Capital Property Fund | | | 46,347 | |
| | 27,000 | | | Fountainhead Property Trust | | | 19,828 | |
| | 70,000 | | | Growthpoint Properties, Ltd. | | | 169,768 | |
| | 110,000 | | | Redefine Properties, Ltd. | | | 99,631 | |
| | | | | | | | 335,574 | |
| | | | | Total Middle East/Africa
(Cost $446,950) | | | 514,286 | |
| North & South America—18.0% | | | | |
| Argentina—0.2% | | | | |
| | 3,100 | | | TGLT SA-ADR (c) | | | 14,268 | |
| Brazil—7.2% | | | | |
| | 9,462 | | | BHG SA-Brazil Hospitality Group (a) | | | 68,352 | |
| | 16,049 | | | BR Malls Participacoes SA | | | 128,889 | |
| | 7,056 | | | BR Properties SA | | | 35,652 | |
| | 6,724 | | | Direcional Engenharia SA | | | 27,679 | |
| | 9,000 | | | Even Construtora e Incorporadora SA | | | 19,468 | |
| | 16,538 | | | General Shopping Brasil SA (a) | | | 45,051 | |
| | 2,500 | | | Helbor Empreendimentos SA | | | 6,114 | |
| | 11,000 | | | MRV Engenharia e Participacoes SA | | | 36,402 | |
| | 3,342 | | | Multiplan Empreendimentos Imobiliarios SA | | | 69,122 | |
| | | | | | | | 436,729 | |
| Chile—0.8% | | | | |
| | 23,000 | | | Parque Arauco SA | | | 47,161 | |
The accompanying notes are an integral part of these financial statements.
51
Alpine Emerging Markets Real Estate Fund
Schedule of Portfolio Investments—Continued
October 31, 2014
| Shares | | | Security
Description | | Value | |
| | | | | | | |
| Common Stocks—continued | | | | |
| North & South America—continued | | | | |
| Mexico—9.8% | | | | |
| | 5,000 | | | Concentradora Fibra Danhos SA de CV | | $ | 12,661 | |
| | 56,000 | | | Concentradora Fibra Hotelera Mexicana SA de CV | | | 94,191 | |
| | 46,244 | | | Corp. Inmobiliaria Vesta SAB de CV | | | 101,648 | |
| | 24,000 | | | Fibra Shop Portafolios Inmobiliarios SAPI de CV | | | 32,597 | |
| | 65,000 | | | Fibra Uno Administracion SA de CV | | | 225,609 | |
| | 40,000 | | | Hoteles City Express SAB de CV (a) | | | 72,478 | |
| | 30,000 | | | Prologis Property Mexico SA de CV | | | 62,133 | |
| | | | | | | | 601,317 | |
| | | | | Total North & South America
(Cost $1,123,271) | | | 1,099,475 | |
| | | | | Total Common Stocks
(Cost $5,274,498) | | | 5,684,699 | |
| Preferred Stocks—0.2% | | | | |
| Europe—0.2% | | | | |
| Russia—0.2% | | | | |
| | 5,000 | | | Raven Russia, Ltd., 12.000% | | | 11,258 | |
| | | | | Total Europe (Cost $11,517) | | | 11,258 | |
| | | | | Total Preferred Stocks
(Cost $11,517) | | | 11,258 | |
| Equity-Linked Structured Notes—6.5% | | | | |
| Asia—6.5% | | | | |
| India—5.6% | | | | |
| | 12,000 | | | DB Realty, Ltd.-Macquarie Bank, Ltd. (a) | | | 13,290 | |
| | 15,000 | | | DFL Ltd. - Macquarie Bank, Ltd. | | | 30,318 | |
| | 12,000 | | | Kolte-Patil Developers, Ltd.-Macquarie Bank, Ltd. | | | 36,743 | |
| | 8,000 | | | Oberoi Realty, Ltd.-Macquarie Bank, Ltd. | | | 32,026 | |
| Shares | | | Security
Description | | Value | |
| | | | | | | |
| India—continued | | | | |
| | 10,310 | | | Phoenix Mills, Ltd.-Macquarie Bank, Ltd. | | $ | 64,102 | |
| | 8,000 | | | Prestige Estates Projects, Ltd.-Macqarie Bank, Ltd. | | | 29,322 | |
| | 26,070 | | | Puravankara Projects, Ltd.-Macquarie Bank, Ltd. | | | 42,523 | |
| | 13,000 | | | Sobha Developers, Ltd.-Macquarie Bank, Ltd. | | | 91,328 | |
| | | | | | | | 339,652 | |
| Vietnam—0.9% | | | | |
| | 47,437 | | | HAGL JSC-GDR-Macquarie Bank, Ltd. | | | 54,666 | |
| | | | | Total Asia (Cost $391,634) | | | 394,318 | |
| | | | | Total Equity-Linked Structured Notes
(Cost $391,634) | | | 394,318 | |
| | | | | | | | | |
Principal
Amount | | | | | | | |
| | | | | | | | | |
| Convertible Bonds—0.0% (d) | | | | |
| North & South America—0.0% (d) | | | | |
| Brazil—0.0% (d) | | | | |
| $ | 80,000 | | | PDG Realty SA Empreendimentos e Participacoes-
Series 8, 0.000%, 9/19/16 (Brazilian Real) (e) | | | 323 | |
| | | | | Total Convertible Bonds
(Cost $28,699) | | | 323 | |
| Short-Term Investments—4.6% | | | | |
| | 283,000 | | | State Street Eurodollar Time Deposit, 0.01% | | | 283,000 | |
| | | | | Total Short-Term Investments
(Cost $283,000) | | | 283,000 | |
Total Investments
(Cost $5,989,348)—104.2% | | | 6,373,598 | |
| Liabilities in Excess of Other Assets—(4.2)% | | | (256,605 | ) |
| TOTAL NET ASSETS 100.0% | | $ | 6,116,993 | |
The accompanying notes are an integral part of these financial statements.
52
Alpine Emerging Markets Real Estate Fund
Schedule of Portfolio Investments—Continued
October 31, 2014
Percentages are stated as a percent of net assets.
| (a) | Non-income producing security. |
| | |
| (b) | Restricted under Rule 144A of the Securities Act of 1933. These securities may be resold in transactions exempt from registration, normally to qualified institutional buyers. These securities have been determined to be liquid under guidelines established by the Board of Trustees. Liquid securities restricted under Rule 144A comprised 0.6% of the Fund’s net assets. |
| | |
| (c) | Reg S—Security exempt from registration under Regulation S of the Securities Act of 1933, which exempts from registration securities offered and sold outside the United States. Security may not be offered or sold in the United States except pursuant to an exemption from, or in a transaction not subject to, the registration requirements of the Securities Act of 1933. As of October 31, 2014, these securities amounted to a total value of $14,268 which comprised 0.2% of the Fund’s net assets. |
| | |
| (d) | Amount is less than 0.05%. |
| | |
| (e) | Represents a zero-coupon bond. |
ADR—American Depositary Receipt
AG—Aktiengesellschaft is a German term that refers to a corporation that is limited by shares, i.e., owned by shareholders.
AS—Anonim Sirketi is the Turkish term for joint stock company.
BHD—Malaysian equivalent to incorporated.
GDR—Global Depositary Receipt
JSC—Joint Stock Company
NVDR—Non-Voting Depositary Receipts
PCL—Public Company Limited
PJSC—Public Joint Stock Company
SA—Generally designates corporations in various countries, mostly those employing the civil law.
SA de CV—Sociedad Anonima de Capital Variable is the Spanish equivalent to Variable Capital Company.
SAB de CV—Sociedad Anonima Bursátil de Capital Variable is the Spanish equivalent to Variable Capital Company.
SAE—Societe Anonyme Egyptienne.
SAPI de CV—Sociedad Anonima Promotora de Inversion de Capital Variable is the Spanish equivalent to Variable Capital Corporation.
The accompanying notes are an integral part of these financial statements.
53
Alpine Global Infrastructure Fund
Schedule of Portfolio Investments
October 31, 2014
| Shares | | | Security
Description | | Value | |
| | | | | | | |
| Common Stocks—93.4% | | | | |
| Asia—17.4% | | | | |
| China—11.7% | | | | |
| | 2,956,000 | | | Beijing Enterprises Water Group, Ltd. (a) | | $ | 2,111,660 | |
| | 3,066,000 | | | China CNR Corp., Ltd.-Class H (a)(b)(c) | | | 3,119,313 | |
| | 896,000 | | | China Everbright International, Ltd. | | | 1,245,479 | |
| | 609,000 | | | China Merchants Holdings International Co., Ltd. | | | 1,923,947 | |
| | 2,820,000 | | | China Railway Construction Corp., Ltd.-Class H | | | 2,978,124 | |
| | 714,000 | | | China Resources Gas Group, Ltd. | | | 2,034,700 | |
| | 744,000 | | | China Resources Power Holdings Co., Ltd. | | | 2,163,362 | |
| | 1,220,972 | | | China State Construction International Holdings, Ltd. | | | 1,889,282 | |
| | 1,575,000 | | | COSCO Pacific, Ltd. | | | 2,075,589 | |
| | 5,434,000 | | | Guangshen Railway Co., Ltd.-Class H | | | 2,333,317 | |
| | 1,802,000 | | | Qinhuangdao Port Co., Ltd.-Class H | | | 901,563 | |
| | 2,084,100 | | | Zhejiang Expressway Co., Ltd.-Class H | | | 2,101,528 | |
| | | | | | | | 24,877,864 | |
| Indonesia—2.3% | | | | |
| | 63,500,000 | | | PT Bakrieland Development TBK (a) | | | 262,722 | |
| | 4,045,000 | | | PT Jasa Marga Persero TBK | | | 2,125,424 | |
| | 3,480,000 | | | PT Tower Bersama Infrastructure TBK | | | 2,562,847 | |
| | | | | | | | 4,950,993 | |
| Japan—1.8% | | | | |
| | 31,100 | | | East Japan Railway Co. | | | 2,393,586 | |
| | 53,000 | | | Japan Airlines Co., Ltd. | | | 1,409,873 | |
| | | | | | | | 3,803,459 | |
| Philippines—0.9% | | | | |
| | 760,900 | | | International Container Terminal Services, Inc. | | | 1,966,895 | |
| Thailand—0.7% | | | | |
| | 5,115,000 | | | BTS Rail Mass Transit Growth Infrastructure Fund | | | 1,570,463 | |
| | | | | Total Asia (Cost $31,741,674) | | | 37,169,674 | |
| Europe—22.0% | | | | |
| France—7.5% | | | | |
| | 18,000 | | | Aeroports de Paris | | | 2,128,450 | |
| | 85,200 | | | Eutelsat Communications SA | | | 2,761,031 | |
| | | | | | | | | |
| | 177,500 | | | Groupe Eurotunnel SA | | | 2,242,136 | |
| | 132,800 | | | Suez Environnement Co. | | | 2,234,998 | |
| | 157,100 | | | Veolia Environnement SA | | | 2,625,260 | |
| | 71,500 | | | Vinci SA | | | 4,074,571 | |
| | | | | | | | 16,066,446 | |
| Germany—3.5% | | | | |
| | 45,100 | | | Fraport AG Frankfurt Airport Services Worldwide | | | 2,787,422 | |
| | 101,100 | | | Hamburger Hafen und Logistik AG | | | 2,212,702 | |
| | 35,500 | | | HeidelbergCement AG | | | 2,416,524 | |
| | | | | | | | 7,416,648 | |
| Shares | | | Security
Description | | Value | |
| | | | | | | |
| Italy—1.2% | | | | |
| | 109,400 | | | Atlantia SpA | | $ | 2,577,379 | |
| Netherlands—1.5% | | | | |
| | 61,300 | | | Koninklijke Vopak NV | | | 3,069,651 | |
| Spain—4.2% | | | | |
| | 663,700 | | | Abengoa SA-B Shares | | | 2,797,060 | |
| | 131,600 | | | Abertis Infraestructuras SA | | | 2,738,406 | |
| | 119,000 | | | Obrascon Huarte Lain SA | | | 3,469,390 | |
| | | | | | | | 9,004,856 | |
| United Kingdom—4.1% | | | | |
| | 71,400 | | | Abengoa Yield PLC (a) | | | 2,320,500 | |
| | 207,800 | | | Ferrovial SA | | | 4,239,387 | |
| | 29,400 | | | National Grid PLC-ADR | | | 2,187,066 | |
| | | | | | | | 8,746,953 | |
| | | | | Total Europe
(Cost $43,119,431) | | | 46,881,933 | |
| North & South America—54.0% | | | | |
| Brazil—5.4% | | | | |
| | 219,200 | | | CCR SA | | | 1,632,124 | |
| | 239,600 | | | Cia de Saneamento Basico do Estado de Sao Paulo-ADR | | | 1,859,296 | |
| | 1,700,000 | | | Cosan Logistica SA (a) | | | 2,847,169 | |
| | 501,600 | | | EcoRodovias Infraestrutura e Logistica SA | | | 2,242,919 | |
| | 200,800 | | | Mills Estruturas e Servicos de Engenharia SA | | | 1,308,737 | |
| | 216,300 | | | Tegma Gestao Logistica | | | 1,588,708 | |
| | | | | | | | 11,478,953 | |
| Canada—4.1% | | | | |
| | 22,300 | | | Canadian Pacific Railway, Ltd. | | | 4,631,264 | |
| | 88,600 | | | Enbridge, Inc. | | | 4,192,394 | |
| | | | | | | | 8,823,658 | |
| Chile—1.0% | | | | |
| | 138,500 | | | Enersis SA-ADR | | | 2,186,915 | |
| Colombia—1.0% | | | | |
| | 25,500 | | | Millicom International Cellular SA-SDR | | | 2,078,912 | |
| Mexico—4.5% | | | | |
| | 404,400 | | | Empresas ICA SAB de CV-ADR (a) | | | 2,883,372 | |
| | 18,600 | | | Grupo Aeroportuario del Sureste SAB de CV-ADR | | | 2,505,048 | |
| | 395,500 | | | Infraestructura Energetica Nova SAB de CV | | | 2,413,016 | |
| | 600,000 | | | OHL Mexico SAB de CV (a) | | | 1,683,765 | |
| | | | | | | | 9,485,201 | |
| Peru—1.0% | | | | |
| | 157,500 | | | Grana y Montero SA-ADR | | | 2,160,900 | |
| United States—37.0% | | | | |
| | 42,800 | | | American Tower Corp. | | | 4,173,000 | |
| | 54,400 | | | American Water Works Co., Inc. | | | 2,903,328 | |
| | 78,400 | | | AT&T, Inc. | | | 2,731,456 | |
| | 51,500 | | | Atmos Energy Corp. | | | 2,729,500 | |
| | 93,000 | | | Cisco Systems, Inc. | | | 2,275,710 | |
| | 84,300 | | | CMS Energy Corp. | | | 2,754,081 | |
| | 48,200 | | | Comcast Corp.-Class A | | | 2,667,870 | |
| | 85,100 | | | Corrections Corp. of America | | | 3,129,978 | |
| | 37,700 | | | Crown Castle International Corp. | | | 2,945,124 | |
| | 43,500 | | | DISH Network Corp.-Class A (a) | | | 2,768,775 | |
| | 37,200 | | | Dominion Resources, Inc. | | | 2,652,360 | |
The accompanying notes are an integral part of these financial statements.
54
Alpine Global Infrastructure Fund
Schedule of Portfolio Investments—Continued
October 31, 2014
| Shares | | | Security
Description | | Value | |
| | | | | | | |
| Common Stocks—continued | | | | |
| North & South America—continued | | | | |
| United States—continued | | | | |
| | 81,800 | | | Exelon Corp. | | $ | 2,993,062 | |
| | 36,000 | | | Genesee & Wyoming, Inc.-Class A (a) | | | 3,463,200 | |
| | 71,000 | | | ITC Holdings Corp. | | | 2,812,310 | |
| | 30,000 | | | Itron, Inc. (a) | | | 1,167,900 | |
| | 114,200 | | | MasTec, Inc. (a) | | | 3,270,688 | |
| | 26,200 | | | NextEra Energy, Inc. | | | 2,625,764 | |
| | 44,900 | | | Northeast Utilities | | | 2,215,815 | |
| | 75,100 | | | NRG Energy, Inc. | | | 2,251,498 | |
| | 49,228 | | | Pattern Energy Group, Inc. | | | 1,416,782 | |
| | 118,000 | | | Progressive Waste Solutions, Ltd. | | | 3,449,140 | |
| | 40,400 | | | SemGroup Corp.-Class A | | | 3,100,700 | |
| | 85,500 | | | T-Mobile U.S., Inc. (a) | | | 2,495,745 | |
| | 100,300 | | | The Geo Group, Inc. | | | 4,005,982 | |
| | 73,000 | | | The Williams Cos., Inc. | | | 4,052,230 | |
| | 195,000 | | | TravelCenters of America LLC (a) | | | 1,887,600 | |
| | 38,700 | | | Union Pacific Corp. | | | 4,506,615 | |
| | 35,000 | | | World Fuel Services Corp. | | | 1,443,400 | |
| | | | | | | | 78,889,613 | |
| | | | | Total North & South America
(Cost $100,947,345) | | | 115,104,152 | |
| | | | | Total Common Stocks
(Cost $175,808,450) | | | 199,155,759 | |
| Shares | | | Security
Description | | Value | |
| | | | | | | |
| Equity-Linked Structured Notes—2.6% | | | | |
| Asia—2.6% | | | | |
| India—2.6% | | | | |
| | 600,000 | | | Adani Ports and Special Economic Zone -Macquarie Bank, Ltd. | | $ | 2,805,049 | |
| | 1,126,800 | | | Power Grid Corp. of India, Ltd.-Macquarie Bank, Ltd. | | | 2,670,185 | |
| | | | | Total Asia
(Cost $3,473,828) | | | 5,475,234 | |
| | | | | Total Equity-Linked Structured Notes
(Cost $3,473,828) | | | 5,475,234 | |
| | | | | | | | | |
Principal
Amount | | | | | | | |
| | | | | | | | | |
| Short-Term Investment—3.4% | | | | |
| $ | 7,275,000 | | | State Street Eurodollar Time Deposit, 0.01% | | | 7,275,000 | |
| | | | | Total Short-Term Investment
(Cost $7,275,000) | | | 7,275,000 | |
| Total Investments (Cost $186,557,278)—99.4% | | | 211,905,993 | |
| Other Assets in Excess of Liabilities—0.6% | | | 1,198,051 | |
| TOTAL NET ASSETS 100.0% | | $ | 213,104,044 | |
Percentages are stated as a percent of net assets.
| (a) | Non-income producing security. |
| | |
| (b) | Restricted under Rule 144A of the Securities Act of 1933. These securities may be resold in transactions exempt from registration, normally to qualified institutional buyers. These securities have been determined to be liquid under guidelines established by the Board of Trustees. Liquid securities restricted under Rule 144A comprised 1.5% of the Fund’s net assets. |
| | |
| (c) | Security fair valued in accordance with procedures approved by the Board of Trustees. These securities comprised 1.5% of the Fund’s net assets. |
ADR—American Depositary Receipt
AG—Aktiengesellschaft is a German term that refers to a corporation that is limited by shares, i.e., owned by shareholders.
NV—Naamloze Vennootschap is the Dutch term for a public limited liability corporation.
PLC—Public Limited Company
SA—Generally designates corporations in various countries, mostly those employing the civil law.
SAB de CV—Sociedad Anonima Bursátil de Capital Variable is the Spanish equivalent to Variable Capital Company.
SDR—Swedish Depositary Receipt
SpA—Societa’ Per Azioni is an Italian shared company.
The accompanying notes are an integral part of these financial statements.
55
Alpine Global Consumer Growth Fund
Schedule of Portfolio Investments
October 31, 2014
| Shares | | | Security
Description | | Value | |
| | | | | | | |
| Common Stocks—96.5% | | | | |
| Asia—20.1% | | | | |
| China—8.9% | | | | |
| | 400 | | | Baidu, Inc.-ADR (a) | | $ | 95,508 | |
| | 20,000 | | | Dongfeng Motor Group Co., Ltd.-Class H | | | 30,896 | |
| | 48,000 | | | Springland International Holdings, Ltd. | | | 18,321 | |
| | 5,000 | | | Tencent Holdings, Ltd. | | | 79,689 | |
| | 22,000 | | | Want Want China Holdings, Ltd. | | | 29,843 | |
| | | | | | | | 254,257 | |
| Hong Kong—3.5% | | |
| | 66,000 | | | Future Bright Holdings, Ltd. | | | 25,276 | |
| | 1,650 | | | Melco Crown Entertainment, Ltd.-ADR | | | 44,781 | |
| | 300,000 | | | REXLot Holdings, Ltd. | | | 30,947 | |
| | | | | | | | 101,004 | |
| Indonesia—2.6% | | |
| | 230,000 | | | PT Erajaya Swasembada TBK (a) | | | 19,412 | |
| | 27,500 | | | PT Indofood CBP Sukses Makmur TBK | | | 25,145 | |
| | 70,000 | | | PT Mitra Adiperkasa TBK | | | 30,699 | |
| | | | | | | | 75,256 | |
| Japan—2.6% | | | | |
| | 4,000 | | | Nissan Motor Co., Ltd. | | | 35,536 | |
| | 1,000 | | | Seven & I Holdings Co., Ltd. | | | 38,113 | |
| | | | | | | | 73,649 | |
| Philippines—1.1% | | | | |
| | 80,000 | | | SM Prime Holdings, Inc. | | | 31,162 | |
| South Korea—1.4% | | | | |
| | 825 | | | Kia Motors Corp. | | | 40,218 | |
| | | | | Total Asia (Cost $491,630) | | | 575,546 | |
| Europe—19.7% | | | | |
| Belgium—3.1% | | | | |
| | 800 | | | Anheuser-Busch InBev NV-ADR | | | 88,784 | |
| France—3.7% | | | | |
| | 300 | | | Kering | | | 57,877 | |
| | 1,400 | | | SES SA | | | 48,334 | |
| | | | | | | | 106,211 | |
| Germany—1.3% | | | | |
| | 360 | | | Bayerische Motoren Werke AG | | | 38,491 | |
| Italy—0.8% | | | | |
| | 1,300 | | | Yoox SpA (a) | | | 23,996 | |
| Netherlands—1.1% | | | | |
| | 800 | | | Unilever NV | | | 31,023 | |
| Russia—0.6% | | | | |
| | 600 | | | Yandex NV-Class A (a) | | | 17,172 | |
| Spain—0.9% | | | | |
| | 875 | | | Inditex SA | | | 24,578 | |
| Switzerland—5.0% | | |
| | 299 | | | Dufry Group (a) | | | 43,041 | |
| | 900 | | | Nestle SA | | | 65,852 | |
| | 70 | | | The Swatch Group AG | | | 33,147 | |
| | | | | | | | 142,040 | |
| | | | | | | | | |
| Shares | | | Security
Description | | Value | |
| | | | | | | |
| United Kingdom—3.2% | | | | |
| | 10,000 | | | ITV PLC | | $ | 32,474 | |
| | 700 | | | Liberty Global PLC-Class A (a) | | | 31,829 | |
| | 600 | | | Liberty Global PLC-Series C (a) | | | 26,682 | |
| | | | | | | | 90,985 | |
| | | | | Total Europe (Cost $458,954) | | | 563,280 | |
| North & South America—56.7% | | | | |
| Argentina—1.7% | | | | |
| | 350 | | | MercadoLibre, Inc. | | | 47,653 | |
| Brazil—6.5% | | | | |
| | 3,200 | | | BR Malls Participacoes SA | | | 25,699 | |
| | 575 | | | Cia Brasileira de Distribuicao Grupo Pao de Acucar-ADR | | | 24,035 | |
| | 3,600 | | | Hypermarcas SA (a) | | | 25,149 | |
| | 3,900 | | | International Meal Co. Holdings SA | | | 27,858 | |
| | 6,812 | | | Kroton Educacional SA | | | 48,549 | |
| | 2,500 | | | Multiplus SA | | | 35,060 | |
| | | | | | | | 186,350 | |
| Mexico—1.2% | | | | |
| | 1,000 | | | Grupo Televisa SA-ADR | | | 36,140 | |
| United States—47.3% | | | | |
| | 850 | | | Abercrombie & Fitch Co.-Class A | | | 28,458 | |
| | 175 | | | Amazon.com, Inc. (a) | | | 53,455 | |
| | 2,000 | | | AMC Entertainment Holdings, Inc.-Class A | | | 50,800 | |
| | 1,050 | | | Apple, Inc. | | | 113,400 | |
| | 1,150 | | | Carnival Corp. | | | 46,173 | |
| | 1,100 | | | CBS Corp.-Class B | | | 59,642 | |
| | 450 | | | Coach, Inc. | | | 15,471 | |
| | 600 | | | Colgate-Palmolive Co. | | | 40,128 | |
| | 1,750 | | | Comcast Corp.-Class A | | | 96,862 | |
| | 400 | | | Dick’s Sporting Goods, Inc. | | | 18,148 | |
| | 2,500 | | | Francesca’s Holdings Corp. (a) | | | 29,775 | |
| | 1,300 | | | GameStop Corp.-Class A | | | 55,588 | |
| | 75 | | | Google, Inc.-Class A (a) | | | 42,590 | |
| | 75 | | | Google, Inc.-Class C (a) | | | 41,931 | |
| | 750 | | | Jarden Corp. (a) | | | 48,818 | |
| | 500 | | | McDonald’s Corp. | | | 46,865 | |
| | 870 | | | Michael Kors Holdings, Ltd. (a) | | | 68,373 | |
| | 650 | | | NIKE, Inc.-Class B | | | 60,430 | |
| | 675 | | | PepsiCo, Inc. | | | 64,915 | |
| | 2,900 | | | Pier 1 Imports, Inc. | | | 37,410 | |
| | 550 | | | The Procter & Gamble Co. | | | 47,999 | |
| | 475 | | | Ulta Salon Cosmetics & Fragrance, Inc. (a) | | | 57,385 | |
| | 1,320 | | | VF Corp. | | | 89,338 | |
| | 350 | | | Visa, Inc.-Class A | | | 84,500 | |
| | 800 | | | Yum! Brands, Inc. | | | 57,464 | |
| | | | | | | | 1,355,918 | |
| | | | | Total North & South America
(Cost $1,203,266) | | | 1,626,061 | |
| | | | | Total Common Stocks
(Cost $2,153,850) | | | 2,764,887 | |
The accompanying notes are an integral part of these financial statements.
56
Alpine Global Consumer Growth Fund
Schedule of Portfolio Investments—Continued
October 31, 2014
Principal
Amount | | | Security
Description | | Value | |
| | | | | | | |
| Short-Term Investments—3.6% | | | | |
| $ | 103,000 | | | State Street Eurodollar Time Deposit, 0.01% | | $ | 103,000 | |
| | | | | Total Short-Term Investments
(Cost $103,000) | | | 103,000 | |
| Total Investments (Cost $2,256,850)—100.1% | | | 2,867,887 | |
| Liabilities in Excess of Other Assets—(0.1)% | | | (3,179 | ) |
| TOTAL NET ASSETS 100.0% | | $ | 2,864,708 | |
Percentages are stated as a percent of net assets.
(a) Non-income producing security.
ADR—American Depositary Receipt
AG—Aktiengesellschaft is a German term that refers to a corporation that is limited by shares, i.e., owned by shareholders.
NV—Naamloze Vennootschap is the Dutch term for a public limited liability corporation.
PLC—Public Limited Company
SA—Generally designates corporations in various countries, mostly those employing the civil law.
SpA—Societa’ Per Azioni is an Italian shared company.
The accompanying notes are an integral part of these financial statements.
57
Alpine Mutual Funds
Statements of Assets and Liabilities
October 31, 2014
| | | International | | Realty | | Cyclical |
| | | Real Estate | | Income & | | Advantage |
| | | Equity Fund | | Growth Fund | | Property Fund |
| ASSETS: | | | | | | | | | | | | | | | |
| Investments, at value(1) | | | | | | | | | | | | | | | |
| Unaffiliated issuers | | | $ | 172,065,020 | | | | $ | 117,591,902 | | | | $ | 59,444,431 | |
| Affiliated issuers | | | | 5,090,232 | | | | | — | | | | | — | |
| Total investments, at value | | | | 177,155,252 | | | | | 117,591,902 | | | | | 59,444,431 | |
| Receivable from investment securities sold | | | | 7,242,147 | | | | | 583,750 | | | | | 6,017,823 | |
| Dividends and interest receivable | | | | 125,322 | | | | | 85,948 | | | | | 38,163 | |
| Receivable from capital shares issued | | | | 2,520 | | | | | 5,030 | | | | | 66 | |
| Unrealized appreciation on forward currency contracts | | | | 1,212,777 | | | | | — | | | | | 583,930 | |
| Due from Adviser | | | | — | | | | | 12,204 | | | | | — | |
| Prepaid expenses and other assets | | | | 94,040 | | | | | 15,157 | | | | | 6,384 | |
| Total assets | | | | 185,832,058 | | | | | 118,293,991 | | | | | 66,090,797 | |
| | | | | | | | | | | | | | | | |
| LIABILITIES: | | | | | | | | | | | | | | | |
| Payable for investment securities purchased | | | | 3,988,284 | | | | | — | | | | | 4,656,074 | |
| Payable for capital shares redeemed | | | | 77,896 | | | | | 12,695 | | | | | 2,765 | |
| Accrued expenses and other liabilities: | | | | | | | | | | | | | | | |
| Investment advisory fees (Note 6) | | | | 140,540 | | | | | 92,408 | | | | | 47,305 | |
| Line of credit (Note 2) | | | | 11,783,433 | | | | | 2,600,264 | | | | | 4,046,627 | |
| Distribution fees (Note 5) | | | | 955 | | | | | 6,168 | | | | | — | |
| Trustee fees | | | | 12,575 | | | | | 5,786 | | | | | 3,819 | |
| Other | | | | 456,858 | | | | | 151,813 | | | | | 79,721 | |
| Total liabilities | | | | 16,460,541 | | | | | 2,869,134 | | | | | 8,836,311 | |
| Net Assets | | | $ | 169,371,517 | | | | $ | 115,424,857 | | | | $ | 57,254,486 | |
| | | | | | | | | | | | | | | | |
| NET ASSETS REPRESENTED BY: | | | | | | | | | | | | | | | |
| Paid-in-capital | | | $ | 1,295,150,636 | | | | $ | 66,983,142 | | | | $ | 97,298,797 | |
| Undistributed (accumulated) net investment income (loss) | | | | (3,336,449 | ) | | | | 127,290 | | | | | 340,996 | |
| Accumulated net realized loss from investments and foreign currency transactions | | | | (1,090,012,434 | ) | | | | (3,950,788 | ) | | | | (45,838,337 | ) |
| Net unrealized appreciation/(depreciation) on: | | | | | | | | | | | | | | | |
| Investments | | | | (33,645,642 | ) | | | | 52,266,287 | | | | | 4,869,227 | |
| Foreign currency translations | | | | 1,215,406 | | | | | (1,074 | ) | | | | 583,803 | |
| Net Assets | | | $ | 169,371,517 | | | | $ | 115,424,857 | | | | $ | 57,254,486 | |
| | | | | | | | | | | | | | | | |
| Net asset value | | | | | | | | | | | | | | | |
| Institutional Class | | | | | | | | | | | | | | | |
| Net assets | | | $ | 169,225,526 | | | | $ | 112,984,206 | | | | $ | 57,254,486 | |
| Shares outstanding | | | | 7,097,799 | | | | | 5,307,129 | | | | | 2,235,528 | |
| Net asset value, offering price and redemption price per share* | | | $ | 23.84 | | | | $ | 21.29 | | | | $ | 25.61 | |
| Class A | | | | | | | | | | | | | | | |
| Net assets | | | $ | 145,991 | | | | $ | 2,440,651 | | | | $ | — | |
| Shares outstanding | | | | 6,146 | | | | | 114,782 | | | | | — | |
| Net asset value per share | | | $ | 23.75 | | | | $ | 21.26 | | | | $ | — | |
| Maximum offering price per share (net asset value plus sales charge of 5.50% of offering price) | | | $ | 25.13 | | | | $ | 22.50 | | | | $ | — | |
| * If applicable, redemption price per share may be reduced by a redemption fee. | | | | | | | | | | | | | | | |
| (1) Total cost of investments | | | | | | | | | | | | | | | |
| Unaffiliated issuers | | | $ | 195,355,778 | | | | $ | 65,325,615 | | | | $ | 54,575,204 | |
| Affiliated issuers | | | $ | 15,445,116 | | | | $ | — | | | | $ | — | |
The accompanying notes are an integral part of these financial statements.
58
Alpine Mutual Funds
Statements of Assets and Liabilities—Continued
October 31, 2014
| | | Emerging | | Global | | Global |
| | | Markets Real | | Infrastructure | | Consumer |
| | | Estate Fund | | Fund | | Growth Fund |
| ASSETS: | | | | | | | | | | | | | | | |
| Investments, at value(1) | | | $ | 6,373,598 | | | | $ | 211,905,993 | | | | $ | 2,867,887 | |
| Foreign currencies, at value(2) | | | | 20,877 | | | | | 54,430 | | | | | 10 | |
| Cash | | | | 135 | | | | | 207 | | | | | 420 | |
| Receivable from investment securities sold | | | | 155,629 | | | | | 174,996 | | | | | — | |
| Dividends and interest receivable | | | | 7,718 | | | | | 135,750 | | | | | 4,187 | |
| Receivable from capital shares issued | | | | 181 | | | | | 257,932 | | | | | — | |
| Unrealized appreciation on forward currency contracts | | | | — | | | | | 1,488,376 | | | | | — | |
| Due from Adviser | | | | 4,608 | | | | | — | �� | | | | 5,040 | |
| Prepaid expenses and other assets | | | | 4,087 | | | | | 19,779 | | | | | 4,238 | |
| Total assets | | | | 6,566,833 | | | | | 214,037,463 | | | | | 2,881,782 | |
| | | | | | | | | | | | | | | | |
| LIABILITIES: | | | | | | | | | | | | | | | |
| Payable for investment securities purchased | | | | 427,868 | | | | | 688,244 | | | | | — | |
| Payable for capital shares redeemed | | | | 101 | | | | | 8,134 | | | | | — | |
| Accrued expenses and other liabilities: | | | | | | | | | | | | | | | |
| Investment advisory fees (Note 6) | | | | 5,070 | | | | | 173,928 | | | | | 2,340 | |
| Distribution fees (Note 5) | | | | 1,383 | | | | | 14,379 | | | | | 917 | |
| Trustee fees | | | | 525 | | | | | 8,882 | | | | | 182 | |
| Other | | | | 14,893 | | | | | 39,852 | | | | | 13,635 | |
| Total liabilities | | | | 449,840 | | | | | 933,419 | | | | | 17,074 | |
| Net Assets | | | $ | 6,116,993 | | | | $ | 213,104,044 | | | | $ | 2,864,708 | |
| | | | | | | | | | | | | | | | |
| NET ASSETS REPRESENTED BY: | | | | | | | | | | | | | | | |
| Paid-in-capital | | | $ | 6,494,460 | | | | $ | 185,887,371 | | | | $ | 2,280,444 | |
| Undistributed (accumulated) net investment income (loss) | | | | 156,831 | | | | | (24,624 | ) | | | | 3,026 | |
| Accumulated net realized gain (loss) from investments and foreign currency transactions | | | | (923,815 | ) | | | | 407,425 | | | | | (29,683 | ) |
| Net unrealized appreciation/(depreciation) on: | | | | | | | | | | | | | | | |
| Investments | | | | 384,250 | | | | | 25,348,715 | | | | | 611,037 | |
| Foreign currency translations | | | | 5,267 | | | | | 1,485,157 | | | | | (116 | ) |
| Net Assets | | | $ | 6,116,993 | | | | $ | 213,104,044 | | | | $ | 2,864,708 | |
| | | | | | | | | | | | | | | | |
| Net asset value | | | | | | | | | | | | | | | |
| Institutional Class | | | | | | | | | | | | | | | |
| Net assets | | | $ | 5,331,801 | | | | $ | 185,903,894 | | | | $ | 2,690,960 | |
| Shares outstanding | | | | 308,243 | | | | | 9,230,060 | | | | | 213,341 | |
| Net asset value, offering price and redemption price per share* | | | $ | 17.30 | | | | $ | 20.14 | | | | $ | 12.61 | |
| Class A | | | | | | | | | | | | | | | |
| Net assets | | | $ | 785,192 | | | | $ | 27,200,150 | | | | $ | 173,748 | |
| Shares outstanding | | | | 45,516 | | | | | 1,352,753 | | | | | 13,808 | |
| Net asset value per share | | | $ | 17.25 | | | | $ | 20.11 | | | | $ | 12.58 | |
| Maximum offering price per share (net asset value plus sales charge of 5.50% of offering price) | | | $ | 18.25 | | | | $ | 21.28 | | | | $ | 13.31 | |
| * If applicable, redemption price per share may be reduced by a redemption fee. | | | | | | | | | | | | | | | |
| (1) Total cost of investments | | | $ | 5,989,348 | | | | $ | 186,557,278 | | | | $ | 2,256,850 | |
| (2) Cost of foreign currencies | | | $ | 20,877 | | | | $ | 54,430 | | | | $ | 10 | |
The accompanying notes are an integral part of these financial statements.
59
Alpine Mutual Funds
Statements of Operations
For the year ended October 31, 2014
| | | International | | Realty | | Cyclical |
| | | Real Estate | | Income & | | Advantage |
| | | Equity Fund | | Growth Fund | | Property Fund |
| INVESTMENT INCOME: | | | | | | | | | | | | | | | |
| Dividend income | | | $ | 3,623,122 | | | | $ | 4,361,183 | | | | $ | 1,589,383 | |
| Less: Foreign taxes withheld | | | | (268,015 | ) | | | | (21,532 | ) | | | | (57,063 | ) |
| Interest income | | | | 14,412 | | | | | — | | | | | 7,200 | |
| Total investment income | | | | 3,369,519 | | | | | 4,339,651 | | | | | 1,539,520 | |
| | | | | | | | | | | | | | | | |
| EXPENSES: | | | | | | | | | | | | | | | |
| Investment advisory fee (Note 6) | | | | 1,842,651 | | | | | 1,052,731 | | | | | 587,566 | |
| Transfer agent fees | | | | 540,991 | | | | | 230,302 | | | | | 116,943 | |
| Audit and tax fees | | | | 167,905 | | | | | 38,576 | | | | | 29,406 | |
| Accounting and custody fees | | | | 95,991 | | | | | 15,347 | | | | | 35,225 | |
| Registration and filing fees | | | | 24,822 | | | | | 25,093 | | | | | 20,163 | |
| Interest (Note 2) | | | | 50,815 | | | | | 69,343 | | | | | 45,675 | |
| Printing and mailing fees | | | | 65,551 | | | | | 31,283 | | | | | 21,201 | |
| Administration fee (Note 6) | | | | 51,927 | | | | | 31,606 | | | | | 16,865 | |
| Trustee fees | | | | 32,597 | | | | | 16,961 | | | | | 10,471 | |
| Legal fees | | | | 30,550 | | | | | 15,632 | | | | | 8,471 | |
| Distribution fees - Class A (Note 5) | | | | 362 | | | | | 5,477 | | | | | — | |
| Other fees | | | | 42,048 | | | | | 19,082 | | | | | 9,304 | |
| Total expenses | | | | 2,946,210 | | | | | 1,551,433 | | | | | 901,290 | |
| Less: Fee waivers and/or expense reimbursements (Note 6) | | | | — | | | | | (55,466 | ) | | | | — | |
| Net expenses | | | | 2,946,210 | | | | | 1,495,967 | | | | | 901,290 | |
| Net investment income | | | | 423,309 | | | | | 2,843,684 | | | | | 638,230 | |
| | | | | | | | | | | | | | | | |
| NET REALIZED AND UNREALIZED GAIN (LOSS) ON INVESTMENTS AND FOREIGN CURRENCY: | | | | | | | | | | | | | | | |
| Net realized gain (loss) from: | | | | | | | | | | | | | | | |
| Investments | | | | 6,896,920 | | | | | 1,804,409 | | | | | 7,158,144 | |
| Foreign currency transactions | | | | 644,958 | | | | | (4,613 | ) | | | | 330,673 | |
| Net realized gain from investments and foreign currency | | | | 7,541,878 | | | | | 1,799,796 | | | | | 7,488,817 | |
| Change in net unrealized appreciation/(depreciation) on: | | | | | | | | | | | | | | | |
| Investments | | | | (9,652,482 | ) | | | | 16,359,773 | | | | | (9,156,123 | ) |
| Foreign currency translations | | | | 1,211,387 | | | | | (1,084 | ) | | | | 566,640 | |
| Change in net unrealized appreciation/(depreciation) on investments and foreign currency | | | | (8,441,095 | ) | | | | 16,358,689 | | | | | (8,589,483 | ) |
| Net gain (loss) on investments and foreign currency | | | | (899,217 | ) | | | | 18,158,485 | | | | | (1,100,666 | ) |
| Increase (decrease) in net assets from operations | | | $ | (475,908 | ) | | | $ | 21,002,169 | | | | $ | (462,436 | ) |
The accompanying notes are an integral part of these financial statements.
60
Alpine Mutual Funds
Statements of Operations—Continued
For the year ended October 31, 2014
| | | Emerging | | Global | | Global |
| | | Markets Real | | Infrastructure | | Consumer |
| | | Estate Fund | | Fund | | Growth Fund |
| INVESTMENT INCOME: | | | | | | | | | | | | | | | |
| Dividend income | | | $ | 248,602 | | | | $ | 8,232,238 | | | | $ | 44,823 | |
| Less: Foreign taxes withheld | | | | (9,298 | ) | | | | (300,757 | ) | | | | (2,878 | ) |
| Interest income | | | | — | | | | | 810 | | | | | 12 | |
| Total investment income | | | | 239,304 | | | | | 7,932,291 | | | | | 41,957 | |
| | | | | | | | | | | | | | | | |
| EXPENSES: | | | | | | | | | | | | | | | |
| Investment advisory fee (Note 6) | | | | 63,121 | | | | | 1,821,691 | | | | | 28,676 | |
| Transfer agent fees | | | | 13,847 | | | | | 83,997 | | | | | 6,129 | |
| Audit and tax fees | | | | 17,936 | | | | | 41,681 | | | | | 17,030 | |
| Accounting and custody fees | | | | 19,587 | | | | | 62,720 | | | | | 9,572 | |
| Registration and filing fees | | | | 23,027 | | | | | 45,293 | | | | | 29,228 | |
| Interest (Note 2) | | | | 529 | | | | | 153 | | | | | — | |
| Printing and mailing fees | | | | 3,269 | | | | | 34,401 | | | | | 414 | |
| Administration fee (Note 6) | | | | 1,736 | | | | | 47,041 | | | | | 760 | |
| Trustee fees | | | | 1,361 | | | | | 28,225 | | | | | 507 | |
| Legal fees | | | | 804 | | | | | 12,920 | | | | | 2,623 | |
| Distribution fees - Class A (Note 5) | | | | 1,797 | | | | | 59,622 | | | | | 451 | |
| Other fees | | | | 5,138 | | | | | 26,102 | | | | | 3,890 | |
| Total expenses | | | | 152,152 | | | | | 2,263,846 | | | | | 99,280 | |
| Less: Fee waivers and/or expense reimbursements (Note 6) | | | | (64,614 | ) | | | | — | | | | | (60,113 | ) |
| Net expenses | | | | 87,538 | | | | | 2,263,846 | | | | | 39,167 | |
| Net investment income | | | | 151,766 | | | | | 5,668,445 | | | | | 2,790 | |
| | | | | | | | | | | | | | | | |
| NET REALIZED AND UNREALIZED GAIN (LOSS) ON INVESTMENTS AND FOREIGN CURRENCY: | | | | | | | | | | | | | | | |
| Net realized gain (loss) from: | | | | | | | | | | | | | | | |
| Investments | | | | (742,405 | ) | | | | 1,241,283 | | | | | 26,436 | |
| Foreign currency transactions | | | | (5,486 | ) | | | | (330,059 | ) | | | | 49 | |
| Net realized gain (loss) from investments and foreign currency | | | | (747,891 | ) | | | | 911,224 | | | | | 26,485 | |
| Change in net unrealized appreciation/(depreciation) on: | | | | | | | | | | | | | | | |
| Investments | | | | 394,899 | | | | | 9,101,302 | | | | | (21,873 | ) |
| Foreign currency translations | | | | 5,048 | | | | | 1,777,090 | | | | | (144 | ) |
| Change in net unrealized appreciation/(depreciation) on investments and foreign currency | | | | 399,947 | | | | | 10,878,392 | | | | | (22,017 | ) |
| Net gain (loss) on investments and foreign currency | | | | (347,944 | ) | | | | 11,789,616 | | | | | 4,468 | |
| Increase (decrease) in net assets from operations | | | $ | (196,178 | ) | | | $ | 17,458,061 | | | | $ | 7,258 | |
The accompanying notes are an integral part of these financial statements.
61
Alpine Mutual Funds
Statements of Changes in Net Assets
| | | International Real Estate Equity Fund |
| | | Year Ended | | Year Ended |
| | | October 31, 2014 | | October 31, 2013 |
| OPERATIONS: | | | | | | | | | | |
| Net investment income (loss) | | | $ | 423,309 | | | | $ | (837,291 | ) |
| Net realized gain (loss) from: | | | | | | | | | | |
| Investments | | | | 6,896,920 | | | | | 4,386,247 | |
| Foreign currency transactions | | | | 644,958 | | | | | (103,441 | ) |
| Change in net unrealized appreciation/(depreciation) on: | | | | | | | | | | |
| Investments | | | | (9,652,482 | ) | | | | 21,923,243 | |
| Foreign currency translations | | | | 1,211,387 | | | | | 14,362 | |
| Increase (decrease) in net assets from operations | | | | (475,908 | ) | | | | 25,383,120 | |
| | | | | | | | | | | |
| DISTRIBUTIONS TO SHAREHOLDERS: | | | | | | | | | | |
| Distributions to Institutional Class Shareholders: | | | | | | | | | | |
| From net investment income | | | | (399,726 | ) | | | | (1,295,320 | ) |
| Distributions to Class A Shareholders: | | | | | | | | | | |
| From net investment income | | | | — | | | | | (318 | ) |
| Decrease in net assets from distributions to shareholders | | | | (399,726 | ) | | | | (1,295,638 | ) |
| | | | | | | | | | | |
| CAPITAL SHARE TRANSACTIONS (NOTE 3): | | | | | | | | | | |
| Net proceeds from shares sold | | | | 3,002,371 | | | | | 11,145,146 | |
| Dividends reinvested | | | | 366,356 | | | | | 1,150,945 | |
| Redemption fees | | | | 1,764 | | | | | 6,920 | |
| Cost of shares redeemed | | | | (39,848,948 | ) | | | | (129,758,252 | ) |
| Decrease in net assets from capital share transactions | | | | (36,478,457 | ) | | | | (117,455,241 | ) |
| Net decrease in net assets | | | | (37,354,091 | ) | | | | (93,367,759 | ) |
| | | | | | | | | | | |
| NET ASSETS: | | | | | | | | | | |
| Beginning of year | | | | 206,725,608 | | | | | 300,093,367 | |
| End of year* | | | $ | 169,371,517 | | | | $ | 206,725,608 | |
| * Including accumulated net investment loss of: | | | $ | (3,336,449 | ) | | | $ | (5,602,578 | ) |
The accompanying notes are an integral part of these financial statements.
62
Alpine Mutual Funds
Statements of Changes in Net Assets—Continued
| | | Realty Income & Growth Fund |
| | | Year Ended
October 31, 2014 | | Year Ended
October 31, 2013 |
| OPERATIONS: | | | | | | | | | | |
| Net investment income | | | $ | 2,843,684 | | | | $ | 3,202,397 | |
| Net realized gain (loss) from: | | | | | | | | | | |
| Investments | | | | 1,804,409 | | | | | 5,295,486 | |
| Foreign currency transactions | | | | (4,613 | ) | | | | (796 | ) |
| Change in net unrealized appreciation/(depreciation) on: | | | | | | | | | | |
| Investments | | | | 16,359,773 | | | | | 885,808 | |
| Foreign currency translations | | | | (1,084 | ) | | | | 1 | |
| Increase in net assets from operations | | | | 21,002,169 | | | | | 9,382,896 | |
| DISTRIBUTIONS TO SHAREHOLDERS: | | | | | | | | | | |
| Distributions to Institutional Class Shareholders: | | | | | | | | | | |
| From net investment income | | | | (2,652,918 | ) | | | | (3,751,100 | ) |
| From net realized gain on investments | | | | (1,345,262 | ) | | | | (557,236 | ) |
| Distributions to Class A Shareholders: | | | | | | | | | | |
| From net investment income | | | | (51,895 | ) | | | | (14,332 | ) |
| From net realized gain on investments | | | | (28,558 | ) | | | | (2,192 | ) |
| Decrease in net assets from distributions to shareholders | | | | (4,078,633 | ) | | | | (4,324,860 | ) |
| CAPITAL SHARE TRANSACTIONS (NOTE 3): | | | | | | | | | | |
| Net proceeds from shares sold | | | | 10,147,042 | | | | | 8,416,187 | |
| Dividends reinvested | | | | 3,629,157 | | | | | 3,880,515 | |
| Redemption fees | | | | 6,982 | | | | | 5,559 | |
| Cost of shares redeemed | | | | (15,247,898 | ) | | | | (23,812,998 | ) |
| Decrease in net assets from capital share transactions | | | | (1,464,717 | ) | | | | (11,510,737 | ) |
| Net increase (decrease) in net assets | | | | 15,458,819 | | | | | (6,452,701 | ) |
| | | | | | | | | | | |
| NET ASSETS: | | | | | | | | | | |
| Beginning of year | | | | 99,966,038 | | | | | 106,418,739 | |
| End of year* | | | $ | 115,424,857 | | | | $ | 99,966,038 | |
| * Including undistributed net investment income of: | | | $ | 127,290 | | | | $ | — | |
The accompanying notes are an integral part of these financial statements.
63
Alpine Mutual Funds
Statements of Changes in Net Assets—Continued
| | | Cyclical Advantage Property Fund |
| | | Year Ended
October 31, 2014 | | Year Ended
October 31, 2013 |
| OPERATIONS: | | | | | | | | | | |
| Net investment income | | | $ | 638,230 | | | | $ | 1,179,984 | |
| Net realized gain (loss) from: | | | | | | | | | | |
| Investments | | | | 7,158,144 | | | | | 1,644,699 | |
| Foreign currency transactions | | | | 330,673 | | | | | (10,618 | ) |
| Change in net unrealized appreciation/(depreciation) on: | | | | | | | | | | |
| Investments | | | | (9,156,123 | ) | | | | 4,268,975 | |
| Foreign currency translations | | | | 566,640 | | | | | 17,297 | |
| Increase (decrease) in net assets from operations | | | | (462,436 | ) | | | | 7,100,337 | |
| | | | | | | | | | | |
| DISTRIBUTIONS TO SHAREHOLDERS: | | | | | | | | | | |
| Distributions to Institutional Class Shareholders: | | | | | | | | | | |
| From net investment income | | | | (1,232,961 | ) | | | | (523,183 | ) |
| Decrease in net assets from distributions to shareholders | | | | (1,232,961 | ) | | | | (523,183 | ) |
| | | | | | | | | | | |
| CAPITAL SHARE TRANSACTIONS (NOTE 3): | | | | | | | | | | |
| Net proceeds from shares sold | | | | 567,261 | | | | | 2,535,452 | |
| Dividends reinvested | | | | 1,210,311 | | | | | 510,363 | |
| Redemption fees | | | | 47 | | | | | 2,260 | |
| Cost of shares redeemed | | | | (4,636,090 | ) | | | | (7,440,538 | ) |
| Decrease in net assets from capital share transactions | | | | (2,858,471 | ) | | | | (4,392,463 | ) |
| Net increase (decrease) in net assets | | | | (4,553,868 | ) | | | | 2,184,691 | |
| | | | | | | | | | | |
| NET ASSETS: | | | | | | | | | | |
| Beginning of year | | | | 61,808,354 | | | | | 59,623,663 | |
| End of year* | | | $ | 57,254,486 | | | | $ | 61,808,354 | |
| * Including undistributed net investment income of: | | | $ | 340,996 | | | | $ | 614,722 | |
The accompanying notes are an integral part of these financial statements.
64
Alpine Mutual Funds
Statements of Changes in Net Assets—Continued
| | | Emerging Markets Real Estate Fund |
| | | Year Ended
October 31, 2014 | | Year Ended
October 31, 2013 |
| OPERATIONS: | | | | | | | | | | |
| Net investment income | | | $ | 151,766 | | | | $ | 92,136 | |
| Net realized gain (loss) from: | | | | | | | | | | |
| Investments | | | | (742,405 | ) | | | | 141,417 | |
| Foreign currency transactions | | | | (5,486 | ) | | | | (20,910 | ) |
| Change in net unrealized appreciation/(depreciation) on: | | | | | | | | | | |
| Investments | | | | 394,899 | | | | | (712,400 | ) |
| Foreign currency translations | | | | 5,048 | | | | | 251 | |
| Decrease in net assets from operations | | | | (196,178 | ) | | | | (499,506 | ) |
| | | | | | | | | | | |
| DISTRIBUTIONS TO SHAREHOLDERS: | | | | | | | | | | |
| Distributions to Institutional Class Shareholders: | | | | | | | | | | |
| From net investment income | | | | (102,193 | ) | | | | (56,766 | ) |
| From net realized gain on investments | | | | (57,004 | ) | | | | — | |
| Distributions to Class A Shareholders: | | | | | | | | | | |
| From net investment income | | | | (8,882 | ) | | | | (2,120 | ) |
| From net realized gain on investments | | | | (5,932 | ) | | | | — | |
| Decrease in net assets from distributions to shareholders | | | | (174,011 | ) | | | | (58,886 | ) |
| | | | | | | | | | | |
| CAPITAL SHARE TRANSACTIONS (NOTE 3): | | | | | | | | | | |
| Net proceeds from shares sold | | | | 1,485,628 | | | | | 9,526,277 | |
| Dividends reinvested | | | | 170,729 | | | | | 57,510 | |
| Redemption fees | | | | 9,658 | | | | | 15,254 | |
| Cost of shares redeemed | | | | (4,937,898 | ) | | | | (3,709,564 | ) |
| Increase (decrease) in net assets from capital share transactions | | | | (3,271,883 | ) | | | | 5,889,477 | |
| Net increase (decrease) in net assets | | | | (3,642,072 | ) | | | | 5,331,085 | |
| | | | | | | | | | | |
| NET ASSETS: | | | | | | | | | | |
| Beginning of year | | | | 9,759,065 | | | | | 4,427,980 | |
| End of year* | | | $ | 6,116,993 | | | | $ | 9,759,065 | |
| * Including undistributed net investment income of: | | | $ | 156,831 | | | | $ | 102,737 | |
The accompanying notes are an integral part of these financial statements.
65
Alpine Mutual Funds
Statements of Changes in Net Assets—Continued
| | | Global Infrastructure Fund |
| | | Year Ended
October 31, 2014 | | Year Ended
October 31, 2013 |
| OPERATIONS: | | | | | | | | | | |
| Net investment income | | | $ | 5,668,445 | | | | $ | 3,918,078 | |
| Net realized gain (loss) from: | | | | | | | | | | |
| Investments | | | | 1,241,283 | | | | | 3,581,109 | |
| Foreign currency transactions | | | | (330,059 | ) | | | | (279,152 | ) |
| Change in net unrealized appreciation/(depreciation) on: | | | | | | | | | | |
| Investments | | | | 9,101,302 | | | | | 12,342,987 | |
| Foreign currency translations | | | | 1,777,090 | | | | | (151,414 | ) |
| Increase in net assets from operations | | | | 17,458,061 | | | | | 19,411,608 | |
| | | | | | | | | | | |
| DISTRIBUTIONS TO SHAREHOLDERS: | | | | | | | | | | |
| Distributions to Institutional Class Shareholders: | | | | | | | | | | |
| From net investment income | | | | (5,793,200 | ) | | | | (3,113,199 | ) |
| From net realized gain on investments | | | | (2,409,615 | ) | | | | — | |
| Distributions to Class A Shareholders: | | | | | | | | | | |
| From net investment income | | | | (811,945 | ) | | | | (413,051 | ) |
| From net realized gain on investments | | | | (388,294 | ) | | | | — | |
| Decrease in net assets from distributions to shareholders | | | | (9,403,054 | ) | | | | (3,526,250 | ) |
| | | | | | | | | | | |
| CAPITAL SHARE TRANSACTIONS (NOTE 3): | | | | | | | | | | |
| Net proceeds from shares sold | | | | 97,805,598 | | | | | 97,147,550 | |
| Dividends reinvested | | | | 6,081,424 | | | | | 2,394,461 | |
| Redemption fees | | | | 14,500 | | | | | 30,630 | |
| Cost of shares redeemed | | | | (44,070,456 | ) | | | | (18,959,074 | ) |
| Increase in net assets from capital share transactions | | | | 59,831,066 | | | | | 80,613,567 | |
| Net increase in net assets | | | | 67,886,073 | | | | | 96,498,925 | |
| | | | | | | | | | | |
| NET ASSETS: | | | | | | | | | | |
| Beginning of year | | | | 145,217,971 | | | | | 48,719,046 | |
| End of year* | | | $ | 213,104,044 | | | | $ | 145,217,971 | |
| * Including undistributed (accumulated) net investment income (loss) of: | | | $ | (24,624 | ) | | | $ | 554,928 | |
The accompanying notes are an integral part of these financial statements.
66
Alpine Mutual Funds
Statements of Changes in Net Assets—Continued
| | | Global Consumer Growth Fund |
| | | Year Ended
October 31, 2014 | | Year Ended
October 31, 2013 |
| OPERATIONS: | | | | | | | | | | |
| Net investment income | | | $ | 2,790 | | | | $ | 7,311 | |
| Net realized gain (loss) from: | | | | | | | | | | |
| Investments | | | | 26,436 | | | | | (6,978 | ) |
| Foreign currency transactions | | | | 49 | | | | | 726 | |
| Change in net unrealized appreciation/(depreciation) on: | | | | | | | | | | |
| Investments | | | | (21,873 | ) | | | | 421,161 | |
| Foreign currency translations | | | | (144 | ) | | | | 32 | |
| Increase in net assets from operations | | | | 7,258 | | | | | 422,252 | |
| | | | | | | | | | | |
| DISTRIBUTIONS TO SHAREHOLDERS: | | | | | | | | | | |
| Distributions to Institutional Class Shareholders: | | | | | | | | | | |
| From net investment income | | | | (7,024 | ) | | | | (9,476 | ) |
| Distributions to Class A Shareholders: | | | | | | | | | | |
| From net investment income | | | | (9 | ) | | | | (227 | ) |
| Decrease in net assets from distributions to shareholders | | | | (7,033 | ) | | | | (9,703 | ) |
| | | | | | | | | | | |
| CAPITAL SHARE TRANSACTIONS (NOTE 3): | | | | | | | | | | |
| Net proceeds from shares sold | | | | 100,200 | | | | | 304,035 | |
| Dividends reinvested | | | | 6,966 | | | | | 9,612 | |
| Cost of shares redeemed | | | | (92,783 | ) | | | | (207,128 | ) |
| Increase in net assets from capital share transactions | | | | 14,383 | | | | | 106,519 | |
| Net increase in net assets | | | | 14,608 | | | | | 519,068 | |
| | | | | | | | | | | |
| NET ASSETS: | | | | | | | | | | |
| Beginning of year | | | | 2,850,100 | | | | | 2,331,032 | |
| End of year* | | | $ | 2,864,708 | | | | $ | 2,850,100 | |
| * Including undistributed net investment income of: | | | $ | 3,026 | | | | $ | 7,028 | |
The accompanying notes are an integral part of these financial statements.
67
Alpine Mutual Funds
Financial Highlights
(For a share outstanding throughout each year)
| | | | International Real Estate Equity Fund | |
| | | | Years Ended October 31, | |
| | | | 2014 | | | | 2013 | | | | 2012 | | | | 2011 | | | | 2010 | |
| Institutional Class: | | | | | | | | | | | | | | | | | | | | | | | | | |
| Net asset value per share, beginning of year | | | $ | 23.87 | | | | $ | 22.23 | | | | $ | 20.53 | | | | $ | 25.75 | | | | $ | 22.59 | |
| Income from investment operations: | | | | | | | | | | | | | | | | | | | | | | | | | |
| Net investment income (loss) | | | | (0.09 | ) | | | | (0.35 | ) | | | | 0.01 | | | | | 0.30 | | | | | (0.08 | ) |
| Net realized and unrealized gain (loss) | | | | 0.11 | | | | | 2.09 | | | | | 2.23 | | | | | (4.84 | ) | | | | 4.03 | |
| Total from investment operations | | | | 0.02 | | | | | 1.74 | | | | | 2.24 | | | | | (4.54 | ) | | | | 3.95 | |
| Redemption fees | | | | 0.00 | (a) | | | | 0.00 | (a) | | | | 0.00 | (a) | | | | 0.00 | (a) | | | | 0.00 | (a) |
| Less distributions: | | | | | | | | | | | | | | | | | | | | | | | | | |
| From net investment income | | | | (0.05 | ) | | | | (0.10 | ) | | | | (0.54 | ) | | | | (0.68 | ) | | | | (0.79 | ) |
| Total distributions | | | | (0.05 | ) | | | | (0.10 | ) | | | | (0.54 | ) | | | | (0.68 | ) | | | | (0.79 | ) |
| Net asset value per share, end of year | | | $ | 23.84 | | | | $ | 23.87 | | | | $ | 22.23 | | | | $ | 20.53 | | | | $ | 25.75 | |
| Total return | | | | 0.08 | % | | | | 7.83 | % | | | | 11.57 | % | | | | (18.17 | )% | | | | 18.07 | % |
| Ratios/Supplemental Data: | | | | | | | | | | | | | | | | | | | | | | | | | |
| Net Assets at end of year (000) | | | $ | 169,226 | | | | $ | 206,580 | | | | $ | 299,965 | | | | $ | 355,433 | | | | $ | 608,488 | |
| Ratio of total expenses to average net assets (b) | | | | 1.60 | % | | | | 1.48 | % | | | | 1.47 | % | | | | 1.37 | % | | | | 1.28 | % |
| Ratio of net investment income (loss) to average net assets | | | | 0.23 | % | | | | (0.32 | )% | | | | 0.51 | % | | | | 1.89 | % | | | | 0.32 | % |
| Portfolio turnover (c) | | | | 23 | % | | | | 19 | % | | | | 12 | % | | | | 20 | % | | | | 34 | % |
| (a) | The amount is less than $0.005 per share. |
| (b) | Ratio of total expenses to average net assets excluding interest expense was 1.57%, 1.44%, 1.39%, 1.26% and 1.20% for the years ended October 31, 2014, 2013, 2012, 2011 and 2010, respectively. |
| (c) | Portfolio turnover is calculated on the basis of the Fund as a whole, without distinguishing between classes of shares issued. |
The accompanying notes are an integral part of these financial statements.
68
Alpine Mutual Funds
Financial Highlights—Continued
(For a share outstanding throughout each period)
| | | International Real Estate Equity Fund |
| | | Years Ended October 31, | | Period
Ended |
| | | 2014 | | 2013 | | October 31, 2012 (a) |
| Class A: | | | | | | | | | | | | | | | |
| Net asset value per share, beginning of period | | | $ | 23.81 | | | | $ | 22.19 | | | | $ | 17.92 | |
| Income from investment operations: | | | | | | | | | | | | | | | |
| Net investment income (loss) | | | | (0.00 | )(b) | | | | (0.12 | ) | | | | 0.08 | |
| Net realized and unrealized gain (loss) | | | | (0.06 | ) | | | | 1.79 | | | | | 4.19 | |
| Total from investment operations | | | | (0.06 | ) | | | | 1.67 | | | | | 4.27 | |
| Redemption fees | | | | 0.00 | (b) | | | | 0.00 | (b) | | | | — | |
| Less distributions: | | | | | | | | | | | | | | | |
| From net investment income | | | | — | | | | | (0.05 | ) | | | | — | |
| Total distributions | | | | — | | | | | (0.05 | ) | | | | — | |
| Net asset value per share, end of period | | | $ | 23.75 | | | | $ | 23.81 | | | | $ | 22.19 | |
| Total return | | | | (0.25 | )% | | | | 7.53 | % | | | | 23.83 | %(c) |
| Ratios/Supplemental Data | | | | | | | | | | | | | | | |
| Net Assets at end of period (000) | | | $ | 146 | | | | $ | 146 | | | | $ | 128 | |
| Ratio of total expenses to average net assets (d) | | | | 1.85 | % | | | | 1.73 | % | | | | 1.72 | %(e) |
| Ratio of net investment income (loss) to average net assets | | | | — | % | | | | (0.46 | )% | | | | 0.48 | %(e) |
| Portfolio turnover (f) | | | | 23 | % | | | | 19 | % | | | | 12 | % |
| (a) | Class A commenced operations on December 30, 2011. |
| (b) | The amount is less than $0.005 per share. |
| (c) | Not annualized. |
| (d) | Ratio of total expenses to average net assets excluding interest expense was 1.82% for the year ended October 31, 2014, 1.69% for the year ended October 31, 2013 and 1.64% for the period ended October 31, 2012. |
| (e) | Annualized. |
| (f) | Portfolio turnover is calculated on the basis of the Fund as a whole, without distinguishing between classes of shares issued. |
The accompanying notes are an integral part of these financial statements.
69
Alpine Mutual Funds
Financial Highlights—Continued
(For a share outstanding throughout each year)
| | | | Realty Income & Growth Fund | |
| | | | Years Ended October 31, | |
| | | | 2014 | | | | 2013 | | | | 2012 | | | | 2011 | | | | 2010 | |
| Institutional Class: | | | | | | | | | | | | | | | | | | | | | | | | | |
| Net asset value per share, beginning of year | | | $ | 18.17 | | | | $ | 17.37 | | | | $ | 15.56 | | | | $ | 14.79 | | | | $ | 10.89 | |
| Income from investment operations: | | | | | | | | | | | | | | | | | | | | | | | | | |
| Net investment income | | | | 0.52 | | | | | 0.54 | | | | | 0.46 | | | | | 0.48 | | | | | 0.56 | |
| Net realized and unrealized gain | | | | 3.35 | | | | | 1.01 | | | | | 2.07 | | | | | 1.01 | | | | | 4.06 | |
| Total from investment operations | | | | 3.87 | | | | | 1.55 | | | | | 2.53 | | | | | 1.49 | | | | | 4.62 | |
| Redemption fees | | | | 0.00 | (a) | | | | 0.00 | (a) | | | | 0.00 | (a) | | | | 0.00 | (a) | | | | 0.00 | (a) |
| Less distributions: | | | | | | | | | | | | | | | | | | | | | | | | | |
| From net investment income | | | | (0.50 | ) | | | | (0.65 | ) | | | | (0.72 | ) | | | | (0.72 | ) | | | | (0.65 | ) |
| From net realized gains | | | | (0.25 | ) | | | | (0.10 | ) | | | | — | | | | | — | | | | | (0.07 | ) |
| Total distributions | | | | (0.75 | ) | | | | (0.75 | ) | | | | (0.72 | ) | | | | (0.72 | ) | | | | (0.72 | ) |
| Net asset value per share, end of year | | | $ | 21.29 | | | | $ | 18.17 | | | | $ | 17.37 | | | | $ | 15.56 | | | | $ | 14.79 | |
| Total return | | | | 21.90 | % | | | | 9.02 | % | | | | 16.44 | % | | | | 10.23 | % | | | | 43.51 | % |
| Ratios/Supplemental Data: | | | | | | | | | | | | | | | | | | | | | | | | | |
| Net Assets at end of year (000) | | | $ | 112,984 | | | | $ | 98,798 | | | | $ | 106,304 | | | | $ | 101,322 | | | | $ | 108,941 | |
| Ratio of total expenses to average net assets: | | | | | | | | | | | | | | | | | | | | | | | | | |
| Before waivers and/or expense reimbursements (b) | | | | 1.47 | % | | | | 1.50 | % | | | | 1.41 | % | | | | 1.32 | % | | | | 1.34 | % |
| After waivers and/or expense reimbursements (c) | | | | 1.42 | % | | | | 1.43 | % | | | | 1.41 | % | | | | 1.32 | % | | | | 1.34 | % |
| Ratio of net investment income to average net assets | | | | 2.71 | % | | | | 2.99 | % | | | | 2.73 | % | | | | 3.09 | % | | | | 4.24 | % |
| Portfolio turnover (d) | | | | 32 | % | | | | 33 | % | | | | 28 | % | | | | 59 | % | | | | 70 | % |
| (a) | The amount is less than $0.005 per share. |
| (b) | Ratio of total expenses to average net assets excluding interest expense before waivers and/or expense reimbursements was 1.40%, 1.42%, 1.33%, 1.23% and 1.24% for the years ended October 31, 2014, 2013, 2012, 2011 and 2010, respectively. |
| (c) | Ratio of total expenses to average net assets excluding interest expense after waivers and/or expense reimbursements was 1.35%, 1.35%, 1.33%, 1.23% and 1.24% for the years ended October 31, 2014, 2013, 2012, 2011 and 2010, respectively. |
| (d) | Portfolio turnover is calculated on the basis of the Fund as a whole, without distinguishing between classes of shares issued. |
The accompanying notes are an integral part of these financial statements.
70
Alpine Mutual Funds
Financial Highlights—Continued
(For a share outstanding throughout each period)
| | | Realty Income & Growth Fund |
| | | Years Ended October 31, | | Period
Ended |
| | | 2014 | | 2013 | | October 31, 2012 (a) |
| Class A: | | | | | | | | | | | | | | | |
| Net asset value per share, beginning of period | | | $ | 18.16 | | | | $ | 17.35 | | | | $ | 15.60 | |
| Income from investment operations: | | | | | | | | | | | | | | | |
| Net investment income | | | | 0.46 | | | | | 0.59 | | | | | 0.32 | |
| Net realized and unrealized gain | | | | 3.34 | | | | | 0.93 | | | | | 1.95 | |
| Total from investment operations | | | | 3.80 | | | | | 1.52 | | | | | 2.27 | |
| Redemption fees | | | | 0.00 | (b) | | | | 0.00 | (b) | | | | 0.00 | (b) |
| Less distributions: | | | | | | | | | | | | | | | |
| From net investment income | | | | (0.45 | ) | | | | (0.61 | ) | | | | (0.52 | ) |
| From net realized gains | | | | (0.25 | ) | | | | (0.10 | ) | | | | — | |
| Total distributions | | | | (0.70 | ) | | | | (0.71 | ) | | | | (0.52 | ) |
| Net asset value per share, end of period | | | $ | 21.26 | | | | $ | 18.16 | | | | $ | 17.35 | |
| Total return | | | | 21.51 | % | | | | 8.85 | % | | | | 14.53 | %(c) |
| Ratios/Supplemental Data | | | | | | | | | | | | | | | |
| Net Assets at end of period (000) | | | $ | 2,441 | | | | $ | 1,168 | | | | $ | 115 | |
| Ratio of total expenses to average net assets: | | | | | | | | | | | | | | | |
| Before waivers and/or expense reimbursements (d) | | | | 1.72 | % | | | | 1.75 | % | | | | 1.66 | %(e) |
| After waivers and/or expense reimbursements (f) | | | | 1.67 | % | | | | 1.67 | % | | | | 1.66 | %(e) |
| Ratio of net investment income to average net assets | | | | 2.42 | % | | | | 3.00 | % | | | | 2.18 | %(e) |
| Portfolio turnover (g) | | | | 32 | % | | | | 33 | % | | | | 28 | % |
| (a) | Class A commenced operations on December 30, 2011. |
| (b) | The amount is less than $0.005 per share. |
| (c) | Not annualized. |
| (d) | Ratio of total expenses to average net assets excluding interest expense before waivers and/or expense reimbursements was 1.65% and 1.67% for the years ended October 31, 2014 and 2013, respectively, and 1.58% for the period ended October 31, 2012. |
| (e) | Annualized. |
| (f) | Ratio of total expenses to average net assets excluding interest expense after waivers and/or expense reimbursements was 1.60% and 1.59% for the years ended October 31, 2014 and 2013, respectively, and 1.58% for the period ended October 31, 2012. |
| (g) | Portfolio turnover is calculated on the basis of the Fund as a whole, without distinguishing between classes of shares issued. |
The accompanying notes are an integral part of these financial statements.
71
Alpine Mutual Funds
Financial Highlights—Continued
(For a share outstanding throughout each year)
| | | | Cyclical Advantage Property Fund | |
| | | | Years Ended October 31, | |
| | | | 2014 | | | | 2013 | | | | 2012 | | | | 2011 | | | | 2010 | |
| Institutional Class: | | | | | | | | | | | | | | | | | | | | | | | | | |
| Net asset value per share, beginning of year | | | $ | 26.33 | | | | $ | 23.64 | | | | $ | 18.13 | | | | $ | 20.27 | | | | $ | 16.65 | |
| Income from investment operations: | | | | | | | | | | | | | | | | | | | | | | | | | |
| Net investment income | | | | 0.28 | | | | | 0.49 | | | | | 0.07 | | | | | 0.07 | | | | | 0.09 | |
| Net realized and unrealized gain (loss) | | | | (0.47 | ) | | | | 2.41 | | | | | 5.53 | | | | | (2.12 | ) | | | | 3.77 | |
| Total from investment operations | | | | (0.19 | ) | | | | 2.90 | | | | | 5.60 | | | | | (2.05 | ) | | | | 3.86 | |
| Redemption fees | | | | 0.00 | (a) | | | | 0.00 | (a) | | | | 0.00 | (a) | | | | 0.00 | (a) | | | | 0.00 | (a) |
| Less distributions: | | | | | | | | | | | | | | | | | | | | | | | | | |
| From net investment income | | | | (0.53 | ) | | | | (0.21 | ) | | | | (0.09 | ) | | | | (0.09 | ) | | | | (0.24 | ) |
| Total distributions | | | | (0.53 | ) | | | | (0.21 | ) | | | | (0.09 | ) | | | | (0.09 | ) | | | | (0.24 | ) |
| Net asset value per share, end of year | | | $ | 25.61 | | | | $ | 26.33 | | | | $ | 23.64 | | | | $ | 18.13 | | | | $ | 20.27 | |
| Total return | | | | (0.70 | )% | | | | 12.33 | % | | | | 31.11 | % | | | | (10.19 | )% | | | | 23.36 | % |
| Ratios/Supplemental Data: | | | | | | | | | | | | | | | | | | | | | | | | | |
| Net Assets at end of year (000) | | | $ | 57,254 | | | | $ | 61,808 | | | | $ | 59,624 | | | | $ | 49,090 | | | | $ | 62,044 | |
| Ratio of total expenses to average net assets (b) | | | | 1.53 | % | | | | 1.43 | % | | | | 1.51 | % | | | | 1.38 | % | | | | 1.32 | % |
| Ratio of net investment income to average net assets | | | | 1.09 | % | | | | 1.90 | % | | | | 0.41 | % | | | | 0.36 | % | | | | 0.51 | % |
| Portfolio turnover | | | | 42 | % | | | | 60 | % | | | | 24 | % | | | | 59 | % | | | | 90 | % |
| (a) | The amount is less than $0.005 per share. |
| (b) | Ratio of total expenses to average net assets excluding interest expense was 1.46%, 1.41%, 1.50%, 1.35% and 1.30% for the years ended October 31, 2014, 2013, 2012, 2011 and 2010, respectively. |
The accompanying notes are an integral part of these financial statements.
72
Alpine Mutual Funds
Financial Highlights—Continued
(For a share outstanding throughout each year)
| | | | Emerging Markets Real Estate Fund | |
| | | | Years Ended October 31, | |
| | | | 2014 | | | | 2013 | | | | 2012 | | | | 2011 | | | | 2010 | |
| Institutional Class: | | | | | | | | | | | | | | | | | | | | | | | | | |
| Net asset value per share, beginning of year | | | $ | 17.37 | | | | $ | 17.16 | | | | $ | 14.68 | | | | $ | 19.20 | | | | $ | 17.03 | |
| Income from investment operations: | | | | | | | | | | | | | | | | | | | | | | | | | |
| Net investment income | | | | 0.50 | | | | | 0.25 | | | | | 0.12 | | | | | 0.40 | | | | | 0.27 | |
| Net realized and unrealized gain (loss) | | | | (0.18 | ) | | | | 0.13 | | | | | 2.36 | | | | | (3.47 | ) | | | | 3.43 | |
| Total from investment operations | | | | 0.32 | | | | | 0.38 | | | | | 2.48 | | | | | (3.07 | ) | | | | 3.70 | |
| Redemption fees | | | | 0.03 | | | | | 0.04 | | | | | 0.00 | (a) | | | | 0.00 | (a) | | | | 0.00 | (a) |
| Less distributions: | | | | | | | | | | | | | | | | | | | | | | | | | |
| From net investment income | | | | (0.27 | ) | | | | (0.21 | ) | | | | — | | | | | (0.08 | ) | | | | (0.87 | ) |
| From net realized gains | | | | (0.15 | ) | | | | — | | | | | — | | | | | (1.37 | ) | | | | (0.66 | ) |
| Total distributions | | | | (0.42 | ) | | | | (0.21 | ) | | | | — | | | | | (1.45 | ) | | | | (1.53 | ) |
| Net asset value per share, end of year | | | $ | 17.30 | | | | $ | 17.37 | | | | $ | 17.16 | | | | $ | 14.68 | | | | $ | 19.20 | |
| Total return | | | | 2.29 | % | | | | 2.36 | % | | | | 16.89 | % | | | | (17.52 | )% | | | | 23.53 | % |
| Ratios/Supplemental Data: | | | | | | | | | | | | | | | | | | | | | | | | | |
| Net Assets at end of year (000) | | | $ | 5,332 | | | | $ | 9,051 | | | | $ | 4,288 | | | | $ | 4,289 | | | | $ | 3,269 | |
| Ratio of total expenses to average net assets: | | | | | | | | | | | | | | | | | | | | | | | | | |
| Before waivers and/or expense reimbursements (b) | | | | 2.38 | % | | | | 2.35 | % | | | | 2.95 | % | | | | 2.42 | % | | | | 2.68 | % |
| After waivers and/or expense reimbursements (c) | | | | 1.36 | % | | | | 1.35 | % | | | | 1.35 | % | | | | 1.35 | % | | | | 1.35 | % |
| Ratio of net investment income to average net assets | | | | 2.39 | % | | | | 1.22 | % | | | | 0.97 | % | | | | 0.54 | % | | | | 0.13 | % |
| Portfolio turnover (d) | | | | 117 | % | | | | 120 | % | | | | 102 | % | | | | 58 | % | | | | 77 | % |
| (a) | The amount is less than $0.005 per share. |
| (b) | Ratio of total expenses to average net assets excluding interest expense before waivers and/or expense reimbursements was 2.37%, 2.35%, 2.95%, 2.42% and 2.68% for the years ended October 31, 2014, 2013, 2012, 2011 and 2010, respectively. |
| (c) | Ratio of total expenses to average net assets excluding interest expense after waivers and/or expense reimbursements was 1.35%, 1.35%, 1.35%, 1.35% and 1.35% for the years ended October 31, 2014, 2013, 2012, 2011 and 2010, respectively. |
| (d) | Portfolio turnover is calculated on the basis of the Fund as a whole, without distinguishing between classes of shares issued. |
The accompanying notes are an integral part of these financial statements.
73
Alpine Mutual Funds
Financial Highlights—Continued
(For a share outstanding throughout each period)
| | | Emerging Markets Real Estate Fund |
| | | Years Ended October 31, | | Period
Ended |
| | | 2014 | | 2013 | | October 31, 2012 (a) |
| Class A: | | | | | | | | | | | | | | | |
| Net asset value per share, beginning of period | | | $ | 17.32 | | | | $ | 17.13 | | | | $ | 13.45 | |
| Income from investment operations: | | | | | | | | | | | | | | | |
| Net investment income | | | | 0.39 | | | | | 0.05 | | | | | 0.13 | |
| Net realized and unrealized gain (loss) | | | | (0.11 | ) | | | | 0.29 | | | | | 3.55 | |
| Total from investment operations | | | | 0.28 | | | | | 0.34 | | | | | 3.68 | |
| Redemption fees | | | | 0.02 | | | | | 0.03 | | | | | 0.00 | |
| Less distributions: | | | | | | | | | | | | | | | |
| From net investment income | | | | (0.22 | ) | | | | (0.18 | ) | | | | — | |
| From net realized gains | | | | (0.15 | ) | | | | — | | | | | — | |
| Total distributions | | | | (0.37 | ) | | | | (0.18 | ) | | | | — | |
| Net asset value per share, end of period | | | $ | 17.25 | | | | $ | 17.32 | | | | $ | 17.13 | |
| Total return | | | | 2.01 | % | | | | 2.10 | % | | | | 27.36 | %(b) |
| Ratios/Supplemental Data | | | | | | | | | | | | | | | |
| Net Assets at end of period (000) | | | $ | 785 | | | | $ | 708 | | | | $ | 140 | |
| Ratio of total expenses to average net assets: | | | | | | | | | | | | | | | |
| Before waivers and/or expense reimbursements (c) | | | | 2.63 | % | | | | 2.60 | % | | | | 3.01 | %(d) |
| After waivers and/or expense reimbursements (e) | | | | 1.61 | % | | | | 1.60 | % | | | | 1.61 | %(d) |
| Ratio of net investment income to average net assets | | | | 2.49 | % | | | | 0.93 | % | | | | 1.05 | %(d) |
| Portfolio turnover (f) | | | | 117 | % | | | | 120 | % | | | | 102 | % |
| (a) | Class A commenced operations on December 30, 2011. |
| (b) | Not annualized. |
| (c) | Ratio of total expenses to average net assets excluding interest expense before waivers and/or expense reimbursements was 2.63% and 2.60% for the years ended October 31, 2014 and 2013, respectively, and 3.01% for the period ended October 31, 2012. |
| (d) | Annualized. |
| (e) | Ratio of total expenses to average net assets excluding interest expense after waivers and/or expense reimbursements was 1.60% and 1.60% for the years ended October 31, 2014 and 2013, respectively, and 1.61% for the period ended October 31, 2012. |
| (f) | Portfolio turnover is calculated on the basis of the Fund as a whole, without distinguishing between classes of shares issued. |
The accompanying notes are an integral part of these financial statements.
74
Alpine Mutual Funds
Financial Highlights—Continued
(For a share outstanding throughout each year)
| | | | Global Infrastructure Fund | |
| | | | Years Ended October 31, | |
| | | | 2014 | | | | 2013 | | | | 2012 | | | | 2011 | | | | 2010 | |
| Institutional Class: | | | | | | | | | | | | | | | | | | | | | | | | | |
| Net asset value per share, beginning of year | | | $ | 19.24 | | | | $ | 15.93 | | | | $ | 14.32 | | | | $ | 15.98 | | | | $ | 13.38 | |
| Income from investment operations: | | | | | | | | | | | | | | | | | | | | | | | | | |
| Net investment income | | | | 0.60 | | | | | 0.71 | | | | | 0.65 | | | | | 0.61 | | | | | 0.43 | |
| Net realized and unrealized gain (loss) | | | | 1.36 | | | | | 3.25 | | | | | 1.60 | | | | | (0.72 | ) | | | | 3.40 | |
| Total from investment operations | | | | 1.96 | | | | | 3.96 | | | | | 2.25 | | | | | (0.11 | ) | | | | 3.83 | |
| Redemption fees | | | | 0.00 | (a) | | | | 0.01 | | | | | 0.00 | (a) | | | | 0.00 | (a) | | | | 0.00 | (a) |
| Less distributions: | | | | | | | | | | | | | | | | | | | | | | | | | |
| From net investment income | | | | (0.71 | ) | | | | (0.66 | ) | | | | (0.64 | ) | | | | (0.99 | ) | | | | (0.20 | ) |
| From net realized gains | | | | (0.35 | ) | | | | — | | | | | — | | | | | (0.55 | ) | | | | (1.03 | ) |
| From tax return of capital | | | | — | | | | | — | | | | | — | | | | | (0.01 | ) | | | | — | |
| Total distributions | | | | (1.06 | ) | | | | (0.66 | ) | | | | (0.64 | ) | | | | (1.55 | ) | | | | (1.23 | ) |
| Net asset value per share, end of year | | | $ | 20.14 | | | | $ | 19.24 | | | | $ | 15.93 | | | | $ | 14.32 | | | | $ | 15.98 | |
| Total return | | | | 10.52 | % | | | | 25.35 | % | | | | 16.09 | % | | | | (1.03 | )% | | | | 30.23 | % |
| Ratios/Supplemental Data: | | | | | | | | | | | | | | | | | | | | | | | | | |
| Net Assets at end of year (000) | | | $ | 185,904 | | | | $ | 125,277 | | | | $ | 46,998 | | | | $ | 29,028 | | | | $ | 2,245 | |
| Ratio of total expenses to average net assets: | | | | | | | | | | | | | | | | | | | | | | | | | |
| Before waivers and/or expense reimbursements (b) | | | | 1.21 | % | | | | 1.24 | % | | | | 1.33 | % | | | | 1.59 | % | | | | 3.03 | % |
| After waivers and/or expense reimbursements (c) | | | | 1.21 | % | | | | 1.24 | % | | | | 1.33 | % | | | | 1.35 | % | | | | 1.35 | % |
| Ratio of net investment income to average net assets | | | | 3.14 | % | | | | 4.18 | % | | | | 4.30 | % | | | | 4.17 | % | | | | 3.40 | % |
| Portfolio turnover (d) | | | | 109 | % | | | | 147 | % | | | | 148 | % | | | | 189 | % | | | | 402 | % |
| (a) | The amount is less than $0.005 per share. |
| (b) | Ratio of total expenses to average net assets excluding interest expense before waivers and/or expense reimbursements was 1.21%, 1.24%, 1.33%, 1.59% and 3.03% for the years ended October 31, 2014, 2013, 2012, 2011 and 2010, respectively. |
| (c) | Ratio of total expenses to average net assets excluding interest expense after waivers and/or expense reimbursements was 1.21%, 1.24%, 1.33%, 1.35% and 1.35% for the years ended October 31, 2014, 2013, 2012, 2011 and 2010, respectively. |
| (d) | Portfolio turnover is calculated on the basis of the Fund as a whole, without distinguishing between classes of shares issued. |
The accompanying notes are an integral part of these financial statements.
75
Alpine Mutual Funds
Financial Highlights—Continued
(For a share outstanding throughout each period)
| | | Global Infrastructure Fund |
| | | | | | | | | | | | | Period
Ended |
| | | Years Ended October 31, | | October 31, |
| | | 2014 | | 2013 | | 2012 (a) |
| Class A: | | | | | | | | | | | | | | | |
| Net asset value per share, beginning of period | | | $ | 19.22 | | | | $ | 15.92 | | | | $ | 13.91 | |
| Income from investment operations: | | | | | | | | | | | | | | | |
| Net investment income | | | | 0.57 | | | | | 0.69 | | | | | 0.43 | |
| Net realized and unrealized gain | | | | 1.34 | | | | | 3.22 | | | | | 2.04 | |
| Total from investment operations | | | | 1.91 | | | | | 3.91 | | | | | 2.47 | |
| Redemption fees | | | | 0.00 | (b) | | | | 0.01 | | | | | 0.00 | (b) |
| Less distributions: | | | | | | | | | | | | | | | |
| From net investment income | | | | (0.67 | ) | | | | (0.62 | ) | | | | (0.46 | ) |
| From net realized gains | | | | (0.35 | ) | | | | — | | | | | — | |
| Total distributions | | | | (1.02 | ) | | | | (0.62 | ) | | | | (0.46 | ) |
| Net asset value per share, end of period | | | $ | 20.11 | | | | $ | 19.22 | | | | $ | 15.92 | |
| Total return | | | | 10.22 | % | | | | 25.04 | % | | | | 17.94 | %(c) |
| Ratios/Supplemental Data | | | | | | | | | | | | | | | |
| Net Assets at end of period (000) | | | $ | 27,200 | | | | $ | 19,941 | | | | $ | 1,721 | |
| Ratio of total expenses to average net assets: | | | | | | | | | | | | | | | |
| Before waivers and/or expense reimbursements | | | | 1.46 | % | | | | 1.49 | % | | | | 1.67 | %(d) |
| After waivers and/or expense reimbursements | | | | 1.46 | % | | | | 1.49 | % | | | | 1.60 | %(d) |
| Ratio of net investment income to average net assets | | | | 2.92 | % | | | | 3.67 | % | | | | 3.67 | %(d) |
| Portfolio turnover (e) | | | | 109 | % | | | | 147 | % | | | | 148 | % |
| (a) | Class A commenced operations on December 30, 2011. |
| (b) | The amount is less than $0.005 per share. |
| (c) | Not annualized. |
| (d) | Annualized. |
| (e) | Portfolio turnover is calculated on the basis of the Fund as a whole, without distinguishing between classes of shares issued. |
The accompanying notes are an integral part of these financial statements.
76
Alpine Mutual Funds
Financial Highlights—Continued
(For a share outstanding throughout each period)
| | | Global Consumer Growth Fund |
| | | | | | | | | | | | | | | Period
Ended |
| | | Years Ended October 31, | | October 31, |
| | | 2014 | | 2013 | | 2012 | | 2011 (a) |
| Institutional Class: | | | | | | | | | | | | | | | | | | | | |
| Net asset value per share, beginning of period | | | $ | 12.60 | | | | $ | 10.74 | | | | $ | 9.59 | | | | $ | 10.00 | |
| Income from investment operations: | | | | | | | | | | | | | | | | | | | | |
| Net investment income | | | | 0.01 | | | | | 0.03 | | | | | 0.04 | | | | | 0.04 | |
| Net realized and unrealized gain (loss) | | | | 0.03 | | | | | 1.88 | | | | | 1.15 | | | | | (0.45 | ) |
| Total from investment operations | | | | 0.04 | | | | | 1.91 | | | | | 1.19 | | | | | (0.41 | ) |
| Less distributions: | | | | | | | | | | | | | | | | | | | | |
| From net investment income | | | | (0.03 | ) | | | | (0.05 | ) | | | | (0.04 | ) | | | | — | |
| Total distributions | | | | (0.03 | ) | | | | (0.05 | ) | | | | (0.04 | ) | | | | — | |
| Net asset value per share, end of period | | | $ | 12.61 | | | | $ | 12.60 | | | | $ | 10.74 | | | | $ | 9.59 | |
| Total return | | | | 0.34 | % | | | | 17.80 | % | | | | 12.48 | % | | | | (4.10 | )%(b) |
| Ratios/Supplemental Data: | | | | | | | | | | | | | | | | | | | | |
| Net Assets at end of period (000) | | | $ | 2,691 | | | | $ | 2,621 | | | | $ | 2,211 | | | | $ | 1,945 | |
| Ratio of total expenses to average net assets: | | | | | | | | | | | | | | | | | | | | |
| Before waivers and/or expense reimbursements | | | | 3.45 | % | | | | 3.80 | % | | | | 5.31 | % | | | | 2.96 | %(c) |
| After waivers and/or expense reimbursements | | | | 1.35 | % | | | | 1.35 | % | | | | 1.35 | % | | | | 1.35 | %(c) |
| Ratio of net investment income to average net assets | | | | 0.11 | % | | | | 0.29 | % | | | | 0.36 | % | | | | 0.54 | %(c) |
| Portfolio turnover (d) | | | | 15 | % | | | | 24 | % | | | | 13 | % | | | | 7 | % |
| (a) | For the period from December 29, 2010 (commencement of operations) to October 31, 2011. |
| (b) | Not annualized. |
| (c) | Annualized. |
| (d) | Portfolio turnover is calculated on the basis of the Fund as a whole, without distinguishing between classes of shares issued. |
The accompanying notes are an integral part of these financial statements.
77
Alpine Mutual Funds
Financial Highlights—Continued
(For a share outstanding throughout each period)
| | | Global Consumer Growth Fund |
| | | | | | | | | | | | | Period
Ended |
| | | Years Ended October 31, | | October 31, |
| | | 2014 | | 2013 | | 2012 (a) |
| Class A: | | | | | | | | | | | | | | | |
| Net asset value per share, beginning of period | | | $ | 12.57 | | | | $ | 10.71 | | | | $ | 8.95 | |
| Income from investment operations: | | | | | | | | | | | | | | | |
| Net investment income (loss) | | | | (0.01 | ) | | | | 0.03 | | | | | 0.02 | |
| Net realized and unrealized gain | | | | 0.02 | | | | | 1.85 | | | | | 1.74 | |
| Total from investment operations | | | | 0.01 | | | | | 1.88 | | | | | 1.76 | |
| Less distributions: | | | | | | | | | | | | | | | |
| From net investment income | | | | (0.00 | )(b) | | | | (0.02 | ) | | | | — | |
| Total distributions | | | | — | | | | | (0.02 | ) | | | | — | |
| Net asset value per share, end of period | | | $ | 12.58 | | | | $ | 12.57 | | | | $ | 10.71 | |
| Total return | | | | 0.08 | % | | | | 17.58 | % | | | | 19.66 | %(c) |
| Ratios/Supplemental Data | | | | | | | | | | | | | | | |
| Net Assets at end of period (000) | | | $ | 174 | | | | $ | 229 | | | | $ | 120 | |
| Ratio of total expenses to average net assets: | | | | | | | | | | | | | | | |
| Before waivers and/or expense reimbursements | | | | 3.70 | % | | | | 4.05 | % | | | | 5.98 | %(d) |
| After waivers and/or expense reimbursements | | | | 1.60 | % | | | | 1.60 | % | | | | 1.60 | %(d) |
| Ratio of net investment income (loss) to average net assets | | | | (0.17 | )% | | | | 0.20 | % | | | | 0.20 | %(d) |
| Portfolio turnover (e) | | | | 15 | % | | | | 24 | % | | | | 13 | % |
| (a) | Class A commenced operations on December 30, 2011. |
| (b) | The amount is less than $0.005 per share. |
| (c) | Not annualized. |
| (d) | Annualized. |
| (e) | Portfolio turnover is calculated on the basis of the Fund as a whole, without distinguishing between classes of shares issued. |
The accompanying notes are an integral part of these financial statements.
78
Alpine Mutual Funds
Notes to Financial Statements
October 31, 2014
Alpine Equity Trust (the “Equity Trust”) was organized in 1988 as a Massachusetts Business Trust, and is registered under the Investment Company Act of 1940, as amended (the “1940 Act”), as an open-end management investment company. The Alpine International Real Estate Equity Fund, Alpine Realty Income & Growth Fund, Alpine Cyclical Advantage Property Fund, Alpine Emerging Markets Real Estate Fund, Alpine Global Infrastructure Fund, and Alpine Global Consumer Growth Fund are six separate series of the Equity Trust (individually referred to as a “Fund” and collectively, “the Funds”). The Alpine International Real Estate Equity Fund, Alpine Cyclical Advantage Property Fund, Alpine Emerging Markets Real Estate Fund, Alpine Global Infrastructure Fund and Alpine Global Consumer Growth Fund are diversified funds. The Alpine Realty Income & Growth Fund is a non-diversified fund. Alpine Woods Capital Investors, LLC (the “Adviser”) is a Delaware limited liability company and serves as the investment manager to the Funds. The Funds offer Institutional Class and Class A shares, except for Cyclical Advantage Property Fund which has only the Institutional Class shares. Institutional Class shares are sold without a sales charge. Class A shares have an initial sales charge which may be waived under certain conditions as described in the Funds’ prospectus. Class A shares may be subject to a Contingent Deferred Sales Charges (“CDSC”) for certain redemptions where no initial sales charge was paid at the time of purchase. All shares of the Funds have equal rights and privileges. Each share of a Fund is entitled to one vote on all matters as to which shares are entitled to vote, to participate equally with other shares in dividends and distributions declared by the Funds and on liquidation to their proportionate share of the assets remaining after satisfaction of outstanding liabilities, except that Class A shares bear certain expenses related to the distribution fee of such shares. Each class has exclusive voting rights with respect to matters relating to its shareholder servicing and distribution expenditures.
| 2. | Significant Accounting Policies: |
The following is a summary of significant accounting policies consistently followed by the Funds in the preparation of their financial statements. The policies are in conformity with accounting principles generally accepted in the United States of America (“GAAP”), which require management to make estimates and assumptions that affect amounts reported herein. Actual results could differ from those estimates. Changes in the economic environment, financial markets and any other parameters used in determining these estimates could cause actual results to differ.
A. Valuation of Securities:
The net asset value (“NAV”) of shares of the Funds are calculated by dividing the value of the Funds’ net assets by the number of outstanding shares. NAV is determined each day the New York Stock Exchange (“NYSE”) is open as of the close of regular trading (normally, 4:00 p.m., Eastern Time). In computing NAV, portfolio securities of the Funds are valued at their current market values determined on the basis of market quotations or if market quotations are not readily available or determined to be unreliable, through procedures and/or guidelines established by the Board of Trustees (the “Board”). In computing the Funds’ NAV, equity securities that are traded on a securities exchange in the United States, except for option securities, are valued at the last reported sale price as of the time of valuation or, lacking any current reported sale at the time of valuation, at the mean between the most recent bid and asked quotations. For equity investments traded on more than one exchange, the last reported sale price on the exchange where the stock is primarily traded is used. Equity-linked structured notes are valued by referencing the last reported sale or settlement price of the underlying security on the day of valuation. Foreign exchange adjustments are applied to the last reported price to convert the underlying security’s trading currency to the equity-linked structured note’s settlement currency. These investments are categorized as Level 2 of the fair value hierarchy. Each option security traded on a securities exchange in the United States is valued at the mid-point of the consolidated bid/ask quote for the option security. Forward currency contracts are valued based on third-party vendor quotations. Each security traded in the over-the-counter market and quoted on the NASDAQ National Market System is valued at the NASDAQ Official Closing Price (“NOCP”), as determined by NASDAQ, or lacking an NOCP, the last current reported sale price as of the time of valuation by NASDAQ, or lacking any current reported sale on NASDAQ at the time of valuation, at the mean between the most recent bid and asked quotations. Each over-the-counter option that is not traded through the Options Clearing Corporation is valued by the counterparty, or if the counterparty’s price is not readily available, then by using the Black-Scholes method. Debt securities are valued based on an evaluated mean price as furnished by pricing services approved by the Board, which may be based on market transactions for comparable securities and various relationships between securities that are generally recognized by institutional traders, a computerized matrix system, or appraisals derived from information concerning the securities or similar securities received from recognized dealers in those securities. Each other security traded over-the-counter is valued at the
79
Alpine Mutual Funds
Notes to Financial Statements—Continued
October 31, 2014
mean between the most recent bid and asked quotations. Short-term securities with maturities of 60 days or less are valued at amortized cost, which approximates fair value.
Equity securities that are principally traded in a foreign market are valued at the last current sale price at the time of valuation or lacking any current or reported sale, at the time of valuation, at the mean between the most recent bid and asked quotations as of the close of the appropriate exchange or other designated time. Trading in securities on European and Far Eastern securities exchanges and over-the-counter markets is normally completed at various times before the close of business on each day on which the NYSE is open. Trading of these securities may not take place on every NYSE business day. In addition, trading may take place in various foreign markets on Saturdays or on other days when the NYSE is not open and on which the Funds’ NAVs are not calculated.
When market quotations are not readily available or when the valuation methods mentioned above are not reflective of a fair value of the security, the security is valued at fair value following procedures and/or guidelines approved by the Board. The Funds may also use fair value pricing, if the value of a security it holds is, pursuant to the Board guidelines, materially affected by events occurring before the Funds’ NAVs are calculated but after the close of the primary market or market transactions for comparable securities and various relationships between securities that are generally recognized by institutional traders, a computerized matrix system, or appraisals derived from information concerning the securities or similar securities received from recognized dealers in those securities. The Board has approved the use of a third-party pricing vendor’s proprietary fair value pricing model to assist in determining current valuation for foreign equities and OTC derivatives traded in markets that close prior to the NYSE. When fair value pricing is employed, the value of the portfolio security used to calculate the Funds’ NAVs may differ from quoted or official closing prices. The Funds may also fair value a security if the Funds or Adviser believes that the market price is stale. Other types of securities that the Funds may hold for which fair value pricing might be required include illiquid securities including restricted securities and private placements for which there is no public market.
As of October 31, 2014, the International Real Estate Equity Fund and Global Infrastructure Fund held securities that were fair valued, which comprised 7.4% and 1.5%, respectively, of the Fund’s net assets.
Fair Value Measurement:
In accordance with GAAP, the Funds use a three-tier hierarchy to establish classification of fair value measurements for disclosure purposes. Inputs refer broadly to the assumptions that market participants would use in pricing the asset or liability, including assumptions about risk. Inputs may be observable or unobservable. Observable inputs are inputs that reflect the assumptions market participants would use in pricing the asset or liability that are developed based on market data obtained from sources independent of the reporting entity. Unobservable inputs are inputs that reflect the reporting entities’ own assumptions about the assumptions market participants would use in pricing the asset or liability that are developed based on the best information available.
| • | Level 1 — | Unadjusted quoted prices in active markets/exchanges for identical investments. |
| • | Level 2 — | Other significant observable inputs (including quoted prices for similar instruments, interest rates, prepayment speeds, credit risk, yield curves, default rates, etc.). |
| • | Level 3 — | Significant unobservable inputs (including the Funds’ own assumptions in determining the fair value of investments). |
The availability of observable inputs can vary from security to security and is affected by a wide variety of factors, including, for example, the type of security, whether the security is new and not yet established in the marketplace, the liquidity of markets, and other characteristics particular to the security. To the extent that valuation is based on models or inputs that are less observable or unobservable in the market, the determination of fair value requires more judgment. Accordingly, the degree of judgment exercised in determining fair value is greatest for instruments categorized in Level 3.
The inputs used to measure fair value may fall into different levels of the fair value hierarchy. In such cases, for disclosure purposes, the level in the fair value hierarchy within which the fair value measurement falls, is determined based on the lowest level input that is significant to the fair value measurement in its entirety.
Various inputs are used in determining the value of the Funds’ investments as of the reporting period end. The designated input levels are not necessarily an indication of the risk or liquidity associated with these investments. These inputs are categorized in the following hierarchy under GAAP.
80
Alpine Mutual Funds
Notes to Financial Statements—Continued
October 31, 2014
The Funds use valuation techniques to measure fair value that are consistent with the market approach and/or income approach, depending on the type of security and the particular circumstance. The market approach uses prices and other relevant information generated by market transactions involving identical or comparable securities. The income approach uses valuation techniques to discount estimated future cash flows to present value.
For certain Level 3 investments the Adviser may perform due diligence that may include visiting a company’s largest projects, meeting with the company’s management team, and having discussions with company management regarding the operation of its business. The Adviser considers all of this information in the determination of fair value. International Real Estate Equity Fund has retained a third-party independent valuation firm to provide input on the methodology to value a particular investment and the range of its values.
The following is a summary of the inputs used to value the Funds’ assets and liabilities carried at fair value as of October 31, 2014:
| | | | | | | | | | | | | | | | | |
| | | Valuation Inputs | | | | | |
| International Real Estate Equity Fund* | | Level 1 | | | Level 2 | | | Level 3 | | | Total Value | |
| Common Stocks | | | | | | | | | | | | | | | | |
| Asia | | $ | 62,184,203 | | | $ | 5,874,725 | | | $ | 12,160,307 | | | $ | 80,219,235 | |
| Europe | | | 65,673,134 | | | | — | | | | 291,317 | | | | 65,964,451 | |
| North & South America | | | 25,353,509 | | | | — | | | | — | | | | 25,353,509 | |
| Equity-Linked Structured Notes | | | — | | | | 4,825,629 | | | | — | | | | 4,825,629 | |
| Investment Companies | | | 792,428 | | | | — | | | | — | | | | 792,428 | |
| Warrants | | | — | | | | 0 | | | | — | | | | 0 | |
| Total | | $ | 154,003,274 | | | $ | 10,700,354 | | | $ | 12,451,624 | | | $ | 177,155,252 | |
| | | | | | | | | | | | | | | | | |
| | | Valuation Inputs | | | | | |
| Other Financial Instruments | | Level 1 | | | Level 2 | | | Level 3 | | | Total Value | |
| Assets | | | | | | | | | | | | | | | | |
| Forward Currency Contracts | | $ | — | | | $ | 1,212,777 | | | $ | — | | | $ | 1,212,777 | |
| Total | | $ | — | | | $ | 1,212,777 | | | $ | — | | | $ | 1,212,777 | |
| | | | | | | | | | | | | | | | | |
| | | Valuation Inputs | | | | | |
| Realty Income & Growth Fund* | | Level 1 | | | Level 2 | | | Level 3 | | | Total Value | |
| Real Estate Investment Trusts | | $ | 114,393,856 | | | $ | — | | | $ | — | | | $ | 114,393,856 | |
| Common Stocks | | | 1,686,520 | | | | — | | | | — | | | | 1,686,520 | |
| Preferred Stocks | | | 1,511,526 | | | | — | | | | — | | | | 1,511,526 | |
| Total | | $ | 117,591,902 | | | $ | — | | | $ | — | | | $ | 117,591,902 | |
| | | | | | | | | | | | | | | | | |
| | | Valuation Inputs | | | | | |
| Cyclical Advantage Property Fund* | | Level 1 | | | Level 2 | | | Level 3 | | | Total Value | |
| Common Stocks | | | | | | | | | | | | | | | | |
| Asia | | $ | 17,456,923 | | | $ | 2,007,890 | | | $ | — | | | $ | 19,464,813 | |
| Europe | | | 14,836,784 | | | | — | | | | — | | | | 14,836,784 | |
| North & South America | | | 22,521,328 | | | | 383,949 | | | | — | | | | 22,905,277 | |
| Equity-Linked Structured Notes | | | — | | | | 2,237,557 | | | | — | | | | 2,237,557 | |
| Warrants | | | — | | | | 0 | | | | — | | | | 0 | |
| Total | | $ | 54,815,035 | | | $ | 4,629,396 | | | $ | — | | | $ | 59,444,431 | |
81
Alpine Mutual Funds
Notes to Financial Statements—Continued
October 31, 2014
| | | Valuation Inputs | | | | | |
| Other Financial Instruments | | Level 1 | | | Level 2 | | | Level 3 | | | Total Value | |
| Assets | | | | | | | | | | | | | | | | |
| Forward Currency Contracts | | $ | — | | | $ | 583,930 | | | $ | — | | | $ | 583,930 | |
| Total | | $ | — | | | $ | 583,930 | | | $ | — | | | $ | 583,930 | |
| | | | | | | | | | | | | | | | | |
| | | Valuation Inputs | | | | | |
| Emerging Markets Real Estate Fund* | | Level 1 | | | Level 2 | | | Level 3 | | | Total Value | |
| Common Stocks | | | | | | | | | | | | | | | | |
| Asia | | $ | 3,474,094 | | | $ | 410,169 | | | $ | — | | | $ | 3,884,263 | |
| Europe | | | 186,675 | | | | — | | | | — | | | | 186,675 | |
| Middle East/Africa | | | 514,286 | | | | — | | | | — | | | | 514,286 | |
| North & South America | | | 1,085,207 | | | | 14,268 | | | | — | | | | 1,099,475 | |
| Preferred Stocks | | | 11,258 | | | | — | | | | — | | | | 11,258 | |
| Equity-Linked Structured Notes | | | — | | | | 394,318 | | | | — | | | | 394,318 | |
| Convertible Bonds | | | — | | | | 323 | | | | — | | | | 323 | |
| Short-Term Investments | | | — | | | | 283,000 | | | | — | | | | 283,000 | |
| Total | | $ | 5,271,520 | | | $ | 1,102,078 | | | $ | — | | | $ | 6,373,598 | |
| | | | | | | | | | | | | | | | | |
| | | Valuation Inputs | | | | | |
| Global Infrastructure Fund* | | Level 1 | | | Level 2 | | | Level 3 | | | Total Value | |
| Common Stocks | | | | | | | | | | | | | | | | |
| Asia | | $ | 32,479,898 | | | $ | 4,689,776 | | | $ | — | | | $ | 37,169,674 | |
| Europe | | | 46,881,933 | | | | — | | | | — | | | | 46,881,933 | |
| North & South America | | | 115,104,152 | | | | — | | | | — | | | | 115,104,152 | |
| Equity-Linked Structured Notes | | | — | | | | 5,475,234 | | | | — | | | | 5,475,234 | |
| Short-Term Investments | | | — | | | | 7,275,000 | | | | — | | | | 7,275,000 | |
| Total | | $ | 194,465,983 | | | $ | 17,440,010 | | | $ | — | | | $ | 211,905,993 | |
| | | | | | | | | | | | | | | | | |
| | | Valuation Inputs | | | | | |
| Other Financial Instruments | | Level 1 | | | Level 2 | | | Level 3 | | | Total Value | |
| Assets | | | | | | | | | | | | | | | | |
| Forward Currency Contracts | | $ | — | | | $ | 1,488,376 | | | $ | — | | | $ | 1,488,376 | |
| Total | | $ | — | | | $ | 1,488,376 | | | $ | — | | | $ | 1,488,376 | |
| | | | | | | | | | | | | | | | | |
| | | Valuation Inputs | | | | | |
| Global Consumer Growth Fund* | | Level 1 | | | Level 2 | | | Level 3 | | | Total Value | |
| Common Stocks | | $ | 2,764,887 | | | $ | — | | | $ | — | | | $ | 2,764,887 | |
| Short-Term Investments | | | — | | | | 103,000 | | | | — | | | | 103,000 | |
| Total | | $ | 2,764,887 | | | $ | 103,000 | | | $ | — | | | $ | 2,867,887 | |
* For detailed country and sector descriptions, see accompanying Schedule of Portfolio Investments.
For the year ended October 31, 2014, there were no transfers between Level 1, Level 2 and Level 3.
82
Alpine Mutual Funds
Notes to Financial Statements—Continued
October 31, 2014
The following is a reconciliation of Level 3 assets for which significant unobservable inputs were used to determine fair value:
| | | International | |
| | | Real Estate | |
| | | Equity Fund | |
| Balance as of October 31, 2013 | | $ | 12,710,485 | |
| Realized gain (loss) | | | — | |
| Change in net unrealized depreciation* | | | (258,861 | ) |
| Purchases | | | — | |
| Sales | | | — | |
| Transfers in to Level 3** | | | — | |
| Transfers out of Level 3** | | | — | |
| Balance as of October 31, 2014 | | $ | 12,451,624 | |
| Change in net unrealized depreciation on Level 3 holdings held at year end | | $ | (258,861 | ) |
| | * | Statements of Operations Location: Change in net unrealized appreciation/(depreciation) on investments. |
| | ** | The Funds recognize transfers as of the beginning of the year. |
The following table shows the valuation techniques and significant amounts of unobservable inputs used in the fair value measurement of the Fund’s Level 3 investments, as of October 31, 2014:
International Real Estate Equity Fund
| | | | | | | | | | | | | Relationship |
| | | | | | | | | | | | | Between Fair |
| | | | | | | | | | | | | Value and |
| | | | | Significant | | Significant | | | | | | Input: If |
| | | Fair Value | | Valuation | | Unobservable | | Range of | | Weighted | | Input Value |
| Asset | | at 10/31/14 | | Technique | | Input | | Values | | Average | | Increases Then: |
| Common Stock | | $12,013,751*+ | | The Income Approach | | Liquidity Discount | | 20% | | 20.0% | | Fair Value would |
| | | | | and Market Approach | | | | | | | | Decrease |
| | | | | were equally weighted. | | Total Enterprise | | 2.50 x to | | 2.75 x | | Fair Value would |
| | | | | The Market Approach | | Value / Revenue | | 3.00 x | | | | Increase |
| | | | | was determined by an | | Total Enterprise | | 8.50 x to | | 9 x | | Fair Value would |
| | | | | equal weighting of three | | Value / Earnings | | 9.50 | | | | Increase |
| | | | | multiples: Total Enterprise | | Before Interest & | | | | | | |
| | | | | Value / Revenue, Total | | Taxes | | | | | | |
| | | | | Enterprise Value / Earnings Before | | Price / Book | | 1.50 x to
1.70 x | | 1.6 x | | Fair Value would Increase |
| | | | | Interest & Taxes, | | | | | | | | |
| | | | | and Price-to-Book | | Adjusted Weighted | | 17-18% | | 17.5% | | Fair Value would |
| | | | | | | Average Cost of | | | | | | Decrease |
| | | | | | | Capital | | | | | | |
| Common Stock | | $291,317* | | Adjusted Book Value | | Discount to NAV | | 50% | | 50% | | Fair Value would |
| | | | | | | | | | | | | Decrease |
| Common Stock | | $146,556* | | Adjusted Book Value | | Liquidity Discount | | 27% | | 27% | | Fair Value would |
| | | | | | | | | | | | | Decrease |
| | + | The valuation methodology changed from the prior period. The prior methodology averaged an equal weighting of the company’s reported book value and the terminal value of the company’s projected cash flows, taking into consideration the potential for a public offering of the company’s shares. The new methodology does not take a potential public offering into consideration. The change in methodology was made to reflect a change in the Adviser’s view regarding the prospects of a public offering of the company’s shares. |
| | * | Represents a single security, as of October 31, 2014. As a result, the range of values and weighted average for each unobservable input refer to a single value. |
83
Alpine Mutual Funds
Notes to Financial Statements—Continued
October 31, 2014
The significant unobservable inputs used in the fair value measurement of common stocks is liquidity discounts, total enterprise value/revenue, total enterprise value/earnings before interest & taxes, price/book, adjusted weighted average cost of capital and discount to NAV. Other market indicators are also considered. Changes in any of those inputs would result in lower or higher fair value measurement.
B. Security Transactions and Investment Income:
Security transactions are accounted for on a trade date basis. Realized gains and losses are computed on the identified cost basis. Dividend income is recorded on the ex-dividend date or in the case of some foreign securities, on the date thereafter when the Funds are made aware of the dividend. Upon notification from issuers, some of the dividend income received from a real estate investment trust may be redesignated as a reduction of cost of the related investment and/or realized gain. Interest income is recorded on the accrual basis and includes accretion of discounts and amortization of premiums, where applicable. To the extent any issuer defaults or a credit event occurs that impacts the issuer, the Funds may halt any additional interest income accruals and consider the realizability of interest accrued up to the date of default or credit event.
C. Line of Credit and Custody Overdrafts:
On December 1, 2010, the Trust entered into a lending agreement with BNP Paribas through its New York branch (“BNPP NY”). Loans in aggregate, whether to cover overdrafts or for investment purposes, may not exceed the maximum amount that is permitted under the 1940 Act. The terms of the lending agreement indicate the rate to be the Fed Funds rate plus 0.95% per annum on amounts borrowed. The BNP Paribas Facility provides secured, uncommitted lines of credit for the Funds where selected Funds assets are pledged against advances made to the respective Fund. Each Fund has granted a security interest in all pledged assets used as collateral to the BNPP Facility. Each Fund is permitted to borrow up to 33.33% of its total assets for extraordinary or emergency purposes. Additionally, each of the following Funds is permitted to borrow up to 10% of its respective total assets for investment purposes but in no case shall any Fund’s total outstanding borrowings exceed 33.33% of its total assets. Either BNPP NY or the Funds may terminate this agreement upon delivery of written notice. For the year ended October 31, 2014, the average interest rate paid on outstanding borrowings under the line of credit was 1.03%, 1.03%, 1.03%, 1.03% and 1.05% for the International Real Estate Equity Fund, Realty Income & Growth Fund, Cyclical Advantage Property Fund, Emerging Markets Real Estate Fund and Global Infrastructure Fund, respectively. The Funds may also incur interest expense on custody overdraft charges.
84
Alpine Mutual Funds
Notes to Financial Statements—Continued
October 31, 2014
| | | | | | Realty | | | Cyclical | | | Emerging | | | | | | Global | |
| | | International | | | Income & | | | Advantage | | | Markets | | | Global | | | Consumer | |
| | | Real Estate | | | Growth | | | Property | | | Real Estate | | | Infrastructure | | | Growth | |
| | | Equity Fund | | | Fund | | | Fund | | | Fund | | | Fund | | | Fund | |
| | | | | | | | | | | | | | | | | | | | | | | | | |
| Total line of credit amount available for investment purposes at October 31, 2014 | | | $18,583,206 | | | | $11,829,399 | | | | $6,609,080 | | | | $656,683 | | | | $21,403,746 | | | | $288,178 | |
| Line of credit outstanding at October 31, 2014 | | | 11,783,433 | | | | 2,600,264 | | | | 4,046,627 | | | | — | | | | — | | | | — | |
| Line of credit amount unused at October 31, 2014 | | | 6,799,773 | | | | 9,229,135 | | | | 2,562,453 | | | | 656,683 | | | | 21,403,746 | | | | 288,178 | |
| Average balance outstanding during the period | | | 4,866,502 | | | | 6,650,943 | | | | 4,379,965 | | | | 50,736 | | | | 14,389 | | | | — | |
| Maximum balance outstanding during the period | | | 12,238,245 | | | | 9,938,480 | | | | 6,498,923 | | | | 1,243,755 | | | | 1,653,435 | | | | — | |
| Interest expense incurred on line of credit during the period | | | 50,815 | | | | 69,343 | | | | 45,675 | | | | 529 | | | | 153 | | | | — | |
| Interest expense incurred on custody overdrafts during the period | | | 1 | | | | 1 | | | | — | | | | — | | | | — | | | | — | |
The line of credit outstanding as of October 31, 2014 approximates its fair value and would be categorized at Level 2.
D. Federal and Other Income Taxes:
It is each Fund’s policy to comply with the Federal income and excise tax requirements of the Internal Revenue Code of 1986 (the “Code”), as amended, applicable to regulated investment companies and to timely distribute, all of its investment company taxable income and net realized capital gains to shareholders in accordance with the timing requirements imposed by the Code. Therefore, no Federal income tax provision is required. Capital gains realized on some foreign securities are subject to foreign taxes. Dividends and interest from non-U.S. sources received by the Funds are generally subject to non-U.S. withholding taxes at rates ranging up to 30%. Such capital gains and withholding taxes, which are accrued as applicable, may be reduced or eliminated under the terms of applicable U.S. income tax treaties, and the Funds intend to undertake procedural steps to claim the benefits of such treaties. Where available, the Funds will file refund claims for foreign taxes withheld.
Management has analyzed the Funds’ tax positions taken on income tax returns for all open tax years and has concluded that as of October 31, 2014, no provision for income tax is required in the Funds’ financial statements. The Funds’ Federal and state income and Federal excise tax returns for tax years for which the applicable statutes of limitations have not expired are subject to examination by the Internal Revenue Service and state departments of revenue. As of October 31, 2014, open Federal and New York tax years include the tax years ended October 31, 2011 through 2014. Also, the Funds have recognized no interest and penalties related to uncertain tax benefits. The Funds are also not aware of any tax positions for which it is reasonably possible that the total amounts of unrecognized tax benefits will significantly change in the next twelve months.
GAAP requires that certain components of net assets be reclassified to reflect permanent differences between financial and tax reporting. These reclassifications have no effect on net assets or net asset values per share.
E. Distributions to Shareholders:
Each Fund intends to distribute all of its net investment income and net realized capital gains, if any, throughout the year to its shareholders in the form of dividends. Distributions to shareholders are recorded at the close of business on the ex-dividend date.
85
Alpine Mutual Funds
Notes to Financial Statements—Continued
October 31, 2014
The amounts of dividends from net investment income and of distributions from net realized gains are determined in accordance with Federal income tax regulations, which may differ from GAAP. These differences are either considered temporary or permanent in nature. To the extent these differences are permanent in nature, such amounts are reclassified within the composition of net assets based on their Federal tax-basis treatment; temporary differences do not require reclassification. In the event dividends and distributions to shareholders exceed net investment income and net realized gains for tax purposes, they are reported as returns of capital.
F. Class Allocations:
Income, expenses (other than class specific expenses) and realized and unrealized gains and losses are allocated among the classes of the Funds based on the relative net assets of each class. Class specific expenses are allocated to the class to which they relate. Currently, class specific expenses are limited to those incurred under the Distribution Plan for Class A shares.
G. Foreign Currency Translation Transactions:
The International Real Estate Equity Fund, Cyclical Advantage Property Fund, Emerging Markets Real Estate Fund, Global Infrastructure Fund, and Global Consumer Growth Fund may invest without limitation in foreign securities. The Realty Income & Growth Fund may invest up to 35% of its net assets in foreign securities. The books and records of each Fund are maintained in U.S. dollars. Non-U.S. dollar-denominated amounts are translated into U.S. dollars as follows, with the resultant translations gains and losses recorded in the Statements of Operations:
| | | i) | market value of investment securities and other assets and liabilities at the exchange rate on the valuation date, |
| | | | |
| | | ii) | purchases and sales of investment securities, income and expenses at the exchange rate prevailing on the respective date of such transactions. |
H. Risks Associated with Foreign Securities and Currencies:
Investments in securities of foreign issuers carry certain risks not ordinarily associated with investments in securities of domestic issuers. Such risks include future political and economic developments and the possible imposition of exchange controls or other foreign governmental laws and restrictions. In addition, with respect to certain countries, there is a possibility of expropriation of assets, confiscatory taxation, political or social instability or diplomatic developments, which could adversely affect investments in those countries. Generally, when the U.S. dollar rises in value against a foreign currency, the Funds’ investments denominated in that currency will lose value because that currency is worth fewer U.S. dollars; the opposite effect occurs if the U.S. dollar falls in relative value.
Certain countries may also impose substantial restrictions on investments in their capital markets by foreign entities, including restrictions on investments in issuers or industries deemed sensitive to relevant national interests. These factors may limit the investment opportunities available to the Funds or result in a lack of liquidity and high price volatility with respect to securities of issuers from developing countries.
I. Equity-Linked Structured Notes:
The Funds may invest in equity-linked structured notes. Equity-linked structured notes are securities which are specially designed to combine the characteristics of one or more underlying securities and their equity derivatives in a single note form. The return and/or yield or income component may be based on the performance of the underlying equity securities, and equity index, and/or option positions. Equity-linked structured notes are typically offered in limited transactions by financial institutions in either registered or non-registered form. An investment in equity-linked structured notes creates exposure to the credit risk of the issuing financial institution, as well as to the market risk of the underlying securities. There is no guaranteed return of principal with these securities and the appreciation potential of these securities may be limited by a maximum payment or call right. In certain cases, equity-linked structured notes may be more volatile and less liquid than less complex securities or other types of fixed-income securities. Such securities may exhibit price behavior that does not correlate with other fixed income securities. International Real Estate Equity Fund, Cyclical Advantage Property Fund, Emerging Markets Real Estate Fund and Global Infrastructure Fund held three, five, nine and two equity-linked structured notes, respectively, at October 31, 2014.
86
Alpine Mutual Funds
Notes to Financial Statements—Continued
October 31, 2014
J. Forward Currency Contracts:
The Funds are subject to foreign currency exchange rate risk in the normal course of pursuing their investment objectives. The Funds may use forward currency contracts to gain exposure to or economically hedge against changes in the value of foreign currencies. A forward currency contract (“forward”) is an agreement between two parties to buy and sell a currency at a set price on a future date. The market value of the forward contract fluctuates with changes in forward currency exchange rates. The forward contract is marked-to-market daily and the change in market value is recorded by each Fund as unrealized appreciation or depreciation. When the forward contract is closed, a Fund records a realized gain or loss equal to the fluctuation in value during the period the forward contract was open. A Fund could be exposed to risk if a counterparty is unable to meet the terms of a forward or if the value of the currency changes unfavorably. The Funds’ forward contracts are not subject to an enforceable master netting agreement or similar agreement. During the year ended October 31, 2014, the International Real Estate Equity Fund, Cyclical Advantage Property Fund and Global Infrastructure Fund entered into thirteen, eleven and nine forward contracts, respectively.
The following forward contracts were held as of October 31, 2014:
| | | | | | | | | | | | | | | | | |
| International Real Estate Equity Fund |
| |
| Description | | Counterparty | | Settlement
Date | | Currency | | | Settlement
Value | | | Current
Value | | | Unrealized
Gain | |
| Contracts Sold: | | | | | | | | | | | | | | | | | | | | |
| Japanese Yen | | State Street Bank & Trust | | 1/28/2015 | | | 1,350,000,000 JPY | | | $ | 13,243,604 | | | $ | 12,030,827 | | | $ | 1,212,777 | |
| | | | | | | | | | | | | | | $ | 12,030,827 | | | $ | 1,212,777 | |
| Cyclical Advantage Property Fund | | | | | | | | | | | | | | | | |
| | | | | | | | | | | | | | | | | |
| Description | | Counterparty | | Settlement
Date | | Currency | | | Settlement
Value | | | Current
Value | | | Unrealized
Gain | |
| Contracts Sold: | | | | | | | | | | | | | | | | | |
| Japanese Yen | | State Street Bank & Trust | | 1/28/2015 | | | 650,000,000 JPY | | | $ | 6,376,550 | | | | $5,792,620 | | | $ | 583,930 | |
| | | | | | | | | | | | | | | | $5,792,620 | | | $ | 583,930 | |
| Global Infrastructure Fund | | | | | | | | | | | | | | | | |
| | | | | | | | | | | | | | | | | |
| Description | | Counterparty | | Settlement
Date | | Currency | | | Settlement
Value | | | Current
Value | | | Unrealized
Gain | |
| Contracts Sold: | | | | | | | | | | | | | | | | | | | | |
| Euro | | State Street Bank & Trust | | 1/7/2015 | | | 13,700,000 EUR | | | $ | 18,663,647 | | | $ | 17,175,271 | | | $ | 1,488,376 | |
| | | | | | | | | | | | | | | $ | 17,175,271 | | | $ | 1,488,376 | |
K. Derivative Instruments and Hedging Activities:
The following tables provide information about the effect of derivatives and hedging activities on the Funds’ Statements of Assets and Liabilities and Statements of Operations as of and for the year ended October 31, 2014. The first table provides additional detail about the amounts and sources of unrealized appreciation/(depreciation) on derivatives at the end of the period. The second table provides additional information about the amounts and sources of net realized gain/(loss) and the change in net unrealized appreciation/(depreciation) resulting from the Funds’ derivatives and hedging activities during the period.
87
Alpine Mutual Funds
Notes to Financial Statements—Continued
October 31, 2014
The effect of derivative instruments in the Statements of Assets and Liabilities as of October 31, 2014:
| International Real Estate Equity Fund | | | |
| | | | | |
| Derivatives | | Statements of Assets
and Liabilities Location | | Unrealized
Appreciation |
| Foreign exchange risk | | Unrealized appreciation on forward currency contracts | | $1,212,777 |
| | | | | |
| Cyclical Advantage Property Fund | | | | |
| Derivatives | | Statements of Assets
and Liabilities Location | | Unrealized
Appreciation |
| Foreign exchange risk | | Unrealized appreciation on forward currency contracts | | $583,930 |
| | | | | |
| Global Infrastructure Fund | | | | |
| | | | | |
| Derivatives | | Statements of Assets
and Liabilities Location | | Unrealized
Appreciation |
| Foreign exchange risk | | Unrealized appreciation on forward currency contracts | | $1,488,376 |
The effect of derivative instruments in the Statements of Operations for the year ended October 31, 2014:
| International Real Estate Equity Fund | | | | |
| Derivatives | | Statements of
Operations Location | | Net Realized Gain | | Unrealized Appreciation |
| Foreign exchange risk | | Net realized gain/(loss) from foreign currency transactions/Change in net unrealized appreciation/(depreciation) on foreign currency translations | | $831,557 | | $1,173,157 |
| |
| Cyclical Advantage Property Fund | | | | |
| Derivatives | | Statements of
Operations Location | | Net Realized Gain | | Unrealized Appreciation |
| Foreign exchange risk | | Net realized gain/(loss) from foreign currency transactions/Change in net unrealized appreciation/(depreciation) on foreign currency translations | | $317,930 | | $568,280 |
| |
| Global Infrastructure Fund | | | |
| Derivatives | | Statements of
Operations Location | | Net Realized Loss | | Unrealized Appreciation |
| Foreign exchange risk | | Net realized gain/(loss) from foreign currency transactions/Change in net unrealized appreciation/(depreciation) on foreign currency translations | | $(351,596) | | $1,784,972 |
L. Redemption Fees:
The Funds of the Alpine Equity Trust impose a redemption fee of 1% of the total redemption amount on all Fund shares redeemed or exchanged within 60 days of buying them, either by purchase or exchange. This fee is assessed and retained by the Funds for the benefit of the remaining shareholders. The redemption fee is accounted for as an increase to paid-in-capital.
88
Alpine Mutual Funds
Notes to Financial Statements—Continued
October 31, 2014
| 3. | | Capital Share Transactions: |
| | | |
| | The Funds have an unlimited number of shares of beneficial interest, with $0.001 par value, authorized. Transactions in shares and dollars of the Funds were as follows: |
| International Real Estate Equity Fund | | | | | | | | |
| | | | Year Ended | | | | Year Ended | |
| | | | October 31, 2014 | | | | October 31, 2013 | |
| | | | Shares | | | | Amount | | | | Shares | | | | Amount | |
| | | | | | | | | | | | | | | | | |
| Institutional Class | | | | | | | | | | | | | | | | |
| Shares sold | | | 129,030 | | | $ | 3,001,722 | | | | 465,270 | | | $ | 11,120,278 | |
| Shares issued in reinvestment of dividends | | | 15,832 | | | | 366,356 | | | | 48,570 | | | | 1,150,627 | |
| Redemption fees | | | — | | | | 1,764 | | | | — | | | | 6,916 | |
| Shares redeemed | | | (1,701,229 | ) | | | (39,848,948 | ) | | | (5,350,431 | ) | | | (129,741,173 | ) |
| Total net change | | | (1,556,367 | ) | | $ | (36,479,106 | ) | | | (4,836,591 | ) | | $ | (117,463,352 | ) |
| Class A | | | | | | | | | | | | | | | | |
| Shares sold | | | 27 | | | $ | 649 | | | | 1,040 | | | $ | 24,868 | |
| Shares issued in reinvestment of dividends | | | — | | | | — | | | | 13 | | | | 318 | |
| Redemption fees | | | — | | | | — | | | | — | | | | 4 | |
| Shares redeemed | | | — | | | | — | | | | (706 | ) | | | (17,079 | ) |
| Total net change | | | 27 | | | $ | 649 | | | | 347 | | | $ | 8,111 | |
| | | | | | | | | |
| Realty Income & Growth Fund | | | | | | | | |
| | | | Year Ended | | | | Year Ended | |
| | | | October 31, 2014 | | | | October 31, 2013 | |
| | | | Shares | | | | Amount | | | | Shares | | | | Amount | |
| | | | | | | | | | | | | | | | | |
| Institutional Class | | | | | | | | | | | | | | | | |
| Shares sold | | | 470,247 | | | $ | 9,049,768 | | | | 396,879 | | | $ | 7,333,676 | |
| Shares issued in reinvestment of dividends | | | 188,120 | | | | 3,551,116 | | | | 213,883 | | | | 3,866,099 | |
| Redemption fees | | | — | | | | 6,834 | | | | — | | | | 5,518 | |
| Shares redeemed | | | (787,237 | ) | | �� | (14,956,430 | ) | | | (1,296,033 | ) | | | (23,806,742 | ) |
| Total net change | | | (128,870 | ) | | $ | (2,348,712 | ) | | | (685,271 | ) | | $ | (12,601,449 | ) |
| Class A | | | | | | | | | | | | | | | | |
| Shares sold | | | 60,631 | | | $ | 1,097,274 | | | | 57,263 | | | $ | 1,082,511 | |
| Shares issued in reinvestment of dividends | | | 4,128 | | | | 78,041 | | | | 817 | | | | 14,416 | |
| Redemption fees | | | — | | | | 148 | | | | — | | | | 41 | |
| Shares redeemed | | | (14,316 | ) | | | (291,468 | ) | | | (342 | ) | | | (6,256 | ) |
| Total net change | | | 50,443 | | | $ | 883,995 | | | | 57,738 | | | $ | 1,090,712 | |
| | | | | | | | | |
| Cyclical Advantage Property Fund | | | | | | | | |
| | | | Year Ended | | | | Year Ended | |
| | | | October 31, 2014 | | | | October 31, 2013 | |
| | | | Shares | | | | Amount | | | | Shares | | | | Amount | |
| | | | | | | | | | | | | | | | | |
| Institutional Class | | | | | | | | | | | | | | | | |
| Shares sold | | | 22,089 | | | $ | 567,261 | | | | 102,636 | | | $ | 2,535,452 | |
| Shares issued in reinvestment of dividends | | | 47,482 | | | | 1,210,311 | | | | 20,925 | | | | 510,363 | |
| Redemption fees | | | — | | | | 47 | | | | — | | | | 2,260 | |
| Shares redeemed | | | (181,517 | ) | | | (4,636,090 | ) | | | (298,522 | ) | | | (7,440,538 | ) |
| Total net change | | | (111,946 | ) | | $ | (2,858,471 | ) | | | (174,961 | ) | | $ | (4,392,463 | ) |
Alpine Mutual Funds
Notes to Financial Statements—Continued
October 31, 2014
| Emerging Markets Real Estate Fund | | | | | | | | |
| | | | Year Ended | | | | Year Ended | |
| | | | October 31, 2014 | | | | October 31, 2013 | |
| | | | Shares | | | | Amount | | | | Shares | | | | Amount | |
| | | | | | | | | | | | | | | | | |
| Institutional Class | | | | | | | | | | | | | | | | |
| Shares sold | | | 77,503 | | | $ | 1,256,776 | | | | 452,465 | | | $ | 8,462,630 | |
| Shares issued in reinvestment of dividends | | | 10,210 | | | | 157,788 | | | | 3,029 | | | | 55,877 | |
| Redemption fees | | | — | | | | 8,873 | | | | — | | | | 14,297 | |
| Shares redeemed | | | (300,530 | ) | | | (4,765,455 | ) | | | (184,263 | ) | | | (3,237,097 | ) |
| Total net change | | | (212,817 | ) | | $ | (3,342,018 | ) | | | 271,231 | | | $ | 5,295,707 | |
| Class A | | | | | | | | | | | | | | | | |
| Shares sold | | | 14,160 | | | $ | 228,852 | | | | 56,958 | | | $ | 1,063,647 | |
| Shares issued in reinvestment of dividends | | | 837 | | | | 12,941 | | | | 89 | | | | 1,633 | |
| Redemption fees | | | — | | | | 785 | | | | — | | | | 957 | |
| Shares redeemed | | | (10,339 | ) | | | (172,443 | ) | | | (24,373 | ) | | | (472,467 | ) |
| Total net change | | | 4,658 | | | $ | 70,135 | | | | 32,674 | | | $ | 593,770 | |
| | | | | | | | | |
| Global Infrastructure Fund | | | | | | | | |
| | | | Year Ended | | | | Year Ended | |
| | | | October 31, 2014 | | | | October 31, 2013 | |
| | | | Shares | | | | Amount | | | | Shares | | | | Amount | |
| | | | | | | | | | | | | | | | | |
| Institutional Class | | | | | | | | | | | | | | | | |
| Shares sold | | | 4,515,044 | | | $ | 88,313,233 | | | | 4,137,898 | | | $ | 74,738,705 | |
| Shares issued in reinvestment of dividends | | | 264,123 | | | | 5,139,124 | | | | 117,131 | | | | 2,085,515 | |
| Redemption fees | | | — | | | | 12,604 | | | | — | | | | 26,140 | |
| Shares redeemed | | | (2,058,798 | ) | | | (39,830,494 | ) | | | (695,683 | ) | | | (12,708,600 | ) |
| Total net change | | | 2,720,369 | | | $ | 53,634,467 | | | | 3,559,346 | | | $ | 64,141,760 | |
| Class A | | | | | | | | | | | | | | | | |
| Shares sold | | | 479,034 | | | $ | 9,492,365 | | | | 1,246,168 | | | $ | 22,408,845 | |
| Shares issued in reinvestment of dividends | | | 48,609 | | | | 942,300 | | | | 17,256 | | | | 308,946 | |
| Redemption fees | | | — | | | | 1,896 | | | | — | | | | 4,490 | |
| Shares redeemed | | | (212,481 | ) | | | (4,239,962 | ) | | | (333,963 | ) | | | (6,250,474 | ) |
| Total net change | | | 315,162 | | | $ | 6,196,599 | | | | 929,461 | | | $ | 16,471,807 | |
Alpine Mutual Funds
Notes to Financial Statements—Continued
October 31, 2014
| Global Consumer Growth Fund | | | | | | | | | | | | | | | | |
| | | | Year Ended | | | | Year Ended | |
| | | | October 31, 2014 | | | | October 31, 2013 | |
| | | | Shares | | | | Amount | | | | Shares | | | | Amount | |
| | | | | | | | | | | | | | | | | |
| Institutional Class | | | | | | | | | | | | | | | | |
| Shares sold | | | 5,211 | | | $ | 66,951 | | | | 1,877 | | | $ | 22,131 | |
| Shares issued in reinvestment of dividends | | | 535 | | | | 6,957 | | | | 844 | | | | 9,385 | |
| Redemption fees | | | — | | | | — | | | | — | | | | — | |
| Shares redeemed | | | (356 | ) | | | (4,580 | ) | | | (750 | ) | | | (8,697 | ) |
| Total net change | | | 5,390 | | | $ | 69,328 | | | | 1,971 | | | $ | 22,819 | |
| Class A | | | | | | | | | | | | | | | | |
| Shares sold | | | 2,614 | | | $ | 33,249 | | | | 24,428 | | | $ | 281,904 | |
| Shares issued in reinvestment of dividends | | | 1 | | | | 9 | | | | 20 | | | | 227 | |
| Redemption fees | | | — | | | | — | | | | — | | | | — | |
| Shares redeemed | | | (7,015 | ) | | | (88,203 | ) | | | (17,413 | ) | | | (198,431 | ) |
| Total net change | | | (4,400 | ) | | $ | (54,945 | ) | | | 7,035 | | | $ | 83,700 | |
| 4. | | Purchases and Sales of Securities: |
| | | |
| | | Purchases and sales of securities (excluding short-term securities) for the year ended October 31, 2014 are as follows: |
| | | | Purchases | | | | Sales | |
| | | | | | | | | |
| International Real Estate Equity | | $ | 42,513,405 | | | $ | 70,085,005 | |
| Realty Income & Growth Fund | | | 35,604,271 | | | | 40,443,737 | |
| Cyclical Advantage Property Fund | | | 26,515,976 | | | | 28,745,651 | |
| Emerging Markets Real Estate Fund | | | 7,392,476 | | | | 10,460,279 | |
| Global Infrastructure Fund | | | 243,298,433 | | | | 188,246,271 | |
| Global Consumer Growth Fund | | | 431,443 | | | | 422,607 | |
| | The Funds did not have purchases and sales of U.S. Government Obligations during the year ended October 31, 2014. |
| | | |
| 5. | | Distribution Plans: |
| | | |
| | | Quasar Distributors, LLC (“Quasar”) serves as each Fund’s distributor. Each of the Funds, except for the Cyclical Advantage Property Fund, has adopted distribution and servicing plans (the “Plans”) for their Class A shares as allowed by Rule 12b-1 under the 1940 Act. The Plans authorize payments by the Funds in connection with the distribution and servicing of their Class A shares at an annual rate, as determined from time to time by the Board, of up to 0.25% of the average daily net assets of the Class A shares of the Funds. Amounts paid under the Plans by the Funds may be spent by the Funds on any activities or expenses primarily intended to result in the sale of Class A shares of the Funds, including but not limited to advertising, compensation for sales and marketing activities of financial institutions and others such as dealers and distributors, shareholder account servicing, the printing and mailing of prospectuses to other than current shareholders and the printing and mailing of sales literature. International Real Estate Equity Fund, Realty Income & Growth Fund, Emerging Markets Real Estate Fund, Global Infrastructure Fund and Global Consumer Growth Fund incurred $362, $5,477, $1,797, $59,622 and $451, respectively, pursuant to the Plans for the year ended October 31, 2014. |
| | | |
| | | The Plans for the Funds may be terminated at any time by vote of the members of the Board of the Equity Trust who are not “interested persons,” as defined by the 1940 Act, or by vote of a majority of the outstanding voting shares of the respective class. |
Alpine Mutual Funds
Notes to Financial Statements—Continued
October 31, 2014
| 6. | Investment Advisory Agreement, Administration Agreement and Other Affiliated Transactions: |
The Adviser provides investment advisory services to each of the Funds. Pursuant to the advisory agreements with the Realty Income & Growth Fund and the Cyclical Advantage Property Fund, the Adviser is entitled to an annual fee based on each Fund’s average daily net assets, in accordance with the following schedule:
| First $750 million | | | 1.00 | % |
| Next $250 million | | | 0.90 | % |
| Over $1 billion | | | 0.80 | % |
The Adviser is entitled to an annual fee based on 1.00% of each Fund’s average daily net assets for the International Real Estate Equity Fund, Emerging Markets Real Estate Fund, Global Infrastructure Fund and Global Consumer Growth Fund.
The Adviser agreed to reimburse the Realty Income & Growth Fund, Emerging Markets Real Estate Fund, Global Infrastructure Fund and Global Consumer Growth Fund to the extent necessary to ensure that ordinary operating expenses (including 12b-1 fees, where applicable, but excluding interest, brokerage commissions, acquired fund fees and extraordinary expenses) do not exceed annually 1.60%, of the respective Fund’s Class A shares average daily net assets, and 1.35% of the respective Fund’s Institutional Class shares average daily net assets. The Adviser may recover expenses paid in excess of the cap on expenses for the three previous years, as long as the recovery does not cause the Funds to exceed such cap on expenses. For the year ended October 31, 2014, the Adviser waived investment advisory fees and other expenses totaling $55,466, $64,614 and $60,113 for the Realty Income & Growth Fund, Emerging Markets Real Estate Fund and Global Consumer Growth Fund, respectively. The expense limitations will remain in effect for the Funds through February 28, 2015 unless and until the Board of the Equity Trust approves their modification or termination with respect to the Funds. Waived expenses subject to potential recovery by year of expiration are as follows:
| | | | | | | | | | | | | | | | | |
| Years of Expiration | | Realty Income &
Growth Fund | | Emerging Markets
Real Estate Fund | | Global
Infrastructure Fund | | Global Consumer
Growth Fund |
| | | | | | | | | | | | | | | | | |
| 10/31/2015 | | $ | — | | | | $65,965 | | | | $— | | | | $84,997 | |
| 10/31/2016 | | | 69,202 | | | | 76,551 | | | | — | | | | 63,885 | |
| 10/31/2017 | | | 55,466 | | | | 64,614 | | | | — | | | | 60,113 | |
The Adviser makes payments to intermediaries that provide omnibus account services, sub-accounting services and/or networking services with respect to the Funds. On February 2, 2012, the Board approved, subject to certain limitations, the reimbursement to the Adviser by the appropriate Fund, of up to a certain percentage of such fees paid by the Adviser to intermediaries that provide omnibus account services, sub-accounting services, and/or networking services. Reimbursement of these fees are subject to review by the Board and are included in the transfer agent fees in the Statements of Operations. The International Real Estate Fund, Realty Income & Growth Fund, Cyclical Advantage Property Fund, Emerging Markets Real Estate Fund, Global Infrastructure Fund and Global Consumer Growth Fund incurred $194,345, $94,204, $33,644, $2,437, $53,977, and $520 respectively, in reimbursements to the Adviser.
State Street Bank and Trust Company (“SSBT”) serves as the fund accounting agent and custodian. The custodian is responsible for the safekeeping of the assets of the Funds and the fund accounting agent is responsible for calculating the Funds’ NAVs. SSBT, as the Funds’ custodian and fund accounting agent, is paid on the basis of net assets and transaction costs of the Funds. SSBT also serves as the administrator for the Equity Trust. SSBT, as the Funds’ administrator, is paid on the basis of net assets of the Funds which are allocated among the series of the Equity Trust, on the basis of relative net assets.
During the fiscal year ended October 31, 2014, the Adviser reimbursed the Alpine International Real Estate Fund and Alpine Cyclical Advantage Fund $14,332 and $14 respectively for certain errors that occurred during the period.
Boston Financial Data Services, Inc. (“BFDS”) serves as the transfer agent to the Equity Trust. BFDS is paid on the basis of net assets, per account fees and certain transaction costs.
92
Alpine Mutual Funds
Notes to Financial Statements—Continued
October 31, 2014
| 7. | Transactions with Affiliates: |
The following issuers are affiliated with the International Real Estate Equity Fund; that is, the Fund held 5% or more of the outstanding voting securities during the year ended October 31, 2014. As defined in Section (2)(a)(3) of the 1940 Act, such issuers are:
| | | Shares at | | | | | | Shares at | | Value at | | Realized | | Dividend |
| Issuer Name | | October 31, 2013 | | Purchases | | Sales | | October 31, 2014 | | October 31, 2014 | | Loss | | Income |
| Yatra Capital, Ltd. | | 1,325,831 | | — | | (228,007) | | 1,097,824 | | $5,090,232 | | $(1,907,651) | | $— |
The Funds invest a substantial amount of their assets in the equity securities of issuers engaged in the real estate industry, including real estate investment trusts (REITs). As a result, the Funds may be more affected by economic developments in the real estate industry than would a general equity fund.
| 9. | Federal Income Tax Information: |
At October 31, 2014, the components of distributable earnings on a tax basis were as follows:
| | | | | | | | | | | | | | | |
| | | International Real | | Realty Income & | | Cyclical Advantage |
| | | Estate Equity Fund | | Growth Fund | | Property Fund |
| Undistributed ordinary income | | $ | — | | | | $ | 127,290 | | | | $ | 1,291,912 | |
| Accumulated capital loss | | | (1,088,456,829 | ) | | | | — | | | | | (45,236,073 | ) |
| Unrealized appreciation/(depreciation) | | | (37,322,290 | ) | | | | 48,314,425 | | | | | 3,899,850 | |
| Total | | $ | (1,125,779,119 | ) | | | $ | 48,441,715 | | | | $ | (40,044,311 | ) |
| | | Emerging Markets | | Global | | Global Consumer |
| | | Real Estate Fund | | Infrastructure Fund | | Growth Fund |
| Undistributed ordinary income | | $ | 157,965 | | | | $ | 1,437,725 | | | | $ | 3,026 | |
| Accumulated capital gain/(loss) | | | (686,155 | ) | | | | 592,707 | | | | | (27,779 | ) |
| Unrealized appreciation/(depreciation) | | | 150,723 | | | | | 25,186,241 | | | | | 609,017 | |
| Total | | $ | (377,467 | ) | | | $ | 27,216,673 | | | | $ | 584,264 | |
Tax components of distributable earnings are determined in accordance with income tax regulations which may differ from the composition of net assets reported under GAAP. Accordingly, for the year ended October 31, 2014, the effects of certain differences were reclassified as follows:
| | | | | | Accumulated | | Accumulated |
| | | | | | net investment | | net realized |
| | | Capital stock | | income | | losses |
| International Real Estate Equity Fund | | | $(2,225,039 | ) | | | | $2,242,546 | | | | $ | (17,507 | ) |
| Realty Income & Growth Fund | | | 194,171 | | | | | 1,362,239 | | | | | (1,556,410 | ) |
| Cyclical Advantage Property Fund | | | — | | | | | 321,005 | | | | | (321,005 | ) |
| Emerging Markets Real Estate Fund | | | — | | | | | 13,388 | | | | | (13,388 | ) |
| Global Infrastructure Fund | | | — | | | | | 357,148 | | | | | (357,148 | ) |
| Global Consumer Growth Fund | | | — | | | | | 241 | | | | | (241 | ) |
93
Alpine Mutual Funds
Notes to Financial Statements—Continued
October 31, 2014
As of October 31, 2014, net unrealized appreciation/(depreciation) of investments, excluding foreign currency, based on Federal tax costs was as follows:
| | | | | | | | | | | | | | | | | | | | |
| Fund | | Cost of
investments | | | Gross unrealized
appreciation | | Gross unrealized
depreciation | | Net unrealized
appreciation/
(depreciation) |
| International Real Estate Equity Fund | | $ | 215,692,948 | | | | | $37,761,951 | | | | $ | (76,299,646 | ) | | | $ | (38,537,695 | ) |
| Realty Income & Growth Fund | | | 69,276,403 | | | | | 48,568,354 | | | | | (252,855 | ) | | | | 48,315,499 | |
| Cyclical Advantage Property Fund | | | 56,128,384 | | | | | 7,145,248 | | | | | (3,829,201 | ) | | | | 3,316,047 | |
| Emerging Markets Real Estate Fund | | | 6,228,142 | | | | | 348,045 | | | | | (202,589 | ) | | | | 145,456 | |
| Global Infrastructure Fund | | | 188,204,911 | | | | | 31,081,089 | | | | | (7,380,007 | ) | | | | 23,701,082 | |
| Global Consumer Growth Fund | | | 2,258,754 | | | | | 798,105 | | | | | (188,972 | ) | | | | 609,133 | |
The tax basis of investments for tax and financial reporting purposes differs principally due to the deferral of losses on wash sales and marked-to-market cost basis adjustments for investments in passive foreign investment companies (PFICs) for tax purposes.
The tax character of distributions paid during the year ended, October 31, 2014 and 2013 were as follows:
| | | 2014 | | | 2013 | | |
| International Real Estate Equity Fund | | | | | | | | | | | |
| Ordinary income | | | $ | 399,726 | | | | $ | 1,295,638 | | |
| Long-term capital gain | | | | — | | | | | — | | |
| | | | $ | 399,726 | | | | $ | 1,295,638 | | |
| Realty Income & Growth Fund | | | | | | | | | | | |
| Ordinary income | | | $ | 2,704,813 | | | | $ | 3,765,432 | | |
| Long-term capital gain | | | | 1,373,820 | | | | | 559,428 | | |
| | | | $ | 4,078,633 | | | | $ | 4,324,860 | | |
| Cyclical Advantage Property Fund | | | | | | | | | | | |
| Ordinary income | | | $ | 1,232,961 | | | | $ | 523,183 | | |
| Long-term capital gain | | | | — | | | | | — | | |
| | | | $ | 1,232,961 | | | | $ | 523,183 | | |
| Emerging Markets Real Estate Fund | | | | | | | | | | | |
| Ordinary income | | | $ | 111,075 | | | | $ | 58,886 | | |
| Long-term capital gain | | | | 62,936 | | | | | — | | |
| | | | $ | 174,011 | | | | $ | 58,886 | | |
| Global Infrastructure Fund | | | | | | | | | | | |
| Ordinary income | | | $ | 7,831,945 | | | | $ | 3,526,250 | | |
| Long-term capital gain | | | | 1,571,109 | | | | | — | | |
| | | | $ | 9,403,054 | | | | $ | 3,526,250 | | |
| Global Consumer Growth Fund | | | | | | | | | | | |
| Ordinary income | | | $ | 7,033 | | | | $ | 9,703 | | |
| Long-term capital gain | | | | — | | | | | — | | |
| | | | $ | 7,033 | | | | $ | 9,703 | | |
94
Alpine Mutual Funds
Notes to Financial Statements—Continued
October 31, 2014
During the year ended October 31, 2014, the International Real Estate Equity Fund, Cyclical Advantage Property Fund and Global Consumer Growth Fund utilized $8,551,876, $7,797,767 and $25,487 of capital loss carryovers, respectively. Capital loss carryovers as of October 31, 2014 are as follows:
| Expiration Date | | International Real
Estate Equity Fund | | Realty Income &
Growth Fund | | Cyclical Advantage
Property Fund |
| 10/31/2016 | | $ | 384,892,332 | | | $ | — | | | $ | 10,211,476 | |
| 10/31/2017 | | $ | 546,087,879 | | | $ | — | | | $ | 26,502,747 | |
| 10/31/2018 | | $ | 65,121,028 | | | $ | — | | | $ | 8,521,849 | |
| 10/31/2019 | | $ | 63,938,162 | | | $ | — | | | $ | — | |
| | | | | | | | | | | | | |
| Expiration Date | | Emerging Markets
Real Estate Fund | | Global
Infrastructure
Fund | | Global
Consumer
Growth Fund |
| 10/31/2016 | | $ | — | | | $ | — | | | $ | — | |
| 10/31/2017 | | $ | — | | | $ | — | | | $ | — | |
| 10/31/2018 | | $ | — | | | $ | — | | | $ | — | |
| 10/31/2019 | | $ | — | | | $ | — | | | $ | — | |
Under the Regulated Investment Company (“RIC”) Modernization Act of 2010, post-enactment capital losses that are carried forward will retain their character as either short-term or long-term capital losses rather than being considered all short-term as under previous law. However, any losses incurred during those future taxable years will be required to be utilized prior to the losses incurred in pre-enactment taxable years, which carry an expiration date. As a result of this ordering rule, pre-enactment capital loss carryovers may be more likely to expire unused. Capital loss carryover as of October 31, 2014 with no expiration are as follows:
| Fund | | Short-Term | | Long-Term | |
| International Real Estate Equity Fund | | $ | — | | | $ | 28,417,428 | |
| Emerging Markets Real Estate Fund | | $ | 686,155 | | | $ | — | |
| Global Consumer Growth Fund | | $ | 27,779 | | | $ | — | |
| 10. | | Recent Accounting Pronouncement: |
In June 2014, the Financial Accounting Standards Board (“FASB”) issued Accounting Standards Update No. 2014-11 Transfers and Servicing (Topic 860): Repurchase-to-Maturity Transactions, Repurchase Financings, and Disclosures to improve the financial reporting of repurchase agreements and other similar transactions. The guidance includes expanded disclosure requirements for entities that enter into repurchase agreements or securities lending transactions. The guidance is effective for financial statements with fiscal years beginning on or after January 1, 2015, and interim periods within those fiscal years. Management is evaluating the impact, if any, of this guidance on the Funds’ financial statement disclosures.
Distributions: The Global Infrastructure Fund - Institutional Class and Class A paid a distribution from short-term capital gains of $0.1348 and from long-term capital gains of $0.0556 on December 5, 2014 to shareholders of record on December 5, 2014.
On December 18, 2014, the Board of Trustees (the “Board”) of the Alpine Global Consumer Growth Fund (the “Fund”), a series of Alpine Equity Trust (the “Trust”) has determined that it is in the best interests of the Fund and its respective shareholders to terminate and wind up the Fund.
The termination and winding up of the Fund will be subject to receipt of approval, at a meeting of shareholders called for the purpose of voting thereon (the “Special Meeting”), by the affirmative vote of a “majority of the outstanding voting securities” of the Fund. The Special Meeting is expected to occur in the first quarter of 2015. If approved by shareholders, the Fund is expected to cease operations shortly after the Special Meeting.
95
Alpine Mutual Funds
Notes to Financial Statements—Continued
October 31, 2014
Alpine Woods Capital Investors, LLC, the Fund’s investment adviser, will bear all of the expenses associated with the Special Meeting.
Effective as of December 19, 2014, the Fund will no longer sell shares to new investors or existing shareholders.
Shareholders of the Fund who elect to redeem their shares prior to the completion of the liquidation will be redeemed in the ordinary course at the Fund’s net asset value per share. Each shareholder who remains in the Fund will receive a liquidating distribution equal to the aggregate net asset value of the shares of the Fund that such shareholder then holds.
A security held by the International Real Estate Equity Fund, South Asian Real Estate PLC (the “Company”) was fair valued at $6.01 per share on October 31, 2014 (or £3.75 per share) using the Income Approach and Market Approach weighted equally. The Market Approach was determined by an equal weighting of three multiples: Total Enterprise Value / Revenue, Total Enterprise Value / Earnings Before Interest & Taxes, and Price-to-Book.
Subsequent to period end, the Adviser received updated information from the Company that negatively impacted the Adviser’s view of the Company’s value.
The nature of the updated information only supported the use of the Market Approach and the Board approved a modification of the valuation methodology to use only the Market Approach until such time as information necessary to also utilize the Income Approach becomes available.
As a result of this updated information, the value of the Company was reduced by approximately 58% and this change in value is reflected in the net asset value of the International Real Estate Equity Fund on December 12, 2014.
96
Alpine Mutual Funds
Report of Independent Registered Public Accounting Firm
To the Shareholders and Board of Trustees of
Alpine Equity Trust:
We have audited the accompanying statements of assets and liabilities, including the schedules of portfolio investments, of Alpine Equity Trust (the “Funds”), comprising the Alpine International Real Estate Equity Fund, Alpine Realty Income & Growth Fund, Alpine Cyclical Advantage Property Fund, Alpine Emerging Markets Real Estate Fund, Alpine Global Infrastructure Fund, and Alpine Global Consumer Growth Fund as of October 31, 2014, and the related statements of operations for the year then ended, the statements of changes in net assets for each of the two years in the period then ended, and the financial highlights for each of the periods presented. These financial statements and financial highlights are the responsibility of the Funds’ management. Our responsibility is to express an opinion on these financial statements and financial highlights based on our audits.
We conducted our audits in accordance with the standards of the Public Company Accounting Oversight Board (United States). Those standards require that we plan and perform the audit to obtain reasonable assurance about whether the financial statements and financial highlights are free of material misstatement. The Funds are not required to have, nor were we engaged to perform, an audit of their internal control over financial reporting. Our audits included consideration of internal control over financial reporting as a basis for designing audit procedures that are appropriate in the circumstances, but not for the purpose of expressing an opinion on the effectiveness of the Funds’ internal control over financial reporting. Accordingly, we express no such opinion. An audit also includes examining, on a test basis, evidence supporting the amounts and disclosures in the financial statements, assessing the accounting principles used and significant estimates made by management, as well as evaluating the overall financial statement presentation. Our procedures included confirmation of securities owned as of October 31, 2014, by correspondence with the custodian and brokers; where replies were not received from brokers, we performed other auditing procedures. We believe that our audits provide a reasonable basis for our opinion.
In our opinion, the financial statements and financial highlights referred to above present fairly, in all material respects, the financial positions of Alpine International Real Estate Equity Fund, Alpine Realty Income & Growth Fund, Alpine Cyclical Advantage Property Fund, Alpine Emerging Markets Real Estate Fund, Alpine Global Infrastructure Fund, and Alpine Global Consumer Growth Fund of Alpine Equity Trust, as of October 31, 2014, the results of their operations for the year then ended, the changes in their net assets for each of the two years in the period then ended, and the financial highlights for each of the periods presented, in conformity with accounting principles generally accepted in the United States of America.

Princeton, New Jersey
December 29, 2014
97
Alpine Mutual Funds
Information about your Funds Expenses (Unaudited)
October 31, 2014
Fund expenses (Unaudited)
Example
As a shareholder of the Fund, you may incur two types of costs: (1) transaction costs, including front-end on purchase payments; and (2) ongoing costs, including management fees; service and/or distribution (12b-1) fees; and other Fund expenses. This example is intended to help you understand your ongoing costs (in dollars) of investing in the Fund and to compare these costs with the ongoing costs of investing in other mutual funds. This example is based on an investment of $1,000 invested on May 1, 2014 and held for the six months ended October 31, 2014.
Actual Expenses
The table below titled “Based on Actual Total Return” provides information about actual account values and actual expenses. You may use the information provided in this table, together with the amount you invested, to estimate the expenses that you paid over the period. To estimate the expenses you paid on your account, divide your ending account value by $1,000 (for example, an $8,600 ending account value divided by $1,000 = 8.6), then multiply the result by the number under the heading entitled “Expenses Paid During the Period”.
Hypothetical Example for Comparison Purposes
The table below titled “Based on Hypothetical Total Return” provides information about hypothetical account values and hypothetical expenses based on the actual expense ratio and an assumed rate of return of 5.00% per year before expenses, which is not the Fund’s actual return. The hypothetical account values and expenses may not be used to estimate the actual ending account balance or expenses you paid for the period. You may use the information provided in this table to compare the ongoing costs of investing in the Fund and other funds. To do so, compare the 5.00% hypothetical example relating to the Fund with the 5.00% hypothetical examples that appear in the shareholder reports of the other funds.
Please note that the expenses shown in the table below are meant to highlight your ongoing costs only and do not reflect any transactional costs, such as front-end or back-end sales charges (loads). Therefore, the table is useful in comparing ongoing costs only, and will not help you determine the relative total costs of owning different funds. In addition, if these transaction costs were included, your costs would have been higher.
International Real Estate Equity Fund
| Based on actual total return(1) | | | | | | | | | | | | | | | |
| Class | | Actual Total
Return Without
Sales Charges (2) | | | Beginning
Account Value | | | Ending
Account Value | | | Annualized
Expense
Ratio | | | Expenses
Paid During
the Period (3) | |
| | | | | | | | | | | | | | | | |
| Institutional | | 1.36% | | | $1,000.00 | | | $1,013.60 | | | 1.65% | | | $8.37 | |
| | | | | | | | | | | | | | | | |
| Class A | | 1.24% | | | $1,000.00 | | | $1,012.40 | | | 1.90% | | | $9.64 | |
| | | | | | | | | | | | | | | | |
| Based on hypothetical total return(1) | | | | | | | | | | | |
| Class | | Hypothetical
Annualized
Total Return | | | Beginning
Account Value | | | Ending
Account Value | | | Annualized
Expense
Ratio | | | Expenses
Paid During
the Period (4) | |
| | | | | | | | | | | | | | | | |
| Institutional | | 5.00% | | | $1,000.00 | | | $1,016.89 | | | 1.65% | | | $8.39 | |
| | | | | | | | | | | | | | | | |
| Class A | | 5.00% | | | $1,000.00 | | | $1,015.63 | | | 1.90% | | | $9.65 | |
98
Alpine Mutual Funds
Information about your Funds Expenses (Unaudited)—Continued
October 31, 2014
Realty Income & Growth Fund
| Based on actual total return(1) | | | | | | | | | | |
| Class | | Actual Total
Return Without
Sales Charges (2) | | | Beginning
Account Value | | | Ending
Account Value | | | Annualized
Expense
Ratio | | | Expenses
Paid During
the Period (3) | |
| | | | | | | | | | | | | | | | |
| Institutional | | 10.87% | | | $1,000.00 | | | $1,108.70 | | | 1.42% | | | $7.55 | |
| | | | | | | | | | | | | | | | |
| Class A | | 10.69% | | | $1,000.00 | | | $1,106.90 | | | 1.67% | | | $8.87 | |
| | | | | | | | | | | | | | | | |
| Based on hypothetical total return(1) | | | | | | | | | | |
| Class | | Hypothetical
Annualized
Total Return | | | Beginning
Account Value | | | Ending
Account Value | | | Annualized
Expense
Ratio | | | Expenses
Paid During
the Period (4) | |
| | | | | | | | | | | | | | | | |
| Institutional | | 5.00% | | | $1,000.00 | | | $1,018.05 | | | 1.42% | | | $7.22 | |
| | | | | | | | | | | | | | | | |
| Class A | | 5.00% | | | $1,000.00 | | | $1,016.79 | | | 1.67% | | | $8.49 | |
| | | | | | | | | | | | | | | | |
| Cyclical Advantage Property Fund | | | | | | | | | | |
| | | | | | | | | | | | | | | | |
| Based on actual total return(1) | | | | | | | | | | | |
| Class | | Actual Total
Return Without
Sales Charges (2) | | | Beginning
Account Value | | | Ending
Account Value | | | Annualized
Expense
Ratio | | | Expenses
Paid During
the Period (3) | |
| | | | | | | | | | | | | | | | |
| Institutional | | 1.95% | | | $1,000.00 | | | $1,019.50 | | | 1.55% | | | $7.89 | |
| | | | | | | | | | | | | | | | |
| Based on hypothetical total return(1) | | | | | | | | | | | |
| Class | | Hypothetical
Annualized
Total Return | | | Beginning
Account Value | | | Ending
Account Value | | | Annualized
Expense
Ratio | | | Expenses
Paid During
the Period (4) | |
| | | | | | | | | | | | | | | | |
| Institutional | | 5.00% | | | $1,000.00 | | | $1,017.39 | | | 1.55% | | | $7.88 | |
| | | | | | | | | | | | | | | | |
| Emerging Markets Real Estate Fund | | | | | | | | | | | |
| | | | | | | | | | | | | | | | |
| Based on actual total return(1) | | | | | | | | | | | |
| Class | | Actual Total
Return Without
Sales Charges (2) | | | Beginning
Account Value | | | Ending
Account Value | | | Annualized
Expense
Ratio | | | Expenses
Paid During
the Period (3) | |
| | | | | | | | | | | | | | | | |
| Institutional | | 7.39% | | | $1,000.00 | | | $1,073.90 | | | 1.35% | | | $7.06 | |
| | | | | | | | | | | | | | | | |
| Class A | | 7.21% | | | $1,000.00 | | | $1,072.10 | | | 1.60% | | | $8.36 | |
| | | | | | | | | | | | | | | | |
| Based on hypothetical total return(1) | | | | | | | | | | | |
| Class | | Hypothetical
Annualized
Total Return | | | Beginning
Account Value | | | Ending
Account Value | | | Annualized
Expense
Ratio | | | Expenses
Paid During
the Period (4) | |
| | | | | | | | | | | | | | | | |
| Institutional | | 5.00% | | | $1,000.00 | | | $1,018.40 | | | 1.35% | | | $6.87 | |
| | | | | | | | | | | | | | | | |
| Class A | | 5.00% | | | $1,000.00 | | | $1,017.14 | | | 1.60% | | | $8.13 | |
99
Alpine Mutual Funds
Information about your Funds Expenses (Unaudited)—Continued
October 31, 2014
| | | | | | | | | | | | | | | | |
| Global Infrastructure Fund | | | | | | | | | | | |
| | | | | | | | | | | | |
| Based on actual total return(1) | | | | | | | | | | | |
| Class | | Actual Total
Return Without
Sales Charges (2) | | | Beginning
Account Value | | | Ending
Account Value | | | Annualized
Expense
Ratio | | | Expenses
Paid During
the Period (3) | |
| | | | | | | | | | | | | | | | |
| Institutional | | 4.37% | | | $1,000.00 | | | $1,043.70 | | | 1.22% | | | $6.28 | |
| | | | | | | | | | | | | | | | |
| Class A | | 4.25% | | | $1,000.00 | | | $1,042.50 | | | 1.47% | | | $7.57 | |
| | | | | | | | | | | | | | | | |
| Based on hypothetical total return(1) | | | | | | | | | | | |
| Class | | Hypothetical
Annualized
Total Return | | | Beginning
Account Value | | | Ending
Account Value | | | Annualized
Expense
Ratio | | | Expenses
Paid During
the Period (4) | |
| | | | | | | | | | | | | | | | |
| Institutional | | 5.00% | | | $1,000.00 | | | $1,019.06 | | | 1.22% | | | $6.21 | |
| | | | | | | | | | | | | | | | |
| Class A | | 5.00% | | | $1,000.00 | | | $1,017.80 | | | 1.47% | | | $7.48 | |
| | | | | | | | | | | | | | | | |
| Global Consumer Growth Fund | | | | | | | | | | | |
| | | | | | | | | | | | |
| Based on actual total return(1) | | | | | | | | | | | |
| Class | | Actual Total
Return Without
Sales Charges (2) | | | Beginning
Account Value | | | Ending
Account Value | | | Annualized
Expense
Ratio | | | Expenses
Paid During
the Period (3) | |
| | | | | | | | | | | | | | | | |
| Institutional | | 0.34% | | | $1,000.00 | | | $1,003.40 | | | 1.35% | | | $6.82 | |
| | | | | | | | | | | | | | | | |
| Class A | | 0.08% | | | $1,000.00 | | | $1,000.80 | | | 1.60% | | | $8.07 | |
| | | | | | | | | | | | | | | | |
| Based on hypothetical total return(1) | | | | | | | | | | | |
| Class | | Hypothetical
Annualized
Total Return | | | Beginning
Account Value | | | Ending
Account Value | | | Annualized
Expense
Ratio | | | Expenses
Paid During
the Period (4) | |
| | | | | | | | | | | | | | | | |
| Institutional | | 5.00% | | | $1,000.00 | | | $1,018.40 | | | 1.35% | | | $6.87 | |
| | | | | | | | | | | | | | | | |
| Class A | | 5.00% | | | $1,000.00 | | | $1,017.14 | | | 1.60% | | | $8.13 | |
| (1) | | For the six months ended October 31, 2014. |
| (2) | | Assumes the reinvestment of all distributions, including returns of capital, if any, at net asset value and does not reflect the deduction of the applicable sales charge. Total return is not annualized, as it may not be representative of the total return for the year. Performance figures may reflect fee waivers and/or expense reimbursements. In the absence of fee waivers and/or expense reimbursements, the total return would have been lower. Past performance is no guarantee of future results. |
| (3) | | Expenses (net of fee waivers and/or expense reimbursements) are equal to each class’ respective annualized expense ratio multiplied by the average account value over the period, multiplied by the number of days in the most recent fiscal half-year then divided by 365. |
| (4) | | Hypothetical expense examples assume a 5% return over a hypothetical 184 day period. |
100
Alpine Mutual Funds
Additional Information (Unaudited)
October 31, 2014
Independent Trustees
| | | | | | | | | # of | | |
| | | Position(s) | | Term of Office | | | | Portfolios in | | |
| | | Held with | | and Length of | | Principal Occupation During | | Fund | | Other Directorships |
| Name and Age | | the Trust | | Time Served | | Past Five Years | | Complex* | | Held by Trustee |
| | | | | | | | | | | |
| H. Guy Leibler (60) | | Independent Trustee | | Indefinite, since the Trust’s inception | | President, Simone Healthcare Development (since 2013); Private investor, (2007-2013). | | 18 | | Chairman Emeritus, White Plains Hospital Center; Trustee, each of the Alpine Trusts. |
| Jeffrey E. Wacksman (54) | | Independent Trustee | | Indefinite, since 2004 | | Partner, Loeb, Block & Partners LLP, (since 1994). | | 18 | | Director, International Succession Planning Association; Director, Bondi Icebergs Inc. (Women’s Sports-wear); Director, MH Properties, Inc.; Trustee, each of the Alpine Trusts. |
| James A. Jacobson (69) | | Independent Trustee | | Indefinite, since July 2009 | | Retired (since 2008); Vice Chairman and Managing Director, Spear Leeds & Kellogg Specialists, LLC, (2003-2008). | | 18 | | Trustee, Allianz Global Investors Multi-Funds; Trustee, each of the Alpine Trusts. |
| Eleanor T.M. Hoagland (63) | | Independent Trustee | | Indefinite, since October 2012 | | Principal, VCS Advisory, LLC (since 2011); Chief Compliance Officer and Senior Managing Director of Magni Asset Management LLC (since 2011) and Park Fifth Capital Management LLC (2011-2013); Vice President (2008-2010) and CCO (2009-2010), Ameriprise Financial Inc.; Managing Director (2000-2008) and CCO (2004-2008), J. & W. Seligman & Co. Incorporated. | | 18 | | Trustee of each of the Alpine Trusts. |
| * | | The term “Fund Complex” refers to the Funds in the Alpine Equity Trust, Alpine Series Trust, and Alpine Income Trust, and Alpine Global Dynamic Dividend Fund, Alpine Total Dynamic Dividend Fund, and Alpine Global Premier Properties Fund (the “Alpine Trusts”). |
101
Alpine Mutual Funds
Additional Information (Unaudited)—Continued
October 31, 2014
Interested Trustees & Officers
| | | | | | | | | # of | | |
| | | Position(s) | | Term of Office | | | | Portfolios in | | |
| | | Held with | | and Length of | | Principal Occupation During | | Fund | | Other Directorships |
| Name and Age | | the Trust | | Time Served | | Past Five Years | | Complex** | | Held by Trustee |
| | | | | | | | | | | |
| Samuel A. Lieber* (58) | | Interested Trustee, President and Portfolio Manager | | Indefinite, since the Trust’s inception | | CEO of Alpine Woods Capital Investors, LLC (since November 1997). President of Alpine Trusts since 1998. | | 18 | | Trustee, each of the Alpine Trusts. |
| Stephen A. Lieber*** (89) | | Vice President | | Indefinite, since the Trust’s inception | | Chairman and Senior Portfolio Manager, Saxon Woods Advisors, LLC (since 1999). | | 18 | | None |
| Kenneth Corrado (50) | | Chief Compliance Officer | | Indefinite, since July 2013 | | Chief Compliance Officer, Alpine Woods Capital Investors, LLC (since July 2013); Independent Compliance Consultant (2012-2013); Vice President and Deputy Chief Compliance Officer, Artio Global Management, LLC (2007-2012). | | 18 | | None |
| Ronald G. Palmer, Jr. (46) | | Chief Financial Officer | | Indefinite, since January 2010 | | Chief Financial Officer, Alpine Woods Capital Investors, LLC (since January 2010); Independent Consultant (2008-2009); Vice President, Cash Management and Foreign Exchange, Macquarie Capital Investment Management, LLC (2007-2008). | | 18 | | None |
| Joe C. Caruso (43) | | Treasurer | | Indefinite, since 2013 | | Fund Accountant, Alpine Woods Capital Investors, LLC (since 2011); Independent tax consultant (2010-2011); Assistant Vice President Global Fund Services, Deutsche Bank AG (2009-2010). | | 18 | | None |
| Andrew Pappert (34) | | Secretary | | Indefinite, since March 2009 | | Director of Fund Operations, Alpine Woods Capital Investors, LLC (since September 2008). | | 18 | | None |
| * | | Denotes Trustees who are “interested persons” of the Trust or Fund under the 1940 Act. |
| ** | | The term “Fund Complex” refers to the Funds in the Alpine Equity Trust, Alpine Series Trust, and Alpine Income Trust, and Alpine Global Dynamic Dividend Fund, Alpine Total Dynamic Dividend Fund, and Alpine Global Premier Properties Fund (the “Alpine Trusts”). |
| *** | | Stephen A. Lieber is the father of Samuel A. Lieber. |
Further information regarding the Funds’ Trustees is also available in the Funds’ Statement of Additional Information, which can be obtained without charge by calling 1-888-785-5578.
102
Alpine Mutual Funds
Additional Information (Unaudited)—Continued
October 31, 2014
Tax Information
The Funds designated the following percentages of dividends declared from net investment income for the fiscal year ended October 31, 2014 as qualified dividend income under the Jobs & Growth Tax Relief Reconciliation Act of 2003.
| International Real Estate Equity Fund | | | 100 | % |
| Realty Income & Growth Fund | | | 4 | % |
| Cyclical Advantage Property Fund | | | 29 | % |
| Emerging Markets Real Estate Fund | | | 37 | % |
| Global Infrastructure Fund | | | 43 | % |
| Global Consumer Growth Fund | | | 100 | % |
The Funds designated the following percentages of dividends declared during the fiscal year ended October 31, 2014 as dividends qualifying for the dividends received deduction available to corporate shareholders.
| International Real Estate Equity Fund | | | 1 | % |
| Realty Income & Growth Fund | | | 3 | % |
| Cyclical Advantage Property Fund | | | 1 | % |
| Emerging Markets Real Estate Fund | | | 0 | % |
| Global Infrastructure Fund | | | 14 | % |
| Global Consumer Growth Fund | | | 100 | % |
The Funds designated the following percentages of taxable ordinary income distributions as short-term capital gain distributions under Internal Revenue Section 871(k)(2)(C).
| International Real Estate Equity Fund | | | 0 | % |
| Realty Income & Growth Fund | | | 0 | % |
| Cyclical Advantage Property Fund | | | 0 | % |
| Emerging Markets Real Estate Fund | | | 0 | % |
| Global Infrastructure Fund | | | 0 | % |
| Global Consumer Growth Fund | | | 0 | % |
The Funds designated as long-term capital gain dividend, pursuant to Internal Revenue Code Section 852(b)(3), the amount necessary to reduce the earnings and profits of the Funds related to net capital gain to zero for the tax year ended October 31, 2014.
Availability of Proxy Voting Information
Information regarding how each Fund votes proxies relating to portfolio securities is available without charge upon request by calling toll-free at 1-888-785-5578 and on the SEC’s website at www.sec.gov. Information regarding how each Fund voted proxies relating to portfolio securities during the most recent twelve month period ended June 30 is available on the SEC’s website at www.sec.gov or by calling the toll-free number listed above.
Availability of Quarterly Portfolio Schedule
Beginning with each Fund’s fiscal quarter ended July 31, 2004, each Fund filed its complete schedules of portfolio holdings on Form N-Q with the SEC. Going forward, each Fund will file Form N-Q for the first and third quarters of each fiscal year on Form N-Q. Each Fund’s Form N-Q is available on the SEC’s website at www.sec.gov and may be reviewed and copied at the SEC’s Public Reference Room in Washington, DC. Information on the operation of the Public Reference Room may be obtained by calling 1-202-551-8090.
103
Alpine Mutual Funds
Additional Information (Unaudited)—Continued
October 31, 2014
Privacy Policy
The Funds collect non-public information about you from the following sources:
| • | | information we receive about you on applications or other forms; |
| • | | information you give us orally; and |
| • | | information about your transactions with others or us. |
The Funds do not disclose any non-public personal information about our customers or former customers without the customer’s authorization, except as required by law or in response to inquiries from governmental authorities. The Funds restrict access to your personal and account information to those employees who need to know that information to provide products and services to you. The Funds also may disclose that information to unaffiliated third parties (such as to brokers or custodians) only as permitted by law and only as needed for us to provide agreed services to you. The Funds maintain physical, electronic and procedural safeguards to guard your non-public personal information.
In the event that you hold shares of the Funds through a financial intermediary, including, but not limited to a broker dealer, bank or trust company, the privacy policy of your financial intermediary would govern how your non-public personal information would be shared with unaffiliated third parties.
104
TRUSTEES
Samuel A. Lieber
Eleanor T.M. Hoagland
James A. Jacobson
H. Guy Leibler
Jeffrey E. Wacksman
CUSTODIAN &
ADMINISTRATOR
State Street Bank & Trust Company
One Lincoln Street
Boston, MA 02111
INDEPENDENT REGISTERED
PUBLIC ACCOUNTING FIRM
Deloitte & Touche LLP
500 College Road East
Princeton, NJ 08540
FUND COUNSEL
Willkie Farr & Gallagher LLP
787 7th Avenue
New York, NY 10019
DISTRIBUTOR
Quasar Distributors, LLC
615 East Michigan Street
Milwaukee, WI 53202
INVESTMENT Adviser
Alpine Woods Capital Investors, LLC
2500 Westchester Ave., Suite 215
Purchase, NY 10577
TRANSFER AGENT
Boston Financial Data Services
2000 Crown Colony Drive
Quincy, MA 02169

SHAREHOLDER | INVESTOR INFORMATION
1(888)785.5578
www.alpinefunds.com
This material must be preceded or accompanied by a current prospectus.
Item 2. Code of Ethics.
(a) The Registrant, as of the end of the period covered by the report, has adopted a code of ethics that applies to the Registrant’s principal executive officer, principal financial officer, principal accounting officer or controller or persons performing similar functions.
(b) Not applicable.
(c) There have been no amendments, during the period covered by this report, to a provision of the code of ethics that applies to the Registrant’s principal executive officer, principal financial officer, principal accounting officer or controller, or persons performing similar functions and that relates to any element of the code of ethics described in Item 2(b) of Form N-CSR.
(d) The Registrant has not granted any waivers, including an implicit waiver, from a provision of the code of ethics that applies to the registrant’s principal executive officer, principal financial officer, principal accounting officer or controller, or persons performing similar functions that relates to any element of the code of ethics described in Item 2(b) of Form N-CSR.
(e) Not applicable.
(f) The Registrant’s Code of Ethics is attached as EX-99.CODE ETH hereto.
Item 3. Audit Committee Financial Expert.
(a)(1) The Board of Trustees of the Registrant has determined that the Registrant has at least one audit committee financial expert serving on its audit committee.
(a)(2) The Board of Trustees has determined that James A. Jacobson and H. Guy Leibler are audit committee financial experts. Messrs. Jacobson and Leibler are “independent” as defined in paragraph (a)(2) of Item 3 to Form N-CSR. It has been determined that Mr. Jacobson qualifies as an audit committee financial expert based on his extensive experience in the financial services industry, including serving for more than 15 years as a senior executive at a New York Stock Exchange (“NYSE”) specialist firm and as a member of the NYSE Board of Directors (including terms as Vice Chair), his other board service, as well as his educational background. It has been determined that Mr. Leibler qualifies as an audit committee financial expert based on his substantial experience as a senior executive of an operating company actively supervising principal financial officers in the preparation of financial statements, other board service, as well as his educational background.
(a)(3) Not applicable.
Item 4. Principal Accountant Fees and Services.
(a) Audit Fees: The aggregate fees billed for each of the last two fiscal years for professional services rendered by the principal accountant for the audit of the registrant’s annual financial statements or services that are normally provided by the accountant in connection with statutory and regulatory filings or engagements for fiscal year 2013 was $200,774 and for fiscal year 2014 was $213,030.
(b) Audit-Related Fees: The aggregate fees billed in each of the last two fiscal years for assurance and related services by the principal accountant that are reasonably related to the performance of the audit of the registrant’s financial statements and are not reported under paragraph (a) of this Item was $0 in fiscal year 2013 and $0 in fiscal year 2014.
(c) Tax Fees: The aggregate fees billed in each of the last two fiscal years for professional services rendered by the principal accountant for tax compliance, tax advice, and tax planning was $15,631 in fiscal year 2013 and $42,945 in fiscal year 2014.
(d) All Other Fees: The aggregate fees billed in each of the last two fiscal years for products and services provided by the principal accountant, other than the services reported in paragraphs (a) through (c) of this Item is $19,029 in fiscal year 2013 and $6,725 in fiscal year 2014. The fees were for consulting and advisory services regarding enterprise risk management.
(e)(1) Audit Committee Pre-Approval Policies and Procedures: All services to be performed by the Registrant’s principal auditors must be pre-approved by the Registrant’s audit committee, which may include the approval of certain services up to an amount determined by the audit committee. Any services that would exceed that amount would require additional approval of the audit committee.
(e)(2) No services described in paragraphs (b) through (d) were approved pursuant to paragraph (c)(7)(i)(C) of Rule 2-01 of Regulation S-X.
(f) Not applicable.
(g) The aggregate non-audit fees billed by the registrant’s accountant for services rendered to the registrant, and the registrant’s investment adviser, and any entity controlling, controlled by, or under common control with the adviser that provides ongoing services to the registrant was $190,297 in fiscal year 2013 and $67,250 in fiscal year 2014. The fees were for consulting and advisory services regarding enterprise risk management.
(h) Not applicable
Item 5. Audit Committee of Listed Registrants.
Not applicable to registrants who are not listed issuers (as defined in Rule 10A-3 under the Securities Exchange Act of 1934).
Item 6. Schedule of Investments.
| (a) | Schedule of Investments is included as part of Item 1 of the Form N-CSR. |
Item 7. Disclosure of Proxy Voting Policies and Procedures for Closed-End Management Investment Companies.
Not applicable to open-end investment management companies.
Item 8. Portfolio Managers of Closed-End Management Investment Companies.
Not applicable to open-end investment management companies.
Item 9. Purchases of Equity Securities by Closed-End Management Investment Company and Affiliated Purchasers.
Not applicable to open-end investment management companies.
Item 10. Submission of Matters to a Vote of Security Holders.
There have been no material changes to the procedures by which the shareholders may recommend nominees to the Registrant’s Board of Trustees, where those changes were implemented after the Registrant last provided disclosure in response to the requirements of Item 407(c)(2)(iv) of Regulation S-K (17 CFR 229.407) (as required by Item 22(b)(15) of Schedule 14A (17 CFR 240.14a-101)), or this Item.
Item 11. Controls and Procedures.
(a) The Registrant’s principal executive officer and principal financial officer have evaluated the Registrant’s disclosure controls and procedures (as defined in Rule 30a-3(c) under the Investment Company Act of 1940, as amended) within 90 days of this filing and have concluded that the registrant’s disclosure controls and procedures were effective, as of that date.
(b) There was no change in the Registrant’s internal control over financial reporting (as defined in Rule 30a-3(d) under the Investment Company Act of 1940, as amended) during the second fiscal quarter of the period covered by this report that has materially affected, or is reasonably likely to materially affect, the Registrant’s internal control over financial reporting.
Item 12. Exhibits.
(a)(1) The Code of Ethics that applies to the Registrant’s principal executive officer and principal financial officer is attached hereto as EX-99.CODE ETH.
(a)(2) The certifications required by Rule 30a-2(a) of the Investment Company Act of 1940, as amended, and Section 302 of the Sarbanes-Oxley Act of 2002 are attached hereto as EX-99.Cert.
(a)(3) Not applicable.
(b) The certifications by the Registrant’s Principal Executive Officer and Principal Financial Officer, as required by Rule 30a-2(b) of the Investment Company Act of 1940, as amended, and Section 906 of the Sarbanes-Oxley Act of 2002 are attached hereto as EX-99.906Cert.
SIGNATURES
Pursuant to the requirements of the Securities Exchange Act of 1934 and the Investment Company Act of 1940, the registrant has duly caused this report to be signed on its behalf by the undersigned, thereunto duly authorized.
Alpine Equity Trust
| By: | /s/ Samuel A. Lieber | |
| | Samuel A. Lieber | |
| | Chief Executive Officer (Principal Executive Officer) |
| | | |
| Date: | January 8, 2015 | |
Pursuant to the requirements of the Securities Exchange Act of 1934 and the Investment Company Act of 1940, this report has been signed below by the following persons on behalf of the registrant and in the capacities and on the dates indicated.
| By: | /s/ Samuel A. Lieber | |
| | Samuel A. Lieber | |
| | Chief Executive Officer (Principal Executive Officer) |
| | | |
| By: | /s/ Ronald G. Palmer, Jr. | |
| | Ronald G. Palmer, Jr. | |
| | Chief Financial Officer (Principal Financial Officer) |
| | | |
| Date: | January 8, 2015 | |