| | |
| • | France Telecom (average weight 0.87%) is one of Europe’s largest telecommunications companies. France Telecom underperformed this period due to a new mobile entrant in France. We were aware of this new entrant but its effect has been more pronounced than expected. We no longer hold this stock in our portfolio. |
| | |
| • | Energy Solutions (average weight 1.14%) processes nuclear waste. In June of 2012, the board unexpectedly appointed a new CEO and CFO and the company issued a profit warning. We believe the new management team has introduced a strategy to increase the earnings of the company. The strategy includes cost reductions, asset sales, improvement of the balance sheet, and growing the business – thus we continue to own the stock. |
Summary and Outlook
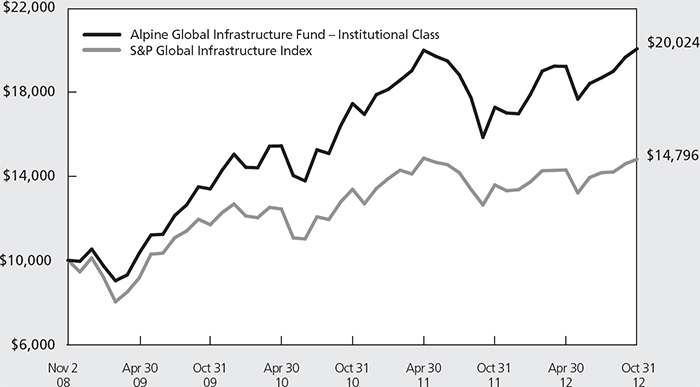
We launched the Alpine Global Infrastructure Fund because we believe that there are special opportunities to benefit from global spending in infrastructure over the next several decades. Even before the financial crisis began to wreak havoc on the budgets of governments and municipalities, the privatization of infrastructure assets began to take place. Now, even more so, we believe there will be an accelerated effort to privatize these assets as public entities will not have the funds to maintain their current infrastructure assets nor to build new infrastructure assets to meet the needs of a growing population. Throughout the world, the owners of infrastructure are primarily government entities. However, over the last several decades, due to the large cost of building and maintaining these facilities, there has been a movement towards privatization of infrastructure assets. In Canada, Australia, the United Kingdom, and throughout Europe and Asia, roads, airports, and seaports have been privatized.
Since the launch of our Fund, the equity markets have been volatile as the world’s economies suffered from the effects of the financial crisis. The amount of debt that governments have on their balance sheets and the austerity measures that are beginning to be enacted will likely lead to slower growth for years to come. The uncertainty over the European debt crisis along with the questionable growth prospects of China has led to extremely volatile markets and, as a result, we have hedged a portion of our Euro currency exposure during the period. We believe that this may create many new opportunities for investors in infrastructure stocks that have the potential for more stable and predictable cash flows. Our portfolio of companies is not immune to swings in share prices, but volatile markets may provide
| |
Alpine Global Infrastructure Fund (Continued) | 
|
| |
an opportunity to continue buying what we believe are high-quality companies with solid balance sheets and good growth prospects at what we believe are inexpensive valuations. In the future, governments may be compelled to sell off infrastructure assets and utilize public/private funds to build/operate/transfer models to finance new projects.
We are pleased with the structure of our portfolio and the outperformance of the Fund during the fiscal year and since inception. We believe the Fund is positioned to take advantage of the anticipated increase in global infrastructure spending. We continue to believe that the
combination of urbanization, rising standards of living, and population growth will propel infrastructure spending for decades to come. We will continue to adapt our investment approach as economic conditions change and look forward to discussing the portfolio and the prospects for the Fund in future communications.
Sincerely,
Joshua E. Duitz
Samuel A. Lieber
Co-Portfolio Managers
| |
| | |
Mutual fund investing involves risk. Principal loss is possible. The Fund is subject to risks including the following: |
Concentration Risk – The Fund’s strategy of concentrating in companies in a specific industry means that its performance will be closely tied to the performance of a particular market segment. The Fund’s concentration in these companies may present more risks than if it were broadly diversified over numerous industries and sectors of the economy. A downturn in these companies would have a larger impact on the Fund than on a mutual fund that does not concentrate in such companies. At times, the performance of these companies will lag the performance of other industries or the broader market as a whole.
Emerging Market Securities Risk – The risks of investing in foreign securities can be intensified in the case of investments in issuers domiciled or operating in emerging market countries. These risks include lack of liquidity and greater price volatility, greater risks of expropriation, less developed legal systems and less reliable custodial services and settlement practices.
Equity Securities Risk – The stock or other security of a company may not perform as well as expected, and may decrease in value, because of factors related to the company (such as poorer than expected earnings or certain management decisions) or to the industry in which the company is engaged (such as a reduction in the demand for products or services in a particular industry).
Foreign Currency Transactions Risk – Foreign securities are often denominated in foreign currencies. As a result, the value of the Fund’s shares is affected by changes in exchange rates. The Fund may enter into foreign currency transactions to try to manage this risk. The Fund’s ability to use foreign currency transactions successfully depends on a number of factors, including the foreign currency transactions being available at prices that are not too costly, the availability of liquid markets and the ability of the portfolio managers to accurately predict the direction of changes in currency exchange rates.
Foreign Securities Risk – Public information available concerning foreign issuers may be more limited than it would be with respect to domestic issuers. Different accounting standards may be used by foreign issuers, and foreign trading markets may not be as liquid as U.S. markets. Additionally, foreign securities also involve currency fluctuation risk, possible imposition of withholding or confiscatory taxes and adverse political or economic developments. These risks may be greater in emerging markets.
Growth Stock Risk – Growth stocks are stocks of companies believed to have above-average potential for growth in revenue and earnings. Growth stocks typically are very sensitive to market movements because their market prices tend to reflect future expectations. When it appears those expectations will not be met, the prices of growth stocks typically fall. Growth stocks as a group may be out of favor and underperform the overall equity market while the market concentrates on undervalued stocks.
Infrastructure-Related Investment Risk – Because the Infrastructure Fund concentrates its investments in infrastructure-related entities, the Infrastructure Fund has greater exposure to the potential adverse economic, regulatory, political and other changes affecting such entities. Infrastructure-related entities are subject to a variety of factors that may adversely affect their business or operations, including high interest costs in connection with capital construction programs, costs associated with environmental and other regulations, the effects of economic slowdown and surplus capacity, increased competition from other providers of services, uncertainties concerning the availability of fuel at reasonable prices, the
39
| |
Alpine Global Infrastructure Fund (Continued) |
|
| |
effects of energy conservation policies and other factors. Additionally, infrastructure-related entities may be subject to regulation by various governmental authorities and may also be affected by governmental regulation of rates charged to customers, service interruption due to environmental, operational or other mishaps and the imposition of special tariffs and changes in tax laws, regulatory policies, government contracts and accounting standards.
Initial Public Offerings and Secondary Risk – The Fund may invest a portion of its assets in shares of IPOs or Secondary Offerings of an issuer. IPOs and Secondary Offerings may have a magnified impact on the performance of a Fund with a small asset base. The impact of IPOs and Secondary Offerings on a Fund’s performance likely will decrease as the Fund’s asset size increases, which could reduce a Fund’s returns. IPOs and Secondary Offerings may not be consistently available to the Fund for investing. IPO offering shares frequently are volatile in price due to the absence of a prior public market, the small number of shares available for trading and limited information about the issuer. Therefore, the Fund may hold IPO and Secondary Offering shares for a very short period of time. This may increase the turnover of the Fund and may lead to increased expenses for the Fund, such as commissions and transaction costs. In addition, IPO and Secondary Offering shares can experience an immediate drop in value if the demand for the securities does not continue to support the offering price.
Interest Rate Risk – Interest rate risk is the risk of a change in the price of debt obligations when prevailing interest rates increase or decline. In general, if interest rates rise, the prices of debt obligations fall, and if interest rates fall, the prices of debt obligations rise. Changes in the values of debt obligations usually will not affect the amount of income the Fund receives from them but will affect the value of the Fund’s shares. Interest rate risk is generally greater for debt obligations with longer maturities.
Management Risk – The Adviser’s judgment about the quality, relative yield or value of, or market trends affecting, a particular security or sector, or about interest rates generally, may be incorrect. The Adviser’s security selections and other investment decisions might produce losses or cause the Fund to underperform when compared to other funds with similar investment objectives and strategies.
Market Risk – The price of a security held by the Fund may fall due to changing market, economic or political conditions.
Portfolio Turnover Risk – High portfolio turnover necessarily results in greater transaction costs which may reduce Fund performance.
Small- and Medium-Capitalization Company Risk – Securities of small- or medium-capitalization companies are more likely to experience sharper swings in market values, less liquid markets, in which it may be more difficult for the Adviser to sell at times and at prices that the Adviser believes appropriate and generally are more volatile than those of larger companies.
Undervalued Stock Risk – The Fund may pursue strategies that may include investing in securities, which, in the opinion of the Adviser, are undervalued. The identification of investment opportunities in undervalued securities is a difficult task and there is no assurance that such opportunities will be successfully recognized or acquired. While investments in undervalued securities offer opportunities for above-average capital appreciation, these investments involve a high degree of financial risk and can result in substantial losses.
Please refer to page 6-8 for other important disclosures and definitions.
40
| | |
Alpine Global Consumer Growth Fund | 
| |
| | |
| | | | | | |
| |
|
Comparative Annualized Returns as of 10/31/12 (Unaudited) |
| | 1 Year | | Since Inception
(12/29/2010) |
| | | | | | |
Alpine Global Consumer Growth Fund — Institutional Class | | 12.48% | | | 4.20% | |
| | | | | | | |
MSCI World Index USD(1) | | 9.45% | | | 3.44% | |
| | | | | | | |
MSCI ACWI Consumer Discretionary Index USD | | 9.62% | | | 4.03% | |
| | | | | | | |
MSCI ACWI Consumer Staples Index USD | | 11.99% | | | 8.57% | |
| | | | | | | |
Lipper Consumer Goods Funds Average(2) | | 12.71% | | | 7.84% | |
| | | | | | | |
Lipper Consumer Goods Funds Ranking(2) | | 19/40 | | | 30/38 | |
| | | | | | | |
Gross Expense Ratio: 2.96%(3) | | | | | | |
| | | | | | | |
Net Expense Ratio: 1.35%(3) | | | | | | |
| | | | | | | |
| | | |
| | |
| (1) | Effective February 28, 2012, the Fund changed the primary benchmark against which it measures its performance to the MSCI World Index. The Adviser believes the MSCI World Index more accurately reflects the investment strategy of the Fund. |
| (2) | The since inception data represents the period beginning 12/31/2010. |
| (3) | As disclosed in the prospectus dated February 28, 2012. |
Performance data quoted represents past performance and is not predictive of future results. Investment return and principal value of the Fund fluctuate, so that shares, when redeemed, may be worth more or less than their original cost. Performance current to the most recent month end may be lower or higher than the performance quoted and may be obtained by calling 1-888-785-5578. Performance data shown does not reflect the 1.00% redemption fee imposed on shares held for fewer than 60 days. If it did, total returns would be reduced.
Performance of Class A shares is not shown because this share class commenced operations on December 30, 2011.
The MSCI World Index USD is a free-float-adjusted market capitalization-weighted index that is designed to measure the equity market performance of developed markets. Source: MSCI. MSCI data may not be reproduced or used for any other purpose. The Lipper Consumer Goods Funds Average is an average of funds that invest primarily in the equity securities of domestic and foreign companies engaged in manufacturing and distributing consumer goods such as food, beverages, tobacco, and nondurable household goods and personal products. MSCI ACWI Consumer Staples Index USD is a market capitalization weighted index that is designed to measure the equity market performance of developed and emerging markets for the Consumer Staples GICS® sector. Source: MSCI. MSCI makes no express or implied warranties or representations and shall have no liability whatsoever with respect to any MSCI data contained herein. The MSCI data may not be further redistributed or used as a basis for other indices or any securities or financial products. This report is not approved, reviewed or produced by MSCI. MSCI ACWI Consumer Discretionary Index USD is a free-float-adjusted market capitalization-weighted index that is designed to measure the equity market performance of developed and emerging markets for the Consumer Discretionary GICS® sector. Source: MSCI. MSCI makes no express or implied warranties or representations and shall have no liability whatsoever with respect to any MSCI data contained herein. The MSCI data may not be further redistributed or used as a basis for other indices or any securities or financial products. This report is not approved, reviewed or produced by MSCI. The MSCI ACWI Consumer Staples Index USD, the MSCI ACWI Consumer Discretionary Index USD and the Lipper Consumer Goods Funds Average are unmanaged and do not reflect direct fees associated with a mutual fund, such as investment adviser fees; however, the Lipper Consumer Goods Funds Average reflects fees charged by the underlying funds. The performance for the Global Consumer Growth Fund reflects the deduction of fees for these value-added services. Investors cannot directly invest in an index. Lipper rankings for the periods shown are based on Fund total returns with dividends and distributions reinvested and do not reflect sales charges.
Expense Ratios reflect the ratios reported in the Fund’s most recent prospectus. The Alpine Global Consumer Growth Fund has a contractual expense waiver that continues through February 28, 2013. Where a Fund’s gross and net expense ratio are the same for the period reported, the contractual expense reimbursement level was not reached as of the end of that period. To the extent the Fund’s expenses were reduced by waivers, the Fund’s total returns were increased. In these cases, in the absence of the expense waivers, the Fund’s total returns would have been lower.
To the extent that the Fund’s historical performance resulted from gains derived from participation in initial public offerings (“IPOs”) and/or secondary offerings, there is no guarantee that these results can be replicated in future periods or that the Fund will be able to participate to the same degree in IPO/Secondary allocations in the future.
41
| |
Alpine Global Consumer Growth Fund (Continued) |
|
| | |
| | | | | | | | |
| |
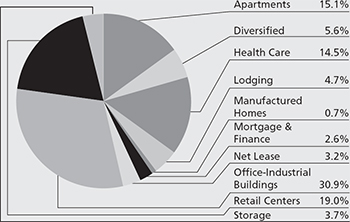
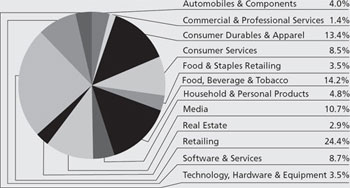
Portfolio Distributions* (Unaudited) | | Top 10 Holdings* (Unaudited) | | |
| | 1. | | Anheuser-Busch InBev
NV-ADR | 3.42% | |
| 2. | | Nestle SA | 2.86% | |
3. | | Comcast Corp.-Class A | 2.82% | |
4. | | Apple, Inc. | 2.81% | |
5. | | VF Corp. | 2.69% | |
6. | | Yum! Brands, Inc. | 2.41% | |
7. | | Kabel Deutschland
Holding AG | 2.32% | |
8. | | PepsiCo, Inc. | 2.23% | |
9. | | Google, Inc.-Class A | 2.19% | |
10. | | Visa, Inc.-Class A | 2.08% | |
| | | | |
* | | Top 10 Holdings do not include short-term investments and are based on total net assets. Portfolio Distributions percentages are based on total investments. Portfolio holdings and sector distributions are as of 10/31/12 and are subject to change. Portfolio holdings are not recommendations to buy or sell any securities. | |
| | | |
|
| |
|
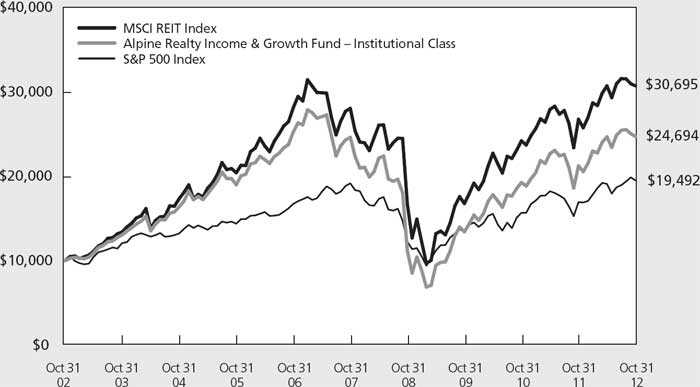
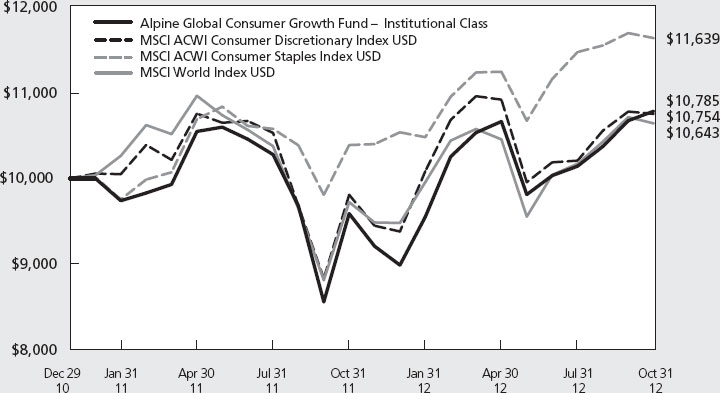
Value of a $10,000 Investment (Unaudited) |
|
|
|
|
This chart represents a comparison of a hypothetical $10,000 investment in the Fund versus a similar investment in the Fund’s benchmark. The graph and the table do not reflect the deduction of taxes that a shareholder would pay on Fund distributions or the redemption of Fund shares. Investment performance reflects the waiver and recovery of certain fees, if applicable. Without the waiver and recovery of fees, the Fund’s total return would have differed.
Performance data quoted represents past performance and is not predictive of future results. Investment return and principal value of the Fund fluctuate, so that shares, when redeemed, may be worth more or less than their original cost.
42
| |
Alpine Global Consumer Growth Fund (Continued) |
|
| | |
In the fiscal year ended October 31, 2012, the Alpine Global Consumer Growth Fund provided a total return of 12.48%. The MSCI All Country World Index posted a total return of 9.45% while the MSCI Consumer Staples and Consumer Discretionary Indices posted total returns of 11.99% and 9.62%, respectively. Since the Fund’s December 29, 2010 inception, it has generated an annualized total return of 4.20%. The MSCI All Country World, Consumer Staples and Consumer Discretionary Indices achieved total returns of 3.44%, 8.57% and 4.03%, respectively, over the same time period. All references in this letter to the Fund’s performance relate to the performance of the Fund’s Institutional Class.
Portfolio Drivers
The direction of the global markets in fiscal 2012 was similar to fiscal 2011 although the triggers were different. A strong rally through the first six months of the fiscal year was retraced as investors worried about stalling growth in the US, the upcoming US election and renewed concerns over the European debt crisis. Central banks in the US and Europe took action to alleviate some of these concerns during the summer months, resulting in a gradual global market rally before flattening out over the final three months of the fiscal year.
| | |
| • | The country exposure of the Fund played a large part in the performance during the fiscal year. The US represented the largest exposure for the Fund (44.4% average weight) and also generated the highest contribution to the performance as the domestic market outperformed most of its international peers. Despite the depreciation of the currency and a slowdown in the economy, Brazil (average weight 9.3%) tallied the next highest contribution. Worries about over capacity and slowing consumer spending in China/Hong Kong (average weight 13.4%) resulted in the underperformance of that segment of the portfolio. |
| | |
| • | From an industry standpoint, the strong market for consumer stocks globally resulted in positive performance for a majority of the segments of the portfolio. The food, beverage & tobacco securities had the largest impact, while media, software & services and retailing were also top contributors. Automobiles & components and food & staples retailing were the two laggards. |
| | |
| • | The Fund’s sector diversification also played a role in the performance of the Fund. All sectors generated a |
| | |
| | positive contribution to the portfolio over the past 12 months. Among the Fund’s focus sectors, the information technology holdings were the top absolute performing segment, followed by consumer staples and then consumer discretionary. The Fund’s smaller industrial and financials exposure also posted strong returns. |
Portfolio Analysis
The top five contributors to the Fund’s performance over the fiscal year ended October 31, 2012 were Lumber Liquidators Holdings Inc. (274.81%), Anheuser-Busch Inbev N.V. Inc. (54.35%), Comcast Corporation (63.18%), Apple Inc. (47.65%) and Debenhams PLC (93.12%).
| | |
| • | Lumber Liquidators (average weight 1.35%) posted better-than-expected results throughout fiscal 2012. An improving housing market drove solid demand for the flooring category. In addition, management’s efforts to improve its supply chain and its product mix resulted in a recovery in the company’s operating margins. |
| | |
| • | Anheuser-Busch Inbev (average weight 3.31%) posted solid numbers as management executed on its plans to improve pricing in North America through price increases on its low end products and product innovation. In addition, the proposed acquisition of Grupo Modelo was well received by the markets. |
| | |
| • | The strong performance in Comcast shares (average weight 2.42%) during the period was driven by solid execution in the cable business resulting in lower subscriber turnover, better pricing and strong free cash flow generation. Meanwhile, the struggling NBC Universal piece of the business benefited from the success of the London Olympics. |
| | |
| • | The adoption of mobile data devices around the globe led by demand for the iPhone and iPad resulted in another year of outperformance for Apple shares (average weight 2.80%). Plus, management’s decision to return some of its cash to shareholders through the initiation of a dividend added an entirely new dimension to the story. |
| | |
| • | Despite sluggish consumer spending in Europe, Debenhams stock (average weight 1.45%) was a strong performer as management’s efforts to improve execution in the stores and to streamline its expense structure paid off with better-than-expected results. |
43
| |
Alpine Global Consumer Growth Fund (Continued) |
|
| | |
Abercrombie & Fitch Co. (-58.28%), ZAGG Inc. (-46.67%), X5 Retail Group (-37.05%), Digital Generation Inc. (-49.31%) and Lianhua Supermarkets (-48.00%) were the bottom five contributors to the Fund’s performance through October 31, 2012.
| | |
| • | Abercrombie & Fitch’s (average weight 1.17%) results deteriorated throughout much of the fiscal year as its international growth engine stalled and the domestic business struggled to keep up with the fashion cycle. |
| | |
| • | While the fundamental performance of ZAGG Inc. (average weight 1.31%) has actually been better than expected over the past twelve months, there have been several other issues that have weighed on the share price, namely the departure of their founder and C.E.O. |
| | |
| • | X5 Retail (average weight 0.84%) struggled with their in-store execution over the past twelve months, resulting in disappointing comparable store sales and margin deterioration. In response, there have been several management departures from the company over the past few quarters and the shares have lagged the market. |
| | |
| • | Digital Generation Inc. (average weight 0.92%) is struggling with execution issues following several acquisitions completed in 2011. The company is currently exploring strategic alternatives for the business, which has led to a recent resurgence in the shares from their 2012 lows. |
| | |
| • | Grocery store chain Lianhua (average weight 0.76%) continued to underperform as competition in the industry continued to ramp up and the consumer spending environment in China slowed. |
Summary & Outlook
The objective of the Global Consumer Growth Fund is to seek long-term capital appreciation. The Fund seeks to invest in companies which have exposure to the rising purchasing power of the global consumer. The Fund aims to achieve diversification by investing primarily across consumer discretionary, consumer staples and technology sectors among both multi-national and local companies. In the developed world, we emphasize investment in
consumer consumption trends, such as the rise in Internet spending and the usage of mobile devices, as well as in firms that have the ability to expand their brands domestically and abroad. In emerging markets, the focus is on those businesses that stand to benefit from the demographic shifts that are taking place as it is our belief that disposable income levels should rise over the next few years.
As we look ahead, we are encouraged by the consumer spending outlook but there are several potential risks to spending. In the US, the mounting worries about the “fiscal cliff” and its impact on economic growth may weigh heavily on the consumer. Assuming we are able to overcome those fears and come to a consensus, a slow but steadily improving employment picture should help support consumer spending. On the expense side of the business, lower input costs have begun to flow through most consumer company balance sheets and may support margins heading into 2013. In Europe, the consumer spending picture remains subdued as austerity measures and general macro economic weakness weigh on confidence. As was the case throughout 2012, the situation will not likely improve materially in 2013, in our opinion, as the region continues to work through its debt problems. Finally, we expect the emerging market consumers may continue their superior relative growth pace. Wage growth and the growing middle class should remain the key drivers to discretionary spending. As we enter 2013, there are question marks surrounding the Chinese and Brazilian consumer markets. However other areas, such as Southeast Asia appear to hold potential promise.
In closing, we are excited about the opportunities for the Global Consumer Growth Fund. We believe that the prospects for the long-term global consumer story are attractive. Despite some near-term headwinds, rising income levels and changing consumer consumption patterns across the globe should provide ample investment opportunities.
Sincerely,
Bryan Keane
Samuel A. Lieber
Co-Portfolio Managers
44
| |
Alpine Global Consumer Growth Fund (Continued) |
|
| | |
| |
| | |
Mutual fund investing involves risk. Principal loss is possible. The Fund is subject to the risks, including the following: |
Concentration Risk – The Fund’s strategy of concentrating in companies in a specific industry means that its performance will be closely tied to the performance of a particular market segment. The Fund’s concentration in these companies may present more risks than if it were broadly diversified over numerous industries and sectors of the economy. A downturn in these companies would have a larger impact on the Fund than on a mutual fund that does not concentrate in such companies. At times, the performance of these companies will lag the performance of other industries or the broader market as a whole.
Consumer Products/Services Sector Risk – Significant problems may affect a particular sector, and returns from that sector may be lower than returns from the overall stock market. Events that affect the consumer products/services sector will have a greater effect on the Fund than they would on a fund that is more widely diversified among a number of unrelated industries. Daily fluctuations in specific market sectors are often more extreme than fluctuations in the overall market. Because the Fund invests a substantial amount of its assets in the consumer product/services sector, the Fund’s performance largely depends on the general condition of that sector. The consumer product/services sector could be adversely affected by overall economic conditions, interest rates, competition, consumer confidence, disposable income, changes in demographics and consumer tastes, and legislative or regulatory changes. The prices of the securities of those issuers also may fluctuate widely in response to such events.
Emerging Market Securities Risk – The risks of investing in foreign securities can be intensified in the case of investments in issuers domiciled or operating in emerging market countries. These risks include lack of liquidity and greater price volatility, greater risks of expropriation, less developed legal systems and less reliable custodial services and settlement practices.
Equity Securities Risk – The stock or other security of a company may not perform as well as expected, and may decrease in value, because of factors related to the company (such as poorer than expected earnings or certain management decisions) or to the industry in which the company is engaged (such as a reduction in the demand for products or services in a particular industry).
Foreign Currency Transactions Risk – Foreign securities are often denominated in foreign currencies. As a result, the value of the Fund’s shares is affected by changes in exchange rates. The Fund may enter into foreign currency transactions to try to manage this risk. The Fund’s ability to use foreign currency transactions successfully depends on a number of factors, including the foreign currency transactions being available at prices that are not too costly, the availability of liquid markets and the ability of the portfolio managers to accurately predict the direction of changes in currency exchange rates.
Foreign Securities Risk – Public information available concerning foreign issuers may be more limited than it would be with respect to domestic issuers. Different accounting standards may be used by foreign issuers, and foreign trading markets may not be as liquid as U.S. markets. Additionally, foreign securities also involve currency fluctuation risk, possible imposition of withholding or confiscatory taxes and adverse political or economic developments. These risks may be greater in emerging markets.
Growth Stock Risk – Growth stocks typically are very sensitive to market movements because their market prices tend to reflect future expectations. When it appears those expectations will not be met, the prices of growth stocks typically fall. Growth stocks as a group may be out of favor and underperform the overall equity market while the market concentrates on undervalued stocks.
Management Risk – The Adviser’s judgment about the quality, relative yield or value of, or market trends affecting, a particular security or sector, or about interest rates generally, may be incorrect. The Adviser’s security selections and other investment decisions might produce losses or cause the Fund to underperform when compared to other funds with similar investment objectives and strategies.
Market Risk – The price of a security held by the Fund may fall due to changing market, economic or political conditions.
Micro-Capitalization Company Risk – Investments in micro-cap companies are associated with similar risks as investments in small- and medium-capitalization companies, but these risks may be even greater with respect to investments in micro-cap companies.
45
| |
Alpine Global Consumer Growth Fund (Continued) |
|
| | |
Small- and Medium-Capitalization Company Risk – Securities of small- or medium-capitalization companies are more likely to experience sharper swings in market values, less liquid markets, in which it may be more difficult for the Adviser to sell at times and at prices that the Adviser believes appropriate and generally are more volatile than those of larger companies.
Undervalued Stock Risk – The Fund may pursue strategies that may include investing in securities, which, in the opinion of the Adviser, are undervalued. The identification of investment opportunities in undervalued securities is a difficult task and there is no assurance that such opportunities will be successfully recognized or acquired. While investments in undervalued securities offer opportunities for above-average capital appreciation, these investments involve a high degree of financial risk and can result in substantial losses.
Please refer to pages 6-8 for other important disclosures and definitions.
46
|
Alpine International Real Estate Equity Fund |
| |
Schedule of Portfolio Investments
October 31, 2012
| | | | | | | |
Shares | | Security
Description | | Value | |
| | | | | | |
| | | | | | | |
Common Stocks—100.3% | | | | |
Asia—32.1% | | | | |
China—4.9% | | | | |
| 3,000,000 | | Evergrande Real Estate
Group, Ltd. | | $ | 1,312,250 | |
| 11,028,960 | | Franshion Properties China, Ltd. | | | 3,372,705 | |
| 2,200,000 | | Guangzhou R&F
Properties Co., Ltd. | | | 2,705,273 | |
| 6,000,000 | | Kaisa Group Holdings, Ltd. (a) | | | 1,122,574 | |
| 4,800,000 | | Poly Property Group Co., Ltd. (a) | | | 2,898,562 | |
| 2,691,373 | | SOCAM Development, Ltd. | | | 2,771,228 | |
| 899,515 | | Soho China, Ltd. | | | 611,666 | |
| | | | | | | |
| | | | | | 14,794,258 | |
| | | | | | | |
Hong Kong—1.5% | | | | |
| 33,002,031 | | CSI Properties, Ltd. | | | 1,362,656 | |
| 965,000 | | Mandarin Oriental
International, Ltd. | | | 1,418,550 | |
| 550,632 | | The Hongkong & Shanghai
Hotels, Ltd. | | | 727,540 | |
| 160,000 | | Wharf Holdings, Ltd. | | | 1,098,315 | |
| | | | | | | |
| | | | | | 4,607,061 | |
| | | | | | | |
India—9.0% | | | | |
| 2,290,373 | | Hirco PLC (a) | | | 1,418,373 | |
| 2,000,000 | | South Asian Real Estate PLC
(a)(b)(c)(d) | | | 15,847,017 | |
| 7,240,153 | | Unitech Corporate Parks PLC (a) | | | 4,030,908 | |
| 1,443,695 | | Yatra Capital, Ltd. (a)(e) | | | 5,782,145 | |
| | | | | | | |
| | | | | | 27,078,443 | |
| | | | | | | |
Indonesia—2.2% | | | | |
| 246,285,560 | | PT Bakrieland Development TBK (a) | | | 1,666,690 | |
| 16,765,928 | | PT Bumi Serpong Damai TBK | | | 2,164,472 | |
| 29,288,857 | | PT Lippo Karawaci TBK | | | 2,835,881 | |
| | | | | | | |
| | | | | | 6,667,043 | |
| | | | | | | |
Japan—2.2% | | | | |
| 15,000 | | Daito Trust Construction Co., Ltd. | | | 1,514,468 | |
| 20,000 | | Kenedix, Inc. (a) | | | 2,593,010 | |
| 130,000 | | Nomura Real Estate Holdings, Inc. | | | 2,333,584 | |
| | | | | | | |
| | | | | | 6,441,062 | |
| | | | | | | |
Malaysia—0.4% | | | | |
| 3,100,591 | | Aseana Properties, Ltd. | | | 1,232,485 | |
| | | | | | | |
Philippines—3.0% | | | | |
| 2,184,000 | | Ayala Land, Inc. | | | 1,248,530 | |
| 40,000,000 | | Megaworld Corp. | | | 2,378,929 | |
| 35,239,555 | | SM Development Corp. | | | 5,337,901 | |
| | | | | | | |
| | | | | | 8,965,360 | |
| | | | | | | |
Singapore—4.5% | | | | |
| 6,979,000 | | Banyan Tree Holdings, Ltd. (a) | | | 3,833,358 | |
| 500,000 | | CapitaMalls Asia, Ltd. | | | 758,321 | |
| 3,401,420 | | Global Logistic Properties, Ltd. | | | 7,166,461 | |
| 625,000 | | Keppel Land, Ltd. | | | 1,742,089 | |
| | | | | | | |
| | | | | | 13,500,229 | |
| | | | | | | |
Thailand—4.4% | | | | |
| 3,762,300 | | Central Pattana PCL | | | 8,715,279 | |
| 7,215,356 | | Minor International PCL | | | 4,308,027 | |
| | | | | | | |
| | | | | | 13,023,306 | |
| | | | | | | |
| | | Total Asia (Cost $123,915,390) | | | 96,309,247 | |
| | | | | | | |
| | | | | | | |
Shares | | Security
Description | | Value | |
| | | | | | |
|
Europe—25.9% | | | | |
France—2.3% | | | | |
| 92,203 | | Kaufman & Broad SA (a) | | $ | 2,108,136 | |
| 154,193 | | Nexity SA | | | 4,750,605 | |
| | | | | | | |
| | | | | | 6,858,741 | |
| | | | | | | |
Germany—3.6% | | | | |
| 250,424 | | DIC Asset AG | | | 2,336,701 | |
| 1,099,999 | | IVG Immobilien AG (a) | | | 2,730,336 | |
| 7,642,900 | | Sirius Real Estate, Ltd. (a) | | | 1,981,268 | |
| 317,573 | | TAG Immobilien AG | | | 3,664,671 | |
| | | | | | | |
| | | | | | 10,712,976 | |
| | | | | | | |
Norway—0.5% | | | | |
| 693,067 | | BWG Homes ASA (a) | | | 1,422,287 | |
| | | | | | | |
Poland—0.2% | | | | |
| 3,265,000 | | Nanette Real Estate | | | | |
| | | Group NV (a)(b)(d) | | | 774,443 | |
| | | | | | | |
Russia—1.4% | | | | |
| 799,367 | | Mirland Development
Corp. PLC (a) | | | 1,515,724 | |
| 1,724,911 | | RGI International, Ltd. (a) | | | 2,794,356 | |
| | | | | | | |
| | | | | | 4,310,080 | |
| | | | | | | |
Sweden—1.3% | | | | |
| 220,877 | | JM AB | | | 3,979,376 | |
| | | | | | | |
Turkey—3.3% | | | | |
| 5,500,522 | | Emlak Konut Gayrimenkul
Yatirim Ortakligi AS | | | 8,193,246 | |
| 2,471,294 | | Sinpas Gayrimenkul
Yatirim Ortakligi AS | | | 1,737,144 | |
| | | | | | | |
| | | | | | 9,930,390 | |
| | | | | | | |
United Kingdom—13.3% | | | | |
| 674,280 | | Development Securities PLC | | | 1,740,990 | |
| 700,339 | | Great Portland Estates PLC | | | 5,284,682 | |
| 5,000,713 | | LXB Retail Properties PLC (a) | | | 9,280,381 | |
| 1,161,792 | | Metric Property
Investments PLC | | | 1,724,853 | |
| 5,145,181 | | Quintain Estates &
Development PLC (a) | | | 4,442,122 | |
| 6,608,407 | | Regus PLC | | | 10,696,304 | |
| 1,600,130 | | Songbird Estates PLC (a) | | | 3,008,273 | |
| 800,130 | | Unite Group PLC | | | 3,655,413 | |
| | | | | | | |
| | | | | | 39,833,018 | |
| | | | | | | |
| | | Total Europe (Cost $100,741,061) | | | 77,821,311 | |
| | | | | | | |
North & South America—42.3% | | | | |
Brazil—37.2% | | | | |
| 268,077 | | Aliansce Shopping Centers SA | | | 3,048,954 | |
| 793,138 | | BHG SA-Brazil Hospitality
Group (a) | | | 7,849,178 | |
| 700,037 | | BR Malls Participacoes SA | | | 9,202,623 | |
| 680,298 | | BR Properties SA | | | 8,909,641 | |
| 580,200 | | Brasil Brokers Participacoes SA | | | 1,628,291 | |
| 400,435 | | Cyrela Commercial Properties
SA Empreendimentos
e Participacoes | | | 5,202,964 | |
| 2,403,408 | | Direcional Engenharia SA | | | 14,389,326 | |
| 912,132 | | General Shopping Brasil SA (a) | | | 4,805,304 | |
| 1,080,302 | | Iguatemi Empresa de Shopping
Centers SA | | | 13,722,849 | |
| 1,488,500 | | JHSF Participacoes SA | | | 6,463,933 | |
| 1,212,612 | | MRV Engenharia e
Participacoes SA | | | 6,149,481 | |
The accompanying notes are an integral part of these financial statements.
47
|
Alpine International Real Estate Equity Fund |
| |
Schedule of Portfolio Investments—Continued
October 31, 2012
| | | | | | | |
Shares | | Security
Description | | Value | |
| | | | | | |
| | | | | | | |
Common Stocks—continued | | | | |
Brazil—continued | | | | |
| 466,788 | | Multiplan Empreendimentos
Imobiliarios SA | | $ | 13,674,644 | |
| 3,544,384 | | PDG Realty SA Empreendimentos
e Participacoes | | | 5,968,240 | |
| 475,394 | | Sao Carlos Empreendimentos
e Participacoes SA | | | 10,673,281 | |
| | | | | | | |
| | | | | | 111,688,709 | |
| | | | | | | |
Canada—0.0% * | | | | |
| 133,000 | | Lakeview Hotel Real Estate
Investment Trust (a) | | | 45,609 | |
| | | | | | | |
Mexico—1.4% | | | | |
| 1,400,000 | | Corp. GEO SAB de CV-Series B (a) | | | 1,680,770 | |
| 177,600 | | Desarrolladora Homex
SAB de C.V.-ADR (a) | | | 2,353,200 | |
| | | | | | | |
| | | | | | 4,033,970 | |
| | | | | | | |
United States—3.7% | | | | |
| 282,300 | | Sunrise Senior Living, Inc. (a)(f) | | | 4,062,297 | |
| 519,696 | | Verde Realty Corp. (a)(b)(c)(d) | | | 6,984,714 | |
| | | | | | | |
| | | | | | 11,047,011 | |
| | | | | | | |
| | | Total North & South America
(Cost $110,477,614) | | | 126,815,299 | |
| | | | | | | |
| | | Total Common Stocks
(Cost $335,134,065) | | | 300,945,857 | |
| | | | | | | |
| | | | | | | |
Shares | | Security
Description | | Value | |
| | | | | | |
| | | | | | | |
Equity-Linked Structured Notes—1.5% | | | | |
Asia—1.5% | | | | |
India—1.5% | | | | |
| 1,190,000 | | Phoenix Mills, Ltd.-Merrill
Lynch & Co., Inc. | | $ | 4,433,051 | |
| | | | | | | |
| | | Total Asia (Cost $3,920,217) | | | 4,433,051 | |
| | | | | | | |
| | | Total Equity-Linked Structured
Notes (Cost $3,920,217) | | | 4,433,051 | |
| | | | | | | |
Investment Companies—0.6% | | | | |
Asia—0.4% | | | | |
India—0.4% | | | | |
| 7,497,900 | | Trinity Capital PLC (a) | | | 1,330,971 | |
| | | | | | | |
| | | Total Asia (Cost $12,613,773) | | | 1,330,971 | |
| | | | | | | |
Europe—0.2% | | | | |
Turkey—0.2% | | | | |
| 920,000 | | The Ottoman Fund, Ltd. (a) | | | 549,320 | |
| | | Total Europe (Cost $1,507,547) | | | 549,320 | |
| | | | | | | |
| | | Total Investment Companies
(Cost $14,121,320) | | | 1,880,291 | |
| | | | | | | |
| | | Total Investments
(Cost $353,175,602)—102.4% | | | 307,259,199 | |
| | | | | | | |
| | | Liabilities in Excess of
Other Assets—(2.4)% | | | (7,165,832 | ) |
| | | | | | | |
| | | TOTAL NET ASSETS 100.0% | | $ | 300,093,367 | |
| | | | | | | |
| | |
| | |
Percentages are stated as a percent of net assets.
|
* | Less than 0.05% of Net Assets.
|
(a) | Non-income producing security.
|
(b) | Illiquid security.
|
(c) | Private placement.
|
(d) | Security fair valued in accordance with procedures approved by the Board of Trustees. These securities comprised 7.9% of the Fund’s net assets.
|
(e) | Affiliated issuer. See Note 6 in the Notes to Financial Statements.
|
(f) | All or a portion of the security is available to serve as collateral on the outstanding loans.
|
AB—Aktiebolag is the Swedish equivalent of a corporation.
|
ADR—American Depositary Receipt
|
AG—Aktiengesellschaft is a German term that refers to a corporation that is limited by shares, i.e., owned by shareholders.
AS—Anonim Sirketi is the Turkish term for joint stock company.
|
ASA—Allmennaksjeselskap is the Norwegian term for a public limited company.
|
NV—Naamloze Vennootschap is the Dutch term for a public limited liability corporation.
PCL—Public Company Limited
PLC—Public Limited Company
SA—Generally designates corporations in various countries, mostly those employing the civil law.
|
SAB de CV—Sociedad Anonima Bursátil de Capital Variable is the Spanish equivalent to Variable Capital Company. |
The accompanying notes are an integral part of these financial statements.
48
|
Alpine Realty Income & Growth Fund |
| |
Schedule of Portfolio Investments
October 31, 2012
| | | | | | | |
Shares | | Security
Description | | Value | |
| | | | | | |
| | | | | | | |
Real Estate Investment Trusts—101.5% | | | | |
Apartments—16.5% | | | | |
| 31,445 | | Associated Estates Realty Corp. | | $ | 471,360 | |
| 25,625 | | AvalonBay Communities, Inc. | | | 3,473,725 | |
| 34,900 | | BRE Properties, Inc. | | | 1,687,415 | |
| 10,000 | | Camden Property Trust | | | 656,300 | |
| 68,360 | | Equity Residential (a) | | | 3,924,548 | |
| 23,665 | | Essex Property Trust, Inc. (a) | | | 3,549,750 | |
| 50,200 | | Home Properties, Inc. (a) | | | 3,051,658 | |
| 31,400 | | UDR, Inc. | | | 762,078 | |
| | | | | | | |
| | | | | | 17,576,834 | |
| | | | | | | |
Diversified—5.6% | | | | |
| 26,114 | | American Assets Trust, Inc. | | | 709,517 | |
| 88,700 | | Crombie Real Estate
Investment Trust | | | 1,340,158 | |
| 48,617 | | Vornado Realty Trust (a) | | | 3,899,570 | |
| | | | | | | |
| | | | | | 5,949,245 | |
| | | | | | | |
Health Care—15.9% | | | | |
| 78,772 | | HCP, Inc. | | | 3,489,600 | |
| 62,903 | | Health Care REIT, Inc. | | | 3,738,325 | |
| 90,047 | | Omega Healthcare Investors, Inc. | | | 2,065,678 | |
| 96,200 | | Sabra Health Care REIT, Inc. | | | 2,137,564 | |
| 37,333 | | Senior Housing Properties Trust | | | 820,580 | |
| 74,212 | | Ventas, Inc. (a) | | | 4,695,393 | |
| | | | | | | |
| | | | | | 16,947,140 | |
| | | | | | | |
Lodging—3.1% | | | | |
| 37,942 | | Chatham Lodging Trust | | | 491,349 | |
| 20,303 | | Chesapeake Lodging Trust | | | 382,711 | |
| 70,000 | | DiamondRock Hospitality Co. | | | 593,600 | |
| 85,000 | | Host Hotels & Resorts, Inc. | | | 1,229,100 | |
| 12,000 | | LaSalle Hotel Properties (a) | | | 287,280 | |
| 15,000 | | Pebblebrook Hotel Trust | | | 318,300 | |
| | | | | | | |
| | | | | | 3,302,340 | |
| | | | | | | |
Manufactured Homes—0.8% | | | | |
| 12,850 | | Equity Lifestyle Properties, Inc. | | | 865,191 | |
| | | | | | | |
Mortgage & Finance—2.4% | | | | |
| 79,232 | | Apollo Commercial Real Estate
Finance, Inc. | | | 1,339,813 | |
| 50,000 | | Starwood Property Trust, Inc. | | | 1,146,000 | |
| | | | | | | |
| | | | | | 2,485,813 | |
| | | | | | | |
Net Lease—0.7% | | | | |
| 17,012 | | Entertainment Properties Trust | | | 756,183 | |
| | | | | | | |
Office-Industrial Buildings—33.0% | | | | |
| 51,528 | | Alexandria Real Estate
Equities, Inc. (a) | | | 3,629,117 | |
| 61,111 | | Boston Properties, Inc. | | | 6,496,099 | |
| 37,671 | | Coresite Realty Corp. | | | 856,262 | |
| 23,153 | | Corporate Office Properties
Trust (a) | | | 577,668 | |
| 55,100 | | Digital Realty Trust, Inc. | | | 3,384,793 | |
| 139,509 | | Douglas Emmett, Inc. | | | 3,271,486 | |
| 40,352 | | DuPont Fabros Technology, Inc. | | | 865,954 | |
| 20,000 | | Government Properties
Income Trust | | | 443,800 | |
| 54,473 | | Kilroy Realty Corp. (a) | | | 2,419,146 | |
| 32,208 | | Liberty Property Trust | | | 1,131,145 | |
| 23,508 | | Mack-Cali Realty Corp. | | | 610,973 | |
| 88,581 | | Mission West Properties, Inc. | | | 733,451 | |
| 264,680 | | MPG Office Trust, Inc. (a)(b) | | | 857,563 | |
| | | | | | | |
Shares | | Security
Description | | Value | |
| | | | | | |
| | | | | | | |
Office-Industrial Buildings—continued | | | | |
| 104,700 | | ProLogis, Inc. | | $ | 3,590,163 | |
| 50,551 | | SL Green Realty Corp. (a) | | | 3,806,490 | |
| 54,537 | | STAG Industrial, Inc. | | | 944,581 | |
| 20,600 | | Terreno Realty Corp. | | | 314,356 | |
| 86,364 | | Verde Realty Corp. (b)(c)(d)(e) | | | 1,160,732 | |
| | | | | | | |
| | | | | | 35,093,779 | |
| | | | | | | |
Retail Centers—19.5% | | | | |
| 153,191 | | CBL & Associates Properties, Inc. | | | 3,426,883 | |
| 12,100 | | Federal Realty Investment Trust (a) | | | 1,304,743 | |
| 60,000 | | General Growth Properties, Inc. | | | 1,179,600 | |
| 50,000 | | Kimco Realty Corp. | | | 976,000 | |
| 57,295 | | Simon Property Group, Inc. (a) | | | 8,720,872 | |
| 24,706 | | Taubman Centers, Inc. (a) | | | 1,940,656 | |
| 56,428 | | The Macerich Co. (a) | | | 3,216,396 | |
| | | | | | | |
| | | | | | 20,765,150 | |
| | | | | | | |
Storage—4.0% | | | | |
| 30,765 | | Public Storage (a) | | | 4,264,952 | |
| | | | | | | |
| | | Total Real Estate Investment
Trusts (Cost $75,091,139) | | | 108,006,627 | |
| | | | | | | |
Common Stocks—1.8% | | | | |
Lodging—1.0% | | | | |
| 20,000 | | Starwood Hotels & Resorts
Worldwide, Inc. (a) | | | 1,037,000 | |
| | | | | | | |
Office-Industrial Buildings—0.8% | | | | |
| 57,000 | | Brookfield Office
Properties, Inc. | | | 879,510 | |
| | | | | | | |
| | | Total Common Stocks
(Cost $1,645,470) | | | 1,916,510 | |
| | | | | | | |
Preferred Stocks—6.2% | | | | |
Diversified—0.5% | | | | |
| 20,000 | | Winthrop Realty Trust-
Series D, 9.250% | | | 533,400 | |
| | | | | | | |
Lodging—1.1% | | | | |
| 14,800 | | LaSalle Hotel Properties-
Series G, 7.250% | | | 380,212 | |
| 30,300 | | Sunstone Hotel Investors,
Inc.-Series A, 8.000% | | | 763,257 | |
| | | | | | | |
| | | | | | 1,143,469 | |
| | | | | | | |
Mortgage & Finance—0.5% | | | | |
| 25,200 | | NorthStar Realty Finance
Corp.-Series B, 8.250% | | | 608,580 | |
| | | | | | | |
Net Lease—2.8% | | | | |
| 19,630 | | CapLease, Inc.-Series A, 8.125% | | | 494,676 | |
| 97,865 | | Entertainment Properties
Trust-Series D, 7.375% | | | 2,465,219 | |
| | | | | | | |
| | | | | | 2,959,895 | |
| | | | | | | |
Retail Centers—1.3% | | | | |
| 55,198 | | CBL & Associates Properties,
Inc.-Series D, 7.375% | | | 1,406,445 | |
| | | | | | | |
| | | Total Preferred Stocks
(Cost $4,817,611) | | | 6,651,789 | |
| | | | | | | |
| | | Total Investments
(Cost $81,554,220)—109.5% | | | 116,574,926 | |
| | | Liabilities in Excess of Other
Assets—(9.5)% | | | (10,156,187 | ) |
| | | | | | | |
| | | TOTAL NET ASSETS 100.0% | | $ | 106,418,739 | |
| | | | | | | |
The accompanying notes are an integral part of these financial statements.
49
|
Alpine Realty Income & Growth Fund |
| |
Schedule of Portfolio Investments—Continued
October 31, 2012
| | |
| | |
|
Percentages are stated as a percent of net assets.
|
(a) | All or a portion of the security is available to serve as collateral on the outstanding loans.
|
(b) | Non-income producing security.
|
(c) | Illiquid security.
|
(d) | Private placement.
|
(e) | Security fair valued in accordance with procedures approved by the Board of Trustees. These securities comprised 1.1% of the Fund’s net assets.
|
REIT—Real Estate Investment Trust |
The accompanying notes are an integral part of these financial statements.
50
|
Alpine Cyclical Advantage Property Fund |
| |
Schedule of Portfolio Investments
October 31, 2012
| | | | | | | |
Shares | | Security
Description | | Value | |
| | | | | | |
| | | | |
Common Stocks—89.4% | | | | |
Asia—24.0% | | | | |
China—5.3% | | | | |
| 342,857 | | China State Construction
International Holdings, Ltd. | | $ | 407,887 | |
| 500,000 | | Evergrande Real Estate
Group, Ltd. | | | 218,708 | |
| 2,500,000 | | Franshion Properties China, Ltd. | | | 764,511 | |
| 400,000 | | Guangzhou R&F Properties
Co., Ltd. | | | 491,868 | |
| 500,000 | | Hopson Development
Holdings, Ltd. (a) | | | 483,868 | |
| 1,000,000 | | Kaisa Group Holdings, Ltd. (a) | | | 187,095 | |
| 1,000,000 | | Poly Property Group Co., Ltd. (a) | | | 603,867 | |
| | | | | | | |
| | | | | | 3,157,804 | |
| | | | | | | |
Hong Kong—1.7% | | | | |
| 6,967,005 | | CSI Properties, Ltd. | | | 287,668 | |
| 60,000 | | Hongkong Land Holdings, Ltd. | | | 381,000 | |
| 50,000 | | Wharf Holdings, Ltd. | | | 343,223 | |
| | | | | | | |
| | | | | | 1,011,891 | |
| | | | | | | |
India—1.0% | | | | |
| 389,105 | | Ascendas India Trust | | | 242,433 | |
| 620,000 | | Unitech Corporate Parks PLC (a) | | | 345,181 | |
| | | | | | | |
| | | | | | 587,614 | |
| | | | | | | |
Indonesia—1.5% | | | | |
| 33,380,487 | | PT Bakrieland Development TBK (a) | | | 225,896 | |
| 3,500,000 | | PT Ciputra Development TBK | | | 247,788 | |
| 4,513,514 | | PT Lippo Karawaci TBK | | | 437,019 | |
| | | | | | | |
| | | | | | 910,703 | |
| | | | | | | |
Japan—3.7% | | | | |
| 2,500 | | Daito Trust Construction Co., Ltd. | | | 252,412 | |
| 180,000 | | Hulic Co., Ltd. (a) | | | 1,427,283 | |
| 2,000 | | Kenedix, Inc. (a) | | | 259,301 | |
| 16,000 | | Nomura Real Estate Holdings, Inc. | | | 287,210 | |
| | | | | | | |
| | | | | | 2,226,206 | |
| | | | | | | |
Philippines—3.4% | | | | |
| 780,000 | | Ayala Land, Inc. | | | 445,904 | |
| 5,000,000 | | Megaworld Corp. | | | 297,366 | |
| 2,751,363 | | Robinsons Land Corp. | | | 1,268,986 | |
| | | | | | | |
| | | | | | 2,012,256 | |
| | | | | | | |
Singapore—1.6% | | | | |
| 100,000 | | CapitaMalls Asia, Ltd. | | | 151,664 | |
| 250,000 | | Global Logistic Properties, Ltd. | | | 526,726 | |
| 100,000 | | Keppel Land, Ltd. | | | 278,734 | |
| | | | | | | |
| | | | | | 957,124 | |
| | | | | | | |
Thailand—5.8% | | | | |
| 300,000 | | Central Pattana PCL | | | 694,943 | |
| 2,200,000 | | LPN Development PCL-NVDR | | | 1,299,184 | |
| 585,239 | | Minor International PCL | | | 349,425 | |
| 1,400,000 | | Supalai PCL | | | 876,999 | |
| 569,550 | | Ticon Industrial Connection PCL | | | 243,429 | |
| | | | | | | |
| | | | | | 3,463,980 | |
| | | | | | | |
| | | Total Asia (Cost $10,165,293) | | | 14,327,578 | |
| | | | | | | |
Europe—14.4% | | | | |
France—1.9% | | | | |
| 67,000 | | Affine SA | | | 1,123,736 | |
| | | | | | | |
| | | | | | | |
Shares | | Security
Description | | Value | |
| | | | | | | |
| | | | |
Germany—5.0% | | | | |
| 39,904 | | DIC Asset AG | | $ | 372,343 | |
| 110,000 | | Patrizia Immobilien AG (a) | | | 774,760 | |
| 159,090 | | TAG Immobilien AG | | | 1,835,838 | |
| | | | | | | |
| | | | | | 2,982,941 | |
| | | | | | | |
Norway—0.1% | | | | |
| 38,469 | | BWG Homes ASA (a) | | | 78,945 | |
| | | | | | | |
Poland—0.4% | | | | |
| 40,000 | | Atrium European Real
Estate, Ltd. | | | 226,100 | |
| | | | | | | |
Russia—1.4% | | | | |
| 783,674 | | Raven Russia, Ltd. | | | 822,025 | |
| | | | | | | |
United Kingdom—5.6% | | | | |
| 778,923 | | LXB Retail Properties PLC (a) | | | 1,445,534 | |
| 964,231 | | Quintain Estates &
Development PLC (a) | | | 832,475 | |
| 341,253 | | Songbird Estates PLC (a) | | | 641,562 | |
| 100,014 | | Unite Group PLC | | | 456,916 | |
| | | | | | | |
| | | | | | 3,376,487 | |
| | | | | | | |
| | | Total Europe (Cost $7,588,585) | | | 8,610,234 | |
| | | | | | | |
North & South America—51.0% | | | | |
Brazil—21.1% | | | | |
| 98,241 | | BHG SA-Brazil Hospitality
Group (a) | | | 972,228 | |
| 84,796 | | BR Malls Participacoes SA | | | 1,114,721 | |
| 95,538 | | BR Properties SA | | | 1,251,230 | |
| 7,500 | | Cyrela Commercial Properties
SA Empreendimentos
e Participacoes-ADR | | | 388,346 | |
| 15,000 | | Cyrela Commercial Properties
SA Empreendimentos
e Participacoes-ADR (b) | | | 776,691 | |
| 230,654 | | Direcional Engenharia SA | | | 1,380,937 | |
| 40,000 | | General Shopping Brasil SA (a) | | | 210,728 | |
| 144,280 | | Iguatemi Empresa de
Shopping Centers SA | | | 1,832,758 | |
| 135,000 | | JHSF Participacoes SA | | | 586,249 | |
| 28,000 | | LPS Brasil Consultoria de
Imoveis SA | | | 481,130 | |
| 91,805 | | MRV Engenharia
e Participacoes SA | | | 465,568 | |
| 82,914 | | Multiplan Empreendimentos
Imobiliarios SA | | | 2,428,982 | |
| 396,895 | | PDG Realty SA
Empreendimentos e Participacoes | | | 668,315 | |
| | | | | | | |
| | | | | | 12,557,883 | |
| | | | | | | |
Canada—1.4% | | | | |
| 49,146 | | Brookfield Residential
Properties, Inc. (a) | | | 850,226 | |
| | | | | | | |
Mexico—1.2% | | | | |
| 254,825 | | Corp. GEO SAB de
CV-Series B (a) | | | 305,930 | |
| 30,300 | | Desarrolladora Homex
SAB de C.V.-ADR (a) | | | 401,475 | |
| | | | | | | |
| | | | | | 707,405 | |
| | | | | | | |
United States—27.3% | | | | |
| 10,000 | | Altisource Portfolio
Solutions SA (a) | | | 1,135,000 | |
| 22,493 | | American Capital Agency Corp. | | | 742,719 | |
The accompanying notes are an integral part of these financial statements.
51
|
Alpine Cyclical Advantage Property Fund |
| |
Schedule of Portfolio Investments—Continued
October 31, 2012
| | | | | | | |
Shares | | Security
Description | | Value | |
| | | | | | | | |
| | | | | | | |
North & South America—continued | | | | |
United States—continued | | | | |
| 25,000 | | American Capital Mortgage
Investment Corp. | | $ | 623,250 | |
| 19,852 | | Apollo Commercial Real
Estate Finance, Inc. | | | 335,697 | |
| 50,000 | | Brookdale Senior Living, Inc. (a) | | | 1,173,000 | |
| 40,491 | | Brookfield Office Properties, Inc. | | | 624,776 | |
| 25,125 | | Chatham Lodging Trust | | | 325,369 | |
| 84,228 | | DiamondRock Hospitality Co. | | | 714,253 | |
| 40,000 | | Excel Trust, Inc. | | | 492,000 | |
| 44,053 | | General Growth Properties, Inc. | | | 866,082 | |
| 5,000 | | Jones Lang LaSalle, Inc. | | | 388,700 | |
| 60,771 | | Ocwen Financial Corp. (a) | | | 2,343,938 | |
| 6,831 | | ProLogis, Inc. | | | 234,235 | |
| 1,923 | | Simon Property Group, Inc. | | | 292,700 | |
| 40,000 | | Starwood Property Trust, Inc. | | | 916,800 | |
| 40,000 | | Sunrise Senior Living, Inc. (a) | | | 575,600 | |
| 48,200 | | TravelCenters of America LLC (a) | | | 234,252 | |
| 87,912 | | Two Harbors Investment Corp. | | | 1,048,790 | |
| 143,940 | | Verde Realty Corp. (a)(c)(d)(e) | | | 1,934,554 | |
| 10,440 | | Vornado Realty Trust | | | 837,392 | |
| 4,292 | | Walter Investment
Management Corp. (a) | | | 207,432 | |
| 10,000 | | Western Asset Mortgage
Capital Corp. | | | 214,500 | |
| | | | | | | |
| | | | | | 16,261,039 | |
| | | | | | | |
| | | Total North & South America
(Cost $25,304,637) | | | 30,376,553 | |
| | | | | | | |
| | | Total Common Stocks
(Cost $43,058,515) | | | 53,314,365 | |
| | | | | | | |
| | | | | | | |
Shares | | Security
Description | | Value | |
| | | | | | | | |
| | | | |
Equity-Linked Structured Notes—1.7% | | | | |
Asia—1.7% | | | | |
India—1.2% | | | | |
| 300,000 | | Peninsula Land, Ltd.-Macquarie
Bank, Ltd. | | $ | 408,774 | |
| 50,000 | | Sobha Developers, Ltd.-Macquarie
Bank, Ltd. | | | 332,791 | |
| | | | | | | |
| | | | | | 741,565 | |
| | | | | | | |
Vietnam—0.5% | | | | |
| 301,875 | | HAGL JSC-GDR-Macquarie
Bank, Ltd. (a) | | | 301,280 | |
| | | | | | | |
| | | Total Asia (Cost $1,542,321) | | | 1,042,845 | |
| | | | | | | |
| | | Total Equity-Linked Structured
Notes (Cost $1,542,321) | | | 1,042,845 | |
| | | | | | | |
| | | | | | | |
Principal
Amount | | | | | | |
| | | | | | | |
Short-Term Investments—8.3% | | | | |
| $4,929,000 | | State Street Eurodollar Time
Deposit, 0.01% | | | 4,929,000 | |
| | | | | | | |
| | | Total Short-Term Investments
(Cost $4,929,000) | | | 4,929,000 | |
| | | | | | | |
| | | Total Investments
(Cost $49,529,836)—99.4% | | | 59,286,210 | |
| | | Other Assets in Excess of
Liabilities—0.6% | | | 337,453 | |
| | | | | | | |
| | | TOTAL NET ASSETS 100.0% | | $ | 59,623,663 | |
| | | | | | | |
| | |
| | |
|
Percentages are stated as a percent of net assets. |
|
(a) | Non-income producing security. |
| |
(b) | Restricted under Rule 144A of the Securities Act of 1933. These securities may be resold in transactions exempt from registration, normally to qualified institutional buyers. These securities have been determined to be liquid under guidelines established by the Board of Trustees. Liquid securities restricted under Rule 144A comprised 1.3% of the Fund’s net assets. |
| |
(c) | Illiquid security. |
| |
(d) | Private placement. |
| |
(e) | Security fair valued in accordance with procedures approved by the Board of Trustees. These securities comprised 3.2% of the Fund’s net assets. |
| |
ADR—American Depositary Receipt |
|
AG—Aktiengesellschaft is a German term that refers to a corporation that is limited by shares, i.e., owned by shareholders. |
|
ASA—Allmennaksjeselskap is the Norwegian term for a public limited company. |
|
GDR—Global Depositary Receipt |
|
JSC—Joint Stock Company |
|
NVDR—Non-Voting Depositary Receipts |
|
PCL—Public Company Limited |
|
PLC—Public Limited Company |
|
SA—Generally designates corporations in various countries, mostly those employing the civil law. |
|
SAB de CV—Sociedad Anonima Bursátil de Capital Variable is the Spanish equivalent to Variable Capital Company. |
The accompanying notes are an integral part of these financial statements.
52
|
Alpine Emerging Markets Real Estate Fund |
| |
Schedule of Portfolio Investments
October 31, 2012
| | | | | | | |
| | | | | | | |
Shares | | Security
Description | | Value | |
| | | | | | | |
| | | | |
Common Stocks—91.3% | | | | |
Asia—59.6% | | | | |
China—25.2% | | | | |
| 125,000 | | C C Land Holdings, Ltd. | | $ | 28,710 | |
| 90,000 | | China Overseas Grand Oceans
Group, Ltd. | | | 94,180 | |
| 79,000 | | China Overseas Land &
Investment, Ltd. | | | 207,947 | |
| 71,000 | | China Resources Land, Ltd. | | | 162,337 | |
| 68,857 | | China State Construction
International Holdings, Ltd. | | | 81,917 | |
| 215,000 | | Evergrande Real Estate
Group, Ltd. | | | 94,045 | �� |
| 131,000 | | Franshion Properties China, Ltd. | | | 40,060 | |
| 16,800 | | Guangzhou R&F Properties
Co., Ltd. | | | 20,658 | |
| 100,000 | | Hopefluent Group Holdings, Ltd. | | | 28,774 | |
| 150,000 | | Kaisa Group Holdings, Ltd. (a) | | | 28,064 | |
| 50,000 | | Longfor Properties Co., Ltd. | | | 88,645 | |
| 95,000 | | Poly Property Group Co., Ltd. (a) | | | 57,367 | |
| 34,000 | | Shimao Property Holdings, Ltd. | | | 64,929 | |
| 50,000 | | Soho China, Ltd. | | | 34,000 | |
| 60,000 | | Sunac China Holdings, Ltd. | | | 31,819 | |
| 195,000 | | Yuexiu Property Co., Ltd. | | | 53,593 | |
| | | | | | | |
| | | | | | 1,117,045 | |
| | | | | | | |
Hong Kong—4.0% | | | | |
| 3,000 | | Cheung Kong Holdings, Ltd. | | | 44,322 | |
| 1,393,401 | | CSI Properties, Ltd. | | | 57,534 | |
| 11,000 | | Wharf Holdings, Ltd. | | | 75,509 | |
| | | | | | | |
| | | | | | 177,365 | |
| | | | | | | |
India—1.5% | | | | |
| 54,474 | | Ascendas India Trust | | | 33,940 | |
| 60,000 | | Unitech Corporate Parks PLC (a) | | | 33,405 | |
| | | | | | | |
| | | | | | 67,345 | |
| | | | | | | |
Indonesia—10.5% | | | | |
| 30,000 | | First Real Estate Investment Trust | | | 25,701 | |
| 110,000 | | Lippo Malls Indonesia Retail Trust | | | 43,737 | |
| 750,000 | | PT Alam Sutera Realty TBK | | | 45,289 | |
| 3,506,945 | | PT Bakrieland
Development TBK (a) | | | 23,732 | |
| 774,659 | | PT Bumi Serpong Damai TBK | | | 100,008 | |
| 500,000 | | PT Ciputra Development TBK | | | 35,398 | |
| 300,000 | | PT Ciputra Property TBK | | | 20,614 | |
| 100,000 | | PT Ciputra Surya TBK | | | 18,220 | |
| 350,000 | | PT Lippo Karawaci TBK | | | 33,888 | |
| 650,000 | | PT Metropolitan Land TBK | | | 32,145 | |
| 375,000 | | PT Summarecon Agung TBK | | | 68,324 | |
| 157,000 | | PT Surya Semesta Internusa TBK | | | 19,288 | |
| | | | | | | |
| | | | | | 466,344 | |
| | | | | | | |
Malaysia—0.9% | | | | |
| 25,000 | | IHH Healthcare BHD (a) | | | 26,838 | |
| 20,000 | | IJM Land BHD | | | 14,511 | |
| | | | | | | |
| | | | | | 41,349 | |
| | | | | | | |
Philippines—5.8% | | | | |
| 216,000 | | Ayala Land, Inc. | | | 123,481 | |
| 500,000 | | Megaworld Corp. | | | 29,737 | |
| 30,136 | | Robinsons Land Corp. | | | 13,899 | |
| 47,691 | | SM Development Corp. | | | 7,224 | |
| 236,250 | | SM Prime Holdings, Inc. | | | 83,156 | |
| | | | | | | |
| | | | | | 257,497 | |
| | | | | | | |
| | | | | | | |
Shares | | Security
Description | | Value | |
| | | | | | | | |
| | | | |
Singapore—1.4% | | | | |
| 28,500 | | Global Logistic Properties, Ltd. | | $ | 60,047 | |
| | | | | | | |
Thailand—9.3% | | | | |
| 80,000 | | Amata Corp. PCL | | | 40,196 | |
| 150,000 | | Asian Property Development PCL | | | 42,578 | |
| 30,000 | | Central Pattana PCL | | | 69,494 | |
| 300,000 | | Hemaraj Land and
Development PCL | | | 30,734 | |
| 90,000 | | LPN Development PCL-NVDR | | | 53,148 | |
| 147,500 | | Minor International PCL | | | 88,067 | |
| 120,000 | | Supalai PCL | | | 75,171 | |
| 23,125 | | Ticon Industrial Connection PCL | | | 9,884 | |
| | | | | | | |
| | | | | | 409,272 | |
| | | | | | | |
United Arab Emirates—1.0% | | | | |
| 43,000 | | Emaar Properties PJSC | | | 42,263 | |
| | | | | | | |
| | | Total Asia (Cost $2,108,644) | | | 2,638,527 | |
| | | | | | | |
Europe—2.7% | | | | |
Russia—2.0% | | | | |
| 2,000 | | Etalon Group, Ltd.-GDR (a)(b) | | | 11,560 | |
| 5,574 | | Mirland Development
Corp. PLC (a) | | | 10,569 | |
| 46,902 | | Raven Russia, Ltd. | | | 49,197 | |
| 11,000 | | RGI International, Ltd. (a) | | | 17,820 | |
| | | | | | | |
| | | | | | 89,146 | |
| | | | | | | |
Turkey—0.7% | | | | |
| 20,000 | | Emlak Konut Gayrimenkul
Yatirim Ortakligi AS | | | 29,791 | |
| | | | | | | |
| | | Total Europe (Cost $87,252) | | | 118,937 | |
| | | | | | | |
Middle East/Africa—2.4% | | | | |
South Africa—2.4% | | | | |
| 18,878 | | Capital Property Fund | | | 21,729 | |
| 20,000 | | Growthpoint Properties, Ltd. | | | 54,460 | |
| 69,393 | | SA Corporate Real Estate Fund
Nominees Property, Ltd. | | | 28,251 | |
| | | | | | | |
| | | | | | 104,440 | |
| | | | | | | |
| | | Total Middle East/Africa
(Cost $119,014) | | | 104,440 | |
| | | | | | | |
North & South America—26.6% | | | | |
Argentina—0.8% | | | | |
| 3,100 | | TGLT SA-ADR | | | 35,161 | |
| | | | | | | |
Brazil—25.2% | | | | |
| 2,000 | | Aliansce Shopping Centers SA | | | 22,747 | |
| 3,462 | | BHG SA-Brazil Hospitality Group (a) | | | 34,261 | |
| 14,549 | | BR Malls Participacoes SA | | | 191,260 | |
| 9,556 | | BR Properties SA | | | 125,152 | |
| 10,000 | | Brasil Brokers Participacoes SA | | | 28,064 | |
| 1,591 | | Cyrela Commercial Properties
SA Empreendimentos
e Participacoes | | | 20,672 | |
| 14,624 | | Direcional Engenharia SA | | | 87,555 | |
| 4,895 | | Even Construtora e
Incorporadora SA | | | 19,522 | |
| 6,000 | | Ez Tec Empreendimentos
e Participacoes SA | | | 78,875 | |
| 8,000 | | Gafisa SA (a) | | | 14,692 | |
| 20,838 | | General Shopping Brasil SA (a) | | | 109,779 | |
| 8,500 | | Helbor Empreendimentos SA | | | 47,918 | |
| 3,500 | | Iguatemi Empresa de Shopping
Centers SA | | | 44,460 | |
| 22,000 | | JHSF Participacoes SA | | | 95,537 | |
The accompanying notes are an integral part of these financial statements.
53
|
Alpine Emerging Markets Real Estate Fund |
| |
Schedule of Portfolio Investments—Continued
October 31, 2012
| | | | | | | |
Shares | | Security
Description | | Value | |
| | | | | | | | |
| | | |
North & South America—continued | | | |
Brazil—continued | | | | |
| 16,050 | | MRV Engenharia e
Participacoes SA | | $ | 81,394 | |
| 50,000 | | PDG Realty SA Empreendimentos
e Participacoes | | | 84,193 | |
| 1,394 | | Sao Carlos Empreendimentos e
Participacoes SA | | | 31,297 | |
| | | | | | | |
| | | | | | 1,117,378 | |
| | | | | | | |
Chile—0.6% | | | | |
| 12,000 | | Parque Arauco SA | | | 27,409 | |
| | | | | | | |
| | | Total North & South America
(Cost $999,218) | | | 1,179,948 | |
| | | | | | | |
| | | Total Common Stocks
(Cost $3,314,128) | | | 4,041,852 | |
| | | | | | | |
Preferred Stocks—1.0% | | | | |
Europe—1.0% | | | | |
Russia—1.0% | | | | |
| 20,000 | | Raven Russia, Ltd., 12.000% | | | 46,153 | |
| | | | | | | |
| | | Total Europe (Cost $40,518) | | | 46,153 | |
| | | | | | | |
| | | Total Preferred Stocks
(Cost $40,518) | | | 46,153 | |
| | | | | | | |
Equity-Linked Structured Notes—5.4% | | | | |
Asia—5.4% | | | | |
India—4.4% | | | | |
| 11,500 | | DFL Ltd.-Macquarie Bank, Ltd. | | | 43,257 | |
| 7,000 | | Oberoi Realty, Ltd.-Macquarie
Bank, Ltd. | | | 35,589 | |
| 12,310 | | Phoenix Mills, Ltd.-Macquarie
Bank, Ltd. | | | 45,858 | |
| 8,000 | | Phoenix Mills, Ltd.-Merrill
Lynch & Co., Inc. | | | 29,802 | |
| 13,500 | | Prestige Estates Projects,
Ltd.-Macquarie Bank, Ltd. | | | 39,174 | |
| | | | | | | |
| | | | | | 193,680 | |
| | | | | | | |
| | | | | | | |
Shares | | Security
Description | | Value | |
| | | | | | |
| | | | |
Vietnam—1.0% | | | | |
| 43,125 | | HAGL JSC-GDR-Macquarie
Bank, Ltd. (a) | | $ | 43,040 | |
| | | | | | | |
| | | Total Asia (Cost $266,827) | | | 236,720 | |
| | | | | | | |
| | | Total Equity-Linked Structured
Notes (Cost $266,827) | | | 236,720 | |
| | | | | | | |
| | | | | | | |
Principal
Amount | | | | | | |
| | | | | | | |
Convertible Bonds—0.6% | | | | |
North & South America—0.6% | | | | |
Brazil—0.6% | | | | |
| $80,000 | | PDG Realty SA Empreendimentos
e Participacoes-Series 8,
0.000%, 9/19/16 (Brazilian Real) | | | 27,572 | |
| | | | | | | |
| | | Total Convertible Bonds
(Cost $28,699) | | | 27,572 | |
| | | | | | | |
| | | | | | | |
Shares | | | | | | |
| | | | | | | |
Warrants—0.7% | | | | |
Asia—0.7% | | | | |
Thailand—0.7% | | | | |
| 14,000 | | The Erawan Group PCL (a)
Expiration: December, 2013
Exercise Price: THB 2.80 | | | 384 | |
| 400,000 | | Sansiri PCL (a)
Expiration: January, 2015
Exercise Price: THB 1.114 | | | 28,972 | |
| | | | | | | |
| | | | | | 29,356 | |
| | | | | | | |
| | | Total Asia (Cost $29,730) | | | 29,356 | |
| | | | | | | |
| | | Total Warrants (Cost $29,730) | | | 29,356 | |
| | | | | | | |
| | | Total Investments
(Cost $3,679,902)—99.0% | | | 4,381,653 | |
| | | Other Assets in Excess of
Liabilities—1.0% | | | 46,327 | |
| | | | | | | |
| | | TOTAL NET ASSETS 100.0% | | $ | 4,427,980 | |
| | | | | | | |
| | |
| | |
|
Percentages are stated as a percent of net assets. |
| |
(a) | Non-income producing security. |
| |
(b) | Restricted under Rule 144A of the Securities Act of 1933. These securities may be resold in transactions exempt from registration, normally to qualified institutional buyers. These securities have been determined to be liquid under guidelines established by the Board of Trustees. Liquid securities restricted under Rule 144A comprised 0.3% of the Fund’s net assets. |
|
ADR—American Depositary Receipt |
|
AS—Anonim Sirketi is the Turkish term for joint stock company. |
|
BHD—Malaysian equivalent to incorporated. |
|
GDR—Global Depositary Receipt |
|
JSC—Joint Stock Company |
|
NVDR—Non-Voting Depositary Receipts |
|
PCL—Public Company Limited |
|
PJSC—Public Joint Stock Company |
|
PLC—Public Limited Company |
|
SA—Generally designates corporations in various countries, mostly those employing the civil law. |
|
THB—Thailand Baht |
The accompanying notes are an integral part of these financial statements.
54
|
Alpine Global Infrastructure Fund |
| |
Schedule of Portfolio Investments
October 31, 2012
| | | | | | | |
Shares | | Security
Description | | Value | |
| | | | | | |
|
Common Stocks—94.0% | | | | |
Asia—17.8% | | | | |
China—10.2% | | | | |
| 1,050,000 | | Anhui Expressway Co.-Class H | | $ | 503,997 | |
| 2,400,000 | | Beijing Enterprises Water
Group, Ltd. | | | 548,126 | |
| 600,000 | | China Everbright
International, Ltd. | | | 308,901 | |
| 37,500 | | China Mobile, Ltd. | | | 415,643 | |
| 500,000 | | China Railway Construction
Corp., Ltd.-Class H | | | 498,706 | |
| 500,972 | | China State Construction
International Holdings, Ltd. | | | 595,991 | |
| 520,000 | | COSCO Pacific, Ltd. | | | 762,214 | |
| 1,550,000 | | Guangshen Railway Co.,
Ltd.-Class H | | | 535,997 | |
| 2,741,000 | | Tianjin Port Development
Holdings, Ltd. | | | 339,528 | |
| 1,050,000 | | Yuexiu Transport
Infrastructure, Ltd. | | | 471,481 | |
| | | | | | | |
| | | | | | 4,980,584 | |
| | | | | | | |
Indonesia—2.2% | | | | |
| 36,000,000 | | PT Bakrieland Development
TBK (a) | | | 243,623 | |
| 1,470,000 | | PT Citra Marga Nusaphala
Persada TBK | | | 355,830 | |
| 800,000 | | PT Jasa Marga TBK | | | 483,082 | |
| | | | | | | |
| | | | | | 1,082,535 | |
| | | | | | | |
Israel—0.5% | | | | |
| 200,000 | | Bezeq The Israeli
Telecommunication Corp.,
Ltd. | | | 243,894 | |
| | | | | | | |
Japan—2.8% | | | | |
| 11,000 | | East Japan Railway Co. | | | 755,104 | |
| 12,800 | | Japan Airlines Co., Ltd. (a) | | | 609,295 | |
| | | | | | | |
| | | | | | 1,364,399 | |
| | | | | | | |
Philippines—2.1% | | | | |
| 250,000 | | International Container
Terminal Services, Inc. | | | 430,878 | |
| 800,000 | | Manila Water Co., Inc. | | | 563,175 | |
| | | | | | | |
| | | | | | 994,053 | |
| | | | | | | |
| | | Total Asia (Cost $7,974,775) | | | 8,665,465 | |
| | | | | | | |
Europe—26.4% | | | | |
Austria—0.8% | | | | |
| 7,000 | | Kapsch TrafficCom AG | | | 408,015 | |
| | | | | | | |
France—5.7% | | | | |
| 6,000 | | Aeroports de Paris | | | 463,892 | |
| 21,000 | | Eutelsat Communications SA | | | 672,313 | |
| 31,000 | | Suez Environnement Co. | | | 329,200 | |
| 35,000 | | Veolia Environnement SA | | | 346,454 | |
| 22,000 | | Vinci SA | | | 973,654 | |
| | | | | | | |
| | | | | | 2,785,513 | |
| | | | | | | |
Germany—5.9% | | | | |
| 8,000 | | Fraport AG Frankfurt Airport
Services Worldwide | | | 469,102 | |
| 21,000 | | Hamburger Hafen und
Logistik AG | | | 509,951 | |
| 13,000 | | HeidelbergCement AG | | | 688,994 | |
| 11,000 | | Hochtief AG (a) | | | 545,497 | |
| 9,000 | | Kabel Deutschland Holding AG | | | 648,477 | |
| | | | | | | |
| | | | | | 2,862,021 | |
| | | | | | | |
| | | | | | | |
Shares | | Security
Description | | Value | |
| | | | | | |
|
Italy—2.0% | | | | |
| 34,650 | | Atlantia SpA | | $ | 571,724 | |
| 85,000 | | Snam Rete Gas SpA | | | 376,130 | |
| | | | | | | |
| | | | | | 947,854 | |
| | | | | | | |
Netherlands—3.2% | | | | |
| 14,500 | | Koninklijke Vopak NV | | | 1,009,435 | |
| 17,000 | | Ziggo NV | | | 550,643 | |
| | | | | | | |
| | | | | | 1,560,078 | |
| | | | | | | |
Spain—1.9% | | | | |
| 62,875 | | Abertis Infraestructuras SA | | | 946,977 | |
| | | | | | | |
Turkey—1.1% | | | | |
| 105,000 | | TAV Havalimanlari Holding | | | 521,339 | |
| | | | | | | |
United Kingdom—5.8% | | | | |
| 100,000 | | Centrica PLC | | | 523,016 | |
| 82,500 | | Ferrovial SA | | | 1,165,562 | |
| 52,500 | | National Grid PLC | | | 598,560 | |
| 205,000 | | Vodafone Group PLC | | | 556,602 | |
| | | | | | | |
| | | | | | 2,843,740 | |
| | | | | | | |
| | | Total Europe (Cost $12,674,410) | | | 12,875,537 | |
| | | | | | | |
North & South America—49.8% | | | | |
Brazil—9.4% | | | | |
| 140,000 | | All America Latina Logistica SA | | | 636,912 | |
| 100,000 | | CCR SA | | | 879,348 | |
| 8,000 | | Cia de Saneamento Basico do
Estado de Sao Paulo-ADR | | | 672,080 | |
| 72,500 | | EcoRodovias Infraestrutura
e Logistica SA | | | 633,244 | |
| 82,500 | | EDP—Energias do Brasil SA | | | 515,866 | |
| 45,000 | | Mills Estruturas e Servicos
de Engenharia SA | | | 689,939 | |
| 32,500 | | Tegma Gestao Logistica SA | | | 560,055 | |
| | | | | | | |
| | | | | | 4,587,444 | |
| | | | | | | |
Canada—3.4% | | | | |
| 8,500 | | Canadian Pacific Railway, Ltd. | | | 782,510 | |
| 22,000 | | Enbridge, Inc. | | | 875,374 | |
| | | | | | | |
| | | | | | 1,657,884 | |
| | | | | | | |
Chile—0.8% | | | | |
| 160,000 | | E.CL SA | | | 391,063 | |
| | | | | | | |
Colombia—1.2% | | | | |
| 6,500 | | Millicom International
Cellular SA-SDR | | | 561,519 | |
| | | | | | | |
Mexico—3.9% | | | | |
| 120,000 | | Empresas ICA SAB de
CV-ADR (a) | | | 1,036,800 | |
| 530,000 | | OHL Mexico SAB de CV (a) | | | 874,294 | |
| | | | | | | |
| | | | | | 1,911,094 | |
| | | | | | | |
Peru—0.9% | | | | |
| 34,200 | | Cementos Pacasmayo
SAA-ADR (a) | | | 405,270 | |
| | | | | | | |
United States—30.2% | | | | |
| 13,500 | | American Tower Corp. | | | 1,016,415 | |
| 16,500 | | American Water Works Co., Inc. | | | 606,210 | |
| 17,000 | | AT&T, Inc. | | | 588,030 | |
| 17,500 | | Atmos Energy Corp. | | | 629,475 | |
| 41,000 | | Calpine Corp. (a) | | | 721,600 | |
| 35,500 | | Cisco Systems, Inc. | | | 608,470 | |
| 23,500 | | CMS Energy Corp. | | | 571,520 | |
| 21,000 | | Comcast Corp.-Class A | | | 787,710 | |
The accompanying notes are an integral part of these financial statements.
55
|
Alpine Global Infrastructure Fund |
| |
Schedule of Portfolio Investments—Continued
October 31, 2012
| | | | | | | |
Shares | | Security
Description | | Value | |
| | | | | | |
|
North & South America—continued | | | | |
United States—continued | | | | |
| 21,000 | | DISH Network Corp. | | $ | 748,230 | |
| 175,000 | | EnergySolutions, Inc. (a) | | | 500,500 | |
| 9,500 | | ITC Holdings Corp. | | | 756,390 | |
| 16,500 | | Itron, Inc. (a) | | | 677,490 | |
| 37,700 | | MasTec, Inc. (a) | | | 850,512 | |
| 14,000 | | Northeast Utilities | | | 550,200 | |
| 43,000 | | Progressive Waste
Solutions, Ltd. | | | 831,620 | |
| 40,000 | | The Geo Group, Inc. | | | 1,108,800 | |
| 16,000 | | The Williams Cos., Inc. | | | 559,840 | |
| 117,500 | | TravelCenters of America LLC (a) | | | 571,050 | |
| 16,500 | | UGI Corp. | | | 532,785 | |
| 3,700 | | Union Pacific Corp. | | | 455,211 | |
| 17,000 | | World Fuel Services Corp. | | | 589,900 | |
| 16,500 | | Xcel Energy, Inc. | | | 466,125 | |
| | | | | | | |
| | | | | | 14,728,083 | |
| | | | | | | |
| | | Total North & South America
(Cost $21,232,034) | | | 24,242,357 | |
| | | | | | | |
| | | Total Common Stocks
(Cost $41,881,219) | | | 45,783,359 | |
| | | | | | | |
| | | | | | | |
Shares | | Security
Description | | Value | |
| | | | | | |
|
Equity-Linked Structured Notes—0.7% | | | | |
Asia—0.7% | | | | |
India—0.7% | | | | |
| 155,000 | | Power Grid Corp. of India,
Ltd.-Macquarie Bank, Ltd. | | $ | 329,045 | |
| | | | | | | |
| | | Total Equity-Linked Structured
Notes (Cost $326,759) | | | 329,045 | |
| | | | | | | |
| | | | | | | |
Principal
Amount | | | | | | |
| | | | | | | |
Short-Term Investment—5.3% | | | | |
| $2,611,000 | | State Street Eurodollar Time
Deposit, 0.01% | | | 2,611,000 | |
| | | | | | | |
| | | Total Short-Term Investment
(Cost $2,611,000) | | | 2,611,000 | |
| | | | | | | |
| | | Total Investments
(Cost $44,818,978)—100.0% | | | 48,723,404 | |
| | | Liabilities in Excess of
Other Assets—0.0% | | | (4,358 | ) |
| | | | | | | |
| | | TOTAL NET ASSETS 100.0% | | $ | 48,719,046 | |
| | | | | | | |
| |
| | |
Percentages are stated as a percent of net assets. |
|
(a) Non-income producing security. |
|
ADR—American Depositary Receipt |
|
AG—Aktiengesellschaft is a German term that refers to a corporation that is limited by shares, i.e., owned by shareholders. |
|
NV—Naamloze Vennootschap is the Dutch term for a public limited liability corporation. |
|
PLC—Public Limited Company |
|
SA—Generally designates corporations in various countries, mostly those employing the civil law. |
|
SAA—Open-Corporations (Sociedades Anonimas Abiertas) |
|
SAB de CV—Sociedad Anonima Bursátil de Capital Variable is the Spanish equivalent to Variable Capital Company. |
|
SDR—Swedish Depositary Receipt |
|
SpA—Societa’ Per Azioni is an Italian shared company. |
The accompanying notes are an integral part of these financial statements.
56
|
Alpine Global Consumer Growth Fund |
| |
Schedule of Portfolio Investments
October 31, 2012
| | | | | | | |
Shares | | Security
Description | | Value | |
| | | | | | |
| | | | | | | |
Common Stocks—95.8% | | | | |
Asia—18.9% | | | | | |
China—10.1% | | | | | |
| 240 | | Baidu, Inc.-ADR (a) | | $ | 25,589 | |
| 26,000 | | Daphne International
Holdings, Ltd. | | | 31,368 | |
| 20,000 | | Dongfeng Motor Group Co., Ltd. | | | 24,774 | |
| 14,000 | | Golden Eagle Retail Group, Ltd. | | | 30,710 | |
| 14,800 | | Lianhua Supermarket
Holdings Co., Ltd. | | | 11,974 | |
| 38,000 | | Springland International
Holdings, Ltd. | | | 18,681 | |
| 1,200 | | Tencent Holdings, Ltd. | | | 42,518 | |
| 22,000 | | Want Want China Holdings, Ltd. | | | 30,090 | |
| 46,000 | | XTEP International Holdings | | | 20,002 | |
| | | | | | | |
| | | | | | 235,706 | |
| | | | | | | |
Hong Kong—3.3% | | | | |
| 76,000 | | Hengdeli Holdings, Ltd. | | | 23,829 | |
| 16,000 | | Li & Fung, Ltd. | | | 26,839 | |
| 350,000 | | REXLot Holdings, Ltd. | | | 25,742 | |
| | | | | | | |
| | | | | | 76,410 | |
| | | | | | | |
Indonesia—2.5% | | | | |
| 50,000 | | PT Erajaya Swasembada TBK (a) | | | 12,494 | |
| 32,500 | | PT Indofood CBP Sukses
Makmur TBK | | | 24,193 | |
| 30,000 | | PT Mitra Adiperkasa TBK | | | 20,458 | |
| | | | | | | |
| | | | | | 57,145 | |
| | | | | | | |
Philippines—1.5% | | | | |
| 100,000 | | SM Prime Holdings, Inc. | | | 35,198 | |
| | | | | | | |
South Korea—1.5% | | | | |
| 625 | | Kia Motors Corp. | | | 34,728 | |
| | | | | | | |
| | | Total Asia (Cost $469,230) | | | 439,187 | |
| | | | | | | |
Europe—23.2% | | | | |
Belgium—3.4% | | | | |
| 950 | | Anheuser-Busch InBev NV-ADR | | | 79,610 | |
| | | | | | | |
France—1.8% | | | | |
| 1,500 | | SES SA | | | 41,509 | |
| | | | | | | |
Germany—5.2% | | | | |
| 450 | | Adidas AG | | | 38,338 | |
| 360 | | Bayerische Motoren Werke AG | | | 28,673 | |
| 750 | | Kabel Deutschland Holding AG | | | 54,040 | |
| | | | | | | |
| | | | | | 121,051 | |
| | | | |
Italy—1.3% |
| 2,050 | | Yoox SpA (a) | | | 31,009 | |
| | | | | | | |
Netherlands—2.8% | | | | |
| 450 | | Heineken NV | | | 27,743 | |
| 1,000 | | Unilever NV | | | 36,720 | |
| | | | | | | |
| | | | | | 64,463 | |
| | | | | | | |
Russia—0.7% | | | | |
| 825 | | X5 Retail Group NV-GDR (a)(b) | | | 15,634 | |
| | | | | | | |
Spain—0.8% | | | | |
| 150 | | Inditex SA | | | 19,139 | |
| | | | | | | |
Switzerland—5.8% | | | | |
| 300 | | Dufry Group (a) | | | 38,076 | |
| 1,050 | | Nestle SA | | | 66,633 | |
| 75 | | The Swatch Group AG | | | 31,037 | |
| | | | | | | |
| | | | | | 135,746 | |
| | | | | | | |
United Kingdom—1.4% | | | | |
| 17,000 | | Debenhams PLC | | | 32,838 | |
| | | | | | | |
| | | Total Europe (Cost $458,464) | | | 540,999 | |
| | | | | | | |
| | | | | | | |
Shares | | Security
Description | | Value | |
| | | | | | |
| | | | | | | |
North & South America—53.7% | | | | |
Brazil—9.5% | | | | |
| 2,200 | | BR Malls Participacoes SA | | $ | 28,921 | |
| 575 | | Cia Brasileira de Distribuicao
Grupo Pao de Acucar-ADR | | | 26,876 | |
| 2,200 | | Estacio Participacoes SA | | | 41,919 | |
| 2,600 | | Hypermarcas SA (a) | | | 20,674 | |
| 3,400 | | Magazine Luiza SA | | | 18,933 | |
| 2,050 | | Marisa Lojas SA | | | 30,088 | |
| 1,300 | | Multiplus SA | | | 30,205 | |
| 900 | | Natura Cosmeticos SA | | | 23,995 | |
| | | | | | | |
| | | | | | 221,611 | |
| | | | | | | |
Mexico—2.0% | | | | |
| 9,000 | | Grupo Comercial Chedraui
SA de CV | | | 24,263 | |
| 1,000 | | Grupo Televisa SA-ADR | | | 22,600 | |
| | | | | | | |
| | | | | | 46,863 | |
| | | | | | | |
United States—42.2% | | | | |
| 675 | | Abercrombie & Fitch Co.-Class A | | | 20,642 | |
| 100 | | Amazon.com, Inc. (a) | | | 23,282 | |
| 110 | | Apple, Inc. | | | 65,461 | |
| 600 | | Carnival Corp. | | | 22,728 | |
| 1,001 | | CBS Corp.-Class B | | | 32,432 | |
| 700 | | Coach, Inc. | | | 39,235 | |
| 300 | | Colgate-Palmolive Co. | | | 31,488 | |
| 1,750 | | Comcast Corp.-Class A | | | 65,642 | |
| 700 | | Dick’s Sporting Goods, Inc. | | | 35,000 | |
| 2,550 | | Digital Generation, Inc. (a) | | | 23,715 | |
| 700 | | Francesca’s Holdings Corp. (a) | | | 20,671 | |
| 75 | | Google, Inc.-Class A (a) | | | 50,983 | |
| 825 | | Guess?, Inc. | | | 20,444 | |
| 600 | | Lumber Liquidators
Holdings, Inc. (a) | | | 33,492 | |
| 500 | | McDonald’s Corp. | | | 43,400 | |
| 320 | | MercadoLibre, Inc. | | | 26,870 | |
| 208 | | Michael Kors Holdings, Ltd. (a) | | | 11,376 | |
| 450 | | NIKE, Inc.-Class B | | | 41,121 | |
| 750 | | PepsiCo, Inc. | | | 51,930 | |
| 975 | | Rue21, Inc. (a) | | | 29,357 | |
| 550 | | Target Corp. | | | 35,062 | |
| 450 | | The Procter & Gamble Co. | | | 31,158 | |
| 400 | | Ulta Salon Cosmetics &
Fragrance, Inc. | | | 36,888 | |
| 400 | | VF Corp. | | | 62,592 | |
| 350 | | Visa, Inc.-Class A | | | 48,566 | |
| 800 | | Yum! Brands, Inc. | | | 56,088 | |
| 3,400 | | Zagg, Inc. (a) | | | 24,412 | |
| | | | | | | |
| | | | | | 984,035 | |
| | | | | | | |
| | | Total North & South America
(Cost $1,093,252) | | | 1,252,509 | |
| | | | | | | |
| | | Total Common Stocks
(Cost $2,020,946) | | | 2,232,695 | |
| | | | | | | |
| | | Total Investments
(Cost $2,020,946)—95.8% | | | 2,232,695 | |
| | | Other Assets in Excess of
Liabilities—4.2% | | | 98,337 | |
| | | | | | | |
| | | TOTAL NET ASSETS 100.0% | | $ | 2,331,032 | |
| | | | | | | |
The accompanying notes are an integral part of these financial statements.
57
|
Alpine Global Consumer Growth Fund |
| |
Schedule of Portfolio Investments—Continued
October 31, 2012
| | |
| | |
Percentages are stated as a percent of net assets. |
|
(a) | Non-income producing security. |
| |
(b) | Restricted under Rule 144A of the Securities Act of 1933. These securities may be resold in transactions exempt from registration, normally to qualified institutional buyers. These securities have been determined to be liquid under guidelines established by the Board of Trustees. Liquid securities restricted under Rule 144A comprised 0.7% of the Fund’s net assets. |
| |
ADR—American Depositary Receipt |
|
AG—Aktiengesellschaft is a German term that refers to a corporation that is limited by shares, i.e., owned by shareholders. |
|
GDR—Global Depositary Receipt |
|
NV—Naamloze Vennootschap is the Dutch term for a public limited liability corporation. |
|
PLC—Public Limited Company |
|
SA—Generally designates corporations in various countries, mostly those employing the civil law. |
|
SA de CV—Sociedad Anonima de Capital Variable is the Spanish equivalent to Variable Capital Company. |
|
SpA—Societa’ Per Azioni is an Italian shared company. |
The accompanying notes are an integral part of these financial statements.
58
Statements of Assets and Liabilities
October 31, 2012
| | | | | | | | | | | | | | | | |
| | | International
Real Estate
Equity Fund | | | | Realty
Income &
Growth Fund | | | Cyclical
Advantage
Property Fund | |
| | | | | | | | | | | |
ASSETS: | | | | | | | | | | |
Investments, at value(1) | | | | | | | | | | |
Unaffiliated issuers | | | $ | 301,477,054 | | | | $ | 116,574,926 | | | | $ | 59,286,210 | | |
Affiliated issuers | | | | 5,782,145 | | | | | — | | | | | — | | |
Cash | | | | 826 | | | | | — | | | | | 514 | | |
Foreign currencies, at value(2) | | | | — | | | | | — | | | | | 19,819 | | |
Receivable for investment securities sold | | | | 2,633,839 | | | | | — | | | | | 206,661 | | |
Dividends and interest receivable | | | | 789,658 | | | | | 89,958 | | | | | 18,136 | | |
Receivable from capital shares issued | | | | 133,275 | | | | | 24,941 | | | | | 197,612 | | |
Prepaid expenses and other assets | | | | 48,349 | | | | | 12,850 | | | | | 5,626 | | |
| | | | | | | | | | | | | | | | |
Total assets | | | | 310,865,146 | | | | | 116,702,675 | | | | | 59,734,578 | | |
| | | | | | | | | | | | | | | | |
| | | | | | | | | | | | | | | | |
LIABILITIES: | | | | | | | | | | | | | | | | |
Payable for capital shares redeemed | | | | 218,654 | | | | | 55,618 | | | | | 13,453 | | |
Accrued expenses and other liabilities: | | | | | | | | | | | | | | | | |
Investment advisory fees (Note 6) | | | | 257,853 | | | | | 91,607 | | | | | 49,770 | | |
Line of credit (Note 2) | | | | 10,110,099 | | | | | 10,096,119 | | | | | — | | |
Distribution fees (Note 5) | | | | 241 | | | | | 233 | | | | | — | | |
Other | | | | 184,932 | | | | | 40,359 | | | | | 47,692 | | |
| | | | | | | | | | | | | | | | |
Total liabilities | | | | 10,771,779 | | | | | 10,283,936 | | | | | 110,915 | | |
| | | | | | | | | | | | | | | | |
Net Assets | | | $ | 300,093,367 | | | | $ | 106,418,739 | | | | $ | 59,623,663 | | |
| | | | | | | | | | | | | | | | |
| | | | | | | | | | | | | | | | |
Net assets represented by: | | | | | | | | | | | | | | | | |
Capital stock | | | $ | 1,451,309,373 | | | | $ | 80,338,977 | | | | $ | 104,551,324 | | |
Accumulated net investment loss | | | | (4,996,546 | ) | | | | — | | | | | (48,290 | ) | |
Accumulated net realized losses from investments and foreign currency transactions | | | | (1,100,292,714 | ) | | | | (8,940,953 | ) | | | | (54,635,611 | ) | |
Net unrealized appreciation/depreciation on: | | | | | | | | | | | | | | | | |
Investments | | | | (45,916,403 | ) | | | | 35,020,706 | | | | | 9,756,374 | | |
Foreign currency translations | | | | (10,343 | ) | | | | 9 | | | | | (134 | ) | |
| | | | | | | | | | | | | | | | |
Total Net Assets | | | $ | 300,093,367 | | | | $ | 106,418,739 | | | | $ | 59,623,663 | | |
| | | | | | | | | | | | | | | | |
| | | | | | | | | | | | | | | | |
Net asset value | | | | | | | | | | | | | | | | |
Class A Shares | | | | | | | | | | | | | | | | |
Net assets | | | $ | 128,074 | | | | $ | 114,547 | | | | $ | — | | |
Shares outstanding | | | | 5,772 | | | | | 6,601 | | | | | — | | |
Net asset value per share | | | $ | 22.19 | | | | $ | 17.35 | | | | $ | — | | |
Maximum offering price per share (net asset value plus sales charge of 5.50% of offering price) | | | $ | 23.48 | | | | $ | 18.36 | | | | $ | — | | |
Institutional Class Shares | | | | | | | | | | | | | | | | |
Net assets | | | $ | 299,965,293 | | | | $ | 106,304,192 | | | | $ | 59,623,663 | | |
Shares outstanding | | | | 13,490,756 | | | | | 6,121,270 | | | | | 2,522,435 | | |
Net asset value, offering price and redemption price per share* | | | $ | 22.23 | | | | $ | 17.37 | | | | $ | 23.64 | | |
* If applicable, redemption price per share may be reduced by a redemption fee. | | | | | | | | | | | | | | | | |
(1) Total cost of investments | | | | | | | | | | | | | | | | |
Unaffiliated issuers | | | $ | 333,166,027 | | | | $ | 81,554,220 | | | | $ | 49,529,836 | | |
Affiliated issuers | | | $ | 20,009,575 | | | | $ | — | | | | $ | — | | |
(2) Cost of foreign currencies | | | $ | — | | | | $ | — | | | | $ | 19,771 | | |
The accompanying notes are an integral part of these financial statements.
59
Statements of Assets and Liabilities—Continued
October 31, 2012
| | | | | | | | | | | | | | | | |
| | Emerging
Markets Real
Estate Fund | | Global
Infrastructure
Fund | | Global
Consumer
Growth Fund | |
| | | | | | | |
ASSETS: | | | | | | | | | | |
Investments, at value(1) | | | $ | 4,381,653 | | | | $ | 48,723,404 | | | | $ | 2,232,695 | | |
Cash | | | | 40,194 | | | | | 181 | | | | | 91,068 | | |
Foreign currencies, at value(2) | | | | 1,178 | | | | | 53,440 | | | | | 17 | | |
Receivable for investment securities sold | | | | 63,263 | | | | | 83,799 | | | | | — | | |
Due from Adviser | | | | 7,805 | | | | | — | | | | | 18,446 | | |
Dividends and interest receivable | | | | 5,091 | | | | | 59,059 | | | | | 2,032 | | |
Receivable from capital shares issued | | | | — | | | | | 18,050 | | | | | 50 | | |
Prepaid expenses and other assets | | | | 2,780 | | | | | 4,814 | | | | | 229 | | |
Unrealized appreciation on forward currency contracts | | | | — | | | | | 4,847 | | | | | — | | |
| | | | | | | | | | | | | | | | |
Total assets | | | | 4,501,964 | | | | | 48,947,594 | | | | | 2,344,537 | | |
| | | | | | | | | | | | | | | | |
| | | | | | | | | | | | | | | | |
LIABILITIES: | | | | | | | | | | | | | | | | |
Payable for investment securities purchased | | | | 56,033 | | | | | 26,854 | | | | | — | | |
Unrealized depreciation on forward currency contracts | | | | — | | | | | 145,194 | | | | | — | | |
Payable for capital shares redeemed | | | | — | | | | | 265 | | | | | — | | |
Accrued expenses and other liabilities: | | | | | | | | | | | | | | | | |
Investment advisory fees (Note 6) | | | | 3,740 | | | | | 42,684 | | | | | 1,983 | | |
Distribution fees (Note 5) | | | | 246 | | | | | 415 | | | | | 236 | | |
Other | | | | 13,965 | | | | | 13,136 | | | | | 11,286 | | |
| | | | | | | | | | | | | | | | |
Total liabilities | | | | 73,984 | | | | | 228,548 | | | | | 13,505 | | |
| | | | | | | | | | | | | | | | |
Net Assets | | | $ | 4,427,980 | | | | $ | 48,719,046 | | | | $ | 2,331,032 | | |
| | | | | | | | | | | | | | | | |
| | | | | | | | | | | | | | | | |
Net assets represented by: | | | | | | | | | | | | | | | | |
Capital stock | | | $ | 3,876,866 | | | | $ | 45,417,734 | | | | $ | 2,159,542 | | |
Accumulated net investment income (loss) | | | | 11,439 | | | | | — | | | | | 7,301 | | |
Accumulated net realized losses from investments and foreign currency transactions | | | | (162,044 | ) | | | | (462,595 | ) | | | | (47,556 | ) | |
Net unrealized appreciation/depreciation on: | | | | | | | | | | | | | | | | |
Investments | | | | 701,751 | | | | | 3,904,426 | | | | | 211,749 | | |
Foreign currency translations | | | | (32 | ) | | | | (140,519 | ) | | | | (4 | ) | |
| | | | | | | | | | | | | | | | |
Total Net Assets | | | $ | 4,427,980 | | | | $ | 48,719,046 | | | | $ | 2,331,032 | | |
| | | | | | | | | | | | | | | | |
| | | | | | | | | | | | | | | | |
Net asset value: | | | | | | | | | | | | | | | | |
Class A Shares | | | | | | | | | | | | | | | | |
Net assets | | | $ | 140,162 | | | | $ | 1,721,305 | | | | $ | 119,682 | | |
Shares outstanding | | | | 8,184 | | | | | 108,130 | | | | | 11,173 | | |
Net asset value per share | | | $ | 17.13 | | | | $ | 15.92 | | | | $ | 10.71 | | |
Maximum offering price per share (net asset value plus sales charge of 5.50% of offering price) | | | $ | 18.13 | | | | $ | 16.85 | | | | $ | 11.33 | | |
Institutional Class Shares | | | | | | | | | | | | | | | | |
Net assets | | | $ | 4,287,818 | | | | $ | 46,997,741 | | | | $ | 2,211,350 | | |
Shares outstanding | | | | 249,829 | | | | | 2,950,345 | | | | | 205,980 | | |
Net asset value, offering price and redemption price per share* | | | $ | 17.16 | | | | $ | 15.93 | | | | $ | 10.74 | | |
* If applicable, redemption price per share may be reduced by a redemption fee. | | | | | | | | | | | | | | | | |
(1) Total cost of investments | | | $ | 3,679,902 | | | | $ | 44,818,978 | | | | $ | 2,020,946 | | |
(2) Cost of foreign currencies | | | $ | 1,175 | | | | $ | 53,450 | | | | $ | 17 | | |
The accompanying notes are an integral part of these financial statements.
60
Statements of Operations
For the year ended October 31, 2012
| | | | | | | | | | | | | | | | |
| | International
Real Estate
Equity Fund | | Realty
Income &
Growth Fund | | Cyclical
Advantage
Property Fund | |
| | | | | | | |
INVESTMENT INCOME: | | | | | | | | | | |
Dividend income | | | $ | 6,277,354 | | | | $ | 4,479,277 | | | | $ | 1,046,196 | | |
Less: Foreign taxes withheld | | | | (222,971 | ) | | | | (50,694 | ) | | | | (52,132 | ) | |
Interest income | | | | 37,777 | | | | | — | | | | | 317 | | |
| | | | | | | | | | | | | | | | |
Total investment income | | | | 6,092,160 | | | | | 4,428,583 | | | | | 994,381 | | |
| | | | | | | | | | | | | | | | |
| | | | | | | | | | | | | | | | |
EXPENSES: | | | | | | | | | | | | | | | | |
Investment advisory fee (Note 6) | | | | 3,066,833 | | | | | 1,069,609 | | | | | 515,745 | | |
Administrative fee (Note 6) | | | | 65,650 | | | | | 22,802 | | | | | 10,375 | | |
Distribution fees—Class A (Note 5) | | | | 238 | | | | | 233 | | | | | — | | |
Transfer agent fees | | | | 414,743 | | | | | 145,644 | | | | | 86,702 | | |
Interest (Note 2) | | | | 258,398 | | | | | 85,358 | | | | | 6,989 | | |
Printing and mailing fees | | | | 191,722 | | | | | 45,056 | | | | | 29,448 | | |
Accounting and custody fees | | | | 180,024 | | | | | 9,122 | | | | | 34,639 | | |
Legal fees | | | | 109,451 | | | | | 29,924 | | | | | 31,416 | | |
Registration and filing fees | | | | 37,840 | | | | | 37,641 | | | | | 29,946 | | |
Audit and tax fees | | | | 64,687 | | | | | 20,521 | | | | | 16,266 | | |
Trustee fees | | | | 49,719 | | | | | 15,425 | | | | | 7,409 | | |
Other fees | | | | 80,340 | | | | | 22,866 | | | | | 12,389 | | |
| | | | | | | | | | | | | | | | |
Total expenses | | | | 4,519,645 | | | | | 1,504,201 | | | | | 781,324 | | |
| | | | | | | | | | | | | | | | |
Net investment income | | | | 1,572,515 | | | | | 2,924,382 | | | | | 213,057 | | |
| | | | | | | | | | | | | | | | |
| | | | | | | | | | | | | | | | |
REALIZED AND UNREALIZED GAIN (LOSS) ON INVESTMENTS AND FOREIGN CURRENCY: | | | | | | | | | | | | | | | | |
Net realized gain (loss) on: | | | | | | | | | | | | | | | | |
Investments | | | | (38,257,364 | ) | | | | 6,402,733 | | | | | 5,047,499 | | |
Foreign currency transactions | | | | 308,893 | | | | | 1,850 | | | | | (16,081 | ) | |
| | | | | | | | | | | | | | | | |
Net realized gain (loss) on investments and foreign currency | | | | (37,948,471 | ) | | | | 6,404,583 | | | | | 5,031,418 | | |
| | | | | | | | | | | | | | | | |
Change in net unrealized appreciation/depreciation on: | | | | | | | | | | | | | | | | |
Investments | | | | 66,958,376 | | | | | 6,919,661 | | | | | 9,118,137 | | |
Foreign currency translations | | | | (36,740 | ) | | | | 72 | | | | | (659 | ) | |
| | | | | | | | | | | | | | | | |
Net change in unrealized appreciation/depreciation on investments and foreign currency | | | | 66,921,636 | | | | | 6,919,733 | | | | | 9,117,478 | | |
| | | | | | | | | | | | | | | | |
Net gain on investments and foreign currency | | | | 28,973,165 | | | | | 13,324,316 | | | | | 14,148,896 | | |
| | | | | | | | | | | | | | | | |
Increase in net assets from operations | | | $ | 30,545,680 | | | | $ | 16,248,698 | | | | $ | 14,361,953 | | |
| | | | | | | | | | | | | | | | |
The accompanying notes are an integral part of these financial statements.
61
Statements of Operations—Continued
For the year ended October 31, 2012
| | | | | | | | | | | | | | | | |
| | Emerging
Markets Real
Estate Fund | | Global
Infrastructure
Fund | | Global
Consumer
Growth Fund | |
| | | | | | | |
INVESTMENT INCOME: | | | | | | | | | | |
Dividend income | | | $ | 100,067 | | | | $ | 2,468,267 | | | | $ | 38,630 | | |
Less: Foreign taxes withheld | | | | (3,947 | ) | | | | (116,132 | ) | | | | (1,945 | ) | |
Interest income | | | | 27 | | | | | 268 | | | | | 5 | | |
| | | | | | | | | | | | | | | | |
Total investment income | | | | 96,147 | | | | | 2,352,403 | | | | | 36,690 | | |
| | | | | | | | | | | | | | | | |
| | | | | | | | | | | | | | | | |
EXPENSES: | | | | | | | | | | | | | | | | |
Investment advisory fee (Note 6) | | | | 41,284 | | | | | 418,102 | | | | | 21,354 | | |
Administrative fee (Note 6) | | | | 823 | | | | | 8,311 | | | | | 424 | | |
Distribution fees—Class A (Note 5) | | | | 249 | | | | | 1,231 | | | | | 236 | | |
Registration and filing fees | | | | 25,124 | | | | | 31,125 | | | | | 23,688 | | |
Accounting and custody fees | | | | 22,976 | | | | | 27,681 | | | | | 12,571 | | |
Audit and tax fees | | | | 12,299 | | | | | 14,553 | | | | | 9,960 | | |
Transfer agent fees | | | | 10,761 | | | | | 22,425 | | | | | 6,587 | | |
Legal fees | | | | 1,249 | | | | | 9,526 | | | | | 5,882 | | |
Printing and mailing fees | | | | 4,571 | | | | | 10,404 | | | | | 31,761 | | |
Trustee fees | | | | 630 | | | | | 5,305 | | | | | 297 | | |
Interest (Note 2) | | | | 137 | | | | | — | | | | | — | | |
Other fees | | | | 1,984 | | | | | 10,074 | | | | | 1,301 | | |
| | | | | | | | | | | | | | | | |
Total expenses | | | | 122,087 | | | | | 558,737 | | | | | 114,061 | | |
Less: Fee waivers and/or expense reimbursements (Note 6) | | | | (65,965 | ) | | | | (343 | ) | | | | (84,997 | ) | |
| | | | | | | | | | | | | | | | |
Net expenses | | | | 56,122 | | | | | 558,394 | | | | | 29,064 | | |
| | | | | | | | | | | | | | | | |
Net investment income | | | | 40,025 | | | | | 1,794,009 | | | | | 7,626 | | |
| | | | | | | | | | | | | | | | |
| | | | | | | | | | | | | | | | |
REALIZED AND UNREALIZED GAIN (LOSS) ON INVESTMENTS AND FOREIGN CURRENCY: | | | | | | | | | | | | | | | | |
Net realized gain (loss) on: | | | | | | | | | | | | | | | | |
Investments* | | | | 87,667 | | | | | (57,563 | ) | | | | (2,054 | ) | |
Foreign currency transactions | | | | (8,889 | ) | | | | 205,242 | | | | | (325 | ) | |
| | | | | | | | | | | | | | | | |
Net realized gain (loss) on investments and foreign currency | | | | 78,778 | | | | | 147,679 | | | | | (2,379 | ) | |
| | | | | | | | | | | | | | | | |
Change in net unrealized appreciation/depreciation on: | | | | | | | | | | | | | | | | |
Investments | | | | 566,381 | | | | | 4,785,503 | | | | | 256,925 | | |
Foreign currency translations | | | | 841 | | | | | (136,931 | ) | | | | (11 | ) | |
| | | | | | | | | | | | | | | | |
| | | | | | | | | | | | | | | | |
Net change in unrealized appreciation/depreciation on investments and foreign currency | | | | 567,222 | | | | | 4,648,572 | | | | | 256,914 | | |
| | | | | | | | | | | | | | | | |
Net gain on investments and foreign currency | | | | 646,000 | | | | | 4,796,251 | | | | | 254,535 | | |
| | | | | | | | | | | | | | | | |
Increase in net assets from operations | | | $ | 686,025 | | | | $ | 6,590,260 | | | | $ | 262,161 | | |
| | | | | | | | | | | | | | | | |
| | | | | | | | | | | | | | | | |
* Net of foreign capital gains taxes | | | $ | 884 | | | | $ | 10,106 | | | | $ | — | | |
The accompanying notes are an integral part of these financial statements.
62
Statements of Changes in Net Assets
| | | | | | | | | | |
| | International Real Estate Equity Fund |
| | |
| | Year Ended
October 31, 2012 | | Year Ended
October 31, 2011 |
| | | | |
OPERATIONS: | | | | | | | | | | |
Net investment income | | | $ | 1,572,515 | | | | $ | 9,706,575 | |
Net realized gain (loss) on: | | | | | | | | | | |
Investments | | | | (38,257,364 | ) | | | | (50,053,818 | ) |
Foreign currency transactions | | | | 308,893 | | | | | (2,102,194 | ) |
Change in unrealized appreciation/depreciation on: | | | | | | | | | | |
Investments | | | | 66,958,376 | | | | | (46,002,633 | ) |
Foreign currency translations | | | | (36,740 | ) | | | | 29,909 | |
| | | | | | | | | | |
Increase (decrease) in net assets from operations | | | | 30,545,680 | | | | | (88,422,161 | ) |
| | | | | | | | | | |
| | | | | | | | | | |
DISTRIBUTIONS TO SHAREHOLDERS: | | | | | | | | | | |
Distributions to Class A Shareholders: | | | | | | | | | | |
From net investment income | | | | — | | | | | — | |
From net realized gain on investments | | | | — | | | | | — | |
Distributions to Institutional Class Shareholders: | | | | | | | | | | |
From net investment income | | | | (8,892,777 | ) | | | | (15,264,706 | ) |
From net realized gain on investments | | | | — | | | | | — | |
| | | | | | | | | | |
Decrease in net assets from distributions to shareholders | | | | (8,892,777 | ) | | | | (15,264,706 | ) |
| | | | | | | | | | |
| | | | | | | | | | |
CAPITAL SHARE TRANSACTIONS (NOTE 3): | | | | | | | | | | |
Net proceeds from shares sold | | | | 26,097,570 | | | | | 54,635,072 | |
Dividends reinvested | | | | 7,845,139 | | | | | 13,263,510 | |
Redemption fees | | | | 7,621 | | | | | 17,897 | |
Cost of shares redeemed | | | | (110,942,453 | ) | | | | (217,285,470 | ) |
| | | | | | | | | | |
Decrease in net assets from capital share transactions | | | | (76,992,123 | ) | | | | (149,368,991 | ) |
| | | | | | | | | | |
Total decrease in net assets | | | | (55,339,220 | ) | | | | (253,055,858 | ) |
| | | | | | | | | | |
| | | | | | | | | | |
NET ASSETS: | | | | | | | | | | |
Beginning of year | | | | 355,432,587 | | | | | 608,488,445 | |
| | | | | | | | | | |
End of year* | | | $ | 300,093,367 | | | | $ | 355,432,587 | |
| | | | | | | | | | |
* Including (accumulated) undistributed net investment (loss) income of: | | | $ | (4,996,546 | ) | | | $ | 740,808 | |
| | | | | | | | | | |
The accompanying notes are an integral part of these financial statements.
63
Statements of Changes in Net Assets—Continued
| | | | | | | | | | | |
| | Realty Income & Growth Fund | |
| | Year Ended
October 31, 2012 | | Year Ended
October 31, 2011 | |
| | | | | |
OPERATIONS: | | | | | | | | | | | |
Net investment income | | | $ | 2,924,382 | | | | $ | 3,344,712 | | |
Net realized gain (loss) on: | | | | | | | | | | | |
Investments | | | | 6,402,733 | | | | | 8,048,128 | | |
Foreign currency transactions | | | | 1,850 | | | | | 2,249 | | |
Swap contracts | | | | — | | | | | (2,858 | ) | |
Change in unrealized appreciation/depreciation on: | | | | | | | | | | | |
Investments | | | | 6,919,661 | | | | | (1,655,833 | ) | |
Foreign currency translations | | | | 72 | | | | | (5,082 | ) | |
| | | | | | | | | | | |
Increase in net assets from operations | | | | 16,248,698 | | | | | 9,731,316 | | |
| | | | | | | | | | | |
| | | | | | | | | | | |
DISTRIBUTIONS TO SHAREHOLDERS: | | | | | | | | | | | |
Distributions to Class A Shareholders: | | | | | | | | | | | |
From net investment income | | | | (3,340 | ) | | | | — | | |
From net realized gain on investments | | | | — | | | | | — | | |
Distributions to Institutional Class Shareholders: | | | | | | | | | | | |
From net investment income | | | | (4,523,288 | ) | | | | (4,932,978 | ) | |
From net realized gain on investments | | | | — | | | | | — | | |
| | | | | | | | | | | |
Decrease in net assets from distributions to shareholders | | | | (4,526,628 | ) | | | | (4,932,978 | ) | |
| | | | | | | | | | | |
| | | | | | | | | | | |
CAPITAL SHARE TRANSACTIONS (NOTE 3): | | | | | | | | | | | |
Net proceeds from shares sold | | | | 10,733,752 | | | | | 13,192,635 | | |
Dividends reinvested | | | | 4,090,369 | | | | | 4,499,252 | | |
Redemption fees | | | | 3,613 | | | | | 16,325 | | |
Cost of shares redeemed | | | | (21,452,781 | ) | | | | (30,125,866 | ) | |
| | | | | | | | | | | |
Decrease in net assets from capital share transactions | | | | (6,625,047 | ) | | | | (12,417,654 | ) | |
| | | | | | | | | | | |
Total increase (decrease) in net assets | | | | 5,097,023 | | | | | (7,619,316 | ) | |
| | | | | | | | | | | |
| | | | | | | | | | | |
NET ASSETS: | | | | | | | | | | | |
Beginning of year | | | | 101,321,716 | | | | | 108,941,032 | | |
| | | | | | | | | | | |
End of year* | | | $ | 106,418,739 | | | | $ | 101,321,716 | | |
| | | | | | | | | | | |
* Including undistributed net investment income of: | | | $ | — | | | | $ | — | | |
| | | | | | | | | | | |
The accompanying notes are an integral part of these financial statements.
64
Statements of Changes in Net Assets—Continued
| | | | | | | | | | | |
| | Cyclical Advantage Property Fund | |
| | | |
| | Year Ended
October 31, 2012 | | Year Ended
October 31, 2011 | |
| | | | | |
OPERATIONS: | | | | | | | | | | | |
Net investment income | | | $ | 213,057 | | | | $ | 215,210 | | |
Net realized gain (loss) on: | | | | | | | | | | | |
Investments | | | | 5,047,499 | | | | | 419,803 | | |
Foreign currency transactions | | | | (16,081 | ) | | | | 22,772 | | |
Change in unrealized appreciation/depreciation on: | | | | | | | | | | | |
Investments | | | | 9,118,137 | | | | | (6,127,324 | ) | |
Foreign currency translations | | | | (659 | ) | | | | (11,196 | ) | |
| | | | | | | | | | | |
Increase (decrease) in net assets from operations | | | | 14,361,953 | | | | | (5,480,735 | ) | |
| | | | | | | | | | | |
| | | | | | | | | | | |
DISTRIBUTIONS TO SHAREHOLDERS: | | | | | | | | | | | |
From net investment income | | | | (251,458 | ) | | | | (265,892 | ) | |
From net realized gain on investments | | | | — | | | | | — | | |
| | | | | | | | | | | |
Decrease in net assets from distributions to shareholders | | | | (251,458 | ) | | | | (265,892 | ) | |
| | | | | | | | | | | |
| | | | | | | | | | | |
CAPITAL SHARE TRANSACTIONS (NOTE 3): | | | | | | | | | | | |
Net proceeds from shares sold | | | | 1,522,677 | | | | | 1,267,115 | | |
Dividends reinvested | | | | 244,257 | | | | | 256,450 | | |
Redemption fees | | | | 77 | | | | | 109 | | |
Cost of shares redeemed | | | | (5,343,438 | ) | | | | (8,731,566 | ) | |
| | | | | | | | | | | |
Decrease in net assets from capital share transactions | | | | (3,576,427 | ) | | | | (7,207,892 | ) | |
| | | | | | | | | | | |
Total increase (decrease) in net assets | | | | 10,534,068 | | | | | (12,954,519 | ) | |
| | | | | | | | | | | |
| | | | | | | | | | | |
NET ASSETS: | | | | | | | | | | | |
Beginning of year | | | | 49,089,595 | | | | | 62,044,114 | | |
| | | | | | | | | | | |
End of year* | | | $ | 59,623,663 | | | | $ | 49,089,595 | | |
| | | | | | | | | | | |
* Including accumulated net investment loss of: | | | $ | (48,290 | ) | | | $ | (26,726 | ) | |
| | | | | | | | | | | |
The accompanying notes are an integral part of these financial statements.
65
Statements of Changes in Net Assets—Continued
| | | | | | | | | | | |
| | Emerging Markets Real Estate Fund | |
| | | |
| | Year Ended
October 31, 2012 | | Year Ended
October 31, 2011 | |
| | | | | |
OPERATIONS: | | | | | | | | | | | |
Net investment income | | | $ | 40,025 | | | | $ | 24,617 | | |
Net realized gain (loss) on: | | | | | | | | | | | |
Investments | | | | 87,667 | | | | | (173,308 | ) | |
Foreign currency transactions | | | | (8,889 | ) | | | | (5,340 | ) | |
Change in unrealized appreciation/depreciation on: | | | | | | | | | | | |
Investments | | | | 566,381 | | | | | (815,864 | ) | |
Foreign currency translations | | | | 841 | | | | | (2,583 | ) | |
| | | | | | | | | | | |
Increase (decrease) in net assets from operations | | | | 686,025 | | | | | (972,478 | ) | |
| | | | | | | | | | | |
| | | | | | | | | | | |
DISTRIBUTIONS TO SHAREHOLDERS: | | | | | | | | | | | |
Distributions to Class A Shareholders: | | | | | | | | | | | |
From net investment income | | | | — | | | | | — | | |
From net realized gain on investments | | | | — | | | | | — | | |
Distributions to Institutional Class Shareholders: | | | | | | | | | | | |
From net investment income | | | | — | | | | | (15,201 | ) | |
From net realized gain on investments | | | | — | | | | | (250,000 | ) | |
| | | | | | | | | | | |
Decrease in net assets from distributions to shareholders | | | | — | | | | | (265,201 | ) | |
| | | | | | | | | | | |
| | | | | | | | | | | |
CAPITAL SHARE TRANSACTIONS (NOTE 3): | | | | | | | | | | | |
Net proceeds from shares sold | | | | 505,557 | | | | | 3,315,249 | | |
Dividends reinvested | | | | — | | | | | 256,293 | | |
Redemption fees | | | | 560 | | | | | 569 | | |
Cost of shares redeemed | | | | (1,053,041 | ) | | | | (1,314,069 | ) | |
| | | | | | | | | | | |
Increase (decrease) in net assets from capital share transactions | | | | (546,924 | ) | | | | 2,258,042 | | |
| | | | | | | | | | | |
Total increase in net assets | | | | 139,101 | | | | | 1,020,363 | | |
| | | | | | | | | | | |
| | | | | | | | | | | |
NET ASSETS: | | | | | | | | | | | |
Beginning of year | | | | 4,288,879 | | | | | 3,268,516 | | |
| | | | | | | | | | | |
End of year* | | | $ | 4,427,980 | | | | $ | 4,288,879 | | |
| | | | | | | | | | | |
* Including undistributed (accumulated) net investment income (loss) of: | | | $ | 11,439 | | | | $ | (65,762 | ) | |
| | | | | | | | | | | |
The accompanying notes are an integral part of these financial statements.
66
Statements of Changes in Net Assets—Continued
| | | | | | | | | | | |
| | Global Infrastructure Fund | |
| | | |
| | Year Ended
October 31, 2012 | | Year Ended
October 31, 2011 | |
| | | | | |
OPERATIONS: | | | | | | | | | | | |
Net investment income | | | $ | 1,794,009 | | | | $ | 474,566 | | |
Net realized gain (loss) on: | | | | | | | | | | | |
Investments | | | | (57,563 | ) | | | | (712,139 | ) | |
Foreign currency transactions | | | | 205,242 | | | | | (10,847 | ) | |
Change in unrealized appreciation/depreciation on: | | | | | | | | | | | |
Investments | | | | 4,785,503 | | | | | (1,447,571 | ) | |
Foreign currency translations | | | | (136,931 | ) | | | | (3,679 | ) | |
| | | | | | | | | | | |
Increase (decrease) in net assets from operations | | | | 6,590,260 | | | | | (1,699,670 | ) | |
| | | | | | | | | | | |
| | | | | | | | | | | |
DISTRIBUTIONS TO SHAREHOLDERS: | | | | | | | | | | | |
Distributions to Class A Shareholders: | | | | | | | | | | | |
From net investment income | | | | (21,335 | ) | | | | — | | |
From net realized gain on investments | | | | — | | | | | — | | |
Distributions to Institutional Class Shareholders: | | | | | | | | | | | |
From net investment income | | | | (1,754,166 | ) | | | | (460,750 | ) | |
From net realized gain on investments | | | | — | | | | | (75,954 | ) | |
From tax return of capital | | | | — | | | | | (8,682 | ) | |
| | | | | | | | | | | |
Decrease in net assets from distributions to shareholders | | | | (1,775,501 | ) | | | | (545,386 | ) | |
| | | | | | | | | | | |
| | | | | | | | | | | |
CAPITAL SHARE TRANSACTIONS (NOTE 3): | | | | | | | | | | | |
Net proceeds from shares sold | | | | 23,939,376 | | | | | 33,763,890 | | |
Dividends reinvested | | | | 1,358,204 | | | | | 498,618 | | |
Redemption fees | | | | 2,368 | | | | | 1,381 | | |
Cost of shares redeemed | | | | (10,424,061 | ) | | | | (5,235,409 | ) | |
| | | | | | | | | | | |
Increase in net assets from capital share transactions | | | | 14,875,887 | | | | | 29,028,480 | | |
| | | | | | | | | | | |
Total increase in net assets | | | | 19,690,646 | | | | | 26,783,424 | | |
| | | | | | | | | | | |
| | | | | | | | | | | |
NET ASSETS: | | | | | | | | | | | |
Beginning of year | | | | 29,028,400 | | | | | 2,244,976 | | |
| | | | | | | | | | | |
End of year* | | | $ | 48,719,046 | | | | $ | 29,028,400 | | |
| | | | | | | | | | | |
* Including undistributed (accumulated) net investment income (loss) of: | | | $ | — | | | | $ | (2,962 | ) | |
| | | | | | | | | | | |
The accompanying notes are an integral part of these financial statements.
67
Statements of Changes in Net Assets—Continued
| | | | | | | | | | | |
| | Global Consumer Growth Fund | |
| | | |
| | Year Ended
October 31, 2012 | | Period Ended
October 31, 2011(1) | |
| | | | | |
OPERATIONS: | | | | | | | | | | | |
Net investment income | | | $ | 7,626 | | | | $ | 9,005 | | |
Net realized loss on: | | | | | | | | | | | |
Investments | | | | (2,054 | ) | | | | (46,230 | ) | |
Foreign currency transactions | | | | (325 | ) | | | | (415 | ) | |
Change in unrealized appreciation/depreciation on: | | | | | | | | | | | |
Investments | | | | 256,925 | | | | | (45,176 | ) | |
Foreign currency translations | | | | (11 | ) | | | | 7 | | |
| | | | | | | | | | | |
Increase (decrease) in net assets from operations | | | | 262,161 | | | | | (82,809 | ) | |
| | | | | | | | | | | |
| | | | | | | | | | | |
DISTRIBUTIONS TO SHAREHOLDERS: | | | | | | | | | | | |
Distributions to Class A Shareholders: | | | | | | | | | | | |
From net investment income | | | | — | | | | | — | | |
From net realized gain on investments | | | | — | | | | | — | | |
Distributions to Institutional Class Shareholders: | | | | | | | | | | | |
From net investment income | | | | (7,862 | ) | | | | — | | |
From net realized gain on investments | | | | — | | | | | — | | |
| | | | | | | | | | | |
Decrease in net assets from distributions to shareholders | | | | (7,862 | ) | | | | — | | |
| | | | | | | | | | | |
| | | | | | | | | | | |
CAPITAL SHARE TRANSACTIONS (NOTE 3): | | | | | | | | | | | |
Net proceeds from shares sold | | | | 124,200 | | | | | 2,027,480 | | |
Dividends reinvested | | | | 7,862 | | | | | — | | |
| | | | | | | | | | | |
Increase in net assets from capital share transactions | | | | 132,062 | | | | | 2,027,480 | | |
| | | | | | | | | | | |
Total increase in net assets | | | | 386,361 | | | | | 1,944,671 | | |
| | | | | | | | | | | |
| | | | | | | | | | | |
NET ASSETS: | | | | | | | | | | | |
Beginning of period | | | | 1,944,671 | | | | | — | | |
| | | | | | | | | | | |
End of period* | | | $ | 2,331,032 | | | | $ | 1,944,671 | | |
| | | | | | | | | | | |
* Including undistributed net investment income of: | | | $ | 7,301 | | | | $ | 7,862 | | |
| | | | | | | | | | | |
(1) Fund commenced operations on December 29, 2010. | | | | | | | | | | | |
The accompanying notes are an integral part of these financial statements.
68
Financial Highlights
(For a share outstanding throughout the period)
| | | | | | |
| | International
Real Estate
Equity Fund | |
| | | |
| | Period Ended
October 31, 2012 (a) | |
| | | |
Class A Shares: | | | | | | |
Net asset value per share, beginning of period | | | $ | 17.92 | | |
| | | | | | |
Income from investment operations: | | | | | | |
Net investment income | | | | 0.08 | | |
Net realized and unrealized gain on investments | | | | 4.19 | | |
| | | | | | |
Total from investment operations | | | | 4.27 | | |
| | | | | | |
Redemption fees | | | | — | | |
Less distributions from: | | | | | | |
Net investment income | | | | — | | |
Net realized gains on investments | | | | — | | |
Tax return of capital | | | | — | | |
| | | | | | |
Total distributions | | | | — | | |
| | | | | | |
Net asset value per share, end of period | | | $ | 22.19 | | |
| | | | | | |
Total return | | | | 23.83 | %(b) | |
Ratios/Supplemental Data | | | | | | |
Net Assets at end of period (000) | | | $ | 128 | | |
Ratio of total expenses to average net assets | | | | 1.72 | %(c) | |
Ratio of interest expense to average net assets | | | | 0.08 | %(c) | |
Ratio of expenses to average net assets excluding interest expense | | | | 1.64 | %(c) | |
Ratio of net investment income to average net assets | | | | 0.48 | %(c) | |
Portfolio turnover (d) | | | | 12 | % | |
| | |
| | |
|
(a) | Class A commenced operations on December 30, 2011.
|
(b) | Not annualized.
|
(c) | Annualized.
|
(d) | Portfolio turnover is calculated on the basis of the Fund as a whole, without distinguishing between classes of shares issued. |
The accompanying notes are an integral part of these financial statements.
69
Financial Highlights—Continued
(For a share outstanding throughout each year)
| | | | | | | | | | | | | | | | |
| | | |
| | International Real Estate Equity Fund | |
| | | |
| | Year Ended October 31, | |
| | | |
| | 2012 | | 2011 | | 2010 | | 2009 | | 2008 | |
| | | | | | | | | | | |
Institutional Class Shares: | | | | | | | | | | | | | | | | |
Net asset value per share, beginning of year | | $ | 20.53 | | $ | 25.75 | | $ | 22.59 | | $ | 12.26 | | $ | 47.58 | |
| | | | | | | | | | | | | | | | |
Income from investment operations: | | | | | | | | | | | | | | | | |
Net investment income (loss) | | | 0.01 | | | 0.30 | | | (0.08 | ) | | 0.20 | (a) | | 0.35 | (a) |
Net realized and unrealized gains (losses) on investments | | | 2.23 | | | (4.84 | ) | | 4.03 | | | 10.12 | | | (33.05 | ) |
| | | | | | | | | | | | | | | | |
Total from investment operations | | | 2.24 | | | (4.54 | ) | | 3.95 | | | 10.32 | | | (32.70 | ) |
| | | | | | | | | | | | | | | | |
Redemption fees | | | 0.00 | (b) | | 0.00 | (b) | | 0.00 | (b) | | 0.01 | | | 0.01 | |
Less distributions from: | | | | | | | | | | | | | | | | |
Net investment income | | | (0.54 | ) | | (0.68 | ) | | (0.79 | ) | | — | | | (0.45 | ) |
Net realized gains on investments | | | — | | | — | | | — | | | — | | | (2.10 | ) |
Tax return of capital | | | — | | | — | | | — | | | — | | | (0.08 | ) |
| | | | | | | | | | | | | | | | |
Total distributions | | | (0.54 | ) | | (0.68 | ) | | (0.79 | ) | | — | | | (2.63 | ) |
| | | | | | | | | | | | | | | | |
Net asset value per share, end of year | | $ | 22.23 | | $ | 20.53 | | $ | 25.75 | | $ | 22.59 | | $ | 12.26 | |
| | | | | | | | | | | | | | | | |
| | | | | | | | | | | | | | | | |
Total return | | | 11.57 | % | | –18.17 | % | | 18.07 | % | | 84.26 | % | | –72.46 | % |
Ratios/Supplemental Data: | | | | | | | | | | | | | | | | |
Net Assets at end of year (000) | | $ | 299,965 | | $ | 355,433 | | $ | 608,488 | | $ | 730,844 | | $ | 583,953 | |
Ratio of total expenses to average net assets | | | 1.47 | % | | 1.37 | % | | 1.28 | % | | 1.26 | % | | 1.22 | % |
Ratio of interest expense to average net assets | | | 0.08 | % | | 0.11 | % | | 0.08 | % | | 0.07 | % | | 0.06 | % |
Ratio of expenses to average net assets excluding interest expense | | | 1.39 | % | | 1.26 | % | | 1.20 | % | | 1.19 | % | | 1.16 | % |
Ratio of net investment income to average net assets | | | 0.51 | % | | 1.89 | % | | 0.32 | % | | 1.13 | % | | 1.29 | % |
Portfolio turnover (c) | | | 12 | % | | 20 | % | | 34 | % | | 51 | % | | 42 | % |
| | |
| | |
|
(a) | Net investment income (loss) per share is calculated using ending balances after consideration of adjustments for permanent book and tax differences.
|
(b) | The amount is less than $0.005 per share.
|
(c) | Portfolio turnover is calculated on the basis of the Fund as a whole, without distinguishing between classes of shares issued. |
The accompanying notes are an integral part of these financial statements.
70
Financial Highlights—Continued
(For a share outstanding throughout the period)
| | | | | | |
| | Realty Income
& Growth Fund | |
| | | |
| | Period Ended
October 31, 2012 (a) | |
| | | |
Class A Shares: | | | | | | |
Net asset value per share, beginning of period | | | $ | 15.60 | | |
| | | | | | |
Income from investment operations: | | | | | | |
Net investment income | | | | 0.32 | | |
Net realized and unrealized gain on investments | | | | 1.95 | | |
| | | | | | |
Total from investment operations | | | | 2.27 | | |
| | | | | | |
Redemption fees | | | | 0.00 | (b) | |
Less distributions: | | | | | | |
From net investment income | | | | (0.52 | ) | |
From net realized gain on investments | | | | — | | |
From tax return of capital | | | | — | | |
| | | | | | |
Total distributions | | | | (0.52 | ) | |
| | | | | | |
Net asset value per share, end of period | | | $ | 17.35 | | |
| | | | | | |
Total return | | | | 14.53 | %(c) | |
Ratios/Supplemental Data | | | | | | |
Net Assets at end of period (000) | | | $ | 115 | | |
Ratio of total expenses to average net assets | | | | 1.66 | %(d) | |
Ratio of interest expense to average net assets | | | | 0.08 | %(d) | |
Ratio of expenses to average net assets excluding interest expense | | | | 1.58 | %(d) | |
Ratio of net investment income to average net assets | | | | 2.18 | %(d) | |
Portfolio turnover rate (e) | | | | 28 | % | |
| | |
| | |
|
(a) | Class A commenced operations on December 30, 2011.
|
(b) | The amount is less than $0.005 per share.
|
(c) | Not annualized.
|
(d) | Annualized.
|
(e) | Portfolio turnover is calculated on the basis of the Fund as a whole, without distinguishing between classes of shares issued. |
The accompanying notes are an integral part of these financial statements.
71
Financial Highlights—Continued
(For a share outstanding throughout each year)
| | | | | | | | | | | | | | | | |
| | | |
| | Realty Income & Growth Fund | |
| | | |
| | Year Ended October 31, | |
| | | |
| | 2012 | | 2011 | | 2010 | | 2009 | | 2008 | |
| | | | | | | | | | | |
Institutional Class Shares: | | | | | | | | | | | | | | | | |
Net asset value per share, beginning of year | | $ | 15.56 | | $ | 14.79 | | $ | 10.89 | | $ | 9.95 | | $ | 25.12 | |
| | | | | | | | | | | | | | | | |
Income from investment operations: | | | | | | | | | | | | | | | | |
Net investment income | | | 0.46 | | | 0.48 | | | 0.56 | | | 0.79 | (a) | | 0.99 | (a) |
Net realized and unrealized gains (losses) on investments | | | 2.07 | | | 1.01 | | | 4.06 | | | 0.94 | | | (13.46 | ) |
| | | | | | | | | | | | | | | | |
Total from investment operations | | | 2.53 | | | 1.49 | | | 4.62 | | | 1.73 | | | (12.47 | ) |
| | | | | | | | | | | | | | | | |
Redemption fees | | | 0.00 | (b) | | 0.00 | (b) | | 0.00 | (b) | | 0.00 | (b) | | 0.00 | (b) |
Less distributions: | | | | | | | | | | | | | | | | |
From net investment income | | | (0.72 | ) | | (0.72 | ) | | (0.65 | ) | | (0.62 | ) | | (0.99 | ) |
From net realized gains on investments | | | — | | | — | | | (0.07 | ) | | — | | | (1.71 | ) |
From tax return of capital | | | — | | | — | | | — | | | (0.17 | ) | | — | |
| | | | | | | | | | | | | | | | |
Total distributions | | | (0.72 | ) | | (0.72 | ) | | (0.72 | ) | | (0.79 | ) | | (2.70 | ) |
| | | | | | | | | | | | | | | | |
Net asset value per share, end of year | | $ | 17.37 | | $ | 15.56 | | $ | 14.79 | | $ | 10.89 | | $ | 9.95 | |
| | | | | | | | | | | | | | | | |
Total return | | | 16.44 | % | | 10.23 | % | | 43.51 | % | | 20.23 | % | | –54.62 | % |
Ratios/Supplemental Data: | | | | | | | | | | | | | | | | |
Net Assets at end of year (000) | | $ | 106,304 | | $ | 101,322 | | $ | 108,941 | | $ | 84,795 | | $ | 95,270 | |
Ratio of total expenses to average net assets: | | | | | | | | | | | | | | | | |
Before waivers and/or expense reimbursements | | | 1.41 | % | | 1.32 | % | | 1.34 | % | | 1.39 | % | | 1.56 | % |
After waivers and/or expense reimbursements | | | 1.41 | % | | 1.32 | % | | 1.34 | % | | 1.39 | % | | 1.43 | % |
Ratio of interest expense to average net assets | | | 0.08 | % | | 0.09 | % | | 0.10 | % | | 0.12 | % | | 0.40 | % |
Ratio of expenses to average net assets excluding | | | | | | | | | | | | | | | | |
interest expense: | | | | | | | | | | | | | | | | |
Before waivers and/or expense reimbursements | | | 1.33 | % | | 1.23 | % | | 1.24 | % | | 1.27 | % | | 1.16 | % |
After waivers and/or expense reimbursements | | | 1.33 | % | | 1.23 | % | | 1.24 | % | | 1.27 | % | | 1.03 | % |
Ratio of net investment income to average net assets | | | 2.73 | % | | 3.09 | % | | 4.24 | % | | 8.57 | % | | 5.55 | % |
Portfolio turnover (c) | | | 28 | % | | 59 | % | | 70 | % | | 111 | % | | 23 | % |
| | |
| | |
|
(a) | Net investment income per share is calculated using ending balances after consideration of adjustments for permanent book and tax differences.
|
(b) | The amount is less than $0.005 per share.
|
(c) | Portfolio turnover is calculated on the basis of the Fund as a whole, without distinguishing between classes of shares issued. |
The accompanying notes are an integral part of these financial statements.
72
Financial Highlights—Continued
(For a share outstanding throughout each year)
| | | | | | | | | | | | | | | | |
| | | |
| | Cyclical Advantage Property Fund | |
| | | |
| | Year Ended October 31, | |
| | | |
| | 2012 | | 2011 | | 2010 | | 2009 | | 2008 | |
| | | | | | | | | | | |
Institutional Class Shares: | | | | | | | | | | | | | | | | |
Net asset value per share, beginning of year | | $ | 18.13 | | $ | 20.27 | | $ | 16.65 | | $ | 13.86 | | $ | 34.97 | |
| | | | | | | | | | | | | | | | |
Income from investment operations: | | | | | | | | | | | | | | | | |
Net investment income | | | 0.07 | | | 0.07 | | | 0.09 | | | 0.26 | (a) | | 0.53 | (a) |
Net realized and unrealized gains (losses) on investments | | | 5.53 | | | (2.12 | ) | | 3.77 | | | 2.65 | | | (21.11 | ) |
| | | | | | | | | | | | | | | | |
Total from investment operations | | | 5.60 | | | (2.05 | ) | | 3.86 | | | 2.91 | | | (20.58 | ) |
| | | | | | | | | | | | | | | | |
Redemption fees | | | 0.00 | (b) | | 0.00 | (b) | | 0.00 | (b) | | 0.00 | (b) | | 0.00 | (b) |
Less distributions: | | | | | | | | | | | | | | | | |
From net investment income | | | (0.09 | ) | | (0.09 | ) | | (0.24 | ) | | (0.12 | ) | | (0.43 | ) |
From tax return of capital | | | — | | | — | | | — | | | — | | | (0.10 | ) |
| | | | | | | | | | | | | | | | |
Total distributions | | | (0.09 | ) | | (0.09 | ) | | (0.24 | ) | | (0.12 | ) | | (0.53 | ) |
| | | | | | | | | | | | | | | | |
Net asset value per share, end of year | | $ | 23.64 | | $ | 18.13 | | $ | 20.27 | | $ | 16.65 | | $ | 13.86 | |
| | | | | | | | | | | | | | | | |
Total return | | | 31.11 | % | | –10.19 | % | | 23.36 | % | | 21.14 | % | | –59.54 | % |
Ratios/Supplemental Data: | | | | | | | | | | | | | | | | |
Net Assets at end of year (000) | | $ | 59,624 | | $ | 49,090 | | $ | 62,044 | | $ | 55,064 | | $ | 47,405 | |
Ratio of total expenses to average net assets | | | 1.51 | % | | 1.38 | % | | 1.32 | % | | 1.45 | % | | 1.70 | % |
Ratio of interest expense to average net assets | | | 0.01 | % | | 0.03 | % | | 0.02 | % | | 0.11 | % | | 0.50 | % |
Ratio of expenses to average net assets excluding interest expense | | | 1.50 | % | | 1.35 | % | | 1.30 | % | | 1.34 | % | | 1.20 | % |
Ratio of net investment income to average net assets | | | 0.41 | % | | 0.36 | % | | 0.51 | % | | 2.28 | % | | 2.68 | % |
Portfolio turnover | | | 24 | % | | 59 | % | | 90 | % | | 135 | % | | 68 | % |
| | |
| | |
|
(a) | Net investment income (loss) per share is calculated using ending balances after consideration of adjustments for permanent book and tax differences.
|
(b) | The amount is less than $0.005 per share. |
The accompanying notes are an integral part of these financial statements.
73
Financial Highlights—Continued
(For a share outstanding throughout the period)
| | | | | | |
| | Emerging Markets
Real Estate Fund | |
| | | |
| | Period Ended
October 31, 2012 (a) | |
| | | |
Class A Shares: | | | | | | |
Net asset value per share, beginning of period | | | $ | 13.45 | | |
| | | | | | |
Income from investment operations: | | | | | | |
Net investment income | | | | 0.13 | | |
Net realized and unrealized gain on investments | | | | 3.55 | | |
| | | | | | |
Total from investment operations | | | | 3.68 | | |
| | | | | | |
Redemption fees | | | | — | | |
Less distributions from: | | | | | | |
Net investment income | | | | — | | |
Net realized gains on investments | | | | — | | |
| | | | | | |
Total distributions | | | | — | | |
| | | | | | |
Net asset value per share, end of period | | | $ | 17.13 | | |
| | | | | | |
Total return | | | | 27.36 | %(b) | |
Ratios/Supplemental Data | | | | | | |
Net Assets at end of period (000) | | | $ | 140 | | |
Ratio of total expenses to average net assets: | | | | | | |
Before waivers and/or expense reimbursements | | | | 3.01 | %(c) | |
After waivers and/or expense reimbursements | | | | 1.61 | %(c) | |
Ratio of interest expense to average net assets | | | | 0.00 | %(c)(d) | |
Ratio of expenses to average net assets excluding interest expense: | | | | | | |
Before waivers and/or expense reimbursements | | | | 3.01 | %(c) | |
After waivers and/or expense reimbursements | | | | 1.61 | %(c) | |
Ratio of net investment income to average net assets | | | | 1.05 | %(c) | |
Portfolio turnover rate (e) | | | | 102 | % | |
| | |
| | |
|
(a) | Class A commenced operations on December 30, 2011.
|
(b) | Not annualized.
|
(c) | Annualized.
|
(d) | The amount is less than $0.005 per share or 0.005%.
|
(e) | Portfolio turnover is calculated on the basis of the Fund as a whole, without distinguishing between classes of shares issued. |
The accompanying notes are an integral part of these financial statements.
74
Financial Highlights—Continued
(For a share outstanding throughout each period)
| | | | | | | | | | | | | | | |
| | | |
| | Emerging Markets Real Estate Fund | |
| | | |
| | | | | | | | | | | Period
Ended
October 31,
2009 (a) | |
| | | | | | | | | | | |
| | Year Ended October 31, | | |
| | | | |
| | 2012 | | 2011 | | 2010 | | |
| | | | | | | | | |
Institutional Class Shares: | | | | | | | | | | | | | | | |
Net asset value per share, beginning of period | | $ | 14.68 | | $ | 19.20 | | $ | 17.03 | | | $ | 10.00 | | |
| | | | | | | | | | | | | | | |
Income from investment operations: | | | | | | | | | | | | | | | |
Net investment income (loss) | | | 0.12 | | | 0.40 | | | 0.27 | | | | (0.08 | )(b) | |
Net realized and unrealized gains (losses) on investments | | | 2.36 | | | (3.47 | ) | | 3.43 | | | | 7.10 | | |
| | | | | | | | | | | | | | | |
Total from investment operations | | | 2.48 | | | (3.07 | ) | | 3.70 | | | | 7.02 | | |
| | | | | | | | | | | | | | | |
Redemption fees | | | 0.00 | (c) | | 0.00 | (c) | | 0.00 | (c) | | | 0.01 | | |
Less distributions from: | | | | | | | | | | | | | | | |
Net investment income | | | — | | | (0.08 | ) | | (0.87 | ) | | | — | | |
Net realized gains on investments | | | — | | | (1.37 | ) | | (0.66 | ) | | | — | | |
| | | | | | | | | | | | | | | |
Total distributions | | | — | | | (1.45 | ) | | (1.53 | ) | | | — | | |
| | | | | | | | | | | | | | | |
Net asset value per share, end of period | | $ | 17.16 | | $ | 14.68 | | $ | 19.20 | | | $ | 17.03 | | |
| | | | | | | | | | | | | | | |
Total return | | | 16.89 | % | –17.52 | % | | 23.53 | % | | | 70.30 | %(d) | |
Ratios/Supplemental Data: | | | | | | | | | | | | | | | |
Net Assets at end of period (000) | | $ | 4,288 | | $ | 4,289 | | $ | 3,269 | | | $ | 2,047 | | |
Ratio of total expenses to average net assets: | | | | | | | | | | | | | | | |
Before waivers and/or expense reimbursements | | | 2.95 | % | | 2.42 | % | | 2.68 | % | | | 4.36 | %(e) | |
After waivers and/or expense reimbursements | | | 1.35 | % | | 1.35 | % | | 1.35 | % | | | 1.35 | %(e) | |
Ratio of interest expense to average net assets | | | 0.00 | %(c) | | 0.00 | %(c) | | 0.00 | % | | | 0.00 | % | |
Ratio of expenses to average net assets excluding interest expense: | | | | | | | | | | | | | | | |
Before waivers and/or expense reimbursements | | | 2.95 | % | | 2.42 | % | | 2.68 | % | | | 4.36 | %(e) | |
After waivers and/or expense reimbursements | | | 1.35 | % | | 1.35 | % | | 1.35 | % | | | 1.35 | %(e) | |
Ratio of net investment income (loss) to average net assets | | | 0.97 | % | | 0.54 | % | | 0.13 | % | | | (0.76 | )%(e) | |
Portfolio turnover (f) | | | 102 | % | | 58 | % | | 77 | % | | | 35 | %(d) | |
| | |
| | |
|
(a) | For the period from November 3, 2008 (inception of fund) to October 31, 2009.
|
(b) | Net investment income per share is calculated using ending balances after consideration of adjustments for permanent book and tax differences.
|
(c) | The amount is less than $0.005 per share or 0.005%.
|
(d) | Not annualized.
|
(e) | Annualized.
|
(f) | Portfolio turnover is calculated on the basis of the Fund as a whole, without distinguishing between classes of shares issued. |
The accompanying notes are an integral part of these financial statements.
75
Financial Highlights—Continued
(For a share outstanding throughout the period)
| | | | | | |
| | Global
Infrastructure
Fund | |
| | | |
| | Period Ended
October 31, 2012 (a) | |
| | | |
Class A Shares: | | | | | | |
Net asset value per share, beginning of period | | | $ | 13.91 | | |
| | | | | | |
Income from investment operations: | | | | | | |
Net investment income | | | | 0.43 | | |
Net realized and unrealized gain on investments | | | | 2.04 | | |
| | | | | | |
Total from investment operations | | | | 2.47 | | |
| | | | | | |
Redemption fees | | | | 0.00 | (b) | |
Less distributions: | | | | | | |
From net investment income | | | | (0.46 | ) | |
From net realized gains on investments | | | | — | | |
From tax return of capital | | | | — | | |
| | | | | | |
Total distributions | | | | (0.46 | ) | |
| | | | | | |
Net asset value per share, end of period | | | $ | 15.92 | | |
| | | | | | |
Total return | | | | 17.94 | %(c) | |
Ratios/Supplemental Data | | | | | | |
Net Assets at end of period (000) | | | $ | 1,721 | | |
Ratio of total expenses to average net assets: | | | | | | |
Before waivers and/or expense reimbursements | | | | 1.67 | %(d) | |
After waivers and/or expense reimbursements | | | | 1.60 | %(d) | |
Ratio of net investment income to average net assets | | | | 3.67 | %(d) | |
Portfolio turnover rate (e) | | | | 148 | % | |
| | |
| | |
|
(a) | Class A commenced operations on December 30, 2011.
|
(b) | The amount is less than $0.005 per share.
|
(c) | Not annualized.
|
(d) | Annualized.
|
(e) | Portfolio turnover is calculated on the basis of the Fund as a whole, without distinguishing between classes of shares issued. |
The accompanying notes are an integral part of these financial statements.
76
Financial Highlights—Continued
(For a share outstanding throughout each period)
| | | | | | | | | | | | | | | |
| | | |
| | Global Infrastructure Fund | |
| | | |
| | | | Period
Ended
October 31,
2009 (a) | |
| | | | |
| | Year Ended October 31, | | |
| | | | |
| | 2012 | | 2011 | | 2010 | | |
| | | | | | | | | |
Institutional Class Shares: | | | | | | | | | | | | | | | |
Net asset value per share, beginning of period | | $ | 14.32 | | $ | 15.98 | | $ | 13.38 | | | $ | 10.00 | | |
| | | | | | | | | | | | | | | |
Income from investment operations: | | | | | | | | | | | | | | | |
Net investment income | | | 0.65 | | | 0.61 | | | 0.43 | | | | 0.19 | (b) | |
Net realized and unrealized gains (losses) on investments | | | 1.60 | | | (0.72 | ) | | 3.40 | | | | 3.19 | | |
| | | | | | | | | | | | | | | |
Total from investment operations | | | 2.25 | | | (0.11 | ) | | 3.83 | | | | 3.38 | | |
| | | | | | | | | | | | | | | |
Redemption fees | | | 0.00 | (c) | | 0.00 | (c) | | — | | | | 0.00 | (c) | |
Less distributions: | | | | | | | | | | | | | | | |
From net investment income | | | (0.64 | ) | | (0.99 | ) | | (0.20 | ) | | | — | | |
From net realized gains on investments | | | — | | | (0.55 | ) | | (1.03 | ) | | | — | | |
From tax return of capital | | | — | | | (0.01 | ) | | — | | | | — | | |
| | | | | | | | | | | | | | | |
Total distributions | | | (0.64 | ) | | (1.55 | ) | | (1.23 | ) | | | — | | |
| | | | | | | | | | | | | | | |
Net asset value per share, end of period | | $ | 15.93 | | $ | 14.32 | | $ | 15.98 | | | $ | 13.38 | | |
| | | | | | | | | | | | | | | |
Total return | | | 16.09 | % | | –1.03 | % | | 30.23 | % | | | 33.80 | %(d) | |
Ratios/Supplemental Data: | | | | | | | | | | | | | | | |
Net Assets at end of period (000) | | $ | 46,998 | | $ | 29,028 | | $ | 2,245 | | | $ | 1,422 | | |
Ratio of total expenses to average net assets: | | | | | | | | | | | | | | | |
Before waivers and/or expense reimbursements | | | 1.33 | % | | 1.59 | % | | 3.03 | % | | | 4.42 | %(e) | |
After waivers and/or expense reimbursements | | | 1.33 | % | | 1.35 | % | | 1.35 | % | | | 1.35 | %(e) | |
Ratio of interest expense to average net assets | | | 0.00 | % | | 0.00 | %(c) | | 0.00 | %(c) | | | 0.00 | %(c)(e) | |
Ratio of expenses to average net assets excluding interest expense: | | | | | | | | | | | | | | | |
Before waivers and/or expense reimbursements | | | 1.33 | % | | 1.59 | % | | 3.03 | % | | | 4.42 | %(e) | |
After waivers and/or expense reimbursements | | | 1.33 | % | | 1.35 | % | | 1.35 | % | | | 1.35 | %(e) | |
Ratio of net investment income to average net assets | | | 4.30 | % | | 4.17 | % | | 3.40 | % | | | 1.76 | %(e) | |
Portfolio turnover (f) | | | 148 | % | | 189 | % | | 402 | % | | | 258 | %(d) | |
| | |
| | |
|
(a) | For the period from November 3, 2008 (inception of fund) to October 31, 2009.
|
(b) | Net investment income per share is calculated using ending balances after consideration of adjustments for permanent book and tax differences.
|
(c) | The amount is less than $0.005 per share or 0.005%.
|
(d) | Not annualized.
|
(e) | Annualized.
|
(f) | Portfolio turnover is calculated on the basis of the Fund as a whole, without distinguishing between classes of shares issued. |
The accompanying notes are an integral part of these financial statements.
77
Financial Highlights—Continued
(For a share outstanding throughout the period)
| | | | | | |
| | Global
Consumer
Growth Fund | |
| | | |
| | Period Ended
October 31, 2012 (a) | |
| | | |
Class A Shares: | | | | | | |
Net asset value per share, beginning of period | | | $ | 8.95 | | |
Income from investment operations: | | | | | | |
Net investment income | | | | 0.02 | | |
Net realized and unrealized gain on investments | | | | 1.74 | | |
| | | | | | |
Total from investment operations | | | | 1.76 | | |
| | | | | | |
Redemption fees | | | | — | | |
Less distributions: | | | | | | |
From net investment income | | | | — | | |
Total distributions | | | | — | | |
| | | | | | |
Net asset value per share, end of period | | | $ | 10.71 | | |
| | | | | | |
Total return | | | | 19.66 | %(b) | |
Ratios/Supplemental Data | | | | | | |
Net Assets at end of period (000) | | | $ | 120 | | |
Ratio of total expenses to average net assets: | | | | | | |
Before waivers and/or expense reimbursements | | | | 5.98 | %(c) | |
After waivers and/or expense reimbursements | | | | 1.60 | %(c) | |
Ratio of net investment income to average net assets | | | | 0.20 | %(c) | |
Portfolio turnover rate(d) | | | | 13 | % | |
| | |
| | |
|
(a) | Class A commenced operations on December 30, 2011.
|
(b) | Not annualized.
|
(c) | Annualized.
|
(d) | Portfolio turnover is calculated on the basis of the Fund as a whole, without distinguishing between classes of shares issued. |
The accompanying notes are an integral part of these financial statements.
78
Financial Highlights—Continued
(For a share outstanding throughout each period)
| | | | | | | | | | | |
| | Global Consumer
Growth Fund | |
| | | |
| | Year
Ended
October 31, 2012 | | Period
Ended
October 31, 2011 (a) | |
| | | | | |
Institutional Class Shares: | | | | | | | | | | | |
Net asset value per share, beginning of period | | | $ | 9.59 | | | | $ | 10.00 | | |
| | | | | | | | | | | |
Income from investment operations: | | | | | | | | | | | |
Net investment income | | | | 0.04 | | | | | 0.04 | | |
Net realized and unrealized gains (losses) on investments | | | | 1.15 | | | | | (0.45 | ) | |
| | | | | | | | | | | |
Total from investment operations | | | | 1.19 | | | | | (0.41 | ) | |
| | | | | | | | | | | |
Redemption fees | | | | — | | | | | — | | |
Less distributions: | | | | | | | | | | | |
From net investment income | | | | (0.04 | ) | | | | — | | |
| | | | | | | | | | | |
Total distributions | | | | (0.04 | ) | | | | — | | |
| | | | | | | | | | | |
Net asset value per share, end of period | | | $ | 10.74 | | | | $ | 9.59 | | |
| | | | | | | | | | | |
Total return | | | | 12.48 | % | | | | –4.10 | %(b) | |
Ratios/Supplemental Data: | | | | | | | | | | | |
Net Assets at end of period (000) | | | $ | 2,211 | | | | $ | 1,945 | | |
Ratio of total expenses to average net assets: | | | | | | | | | | | |
Before waivers and/or expense reimbursements | | | | 5.31 | % | | | | 2.96 | %(c) | |
After waivers and/or expense reimbursements | | | | 1.35 | % | | | | 1.35 | %(c) | |
Ratio of net investment income to average net assets | | | | 0.36 | % | | | | 0.54 | %(c) | |
Portfolio turnover (d) | | | | 13 | % | | | | 7 | %(b) | |
| | |
| | |
|
(a) | For the period from December 29, 2010 (inception of fund) to October 31, 2011.
|
(b) | Not annualized.
|
(c) | Annualized.
|
(d) | Portfolio turnover is calculated on the basis of the Fund as a whole, without distinguishing between classes of shares issued. |
The accompanying notes are an integral part of these financial statements.
79
Notes to Financial Statements
October 31, 2012
| |
1. | Organization: |
| |
| Alpine Equity Trust (the “Equity Trust”) was organized in 1988 as a Massachusetts Business Trust, and is registered under the Investment Company Act of 1940, as amended (the “1940 Act”), as an open-ended management investment company. The Alpine International Real Estate Equity Fund, Alpine Realty Income & Growth Fund, Alpine Cyclical Advantage Property Fund, Alpine Emerging Markets Real Estate Fund, Alpine Global Infrastructure Fund, and Alpine Global Consumer Growth Fund are six separate funds of the Equity Trust (individually referred to as a “Fund” and collectively, “the Funds”). The Alpine International Real Estate Equity Fund, Alpine Cyclical Advantage Property Fund, Alpine Emerging Markets Real Estate Fund, Alpine Global Infrastructure Fund and Alpine Global Consumer Growth Fund are diversified funds. The Alpine Realty Income & Growth Fund is a non-diversified fund. Alpine Woods Capital Investors, LLC (the “Adviser”) is a Delaware limited liability company and serves as the investment manager to the Funds. |
| |
2. | Significant Accounting Policies: |
| |
| The following is a summary of significant accounting policies consistently followed by the Funds in the preparation of their financial statements. The policies are in conformity with accounting principles generally accepted in the United States of America (“GAAP”), which require management to make estimates and assumptions that affect amounts reported herein. Actual results could differ from those estimates. Changes in the economic environment financial markets and any other parameters used in determining these estimates could cause actual results to differ. |
| |
| A. Valuation of Securities: |
| |
| The net asset value (“NAV”) of shares of the Funds are calculated by dividing the value of the Funds’ net assets by the number of outstanding shares. NAV is determined each day the New York Stock Exchange (“NYSE”) is open as of the close of regular trading (normally, 4:00 p.m., Eastern time). In computing NAV, portfolio securities of the Funds are valued at their current market values determined on the basis of market quotations or if market quotations are not available or determined to be reliable, through procedures and/or guidelines established by the Board of Trustees. In computing the Funds’ net asset values, equity securities that are traded on a securities exchange in the United States are valued at the last reported sale price as of the time of valuation, or lacking any current reported sale at the time of valuation, at the mean between the most recent bid and asked quotations. Each option security traded on a securities exchange in the United States is valued at the last current reported sale price as of the time of valuation, or lacking any current reported sale at the time of valuation, the option is valued at the mid-point of the consolidated bid/ask quote for the option security. Forward currency contracts are valued based on third-party vendor quotations. Each security traded in the over-the-counter market and quoted on the NASDAQ National Market System, is valued at the NASDAQ Official Closing Price (“NOCP”), as determined by NASDAQ, or lacking an NOCP, the last current reported sale price as of the time of valuation by NASDAQ, or lacking any current reported sale on NASDAQ at the time of valuation, at the mean between the most recent bid and asked quotations. Each over-the-counter option that is not traded through the Options Clearing Corporation is valued by the counterparty, or if the counterparty’s price is not readily available then by using the Black-Scholes method. Debt securities are valued based on an evaluated mean price as furnished by pricing services approved by the Board of Trustees, which may be based on market transactions for comparable securities and various relationships between securities that are generally recognized by institutional traders, a computerized matrix system, or appraisals derived from information concerning the securities or similar securities received from recognized dealers in those securities. Short-term securities with maturities of 60 days or less are valued at amortized cost, which approximates fair value. |
| |
| Equity securities that are principally traded in a foreign market are valued at the last current sale price at the time of valuation or lacking any current or reported sale at the time of valuation, at the mean between the most recent bid and asked quotations as of the close of the appropriate exchange or other designated time. Trading in securities on European and Far Eastern securities exchanges and over-the-counter markets is normally completed at various times before the close of business on each day on which the NYSE is open. Trading of these securities may not take place on every NYSE business day. In addition, trading may take place in various foreign markets on Saturdays or on other days when the NYSE is not open and on which the Funds’ net asset values are not calculated. If the market prices are not readily available or not reflective of the fair value of the security, as of the close of the regular trading on the NYSE, the security will be priced at fair value following procedures approved by the Board of Trustees. |
80
Notes to Financial Statements—Continued
October 31, 2012
| |
| When market quotations are not readily available or when the valuation methods mentioned above are not reflective of a fair value of the security, the security is valued at fair value following procedures and/or guidelines approved by the Board of Trustees. The Board has approved the use of Interactive Data’s proprietary fair value pricing model to assist in determining current valuation for foreign securities traded in markets that close prior to the NYSE. When fair value pricing is employed, the value of the portfolio security used to calculate the Funds’ net asset values may differ from quoted or official closing prices. |
| |
| As of October 31, 2012, the International Real Estate Equity Fund, Realty Income & Growth Fund, and Cyclical Advantage Property Fund held securities that are fair valued, which comprised 7.9%, 1.1%, and 3.2%, respectively, of each Fund’s net assets. |
| |
| Fair Value Measurement: The Fund’s have adopted Financial Accounting Standards Board (“FASB”) Codification Topic 820 (“ASC Topic 820”). ASC Topic 820 establishes a single definition of fair value, creates a three-tier hierarchy as a framework for measuring fair value based on inputs used to value the Funds’ investments, and requires additional disclosure about fair value. The hierarchy of inputs is summarized below. |
| | |
| • Level 1 — | quoted prices in active markets for identical investments. |
|
| • Level 2 — | other significant observable inputs (including quoted prices for similar investments, interest rates, prepayment speeds, credit risk, yield curves, default rates, etc.). |
|
| • Level 3 — | significant unobservable inputs (including the Funds’ own assumptions in determining the fair value of investments). |
| |
| The inputs or methodology used for valuing securities are not necessarily an indication of the risk associated with investing in those securities. |
| |
| The Funds use valuation techniques to measure fair value that are consistent with the market approach and/or income approach, depending on the type of security and the particular circumstance. The market approach uses prices and other relevant information generated by market transactions involving identical or comparable securities. The income approach uses valuation techniques to discount estimated future cash flows to present value. |
| |
| The following is a summary of the inputs used in valuing the Funds’ assets and liabilities carried at fair value: |
| | | | | | | | | | | | | | |
| | Valuation Inputs | | | | |
| | | | | | |
International Real Estate Equity Fund * | | | Level 1 | | Level 2 | | Level 3 | | Total Value | |
| | | | | | | | | | | |
Common Stocks | | | | | | | | | | | | | |
Asia | | $ | 67,438,924 | | $ | 13,023,306 | | $ | 15,847,017 | | $ | 96,309,247 | |
Europe | | | 77,046,868 | | | — | | | 774,443 | | | 77,821,311 | |
North & South America | | | 119,830,585 | | | 6,984,714 | | | — | | | 126,815,299 | |
Equity-Linked Structured Notes | | | — | | | 4,433,051 | | | — | | | 4,433,051 | |
Investment Companies | | | 1,880,291 | | | — | | | — | | | 1,880,291 | |
| | | | | | | | | | | | | |
Total | | $ | 266,196,668 | | $ | 24,441,071 | | $ | 16,621,460 | | $ | 307,259,199 | |
| | | | | | | | | | | | | |
81
Notes to Financial Statements—Continued
October 31, 2012
| | | | | | | | | | | | | | |
| | Valuation Inputs | | | | |
| | | | | | |
Realty Income & Growth Fund * | | | Level 1 | | Level 2 | | Level 3 | | Total Value | |
| | | | | | | | | | | |
Real Estate Investment Trusts | | | | | | | | | | | | | |
Apartments | | $ | 17,576,834 | | $ | — | | $ | — | | $ | 17,576,834 | |
Diversified | | | 5,949,245 | | | — | | | — | | | 5,949,245 | |
Health Care | | | 16,947,140 | | | — | | | — | | | 16,947,140 | |
Lodging | | | 3,302,340 | | | — | | | — | | | 3,302,340 | |
Manufactured Homes | | | 865,191 | | | — | | | — | | | 865,191 | |
Mortgage & Finance | | | 2,485,813 | | | — | | | — | | | 2,485,813 | |
Net Lease | | | 756,183 | | | — | | | — | | | 756,183 | |
Office-Industrial Buildings | | | 33,933,047 | | | 1,160,732 | | | — | | | 35,093,779 | |
Retail Centers | | | 20,765,150 | | | — | | | — | | | 20,765,150 | |
Storage | | | 4,264,952 | | | — | | | — | | | 4,264,952 | |
Common Stocks | | | 1,916,510 | | | — | | | — | | | 1,916,510 | |
Preferred Stocks | | | 6,651,789 | | | — | | | — | | | 6,651,789 | |
| | | | | | | | | | | | | |
Total | | $ | 115,414,194 | | $ | 1,160,732 | | $ | — | | $ | 116,574,926 | |
| | | | | | | | | | | | | |
| | | | | | | | | | | | | |
| | Valuation Inputs | | | | |
| | | | | | |
Cyclical Advantage Property Fund * | | | Level 1 | | Level 2 | | Level 3 | | Total Value | |
| | | | | | | | | | | |
Common Stocks | | | | | | | | | | | | | |
Asia | | $ | 10,863,598 | | $ | 3,463,980 | | $ | — | | $ | 14,327,578 | |
Europe | | | 8,610,234 | | | — | | | — | | | 8,610,234 | |
North & South America | | | 27,276,962 | | | 3,099,591 | | | — | | | 30,376,553 | |
Equity-Linked Structured Notes | | | — | | | 1,042,845 | | | — | | | 1,042,845 | |
Short-Term Investments | | | — | | | 4,929,000 | | | — | | | 4,929,000 | |
| | | | | | | | | | | | | |
Total | | $ | 46,750,794 | | $ | 12,535,416 | | $ | — | | $ | 59,286,210 | |
| | | | | | | | | | | | | |
| | | | | | | | | | | | | |
| | Valuation Inputs | | | | |
| | | | | | |
Emerging Markets Real Estate Fund * | | | Level 1 | | Level 2 | | Level 3 | | Total Value | |
| | | | | | | | | | | |
Common Stocks | | | | | | | | | | | | | |
Asia | | $ | 2,229,256 | | $ | 409,271 | | $ | — | | $ | 2,638,527 | |
Europe | | | 107,377 | | | 11,560 | | | — | | | 118,937 | |
Middle East/Africa | | | 104,440 | | | — | | | — | | | 104,440 | |
North & South America | | | 1,144,787 | | | 35,161 | | | — | | | 1,179,948 | |
Preferred Stocks | | | 46,153 | | | — | | | — | | | 46,153 | |
Equity-Linked Structured Notes | | | — | | | 236,720 | | | — | | | 236,720 | |
Convertible Bonds | | | — | | | 27,572 | | | — | | | 27,572 | |
Warrants | | | — | | | 29,356 | | | — | | | 29,356 | |
| | | | | | | | | | | | | |
Total | | $ | 3,632,013 | | $ | 749,640 | | $ | — | | $ | 4,381,653 | |
| | | | | | | | | | | | | |
| | | | | | | | | | | | | |
| | Valuation Inputs | | | | |
| | | | | | |
Global Infrastructure Fund * | | | Level 1 | | Level 2 | | Level 3 | | Total Value | |
| | | | | | | | | | | |
Common Stocks | | $ | 45,783,359 | | $ | — | | $ | — | | $ | 45,783,359 | |
Equity-Linked Structured Notes | | | — | | | 329,045 | | | — | | | 329,045 | |
Short-Term Investments | | | — | | | 2,611,000 | | | — | | | 2,611,000 | |
| | | | | | | | | | | | | |
Total | | $ | 45,783,359 | | $ | 2,940,045 | | $ | — | | $ | 48,723,404 | |
| | | | | | | | | | | | | |
82
Notes to Financial Statements—Continued
October 31, 2012
| | | | | | | | | | | | | | |
| | Valuation Inputs | | | | |
| | | | | | |
Other Financial Instruments | | | Level 1 | | Level 2 | | Level 3 | | Total Value | |
| | | | | | | | | | | |
Assets | | | | | | | | | | | | | |
Forward Currency Contracts | | $ | — | | $ | 4,847 | | $ | — | | $ | 4,847 | |
Liabilities | | | | | | | | | | | | | |
Forward Currency Contracts | | | — | | | (145,194 | ) | | — | | | (145,194 | ) |
| | | | | | | | | | | | | |
Total | | $ | — | | $ | (140,347 | ) | $ | — | | $ | (140,347 | ) |
| | | | | | | | | | | | | |
| | | | | | | | | | | | | |
| | Valuation Inputs | | | | |
| | | | | | |
Global Consumer Growth Fund * | | | Level 1 | | Level 2 | | Level 3 | | Total Value | |
| | | | | | | | | | | |
Common Stocks | | | | | | | | | | | | | |
Asia | | $ | 439,187 | | $ | — | | $ | — | | $ | 439,187 | |
Europe | | | 525,365 | | | 15,634 | | | — | | | 540,999 | |
North & South America | | | 1,252,509 | | | — | | | — | | | 1,252,509 | |
| | | | | | | | | | | | | |
Total | | $ | 2,217,061 | | $ | 15,634 | | $ | — | | $ | 2,232,695 | |
| | | | | | | | | | | | | |
| |
* | For detailed country and sector descriptions, see accompanying Schedule of Portfolio Investments. |
The following table shows transfers between Level 1 and Level 2:
| | | | | | | | | | | | | |
| | Transfers In* | | Transfers Out* | |
| | | | | |
| | Level 1 | | Level 2 | | Level 1 | | Level 2 | |
| | | | | | | | | |
International Real Estate Equity Fund | | $ | 137,479,478 | | $ | — | | $ | — | | $ | (137,479,478 | ) |
Cyclical Advantage Property Fund | | | 8,915,272 | | | — | | | — | | | (8,915,272 | ) |
Emerging Markets Real Estate Fund | | | 1,202,314 | | | — | | | — | | | (1,202,314 | ) |
Global Infrastructure Fund | | | 10,010,274 | | | — | | | — | | | (10,010,274 | ) |
| |
* | The Funds recognize transfers between Levels based on values as of the beginning of the year. The transfers were due to the fair valuation, in accordance with procedures approved by the Board of Trustees, as of October 31, 2011 of certain securities due to developments that occurred between the time of the close of the foreign markets on which they trade and the close of regular session trading on the NYSE. No such fair valuation was required on October 31, 2012. |
83
Notes to Financial Statements—Continued
October 31, 2012
Following is a reconciliation of Level 3 assets for which significant unobservable inputs were used to determine fair value:
| | | | | | | | | | | | | | | | |
| | International
Real Estate
Equity Fund | | Realty
Income &
Growth Fund | | Cyclical
Advantage
Property Fund | |
| | | | | | | |
Balance as of October 31, 2011 | | | $ | 24,716,446 | | | | $ | 1,459,551 | | | | $ | 2,432,586 | | |
Accrued discounts / premiums | | | | — | | | | | — | | | | | — | | |
Realized gain (loss) | | | | — | | | | | — | | | | | — | | |
Change in unrealized depreciation* | | | | 687,876 | | | | | — | | | | | — | | |
Purchases | | | | — | | | | | — | | | | | — | | |
Sales | | | | — | | | | | — | | | | | — | | |
Transfers in to Level 3 | | | | — | | | | | — | | | | | — | | |
Transfers out of Level 3 | | | | (8,782,862 | ) | | | | (1,459,551 | ) | | | | (2,432,586 | ) | |
| | | | | | | | | | | | | | | | |
Balance as of October 31, 2012 | | | $ | 16,621,460 | | | | $ | — | | | | $ | — | | |
| | | | | | | | | | | | | | | | |
| | | | | | | | | | | | | | | | |
Change in net unrealized depreciation on Level 3 holdings held at year end | | | $ | 687,876 | | | | $ | — | | | | $ | — | | |
| | | | | | | | | | | | | | | | |
| |
* | Statements of Operations Location: Change in net unrealized appreciation/depreciation on investments |
|
** | The Funds recognize transfers as of the beginning of the year. |
The following table shows the valuation techniques and significant amounts of unobservable inputs used in the fair value measurement of the Funds’ Level 3 investments, as of October 31, 2012:
International Real Estate Equity Fund
| | | | | | | | | | | | | |
Asset | | | Fair Value
at 10/31/12 | | Valuation
Technique (s) | | Significant
Unobservable
Input (s) | | Range of
Values | | Weighted
Average | | Relationship
Between Fair
Value and
Input: If
Input Value
Increases Then: |
| | | | | | | | | | | | | | |
Common Stocks | | 15,847,017 | | Average of terminal value and price to book value | | Liquidity Discount | | 15% | | 15% | | Fair Value would Decrease |
| | | | | | Adjusted Weighted Average Cost of Capital | | 13% | | 13% | | Fair Value would Decrease |
| | | | | | Terminal Value Discount | | 21% | | 21% | | Fair Value would Decrease |
Common Stocks | | 774,443 | | Adjusted Book Value | | Discount to NAV | | 50% | | 50% | | Fair Value would Decrease |
The significant unobservable inputs used in the fair value measurement of common stocks and real estate investment trusts are liquidity discounts, market risk and private quotes. Other market indicators are also considered. Changes in any of those inputs would result in lower or higher fair value measurement.
| |
| B. Security Transactions and Investment Income: |
| |
| Securities transactions are accounted for on a trade date basis. Realized gains and losses are computed on the identified cost basis. Interest income is recorded on the accrual basis and includes accretion of discounts and amortization of premiums, where applicable. To the extent any issuer defaults or a credit event occurs that impacts the issuer, the Funds’ may halt any additional interest income accruals and consider the realizability of interest accrued up to the date of default or credit event. Dividend income is recorded on the ex-dividend date or in the case of some foreign securities, on the date thereafter when the Funds are made aware of the dividend. Foreign income may be subject to foreign withholding taxes, which are accrued as applicable. Capital gains realized on some foreign securities are subject to foreign taxes, which are accrued as applicable. |
| |
| Dividends and interest from non-U.S. sources received by the Funds are generally subject to non-U.S. withholding taxes at rates ranging up to 30%. Such withholding taxes may be reduced or eliminated under the terms of applicable U.S. income tax treaties, and the Funds intend to undertake any procedural steps required to claim the benefits of such treaties. |
84
Notes to Financial Statements—Continued
October 31, 2012
| |
| C. Line of Credit and Custody Overdrafts: |
| |
| On December 1, 2010 the Trust entered into a lending agreement with BNP Paribas through its New York branch (“BNPP NY”). Loans in aggregate, whether to cover overdrafts or for investment purposes, may not exceed the maximum amount that is permitted under the 1940 Act. The terms of the lending agreement indicate the rate to be the Fed Funds rate plus 0.95% per annum on amounts borrowed. The BNP Paribas Facility provides for secured, uncommitted lines of credit for the Funds where selected Funds assets are pledged against advances made to the Fund. Each Fund is permitted to borrow up to 33.33% of its total assets for extraordinary or emergency purposes. Additionally the funds are permitted to borrow up to 10% of its total assets for investment purposes but in no case shall any Fund’s total outstanding borrowings exceed 33.33% of its total assets. Either BNPP NY or the Funds may terminate this agreement upon delivery of written notice. For the year ended October 31, 2012, the average interest rate paid on outstanding borrowings under the line of credit was 1.07%, 1.08%, 1.10% and 1.07% for the International Real Estate Equity Fund, Realty Income & Growth Fund, Cyclical Advantage Property Fund and Emerging Markets Real Estate Fund, respectively. The Funds may also incur interest expense on custody overdraft charges. |
| | | | | | | | | | | | | | | | | | | | | | | | | | | | | | | |
| | International
Real Estate
Equity Fund | | Realty
Income &
Growth
Fund | | Cyclical
Advantage
Property
Fund | | Emerging
Markets
Real Estate
Fund | | Global
Infrastructure
Fund | | Global
Consumer
Growth
Fund | |
| | | | | | | | | | | | | |
| | | | | | | | | | | | | | | | | | | | | | | | | | | | | | | |
Total line of credit amount available for investment purposes at October 31, 2012 | | | $ | 31,086,515 | | | | $ | 11,670,268 | | | | $ | 5,973,458 | | | | $ | 450,196 | | | | $ | 4,894,275 | | | | $ | 234,454 | | |
Line of credit outstanding at October 31, 2012 | | | | 10,110,099 | | | | | 10,096,119 | | | | | — | | | | | — | | | | | — | | | | | — | | |
Line of credit amount unused at October 31, 2012 | | | | 20,976,416 | | | | | 1,574,149 | | | | | 5,973,458 | | | | | 450,196 | | | | | 4,894,275 | | | | | 234,454 | | |
Average balance outstanding during the year | | | | 23,643,402 | | | | | 7,759,093 | | | | | 624,796 | | | | | 12,561 | | | | | — | | | | | — | | |
Interest expense incurred on line of credit during the year | | | | 258,398 | | | | | 85,358 | | | | | 6,989 | | | | | 137 | | | | | — | | | | | — | | |
Interest expense incurred on custody overdrafts during the year | | | | — | | | | | — | | | | | — | | | | | — | | | | | — | | | | | — | | |
| |
| The line of credit outstanding as of October 31, 2012 approximates its fair value and would be categorized at Level 2. |
| |
| D. Federal and Other Income Taxes: |
| |
| It is each Fund’s policy to comply with the Federal income and excise tax requirements of the Internal Revenue Code of 1986 (the “Code”), as amended applicable to regulated investment companies and to distribute timely, all of its investment company taxable income and net realized capital gains to shareholders in accordance with the timing requirements imposed by the Code. Therefore, no federal income tax provision is recorded. Under applicable foreign tax laws, a withholding tax may be imposed on interest, dividends, and capital gains earned on foreign investments. Where available, the Funds will file refund claims for foreign taxes withheld. |
| |
| Management has analyzed the Funds’ tax positions taken on income tax returns for all open tax years and has concluded that as of October 31, 2012, no provision for income tax is required in the Funds’ financial statements. The Funds’ federal and state income and federal excise tax returns for tax years for which the applicable statutes of limitations have not expired are subject to examination by Internal Revenue Service and state departments of revenue. |
| |
| GAAP requires that certain components of net assets be reclassified to reflect permanent differences between financial and tax reporting. These reclassifications have no effect on net assets or net asset values per share. |
85
Notes to Financial Statements—Continued
October 31, 2012
| | | |
| E. Distributions to Shareholders: |
| |
| Each Fund intends to distribute all of its net investment income and net realized capital gains, if any, throughout the year to its shareholders in the form of dividends. Distributions to shareholders are recorded at the close of business on the ex-dividend date. |
| |
| The amounts of dividends from net investment income and of distributions from net realized gains are determined in accordance with federal income tax regulations, which may differ from GAAP. These differences are either considered temporary or permanent in nature. To the extent these differences are permanent in nature, such amounts are reclassified within the composition of net assets based on their federal tax-basis treatment; temporary differences do not require reclassification. In the event dividends and distributions to shareholders exceed net investment income and net realized gains for tax purposes, they are reported as returns of capital. |
| |
| F. Class Allocations: |
| |
| Income, expenses (other than class specific expenses) and realized and unrealized gains and losses are allocated among the classes of the International Real Estate Fund, Realty & Income Growth Fund, Emerging Markets Real Estate Fund, Global Infrastructure Fund, and Global Consumer Growth Fund based on the relative net assets of each class. Class specific expenses are allocated to the class to which they relate. Currently, class specific expenses are limited to those incurred under the Distribution Plan for Class A shares. |
| |
| G. Foreign Currency Translation Transactions: |
| |
| The International Real Estate Equity Fund, Cyclical Advantage Property Fund, Emerging Markets Real Estate Fund, Global Infrastructure Fund, and Global Consumer Growth Fund may invest without limitation in foreign securities. The Realty Income & Growth Fund may invest up to 35% of the value of its net assets in foreign securities. The books and records of each Fund are maintained in U.S. dollars. Non-U.S. dollar denominated amounts are translated into U.S. dollars as follows, with the resultant gains and losses recorded in the Statements of Operations: |
| |
| | i) | market value of investment securities and other assets and liabilities at the exchange rate on the valuation date, |
|
| | ii) | purchases and sales of investment securities, income and expenses at the exchange rate prevailing on the respective date of such transactions. |
|
| H. Risk Associated with Foreign Securities and Currencies: |
| | |
| Investments in securities of foreign issuers carry certain risks not ordinarily associated with investments in securities of domestic issuers. Such risks include future political and economic developments and the possible imposition of exchange controls or other foreign governmental laws and restrictions. In addition, with respect to certain countries, there is a possibility of expropriation of assets, confiscatory taxation, political or social instability or diplomatic developments, which could adversely affect investments in those countries. |
| |
| Certain countries may also impose substantial restrictions on investments in their capital markets by foreign entities, including restrictions on investments in issuers or industries deemed sensitive to relevant national interests. These factors may limit the investment opportunities available to the Funds or result in a lack of liquidity and high price volatility with respect to securities of issuers from developing countries. |
| |
| I. Equity-Linked Structured Notes: |
| |
| The Funds may invest in equity-linked structured notes. Equity-linked structured notes are securities which are specially designed to combine the characteristics of one or more underlying securities and their equity derivatives in a single note form. The return and/or yield or income component may be based on the performance of the underlying equity securities, and equity index, and/or option positions. Equity-linked structured notes are typically offered in limited transactions by financial institutions in either registered or non-registered form. An investment in equity-linked structured notes creates exposure to the credit risk of the issuing financial institution, as well as to the market risk of the underlying securities. There is no guaranteed return of principal with these securities and the appreciation potential of these securities may be limited by a maximum payment or call right. In certain cases, equity-linked structured notes may be more volatile and less liquid than less complex securities or other types of fixed income securities. Such securities may exhibit price behavior that does not correlate with other fixed-income securities. International Real Estate Equity Fund, Cyclical Advantage Property Fund, Emerging Markets Real Estate Fund and Global Infrastructure Fund held 1, 3, 6 and 1 equity-linked structured notes, respectively, at October 31, 2012. |
86
Notes to Financial Statements—Continued
October 31, 2012
| |
| J. Forward Currency Contracts: |
| |
| The Funds are subject to foreign currency exchange rate risk in the normal course of pursuing their investment objectives. The Funds may use forward currency contracts to gain exposure to or economically hedge against changes in the value of foreign currencies. A forward currency contract (“forward”) is an agreement between two parties to buy and sell a currency at a set price on a future date. The market value of the forward contract fluctuates with changes in forward currency exchange rates. The forward contract is marked-to-market daily and the change in market value is recorded by each Fund as unrealized appreciation or depreciation. When the forward contract is closed, a Fund records a realized gain or loss equal to the fluctuation in value during the period the forward contract was open. A Fund could be exposed to risk if a counterparty is unable to meet the terms of a forward or if the value of the currency changes unfavorably. During the year ended October 31, 2012, the International Real Estate Equity Fund and Global Infrastructure Fund entered into 2 and 5 forward currency contracts, respectively. |
| |
| The following forward currency contracts were held at October 31, 2012: |
| | | | | | | | | | | | | | | | | | | | |
Global Infrastructure Fund | | | | | | | | | | | | | | | | |
| | | | | | | | | | | | | | | | |
Description | | Expiration
Date | | Contracts to
Deliver/Receive | | Settlement
Value | | | Current
Value | | Unrealized
Gain/(Loss) | |
| | | | | | | | | | | |
| | | | | | | | | | | |
| | | | | | | | | | | | | | | | | | | | |
Contracts Sold: | | | | | | | | | | | | | | | | | | | | |
Euro | | 02/06/13 | | | 2,600,000 EUR | | | $ | 3,228,030 | | | $ | 3,373,224 | | | $ | (145,194 | ) | |
Euro | | 02/06/13 | | | 650,000 EUR | | | | 848,153 | | | | 843,306 | | | | 4,847 | | |
| | | | | | | | | | | | | | | | | | | | |
| | | | | | | | | | | | | $ | 4,216,530 | | | $ | (140,347 | ) | |
| | | | | | | | | | | | | | | | | | | | |
| |
| K. Derivative Instruments and Hedging Activities: |
| |
| FASB Codification Topic 815 requires enhanced disclosure about an entity’s derivative and hedging activities. |
| |
| The following tables provide information about the effect of derivatives and hedging activities on the Funds’ Statements of Operations for the year ended October 31, 2012. The first table provides additional detail about the amounts and sources of gains (losses) realized on derivatives during the year. The second table provides additional information about the change in unrealized appreciation/depreciation resulting from the Funds’ derivatives and hedging activities during the year. |
87
Notes to Financial Statements—Continued
October 31, 2012
The effect of derivative instruments on the Statements of Assets and Liabilities as of October 31, 2012:
Global Infrastructure Fund
| | | | | | | | | |
Derivatives | | | Statements of Assets
and Liabilities Location | | Unrealized Appreciation/
Depreciation | |
| | | | | | | |
Forward Currency Contracts | | Unrealized appreciation on
forward currency contracts | | | | 4,847 | | |
Forward Currency Contracts | | Unrealized depreciation on
forward currency contracts | | | | (145,194 | ) | |
| | | | | | | | |
Total | | | | | $ | (140,347 | ) | |
| | | | | | | | |
The effect of derivative instruments on the Statements of Operations for the year ended October 31, 2012:
International Real Estate Equity Fund
| | | | | | | | |
Derivatives | | | Statements of
Operations Location | | Net Realized Gain | | Change in
Unrealized Appreciation | |
| | | | | | | | | |
Forward Currency Contracts | | Net realized gain (loss) on
foreign currency transactions/
Change in unrealized
appreciation/depreciation on
foreign currency translations | | $544,840 | | $(40,457) | |
| | | | | | | |
Global Infrastructure Fund | | | | | | | |
| | | | | | | | |
Derivatives | | | Statements of
Operations Location | | Net Realized Gain | | Change in
Unrealized Depreciation | |
| | | | | | | | | |
Forward Currency Contracts | | Net realized gain (loss) on
foreign currency transactions/
Change in unrealized
appreciation/depreciation on
foreign currency translations | | $222,818 | | $(140,347) | |
| |
3. | Capital Share Transactions: |
| |
| The Funds have an unlimited number of shares of beneficial interest, with $0.0001 par value, authorized. Transactions in shares and dollars of the Funds were as follows: |
| |
| International Real Estate Equity Fund |
| | | | | | | | | | | | | | | | | | | |
| | Year Ended
October 31, 2012* | | Year Ended
October 31, 2011* | |
| | | | | |
| | Shares | | Amount | | Shares | | Amount | |
| | | | | | | | | | | | | | | | | |
Class A | | | | | | | | | | | |
Shares sold | | 5,775 | | $ | 104,301 | | N/A | | | N/A | |
Shares issued in reinvestment of dividends | | — | | | — | | N/A | | | N/A | |
Redemption fees | | — | | | 2 | | N/A | | | N/A | |
Shares redeemed | | (3 | ) | | (68 | ) | N/A | | | N/A | |
| | | | | | | | | | | |
Total net change | | 5,772 | | $ | 104,235 | | N/A | | | N/A | |
| | | | | | | | | | | |
Institutional Class | | | | | | | | | | | |
Shares sold | | 1,267,230 | | $ | 25,993,269 | | 2,195,037 | | $ | 54,635,072 | |
Shares issued in reinvestment of dividends | | 439,750 | | | 7,845,139 | | 511,118 | | | 13,263,510 | |
Redemption fees | | — | | | 7,619 | | — | | | 17,897 | |
Shares redeemed | | (5,530,908 | ) | $ | (110,942,385 | ) | (9,023,277 | ) | | (217,285,470 | ) |
| | | | | | | | | | | |
Total net change | | (3,823,928 | ) | $ | (77,096,358 | ) | (6,317,122 | ) | $ | (149,368,991 | ) |
| | | | | | | | | | | |
88
Notes to Financial Statements—Continued
October 31, 2012
| | | | | | | | | | | | | | | | | | | |
Realty Income & Growth Fund | | | | | |
| | | | | |
| | Year Ended
October 31, 2012* | | Year Ended
October 31, 2011* | |
| | | | | |
| | Shares | | Amount | | Shares | | Amount | |
| | | | | | | | | | | | | | | | | |
Class A | | | | | | | | | | | |
Shares sold | | 6,414 | | $ | 100,066 | | N/A | | | N/A | |
Shares issued in reinvestment of dividends | | 191 | | | 3,339 | | N/A | | | N/A | |
Redemption fees | | — | | | 3 | | N/A | | | N/A | |
Shares redeemed | | (4 | ) | | (64 | ) | N/A | | | N/A | |
| | | | | | | | | | | |
Total net change | | 6,601 | | $ | 103,344 | | N/A | | | N/A | |
| | | | | | | | | | | |
Institutional Class | | | | | | | | | | | |
Shares sold | | 636,722 | | $ | 10,633,686 | | 827,759 | | $ | 13,192,635 | |
Shares issued in reinvestment of dividends | | 240,721 | | | 4,087,030 | | 292,882 | | | 4,499,252 | |
Redemption fees | | — | | | 3,610 | | — | | | 16,325 | |
Shares redeemed | | (1,267,504 | ) | | (21,452,717 | ) | (1,973,312 | ) | | (30,125,866 | ) |
| | | | | | | | | | | |
Total net change | | (390,061 | ) | $ | (6,728,391 | ) | (852,671 | ) | $ | (12,417,654 | ) |
| | | | | | | | | | | |
| | | | | | | | | | | |
Cyclical Advantage Property Fund | | | | | | | | | | | |
| | | | | | | | | | | | | | | | | | | |
| | Year Ended
October 31, 2012* | | Year Ended
October 31, 2011* | |
| | | | | |
| | Shares | | Amount | | Shares | | Amount | |
| | | | | | | | | | | | | | | | | |
Institutional Class | | | | | | | | | | | |
Shares sold | | 73,565 | | $ | 1,522,677 | | 60,571 | | $ | 1,267,115 | |
Shares issued in reinvestment of dividends | | 14,259 | | | 244,257 | | 11,900 | | | 256,450 | |
Redemption fees | | — | | | 77 | | — | | | 109 | |
Shares redeemed | | (272,500 | ) | | (5,343,438 | ) | (426,350 | ) | | (8,731,566 | ) |
| | | | | | | | | | | |
Total net change | | (184,676 | ) | $ | (3,576,427 | ) | (353,879 | ) | $ | (7,207,892 | ) |
| | | | | | | | | | | |
| | | | | | | | | | | |
Emerging Markets Real Estate Fund | | | | | | | | | | | |
| | | | | | | | | | | | | | | | | | | |
| | Year Ended
October 31, 2012* | | Year Ended
October 31, 2011* | |
| | | | | |
| | Shares | | Amount | | Shares | | Amount | |
| | | | | | | | | | | | | | | | | |
Class A | | | | | | | | | | | |
Shares sold | | 8,184 | | $ | 111,813 | | N/A | | | N/A | |
Shares issued in reinvestment of dividends | | — | | | — | | N/A | | | N/A | |
Redemption fees | | — | | | — | | N/A | | | N/A | |
Shares redeemed | | — | | | — | | N/A | | | N/A | |
| | | | | | | | | | | |
Total net change | | 8,184 | | $ | 111,813 | | N/A | | | N/A | |
| | | | | | | | | | | |
| | | | | | | | | | | |
Institutional Class | | | | | | | | | | | |
Shares sold | | 25,841 | | $ | 393,744 | | 189,308 | | $ | 3,315,249 | |
Shares issued in reinvestment of dividends | | — | | | — | | 13,959 | | | 256,293 | |
Redemption fees | | — | | | 560 | | — | | | 569 | |
Shares redeemed | | (68,074 | ) | | (1,053,041 | ) | (81,399 | ) | | (1,314,069 | ) |
| | | | | | | | | | | |
Total net change | | (42,233 | ) | $ | (658,737 | ) | 121,868 | | $ | 2,258,042 | |
| | | | | | | | | | | |
89
Notes to Financial Statements—Continued
October 31, 2012
Global Infrastructure Fund
| | | | | | | | | | | | | | | | | | | |
| | Year Ended
October 31, 2012* | | Year Ended
October 31, 2011* | |
| | | | | |
| | Shares | | Amount | | Shares | | Amount | |
| | | | | | | | | | | | | | | | | |
Class A | | | | | | | | | | | |
Shares sold | | 107,333 | | $ | 1,627,209 | | N/A | | | N/A | |
Shares issued in reinvestment of dividends | | 1,338 | | | 20,570 | | N/A | | | N/A | |
Redemption fees | | — | | | 18 | | N/A | | | N/A | |
Shares redeemed | | (541 | ) | | (7,742 | ) | N/A | | | N/A | |
| | | | | | | | | | | |
Total net change | | 108,130 | | $ | 1,640,055 | | N/A | | | N/A | |
| | | | | | | | | | | |
Institutional Class | | | | | | | | | | | |
Shares sold | | 1,517,961 | | $ | 22,312,167 | | 2,247,714 | | $ | 33,763,890 | |
Shares issued in reinvestment of dividends | | 89,244 | | | 1,337,634 | | 34,028 | | | 498,618 | |
Redemption fees | | | | | 2,350 | | — | | | 1,381 | |
Shares redeemed | | (683,673 | ) | | (10,416,319 | ) | (395,432 | ) | | (5,235,409 | ) |
| | | | | | | | | | | |
Total net change | | 923,532 | | $ | 13,235,832 | | 1,886,310 | | $ | 29,028,480 | |
| | | | | | | | | | | |
| | | | | | | | | | | | | | | | | | | |
Global Consumer Growth Fund | | | | | | | | | | | | | | | | | | | |
| | | | | | | | | | | | | | | | | | | |
| | Year Ended
October 31, 2012* | | Year Ended
October 31, 2011* | |
| | | | | |
| | Shares | | Amount | | Shares | | Amount | |
| | | | | | | | | | | | | | | | | |
Class A | | | | | | | | | | | |
Shares sold | | 11,173 | | $ | 100,000 | | N/A | | | N/A | |
Shares issued in reinvestment of dividends | | — | | | — | | N/A | | | N/A | |
Redemption fees | | — | | | — | | N/A | | | N/A | |
Shares redeemed | | — | | | — | | N/A | | | N/A | |
| | | | | | | | | | | |
Total net change | | 11,173 | | $ | 100,000 | | N/A | | | N/A | |
| | | | | | | | | | | |
Institutional Class | | | | | | | | | | | |
Shares sold | | 2,286 | | $ | 24,200 | | 202,816 | | $ | 2,027,480 | |
Shares issued in reinvestment of dividends | | 878 | | | 7,862 | | — | | | — | |
Redemption fees | | — | | | — | | — | | | — | |
Shares redeemed | | — | | | — | | — | | | — | |
| | | | | | | | | | | |
Total net change | | 3,164 | | $ | 32,062 | | 202,816 | | $ | 2,027,480 | |
| | | | | | | | | | | |
| |
| * Class A commenced operations on December 30, 2011. |
| |
4. | Purchases and Sales of Securities: |
| |
| Purchases and sales of securities (excluding short-term securities) for the year ended October 31, 2012 are as follows: |
| | | | | | | | | | | |
| | Purchases | | Sales | |
| | | | | | | | | |
International Real Estate Equity Fund | | $ | 38,450,551 | | $ | 140,374,026 | |
Realty Income & Growth Fund | | | 32,523,686 | | | 35,272,712 | |
Cyclical Advantage Property Fund | | | 12,594,419 | | | 21,498,550 | |
Emerging Markets Real Estate Fund | | | 4,176,689 | | | 4,743,377 | |
Global Infrastructure Fund | | | 73,075,961 | | | 57,546,559 | |
Global Consumer Growth Fund | | | 402,870 | | | 264,550 | |
The Funds did not have purchases and sales of U.S. Government obligations for the year ended October 31, 2012.
90
Notes to Financial Statements—Continued
October 31, 2012
| |
5. | Distribution Plans: |
| |
| Quasar Distributors, LLC (“Quasar”) serves as each Fund’s distributor. Each of the Funds, except for the Cyclical Advantage Property Fund, has adopted distribution and servicing plans (the “Plans”) for their Class A shares as allowed by Rule 12b-1 under the 1940 Act. The Plans authorize payments by the Funds in connection with the distribution and servicing of their Class A shares at an annual rate, as determined from time to time by the Board of Trustees, of up to 0.25% of the average daily net assets of the Class A shares of the Funds. Amounts paid under the Plans by the Funds may be spent by the Funds on any activities or expenses primarily intended to result in the sale of Class A shares of the Fund, including but not limited to advertising, compensation for sales and marketing activities of financial institutions and others such as dealers and distributors, shareholder account servicing, the printing and mailing of prospectuses to other than current shareholders and the printing and mailing of sales literature. |
| |
| International Real Estate Equity Fund, Realty Income & Growth Fund, Emerging Markets Real Estate Fund, Global Infrastructure Fund and Global Consumer Growth Fund incurred $238, $233, $249, $1,231 and $236, respectively, pursuant to the Plans for the year ended October 31, 2012. |
| |
| The Plans for the Funds may be terminated at any time by vote of the Board of Trustees of the Equity Trust who are not “interested persons,” as defined by the 1940 Act, of the Equity Trust, or by vote of a majority of the outstanding voting shares of the respective class. |
| |
| Alpine Woods Capital Investors, LLC (the “Adviser”) makes payments to intermediaries that provide omnibus account services, sub-accounting services and/or networking services with respect to the Funds. On February 2, 2012, the Board of Trustees approved, subject to certain limitations, the reimbursement to the Adviser by the appropriate Fund, of up to a certain percentage of such fees paid by the Adviser to intermediaries that provide omnibus account services, sub-accounting services, and/or networking services. Reimbursement of these fees are subject to review by the Board of Trustees and are included in the transfer agent fees in the Statements of Operations. |
| |
6. | Investment Advisory Agreement, Administration Agreement and Other Affiliated Transactions: |
| |
| The Adviser provides investment advisory services to each of the Funds. Pursuant to the advisory agreements with the Realty Income & Growth Fund and the Cyclical Advantage Property Fund, the Adviser is entitled to an annual fee based on each Fund’s average daily net assets, in accordance with the following schedule: |
| | | | |
First $750 million | | | 1.00 | % |
Next $250 million | | | 0.90 | % |
Over $1 billion | | | 0.80 | % |
| |
| The Adviser is entitled to an annual fee based on 1.00% of each Fund’s average daily net assets for the International Real Estate Equity Fund, Emerging Markets Real Estate Fund, Global Infrastructure Fund and Global Consumer Growth Fund. |
| |
| The Adviser agreed to reimburse the Realty Income & Growth Fund, Emerging Markets Real Estate Fund, Global Infrastructure Fund and Global Consumer Growth Fund to the extent necessary to ensure that ordinary operating expenses (including 12b-1 fees, but excluding interest, brokerage commissions, acquired fund fees and extraordinary expenses) do not exceed annually 1.75%, 1.60%, 1.60% and 1.60%, respectively, of the Fund’s Class A Shares average daily net assets, and 1.50%, 1.35%, 1.35% and 1.35% of each Fund’s Institutional Class Shares average daily net assets. The Adviser may recover expenses paid in excess of the cap on expenses for the three previous years, as long as the recovery does not cause the Funds to exceed such cap on expenses. For the year ended October 31, 2012, the Adviser waived investment advisory fees and other expenses totaling $65,965 and $84,997 for the Emerging Markets Real Estate Fund and Global Consumer Growth Fund, respectively. The expense limitations will remain in effect for the Funds through February 28, 2013 unless and until the Board of Trustees of the Equity Trust approves their modification or termination with respect to the Funds. |
91
Notes to Financial Statements—Continued
October 31, 2012
| |
| Waived expenses subject to potential recovery by year of expiration are as follows: |
| | | | | | | | | | | | | | | | | |
Years of Expiration | | Emerging Markets
Real Estate Fund | | Global
Infrastructure Fund | | Global Consumer
Growth Fund | |
| | | | | | | | | |
|
10/31/2013 | | | | $ | 31,563 | | | | $ | 30,973 | | | | $ | — | | |
|
10/31/2014 | | | $ | 48,844 | | | | $ | 27,165 | | | | $ | 26,927 | | |
|
10/31/2015 | | | $ | 65,965 | | | | $ | — | | | | $ | 84,997 | | |
| |
| State Street Bank and Trust Company (“SSBT”) serves as the Funds’ administrator pursuant to an Administration Agreement with the Funds. As compensation for its services to the Funds, SSBT receives an annual administration fee of 0.02% of total net assets on the first $5 billion and 0.015% on total net assets exceeding $5 billion, computed daily and payable monthly. |
| |
7. | Transactions with Affiliates: |
| |
| The following issuers are affiliated with the International Real Estate Equity Fund; that is, the Fund held 5% or more of the outstanding voting securities during the year ended October 31, 2012. As defined in Section (2)(a)(3) of the Investment Company Act of 1940, such issuers are: |
| | | | | | | | | | | | | | | | | | | |
Issuer Name | | Balance at
October 31, 2011 | | Purchases | | Sales | | Balance at
October 31, 2012 | | Value at
October 31, 2012 | | Realized
Loss | |
| | | | | | | | | | | | | | |
Yatra | | | | | | | | | | | | | | | | | | | |
Capital, Ltd. | | 1,491,800 | | — | | 48,105 | | 1,443,695 | | $5,782,145 | | $(447,969) | |
| |
8. | Concentration of Risk: |
| |
| The Funds invest a substantial amount of their assets in the equity securities of issuers engaged in the real estate industry, including real estate investment trusts (REITs). As a result, the Funds may be more affected by economic developments in the real estate industry than would a general equity fund. |
| |
9. | Federal Income Tax Information: |
| |
| At October 31, 2012, the components of distributable earnings on a tax basis were as follows: |
| | | | | | | | | | | | | | | | |
| | International Real
Estate Equity Fund | | Realty Income &
Growth Fund | | Cyclical Advantage
Property Fund | |
| | | | | | | | | | | | | |
Undistributed ordinary Income | | | $ | 1,897,548 | | | | $ | — | | | | $ | 276,013 | | |
Accumulated capital loss | | | | (1,099,421,435 | ) | | | | (4,663,247 | ) | | | | (54,626,492 | ) | |
Unrealized appreciation/depreciation | | | | (53,692,119 | ) | | | | 30,743,009 | | | | | 9,422,818 | | |
| | | | | | | | | | | | | | | | |
Total | | | $ | (1,151,216,006 | ) | | | $ | 26,079,762 | | | | $ | (44,927,661 | ) | |
| | | | | | | | | | | | | | | | |
|
| | Emerging Markets
Real Estate Fund | | Global
Infrastructure Fund | | Global Consumer
Growth Fund | |
| | | | | | | | | | | | | |
Undistributed ordinary Income | | | $ | 58,098 | | | | $ | — | | | | $ | 7,301 | | |
Accumulated capital loss | | | | (113,559 | ) | | | | (459,887 | ) | | | | (44,895 | ) | |
Unrealized appreciation/depreciation | | | | 606,575 | | | | | 3,761,199 | | | | | 209,084 | | |
| | | | | | | | | | | | | | | | |
Total | | | $ | 551,114 | | | | $ | 3,301,312 | | | | $ | 171,490 | | |
| | | | | | | | | | | | | | | | |
92
Notes to Financial Statements—Continued
October 31, 2012
Tax components of distributable earnings are determined in accordance with income tax regulations which may differ from the composition of net assets reported under GAAP. Accordingly, for the year ended October 31, 2012, the effects of certain differences were reclassified as follows:
| | | | | | | | | | | | | | | | |
| | Capital stock | | Accumulated
net investment
income (loss) | | Accumulated
net realized
gains (losses) | |
| | | | | | | |
International Real Estate Equity Fund | | | $ | 1 | | | | $ | 1,582,908 | | | | $ | (1,582,909 | ) | |
Realty Income & Growth Fund | | | | (1,600,402 | ) | | | | 1,602,246 | | | | | (1,844 | ) | |
Cyclical Advantage Property Fund | | | | (2 | ) | | | | 16,837 | | | | | (16,835 | ) | |
Emerging Markets Real Estate Fund | | | | (3 | ) | | | | 37,176 | | | | | (37,173 | ) | |
Global Infrastructure Fund | | | | (25,122 | ) | | | | (15,546 | ) | | | | 40,668 | | |
Global Consumer Growth Fund | | | | — | | | | | (325 | ) | | | | 325 | | |
As of October 31, 2012, the net unrealized appreciation/depreciation of investments, excluding foreign currency, based on federal tax costs was as follows:
| | | | | | | | | | | | | | | | |
| | International Real
Estate Equity Fund | | Realty Income &
Growth Fund | | Cyclical Advantage
Property Fund | |
| | | | | | | |
Cost of investments | | | $ | 360,944,152 | | | | $ | 85,831,927 | | | | $ | 49,863,285 | | |
| | | | | | | | | | | | | | | | |
Gross unrealized appreciation | | | | 71,271,206 | | | | | 33,099,791 | | | | | 15,632,586 | | |
Gross unrealized depreciation | | | | (124,956,159 | ) | | | | (2,356,792 | ) | | | | (6,209,661 | ) | |
| | | | | | | | | | | | | | | | |
Net unrealized appreciation (depreciation) | | | | (53,684,953 | ) | | | | 30,742,999 | | | | | 9,422,925 | | |
| | | | | | | | | | | | | | | | |
| | | | | | | | | | | | | | | | |
| | Emerging Markets
Real Estate Fund | | Global
Infrastructure Fund | | Global Consumer
Growth Fund | |
| | | | | | | |
Cost of investments | | | $ | 3,775,046 | | | | $ | 44,962,033 | | | | $ | 2,023,607 | | |
| | | | | | | | | | | | | | | | |
Gross unrealized appreciation | | | | 732,792 | | | | | 5,834,176 | | | | | 398,178 | | |
Gross unrealized depreciation | | | | (126,185 | ) | | | | (2,072,805 | ) | | | | (189,090 | ) | |
| | | | | | | | | | | | | | | | |
Net unrealized appreciation (depreciation) | | | | 606,607 | | | | | 3,761,371 | | | | | 209,088 | | |
| | | | | | | | | | | | | | | | |
The tax basis of investments for tax and financial reporting purposes differs principally due to the deferral of losses on wash sales, partnership tax adjustments, and mark-to-market cost basis adjustments for investments in passive foreign investment companies (PFICs) for tax purposes.
The tax character of distributions paid during the years ended October 31, 2012 and 2011 were as follows:
| | | | | | | |
| | 2012 | | 2011 | |
| | | | | |
International Real Estate Equity Fund | | | | | | | |
Ordinary income | | $ | 8,892,777 | | $ | 15,264,706 | |
Long-term capital gain | | | — | | | — | |
| | | | | | | |
| | $ | 8,892,777 | | $ | 15,264,706 | |
| | | | | | | |
| | | | | | | |
Realty Income & Growth Fund | | | | | | | |
Ordinary income | | $ | 4,526,628 | | $ | 4,932,978 | |
Long-term capital gain | | | — | | | — | |
| | | | | | | |
| | $ | 4,526,628 | | $ | 4,932,978 | |
| | | | | | | |
93
Notes to Financial Statements—Continued
October 31, 2012
| | | | | | | |
| | 2012 | | 2011 | |
| | | | | |
Cyclical Advantage Property Fund | | | | | | | |
Ordinary income | | $ | 251,458 | | $ | 265,892 | |
Long-term capital gain | | | — | | | — | |
| | | | | | | |
| | $ | 251,458 | | $ | 265,892 | |
| | | | | | | |
Emerging Markets Real Estate Fund | | | | | | | |
Ordinary income | | $ | — | | $ | 98,488 | |
Long-term capital gain | | | — | | | 166,713 | |
| | | | | | | |
| | $ | — | | $ | 265,201 | |
| | | | | | | |
Global Infrastructure Fund | | | | | | | |
Ordinary income | | $ | 1,775,501 | | $ | 535,700 | |
Long-term capital gain | | | — | | | 1,004 | |
Return of capital | | | — | | | 8,682 | |
| | | | | | | |
| | $ | 1,775,501 | | $ | 545,386 | |
| | | | | | | |
Global Consumer Growth Fund | | | | | | | |
Ordinary income | | $ | 7,862 | | $ | — | |
Long-term capital gain | | | — | | | — | |
| | | | | | | |
| | $ | 7,862 | | $ | — | |
| | | | | | | |
During the year ended October 31, 2012, the Realty Income & Growth Fund, Cyclical Advantage Property Fund, Emerging Markets Real Estate Fund, Global Infrastructure Fund and Global Consumer Growth Fund utilized $6,287,395, $4,570,317, $62,593, $58,397 and $607 of capital loss carryovers, respectively.
Capital loss carryovers as of October 31, 2012 are as follows:
| | | | | | | | | | | | | | | | | |
Expiration Date | | | International Real
Estate Equity Fund | | Realty Income &
Growth Fund | | Cyclical Advantage
Property Fund | |
| | | | | | | | | |
10/31/2015 | | | $ | — | | | | $ | — | | | | $ | 228,943 | | |
10/31/2016 | | | $ | 384,892,332 | | | | $ | — | | | | $ | 19,372,953 | | |
10/31/2017 | | | $ | 546,087,879 | | | | $ | 4,663,247 | | | | $ | 26,502,747 | | |
10/31/2018 | | | $ | 65,121,028 | | | | $ | — | | | | $ | 8,521,849 | | |
10/31/2019 | | | $ | 63,938,162 | | | | $ | — | | | | $ | — | | |
| | | | | | | | | | | | | | | | | |
Expiration Date | | | Emerging Markets
Real Estate Fund | | Global
Infrastructure
Fund | | Global
Consumer
Growth Fund | |
| | | | | | | | | |
10/31/2015 | | | $ | — | | | | $ | — | | | | $ | — | | |
10/31/2016 | | | $ | — | | | | $ | — | | | | $ | — | | |
10/31/2017 | | | $ | — | | | | $ | — | | | | $ | — | | |
10/31/2018 | | | $ | — | | | | $ | — | | | | $ | — | | |
10/31/2019 | | | $ | 113,559 | | | | $ | 459,887 | | | | $ | — | | |
Under the Regulated Investment Company (“RIC”) Modernization Act of 2010 (“the Modernization Act”), post-enactment capital losses that are carried forward will retain their character as either short-term or long-term capital losses rather than being considered all short-term as under previous law. However, any losses incurred during those future taxable years will be required to be utilized prior to the losses incurred in pre-enactment taxable years, which carry an expiration date. As a result of this ordering rule, pre-enactment capital loss carryovers may be more likely to expire unused.
94
Notes to Financial Statements—Continued
October 31, 2012
Capital loss carryover as of October 31, 2012 with no expiration are as follows:
| | | | | | | | | | | | |
Fund | | | Short Term | | Long Term | |
| | | | | | | | | | | |
International Real Estate Equity Fund | | | $ | 3,599,589 | | | | $ | 35,782,445 | | |
Global Consumer Growth Fund | | | | 44,895 | | | | | — | | |
| |
| In accordance with U.S. GAAP, the Funds have previously adopted accounting standards related to the accounting for uncertain tax positions. In accordance with this guidance, the Funds analyzed all open tax years, as defined by the Statute of Limitations, for all major jurisdictions. Open tax years are those that are open for exam by taxing authorities. Major jurisdictions for the Funds included Federal and the state of New York. As of October 31, 2012, open Federal and New York tax years include the tax years ended October 31, 2009 through 2012. The Funds have no examinations in progress. |
| |
| The Funds have reviewed all open tax years and major jurisdictions and concluded that there is no impact on the Funds’ net assets and no tax liability resulting from unrecognized tax benefits relating to uncertain income tax positions taken in previous years or expected to be taken on the tax return for the fiscal year ended October 31, 2012. Also, the Funds have recognized no interest and penalties related to uncertain tax benefits. The Funds are also not aware of any tax positions for which it is reasonably possible that the total amounts of unrecognized tax benefits will significantly change in the next twelve months. |
| |
10. | Subsequent Events: |
| |
| On December 19, 2012, the Board of Trustees approved an expense cap reduction on the Realty Income & Growth Fund from 1.75% to 1.60% on Class A Shares, and from 1.50% to 1.35% on Institutional Class Shares. |
95
Report of Independent Registered Public Accounting Firm
To the Shareholders and Board of Trustees of
Alpine Equity Trust:
We have audited the accompanying statements of assets and liabilities, including the schedules of portfolio investments, of Alpine Equity Trust, comprised of the Alpine International Real Estate Equity Fund, Alpine Realty Income & Growth Fund, Alpine Cyclical Advantage Property Fund, Alpine Emerging Markets Real Estate Fund, Alpine Global Infrastructure Fund, and Alpine Global Consumer Growth Fund (collectively the “Funds”) as of October 31, 2012, and the related statements of operations for the year then ended, and the statements of changes in net assets and the financial highlights for each of the periods presented. These financial statements and financial highlights are the responsibility of the Funds’ management. Our responsibility is to express an opinion on these financial statements and financial highlights based on our audits.
We conducted our audits in accordance with the standards of the Public Company Accounting Oversight Board (United States). Those standards require that we plan and perform the audit to obtain reasonable assurance about whether the financial statements and financial highlights are free of material misstatement. The Funds are not required to have, nor were we engaged to perform, an audit of their internal control over financial reporting. Our audits included consideration of internal control over financial reporting as a basis for designing audit procedures that are appropriate in the circumstances, but not for the purpose of expressing an opinion on the effectiveness of the Funds’ internal control over financial reporting. Accordingly, we express no such opinion. An audit also includes examining, on a test basis, evidence supporting the amounts and disclosures in the financial statements, assessing the accounting principles used and significant estimates made by management, as well as evaluating the overall financial statement presentation. Our procedures included confirmation of securities owned as of October 31, 2012, by correspondence with the custodian and brokers; where replies were not received from brokers, we performed other auditing procedures. We believe that our audits provide a reasonable basis for our opinion.
In our opinion, the financial statements and financial highlights referred to above present fairly, in all material respects, the financial positions of Alpine International Real Estate Equity Fund, Alpine Realty Income & Growth Fund, Alpine Cyclical Advantage Property Fund, Alpine Emerging Markets Real Estate Fund, Alpine Global Infrastructure Fund, and Alpine Global Consumer Growth Fund of Alpine Equity Trust, as of October 31, 2012, the results of their operations for the year then ended and the changes in their net assets and the financial highlights for each of the periods presented, in conformity with accounting principles generally accepted in the United States of America.

Princeton, New Jersey
December 28, 2012
96
Information about your Funds Expenses (unaudited)
October 31, 2012
Fund expenses
Example
As a shareholder of the Fund, you may incur two types of costs: (1) transaction costs, including front-end on purchase payments; and (2) ongoing costs, including management fees; service and/or distribution (12b-1) fees; and other Fund expenses. This example is intended to help you understand your ongoing costs (in dollars) of investing in the Fund and to compare these costs with the ongoing costs of investing in other mutual funds.
This example is based on an investment of $1,000 invested on May 1, 2012 and held for the six months ended October 31, 2012.
Actual Expenses
The table below titled “Based on Actual Total Return” provides information about actual account values and actual expenses. You may use the information provided in this table, together with the amount you invested, to estimate the expenses that you paid over the period. To estimate the expenses you paid on your account, divide your ending account value by $1,000 (for example, an $8,600 ending account value divided by $1,000 = 8.6), then multiply the result by the number under the heading entitled “Expenses Paid During the Period”.
Hypothetical Example for Comparison Purposes
The table below titled “Based on Hypothetical Total Return” provides information about hypothetical account values and hypothetical expenses based on the actual expense ratio and an assumed rate of return of 5.00% per year before expenses, which is not the Fund’s actual return. The hypothetical account values and expenses may not be used to estimate the actual ending account balance or expenses you paid for the period. You may use the information provided in this table to compare the ongoing costs of investing in the Fund and other funds. To do so, compare the 5.00% hypothetical example relating to the Fund with the 5.00% hypothetical examples that appear in the shareholder reports of the other funds.
Please note that the expenses shown in the table below are meant to highlight your ongoing costs only and do not reflect any transactional costs, such as front-end or back-end sales charges (loads). Therefore, the table is useful in comparing ongoing costs only, and will not help you determine the relative total costs of owning different funds. In addition, if these transaction costs were included, your costs would have been higher.
Alpine International Real Estate Equity Fund
| | | | | | | | | | | | | | | | | | | | | | | | | |
Based on actual total return (1) | | | | | | | | | | | | | | | | | | | | |
Class | | | Actual Total
Return Without
Sales Charges (2) | | Beginning
Account Value | | Ending
Account Value | | Annualized
Expense
Ratio | | Expenses
Paid During
the Period (3) | |
| | | | | | | | | | | | | |
|
Class A | | | | 5.17% | | | | $ | 1,000.00 | | | | $ | 1,051.70 | | | | 1.77% | | | $ | 9.13 | | |
| | | | | | | | | | | | | | | | | | | | | | | | |
Institutional | | | | 5.26% | | | | $ | 1,000.00 | | | | $ | 1,052.60 | | | | 1.52% | | | $ | 7.84 | | |
| | | | | | | | | | | | | | | | | | | | | | | | |
Based on hypothetical total return (1) | | | | | | | | | | | | | | | | | | | | |
Class | | | Hypothetical
Annualized
Total Return | | Beginning
Account Value | | Ending
Account Value | | Annualized
Expense
Ratio | | Expenses
Paid During
the Period (4) | |
| | | | | | | | | | | | | |
|
Class A | | | | 5.00% | | | | $ | 1,000.00 | | | | $ | 1,016.24 | | | | 1.77% | | | $ | 8.97 | | |
| | | | | | | | | | | | | | | | | | | | | | | | |
Institutional | | | | 5.00% | | | | $ | 1,000.00 | | | | $ | 1,017.50 | | | | 1.52% | | | $ | 7.71 | | |
97
Information about your Funds Expenses (unaudited)—Continued
October 31, 2012
Alpine Realty Income & Growth Fund
Based on actual total return (1)
| | | | | | | | | | | | | | | | | | |
Class | | | Actual Total
Return Without
Sales Charges (2) | | Beginning
Account Value | | Ending
Account Value | | Annualized
Expense
Ratio | | Expenses
Paid During
the Period (3) | |
| | | | | | | | | | | | | |
| | | | | | | | | | | | | | | | | |
Class A | | (0.04 | )% | | $ | 1,000.00 | | $ | 999.60 | | | 1.71 | % | | $ | 8.60 | |
| | | | | | | | | | | | | | | | | |
Institutional | | 0.15 | % | | $ | 1,000.00 | | $ | 1,001.50 | | | 1.47 | % | | $ | 7.40 | |
| | | | | | | | | | | | | | | | |
Based on hypothetical total return (1) |
| | | | | | | | | | | |
Class | | | Hypothetical
Annualized
Total Return | | Beginning
Account Value | | Ending
Account Value | | Annualized
Expense
Ratio | | Expenses
Paid During
the Period (4) | |
| | | | | | | | | | | | | |
| | | | | | | | | | | | | | | | | |
Class A | | 5.00 | % | | $ | 1,000.00 | | $ | 1,016.54 | | | 1.71 | % | | $ | 8.67 | |
| | | | | | | | | | | | | | | | | |
Institutional | | 5.00 | % | | $ | 1,000.00 | | $ | 1,017.75 | | | 1.47 | % | | $ | 7.46 | |
| | | | | | | | | | | | | | | | |
Alpine Cyclical Advantage Property Fund |
|
Based on actual total return (1) |
| | | | | | | | | | | | | | | | |
Class | | | Actual Total
Return Without
Sales Charges (2) | | Beginning
Account Value | | Ending
Account Value | | Annualized
Expense
Ratio | | Expenses
Paid During
the Period (3) | |
| | | | | | | | | | | | | |
| | | | | | | | | | | | | | | | | |
Institutional | | 15.83 | % | | $ | 1,000.00 | | $ | 1,158.30 | | | 1.55 | % | | $ | 8.41 | |
| | | | | | | | | | | | | | | | |
Based on hypothetical total return (1) |
| | | | | | | | | | | |
Class | | | Hypothetical
Annualized
Total Return | | Beginning
Account Value | | Ending
Account Value | | Annualized
Expense
Ratio | | Expenses
Paid During
the Period (4) | |
| | | | | | | | | | | | | |
| | | | | | | | | | | | | | | | | |
Institutional | | 5.00 | % | | $ | 1,000.00 | | $ | 1,017.34 | | | 1.55 | % | | $ | 7.86 | |
| | | | | | | | | | | | | | | | |
Alpine Emerging Markets Real Estate Fund |
|
Based on actual total return (1) |
| | | | | | | | | | | | | | | | |
Class | | | Actual Total
Return Without
Sales Charges (2) | | Beginning
Account Value | | Ending
Account Value | | Annualized
Expense
Ratio | | Expenses
Paid During
the Period (3) | |
| | | | | | | | | | | | | |
| | | | | | | | | | | | | | | | | |
Class A | | 5.68 | % | | $ | 1,000.00 | | $ | 1,056.80 | | | 1.61 | % | | $ | 8.32 | |
| | | | | | | | | | | | | | | | | |
Institutional | | 5.73 | % | | $ | 1,000.00 | | $ | 1,057.30 | | | 1.36 | % | | $ | 7.03 | |
| | | | | | | | | | | | | | | | |
Based on hypothetical total return (1) |
| | | | | | | | | | | | | | | | |
Class | | | Hypothetical
Annualized
Total Return | | Beginning
Account Value | | Ending
Account Value | | Annualized
Expense
Ratio | | Expenses
Paid During
the Period (4) | |
| | | | | | | | | | | | | |
| | | | | | | | | | | | | | | | | |
Class A | | 5.00 | % | | $ | 1,000.00 | | $ | 1,017.04 | | | 1.61 | % | | $ | 8.16 | |
| | | | | | | | | | | | | | | | | |
Institutional | | 5.00 | % | | $ | 1,000.00 | | $ | 1,018.30 | | | 1.36 | % | | $ | 6.90 | |
98
Information about your Funds Expenses (unaudited)—Continued
October 31, 2012
Alpine Global Infrastructure Fund
Based on actual total return (1)
| | | | | | | | | | | | | | | | | | |
Class | | | Actual Total
Return Without
Sales Charges (2) | | Beginning
Account Value | | Ending
Account Value | | Annualized
Expense
Ratio | | Expenses
Paid During
the Period (3) | |
| | | | | | | | | | | | | |
| | | | | | | | | | | | | | | | | |
Class A | | 4.23 | % | | $ | 1,000.00 | | $ | 1,042.30 | | | 1.68 | % | | $ | 8.62 | |
| | | | | | | | | | | | | | | | | |
Institutional | | 4.35 | % | | $ | 1,000.00 | | $ | 1,043.50 | | | 1.37 | % | | $ | 7.04 | |
| | | | | | | | | | | | | | | | |
Based on hypothetical total return (1) |
| | | | | | | | | | | | | | | | |
Class | | | Hypothetical
Annualized
Total Return | | Beginning
Account Value | | Ending
Account Value | | Annualized
Expense
Ratio | | Expenses
Paid During
the Period (4) | |
| | | | | | | | | | | | | |
| | | | | | | | | | | | | | | | | |
Class A | | 5.00 | % | | $ | 1,000.00 | | $ | 1,016.69 | | | 1.68 | % | | $ | 8.52 | |
| | | | | | | | | | | | | | | | | |
Institutional | | 5.00 | % | | $ | 1,000.00 | | $ | 1,018.25 | | | 1.37 | % | | $ | 6.95 | |
| | | | | | | | | | | | | | | | |
Alpine Global Consumer Growth Fund |
| | | | | | | | | | | | | | | | |
Based on actual total return (1) |
| | | | | | | | | | | | | | | | |
Class | | | Actual Total
Return Without
Sales Charges (2) | | Beginning
Account Value | | Ending
Account Value | | Annualized
Expense
Ratio | | Expenses
Paid During
the Period (3) | |
| | | | | | | | | | | | | |
| | | | | | | | | | | | | | | | | |
Class A | | 0.94 | % | | $ | 1,000.00 | | $ | 1,009.40 | | | 1.60 | % | | $ | 8.08 | |
| | | | | | | | | | | | | | | | | |
Institutional | | 1.13 | % | | $ | 1,000.00 | | $ | 1,011.30 | | | 1.35 | % | | $ | 6.83 | |
| | | | | | | | | | | | | | | | |
Based on hypothetical total return (1) |
| | | | | | | | | | | | | | | | |
Class | | | Hypothetical
Annualized
Total Return | | Beginning
Account Value | | Ending
Account Value | | Annualized
Expense
Ratio | | Expenses
Paid During
the Period (4) | |
| | | | | | | | | | | | | |
| | | | | | | | | | | | | | | | | |
Class A | | 5.00 | % | | $ | 1,000.00 | | $ | 1,017.09 | | | 1.60 | % | | $ | 8.11 | |
| | | | | | | | | | | | | | | | | |
Institutional | | 5.00 | % | | $ | 1,000.00 | | $ | 1,018.35 | | | 1.35 | % | | $ | 6.85 | |
| | |
| | |
(1) | For the six months ended October 31, 2012. |
(2) | Assumes the reinvestment of all distributions, including returns of capital, if any, at net asset value and does not reflect the deduction of the applicable sales charge. Total return is not annualized, as it may not be representative of the total return for the year. Performance figures may reflect fee waivers and/or expense reimbursements. In the absence of fee waivers and/or expense reimbursements, the total return would have been lower. Past performance is no guarantee of future results. |
(3) | Expenses (net of fee waivers and/or expense reimbursements) are equal to each class’ respective annualized expense ratio multiplied by the average account value over the period, multiplied by the number of days in the most recent fiscal half-year, then divided by 366. |
(4) | Hypothetical expense examples assume a 5% return over a hypothetical 184 day period. |
99
Additional Information (unaudited)
October 31, 2012
| | | | | | | | | | |
Independent Trustees |
| |
| | | | | | | | | | |
Name and Age | | Position(s)
Held with
the Trust | | Term of Office
and Length of
Time Served | | Principal Occupation During
Past Five Years | | # of
Portfolios in
Fund
Complex** | | Other Directorships
Held by Trustee |
| | | | | | | | | | |
| | | | | | | | | | |
H. Guy Leibler (58) | | Independent
Trustee | | Indefinite,
since the
Trust’s
inception | | Private investor, since 2007; Vice Chair & Chief Operating Officer of L&L Acquisitions, LLC (2004-2007); President, Skidmore, Owings & Merrill LLP (2001-2004). | | 17 | | Chairman Emeritus, White Plains Hospital Center; Trustee, each of the Alpine Trusts.** |
| | | | | | | | | | |
| | | | | | | | | | | |
Jeffrey E. Wacksman (52) | | Independent
Trustee | | Indefinite,
since 2004 | | Partner, Loeb, Block & Partners LLP, since 1994. | | 17 | | Director, International Succession Planning Association; Director, Bondi Icebergs Inc. (Women’s Sports-wear); Director, MH Properties, Inc.; Trustee, each of the Alpine Trusts.* |
| | | | | | | | | | |
| | | | | | | | | | | |
James A. Jacobson (67) | | Independent
Trustee | | Indefinite,
since July
2009 | | Retired, since November 2008; Vice Chairman and Managing Director, Spear Leeds & Kellogg Specialists, LLC, January 2003 to November 2008. | | 17 | | Trustee, Allianz Global Investors Multi-Funds. Trustee, each of the Alpine Trusts.* |
| | | | | | | | | | |
| | | | | | | | | | | |
Eleanor T.M. Hoagland (61) | | Independent
Trustee | | Indefinite,
since October
2012 | | Principal, VCS Advisory, LLC (since 2011); Chief Compliance Officer and Senior Managing Director of Magni Asset Management LLC (since 2011) and Park Fifth Capital Management LLC (since 2011); Vice President (2008-2010) and CCO (2009-2010), Ameriprise Financial Inc.; Managing Director (2000-2008) and CCO (2004-2008), J. & W. Seligman & Co. Incorporated. | | 17 | | Trustee of each of the Alpine Trusts.* |
| | | | | | | | | | |
| | | | | | | | | | | |
| |
** | The term “Fund Complex” refers to the Funds in the Alpine Equity Trust, Alpine Series Trust, and Alpine Income Trust, and Alpine Global Dynamic Dividend Fund, Alpine Total Dynamic Dividend Fund, and Alpine Global Premier Properties Fund (the “Alpine Trusts”). |
100
Additional Information (unaudited)—Continued
October 31, 2012
| | | | | | | | | | |
Interested Trustees & Officers |
| |
| | | | | | | | | | |
Name and Age | | Position(s)
Held with
the Trust | | Term of Office
and Length of
Time Served | | Principal Occupation During
Past Five Years | | # of
Portfolios in
Fund
Complex** | | Other Directorships
Held by Trustee |
| | | | | | | | | | |
| | | | | | | | | | |
Samuel A. Lieber* (56) | | Interested
Trustee, President and Portfolio Manager | | Indefinite,
since the
Trust’s
inception | | CEO of Alpine Woods Capital Investors, LLC since November 1997. President of Alpine Trusts since 1998. | | 17 | | Trustee, each of the Alpine Trusts. |
| | | | | | | | | | |
| | | | | | | | | | | |
Stephen A. Lieber*** (87) | | Vice President
and Portfolio
Manager | | Indefinite,
since the
Trust’s
inception | | Chief Investment Officer, Alpine Woods Capital Investors, LLC since 2003; Chairman and Senior Portfolio Manager, Saxon Woods Advisors, LLC since 1999. | | 17 | | None |
| | | | | | | | | | |
| | | | | | | | | | | |
John Megyesi (52) | | Chief Compliance Officer | | Indefinite,
since January
2009 | | Chief Compliance Officer, Alpine Woods Capital Investors, LLC since January 2009; Vice President and Manager, Trade Surveillance, Credit Suisse Asset Management, LLC (2006-2009); Manager, Trading and Surveillance, Allianz Global Investors (2004-2006). | | 17 | | None |
| | | | | | | | | | |
| | | | | | | | | | | |
Ronald Palmer (44) | | Chief Financial
Officer and
Treasurer | | Indefinite,
since January
2010 | | Chief Financial Officer, Alpine Woods Capital Investors, LLC since January 2010; Independent Consultant (2008-2009); Vice President, Cash Management and Foreign Exchange, Macquarie Capital Investment Management, LLC (2007-2008); Chief Operating Officer, Macquarie Fund Adviser, LLC (2004-2007). | | 17 | | None |
| | | | | | | | | | |
| | | | | | | | | | | |
Andrew Pappert (32) | | Secretary | | Indefinite,
since March
2009 | | Director of Fund Operations, Alpine Woods Capital Investors, LLC since September 2008; Assistant Vice President, Mutual Fund Operations, Credit Suisse Asset Management, LLC (2003-2008). | | 17 | | None |
| | | | | | | | | | |
| | | | | | | | | | | |
| | |
* | | Denotes Trustees who are “interested persons” of the Trust or Fund under the 1940 Act. |
** | | The term “Fund Complex” refers to the Funds in the Alpine Equity Trust, Alpine Series Trust, and Alpine Income Trust, and Alpine Global Dynamic Dividend Fund, Alpine Total Dynamic Dividend Fund, and Alpine Global Premier Properties Fund (the “Alpine Trusts”). |
*** | | Stephen A. Lieber is the father of Samuel A. Lieber. |
Further information regarding the Fund’s Trustees is also available in the Funds’ Statement of Additional Information, which can be obtained without charge by calling 1-888-785-5578.
101
Additional Information (unaudited)—Continued
October 31, 2012
Tax Information
The Funds designated the following percentages of dividends declared from net investment income for the fiscal year ended October 31, 2012 as qualified dividend income under the Jobs & Growth Tax Relief Reconciliation Act of 2003.
| | |
International Real Estate Equity Fund | | 0% |
Realty Income & Growth Fund | | 1% |
Cyclical Advantage Property Fund | | 71% |
Emerging Markets Real Estate Fund | | 0% |
Global Infrastructure Fund | | 57% |
Global Consumer Growth Fund | | 100% |
The Funds designated the following percentages of dividends declared during the fiscal year ended October 31, 2012 as dividends qualifying for the dividends received deduction available to corporate shareholders.
| | |
International Real Estate Equity Fund | | 0% |
Realty Income & Growth Fund | | 0% |
Cyclical Advantage Property Fund | | 19% |
Emerging Markets Real Estate Fund | | 0% |
Global Infrastructure Fund | | 12% |
Global Consumer Growth Fund | | 100% |
The Funds designated the following percentages of taxable ordinary income distributions as short-term capital gain distributions under Internal Revenue Section 871(k)(2)(C).
| | |
International Real Estate Equity Fund | | 0% |
Realty Income & Growth Fund | | 0% |
Cyclical Advantage Property Fund | | 0% |
Emerging Markets Real Estate Fund | | 0% |
Global Infrastructure Fund | | 0% |
Global Consumer Growth Fund | | 0% |
The Funds designated as long-term capital gain dividend, pursuant to Internal Revenue Code Section 852(b)(3), the amount necessary to reduce the earnings and profits of the Funds related to net capital gain to zero for the tax year ended October 31, 2012.
Availability of Proxy Voting Information
Information regarding how each Fund votes proxies relating to portfolio securities is available without charge upon request by calling toll-free at 1-888-785-5578 and on the SEC’s website at www.sec.gov. Information regarding how each Fund voted proxies relating to portfolio securities during the most recent twelve month period ended June 30 is available on the SEC’s website at www.sec.gov or by calling the toll-free number listed above.
Availability of Quarterly Portfolio Schedule
Beginning with each Fund’s fiscal quarter ended July 31, 2004, each Fund filed its complete schedules of portfolio holdings on Form N-Q with the SEC. Going forward, each Fund will file Form N-Q for the first and third quarters of each fiscal year on Form N-Q. Each Fund’s Form N-Q is available on the SEC’s website at www.sec.gov and may be reviewed and copied at the SEC’s Public Reference Room in Washington, DC. Information on the operation of the Public Reference Room may be obtained by calling 1-202-551-8090.
102
Additional Information (unaudited)—Continued
October 31, 2012
Privacy Policy
The Funds collect non-public information about you from the following sources:
| | |
| • | information we receive about you on applications or other forms; |
| • | information you give us orally; and |
| • | information about your transactions with others or us. |
The Funds do not disclose any non-public personal information about our customers or former customers without the customer’s authorization, except as required by law or in response to inquiries from governmental authorities. The Funds restrict access to your personal and account information to those employees who need to know that information to provide products and services to you. The Funds also may disclose that information to unaffiliated third parties (such as to brokers or custodians) only as permitted by law and only as needed for us to provide agreed services to you. The Funds maintain physical, electronic and procedural safeguards to guard your non-public personal information.
In the event that you hold shares of the Funds through a financial intermediary, including, but not limited to a broker dealer, bank or trust company, the privacy policy of your financial intermediary would govern how your non-public personal information would be shared with unaffiliated third parties.
SHAREHOLDER MEETING
On June 8, 2012, the Trusts held their Annual Meeting of Shareholders (the “Meeting”) for the purpose of voting on proposals below. The results stated as a percentage of the shares voted are as follows:
Proposal 1: To elect H. Guy Leibler, James A. Jacobson, Jeffrey E. Wacksman, and Samuel A. Lieber as Trustee to the Board of Trustees for an indefinite term or until his successor has been duly elected and qualified.
| | | |
| For | Withheld | |
H. Guy Leibler | 95.47% | 4.53% | |
James A. Jacobson | 95.57% | 4.43% | |
Jeffrey E. Wacksman | 95.48% | 4.52% | |
Samuel A. Lieber | 95.48% | 4.52% | |
Proposal 2: To transact such other business as may properly come before the meeting or any adjournments or postponements thereof.
| | | |
| For | 82.90% | |
| Against | 15.03% | |
| Abstain | 2.07% | |
103
|
TRUSTEES |
Samuel A. Lieber
Eleanor T.M. Hoagland
James A. Jacobson
H. Guy Leibler
Jeffrey E. Wacksman |
|
CUSTODIAN &
ADMINISTRATOR |
State Street Bank & Trust Company
One Lincoln Street
Boston, MA 02111 |
|
INDEPENDENT REGISTERED
PUBLIC ACCOUNTING FIRM |
Deloitte & Touche LLP
500 College Road East
Princeton, NJ 08540 |
|
FUND COUNSEL |
Wilkie Farr & Gallagher
787 7th Avenue, 40th FL |
New York, NY 10019 |
|
DISTRIBUTOR |
Quasar Distributors, LLC
615 East Michigan Street
Milwaukee, WI 53202 |
|
INVESTMENT ADVISER |
Alpine Woods Capital Investors, LLC
2500 Westchester Ave., Suite 215
Purchase, NY 10577 |
|
TRANSFER AGENT |
Boston Financial Data Services
Two Heritage Drive
North Quincy, MA 02171 |
|
|
|

|
|
SHAREHOLDER | INVESTOR INFORMATION |
|
1(888)785.5578
www.alpinefunds.com |
|
This material must be preceded or accompanied by a current prospectus. |
| |
Item 2. | Code of Ethics. |
| |
| (a) The Registrant, as of the end of the period covered by the report, has adopted a code of ethics that applies to the Registrant’s principal executive officer, principal financial officer, principal accounting officer or controller or persons performing similar functions. |
| |
| (b) Not applicable. |
| |
| (c) There have been no amendments, during the period covered by this report, to a provision of the code of ethics that applies to the Registrant’s principal executive officer, principal financial officer, principal accounting officer or controller, or persons performing similar functions and that relates to any element of the code of ethics described in Item 2(b) of Form N-CSR. |
| |
| (d) The Registrant has not granted any waivers, including an implicit waiver, from a provision of the code of ethics that applies to the registrant’s principal executive officer, principal financial officer, principal accounting officer or controller, or persons performing similar functions that relates to any element of the code of ethics described in Item 2(b) of Form N-CSR. |
| |
| (e) Not applicable. |
| |
| (f) The Registrant’s Code of Ethics is attached as Exhibit 12(A)(1) hereto. |
| |
Item 3. | Audit Committee Financial Expert. |
| |
| (a)(1) The Board of Trustees of the Registrant has determined that the Registrant has at least one audit committee financial expert serving on its audit committee. |
| |
| (a)(2) The Board of Trustees has determined that James A. Jacobson and H. Guy Leibler are audit committee financial experts. Messrs. Jacobson and Leibler are “independent” as defined in paragraph (a)(2) of Item 3 to Form N-CSR. It has been determined that Mr. Jacobson qualifies as an audit committee financial expert based on his extensive experience in the financial services industry, including serving for more than 15 years as a senior executive at a New York Stock Exchange (“NYSE”) specialist firm and as a member of the NYSE Board of Directors (including terms as Vice Chair), his other board service, as well as his educational background. It has been determined that Mr. Leibler qualifies as an audit committee financial expert based on his substantial experience as a senior executive of an operating company actively supervising principal financial officers in the preparation of financial statements, other board service, as well as his educational background. |
| |
| (a)(3) Not applicable. |
| |
Item 4. | Principal Accountant Fees and Services. |
| |
| (a) Audit Fees: The aggregate fees billed for each of the last two fiscal years for professional services rendered by the principal accountant for the audit of the registrant’s annual financial statements or services that are normally provided by the accountant in connection with statutory and regulatory filings or engagements for fiscal year 2011 was $124,468 and fiscal year 2012 was $89,390. |
| |
| (b) Audit-Related Fees: The aggregate fees billed in each of the last two fiscal years for assurance and related services by the principal accountant that are reasonably related to the performance of the audit of the registrant’s financial statements and are not reported under paragraph (a) of this Item was $0 in fiscal year 2011 and $0 in fiscal year 2012. |
| |
| (c) Tax Fees: The aggregate fees billed in each of the last two fiscal years for professional services rendered by the principal accountant for tax compliance, tax advice, and tax planning was $22,794 in fiscal year 2011 and $20,357 in fiscal year 2012. |
| |
| (d) All Other Fees: The aggregate fees billed in each of the last two fiscal years for products and services provided by the principal accountant, other than the services reported in paragraphs (a) through (c) of this Item is $0 in fiscal year 2011 and $10,947 in fiscal year 2012. The fees were for consulting and advisory services regarding enterprise risk management. |
| |
| (e)(1) Audit Committee Pre-Approval Policies and Procedures: All services to be performed by the Registrant’s principal auditors must be pre-approved by the Registrant’s audit committee, which may include the approval of certain services up to an amount determined by the audit committee. Any services that would exceed that amount would require additional approval of the audit committee. |
| |
| (e)(2) No services described in paragraphs (b) through (d) were approved pursuant to paragraph (c)(7)(i)(C) of Rule 2-01 of Regulation S-X. |
| |
| (f) Not applicable. |
| |
| (g) The aggregate non-audit fees billed by the registrant’s accountant for services rendered to the registrant, and the registrant’s investment adviser, and any entity controlling, controlled by, or under common control with the adviser that provides ongoing services to the registrant was $0 in fiscal year 2011 and $109,474 in fiscal year 2012. |
| |
| (h) Not applicable |
Item 5. Audit Committee of Listed Registrants
Not applicable to registrants who are not listed issuers (as defined in Rule 10A-3 under the Securities Exchange Act of 1934).
Item 6. Schedule of Investments
(a) Schedule of Investments is included as part of Item 1 of the Form N-CSR.
(b) Not applicable.
Item 7. Disclosure of Proxy Voting Policies and Procedures for Closed-End Management Investment Companies.
Not applicable to open-end investment management companies.
Item 8. Portfolio Managers of Closed-End Management Investment Companies.
Not applicable to open-end investment management companies.
Item 9. Purchases of Equity Securities by Closed-End Management Investment Company and Affiliated Purchasers.
Not applicable to open-end investment management companies.
Item 10. Submission of Matters to a Vote of Security Holders.
There were no material changes to the procedures by which shareholders may recommend nominees to the Registrant’s Board of Trustees.
Item 11. Controls and Procedures.
| |
| (a) The Registrant’s principal executive officer and principal financial officer have evaluated the registrant’s disclosure controls and procedures (as defined in Rule 30a-3(c) under the Investment Company Act of 1940, as amended) within 90 days of this filing and have concluded that the Registrant’s disclosure controls and procedures were effective, as of that date. |
| |
| (b) There was no change in the Registrant’s internal control over financial reporting (as defined in Rule 30a-3(d) under the Investment Company Act of 1940, as amended) during the second fiscal quarter of the period covered by this report that has materially affected, or is reasonably likely to materially affect, the Registrant’s internal control over financial reporting. |
| |
Item 12. | Exhibits. |
| |
| (a)(1) The Code of Ethics that applies to the Registrant’s principal executive officer and principal financial officer is attached hereto as Exhibit 12.A.1. |
| |
| (a)(2) The certifications required by Rule 30a-2(a) of the Investment Company Act of 1940, as amended, and Section 302 of the Sarbanes-Oxley Act of 2002 are attached hereto as Ex99.Cert. |
| |
| (a)(3) Not applicable. |
| |
| (b) The certifications by the Registrant’s Principal Executive Officer and Principal Financial Officer, as required by Rule 30a-2(b) of the Investment Company Act of 1940, as amended, and Section 906 of the Sarbanes-Oxley Act of 2002 are attached hereto as Ex99.906Cert. |
SIGNATURES
Pursuant to the requirements of the Securities Exchange Act of 1934 and the Investment Company Act of 1940, the registrant has duly caused this report to be signed on its behalf by the undersigned, thereunto duly authorized.
Alpine Equity Trust
| | |
By: | /s/ Samuel A. Lieber | |
|
| |
| Samuel A. Lieber | |
| Chief Executive Officer (Principal Executive Officer) |
| | |
Date: | January 7, 2013 | |
Pursuant to the requirements of the Securities Exchange Act of 1934 and the Investment Company Act of 1940, this report has been signed below by the following persons on behalf of the registrant and in the capacities and on the dates indicated.
| | |
By: | /s/ Samuel A. Lieber | |
|
| |
| Samuel A. Lieber | |
| Chief Executive Officer (Principal Executive Officer) |
| | |
By: | /s/ Ronald G. Palmer, Jr. | |
|
| |
| Ronald G. Palmer, Jr. | |
| Chief Financial Officer (Principal Financial Officer) |
| | |
Date: | January 7, 2013 | |