We are pleased to report on your Funds and their investments for the annual period ended March 31, 2010.
What a difference a year can make. Last year at this time we were just recovering from one of the most difficult bear markets in history and were in the grips of a worldwide recession. Today, most economies have improved and we are enjoying a very powerful stock market rally. The S&P 500 Index returned 49.77% over the twelve months ended March 31, 2010 - one of the best years on record. This has been quite a recovery, but not surprising considering the low levels reached in early of March of 2009. Every sector in the S&P 500 Index posted positive returns, with Financials producing the strongest gains. Again not surprising as this was the most devastated sector during the bear market.
The FBP Value Fund and the FBP Balanced Fund each produced very strong returns over this period, rising 62.84% and 44.01%, respectively. The key to achieving these results was staying true to our investment philosophy and process. We believed that tremendous values had been created during the weakness of the bear market. By sticking with our disciplines, we were able to stay invested a year ago when others may have become too conservative. Our investment team worked to improve the quality of the equity holdings and to maintain sufficient equity exposure in the Balanced Fund. Therefore, as the recovery has unfolded, the performance of the equities in the Funds drove the Funds’ returns. And just as with the S&P 500 Index, all sectors held by the Funds produced positive results. The Energy sector was the strongest performer, dri ven by Pioneer Natural Resources (+243%) and BJ Services (+122%). Industrials were quite strong relative to the S&P 500 Index with Ingersoll-Rand (+157%) a large contributor. Financials were also a major contributor. We had reduced the exposure to the Financials sector early in 2009, but the Funds maintained a higher weight than the S&P 500 Index and produced a higher return. JPMorgan Chase (+69%) and Lincoln National (+360%) provided the most lift in this sector. Two sectors, Materials and Consumer Staples, contributed negatively on a relative basis. While both sectors were up nicely, a combination of weighting and relative return produced the slight detraction. The best individual stock was Wyndham Worldwide (+521%), just recently eliminated from the Funds, and the worst was Watson Pharmaceuticals (+2%), which was sold early in the fiscal year.
Just as investors began to feel more comfortable with the equity markets, several significant events occurred: The rise in risk premiums due to Greece’s financial problems and market weakness in China seem to be tipping points, and most likely are accompanying a near-term correction in equity prices. We are not surprised; as we believed the markets had been due to adjust following the past year’s powerful run. The exaggerated price swings witnessed on May 7th have unnerved many and will surely lead to some changes in trading rules, hopefully to minimize such occurrences in the future. The public turmoil in opposition to necessary austerity measures resulting from Greece’s large debt load is indeed troubling. The rest of Europe has prepared a financial
rescue package to allow Greece to work out of its difficulties over time. But this should be a warning signal to any country that takes on too much debt, whatever its reason.
While the recession most likely ended sometime in the second half of 2009 and economic growth is improved, the strength and longevity of this cycle remain uncertain. We expect domestic GDP growth to be in the 3% to 3.5% range for the calendar year, a decent economic environment. Unemployment remains high at 9.7%, but is down from its seasonally-adjusted peak last year of 10.1%. We expect the unemployment rate, which is traditionally a lagging indicator, to improve gradually as the economy continues to gain traction. Some evidence of this improvement is already appearing, with unemployment claims recently making an 18-month low. Understandably, consumer spending remains subdued, and consumers are continuing to deleverage their balance sheets. Expectations for spending are very low, so even minor upticks in retail sales numbers are being favorably received by investors. We believe a pickup in corporate spending will be a key driver of the economic recovery. During the uncertainty of the recession, companies became reluctant to spend and began hoarding cash. We expect that, as managements see continued economic improvement, they will loosen their purse strings and invest in capital projects, technology and payrolls. The credit markets have normalized, but there are signs that bank lending hasn’t returned to normal levels yet. As bank balance sheets continue to improve over time, lending should pick up and provide additional fuel for the recovering economy.
With interest rates at historically low levels, equity valuation levels reasonable, skepticism still abundant and a decade of very low returns behind us, we are quite optimistic about the potential for stocks to perform well over the long term. During the downturn, many companies cut costs and should be better positioned to generate relatively strong earnings in a gradually improving economic environment. Our focus is to build the Funds’ portfolios with companies trading at substantial discounts to our estimated values. We want to understand the businesses we invest in and to understand the drivers of future value. Strong financial flexibility, excess cash flow generation, revenue and margin potential and competitive position are some of the key factors we consider.
The bond market is ending a multiyear period of relatively strong performance, just as one would expect with interest rates moving to record low levels. As the economy improves, the potential for interest rates to rise is quite likely, which will offer an unattractive return profile for bonds, whose prices move inversely to interest rates. Our current strategy is to maintain short maturities to protect principal value. With government yields so low, our focus will be more on opportunities in investment-grade corporate bonds through which we can generate higher income for the Balanced Fund.
This month we are celebrating our twenty-fifth year as Flippin, Bruce & Porter. Much has changed over the years. Our firm has grown and as a result we have more depth and experience. We have had the pleasure of working with many excellent employees and seeing their families grow up among us. The dynamics of the markets change through time. Now both domestic and global events shape the markets, and we are constantly challenged to understand what is occurring and to invest accordingly. What will never
change, however, is our dedication to you, our clients, who have placed your confidence and trust in us. We appreciate you as our client and look forward each day to come to work on your behalf.
Please visit our website at www.fbpfunds.com for information on your Funds and the investment philosophy and process we utilize to achieve their investment objectives.
John T. Bruce, CFA
Data presented reflects past performance, which is no guarantee of future results. Investment results and principal value will fluctuate so that shares, when redeemed, may be worth more or less than their original cost. Due to market volatility, current performance may be higher or lower than the performance shown. Updated performance information, current through the most recent month-end, is available by contacting the Funds at 1-866-738-1127.
This report is submitted for the general information of the shareholders of the Funds. It reflects our views, opinions and portfolio holdings as of March 31, 2010, the end of the reporting period. These views are subject to change at any time based upon market or other conditions. For more current information throughout the year please visit www.fbpfunds.com or call the Funds at 1-866-738-1127. This report is not authorized for distribution to prospective investors in the Funds unless accompanied by a current prospectus. Distributed by Ultimus Fund Distributors, LLC
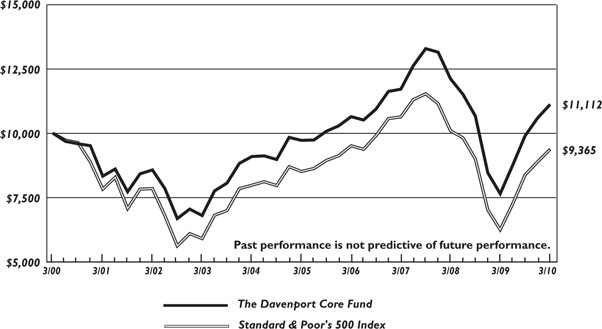
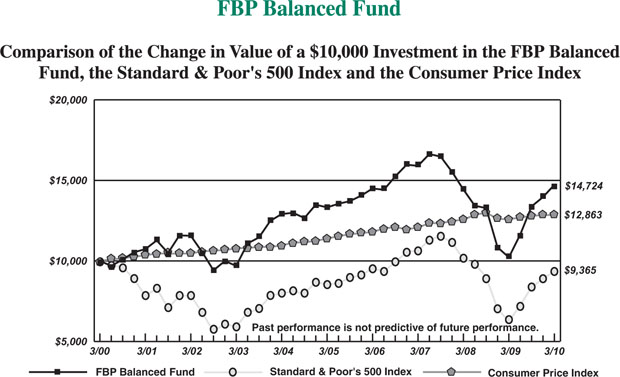
Performance for each Fund is compared to the most appropriate broad-based index, the S&P 500 Index, an unmanaged index of 500 large common stocks. Over time, this index has the potential to outpace the FBP Balanced Fund, which normally maintains at least 25% of its investable assets in bonds. Balanced funds have the growth potential to outpace inflation, but they will typically lag a 100% stock index over the long term because of the bond portion of their portfolios. However, the advantage of the bond portion is that it can make the return and principal of a balanced fund more stable than a portfolio completely invested in stocks. Results are also compared to the Consumer Price Index, a measure of inflation.
Average Annual Total Returns(a) (for periods ended March 31, 2010) |
| | 1 Year | 5 Years | 10 Years |
| FBP Value Fund | 62.84% | -0.17% | 2.71% |
| FBP Balanced Fund | 44.01% | 2.02% | 3.94% |
| Standard & Poor’s 500 Index | 49.77% | 1.92% | -0.65% |
| Consumer Price Index | 2.13% | 2.47% | 2.55% |
| (a) | Total returns are a measure of the change in value of an investment in the Funds over the periods covered, which assumes any dividends or capital gains distributions are reinvested in shares of the Funds. Returns do not reflect the deduction of taxes a shareholder would pay on the Funds’ distributions or the redemption of Fund shares. |
FBP VALUE FUND PORTFOLIO INFORMATION MARCH 31, 2010 (Unaudited) |
| General Information | | Asset Allocation |
| Net Asset Value Per Share | $19.42 | |
| Total Net Assets (Millions) | $28.6 |
| Current Expense Ratio | 1.07% |
| Portfolio Turnover | 21% |
| Fund Inception Date | 7/30/93 |
| | | |
| Stock Characteristics | FBP Value Fund | S&P 500 Index |
| Number of Stocks | 43 | 500 |
| Weighted Avg Market Capitalization (Billions) | $63.4 | $82.1 |
Price-to-Earnings Ratio (IBES 1 Yr. Forecast EPS) | 12.6 | 14.2 |
| Price-to-Book Value | 2.0 | 2.2 |
| Sector Diversification vs. the S&P 500 Index |
| Ten Largest Equity Holdings | % of Net Assets |
| JPMorgan Chase & Company | 4.7% |
| Travelers Companies, Inc. (The) | 3.8% |
| McGraw-Hill Companies, Inc. (The) | 3.1% |
| SUPERVALU, Inc. | 3.0% |
| Sealed Air Corporation | 3.0% |
| Johnson & Johnson | 3.0% |
| Willis Group Holdings plc | 3.0% |
| Devon Energy Corporation | 2.9% |
| Hewlett-Packard Company | 2.8% |
| Ingersoll-Rand plc | 2.7% |
FBP BALANCED FUND PORTFOLIO INFORMATION MARCH 31, 2010 (Unaudited) |
| General Information | | Asset Allocation |
| Net Asset Value Per Share | $15.49 | |
| Total Net Assets (Millions ) | $45.5 |
| Current Expense Ratio | 1.00% |
| Portfolio Turnover | 24% |
| Fund Inception Date | 7/3/89 |
| | |
| | |
| | |
| | |
| | |
| | |
| | |
| | |
| | |
| | |
| | |
| Common Stock Portfolio (72.5% of Net Assets) |
| Number of Stocks | 52 | | Ten Largest Equity Holdings | % of Net Assets |
| Weighted Avg Market Capitalization (Billions) | $64.2 | | JPMorgan Chase & Company | 3.0% |
| Price-to-Earnings Ratio (IBES 1 Yr. Forecast EPS) | 12.4 | | International Business Machines Corporation | 2.7% |
| Price-to-Book Value | 2.0 | | Travelers Companies, Inc. (The) | 2.5% |
| | | | McGraw-Hill Companies, Inc. (The) | 2.0% |
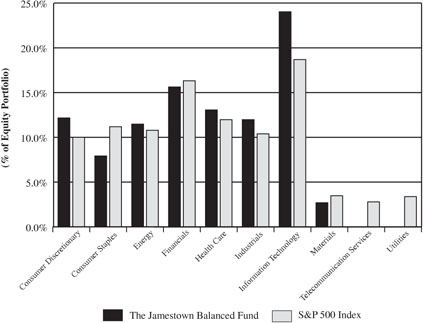
| Five Largest Sectors | % of Net Assets | | Johnson & Johnson | 2.0% |
| Information Technology | 12.6% | | SUPERVALU, Inc. | 2.0% |
| Financials | 11.1% | | Devon Energy Corporation | 2.0% |
| Consumer Staples | 10.5% | | Sealed Air Corporation | 1.9% |
| Industrials | 9.1% | | Willis Group Holdings plc | 1.9% |
| Consumer Discretionary | 7.7% | | Hewlett-Packard Company | 1.9% |
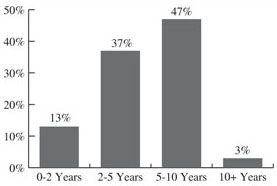
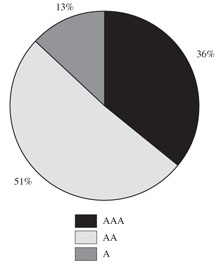
| Fixed-Income Portfolio (20.7% of Net Assets) |
| Number of Fixed-Income Securities | 12 | | |
| Average Quality | A | U.S. Treasury | 1.7% |
| Average Weighted Maturity | 1.9 yrs | U.S. Government Agency | 1.7% |
| Average Effective Duration | 1.8 yrs | Corporate | 17.3% |
FBP VALUE FUND SCHEDULE OF INVESTMENTS March 31, 2010 |
| | | | | | |
| Consumer Discretionary — 11.4% | | | | | | |
| H&R Block, Inc. | | | 16,000 | | | $ | 284,800 | |
| Home Depot, Inc. (The) | | | 21,000 | | | | 679,350 | |
| KB Home | | | 23,000 | | | | 385,250 | |
Kohl's Corporation (a) | | | 8,000 | | | | 438,240 | |
| Macy's, Inc. | | | 26,500 | | | | 576,905 | |
| McGraw-Hill Companies, Inc. (The) | | | 25,000 | | | | 891,250 | |
| | | | | | | | 3,255,795 | |
| Consumer Staples — 14.3% | | | | | | | | |
| Avon Products, Inc. | | | 11,600 | | | | 392,892 | |
| CVS Caremark Corporation | | | 16,500 | | | | 603,240 | |
| Kimberly-Clark Corporation | | | 9,000 | | | | 565,920 | |
| SUPERVALU, Inc. | | | 52,000 | | | | 867,360 | |
| Sysco Corporation | | | 10,000 | | | | 295,000 | |
| Walgreen Company | | | 19,000 | | | | 704,710 | |
| Wal-Mart Stores, Inc. | | | 12,000 | | | | 667,200 | |
| | | | | | | | 4,096,322 | |
| Energy — 8.5% | | | | | | | | |
| Chevron Corporation | | | 3,800 | | | | 288,154 | |
| Devon Energy Corporation | | | 13,100 | | | | 844,033 | |
| Pioneer Natural Resources Company | | | 12,800 | | | | 720,896 | |
| Royal Dutch Shell plc - Class A - ADR | | | 10,000 | | | | 578,600 | |
| | | | | | | | 2,431,683 | |
| Financials — 16.9% | | | | | | | | |
| Comerica, Inc. | | | 14,000 | | | | 532,560 | |
| First American Corporation | | | 10,000 | | | | 338,400 | |
| JPMorgan Chase & Company | | | 30,000 | | | | 1,342,500 | |
| Lincoln National Corporation | | | 23,000 | | | | 706,100 | |
| Travelers Companies, Inc. (The) | | | 20,000 | | | | 1,078,800 | |
| Willis Group Holdings plc | | | 27,000 | | | | 844,830 | |
| | | | | | | | 4,843,190 | |
| Health Care — 10.8% | | | | | | | | |
Amgen, Inc. (a) | | | 8,400 | | | | 501,984 | |
| Johnson & Johnson | | | 13,000 | | | | 847,600 | |
| Merck & Company, Inc. | | | 16,000 | | | | 597,600 | |
| Pfizer, Inc. | | | 42,000 | | | | 720,300 | |
WellPoint, Inc. (a) | | | 6,300 | | | | 405,594 | |
| | | | | | | | 3,073,078 | |
| Industrials — 13.2% | | | | | | | | |
| Avery Dennison Corporation | | | 17,900 | | | | 651,739 | |
| FedEx Corporation | | | 5,800 | | | | 541,720 | |
| General Electric Company | | | 33,000 | | | | 600,600 | |
| Ingersoll-Rand plc | | | 22,500 | | | | 784,575 | |
| Lockheed Martin Corporation | | | 7,900 | | | | 657,438 | |
| Masco Corporation | | | 35,000 | | | | 543,200 | |
| | | | | | | | 3,779,272 | |
FBP VALUE FUND SCHEDULE OF INVESTMENTS (Continued) |
COMMON STOCKS — 96.5% (Continued) | | | | | | |
| Information Technology — 18.4% | | | | | | |
Cisco Systems, Inc. (a) | | | 22,000 | | | $ | 572,660 | |
Computer Sciences Corporation (a) | | | 14,000 | | | | 762,860 | |
Dell, Inc. (a) | | | 50,000 | | | | 750,500 | |
Flextronics International Ltd. (a) | | | 84,000 | | | | 658,560 | |
| Hewlett-Packard Company | | | 15,000 | | | | 797,250 | |
| International Business Machines Corporation | | | 6,000 | | | | 769,500 | |
| Microsoft Corporation | | | 23,000 | | | | 673,210 | |
| Western Union Company (The) | | | 16,900 | | | | 286,624 | |
| | | | | | | | 5,271,164 | |
| Materials — 3.0% | | | | | | | | |
| Sealed Air Corporation | | | 41,100 | | | | 866,388 | |
| | | | | | | | | |
Total Common Stocks (Cost $22,054,024) | | | | | | $ | 27,616,892 | |
MONEY MARKET FUNDS — 2.2% | | | | | | |
Fidelity Institutional Money Market Government Portfolio - Class I, 0.04% (b) (Cost $632,035) | | | 632,035 | | | $ | 632,035 | |
| | | | | | | | | |
Total Investments at Value — 98.7% (Cost $22,686,059) | | | | | | $ | 28,248,927 | |
| | | | | | | | | |
| Other Assets in Excess of Liabilities — 1.3% | | | | | | | 367,673 | |
| | | | | | | | | |
| Total Net Assets — 100.0% | | | | | | $ | 28,616,600 | |
| ADR - American Depositary Receipt |
| |
| (a) | Non-income producing security. |
| | |
| (b) | Variable rate security. The rate shown is the 7-day effective yield as of March 31, 2010. |
| | |
| See accompanying notes to financial statements. |
FBP BALANCED FUND SCHEDULE OF INVESTMENTS March 31, 2010 |
| | | | | | |
| Consumer Discretionary — 7.7% | | | | | | |
| H&R Block, Inc. | | | 17,000 | | | $ | 302,600 | |
| Home Depot, Inc. (The) | | | 23,000 | | | | 744,050 | |
| KB Home | | | 26,000 | | | | 435,500 | |
Kohl's Corporation (a) | | | 7,500 | | | | 410,850 | |
| Macy's, Inc. | | | 32,000 | | | | 696,640 | |
| McGraw-Hill Companies, Inc. (The) | | | 26,000 | | | | 926,900 | |
| | | | | | | | 3,516,540 | |
| Consumer Staples — 10.5% | | | | | | | | |
| Avon Products, Inc. | | | 12,000 | | | | 406,440 | |
| CVS Caremark Corporation | | | 17,500 | | | | 639,800 | |
| Kimberly-Clark Corporation | | | 9,300 | | | | 584,784 | |
| Philip Morris International, Inc. | | | 6,500 | | | | 339,040 | |
| SUPERVALU, Inc. | | | 54,000 | | | | 900,720 | |
| Sysco Corporation | | | 11,600 | | | | 342,200 | |
| Walgreen Company | | | 22,000 | | | | 815,980 | |
| Wal-Mart Stores, Inc. | | | 13,500 | | | | 750,600 | |
| | | | | | | | 4,779,564 | |
| Energy — 7.5% | | | | | | | | |
| BP plc - ADR | | | 5,000 | | | | 285,350 | |
| Chevron Corporation | | | 4,000 | | | | 303,320 | |
| ConocoPhillips | | | 12,500 | | | | 639,625 | |
| Devon Energy Corporation | | | 13,900 | | | | 895,577 | |
| Pioneer Natural Resources Company | | | 13,000 | | | | 732,160 | |
| Royal Dutch Shell plc - Class A - ADR | | | 10,000 | | | | 578,600 | |
| | | | | | | | 3,434,632 | |
| Financials — 11.1% | | | | | | | | |
| Comerica, Inc. | | | 15,000 | | | | 570,600 | |
| First American Corporation | | | 11,000 | | | | 372,240 | |
| JPMorgan Chase & Company | | | 31,000 | | | | 1,387,250 | |
| Lincoln National Corporation | | | 22,700 | | | | 696,890 | |
| Travelers Companies, Inc. (The) | | | 21,000 | | | | 1,132,740 | |
| Willis Group Holdings plc | | | 28,000 | | | | 876,120 | |
| | | | | | | | 5,035,840 | |
| Health Care — 7.6% | | | | | | | | |
Amgen, Inc. (a) | | | 8,850 | | | | 528,876 | |
| Eli Lilly & Company | | | 6,000 | | | | 217,320 | |
| Johnson & Johnson | | | 14,000 | | | | 912,800 | |
| Merck & Company, Inc. | | | 15,600 | | | | 582,660 | |
| Pfizer, Inc. | | | 46,000 | | | | 788,900 | |
WellPoint, Inc. (a) | | | 6,500 | | | | 418,470 | |
| | | | | | | | 3,449,026 | |
FBP BALANCED FUND SCHEDULE OF INVESTMENTS (Continued) |
COMMON STOCKS — 72.5% (Continued) | | | | | | |
| Industrials — 9.1% | | | | | | |
| Avery Dennison Corporation | | | 19,000 | | | $ | 691,790 | |
| FedEx Corporation | | | 6,400 | | | | 597,760 | |
| General Electric Company | | | 39,000 | | | | 709,800 | |
| Ingersoll-Rand plc | | | 24,000 | | | | 836,880 | |
| Lockheed Martin Corporation | | | 8,400 | | | | 699,048 | |
| Masco Corporation | | | 39,000 | | | | 605,280 | |
| | | | | | | | 4,140,558 | |
| Information Technology — 12.6% | | | | | | | | |
Cisco Systems, Inc. (a) | | | 25,000 | | | | 650,750 | |
Computer Sciences Corporation (a) | | | 14,000 | | | | 762,860 | |
Dell, Inc. (a) | | | 35,000 | | | | 525,350 | |
Flextronics International Ltd. (a) | | | 85,000 | | | | 666,400 | |
| Hewlett-Packard Company | | | 16,000 | | | | 850,400 | |
| International Business Machines Corporation | | | 9,500 | | | | 1,218,375 | |
| Microsoft Corporation | | | 27,000 | | | | 790,290 | |
| Western Union Company (The) | | | 17,000 | | | | 288,320 | |
| | | | | | | | 5,752,745 | |
| Materials — 3.9% | | | | | | | | |
| E.I. du Pont de Nemours and Company | | | 18,000 | | | | 670,320 | |
| RPM International, Inc. | | | 10,000 | | | | 213,400 | |
| Sealed Air Corporation | | | 42,000 | | | | 885,360 | |
| | | | | | | | 1,769,080 | |
| Telecommunication Services — 0.5% | | | | | | | | |
| Verizon Communications, Inc. | | | 7,500 | | | | 232,650 | |
| | | | | | | | | |
| Utilities — 2.0% | | | | | | | | |
| American Electric Power Company, Inc. | | | 14,000 | | | | 478,520 | |
| Duke Energy Corporation | | | 26,000 | | | | 424,320 | |
| | | | | | | | 902,840 | |
| | | | | | | | | |
Total Common Stocks (Cost $25,126,647) | | | | | | $ | 33,013,475 | |
| | | | | | |
| BB&T Capital Trust VII (Cost $550,000) | | | 22,000 | | | $ | 586,080 | |
U.S. GOVERNMENT & AGENCY OBLIGATIONS — 3.4% | | | | | | |
| U.S. Treasury Notes — 1.7% | | | | | | |
| 4.50%, due 11/15/2010 | | $ | 750,000 | | | $ | 769,570 | |
| | | | | | | | | |
| Federal Home Loan Bank — 1.7% | | | | | | | | |
| 4.375%, due 10/22/2010 | | | 750,000 | | | | 765,751 | |
| | | | | | | | | |
Total U.S. Government & Agency Obligations (Cost $1,505,741) | | | | | | $ | 1,535,321 | |
FBP BALANCED FUND SCHEDULE OF INVESTMENTS (Continued) |
| | | | | | |
| Consumer Staples — 1.7% | | | | | | |
| Kraft Foods, Inc., 5.625%, due 11/01/2011 | | $ | 750,000 | | | $ | 796,575 | |
| | | | | | | | | |
| Financials — 3.5% | | | | | | | | |
| Berkley (W.R.) Corporation, 5.60%, due 05/15/2015 | | | 750,000 | | | | 770,667 | |
| Prudential Financial, Inc., 5.80%, due 06/15/2012 | | | 750,000 | | | | 804,952 | |
| | | | | | | | 1,575,619 | |
| Health Care — 1.7% | | | | | | | | |
| UnitedHealth Group, Inc., 5.25%, due 03/15/2011 | | | 750,000 | | | | 778,804 | |
| | | | | | | | | |
| Industrials — 5.2% | | | | | | | | |
| Eaton Corporation, 5.95%, due 03/20/2014 | | | 750,000 | | | | 828,548 | |
| Ryder System, Inc., 5.00%, due 04/01/2011 | | | 750,000 | | | | 772,965 | |
| Union Pacific Corporation, 3.625%, due 06/01/2010 | | | 750,000 | | | | 753,488 | |
| | | | | | | | 2,355,001 | |
| Information Technology — 1.7% | | | | | | | | |
| Analog Devices, Inc., 5.00%, due 07/01/2014 | | | 750,000 | | | | 792,080 | |
| | | | | | | | | |
| Utilities — 3.5% | | | | | | | | |
| Ohio Power Company, 5.30%, due 11/01/2010 | | | 750,000 | | | | 769,136 | |
| SBC Communications, Inc., 5.875%, due 02/01/2012 | | | 750,000 | | | | 804,807 | |
| | | | | | | | 1,573,943 | |
| | | | | | | | | |
Total Corporate Bonds (Cost $7,498,721) | | | | | | $ | 7,872,022 | |
MONEY MARKET FUNDS — 5.0% | | | | | | |
Fidelity Institutional Money Market Government Portfolio - Class I, 0.04% (b) (Cost $2,252,232) | | | 2,252,232 | | | $ | 2,252,232 | |
| | | | | | | | | |
Total Investments at Value — 99.5% (Cost $36,933,341) | | | | | | $ | 45,259,130 | |
| | | | | | | | | |
| Other Assets in Excess of Liabilities — 0.5% | | | | | | | 247,604 | |
| | | | | | | | | |
| Total Net Assets — 100.0% | | | | | | $ | 45,506,734 | |
| ADR - American Depositary Receipt |
| |
| (a) | Non-income producing security. |
| | |
| (b) | Variable rate security. The rate shown is the 7-day effective yield as of March 31, 2010. |
| | |
| See accompanying notes to financial statements. |
THE FLIPPIN, BRUCE & PORTER FUNDS STATEMENTS OF ASSETS AND LIABILITIES March 31, 2010 |
| | | | | | |
| ASSETS | | | | | | |
| Investments in securities: | | | | | | |
| At acquisition cost | | $ | 22,686,059 | | | $ | 36,933,341 | |
| At value (Note 1) | | $ | 28,248,927 | | | $ | 45,259,130 | |
| Dividends and interest receivable | | | 36,106 | | | | 179,295 | |
Receivable for investment securities sold | | | 640,820 | | | | 427,688 | |
| Receivable for capital shares sold | | | 425 | | | | — | |
| Other assets | | | 6,270 | | | | 4,732 | |
| TOTAL ASSETS | | | 28,932,548 | | | | 45,870,845 | |
| | | | | | | | | |
| LIABILITIES | | | | | | | | |
| Distributions payable | | | 1,225 | | | | 24,299 | |
Payable for investment securities purchased | | | 287,810 | | | | 289,514 | |
| Payable for capital shares redeemed | | | 214 | | | | 10,130 | |
Accrued investment advisory fees (Note 3) | | | 16,064 | | | | 27,143 | |
| Payable to administrator (Note 3) | | | 4,700 | | | | 6,000 | |
| Other accrued expenses | | | 5,935 | | | | 7,025 | |
| TOTAL LIABILITIES | | | 315,948 | | | | 364,111 | |
| | | | | | | | | |
| NET ASSETS | | $ | 28,616,600 | | | $ | 45,506,734 | |
| | | | | | | | | |
| Net assets consist of: | | | | | | | | |
| Paid-in capital | | $ | 27,379,006 | | | $ | 39,485,070 | |
| Undistributed (distributions in excess of) net investment income | | | (1,225 | ) | | | 4,877 | |
| Accumulated net realized losses from security transactions | | | (4,324,049 | ) | | | (2,309,002 | ) |
Net unrealized appreciation on investments | | | 5,562,868 | | | | 8,325,789 | |
| Net assets | | $ | 28,616,600 | | | $ | 45,506,734 | |
| | | | | | | | | |
| Shares of beneficial interest outstanding (unlimited number of shares authorized, no par value) | | | 1,473,711 | | | | 2,937,816 | |
| | | | | | | | | |
| Net asset value, offering price and redemption price per share (Note 1) | | $ | 19.42 | | | $ | 15.49 | |
| See accompanying notes to financial statements. |
THE FLIPPIN, BRUCE & PORTER FUNDS STATEMENTS OF OPERATIONS Year Ended March 31, 2010 |
| | | | | | |
| INVESTMENT INCOME | | | | | | |
| Interest | | $ | 8 | | | $ | 534,653 | |
| Dividends | | | 480,639 | | | | 689,724 | |
Foreign withholding taxes on dividends | | | (6,432 | ) | | | (7,005 | ) |
TOTAL INVESTMENT INCOME | | | 474,215 | | | | 1,217,372 | |
| | | | | | | | | |
| EXPENSES | | | | | | | | |
| Investment advisory fees (Note 3) | | | 183,733 | | | | 294,117 | |
| Administration fees (Note 3) | | | 48,000 | | | | 58,821 | |
| Professional fees | | | 17,740 | | | | 19,240 | |
| Trustees’ fees and expenses | | | 14,702 | | | | 14,702 | |
| Registration fees | | | 11,664 | | | | 8,340 | |
| Compliance service fees (Note 3) | | | 8,400 | | | | 8,400 | |
| Custodian and bank service fees | | | 7,672 | | | | 8,923 | |
| Postage and supplies | | | 6,825 | | | | 5,868 | |
| Printing of shareholder reports | | | 5,125 | | | | 3,586 | |
| Insurance expense | | | 3,129 | | | | 4,725 | |
| Other expenses | | | 6,029 | | | | 8,365 | |
| TOTAL EXPENSES | | | 313,019 | | | | 435,087 | |
Fees voluntarily waived by the Adviser (Note 3) | | | (32,170 | ) | | | (14,920 | ) |
| NET EXPENSES | | | 280,849 | | | | 420,167 | |
| | | | | | | | | |
| NET INVESTMENT INCOME | | | 193,366 | | | | 797,205 | |
| | | | | | | | | |
| REALIZED AND UNREALIZED GAINS ON INVESTMENTS | | | | | | | | |
| Net realized gains on security transactions | | | 1,048,186 | | | | 1,458,838 | |
| Net realized gains on option contracts written | | | 28,944 | | | | 32,808 | |
| Net change in unrealized appreciation/depreciation on investments | | | 10,893,329 | | | | 12,459,369 | |
| | | | | | | | | |
REALIZED AND UNREALIZED GAINS ON INVESTMENTS | | | 11,970,459 | | | | 13,951,015 | |
| | | | | | | | | |
NET INCREASE IN NET ASSETS FROM OPERATIONS | | $ | 12,163,825 | | | $ | 14,748,220 | |
| See accompanying notes to financial statements. |
THE FLIPPIN, BRUCE & PORTER FUNDS STATEMENTS OF CHANGES IN NET ASSETS |
| | | | | | | |
| | | | | | | | | | | | |
| FROM OPERATIONS | | | | | | | | | | | | |
| Net investment income | | $ | 193,366 | | | $ | 495,561 | | | $ | 797,205 | | | $ | 1,039,325 | |
| Net realized gains (losses) on: | | | | | | | | | | | | | | | | |
| Security transactions | | | 1,048,186 | | | | (5,387,493 | ) | | | 1,458,838 | | | | (3,859,162 | ) |
| Option contracts written | | | 28,944 | | | | (13,686 | ) | | | 32,808 | | | | 78,285 | |
| Net change in unrealized appreciation/depreciation on investments | | | 10,893,329 | | | | (11,397,617 | ) | | | 12,459,369 | | | | (12,251,683 | ) |
| Net increase (decrease) in net assets from operations | | | 12,163,825 | | | | (16,303,235 | ) | | | 14,748,220 | | | | (14,993,235 | ) |
| | | | | | | | | | | | | | | | | |
| DISTRIBUTIONS TO SHAREHOLDERS | | | | | | | | | | | | | | | | |
| From net investment income | | | (205,334 | ) | | | (472,135 | ) | | | (838,744 | ) | | | (963,884 | ) |
| | | | | | | | | | | | | | | | | |
| FROM CAPITAL SHARE TRANSACTIONS | | | | | | | | | | | | | | | | |
| Proceeds from shares sold | | | 811,111 | | | | 1,826,232 | | | | 1,129,444 | | | | 1,127,417 | |
| Net asset value of shares issued in reinvestment of distributions to shareholders | | | 199,289 | | | | 459,482 | | | | 747,349 | | | | 868,323 | |
| Payments for shares redeemed | | | (4,957,268 | ) | | | (7,976,893 | ) | | | (4,478,899 | ) | | | (6,834,380 | ) |
| Net decrease in net assets from capital share transactions | | | (3,946,868 | ) | | | (5,691,179 | ) | | | (2,602,106 | ) | | | (4,838,640 | ) |
| | | | | | | | | | | | | | | | | |
| TOTAL INCREASE (DECREASE) IN NET ASSETS | | | 8,011,623 | | | | (22,466,549 | ) | | | 11,307,370 | | | | (20,795,759 | ) |
| | | | | | | | | | | | | | | | | |
| NET ASSETS | | | | | | | | | | | | | | | | |
| Beginning of year | | | 20,604,977 | | | | 43,071,526 | | | | 34,199,364 | | | | 54,995,123 | |
| End of year | | $ | 28,616,600 | | | $ | 20,604,977 | | | $ | 45,506,734 | | | $ | 34,199,364 | |
| | | | | | | | | | | | | | | | | |
| UNDISTRIBUTED (DISTRIBUTIONS IN EXCESS OF) NET INVESTMENT INCOME | | $ | (1,225 | ) | | $ | 303 | | | $ | 4,877 | | | $ | 26,645 | |
| | | | | | | | | | | | | | | | | |
| CAPITAL SHARE ACTIVITY | | | | | | | | | | | | | | | | |
| Shares sold | | | 50,497 | | | | 115,697 | | | | 83,529 | | | | 85,110 | |
| Shares reinvested | | | 12,030 | | | | 29,288 | | | | 53,343 | | | | 66,451 | |
| Shares redeemed | | | (303,238 | ) | | | (482,157 | ) | | | (317,389 | ) | | | (504,104 | ) |
| Net decrease in shares outstanding | | | (240,711 | ) | | | (337,172 | ) | | | (180,517 | ) | | | (352,543 | ) |
| Shares outstanding at beginning of year | | | 1,714,422 | | | | 2,051,594 | | | | 3,118,333 | | | | 3,470,876 | |
| Shares outstanding at end of year | | | 1,473,711 | | | | 1,714,422 | | | | 2,937,816 | | | | 3,118,333 | |
| See accompanying notes to financial statements. |
FBP VALUE FUND FINANCIAL HIGHLIGHTS |
Selected Per Share Data and Ratios for a Share Outstanding Throughout Each Year | |
| | | | |
| | | | | | | | | | | | | | | |
| Net asset value at beginning of year | | $ | 12.02 | | | $ | 20.99 | | | $ | 27.30 | | | $ | 26.60 | | | $ | 25.73 | |
| | | | | | | | | | | | | | | | | | | | | |
| Income (loss) from investment operations: | | | | | | | | | | | | | | | | | | | | |
| Net investment income | | | 0.12 | | | | 0.27 | | | | 0.32 | | | | 0.33 | | | | 0.32 | |
| Net realized and unrealized gains (losses) on investments | | | 7.41 | | | | (8.98 | ) | | | (4.43 | ) | | | 2.71 | | | | 2.70 | |
| Total from investment operations | | | 7.53 | | | | (8.71 | ) | | | (4.11 | ) | | | 3.04 | | | | 3.02 | |
| | | | | | | | | | | | | | | | | | | | | |
| Less distributions: | | | | | | | | | | | | | | | | | | | | |
| Dividends from net investment income | | | (0.13 | ) | | | (0.26 | ) | | | (0.32 | ) | | | (0.33 | ) | | | (0.32 | ) |
| Distributions from net realized gains | | | — | | | | — | | | | (1.68 | ) | | | (2.01 | ) | | | (1.83 | ) |
| Return of capital | | | — | | | | — | | | | (0.20 | ) | | | — | | | | — | |
| Total distributions | | | (0.13 | ) | | | (0.26 | ) | | | (2.20 | ) | | | (2.34 | ) | | | (2.15 | ) |
| | | | | | | | | | | | | | | | | | | | | |
| Net asset value at end of year | | $ | 19.42 | | | $ | 12.02 | | | $ | 20.99 | | | $ | 27.30 | | | $ | 26.60 | |
| | | | | | | | | | | | | | | | | | | | | |
Total return (a) | | | 62.84% | | | | (41.78% | ) | | | (16.33% | ) | | | 11.57% | | | | 12.03% | |
| | | | | | | | | | | | | | | | | | | | | |
Net assets at end of year (000’s) | | $ | 28,617 | | | $ | 20,605 | | | $ | 43,072 | | | $ | 60,233 | | | $ | 59,611 | |
| | | | | | | | | | | | | | | | | | | | | |
| Ratio of net expenses to average net assets | | | 1.07% | (b) | | | 1.07% | (b) | | | 1.01% | | | | 1.01% | | | | 1.01% | |
| | | | | | | | | | | | | | | | | | | | | |
| Ratio of net investment income to average net assets | | | 0.74% | | | | 1.59% | | | | 1.21% | | | | 1.19% | | | | 1.17% | |
| | �� | | | | | | | | | | | | | | | | | | | |
| Portfolio turnover rate | | | 21% | | | | 16% | | | | 26% | | | | 16% | | | | 15% | |
| (a) | Total return is a measure of the change in value of an investment in the Fund over the periods covered, which assumes any dividends or capital gains distributions are reinvested in shares of the Fund. Returns shown do not reflect the deduction of taxes a shareholder would pay on Fund distributions or the redemption of Fund shares. |
| | |
| (b) | Absent investment advisory fees voluntarily waived by the Adviser, the ratio of expenses to average net assets would have been 1.19% and 1.18% for the years ended March 31, 2010 and 2009, respectively (Note 3). |
| | |
| See accompanying notes to financial statements. |
FBP BALANCED FUND FINANCIAL HIGHLIGHTS |
Selected Per Share Data and Ratios for a Share Outstanding Throughout Each Year | |
| | | | |
| | | | | | | | | | | | | | | |
| Net asset value at beginning of year | | $ | 10.97 | | | $ | 15.84 | | | $ | 18.95 | | | $ | 18.39 | | | $ | 18.06 | |
| | | | | | | | | | | | | | | | | | | | | |
| Income (loss) from investment operations: | | | | | | | | | | | | | | | | | | | | |
| Net investment income | | | 0.27 | | | | 0.32 | | | | 0.38 | | | | 0.37 | | | | 0.33 | |
| Net realized and unrealized gains (losses) on investments | | | 4.53 | | | | (4.89 | ) | | | (2.01 | ) | | | 1.39 | | | | 1.22 | |
| Total from investment operations | | | 4.80 | | | | (4.57 | ) | | | (1.63 | ) | | | 1.76 | | | | 1.55 | |
| | | | | | | | | | | | | | | | | | | | | |
| Less distributions: | | | | | | | | | | | | | | | | | | | | |
| Dividends from net investment income | | | (0.28 | ) | | | (0.30 | ) | | | (0.39 | ) | | | (0.37 | ) | | | (0.32 | ) |
| Distributions from net realized gains | | | — | | | | — | | | | (1.02 | ) | | | (0.83 | ) | | | (0.90 | ) |
| Return of capital | | | — | | | | — | | | | (0.07 | ) | | | — | | | | — | |
| Total distributions | | | (0.28 | ) | | | (0.30 | ) | | | (1.48 | ) | | | (1.20 | ) | | | (1.22 | ) |
| | | | | | | | | | | | | | | | | | | | | |
| Net asset value at end of year | | $ | 15.49 | | | $ | 10.97 | | | $ | 15.84 | | | $ | 18.95 | | | $ | 18.39 | |
| | | | | | | | | | | | | | | | | | | | | |
Total return (a) | | | 44.01% | | | | (29.15% | ) | | | (9.27% | ) | | | 9.70% | | | | 8.81% | |
| | | | | | | | | | | | | | | | | | | | | |
| Net assets at end of year (000’s) | | $ | 45,507 | | | $ | 34,199 | | | $ | 54,995 | | | $ | 66,358 | | | $ | 62,781 | |
| | | | | | | | | | | | | | | | | | | | | |
| Ratio of net expenses to average net assets | | | 1.00% | (b) | | | 1.00% | (b) | | | 0.96% | | | | 0.97% | | | | 0.99% | |
| | | | | | | | | | | | | | | | | | | | | |
| Ratio of net investment income to average net assets | | | 1.90% | | | | 2.36% | | | | 2.05% | | | | 1.95% | | | | 1.75% | |
| | | | | | | | | | | | | | | | | | | | | |
| Portfolio turnover rate | | | 24% | | | | 24% | | | | 29% | | | | 17% | | | | 24% | |
| (a) | Total return is a measure of the change in value of an investment in the Fund over the periods covered, which assumes any dividends or capital gains distributions are reinvested in shares of the Fund. Returns shown do not reflect the deduction of taxes a shareholder would pay on Fund distributions or the redemption of Fund shares. |
| | |
| (b) | Absent investment advisory fees voluntarily waived by the Adviser, the ratio of expenses to average net assets would have been 1.03% and 1.05% for the years ended March 31, 2010 and 2009 (Note 3). |
| | |
| See accompanying notes to financial statements. |
THE FLIPPIN, BRUCE & PORTER FUNDS NOTES TO FINANCIAL STATEMENTS March 31, 2010 |
1. Organization and Significant Accounting Policies
The FBP Value Fund and the FBP Balanced Fund (the “Funds”) are no-load, diversified series of the Williamsburg Investment Trust (the “Trust”), an open-end management investment company registered under the Investment Company Act of 1940. The Trust was organized as a Massachusetts business trust on July 18, 1988. Other series of Williamsburg Investment Trust are not included in this report.
The FBP Value Fund seeks long term growth of capital through investment in a diversified portfolio comprised primarily of equity securities, with current income as a secondary objective.
The FBP Balanced Fund seeks long term capital appreciation and current income through investment in a balanced portfolio of equity and fixed income securities assuming a moderate level of investment risk.
The following is a summary of the Funds’ significant accounting policies:
Securities valuation — The Funds’ portfolio securities are valued as of the close of business of the regular session of the New York Stock Exchange (normally 4:00 p.m., Eastern time). Securities traded on a national stock exchange are valued based upon the closing price on the principal exchange where the security is traded. Securities which are quoted by NASDAQ are valued at the NASDAQ Official Closing Price. Securities which are traded over-the-counter are valued at the last sales price, if available, otherwise, at the last quoted bid price. It is expected that fixed income securities will ordinarily be traded in the over-the-counter market, and common stocks will ordinarily be traded on a national securities exchange, but may also be traded in the over-the-counter market. Call options written by the Funds are valued at t he then current market quotation, using the ask price as of the close of each day on the principal exchanges on which they are traded. Short-term instruments (those with remaining maturities of 60 days or less) may be valued at amortized cost, which approximates market value.
When market quotations are not readily available, securities may be valued on the basis of prices provided by an independent pricing service. The prices provided by the pricing service are determined with consideration given to institutional bid and last sale prices and take into account securities prices, yields, maturities, call features, ratings, institutional trading in similar groups of securities and developments related to specific securities. If a pricing service cannot provide a valuation, securities will be valued in good faith at fair value using methods consistent with those determined by the Board of Trustees. Such methods of fair valuation may include, but are not limited to: multiple of earnings, multiple of book value, discount from market of a similar freely traded security, purchase price of security, subsequent priva te transactions in the security or related securities, or a combination of these and other factors.
Accounting principles generally accepted in the United States (“GAAP”) establish a single authoritative definition of fair value, set out a framework for measuring fair value and require additional disclosures about fair value measurements. Various inputs are used in determining the value of each Fund’s investments. These inputs are summarized in the three broad levels listed below:
• Level 1 – quoted prices in active markets for identical securities
• Level 2 – other significant observable inputs
• Level 3 – significant unobservable inputs
The inputs or methodology used for valuing securities are not necessarily an indication of the risks associated with investing in those securities.
THE FLIPPIN, BRUCE & PORTER FUNDS NOTES TO FINANCIAL STATEMENTS (Continued) |
The following is a summary of the inputs used to value each Fund’s investments as of March 31, 2010 by security type:
| FBP Value Fund | | Level 1 | | | Level 2 | | | Level 3 | | | Total | |
| Common Stocks | | $ | 27,616,892 | | | $ | — | | | $ | — | | | $ | 27,616,892 | |
| Money Market Funds | | | — | | | | 632,035 | | | | — | | | | 632,035 | |
| Total | | $ | 27,616,892 | | | $ | 632,035 | | | $ | — | | | $ | 28,248,927 | |
| FBP Balanced Fund | | Level 1 | | | Level 2 | | | Level 3 | | | Total | |
| Common Stocks | | $ | 33,013,475 | | | $ | — | | | $ | — | | | $ | 33,013,475 | |
| Preferred Stocks | | | 586,080 | | | | — | | | | — | | | | 586,080 | |
| U.S. Government & Agency Obligations | | | — | | | | 1,535,321 | | | | — | | | | 1,535,321 | |
| Corporate Bonds | | | — | | | | 7,872,022 | | | | — | | | | 7,872,022 | |
| Money Market Funds | | | — | | | | 2,252,232 | | | | — | | | | 2,252,232 | |
| Total | | $ | 33,599,555 | | | $ | 11,659,575 | | | $ | — | | | $ | 45,259,130 | |
Refer to each Fund’s Schedule of Investments for a listing of the common stocks and corporate bonds valued using Level 1 and Level 2 inputs by sector type.
Share valuation — The net asset value per share of each Fund is calculated daily by dividing the total value of its assets, less liabilities, by the number of shares outstanding. The offering price and redemption price per share of each Fund is equal to its net asset value per share.
Investment income — Interest income is accrued as earned. Dividend income is recorded on the ex-dividend date. Discounts and premiums on fixed income securities purchased are amortized using the interest method.
Repurchase agreements — Each Fund may enter into repurchase agreements. A repurchase agreement, which is collateralized by U.S. Government obligations, is valued at cost which, together with accrued interest, approximates market value. At the time a Fund enters into a repurchase agreement, the Fund takes possession of the underlying securities and the seller agrees that the value of the underlying securities, including accrued interest, will at all times be equal to or exceed the face amount of the repurchase agreement. In addition, the Funds actively monitor and seek additional collateral, as needed. If the seller defaults, the fair value of the collateral may decline and realization of the collateral by the Funds may be delayed or limited.
Distributions to shareholders — Dividends arising from net investment income are declared and paid quarterly to shareholders of each Fund. Net realized short-term capital gains, if any, may be distributed throughout the year and net realized long-term capital gains, if any, are distributed at least once each year. The amount of distributions from net investment income and net realized gains are determined in accordance with federal income tax regulations, which may differ from GAAP. These “book/tax” differences are either temporary or permanent in nature.
THE FLIPPIN, BRUCE & PORTER FUNDS NOTES TO FINANCIAL STATEMENTS (Continued) |
The tax character of distributions paid by each Fund during the years ended March 31, 2010 and March 31, 2009 is ordinary income.
Security transactions — Security transactions are accounted for on trade date. Gains and losses on securities sold are determined on a specific identification basis.
Common expenses — Common expenses of the Trust are allocated among the funds of the Trust based on relative net assets of each fund or the nature of the services performed and the relative applicability to each fund.
Options transactions — When the Funds’ investment adviser believes that individual portfolio securities held by the Funds are approaching the top of the adviser’s growth and price expectations, the Funds may write covered call options for which premiums are received and are recorded as liabilities, and are subsequently valued daily at the closing prices on their primary exchanges. Premiums received from writing options which expire are treated as realized gains. Premiums received from writing options which are exercised increase the proceeds used to calculate the realized gain or loss on the sale of the security. If a closing purchase transaction is used to terminate a Fund’s obligation on a call option, a gain or loss will be realized, depending upon whether the price of the closing purchase transaction is more or less than the premium previously received on the call option written.
Estimates — The preparation of financial statements in conformity with GAAP requires management to make estimates and assumptions that affect the reported amounts of assets and liabilities and the disclosure of contingent assets and liabilities at the date of the financial statements and the reported amounts of income and expenses during the reporting period. Actual results could differ from those estimates.
Federal income tax — It is each Fund’s policy to comply with the special provisions of Subchapter M of the Internal Revenue Code applicable to regulated investment companies. As provided therein, in any fiscal year in which a Fund so qualifies and distributes at least 90% of its taxable net income, the Fund (but not the shareholders) will be relieved of federal income tax on the income distributed. Accordingly, no provision for income taxes has been made.
In order to avoid imposition of the excise tax applicable to regulated investment companies, it is also each Fund’s intention to declare as dividends in each calendar year at least 98% of its net investment income (earned during the calendar year) and 98% of its net realized capital gains (earned during the twelve months ended October 31) plus undistributed amounts from prior years.
THE FLIPPIN, BRUCE & PORTER FUNDS NOTES TO FINANCIAL STATEMENTS (Continued) |
The following information is computed on a tax basis for each item as of March 31, 2010:
| | | FBP Value Fund | | | FBP Balanced Fund | |
| Cost of portfolio investments | | $ | 22,686,059 | | | $ | 36,929,609 | |
| Gross unrealized appreciation | | $ | 7,725,547 | | | $ | 10,494,345 | |
| Gross unrealized depreciation | | | (2,162,679 | ) | | | (2,164,824 | ) |
| Net unrealized appreciation | | | 5,562,868 | | | | 8,329,521 | |
| Undistributed ordinary income | | | — | | | | 25,444 | |
| Capital loss carryforwards | | | (4,324,049 | ) | | | (2,309,002 | ) |
| Other temporary differences | | | (1,225 | ) | | | (24,299 | ) |
| Total distributable earnings | | $ | 1,237,594 | | | $ | 6,021,664 | |
The difference between the federal income tax cost of portfolio investments and the financial statement cost for the FBP Balanced Fund is due to certain differences in the recognition of capital gains and losses under income tax regulations and GAAP. These “book/tax” differences are temporary in nature and are primarily due to differing methods in the amortization of discounts and premiums on fixed income securities.
As of March 31, 2010, the Funds had the following capital loss carryforwards for federal income tax purposes:
| Expires March 31, | | FBP Value Fund | | | FBP Balanced Fund | |
| 2017 | | $ | 2,475,616 | | | $ | 1,823,332 | |
| 2018 | | | 1,848,433 | | | | 485,670 | |
| | | $ | 4,324,049 | | | $ | 2,309,002 | |
These capital loss carryforwards may be utilized in future years to offset net realized capital gains, if any, prior to distributing such gains to shareholders.
For the year ended March 31, 2010, the FBP Balanced Fund reclassified accumulated net realized gains from security transactions of $19,771 against undistributed net investment income on the Statements of Assets and Liabilities. For the year ended March 31, 2010, the FBP Value Fund reclassified distributions in excess of net investment income of $10,440 against paid-in capital on the Statements of Assets and Liabilities. Such reclassifications, the result of permanent differences between the financial statement and income tax reporting requirements, has no effect on the Funds’ net assets or net asset value per share.
The Funds recognize the tax benefits or expenses of uncertain tax positions only when the position is “more likely than not” to be sustained assuming examination by tax authorities. Management has reviewed the tax positions taken on Federal income tax returns for all open tax years (tax years ended March 31, 2007 through March 31, 2010) of each Fund and has concluded that no provision for unrecognized tax benefits or expenses is required in these financial statements.
2. Investment Transactions
During the year ended March 31, 2010, cost of purchases and proceeds from sales and maturities of investment securities, other than short-term investments and U.S. government securities, totaled $5,368,537 and $9,716,518, respectively, for the FBP Value Fund and $9,586,131 and $11,966,725, respectively, for the FBP Balanced Fund.
THE FLIPPIN, BRUCE & PORTER FUNDS NOTES TO FINANCIAL STATEMENTS (Continued) |
3. Transactions with Affiliates
INVESTMENT ADVISORY AGREEMENT
The Funds’ investments are managed by Flippin, Bruce & Porter, Inc. (the “Adviser”) under the terms of an Investment Advisory Agreement. Under the Investment Advisory Agreement, each Fund pays the Adviser a fee, which is computed and accrued daily and paid monthly, at an annual rate of .70% of its average daily net assets up to $250 million; .65% of the next $250 million of such assets; and .50% of such assets in excess of $500 million.
During the year ended March 31, 2010, the Adviser voluntarily waived $32,170 and $14,920 of its investment advisory fees from the FBP Value Fund and the FBP Balanced Fund, respectively.
Certain officers of the Trust are also officers of the Adviser.
MUTUAL FUND SERVICES AGREEMENT
Under the terms of a Mutual Fund Services Agreement between the Trust and Ultimus Fund Solutions, LLC (“Ultimus”), Ultimus provides administrative, pricing, accounting, dividend disbursing, shareholder servicing and transfer agent services for the Funds. For these services, Ultimus receives a monthly fee from each Fund at an annual rate of .15% of its average daily net assets up to $25 million, .125% of the next $25 million of such assets, and .10% of such assets in excess of $50 million, subject to a minimum monthly fee of $4,000; plus a shareholder recordkeeping fee at the annual rate of $10 per shareholder account in excess of 1,000 accounts. In addition, each Fund pays out-of-pocket expenses including, but not limited to, postage, supplies and costs of pricing portfolio securities. Certain officers of the Trust are also officers of Ultimus, or of Ultimus Fund Distributors, LLC (the “Distributor”), the principal underwriter of each Fund’s shares. The Distributor is compensated by the Adviser (not the Funds) for acting as principal underwriter.
COMPLIANCE CONSULTING AGREEMENT
Under the terms of a Compliance Consulting Agreement between the Trust and Ultimus, Ultimus provides an individual to serve as the Trust’s Chief Compliance Officer and to administer the Funds’ compliance policies and procedures. For these services, the Funds pay Ultimus an annual base fee of $16,800 plus an asset-based fee equal to 0.01% per annum on the Funds’ aggregate net assets in excess of $100 million. In addition, the Funds reimburse Ultimus for reasonable out-of-pocket expenses, if any, incurred in connection with these services.
4. Covered Call Options
Transactions in option contracts written by the Funds during the year ended March 31, 2010 were as follows:
| | | FBP Value Fund | | | FBP Balanced Fund | |
| | | Option Contracts | | | Option Premiums | | | Option Contracts | | | Option Premiums | |
| Options outstanding at beginning of year | | | — | | | $ | — | | | | — | | | $ | — | |
| Options written | | | 350 | | | | 101,574 | | | | 395 | | | | 105,185 | |
| Options expired | | | (145 | ) | | | (28,709 | ) | | | (170 | ) | | | (32,613 | ) |
| Options exercised | | | (205 | ) | | | (72,865 | ) | | | (225 | ) | | | (72,572 | ) |
| Options outstanding at end of year | | | — | | | $ | — | | | | — | | | $ | — | |
The average monthly notional amount of option contracts during the year ended March 31, 2010 was $840,958 and $882,917, respectively, for the FBP Value Fund and the FBP Balanced Fund.
THE FLIPPIN, BRUCE & PORTER FUNDS NOTES TO FINANCIAL STATEMENTS (Continued) |
5. Contingencies and Commitments
The Funds indemnify the Trust’s officers and Trustees for certain liabilities that might arise from their performance of their duties to the Funds. Additionally, in the normal course of business the Funds enter into contracts that contain a variety of representations and warranties and which provide general indemnifications. The Funds’ maximum exposure under these arrangements is unknown, as this would involve future claims that may be made against the Funds that have not yet occurred. However, based on experience, the Funds expect the risk of loss to be remote.
6. Subsequent Events
The Funds are required to recognize in the financial statements the effects of all subsequent events that provide additional evidence about conditions that existed as of the date of the Statements of Assets and Liabilities. For non-recognized subsequent events that must be disclosed to keep the financial statements from being misleading, the Funds are required to disclose the nature of the event as well as an estimate of its financial effect, or a statement that such an estimate cannot be made. Management has evaluated subsequent events through the issuance of these financial statements and has noted no such events.
7. Recent Accounting Pronouncement
In January 2010, the Financial Accounting Standards Board (“FASB”) issued Accounting Standards Update (“ASU”) No. 2010-06 “Improving Disclosures about Fair Value Measurements.” ASU No. 2010-06 amends FASB Accounting Standards Codification Topic 820, Fair Value Measurements and Disclosures, to require additional disclosures regarding fair value measurements. Certain disclosures required by ASU No. 2010-06 are effective for interim and annual reporting periods beginning after December 31, 2009 and others for fiscal years beginning after December 15, 2010 and for interim periods within those fiscal years. Management is currently evaluating the impact ASU No. 2010-06 will have on the Funds’ financial statement disclosures.
THE FLIPPIN, BRUCE & PORTER FUNDS REPORT OF INDEPENDENT REGISTERED PUBLIC ACCOUNTING FIRM |
The Board of Trustees and Shareholders of
the FBP Value Fund and the FBP Balanced Fund
of the Williamsburg Investment Trust
We have audited the accompanying statements of assets and liabilities, including the schedules of investments, of the FBP Value Fund and the FBP Balanced Fund (the “Funds”) (each a series of the Williamsburg Investment Trust), as of March 31, 2010, and the related statements of operations for the year then ended, the statements of changes in net assets for each of the two years in the period then ended, and the financial highlights for each of the five years in the period then ended. These financial statements and financial highlights are the responsibility of the Funds’ management. Our responsibility is to express an opinion on these financial statements and financial highlights based on our audits.
We conducted our audits in accordance with the standards of the Public Company Accounting Oversight Board (United States). Those standards require that we plan and perform the audits to obtain reasonable assurance about whether the financial statements and financial highlights are free of material misstatement. We were not engaged to perform an audit of the Funds’ internal control over financial reporting. Our audits included consideration of internal control over financial reporting as a basis for designing audit procedures that are appropriate in the circumstances, but not for the purpose of expressing an opinion on the effectiveness of the Funds’ internal control over financial reporting. Accordingly, we express no such opinion. An audit also includes examining, on a test basis, evidence supporting the amounts and disclo sures in the financial statements and financial highlights, assessing the accounting principles used and significant estimates made by management, and evaluating the overall financial statement presentation. Our procedures included confirmation of securities owned as of March 31, 2010, by correspondence with the custodian and brokers. We believe that our audits provide a reasonable basis for our opinion.
In our opinion, the financial statements and financial highlights referred to above present fairly, in all material respects, the financial position of the FBP Value Fund and the FBP Balanced Fund at March 31, 2010, the results of their operations for the year then ended, the changes in their net assets for each of the two years in the period then ended, and the financial highlights for each of the five years in the period then ended, in conformity with U.S. generally accepted accounting principles.
Cincinnati, Ohio
May 27, 2010
THE FLIPPIN, BRUCE & PORTER FUNDS BOARD OF TRUSTEES AND EXECUTIVE OFFICERS (Unaudited) |
Overall responsibility for management of the Fund rests with the Board of Trustees. The Trustees serve during the lifetime of the Trust and until its termination, or until death, resignation, retirement or removal. The Trustees, in turn, elect the officers of the Fund. The officers have been elected for an annual term. The following are the Trustees and executive officers of the Fund:
| | Trustee | Address | Age | Position Held with the Trust | Length of Time Served |
| * | Charles M. Caravati, Jr. | 931 Broad Street Road Manakin-Sabot, VA | 73 | Chairman and Trustee | Since June 1991 |
| * | Austin Brockenbrough III | 1802 Bayberry Court, Suite 400 Richmond, VA | 73 | Trustee | Since September 1988 |
| * | John T. Bruce | 800 Main Street Lynchburg, VA | 56 | Trustee | Since September 1988 |
| | Robert S. Harris | 100 Darden Boulevard Charlottesville, VA | 60 | Trustee | Since January 2007 |
| | J. Finley Lee, Jr. | 448 Pond Apple Drive North Naples, FL | 70 | Trustee | Since September 1988 |
| | Richard L. Morrill | University of Richmond Richmond, VA | 70 | Trustee | Since March 1993 |
| | Harris V. Morrissette | 100 Jacintoport Boulevard Saraland, AL | 50 | Trustee | Since March 1993 |
| | Samuel B. Witt III | 302 Clovelly Road Richmond, VA | 74 | Trustee | Since November 1988 |
| | John M. Flippin | 800 Main Street Lynchburg, VA | 68 | Vice President | Since September 1988 |
| | R. Gregory Porter III | 800 Main Street Lynchburg, VA | 68 | Vice President | Since September 1988 |
| | John H. Hanna IV | 800 Main Street Lynchburg, VA | 54 | Vice President | Since February 2007 |
| | David J. Marshall | 800 Main Street Lynchburg, VA | 53 | Vice President | Since February 2007 |
| | Robert G. Dorsey | 225 Pictoria Drive, Suite 450 Cincinnati, OH | 53 | Vice President | Since November 2000 |
| | Mark J. Seger | 225 Pictoria Drive, Suite 450 Cincinnati, OH | 48 | Treasurer | Since November 2000 |
| | John F. Splain | 225 Pictoria Drive, Suite 450 Cincinnati, OH | 53 | Secretary | Since November 2000 |
| | Tina H. Bloom | 225 Pictoria Drive, Suite 450 Cincinnati, OH | 41 | Chief Compliance Officer | Since August 2006 |
| * | Messrs. Bruce and Brockenbrough, as affiliated persons of investment advisers to the Trust, are “interested persons” of the Trust within the meaning of Section 2(a)(19) of the Investment Company Act of 1940. Charles M. Caravati, Jr. is the father of Charles M. Caravati III, an officer of The Jamestown Funds, which are other series of the Trust. |
THE FLIPPIN, BRUCE & PORTER FUNDS BOARD OF TRUSTEES AND EXECUTIVE OFFICERS (Unaudited) (Continued) |
Each Trustee oversees nine portfolios of the Trust, including the Fund. The principal occupations of the Trustees and executive officers of the Fund during the past five years and public directorships held by the Trustees are set forth below:
Charles M. Caravati, Jr. is a retired physician. He is also the retired President of Dermatology Associates of Virginia, P.C.
Austin Brockenbrough III is President and Managing Director of Lowe, Brockenbrough & Company, Inc. (an investment advisory firm). He is a member of the Board of Directors of Tredegar Corporation (a plastics manufacturer) and Wilkinson O’Grady & Co., Inc. (a global asset manager).
John T. Bruce is a Principal of Flippin, Bruce & Porter, Inc. (an investment advisory firm).
Robert S. Harris is the C. Stewart Sheppard Professor of Business Administration at The Darden Graduate School of Business Administration at the University of Virginia. He was previously the dean at Darden. Professor Harris has published widely on corporate finance, financial markets and mergers and acquisitions and has served as a consultant to corporations and government agencies.
J. Finley Lee, Jr. is a financial consultant and the Julian Price Professor Emeritus at the University of North Carolina.
Richard L. Morrill serves as President of the Teagle Foundation (charitable foundation) and Chancellor of the University of Richmond. He is also a member of the Board of Directors of Tredegar Corporation and Albemarle Corporation (specialty chemical manufacturer).
Harris V. Morrissette is President of China Doll Rice and Beans Inc. and Dixie Lily Foods. He is a member of the Board of Directors of BancTrust Financial Group, Inc. (a bank holding company). In addition, he is Chairman of Azalea Aviation, Inc. (an airplane fueling company).
Samuel B. Witt III is the retired Senior Vice President and General Counsel of Stateside Associates, Inc. He is also a member of the Board of Directors of The Swiss Helvetia Fund, Inc. (a closed-end investment company).
John M. Flippin is a Principal of the Adviser.
R. Gregory Porter III is a Principal of the Adviser.
John H. Hanna IV is a Principal of the Adviser.
David J. Marshall is a Principal of the Adviser.
Robert G. Dorsey is a Managing Director of Ultimus Fund Solutions, LLC and Ultimus Fund Distributors, LLC.
Mark J. Seger is a Managing Director of Ultimus Fund Solutions, LLC and Ultimus Fund Distributors, LLC.
John F. Splain is a Managing Director of Ultimus Fund Solutions, LLC and Ultimus Fund Distributors, LLC.
Tina H. Bloom is Vice President of Administration of Ultimus Fund Solutions, LLC.
Additional information about members of the Board of Trustees and executive officers is available in the Statement of Additional Information (“SAI”). To obtain a free copy of the SAI, please call 1-800-281-3217.
THE FLIPPIN, BRUCE & PORTER FUNDS ABOUT YOUR FUNDS’ EXPENSES (Unaudited) |
We believe it is important for you to understand the impact of costs on your investment. All mutual funds have operating expenses. As a shareholder of the Funds, you incur ongoing costs, including management fees and other operating expenses. These ongoing costs, which are deducted from each Fund’s gross income, directly reduce the investment return of the Funds.
A mutual fund’s ongoing costs are expressed as a percentage of its average net assets. This figure is known as the expense ratio. The following examples are intended to help you understand the ongoing costs (in dollars) of investing in the Funds and to compare these costs with the ongoing costs of investing in other mutual funds. The examples below are based on an investment of $1,000 made at the beginning of the period shown and held for the entire period (October 1, 2009 through March 31, 2010).
The table below illustrates each Fund’s ongoing costs in two ways:
Actual fund return – This section helps you to estimate the actual expenses that you paid over the period. The “Ending Account Value” shown is derived from each Fund’s actual return, and the third column shows the dollar amount of operating expenses that would have been paid by an investor who started with $1,000 in the Funds. You may use the information here, together with the amount you invested, to estimate the expenses that you paid over the period.
To do so, simply divide your account value by $1,000 (for example, an $8,600 account value divided by $1,000 = 8.6), then multiply the result by the number given for the Funds under the heading “Expenses Paid During Period.”
Hypothetical 5% return – This section is intended to help you compare the Funds’ ongoing costs with those of other mutual funds. It assumes that each Fund had an annual return of 5% before expenses during the period shown, but that the expense ratio is unchanged. In this case, because the returns used are not the Funds’ actual returns, the results do not apply to your investment. The example is useful in making comparisons because the Securities and Exchange Commission (“SEC”) requires all mutual funds to calculate expenses based on a 5% return. You can assess each Fund’s ongoing costs by comparing this hypothetical example with the hypothetical examples that appear in shareholder reports of other funds.
Note that expenses shown in the table are meant to highlight and help you compare ongoing costs only. The Funds do not charge sales loads or redemption fees, nor do they carry a “sales load.”
The calculations assume no shares were bought or sold during the period. Your actual costs may have been higher or lower, depending on the amount of your investment and the timing of any purchases or redemptions.
More information about the Funds’ expenses, including annual expense ratios for the past five fiscal years, can be found in this report. For additional information on operating expenses and other shareholder costs, please refer to the Funds’ prospectus.
FBP Value Fund
| | Beginning Account Value October 1, 2009 | Ending Account Value March 31, 2010 | Expenses Paid During Period* |
Based on Actual Fund Return | $1,000.00 | $1,127.40 | $5.68 |
| Based on Hypothetical 5% Return (before expenses) | $1,000.00 | $1,019.60 | $5.39 |
| * | Expenses are equal to the FBP Value Fund’s annualized expense ratio of 1.07% for the period, multiplied by the average account value over the period, multiplied by 182/365 (to reflect the one-half year period). |
THE FLIPPIN, BRUCE & PORTER FUNDS ABOUT YOUR FUNDS’ EXPENSES (Unaudited) (Continued) |
FBP Balanced Fund
| | Beginning Account Value October 1, 2009 | Ending Account Value March 31, 2010 | Expenses Paid During Period* |
Based on Actual Fund Return | $1,000.00 | $1,099.70 | $5.23 |
| Based on Hypothetical 5% Return (before expenses) | $1,000.00 | $1,019.95 | $5.04 |
| * | Expenses are equal to the FBP Balanced Fund’s annualized expense ratio of 1.00% for the period, multiplied by the average account value over the period, multiplied by 182/365 (to reflect the one-half year period). |
OTHER INFORMATION (Unaudited) |
The Trust files a complete listing of portfolio holdings for the Funds with the SEC as of the first and third quarters of each fiscal year on Form N-Q. The filings are available upon request, by calling 1-800-327-9375. Furthermore, you may obtain a copy of these filings on the SEC’s website at http://www.sec.gov. The Trust’s Forms N-Q may also be reviewed and copied at the SEC’s Public Reference Room in Washington, DC, and information on the operation of the Public Reference Room may be obtained by calling 1-800-SEC-0330.
A description of the policies and procedures that the Funds use to determine how to vote proxies relating to portfolio securities is available without charge upon request by calling toll-free 1-800-327-9375, or on the SEC’s website at http://www.sec.gov. Information regarding how the Funds voted proxies relating to portfolio securities during the most recent 12-month period ended June 30 is also available without charge upon request by calling toll-free 1-800-327-9375, or on the SEC’s website at http://www.sec.gov.
FEDERAL TAX INFORMATION (Unaudited) |
In accordance with federal tax requirements, the following provides shareholders with information concerning distributions from ordinary income made by the Funds during the year ended March 31, 2010. For the fiscal year ended March 31, 2010, certain dividends paid by the Funds may be subject to a maximum tax rate of 15%, as provided by the Jobs and Growth Tax Relief Reconciliation Act of 2003. The FBP Value Fund and the FBP Balanced Fund intend to designate up to a maximum amount of $205,334 and $838,744, respectively, as taxed at a maximum rate of 15%. Additionally, for the fiscal year ended March 31, 2010, 100% and 73% of the dividends paid from ordinary income by the FBP Value Fund and the FBP Balanced Fund, respectively, qualified for the dividends received deduction for corporations. As required by federal regulations, complete in formation will be computed and reported in conjunction with your 2010 Form 1099-DIV.
THE FLIPPIN, BRUCE & PORTER FUNDS DISCLOSURE REGARDING APPROVAL OF INVESTMENT ADVISORY AGREEMENT (Unaudited) |
At an in-person meeting held on February 9, 2010, the Board of Trustees, including a majority of the Independent Trustees, approved the continuance for a one-year period of the Investment Advisory Agreements with the Adviser on behalf of the FBP Value Fund and the FBP Balanced Fund. Below is a discussion of the factors considered by the Board of Trustees along with their conclusions with respect thereto that formed the basis for the Board’s approvals.
In selecting the Adviser and approving the continuance of the Investment Advisory Agreements, the Trustees considered all information they deemed reasonably necessary to evaluate the terms of the Agreements. The principal areas of review by the Trustees were the nature, extent and quality of the services provided by the Adviser and the reasonableness of the fees charged for those services. These matters were considered by the Independent Trustees consulting with experienced counsel for the Independent Trustees, who is independent of the Adviser.
The Trustees’ evaluation of the quality of the Adviser’s services took into account their knowledge and experience gained through meetings with and reports of the Adviser’s senior management over the course of the preceding year. Both short-term and long-term investment performance of the Funds was considered. Each Fund’s performance was compared to its performance benchmark and to that of competitive funds with similar investment objectives and to the Adviser’s comparably managed private accounts. The Trustees also considered the scope and quality of the in-house capabilities of the Adviser and other resources dedicated to performing services for the Funds. The quality of administrative and other services, including the Adviser’s role in coordinating the activities of the Funds’ other service providers, were considered in light of the Funds’ compliance with investment policies and applicable laws and regulations and of related reports by management and the Funds’ independent public accounting firm in periodic meetings with the Trust’s Audit Committee. The Trustees also considered the business reputation of the Adviser, the qualifications of its key investment and compliance personnel, and its financial resources.
In reviewing the fees payable under the Investment Advisory Agreements, the Trustees compared the advisory fees and overall expense levels of each Fund with those of competitive funds with similar investment objectives as well as the private accounts managed by the Adviser. The Trustees considered information provided by the Adviser concerning the Adviser’s profitability with respect to each Fund, including the assumptions and methodology used in preparing the profitability information, in light of applicable case law relating to advisory fees. For these purposes, the Trustees took into account not only the fees paid by the Funds, but also so-called “fallout” benefits to the Adviser, such as the benefits of research made available to the Adviser by reason of brokerage commissions generated by the Funds’ securiti es transactions. The Trustees also reviewed the revenue sharing arrangements relating to the Funds, whereby fees are paid by the Adviser to various intermediaries that direct assets to the Funds. In evaluating the Funds’ advisory fees, the Trustees took into account the complexity and quality of the investment management of the Funds.
Based upon their review of this information, the Independent Trustees concluded that: (i) based upon the performance of each Fund during 2009, which exceeded the returns of its primary benchmark and Lipper peer group average, as well as the longer term performance of each Fund, and the services provided to shareholders, the Adviser has provided quality services to the Funds as compared to similarly managed funds; (ii) although the contractual advisory fee rates for each Fund are in the higher range of fees for other comparably managed funds, the Independent Trustees believe the fees to be reasonable given the scope and
THE FLIPPIN, BRUCE & PORTER FUNDS DISCLOSURE REGARDING APPROVAL OF INVESTMENT ADVISORY AGREEMENT (Unaudited) (Continued) |
quality of services provided by the Adviser; (iii) the total operating expense ratio of each Fund is lower than the average expense ratio for comparably managed funds, according to statistics derived from Morningstar, Inc.; and (iv) the Adviser’s voluntary waivers of a portion of its advisory fees has enabled each Fund to further increase returns for shareholders. The Board noted that the Adviser’s profitability analysis indicated that the Adviser did not derive any profits from its management of the Funds over the past year. Given the current size of the Funds and their expected growth, the Independent Trustees did not believe that at the present time it would be relevant to consider the extent to which economies of scale would be realized as the Funds grow, and whether fee levels reflect these economies of scale. The Inde pendent Trustees also considered the “fallout” benefits to the Adviser with respect to the Funds, but given the amounts involved viewed these as secondary factors in connection with the evaluation of the reasonableness of the advisory fees paid by the Funds.
No single factor was considered in isolation or to be determinative to the decision of the Trustees to approve continuance of the Investment Advisory Agreements. Rather the Trustees concluded, in light of a weighing and balancing of all factors considered, that it was in the best interests of each Fund and its shareholders to continue its Investment Advisory Agreement without modification to its terms, including the fees charged for services thereunder.
| | | | | | | |
| | | | | | | |
| | | |
| | | |
| | | | Investment Adviser Flippin, Bruce & Porter, Inc. 800 Main Street, Second Floor P.O. Box 6138 Lynchburg, Virginia 24505 Toll-Free 1-800-327-9375 www.fbpinc.com
Administrator Ultimus Fund Solutions, LLC P.O. Box 46707 Cincinnati, Ohio 45246-0707 Toll-Free 1-866-738-1127
Custodian US Bank NA 425 Walnut Street Cincinnati, Ohio 45202
Independent Registered Public Accounting Firm Ernst & Young LLP 1900 Scripps Center 312 Walnut Street Cincinnati, Ohio 45202 | Legal Counsel Sullivan & Worcester LLP One Post Office Square Boston, Massachusetts 02109
Officers John T. Bruce, President and Portfolio Manager John M. Flippin, Vice President R. Gregory Porter, III, Vice President John H. Hanna, IV, Vice President David J. Marshall, Vice President
Trustees Austin Brockenbrough, III John T. Bruce Charles M. Caravati, Jr. Robert S. Harris J. Finley Lee, Jr. Richard L. Morrill Harris V. Morrissette Samuel B. Witt, III | | | |
| | | | | | | |
| | | | | | | | |
| | | | | | | |
THE GOVERNMENT STREET FUNDS No-Load Mutual Funds Annual Report March 31, 2010 |
The Government Street Equity Fund The Government Street Mid-Cap Fund The Alabama Tax Free Bond Fund |
| LETTER FROM THE PRESIDENT | May 13, 2010 |
Dear Fellow Shareholders:
We are enclosing for your review the Annual Report for The Government Street Funds for the year ended March 31, 2010.
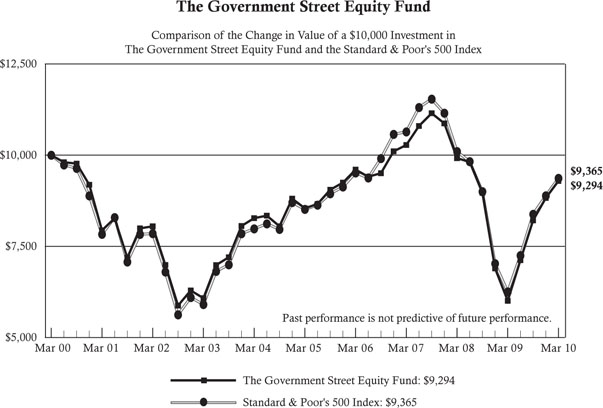
The Government Street Equity Fund
The Government Street Equity Fund had a positive 54.71% total return for the fiscal year ended March 31, 2010. By comparison, the S&P 500 Index and the Morningstar Large Blend Equity category were up 49.77% and 50.08%, respectively. In direct contrast to the previous year, the returns were products of an equity market that was positive across all capitalizations and economic sectors. “A rising tide was lifting all ships.”
The current Administration and the Congress have ratified tremendous economic stimulus plans to activate the economy. The amounts of absolute debt incurred in the process are unprecedented. It is certain that these actions have given a reprieve to financial institutions on the brink of fiscal disaster. The result appears to have set the nation’s economy on a slow and arduous recovery. At this point the stock market, as reflected in the explosive positive return, seems to have bought into the prospect of recovery. There is little doubt that such activities will be manifested in a myriad of reactions and counter-reactions that will directly impact investment returns in the future.
Our thoughts for the future of The Government Street Equity Fund focus more on risk control than return production at this point. However, we expect to achieve capital market returns that are competitive. By managing the risk (variability) of current returns, greater compounded results will be realized. Diversification is our primary tool to accomplish this goal. You will find your investment broadly spread across all capitalization ranges, into growth and value classifications, into international and emerging market economies, into real estate investment trust and commodity related securities. This is accomplished using individual corporate securities, exchange-traded funds, master limited partnerships, writing covered call options and using short term bond substitutes for money market funds.
The top 10 holdings in The Government Street Equity Fund as of March 31, 2010 are:
| Vanguard Mid-Cap ETF | 4.5% |
| Vanguard Emerging Market ETF | 3.7% |
| US Bank Commercial Paper | 2.6% |
| Philip Morris International, Inc. | 2.5% |
| General Dynamics Corporation | 2.3% |
| Hewlett-Packard Company | 2.1% |
| United Technologies Corporation | 2.0% |
| PowerShares QQQ | 2.0% |
| Chevron Corporation | 2.0% |
| Market Vectors Coal ETF | 2.0% |
Exchange-traded funds (“ETFs”) have taken a prominent role in the portfolio’s investment holdings, as evidenced by 4 of the top 10 holdings. Each ETF represents a composite holding of an extensive number of securities that have some common characteristic.
The Vanguard Mid-Cap ETF represents an investment in over 450 individual securities that meet Vanguard’s definition of mid-capitalization corporate equities. The inclusion of this one security in the portfolio insures representation in a broad diversified holding that would be impossible to achieve individually in a fund the size of The Government Street Equity Fund. The ability to achieve diversification utilizing ETF’s has allowed your manager an opportunity for risk control that would be otherwise unattainable.
A second example of your Fund’s ETF holdings is the Market Vectors Coal ETF. As an investment idea, the prospect of including coal as a part of the energy component in the portfolio is highly desirable in our view. The current dollar commitment would probably allow one or at most two individual securities. This Coal ETF has approximately 40 companies behind it. They range from coal equipment (Joy Global), to mining companies (Consolidated Energy) to direct ownership (Arch Coal). This ETF invests in both domestic and international holdings. The investment achieves a broad diversification into what we consider a highly desirable economic sector for your portfolio. The Schedule of Investments shows that your Fund currently holds approximately 17.3% of its net assets in ETFs.
There were significant individual performances for the entire fiscal year. The 5 highest returns as measured by the internal rate of return for the entire period were:
| Manitowoc Company, Inc. (The) | +359.22% |
| Colonial Properties Trust - REIT | +287.97% |
| Dow Chemical Company (The) | +246.52% |
| Bank of America Corporation | +207.58% |
| Aflac, Inc. | +188.97% |
The 5 lowest significant individual performances for the entire fiscal year as measured by internal rate of return for the entire period were:
| Genzyme Corporation | -10.69% |
| Quanta Services, Inc. | -9.84% |
| Gilead Sciences, Inc. | -1.84% |
| FirstEnergy Corporation | 7.00% |
| Exxon Mobil Corporation | 7.61% |
The best economic sector performance for the fiscal year was in the Financials area’s growth segment at +208.23%. The holdings in this sector at fiscal year end were Bank of America and Brookfield Management, Ltd. Second place went to the Materials growth sector with a return of +161.96%. Components of this sector at fiscal year end were Alcoa, Dow Chemical and Freeport McMoran Gold and Copper.
Note: The investment performances listed for economic sectors and securities in the two preceding paragraphs are extracted from an in-house independent internal rate of return computation by the Advent Axys portfolio accounting system. The calculations are gross investment returns. Total investment returns are for the fiscal year ended March 31, 2010.
We believe that continued upward movement of markets and economies worldwide are highly dependent on governments getting their financial balance sheets in order. There has been unparalleled deficit spending around the world. Those economies not directly participating in the credit shortfalls will be indirectly impacted by lower import/export activities brought on by a significant debt imposed slowdown. This will occur domestically and internationally as economies have become more highly correlated in their economic cycles.
In response to this perceived scenario, risk management takes precedent over return pursuits in the near term. Your Fund remains essentially fully invested to capture returns, but highly diversified to mitigate the risks associated with that position.
As of March 31, 2010, the Fund’s net assets were $57,766,328, up from $37,656,373 at the beginning of the fiscal year; net asset value per share was $40.89; the ratio of expenses to net average assets was .90%. Portfolio turnover rate was 30%. Income dividends of $.4010 per share were distributed to shareholders during the year.
The Government Street Mid-Cap Fund
The Government Street Mid-Cap Fund completed its sixth year on March 31, 2010. The Fund produced a one year return of 52.73% as compared to a return of 64.07% for its benchmark, the S&P MidCap 400 Index (the “S&P 400”). Coming off the March 2009 lows in the markets, mid-cap stocks outperformed both large-cap and small-cap stocks for the year ended March 31, 2010. The top performing sectors in the S&P 400 were Energy and Materials. The Government Street Mid-Cap Fund’s underperformance relative to the benchmark was primarily attributable to a significant cash position and an underweighting of Consumer Discretionary stocks. In March of 2009, the Fund had a cash balance in excess of 10%. While this helped during the market correction, it hurt as stocks took off in 2009. The cash was invested throughout the co urse of the year but it was a drag on performance. The Fund’s allocation to Consumer Discretionary stocks in March of 2009 was well below the allocation in the S&P 400. The discrepancy narrowed throughout 2009, but since Consumer Discretionary was the third best performing sector in the S&P 400 during the year ended March 31, 2010, The Government Street Mid-Cap Fund’s underweighting hurt relative performance. Some of the biggest contributors to the Fund’s performance over the past year were Pioneer Natural Resources (+243%), Cree, Inc. (+198%) and Cognizant Technology Solutions (+145%).
The longer term performance of the Fund relative to the S&P 400 has been good, with the Fund having a three-year annualized return of 0.56% as compared to -0.83% for the S&P 400. The five-year annualized return for the Government Street Mid-Cap Fund was 5.11% versus 5.17% for the S&P 400. Large-cap stocks as measured by the S&P 500 Index returned -4.17% for the past three years and 1.92% over the past five years.
Value stocks regained the performance edge in 2009 after several years of underperformance. Over three and five years, growth stocks still hold the lead over value stocks, but over the past twelve months and the previous ten years, value stocks have a better track record than growth stocks. Looking at performance as it relates to market capitalization, mid-cap stocks hold a commanding lead over large-cap stocks for one, three, five and ten years. Over the ten year period ended March 31, 2010, mid-cap stocks returned an annualized 6.01%, while small-cap stocks earned 3.68% and large-cap stocks generated -0.65%. This lends support to our belief that mid-cap stocks are in the enviable position of being more stable than small-cap stocks while offering higher growth potential than large-cap stocks. We expect that mid-cap stocks will contin ue to provide excellent long-term performance.
Coming out of the most challenging economic period since the Great Depression, stocks have performed exceptionally well as companies have benefited from major cost cutting initiatives that were implemented as the result of the economic contraction. As demand slowly returns, company earnings have been comparatively strong as businesses have been slow to increase costs. As a result, unemployment stands near 10% even though there has been marginal improvement in initial jobless claims. Unemployment tends to lag economic activity as employers do not want to rehire coming out of a contraction until absolutely necessary. Globally, the current focus is on Europe and the sovereign debt issues in Greece. International markets have lagged domestic markets due to fears that the debt issues in Greece may spread to other nations, namely Portugal, Italy and Spain. The current solution, in the form of a bailout, looks to transfer the debt to the other nations in the European Union. This does not erase the debt but does provide more time to pay it off. Debt is still a considerable concern for many nations around the world, including the U.S. While investors currently are content to finance this debt at low rates, it remains to be seen what investor appetite will be going forward and what that will mean for future rates and inflation.
As of March 31, 2010, the net assets of The Government Street Mid-Cap Fund were $32,197,972 and the net asset value per share was $12.87. The turnover rate for the previous twelve months was 10% and the total number of holdings was 177 as of March 31, 2010. The net expense ratio for the Fund is 1.13%.
The Alabama Tax Free Bond Fund
Fixed income markets generally returned to sound footing during the past twelve months as investors gained confidence that the worst of the credit crisis had passed. Investors left the safe haven of United States Treasury securities behind and poured enormous amounts of cash into riskier bonds in search of higher returns. In fact, the Treasury market was the only class of fixed income securities to post negative returns for the year. The Federal Reserve has continued to maintain the Federal Funds target range at a record low level of 0% to .25% and the yield curve steepened as the year progressed in expectation of higher rates ahead.
Although the financial condition of many states and municipalities attracted the scrutiny of investors in the market, municipal bonds provided positive returns over the past twelve months. The supply of bonds issued in the market was
influenced by the implementation of the Build America Bond (“BAB”) program in 2009. This program allows municipalities to issue taxable bonds for qualified projects and receive a subsidy from the federal government of 35% of their interest cost. The program has been successfully received to the extent that about 30% of the new municipal bond issuance has been in the form of BAB securities. The BAB program is scheduled to expire at the end of 2010 but the expectation is that it will likely be extended with a reduction in the amount of the federal subsidy. Regardless, the taxability of the income from these bonds makes them unsuitable investments for the Fund.
With the steepening of the yield curve, the duration of The Alabama Tax Free Bond Fund was extended slightly over the twelve months ended March 31, 2010, though it remains at the lower end of the targeted range. In anticipation of higher rates, the Fund maintains a generally defensive posture with a laddered portfolio of short and intermediate-term high quality Alabama municipal bonds. For the year ended March 31, 2010, the Fund had a total return of 2.88% as compared to the return of 3.68% for the Barclays Capital 3-Year Municipal Bond Index, 6.49% for the Barclays Capital 7-Year Municipal Bond Index and 8.58% for the Lipper Intermediate Municipal Fund Index. It should be noted that The Alabama Tax Free Bond Fund has a shorter average maturity than the Lipper Intermediate Municipal Fund Index and the Barclays Capital 7-Year Municipal Bond Index and consistently maintains a portfolio of higher rated securities, on average, than the holdings comprising the comparable indices. Additionally, while the Fund holds securities with maturities ranging from less than one year to more than ten years, the Barclays Capital 3-Year Municipal Bond Index holds only securities with maturities of approximately three years and the Barclays Capital 7-Year Municipal Bond Index only holds securities with maturities between six and eight years. Also, the Barclays indices include zero coupon bonds as well as bonds that are subject to the alternative minimum tax. The Fund holds neither of these types of securities.
As of March 31, 2010, 95.8% of the value of the Fund’s portfolio securities were rated A or better and the weighted average maturity of the portfolio was 4.1 years, up slightly from 4.0 years from a year ago. The net assets of the Fund as of March 31, 2010 were $29,716,266 and the net asset value was $10.53. The ratio of net investment income to average net assets during the fiscal year was 2.85%.
Thank you for your continued confidence in The Government Street Funds. Please call us if we can be of further service to you.
Very truly yours,
Thomas W. Leavell
President
Leavell Investment Management, Inc.
The Government Street Funds
Data presented reflects past performance, which is no guarantee of future results. Investment results and principal value will fluctuate so that shares, when redeemed, may be worth more or less than their original cost. Due to market volatility, current performance may be higher or lower than the performance shown.
This report is submitted for the general information of the shareholders of the Funds. The report is not authorized for distribution to prospective investors in the Funds unless it is accompanied by a current prospectus.
This report reflects our views, opinions and portfolio holdings as of March 31, 2010, the end of the reporting period. These views are subject to change at any time based upon market or other conditions. For more current information throughout the year please visit www.leavellinvestments.com.
THE GOVERNMENT STREET EQUITY FUND PERFORMANCE INFORMATION (Unaudited) |
| | Average Annual Total Returns(a) (for periods ended March 31, 2010) |
| | 1 Year | 5 Years | 10 Years |
| The Government Street Equity Fund | 54.71% | 1.70% | -0.73% |
| Standard & Poor’s 500 Index | 49.77% | 1.92% | -0.65% |
| (a) | Total return is a measure of the change in value of an investment in the Fund over the periods covered, which assumes any dividends or capital gains distributions are reinvested in shares of the Fund. Returns do not reflect the deduction of taxes a shareholder would pay on Fund distributions or the redemption of Fund shares. |
THE GOVERNMENT STREET MID-CAP FUND PERFORMANCE INFORMATION (Unaudited) |
| | Average Annual Total Returns(a) (for periods ended March 31, 2010) |
| | 1 Year | 5 Years | Since Inception* |
| The Government Street Mid-Cap Fund | 52.73% | 5.11% | 6.58% |
| Standard & Poor’s MidCap 400 Index | 64.07% | 5.17% | 7.20% |
| (a) | Total return is a measure of the change in value of an investment in the Fund over the periods covered, which assumes any dividends or capital gains distributions are reinvested in shares of the Fund. Returns do not reflect the deduction of taxes a shareholder would pay on Fund distributions or the redemption of Fund shares. |
| * | Initial public offering of shares was November 17, 2003. |
THE ALABAMA TAX FREE BOND FUND PERFORMANCE INFORMATION (Unaudited) |
| | Average Annual Total Returns(a) (for periods ended March 31, 2010) |
| | 1 Year | 5 Years | 10 Years |
| The Alabama Tax Free Bond Fund | 2.88% | 3.30% | 3.95% |
| Barclays Capital 7-Year Municipal Bond Index | 6.49% | 5.05% | 5.55% |
| Barclays Capital 3-Year Municipal Bond Index | 3.68% | 4.25% | 4.33% |
| Lipper Intermediate Municipal Fund Index | 8.58% | 3.90% | 4.58% |
| (a) | Total return is a measure of the change in value of an investment in the Fund over the periods covered, which assumes any dividends or capital gains distributions are reinvested in shares of the Fund. Returns do not reflect the deduction of taxes a shareholder would pay on Fund distributions or the redemption of Fund shares. |
THE GOVERNMENT STREET EQUITY FUND PORTFOLIO INFORMATION March 31, 2010 (Unaudited) |
| Sector Concentration vs. the S&P 500 Index |
| Security Description | % of Net Assets |
| Vanguard Mid-Cap ETF | 4.5% |
| Vanguard Emerging Markets ETF | 3.7% |
| Philip Morris International, Inc. | 2.5% |
| General Dynamics Corporation | 2.3% |
| Hewlett-Packard Company | 2.1% |
| United Technologies Corporation | 2.0% |
| PowerShares QQQ | 2.0% |
| Chevron Corporation | 2.0% |
| Market Vectors Coal ETF | 2.0% |
| Aflac, Inc. | 1.9% |
THE GOVERNMENT STREET MID-CAP FUND PORTFOLIO INFORMATION March 31, 2010 (Unaudited) |
| Sector Concentration vs. the S&P MidCap 400 Index |
| Security Description | % of Net Assets |
| iShares S&P MidCap 400 Index Fund | 3.0% |
| Vanguard Mid-Cap ETF | 2.9% |
| Vanguard Short-Term Bond ETF | 1.9% |
| Cerner Corporation | 1.6% |
| Cree, Inc. | 1.4% |
| Stericycle, Inc. | 1.4% |
| Cognizant Technology Solutions Corporation - Class A | 1.3% |
| Vanguard Emerging Markets ETF | 1.2% |
| FMC Technologies, Inc. | 1.2% |
| Church & Dwight Company, Inc. | 1.1% |
THE ALABAMA TAX FREE BOND FUND PORTFOLIO INFORMATION March 31, 2010 (Unaudited) |
Asset Allocation (% of Net Assets) |
| Distribution by Rating |
| Rating | | % Holdings |
| AAA | | 31.1% |
| AA | | 54.5% |
| A | | 10.2% |
| Not Rated | | 4.2% |
GOVERNMENT STREET EQUITY FUND SCHEDULE OF INVESTMENTS March 31, 2010 |
| | | | | | |
| Consumer Discretionary — 6.0% | | | | | | |
| Darden Restaurants, Inc. | | | 4,000 | | | $ | 178,160 | |
| Home Depot, Inc. (The) | | | 17,500 | | | | 566,125 | |
| Johnson Controls, Inc. | | | 20,000 | | | | 659,800 | |
| McDonald's Corporation | | | 5,500 | | | | 366,960 | |
| NIKE, Inc. - Class B | | | 9,000 | | | | 661,500 | |
| Walt Disney Company (The) | | | 30,000 | | | | 1,047,300 | |
| | | | | | | | 3,479,845 | |
| Consumer Staples — 7.9% | | | | | | | | |
| Altria Group, Inc. | | | 33,000 | | | | 677,160 | |
| Coca-Cola Company (The) | | | 6,000 | | | | 330,000 | |
| Kraft Foods, Inc. - Class A | | | 22,836 | | | | 690,561 | |
| McCormick & Company, Inc. | | | 6,000 | | | | 230,160 | |
| Mead Johnson Nutrition Company | | | 10,000 | | | | 520,300 | |
| Philip Morris International, Inc. | | | 28,000 | | | | 1,460,480 | |
| Procter & Gamble Company (The) | | | 10,000 | | | | 632,700 | |
| | | | | | | | 4,541,361 | |
| Energy — 9.9% | | | | | | | | |
| Apache Corporation | | | 5,089 | | | | 516,534 | |
| BP plc - ADR | | | 7,300 | | | | 416,611 | |
| Chevron Corporation | | | 15,000 | | | | 1,137,450 | |
| ConocoPhillips | | | 18,500 | | | | 946,645 | |
| Ensco International plc - ADR | | | 11,000 | | | | 492,580 | |
| Exxon Mobil Corporation | | | 2,550 | | | | 170,799 | |
Plains Exploration & Production Company (a) | | | 9,000 | | | | 269,910 | |
Southwestern Energy Company (a) | | | 3,000 | | | | 122,160 | |
| TransCanada Corporation | | | 10,000 | | | | 367,600 | |
Transocean Ltd. (a) | | | 8,996 | | | | 777,074 | |
| XTO Energy, Inc. | | | 10,000 | | | | 471,800 | |
| | | | | | | | 5,689,163 | |
| Financials — 8.7% | | | | | | | | |
Aegon N.V. - ARS (a) | | | 27,900 | | | | 189,999 | |
Aflac, Inc. (b) | | | 20,600 | | | | 1,118,374 | |
American Capital Ltd. (a) | | | 2,990 | | | | 15,189 | |
| Bank of America Corporation | | | 40,000 | | | | 714,000 | |
| Brookfield Asset Management, Inc. | | | 14,000 | | | | 355,880 | |
| Charles Schwab Corporation (The) | | | 15,000 | | | | 280,350 | |
| Colonial Properties Trust | | | 60,000 | | | | 772,800 | |
| Hartford Financial Services Group, Inc. | | | 20,000 | | | | 568,400 | |
| U.S. Bancorp | | | 39,300 | | | | 1,017,084 | |
| | | | | | | | 5,032,076 | |
| Health Care — 11.6% | | | | | | | | |
| Abbott Laboratories | | | 3,000 | | | | 158,040 | |
| Becton, Dickinson and Company | | | 3,290 | | | | 259,022 | |
| Cardinal Health, Inc. | | | 12,000 | | | | 432,360 | |
CareFusion Corporation (a) | | | 6,000 | | | | 158,580 | |
Cerner Corporation (a) | | | 7,500 | | | | 637,950 | |
| Computer Programs & Systems, Inc. | | | 9,100 | | | | 355,628 | |
GOVERNMENT STREET EQUITY FUND SCHEDULE OF INVESTMENTS (Continued) |
COMMON STOCKS — 80.2% (Continued) | | | | | | |
| Health Care — 11.6% (Continued) | | | | | | |
Covance, Inc. (a) | | | 8,000 | | | $ | 491,120 | |
| Covidien plc | | | 5,000 | | | | 251,400 | |
Elan Corporation plc - ADR (a) | | | 20,000 | | | | 151,600 | |
| Fresenius Medical Care AG & Company - ADR | | | 5,000 | | | | 280,800 | |
Genzyme Corporation (a) | | | 9,500 | | | | 492,385 | |
Gilead Sciences, Inc. (a) | | | 7,000 | | | | 318,360 | |
| Johnson & Johnson | | | 5,000 | | | | 326,000 | |
| Techne Corporation | | | 10,000 | | | | 636,900 | |
| Teva Pharmaceutical Industries Ltd. - ADR | | | 8,000 | | | | 504,640 | |
UnitedHealth Group, Inc. (a) | | | 10,000 | | | | 326,700 | |
Waters Corporation (a) | | | 14,000 | | | | 945,560 | |
| | | | | | | | 6,727,045 | |
| Industrials — 11.6% | | | | | | | | |
| C.H. Robinson Worldwide, Inc. | | | 3,000 | | | | 167,550 | |
| Caterpillar, Inc. | | | 16,000 | | | | 1,005,600 | |
| Emerson Electric Company | | | 20,000 | | | | 1,006,800 | |
| General Dynamics Corporation | | | 17,000 | | | | 1,312,400 | |
| Ingersoll-Rand plc | | | 13,500 | | | | 470,745 | |
| Manitowoc Company, Inc. (The) | | | 13,000 | | | | 169,000 | |
| Norfolk Southern Corporation | | | 10,000 | | | | 558,900 | |
Quanta Services, Inc. (a) | | | 20,000 | | | | 383,200 | |
Stericycle, Inc. (a) | | | 8,000 | | | | 436,000 | |
United Technologies Corporation (b) | | | 16,000 | | | | 1,177,760 | |
| | | | | | | | 6,687,955 | |
| Information Technology — 16.1% | | | | | | | | |
| Accenture plc - Class A | | | 9,500 | | | | 398,525 | |
Adobe Systems, Inc. (a) | | | 25,000 | | | | 884,250 | |
| ADTRAN, Inc. | | | 8,000 | | | | 210,800 | |
Apple, Inc. (a) | | | 4,000 | | | | 939,720 | |
| Automatic Data Processing, Inc. | | | 20,000 | | | | 889,400 | |
| Broadridge Financial Solutions, Inc. | | | 5,000 | | | | 106,900 | |
Cisco Systems, Inc. (a) | | | 23,450 | | | | 610,403 | |
| Corning, Inc. | | | 28,000 | | | | 565,880 | |
eBay, Inc. (a) | | | 2,000 | | | | 53,900 | |
Google, Inc. - Class A (a) | | | 400 | | | | 226,804 | |
Hewlett-Packard Company (b) | | | 22,300 | | | | 1,185,245 | |
| International Business Machines Corporation | | | 8,000 | | | | 1,026,000 | |
Lam Research Corporation (a) | | | 3,000 | | | | 111,960 | |
| MasterCard, Inc. - Class A | | | 3,000 | | | | 762,000 | |
NetApp, Inc. (a) | | | 13,000 | | | | 423,280 | |
| Oracle Corporation | | | 10,000 | | | | 256,900 | |
| Texas Instruments, Inc. | | | 10,000 | | | | 244,700 | |
| Tyco Electronics Ltd. | | | 7,000 | | | | 192,360 | |
Varian Semiconductor Equipment Associates, Inc. (a) | | | 3,000 | | | | 99,360 | |
Western Digital Corporation (a) | | | 3,000 | | | | 116,970 | |
| | | | | | | | 9,305,357 | |
GOVERNMENT STREET EQUITY FUND SCHEDULE OF INVESTMENTS (Continued) |
COMMON STOCKS — 80.2% (Continued) | | | | | | |
| Materials — 3.6% | | | | | | |
| Dow Chemical Company (The) | | | 17,000 | | | $ | 502,690 | |
| Freeport-McMoRan Copper & Gold, Inc. | | | 4,966 | | | | 414,860 | |
| Nucor Corporation | | | 11,000 | | | | 499,180 | |
| Praxair, Inc. | | | 8,000 | | | | 664,000 | |
| | | | | | | | 2,080,730 | |
| Telecommunication Services — 1.0% | | | | | | | | |
| América Móvil S.A.B. de C.V. - Series L - ADR | | | 12,000 | | | | 604,080 | |
| | | | | | | | | |
| Utilities — 3.8% | | | | | | | | |
| Duke Energy Corporation | | | 65,980 | | | | 1,076,793 | |
| FirstEnergy Corporation | | | 20,000 | | | | 781,800 | |
| Wisconsin Energy Corporation | | | 7,000 | | | | 345,870 | |
| | | | | | | | 2,204,463 | |
| | | | | | | | | |
Total Common Stocks (Cost $29,893,075) | | | | | | $ | 46,352,075 | |
EXCHANGE-TRADED FUNDS — 17.3% | | | | | | |
iShares COMEX Gold Trust (a) | | | 2,000 | | | $ | 218,060 | |
| iShares MSCI BRIC Index Fund | | | 18,000 | | | | 834,840 | |
| Market Vectors Agribusiness ETF | | | 21,000 | | | | 948,990 | |
| Market Vectors Coal ETF | | | 30,000 | | | | 1,131,300 | |
| Market Vectors Gold Miners ETF | | | 5,000 | | | | 222,050 | |
| Market Vectors Steel ETF | | | 11,000 | | | | 751,850 | |
| PowerShares QQQ | | | 24,000 | | | | 1,156,320 | |
| Vanguard Emerging Markets ETF | | | 50,000 | | | | 2,109,000 | |
| Vanguard Mid-Cap ETF | | | 40,000 | | | | 2,606,400 | |
Total Exchange-Traded Funds (Cost $7,787,920) | | | | | | $ | 9,978,810 | |
| | | | | | |
| U.S. Bank, N.A., discount, 0.05%, due 04/01/2010 (Cost $1,489,000) | | $ | 1,489,000 | | | $ | 1,489,000 | |
GOVERNMENT STREET EQUITY FUND SCHEDULE OF INVESTMENTS (Continued) |
MONEY MARKET FUNDS — 0.0% | | | | | | |
AIM STIT - STIC Prime Portfolio - Institutional Class, 0.11% (c) (Cost $694) | | | 694 | | | $ | 694 | |
| | | | | | | | | |
Total Investments at Value — 100.1% (Cost $39,170,689) | | | | | | $ | 57,820,579 | |
| | | | | | | | | |
| Liabilities in Excess of Other Assets — (0.1%) | | | | | | | (54,251 | ) |
| | | | | | | | | |
| Net Assets — 100.0% | | | | | | $ | 57,766,328 | |
| ADR - American Depositary Receipt |
| |
| ARS - American Registered Shares. |
| |
| (a) | Non-income producing security. |
| | |
| (b) | Security covers a written call option. |
| | |
| (c) | Variable rate security. The rate shown is the 7-day effective yield as of March 31, 2010. |
| | |
| See accompanying notes to financial statements. |
GOVERNMENT STREET EQUITY FUND SCHEDULE OF OPEN OPTION CONTRACTS March 31, 2010 |
| | | | | | | | | |
| Aflac, Inc., | | | | | | | | | |
| 05/22/2010 at $55 | | | 56 | | | $ | 8,400 | | | $ | 4,979 | |
| Hewlett Packard Company, | | | | | | | | | | | | |
| 05/22/2010 at $55 | | | 50 | | | | 4,000 | | | | 3,900 | |
| United Technologies Corporation, | | | | | | | | | | | | |
| 05/22/2010 at $75 | | | 60 | | | | 9,480 | | | | 3,599 | |
| | | | | | | $ | 21,880 | | | $ | 12,478 | |
| See accompanying notes to financial statements. |
THE GOVERNMENT STREET MID-CAP FUND SCHEDULE OF INVESTMENTS March 31, 2010 |
| | | | | | |
| Consumer Discretionary — 13.0% | | | | | | |
| Barnes & Noble, Inc. | | | 3,500 | | | $ | 75,670 | |
| BorgWarner, Inc. | | | 2,100 | | | | 80,178 | |
Buffalo Wild Wings, Inc. (a) | | | 2,400 | | | | 115,464 | |
| Chico's FAS, Inc. | | | 6,400 | | | | 92,288 | |
| Coach, Inc. | | | 5,200 | | | | 205,504 | |
| Darden Restaurants, Inc. | | | 1,675 | | | | 74,604 | |
| DeVry, Inc. | | | 1,400 | | | | 91,280 | |
Dollar Tree, Inc. (a) | | | 1,400 | | | | 82,908 | |
DreamWorks Animation SKG, Inc. - Class A (a) | | | 4,300 | | | | 169,377 | |
| Family Dollar Stores, Inc. | | | 2,800 | | | | 102,508 | |
Gildan Activewear, Inc. - Class A (a) | | | 6,600 | | | | 173,514 | |
| Guess?, Inc. | | | 4,700 | | | | 220,806 | |
| Hasbro, Inc. | | | 2,525 | | | | 96,657 | |
| Interactive Data Corporation | | | 3,000 | | | | 96,000 | |
ITT Educational Services, Inc. (a) | | | 905 | | | | 101,794 | |
| Jarden Corporation | | | 5,050 | | | | 168,115 | |
| John Wiley & Sons, Inc. - Class A | | | 1,800 | | | | 77,904 | |
Liberty Global, Inc. - Class A (a) | | | 3,150 | | | | 91,854 | |
Netflix, Inc. (a) | | | 1,425 | | | | 105,080 | |
| Nordstrom, Inc. | | | 3,300 | | | | 134,805 | |
O'Reilly Automotive, Inc. (a) | | | 5,050 | | | | 210,635 | |
Panera Bread Company - Class A (a) | | | 1,100 | | | | 84,139 | |
| PetSmart, Inc. | | | 3,500 | | | | 111,860 | |
| Phillips-Van Heusen Corporation | | | 3,400 | | | | 195,024 | |
priceline.com, Inc. (a) | | | 950 | | | | 242,250 | |
| Ross Stores, Inc. | | | 3,000 | | | | 160,410 | |
| Service Corporation International | | | 9,000 | | | | 82,620 | |
| Tiffany & Company | | | 3,175 | | | | 150,781 | |
True Religion Apparel, Inc. (a) | | | 7,250 | | | | 220,110 | |
Urban Outfitters, Inc. (a) | | | 4,400 | | | | 167,332 | |
Vail Resorts, Inc. (a) | | | 2,700 | | | | 108,243 | |
| VF Corporation | | | 1,175 | | | | 94,176 | |
| | | | | | | | 4,183,890 | |
| Consumer Staples — 3.7% | | | | | | | | |
| Church & Dwight Company, Inc. | | | 5,400 | | | | 361,530 | |
| Hormel Foods Corporation | | | 6,000 | | | | 252,060 | |
| J.M. Smucker Company (The) | | | 4,700 | | | | 283,222 | |
| Mead Johnson Nutrition Company | | | 1,000 | | | | 52,030 | |
NBTY, Inc. (a) | | | 3,000 | | | | 143,940 | |
| Universal Corporation | | | 1,740 | | | | 91,680 | |
| | | | | | | | 1,184,462 | |
| Energy — 7.2% | | | | | | | | |
Cameron International Corporation (a) | | | 6,610 | | | | 283,305 | |
FMC Technologies, Inc. (a) | | | 5,780 | | | | 373,561 | |
| Murphy Oil Corporation | | | 3,740 | | | | 210,150 | |
Newfield Exploration Company (a) | | | 2,800 | | | | 145,740 | |
Noble Corporation (a) | | | 5,360 | | | | 224,155 | |
THE GOVERNMENT STREET MID-CAP FUND SCHEDULE OF INVESTMENTS (Continued) |
COMMON STOCKS — 89.6% (Continued) | | | | | | |
| Energy — 7.2% (Continued) | | | | | | |
| Overseas Shipholding Group, Inc. | | | 3,600 | | | $ | 141,228 | |
Patriot Coal Corporation (a) | | | 960 | | | | 19,642 | |
| Peabody Energy Corporation | | | 4,800 | | | | 219,360 | |
| Pioneer Natural Resources Company | | | 4,380 | | | | 246,682 | |
Pride International, Inc. (a) | | | 5,000 | | | | 150,550 | |
Seahawk Drilling, Inc. (a) | | | 333 | | | | 6,277 | |
| Smith International, Inc. | | | 4,500 | | | | 192,690 | |
| Valero Energy Corporation | | | 4,950 | | | | 97,515 | |
| | | | | | | | 2,310,855 | |
| Financials — 12.3% | | | | | | | | |
| American Financial Group, Inc. | | | 8,400 | | | | 238,980 | |
| Arthur J. Gallagher & Company | | | 6,750 | | | | 165,712 | |
| Associated Banc-Corp | | | 7,300 | | | | 100,740 | |
| Bank of Hawaii Corporation | | | 6,000 | | | | 269,700 | |
| Berkley (W.R.) Corporation | | | 10,050 | | | | 262,204 | |
| Cullen/Frost Bankers, Inc. | | | 5,600 | | | | 312,480 | |
| Eaton Vance Corporation | | | 10,250 | | | | 343,785 | |
| Everest Re Group Ltd. | | | 2,600 | | | | 210,418 | |
| HCC Insurance Holdings, Inc. | | | 9,300 | | | | 256,680 | |
| Jefferies Group, Inc. | | | 10,400 | | | | 246,168 | |
| Legg Mason, Inc. | | | 3,780 | | | | 108,373 | |
| Liberty Property Trust | | | 4,600 | | | | 156,124 | |
| New York Community Bancorp, Inc. | | | 10,270 | | | | 169,866 | |
| Potlatch Corporation | | | 6,941 | | | | 243,213 | |
| Rayonier, Inc. | | | 7,000 | | | | 318,010 | |
| State Street Corporation | | | 4,400 | | | | 198,616 | |
| Synovus Financial Corporation | | | 16,400 | | | | 53,956 | |
| Westamerica Bancorporation | | | 3,300 | | | | 190,245 | |
| Wilmington Trust Corporation | | | 6,650 | | | | 110,190 | |
| | | | | | | | 3,955,460 | |
| Health Care — 12.5% | | | | | | | | |
Alexion Pharmaceuticals, Inc. (a) | | | 800 | | | | 43,496 | |
Almost Family, Inc. (a) | | | 1,000 | | | | 37,690 | |
Bio-Rad Laboratories, Inc. - Class A (a) | | | 2,500 | | | | 258,800 | |
| C.R. Bard, Inc. | | | 1,000 | | | | 86,620 | |
| Cantel Medical Corporation | | | 2,000 | | | | 39,700 | |
Cephalon, Inc. (a) | | | 2,000 | | | | 135,560 | |
Cerner Corporation (a) | | | 6,000 | | | | 510,360 | |
Charles River Laboratories International, Inc. (a) | | | 1,000 | | | | 39,310 | |
| Computer Programs & Systems, Inc. | | | 1,800 | | | | 70,344 | |
Covance, Inc. (a) | | | 4,000 | | | | 245,560 | |
| Covidien plc | | | 1,500 | | | | 75,420 | |
Edwards Lifesciences Corporation (a) | | | 2,500 | | | | 247,200 | |
| Ensign Group, Inc. (The) | | | 3,000 | | | | 51,990 | |
| Fresenius Medical Care AG & Company - ADR | | | 4,000 | | | | 224,640 | |
Gilead Sciences, Inc. (a) | | | 650 | | | | 29,562 | |
Hanger Orthopedic Group, Inc. (a) | | | 4,000 | | | | 72,720 | |
HealthSpring, Inc. (a) | | | 2,500 | | | | 44,000 | |
THE GOVERNMENT STREET MID-CAP FUND SCHEDULE OF INVESTMENTS (Continued) |
COMMON STOCKS — 89.6% (Continued) | | | | | | |
| Health Care — 12.5% (Continued) | | | | | | |
Henry Schein, Inc. (a) | | | 2,000 | | | $ | 117,800 | |
Illumina, Inc. (a) | | | 1,000 | | | | 38,900 | |
Intuitive Surgical, Inc. (a) | | | 200 | | | | 69,626 | |
Life Technologies Corporation (a) | | | 2,891 | | | | 151,113 | |
Millipore Corporation (a) | | | 2,000 | | | | 211,200 | |
Mylan, Inc. (a) | | | 5,700 | | | | 129,447 | |
Myriad Genetics, Inc. (a) | | | 1,000 | | | | 24,050 | |
Myriad Pharmaceuticals, Inc. (a) | | | 250 | | | | 1,130 | |
PSS World Medical, Inc. (a) | | | 2,000 | | | | 47,020 | |
Questcor Pharmaceuticals, Inc. (a) | | | 3,000 | | | | 24,690 | |
ResMed, Inc. (a) | | | 3,000 | | | | 190,950 | |
| Shire plc - ADR | | | 1,000 | | | | 65,960 | |
| Techne Corporation | | | 4,500 | | | | 286,605 | |
| Teleflex, Inc. | | | 3,000 | | | | 192,210 | |
| Teva Pharmaceutical Industries Ltd. - ADR | | | 2,163 | | | | 136,442 | |
Waters Corporation (a) | | | 2,000 | | | | 135,080 | |
| | | | | | | | 4,035,195 | |
| Industrials — 13.5% | | | | | | | | |
| Alexander & Baldwin, Inc. | | | 3,000 | | | | 99,150 | |
| AMETEK, Inc. | | | 7,500 | | | | 310,950 | |
| C.H. Robinson Worldwide, Inc. | | | 5,000 | | | | 279,250 | |
| Donaldson Company, Inc. | | | 6,000 | | | | 270,720 | |
| Expeditors International of Washington, Inc. | | | 6,000 | | | | 221,520 | |
| Fastenal Company | | | 7,000 | | | | 335,930 | |
| Goodrich Corporation | | | 3,500 | | | | 246,820 | |
| Graco, Inc. | | | 6,000 | | | | 192,000 | |
| Harsco Corporation | | | 3,000 | | | | 95,820 | |
| Herman Miller, Inc. | | | 5,500 | | | | 99,330 | |
Jacobs Engineering Group, Inc. (a) | | | 4,475 | | | | 202,225 | |
| John Bean Technologies Corporation | | | 1,248 | | | | 21,890 | |
| Joy Global, Inc. | | | 2,000 | | | | 113,200 | |
| L-3 Communications Holdings, Inc. | | | 3,000 | | | | 274,890 | |
| Manpower, Inc. | | | 4,000 | | | | 228,480 | |
| MSC Industrial Direct Company, Inc. - Class A | | | 5,000 | | | | 253,300 | |
| Snap-on, Inc. | | | 3,300 | | | | 143,022 | |
| SPX Corporation | | | 5,000 | | | | 331,600 | |
Stericycle, Inc. (a) | | | 8,275 | | | | 450,987 | |
| Trinity Industries, Inc. | | | 5,000 | | | | 99,800 | |
WESCO International, Inc. (a) | | | 1,850 | | | | 64,214 | |
| | | | | | | | 4,335,098 | |
| Information Technology — 14.7% | | | | | | | | |
| Activision Blizzard, Inc. | | | 16,000 | | | | 192,960 | |
ADC Telecommunications, Inc. (a) | | | 8,500 | | | | 62,135 | |
| ADTRAN, Inc. | | | 6,000 | | | | 158,100 | |
Advent Software, Inc. (a) | | | 4,000 | | | | 179,000 | |
Alliance Data Systems Corporation (a) | | | 5,000 | | | | 319,950 | |
Arrow Electronics, Inc. (a) | | | 8,000 | | | | 241,040 | |
Aviat Networks, Inc. (a) | | | 1,490 | | | | 9,879 | |
THE GOVERNMENT STREET MID-CAP FUND SCHEDULE OF INVESTMENTS (Continued) |
COMMON STOCKS — 89.6% (Continued) | | | | | | |
| Information Technology — 14.7% (Continued) | | | | | | |
Cognizant Technology Solutions Corporation - Class A (a) | | | 8,000 | | | $ | 407,840 | |
CommScope, Inc. (a) | | | 1,000 | | | | 28,020 | |
Cree, Inc. (a) | | | 6,500 | | | | 456,430 | |
| DST Systems, Inc. | | | 4,000 | | | | 165,800 | |
| Harris Corporation | | | 6,000 | | | | 284,940 | |
IAC/InterActiveCorporation (a) | | | 3,000 | | | | 68,220 | |
Integrated Device Technology, Inc. (a) | | | 10,000 | | | | 61,300 | |
| Jack Henry & Associates, Inc. | | | 9,000 | | | | 216,540 | |
Lam Research Corporation (a) | | | 6,000 | | | | 223,920 | |
| Linear Technology Corporation | | | 5,000 | | | | 141,400 | |
| Microchip Technology, Inc. | | | 5,000 | | | | 140,800 | |
| National Instruments Corporation | | | 8,000 | | | | 266,800 | |
NetApp, Inc. (a) | | | 5,000 | | | | 162,800 | |
Polycom, Inc. (a) | | | 4,000 | | | | 122,320 | |
Rovi Corporation (a) | | | 6,000 | | | | 222,780 | |
SanDisk Corporation (a) | | | 5,000 | | | | 173,150 | |
Sybase, Inc. (a) | | | 4,000 | | | | 186,480 | |
| Xilinx, Inc. | | | 7,000 | | | | 178,500 | |
Zebra Technologies Corporation - Class A (a) | | | 2,500 | | | | 74,000 | |
| | | | | | | | 4,745,104 | |
| Materials — 6.7% | | | | | | | | |
| Airgas, Inc. | | | 4,000 | | | | 254,480 | |
| Albemarle Corporation | | | 8,000 | | | | 341,040 | |
| Ashland, Inc. | | | 3,000 | | | | 158,310 | |
| Cabot Corporation | | | 4,000 | | | | 121,600 | |
Clearwater Paper Corporation (a) | | | 1,983 | | | | 97,663 | |
| Eagle Materials, Inc. | | | 2,500 | | | | 66,350 | |
| Martin Marietta Materials, Inc. | | | 2,500 | | | | 208,875 | |
| Scotts Miracle-Gro Company (The) - Class A | | | 4,000 | | | | 185,400 | |
| Sonoco Products Company | | | 9,570 | | | | 294,660 | |
| Steel Dynamics, Inc. | | | 12,000 | | | | 209,640 | |
| Valspar Corporation (The) | | | 7,000 | | | | 206,360 | |
| | | | | | | | 2,144,378 | |
| Telecommunication Services — 0.1% | | | | | | | | |
| Telephone & Data Systems, Inc. | | | 1,000 | | | | 33,850 | |
| | | | | | | | | |
| Utilities — 5.9% | | | | | | | | |
| AGL Resources, Inc. | | | 8,400 | | | | 324,660 | |
| EQT Corporation | | | 7,000 | | | | 287,000 | |
| Great Plains Energy, Inc. | | | 9,050 | | | | 168,059 | |
| MDU Resources Group, Inc. | | | 8,850 | | | | 190,983 | |
| ONEOK, Inc. | | | 5,750 | | | | 262,487 | |
| Pepco Holdings, Inc. | | | 7,900 | | | | 135,485 | |
| SCANA Corporation | | | 7,530 | | | | 283,053 | |
| Vectren Corporation | | | 10,600 | | | | 262,032 | |
| | | | | | | | 1,913,759 | |
| | | | | | | | | |
Total Common Stocks (Cost $22,090,104) | | | | | | $ | 28,842,051 | |
THE GOVERNMENT STREET MID-CAP FUND SCHEDULE OF INVESTMENTS (Continued) |
EXCHANGE-TRADED FUNDS — 10.1% | | | | | | |
| iShares Dow Jones U.S. Home Construction Index Fund | | | 3,600 | | | $ | 48,780 | |
| iShares S&P MidCap 400 Index Fund | | | 12,070 | | | | 949,909 | |
| Vanguard Emerging Markets ETF | | | 9,000 | | | | 379,620 | |
| Vanguard Mid-Cap ETF | | | 14,500 | | | | 944,820 | |
| Vanguard Short-Term Bond ETF | | | 7,750 | | | | 620,078 | |
| WisdomTree Emerging Markets Equity Income Fund | | | 3,000 | | | | 157,230 | |
| WisdomTree International MidCap Dividend Fund | | | 3,000 | | | | 145,488 | |
Total Exchange-Traded Funds (Cost $2,540,908) | | | | | | $ | 3,245,925 | |
| | | | | | |
| U.S. Bank, N.A., discount, 0.05%, due 04/01/2010 (Cost $107,000) | | $ | 107,000 | | | $ | 107,000 | |
MONEY MARKET FUNDS — 0.0% | | | | | | |
AIM STIT - STIC Prime Portfolio - Institutional Class, 0.11% (b) (Cost $150) | | | 150 | | | $ | 150 | |
| | | | | | | | | |
Total Investments at Value — 100.0% (Cost $24,738,162) | | | | | | $ | 32,195,126 | |
| | | | | | | | | |
| Other Assets in Excess of Liabilities — 0.0% | | | | | | | 2,846 | |
| | | | | | | | | |
| Net Assets — 100.0% | | | | | | $ | 32,197,972 | |
| ADR - American Depositary Receipt. |
| |
| (a) | Non-income producing security. |
| | |
| (b) | Variable rate security. The rate shown is the 7-day effective yield as of March 31, 2010. |
| | |
| See accompanying notes to financial statements. |
THE ALABAMA TAX FREE BOND FUND SCHEDULE OF INVESTMENTS March 31, 2010 |
ALABAMA FIXED RATE REVENUE AND GENERAL OBLIGATION (GO) BONDS — 95.8% | | | | | | |
| Alabama Drinking Water Financing Auth., Rev., | | | | | | |
| 4.00%, due 08/15/2014 | | $ | 250,000 | | | $ | 263,693 | |
| 5.00%, due 08/15/2018 | | | 400,000 | | | | 424,748 | |
| Alabama Special Care Facilities Financing Auth., Birmingham, Rev., | | | | | | | | |
| 5.375%, due 11/01/2012, ETM | | | 400,000 | | | | 401,496 | |
| Alabama Special Care Facilities Financing Auth., Mobile, Hospital Rev., | | | | | | | | |
| 4.50%, due 11/01/2010, ETM | | | 250,000 | | | | 250,870 | |
| Alabama State Federal Highway Financing Auth., Rev., | | | | | | | | |
| 5.00%, due 03/01/2016 | | | 300,000 | | | | 318,219 | |
| Alabama State Parks System Improvement Corporation, GO, | | | | | | | | |
| 5.50%, due 06/01/2010 | | | 200,000 | | | | 201,744 | |
| Alabama State Public School & College Auth., Capital Improvements, Rev., | | | | | | | | |
| 5.00%, due 12/01/2011 | | | 350,000 | | | | 374,287 | |
| Alabama State Public School & College Auth., Capital Improvements, Series A, Rev., | | | | | | | | |
| 4.00%, due 02/17/2017 | | | 250,000 | | | | 264,225 | |
| Alabama State Public School & College Auth., Rev., | | | | | | | | |
| 5.00%, due 05/01/2010 | | | 355,000 | | | | 356,377 | |
| 5.00%, due 12/01/2017 | | | 300,000 | | | | 337,092 | |
| Alabama State, GO, | | | | | | | | |
| 5.00%, due 06/01/2012 | | | 250,000 | | | | 251,820 | |
| 5.00%, due 09/01/2015 | | | 300,000 | | | | 308,322 | |
| 5.00%, due 09/01/2016 | | | 300,000 | | | | 308,322 | |
| 5.00%, due 09/01/2017 | | | 300,000 | | | | 329,901 | |
| Alabama Water Pollution Control Auth., Rev., | | | | | | | | |
| 5.00%, due 08/15/2010 | | | 500,000 | | | | 504,635 | |
| 5.375%, due 08/15/2014 | | | 225,000 | | | | 239,031 | |
| Anniston, AL, Waterworks & Sewer Board, Rev., | | | | | | | | |
| 4.00%, due 06/01/2015 | | | 400,000 | | | | 400,992 | |
| Athens, AL, Electric Rev., Warrants, | | | | | | | | |
| 3.00%, due 06/01/2011 | | | 500,000 | | | | 511,415 | |
| Auburn University, AL, General Fee Rev., | | | | | | | | |
| 4.45%, due 06/01/2011, Prerefunded 06/01/2010 @ 100 | | | 400,000 | | | | 402,764 | |
| 5.25%, due 06/01/2015 | | | 400,000 | | | | 430,312 | |
| Auburn, AL, GO, Warrants, | | | | | | | | |
| 5.00%, due 08/01/2012 | | | 225,000 | | | | 245,239 | |
| Auburn, AL, Waterworks Board, Rev., | | | | | | | | |
| 5.00%, due 07/01/2015 | | | 335,000 | | | | 354,909 | |
| Baldwin Co., AL, Board of Education, Rev., Warrants, | | | | | | | | |
| 5.00%, due 06/01/2010 | | | 300,000 | | | | 302,175 | |
| Baldwin Co., AL, GO, Warrants, | | | | | | | | |
| 5.00%, due 02/01/2015 | | | 200,000 | | | | 221,156 | |
THE ALABAMA TAX FREE BOND FUND SCHEDULE OF INVESTMENTS (Continued) |
ALABAMA FIXED RATE REVENUE AND GENERAL OBLIGATION (GO) BONDS — 95.8% (Continued) | | | | | | |
| Baldwin Co., AL, Series A, GO, Warrants, | | | | | | |
| 5.00%, due 02/01/2017 | | $ | 320,000 | | | $ | 360,739 | |
| Calhoun Co., AL, Gas Tax Anticipation, Series A, Rev., Warrants, | | | | | | | | |
| 4.00%, due 03/01/2016 | | | 445,000 | | | | 470,414 | |
| Calhoun Co., AL, Gas Tax Anticipation, Series B, Rev., Warrants, | | | | | | | | |
| 2.00%, due 03/01/2011 | | | 365,000 | | | | 368,435 | |
| Chelsea, AL, GO, | | | | | | | | |
| 4.00%, due 05/01/2015 | | | 260,000 | | | | 277,529 | |
| Enterprise, AL, GO, School Warrants, | | | | | | | | |
| 4.00%, due 02/01/2016 | | | 400,000 | | | | 428,328 | |
| Florence, AL, Electric Rev., Warrants, | | | | | | | | |
| 3.10%, due 06/01/2015 | | | 300,000 | | | | 303,903 | |
| Foley, AL, GO, Warrants, | | | | | | | | |
| 4.00%, due 01/01/2015 | | | 315,000 | | | | 339,989 | |
| Foley, AL, Utilities Board, Utilities Rev., | | | | | | | | |
| 4.00%, due 11/01/2018 | | | 710,000 | | | | 741,091 | |
| 4.50%, due 11/01/2019 | | | 250,000 | | | | 261,540 | |
| Homewood, AL, GO, Warrants, | | | | | | | | |
| 5.00%, due 09/01/2014, Prerefunded 09/01/2011 @ 101 | | | 500,000 | | | | 535,715 | |
| 5.00%, due 09/01/2015 | | | 250,000 | | | | 284,638 | |
| Hoover, AL, Special Tax, Warrants, | | | | | | | | |
| 5.00%, due 02/15/2015 | | | 370,000 | | | | 393,920 | |
| Houston Co., AL, Board of Education, GO, Capital Outlay Warrants, | | | | | | | | |
| 4.00%, due 12/01/2013 | | | 545,000 | | | | 590,497 | |
| Houston Co., AL, GO, | | | | | | | | |
| 4.75%, due 10/15/2016 | | | 500,000 | | | | 535,815 | |
| Huntsville, AL, Capital Improvements, Series C, GO, Warrants, | | | | | | | | |
| 3.25%, due 11/01/2010 | | | 100,000 | | | | 101,728 | |
| 5.00%, due 11/01/2017 | | | 300,000 | | | | 331,131 | |
| Huntsville, AL, Electric Systems, Rev., | | | | | | | | |
| 4.00%, due 12/01/2013 | | | 300,000 | | | | 326,352 | |
| Huntsville, AL, GO, | | | | | | | | |
| 5.00%, due 08/01/2011 | | | 500,000 | | | | 529,375 | |
| 5.125%, due 05/01/2020 | | | 300,000 | | | | 329,091 | |
| Jefferson Co., AL, Sewer Rev., | | | | | | | | |
| 5.00%, due 02/01/2041, Prerefunded 02/01/2011 @ 101 | | | 225,000 | | | | 233,642 | |
| Limestone Co., AL, Board of Education, Rev., | | | | | | | | |
| 4.75%, due 11/01/2010 | | | 250,000 | | | | 256,035 | |
| Macon Co., AL, GO, Warrants, | | | | | | | | |
| 4.25%, due 10/01/2027, Prerefunded 10/01/2017 @ 100 | | | 200,000 | | | | 223,728 | |
THE ALABAMA TAX FREE BOND FUND SCHEDULE OF INVESTMENTS (Continued) |
ALABAMA FIXED RATE REVENUE AND GENERAL OBLIGATION (GO) BONDS — 95.8% (Continued) | | | | | | |
| Madison Co., AL, Board of Education, Capital Outlay Tax Anticipation Warrants, | | | | | | |
| 5.20%, due 03/01/2011 | | $ | 400,000 | | | $ | 404,432 | |
| 5.20%, due 03/01/2014 | | | 250,000 | | | | 252,770 | |
| Madison Co., AL, Board of Education, Series B, Tax Anticipation Warrants, | | | | | | | | |
| 3.00%, due 09/01/2017 | | | 410,000 | | | | 401,247 | |
| Mobile Co., AL, GO, | | | | | | | | |
| 5.25%, due 08/01/2015 | | | 400,000 | | | | 449,376 | |
| Mobile, AL, GO, | | | | | | | | |
| 4.50%, due 08/01/2013 | | | 100,000 | | | | 109,806 | |
| 4.75%, due 02/15/2014 | | | 400,000 | | | | 417,552 | |
| 5.50%, due 08/15/2015, Prerefunded 08/15/2011 @ 102 | | | 500,000 | | | | 543,245 | |
| 5.20%, due 08/15/2018, Prerefunded 08/15/2011 @ 102 | | | 725,000 | | | | 784,740 | |
| Mobile, AL, Water & Sewer, Rev., | | | | | | | | |
| 5.25%, due 01/01/2012 | | | 205,000 | | | | 219,073 | |
| 5.25%, due 01/01/2014 | | | 300,000 | | | | 316,623 | |
| 5.25%, due 01/01/2020 | | | 400,000 | | | | 418,292 | |
| Montgomery, AL, GO, | | | | | | | | |
| 5.00%, due 11/01/2015 | | | 300,000 | | | | 310,446 | |
| Montgomery, AL, Waterworks & Sanitation, Rev., | | | | | | | | |
| 5.25%, due 09/01/2011 | | | 350,000 | | | | 372,407 | |
| Mountain Brook, AL, City Board of Education, Capital Outlay Warrants, | | | | | | | | |
| 4.80%, due 02/15/2011 | | | 405,000 | | | | 406,324 | |
| Oxford, AL, Waterworks & Sewer Board, Rev., | | | | | | | | |
| 3.00%, due 12/01/2011 | | | 415,000 | | | | 426,437 | |
| Prattville, AL, GO, Warrants, | | | | | | | | |
| 4.00%, due 09/01/2016 | | | 450,000 | | | | 478,323 | |
| Prattville, AL, Waterworks Board, Rev., | | | | | | | | |
| 3.00%, due 08/01/2017 | | | 290,000 | | | | 285,238 | |
| Scottsboro, AL, Waterworks Sewer & Gas Board, Rev., | | | | | | | | |
| 4.35%, due 08/01/2011 | | | 200,000 | | | | 200,174 | |
| Sheffield, AL, Electric Rev., | | | | | | | | |
| 4.00%, due 07/01/2017 | | | 600,000 | | | | 621,180 | |
| Smiths, AL, Water & Sewer Auth., Rev., | | | | | | | | |
| 4.00%, due 06/01/2013 | | | 200,000 | | | | 211,894 | |
| St. Clair Co., AL, GO, | | | | | | | | |
| 4.00%, due 08/01/2013 | | | 145,000 | | | | 156,810 | |
| 4.00%, due 08/01/2014 | | | 205,000 | | | | 222,983 | |
| Sumter Co., AL, School Rev., Warrants, | | | | | | | | |
| 4.50%, due 02/01/2031, Prerefunded 02/01/16 @ 100 | | | 500,000 | | | | 564,845 | |
| Trussville, AL, Warrants, | | | | | | | | |
| 4.30%, due 10/01/2010 | | | 400,000 | | | | 408,028 | |
THE ALABAMA TAX FREE BOND FUND SCHEDULE OF INVESTMENTS (Continued) |
ALABAMA FIXED RATE REVENUE AND GENERAL OBLIGATION (GO) BONDS — 95.8% (Continued) | | | | | | |
| Tuscaloosa, AL, GO, Warrants, | | | | | | |
| 4.25%, due 02/15/2011 | | $ | 145,000 | | | $ | 149,707 | |
| Tuscaloosa, AL, Public Building Auth., Student Housing Rev., | | | | | | | | |
| 4.00%, due 07/01/2013 | | | 350,000 | | | | 373,223 | |
| University of Alabama, AL, Birmingham, Series A, Hospital Rev., | | | | | | | | |
| 5.00%, due 09/01/2011 | | | 100,000 | | | | 104,930 | |
| 5.00%, due 09/01/2012 | | | 180,000 | | | | 192,393 | |
| University of Alabama, AL, General Fee Rev., | | | | | | | | |
| 4.10%, due 12/01/2013 | | | 240,000 | | | | 253,939 | |
| University of Alabama, AL, Series A, Rev., | | | | | | | | |
| 4.00%, due 10/01/2010 | | | 375,000 | | | | 381,982 | |
| 3.00%, due 07/01/2016 | | | 340,000 | | | | 347,001 | |
| 5.00%, due 07/01/2017 | | | 245,000 | | | | 280,047 | |
| Vestavia Hills, AL, Series A, GO, Warrants, | | | | | | | | |
| 5.00%, due 02/01/2012 | | | 565,000 | | | | 594,973 | |
| 3.00%, due 02/01/2018 | | | 240,000 | | | | 237,643 | |
| Wetumpka, AL, Waterworks & Sewer, Rev., | | | | | | | | |
| 4.00%, due 03/01/2018 | | | 320,000 | | | | 324,262 | |
| | | | | | | | | |
Total Alabama Fixed Rate Revenue and General Obligation (GO) Bonds (Cost $27,803,146) | | | | | | $ | 28,449,724 | |
MONEY MARKET FUNDS — 3.4% | | | | | | |
Alpine Municipal Money Market Fund - Class I, 0.18% (a) (Cost $1,019,548) | | | 1,019,548 | | | $ | 1,019,548 | |
| | | | | | | | | |
Total Investments at Value - 99.2% (Cost $28,822,694) | | | | | | $ | 29,469,272 | |
| | | | | | | | | |
| Other Assets in Excess of Liabilities — 0.8% | | | | | | | 246,994 | |
| | | | | | | | | |
| Net Assets — 100.0% | | | | | | $ | 29,716,266 | |
| ETM - Escrowed to Maturity. |
| |
| (a) | Variable rate security. The rate shown is the 7-day effective yield as of March 31, 2010. |
| | |
| See accompanying notes to financial statements. |
THE GOVERNMENT STREET FUNDS STATEMENTS OF ASSETS AND LIABILITIES March 31, 2010 |
| | Government Street Equity Fund | | | Government Street Mid-Cap Fund | | | | |
| ASSETS | | | | | | | | | |
| Investments in securities: | | | | | | | | | |
| At acquisition cost | | $ | 39,170,689 | | | $ | 24,738,162 | | | $ | 28,822,694 | |
| At value (Note 1) | | $ | 57,820,579 | | | $ | 32,195,126 | | | $ | 29,469,272 | |
| Dividends and interest receivable | | | 72,342 | | | | 26,914 | | | | 280,082 | |
| Receivable for capital shares sold | | | 5,000 | | | | 1,732 | | | | — | |
| Other assets | | | 12,393 | | | | 9,712 | | | | 8,983 | |
| TOTAL ASSETS | | | 57,910,314 | | | | 32,233,484 | | | | 29,758,337 | |
| | | | | | | | | | | | | |
| LIABILITIES | | | | | | | | | | | | |
| Bank overdraft | | | 1,235 | | | | — | | | | — | |
| Distributions payable | | | 3,537 | | | | — | | | | 20,861 | |
| Written call options, at value (Notes 1 and 4) (premiums received $12,478) | | | 21,880 | | | | — | | | | — | |
| Payable for capital shares redeemed | | | 76,373 | | | | 7,577 | | | | 4,946 | |
| Accrued investment advisory fees (Note 3) | | | 29,109 | | | | 20,313 | | | | 7,679 | |
| Accrued administration fees (Note 3) | | | 7,200 | | | | 4,000 | | | | 3,700 | |
| Accrued compliance fees (Note 3) | | | 565 | | | | 550 | | | | 550 | |
| Other accrued expenses | | | 4,087 | | | | 3,072 | | | | 4,335 | |
| TOTAL LIABILITIES | | | 143,986 | | | | 35,512 | | | | 42,071 | |
| | | | | | | | | | | | | |
| NET ASSETS | | $ | 57,766,328 | | | $ | 32,197,972 | | | $ | 29,716,266 | |
| | | | | | | | | | | | | |
| Net assets consist of: | | | | | | | | | | | | |
| Paid-in capital | | $ | 39,150,276 | | | $ | 25,357,852 | | | $ | 29,087,177 | |
| Undistributed net investment income | | | 765 | | | | 12,399 | | | | 7,280 | |
| Accumulated net realized losses from security transactions | | | (25,201 | ) | | | (629,243 | ) | | | (24,769 | ) |
Net unrealized appreciation on investments | | | 18,640,488 | | | | 7,456,964 | | | | 646,578 | |
| | | | | | | | | | | | | |
| Net assets | | $ | 57,766,328 | | | $ | 32,197,972 | | | $ | 29,716,266 | |
| | | | | | | | | | | | | |
Shares of beneficial interest outstanding (unlimited number of shares authorized, no par value) | | | 1,412,880 | | | | 2,501,834 | | | | 2,822,226 | |
| | | | | | | | | | | | | |
| Net asset value, offering price and redemption price per share (Note 1) | | $ | 40.89 | | | $ | 12.87 | | | $ | 10.53 | |
| See accompanying notes to financial statements. |
THE GOVERNMENT STREET FUNDS STATEMENTS OF OPERATIONS Year Ended March 31, 2010 |
| | Government Street Equity Fund | | | Government Street Mid-Cap Fund | | | | |
| INVESTMENT INCOME | | | | | | | | | |
| Interest | | $ | 656 | | | $ | 426 | | | $ | 1,035,379 | |
| Dividends | | | 1,017,931 | | | | 449,653 | | | | 12,719 | |
| Foreign withholding taxes on dividends | | | (3,840 | ) | | | (1,365 | ) | | | — | |
| TOTAL INVESTMENT INCOME | | | 1,014,747 | | | | 448,714 | | | | 1,048,098 | |
| | | | | | | | | | | | | |
| EXPENSES | | | | | | | | | | | | |
| Investment advisory fees (Note 3) | | | 297,388 | | | | 208,870 | | | | 104,705 | |
| Administration fees (Note 3) | | | 68,314 | | | | 48,000 | | | | 43,842 | |
| Professional fees | | | 19,150 | | | | 16,695 | | | | 14,950 | |
| Trustees’ fees and expenses | | | 14,702 | | | | 14,702 | | | | 14,702 | |
| Custodian and bank service fees | | | 10,245 | | | | 8,175 | | | | 5,876 | |
| Compliance fees and expenses (Note 3) | | | 6,769 | | | | 6,616 | | | | 6,620 | |
| Pricing costs | | | 1,841 | | | | 3,436 | | | | 12,705 | |
| Account maintenance fees | | | 6,422 | | | | 6,370 | | | | 1,567 | |
| Insurance expense | | | 5,282 | | | | 3,223 | | | | 4,127 | |
| Printing of shareholder reports | | | 5,618 | | | | 2,902 | | | | 2,825 | |
| Postage and supplies | | | 4,220 | | | | 3,441 | | | | 3,533 | |
| Registration fees | | | 3,606 | | | | 3,144 | | | | 3,034 | |
| Other expenses | | | 5,134 | | | | 4,621 | | | | 4,549 | |
| TOTAL EXPENSES | | | 448,691 | | | | 330,195 | | | | 223,035 | |
| Fees waived by the Adviser (Note 3) | | | — | | | | (13,860 | ) | | | (28,581 | ) |
| NET EXPENSES | | | 448,691 | | | | 316,335 | | | | 194,454 | |
| | | | | | | | | | | | | |
| NET INVESTMENT INCOME | | | 566,056 | | | | 132,379 | | | | 853,644 | |
| | | | | | | | | | | | | |
| REALIZED AND UNREALIZED GAINS (LOSSES) ON INVESTMENTS | | | | | | | | | | | | |
Net realized gains from security transactions | | | 148,167 | | | | 34,204 | | | | 51,774 | |
| Net realized gains from in-kind redemptions (Note 1) | | | 1,241,775 | | | | 309,466 | | | | — | |
| Net change in unrealized appreciation (depreciation) on: | | | | | | | | | | | | |
| Investments | | | 18,422,393 | | | | 10,895,821 | | | | (64,236 | ) |
| Option contracts written | | | (9,402 | ) | | | — | | | | — | |
| | | | | | | | | | | | | |
NET REALIZED AND UNREALIZED GAINS (LOSSES) ON INVESTMENTS | | | 19,802,933 | | | | 11,239,491 | | | | (12,462 | ) |
| | | | | | | | | | | | | |
NET INCREASE IN NET ASSETS FROM OPERATIONS | | $ | 20,368,989 | | | $ | 11,371,870 | | | $ | 841,182 | |
| See accompanying notes to financial statements. |
THE GOVERNMENT STREET FUNDS STATEMENTS OF CHANGES IN NET ASSETS |
| | | Government Street Equity Fund | | | Government Street Mid-Cap Fund | |
| | | | | | | | | | | | |
| FROM OPERATIONS | | | | | | | | | | | | |
| Net investment income | | $ | 566,056 | | | $ | 800,984 | | | $ | 132,379 | | | $ | 130,103 | |
| Net realized gains (losses) from security transactions | | | 148,167 | | | | (173,368 | ) | | | 34,204 | | | | (663,447 | ) |
| Net realized gains from in-kind redemptions (Note 1) | | | 1,241,775 | | | | 1,939,512 | | | | 309,466 | | | | 446,671 | |
| Net change in unrealized appreciation (depreciation) on: | | | | | | | | | | | | | | | | |
| Investments | | | 18,422,393 | | | | (28,078,838 | ) | | | 10,895,821 | | | | (9,436,552 | ) |
| Option contracts written | | | (9,402 | ) | | | — | | | | — | | | | — | |
| Net increase (decrease) in net assets from operations | | | 20,368,989 | | | | (25,511,710 | ) | | | 11,371,870 | | | | (9,523,225 | ) |
| | | | | | | | | | | | | | | | | |
| DISTRIBUTIONS TO SHAREHOLDERS | | | | | | | | | | | | | | | | |
| From net investment income | | | (566,303 | ) | | | (753,088 | ) | | | (119,980 | ) | | | (141,611 | ) |
| In excess of net investment income | | | — | | | | — | | | | — | | | | (2,489 | ) |
| From realized capital gains on security transactions | | | — | | | | — | | | | — | | | | (7,284 | ) |
| Decrease in net assets from distributions to shareholders | | | (566,303 | ) | | | (753,088 | ) | | | (119,980 | ) | | | (151,384 | ) |
| | | | | | | | | | | | | | | | | |
| FROM CAPITAL SHARE TRANSACTIONS | | | | | | | | | | | | | | | | |
| Proceeds from shares sold | | | 5,064,427 | | | | 2,476,764 | | | | 1,574,608 | | | | 1,776,042 | |
| Net asset value of shares issued in reinvestment of distributions to shareholders | | | 542,448 | | | | 719,467 | | | | 112,182 | | | | 141,942 | |
| Payments for shares redeemed | | | (5,299,606 | ) | | | (6,541,942 | ) | | | (2,262,835 | ) | | | (2,144,940 | ) |
| Net increase (decrease) in net assets from capital share transactions | | | 307,269 | | | | (3,345,711 | ) | | | (576,045 | ) | | | (226,956 | ) |
| | | | | | | | | | | | | | | | | |
| TOTAL INCREASE (DECREASE) IN NET ASSETS | | | 20,109,955 | | | | (29,610,509 | ) | | | 10,675,845 | | | | (9,901,565 | ) |
| | | | | | | | | | | | | | | | | |
| NET ASSETS | | | | | | | | | | | | | | | | |
| Beginning of year | | | 37,656,373 | | | | 67,266,882 | | | | 21,522,127 | | | | 31,423,692 | |
| End of year | | $ | 57,766,328 | | | $ | 37,656,373 | | | $ | 32,197,972 | | | $ | 21,522,127 | |
| | | | | | | | | | | | | | | | | |
| UNDISTRIBUTED NET INVESTMENT INCOME | | $ | 765 | | | $ | 1,012 | | | $ | 12,399 | | | $ | — | |
| | | | | | | | | | | | | | | | | |
| CAPITAL SHARE ACTIVITY | | | | | | | | | | | | | | | | |
| Shares sold | | | 135,218 | | | | 68,142 | | | | 147,313 | | | | 174,611 | |
| Shares reinvested | | | 14,817 | | | | 20,123 | | | | 9,427 | | | | 15,726 | |
| Shares redeemed | | | (146,410 | ) | | | (181,776 | ) | | | (199,510 | ) | | | (205,129 | ) |
Net increase (decrease) in shares outstanding | | | 3,625 | | | | (93,511 | ) | | | (42,770 | ) | | | (14,792 | ) |
| Shares outstanding, beginning of year | | | 1,409,255 | | | | 1,502,766 | | | | 2,544,604 | | | | 2,559,396 | |
| Shares outstanding, end of year | | | 1,412,880 | | | | 1,409,255 | | | | 2,501,834 | | | | 2,544,604 | |
| See accompanying notes to financial statements. |
THE GOVERNMENT STREET FUNDS STATEMENTS OF CHANGES IN NET ASSETS |
| | | Alabama Tax Free Bond Fund | |
| | | | | | |
| FROM OPERATIONS | | | | | | |
| Net investment income | | $ | 853,644 | | | $ | 909,831 | |
Net realized gains from security transactions | | | 51,774 | | | | 5,706 | |
| Net change in unrealized appreciation (depreciation) on investments | | | (64,236 | ) | | | 110,981 | |
| Net increase in net assets from operations | | | 841,182 | | | | 1,026,518 | |
| | | | | | | | | |
| DISTRIBUTIONS TO SHAREHOLDERS | | | | | | | | |
| From net investment income | | | (850,484 | ) | | | (906,325 | ) |
| From realized capital gains on security transactions | | | (29,128 | ) | | | (205 | ) |
| Decrease in net assets from distributions to shareholders | | | (879,612 | ) | | | (906,530 | ) |
| | | | | | | | | |
| FROM CAPITAL SHARE TRANSACTIONS | | | | | | | | |
| Proceeds from shares sold | | | 5,264,512 | | | | 3,972,100 | |
| Net asset value of shares issued in reinvestment of distributions to shareholders | | | 598,837 | | | | 576,864 | |
| Payments for shares redeemed | | | (4,466,191 | ) | | | (1,737,811 | ) |
| Net increase in net assets from capital share transactions | | | 1,397,158 | | | | 2,811,153 | |
| | | | | | | | | |
| TOTAL INCREASE IN NET ASSETS | | | 1,358,728 | | | | 2,931,141 | |
| | | | | | | | | |
| NET ASSETS | | | | | | | | |
| Beginning of year | | | 28,357,538 | | | | 25,426,397 | |
| End of year | | $ | 29,716,266 | | | $ | 28,357,538 | |
| | | | | | | | | |
| UNDISTRIBUTED NET INVESTMENT INCOME | | $ | 1,160 | | | $ | 17,525 | |
| | | | | | | | | |
| CAPITAL SHARE ACTIVITY | | | | | | | | |
| Shares sold | | | 498,641 | | | | 378,942 | |
| Shares reinvested | | | 56,622 | | | | 55,131 | |
| Shares redeemed | | | (422,233 | ) | | | (166,312 | ) |
| Net increase in shares outstanding | | | 133,030 | | | | 267,761 | |
| Shares outstanding, beginning of year | | | 2,689,196 | | | | 2,421,435 | |
| Shares outstanding, end of year | | | 2,822,226 | | | | 2,689,196 | |
| See accompanying notes to financial statements. |
THE GOVERNMENT STREET EQUITY FUND FINANCIAL HIGHLIGHTS |
Selected Per Share Data and Ratios for a Share Outstanding Throughout Each Year | |
| | | | |
| | | | | | | | | | | | | | | |
| Net asset value at beginning of year | | $ | 26.72 | | | $ | 44.76 | | | $ | 48.37 | | | $ | 52.42 | | | $ | 47.11 | |
| | | | | | | | | | | | | | | | | | | | | |
| Income (loss) from investment operations: | | | | | | | | | | | | | | | | | | | | |
| Net investment income | | | 0.40 | | | | 0.55 | | | | 0.57 | | | | 0.48 | | | | 0.50 | |
| Net realized and unrealized gains (losses) on investments | | | 14.17 | | | | (18.07 | ) | | | (2.12 | ) | | | 2.90 | | | | 5.31 | |
| Total from investment operations | | | 14.57 | | | | (17.52 | ) | | | (1.55 | ) | | | 3.38 | | | | 5.81 | |
| | | | | | | | | | | | | | | | | | | | | |
| Less distributions: | | | | | | | | | | | | | | | | | | | | |
| Dividends from net investment income | | | (0.40 | ) | | | (0.52 | ) | | | (0.57 | ) | | | (0.48 | ) | | | (0.50 | ) |
| Distributions from net realized gains | | | — | | | | — | | | | (1.31 | ) | | | (6.95 | ) | | | — | |
| Return of capital | | | — | | | | — | | | | (0.18 | ) | | | — | | | | — | |
| Total distributions | | | (0.40 | ) | | | (0.52 | ) | | | (2.06 | ) | | | (7.43 | ) | | | (0.50 | ) |
| | | | | | | | | | | | | | | | | | | | | |
| Net asset value at end of year | | $ | 40.89 | | | $ | 26.72 | | | $ | 44.76 | | | $ | 48.37 | | | $ | 52.42 | |
| | | | | | | | | | | | | | | | | | | | | |
Total return (a) | | | 54.71% | | | | (39.43% | ) | | | (3.51% | ) | | | 7.04% | | | | 12.39% | |
| | | | | | | | | | | | | | | | | | | | | |
Net assets at end of year (000’s) | | $ | 57,766 | | | $ | 37,656 | | | $ | 67,267 | | | $ | 87,757 | | | $ | 107,243 | |
| | | | | | | | | | | | | | | | | | | | | |
| Ratio of expenses to average net assets | | | 0.90% | | | | 0.91% | | | | 0.84% | | | | 0.84% | | | | 0.78% | |
| | | | | | | | | | | | | | | | | | | | | |
| Ratio of net investment income to average net assets | | | 1.14% | | | | 1.47% | | | | 1.12% | | | | 0.96% | | | | 0.95% | |
| | | | | | | | | | | | | | | | | | | | | |
| Portfolio turnover rate | | | 30% | | | | 35% | | | | 12% | | | | 15% | | | | 17% | |
| (a) | Total return is a measure of the change in value of an investment in the Fund over the period covered, which assumes any dividends or capital gains distributions are reinvested in shares of the Fund. Returns do not reflect the deduction of taxes a shareholder would pay on Fund distributions or the redemption of Fund shares. |
| | |
| See accompanying notes to financial statements. |
THE GOVERNMENT STREET MID-CAP FUND FINANCIAL HIGHLIGHTS |
Selected Per Share Data and Ratios for a Share Outstanding Throughout Each Year | |
| | | | |
| | | | | | | | | | | | | | | |
| Net asset value at beginning of year | | $ | 8.46 | | | $ | 12.28 | | | $ | 13.13 | | | $ | 13.71 | | | $ | 11.30 | |
| | | | | | | | | | | | | | | | | | | | | |
| Income (loss) from investment operations: | | | | | | | | | | | | | | | | | | | | |
| Net investment income | | | 0.05 | | | | 0.05 | | | | 0.03 | | | | 0.04 | | | | 0.05 | |
| Net realized and unrealized gains (losses) on investments | | | 4.41 | | | | (3.82 | ) | | | (0.53 | ) | | | 0.45 | | | | 2.38 | |
| Total from investment operations | | | 4.46 | | | | (3.77 | ) | | | (0.50 | ) | | | 0.49 | | | | 2.43 | |
| | | | | | | | | | | | | | | | | | | | | |
| Less distributions: | | | | | | | | | | | | | | | | | | | | |
| Dividends from net investment income | | | (0.05 | ) | | | (0.05 | ) | | | (0.05 | ) | | | (0.05 | ) | | | (0.02 | ) |
| In excess of net investment income | | | — | | | | (0.00 | )(a) | | | — | | | | — | | | | — | |
| Distributions from net realized gains | | | — | | | | (0.00 | )(a) | | | (0.30 | ) | | | (1.02 | ) | | | — | |
| Total distributions | | | (0.05 | ) | | | (0.05 | ) | | | (0.35 | ) | | | (1.07 | ) | | | (0.02 | ) |
| | | | | | | | | | | | | | | | | | | | | |
| Net asset value at end of year | | $ | 12.87 | | | $ | 8.46 | | | $ | 12.28 | | | $ | 13.13 | | | $ | 13.71 | |
| | | | | | | | | | | | | | | | | | | | | |
Total return (b) | | | 52.73% | | | | (30.65% | ) | | | (3.99% | ) | | | 3.83% | | | | 21.51% | |
| | | | | | | | | | | | | | | | | | | | | |
Net assets at end of year (000’s) | | $ | 32,198 | | | $ | 21,522 | | | $ | 31,424 | | | $ | 33,961 | | | $ | 37,619 | |
| | | | | | | | | | | | | | | | | | | | | |
Ratio of net expenses to average net assets(c) | | | 1.13% | | | | 1.10% | | | | 1.10% | | | | 1.10% | | | | 1.10% | |
| | | | | | | | | | | | | | | | | | | | | |
| Ratio of net investment income to average net assets | | | 0.47% | | | | 0.47% | | | | 0.25% | | | | 0.26% | | | | 0.37% | |
| | | | | | | | | | | | | | | | | | | | | |
| Portfolio turnover rate | | | 10% | | | | 14% | | | | 11% | | | | 11% | | | | 28% | |
| (a) | Amount rounds to less than $0.01 per share. |
| | |
| (b) | Total return is a measure of the change in value of an investment in the Fund over the period covered, which assumes any dividends or capital gains distributions are reinvested in shares of the Fund. Returns do not reflect the deduction of taxes a shareholder would pay on Fund distributions or the redemption of Fund shares. |
| | |
| (c) | Absent investment advisory fees voluntarily waived by the Adviser, the ratios of expenses to average net assets would have been 1.18%, 1.23%, 1.12%, 1.12% and 1.11% for the years ended March 31, 2010, 2009, 2008, 2007 and 2006, respectively (Note 3). |
| | |
| See accompanying notes to financial statements. |
THE ALABAMA TAX FREE BOND FUND FINANCIAL HIGHLIGHTS |
Selected Per Share Data and Ratios for a Share Outstanding Throughout Each Year | |
| | | | |
| | | | | | | | | | | | | | | |
| Net asset value at beginning of year | | $ | 10.54 | | | $ | 10.50 | | | $ | 10.39 | | | $ | 10.40 | | | $ | 10.55 | |
| | | | | | | | | | | | | | | | | | | | | |
| Income (loss) from investment operations: | | | | | | | | | | | | | | | | | | | | |
| Net investment income | | | 0.28 | | | | 0.35 | | | | 0.36 | | | | 0.36 | | | | 0.34 | |
| Net realized and unrealized gains (losses) on investments | | | (0.00 | )(a) | | | 0.04 | | | | 0.12 | | | | (0.01 | ) | | | (0.15 | ) |
| Total from investment operations | | | 0.28 | | | | 0.39 | | | | 0.48 | | | | 0.35 | | | | 0.19 | |
| | | | | | | | | | | | | | | | | | | | | |
| Less distributions: | | | | | | | | | | | | | | | | | | | | |
| Dividends from net investment income | | | (0.28 | ) | | | (0.35 | ) | | | (0.36 | ) | | | (0.36 | ) | | | (0.34 | ) |
| Distributions from net realized gains | | | (0.01 | ) | | | (0.00 | )(a) | | | (0.01 | ) | | | — | | | | — | |
| Total distributions | | | (0.29 | ) | | | (0.35 | ) | | | (0.37 | ) | | | (0.36 | ) | | | (0.34 | ) |
| | | | | | | | | | | | | | | | | | | | | |
| Net asset value at end of year | | $ | 10.53 | | | $ | 10.54 | | | $ | 10.50 | | | $ | 10.39 | | | $ | 10.40 | |
| | | | | | | | | | | | | | | | | | | | | |
Total return (b) | | | 2.88% | | | | 3.80% | | | | 4.66% | | | | 3.38% | | | | 1.80% | |
| | | | | | | | | | | | | | | | | | | | | |
Net assets at end of year (000’s) | | $ | 29,716 | | | $ | 28,358 | | | $ | 25,426 | | | $ | 25,968 | | | $ | 26,182 | |
| | | | | | | | | | | | | | | | | | | | | |
Ratio of net expenses to average net assets(c) | | | 0.65% | | | | 0.65% | | | | 0.65% | | | | 0.65% | | | | 0.65% | |
| | | | | | | | | | | | | | | | | | | | | |
| Ratio of net investment income to average net assets | | | 2.85% | | | | 3.36% | | | | 3.46% | | | | 3.44% | | | | 3.25% | |
| | | | | | | | | | | | | | | | | | | | | |
| Portfolio turnover rate | | | 32% | | | | 8% | | | | 6% | | | | 15% | | | | 5% | |
| (a) | Amount rounds to less than $0.01 per share. |
| | |
| (b) | Total return is a measure of the change in value of an investment in the Fund over the period covered, which assumes any dividends or capital gains distributions are reinvested in shares of the Fund. Returns do not reflect the deduction of taxes a shareholder would pay on Fund distributions or the redemption of Fund shares. |
| | |
| (c) | Absent investment advisory fees voluntarily waived by the Adviser, the ratios of expenses to average net assets would have been 0.75%, 0.79%, 0.78%, 0.76% and 0.73% for the years ended March 31, 2010, 2009, 2008, 2007 and 2006, respectively (Note 3). |
| | |
| See accompanying notes to financial statements. |
THE GOVERNMENT STREET FUNDS NOTES TO FINANCIAL STATEMENTS March 31, 2010 |
1. Organization and Significant Accounting Policies
The Government Street Equity Fund, The Government Street Mid-Cap Fund and The Alabama Tax Free Bond Fund (the “Funds”) are each a no-load series of the Williamsburg Investment Trust (the “Trust”), an open-end management investment company registered under the Investment Company Act of 1940. The Trust was organized as a Massachusetts business trust on July 18, 1988. Other series of the Trust are not included in this report.
The Government Street Equity Fund’s investment objective is to seek capital appreciation through the compounding of dividends and of capital gains, both realized and unrealized, by investing primarily in common stocks.
The Government Street Mid-Cap Fund’s investment objective is to seek capital appreciation by investing primarily in common stocks of mid-cap companies.
The Alabama Tax Free Bond Fund’s investment objectives are to provide current income exempt from federal income taxes and from the personal income taxes of Alabama and to preserve capital.
The following is a summary of the Funds’ significant accounting policies:
Securities valuation — The Funds’ portfolio securities are valued as of the close of business of the regular session of the New York Stock Exchange (normally 4:00 p.m., Eastern time). Securities traded on a national stock exchange are valued based upon the closing price on the principal exchange where the security is traded. Securities which are quoted by NASDAQ are valued at the NASDAQ Official Closing Price. Securities which are traded over-the-counter are valued at the last sales price, if available, otherwise, at the last quoted bid price. It is expected that fixed income securities will ordinarily be traded in the over-the-counter market, and common stocks will ordinarily be traded on a national securities exchange, but may also be traded in the over-the-counter market. Call options written by the Funds are valued at t he then current market quotation, using the ask price as of the close of each day on the principal exchanges on which they are traded. Short-term instruments (those with remaining maturities of 60 days or less) may be valued at amortized cost, which approximates market value.
When market quotations are not readily available, securities may be valued on the basis of prices provided by an independent pricing service. The prices provided by the pricing service are determined with consideration given to institutional bid and last sale prices and take into account securities prices, yields, maturities, call features, ratings, institutional trading in similar groups of securities and developments related to specific securities. If a pricing service cannot provide a valuation, securities will be valued in good faith at fair value using procedures established by and under the general supervision of the Board of Trustees. Such methods of fair valuation may include, but are not limited to: multiple of earnings, multiple of book value, discount from market of a similar freely traded security, purchase price of securit y, subsequent private transactions in the security or related securities, or a combination of these and other factors.
THE GOVERNMENT STREET FUNDS NOTES TO FINANCIAL STATEMENTS (Continued) |
Accounting principles generally accepted in the United States (“GAAP”) establish a single authoritative definition of fair value, set out a framework for measuring fair value and require additional disclosures about fair value measurements.
Various inputs are used in determining the value of each of the Fund’s investments. These inputs are summarized in the three broad levels listed below:
• Level 1 – quoted prices in active markets for identical securities
• Level 2 – other significant observable inputs
• Level 3 – significant unobservable inputs
The inputs or methodology used for valuing securities are not necessarily an indication of the risks associated with investing in those securities.
The following is a summary of the inputs used to value each Fund’s investments as of March 31, 2010 by security type:
| The Government Street Equity Fund: | | Level 1 | | | Level 2 | | | Level 3 | | | Total | |
| Common Stocks | | $ | 46,352,075 | | | $ | — | | | $ | — | | | $ | 46,352,075 | |
Exchange-Traded Funds | | | 9,978,810 | | | | — | | | | — | | | | 9,978,810 | |
| Commercial Paper | | | — | | | | 1,489,000 | | | | — | | | | 1,489,000 | |
| Money Market Funds | | | — | | | | 694 | | | | — | | | | 694 | |
Written Call Option Contracts | | | (21,880 | ) | | | — | | | | — | | | | (21,880 | ) |
| Total | | $ | 56,309,005 | | | $ | 1,489,694 | | | $ | — | | | $ | 57,798,699 | |
| The Government Street Mid-Cap Fund: | | Level 1 | | | Level 2 | | | Level 3 | | | Total | |
| Common Stocks | | $ | 28,842,051 | | | $ | — | | | $ | — | | | $ | 28,842,051 | |
Exchange-Traded Funds | | | 3,245,925 | | | | — | | | | — | | | | 3,245,925 | |
| Commercial Paper | | | — | | | | 107,000 | | | | — | | | | 107,000 | |
| Money Market Funds | | | — | | | | 150 | | | | — | | | | 150 | |
| Total | | $ | 32,087,976 | | | $ | 107,150 | | | $ | — | | | $ | 32,195,126 | |
| The Alabama Tax Free Bond Fund: | | Level 1 | | | Level 2 | | | Level 3 | | | Total | |
| Municipal Bonds | | $ | — | | | $ | 28,449,724 | | | $ | — | | | $ | 28,449,724 | |
| Money Market Funds | | | — | | | | 1,019,548 | | | | — | | | | 1,019,548 | |
| Total | | $ | — | | | $ | 29,469,272 | | | $ | — | | | $ | 29,469,272 | |
Refer to The Government Street Equity Fund’s and The Government Street Mid-Cap Fund’s Schedule of Investments for a listing of the common stocks valued using Level 1 inputs by sector type.
Share valuation — The net asset value per share of each Fund is calculated daily by dividing the total value of each Fund’s assets, less liabilities, by the number of shares outstanding. The offering price and redemption price per share of each Fund is equal to the net asset value per share.
THE GOVERNMENT STREET FUNDS NOTES TO FINANCIAL STATEMENTS (Continued) |
Investment income — Interest income is accrued as earned. Dividend income is recorded on the ex-dividend date. Discounts and premiums on fixed-income securities purchased are amortized using the interest method.
Repurchase agreements — The Funds may enter into repurchase agreements. A repurchase agreement, which is collateralized by U.S. Government obligations, is valued at cost which, together with accrued interest, approximates market value. At the time a Fund enters into a repurchase agreement, the seller agrees that the value of the underlying securities, including accrued interest, will at all times be equal to or exceed the face amount of the repurchase agreement. In addition, the Funds actively monitor and seek additional collateral, as needed. If the seller defaults, the fair value of the collateral may decline and realization of the collateral by the Funds may be delayed or limited.
Distributions to shareholders — Dividends arising from net investment income are declared and paid quarterly to shareholders of The Government Street Equity Fund; declared and paid annually to shareholders of The Government Street Mid-Cap Fund; and declared daily and paid monthly to shareholders of The Alabama Tax Free Bond Fund. Net realized short-term capital gains, if any, may be distributed throughout the year and net realized long-term capital gains, if any, are distributed at least once each year. The amount of distributions from net investment income and net realized gains are determined in accordance with federal income tax regulations, which may differ from GAAP. These “book/tax” differences are either temporary or permanent in nature.
The tax character of distributions paid during the years ended March 31, 2010 and March 31, 2009 is as follows:
| | Years Ended | | Ordinary Income | | | Exempt- Interest Dividends | | | Long-Term Gains | | | Total Distributions | |
| The Government Street Equity Fund | 03/31/10 | | $ | 566,303 | | | $ | — | | | $ | — | | | $ | 566,303 | |
| | 03/31/09 | | $ | 753,088 | | | $ | — | | | $ | — | | | $ | 753,088 | |
| The Government Street Mid-Cap Fund | 03/31/10 | | $ | 119,980 | | | $ | — | | | $ | — | | | $ | 119,980 | |
| | 03/31/09 | | $ | 144,299 | | | $ | — | | | $ | 7,085 | | | $ | 151,384 | |
| The Alabama Tax Free Bond Fund | 03/31/10 | | $ | 27,129 | | | $ | 850,484 | | | $ | 1,999 | | | $ | 879,612 | |
| | 03/31/09 | | $ | — | | | $ | 906,325 | | | $ | 205 | | | $ | 906,530 | |
Security transactions — Security transactions are accounted for on trade date. Gains and losses on securities sold are determined on a specific identification basis.
Common expenses — Common expenses of the Trust are allocated among the series of the Trust based on relative net assets of each series or the nature of the services performed and the relative applicability to each series.
Options transactions — With the intent of increasing the total returns of the investment portfolios of The Government Street Equity Fund and The Government Street Mid-Cap Fund, the Funds may write covered call options, primarily against highly appreciated, low basis securities to increase income. When the Funds write a
THE GOVERNMENT STREET FUNDS NOTES TO FINANCIAL STATEMENTS (Continued) |
covered call option contract, premiums are received and are recorded as liabilities, and are subsequently valued daily at the closing prices on their primary exchanges. Premiums received from writing options which expire are treated as realized gains. Premiums received from writing options which are exercised increase the proceeds used to calculate the realized gain or loss on the sale of the security. If a closing purchase transaction is used to terminate a Fund’s obligation on a written call option contract, a gain or loss will be realized, depending upon whether the price of the closing purchase transaction is more or less than the premium previously received on the call option written.
Estimates — The preparation of financial statements in conformity with GAAP requires management to make estimates and assumptions that affect the reported amounts of assets and liabilities and the disclosure of contingent assets and liabilities as of the date of the financial statements and the reported amounts of income and expenses during the reporting period. Actual results could differ from those estimates.
Federal income tax — It is each Fund’s policy to comply with the special provisions of Subchapter M of the Internal Revenue Code applicable to regulated investment companies. As provided therein, in any fiscal year in which a Fund so qualifies, and distributes at least 90% of its taxable net income, the Fund (but not the shareholders) will be relieved of federal income tax on the income distributed. Accordingly, no provision for income taxes has been made.
In order to avoid imposition of the excise tax applicable to regulated investment companies, it is also each Fund’s intention to declare as dividends in each calendar year at least 98% of its net investment income (earned during the calendar year) and 98% of its net realized capital gains (earned during the twelve months ended October 31) plus undistributed amounts from prior years.
The following information is computed on a tax basis for each item as of March 31, 2010:
| | | Government Street Equity Fund | | | Government Street Mid-Cap Fund | | | Alabama Tax Free Bond Fund | |
| Cost of portfolio investments and written call options | | $ | 39,298,070 | | | $ | 24,738,162 | | | $ | 28,844,561 | |
| Gross unrealized appreciation | | $ | 20,743,179 | | | $ | 9,040,649 | | | $ | 679,598 | |
| Gross unrealized depreciation | | | (2,242,550 | ) | | | (1,583,685 | ) | | | (54,887 | ) |
| Net unrealized appreciation | | | 18,500,629 | | | | 7,456,964 | | | | 624,711 | |
| Undistributed ordinary income | | | 4,302 | | | | 12,399 | | | | 1,634 | |
| Undistributed long-term gains | | | 114,658 | | | | — | | | | — | |
| Undistributed tax exempt income | | | — | | | | — | | | | 25,347 | |
| Capital loss carryforwards | | | — | | | | (629,243 | ) | | | (1,742 | ) |
| Other temporary differences | | | (3,537 | ) | | | — | | | | (20,861 | ) |
| Total distributable earnings | | $ | 18,616,052 | | | $ | 6,840,120 | | | $ | 629,089 | |
THE GOVERNMENT STREET FUNDS NOTES TO FINANCIAL STATEMENTS (Continued) |
The difference between the federal income tax cost of portfolio investments and the financial statement cost for The Government Street Equity Fund and The Alabama Tax Free Bond Fund is due to certain timing differences in the recognition of capital gains or losses under income tax regulations and GAAP. These “book/tax” differences are temporary in nature and are primarily due to the tax deferral of losses on wash sales and/or differing methods in the amortization of market discount and premium on fixed income securities.
During the year ended March 31, 2010, The Government Street Equity Fund utilized capital loss carryforwards of $71,454 to offset current year realized gains.
As of March 31, 2010, The Government Street Mid-Cap Fund had capital loss carryforwards for federal income tax purposes of $629,243, of which $223,256 expires March 31, 2017 and $405,987 expires March 31, 2018. The Alabama Tax Free Bond Fund had a capital loss carryforward for federal income tax purposes of $1,742, which expires March 31, 2018. These capital loss carryforwards may be utilized in future years to offset net realized capital gains, if any, prior to distribution to shareholders.
During the year ended March 31, 2010, The Government Street Equity Fund and The Government Street Mid-Cap Fund realized $1,241,775 and $309,466, respectively of net capital gains resulting from in-kind redemptions (redemptions in which shareholders who redeemed Fund shares received securities held by the Fund rather than cash). The Funds recognize a gain on in-kind redemptions to the extent that the value of the distributed securities on the date of redemption exceeds the cost of those securities. Such gains are not taxable to the Funds and are not required to be distributed to shareholders. The Funds have reclassified these amounts against paid-in capital. These reclassifications are reflected on the Statements of Assets and Liabilities. Such reclassifications, the result of permanent differences between the financial statement and in come tax reporting requirements, had no effect on each Fund’s net assets or net asset value per share.
For the year ended March 31, 2010, The Alabama Tax Free Bond Fund reclassified $13,405 of undistributed net investment income against accumulated net realized losses on the Statements of Assets and Liabilities. Such reclassification, the result of permanent differences between the financial statement and income tax reporting requirements, had no effect on the Fund’s net assets or net asset value per share.
The Funds recognize the tax benefits or expenses of uncertain tax positions only when the position is “more likely than not” to be sustained assuming examination by tax authorities. Management has reviewed the tax positions taken on Federal income tax returns for all open tax years (tax years ended March 31, 2007 through March 31, 2010) of each Fund and has concluded that no provision for unrecognized tax benefits or expenses is required in these financial statements.
THE GOVERNMENT STREET FUNDS NOTES TO FINANCIAL STATEMENTS (Continued) |
2. Investment Transactions
During the year ended March 31, 2010, cost of purchases and proceeds from sales and maturities of investment securities, other than short-term investments and U.S. government securities, totaled $14,263,271 and $14,288,955, respectively, for The Government Street Equity Fund; $4,385,675 and $2,776,428, respectively, for The Government Street Mid-Cap Fund; and $10,786,176 and $8,863,750, respectively, for The Alabama Tax Free Bond Fund.
3. Transactions with Affiliates
INVESTMENT ADVISORY AGREEMENT
The Funds’ investments are managed by Leavell Investment Management, Inc. (the “Adviser”) under the terms of an Investment Advisory Agreement. Under the Investment Advisory Agreement, The Government Street Equity Fund pays the Adviser a fee, which is computed and accrued daily and paid monthly, at an annual rate of .60% of its average daily net assets up to $100 million and .50% of such assets in excess of $100 million. The Government Street Mid-Cap Fund pays the Adviser a fee at an annual rate of .75% of its average daily net assets. The Alabama Tax Free Bond Fund pays the Adviser a fee at an annual rate of .35% of its average daily net assets up to $100 million and .25% of such assets in excess of $100 million.
During the period from August 1, 2009 through January 20, 2010, the Adviser voluntarily undertook to limit the advisory fees it received from The Government Street Mid-Cap Fund to .65% of the Fund’s average daily net assets. Additionally, during the year ended March 31, 2010, the Adviser voluntarily undertook to limit the total operating expenses of The Alabama Tax Free Bond Fund to .65% of the Fund’s average daily net assets. Accordingly, the Adviser waived $13,860 and $28,581, respectively, of its investment advisory fees from The Government Street Mid-Cap Fund and The Alabama Tax Free Bond Fund during the year ended March 31, 2010.
Certain officers of the Trust are also officers of the Adviser.
MUTUAL FUND SERVICES AGREEMENT
Under the terms of a Mutual Fund Services Agreement between the Trust and Ultimus Fund Solutions, LLC (“Ultimus”), Ultimus provides administrative, pricing, accounting, dividend disbursing, shareholder servicing and transfer agent services for the Funds. For these services, Ultimus receives a monthly fee from each Fund at an annual rate of .15% of the Fund’s average daily net assets up to $25 million, .125% of the next $25 million of such assets, and .10% of such assets in excess of $50 million. The minimum monthly fee payable to Ultimus is $4,000 with respect to The Government Street Equity Fund and The Government Street Mid-Cap Fund and $3,500 with respect to The Alabama Tax Free Bond Fund. In addition, each Fund pays out-of-pocket expenses including, but not limited to, postage, supplies and costs of pricing portfo lio securities. Certain officers of the Trust are also officers of Ultimus, or of Ultimus Fund Distributors, LLC (the
THE GOVERNMENT STREET FUNDS NOTES TO FINANCIAL STATEMENTS (Continued) |
“Distributor”), the principal underwriter of each Fund’s shares and an affiliate of Ultimus. The Distributor is compensated by the Adviser (not the Funds) for acting as principal underwriter.
COMPLIANCE CONSULTING AGREEMENT
Under the terms of a Compliance Consulting Agreement between the Trust and Ultimus, Ultimus provides an individual to serve as the Trust’s Chief Compliance Officer and to administer the Funds’ compliance policies and procedures. For these services, the Funds pay Ultimus an annual base fee of $18,600 plus an asset-based fee equal to 0.01% per annum on the Funds’ aggregate net assets in excess of $100 million. In addition, the Funds reimburse Ultimus for reasonable out-of-pocket expenses, if any, incurred in connection with these services.
4. Option Contracts Written
Transactions in option contracts written by The Government Street Equity Fund during the year ended March 31, 2010 were as follows:
| | | Options Contracts | | | Option Premiums | |
| Options outstanding at beginning of year | | | — | | | $ | — | |
| Options written | | | 166 | | | | 12,478 | |
Options outstanding at end of year | | | 166 | | | $ | 12,478 | |
The average monthly notional amount of option contracts during the year ended March 31, 2010 was $172,167 for the Government Street Equity Fund.
No option contracts were written by The Government Street Mid-Cap Fund during the year ended March 31, 2010.
5. Contingencies and Commitments
The Funds indemnify the Trust’s officers and Trustees for certain liabilities that might arise from their performance of their duties to the Funds. Additionally, in the normal course of business the Funds enter into contracts that contain a variety of representations and warranties and which provide general indemnifications. The Funds’ maximum exposure under these arrangements is unknown, as this would involve future claims that may be made against the Funds that have not yet occurred. However, based on experience, the Funds expect the risk of loss to be remote.
THE GOVERNMENT STREET FUNDS NOTES TO FINANCIAL STATEMENTS (Continued) |
6. Subsequent Events
The Funds are required to recognize in the financial statements the effects of all subsequent events that provide additional evidence about conditions that existed as of the date of the Statements of Assets and Liabilities. For non-recognized subsequent events that must be disclosed to keep the financial statements from being misleading, the Funds are required to disclose the nature of the event as well as an estimate of its financial effect, or a statement that such an estimate cannot be made. Management has evaluated subsequent events through the issuance of these financial statements and has noted no such events.
7. Recent Accounting Pronouncement
In January 2010, the Financial Accounting Standards Board (“FASB”) issued Accounting Standards Update (“ASU”) No. 2010-06 “Improving Disclosures about Fair Value Measurements.” ASU No. 2010-06 amends FASB Accounting Standards Codification Topic 820, Fair Value Measurements and Disclosures, to require additional disclosures regarding fair value measurements. Certain disclosures required by ASU No. 2010-06 are effective for interim and annual reporting periods beginning after December 31, 2009 and others for fiscal years beginning after December 15, 2010 and for interim periods within those fiscal years. Management is currently evaluating the impact ASU No. 2010-06 will have on the Funds’ financial statement disclosures.
THE GOVERNMENT STREET FUNDS REPORT OF INDEPENDENT REGISTERED PUBLIC ACCOUNTING FIRM |
The Board of Trustees and Shareholders of
The Government Street Equity Fund,
The Government Street Mid-Cap Fund, and
The Alabama Tax-Free Bond Fund of the Williamsburg Investment Trust
We have audited the accompanying statements of assets and liabilities, including the schedules of investments, of The Government Street Equity Fund, The Government Street Mid-Cap Fund, and The Alabama Tax-Free Bond Fund (the “Funds”) (each a series of the Williamsburg Investment Trust), as of March 31, 2010, and the related statements of operations for the year then ended, the statements of changes in net assets for each of the two years in the period then ended, and the financial highlights for each of the five years in the period then ended. These financial statements and financial highlights are the responsibility of the Funds’ management. Our responsibility is to express an opinion on these financial statements and financial highlights based on our audits.
We conducted our audits in accordance with the standards of the Public Company Accounting Oversight Board (United States). Those standards require that we plan and perform the audits to obtain reasonable assurance about whether the financial statements and financial highlights are free of material misstatement. We were not engaged to perform an audit of the Funds’ internal control over financial reporting. Our audits included consideration of internal control over financial reporting as a basis for designing audit procedures that are appropriate in the circumstances, but not for the purpose of expressing an opinion on the effectiveness of the Funds’ internal control over financial reporting. Accordingly, we express no such opinion. An audit also includes examining, on a test basis, evidence supporting the amounts and disclo sures in the financial statements and financial highlights, assessing the accounting principles used and significant estimates made by management, and evaluating the overall financial statement presentation. Our procedures included confirmation of securities owned as of March 31, 2010, by correspondence with the custodian and brokers. We believe that our audits provide a reasonable basis for our opinion.
In our opinion, the financial statements and financial highlights referred to above present fairly, in all material respects, the financial position of The Government Street Equity Fund, The Government Street Mid-Cap Fund and The Alabama Tax-Free Bond Fund at March 31, 2010, the results of their operations for the year then ended, the changes in their net assets for each of the two years in the period then ended, and the financial highlights for each of the five years in the period then ended, in conformity with U.S. generally accepted accounting principles.
Cincinnati, Ohio
May 27, 2010
THE GOVERNMENT STREET FUNDS ABOUT YOUR FUNDS’ EXPENSES (Unaudited) |
We believe it is important for you to understand the impact of costs on your investment. All mutual funds have operating expenses. As a shareholder of the Funds, you incur ongoing costs, including management fees and other expenses. These ongoing costs, which are deducted from each Fund’s gross income, directly reduce the investment returns of the Funds.
A mutual fund’s ongoing costs are expressed as a percentage of its average net assets. This figure is known as the expense ratio. The following examples are intended to help you understand the ongoing costs (in dollars) of investing in the Funds and to compare these costs with the ongoing costs of investing in other mutual funds. The examples below are based on an investment of $1,000 made at the beginning of the period shown and held for the entire period (October 1, 2009 through March 31, 2010).
The table below illustrates each Fund’s ongoing costs in two ways:
Actual fund return – This section helps you to estimate the actual expenses that you paid over the period. The “Ending Account Value” shown is derived from each Fund’s actual return, and the third column shows the dollar amount of operating expenses that would have been paid by an investor who started with $1,000 in the Funds. You may use the information here, together with the amount you invested, to estimate the expenses that you paid over the period.
To do so, simply divide your account value by $1,000 (for example, an $8,600 account value divided by $1,000 = 8.6), then multiply the result by the number given for the Funds under the heading “Expenses Paid During Period.”
Hypothetical 5% return – This section is intended to help you compare the Funds’ ongoing costs with those of other mutual funds. It assumes that each Fund had an annual return of 5% before expenses during the period shown, but that the expense ratio is unchanged. In this case, because the returns used are not the Funds’ actual returns, the results do not apply to your investment. The example is useful in making comparisons because the Securities and Exchange Commission (the “SEC”) requires all mutual funds to calculate expenses based on a 5% return. You can assess each Fund’s ongoing costs by comparing this hypothetical example with the hypothetical examples that appear in shareholder reports of other funds.
Note that expenses shown in the table are meant to highlight and help you compare ongoing costs only. The Funds do not charge sales loads or redemption fees.
The calculations assume no shares were bought or sold during the period. Your actual costs may have been higher or lower, depending on the amount of your investment and the timing of any purchases or redemptions.
THE GOVERNMENT STREET FUNDS ABOUT YOUR FUNDS’ EXPENSES (Unaudited) (Continued) |
More information about the Funds’ expenses, including historical expense ratios, can be found in this report. For additional information on operating expenses and other shareholder costs, please refer to the Funds’ prospectus.
| | Beginning Account Value October 1, 2009 | Ending Account Value March 31, 2010 | Expenses Paid During Period* |
| The Government Street Equity Fund |
Based on Actual Fund Return | $1,000.00 | $1,131.70 | $4.78 |
| Based on Hypothetical 5% Return (before expenses) | $1,000.00 | $1,020.44 | $4.53 |
| The Government Street Mid-Cap Fund |
Based on Actual Fund Return | $1,000.00 | $1,142.40 | $5.72 |
| Based on Hypothetical 5% Return (before expenses) | $1,000.00 | $1,019.60 | $5.39 |
| The Alabama Tax Free Bond Fund |
Based on Actual Fund Return | $1,000.00 | $1,003.80 | $3.25 |
| Based on Hypothetical 5% Return (before expenses) | $1,000.00 | $1,021.69 | $3.28 |
| * | Expenses are equal to the Funds’ annualized expense ratios for the period as stated below, multiplied by the average account value over the period, multiplied by 182/365 (to reflect the one-half year period). |
| The Government Street Equity Fund | 0.90% |
| The Government Street Mid-Cap Fund | 1.07% |
| The Alabama Tax Free Bond Fund | 0.65% |
THE GOVERNMENT STREET FUNDS BOARD OF TRUSTEES AND EXECUTIVE OFFICERS (Unaudited) |
Overall responsibility for management of the Funds rests with the Board of Trustees. The Trustees serve during the lifetime of the Trust and until its termination, or until death, resignation, retirement or removal. The Trustees, in turn, elect the officers of the Funds. The officers have been elected for an annual term. The following are the Trustees and executive officers of the Funds:
| Trustee | Address | Age | Position Held with the Trust | Length of Time Served |
| * | Charles M. Caravati, Jr. | 931 Broad Street Road Manakin-Sabot, VA | 73 | Chairman and Trustee | Since June 1991 |
| * | Austin Brockenbrough III | 1802 Bayberry Court, Suite 400 Richmond, VA | 73 | Trustee | Since September 1988 |
| * | John T. Bruce | 800 Main Street Lynchburg, VA | 56 | Trustee | Since September 1988 |
| | Robert S. Harris | 100 Darden Boulevard Charlottesville, VA | 60 | Trustee | Since January 2007 |
| | J. Finley Lee, Jr. | 448 Pond Apple Drive North Naples, FL | 70 | Trustee | Since September 1988 |
| | Richard L. Morrill | University of Richmond Richmond, VA | 70 | Trustee | Since March 1993 |
| | Harris V. Morrissette | 100 Jacintoport Boulevard Saraland, AL | 50 | Trustee | Since March 1993 |
| | Samuel B. Witt III | 302 Clovelly Road Richmond, VA | 74 | Trustee | Since November 1988 |
| | Thomas W. Leavell | P.O. Box 1307 Mobile, AL | 66 | President | Since February 2004 |
| | Mary Shannon Hope | P.O. Box 1307 Mobile, AL | 46 | Vice President | Since August 2008 |
| | Timothy S. Healey | 600 Luckie Drive Suite 305 Birmingham, AL | 57 | Vice President of The Government Street Mid-Cap Fund and The Alabama Tax Free Bond Fund | Since January 1995 |
| | Robert G. Dorsey | 225 Pictoria Drive, Suite 450 Cincinnati, OH | 53 | Vice President | Since November 2000 |
| | Mark J. Seger | 225 Pictoria Drive, Suite 450 Cincinnati, OH | 48 | Treasurer | Since November 2000 |
| | John F. Splain | 225 Pictoria Drive, Suite 450 Cincinnati, OH | 53 | Secretary | Since November 2000 |
| | Tina H. Bloom | 225 Pictoria Drive, Suite 450 Cincinnati, OH | 41 | Chief Compliance Officer | Since August 2006 |
| * | Messrs. Bruce, Brockenbrough and Caravati are “interested persons” of the Trust within the meaning of Section 2(a)(19) of the Investment Company Act of 1940. Messrs. Bruce and Brockenbrough are “interested persons” of the Trust by virtue of their affiliation with investment advisers to other series of the Trust. Charles M. Caravati, Jr. is the father of Charles M. Caravati III, an officer of The Jamestown Funds, which are other series of the Trust. |
THE GOVERNMENT STREET FUNDS BOARD OF TRUSTEES AND EXECUTIVE OFFICERS (Unaudited) (Continued) |
Each Trustee oversees nine portfolios of the Trust, including the Funds. The principal occupations of the Trustees and executive officers of the Funds during the past five years and public directorships held by the Trustees are set forth below:
Charles M. Caravati, Jr. is a retired physician. He is also the retired President of Dermatology Associates of Virginia, P.C.
Austin Brockenbrough III is President and Managing Director of Lowe, Brockenbrough & Company, Inc. (an investment advisory firm). He is a member of the Board of Directors of Tredegar Corporation (a plastics manufacturer) and Wilkinson O’Grady & Co., Inc. (a global asset manager).
John T. Bruce is a Principal of Flippin, Bruce & Porter, Inc. (an investment advisory firm).
Robert S. Harris is the C. Stewart Sheppard Professor of Business Administration at The Darden Graduate School of Business Administration at the University of Virginia. He was previously the dean at Darden. Professor Harris has published widely on corporate finance, financial markets and mergers and acquisitions and has served as a consultant to corporations and government agencies.
J. Finley Lee, Jr. is a financial consultant and the Julian Price Professor Emeritus at the University of North Carolina.
Richard L. Morrill serves as President of the Teagle Foundation (charitable foundation) and Chancellor of the University of Richmond. He is also a member of the Board of Directors of Tredegar Corporation and Albemarle Corporation (specialty chemical manufacturer).
Harris V. Morrissette is President of China Doll Rice and Beans Inc. and Dixie Lily Foods. He is a member of the Board of Directors of BancTrust Financial Group, Inc. (a bank holding company). In addition, he is Chairman of Azalea Aviation, Inc. (an airplane fueling company).
Samuel B.Witt III is the retired Senior Vice President and General Counsel of Stateside Associates, Inc. He is also a member of the Board of Directors of The Swiss Helvetia Fund, Inc. (a closed-end investment company).
Thomas W. Leavell is a Principal of the Adviser.
Mary Shannon Hope is a Principal of the Adviser.
Timothy S. Healey is a Principal of the Adviser.
THE GOVERNMENT STREET FUNDS BOARD OF TRUSTEES AND EXECUTIVE OFFICERS (Unaudited) (Continued) |
Robert G. Dorsey is a Managing Director of Ultimus Fund Solutions, LLC and Ultimus Fund Distributors, LLC.
Mark J. Seger is a Managing Director of Ultimus Fund Solutions, LLC and Ultimus Fund Distributors, LLC.
John F. Splain is a Managing Director of Ultimus Fund Solutions, LLC and Ultimus Fund Distributors, LLC.
Tina H. Bloom is Vice President of Administration of Ultimus Fund Solutions, LLC and Ultimus Fund Distributors, LLC.
Additional information about members of the Board of Trustees and executive officers is available in the Statement of Additional Information (“SAI”). To obtain a free copy of the SAI, please call 1-800-281-3217.
FEDERAL TAX INFORMATION (Unaudited) |
In accordance with federal tax requirements, the following provides shareholders with information concerning distributions from ordinary income and net realized gains made by the Funds during the fiscal year ended March 31, 2010. Certain dividends paid by the Funds may be subject to a maximum tax rate of 15%, as provided by the Jobs and Growth Tax Relief Reconciliation Act of 2003. The Government Street Equity Fund and The Government Street Mid-Cap Fund intend to designate up to a maximum amount of $566,303 and $119,980, respectively, as taxed at a maximum rate of 15%. Additionally, The Alabama Tax Free Bond Fund intends to designate $1,999 as a long-term capital gain distribution. For the fiscal year ended March 31, 2010, 100% of the dividends paid from ordinary income by The Government Street Equity Fund and The Government Street Mid - -Cap Fund qualified for the dividends received deduction for corporations.
As required by federal regulations, complete information will be computed and reported in conjunction with your 2010 Form 1099-DIV.
THE GOVERNMENT STREET FUNDS OTHER INFORMATION (Unaudited) |
A description of the policies and procedures that the Funds use to vote proxies relating to portfolio securities is available without charge upon request by calling toll-free 1-866-738-1125, or on the SEC’s website at http://www.sec.gov. Information regarding how the Funds voted proxies relating to portfolio securities during the most recent 12-month period ended June 30 is also available without charge upon request by calling toll-free 1-866-738-1125 or on the SEC’s website at http://www.sec.gov.
The Trust files a complete listing of portfolio holdings for the Funds with the SEC as of the end of the first and third quarters of each fiscal year on Form N-Q. The filings are available upon request, by calling 1-866-738-1125. Furthermore, you may obtain a copy of these filings on the SEC’s website at http://www.sec.gov. The Trust’s Forms N-Q may also be reviewed and copied at the SEC’s Public Reference Room in Washington, DC, and information on the operation of the Public Reference Room may be obtained by calling 1-800-SEC-0330.
THE GOVERNMENT STREET FUNDS DISCLOSURE REGARDING APPROVAL OF INVESTMENT ADVISORY AGREEMENTS (Unaudited) |
At an in-person meeting held on February 9, 2010, the Board of Trustees, including a majority of the Independent Trustees, approved the continuance for a one-year period of the Investment Advisory Agreements with the Adviser on behalf of The Government Street Equity Fund, The Government Street Mid-Cap Fund and The Alabama Tax Free Bond Fund. Below is a discussion of the factors considered by the Board of Trustees along with the conclusions with respect thereto that formed the basis for the Board’s approvals.
In selecting the Adviser and approving the continuance of the Investment Advisory Agreements, the Trustees considered all information they deemed reasonably necessary to evaluate the terms of the Agreements. The principal areas of review by the Trustees were the nature, extent and quality of the services provided by the Adviser and the reasonableness of the fees charged for those services. These matters were considered by the Independent Trustees consulting with experienced counsel for the Independent Trustees, who is independent of the Adviser.
The Trustees’ evaluation of the quality of the Adviser’s services took into account their knowledge and experience gained through meetings with and reports of the Adviser’s senior management over the course of the preceding year. Both short-term and long-term investment performance of the Funds was considered. Each Fund’s performance was compared to its performance benchmark and to that of competitive funds with similar investment objectives. The Trustees also considered the scope and quality of the in-house capabilities of the Adviser and other resources dedicated to performing services for the Funds. The quality of administrative and other services, including the Adviser’s role in coordinating the activities of the Funds’ other service providers, were considered in light of the Funds’ complia nce with investment policies and applicable laws and regulations and of related reports by management and the Funds’ independent public accounting firm in periodic meetings with the Trust’s Audit Committee. The Trustees also considered the business reputation of the Adviser, the qualifications of its key investment and compliance personnel, and its financial resources.
In reviewing the fees payable under the Investment Advisory Agreements, the Trustees compared the advisory fees and overall expense levels of each Fund with those of competitive funds with similar investment objectives. The Trustees considered information provided by the Adviser concerning the Adviser’s profitability with respect to each Fund, including the assumptions and methodology used in preparing the profitability information, in light of applicable case law relating to advisory fees. For these purposes, the Trustees took into account not only the fees paid by the Funds, but also so-called “fallout” benefits to the Adviser. The Trustees also considered the Adviser’s representations that all of the Funds’ portfolio trades were executed based on the best price and execution available, and that the Advi ser does not participate in any soft dollar or directed brokerage arrangements. The Trustees further considered that neither the Funds nor the Adviser participate in any revenue sharing arrangements on behalf of the Funds. In
THE GOVERNMENT STREET FUNDS DISCLOSURE REGARDING APPROVAL OF INVESTMENT ADVISORY AGREEMENTS (Unaudited) (Continued) |
evaluating the Funds’ advisory fees, the Trustees took into account the complexity and quality of the investment management of the Funds.
Based upon their review of this information, the Independent Trustees concluded that: (i) based upon the performance of The Government Street Equity Fund during 2009, which exceeded the return of the S&P 500 Index, as well as the longer term performance of the Fund, the Adviser has provided quality services to the Fund; (ii) although the performance of The Government Street Mid-Cap Fund during 2009 lagged the returns of the S&P MidCap 400 Index and the average of its Lipper peer group, such Fund’s longer term performance has been very good, outperforming each of those benchmarks over the 3 years and 5 years ended December 31, 2009 and earning a 5-star overall rating from Morningstar, Inc.; (iii) although the short-term and long-term performance of The Alabama Tax Free Bond Fund has lagged its benchmark index and the avera ge returns for comparably managed funds, the Fund is managed in a conservative investment style and is not managed to correlate to any particular index, and the Independent Trustees believe that the Fund has satisfactorily met the goal of providing tax-exempt income with limited exposure to credit and maturity risks; (iv) the investment advisory fees payable to the Adviser by each Fund are competitive with similarly managed funds, and the Independent Trustees believe the fees to be reasonable given the scope and quality of investment advisory services provided by the Adviser and other services provided to the shareholders; (v) the total operating expense ratio of each Fund is less than the average expense ratio for comparably managed funds, according to statistics derived from Morningstar, Inc.; and (vi) the Adviser’s voluntary commitment to cap overall operating expenses of The Alabama Tax Free Bond Fund through advisory fee waivers has enabled that Fund to further increase returns for shareholders. T he Board noted that the Adviser’s profitability analysis indicated that the Adviser did not derive any profits from its management of the Funds over the past year. Given the current size of the Funds and their expected growth, the Independent Trustees did not believe that at the present time it would be relevant to consider the extent to which economies of scale would be realized as the Funds grow, and whether fee levels reflect these economies of scale. The Independent Trustees also considered the “fallout” benefits to the Adviser with respect to the Funds, but given the amounts involved viewed these as secondary factors in connection with the evaluation of the reasonableness of the advisory fees paid by the Funds.
No single factor was considered in isolation or to be determinative to the decision of the Trustees to approve continuance of the Investment Advisory Agreements. Rather the Trustees concluded, in light of a weighing and balancing of all factors considered, that it was in the best interests of each Fund and its shareholders to continue its Investment Advisory Agreement without modification to its terms, including the fees charged for services thereunder.
| | | | |
| | | | | |
| | | The Government Street Funds
No Load Mutual Funds Investment Adviser Leavell Investment Management, Inc. Post Office Box 1307 Mobile, AL 36633 Administrator Ultimus Fund Solutions, LLC P.O. Box 46707 Cincinnati, OH 45246-0707 1-866-738-1125 Legal Counsel Sullivan & Worcester LLP One Post Office Square Boston, MA 02109 Independent Registered Public Accounting Firm Ernst & Young LLP 1900 Scripps Center 312 Walnut Street Cincinnati, OH 45202 Board of Trustees Austin Brockenbrough, III John T. Bruce Charles M. Caravati, Jr. Robert S. Harris J. Finley Lee, Jr. Richard L. Morrill Harris V. Morrissette Samuel B. Witt, III Portfolio Managers Thomas W. Leavell, The Government Street Equity Fund The Government Street Mid-Cap Fund Timothy S. Healey, The Government Street Mid-Cap Fund The Alabama Tax Free Bond Fund Richard E. Anthony, Jr., CFA, The Government Street Mid-Cap Fund Michael J. Hofto, CFA, The Government Street Mid-Cap Fund | | |
| | | | | |
| | | | |
| | | | |
| | | | | |
| | | THE JAMESTOWN FUNDS No-Load Funds The Jamestown Balanced Fund The Jamestown Equity Fund The Jamestown Tax Exempt Virginia Fund ANNUAL REPORT March 31, 2010 Investment Adviser Lowe, Brockenbrough & Company, Inc. Richmond, Virginia | | |
| | | | | |
| | | | |
| LETTER TO SHAREHOLDERS | May 13, 2010 |
The Jamestown Balanced Fund
For the fiscal year ended March 31, 2010, The Jamestown Balanced Fund returned 22.56% versus a return of 49.77% for the S&P 500 Index and a return of 31.42% for a blend of 60% S&P 500 Index / 40% Barclays Capital U.S. Intermediate Government/Credit Bond Index. The underperformance relative to the 60/40% blended benchmark was primarily attributable to stock selection in the equity portion of the Fund. Our equity strategy focuses on owning high quality companies with attractive earnings characteristics that trade at reasonable valuation. While these types of stocks did not keep up with the market advance during the past twelve months, they served the Fund well in the previous two years. Despite the relative underperformance over the past 12 months, The Jamestown Balanced Fund is flat over the previous 3 years compared to an annua lized return of -4.17% for the S&P 500 Index and an annualized return of 0.40% for the blend of 60% S&P 500 Index / 40% Barclays Capital U.S. Intermediate Government/Credit Bond Index.
During the past 12 months, stock selection within three of the more cyclical sectors of the S&P 500 Index detracted from relative performance: Consumer Discretionary, Financials, and Information Technology. In the Consumer Discretionary sector, performance was hurt by positions in GameStop and The Apollo Group. Underperforming stocks in the Financials sector included Northern Trust, AON Corporation, and Travelers, all of which failed to keep pace with the massive rally in the sector. In the Information Technology sector the rebound was also led by some of the more cyclical stocks and our holdings in QUALCOMM, Symantec, and IBM lagged. Energy was the sector in which stock selection added to relative performance, with boosts from holdings in Noble Corporation, Transocean, and Apache.
The Federal Reserve maintained its accommodative monetary policy and kept short-term interest rates near zero percent as the U.S. economy began to emerge from the deep and protracted recession. As a result, credit markets rebounded impressively during the past 12 months after suffering severe stress the prior year. The flight-to-quality that exemplified the risk aversion during the financial crisis was largely unwound, causing prices on U.S. Treasury debt to drop as investors moved into higher yielding spread product. Demand for higher yielding, riskier bonds surged, and fixed income mutual funds experienced record inflows. Thus the divergence in bond sector performance was essentially the inverse of the prior 12 months, as corporate bonds vastly outperformed government bonds for the year ended March 31, 2010.
The fixed income portion of the portfolio posted a return of 5.97% compared to 6.92% for the Barclays Capital U.S. Intermediate Government/Credit Bond Index during the fiscal year ended March 31, 2010. The Fund’s sector strategy added value throughout the year with a large overweight in corporate bonds and underweight in government bonds. The Fund’s corporate bonds posted a total return of 9.6% versus a return of 0.5% for the Fund’s government bonds and 5.1% for the Fund’s mortgage-backed securities. Yet the performance did not keep pace with the 21.6% return of intermediate corporate bonds in the benchmark, which was led by intermediate bonds of financial institutions, with a 29.6% return for the
12 months. Simply put, the Fund lacked exposure to the most distressed corporate credits, especially financial credits that recovered the most after suffering severe price declines in the prior year. This was most evident during the first six months of the fiscal year when the fixed income portfolio trailed the benchmark by about 100 basis points; fixed income performance was slightly ahead of the benchmark during the second half of the fiscal year. We note that the Fund’s bias to higher quality credits served shareholders well over the previous three years, with the fixed income portion of the Fund returning 6.86% as compared to 5.88% for the Barclays Intermediate Government/Credit Bond Index.
Duration strategy has been defensive, with the Fund’s duration shorter than that of the benchmark throughout the fiscal year, in anticipation of higher yields as the economic recovery unfolds. We were correct in predicting the direction of government bond yields, which did indeed move higher during the year, resulting in negative returns for Treasury notes with maturities of 5 years and longer. Yet the defensive duration stance contributed to the underperformance within the corporate bond holdings because the sector duration was significantly shorter than that of the corporate bonds in the index. Consequently, the Fund’s corporate bonds did not gain as much as those in the index during the rally in corporate credit.
As of March 31, 2010, the Fund had 1.0% in cash, 31.1% in fixed income, and 67.9% in equities. We continue to see more value in equities than fixed income, although given optimistic short-term sentiment levels, the equity market may be due for a pause.
The equity portion of the Fund emphasizes companies with strong earnings growth characteristics and attractive valuations. The Fund is most overweight in the Consumer Discretionary and Information Technology sectors. Telecommunications and Utilities are the largest sector underweights in the portfolio.
The domestic economic recovery is gaining momentum, but will likely remain sluggish, with higher unemployment persisting in 2010. Inventory rebuilding should continue to contribute to near term economic growth. Corporate profits continue to surprise on the upside as revenue growth materializes. Consumer spending is expected to grow, but will remain muted relative to past recoveries.
Equities remain reasonably valued at about 15X estimated 2010 earnings. They have historically traded closer to 18X earnings, on average, in interest rate and inflation environments similar to what we are experiencing today. However, given macroeconomic headwinds, we believe a lower multiple is appropriate, with further market gains more dependent on earnings growth. On this front, the picture currently looks bright, as earnings estimates continue to increase. While interest rates have risen lately, the interest rate and credit market environment are still supportive of equities. The exception would be spreads on bonds in some of the smaller European countries, where concerns over budget deficits, particularly in Greece, have roiled markets. This will be a key area to monitor closely as governments across developed economies begin to c ut back on fiscal support to focus on containing budget deficits. Short term sentiment has become fairly optimistic, suggesting that equities could be due for a pause. Longer term sentiment measures are still favoring equities – since March 2009, almost $350 billion of new money has flowed into bond funds while only $24 billion has gone into equity funds.
The Jamestown Equity Fund
For the fiscal year ended March 31, 2010, The Jamestown Equity Fund rose 33.96% versus a return of 49.77% for the S&P 500 Index. The primary drag on the Fund relative to the S&P 500 Index was stock selection in the portfolio. Our equity strategy focuses on owning high quality companies with attractive earnings characteristics that trade at reasonable valuation. While these types of stocks did not keep up with the market in the past twelve months, they served the Fund well in the previous two years. Despite the relative underperformance over the past 12 months, over the three year period The Jamestown Equity Fund has returned -3.54% as compared to a -4.17% return for the S&P 500 Index.
Over the past twelve months, we have witnessed one of the most significant equity market turnarounds in history. While the Fund delivered solid absolute performance during this fiscal year, the results lagged our benchmarks, particularly in the second and third quarter of 2009. The equity market’s sharp recovery was led by companies with declining and depressed earnings, high relative valuations, and lower financial quality. Our equity process focuses on investing in companies that exhibit attractive, consistent earnings characteristics, sound financials, and reasonable valuations. Over longer periods of time, this combination of factors has been a consistently positive contributor to stock selection. In fact, during the period leading up to and including the financial crisis, the Fund nicely outperformed its benchmark. Despite t he last year’s highly unusual market dynamics, we are confident that market prices will ultimately respond to favorable earnings characteristics and attractive valuations, as they have typically done in past market cycles.
During the past 12 months, stock selection in the Fund was a drag on relative performance primarily due to the performance in three of the more cyclical sectors in the S&P 500 Index. Stock selection in the Consumer Discretionary, Financials, and Information Technology sectors struggled during the fiscal year ended March 31, 2010. In the Consumer Discretionary sector, performance was hurt by positions in GameStop and The Apollo Group. Underperforming stocks in the Financials sector included Northern Trust, AON Corporation, and Travelers, which all failed to keep pace with the massive rally in the sector. In the Information Technology sector, the rebound was also led by some of the more cyclical stocks and our holdings in QUALCOMM, Symantec, and IBM failed to keep pace. Energy was the sector where we experienced the best stock select ion, with above sector performance turned in by Noble Corporation, Transocean, and Apache.
The Fund emphasizes companies with strong earnings growth characteristics and attractive valuations. The Fund is most overweight in the Consumer Discretionary and Information Technology sectors. Telecommunications and Utilities are the largest sector underweights in the portfolio.
The domestic economic recovery is gaining momentum, but will likely remain sluggish, with higher unemployment persisting in 2010. Inventory rebuilding should continue to contribute to near term economic growth. Corporate profits continue to surprise on the upside as revenue growth materializes. Consumer spending is expected to grow, but will remain muted relative to past recoveries.
Equities remain reasonably valued at about 15X estimated 2010 earnings. They have historically traded closer to 18X earnings, on average, in interest rate and inflation environments similar to what we are experiencing today. However, given macroeconomic headwinds, we believe a lower multiple is appropriate, with further market gains more dependent on earnings growth. On this front, the picture currently looks bright, as earnings estimates continue to increase. While interest rates have risen lately, the interest rate and credit market environment are still supportive of equities. The exception would be spreads on bonds in some of the smaller European countries, where concerns over budget deficits, particularly in Greece, have roiled markets. This will be a key area to monitor closely as governments across developed economies begin to c ut back on fiscal support to focus on containing budget deficits. Short term sentiment has become fairly optimistic, suggesting that equities could be due for a pause. Longer term sentiment measures are still favoring equities – since March 2009, almost $350 billion of new money has flowed into bond funds while only $24 billion has gone into equity funds.
The Jamestown Tax Exempt Virginia Fund
For the fiscal year ended March 31, 2010, The Jamestown Tax Exempt Virginia Fund earned a total return of 4.04%, compared to 5.91% for the Barclays Capital 5-year Municipal Bond Index. As of March 31, 2010, the portfolio had an average stated maturity of 6.2 years, an expected average life of 4.8 years and an average effective duration of 4.7 years. As of March 31, 2010, the Fund’s SEC 30-day yield was 2.19%, which results in a tax equivalent yield of 3.37% for investors in the 35% federal tax bracket. The Fund held no issues subject to Alternative Minimum Tax during the fiscal year.
The Federal Reserve maintained its accommodative monetary policy and kept short-term interest rates near zero percent as the U.S. economy began to emerge from the deep and protracted recession. As a result, credit markets rebounded impressively during the past 12 months after suffering severe stress the prior year. Yields on municipal, corporate and high yield bonds declined as bond prices recovered from distressed levels. The flight-to-quality that exemplified the risk aversion during the financial crisis was largely unwound, causing prices on U.S. Treasury debt to drop as investors moved into higher yielding spread product. Demand for tax-exempt bonds surged, and the market was buoyed by record inflows into tax-exempt bond mutual funds. Demand also benefited from anticipation of higher federal income tax rates starting in 2011. Munic ipal bonds posted significantly greater returns than U.S. Treasury debt during the fiscal year.
Performance attribution shows that net coupon income generated by the Fund’s holdings contributed about 3.1% while appreciation in the Fund’s net asset value added about 0.9% to the total return. Factors that materially affected the Fund’s performance included a modest decline in market yields for tax-exempt bonds and the narrowing of quality spreads. To illustrate, the representative yield-to-maturity of a “AAA” rated general obligation bond with a 5-year maturity moved from 2.07% on March 31, 2009 to 1.77% on March 31, 2010. With a steep yield curve, bonds also benefit from “roll down” as the passage of time allows bonds to reprice to lower yields as the maturity shortens. The narrowing of quality spreads can be shown by the yield difference in “A” rated
general obligations versus stronger “AAA” rated obligations. For a 5-year maturity, the quality spread tightened by 93 basis points, resulting in additional price appreciation for lower quality credits. “AA” rated credits did not enjoy the same degree of spread tightening as did “A” and lower rated credits.
The Fund’s conservative strategy allowed it to participate in the municipal market rally of 2009 while continuing to be mindful of taking excessive risk. The Fund’s relative underperformance vis-à-vis its benchmark can be primarily attributed to its intermediate maturity structure and its emphasis on high credit quality. The municipal yield curve experienced a bull flattening during the fiscal year, with yields on long maturities declining far more than yields on short and intermediate maturities. The increased issuance of Build America Bonds (taxable to investors) has curtailed the supply of longer maturity tax-exempt bonds, thus helping support prices for tax-exempt paper in the long-end of the yield curve. With greater price sensitivity to changes in interest rates, longer maturity bonds thus enjoyed greater increas es in market value than shorter maturities. Funds that were positioned in intermediate maturities generally lagged the performance of funds that concentrate on long maturities.
Similarly, investors demonstrated renewed appetite for credit risk and bid up prices for lower quality bonds that had been under severe stress in 2008 and early 2009. Returns on higher quality bonds generally trailed the performance of lower quality issues that recovered more in price as investors reached for extra income. Because Virginia is considered a high quality state in the municipal market, its paper tends to trade at lower yields than that of some other states. The Fund’s relative performance lagged that of other tax-exempt bond funds that devote greater amounts to lower tier credits and/or have exposure to states with higher yielding bonds.
Municipal credit quality continues to be challenged by tax revenue shortfalls; diligence on credit risk remains an essential element of our strategy. Yet state and local governments are generally responding as they must by cutting spending and seeking new sources of revenue. Assistance from the federal government helped ease the budgetary stress over the last year, and some jurisdictions are starting to see the first increases in cyclical tax revenue as the economic recovery begins.
 |  |
Charles M. Caravati, III, CFA President Jamestown Balanced Fund Jamestown Equity Fund | Joseph A. Jennings, III, CFA President Jamestown Tax Exempt Virginia Fund |
Data presented reflects past performance, which is no guarantee of future results. Investment results and principal value will fluctuate so that shares, when redeemed, may be worth more or less than their original cost. Due to market volatility, current performance may be higher or lower than the performance shown.
This report is submitted for the general information of the shareholders of the Funds. The report is not authorized for distribution to prospective investors in the Funds unless it is accompanied by a current prospectus.
This report reflects our views, opinions and portfolio holdings as of March 31, 2010, the end of the reporting period. These views are subject to change at any time based upon market or other conditions. For more current information throughout the year please visit www.jamestownfunds.com. The Funds are distributed by Ultimus Fund Distributors, LLC.
THE JAMESTOWN BALANCED FUND PERFORMANCE INFORMATION (Unaudited) |
| | Average Annual Total Returns(a) (for periods ended March 31, 2010) |
| | 1 Year | 5 Years | 10 Years |
| The Jamestown Balanced Fund | 22.56% | 3.07% | 0.90% |
| Standard & Poor’s 500 Index | 49.77% | 1.92% | -0.65% |
| 60% S&P 500 Index / 40% Barclays Capital U.S. Intermediate Government/Credit Bond Index | 31.42% | 3.64% | 2.43% |
| (a) | Total return is a measure of the change in value of an investment in the Fund over the periods covered, which assumes any dividends or capital gains distributions are reinvested in shares of the Fund. Returns shown do not reflect the deduction of taxes a shareholder would pay on Fund distributions or the redemption of Fund shares. |
THE JAMESTOWN EQUITY FUND PERFORMANCE INFORMATION (Unaudited) |
| | Average Annual Total Returns(a) (for periods ended March 31, 2010) |
| | 1 Year | 5 Years | 10 Years |
| The Jamestown Equity Fund | 33.96% | 1.57% | -1.71% |
| Standard & Poor’s 500 Index | 49.77% | 1.92% | -0.65% |
| (a) | Total return is a measure of the change in value of an investment in the Fund over the periods covered, which assumes any dividends or capital gains distributions are reinvested in shares of the Fund. Returns shown do not reflect the deduction of taxes a shareholder would pay on Fund distributions or the redemption of Fund shares. |
THE JAMESTOWN TAX EXEMPT VIRGINIA FUND PERFORMANCE INFORMATION (Unaudited) |
| | Average Annual Total Returns(a) (for periods ended March 31, 2010) |
| | 1 Year | 5 Years | 10 Years |
| The Jamestown Tax Exempt Virginia Fund | 4.04% | 3.71% | 4.23% |
| Barclays Capital 5-Year Municipal Bond Index | 5.91% | 4.90% | 5.19% |
| Lipper Intermediate Municipal Fund Index | 8.58% | 3.90% | 4.57% |
| Barclays Capital Municipal Bond Index | 9.69% | 4.58% | 5.58% |
| (a) | Total return is a measure of the change in value of an investment in the Fund over the periods covered, which assumes any dividends or capital gains distributions are reinvested in shares of the Fund. Returns shown do not reflect the deduction of taxes a shareholder would pay on Fund distributions or the redemption of Fund shares. |
| | |
| * | The Barclays Capital 5-Year Municipal Bond Index is an unmanaged index generally representative of 5-year tax-exempt bonds. Because the Fund is typically classified as an intermediate-term fund (with an average duration of between 2 and 10 years), this Index is believed to be the most appropriate broad-based securities market index against which to compare the Fund’s performance. |
THE JAMESTOWN BALANCED FUND PORTFOLIO INFORMATION MARCH 31, 2010 (Unaudited) |
| Asset Allocation (% of Net Assets) | | Ten Largest Equity Holdings | % of Net Assets |
 | | Cisco Systems, Inc. | 1.6% |
| | United Technologies Corporation | 1.6% |
| | Dollar Tree, Inc. | 1.5% |
| | General Dynamics Corporation | 1.5% |
| | Microsoft Corporation | 1.5% |
| | Express Scripts, Inc. | 1.5% |
| | Home Depot, Inc. (The) | 1.5% |
| | Norfolk Southern Corporation | 1.5% |
| | Intel Corporation | 1.5% |
| | Teva Pharmaceutical Industries Ltd. - ADR | 1.5% |
| Equity Sector Concentration vs. the S&P 500 Index (68.3%of Net Assets) |
| Fixed-Income Portfolio ( 30.9% of Net Assets) | | Credit Quality | % of Fixed Income Portfolio |
| Average Stated Maturity (Years) | 3.76 | | AAA | 38.1% |
| Average Duration (Years) | 3.23 | | A | 49.3% |
| Average Coupon | 5.54% | | BBB | 12.6% |
| Average Yield to Maturity | 2.68% | | | |
| | | | | |
| Sector Breakdown | % of Fixed Income Portfolio | | | |
| U.S. Treasury Obligations | 11.7% | | | |
| U.S. Government Agency Obligations | 8.1% | | | |
| Mortgage-Backed Securities | 18.3% | | | |
| Corporate Bonds | 61.9% | | | |
THE JAMESTOWN EQUITY FUND PORTFOLIO INFORMATION MARCH 31, 2010 (Unaudited) |
| Asset Allocation (% of Net Assets) | | Ten Largest Equity Holdings | % of Net Assets |
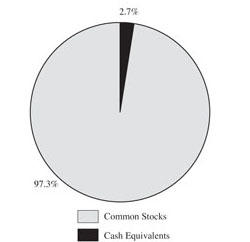 | | Cisco Systems, Inc. | 2.3% |
| | Teva Pharmaceutical Industries Ltd. - ADR | 2.2% |
| | United Technologies Corporation | 2.2% |
| | Dollar Tree, Inc. | 2.2% |
| | Express Scripts, Inc. | 2.2% |
| | General Dynamics Corporation | 2.2% |
| | PepsiCo, Inc. | 2.2% |
| | Accenture plc - Class A | 2.2% |
| | Microsoft Corporation | 2.2% |
| | Vaicom, Inc. - Class B | 2.1% |
| Sector Concentration vs. the S&P 500 Index |
THE JAMESTOWN TAX EXEMPT VIRGINIA FUND PORTFOLIO INFORMATION MARCH 31, 2010 (Unaudited) |
Characteristics (Weighted Average) | | Maturity Breakdown (% of Portfolio) |
| 30-day SEC Yield | 2.19% | | |
| Tax-Equivalent Yield | 3.37%* |
| Average Maturity (years) | 6.2 |
| Average Duration (years) | 4.7 |
| Average Quality | AA |
| Number of Issues | 54 |
| | |
| * Assumes a maximum 35.0% federal tax rate. |
| | |
| | |
| Credit Quality (% of Portfolio) | | Sector Diversification (% of Portfolio) |
| | |
THE JAMESTOWN BALANCED FUND SCHEDULE OF INVESTMENTS March 31, 2010 |
| | | | | | |
| Consumer Discretionary — 8.5% | | | | | | |
| Comcast Corporation - Class A | | | 15,000 | | | $ | 282,300 | |
Dollar Tree, Inc. (a) | | | 5,800 | | | | 343,476 | |
| Home Depot, Inc. (The) | | | 10,300 | | | | 333,205 | |
| McDonald's Corporation | | | 4,500 | | | | 300,240 | |
Viacom, Inc. - Class B (a) | | | 9,500 | | | | 326,610 | |
| Yum! Brands, Inc. | | | 7,500 | | | | 287,475 | |
| | | | | | | | 1,873,306 | |
| Consumer Staples — 5.5% | | | | | | | | |
| CVS Caremark Corporation | | | 8,300 | | | | 303,448 | |
| General Mills, Inc. | | | 4,200 | | | | 297,318 | |
| PepsiCo, Inc. | | | 4,750 | | | | 314,260 | |
| Wal-Mart Stores, Inc. | | | 5,500 | | | | 305,800 | |
| | | | | | | | 1,220,826 | |
| Energy — 7.9% | | | | | | | | |
| Apache Corporation | | | 2,400 | | | | 243,600 | |
| BP plc - ADR | | | 5,200 | | | | 296,764 | |
| Chevron Corporation | | | 3,950 | | | | 299,528 | |
| ConocoPhillips | | | 5,800 | | | | 296,786 | |
Noble Corporation (a) | | | 7,600 | | | | 317,832 | |
Transocean Ltd. (a) | | | 3,500 | | | | 302,330 | |
| | | | | | | | 1,756,840 | |
| Financials — 10.8% | | | | | | | | |
| Aflac, Inc. | | | 4,700 | | | | 255,163 | |
| Ameriprise Financial, Inc. | | | 3,700 | | | | 167,832 | |
| Bank of America Corporation | | | 1,500 | | | | 26,775 | |
| Franklin Resources, Inc. | | | 2,800 | | | | 310,520 | |
| Goldman Sachs Group, Inc. (The) | | | 1,800 | | | | 307,134 | |
| JPMorgan Chase & Company | | | 6,600 | | | | 295,350 | |
| PNC Financial Services Group, Inc. | | | 5,000 | | | | 298,500 | |
| Prudential Financial, Inc. | | | 3,000 | | | | 181,500 | |
| Toronto-Dominion Bank (The) | | | 4,000 | | | | 298,320 | |
| Travelers Companies, Inc. (The) | | | 4,700 | | | | 253,518 | |
| | | | | | | | 2,394,612 | |
| Health Care — 9.0% | | | | | | | | |
| Abbott Laboratories | | | 5,500 | | | | 289,740 | |
| AmerisourceBergen Corporation | | | 10,400 | | | | 300,768 | |
Amgen, Inc. (a) | | | 2,600 | | | | 155,376 | |
| Bristol-Myers Squibb Company | | | 5,700 | | | | 152,190 | |
Express Scripts, Inc. (a) | | | 3,300 | | | | 335,808 | |
Gilead Sciences, Inc. (a) | | | 6,400 | | | | 291,072 | |
| Medtronic, Inc. | | | 3,350 | | | | 150,851 | |
| Teva Pharmaceutical Industries Ltd. - ADR | | | 5,200 | | | | 328,016 | |
| | | | | | | | 2,003,821 | |
THE JAMESTOWN BALANCED FUND SCHEDULE OF INVESTMENTS (Continued) |
COMMON STOCKS — 68.3% (Continued) | | | | | | |
| Industrials — 8.2% | | | | | | |
| Dover Corporation | | | 5,200 | | | $ | 243,100 | |
| General Dynamics Corporation | | | 4,400 | | | | 339,680 | |
| General Electric Company | | | 5,500 | | | | 100,100 | |
| Illinois Tool Works, Inc. | | | 3,250 | | | | 153,920 | |
| ITT Corporation | | | 5,900 | | | | 316,299 | |
| Norfolk Southern Corporation | | | 5,900 | | | | 329,751 | |
| United Technologies Corporation | | | 4,700 | | | | 345,967 | |
| | | | | | | | 1,828,817 | |
| Information Technology — 16.6% | | | | | | | | |
| Accenture plc - Class A | | | 7,800 | | | | 327,210 | |
Apple, Inc. (a) | | | 1,300 | | | | 305,409 | |
Cisco Systems, Inc. (a) | | | 13,700 | | | | 356,611 | |
EMC Corporation (a) | | | 17,600 | | | | 317,504 | |
Google, Inc. - Class A (a) | | | 450 | | | | 255,155 | |
| Hewlett-Packard Company | | | 5,900 | | | | 313,585 | |
| Intel Corporation | | | 14,800 | | | | 329,448 | |
| International Business Machines Corporation | | | 2,225 | | | | 285,356 | |
| Microsoft Corporation | | | 11,500 | | | | 336,605 | |
| Oracle Corporation | | | 12,700 | | | | 326,263 | |
| QUALCOMM, Inc. | | | 5,800 | | | | 243,542 | |
Symantec Corporation (a) | | | 16,600 | | | | 280,872 | |
| | | | | | | | 3,677,560 | |
| Materials — 1.8% | | | | | | | | |
| Monsanto Company | | | 2,400 | | | | 171,408 | |
| Praxair, Inc. | | | 2,800 | | | | 232,400 | |
| | | | | | | | 403,808 | |
| | | | | | | | | |
Total Common Stocks (Cost $11,355,597) | | | | | | $ | 15,159,590 | |
U.S. TREASURY OBLIGATIONS — 3.6% | | | | | | |
| U.S. Treasury Notes — 3.6% | | | | | | |
| 4.25%, due 11/15/2014 | | $ | 350,000 | | | $ | 379,285 | |
| 4.25%, due 11/15/2017 | | | 400,000 | | | | 423,125 | |
Total U.S. Treasury Obligations (Cost $755,555) | | | | | | $ | 802,410 | |
U.S. GOVERNMENT AGENCY OBLIGATIONS — 2.5% | | | | | | |
| Federal Home Loan Mortgage Corporation — 2.5% | | | | | | |
| 5.25%, due 04/18/2016 (Cost $494,659) | | $ | 500,000 | | | $ | 553,024 | |
THE JAMESTOWN BALANCED FUND SCHEDULE OF INVESTMENTS (Continued) |
MORTGAGE-BACKED SECURITIES — 5.7% | | | | | | |
| Federal Home Loan Mortgage Corporation — 1.1% | | | | | | |
| Pool #E90624, 6.00%, due 08/01/2017 | | $ | 13,998 | | | $ | 15,114 | |
| Pool #A43942, 5.50%, due 03/01/2036 | | | 205,937 | | | | 217,878 | |
| | | | | | | | 232,992 | |
| Federal National Mortgage Association — 4.5% | | | | | | | | |
| Pool #618465, 5.00%, due 12/01/2016 | | | 115,410 | | | | 121,863 | |
| Pool #684231, 5.00%, due 01/01/2018 | | | 167,620 | | | | 176,992 | |
| Pool #255455, 5.00%, due 10/01/2024 | | | 178,026 | | | | 185,549 | |
| Pool #255702, 5.00%, due 05/01/2025 | | | 282,215 | | | | 293,787 | |
| Pool #808413, 5.50%, due 01/01/2035 | | | 206,989 | | | | 218,377 | |
| | | | | | | | 996,568 | |
| Government National Mortgage Association — 0.1% | | | | | | | | |
| Pool #781344, 6.50%, due 10/15/2031 | | | 24,761 | | | | 26,699 | |
| | | | | | | | | |
Total Mortgage-Backed Securities (Cost $1,192,109) | | | | | | $ | 1,256,259 | |
| | | | | | |
| Consumer Staples — 2.9% | | | | | | |
Coca-Cola Company (The),
5.35%, due 11/15/2017 | | $ | 250,000 | | | $ | 275,036 | |
General Mills, Inc.,
5.70%, due 02/15/2017 | | | 150,000 | | | | 162,716 | |
PepsiCo, Inc.,
4.65%, due 02/15/2013 | | | 200,000 | | | | 215,742 | |
| | | | | | | | 653,494 | |
| Energy — 0.9% | | | | | | | | |
Burlington Resources, Inc.,
6.68%, due 02/15/2011 | | | 200,000 | | | | 210,511 | |
| | | | | | | | | |
| Financials — 5.6% | | | | | | | | |
American Express Company,
4.875%, due 07/15/2013 | | | 150,000 | | | | 158,214 | |
BB&T Corporation,
6.50%, due 08/01/2011 | | | 325,000 | | | | 343,794 | |
JPMorgan Chase & Company,
6.75%, due 02/01/2011 | | | 300,000 | | | | 314,528 | |
Morgan Stanley,
5.30%, due 03/01/2013 | | | 250,000 | | | | 266,059 | |
Northern Trust Corporation,
4.625%, due 05/01/2014 | | | 150,000 | | | | 159,530 | |
| | | | | | | | 1,242,125 | |
| Health Care — 1.7% | | | | | | | | |
Amgen, Inc.,
5.85%, due 06/01/2017 | | | 150,000 | | | | 166,348 | |
GlaxoSmithKline plc,
5.65%, due 05/15/2018 | | | 200,000 | | | | 217,169 | |
| | | | | | | | 383,517 | |
THE JAMESTOWN BALANCED FUND SCHEDULE OF INVESTMENTS (Continued) |
CORPORATE BONDS — 19.1% (Continued) | | | | | | |
| Industrials — 2.2% | | | | | | |
Dover Corporation,
6.50%, due 02/15/2011 | | $ | 195,000 | | | $ | 204,740 | |
United Technologies Corporation,
6.10%, due 05/15/2012 | | | 250,000 | | | | 273,406 | |
| | | | | | | | 478,146 | |
| Materials — 1.9% | | | | | | | | |
Alcoa, Inc.,
6.50%, due 06/01/2011 | | | 250,000 | | | | 262,028 | |
E.I. du Pont de Nemours and Company,
5.875%, due 01/15/2014 | | | 150,000 | | | | 166,794 | |
| | | | | | | | 428,822 | |
| Telecommunication Services — 3.3% | | | | | | | | |
AT&T, Inc.,
4.95%, due 01/15/2013 | | | 250,000 | | | | 268,548 | |
Deutsche Telekom AG,
8.50%, due 06/15/2010 | | | 150,000 | | | | 152,218 | |
GTE Northwest, Inc.,
6.30%, due 06/01/2010 | | | 300,000 | | | | 302,155 | |
| | | | | | | | 722,921 | |
| Utilities — 0.6% | | | | | | | | |
Virginia Electric & Power Company,
5.00%, due 06/30/2019 | | | 125,000 | | | | 128,406 | |
| | | | | | | | | |
Total Corporate Bonds (Cost $4,022,504) | | | | | | $ | 4,247,942 | |
MONEY MARKET FUNDS — 1.0% | | | | | | |
Fidelity Institutional Money Market Portfolio - Select Class, 0.16% (b) (Cost $217,353) | | | 217,353 | | | $ | 217,353 | |
| | | | | | | | | |
Total Investments at Value — 100.2% (Cost $18,037,777) | | | | | | $ | 22,236,578 | |
| | | | | | | | | |
| Liabilities in Excess of Other Assets — (0.2%) | | | | | | | (53,109 | ) |
| | | | | | | | | |
| Net Assets — 100.0% | | | | | | $ | 22,183,469 | |
| ADR - American Depositary Receipt |
| |
| (a) | Non-income producing security. |
| | |
| (b) | Variable rate security. The rate shown is the 7-day effective yield as of March 31, 2010. |
| | |
| See accompanying notes to financial statements. |
THE JAMESTOWN EQUITY FUND SCHEDULE OF INVESTMENTS March 31, 2010 |
| | | | | | |
| Consumer Discretionary — 12.0% | | | | | | |
| Comcast Corporation - Class A | | | 24,500 | | | $ | 461,090 | |
Dollar Tree, Inc. (a) | | | 9,800 | | | | 580,356 | |
| Home Depot, Inc. (The) | | | 17,000 | | | | 549,950 | |
| McDonald's Corporation | | | 8,100 | | | | 540,432 | |
Viacom, Inc. - Class B (a) | | | 16,500 | | | | 567,270 | |
| Yum! Brands, Inc. | | | 12,300 | | | | 471,459 | |
| | | | | | | | 3,170,557 | |
| Consumer Staples — 8.2% | | | | | | | | |
| CVS Caremark Corporation | | | 14,400 | | | | 526,464 | |
| General Mills, Inc. | | | 8,000 | | | | 566,320 | |
| PepsiCo, Inc. | | | 8,700 | | | | 575,592 | |
| Wal-Mart Stores, Inc. | | | 9,300 | | | | 517,080 | |
| | | | | | | | 2,185,456 | |
| Energy — 11.2% | | | | | | | | |
| Apache Corporation | | | 3,800 | | | | 385,700 | |
| BP plc - ADR | | | 8,950 | | | | 510,776 | |
| Chevron Corporation | | | 6,600 | | | | 500,478 | |
| ConocoPhillips | | | 9,900 | | | | 506,583 | |
Noble Corporation (a) | | | 13,000 | | | | 543,660 | |
Transocean Ltd. (a) | | | 6,000 | | | | 518,280 | |
| | | | | | | | 2,965,477 | |
| Financials — 15.4% | | | | | | | | |
| Aflac, Inc. | | | 8,000 | | | | 434,320 | |
| Ameriprise Financial, Inc. | | | 6,500 | | | | 294,840 | |
| Franklin Resources, Inc. | | | 4,800 | | | | 532,320 | |
| Goldman Sachs Group, Inc. (The) | | | 3,000 | | | | 511,890 | |
| JPMorgan Chase & Company | | | 11,800 | | | | 528,050 | |
| PNC Financial Services Group, Inc. | | | 8,650 | | | | 516,405 | |
| Prudential Financial, Inc. | | | 5,000 | | | | 302,500 | |
| Toronto-Dominion Bank (The) | | | 7,000 | | | | 522,060 | |
| Travelers Companies, Inc. (The) | | | 8,400 | | | | 453,096 | |
| | | | | | | | 4,095,481 | |
| Health Care — 13.0% | | | | | | | | |
| Abbott Laboratories | | | 9,300 | | | | 489,924 | |
| AmerisourceBergen Corporation | | | 16,500 | | | | 477,180 | |
Amgen, Inc. (a) | | | 4,500 | | | | 268,920 | |
| Bristol-Myers Squibb Company | | | 9,900 | | | | 264,330 | |
Express Scripts, Inc. (a) | | | 5,700 | | | | 580,032 | |
Gilead Sciences, Inc. (a) | | | 11,500 | | | | 523,020 | |
| Medtronic, Inc. | | | 5,900 | | | | 265,677 | |
| Teva Pharmaceutical Industries Ltd. - ADR | | | 9,300 | | | | 586,644 | |
| | | | | | | | 3,455,727 | |
THE JAMESTOWN EQUITY FUND SCHEDULE OF INVESTMENTS (Continued) |
COMMON STOCKS — 97.3% (Continued) | | | | | | |
| Industrials — 11.5% | | | | | | |
| Dover Corporation | | | 8,900 | | | $ | 416,075 | |
| General Dynamics Corporation | | | 7,500 | | | | 579,000 | |
| General Electric Company | | | 6,000 | | | | 109,200 | |
| Illinois Tool Works, Inc. | | | 5,600 | | | | 265,216 | |
| ITT Corporation | | | 10,100 | | | | 541,461 | |
| Norfolk Southern Corporation | | | 9,900 | | | | 553,311 | |
| United Technologies Corporation | | | 7,900 | | | | 581,519 | |
| | | | | | | | 3,045,782 | |
| Information Technology — 23.4% | | | | | | | | |
| Accenture plc - Class A | | | 13,700 | | | | 574,715 | |
Apple, Inc. (a) | | | 2,300 | | | | 540,339 | |
Cisco Systems, Inc. (a) | | | 23,000 | | | | 598,690 | |
EMC Corporation (a) | | | 28,500 | | | | 514,140 | |
Google, Inc. - Class A (a) | | | 785 | | | | 445,103 | |
| Hewlett-Packard Company | | | 9,700 | | | | 515,555 | |
| Intel Corporation | | | 24,300 | | | | 540,918 | |
| International Business Machines Corporation | | | 3,800 | | | | 487,350 | |
| Microsoft Corporation | | | 19,600 | | | | 573,692 | |
| Oracle Corporation | | | 20,800 | | | | 534,352 | |
| QUALCOMM, Inc. | | | 9,800 | | | | 411,502 | |
Symantec Corporation (a) | | | 28,200 | | | | 477,144 | |
| | | | | | | | 6,213,500 | |
| Materials — 2.6% | | | | | | | | |
| Monsanto Company | | | 4,000 | | | | 285,680 | |
| Praxair, Inc. | | | 4,800 | | | | 398,400 | |
| | | | | | | | 684,080 | |
| | | | | | | | | |
Total Common Stocks (Cost $19,790,043) | | | | | | $ | 25,816,060 | |
MONEY MARKET FUNDS — 0.6% | | | | | | |
Fidelity Institutional Money Market Portfolio - Select Class, 0.16% (b) (Cost $169,548) | | | 169,548 | | | $ | 169,548 | |
THE JAMESTOWN EQUITY FUND SCHEDULE OF INVESTMENTS (Continued) |
REPURCHASE AGREEMENTS — 2.7% | | | | | | |
U.S. Bank N.A., 0.01%, dated 03/31/2010, due 04/01/2010, repurchase proceeds: $705,175 (Cost $705,175) (c) | | $ | 705,175 | | | $ | 705,175 | |
| | | | | | | | | |
Total Investments at Value — 100.6% (Cost $20,664,766) | | | | | | $ | 26,690,783 | |
| | | | | | | | | |
| Liabilities in Excess of Other Assets — (0.6%) | | | | | | | (157,146 | ) |
| | | | | | | | | |
| Net Assets — 100.0% | | | | | | $ | 26,533,637 | |
| ADR - American Depositary Receipt |
| |
| (a) | Non-income producing security. |
| | |
| (b) | Variable rate security. The rate shown is the 7-day effective yield as of March 31, 2010. |
| | |
| (c) | Repurchase agreement is fully collateralized by $1,854,000 FNCI #254919, 4.00%, due 09/01/2018. The aggregate market value of the collateral at March 31, 2010 was $719,575. |
| | |
| See accompanying notes to financial statements. |
THE JAMESTOWN TAX EXEMPT VIRGINIA FUND SCHEDULE OF INVESTMENTS March 31, 2010 |
VIRGINIA REVENUE AND GENERAL OBLIGATION (GO) BONDS — 94.8% | | | | | | |
| Alexandria, Virginia, GO, | | | | | | |
| 5.00%, due 06/15/2011, prerefunded 06/15/2010 @ 101 | | $ | 1,000,000 | | | $ | 1,019,640 | |
| Arlington Co., Virginia, GO, | | | | | | | | |
| 4.10%, due 11/01/2018 | | | 500,000 | | | | 526,665 | |
| Capital Region Airport Commission, Virginia, Airport Revenue, | | | | | | | | |
| 4.50%, due 07/01/2016 | | | 520,000 | | | | 570,029 | |
| Chesterfield Co., Virginia, GO, | | | | | | | | |
| 5.00%, due 01/01/2020 | | | 700,000 | | | | 784,035 | |
| Fairfax Co., Virginia, Economic Dev. Authority, Revenue, | | | | | | | | |
| 5.00%, due 06/01/2018 | | | 1,000,000 | | | | 1,092,330 | |
| Fairfax Co., Virginia, GO, | | | | | | | | |
| 5.00%, due 10/01/2011 | | | 700,000 | | | | 746,578 | |
| Fairfax Co., Virginia, Industrial Dev. Authority, Revenue, | | | | | | | | |
| 5.00%, due 05/15/2022 | | | 750,000 | | | | 799,320 | |
| Fauquier Co., Virginia, GO, | | | | | | | | |
| 5.00%, due 07/01/2017 | | | 500,000 | | | | 568,945 | |
| Hampton Roads Sanitation District, Virginia, Wastewater, Revenue, | | | | | | | | |
| 5.00%, due 04/01/2022 | | | 400,000 | | | | 442,288 | |
| Hampton, Virginia, GO, | | | | | | | | |
| 5.00%, due 04/01/2020, prerefunded 04/01/2015 @ 100 | | | 500,000 | | | | 575,145 | |
| Henrico Co., Virginia, Public Improvement, Series A, GO, | | | | | | | | |
| 5.00%, due 12/01/2015 | | | 250,000 | | | | 290,857 | |
| Henrico Co., Virginia, Water & Sewer, Revenue, | | | | | | | | |
| 5.00%, due 05/01/2020 | | | 350,000 | | | | 400,109 | |
| 5.00%, due 05/01/2022 | | | 300,000 | | | | 338,556 | |
| James City, Virginia, School District, GO, | | | | | | | | |
| 5.00%, due 12/15/2018 | | | 500,000 | | | | 549,930 | |
| James City, Virginia, Service Authority, Water & Sewer, Revenue, | | | | | | | | |
| 5.125%, due 01/15/2017 | | | 1,000,000 | | | | 1,072,990 | |
| Leesburg, Virginia, GO, | | | | | | | | |
| 5.00%, due 09/15/2016 | | | 500,000 | | | | 572,100 | |
| Loudoun Co., Virginia, GO, | | | | | | | | |
| 5.00%, due 07/01/2012 | | | 500,000 | | | | 546,375 | |
| Loudoun Co., Virginia, Industrial Dev. Authority, Public Facility Lease, Revenue, | | | | | | | | |
| 5.00%, due 03/01/2019 | | | 1,000,000 | | | | 1,085,280 | |
| Lynchburg, Virginia, GO, | | | | | | | | |
| 5.00%, due 06/01/2015 | | | 500,000 | | | | 576,000 | |
| Lynchburg, Virginia, Public Improvement, Series A, GO, | | | | | | | | |
| 5.00%, due 08/01/2019 | | | 625,000 | | | | 718,119 | |
| Medical College of Virginia, Hospitals Authority, Revenue, | | | | | | | | |
| 5.00%, due 07/01/2013 | | | 700,000 | | | | 703,682 | |
| New Kent Co., Virginia, Economic Dev. Authority, Revenue, | | | | | | | | |
| 5.00%, due 02/01/2019 | | | 500,000 | | | | 544,735 | |
THE JAMESTOWN TAX EXEMPT VIRGINIA FUND SCHEDULE OF INVESTMENTS (Continued) |
VIRGINIA REVENUE AND GENERAL OBLIGATION (GO) BONDS — 94.8% (Continued) | | | | | | |
| New River Valley Regional Jail Authority, Revenue, | | | | | | |
| 4.00%, due 04/01/2011 | | $ | 250,000 | | | $ | 252,763 | |
| Norfolk, Virginia, GO, | | | | | | | | |
| 4.50%, due 06/01/2015 | | | 500,000 | | | | 549,995 | |
| Norfolk, Virginia, Water, Revenue, | | | | | | | | |
| 5.00%, due 11/01/2016 | | | 1,000,000 | | | | 1,059,830 | |
| Portsmouth, Virginia, Series A, GO, | | | | | | | | |
| 5.00%, due 04/01/2016 | | | 500,000 | | | | 554,935 | |
| Portsmouth, Virginia, Series D, GO, | | | | | | | | |
| 4.00%, due 12/01/2017 | | | 215,000 | | | | 231,499 | |
| Richmond, Virginia, Industrial Dev. Authority, Government Facilities, Revenue, | | | | | | | | |
| 4.75%, due 07/15/2010 | | | 510,000 | | | | 515,248 | |
| Richmond, Virginia, Metropolitan Authority, Revenue, | | | | | | | | |
| 5.25%, due 07/15/2014 | | | 1,000,000 | | | | 1,110,030 | |
| Southeastern Public Service Authority, Virginia, Revenue, | | | | | | | | |
| 5.00%, due 07/01/2015 | | | 1,000,000 | | | | 1,080,190 | |
| Spotsylvania Co., Virginia, GO, | | | | | | | | |
| 5.00%, due 01/15/2016 | | | 500,000 | | | | 545,755 | |
| Spotsylvania Co., Virginia, Water & Sewer, Revenue, | | | | | | | | |
| 5.00%, due 06/01/2026 | | | 500,000 | | | | 529,325 | |
| University of Virginia, Revenue, | | | | | | | | |
| 5.00%, due 06/01/2013 | | | 585,000 | | | | 653,767 | |
| Upper Occoquan, Virginia, Sewer Authority, Revenue, | | | | | | | | |
| 5.15%, due 07/01/2020 | | | 250,000 | | | | 288,275 | |
| Virginia Beach, Virginia, Public Improvement, GO, | | | | | | | | |
| 5.00%, due 06/01/2021 | | | 250,000 | | | | 291,130 | |
| Virginia Biotechnology Research Partnership Authority, Lease Revenue, | | | | | | | | |
| 5.00%, due 09/01/2020 | | | 500,000 | | | | 563,260 | |
| Virginia College Building Authority, Educational Facilities, Revenue, | | | | | | | | |
| 5.00%, due 02/01/2017, prerefunded 02/01/2014 @ 100 | | | 500,000 | | | | 565,705 | |
| 5.00%, due 04/01/2017 | | | 500,000 | | | | 553,270 | |
| Virginia Commonwealth Transportation Board, Federal Highway Reimbursement Anticipation Note, Revenue, | | | | | | | | |
| 5.00%, due 09/28/2015 | | | 500,000 | | | | 577,000 | |
| Virginia Polytechnic Institute & State University, Revenue, | | | | | | | | |
| 5.00%, due 06/01/2016 | | | 500,000 | | | | 553,075 | |
| Virginia Small Business Financing Authority, Healthcare Facilities Revenue, | | | | | | | | |
| 5.00%, due 11/01/2017 | | | 250,000 | | | | 274,258 | |
| Virginia State Public Building Authority, Public Facilities, Series D, Revenue, | | | | | | | | |
| 5.00%, due 08/01/2016 | | | 1,000,000 | | | | 1,100,440 | |
| Virginia State Public Building Authority, Revenue, | | | | | | | | |
| 5.00%, due 08/01/2012 | | | 635,000 | | | | 694,125 | |
THE JAMESTOWN TAX EXEMPT VIRGINIA FUND SCHEDULE OF INVESTMENTS (Continued) |
VIRGINIA REVENUE AND GENERAL OBLIGATION (GO) BONDS — 94.8% (Continued) | | | | | | |
| Virginia State Public School Authority, Series A, Revenue, | | | | | | |
| 5.00%, due 08/01/2020 | | $ | 585,000 | | | $ | 639,194 | |
| Virginia State Public School Authority, Series B, Revenue, | | | | | | | | |
| 4.00%, due 08/01/2014 | | | 400,000 | | | | 439,412 | |
| Virginia State Public School Authority, Series B-1, Revenue, | | | | | | | | |
| 5.00%, due 08/01/2018 | | | 500,000 | | | | 570,855 | |
| Virginia State Resources Authority, Clean Water, Revenue, | | | | | | | | |
| 5.00%, due 10/01/2021 | | | 500,000 | | | | 566,135 | |
| Virginia State Resources Authority, Infrastructure, Revenue, | | | | | | | | |
| 5.50%, due 05/01/2017, prerefunded 05/01/2010 @ 101 | | | 400,000 | | | | 405,740 | |
| 5.50%, due 05/01/2017 | | | 100,000 | | | | 101,406 | |
| Virginia State Resources Authority, Infrastructure, Series B, Revenue, | | | | | | | | |
| 5.00%, due 11/01/2024 | | | 500,000 | | | | 556,865 | |
| Virginia State, Series B, GO, | | | | | | | | |
| 5.00%, due 06/01/2012 | | | 500,000 | | | | 544,820 | |
| 5.00%, due 06/01/2017 | | | 250,000 | | | | 289,950 | |
| | | | | | | | | |
Total Virginia Revenue and General Obligation (GO) Bonds (Cost $29,892,090) | | | | | | $ | 31,181,960 | |
WASHINGTON, D.C. REVENUE BONDS — 1.6% | | | | | | |
| Metropolitan Washington Airports Authority, Series C, Revenue, | | | | | | |
| 5.00%, due 10/01/2022 (Cost $510,341) | | $ | 500,000 | | | $ | 539,540 | |
MONEY MARKET FUNDS — 2.4% | | | | | | |
Fidelity Tax Exempt Portfolio - Class I, 0.11% (a) (Cost $794,235) | | | 794,235 | | | $ | 794,235 | |
| | | | | | | | | |
Total Investments at Value — 98.8% (Cost $31,196,666) | | | | | | $ | 32,515,735 | |
| | | | | | | | | |
| Other Assets in Excess of Liabilities — 1.2% | | | | | | | 388,860 | |
| | | | | | | | | |
| Net Assets — 100.0% | | | | | | $ | 32,904,595 | |
| (a) | Variable rate security. The rate shown is the 7-day effective yield as of March 31, 2010. |
| | |
| See accompanying notes to financial statements. |
THE JAMESTOWN FUNDS STATEMENTS OF ASSETS AND LIABILITIES March 31, 2010 |
| | | | | | | | Jamestown Tax Exempt Virginia Fund | |
| ASSETS | | | | | | | | | |
| Investments in securities: | | | | | | | | | |
| At acquisition cost | | $ | 18,037,777 | | | $ | 20,664,766 | | | $ | 31,196,666 | |
| At value (Note 1) | | $ | 22,236,578 | | | $ | 26,690,783 | | | $ | 32,515,735 | |
| Dividends and interest receivable | | | 93,401 | | | | 11,061 | | | | 421,459 | |
| Receivable for investment securities sold | | | 986,621 | | | | 1,689,611 | | | | — | |
| Receivable for capital shares sold | | | — | | | | 500 | | | | 1,000 | |
| Other assets | | | 2,101 | | | | 11,119 | | | | 8,599 | |
| TOTAL ASSETS | | | 23,318,701 | | | | 28,403,074 | | | | 32,946,793 | |
| | | | | | | | | | | | | |
| LIABILITIES | | | | | | | | | | | | |
| Distributions payable | | | 12,024 | | | | — | | | | 12,073 | |
| Payable for investment securities purchased | | | 1,053,508 | | | | 1,839,375 | | | | — | |
| Payable for capital shares redeemed | | | 45,412 | | | | 10,112 | | | | 16,726 | |
| Accrued investment advisory fees (Note 3) | | | 12,182 | | | | 14,432 | | | | 5,428 | |
| Accrued administration fees (Note 3) | | | 4,000 | | | | 4,000 | | | | 4,100 | |
| Accrued compliance fees (Note 3) | | | 515 | | | | 515 | | | | 515 | |
| Other accrued expenses | | | 7,591 | | | | 1,003 | | | | 3,356 | |
| TOTAL LIABILITIES | | | 1,135,232 | | | | 1,869,437 | | | | 42,198 | |
| | | | | | | | | | | | | |
| NET ASSETS | | $ | 22,183,469 | | | $ | 26,533,637 | | | $ | 32,904,595 | |
| | | | | | | | | | | | | |
| Net assets consist of: | | | | | | | | | | | | |
| Paid-in capital | | $ | 19,823,863 | | | $ | 24,185,318 | | | $ | 31,565,481 | |
| Undistributed (overdistributed) net investment income | | | (25,209 | ) | | | 43,196 | | | | — | |
| Accumulated net realized gains (losses) from security transactions | | | (1,813,986 | ) | | | (3,720,894 | ) | | | 20,045 | |
| Net unrealized appreciation on investments | | | 4,198,801 | | | | 6,026,017 | | | | 1,319,069 | |
| Net assets | | $ | 22,183,469 | | | $ | 26,533,637 | | | $ | 32,904,595 | |
| | | | | | | | | | | | | |
Shares of beneficial interest outstanding (unlimited number of shares authorized, no par value) | | | 1,831,230 | | | | 1,808,927 | | | | 3,186,420 | |
| | | | | | | | | | | | | |
| Net asset value, offering price and redemption price per share | | $ | 12.11 | | | $ | 14.67 | | | $ | 10.33 | |
| See accompanying notes to financial statements. |
THE JAMESTOWN FUNDS STATEMENTS OF OPERATIONS Year Ended March 31, 2010 |
| | | | | | | | Jamestown Tax Exempt Virginia Fund | |
| INVESTMENT INCOME | | | | | | | | | |
| Dividends | | $ | 267,342 | | | $ | 433,459 | | | $ | 1,485 | |
| Foreign withholding taxes on dividends | | | (337 | ) | | | (545 | ) | | | — | |
| Interest | | | 424,959 | | | | 58 | | | | 1,195,320 | |
| TOTAL INVESTMENT INCOME | | | 691,964 | | | | 432,972 | | | | 1,196,805 | |
| | | | | | | | | | | | | |
| EXPENSES | | | | | | | | | | | | |
| Investment advisory fees (Note 3) | | | 145,211 | | | | 148,417 | | | | 133,865 | |
| Administration fees (Note 3) | | | 48,000 | | | | 48,000 | | | | 48,153 | |
| Professional fees | | | 20,713 | | | | 17,788 | | | | 14,988 | |
| Trustees’ fees and expenses | | | 14,702 | | | | 14,702 | | | | 14,702 | |
| Custodian and bank service fees | | | 7,349 | | | | 7,882 | | | | 5,718 | |
| Compliance fees (Note 3) | | | 5,373 | | | | 5,373 | | | | 5,373 | |
| Pricing costs | | | 6,013 | | | | 1,137 | | | | 8,697 | |
| Postage and supplies | | | 3,851 | | | | 4,121 | | | | 3,571 | |
| Printing of shareholder reports | | | 3,345 | | | | 5,309 | | | | 2,233 | |
| Insurance expense | | | 3,177 | | | | 2,841 | | | | 4,575 | |
| Registration fees | | | 4,087 | | | | 4,670 | | | | 1,829 | |
| Other expenses | | | 5,199 | | | | 5,748 | | | | 6,326 | |
| TOTAL EXPENSES | | | 267,020 | | | | 265,988 | | | | 250,030 | |
Fees voluntarily waived by the Adviser (Note 3) | | | — | | | | — | | | | (19,113 | ) |
| Expenses reimbursed through a directed brokerage arrangement (Note 4) | | | (18,000 | ) | | | (11,000 | ) | | | — | |
| NET EXPENSES | | | 249,020 | | | | 254,988 | | | | 230,917 | |
| | | | | | | | | | | | | |
| NET INVESTMENT INCOME | | | 442,944 | | | | 177,984 | | | | 965,888 | |
| | | | | | | | | | | | | |
REALIZED AND UNREALIZED GAINS (LOSSES) ON INVESTMENTS | | | | | | | | | | | | |
| Net realized gains (losses) on security transactions | | | (520,906 | ) | | | (1,004,607 | ) | | | 54,035 | |
| Net change in unrealized appreciation/depreciation on investments | | | 4,616,015 | | | | 7,294,861 | | | | 294,919 | |
| | | | | | | | | | | | | |
NET REALIZED AND UNREALIZED GAINS ON INVESTMENTS | | | 4,095,109 | | | | 6,290,254 | | | | 348,954 | |
| | | | | | | | | | | | | |
NET INCREASE IN NET ASSETS FROM OPERATIONS | | $ | 4,538,053 | | | $ | 6,468,238 | | | $ | 1,314,842 | |
| See accompanying notes to financial statements. |
THE JAMESTOWN FUNDS STATEMENTS OF CHANGES IN NET ASSETS |
| | | | | | | |
| | | | | | | | | | | | |
| FROM OPERATIONS | | | | | | | | | | | | |
| Net investment income | | $ | 442,944 | | | $ | 568,712 | | | $ | 177,984 | | | $ | 148,523 | |
| Net realized losses on security transactions | | | (520,906 | ) | | | (1,243,572 | ) | | | (1,004,607 | ) | | | (2,678,409 | ) |
| Net change in unrealized appreciation/depreciation on investments | | | 4,616,015 | | | | (5,607,996 | ) | | | 7,294,861 | | | | (7,869,783 | ) |
| Net increase (decrease) in net assets from operations | | | 4,538,053 | | | | (6,282,856 | ) | | | 6,468,238 | | | | (10,399,669 | ) |
| | | | | | | | | | | | | | | | | |
| DISTRIBUTIONS TO SHAREHOLDERS | | | | | | | | | | | | | | | | |
| From net investment income | | | (464,931 | ) | | | (449,455 | ) | | | (134,788 | ) | | | — | |
| Return of capital | | | — | | | | — | | | | — | | | | (127,900 | ) |
| Decrease in net assets from distributions to shareholders | | | (464,931 | ) | | | (449,455 | ) | | | (134,788 | ) | | | (127,900 | ) |
| | | | | | | | | | | | | | | | | |
| FROM CAPITAL SHARE TRANSACTIONS | | | | | | | | | | | | | | | | |
| Proceeds from shares sold | | | 246,821 | | | | 748,777 | | | | 4,602,946 | | | | 1,613,782 | |
| Net asset value of shares issued in reinvestment of distributions to shareholders | | | 400,602 | | | | 386,123 | | | | 128,492 | | | | 117,283 | |
| Payments for shares redeemed | | | (3,608,673 | ) | | | (5,388,675 | ) | | | (3,321,397 | ) | | | (4,729,875 | ) |
| Net increase (decrease) in net assets from capital share transactions | | | (2,961,250 | ) | | | (4,253,775 | ) | | | 1,410,041 | | | | (2,998,810 | ) |
| | | | | | | | | | | | | | | | | |
TOTAL INCREASE (DECREASE) IN NET ASSETS | | | 1,111,872 | | | | (10,986,086 | ) | | | 7,743,491 | | | | (13,526,379 | ) |
| | | | | | | | | | | | | | | | | |
| NET ASSETS | | | | | | | | | | | | | | | | |
| Beginning of year | | | 21,071,597 | | | | 32,057,683 | | | | 18,790,146 | | | | 32,316,525 | |
| End of year | | $ | 22,183,469 | | | $ | 21,071,597 | | | $ | 26,533,637 | | | $ | 18,790,146 | |
| | | | | | | | | | | | | | | | | |
| UNDISTRIBUTED (OVERDISTRIBUTED) NET INVESTMENT INCOME | | $ | (25,209 | ) | | $ | (13,328 | ) | | $ | 43,196 | | | $ | — | |
| | | | | | | | | | | | | | | | | |
| CAPITAL SHARE ACTIVITY | | | | | | | | | | | | | | | | |
| Shares sold | | | 21,848 | | | | 72,678 | | | | 336,642 | | | | 127,845 | |
| Shares reinvested | | | 35,858 | | | | 32,928 | | | | 9,198 | | | | 8,974 | |
| Shares redeemed | | | (315,673 | ) | | | (492,194 | ) | | | (243,780 | ) | | | (367,801 | ) |
| Net increase (decrease) in shares outstanding | | | (257,967 | ) | | | (386,588 | ) | | | 102,060 | | | | (230,982 | ) |
| Shares outstanding, beginning of year | | | 2,089,197 | | | | 2,475,785 | | | | 1,706,867 | | | | 1,937,849 | |
| Shares outstanding, end of year | | | 1,831,230 | | | | 2,089,197 | | | | 1,808,927 | | | | 1,706,867 | |
| See accompanying notes to financial statements. |
THE JAMESTOWN FUNDS STATEMENTS OF CHANGES IN NET ASSETS |
| | | Jamestown Tax Exempt Virginia Fund | |
| | | | | | |
| FROM OPERATIONS | | | | | | |
| Net investment income | | $ | 965,888 | | | $ | 1,002,793 | |
| Net realized gains on security transactions | | | 54,035 | | | | 8,422 | |
| Net change in unrealized appreciation/depreciation on investments | | | 294,919 | | | | 488,234 | |
| Net increase in net assets from operations | | | 1,314,842 | | | | 1,499,449 | |
| | | | | | | | | |
| DISTRIBUTIONS TO SHAREHOLDERS | | | | | | | | |
| From net investment income | | | (991,361 | ) | | | (990,933 | ) |
| From net realized gains from security transactions | | | (40,804 | ) | | | (3,442 | ) |
| Decrease in net assets from distributions to shareholders | | | (1,032,165 | ) | | | (994,375 | ) |
| | | | | | | | | |
| FROM CAPITAL SHARE TRANSACTIONS | | | | | | | | |
| Proceeds from shares sold | | | 1,899,062 | | | | 4,688,555 | |
| Net asset value of shares issued in reinvestment of distributions to shareholders | | | 876,547 | | | | 845,363 | |
| Payments for shares redeemed | | | (2,883,645 | ) | | | (2,402,415 | ) |
| Net increase (decrease) in net assets from capital share transactions | | | (108,036 | ) | | | 3,131,503 | |
| | | | | | | | | |
| TOTAL INCREASE IN NET ASSETS | | | 174,641 | | | | 3,636,577 | |
| | | | | | | | | |
| NET ASSETS | | | | | | | | |
| Beginning of year | | | 32,729,954 | | | | 29,093,377 | |
| End of year | | $ | 32,904,595 | | | $ | 32,729,954 | |
| | | | | | | | | |
| UNDISTRIBUTED NET INVESTMENT INCOME | | $ | — | | | $ | 27,239 | |
| | | | | | | | | |
| CAPITAL SHARE ACTIVITY | | | | | | | | |
| Shares sold | | | 184,087 | | | | 467,416 | |
| Shares reinvested | | | 84,650 | | | | 83,841 | |
| Shares redeemed | | | (277,154 | ) | | | (237,160 | ) |
Net increase (decrease) in shares outstanding | | | (8,417 | ) | | | 314,097 | |
| Shares outstanding, beginning of year | | | 3,194,837 | | | | 2,880,740 | |
| Shares outstanding, end of year | | | 3,186,420 | | | | 3,194,837 | |
| See accompanying notes to financial statements. |
THE JAMESTOWN BALANCED FUND FINANCIAL HIGHLIGHTS |
Selected Per Share Data and Ratios for a Share Outstanding Throughout Each Year | |
| | | | |
| | | | | | | | | | | | | | | |
| Net asset value at beginning of year | | $ | 10.09 | | | $ | 12.95 | | | $ | 14.53 | | | $ | 14.97 | | | $ | 14.92 | |
| | | | | | | | | | | | | | | | | | | | | |
| Income (loss) from investment operations: | | | | | | | | | | | | | | | | | | | | |
| Net investment income | | | 0.22 | | | | 0.25 | | | | 0.26 | | | | 0.27 | | | | 0.26 | |
| Net realized and unrealized gains (losses) on investments | | | 2.04 | | | | (2.91 | ) | | | 0.27 | | | | 0.69 | | | | 1.06 | |
| Total from investment operations | | | 2.26 | | | | (2.66 | ) | | | 0.53 | | | | 0.96 | | | | 1.32 | |
| | | | | | | | | | | | | | | | | | | | | |
| Less distributions: | | | | | | | | | | | | | | | | | | | | |
| Dividends from net investment income | | | (0.24 | ) | | | (0.20 | ) | | | (0.28 | ) | | | (0.29 | ) | | | (0.27 | ) |
| Distributions from net realized gains | | | — | | | | — | | | | (1.83 | ) | | | (1.11 | ) | | | (1.00 | ) |
| Total distributions | | | (0.24 | ) | | | (0.20 | ) | | | (2.11 | ) | | | (1.40 | ) | | | (1.27 | ) |
| | | | | | | | | | | | | | | | | | | | | |
| Net asset value at end of year | | $ | 12.11 | | | $ | 10.09 | | | $ | 12.95 | | | $ | 14.53 | | | $ | 14.97 | |
| | | | | | | | | | | | | | | | | | | | | |
Total return (a) | | | 22.56% | | | | (20.75% | ) | | | 2.97% | | | | 6.57% | | | | 9.14% | |
| | | | | | | | | | | | | | | | | | | | | |
Net assets at end of year (000’s) | | $ | 22,183 | | | $ | 21,072 | | | $ | 32,058 | | | $ | 45,460 | | | $ | 56,879 | |
| | | | | | | | | | | | | | | | | | | | | |
| Ratio of gross expenses to average net assets | | | 1.20% | | | | 1.14% | | | | 1.01% | | | | 0.94% | | | | 0.93% | |
| | | | | | | | | | | | | | | | | | | | | |
Ratio of net expenses to average net assets (b) | | | 1.11% | | | | 1.05% | | | | 0.95% | | | | 0.89% | | | | 0.89% | |
| | | | | | | | | | | | | | | | | | | | | |
| Ratio of net investment income to average net assets | | | 1.98% | | | | 2.10% | | | | 1.71% | | | | 1.80% | | | | 1.72% | |
| | | | | | | | | | | | | | | | | | | | | |
| Portfolio turnover rate | | | 40% | | | | 43% | | | | 30% | | | | 40% | | | | 49% | |
| (a) | Total return is a measure of the change in value of an investment in the Fund over the period covered, which assumes any dividends or capital gains distributions are reinvested in shares of the Fund. Returns do not reflect the deduction of taxes a shareholder would pay on Fund distributions or the redemption of Fund shares. |
| | |
| (b) | Ratios were determined based on net expenses after expense reimbursements through a directed brokerage arrangement (Note 4). |
| | |
| See accompanying notes to financial statements. |
THE JAMESTOWN EQUITY FUND FINANCIAL HIGHLIGHTS |
Selected Per Share Data and Ratios for a Share Outstanding Throughout Each Year | |
| | | | |
| | | | | | | | | | | | | | | |
| Net asset value at beginning of year | | $ | 11.01 | | | $ | 16.68 | | | $ | 18.12 | | | $ | 18.45 | | | $ | 17.69 | |
| | | | | | | | | | | | | | | | | | | | | |
| Income (loss) from investment operations: | | | | | | | | | | | | | | | | | | | | |
| Net investment income | | | 0.10 | | | | 0.08 | | | | 0.08 | | | | 0.10 | | | | 0.07 | |
| Net realized and unrealized gains (losses) on investments | | | 3.64 | | | | (5.68 | ) | | | 0.20 | | | | 1.15 | | | | 2.11 | |
| Total from investment operations | | | 3.74 | | | | (5.60 | ) | | | 0.28 | | | | 1.25 | | | | 2.18 | |
| | | | | | | | | | | | | | | | | | | | | |
| Less distributions: | | | | | | | | | | | | | | | | | | | | |
| Dividends from net investment income | | | (0.08 | ) | | | — | | | | (0.08 | ) | | | (0.10 | ) | | | (0.07 | ) |
| Distributions from net realized gains | | | — | | | | — | | | | (1.50 | ) | | | (1.48 | ) | | | (1.35 | ) |
| Return of capital | | | — | | | | (0.07 | ) | | | (0.14 | ) | | | — | | | | — | |
| Total distributions | | | (0.08 | ) | | | (0.07 | ) | | | (1.72 | ) | | | (1.58 | ) | | | (1.42 | ) |
| | | | | | | | | | | | | | | | | | | | | |
| Net asset value at end of year | | $ | 14.67 | | | $ | 11.01 | | | $ | 16.68 | | | $ | 18.12 | | | $ | 18.45 | |
| | | | | | | | | | | | | | | | | | | | | |
Total return (a) | | | 33.96% | | | | (33.63% | ) | | | 0.94% | | | | 6.92% | | | | 12.69% | |
| | | | | | | | | | | | | | | | | | | | | |
Net assets at end of year (000’s) | | $ | 26,534 | | | $ | 18,790 | | | $ | 32,317 | | | $ | 37,128 | | | $ | 42,770 | |
| | | | | | | | | | | | | | | | | | | | | |
| Ratio of gross expenses to average net assets | | | 1.16% | | | | 1.15% | | | | 0.99% | | | | 0.97% | | | | 0.97% | |
| | | | | | | | | | | | | | | | | | | | | |
Ratio of net expenses to average net assets (b) | | | 1.12% | | | | 1.10% | | | | 0.95% | | | | 0.91% | | | | 0.92% | |
| | | | | | | | | | | | | | | | | | | | | |
| Ratio of net investment income to average net assets | | | 0.78% | | | | 0.56% | | | | 0.38% | | | | 0.52% | | | | 0.36% | |
| | | | | | | | | | | | | | | | | | | | | |
| Portfolio turnover rate | | | 59% | | | | 69% | | | | 46% | | | | 53% | | | | 60% | |
| (a) | Total return is a measure of the change in value of an investment in the Fund over the period covered, which assumes any dividends or capital gains distributions are reinvested in shares of the Fund. Returns do not reflect the deduction of taxes a shareholder would pay on Fund distributions or the redemption of Fund shares. |
| | |
| (b) | Ratios were determined based on net expenses after expense reimbursements through a directed brokerage arrangement (Note 4). |
| | |
| See accompanying notes to financial statements. |
THE JAMESTOWN TAX EXEMPT VIRGINIA FUND FINANCIAL HIGHLIGHTS |
Selected Per Share Data and Ratios for a Share Outstanding Throughout Each Year | |
| | | | |
| | | | | | | | | | | | | | | |
| Net asset value at beginning of year | | $ | 10.24 | | | $ | 10.10 | | | $ | 10.06 | | | $ | 10.05 | | | $ | 10.22 | |
| | | | | | | | | | | | | | | | | | | | | |
| Income (loss) from investment operations: | | | | | | | | | | | | | | | | | | | | |
| Net investment income | | | 0.30 | | | | 0.34 | | | | 0.36 | | | | 0.37 | | | | 0.36 | |
| Net realized and unrealized gains (losses) on investments | | | 0.11 | | | | 0.13 | | | | 0.05 | | | | 0.01 | | | | (0.17 | ) |
| Total from investment operations | | | 0.41 | | | | 0.47 | | | | 0.41 | | | | 0.38 | | | | 0.19 | |
| | | | | | | | | | | | | | | | | | | | | |
| Less distributions: | | | | | | | | | | | | | | | | | | | | |
| Dividends from net investment income | | | (0.31 | ) | | | (0.33 | ) | | | (0.36 | ) | | | (0.36 | ) | | | (0.36 | ) |
| Distributions from net realized gains | | | (0.01 | ) | | | (0.00 | )(b) | | | (0.01 | ) | | | (0.01 | ) | | | — | |
| Total distributions | | | (0.32 | ) | | | (0.33 | ) | | | (0.37 | ) | | | (0.37 | ) | | | (0.36 | ) |
| | | | | | | | | | | | | | | | | | | | | |
| Net asset value at end of year | | $ | 10.33 | | | $ | 10.24 | | | $ | 10.10 | | | $ | 10.06 | | | $ | 10.05 | |
| | | | | | | | | | | | | | | | | | | | | |
Total return (a) | | | 4.04% | | | | 4.77% | | | | 4.09% | | | | 3.85% | | | | 1.83% | |
| | | | | | | | | | | | | | | | | | | | | |
Net assets at end of year (000’s) | | $ | 32,905 | | | $ | 32,730 | | | $ | 29,093 | | | $ | 28,981 | | | $ | 30,421 | |
| | | | | | | | | | | | | | | | | | | | | |
| Ratio of gross expenses to average net assets | | | 0.75% | | | | 0.77% | | | | 0.77% | | | | 0.75% | | | | 0.73% | |
| | | | | | | | | | | | | | | | | | | | | |
| Ratio of net expenses to average net assets | | | 0.69% | | | | 0.69% | | | | 0.69% | | | | 0.69% | | | | 0.69% | |
| | | | | | | | | | | | | | | | | | | | | |
| Ratio of net investment income to average net assets | | | 2.89% | | | | 3.31% | | | | 3.54% | | | | 3.66% | | | | 3.50% | |
| | | | | | | | | | | | | | | | | | | | | |
| Portfolio turnover rate | | | 16% | | | | 10% | | | | 13% | | | | 10% | | | | 22% | |
| (a) | Total return is a measure of the change in value of an investment in the Fund over the period covered, which assumes any dividends or capital gains distributions are reinvested in shares of the Fund. Returns do not reflect the deduction of taxes a shareholder would pay on Fund distributions or the redemption of Fund shares. |
| | |
| (b) | Amount rounds to less than a penny per share. |
| | |
| See accompanying notes to financial statements. |
THE JAMESTOWN FUNDS NOTES TO FINANCIAL STATEMENTS March 31, 2010 |
1. Organization and Significant Accounting Policies
The Jamestown Balanced Fund, The Jamestown Equity Fund and The Jamestown Tax Exempt Virginia Fund (individually, a “Fund,” and, collectively, the “Funds”) are each a no-load series of Williamsburg Investment Trust (the “Trust”), an open-end management investment company registered under the Investment Company Act of 1940. The Trust was organized as a Massachusetts business trust on July 18, 1988. Other series of the Trust are not included in this report.
The Jamestown Balanced Fund’s investment objectives are long-term growth of capital and income through investment in a portfolio of equity and fixed income securities. Capital protection and low volatility are important investment goals.
The Jamestown Equity Fund’s investment objective is long-term growth of capital through investment in a diversified portfolio composed primarily of common stocks and other equity securities. Current income is incidental to this objective and may not be significant.
The Jamestown Tax Exempt Virginia Fund’s investment objectives are to provide current income exempt from federal income taxes and from the personal income taxes of Virginia, to preserve capital, to limit credit risk and to take advantage of opportunities to increase and enhance the value of a shareholder’s investment.
The following is a summary of the Funds’ significant accounting policies:
Securities valuation — The Funds’ portfolio securities are valued as of the close of business of the regular session of the New York Stock Exchange (normally 4:00 p.m., Eastern time). Securities traded on a national stock exchange are generally valued based upon the closing price on the principal exchange where the security is traded. Securities which are quoted by NASDAQ are valued at the NASDAQ Official Closing Price. Securities which are traded over-the-counter are valued at the last sales price, if available, otherwise, at the last quoted bid price. It is expected that fixed income securities will ordinarily be traded in the over-the-counter market, and common stocks will ordinarily be traded on a national securities exchange, but may also be traded in the over-the-counter market. Short-term instruments (those with rema ining maturities of 60 days or less) may be valued at amortized cost, which approximates market value.
When market quotations are not readily available, securities may be valued on the basis of prices provided by an independent pricing service. The prices provided by the pricing service are determined with consideration given to institutional bid and last sale prices and take into account securities prices, yields, maturities, call features, ratings, institutional trading in similar groups of securities and developments related to specific securities. If a pricing service cannot provide a valuation, securities will be valued in good faith at fair value using methods consistent with those established by and under the general supervision of the Board of Trustees. Such methods of fair valuation may include, but are not limited to: multiple of earnings, multiple of book value, discount from market of a similar freely traded security, purcha se price of security, subsequent private transactions in the security or related securities, or a combination of these and other factors.
THE JAMESTOWN FUNDS NOTES TO FINANCIAL STATEMENTS (Continued) |
Accounting principles generally accepted in the United States (“GAAP”) establish a single authoritative definition of fair value, set out a framework for measuring fair value and require additional disclosures about fair value measurements.
Various inputs are used in determining the value of each Fund’s investments. These inputs are summarized in the three broad levels listed below:
• Level 1 – quoted prices in active markets for identical securities
• Level 2 – other significant observable inputs
• Level 3 – significant unobservable inputs
The inputs or methodology used for valuing securities are not necessarily an indication of the risks associated with investing in those securities.
The following is a summary of the inputs used to value each Fund’s investments as of March 31, 2010 by security type:
| The Jamestown Balanced Fund | | Level 1 | | | Level 2 | | | Level 3 | | | Total | |
| Common Stocks | | $ | 15,159,590 | | | $ | — | | | $ | — | | | $ | 15,159,590 | |
U.S. Treasury & Agency Bonds | | | — | | | | 1,355,434 | | | | — | | | | 1,355,434 | |
Mortgage-Backed Securities | | | — | | | | 1,256,259 | | | | — | | | | 1,256,259 | |
| Corporate Bonds | | | — | | | | 4,247,942 | | | | — | | | | 4,247,942 | |
| Money Market Funds | | | — | | | | 217,353 | | | | — | | | | 217,353 | |
| Total | | $ | 15,159,590 | | | $ | 7,076,988 | | | $ | — | | | $ | 22,236,578 | |
| The Jamestown Equity Fund | | Level 1 | | | Level 2 | | | Level 3 | | | Total | |
| Common Stocks | | $ | 25,816,060 | | | $ | — | | | $ | — | | | $ | 25,816,060 | |
| Money Market Funds | | | — | | | | 169,548 | | | | — | | | | 169,548 | |
| Repurchase Agreements | | | — | | | | 705,175 | | | | — | | | | 705,175 | |
| Total | | $ | 25,816,060 | | | $ | 874,723 | | | $ | — | | | $ | 26,690,783 | |
| The Jamestown Tax Exempt Virginia Fund | | Level 1 | | | Level 2 | | | Level 3 | | | Total | |
| Municipal Bonds | | $ | — | | | $ | 31,721,500 | | | $ | — | | | $ | 31,721,500 | |
| Money Market Funds | | | — | | | | 794,235 | | | | — | | | | 794,235 | |
| Total | | $ | — | | | $ | 32,515,735 | | | $ | — | | | $ | 32,515,735 | |
Refer to The Jamestown Balanced Fund’s and The Jamestown Equity Fund’s Schedule of Investments for a listing of the common stocks and corporate bonds valued using Level 1 and Level 2 inputs by sector type.
Repurchase agreements — The Funds may enter into repurchase agreements. A repurchase agreement, which is collateralized by U.S. Government obligations, is valued at cost which, together with accrued interest, approximates market value. At the time a Fund enters into a repurchase agreement, the seller agrees that the value of the underlying securities, including accrued interest, will at all times be equal to or exceed the face amount of the repurchase
THE JAMESTOWN FUNDS NOTES TO FINANCIAL STATEMENTS (Continued) |
agreement. In addition, the Funds actively monitor and seek additional collateral, as needed. If the seller defaults, the fair value of the collateral may decline and realization of the collateral by the Funds may be delayed or limited.
Share valuation — The net asset value per share of each Fund is calculated daily by dividing the total value of each Fund’s assets, less liabilities, by the number of shares outstanding. The offering price and redemption price per share of each Fund is equal to the net asset value per share.
Investment income — Interest income is accrued as earned. Dividend income is recorded on the ex-dividend date. Discounts and premiums on fixed income securities purchased are amortized using the interest method.
Distributions to shareholders — Dividends arising from net investment income, if any, are declared and paid quarterly to shareholders of The Jamestown Balanced Fund and The Jamestown Equity Fund. Dividends arising from net investment income are declared daily and paid monthly to shareholders of The Jamestown Tax Exempt Virginia Fund. Net realized short-term capital gains, if any, may be distributed throughout the year and net realized long-term capital gains, if any, are distributed at least once each year. The amount of distributions from net investment income and net realized gains are determined in accordance with federal income tax regulations which may differ from GAAP. These “book/tax” differences are either temporary or permanent in nature.
The tax character of distributions paid during the years ended March 31, 2010 and March 31, 2009 was as follows:
| | Years Ended | | Ordinary Income | | | Long-Term Capital Gains | | | Exempt- Interest Dividends | | | Return of Capital | | | Total Distributions | |
| The Jamestown Balanced Fund | 3/31/10 | | $ | 464,931 | | | $ | — | | | $ | — | | | $ | — | | | $ | 464,931 | |
| | 3/31/09 | | $ | 449,455 | | | $ | — | | | $ | — | | | $ | — | | | $ | 449,455 | |
| The Jamestown Equity Fund | 3/31/10 | | $ | 134,788 | | | $ | — | | | $ | — | | | $ | — | | | $ | 134,788 | |
| | 3/31/09 | | $ | — | | | $ | — | | | $ | — | | | $ | 127,900 | | | $ | 127,900 | |
| The Jamestown Tax Exempt Virginia Fund | 3/31/10 | | $ | 2,107 | | | $ | 38,697 | | | $ | 991,361 | | | $ | — | | | $ | 1,032,165 | |
| | 3/31/09 | | $ | — | | | $ | 3,442 | | | $ | 990,933 | | | $ | — | | | $ | 994,375 | |
Security transactions — Security transactions are accounted for on trade date. Gains and losses on securities sold are determined on a specific identification basis.
Securities traded on a “to-be-announced” basis — The Jamestown Balanced Fund may trade securities on a “to-be-announced” (“TBA”) basis. In a TBA transaction, the Fund has committed to purchase securities for which all specific information is not yet known at the time of the trade, particularly the face amount in mortgage-backed securities transactions. Securities purchased on a TBA basis are not settled until they are delivered to the Fund, normally 15 to 45 days later. These transactions are subject to market fluctuations and their current value is determined in the same manner as for other portfolio securities.
Common expenses — Common expenses of the Trust are allocated among the series of the Trust based on relative net assets of each series or the nature of the services performed and the relative applicability to each series.
THE JAMESTOWN FUNDS NOTES TO FINANCIAL STATEMENTS (Continued) |
Estimates — The preparation of financial statements in conformity with GAAP requires management to make estimates and assumptions that affect the reported amounts of assets and liabilities and the disclosure of contingent assets and liabilities at the date of the financial statements and the reported amounts of income and expenses during the reporting period. Actual results could differ from those estimates.
Federal income tax — It is each Fund’s policy to comply with the special provisions of Subchapter M of the Internal Revenue Code applicable to regulated investment companies. As provided therein, in any fiscal year in which a Fund so qualifies and distributes at least 90% of its taxable net income, the Fund (but not the shareholders) will be relieved of federal income tax on the income distributed. Accordingly, no provision for income taxes has been made.
In order to avoid imposition of the excise tax applicable to regulated investment companies, it is also each Fund’s intention to declare as dividends in each calendar year at least 98% of its net investment income (earned during the calendar year) and 98% of its net realized capital gains (earned during the twelve months ended October 31) plus undistributed amounts from prior years.
The tax character of distributable earnings at March 31, 2010 was as follows:
| | | The Jamestown Balanced Fund | | | The Jamestown Equity Fund | | | The Jamestown Tax Exempt Virginia Fund | |
| Cost of portfolio investments | | $ | 18,093,384 | | | $ | 20,755,942 | | | $ | 31,196,666 | |
| Gross unrealized appreciation | | $ | 4,269,391 | | | $ | 6,147,193 | | | $ | 1,345,195 | |
| Gross unrealized depreciation | | | (126,197 | ) | | | (212,352 | ) | | | (26,126 | ) |
| Net unrealized appreciation on investments | | | 4,143,194 | | | | 5,934,841 | | | | 1,319,069 | |
| Undistributed ordinary income | | | 18,855 | | | | 43,196 | | | | — | |
| Undistributed tax exempt income | | | — | | | | — | | | | 12,466 | |
| Undistributed long-term gains | | | — | | | | — | | | | 19,652 | |
| Capital loss carryforwards | | | (1,681,314 | ) | | | (3,234,415 | ) | | | — | |
| Post-October losses | | | (109,105 | ) | | | (395,303 | ) | | | — | |
| Other temporary differences | | | (12,024 | ) | | | — | | | | (12,073 | ) |
| Total distributable earnings | | $ | 2,359,606 | | | $ | 2,348,319 | | | $ | 1,339,114 | |
The difference between the federal income tax cost of portfolio investments and the Schedule of Investments cost for The Jamestown Balanced Fund and The Jamestown Equity Fund is due to certain timing differences in the recognition of capital gains or losses under income tax regulations and GAAP. These “book/tax” differences are temporary in nature and are primarily due to the tax deferral of losses on wash sales and/or differing methods in the amortization of market discount and premium on fixed income securities.
As of March 31, 2010, The Jamestown Balanced Fund and The Jamestown Equity Fund had the following capital loss carryforwards for federal income tax purposes:
THE JAMESTOWN FUNDS NOTES TO FINANCIAL STATEMENTS (Continued) |
| | | Amount | | | Expires March 31, | |
| The Jamestown Balanced Fund | | $ | 931,525 | | | | 2017 | |
| | | | 749,789 | | | | 2018 | |
| | | $ | 1,681,314 | | | | | |
| | | | | | | | | |
| The Jamestown Equity Fund | | $ | 1,615,894 | | | | 2017 | |
| | | | 1,618,521 | | | | 2018 | |
| | | $ | 3,234,415 | | | | | |
In addition, The Jamestown Balanced Fund and The Jamestown Equity Fund had net realized capital losses of $109,105 and $395,303, respectively, during the period November 1, 2009 through March 31, 2010, which are treated for federal income tax purposes as arising during the Funds’ tax year ending March 31, 2011. These capital loss carryforwards and “post-October” losses may be utilized in future years to offset net realized capital gains, if any, prior to distribution to shareholders.
For the year ended March 31, 2010, The Jamestown Balanced Fund reclassified $10,106 of overdistributed net investment income against accumulated net realized losses on the Statements of Assets and Liabilities due to permanent differences in the recognition of capital gains or losses under income tax regulations and GAAP. These differences are primarily due to the tax treatment of certain debt obligations and paydown adjustments. Such reclassification had no effect on the Fund’s net assets or net asset value per share.
For the year ended March 31, 2010, The Jamestown Tax Exempt Virginia Fund reclassified $1,766 of undistributed net investment income against undistributed net realized gains on the Statements of Assets and Liabilities due to permanent differences in the recognition of capital gains or losses under income tax regulations and GAAP. These differences are primarily due to the tax treatment of certain debt obligations. Such reclassification had no effect on the Fund’s net assets or net asset value per share.
The Funds recognize the tax benefits or expenses of uncertain tax positions only when the position is “more likely than not” to be sustained assuming examination by tax authorities. Management has reviewed the tax positions taken on Federal income tax returns for all open tax years (tax years ended March 31, 2007 through March 31, 2010) of each Fund and has concluded that no provision for unrecognized tax benefits or expenses is required in these financial statements.
2. Investment Transactions
Investment transactions, other than short-term investments and U.S. government securities, were as follows for the year ended March 31, 2010:
| | | The Jamestown Balanced Fund | | | The Jamestown Equity Fund | | | The Jamestown Tax Exempt Virginia Fund | |
| Purchase of investment securities | | $ | 8,795,971 | | | $ | 14,964,046 | | | $ | 5,476,342 | |
| Proceeds from sales and maturities of investment securities | | $ | 9,466,171 | | | $ | 12,959,821 | | | $ | 5,035,085 | |
THE JAMESTOWN FUNDS NOTES TO FINANCIAL STATEMENTS (Continued) |
3. Transactions with Affiliates
INVESTMENT ADVISORY AGREEMENT
Each Fund’s investments are managed by Lowe, Brockenbrough & Company, Inc. (the “Adviser”) under the terms of an Investment Advisory Agreement. Under the Investment Advisory Agreement, The Jamestown Balanced Fund pays the Adviser a fee, which is computed and accrued daily and paid monthly, at an annual rate of .65% of its average daily net assets up to $250 million, .60% of the next $250 million of such assets and .55% of such assets in excess of $500 million. The Jamestown Equity Fund pays the Adviser a fee at an annual rate of .65% of its average daily net assets up to $500 million and .55% of such assets in excess of $500 million. The Jamestown Tax Exempt Virginia Fund pays the Adviser a fee at an annual rate of .40% of its average daily net assets up to $250 million, .35% of the next $250 million of such asset s and .30% of such assets in excess of $500 million. Certain Trustees and officers of the Trust are also officers of the Adviser.
During the year ended March 31, 2010, the Adviser voluntarily undertook to limit the total annual operating expenses of The Jamestown Tax Exempt Virginia Fund to .69% of average daily net assets. Accordingly, the Adviser voluntarily waived $19,113 of the Fund’s investment advisory fees during the year ended March 31, 2010.
MUTUAL FUND SERVICES AGREEMENT
Under the terms of a Mutual Fund Services Agreement between the Trust and Ultimus Fund Solutions, LLC (“Ultimus”), Ultimus provides administrative, pricing, accounting, dividend disbursing, shareholder servicing and transfer agent services for the Funds. For these services, Ultimus receives a monthly fee from each Fund at an annual rate of .15% of its average daily net assets up to $25 million; .125% of the next $25 million of such assets; and .10% of such assets in excess of $50 million. The Jamestown Balanced Fund and The Jamestown Equity Fund are each subject to a minimum monthly fee of $4,000. The Jamestown Tax Exempt Virginia Fund is subject to a minimum monthly fee of $3,500. In addition, each Fund pays out-of-pocket expenses including, but not limited to, postage, supplies and costs of pricing portfolio securities. C ertain officers of the Trust are also officers of Ultimus, or of Ultimus Fund Distributors, LLC (the “Distributor”), the principal underwriter of each Fund’s shares and an affiliate of Ultimus. The Distributor is compensated by the Adviser (not the Funds) for acting as principal underwriter.
COMPLIANCE CONSULTING AGREEMENT
Under the terms of a Compliance Consulting Agreement between the Trust and Ultimus, Ultimus provides an individual to serve as the Trust’s Chief Compliance Officer and to administer the Funds’ compliance policies and procedures. For these services, the Funds pay Ultimus an annual base fee of $18,600 plus an asset-based fee equal to 0.01% per annum on the Funds’ aggregate net assets in excess of $100 million. In addition, the Funds reimburse Ultimus for reasonable out-of-pocket expenses, if any, incurred in connection with these services.
THE JAMESTOWN FUNDS NOTES TO FINANCIAL STATEMENTS (Continued) |
4. Brokerage Arrangement
In order to reduce the total operating expenses of The Jamestown Balanced Fund and The Jamestown Equity Fund, a portion of each Fund’s operating expenses have been paid through an arrangement with a third-party broker-dealer who is compensated through commission trades. Payment of expenses by the broker-dealer is based on a percentage of commissions earned.
Expenses reimbursed through the brokerage arrangement totaled $18,000 and $11,000 for The Jamestown Balanced Fund and The Jamestown Equity Fund, respectively, for the year ended March 31, 2010.
5. Contingencies and Commitments
The Funds indemnify the Trust’s officers and Trustees for certain liabilities that might arise from their performance of their duties to the Funds. Additionally, in the normal course of business the Funds enter into contracts that contain a variety of representations and warranties and which provide general indemnifications. The Funds’ maximum exposure under these arrangements is unknown, as this would involve future claims that may be made against the Funds that have not yet occurred. However, based on experience, the Funds expect the risk of loss to be remote.
6. Subsequent Events
The Funds are required to recognize in the financial statements the effects of all subsequent events that provide additional evidence about conditions that existed as of the date of the Statements of Assets and Liabilities. For non-recognized subsequent events that must be disclosed to keep the financial statements from being misleading, the Funds are required to disclose the nature of the event as well as an estimate of its financial effect, or a statement that such an estimate cannot be made. Management has evaluated subsequent events through the issuance of these financial statements and has noted no such events.
7. Recent Accounting Pronouncement
In January 2010, the Financial Accounting Standards Board (“FASB”) issued Accounting Standards Update (“ASU”) No. 2010-06 “Improving Disclosures about Fair Value Measurements.” ASU No. 2010-06 amends FASB Accounting Standards Codification Topic 820, Fair Value Measurements and Disclosures, to require additional disclosures regarding fair value measurements. Certain disclosures required by ASU No. 2010-06 are effective for interim and annual reporting periods beginning after December 31, 2009 and others for fiscal years beginning after December 15, 2010 and for interim periods within those fiscal years. Management is currently evaluating the impact ASU No. 2010-06 will have on the Funds’ financial statement disclosures.
THE JAMESTOWN FUNDS REPORT OF INDEPENDENT REGISTERED PUBLIC ACCOUNTING FIRM |
The Board of Trustees and Shareholders of
The Jamestown Balanced Fund,
The Jamestown Equity Fund,
and The Jamestown Tax Exempt Virginia Fund of the Williamsburg Investment Trust:
We have audited the accompanying statements of assets and liabilities, including the schedules of investments, of The Jamestown Balanced Fund, The Jamestown Equity Fund, and The Jamestown Tax Exempt Virginia Fund (the “Funds”) (each a series of the Williamsburg Investment Trust), as of March 31, 2010, and the related statements of operations for the year then ended, the statements of changes in net assets for each of the two years in the period then ended, and the financial highlights for each of the five years in the period then ended. These financial statements and financial highlights are the responsibility of the Funds’ management. Our responsibility is to express an opinion on these financial statements and financial highlights based on our audits.
We conducted our audits in accordance with the standards of the Public Company Accounting Oversight Board (United States). Those standards require that we plan and perform the audits to obtain reasonable assurance about whether the financial statements and financial highlights are free of material misstatement. We were not engaged to perform an audit of the Funds’ internal control over financial reporting. Our audits included consideration of internal control over financial reporting as a basis for designing audit procedures that are appropriate in the circumstances, but not for the purpose of expressing an opinion on the effectiveness of the Funds’ internal control over financial reporting. Accordingly, we express no such opinion. An audit also includes examining, on a test basis, evidence supporting the amounts and disclo sures in the financial statements and financial highlights, assessing the accounting principles used and significant estimates made by management, and evaluating the overall financial statement presentation. Our procedures included confirmation of securities owned as of March 31, 2010, by correspondence with the custodian. We believe that our audits provide a reasonable basis for our opinion.
In our opinion, the financial statements and financial highlights referred to above present fairly, in all material respects, the financial position of The Jamestown Balanced Fund, The Jamestown Equity Fund, The Jamestown Tax Exempt Virginia Fund, and The Jamestown Select Fund at March 31, 2010, the results of their operations for the year then ended, the changes in their net assets for each of the two years in the period then ended, and the financial highlights for each of the five years in the period then ended, in conformity with U.S. generally accepted accounting principles.
Cincinnati, Ohio
May 27, 2010
THE JAMESTOWN FUNDS BOARD OF TRUSTEES AND EXECUTIVE OFFICERS (Unaudited) |
Overall responsibility for management of the Funds rests with the Board of Trustees. The Trustees serve during the lifetime of the Trust and until its termination, or until death, resignation, retirement or removal. The Trustees, in turn, elect the officers of the Funds. The officers have been elected for an annual term. The following are the Trustees and executive officers of the Funds:
| Trustee | Address | Age | Position Held with the Trust | Length of Time Served |
| * | Charles M. Caravati, Jr. | 931 Broad Street Road Manakin-Sabot, VA | 73 | Chairman and Trustee | Since June 1991 |
| * | Austin Brockenbrough III | 1802 Bayberry Court, Suite 400 Richmond, VA | 73 | Trustee and Vice President | Since September 1988 |
| * | John T. Bruce | 800 Main Street Lynchburg, VA | 56 | Trustee | Since September 1988 |
| | Robert S. Harris | 100 Darden Boulevard Charlottesville, VA | 60 | Trustee | Since January 2007 |
| | J. Finley Lee, Jr. | 448 Pond Apple Drive North Naples, FL | 70 | Trustee | Since September 1988 |
| | Richard L. Morrill | University of Richmond Richmond, VA | 70 | Trustee | Since March 1993 |
| | Harris V. Morrissette | 100 Jacintoport Boulevard Saraland, AL | 50 | Trustee | Since March 1993 |
| | Samuel B. Witt III | 302 Clovelly Road Richmond, VA | 74 | Trustee | Since November 1988 |
| | Charles M. Caravati III | 1802 Bayberry Court, Suite 400 Richmond, VA | 45 | President, Jamestown Balanced Fund and Jamestown Equity Fund | Since January 1996 |
| | Joseph A. Jennings, III | 1802 Bayberry Court, Suite 400 Richmond, VA | 47 | President, Jamestown Tax Exempt Virginia Fund | Since July 2005 |
| | Lawrence B. Whitlock, Jr. | 1802 Bayberry Court, Suite 400 Richmond, VA | 62 | Vice President, Jamestown Balanced Fund and Jamestown Equity Fund | Since February 2002 |
| | Connie R. Taylor | 1802 Bayberry Court, Suite 400 Richmond, VA | 60 | Vice President, Jamestown Balanced Fund and Jamestown Equity Fund | Since March 1993 |
| | Robert G. Dorsey | 225 Pictoria Drive, Suite 450 Cincinnati, OH | 53 | Vice President | Since November 2000 |
| | Mark J. Seger | 225 Pictoria Drive, Suite 450 Cincinnati, OH | 48 | Treasurer | Since November 2000 |
| | John F. Splain | 225 Pictoria Drive, Suite 450 Cincinnati, OH | 53 | Secretary | Since November 2000 |
| | Tina H. Bloom | 225 Pictoria Drive, Suite 450 Cincinnati, OH | 41 | Chief Compliance Officer | Since August 2006 |
| * | Messrs. Bruce and Brockenbrough, as affiliated persons of investment advisers to the Trust, are “interested persons” of the Trust within the meaning of Section 2(a)(19) of the Investment Company Act of 1940. Charles M. Caravati, Jr. is the father of Charles M. Caravati III. |
THE JAMESTOWN FUNDS BOARD OF TRUSTEES AND EXECUTIVE OFFICERS (Unaudited) (Continued) |
Each Trustee oversees nine series of the Trust, including the Funds. The principal occupations of the Trustees and executive officers of the Funds during the past five years and public directorships held by the Trustees are set forth below:
Charles M. Caravati, Jr. is a retired physician. He is also the retired President of Dermatology Associates of Virginia, P.C.
Austin Brockenbrough III is President and Managing Director of the Adviser. He is a member of the Board of Directors of Tredegar Corporation (a plastics manufacturer) and Wilkinson O’Grady & Co., Inc. (a global asset manager).
John T. Bruce is a Principal of Flippin, Bruce & Porter, Inc. (an investment advisory firm).
Robert S. Harris is the C. Stewart Sheppard Professor of Business Administration at The Darden Graduate School of Business Administration at the University of Virginia. He was previously the dean at Darden. Professor Harris has published widely on corporate finance, financial markets and mergers and acquisitions and has served as a consultant to corporations and government agencies.
J. Finley Lee, Jr. is a financial consultant and the Julian Price Professor Emeritus at the University of North Carolina.
Richard L. Morrill serves as President of the Teagle Foundation (charitable foundation) and Chancellor of the University of Richmond. He is also a member of the Board of Directors of Tredegar Corporation and Albemarle Corporation (specialty chemicals manufacturer).
Harris V. Morrissette is President of China Doll Rice and Beans Inc. and Dixie Lily Foods. He is a member of the Board of Directors of BancTrust Financial Group, Inc. (a bank holding company). In addition, he is Chairman of Azalea Aviation, Inc. (an airplane fueling company).
Samuel B. Witt III is the retired Senior Vice President and General Counsel of Stateside Associates, Inc. He is also a member of the Board of Directors of The Swiss Helvetia Fund, Inc. (a closed-end investment company).
Charles M. Caravati III is a Managing Director of the Adviser.
Joseph A. Jennings, III is Vice President and a Portfolio Manager of the Adviser.
Lawrence B. Whitlock, Jr. is a Managing Director of the Adviser.
Connie R. Taylor is an Administrator of the Adviser.
Robert G. Dorsey is a Managing Director of Ultimus Fund Solutions, LLC and Ultimus Fund Distributors, LLC.
Mark J. Seger is a Managing Director of Ultimus Fund Solutions, LLC and Ultimus Fund Distributors, LLC.
THE JAMESTOWN FUNDS BOARD OF TRUSTEES AND EXECUTIVE OFFICERS (Unaudited) (Continued) |
John F. Splain is a Managing Director of Ultimus Fund Solutions, LLC and Ultimus Fund Distributors, LLC.
Tina H. Bloom is Vice President of Administration of Ultimus Fund Solutions, LLC and Ultimus Fund Distributors, LLC.
Additional information about members of the Board of Trustees and executive officers is available in the Statement of Additional Information (“SAI”). To obtain a free copy of the SAI, please call 1-866-738-1126.
FEDERAL TAX INFORMATION (Unaudited) |
In accordance with federal tax requirements, the following provides shareholders with information concerning distributions from ordinary income and net realized gains made by the Funds during the fiscal year ended March 31, 2010. Certain dividends paid by the Funds may be subject to a maximum tax rate of 15%, as provided by the Jobs and Growth Tax Relief Reconciliation Act of 2003. The Jamestown Balanced Fund and The Jamestown Equity Fund intend to designate up to a maximum amount of $464,931 and $134,788, respectively, as taxed at a maximum rate of 15%. The Jamestown Tax Exempt Virginia Fund designates $38,304 as long-term gain distributions. For the fiscal year ended March 31, 2010, 51% and 100% of the dividends paid from ordinary income by The Jamestown Balanced Fund and The Jamestown Equity Fund, respectively, qualified for the div idends received deduction for corporations.
As required by federal regulations, complete information will be computed and reported in conjunction with your 2010 Form 1099-DIV.
THE JAMESTOWN FUNDS ABOUT YOUR FUNDS’ EXPENSES (Unaudited) |
We believe it is important for you to understand the impact of costs on your investment. As a shareholder of the Funds, you may incur two types of costs: (1) transaction costs; and (2) ongoing costs, including management fees and other Fund expenses. The following examples are intended to help you understand your ongoing costs (in dollars) of investing in the Funds and to compare these costs with the ongoing costs of investing in other mutual funds.
A mutual fund’s ongoing costs are expressed as a percentage of its average net assets. This figure is known as the expense ratio. The expenses in the table below are based on an investment of $1,000 made at the beginning of the period shown and held for the entire period (October 1, 2009 through March 31, 2010).
The table below illustrates each Fund’s costs in two ways:
Actual fund return – This section helps you to estimate the actual expenses that you paid over the period. The “Ending Account Value” shown is derived from each Fund’s actual return, and the third column shows the dollar amount of operating expenses that would have been paid by an investor who started with $1,000 in the Funds. You may use the information here, together with the amount you invested, to estimate the expenses that you paid over the period.
To do so, simply divide your account value by $1,000 (for example, an $8,600 account value divided by $1,000 = 8.6), then multiply the result by the number given for the Funds under the heading “Expenses Paid During Period.”
Hypothetical 5% return – This section is intended to help you compare the Funds’ ongoing costs with those of other mutual funds. It assumes that each Fund had an annual return of 5% before expenses during the period shown, but that the expense ratio is unchanged. In this case, because the returns used are not the Funds’ actual returns, the results do not apply to your investment. The example is useful in making comparisons because the Securities and Exchange Commission (“SEC”) requires all mutual funds to calculate expenses based on a 5% return. You can assess each Fund’s ongoing costs by comparing this hypothetical example with the hypothetical examples that appear in shareholder reports of other funds.
Note that expenses shown in the table are meant to highlight and help you compare ongoing costs only. The Funds do not charge sales loads or redemption fees.
The calculations assume no shares were bought or sold during the period. Your actual costs may have been higher or lower, depending on the amount of your investment and the timing of any purchases or redemptions.
More information about the Funds’ expenses, including annual expense ratios for the prior five fiscal years, can be found in this report. For additional information on operating expenses and other shareholder costs, please refer to the Funds’ prospectus.
THE JAMESTOWN FUNDS ABOUT YOUR FUNDS’ EXPENSES (Unaudited) (Continued) |
| | Beginning Account Value October 1, 2009 | Ending Account Value March 31, 2010 | Expenses Paid During Period* |
| The Jamestown Balanced Fund | | | |
Based on Actual Fund Return | $1,000.00 | $1,073.10 | $5.79 |
| Based on Hypothetical 5% Return (before expenses) | $1,000.00 | $1,019.35 | $5.64 |
| The Jamestown Equity Fund | | | |
Based on Actual Fund Return | $1,000.00 | $1,099.00 | $5.49 |
| Based on Hypothetical 5% Return (before expenses) | $1,000.00 | $1,019.70 | $5.29 |
| The Jamestown Tax Exempt Virginia Fund | | | |
Based on Actual Fund Return | $1,000.00 | $ 998.60 | $3.44 |
| Based on Hypothetical 5% Return (before expenses) | $1,000.00 | $1,021.49 | $3.48 |
| * | Expenses are equal to the Funds’ annualized expense ratios for the period as stated below, multiplied by the average account value over the period, multiplied by 182/365 (to reflect the one-half year period). |
| The Jamestown Balanced Fund | 1.12% |
| The Jamestown Equity Fund | 1.05% |
| The Jamestown Tax Exempt Virginia Fund | 0.69% |
OTHER INFORMATION (Unaudited) |
A description of the policies and procedures that the Funds use to vote proxies relating to portfolio securities is available without charge upon request by calling toll-free 1-866-738-1126, or on the SEC’s website at http://www.sec.gov. Information regarding how the Funds voted proxies relating to portfolio securities during the most recent 12-month period ended June 30 is also available without charge upon request by calling toll-free 1-866-738-1126, or on the SEC’s website at http://www.sec.gov.
The Trust files a complete listing of portfolio holdings of the Funds with the SEC as of the end of the first and third quarters of each fiscal year on Form N-Q. The filings are available upon request, by calling 1-866-738-1126. Furthermore, you may obtain a copy of these filings on the SEC’s website at http://www.sec.gov. The Trust’s Forms N-Q may also be reviewed and copied at the SEC’s Public Reference Room in Washington, DC, and information on the operation of the Public Reference Room may be obtained by calling 1-800-SEC-0330.
THE JAMESTOWN FUNDS DISCLOSURE REGARDING APPROVAL OF INVESTMENT ADVISORY AGREEMENTS (Unaudited) |
At an in-person meeting held on February 9, 2010, the Board of Trustees, including a majority of the Independent Trustees, approved the continuance for a one-year period of the Investment Advisory Agreements with the Adviser on behalf of The Jamestown Balanced Fund, The Jamestown Equity Fund and The Jamestown Tax Exempt Virginia Fund. Below is a discussion of the factors considered by the Board of Trustees along with their conclusions with respect thereto that formed the basis for the Board’s approvals.
In selecting the Adviser and approving the continuance of the Investment Advisory Agreements, the Trustees considered all information they deemed reasonably necessary to evaluate the terms of the Agreements. The principal areas of review by the Trustees were the nature, extent and quality of the services provided by the Adviser and the reasonableness of the fees charged for those services. These matters were considered by the Independent Trustees consulting with experienced counsel for the Independent Trustees, who is independent of the Adviser.
The Trustees’ evaluation of the quality of the Adviser’s services took into account their knowledge and experience gained through meetings with and reports of the Adviser’s senior management over the course of the preceding year. Both short-term and long-term investment performance of the Funds was considered. Each Fund’s performance was compared to its performance benchmark and to that of competitive funds with similar investment objectives and to the Adviser’s comparably managed private accounts. The Trustees also considered the scope and quality of the in-house capabilities of the Adviser and other resources dedicated to performing services for the Funds. The quality of administrative and other services, including the Adviser’s role in coordinating the activities of the Funds’ other service providers, were considered in light of the Funds’ compliance with investment policies and applicable laws and regulations and of related reports by management and the Funds’ independent public accounting firm in periodic meetings with the Trust’s Audit Committee. The Trustees also considered the business reputation of the Adviser, the qualifications of its key investment and compliance personnel, and its financial resources.
In reviewing the fees payable under the Investment Advisory Agreements, the Trustees compared the advisory fees and overall expense levels of each Fund with those of competitive funds with similar investment objectives as well as the private accounts managed by the Adviser. The Trustees considered information provided by the Adviser concerning the Adviser’s profitability with respect to each Fund, including the assumptions and methodology used in preparing the profitability information, in light of applicable case law relating to advisory fees. For these purposes, the Trustees took into account not only the fees paid by the Funds, but also so-called “fallout” benefits to the Adviser, such as the benefits of research made available to the Adviser by reason of brokerage commissions generated by the Funds’ securiti es transactions. The Trustees also reviewed the revenue sharing arrangements relating to the Funds, whereby fees are paid by the Adviser to various intermediaries that direct assets to the Funds. In evaluating the Funds’ advisory fees, the Trustees took into account the complexity and quality of the investment management of the Funds.
Based upon their review of this information, the Independent Trustees concluded that: (i) upon consideration of the 2009 performance and the longer term performance of The Jamestown
THE JAMESTOWN FUNDS DISCLOSURE REGARDING APPROVAL OF INVESTMENT ADVISORY AGREEMENTS (Unaudited) (Continued) |
Balanced Fund and The Jamestown Equity Fund, in light of the Adviser’s investment approach and each Fund’s investment objective, as well as the services provided to shareholders, the Adviser has provided satisfactory services to the Funds; (ii) although the short-term and long-term performance of The Jamestown Tax Exempt Virginia Fund has lagged its benchmark index and the average returns for comparably managed mutual funds, the Fund is managed in a conservative investment style and is not managed to correlate to any particular index, and the Independent Trustees believe that the Fund has satisfactorily met the goal of providing tax-exempt income with limited exposure to credit and maturity risks; (iii) the investment advisory fees of each Fund are competitive with comparably managed funds and each Fund’s total operat ing expense ratio is competitive with (and, in the case of The Jamestown Equity Fund and The Jamestown Tax Exempt Virginia Fund, significantly lower than) the average expense ratio for comparably managed funds, according to statistics derived from Morningstar, Inc.; and (iv) the Adviser’s commitment to cap overall operating expenses of The Jamestown Tax-Exempt Virginia Fund by waiving a portion of its investment advisory fees has enabled such Fund to increase returns for its shareholders and to maintain an overall expense ratio that is competitive with the average for similarly managed funds, despite the small size of the Fund. Given the current size of the Funds and their expected growth, the Independent Trustees did not believe that at the present time it would be relevant to consider the extent to which economies of scale would be realized as the Funds grow, and whether fee levels reflect these economies of scale. The Independent Trustees also considered the “fallout” benefits to, and th e profitability of, the Adviser with respect to the Funds, but given the amounts involved viewed these as secondary factors in connection with the evaluation of the reasonableness of the advisory fees paid by the Funds.
No single factor was considered in isolation or to be determinative to the decision of the Trustees to approve continuance of the Investment Advisory Agreements. Rather the Trustees concluded, in light of a weighing and balancing of all factors considered, that it was in the best interests of each Fund and its shareholders to continue its Investment Advisory Agreement without modification to its terms, including the fees charged for services thereunder
This page intentionally left blank.
| | | | |
| | | | | |
| | | THE JAMESTOWN FUNDS Investment Adviser Lowe, Brockenbrough & Company, Inc. 1802 Bayberry Court Suite 400 Richmond, Virginia 23226 www.jamestownfunds.com Administrator Ultimus Fund Solutions, LLC P.O. Box 46707 Cincinnati, Ohio 45246-0707 (Toll-Free) 1-866-738-1126 Independent Registered Public Accounting Firm Ernst & Young LLP 1900 Scripps Center 312 Walnut Street Cincinnati, Ohio 45202 Legal Counsel Sullivan & Worcester LLP One Post Office Square Boston, Massachusetts 02109 Board of Trustees Austin Brockenbrough, III John T. Bruce Charles M. Caravati, Jr. Robert S. Harris J. Finley Lee, Jr. Richard L. Morrill Harris V. Morrissette Samuel B. Witt, III | | |
| | | | | |
| | | | |
As of the end of the period covered by this report, the registrant has adopted a code of ethics that applies to the registrant’s principal executive officer, principal financial officer, principal accounting officer or controller, or persons performing similar functions, regardless of whether these individuals are employed by the registrant or a third party. Pursuant to Item 12(a)(1), a copy of registrant’s code of ethics is filed as an exhibit to this Form N-CSR. During the period covered by this report, the code of ethics has not been amended, and the registrant has not granted any waivers, including implicit waivers, from the provisions of the code of ethics.
| Item 3. | Audit Committee Financial Expert. |
The registrant’s board of trustees has determined that the registrant has at least one audit committee financial expert serving on its audit committee. The name of the audit committee financial expert is Dr. Robert S. Harris. Dr. Harris is “independent” for purposes of this Item.
| Item 4. | Principal Accountant Fees and Services. |
| | (a) | Audit Fees. The aggregate fees billed for professional services rendered by the principal accountant for the audit of the registrant’s annual financial statements or for services that are normally provided by the accountant in connection with statutory and regulatory filings or engagements were $125,200 and $136,310 with respect to the registrant’s fiscal years ended March 31, 2010 and 2009, respectively. |
| | (b) | Audit-Related Fees. No fees were billed in either of the last two fiscal years for assurance and related services by the principal accountant that are reasonably related to the performance of the audit of the registrant’s financial statements and are not reported under paragraph (a) of this Item. |
| | (c) | Tax Fees. No fees were billed in either of the last two fiscal years for professional services rendered by the principal accountant for tax compliance, tax advice, and tax planning. |
| | (d) | All Other Fees. No fees were billed in either of the last two fiscal years for products and services provided by the principal accountant, other than the services reported in paragraphs (a) through (c) of this Item. |
| | (e)(1) | The audit committee has adopted pre-approval policies and procedures described in paragraph (c)(7) of Rule 2-01 of Regulation S-X. Pursuant to the pre-approval policies and procedures, the audit committee has pre-approved certain audit, audit-related and tax services and has established, with respect to each fiscal year of the registrant, the following maximum fee levels for services covered under the pre-approval policies and procedures: |
| | · | Services, relating to a new series or class of a series, associated with SEC registration statements, periodic reports and other documents filed by the registrant with the SEC or other documents issued by the registrant in connection with securities offerings and assistance in responding to SEC comment letters—$5,000 |
| | · | Consultations with management of the registrant, not in connection with an audit, as to the accounting or disclosure treatment of transactions or events and/or the actual or potential impact of final or proposed rules, standards or interpretations by the SEC, FASB or other regulatory or standard setting bodies—$5,000 |
| | · | All tax services provided to the registrant in the aggregate—$5,000 |
| | (e)(2) | None of the services described in paragraph (b) through (d) of this Item were approved by the audit committee pursuant to paragraph (c)(7)(i)(C) of Rule 2-01 of Regulation S-X. |
| | (f) | Less than 50% of hours expended on the principal accountant’s engagement to audit the registrant’s financial statements for the most recent fiscal year were attributed to work performed by persons other than the principal accountant’s full-time, permanent employees. |
| | (g) | No non-audit fees were billed in either of the last two fiscal years by the registrant’s principal accountant for services rendered to the registrant, and rendered to the registrant’s investment adviser (not including any sub-adviser whose role is primarily portfolio management and is subcontracted with or overseen by another investment adviser), and any entity controlling, controlled by, or under common control with the adviser that provides ongoing services to the registrant. |
| | (h) | The principal accountant has not provided any non-audit services to the registrant’s investment adviser (not including any sub-adviser whose role is primarily portfolio management and is subcontracted with or overseen by another investment adviser), and any entity controlling, controlled by, or under common control with the investment adviser that provides ongoing services to the registrant. |
| Item 5. | Audit Committee of Listed Registrants. |
Not applicable
| Item 6. | Schedule of Investments. |
| (a) | Not applicable [schedule filed with Item 1] |
| Item 7. | Disclosure of Proxy Voting Policies and Procedures for Closed-End Management Investment Companies. |
| Item 8. | Portfolio Managers of Closed-End Management Investment Companies. |
| Item 9. | Purchases of Equity Securities by Closed-End Management Investment Company and Affiliated Purchasers. |
| Item 10. | Submission of Matters to a Vote of Security Holders. |
The registrant’s Nominating Committee shall review shareholder recommendations to fill vacancies on the registrant’s board of trustees if such recommendations are submitted in writing, addressed to the Committee at the registrant’s offices and meet any minimum qualifications adopted by the Committee. The Committee may adopt, by resolution, a policy regarding its procedures for considering candidates for the board of trustees, including any recommended by shareholders.
| Item 11. | Controls and Procedures. |
(a) Based on their evaluation of the registrant’s disclosure controls and procedures (as defined in Rule 30a-3(c) under the Investment Company Act of 1940) as of a date within 90 days of the filing date of this report, the registrant’s principal executive officers and principal financial officer have concluded that such disclosure controls and procedures are reasonably designed and are operating effectively to ensure that material information relating to the registrant, including its consolidated subsidiaries, is made known to them by others within those entities, particularly during the period in which this report is being prepared, and that the information required in filings on Form N-CSR is recorded, processed, summarized, and reported on a timely basis.
(b) There were no changes in the registrant’s internal control over financial reporting (as defined in Rule 30a-3(d) under the Investment Company Act of 1940) that occurred during the second fiscal quarter of the period covered by this report that have materially affected, or are reasonably likely to materially affect, the registrant’s internal control over financial reporting.
File the exhibits listed below as part of this Form. Letter or number the exhibits in the sequence indicated.
(a)(1) Any code of ethics, or amendment thereto, that is the subject of the disclosure required by Item 2, to the extent that the registrant intends to satisfy the Item 2 requirements through filing of an exhibit: Attached hereto
(a)(2) A separate certification for each principal executive officer and principal financial officer of the registrant as required by Rule 30a-2(a) under the Act (17 CFR 270.30a-2(a)): Attached hereto
(a)(3) Any written solicitation to purchase securities under Rule 23c-1 under the Act (17 CFR 270.23c-1) sent or given during the period covered by the report by or on behalf of the registrant to 10 or more persons: Not applicable
(b) Certifications required by Rule 30a-2(b) under the Act (17 CFR 270.30a-2(b)): Attached hereto
| Exhibit 99.CODE ETH | Code of Ethics |
| Exhibit 99.CERT | Certifications required by Rule 30a-2(a) under the Act |
| Exhibit 99.906CERT | Certifications required by Rule 30a-2(b) under the Act |
SIGNATURES
Pursuant to the requirements of the Securities Exchange Act of 1934 and the Investment Company Act of 1940, the registrant has duly caused this report to be signed on its behalf by the undersigned, thereunto duly authorized.
(Registrant) Williamsburg Investment Trust
| By (Signature and Title)* | /s/ John F. Splain | |
| | John F. Splain, Secretary | |
| Date | June 2, 2010 | | |
Pursuant to the requirements of the Securities Exchange Act of 1934 and the Investment Company Act of 1940, this report has been signed below by the following persons on behalf of the registrant and in the capacities and on the dates indicated.
| By (Signature and Title)* | /s/ John T. Bruce | |
| | John T. Bruce, President (FBP Value Fund and FBP Balanced Fund) | |
| Date | June 2, 2010 | | |
| | | |
| | | |
| | | |
| By (Signature and Title)* | /s/ Thomas W. Leavell | |
| | Thomas W. Leavell, President (The Government Street Equity Fund, The Government Street Mid-Cap Fund and The Alabama Tax Free Bond Fund) | |
| Date | June 2, 2010 | | |
| | | |
| | | |
| | | |
| By (Signature and Title)* | /s/ Charles M. Caravati III | |
| | Charles M. Caravati III, President (The Jamestown Balanced Fund and The Jamestown Equity Fund) | |
| Date | June 2, 2010 | | |
| | | |
| | | |
| | | |
| By (Signature and Title)* | /s/ Joseph A. Jennings III | |
| | Joseph A. Jennings III, President | |
| | (The Jamestown Tax Exempt Virginia Fund) | |
| Date | June 2, 2010 | | |
| | | |
| | | |
| | | |
| By (Signature and Title)* | /s/ John P. Ackerly, IV | |
| | John P. Ackerly, IV, President | |
| | (The Davenport Core Fund) | |
| Date | June 2, 2010 | | |
| | | |
| | | |
| | | |
| By (Signature and Title)* | /s/ Mark J. Seger | |
| | Mark J. Seger, Treasurer | |
| Date | June 2, 2010 | | |
* Print the name and title of each signing officer under his or her signature.