Washington, D.C. 20549
W. Lee H. Dunham, Esq.
Form N-CSR is to be used by management investment companies to file reports with the Commission not later than 10 days after the transmission to stockholders of any report that is required to be transmitted to stockholders under Rule 30e-1 under the Investment Company Act of 1940 (17 CFR 270.30e-1). The Commission may use the information provided on Form N-CSR in its regulatory, disclosure review, inspection, and policymaking roles.
A registrant is required to disclose the information specified by Form N-CSR, and the Commission will make this information public. A registrant is not required to respond to the collection of information contained in Form N-CSR unless the Form displays a currently valid Office of Management and Budget ("OMB") control number. Please direct comments concerning the accuracy of the information collection burden estimate and any suggestions for reducing the burden to Secretary, Securities and Exchange Commission, 450 Fifth Street, NW, Washington, DC 20549-0609. The OMB has reviewed this collection of information under the clearance requirements of 44 U.S.C. § 3507.
THE DAVENPORT FUNDS LETTER TO SHAREHOLDERS | |
Equity markets roared higher in the quarter ended March 31, 2013. The S&P 500 Index gained 10.61%, the Dow Jones Industrial Average advanced 11.93% and the Russell 2000 Index surged 12.39%. The Dow and S&P have both been hitting fresh all-time highs. Early in the quarter, markets bounced as fear of an acute event associated with the “fiscal cliff” waned. In fact, the S&P 500 posted its best January since 1997. Subsequently, markets shrugged off fears surrounding sequestration in the U.S. (i.e. mandated government spending cuts), a slowdown in domestic consumer spending, and fresh budget woes in Europe.
Why the rally? For one, economic and corporate fundamentals appear to be improving. Credit Suisse First Boston (CSFB) recently noted: “The idea that the cliff, or the election, held back the economy heading into year-end is everywhere but in the actual data.” Corporate earnings have generally exceeded expectations, implying estimates for 2013 earnings could move upward. The unemployment rate has continued to decline, the housing market is rebounding sharply, and consumer spending has proven resilient in the face of higher gas prices and payroll taxes. Furthermore, the financial system is on much stronger footing as evidenced by most banks’ solid showing in the recent “stress test.”
We’ve also begun to see a pickup in mergers & acquisitions, with deal value up 14% year-over-year according to CSFB. Further takeout activity makes sense given that deal value is still running 36% below its 10-year average in the U.S. and 64% below average in Europe. Given depressed financing costs and leverage levels near a 20-year low, most companies certainly have the capacity to look at opportunities. Alternatively, many of these companies may look to repurchase their own stock. CSFB points out that more optimal leverage could allow companies to buy back 9% of the market capitalization of the U.S. Both takeouts and share repurchase activity shrink the available supply of equities and are generally supportive for the market.
Perhaps most notable, we’ve begun to see money flows shift. After five years of bond inflows dwarfing stock inflows, billions have flowed into equity funds year-to-date as fear has abated and stocks have flexed their muscle as a relatively attractive asset class. Many investors and money managers have been under-exposed to equities; hence, improving market conditions have created somewhat of a “buying panic.” At times in the past, such a surge of money into stocks has been a warning signal. But we’re hopeful that it can last more than three months (especially when considering how long it went the other way). We’re also comforted by the fact that valuations remain reasonable by historical standards (S&P trades for 14.5x earnings) and, while we are close to all-time highs, we’re just getting back to the prior market peaks of 2000 and 2007.
As always, there are factors that could derail the market’s momentum. The U.S. budget deficit, peaking corporate profit margins, fiscal issues in Europe, and slowing growth in China are threats that come to mind. However, the “elephant in the room” appears to be the threat of a shift in interest rates. Interest rates have been declining for many years alongside a secular bull market for bonds and remain depressed (a 10-year Treasury currently yields 1.9%) due in great
part to monetary policy. Ironically, we seem to run the risk of things getting too good. That is, if economic momentum builds too quickly, we are likely to see policy shift and interest rates hit a much anticipated inflection point.
BCA Research points out that U.S. stocks have historically suffered swift corrections following the end of long bull cycles for Treasuries (for more information, please visit www.bcaresearch.com). When looking at four prior cycles, they note that stocks have seen mean declines exceeding 20% over just 10 months once the bull cycle ends and interest rates turn upward. This is clearly an alarming statistic; however, BCA also notes that equities go on to generate robust long-term returns. In fact, the 10-year compound annual growth rate for equities after the end of those same cycles was roughly 9%. In other words, investors were rewarded with substantial long-term gains after some short-term pain. We acknowledge the world seems to be floating on “cheap money” and recognize higher rates may ultimately put a damper on the market, but this could prove very difficult to time and history suggests we shouldn’t try.
In sum, we still think the big picture for equities looks pretty good. When we started the year, we suggested stocks seemed positioned to enjoy a good 2013, albeit probably not as good as 2012. Now, we find ourselves in the interesting predicament of having squeezed a lot of return into a short period of time. Such gains can’t be sustained at this pace and we suspect a hiccup is forthcoming. While our antennas are up, we aren’t market timers and will continue to focus on the simple but time-tested strategy of owning shares of good businesses for an extended period.
Davenport Core Fund
The following chart represents Davenport Core Fund (the “Core Fund”) performance and the performance of the S&P 500 Index*, the Core Fund’s primary benchmark, for the periods ended March 31, 2013.
| | | | | | | Fiscal Year 2013 Expense Ratio |
| Core Fund | 9.34% | 12.47% | 12.34% | 5.39% | 8.76% | 5.29% | 0.95% |
| S&P 500 Index* | 10.61% | 13.96% | 12.67% | 5.81% | 8.53% | 5.25% | — |
Past performance is no guarantee of future results. Investment return and principal value of an investment will fluctuate so that an investor’s shares, when redeemed, may be worth more or less than their original cost. Current performance may be lower or higher than the performance data quoted. Performance data, current to the most recent month end, may be obtained by calling 1-800-281-3217.
| * | The S&P 500 Index is comprised of 500 U.S. stocks and is an indicator of the performance of the overall U.S. stock market. An index is not available for direct investment; therefore, its performance does not reflect the expenses, fees and taxes generally paid with the active management of an actual portfolio. |
| | |
| ** | Annualized. |
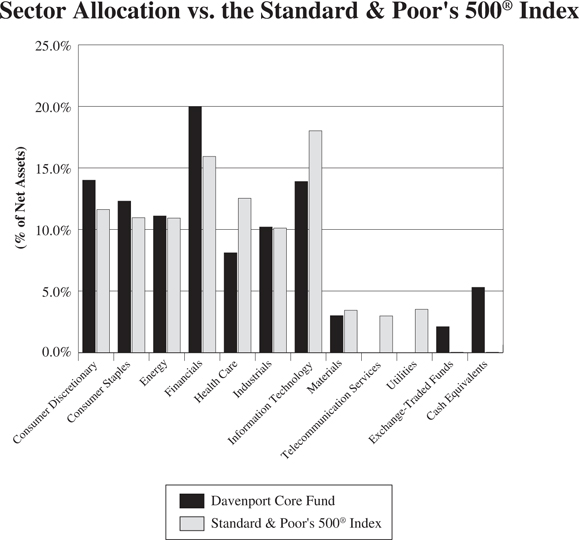
The Core Fund advanced 12.47% during the year ended March 31, 2013, slightly lagging the 13.96% gain for the S&P 500 Index. Though we lagged the benchmark slightly, we are very pleased to have had such a strong year of absolute returns. Furthermore, we were especially encouraged to close the fiscal year with strong fourth quarter results.
Though most of the Energy sector struggled throughout the fiscal year, leading oil refiner, Valero Energy (VLO), was the Core Fund’s top performer as it became evident that the company is a key beneficiary of increasing domestic oil production. Other key contributors included the Fund’s holdings in Visa (V), CarMax (KMX), and News Corp. (NWSA). Ironically, in what was one of the best quarters of all time for the S&P 500, historically defensive sectors such as Consumer Staples and Health Care produced the biggest gains during the fourth quarter. In Consumer Staples, Walgreen (WAG), J.M. Smucker (SJM) and PepsiCo (PEP) were standouts. WAG gained nearly 30% in Q4 on the heels of better results and a major distribution announcement with recently purchased drug distribution and logistics company, AmerisourceBergen (ABC). Despite serving as a headwind for much of the fiscal year, being underweight Apple (AAPL) contributed positively to relative performance as the shares pulled back. We feel the shares look much more reasonably valued at current levels, reflecting some of the challenges inherent in maintaining a high rate of profitability and revenue growth.
Within the Financials sector, we made various opportunistic transactions that we believe have repositioned the Core Fund’s exposure to this sector positively. For one, we elected to sell names such as Fiserv (FISV), Bank of America (BAC) and T. Rowe Price (TROW), all of which were hitting new highs and seemed to be more fairly valued. With the proceeds from these transactions, we were able to add to high-conviction ideas such as Markel (MKL) and Capital One (COF), both of which had fallen under pressure. In the case of MKL, the stock sold off meaningfully following a major acquisition announcement. As a result, we were able to purchase the shares around book value, which we thought was very attractive in light of the company’s track record of compounding book value at an impressive rate over the last 20 years. In terms of COF, the stock had weakened in response to disappointing results and asset sales that surprised investors. While disappointed in these developments, we believed the resulting valuation discount to peers was simply too excessive given the company’s significant earnings power.
Near the end of the year, we elected to add to the Fund’s position in Danaher Corp. (DHR). We have long regarded DHR as one of the highest quality names in the Industrials sector due to management’s impressive track record of cash generation and above-average returns on capital. The stock has performed well over the years and currently sits near all time highs; however, we feel the shares are attractively valued at current levels given the company’s best-in-class management team, high quality portfolio of assets, and free cash flow yield in the high single digits. While we believe management will continue to wring out efficiencies from its current portfolio of businesses (pushing free cash flow and returns higher), we also note that the company is well positioned to deploy significant amounts of incremental capital via acquisitions and buybacks. Given management’s virtually unrivaled success with acquisitions over the decades, we believe further Mergers & Acquisitions (M&A) can be meaningfully accretive to shareholder value over time.
In conclusion, we are pleased with recent results and remain constructive on the outlook for the coming year. Though we are doubtful that the pace of gains seen in the fiscal fourth quarter can continue, we are comfortable with the Core Fund’s positioning and continue to think large cap stocks look attractive.
New Positions
Amgen, Inc. (AMGN) is a leading biotechnology firm with core franchises in nephrology, oncology and inflammatory diseases.
AmerisourceBergen Corporation (ABC) is a leading drug distribution and logistics company. After our initial purchase, we subsequently increased the Fund’s position in ABC.
General Electric Company (GE) is an industrial conglomerate with exposure to core markets such as energy, aerospace, health care, transportation and finance.
Increased Positions
Aon plc (AON)** is an insurance brokerage and human resources outsourcing firm.
Danaher Corporation (DHR) is a large, well-diversified manufacturing company with a long track record of achieving best-in-class returns through acquiring smaller competitors and improving operations though Danaher Business System.
Markel Corporation (MKL) is a Richmond, VA-based specialty insurer.
Davenport Value & Income Fund
The following chart represents Davenport Value & Income Fund (the “Value & Income Fund”) performance and the performance of the S&P 500 Index, the Value & Income Fund’s primary benchmark, and the Lipper Equity Income Index for the periods ended March 31, 2013.
| | | Since Inception** 12/31/2010 | Fiscal Year 2013 Expense Ratio |
| Value & Income Fund | 12.61% | 18.69% | 16.28% | 0.96% |
| S&P 500 Index* | 10.61% | 13.96% | 12.78% | — |
| Lipper Equity Income Index* | 10.59% | 15.06% | 12.03% | — |
30-Day SEC Yield: 1.81%
Past performance is no guarantee of future results. Investment return and principal value of an investment will fluctuate so that an investor’s shares, when redeemed, may be worth more or less than their original cost. Current performance may be lower or higher than the performance data quoted. Performance data, current to the most recent month end, may be obtained by calling 1-800-281-3217.
| * | The S&P 500 Index is comprised of 500 U.S. stocks and is an indicator of the performance of the overall U.S. stock market. The Lipper Equity Income Index is an unmanaged index of the 30 largest funds, based on total year-end net asset value, in the Lipper Equity Income Index. An index is not available for direct investment; therefore, its performance does not reflect the expenses, fees and taxes generally paid with the active management of an actual portfolio. |
| | |
| ** | Annualized. |
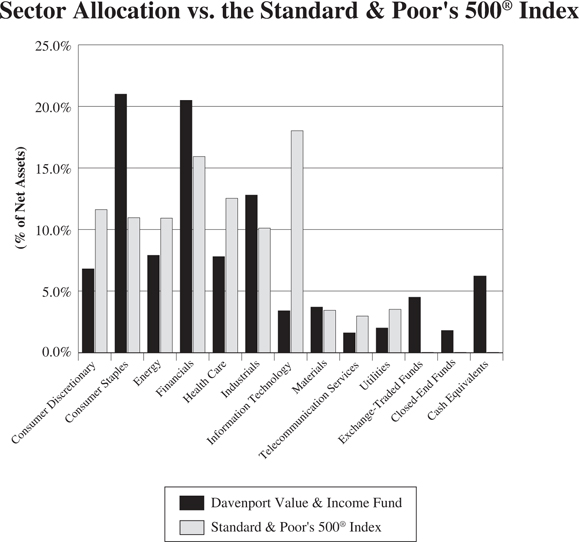
The Value & Income Fund advanced 18.69% during the year ended March 31, 2013, nicely exceeding the 13.96% and 15.06% gain for the S&P 500 Index and the Lipper Equity Income Index, respectively. After taking a bit of a breather to close 2012, it was impressive to see the strategy close the year with a 12.61% gain in fiscal Q4. As retail fund flows finally started to move towards equity funds to close the year, it was clear that income is still a top priority on investors’ wish list. The Value & Income Fund’s 30-day SEC yield as of March 31, 2013 was 1.81%.
Housing related companies exhibited strong performance during the fiscal year as improving industry data coupled with the Federal Reserve System’s announcement of QE3 fueled gains across the group. Weyerhaeuser (WY) and Fidelity National Financial (FNF) were top performers as each company benefitted from the aforementioned developments. The Fund also benefitted from strong performance within the REIT sector, where holdings such as Sun Communities (SUI) and W.P. Carey (WPC) posted strong gains. Despite a very good year from Johnson & Johnson (JNJ), the Health Care sector was a key detractor from relative performance given relatively weak results from the Fund’s holdings in GlaxoSmithKline (GSK) and WellPoint (WLP).
The Energy sector was a source of strength during the fiscal year, with Marathon Petroleum (MPC) and Tortoise Energy Infrastructure (TYG) emerging as top performers. Despite our belief in the long-term attractiveness of the domestic refining industry, we elected to chip the Fund’s position in MPC given the stock’s sharp move and considering the extreme volatility of the refining industry. In addition to the chip of MPC, the fiscal fourth quarter saw a lot of activity in the Energy space. As a result, the Fund’s exposure to the sector has decreased slightly and has become more focused on companies with what we believe is above-average potential for dividend growth.
In keeping with this theme, we added to the Fund’s position in BP plc (BP) and sold the position in Royal Dutch Shell (RDS’B). RDS’B has lagged the Energy sector amid disappointing results and concerns regarding the company’s increasing capital expenditure profile. Though we are confident in the company’s ability to maintain its healthy dividend (yields over 5%), we are concerned that increasing capital expenditures will limit future dividend growth. While BP has a similar dividend yield (5.1%), we feel the steps the company has taken to restructure the business could lead to significant increases in returns, cash flows and the dividend in coming years. Although there is still ample headline risk related to the ongoing Macondo spill civil trial, we believe decidedly negative outcomes have already been priced into the shares. As such, any resolution of the matter should remove an overhang and allow the stock to move higher.
Later in the year, we purchased a position in regional gaming operator Penn National Gaming (PENN). On Nov 15th, the company announced that it intends to split its real estate and operating assets into two separate companies. To summarize the transaction, one entity will be structured as a REIT, which we anticipate will pay an attractive dividend and have substantial growth opportunity, while the other entity will be a smaller casino operator that could grow significantly. We have a long history with the company and view management as being among the sharpest value creators we’ve encountered. This new structure (first of its kind in the industry) could be another feather in their cap. Insider ownership is high and management acts more like shareholders/owners as a result. Further, we were excited to see the company’s CFO purchase a substantial amount of stock in the high $40’s after the deal was announced. Ultimately, we think the value of the combined entity could have significant price appreciation as the transaction comes closer to being consummated in early 2014. Also, bear in mind this will ultimately be two separate positions, one of which we anticipate will pay a meaningful dividend (approximately 8.5% yield implied by the valuation at the time of purchase), and both of which could have attractive long-term growth opportunities.
While we are certainly happy with this year’s performance, we remain thoughtful about the Value & Income Fund’s positioning and are vigilantly committed to finding new ideas. Though we will always focus on high-quality companies with above-average payouts, we continue to seek a balance between higher yielding defensive stocks and those that have the ability to grow their dividends over time.
New Positions
Capital One Financial Corporation (COF) is a credit card and consumer banking franchise. After our initial purchase, we subsequently increased the Fund’s position in COF. Current yield: 0.4%.
Penn National Gaming, Inc. (PENN) is a regional casino operator with an attractive portfolio of 19 casinos throughout the United States. Current yield: N/A. PENN is currently in the process of becoming a REIT.
WisdomTree Japan Hedged Equity Fund (DXJ) Current yield: 1.3%.
Increased Positions
BP plc (BP)** is headquartered in the United Kingdom and is a one of the world’s leading integrated energy companies with operations in over one hundred countries worldwide. Current yield: 5.1%.
The Dow Chemical Company (DOW) is a global chemical innovator and producer. Current yield: 4.0%.
General Electric Company (GE) is an industrial conglomerate with exposure to core markets such as energy, aerospace, health care, transportation and finance. Current yield: 3.3%.
Hartford Financial Services Group, Inc. (HIG) is a multi-line insurer. Current yield: 1.6%.
LinnCo, LLC (LNCO) is a C-Corp formed for the sole purpose to invest in the units of upstream oil and gas Master Limited Partnership (MLP) Linn Energy (LINE). Current yield: 7.3%.
Davenport Equity Opportunities Fund
The following chart represents Davenport Equity Opportunities Fund (the “Equity Opportunities Fund”) performance and the performance of the Russell Midcap Index, the Fund’s primary benchmark, and the S&P 500 Index for the periods ended March 31, 2013.
| | | Since Inception** 12/31/2010 | Fiscal Year 2013 Expense Ratio |
| Equity Opportunities Fund | 11.33% | 18.77% | 17.11% | 1.01% |
| Russell Midcap Index* | 12.96% | 17.30% | 12.55% | — |
| S&P 500 Index* | 10.61% | 13.96% | 12.78% | — |
Past performance is no guarantee of future results. Investment return and principal value of an investment will fluctuate so that an investor’s shares, when redeemed, may be worth more or less than their original cost. Current performance may be lower or higher than the performance data quoted. Performance data, current to the most recent month end, may be obtained by calling 1-800-281-3217.
| * | The Russell Midcap Index measures the performance of the 800 smallest companies in the Russell 1000, which represent approximately 25% of the total market capitalization of the Russell 1000. The S&P 500 Index is comprised of 500 U.S. stocks and is an indicator of the performance of the overall U.S. stock market. An index is not available for direct investment; therefore, its performance does not reflect the expenses, fees and taxes generally paid with the active management of an actual portfolio. |
| | |
| ** | Annualized. |
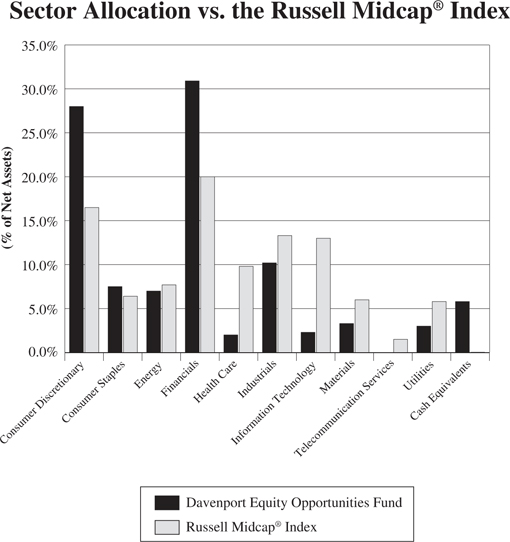
The Equity Opportunities Fund advanced 18.77% during the year ended March 31, 2013. This compares to gains of 17.30% and 13.96%, respectively, for the Russell Midcap Index and S&P 500 Index. Not surprisingly, a few holdings that finished 2012 on an unusually strong note lagged a bit as we entered 2013. Nonetheless, we managed to participate nicely in the market’s upside. It is fun to report such results, but most quarters won’t resemble fiscal Q4 and we are much more focused on generating attractive multi-year returns. Below, we discuss recent performance and a few recent transactions.
Dollar Tree (DLTR) and Markel (MKL) were among the top contributors in the fiscal fourth quarter and for the fiscal year. Their performance was particularly gratifying since we recently added to both positions when the stocks were under pressure. Further, it displays the benefits of adding to quality franchises when they are out of favor with investors for short-term reasons. Delta Air Lines (DAL) also took flight. Its shares gained roughly 42% in the fourth quarter. We probably seemed crazy when we bought this stock given the airline industry’s checkered past (as far as investors are concerned). Thus far, however, our outlook for renewed operating discipline, declining debt levels and higher returns on capital has come to fruition nicely. The biggest disappointment was Capital One (COF), which declined 9% in February as a subdued 2013 outlook and uncertainty about the benefit of recent acquisitions weighed on the name. We are frustrated with the stock’s action, but it remains a top holding and we think the risk/reward from here is very favorable.
We’ve recently built positions in a couple of depressed energy stocks. We aren’t particularly bullish on oil and gas prices given growing supplies, but each stock has a unique story and seems to possess little downside risk. The first is CONSOL Energy (CNX), which is a domestic coal and natural gas producer. Most analysts and investors focus on the company’s coal business, which has struggled in the face of lower coal prices and may face secular headwinds. We are more focused on the company’s growing base of natural gas assets, which are positioned in some of the lowest cost and most prolific shale plays in the U.S. These assets seem somewhat unappreciated and currently contribute little to earnings, but could be a significant source of value in coming years even in the absence of material improvement in gas prices.
Another is National Oilwell Varco (NOV), which is a bellwether name in the oil services industry. With a 50%+ market share, NOV is the dominant provider of equipment for drilling rigs. Recently, the stock has struggled due to a declining earnings outlook for the company’s North American land business as producers have curtailed drilling for conventional natural gas. We believe this presents an opportunity to purchase a cash generative business with high barriers to entry at a very reasonable price. While the North American land business may remain weak, NOV’s deepwater rig equipment business has a bright outlook with high international oil prices prompting new build rig orders. Also, the company has a strong balance sheet and record $12 billion backlog. Finally, we’ve been pleased to see that Berkshire Hathaway has been accumulating the stock over the past year.
We have also established a position in American International Group (AIG), which is a name that causes many people to cringe. The company’s epic collapse and subsequent bailout by the U.S. Government continue to leave a bad taste in many investors’ mouths. Hence, this appears to be one of the most “under-owned” and misunderstood names around. Meanwhile, not only are insurance rates firming industry-wide, but AIG has become more focused on disciplined underwriting and cost efficiencies. Further, the company’s capital position has been bolstered by asset sales and the United States Treasury recently exited its stake in the company. With the stock now trading at roughly 50% of book value, we think the risk/reward here is very favorable. This adds to our kitty of insurance names, which also includes Markel (MKL), Aon (AON) and Safety Insurance Group (SAFT). Each company has unique drivers, but all could benefit from improved pricing dynamics.
We chipped and sold a few positions during the fourth quarter. Strength in names such as Lamar Advertising (LAMR), Colfax (CFX) and Rockwell Collins (COL) prompted us to take some gains. We like each company, but outsized returns in a short period led us to believe there were better opportunities elsewhere. In another case, Check Point Software (CHKP), we sold the Fund’s position given changing competitive dynamics and decelerating revenue growth. The Fund remains underweight in the Information Technology sector, where we struggle with rapid change, pricing pressure and product obsolescence. In fact, it often seems today’s high flyers are tomorrow’s has-beens. Such rapid change may be good for consumers, but is troublesome for us as investors and we’d much rather own companies with a higher degree of visibility. Take J.M. Smucker (SJM) for example. While we can’t say how CHKP will be positioned in five years, we’re pretty certain SJM’s jams, peanut butter and coffee will stand the test of time.
New Positions
American International Group, Inc. (AIG) is a leading global insurance company with a focus on property and casualty lines of business.
National Oilwell Varco, Inc. (NOV) is a leading oilfield services company that makes and sells systems and components used in oil and gas drilling and production.
Valero Energy Corporation (VLO) is the world’s largest independent oil refiner, with 2.3 million barrels of refining capacity.
Increased Positions
CONSOL Energy, Inc. (CNX) is a coal producer in the Northeast United States with considerable natural gas assets in the Marcellus and Utica shales.
Dollar Tree, Inc. (DLTR) is a leading discount retailer based in Chesapeake, VA.
We are pleased that The Davenport Funds are off to a good start thus far in 2013. We thank you for your trust and look forward to reporting back as we proceed through the year.
Sincerely,
John P. Ackerly, IV
President, The Davenport Funds
DAVENPORT CORE FUND PERFORMANCE INFORMATION (Unaudited) |
| | Average Annual Total Returns(a) (for years ended March 31, 2013) |
| | 1 Year | 5 Years | 10 Years |
| Davenport Core Fund | 12.47% | 5.39% | 8.76% |
Standard & Poor’s 500® Index | 13.96% | 5.81% | 8.53% |
(a) The total returns shown do not reflect the deduction of taxes that a shareholder would pay on Fund distributions or the redemption of Fund shares. |
DAVENPORT VALUE & INCOME FUND PERFORMANCE INFORMATION (Unaudited) |
| | Average Annual Total Returns(a) (for periods ended March 31, 2013) |
| | 1 Year | Since Inception(b) |
| Davenport Value & Income Fund | 18.69% | 16.28% |
Standard & Poor’s 500® Index | 13.96% | 12.78% |
| Lipper Equity Income Index | 15.06% | 12.02% |
(a) The total returns shown do not reflect the deduction of taxes that a shareholder would pay on Fund distributions or the redemption of Fund shares. |
| |
(b) Commencement of operations was December 31, 2010. |
DAVENPORT EQUITY OPPORTUNITIES FUND PERFORMANCE INFORMATION (Unaudited) |
| | Average Annual Total Returns(a) (for periods ended March 31, 2013) |
| | 1 Year | Since Inception(b) |
| Davenport Equity Opportunities Fund | 18.77% | 17.11% |
Russell Midcap® Index | 17.30% | 12.55% |
(a) The total returns shown do not reflect the deduction of taxes that a shareholder would pay on Fund distributions or the redemption of Fund shares. |
| |
(b) Commencement of operations was December 31, 2010. |
DAVENPORT CORE FUND PORTFOLIO INFORMATION March 31, 2013 (Unaudited) |
Top Ten Equity Holdings
| Security Description | % of Net Assets |
| Johnson & Johnson | 3.0% |
| CarMax, Inc. | 2.9% |
| Markel Corporation | 2.9% |
| Berkshire Hathaway, Inc. - Class B | 2.6% |
| Brookfield Asset Management, Inc. - Class A | 2.6% |
| Danaher Corporation | 2.5% |
| Capital One Financial Corporation | 2.5% |
| Wells Fargo & Company | 2.3% |
| Exxon Mobil Corporation | 2.3% |
| J.M. Smucker Company (The) | 2.3% |
DAVENPORT VALUE & INCOME FUND PORTFOLIO INFORMATION March 31, 2013 (Unaudited) |
Top Ten Equity Holdings
| Security Description | % of Net Assets |
| JPMorgan Chase & Company | 2.7% |
| Travelers Companies, Inc. (The) | 2.6% |
| Walgreen Company | 2.6% |
| Johnson & Johnson | 2.6% |
| General Electric Company | 2.6% |
| W.P. Carey, Inc. | 2.5% |
SPDR EURO STOXX 50® ETF | 2.4% |
| Wells Fargo & Company | 2.4% |
| Sun Communities, Inc. | 2.4% |
| Dow Chemical Company (The) | 2.3% |
DAVENPORT EQUITY OPPORTUNITIES FUND PORTFOLIO INFORMATION March 31, 2013 (Unaudited) |
Top Ten Equity Holdings
| Security Description | % of Net Assets |
| Penn National Gaming, Inc. | 6.0% |
| Markel Corporation | 5.5% |
| CarMax, Inc. | 5.4% |
| Dollar Tree, Inc. | 4.6% |
| O'Reilly Automotive, Inc. | 4.0% |
| Brookfield Asset Management, Inc. - Class A | 4.0% |
| Aon plc | 3.9% |
| Sun Communities, Inc. | 3.7% |
| Albemarle Corporation | 3.3% |
| International Game Technology | 3.3% |
DAVENPORT CORE FUND SCHEDULE OF INVESTMENTS March 31, 2013 | |
| | | | | | |
| Consumer Discretionary — 14.0% | | | | | | |
Amazon.com, Inc. (a) | | | 15,073 | | | $ | 4,016,804 | |
CarMax, Inc. (a) | | | 148,617 | | | | 6,197,329 | |
General Motors Company (a) | | | 125,945 | | | | 3,503,790 | |
Lowe's Companies, Inc. | | | 93,816 | | | | 3,557,503 | |
McDonald's Corporation | | | 41,990 | | | | 4,185,983 | |
News Corporation - Class A | | | 128,851 | | | | 3,932,532 | |
Walt Disney Company (The) | | | 70,778 | | | | 4,020,190 | |
| | | | | | | | 29,414,131 | |
| Consumer Staples — 12.3% | | | | | | | | |
Anheuser-Busch InBev SA/NV - ADR | | | 34,645 | | | | 3,448,910 | |
J.M. Smucker Company (The) | | | 48,862 | | | | 4,845,156 | |
Nestle SA - ADR | | | 39,993 | | | | 2,898,293 | |
PepsiCo, Inc. | | | 47,176 | | | | 3,732,094 | |
Procter & Gamble Company (The) | | | 38,639 | | | | 2,977,521 | |
Walgreen Company | | | 81,700 | | | | 3,895,456 | |
Wal-Mart Stores, Inc. | | | 54,557 | | | | 4,082,500 | |
| | | | | | | | 25,879,930 | |
| Energy — 11.1% | | | | | | | | |
Chevron Corporation | | | 36,387 | | | | 4,323,503 | |
Exxon Mobil Corporation | | | 54,567 | | | | 4,917,032 | |
National Oilwell Varco, Inc. | | | 53,750 | | | | 3,802,813 | |
Occidental Petroleum Corporation | | | 40,104 | | | | 3,142,950 | |
Schlumberger Ltd. | | | 42,338 | | | | 3,170,693 | |
Valero Energy Corporation | | | 91,046 | | | | 4,141,683 | |
| | | | | | | | 23,498,674 | |
| Financials — 20.0% | | | | | | | | |
American Tower Corporation | | | 47,658 | | | | 3,665,853 | |
Aon plc | | | 69,605 | | | | 4,280,708 | |
Berkshire Hathaway, Inc. - Class B (a) | | | 52,476 | | | | 5,467,999 | |
| Brookfield Asset Management, Inc. - Class A | | | 147,924 | | | | 5,397,747 | |
Capital One Financial Corporation | | | 95,642 | | | | 5,255,528 | |
Goldman Sachs Group, Inc. (The) | | | 25,625 | | | | 3,770,719 | |
JPMorgan Chase & Company | | | 69,728 | | | | 3,309,291 | |
Markel Corporation (a) | | | 12,023 | | | | 6,053,580 | |
Wells Fargo & Company | | | 133,129 | | | | 4,924,442 | |
| | | | | | | | 42,125,867 | |
| Health Care — 8.1% | | | | | | | | |
AmerisourceBergen Corporation | | | 79,700 | | | | 4,100,565 | |
Amgen, Inc. | | | 32,555 | | | | 3,337,213 | |
Johnson & Johnson | | | 78,248 | | | | 6,379,559 | |
WellPoint, Inc. | | | 50,390 | | | | 3,337,330 | |
| | | | | | | | 17,154,667 | |
DAVENPORT CORE FUND SCHEDULE OF INVESTMENTS (Continued) | |
COMMON STOCKS — 92.6% (Continued) | | | | | | |
| Industrials — 10.2% | | | | | | |
Danaher Corporation | | | 85,872 | | | $ | 5,336,944 | |
General Electric Company | | | 127,965 | | | | 2,958,551 | |
Illinois Tool Works, Inc. | | | 45,699 | | | | 2,784,897 | |
Stanley Black & Decker, Inc. | | | 39,738 | | | | 3,217,586 | |
Union Pacific Corporation | | | 23,690 | | | | 3,373,693 | |
United Technologies Corporation | | | 41,779 | | | | 3,903,412 | |
| | | | | | | | 21,575,083 | |
| Information Technology — 13.9% | | | | | | | | |
Accenture plc - Class A | | | 56,144 | | | | 4,265,260 | |
Apple, Inc. | | | 6,635 | | | | 2,936,850 | |
Automatic Data Processing, Inc. | | | 49,175 | | | | 3,197,359 | |
Google, Inc. - Class A (a) | | | 4,279 | | | | 3,397,654 | |
| International Business Machines Corporation | | | 21,957 | | | | 4,683,428 | |
Microsoft Corporation | | | 105,598 | | | | 3,021,159 | |
QUALCOMM, Inc. | | | 47,820 | | | | 3,201,549 | |
Visa, Inc. - Class A | | | 26,593 | | | | 4,516,555 | |
| | | | | | | | 29,219,814 | |
| Materials — 3.0% | | | | | | | | |
Albemarle Corporation | | | 55,483 | | | | 3,468,797 | |
Praxair, Inc. | | | 26,046 | | | | 2,905,171 | |
| | | | | | | | 6,373,968 | |
| | | | | | | | | |
Total Common Stocks (Cost $136,401,294) | | | | | | $ | 195,242,134 | |
EXCHANGE-TRADED FUNDS — 2.1% | | | | | | |
| iShares Nasdaq Biotechnology Index Fund (Cost $3,875,987) | | | 27,372 | | | $ | 4,377,604 | |
MONEY MARKET FUNDS — 3.1% | | | | | | |
First American Treasury Obligations Fund - Class Z, 0.00% (b) (Cost $6,599,017) | | | 6,599,017 | | | $ | 6,599,017 | |
| | | | | | | | | |
Total Investments at Value — 97.8% (Cost $146,876,298) | | | | | | $ | 206,218,755 | |
| | | | | | | | | |
| Other Assets in Excess of Liabilities — 2.2% | | | | | | | 4,680,250 | |
| | | | | | | | | |
Net Assets — 100.0% | | | | | | $ | 210,899,005 | |
| ADR - American Depositary Receipt. |
| (a) | Non-income producing security. |
| (b) | The rate shown is the 7-day effective yield as of March 31, 2013. |
| See accompanying notes to financial statements. |
DAVENPORT VALUE & INCOME FUND SCHEDULE OF INVESTMENTS March 31, 2013 | |
| | | | | | |
| Consumer Discretionary — 6.8% | | | | | | |
Cracker Barrel Old Country Store, Inc. | | | 34,950 | | | $ | 2,825,708 | |
Darden Restaurants, Inc. | | | 47,950 | | | | 2,478,056 | |
McDonald's Corporation | | | 39,210 | | | | 3,908,845 | |
Penn National Gaming, Inc. (a) | | | 75,805 | | | | 4,126,066 | |
| | | | | | | | 13,338,675 | |
| Consumer Staples — 21.0% | | | | | | | | |
Altria Group, Inc. | | | 78,906 | | | | 2,713,577 | |
Anheuser-Busch InBev SA/NV - ADR | | | 36,210 | | | | 3,604,706 | |
Archer-Daniels-Midland Company | | | 93,310 | | | | 3,147,346 | |
Coca-Cola Company (The) | | | 93,800 | | | | 3,793,272 | |
Diageo plc - ADR | | | 23,175 | | | | 2,916,342 | |
Dr. Pepper Snapple Group, Inc. | | | 57,372 | | | | 2,693,616 | |
H.J. Heinz Company | | | 39,430 | | | | 2,849,606 | |
PepsiCo, Inc. | | | 49,355 | | | | 3,904,474 | |
Philip Morris International, Inc. | | | 38,940 | | | | 3,610,128 | |
Procter & Gamble Company (The) | | | 38,720 | | | | 2,983,763 | |
Walgreen Company | | | 106,780 | | | | 5,091,270 | |
Wal-Mart Stores, Inc. | | | 53,552 | | | | 4,007,296 | |
| | | | | | | | 41,315,396 | |
| Energy — 7.9% | | | | | | | | |
BP plc - ADR | | | 92,820 | | | | 3,930,927 | |
Chevron Corporation | | | 34,956 | | | | 4,153,472 | |
LinnCo, LLC | | | 93,695 | | | | 3,658,790 | |
Marathon Petroleum Corporation | | | 42,485 | | | | 3,806,656 | |
| | | | | | | | 15,549,845 | |
| Financials — 20.5% | | | | | | | | |
Capital One Financial Corporation | | | 71,385 | | | | 3,922,606 | |
Fidelity National Financial, Inc. - Class A | | | 143,320 | | | | 3,615,963 | |
Hartford Financial Services Group, Inc. | | | 156,025 | | | | 4,025,445 | |
JPMorgan Chase & Company | | | 113,380 | | | | 5,381,015 | |
Sun Communities, Inc. | | | 95,113 | | | | 4,691,924 | |
Travelers Companies, Inc. (The) | | | 60,810 | | | | 5,119,594 | |
W.P. Carey, Inc. | | | 72,204 | | | | 4,866,549 | |
Wells Fargo & Company | | | 128,540 | | | | 4,754,695 | |
Weyerhaeuser Company | | | 129,634 | | | | 4,067,915 | |
| | | | | | | | 40,445,706 | |
| Health Care — 7.8% | | | | | | | | |
GlaxoSmithKline plc - ADR | | | 85,535 | | | | 4,012,447 | |
Johnson & Johnson | | | 62,445 | | | | 5,091,141 | |
Merck & Company, Inc. | | | 70,405 | | | | 3,114,013 | |
WellPoint, Inc. | | | 47,935 | | | | 3,174,735 | |
| | | | | | | | 15,392,336 | |
DAVENPORT VALUE & INCOME FUND SCHEDULE OF INVESTMENTS (Continued) | |
COMMON STOCKS — 87.5% (Continued) | | | | | | |
| Industrials — 12.8% | | | | | | |
3M Company | | | 31,085 | | | $ | 3,304,646 | |
Eaton Corporation plc | | | 64,297 | | | | 3,938,191 | |
General Electric Company | | | 220,000 | | | | 5,086,400 | |
Illinois Tool Works, Inc. | | | 41,920 | | | | 2,554,605 | |
Norfolk Southern Corporation | | | 44,775 | | | | 3,451,257 | |
Raytheon Company | | | 57,316 | | | | 3,369,608 | |
Watsco, Inc. | | | 40,845 | | | | 3,438,332 | |
| | | | | | | | 25,143,039 | |
| Information Technology — 3.4% | | | | | | | | |
Automatic Data Processing, Inc. | | | 57,810 | | | | 3,758,806 | |
Microsoft Corporation | | | 105,800 | | | | 3,026,938 | |
| | | | | | | | 6,785,744 | |
| Materials — 3.7% | | | | | | | | |
Dow Chemical Company (The) | | | 141,030 | | | | 4,490,395 | |
E.I. du Pont de Nemours and Company | | | 56,665 | | | | 2,785,652 | |
| | | | | | | | 7,276,047 | |
| Telecommunication Services — 1.6% | | | | | | | | |
Vodafone Group plc - ADR | | | 114,525 | | | | 3,253,655 | |
| | | | | | | | | |
| Utilities — 2.0% | | | | | | | | |
Dominion Resources, Inc. | | | 66,205 | | | | 3,851,807 | |
| | | | | | | | | |
Total Common Stocks (Cost $144,747,782) | | | | | | $ | 172,352,250 | |
EXCHANGE-TRADED FUNDS — 4.5% | | | | | | |
SPDR EURO STOXX 50® ETF | | | 145,830 | | | $ | 4,818,223 | |
WisdomTree Japan Hedged Equity Fund | | | 90,855 | | | | 3,923,119 | |
Total Exchange-Traded Funds (Cost $7,942,048) | | | | | | $ | 8,741,342 | |
| | | | | | |
| Tortoise Energy Infrastructure Corporation (Cost $2,827,624) | | | 70,735 | | | $ | 3,492,894 | |
DAVENPORT VALUE & INCOME FUND SCHEDULE OF INVESTMENTS (Continued) | |
MONEY MARKET FUNDS — 2.8% | | | | | | |
First American Treasury Obligations Fund - Class Z, 0.00% (b) (Cost $5,604,664) | | | 5,604,664 | | | $ | 5,604,664 | |
| | | | | | | | | |
Total Investments at Value — 96.6% (Cost $161,122,118) | | | | | | $ | 190,191,150 | |
| | | | | | | | | |
| Other Assets in Excess of Liabilities — 3.4% | | | | | | | 6,698,721 | |
| | | | | | | | | |
Net Assets — 100.0% | | | | | | $ | 196,889,871 | |
| ADR - American Depositary Receipt. |
| (a) | Non-income producing security. |
| (b) | The rate shown is the 7-day effective yield as of March 31, 2013. |
| See accompanying notes to financial statements. |
DAVENPORT EQUITY OPPORTUNITIES FUND SCHEDULE OF INVESTMENTS March 31, 2013 | |
| | | | | | |
| Consumer Discretionary — 28.0% | | | | | | |
CarMax, Inc. (a) | | | 133,410 | | | $ | 5,563,197 | |
Dollar Tree, Inc. (a) | | | 97,200 | | | | 4,707,396 | |
Hanesbrands, Inc. (a) | | | 60,990 | | | | 2,778,705 | |
International Game Technology | | | 202,660 | | | | 3,343,890 | |
Lamar Advertising Company - Class A (a) | | | 42,995 | | | | 2,089,987 | |
O'Reilly Automotive, Inc. (a) | | | 40,505 | | | | 4,153,788 | |
Penn National Gaming, Inc. (a) | | | 112,845 | | | | 6,142,153 | |
| | | | | | | | 28,779,116 | |
| Consumer Staples — 7.5% | | | | | | | | |
Church & Dwight Company, Inc. | | | 32,930 | | | | 2,128,266 | |
J.M. Smucker Company (The) | | | 31,725 | | | | 3,145,851 | |
Walgreen Company | | | 50,705 | | | | 2,417,614 | |
| | | | | | | | 7,691,731 | |
| Energy — 7.0% | | | | | | | | |
CONSOL Energy, Inc. | | | 91,920 | | | | 3,093,108 | |
National Oilwell Varco, Inc. | | | 28,745 | | | | 2,033,709 | |
Valero Energy Corporation | | | 45,455 | | | | 2,067,748 | |
| | | | | | | | 7,194,565 | |
| Financials — 30.9% | | | | | | | | |
American International Group, Inc. (a) | | | 50,485 | | | | 1,959,828 | |
American Tower Corporation | | | 33,640 | | | | 2,587,589 | |
Aon plc | | | 65,940 | | | | 4,055,310 | |
| Brookfield Asset Management, Inc. - Class A | | | 111,610 | | | | 4,072,649 | |
Capital One Financial Corporation | | | 60,006 | | | | 3,297,330 | |
Fidelity National Financial, Inc. - Class A | | | 74,855 | | | | 1,888,592 | |
Markel Corporation (a) | | | 11,275 | | | | 5,676,962 | |
Safety Insurance Group, Inc. | | | 49,830 | | | | 2,449,144 | |
Sun Communities, Inc. | | | 78,055 | | | | 3,850,453 | |
SunTrust Banks, Inc. | | | 64,900 | | | | 1,869,769 | |
| | | | | | | | 31,707,626 | |
| Health Care — 2.0% | | | | | | | | |
Henry Schein, Inc. (a) | | | 22,455 | | | | 2,078,210 | |
| | | | | | | | | |
| Industrials — 10.2% | | | | | | | | |
Colfax Corporation (a) | | | 42,445 | | | | 1,975,390 | |
Delta Air Lines, Inc. (a) | | | 152,555 | | | | 2,518,683 | |
Pall Corporation | | | 29,590 | | | | 2,023,068 | |
Rockwell Collins, Inc. | | | 32,300 | | | | 2,038,776 | |
Watsco, Inc. | | | 22,510 | | | | 1,894,892 | |
| | | | | | | | 10,450,809 | |
| Information Technology — 2.3% | | | | | | | | |
Intuit, Inc. | | | 37,005 | | | | 2,429,378 | |
DAVENPORT EQUITY OPPORTUNITIES FUND SCHEDULE OF INVESTMENTS (Continued) | |
COMMON STOCKS — 94.2% (Continued) | | | | | | |
| Materials — 3.3% | | | | | | |
Albemarle Corporation | | | 54,180 | | | $ | 3,387,334 | |
| | | | | | | | | |
| Utilities — 3.0% | | | | | | | | |
ITC Holdings Corporation | | | 34,240 | | | | 3,056,262 | |
| | | | | | | | | |
Total Common Stocks (Cost $78,600,744) | | | | | | $ | 96,775,031 | |
MONEY MARKET FUNDS — 2.8% | | | | | | |
First American Treasury Obligations Fund - Class Z, 0.00% (b) (Cost $2,825,594) | | | 2,825,594 | | | $ | 2,825,594 | |
| | | | | | | | | |
Total Investments at Value — 97.0% (Cost $81,426,338) | | | | | | $ | 99,600,625 | |
| | | | | | | | | |
| Other Assets in Excess of Liabilities — 3.0% | | | | | | | 3,078,370 | |
| | | | | | | | | |
Net Assets — 100.0% | | | | | | $ | 102,678,995 | |
| (a) | Non-income producing security. |
| (b) | The rate shown is the 7-day effective yield as of March 31, 2013. |
| See accompanying notes to financial statements. |
THE DAVENPORT FUNDS STATEMENTS OF ASSETS AND LIABILITIES March 31, 2013 | |
| | | | | Davenport Value & Income Fund | | | Davenport Equity Opportunities Fund | |
| ASSETS | | | | | | | | | |
| Investments in securities: | | | | | | | | | |
At acquisition cost | | $ | 146,876,298 | | | $ | 161,122,118 | | | $ | 81,426,338 | |
At market value (Note 2) | | $ | 206,218,755 | | | $ | 190,191,150 | | | $ | 99,600,625 | |
Cash | | | 32,345 | | | | 5,220,499 | | | | 3,364,270 | |
Dividends receivable | | | 225,873 | | | | 530,660 | | | | 76,719 | |
Receivable for capital shares sold | | | 757,451 | | | | 1,292,034 | | | | 391,600 | |
Receivable for securities sold | | | 5,829,385 | | | | — | | | | 1,445,076 | |
Other assets | | | 12,279 | | | | 7,529 | | | | 6,974 | |
TOTAL ASSETS | | | 213,076,088 | | | | 197,241,872 | | | | 104,885,264 | |
| | | | | | | | | | | | | |
| LIABILITIES | | | | | | | | | | | | |
Payable for investment securities purchased | | | 1,901,845 | | | | — | | | | 2,026,453 | |
Payable for capital shares redeemed | | | 97,292 | | | | 201,442 | | | | 96,552 | |
Accrued investment advisory fees (Note 4) | | | 145,951 | | | | 123,184 | | | | 66,057 | |
Payable to administrator (Note 4) | | | 24,900 | | | | 22,600 | | | | 13,050 | |
Other accrued expenses and liabilities | | | 7,095 | | | | 4,775 | | | | 4,157 | |
TOTAL LIABILITIES | | | 2,177,083 | | | | 352,001 | | | | 2,206,269 | |
| | | | | | | | | | | | | |
NET ASSETS | | $ | 210,899,005 | | | $ | 196,889,871 | | | $ | 102,678,995 | |
| | | | | | | | | | | | | |
| Net assets consist of: | | | | | | | | | | | | |
Paid-in capital | | $ | 150,421,112 | | | $ | 164,586,438 | | | $ | 82,116,288 | |
Undistributed net investment income | | | 11,648 | | | | 3,121 | | | | 25,889 | |
Accumulated net realized gains from
security transactions | | | 1,123,788 | | | | 3,231,280 | | | | 2,362,531 | |
Net unrealized appreciation on investments | | | 59,342,457 | | | | 29,069,032 | | | | 18,174,287 | |
Net assets | | $ | 210,899,005 | | | $ | 196,889,871 | | | $ | 102,678,995 | |
| | | | | | | | | | | | | |
Shares of beneficial interest outstanding
(unlimited number of shares authorized,
$0.01 par value) | | | 12,594,528 | | | | 14,936,637 | | | | 7,409,101 | |
| | | | | | | | | | | | | |
Net asset value, offering price and redemption
price per share (Note 2) | | $ | 16.75 | | | $ | 13.18 | | | $ | 13.86 | |
| See accompanying notes to financial statements. |
THE DAVENPORT FUNDS STATEMENTS OF OPERATIONS Year Ended March 31, 2013 | |
| | | | | Davenport Value & Income Fund | | | Davenport Equity Opportunities Fund | |
| INVESTMENT INCOME | | | | | | | | | |
Dividends | | $ | 3,092,980 | | | $ | 4,635,894 | | | $ | 918,533 | |
Foreign withholding taxes on dividends | | | (46,538 | ) | | | (2,497 | ) | | | (13,292 | ) |
Interest | | | 136 | | | | — | | | | — | |
TOTAL INVESTMENT INCOME | | | 3,046,578 | | | | 4,633,397 | | | | 905,241 | |
| | | | | | | | | | | | | |
| EXPENSES | | | | | | | | | | | | |
Investment advisory fees (Note 4) | | | 1,372,583 | | | | 1,040,060 | | | | 547,147 | |
Administration fees (Note 4) | | | 245,401 | | | | 189,617 | | | | 110,238 | |
Custodian and bank service fees | | | 18,536 | | | | 24,235 | | | | 12,106 | |
Professional fees | | | 19,038 | | | | 16,818 | | | | 16,818 | |
Compliance service fees (Note 4) | | | 19,865 | | | | 16,502 | | | | 11,593 | |
Registration and filing fees | | | 17,786 | | | | 14,541 | | | | 13,335 | |
Trustees’ fees and expenses (Note 4) | | | 9,275 | | | | 9,275 | | | | 9,275 | |
Printing of shareholder reports | | | 14,309 | | | | 5,960 | | | | 4,738 | |
Insurance expense | | | 11,709 | | | | 6,830 | | | | 4,520 | |
Other expenses | | | 10,869 | | | | 10,113 | | | | 10,563 | |
TOTAL EXPENSES | | | 1,739,371 | | | | 1,333,951 | | | | 740,333 | |
| | | | | | | | | | | | | |
NET INVESTMENT INCOME | | | 1,307,207 | | | | 3,299,446 | | | | 164,908 | |
| | | | | | | | | | | | | |
REALIZED AND UNREALIZED
GAINS ON INVESTMENTS | | | | | | | | | | | | |
Net realized gains from security transactions | | | 9,676,207 | | | | 6,183,266 | | | | 4,578,353 | |
Net change in unrealized appreciation/
depreciation on investments | | | 12,010,397 | | | | 18,460,679 | | | | 10,165,302 | |
| | | | | | | | | | | | | |
NET REALIZED AND UNREALIZED
GAINS ON INVESTMENTS | | | 21,686,604 | | | | 24,643,945 | | | | 14,743,655 | |
| | | | | | | | | | | | | |
NET INCREASE IN NET ASSETS
FROM OPERATIONS | | $ | 22,993,811 | | | $ | 27,943,391 | | | $ | 14,908,563 | |
| See accompanying notes to financial statements. |
DAVENPORT CORE FUND STATEMENTS OF CHANGES IN NET ASSETS | |
| | | | | | |
| FROM OPERATIONS | | | | | | |
Net investment income | | $ | 1,307,207 | | | $ | 1,034,589 | |
Net realized gains from security transactions | | | 9,676,207 | | | | 2,194,465 | |
Net change in unrealized appreciation/
depreciation on investments | | | 12,010,397 | | | | 12,450,152 | |
Net increase in net assets from operations | | | 22,993,811 | | | | 15,679,206 | |
| | | | | | | | | |
| DISTRIBUTIONS TO SHAREHOLDERS | | | | | | | | |
From net investment income | | | (1,315,956 | ) | | | (1,036,002 | ) |
| | | | | | | | | |
| FROM CAPITAL SHARE TRANSACTIONS | | | | | | | | |
Proceeds from shares sold | | | 32,795,331 | | | | 17,735,914 | |
Net asset value of shares issued in reinvestment
of distributions to shareholders | | | 1,246,351 | | | | 972,757 | |
Payments for shares redeemed | | | (19,718,238 | ) | | | (18,348,617 | ) |
Net increase in net assets from capital share transactions | | | 14,323,444 | | | | 360,054 | |
| | | | | | | | | |
TOTAL INCREASE IN NET ASSETS | | | 36,001,299 | | | | 15,003,258 | |
| | | | | | | | | |
| NET ASSETS | | | | | | | | |
Beginning of year | | | 174,897,706 | | | | 159,894,448 | |
End of year | | $ | 210,899,005 | | | $ | 174,897,706 | |
| | | | | | | | | |
UNDISTRIBUTED NET INVESTMENT INCOME | | $ | 11,648 | | | $ | 20,397 | |
| | | | | | | | | |
| CAPITAL SHARE ACTIVITY | | | | | | | | |
Shares sold | | | 2,156,214 | | | | 1,299,210 | |
Shares reinvested | | | 82,322 | | | | 73,427 | |
Shares redeemed | | | (1,300,040 | ) | | | (1,362,591 | ) |
Net increase in shares outstanding | | | 938,496 | | | | 10,046 | |
Shares outstanding at beginning of year | | | 11,656,032 | | | | 11,645,986 | |
Shares outstanding at end of year | | | 12,594,528 | | | | 11,656,032 | |
| See accompanying notes to financial statements. |
DAVENPORT VALUE & INCOME FUND STATEMENTS OF CHANGES IN NET ASSETS | |
| | | | | | |
| FROM OPERATIONS | | | | | | |
Net investment income | | $ | 3,299,446 | | | $ | 1,533,671 | |
Net realized gains (losses) from security transactions | | | 6,183,266 | | | | (989,066 | ) |
Net change in unrealized appreciation/
depreciation on investments | | | 18,460,679 | | | | 9,378,913 | |
Net increase in net assets from operations | | | 27,943,391 | | | | 9,923,518 | |
| | | | | | | | | |
| DISTRIBUTIONS TO SHAREHOLDERS | | | | | | | | |
From net investment income | | | (3,316,928 | ) | | | (1,522,098 | ) |
From net realized gains from security transactions | | | (1,962,920 | ) | | | (71,734 | ) |
Decrease in net assets from distributions to shareholders | | | (5,279,848 | ) | | | (1,593,832 | ) |
| | | | | | | | | |
| FROM CAPITAL SHARE TRANSACTIONS | | | | | | | | |
Proceeds from shares sold | | | 85,076,371 | | | | 44,865,899 | |
Net asset value of shares issued in reinvestment
of distributions to shareholders | | | 4,722,338 | | | | 1,359,339 | |
Payments for shares redeemed | | | (14,329,788 | ) | | | (4,628,047 | ) |
Net increase in net assets from capital share transactions | | | 75,468,921 | | | | 41,597,191 | |
| | | | | | | | | |
TOTAL INCREASE IN NET ASSETS | | | 98,132,464 | | | | 49,926,877 | |
| | | | | | | | | |
| NET ASSETS | | | | | | | | |
Beginning of year | | | 98,757,407 | | | | 48,830,530 | |
End of year | | $ | 196,889,871 | | | $ | 98,757,407 | |
| | | | | | | | | |
| UNDISTRIBUTED NET INVESTMENT INCOME | | $ | 3,121 | | | $ | 20,603 | |
| | | | | | | | | |
| CAPITAL SHARE ACTIVITY | | | | | | | | |
Shares sold | | | 7,171,909 | | | | 4,240,900 | |
Shares reinvested | | | 398,116 | | | | 130,856 | |
Shares redeemed | | | (1,212,247 | ) | | | (444,451 | ) |
Net increase in shares outstanding | | | 6,357,778 | | | | 3,927,305 | |
Shares outstanding at beginning of year | | | 8,578,859 | | | | 4,651,554 | |
Shares outstanding at end of year | | | 14,936,637 | | | | 8,578,859 | |
| See accompanying notes to financial statements. |
DAVENPORT EQUITY OPPORTUNITIES FUND STATEMENTS OF CHANGES IN NET ASSETS | |
| | | | | | |
| FROM OPERATIONS | | | | | | |
Net investment income (loss) | | $ | 164,908 | | | $ | (99,423 | ) |
Net realized gains (losses) from security transactions | | | 4,578,353 | | | | (469,701 | ) |
Net change in unrealized appreciation/
depreciation on investments | | | 10,165,302 | | | | 6,678,341 | |
Net increase in net assets from operations | | | 14,908,563 | | | | 6,109,217 | |
| | | | | | | | | |
| DISTRIBUTIONS TO SHAREHOLDERS | | | | | | | | |
From net investment income | | | (139,019 | ) | | | — | |
From net realized gains from security transactions | | | (1,731,142 | ) | | | (163,030 | ) |
Decrease in net assets from distributions to shareholders | | | (1,870,161 | ) | | | (163,030 | ) |
| | | | | | | | | |
| FROM CAPITAL SHARE TRANSACTIONS | | | | | | | | |
Proceeds from shares sold | | | 33,820,160 | | | | 23,587,122 | |
Net asset value of shares issued in reinvestment
of distributions to shareholders | | | 1,800,189 | | | | 157,487 | |
Payments for shares redeemed | | | (5,114,447 | ) | | | (4,931,526 | ) |
Net increase in net assets from capital share transactions | | | 30,505,902 | | | | 18,813,083 | |
| | | | | | | | | |
TOTAL INCREASE IN NET ASSETS | | | 43,544,304 | | | | 24,759,270 | |
| | | | | | | | | |
| NET ASSETS | | | | | | | | |
Beginning of year | | | 59,134,691 | | | | 34,375,421 | |
End of year | | $ | 102,678,995 | | | $ | 59,134,691 | |
| | | | | | | | | |
UNDISTRIBUTED NET INVESTMENT INCOME | | $ | 25,889 | | | $ | — | |
| | | | | | | | | |
| CAPITAL SHARE ACTIVITY | | | | | | | | |
Shares sold | | | 2,737,625 | | | | 2,186,580 | |
Shares reinvested | | | 145,972 | | | | 15,593 | |
Shares redeemed | | | (419,552 | ) | | | (464,812 | ) |
Net increase in shares outstanding | | | 2,464,045 | | | | 1,737,361 | |
Shares outstanding at beginning of year | | | 4,945,056 | | | | 3,207,695 | |
Shares outstanding at end of year | | | 7,409,101 | | | | 4,945,056 | |
| See accompanying notes to financial statements. |
DAVENPORT CORE FUND FINANCIAL HIGHLIGHTS | |
Selected Per Share Data and Ratios for a Share Outstanding Throughout Each Year | |
| | | | |
| | | | | | | | | | | | | | | |
| Net asset value at beginning of year | | $ | 15.00 | | | $ | 13.73 | | | $ | 12.05 | | | $ | 8.36 | | | $ | 13.82 | |
| | | | | | | | | | | | | | | | | | | | | |
| Income (loss) from investment operations: | | | | | | | | | | | | | | | | | | | | |
Net investment income | | | 0.11 | | | | 0.09 | | | | 0.07 | | | | 0.08 | | | | 0.11 | |
Net realized and unrealized gains
(losses) on investments | | | 1.75 | | | | 1.27 | | | | 1.68 | | | | 3.69 | | | | (5.17 | ) |
| Total from investment operations | | | 1.86 | | | | 1.36 | | | | 1.75 | | | | 3.77 | | | | (5.06 | ) |
| | | | | | | | | | | | | | | | | | | | | |
| Less distributions: | | | | | | | | | | | | | | | | | | | | |
| Dividends from net investment income | | | (0.11 | ) | | | (0.09 | ) | | | (0.07 | ) | | | (0.08 | ) | | | (0.11 | ) |
| Distributions from net realized gains | | | — | | | | — | | | | — | | | | — | | | | (0.29 | ) |
Total distributions | | | (0.11 | ) | | | (0.09 | ) | | | (0.07 | ) | | | (0.08 | ) | | | (0.40 | ) |
| | | | | | | | | | | | | | | | | | | | | |
| Net asset value at end of year | | $ | 16.75 | | | $ | 15.00 | | | $ | 13.73 | | | $ | 12.05 | | | $ | 8.36 | |
| | | | | | | | | | | | | | | | | | | | | |
Total return (a) | | | 12.47% | | | | 9.99% | | | | 14.61% | | | | 45.20% | | | | (36.85% | ) |
| | | | | | | | | | | | | | | | | | | | | |
| Net assets at end of year (000’s) | | $ | 210,899 | | | $ | 174,898 | | | $ | 159,894 | | | $ | 132,662 | | | $ | 92,358 | |
| | | | | | | | | | | | | | | | | | | | | |
| Ratio of total expenses to average net assets | | | 0.95% | | | | 0.96% | | | | 0.99% | | | | 1.00% | | | | 1.00% | |
| | | | | | | | | | | | | | | | | | | | | |
Ratio of net investment income
to average net assets | | | 0.71% | | | | 0.66% | | | | 0.58% | | | | 0.75% | | | | 0.98% | |
| | | | | | | | | | | | | | | | | | | | | |
Portfolio turnover rate | | | 26% | | | | 19% | | | | 34% | | | | 25% | | | | 39% | |
| (a) | Total return is a measure of the change in value of an investment in the Fund over the years covered, which assumes any dividends or capital gains distributions are reinvested in shares of the Fund. Returns shown do not reflect the deduction of taxes a shareholder would pay on Fund distributions or the redemption of Fund shares. |
| See accompanying notes to financial statements. |
DAVENPORT VALUE & INCOME FUND FINANCIAL HIGHLIGHTS | |
Selected Per Share Data and Ratios for a Share Outstanding Throughout Each Period | |
| | | | | | | | Period Ended March 31, 2011 (a) | |
| Net asset value at beginning of period | | $ | 11.51 | | | $ | 10.50 | | | $ | 10.00 | |
| | | | | | | | | | | | | |
| Income from investment operations: | | | | | | | | | | | | |
| Net investment income | | | 0.28 | | | | 0.23 | | | | 0.04 | |
| Net realized and unrealized gains on investments | | | 1.81 | | | | 1.02 | | | | 0.49 | |
| Total from investment operations | | | 2.09 | | | | 1.25 | | | | 0.53 | |
| | | | | | | | | | | | | |
| Less distributions: | | | | | | | | | | | | |
| Dividends from net investment income | | | (0.27 | ) | | | (0.23 | ) | | | (0.03 | ) |
| Distributions from net realized gains | | | (0.15 | ) | | | (0.01 | ) | | | — | |
| Total distributions | | | (0.42 | ) | | | (0.24 | ) | | | (0.03 | ) |
| | | | | | | | | | | | | |
| Net asset value at end of period | | $ | 13.18 | | | $ | 11.51 | | | $ | 10.50 | |
| | | | | | | | | | | | | |
Total return (b) | | | 18.69% | | | | 12.23% | | | | 5.35% | (c) |
| | | | | | | | | | | | | |
| Net assets at end of period (000’s) | | $ | 196,890 | | | $ | 98,757 | | | $ | 48,831 | |
| | | | | | | | | | | | | |
| Ratio of total expenses to average net assets | | | 0.96% | | | | 1.04% | | | | 1.25% | (d) |
| | | | | | | | | | | | | |
| Ratio of net investment income to average net assets | | | 2.43% | | | | 2.30% | | | | 1.99% | (d) |
| | | | | | | | | | | | | |
| Portfolio turnover rate | | | 29% | | | | 27% | | | | 10% | (c) |
| (a) | Represents the period from commencement of operations (December 31, 2010) through March 31, 2011. |
| (b) | Total return is a measure of the change in value of an investment in the Fund over the periods covered, which assumes any dividends or capital gains distributions are reinvested in shares of the Fund. Returns shown do not reflect the deduction of taxes a shareholder would pay on Fund distributions or the redemption of Fund shares. |
| See accompanying notes to financial statements. |
DAVENPORT EQUITY OPPORTUNITIES FUND FINANCIAL HIGHLIGHTS | |
Selected Per Share Data and Ratios for a Share Outstanding Throughout Each Period | |
| | | | | | | | Period Ended March 31, 2011 (a) | |
| Net asset value at beginning of period | | $ | 11.96 | | | $ | 10.72 | | | $ | 10.00 | |
| | | | | | | | | | | | | |
| Income (loss) from investment operations: | | | | | | | | | | | | |
| Net investment income (loss) | | | 0.03 | | | | (0.02 | ) | | | (0.01 | ) |
| Net realized and unrealized gains on investments | | | 2.17 | | | | 1.30 | | | | 0.73 | |
| Total from investment operations | | | 2.20 | | | | 1.28 | | | | 0.72 | |
| | | | | | | | | | | | | |
| Less distributions: | | | | | | | | | | | | |
| Dividends from net investment income | | | (0.02 | ) | | | — | | | | — | |
| Distributions from net realized gains | | | (0.28 | ) | | | (0.04 | ) | | | — | |
| Total distributions | | | (0.30 | ) | | | (0.04 | ) | | | — | |
| | | | | | | | | | | | | |
| Net asset value at end of period | | $ | 13.86 | | | $ | 11.96 | | | $ | 10.72 | |
| | | | | | | | | | | | | |
Total return (b) | | | 18.77% | | | | 12.00% | | | | 7.20% | (c) |
| | | | | | | | | | | | | |
| Net assets at end of period (000’s) | | $ | 102,679 | | | $ | 59,135 | | | $ | 34,375 | |
| | | | | | | | | | | | | |
| Ratio of total expenses to average net assets | | | 1.01% | | | | 1.10% | | | | 1.25% | (d) |
| | | | | | | | | | | | | |
| Ratio of net investment income (loss) to average net assets | | | 0.23% | | | | (0.22% | ) | | | (0.40% | )(d) |
| | | | | | | | | | | | | |
| Portfolio turnover rate | | | 41% | | | | 35% | | | | 6% | (c) |
| (a) | Represents the period from commencement of operations (December 31, 2010) through March 31, 2011. |
| (b) | Total return is a measure of the change in value of an investment in the Fund over the periods covered, which assumes any dividends or capital gains distributions are reinvested in shares of the Fund. Returns shown do not reflect the deduction of taxes a shareholder would pay on Fund distributions or the redemption of Fund shares. |
| See accompanying notes to financial statements. |
THE DAVENPORT FUNDS
NOTES TO FINANCIAL STATEMENTS
1. Organization
Davenport Core Fund, Davenport Value & Income Fund and Davenport Equity Opportunities Fund (individually, a “Fund,” and, collectively, the “Funds”) are each a no-load, diversified series of the Williamsburg Investment Trust (the “Trust”), an open-end management investment company registered under the Investment Company Act of 1940. The Trust was organized as a Massachusetts business trust on July 18, 1988. Other series of the Trust are not incorporated in this report. Davenport Core Fund began operations on January 15, 1998. Davenport Value & Income Fund and Davenport Equity Opportunities Fund each began operations on December 31, 2010.
Davenport Core Fund’s investment objective is long term growth of capital.
Davenport Value & Income Fund’s investment objective is to achieve long term growth while generating current income through dividend payments on portfolio securities.
Davenport Equity Opportunities Fund’s investment objective is long term capital appreciation.
2. Significant Accounting Policies
The following is a summary of the Funds’ significant accounting policies. The policies are in conformity with accounting principles generally accepted in the United States of America (“GAAP”).
Securities valuation — The Funds’ portfolio securities are valued as of the close of business of the regular session of the New York Stock Exchange (normally 4:00 p.m., Eastern time). Securities traded on a national stock exchange are valued based upon the closing price on the principal exchange where the security is traded. Securities which are quoted by NASDAQ are valued at the NASDAQ Official Closing Price. Securities which are traded over-the-counter are valued at the last sales price, if available, otherwise, at the last quoted bid price. Fixed income securities will ordinarily be traded in the over-the-counter market and common stocks will ordinarily be traded on a national securities exchange, but may also be traded in the over-the-counter market.
When market quotations are not readily available, securities may be valued on the basis of prices provided by an independent pricing service. The prices provided by the pricing service are determined with consideration given to institutional bid and last sale prices and take into account securities prices, yields, maturities, call features, ratings, institutional trading in similar groups of securities and developments related to specific securities. If a pricing service cannot provide a valuation or the investment adviser believes the price received from the pricing service is not indicative of fair value, securities will be valued in good faith at fair value using methods consistent with those determined by the Board of Trustees and will be classified as Level 2 or 3 within the fair value hierarchy (see below), depending on the inputs used. Such methods of fair valuation may include, but are not limited to: multiple of earnings, multiple of book value,
THE DAVENPORT FUNDS
NOTES TO FINANCIAL STATEMENTS (Continued)
discount from market of a similar freely traded security, purchase price of the security, subsequent private transactions in the security or related securities, or a combination of these and other factors.
Short-term instruments (those with remaining maturities of 60 days or less) may be valued at amortized cost, which approximates market value. Money market funds have been determined to be represented at amortized cost which approximates fair value, absent unusual circumstances.
GAAP establishes a single authoritative definition of fair value, sets out a framework for measuring fair value and requires additional disclosures about fair value measurements.
Various inputs are used in determining the value of the Funds’ investments. These inputs are summarized in the three broad levels listed below:
• Level 1 – quoted prices in active markets for identical securities
• Level 2 – other significant observable inputs
• Level 3 – significant unobservable inputs
The inputs or methodology used for valuing securities are not necessarily an indication of the risks associated with investing in those securities. The inputs used to measure fair value may fall into different levels of the fair value hierarchy. In such cases, for disclosure purposes, the level in the fair value hierarchy within which the fair value measurement falls in its entirety is determined based on the lowest level input that is significant to the fair value measurement.
The following is a summary of the inputs used to value the Funds’ investments as of March 31, 2013 by security type:
| | | | | | | | | | | | |
Common Stocks | | $ | 195,242,134 | | | $ | — | | | $ | — | | | $ | 195,242,134 | |
Exchange-Traded Funds | | | 4,377,604 | | | | — | | | | — | | | | 4,377,604 | |
Money Market Funds | | | 6,599,017 | | | | — | | | | — | | | | 6,599,017 | |
Total | | $ | 206,218,755 | | | $ | — | | | $ | — | | | $ | 206,218,755 | |
Davenport Value & Income Fund | | | | | | | | | | | | |
Common Stocks | | $ | 172,352,250 | | | $ | — | | | $ | — | | | $ | 172,352,250 | |
Exchange-Traded Funds | | | 8,741,342 | | | | — | | | | — | | | | 8,741,342 | |
Closed-End Funds | | | 3,492,894 | | | | — | | | | — | | | | 3,492,894 | |
Money Market Funds | | | 5,604,664 | | | | — | | | | — | | | | 5,604,664 | |
Total | | $ | 190,191,150 | | | $ | — | | | $ | — | | | $ | 190,191,150 | |
Davenport Equity Opportunities Fund | | | | | | | | | | | | |
Common Stocks | | $ | 96,775,031 | | | $ | — | | | $ | — | | | $ | 96,775,031 | |
Money Market Funds | | | 2,825,594 | | | | — | | | | — | | | | 2,825,594 | |
Total | | $ | 99,600,625 | | | $ | — | | | $ | — | | | $ | 99,600,625 | |
THE DAVENPORT FUNDS
NOTES TO FINANCIAL STATEMENTS (Continued)
Refer to each Fund’s Schedule of Investments for a listing of the securities valued by sector type. As of March 31, 2013, the Funds did not have any transfers in and out of any Level. There were no Level 2 or Level 3 securities or derivative instruments held by the Funds as of March 31, 2013. It is the Funds’ policy to recognize transfers into and out of any Level at the end of the reporting period.
Repurchase agreements — The Funds may enter into repurchase agreements. The repurchase agreement, which is collateralized by U.S. Government obligations, is valued at cost which, together with accrued interest, approximates market value. At the time a Fund enters into the repurchase agreement, the Fund takes possession of the underlying securities and the seller agrees that the value of the underlying securities, including accrued interest, will at all times be equal to or exceed the face amount of the repurchase agreement. In addition, the Funds actively monitor and seek additional collateral, as needed. If the seller defaults, the fair value of the collateral may decline and realization of the collateral by the Funds may be delayed or limited.
Share valuation — The net asset value per share of each Fund is calculated daily by dividing the total value of its assets, less liabilities, by the number of shares outstanding. The offering price and redemption price per share of each Fund is equal to the net asset value per share.
Investment income — Interest income is accrued as earned. Dividend income is recorded on the ex-dividend date. Discounts and premiums on fixed-income securities purchased are amortized using the interest method.
Security transactions — Security transactions are accounted for on trade date for financial reporting purposes. Gains and losses on securities sold are determined on a specific identification basis.
Common expenses — Common expenses of the Trust are allocated among the funds within the Trust based on relative net assets of each fund or the nature of the services performed and the relative applicability to each fund.
Distributions to shareholders — Dividends arising from net investment income, if any, are declared and paid quarterly to shareholders of Davenport Core Fund and Davenport Value & Income Fund; and declared and paid annually to shareholders of Davenport Equity Opportunities Fund. Net realized short-term capital gains, if any, may be distributed throughout the year and net realized long-term capital gains, if any, are distributed at least once each year. The amount of distributions from net investment income and net realized gains are determined in accordance with federal income tax regulations which may differ from GAAP. Dividends and distributions are recorded on the ex-dividend date.
THE DAVENPORT FUNDS
NOTES TO FINANCIAL STATEMENTS (Continued)
The tax character of distributions paid during the years ended March 31, 2013 and March 31, 2012 is as follows:
| | | | | | | | | | |
| Davenport Core Fund | 3/31/13 | | $ | 1,315,956 | | | $ | — | | | $ | 1,315,956 | |
| | 3/31/12 | | $ | 1,036,002 | | | $ | — | | | $ | 1,036,002 | |
| Davenport Value & Income Fund | 3/31/13 | | $ | 3,316,928 | | | $ | 1,962,920 | | | $ | 5,279,848 | |
| | 3/31/12 | | $ | 1,593,832 | | | $ | — | | | $ | 1,593,832 | |
| Davenport Equity Opportunities Fund | 3/31/13 | | $ | 505,327 | | | $ | 1,364,834 | | | $ | 1,870,161 | |
| | 3/31/12 | | $ | 163,030 | | | $ | — | | | $ | 163,030 | |
Estimates — The preparation of financial statements in conformity with GAAP requires management to make estimates and assumptions that affect the reported amounts of assets and liabilities and disclosure of contingent assets and liabilities as of the date of the financial statements and the reported amounts of income and expenses during the reporting period. Actual results could differ from those estimates.
Federal income tax — It is each Fund’s policy to comply with the special provisions of Subchapter M of the Internal Revenue Code applicable to regulated investment companies. As provided therein, in any fiscal year in which a Fund so qualifies and distributes at least 90% of its taxable net income, the Fund (but not the shareholders) will be relieved of federal income tax on the income distributed. Accordingly, no provision for income taxes has been made.
In order to avoid imposition of the excise tax applicable to regulated investment companies, it is also each Fund’s intention to declare as dividends in each calendar year at least 98% of its net investment income (earned during the calendar year) and 98.2% of its net realized capital gains (earned during the twelve months ended October 31) plus undistributed amounts from prior years.
The following information is computed on a tax basis for each item as of March 31, 2013:
| | | | | Davenport Value & Income Fund | | | Davenport Equity Opportunities Fund | |
Cost of portfolio investments | | $ | 147,207,987 | | | $ | 161,144,316 | | | $ | 81,479,572 | |
Gross unrealized appreciation | | $ | 59,689,594 | | | $ | 29,613,649 | | | $ | 18,231,524 | |
Gross unrealized depreciation | | | (678,826 | ) | | | (566,815 | ) | | | (110,471 | ) |
Net unrealized appreciation | | | 59,010,768 | | | | 29,046,834 | | | | 18,121,053 | |
Undistributed ordinary income | | | 11,648 | | | | 598,977 | | | | 36,859 | |
Undistributed long-term gains | | | 1,455,477 | | | | 2,657,623 | | | | 2,404,795 | |
Total distributable earnings | | $ | 60,477,893 | | | $ | 32,303,434 | | | $ | 20,562,707 | |
THE DAVENPORT FUNDS
NOTES TO FINANCIAL STATEMENTS (Continued)
The difference between the federal income tax cost and the financial statement cost for the Funds is due to certain timing differences in the recognition of capital gains and losses under income tax regulations and GAAP. These timing differences are temporary in nature and are due to the tax deferral of losses on wash sales and adjustments to basis on public traded partnerships.
During the year ended March 31, 2013, Davenport Core Fund and Davenport Value & Income Fund utilized short-term capital loss carryforwards in the amount of $8,216,252 and $510,828, respectively, to offset current year realized gains.
The Funds recognize the tax benefits or expenses of uncertain tax positions only when the position is “more likely than not” to be sustained assuming examination by tax authorities. Management has reviewed the tax positions taken on Federal income tax returns for all applicable open tax years (tax years ended March 31, 2010 through March 31, 2013) of each Fund and has concluded that no provision for unrecognized tax benefits or expenses is required in these financial statements.
3. Investment Transactions
During the year ended March 31, 2013, the cost of purchases and proceeds from sales and maturities of investment securities, other than short-term investments and U.S. Government securities, totaled $52,113,492 and $45,242,839, respectively, for Davenport Core Fund; $102,713,211 and $38,444,311, respectively, for Davenport Value & Income Fund; and $53,302,882 and $28,526,903, respectively, for Davenport Equity Opportunities Fund.
4. Transactions with Related Parties
INVESTMENT ADVISORY AGREEMENTS
Each Fund’s investments are managed by Davenport & Company LLC (the “Adviser”) under the terms of an Investment Advisory Agreement. Under the Investment Advisory Agreement, each Fund pays the Adviser a fee, which is computed and accrued daily and paid monthly, at an annual rate of .75% on its average daily net assets.
Certain officers of the Trust are also officers of the Adviser.
MUTUAL FUND SERVICES AGREEMENT
Under the terms of a Mutual Fund Services Agreement between the Trust and Ultimus Fund Solutions, LLC (“Ultimus”), Ultimus provides administrative, pricing, accounting, dividend disbursing, shareholder servicing and transfer agent services for the Funds. For these services, Ultimus receives a monthly fee from each Fund at an annual rate of .15% on its average daily net assets up to $25 million, .125% on the next $25 million of such assets and .10% on such assets in excess of $50 million, subject to a minimum monthly fee of $4,000, plus a shareholder recordkeeping fee at the annual rate of $10 per shareholder account in excess of 1,000 accounts. In addition, the Funds pay out-of-pocket expenses including, but not limited to, postage, supplies and costs of pricing the Funds’ portfolio securities.
THE DAVENPORT FUNDS
NOTES TO FINANCIAL STATEMENTS (Continued)
Certain officers of the Trust are also officers of Ultimus, or of Ultimus Fund Distributors, LLC (the “Distributor”), the principal underwriter of the Funds’ shares and an affiliate of Ultimus. The Distributor is compensated by the Adviser (not the Funds) for acting as principal underwriter.
COMPLIANCE CONSULTING AGREEMENT
Under the terms of a Compliance Consulting Agreement between the Trust and Ultimus, Ultimus provides an individual to serve as the Trust’s Chief Compliance Officer and to administer the Trust’s compliance policies and procedures. For these services, the Funds pay Ultimus an annual base fee of $18,600 plus an asset-based fee equal to 0.01% per annum on the Funds’ aggregate average net assets in excess of $100 million. In addition, the Funds reimburse Ultimus for any reasonable out-of-pocket expenses, if any, incurred in providing these services.
COMPENSATION OF TRUSTEES
Trustees and officers affiliated with the Adviser or Ultimus are not compensated by the Trust for their services. Each Trustee who is not an affiliated person of the Adviser or Ultimus receives from the Trust an annual retainer of $8,000, payable quarterly; a fee of $ 1,500 for attendance at each meeting of the Board of Trustees (except that such fee is $2,500 for the independent chairman); and $1,000 for attendance at each meeting for any committee of the Board (except that such fee is $1,500 for the committee chairman); plus reimbursement of travel and other expenses incurred in attending meetings.
5. Sector Risk
If a Fund has significant investments in the securities of issuers in industries within a particular sector, any development affecting that sector will have a greater impact on the value of the net assets of the Fund than would be the case if the Fund did not have significant investments in that sector. In addition, this may increase the risk of loss of an investment in the Fund and increase the volatility of the Fund’s net asset value per share. From time to time, circumstances may affect a particular sector and the companies within such sector. For instance, economic or market factors, regulation or deregulation, or other developments may negatively impact all companies in a particular sector and therefore the value of the Fund’s portfolio would be adversely affected. As of March 31, 2013, Davenport Equity Opportunities Fund had 30.9% and 28.0% of the value of its net assets invested in stocks within the Financials sector and Consumer Discretionary sector, respectively.
6. Contingencies and Commitments
The Funds indemnify the Trust’s officers and Trustees for certain liabilities that might arise from their performance of their duties to the Funds. Additionally, in the normal course of business the Funds enter into contracts that contain a variety of representations and warranties and which provide general indemnifications. The Funds’ maximum exposure under these arrangements is unknown, as this would involve future claims that may be made against the Funds that have not yet occurred. However, based on experience, the Funds expect the risk of loss to be remote.
THE DAVENPORT FUNDS
NOTES TO FINANCIAL STATEMENTS (Continued)
7. Subsequent Events
The Funds are required to recognize in the financial statements the effects of all subsequent events that provide additional evidence about conditions that existed as of the date of the Statements of Assets and Liabilities. For non-recognized subsequent events that must be disclosed to keep the financial statements from being misleading, the Funds are required to disclose the nature of the event as well as an estimate of its financial effect, or a statement that such an estimate cannot be made. Management has evaluated subsequent events through the issuance of these financial statements and has noted no such events.
THE DAVENPORT FUNDS
REPORT OF INDEPENDENT REGISTERED
The Board of Trustees and Shareholders of
The Davenport Core Fund,
The Davenport Value & Income Fund, and
The Davenport Equity Opportunities Fund a series of the Williamsburg Investment Trust
We have audited the accompanying statements of assets and liabilities of The Davenport Core Fund, The Davenport Value & Income Fund, and The Davenport Equity Opportunities Fund (the “Funds”) (each a series of the Williamsburg Investment Trust), including the schedules of investments, as of March 31, 2013, and the related statements of operations for the year then ended, the statements of changes in net assets for each of the two years in the period then ended, and the financial highlights for each of the five years or period in the period then ended. These financial statements and financial highlights are the responsibility of the Funds’ management. Our responsibility is to express an opinion on these financial statements and financial highlights based on our audits.
We conducted our audits in accordance with the standards of the Public Company Accounting Oversight Board (United States). Those standards require that we plan and perform the audits to obtain reasonable assurance about whether the financial statements and financial highlights are free of material misstatement. We were not engaged to perform an audit of the Funds’ internal control over financial reporting. Our audits included consideration of internal control over financial reporting as a basis for designing audit procedures that are appropriate in the circumstances, but not for the purpose of expressing an opinion on the effectiveness of the Funds’ internal control over financial reporting. Accordingly, we express no such opinion. An audit also includes examining, on a test basis, evidence supporting the amounts and disclosures in the financial statements and financial highlights, assessing the accounting principles used and significant estimates made by management, and evaluating the overall financial statement presentation. Our procedures included confirmation of securities owned as of March 31, 2013, by correspondence with the custodian and brokers. We believe that our audits provide a reasonable basis for our opinion.
In our opinion, the financial statements and financial highlights referred to above present fairly, in all material respects, the financial position of each of the respective Funds comprising Williamsburg Investment Trust at March 31, 2013, the results of their operations for the year then ended, the changes in their net assets for each of the two years in the period then ended, and the financial highlights for each of the five years or period in the period then ended, in conformity with U.S. generally accepted accounting principles.
Cincinnati, Ohio
May 24, 2013
THE DAVENPORT FUNDS
BOARD OF TRUSTEES AND EXECUTIVE OFFICERS
Overall responsibility for management of the Funds rests with the Board of Trustees. The Trustees serve during the lifetime of the Trust and until its termination, or until death, resignation, retirement or removal. The Trustees, in turn, elect the officers of the Funds. The officers have been elected for an annual term. The following are the Trustees and executive officers of the Funds:
| | Trustee | Address | Year of Birth | Position Held with the Trust | Length of Time Served |
| | Robert S. Harris | 100 Darden Boulevard Charlottesville, VA | 1949 | Chairman and Trustee | Since January 2007 |
| * | John P. Ackerly IV | One James Center 901 E. Cary Street Richmond, VA | 1963 | Trustee and President | Since November 1997 |
| * | John T. Bruce | 800 Main Street Lynchburg, VA | 1953 | Trustee | Since September 1988 |
| | J. Finley Lee, Jr. | 448 Pond Apple Drive North Naples, FL | 1939 | Trustee | Since September 1988 |
| | Richard L. Morrill | University of Richmond Richmond, VA | 1939 | Trustee | Since March 1993 |
| | Harris V. Morrissette | 100 Jacintoport Boulevard Saraland, AL | 1959 | Trustee | Since March 1993 |
| | I. Lee Chapman, IV | One James Center 901 E. Cary Street Richmond, VA | 1971 | Vice President | Since November 2010 |
| | George L. Smith, III | One James Center 901 E. Cary Street Richmond, VA | 1976 | Vice President | Since February 2011 |
| | Robert G. Dorsey | 225 Pictoria Drive, Suite 450 Cincinnati, OH | 1957 | Vice President | Since November 2000 |
| | Mark J. Seger | 225 Pictoria Drive, Suite 450 Cincinnati, OH | 1962 | Treasurer | Since November 2000 |
| | Tina H. Bloom | 225 Pictoria Drive, Suite 450 Cincinnati, OH | 1968 | Secretary and Chief Compliance Officer | Since August 2006 |
| * | Messrs. Ackerly and Bruce, as affiliated persons of investment advisers to the Trust, are “interested persons” of the Trust within the meaning of Section 2(a)(19) of the Investment Company Act of 1940. |
THE DAVENPORT FUNDS
BOARD OF TRUSTEES AND EXECUTIVE OFFICERS
Each Trustee oversees eleven portfolios of the Trust, including the Funds. The principal occupations of the Trustees and executive officers of the Funds during the past five years and public directorships held by the Trustees are set forth below:
Robert S. Harris is the C. Stewart Sheppard Professor of Business Administration at The Darden Graduate School of Business Administration at the University of Virginia. He was previously the dean at Darden. Professor Harris has published widely on corporate finance, financial markets and mergers and acquisitions and has served as a consultant to corporations and government agencies.
John P. Ackerly IV is Senior Vice President and Portfolio Manager of the Adviser.
John T. Bruce is a President, Director and member of the Executive Committee of Flippin, Bruce & Porter, Inc. (an investment advisory firm).
J. Finley Lee, Jr. is the retired Julian Price Professor Emeritus at the University of North Carolina.
Richard L. Morrill serves as President of the Teagle Foundation (charitable foundation) and Chancellor of the University of Richmond. He is also a member of the Board of Directors of Tredegar Corporation (a plastics manufacturer).
Harris V. Morrissette is President of China Doll Rice and Beans Inc. and Dixie Lily Foods. He is a member of the Board of Directors of BancTrust Financial Group, Inc. (a bank holding company) and International Shipholding Corporation (cargo transportation).
I. Lee Chapman, IV is President and Portfolio Manager of the Adviser.
George L. Smith, III is Senior Vice President and Chief Executive Officer of the Adviser.
Robert G. Dorsey is a Managing Director of Ultimus Fund Solutions, LLC and Ultimus Fund Distributors, LLC.
Mark J. Seger is a Managing Director of Ultimus Fund Solutions, LLC and Ultimus Fund Distributors, LLC.
Tina H. Bloom is Director of Fund Administration of Ultimus Fund Solutions, LLC.
Additional information about members of the Board of Trustees and executive officers is available in the Statement of Additional Information (“SAI”). To obtain a free copy of the SAI, please call 1-800-281-3217.
THE DAVENPORT FUNDS
YOUR FUNDS’ EXPENSES (Unaudited)
We believe it is important for you to understand the impact of costs on your investment. All mutual funds have operating expenses. As a shareholder of the Funds, you incur ongoing costs, including management fees and other expenses. These ongoing costs, which are deducted from each Fund’s gross income, directly reduce the investment return of the Funds.
A mutual fund’s ongoing costs are expressed as a percentage of its average net assets. This figure is known as the expense ratio. The following examples are intended to help you understand the ongoing costs (in dollars) of investing in the Funds and to compare these costs with the ongoing costs of investing in other mutual funds. The examples below are based on an investment of $1,000 made at the beginning of the period shown and held for the entire period (October 1, 2012 through March 31, 2013).
The table below illustrates each Fund’s ongoing costs in two ways:
Actual fund return – This section helps you to estimate the actual expenses that you paid over the period. The “Ending Account Value” shown is derived from each Fund’s actual return, and the third column shows the dollar amount of operating expenses that would have been paid by an investor who started with $1,000 in the Funds. You may use the information here, together with the amount you invested, to estimate the expenses that you paid over the period.
To do so, simply divide your account value by $1,000 (for example, an $8,600 account value divided by $1,000 = 8.6), then multiply the result by the number given for the Funds under the heading “Expenses Paid During Period.”
Hypothetical 5% return – This section is intended to help you compare each Fund’s ongoing costs with those of other mutual funds. It assumes that each Fund had an annual return of 5% before expenses during the period shown, but that the expense ratio is unchanged. In this case, because the return used is not each Fund’s actual return, the results do not apply to your investment. The example is useful in making comparisons because the Securities and Exchange Commission (“SEC”) requires all mutual funds to calculate expenses based on a 5% return. You can assess each Fund’s ongoing costs by comparing this hypothetical example with the hypothetical examples that appear in shareholder reports of other funds.
Note that expenses shown in the table are meant to highlight and help you compare ongoing costs only. The Funds do not charge transaction fees, such as purchase or redemption fees, nor do they carry a “sales load.”
The calculations assume no shares were bought or sold during the period. Your actual costs may have been higher or lower, depending on the amount of your investment and the timing of any purchases or redemptions.
More information about each Fund’s expenses, including historical annual expense ratios, can be found in this report. For additional information on operating expenses and other shareholder costs, please refer to the Funds’ prospectus.
THE DAVENPORT FUNDS
YOUR FUNDS’ EXPENSES (Unaudited) (Continued)
| Beginning Account Value October 1, 2012 | Ending Account Value March 31, 2013 | Expenses Paid During Period* |
Based on Actual Fund Return | $1,000.00 | $1,109.40 | $5.00 |
Based on Hypothetical 5% Return (before expenses) | $1,000.00 | $1,020.19 | $4.78 |
| * | Expenses are equal to Davenport Core Fund’s annualized expense ratio of 0.95% for the period, multiplied by the average account value over the period, multiplied by 182/365 (to reflect the one-half year period). |
Davenport Value & Income Fund | Beginning Account Value October 1, 2012 | Ending Account Value March 31, 2013 | Expenses Paid During Period* |
Based on Actual Fund Return | $1,000.00 | $1,127.90 | $4.99 |
Based on Hypothetical 5% Return (before expenses) | $1,000.00 | $1,020.24 | $4.73 |
| * | Expenses are equal to Davenport Value & Income Fund’s annualized expense ratio of 0.94% for the period, multiplied by the average account value over the period, multiplied by 182/365 (to reflect the one-half year period). |
Davenport Equity Opportunities Fund | Beginning Account Value October 1, 2012 | Ending Account Value March 31, 2013 | Expenses Paid During Period* |
Based on Actual Fund Return | $1,000.00 | $1,175.90 | $5.37 |
Based on Hypothetical 5% Return (before expenses) | $1,000.00 | $1,020.00 | $4.99 |
| * | Expenses are equal to Davenport Equity Opportunities Fund’s annualized expense ratio of 0.99% for the period, multiplied by the average account value over the period, multiplied by 182/365 (to reflect the one-half year period). |
THE DAVENPORT FUNDS
OTHER INFORMATION (Unaudited)
A description of the policies and procedures that the Funds use to vote proxies relating to portfolio securities is available without charge upon request by calling toll-free 1-800-281-3217, or on the SEC’s website at http://www.sec.gov. Information regarding how the Funds voted proxies relating to portfolio securities during the most recent 12-month period ended June 30 is also available without charge upon request by calling toll-free 1-800-281-3217, or on the SEC’s website at http://www.sec.gov.
The Trust files a complete listing of portfolio holdings for the Funds with the SEC as of the end of the first and third quarters of each fiscal year on Form N-Q. These filings are available upon request by calling 1-800-281-3217. Furthermore, you may obtain a copy of these filings on the SEC’s website at http://www.sec.gov. The Trust’s Forms N-Q may also be reviewed and copied at the SEC’s Public Reference Room in Washington, DC, and information on the operation of the Public Reference Room may be obtained by calling 1-800-SEC-0330.
A complete listing of portfolio holdings for the Funds is updated daily and can be reviewed at the Funds’ website at http://www.investdavenport.com.
FEDERAL TAX INFORMATION (Unaudited)
In accordance with federal tax requirements, the following provides shareholders with information concerning distributions from ordinary income and net realized gains made by the Funds during the year ended March 31, 2013. During the year ended March 31, 2013, Davenport Value & Income Fund and Davenport Equity Opportunities Fund paid a long-term capital gain distribution of $1,962,920 and $1,364,834, respectively. Certain dividends paid by the Funds may be subject to a maximum tax rate of 15%, as provided by the Jobs and Growth Tax Relief Reconciliation Act of 2003. Davenport Core Fund, Davenport Value & Income Fund and Davenport Equity Opportunities Fund intend to designate up to a maximum amount of $1,315,956, $3,316,928 and $505,327, respectively, as taxed at a maximum rate of 15%. For the fiscal year ended March 31, 2013, 100% of the dividends paid from ordinary income by the Funds qualified for the dividends received deduction for corporations.
As required by federal regulations, complete information will be computed and reported in conjunction with your 2013 1099-DIV.
THE DAVENPORT FUNDS DISCLOSURE REGARDING APPROVAL OF INVESTMENT ADVISORY AGREEMENTS (Unaudited) |
At an in-person meeting held on February 26, 2013, the Board of Trustees, including a majority of the Independent Trustees, approved the continuance for a one-year period of the Investment Advisory Agreements with the Adviser on behalf of Davenport Core Fund, the Davenport Value & Income Fund and the Davenport Equity Opportunities Fund. Below is a discussion of the factors considered by the Board of Trustees along with the conclusions with respect thereto that formed the basis for the Board’s approval.
In selecting the Adviser and approving the continuance of the Investment Advisory Agreements, the Trustees considered all information they deemed reasonably necessary to evaluate the terms of the Agreements. The principal areas of review by the Trustees were the nature, extent and quality of the services provided by the Adviser and the reasonableness of the fees charged for those services. These matters were considered by the Independent Trustees consulting with experienced counsel for the Independent Trustees, who is independent of the Adviser.
The Trustees’ evaluation of the quality of the Adviser’s services took into account their knowledge and experience gained through meetings with and reports of the Adviser’s senior management over the course of the preceding year. Both short-term and long-term investment performance of the Funds was considered. Each Fund’s performance was compared to its performance benchmark and to that of competitive funds with similar investment objectives and to the Adviser’s comparably managed private accounts. The Trustees also considered the scope and quality of the in-house capabilities of the Adviser and other resources dedicated to performing services for the Funds. The quality of administrative and other services, including the Adviser’s role in coordinating the activities of the Funds’ other service providers, were considered in light of the Funds’ compliance with investment policies and applicable laws and regulations and of related reports by management and the Funds’ independent public accounting firm in periodic meetings with the Trust’s Audit Committee. The Trustees also considered the business reputation of the Adviser, the qualifications of its key investment and compliance personnel, and its financial resources.
In reviewing the fees payable under the Investment Advisory Agreements, the Trustees compared the advisory fees and overall expense levels of each Fund with those of competitive funds with similar investment objectives as well as the private accounts managed by the Adviser. The Trustees considered information provided by the Adviser concerning the Adviser’s profitability with respect to each Fund, including the assumptions and methodology used in preparing the profitability information, in light of applicable case law relating to advisory fees. For these purposes, the Trustees took into account not only the fees paid by the Funds, but also so-called “fallout” benefits to the Adviser. The Trustees also considered the fact that all of the Funds’ portfolio trades were executed by the Adviser at no cost to the Funds. In evaluating each Fund’s advisory fees, the Trustees took into account the complexity and quality of the investment management of the Fund.
THE DAVENPORT FUNDS DISCLOSURE REGARDING APPROVAL OF INVESTMENT ADVISORY AGREEMENTS (Unaudited) (Continued) |
Based upon their review of this information, the Independent Trustees concluded that: (i) based on the performance of each of the Funds, the Adviser’s demonstrated commitment to long-term investing and its team-oriented management approach, the Adviser has provided quality services to the Funds; (ii) although the advisory fees payable by each Fund to the Adviser are in the higher range of fees for other comparably managed funds, the Independent Trustees believe the fees to be reasonable given the scope and quality of services provided by the Adviser and the resources that are dedicated to its investment process; (iii) the total operating expense ratio of each Fund is lower than the average expense ratio for comparably managed funds, according to statistics derived from Morningstar, Inc.; (iv) the Adviser has further benefited the Funds’ shareholders by executing portfolio transactions at no cost to the Funds; and (v) the level of the Adviser’s profitability with respect to its management of the Funds is reasonable.
Given the current size of the Funds, the Independent Trustees did not believe that at the present time it would be relevant to consider the extent to which economies of scale would be realized as the Funds grow, and whether fee levels reflect these economies of scale. The Independent Trustees also considered the “fallout” benefits to, and the profitability of, the Adviser with respect to the Funds, but given the amounts involved viewed these as secondary factors in connection with the evaluation of the reasonableness of the advisory fees paid by the Funds.
No single factor was considered in isolation or to be determinative to the decision of the Trustees to approve continuance of the Investment Advisory Agreements. Rather the Trustees concluded, in light of a weighing and balancing of all factors considered, that it was in the best interests of each Fund and its shareholders to continue the Investment Advisory Agreements without modification to its terms, including the fees charged for services thereunder.
| | THE DAVENPORT FUNDS Investment Adviser Davenport & Company LLC One James Center 901 East Cary Street Richmond, Virginia 23219-4037 Administrator Ultimus Fund Solutions, LLC P.O. Box 46707 Cincinnati, Ohio 45246-0707 1-800-281-3217 Custodian US Bank NA 425 Walnut Street Cincinnati, Ohio 45202 Independent Registered Public Accounting Firm Ernst & Young LLP 1900 Scripps Center 312 Walnut Street Cincinnati, Ohio 45202 Legal Counsel Sullivan & Worcester LLP One Post Office Square Boston, Massachusetts 02109 Board of Trustees John P. Ackerly, IV John T. Bruce Robert S. Harris J. Finley Lee, Jr. Richard L. Morrill Harris V. Morrissette Officers John P. Ackerly, IV, President I. Lee Chapman, IV, Vice President George L. Smith, III, Vice President | |
Davenport & Company LLC
One James Center
901 East Cary Street
Richmond, VA 23219
Member: NYSE • SIPC
Toll Free: (800) 846-6666
www.investdavenport.com
We are pleased to report on your Funds and their investments for the annual period ended March 31, 2013. The past year gave us plenty to ponder and be concerned with, from European sovereign debt issues to the U.S. Presidential election to the fiscal cliff. The Flippin, Bruce & Porter Funds produced attractive returns this past year, so we will discuss the major factors that affected these results and also update you on recent changes to the Funds’ portfolios.
Economic and Market Update
Despite dire warnings of coming economic implosion caused by the fiscal cliff and sequestration, the U.S. economy and stock market plowed ahead to begin 2013. In actuality, the market did more than just move forward, it spiked up with the S&P 500 Index generating a double-digit gain during the quarter ended March 31, 2013. Since bottoming shortly after the election in November, the market rallied almost 17% through March 31, and most major indexes hit new all-time high levels during this final quarter of the Funds’ fiscal year.
Calendar 2013 began with much hand wringing due to the inability of Congress and the President to agree on several key tax and spending issues. At the final hour a compromise was reached, which proved to be more favorable than expected on several fronts. For example, most taxpayers will see no increase in dividend and capital gains tax rates, and the increase for the highest earners will be modest. The equivalent treatment for dividends and capital gains suggests that corporate managements will likely allocate significant portions of free cash flow toward increasing dividends over time. Rising dividend levels should ultimately attract investor capital and lead to continued support for stock prices. The expiration of the payroll tax break probably had the most negative impact on the economy but this will likely be temporary. We believe the U.S. economy has the potential for stronger long-term economic growth than most forecast. This outlook is driven by improvement in domestic housing and autos, the ongoing development of North American energy resources, and a resurgence in U.S. manufacturing. We believe the markets are gradually recognizing this potential.
However, instability in Europe remains among the largest risks to the U.S. economy and markets in general. The sovereign debt crisis that has swept across the continent over the last few years recently settled on Cyprus. The tiny island nation’s banking system was the latest to seek bailout assistance from the European Union. The stiff penalties originally proposed by the EU were rejected by the populace. This caused fear that the economy would collapse and that Cyprus would be forced to exit the EU, thereby destabilizing the euro-zone. Near quarter-end, terms for a bailout were reached but the banking/debt crisis there remained uncertain. While the U.S. is far from a crisis point regarding its government debt levels, the situation in Europe should serve as a warning to policy makers here that eventually budget deficits and debt loads must be addressed.
The stock market over the past year was strong, however as previously discussed, most of the return occurred this past quarter. Merger and acquisition activity heated up with several deals announced recently including the AMR and US Airways merger, the Office Depot and Office Max combination and the Heinz acquisition by Berkshire Hathaway. Additionally, leveraged buyout discussions have been on the rise, most notably at Dell where founder Michael Dell and various private equity partners have proposed taking the company private, albeit at a level that would not generate a boost to the stock price.
FBP Equity & Dividend Plus Fund Review
The FBP Equity & Dividend Plus Fund performed well versus the S&P 500 Index during the quarter ended March 31, 2013 and for the trailing 12 months. The Fund was up 14.47% for the quarter and 16.19% for the fiscal year, while the S&P 500 Index was up 10.61% for the quarter and 13.96% for the fiscal year. Demand by investors for dividend paying stocks continues to be strong and certainly was a contributing factor to the Fund’s positive returns. Performance was also driven by positive attribution from the Industrials, Information Technology and Materials sectors. Avery Dennison and Philips Electronics in the Industrials sector, Dell and Computer Sciences in Information Technology, as well as Consumer Discretionary stocks H&R Block and Best Buy were strong contributors. The Consumer Discretionary, Energy and Financials sectors were laggards, even though they produced positive returns for the full year. Supervalu, which underperformed this past year, was sold after a private equity firm made a bid for the company. We have made several other recent changes. The Fund added new positions in Norfolk Southern, DuPont, Occidental Petroleum, Dell, Sonoco Products and Prudential Financial. We are optimistic about both the dividend growth opportunity and capital appreciation potential for each of these companies given our economic outlook and their attractive valuations. Also, holdings of Lockheed Martin, Kimberly Clark, Bemis, and Eli Lilly were sold from the Fund due to less attractive valuation levels following price appreciation over the course of the year. Going forward, we will continue to look for investments in quality companies where we believe the opportunity for dividend growth as well as appreciation potential will prove rewarding for investors.
The Fund’s valuation characteristics are attractive compared to the overall market and the portfolio offers an above average dividend yield. With interest rates remaining low, we believe investors will continue to be attracted to stocks with high dividend yields, especially if these companies also have the potential to raise dividends in the future. In our view, this dynamic should lead to continued attractive total return performance from stocks that exhibit both of these characteristics
FBP Appreciation & Income Opportunities Fund Review
The FBP Appreciation & Income Opportunities Fund also produced positive results, returning 11.69% for the quarter and 12.51% for the fiscal year, while the S&P 500 Index was up 10.61% for the quarter and 13.96% for the fiscal year. The returns from the equity portion of the Fund were well ahead of the S&P 500 Index for both periods, therefore the Fund’s equity allocation was additive to the strong returns. Performance was also driven by positive attribution from the Industrials, Information Technology and Financials sectors and from significant recoveries in the prices of a number of stocks that lagged the market in 2012 including Hewlett- Packard, Dell and Avon Products. H&R Block also performed well, and we used strength in the stock to reduce our weightings. We eliminated the Fund’s holding in Northrop Grumman and reduced the holding in Lockheed Martin given the likelihood that defense spending would be trimmed this year, either through sequestration in March or through a negotiated plan by Congress. Macy’s, Kimberly Clark and KB Home were sold after very nice price appreciation. Supervalu, which underperformed this past year, was sold after a private equity firm made a bid for the company. Following last year’s Presidential election, the market did experience a modest pullback providing an opportunity for the Fund to purchase several additional securities including Norfolk Southern, Sonoco Products, AT&T, People’s United Financial and Occidental Petroleum. We believe these companies are well-managed entities trading at attractive valuations and paying above average dividend yields. Also, most of these stocks possess some economic sensitivity and are likely to perform well as economic growth continues. We also added new positions in Apple and Capital One during the first calendar quarter of 2013. Although their stock prices were temporarily depressed, we believed their strong market positions and solid balance sheets created good long-term investment opportunities.
As we have discussed in past letters, the fixed income portion of the Fund is positioned in a defensive manner, anticipating that higher interest rates in the future would lead to disappointing fixed income returns. While for the full year the Fund did not see the benefit of that strategy, we believe that today’s very low level of interest rates does not provide an attractive risk / reward trade-off. Our concern is not what will happen quarter to quarter, but what will happen with interest rates long term if either the economy displays more strength or inflation begins to become more apparent.
In conclusion, we remain positive about the direction of the economy and stock market over the longer term, however we acknowledge that the recent upward trajectory of the market is likely due for a pause. Valuations do not appear excessive from a historical perspective with the S&P 500 Index trading at 13.6 times forward earnings, especially when compared to the current level of interest rates. Some of the defensive sectors, such as Consumer Staples and Utilities seem to be elevated in valuation compared to the past few years. Therefore increased volatility over the coming months combined with a market correction would not be a surprise and would most likely provide additional investment opportunities.
We want to thank you for your support and trust that you show by being a shareholder with us. Be assured we will continue to work diligently on your behalf. Please visit our website at www.fbpfunds.com for information on your Funds and the investment philosophy and process we utilize to achieve their investment objectives.
John T. Bruce, CFA
President - Portfolio Manager
May 6, 2013
Data presented reflects past performance, which is no guarantee of future results. Investment results and principal value will fluctuate so that shares, when redeemed, may be worth more or less than their original cost. Due to market volatility, current performance may be higher or lower than the performance shown. Updated performance information, current through the most recent month-end, is available by contacting the Funds at 1-866-738-1127.
This report is submitted for the general information of the shareholders of the Funds. It reflects our views, opinions and portfolio holdings as of March 31, 2013, the end of the reporting period. These views are subject to change at any time based upon market or other conditions. For more current information throughout the year please visit www.fbpfunds.com or call the Funds at 1-866-738-1127. This report is not authorized for distribution to prospective investors in the Funds unless accompanied by a current prospectus. Distributed by Ultimus Fund Distributors, LLC.
THE FLIPPIN, BRUCE & PORTER FUNDS COMPARATIVE PERFORMANCE CHARTS (Unaudited) |
Performance for each Fund is compared to the most appropriate broad-based index, the S&P 500® Index, an unmanaged index of 500 large common stocks. Results are also compared to the Consumer Price Index, a measure of inflation.
THE FLIPPIN, BRUCE & PORTER FUNDS COMPARATIVE PERFORMANCE CHARTS (Unaudited) (Continued) |
Average Annual Total Returns(a) (for periods ended March 31, 2013) |
| | 1 Year | 5 Years | 10 Years |
| FBP Equity & Dividend Plus Fund | 16.19% | 2.04% | 5.91% |
| FBP Appreciation & Income Opportunities Fund | 12.51% | 4.03% | 6.13% |
Standard & Poor’s 500® Index | 13.96% | 5.81% | 8.53% |
| Consumer Price Index | 1.99% | 1.86% | 2.48% |
| (a) | Total returns are a measure of the change in value of an investment in the Funds over the periods covered, which assumes any dividends or capital gains distributions are reinvested in shares of the Funds. Returns do not reflect the deduction of taxes a shareholder would pay on the Funds’ distributions or the redemption of Fund shares. |
FBP EQUITY & DIVIDEND PLUS FUND PORTFOLIO INFORMATION March 31, 2013 (Unaudited) |
| | | Asset Allocation (% of Net Assets) |
| Net Asset Value Per Share | $21.67 | |
| Total Net Assets (Millions) | $22.6 |
| Current Expense Ratio | 1.07% |
| Portfolio Turnover | 32% |
| Fund Inception Date | 7/30/1993 |
| | | |
| FBP Equity
& Dividend
Plus Fund | |
| Number of Stocks | 47 | 500 |
| Weighted Avg Market Capitalization (Billions) | $85.5 | $106.1 |
| Price-to-Earnings Ratio (Bloomberg 1 Yr. Forecast EPS) | 11.5 | 13.6 |
| Price-to-Book Value | 1.9 | 2.3 |
Sector Diversification vs. the S&P 500® Index |
| Ten Largest Equity Holdings | % of Net Assets |
| Johnson & Johnson | 3.8% |
| JPMorgan Chase & Company | 3.6% |
| ConAgra Foods, Inc. | 3.3% |
| Computer Sciences Corporation | 3.3% |
| ConocoPhillips | 3.2% |
| PepsiCo, Inc. | 3.1% |
| Avery Dennison Corporation | 3.1% |
| Royal Dutch Shell plc - Class A - ADR | 3.0% |
| Chevron Corporation | 3.0% |
| 3M Company | 3.0% |
FBP APPRECIATION & INCOME OPPORTUNITIES FUND PORTFOLIO INFORMATION March 31, 2013 (Unaudited) |
| | Asset Allocation (% of Net Assets) |
| Net Asset Value Per Share | $17.16 | |
| Total Net Assets (Millions) | $36.8 |
| Current Expense Ratio | 1.00% |
| Portfolio Turnover | 15% |
| Fund Inception Date | 7/3/1989 |
| | |
Common Stock Portfolio (75.0% of Fund) |
| Number of Stocks | 56 |
| Weighted Avg Market Capitalization ( Billions ) | $82.4 |
| Price-to-Earnings Ratio (Bloomberg 1 Yr. Forecast EPS) | 10.9 |
| Price-to-Book Value | 1.6 |
Ten Largest Equity Holdings | |
| Johnson & Johnson | 2.8% |
| JPMorgan Chase & Company | 2.7% |
| Bank of America Corporation | 2.3% |
| Cisco Systems, Inc. | 2.3% |
| Microsoft Corporation | 2.3% |
| Pfizer, Inc. | 2.2% |
| MetLife, Inc. | 2.1% |
| ConocoPhillips | 2.0% |
| Royal Dutch Shell plc - Class A - ADR | 1.9% |
| Sealed Air Corporation | 1.9% |
| |
| Financials | 15.4% |
| Information Technology | 12.0% |
| Industrials | 9.9% |
| Energy | 9.6% |
| Consumer Staples | 6.8% |
Fixed-Income Portfolio (12.2% of Fund) |
| Number of Fixed-Income Securities | 7 |
| Average Quality | BBB+ |
| Average Weighted Maturity | 1.6 yrs. |
| Average Effective Duration | 1.6 yrs. |
| |
| Financials | 5.7% |
| Industrials | 3.6% |
| Information Technology | 2.1% |
| Municipal Bonds | 0.8% |
FBP EQUITY & DIVIDEND PLUS FUND SCHEDULE OF INVESTMENTS March 31, 2013 | |
| | | | | | |
| Consumer Discretionary — 6.6% | | | | | | |
Best Buy Company, Inc. | | | 17,000 | | | $ | 376,550 | |
H&R Block, Inc. (a) | | | 10,000 | | | | 294,200 | |
Kohl's Corporation (a) | | | 9,000 | | | | 415,170 | |
Staples, Inc. | | | 30,000 | | | | 402,900 | |
| | | | | | | | 1,488,820 | |
| Consumer Staples — 13.3% | | | | | | | | |
Avon Products, Inc. (a) | | | 15,000 | | | | 310,950 | |
Coca-Cola Company (The) | | | 5,000 | | | | 202,200 | |
ConAgra Foods, Inc. (a) | | | 21,000 | | | | 752,010 | |
PepsiCo, Inc. | | | 8,800 | | | | 696,168 | |
Procter & Gamble Company (The) | | | 8,500 | | | | 655,010 | |
Sysco Corporation | | | 11,000 | | | | 386,870 | |
| | | | | | | | 3,003,208 | |
| Energy — 10.7% | | | | | | | | |
Chevron Corporation | | | 5,700 | | | | 677,274 | |
ConocoPhillips | | | 12,200 | | | | 733,220 | |
Occidental Petroleum Corporation | | | 4,000 | | | | 313,480 | |
Royal Dutch Shell plc - Class A - ADR | | | 10,500 | | | | 684,180 | |
| | | | | | | | 2,408,154 | |
| Financials — 15.1% | | | | | | | | |
Bank of Hawaii Corporation (a) | | | 6,000 | | | | 304,860 | |
Bank of New York Mellon Corporation (The) (a) | | | 20,000 | | | | 559,800 | |
BB&T Corporation | | | 10,000 | | | | 313,900 | |
JPMorgan Chase & Company | | | 17,000 | | | | 806,820 | |
Manulife Financial Corporation | | | 20,000 | | | | 294,400 | |
People's United Financial, Inc. | | | 23,000 | | | | 309,120 | |
Prudential Financial, Inc. | | | 6,000 | | | | 353,940 | |
Travelers Companies, Inc. (The) (a) | | | 5,501 | | | | 463,130 | |
| | | | | | | | 3,405,970 | |
| Health Care — 8.8% | | | | | | | | |
Johnson & Johnson | | | 10,400 | | | | 847,912 | |
Merck & Company, Inc. | | | 12,800 | | | | 566,144 | |
Pfizer, Inc. | | | 20,000 | | | | 577,200 | |
| | | | | | | | 1,991,256 | |
| Industrials — 14.4% | | | | | | | | |
3M Company (a) | | | 6,300 | | | | 669,753 | |
Avery Dennison Corporation (a) | | | 16,000 | | | | 689,120 | |
Emerson Electric Company | | | 8,300 | | | | 463,721 | |
General Electric Company | | | 20,000 | | | | 462,400 | |
Koninklijke Philips Electronics N.V. - ADR | | | 14,400 | | | | 425,520 | |
Norfolk Southern Corporation (a) | | | 3,600 | | | | 277,488 | |
R.R. Donnelley & Sons Company | | | 21,000 | | | | 253,050 | |
| | | | | | | | 3,241,052 | |
FBP EQUITY & DIVIDEND PLUS FUND SCHEDULE OF INVESTMENTS (Continued) | |
COMMON STOCKS — 99.0% (Continued) | | | | | | |
| Information Technology — 15.7% | | | | | | |
Applied Materials, Inc. | | | 30,000 | | | $ | 404,400 | |
Cisco Systems, Inc. | | | 24,800 | | | | 518,568 | |
Computer Sciences Corporation (a) | | | 15,000 | | | | 738,450 | |
Dell, Inc. | | | 22,300 | | | | 319,559 | |
Hewlett-Packard Company | | | 25,000 | | | | 596,000 | |
Intel Corporation | | | 16,000 | | | | 349,600 | |
Microsoft Corporation | | | 21,500 | | | | 615,115 | |
| | | | | | | | 3,541,692 | |
| Materials — 6.8% | | | | | | | | |
E.I. du Pont de Nemours and Company | | | 5,000 | | | | 245,800 | |
Nucor Corporation (a) | | | 10,000 | | | | 461,500 | |
Sealed Air Corporation | | | 20,000 | | | | 482,200 | |
Sonoco Products Company | | | 10,000 | | | | 349,900 | |
| | | | | | | | 1,539,400 | |
| Telecommunication Services — 2.1% | | | | | | | | |
AT&T, Inc. | | | 13,000 | | | | 476,970 | |
| | | | | | | | | |
| Utilities — 5.5% | | | | | | | | |
American Electric Power Company, Inc. (a) | | | 8,000 | | | | 389,040 | |
FirstEnergy Corporation | | | 9,000 | | | | 379,800 | |
PPL Corporation | | | 15,300 | | | | 479,043 | |
| | | | | | | | 1,247,883 | |
| | | | | | | | | |
Total Common Stocks (Cost $17,618,655) | | | | | | $ | 22,344,405 | |
MONEY MARKET FUNDS — 2.0% | | | | | | |
Fidelity Institutional Money Market Government Portfolio - Class I, 0.01% (b) (Cost $452,863) | | | 452,863 | | | $ | 452,863 | |
| | | | | | | | | |
Total Investments at Value — 101.0% (Cost $18,071,518) | | | | | | $ | 22,797,268 | |
| | | | | | | | | |
| Liabilities in Excess of Other Assets — (1.0%) | | | | | | | (227,304 | ) |
| | | | | | | | | |
Net Assets — 100.0% | | | | | | $ | 22,569,964 | |
| ADR - American Depositary Receipt. |
| | |
| (a) | Security covers a written call option. |
| | |
| (b) | The rate shown is the 7-day effective yield as of March 31, 2013. |
| | |
| See accompanying notes to financial statements. |
FBP EQUITY & DIVIDEND PLUS FUND SCHEDULE OF OPEN OPTION CONTRACTS March 31, 2013 | |
| | | | | | | | | |
| 3M Company, | | | | | | | | | |
04/20/2013 at $100 | | | 35 | | | $ | 22,225 | | | $ | 8,679 | |
| American Electric Power Company, Inc., | | | | | | | | | | | | |
05/18/2013 at $45 | | | 50 | | | | 19,000 | | | | 7,099 | |
| Avery Dennison Corporation, | | | | | | | | | | | | |
07/20/2013 at $35 | | | 65 | | | | 59,150 | | | | 12,478 | |
| Avon Products, Inc., | | | | | | | | | | | | |
07/20/2013 at $20 | | | 150 | | | | 24,150 | | | | 29,546 | |
| Bank of Hawaii Corporation, | | | | | | | | | | | | |
10/19/2013 at $50 | | | 60 | | | | 13,800 | | | | 13,220 | |
| Bank of New York Mellon Corporation (The), | | | | | | | | | | | | |
06/22/2013 at $27 | | | 86 | | | | 13,416 | | | | 8,770 | |
| Computer Sciences Corporation, | | | | | | | | | | | | |
06/22/2013 at $40 | | | 50 | | | | 49,500 | | | | 9,617 | |
| Computer Sciences Corporation, | | | | | | | | | | | | |
06/22/2013 at $45 | | | 50 | | | | 28,000 | | | | 8,349 | |
| Computer Sciences Corporation, | | | | | | | | | | | | |
01/18/2014 at $35 | | | 50 | | | | 76,000 | | | | 13,599 | |
| ConAgra Foods, Inc., | | | | | | | | | | | | |
06/22/2013 at $30 | | | 98 | | | | 58,800 | | | | 9,994 | |
| H&R Block, Inc., | | | | | | | | | | | | |
07/20/2013 at $25 | | | 100 | | | | 48,000 | | | | 14,395 | |
| Kohl's Corporation, | | | | | | | | | | | | |
04/20/2013 at $60 | | | 45 | | | | 225 | | | | 8,189 | |
| Norfolk Southern Corporation, | | | | | | | | | | | | |
01/18/2014 at $85 | | | 36 | | | | 8,280 | | | | 7,096 | |
| Nucor Corporation, | | | | | | | | | | | | |
07/20/2013 at $49 | | | 45 | | | | 4,590 | | | | 7,739 | |
| Travelers Companies, Inc. (The), | | | | | | | | | | | | |
07/20/2013 at $78 | | | 55 | | | | 41,250 | | | | 11,235 | |
| | | | | | | $ | 466,386 | | | $ | 170,005 | |
| See accompanying notes to financial statements. |
FBP APPRECIATION & INCOME OPPORTUNITIES FUND SCHEDULE OF INVESTMENTS March 31, 2013 | |
| | | | | | |
| Consumer Discretionary — 3.8% | | | | | | |
Best Buy Company, Inc. (a) | | | 18,000 | | | $ | 398,700 | |
H&R Block, Inc. (a) | | | 5,000 | | | | 147,100 | |
Kohl's Corporation | | | 9,500 | | | | 438,235 | |
Staples, Inc. | | | 31,000 | | | | 416,330 | |
| | | | | | | | 1,400,365 | |
| Consumer Staples — 6.8% | | | | | | | | |
Archer-Daniels-Midland Company | | | 16,000 | | | | 539,680 | |
Avon Products, Inc. | | | 24,000 | | | | 497,520 | |
CVS Caremark Corporation | | | 9,000 | | | | 494,910 | |
PepsiCo, Inc. | | | 4,200 | | | | 332,262 | |
Walgreen Company (a) | | | 6,000 | | | | 286,080 | |
Wal-Mart Stores, Inc. | | | 4,500 | | | | 336,735 | |
| | | | | | | | 2,487,187 | |
| Energy — 9.6% | | | | | | | | |
Baker Hughes, Inc. (a) | | | 11,000 | | | | 510,510 | |
Chevron Corporation | | | 5,000 | | | | 594,100 | |
ConocoPhillips | | | 12,500 | | | | 751,250 | |
Devon Energy Corporation | | | 11,000 | | | | 620,620 | |
Occidental Petroleum Corporation | | | 4,200 | | | | 329,154 | |
Royal Dutch Shell plc - Class A - ADR | | | 11,000 | | | | 716,760 | |
| | | | | | | | 3,522,394 | |
| Financials — 15.4% | | | | | | | | |
Bank of America Corporation | | | 69,000 | | | | 840,420 | |
Bank of New York Mellon Corporation (The) | | | 20,000 | | | | 559,800 | |
Capital One Financial Corporation | | | 4,000 | | | | 219,800 | |
Comerica, Inc. | | | 13,000 | | | | 467,350 | |
JPMorgan Chase & Company | | | 21,000 | | | | 996,660 | |
Lincoln National Corporation | | | 20,000 | | | | 652,200 | |
Manulife Financial Corporation | | | 24,000 | | | | 353,280 | |
MetLife, Inc. | | | 20,000 | | | | 760,400 | |
People's United Financial, Inc. | | | 18,000 | | | | 241,920 | |
Travelers Companies, Inc. (The) | | | 7,000 | | | | 589,330 | |
| | | | | | | | 5,681,160 | |
| Health Care — 6.6% | | | | | | | | |
Johnson & Johnson | | | 12,500 | | | | 1,019,125 | |
Merck & Company, Inc. | | | 14,000 | | | | 619,220 | |
Pfizer, Inc. | | | 28,000 | | | | 808,080 | |
| | | | | | | | 2,446,425 | |
| Industrials — 9.9% | | | | | | | | |
Avery Dennison Corporation | | | 14,500 | | | | 624,515 | |
FedEx Corporation (a) | | | 5,400 | | | | 530,280 | |
General Electric Company | | | 17,000 | | | | 393,040 | |
Ingersoll-Rand plc (a) | | | 9,500 | | | | 522,595 | |
Koninklijke Philips Electronics N.V. - ADR | | | 16,000 | | | | 472,800 | |
Lockheed Martin Corporation | | | 4,400 | | | | 424,688 | |
Masco Corporation (a) | | | 6,500 | | | | 131,625 | |
FBP APPRECIATION & INCOME OPPORTUNITIES FUND SCHEDULE OF INVESTMENTS (Continued) | |
COMMON STOCKS — 75.0% (Continued) | | | | | | |
| Industrials — 9.9% (Continued) | | | | | | |
Norfolk Southern Corporation (a) | | | 4,000 | | | $ | 308,320 | |
R.R. Donnelley & Sons Company | | | 20,000 | | | | 241,000 | |
| | | | | | | | 3,648,863 | |
| Information Technology — 12.0% | | | | | | | | |
Apple, Inc. | | | 600 | | | | 265,578 | |
Cisco Systems, Inc. | | | 40,000 | | | | 836,400 | |
Computer Sciences Corporation (a) | | | 10,000 | | | | 492,300 | |
Dell, Inc. | | | 35,000 | | | | 501,550 | |
Flextronics International Ltd. (b) | | | 35,000 | | | | 236,600 | |
Hewlett-Packard Company (a) | | | 29,000 | | | | 691,360 | |
Intel Corporation | | | 10,000 | | | | 218,500 | |
Microsoft Corporation | | | 29,000 | | | | 829,690 | |
Western Union Company (The) | | | 23,000 | | | | 345,920 | |
| | | | | | | | 4,417,898 | |
| Materials — 6.3% | | | | | | | | |
E.I. du Pont de Nemours and Company | | | 12,000 | | | | 589,920 | |
Martin Marietta Materials, Inc. (a) | | | 2,500 | | | | 255,050 | |
Nucor Corporation (a) | | | 8,000 | | | | 369,200 | |
Sealed Air Corporation | | | 29,000 | | | | 699,190 | |
Sonoco Products Company | | | 12,000 | | | | 419,880 | |
| | | | | | | | 2,333,240 | |
| Telecommunication Services — 1.5% | | | | | | | | |
AT&T, Inc. | | | 15,000 | | | | 550,350 | |
| | | | | | | | | |
| Utilities — 3.1% | | | | | | | | |
American Electric Power Company, Inc. | | | 10,000 | | | | 486,300 | |
FirstEnergy Corporation | | | 5,000 | | | | 211,000 | |
PPL Corporation | | | 14,000 | | | | 438,340 | |
| | | | | | | | 1,135,640 | |
| | | | | | | | | |
Total Common Stocks (Cost $20,545,032) | | | | | | $ | 27,623,522 | |
| | | | | | |
| Financials — 5.7% | | | | | | |
| American Express Company, 4.875%, due 07/15/2013 | | $ | 750,000 | | | $ | 759,377 | |
| Berkley (W.R.) Corporation, 5.60%, due 05/15/2015 | | | 750,000 | | | | 809,793 | |
| Prudential Financial, Inc., 3.00%, due 05/12/2016 | | | 500,000 | | | | 528,571 | |
| | | | | | | | 2,097,741 | |
| Industrials — 3.6% | | | | | | | | |
Eaton Corporation, 5.95%, due 03/20/2014 | | | 750,000 | | | | 787,637 | |
Equifax, Inc., 4.45%, due 12/01/2014 | | | 500,000 | | | | 526,419 | |
| | | | | | | | 1,314,056 | |
| Information Technology — 2.1% | | | | | | | | |
Analog Devices, Inc., 5.00%, due 07/01/2014 | | | 750,000 | | | | 790,884 | |
| | | | | | | | | |
Total Corporate Bonds (Cost $4,044,577) | | | | | | $ | 4,202,681 | |
FBP APPRECIATION & INCOME OPPORTUNITIES FUND SCHEDULE OF INVESTMENTS (Continued) | |
| | | | | | |
| Wise Co., Virginia, Industrial Dev. Authority, Revenue, | | | | | | |
1.70%, due 02/01/2017 (Cost $298,458) | | $ | 300,000 | | | $ | 297,861 | |
MONEY MARKET FUNDS — 13.3% | | | | | | |
Fidelity Institutional Money Market Government Portfolio - Class I, 0.01% (c) | | | 3,462,898 | | | $ | 3,462,898 | |
First American Government Obligations Fund, 0.02% (c) | | | 1,419,023 | | | | 1,419,023 | |
Total Money Market Funds (Cost $4,881,921) | | | | | | $ | 4,881,921 | |
| | | | | | | | | |
Total Investments at Value — 100.5% (Cost $29,769,988) | | | | | | $ | 37,005,985 | |
| | | | | | | | | |
| Liabilities in Excess of Other Assets — (0.5%) | | | | | | | (180,883 | ) |
| | | | | | | | | |
Net Assets — 100.0% | | | | | | $ | 36,825,102 | |
| ADR - American Depositary Receipt. |
| | |
| (a) | Security covers a written call option. |
| | |
| (b) | Non-income producing security. |
| | |
| (c) | The rate shown is the 7-day effective yield as of March 31, 2013. |
| | |
| See accompanying notes to financial statements. |
FBP APPRECIATION & INCOME OPPORTUNITIES FUND SCHEDULE OF OPEN OPTION CONTRACTS March 31, 2013 | |
| | | | | | | | | |
| Baker Hughes, Inc., | | | | | | | | | |
01/18/2014 at $50 | | | 20 | | | $ | 5,940 | | | $ | 4,040 | |
| Best Buy Company, Inc., | | | | | | | | | | | | |
01/18/2014 at $18 | | | 30 | | | | 16,200 | | | | 3,209 | |
| Computer Sciences Corporation, | | | | | | | | | | | | |
01/18/2014 at $35 | | | 50 | | | | 76,000 | | | | 13,599 | |
| FedEx Corporation, | | | | | | | | | | | | |
01/18/2014 at $110 | | | 28 | | | | 8,372 | | | | 12,235 | |
| H&R Block, Inc., | | | | | | | | | | | | |
07/20/2013 at $25 | | | 50 | | | | 24,000 | | | | 6,850 | |
| Hewlett-Packard Company, | | | | | | | | | | | | |
01/18/2014 at $20 | | | 50 | | | | 24,800 | | | | 6,599 | |
| Ingersoll-Rand plc, | | | | | | | | | | | | |
01/18/2014 at $58 | | | 25 | | | | 9,000 | | | | 5,799 | |
| Martin Marietta Materials, Inc., | | | | | | | | | | | | |
07/20/2013 at $95 | | | 25 | | | | 25,250 | | | | 14,674 | |
| Masco Corporation, | | | | | | | | | | | | |
07/20/2013 at $18 | | | 65 | | | | 19,175 | | | | 10,410 | |
| Norfolk Southern Corporation, | | | | | | | | | | | | |
01/18/2014 at $85 | | | 40 | | | | 9,200 | | | | 7,884 | |
| Nucor Corporation, | | | | | | | | | | | | |
07/20/2013 at $49 | | | 40 | | | | 4,080 | | | | 6,879 | |
| Walgreen Company, | | | | | | | | | | | | |
10/19/2013 at $47 | | | 60 | | | | 18,000 | | | | 11,220 | |
| | | | | | | $ | 240,017 | | | $ | 103,398 | |
| See accompanying notes to financial statements. |
THE FLIPPIN, BRUCE & PORTER FUNDS STATEMENTS OF ASSETS AND LIABILITIES March 31, 2013 | |
| | FBP Equity & Dividend Plus Fund | | | FBP Appreciation & Income Opportunities Fund | |
| ASSETS | | | | | | |
| Investments in securities: | | | | | | |
At acquisition cost | | $ | 18,071,518 | | | $ | 29,769,988 | |
At value (Note 2) | | $ | 22,797,268 | | | $ | 37,005,985 | |
Cash | | | 14,570 | | | | 25,917 | |
Dividends and interest receivable | | | 39,139 | | | | 90,793 | |
Receivable for investment securities sold | | | 246,143 | | | | 293,347 | |
Receivable for capital shares sold | | | 819 | | | | — | |
Other assets | | | 5,693 | | | | 4,028 | |
TOTAL ASSETS | | | 23,103,632 | | | | 37,420,070 | |
| | | | | | | | | |
| LIABILITIES | | | | | | | | |
Covered call options, at value (Notes 2 and 5)
(premiums received $170,005 and $103,398, respectively) | | | 466,386 | | | | 240,017 | |
Distributions payable | | | 3,546 | | | | 16,314 | |
Payable for investment securities purchased | | | 32,518 | | | | 286,146 | |
Payable for capital shares redeemed | | | 358 | | | | 8,783 | |
Accrued investment advisory fees (Note 4) | | | 9,860 | | | | 20,893 | |
Payable to administrator (Note 4) | | | 5,200 | | | | 5,200 | |
Other accrued expenses | | | 15,800 | | | | 17,615 | |
TOTAL LIABILITIES | | | 533,668 | | | | 594,968 | |
| | | | | | | | | |
NET ASSETS | | $ | 22,569,964 | | | $ | 36,825,102 | |
| | | | | | | | | |
| Net assets consist of: | | | | | | | | |
Paid-in capital | | $ | 19,616,441 | | | $ | 28,849,069 | |
Undistributed (distributions in excess of)
net investment income | | | 442 | | | | (50,309 | ) |
Accumulated net realized gains (losses)
from security transactions | | | (1,476,288 | ) | | | 926,964 | |
| Net unrealized appreciation (depreciation) on: | | | | | | | | |
Investments | | | 4,725,750 | | | | 7,235,997 | |
Option contracts | | | (296,381 | ) | | | (136,619 | ) |
Net assets | | $ | 22,569,964 | | | $ | 36,825,102 | |
| | | | | | | | | |
Shares of beneficial interest outstanding
(unlimited number of shares authorized, $0.01 par value) | | | 1,041,495 | | | | 2,145,935 | |
| | | | | | | | | |
Net asset value, offering price and
redemption price per share (Note 2) | | $ | 21.67 | | | $ | 17.16 | |
| See accompanying notes to financial statements. |
THE FLIPPIN, BRUCE & PORTER FUNDS STATEMENTS OF OPERATIONS Year Ended March 31, 2013 | |
| | FBP Equity & Dividend Plus Fund | | | FBP
Appreciation & Income Opportunities Fund | |
| INVESTMENT INCOME | | | | | | |
Dividends | | $ | 768,537 | | | $ | 815,951 | |
Foreign withholding taxes on dividends | | | (11,831 | ) | | | (10,816 | ) |
Interest | | | 30 | | | | 181,145 | |
TOTAL INVESTMENT INCOME | | | 756,736 | | | | 986,280 | |
| | | | | | | | | |
| EXPENSES | | | | | | | | |
Investment advisory fees (Note 4) | | | 152,606 | | | | 243,559 | |
Administration fees (Note 4) | | | 50,000 | | | | 51,407 | |
Professional fees | | | 19,218 | | | | 20,818 | |
Registration and filing fees | | | 14,681 | | | | 10,048 | |
Trustees’ fees and expenses (Note 4) | | | 9,275 | | | | 9,275 | |
Compliance service fees (Note 4) | | | 8,400 | | | | 8,400 | |
Custodian and bank service fees | | | 7,264 | | | | 8,140 | |
Printing of shareholder reports | | | 5,847 | | | | 4,018 | |
Postage and supplies | | | 5,525 | | | | 4,297 | |
Insurance expense | | | 2,128 | | | | 3,396 | |
Other expenses | | | 5,838 | | | | 7,498 | |
TOTAL EXPENSES | | | 280,782 | | | | 370,856 | |
| Fees voluntarily waived by the Adviser (Note 4) | | | (47,512 | ) | | | (22,915 | ) |
NET EXPENSES | | | 233,270 | | | | 347,941 | |
| | | | | | | | | |
NET INVESTMENT INCOME | | | 523,466 | | | | 638,339 | |
| | | | | | | | | |
REALIZED AND UNREALIZED GAINS
(LOSSES) ON INVESTMENTS | | | | | | | | |
| Net realized gains from: | | | | | | | | |
Security transactions | | | 519,446 | | | | 1,954,011 | |
Option contracts (Note 5) | | | 43,281 | | | | 82,796 | |
| Net realized gains from in-kind redemptions (Note 2) | | | — | | | | 149,541 | |
| Net change in unrealized appreciation/depreciation on: | | | | | | | | |
Investments | | | 2,435,149 | | | | 1,160,720 | |
Option contracts (Note 5) | | | (272,339 | ) | | | (84,990 | ) |
| | | | | | | | | |
NET REALIZED AND UNREALIZED
GAINS ON INVESTMENTS | | | 2,725,537 | | | | 3,262,078 | |
| | | | | | | | | |
NET INCREASE IN NET ASSETS
FROM OPERATIONS | | $ | 3,249,003 | | | $ | 3,900,417 | |
| See accompanying notes to financial statements. |
THE FLIPPIN, BRUCE & PORTER FUNDS STATEMENTS OF CHANGES IN NET ASSETS | |
| | | FBP Equity & Dividend Plus Fund | | | FBP Appreciation & Income Opportunities Fund | |
| | | | | | | | | | | | |
| FROM OPERATIONS | | | | | | | | | | | | |
Net investment income | | $ | 523,466 | | | $ | 290,846 | | | $ | 638,339 | | | $ | 699,369 | |
| Net realized gains from: | | | | | | | | | | | | | | | | |
Security transactions | | | 519,446 | | | | 710,636 | | | | 1,954,011 | | | | 313,845 | |
Option contracts (Note 5) | | | 43,281 | | | | 91,660 | | | | 82,796 | | | | 181,782 | |
Net realized gains from in-kind
redemptions (Note 2) | | | — | | | | 543,794 | | | | 149,541 | | | | 1,339,904 | |
Net change in unrealized
appreciation/depreciation on: | | | | | | | | | | | | | | | | |
Investments | | | 2,435,149 | | | | (3,400,204 | ) | | | 1,160,720 | | | | (3,357,018 | ) |
Option contracts (Note 5) | | | (272,339 | ) | | | (44,343 | ) | | | (84,990 | ) | | | (65,994 | ) |
Net increase (decrease) in
net assets from operations | | | 3,249,003 | | | | (1,807,611 | ) | | | 3,900,417 | | | | (888,112 | ) |
| | | | | | | | | | | | | | | | | |
| DISTRIBUTIONS TO SHAREHOLDERS | | | | | | | | | | | | | | | | |
From net investment income | | | (520,286 | ) | | | (301,039 | ) | | | (665,559 | ) | | | (781,190 | ) |
From net realized gains
from security transactions | | | — | | | | — | | | | (626,479 | ) | | | — | |
Decrease in net assets from
distributions to shareholders | | | (520,286 | ) | | | (301,039 | ) | | | (1,292,038 | ) | | | (781,190 | ) |
| | | | | | | | | | | | | | | | | |
| FROM CAPITAL SHARE TRANSACTIONS | | | | | | | | | | | | | | | | |
Proceeds from shares sold | | | 1,432,990 | | | | 1,455,754 | | | | 1,092,453 | | | | 747,647 | |
Net asset value of shares issued in
reinvestment of distributions to
shareholders | | | 504,248 | | | | 290,667 | | | | 1,171,415 | | | | 678,317 | |
Payments for shares redeemed | | | (5,289,545 | ) | | | (3,850,963 | ) | | | (7,567,218 | ) | | | (6,642,892 | ) |
Net decrease in net assets from capital
share transactions | | | (3,352,307 | ) | | | (2,104,542 | ) | | | (5,303,350 | ) | | | (5,216,928 | ) |
| | | | | | | | | | | | | | | | | |
| TOTAL DECREASE IN NET ASSETS | | | (623,590 | ) | | | (4,213,192 | ) | | | (2,694,971 | ) | | | (6,886,230 | ) |
| | | | | | | | | | | | | | | | | |
| NET ASSETS | | | | | | | | | | | | | | | | |
Beginning of year | | | 23,193,554 | | | | 27,406,746 | | | | 39,520,073 | | | | 46,406,303 | |
End of year | | $ | 22,569,964 | | | $ | 23,193,554 | | | $ | 36,825,102 | | | $ | 39,520,073 | |
| | | | | | | | | | | | | | | | | |
UNDISTRIBUTED (DISTRIBUTIONS
IN EXCESS OF) NET
INVESTMENT INCOME | | $ | 442 | | | $ | (2,738 | ) | | $ | (50,309 | ) | | $ | (47,419 | ) |
| | | | | | | | | | | | | | | | | |
| CAPITAL SHARE ACTIVITY | | | | | | | | | | | | | | | | |
Shares sold | | | 74,836 | | | | 78,890 | | | | 68,122 | | | | 48,776 | |
Shares reinvested | | | 26,081 | | | | 16,156 | | | | 75,820 | | | | 45,367 | |
Shares redeemed | | | (273,612 | ) | | | (204,844 | ) | | | (491,200 | ) | | | (439,158 | ) |
Net decrease in shares outstanding | | | (172,695 | ) | | | (109,798 | ) | | | (347,258 | ) | | | (345,015 | ) |
| Shares outstanding at beginning of year | | | 1,214,190 | | | | 1,323,988 | | | | 2,493,193 | | | | 2,838,208 | |
Shares outstanding at end of year | | | 1,041,495 | | | | 1,214,190 | | | | 2,145,935 | | | | 2,493,193 | |
| See accompanying notes to financial statements. |
FBP EQUITY & DIVIDEND PLUS FUND FINANCIAL HIGHLIGHTS | |
Selected Per Share Data and Ratios for a Share Outstanding Throughout Each Year | |
| | | | |
| | | | | | | | | | | | | | | |
| Net asset value at beginning of year | | $ | 19.10 | | | $ | 20.70 | | | $ | 19.42 | | | $ | 12.02 | | | $ | 20.99 | |
| | | | | | | | | | | | | | | | | | | | | |
| Income (loss) from investment operations: | | | | | | | | | | | | | | | | | | | | |
| Net investment income | | | 0.47 | | | | 0.23 | | | | 0.15 | | | | 0.12 | | | | 0.27 | |
Net realized and unrealized gains
(losses) on investments | | | 2.56 | | | | (1.59 | ) | | | 1.27 | | | | 7.41 | | | | (8.98 | ) |
| Total from investment operations | | | 3.03 | | | | (1.36 | ) | | | 1.42 | | | | 7.53 | | | | (8.71 | ) |
| | | | | | | | | | | | | | | | | | | | | |
| Less distributions: | | | | | | | | | | | | | | | | | | | | |
| Dividends from net investment income | | | (0.46 | ) | | | (0.24 | ) | | | (0.14 | ) | | | (0.13 | ) | | | (0.26 | ) |
| | | | | | | | | | | | | | | | | | | | | |
| Net asset value at end of year | | $ | 21.67 | | | $ | 19.10 | | | $ | 20.70 | | | $ | 19.42 | | | $ | 12.02 | |
| | | | | | | | | | | | | | | | | | | | | |
Total return (a) | | | 16.19% | | | | (6.49% | ) | | | 7.40% | | | | 62.84% | | | | (41.78% | ) |
| | | | | | | | | | | | | | | | | | | | | |
| Net assets at end of year (000’s) | | $ | 22,570 | | | $ | 23,194 | | | $ | 27,407 | | | $ | 28,617 | | | $ | 20,605 | |
| | | | | | | | | | | | | | | | | | | | | |
| Ratio of total expenses to average net assets | | | 1.29% | | | | 1.29% | | | | 1.19% | | | | 1.19% | | | | 1.18% | |
| | | | | | | | | | | | | | | | | | | | | |
Ratio of net expenses to average net assets (b) | | | 1.07% | | | | 1.07% | | | | 1.07% | | | | 1.07% | | | | 1.07% | |
| | | | | | | | | | | | | | | | | | | | | |
Ratio of net investment income to
average net assets (b) | | | 2.40% | | | | 1.24% | | | | 0.78% | | | | 0.74% | | | | 1.59% | |
| | | | | | | | | | | | | | | | | | | | | |
| Portfolio turnover rate | | | 32% | | | | 46% | | | | 25% | | | | 21% | | | | 16% | |
| (a) | Total return is a measure of the change in value of an investment in the Fund over the periods covered, which assumes any dividends or capital gains distributions are reinvested in shares of the Fund. Returns shown do not reflect the deduction of taxes a shareholder would pay on Fund distributions or the redemption of Fund shares. |
| | |
| (b) | Ratios were determined after voluntary advisory fee reductions by the Adviser (Note 4). |
| | |
| See accompanying notes to financial statements. |
FBP APPRECIATION & INCOME OPPORTUNITIES FUND FINANCIAL HIGHLIGHTS | |
Selected Per Share Data and Ratios for a Share Outstanding Throughout Each Year | |
| | | | |
| | | | | | | | | | | | | | | |
| Net asset value at beginning of year | | $ | 15.85 | | | $ | 16.35 | | | $ | 15.49 | | | $ | 10.97 | | | $ | 15.84 | |
| | | | | | | | | | | | | | | | | | | | | |
| Income (loss) from investment operations: | | | | | | | | | | | | | | | | | | | | |
| Net investment income | | | 0.29 | | | | 0.26 | | | | 0.24 | | | | 0.27 | | | | 0.32 | |
Net realized and unrealized gains
(losses) on investments | | | 1.61 | | | | (0.46 | ) | | | 0.88 | | | | 4.53 | | | | (4.89 | ) |
| Total from investment operations | | | 1.90 | | | | (0.20 | ) | | | 1.12 | | | | 4.80 | | | | (4.57 | ) |
| | | | | | | | | | | | | | | | | | | | | |
| Less distributions: | | | | | | | | | | | | | | | | | | | | |
| Dividends from net investment income | | | (0.30 | ) | | | (0.30 | ) | | | (0.26 | ) | | | (0.28 | ) | | | (0.30 | ) |
| Distributions from net realized gains | | | (0.29 | ) | | | — | | | | — | | | | — | | | | — | |
| Total distributions | | | (0.59 | ) | | | (0.30 | ) | | | (0.26 | ) | | | (0.28 | ) | | | (0.30 | ) |
| | | | | | | | | | | | | | | | | | | | | |
| Net asset value at end of year | | $ | 17.16 | | | $ | 15.85 | | | $ | 16.35 | | | $ | 15.49 | | | $ | 10.97 | |
| | | | | | | | | | | | | | | | | | | | | |
Total return (a) | | | 12.51% | | | | (1.13% | ) | | | 7.35% | | | | 44.01% | | | | (29.15% | ) |
| | | | | | | | | | | | | | | | | | | | | |
| Net assets at end of year (000’s) | | $ | 36,825 | | | $ | 39,520 | | | $ | 46,406 | | | $ | 45,507 | | | $ | 34,199 | |
| | | | | | | | | | | | | | | | | | | | | |
| Ratio of total expenses to average net assets | | | 1.06% | | | | 1.06% | | | | 1.03% | | | | 1.03% | | | | 1.05% | |
| | | | | | | | | | | | | | | | | | | | | |
Ratio of net expenses to average net assets (b) | | | 1.00% | | | | 1.00% | | | | 1.00% | | | | 1.00% | | | | 1.00% | |
| | | | | | | | | | | | | | | | | | | | | |
Ratio of net investment income to
average net assets (b) | | | 1.91% | | | | 1.71% | | | | 1.59% | | | | 1.90% | | | | 2.36% | |
| | | | | | | | | | | | | | | | | | | | | |
| Portfolio turnover rate | | | 15% | | | | 17% | | | | 24% | | | | 24% | | | | 24% | |
| (a) | Total return is a measure of the change in value of an investment in the Fund over the periods covered, which assumes any dividends or capital gains distributions are reinvested in shares of the Fund. Returns shown do not reflect the deduction of taxes a shareholder would pay on Fund distributions or the redemption of Fund shares. |
| | |
| (b) | Ratios were determined after voluntary advisory fee reductions by the Adviser (Note 4). |
| | |
| See accompanying notes to financial statements. |
THE FLIPPIN, BRUCE & PORTER FUNDS NOTES TO FINANCIAL STATEMENTS March 31, 2013 |
1. Organization
FBP Equity & Dividend Plus Fund and FBP Appreciation & Income Opportunities Fund (the “Funds”) are no-load, diversified series of the Williamsburg Investment Trust (the “Trust”), an open-end management investment company registered under the Investment Company Act of 1940. The Trust was organized as a Massachusetts business trust on July 18, 1988. Other series of Williamsburg Investment Trust are not included in this report.
FBP Equity & Dividend Plus Fund seeks to provide above-average and growing income while also achieving long-term growth of capital.
FBP Appreciation & Income Opportunities Fund seeks long term capital appreciation and current income, assuming a moderate level of investment risk.
2. Significant Accounting Policies
The following is a summary of the Funds’ significant accounting policies. The policies are in conformity with accounting principles generally accepted in the United States of America (“GAAP”).
Securities valuation — The Funds’ portfolio securities are valued as of the close of business of the regular session of the New York Stock Exchange (normally 4:00 p.m., Eastern time). Securities traded on a national stock exchange are valued based upon the closing price on the principal exchange where the security is traded. Securities which are quoted by NASDAQ are valued at the NASDAQ Official Closing Price. Securities which are traded over-the-counter are valued at the last sales price, if available, otherwise, at the last quoted bid price. It is expected that fixed income securities will ordinarily be traded in the over-the-counter market, and common stocks will ordinarily be traded on a national securities exchange, but may also be traded in the over-the-counter market. Call options written by the Funds are valued at the then current market quotation, using the ask price as of the close of each day on the principal exchanges on which they are traded. Short-term instruments (those with remaining maturities of 60 days or less) may be valued at amortized cost, which approximates market value.
When market quotations are not readily available, securities may be valued on the basis of prices provided by an independent pricing service. The prices provided by the pricing service are determined with consideration given to institutional bid and last sale prices and take into account securities prices, yields, maturities, call features, ratings, institutional trading in similar groups of securities and developments related to specific securities and will be classified as Level 2 within the fair value hierarchy (see below). If a pricing service cannot provide a valuation or the investment adviser believes the price received from the pricing service is not indicative of fair value, securities will be valued in good faith at fair value using methods consistent with those determined by the Board of Trustees and will be classified as Level 2 or 3 within the fair value hierarchy, depending on the inputs used. Such methods of fair valuation may include, but are not limited to: multiple of earnings, multiple of book value, discount from market of a similar freely traded security, purchase price of the security, subsequent private transactions in the security or related securities, or a combination of these and other factors.
THE FLIPPIN, BRUCE & PORTER FUNDS NOTES TO FINANCIAL STATEMENTS (Continued) |
GAAP establishes a single authoritative definition of fair value, sets out a framework for measuring fair value and requires additional disclosures about fair value measurements. Various inputs are used in determining the value of each Fund’s investments. These inputs are summarized in the three broad levels listed below:
• Level 1 – quoted prices in active markets for identical securities
• Level 2 – other significant observable inputs
• Level 3 – significant unobservable inputs
For example, fixed income securities, including corporate bonds and municipal bonds, held by FBP Appreciation & Income Opportunities Fund are classified as Level 2 since the values for such securities are based on prices provided by an independent pricing service that utilizes various “other significant observable inputs” including bid and ask quotations, prices of similar securities and interest rates, among other factors.
The inputs or methodology used for valuing securities are not necessarily an indication of the risks associated with investing in those securities. The inputs used to measure fair value may fall into different levels of the fair value hierarchy. In such cases, for disclosure purposes, the level in the fair value hierarchy within which the fair value measurement falls in its entirety is determined based on the lowest level input that is significant to the fair value measurement.
The following is a summary of the inputs used to value each Fund’s investments and other financial instruments as of March 31, 2013 by security type:
FBP Equity & Dividend Plus Fund | | | | | | | | | | | | |
| Investments in Securities: | | | | | | | | | | | | |
Common Stocks | | $ | 22,344,405 | | | $ | — | | | $ | — | | | $ | 22,344,405 | |
Money Market Funds | | | 452,863 | | | | — | | | | — | | | | 452,863 | |
Total | | $ | 22,797,268 | | | $ | — | | | $ | — | | | $ | 22,797,268 | |
| | | | | | | | | | | | | | | | | |
| Other Financial Instruments: | | | | | | | | | | | | | | | | |
Covered Call Options | | $ | (466,386 | ) | | $ | — | | | $ | — | | | $ | (466,386 | ) |
Total | | $ | (466,386 | ) | | $ | — | | | $ | — | | | $ | (466,386 | ) |
FBP Appreciation & Income Opportunities Fund | | | | | | | | | | | | |
| Investments in Securities: | | | | | | | | | | | | |
Common Stocks | | $ | 27,623,522 | | | $ | — | | | $ | — | | | $ | 27,623,522 | |
Corporate Bonds | | | — | | | | 4,202,681 | | | | — | | | | 4,202,681 | |
Municipal Bonds | | | — | | | | 297,861 | | | | — | | | | 297,861 | |
Money Market Funds | | | 4,881,921 | | | | — | | | | — | | | | 4,881,921 | |
Total | | $ | 32,505,443 | | | $ | 4,500,542 | | | $ | — | | | $ | 37,005,985 | |
| | | | | | | | | | | | | | | | | |
| Other Financial Instruments: | | | | | | | | | | | | | | | | |
Covered Call Options | | $ | (240,017 | ) | | $ | — | | | $ | — | | | $ | (240,017 | ) |
Total | | $ | (240,017 | ) | | $ | — | | | $ | — | | | $ | (240,017 | ) |
THE FLIPPIN, BRUCE & PORTER FUNDS NOTES TO FINANCIAL STATEMENTS (Continued) |
Refer to each Fund’s Schedule of Investments for a listing of the common stocks and corporate bonds valued by sector type. As of March 31, 2013, the Funds did not have any transfers in and out of any Level. There were no Level 3 securities held by the Funds as of March 31, 2013. It is the Funds’ policy to recognize transfers into and out of any Level at the end of the reporting period.
Share valuation — The net asset value per share of each Fund is calculated daily by dividing the total value of its assets, less liabilities, by the number of shares outstanding. The offering price and redemption price per share of each Fund is equal to its net asset value per share.
Investment income — Interest income is accrued as earned. Dividend income is recorded on the ex-dividend date. Discounts and premiums on fixed income securities purchased are amortized using the interest method.
Repurchase agreements — Each Fund may enter into repurchase agreements. A repurchase agreement, which is collateralized by U.S. Government obligations, is valued at cost which, together with accrued interest, approximates market value. At the time a Fund enters into a repurchase agreement, the Fund takes possession of the underlying securities and the seller agrees that the value of the underlying securities, including accrued interest, will at all times be equal to or exceed the face amount of the repurchase agreement. In addition, the Funds actively monitor and seek additional collateral, as needed. If the seller defaults, the fair value of the collateral may decline and realization of the collateral by the Funds may be delayed or limited.
Distributions to shareholders — Dividends arising from net investment income are declared and paid quarterly to shareholders of each Fund. Net realized short-term capital gains, if any, may be distributed throughout the year and net realized long-term capital gains, if any, are distributed at least once each year. The amount of distributions from net investment income and net realized gains are determined in accordance with federal income tax regulations, which may differ from GAAP. These “book/tax” differences are either temporary or permanent in nature. The tax character of distributions paid during the years ended March 31, 2013 and March 31, 2012 was as follows:
| | | | | | | | | | |
| FBP Equity & Dividend Plus Fund | 3/31/2013 | | $ | 520,286 | | | $ | — | | | $ | 520,286 | |
| | 3/31/2012 | | $ | 301,039 | | | $ | — | | | $ | 301,039 | |
| | | | | | | | | | | | | | |
| FBP Appreciation & Income Opportunities Fund | 3/31/2013 | | $ | 665,559 | | | $ | 626,479 | | | $ | 1,292,038 | |
| | 3/31/2012 | | $ | 781,190 | | | $ | — | | | $ | 781,190 | |
Security transactions — Security transactions are accounted for on trade date for financial reporting purposes. Gains and losses on securities sold are determined on a specific identification basis.
Common expenses — Common expenses of the Trust are allocated among the series of the Trust based on relative net assets of each series or the nature of the services performed and the relative applicability to each series.
Options transactions — When the Funds’ investment adviser believes that individual portfolio securities held by the Funds are approaching the top of the adviser’s growth and price expectations, the Funds may write covered call options for which premiums are received and are recorded as liabilities, and are subsequently valued daily at
THE FLIPPIN, BRUCE & PORTER FUNDS NOTES TO FINANCIAL STATEMENTS (Continued) |
the closing prices on their primary exchanges. Premiums received from writing options which expire are treated as realized gains. Premiums received from writing options which are exercised increase the proceeds used to calculate the realized gain or loss on the sale of the security. If a closing purchase transaction is used to terminate a Fund’s obligation on a call option, a gain or loss will be realized, depending upon whether the price of the closing purchase transaction is more or less than the premium previously received on the call option written.
Estimates — The preparation of financial statements in conformity with GAAP requires management to make estimates and assumptions that affect the reported amounts of assets and liabilities and the disclosure of contingent assets and liabilities as of the date of the financial statements and the reported amounts of income and expenses during the reporting period. Actual results could differ from those estimates.
Federal income tax — It is each Fund’s policy to comply with the special provisions of Subchapter M of the Internal Revenue Code applicable to regulated investment companies. As provided therein, in any fiscal year in which a Fund so qualifies and distributes at least 90% of its taxable net income, the Fund (but not the shareholders) will be relieved of federal income tax on the income distributed. Accordingly, no provision for income taxes has been made.
In order to avoid imposition of the excise tax applicable to regulated investment companies, it is also each Fund’s intention to declare as dividends in each calendar year at least 98% of its net investment income (earned during the calendar year) and 98.2% of its net realized capital gains (earned during the twelve months ended October 31) plus undistributed amounts from prior years.
The following information is computed on a tax basis for each item as of March 31, 2013:
| | FBP Equity & Dividend Plus Fund | | | FBP Appreciation & Income Opportunities Fund | |
| Tax cost of portfolio investments | | $ | 18,071,518 | | | $ | 29,821,848 | |
| Gross unrealized appreciation | | $ | 5,053,370 | | | $ | 8,035,153 | |
| Gross unrealized depreciation | | | (327,620 | ) | | | (851,016 | ) |
| Net unrealized appreciation on investments | | | 4,725,750 | | | | 7,184,137 | |
| Net unrealized depreciation on option contracts | | | (296,381 | ) | | | (136,619 | ) |
| Undistributed ordinary income | | | 3,988 | | | | 17,865 | |
| Capital loss carryforwards | | | (1,476,288 | ) | | | — | |
| Undistributed long-term gains | | | — | | | | 926,964 | |
| Other temporary differences | | | (3,546 | ) | | | (16,314 | ) |
| Accumulated earnings | | $ | 2,953,523 | | | $ | 7,976,033 | |
As of March 31, 2013, the tax cost of written options for FBP Equity & Dividend Plus Fund and FBP Appreciation & Income Opportunities Fund is $170,005 and $103,398, respectively.
The difference between the federal income tax cost of portfolio investments and the financial statement cost for FBP Appreciation & Income Opportunities Fund is due to certain differences in the recognition of capital gains and losses under income tax regulations and GAAP. These “book/tax” differences are temporary in nature and are primarily due to differing methods in the amortization of discounts and premiums on fixed income securities.
THE FLIPPIN, BRUCE & PORTER FUNDS NOTES TO FINANCIAL STATEMENTS (Continued) |
During the year ended March 31, 2013, FBP Equity & Dividend Plus Fund and FBP Appreciation & Income Opportunities Fund utilized $551,577 and $147,097, respectively, of short-term capital loss carryforwards to offset current year gains.
As of March 31, 2013, FBP Equity & Dividend Plus Fund had short-term capital loss carryforwards for federal income tax purposes of $1,476,288 which expire on March 31, 2018. These capital loss carryforwards may be utilized in future years to offset net realized capital gains, if any, prior to distributing such gains to shareholders.
Under the Regulated Investment Company Modernization Act of 2010 (the “Act”), net capital losses realized after March 31, 2011 may be carried forward indefinitely and their character is retained as short-term and/or long-term losses. Under the law in effect prior to the Act, pre-enactment net capital losses were carried forward for eight years and treated as short-term losses. As a transition rule, the Act requires that post-enactment net capital losses be used before pre-enactment net capital losses. Therefore, there may be a greater likelihood that all or a portion of the FBP Equity & Dividend Plus Fund’s pre-enactment capital loss carryovers may expire without being utilized.
For the year ended March 31, 2013, FBP Appreciation & Income Opportunities Fund reclassified accumulated net realized gains from security transactions of $24,330 against distributions in excess of net investment income on the Statements of Assets and Liabilities. Such reclassification, the result of permanent differences between the financial statement and income tax reporting requirements, has no effect on the Fund’s net assets or net asset value per share.
During the year ended March 31, 2013, FBP Appreciation & Income Opportunities Fund realized $149,541 of net capital gains resulting from in-kind redemptions (redemptions in which shareholders who redeemed Fund shares received securities held by the Fund rather than cash). The Fund recognizes a gain on in-kind redemptions to the extent that the value of the distributed securities on the date of redemption exceeds the cost of those securities. Such gains are not taxable to the Fund and are not required to be distributed to shareholders. The Fund has reclassified these amounts against paid-in capital. This reclassification is reflected on the Statements of Assets and Liabilities. Such reclassification, the result of permanent differences between the financial statement and income tax reporting requirements, has no effect on the Fund’s net assets or net asset value per share.
The Funds recognize the tax benefits or expenses of uncertain tax positions only when the position is “more likely than not” to be sustained assuming examination by tax authorities. Management has reviewed the tax positions taken on federal income tax returns for all open tax years (tax years ended March 31, 2010 through March 31, 2013) of each Fund and has concluded that no provision for unrecognized tax benefits or expenses is required in these financial statements.
3. Investment Transactions
During the year ended March 31, 2013, cost of purchases and proceeds from sales and maturities of investment securities, other than short-term investments and U.S. Government securities, totaled $6,604,380 and $7,161,299, respectively, for FBP Equity & Dividend Plus Fund and $4,837,685 and $13,548,297, respectively, for FBP Appreciation & Income Opportunities Fund.
THE FLIPPIN, BRUCE & PORTER FUNDS NOTES TO FINANCIAL STATEMENTS (Continued) |
4. Transactions with Related Parties
INVESTMENT ADVISORY AGREEMENTS
The Funds’ investments are managed by Flippin, Bruce & Porter, Inc. (the “Adviser”) under the terms of an Investment Advisory Agreement. Under the Investment Advisory Agreement, each Fund pays the Adviser a fee, which is computed and accrued daily and paid monthly, at an annual rate of .70% of its average daily net assets up to $250 million; .65% of the next $250 million of such assets; and .50% of such assets in excess of $500 million.
During the year ended March 31, 2013, the Adviser voluntarily waived $47,512 and $22,915 of its investment advisory fees from FBP Equity & Dividend Plus Fund and FBP Appreciation & Income Opportunities Fund, respectively.
Certain officers of the Trust are also officers of the Adviser.
MUTUAL FUND SERVICES AGREEMENT
Under the terms of a Mutual Fund Services Agreement between the Trust and Ultimus Fund Solutions, LLC (“Ultimus”), Ultimus provides administrative, pricing, accounting, dividend disbursing, shareholder servicing and transfer agent services for the Funds. For these services, Ultimus receives a monthly fee from each Fund at an annual rate of .15% of its average daily net assets up to $25 million, .125% of the next $25 million of such assets, and .10% of such assets in excess of $50 million, subject to a minimum monthly fee of $4,500. Prior to December 1, 2012, the minimum monthly fee was $4,000. In addition, each Fund pays out-of-pocket expenses including, but not limited to, postage, supplies and costs of pricing the Funds’ portfolio securities.
Certain officers of the Trust are also officers of Ultimus, or of Ultimus Fund Distributors, LLC (the “Distributor”), the principal underwriter of each Fund’s shares and an affiliate of Ultimus. The Distributor is compensated by the Adviser (not the Funds) for acting as principal underwriter.
COMPLIANCE CONSULTING AGREEMENT
Under the terms of a Compliance Consulting Agreement between the Trust and Ultimus, Ultimus provides an individual to serve as the Trust’s Chief Compliance Officer and to administer the Funds’ compliance policies and procedures. For these services, the Funds pay Ultimus an annual base fee of $16,800 plus an asset-based fee equal to 0.01% per annum on the Funds’ aggregate net assets in excess of $100 million. In addition, the Funds reimburse Ultimus for reasonable out-of-pocket expenses, if any, incurred in connection with these services.
COMPENSATION OF TRUSTEES
Trustees and officers affiliated with the Adviser or Ultimus are not compensated by the Trust for their services. Each Trustee who is not an affiliated person of the Adviser or Ultimus receives from the Trust an annual retainer of $8,000, payable quarterly; a fee of $1,500 for attendance at each meeting of the Board of Trustees (except that such fee is $2,500 for the independent chariman); and $1,000 for attendance at each meeting for any committee of the Board (except that such fee is $1,500 for the committee chairman); plus reimbursement of travel and other expenses incurred in attending meetings.
THE FLIPPIN, BRUCE & PORTER FUNDS NOTES TO FINANCIAL STATEMENTS (Continued) |
5. Derivatives Transactions
Transactions in option contracts written by the Funds during the year ended March 31, 2013 were as follows:
| | | FBP Equity & Dividend Plus Fund | | | FBP Appreciation & Income Opportunities Fund | |
| | | | | | | | | | | | |
| Options outstanding at beginning of year | | | 248 | | | $ | 42,758 | | | | 748 | | | $ | 159,001 | |
| Options written | | | 1,290 | | | | 226,620 | | | | 773 | | | | 179,028 | |
| Options cancelled in a closing purchase transaction | | | (80 | ) | | | (13,795 | ) | | | (171 | ) | | | (38,491 | ) |
| Options expired | | | (218 | ) | | | (31,478 | ) | | | (228 | ) | | | (57,231 | ) |
| Options exercised | | | (265 | ) | | | (54,100 | ) | | | (639 | ) | | | (138,909 | ) |
| Options outstanding at end of year | | | 975 | | | $ | 170,005 | | | | 483 | | | $ | 103,398 | |
The location in the Statements of Assets and Liabilities of the Funds’ derivative positions is as follows:
FBP Equity & Dividend Plus Fund
| | | | | | | | |
| | | | | | | | | Gross Notional Amount Outstanding
March 31, 2013 | |
| Covered call options written | Covered call options, at value | | | — | | | $ | (466,386 | ) | | $ | (4,291,095 | ) |
FBP Appreciation & Income Opportunities Fund
| | | | | | | | |
| | | | | | | | | Gross Notional Amount Outstanding
March 31, 2013 | |
| Covered call options written | Covered call options, at value | | | — | | | $ | (240,017 | ) | | $ | (2,249,880 | ) |
The average monthly notional amount of option contracts during the year ended March 31, 2013 was $2,663,806 and $2,403,571 for FBP Equity & Dividend Plus Fund and FBP Appreciation & Income Opportunities Fund, respectively.
THE FLIPPIN, BRUCE & PORTER FUNDS NOTES TO FINANCIAL STATEMENTS (Continued) |
Transactions in derivative instruments during the year ended March 31, 2013 by the Funds are recorded in the following location in the Statements of Operations:
FBP Equity & Dividend Plus Fund
| | | | Change in
Unrealized
Gains (Losses) |
| Covered call options written | Net realized gains from option contracts | $43,281 | Net change in unrealized appreciation/depreciation on option contracts | $(272,339) |
FBP Appreciation & Income Opportunities Fund
| | | | Change in
Unrealized
Gains (Losses) |
| Covered call options written | Net realized gains from option contracts | $82,796 | Net change in unrealized appreciation/depreciation on option contracts | $(84,990) |
6. Contingencies and Commitments
The Funds indemnify the Trust’s officers and Trustees for certain liabilities that might arise from their performance of their duties to the Funds. Additionally, in the normal course of business the Funds enter into contracts that contain a variety of representations and warranties and which provide general indemnifications. The Funds’ maximum exposure under these arrangements is unknown, as this would involve future claims that may be made against the Funds that have not yet occurred. However, based on experience, the Funds expect the risk of loss to be remote.
7. Subsequent Events
The Funds are required to recognize in the financial statements the effects of all subsequent events that provide additional evidence about conditions that existed as of the date of the Statements of Assets and Liabilities. For non-recognized subsequent events that must be disclosed to keep the financial statements from being misleading, the Funds are required to disclose the nature of the event as well as an estimate of its financial effect, or a statement that such an estimate cannot be made. Management has evaluated subsequent events through the issuance of these financial statements and has noted no such events.
THE FLIPPIN, BRUCE & PORTER FUNDS REPORT OF INDEPENDENT REGISTERED PUBLIC ACCOUNTING FIRM |
The Board of Trustees and Shareholders of
the FBP Equity & Dividend Plus Fund and the FBP Appreciation & Income Opportunities Fund
of the Williamsburg Investment Trust
We have audited the accompanying statements of assets and liabilities of the FBP Equity & Dividend Plus Fund and the FBP Appreciation & Income Opportunities Fund, (the “Funds”) (each a series of the Williamsburg Investment Trust), including the schedules of investments, as of March 31, 2013, and the related statements of operations for the year then ended, the statements of changes in net assets for each of the two years in the period then ended, and the financial highlights for each of the five years in the period then ended. These financial statements and financial highlights are the responsibility of the Funds’ management. Our responsibility is to express an opinion on these financial statements and financial highlights based on our audits.
We conducted our audits in accordance with the standards of the Public Company Accounting Oversight Board (United States). Those standards require that we plan and perform the audits to obtain reasonable assurance about whether the financial statements and financial highlights are free of material misstatement. We were not engaged to perform an audit of the Funds’ internal control over financial reporting. Our audits included consideration of internal control over financial reporting as a basis for designing audit procedures that are appropriate in the circumstances, but not for the purpose of expressing an opinion on the effectiveness of the Funds’ internal control over financial reporting. Accordingly, we express no such opinion. An audit also includes examining, on a test basis, evidence supporting the amounts and disclosures in the financial statements and financial highlights, assessing the accounting principles used and significant estimates made by management, and evaluating the overall financial statement presentation. Our procedures included confirmation of securities owned as of March 31, 2013, by correspondence with the custodian and brokers. We believe that our audits provide a reasonable basis for our opinion.
In our opinion, the financial statements and financial highlights referred to above present fairly, in all material respects, the financial position of each of the respective Funds comprising Williamsburg Investment Trust at March 31, 2013, the results of their operations for the year then ended, the changes in their net assets for each of the two years in the period then ended, and the financial highlights for each of the five years in the period then ended, in conformity with U.S. generally accepted accounting principles.
Cincinnati, Ohio
May 24, 2013
THE FLIPPIN, BRUCE & PORTER FUNDS BOARD OF TRUSTEES AND EXECUTIVE OFFICERS (Unaudited) |
Overall responsibility for management of the Funds rests with the Board of Trustees. The Trustees serve during the lifetime of the Trust and until its termination, or until death, resignation, retirement or removal. The Trustees, in turn, elect the officers of the Funds. The officers have been elected for an annual term. The following are the Trustees and executive officers of the Funds:
| | Trustee | Address | Year
of
Birth | Position Held with the Trust | Length of Time Served |
| | Robert S. Harris | 100 Darden Boulevard Charlottesville, VA | 1949 | Chairman and Trustee | Since January 2007 |
| * | John P. Ackerly IV | One James Center 901 E. Cary Street Richmond, VA | 1963 | Trustee | Since July 2012 |
| * | John T. Bruce | 800 Main Street Lynchburg, VA | 1953 | Trustee and President | Since September 1988 |
| | J. Finley Lee, Jr. | 448 Pond Apple Drive North Naples, FL | 1939 | Trustee | Since September 1988 |
| | Richard L. Morrill | University of Richmond Richmond, VA | 1939 | Trustee | Since March 1993 |
| | Harris V. Morrissette | 100 Jacintoport Boulevard Saraland, AL | 1959 | Trustee | Since March 1993 |
| | John M. Flippin | 800 Main Street Lynchburg, VA | 1942 | Vice President | Since September 1988 |
| | R. Gregory Porter III | 800 Main Street Lynchburg, VA | 1941 | Vice President | Since September 1988 |
| | John H. Hanna IV | 800 Main Street Lynchburg, VA | 1955 | Vice President | Since February 2007 |
| | David J. Marshall | 800 Main Street Lynchburg, VA | 1956 | Vice President | Since February 2007 |
| | Robert G. Dorsey | 225 Pictoria Drive, Suite 450 Cincinnati, OH | 1957 | Vice President | Since November 2000 |
| | Mark J. Seger | 225 Pictoria Drive, Suite 450 Cincinnati, OH | 1962 | Treasurer | Since November 2000 |
| | Tina H. Bloom | 225 Pictoria Drive, Suite 450 Cincinnati, OH | 1968 | Secretary and Chief Compliance Officer | Since August 2006 |
| * | Messrs. Ackerly and Bruce, as affiliated persons of investment advisers to the Trust, are “interested persons” of the Trust within the meaning of Section 2(a)(19) of the Investment Company Act of 1940. |
THE FLIPPIN, BRUCE & PORTER FUNDS BOARD OF TRUSTEES AND EXECUTIVE OFFICERS (Unaudited) (Continued) |
Each Trustee oversees eleven portfolios of the Trust, including the Funds. The principal occupations of the Trustees and executive officers of the Funds during the past five years and public directorships held by the Trustees are set forth below:
Robert S. Harris is the C. Stewart Sheppard Professor of Business Administration at The Darden Graduate School of Business Administration at the University of Virginia. He was previously the dean at Darden. Professor Harris has published widely on corporate finance, financial markets and mergers and acquisitions and has served as a consultant to corporations and government agencies.
John P. Ackerly IV is Senior Vice President and Portfolio Manager of Davenport & Company LLC (an investment advisory firm).
John T. Bruce is President, Director and member of the Executive Committee of Flippin, Bruce & Porter, Inc. (an investment advisory firm).
J. Finley Lee, Jr. is the retired Julian Price Professor Emeritus at the University of North Carolina.
Richard L. Morrill serves as President of the Teagle Foundation (charitable foundation) and Chancellor of the University of Richmond. He is also a member of the Board of Directors of Tredegar Corporation (a plastics manufacturer).
Harris V. Morrissette is President of China Doll Rice and Beans Inc. and Dixie Lily Foods. He is a member of the Board of Directors of BancTrust Financial Group, Inc. (a bank holding company) and International Shipholding Corporation (cargo transportation).
John M. Flippin is a Director of the Adviser.
R. Gregory Porter III is a Director of the Adviser.
John H. Hanna IV is a Vice President, Director and member of the Executive Committee of the Adviser.
David J. Marshall is Secretary, Director and member of the Executive Committee of the Adviser.
Robert G. Dorsey is a Managing Director of Ultimus Fund Solutions, LLC and Ultimus Fund Distributors, LLC.
Mark J. Seger is a Managing Director of Ultimus Fund Solutions, LLC and Ultimus Fund Distributors, LLC.
Tina H. Bloom is Director of Fund Administration of Ultimus Fund Solutions, LLC.
Additional information about members of the Board of Trustees and executive officers is available in the Statement of Additional Information (“SAI”). To obtain a free copy of the SAI, please call 1-800-281-3217.
THE FLIPPIN, BRUCE & PORTER FUNDS ABOUT YOUR FUNDS’ EXPENSES (Unaudited) |
We believe it is important for you to understand the impact of costs on your investment. All mutual funds have operating expenses. As a shareholder of the Funds, you incur ongoing costs, including management fees and other operating expenses. These ongoing costs, which are deducted from each Fund’s gross income, directly reduce the investment return of the Funds.
A mutual fund’s ongoing costs are expressed as a percentage of its average net assets. This figure is known as the expense ratio. The following examples are intended to help you understand the ongoing costs (in dollars) of investing in the Funds and to compare these costs with the ongoing costs of investing in other mutual funds. The examples below are based on an investment of $1,000 made at the beginning of the period shown and held for the entire period (October 1, 2012 through March 31, 2013).
The table below illustrates each Fund’s ongoing costs in two ways:
Actual fund return – This section helps you to estimate the actual expenses that you paid over the period. The “Ending Account Value” shown is derived from each Fund’s actual return, and the third column shows the dollar amount of operating expenses that would have been paid by an investor who started with $1,000 in the Funds. You may use the information here, together with the amount you invested, to estimate the expenses that you paid over the period.
To do so, simply divide your account value by $1,000 (for example, an $8,600 account value divided by $1,000 = 8.6), then multiply the result by the number given for the Funds under the heading “Expenses Paid During Period.”
Hypothetical 5% return – This section is intended to help you compare the Funds’ ongoing costs with those of other mutual funds. It assumes that each Fund had an annual return of 5% before expenses during the period shown, but that the expense ratio is unchanged. In this case, because the returns used are not the Funds’ actual returns, the results do not apply to your investment. The example is useful in making comparisons because the Securities and Exchange Commission (“SEC”) requires all mutual funds to calculate expenses based on a 5% return. You can assess each Fund’s ongoing costs by comparing this hypothetical example with the hypothetical examples that appear in shareholder reports of other funds.
Note that expenses shown in the table are meant to highlight and help you compare ongoing costs only. The Funds do not charge sales loads or redemption fees, nor do they carry a “sales load.”
The calculations assume no shares were bought or sold during the period. Your actual costs may have been higher or lower, depending on the amount of your investment and the timing of any purchases or redemptions.
More information about the Funds’ expenses, including annual expense ratios for the past five fiscal years, can be found in this report. For additional information on operating expenses and other shareholder costs, please refer to the Funds’ prospectus.
THE FLIPPIN, BRUCE & PORTER FUNDS ABOUT YOUR FUNDS’ EXPENSES (Unaudited)
(Continued) |
FBP Equity & Dividend Plus Fund
| Beginning Account Value October 1, 2012 | Ending Account Value March 31, 2013 | Expenses Paid During Period* |
| Based on Actual Fund Return | $1,000.00 | $1,152.20 | $5.74 |
| Based on Hypothetical 5% Return (before expenses) | $1,000.00 | $1,019.60 | $5.39 |
| * | Expenses are equal to the FBP Equity & Dividend Plus Fund’s annualized expense ratio of 1.07% for the period, multiplied by the average account value over the period, multiplied by 182/365 (to reflect the one-half year period). |
FBP Appreciation & Income Opportunities Fund
| Beginning Account Value October 1, 2012 | Ending Account Value March 31, 2013 | Expenses Paid During Period* |
| Based on Actual Fund Return | $1,000.00 | $1,125.70 | $5.30 |
| Based on Hypothetical 5% Return (before expenses) | $1,000.00 | $1,019.95 | $5.04 |
| * | Expenses are equal to the FBP Appreciation & Income Opportunities Fund’s annualized expense ratio of 1.00% for the period, multiplied by the average account value over the period, multiplied by 182/365 (to reflect the one-half year period). |
OTHER INFORMATION (Unaudited) |
The Trust files a complete listing of portfolio holdings for the Funds with the SEC as of the end of the first and third quarters of each fiscal year on Form N-Q. The filings are available upon request, by calling 1-800-327-9375. Furthermore, you may obtain a copy of these filings on the SEC’s website at http://www.sec.gov. The Trust’s Forms N-Q may also be reviewed and copied at the SEC’s Public Reference Room in Washington, DC, and information on the operation of the Public Reference Room may be obtained by calling 1-800-SEC-0330.
A description of the policies and procedures that the Funds use to determine how to vote proxies relating to portfolio securities is available without charge upon request by calling toll-free 1-800-327-9375, or on the SEC’s website at http://www.sec.gov. Information regarding how the Funds voted proxies relating to portfolio securities during the most recent 12-month period ended June 30 is also available without charge upon request by calling toll-free 1-800-327-9375, or on the SEC’s website at http://www.sec.gov.
THE FLIPPIN, BRUCE & PORTER FUNDS
FEDERAL TAX INFORMATION (Unaudited)
In accordance with federal tax requirements, the following provides shareholders with information concerning distributions from ordinary income and net realized gains made by the Funds during the year ended March 31, 2013. During the year ended March 31, 2013, FBP Appreciation & Income Opportunities Fund paid a long-term capital gain distribution of $626,479. Certain dividends paid by the Funds may be subject to a maximum tax rate of 15%, as provided by the Jobs and Growth Tax Relief Reconciliation Act of 2003. FBP Equity & Dividend Plus Fund and FBP Appreciation & Income Opportunities Fund intend to designate up to a maximum amount of $520,286 and $665,559, respectively, as taxed at a maximum rate of 15%. Additionally, for the fiscal year ended March 31, 2013, 100% and 100% of the dividends paid from ordinary income by FBP Equity & Dividend Plus Fund and FBP Appreciation & Income Opportunities Fund, respectively, qualified for the dividends received deduction for corporations.
As required by federal regulations, complete information will be computed and reported in conjunction with your 2013 Form 1099-DIV.
THE FLIPPIN, BRUCE & PORTER FUNDS DISCLOSURE REGARDING APPROVAL OF INVESTMENT ADVISORY AGREEMENTS (Unaudited) |
At an in-person meeting held on February 26, 2013, the Board of Trustees, including a majority of the Independent Trustees, approved the continuance for a one-year period of the Investment Advisory Agreements with the Adviser on behalf of the FBP Equity & Dividend Plus Fund and the FBP Appreciation and Income Opportunities Fund. Below is a discussion of the factors considered by the Board of Trustees along with their conclusions with respect thereto that formed the basis for the Board’s approvals.
In selecting the Adviser and approving the continuance of the Investment Advisory Agreements, the Trustees considered all information they deemed reasonably necessary to evaluate the terms of the Agreements. The principal areas of review by the Trustees were the nature, extent and quality of the services provided by the Adviser and the reasonableness of the fees charged for those services. These matters were considered by the Independent Trustees consulting with experienced counsel for the Independent Trustees, who is independent of the Adviser.
The Trustees’ evaluation of the quality of the Adviser’s services took into account their knowledge and experience gained through meetings with and reports of the Adviser’s senior management over the course of the preceding year. Both short-term and long-term investment performance of the Funds was considered. Each Fund’s performance was compared to its performance benchmark and to that of competitive funds with similar investment objectives and to the Adviser’s comparably managed private accounts. The Trustees also considered the scope and quality of the in-house capabilities of the Adviser and other resources dedicated to performing services for the Funds. The quality of administrative and other services, including the Adviser’s role in coordinating the activities of the Funds’ other service providers, were considered in light of the Funds’ compliance with investment policies and applicable laws and regulations and of related reports by management and the Funds’ independent public accounting firm in periodic meetings with the Trust’s Audit Committee. The Trustees also considered the business reputation of the Adviser, the qualifications of its key investment and compliance personnel, and its financial resources.
In reviewing the fees payable under the Investment Advisory Agreements, the Trustees compared the advisory fees and overall expense levels of each Fund with those of competitive funds with similar investment objectives as well as the private accounts managed by the Adviser. The Trustees considered information provided by the Adviser concerning the Adviser’s profitability with respect to each Fund, including the assumptions and methodology used in preparing the profitability information, in light of applicable case law relating to advisory fees. For these purposes, the Trustees took into account not only the fees paid by the Funds, but also so-called “fallout” benefits to the Adviser, such as the benefits of research made available to the Adviser by reason of brokerage commissions generated by the Funds’ securities transactions. The Trustees also reviewed the revenue sharing arrangements relating to the Funds, whereby fees are paid by the Adviser to various intermediaries that direct assets to the Funds. In evaluating the Funds’ advisory fees, the Trustees took into account the complexity and quality of the investment management of the Funds.
Based upon their review of this information, the Independent Trustees concluded that: (i) based upon the improvement of each Fund’s one-year performance relative to its benchmark since the previous year’s review, and the services provided to shareholders, the Adviser has provided satisfactory services to the Funds; (ii) although the contractual advisory fee rates for each Fund are in the higher range of fees for comparably managed funds, the Independent Trustees believe the fees to be reasonable given the scope and quality of services provided by the Adviser and the resources it was committed to improve the Funds’
THE FLIPPIN, BRUCE & PORTER FUNDS DISCLOSURE REGARDING APPROVAL OF INVESTMENT ADVISORY AGREEMENTS (Unaudited) (Continued) |
investment processes; (iii) the total operating expense ratio of each Fund, after fee waivers, is competitive with (and in the case of the FBP Equity & Dividend Plus Fund, lower than) the average expense ratio for comparably managed funds, according to statistics derived from Morningstar, Inc.; (iv) the Adviser’s decision to cap overall operating expenses of the Funds by voluntarily waiving a portion of its advisory fees has enabled each Fund to increase returns for shareholders and to maintain an overall expense ratio that is competitive with the average for similarly managed funds, despite the small size of the Funds; (v) the Adviser’s profitabllity with respect to the FBP Appreciation & Income Opportunities Fund is reasonable and the Adviser did not realize any profits with respect to its management of the FBP Equity & Dividend Plus Fund. Given the current size of the Funds and their expected growth, the Independent Trustees did not believe that at the present time it would be relevant to consider the extent to which economies of scale would be realized as the Funds grow, and whether fee levels reflect these economies of scale. The Independent Trustees also considered the “fallout” benefits to, and the profitability of, the Adviser with respect to the Funds, but given the amounts involved viewed these as secondary factors in connection with the evaluation of the reasonableness of the advisory fees paid by the Funds.
No single factor was considered in isolation or to be determinative to the decision of the Trustees to approve continuance of the Investment Advisory Agreements. Rather the Trustees concluded, in light of a weighing and balancing of all factors considered, that it was in the best interests of each Fund and its shareholders to continue its Investment Advisory Agreement without modification to its terms, including the fees charged for services thereunder.
This page intentionally left blank.
This page intentionally left blank.
| | | | | | |
| | | | | | | |
| | | | | | | |
| | | | | | | |
| | | | Investment Adviser Flippin, Bruce & Porter, Inc. 800 Main Street, Second Floor P.O. Box 6138 Lynchburg, Virginia 24505 Toll-Free 1-800-327-9375 www.fbpfunds.com Administrator Ultimus Fund Solutions, LLC P.O. Box 46707 Cincinnati, Ohio 45246-0707 Toll-Free 1-866-738-1127 Custodian US Bank NA 425 Walnut Street Cincinnati, Ohio 45202 Independent Registered Public Accounting Firm Ernst & Young LLP 1900 Scripps Center 312 Walnut Street Cincinnati, Ohio 45202 | Legal Counsel Sullivan & Worcester LLP One Post Office Square Boston, Massachusetts 02109 Officers John T. Bruce, President and Portfolio Manager John M. Flippin, Vice President John H. Hanna, IV, Vice President David J. Marshall, Vice President R. Gregory Porter, III, Vice President Trustees John P. Ackerly, IV John T. Bruce Robert S. Harris J. Finley Lee, Jr. Richard L. Morrill Harris V. Morrissette | | | |
| | | | | | | |
| | | | | | | |
| | | | | | |
THE GOVERNMENT STREET FUNDS No-Load Mutual Funds Annual Report March 31, 2013 |
The Government Street Equity Fund The Government Street Mid-Cap Fund The Alabama Tax Free Bond Fund |
LETTER FROM THE PRESIDENT | |
Dear Fellow Shareholders:
We are enclosing for your review the audited Annual Reports of The Government Street Funds for the year ended March 31, 2013.
The Government Street Equity Fund
The Government Street Equity Fund had a positive 9.93% total return for the fiscal year ended March 31, 2013. By comparison, the S&P 500 Index and the Morningstar Large Blend Equity category were up 13.96% and 12.98%, respectively. The old saying that the “market climbs a wall of worry” has never been more evident. Slow domestic GDP growth expectations, economic disarray in the Eurozone, international military instability, high worldwide unemployment, continued Governmental borrowing and spending, all took a backseat to the positive results of the stock market. A complete recovery of the market lows reached in 2009 from the 2007 peak was exceeded by the S&P 500 Index. While this achievement is important, in the context of market history, it marks one of the slowest recoveries at a total of approximately 38 months elapsed time.
The positive results in equity markets seem to be most logically explained as a by-product, or maybe an intended result, of Federal Reserve policies. The continued stimulus of the Fed by the $85 billion per month purchase of Treasury bonds and mortgage backed securities and resulting lowering of interest rates, continues to push investors into riskier equity assets. The interest rate levels of bonds being equal to or less than income from various equity and equity like products promotes the migration to stocks. At this point, the Fed does not seem to have plans to end the stimulus in the near term.
On the other hand, fiscal policy seems to be prisoner to political gamesmanship. Our nation continues to borrow and spend. The argument between reducing spending and raising taxes seems to be perpetual and partisan. No progress toward an answer creates massive uncertainty for business and personal planning.
So while corporate and personal balance sheets are improving marginally, a fertile environment for growth of capital and personal spending does not have a good foundation. Against such a backdrop, it is difficult to see the soundness of the equity value expansion. Hopefully, since we believe that the stock market is a leading economic indicator, the collective wisdom causing its increasing value is a positive statement on the future.
Previous letters have identified The Government Street Equity Fund’s approach to risk management through diversification into mid and small capitalization companies, international investments, real estate investment trusts, master limited partnerships, etc. That is and will continue to be a basic strategy. Within all categories, broad diversification of individual holdings is maintained. The approach this year is the primary reason for the underperformance of your Fund compared to the S&P 500 Index. However, periodic underperformance of relative return by a diversified portfolio, when compared to any one of its components, is to be expected. That fact is the essential reason for the approach. A narrowly defined investment strategy
results in periodic extreme volatility which diversification attempts to avoid. In such an environment as described earlier in this letter, we feel that risk management is extremely important.
The top 10 holdings in The Government Street Equity Fund as of March 31, 2013 were:
| Security Description | % of Net Assets |
| Vanguard Mid-Cap ETF | 3.1% |
| JPMorgan Alerian MLP Index ETN | 2.9% |
| Apple, Inc. | 2.7% |
| MasterCard, Inc. – Class A | 2.3% |
| International Business Machines Corporation | 2.2% |
| Walt Disney Company (The) | 2.1% |
| Colonial Properties Trust | 2.1% |
| Visa, Inc. – Class A | 2.0% |
| Philip Morris International, Inc. | 1.9% |
| ConocoPhillips | 1.8% |
Exchange-traded funds and exchange-traded notes have continued a prominent role in the Fund’s investment holdings, as evidenced by 2 of the top 10 holdings. Each ETF/ETN represents a composite holding of an extensive number of securities that have some common characteristic.
The Vanguard Mid-Cap ETF represents an investment in over 450 individual securities that meet Vanguard’s definition of mid capitalization corporate equities. The inclusion of this one security in the portfolio provided the Fund with broad diversification that would be impossible to achieve individually in a fund with the total value of The Government Street Equity Fund. The ability to achieve diversification utilizing ETF’s has allowed us an opportunity for managing risk that would be otherwise unattainable. Exchange-traded funds and notes, as a whole, represented 11.5% of your Fund’s net assets as of March 31, 2013.
There were significant individual performances during the fiscal year. The 5 highest returning stocks, held for the entire fiscal year, as measured by the internal rate of return for the entire period were:
| Manitowoc Company, Inc. | 48.99% |
| Rayonier, Inc. | 47.25% |
| eBay, Inc. | 46.94% |
| Anheuser-Busch InBev SA/NV - ADR | 46.63% |
| Visa, Inc. - Class A | 46.21% |
The 5 worst individual stock performances, held for the entire fiscal year, as measured by internal rate of return for the entire period were:
| Apache Corporation | -22.58% |
| Questcor Pharmaceuticals, Inc. | -22.73% |
| NetApp, Inc. | -23.70% |
| Elan Corporation plc - ADR | -26.55% |
| ADTRAN, Inc. | -39.71% |
The Fund’s best performing economic sector for the fiscal year was Telecommunication Services, up 31.36%. The second best sector was Consumer Discretionary, up 22.59%. The worst performing sector was Materials, down -10.98.
Note: The investment performances listed for economic sectors and securities in the two preceding paragraphs are extracted from an in-house independent internal rate of return computation by the Advent Axys portfolio accounting system. The calculations are gross investment returns. Total investment returns are for the fiscal year April 1, 2012 through March 31, 2013.
Instead of trying to summarize prospects for the year ahead with new insights, the statement from two years previous still portrays our view. On March 31, 2011 we wrote:
We believe that continued upward movement of markets and economies worldwide are highly dependent on Governments getting their financial balance sheets in order. There has been unparalleled deficit spending around the world. Those economies not directly participating in the credit shortfalls will be indirectly impacted by lower import/export activities brought on by significant debt imposed slowdown. This will occur domestically and internationally as economies have become more highly correlated in their economic cycles.
In response to this perceived scenario, risk management takes precedent over return pursuits in the near term. Your Fund remains essentially fully invested to capture returns, but highly diversified to mitigate the risks associated with that position.
Additionally, we believe that the Federal Reserve actions have created an exogenous influence that has temporarily offset the ultimately destructive nature of excessive deficit financing. We believe that the future transition to a sound economic scenario will determine the continued retention of current positive performances.
While significant risks exist, we continue to believe that investors have prospects for one of the greatest investment environments for generations. There are over 7 billion people in the world today. (USA population is approximately 320 million) Many of these potential consumers are moving into middle class ranks. In our opinion, the future demand for goods and services is tremendous. Remember that, in our own economy, approximately 60% of GDP is tied to consumers. With the business advantages that the USA enjoys in manufacturing know how, technology, intellectual content, productivity and numerous other characteristics, if the Government will provide a competitive framework for operating, the benefits could be the best ever.
As of March 31, 2013, the Fund’s net assets were $81.7 million, up from $72.3 million at the beginning of the fiscal year; net asset value per share was $53.61 and the ratio of expenses to net average assets was 0.85%. Portfolio turnover rate was 38%. Income dividends of $0.64 per share and capital gains of $1.02 per share were distributed to shareholders during the year.
The Government Street Mid Cap Fund
The Government Street Mid-Cap Fund completed its ninth year on March 31, 2013. The Fund produced a one year return of 13.35% while the Fund’s benchmark, the S&P MidCap 400 Index (the “S&P 400”), produced a one year return of 17.83%.
The S&P 400 is an index maintained by the Standard & Poor’s Index Committee that selects companies with market capitalizations between $1 billion and $4.4 billion. The goal of the index is to identify companies that represent the risk and reward characteristics of mid-sized companies. The top performing sectors in the S&P 400 were Consumer Staples and Utilities. The weakest sector in the S&P 400 was Information Technology which was up only 3% over the past year. The Government Street Mid-Cap Fund underperformed the S&P 400 over the past year due to relative underperformance in Consumer Discretionary stocks and Industrials stocks. The Fund’s portfolio includes ETFs that provide exposure to asset classes not included in the S&P 400 in an attempt to enhance performance through diversification. Some of the biggest individual contributors to the Fund’s performance over the past year were Alliance Data Systems (+25%), Valero Energy (+72%), Jack Henry & Associates (+34%) and Jarden Corporation (+40%).
See the table below for information on how the Fund’s average annual total returns compare to the S&P 400, the S&P 500 Index, and the Russell 2000 Index for 3 year and 5 year periods ended March 31, 2013.
| | |
| Government Street Mid-Cap Fund | 12.92% | 8.80% |
| S&P MidCap 400 Index | 15.12% | 9.85% |
| S&P 500 Index | 12.67% | 5.81% |
| Russell 2000 Index | 13.45% | 8.24% |
Mid-cap stocks as measured by the S&P 400 have outperformed both large-cap stocks (S&P 500) and small-cap stocks (Russell 2000) over the past year. Over the three, five, ten and fifteen year time periods, mid-cap stocks have also outperformed both large and small capitalization stocks. For the past fifteen years, the S&P 400 has an annualized return of 9.30% as compared to 4.27% for the S&P 500 and 6.04% for the Russell 2000. We believe that mid-cap stocks offer an attractive combination of growth and safety as they have successfully overcome startup challenges yet remain nimble enough to generate stronger growth than large-cap stocks. Over the past fifteen years, mid-cap stocks have generally been able to match the performance of large-cap stocks in down markets, while exceeding large-cap performance in up markets, leading to long-term outperformance.
Since the near-term low reached in November of 2012, the market has been ripping higher with each minor pullback met by aggressive buying. Defensive stocks have led this rally while technology and other cyclicals have lagged. While political stalemate and global debt policies have created the proverbial “wall of worry” for stocks to climb, corporate America has proven to be a good steward by maintaining low debt levels and keeping expenses down. This has resulted in healthy corporate balance sheets and improved earnings. Fortunately we invest in companies as opposed to political candidates and business leaders have proven to be more prudent and forward thinking. But in order for this market to continue to climb there is going to have to be organic growth as opposed to Fed induced risk taking via zero interest rate policy. With GDP at anemic yet positive levels and unemployment still relatively high, the current optimism present in the markets is a bit surprising. The current
move appears to have been fueled by Fed policy and investors moving from cash to stocks for fear of missing out. Global growth rates will need to improve for this to continue. As always the near-term is cloudy with compelling data points for and against continued gains, which confirms the case for proper portfolio diversification and long-term planning.
As of March 31, 2013, the net assets of The Government Street Mid-Cap Fund were $45,917,970 and the net asset value per share was $18.26. The portfolio turnover rate for the fiscal year ended March 31, 2013 was 12% and the net expense ratio for the Fund was 1.08%. The total number of holdings was 161 as of March 31, 2013.
The Alabama Tax Free Bond Fund
The municipal bond market was mostly stable during the past twelve months, recovering in the first quarter of 2013 from a modest sell-off at the end of 2012. Yields remain near historically low levels, influenced by continued quantitative easing measures by the Federal Reserve and subdued inflation. We believe the overall health of the municipal bond market is strong despite isolated issues with some local municipalities. Investor demand remains healthy across the maturity range and quality spectrum. Higher income tax rates at the federal level have increased the value of tax exempt income providing further support for the municipal market. Defaults remain rare and most municipalities are addressing tough budget issues and focusing on the longer term problems presented by employee pension obligations. Although there has been much discussion of a rotation out of fixed income securities into common stocks, overall fund flows do not yet signal such movement. In fact, yields in both the U. S. Treasury and municipal bond markets reflect continued healthy demand for fixed income securities.
The Alabama Tax Free Bond Fund continues to maintain a defensive posture, with a focus on short maturities and high quality issues. The duration of the portfolio as of March 31, 2013 remained unchanged from last year at 3.7 years. More than 97% of the portfolio was invested in securities rated A, AA, or AAA by Moody’s or Standard and Poor’s rating agencies.
For the twelve months ended March 31, 2013, the Fund had a return of 1.64% as compared to returns of 1.66% for the Barclays 3-year Municipal Bond Index and 4.41% for the Barclays 7-year Municipal Bond Index. The Alabama Tax Free Bond Fund has a shorter average maturity than the Barclays 7-year Municipal Bond Index and consistently maintains a portfolio of higher rated securities, on average, than those included in the comparable indices. Additionally, the Barclays Indices include zero-coupon bonds as well as bonds that are subject to the alternative minimum tax. The Fund holds neither of these types of securities.
As of March 31, 2013, the weighted average maturity of the portfolio was 4.1 years, unchanged from the end of the last fiscal year. The net assets of the Fund as of March 31, 2013 were $33,264,646 and the net asset value per share was $10.63. The ratio of net investment income to average net assets during the fiscal year was 1.70% and the ratio of net expenses to average net assets was 0.65%.
Thank you for your continued confidence in The Government Street Funds. Please call us if we can be of further service to you.
Very truly yours,
Thomas W. Leavell
President
Leavell Investment Management, Inc.
The Government Street Funds
Data presented reflects past performance, which is no guarantee of future results. Investment results and principal value will fluctuate so that shares, when redeemed, may be worth more or less than their original cost. Due to market volatility, current performance may be higher or lower than the performance shown.
This report is submitted for the general information of the shareholders of the Funds. The report is not authorized for distribution to prospective investors in the Funds unless it is accompanied by a current prospectus.
This report reflects our views, opinions and portfolio holdings as of March 31, 2013, the end of the reporting period. These views are subject to change at any time based upon market or other conditions. For more current information throughout the year please visit www.leavellinvestments.com.
THE GOVERNMENT STREET EQUITY FUND PERFORMANCE INFORMATION (Unaudited) |
| | Average Annual Total Returns(a) (for periods ended March 31, 2013) |
| | 1 Year | 5 Years | 10 Years |
| The Government Street Equity Fund | 9.93% | 5.46% | 7.84% |
Standard & Poor’s 500® Index | 13.96% | 5.81% | 8.53% |
| (a) | Total return is a measure of the change in value of an investment in the Fund over the periods covered, which assumes any dividends or capital gains distributions are reinvested in shares of the Fund. Returns do not reflect the deduction of taxes a shareholder would pay on Fund distributions or the redemption of Fund shares. |
THE GOVERNMENT STREET MID-CAP FUND PERFORMANCE INFORMATION (Unaudited) |
| | Average Annual Total Returns(a) (for periods ended March 31, 2013) |
| | 1 Year | 5 Years | Since Inception* |
| The Government Street Mid-Cap Fund | 13.35% | 8.80% | 8.57% |
Standard & Poor’s MidCap 400® Index | 17.83% | 9.85% | 9.68% |
| (a) | Total return is a measure of the change in value of an investment in the Fund over the periods covered, which assumes any dividends or capital gains distributions are reinvested in shares of the Fund. Returns do not reflect the deduction of taxes a shareholder would pay on Fund distributions or the redemption of Fund shares. |
| * | Initial public offering of shares was November 17, 2003. |
THE ALABAMA TAX FREE BOND FUND PERFORMANCE INFORMATION (Unaudited) |
| | Average Annual Total Returns(a) (for periods ended March 31, 2013) |
| | 1 Year | 5 Years | 10 Years |
| The Alabama Tax Free Bond Fund | 1.64% | 2.82% | 2.72% |
| Barclays 7-Year Municipal Bond Index | 4.41% | 6.01% | 4.96% |
| Barclays 3-Year Municipal Bond Index | 1.66% | 3.33% | 3.14% |
| (a) | Total return is a measure of the change in value of an investment in the Fund over the periods covered, which assumes any dividends or capital gains distributions are reinvested in shares of the Fund. Returns do not reflect the deduction of taxes a shareholder would pay on Fund distributions or the redemption of Fund shares. |
THE GOVERNMENT STREET EQUITY FUND PORTFOLIO INFORMATION March 31, 2013 (Unaudited) |
| |
| Vanguard Mid-Cap ETF | 3.1% |
| JPMorgan Alerian MLP Index ETN | 2.9% |
| Apple, Inc. | 2.7% |
| MasterCard, Inc. - Class A | 2.3% |
| International Business Machines Corporation | 2.2% |
| Walt Disney Company (The) | 2.1% |
| Colonial Properties Trust | 2.1% |
| Visa, Inc. - Class A | 2.0% |
| Philip Morris International, Inc. | 1.9% |
| ConocoPhillips | 1.8% |
THE GOVERNMENT STREET MID-CAP FUND PORTFOLIO INFORMATION March 31, 2013 (Unaudited) |
| |
| Vanguard Mid-Cap ETF | 3.0% |
| JPMorgan Alerian MLP Index ETN | 2.7% |
| iShares Core S&P Mid-Cap ETF | 2.3% |
SPDR® S&P MIDCAP 400® ETF Trust | 2.3% |
| Guggenheim Mid-Cap Core ETF | 2.2% |
| Stericycle, Inc. | 1.7% |
| Alliance Data Systems Corporation | 1.7% |
| Church & Dwight Company, Inc. | 1.5% |
| Colonial Properties Trust | 1.5% |
| ONEOK, Inc. | 1.2% |
THE ALABAMA TAX FREE BOND FUND PORTFOLIO INFORMATION March 31, 2013 (Unaudited) |
|
| | |
| AAA | | 9.0% |
| AA | | 83.9% |
| A | | 4.9% |
| Not Rated | | 2.2% |
THE GOVERNMENT STREET EQUITY FUND SCHEDULE OF INVESTMENTS March 31, 2013 | |
| | | | | | |
| Consumer Discretionary — 9.7% | | | | | | |
Comcast Corporation - Class A | | | 30,000 | | | $ | 1,260,300 | |
Darden Restaurants, Inc. | | | 11,000 | | | | 568,480 | |
Home Depot, Inc. (The) | | | 17,500 | | | | 1,221,150 | |
Johnson Controls, Inc. | | | 18,600 | | | | 652,302 | |
McDonald's Corporation | | | 7,000 | | | | 697,830 | |
NIKE, Inc. - Class B | | | 12,000 | | | | 708,120 | |
Tractor Supply Company | | | 7,000 | | | | 728,910 | |
Urban Outfitters, Inc. (a) | | | 10,000 | | | | 387,400 | |
Walt Disney Company (The) | | | 30,000 | | | | 1,704,000 | |
| | | | | | | | 7,928,492 | |
| Consumer Staples — 10.4% | | | | | | | | |
Altria Group, Inc. | | | 33,000 | | | | 1,134,870 | |
Anheuser-Busch InBev SA/NV - ADR | | | 11,500 | | | | 1,144,825 | |
Coca-Cola Company (The) | | | 25,000 | | | | 1,011,000 | |
Costco Wholesale Corporation | | | 1,500 | | | | 159,165 | |
Kraft Foods Group, Inc. | | | 8,278 | | | | 426,565 | |
McCormick & Company, Inc. - Non-Voting Shares | | | 10,000 | | | | 735,500 | |
Mondelēz International, Inc. - Class A | | | 24,836 | | | | 760,230 | |
Philip Morris International, Inc. | | | 16,500 | | | | 1,529,715 | |
Procter & Gamble Company (The) | | | 10,000 | | | | 770,600 | |
Whole Foods Market, Inc. | | | 9,500 | | | | 824,125 | |
| | | | | | | | 8,496,595 | |
| Energy — 9.5% | | | | | | | | |
Apache Corporation | | | 2,489 | | | | 192,051 | |
Chevron Corporation | | | 10,000 | | | | 1,188,200 | |
ConocoPhillips | | | 24,500 | | | | 1,472,450 | |
Marathon Oil Corporation | | | 11,000 | | | | 370,920 | |
Phillips 66 | | | 12,250 | | | | 857,133 | |
Pioneer Natural Resources Company | | | 8,000 | | | | 994,000 | |
Plains Exploration & Production Company (a) | | | 16,000 | | | | 759,520 | |
Range Resources Corporation | | | 10,000 | | | | 810,400 | |
Spectra Energy Corporation | | | 5,000 | | | | 153,750 | |
TransCanada Corporation | | | 16,000 | | | | 766,240 | |
Valero Energy Corporation | | | 4,000 | | | | 181,960 | |
| | | | | | | | 7,746,624 | |
| Financials — 12.5% | | | | | | | | |
Aflac, Inc. | | | 11,065 | | | | 575,601 | |
American Capital Ltd. (a) | | | 12,990 | | | | 189,589 | |
American International Group, Inc. (a) | | | 15,000 | | | | 582,300 | |
Bank of America Corporation | | | 40,000 | | | | 487,200 | |
Brookfield Asset Management, Inc. - Class A | | | 21,000 | | | | 766,290 | |
Capital One Financial Corporation | | | 11,000 | | | | 604,450 | |
THE GOVERNMENT STREET EQUITY FUND SCHEDULE OF INVESTMENTS (Continued) | |
COMMON STOCKS — 85.5% (Continued) | | | | | | |
| Financials — 12.5% (Continued) | | | | | | |
Colonial Properties Trust | | | 75,000 | | | $ | 1,695,750 | |
Cullen/Frost Bankers, Inc. | | | 13,500 | | | | 844,155 | |
JPMorgan Chase & Company | | | 25,000 | | | | 1,186,500 | |
Plum Creek Timber Company, Inc. | | | 15,000 | | | | 783,000 | |
Protective Life Corporation | | | 12,000 | | | | 429,600 | |
Rayonier, Inc. | | | 13,000 | | | | 775,710 | |
U.S. Bancorp | | | 15,700 | | | | 532,701 | |
Wells Fargo & Company | | | 21,500 | | | | 795,285 | |
| | | | | | | | 10,248,131 | |
| Health Care — 9.7% | | | | | | | | |
Abbott Laboratories | | | 9,000 | | | | 317,880 | |
AbbVie, Inc. | | | 9,000 | | | | 367,020 | |
Alexion Pharmaceuticals, Inc. (a) | | | 8,690 | | | | 800,697 | |
Cardinal Health, Inc. | | | 13,315 | | | | 554,170 | |
CareFusion Corporation (a) | | | 6,000 | | | | 209,940 | |
Cerner Corporation (a) | | | 12,000 | | | | 1,137,000 | |
Elan Corporation plc - ADR (a) | | | 6,500 | | | | 76,700 | |
Fresenius Medical Care AG & Company KGaA - ADR | | | 12,000 | | | | 406,320 | |
Gilead Sciences, Inc. (a) | | | 16,000 | | | | 782,880 | |
Pfizer, Inc. | | | 20,000 | | | | 577,200 | |
Prothena Corporation plc (a) | | | 158 | | | | 1,057 | |
Questcor Pharmaceuticals, Inc. | | | 4,000 | | | | 130,160 | |
Regeneron Pharmaceuticals, Inc. (a) | | | 2,300 | | | | 405,720 | |
Shire plc - ADR | | | 5,000 | | | | 456,800 | |
Techne Corporation | | | 10,000 | | | | 678,500 | |
Waters Corporation (a) | | | 11,100 | | | | 1,042,401 | |
| | | | | | | | 7,944,445 | |
| Industrials — 8.8% | | | | | | | | |
C.H. Robinson Worldwide, Inc. | | | 3,000 | | | | 178,380 | |
Caterpillar, Inc. | | | 10,350 | | | | 900,140 | |
Emerson Electric Company | | | 15,000 | | | | 838,050 | |
General Dynamics Corporation | | | 15,000 | | | | 1,057,650 | |
Ingersoll-Rand plc | | | 10,000 | | | | 550,100 | |
Manitowoc Company, Inc. (The) | | | 14,000 | | | | 287,840 | |
Norfolk Southern Corporation | | | 10,000 | | | | 770,800 | |
Quanta Services, Inc. (a) | | | 15,000 | | | | 428,700 | |
Stericycle, Inc. (a) | | | 7,000 | | | | 743,260 | |
United Technologies Corporation | | | 15,500 | | | | 1,448,165 | |
| | | | | | | | 7,203,085 | |
| Information Technology — 16.0% | | | | | | | | |
Accenture plc - Class A | | | 9,500 | | | | 721,715 | |
Adobe Systems, Inc. (a) | | | 25,000 | | | | 1,087,750 | |
ADTRAN, Inc. | | | 15,000 | | | | 294,750 | |
THE GOVERNMENT STREET EQUITY FUND SCHEDULE OF INVESTMENTS (Continued) | |
COMMON STOCKS — 85.5% (Continued) | | | | | | |
| Information Technology — 16.0% (Continued) | | | | | | |
Apple, Inc. | | | 5,005 | | | $ | 2,215,363 | |
Automatic Data Processing, Inc. | | | 12,400 | | | | 806,248 | |
Broadridge Financial Solutions, Inc. | | | 5,000 | | | | 124,200 | |
eBay, Inc. (a) | | | 4,000 | | | | 216,880 | |
Google, Inc. - Class A (a) | | | 1,200 | | | | 952,836 | |
International Business Machines Corporation | | | 8,500 | | | | 1,813,050 | |
MasterCard, Inc. - Class A | | | 3,500 | | | | 1,893,955 | |
NetApp, Inc. (a) | | | 13,000 | | | | 444,080 | |
TE Connectivity Ltd. | | | 12,000 | | | | 503,160 | |
Texas Instruments, Inc. | | | 10,000 | | | | 354,800 | |
Visa, Inc. - Class A | | | 9,500 | | | | 1,613,480 | |
| | | | | | | | 13,042,267 | |
| Materials — 2.6% | | | | | | | | |
Dow Chemical Company (The) | | | 12,000 | | | | 382,080 | |
FMC Corporation | | | 4,500 | | | | 256,635 | |
Freeport-McMoRan Copper & Gold, Inc. | | | 17,932 | | | | 593,549 | |
Monsanto Company | | | 3,000 | | | | 316,890 | |
Praxair, Inc. | | | 5,000 | | | | 557,700 | |
| | | | | | | | 2,106,854 | |
| Telecommunication Services — 2.7% | | | | | | | | |
AT&T, Inc. | | | 17,000 | | | | 623,730 | |
Telstra Corporation Ltd. - ADR | | | 30,000 | | | | 707,100 | |
Verizon Communications, Inc. | | | 18,000 | | | | 884,700 | |
| | | | | | | | 2,215,530 | |
| Utilities — 3.6% | | | | | | | | |
Duke Energy Corporation | | | 20,000 | | | | 1,451,800 | |
Southern Company (The) | | | 18,000 | | | | 844,560 | |
Wisconsin Energy Corporation | | | 14,000 | | | | 600,460 | |
| | | | | | | | 2,896,820 | |
| | | | | | | | | |
Total Common Stocks (Cost $42,795,543) | | | | | | $ | 69,828,843 | |
EXCHANGE-TRADED FUNDS — 8.6% | | | | | | |
EGShares Emerging Markets Consumer ETF | | | 25,000 | | | $ | 664,750 | |
iShares Core S&P Mid-Cap ETF | | | 5,000 | | | | 575,350 | |
iShares Russell 2000 Index Fund | | | 14,000 | | | | 1,319,640 | |
Market Vectors Agribusiness ETF | | | 26,000 | | | | 1,407,900 | |
ProShares Credit Suisse 130/30 ETF | | | 8,000 | | | | 586,952 | |
Vanguard Mid-Cap ETF | | | 26,900 | | | | 2,498,741 | |
Total Exchange-Traded Funds (Cost $5,450,381) | | | | | | $ | 7,053,333 | |
THE GOVERNMENT STREET EQUITY FUND SCHEDULE OF INVESTMENTS (Continued) | |
EXCHANGE-TRADED NOTES — 2.9% | | | | | | |
JPMorgan Alerian MLP Index ETN (Cost $1,843,715) | | | 52,000 | | | $ | 2,364,960 | |
| | | | | | |
American International Group, Inc., 01/19/2021 at $45 (a) (Cost $13,600) | | | 800 | | | $ | 12,160 | |
| | | | | | |
U.S. Bank, N.A., discount, 0.02% (c), due 04/01/2013 (Cost $2,469,000) | | $ | 2,469,000 | | | $ | 2,469,000 | |
MONEY MARKET FUNDS — 0.0% (b) | | | | | | |
Invesco STIT - STIC Prime Portfolio (The) - Institutional Class, 0.09% (d) (Cost $940) | | | 940 | | | $ | 940 | |
| | | | | | | | | |
Total Investments at Value — 100.0% (Cost $52,573,179) | | | | | | $ | 81,729,236 | |
| | | | | | | | | |
Liabilities in Excess of Other Assets — (0.0%) (e) | | | | | | | (40,560 | ) |
| | | | | | | | | |
Net Assets — 100.0% | | | | | | $ | 81,688,676 | |
| ADR - American Depositary Receipt. |
| | |
| (a) | Non-income producing security. |
| | |
| (b) | Percentage rounds to less than 0.1%. |
| | |
| (c) | Rate shown is the annualized yield at time of purchase, not a coupon rate. |
| | |
| (d) | Rate shown is the 7-day effective yield as of March 31, 2013. |
| | |
| (e) | Percentage rounds to greater than (0.1%). |
| | |
| See accompanying notes to financial statements. |
THE GOVERNMENT STREET MID-CAP FUND SCHEDULE OF INVESTMENTS March 31, 2013 | |
| | | | | | |
| Consumer Discretionary — 13.0% | | | | | | |
BorgWarner, Inc. (a) | | | 2,800 | | | $ | 216,552 | |
Buffalo Wild Wings, Inc. (a) | | | 2,400 | | | | 210,072 | |
Chico's FAS, Inc. | | | 7,100 | | | | 119,280 | |
Coach, Inc. | | | 5,825 | | | | 291,192 | |
Darden Restaurants, Inc. | | | 2,275 | | | | 117,572 | |
Dollar Tree, Inc. (a) | | | 4,200 | | | | 203,406 | |
Family Dollar Stores, Inc. | | | 2,800 | | | | 165,340 | |
Gildan Activewear, Inc. - Class A | | | 8,600 | | | | 343,226 | |
Guess?, Inc. | | | 6,075 | | | | 150,842 | |
Hasbro, Inc. | | | 2,525 | | | | 110,948 | |
Jarden Corporation (a) | | | 8,475 | | | | 363,154 | |
John Wiley & Sons, Inc. - Class A | | | 1,800 | | | | 70,128 | |
Liberty Global, Inc. - Class A (a) | | | 5,125 | | | | 376,175 | |
Nordstrom, Inc. | | | 3,900 | | | | 215,397 | |
O'Reilly Automotive, Inc. (a) | | | 4,775 | | | | 489,676 | |
Panera Bread Company - Class A (a) | | | 1,600 | | | | 264,384 | |
PetSmart, Inc. | | | 3,500 | | | | 217,350 | |
PVH Corporation | | | 4,100 | | | | 437,921 | |
Ross Stores, Inc. | | | 6,000 | | | | 363,720 | |
Service Corporation International | | | 15,200 | | | | 254,296 | |
Tiffany & Company | | | 3,475 | | | | 241,652 | |
True Religion Apparel, Inc. | | | 8,600 | | | | 224,546 | |
Urban Outfitters, Inc. (a) | | | 5,600 | | | | 216,944 | |
Vail Resorts, Inc. | | | 1,700 | | | | 105,944 | |
VF Corporation | | | 1,175 | | | | 197,106 | |
| | | | | | | | 5,966,823 | |
| Consumer Staples — 3.8% | | | | | | | | |
Church & Dwight Company, Inc. | | | 10,800 | | | | 698,004 | |
Green Mountain Coffee Roasters, Inc. (a) | | | 650 | | | | 36,894 | |
Hormel Foods Corporation | | | 12,000 | | | | 495,840 | |
J.M. Smucker Company (The) | | | 4,700 | | | | 466,052 | |
Tyson Foods, Inc. - Class A | | | 2,000 | | | | 49,640 | |
| | | | | | | | 1,746,430 | |
| Energy — 5.7% | | | | | | | | |
Cameron International Corporation (a) | | | 4,010 | | | | 261,452 | |
Cimarex Energy Company | | | 3,250 | | | | 245,180 | |
Murphy Oil Corporation | | | 3,740 | | | | 238,350 | |
Noble Corporation | | | 5,360 | | | | 204,484 | |
NuStar Energy, L.P. | | | 4,350 | | | | 232,029 | |
Peabody Energy Corporation | | | 8,200 | | | | 173,430 | |
Pioneer Natural Resources Company | | | 2,680 | | | | 332,990 | |
Range Resources Corporation | | | 3,500 | | | | 283,640 | |
THE GOVERNMENT STREET MID-CAP FUND SCHEDULE OF INVESTMENTS (Continued) | |
COMMON STOCKS — 81.5% (Continued) | | | | | | |
| Energy — 5.7% (Continued) | | | | | | |
Schlumberger Ltd. | | | 3,134 | | | $ | 234,705 | |
Ultra Petroleum Corporation (a) | | | 9,900 | | | | 198,990 | |
Valero Energy Corporation | | | 4,950 | | | | 225,176 | |
| | | | | | | | 2,630,426 | |
| Financials — 14.7% | | | | | | | | |
Alexander & Baldwin, Inc. (a) | | | 3,000 | | | | 107,250 | |
Alleghany Corporation (a) | | | 765 | | | | 302,879 | |
American Financial Group, Inc. | | | 6,600 | | | | 312,708 | |
Annaly Capital Management, Inc. | | | 12,200 | | | | 193,858 | |
Arch Capital Group Ltd. (a) | | | 5,650 | | | | 297,021 | |
Arthur J. Gallagher & Company | | | 6,750 | | | | 278,842 | |
Axis Capital Holdings Ltd. | | | 5,000 | | | | 208,100 | |
Bank of Hawaii Corporation | | | 6,000 | | | | 304,860 | |
Berkley (W.R.) Corporation | | | 6,450 | | | | 286,186 | |
Colonial Properties Trust | | | 30,000 | | | | 678,300 | |
Cullen/Frost Bankers, Inc. | | | 4,400 | | | | 275,132 | |
Eaton Vance Corporation | | | 8,500 | | | | 355,555 | |
Everest Re Group Ltd. | | | 2,050 | | | | 266,213 | |
IntercontinentalExchange, Inc. (a) | | | 1,850 | | | | 301,679 | |
Jones Lang LaSalle, Inc. | | | 2,800 | | | | 278,348 | |
Kemper Corporation | | | 6,200 | | | | 202,182 | |
Liberty Property Trust | | | 5,680 | | | | 225,780 | |
NASDAQ OMX Group, Inc. (The) | | | 9,500 | | | | 306,850 | |
New York Community Bancorp, Inc. | | | 12,970 | | | | 186,120 | |
Old Republic International Corporation | | | 21,400 | | | | 271,994 | |
Potlatch Corporation | | | 6,941 | | | | 318,314 | |
Rayonier, Inc. | | | 5,250 | | | | 313,268 | |
SEI Investments Company | | | 10,000 | | | | 288,500 | |
Westamerica Bancorporation | | | 4,370 | | | | 198,092 | |
| | | | | | | | 6,758,031 | |
| Health Care — 8.2% | | | | | | | | |
Alexion Pharmaceuticals, Inc. (a) | | | 1,200 | | | | 110,568 | |
Almost Family, Inc. | | | 1,000 | | | | 20,430 | |
Bio-Rad Laboratories, Inc. - Class A (a) | | | 2,500 | | | | 315,000 | |
C.R. Bard, Inc. | | | 1,000 | | | | 100,780 | |
Cantel Medical Corporation | | | 3,000 | | | | 90,180 | |
Cerner Corporation (a) | | | 1,700 | | | | 161,075 | |
Charles River Laboratories International, Inc. (a) | | | 3,000 | | | | 132,810 | |
Chemed Corporation | | | 1,000 | | | | 79,980 | |
Computer Programs & Systems, Inc. | | | 1,800 | | | | 97,398 | |
Covance, Inc. (a) | | | 4,000 | | | | 297,280 | |
Covidien plc | | | 1,500 | | | | 101,760 | |
Edwards Lifesciences Corporation (a) | | | 1,000 | | | | 82,160 | |
THE GOVERNMENT STREET MID-CAP FUND SCHEDULE OF INVESTMENTS (Continued) | |
COMMON STOCKS — 81.5% (Continued) | | | | | | |
| Health Care — 8.2% (Continued) | | | | | | |
Ensign Group, Inc. (The) | | | 3,000 | | | $ | 100,200 | |
Fresenius Medical Care AG & Company KGaA - ADR | | | 4,400 | | | | 148,984 | |
Gilead Sciences, Inc. (a) | | | 300 | | | | 14,679 | |
Hanger, Inc. (a) | | | 4,000 | | | | 126,120 | |
Henry Schein, Inc. (a) | | | 2,000 | | | | 185,100 | |
Illumina, Inc. (a) | | | 1,000 | | | | 54,000 | |
Intuitive Surgical, Inc. (a) | | | 200 | | | | 98,238 | |
Life Technologies Corporation (a) | | | 2,891 | | | | 186,845 | |
Myriad Genetics, Inc. (a) | | | 1,000 | | | | 25,400 | |
ResMed, Inc. | | | 6,000 | | | | 278,160 | |
Shire plc - ADR | | | 1,500 | | | | 137,040 | |
Techne Corporation | | | 4,500 | | | | 305,325 | |
Teleflex, Inc. | | | 4,000 | | | | 338,040 | |
Waters Corporation (a) | | | 2,000 | | | | 187,820 | |
| | | | | | | | 3,775,372 | |
| Industrials — 12.5% | | | | | | | | |
AMETEK, Inc. | | | 1,350 | | | | 58,536 | |
C.H. Robinson Worldwide, Inc. | | | 5,000 | | | | 297,300 | |
Deluxe Corporation | | | 5,000 | | | | 207,000 | |
Donaldson Company, Inc. | | | 12,000 | | | | 434,280 | |
Engility Holdings, Inc. (a) | | | 500 | | | | 11,990 | |
Expeditors International of Washington, Inc. | | | 6,000 | | | | 214,260 | |
Fastenal Company | | | 9,950 | | | | 510,932 | |
Graco, Inc. | | | 6,000 | | | | 348,180 | |
Jacobs Engineering Group, Inc. (a) | | | 4,475 | | | | 251,674 | |
Joy Global, Inc. | | | 2,000 | | | | 119,040 | |
L-3 Communications Holdings, Inc. | | | 3,000 | | | | 242,760 | |
Manpower, Inc. | | | 4,000 | | | | 226,880 | |
Matson, Inc. | | | 3,000 | | | | 73,800 | |
MSC Industrial Direct Company, Inc. - Class A | | | 5,000 | | | | 428,900 | |
Pentair Ltd. | | | 2,400 | | | | 126,600 | |
Snap-on, Inc. | | | 4,275 | | | | 353,543 | |
SPX Corporation | | | 5,000 | | | | 394,800 | |
Stericycle, Inc. (a) | | | 7,500 | | | | 796,350 | |
Timken Company | | | 5,000 | | | | 282,900 | |
Waste Connections, Inc. | | | 6,000 | | | | 215,880 | |
WESCO International, Inc. (a) | | | 1,850 | | | | 134,329 | |
| | | | | | | | 5,729,934 | |
| Information Technology — 13.3% | | | | | | | | |
ADTRAN, Inc. | | | 8,000 | | | | 157,200 | |
Advent Software, Inc. (a) | | | 8,000 | | | | 223,760 | |
Alliance Data Systems Corporation (a) | | | 4,710 | | | | 762,502 | |
Arrow Electronics, Inc. (a) | | | 8,600 | | | | 349,332 | |
THE GOVERNMENT STREET MID-CAP FUND SCHEDULE OF INVESTMENTS (Continued) | |
COMMON STOCKS — 81.5% (Continued) | | | | | | |
| Information Technology — 13.3% (Continued) | | | | | | |
Cognizant Technology Solutions Corporation - Class A (a) | | | 3,000 | | | $ | 229,830 | |
Cree, Inc. (a) | | | 4,820 | | | | 263,702 | |
Diebold, Inc. | | | 5,000 | | | | 151,600 | |
DST Systems, Inc. | | | 4,000 | | | | 285,080 | |
Harris Corporation | | | 6,000 | | | | 278,040 | |
IAC/InterActiveCorporation | | | 3,000 | | | | 134,040 | |
Integrated Device Technology, Inc. (a) | | | 10,000 | | | | 74,700 | |
Jack Henry & Associates, Inc. | | | 9,000 | | | | 415,890 | |
Lam Research Corporation (a) | | | 6,000 | | | | 248,760 | |
Linear Technology Corporation | | | 6,000 | | | | 230,220 | |
Microchip Technology, Inc. | | | 5,000 | | | | 183,800 | |
National Instruments Corporation | | | 12,000 | | | | 393,000 | |
NetApp, Inc. (a) | | | 5,000 | | | | 170,800 | |
Polycom, Inc. (a) | | | 8,000 | | | | 88,640 | |
Rackspace Hosting, Inc. (a) | | | 4,000 | | | | 201,920 | |
Rovi Corporation (a) | | | 6,000 | | | | 128,460 | |
SanDisk Corporation (a) | | | 5,000 | | | | 275,000 | |
Solera Holdings, Inc. | | | 4,000 | | | | 233,320 | |
Western Union Company (The) | | | 12,400 | | | | 186,496 | |
Xilinx, Inc. | | | 7,000 | | | | 267,190 | |
Zebra Technologies Corporation - Class A (a) | | | 4,000 | | | | 188,520 | |
| | | | | | | | 6,121,802 | |
| Materials — 5.8% | | | | | | | | |
Airgas, Inc. | | | 4,000 | | | | 396,640 | |
Albemarle Corporation | | | 8,000 | | | | 500,160 | |
Ashland, Inc. | | | 3,000 | | | | 222,900 | |
Cabot Corporation | | | 4,000 | | | | 136,800 | |
Martin Marietta Materials, Inc. | | | 2,500 | | | | 255,050 | |
Packaging Corporation of America | | | 5,000 | | | | 224,350 | |
Scotts Miracle-Gro Company (The) - Class A | | | 4,000 | | | | 172,960 | |
Sonoco Products Company | | | 5,000 | | | | 174,950 | |
Steel Dynamics, Inc. | | | 12,000 | | | | 190,440 | |
Valspar Corporation (The) | | | 6,000 | | | | 373,500 | |
| | | | | | | | 2,647,750 | |
| Utilities — 4.5% | | | | | | | | |
AGL Resources, Inc. | | | 8,400 | | | | 352,380 | |
Great Plains Energy, Inc. | | | 9,050 | | | | 209,869 | |
ONEOK, Inc. | | | 12,000 | | | | 572,040 | |
Pepco Holdings, Inc. | | | 7,900 | | | | 169,060 | |
SCANA Corporation | | | 7,530 | | | | 385,235 | |
Vectren Corporation | | | 10,600 | | | | 375,452 | |
| | | | | | | | 2,064,036 | |
| | | | | | | | | |
Total Common Stocks (Cost $22,192,198) | | | | | | $ | 37,440,604 | |
THE GOVERNMENT STREET MID-CAP FUND SCHEDULE OF INVESTMENTS (Continued) | |
EXCHANGE-TRADED FUNDS — 11.7% | | | | | | |
First Trust NYSE Arca Biotechnology Index Fund | | | 8,000 | | | $ | 434,720 | |
Guggenheim Mid-Cap Core ETF | | | 26,000 | | | | 1,001,000 | |
iShares Core S&P Mid-Cap ETF | | | 9,355 | | | | 1,076,480 | |
iShares Nasdaq Biotechnology Index Fund | | | 2,000 | | | | 319,860 | |
SPDR® S&P Homebuilders ETF Trust | | | 3,625 | | | | 108,714 | |
SPDR® S&P MIDCAP 400® ETF Trust | | | 5,000 | | | | 1,048,600 | |
Vanguard Mid-Cap ETF | | | 15,000 | | | | 1,393,350 | |
Total Exchange-Traded Funds (Cost $4,188,787) | | | | | | $ | 5,382,724 | |
EXCHANGE-TRADED NOTES — 2.7% | | | | | | |
JPMorgan Alerian MLP Index ETN (Cost $980,004) | | | 27,000 | | | $ | 1,227,960 | |
| | | | | | |
U.S. Bank, N.A., discount, 0.02% (b), due 04/01/2013 (Cost $1,867,000) | | $ | 1,867,000 | | | $ | 1,867,000 | |
MONEY MARKET FUNDS — 0.0% (c) | | | | | | |
Invesco STIT - STIC Prime Portfolio (The) - Institutional Class, 0.09% (d) (Cost $293) | | | 293 | | | $ | 293 | |
| | | | | | | | | |
Total Investments at Value — 100.0% (Cost $29,228,282) | | | | | | $ | 45,918,581 | |
| | | | | | | | | |
Liabilities in Excess of Other Assets — (0.0%) (e) | | | | | | | (611 | ) |
| | | | | | | | | |
Net Assets — 100.0% | | | | | | $ | 45,917,970 | |
| ADR - American Depositary Receipt. |
| | |
| (a) | Non-income producing security. |
| | |
| (b) | Rate shown is the annualized yield at time of purchase, not a coupon rate. |
| | |
| (c) | Percentage rounds to less than 0.1%. |
| | |
| (d) | Rate shown is the 7-day effective yield as of March 31, 2013. |
| | |
| (e) | Percentage rounds to greater than (0.1%). |
| | |
| See accompanying notes to financial statements. |
THE ALABAMA TAX FREE BOND FUND SCHEDULE OF INVESTMENTS March 31, 2013 | |
ALABAMA FIXED RATE REVENUE AND
GENERAL OBLIGATION (GO) BONDS — 93.9% | | | | | | |
| Alabama Drinking Water Financing Auth., Rev., | | | | | | |
4.00%, due 08/15/2014 | | $ | 250,000 | | | $ | 254,985 | |
5.00%, due 08/15/2018 | | | 400,000 | | | | 429,128 | |
| Alabama State Public School & College Auth., Capital Improvements, Rev., | | | | | | | | |
5.00%, due 12/01/2017 | | | 470,000 | | | | 558,708 | |
| Alabama State Public School & College Auth., Capital Improvements, Series A, Rev., | | | | | | | | |
4.00%, due 02/01/2017 | | | 250,000 | | | | 280,417 | |
3.75%, due 02/01/2018 | | | 200,000 | | | | 225,202 | |
| Alabama State, GO, | | | | | | | | |
5.00%, due 09/01/2015 | | | 300,000 | | | | 301,176 | |
5.00%, due 02/01/2016 | | | 575,000 | | | | 622,713 | |
5.00%, due 09/01/2016 | | | 300,000 | | | | 301,176 | |
5.00%, due 09/01/2017 | | | 300,000 | | | | 307,173 | |
| Anniston, AL, Waterworks & Sewer Board, Water & Sewer, Rev., | | | | | | | | |
3.50%, due 06/01/2016 | | | 500,000 | | | | 535,680 | |
| Athens, AL, Electric Rev., Warrants, | | | | | | | | |
3.00%, due 06/01/2016 | | | 510,000 | | | | 538,478 | |
| Athens, AL, Warrants, | | | | | | | | |
4.00%, due 09/01/2018 | | | 300,000 | | | | 343,818 | |
| Auburn University, AL, General Fee Rev., | | | | | | | | |
5.00%, due 06/01/2018 | | | 315,000 | | | | 377,543 | |
5.00%, due 06/01/2020 | | | 350,000 | | | | 431,501 | |
| Auburn, AL, Refunding & Capital Improvements, Series B, GO, Warrants, | | | | | | | | |
4.00%, due 08/01/2018 | | | 200,000 | | | | 229,200 | |
| Auburn, AL, School, Series A, GO, Warrants, | | | | | | | | |
5.00%, due 08/01/2018 | | | 500,000 | | | | 602,155 | |
| Auburn, AL, Waterworks Board, Water Rev., | | | | | | | | |
5.00%, due 09/01/2014 | | | 205,000 | | | | 216,964 | |
| Baldwin Co., AL, Board of Education, Rev., Capital Outlay School Warrants, | | | | | | | | |
5.00%, due 07/01/2018 | | | 590,000 | | | | 673,031 | |
| Baldwin Co., AL, GO, Warrants, | | | | | | | | |
5.00%, due 02/01/2015 | | | 200,000 | | | | 207,670 | |
4.00%, due 06/01/2019 | | | 200,000 | | | | 227,406 | |
| Baldwin Co., AL, Series A, GO, Warrants, | | | | | | | | |
5.00%, due 02/01/2017 | | | 320,000 | | | | 371,021 | |
THE ALABAMA TAX FREE BOND FUND SCHEDULE OF INVESTMENTS (Continued) | |
ALABAMA FIXED RATE REVENUE AND
GENERAL OBLIGATION (GO) BONDS — 93.9% (Continued) | | | | | | |
| Birmingham, AL, Waterworks Board, Water Rev., | | | | | | |
5.00%, due 01/01/2017 | | $ | 400,000 | | | $ | 456,004 | |
3.625%, due 07/01/2018 | | | 250,000 | | | | 276,095 | |
| Calera, AL, GO, Warrants, | | | | | | | | |
3.00%, due 12/01/2016 | | | 250,000 | | | | 267,592 | |
3.00%, due 12/01/2017 | | | 410,000 | | | | 442,616 | |
| Calhoun Co., AL, Gas Tax Anticipation, Series A, Rev., Warrants, | | | | | | | | |
4.00%, due 03/01/2016 | | | 445,000 | | | | 481,027 | |
| Chambers Co., AL, Gasoline Tax Anticipation, Rev., Warrants, | | | | | | | | |
2.00%, due 11/01/2019 | | | 290,000 | | | | 291,650 | |
| Chelsea, AL, GO, | | | | | | | | |
4.00%, due 05/01/2015 | | | 260,000 | | | | 275,603 | |
| Enterprise, AL, GO, School Warrants, | | | | | | | | |
4.00%, due 02/01/2016 | | | 400,000 | | | | 437,584 | |
| Florence, AL, Board of Education, Rev., | | | | | | | | |
3.00%, due 03/01/2016 | | | 500,000 | | | | 528,930 | |
| Florence, AL, Electric Rev., Warrants, | | | | | | | | |
3.10%, due 06/01/2015 | | | 300,000 | | | | 312,192 | |
3.50%, due 06/01/2017 | | | 515,000 | | | | 557,415 | |
| Foley, AL, GO, Warrants, | | | | | | | | |
4.00%, due 01/01/2015 | | | 315,000 | | | | 333,988 | |
| Foley, AL, Utilities Board, Utilities Rev., | | | | | | | | |
4.00%, due 11/01/2018 | | | 710,000 | | | | 816,365 | |
4.00%, due 11/01/2019 | | | 225,000 | | | | 262,760 | |
4.50%, due 11/01/2019 | | | 250,000 | | | | 276,100 | |
| Gadsden, AL, GO, School Warrants, | | | | | | | | |
3.00%, due 08/01/2015 | | | 250,000 | | | | 261,150 | |
| Homewood, AL, GO, Warrants, | | | | | | | | |
5.00%, due 09/01/2015 | | | 250,000 | | | | 276,845 | |
| Homewood, AL, Board of Education, Special Tax School Warrants, | | | | | | | | |
4.00%, due 04/01/2017 | | | 500,000 | | | | 555,415 | |
| Hoover City, AL, Board of Education, Special Tax School Warrants, | | | | | | | | |
4.00%, due 02/15/2020 | | | 470,000 | | | | 540,829 | |
4.00%, due 02/15/2021 | | | 245,000 | | | | 281,155 | |
4.00%, due 02/15/2022 | | | 250,000 | | | | 284,042 | |
| Houston Co., AL, Board of Education, GO, Capital Outlay Warrants, | | | | | | | | |
4.00%, due 12/01/2013 | | | 545,000 | | | | 556,189 | |
THE ALABAMA TAX FREE BOND FUND SCHEDULE OF INVESTMENTS (Continued) | |
ALABAMA FIXED RATE REVENUE AND
GENERAL OBLIGATION (GO) BONDS — 93.9% (Continued) | | | | | | |
| Houston Co., AL, GO, | | | | | | |
4.75%, due 10/15/2016 | | $ | 500,000 | | | $ | 528,815 | |
| Huntsville, AL, Electric Systems, Rev., | | | | | | | | |
4.00%, due 12/01/2013 | | | 300,000 | | | | 307,581 | |
3.00%, due 12/01/2016 | | | 375,000 | | | | 405,908 | |
| Huntsville, AL, GO, Capital Improvement Warrants, | | | | | | | | |
4.00%, due 03/01/2015 | | | 550,000 | | | | 587,048 | |
| 5.00%, due 11/01/2017, | | | | | | | | |
Prerefunded 11/1/2013 @ 100 | | | 300,000 | | | | 308,357 | |
| Huntsville, AL, GO, Refunding and Capital Improvement Warrants, | | | | | | | | |
4.00%, due 09/01/2016 | | | 500,000 | | | | 555,670 | |
4.00%, due 09/01/2018 | | | 500,000 | | | | 575,785 | |
| Limestone Co., AL, Board of Education, Special Tax Warrants, | | | | | | | | |
3.00%, due 11/01/2019 | | | 560,000 | | | | 599,066 | |
| Macon Co., AL, GO, Warrants, | | | | | | | | |
| 4.25%, due 10/01/2027, | | | | | | | | |
Prerefunded 10/01/2017 @ 100 | | | 200,000 | | | | 231,908 | |
| Madison Co., AL, Board of Education, Rev., Tax Anticipation Warrants, | | | | | | | | |
2.00%, due 09/01/2019 | | | 220,000 | | | | 224,675 | |
| Madison Co., AL, Series A, Water Rev., Warrants, | | | | | | | | |
2.00%, due 07/01/2017 | | | 250,000 | | | | 260,448 | |
| Mobile Co., AL, GO, Refunding and Improvement Warrants, | | | | | | | | |
4.50%, due 08/01/2013 | | | 100,000 | | | | 101,449 | |
| 5.25%, due 08/01/2015, | | | | | | | | |
Prerefunded 08/01/2014 @ 100 | | | 400,000 | | | | 426,732 | |
| Montgomery, AL, GO, Warrants, | | | | | | | | |
3.00%, due 11/01/2014 | | | 500,000 | | | | 519,695 | |
2.50%, due 04/01/2021 | | | 500,000 | | | | 519,735 | |
| Montgomery, AL, Waterworks & Sanitation, Rev., | | | | | | | | |
5.00%, due 09/01/2017 | | | 250,000 | | | | 294,963 | |
| Morgan Co., AL, Board of Education, Rev., Capital Outlay Warrants, | | | | | | | | |
4.00%, due 03/01/2019 | | | 250,000 | | | | 283,120 | |
| Mountain Brook, AL, City Board of Education, GO, Warrants, | | | | | | | | |
3.00%, due 03/01/2020 | | | 300,000 | | | | 326,439 | |
| North Alabama Gas District, Rev., | | | | | | | | |
3.00%, due 06/01/2020 | | | 420,000 | | | | 440,756 | |
THE ALABAMA TAX FREE BOND FUND SCHEDULE OF INVESTMENTS (Continued) | |
ALABAMA FIXED RATE REVENUE AND GENERAL OBLIGATION (GO) BONDS — 93.9% (Continued) | | | | | | |
| Opelika, AL, GO, Warrants, | | | | | | |
2.00%, due 11/01/2017 | | $ | 275,000 | | | $ | 286,528 | |
| Opelika, AL, Utilities Board, Series B, Rev., | | | | | | | | |
3.00%, due 06/01/2016 | | | 475,000 | | | | 504,873 | |
3.00%, due 06/01/2018 | | | 215,000 | | | | 232,178 | |
| Orange Beach, AL, GO, Warrants, | | | | | | | | |
4.00%, due 02/01/2018 | | | 200,000 | | | | 225,338 | |
5.00%, due 02/01/2019 | | | 240,000 | | | | 288,684 | |
| Prattville, AL, Waterworks Board, Rev., | | | | | | | | |
3.00%, due 08/01/2017 | | | 290,000 | | | | 310,462 | |
| Sheffield, AL, Electric Rev., | | | | | | | | |
4.00%, due 07/01/2017 | | | 600,000 | | | | 662,556 | |
| Smiths, AL, Water & Sewer Auth., Rev., | | | | | | | | |
4.00%, due 06/01/2013 | | | 200,000 | | | | 201,084 | |
| St. Clair Co., AL, GO, | | | | | | | | |
4.00%, due 08/01/2013 | | | 145,000 | | | | 146,631 | |
4.00%, due 08/01/2014 | | | 205,000 | | | | 213,834 | |
| Sumter Co., AL, School Rev., Warrants, | | | | | | | | |
| 4.50%, due 02/01/2031, | | | | | | | | |
Prerefunded 02/01/2016 @ 100 | | | 500,000 | | | | 557,275 | |
| Tuscaloosa, AL, Public Building Auth., Student Housing Rev., | | | | | | | | |
4.00%, due 07/01/2013 | | | 350,000 | | | | 353,108 | |
| Tuscaloosa, AL, Series B, GO, Warrants, | | | | | | | | |
4.00%, due 01/01/2020 | | | 500,000 | | | | 578,305 | |
| University of Alabama, AL, Rev., | | | | | | | | |
4.00%, due 10/01/2014 | | | 500,000 | | | | 527,315 | |
| University of Alabama, AL, Series A, Rev., | | | | | | | | |
3.00%, due 07/01/2016 | | | 340,000 | | | | 366,976 | |
5.00%, due 07/01/2017 | | | 245,000 | | | | 286,701 | |
| Vestavia Hills, AL, GO, Warrants, | | | | | | | | |
4.00%, due 02/01/2018 | | | 515,000 | | | | 580,245 | |
| Vestavia Hills, AL, Series A, GO, Warrants, | | | | | | | | |
3.00%, due 02/01/2018 | | | 240,000 | | | | 260,554 | |
| Wetumpka, AL, Waterworks & Sewer, Rev., | | | | | | | | |
4.00%, due 03/01/2018 | | | 320,000 | | | | 353,731 | |
| | | | | | | | | |
Total Alabama Fixed Rate Revenue and General Obligation (GO) Bonds (Cost $30,352,058) | | | | | | $ | 31,241,219 | |
THE ALABAMA TAX FREE BOND FUND SCHEDULE OF INVESTMENTS (Continued) | |
MONEY MARKET FUNDS — 6.1% | | | | | | |
Alpine Municipal Money Market Fund - Class I, 0.05% (a) | | | 1,622,438 | | | $ | 1,622,438 | |
Fidelity Tax Exempt Portfolio - Class I, 0.01% (a) | | | 405,759 | | | | 405,759 | |
Total Money Market Funds (Cost $2,028,197) | | | | | | $ | 2,028,197 | |
| | | | | | | | | |
Total Investments at Value — 100.0% (Cost $32,380,255) | | | | | | $ | 33,269,416 | |
| | | | | | | | | |
Liabilities in Excess of Other Assets — (0.0%) (b) | | | | | | | (4,770 | ) |
| | | | | | | | | |
Net Assets — 100.0% | | | | | | $ | 33,264,646 | |
| (a) | Rate shown is the 7-day effective yield as of March 31, 2013. |
| | |
| (b) | Percentage rounds to greater than (0.1%). |
| | |
| See accompanying notes to financial statements. |
THE GOVERNMENT STREET FUNDS STATEMENTS OF ASSETS AND LIABILITIES March 31, 2013 | |
| | Government Street Equity Fund | | | Government Street Mid-Cap Fund | | | | |
| ASSETS | | | | | | | | | |
| Investments in securities: | | | | | | | | | |
At acquisition cost | | $ | 52,573,179 | | | $ | 29,228,282 | | | $ | 32,380,255 | |
At value (Note 2) | | $ | 81,729,236 | | | $ | 45,918,581 | | | $ | 33,269,416 | |
Cash | | | 14,350 | | | | 5,460 | | | | — | |
Dividends and interest receivable | | | 99,080 | | | | 32,511 | | | | 277,241 | |
Receivable for capital shares sold | | | 1,519 | | | | 147 | | | | — | |
Other assets | | | 3,195 | | | | 2,949 | | | | 2,545 | |
TOTAL ASSETS | | | 81,847,380 | | | | 45,959,648 | | | | 33,549,202 | |
| | | | | | | | | | | | | |
| LIABILITIES | | | | | | | | | | | | |
Distributions payable | | | 8,790 | | | | — | | | | 5,408 | |
Payable for investment securities purchased | | | — | | | | — | | | | 233,711 | |
Payable for capital shares redeemed | | | 94,368 | | | | 3,400 | | | | 27,984 | |
Accrued investment advisory fees (Note 4) | | | 41,083 | | | | 28,715 | | | | 8,403 | |
Payable to administrator (Note 4) | | | 9,150 | | | | 5,925 | | | | 4,600 | |
Other accrued expenses | | | 5,313 | | | | 3,638 | | | | 4,450 | |
TOTAL LIABILITIES | | | 158,704 | | | | 41,678 | | | | 284,556 | |
| | | | | | | | | | | | | |
NET ASSETS | | $ | 81,688,676 | | | $ | 45,917,970 | | | $ | 33,264,646 | |
| | | | | | | | | | | | | |
| Net assets consist of: | | | | | | | | | | | | |
Paid-in capital | | $ | 52,528,651 | | | $ | 29,174,087 | | | $ | 32,423,628 | |
Undistributed (Distributions in excess of)
net investment income | | | (2,316 | ) | | | 9,624 | | | | 1,710 | |
Accumulated net realized gains (losses)
from security transactions | | | 6,284 | | | | 43,960 | | | | (49,853 | ) |
Net unrealized appreciation on investments | | | 29,156,057 | | | | 16,690,299 | | | | 889,161 | |
| | | | | | | | | | | | | |
Net assets | | $ | 81,688,676 | | | $ | 45,917,970 | | | $ | 33,264,646 | |
| | | | | | | | | | | | | |
Shares of beneficial interest outstanding
(unlimited number of shares authorized,
$0.01 par value) | | | 1,523,687 | | | | 2,514,742 | | | | 3,130,298 | |
| | | | | | | | | | | | | |
Net asset value, offering price and
redemption price per share (Note 2) | | $ | 53.61 | | | $ | 18.26 | | | $ | 10.63 | |
| See accompanying notes to financial statements. |
THE GOVERNMENT STREET FUNDS STATEMENTS OF OPERATIONS Year Ended March 31, 2013 | |
| | Government Street Equity Fund | | | Government Street Mid-Cap Fund | | | | |
| INVESTMENT INCOME | | | | | | | | | |
Dividends | | $ | 1,606,966 | | | $ | 687,940 | | | $ | 731 | |
Foreign withholding taxes on dividends | | | (12,530 | ) | | | (925 | ) | | | — | |
Interest | | | 311 | | | | 221 | | | | 642,073 | |
TOTAL INVESTMENT INCOME | | | 1,594,747 | | | | 687,236 | | | | 642,804 | |
| | | | | | | | | | | | | |
| EXPENSES | | | | | | | | | | | | |
Investment advisory fees (Note 4) | | | 445,602 | | | | 301,556 | | | | 95,507 | |
Administration fees (Note 4) | | | 93,135 | | | | 56,615 | | | | 44,000 | |
Professional fees | | | 20,623 | | | | 17,772 | | | | 16,147 | |
Trustees’ fees and expenses (Note 4) | | | 9,275 | | | | 9,275 | | | | 9,275 | |
Registration and filing fees | | | 9,964 | | | | 8,540 | | | | 6,331 | |
Account maintenance fees | | | 14,311 | | | | 7,736 | | | | 2,101 | |
Compliance fees and expenses (Note 4) | | | 8,409 | | | | 7,365 | | | | 7,000 | |
Custodian and bank service fees | | | 11,444 | | | | 6,492 | | | | 4,700 | |
Pricing costs | | | 1,878 | | | | 3,049 | | | | 11,619 | |
Printing of shareholder reports | | | 6,000 | | | | 3,488 | | | | 2,780 | |
Insurance expense | | | 5,364 | | | | 3,347 | | | | 2,209 | |
Postage and supplies | | | 4,258 | | | | 3,367 | | | | 2,974 | |
Other expenses | | | 5,360 | | | | 5,159 | | | | 4,026 | |
TOTAL EXPENSES | | | 635,623 | | | | 433,761 | | | | 208,669 | |
| Fees voluntarily waived by the Adviser (Note 4) | | | — | | | | — | | | | (31,299 | ) |
NET EXPENSES | | | 635,623 | | | | 433,761 | | | | 177,370 | |
| | | | | | | | | | | | | |
NET INVESTMENT INCOME | | | 959,124 | | | | 253,475 | | | | 465,434 | |
| | | | | | | | | | | | | |
REALIZED AND UNREALIZED GAINS
(LOSSES) ON INVESTMENTS | | | | | | | | | | | | |
Net realized gains from security transactions | | | 1,064,199 | | | | 51,266 | | | | 1,630 | |
Net realized gains from in-kind
redemptions (Note 2) | | | 3,319,533 | | | | 1,118,636 | | | | — | |
Net change in unrealized appreciation
(depreciation) on investments | | | 2,117,277 | | | | 3,942,003 | | | | (72,420 | ) |
| | | | | | | | | | | | | |
NET REALIZED AND UNREALIZED
GAINS (LOSSES) ON INVESTMENTS | | | 6,501,009 | | | | 5,111,905 | | | | (70,790 | ) |
| | | | | | | | | | | | | |
NET INCREASE IN NET ASSETS
FROM OPERATIONS | | $ | 7,460,133 | | | $ | 5,365,380 | | | $ | 394,644 | |
| See accompanying notes to financial statements. |
THE GOVERNMENT STREET FUNDS STATEMENTS OF CHANGES IN NET ASSETS | |
| | | Government Street Equity Fund | | | Government Street Mid-Cap Fund | |
| | | | | | | | | | | | |
| FROM OPERATIONS | | | | | | | | | | | | |
Net investment income | | $ | 959,124 | | | $ | 650,404 | | | $ | 253,475 | | | $ | 108,529 | |
Net realized gains from security transactions | | | 1,064,199 | | | | 758,941 | | | | 51,266 | | | | 544,917 | |
Net realized gains from in-kind
redemptions (Note 2) | | | 3,319,533 | | | | 3,635,297 | | | | 1,118,636 | | | | 2,000,710 | |
Net change in unrealized appreciation
(depreciation) on investments | | | 2,117,277 | | | | (627,943 | ) | | | 3,942,003 | | | | (1,949,003 | ) |
Net increase in net assets from operations | | | 7,460,133 | | | | 4,416,699 | | | | 5,365,380 | | | | 705,153 | |
| | | | | | | | | | | | | | | | | |
| DISTRIBUTIONS TO SHAREHOLDERS | | | | | | | | | | | | | | | | |
From net investment income | | | (956,588 | ) | | | (661,640 | ) | | | (267,235 | ) | | | (85,163 | ) |
From net realized capital gains on
security transactions | | | (1,539,170 | ) | | | (309,515 | ) | | | (107,026 | ) | | | (6,083 | ) |
Decrease in net assets from
distributions to shareholders | | | (2,495,758 | ) | | | (971,155 | ) | | | (374,261 | ) | | | (91,246 | ) |
| | | | | | | | | | | | | | | | | |
| FROM CAPITAL SHARE TRANSACTIONS | | | | | | | | | | | | | | | | |
Proceeds from shares sold | | | 10,723,235 | | | | 8,563,528 | | | | 3,762,403 | | | | 3,210,252 | |
| Net asset value of shares issued in reinvestment of distributions to shareholders | | | 2,337,254 | | | | 911,251 | | | | 318,690 | | | | 77,453 | |
Payments for shares redeemed | | | (8,604,620 | ) | | | (7,024,462 | ) | | | (2,997,134 | ) | | | (4,042,108 | ) |
Net increase (decrease) in net assets from
capital share transactions | | | 4,455,869 | | | | 2,450,317 | | | | 1,083,959 | | | | (754,403 | ) |
| | | | | | | | | | | | | | | | | |
TOTAL INCREASE (DECREASE)
IN NET ASSETS | | | 9,420,244 | | | | 5,895,861 | | | | 6,075,078 | | | | (140,496 | ) |
| | | | | | | | | | | | | | | | | |
| NET ASSETS | | | | | | | | | | | | | | | | |
Beginning of year | | | 72,268,432 | | | | 66,372,571 | | | | 39,842,892 | | | | 39,983,388 | |
End of year | | $ | 81,688,676 | | | $ | 72,268,432 | | | $ | 45,917,970 | | | $ | 39,842,892 | |
| | | | | | | | | | | | | | | | | |
UNDISTRIBUTED (DISTRIBUTIONS
IN EXCESS OF) NET
INVESTMENT INCOME | | $ | (2,316 | ) | | $ | (4,852 | ) | | $ | 9,624 | | | $ | 23,366 | |
| | | | | | | | | | | | | | | | | |
| CAPITAL SHARE ACTIVITY | | | | | | | | | | | | | | | | |
Shares sold | | | 216,009 | | | | 186,294 | | | | 228,901 | | | | 212,716 | |
Shares reinvested | | | 47,153 | | | | 19,849 | | | | 19,774 | | | | 5,301 | |
Shares redeemed | | | (172,812 | ) | | | (155,436 | ) | | | (184,890 | ) | | | (283,058 | ) |
| Net increase (decrease) in shares outstanding | | | 90,350 | | | | 50,707 | | | | 63,785 | | | | (65,041 | ) |
Shares outstanding, beginning of year | | | 1,433,337 | | | | 1,382,630 | | | | 2,450,957 | | | | 2,515,998 | |
Shares outstanding, end of year | | | 1,523,687 | | | | 1,433,337 | | | | 2,514,742 | | | | 2,450,957 | |
| See accompanying notes to financial statements. |
THE GOVERNMENT STREET FUNDS STATEMENTS OF CHANGES IN NET ASSETS | |
| | | Alabama Tax Free Bond Fund | |
| | | | | | |
| FROM OPERATIONS | | | | | | |
Net investment income | | $ | 465,434 | | | $ | 555,780 | |
Net realized gains from security transactions | | | 1,630 | | | | 1,407 | |
| Net change in unrealized appreciation (depreciation) on investments | | | (72,420 | ) | | | 481,275 | |
Net increase in net assets from operations | | | 394,644 | | | | 1,038,462 | |
| | | | | | | | | |
| DISTRIBUTIONS TO SHAREHOLDERS | | | | | | | | |
From net investment income | | | (464,913 | ) | | | (554,802 | ) |
| | | | | | | | | |
| FROM CAPITAL SHARE TRANSACTIONS | | | | | | | | |
Proceeds from shares sold | | | 10,825,742 | | | | 1,221,790 | |
| Net asset value of shares issued in reinvestment of distributions to shareholders | | | 386,377 | | | | 457,259 | |
Payments for shares redeemed | | | (2,595,786 | ) | | | (4,470,616 | ) |
| Net increase (decrease) in net assets from capital share transactions | | | 8,616,333 | | | | (2,791,567 | ) |
| | | | | | | | | |
| TOTAL INCREASE (DECREASE) IN NET ASSETS | | | 8,546,064 | | | | (2,307,907 | ) |
| | | | | | | | | |
| NET ASSETS | | | | | | | | |
Beginning of year | | | 24,718,582 | | | | 27,026,489 | |
End of year | | $ | 33,264,646 | | | $ | 24,718,582 | |
| | | | | | | | | |
UNDISTRIBUTED (DISTRIBUTIONS IN EXCESS OF)
NET INVESTMENT INCOME | | $ | 1,710 | | | $ | 1,628 | |
| | | | | | | | | |
| CAPITAL SHARE ACTIVITY | | | | | | | | |
Shares sold | | | 1,014,633 | | | | 114,925 | |
Shares reinvested | | | 36,212 | | | | 43,022 | |
Shares redeemed | | | (243,171 | ) | | | (420,758 | ) |
| Net increase (decrease) in shares outstanding | | | 807,674 | | | | (262,811 | ) |
Shares outstanding, beginning of year | | | 2,322,624 | | | | 2,585,435 | |
Shares outstanding, end of year | | | 3,130,298 | | | | 2,322,624 | |
| See accompanying notes to financial statements. |
THE GOVERNMENT STREET EQUITY FUND FINANCIAL HIGHLIGHTS | |
Selected Per Share Data and Ratios for a Share Outstanding Throughout Each Year | |
| | | | |
| | | | | | | | | | | | | | | |
Net asset value at beginning of year | | $ | 50.42 | | | $ | 48.00 | | | $ | 40.89 | | | $ | 26.72 | | | $ | 44.76 | |
| | | | | | | | | | | | | | | | | | | | | |
| Income (loss) from investment operations: | | | | | | | | | | | | | | | | | | | | |
Net investment income | | | 0.64 | | | | 0.47 | | | | 0.39 | | | | 0.40 | | | | 0.55 | |
Net realized and unrealized gains
(losses) on investments | | | 4.21 | | | | 2.66 | | | | 7.19 | | | | 14.17 | | | | (18.07 | ) |
Total from investment operations | | | 4.85 | | | | 3.13 | | | | 7.58 | | | | 14.57 | | | | (17.52 | ) |
| | | | | | | | | | | | | | | | | | | | | |
| Less distributions: | | | | | | | | | | | | | | | | | | | | |
Dividends from net investment income | | | (0.64 | ) | | | (0.48 | ) | | | (0.39 | ) | | | (0.40 | ) | | | (0.52 | ) |
Distributions from net realized gains | | | (1.02 | ) | | | (0.23 | ) | | | (0.08 | ) | | | — | | | | — | |
Total distributions | | | (1.66 | ) | | | (0.71 | ) | | | (0.47 | ) | | | (0.40 | ) | | | (0.52 | ) |
| | | | | | | | | | | | | | | | | | | | | |
Net asset value at end of year | | $ | 53.61 | | | $ | 50.42 | | | $ | 48.00 | | | $ | 40.89 | | | $ | 26.72 | |
| | | | | | | | | | | | | | | | | | | | | |
Total return (a) | | | 9.93% | | | | 6.67% | | | | 18.69% | | | | 54.71% | | | | (39.43% | ) |
| | | | | | | | | | | | | | | | | | | | | |
Net assets at end of year (000’s) | | $ | 81,689 | | | $ | 72,268 | | | $ | 66,373 | | | $ | 57,766 | | | $ | 37,656 | |
| | | | | | | | | | | | | | | | | | | | | |
Ratio of total expenses to average net assets | | | 0.85% | | | | 0.87% | | | | 0.88% | | | | 0.90% | | | | 0.91% | |
| | | | | | | | | | | | | | | | | | | | | |
Ratio of net investment income to
average net assets | | | 1.29% | | | | 1.01% | | | | 0.92% | | | | 1.14% | | | | 1.47% | |
| | | | | | | | | | | | | | | | | | | | | |
Portfolio turnover rate | | | 38% | | | | 36% | | | | 26% | | | | 30% | | | | 35% | |
| (a) | Total return is a measure of the change in value of an investment in the Fund over the period covered, which assumes any dividends or capital gains distributions are reinvested in shares of the Fund. Returns do not reflect the deduction of taxes a shareholder would pay on Fund distributions or the redemption of Fund shares. |
| | |
| See accompanying notes to financial statements. |
THE GOVERNMENT STREET MID-CAP FUND FINANCIAL HIGHLIGHTS | |
Selected Per Share Data and Ratios for a Share Outstanding Throughout Each Year | |
| | | | |
| | | | | | | | | | | | | | | |
Net asset value at beginning of year | | $ | 16.26 | | | $ | 15.89 | | | $ | 12.87 | | | $ | 8.46 | | | $ | 12.28 | |
| | | | | | | | | | | | | | | | | | | | | |
| Income (loss) from investment operations: | | | | | | | | | | | | | | | | | | | | |
Net investment income | | | 0.10 | | | | 0.04 | | | | 0.03 | | | | 0.05 | | | | 0.05 | |
Net realized and unrealized gains
(losses) on investments | | | 2.05 | | | | 0.37 | | | | 3.03 | | | | 4.41 | | | | (3.82 | ) |
Total from investment operations | | | 2.15 | | | | 0.41 | | | | 3.06 | | | | 4.46 | | | | (3.77 | ) |
| | | | | | | | | | | | | | | | | | | | | |
| Less distributions: | | | | | | | | | | | | | | | | | | | | |
Dividends from net investment income | | | (0.11 | ) | | | (0.04 | ) | | | (0.03 | ) | | | (0.05 | ) | | | (0.05 | ) |
In excess of net investment income | | | — | | | | — | | | | (0.01 | ) | | | — | | | | (0.00 | )(a) |
Distributions from net realized gains | | | (0.04 | ) | | | (0.00 | )(a) | | | — | | | | — | | | | (0.00 | )(a) |
Total distributions | | | (0.15 | ) | | | (0.04 | ) | | | (0.04 | ) | | | (0.05 | ) | | | (0.05 | ) |
| | | | | | | | | | | | | | | | | | | | | |
Net asset value at end of year | | $ | 18.26 | | | $ | 16.26 | | | $ | 15.89 | | | $ | 12.87 | | | $ | 8.46 | |
| | | | | | | | | | | | | | | | | | | | | |
Total return (b) | | | 13.35% | | | | 2.59% | | | | 23.80% | | | | 52.73% | | | | (30.65% | ) |
| | | | | | | | | | | | | | | | | | | | | |
Net assets at end of year (000’s) | | $ | 45,918 | | | $ | 39,843 | | | $ | 39,983 | | | $ | 32,198 | | | $ | 21,522 | |
| | | | | | | | | | | | | | | | | | | | | |
Ratio of total expenses to average net assets | | | 1.08% | | | | 1.09% | | | | 1.13% | | | | 1.18% | | | | 1.23% | |
| | | | | | | | | | | | | | | | | | | | | |
Ratio of net expenses to average net assets | | | 1.08% | | | | 1.09% | | | | 1.13% | | | | 1.13% | (c) | | | 1.10% | (c) |
| | | | | | | | | | | | | | | | | | | | | |
Ratio of net investment income to
average net assets | | | 0.63% | | | | 0.29% | | | | 0.21% | | | | 0.47% | (c) | | | 0.47% | (c) |
| | | | | | | | | | | | | | | | | | | | | |
Portfolio turnover rate | | | 12% | | | | 18% | | | | 20% | | | | 10% | | | | 14% | |
| (a) | Amount rounds to less than $0.01 per share. |
| | |
| (b) | Total return is a measure of the change in value of an investment in the Fund over the period covered, which assumes any dividends or capital gains distributions are reinvested in shares of the Fund. Returns do not reflect the deduction of taxes a shareholder would pay on Fund distributions or the redemption of Fund shares. |
| | |
| (c) | Ratios were determined after voluntary advisory fee waivers by the Adviser. |
| | |
| See accompanying notes to financial statements. |
THE ALABAMA TAX FREE BOND FUND FINANCIAL HIGHLIGHTS | |
Selected Per Share Data and Ratios for a Share Outstanding Throughout Each Year | |
| | | | |
| | | | | | | | | | | | | | | |
Net asset value at beginning of year | | $ | 10.64 | | | $ | 10.45 | | | $ | 10.53 | | | $ | 10.54 | | | $ | 10.50 | |
| | | | | | | | | | | | | | | | | | | | | |
| Income (loss) from investment operations: | | | | | | | | | | | | | | | | | | | | |
Net investment income | | | 0.18 | | | | 0.23 | | | | 0.26 | | | | 0.28 | | | | 0.35 | |
Net realized and unrealized gains
(losses) on investments | | | (0.01 | ) | | | 0.19 | | | | (0.07 | ) | | | (0.00 | )(a) | | | 0.04 | |
Total from investment operations | | | 0.17 | | | | 0.42 | | | | 0.19 | | | | 0.28 | | | | 0.39 | |
| | | | | | | | | | | | | | | | | | | | | |
| Less distributions: | | | | | | | | | | | | | | | | | | | | |
Dividends from net investment income | | | (0.18 | ) | | | (0.23 | ) | | | (0.27 | ) | | | (0.28 | ) | | | (0.35 | ) |
Distributions from net realized gains | | | — | | | | — | | | | (0.00 | )(a) | | | (0.01 | ) | | | (0.00 | )(a) |
Total distributions | | | (0.18 | ) | | | (0.23 | ) | | | (0.27 | ) | | | (0.29 | ) | | | (0.35 | ) |
| | | | | | | | | | | | | | | | | | | | | |
Net asset value at end of year | | $ | 10.63 | | | $ | 10.64 | | | $ | 10.45 | | | $ | 10.53 | | | $ | 10.54 | |
| | | | | | | | | | | | | | | | | | | | | |
Total return (b) | | | 1.64% | | | | 4.04% | | | | 1.78% | | | | 2.88% | | | | 3.80% | |
| | | | | | | | | | | | | | | | | | | | | |
Net assets at end of year (000’s) | | $ | 33,265 | | | $ | 24,719 | | | $ | 27,026 | | | $ | 29,716 | | | $ | 28,358 | |
| | | | | | | | | | | | | | | | | | | | | |
Ratio of total expenses to average net assets | | | 0.76% | | | | 0.80% | | | | 0.77% | | | | 0.75% | | | | 0.79% | |
| | | | | | | | | | | | | | | | | | | | | |
Ratio of net expenses to average net assets (c) | | | 0.65% | | | | 0.65% | | | | 0.65% | | | | 0.65% | | | | 0.65% | |
| | | | | | | | | | | | | | | | | | | | | |
Ratio of net investment income to
average net assets (c) | | | 1.70% | | | | 2.17% | | | | 2.51% | | | | 2.85% | | | | 3.36% | |
| | | | | | | | | | | | | | | | | | | | | |
Portfolio turnover rate | | | 7% | | | | 18% | | | | 21% | | | | 32% | | | | 8% | |
| (a) | Amount rounds to less than $0.01 per share. |
| | |
| (b) | Total return is a measure of the change in value of an investment in the Fund over the period covered, which assumes any dividends or capital gains distributions are reinvested in shares of the Fund. Returns do not reflect the deduction of taxes a shareholder would pay on Fund distributions or the redemption of Fund shares. |
| | |
| (c) | Ratios were determined after voluntary advisory fee waivers by the Adviser (Note 4). |
| | |
| See accompanying notes to financial statements. |
THE GOVERNMENT STREET FUNDS NOTES TO FINANCIAL STATEMENTS March 31, 2013 |
1. Organization
The Government Street Equity Fund, The Government Street Mid-Cap Fund and The Alabama Tax Free Bond Fund (the “Funds”) are each a no-load series of the Williamsburg Investment Trust (the “Trust”), an open-end management investment company registered under the Investment Company Act of 1940. The Trust was organized as a Massachusetts business trust on July 18, 1988. Other series of the Trust are not included in this report.
The Government Street Equity Fund’s investment objective is to seek capital appreciation.
The Government Street Mid-Cap Fund’s investment objective is to seek capital appreciation.
The Alabama Tax Free Bond Fund’s investment objectives are to provide current income exempt from federal income taxes and from the personal income taxes of Alabama and to preserve capital.
2. Significant Accounting Policies
The following is a summary of the Funds’ significant accounting policies. The policies are in conformity with accounting principles generally accepted in the United States of America (“GAAP”).
Securities valuation — The Funds’ portfolio securities are valued as of the close of business of the regular session of the New York Stock Exchange (normally 4:00 p.m., Eastern time). Securities traded on a national stock exchange are valued based upon the closing price on the principal exchange where the security is traded. Securities which are quoted by NASDAQ are valued at the NASDAQ Official Closing Price. Securities which are traded over-the-counter are valued at the last sales price, if available, otherwise, at the last quoted bid price. It is expected that fixed income securities will ordinarily be traded in the over-the-counter market, and common stocks will ordinarily be traded on a national securities exchange, but may also be traded in the over-the-counter market.
When market quotations are not readily available, securities may be valued on the basis of prices provided by an independent pricing service. The prices provided by the pricing service are determined with consideration given to institutional bid and last sale prices and take into account securities prices, yields, maturities, call features, ratings, institutional trading in similar groups of securities and developments related to specific securities. If a pricing service cannot provide a valuation or the investment adviser believes the price received from the pricing service is not indicative of fair value, securities will be valued in good faith at fair value using procedures established by and under the general supervision of the Board of Trustees and will be classified as Level
THE GOVERNMENT STREET FUNDS NOTES TO FINANCIAL STATEMENTS (Continued) |
2 or 3 within the fair value hierarchy (see below), depending on the inputs used. Such methods of fair valuation may include, but are not limited to: multiple of earnings, multiple of book value, discount from market of a similar freely traded security, purchase price of the security, subsequent private transactions in the security or related securities, or a combination of these and other factors. Short-term instruments (those with remaining maturities of 60 days or less) may be valued at amortized cost, which approximates market value.
GAAP establishes a single authoritative definition of fair value, sets out a framework for measuring fair value and requires additional disclosures about fair value measurements.
Various inputs are used in determining the value of each of the Fund’s investments. These inputs are summarized in the three broad levels listed below:
| • | Level 1 – quoted prices in active markets for identical securities |
| • | Level 2 – other significant observable inputs |
| • | Level 3 – significant unobservable inputs |
Fixed income securities, including municipal bonds, are classified as Level 2 since the values for such securities are based on prices provided by an independent pricing service that utilizes various “other significant observable inputs” including bid and ask quotations, prices of similar securities and interest rates, among other factors. Commercial paper held by the Funds is classified as Level 2 since it is valued at amortized cost, which approximates the current fair value of the security and is not obtained from a quoted price in an active market.
The inputs or methodology used for valuing securities are not necessarily an indication of the risks associated with investing in those securities. The inputs used to measure fair value may fall into different levels of the fair value hierarchy. In such cases, for disclosure purposes, the level in the fair value hierarchy within which the fair value measurement falls in its entirety is determined based on the lowest level input that is significant to the fair value measurement.
The following is a summary of the inputs used to value each Fund’s investments as of March 31, 2013 by security type:
The Government Street Equity Fund: | | | | | | | | | | | | |
Common Stocks | | $ | 69,828,843 | | | $ | — | | | $ | — | | | $ | 69,828,843 | |
Exchange-Traded Funds | | | 7,053,333 | | | | — | | | | — | | | | 7,053,333 | |
Exchange-Traded Notes | | | 2,364,960 | | | | — | | | | — | | | | 2,364,960 | |
Warrants | | | 12,160 | | | | — | | | | — | | | | 12,160 | |
Commercial Paper | | | — | | | | 2,469,000 | | | | — | | | | 2,469,000 | |
Money Market Funds | | | 940 | | | | — | | | | — | | | | 940 | |
Total | | $ | 79,260,236 | | | $ | 2,469,000 | | | $ | — | | | $ | 81,729,236 | |
THE GOVERNMENT STREET FUNDS NOTES TO FINANCIAL STATEMENTS (Continued) |
The Government Street Mid-Cap Fund: | | | | | | | | | | | | |
Common Stocks | | $ | 37,440,604 | | | $ | — | | | $ | — | | | $ | 37,440,604 | |
Exchange-Traded Funds | | | 5,382,724 | | | | — | | | | — | | | | 5,382,724 | |
Exchange-Traded Notes | | | 1,227,960 | | | | — | | | | — | | | | 1,227,960 | |
Commercial Paper | | | — | | | | 1,867,000 | | | | — | | | | 1,867,000 | |
Money Market Funds | | | 293 | | | | — | | | | — | | | | 293 | |
Total | | $ | 44,051,581 | | | $ | 1,867,000 | | | $ | — | | | $ | 45,918,581 | |
The Alabama Tax Free Bond Fund: | | | | | | | | | | | | |
Municipal Bonds | | $ | — | | | $ | 31,241,219 | | | $ | — | | | $ | 31,241,219 | |
Money Market Funds | | | 2,028,197 | | | | — | | | | — | | | | 2,028,197 | |
Total | | $ | 2,028,197 | | | $ | 31,241,219 | | | $ | — | | | $ | 33,269,416 | |
Refer to The Government Street Equity Fund’s and The Government Street Mid-Cap Fund’s Schedules of Investments for a listing of the common stocks valued by sector type. As of March 31, 2013, the Funds did not have any transfers in and out of any Level. There were no Level 3 securities or derivative instruments held in the Funds as of March 31, 2013. It is the Funds’ policy to recognize transfers into and out of any Level at the end of the reporting period.
Share valuation — The net asset value per share of each Fund is calculated daily by dividing the total value of its assets, less liabilities, by the number of shares outstanding. The offering price and redemption price per share of each Fund is equal to the net asset value per share.
Investment income — Interest income is accrued as earned. Dividend income is recorded on the ex-dividend date. Discounts and premiums on fixed-income securities purchased are amortized using the interest method.
Repurchase agreements — The Funds may enter into repurchase agreements. A repurchase agreement, which is collateralized by U.S. Government obligations, is valued at cost which, together with accrued interest, approximates market value. At the time a Fund enters into a repurchase agreement, the seller agrees that the value of the underlying securities, including accrued interest, will at all times be equal to or exceed the face amount of the repurchase agreement. In addition, the Funds actively monitor and seek additional collateral, as needed. If the seller defaults, the fair value of the collateral may decline and realization of the collateral by the Funds may be delayed or limited. The Funds did not enter into any repurchase agreements during the year ended March 31, 2013.
THE GOVERNMENT STREET FUNDS NOTES TO FINANCIAL STATEMENTS (Continued) |
Distributions to shareholders — Dividends arising from net investment income are declared and paid quarterly to shareholders of The Government Street Equity Fund; declared and paid annually to shareholders of The Government Street Mid-Cap Fund; and declared daily and paid monthly to shareholders of The Alabama Tax Free Bond Fund. Net realized short-term capital gains, if any, may be distributed throughout the year and net realized long-term capital gains, if any, are distributed at least once each year. The amount of distributions from net investment income and net realized gains are determined in accordance with federal income tax regulations, which may differ from GAAP. These “book/tax” differences are either temporary or permanent in nature.
The tax character of distributions paid during the years ended March 31, 2013 and March 31, 2012 is as follows:
| | | | | | | | | | | | | |
| The Government Street Equity Fund | 3/31/13 | | $ | 1,017,044 | | | $ | — | | | $ | 1,478,714 | | | $ | 2,495,758 | |
| | 3/31/12 | | $ | 971,155 | | | $ | — | | | $ | — | | | $ | 971,155 | |
| The Government Street Mid-Cap Fund | 3/31/13 | | $ | 267,235 | | | $ | — | | | $ | 107,026 | | | $ | 374,261 | |
| | 3/31/12 | | $ | 85,163 | | | $ | — | | | $ | 6,083 | | | $ | 91,246 | |
| The Alabama Tax Free Bond Fund | 3/31/13 | | $ | 1,252 | | | $ | 463,661 | | | $ | — | | | $ | 464,913 | |
| | 3/31/12 | | $ | — | | | $ | 554,802 | | | $ | — | | | $ | 554,802 | |
Security transactions — Security transactions are accounted for on trade date for financial reporting purposes. Gains and losses on securities sold are determined on a specific identification basis.
Common expenses — Common expenses of the Trust are allocated among the series of the Trust based on relative net assets of each series or the nature of the services performed and the relative applicability to each series.
Estimates — The preparation of financial statements in conformity with GAAP requires management to make estimates and assumptions that affect the reported amounts of assets and liabilities and the disclosure of contingent assets and liabilities as of the date of the financial statements and the reported amounts of income and expenses during the reporting period. Actual results could differ from those estimates.
Federal income tax — It is each Fund’s policy to comply with the special provisions of Subchapter M of the Internal Revenue Code applicable to regulated investment companies. As provided therein, in any fiscal year in which a Fund so qualifies, and distributes at least 90% of its taxable net income, the Fund (but not the shareholders) will be relieved of federal income tax on the income distributed. Accordingly, no provision for income taxes has been made.
THE GOVERNMENT STREET FUNDS NOTES TO FINANCIAL STATEMENTS (Continued) |
In order to avoid imposition of the excise tax applicable to regulated investment companies, it is also each Fund’s intention to declare as dividends in each calendar year at least 98% of its net investment income (earned during the calendar year) and 98.2% of its net realized capital gains (earned during the twelve months ended October 31) plus undistributed amounts from prior years.
The following information is computed on a tax basis for each item as of March 31, 2013:
| | The Government Street Equity Fund | | | The Government Street Mid-Cap Fund | | | The Alabama Tax Free Bond Fund | |
Cost of portfolio investments | | $ | 52,573,179 | | | $ | 29,218,658 | | | $ | 32,380,255 | |
Gross unrealized appreciation | | $ | 29,740,671 | | | $ | 17,190,706 | | | $ | 938,282 | |
Gross unrealized depreciation | | | (584,614 | ) | | | (490,783 | ) | | | (49,121 | ) |
Net unrealized appreciation | | | 29,156,057 | | | | 16,699,923 | | | | 889,161 | |
Undistributed ordinary income | | | 6,474 | | | | — | | | | 1,238 | |
Undistributed tax exempt income | | | — | | | | — | | | | 5,880 | |
Undistributed long-term gains | | | 6,284 | | | | 43,960 | | | | — | |
Capital loss carryforwards | | | — | | | | — | | | | (40,120 | ) |
Qualified late-year losses | | | — | | | | — | | | | (9,733 | ) |
Other temporary differences | | | (8,790 | ) | | | — | | | | (5,408 | ) |
Total distributable earnings | | $ | 29,160,025 | | | $ | 16,743,883 | | | $ | 841,018 | |
The difference between the federal income tax cost and the financial statement cost for The Government Street Mid-Cap Fund is due to certain timing differences in the recognition of capital gains and losses under income tax regulations and GAAP. These timing differences are temporary in nature and are due to adjustments to basis on public traded partnerships.
As of March 31, 2013, The Alabama Tax Free Bond Fund had a short-term capital loss carryforward for federal income tax purposes of $23,075 and a long-term capital loss carryforward for federal income tax purposes of $17,045, both of which may be carried forward indefinitely. The Fund also had net realized losses of $9,733 during the period November 1, 2012 through March 31, 2013 (“post-October losses”), which are treated for federal income tax purposes as arising during the Fund’s tax year ending March 31, 2014. These capital loss carryforwards and post-October losses are available to offset realized capital gains in future years, thereby reducing future taxable gains distributions.
During the year ended March 31, 2013, The Government Street Equity Fund and The Government Street Mid-Cap Fund realized $3,319,533 and $1,118,636, respectively, of net capital gains resulting from in-kind redemptions (redemptions in which shareholders who redeemed Fund shares received securities held by the Fund
THE GOVERNMENT STREET FUNDS NOTES TO FINANCIAL STATEMENTS (Continued) |
rather than cash). The Funds recognize a gain on in-kind redemptions to the extent that the value of the distributed securities on the date of redemption exceeds the cost of those securities. Such gains are not taxable to the Funds and are not required to be distributed to shareholders. The Funds have reclassified these amounts against paid-in capital. These reclassifications are reflected on the Statements of Assets and Liabilities. Such reclassifications, the result of permanent differences between the financial statement and income tax reporting requirements, had no effect on each Fund’s net assets or net asset value per share.
For the year ended March 31, 2013, The Alabama Tax Free Bond Fund reclassified $439 of undistributed net investment income against accumulated net realized losses from security transactions and The Government Street Mid-Cap Fund reclassified $18 of undistributed net investment income against paid-in capital on the Statements of Assets and Liabilities. Such reclassifications, the result of permanent differences between the financial statement and income tax reporting requirements, had no effect on the Funds’ net assets or net asset value per share.
The Funds recognize the tax benefits or expenses of uncertain tax positions only when the position is “more likely than not” to be sustained assuming examination by tax authorities. Management has reviewed the tax positions taken on federal income tax returns for all open tax years (tax years ended March 31, 2010 through March 31, 2013) of each Fund and has concluded that no provision for unrecognized tax benefits or expenses is required in these financial statements.
3. Investment Transactions
During the year ended March 31, 2013, cost of purchases and proceeds from sales and maturities of investment securities, other than short-term investments and U.S. government securities, totaled $28,950,820 and $27,682,116, respectively, for The Government Street Equity Fund; $4,908,985 and $5,488,894, respectively, for The Government Street Mid-Cap Fund; and $9,501,596 and $1,783,400, respectively, for The Alabama Tax Free Bond Fund.
4. Transactions with Related Parties
INVESTMENT ADVISORY AGREEMENT
The Funds’ investments are managed by Leavell Investment Management, Inc. (the “Adviser”) under the terms of an Investment Advisory Agreement. The Government Street Equity Fund pays the Adviser a fee, which is computed and accrued daily and paid monthly, at an annual rate of .60% of its average daily net assets up to $100 million and .50% of such assets in excess of $100 million. The Government Street Mid-Cap Fund pays the Adviser a fee, which is computed and accrued daily and paid monthly, at an annual rate of .75% of its average daily net assets. The Alabama Tax
THE GOVERNMENT STREET FUNDS NOTES TO FINANCIAL STATEMENTS (Continued) |
Free Bond Fund pays the Adviser a fee, which is computed and accrued daily and paid monthly, at an annual rate of .35% of its average daily net assets up to $100 million and .25% of such assets in excess of $100 million.
During the year ended March 31, 2013, the Adviser voluntarily undertook to limit the total operating expenses of The Alabama Tax Free Bond Fund to .65% of the Fund’s average daily net assets. Accordingly, the Adviser waived $31,299 of its investment advisory fees from The Alabama Tax Free Bond Fund during the year ended March 31, 2013.
Certain officers of the Trust are also officers of the Adviser.
MUTUAL FUND SERVICES AGREEMENT
Under the terms of a Mutual Fund Services Agreement between the Trust and Ultimus Fund Solutions, LLC (“Ultimus”), Ultimus provides administrative, pricing, accounting, dividend disbursing, shareholder servicing and transfer agent services for the Funds. For these services, Ultimus receives a monthly fee from each Fund at an annual rate of .15% of the Fund’s average daily net assets up to $25 million, .125% of the next $25 million of such assets, and .10% of such assets in excess of $50 million. The Government Street Equity Fund and The Government Street Mid-Cap Fund are each subject to a minimum monthly fee of $4,500 and The Alabama Tax Free Bond Fund is subject to a minimum monthly fee of $4,000. Prior to December 31, 2012, the minimum monthly fee for The Government Street Equity Fund and The Government Street Mid-Cap Fund was $4,000 and the minimum monthly fee for The Alabama Tax Free Bond Fund was $3,500. In addition, each Fund pays out-of-pocket expenses including, but not limited to, postage, supplies and costs of pricing portfolio securities.
Certain officers of the Trust are also officers of Ultimus, or of Ultimus Fund Distributors, LLC (the “Distributor”), the principal underwriter of each Fund’s shares and an affiliate of Ultimus. The Distributor is compensated by the Adviser (not the Funds) for acting as principal underwriter.
COMPLIANCE CONSULTING AGREEMENT
Under the terms of a Compliance Consulting Agreement between the Trust and Ultimus, Ultimus provides an individual to serve as the Trust’s Chief Compliance Officer and to administer the Funds’ compliance policies and procedures. For these services, the Funds pay Ultimus an annual base fee of $18,600 plus an asset-based fee equal to 0.01% per annum on the Funds’ aggregate net assets in excess of $100 million. In addition, the Funds reimburse Ultimus for reasonable out-of-pocket expenses, if any, incurred in connection with these services.
COMPENSATION OF TRUSTEES
Trustees and officers affiliated with the Adviser or Ultimus are not compensated by the Trust for their services. Each Trustee who is not an affiliated person of the Adviser or Ultimus receives from the Trust an annual retainer of $8,000, payable quarterly; a fee of $1,500 for attendance at each meeting of the Board of Trustees (except that such
THE GOVERNMENT STREET FUNDS NOTES TO FINANCIAL STATEMENTS (Continued) |
fee is $2,500 for the independent chairman); and $1,000 for attendance at each meeting for any committee of the Board (except that such fee is $1,500 for the committee chairman); plus reimbursement of travel and other expenses incurred in attending meetings.
5. Contingencies and Commitments
The Funds indemnify the Trust’s officers and Trustees for certain liabilities that might arise from their performance of their duties to the Funds. Additionally, in the normal course of business the Funds enter into contracts that contain a variety of representations and warranties and which provide general indemnifications. The Funds’ maximum exposure under these arrangements is unknown, as this would involve future claims that may be made against the Funds that have not yet occurred. However, based on experience, the Funds expect the risk of loss to be remote.
6. Concentration of Credit Risk
The Alabama Tax Free Bond Fund invests primarily in debt instruments of municipal issuers in the state of Alabama. The issuers’ abilities to meet their obligations may be affected by economic developments in the state or its region, as well as disruptions in the credit markets and the economy, generally.
7. Subsequent Events
The Funds are required to recognize in the financial statements the effects of all subsequent events that provide additional evidence about conditions that existed as of the date of the Statements of Assets and Liabilities. For non-recognized subsequent events that must be disclosed to keep the financial statements from being misleading, the Funds are required to disclose the nature of the event as well as an estimate of its financial effect, or a statement that such an estimate cannot be made. Management has evaluated subsequent events through the issuance of these financial statements and has noted no such events.
THE GOVERNMENT STREET FUNDS REPORT OF INDEPENDENT REGISTERED PUBLIC ACCOUNTING FIRM |
The Board of Trustees and Shareholders of
The Government Street Equity Fund,
The Government Street Mid-Cap Fund, and
The Alabama Tax-Free Bond Fund of the Williamsburg Investment Trust
We have audited the accompanying statements of assets and liabilities of The Government Street Equity Fund, The Government Street Mid-Cap Fund, and The Alabama Tax-Free Bond Fund (the “Funds”) (each a series of the Williamsburg Investment Trust), including the schedules of investments, as of March 31, 2013, and the related statements of operations for the year then ended, the statements of changes in net assets for each of the two years in the period then ended, and the financial highlights for each of the five years in the period then ended. These financial statements and financial highlights are the responsibility of the Funds’ management. Our responsibility is to express an opinion on these financial statements and financial highlights based on our audits.
We conducted our audits in accordance with the standards of the Public Company Accounting Oversight Board (United States). Those standards require that we plan and perform the audits to obtain reasonable assurance about whether the financial statements and financial highlights are free of material misstatement. We were not engaged to perform an audit of the Funds’ internal control over financial reporting. Our audits included consideration of internal control over financial reporting as a basis for designing audit procedures that are appropriate in the circumstances, but not for the purpose of expressing an opinion on the effectiveness of the Funds’ internal control over financial reporting. Accordingly, we express no such opinion. An audit also includes examining, on a test basis, evidence supporting the amounts and disclosures in the financial statements and financial highlights, assessing the accounting principles used and significant estimates made by management, and evaluating the overall financial statement presentation. Our procedures included confirmation of securities owned as of March 31, 2013, by correspondence with the custodian and brokers. We believe that our audits provide a reasonable basis for our opinion.
In our opinion, the financial statements and financial highlights referred to above present fairly, in all material respects, the financial position of each of the respective Funds comprising Williamsburg Investment Trust at March 31, 2013, the results of their operations for the year then ended, the changes in their net assets for each of the two years in the period then ended, and the financial highlights for each of the five years in the period then ended, in conformity with U.S. generally accepted accounting principles.
Cincinnati,Ohio
May 24, 2013
THE GOVERNMENT STREET FUNDS ABOUT YOUR FUNDS’ EXPENSES (Unaudited) |
We believe it is important for you to understand the impact of costs on your investment. All mutual funds have operating expenses. As a shareholder of the Funds, you incur ongoing costs, including management fees and other expenses. These ongoing costs, which are deducted from each Fund’s gross income, directly reduce the investment returns of the Funds.
A mutual fund’s ongoing costs are expressed as a percentage of its average net assets. This figure is known as the expense ratio. The following examples are intended to help you understand the ongoing costs (in dollars) of investing in the Funds and to compare these costs with the ongoing costs of investing in other mutual funds. The examples below are based on an investment of $1,000 made at the beginning of the period shown and held for the entire period (October 1, 2012 through March 31, 2013).
The table below illustrates each Fund’s ongoing costs in two ways:
Actual fund return – This section helps you to estimate the actual expenses that you paid over the period. The “Ending Account Value” shown is derived from each Fund’s actual return, and the third column shows the dollar amount of operating expenses that would have been paid by an investor who started with $1,000 in the Funds. You may use the information here, together with the amount you invested, to estimate the expenses that you paid over the period.
To do so, simply divide your account value by $1,000 (for example, an $8,600 account value divided by $1,000 = 8.6), then multiply the result by the number given for the Funds under the heading “Expenses Paid During Period.”
Hypothetical 5% return – This section is intended to help you compare the Funds’ ongoing costs with those of other mutual funds. It assumes that each Fund had an annual return of 5% before expenses during the period shown, but that the expense ratio is unchanged. In this case, because the returns used are not the Funds’ actual returns, the results do not apply to your investment. The example is useful in making comparisons because the Securities and Exchange Commission (the “SEC”) requires all mutual funds to calculate expenses based on a 5% return. You can assess each Fund’s ongoing costs by comparing this hypothetical example with the hypothetical examples that appear in shareholder reports of other funds.
Note that expenses shown in the table are meant to highlight and help you compare ongoing costs only. The Funds do not charge sales loads or redemption fees.
The calculations assume no shares were bought or sold during the period. Your actual costs may have been higher or lower, depending on the amount of your investment and the timing of any purchases or redemptions.
THE GOVERNMENT STREET FUNDS ABOUT YOUR FUNDS’ EXPENSES (Unaudited) (Continued) |
More information about the Funds’ expenses, including historical expense ratios, can be found in this report. For additional information on operating expenses and other shareholder costs, please refer to the Funds’ prospectus.
| | Beginning Account Value October 1, 2012 | Ending Account Value March 31, 2013 | Expenses Paid During Period* |
The Government Street Equity Fund |
Based on Actual Fund Return | $1,000.00 | $1,085.20 | $4.42 |
| Based on Hypothetical 5% Return (before expenses) | $1,000.00 | $1,020.69 | $4.28 |
The Government Street Mid-Cap Fund |
| Based on Actual Fund Return | $1,000.00 | $1,139.70 | $5.76 |
| Based on Hypothetical 5% Return (before expenses) | $1,000.00 | $1,019.55 | $5.44 |
The Alabama Tax Free Bond Fund |
| Based on Actual Fund Return | $1,000.00 | $1,001.20 | $3.24 |
| Based on Hypothetical 5% Return (before expenses) | $1,000.00 | $1,021.69 | $3.28 |
| * | Expenses are equal to the Funds’ annualized expense ratios for the period as stated below, multiplied by the average account value over the period, multiplied by 182/365 (to reflect the one-half year period). |
| The Government Street Equity Fund | 0.85% |
| The Government Street Mid-Cap Fund | 1.08% |
| The Alabama Tax Free Bond Fund | 0.65% |
THE GOVERNMENT STREET FUNDS BOARD OF TRUSTEES AND EXECUTIVE OFFICERS (Unaudited) |
Overall responsibility for management of the Funds rests with the Board of Trustees. The Trustees serve during the lifetime of the Trust and until its termination, or until death, resignation, retirement or removal. The Trustees, in turn, elect the officers of the Funds. The officers have been elected for an annual term. The following are the Trustees and executive officers of the Funds:
| Trustee | Address | Year of Birth | Position Held with the Trust | Length of Time Served |
| | Robert S. Harris | 100 Darden Boulevard Charlottesville, VA | 1949 | Chairman and Trustee | Since January 2007 |
| * | John P. Ackerly, IV | One James Center 901 E. Cary Street Richmond, VA | 1963 | Trustee | Since July 2012 |
| * | John T. Bruce | 800 Main Street Lynchburg, VA | 1953 | Trustee | Since September 1988 |
| | J. Finley Lee, Jr. | 448 Pond Apple Drive North Naples, FL | 1939 | Trustee | Since September 1988 |
| | Richard L. Morrill | University of Richmond Richmond, VA | 1939 | Trustee | Since March 1993 |
| | Harris V. Morrissette | 100 Jacintoport Boulevard Saraland, AL | 1959 | Trustee | Since March 1993 |
| | Thomas W. Leavell | P.O. Box 1307 Mobile, AL | 1943 | President | Since February 2004 |
| | Mary Shannon Hope | P.O. Box 1307 Mobile, AL | 1963 | Vice President | Since August 2008 |
| | Timothy S. Healey | 2712 18th Place South Birmingham, AL | 1953 | Vice President of The Government Street Mid-Cap Fund and The Alabama Tax Free Bond Fund | Since January 1995 |
| | Robert G. Dorsey | 225 Pictoria Drive, Suite 450 Cincinnati, OH | 1957 | Vice President | Since November 2000 |
| | Mark J. Seger | 225 Pictoria Drive, Suite 450 Cincinnati, OH | 1962 | Treasurer | Since November 2000 |
| | Tina H. Bloom | 225 Pictoria Drive, Suite 450 Cincinnati, OH | 1968 | Secretary and Chief Compliance Officer | Since August 2006 |
| * | Messrs. Ackerly and Bruce, as affiliated persons of investment advisers to the Trust, are “interested persons” of the Trust within the meaning of Section 2(a)(19) of the Investment Company Act of 1940. |
THE GOVERNMENT STREET FUNDS BOARD OF TRUSTEES AND EXECUTIVE OFFICERS (Unaudited) (Continued) |
Each Trustee oversees eleven portfolios of the Trust, including the Funds. The principal occupations of the Trustees and executive officers of the Funds during the past five years and public directorships held by the Trustees are set forth below:
Robert S. Harris is the C. Stewart Sheppard Professor of Business Administration at The Darden Graduate School of Business Administration at the University of Virginia. He was previously the dean at Darden. Professor Harris has published widely on corporate finance, financial markets and mergers and acquisitions and has served as a consultant to corporations and government agencies.
John P. Ackerly, IV, is Senior Vice President and Portfolio Manager of Davenport & Company, LLC, (an investment advisory firm).
John T. Bruce is a President, Director and member of the Executive Committee of Flippin, Bruce & Porter, Inc. (an investment advisory firm).
J. Finley Lee, Jr. is the retired Julian Price Professor Emeritus at the University of North Carolina.
Richard L. Morrill serves as President of the Teagle Foundation (charitable foundation) and Chancellor of the University of Richmond. He is also a member of the Board of Directors of Tredegar Corporation (a plastics manufacturer).
Harris V. Morrissette is President of China Doll Rice and Beans Inc. and Dixie Lily Foods. He is a member of the Board of Directors of BancTrust Financial Group, Inc. (a bank holding company) and International Shipholding Corporation (cargo transportation).
Thomas W. Leavell is a President and Chief Executive Officer of the Adviser.
Mary Shannon Hope is a Vice President and Portfolio Manager of the Adviser.
Timothy S. Healey is an Executive Vice President and Chief Investment Officer of the Adviser.
Robert G. Dorsey is a Managing Director of Ultimus Fund Solutions, LLC and Ultimus Fund Distributors, LLC.
Mark J. Seger is a Managing Director of Ultimus Fund Solutions, LLC and Ultimus Fund Distributors, LLC.
Tina H. Bloom is Director of Fund Administration of Ultimus Fund Solutions, LLC.
THE GOVERNMENT STREET FUNDS OTHER INFORMATION (Unaudited) |
A description of the policies and procedures that the Funds use to vote proxies relating to portfolio securities is available without charge upon request by calling toll-free 1-866-738-1125, or on the SEC’s website at http://www.sec.gov. Information regarding how the Funds voted proxies relating to portfolio securities during the most recent 12-month period ended June 30 is also available without charge upon request by calling toll-free 1-866-738-1125 or on the SEC’s website at http://www.sec.gov.
The Trust files a complete listing of portfolio holdings for the Funds with the SEC as of the end of the first and third quarters of each fiscal year on Form N-Q. The filings are available upon request, by calling 1-866-738-1125. Furthermore, you may obtain a copy of these filings on the SEC’s website at http://www.sec.gov. The Trust’s Forms N-Q may also be reviewed and copied at the SEC’s Public Reference Room in Washington, DC, and information on the operation of the Public Reference Room may be obtained by calling 1-800-SEC-0330.
FEDERAL TAX INFORMATION (Unaudited)
In accordance with federal tax requirements, the following provides shareholders with information concerning distributions from ordinary income and net realized gains made by the Funds during the fiscal year ended March 31, 2013. Certain dividends paid by the Funds may be subject to a maximum tax rate of 15%, as provided by the Jobs and Growth Tax Relief Reconciliation Act of 2003. The Government Street Equity Fund and The Government Street Mid-Cap Fund intend to designate up to a maximum amount of $1,017,044 and $267,235, respectively, as taxed at a maximum rate of 15%. Additionally, The Government Street Equity Fund and The Government Street Mid-Cap Fund intend to designate up to a maximum amount of $1,478,714 and $107,026, respectively, as a long-term gain distribution. For the fiscal year ended March 31, 2013, 100% of the dividends paid from ordinary income by The Government Street Equity Fund and The Government Street Mid-Cap Fund qualified for the dividends received deduction for corporations.
As required by federal regulations, complete information will be computed and reported in conjunction with your 2013 Form 1099-DIV.
THE GOVERNMENT STREET FUNDS
DISCLOSURE REGARDING APPROVAL OF
INVESTMENT ADVISORY AGREEMENTS (Unaudited)
At an in-person meeting held on February 26, 2013, the Board of Trustees, including a majority of the Independent Trustees, approved the continuance for a one-year period of the Investment Advisory Agreements with the Adviser on behalf of The Government Street Equity Fund, The Government Street Mid-Cap Fund and The Alabama Tax Free Bond Fund. Below is a discussion of the factors considered by the Board of Trustees along with the conclusions with respect thereto that formed the basis for the Board’s approvals.
In selecting the Adviser and approving the continuance of the Investment Advisory Agreements, the Trustees considered all information they deemed reasonably necessary to evaluate the terms of the Agreements. The principal areas of review by the Trustees were the nature, extent and quality of the services provided by the Adviser and the reasonableness of the fees charged for those services. These matters were considered by the Independent Trustees consulting with experienced counsel for the Independent Trustees, who is independent of the Adviser.
The Trustees’ evaluation of the quality of the Adviser’s services took into account their knowledge and experience gained through meetings with and reports of the Adviser’s senior management over the course of the preceding year. Both short-term and long-term investment performance of the Funds was considered. Each Fund’s performance was compared to its performance benchmark and to that of competitive funds with similar investment objectives. The Trustees also considered the scope and quality of the in-house capabilities of the Adviser and other resources dedicated to performing services for the Funds. The quality of administrative and other services, including the Adviser’s role in coordinating the activities of the Funds’ other service providers, were considered in light of the Funds’ compliance with investment policies and applicable laws and regulations and of related reports by management and the Funds’ independent public accounting firm in periodic meetings with the Trust’s Audit Committee. The Trustees also considered the business reputation of the Adviser, the qualifications of its key investment and compliance personnel, and its financial resources.
In reviewing the fees payable under the Investment Advisory Agreements, the Trustees compared the advisory fees and overall expense levels of each Fund with those of competitive funds with similar investment objectives. The Trustees considered information provided by the Adviser concerning the Adviser’s profitability with respect to each Fund, including the assumptions and methodology used in preparing the profitability information, in light of applicable case law relating to advisory fees. For these purposes, the Trustees took into account not only the fees paid by the Funds, but also so-called “fallout” benefits to the Adviser. The Trustees also considered the Adviser’s representations that all of the Funds’ portfolio trades were executed based on the best price and execution available, and that the Adviser does not participate in any soft dollar or directed brokerage arrangements. The Trustees further considered
THE GOVERNMENT STREET FUNDS DISCLOSURE REGARDING APPROVAL OF INVESTMENT ADVISORY AGREEMENTS (Unaudited) (Continued) |
that the Adviser does not participate in any revenue sharing arrangements relating to the Funds. In evaluating the Funds’ advisory fees, the Trustees took into account the complexity and quality of the investment management of the Funds.
Based upon their review of this information, the Independent Trustees concluded that: (i) based upon the performance of The Government Street Equity Fund and The Government Street Mid-Cap Fund during 2012, as well as their longer term performance, the Adviser has provided quality services to those Funds; (ii) although the short-term and long-term performance of The Alabama Tax Free Bond Fund has lagged its benchmark index and the average returns for comparably managed funds, such Fund is managed in a conservative investment style and has satisfactorily met the goal of providing tax-exempt income with limited exposure to credit and maturity risks; (iii) the investment advisory fees payable to the Adviser by each Fund are competitive with similarly managed funds, and the Independent Trustees believe the fees to be reasonable given the scope and quality of investment advisory services provided by the Adviser and other services provided to shareholders; (iv) the total operating expense ratio of each Fund is less than the average expense ratio for comparably managed funds, according to statistics derived from Morningstar, Inc.; (v) the Adviser’s voluntary commitment to cap overall operating expenses of The Alabama Tax Free Bond Fund through advisory fee waivers has enabled that Fund to further increase returns for shareholders; and (vi) the level of the Adviser’s profitability with respect to its management of the Funds is reasonable. Given the current size of the Funds and their expected growth, the Independent Trustees did not believe that at the present time it would be relevant to consider the extent to which economies of scale would be realized as the Funds grow, and whether fee levels reflect these economies of scale. The Independent Trustees also considered the “fallout” benefits to, and the profitability of, the Adviser with respect to the Funds, but given the amounts involved viewed these as secondary factors in connection with the evaluation of the reasonableness of the advisory fees paid by the Funds.
No single factor was considered in isolation or to be determinative to the decision of the Trustees to approve continuance of the Investment Advisory Agreements. Rather the Trustees concluded, in light of a weighing and balancing of all factors considered, that it was in the best interests of each Fund and its shareholders to continue its Investment Advisory Agreement without modification to its terms, including the fees charged for services thereunder.
| | | | | | | | |
| | | | | | | | | |
| | | | | | | | | |
| | | | | The Government Street Funds | | | | |
| | | | | | | | | |
| | | | | Investment Adviser Leavell Investment Management, Inc. Post Office Box 1307 Mobile, AL 36633
Administrator Ultimus Fund Solutions, LLC P.O. Box 46707 Cincinnati, OH 45246-0707 1-866-738-1125
Legal Counsel Sullivan & Worcester LLP One Post Office Square Boston, MA 02109
Independent Registered Public Accounting Firm Ernst & Young LLP 1900 Scripps Center 312 Walnut Street Cincinnati, OH 45202
Board of Trustees John P. Ackerly, IV John T. Bruce Robert S. Harris J. Finley Lee, Jr. Richard L. Morrill Harris V. Morrissette
Portfolio Managers Thomas W. Leavell, The Government Street Equity Fund The Government Street Mid-Cap Fund Timothy S. Healey, The Government Street Mid-Cap Fund The Alabama Tax Free Bond Fund Richard E. Anthony, Jr., CFA, The Government Street Mid-Cap Fund Michael J. Hofto, CFA, The Government Street Mid-Cap Fund | | | | |
| | | | | | | | | |
| | | | | | | | | |
| | | | | | | | |
| | | | | | | | |
| | | | | | | | | |
| | | | | | | | | |
| | | | | THE JAMESTOWN FUNDS
No-Load Funds
The Jamestown Balanced Fund The Jamestown Equity Fund The Jamestown Tax Exempt Virginia Fund
ANNUAL REPORT
March 31, 2013
Investment Adviser Lowe, Brockenbrough & Company, Inc. Richmond, Virginia | | | | |
| | | | | | | | | |
| | | | | | | | | |
| | | | | | | | |
The Jamestown Balanced Fund
For the fiscal year ended March 31, 2013, The Jamestown Balanced Fund returned 8.68% compared to 13.96% for the S&P 500 Index and 9.83% for a blend of 60% S&P 500 Index and 40% Barclays Intermediate U.S. Government/Credit Index. The primary drag on performance was our allocation decision to hold higher than normal levels of cash maintained as a hedge against the uncertainty of the global macroeconomic environment and the unattractive level of current interest rates in the United States.
In the equity portion of the Fund, sector selection was negative due to the cash holdings. Sector selection outside of the cash was slightly negative as our underweight in some of the defensive sectors of the market, such as Telecommunication Services and Utilities, was a drag on performance. This was partially offset by the correct decision to be underweight the Materials sector, which came under pressure as concerns about commodity prices and global growth weighed on the sector. At the end of the fiscal year, the Fund was overweight the Health Care, Energy, and Consumer Discretionary sectors, and underweight Financials, Utilities, Telecommunication Services, and Materials. While the outperformance of more cyclical sectors of the market will likely require modestly stronger global economic growth, the cyclical sectors of the market are cheaper relative to the more defensive sectors than they have been in the past 15 years.
Equity selection in the Fund was in line with the S&P 500 over the trailing twelve months. Strong selection in Consumer Staples and Industrials was offset by weaker selection in the Information Technology and Financials sectors. The best performing stocks in the Fund for the year were Ryder System, Marathon Petroleum, Kroger, Thermo Fisher, and Comcast. The worst performing stocks were Apple, Intel, EMC, Apache, and Microsoft.
We currently expect global economic growth to remain positive, but modest, as better growth in the U.S. offsets continued weakness across most of the European economies. Economic growth in China has slowed as leaders there try to achieve a better balance between domestic consumption and infrastructure spending that has led the way over the past two decades. Inflation has been running below expectations across the globe, leaving plenty of room for global Central Banks to maintain very accommodative monetary policies. Recently, the Bank of Japan has joined other Central Banks in adopting very accommodative policies, causing their currency to fall and their equity markets to improve. These policies are likely to cause interest rates to stay below fair value until economic growth accelerates or some of the more accommodative policies are scaled back.
Absent an unlikely near-term rise in interest rates, we do not feel that investors are being compensated for taking on significant interest rate exposure by owning longer maturity fixed income securities. As a result, the bond portion of the Fund continues to have lower duration than the Barclays Intermediate U.S. Government/Credit Index. Given the extra yield and strong corporate balance sheets, we continue to maintain an overweight in corporate bonds funded by our underweight in Treasury securities.
As of March 31, 2013 the Fund had 11.6% in cash equivalents, 22.4% in fixed income, and 66.0% in equities.
The Jamestown Equity Fund
For the fiscal year ended March 31, 2013, The Jamestown Equity Fund returned 11.84% compared to 13.96% for the S&P 500 Index. The primary drag on performance was our allocation decision to hold higher than normal levels of cash maintained as a hedge against the uncertainty of the global macroeconomic environment.
Sector selection was negative due to the cash holdings. In addition, sector selection outside of the cash was slightly negative as our underweight in some of the defensive sectors of the market, such as Telecommunication Services and Utilities, was a drag on performance. This was partially offset by the correct decision to be underweight the Materials sector, which came under pressure as concerns about commodity prices and global growth weighed on the sector. At the end of the fiscal year, the Fund was overweight the Health Care, Energy, and Consumer Discretionary sectors, and underweight Financials, Utilities, Telecommunication Services, and Materials. While the outperformance of more cyclical sectors of the market will likely require modestly stronger global economic growth, the cyclical sectors of the market are cheaper relative to the more defensive sectors than they have been in the past 15 years.
Equity selection in the Fund was in line with the S&P 500 over the trailing twelve months. Strong selection in Consumer Staples and Industrials was offset by weaker selection in the Information Technology and Financials sectors. The best performing stocks in the Fund for the year were Ryder System, Marathon Petroleum, Kroger, Thermo Fisher, and Comcast. The worst performing stocks were Apple, Intel, EMC, Apache, and Microsoft.
We currently expect global economic growth to remain positive, but modest, as better growth in the U.S. offsets continued weakness across most of the European economies. Economic growth in China has slowed as leaders there try to achieve a better balance between domestic consumption and infrastructure spending that has led the way over the past two decades. Inflation has been running below expectations across the globe, leaving plenty of room for global Central Banks to maintain very accommodative monetary policies. Recently, the Bank of Japan has joined other Central Banks in adopting very accommodative policies, causing their currency to fall and their equity markets to improve. These policies are likely to cause interest rates to stay below fair value until economic growth accelerates or some of the more accommodative policies are scaled back.
As of March 31, 2013, the Fund had 7.8% in cash equivalents and 92.2% in equities.
Jamestown Tax Exempt Virginia Fund
For the fiscal year ended March 31, 2013, The Jamestown Tax Exempt Virginia Fund earned a total return of 1.88%. By comparison, the Barclays 5-year Municipal Bond Index was up 3.22% for the one-year period. As of March 31, 2013, the Fund’s SEC 30-day yield was 1.42%, which results in a tax equivalent yield of 2.33% for investors in the 39% federal tax bracket. The Fund held no issues subject to Alternative Minimum Tax during the fiscal year.
The U.S. economy experienced moderate real growth of 1.8% during the fiscal year. The Federal Reserve maintained its extremely accommodative monetary policy and kept short-term interest rates near zero percent as the unemployment rate, while trending lower, remains elevated. The Fed embarked on an additional round of quantitative easing by expanding its bond buying program.
Municipal bonds generally rallied during the first six months of the fiscal year, with prices climbing steadily and yields moving lower. The price momentum peaked in November 2012, when municipal bond yields fell to all-time lows. Factors that contributed to buoyant conditions included lighter than normal municipal issuance, strong net inflows to tax-exempt bond mutual funds, and a decline in yields on U.S. Treasury debt. The muni market reversed in December as the frothy conditions could not be sustained. Tax exempt yields then drifted higher in the final quarter of the fiscal year as equity markets soared. To illustrate, the representative yield-to-maturity of a “AAA” rated general obligation bond with a 5-year maturity moved from 0.98% at March 31, 2012 to 0.64% at November 30, 2012 and ended at 0.84% at March 31, 2013.
The Fund’s relative underperformance can be attributed to its intermediate maturity structure and its emphasis on high credit quality. The municipal yield curve experienced a bull flattening during the fiscal year, with yields on long maturities declining far more than yields on short and intermediate maturities, resulting in greater gains in market value. Bond strategies that emphasize intermediate maturities generally saw smaller total returns than those that concentrate on long maturities. The Jamestown Tax-Exempt Virginia Fund’s maturity structure and effective duration lengthened over the course of the fiscal year. At March 31, 2013, the Fund’s average stated maturity was 6.3 years, and the average effective duration was 4.2 years, compared to an average maturity of 5.9 years and an average effective duration of 3.7 years at the beginning of the fiscal year.
Quality spreads compressed during the period, as yield-starved investors continued to buy lower quality credits for the incremental yield despite new headlines on default risk in California municipalities and elsewhere. The Fund remains positioned in predominantly “AA” and “AAA” rated credits from Virginia municipal issuers, so the underperformance of higher quality credits was a factor in the Fund’s performance relative to benchmarks comprised of national credits.
State and local tax revenue continued to recover from the 2008-09 recession, led by sales and income tax receipts. Virginia reported a $448 million surplus for its fiscal year ended June 30, 2012, the third consecutive year of surplus. Revenue trends continue to be positive, with general fund collections exceeding budget forecast by $129 million. On the savings side, there was $319 million in unspent general fund appropriations, recoveries, and non-general fund balances at fiscal year-end as state agencies spent less than budgeted. Of the surplus, $78.3 million was added to the Rainy Day Fund, bringing its balance to $689 million, the highest balance since FY 2008. Virginia’s unemployment rate edged down to 5.3% in March 2013, compared to 5.9% a year ago. State employment has rebounded to near the peak of January 2008.
The effect of sequestration is difficult to predict. Federal spending is significant to Virginia’s economy, especially in Northern Virginia and Hampton Roads, which benefit from Department of Defense contracts and military bases. While federal spending cuts will adversely affect these regions, the impact is likely to be felt slowly and with lags. Virginia counties and cities have managed through two recessions over the last decade, and their credit ratings remain in the highest
tiers. Nonetheless, the threat that federal spending cuts will disproportionately hurt Virginia’s economy is the reason why Moody’s continues to have a negative outlook on the Aaa credit rating for the Commonwealth and many of the Aaa-rated localities in Northern Virginia.
 |  |
Charles M. Caravati, III, CFA President Jamestown Balanced Fund Jamestown Equity Fund | Joseph A. Jennings, III, CFA President Jamestown Tax Exempt Virginia Fund |
Data presented reflects past performance, which is no guarantee of future results. Investment results and principal value will fluctuate so that shares, when redeemed, may be worth more or less than their original cost. Due to market volatility, current performance may be higher or lower than the performance shown.
This report is submitted for the general information of the shareholders of the Funds. The report is not authorized for distribution to prospective investors in the Funds unless it is accompanied by a current prospectus.
This report reflects our views, opinions and portfolio holdings as of March 31, 2013, the end of the reporting period. These views are subject to change at any time based upon market or other conditions. For more current information throughout the year please visit www.jamestownfunds.com. The Funds are distributed by Ultimus Fund Distributors, LLC.
THE JAMESTOWN BALANCED FUND PERFORMANCE INFORMATION (Unaudited) |
| | Average Annual Total Returns(a) (for periods ended March 31, 2013) |
| | 1 Year | 5 Years | 10 Years |
| The Jamestown Balanced Fund | 8.68% | 4.40% | 6.27% |
Standard & Poor’s 500® Index | 13.96% | 5.81% | 8.53% |
| 60% S&P 500 Index / 40% Barclays Intermediate U.S. Government/Credit Index | 9.83% | 5.79% | 7.20% |
| (a) | Total return is a measure of the change in value of an investment in the Fund over the periods covered, which assumes any dividends or capital gains distributions are reinvested in shares of the Fund. Returns shown do not reflect the deduction of taxes a shareholder would pay on Fund distributions or the redemption of Fund shares. |
THE JAMESTOWN EQUITY FUND PERFORMANCE INFORMATION (Unaudited) |
| | Average Annual Total Returns(a) (for periods ended March 31, 2013) |
| | 1 Year | 5 Years | 10 Years |
| The Jamestown Equity Fund | 11.84% | 4.01% | 7.23% |
Standard & Poor’s 500® Index | 13.96% | 5.81% | 8.53% |
| (a) | Total return is a measure of the change in value of an investment in the Fund over the periods covered, which assumes any dividends or capital gains distributions are reinvested in shares of the Fund. Returns shown do not reflect the deduction of taxes a shareholder would pay on Fund distributions or the redemption of Fund shares. |
THE JAMESTOWN TAX EXEMPT VIRGINIA FUND PERFORMANCE INFORMATION (Unaudited) |
| | Average Annual Total Returns(a) (for periods ended March 31, 2013) |
| | 1 Year | 5 Years | 10 Years |
| The Jamestown Tax Exempt Virginia Fund | 1.88% | 3.79% | 3.24% |
| Barclays 5-Year Municipal Bond Index | 3.22% | 5.05% | 4.23% |
| Barclays Municipal Bond Index | 5.25% | 6.10% | 5.01% |
| * | The Barclays 5-Year Municipal Bond Index is an unmanaged index generally representative of 5-year tax-exempt bonds. Because the Fund is typically classified as an intermediate-term fund (with an average duration of between 2 and 10 years), this index is believed to be the most appropriate broad-based securities market index against which to compare the Fund’s performance. |
| | |
| (a) | Total return is a measure of the change in value of an investment in the Fund over the periods covered, which assumes any dividends or capital gains distributions are reinvested in shares of the Fund. Returns shown do not reflect the deduction of taxes a shareholder would pay on Fund distributions or the redemption of Fund shares. |
THE JAMESTOWN BALANCED FUND PORTFOLIO INFORMATION March 31, 2013 (Unaudited) |
Asset Allocation (% of Net Assets) | | Ten Largest Equity Holdings | |
| | Apple, Inc. | 2.6% |
| | Kroger Company (The) | 1.9% |
| | Noble Corporation | 1.7% |
| | Google, Inc. - Class A | 1.7% |
| | Aetna, Inc. | 1.7% |
| | JPMorgan Chase & Company | 1.6% |
| | Ameriprise Financial, Inc. | 1.6% |
| | PepsiCo, Inc. | 1.6% |
| | Norfolk Southern Corporation | 1.6% |
| | Eaton Corporation plc | 1.6% |
| | | |
Equity Sector Concentration vs. the S&P 500® Index (66.0% of Net Assets) |
Fixed-Income Portfolio (22.4% of Net Assets) | | | % of Fixed Income Portfolio |
| Average Stated Maturity (Years) | 4.3 | | AAA | 53.4% |
| Average Duration (Years) | 3.8 | | AA | 6.7% |
| Average Coupon | 4.50% | | A | 31.9% |
| Average Yield to Maturity | 1.20% | | BBB | 8.0% |
| | | | | |
| % of Fixed Income Portfolio | | | |
| U.S. Treasury Obligations | 26.3% | | | |
| U.S. Government Agency Obligations | 13.0% | | | |
| Mortgage-Backed Securities | 11.6% | | | |
| Municipal Bonds | 2.4% | | | |
| Corporate Bonds | 46.7% | | | |
THE JAMESTOWN EQUITY FUND PORTFOLIO INFORMATION March 31, 2013 (Unaudited) |
Asset Allocation (% of Net Assets) | | Ten Largest Equity Holdings | |
| | Apple, Inc. | 3.9% |
| | Kroger Company (The) | 2.5% |
| | Google, Inc. - Class A | 2.5% |
| | Noble Corporation | 2.5% |
| | PepsiCo, Inc. | 2.4% |
| | General Electric Company | 2.4% |
| | QUALCOMM, Inc. | 2.2% |
| | JPMorgan Chase & Company | 2.2% |
| | EMC Corporation | 2.2% |
| | PNC Financial Services Group, Inc. | 2.2% |
| | | |
Sector Concentration vs. the S&P 500® Index |
THE JAMESTOWN TAX EXEMPT VIRGINIA FUND PORTFOLIO INFORMATION March 31, 2013 (Unaudited) |
Characteristics (Weighted Average) | | Maturity Breakdown (%of Portfolio) |
| 30-day SEC Yield | 1.42% | | |
| Tax-Equivalent Yield | 2.33%* | |
| Average Maturity (years) | 6.3 | |
| Average Duration (years) | 4.2 | |
| Average Quality | AA | |
| Number of Issues | 51 | |
| | | |
* Assumes a maximum 39% federal tax rate. | |
Credit Quality (%of Portfolio) | | Sector Diversification (%of Portfolio) |
| | |
THE JAMESTOWN BALANCED FUND SCHEDULE OF INVESTMENTS March 31, 2013 | |
| | | | | | |
| Consumer Discretionary — 9.9% | | | | | | |
Comcast Corporation - Class A | | | 5,700 | | | $ | 239,457 | |
Discovery Communications, Inc. - Class A (a) | | | 2,300 | | | | 181,102 | |
Dollar Tree, Inc. (a) | | | 6,200 | | | | 300,266 | |
Macy's, Inc. | | | 6,200 | | | | 259,408 | |
McDonald's Corporation | | | 2,000 | | | | 199,380 | |
TJX Companies, Inc. (The) | | | 5,500 | | | | 257,125 | |
Viacom, Inc. - Class B | | | 4,700 | | | | 289,379 | |
Yum! Brands, Inc. | | | 3,200 | | | | 230,208 | |
| | | | | | | | 1,956,325 | |
| Consumer Staples — 7.7% | | | | | | | | |
CVS Caremark Corporation | | | 5,000 | | | | 274,950 | |
Kroger Company (The) | | | 11,200 | | | | 371,168 | |
| Mondelēz International, Inc. - Class A | | | 7,400 | | | | 226,514 | |
PepsiCo, Inc. | | | 4,000 | | | | 316,440 | |
Sysco Corporation | | | 4,400 | | | | 154,748 | |
Wal-Mart Stores, Inc. | | | 2,400 | | | | 179,592 | |
| | | | | | | | 1,523,412 | |
| Energy — 9.3% | | | | | | | | |
Apache Corporation | | | 3,700 | | | | 285,492 | |
Baker Hughes, Inc. | | | 4,900 | | | | 227,409 | |
Chevron Corporation | | | 2,000 | | | | 237,640 | |
Hess Corporation | | | 4,000 | | | | 286,440 | |
Marathon Oil Corporation | | | 3,900 | | | | 131,508 | |
Marathon Petroleum Corporation | | | 1,000 | | | | 89,600 | |
Noble Corporation | | | 8,900 | | | | 339,535 | |
Royal Dutch Shell plc - Class A - ADR | | | 3,700 | | | | 241,092 | |
| | | | | | | | 1,838,716 | |
| Financials — 9.1% | | | | | | | | |
American Express Company | | | 4,300 | | | | 290,078 | |
Ameriprise Financial, Inc. | | | 4,300 | | | | 316,695 | |
BB&T Corporation | | | 9,100 | | | | 285,649 | |
JPMorgan Chase & Company | | | 6,700 | | | | 317,982 | |
MetLife, Inc. | | | 7,300 | | | | 277,546 | |
PNC Financial Services Group, Inc. | | | 4,500 | | | | 299,250 | |
| | | | | | | | 1,787,200 | |
| Health Care — 9.9% | | | | | | | | |
Abbott Laboratories | | | 3,500 | | | | 123,620 | |
AbbVie, Inc. | | | 3,500 | | | | 142,730 | |
Aetna, Inc. | | | 6,400 | | | | 327,168 | |
AmerisourceBergen Corporation | | | 5,800 | | | | 298,410 | |
Amgen, Inc. | | | 2,400 | | | | 246,024 | |
McKesson Corporation | | | 2,300 | | | | 248,308 | |
Thermo Fisher Scientific, Inc. | | | 3,600 | | | | 275,364 | |
THE JAMESTOWN BALANCED FUND SCHEDULE OF INVESTMENTS (Continued) | |
COMMON STOCKS — 66.0% (Continued) | | | | | | |
| Health Care — 9.9% (Continued) | | | | | | |
UnitedHealth Group, Inc. | | | 4,900 | | | $ | 280,329 | |
| | | | | | | | 1,941,953 | |
| Industrials — 7.5% | | | | | | | | |
Dover Corporation | | | 3,700 | | | | 269,656 | |
Eaton Corporation plc | | | 5,000 | | | | 306,250 | |
General Electric Company | | | 13,000 | | | | 300,560 | |
Norfolk Southern Corporation | | | 4,000 | | | | 308,320 | |
Ryder System, Inc. | | | 4,700 | | | | 280,825 | |
| | | | | | | | 1,465,611 | |
| Information Technology — 12.6% | | | | | | | | |
Apple, Inc. | | | 1,175 | | | | 520,090 | |
Cisco Systems, Inc. | | | 14,000 | | | | 292,740 | |
EMC Corporation (a) | | | 12,600 | | | | 301,014 | |
Google, Inc. - Class A (a) | | | 425 | | | | 337,463 | |
Intel Corporation | | | 6,100 | | | | 133,285 | |
International Business Machines Corporation | | | 900 | | | | 191,970 | |
Microsoft Corporation | | | 4,400 | | | | 125,884 | |
Oracle Corporation | | | 8,500 | | | | 274,890 | |
QUALCOMM, Inc. | | | 4,400 | | | | 294,580 | |
| | | | | | | | 2,471,916 | |
| | | | | | | | | |
Total Common Stocks (Cost $8,167,987) | | | | | | $ | 12,985,133 | |
U.S. TREASURY OBLIGATIONS — 5.9% | | | | | | |
| U.S. Treasury Notes — 5.9% | | | | | | |
4.25%, due 11/15/2014 | | $ | 350,000 | | | $ | 372,777 | |
4.25%, due 11/15/2017 | | | 400,000 | | | | 464,906 | |
2.625%, due 08/15/2020 | | | 175,000 | | | | 191,147 | |
2.125%, due 08/15/2021 | | | 120,000 | | | | 125,400 | |
Total U.S. Treasury Obligations (Cost $1,055,195) | | | | | | $ | 1,154,230 | |
U.S. GOVERNMENT AGENCY OBLIGATIONS — 2.9% | | | | | | |
| Federal Home Loan Mortgage Corporation — 2.9% | | | | | | |
5.25%, due 04/18/2016 (Cost $497,080) | | $ | 500,000 | | | $ | 572,651 | |
THE JAMESTOWN BALANCED FUND SCHEDULE OF INVESTMENTS (Continued) | |
| | | | | | |
| Consumer Discretionary — 1.1% | | | | | | |
| Anheuser-Busch Companies, Inc., | | | | | | |
4.50%, due 04/01/2018 | | $ | 100,000 | | | $ | 112,969 | |
| Comcast Corporation, | | | | | | | | |
5.70%, due 07/01/2019 | | | 75,000 | | | | 91,433 | |
| | | | | | | | 204,402 | |
| Consumer Staples — 1.8% | | | | | | | | |
| Colgate-Palmolive Company, | | | | | | | | |
1.95%, due 02/01/2023 | | | 100,000 | | | | 96,003 | |
| General Mills, Inc., | | | | | | | | |
5.70%, due 02/15/2017 | | | 150,000 | | | | 175,086 | |
| Wal-Mart Stores, Inc., | | | | | | | | |
4.25%, due 04/15/2021 | | | 75,000 | | | | 85,973 | |
| | | | | | | | 357,062 | |
| Energy — 0.6% | | | | | | | | |
| Shell International Finance B.V., | | | | | | | | |
4.30%, due 09/22/2019 | | | 100,000 | | | | 115,831 | |
| | | | | | | | | |
| Financials — 3.5% | | | | | | | | |
| Aflac, Inc., | | | | | | | | |
2.65%, due 02/15/2017 | | | 75,000 | | | | 78,849 | |
| American Express Company, | | | | | | | | |
4.875%, due 07/15/2013 | | | 150,000 | | | | 151,876 | |
| BB&T Corporation, | | | | | | | | |
2.15%, due 03/22/2017 | | | 60,000 | | | | 61,754 | |
| JPMorgan Chase & Company, | | | | | | | | |
3.40%, due 06/24/2015 | | | 110,000 | | | | 115,804 | |
| Northern Trust Corporation, | | | | | | | | |
4.625%, due 05/01/2014 | | | 150,000 | | | | 156,865 | |
| PNC Funding Corporation, | | | | | | | | |
5.125%, due 02/08/2020 | | | 110,000 | | | | 128,751 | |
| | | | | | | | 693,899 | |
| Health Care — 2.1% | | | | | | | | |
| Amgen, Inc., | | | | | | | | |
5.85%, due 06/01/2017 | | | 150,000 | | | | 177,188 | |
| GlaxoSmithKline plc, | | | | | | | | |
5.65%, due 05/15/2018 | | | 200,000 | | | | 241,771 | |
| | | | | | | | 418,959 | |
| Information Technology — 0.4% | | | | | | | | |
| Cisco Systems, Inc., | | | | | | | | |
4.95%, due 02/15/2019 | | | 71,000 | | | | 83,809 | |
| | | | | | | | | |
| Materials — 0.1% | | | | | | | | |
| E.I. du Pont de Nemours and Company, | | | | | | | | |
5.875%, due 01/15/2014 | | | 26,000 | | | | 27,098 | |
THE JAMESTOWN BALANCED FUND SCHEDULE OF INVESTMENTS (Continued) | |
CORPORATE BONDS — 10.4% (Continued) | | | | | | |
| Utilities — 0.8% | | | | | | |
| Virginia Electric & Power Company, | | | | | | |
5.00%, due 06/30/2019 | | $ | 125,000 | | | $ | 148,471 | |
| | | | | | | | | |
Total Corporate Bonds (Cost $1,888,191) | | | | | | $ | 2,049,531 | |
MORTGAGE-BACKED SECURITIES — 2.6% | | | | | | |
| Federal Home Loan Mortgage Corporation — 0.7% | | | | | | |
Pool #A43942, 5.50%, due 03/01/2036 | | $ | 47,290 | | | $ | 51,350 | |
Pool #A97047, 4.50%, due 02/01/2041 | | | 87,353 | | | | 93,628 | |
| | | | | | | | 144,978 | |
| Federal National Mortgage Association — 1.8% | | | | | | | | |
Pool #618465, 5.00%, due 12/01/2016 | | | 27,287 | | | | 29,464 | |
Pool #684231, 5.00%, due 01/01/2018 | | | 41,220 | | | | 44,509 | |
Pool #255455, 5.00%, due 10/01/2024 | | | 63,656 | | | | 69,959 | |
Pool #255702, 5.00%, due 05/01/2025 | | | 90,426 | | | | 99,154 | |
Pool #808413, 5.50%, due 01/01/2035 | | | 96,208 | | | | 105,268 | |
| | | | | | | | 348,354 | |
| Government National Mortgage Association — 0.1% | | | | | | | | |
Pool #781344, 6.50%, due 10/15/2031 | | | 12,527 | | | | 14,275 | |
| | | | | | | | | |
Total Mortgage-Backed Securities (Cost $469,217) | | | | | | $ | 507,607 | |
| | | | | | |
| Virginia State, Build America Bonds, Taxable, GO, | | | | | | |
2.95%, due 06/01/2019 (Cost $99,942) | | $ | 100,000 | | | $ | 107,802 | |
| | | | | | | | | |
Total Investments at Value — 88.4% (Cost $12,177,612) | | | | | | $ | 17,376,954 | |
| | | | | | | | | |
Other Assets in Excess of Liabilities — 11.6% | | | | | | | 2,286,745 | |
| | | | | | | | | |
Net Assets — 100.0% | | | | | | $ | 19,663,699 | |
| ADR - American Depositary Receipt. |
| |
| GO - General Obligation. |
| |
| (a) | Non-income producing security. |
| | |
| See accompanying notes to financial statements. |
THE JAMESTOWN EQUITY FUND SCHEDULE OF INVESTMENTS March 31, 2013 | |
| | | | | | |
| Consumer Discretionary — 13.5% | | | | | | |
Comcast Corporation - Class A | | | 11,200 | | | $ | 470,512 | |
Discovery Communications, Inc. - Class A (a) | | | 4,200 | | | | 330,708 | |
Dollar Tree, Inc. (a) | | | 12,000 | | | | 581,160 | |
Macy's, Inc. | | | 13,100 | | | | 548,104 | |
McDonald's Corporation | | | 4,000 | | | | 398,760 | |
TJX Companies, Inc. (The) | | | 11,500 | | | | 537,625 | |
Viacom, Inc. - Class B | | | 8,700 | | | | 535,659 | |
Yum! Brands, Inc. | | | 6,000 | | | | 431,640 | |
| | | | | | | | 3,834,168 | |
| Consumer Staples — 10.9% | | | | | | | | |
CVS Caremark Corporation | | | 10,200 | | | | 560,898 | |
Kroger Company (The) | | | 21,200 | | | | 702,568 | |
| Mondelēz International, Inc. - Class A | | | 15,000 | | | | 459,150 | |
PepsiCo, Inc. | | | 8,600 | | | | 680,346 | |
Sysco Corporation | | | 8,300 | | | | 291,911 | |
Wal-Mart Stores, Inc. | | | 5,100 | | | | 381,633 | |
| | | | | | | | 3,076,506 | |
| Energy — 13.1% | | | | | | | | |
Apache Corporation | | | 7,600 | | | | 586,416 | |
Baker Hughes, Inc. | | | 9,650 | | | | 447,857 | |
Chevron Corporation | | | 4,100 | | | | 487,162 | |
Hess Corporation | | | 8,000 | | | | 572,880 | |
Marathon Oil Corporation | | | 7,800 | | | | 263,016 | |
Marathon Petroleum Corporation | | | 1,800 | | | | 161,280 | |
Noble Corporation | | | 18,200 | | | | 694,330 | |
Royal Dutch Shell plc - Class A - ADR | | | 7,600 | | | | 495,216 | |
| | | | | | | | 3,708,157 | |
| Financials — 12.4% | | | | | | | | |
American Express Company | | | 8,500 | | | | 573,410 | |
Ameriprise Financial, Inc. | | | 8,000 | | | | 589,200 | |
BB&T Corporation | | | 18,500 | | | | 580,715 | |
JPMorgan Chase & Company | | | 13,200 | | | | 626,472 | |
MetLife, Inc. | | | 14,000 | | | | 532,280 | |
PNC Financial Services Group, Inc. | | | 9,300 | | | | 618,450 | |
| | | | | | | | 3,520,527 | |
| Health Care — 13.8% | | | | | | | | |
Abbott Laboratories | | | 8,000 | | | | 282,560 | |
AbbVie, Inc. | | | 8,000 | | | | 326,240 | |
Aetna, Inc. | | | 12,000 | | | | 613,440 | |
AmerisourceBergen Corporation | | | 11,000 | | | | 565,950 | |
Amgen, Inc. | | | 4,800 | | | | 492,048 | |
McKesson Corporation | | | 4,800 | | | | 518,208 | |
Thermo Fisher Scientific, Inc. | | | 7,300 | | | | 558,377 | |
THE JAMESTOWN EQUITY FUND SCHEDULE OF INVESTMENTS (Continued) | |
COMMON STOCKS — 92.2% (Continued) | | | | | | |
| Health Care — 13.8% (Continued) | | | | | | |
UnitedHealth Group, Inc. | | | 9,500 | | | $ | 543,495 | |
| | | | | | | | 3,900,318 | |
| Industrials — 10.5% | | | | | | | | |
Dover Corporation | | | 7,500 | | | | 546,600 | |
Eaton Corporation plc | | | 9,500 | | | | 581,875 | |
General Electric Company | | | 28,900 | | | | 668,168 | |
Norfolk Southern Corporation | | | 8,000 | | | | 616,640 | |
Ryder System, Inc. | | | 9,400 | | | | 561,650 | |
| | | | | | | | 2,974,933 | |
| Information Technology — 18.0% | | | | | | | | |
Apple, Inc. | | | 2,500 | | | | 1,106,575 | |
Cisco Systems, Inc. | | | 25,000 | | | | 522,750 | |
EMC Corporation (a) | | | 26,000 | | | | 621,140 | |
Google, Inc. - Class A (a) | | | 875 | | | | 694,776 | |
Intel Corporation | | | 12,200 | | | | 266,570 | |
International Business Machines Corporation | | | 2,000 | | | | 426,600 | |
Microsoft Corporation | | | 9,100 | | | | 260,351 | |
Oracle Corporation | | | 17,300 | | | | 559,482 | |
QUALCOMM, Inc. | | | 9,500 | | | | 636,025 | |
| | | | | | | | 5,094,269 | |
| | | | | | | | | |
Total Investments at Value — 92.2% (Cost $16,779,703) | | | | | | $ | 26,108,878 | |
| | | | | | | | | |
Other Assets in Excess of Liabilities — 7.8% | | | | | | | 2,206,793 | |
| | | | | | | | | |
Net Assets — 100.0% | | | | | | $ | 28,315,671 | |
| ADR - American Depositary Receipt. |
| | |
| (a) | Non-income producing security. |
| | |
| See accompanying notes to financial statements. |
THE JAMESTOWN TAX EXEMPT VIRGINIA FUND SCHEDULE OF INVESTMENTS March 31, 2013 | |
VIRGINIA REVENUE AND GENERAL
OBLIGATION (GO) BONDS — 93.9% | | | | | | |
| Arlington Co., Virginia, GO, | | | | | | |
4.10%, due 11/01/2018 | | $ | 500,000 | | | $ | 525,005 | |
| Capital Region Airport Commission, Virginia, Airport Revenue, | | | | | | | | |
4.50%, due 07/01/2016 | | | 520,000 | | | | 580,684 | |
| Chesterfield Co., Virginia, GO, | | | | | | | | |
5.00%, due 01/01/2020 | | | 700,000 | | | | 807,786 | |
| Fairfax Co., Virginia, Industrial Dev. Authority, Revenue, | | | | | | | | |
5.00%, due 05/15/2022 | | | 750,000 | | | | 873,450 | |
| Fairfax Co., Virginia, Sewer, Revenue, | | | | | | | | |
4.50%, due 07/15/2030 | | | 250,000 | | | | 284,237 | |
| Fauquier Co., Virginia, GO, | | | | | | | | |
| 5.00%, due 07/01/2017, | | | | | | | | |
prerefunded 07/01/2016 @ 100 | | | 500,000 | | | | 572,275 | |
| Hampton Roads Sanitation District, Virginia, Wastewater, Revenue, | | | | | | | | |
5.00%, due 04/01/2022 | | | 400,000 | | | | 472,092 | |
| Hampton Roads Sanitation District, Virginia, Wastewater, Series A, Revenue, | | | | | | | | |
5.00%, due 01/01/2027 | | | 400,000 | | | | 474,140 | |
| Hampton, Virginia, GO, | | | | | | | | |
| 5.00%, due 04/01/2020, | | | | | | | | |
prerefunded 04/01/2015 @ 100 | | | 500,000 | | | | 546,650 | |
5.00%, due 04/01/2025 | | | 500,000 | | | | 605,655 | |
| Henrico Co., Virginia, Public Improvement, Series A, GO, | | | | | | | | |
5.00%, due 12/01/2015 | | | 250,000 | | | | 280,745 | |
| Henrico Co., Virginia, Water & Sewer, Revenue, | | | | | | | | |
5.00%, due 05/01/2020 | | | 350,000 | | | | 424,851 | |
5.00%, due 05/01/2022 | | | 430,000 | | | | 520,558 | |
| James City, Virginia, School District, GO, | | | | | | | | |
5.00%, due 12/15/2018 | | | 500,000 | | | | 560,485 | |
| Leesburg, Virginia, GO, | | | | | | | | |
5.00%, due 09/15/2016 | | | 500,000 | | | | 574,245 | |
| Lynchburg, Virginia, GO, | | | | | | | | |
5.00%, due 06/01/2015 | | | 500,000 | | | | 549,275 | |
| Lynchburg, Virginia, Public Improvement, Series A, GO, | | | | | | | | |
5.00%, due 08/01/2019 | | | 625,000 | | | | 768,181 | |
| Manassas, Virginia, Public Improvement, Series D, GO, | | | | | | | | |
5.00%, due 07/01/2019 | | | 250,000 | | | | 308,465 | |
| New Kent Co., Virginia, Economic Dev. Authority, Revenue, | | | | | | | | |
5.00%, due 02/01/2019 | | | 500,000 | | | | 567,910 | |
| Norfolk, Virginia, GO, | | | | | | | | |
4.50%, due 06/01/2015 | | | 500,000 | | | | 524,125 | |
THE JAMESTOWN TAX EXEMPT VIRGINIA FUND SCHEDULE OF INVESTMENTS (Continued) | |
VIRGINIA REVENUE AND GENERAL
OBLIGATION (GO) BONDS — 93.9% (Continued) | | | | | | |
| Portsmouth, Virginia, Series A, GO, | | | | | | |
5.00%, due 04/01/2016 | | $ | 250,000 | | | $ | 272,927 | |
| Portsmouth, Virginia, Series D, GO, | | | | | | | | |
4.00%, due 12/01/2017 | | | 215,000 | | | | 245,857 | |
| Prince William Co., Virginia, Lease Participation Certificates, | | | | | | | | |
5.00%, due 10/01/2020 | | | 500,000 | | | | 608,450 | |
| Richmond, Virginia, Metropolitan Authority, Revenue, | | | | | | | | |
5.25%, due 07/15/2014, ETM | | | 715,000 | | | | 757,478 | |
5.25%, due 07/15/2014 | | | 285,000 | | | | 301,450 | |
| Richmond, Virginia, Public Improvement, Series A, GO, | | | | | | | | |
5.00%, due 03/01/2024 | | | 280,000 | | | | 340,729 | |
| Roanoke, Virginia, Public Improvement, Series A, GO, | | | | | | | | |
5.00%, due 07/15/2025 | | | 400,000 | | | | 497,220 | |
| Southeastern Public Service Authority, Virginia, Revenue, | | | | | | | | |
5.00%, due 07/01/2015, ETM | | | 1,000,000 | | | | 1,077,632 | |
| Spotsylvania Co., Virginia, Economic Dev. Authority, Revenue, | | | | | | | | |
5.00%, due 06/01/2021 | | | 300,000 | | | | 371,331 | |
| Spotsylvania Co., Virginia, GO, | | | | | | | | |
5.00%, due 01/15/2016 | | | 500,000 | | | | 518,560 | |
| Spotsylvania Co., Virginia, Water & Sewer, Revenue, | | | | | | | | |
5.00%, due 06/01/2026 | | | 500,000 | | | | 540,630 | |
| Suffolk, Virginia, Public Improvement, Series A, GO, | | | | | | | | |
4.00%, due 08/01/2018 | | | 250,000 | | | | 288,745 | |
| Upper Occoquan, Virginia, Sewer Authority, Revenue, | | | | | | | | |
5.15%, due 07/01/2020 | | | 250,000 | | | | 299,458 | |
| Virginia Beach, Virginia, Public Improvement, GO, | | | | | | | | |
| 5.00%, due 06/01/2021, | | | | | | | | |
prerefunded 06/01/2019 @ 100 | | | 250,000 | | | | 307,580 | |
| Virginia Biotechnology Research Partnership Authority, Lease Revenue, | | | | | | | | |
5.00%, due 09/01/2020 | | | 500,000 | | | | 620,660 | |
| Virginia College Building Authority, Educational Facilities, Revenue, | | | | | | | | |
5.00%, due 04/01/2017 | | | 500,000 | | | | 540,395 | |
5.00%, due 03/01/2019 | | | 250,000 | | | | 301,378 | |
4.00%, due 09/01/2026 | | | 500,000 | | | | 548,830 | |
| Virginia Commonwealth Transportation Board, Federal Highway Reimbursement Anticipation Notes, Revenue, | | | | | | | | |
5.00%, due 09/28/2015 | | | 500,000 | | | | 556,760 | |
| Virginia Polytechnic Institute & State University, General and Athletic Facilities, Series D, Revenue, | | | | | | | | |
| 5.00%, due 06/01/2016, | | | | | | | | |
prerefunded 06/01/2014 @ 101 | | | 385,000 | | | | 410,152 | |
5.00%, due 06/01/2016 | | | 115,000 | | | | 122,453 | |
THE JAMESTOWN TAX EXEMPT VIRGINIA FUND SCHEDULE OF INVESTMENTS (Continued) | |
VIRGINIA REVENUE AND GENERAL
OBLIGATION (GO) BONDS — 93.9% (Continued) | | | | | | |
| Virginia Small Business Financing Authority, Healthcare Facilities, Revenue, | | | | | | |
5.00%, due 11/01/2017 | | $ | 250,000 | | | $ | 292,803 | |
| Virginia State Commonwealth Transportation Board, Federal Transportation Grant Anticipation Notes, Series A, Revenue, | | | | | | | | |
5.00%, due 03/15/2023 | �� | | 500,000 | | | | 616,255 | |
| Virginia State Public Building Authority, Public Facilities, Series D, Revenue, | | | | | | | | |
5.00%, due 08/01/2016 | | | 1,000,000 | | | | 1,063,010 | |
| Virginia State Public School Authority, Revenue, | | | | | | | | |
5.00%, due 08/01/2023 | | | 500,000 | | | | 618,240 | |
| Virginia State Public School Authority, Series A, Revenue, | | | | | | | | |
5.00%, due 08/01/2020 | | | 585,000 | | | | 664,250 | |
| Virginia State Public School Authority, Series B-1, Revenue, | | | | | | | | |
5.00%, due 08/01/2018 | | | 500,000 | | | | 602,555 | |
| Virginia State Resources Authority, Clean Water, Revenue, | | | | | | | | |
5.00%, due 10/01/2021 | | | 500,000 | | | | 613,065 | |
| Virginia State Resources Authority, Infrastructure, Series B, Revenue, | | | | | | | | |
5.00%, due 11/01/2024 | | | 800,000 | | | | 966,585 | |
| Virginia State, Series B, GO, | | | | | | | | |
5.00%, due 06/01/2017 | | | 250,000 | | | | 295,058 | |
| | | | | | | | | |
Total Virginia Revenue and General Obligation (GO) Bonds (Cost $24,361,068) | | | | | | $ | 26,081,310 | |
WASHINGTON, D.C. REVENUE BONDS — 2.1% | | | | | | |
| Metropolitan Washington Airports Authority, Series C, Revenue, | | | | | | |
5.00%, due 10/01/2022 (Cost $507,147) | | $ | 500,000 | | | $ | 590,335 | |
EXCHANGE-TRADED FUNDS — 0.9% | | | | | | |
SPDR Nuveen Barclays Short Term Municipal Bond ETF (Cost $241,000) | | | 10,000 | | | $ | 243,500 | |
THE JAMESTOWN TAX EXEMPT VIRGINIA FUND SCHEDULE OF INVESTMENTS (Continued) | |
MONEY MARKET FUNDS — 2.1% | | | | | | |
Fidelity Tax Exempt Portfolio - Class I, 0.01% (a) (Cost $577,892) | | | 577,892 | | | $ | 577,892 | |
| | | | | | | | | |
Total Investments at Value — 99.0% (Cost $25,687,107) | | | | | | $ | 27,493,037 | |
| | | | | | | | | |
Other Assets in Excess of Liabilities — 1.0% | | | | | | | 288,984 | |
| | | | | | | | | |
Net Assets — 100.0% | | | | | | $ | 27,782,021 | |
| ETM - Escrowed to Maturity. |
| | |
| (a) | The rate shown is the 7-day effective yield as of March 31, 2013. |
| | |
| See accompanying notes to financial statements. |
THE JAMESTOWN FUNDS STATEMENTS OF ASSETS AND LIABILITIES March 31, 2013 | |
| | | | | | | | The Jamestown Tax Exempt Virginia Fund | |
| ASSETS | | | | | | | | | |
| Investments in securities: | | | | | | | | | |
At acquisition cost | | $ | 12,177,612 | | | $ | 16,779,703 | | | $ | 25,687,107 | |
At value (Note 2) | | $ | 17,376,954 | | | $ | 26,108,878 | | | $ | 27,493,037 | |
Cash | | | 2,272,259 | | | | 2,200,221 | | | | — | |
Dividends and interest receivable | | | 59,444 | | | | 19,011 | | | | 329,457 | |
Receivable for capital shares sold | | | — | | | | 21,500 | | | | — | |
Other assets | | | 1,913 | | | | 2,766 | | | | 1,191 | |
TOTAL ASSETS | | | 19,710,570 | | | | 28,352,376 | | | | 27,823,685 | |
| | | | | | | | | | | | | |
| LIABILITIES | | | | | | | | | | | | |
Distributions payable | | | 1,887 | | | | 1,531 | | | | 7,980 | |
Payable for capital shares redeemed | | | 10,605 | | | | 12,995 | | | | 21,083 | |
Accrued investment advisory fees (Note 4) | | | 10,272 | | | | 15,424 | | | | 7,793 | |
Payable to administrator (Note 4) | | | 5,015 | | | | 5,015 | | | | 4,515 | |
Other accrued expenses | | | 19,092 | | | | 1,740 | | | | 293 | |
TOTAL LIABILITIES | | | 46,871 | | | | 36,705 | | | | 41,664 | |
| | | | | | | | | | | | | |
| NET ASSETS | | $ | 19,663,699 | | | $ | 28,315,671 | | | $ | 27,782,021 | |
| | | | | | | | | | | | | |
| Net assets consist of: | | | | | | | | | | | | |
Paid-in capital | | $ | 14,168,528 | | | $ | 18,239,895 | | | $ | 25,963,757 | |
Undistributed (distributions in excess of)
net investment income | | | (16,454 | ) | | | 1,334 | | | | — | |
Accumulated net realized gains
from security transactions | | | 312,283 | | | | 745,267 | | | | 12,334 | |
Net unrealized appreciation on investments | | | 5,199,342 | | | | 9,329,175 | | | | 1,805,930 | |
Net assets | | $ | 19,663,699 | | | $ | 28,315,671 | | | $ | 27,782,021 | |
| | | | | | | | | | | | | |
Shares of beneficial interest outstanding (unlimited number
of shares authorized, $0.01 par value) | | | 1,379,867 | | | | 1,444,511 | | | | 2,652,631 | |
| | | | | | | | | | | | | |
Net asset value, offering price and
redemption price per share (Note 2) | | $ | 14.25 | | | $ | 19.60 | | | $ | 10.47 | |
See accompanying notes to financial statements.
THE JAMESTOWN FUNDS STATEMENTS OF OPERATIONS Year Ended March 31, 2013 | |
| | | | | | | | The Jamestown Tax Exempt Virginia Fund | |
| INVESTMENT INCOME | | | | | | | | | |
Dividends | | $ | 244,217 | | | $ | 501,294 | | | $ | 2,979 | |
Foreign withholding taxes on dividends | | | (1,935 | ) | | | (3,947 | ) | | | — | |
Interest | | | 192,960 | | | | 113 | | | | 950,155 | |
TOTAL INVESTMENT INCOME | | | 435,242 | | | | 497,460 | | | | 953,134 | |
| | | | | | | | | | | | | |
| EXPENSES | | | | | | | | | | | | |
Investment advisory fees (Note 4) | | | 120,998 | | | | 172,346 | | | | 118,954 | |
Administration fees (Note 4) | | | 50,000 | | | | 50,000 | | | | 45,548 | |
Professional fees | | | 22,198 | | | | 19,038 | | | | 16,028 | |
Trustees’ fees and expenses (Note 4) | | | 9,275 | | | | 9,275 | | | | 9,275 | |
Compliance service fees (Note 4) | | | 6,200 | | | | 6,200 | | | | 6,200 | |
Custodian and bank service fees | | | 5,918 | | | | 7,868 | | | | 4,795 | |
Pricing costs | | | 5,749 | | | | 904 | | | | 9,367 | |
Registration and filing fees | | | 5,458 | | | | 6,792 | | | | 3,507 | |
Account maintenance fees | | | 1,648 | | | | 5,700 | | | | 6,335 | |
Printing of shareholder reports | | | 3,627 | | | | 6,011 | | | | 2,368 | |
Postage and supplies | | | 3,539 | | | | 3,982 | | | | 3,087 | |
Other expenses | | | 5,315 | | | | 5,943 | | | | 2,082 | |
TOTAL EXPENSES | | | 239,925 | | | | 294,059 | | | | 227,546 | |
Fees voluntarily waived by the Adviser (Note 4) | | | (1,500 | ) | | | — | | | | (22,351 | ) |
Expenses reimbursed through a directed brokerage
arrangement (Note 5) | | | (10,500 | ) | | | (12,000 | ) | | | — | |
NET EXPENSES | | | 227,925 | | | | 282,059 | | | | 205,195 | |
| | | | | | | | | | | | | |
NET INVESTMENT INCOME | | | 207,317 | | | | 215,401 | | | | 747,939 | |
| | | | | | | | | | | | | |
REALIZED AND UNREALIZED GAINS
(LOSSES) ON INVESTMENTS | | | | | | | | | | | | |
Net realized gains on security transactions | | | 889,984 | | | | 1,922,949 | | | | 78,456 | |
Net change in unrealized appreciation/
depreciation on investments | | | 478,467 | | | | 876,033 | | | | (242,548 | ) |
| | | | | | | | | | | | | |
NET REALIZED AND UNREALIZED GAINS
(LOSSES) ON INVESTMENTS | | | 1,368,451 | | | | 2,798,982 | | | | (164,092 | ) |
| | | | | | | | | | | | | |
NET INCREASE IN NET ASSETS
FROM OPERATIONS | | $ | 1,575,768 | | | $ | 3,014,383 | | | $ | 583,847 | |
See accompanying notes to financial statements.
THE JAMESTOWN FUNDS STATEMENTS OF CHANGES IN NET ASSETS | |
| | | The Jamestown Balanced Fund | | | | |
| | Year Ended March 31, 2013 | | | Year Ended March 31, 2012 | | | Year Ended March 31, 2013 | | | Year Ended March 31, 2012 | |
| FROM OPERATIONS | | | | | | | | | | | | |
Net investment income | | $ | 207,317 | | | $ | 206,139 | | | $ | 215,401 | | | $ | 147,499 | |
Net realized gains on security
transactions | | | 889,984 | | | | 639,185 | | | | 1,922,949 | | | | 574,141 | |
Net change in unrealized appreciation/
depreciation on investments | | | 478,467 | | | | 224,412 | | | | 876,033 | | | | 1,208,217 | |
Net increase in net assets from operations | | | 1,575,768 | | | | 1,069,736 | | | | 3,014,383 | | | | 1,929,857 | |
| | | | | | | | | | | | | | | | | |
| DISTRIBUTIONS TO SHAREHOLDERS | | | | | | | | | | | | | | | | |
From net investment income | | | (224,146 | ) | | | (216,245 | ) | | | (215,083 | ) | | | (172,098 | ) |
From net realized gains from
security transactions | | | (790,954 | ) | | | — | | | | (94,273 | ) | | | — | |
Decrease in net assets from
distributions to shareholders | | | (1,015,100 | ) | | | (216,245 | ) | | | (309,356 | ) | | | (172,098 | ) |
| | | | | | | | | | | | | | | | | |
| FROM CAPITAL SHARE TRANSACTIONS | | | | | | | | | | | | | | | | |
Proceeds from shares sold | | | 131,667 | | | | 56,248 | | | | 1,576,724 | | | | 1,054,254 | |
Net asset value of shares issued
in reinvestment of distributions
to shareholders | | | 974,201 | | | | 201,973 | | | | 300,415 | | | | 164,795 | |
Payments for shares redeemed | | | (1,050,797 | ) | | | (3,394,853 | ) | | | (3,969,846 | ) | | | (3,632,850 | ) |
Net increase (decrease) in net assets from
capital share transactions | | | 55,071 | | | | (3,136,632 | ) | | | (2,092,707 | ) | | | (2,413,801 | ) |
| | | | | | | | | | | | | | | | | |
TOTAL INCREASE (DECREASE)
IN NET ASSETS | | | 615,739 | | | | (2,283,141 | ) | | | 612,320 | | | | (656,042 | ) |
| | | | | | | | | | | | | | | | | |
| NET ASSETS | | | | | | | | | | | | | | | | |
Beginning of year | | | 19,047,960 | | | | 21,331,101 | | | | 27,703,351 | | | | 28,359,393 | |
End of year | | $ | 19,663,699 | | | $ | 19,047,960 | | | $ | 28,315,671 | | | $ | 27,703,351 | |
| | | | | | | | | | | | | | | | | |
UNDISTRIBUTED (DISTRIBUTIONS
IN EXCESS OF) NET
INVESTMENT INCOME | | $ | (16,454 | ) | | $ | (2,683 | ) | | $ | 1,334 | | | $ | 1,016 | |
| | | | | | | | | | | | | | | | | |
| CAPITAL SHARE ACTIVITY | | | | | | | | | | | | | | | | |
Shares sold | | | 9,633 | | | | 4,146 | | | | 89,792 | | | | 64,426 | |
Shares reinvested | | | 73,177 | | | | 15,667 | | | | 16,841 | | | | 10,013 | |
Shares redeemed | | | (77,534 | ) | | | (265,758 | ) | | | (224,592 | ) | | | (227,053 | ) |
Net increase (decrease) in
shares outstanding | | | 5,276 | | | | (245,945 | ) | | | (117,959 | ) | | | (152,614 | ) |
Shares outstanding, beginning of year | | | 1,374,591 | | | | 1,620,536 | | | | 1,562,470 | | | | 1,715,084 | |
Shares outstanding, end of year | | | 1,379,867 | | | | 1,374,591 | | | | 1,444,511 | | | | 1,562,470 | |
See accompanying notes to financial statements.
THE JAMESTOWN FUNDS STATEMENTS OF CHANGES IN NET ASSETS | |
| | | The Jamestown Tax Exempt Virginia Fund | |
| | Year Ended March 31, 2013 | | | Year Ended March 31, 2012 | |
| FROM OPERATIONS | | | | | | |
Net investment income | | $ | 747,939 | | | $ | 828,596 | |
Net realized gains on security transactions | | | 78,456 | | | | 37,982 | |
| Net change in unrealized appreciation/depreciation on investments | | | (242,548 | ) | | | 901,005 | |
Net increase in net assets from operations | | | 583,847 | | | | 1,767,583 | |
| | | | | | | | | |
| DISTRIBUTIONS TO SHAREHOLDERS | | | | | | | | |
From net investment income | | | (747,939 | ) | | | (828,596 | ) |
| From net realized gains from security transactions | | | (93,442 | ) | | | (11,396 | ) |
| Decrease in net assets from distributions to shareholders | | | (841,381 | ) | | | (839,992 | ) |
| | | | | | | | | |
| FROM CAPITAL SHARE TRANSACTIONS | | | | | | | | |
Proceeds from shares sold | | | 734,926 | | | | 1,078,274 | |
Net asset value of shares issued in reinvestment of
distributions to shareholders | | | 708,237 | | | | 716,177 | |
Payments for shares redeemed | | | (3,466,314 | ) | | | (3,027,810 | ) |
| Net decrease in net assets from capital share transactions | | | (2,023,151 | ) | | | (1,233,359 | ) |
| | | | | | | | | |
TOTAL DECREASE IN NET ASSETS | | | (2,280,685 | ) | | | (305,768 | ) |
| | | | | | | | | |
| NET ASSETS | | | | | | | | |
Beginning of year | | | 30,062,706 | | | | 30,368,474 | |
End of year | | $ | 27,782,021 | | | $ | 30,062,706 | |
| | | | | | | | | |
| UNDISTRIBUTED NET INVESTMENT INCOME | | $ | — | | | $ | — | |
| | | | | | | | | |
| CAPITAL SHARE ACTIVITY | | | | | | | | |
Shares sold | | | 69,415 | | | | 102,093 | |
Shares reinvested | | | 66,905 | | | | 67,988 | |
Shares redeemed | | | (328,521 | ) | | | (288,051 | ) |
Net decrease in shares outstanding | | | (192,201 | ) | | | (117,970 | ) |
Shares outstanding, beginning of year | | | 2,844,832 | | | | 2,962,802 | |
Shares outstanding, end of year | | | 2,652,631 | | | | 2,844,832 | |
See accompanying notes to financial statements.
THE JAMESTOWN BALANCED FUND FINANCIAL HIGHLIGHTS | |
Selected Per Share Data and Ratios for a Share Outstanding Throughout Each Year | |
| | | | |
| | | | | | | | | | | | | | | |
Net asset value at beginning of year | | $ | 13.86 | | | $ | 13.16 | | | $ | 12.11 | | | $ | 10.09 | | | $ | 12.95 | |
| | | | | | | | | | | | | | | | | | | | | |
| Income (loss) from investment operations: | | | | | | | | | | | | | | | | | | | | |
Net investment income | | | 0.15 | | | | 0.14 | | | | 0.16 | | | | 0.22 | | | | 0.25 | |
Net realized and unrealized gains
(losses) on investments | | | 0.98 | | | | 0.71 | | | | 1.06 | | | | 2.04 | | | | (2.91 | ) |
Total from investment operations | | | 1.13 | | | | 0.85 | | | | 1.22 | | | | 2.26 | | | | (2.66 | ) |
| | | | | | | | | | | | | | | | | | | | | |
| Less distributions: | | | | | | | | | | | | | | | | | | | | |
| Dividends from net investment income | | | (0.16 | ) | | | (0.15 | ) | | | (0.17 | ) | | | (0.24 | ) | | | (0.20 | ) |
Distributions from net realized gains | | | (0.58 | ) | | | — | | | | — | | | | — | | | | — | |
Total distributions | | | (0.74 | ) | | | (0.15 | ) | | | (0.17 | ) | | | (0.24 | ) | | | (0.20 | ) |
| | | | | | | | | | | | | | | | | | | | | |
Net asset value at end of year | | $ | 14.25 | | | $ | 13.86 | | | $ | 13.16 | | | $ | 12.11 | | | $ | 10.09 | |
| | | | | | | | | | | | | | | | | | | | | |
Total return (a) | | | 8.68% | | | | 6.56% | | | | 10.24% | | | | 22.56% | | | | (20.75% | ) |
| | | | | | | | | | | | | | | | | | | | | |
Net assets at end of year (000’s) | | $ | 19,664 | | | $ | 19,048 | | | $ | 21,331 | | | $ | 22,183 | | | $ | 21,072 | |
| | | | | | | | | | | | | | | | | | | | | |
| Ratio of total expenses to average net assets | | | 1.29% | | | | 1.28% | | | | 1.24% | | | | 1.20% | | | | 1.14% | |
| | | | | | | | | | | | | | | | | | | | | |
Ratio of net expenses to average net assets (b) | | | 1.22% | | | | 1.21% | | | | 1.18% | | | | 1.11% | | | | 1.05% | |
| | | | | | | | | | | | | | | | | | | | | |
Ratio of net investment income to
average net assets (b) | | | 1.11% | | | | 1.08% | | | | 1.31% | | | | 1.98% | | | | 2.10% | |
| | | | | | | | | | | | | | | | | | | | | |
Portfolio turnover rate | | | 21% | | | | 20% | | | | 30% | | | | 40% | | | | 43% | |
| (a) | Total return is a measure of the change in value of an investment in the Fund over the period covered, which assumes any dividends or capital gains distributions are reinvested in shares of the Fund. Returns do not reflect the deduction of taxes a shareholder would pay on Fund distributions or the redemption of Fund shares. |
| | |
| (b) | Ratios were determined based on net expenses after voluntary advisory fee waivers by the Adviser (Note 4) and/or expense reimbursements through a directed brokerage arrangement (Note 5). |
| | |
| See accompanying notes to financial statements. |
THE JAMESTOWN EQUITY FUND FINANCIAL HIGHLIGHTS | |
Selected Per Share Data and Ratios for a Share Outstanding Throughout Each Year | |
| | | | |
| | | | | | | | | | | | | | | |
Net asset value at beginning of year | | $ | 17.73 | | | $ | 16.54 | | | $ | 14.67 | | | $ | 11.01 | | | $ | 16.68 | |
| | | | | | | | | | | | | | | | | | | | | |
| Income (loss) from investment operations: | | | | | | | | | | | | | | | | | | | | |
Net investment income | | | 0.15 | | | | 0.09 | | | | 0.09 | | | | 0.10 | | | | 0.08 | |
Net realized and unrealized gains
(losses) on investments | | | 1.93 | | | | 1.21 | | | | 1.87 | | | | 3.64 | | | | (5.68 | ) |
Total from investment operations | | | 2.08 | | | | 1.30 | | | | 1.96 | | | | 3.74 | | | | (5.60 | ) |
| | | | | | | | | | | | | | | | | | | | | |
| Less distributions: | | | | | | | | | | | | | | | | | | | | |
| Dividends from net investment income | | | (0.15 | ) | | | (0.11 | ) | | | (0.09 | ) | | | (0.08 | ) | | | — | |
Distributions from net realized gains | | | (0.06 | ) | | | — | | | | — | | | | — | | | | — | |
Return of capital | | | — | | | | — | | | | — | | | | — | | | | (0.07 | ) |
Total distributions | | | (0.21 | ) | | | (0.11 | ) | | | (0.09 | ) | | | (0.08 | ) | | | (0.07 | ) |
| | | | | | | | | | | | | | | | | | | | | |
Net asset value at end of year | | $ | 19.60 | | | $ | 17.73 | | | $ | 16.54 | | | $ | 14.67 | | | $ | 11.01 | |
| | | | | | | | | | | | | | | | | | | | | |
Total return (a) | | | 11.84% | | | | 7.89% | | | | 13.48% | | | | 33.96% | | | | (33.63% | ) |
| | | | | | | | | | | | | | | | | | | | | |
Net assets at end of year (000’s) | | $ | 28,316 | | | $ | 27,703 | | | $ | 28,359 | | | $ | 26,534 | | | $ | 18,790 | |
| | | | | | | | | | | | | | | | | | | | | |
| Ratio of total expenses to average net assets | | | 1.11% | | | | 1.11% | | | | 1.13% | | | | 1.16% | | | | 1.15% | |
| | | | | | | | | | | | | | | | | | | | | |
Ratio of net expenses to average net assets (b) | | | 1.06% | | | | 1.06% | | | | 1.09% | | | | 1.12% | | | | 1.10% | |
| | | | | | | | | | | | | | | | | | | | | |
Ratio of net investment income to
average net assets (b) | | | 0.81% | | | | 0.56% | | | | 0.56% | | | | 0.78% | | | | 0.56% | |
| | | | | | | | | | | | | | | | | | | | | |
Portfolio turnover rate | | | 28% | | | | 28% | | | | 49% | | | | 59% | | | | 69% | |
| (a) | Total return is a measure of the change in value of an investment in the Fund over the period covered, which assumes any dividends or capital gains distributions are reinvested in shares of the Fund. Returns do not reflect the deduction of taxes a shareholder would pay on Fund distributions or the redemption of Fund shares. |
| | |
| (b) | Ratios were determined based on net expenses after expense reimbursements through a directed brokerage arrangement (Note 5). |
| | |
| See accompanying notes to financial statements. |
THE JAMESTOWN TAX EXEMPT VIRGINIA FUND FINANCIAL HIGHLIGHTS | |
Selected Per Share Data and Ratios for a Share Outstanding Throughout Each Year | |
| | | | |
| | | | | | | | | | | | | | | |
Net asset value at beginning of year | | $ | 10.57 | | | $ | 10.25 | | | $ | 10.33 | | | $ | 10.24 | | | $ | 10.10 | |
| | | | | | | | | | | | | | | | | | | | | |
| Income (loss) from investment operations: | | | | | | | | | | | | | | | | | | | | |
Net investment income | | | 0.26 | | | | 0.29 | | | | 0.29 | | | | 0.30 | | | | 0.34 | |
Net realized and unrealized gains
(losses) on investments | | | (0.06 | ) | | | 0.32 | | | | (0.06 | ) | | | 0.11 | | | | 0.13 | |
Total from investment operations | | | 0.20 | | | | 0.61 | | | | 0.23 | | | | 0.41 | | | | 0.47 | |
| | | | | | | | | | | | | | | | | | | | | |
| Less distributions: | | | | | | | | | | | | | | | | | | | | |
| Dividends from net investment income | | | (0.27 | ) | | | (0.29 | ) | | | (0.29 | ) | | | (0.31 | ) | | | (0.33 | ) |
Distributions from net realized gains | | | (0.03 | ) | | | (0.00 | )(a) | | | (0.02 | ) | | | (0.01 | ) | | | (0.00 | )(a) |
Total distributions | | | (0.30 | ) | | | (0.29 | ) | | | (0.31 | ) | | | (0.32 | ) | | | (0.33 | ) |
| | | | | | | | | | | | | | | | | | | | | |
Net asset value at end of year | | $ | 10.47 | | | $ | 10.57 | | | $ | 10.25 | | | $ | 10.33 | | | $ | 10.24 | |
| | | | | | | | | | | | | | | | | | | | | |
Total return (b) | | | 1.88% | | | | 6.03% | | | | 2.26% | | | | 4.04% | | | | 4.77% | |
| | | | | | | | | | | | | | | | | | | | | |
Net assets at end of year (000’s) | | $ | 27,782 | | | $ | 30,063 | | | $ | 30,368 | | | $ | 32,905 | | | $ | 32,730 | |
| | | | | | | | | | | | | | | | | | | | | |
| Ratio of total expenses to average net assets | | | 0.76% | | | | 0.77% | | | | 0.76% | | | | 0.75% | | | | 0.77% | |
| | | | | | | | | | | | | | | | | | | | | |
Ratio of net expenses to average net assets (c) | | | 0.69% | | | | 0.69% | | | | 0.69% | | | | 0.69% | | | | 0.69% | |
| | | | | | | | | | | | | | | | | | | | | |
Ratio of net investment income to
average net assets (c) | | | 2.50% | | | | 2.75% | | | | 2.78% | | | | 2.89% | | | | 3.31% | |
| | | | | | | | | | | | | | | | | | | | | |
Portfolio turnover rate | | | 15% | | | | 2% | | | | 8% | | | | 16% | | | | 10% | |
| (a) | Amount rounds to less than a penny per share. |
| | |
| (b) | Total return is a measure of the change in value of an investment in the Fund over the period covered, which assumes any dividends or capital gains distributions are reinvested in shares of the Fund. Returns do not reflect the deduction of taxes a shareholder would pay on Fund distributions or the redemption of Fund shares. |
| | |
| (c) | Ratios were determined after voluntary advisory fee waivers by the Adviser (Note 4). |
| | |
| See accompanying notes to financial statements. |
THE JAMESTOWN FUNDS NOTES TO FINANCIAL STATEMENTS March 31, 2013 |
1. Organization
The Jamestown Balanced Fund, The Jamestown Equity Fund and The Jamestown Tax Exempt Virginia Fund (individually, a “Fund,” and, collectively, the “Funds”) are each a no-load series of Williamsburg Investment Trust (the “Trust”), an open-end management investment company registered under the Investment Company Act of 1940. The Trust was organized as a Massachusetts business trust on July 18, 1988. Other series of the Trust are not included in this report.
The Jamestown Balanced Fund’s investment objectives are long-term growth of capital and income.
The Jamestown Equity Fund’s investment objective is long-term growth of capital.
The Jamestown Tax Exempt Virginia Fund’s investment objectives are to provide current income exempt from federal income taxes and from the personal income taxes of Virginia, to preserve capital, to limit credit risk and to take advantage of opportunities to increase and enhance the value of a shareholder’s investment.
2. Significant Accounting Policies
The following is a summary of the Funds’ significant accounting policies. The policies are in conformity with accounting principles generally accepted in the United States of America (“GAAP”).
Securities valuation — The Funds’ portfolio securities are valued as of the close of business of the regular session of the New York Stock Exchange (normally 4:00 p.m., Eastern time). Securities traded on a national stock exchange are generally valued based upon the closing price on the principal exchange where the security is traded. Securities which are quoted by NASDAQ are valued at the NASDAQ Official Closing Price. Securities which are traded over-the-counter are valued at the last sales price, if available, otherwise, at the last quoted bid price. It is expected that fixed income securities will ordinarily be traded in the over-the-counter market, and common stocks will ordinarily be traded on a national securities exchange, but may also be traded in the over-the-counter market. Short-term instruments (those with remaining maturities of 60 days or less) may be valued at amortized cost, which approximates market value.
When market quotations are not readily available, securities may be valued on the basis of prices provided by an independent pricing service. The prices provided by the pricing service are determined with consideration given to institutional bid and last sale prices and take into account securities prices, yields, maturities, call features, ratings, institutional trading in similar groups of securities and developments related to specific securities. If a pricing service cannot provide a valuation or the investment adviser believes the price received from the pricing service is not indicative of fair value, securities will be valued in good faith at fair value using methods consistent with those established by and under the general supervision of the Board of Trustees and will be classified as Level 2 or 3 within the fair value hierarchy (see below), depending on
THE JAMESTOWN FUNDS NOTES TO FINANCIAL STATEMENTS (Continued) |
the inputs used. Such methods of fair valuation may include, but are not limited to: multiple of earnings, multiple of book value, discount from market of a similar freely traded security, purchase price of the security, subsequent private transactions in the security or related securities, or a combination of these and other factors.
GAAP establishes a single authoritative definition of fair value, sets out a framework for measuring fair value and requires additional disclosures about fair value measurements.
Various inputs are used in determining the value of each Fund’s investments. These inputs are summarized in the three broad levels listed below:
| • | Level 1 – quoted prices in active markets for identical securities |
| • | Level 2 – other significant observable inputs |
| • | Level 3 – significant unobservable inputs |
Fixed income securities, including municipal bonds, corporate bonds, obligations of the U.S. Treasury and U.S. Government agencies, are classified as Level 2 since the values for such securities are based on prices provided by an independent pricing service that utilizes various “other significant observable inputs” including bid and ask quotations, prices of similar securities and interest rates, among other factors.
The inputs or methodology used for valuing securities are not necessarily an indication of the risks associated with investing in those securities. The inputs used to measure fair value may fall into different levels of the fair value hierarchy. In such cases, for disclosure purposes, the level in the fair value hierarchy within which the fair value measurement falls in its entirety is determined based on the lowest level input that is significant to the fair value measurement.
The following is a summary of the inputs used to value each Fund’s investments as of March 31, 2013 by security type:
The Jamestown Balanced Fund | | | | | | | | | | | | |
Common Stocks | | $ | 12,985,133 | | | $ | — | | | $ | — | | | $ | 12,985,133 | |
U.S. Treasury Obligations | | | — | | | | 1,154,230 | | | | — | | | | 1,154,230 | |
| U.S. Government Agency Obligations | | | — | | | | 572,651 | | | | — | | | | 572,651 | |
Corporate Bonds | | | — | | | | 2,049,531 | | | | — | | | | 2,049,531 | |
Mortgage-Backed Securities | | | — | | | | 507,607 | | | | — | | | | 507,607 | |
Municipal Bonds | | | — | | | | 107,802 | | | | — | | | | 107,802 | |
Total | | $ | 12,985,133 | | | $ | 4,391,821 | | | $ | — | | | $ | 17,376,954 | |
The Jamestown Equity Fund | | | | | | | | | | | | |
Common Stocks | | $ | 26,108,878 | | | $ | — | | | $ | — | | | $ | 26,108,878 | |
Total | | $ | 26,108,878 | | | $ | — | | | $ | — | | | $ | 26,108,878 | |
THE JAMESTOWN FUNDS NOTES TO FINANCIAL STATEMENTS (Continued) |
The Jamestown Tax Exempt Virginia Fund | | | | | | | | | | | | |
Municipal Bonds | | $ | — | | | $ | 26,671,645 | | | $ | — | | | $ | 26,671,645 | |
Exchange-Traded Funds | | | 243,500 | | | | — | | | | — | | | | 243,500 | |
Money Market Funds | | | 577,892 | | | | — | | | | — | | | | 577,892 | |
Total | | $ | 821,392 | | | $ | 26,671,645 | | | $ | — | | | $ | 27,493,037 | |
Refer to The Jamestown Balanced Fund’s and The Jamestown Equity Fund’s Schedules of Investments for a listing of the common stocks and corporate bonds valued by sector type. As of March 31, 2013, the Funds did not have any transfers in and out of any Level. There were no Level 3 securities or derivative instruments held by the Funds as of March 31, 2013. It is the Funds’ policy to recognize transfers into and out of any Level at the end of the reporting period.
Repurchase agreements — The Funds may enter into repurchase agreements. A repurchase agreement, which is collateralized by U.S. Government obligations, is valued at cost which, together with accrued interest, approximates market value. At the time a Fund enters into a repurchase agreement, the seller agrees that the value of the underlying securities, including accrued interest, will at all times be equal to or exceed the face amount of the repurchase agreement. In addition, the Funds actively monitor and seek additional collateral, as needed. If the seller defaults, the fair value of the collateral may decline and realization of the collateral by the Funds may be delayed or limited.
Share valuation — The net asset value per share of each Fund is calculated daily by dividing the total value of its assets, less liabilities, by the number of shares outstanding. The offering price and redemption price per share of each Fund is equal to the net asset value per share.
Investment income — Interest income is accrued as earned. Dividend income is recorded on the ex-dividend date. Discounts and premiums on fixed income securities purchased are amortized using the interest method.
Distributions to shareholders — Dividends arising from net investment income, if any, are declared and paid quarterly to shareholders of The Jamestown Balanced Fund and The Jamestown Equity Fund. Dividends arising from net investment income are declared daily and paid monthly to shareholders of The Jamestown Tax Exempt Virginia Fund. Net realized short-term capital gains, if any, may be distributed throughout the year and net realized long-term capital gains, if any, are distributed at least once each year. The amount of distributions from net investment income and net realized gains are determined in accordance with federal income tax regulations which may differ from GAAP. These “book/tax” differences are either temporary or permanent in nature. Dividends and distributions are recorded on the ex-dividend date.
THE JAMESTOWN FUNDS NOTES TO FINANCIAL STATEMENTS (Continued) |
The tax character of distributions paid during the years ended March 31, 2013 and March 31, 2012 was as follows:
| | | | | | | | | | | | | |
| The Jamestown Balanced Fund | 3/31/13 | | $ | 298,063 | | | $ | 717,037 | | | $ | — | | | $ | 1,015,100 | |
| | 3/31/12 | | $ | 216,245 | | | $ | — | | | $ | — | | | $ | 216,245 | |
| The Jamestown Equity Fund | 3/31/13 | | $ | 215,083 | | | $ | 94,273 | | | $ | — | | | $ | 309,356 | |
| | 3/31/12 | | $ | 172,098 | | | $ | — | | | $ | — | | | $ | 172,098 | |
| The Jamestown Tax Exempt Virginia Fund | 3/31/13 | | $ | 108 | | | $ | 93,334 | | | $ | 747,939 | | | $ | 841,381 | |
| | 3/31/12 | | $ | 121 | | | $ | 11,275 | | | $ | 828,596 | | | $ | 839,992 | |
Security transactions — Security transactions are accounted for on trade date for financial reporting purposes. Gains and losses on securities sold are determined on a specific identification basis.
Securities traded on a “to-be-announced” basis — The Jamestown Balanced Fund may trade securities on a “to-be-announced” (“TBA”) basis. In a TBA transaction, the Fund has committed to purchase securities for which all specific information is not yet known at the time of the trade, particularly the face amount in mortgage-backed securities transactions. Securities purchased on a TBA basis are not settled until they are delivered to the Fund, normally 15 to 45 days later. These transactions are subject to market fluctuations and their current value is determined in the same manner as for other portfolio securities.
Common expenses — Common expenses of the Trust are allocated among the series of the Trust based on relative net assets of each series or the nature of the services performed and the relative applicability to each series.
Estimates — The preparation of financial statements in conformity with GAAP requires management to make estimates and assumptions that affect the reported amounts of assets and liabilities and the disclosure of contingent assets and liabilities as of the date of the financial statements and the reported amounts of income and expenses during the reporting period. Actual results could differ from those estimates.
Federal income tax — It is each Fund’s policy to comply with the special provisions of Subchapter M of the Internal Revenue Code applicable to regulated investment companies. As provided therein, in any fiscal year in which a Fund so qualifies and distributes at least 90% of its taxable net income, the Fund (but not the shareholders) will be relieved of federal income tax on the income distributed. Accordingly, no provision for income taxes has been made.
In order to avoid imposition of the excise tax applicable to regulated investment companies, it is also each Fund’s intention to declare as dividends in each calendar year at least 98% of its net investment income (earned during the calendar year) and 98.2% of its net realized capital gains (earned during the twelve months ended October 31) plus undistributed amounts from prior years.
THE JAMESTOWN FUNDS NOTES TO FINANCIAL STATEMENTS (Continued) |
The tax character of distributable earnings at March 31, 2013 was as follows:
| | The Jamestown Balanced Fund | | | | | | The Jamestown Tax Exempt Virginia Fund | |
Cost of portfolio investments | | $ | 12,239,477 | | | $ | 16,857,608 | | | $ | 25,687,107 | |
Gross unrealized appreciation | | $ | 5,214,525 | | | $ | 9,394,975 | | | $ | 1,854,575 | |
Gross unrealized depreciation | | | (77,048 | ) | | | (143,705 | ) | | | (48,645 | ) |
| Net unrealized appreciation on investments | | | 5,137,477 | | | | 9,251,270 | | | | 1,805,930 | |
Undistributed ordinary income | | | 103,370 | | | | 2,865 | | | | — | |
Undistributed tax exempt income | | | — | | | | — | | | | 7,980 | |
Undistributed long-term gains | | | 256,211 | | | | 823,172 | | | | 12,334 | |
Other temporary differences | | | (1,887 | ) | | | (1,531 | ) | | | (7,980 | ) |
Total distributable earnings | | $ | 5,495,171 | | | $ | 10,075,776 | | | $ | 1,818,264 | |
The difference between the federal income tax cost of portfolio investments and the financial statement cost for The Jamestown Balanced Fund and The Jamestown Equity Fund is due to certain timing differences in the recognition of capital gains or losses under income tax regulations and GAAP. These “book/tax” differences are temporary in nature and are primarily due to the tax deferral of losses on wash sales and/or differing methods in the amortization of market discount and premium on fixed income securities.
During the year ended March 31, 2013, The Jamestown Equity Fund utilized $986,704 of capital loss carryforwards to offset current year realized gains.
For the year ended March 31, 2013, The Jamestown Balanced Fund reclassified $3,058 of distributions in excess of net investment income against accumulated net realized gains from security transactions and The Jamestown Tax Exempt Virginia Fund reclassified $2 of accumulated net realized gains from security transaction against paid-in capital on the Statements of Assets and Liabilities due to permanent differences in the recognition of capital gains or losses under income tax regulations and GAAP. These differences are primarily due to the tax treatment of certain debt obligations and paydown adjustments. Such reclassifications had no effect on the Funds’ net assets or net asset value per share.
The Funds recognize the tax benefits or expenses of uncertain tax positions only when the position is “more likely than not” to be sustained assuming examination by tax authorities. Management has reviewed the tax positions taken on Federal income tax returns for all open tax years (tax years ended March 31, 2010 through March 31, 2013) of each Fund and has concluded that no provision for unrecognized tax benefits or expenses is required in these financial statements.
THE JAMESTOWN FUNDS NOTES TO FINANCIAL STATEMENTS (Continued) |
3. Investment Transactions
Investment transactions, other than short-term investments and U.S. government securities, were as follows for the year ended March 31, 2013:
| | The Jamestown Balanced Fund | | | | | | The Jamestown Tax Exempt Virginia Fund | |
Purchase of investment securities | | $ | 3,500,906 | | | $ | 7,050,928 | | | $ | 4,167,961 | |
Proceeds from sales and maturities of investment securities | | $ | 4,502,092 | | | $ | 8,781,241 | | | $ | 6,149,319 | |
4. Transactions with Related Parties
INVESTMENT ADVISORY AGREEMENTS
Each Fund’s investments are managed by Lowe, Brockenbrough & Company, Inc. (the “Adviser”) under the terms of an Investment Advisory Agreement. The Jamestown Balanced Fund pays the Adviser a fee, which is computed and accrued daily and paid monthly, at an annual rate of .65% of its average daily net assets up to $250 million, .60% of the next $250 million of such assets and .55% of such assets in excess of $500 million. The Jamestown Equity Fund pays the Adviser a fee, which is computed and accrued daily and paid monthly, at an annual rate of .65% of its average daily net assets up to $500 million and .55% of such assets in excess of $500 million. The Jamestown Tax Exempt Virginia Fund pays the Adviser a fee, which is computed and accrued daily and paid monthly, at an annual rate of .40% of its average daily net assets up to $250 million, .35% of the next $250 million of such assets and .30% of such assets in excess of $500 million. Certain officers of the Trust are also officers of the Adviser.
During the year ended March 31, 2013, the Adviser voluntarily undertook to limit the total annual operating expenses of The Jamestown Balanced Fund and The Jamestown Tax Exempt Virginia Fund to 1.22% and .69%, respectively, of average daily net assets. Accordingly, the Adviser voluntarily waived $1,500 and $22,351 with respect to The Jamestown Balanced Fund and The Jamestown Tax Exempt Virginia Fund, respectively, of its investment advisory fees during the year ended March 31, 2013.
MUTUAL FUND SERVICES AGREEMENT
Under the terms of a Mutual Fund Services Agreement between the Trust and Ultimus Fund Solutions, LLC (“Ultimus”), Ultimus provides administrative, pricing, accounting, dividend disbursing, shareholder servicing and transfer agent services for the Funds. For these services, Ultimus receives a monthly fee from each Fund at an annual rate of .15% of its average daily net assets up to $25 million; .125% of the next $25 million of such assets; and .10% of such assets in excess of $50 million. The Jamestown Balanced Fund and The Jamestown Equity Fund are each subject to a minimum monthly fee of $4,500 and The Jamestown Tax Exempt Virginia Fund is subject to a minimum monthly fee of $4,000. Prior to December 1, 2012, the minimum monthly fee for The Jamestown Balanced Fund and The Jamestown Equity Fund was $4,000 and the
THE JAMESTOWN FUNDS NOTES TO FINANCIAL STATEMENTS (Continued) |
minimum monthly fee for The Jamestown Tax Exempt Virginia Fund was $3,500. In addition, each Fund pays out-of-pocket expenses including, but not limited to, postage, supplies and costs of pricing portfolio securities. Certain officers of the Trust are also officers of Ultimus, or of Ultimus Fund Distributors, LLC (the “Distributor”), the principal underwriter of each Fund’s shares and an affiliate of Ultimus. The Distributor is compensated by the Adviser (not the Funds) for acting as principal underwriter.
COMPLIANCE CONSULTING AGREEMENT
Under the terms of a Compliance Consulting Agreement between the Trust and Ultimus, Ultimus provides an individual to serve as the Trust’s Chief Compliance Officer and to administer the Funds’ compliance policies and procedures. For these services, the Funds pay Ultimus an annual base fee of $18,600 plus an asset-based fee equal to 0.01% per annum on the Funds’ aggregate net assets in excess of $100 million. In addition, the Funds reimburse Ultimus for reasonable out-of-pocket expenses, if any, incurred in connection with these services.
COMPENSATION OF TRUSTEES
Trustees and officers affiliated with the Adviser or Ultimus are not compensated by the Trust for their services. Each Trustee who is not an affiliated person of the Adviser or Ultimus receives from the Trust an annual retainer of $8,000, payable quarterly; a fee of $1,500 for attendance at each meeting of the Board of Trustees (except that such fee is $2,500 for the independent chairman); and $1,000 for attendance at each meeting for any committee of the Board (except that such fee is $1,500 for the committee chairman); plus reimbursement of travel and other expenses incurred in attending meetings.
5. Brokerage Arrangement
In order to reduce the total operating expenses of The Jamestown Balanced Fund and The Jamestown Equity Fund, a portion of each Fund’s operating expenses have been paid through an arrangement with a third-party broker-dealer who is compensated through commission trades. Payment of expenses by the broker-dealer is based on a percentage of commissions earned.
Expenses reimbursed through the brokerage arrangement totaled $10,500 and $12,000 for The Jamestown Balanced Fund and The Jamestown Equity Fund, respectively, for the year ended March 31, 2013.
6. Contingencies and Commitments
The Funds indemnify the Trust’s officers and Trustees for certain liabilities that might arise from their performance of their duties to the Funds. Additionally, in the normal course of business the Funds enter into contracts that contain a variety of representations and warranties and which provide general indemnifications. The Funds’ maximum exposure under these arrangements is unknown, as this would involve future claims that may be made against the Funds that have not yet occurred. However, based on experience, the Funds expect the risk of loss to be remote.
THE JAMESTOWN FUNDS NOTES TO FINANCIAL STATEMENTS (Continued) |
7. Concentration of Credit Risk
The Jamestown Tax Exempt Virginia Fund invests primarily in debt instruments of municipal issuers in the Commonwealth of Virginia. The issuers’ abilities to meet their obligations may be affected by economic developments in the Commonwealth or its region, as well as disruptions in the credit markets and the economy, generally.
8. Subsequent Events
The Funds are required to recognize in the financial statements the effects of all subsequent events that provide additional evidence about conditions that existed as of the date of the Statements of Assets and Liabilities. For non-recognized subsequent events that must be disclosed to keep the financial statements from being misleading, the Funds are required to disclose the nature of the event as well as an estimate of its financial effect, or a statement that such an estimate cannot be made. Management has evaluated subsequent events through the issuance of these financial statements and has noted no such events.
THE JAMESTOWN FUNDS REPORT OF INDEPENDENT REGISTERED PUBLIC ACCOUNTING FIRM |
The Board of Trustees and Shareholders of
The Jamestown Balanced Fund,
The Jamestown Equity Fund, and
The Jamestown Tax Exempt Virginia Fund of the Williamsburg Investment Trust
We have audited the accompanying statements of assets and liabilities of The Jamestown Balanced Fund, The Jamestown Equity Fund, and The Jamestown Tax Exempt Virginia Fund (the “Funds”) (each a series of the Williamsburg Investment Trust), including the schedules of investments, as of March 31, 2013, and the related statements of operations for the year then ended, the statements of changes in net assets for each of the two years in the period then ended, and the financial highlights for each of the five years in the period then ended. These financial statements and financial highlights are the responsibility of the Funds’ management. Our responsibility is to express an opinion on these financial statements and financial highlights based on our audits.
We conducted our audits in accordance with the standards of the Public Company Accounting Oversight Board (United States). Those standards require that we plan and perform the audits to obtain reasonable assurance about whether the financial statements and financial highlights are free of material misstatement. We were not engaged to perform an audit of the Funds’ internal control over financial reporting. Our audits included consideration of internal control over financial reporting as a basis for designing audit procedures that are appropriate in the circumstances, but not for the purpose of expressing an opinion on the effectiveness of the Funds’ internal control over financial reporting. Accordingly, we express no such opinion. An audit also includes examining, on a test basis, evidence supporting the amounts and disclosures in the financial statements and financial highlights, assessing the accounting principles used and significant estimates made by management, and evaluating the overall financial statement presentation. Our procedures included confirmation of securities owned as of March 31, 2013, by correspondence with the custodian. We believe that our audits provide a reasonable basis for our opinion.
In our opinion, the financial statements and financial highlights referred to above present fairly, in all material respects, the financial position of each of the respective Funds comprising Williamsburg Investment Trust at March 31, 2013, the results of their operations for the year then ended, the changes in their net assets for each of the two years in the period then ended, and the financial highlights for each of the five years in the period then ended, in conformity with U.S. generally accepted accounting principles.
Cincinnati, Ohio
May 24, 2013
THE JAMESTOWN FUNDS BOARD OF TRUSTEES AND EXECUTIVE OFFICERS (Unaudited) |
Overall responsibility for management of the Funds rests with the Board of Trustees. The Trustees serve during the lifetime of the Trust and until its termination, or until death, resignation, retirement or removal. The Trustees, in turn, elect the officers of the Funds. The officers have been elected for an annual term. The following are the Trustees and executive officers of the Funds:
| Trustee | Address | Year of Birth | Position Held with the Trust | Length of Time Served |
| | Robert S. Harris | 100 Darden Boulevard Charlottesville, VA | 1949 | Chairman and Trustee | Since January 2007 |
| * | John P. Ackerly, IV | One James Center 901 E. Cary Street Richmond, VA | 1963 | Trustee | Since July 2012 |
| * | John T. Bruce | 800 Main Street Lynchburg, VA | 1953 | Trustee | Since September 1988 |
| | J. Finley Lee, Jr. | 448 Pond Apple Drive North Naples, FL | 1939 | Trustee | Since September 1988 |
| | Richard L. Morrill | University of Richmond Richmond, VA | 1939 | Trustee | Since March 1993 |
| | Harris V. Morrissette | 100 Jacintoport Boulevard Saraland, AL | 1959 | Trustee | Since March 1993 |
| | Austin Brockenbrough, III | 1802 Bayberry Court, Suite 400 Richmond, VA | 1937 | Vice President, The Jamestown Funds | Since September 1988 |
| | Charles M. Caravati, III | 1802 Bayberry Court, Suite 400 Richmond, VA | 1965 | President, The Jamestown Balanced Fund and The Jamestown Equity Fund | Since January 1996 |
| | Joseph A. Jennings, III | 1802 Bayberry Court, Suite 400 Richmond, VA | 1962 | President, The Jamestown Tax Exempt Virginia Fund | Since July 2005 |
| | Lawrence B. Whitlock, Jr. | 1802 Bayberry Court, Suite 400 Richmond, VA | 1948 | Vice President, The Jamestown Balanced Fund and The Jamestown Equity Fund | Since February 2002 |
| | Connie R. Taylor | 1802 Bayberry Court, Suite 400 Richmond, VA | 1950 | Vice President, The Jamestown Balanced Fund and The Jamestown Equity Fund | Since March 1993 |
| | Robert G. Dorsey | 225 Pictoria Drive, Suite 450 Cincinnati, OH | 1957 | Vice President | Since November 2000 |
| | Mark J. Seger | 225 Pictoria Drive, Suite 450 Cincinnati, OH | 1962 | Treasurer | Since November 2000 |
| | Tina H. Bloom | 225 Pictoria Drive, Suite 450 Cincinnati, OH | 1968 | Secretary and Chief Compliance Officer | Since August 2006 |
| * | Messrs. Ackerly and Bruce, as affiliated persons of investment advisers to the Trust, are “interested persons” of the Trust within the meaning of Section 2(a)(19) of the Investment Company Act of 1940. |
THE JAMESTOWN FUNDS BOARD OF TRUSTEES AND EXECUTIVE OFFICERS (Unaudited) (Continued) |
Each Trustee oversees eleven series of the Trust, including the Funds. The principal occupations of the Trustees and executive officers of the Funds during the past five years and public directorships held by the Trustees are set forth below:
Robert S. Harris is the C. Stewart Sheppard Professor of Business Administration at The Darden Graduate School of Business Administration at the University of Virginia. He was previously the dean at Darden. Professor Harris has published widely on corporate finance, financial markets and mergers and acquisitions and has served as a consultant to corporations and government agencies.
John P. Ackerly IV is Senior Vice President and Portfolio Manager of Davenport & Company LLC. (an investment advisory firm).
John T. Bruce is President, Director and member of the Executive Committee of Flippin, Bruce & Porter, Inc. (an investment advisory firm).
J. Finley Lee, Jr. is the retired Julian Price Professor Emeritus at the University of North Carolina.
Richard L. Morrill serves as President of the Teagle Foundation (charitable foundation) and Chancellor of the University of Richmond. He is also a member of the Board of Directors of Tredegar Corporation (a plastics manufacturer).
Harris V. Morrissette is President of China Doll Rice and Beans Inc. and Dixie Lily Foods. He is a member of the Board of Directors of BancTrust Financial Group, Inc. (a bank holding company) and International Shipholding Corporation (cargo transportation).
Austin Brockenbrough III is President and Managing Director of the Adviser. He is a member of the Board of Directors of Tredegar Corporation (a plastics manufacturer) and Wilkinson O’Grady & Co., Inc. (a global asset manager).
Charles M. Caravati, III is a Managing Director of the Adviser.
Joseph A. Jennings, III is a Portfolio Manager of the Adviser.
Lawrence B. Whitlock, Jr. is a Managing Director of the Adviser.
Connie R. Taylor is Account Administrator of the Adviser.
Robert G. Dorsey is a Managing Director of Ultimus Fund Solutions, LLC and Ultimus Fund Distributors, LLC.
Mark J. Seger is a Managing Director of Ultimus Fund Solutions, LLC and Ultimus Fund Distributors, LLC.
Tina H. Bloom is Director of Fund Administration of Ultimus Fund Solutions, LLC and Ultimus Fund Distributors, LLC.
Additional information about members of the Board of Trustees and executive officers is available in the Statement of Additional Information (“SAI”). To obtain a free copy of the SAI, please call 1-866-738-1126.
THE JAMESTOWN FUNDS FEDERAL TAX INFORMATION (Unaudited) |
In accordance with federal tax requirements, the following provides shareholders with information concerning distributions from ordinary income and net realized gains made by the Funds during the year ended March 31, 2013. Certain dividends paid by the Funds may be subject to a maximum tax rate of 15%, as provided by the Jobs and Growth Tax Relief Reconciliation Act of 2003. The Jamestown Balanced Fund and The Jamestown Equity Fund intend to designate up to a maximum amount of $298,063 and $215,083, respectively, as taxed at a maximum rate of 15%. During the year ended March 31, 2013, The Jamestown Balanced Fund, The Jamestown Equity Fund and The Jamestown Tax-Exempt Virginia Fund designated $717,037, $94,273 and $93,334, respectively, as long-term gain distributions. For the fiscal year ended March 31, 2013, 100% and 100% of the dividends paid from ordinary income by The Jamestown Balanced and The Jamestown Equity Fund, respectively, qualified for the dividends received deduction for corporations.
As required by federal regulations, complete information will be computed and reported in conjunction with your 2013 Form 1099-DIV.
THE JAMESTOWN FUNDS ABOUT YOUR FUNDS’ EXPENSES (Unaudited) |
We believe it is important for you to understand the impact of costs on your investment. All mutual funds have operating expenses. As a shareholder of the Funds, you incur ongoing costs, including management fees and other expenses. The following examples are intended to help you understand your ongoing costs (in dollars) of investing in the Funds and to compare these costs with the ongoing costs of investing in other mutual funds.
A mutual fund’s ongoing costs are expressed as a percentage of its average net assets. This figure is known as the expense ratio. The expenses in the table below are based on an investment of $1,000 made at the beginning of the period shown and held for the entire period (October 1, 2012 through March 31, 2013).
The table below illustrates each Fund’s costs in two ways:
Actual fund return – This section helps you to estimate the actual expenses that you paid over the period. The “Ending Account Value” shown is derived from each Fund’s actual return, and the third column shows the dollar amount of operating expenses that would have been paid by an investor who started with $1,000 in the Funds. You may use the information here, together with the amount you invested, to estimate the expenses that you paid over the period.
To do so, simply divide your account value by $1,000 (for example, an $8,600 account value divided by $1,000 = 8.6), then multiply the result by the number given for the Funds under the heading “Expenses Paid During Period.”
Hypothetical 5% return – This section is intended to help you compare the Funds’ ongoing costs with those of other mutual funds. It assumes that each Fund had an annual return of 5% before expenses during the period shown, but that the expense ratio is unchanged. In this case, because the returns used are not the Funds’ actual returns, the results do not apply to your investment. The example is useful in making comparisons because the Securities and Exchange Commission (“SEC”) requires all mutual funds to calculate expenses based on a 5% return. You can assess each Fund’s ongoing costs by comparing this hypothetical example with the hypothetical examples that appear in shareholder reports of other funds.
Note that expenses shown in the table are meant to highlight and help you compare ongoing costs only. The Funds do not charge sales loads or redemption fees.
The calculations assume no shares were bought or sold during the period. Your actual costs may have been higher or lower, depending on the amount of your investment and the timing of any purchases or redemptions.
More information about the Funds’ expenses, including annual expense ratios for the prior five fiscal years, can be found in this report. For additional information on operating expenses and other shareholder costs, please refer to the Funds’ prospectus.
THE JAMESTOWN FUNDS ABOUT YOUR FUNDS’ EXPENSES (Unaudited) (Continued) |
| | Beginning Account Value October 1, 2012 | Ending Account Value March 31, 2013 | Expenses Paid During Period* |
The Jamestown Balanced Fund |
Based on Actual Fund Return | $1,000.00 | $1,072.70 | $6.36 |
Based on Hypothetical 5% Return (before expenses) | $1,000.00 | $1,018.80 | $6.19 |
The Jamestown Equity Fund |
Based on Actual Fund Return | $1,000.00 | $1,104.60 | $5.56 |
Based on Hypothetical 5% Return (before expenses) | $1,000.00 | $1,019.65 | $5.34 |
The Jamestown Tax Exempt Virginia Fund |
Based on Actual Fund Return | $1,000.00 | $1,000.00 | $3.44 |
Based on Hypothetical 5% Return (before expenses) | $1,000.00 | $1,021.49 | $3.48 |
| * | Expenses are equal to the Funds’ annualized expense ratios for the period as stated below, multiplied by the average account value over the period, multiplied by 182/365 (to reflect the one-half year period). |
| The Jamestown Balanced Fund | 1.23% |
| The Jamestown Equity Fund | 1.06% |
| The Jamestown Tax Exempt Virginia Fund | 0.69% |
THE JAMESTOWN FUNDS OTHER INFORMATION (Unaudited) |
A description of the policies and procedures that the Funds use to vote proxies relating to portfolio securities is available without charge upon request by calling toll-free 1-866-738-1126, or on the SEC’s website at http://www.sec.gov. Information regarding how the Funds voted proxies relating to portfolio securities during the most recent 12-month period ended June 30 is also available without charge upon request by calling toll-free 1-866-738-1126, or on the SEC’s website at http://www.sec.gov.
The Trust files a complete listing of portfolio holdings of the Funds with the SEC as of the end of the first and third quarters of each fiscal year on Form N-Q. The filings are available upon request, by calling 1-866-738-1126. Furthermore, you may obtain a copy of these filings on the SEC’s website at http://www.sec.gov. The Trust’s Forms N-Q may also be reviewed and copied at the SEC’s Public Reference Room in Washington, DC, and information on the operation of the Public Reference Room may be obtained by calling 1-800-SEC-0330.
THE JAMESTOWN FUNDS DISCLOSURE REGARDING APPROVAL OF INVESTMENT ADVISORY AGREEMENTS (Unaudited) |
At an in-person meeting held on February 26, 2013, the Board of Trustees, including a majority of the Independent Trustees, approved the continuance for a one-year period of the Investment Advisory Agreements with the Adviser on behalf of The Jamestown Balanced Fund, The Jamestown Equity Fund and The Jamestown Tax Exempt Virginia Fund. Below is a discussion of the factors considered by the Board of Trustees along with their conclusions with respect thereto that formed the basis for the Board’s approvals.
In selecting the Adviser and approving the continuance of the Investment Advisory Agreements, the Trustees considered all information they deemed reasonably necessary to evaluate the terms of the Agreements. The principal areas of review by the Trustees were the nature, extent and quality of the services provided by the Adviser and the reasonableness of the fees charged for those services. These matters were considered by the Independent Trustees consulting with experienced counsel for the Independent Trustees, who is independent of the Adviser.
The Trustees’ evaluation of the quality of the Adviser’s services took into account their knowledge and experience gained through meetings with and reports of the Adviser’s senior management over the course of the preceding year. Both short-term and long-term investment performance of the Funds was considered. Each Fund’s performance was compared to its performance benchmark and to that of competitive funds with similar investment objectives and to the Adviser’s comparably managed private accounts. The Trustees also considered the scope and quality of the in-house capabilities of the Adviser and other resources dedicated to performing services for the Funds. The quality of administrative and other services, including the Adviser’s role in coordinating the activities of the Funds’ other service providers, were considered in light of the Funds’ compliance with investment policies and applicable laws and regulations and of related reports by management and the Funds’ independent public accounting firm in periodic meetings with the Trust’s Audit Committee. The Trustees also considered the business reputation of the Adviser, the qualifications of its key investment and compliance personnel, and its financial resources.
In reviewing the fees payable under the Investment Advisory Agreements, the Trustees compared the advisory fees and overall expense levels of each Fund with those of competitive funds with similar investment objectives as well as the private accounts managed by the Adviser. The Trustees considered information provided by the Adviser concerning the Adviser’s profitability with respect to each Fund, including the assumptions and methodology used in preparing the profitability information, in light of applicable case law relating to advisory fees. For these purposes, the Trustees took into account not only the fees paid by the Funds, but also so-called “fallout” benefits to the Adviser, such as the benefits of research made available to the Adviser by reason of brokerage commissions generated by the Funds’ securities transactions. The Trustees also reviewed the revenue sharing arrangements relating to the Funds, whereby fees are paid by the Adviser to various intermediaries that direct assets to the Funds. In evaluating the Funds’ advisory fees, the Trustees took into account the complexity and quality of the investment management of the Funds.
THE JAMESTOWN FUNDS DISCLOSURE REGARDING APPROVAL OF INVESTMENT ADVISORY AGREEMENTS (Unaudited) |
Based upon their review of this information, the Independent Trustees concluded that: (i) upon consideration of the one-year and longer term performance of each Fund, the effectiveness of the Adviser in achieving each Fund’s investment objective, as well as the services provided to shareholders, the Adviser has provided satisfactory services to the Funds as compared to similarly managed funds; (ii) the investment advisory fees of each Fund are competitive with comparably managed funds and each Fund’s total operating expense ratio is competitive with (and, in the case of The Jamestown Equity Fund and The Jamestown Tax Exempt Virginia Fund, lower than) the average expense ratio for comparably managed funds, according to statistics derived from Morningstar, Inc.; (iii) the Adviser’s commitment to cap overall operating expenses of The Jamestown Tax-Exempt Virginia Fund by voluntarily waiving a portion of its investment advisory fees has enabled such Fund to increase returns for its shareholders and to maintain an overall expense ratio that is competitive with the average for similarly managed funds, despite the small size of the Fund; and (iv) the Adviser’s profitability with respect to The Jamestown Balanced Fund and The Jamestown Equity Fund is reasonable and the Adviser did not realize any profits with respect to its management of The Jamestown Tax Exempt Virginia Fund. Given the current size of each Fund and its expected growth, the Independent Trustees did not believe that at the present time it would be relevant to consider the extent to which economies of scale would be realized as the Funds grow, and whether fee levels reflect these economies of scale. The Independent Trustees also considered the “fallout” benefits to, and the profitability of, the Adviser with respect to the Funds, but given the amounts involved viewed these as secondary factors in connection with the evaluation of the reasonableness of the advisory fees paid by the Funds.
No single factor was considered in isolation or to be determinative to the decision of the Trustees to approve continuance of the Investment Advisory Agreements. Rather the Trustees concluded, in light of a weighing and balancing of all factors considered, that it was in the best interests of each Fund and its shareholders to continue its Investment Advisory Agreement without modification to its terms, including the fees charged for services thereunder.
This page intentionally left blank.
| | | | | | | | |
| | | | | | | | | |
| | | | | | | | | |
| | | | | THE JAMESTOWN FUNDS www.jamestownfunds.com Investment Adviser Lowe, Brockenbrough & Company, Inc. 1802 Bayberry Court Suite 400 Richmond, Virginia 23226 Administrator Ultimus Fund Solutions, LLC P.O. Box 46707 Cincinnati, Ohio 45246-0707 (Toll-Free) 1-866-738-1126 Independent Registered Public Accounting Firm Ernst & Young LLP 1900 Scripps Center 312 Walnut Street Cincinnati, Ohio 45202 Legal Counsel Sullivan & Worcester LLP One Post Office Square Boston, Massachusetts 02109 Board of Trustees John P. Ackerly, IV John T. Bruce Robert S. Harris J. Finley Lee, Jr. Richard L. Morrill Harris V. Morrissette | | | | |
| | | | | | | | | |
| | | | | | | | | |
| | | | | | | | |
As of the end of the period covered by this report, the registrant has adopted a code of ethics that applies to the registrant’s principal executive officer, principal financial officer, principal accounting officer or controller, or persons performing similar functions, regardless of whether these individuals are employed by the registrant or a third party. Pursuant to Item 12(a)(1), a copy of registrant’s code of ethics is filed as an exhibit to this Form N-CSR. During the period covered by this report, the code of ethics has not been amended, and the registrant has not granted any waivers, including implicit waivers, from the provisions of the code of ethics.
The registrant’s board of trustees has determined that the registrant has at least one audit committee financial expert serving on its audit committee. The name of the audit committee financial expert is Dr. Robert S. Harris. Dr. Harris is “independent” for purposes of this Item.
The registrant’s Nominating Committee shall review shareholder recommendations to fill vacancies on the registrant’s board of trustees if such recommendations are submitted in writing, addressed to the Committee at the registrant’s offices and meet any minimum qualifications adopted by the Committee. The Committee may adopt, by resolution, a policy regarding its procedures for considering candidates for the board of trustees, including any recommended by shareholders.
(a) Based on their evaluation of the registrant’s disclosure controls and procedures (as defined in Rule 30a-3(c) under the Investment Company Act of 1940) as of a date within 90 days of the filing date of this report, the registrant’s principal executive officers and principal financial officer have concluded that such disclosure controls and procedures are reasonably designed and are operating effectively to ensure that material information relating to the registrant, including its consolidated subsidiaries, is made known to them by others within those entities, particularly during the period in which this report is being prepared, and that the information required in filings on Form N-CSR is recorded, processed, summarized, and reported on a timely basis.
(b) There were no changes in the registrant’s internal control over financial reporting (as defined in Rule 30a-3(d) under the Investment Company Act of 1940) that occurred during the second fiscal quarter of the period covered by this report that have materially affected, or are reasonably likely to materially affect, the registrant’s internal control over financial reporting.
File the exhibits listed below as part of this Form. Letter or number the exhibits in the sequence indicated.
(a)(1) Any code of ethics, or amendment thereto, that is the subject of the disclosure required by Item 2, to the extent that the registrant intends to satisfy the Item 2 requirements through filing of an exhibit: Attached hereto
(a)(2) A separate certification for each principal executive officer and principal financial officer of the registrant as required by Rule 30a-2(a) under the Act (17 CFR 270.30a-2(a)): Attached hereto
(a)(3) Any written solicitation to purchase securities under Rule 23c-1 under the Act (17 CFR 270.23c-1) sent or given during the period covered by the report by or on behalf of the registrant to 10 or more persons: Not applicable
(b) Certifications required by Rule 30a-2(b) under the Act (17 CFR 270.30a-2(b)): Attached hereto