THE DAVENPORT FUNDS LETTER TO SHAREHOLDERS | May 11, 2015 |
Dear Shareholders,
Domestic equity markets behaved like a yo-yo in the quarter ended March 31, 2015. The S&P 500 Index (“S&P 500”) declined in January, bounced back sharply in February and declined once more in March. Ultimately, the S&P 500 finished the quarter up 0.95%. Smaller cap stocks acted better as evidenced by the Russell 2000 Index’s 4.32% gain for the quarter. This makes sense given that small-cap stocks underperformed in 2014 and are typically less exposed to the currency headwinds that have recently plagued many U.S. multinationals. We were pleased with the performance of The Davenport Funds, which generally fared better than their benchmarks.
Strength in the U.S. dollar has recently captured investor attention. The currency’s upward move has been both quick and violent. Indeed, the dollar has appreciated 23% versus a trade-weighted basket of currencies over the past 9 months.1 This phenomenon has been caused by an improving U.S. economy and resultant divergence of monetary policies with many other countries. In other words, the Federal Reserve now appears closer to raising interest rates, whereas other central banks are still trying to suppress interest rates in order to stimulate stagnating economies. The strong U.S. dollar has pressured the earnings of U.S. companies that do business all over the world as sales in foreign currencies are translated back into fewer dollars.
Dollar strength is understandable in the context of the current global economic environment and could persist. However, it may not continue at its recent pace and is starting to appear overdone. We certainly aren’t currency experts, but can recall just a few years ago when some investors were calling for the dollar’s collapse. In fact, a handful of celebrities publicly shunned the dollar and demanded payment in euros. Such fond memories should remind us not to get too caught up in prevailing headlines and trends. To that end, we think it’s an interesting time to invest in good companies with share prices that may be temporarily depressed by currency headwinds. As you will read in our portfolio discussions below, we’ve already begun to capitalize on a few of these opportunities.
The Federal Reserve remains in the spotlight. As our economy improves, investors continue to anticipate a departure from longstanding zero interest rate policy. With little evidence of any inflationary pressure and declines in many commodity prices (especially oil), we don’t think the Federal Reserve is in a rush to raise interest rates and will be very slow in doing so. We also note it may be harder for them to act with the backdrop of a strong dollar, which both dampens export growth and reduces inflationary pressures by allowing the U.S. to import goods more cheaply. Chairwoman Yellen’s recent comments certainly acknowledged these facts. Hence, even if we do see a slight rate hike, we don’t envision an end to generally “dovish” policy anytime soon.
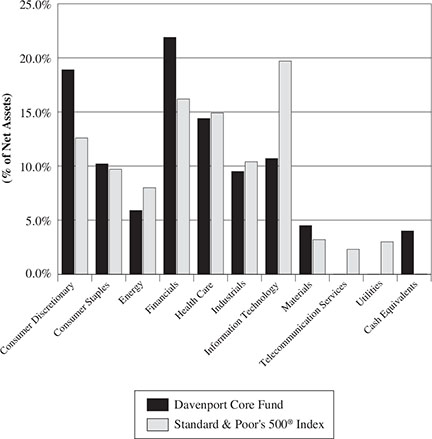
Meanwhile, the picture continues to improve for domestic consumers. Job creation has trended upward and recent employment readings have been better than expected. In fact, the unemployment rate recently stood at 5.6%, a level that seemed unthinkable just a few years ago when we were dealing with a double-digit unemployment rate. Also, gasoline prices remain depressed alongside lower oil prices. Cheaper prices at the pump should provide a nice lift to discretionary spending. For these reasons, we remain bullish on the U.S. consumer and continue to overweight the consumer discretionary sector in the Funds’ portfolios.
All told, we think a combination of accommodative monetary policy and improving domestic trends provide a constructive backdrop for equity markets. While stocks are no longer “cheap” with the S&P 500 trading at 17.5x this year’s earnings estimate, they seem fair in the context of this backdrop. We reiterate our belief that returns should be okay going forward, but are unlikely to rival the past few years when declining interest rates and a wave of cheap money pushed valuations higher. As noted earlier, we also think that stocks with international exposure are beginning to look relatively attractive following a period of weak performance. Please read on for a discussion of Fund themes and ideas. We thank you for your trust and look forward to reporting back to you later in the year.
| 1 | Source: Federal Reserve, Bloomberg |
Davenport Core Fund
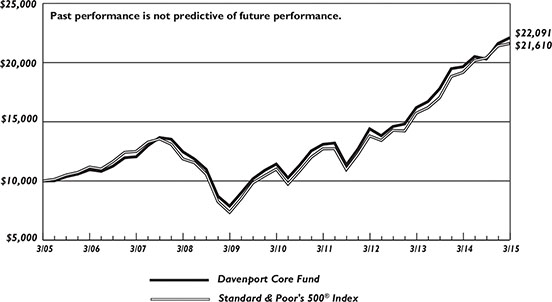
The following chart represents Davenport Core Fund (the “Core Fund”) performance and the performance of the S&P 500 Index*, the Core Fund’s primary benchmark, for the periods ended March 31, 2015.
| | Q1 2015 | 1 Year | 3 Years** | 5 Years** | 10 Years** | Since Inception** 1/15/98 | Fiscal Year 2015 Expense Ratio |
| Core Fund | 2.22% | 12.42% | 15.33% | 14.10% | 8.25% | 6.56% | 0.94% |
| S&P 500 Index* | 0.95% | 12.73% | 16.11% | 14.47% | 8.01% | 6.57% | — |
30-Day SEC Yield: 0.46%; Expense Ratio in current prospectus: 0.94%
Past performance is no guarantee of future results. Investment return and principal value of an investment will fluctuate so that an investor’s shares, when redeemed, may be worth more or less than their original cost. Current performance may be lower or higher than the performance data quoted. Performance data, current to the most recent month end, may be obtained by calling 1-800-281-3217.
| * | The S&P 500 Index is comprised of 500 U.S. stocks and is an indicator of the performance of the overall U.S. stock market. An investor cannot invest in an index and its returns are not indicative of the performance of any specific investment. |
The Core Fund had a solid fiscal year, returning 12.42% for the year ended March 31, 2015, versus the 12.73% gain in the S&P 500.
The Core Fund’s holdings in the Health Care sector performed particularly well. Valeant Pharmaceuticals (VRX), AmerisourceBergen (ABC) and Anthem (ANTM) were top contributors. We elected to chip VRX and ABC as each stock reached new highs. Key detractors included many commodity-related names, which have been hurt by the strength in the U.S. dollar as well as the six month meltdown in oil prices. Examples include Range Resources (RRC), Chicago Bridge & Iron (CBI), Schlumberger (SLB), and Exxon Mobil (XOM). Fortunately, the Core Fund has been underweight the Energy sector for quite some time as we have been concerned about the growth in U.S. oil supplies, and this underweight position paid off for us in fiscal 2015.
Recent Fund transactions had a slightly contrarian feel. Two examples of new purchases, Mondelēz International (MDLZ) and The Priceline Group (PCLN), have been beaten up by near-term concerns about the impact of a stronger dollar on results. We think this has presented an attractive opportunity to purchase businesses with great cash flow generation and sustainable competitive moats that are well positioned for multiyear growth in earnings. MDLZ is the Kraft Foods international spinoff, selling food products in roughly 165 countries. In addition to currency headwinds, investors have been disappointed with margins that are well below industry averages. The company has an impressive slate of top tier food brands (such as Oreo, Cadbury and Trident), a stable business profile and an opportunity for “self help.” As management executes on a $3.5B restructuring program, we think the margin profile can increase from the low teens towards the targeted 15-16% range. Finally, we note the company is a rumored takeout candidate in a consolidating industry, which, alongside a meaningful stock buyback program, could provide downside support.
PCLN is an industry leading e-commerce company that provides access to online accommodation and travel reservation services through Priceline.com, Booking.com, KAYAK.com, rentalcars.com, and recently acquired OpenTable. The bulk of PCLN’s business is derived from international operations, primarily through Booking.com, as approximately 87% of gross bookings and approximately 94% of consolidated operating income was generated outside the U.S. during 2014. The stock has trailed the market for a year, despite executing well. As the key link between two fragmented end users (hotel operators and travelers), PCLN is able to achieve very impressive levels of profitability (gross margins were 90% of revenue in 2014) while maintaining share in a growing category.
We are pleased with the Core Fund’s performance in fiscal 2015. We constantly strive to reallocate funds towards situations we believe present the best risk/reward opportunity available, and we believe the actions discussed above are consistent with this approach. Going forward, we feel the Core Fund is well positioned given our focus on what we believe are high quality companies with defensible growth characteristics.
The following are transactions performed in the Core Fund for the quarter ended March 31, 2015 and we have provided our rationale for each transaction.
Recent Purchases
JPMorgan Chase & Company (JPM) We added to JPM after a flattening yield curve and a disappointing Q4 earnings release provided an attractive entry point.
Liberty Media Corporation (LMCK) LMCK recently spun off its cable assets, and the bulk of the value now comes from Sirius XM Radio, a highly cash generative business. We added to this position as we think the stock is trading at a discount to our sum of the parts valuation.
Mondelēz International, Inc. (MDLZ) We purchased a position in this Kraft Foods international spinoff given its stable business profile and prospects for margins to increase as management executes a restructuring program.
Priceline Group, Inc. (The) (PCLN) We purchased a position in PCLN due to robust cash generation and large international growth opportunity protected by sustainable barriers to entry.
Recent Sales
AmerisourceBergen Corporation (ABC) We chipped this position after numerous positive developments have transpired to move the stock significantly higher.
Automatic Data Processing, Inc. (ADP) We sold ADP after a long rally in the share price left the stock trading at a pricey ~30x earnings.
Celgene Corporation (CELG) We chipped CELG after an outsized rally provided an opportunity to reduce this position size slightly.
Valeant Pharmaceuticals International, Inc. (VRX) We chipped this position given recent strong performance as the stock has come back in favor with investors.**
Davenport Value & Income Fund
The following chart represents Davenport Value & Income Fund (the “Value & Income Fund”) performance and the performance of the S&P 500 Index, the Value & Income Fund’s primary benchmark, and the Lipper Equity Income Index for the periods ended March 31, 2015.
| | Q1 2015 | 1 Year | 3 Years** | Since Inception** 12/31/2010 | Fiscal Year 2015 Expense Ratio |
| Value & Income Fund | 1.76% | 11.92% | 16.24% | 15.69% | 0.92% |
| S&P 500 Index* | 0.95% | 12.73% | 16.11% | 14.84% | — |
| Lipper Equity Income Index* | -0.01% | 8.45% | 14.01% | 12.54% | — |
30-Day SEC Yield: 1.92%; Expense Ratio in current prospectus: 1.07%
Past performance is no guarantee of future results. Investment return and principal value of an investment will fluctuate so that an investor’s shares, when redeemed, may be worth more or less than their original cost. Current performance may be lower or higher than the performance data quoted. Performance data, current to the most recent month end, may be obtained by calling 1-800-281-3217.
| * | The S&P 500 Index is comprised of 500 U.S. stocks and is an indicator of the performance of the overall U.S. stock market. The Lipper Equity Income Index is an unmanaged index of the 30 largest funds in the Lipper Equity Income fund category. An investor cannot invest in an index and its returns are not indicative of the performance of any specific investment. |
The Value & Income Fund returned 11.92% for the fiscal year ended March 31, 2015, nicely outpacing the Lipper Equity Income Index’s gain of 8.45% and just behind the S&P 500’s 12.73% gain for the period. Actively managed income funds lagged this year as the market began to price in an eventual hike in interest rates. We believe the Fund’s performance was driven largely by our focus on investing in what we consider to be high quality companies that can consistently grow their dividends at an above-average rate over time. Further differentiating our investment approach, we are willing to look in unconventional places in our search for value.
Speaking of unconventional places, the Value & Income Fund’s top performing stock for the year was the Deutsche X-trackers Harvest CSI 300 China A-Shares ETF (ASHR). Investor sentiment towards China had reached what we believed to be exceptionally bearish levels (just a few years after unbridled enthusiasm), and the domestic equity index was down 2/3rds from its high in 2007 at the time of our purchase. Trading under 10x forward earnings, the domestic Chinese market was, in our opinion, one of the cheapest in the world, despite having one of the fastest growing GDP rates. The Value & Income Fund was rewarded with a 90% gain during the year as the government has eased monetary policy and opened up markets for international investors.
Closer to home, leading HVAC distributor, Watsco (WSO), was a meaningful contributor for the year. Since we added to the position in October of 2014, the shares have produced gains north of 40%. WSO’s dividend has doubled since the end of 2013 (currently yields 2.2%), and we expect to see further increases alongside strong earnings growth. After struggling for much of the year, casino REIT Gaming and Leisure Properties (GLPI) has been another key contributor lately as the shares responded favorably to the announcement of the company’s hostile takeover bid for the real estate assets of Pinnacle Entertainment (PNK), a large regional gaming company. We added to the position during the quarter due to the company’s stable, above-average dividend (yielding 5.9%) and the belief that the aforementioned transaction should create significant value if consummated.
Commodity and material related stocks struggled during the year, as oil prices collapsed 50% due to oversupply from U.S. drilling and a lack of willingness from the Organization of the Petroleum Exporting Countries (OPEC) to cut production. Declining commodity prices and a strengthening U.S. dollar caused shares of Exxon Mobil (XOM), Eastman Chemical (EMN) and Potash (POT) to underperform. The strong dollar also impacted companies with significant international revenues, such as Johnson & Johnson (JNJ) and Phillip Morris International (PM). As described below, we elected to use this weakness as an opportunity to add to the Fund’s position in PM.
With virtually all of its revenue coming from outside the U.S., PM’s share price has struggled as currencies in its end market countries have fallen significantly versus the U.S. dollar. Despite these headwinds, the company continues to perform well at the operational level, with 2015 currency-neutral revenue growth expectations of 4-6% resulting in adjusted diluted Earnings Per Share (EPS) growth of 8-10%. Furthermore, we note the company pays a generous dividend that yields 5.3%, which should provide downside support. Dollar strength versus foreign currencies has tended to ebb and flow over time and, at some point, we think this headwind may again become a tailwind for PM. At a minimum, we feel stabilization in exchange rates should allow investors to focus more on the company’s strong brand portfolio, international growth runway and attractive dividend. Given these factors, we elected to use pronounced weakness to make the position more meaningful.
We initiated a position in global casino and resort developer Las Vegas Sands (LVS). Though it is better known to U.S. investors for properties in Las Vegas, NV, such as The Venetian and The Palazzo, the majority of the company’s earnings come from its four properties in Macau, China (60% of cash flow), in addition to a large property in Singapore (30% of cash flow). While the company’s domestic and Singapore operations have been performing well as of late, the Macau operations have been negatively impacted by Chinese anti-corruption regulation which, when combined with a recent smoking ban, has curbed visitation and gambling activity in the region. These developments have caused significant reductions to earnings estimates, resulting in a severe correction in the stock. Though the investment community lacks visibility into the near term outlook, we felt this was an attractive opportunity to gain access to a company with a top tier asset
portfolio, in a supply constrained market with clear long-term tailwinds such as China’s growing middle class. Furthermore, we note that management is committed to maximizing shareholders’ returns, as evidenced by recent announcements of a 30% dividend increase (yield of 4.7%) and a $2 billion stock repurchase program. With the stock down over 35% from recent highs, we felt the risk/reward was attractive.
We are pleased to have closed out the year on a strong note, especially in light of what was a difficult year for most “value” managers. Though we are likely to encounter volatility over the coming year, we feel our continued emphasis on strong franchises that can support and grow their dividends leaves us well positioned for the long term.
The following are transactions performed in the Value & Income Fund for the quarter ended March 31, 2015 and we have provided our rationale for each transaction.
Recent Purchases
Diageo plc - ADR (DEO) We added to this global spirits industry leader after the stock underperformed the last couple of years. Current yield: 3.0%
Gaming & Leisure Properties, Inc. (GLPI) We added to this position twice during the quarter as we still view the stock as a value situation and think that the potential Pinnacle deal could create a lot of value for shareholders. Current yield: 5.9%
iShares China Large-Cap ETF (FXI) We purchased a position in FXI as the H share market in Hong Kong now looks undervalued. Current yield: 2.4%
JPMorgan Chase & Company (JPM) We added to JPM after a flattening yield curve and a disappointing Q4 earnings release provided an attractive entry point. Current yield: 2.6%
Las Vegas Sands Corporation (LVS) We purchased a position after the stock was shellacked over the decline in the Macau gaming market. We think the stock is a good value here and don’t think gambling in China is dead. Current yield: 4.7%
McDonald’s Corporation (MCD) We added to this down and out stock as we remain attracted to the business model and the free cash flow it generates. Current yield: 3.5%
Merck & Company, Inc. (MRK) We added to this reasonably-priced pharmaceutical that appears to be well positioned to benefit from new drug launches. Current yield: 3.1%
Microsoft Corporation (MSFT) We purchased a position given weak recent performance as we are attracted to the company’s strong cash flow and economic moat. Current yield: 3.1%
Philip Morris International, Inc. (PM) We added to PM as currency headwinds have caused a selloff in the stock price. The 5.3% dividend yield should provide support for this high quality cash generator. Current yield: 5.3%
Sanofi-Aventis - ADR (SNY) We purchased this out of favor big pharmaceutical company, which gives us inexpensive ownership in highly profitable existing drugs and a promising pipeline. Current yield: 3.3%
Recent Sales
Automatic Data Processing, Inc. (ADP) We sold ADP after a sharp rally in the share price left the stock trading at a pricey ~30x earnings. Current yield: 2.2%
Aflac, Inc. (AFL) We sold AFL after the stock has struggled due to a weakening currency in their largest market (Japan) and extremely low interest rates that constrain profits. Current yield: 2.7%
Deutsche X-trackers Harvest CSI 300 China A-Share ETF (ASHR) We chipped ASHR as the A share market in China has generated significant profits in this holding. Current yield: 0.2%
Equity Lifestyle Properties, Inc. (ELS) We chipped this position after a strong rally brought share prices closer to intrinsic value. We also found it prudent to reduce the Fund’s REIT exposure in light of interest rate uncertainty. Current yield: 2.7%
Hartford Financial Services Group, Inc. (HIG) We chipped HIG after the stock moved much closer to its intrinsic value. Current yield: 1.7%
Kinder Morgan, Inc. (KMI) We chipped KMI given a fairly robust valuation, risks from the oil & gas environment, and share prices near highs. Current yield: 4.3%
Marathon Petroleum Corporation (MPC) We sold this position after a threefold increase as the risk/reward looks less attractive for this refiner. Current yield: 1.9%
Penn National Gaming, Inc. (PENN) We sold this small position and redeployed the proceeds into a higher yielding opportunity. Current yield: n/a
Sun Communities, Inc. (SUI) We chipped this position twice during the quarter after a strong rally brought share prices closer to intrinsic value. We also found it prudent to reduce the Fund’s REIT exposure in light of interest rate uncertainty. Current yield: 3.9%
Davenport Equity Opportunities Fund
The following chart represents Davenport Equity Opportunities Fund (the “Equity Opportunities Fund”) performance and the performance of the Russell Midcap Index, the Fund’s primary benchmark, and the S&P 500 Index for the periods ended March 31, 2015.
| | Q1 2015 | 1 Year | 3 Years** | Since Inception** 12/31/2010 | Fiscal Year 2015 Expense Ratio |
| Equity Opportunities Fund | 5.59% | 16.67% | 18.99% | 18.04% | 0.96% |
| Russell Midcap Index* | 3.95% | 13.68% | 18.10% | 15.31% | — |
| S&P 500 Index* | 0.95% | 12.73% | 16.11% | 14.84% | — |
30-Day SEC Yield: 0.25%; Expense Ratio in current prospectus: 0.98%
Past performance is no guarantee of future results. Investment return and principal value of an investment will fluctuate so that an investor’s shares, when redeemed, may be worth more or less than their original cost. Current performance may be lower or higher than the performance data quoted. Performance data, current to the most recent month end, may be obtained by calling 1-800-281-3217.
| * | The Russell Midcap Index measures the performance of the 800 smallest companies in the Russell 1000 Index, which represent approximately 25% of the total market capitalization of the Russell 1000. The S&P 500 Index is comprised of 500 U.S. stocks and is an indicator of the performance of the overall U.S. stock market. An investor cannot invest in an index and its returns are not indicative of the performance of any specific investment. |
The Equity Opportunities Fund enjoyed a nice close to fiscal 2015. For the one year period ended March 31, 2015, the Fund advanced 16.67% as compared to gains of 13.68% and 12.73%, respectively, for the Russell Midcap and S&P 500 indices. We were pleased to see a handful of the Fund’s holdings perform admirably in what proved to be a choppy market environment at year end.
Gaming & Leisure Properties (GLPI) emerged as the Fund’s top performing stock for the fourth quarter. We had been adding to shares of this casino REIT at what we considered to be depressed prices and were pleased to see it get some love from investors. We continue to think GLPI’s savvy management team can build value via acquisitions and note our patience is being rewarded with a 5.9% dividend yield. As we write this letter, we are hopeful that GLPI will come to an agreement to acquire the real estate of Pinnacle Entertainment (PNK), which is one of the largest regional casino operators. This deal would diversify the company’s tenant base, enhance its scale and potentially grow the dividend meaningfully. Colfax (CFX) and Discovery Communications (DISCK) were among the worst performers for the Fund. We’ve been adding to both positions as issues like currency headwinds have caused the stocks to decline sharply. Such headwinds are masking solid franchises run by exceptionally talented capital allocators, in our opinion. At current prices, we still feel both stocks have among the best risk/reward profiles in the Fund.
We reduced stakes in a few strong performers as we rotated capital to more depressed situations like DISCK and CFX. Penn National Gaming (PENN) and Sun Communities (SUI) serve as good examples. PENN has rallied roughly 40% over the last six months and has moved from being deeply out of favor to being a popular play on a regional gaming recovery. SUI, which operates manufactured housing communities, has steadily appreciated as the company consummated a large acquisition and the stock has hit the radars of income-thirsty investors. Both of these stocks should be okay long-term, but appear to offer more balanced risk/reward profiles and are unlikely to sustain the returns of recent quarters.
We’ve added a couple new positions to the Equity Opportunities Fund’s portfolio. The first is Live Nation (LYV), which is the world’s leading concert company. To put the company’s dominance into perspective, last year LYV controlled 22 of the top 25 global tours. There are four tailwinds to consider from a big picture perspective: 1) concert attendance is growing, 2) similar to live sporting events, the value of live concerts to advertisers is increasing as traditional media is being disrupted, 3) artists/musicians are more inclined to tour as traditional forms of promotion are impaired (e.g., radio), and 4) global popularity is adding a new international component to concerts/tours. The concerts themselves are low margin productions, but the company has built a machine where concerts feed other high margin businesses including venue management, artist management, advertising/sponsorship and Ticketmaster, which controls 60% of the ticketing market. The company is in the early stages of monetizing live content across these platforms and appears poised to drive meaningful free cash flow growth. We are also encouraged by the involvement of Liberty Media (LMCK), which is best known for Chairman John Malone’s long history of savvy deal-making and value creation. LMCK owns 27% of LYV and its CEO (and Malone protégé) Greg Maffei sits on the company’s Board. We think he will most certainly be a positive influence.
Continuing the LMCK/John Malone theme, another new investment is Liberty Broadband (LBRDK). This company was recently separated from LMCK and is comprised primarily of a 26% stake in cable company Charter Communications (CHTR). CHTR is a story of both operational improvement and growth by acquisition. CHTR CEO Tom Rutledge, a highly
regarded cable operator who joined in 2012, is improving system quality, customer service and customer penetration. On the acquisition front, CHTR has emerged as a likely acquirer of Time Warner Cable (TWC) after the mega-merger between TWC and Comcast (CMCSK) failed to clear regulatory hurdles. More recently, the company announced a deal to purchase Bright House, which is the country’s sixth biggest cable company with 2.5 million subscribers. All told, increasing scale will bring synergies (e.g., more negotiating clout with content providers) and allow Mr. Rutledge to work his operational magic across a bigger platform. We think LBRDK represents a unique way to play the CHTR growth story because it trades at a slight discount to the value of its investments and could have extra upside associated with Chairman John Malone’s deal making skills.
While we can’t guarantee markets won’t take a breather at some point soon, we do feel very good about the potential for new and existing holdings to create material value for investors in coming years. We like investing alongside talented value creators like Mr. Malone that have significant “skin in the game” and a history of exceptional results. Such leaders tend to have a penchant not only for compounding wealth, but also for managing risk through difficult economic and market cycles. Hopefully, we can do the same by aligning ourselves with them.
The following are transactions performed in the Equity Opportunities Fund for the quarter ended March 31, 2015 and we have provided our rationale for each transaction.
Recent Purchases
Capital One Financial Corporation (COF) We added to the Fund’s position in this high-quality credit card company with an inexpensive valuation.
Colfax Corporation (CFX) We added to this stock, well off its high due to weakness in oil & gas as well as European business, as we continue to like the long-term outlook.
Discovery Communications, Inc. (DISCK) We added to DISCK as we think concerns (euro weakness, recent subscriber trends) are overblown and upside is very meaningful.
Fairfax Financial Holdings Ltd. (FRFHF) We added to FRFHF as we continue to like the company’s defensive positioning and the stock has had a weak year to date.**
Gaming and Leisure Properties, Inc. (GLPI) We added to this position as the stock is still trading very cheaply and our confidence in management remains high.
Liberty Broadband Corporation (LBRDK) We purchased and subsequently added to this position as we find it an intriguing story of self help, growing scale and improving negotiating leverage with content providers, with M&A upside.
Live Nation Entertainment, Inc. (LYV) We purchased and subsequently added to this dominant concert promoter as we are attracted to the defensible long-term story of rising cash flows.
NRG Energy, Inc. (NRG) We added to NRG as lower natural gas has caused weakness in the share price that we believe is unjustified given numerous upside opportunities, including capacity payment reform and renewable power initiatives.
PRA Group, Inc. (PRAA) We added to PRAA on weakness related to an increased regulatory burden and limited credit supply. We view the company’s expansion into Europe favorably and think this management team will continue to create value for shareholders both here and abroad.
WABCO Holdings, Inc. (WBC) We added to WBC as currency (euro) concerns caused a pullback in this truck parts maker with a strong secular growth outlook.
Recent Sales
American Airlines Group, Inc. (AAL) We chipped this “high flying” airline stock, locking in some profits after a great year.
CarMax, Inc. (KMX) We chipped KMX after recent strength prompted us to reduce the position size.
Krispy Kreme Doughnuts, Inc. (KKD) We sold this doughnut maker as shares have moved higher and we found better opportunities elsewhere.
Morgan Stanley China A Share Fund, Inc. (CAF) We chipped this position after strong performance allowed us to lock in some profits.
Penn National Gaming, Inc. (PENN) We chipped this position three times during the quarter after a ~50% rally off the bottom six months ago, as the outlook for regional casinos has improved.
Sun Communities, Inc. (SUI) We chipped this position twice during the quarter after a strong rally has brought share prices closer to intrinsic value.
Davenport Small Cap Focus Fund
The following chart represents Davenport Small Cap Focus Fund (the “Small Cap Focus Fund”) performance and the performance of the Russell 2000 Index (the “Russell”), the Small Cap Focus Fund’s primary benchmark, for the periods ended March 31, 2015.
| | Q1 2015 | | Fiscal Year 2015 Gross Expense Ratio | Fiscal Year 2015 Net Expense Ratio |
| Small Cap Focus Fund | 4.10% | 4.10% | 1.42% | 1.25%1 |
| Russell 2000 Index* | 4.32% | 4.32% | — | — |
30-Day SEC Yield: -0.46%; Gross Expense Ratio in current prospectus: 2.15%; Net Expense Ratio in current prospectus: 1.26%
Past performance is no guarantee of future results. Investment return and principal value of an investment will fluctuate so that an investor’s shares, when redeemed, may be worth more or less than their original cost. Current performance may be lower or higher than the performance data quoted. Performance data, current to the most recent month end, may be obtained by calling 1-800-281-3217.
| * | The Russell 2000 Index measures the performance of the 2000 smallest companies in the Russell 3000 Index, which represents approximately 8% of the total market. An investor cannot invest in an index and its returns are not indicative of the performance of any specific investment. |
| 1 | Davenport & Company LLC has contractually agreed, until August 1, 2016, to reduce management fees and to reimburse other expenses to the extent necessary to limit total annual Fund operating expenses (excluding acquired fund fees and expenses) to an amount not exceeding 1.25% of the Fund’s average daily net assets. Total annual Fund operating expenses exclude brokerage costs, taxes, interest, costs to organize the Fund and extraordinary expenses. For additional details please request a prospectus. |
The Small Cap Focus Fund generated solid results during its inaugural quarter. Small cap equities, as measured by the Russell 2000, were up 4.32% for the quarter ending March 31, 2015, outperforming the large cap biased S&P 500’s 0.95% gain. This outperformance makes sense to us given the Russell 2000’s domestic bias and considering the fact that small caps underperformed in 2014; however, this environment made it challenging to keep up during the period. As such, we were pleased with the Small Cap Focus Fund’s 4.10% gain. As expected, the Small Cap Focus Fund’s cash position was a bit of a drag amid the market’s strong advances; however, we were pleased to see solid performance from individual names offset much of this impact while allowing us to deploy funds in a prudent manner. The Small Cap Focus Fund has a flexible approach in that it is not constrained by a particular investment style; however, we believe the Fund has a bit of a “value tilt” at the moment. Here again, we are glad to have kept pace given the outperformance of growth stocks during the period. Ultimately, we think a number of the Fund’s holdings look cheap and could be primed for future outperformance.
From a sector vantage point, the Small Cap Focus Fund is materially overweight Consumer Discretionary and Industrials stocks. Stocks in the consumer space have led the Fund’s performance as shares of retailers and regional casino companies such as Isle of Capri (ISLE), Monarch Casino & Resort (MCRI) and Penn National (PENN) have benefitted from cheaper gasoline prices and improving results. In terms of the regional casino stocks mentioned above, we have a long history with each company and felt it was an appropriate time to include them in the Small Cap Focus Fund. After struggling for much of 2014, each company finds itself in a “sweet spot” with improving same-store sales growth, cheaper gasoline prices and interesting development opportunities (not to mention no foreign currency exposure).
The Small Cap Focus Fund has been hurt somewhat by a few positions in the Energy and Materials spaces. We expect to typically be underweight in these sectors, but a few stocks that were already down sharply looked interesting as we started the year. While we have limited exposure to the energy industry and zero exposure to oil producers, the Fund does own what we consider to be a well run Canadian natural gas producer, Peyto Energy (PEYUF). The stock was sharply off its highs when purchased, but has remained weak. Even modest improvement in natural gas prices could help this depressed play with a long asset life and solid track record of value creation. The Small Cap Focus Fund also owns a meaningful position in industrial Colfax (CFX), which counts oil & gas as an important market and has also been impacted by currency headwinds. The stock was already down sharply when purchased, but has continued to drift lower and should be near a bottom in our opinion.
We added a couple new names that could be considered “deep value” situations – Stewart Information Services (STC) and FRP Holdings (FRPH). Stewart is a title insurance company with minimal analyst coverage. The company’s operating margins are far below industry standards and efforts to improve profitability could yield earnings power of $5.00+ per share (on a $40 stock). The increasing involvement of some activist shareholders seems to make this earnings target more likely. FRPH recently spun off a transportation business and is now comprised of two real estate businesses: mining royalties and property development. The mining business owns land with aggregate deposits and collects royalties under long-term mining agreements. The development business consists of both income generating real estate and undeveloped land including riverfront property in Washington D.C. We think the shares could trade into the mid-$40’s based on a conservative sum-of-the-parts analysis and would note this very small company gets virtually no Wall Street attention.
In our opinion, the most exciting aspect of small cap investing is the potential to find uncommon value in companies that are off the beaten path. We feel like we are currently finding such names and “stocking the pond” with companies that seem to have very good risk/reward profiles. You won’t hear about these companies at cocktail parties or on Fast Money, but they could deliver us solid returns over the next couple years.
We are pleased that The Davenport Funds are off to a good start thus far in 2015. We thank you for your trust and look forward to reporting back as we proceed through the year.
Sincerely,
John P. Ackerly, IV
President, The Davenport Funds
DAVENPORT CORE FUND
PERFORMANCE INFORMATION (Unaudited)
Comparison of the Change in Value of a $10,000 Investment in
Davenport Core Fund and the Standard & Poor's 500® Index
| | Average Annual Total Returns(a) (for years ended March 31, 2015) |
| | 1 Year | 5 Years | 10 Years |
| Davenport Core Fund | 12.42% | 14.10% | 8.25% |
Standard & Poor’s 500® Index | 12.73% | 14.47% | 8.01% |
| (a) | The total returns shown do not reflect the deduction of taxes that a shareholder would pay on Fund distributions or the redemption of Fund shares. |
DAVENPORT VALUE & INCOME FUND
PERFORMANCE INFORMATION (Unaudited)
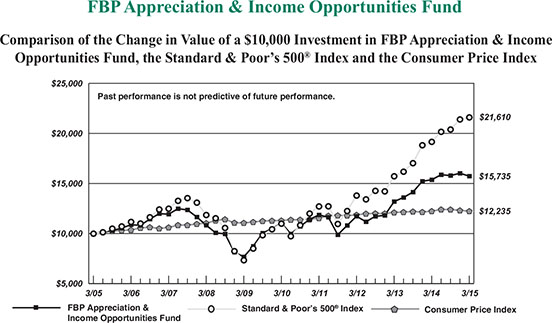
Comparison of the Change in Value of a $10,000 Investment in
Davenport Value & Income Fund, the Standard & Poor's 500® Index
and the Lipper Equity Income Index
| | Average Annual Total Returns(a) (for periods ended March 31, 2015) |
| | 1 Year | Since Inception(b) |
| Davenport Value & Income Fund | 11.92% | 15.69% |
Standard & Poor’s 500® Index | 12.73% | 14.84% |
| Lipper Equity Income Index | 8.46% | 12.71% |
| (a) | The total returns shown do not reflect the deduction of taxes that a shareholder would pay on Fund distributions or the redemption of Fund shares. |
| (b) | Commencement of operations was December 31, 2010. |
DAVENPORT EQUITY OPPORTUNITIES FUND
PERFORMANCE INFORMATION (Unaudited)
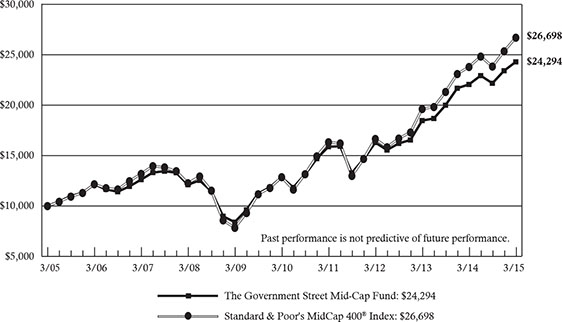
Comparison of the Change in Value of a $10,000 Investment in
Davenport Equity Opportunities Fund and the Russell Midcap® Index
| | Average Annual Total Returns(a) (for periods ended March 31, 2015) |
| | 1 Year | Since Inception(b) |
| Davenport Equity Opportunities Fund | 16.67% | 18.04% |
Russell Midcap® Index | 13.68% | 15.31% |
| (a) | The total returns shown do not reflect the deduction of taxes that a shareholder would pay on Fund distributions or the redemption of Fund shares. |
| (b) | Commencement of operations was December 31, 2010. |
DAVENPORT SMALL CAP FOCUS FUND
PERFORMANCE INFORMATION (Unaudited)
Comparison of the Change in Value of a $10,000 Investment in
Davenport Small Cap Focus Fund and the Russel 2000® Index
| | Total Returns(a) (for period ended March 31, 2015) |
| | Since Inception(b) |
| Davenport Small Cap Focus Fund | 4.10% |
Russell 2000® Index | 4.32% |
| (a) | The total returns shown do not reflect the deduction of taxes that a shareholder would pay on Fund distributions or the redemption of Fund shares. |
| (b) | Commencement of operations was December 31, 2014. |
DAVENPORT CORE FUND
PORTFOLIO INFORMATION
March 31, 2015 (Unaudited)
Sector Allocation vs. the Standard & Poor's 500® Index
Top Ten Equity Holdings
| Security Description | % of Net Assets |
| CarMax, Inc. | 3.5% |
| Brookfield Asset Management, Inc. - Class A | 3.5% |
| Markel Corporation | 3.1% |
| Capital One Financial Corporation | 2.6% |
| Berkshire Hathaway, Inc. - Class B | 2.6% |
| American Tower Corporation - Class A | 2.6% |
| Danaher Corporation | 2.5% |
| Nestlé SA - ADR | 2.4% |
| Accenture plc - Class A | 2.3% |
| Celgene Corporation | 2.3% |
DAVENPORT VALUE & INCOME FUND
PORTFOLIO INFORMATION
March 31, 2015 (Unaudited)
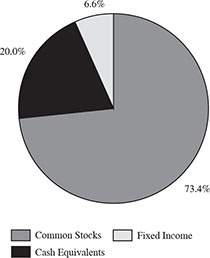
Sector Allocation vs. the Standard & Poor's 500® Index
Top Ten Holdings
| Security Description | % of Net Assets |
| W.P. Carey, Inc. | 3.0% |
| Markel Corporation | 3.0% |
| SPDR EURO STOXX 50 ETF | 2.9% |
| Wells Fargo & Company | 2.7% |
| JPMorgan Chase & Company | 2.6% |
| Watsco, Inc. | 2.6% |
| Gaming and Leisure Properties, Inc. | 2.6% |
| Johnson & Johnson | 2.4% |
| Teva Pharmaceutical Industries Ltd. - ADR | 2.3% |
| Capital One Financial Corporation | 2.2% |
DAVENPORT EQUITY OPPORTUNITIES FUND
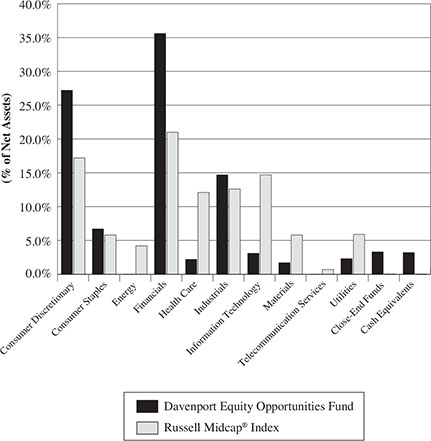
PORTFOLIO INFORMATION
March 31, 2015 (Unaudited)
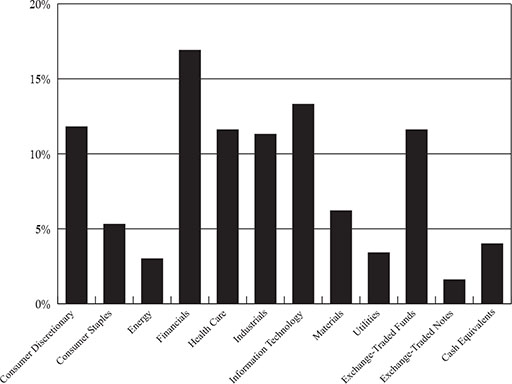
Sector Allocation vs. the Russell Midcap® Index
Top Ten Holdings
| Security Description | % of Net Assets |
| Markel Corporation | 5.9% |
| Gaming and Leisure Properties, Inc. | 5.8% |
| Brookfield Asset Management, Inc. - Class A | 5.3% |
| CarMax, Inc. | 4.9% |
| Capital One Financial Corporation | 4.2% |
| American Tower Corporation - Class A | 4.1% |
| Colfax Corporation | 3.8% |
| Penn National Gaming, Inc. | 3.7% |
| WABCO Holdings, Inc. | 3.5% |
| J.M. Smucker Company (The) | 3.4% |
DAVENPORT SMALL CAP FOCUS FUND
PORTFOLIO INFORMATION
March 31, 2015 (Unaudited)
Sector Allocation vs. the Russell 2000® Index
Top Ten Holdings
| Security Description | % of Net Assets |
| Liberty Broadband Corporation - Class C | 3.1% |
| Gaming and Leisure Properties, Inc. | 2.9% |
| Colfax Corporation | 2.8% |
| Monarch Casino & Resort, Inc. | 2.7% |
| Live Nation Entertainment, Inc. | 2.7% |
| Encore Capital Group, Inc. | 2.6% |
| Sunoco LP | 2.6% |
| Universal Corporation | 2.4% |
| Fortuna Silver Mines, Inc. | 2.4% |
| Marten Transport Ltd. | 2.3% |
DAVENPORT CORE FUND
SCHEDULE OF INVESTMENTS
March 31, 2015
| COMMON STOCKS — 96.0% | | Shares | | | Value | |
| Consumer Discretionary — 18.9% | | | | | | |
Amazon.com, Inc. (a) | | | 17,008 | | | $ | 6,328,677 | |
CarMax, Inc. (a) | | | 170,027 | | | | 11,733,563 | |
DIRECTV (a) | | | 62,925 | | | | 5,354,918 | |
Dish Network Corporation - Class A (a) | | | 67,210 | | | | 4,708,733 | |
| General Motors Company | | | 142,500 | | | | 5,343,750 | |
Liberty Broadband Corporation - Class A (a) | | | 10,584 | | | | 597,784 | |
Liberty Broadband Corporation - Class C (a) | | | 27,519 | | | | 1,557,575 | |
Liberty Media Corporation - Series A (a) | | | 42,337 | | | | 1,632,091 | |
Liberty Media Corporation - Series C (a) | | | 127,064 | | | | 4,853,845 | |
Priceline Group, Inc. (The) (a) | | | 3,938 | | | | 4,584,423 | |
| PVH Corporation | | | 51,272 | | | | 5,463,544 | |
| Starbucks Corporation | | | 53,035 | | | | 5,022,415 | |
| Walt Disney Company (The) | | | 50,256 | | | | 5,271,352 | |
| | | | | | | | 62,452,670 | |
| Consumer Staples — 10.2% | | | | | | | | |
| Anheuser-Busch InBev SA/NV - ADR | | | 38,960 | | | | 4,749,613 | |
| Hershey Company (The) | | | 48,065 | | | | 4,850,239 | |
| J.M. Smucker Company (The) | | | 55,612 | | | | 6,435,977 | |
Mondelēz International, Inc. - Class A | | | 131,520 | | | | 4,746,557 | |
| Nestlé SA - ADR | | | 106,802 | | | | 8,033,705 | |
| PepsiCo, Inc. | | | 53,461 | | | | 5,111,941 | |
| | | | | | | | 33,928,032 | |
| Energy — 5.9% | | | | | | | | |
| Chevron Corporation | | | 41,122 | | | | 4,316,987 | |
| Exxon Mobil Corporation | | | 62,127 | | | | 5,280,795 | |
| Range Resources Corporation | | | 94,117 | | | | 4,897,849 | |
| Schlumberger Ltd. | | | 60,245 | | | | 5,026,843 | |
| | | | | | | | 19,522,474 | |
| Financials — 21.9% | | | | | | | | |
| American Tower Corporation - Class A | | | 90,837 | | | | 8,552,304 | |
Berkshire Hathaway, Inc. - Class B (a) | | | 59,361 | | | | 8,566,979 | |
| Brookfield Asset Management, Inc. - Class A | | | 214,728 | | | | 11,511,568 | |
| Capital One Financial Corporation | | | 108,707 | | | | 8,568,286 | |
| Citigroup, Inc. | | | 89,812 | | | | 4,627,114 | |
| CME Group, Inc. | | | 79,336 | | | | 7,513,913 | |
| JPMorgan Chase & Company | | | 111,863 | | | | 6,776,660 | |
Markel Corporation (a) | | | 13,338 | | | | 10,256,388 | |
| Wells Fargo & Company | | | 109,149 | | | | 5,937,706 | |
| | | | | | | | 72,310,918 | |
| Health Care — 14.4% | | | | | | | | |
| AmerisourceBergen Corporation | | | 64,280 | | | | 7,306,707 | |
| Amgen, Inc. | | | 28,836 | | | | 4,609,435 | |
| Anthem, Inc. | | | 39,256 | | | | 6,061,519 | |
DAVENPORT CORE FUND
SCHEDULE OF INVESTMENTS (Continued)
| COMMON STOCKS — 96.0% (Continued) | | Shares | | | Value | |
| Health Care — 14.4% (Continued) | | | | | | |
| Baxter International, Inc. | | | 73,108 | | | $ | 5,007,898 | |
Celgene Corporation (a) | | | 65,393 | | | | 7,538,505 | |
Express Scripts Holding Company (a) | | | 81,126 | | | | 7,039,303 | |
| Johnson & Johnson | | | 54,138 | | | | 5,446,283 | |
Valeant Pharmaceuticals International, Inc. (a) | | | 22,837 | | | | 4,535,885 | |
| | | | | | | | 47,545,535 | |
| Industrials — 9.5% | | | | | | | | |
| American Airlines Group, Inc. | | | 100,470 | | | | 5,302,806 | |
| Cummins, Inc. | | | 28,709 | | | | 3,980,216 | |
| Danaher Corporation | | | 96,722 | | | | 8,211,698 | |
| General Electric Company | | | 152,520 | | | | 3,784,021 | |
| Parker Hannifin Corporation | | | 39,450 | | | | 4,685,871 | |
| United Technologies Corporation | | | 47,439 | | | | 5,559,851 | |
| | | | | | | | 31,524,463 | |
| Information Technology — 10.7% | | | | | | | | |
| Accenture plc - Class A | | | 80,761 | | | | 7,566,498 | |
| Apple, Inc. | | | 52,695 | | | | 6,556,839 | |
| Cisco Systems, Inc. | | | 173,988 | | | | 4,789,020 | |
Google, Inc. - Class A (a) | | | 6,820 | | | | 3,783,054 | |
Google, Inc. - Class C (a) | | | 6,370 | | | | 3,490,760 | |
| QUALCOMM, Inc. | | | 54,875 | | | | 3,805,032 | |
| Visa, Inc. - Class A | | | 82,536 | | | | 5,398,680 | |
| | | | | | | | 35,389,883 | |
| Materials — 4.5% | | | | | | | | |
| Alcoa, Inc. | | | 352,748 | | | | 4,557,504 | |
| Monsanto Company | | | 47,990 | | | | 5,400,795 | |
| Praxair, Inc. | | | 39,673 | | | | 4,790,118 | |
| | | | | | | | 14,748,417 | |
| | | | | | | | | |
Total Common Stocks (Cost $217,291,325) | | | | | | $ | 317,422,392 | |
DAVENPORT CORE FUND
SCHEDULE OF INVESTMENTS (Continued)
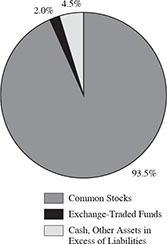
| MONEY MARKET FUNDS — 2.0% | | Shares | | | Value | |
First American Treasury Obligations Fund - Class Z, 0.00% (b) (Cost $6,485,704) | | | 6,485,704 | | | $ | 6,485,704 | |
| | | | | | | | | |
Total Investments at Value — 98.0% (Cost $223,777,029) | | | | | | $ | 323,908,096 | |
| | | | | | | | | |
| Other Assets in Excess of Liabilities — 2.0% | | | | | | | 6,778,558 | |
| | | | | | | | | |
| Net Assets — 100.0% | | | | | | $ | 330,686,654 | |
ADR - American Depositary Receipt.
| (a) | Non-income producing security. |
| (b) | The rate shown is the 7-day effective yield as of March 31, 2015. |
See accompanying notes to financial statements.
DAVENPORT VALUE & INCOME FUND
SCHEDULE OF INVESTMENTS
March 31, 2015
| COMMON STOCKS — 90.8% | | Shares | | | Value | |
| Consumer Discretionary — 7.2% | | | | | | |
| H&R Block, Inc. | | | 254,420 | | | $ | 8,159,250 | |
| Las Vegas Sands Corporation | | | 111,335 | | | | 6,127,878 | |
| McDonald's Corporation | | | 84,690 | | | | 8,252,194 | |
| Six Flags Entertainment Corporation | | | 139,825 | | | | 6,768,928 | |
| | | | | | | | 29,308,250 | |
| Consumer Staples — 13.4% | | | | | | | | |
| Altria Group, Inc. | | | 123,181 | | | | 6,161,514 | |
| Anheuser-Busch InBev SA/NV - ADR | | | 57,120 | | | | 6,963,499 | |
| Archer-Daniels-Midland Company | | | 144,555 | | | | 6,851,907 | |
| Coca-Cola Company (The) | | | 147,885 | | | | 5,996,737 | |
| Diageo plc - ADR | | | 67,720 | | | | 7,487,800 | |
| PepsiCo, Inc. | | | 77,795 | | | | 7,438,758 | |
| Philip Morris International, Inc. | | | 92,800 | | | | 6,990,624 | |
| Wal-Mart Stores, Inc. | | | 84,282 | | | | 6,932,194 | |
| | | | | | | | 54,823,033 | |
| Energy — 5.2% | | | | | | | | |
| Chevron Corporation | | | 55,106 | | | | 5,785,028 | |
| Exxon Mobil Corporation | | | 69,650 | | | | 5,920,250 | |
| Kinder Morgan, Inc. | | | 140,875 | | | | 5,925,202 | |
| Occidental Petroleum Corporation | | | 51,165 | | | | 3,735,045 | |
| | | | | | | | 21,365,525 | |
| Financials — 29.0% | | | | | | | | |
| Capital One Financial Corporation | | | 112,490 | | | | 8,866,462 | |
| Citigroup, Inc. | | | 152,265 | | | | 7,844,693 | |
| Equity Lifestyle Properties, Inc. | | | 150,295 | | | | 8,258,710 | |
| FNF Group | | | 227,785 | | | | 8,373,376 | |
| Gaming and Leisure Properties, Inc. | | | 284,939 | | | | 10,505,701 | |
| Hartford Financial Services Group, Inc. (The) | | | 143,505 | | | | 6,001,379 | |
| JPMorgan Chase & Company | | | 175,670 | | | | 10,642,089 | |
| Lamar Advertising Company - Class A | | | 109,075 | | | | 6,464,875 | |
Markel Corporation (a) | | | 15,731 | | | | 12,096,510 | |
| Sun Communities, Inc. | | | 121,580 | | | | 8,111,818 | |
| W.P. Carey, Inc. | | | 178,974 | | | | 12,170,232 | |
| Waddell & Reed Financial, Inc. - Class A | | | 158,750 | | | | 7,864,475 | |
| Wells Fargo & Company | | | 202,090 | | | | 10,993,696 | |
| | | | | | | | 118,194,016 | |
| Health Care — 10.5% | | | | | | | | |
| Anthem, Inc. | | | 51,165 | | | | 7,900,388 | |
| Johnson & Johnson | | | 98,150 | | | | 9,873,890 | |
| Merck & Company, Inc. | | | 137,020 | | | | 7,875,910 | |
| Sanofi-Aventis - ADR | | | 160,060 | | | | 7,913,366 | |
| Teva Pharmaceutical Industries Ltd. - ADR | | | 148,060 | | | | 9,224,138 | |
| | | | | | | | 42,787,692 | |
DAVENPORT VALUE & INCOME FUND
SCHEDULE OF INVESTMENTS (Continued)
| COMMON STOCKS — 90.8%(Continued) | | Shares | | | Value | |
| Industrials — 11.5% | | | | | | |
| 3M Company | | | 48,975 | | | $ | 8,078,426 | |
| Eaton Corporation plc | | | 101,277 | | | | 6,880,759 | |
| General Electric Company | | | 346,760 | | | | 8,603,116 | |
| Illinois Tool Works, Inc. | | | 65,355 | | | | 6,348,585 | |
| Raytheon Company | | | 56,681 | | | | 6,192,399 | |
| Watsco, Inc. | | | 84,420 | | | | 10,611,594 | |
| | | | | | | | 46,714,879 | |
| Information Technology — 4.2% | | | | | | | | |
| Cisco Systems, Inc. | | | 224,370 | | | | 6,175,784 | |
| Hewlett-Packard Company | | | 166,105 | | | | 5,175,832 | |
| Microsoft Corporation | | | 139,458 | | | | 5,669,665 | |
| | | | | | | | 17,021,281 | |
| Materials — 5.6% | | | | | | | | |
| E.I. du Pont de Nemours and Company | | | 88,750 | | | | 6,342,962 | |
| Eastman Chemical Company | | | 84,195 | | | | 5,831,346 | |
| Nucor Corporation | | | 107,845 | | | | 5,125,873 | |
| Potash Corporation of Saskatchewan, Inc. | | | 168,560 | | | | 5,436,060 | |
| | | | | | | | 22,736,241 | |
| Telecommunication Services — 2.9% | | | | | | | | |
| TELUS Corporation | | | 144,905 | | | | 4,816,642 | |
| Verizon Communications, Inc. | | | 147,270 | | | | 7,161,740 | |
| | | | | | | | 11,978,382 | |
| Utilities — 1.3% | | | | | | | | |
| Dominion Resources, Inc. | | | 73,855 | | | | 5,234,104 | |
| | | | | | | | | |
Total Common Stocks (Cost $308,706,948) | | | | | | $ | 370,163,403 | |
| EXCHANGE-TRADED FUNDS — 6.2% | | Shares | | | Value | |
| Deutsche X-trackers Harvest CSI 300 China A-Shares ETF | | | 175,370 | | | $ | 7,302,407 | |
| iShares China Large-Cap ETF | | | 142,980 | | | | 6,355,461 | |
| SPDR EURO STOXX 50 ETF | | | 305,810 | | | | 11,871,544 | |
Total Exchange-Traded Funds (Cost $20,914,871) | | | | | | $ | 25,529,412 | |
DAVENPORT VALUE & INCOME FUND
SCHEDULE OF INVESTMENTS (Continued)
| MONEY MARKET FUNDS — 2.6% | | Shares | | | Value | |
First American Treasury Obligations Fund - Class Z, 0.00% (b) (Cost $10,581,923) | | | 10,581,923 | | | $ | 10,581,923 | |
| | | | | | | | | |
Total Investments at Value — 99.6% (Cost $340,203,742) | | | | | | $ | 406,274,738 | |
| | | | | | | | | |
| Other Assets in Excess of Liabilities — 0.4% | | | | | | | 1,502,058 | |
| | | | | | | | | |
| Net Assets — 100.0% | | | | | | $ | 407,776,796 | |
ADR - American Depositary Receipt.
| (a) | Non-income producing security. |
| (b) | The rate shown is the 7-day effective yield as of March 31, 2015. |
See accompanying notes to financial statements.
DAVENPORT EQUITY OPPORTUNITIES FUND
SCHEDULE OF INVESTMENTS
March 31, 2015
COMMON STOCKS — 93.5% | | Shares | | | Value | |
| Consumer Discretionary — 27.2% | | | | | | |
Amazon.com, Inc. (a) | | | 21,640 | | | $ | 8,052,244 | |
Cabela's, Inc. (a) | | | 153,755 | | | | 8,607,205 | |
CarMax, Inc. (a) | | | 195,873 | | | | 13,517,196 | |
Discovery Communications, Inc. (a) | | | 316,970 | | | | 9,342,691 | |
Discovery Communications, Inc. - Class A (a) | | | 102,115 | | | | 3,141,057 | |
| Hanesbrands, Inc. | | | 250,390 | | | | 8,390,569 | |
Liberty Broadband Corporation - Class C (a) | | | 132,390 | | | | 7,493,274 | |
Live Nation Entertainment, Inc. (a) | | | 271,750 | | | | 6,856,252 | |
Penn National Gaming, Inc. (a) | | | 650,833 | | | | 10,192,045 | |
| | | | | | | | 75,592,533 | |
| Consumer Staples — 6.7% | | | | | | | | |
| Church & Dwight Company, Inc. | | | 106,820 | | | | 9,124,565 | |
| J.M. Smucker Company (The) | | | 81,580 | | | | 9,441,253 | |
| | | | | | | | 18,565,818 | |
| Financials — 35.6% | | | | | | | | |
| American Tower Corporation - Class A | | | 119,770 | | | | 11,276,346 | |
| Brookfield Asset Management, Inc. - Class A | | | 277,120 | | | | 14,856,403 | |
| Capital One Financial Corporation | | | 147,224 | | | | 11,604,196 | |
| Fairfax Financial Holdings Ltd. | | | 16,513 | | | | 9,224,327 | |
| FNF Group | | | 141,690 | | | | 5,208,524 | |
| Gaming and Leisure Properties, Inc. | | | 436,699 | | | | 16,101,092 | |
Markel Corporation (a) | | | 21,365 | | | | 16,428,830 | |
PRA Group, Inc. (a) | | | 136,540 | | | | 7,416,853 | |
| Sun Communities, Inc. | | | 102,115 | | | | 6,813,113 | |
| | | | | | | | 98,929,684 | |
| Health Care — 2.2% | | | | | | | | |
Henry Schein, Inc. (a) | | | 42,450 | | | | 5,926,869 | |
| | | | | | | | | |
| Industrials — 14.7% | | | | | | | | |
| American Airlines Group, Inc. | | | 145,895 | | | | 7,700,338 | |
Colfax Corporation (a) | | | 218,840 | | | | 10,445,233 | |
| Pall Corporation | | | 75,660 | | | | 7,595,507 | |
WABCO Holdings, Inc. (a) | | | 78,260 | | | | 9,616,589 | |
| Watsco, Inc. | | | 42,560 | | | | 5,349,792 | |
| | | | | | | | 40,707,459 | |
| Information Technology — 3.1% | | | | | | | | |
| Intuit, Inc. | | | 88,500 | | | | 8,580,960 | |
| | | | | | | | | |
| Materials — 1.7% | | | | | | | | |
| Alcoa, Inc. | | | 368,220 | | | | 4,757,402 | |
DAVENPORT EQUITY OPPORTUNITIES FUND
SCHEDULE OF INVESTMENTS (Continued)
| COMMON STOCKS — 93.5% (Continued) | | Shares | | | Value | |
| Utilities — 2.3% | | | | | | |
| NRG Energy, Inc. | | | 257,140 | | | $ | 6,477,357 | |
| | | | | | | | | |
Total Common Stocks (Cost $215,543,832) | | | | | | $ | 259,538,082 | |
| CLOSED-END FUNDS — 3.3% | | Shares | | | Value | |
| Morgan Stanley China A Share Fund, Inc. (Cost $6,756,651) | | | 280,665 | | | $ | 9,239,492 | |
| MONEY MARKET FUNDS — 2.8% | | Shares | | | Value | |
First American Treasury Obligations Fund - Class Z, 0.00% (b) (Cost $7,731,436) | | | 7,731,436 | | | $ | 7,731,436 | |
| | | | | | | | | |
Total Investments at Value — 99.6% (Cost $230,031,919) | | | | | | $ | 276,509,010 | |
| | | | | | | | | |
| Other Assets in Excess of Liabilities — 0.4% | | | | | | | 1,194,472 | |
| | | | | | | | | |
| Net Assets — 100.0% | | | | | | $ | 277,703,482 | |
| (a) | Non-income producing security. |
| (b) | The rate shown is the 7-day effective yield as of March 31, 2015. |
See accompanying notes to financial statements.
DAVENPORT SMALL CAP FOCUS FUND
SCHEDULE OF INVESTMENTS
March 31, 2015
| COMMON STOCKS — 78.1% | | Shares | | | Value | |
| Consumer Discretionary — 23.1% | | | | | | |
Cabela's, Inc. (a) | | | 10,213 | | | $ | 571,724 | |
| Core-Mark Holding Company, Inc. | | | 10,918 | | | | 702,246 | |
Five Below, Inc. (a) | | | 15,064 | | | | 535,826 | |
Isle of Capri Casinos, Inc. (a) | | | 35,693 | | | | 501,487 | |
Liberty Broadband Corporation - Class C (a) | | | 16,889 | | | | 955,917 | |
Live Nation Entertainment, Inc. (a) | | | 33,405 | | | | 842,808 | |
Media General, Inc. (a) | | | 28,139 | | | | 464,012 | |
Monarch Casino & Resort, Inc. (a) | | | 44,405 | | | | 849,912 | |
Penn National Gaming, Inc. (a) | | | 22,256 | | | | 348,529 | |
Pinnacle Entertainment, Inc. (a) | | | 19,000 | | | | 685,710 | |
| Pool Corporation | | | 7,142 | | | | 498,226 | |
Unifi, Inc. (a) | | | 7,564 | | | | 272,985 | |
| | | | | | | | 7,229,382 | |
| Consumer Staples — 3.6% | | | | | | | | |
| Snyder's-Lance, Inc. | | | 11,221 | | | | 358,623 | |
| Universal Corporation | | | 16,197 | | | | 763,851 | |
| | | | | | | | 1,122,474 | |
| Energy — 5.4% | | | | | | | | |
Fission Uranium Corporation (a) | | | 320,000 | | | | 332,800 | |
Peyto Exploration & Development Corporation (a) | | | 20,334 | | | | 543,182 | |
Sunoco LP (a) | | | 15,778 | | | | 810,200 | |
| | | | | | | | 1,686,182 | |
| Financials — 15.7% | | | | | | | | |
| Diamond Hill Investment Group, Inc. | | | 3,366 | | | | 538,560 | |
Encore Capital Group, Inc. (a) | | | 19,492 | | | | 810,672 | |
FNFV Group (a) | | | 36,000 | | | | 507,600 | |
FRP Holdings, Inc. (a) | | | 11,129 | | | | 405,096 | |
| Gaming and Leisure Properties, Inc. | | | 24,750 | | | | 912,532 | |
| Outfront Media, Inc. | | | 18,617 | | | | 557,021 | |
PRA Group, Inc. (a) | | | 10,608 | | | | 576,226 | |
| Stewart Information Services Corporation | | | 10,400 | | | | 422,656 | |
| TowneBank | | | 12,000 | | | | 192,960 | |
| | | | | | | | 4,923,323 | |
| Health Care — 2.4% | | | | | | | | |
VCA, Inc. (a) | | | 6,744 | | | | 369,706 | |
VWR Corporation (a) | | | 15,000 | | | | 389,850 | |
| | | | | | | | 759,556 | |
| Industrials — 15.4% | | | | | | | | |
| Brink's Company (The) | | | 23,523 | | | | 649,940 | |
Colfax Corporation (a) | | | 18,338 | | | | 875,273 | |
Covenant Transportation Group, Inc. - Class A (a) | | | 10,000 | | | | 331,600 | |
Genesee & Wyoming, Inc. - Class A (a) | | | 6,700 | | | | 646,148 | |
| Marten Transport Ltd. | | | 31,637 | | | | 733,978 | |
DAVENPORT SMALL CAP FOCUS FUND
SCHEDULE OF INVESTMENTS (Continued)
| COMMON STOCKS — 78.1% (Continued) | | Shares | | | Value | |
| Industrials — 15.4% (Continued) | | | | | | |
Mistras Group, Inc. (a) | | | 37,362 | | | $ | 719,592 | |
MRC Global, Inc. (a) | | | 26,950 | | | | 319,358 | |
| Watsco, Inc. | | | 4,260 | | | | 535,482 | |
| | | | | | | | 4,811,371 | |
| Information Technology — 3.3% | | | | | | | | |
BlackBerry Ltd. (a) | | | 45,400 | | | | 405,422 | |
EchoStar Corporation - Class A (a) | | | 12,022 | | | | 621,778 | |
| | | | | | | | 1,027,200 | |
| Materials — 6.5% | | | | | | | | |
Fortuna Silver Mines, Inc. (a) | | | 194,016 | | | | 745,022 | |
Intrepid Potash, Inc. (a) | | | 25,311 | | | | 292,342 | |
| NewMarket Corporation | | | 738 | | | | 352,616 | |
| Tredegar Corporation | | | 32,482 | | | | 653,213 | |
| | | | | | | | 2,043,193 | |
| Telecommunication Services — 2.7% | | | | | | | | |
Iridium Communications, Inc. (a) | | | 50,000 | | | | 485,500 | |
United States Cellular Corporation (a) | | | 9,500 | | | | 339,340 | |
| | | | | | | | 824,840 | |
| | | | | | | | | |
Total Common Stocks (Cost $23,367,879) | | | | | | $ | 24,427,521 | |
| EXCHANGE-TRADED FUNDS — 6.1% | | Shares | | | Value | |
| iShares Core S&P Small-Cap ETF | | | 5,671 | | | $ | 669,348 | |
| iShares MSCI Emerging Markets Small-Cap ETF | | | 12,879 | | | | 608,790 | |
| iShares Russell 2000 Value ETF | | | 6,179 | | | | 637,735 | |
Total Exchange-Traded Funds (Cost $1,840,587) | | | | | | $ | 1,915,873 | |
| MONEY MARKET FUNDS — 17.8% | | Shares | | | Value | |
First American Treasury Obligations Fund - Class Z, 0.00% (b) (Cost $5,586,579) | | | 5,586,579 | | | $ | 5,586,579 | |
| | | | | | | | | |
Total Investments at Value — 102.0% (Cost $30,795,045) | | | | | | $ | 31,929,973 | |
| | | | | | | | | |
| Liabilities in Excess of Other Assets — (2.0%) | | | | | | | (638,598 | ) |
| | | | | | | | | |
| Net Assets — 100.0% | | | | | | $ | 31,291,375 | |
| (a) | Non-income producing security. |
| (b) | The rate shown is the 7-day effective yield as of March 31, 2015. |
See accompanying notes to financial statements.
THE DAVENPORT FUNDS
STATEMENTS OF ASSETS AND LIABILITIES
March 31, 2015
| | | | | | Davenport Value & Income Fund | |
| ASSETS | | | | | | |
| Investments in securities: | | | | | | |
| At acquisition cost | | $ | 223,777,029 | | | $ | 340,203,742 | |
| At market value (Note 2) | | $ | 323,908,096 | | | $ | 406,274,738 | |
| Cash | | | 6,360,686 | | | | — | |
| Dividends receivable | | | 196,056 | | | | 1,120,780 | |
| Receivable for capital shares sold | | | 652,849 | | | | 1,555,351 | |
| Other assets | | | 14,387 | | | | 14,643 | |
| TOTAL ASSETS | | | 331,132,074 | | | | 408,965,512 | |
| | | | | | | | | |
| LIABILITIES | | | | | | | | |
| Payable for capital shares redeemed | | | 191,477 | | | | 873,714 | |
| Accrued investment advisory fees (Note 4) | | | 210,400 | | | | 257,192 | |
| Payable to administrator (Note 4) | | | 35,400 | | | | 41,900 | |
| Other accrued expenses | | | 8,143 | | | | 15,910 | |
| TOTAL LIABILITIES | | | 445,420 | | | | 1,188,716 | |
| | | | | | | | | |
| NET ASSETS | | $ | 330,686,654 | | | $ | 407,776,796 | |
| | | | | | | | | |
| Net assets consist of: | | | | | | | | |
| Paid-in capital | | $ | 224,334,867 | | | $ | 330,307,314 | |
| Undistributed net investment income | | | — | | | | 254,321 | |
| Undistributed net realized gains from security transactions | | | 6,220,720 | | | | 11,144,165 | |
| Net unrealized appreciation on investments | | | 100,131,067 | | | | 66,070,996 | |
| Net assets | | $ | 330,686,654 | | | $ | 407,776,796 | |
| | | | | | | | | |
| Shares of beneficial interest outstanding (unlimited number of shares authorized, $0.01 par value) | | | 16,519,243 | | | | 26,382,501 | |
| | | | | | | | | |
| Net asset value, offering price and redemption price per share (Note 2) | | $ | 20.02 | | | $ | 15.46 | |
See accompanying notes to financial statements.
THE DAVENPORT FUNDS
STATEMENTS OF ASSETS AND LIABILITIES (Continued)
March 31, 2015
| | | Davenport Equity Opportunities Fund | | | Davenport Small Cap Focus Fund | |
| ASSETS | | | | | | |
| Investments in securities: | | | | | | |
| At acquisition cost | | $ | 230,031,919 | | | $ | 30,795,045 | |
| At market value (Note 2) | | $ | 276,509,010 | | | $ | 31,929,973 | |
| Cash | | | 15,352,862 | | | | — | |
| Dividends receivable | | | 65,159 | | | | 5,108 | |
| Receivable for capital shares sold | | | 889,534 | | | | 615,893 | |
| Other assets | | | 14,657 | | | | 10,974 | |
| TOTAL ASSETS | | | 292,831,222 | | | | 32,561,948 | |
| | | | | | | | | |
| LIABILITIES | | | | | | | | |
| Payable for investment securities purchased | | | 14,642,120 | | | | 1,247,766 | |
| Payable for capital shares redeemed | | | 269,081 | | | | 5,078 | |
| Accrued investment advisory fees (Note 4) | | | 172,378 | | | | 7,594 | |
| Payable to administrator (Note 4) | | | 31,100 | | | | 5,600 | |
| Other accrued expenses | | | 13,061 | | | | 4,535 | |
| TOTAL LIABILITIES | | | 15,127,740 | | | | 1,270,573 | |
| | | | | | | | | |
| NET ASSETS | | $ | 277,703,482 | | | $ | 31,291,375 | |
| | | | | | | | | |
| Net assets consist of: | | | | | | | | |
| Paid-in capital | | $ | 225,517,552 | | | $ | 30,111,674 | |
| Accumulated net investment income | | | — | | | | 6,827 | |
| Undistributed net realized gains from security transactions | | | 5,708,839 | | | | 37,946 | |
| Net unrealized appreciation on investments | | | 46,477,091 | | | | 1,134,928 | |
| Net assets | | $ | 277,703,482 | | | $ | 31,291,375 | |
| | | | | | | | | |
| Shares of beneficial interest outstanding (unlimited number of shares authorized, $0.01 par value) | | | 16,721,556 | | | | 3,006,132 | |
| | | | | | | | | |
| Net asset value, offering price and redemption price per share (Note 2) | | $ | 16.61 | | | $ | 10.41 | |
See accompanying notes to financial statements.
THE DAVENPORT FUNDS
STATEMENTS OF OPERATIONS
Year Ended March 31, 2015
| | | | | | Davenport Value & Income Fund | |
| INVESTMENT INCOME | | | | | | |
| Dividends | | $ | 4,402,052 | | | $ | 9,216,273 | |
| Foreign withholding taxes on dividends | | | (87,512 | ) | | | (99,342 | ) |
| TOTAL INVESTMENT INCOME | | | 4,314,540 | | | | 9,116,931 | |
| | | | | | | | | |
| EXPENSES | | | | | | | | |
| Investment advisory fees (Note 4) | | | 2,283,706 | | | | 2,629,441 | |
| Administration fees (Note 4) | | | 369,866 | | | | 415,753 | |
| Registration and filing fees | | | 31,489 | | | | 40,310 | |
| Professional fees | | | 30,948 | | | | 31,448 | |
| Compliance service fees (Note 4) | | | 27,193 | | | | 30,438 | |
| Custodian and bank service fees | | | 23,767 | | | | 30,305 | |
| Postage and supplies | | | 18,294 | | | | 18,440 | |
| Insurance expense | | | 11,403 | | | | 12,222 | |
| Trustees’ fees and expenses (Note 4) | | | 11,804 | | | | 11,804 | |
| Printing of shareholder reports | | | 9,169 | | | | 9,950 | |
| Other expenses | | | 8,858 | | | | 9,417 | |
| TOTAL EXPENSES | | | 2,826,497 | | | | 3,239,528 | |
| | | | | | | | | |
| NET INVESTMENT INCOME | | | 1,488,043 | | | | 5,877,403 | |
| | | | | | | | | |
| REALIZED AND UNREALIZED GAINS ON INVESTMENTS | | | | | | | | |
| Net realized gains from security transactions | | | 14,551,320 | | | | 18,731,719 | |
| Net change in unrealized appreciation/depreciation on investments | | | 19,717,017 | | | | 14,874,206 | |
| NET REALIZED AND UNREALIZED GAINS ON INVESTMENTS | | | 34,268,337 | | | | 33,605,925 | |
| | | | | | | | | |
| NET INCREASE IN NET ASSETS FROM OPERATIONS | | $ | 35,756,380 | | | $ | 39,483,328 | |
See accompanying notes to financial statements.
THE DAVENPORT FUNDS
STATEMENTS OF OPERATIONS (Continued)
Year Ended March 31, 2015(a)
| | | Davenport Equity Opportunities Fund | | | Davenport Small Cap Focus Fund | |
| INVESTMENT INCOME | | | | | | |
| Dividends | | $ | 2,807,597 | | | $ | 58,657 | |
| Foreign withholding taxes on dividends | | | (41,633 | ) | | | (1,152 | ) |
| TOTAL INVESTMENT INCOME | | | 2,765,964 | | | | 57,505 | |
| | | | | | | | | |
| EXPENSES | | | | | | | | |
| Investment advisory fees (Note 4) | | | 1,593,177 | | | | 45,624 | |
| Administration fees (Note 4) | | | 283,576 | | | | 15,000 | |
| Registration and filing fees | | | 38,485 | | | | 7,975 | |
| Professional fees | | | 23,748 | | | | 5,206 | |
| Compliance service fees (Note 4) | | | 20,644 | | | | 1,690 | |
| Custodian and bank service fees | | | 18,476 | | | | 3,453 | |
| Postage and supplies | | | 19,900 | | | | 1,849 | |
| Trustees’ fees and expenses (Note 4) | | | 11,804 | | | | 2,935 | |
| Printing of shareholder reports | | | 8,186 | | | | 2,305 | |
| Insurance expense | | | 7,328 | | | | — | |
| Other expenses | | | 9,752 | | | | 747 | |
| TOTAL EXPENSES | | | 2,035,076 | | | | 86,784 | |
| Fee reductions by the Adviser (Note 4) | | | — | | | | (10,744 | ) |
| NET EXPENSES | | | 2,035,076 | | | | 76,040 | |
| | | | | | | | | |
| NET INVESTMENT INCOME (LOSS) | | | 730,888 | | | | (18,535 | ) |
| | | | | | | | | |
| REALIZED AND UNREALIZED GAINS ON INVESTMENTS | | | | | | | | |
| Net realized gains from security transactions | | | 15,756,298 | | | | 63,308 | |
| Net change in unrealized appreciation/depreciation on investments | | | 18,256,256 | | | | 1,134,928 | |
| NET REALIZED AND UNREALIZED GAINS ON INVESTMENTS | | | 34,012,554 | | | | 1,198,236 | |
| | | | | | | | | |
| NET INCREASE IN NET ASSETS FROM OPERATIONS | | $ | 34,743,442 | | | $ | 1,179,701 | |
| (a) | Except for Davenport Small Cap Focus Fund, which represents the period from the commencement of operations (December 31, 2014) through March 31, 2015. |
See accompanying notes to financial statements.
DAVENPORT CORE FUND
STATEMENTS OF CHANGES IN NET ASSETS
| | | | | | | |
| FROM OPERATIONS | | | | | | |
| Net investment income | | $ | 1,488,043 | | | $ | 1,587,651 | |
| Net realized gains from security transactions | | | 14,551,320 | | | | 24,247,628 | |
| Net change in unrealized appreciation/depreciation on investments | | | 19,717,017 | | | | 21,071,593 | |
| Net increase in net assets from operations | | | 35,756,380 | | | | 46,906,872 | |
| | | | | | | | | |
| DISTRIBUTIONS TO SHAREHOLDERS | | | | | | | | |
| From net investment income | | | (1,509,705 | ) | | | (1,572,542 | ) |
| From net realized gains from security transactions | | | (22,409,339 | ) | | | (11,297,772 | ) |
| Decrease in net assets from distributions to shareholders | | | (23,919,044 | ) | | | (12,870,314 | ) |
| | | | | | | | | |
| FROM CAPITAL SHARE TRANSACTIONS | | | | | | | | |
| Proceeds from shares sold | | | 43,532,772 | | | | 44,315,591 | |
| Net asset value of shares issued in reinvestment of distributions to shareholders | | | 23,153,291 | | | | 12,476,055 | |
| Payments for shares redeemed | | | (29,067,963 | ) | | | (20,495,991 | ) |
| Net increase in net assets from capital share transactions | | | 37,618,100 | | | | 36,295,655 | |
| | | | | | | | | |
| TOTAL INCREASE IN NET ASSETS | | | 49,455,436 | | | | 70,332,213 | |
| | | | | | | | | |
| NET ASSETS | | | | | | | | |
| Beginning of year | | | 281,231,218 | | | | 210,899,005 | |
| End of year | | $ | 330,686,654 | | | $ | 281,231,218 | |
| | | | | | | | | |
| UNDISTRIBUTED NET INVESTMENT INCOME | | $ | — | | | $ | 27,002 | |
| | | | | | | | | |
| CAPITAL SHARE ACTIVITY | | | | | | | | |
| Shares sold | | | 2,233,700 | | | | 2,414,969 | |
| Shares reinvested | | | 1,207,808 | | | | 681,244 | |
| Shares redeemed | | | (1,495,763 | ) | | | (1,117,243 | ) |
| Net increase in shares outstanding | | | 1,945,745 | | | | 1,978,970 | |
| Shares outstanding at beginning of year | | | 14,573,498 | | | | 12,594,528 | |
| Shares outstanding at end of year | | | 16,519,243 | | | | 14,573,498 | |
See accompanying notes to financial statements.
DAVENPORT VALUE & INCOME FUND
STATEMENTS OF CHANGES IN NET ASSETS
| | | | | | | |
| FROM OPERATIONS | | | | | | |
| Net investment income | | $ | 5,877,403 | | | $ | 5,531,182 | |
| Net realized gains from security transactions | | | 18,731,719 | | | | 14,211,440 | |
| Net change in unrealized appreciation/depreciation on investments | | | 14,874,206 | | | | 22,127,758 | |
| Net increase in net assets from operations | | | 39,483,328 | | | | 41,870,380 | |
| | | | | | | | | |
| DISTRIBUTIONS TO SHAREHOLDERS | | | | | | | | |
| From net investment income | | | (5,878,113 | ) | | | (5,277,593 | ) |
| From net realized gains from security transactions | | | (15,874,061 | ) | | | (9,157,892 | ) |
| Decrease in net assets from distributions to shareholders | | | (21,752,174 | ) | | | (14,435,485 | ) |
| | | | | | | | | |
| FROM CAPITAL SHARE TRANSACTIONS | | | | | | | | |
| Proceeds from shares sold | | | 93,258,289 | | | | 87,997,225 | |
| Net asset value of shares issued in reinvestment of distributions to shareholders | | | 20,026,663 | | | | 13,263,859 | |
| Payments for shares redeemed | | | (27,526,918 | ) | | | (21,298,242 | ) |
| Net increase in net assets from capital share transactions | | | 85,758,034 | | | | 79,962,842 | |
| | | | | | | | | |
| TOTAL INCREASE IN NET ASSETS | | | 103,489,188 | | | | 107,397,737 | |
| | | | | | | | | |
| NET ASSETS | | | | | | | | |
| Beginning of year | | | 304,287,608 | | | | 196,889,871 | |
| End of year | | $ | 407,776,796 | | | $ | 304,287,608 | |
| | | | | | | | | |
| UNDISTRIBUTED NET INVESTMENT INCOME | | $ | 254,321 | | | $ | 256,710 | |
| | | | | | | | | |
| CAPITAL SHARE ACTIVITY | | | | | | | | |
| Shares sold | | | 6,192,254 | | | | 6,314,504 | |
| Shares reinvested | | | 1,332,807 | | | | 959,324 | |
| Shares redeemed | | | (1,830,740 | ) | | | (1,522,285 | ) |
| Net increase in shares outstanding | | | 5,694,321 | | | | 5,751,543 | |
| Shares outstanding at beginning of year | | | 20,688,180 | | | | 14,936,637 | |
| Shares outstanding at end of year | | | 26,382,501 | | | | 20,688,180 | |
See accompanying notes to financial statements.
DAVENPORT EQUITY OPPORTUNITIES FUND
STATEMENTS OF CHANGES IN NET ASSETS
| | | | | | | |
| FROM OPERATIONS | | | | | | |
| Net investment income | | $ | 730,888 | | | $ | 2,650,696 | |
| Net realized gains from security transactions | | | 15,756,298 | | | | 14,022,701 | |
| Net change in unrealized appreciation/depreciation on investments | | | 18,256,256 | | | | 10,046,548 | |
| Net increase in net assets from operations | | | 34,743,442 | | | | 26,719,945 | |
| | | | | | | | | |
| DISTRIBUTIONS TO SHAREHOLDERS | | | | | | | | |
| From net investment income | | | (3,196,404 | ) | | | (224,384 | ) |
| From net realized gains from security transactions | | | (18,954,387 | ) | | | (7,464,989 | ) |
| Decrease in net assets from distributions to shareholders | | | (22,150,791 | ) | | | (7,689,373 | ) |
| | | | | | | | | |
| FROM CAPITAL SHARE TRANSACTIONS | | | | | | | | |
| Proceeds from shares sold | | | 86,334,585 | | | | 54,980,702 | |
| Net asset value of shares issued in reinvestment of distributions to shareholders | | | 21,241,419 | | | | 7,445,644 | |
| Payments for shares redeemed | | | (16,954,232 | ) | | | (9,646,854 | ) |
| Net increase in net assets from capital share transactions | | | 90,621,772 | | | | 52,779,492 | |
| | | | | | | | | |
| TOTAL INCREASE IN NET ASSETS | | | 103,214,423 | | | | 71,810,064 | |
| | | | | | | | | |
| NET ASSETS | | | | | | | | |
| Beginning of year | | | 174,489,059 | | | | 102,678,995 | |
| End of year | | $ | 277,703,482 | | | $ | 174,489,059 | |
| | | | | | | | | |
| UNDISTRIBUTED NET INVESTMENT INCOME | | $ | — | | | $ | 2,451,767 | |
| | | | | | | | | |
| CAPITAL SHARE ACTIVITY | | | | | | | | |
| Shares sold | | | 5,452,269 | | | | 3,699,725 | |
| Shares reinvested | | | 1,376,196 | | | | 510,464 | |
| Shares redeemed | | | (1,074,814 | ) | | | (651,385 | ) |
| Net increase in shares outstanding | | | 5,753,651 | | | | 3,558,804 | |
| Shares outstanding at beginning of year | | | 10,967,905 | | | | 7,409,101 | |
| Shares outstanding at end of year | | | 16,721,556 | | | | 10,967,905 | |
See accompanying notes to financial statements.
DAVENPORT SMALL CAP FOCUS FUND
STATEMENT OF CHANGES IN NET ASSETS
| | | Period Ended March 31, 2015 (a) | |
| FROM OPERATIONS | | | |
| Net investment loss | | $ | (18,535 | ) |
| Net realized gains from security transactions | | | 63,308 | |
| Net change in unrealized appreciation/depreciation on investments | | | 1,134,928 | |
| Net increase in net assets from operations | | | 1,179,701 | |
| | | | | |
| FROM CAPITAL SHARE TRANSACTIONS | | | | |
| Proceeds from shares sold | | | 30,137,020 | |
| Payments for shares redeemed | | | (25,346 | ) |
| Net increase in net assets from capital share transactions | | | 30,111,674 | |
| | | | | |
| TOTAL INCREASE IN NET ASSETS | | | 31,291,375 | |
| | | | | |
| NET ASSETS | | | | |
| Beginning of period | | | — | |
| End of period | | $ | 31,291,375 | |
| | | | | |
| ACCUMULATED NET INVESTMENT INCOME | | $ | 6,827 | |
| | | | | |
| CAPITAL SHARE ACTIVITY | | | | |
| Shares sold | | | 3,008,657 | |
| Shares redeemed | | | (2,525 | ) |
| Net increase in shares outstanding | | | 3,006,132 | |
| Shares outstanding at beginning of period | | | — | |
| Shares outstanding at end of period | | | 3,006,132 | |
| (a) | Represents the period from the commencement of operations (December 31, 2014) through March 31, 2015. |
See accompanying notes to financial statements.
DAVENPORT CORE FUND
FINANCIAL HIGHLIGHTS
| Selected Per Share Data and Ratios for a Share Outstanding Throughout Each Year | |
| | | Years Ended March 31, | |
| | 2015 | | | 2014 | | | 2013 | | | 2012 | | | 2011 | |
| Net asset value at beginning of year | | $ | 19.30 | | | $ | 16.75 | | | $ | 15.00 | | | $ | 13.73 | | | $ | 12.05 | |
| | | | | | | | | | | | | | | | | | | | | |
| Income from investment operations: | | | | | | | | | | | | | | | | | | | | |
| Net investment income | | | 0.10 | | | | 0.12 | | | | 0.11 | | | | 0.09 | | | | 0.07 | |
| Net realized and unrealized gains on investments | | | 2.20 | | | | 3.39 | | | | 1.75 | | | | 1.27 | | | | 1.68 | |
| Total from investment operations | | | 2.30 | | | | 3.51 | | | | 1.86 | | | | 1.36 | | | | 1.75 | |
| | | | | | | | | | | | | | | | | | | | | |
| Less distributions: | | | | | | | | | | | | | | | | | | | | |
| Dividends from net investment income | | | (0.10 | ) | | | (0.12 | ) | | | (0.11 | ) | | | (0.09 | ) | | | (0.07 | ) |
| Distributions from net realized gains | | | (1.48 | ) | | | (0.84 | ) | | | — | | | | — | | | | — | |
| Total distributions | | | (1.58 | ) | | | (0.96 | ) | | | (0.11 | ) | | | (0.09 | ) | | | (0.07 | ) |
| | | | | | | | | | | | | | | | | | | | | |
| Net asset value at end of year | | $ | 20.02 | | | $ | 19.30 | | | $ | 16.75 | | | $ | 15.00 | | | $ | 13.73 | |
| | | | | | | | | | | | | | | | | | | | | |
Total return (a) | | | 12.42 | % | | | 21.32 | % | | | 12.47 | % | | | 9.99 | % | | | 14.61 | % |
| | | | | | | | | | | | | | | | | | | | | |
| Net assets at end of year (000’s) | | $ | 330,687 | | | $ | 281,231 | | | $ | 210,899 | | | $ | 174,898 | | | $ | 159,894 | |
| | | | | | | | | | | | | | | | | | | | | |
| Ratio of total expenses to average net assets | | | 0.93 | % | | | 0.94 | % | | | 0.95 | % | | | 0.96 | % | | | 0.99 | % |
| | | | | | | | | | | | | | | | | | | | | |
| Ratio of net investment income to average net assets | | | 0.49 | % | | | 0.64 | % | | | 0.71 | % | | | 0.66 | % | | | 0.58 | % |
| | | | | | | | | | | | | | | | | | | | | |
| Portfolio turnover rate | | | 21 | % | | | 29 | % | | | 26 | % | | | 19 | % | | | 34 | % |
| (a) | Total return is a measure of the change in value of an investment in the Fund over the period covered, which assumes any dividends or capital gains distributions are reinvested in shares of the Fund. Returns shown do not reflect the deduction of taxes a shareholder would pay on Fund distributions or the redemption of Fund shares. |
See accompanying notes to financial statements.
DAVENPORT VALUE & INCOME FUND
FINANCIAL HIGHLIGHTS
| Selected Per Share Data and Ratios for a Share Outstanding Throughout Each Period | |
| | | | | | | | | | | | | | | Period Ended March 31, 2011 (a) | |
| Net asset value at beginning of period | | $ | 14.71 | | | $ | 13.18 | | | $ | 11.51 | | | $ | 10.50 | | | $ | 10.00 | |
| | | | | | | | | | | | | | | | | | | | | |
| Income from investment operations: | | | | | | | | | | | | | | | | | | | | |
| Net investment income | | | 0.25 | | | | 0.30 | | | | 0.28 | | | | 0.23 | | | | 0.04 | |
| Net realized and unrealized gains on investments | | | 1.45 | | | | 2.04 | | | | 1.81 | | | | 1.02 | | | | 0.49 | |
| Total from investment operations | | | 1.70 | | | | 2.34 | | | | 2.09 | | | | 1.25 | | | | 0.53 | |
| | | | | | | | | | | | | | | | | | | | | |
| Less distributions: | | | | | | | | | | | | | | | | | | | | |
| Dividends from net investment income | | | (0.25 | ) | | | (0.29 | ) | | | (0.27 | ) | | | (0.23 | ) | | | (0.03 | ) |
| Distributions from net realized gains | | | (0.70 | ) | | | (0.52 | ) | | | (0.15 | ) | | | (0.01 | ) | | | — | |
| Total distributions | | | (0.95 | ) | | | (0.81 | ) | | | (0.42 | ) | | | (0.24 | ) | | | (0.03 | ) |
| | | | | | | | | | | | | | | | | | | | | |
| Net asset value at end of period | | $ | 15.46 | | | $ | 14.71 | | | $ | 13.18 | | | $ | 11.51 | | | $ | 10.50 | |
| | | | | | | | | | | | | | | | | | | | | |
Total return (b) | | | 11.92 | % | | | 18.25 | % | | | 18.69 | % | | | 12.23 | % | | | 5.35 | %(c) |
| | | | | | | | | | | | | | | | | | | | | |
| Net assets at end of period (000’s) | | $ | 407,777 | | | $ | 304,288 | | | $ | 196,890 | | | $ | 98,757 | | | $ | 48,831 | |
| | | | | | | | | | | | | | | | | | | | | |
| Ratio of total expenses to average net assets | | | 0.92 | % | | | 0.94 | % | | | 0.96 | % | | | 1.04 | % | | | 1.25 | %(d) |
| | | | | | | | | | | | | | | | | | | | | |
| Ratio of net investment income to average net assets | | | 1.66 | % | | | 2.22 | % | | | 2.37 | % | | | 2.30 | % | | | 1.99 | %(d) |
| | | | | | | | | | | | | | | | | | | | | |
| Portfolio turnover rate | | | 23 | % | | | 32 | % | | | 29 | % | | | 27 | % | | | 10 | %(c) |
| (a) | Represents the period from commencement of operations (December 31, 2010) through March 31, 2011. |
| (b) | Total return is a measure of the change in value of an investment in the Fund over the period covered, which assumes any dividends or capital gains distributions are reinvested in shares of the Fund. Returns shown do not reflect the deduction of taxes a shareholder would pay on Fund distributions or the redemption of Fund shares. |
See accompanying notes to financial statements.
DAVENPORT EQUITY OPPORTUNITIES FUND
FINANCIAL HIGHLIGHTS
| Selected Per Share Data and Ratios for a Share Outstanding Throughout Each Period | |
| | | | | | | | | | | | | | | Period Ended March 31, 2011 (a) | |
| Net asset value at beginning of period | | $ | 15.91 | | | $ | 13.86 | | | $ | 11.96 | | | $ | 10.72 | | | $ | 10.00 | |
| | | | | | | | | | | | | | | | | | | | | |
| Income (loss) from investment operations: | | | | | | | | | | | | | | | | | | | | |
| Net investment income (loss) | | | 0.04 | | | | 0.24 | | | | 0.03 | | | | (0.02 | ) | | | (0.01 | ) |
| Net realized and unrealized gains on investments | | | 2.42 | | | | 2.65 | | | | 2.17 | | | | 1.30 | | | | 0.73 | |
| Total from investment operations | | | 2.46 | | | | 2.89 | | | | 2.20 | | | | 1.28 | | | | 0.72 | |
| | | | | | | | | | | | | | | | | | | | | |
| Less distributions: | | | | | | | | | | | | | | | | | | | | |
| Dividends from net investment income | | | (0.26 | ) | | | (0.02 | ) | | | (0.02 | ) | | | — | | | | — | |
| Distributions from net realized gains | | | (1.50 | ) | | | (0.82 | ) | | | (0.28 | ) | | | (0.04 | ) | | | — | |
| Total distributions | | | (1.76 | ) | | | (0.84 | ) | | | (0.30 | ) | | | (0.04 | ) | | | — | |
| | | | | | | | | | | | | | | | | | | | | |
| Net asset value at end of period | | $ | 16.61 | | | $ | 15.91 | | | $ | 13.86 | | | $ | 11.96 | | | $ | 10.72 | |
| | | | | | | | | | | | | | | | | | | | | |
Total return (b) | | | 16.67 | % | | | 21.57 | % | | | 18.77 | % | | | 12.00 | % | | | 7.20 | %(c) |
| | | | | | | | | | | | | | | | | | | | | |
| Net assets at end of period (000’s) | | $ | 277,703 | | | $ | 174,489 | | | $ | 102,679 | | | $ | 59,135 | | | $ | 34,375 | |
| | | | | | | | | | | | | | | | | | | | | |
| Ratio of total expenses to average net assets | | | 0.96 | % | | | 0.97 | % | | | 1.01 | % | | | 1.10 | % | | | 1.25 | %(d) |
| | | | | | | | | | | | | | | | | | | | | |
| Ratio of net investment income (loss) to average net assets | | | 0.33 | % | | | 1.96 | % | | | 0.23 | % | | | (0.22 | %) | | | (0.40% | )(d) |
| | | | | | | | | | | | | | | | | | | | | |
| Portfolio turnover rate | | | 31 | % | | | 49 | % | | | 41 | % | | | 35 | % | | | 6 | %(c) |
| (a) | Represents the period from commencement of operations (December 31, 2010) through March 31, 2011. |
| (b) | Total return is a measure of the change in value of an investment in the Fund over the period covered, which assumes any dividends or capital gains distributions are reinvested in shares of the Fund. Returns shown do not reflect the deduction of taxes a shareholder would pay on Fund distributions or the redemption of Fund shares. |
See accompanying notes to financial statements.
DAVENPORT SMALL CAP FOCUS FUND
FINANCIAL HIGHLIGHTS
| Selected Per Share Data and Ratios for a Share Outstanding Throughout the Period | |
| | | Period Ended March 31, 2015 (a) | |
| Net asset value at beginning of period | | $ | 10.00 | |
| | | | | |
| Income (loss) from investment operations: | | | | |
| Net investment loss | | | (0.01 | ) |
| Net realized and unrealized gains on investments | | | 0.42 | |
| Total from investment operations | | | 0.41 | |
| | | | | |
| Net asset value at end of period | | $ | 10.41 | |
| | | | | |
Total return (b) | | | 4.10 | %(c) |
| | | | | |
| Net assets at end of period (000’s) | | $ | 31,291 | |
| | | | | |
| Ratio of total expenses to average net assets | | | 1.42 | %(d) |
| | | | | |
| Ratio of net expenses to average net assets | | | 1.25 | %(d)(e) |
| | | | | |
| Ratio of net investment loss to average net assets | | | (0.30% | )(d)(e) |
| | | | | |
| Portfolio turnover rate | | | 15 | %(c) |
| (a) | Represents the period from commencement of operations (December 31, 2014) through March 31, 2015. |
| (b) | Total return is a measure of the change in value of an investment in the Fund over the period covered, which assumes any dividends or capital gains distributions are reinvested in shares of the Fund. The return shown does not reflect the deduction of taxes a shareholder would pay on Fund distributions or the redemption of Fund shares. |
| (e) | Ratio was determined after advisory fee reductions (Note 4). |
See accompanying notes to financial statements.
THE DAVENPORT FUNDS
NOTES TO FINANCIAL STATEMENTS
March 31, 2015
1. Organization
Davenport Core Fund, Davenport Value & Income Fund, Davenport Equity Opportunities Fund and Davenport Small Cap Focus Fund (individually, a “Fund,” and, collectively, the “Funds”) are each a no-load series of the Williamsburg Investment Trust (the “Trust”), an open-end management investment company registered under the Investment Company Act of 1940. The Trust was organized as a Massachusetts business trust on July 18, 1988. Other series of the Trust are not incorporated in this report. Davenport Core Fund began operations on January 15, 1998. Davenport Value & Income Fund and Davenport Equity Opportunities Fund each began operations on December 31, 2010. Davenport Small Cap Focus Fund began operations on December 31, 2014.
Davenport Core Fund’s investment objective is long term growth of capital.
Davenport Value & Income Fund’s investment objective is to achieve long term growth while generating current income through dividend payments on portfolio securities.
Davenport Equity Opportunities Fund’s investment objective is long term capital appreciation.
Davenport Small Cap Focus Fund’s investment objective is long term capital appreciation.
Davenport Core Fund and Davenport Value & Income Fund are each classified as a diversified fund. Davenport Equity Opportunities Fund and Davenport Small Cap Focus Fund are each classified as a non-diversified fund.
2. Significant Accounting Policies
As an investment company, as defined in Financial Accounting Standards Board (“FASB”) Accounting Standards Update 2013-08, the Funds follow accounting and reporting guidance under FASB Accounting Standards Codification Topic 946, “Financial Services – Investment Companies.” The following is a summary of the Funds’ significant accounting policies. The policies are in conformity with accounting principles generally accepted in the United States of America (“GAAP”).
Securities valuation — The Funds’ portfolio securities are valued as of the close of business of the regular session of the New York Stock Exchange (normally 4:00 p.m., Eastern time). Securities traded on a national stock exchange are valued based upon the closing price on the principal exchange where the security is traded, if available, otherwise, at the last quoted bid price. Securities which are quoted by NASDAQ are valued at the NASDAQ Official Closing Price. Investments representing shares of other investment companies are valued at their net asset value as reported by such companies.
THE DAVENPORT FUNDS
NOTES TO FINANCIAL STATEMENTS (Continued)
Fixed income securities are typically valued on the basis of prices provided by an independent pricing service. The prices provided by the pricing service are determined with consideration given to institutional bid and last sale prices and take into account securities prices, yields, maturities, call features, ratings, institutional trading in similar groups of securities and developments related to specific securities.
When market quotations are not readily available, if a pricing service cannot provide a price or the investment adviser believes the price received from the pricing service is not indicative of market value, securities will be valued in good faith at fair value using methods consistent with procedures adopted by the Board of Trustees and will be classified as Level 2 or 3 within the fair value hierarchy (see below), depending on the inputs used. Such methods of fair valuation may include, but are not limited to: multiple of earnings, multiple of book value, discount from market of a similar freely traded security, purchase price of the security, subsequent private transactions in the security or related securities, or a combination of these and other factors.
GAAP establishes a single authoritative definition of fair value, sets out a framework for measuring fair value and requires additional disclosures about fair value measurements.
Various inputs are used in determining the value of the Funds’ investments. These inputs are summarized in the three broad levels listed below:
| • | Level 1 – quoted prices in active markets for identical securities |
| • | Level 2 – other significant observable inputs |
| • | Level 3 – significant unobservable inputs |
The inputs or methodology used for valuing securities are not necessarily an indication of the risks associated with investing in those securities. The inputs used to measure fair value may fall into different levels of the fair value hierarchy. In such cases, for disclosure purposes, the level in the fair value hierarchy within which the fair value measurement falls in its entirety is determined based on the lowest level input that is significant to the fair value measurement.
The following is a summary of the inputs used to value the Funds’ investments as of March 31, 2015 by security type:
| Davenport Core Fund | | Level 1 | | | Level 2 | | | Level 3 | | | Total | |
| Common Stocks | | $ | 317,422,392 | | | $ | — | | | $ | — | | | $ | 317,422,392 | |
| Money Market Funds | | | 6,485,704 | | | | — | | | | — | | | | 6,485,704 | |
| Total | | $ | 323,908,096 | | | $ | — | | | $ | — | | | $ | 323,908,096 | |
| Davenport Value & Income Fund | | Level 1 | | | Level 2 | | | Level 3 | | | Total | |
| Common Stocks | | $ | 370,163,403 | | | $ | — | | | $ | — | | | $ | 370,163,403 | |
| Exchange-Traded Funds | | | 25,529,412 | | | | — | | | | — | | | | 25,529,412 | |
| Money Market Funds | | | 10,581,923 | | | | — | | | | — | | | | 10,581,923 | |
| Total | | $ | 406,274,738 | | | $ | — | | | $ | — | | | $ | 406,274,738 | |
THE DAVENPORT FUNDS
NOTES TO FINANCIAL STATEMENTS (Continued)
| Davenport Equity Opportunities Fund | | Level 1 | | | Level 2 | | | Level 3 | | | Total | |
| Common Stocks | | $ | 259,538,082 | | | $ | — | | | $ | — | | | $ | 259,538,082 | |
| Closed-End Funds | | | 9,239,492 | | | | — | | | | — | | | | 9,239,492 | |
| Money Market Funds | | | 7,731,436 | | | | — | | | | — | | | | 7,731,436 | |
| Total | | $ | 276,509,010 | | | $ | — | | | $ | — | | | $ | 276,509,010 | |
| Davenport Small Cap Focus Fund | | Level 1 | | | Level 2 | | | Level 3 | | | Total | |
| Common Stocks | | $ | 24,427,521 | | | $ | — | | | $ | — | | | $ | 24,427,521 | |
| Exchange-Traded Funds | | | 1,915,873 | | | | — | | | | — | | | | 1,915,873 | |
| Money Market Funds | | | 5,586,579 | | | | — | | | | — | | | | 5,586,579 | |
| Total | | $ | 31,929,973 | | | $ | — | | | $ | — | | | $ | 31,929,973 | |
Refer to each Fund’s Schedule of Investments for a listing of the securities by sector type. As of March 31, 2015, the Funds did not have any transfers into and out of any Level. There were no Level 2 or Level 3 securities or derivative instruments held by the Funds as of March 31, 2015. It is the Funds’ policy to recognize transfers into and out of any Level at the end of the reporting period.
Share valuation — The net asset value per share of each Fund is calculated daily by dividing the total value of its assets, less liabilities, by the number of shares outstanding. The offering price and redemption price per share of each Fund is equal to the net asset value per share.
Investment income — Interest income is accrued as earned. Dividend income is recorded on the ex-dividend date. Discounts and premiums on fixed-income securities purchased are amortized using the interest method.
Security transactions — Security transactions are accounted for on trade date for financial reporting purposes. Gains and losses on securities sold are determined on a specific identification basis.
Common expenses — Common expenses of the Trust are allocated among the series of the Trust based on relative net assets of each series or the nature of the services performed and the relative applicability to each series.
Distributions to shareholders — Dividends arising from net investment income, if any, are declared and paid quarterly to shareholders of Davenport Core Fund, Davenport Value & Income Fund and Davenport Small Cap Focus Fund; and declared and paid annually to shareholders of Davenport Equity Opportunities Fund. Net realized short-term capital gains, if any, may be distributed throughout the year and net realized long-term capital gains, if any, are distributed at least once each year. The amount of distributions from net investment income and net realized gains are determined in accordance with federal income tax regulations which may differ from GAAP. Dividends and distributions are recorded on the ex-dividend date.
THE DAVENPORT FUNDS
NOTES TO FINANCIAL STATEMENTS (Continued)
The tax character of distributions paid during the years ended March 31, 2015 and March 31, 2014 is as follows:
| | | | | |
| Davenport Core Fund | 3/31/15 | $2,802,392 | $21,116,652 | $23,919,044 |
| | 3/31/14 | $1,949,919 | $10,920,395 | $12,870,314 |
| Davenport Value & Income Fund | 3/31/15 | $7,486,896 | $14,265,278 | $21,752,174 |
| | 3/31/14 | $7,813,611 | $6,621,874 | $14,435,485 |
| Davenport Equity Opportunities Fund | 3/31/15 | $10,493,395 | $11,657,396 | $22,150,791 |
| | 3/31/14 | $1,238,779 | $6,450,594 | $7,689,373 |
There were no distributions paid by Davenport Small Cap Focus Fund during the period ended March 31, 2015.
Estimates — The preparation of financial statements in conformity with GAAP requires management to make estimates and assumptions that affect the reported amounts of assets and liabilities and disclosure of contingent assets and liabilities as of the date of the financial statements and the reported amounts of income and expenses during the reporting period. Actual results could differ from those estimates.
Federal income tax — Each Fund has qualified and intends to continue to qualify as a regulated investment company under the Internal Revenue Code of 1986 (the “Code”). Qualification generally will relieve the Funds of liability for federal income taxes to the extent 100% of their net investment income and net realized capital gains are distributed in accordance with the Code. Accordingly, no provision for income tax has been made.
In order to avoid imposition of the excise tax applicable to regulated investment companies, it is also each Fund’s intention to declare as dividends in each calendar year at least 98% of its net investment income (earned during the calendar year) and 98.2% of its net realized capital gains (earned during the twelve months ended October 31) plus undistributed amounts from prior years.
The following information is computed on a tax basis for each item as of March 31, 2015:
| | | | | | Davenport Value & Income Fund | | | Davenport Equity Opportunities Fund | | | Davenport Small Cap Focus Fund | |
| Cost of portfolio investments | | $ | 223,789,507 | | | $ | 340,210,300 | | | $ | 230,032,594 | | | $ | 30,788,218 | |
| Gross unrealized appreciation | | $ | 105,390,113 | | | $ | 72,593,649 | | | $ | 54,034,217 | | | $ | 1,731,301 | |
| Gross unrealized depreciation | | | (5,271,524 | ) | | | (6,529,211 | ) | | | (7,557,801 | ) | | | (589,546 | ) |
| Net unrealized appreciation | | | 100,118,589 | | | | 66,064,438 | | | | 46,476,416 | | | | 1,141,755 | |
| Undistributed ordinary income | | | — | | | | 707,467 | | | | 345,681 | | | | 37,946 | |
| Undistributed long-term gains | | | 6,233,198 | | | | 10,697,577 | | | | 5,363,833 | | | | — | |
| Accumulated earnings | | $ | 106,351,787 | | | $ | 77,469,482 | | | $ | 52,185,930 | | | $ | 1,179,701 | |
THE DAVENPORT FUNDS
NOTES TO FINANCIAL STATEMENTS (Continued)
The difference between the federal income tax cost of portfolio investments and the financial statement cost for each Fund is due to certain timing differences in the recognition of capital gains and losses under income tax regulations and GAAP. These timing differences are temporary in nature and are due to the tax deferral of losses on wash sales, adjustments to basis on publicly traded partnerships and/or holdings classified as passive foreign investment companies (PFICs).
For the year ended March 31, 2015, the following reclassifications were made as a result of permanent differences between the financial statement and income tax reporting requirements:
| | | | | | Davenport Value & Income Fund | | | Davenport Equity Opportunities Fund | | | Davenport Small Cap Focus Fund | |
| Undistributed net investment income | | $ | (5,340 | ) | | $ | (1,679 | ) | | $ | 13,749 | | | $ | 25,362 | |
| Undistributed net realized gains from security transactions | | $ | 5,340 | | | $ | 1,679 | | | $ | (13,749 | ) | | $ | (25,362 | ) |
Such reclassifications have no effect on each Fund’s total net assets or its net asset value per share.
The Funds recognize the tax benefits or expenses of uncertain tax positions only when the position is “more likely than not” to be sustained assuming examination by tax authorities. Management has reviewed the tax positions taken on Federal income tax returns for the current and all applicable open tax years (tax years ended March 31, 2012 through March 31, 2015) of each Fund and has concluded that no provision for unrecognized tax benefits or expenses is required in these financial statements.
3. Investment Transactions
Investment transactions, other than short-term investments and U.S. government securities, were as follows for the year ended March 31, 2015:
| | | | | | Davenport Value & Income Fund | | | Davenport Equity Opportunities Fund | | | Davenport Small Cap Focus Fund | |
| Purchases of investment securities | | $ | 77,492,444 | | | $ | 152,138,827 | | | $ | 136,266,040 | | | $ | 28,703,051 | |
| Proceeds from sales and maturities of investment securities | | $ | 62,432,778 | | | $ | 78,982,934 | | | $ | 63,628,676 | | | $ | 3,557,891 | |
THE DAVENPORT FUNDS
NOTES TO FINANCIAL STATEMENTS (Continued)
4. Transactions with Related Parties
INVESTMENT ADVISORY AGREEMENTS
Each Fund’s investments are managed by Davenport & Company LLC (the “Adviser”) under the terms of an Investment Advisory Agreement. Under the Investment Advisory Agreement, each Fund pays the Adviser a fee, which is computed and accrued daily and paid monthly, at an annual rate of .75% on its average daily net assets. Certain officers of the Trust are also officers of the Adviser.
The Adviser has agreed, until August 1, 2016, to reduce its investment advisory fees and to reimburse other operating expenses to the extent necessary to limit total annual fund operating expenses (excluding acquired fund fees and expenses) of Davenport Small Cap Focus Fund to an amount not exceeding 1.25% of the Fund’s average daily net assets. Any such fee reductions by the Adviser, or payments by the Adviser of expenses which are Davenport Small Cap Focus Fund’s obligation, are subject to repayment by the Fund for a period of three years from the end of the fiscal year when such fee reductions or reimbursements occurred, provided the Fund is able to effect such repayment and remain in compliance with the undertaking by the Adviser to limit expenses of the Fund. During the period ended March 31, 2015, the Adviser reduced its investment advisory fees for Davenport Small Cap Focus Fund by $10,744. The Adviser may seek repayment of such investment advisory fee reductions no later than March 31, 2018.
OTHER SERVICE PROVIDERS
Ultimus Fund Solutions, LLC (“Ultimus”) provides fund administration, fund accounting, compliance and transfer agent services to the Funds. The Funds pay Ultimus fees in accordance with the agreements for such services. In addition, the Funds pay out-of-pocket expenses including, but not limited to, postage, supplies, and costs of pricing the Funds’ portfolio securities. Certain officers of the Trust are also officers of Ultimus, or of Ultimus Fund Distributors, LLC (the “Distributor”), the principal underwriter of each Fund’s shares and an affiliate of Ultimus. The Distributor is compensated by the Adviser (not the Funds) for acting as principal underwriter.
COMPENSATION OF TRUSTEES
Trustees and officers affiliated with an investment adviser to the Trust or Ultimus are not compensated by the Trust for their services. Each Trustee who is not an affiliated person of an investment adviser or Ultimus receives from the Trust an annual retainer of $12,000, payable quarterly; a fee of $1,500 for attendance at each meeting of the Board of Trustees (except that such fee is $2,500 for the independent chairman); and a fee of $1,000 for attendance at each meeting of any committee of the Board (except that such fee is $1,500 for the committee chairman); plus reimbursement of travel and other expenses incurred in attending meetings. Prior to July 1, 2014, the annual retainer was $10,000.
THE DAVENPORT FUNDS
NOTES TO FINANCIAL STATEMENTS (Continued)
5. Sector Risk
If a Fund has significant investments in the securities of issuers in industries within a particular sector, any development affecting that sector will have a greater impact on the value of the net assets of the Fund than would be the case if the Fund did not have significant investments in that sector. In addition, this may increase the risk of loss of an investment in the Fund and increase the volatility of the Fund’s net asset value per share. From time to time, circumstances may affect a particular sector and the companies within such sector. For instance, economic or market factors, regulation or deregulation, or other developments may negatively impact all companies in a particular sector and therefore the value of a Fund’s portfolio would be adversely affected. As of March 31, 2015, Davenport Value & Income Fund had 29.0% of the value of its net assets invested in stocks within the Financials sector and Davenport Equity Opportunities Fund had 27.2% and 35.6% of the value of its net assets invested in stocks within the Consumer Discretionary sector and Financials sector, respectively.
6. Contingencies and Commitments
The Funds indemnify the Trust’s officers and Trustees for certain liabilities that might arise from their performance of their duties to the Funds. Additionally, in the normal course of business the Funds enter into contracts that contain a variety of representations and warranties and which provide general indemnifications. The Funds’ maximum exposure under these arrangements is unknown, as this would involve future claims that may be made against the Funds that have not yet occurred. However, based on experience, the Funds expect the risk of loss to be remote.
7. Subsequent Events
The Funds are required to recognize in the financial statements the effects of all subsequent events that provide additional evidence about conditions that existed as of the date of the Statements of Assets and Liabilities. For non-recognized subsequent events that must be disclosed to keep the financial statements from being misleading, the Funds are required to disclose the nature of the event as well as an estimate of its financial effect, or a statement that such an estimate cannot be made. Management has evaluated subsequent events through the issuance of these financial statements and has noted no such events.
THE DAVENPORT FUNDS
REPORT OF INDEPENDENT REGISTERED
PUBLIC ACCOUNTING FIRM
The Board of Trustees and Shareholders of
The Davenport Core Fund,
The Davenport Value & Income Fund,
The Davenport Equity Opportunities Fund, and
The Davenport Small Cap Focus Fund, each a series of the Williamsburg Investment Trust
We have audited the accompanying statements of assets and liabilities of The Davenport Core Fund, The Davenport Value & Income Fund, The Davenport Equity Opportunities Fund and The Davenport Small Cap Focus Fund (commenced operations on December 31, 2014), (collectively referred to as the “Funds”), (each a series of the Williamsburg Investment Trust), including the schedules of investments, as of March 31, 2015, and the related statements of operations for the year or period then ended, the statements of changes in net assets for each of the two years or period indicated therein, and the financial highlights for each of the five years or period indicated therein. These financial statements and financial highlights are the responsibility of the Funds’ management. Our responsibility is to express an opinion on these financial statements and financial highlights based on our audits.
We conducted our audits in accordance with the standards of the Public Company Accounting Oversight Board (United States). Those standards require that we plan and perform the audits to obtain reasonable assurance about whether the financial statements and financial highlights are free of material misstatement. We were not engaged to perform an audit of the Funds’ internal control over financial reporting. Our audits included consideration of internal control over financial reporting as a basis for designing audit procedures that are appropriate in the circumstances, but not for the purpose of expressing an opinion on the effectiveness of the Funds’ internal control over financial reporting. Accordingly, we express no such opinion. An audit also includes examining, on a test basis, evidence supporting the amounts and disclosures in the financial statements and financial highlights, assessing the accounting principles used and significant estimates made by management, and evaluating the overall financial statement presentation. Our procedures included confirmation of securities owned as of March 31, 2015, by correspondence with the custodian and brokers. We believe that our audits provide a reasonable basis for our opinion.
In our opinion, the financial statements and financial highlights referred to above present fairly, in all material respects, the financial position of each of the respective Funds comprising the Williamsburg Investment Trust at March 31, 2015, the results of their operations for the year or period then ended, the changes in their net assets for each of the two years or period indicated therein, and the financial highlights for each of the periods indicated therein, in conformity with U.S. generally accepted accounting principles.
Cincinnati, Ohio
May 22, 2015
THE DAVENPORT FUNDS
BOARD OF TRUSTEES AND EXECUTIVE OFFICERS
(Unaudited)
Overall responsibility for management of the Funds rests with the Board of Trustees. The Trustees serve during the lifetime of the Trust and until its termination, or until death, resignation, retirement or removal. The Trustees, in turn, elect the officers of the Funds. The officers have been elected for an annual term. The following are the Trustees and executive officers of the Funds:
| | Trustee | Address | Year of Birth | Position Held with the Trust | Length of Time Served |
| | Robert S. Harris, Ph.D. | 100 Darden Boulevard Charlottesville, VA | 1949 | Chairman and Trustee | Since January 2007 |
| * | John P. Ackerly, IV | One James Center 901 E. Cary Street Richmond, VA | 1963 | Trustee and President of Davenport Funds | Since November 1997 |
| * | John T. Bruce | 800 Main Street Lynchburg, VA | 1953 | Trustee and President of FBP Funds | Since September 1988 |
| | George K. Jennison | 5101 Stratford Crescent Richmond, VA 23226 | 1957 | Trustee | Since January 2015 |
| | J. Finley Lee, Jr., Ph.D | 448 Pond Apple Drive North Naples, FL | 1939 | Trustee | Since September 1988 |
| | Harris V. Morrissette | 100 Jacintoport Boulevard Saraland, AL | 1959 | Trustee | Since March 1993 |
| | Elizabeth W. Robertson | 8908 Norwick Road Richmond, VA | 1953 | Trustee | Since February 2014 |
| | I. Lee Chapman, IV | One James Center 901 E. Cary Street Richmond, VA | 1971 | Vice President | Since November 2010 |
| | George L. Smith, III | One James Center 901 E. Cary Street Richmond, VA | 1976 | Vice President | Since February 2011 |
| | Robert G. Dorsey | 225 Pictoria Drive, Suite 450 Cincinnati, OH | 1957 | Vice President | Since November 2000 |
| | Mark J. Seger | 225 Pictoria Drive, Suite 450 Cincinnati, OH | 1962 | Treasurer | Since November 2000 |
| | Tina H. Bloom | 225 Pictoria Drive, Suite 450 Cincinnati, OH | 1968 | Chief Compliance Officer and Secretary | Since August 2006 |
| * | Messrs. Ackerly and Bruce, as affiliated persons of investment advisers to the Trust, are “interested persons” of the Trust within the meaning of Section 2(a)(19) of the Investment Company Act of 1940. |
THE DAVENPORT FUNDS
BOARD OF TRUSTEES AND EXECUTIVE OFFICERS
(Unaudited) (Continued)
Each Trustee oversees twelve portfolios of the Trust, including the Funds. The principal occupations of the Trustees and executive officers of the Funds during the past five years and public directorships held by the Trustees are set forth below:
Robert S. Harris, Ph.D. is the C. Stewart Sheppard Professor of Business Administration at The Darden Graduate School of Business Administration at the University of Virginia. He was previously the dean at Darden. Professor Harris has published widely on corporate finance, financial markets and mergers and acquisitions and has served as a consultant to corporations and government agencies.
John P. Ackerly, IV is Senior Vice President and Portfolio Manager of the Adviser.
John T. Bruce is a President, Director and member of the Executive Committee of Flippin, Bruce & Porter, Inc. (an investment advisory firm).
George K. Jennison is President of Oyster Consulting, LLC (a financial consulting firm). He previously was a financial adviser with Wells Fargo Advisors, LLC.
J. Finley Lee, Jr., Ph.D. is the retired Julian Price Professor Emeritus at the University of North Carolina.
Harris V. Morrissette is President of China Doll Rice and Beans, Inc. and Dixie Lily Foods. He is also a Director of International Shipholding Corporation (cargo transportation) and a Director of Trustmark National Bank (bank holding company). Previously, he was Chairman of Azalea Aviation, Inc. (airplane fueling) until January 2012.
Elizabeth W. Robertson has been Chief Financial Officer for Monument Restaurants LLC (restaurant franchises) since 2011 and a Director of Franklin Financial Corporation and Franklin Federal Savings Bank since 1996.
I. Lee Chapman, IV is President and Chief Executive Officer of the Adviser.
George L. Smith, III is Senior Vice President and Portfolio Manager of the Adviser.
Robert G. Dorsey is a Managing Director of Ultimus Fund Solutions, LLC and Ultimus Fund Distributors, LLC.
Mark J. Seger is a Managing Director of Ultimus Fund Solutions, LLC and Ultimus Fund Distributors, LLC.
Tina H. Bloom is Director of Fund Administration of Ultimus Fund Solutions, LLC.
Additional information about members of the Board of Trustees and executive officers is available in the Statement of Additional Information (“SAI”). To obtain a free copy of the SAI, please call 1-800-281-3217.
THE DAVENPORT FUNDS
YOUR FUNDS’ EXPENSES (Unaudited)
We believe it is important for you to understand the impact of costs on your investment. All mutual funds have operating expenses. As a shareholder of the Funds, you incur ongoing costs, including management fees and other expenses. These ongoing costs, which are deducted from each Fund’s gross income, directly reduce the investment return of the Funds.
A mutual fund’s ongoing costs are expressed as a percentage of its average net assets. This figure is known as the expense ratio. The following examples are intended to help you understand the ongoing costs (in dollars) of investing in the Funds and to compare these costs with the ongoing costs of investing in other mutual funds. The examples below are based on an investment of $1,000 made at the beginning of the period shown and held for the entire period (October 1, 2014 for Davenport Core Fund, Davenport Value & Income Fund and Davenport Equity Opportunities Fund and December 31, 2014 for Davenport Small Cap Focus Fund) and held through the end of the period (March 31, 2015).
The table below illustrates each Fund’s ongoing costs in two ways:
Actual fund return – This section helps you to estimate the actual expenses that you paid over the period. The “Ending Account Value” shown is derived from each Fund’s actual return, and the third column shows the dollar amount of operating expenses that would have been paid by an investor who started with $1,000 in the Funds. You may use the information here, together with the amount you invested, to estimate the expenses that you paid over the period.
To do so, simply divide your account value by $1,000 (for example, an $8,600 account value divided by $1,000 = 8.6), then multiply the result by the number given for the Funds under the heading “Expenses Paid During Period.”
Hypothetical 5% return – This section is intended to help you compare each Fund’s ongoing costs with those of other mutual funds. It assumes that each Fund had an annual return of 5% before expenses during the period shown, but that the expense ratio is unchanged. In this case, because the return used is not each Fund’s actual return, the results do not apply to your investment. The example is useful in making comparisons because the Securities and Exchange Commission (“SEC”) requires all mutual funds to calculate expenses based on a 5% return. You can assess each Fund’s ongoing costs by comparing this hypothetical example with the hypothetical examples that appear in shareholder reports of other funds.
Note that expenses shown in the table are meant to highlight and help you compare ongoing costs only. The Funds do not charge sales loads or redemption fees.
The calculations assume no shares were bought or sold during the period. Your actual costs may have been higher or lower, depending on the amount of your investment and the timing of any purchases or redemptions.
More information about each Fund’s expenses, including historical annual expense ratios, can be found in this report. For additional information on operating expenses and other shareholder costs, please refer to the Funds’ prospectus.
THE DAVENPORT FUNDS
YOUR FUNDS’ EXPENSES (Unaudited) (Continued)
| | Beginning Account Value October 1, 2014 | Ending Account Value March 31, 2015 | | Expenses Paid During Period(b) |
| Davenport Core Fund | | | | |
| Based on Actual Fund Return | $1,000.00 | $1,088.20 | 0.92% | $4.79 |
| Based on Hypothetical 5% Return (before expenses) | $1,000.00 | $1,020.34 | 0.92% | $4.63 |
| Davenport Value & Income Fund | | | | |
| Based on Actual Fund Return | $1,000.00 | $1,083.90 | 0.92% | $4.78 |
| Based on Hypothetical 5% Return (before expenses) | $1,000.00 | $1,020.34 | 0.92% | $4.63 |
| Davenport Equity Opportunities Fund | | | |
| Based on Actual Fund Return | $1,000.00 | $1,160.70 | 0.95% | $5.12 |
| Based on Hypothetical 5% Return (before expenses) | $1,000.00 | $1,020.19 | 0.95% | $4.78 |
| (a) | Annualized, based on the Fund’s most recent one-half year expenses. |
| (b) | Expenses are equal to the Fund’s annualized expense ratio multiplied by the average account value over the period, multiplied by 182/365 (to reflect the one-half year period). |
| | Beginning Account Value October 1, 2014(a) | Ending Account Value March 31, 2015 | Net Expense Ratio(b) | Expenses Paid During Period(c) |
| Davenport Small Cap Focus Fund | | | | |
| Based on Actual Fund Return | $1,000.00 | $1,041.00 | 1.25% | $3.18 |
| Based on Hypothetical 5% Return (before expenses) | $1,000.00 | $1,018.70 | 1.25% | $6.29 |
| (a) | Beginning Account Value is as of December 31, 2014 (date of commencement of operations) for the Actual Fund Return information. |
| (b) | Annualized, based on the Fund’s expenses for the period since the commencement of operations (December 31, 2014). |
| (c) | Expenses are equal to the Fund’s annualized expense ratio multiplied by the average account value over the period, multiplied by 91/365 (to reflect the period since inception) and 182/365 (to reflect the one-half year period), for Actual Fund Return and Hypothectical 5% Return information, respectively. |
THE DAVENPORT FUNDS
OTHER INFORMATION (Unaudited)
A description of the policies and procedures that the Funds use to vote proxies relating to portfolio securities is available without charge upon request by calling toll-free 1-800-281-3217, or on the SEC’s website at http://www.sec.gov. Information regarding how the Funds voted proxies relating to portfolio securities during the most recent 12-month period ended June 30 is also available without charge upon request by calling toll-free 1-800-281-3217, or on the SEC’s website at http://www.sec.gov.
The Trust files a complete listing of portfolio holdings for the Funds with the SEC as of the end of the first and third quarters of each fiscal year on Form N-Q. These filings are available upon request by calling 1-800-281-3217. Furthermore, you may obtain a copy of these filings on the SEC’s website at http://www.sec.gov. The Trust’s Forms N-Q may also be reviewed and copied at the SEC’s Public Reference Room in Washington, DC, and information on the operation of the Public Reference Room may be obtained by calling 1-800-SEC-0330.
A complete listing of portfolio holdings for the Funds is updated daily and can be reviewed at the Funds’ website at http://www.investdavenport.com.
FEDERAL TAX INFORMATION (Unaudited)
In accordance with federal tax requirements, the following provides shareholders with information concerning distributions from ordinary income and net realized gains made by Davenport Core Fund, Davenport Value & Income Fund and Davenport Equity Opportunities Fund during the year ended March 31, 2015. During the year ended March 31, 2015, Davenport Core Fund, Davenport Value & Income Fund and Davenport Equity Opportunities Fund paid a long-term capital gain distribution of $22,409,339, $14,265,278 and $11,657,396, respectively. Certain dividends paid by the Funds may be subject to a maximum rate of 23.8%. Davenport Core Fund, Davenport Value & Income Fund and Davenport Equity Opportunities Fund intend to designate up to a maximum amount of $1,509,705, $7,486,896 and $10,493,395, respectively, as taxed at a maximum rate of 23.8%. For the fiscal year ended March 31, 2015, 100% of the dividends paid from ordinary income by the Funds qualified for the dividends received deduction for corporations.
As required by federal regulations, complete information will be computed and reported in conjunction with your 2015 1099-DIV.
THE DAVENPORT FUNDS
DISCLOSURE REGARDING APPROVAL OF
INVESTMENT ADVISORY AGREEMENTS (Unaudited)
At an in-person meeting held on February 24, 2015, the Board of Trustees, including a majority of the Independent Trustees, approved the continuance for a one-year period of the Investment Advisory Agreements with the Adviser on behalf of Davenport Core Fund, the Davenport Value & Income Fund and the Davenport Equity Opportunities Fund. Below is a discussion of the factors considered by the Board of Trustees along with the conclusions with respect thereto that formed the basis for the Board’s approval.
In selecting the Adviser and approving the continuance of the Investment Advisory Agreements, the Trustees considered all information they deemed reasonably necessary to evaluate the terms of the Agreements. The principal areas of review by the Trustees were the nature, extent and quality of the services provided by the Adviser and the reasonableness of the fees charged for those services. These matters were considered by the Independent Trustees consulting with experienced counsel for the Independent Trustees, who is independent of the Adviser.
The Trustees’ evaluation of the quality of the Adviser’s services took into account their knowledge and experience gained through meetings with and reports of the Adviser’s senior management over the course of the preceding year. Both short-term and long-term investment performance of the Funds was considered. Each Fund’s performance was compared to its performance benchmark and to that of competitive funds with similar investment objectives and to the Adviser’s comparably managed private accounts. The Trustees also considered the scope and quality of the in-house capabilities of the Adviser and other resources dedicated to performing services for the Funds. The quality of administrative and other services, including the Adviser’s role in coordinating the activities of the Funds’ other service providers, were considered in light of the Funds’ compliance with investment policies and applicable laws and regulations and of related reports by management and the Funds’ independent public accounting firm in periodic meetings with the Trust’s Audit Committee. The Trustees also considered the business reputation of the Adviser, the qualifications of its key investment and compliance personnel, and its financial resources.
In reviewing the fees payable under the Investment Advisory Agreements, the Trustees compared the advisory fees and overall expense levels of each Fund with those of competitive funds with similar investment objectives as well as the private accounts managed by the Adviser. The Trustees considered information provided by the Adviser concerning the Adviser’s profitability with respect to each Fund, including the assumptions and methodology used in preparing the profitability information, in light of applicable case law relating to advisory fees. For these purposes, the Trustees took into account not only the fees paid by the Funds, but also so-called “fallout” benefits to the Adviser. The Trustees also considered the fact that all of the Funds’ portfolio trades were executed by the Adviser at no cost to the Funds. In evaluating each Fund’s advisory fees, the Trustees took into account the complexity and quality of the investment management of the Fund.
THE DAVENPORT FUNDS
DISCLOSURE REGARDING APPROVAL OF
INVESTMENT ADVISORY AGREEMENTS (Unaudited)
(Continued)
Based upon their review of this information, the Independent Trustees concluded that: (i) based on the performance of each of the Funds, the Adviser’s demonstrated commitment to long-term investing and its team-oriented management approach, the Adviser has provided quality services to the Funds; (ii) the advisory fees payable by each Fund to the Adviser are competitive with fees for comparably managed funds and the Independent Trustees believe the fees to be reasonable given the scope and quality of services provided by the Adviser and the resources that are dedicated to its investment process; (iii) the total operating expense ratio of each Fund is lower than the average expense ratio for comparably managed funds, according to statistics derived from Morningstar, Inc.; (iv) the Adviser has further benefited the Funds’ shareholders by executing portfolio transactions at no cost to the Funds; and (v) the level of the Adviser’s profitability with respect to its management of the Funds are not unreasonable and represent a fair and entrepreneurial profit, in light of the quality and scope of services that are provided to the Funds.
The Independent Trustees considered the extent to which economies of scale are being realized as the Funds grow and whether fee levels reflect these economies of scale. The Independent Trustees also considered the “fallout” benefits to the Adviser with respect to the Funds, but given the amounts involved viewed these as secondary factors in connection with the evaluation of the reasonableness of the advisory fees paid by the Funds.
No single factor was considered in isolation or to be determinative to the decision of the Trustees to approve continuance of the Investment Advisory Agreements. Rather the Trustees concluded, in light of a weighing and balancing of all factors considered, that it was in the best interests of each Fund and its shareholders to continue the Investment Advisory Agreements without modification to its terms, including the fees charged for services thereunder.
This page intentionally left blank.
This page intentionally left blank.
This page intentionally left blank.
| THE DAVENPORT FUNDS
Investment Adviser Davenport & Company LLC One James Center 901 East Cary Street Richmond, Virginia 23219-4037
Administrator Ultimus Fund Solutions, LLC P.O. Box 46707 Cincinnati, Ohio 45246-0707 1-800-281-3217
Custodian US Bank NA 425 Walnut Street Cincinnati, Ohio 45202
Independent Registered Public Accounting Firm Ernst & Young LLP 1900 Scripps Center 312 Walnut Street Cincinnati, Ohio 45202
Legal Counsel Sullivan & Worcester LLP One Post Office Square Boston, Massachusetts 02109
Board of Trustees Robert S. Harris, Ph.D., Chairman John P. Ackerly, IV John T. Bruce George K. Jennison J. Finley Lee, Jr., Ph.D. Harris V. Morrissette Elizabeth W. Robertson
Officers John P. Ackerly, IV, President George L. Smith, III, Vice President |
Davenport & Company LLC
One James Center
901 East Cary Street
Richmond, VA 23219
Member: NYSE • SIPC
Toll Free: (800) 846-6666
www.investdavenport.com
| | | | | | |
| | | | | | | |
| | | | | | | |
| | | |
FBP Equity & Dividend Plus Fund FBP Appreciation & Income Opportunities Fund
Annual Report
March 31, 2015
No-Load Funds | | | |
| | | | | | | |
| | | | | | | |
| | | | | | |
| Letter to Shareholders | May 11, 2015 |
We are pleased to report on your Funds and their investments for the annual period ended March 31, 2015 and to provide some additional information since we last communicated with you.
Economic and Market Update
It should be noted that the 2014 U.S. GDP growth rate of 2.4% wouldn’t normally be considered outstanding, but with China’s growth rate slowing appreciably and the Euro zone stagnant, the U.S. has been the bright spot for global growth. In spite of the fact that the just released first quarter 2015 GDP report was quite weak, the Federal Reserve still appears poised to increase interest rates later this year. This will be the first increase since 2006, and the timing will be dependent on economic conditions as the year progresses. In contrast, central banks in Europe, Japan and China are working to stimulate their respective economies with quantitative and/or monetary easing. While higher rates in the U.S. point to improving health of our economy, markets will need some time to adjust to this new environment. This adjustment phase has added, and will likely continue to add, to both bond and stock market volatility.
Relatively strong U.S. GDP over the past year has also produced dramatic swings in currency markets, with the dollar showing strength versus most currencies, but particularly compared to the euro. This has created challenging headwinds for earnings for U.S. companies with foreign exposure and has increased volatility in domestic equity markets. Along with currencies, commodity prices have also been impacted by the generally slow global economic conditions. Specifically, the lower growth rate in China led to reduced demand for industrial commodities and contributed to significant pressure on prices. The S&P GSCI commodity index is down more than 40% year over year, with energy commodities showing the greatest weakness.
In this environment, one would expect energy and commodity stocks to lag the market and that has certainly been the case for the last few quarters. In general, value strategies (which tend to be more cyclical) have lagged and growth and momentum strategies have outperformed. Large, mature, dividend-paying multinational companies also underperformed as they face earnings translation pressures due to the strong dollar. Health Care has been particularly strong and was the best performing sector for the past year. Within that group, Biotechnology and Medical Technology have far and away been the leading industries. These stocks trade at excessive price earnings ratios and few pay dividends - attributes that make them unlikely candidates for the Funds. Fixed income returns were generally positive as interest rates surprised most investors and moved lower year over year, the opposite of what was expected.
Following three consecutive years of double digit returns, the domestic equity markets also took time out for a break during the first quarter of 2015. It is understandable that investors would need to catch their breaths; equities are up almost 200% in the six years since the bear market bottomed in March of 2009. Over this period interest rates have continued to stay at very low levels and equity valuations have moved higher as investors sought out a higher return. Stocks now trade at roughly 17x projected earnings for the S&P 500. Continued slow economic growth, slightly higher interest rates and a strong dollar suggest to us modest earnings growth going forward and a more balanced risk/reward environment for the equity markets.
FBP Equity & Dividend Plus Fund Review
The FBP Equity & Dividend Plus Fund returned 4.23% for the fiscal year ended March 31, 2015. The S&P 500 Index (the “Index”) returned 12.73% over the same period. The Fund was 92.2% equity and 7.8% cash at fiscal year end. As mentioned previously, value strategies lagged this past year but the Fund’s returns were also held back due to higher cash positions and increased covered call activity, defensive positioning
reflecting the higher valuations we are experiencing for the overall equity market. Energy, Materials and Financials were the weakest contributors to performance in addition to the lack of exposure to the Biotechs. Consumer Discretionary was the best sector for the Fund with Information Technology also doing well.
Since our last report to you, we initiated new positions in Noble Corp. and Eaton Corp. Noble has streamlined its fleet of offshore drilling rigs and now has a stable of newer technology rigs. This gives it a competitive advantage in an industry facing cyclical pressures due to commodity price declines. We expect company cash flows will hold up relatively well even given challenging conditions for the industry. Eaton, a diversified industrial company with segments such as vehicle manufacturing, electrical equipment, hydraulic systems and aerospace, was added to the portfolio on weakness after it lowered forward earnings guidance last year. While it has a solid base of revenues in the U.S., Eaton also has exposure to China and other international markets that give it growth potential in the coming years.
We eliminated several companies from the Fund’s portfolio. Sealed Air had performed quite well for the Fund, and the final sale was facilitated through the use of covered call options. Transocean and Freeport-McMoran were sold as their dividend policies no longer fit the Fund’s strategy. California Resources, a very small holding that was a spin off from Occidental Petroleum, was also sold. We took advantage of market volatility to increase our holdings in Prudential, HSBC, Potash, Occidental Petroleum, IBM and CenturyLink. Portfolio cash generation was enhanced with these changes.
FBP Appreciation & Income Opportunities Fund Review
The FBP Appreciation & Income Opportunities Fund returned 2.36% for the fiscal year ended March 31, 2015. The S&P 500 Index returned 12.73% and the Barclays U.S. Government/Credit Index returned 5.91% over the same period. The Fund was 73.4% equity, 6.6% fixed income and 20.0% cash at fiscal year end. Returns for the past year were influenced by many of the same factors that affected our Equity & Dividend Plus Fund. Value strategies lagged this past year but the Fund’s returns were also held back this period due to higher cash positions, a short duration defensive fixed income position and increased covered call activity. Energy, Materials and Financials were the weakest contributors to performance in addition to the lack of exposure to the Biotechs. Consumer Discretionary was the best sector for the Fund with Information Technology also doing well.
Since our last report to you, we initiated new positions in Noble Corp. and Eaton Corp. Noble has streamlined its fleet of offshore drilling rigs and now has a stable of newer technology rigs. This gives it a competitive advantage in an industry facing cyclical pressures due to commodity price declines. We expect company cash flows will hold up relatively well even given challenging conditions for the industry. Eaton, a diversified industrial company with segments such as vehicle manufacturing, electrical equipment, hydraulic systems and aerospace, was added to the portfolio on weakness after it lowered forward earnings guidance last year. While it has a solid base of revenues in the U.S., Eaton also has exposure to China and other international markets that give it growth potential in the coming years. We also added to the Fund’s positions in IBM, Freeport-McMoran and Capital One following price weakness which made these stocks’ risk/return profile more favorable.
We eliminated several companies from the Fund’s portfolio. Sonoco and Archer-Daniels-Midland were sold after achieving our price objectives and producing nice gains. Additionally, we completed sales of Allegion and California Resources, both smaller holdings that the Fund received as spin-offs from Ingersoll-Rand and Occidental Petroleum, respectively. We cut the Fund’s position in Baker Hughes following a price spike and rumors of being acquired by Halliburton. Sealed Air, Hewlett-Packard, Kohl’s, DuPont and Best Buy positions were reduced in the Fund as they moved towards our price objectives and had produced positive gains for the Fund.
In closing, we would like to comment on a couple of additional items. First, since March 31, 2015 many of last year’s trends that had a relatively negative impact on both Funds’ performance are showing signs of reversing. Expectations of improving economic conditions abroad, higher energy and commodity prices and the possibility of higher inflation have resulted in a weaker dollar and improved prices in many cyclical and energy securities, benefiting both Funds.
And we must sadly report to you the passing of John Flippin on January 3, 2015. John had a passion for investing and unique investment beliefs and disciplines that became part of the foundation of our firm and of the Flippin, Bruce & Porter Funds. Although John had reduced his activities with the firm many years ago, he continued as an avid supporter of the Funds and loved to share his belief in them with anyone he met. While his death will create a deep void in our lives and hearts, we will carry on his legacy at Flippin, Bruce and Porter.
We want to thank you for your continued support and investment in the Flippin, Bruce & Porter Funds. Please visit our website at www.fbpfunds.com for information on your Funds and the investment philosophy and process we utilize to achieve their investment objectives.
John T. Bruce, CFA
President - Portfolio Manager
May 7, 2015
Data presented reflects past performance, which is no guarantee of future results. Investment results and principal value will fluctuate so that shares, when redeemed, may be worth more or less than their original cost. Due to market volatility, current performance may be higher or lower than the performance shown. Updated performance information, current through the most recent month-end, is available by contacting the Funds at 1-866-738-1127.
This report is submitted for the general information of the shareholders of the Funds. It reflects our views, opinions and portfolio holdings as of the date of this letter. These views are subject to change at any time based upon market or other conditions. For more current information throughout the year please visit www.fbpfunds.com or call the Funds at 1-866-738-1127. This report is not authorized for distribution to prospective investors in the Funds unless accompanied by a current prospectus.
THE FLIPPIN, BRUCE & PORTER FUNDS
COMPARATIVE PERFORMANCE CHARTS
(Unaudited)
Performance for each Fund is compared to the most appropriate broad-based index, the S&P 500® Index, an unmanaged index of 500 large common stocks. Results are also compared to the Consumer Price Index, a measure of inflation.
THE FLIPPIN, BRUCE & PORTER FUNDS
COMPARATIVE PERFORMANCE CHARTS
(Unaudited) (Continued)
Average Annual Total Returns(a) (for periods ended March 31, 2015) |
| | 1 Year | 5 Years | 10 Years |
| FBP Equity & Dividend Plus Fund | 4.23% | 7.20% | 3.45% |
| FBP Appreciation & Income Opportunities Fund | 2.36% | 7.33% | 4.64% |
Standard & Poor’s 500® Index | 12.73% | 14.47% | 8.01% |
| Consumer Price Index | -0.03% | 1.60% | 2.04% |
| (a) | Total returns are a measure of the change in value of an investment in the Funds over the periods covered, which assumes any dividends or capital gains distributions are reinvested in shares of the Funds. Returns do not reflect the deduction of taxes a shareholder would pay on the Funds’ distributions or the redemption of Fund shares. |
FBP EQUITY & DIVIDEND PLUS FUND
PORTFOLIO INFORMATION
March 31, 2015 (Unaudited)
| General Information | |
| Net Asset Value Per Share | $24.89 |
| Total Net Assets (Millions) | $28.8 |
| Current Expense Ratio | 1.07% |
| Portfolio Turnover | 19% |
| Fund Inception Date | 7/30/1993 |
| Stock Characteristics | Fund | S&P 500® Index |
| Number of Stocks | 47 | 500 |
| Weighted Avg Market Capitalization (Billions) | $122.2 | $133.5 |
| Price-to-Earnings Ratio (Bloomberg 1 Yr. Forecast EPS) | 13.9 | 16.8 |
| Price-to-Book Value | 1.9 | 2.9 |
| Asset Allocation (% of Net Assets) |
Sector Diversification vs. the S&P 500® Index |
| Ten Largest Equity Holdings | % of Net Assets |
| Apple, Inc. | 3.9% |
| JPMorgan Chase & Company | 3.6% |
| Cisco Systems, Inc. | 3.1% |
| Target Corporation | 2.8% |
| Best Buy Company, Inc. | 2.8% |
| Western Union Company (The) | 2.7% |
| ConocoPhillips | 2.6% |
| Merck & Company, Inc. | 2.6% |
| Royal Dutch Shell plc - Class A - ADR | 2.5% |
| R.R.Donnelley & Sons Company | 2.4% |
FBP APPRECIATION & INCOME OPPORTUNITIES FUND
PORTFOLIO INFORMATION
March 31, 2015 (Unaudited)
| General Information |
| Net Asset Value Per Share | $18.53 |
| Total Net Assets (Millions) | $39.0 |
| Current Expense Ratio | 1.00% |
| Portfolio Turnover | 12% |
| Fund Inception Date | 7/3/1989 |
| Asset Allocation (% of Net Assets) |
| Common Stock Portfolio (73.4% of Fund ) |
| Number of Stocks | 55 |
| Weighted Avg Market Capitalization (Billions) | $120.0 |
| Price-to-Earnings Ratio (Bloomberg 1 Yr. Forecast EPS) | 13.9 |
| Price-to-Book Value | 1.6 |
| Ten Largest Equity Holdings | % of Net Assets |
| JPMorgan Chase & Company | 3.2% |
| Cisco Systems, Inc. | 2.8% |
| Bank of America Corporation | 2.7% |
| Apple, Inc. | 2.7% |
| MetLife, Inc. | 2.6% |
| Johnson & Johnson | 2.6% |
| Lincoln National Corporation | 2.6% |
| Pfizer, Inc. | 2.5% |
| Merck & Company, Inc. | 2.0% |
| ConocoPhillips | 2.0% |
| Five Largest Sectors | % of Net Assets |
| Financials | 18.8% |
| Information Technology | 12.3% |
| Energy | 10.0% |
| Materials | 7.6% |
| Health Care | 7.1% |
| Fixed-Income Portfolio (6.6% of Fund) |
| Number of Fixed-Income Securities | 5 |
| Average Quality | BBB+ |
| Average Weighted Maturity | 2.2 |
| Average Effective Duration | 2.1 |
| Sector Breakdown | % of Net Assets |
| Financials | 3.2% |
| Consumer Discretionary | 1.3% |
| Energy | 1.3% |
| Municipal Bond | 0.8% |
FBP EQUITY & DIVIDEND PLUS FUND
SCHEDULE OF INVESTMENTS
March 31, 2015
| COMMON STOCKS — 92.2% | | Shares | | | Value | |
| Consumer Discretionary — 9.9% | | | | | | |
Best Buy Company, Inc. (a) | | | 21,000 | | | $ | 793,590 | |
Kohl's Corporation (a) | | | 8,000 | | | | 626,000 | |
Staples, Inc. (a) | | | 38,000 | | | | 618,830 | |
Target Corporation (a) | | | 9,900 | | | | 812,493 | |
| | | | | | | | 2,850,913 | |
| Consumer Staples — 8.7% | | | | | | | | |
| Coca-Cola Company (The) | | | 16,000 | | | | 648,800 | |
ConAgra Foods, Inc. (a) | | | 12,000 | | | | 438,360 | |
PepsiCo, Inc. (a) | | | 4,800 | | | | 458,976 | |
Procter & Gamble Company (The) (a) | | | 8,500 | | | | 696,490 | |
Sysco Corporation (a) | | | 6,700 | | | | 252,791 | |
| | | | | | | | 2,495,417 | |
| Energy — 10.3% | | | | | | | | |
| Chevron Corporation | | | 6,300 | | | | 661,374 | |
| ConocoPhillips | | | 12,200 | | | | 759,572 | |
| Noble Corporation plc | | | 28,800 | | | | 411,264 | |
| Occidental Petroleum Corporation | | | 5,900 | | | | 430,700 | |
| Royal Dutch Shell plc - Class A - ADR | | | 12,000 | | | | 715,800 | |
| | | | | | | | 2,978,710 | |
| Financials — 15.4% | | | | | | | | |
| BB&T Corporation | | | 10,000 | | | | 389,900 | |
| First Niagara Financial Group, Inc. | | | 53,000 | | | | 468,520 | |
| HSBC Holdings plc - ADR | | | 13,400 | | | | 570,706 | |
JPMorgan Chase & Company (a) | | | 17,000 | | | | 1,029,860 | |
| Manulife Financial Corporation | | | 20,000 | | | | 340,200 | |
| MetLife, Inc. | | | 11,200 | | | | 566,160 | |
| People's United Financial, Inc. | | | 33,400 | | | | 507,680 | |
| Prudential Financial, Inc. | | | 6,900 | | | | 554,139 | |
| | | | | | | | 4,427,165 | |
| Health Care — 5.9% | | | | | | | | |
| Johnson & Johnson | | | 2,600 | | | | 261,560 | |
Merck & Company, Inc. (a) | | | 12,800 | | | | 735,744 | |
| Pfizer, Inc. | | | 20,000 | | | | 695,800 | |
| | | | | | | | 1,693,104 | |
| Industrials — 9.4% | | | | | | | | |
| Eaton Corporation plc | | | 5,000 | | | | 339,700 | |
| Emerson Electric Company | | | 10,600 | | | | 600,172 | |
| General Electric Company | | | 27,000 | | | | 669,870 | |
| Koninklijke Philips N.V. | | | 14,482 | | | | 410,420 | |
R.R. Donnelley & Sons Company (a) | | | 36,400 | | | | 698,516 | |
| | | | | | | | 2,718,678 | |
FBP EQUITY & DIVIDEND PLUS FUND
SCHEDULE OF INVESTMENTS (Continued)
| COMMON STOCKS — 92.2% (Continued) | | Shares | | | Value | |
| Information Technology — 17.9% | | | | | | |
Apple, Inc. (a) | | | 9,100 | | | $ | 1,132,313 | |
Applied Materials, Inc. (a) | | | 15,000 | | | | 338,400 | |
Cisco Systems, Inc. (a) | | | 32,000 | | | | 880,800 | |
| Hewlett-Packard Company | | | 19,500 | | | | 607,620 | |
| Intel Corporation | | | 10,000 | | | | 312,700 | |
| International Business Machines Corporation | | | 3,700 | | | | 593,850 | |
| Microsoft Corporation | | | 12,500 | | | | 508,188 | |
Western Union Company (The) (a) | | | 37,000 | | | | 769,970 | |
| | | | | | | | 5,143,841 | |
| Materials — 7.0% | | | | | | | | |
Avery Dennison Corporation (a) | | | 5,000 | | | | 264,550 | |
E.I. du Pont de Nemours and Company (a) | | | 2,500 | | | | 178,675 | |
| Nucor Corporation | | | 10,000 | | | | 475,300 | |
| Potash Corporation of Saskatchewan, Inc. | | | 18,000 | | | | 580,500 | |
| Rio Tinto plc - ADR | | | 12,600 | | | | 521,640 | |
| | | | | | | | 2,020,665 | |
| Telecommunication Services — 3.6% | | | | | | | | |
| AT&T, Inc. | | | 18,000 | | | | 587,700 | |
| CenturyLink, Inc. | | | 12,800 | | | | 442,240 | |
| | | | | | | | 1,029,940 | |
| Utilities — 4.1% | | | | | | | | |
| FirstEnergy Corporation | | | 19,000 | | | | 666,140 | |
| PPL Corporation | | | 15,300 | | | | 514,998 | |
| | | | | | | | 1,181,138 | |
| | | | | | | | | |
Total Common Stocks (Cost $20,407,745) | | | | | | $ | 26,539,571 | |
FBP EQUITY & DIVIDEND PLUS FUND
SCHEDULE OF INVESTMENTS (Continued)
| MONEY MARKET FUNDS — 9.5% | | Shares | | | Value | |
Fidelity Institutional Money Market Government Portfolio - Class I, 0.01% (b) (Cost $2,724,707) | | | 2,724,707 | | | $ | 2,724,707 | |
| | | | | | | | | |
Total Investments at Value — 101.7% (Cost $23,132,452) | | | | | | $ | 29,264,278 | |
| | | | | | | | | |
Liabilities in Excess of Other Assets — (1.7%) | | | | | | | (482,384 | ) |
| | | | | | | | | |
| Net Assets — 100.0% | | | | | | $ | 28,781,894 | |
ADR - American Depositary Receipt.
| (a) | Security covers a written call option. |
| (b) | The rate shown is the 7-day effective yield as of March 31, 2015. |
See accompanying notes to financial statements.
FBP EQUITY & DIVIDEND PLUS FUND
SCHEDULE OF OPEN OPTION CONTRACTS
March 31, 2015
WRITTEN COVERED
CALL OPTIONS | | Option Contracts | | | Value of
Options | | | Premiums Received | |
| Apple, Inc., | | | | | | | | | |
| 04/17/2015 at $105 | | | 30 | | | $ | 59,400 | | | $ | 16,633 | |
| 07/17/2015 at $125 | | | 25 | | | | 17,250 | | | | 15,174 | |
| Applied Materials, Inc., | | | | | | | | | | | | |
| 07/17/2015 at $26 | | | 150 | | | | 10,050 | | | | 22,044 | |
| Avery Dennison Corporation, | | | | | | | | | | | | |
| 07/17/2015 at $50 | | | 50 | | | | 21,500 | | | | 15,848 | |
| Best Buy Company, Inc., | | | | | | | | | | | | |
| 06/19/2015 at $39.49 | | | 110 | | | | 18,920 | | | | 34,865 | |
| Cisco Systems, Inc., | | | | | | | | | | | | |
| 07/17/2015 at $29 | | | 100 | | | | 6,400 | | | | 10,696 | |
| Conagra Foods, Inc, | | | | | | | | | | | | |
| 09/18/2015 at $36 | | | 120 | | | | 27,960 | | | | 16,435 | |
| E.I. du Pont de Nemours and Company, | | | | | | | | | | | | |
| 07/17/2015 at $77.5 | | | 25 | | | | 2,000 | | | | 4,924 | |
| JPMorgan Chase & Company, | | | | | | | | | | | | |
| 09/18/2015 at $67.5 | | | 10 | | | | 690 | | | | 1,880 | |
| Kohl's Corporation, | | | | | | | | | | | | |
| 07/17/2015 at $67.5 | | | 80 | | | | 100,000 | | | | 28,556 | |
| Merck & Company, Inc., | | | | | | | | | | | | |
| 07/17/2015 at $62.5 | | | 60 | | | | 3,660 | | | | 17,817 | |
| PepsiCo, Inc., | | | | | | | | | | | | |
| 07/17/2015 at $105 | | | 48 | | | | 3,552 | | | | 11,134 | |
| Procter & Gamble Company (The), | | | | | | | | | | | | |
| 04/17/2015 at $87.5 | | | 30 | | | | 90 | | | | 5,609 | |
| R.R. Donnelley & Sons Company, | | | | | | | | | | | | |
| 09/18/2015 at $20 | | | 165 | | | | 13,200 | | | | 16,823 | |
| Staples, Inc., | | | | | | | | | | | | |
| 06/19/2015 at $16 | | | 70 | | | | 8,400 | | | | 7,837 | |
| 06/19/2015 at $18 | | | 150 | | | | 5,250 | | | | 19,044 | |
| Sysco Corporation, | | | | | | | | | | | | |
| 05/15/2015 at $42 | | | 67 | | | | 1,541 | | | | 8,506 | |
| Target Corporation, | | | | | | | | | | | | |
| 07/17/2015 at $77.5 | | | 39 | | | | 23,985 | | | | 11,191 | |
| 07/17/2015 at $80 | | | 60 | | | | 27,300 | | | | 14,877 | |
| Western Union Company (The), | | | | | | | | | | | | |
| 11/20/2015 at $21 | | | 150 | | | | 21,000 | | | | 13,794 | |
| | | | | | | $ | 372,148 | | | $ | 293,687 | |
See accompanying notes to financial statements.
FBP APPRECIATION & INCOME OPPORTUNITIES FUND
SCHEDULE OF INVESTMENTS
March 31, 2015
| COMMON STOCKS — 73.4% | | Shares | | | Value | |
| Consumer Discretionary — 4.6% | | | | | | |
| Best Buy Company, Inc. | | | 10,000 | | | $ | 377,900 | |
Kohl's Corporation (a) | | | 5,500 | | | | 430,375 | |
Staples, Inc. (a) | | | 35,000 | | | | 569,975 | |
Target Corporation (a) | | | 5,000 | | | | 410,350 | |
| | | | | | | | 1,788,600 | |
| Consumer Staples — 3.7% | | | | | | | | |
| Avon Products, Inc. | | | 48,000 | | | | 383,520 | |
| CVS Caremark Corporation | | | 3,800 | | | | 392,198 | |
| PepsiCo, Inc. | | | 3,200 | | | | 305,984 | |
| Wal-Mart Stores, Inc. | | | 4,500 | | | | 370,125 | |
| | | | | | | | 1,451,827 | |
| Energy — 10.0% | | | | | | | | |
| Baker Hughes, Inc. | | | 4,500 | | | | 286,110 | |
| Chevron Corporation | | | 5,000 | | | | 524,900 | |
| ConocoPhillips | | | 12,500 | | | | 778,250 | |
Devon Energy Corporation (a) | | | 12,000 | | | | 723,720 | |
| Noble Corporation plc | | | 25,500 | | | | 364,140 | |
| Occidental Petroleum Corporation | | | 5,200 | | | | 379,600 | |
| Peabody Energy Corporation | | | 26,000 | | | | 127,920 | |
| Royal Dutch Shell plc - Class A - ADR | | | 11,000 | | | | 656,150 | |
| Transocean Ltd. | | | 5,000 | | | | 73,350 | |
| | | | | | | | 3,914,140 | |
| Financials — 18.8% | | | | | | | | |
| Bank of America Corporation | | | 69,000 | | | | 1,061,910 | |
| Bank of New York Mellon Corporation (The) | | | 13,500 | | | | 543,240 | |
| Capital One Financial Corporation | | | 5,000 | | | | 394,100 | |
| Comerica, Inc. | | | 7,000 | | | | 315,910 | |
| First Niagara Financial Group, Inc. | | | 35,000 | | | | 309,400 | |
| JPMorgan Chase & Company | | | 20,300 | | | | 1,229,774 | |
Lincoln National Corporation (a) | | | 17,500 | | | | 1,005,550 | |
| Manulife Financial Corporation | | | 24,000 | | | | 408,240 | |
| MetLife, Inc. | | | 20,000 | | | | 1,011,000 | |
| People's United Financial, Inc. | | | 18,000 | | | | 273,600 | |
| Travelers Companies, Inc. (The) | | | 7,000 | | | | 756,910 | |
| | | | | | | | 7,309,634 | |
| Health Care — 7.1% | | | | | | | | |
| Johnson & Johnson | | | 10,000 | | | | 1,006,000 | |
Merck & Company, Inc. (a) | | | 14,000 | | | | 804,720 | |
| Pfizer, Inc. | | | 28,000 | | | | 974,120 | |
| | | | | | | | 2,784,840 | |
FBP APPRECIATION & INCOME OPPORTUNITIES FUND
SCHEDULE OF INVESTMENTS (Continued)
| COMMON STOCKS — 73.4% (Continued) | | Shares | | | Value | |
| Industrials — 5.4% | | | | | | |
| Eaton Corporation plc | | | 4,000 | | | $ | 271,760 | |
| FedEx Corporation | | | 1,200 | | | | 198,540 | |
| General Electric Company | | | 17,000 | | | | 421,770 | |
| Ingersoll-Rand plc | | | 4,700 | | | | 319,976 | |
| Koninklijke Philips N.V. | | | 15,517 | | | | 439,752 | |
| R.R. Donnelley & Sons Company | | | 23,000 | | | | 441,370 | |
| | | | | | | | 2,093,168 | |
| Information Technology — 12.3% | | | | | | | | |
Apple, Inc. (a) | | | 8,400 | | | | 1,045,212 | |
Cisco Systems, Inc. (a) | | | 40,000 | | | | 1,101,000 | |
| Hewlett-Packard Company | | | 16,000 | | | | 498,560 | |
| Intel Corporation | | | 7,000 | | | | 218,890 | |
| International Business Machines Corporation | | | 3,300 | | | | 529,650 | |
Microsoft Corporation (a) | | | 17,000 | | | | 691,135 | |
| Western Union Company (The) | | | 34,000 | | | | 707,540 | |
| | | | | | | | 4,791,987 | |
| Materials — 7.6% | | | | | | | | |
| Avery Dennison Corporation | | | 10,000 | | | | 529,100 | |
| E.I. du Pont de Nemours and Company | | | 8,000 | | | | 571,760 | |
| Freeport-McMoRan, Inc. | | | 25,000 | | | | 473,750 | |
| Mosaic Company (The) | | | 6,000 | | | | 276,360 | |
| Nucor Corporation | | | 8,000 | | | | 380,240 | |
| Rio Tinto plc - ADR | | | 11,000 | | | | 455,400 | |
Sealed Air Corporation (a) | | | 6,000 | | | | 273,360 | |
| | | | | | | | 2,959,970 | |
| Telecommunication Services — 2.0% | | | | | | | | |
| AT&T, Inc. | | | 15,000 | | | | 489,750 | |
| CenturyLink, Inc. | | | 8,000 | | | | 276,400 | |
| | | | | | | | 766,150 | |
| Utilities — 1.9% | | | | | | | | |
| FirstEnergy Corporation | | | 8,000 | | | | 280,480 | |
| PPL Corporation | | | 14,000 | | | | 471,240 | |
| | | | | | | | 751,720 | |
| | | | | | | | | |
Total Common Stocks (Cost $19,036,228) | | | | | | $ | 28,612,036 | |
FBP APPRECIATION & INCOME OPPORTUNITIES FUND
SCHEDULE OF INVESTMENTS (Continued)
| CORPORATE BONDS — 5.8% | | Par Value | | | Value | |
| Consumer Discretionary — 1.3% | | | | | | |
| Mattel, Inc., 2.35%, due 05/06/2019 | | $ | 500,000 | | | $ | 498,705 | |
| | | | | | | | | |
| Energy — 1.3% | | | | | | | | |
| Dominion Resources, Inc., 2.50%, due 12/01/2019 | | | 500,000 | | | | 508,128 | |
| | | | | | | | | |
| Financials — 3.2% | | | | | | | | |
| Berkley (W.R.) Corporation, 5.60%, due 05/15/2015 | | | 750,000 | | | | 753,922 | |
| Prudential Financial, Inc., 3.00%, due 05/12/2016 | | | 500,000 | | | | 511,307 | |
| | | | | | | | 1,265,229 | |
| | | | | | | | | |
Total Corporate Bonds (Cost $2,255,475) | | | | | | $ | 2,272,062 | |
| MUNICIPAL BONDS — 0.8% | | Par Value | | | Value | |
| Wise Co., Virginia, Industrial Dev. Authority, Revenue, 1.70%, due 02/01/2017 (Cost $299,298) | | $ | 300,000 | | | $ | 300,021 | |
| MONEY MARKET FUNDS — 20.4% | | Shares | | | Value | |
Fidelity Institutional Money Market Government Portfolio - Class I, 0.01% (b) | | | 3,871,238 | | | $ | 3,871,238 | |
First American Government Obligations Fund - Class Z, 0.01% (b) | | | 3,857,142 | | | | 3,857,142 | |
Invesco Short-Term Investments Trust - Treasury Portfolio - Institutional Shares, 0.01% (b) | | | 224,247 | | | | 224,247 | |
Total Money Market Funds (Cost $7,952,627) | | | | | | $ | 7,952,627 | |
| | | | | | | | | |
Total Investments at Value — 100.4% (Cost $29,543,628) | | | | | | $ | 39,136,746 | |
| | | | | | | | | |
| Liabilities in Excess of Other Assets — (0.4%) | | | | | | | (146,060 | ) |
| | | | | | | | | |
| Net Assets — 100.0% | | | | | | $ | 38,990,686 | |
ADR - American Depositary Receipt.
| (a) | Security covers a written call option. |
| (b) | The rate shown is the 7-day effective yield as of March 31, 2015. |
See accompanying notes to financial statements.
FBP APPRECIATION & INCOME OPPORTUNITIES FUND
SCHEDULE OF OPEN OPTION CONTRACTS
March 31, 2015
WRITTEN COVERED
CALL OPTIONS | | Option Contracts | | | Value of
Options | | | Premiums Received | |
| Apple, Inc., | | | | | | | | | |
| 04/17/2015 at $110 | | | 28 | | | $ | 41,020 | | | $ | 11,815 | |
| 07/17/2015 at $125 | | | 25 | | | | 17,250 | | | | 15,174 | |
| Cisco Systems, Inc., | | | | | | | | | | | | |
| 07/17/2015 at $29 | | | 100 | | | | 6,400 | | | | 10,696 | |
| Devon Energy Corporation, | | | | | | | | | | | | |
| 07/17/2015 at $70 | | | 40 | | | | 3,280 | | | | 13,878 | |
| Kohl's Corporation, | | | | | | | | | | | | |
| 07/17/2015 at $67.5 | | | 55 | | | | 68,750 | | | | 19,632 | |
| Lincoln National Corporation, | | | | | | | | | | | | |
| 04/17/2015 at $57.5 | | | 30 | | | | 3,150 | | | | 8,158 | |
| 04/17/2015 at $60 | | | 20 | | | | 380 | | | | 4,139 | |
| Merck & Company, Inc., | | | | | | | | | | | | |
| 07/17/2015 at $62.5 | | | 70 | | | | 4,270 | | | | 20,787 | |
| Microsoft Corporation, | | | | | | | | | | | | |
| 04/17/2015 at $47 | | | 30 | | | | 30 | | | | 5,309 | |
| Sealed Air Corporation, | | | | | | | | | | | | |
| 07/17/2015 at $47 | | | 60 | | | | 11,700 | | | | 12,717 | |
| Staples, Inc., | | | | | | | | | | | | |
| 06/19/2015 at $18 | | | 150 | | | | 5,250 | | | | 19,044 | |
| Target Corporation, | | | | | | | | | | | | |
| 07/17/2015 at $80 | | | 25 | | | | 11,375 | | | | 6,199 | |
| | | | | | | $ | 172,855 | | | $ | 147,548 | |
See accompanying notes to financial statements.
THE FLIPPIN, BRUCE & PORTER FUNDS
STATEMENTS OF ASSETS AND LIABILITIES
March 31, 2015
| | | FBP Equity
& Dividend
Plus Fund | | | FBP
Appreciation
& Income
Opportunities
Fund | |
| ASSETS | | | | | | |
| Investments in securities: | | | | | | |
| At acquisition cost | | $ | 23,132,452 | | | $ | 29,543,628 | |
| At value (Note 2) | | $ | 29,264,278 | | | $ | 39,136,746 | |
| Cash | | | — | | | | 1,363 | |
| Dividends and interest receivable | | | 91,394 | | | | 93,411 | |
| Receivable for capital shares sold | | | 3,163 | | | | — | |
| Other assets | | | 3,933 | | | | 3,601 | |
| TOTAL ASSETS | | | 29,362,768 | | | | 39,235,121 | |
| | | | | | | | | |
| LIABILITIES | | | | | | | | |
| Covered call options, at value (Notes 2 and 5) (premiums received $293,687 and $147,548, respectively) | | | 372,148 | | | | 172,855 | |
| Distributions payable | | | 3,010 | | | | 16,102 | |
| Payable for securities purchased | | | 131,381 | | | | — | |
| Payable for capital shares redeemed | | | 39,437 | | | | 12,804 | |
| Accrued investment advisory fees (Note 4) | | | 17,703 | | | | 23,446 | |
| Payable to administrator (Note 4) | | | 5,700 | | | | 5,700 | |
| Other accrued expenses | | | 11,495 | | | | 13,528 | |
| TOTAL LIABILITIES | | | 580,874 | | | | 244,435 | |
| | | | | | | | | |
| NET ASSETS | | $ | 28,781,894 | | | $ | 38,990,686 | |
| | | | | | | | | |
| Net assets consist of: | | | | | | | | |
| Paid-in capital | | $ | 22,589,155 | | | $ | 28,264,582 | |
| Undistributed net investment income | | | 1,582 | | | | 15,993 | |
| Accumulated net realized gains from security transactions | | | 137,792 | | | | 1,142,300 | |
| Net unrealized appreciation (depreciation) on: | | | | | | | | |
| Investments | | | 6,131,826 | | | | 9,593,118 | |
| Option contracts | | | (78,461 | ) | | | (25,307 | ) |
| Net assets | | $ | 28,781,894 | | | $ | 38,990,686 | |
| | | | | | | | | |
| Shares of beneficial interest outstanding (unlimited number of shares authorized, $0.01 par value) | | | 1,156,156 | | | | 2,104,607 | |
| | | | | | | | | |
| Net asset value, offering price and redemption price per share (Note 2) | | $ | 24.89 | | | $ | 18.53 | |
See accompanying notes to financial statements.
THE FLIPPIN, BRUCE & PORTER FUNDS
STATEMENTS OF OPERATIONS
Year Ended March 31, 2015
| | | FBP Equity
& Dividend
Plus Fund | | | FBP Appreciation
& Income
Opportunities
Fund | |
| INVESTMENT INCOME | | | | | | |
| Dividends | | $ | 909,739 | | | $ | 878,577 | |
| Foreign withholding taxes on dividends | | | (10,697 | ) | | | (8,251 | ) |
| Interest | | | — | | | | 77,794 | |
| TOTAL INVESTMENT INCOME | | | 899,042 | | | | 948,120 | |
| | | | | | | | | |
| EXPENSES | | | | | | | | |
| Investment advisory fees (Note 4) | | | 206,036 | | | | 280,930 | |
| Administration fees (Note 4) | | | 60,000 | | | | 60,000 | |
| Professional fees | | | 15,958 | | | | 16,673 | |
| Trustees’ fees and expenses (Note 4) | | | 11,804 | | | | 11,804 | |
| Registration and filing fees | | | 11,899 | | | | 8,249 | |
| Custodian and bank service fees | | | 8,059 | | | | 8,764 | |
| Compliance service fees (Note 4) | | | 8,400 | | | | 8,400 | |
| Postage and supplies | | | 6,947 | | | | 5,496 | |
| Printing of shareholder reports | | | 7,232 | | | | 4,459 | |
| Insurance expense | | | 1,551 | | | | 2,077 | |
| Other expenses | | | 7,262 | | | | 9,129 | |
| TOTAL EXPENSES | | | 345,148 | | | | 415,981 | |
| Fees voluntarily waived by the Adviser (Note 4) | | | (30,208 | ) | | | (14,652 | ) |
| NET EXPENSES | | | 314,940 | | | | 401,329 | |
| | | | | | | | | |
| NET INVESTMENT INCOME | | | 584,102 | | | | 546,791 | |
| | | | | | | | | |
| REALIZED AND UNREALIZED GAINS (LOSSES) ON INVESTMENTS | | | | | | | | |
| Net realized gains (losses) from: | | | | | | | | |
| Security transactions | | | 811,457 | | | | 1,667,644 | |
| Option contracts (Note 5) | | | 21,232 | | | | (13,048 | ) |
| Net change in unrealized appreciation/depreciation on: | | | | | | | | |
| Investments | | | (177,321 | ) | | | (1,283,661 | ) |
| Option contracts (Note 5) | | | (28,993 | ) | | | 34,663 | |
| | | | | | | | | |
| NET REALIZED AND UNREALIZED GAINS ON INVESTMENTS | | | 626,375 | | | | 405,598 | |
| | | | | | | | | |
| NET INCREASE IN NET ASSETS FROM OPERATIONS | | $ | 1,210,477 | | | $ | 952,389 | |
See accompanying notes to financial statements.
THE FLIPPIN, BRUCE & PORTER FUNDS
STATEMENTS OF CHANGES IN NET ASSETS
| | | FBP Equity &
Dividend Plus Fund | | | FBP Appreciation
& Income
Opportunities Fund | |
| | | Year Ended
March 31,
2015 | | | Year Ended
March 31,
2014 | | | Year Ended
March 31,
2015 | | | Year Ended
March 31,
2014 | |
| FROM OPERATIONS | | | | | | | | | | | | |
| Net investment income | | $ | 584,102 | | | $ | 466,278 | | | $ | 546,791 | | | $ | 528,175 | |
| Net realized gains (losses) from: | | | | | | | | | | | | | | | | |
| Security transactions | | | 811,457 | | | | 1,384,299 | | | | 1,667,644 | | | | 1,586,562 | |
| Option contracts (Note 5) | | | 21,232 | | | | (84,400 | ) | | | (13,048 | ) | | | (137,226 | ) |
| Net realized gains from in-kind redemptions (Note 2) | | | — | | | | 235,484 | | | | — | | | | 210,674 | |
| Net change in unrealized appreciation/depreciation on: | | | | | | | | | | | | | | | | |
| Investments | | | (177,321 | ) | | | 1,583,397 | | | | (1,283,661 | ) | | | 3,640,782 | |
| Option contracts (Note 5) | | | (28,993 | ) | | | 246,913 | | | | 34,663 | | | | 76,649 | |
| Net increase in net assets from operations | | | 1,210,477 | | | | 3,831,971 | | | | 952,389 | | | | 5,905,616 | |
| | | | | | | | | | | | | | | | | |
| DISTRIBUTIONS TO SHAREHOLDERS | | | | | | | | | | | | | | | | |
| From net investment income | | | (587,146 | ) | | | (462,094 | ) | | | (553,302 | ) | | | (556,942 | ) |
| From net realized gains from security transactions | | | (518,508 | ) | | | — | | | | (1,338,239 | ) | | | (1,448,777 | ) |
| Decrease in net assets from distributions to shareholders | | | (1,105,654 | ) | | | (462,094 | ) | | | (1,891,541 | ) | | | (2,005,719 | ) |
| | | | | | | | | | | | | | | | | |
| FROM CAPITAL SHARE TRANSACTIONS | | | | | | | | | | | | | | | | |
| Proceeds from shares sold | | | 2,990,599 | | | | 3,288,580 | | | | 1,229,570 | | | | 739,705 | |
| Net asset value of shares issued in reinvestment of distributions to shareholders | | | 1,079,702 | | | | 449,317 | | | | 1,747,129 | | | | 1,842,320 | |
| Payments for shares redeemed | | | (3,187,091 | ) | | | (1,883,877 | ) | | | (2,997,545 | ) | | | (3,356,340 | ) |
| Net increase (decrease) in net assets from capital share transactions | | | 883,210 | | | | 1,854,020 | | | | (20,846 | ) | | | (774,315 | ) |
| | | | | | | | | | | | | | | | | |
| TOTAL INCREASE (DECREASE) IN NET ASSETS | | | 988,033 | | | | 5,223,897 | | | | (959,998 | ) | | | 3,125,582 | |
| | | | | | | | | | | | | | | | | |
| NET ASSETS | | | | | | | | | | | | | | | | |
| Beginning of year | | | 27,793,861 | | | | 22,569,964 | | | | 39,950,684 | | | | 36,825,102 | |
| End of year | | $ | 28,781,894 | | | $ | 27,793,861 | | | $ | 38,990,686 | | | $ | 39,950,684 | |
| | | | | | | | | | | | | | | | | |
| UNDISTRIBUTED (DISTRIBUTIONS IN EXCESS OF) NET INVESTMENT INCOME | | $ | 1,582 | | | $ | 4,626 | | | $ | 15,993 | | | $ | (7,533 | ) |
| | | | | | | | | | | | | | | | | |
| CAPITAL SHARE ACTIVITY | | | | | | | | | | | | | | | | |
| Shares sold | | | 117,967 | | | | 140,207 | | | | 64,403 | | | | 40,597 | |
| Shares reinvested | | | 42,203 | | | | 18,951 | | | | 91,891 | | | | 103,512 | |
| Shares redeemed | | | (125,668 | ) | | | (78,999 | ) | | | (157,941 | ) | | | (183,790 | ) |
| Net increase (decrease) in shares outstanding | | | 34,502 | | | | 80,159 | | | | (1,647 | ) | | | (39,681 | ) |
| Shares outstanding, beginning of year | | | 1,121,654 | | | | 1,041,495 | | | | 2,106,254 | | | | 2,145,935 | |
| Shares outstanding, end of year | | | 1,156,156 | | | | 1,121,654 | | | | 2,104,607 | | | | 2,106,254 | |
See accompanying notes to financial statements.
FBP EQUITY & DIVIDEND PLUS FUND
FINANCIAL HIGHLIGHTS
| Selected Per Share Data and Ratios for a Share Outstanding Throughout Each Year | |
| | | Years Ended March 31, | |
| | | 2015 | | | 2014 | | | 2013 | | | 2012 | | | 2011 | |
| Net asset value at beginning of year | | $ | 24.78 | | | $ | 21.67 | | | $ | 19.10 | | | $ | 20.70 | | | $ | 19.42 | |
| | | | | | | | | | | | | | | | | | | | | |
| Income (loss) from investment operations: | | | | | | | | | | | | | | | | | | | | |
| Net investment income | | | 0.50 | | | | 0.42 | | | | 0.47 | | | | 0.23 | | | | 0.15 | |
| Net realized and unrealized gains (losses) on investments | | | 0.57 | | | | 3.11 | | | | 2.56 | | | | (1.59 | ) | | | 1.27 | |
| Total from investment operations | | | 1.07 | | | | 3.53 | | | | 3.03 | | | | (1.36 | ) | | | 1.42 | |
| | | | | | | | | | | | | | | | | | | | | |
| Less distributions: | | | | | | | | | | | | | | | | | | | | |
| Dividends from net investment income | | | (0.51 | ) | | | (0.42 | ) | | | (0.46 | ) | | | (0.24 | ) | | | (0.14 | ) |
| Distributions from net realized gains | | | (0.45 | ) | | | — | | | | — | | | | — | | | | — | |
| Total distributions | | | (0.96 | ) | | | (0.42 | ) | | | (0.46 | ) | | | (0.24 | ) | | | (0.14 | ) |
| | | | | | | | | | | | | | | | | | | | | |
| Net asset value at end of year | | $ | 24.89 | | | $ | 24.78 | | | $ | 21.67 | | | $ | 19.10 | | | $ | 20.70 | |
| | | | | | | | | | | | | | | | | | | | | |
Total return (a) | | | 4.23 | % | | | 16.40 | % | | | 16.19 | % | | | (6.49 | %) | | | 7.40 | % |
| | | | | | | | | | | | | | | | | | | | | |
| Net assets at end of year (000’s) | | $ | 28,782 | | | $ | 27,794 | | | $ | 22,570 | | | $ | 23,194 | | | $ | 27,407 | |
| | | | | | | | | | | | | | | | | | | | | |
| Ratio of total expenses to average net assets | | | 1.17 | % | | | 1.21 | % | | | 1.29 | % | | | 1.29 | % | | | 1.19 | % |
| | | | | | | | | | | | | | | | | | | | | |
Ratio of net expenses to average net assets (b) | | | 1.07 | % | | | 1.07 | % | | | 1.07 | % | | | 1.07 | % | | | 1.07 | % |
| | | | | | | | | | | | | | | | | | | | | |
Ratio of net investment income to average net assets (b) | | | 1.98 | % | | | 1.82 | % | | | 2.40 | % | | | 1.24 | % | | | 0.78 | % |
| | | | | | | | | | | | | | | | | | | | | |
| Portfolio turnover rate | | | 19 | % | | | 24 | % | | | 32 | % | | | 46 | % | | | 25 | % |
| (a) | Total return is a measure of the change in value of an investment in the Fund over the year covered, which assumes any dividends or capital gains distributions are reinvested in shares of the Fund. Returns shown do not reflect the deduction of taxes a shareholder would pay on Fund distributions or the redemption of Fund shares. |
| (b) | Ratios were determined after voluntary advisory fee waivers by the Adviser (Note 4). |
See accompanying notes to financial statements.
FBP APPRECIATION & INCOME OPPORTUNITIES FUND
FINANCIAL HIGHLIGHTS
| Selected Per Share Data and Ratios for a Share Outstanding Throughout Each Year | |
| | | Years Ended March 31, | |
| | | 2015 | | | 2014 | | | 2013 | | | 2012 | | | 2011 | |
| Net asset value at beginning of year | | $ | 18.97 | | | $ | 17.16 | | | $ | 15.85 | | | $ | 16.35 | | | $ | 15.49 | |
| | | | | | | | | | | | | | | | | | | | | |
| Income (loss) from investment operations: | | | | | | | | | | | | | | | | | | | | |
| Net investment income | | | 0.26 | | | | 0.25 | | | | 0.29 | | | | 0.26 | | | | 0.24 | |
| Net realized and unrealized gains (losses) on investments | | | 0.19 | | | | 2.50 | | | | 1.61 | | | | (0.46 | ) | | | 0.88 | |
| Total from investment operations | | | 0.45 | | | | 2.75 | | | | 1.90 | | | | (0.20 | ) | | | 1.12 | |
| | | | | | | | | | | | | | | | | | | | | |
| Less distributions: | | | | | | | | | | | | | | | | | | | | |
| Dividends from net investment income | | | (0.26 | ) | | | (0.26 | ) | | | (0.30 | ) | | | (0.30 | ) | | | (0.26 | ) |
| Distributions from net realized gains | | | (0.63 | ) | | | (0.68 | ) | | | (0.29 | ) | | | — | | | | — | |
| Total distributions | | | (0.89 | ) | | | (0.94 | ) | | | (0.59 | ) | | | (0.30 | ) | | | (0.26 | ) |
| | | | | | | | | | | | | | | | | | | | | |
| Net asset value at end of year | | $ | 18.53 | | | $ | 18.97 | | | $ | 17.16 | | | $ | 15.85 | | | $ | 16.35 | |
| | | | | | | | | | | | | | | | | | | | | |
Total return (a) | | | 2.36 | % | | | 16.50 | % | | | 12.51 | % | | | (1.13 | %) | | | 7.35 | % |
| | | | | | | | | | | | | | | | | | | | | |
| Net assets at end of year (000’s) | | $ | 38,991 | | | $ | 39,951 | | | $ | 36,825 | | | $ | 39,520 | | | $ | 46,406 | |
| | | | | | | | | | | | | | | | | | | | | |
| Ratio of total expenses to average net assets | | | 1.04 | % | | | 1.03 | % | | | 1.06 | % | | | 1.06 | % | | | 1.03 | % |
| | | | | | | | | | | | | | | | | | | | | |
Ratio of net expenses to average net assets (b) | | | 1.00 | % | | | 1.00 | % | | | 1.00 | % | | | 1.00 | % | | | 1.00 | % |
| | | | | | | | | | | | | | | | | | | | | |
Ratio of net investment income to average net assets (b) | | | 1.36 | % | | | 1.36 | % | | | 1.83 | % | | | 1.71 | % | | | 1.59 | % |
| | | | | | | | | | | | | | | | | | | | | |
| Portfolio turnover rate | | | 12 | % | | | 10 | % | | | 15 | % | | | 17 | % | | | 24 | % |
| (a) | Total return is a measure of the change in value of an investment in the Fund over the year covered, which assumes any dividends or capital gains distributions are reinvested in shares of the Fund. Returns shown do not reflect the deduction of taxes a shareholder would pay on Fund distributions or the redemption of Fund shares. |
| (b) | Ratios were determined after voluntary advisory fee waivers by the Adviser (Note 4). |
See accompanying notes to financial statements.
THE FLIPPIN, BRUCE & PORTER FUNDS
NOTES TO FINANCIAL STATEMENTS
March 31, 2015
1. Organization
FBP Equity & Dividend Plus Fund and FBP Appreciation & Income Opportunities Fund (the “Funds”) are no-load, diversified series of Williamsburg Investment Trust (the “Trust”), an open-end management investment company registered under the Investment Company Act of 1940. The Trust was organized as a Massachusetts business trust on July 18, 1988. Other series of the Trust are not included in this report.
FBP Equity & Dividend Plus Fund seeks to provide above-average and growing income while also achieving long-term growth of capital.
FBP Appreciation & Income Opportunities Fund seeks long term capital appreciation and current income, assuming a moderate level of investment risk.
2. Significant Accounting Policies
As an investment company, as defined in Financial Accounting Standards Board (“FASB”) Accounting Standards Update 2013-08, the Funds follow accounting and reporting guidance under FASB Accounting Standards Codification Topic 946, “Financial Services – Investment Companies.” The following is a summary of the Funds’ significant accounting policies. These policies are in conformity with accounting principles generally accepted in the United States of America (“GAAP”).
Securities valuation — The Funds’ portfolio securities are valued as of the close of business of the regular session of the New York Stock Exchange (normally 4:00 p.m., Eastern time). Securities traded on a national stock exchange are valued based upon the closing price on the principal exchange where the security is traded, if available, otherwise, at the last quoted bid price. Securities which are quoted by NASDAQ are valued at the NASDAQ Official Closing Price. Covered call options written by the Funds are valued at the last quoted sale price or, in the absence of a sale, at the ask price on the principal exchanges on which they are traded. Investments representing shares of other investment companies are valued at their net asset value as reported by such companies.
Fixed income securities are typically valued on the basis of prices provided by an independent pricing service. The prices provided by the pricing service are determined with consideration given to institutional bid and last sale prices and take into account securities prices, yields, maturities, call features, ratings, institutional trading in similar groups of securities and developments related to specific securities.
When market quotations are not readily available, if a pricing service cannot provide a price or the investment adviser believes the price received from the pricing service is not indicative of fair value, securities will be valued in good faith at fair value using methods consistent with those determined by the Board of Trustees and will be classified as Level 2 or 3 within the fair value hierarchy (see below), depending on the inputs used. Such methods of fair valuation may include, but are not limited to: multiple of earnings, multiple of book value, discount from market of a similar freely traded security, purchase price of the security, subsequent private transactions in the security or related securities, or a combination of these and other factors.
THE FLIPPIN, BRUCE & PORTER FUNDS
NOTES TO FINANCIAL STATEMENTS (Continued)
GAAP establishes a single authoritative definition of fair value, sets out a framework for measuring fair value and requires additional disclosures about fair value measurements. Various inputs are used in determining the value of each Fund’s investments. These inputs are summarized in the three broad levels listed below:
| • | Level 1 – quoted prices in active markets for identical securities |
| • | Level 2 – other significant observable inputs |
| • | Level 3 – significant unobservable inputs |
Fixed income securities, including corporate bonds and municipal bonds, held by FBP Appreciation & Income Opportunities Fund are classified as Level 2 since the values for such securities are based on prices provided by an independent pricing service that utilizes various “other significant observable inputs” including bid and ask quotations, prices of similar securities and interest rates, among other factors.
The inputs or methodology used for valuing securities are not necessarily an indication of the risks associated with investing in those securities. The inputs used to measure fair value may fall into different levels of the fair value hierarchy. In such cases, for disclosure purposes, the level in the fair value hierarchy within which the fair value measurement falls in its entirety is determined based on the lowest level input that is significant to the fair value measurement.
The following is a summary of the inputs used to value each Fund’s investments and other financial instruments as of March 31, 2015 by security type:
| FBP Equity & Dividend Plus Fund | | Level 1 | | | Level 2 | | | Level 3 | | | Total | |
| Investments in Securities: | | | | | | | | | | | | |
| Common Stocks | | $ | 26,539,571 | | | $ | — | | | $ | — | | | $ | 26,539,571 | |
| Money Market Funds | | | 2,724,707 | | | | — | | | | — | | | | 2,724,707 | |
| Total | | $ | 29,264,278 | | | $ | — | | | $ | — | | | $ | 29,264,278 | |
| | | | | | | | | | | | | | | | | |
| Other Financial Instruments: | | | | | | | | | | | | | | | | |
| Written Covered Call Options | | $ | (372,148 | ) | | $ | — | | | $ | — | | | $ | (372,148 | ) |
| Total | | $ | (372,148 | ) | | $ | — | | | $ | — | | | $ | (372,148 | ) |
| FBP Appreciation & Income Opportunities Fund | | Level 1 | | | Level 2 | | | Level 3 | | | Total | |
| Investments in Securities: | | | | | | | | | | | | |
| Common Stocks | | $ | 28,612,036 | | | $ | — | | | $ | — | | | $ | 28,612,036 | |
| Corporate Bonds | | | — | | | | 2,272,062 | | | | — | | | | 2,272,062 | |
| Municipal Bonds | | | — | | | | 300,021 | | | | — | | | | 300,021 | |
| Money Market Funds | | | 7,952,627 | | | | — | | | | — | | | | 7,952,627 | |
| Total | | $ | 36,564,663 | | | $ | 2,572,083 | | | $ | — | | | $ | 39,136,746 | |
| | | | | | | | | | | | | | | | | |
| Other Financial Instruments: | | | | | | | | | | | | | | | | |
| Written Covered Call Options | | $ | (172,855 | ) | | $ | — | | | $ | — | | | $ | (172,855 | ) |
| Total | | $ | (172,855 | ) | | $ | — | | | $ | — | | | $ | (172,855 | ) |
THE FLIPPIN, BRUCE & PORTER FUNDS
NOTES TO FINANCIAL STATEMENTS (Continued)
Refer to each Fund’s Schedule of Investments for a listing of the common stocks and corporate bonds by sector type. As of March 31, 2015, the Funds did not have any transfers into and out of any Level. There were no Level 3 securities held by the Funds as of March 31, 2015. It is the Funds’ policy to recognize transfers into and out of any Level at the end of the reporting period.
Share valuation — The net asset value per share of each Fund is calculated daily by dividing the total value of its assets, less liabilities, by the number of shares outstanding. The offering price and redemption price per share of each Fund is equal to its net asset value per share.
Investment income — Interest income is accrued as earned. Dividend income is recorded on the ex-dividend date. Discounts and premiums on fixed income securities purchased are amortized using the interest method.
Distributions to shareholders — Dividends arising from net investment income are declared and paid quarterly to shareholders of each Fund. Net realized short-term capital gains, if any, may be distributed throughout the year and net realized long-term capital gains, if any, are distributed at least once each year. The amount of distributions from net investment income and net realized gains are determined in accordance with federal income tax regulations, which may differ from GAAP. These “book/tax” differences are either temporary or permanent in nature. Dividends and distributions are recorded on the ex-dividend date. The tax character of distributions paid during the years ended March 31, 2015 and March 31, 2014 was as follows:
| | Year
Ended | | Ordinary Income | | | Long-Term Capital Gains | | | Total Distributions | |
| FBP Equity & Dividend Plus Fund | | 3/31/2015 | | $ | 587,146 | | | $ | 518,508 | | | $ | 1,105,654 | |
| | | | 3/31/2014 | | $ | 462,094 | | | $ | — | | | $ | 462,094 | |
| FBP Appreciation & Income Opportunities Fund | | 3/31/2015 | | $ | 553,302 | | | $ | 1,338,239 | | | $ | 1,891,541 | |
| | | | 3/31/2014 | | $ | 559,059 | | | $ | 1,446,660 | | | $ | 2,005,719 | |
Security transactions — Security transactions are accounted for on trade date for financial reporting purposes. Gains and losses on securities sold are determined on a specific identification basis.
Common expenses — Common expenses of the Trust are allocated among the series of the Trust based on relative net assets of each series or the nature of the services performed and the relative applicability to each series.
Options transactions — When the Funds’ investment adviser believes that individual portfolio securities held by the Funds are approaching the top of the adviser’s growth and price expectations, covered call options may be written (sold) against such securities and the Funds will receive a premium in return. The Funds write options only for income generation and hedging purposes and not for speculation. The premiums received from writing the options are recorded as a liability and are subsequently valued daily at the closing prices on their primary exchanges. Premiums received from writing options which expire are treated as realized gains. Premiums received from writing options which are exercised increase the proceeds used to calculate the realized gain or loss on the sale of the security. If a closing purchase transaction is used to terminate a Fund’s obligation on a call option, a gain or loss will be realized, depending upon whether the price of the closing purchase transaction is more or less than the premium previously received on the call option written.
THE FLIPPIN, BRUCE & PORTER FUNDS
NOTES TO FINANCIAL STATEMENTS (Continued)
The Funds may also purchase put options on stock indices. By purchasing a put option on a stock index, a Fund could hedge the risk of a general market decline. The value of the put option would be expected to rise as a result of a market decline and thus could offset all or a portion of losses resulting from declines in the prices of individual securities held by a Fund. However, option premiums tend to decrease over time as the expiration date nears. Therefore, because of the cost of the option (in the form of premium and transaction costs), a Fund would suffer a loss on the put option if prices do not decline, or do not decline sufficiently, to offset the deterioration in the value of the option premium. Premiums paid for buying options that expire are treated as realized losses. Premiums paid from buying options which are exercised decrease the proceeds used to calculate the realized gain or loss on the exercise of the options.
Estimates — The preparation of financial statements in conformity with GAAP requires management to make estimates and assumptions that affect the reported amounts of assets and liabilities and the disclosure of contingent assets and liabilities as of the date of the financial statements and the reported amounts of income and expenses during the reporting period. Actual results could differ from those estimates.
Federal income tax — Each Fund has qualified and intends to continue to qualify as a regulated investment company under the Internal Revenue Code of 1986 (the “Code”). Qualification generally will relieve the Funds of liability for federal income taxes to the extent 100% of their net investment income and any net realized capital gains are distributed in accordance with the Code. Accordingly, no provision for income tax has been made.
In order to avoid imposition of the excise tax applicable to regulated investment companies, it is also each Fund’s intention to declare as dividends in each calendar year at least 98% of its net investment income (earned during the calendar year) and 98.2% of its net realized capital gains (earned during the twelve months ended October 31) plus undistributed amounts from prior years.
The following information is computed on a tax basis for each item as of March 31, 2015:
| | | FBP Equity
& Dividend
Plus Fund | | | FBP Appreciation & Income Opportunities
Fund | |
| Tax cost of portfolio investments | | $ | 23,132,452 | | | $ | 29,530,663 | |
| Gross unrealized appreciation | | $ | 6,593,182 | | | $ | 10,871,388 | |
| Gross unrealized depreciation | | | (461,356 | ) | | | (1,265,305 | ) |
| Net unrealized appreciation on investments | | | 6,131,826 | | | | 9,606,083 | |
| Net unrealized depreciation on option contracts | | | (78,461 | ) | | | (25,307 | ) |
| Undistributed ordinary income | | | 4,592 | | | | 19,130 | |
| Undistributed long-term gains | | | 137,792 | | | | 1,142,300 | |
| Other temporary differences | | | (3,010 | ) | | | (16,102 | ) |
| Accumulated earnings | | $ | 6,192,739 | | | $ | 10,726,104 | |
As of March 31, 2015, the tax cost of written options for FBP Equity & Dividend Plus Fund and FBP Appreciation & Income Opportunities Fund is $293,687 and $147,548, respectively.
THE FLIPPIN, BRUCE & PORTER FUNDS
NOTES TO FINANCIAL STATEMENTS (Continued)
The difference between the federal income tax cost of portfolio investments and the financial statement cost for FBP Appreciation & Income Opportunities Fund is due to certain differences in the recognition of capital gains and losses under income tax regulations and GAAP. These “book/tax” differences are temporary in nature and are primarily due to differing methods in the amortization of discounts and premiums on fixed income securities.
During the year ended March 31, 2015, FBP Equity & Dividend Plus Fund utilized $176,389 of short-term capital loss carryforwards to offset current year gains.
For the year ended March 31, 2015, FBP Appreciation & Income Opportunities Fund reclassified accumulated net realized gains from security transactions of $30,037 against undistributed net investment income on the Statements of Assets and Liabilities. Such reclassification, the result of permanent differences between the financial statements and income tax reporting requirements, has no effect on the Fund’s net assets or net asset value per share.
During the year ended March 31, 2014, FBP Equity & Dividend Plus Fund and FBP Appreciation & Income Opportunities Fund realized $235,484 and $210,674, respectively, of net capital gains resulting from in-kind redemptions (redemptions in which shareholders who redeemed Fund shares received securities held by the Fund rather than cash). The Fund recognizes a gain on in-kind redemptions to the extent that the value of the distributed securities on the date of redemption exceeds the cost of those securities. Such gains are not taxable to the Fund and are not required to be distributed to shareholders. The Funds have reclassified these amounts against paid-in capital on the Statements of Assets and Liabilities. Such reclassifications, the result of permanent differences between the financial statement and income tax reporting requirements, have no effect on the Funds’ net assets or net asset value per share.
The Funds recognize the tax benefits or expenses of uncertain tax positions only when the position is “more likely than not” to be sustained assuming examination by tax authorities. Management has reviewed the tax positions taken on federal income tax returns for all open tax years (tax years ended March 31, 2012 through March 31, 2015) of each Fund and has concluded that no provision for unrecognized tax benefits or expenses is required in these financial statements.
3. Investment Transactions
Investment transactions, other than short-term investments and U.S. government securities, were as follows for the year ended March 31, 2015:
| | | FBP Equity
& Dividend
Plus Fund | | | FBP Appreciation & Income Opportunities
Fund | |
| Purchases of investment securities | | $ | 5,335,855 | | | $ | 3,954,101 | |
| Proceeds from sales and maturities of investment securities | | $ | 5,002,302 | | | $ | 5,461,226 | |
THE FLIPPIN, BRUCE & PORTER FUNDS
NOTES TO FINANCIAL STATEMENTS (Continued)
4. Transactions with Related Parties
INVESTMENT ADVISORY AGREEMENTS
Each Fund’s investments are managed by Flippin, Bruce & Porter, Inc. (the “Adviser”) under the terms of an Investment Advisory Agreement. Under the Investment Advisory Agreements, each Fund pays the Adviser a fee, which is computed and accrued daily and paid monthly, at an annual rate of .70% of its average daily net assets up to $250 million; .65% of the next $250 million of such assets; and .50% of such assets in excess of $500 million.
During the year ended March 31, 2015, the Adviser voluntarily waived $30,208 and $14,652 of its investment advisory fees from FBP Equity & Dividend Plus Fund and FBP Appreciation & Income Opportunities Fund, respectively.
Certain officers of the Trust are also officers of the Adviser.
OTHER SERVICE PROVIDERS
Ultimus Fund Solutions, LLC (“Ultimus”) provides fund administration, fund accounting, compliance and transfer agent services to the Funds. The Funds pay Ultimus fees in accordance with the agreements for such services. In addition, the Funds pay out-of-pocket expenses including, but not limited to, postage, supplies, and costs of pricing the Funds’ portfolio securities. Certain officers of the Trust are also officers of Ultimus, or of Ultimus Fund Distributors, LLC (the “Distributor”), the principal underwriter of each Fund’s shares and an affiliate of Ultimus. The Distributor is compensated by the Adviser (not the Funds) for acting as principal underwriter.
COMPENSATION OF TRUSTEES
Trustees and officers affiliated with the Adviser or Ultimus are not compensated by the Trust for their services. Each Trustee who is not an affiliated person of the Adviser or Ultimus receives from the Trust an annual retainer of $12,000, payable quarterly; a fee of $1,500 for attendance at each meeting of the Board of Trustees (except that such fee is $2,500 for the independent chariman); and a fee of $1,000 for attendance at each meeting of any committee of the Board (except that such fee is $1,500 for the committee chairman); plus reimbursement of travel and other expenses incurred in attending meetings. Prior to July 1, 2014, the annual retainer was $10,000.
5. Derivatives Transactions
Transactions in covered call option contracts written by the Funds during the year ended March 31, 2015 were as follows:
| | | FBP Equity &
Dividend Plus Fund | | | FBP Appreciation & Income
Opportunities Fund | |
| | | Option Contracts | | | Option Premiums | | | Option Contracts | | | Option Premiums | |
| Options outstanding at beginning of year | | | 1,053 | | | $ | 162,724 | | | | 493 | | | $ | 107,372 | |
| Options written | | | 3,058 | | | | 497,324 | | | | 1,339 | | | | 271,262 | |
| Options cancelled in a closing purchase transaction | | | (718 | ) | | | (104,560 | ) | | | (201 | ) | | | (32,410 | ) |
| Options expired | | | (847 | ) | | | (104,625 | ) | | | (222 | ) | | | (50,393 | ) |
| Options exercised | | | (1,007 | ) | | | (157,176 | ) | | | (776 | ) | | | (148,283 | ) |
| Options outstanding at end of year | | | 1,539 | | | $ | 293,687 | | | | 633 | | | $ | 147,548 | |
THE FLIPPIN, BRUCE & PORTER FUNDS
NOTES TO FINANCIAL STATEMENTS (Continued)
The location in the Statements of Assets and Liabilities of the Funds’ derivative positions is as follows:
FBP Equity & Dividend Plus Fund
| | | Fair Value | | | | |
| Type of Derivative | Location | | Asset Derivatives | | | Liability Derivatives | | | Gross Notional Amount Outstanding March 31,
2015 | |
| Covered call options written | Covered call options, at value | | | — | | | $ | (372,148 | ) | | $ | (6,383,885 | ) |
FBP Appreciation & Income Opportunities Fund
| | | Fair Value | | | | |
| Type of Derivative | Location | | Asset
Derivatives | | | Liability
Derivatives | | | Gross Notional Amount Outstanding March 31,
2015 | |
| Covered call options written | Covered call options, at value | | | — | | | $ | (172,855 | ) | | $ | (3,140,779 | ) |
The average monthly notional amount of option contracts written during the year ended March 31, 2015 was $4,976,355 and $3,171,844 for FBP Equity & Dividend Plus Fund and FBP Appreciation & Income Opportunities Fund, respectively.
The Funds held no put option contracts on stock indices as of March 31, 2015. The average notional amount of put option contracts purchased during the year ended March 31, 2015 for FBP Equity & Dividend Plus Fund and FBP Appreciation & Income Opportunities Fund was $804,446 and $1,206,669, respectively.
Transactions in derivative instruments during the year ended March 31, 2015 by the Funds are recorded in the following location in the Statements of Operations:
FBP Equity & Dividend Plus Fund
| Type of Derivative | Location | | Net
Realized
Gains (Losses) | | Location | | Change in Unrealized Appreciation (Depreciation) | |
| Covered call options written | Net realized gains (losses) from option contracts | | $ | 72,409 | | Net change in unrealized appreciation/depreciation on option contracts | | $ | (28,993 | ) |
| Purchased index put options | Net realized gains (losses) from option contracts | | $ | (51,177 | ) | Net change in unrealized appreciation/depreciation on option contracts | | $ | — | |
THE FLIPPIN, BRUCE & PORTER FUNDS
NOTES TO FINANCIAL STATEMENTS (Continued)
FBP Appreciation & Income Opportunities Fund
| Type of Derivative | Location | | Net
Realized
Gains (Losses) | | Location | | Change in Unrealized Appreciation (Depreciation) | |
| Covered call options written | Net realized gains (losses) from option contracts | | $ | 63,718 | | Net change in unrealized appreciation/depreciation on option contracts | | $ | 34,663 | |
| Purchased index put options | Net realized gains (losses) from option contracts | | $ | (76,766 | ) | Net change in unrealized appreciation/depreciation on option contracts | | $ | — | |
6. Contingencies and Commitments
The Funds indemnify the Trust’s officers and Trustees for certain liabilities that might arise from their performance of their duties to the Funds. Additionally, in the normal course of business the Funds enter into contracts that contain a variety of representations and warranties and which provide general indemnifications. The Funds’ maximum exposure under these arrangements is unknown, as this would involve future claims that may be made against the Funds that have not yet occurred. However, based on experience, the Funds expect the risk of loss to be remote.
7. Subsequent Events
The Funds are required to recognize in the financial statements the effects of all subsequent events that provide additional evidence about conditions that existed as of the date of the Statements of Assets and Liabilities. For non-recognized subsequent events that must be disclosed to keep the financial statements from being misleading, the Funds are required to disclose the nature of the event as well as an estimate of its financial effect, or a statement that such an estimate cannot be made. Management has evaluated subsequent events through the issuance of these financial statements and has noted no such events.
THE FLIPPIN, BRUCE & PORTER FUNDS
REPORT OF INDEPENDENT REGISTERED
PUBLIC ACCOUNTING FIRM
The Board of Trustees and Shareholders of
the FBP Equity & Dividend Plus Fund and the FBP Appreciation &
Income Opportunities Fund, each a series of the of the Williamsburg Investment Trust
We have audited the accompanying statements of assets and liabilities of the FBP Equity & Dividend Plus Fund and the FBP Appreciation & Income Opportunities Fund, (collectively referred to as the “Funds”) (each a series of the Williamsburg Investment Trust), including the schedules of investments, as of March 31, 2015, and the related statements of operations for the year then ended, the statements of changes in net assets for each of the two years in the period then ended, and the financial highlights for each of the five years in the period then ended. These financial statements and financial highlights are the responsibility of the Funds’ management. Our responsibility is to express an opinion on these financial statements and financial highlights based on our audits.
We conducted our audits in accordance with the standards of the Public Company Accounting Oversight Board (United States). Those standards require that we plan and perform the audits to obtain reasonable assurance about whether the financial statements and financial highlights are free of material misstatement. We were not engaged to perform an audit of the Funds’ internal control over financial reporting. Our audits included consideration of internal control over financial reporting as a basis for designing audit procedures that are appropriate in the circumstances, but not for the purpose of expressing an opinion on the effectiveness of the Funds’ internal control over financial reporting. Accordingly, we express no such opinion. An audit also includes examining, on a test basis, evidence supporting the amounts and disclosures in the financial statements and financial highlights, assessing the accounting principles used and significant estimates made by management, and evaluating the overall financial statement presentation. Our procedures included confirmation of securities owned as of March 31, 2015, by correspondence with the custodian and brokers or by other appropriate auditing procedures where replies from brokers were not received. We believe that our audits provide a reasonable basis for our opinion.
In our opinion, the financial statements and financial highlights referred to above present fairly, in all material respects, the financial position of each of the respective Funds comprising the Williamsburg Investment Trust at March 31, 2015, the results of their operations for the year then ended, the changes in their net assets for each of the two years in the period then ended, and the financial highlights for each of the five years in the period then ended, in conformity with U.S. generally accepted accounting principles.
Cincinnati, Ohio
May 22, 2015
THE FLIPPIN, BRUCE & PORTER FUNDS
BOARD OF TRUSTEES AND EXECUTIVE OFFICERS
(Unaudited)
Overall responsibility for management of the Funds rests with the Board of Trustees. The Trustees serve during the lifetime of the Trust and until its termination, or until death, resignation, retirement or removal. The Trustees, in turn, elect the officers of the Funds. The officers have been elected for an annual term. The following are the Trustees and executive officers of the Funds:
| | Trustee | Address | Year of Birth | Position Held
with the Trust | Length of
Time Served |
| | Robert S. Harris, Ph.D. | 100 Darden Boulevard
Charlottesville, VA | 1949 | Chairman and Trustee | Since
January 2007 |
| * | John P. Ackerly, IV | One James Center
901 E. Cary Street
Richmond, VA | 1963 | Trustee and President of Davenport Funds | Since
July 2012 |
| * | John T. Bruce | 800 Main Street
Lynchburg, VA | 1953 | Trustee and
President of FBP Funds | Since
September 1988 |
| | George K. Jennison | 5101 Stratford Crescent
Richmond, VA | 1957 | Trustee | Since
January 2015 |
| | J. Finley Lee, Jr., Ph.D. | 448 Pond Apple Drive North
Naples, FL | 1939 | Trustee | Since
September 1988 |
| | Harris V. Morrissette | 100 Jacintoport Boulevard
Saraland, AL | 1959 | Trustee | Since
March 1993 |
| | Elizabeth W. Robertson | 8908 Norwick Road
Richmond, VA | 1953 | Trustee | Since
February 2014 |
| | John H. Hanna IV | 800 Main Street
Lynchburg, VA | 1955 | Vice President | Since
February 2007 |
| | David J. Marshall | 800 Main Street
Lynchburg, VA | 1956 | Vice President | Since
February 2007 |
| | R. Gregory Porter III | 800 Main Street
Lynchburg, VA | 1941 | Vice President | Since
September 1988 |
| | Robert G. Dorsey | 225 Pictoria Drive, Suite 450
Cincinnati, OH | 1957 | Vice President | Since
November 2000 |
| | Mark J. Seger | 225 Pictoria Drive, Suite 450
Cincinnati, OH | 1962 | Treasurer | Since
November 2000 |
| | Tina H. Bloom | 225 Pictoria Drive, Suite 450
Cincinnati, OH | 1968 | Secretary and Chief Compliance Officer | Since
August 2006 |
| * | Messrs. Ackerly and Bruce, as affiliated persons of investment advisers to the Trust, are “interested persons” of the Trust within the meaning of Section 2(a)(19) of the Investment Company Act of 1940. |
THE FLIPPIN, BRUCE & PORTER FUNDS
BOARD OF TRUSTEES AND EXECUTIVE OFFICERS
(Unaudited) (Continued)
Each Trustee oversees twelve portfolios of the Trust, including the Funds. The principal occupations of the Trustees and executive officers of the Funds during the past five years and public directorships held by the Trustees are set forth below:
Robert S. Harris, Ph.D. is the C. Stewart Sheppard Professor of Business Administration at The Darden Graduate School of Business Administration at the University of Virginia. He was previously the dean at Darden. Professor Harris has published widely on corporate finance, financial markets and mergers and acquisitions and has served as a consultant to corporations and government agencies.
John P. Ackerly, IV is Senior Vice President and Portfolio Manager of Davenport & Company LLC (an investment advisory firm).
John T. Bruce is President, Director and member of the Executive Committee of the Adviser.
George K. Jennison is President of Oyster Consulting, LLC (a financial consulting firm). He previously was a financial adviser with Wells Fargo Advisors, LLC.
J. Finley Lee, Jr., Ph.D. is the retired Julian Price Professor Emeritus at the University of North Carolina.
Harris V. Morrissette is President of China Doll Rice and Beans, Inc. and Dixie Lily Foods. He is also a Director of International Shipholding Corporation (cargo transportation) and a Director of Trustmark National Bank (bank holding company). Previously, he was Chairman of Azalea Aviation, Inc. (airplane fueling) until January 2012.
Elizabeth W. Robertson has been Chief Financial Officer for Monument Restaurants LLC (restaurant franchises) since 2011 and a Director of Franklin Financial Corporation and Franklin Federal Savings Bank since 1996.
John H. Hanna IV is Vice President, Director and member of the Executive Committee of the Adviser.
David J. Marshall is Secretary, Director and member of the Executive Committee of the Adviser.
R. Gregory Porter III is Director of the Adviser.
Robert G. Dorsey is a Managing Director of Ultimus Fund Solutions, LLC and Ultimus Fund Distributors, LLC.
Mark J. Seger is a Managing Director of Ultimus Fund Solutions, LLC and Ultimus Fund Distributors, LLC.
Tina H. Bloom is Director of Fund Administration of Ultimus Fund Solutions, LLC.
Additional information about members of the Board of Trustees and executive officers is available in the Statement of Additional Information (“SAI”). To obtain a free copy of the SAI, please call 1-800-281-3217.
THE FLIPPIN, BRUCE & PORTER FUNDS
ABOUT YOUR FUNDS’ EXPENSES (Unaudited)
We believe it is important for you to understand the impact of costs on your investment. All mutual funds have operating expenses. As a shareholder of the Funds, you incur ongoing costs, including management fees and other operating expenses. These ongoing costs, which are deducted from each Fund’s gross income, directly reduce the investment return of the Funds.
A mutual fund’s ongoing costs are expressed as a percentage of its average net assets. This figure is known as the expense ratio. The following examples are intended to help you understand the ongoing costs (in dollars) of investing in the Funds and to compare these costs with the ongoing costs of investing in other mutual funds. The examples below are based on an investment of $1,000 made at the beginning of the period shown and held for the entire period (October 1, 2014 through March 31, 2015).
The table below illustrates each Fund’s ongoing costs in two ways:
Actual fund return – This section helps you to estimate the actual expenses that you paid over the period. The “Ending Account Value” shown is derived from each Fund’s actual return, and the third column shows the dollar amount of operating expenses that would have been paid by an investor who started with $1,000 in the Funds. You may use the information here, together with the amount you invested, to estimate the expenses that you paid over the period.
To do so, simply divide your account value by $1,000 (for example, an $8,600 account value divided by $1,000 = 8.6), then multiply the result by the number given for the Funds under the heading “Expenses Paid During Period.”
Hypothetical 5% return – This section is intended to help you compare the Funds’ ongoing costs with those of other mutual funds. It assumes that each Fund had an annual return of 5% before expenses during the period shown, but that the expense ratio is unchanged. In this case, because the returns used are not the Funds’ actual returns, the results do not apply to your investment. The example is useful in making comparisons because the Securities and Exchange Commission (“SEC”) requires all mutual funds to calculate expenses based on a 5% return. You can assess each Fund’s ongoing costs by comparing this hypothetical example with the hypothetical examples that appear in shareholder reports of other funds.
Note that expenses shown in the table are meant to highlight and help you compare ongoing costs only. The Funds do not charge sales loads or redemption fees.
The calculations assume no shares were bought or sold during the period. Your actual costs may have been higher or lower, depending on the amount of your investment and the timing of any purchases or redemptions.
More information about the Funds’ expenses, including annual expense ratios for the past five fiscal years, can be found in this report. For additional information on operating expenses and other shareholder costs, please refer to the Funds’ prospectus.
THE FLIPPIN, BRUCE & PORTER FUNDS
ABOUT YOUR FUNDS’ EXPENSES (Unaudited) (Continued)
| Beginning
Account Value
October 1, 2014 | Ending
Account Value
March 31, 2015 | Net Expense Ratio(a) | Expenses Paid
During Period(b) |
| FBP Equity & Dividend Plus Fund | | | |
| Based on Actual Fund Return | $1,000.00 | $997.40 | 1.07% | $5.33 |
| Based on Hypothetical 5% Return (before expenses) | $1,000.00 | $1,019.60 | 1.07% | $5.39 |
| FBP Appreciation & Income Opportunities Fund | | | |
| Based on Actual Fund Return | $1,000.00 | $996.40 | 1.00% | $4.98 |
| Based on Hypothetical 5% Return (before expenses) | $1,000.00 | $1,019.95 | 1.00% | $5.04 |
| (a) | Annualized, based on the Fund’s most recent one-half year expenses. |
| (b) | Expenses are equal to the Fund’s annualized expense ratio multiplied by the average account value over the period, multiplied by 182/365 (to reflect the one-half year period). |
OTHER INFORMATION (Unaudited)
The Trust files a complete listing of portfolio holdings for the Funds with the SEC as of the end of the first and third quarters of each fiscal year on Form N-Q. The filings are available upon request, by calling 1-800-327-9375. Furthermore, you may obtain a copy of these filings on the SEC’s website at http://www.sec.gov. The Trust’s Forms N-Q may also be reviewed and copied at the SEC’s Public Reference Room in Washington, DC, and information on the operation of the Public Reference Room may be obtained by calling 1-800-SEC-0330.
A description of the policies and procedures that the Funds use to determine how to vote proxies relating to portfolio securities is available without charge upon request by calling toll-free 1-800-327-9375, or on the SEC’s website at http://www.sec.gov. Information regarding how the Funds voted proxies relating to portfolio securities during the most recent 12-month period ended June 30 is also available without charge upon request by calling toll-free 1-800-327-9375, or on the SEC’s website at http://www.sec.gov.
THE FLIPPIN, BRUCE & PORTER FUNDS
FEDERAL TAX INFORMATION (Unaudited)
In accordance with federal tax requirements, the following provides shareholders with information concerning distributions from ordinary income and net realized gains made by the Funds during the year ended March 31, 2015. During the year ended March 31, 2015, FBP Equity & Dividend Plus Fund and FBP Appreciation & Income Opportunities Fund paid a long-term capital gain distribution of $518,508 and $1,338,239, respectively. Certain dividends paid by the Funds may be subject to a maximum tax rate of 23.8%. FBP Equity & Dividend Plus Fund and FBP Appreciation & Income Opportunities Fund intend to designate up to a maximum amount of $587,146 and $533,302, respectively, as taxed at a maximum rate of 23.8%. Additionally, for the fiscal year ended March 31, 2015, all of the dividends paid from ordinary income by FBP Equity & Dividend Plus Fund and FBP Appreciation & Income Opportunities Fund, qualified for the dividends received deduction for corporations.
As required by federal regulations, complete information will be computed and reported in conjunction with your 2015 Form 1099-DIV.
THE FLIPPIN, BRUCE & PORTER FUNDS
DISCLOSURE REGARDING APPROVAL OF
INVESTMENT ADVISORY AGREEMENTS (Unaudited)
At an in-person meeting held on February 24, 2015, the Board of Trustees, including a majority of the Independent Trustees, approved the continuance for a one-year period of the Investment Advisory Agreements with the Adviser on behalf of the FBP Equity & Dividend Plus Fund and the FBP Appreciation and Income Opportunities Fund. Below is a discussion of the factors considered by the Board of Trustees along with its conclusions with respect thereto that formed the basis for the Board’s approvals.
In selecting the Adviser and approving the continuance of the Investment Advisory Agreements, the Trustees considered all information they deemed reasonably necessary to evaluate the terms of the Agreements. The principal areas of review by the Trustees were the nature, extent and quality of the services provided by the Adviser and the reasonableness of the fees charged for those services. These matters were considered by the Independent Trustees consulting with experienced counsel for the Independent Trustees, who is independent of the Adviser.
The Trustees’ evaluation of the quality of the Adviser’s services took into account their knowledge and experience gained through meetings with and reports of the Adviser’s senior management over the course of the preceding year. Both short-term and long-term investment performance of the Funds was considered. Each Fund’s performance was compared to its performance benchmark and to that of competitive funds with similar investment objectives and to the Adviser’s comparably managed private accounts. The Trustees also considered the scope and quality of the in-house capabilities of the Adviser and other resources dedicated to performing services for the Funds. The quality of administrative and other services, including the Adviser’s role in coordinating the activities of the Funds’ other service providers, were considered in light of the Funds’ compliance with investment policies and applicable laws and regulations and of related reports by management and the Funds’ independent public accounting firm in periodic meetings with the Trust’s Audit Committee. The Trustees also considered the business reputation of the Adviser, the qualifications of its key investment and compliance personnel, and its financial resources.
In reviewing the fees payable under the Investment Advisory Agreements, the Trustees compared the advisory fees and overall expense levels of each Fund with those of competitive funds with similar investment objectives as well as the private accounts managed by the Adviser. The Trustees considered information provided by the Adviser concerning the Adviser’s profitability with respect to each Fund, including the assumptions and methodology used in preparing the profitability information, in light of applicable case law relating to advisory fees. For these purposes, the Trustees took into account not only the fees paid by the Funds, but also so-called “fallout” benefits to the Adviser, such as the benefits of research made available to the Adviser by reason of brokerage commissions generated by the Funds’ securities transactions. The Trustees also reviewed the revenue sharing arrangements relating to the Funds, whereby fees are paid by the Adviser to various intermediaries that direct assets to the Funds. In evaluating the Funds’ advisory fees, the Trustees took into account the complexity and quality of the investment management of the Funds.
Based upon their review of this information, the Independent Trustees concluded that: (i) the performance of the Funds has been reasonable and the Adviser has provided satisfactory services to the Funds; (ii) the advisory fee rates for each Fund are competitive with similarly managed funds; (iii) the total operating expense ratio of each Fund, after fee waivers, is competitive with (and in the case of the FBP Equity & Dividend Plus Fund, lower than) the average expense ratio for comparably managed funds, according to statistics derived from Morningstar, Inc.; (iv) the Adviser’s decision to cap overall operating expenses of
THE FLIPPIN, BRUCE & PORTER FUNDS
DISCLOSURE REGARDING APPROVAL OF
INVESTMENT ADVISORY AGREEMENTS (Unaudited)
(Continued)
the Funds by voluntarily waiving a portion of its advisory fees has enabled each Fund to increase returns for shareholders and to maintain an overall expense ratio that is competitive with the average for similarly managed funds, despite the small size of the Funds; (v) the Adviser did not realize any profits with respect to its management of the Funds. Given the current size of the Funds and their expected growth, the Independent Trustees did not believe that at the present time it would be relevant to consider the extent to which economies of scale would be realized as the Funds grow, and whether fee levels reflect these economies of scale. The Independent Trustees also considered the “fallout” benefits to the Adviser with respect to the Funds, but given the amounts involved viewed these as secondary factors in connection with the evaluation of the reasonableness of the advisory fees paid by the Funds.
No single factor was considered in isolation or to be determinative to the decision of the Trustees to approve continuance of the Investment Advisory Agreements. Rather the Trustees concluded, in light of a weighing and balancing of all factors considered, that it was in the best interests of each Fund and its shareholders to continue its Investment Advisory Agreement without modification to its terms, including the fees charged for services thereunder.
This page intentionally left blank.
THE GOVERNMENT STREET FUNDS No-Load Mutual Funds Annual Report
March 31, 2015 |
The Government Street Equity Fund The Government Street Mid-Cap Fund The Alabama Tax Free Bond Fund |
| LETTER FROM THE PRESIDENT | May, 2015 |
Dear Fellow Shareholders:
We are enclosing for your review the audited Annual Report of The Government Street Funds for the year ended March 31, 2015.
The Government Street Equity Fund
The Government Street Equity Fund had a positive 11.87% total return for the fiscal year ended March 31, 2015. By comparison, the S&P 500 Index and the Morningstar Large Cap Blend category were up 12.73% and 10.16%, respectively. Hopefully, the absolute and relative performance of your investment is indicative of good things to come. After the S&P 500 was cited by many performance rating services to have outperformed more than 80% of large capitalization blended funds, to be within 1% of the Index’s recent 12 month record is gratifying. The last fiscal quarter of this year aided the result with The Government Street Equity Fund outperforming the S&P 500 by 2.34% vs 0.95%. The return of the Morningstar Large Cap Blend, for the same period, was 1.13%.
However, it is hard to expect continued double digit investment returns in the future. Almost all measures of stock valuations are near the top end of their metrics. Since the stock market, as measured by the S&P 500, bottomed in March 2009, almost exactly 6 years ago, it has increased 194.30% cumulative or a 19.71% per year average.
There are plenty of reasons to question the future size of equity returns. Simply said, the underlying economy of the United States is not currently expanding rapidly enough to support extended double digit returns. The possible sources of negative considerations are myriad. Slow GDP growth, the scope of our national debt, rising wages, stymied Federal Reserve policy, incomprehensible tax policy, diminishing international prestige, record dollar currency strength and an aging population are a few examples. The lack of clear policies to deal with any of these issues creates an uncomfortable environment for investments. However, hope springs eternal and history has proven that underestimating America’s propensity to respond to adversity must be remembered.
The top 10 holdings in The Government Street Equity Fund as of March 31, 2015 were:
| Security Description | % of Net Assets |
| Apple, Inc. | 5.9% |
| Vanguard Mid-Cap ETF | 3.8% |
| Walt Disney Company (The) | 3.0% |
| Visa, Inc. – Class A | 2.9% |
| JPMorgan Alerian MLP Index ETN | 2.5% |
| MasterCard, Inc. – Class A | 2.5% |
| Schwab U.S. Mid-Cap ETF | 2.3% |
| General Dynamics Corporation | 2.2% |
| United Technologies Corporation | 1.9% |
| Actavis plc | 1.9% |
Exchange-traded funds (“ETFs”) and exchange-traded notes (“ETNs”) have continued to play a prominent role in the Fund’s investment holdings, as evidenced by 3 of the top 10 holdings. Each ETF/ETN represents a composite holding of an extensive number of securities that have some common characteristic.
As an example, the Vanguard Mid-Cap ETF represents an investment in over 450 individual securities that meet Vanguard’s definition of mid capitalization corporate equities. The inclusion of this one security in the portfolio provided the Fund with broad diversification that would be impossible to achieve individually in a fund with the total value of The Government Street Equity Fund. The ability to achieve diversification utilizing ETFs has allowed us an opportunity for risk control that would be otherwise unattainable. ETFs, as a whole, represented 11.0% of your Fund’s net assets as of March 31, 2015.
There were significant individual performances during the fiscal year. The 5 highest returns, held for the entire fiscal year, as measured by the internal rate of return for the entire period were:
| Security Description | 1 Year Performance |
| Shire plc - ADR | 114.51% |
| Apple, Inc. | 65.81% |
| Kraft Foods Group, Inc. | 60.36% |
| Regeneron Pharmaceuticals, Inc. | 50.35% |
| CVS Health Corporation | 43.10% |
The 5 worst individual performances, held for the entire fiscal year, as measured by internal rate of return for the entire period were:
| Security Description | 1 Year Performance |
| Pioneer Natural Resources Company | -12.38% |
| Emerson Electric Company | -12.69% |
| Quanta Services, Inc. | -23.36% |
| Google, Inc. - Class A | -29.40% |
| Freeport-McMoRan, Inc. | -40.85% |
The Fund’s best performing economic sector for the fiscal year was Health Care, up 28.74%. The second best sector was Information Technology, up 22.94%. The worst performing sector was Energy, down -12.21%.
Note: The investment performances listed for economic sectors and securities in the two preceding paragraphs are extracted from an in-house independent internal rate of return computation by the Advent Axys portfolio accounting system. The calculations are gross investment returns. Total investment returns are for the fiscal year April 1, 2014 through March 31, 2015.
While the following commentary is redundant across the past 5 years we still believe it relevant. Instead of trying to summarize prospects for the year ahead with new insights, beyond the opening comments, the statement from three years previous still portrays our view. On March 31, 2010 we wrote:
“We believe that continued upward movement of markets and economies worldwide are highly dependent on Governments getting their financial balance sheets in order. There has been unparalleled deficit spending around the world. Those economies not directly participating in the credit shortfalls will be indirectly impacted by lower import/export activities brought on by significant debt imposed slowdown. This will occur domestically and internationally as economies have become more highly correlated in their economic cycles.
In response to this perceived scenario, risk management takes precedent over return pursuits in the near term. Your Fund remains essentially fully invested to capture returns, but highly diversified to mitigate the risks associated with that position.”
Additionally, we have to acknowledge we still believe the truth of the 2011 statement. However, we believe that the Federal Reserve actions have created an exogenous influence that has temporarily offset the ultimately destructive nature of excessive deficit financing. We believe that the future transition to a sound economic scenario will determine the continuation of current positive performances.
While significant risks exist, we continue to believe that investors have potential for one of the greatest investment environments for generations. There are over 7 billion people in the world today. (USA population is approximately 320 million.) Many of these potential consumers are moving into middle class ranks. In our opinion, the demand for goods and services for the future is tremendous. Remember that, in our own economy, approximately 60% of GDP is tied to consumers. With the business advantages that the USA enjoys in manufacturing know how, technology, intellectual content, productivity and numerous other characteristics, if Government will provide a competitive framework for operating, the benefits could be the best ever.
There are many additional moving parts in our economy and exogenous factors, such as the geopolitical instabilities, that will always have uneven effects. However, it is our thought that keeping our fiscal house in order is basic to all considerations. The irresponsible spending activities of our government continue to unnerve us. It remains to be seen if the economy can overcome the negative influence of government and have a successful impact on market values.
As of March 31, 2015, the Fund’s net assets were $93.8 million, down from $94.3 million at the beginning of the fiscal year; net asset value per share was $65.95; and the ratio of expenses to net average assets was 0.84%. Portfolio turnover rate was 26%. Income dividends totaling $0.6410 per share and capital gains totaling $3.4061 per share were distributed to shareholders during the year.
The Government Street Mid-Cap Fund
The Government Street Mid-Cap Fund, as of March 31, 2015, produced a one year total return of 10.14%. By comparison the Standard & Poor’s MidCap 400 Index and the Morningstar Mid Cap Blended Index, used as relative performance benchmarks, were up 12.20% and 9.36%, respectively.
The mid-capitalization category of individual companies is usually proxied by the Standard & Poor’s Mid-Cap 400 ranging from $1.2 billion to $5.1 billion market values. Generally, these companies are considered to have slightly higher risk and
return characteristics than the S&P 500 companies, which start at the upper end of the mid cap values and range to sizes 10 times or greater in terms of capitalization. As you would guess, the mid cap companies tend to be primarily domestically oriented.
The top 10 holdings in The Government Street Mid Cap Fund as of March 31, 2015 were:
| Security Description | % of Net Assets |
| Schwab U.S. Mid-Cap ETF | 3.7% |
| Vanguard Mid-Cap ETF | 3.3% |
| Guggenheim Mid-Cap Core ETF | 2.6% |
| iShares Nasdaq Biotechnology Index Fund | 2.0% |
| Mid-American Apartment Communities, Inc. | 1.9% |
| Church & Dwight Company, Inc. | 1.8% |
| JPMorgan Alerian MLP Index ETN | 1.6% |
| Hormel Foods Corporation | 1.3% |
| Jarden Corporation | 1.2% |
| Ross Stores, Inc. | 1.2% |
ETFs and ETNs represent significant holdings in the Fund. Schwab, Vanguard and Guggenheim mid-caps are all constituted differently, but cover the capitalization ranges mentioned earlier. Since the mid cap universe contains a much greater number of companies than its larger index counterparts, we like to broaden your portfolio’s exposure across the range to govern risk control through diversification.
This same rationale for risk control is implemented through investment in the iShares Nasdaq Biotechnology Index Fund and the JPMorgan Alerian MLP Index ETN. However, these investments are more specific to homogeneous industries rather than broad market coverage. The Government Street Mid Cap Fund is not large enough to provide for multiple investments in Biotech stocks or Mid-Stream Oil master limited partnerships on an individual security basis. These instruments allow participation in attractive investment categories while allowing sufficient risk control thru diversification. A total of 128 investments, including the described securities were held in the Fund as of March 31, 2015.
There were significant individual performances during the fiscal year. The 5 highest returns, held for the entire period, as measured by the internal rate of return, were:
| Security Description | 1 Year Performance |
| Laboratory Corporation of America Holdings | 87.74% |
| United Therapeutics Corporation | 85.44% |
| Matson, Inc. | 74.27% |
| ResMed, Inc. | 62.91% |
| Shire plc - ADR | 61.75% |
The 5 worst individual performances, held for the entire period, as measured by internal rate of return, were:
| Security Description | 1 Year Performance |
| Cameron International Corporation | -26.95% |
| Rayonier, Inc. | -28.04% |
| Jacobs Engineering Group, Inc. | -28.88% |
| Cree, Inc. | -37.02% |
| Range Resources Corporation | -37.12% |
The Fund’s best performing economic sector for the fiscal year was Health Care, up 27.08%. The second best sector was Consumer Staples, up 21.23%. The worst performing sector was Energy, down -15.34%.
Note: The investment performances listed for economic sectors and securities in the two preceding paragraphs are extracted from an in-house independent internal rate of return computation by the Advent Axys portfolio accounting system. The calculations are gross investment returns. Total investment returns are for the fiscal year April 1, 2014 through March 31, 2015.
We believe that mid cap stocks offer an attractive combination of growth and safety as they have successfully overcome startup challenges yet remain nimble enough to generate stronger growth than large cap stocks. Mid cap stocks have often been able to match the performance of large cap stocks in down markets while exceeding large cap performance in up markets, leading to long-term outperformance.
The most significant economic event of the past 12 months appears to be the collapse of oil pricing. We believe that, over a longer period, a continued reduction in the cost of this commodity should have positive effects on the market. In mid cap markets, the consumer area and the smaller manufacturing components will benefit greatly from prolonged lower pricing. Energy costs make up large proportions of their expense budgets. So, combined with the lower capitalization characteristics of mid cap companies, hopefully lower energy prices will have increased positive effects on future values, relative to larger stocks.
As of March 31, 2015, the net assets of The Government Street Mid-Cap Fund were $51,898,447 and the net asset value per share was $22.96. The turnover rate for the previous twelve months was 16% and the total number of holdings was 128 as of March 31, 2015. The net expense ratio for the Fund is 1.05%.
The Alabama Tax Free Bond Fund
Fixed income investors were focused on the Federal Reserve for most of the past year as it contemplated the necessity and timing of when to begin raising interest rates. The United States economy is continuing to make progress, though there are pockets of weakness that give the Federal Reserve reason to pause. A harsh winter season, a strong United States dollar, weak energy prices, a stronger employment picture, a low inflation rate and anemic wage growth are among the many factors which the Federal Reserve must weigh as it decides when to begin raising interest rates. The Federal Reserve Board’s March, 2015 statement took the step of removing the word “patient”
from the official text, yet Board Chairman Janet Yellen continues to suggest that the Fed will exercise caution as it moves towards its first rate increase since 2006 and considers the pace of subsequent hikes.
With a pronounced lack of competition from other developed market bonds, United States Treasuries provided relatively attractive returns, though the yield on the 10-year bond was only 1.9% on March 31, 2015. In general, market based rates were lower across all maturities when compared to a year earlier. Additionally, the shape of the yield curve became flatter over the course of the past twelve months, reflecting the outperformance of bonds at the longer end of the maturity spectrum.
Although issuance of new bonds in the municipal bond market picked up in early 2015, for most of the past twelve months lower levels of supply provided support for bond prices. Roughly two-thirds of new issuance in the past year has been in the form of refunding, which is reflective of the continued reluctance by municipalities to take on new projects. For the remainder of 2015, investors may have to deal with a “rush to market” as issuers attempt to get ahead of the Federal Reserve rate hikes on the horizon. Municipal bond yields have fallen over the past year, though the tax-exempt market did not keep pace with the rally in the Treasury market. However, taxable equivalent yields on municipal bonds still are appealing to investors seeking tax sheltered income. Fundamental conditions in the municipal market continue to improve. The United States Census Bureau reports that total state tax collections continue to rise, climbing 2.2% for the year ended December 31, 2014. Locally, property tax revenue is also improving, growing 2.7% for calendar year 2014. Illinois, Chicago and Puerto Rico remain “hot spots” and will continue to draw attention on a national level.
The Alabama Tax Free Bond Fund has maintained its short duration, defensive posture over the past twelve months. Although expected interest rate hikes by the Federal Reserve have been slower to materialize than we had expected, we remain focused on preservation of capital and risk control in the Fund through the purchase of high quality, short maturity issues. The duration of the portfolio was 2.8 years on March 31, 2015, down from 3.3 years at the end of the last fiscal year. The Fund maintains a high quality portfolio with more than 98% of the holdings rated A, AA or AAA by Moody’s or Standard & Poor’s rating agencies.
For the twelve months ended March 31, 2015, the Fund had a total return of 1.14% as compared to returns of 1.30% for the Barclays Capital 3-Year Municipal Bond Index and 5.13% for the Barclays Capital 7-Year Municipal Bond Index. The Alabama Tax Free Fund has a shorter average maturity than the Barclays Capital 7-Year Bond Index and consistently maintains a portfolio of higher rated securities, on average, than those included in the comparable indices. Additionally, the Barclays Capital indices include zero coupon bonds as well as bonds that are subject to the alternative minimum tax. The Fund holds neither of these types of securities.
As of March 31, 2015, the weighted average maturity of the Fund was 3.1 years, down from 3.5 years at the end of the last fiscal year. The net assets of the Fund as of March 31, 2015, were $29,969,415 and the net asset value per share was $10.49. The ratio of net investment income to average net assets during the fiscal year was 1.32%.
Thank you for your continued confidence in The Government Street Funds. Please call us if we can be of further service to you.
Very truly yours,
Thomas W. Leavell
President
Leavell Investment Management, Inc.
The Government Street Funds
Data presented reflects past performance, which is no guarantee of future results. Investment results and principal value will fluctuate so that shares, when redeemed, may be worth more or less than their original cost. Due to market volatility, current performance may be higher or lower than the performance shown.
This report is submitted for the general information of the shareholders of the Funds. The report is not authorized for distribution to prospective investors in the Funds unless it is accompanied by a current prospectus.
This report reflects our views, opinions and portfolio holdings as of March 31, 2015, the end of the reporting period. These views are subject to change at any time based upon market or other conditions. For more current information throughout the year please visit www.leavellinvestments.com.
THE GOVERNMENT STREET EQUITY FUND
PERFORMANCE INFORMATION (Unaudited)
The Government Street Equity Fund
Comparison of the Change in Value of a $10,000 Investment in
The Government Street Equity Fund and the Standard & Poor’s 500® Index
| | Average Annual Total Returns(a) (for periods ended March 31, 2015) |
| | 1 Year | 5 Years | 10 Years |
| The Government Street Equity Fund | 11.87% | 13.00% | 7.20% |
Standard & Poor’s 500® Index | 12.73% | 14.47% | 8.01% |
| (a) | Total return is a measure of the change in value of an investment in the Fund over the periods covered, which assumes any dividends or capital gains distributions are reinvested in shares of the Fund. Returns do not reflect the deduction of taxes a shareholder would pay on Fund distributions or the redemption of Fund shares. |
THE GOVERNMENT STREET MID-CAP FUND
PERFORMANCE INFORMATION (Unaudited)
The Government Street Mid-Cap Fund
Comparison of the Change in Value of a $10,000 Investment in The Government Street
Mid-Cap Fund and the Standard & Poor’s MidCap 400® Index
| | Average Annual Total Returns(a) (for periods ended March 31, 2015) |
| | 1 Year | 5 Years | 10 Years |
| The Government Street Mid-Cap Fund | 10.14% | 13.62% | 9.28% |
Standard & Poor’s MidCap 400® Index | 12.20% | 15.72% | 10.32% |
| (a) | Total return is a measure of the change in value of an investment in the Fund over the periods covered, which assumes any dividends or capital gains distributions are reinvested in shares of the Fund. Returns do not reflect the deduction of taxes a shareholder would pay on Fund distributions or the redemption of Fund shares. |
THE ALABAMA TAX FREE BOND FUND
PERFORMANCE INFORMATION (Unaudited)
The Alabama Tax Free Bond Fund
Comparison of the Change in Value of a $10,000 Investment in The Alabama Tax Free Bond Fund,
the Barclays Capital 7-Year Municipal Bond Index and the Barclays Capital 3-Year Municipal Bond Index
| | Average Annual Total Returns(a) (for periods ended March 31, 2015) |
| | 1 Year | 5 Years | 10 Years |
| The Alabama Tax Free Bond Fund | 1.14% | 1.77% | 2.53% |
| Barclays Capital 7-Year Municipal Bond Index | 5.13% | 4.73% | 4.89% |
| Barclays Capital 3-Year Municipal Bond Index | 1.30% | 1.96% | 3.09% |
| (a) | Total return is a measure of the change in value of an investment in the Fund over the periods covered, which assumes any dividends or capital gains distributions are reinvested in shares of the Fund. Returns do not reflect the deduction of taxes a shareholder would pay on Fund distributions or the redemption of Fund shares. |
THE GOVERNMENT STREET EQUITY FUND
PORTFOLIO INFORMATION
March 31, 2015 (Unaudited)
Asset Allocation
(% of Net Assets)
Top Ten Equity Holdings
| Security Description | % of Net Assets |
| Apple, Inc. | 5.9% |
| Vanguard Mid-Cap ETF | 3.8% |
| Walt Disney Company (The) | 3.0% |
| Visa, Inc. - Class A | 2.9% |
| JPMorgan Alerian MLP Index ETN | 2.5% |
| MasterCard, Inc. - Class A | 2.5% |
| Schwab U.S. Mid-Cap ETF | 2.3% |
| General Dynamics Corporation | 2.2% |
| United Technologies Corporation | 1.9% |
| Actavis plc | 1.9% |
THE GOVERNMENT STREET MID-CAP FUND
PORTFOLIO INFORMATION
March 31, 2015 (Unaudited)
Asset Allocation
(% of Net Assets)
Top Ten Equity Holdings
| Security Description | % of Net Assets |
| Schwab U.S. Mid-Cap ETF | 3.7% |
| Vanguard Mid-Cap ETF | 3.3% |
| Guggenheim Mid-Cap Core ETF | 2.6% |
| iShares Nasdaq Biotechnology Index Fund | 2.0% |
| Mid-American Apartment Communities, Inc. | 1.9% |
| Church & Dwight Company, Inc. | 1.8% |
| JPMorgan Alerian MLP Index ETN | 1.6% |
| Hormel Foods Corporation | 1.3% |
| Jarden Corporation | 1.2% |
| Ross Stores, Inc. | 1.2% |
THE ALABAMA TAX FREE BOND FUND
PORTFOLIO INFORMATION
March 31, 2015 (Unaudited)
Asset Allocation
(% of Net Assets)
| Distribution by Rating |
| Rating | | % of Holdings |
| AAA | | 6.4% |
| AA | | 83.7% |
| A | | 8.5% |
| Not Rated | | 1.4% |
THE GOVERNMENT STREET EQUITY FUND
SCHEDULE OF INVESTMENTS
March 31, 2015
| COMMON STOCKS — 87.8% | | Shares | | | Value | |
| Consumer Discretionary — 9.7% | | | | | | |
| Comcast Corporation - Class A | | | 30,000 | | | $ | 1,694,100 | |
| Home Depot, Inc. (The) | | | 5,200 | | | | 590,772 | |
| Johnson Controls, Inc. | | | 15,400 | | | | 776,776 | |
| Lowe's Companies, Inc. | | | 8,000 | | | | 595,120 | |
| McDonald's Corporation | | | 6,500 | | | | 633,360 | |
| NIKE, Inc. - Class B | | | 12,300 | | | | 1,234,059 | |
| Tractor Supply Company | | | 9,000 | | | | 765,540 | |
| Walt Disney Company (The) | | | 27,125 | | | | 2,845,141 | |
| | | | | | | | 9,134,868 | |
| Consumer Staples — 7.6% | | | | | | | | |
| Altria Group, Inc. | | | 16,700 | | | | 835,334 | |
| Anheuser-Busch InBev SA/NV - ADR | | | 10,000 | | | | 1,219,100 | |
| Coca-Cola Company (The) | | | 12,000 | | | | 486,600 | |
| CVS Health Corporation | | | 9,000 | | | | 928,890 | |
| Kraft Foods Group, Inc. | | | 8,278 | | | | 721,138 | |
| McCormick & Company, Inc. - Non-Voting Shares | | | 7,000 | | | | 539,770 | |
| Mondelez International, Inc. - Class A | | | 28,336 | | | | 1,022,646 | |
| Philip Morris International, Inc. | | | 7,860 | | | | 592,094 | |
| Procter & Gamble Company (The) | | | 10,000 | | | | 819,400 | |
| | | | | | | | 7,164,972 | |
| Energy — 5.4% | | | | | | | | |
| Chevron Corporation | | | 6,100 | | | | 640,378 | |
| ConocoPhillips | | | 24,500 | | | | 1,525,370 | |
| Phillips 66 | | | 14,300 | | | | 1,123,980 | |
| Pioneer Natural Resources Company | | | 7,500 | | | | 1,226,325 | |
| Tesoro Corporation | | | 6,000 | | | | 547,740 | |
| | | | | | | | 5,063,793 | |
| Financials — 9.2% | | | | | | | | |
| Aflac, Inc. | | | 10,565 | | | | 676,266 | |
American Capital Ltd. (a) | | | 12,990 | | | | 192,122 | |
| American International Group, Inc. | | | 21,000 | | | | 1,150,590 | |
| Brookfield Asset Management, Inc. - Class A | | | 21,000 | | | | 1,125,810 | |
| Goldman Sachs Group, Inc. (The) | | | 6,000 | | | | 1,127,820 | |
| JPMorgan Chase & Company | | | 28,000 | | | | 1,696,240 | |
| KKR & Company, L.P. | | | 20,000 | | | | 456,200 | |
| Mid-America Apartment Communities, Inc. | | | 11,394 | | | | 880,414 | |
| Wells Fargo & Company | | | 24,000 | | | | 1,305,600 | |
| | | | | | | | 8,611,062 | |
| Health Care — 14.9% | | | | | | | | |
| Abbott Laboratories | | | 11,000 | | | | 509,630 | |
| AbbVie, Inc. | | | 11,500 | | | | 673,210 | |
Actavis plc (a) | | | 6,000 | | | | 1,785,720 | |
THE GOVERNMENT STREET EQUITY FUND
SCHEDULE OF INVESTMENTS (Continued)
| COMMON STOCKS — 87.8% (Continued) | | Shares | | | Value | |
| Health Care — 14.9% (Continued) | | | | | | |
Alexion Pharmaceuticals, Inc. (a) | | | 2,190 | | | $ | 379,527 | |
| Amgen, Inc. | | | 1,000 | | | | 159,850 | |
| Becton, Dickinson and Company | | | 622 | | | | 89,256 | |
| Bio-Techne Corporation | | | 10,000 | | | | 1,002,900 | |
| Cardinal Health, Inc. | | | 15,000 | | | | 1,354,050 | |
Cerner Corporation (a) | | | 8,355 | | | | 612,087 | |
Gilead Sciences, Inc. (a) | | | 16,000 | | | | 1,570,080 | |
Henry Schein, Inc. (a) | | | 4,500 | | | | 628,290 | |
| Johnson & Johnson | | | 3,000 | | | | 301,800 | |
| Merck & Company, Inc. | | | 9,000 | | | | 517,320 | |
| Novartis AG - ADR | | | 9,000 | | | | 887,490 | |
| Pfizer, Inc. | | | 27,000 | | | | 939,330 | |
Regeneron Pharmaceuticals, Inc. (a) | | | 2,300 | | | | 1,038,404 | |
| Shire plc - ADR | | | 3,000 | | | | 717,870 | |
Waters Corporation (a) | | | 6,475 | | | | 804,972 | |
| | | | | | | | 13,971,786 | |
| Industrials — 13.8% | | | | | | | | |
| Allegion plc | | | 3,333 | | | | 203,880 | |
| Boeing Company (The) | | | 6,000 | | | | 900,480 | |
| Emerson Electric Company | | | 15,000 | | | | 849,300 | |
| General Dynamics Corporation | | | 15,000 | | | | 2,035,950 | |
| Honeywell International, Inc. | | | 10,000 | | | | 1,043,100 | |
| Ingersoll-Rand plc | | | 10,000 | | | | 680,800 | |
| Lockheed Martin Corporation | | | 7,000 | | | | 1,420,720 | |
| Norfolk Southern Corporation | | | 10,000 | | | | 1,029,200 | |
Quanta Services, Inc. (a) | | | 11,500 | | | | 328,095 | |
| Southwest Airlines Company | | | 10,000 | | | | 443,000 | |
Stericycle, Inc. (a) | | | 7,000 | | | | 983,010 | |
| Union Pacific Corporation | | | 11,000 | | | | 1,191,410 | |
| United Technologies Corporation | | | 15,500 | | | | 1,816,600 | |
| | | | | | | | 12,925,545 | |
| Information Technology — 21.3% | | | | | | | | |
| Accenture plc - Class A | | | 9,500 | | | | 890,055 | |
Adobe Systems, Inc. (a) | | | 5,000 | | | | 369,700 | |
| Apple, Inc. | | | 44,185 | | | | 5,497,940 | |
| Automatic Data Processing, Inc. | | | 12,400 | | | | 1,061,936 | |
| CDK Global, Inc. | | | 8,133 | | | | 380,299 | |
First Solar, Inc. (a) | | | 5,000 | | | | 298,950 | |
Google, Inc. - Class A (a) | | | 1,400 | | | | 776,580 | |
Google, Inc. - Class C (a) | | | 1,400 | | | | 767,200 | |
| Intel Corporation | | | 12,000 | | | | 375,240 | |
| MasterCard, Inc. - Class A | | | 26,750 | | | | 2,310,932 | |
Micron Technology, Inc. (a) | | | 28,000 | | | | 759,640 | |
| Oracle Corporation | | | 13,000 | | | | 560,950 | |
THE GOVERNMENT STREET EQUITY FUND
SCHEDULE OF INVESTMENTS (Continued)
| COMMON STOCKS — 87.8% (Continued) | | Shares | | | Value | |
| Information Technology — 21.3% (Continued) | | | | | | |
| QUALCOMM, Inc. | | | 11,000 | | | $ | 762,740 | |
| TE Connectivity Ltd. | | | 12,500 | | | | 895,250 | |
| Texas Instruments, Inc. | | | 10,000 | | | | 571,850 | |
| Visa, Inc. - Class A | | | 42,000 | | | | 2,747,220 | |
| Western Digital Corporation | | | 8,000 | | | | 728,080 | |
Yahoo!, Inc. (a) | | | 6,000 | | | | 266,610 | |
| | | | | | | | 20,021,172 | |
| Materials — 2.1% | | | | | | | | |
| Dow Chemical Company (The) | | | 11,000 | | | | 527,780 | |
| Ecolab, Inc. | | | 6,000 | | | | 686,280 | |
| Freeport-McMoRan, Inc. | | | 7,932 | | | | 150,311 | |
| Praxair, Inc. | | | 5,000 | | | | 603,700 | |
| | | | | | | | 1,968,071 | |
| Telecommunication Services — 1.5% | | | | | | | | |
Level 3 Communications, Inc. (a) | | | 5,000 | | | | 269,200 | |
| Telstra Corporation Ltd. - ADR | | | 30,000 | | | | 715,500 | |
| Verizon Communications, Inc. | | | 8,000 | | | | 389,040 | |
| | | | | | | | 1,373,740 | |
| Utilities — 2.3% | | | | | | | | |
| AGL Resources, Inc. | | | 6,000 | | | | 297,900 | |
| Duke Energy Corporation | | | 8,250 | | | | 633,435 | |
| Southern Company (The) | | | 11,000 | | | | 487,080 | |
| Wisconsin Energy Corporation | | | 14,000 | | | | 693,000 | |
| | | | | | | | 2,111,415 | |
| | | | | | | | | |
Total Common Stocks (Cost $45,206,549) | | | | | | $ | 82,346,424 | |
| EXCHANGE-TRADED FUNDS — 8.5% | | Shares | | | Value | |
| iShares Nasdaq Biotechnology ETF | | | 3,000 | | | $ | 1,030,290 | |
| ProShares Large Cap Core Plus | | | 12,000 | | | | 1,205,880 | |
| Schwab U.S. Mid-Cap ETF | | | 50,000 | | | | 2,159,000 | |
| Vanguard Mid-Cap ETF | | | 26,900 | | | | 3,569,630 | |
Total Exchange-Traded Funds (Cost $5,242,642) | | | | | | $ | 7,964,800 | |
THE GOVERNMENT STREET EQUITY FUND
SCHEDULE OF INVESTMENTS (Continued)
| EXCHANGE-TRADED NOTES — 2.5% | | Shares | | | Value | |
| JPMorgan Alerian MLP Index ETN (Cost $1,956,980) | | | 54,000 | | | $ | 2,311,200 | |
WARRANTS — 0.0% (b) | | Shares | | | Value | |
| American International Group, Inc., 01/19/2021 at $45 (Cost $13,600) | | | 800 | | | $ | 17,472 | |
| COMMERCIAL PAPER — 1.2% | | Par Value | | | Value | |
U.S. Bank, N.A., discount, 0.02% (c), due 04/01/2015 (Cost $1,084,000) | | $ | 1,084,000 | | | $ | 1,084,000 | |
| MONEY MARKET FUNDS — 0.1% | | Shares | | | Value | |
Invesco STIT - STIC Prime Portfolio (The) - Institutional Class, 0.04% (d) (Cost $134,961) | | | 134,961 | | | $ | 134,961 | |
| | | | | | | | | |
Total Investments at Value — 100.1% (Cost $53,638,732) | | | | | | $ | 93,858,857 | |
| | | | | | | | | |
| Liabilities in Excess of Other Assets — (0.1%) | | | | | | | (80,602 | ) |
| | | | | | | | | |
| Net Assets — 100.0% | | | | | | $ | 93,778,255 | |
ADR - American Depositary Receipt.
| (a) | Non-income producing security. |
| (b) | Percentage rounds to less than 0.1%. |
| (c) | Rate shown is the annualized yield at time of purchase, not a coupon rate. |
| (d) | The rate shown is the 7-day effective yield as of March 31, 2015. |
See accompanying notes to financial statements.
THE GOVERNMENT STREET MID-CAP FUND
SCHEDULE OF INVESTMENTS
March 31, 2015
| COMMON STOCKS — 82.8% | | Shares | | | Value | |
| Consumer Discretionary — 11.8% | | | | | | |
Buffalo Wild Wings, Inc. (a) | | | 2,235 | | | $ | 405,071 | |
| Chico's FAS, Inc. | | | 7,100 | | | | 125,599 | |
Dollar Tree, Inc. (a) | | | 5,300 | | | | 430,068 | |
| Family Dollar Stores, Inc. | | | 2,800 | | | | 221,872 | |
| Gildan Activewear, Inc. - Class A | | | 13,400 | | | | 395,568 | |
| Hasbro, Inc. | | | 3,525 | | | | 222,921 | |
Jarden Corporation (a) | | | 12,137 | | | | 642,047 | |
| Leggett & Platt, Inc. | | | 5,000 | | | | 230,450 | |
Liberty Global plc - Series A (a) | | | 5,475 | | | | 281,798 | |
Liberty Global plc - Series C (a) | | | 4,475 | | | | 222,900 | |
| Nordstrom, Inc. | | | 3,900 | | | | 313,248 | |
O'Reilly Automotive, Inc. (a) | | | 2,825 | | | | 610,878 | |
Panera Bread Company - Class A (a) | | | 2,090 | | | | 334,390 | |
| Ross Stores, Inc. | | | 6,000 | | | | 632,160 | |
| Service Corporation International | | | 15,200 | | | | 395,960 | |
| Tiffany & Company | | | 3,475 | | | | 305,835 | |
| VF Corporation | | | 4,700 | | | | 353,957 | |
| | | | | | | | 6,124,722 | |
| Consumer Staples — 5.3% | | | | | | | | |
| Church & Dwight Company, Inc. | | | 10,800 | | | | 922,536 | |
| Energizer Holdings, Inc. | | | 2,500 | | | | 345,125 | |
| Hormel Foods Corporation | | | 12,000 | | | | 682,200 | |
| J.M. Smucker Company (The) | | | 4,700 | | | | 543,931 | |
| Tyson Foods, Inc. - Class A | | | 7,000 | | | | 268,100 | |
| | | | | | | | 2,761,892 | |
| Energy — 3.0% | | | | | | | | |
Cameron International Corporation (a) | | | 4,010 | | | | 180,931 | |
| Murphy Oil Corporation | | | 3,740 | | | | 174,284 | |
| ONEOK, Inc. | | | 9,200 | | | | 443,808 | |
| Range Resources Corporation | | | 3,500 | | | | 182,140 | |
| Schlumberger Ltd. | | | 3,134 | | | | 261,501 | |
| Valero Energy Corporation | | | 4,950 | | | | 314,919 | |
| | | | | | | | 1,557,583 | |
| Financials — 16.9% | | | | | | | | |
| Alexander & Baldwin, Inc. | | | 3,000 | | | | 129,540 | |
Alleghany Corporation (a) | | | 765 | | | | 372,555 | |
| American Financial Group, Inc. | | | 6,600 | | | | 423,390 | |
| Arthur J. Gallagher & Company | | | 6,750 | | | | 315,563 | |
| Axis Capital Holdings Ltd. | | | 5,000 | | | | 257,900 | |
| Bank of Hawaii Corporation | | | 6,000 | | | | 367,260 | |
| Berkley (W.R.) Corporation | | | 6,450 | | | | 325,789 | |
| Camden Property Trust | | | 3,000 | | | | 234,390 | |
THE GOVERNMENT STREET MID-CAP FUND
SCHEDULE OF INVESTMENTS (Continued)
| COMMON STOCKS — 82.8% (Continued) | | Shares | | | Value | |
| Financials — 16.9% (Continued) | | | | | | |
| CME Group, Inc. | | | 4,735 | | | $ | 448,452 | |
| Eaton Vance Corporation | | | 8,500 | | | | 353,940 | |
| Everest Re Group Ltd. | | | 2,050 | | | | 356,700 | |
| HCC Insurance Holdings, Inc. | | | 4,575 | | | | 259,265 | |
| IntercontinentalExchange, Inc. | | | 2,000 | | | | 466,540 | |
| Jones Lang LaSalle, Inc. | | | 2,800 | | | | 477,120 | |
| Kemper Corporation | | | 6,200 | | | | 241,552 | |
| Mid-America Apartment Communities, Inc. | | | 12,800 | | | | 989,056 | |
| NASDAQ OMX Group, Inc. (The) | | | 9,500 | | | | 483,930 | |
| Old Republic International Corporation | | | 21,400 | | | | 319,716 | |
| PNC Financial Services Group, Inc. | | | 2,745 | | | | 255,944 | |
| Potlatch Corporation | | | 6,941 | | | | 277,918 | |
| Rayonier, Inc. | | | 6,250 | | | | 168,500 | |
| Realty Income Corporation | | | 7,025 | | | | 362,490 | |
| SEI Investments Company | | | 10,000 | | | | 440,900 | |
| Tanger Factory Outlet Centers, Inc. | | | 6,000 | | | | 211,020 | |
| Ventas, Inc. | | | 3,000 | | | | 219,060 | |
| | | | | | | | 8,758,490 | |
| Health Care — 11.6% | | | | | | | | |
Bio-Rad Laboratories, Inc. - Class A (a) | | | 2,500 | | | | 337,950 | |
| Bio-Techne Corporation | | | 4,500 | | | | 451,305 | |
Charles River Laboratories International, Inc. (a) | | | 4,500 | | | | 356,805 | |
| Chemed Corporation | | | 2,500 | | | | 298,500 | |
| Computer Programs & Systems, Inc. | | | 2,300 | | | | 124,798 | |
Endo International plc (a) | | | 3,000 | | | | 269,100 | |
| Ensign Group, Inc. (The) | | | 6,000 | | | | 281,160 | |
Henry Schein, Inc. (a) | | | 3,500 | | | | 488,670 | |
Illumina, Inc. (a) | | | 2,500 | | | | 464,100 | |
Laboratory Corporation of America Holdings (a) | | | 1,574 | | | | 198,466 | |
MEDNAX, Inc. (a) | | | 4,000 | | | | 290,040 | |
| Medtronic plc | | | 3,346 | | | | 260,955 | |
| ResMed, Inc. | | | 6,500 | | | | 466,570 | |
| Shire plc - ADR | | | 1,500 | | | | 358,935 | |
| Teleflex, Inc. | | | 4,000 | | | | 483,320 | |
United Therapeutics Corporation (a) | | | 2,300 | | | | 396,600 | |
Valeant Pharmaceuticals International, Inc. (a) | | | 1,300 | | | | 258,206 | |
Waters Corporation (a) | | | 2,000 | | | | 248,640 | |
| | | | | | | | 6,034,120 | |
| Industrials — 11.3% | | | | | | | | |
| AMETEK, Inc. | | | 1,350 | | | | 70,929 | |
| C.H. Robinson Worldwide, Inc. | | | 6,000 | | | | 439,320 | |
| Deluxe Corporation | | | 5,000 | | | | 346,400 | |
| Donaldson Company, Inc. | | | 12,000 | | | | 452,520 | |
| Engility Holdings, Inc. | | | 500 | | | | 15,020 | |
THE GOVERNMENT STREET MID-CAP FUND
SCHEDULE OF INVESTMENTS (Continued)
| COMMON STOCKS — 82.8% (Continued) | | Shares | | | Value | |
| Industrials — 11.3% (Continued) | | | | | | |
| Expeditors International of Washington, Inc. | | | 8,000 | | | $ | 385,440 | |
| Fastenal Company | | | 9,950 | | | | 412,278 | |
| Graco, Inc. | | | 6,000 | | | | 432,960 | |
Jacobs Engineering Group, Inc. (a) | | | 4,475 | | | | 202,091 | |
| L-3 Communications Holdings, Inc. | | | 3,000 | | | | 377,370 | |
| Matson, Inc. | | | 3,000 | | | | 126,480 | |
| MSC Industrial Direct Company, Inc. - Class A | | | 5,000 | | | | 361,000 | |
| Pentair plc | | | 2,400 | | | | 150,936 | |
| Snap-on, Inc. | | | 4,275 | | | | 628,681 | |
| SPX Corporation | | | 5,000 | | | | 424,500 | |
Stericycle, Inc. (a) | | | 2,900 | | | | 407,247 | |
| Timken Company (The) | | | 5,000 | | | | 210,700 | |
| Waste Connections, Inc. | | | 6,000 | | | | 288,840 | |
WESCO International, Inc. (a) | | | 1,850 | | | | 129,297 | |
| | | | | | | | 5,862,009 | |
| Information Technology — 13.3% | | | | | | | | |
ANSYS, Inc. (a) | | | 3,000 | | | | 264,570 | |
Arrow Electronics, Inc. (a) | | | 8,600 | | | | 525,890 | |
| CDK Global, Inc. | | | 7,500 | | | | 350,700 | |
Cree, Inc. (a) | | | 5,820 | | | | 206,552 | |
| DST Systems, Inc. | | | 4,300 | | | | 476,053 | |
FARO Technologies, Inc. (a) | | | 6,000 | | | | 372,780 | |
| Harris Corporation | | | 6,000 | | | | 472,560 | |
| IAC/InterActiveCorp | | | 4,000 | | | | 269,880 | |
Integrated Device Technology, Inc. (a) | | | 22,000 | | | | 440,440 | |
| Jack Henry & Associates, Inc. | | | 9,000 | | | | 629,010 | |
| Lam Research Corporation | | | 8,500 | | | | 596,997 | |
| Linear Technology Corporation | | | 7,000 | | | | 327,600 | |
| Microchip Technology, Inc. | | | 6,000 | | | | 293,400 | |
| National Instruments Corporation | | | 12,000 | | | | 384,480 | |
| NetApp, Inc. | | | 5,000 | | | | 177,300 | |
Polycom, Inc. (a) | | | 8,000 | | | | 107,200 | |
| SanDisk Corporation | | | 5,000 | | | | 318,100 | |
| Xilinx, Inc. | | | 7,000 | | | | 296,100 | |
Zebra Technologies Corporation - Class A (a) | | | 4,000 | | | | 362,860 | |
| | | | | | | | 6,872,472 | |
| Materials — 6.2% | | | | | | | | |
| Airgas, Inc. | | | 4,000 | | | | 424,440 | |
| Albemarle Corporation | | | 8,000 | | | | 422,720 | |
| Ashland, Inc. | | | 3,000 | | | | 381,930 | |
| Martin Marietta Materials, Inc. | | | 2,500 | | | | 349,500 | |
| Packaging Corporation of America | | | 5,000 | | | | 390,950 | |
| Scotts Miracle-Gro Company (The) - Class A | | | 4,000 | | | | 268,680 | |
| Sonoco Products Company | | | 5,000 | | | | 227,300 | |
THE GOVERNMENT STREET MID-CAP FUND
SCHEDULE OF INVESTMENTS (Continued)
| COMMON STOCKS — 82.8% (Continued) | | Shares | | | Value | |
| Materials — 6.2% (Continued) | | | | | | |
| Steel Dynamics, Inc. | | | 12,000 | | | $ | 241,200 | |
| Valspar Corporation (The) | | | 6,000 | | | | 504,180 | |
| | | | | | | | 3,210,900 | |
| Utilities — 3.4% | | | | | | | | |
| AGL Resources, Inc. | | | 8,400 | | | | 417,060 | |
| Great Plains Energy, Inc. | | | 9,050 | | | | 241,454 | |
| One Gas, Inc. | | | 3,000 | | | | 129,690 | |
| SCANA Corporation | | | 7,530 | | | | 414,075 | |
| UGI Corporation | | | 3,000 | | | | 97,770 | |
| Vectren Corporation | | | 10,600 | | | | 467,884 | |
| | | | | | | | 1,767,933 | |
| | | | | | | | | |
Total Common Stocks (Cost $21,732,562) | | | | | | $ | 42,950,121 | |
| EXCHANGE-TRADED FUNDS — 11.6% | | Shares | | | Value | |
| Guggenheim Mid-Cap Core ETF | | | 26,000 | | | $ | 1,333,800 | |
| iShares Nasdaq Biotechnology ETF | | | 3,025 | | | | 1,038,876 | |
| Schwab U.S. Mid-Cap ETF | | | 45,000 | | | | 1,943,100 | |
| Vanguard Mid-Cap ETF | | | 12,850 | | | | 1,705,195 | |
Total Exchange-Traded Funds (Cost $4,250,068) | | | | | | $ | 6,020,971 | |
| EXCHANGE-TRADED NOTES — 1.6% | | Shares | | | Value | |
| JPMorgan Alerian MLP Index ETN (Cost $698,490) | | | 18,700 | | | $ | 800,360 | |
| COMMERCIAL PAPER — 3.9% | | Par Value | | | Value | |
U.S. Bank, N.A., discount, 0.02% (b), due 04/01/2015 (Cost $2,044,000) | | $ | 2,044,000 | | | $ | 2,044,000 | |
THE GOVERNMENT STREET MID-CAP FUND
SCHEDULE OF INVESTMENTS (Continued)
| MONEY MARKET FUNDS — 0.2% | | Shares | | | Value | |
Invesco STIT - STIC Prime Portfolio (The) - Institutional Class, 0.04% (c) (Cost $129,025) | | | 129,025 | | | $ | 129,025 | |
| | | | | | | | | |
Total Investments at Value — 100.1% (Cost $28,854,145) | | | | | | $ | 51,944,477 | |
| | | | | | | | | |
| Liabilities in Excess of Other Assets — (0.1%) | | | | | | | (46,030 | ) |
| | | | | | | | | |
| Net Assets — 100.0% | | | | | | $ | 51,898,447 | |
ADR - American Depositary Receipt.
| (a) | Non-income producing security. |
| (b) | Rate shown is the annualized yield at time of purchase, not a coupon rate. |
| (c) | The rate shown is the 7-day effective yield as of March 31, 2015. |
See accompanying notes to financial statements.
THE ALABAMA TAX FREE BOND FUND
SCHEDULE OF INVESTMENTS
March 31, 2015
| ALABAMA FIXED RATE REVENUE AND GENERAL OBLIGATION (GO) BONDS — 94.6% | | Par Value | | | Value | |
| Alabama Drinking Water Financing Auth., Series A, Rev., | | | | | | |
| 5.00%, due 08/15/2018 | | $ | 400,000 | | | $ | 407,116 | |
| 3.00%, due 08/15/2019 | | | 530,000 | | | | 569,411 | |
| Alabama State Public School & College Auth., Capital Improvements, Rev., | | | | | | | | |
| 5.00%, due 12/01/2017 | | | 470,000 | | | | 522,189 | |
| Alabama State Public School & College Auth., Capital Improvements, Series A, Rev., | | | | | | | | |
| 4.00%, due 02/01/2017 | | | 250,000 | | | | 265,590 | |
| 3.75%, due 02/01/2018 | | | 200,000 | | | | 216,032 | |
| Alabama State Public School & College Auth., Capital Improvements, Series D, Rev., | | | | | | | | |
| 2.00%, due 09/01/2018 | | | 565,000 | | | | 583,594 | |
| Alabaster, AL, Water Rev., | | | | | | | | |
| 3.00%, due 09/01/2017 | | | 400,000 | | | | 418,752 | |
| Anniston, AL, Waterworks & Sewer Board, Water & Sewer Rev., | | | | | | | | |
| 3.50%, due 06/01/2016 | | | 500,000 | | | | 516,215 | |
| Athens, AL, Electric Rev., Warrants, | | | | | | | | |
| 3.00%, due 06/01/2016 | | | 510,000 | | | | 523,581 | |
| 3.00%, due 06/01/2019 | | | 375,000 | | | | 397,268 | |
| Athens, AL, GO, Warrants, | | | | | | | | |
| 4.00%, due 09/01/2018 | | | 300,000 | | | | 327,642 | |
| Auburn University, AL, General Fee Rev., | | | | | | | | |
| 5.00%, due 06/01/2018 | | | 315,000 | | | | 354,470 | |
| 5.00%, due 06/01/2020 | | | 350,000 | | | | 410,994 | |
| 5.00%, due 06/01/2021 | | | 200,000 | | | | 238,860 | |
| Auburn, AL, Refunding & Capital Improvements, Series B, GO, Warrants, | | | | | | | | |
| 4.00%, due 08/01/2018 | | | 200,000 | | | | 218,904 | |
| Auburn, AL, School, Series A, GO, Warrants, | | | | | | | | |
| 5.00%, due 08/01/2018 | | | 500,000 | | | | 564,835 | |
| Baldwin Co., AL, Board of Education, Rev., | | | | | | | | |
| 5.00%, due 07/01/2018 | | | 590,000 | | | | 646,669 | |
| Baldwin Co., AL, GO, Warrants, | | | | | | | | |
| 4.00%, due 06/01/2019 | | | 200,000 | | | | 222,174 | |
| Baldwin Co., AL, Series A, GO, Warrants, | | | | | | | | |
| 5.00%, due 02/01/2017 | | | 320,000 | | | | 345,782 | |
| Birmingham, AL, Waterworks Board, Water Rev., | | | | | | | | |
| 5.00%, due 01/01/2017 | | | 400,000 | | | | 429,788 | |
| 3.625%, due 07/01/2018 | | | 250,000 | | | | 269,430 | |
THE ALABAMA TAX FREE BOND FUND
SCHEDULE OF INVESTMENTS (Continued)
| ALABAMA FIXED RATE REVENUE AND GENERAL OBLIGATION (GO) BONDS — 94.6% (Continued) | | Par Value | | | Value | |
| Calera, AL, GO, Warrants, | | | | | | |
| 3.00%, due 12/01/2016 | | $ | 250,000 | | | $ | 259,465 | |
| 3.00%, due 12/01/2017 | | | 410,000 | | | | 430,520 | |
| Calhoun Co., AL, Gas Tax Anticipation, Series A, Rev., Warrants, | | | | | | | | |
| 4.00%, due 03/01/2016 | | | 445,000 | | | | 458,715 | |
| Chambers Co., AL, Gasoline Tax Anticipation, Rev., Warrants, | | | | | | | | |
| 2.00%, due 11/01/2019 | | | 290,000 | | | | 289,829 | |
| Chelsea, AL, GO, | | | | | | | | |
| 4.00%, due 05/01/2015 | | | 260,000 | | | | 260,783 | |
| Decatur, AL, Sewer Rev., Warrants, | | | | | | | | |
| 3.00%, due 08/15/2019 | | | 500,000 | | | | 533,435 | |
| Enterprise, AL, GO, School Warrants, | | | | | | | | |
| 4.00%, due 02/01/2016 | | | 400,000 | | | | 412,284 | |
| Florence, AL, Board of Education, Rev., | | | | | | | | |
| 3.00%, due 03/01/2016 | | | 500,000 | | | | 511,230 | |
| Florence, AL, Electric Rev., Warrants, | | | | | | | | |
| 3.10%, due 06/01/2015 | | | 300,000 | | | | 301,227 | |
| 3.50%, due 06/01/2017 | | | 515,000 | | | | 539,591 | |
| Florence, AL, GO, Warrants, | | | | | | | | |
| 4.00%, due 08/01/2018 | | | 575,000 | | | | 625,238 | |
| Foley, AL, Utilities Board, Utilities Rev., | | | | | | | | |
| 4.00%, due 11/01/2018 | | | 710,000 | | | | 777,578 | |
| 4.00%, due 11/01/2019 | | | 225,000 | | | | 251,228 | |
| 4.50%, due 11/01/2019 | | | 250,000 | | | | 256,257 | |
| Gadsden, AL, GO, School Warrants, | | | | | | | | |
| 3.00%, due 08/01/2015 | | | 250,000 | | | | 252,117 | |
| Homewood, AL, Board of Education, Special Tax School Warrants, | | | | | | | | |
| 4.00%, due 04/01/2017 | | | 500,000 | | | | 530,810 | |
| Homewood, AL, GO, Warrants, | | | | | | | | |
| 5.00%, due 09/01/2015 | | | 250,000 | | | | 255,052 | |
| Hoover City, AL, Board of Education, Special Tax School Warrants, | | | | | | | | |
| 4.00%, due 02/15/2020 | | | 470,000 | | | | 526,419 | |
| Huntsville, AL, Electric Systems, Rev., | | | | | | | | |
| 3.00%, due 12/01/2016 | | | 375,000 | | | | 390,281 | |
| Huntsville, AL, GO, Refunding and Capital Improvement Warrants, | | | | | | | | |
| 4.00%, due 09/01/2016 | | | 500,000 | | | | 525,640 | |
| 4.00%, due 09/01/2018 | | | 500,000 | | | | 550,540 | |
THE ALABAMA TAX FREE BOND FUND
SCHEDULE OF INVESTMENTS (Continued)
| ALABAMA FIXED RATE REVENUE AND GENERAL OBLIGATION (GO) BONDS — 94.6% (Continued) | | Par Value | | | Value | |
| Jacksonville, AL, GO, Warrants, | | | | | | |
| 2.00%, due 09/01/2016 | | $ | 200,000 | | | $ | 203,522 | |
| Limestone Co., AL, Board of Education, Special Tax Warrants, | | | | | | | | |
| 3.00%, due 11/01/2019 | | | 560,000 | | | | 584,069 | |
| Macon Co., AL, GO, Warrants, | | | | | | | | |
| 4.25%, due 10/01/2027, | | | | | | | | |
| Prerefunded 10/01/2017 @ 100 | | | 200,000 | | | | 217,746 | |
| Madison Co., AL, Board of Education, Rev., Tax Anticipation Warrants, | | | | | | | | |
| 2.00%, due 09/01/2019 | | | 220,000 | | | | 224,774 | |
| Madison Co., AL, GO, Warrants, | | | | | | | | |
| 4.00%, due 09/01/2021 | | | 465,000 | | | | 526,017 | |
| Madison Co., AL, Series A, Water Rev., Warrants, | | | | | | | | |
| 2.00%, due 07/01/2017 | | | 250,000 | | | | 256,280 | |
| Madison Co., AL, Water & Wastewater Board, Rev., | | | | | | | | |
| 3.00%, due 12/01/2019 | | | 430,000 | | | | 459,627 | |
| Mobile Co., AL, GO, Refunding, | | | | | | | | |
| 5.00%, due 06/01/2023 | | | 520,000 | | | | 630,781 | |
| Montgomery, AL, GO, Warrants, | | | | | | | | |
| 2.50%, due 04/01/2021 | | | 500,000 | | | | 506,850 | |
| Montgomery, AL, Waterworks & Sanitation, Rev., | | | | | | | | |
| 5.00%, due 09/01/2017 | | | 250,000 | | | | 275,435 | |
| Morgan Co., AL, Board of Education, Rev., Capital Outlay Warrants, | | | | | | | | |
| 4.00%, due 03/01/2019 | | | 250,000 | | | | 273,760 | |
| Mountain Brook, AL, City Board of Education, GO, Warrants, | | | | | | | | |
| 3.00%, due 03/01/2020 | | | 300,000 | | | | 322,041 | |
| North Alabama Gas District, Rev., | | | | | | | | |
| 3.00%, due 06/01/2020 | | | 420,000 | | | | 431,886 | |
| Opelika, AL, GO, Warrants, | | | | | | | | |
| 2.00%, due 11/01/2017 | | | 275,000 | | | | 282,296 | |
| Opelika, AL, Utilities Board, Series B, Rev., | | | | | | | | |
| 3.00%, due 06/01/2016 | | | 475,000 | | | | 488,210 | |
| Series B, 3.00%, due 06/01/2018 | | | 215,000 | | | | 226,610 | |
| Orange Beach, AL, GO, Warrants, | | | | | | | | |
| 4.00%, due 02/01/2018 | | | 200,000 | | | | 216,784 | |
| 5.00%, due 02/01/2019 | | | 240,000 | | | | 273,288 | |
| Prattville, AL, Waterworks Board, Rev., | | | | | | | | |
| 3.00%, due 08/01/2017 | | | 290,000 | | | | 302,859 | |
| Sheffield, AL, Electric Rev., | | | | | | | | |
| 4.00%, due 07/01/2017 | | | 600,000 | | | | 643,002 | |
THE ALABAMA TAX FREE BOND FUND
SCHEDULE OF INVESTMENTS (Continued)
| ALABAMA FIXED RATE REVENUE AND GENERAL OBLIGATION (GO) BONDS — 94.6% (Continued) | | Par Value | | | Value | |
| Sumter Co., AL, School Rev., Warrants, | | | | | | |
| 4.50%, due 02/01/2031, | | | | | | |
| Prerefunded 02/01/2016 @ 100 | | $ | 500,000 | | | $ | 517,740 | |
| Sylacauga, AL, Utilities Board, Rev., | | | | | | | | |
| 3.00%, due 05/01/2021 | | | 310,000 | | | | 329,325 | |
| Trussville, AL, GO, | | | | | | | | |
| 5.00%, due 10/01/2019 | | | 400,000 | | | | 466,004 | |
| Tuscaloosa, AL, Series B, GO, Warrants, | | | | | | | | |
| 4.00%, due 01/01/2020 | | | 500,000 | | | | 559,045 | |
| University of Alabama, AL, Series A, Rev., | | | | | | | | |
| Series A, 3.00%, due 07/01/2016 | | | 340,000 | | | | 351,574 | |
| Series A, 5.00%, due 07/01/2017 | | | 245,000 | | | | 268,765 | |
| Vestavia Hills, AL, GO, Warrants, | | | | | | | | |
| 4.00%, due 02/01/2018 | | | 515,000 | | | | 556,262 | |
| Vestavia Hills, AL, Series A, GO, Warrants, | | | | | | | | |
| 3.00%, due 02/01/2018 | | | 240,000 | | | | 252,682 | |
| Wetumpka, AL, Waterworks & Sewer, Rev., | | | | | | | | |
| 4.00%, due 03/01/2018 | | | 320,000 | | | | 337,242 | |
| | | | | | | | | |
Total Alabama Fixed Rate Revenue and General Obligation (GO) Bonds (Cost $27,878,711) | | | | | | $ | 28,372,011 | |
| MONEY MARKET FUNDS — 4.7% | | Shares | | | Value | |
Alpine Municipal Money Market Fund - Class I, 0.01% (a) (Cost $1,400,693) | | | 1,400,693 | | | $ | 1,400,693 | |
| | | | | | | | | |
Total Investments at Value — 99.3% (Cost $29,279,404) | | | | | | $ | 29,772,704 | |
| | | | | | | | | |
| Other Assets in Excess of Liabilities — 0.7% | | | | | | | 196,711 | |
| | | | | | | | | |
| Net Assets — 100.0% | | | | | | $ | 29,969,415 | |
| (a) | The rate shown is the 7-day effective yield as of March 31, 2015. |
See accompanying notes to financial statements.
THE GOVERNMENT STREET FUNDS
STATEMENTS OF ASSETS AND LIABILITIES
March 31, 2015
| | | Government Street
Equity
Fund | | | Government
Street
Mid-Cap
Fund | | | Alabama
Tax Free
Bond
Fund | |
| ASSETS | | | | | | | | | |
| Investments in securities: | | | | | | | | | |
| At acquisition cost | | $ | 53,638,732 | | | $ | 28,854,145 | | | $ | 29,279,404 | |
| At value (Note 2) | | $ | 93,858,857 | | | $ | 51,944,477 | | | $ | 29,772,704 | |
| Cash | | | 6,268 | | | | 51 | | | | — | |
| Dividends and interest receivable | | | 112,773 | | | | 28,389 | | | | 235,353 | |
| Receivable for capital shares sold | | | 4,510 | | | | 1,422 | | | | — | |
| Other assets | | | 3,573 | | | | 2,607 | | | | 2,379 | |
| TOTAL ASSETS | | | 93,985,981 | | | | 51,976,946 | | | | 30,010,436 | |
| | | | | | | | | | | | | |
| LIABILITIES | | | | | | | | | | | | |
| Distributions payable | | | 3,781 | | | | — | | | | 2,654 | |
| Payable for capital shares redeemed | | | 108,291 | | | | — | | | | 22,081 | |
| Accrued investment advisory fees (Note 4) | | | 81,489 | | | | 68,825 | | | | 6,476 | |
| Payable to administrator (Note 4) | | | 10,550 | | | | 6,800 | | | | 5,625 | |
| Other accrued expenses | | | 3,615 | | | | 2,874 | | | | 4,185 | |
| TOTAL LIABILITIES | | | 207,726 | | | | 78,499 | | | | 41,021 | |
| | | | | | | | | | | | | |
| NET ASSETS | | $ | 93,778,255 | | | $ | 51,898,447 | | | $ | 29,969,415 | |
| | | | | | | | | | | | | |
| Net assets consist of: | | | | | | | | | | | | |
| Paid-in capital | | $ | 51,855,782 | | | $ | 27,161,348 | | | $ | 29,539,476 | |
| Undistributed net investment income | | | 54,060 | | | | 43,687 | | | | — | |
| Accumulated net realized gains (losses) from security transactions | | | 1,648,288 | | | | 1,603,080 | | | | (63,361 | ) |
| Net unrealized appreciation on investments | | | 40,220,125 | | | | 23,090,332 | | | | 493,300 | |
| | | | | | | | | | | | | |
| Net assets | | $ | 93,778,255 | | | $ | 51,898,447 | | | $ | 29,969,415 | |
| | | | | | | | | | | | | |
| Shares of beneficial interest outstanding (unlimited number of shares authorized, $0.01 par value) | | | 1,422,022 | | | | 2,260,575 | | | | 2,857,641 | |
| | | | | | | | | | | | | |
| Net asset value, offering price and redemption price per share (Note 2) | | $ | 65.95 | | | $ | 22.96 | | | $ | 10.49 | |
See accompanying notes to financial statements.
THE GOVERNMENT STREET FUNDS
STATEMENTS OF OPERATIONS
Year Ended March 31, 2015
| | | Government
Street
Equity
Fund | | | Government
Street
Mid-Cap
Fund | | | Alabama
Tax Free
Bond
Fund | |
| INVESTMENT INCOME | | | | | | | | | |
| Dividends | | $ | 1,758,715 | | | $ | 784,044 | | | $ | 119 | |
| Foreign withholding taxes on dividends | | | (7,829 | ) | | | (747 | ) | | | — | |
| Interest | | | 486 | | | | 420 | | | | 609,586 | |
| TOTAL INVESTMENT INCOME | | | 1,751,372 | | | | 783,717 | | | | 609,705 | |
| | | | | | | | | | | | | |
| EXPENSES | | | | | | | | | | | | |
| Investment advisory fees (Note 4) | | | 565,636 | | | | 384,824 | | | | 108,141 | |
| Administration fees (Note 4) | | | 113,079 | | | | 70,083 | | | | 56,000 | |
| Professional fees | | | 19,913 | | | | 17,413 | | | | 16,113 | |
| Account maintenance fees | | | 28,079 | | | | 14,695 | | | | 7,634 | |
| Trustees’ fees and expenses (Note 4) | | | 11,804 | | | | 11,804 | | | | 11,804 | |
| Compliance fees and expenses (Note 4) | | | 10,401 | | | | 8,549 | | | | 7,684 | |
| Registration and filing fees | | | 9,910 | | | | 8,733 | | | | 7,229 | |
| Custodian and bank service fees | | | 11,834 | | | | 6,718 | | | | 4,733 | |
| Pricing costs | | | 2,010 | | | | 2,995 | | | | 11,809 | |
| Postage and supplies | | | 6,325 | | | | 5,323 | | | | 4,713 | |
| Printing of shareholder reports | | | 6,306 | | | | 3,858 | | | | 3,048 | |
| Insurance expense | | | 4,196 | | | | 2,701 | | | | 1,723 | |
| Other expenses | | | 4,163 | | | | 2,546 | | | | 3,694 | |
| TOTAL EXPENSES | | | 793,656 | | | | 540,242 | | | | 244,325 | |
| Fees voluntarily waived by the Adviser (Note 4) | | | — | | | | — | | | | (43,491 | ) |
| NET EXPENSES | | | 793,656 | | | | 540,242 | | | | 200,834 | |
| | | | | | | | | | | | | |
| NET INVESTMENT INCOME | | | 957,716 | | | | 243,475 | | | | 408,871 | |
| | | | | | | | | | | | | |
| REALIZED AND UNREALIZED GAINS (LOSSES) ON INVESTMENTS | | | | | | | | | | | | |
| Net realized gains (losses) from security transactions | | | 2,980,788 | | | | 1,879,231 | | | | (10,382 | ) |
| Net realized gains from in-kind redemptions (Note 2) | | | 3,609,846 | | | | 3,329,346 | | | | — | |
| Net change in unrealized appreciation (depreciation) on investments | | | 3,040,301 | | | | (461,181 | ) | | | (43,213 | ) |
| | | | | | | | | | | | | |
| NET REALIZED AND UNREALIZED GAINS (LOSSES) ON INVESTMENTS | | | 9,630,935 | | | | 4,747,396 | | | | (53,595 | ) |
| | | | | | | | | | | | | |
| NET INCREASE IN NET ASSETS FROM OPERATIONS | | $ | 10,588,651 | | | $ | 4,990,871 | | | $ | 355,276 | |
| See accompanying notes to financial statements. |
THE GOVERNMENT STREET FUNDS
STATEMENTS OF CHANGES IN NET ASSETS
| | Government Street
Equity Fund | | | Government Street
Mid-Cap Fund | |
| | | Year
Ended
March 31, 2015 | | | Year
Ended
March 31, 2014 | | | Year
Ended
March 31, 2015 | | | Year
Ended
March 31, 2014 | |
| FROM OPERATIONS | | | | | | | | | | | | |
| Net investment income | | $ | 957,716 | | | $ | 936,908 | | | $ | 243,475 | | | $ | 215,501 | |
| Net realized gains from security transactions | | | 2,980,788 | | | | 422,386 | | | | 1,879,231 | | | | 198,853 | |
| Net realized gains from in-kind redemptions (Note 2) | | | 3,609,846 | | | | 5,368,195 | | | | 3,329,346 | | | | 1,694,001 | |
| Net change in unrealized appreciation (depreciation) on investments | | | 3,040,301 | | | | 8,023,767 | | | | (461,181 | ) | | | 6,861,214 | |
| Net increase in net assets from operations | | | 10,588,651 | | | | 14,751,256 | | | | 4,990,871 | | | | 8,969,569 | |
| | | | | | | | | | | | | | | | | |
| DISTRIBUTIONS TO SHAREHOLDERS | | | | | | | | | | | | | | | | |
| From net investment income | | | (919,996 | ) | | | (917,652 | ) | | | (164,104 | ) | | | (270,068 | ) |
| From net realized capital gains on security transactions | | | (4,883,611 | ) | | | (14,611 | ) | | | (1,759,524 | ) | | | (44,110 | ) |
| Decrease in net assets from distributions to shareholders | | | (5,803,607 | ) | | | (932,263 | ) | | | (1,923,628 | ) | | | (314,178 | ) |
| | | | | | | | | | | | | | | | | |
| FROM CAPITAL SHARE TRANSACTIONS | | | | | | | | | | | | | | | | |
| Proceeds from shares sold | | | 4,442,263 | | | | 8,616,023 | | | | 909,807 | | | | 3,573,791 | |
| Net asset value of shares issued in reinvestment of distributions to shareholders | | | 5,687,312 | | | | 893,022 | | | | 1,779,485 | | | | 279,774 | |
| Payments for shares redeemed | | | (15,423,430 | ) | | | (10,729,648 | ) | | | (8,733,265 | ) | | | (3,551,749 | ) |
| Net increase (decrease) in net assets from capital share transactions | | | (5,293,855 | ) | | | (1,220,603 | ) | | | (6,043,973 | ) | | | 301,816 | |
| | | | | | | | | | | | | | | | | |
| TOTAL INCREASE (DECREASE) IN NET ASSETS | | | (508,811 | ) | | | 12,598,390 | | | | (2,976,730 | ) | | | 8,957,207 | |
| | | | | | | | | | | | | | | | | |
| NET ASSETS | | | | | | | | | | | | | | | | |
| Beginning of year | | | 94,287,066 | | | | 81,688,676 | | | | 54,875,177 | | | | 45,917,970 | |
| End of year | | $ | 93,778,255 | | | $ | 94,287,066 | | | $ | 51,898,447 | | | $ | 54,875,177 | |
| | | | | | | | | | | | | | | | | |
| ACCUMULATED (DISTRIBUTIONS IN EXCESS OF) NET INVESTMENT INCOME | | $ | 54,060 | | | $ | 435 | | | $ | 43,687 | | | $ | (54,482 | ) |
| | | | | | | | | | | | | | | | | |
| CAPITAL SHARE ACTIVITY | | | | | | | | | | | | | | | | |
| Shares sold | | | 68,466 | | | | 147,014 | | | | 40,835 | | | | 183,688 | |
| Shares reinvested | | | 89,486 | | | | 15,199 | | | | 83,509 | | | | 13,169 | |
| Shares redeemed | | | (237,871 | ) | | | (183,959 | ) | | | (395,465 | ) | | | (179,903 | ) |
| Net increase (decrease) in shares outstanding | | | (79,919 | ) | | | (21,746 | ) | | | (271,121 | ) | | | 16,954 | |
| Shares outstanding, beginning of year | | | 1,501,941 | | | | 1,523,687 | | | | 2,531,696 | | | | 2,514,742 | |
| Shares outstanding, end of year | | | 1,422,022 | | | | 1,501,941 | | | | 2,260,575 | | | | 2,531,696 | |
See accompanying notes to financial statements.
THE GOVERNMENT STREET FUNDS
STATEMENTS OF CHANGES IN NET ASSETS (Continued)
| | Alabama Tax Free
Bond Fund | |
| | | Year
Ended
March 31, 2015 | | | Year
Ended
March 31, 2014 | |
| FROM OPERATIONS | | | | | | |
| Net investment income | | $ | 408,871 | | | $ | 465,168 | |
| Net realized losses from security transactions | | | (10,382 | ) | | | (3,126 | ) |
| Net change in unrealized appreciation (depreciation) on investments | | | (43,213 | ) | | | (352,648 | ) |
| Net increase in net assets from operations | | | 355,276 | | | | 109,394 | |
| | | | | | | | | |
| DISTRIBUTIONS TO SHAREHOLDERS | | | | | | | | |
| From net investment income | | | (408,862 | ) | | | (466,887 | ) |
| | | | | | | | | |
| FROM CAPITAL SHARE TRANSACTIONS | | | | | | | | |
| Proceeds from shares sold | | | 1,505,115 | | | | 2,039,630 | |
| Net asset value of shares issued in reinvestment of distributions to shareholders | | | 369,143 | | | | 412,246 | |
| Payments for shares redeemed | | | (4,481,199 | ) | | | (2,729,087 | ) |
| Net decrease in net assets from capital share transactions | | | (2,606,941 | ) | | | (277,211 | ) |
| | | | | | | | | |
| TOTAL DECREASE IN NET ASSETS | | | (2,660,527 | ) | | | (634,704 | ) |
| | | | | | | | | |
| NET ASSETS | | | | | | | | |
| Beginning of year | | | 32,629,942 | | | | 33,264,646 | |
| End of year | | $ | 29,969,415 | | | $ | 32,629,942 | |
| | | | | | | | | |
| ACCUMULATED (DISTRIBUTION IN EXCESS OF) NET INVESTMENT INCOME | | $ | — | | | $ | (9 | ) |
| | | | | | | | | |
| CAPITAL SHARE ACTIVITY | | | | | | | | |
| Shares sold | | | 142,760 | | | | 194,253 | |
| Shares reinvested | | | 35,041 | | | | 39,198 | |
| Shares redeemed | | | (424,837 | ) | | | (259,072 | ) |
| Net decrease in shares outstanding | | | (247,036 | ) | | | (25,621 | ) |
| Shares outstanding, beginning of year | | | 3,104,677 | | | | 3,130,298 | |
| Shares outstanding, end of year | | | 2,857,641 | | | | 3,104,677 | |
See accompanying notes to financial statements.
THE GOVERNMENT STREET EQUITY FUND
FINANCIAL HIGHLIGHTS
| Selected Per Share Data and Ratios for a Share Outstanding Throughout Each Year | |
| | | Years Ended March 31, | |
| | 2015 | | | 2014 | | | 2013 | | | 2012 | | | 2011 | |
| Net asset value at beginning of year | | $ | 62.78 | | | $ | 53.61 | | | $ | 50.42 | | | $ | 48.00 | | | $ | 40.89 | |
| | | | | | | | | | | | | | | | | | | | | |
| Income from investment operations: | | | | | | | | | | | | | | | | | | | | |
| Net investment income | | | 0.67 | | | | 0.62 | | | | 0.64 | | | | 0.47 | | | | 0.39 | |
Net realized and unrealized gains
on investments | | | 6.55 | | | | 9.17 | | | | 4.21 | | | | 2.66 | | | | 7.19 | |
| Total from investment operations | | | 7.22 | | | | 9.79 | | | | 4.85 | | | | 3.13 | | | | 7.58 | |
| | | | | | | | | | | | | | | | | | | | | |
| Less distributions: | | | | | | | | | | | | | | | | | | | | |
| Dividends from net investment income | | | (0.64 | ) | | | (0.61 | ) | | | (0.64 | ) | | | (0.48 | ) | | | (0.39 | ) |
| Distributions from net realized gains | | | (3.41 | ) | | | (0.01 | ) | | | (1.02 | ) | | | (0.23 | ) | | | (0.08 | ) |
| Total distributions | | | (4.05 | ) | | | (0.62 | ) | | | (1.66 | ) | | | (0.71 | ) | | | (0.47 | ) |
| | | | | | | | | | | | | | | | | | | | | |
| Net asset value at end of year | | $ | 65.95 | | | $ | 62.78 | | | $ | 53.61 | | | $ | 50.42 | | | $ | 48.00 | |
| | | | | | | | | | | | | | | | | | | | | |
Total return (a) | | | 11.87 | % | | | 18.34 | % | | | 9.93 | % | | | 6.67 | % | | | 18.69 | % |
| | | | | | | | | | | | | | | | | | | | | |
| Net assets at end of year (000’s) | | $ | 93,778 | | | $ | 94,287 | | | $ | 81,689 | | | $ | 72,268 | | | $ | 66,373 | |
| | | | | | | | | | | | | | | | | | | | | |
| Ratio of total expenses to average net assets | | | 0.84 | % | | | 0.84 | % | | | 0.85 | % | | | 0.87 | % | | | 0.88 | % |
| | | | | | | | | | | | | | | | | | | | | |
Ratio of net investment income
to average net assets | | | 1.02 | % | | | 1.06 | % | | | 1.29 | % | | | 1.01 | % | | | 0.92 | % |
| | | | | | | | | | | | | | | | | | | | | |
| Portfolio turnover rate | | | 26 | % | | | 36 | % | | | 38 | % | | | 36 | % | | | 26 | % |
| (a) | Total return is a measure of the change in value of an investment in the Fund over the period covered, which assumes any dividends or capital gains distributions are reinvested in shares of the Fund. Returns do not reflect the deduction of taxes a shareholder would pay on Fund distributions or the redemption of Fund shares. |
See accompanying notes to financial statements.
THE GOVERNMENT STREET MID-CAP FUND
FINANCIAL HIGHLIGHTS
| Selected Per Share Data and Ratios for a Share Outstanding Throughout Each Year | |
| | | Years Ended March 31, | |
| | 2015 | | | 2014 | | | 2013 | | | 2012 | | | 2011 | |
| Net asset value at beginning of year | | $ | 21.68 | | | $ | 18.26 | | | $ | 16.26 | | | $ | 15.89 | | | $ | 12.87 | |
| | | | | | | | | | | | | | | | | | | | | |
| Income from investment operations: | | | | | | | | | | | | | | | | | | | | |
| Net investment income | | | 0.10 | | | | 0.09 | | | | 0.10 | | | | 0.04 | | | | 0.03 | |
Net realized and unrealized gains
on investments | | | 2.02 | | | | 3.46 | | | | 2.05 | | | | 0.37 | | | | 3.03 | |
| Total from investment operations | | | 2.12 | | | | 3.55 | | | | 2.15 | | | | 0.41 | | | | 3.06 | |
| | | | | | | | | | | | | | | | | | | | | |
| Less distributions: | | | | | | | | | | | | | | | | | | | | |
| Dividends from net investment income | | | (0.07 | ) | | | (0.11 | ) | | | (0.11 | ) | | | (0.04 | ) | | | (0.03 | ) |
Distributions in excess of net
investment income | | | — | | | | — | | | | — | | | | — | | | | (0.01 | ) |
| Distributions from net realized gains | | | (0.77 | ) | | | (0.02 | ) | | | (0.04 | ) | | | (0.00 | )(a) | | | — | |
| Total distributions | | | (0.84 | ) | | | (0.13 | ) | | | (0.15 | ) | | | (0.04 | ) | | | (0.04 | ) |
| | | | | | | | | | | | | | | | | | | | | |
| Net asset value at end of year | | $ | 22.96 | | | $ | 21.68 | | | $ | 18.26 | | | $ | 16.26 | | | $ | 15.89 | |
| | | | | | | | | | | | | | | | | | | | | |
Total return (b) | | | 10.14 | % | | | 19.43 | % | | | 13.35 | % | | | 2.59 | % | | | 23.80 | % |
| | | | | | | | | | | | | | | | | | | | | |
| Net assets at end of year (000’s) | | $ | 51,898 | | | $ | 54,875 | | | $ | 45,918 | | | $ | 39,843 | | | $ | 39,983 | |
| | | | | | | | | | | | | | | | | | | | | |
| Ratio of total expenses to average net assets | | | 1.05 | % | | | 1.06 | % | | | 1.08 | % | | | 1.09 | % | | | 1.13 | % |
| | | | | | | | | | | | | | | | | | | | | |
Ratio of net investment income
to average net assets | | | 0.47 | % | | | 0.43 | % | | | 0.63 | % | | | 0.29 | % | | | 0.21 | % |
| | | | | | | | | | | | | | | | | | | | | |
| Portfolio turnover rate | | | 16 | % | | | 10 | % | | | 12 | % | | | 18 | % | | | 20 | % |
| (a) | Amount rounds to less than $0.01 per share. |
| (b) | Total return is a measure of the change in value of an investment in the Fund over the period covered, which assumes any dividends or capital gains distributions are reinvested in shares of the Fund. Returns do not reflect the deduction of taxes a shareholder would pay on Fund distributions or the redemption of Fund shares. |
See accompanying notes to financial statements.
THE ALABAMA TAX FREE BOND FUND
FINANCIAL HIGHLIGHTS
| Selected Per Share Data and Ratios for a Share Outstanding Throughout Each Year | |
| | | Years Ended March 31, | |
| | 2015 | | | 2014 | | | 2013 | | | 2012 | | | 2011 | |
| Net asset value at beginning of year | | $ | 10.51 | | | $ | 10.63 | | | $ | 10.64 | | | $ | 10.45 | | | $ | 10.53 | |
| | | | | | | | | | | | | | | | | | | | | |
| Income (loss) from investment operations: | | | | | | | | | | | | | | | | | | | | |
| Net investment income | | | 0.14 | | | | 0.15 | | | | 0.18 | | | | 0.23 | | | | 0.26 | |
Net realized and unrealized gains
(losses) on investments | | | (0.02 | ) | | | (0.12 | ) | | | (0.01 | ) | | | 0.19 | | | | (0.07 | ) |
| Total from investment operations | | | 0.12 | | | | 0.03 | | | | 0.17 | | | | 0.42 | | | | 0.19 | |
| | | | | | | | | | | | | | | | | | | | | |
| Less distributions: | | | | | | | | | | | | | | | | | | | | |
| Dividends from net investment income | | | (0.14 | ) | | | (0.15 | ) | | | (0.18 | ) | | | (0.23 | ) | | | (0.27 | ) |
| Distributions from net realized gains | | | — | | | | — | | | | — | | | | — | | | | (0.00 | )(a) |
| Total distributions | | | (0.14 | ) | | | (0.15 | ) | | | (0.18 | ) | | | (0.23 | ) | | | (0.27 | ) |
| | | | | | | | | | | | | | | | | | | | | |
| Net asset value at end of year | | $ | 10.49 | | | $ | 10.51 | | | $ | 10.63 | | | $ | 10.64 | | | $ | 10.45 | |
| | | | | | | | | | | | | | | | | | | | | |
Total return (b) | | | 1.14 | % | | | 0.28 | % | | | 1.64 | % | | | 4.04 | % | | | 1.78 | % |
| | | | | | | | | | | | | | | | | | | | | |
| Net assets at end of year (000’s) | | $ | 29,969 | | | $ | 32,630 | | | $ | 33,265 | | | $ | 24,719 | | | $ | 27,026 | |
| | | | | | | | | | | | | | | | | | | | | |
| Ratio of total expenses to average net assets | | | 0.79 | % | | | 0.76 | % | | | 0.76 | % | | | 0.80 | % | | | 0.77 | % |
| | | | | | | | | | | | | | | | | | | | | |
Ratio of net expenses to average net assets (c) | | | 0.65 | % | | | 0.65 | % | | | 0.65 | % | | | 0.65 | % | | | 0.65 | % |
| | | | | | | | | | | | | | | | | | | | | |
Ratio of net investment income
to average net assets (c) | | | 1.32 | % | | | 1.41 | % | | | 1.70 | % | | | 2.17 | % | | | 2.51 | % |
| | | | | | | | | | | | | | | | | | | | | |
| Portfolio turnover rate | | | 6 | % | | | 10 | % | | | 7 | % | | | 18 | % | | | 21 | % |
| (a) | Amount rounds to less than $0.01 per share. |
| (b) | Total return is a measure of the change in value of an investment in the Fund over the period covered, which assumes any dividends or capital gains distributions are reinvested in shares of the Fund. Returns do not reflect the deduction of taxes a shareholder would pay on Fund distributions or the redemption of Fund shares. |
| (c) | Ratios were determined after voluntary advisory fee waivers by the Adviser (Note 4). |
See accompanying notes to financial statements.
THE GOVERNMENT STREET FUNDS
NOTES TO FINANCIAL STATEMENTS
March 31, 2015
1. Organization
The Government Street Equity Fund, The Government Street Mid-Cap Fund and The Alabama Tax Free Bond Fund (the “Funds”) are each a no-load series of the Williamsburg Investment Trust (the “Trust”), an open-end management investment company registered under the Investment Company Act of 1940. The Government Street Equity Fund and The Government Street Mid-Cap Fund are each a diversified fund and The Alabama Tax Free Bond Fund is a non-diversified fund. The Trust was organized as a Massachusetts business trust on July 18, 1988. Other series of the Trust are not included in this report.
The Government Street Equity Fund’s investment objective is to seek capital appreciation.
The Government Street Mid-Cap Fund’s investment objective is to seek capital appreciation.
The Alabama Tax Free Bond Fund’s investment objectives are to provide current income exempt from federal income taxes and from the personal income taxes of Alabama and to preserve capital.
2. Significant Accounting Policies
As an investment company, as defined in Financial Accounting Standards Board (“FASB”) Accounting Standards Update 2013-08, the Funds follow accounting and reporting guidance under FASB Accounting Standards Codification Topic 946, “Financial Services – Investment Companies.” The following is a summary of the Funds’ significant accounting policies. The policies are in conformity with accounting principles generally accepted in the United States of America (“GAAP”).
Securities valuation — The Funds’ portfolio securities are valued as of the close of business of the regular session of the New York Stock Exchange (normally 4:00 p.m., Eastern time). Securities traded on a national stock exchange are valued based upon the closing price on the principal exchange where the security is traded, if available, otherwise, at the last quoted bid price. Securities which are quoted by NASDAQ are valued at the NASDAQ Official Closing Price. Investments representing shares of other investment companies are valued at their net asset value as reported by such companies.
Fixed income securities are typically valued on the basis of prices provided by an independent pricing service. The prices provided by the pricing service are determined with consideration given to institutional bid and last sale prices and take into account securities prices, yields, maturities, call features, ratings, institutional trading in similar groups of securities and developments related to specific securities. Commercial paper may be valued at amortized cost, which under normal circumstances approximates market value.
When market quotations are not readily available, if a pricing service cannot provide a price or the investment adviser believes the price received from the pricing service is not indicative of market value, securities will be valued in good faith at fair value
THE GOVERNMENT STREET FUNDS
NOTES TO FINANCIAL STATEMENTS (Continued)
using methods consistent with procedures adopted by the Board of Trustees and will be classified as Level 2 or 3 within the fair value hierarchy (see below), depending on the inputs used. Such methods of fair valuation may include, but are not limited to: multiple of earnings, multiple of book value, discount from market of a similar freely traded security, purchase price of the security, subsequent private transactions in the security or related securities, or a combination of these and other factors.
GAAP establishes a single authoritative definition of fair value, sets out a framework for measuring fair value and requires additional disclosures about fair value measurements.
Various inputs are used in determining the value of each of the Fund’s investments. These inputs are summarized in the three broad levels listed below:
| • | Level 1 – quoted prices in active markets for identical securities |
| • | Level 2 – other significant observable inputs |
| • | Level 3 – significant unobservable inputs |
Fixed income securities, including municipal bonds, are classified as Level 2 since the values for such securities are based on prices provided by an independent pricing service that utilizes various “other significant observable inputs” including bid and ask quotations, prices of similar securities and interest rates, among other factors. Commercial paper held by the Funds is classified as Level 2 since it is valued at amortized cost, which approximates the current market value of the security and is not obtained from a quoted price in an active market.
The inputs or methodology used for valuing securities are not necessarily an indication of the risks associated with investing in those securities. The inputs used to measure fair value may fall into different levels of the fair value hierarchy. In such cases, for disclosure purposes, the level in the fair value hierarchy within which the fair value measurement falls in its entirety is determined based on the lowest level input that is significant to the fair value measurement.
The following is a summary of the inputs used to value each Fund’s investments as of March 31, 2015 by security type:
| The Government Street Equity Fund | | Level 1 | | | Level 2 | | | Level 3 | | | Total | |
| Common Stocks | | $ | 82,346,424 | | | $ | — | | | $ | — | | | $ | 82,346,424 | |
| Exchange-Traded Funds | | | 7,964,800 | | | | — | | | | — | | | | 7,964,800 | |
| Exchange-Traded Notes | | | 2,311,200 | | | | — | | | | — | | | | 2,311,200 | |
| Warrants | | | 17,472 | | | | — | | | | — | | | | 17,472 | |
| Commercial Paper | | | — | | | | 1,084,000 | | | | — | | | | 1,084,000 | |
| Money Market Funds | | | 134,961 | | | | — | | | | — | | | | 134,961 | |
| Total | | $ | 92,774,857 | | | $ | 1,084,000 | | | $ | — | | | $ | 93,858,857 | |
THE GOVERNMENT STREET FUNDS
NOTES TO FINANCIAL STATEMENTS (Continued)
| The Government Street Mid-Cap Fund | | Level 1 | | | Level 2 | | | Level 3 | | | Total | |
| Common Stocks | | $ | 42,950,121 | | | $ | — | | | $ | — | | | $ | 42,950,121 | |
| Exchange-Traded Funds | | | 6,020,971 | | | | — | | | | — | | | | 6,020,971 | |
| Exchange-Traded Notes | | | 800,360 | | | | — | | | | — | | | | 800,360 | |
| Commercial Paper | | | — | | | | 2,044,000 | | | | — | | | | 2,044,000 | |
| Money Market Funds | | | 129,025 | | | | — | | | | — | | | | 129,025 | |
| Total | | $ | 49,900,477 | | | $ | 2,044,000 | | | $ | — | | | $ | 51,944,477 | |
| The Alabama Tax Free Bond Fund | | Level 1 | | | Level 2 | | | Level 3 | | | Total | |
| Municipal Bonds | | $ | — | | | $ | 28,372,011 | | | $ | — | | | $ | 28,372,011 | |
| Money Market Funds | | | 1,400,693 | | | | — | | | | — | | | | 1,400,693 | |
| Total | | $ | 1,400,693 | | | $ | 28,372,011 | | | $ | — | | | $ | 29,772,704 | |
Refer to The Government Street Equity Fund’s and The Government Street Mid-Cap Fund’s Schedules of Investments for a listing of the common stocks by sector type. As of March 31, 2015, the Funds did not have any transfers into and out of any Level. There were no Level 3 securities or derivative instruments held by the Funds as of March 31, 2015. It is the Funds’ policy to recognize transfers into and out of any Level at the end of the reporting period.
Share valuation — The net asset value per share of each Fund is calculated daily by dividing the total value of its assets, less liabilities, by the number of shares outstanding. The offering price and redemption price per share of each Fund is equal to the net asset value per share.
Investment income — Interest income is accrued as earned. Dividend income is recorded on the ex-dividend date. Discounts and premiums on fixed-income securities purchased are amortized using the interest method.
Distributions to shareholders — Dividends arising from net investment income are declared and paid quarterly to shareholders of The Government Street Equity Fund; declared and paid annually to shareholders of The Government Street Mid-Cap Fund; and declared daily and paid monthly to shareholders of The Alabama Tax Free Bond Fund. Net realized short-term capital gains, if any, may be distributed throughout the year and net realized long-term capital gains, if any, are distributed at least once each year. The amount of distributions from net investment income and net realized gains are determined in accordance with federal income tax regulations, which may differ from GAAP. These “book/tax” differences are either temporary or permanent in nature.
THE GOVERNMENT STREET FUNDS
NOTES TO FINANCIAL STATEMENTS (Continued)
The tax character of distributions paid during the years ended March 31, 2015 and March 31, 2014 is as follows:
| | Year
Ended | | Ordinary Income | | | Exempt- Interest Dividends | | | Long-Term Gains | | | Total Distributions | |
| The Government Street Equity Fund | 3/31/15 | | $ | 919,996 | | | $ | — | | | $ | 4,883,611 | | | $ | 5,803,607 | |
| 3/31/14 | | $ | 917,652 | | | $ | — | | | $ | 14,611 | | | $ | 932,263 | |
| The Government Street Mid-Cap Fund | 3/31/15 | | $ | 164,104 | | | $ | — | | | $ | 1,759,524 | | | $ | 1,923,628 | |
| 3/31/14 | | $ | 270,068 | | | $ | — | | | $ | 44,110 | | | $ | 314,178 | |
| The Alabama Tax Free Bond Fund | 3/31/15 | | $ | — | | | $ | 408,862 | | | $ | — | | | $ | 408,862 | |
| 3/31/14 | | $ | 1,238 | | | $ | 465,649 | | | $ | — | | | $ | 466,887 | |
Security transactions — Security transactions are accounted for on trade date for financial reporting purposes. Gains and losses on securities sold are determined on a specific identification basis.
Common expenses — Common expenses of the Trust are allocated among the series of the Trust based on relative net assets of each series or the nature of the services performed and the relative applicability to each series.
Estimates — The preparation of financial statements in conformity with GAAP requires management to make estimates and assumptions that affect the reported amounts of assets and liabilities and the disclosure of contingent assets and liabilities as of the date of the financial statements and the reported amounts of income and expenses during the reporting period. Actual results could differ from those estimates.
Federal income tax — Each Fund has qualified and intends to continue to qualify as a regulated investment company under the Internal Revenue Code of 1986 (the “Code”). Qualification generally will relieve the Funds of liability for federal income taxes to the extent 100% of their net investment income and any realized capital gains are distributed in accordance with the Code. Accordingly, no provision for income tax has been made.
In order to avoid imposition of the excise tax applicable to regulated investment companies, it is also each Fund’s intention to declare as dividends in each calendar year at least 98% of its net investment income (earned during the calendar year) and 98.2% of its net realized capital gains (earned during the twelve months ended October 31) plus undistributed amounts from prior years.
THE GOVERNMENT STREET FUNDS
NOTES TO FINANCIAL STATEMENTS (Continued)
The following information is computed on a tax basis for each item as of March 31, 2015:
| | | The Government
Street Equity
Fund | | | The Government
Street Mid-Cap
Fund | | | The Alabama
Tax Free Bond
Fund | |
| Cost of portfolio investments | | $ | 53,659,300 | | | $ | 28,854,145 | | | $ | 29,279,404 | |
| Gross unrealized appreciation | | $ | 40,405,931 | | | $ | 23,204,926 | | | $ | 528,304 | |
| Gross unrealized depreciation | | | (206,374 | ) | | | (114,594 | ) | | | (35,004 | ) |
| Net unrealized appreciation | | | 40,199,557 | | | | 23,090,332 | | | | 493,300 | |
| Undistributed ordinary income | | | 57,841 | | | | 82,068 | | | | — | |
| Undistributed tax exempt income | | | — | | | | — | | | | 2,654 | |
| Undistributed long-term gains | | | 1,668,856 | | | | 1,564,699 | | | | — | |
| Capital loss carryforwards | | | — | | | | — | | | | (63,361 | ) |
| Other temporary differences | | | (3,781 | ) | | | — | | | | (2,654 | ) |
| Total distributable earnings | | $ | 41,922,473 | | | $ | 24,737,099 | | | $ | 429,939 | |
The difference between the federal income tax cost and the financial statement cost of portfolio investments for The Government Street Equity Fund is due to certain timing differences in the recognition of capital gains and losses under income tax regulations and GAAP. These timing differences are temporary in nature and are due to adjustments to basis on publicly traded partnerships.
As of March 31, 2015, The Alabama Tax Free Bond Fund had a short-term capital loss carryforward for federal income tax purposes of $24,704 and a long-term capital loss carryforward for federal income tax purposes of $38,657, both of which may be carried forward indefinitely. These capital loss carryforwards are available to offset realized capital gains in future years, thereby reducing future taxable gains distributions.
For the year ended March 31, 2015, the following reclassifications were made as a result of permanent differences between the financial statement and income tax reporting requirements:
| | | The Government
Street Equity
Fund | | | The Government
Street Mid-Cap
Fund | | | The Alabama
Tax Free Bond
Fund | |
| Paid-in capital | | $ | 473,394 | | | $ | 2,037,036 | | | $ | — | |
| Undistributed net investment income | | $ | 15,905 | | | $ | 18,798 | | | $ | — | |
| Undistributed net realized gains from security transactions | | $ | (489,299 | ) | | $ | (2,055,834 | ) | | $ | — | |
Such reclassifications have no effect on each Fund’s total net assets or its net asset value per share.
THE GOVERNMENT STREET FUNDS
NOTES TO FINANCIAL STATEMENTS (Continued)
The Funds recognize the tax benefits or expenses of uncertain tax positions only when the position is “more likely than not” to be sustained assuming examination by tax authorities. Management has reviewed the tax positions taken on federal income tax returns for all open tax years (tax years ended March 31, 2012 through March 31, 2015) of each Fund and has concluded that no provision for unrecognized tax benefits or expenses is required in these financial statements.
3. Investment Transactions
Investment transactions, other than short-term investments and U.S. government securities, were as follows for the year ended March 31, 2015:
| | | The Government
Street Equity
Fund | | | The Government
Street Mid-Cap
Fund | | | The Alabama
Tax Free Bond
Fund | |
| Purchases of investment securities | | $ | 23,482,188 | | | $ | 7,743,096 | | | $ | 1,729,947 | |
| Proceeds from sales and maturities of investment securities | | $ | 31,948,854 | | | $ | 15,821,639 | | | $ | 4,884,413 | |
4. Transactions with Related Parties
INVESTMENT ADVISORY AGREEMENT
The Funds’ investments are managed by Leavell Investment Management, Inc. (the “Adviser”) under the terms of an Investment Advisory Agreement. The Government Street Equity Fund pays the Adviser a fee, which is computed and accrued daily and paid monthly, at an annual rate of .60% of its average daily net assets up to $100 million and .50% of such assets in excess of $100 million. The Government Street Mid-Cap Fund pays the Adviser a fee, which is computed and accrued daily and paid monthly, at an annual rate of .75% of its average daily net assets. The Alabama Tax Free Bond Fund pays the Adviser a fee, which is computed and accrued daily and paid monthly, at an annual rate of .35% of its average daily net assets up to $100 million and .25% of such assets in excess of $100 million.
During the year ended March 31, 2015, the Adviser voluntarily limited the total operating expenses of The Alabama Tax Free Bond Fund to .65% of the Fund’s average daily net assets. Accordingly, the Adviser waived $43,491 of its investment advisory fees from The Alabama Tax Free Bond Fund during the year ended March 31, 2015.
Certain officers of the Trust are also officers of the Adviser.
OTHER SERVICE PROVIDERS
Ultimus Fund Solutions, LLC (“Ultimus”) provides fund administration, fund accounting, compliance and transfer agent services to the Funds. The Funds pay Ultimus fees in accordance with the agreements for such services. In addition, the
THE GOVERNMENT STREET FUNDS
NOTES TO FINANCIAL STATEMENTS (Continued)
Funds pay out-of-pocket expenses including, but not limited to, postage, supplies, and costs of pricing the Funds’ portfolio securities. Certain officers of the Trust are also officers of Ultimus, or of Ultimus Fund Distributors, LLC (the “Distributor”), the principal underwriter of each Fund’s shares and an affiliate of Ultimus. The Distributor is compensated by the Adviser (not the Funds) for acting as principal underwriter.
COMPENSATION OF TRUSTEES
Trustees and officers affiliated with the Adviser or Ultimus are not compensated by the Trust for their services. Each Trustee who is not an affiliated person of the Adviser or Ultimus receives from the Trust an annual retainer of $12,000, payable quarterly; a fee of $1,500 for attendance at each meeting of the Board of Trustees (except that such fee is $2,500 for the independent chairman); and a fee of $1,000 for attendance at each meeting of any committee of the Board (except that such fee is $1,500 for the committee chairman); plus reimbursement of travel and other expenses incurred in attending meetings. Prior to July 1, 2014, the annual retainer was $10,000.
5. Contingencies and Commitments
The Funds indemnify the Trust’s officers and Trustees for certain liabilities that might arise from their performance of their duties to the Funds. Additionally, in the normal course of business the Funds enter into contracts that contain a variety of representations and warranties and which provide general indemnifications. The Funds’ maximum exposure under these arrangements is unknown, as this would involve future claims that may be made against the Funds that have not yet occurred. However, based on experience, the Funds expect the risk of loss to be remote.
6. Concentration of Credit Risk
The Alabama Tax Free Bond Fund invests primarily in debt instruments of municipal issuers in the state of Alabama. The issuers’ abilities to meet their obligations may be affected by economic developments in the state or its region, as well as disruptions in the credit markets and the economy, generally.
7. Subsequent Events
The Funds are required to recognize in the financial statements the effects of all subsequent events that provide additional evidence about conditions that existed as of the date of the Statements of Assets and Liabilities. For non-recognized subsequent events that must be disclosed to keep the financial statements from being misleading, the Funds are required to disclose the nature of the event as well as an estimate of its financial effect, or a statement that such an estimate cannot be made. Management has evaluated subsequent events through the issuance of these financial statements and has noted no such events.
THE GOVERNMENT STREET FUNDS
REPORT OF INDEPENDENT REGISTERED
PUBLIC ACCOUNTING FIRM
The Board of Trustees and Shareholders of
The Government Street Equity Fund,
The Government Street Mid-Cap Fund, and
The Alabama Tax-Free Bond Fund, each a series of the Williamsburg Investment Trust
We have audited the accompanying statements of assets and liabilities of The Government Street Equity Fund, The Government Street Mid-Cap Fund, and The Alabama Tax-Free Bond Fund (collectively referred to as the “Funds”) (each a series of the Williamsburg Investment Trust), including the schedules of investments, as of March 31, 2015, and the related statements of operations for the year then ended, the statements of changes in net assets for each of the two years in the period then ended, and the financial highlights for each of the five years in the period then ended. These financial statements and financial highlights are the responsibility of the Funds’ management. Our responsibility is to express an opinion on these financial statements and financial highlights based on our audits.
We conducted our audits in accordance with the standards of the Public Company Accounting Oversight Board (United States). Those standards require that we plan and perform the audits to obtain reasonable assurance about whether the financial statements and financial highlights are free of material misstatement. We were not engaged to perform an audit of the Funds’ internal control over financial reporting. Our audits included consideration of internal control over financial reporting as a basis for designing audit procedures that are appropriate in the circumstances, but not for the purpose of expressing an opinion on the effectiveness of the Funds’ internal control over financial reporting. Accordingly, we express no such opinion. An audit also includes examining, on a test basis, evidence supporting the amounts and disclosures in the financial statements and financial highlights, assessing the accounting principles used and significant estimates made by management, and evaluating the overall financial statement presentation. Our procedures included confirmation of securities owned as of March 31, 2015, by correspondence with the custodian and brokers. We believe that our audits provide a reasonable basis for our opinion.
In our opinion, the financial statements and financial highlights referred to above present fairly, in all material respects, the financial position of each of the respective Funds comprising the Williamsburg Investment Trust at March 31, 2015, the results of their operations for the year then ended, the changes in their net assets for each of the two years in the period then ended, and the financial highlights for each of the five years in the period then ended, in conformity with U.S. generally accepted accounting principles.
Cincinnati, Ohio
May 22, 2015
THE GOVERNMENT STREET FUNDS
ABOUT YOUR FUNDS’ EXPENSES (Unaudited)
We believe it is important for you to understand the impact of costs on your investment. All mutual funds have operating expenses. As a shareholder of the Funds, you incur ongoing costs, including management fees and other expenses. These ongoing costs, which are deducted from each Fund’s gross income, directly reduce the investment returns of the Funds.
A mutual fund’s ongoing costs are expressed as a percentage of its average net assets. This figure is known as the expense ratio. The following examples are intended to help you understand the ongoing costs (in dollars) of investing in the Funds and to compare these costs with the ongoing costs of investing in other mutual funds. The examples below are based on an investment of $1,000 made at the beginning of the period shown and held for the entire period (October 1, 2014 through March 31, 2015).
The table below illustrates each Fund’s ongoing costs in two ways:
Actual fund return – This section helps you to estimate the actual expenses that you paid over the period. The “Ending Account Value” shown is derived from each Fund’s actual return, and the third column shows the dollar amount of operating expenses that would have been paid by an investor who started with $1,000 in the Funds. You may use the information here, together with the amount you invested, to estimate the expenses that you paid over the period.
To do so, simply divide your account value by $1,000 (for example, an $8,600 account value divided by $1,000 = 8.6), then multiply the result by the number given for the Funds under the heading “Expenses Paid During Period.”
Hypothetical 5% return – This section is intended to help you compare the Funds’ ongoing costs with those of other mutual funds. It assumes that each Fund had an annual return of 5% before expenses during the period shown, but that the expense ratio is unchanged. In this case, because the returns used are not the Funds’ actual returns, the results do not apply to your investment. The example is useful in making comparisons because the Securities and Exchange Commission (the “SEC”) requires all mutual funds to calculate expenses based on a 5% return. You can assess each Fund’s ongoing costs by comparing this hypothetical example with the hypothetical examples that appear in shareholder reports of other funds.
Note that expenses shown in the table are meant to highlight and help you compare ongoing costs only. The Funds do not charge sales loads or redemption fees.
The calculations assume no shares were bought or sold during the period. Your actual costs may have been higher or lower, depending on the amount of your investment and the timing of any purchases or redemptions.
More information about the Funds’ expenses, including historical expense ratios, can be found in this report. For additional information on operating expenses and other shareholder costs, please refer to the Funds’ prospectus.
THE GOVERNMENT STREET FUNDS
ABOUT YOUR FUNDS’ EXPENSES (Unaudited)
(Continued)
| | Beginning
Account Value
October 1, 2014 | Ending
Account Value
March 31, 2015 | Net Expense Ratio(a) | Expenses
Paid During
Period(b) |
| The Government Street Equity Fund |
| Based on Actual Fund Return | $1,000.00 | $1,057.40 | 0.84% | $4.31 |
| Based on Hypothetical 5% Return (before expenses) | $1,000.00 | $1,020.74 | 0.84% | $4.23 |
| The Government Street Mid-Cap Fund |
| Based on Actual Fund Return | $1,000.00 | $1,095.60 | 1.06% | $5.54 |
| Based on Hypothetical 5% Return (before expenses) | $1,000.00 | $1,019.65 | 1.06% | $5.34 |
| The Alabama Tax Free Bond Fund |
| Based on Actual Fund Return | $1,000.00 | $1,001.70 | 0.65% | $3.24 |
| Based on Hypothetical 5% Return (before expenses) | $1,000.00 | $1,021.69 | 0.65% | $3.28 |
| (a) | Annualized, based on the Fund’s most recent one-half year expenses. |
| (b) | Expenses are equal to the Fund’s annualized expense ratio multiplied by the average account value over the period, multiplied by 182/365 (to reflect the one-half year period). |
THE GOVERNMENT STREET FUNDS
BOARD OF TRUSTEES AND EXECUTIVE OFFICERS
(Unaudited)
Overall responsibility for management of the Funds rests with the Board of Trustees. The Trustees serve during the lifetime of the Trust and until its termination, or until death, resignation, retirement or removal. The Trustees, in turn, elect the officers of the Funds. The officers have been elected for an annual term. The following are the Trustees and executive officers of the Funds:
| Trustee | Address | Year of Birth | Position Held
with the Trust | Length of
Time Served |
| | Robert S. Harris, Ph.D. | 100 Darden Boulevard
Charlottesville, VA | 1949 | Chairman and Trustee | Since
January 2007 |
| * | John P. Ackerly, IV | One James Center
901 E. Cary Street
Richmond, VA | 1963 | Trustee and President of Davenport Funds | Since
July 2012 |
| * | John T. Bruce | 800 Main Street
Lynchburg, VA | 1953 | Trustee and President of FBP Funds | Since
September 1988 |
| | George K. Jennison | 5101 Stratford Crescent
Richmond, VA 23226 | 1957 | Trustee | Since
January 2015 |
| | J. Finley Lee, Jr., Ph.D. | 448 Pond Apple Drive North
Naples, FL | 1939 | Trustee | Since
September 1988 |
| | Harris V. Morrissette | 100 Jacintoport Boulevard
Saraland, AL | 1959 | Trustee | Since
March 1993 |
| | Elizabeth W. Robertson | 8908 Norwick Road
Richmond, VA | 1953 | Trustee | Since
February 2014 |
| | Thomas W. Leavell | P.O. Box 1307
Mobile, AL | 1943 | President | Since
February 2004 |
| | Mary Shannon Hope | P.O. Box 1307
Mobile, AL | 1963 | Vice President | Since
August 2008 |
| | Timothy S. Healey | 2712 18th Place South
Birmingham, AL | 1953 | Vice President of The Government Street Mid-Cap Fund and The Alabama Tax Free Bond Fund | Since
January 1995 |
| | Robert G. Dorsey | 225 Pictoria Drive, Suite 450
Cincinnati, OH | 1957 | Vice President | Since
November 2000 |
| | Mark J. Seger | 225 Pictoria Drive, Suite 450
Cincinnati, OH | 1962 | Treasurer | Since
November 2000 |
| | Tina H. Bloom | 225 Pictoria Drive, Suite 450
Cincinnati, OH | 1968 | Secretary and Chief Compliance Officer | Since
August 2006 |
| * | Messrs. Ackerly and Bruce, as affiliated persons of investment advisers to the Trust, are “interested persons” of the Trust within the meaning of Section 2(a)(19) of the Investment Company Act of 1940. |
THE GOVERNMENT STREET FUNDS
BOARD OF TRUSTEES AND EXECUTIVE OFFICERS
(Unaudited) (Continued)
Each Trustee oversees twelve portfolios of the Trust, including the Funds. The principal occupations of the Trustees and executive officers of the Funds during the past five years and public directorships held by the Trustees are set forth below:
Robert S. Harris, Ph.D. is the C. Stewart Sheppard Professor of Business Administration at The Darden Graduate School of Business Administration at the University of Virginia. He was previously the dean at Darden. Professor Harris has published widely on corporate finance, financial markets and mergers and acquisitions and has served as a consultant to corporations and government agencies.
John P. Ackerly, IV, is Senior Vice President and Portfolio Manager of Davenport & Company, LLC (an investment advisory firm).
John T. Bruce is a President, Director and member of the Executive Committee of Flippin, Bruce & Porter, Inc. (an investment advisory firm).
George K. Jennison is President of Oyster Consulting, LLC (a financial consulting firm). He previously was a financial adviser with Wells Fargo Advisors, LLC.
J. Finley Lee, Jr., Ph.D. is the retired Julian Price Professor Emeritus at the University of North Carolina.
Harris V. Morrissette is President of China Doll Rice and Beans, Inc. and Dixie Lily Foods. He is also a Director of International Shipholding Corporation (cargo transportation); and a Director of Trustmark National Bank (bank holding company). Previously, he was Chairman of Azalea Aviation, Inc. (airplane fueling) until January 2012.
Elizabeth W. Robertson has been Chief Financial Officer for Monument Restaurants LLC (restaurant franchises) since 2011 and a Director of Franklin Financial Corporation and Franklin Federal Savings Bank since 1996.
Thomas W. Leavell is President and Chief Executive Officer of the Adviser.
Mary Shannon Hope is a Vice President and Portfolio Manager of the Adviser.
Timothy S. Healey is an Executive Vice President and Chief Investment Officer of the Adviser.
Robert G. Dorsey is a Managing Director of Ultimus Fund Solutions, LLC and Ultimus Fund Distributors, LLC.
Mark J. Seger is a Managing Director of Ultimus Fund Solutions, LLC and Ultimus Fund Distributors, LLC.
Tina H. Bloom is Director of Fund Administration of Ultimus Fund Solutions, LLC.
THE GOVERNMENT STREET FUNDS
OTHER INFORMATION (Unaudited)
A description of the policies and procedures that the Funds use to vote proxies relating to portfolio securities is available without charge upon request by calling toll-free 1-866-738-1125, or on the SEC’s website at http://www.sec.gov. Information regarding how the Funds voted proxies relating to portfolio securities during the most recent 12-month period ended June 30 is also available without charge upon request by calling toll-free 1-866-738-1125 or on the SEC’s website at http://www.sec.gov.
The Trust files a complete listing of portfolio holdings for the Funds with the SEC as of the end of the first and third quarters of each fiscal year on Form N-Q. The filings are available upon request, by calling 1-866-738-1125. Furthermore, you may obtain a copy of these filings on the SEC’s website at http://www.sec.gov. The Trust’s Forms N-Q may also be reviewed and copied at the SEC’s Public Reference Room in Washington, DC, and information on the operation of the Public Reference Room may be obtained by calling 1-800-SEC-0330.
FEDERAL TAX INFORMATION (Unaudited)
In accordance with federal tax requirements, the following provides shareholders with information concerning distributions from ordinary income and net realized capital gains made by the Funds during the fiscal year ended March 31, 2015. Certain dividends paid by the Funds may be subject to a maximum tax rate of 23.8%. The Government Street Equity Fund and The Government Street Mid-Cap Fund intend to designate up to a maximum amount of $919,996 and $164,104, respectively, as taxed at a maximum rate of 23.8%. Additionally, The Government Street Equity Fund and The Government Street Mid-Cap Fund intend to designate up to a maximum amount of $4,883,611 and $1,759,524, respectively, as a long-term capital gain distribution. For the fiscal year ended March 31, 2015, 100% of the dividends paid from ordinary income by The Government Street Equity Fund and The Government Street Mid-Cap Fund qualified for the dividends received deduction for corporations.
As required by federal regulations, complete information will be computed and reported in conjunction with your 2014 Form 1099-DIV.
THE GOVERNMENT STREET FUNDS
DISCLOSURE REGARDING APPROVAL OF
INVESTMENT ADVISORY AGREEMENTS (Unaudited)
At an in-person meeting held on February 24, 2015, the Board of Trustees, including a majority of the Independent Trustees, approved the continuance for a one-year period of the Investment Advisory Agreements with the Adviser on behalf of The Government Street Equity Fund, The Government Street Mid-Cap Fund and The Alabama Tax Free Bond Fund. Below is a discussion of the factors considered by the Board of Trustees along with its conclusions with respect thereto that formed the basis for the Board’s approvals.
In selecting the Adviser and approving the continuance of the Investment Advisory Agreements, the Trustees considered all information they deemed reasonably necessary to evaluate the terms of the Agreements. The principal areas of review by the Trustees were the nature, extent and quality of the services provided by the Adviser and the reasonableness of the fees charged for those services. These matters were considered by the Independent Trustees consulting with experienced counsel for the Independent Trustees, who is independent of the Adviser.
The Trustees’ evaluation of the quality of the Adviser’s services took into account their knowledge and experience gained through meetings with and reports of the Adviser’s senior management over the course of the preceding year. Both short-term and long-term investment performance of the Funds was considered. Each Fund’s performance was compared to its performance benchmark and to that of competitive funds with similar investment objectives. The Trustees also considered the scope and quality of the in-house capabilities of the Adviser and other resources dedicated to performing services for the Funds. The quality of administrative and other services, including the Adviser’s role in coordinating the activities of the Funds’ other service providers, were considered in light of the Funds’ compliance with investment policies and applicable laws and regulations and of related reports by management and the Funds’ independent public accounting firm in periodic meetings with the Trust’s Audit Committee. The Trustees also considered the business reputation of the Adviser, the qualifications of its key investment and compliance personnel, and its financial resources.
In reviewing the fees payable under the Investment Advisory Agreements, the Trustees compared the advisory fees and overall expense levels of each Fund with those of competitive funds with similar investment objectives. The Trustees considered information provided by the Adviser concerning the Adviser’s profitability with respect to each Fund, including the assumptions and methodology used in preparing the profitability information, in light of applicable case law relating to advisory fees. For these purposes, the Trustees took into account not only the fees paid by the Funds, but also so-called “fallout” benefits to the Adviser. The Trustees also considered the Adviser’s representations that all of the Funds’ portfolio trades were executed based on the best price and execution available, and that the Adviser does not participate in any soft dollar or directed brokerage arrangements. The Trustees further considered
THE GOVERNMENT STREET FUNDS
DISCLOSURE REGARDING APPROVAL OF
INVESTMENT ADVISORY AGREEMENTS (Unaudited)
(Continued)
that the Adviser does not participate in any revenue sharing arrangements relating to the Funds. In evaluating the Funds’ advisory fees, the Trustees took into account the complexity and quality of the investment management of the Funds.
Based upon their review of this information, the Independent Trustees concluded that: (i) based upon the portfolio composition and performance of The Government Street Equity Fund and The Government Street Mid-Cap Fund during 2014, as well as the Funds’ longer term performance, the Adviser has been effective in adhering to its investment philosophy of seeking to reduce the variability of returns through diversification and has provided quality services to those Funds; (ii) although the short-term and long-term performance of The Alabama Tax Free Bond Fund has lagged its benchmark index and the average returns for comparably managed funds, such Fund is managed in a conservative investment style and has satisfactorily met the goal of providing tax-exempt income with limited exposure to credit and maturity risks; (iii) the investment advisory fees payable to the Adviser by each Fund are competitive with similarly managed funds, and the Independent Trustees believe the fees to be reasonable given the scope and quality of investment advisory services provided by the Adviser and other services provided to shareholders; (iv) the total operating expense ratio of each Fund is less than the average expense ratio for comparably managed funds, according to statistics derived from Morningstar, Inc.; (v) the Adviser’s voluntary commitment to cap overall operating expenses of The Alabama Tax Free Bond Fund through advisory fee waivers has enabled that Fund to further increase returns for shareholders; and (vi) the level of the Adviser’s profitability with respect to its management of the Funds is reasonable. Given the current size of the Funds and their expected growth, the Independent Trustees did not believe that at the present time it would be relevant to consider the extent to which economies of scale would be realized as the Funds grow, and whether fee levels reflect these economies of scale. The Independent Trustees also considered the “fallout” benefits to the Adviser with respect to the Funds, but given the amounts involved viewed these as secondary factors in connection with the evaluation of the reasonableness of the advisory fees paid by the Funds.
No single factor was considered in isolation or to be determinative to the decision of the Trustees to approve continuance of the Investment Advisory Agreements. Rather the Trustees concluded, in light of a weighing and balancing of all factors considered, that it was in the best interests of each Fund and its shareholders to continue its Investment Advisory Agreement without modification to its terms, including the fees charged for services thereunder.
This page intentionally left blank.
| | | | | | | | |
| | | | | | | | | |
| | | | | | | | | |
| | | | | The Government Street Funds | | | | |
| | | | | No Load Mutual Funds | | | | |
| | | | | Investment Adviser Leavell Investment Management, Inc. 210 St. Joseph Street Mobile, AL 36602
Administrator Ultimus Fund Solutions, LLC P.O. Box 46707 Cincinnati, OH 45246-0707 1-866-738-1125
Legal Counsel Sullivan & Worcester LLP One Post Office Square Boston, MA 02109
Independent Registered Public Accounting Firm Ernst & Young LLP 1900 Scripps Center 312 Walnut Street Cincinnati, OH 45202
Board of Trustees Robert S. Harris, Ph.D., Chairman John P. Ackerly, IV John T. Bruce George K. Jennison J. Finley Lee, Jr., Ph.D. Harris V. Morrissette Elizabeth W. Robertson
Portfolio Managers Thomas W. Leavell, The Government Street Equity Fund The Government Street Mid-Cap Fund Timothy S. Healey, The Government Street Mid-Cap Fund The Alabama Tax Free Bond Fund Richard E. Anthony, Jr., CFA, The Government Street Mid-Cap Fund Michael J. Hofto, CFA, The Government Street Mid-Cap Fund | | | | |
| | | | | | | | | |
| | | | | | | | | |
| | | | | | | | |
| | | | | | | | |
| | | | | | | | | |
| | | | | | | | | |
| | | | | THE JAMESTOWN FUNDS
No-Load Funds
The Jamestown Balanced Fund
The Jamestown Equity Fund
The Jamestown Tax Exempt Virginia Fund
ANNUAL REPORT
March 31, 2015
Investment Advisor Lowe, Brockenbrough & Company, Inc. Richmond, Virginia | | | | |
| | | | | | | | | |
| | | | | | | | | |
| | | | | | | | |
| LETTER TO SHAREHOLDERS | May 12, 2015 |
The Jamestown Balanced Fund
For the fiscal year ended March 31, 2015, The Jamestown Balanced Fund (the “Fund”) returned 7.31% compared to 9.10% for a blend of 60% S&P 500 Index /40% Barclays Intermediate U.S. Government/Credit Index. Equity markets enjoyed strong performance during the past twelve months with the S&P 500 Index rising 12.73% during the fiscal year. Interest rates fell modestly during the period and the Barclays Intermediate U.S. Government/Credit Index ended the fiscal year up 3.58%.
The underperformance of the Fund was primarily driven by stock selection in the equity portion of the Fund. Sector selection was essentially neutral as the overweight to equities relative to the blend of 60% S&P 500 Index /40% Barclays Intermediate U.S. Government/Credit Index was offset by the impact of holding some cash reserves in the portfolio during the past twelve months while equity and fixed income markets rallied. The Fund was helped by the overweight in Health Care and underweights in the Energy, Materials, Utilities and Telecommunication Services sectors, all of which were still in place at the end of the fiscal year.
Stock selection in the equity portion of the Fund was the largest drag on relative performance during the fiscal year. The negatives of poor stock selection in the Energy and Financials sectors more than offset strong stock selection in the Health Care and Consumer Staples sectors. The best performing stocks in the Fund for the year were Apple, AmerisourceBergen, Actavis, CVS Healthcare and Dollar Tree, all of which were still in the portfolio at the end of the fiscal year. The worst performing stocks were Noble, Marathon Oil, Apache, Hess and Viacom. Apache and Viacom were sold out of the portfolio during the fiscal year.
We currently expect global economic growth to remain positive, but modest, as growth in the U.S. is joined by modest growth in Europe and slower growth in China. Economic growth in China has slowed as leaders there try to achieve a better balance between domestic consumption and infrastructure spending that has led the way over the past two decades. Inflation has been running below expectations across the globe, leaving plenty of room for global Central Banks to maintain very accommodative monetary policies. While the Federal Reserve ended their open market purchases of bonds, most central banks in developed economies continue to be very accommodative. These policies are likely to cause interest rates to stay below fair value until economic growth accelerates or some of the more accommodative policies are scaled back.
Despite what we believe will be a gradual increase in interest rates, we do not feel that investors are being compensated for taking on significant interest rate exposure by owning longer dated fixed income securities. As a result, the bond portion of the Fund continues to have lower duration than the Barclays Intermediate U.S. Government/Credit Index. Given the extra yield and strong corporate balance sheets, we continue to maintain an overweight in corporate bonds funded by our underweight in Treasury securities.
As of March 31, 2015, the Fund had 4.2% of its portfolio in cash equivalents, 29.3% in fixed income, and 66.5% in equities and exchange traded funds.
The Jamestown Equity Fund
For the fiscal year ended March 31, 2015, The Jamestown Equity Fund (the “Fund”) returned 10.14% compared to 12.73% for the S&P 500 Index. Modest earnings growth contributed to the rise in the equity markets during the past twelve months, but most of the increase came from an expansion in price-to-earnings multiples.
The underperformance of the Fund was driven by stock selection and a modest negative contribution from sector selection. Sector selection was hurt by the impact of holding some cash reserves in the portfolio during the past twelve months while equity markets rallied. The Fund was helped by the overweight in Health Care and underweights in the Energy, Materials, Utilities and Telecommunication Services sectors, all of which were still in place at the end of the fiscal year.
Stock selection was the largest drag on relative performance during the fiscal year. The negatives of poor stock selection in the Energy and Financials sectors more than offset strong stock selection in the Health Care and Consumer Staples sectors. The best performing stocks in the Fund for the year were Apple, AmerisourceBergen, Actavis, CVS Healthcare and Dollar Tree, all of which were still in the portfolio at the end of the fiscal year. The worst performing stocks were Noble, Marathon Oil, Apache, Hess and Viacom. Apache and Viacom were sold out of the portfolio during the fiscal year.
We currently expect global economic growth to remain positive, but modest, as growth in the U.S. is joined by modest growth in Europe and slower growth in China. Economic growth in China has slowed as leaders there try to achieve a better balance between domestic consumption and infrastructure spending that has led the way over the past two decades. Inflation has been running below expectations across the globe, leaving plenty of room for global Central Banks to maintain very accommodative monetary policies. While the Federal Reserve ended their open market purchases of bonds, most central banks in developed economies continue to be very accommodative. These policies are likely to cause interest rates to stay below fair value until economic growth accelerates or some of the more accommodative policies are scaled back.
As of March 31, 2015, the Fund had 4.5% of its portfolio in cash equivalents and 95.5% in equities and exchange traded funds.
The Jamestown Tax Exempt Virginia Fund
For the fiscal year ended March 31, 2015, The Jamestown Tax Exempt Virginia Fund (the “Fund”) returned 2.61%. By comparison, the Barclays 1-10 Year Municipal Blend Index returned 3.87%, while the Barclays 5-Year Municipal Bond Index returned 2.95%. The Fund was conservatively positioned with regard to interest rate risk and credit quality. As of March 31, 2015, the Fund’s 30-day SEC yield was 1.64%, which is a taxable equivalent yield of 2.90% for investors subject to the maximum 43.4% federal income tax bracket.
The U.S. economy experienced moderate growth with real GDP expanding by 3.0% year-over-year as of March 31, 2015. With the plunge in oil prices, inflation remained subdued with the GDP deflator edging up 0.9% over the same time period. Monetary policy was extraordinarily accommodative throughout the fiscal year. The Federal Reserve concluded its third quantitative easing program in October 2014, yet the central bank kept short-term interest rates near zero, where they have been since late 2008. Fed officials have signaled their intention to begin normalizing interest rates, but they have not yet decided when to do so. Markets are anticipating that the first such rate increase in short-term rates will happen later in 2015.
Bond prices generally gained during much of the fiscal year, as interest rates moved lower in all sectors of the fixed income market. The yield on the 10-year Treasury note declined from 2.72% as of March 31, 2014, to 1.92% as of March 31, 2015, with the yield falling in each calendar quarter. During the same period, the tax-exempt yield of AAA-rated general obligations with a 5-year maturity fell 7 basis points to 1.24%, while the 10-year maturity declined 54 basis points to 1.96%, according to Municipal Market Data. Tax exempt yields moved steadily lower for the first half of the reporting period. After yields bottomed in mid-October, the Fund’s net asset value fluctuated in a narrow range as bond prices retraced some of their gains into year-end. The final three months of the fiscal year saw another rally in municipal bond prices in January, followed by a selloff in February and early March.
The Fund’s relative performance can be attributed to its duration, its yield curve positioning, and its emphasis on high credit quality. The portfolio’s average maturity and duration lengthened moderately during the course of the twelve-month period. At March 31, 2015, the Fund’s average stated maturity was 5.9 years, compared to 5.2 years at the beginning of the period, and the effective duration increased to 3.9 years from 3.5 years. For much of the fiscal year, the Fund’s duration was shorter than that of its primary benchmark, which hurt relative performance when bond prices were rising. Long maturity bonds generally outperformed shorter maturity bonds as the difference between short-term yields and long-term yields narrowed, resulting in a flatter yield curve. The Fund’s overweight in short duration bonds was detrimental to relative performance.
Quality spreads narrowed during the last year. Lower quality bonds outperformed higher quality debt during the fiscal year as yield-starved investors reverted to reaching for extra income in lower quality credits. The Fund remains positioned in predominantly AAA and AA-rated credits from Virginia municipal issuers, and it did not have as much exposure to lower quality bonds as its benchmark.
The state of Virginia completed its fiscal year ended June 30, 2014 with $439 million less revenue than expected. State officials subsequently projected a $1.5 billion revenue shortfall for the next two years and took steps to slash spending in order to balance the budget. General obligation bonds issued by the state continue to carry the top credit rating by all three major rating firms, with a stable outlook, despite some concern over the state’s unfunded pension liability.
Notably, the Fund has no exposure to Puerto Rico bonds, which continued to decline in price during the past year due to deteriorating credit fundamentals. Many state-specific municipal funds have owned Puerto Rico debt because the interest is exempt from federal, state and local income taxes in all U.S. states, and the Island’s debt typically offers greater yield than most U.S. issuers. Puerto Rico’s financial struggles have had little impact on the broader municipal market thus far.
 |  |
Charles M. Caravati, III, CFA President Jamestown Balanced Fund Jamestown Equity Fund | Joseph A. Jennings, III, CFA President Jamestown Tax Exempt Virginia Fund |
Data presented reflects past performance, which is no guarantee of future results. Investment results and principal value will fluctuate so that shares, when redeemed, may be worth more or less than their original cost. Due to market volatility, current performance may be higher or lower than the performance shown. Performance data, current to the most recent month end, may be obtained by calling 1-866-738-1126.
This report is submitted for the general information of the shareholders of the Funds. The report is not authorized for distribution to prospective investors in the Funds unless it is accompanied by a current prospectus.
This report reflects our views, opinions and portfolio holdings as of March 31, 2015, the end of the reporting period. These views are subject to change at any time based upon market or other conditions. For more current information throughout the year please visit www.jamestownfunds.com. The Funds are distributed by Ultimus Fund Distributors, LLC.
THE JAMESTOWN BALANCED FUND
PERFORMANCE INFORMATION (Unaudited)
Comparison of the Change in Value of a $10,000 Investment in
The Jamestown Balanced Fund, the Standard & Poor’s 500® Index and the
60% S&P 500® Index / 40% Barclays Intermediate U.S. Government/Credit Index
| | Average Annual Total Returns(a)
(for periods ended March 31, 2015) |
| | 1 Year | 5 Years | 10 Years |
| The Jamestown Balanced Fund | 7.31% | 9.69% | 6.33% |
Standard & Poor’s 500® Index | 12.73% | 14.47% | 8.01% |
60% S&P 500® Index / 40% Barclays Intermediate U.S. Government/Credit Index | 9.10% | 10.20% | 6.82% |
| (a) | Total return is a measure of the change in value of an investment in the Fund over the periods covered, which assumes any dividends or capital gains distributions are reinvested in shares of the Fund. Returns shown do not reflect the deduction of taxes a shareholder would pay on Fund distributions or the redemption of Fund shares. |
THE JAMESTOWN EQUITY FUND
PERFORMANCE INFORMATION (Unaudited)
Comparison of the Change in Value of a $10,000 Investment in
The Jamestown Equity Fund and the Standard & Poor’s 500® Index
| | Average Annual Total Returns(a)
(for periods ended March 31, 2015) |
| | 1 Year | 5 Years | 10 Years |
| The Jamestown Equity Fund | 10.14% | 13.25% | 7.26% |
Standard & Poor’s 500® Index | 12.73% | 14.47% | 8.01% |
| (a) | Total return is a measure of the change in value of an investment in the Fund over the periods covered, which assumes any dividends or capital gains distributions are reinvested in shares of the Fund. Returns shown do not reflect the deduction of taxes a shareholder would pay on Fund distributions or the redemption of Fund shares. |
THE JAMESTOWN TAX EXEMPT VIRGINIA FUND
PERFORMANCE INFORMATION (Unaudited)
Comparison of the Change in Value of a $10,000 Investment in
The Jamestown Tax Exempt Virginia Fund, the Barclays 1-10 Year Municipal Blend Index*
and the Barclays Capital Municipal Bond Index
| | Average Annual Total Returns(a)
(for periods ended March 31, 2015) |
| | 1 Year | 5 Years | 10 Years |
| The Jamestown Tax Exempt Virginia Fund | 2.61% | 2.46% | 3.08% |
| Barclays 1-10 Year Municipal Blend Index | 3.87% | 3.69% | 4.17% |
| Barclays Capital Municipal Bond Index | 6.62% | 5.11% | 4.85% |
| * | The Barclays 1-10 Year Municipal Blend Index is an unmanaged, market value-weighted index which covers the short and intermediate components of the U.S. investment-grade tax-exempt bond market. |
| (a) | Total return is a measure of the change in value of an investment in the Fund over the periods covered, which assumes any dividends or capital gains distributions are reinvested in shares of the Fund. Returns shown do not reflect the deduction of taxes a shareholder would pay on Fund distributions or the redemption of Fund shares. |
THE JAMESTOWN BALANCED FUND
PORTFOLIO INFORMATION
March 31, 2015 (Unaudited)
| Asset Allocation (% of Net Assets) | | Ten Largest Equity Holdings | % of
Net Assets |
| | Apple, Inc. | 3.5% |
| Actavis plc | 2.0% |
| AmerisourceBergen Corporation | 1.9% |
| CVS Health Corporation | 1.8% |
| JPMorgan Chase & Company | 1.7% |
| McKesson Corporation | 1.6% |
| General Electric Company | 1.6% |
| Lennar Corporation - Class A | 1.5% |
| TE Connectivity Ltd. | 1.5% |
| Aetna, Inc. | 1.5% |
| Equity Sector Concentration vs. the S&P 500 Index (65.1% of Net Assets) |
| Fixed-Income Portfolio (29.3% of Net Assets) | | Credit Quality | Composite Quality |
| Average Stated Maturity (Years) | 3.51 | | AAA | 41.6% |
| Average Duration (Years) | 3.18 | | AA | 15.1% |
| Average Coupon | 3.78% | | A | 34.7% |
| Average Yield to Maturity | 1.31% | | BBB | 8.6% |
| Sector Breakdown | % of Fixed Income Portfolio | | | |
| Corporate Bonds | 58.4% | | | |
| U.S. Treasury Obligations | 25.6% | | | |
| U.S. Government Agency Obligations | 9.8% | | | |
| Mortgage-Backed Securities | 4.2% | | | |
| Municipal Bonds | 2.0% | | | |
THE JAMESTOWN EQUITY FUND
PORTFOLIO INFORMATION
March 31, 2015 (Unaudited)
| Asset Allocation (% of Net Assets) | | Ten Largest Equity Holdings | % of
Net Assets |
| | Apple, Inc. | 5.1% |
| AmerisourceBergen Corporation | 3.3% |
| Actavis plc | 2.8% |
| CVS Health Corporation | 2.5% |
| General Electric Company | 2.3% |
| Aetna, Inc. | 2.3% |
| JPMorgan Chase & Company | 2.3% |
| Lennar Corporation - Class A | 2.2% |
| McKesson Corporation | 2.1% |
| Ameriprise Financial, Inc. | 2.1% |
| |
Sector Concentration vs. the S&P 500® Index |
THE JAMESTOWN TAX EXEMPT VIRGINIA FUND
PORTFOLIO INFORMATION
March 31, 2015 (Unaudited)
Characteristics
(Weighted Average) | | Maturity Breakdown
(% of Portfolio) |
| 30-day SEC Yield | 1.64% | | |
| Tax-Equivalent Yield | 2.90%* | |
| Average Maturity (years) | 5.9 | |
| Average Duration (years) | 3.9 | |
| Average Quality | AA | |
| Number of Issues | 60 | |
| | | |
| * Assumes a maximum 43.4% federal tax rate. | |
| Credit Quality (% of Portfolio) | | Sector Diversification (% of Portfolio) |
| |  |
THE JAMESTOWN BALANCED FUND
SCHEDULE OF INVESTMENTS
March 31, 2015
| COMMON STOCKS — 65.1% | | Shares | | | Value | |
| Consumer Discretionary — 10.2% | | | | | | |
| Comcast Corporation - Class A | | | 4,500 | | | $ | 254,115 | |
Dollar Tree, Inc. (a) | | | 2,400 | | | | 194,748 | |
| Johnson Controls, Inc. | | | 5,200 | | | | 262,288 | |
| Lennar Corporation - Class A | | | 5,350 | | | | 277,183 | |
| Macy's, Inc. | | | 4,000 | | | | 259,640 | |
Priceline Group, Inc. (The) (a) | | | 125 | | | | 145,519 | |
| Royal Caribbean Cruises Ltd. | | | 2,450 | | | | 200,533 | |
| TJX Companies, Inc. (The) | | | 3,800 | | | | 266,190 | |
| | | | | | | | 1,860,216 | |
| Consumer Staples — 4.2% | | | | | | | | |
| Archer-Daniels-Midland Company | | | 2,400 | | | | 113,760 | |
| CVS Health Corporation | | | 3,100 | | | | 319,951 | |
| PepsiCo, Inc. | | | 2,100 | | | | 200,802 | |
| Procter & Gamble Company (The) | | | 1,700 | | | | 139,298 | |
| | | | | | | | 773,811 | |
| Energy — 3.8% | | | | | | | | |
| Chevron Corporation | | | 2,030 | | | | 213,109 | |
| Hess Corporation | | | 3,000 | | | | 203,610 | |
| Marathon Oil Corporation | | | 6,600 | | | | 172,326 | |
| Noble Corporation plc | | | 7,700 | | | | 109,956 | |
| | | | | | | | 699,001 | |
| Financials — 10.9% | | | | | | | | |
| Ameriprise Financial, Inc. | | | 2,000 | | | | 261,680 | |
| Discover Financial Services | | | 4,000 | | | | 225,400 | |
| Invesco Ltd. | | | 6,000 | | | | 238,140 | |
| JPMorgan Chase & Company | | | 5,000 | | | | 302,900 | |
| MetLife, Inc. | | | 4,600 | | | | 232,530 | |
| Morgan Stanley | | | 6,450 | | | | 230,200 | |
| PNC Financial Services Group, Inc. (The) | | | 2,700 | | | | 251,748 | |
| Principal Financial Group, Inc. | | | 4,700 | | | | 241,439 | |
| | | | | | | | 1,984,037 | |
| Health Care — 12.1% | | | | | | | | |
| Abbott Laboratories | | | 3,000 | | | | 138,990 | |
| AbbVie, Inc. | | | 2,250 | | | | 131,715 | |
Actavis plc (a) | | | 1,200 | | | | 357,144 | |
| Aetna, Inc. | | | 2,500 | | | | 266,325 | |
| AmerisourceBergen Corporation | | | 3,000 | | | | 341,010 | |
| Amgen, Inc. | | | 1,500 | | | | 239,775 | |
| McKesson Corporation | | | 1,300 | | | | 294,060 | |
| Thermo Fisher Scientific, Inc. | | | 1,875 | | | | 251,887 | |
| UnitedHealth Group, Inc. | | | 1,600 | | | | 189,264 | |
| | | | | | | | 2,210,170 | |
THE JAMESTOWN BALANCED FUND
SCHEDULE OF INVESTMENTS (Continued)
| COMMON STOCKS — 65.1% (Continued) | | Shares | | | Value | |
| Industrials — 10.2% | | | | | | |
| Dover Corporation | | | 1,800 | | | $ | 124,416 | |
| Eaton Corporation plc | | | 3,450 | | | | 234,393 | |
| FedEx Corporation | | | 1,500 | | | | 248,175 | |
| General Electric Company | | | 11,850 | | | | 293,999 | |
| Nielsen N.V. | | | 5,600 | | | | 249,592 | |
| Norfolk Southern Corporation | | | 2,200 | | | | 226,424 | |
| Ryder System, Inc. | | | 2,700 | | | | 256,203 | |
| United Technologies Corporation | | | 2,000 | | | | 234,400 | |
| | | | | | | | 1,867,602 | |
| Information Technology — 12.8% | | | | | | | | |
| Apple, Inc. | | | 5,200 | | | | 647,036 | |
| Cisco Systems, Inc. | | | 9,000 | | | | 247,725 | |
| EMC Corporation | | | 8,500 | | | | 217,260 | |
Google, Inc. - Class A (a) | | | 300 | | | | 166,410 | |
Google, Inc. - Class C (a) | | | 325 | | | | 178,100 | |
| Microsoft Corporation | | | 3,000 | | | | 121,965 | |
| Oracle Corporation | | | 5,850 | | | | 252,428 | |
| QUALCOMM, Inc. | | | 3,300 | | | | 228,822 | |
| TE Connectivity Ltd. | | | 3,800 | | | | 272,156 | |
| | | | | | | | 2,331,902 | |
| Materials — 0.9% | | | | | | | | |
| LyondellBasell Industries N.V. - Class A | | | 1,900 | | | | 166,820 | |
| | | | | | | | | |
Total Common Stocks (Cost $6,630,486) | | | | | | $ | 11,893,559 | |
| EXCHANGE-TRADED FUNDS — 1.4% | | Shares | | | Value | |
Consumer Staples Select Sector SPDR® Fund (Cost $241,424) | | | 5,200 | | | $ | 253,448 | |
| U.S. TREASURY OBLIGATIONS — 7.5% | | Par Value | | | Value | |
| U.S. Treasury Notes — 7.5% | | | | | | |
| 0.375%, 08/31/2015 | | $ | 300,000 | | | $ | 300,328 | |
| 4.25%, 11/15/2017 | | | 400,000 | | | | 436,125 | |
| 2.625%, 08/15/2020 | | | 175,000 | | | | 185,445 | |
| 2.125%, 08/15/2021 | | | 120,000 | | | | 123,516 | |
| 2.00%, 02/15/2023 | | | 150,000 | | | | 152,438 | |
| 2.75%, 02/15/2024 | | | 160,000 | | | | 171,475 | |
Total U.S. Treasury Obligations (Cost $1,317,261) | | | | | | $ | 1,369,327 | |
THE JAMESTOWN BALANCED FUND
SCHEDULE OF INVESTMENTS (Continued)
| U.S. GOVERNMENT AGENCY OBLIGATIONS — 2.9% | | Par Value | | | Value | |
| Federal Home Loan Mortgage Corporation — 2.9% | | | | | | |
| 5.25%, due 04/18/2016 (Cost $498,924) | | $ | 500,000 | | | $ | 525,374 | |
| CORPORATE BONDS — 17.1% | | Par Value | | | Value | |
| Consumer Discretionary — 1.1% | | | | | | |
Anheuser-Busch Companies, Inc.,
4.50%, due 04/01/2018 | | $ | 100,000 | | | $ | 108,405 | |
Comcast Corporation,
5.70%, due 07/01/2019 | | | 75,000 | | | | 86,764 | |
| | | | | | | | 195,169 | |
| Consumer Staples — 1.9% | | | | | | | | |
Colgate-Palmolive Company,
1.95%, due 02/01/2023 | | | 100,000 | | | | 96,535 | |
General Mills, Inc.,
5.70%, due 02/15/2017 | | | 150,000 | | | | 162,577 | |
Wal-Mart Stores, Inc.,
4.25%, due 04/15/2021 | | | 75,000 | | | | 84,193 | |
| | | | | | | | 343,305 | |
| Energy — 1.1% | | | | | | | | |
Shell International Finance B.V.,
4.30%, due 09/22/2019 | | | 100,000 | | | | 110,921 | |
Total Capital S.A.,
3.00%, due 06/24/2015 | | | 100,000 | | | | 100,578 | |
| | | | | | | | 211,499 | |
| Financials — 6.0% | | | | | | | | |
Aflac, Inc.,
2.65%, due 02/15/2017 | | | 75,000 | | | | 77,316 | |
American Express Credit Corporation,
2.125%, due 03/18/2019 | | | 80,000 | | | | 81,030 | |
BB&T Corporation,
2.15%, due 03/22/2017 | | | 100,000 | | | | 101,821 | |
Berkshire Hathaway Finance Corporation,
2.90%, due 10/15/2020 | | | 100,000 | | | | 105,616 | |
General Electric Capital Corporation,
4.65%, due 10/17/2021 | | | 84,000 | | | | 95,069 | |
Goldman Sachs Group, Inc.,
3.70%, due 08/01/2015 | | | 100,000 | | | | 100,981 | |
JPMorgan Chase & Company,
3.40%, due 06/24/2015 | | | 110,000 | | | | 110,712 | |
PNC Funding Corporation,
5.125%, due 02/08/2020 | | | 110,000 | | | | 125,697 | |
Royal Bank of Canada,
2.30%, due 07/20/2016 | | | 100,000 | | | | 101,964 | |
Toyota Motor Credit Corporation,
1.125%, due 05/16/2017 | | | 95,000 | | | | 95,269 | |
THE JAMESTOWN BALANCED FUND
SCHEDULE OF INVESTMENTS (Continued)
| CORPORATE BONDS — 17.1% (Continued) | | Par Value | | | Value | |
| Financials — 6.0% (Continued) | | | | | | |
Wells Fargo Bank,
5.75%, due 05/16/2016 | | $ | 105,000 | | | $ | 110,825 | |
| | | | | | | | 1,106,300 | |
| Health Care — 3.2% | | | | | | | | |
Amgen, Inc.,
5.85%, due 06/01/2017 | | | 125,000 | | | | 137,334 | |
GlaxoSmithKline plc,
5.65%, due 05/15/2018 | | | 200,000 | | | | 226,228 | |
Medtronic, Inc.,
4.75%, due 09/15/2015 | | | 100,000 | | | | 101,859 | |
Novartis Securities Investment Ltd.,
5.125%, due 02/10/2019 | | | 100,000 | | | | 112,856 | |
| | | | | | | | 578,277 | |
| Industrials — 0.6% | | | | | | | | |
Illinois Tool Works, Inc.,
3.50%, due 03/01/2024 | | | 100,000 | | | | 106,064 | |
| | | | | | | | | |
| Information Technology — 1.0% | | | | | | | | |
Cisco Systems, Inc.,
4.95%, due 02/15/2019 | | | 71,000 | | | | 79,881 | |
Oracle Corporation,
2.50%, due 10/15/2022 | | | 100,000 | | | | 100,005 | |
| | | | | | | | 179,886 | |
| Materials — 0.6% | | | | | | | | |
Monsanto Company,
2.75%, due 07/15/2021 | | | 100,000 | | | | 102,344 | |
| | | | | | | | | |
| Telecommunication Services — 0.8% | | | | | | | | |
Discovery Communications, Inc.,
5.05%, due 06/01/2020 | | | 100,000 | | | | 111,307 | |
Verizon Communications, Inc.,
2.50%, due 09/15/2016 | | | 44,000 | | | | 44,937 | |
| | | | | | | | 156,244 | |
| Utilities — 0.8% | | | | | | | | |
Virginia Electric & Power Company,
5.00%, due 06/30/2019 | | | 125,000 | | | | 140,655 | |
| | | | | | | | | |
Total Corporate Bonds (Cost $3,006,791) | | | | | | $ | 3,119,743 | |
THE JAMESTOWN BALANCED FUND
SCHEDULE OF INVESTMENTS (Continued)
| MORTGAGE-BACKED SECURITIES — 1.2% | | Par Value | | | Value | |
| Federal Home Loan Mortgage Corporation — 0.3% | | | | | | |
| Pool #A97047, 4.50%, due 02/01/2041 | | $ | 55,283 | | | $ | 60,405 | |
| | | | | | | | | |
| Federal National Mortgage Association — 0.9% | | | | | | | | |
| Pool #618465, 5.00%, due 12/01/2016 | | | 8,237 | | | | 8,768 | |
| Pool #255455, 5.00%, due 10/01/2024 | | | 34,788 | | | | 38,638 | |
| Pool #255702, 5.00%, due 05/01/2025 | | | 45,131 | | | | 50,125 | |
| Pool #808413, 5.50%, due 01/01/2035 | | | 52,366 | | | | 59,313 | |
| | | | | | | | 156,844 | |
Government National Mortgage Association — 0.0% (b) | | | | | | | | |
| Pool #781344, 6.50%, due 10/15/2031 | | | 7,181 | | | | 8,350 | |
| | | | | | | | | |
Total Mortgage-Backed Securities (Cost $205,508) | | | | | | $ | 225,599 | |
| VIRGINIA REVENUE AND GENERAL OBLIGATION (GO) BONDS — 0.6% | | Par Value | | | Value | |
| Virginia State, Build America Bonds, Taxable, GO, | | | | | | |
| 2.95%, due 06/01/2019 (Cost $97,035) | | $ | 100,000 | | | $ | 106,119 | |
| | | | | | | | | |
Total Investments at Value — 95.8% (Cost $11,997,429) | | | | | | $ | 17,493,169 | |
| | | | | | | | | |
| Other Assets in Excess of Liabilities — 4.2% | | | | | | | 761,003 | |
| | | | | | | | | |
| Net Assets — 100.0% | | | | | | $ | 18,254,172 | |
| (a) | Non-income producing security. |
| (b) | Percentage rounds to less than 0.1%. |
See accompanying notes to financial statements.
THE JAMESTOWN EQUITY FUND
SCHEDULE OF INVESTMENTS
March 31, 2015
| COMMON STOCKS — 93.5% | | Shares | | | Value | |
| Consumer Discretionary — 14.2% | | | | | | |
| Comcast Corporation - Class A | | | 10,000 | | | $ | 564,700 | |
Dollar Tree, Inc. (a) | | | 5,650 | | | | 458,470 | |
| Johnson Controls, Inc. | | | 11,800 | | | | 595,192 | |
| Lennar Corporation - Class A | | | 12,800 | | | | 663,168 | |
| Macy's, Inc. | | | 8,500 | | | | 551,735 | |
Priceline Group, Inc. (The) (a) | | | 255 | | | | 296,858 | |
| Royal Caribbean Cruises Ltd. | | | 5,900 | | | | 482,915 | |
| TJX Companies, Inc. (The) | | | 8,300 | | | | 581,415 | |
| | | | | | | | 4,194,453 | |
| Consumer Staples — 6.1% | | | | | | | | |
| Archer-Daniels-Midland Company | | | 6,000 | | | | 284,400 | |
| CVS Health Corporation | | | 7,250 | | | | 748,272 | |
| PepsiCo, Inc. | | | 4,700 | | | | 449,414 | |
| Procter & Gamble Company (The) | | | 3,800 | | | | 311,372 | |
| | | | | | | | 1,793,458 | |
| Energy — 5.5% | | | | | | | | |
| Chevron Corporation | | | 4,700 | | | | 493,406 | |
| Hess Corporation | | | 7,150 | | | | 485,271 | |
| Marathon Oil Corporation | | | 15,400 | | | | 402,094 | |
| Noble Corporation plc | | | 17,600 | | | | 251,328 | |
| | | | | | | | 1,632,099 | |
| Financials — 15.5% | | | | | | | | |
| Ameriprise Financial, Inc. | | | 4,800 | | | | 628,032 | |
| Discover Financial Services | | | 9,000 | | | | 507,150 | |
| Invesco Ltd. | | | 14,500 | | | | 575,505 | |
| JPMorgan Chase & Company | | | 11,000 | | | | 666,380 | |
| MetLife, Inc. | | | 10,400 | | | | 525,720 | |
| Morgan Stanley | | | 15,500 | | | | 553,195 | |
| PNC Financial Services Group, Inc. (The) | | | 6,000 | | | | 559,440 | |
| Principal Financial Group, Inc. | | | 10,800 | | | | 554,796 | |
| | | | | | | | 4,570,218 | |
| Health Care — 17.9% | | | | | | | | |
| Abbott Laboratories | | | 6,600 | | | | 305,778 | |
| AbbVie, Inc. | | | 5,500 | | | | 321,970 | |
Actavis plc (a) | | | 2,780 | | | | 827,384 | |
| Aetna, Inc. | | | 6,300 | | | | 671,139 | |
| AmerisourceBergen Corporation | | | 8,600 | | | | 977,562 | |
| Amgen, Inc. | | | 3,450 | | | | 551,482 | |
| McKesson Corporation | | | 2,800 | | | | 633,360 | |
| Thermo Fisher Scientific, Inc. | | | 4,300 | | | | 577,662 | |
| UnitedHealth Group, Inc. | | | 3,600 | | | | 425,844 | |
| | | | | | | | 5,292,181 | |
THE JAMESTOWN EQUITY FUND
SCHEDULE OF INVESTMENTS (Continued)
| COMMON STOCKS — 93.5% (Continued) | | Shares | | | Value | |
| Industrials — 14.8% | | | | | | |
| Dover Corporation | | | 4,300 | | | $ | 297,216 | |
| Eaton Corporation plc | | | 7,750 | | | | 526,535 | |
| FedEx Corporation | | | 3,400 | | | | 562,530 | |
| General Electric Company | | | 27,600 | | | | 684,756 | |
| Nielsen Holdings N.V. | | | 13,300 | | | | 592,781 | |
| Norfolk Southern Corporation | | | 5,300 | | | | 545,476 | |
| Ryder System, Inc. | | | 6,500 | | | | 616,785 | |
| United Technologies Corporation | | | 4,800 | | | | 562,560 | |
| | | | | | | | 4,388,639 | |
| Information Technology — 18.2% | | | | | | | | |
| Apple, Inc. | | | 12,200 | | | | 1,518,046 | |
| Cisco Systems, Inc. | | | 21,000 | | | | 578,025 | |
| EMC Corporation | | | 19,000 | | | | 485,640 | |
Google, Inc. - Class A (a) | | | 700 | | | | 388,290 | |
Google, Inc. - Class C (a) | | | 700 | | | | 383,600 | |
| Microsoft Corporation | | | 8,000 | | | | 325,240 | |
| Oracle Corporation | | | 13,500 | | | | 582,525 | |
| QUALCOMM, Inc. | | | 7,700 | | | | 533,918 | |
| TE Connectivity Ltd. | | | 8,400 | | | | 601,608 | |
| | | | | | | | 5,396,892 | |
| Materials — 1.3% | | | | | | | | |
| LyondellBasell Industries N.V. - Class A | | | 4,500 | | | | 395,100 | |
| | | | | | | | | |
Total Common Stocks (Cost $15,562,612) | | | | | | $ | 27,663,040 | |
| EXCHANGE-TRADED FUNDS — 2.0% | | Shares | | | Value | |
Consumer Staples Select Sector SPDR® Fund (Cost $587,468) | | | 12,000 | | | $ | 584,880 | |
| | | | | | | | | |
Total Investments at Value — 95.5% (Cost $16,150,080) | | | | | | $ | 28,247,920 | |
| | | | | | | | | |
| Other Assets in Excess of Liabilities — 4.5% | | | | | | | 1,348,016 | |
| | | | | | | | | |
| Net Assets — 100.0% | | | | | | $ | 29,595,936 | |
| (a) | Non-income producing security. |
See accompanying notes to financial statements.
THE JAMESTOWN TAX EXEMPT VIRGINIA FUND
SCHEDULE OF INVESTMENTS
March 31, 2015
| VIRGINIA REVENUE AND GENERAL OBLIGATION (GO) BONDS — 94.2% | | Par Value | | | Value | |
| Capital Region Airport Commission, Virginia, Airport Revenue, | | | | | | |
| 4.50%, due 07/01/2016 | | $ | 520,000 | | | $ | 546,151 | |
| Chesterfield Co., Virginia, GO, | | | | | | | | |
| 5.00%, due 01/01/2020 | | | 700,000 | | | | 754,684 | |
| 5.00%, due 01/01/2024 | | | 250,000 | | | | 301,333 | |
| 5.00%, due 01/01/2025 | | | 460,000 | | | | 571,927 | |
| City of Winchester, Virginia, GO, | | | | | | | | |
| 5.00%, due 09/01/2027 | | | 125,000 | | | | 153,901 | |
| Fairfax Co., Virginia, Industrial Dev. Authority, Revenue, | | | | | | | | |
| 5.00%, due 05/15/2022 | | | 750,000 | | | | 860,947 | |
| Fairfax Co., Virginia, Sewer, Revenue, | | | | | | | | |
| 4.50%, due 07/15/2030 | | | 250,000 | | | | 277,845 | |
| Fairfax Co., Virginia, Water, Revenue, | | | | | | | | |
| 5.00%, due 04/01/2027 | | | 500,000 | | | | 594,480 | |
| Fauquier Co., Virginia, GO, | | | | | | | | |
| 5.00%, due 07/01/2017, | | | | | | | | |
| prerefunded 07/01/2016 @ 100 | | | 500,000 | | | | 529,360 | |
| Hampton Roads Sanitation District, Virginia, Wastewater, Revenue, | | | | | | | | |
| 5.00%, due 04/01/2022 | | | 400,000 | | | | 448,500 | |
| 5.00%, due 07/01/2026 | | | 500,000 | | | | 612,135 | |
| Hampton Roads Sanitation District, Virginia, Wastewater, Series A, Revenue, | | | | | | | | |
| 5.00%, due 01/01/2027 | | | 400,000 | | | | 461,336 | |
| Hampton, Virginia, GO, | | | | | | | | |
| 5.00%, due 04/01/2020, | | | | | | | | |
| prerefunded 04/01/2015 @ 100 | | | 500,000 | | | | 500,000 | |
| 5.00%, due 04/01/2025 | | | 500,000 | | | | 601,880 | |
| Harrisonburg, Virginia, GO, | | | | | | | | |
| 5.00%, due 07/15/2022 | | | 350,000 | | | | 426,741 | |
| Henrico Co., Virginia, Public Improvement, Series A, GO, | | | | | | | | |
| 5.00%, due 12/01/2015 | | | 250,000 | | | | 258,115 | |
| Henrico Co., Virginia, Water & Sewer, Revenue, | | | | | | | | |
| 5.00%, due 05/01/2020 | | | 350,000 | | | | 402,847 | |
| 5.00%, due 05/01/2022 | | | 430,000 | | | | 495,738 | |
| James City, Virginia, School District, GO, | | | | | | | | |
| 5.00%, due 12/15/2018 | | | 500,000 | | | | 516,920 | |
| Leesburg, Virginia, GO, | | | | | | | | |
| 5.00%, due 09/15/2016 | | | 500,000 | | | | 533,840 | |
| Lynchburg, Virginia, GO, | | | | | | | | |
| 5.00%, due 06/01/2015 | | | 500,000 | | | | 504,065 | |
THE JAMESTOWN TAX EXEMPT VIRGINIA FUND
SCHEDULE OF INVESTMENTS (Continued)
| VIRGINIA REVENUE AND GENERAL OBLIGATION (GO) BONDS — 94.2% (Continued) | | Par Value | | | Value | |
| Lynchburg, Virginia, Public Improvement, Series A, GO, | | | | | | |
| 5.00%, due 08/01/2019 | | $ | 625,000 | | | $ | 723,875 | |
| Manassas, Virginia, Public Improvement, Series D, GO, | | | | | | | | |
| 5.00%, due 07/01/2019 | | | 250,000 | | | | 289,242 | |
| New Kent Co., Virginia, Economic Dev. Authority, Revenue, | | | | | | | | |
| 5.00%, due 02/01/2019 | | | 500,000 | | | | 539,615 | |
| Northern Virginia Transportation Authority, Special Tax, Revenue, | | | | | | | | |
| 5.00%, due 06/01/2026 | | | 400,000 | | | | 490,772 | |
| Portsmouth, Virginia, GO, | | | | | | | | |
| 5.00%, due 04/01/2016, | | | | | | | | |
| prerefunded 4/1/2015 @ 100 | | | 160,000 | | | | 160,000 | |
| 5.00%, due 04/01/2016 | | | 90,000 | | | | 90,073 | |
| Portsmouth, Virginia, Series D, GO, | | | | | | | | |
| 4.00%, due 12/01/2017 | | | 215,000 | | | | 233,449 | |
| Prince William Co., Virginia, Lease Participation Certificates, | | | | | | | | |
| 5.00%, due 10/01/2020 | | | 500,000 | | | | 585,855 | |
| Roanoke, Virginia, Public Improvement, Series A, GO, | | | | | | | | |
| 5.00%, due 07/15/2025 | | | 400,000 | | | | 485,500 | |
| Southeastern Public Service Authority, Virginia, Revenue, | | | | | | | | |
| 5.00%, due 07/01/2015, ETM | | | 510,000 | | | | 516,100 | |
| Spotsylvania Co., Virginia, Economic Dev. Authority, Revenue, | | | | | | | | |
| 5.00%, due 06/01/2021 | | | 300,000 | | | | 357,435 | |
| Spotsylvania Co., Virginia, GO, | | | | | | | | |
| 5.00%, due 01/15/2023 | | | 400,000 | | | | 492,136 | |
| Spotsylvania Co., Virginia, Water & Sewer, Revenue, | | | | | | | | |
| 5.00%, due 06/01/2026 | | | 500,000 | | | | 503,910 | |
| Suffolk, Virginia, Public Improvement, Series A, GO, | | | | | | | | |
| 4.00%, due 08/01/2018 | | | 250,000 | | | | 274,940 | |
| Upper Occoquan, Virginia, Sewer Authority, Revenue, | | | | | | | | |
| 5.15%, due 07/01/2020 | | | 250,000 | | | | 282,042 | |
| 5.00%, due 07/01/2027 | | | 350,000 | | | | 436,212 | |
| Virginia Beach, Virginia, Public Improvement, GO, | | | | | | | | |
| 5.00%, due 06/01/2021, | | | | | | | | |
| prerefunded 06/01/2019 @ 100 | | | 250,000 | | | | 289,045 | |
| 4.00%, due 04/01/2027 | | | 205,000 | | | | 228,188 | |
| Virginia Biotechnology Research Partnership Authority, Lease Revenue, | | | | | | | | |
| 5.00%, due 09/01/2020 | | | 500,000 | | | | 589,750 | |
THE JAMESTOWN TAX EXEMPT VIRGINIA FUND
SCHEDULE OF INVESTMENTS (Continued)
| VIRGINIA REVENUE AND GENERAL OBLIGATION (GO) BONDS — 94.2% (Continued) | | Par Value | | | Value | |
| Virginia College Building Authority, Educational Facilities, Revenue, | | | | | | |
| 5.00%, due 04/01/2017 | | $ | 500,000 | | | $ | 501,975 | |
| 5.00%, due 03/01/2019 | | | 250,000 | | | | 286,450 | |
| 4.00%, due 09/01/2026 | | | 500,000 | | | | 554,885 | |
| Virginia Commonwealth Transportation Board, Federal Highway Reimbursement Anticipation Notes, Revenue, | | | | | | | | |
| 5.00%, due 09/28/2015 | | | 500,000 | | | | 511,965 | |
| 5.00%, due 03/15/2025 | | | 500,000 | | | | 601,335 | |
| Virginia Polytechnic Institute & State University, General and Athletic Facilities, Series D, Revenue, | | | | | | | | |
| 5.00%, due 06/01/2016 | | | 115,000 | | | | 115,929 | |
| Virginia Small Business Financing Authority, Healthcare Facilities, Revenue, | | | | | | | | |
| 5.00%, due 11/01/2017 | | | 250,000 | | | | 275,725 | |
| Virginia State Commonwealth Transportation Board, Federal Transportation Grant Anticipation Notes, Series A, Revenue, | | | | | | | | |
| 5.00%, due 03/15/2023 | | | 500,000 | | | | 600,320 | |
| Virginia State Public School Authority, Revenue, | | | | | | | | |
| 5.00%, due 08/01/2023 | | | 500,000 | | | | 605,405 | |
| 5.00%, due 07/15/2026 | | | 300,000 | | | | 364,827 | |
| Virginia State Public School Authority, Series A, Revenue, | | | | | | | | |
| 5.00%, due 08/01/2020 | | | 585,000 | | | | 621,217 | |
| Virginia State Public School Authority, Series B-1, Revenue, | | | | | | | | |
| 5.00%, due 08/01/2018 | | | 500,000 | | | | 565,685 | |
| Virginia State Resources Authority, Clean Water, Revenue, | | | | | | | | |
| 5.00%, due 10/01/2021 | | | 500,000 | | | | 586,500 | |
| Virginia State Resources Authority, Infrastructure, Revenue, | | | | | | | | |
| 5.00%, due 11/01/2024, | | | | | | | | |
| prerefunded 11/1/2018 @ 100 | | | 95,000 | | | | 108,348 | |
| 5.00%, due 11/01/2024 | | | 405,000 | | | | 458,492 | |
| Virginia State Resources Authority, Infrastructure, Series B, Revenue, | | | | | | | | |
| 5.00%, due 11/01/2024 | | | 150,000 | | | | 181,574 | |
| Virginia State, Series B, GO, | | | | | | | | |
| 5.00%, due 06/01/2017 | | | 250,000 | | | | 273,698 | |
| | | | | | | | | |
Total Virginia Revenue and General Obligation (GO) Bonds (Cost $24,130,604) | | | | | | $ | 25,135,214 | |
THE JAMESTOWN TAX EXEMPT VIRGINIA FUND
SCHEDULE OF INVESTMENTS (Continued)
| WASHINGTON, D.C. REVENUE BONDS — 2.1% | | Par Value | | | Value | |
| Metropolitan Washington Airports Authority, Series C, Revenue, | | | | | | |
| 5.00%, due 10/01/2022 (Cost $504,757) | | $ | 500,000 | | | $ | 563,435 | |
| EXCHANGE-TRADED FUNDS — 0.4% | | Shares | | | Value | |
| SPDR Nuveen Barclays Short Term Municipal Bond ETF (Cost $120,500) | | | 5,000 | | | $ | 121,600 | |
| MONEY MARKET FUNDS — 1.4% | | Shares | | | Value | |
Fidelity Tax Exempt Portfolio - Class I, 0.01% (a) (Cost $372,240) | | | 372,240 | | | $ | 372,240 | |
| | | | | | | | | |
Total Investments at Value — 98.1% (Cost $25,128,101) | | | | | | $ | 26,192,489 | |
| | | | | | | | | |
| Other Assets in Excess of Liabilities — 1.9% | | | | | | | 502,385 | |
| | | | | | | | | |
| Net Assets — 100.0% | | | | | | $ | 26,694,874 | |
ETM - Escrowed to Maturity.
| (a) | The rate shown is the 7-day effective yield as of March 31, 2015. |
See accompanying notes to financial statements.
THE JAMESTOWN FUNDS
STATEMENTS OF ASSETS AND LIABILITIES
March 31, 2015
| | | The
Jamestown
Balanced
Fund | | | The Jamestown
Equity
Fund | | | The
Jamestown
Tax Exempt
Virginia
Fund | |
| ASSETS | | | | | | | | | |
| Investments in securities: | | | | | | | | | |
| At acquisition cost | | $ | 11,997,429 | | | $ | 16,150,080 | | | $ | 25,128,101 | |
| At value (Note 2) | | $ | 17,493,169 | | | $ | 28,247,920 | | | $ | 26,192,489 | |
| Cash | | | 742,189 | | | | 1,367,540 | | | | — | |
| Dividends and interest receivable | | | 61,902 | | | | 23,256 | | | | 330,932 | |
| Receivable for capital shares sold | | | 100 | | | | 3,873 | | | | 226,000 | |
| Other assets | | | 1,411 | | | | 2,553 | | | | 1,126 | |
| TOTAL ASSETS | | | 18,298,771 | | | | 29,645,142 | | | | 26,750,547 | |
| | | | | | | | | | | | | |
| LIABILITIES | | | | | | | | | | | | |
| Distributions payable | | | 2,739 | | | | 1,873 | | | | 5,768 | |
| Payable for capital shares redeemed | | | 16,802 | | | | 24,150 | | | | 39,260 | |
| Accrued investment advisory fees (Note 4) | | | 7,801 | | | | 16,440 | | | | 2,971 | |
| Payable to administrator (Note 4) | | | 5,515 | | | | 5,515 | | | | 5,515 | |
| Other accrued expenses | | | 11,742 | | | | 1,228 | | | | 2,159 | |
| TOTAL LIABILITIES | | | 44,599 | | | | 49,206 | | | | 55,673 | |
| | | | | | | | | | | | | |
| NET ASSETS | | $ | 18,254,172 | | | $ | 29,595,936 | | | $ | 26,694,874 | |
| | | | | | | | | | | | | |
| Net assets consist of: | | | | | | | | | | | | |
| Paid-in capital | | $ | 12,490,729 | | | $ | 16,154,190 | | | $ | 25,641,333 | |
| Distributions in excess of net investment income | | | (78,318 | ) | | | (1,873 | ) | | | — | |
| Accumulated net realized gains (losses) from security transactions | | | 346,021 | | | | 1,345,779 | | | | (10,847 | ) |
| Net unrealized appreciation on investments | | | 5,495,740 | | | | 12,097,840 | | | | 1,064,388 | |
| Net assets | | $ | 18,254,172 | | | $ | 29,595,936 | | | $ | 26,694,874 | |
| | | | | | | | | | | | | |
| Shares of beneficial interest outstanding (unlimited number of shares authorized, $0.01 par value) | | | 1,245,675 | | | | 1,351,050 | | | | 2,622,891 | |
| | | | | | | | | | | | | |
| Net asset value, offering price and redemption price per share (Note 2) | | $ | 14.65 | | | $ | 21.91 | | | $ | 10.18 | |
See accompanying notes to financial statements.
THE JAMESTOWN FUNDS
STATEMENTS OF OPERATIONS
Year Ended March 31, 2015
| | | The Jamestown Balanced
Fund | | | The Jamestown Equity
Fund | | | The Jamestown Tax Exempt Virginia
Fund | |
| INVESTMENT INCOME | | | | | | | | | |
| Dividends | | $ | 229,675 | | | $ | 538,603 | | | $ | 1,217 | |
| Foreign withholding taxes on dividends | | | (210 | ) | | | (499 | ) | | | — | |
| Interest | | | 158,770 | | | | — | | | | 809,578 | |
| TOTAL INVESTMENT INCOME | | | 388,235 | | | | 538,104 | | | | 810,795 | |
| | | | | | | | | | | | | |
| EXPENSES | | | | | | | | | | | | |
| Investment advisory fees (Note 4) | | | 119,941 | | | | 198,253 | | | | 105,660 | |
| Administration fees (Note 4) | | | 60,000 | | | | 60,000 | | | | 56,000 | |
| Professional fees | | | 16,651 | | | | 15,848 | | | | 15,548 | |
| Trustees’ fees and expenses (Note 4) | | | 11,804 | | | | 11,804 | | | | 11,804 | |
| Compliance service fees (Note 4) | | | 6,200 | | | | 6,200 | | | | 6,200 | |
| Pricing costs | | | 7,515 | | | | 1,152 | | | | 9,510 | |
| Custodian and bank service fees | | | 5,211 | | | | 7,332 | | | | 5,428 | |
| Registration and filing fees | | | 5,304 | | | | 6,607 | | | | 3,619 | |
| Account maintenance fees | | | 2,029 | | | | 5,419 | | | | 7,623 | |
| Printing of shareholder reports | | | 3,809 | | | | 6,235 | | | | 2,370 | |
| Other expenses | | | 10,152 | | | | 13,940 | | | | 8,689 | |
| TOTAL EXPENSES | | | 248,616 | | | | 332,790 | | | | 232,451 | |
| Fees voluntarily waived by the Adviser (Note 4) | | | (11,243 | ) | | | — | | | | (50,188 | ) |
| Expenses reimbursed through a directed brokerage arrangement (Note 5) | | | (6,000 | ) | | | (12,000 | ) | | | — | |
| NET EXPENSES | | | 231,373 | | | | 320,790 | | | | 182,263 | |
| | | | | | | | | | | | | |
| NET INVESTMENT INCOME | | | 156,862 | | | | 217,314 | | | | 628,532 | |
| | | | | | | | | | | | | |
| REALIZED AND UNREALIZED GAINS (LOSSES) ON INVESTMENTS | | | | | | | | | | | | |
| Net realized gains on security transactions | | | 1,264,397 | | | | 3,030,039 | | | | 9,689 | |
| Net realized gains from in-kind redemptions (Note 2) | | | 350,159 | | | | — | | | | — | |
| Net change in unrealized appreciation/depreciation on investments | | | (454,261 | ) | | | (316,145 | ) | | | 32,334 | |
| | | | | | | | | | | | | |
| NET REALIZED AND UNREALIZED GAINS ON INVESTMENTS | | | 1,160,295 | | | | 2,713,894 | | | | 42,023 | |
| | | | | | | | | | | | | |
| NET INCREASE IN NET ASSETS FROM OPERATIONS | | $ | 1,317,157 | | | $ | 2,931,208 | | | $ | 670,555 | |
See accompanying notes to financial statements.
THE JAMESTOWN FUNDS
STATEMENTS OF CHANGES IN NET ASSETS
| | | The Jamestown
Balanced Fund | | | The Jamestown
Equity Fund | |
| | | Year
Ended
March 31, 2015 | | | Year
Ended
March 31, 2014 | | | Year
Ended
March 31, 2015 | | | Year
Ended
March 31, 2014 | |
| FROM OPERATIONS | | | | | | | | | | | | |
| Net investment income | | $ | 156,862 | | | $ | 176,046 | | | $ | 217,314 | | | $ | 217,453 | |
| Net realized gains on security transactions | | | 1,264,397 | | | | 1,929,585 | | | | 3,030,039 | | | | 3,074,559 | |
| Net realized gains from in-kind redemptions (Note 2) | | | 350,159 | | | | — | | | | — | | | | — | |
| Net change in unrealized appreciation/depreciation on investments | | | (454,261 | ) | | | 750,659 | | | | (316,145 | ) | | | 3,084,810 | |
| Net increase in net assets from operations | | | 1,317,157 | | | | 2,856,290 | | | | 2,931,208 | | | | 6,376,822 | |
| | | | | | | | | | | | | | | | | |
| DISTRIBUTIONS TO SHAREHOLDERS | | | | | | | | | | | | | | | | |
| From net investment income | | | (201,648 | ) | | | (206,179 | ) | | | (220,231 | ) | | | (214,899 | ) |
| From net realized gains from security transactions | | | (1,798,229 | ) | | | (1,348,960 | ) | | | (3,470,588 | ) | | | (2,036,342 | ) |
| Decrease in net assets from distributions to shareholders | | | (1,999,877 | ) | | | (1,555,139 | ) | | | (3,690,819 | ) | | | (2,251,241 | ) |
| | | | | | | | | | | | | | | | | |
| FROM CAPITAL SHARE TRANSACTIONS | | | | | | | | | | | | | | | | |
| Proceeds from shares sold | | | 184,415 | | | | 73,538 | | | | 585,424 | | | | 1,644,087 | |
| Net asset value of shares issued in reinvestment of distributions to shareholders | | | 1,823,314 | | | | 1,443,519 | | | | 3,513,477 | | | | 2,153,131 | |
| Payments for shares redeemed | | | (1,874,252 | ) | | | (3,678,492 | ) | | | (4,488,942 | ) | | | (5,492,882 | ) |
| Net increase (decrease) in net assets from capital share transactions | | | 133,477 | | | | (2,161,435 | ) | | | (390,041 | ) | | | (1,695,664 | ) |
| | | | | | | | | | | | | | | | | |
| TOTAL INCREASE (DECREASE) IN NET ASSETS | | | (549,243 | ) | | | (860,284 | ) | | | (1,149,652 | ) | | | 2,429,917 | |
| | | | | | | | | | | | | | | | | |
| NET ASSETS | | | | | | | | | | | | | | | | |
| Beginning of year | | | 18,803,415 | | | | 19,663,699 | | | | 30,745,588 | | | | 28,315,671 | |
| End of year | | $ | 18,254,172 | | | $ | 18,803,415 | | | $ | 29,595,936 | | | $ | 30,745,588 | |
| | | | | | | | | | | | | | | | | |
| UNDISTRIBUTED (DISTRIBUTIONS IN EXCESS OF) NET INVESTMENT INCOME | | $ | (78,318 | ) | | $ | (42,176 | ) | | $ | (1,873 | ) | | $ | 3,888 | |
| | | | | | | | | | | | | | | | | |
| CAPITAL SHARE ACTIVITY | | | | | | | | | | | | | | | | |
| Shares sold | | | 12,322 | | | | 4,911 | | | | 26,969 | | | | 77,915 | |
| Shares reinvested | | | 125,223 | | | | 98,321 | | | | 164,154 | | | | 103,431 | |
| Shares redeemed | | | (126,460 | ) | | | (248,509 | ) | | | (208,164 | ) | | | (257,766 | ) |
| Net increase (decrease) in shares outstanding | | | 11,085 | | | | (145,277 | ) | | | (17,041 | ) | | | (76,420 | ) |
| Shares outstanding, beginning of year | | | 1,234,590 | | | | 1,379,867 | | | | 1,368,091 | | | | 1,444,511 | |
| Shares outstanding, end of year | | | 1,245,675 | | | | 1,234,590 | | | | 1,351,050 | | | | 1,368,091 | |
See accompanying notes to financial statements.
THE JAMESTOWN FUNDS
STATEMENTS OF CHANGES IN NET ASSETS (Continued)
| | | The Jamestown Tax Exempt
Virginia Fund | |
| | | Year
Ended
March 31, 2015 | | | Year
Ended
March 31, 2014 | |
| FROM OPERATIONS | | | | | | |
| Net investment income | | $ | 628,532 | | | $ | 676,375 | |
| Net realized gains (losses) on security transactions | | | 9,689 | | | | (20,536 | ) |
| Net change in unrealized appreciation/depreciation on investments | | | 32,334 | | | | (773,876 | ) |
| Net increase (decrease) in net assets from operations | | | 670,555 | | | | (118,037 | ) |
| | | | | | | | | |
| DISTRIBUTIONS TO SHAREHOLDERS | | | | | | | | |
| From net investment income | | | (628,553 | ) | | | (676,352 | ) |
| From net realized gains from security transactions | | | — | | | | (12,336 | ) |
| Decrease in net assets from distributions to shareholders | | | (628,553 | ) | | | (688,688 | ) |
| | | | | | | | | |
| FROM CAPITAL SHARE TRANSACTIONS | | | | | | | | |
| Proceeds from shares sold | | | 2,186,736 | | | | 1,324,814 | |
| Net asset value of shares issued in reinvestment of distributions to shareholders | | | 550,371 | | | | 586,079 | |
| Payments for shares redeemed | | | (2,368,257 | ) | | | (2,602,167 | ) |
| Net increase (decrease) in net assets from capital share transactions | | | 368,850 | | | | (691,274 | ) |
| | | | | | | | | |
| TOTAL INCREASE (DECREASE) IN NET ASSETS | | | 410,852 | | | | (1,497,999 | ) |
| | | | | | | | | |
| NET ASSETS | | | | | | | | |
| Beginning of year | | | 26,284,022 | | | | 27,782,021 | |
| End of year | | $ | 26,694,874 | | | $ | 26,284,022 | |
| | | | | | | | | |
| UNDISTRIBUTED NET INVESTMENT INCOME | | $ | — | | | $ | 21 | |
| | | | | | | | | |
| CAPITAL SHARE ACTIVITY | | | | | | | | |
| Shares sold | | | 214,675 | | | | 130,015 | |
| Shares reinvested | | | 53,901 | | | | 57,356 | |
| Shares redeemed | | | (232,059 | ) | | | (253,628 | ) |
| Net increse (decrease) in shares outstanding | | | 36,517 | | | | (66,257 | ) |
| Shares outstanding, beginning of year | | | 2,586,374 | | | | 2,652,631 | |
| Shares outstanding, end of year | | | 2,622,891 | | | | 2,586,374 | |
See accompanying notes to financial statements.
THE JAMESTOWN BALANCED FUND
FINANCIAL HIGHLIGHTS
| Selected Per Share Data and Ratios for a Share Outstanding Throughout Each Year | |
| | | Years Ended March 31, | |
| | 2015 | | | 2014 | | | 2013 | | | 2012 | | | 2011 | |
| Net asset value at beginning of year | | $ | 15.23 | | | $ | 14.25 | | | $ | 13.86 | | | $ | 13.16 | | | $ | 12.11 | |
| | | | | | | | | | | | | | | | | | | | | |
| Income from investment operations: | | | | | | | | | | | | | | | | | | | | |
| Net investment income | | | 0.13 | | | | 0.14 | | | | 0.15 | | | | 0.14 | | | | 0.16 | |
| Net realized and unrealized gains on investments | | | 0.92 | | | | 2.06 | | | | 0.98 | | | | 0.71 | | | | 1.06 | |
| Total from investment operations | | | 1.05 | | | | 2.20 | | | | 1.13 | | | | 0.85 | | | | 1.22 | |
| | | | | | | | | | | | | | | | | | | | | |
| Less distributions: | | | | | | | | | | | | | | | | | | | | |
| Dividends from net investment income | | | (0.16 | ) | | | (0.16 | ) | | | (0.16 | ) | | | (0.15 | ) | | | (0.17 | ) |
| Distributions from net realized gains | | | (1.47 | ) | | | (1.06 | ) | | | (0.58 | ) | | | — | | | | — | |
| Total distributions | | | (1.63 | ) | | | (1.22 | ) | | | (0.74 | ) | | | (0.15 | ) | | | (0.17 | ) |
| | | | | | | | | | | | | | | | | | | | | |
| Net asset value at end of year | | $ | 14.65 | | | $ | 15.23 | | | $ | 14.25 | | | $ | 13.86 | | | $ | 13.16 | |
| | | | | | | | | | | | | | | | | | | | | |
Total return (a) | | | 7.31 | % | | | 15.92 | % | | | 8.68 | % | | | 6.56 | % | | | 10.24 | % |
| | | | | | | | | | | | | | | | | | | | | |
| Net assets at end of year (000’s) | | $ | 18,254 | | | $ | 18,803 | | | $ | 19,664 | | | $ | 19,048 | | | $ | 21,331 | |
| | | | | | | | | | | | | | | | | | | | | |
| Ratio of total expenses to average net assets | | | 1.35 | % | | | 1.25 | % | | | 1.29 | % | | | 1.28 | % | | | 1.24 | % |
| | | | | | | | | | | | | | | | | | | | | |
Ratio of net expenses to average net assets (b) | | | 1.25 | % | | | 1.19 | % | | | 1.22 | % | | | 1.21 | % | | | 1.18 | % |
| | | | | | | | | | | | | | | | | | | | | |
Ratio of net investment income to average net assets (b) | | | 0.87 | % | | | 0.91 | % | | | 1.11 | % | | | 1.08 | % | | | 1.31 | % |
| | | | | | | | | | | | | | | | | | | | | |
| Portfolio turnover rate | | | 25 | % | | | 21 | % | | | 21 | % | | | 20 | % | | | 30 | % |
| (a) | Total return is a measure of the change in value of an investment in the Fund over the year covered, which assumes any dividends or capital gains distributions are reinvested in shares of the Fund. Returns do not reflect the deduction of taxes a shareholder would pay on Fund distributions or the redemption of Fund shares. |
| (b) | Ratios were determined based on net expenses after voluntary advisory fee waivers by the Adviser (Note 4) and/or expense reimbursements through a directed brokerage arrangement (Note 5). |
See accompanying notes to financial statements.
THE JAMESTOWN EQUITY FUND
FINANCIAL HIGHLIGHTS
| Selected Per Share Data and Ratios for a Share Outstanding Throughout Each Year | |
| | | Years Ended March 31, | |
| | 2015 | | | 2014 | | | 2013 | | | 2012 | | | 2011 | |
| Net asset value at beginning of year | | $ | 22.47 | | | $ | 19.60 | | | $ | 17.73 | | | $ | 16.54 | | | $ | 14.67 | |
| | | | | | | | | | | | | | | | | | | | | |
| Income from investment operations: | | | | | | | | | | | | | | | | | | | | |
| Net investment income | | | 0.16 | | | | 0.15 | | | | 0.15 | | | | 0.09 | | | | 0.09 | |
| Net realized and unrealized gains on investments | | | 1.96 | | | | 4.30 | | | | 1.93 | | | | 1.21 | | | | 1.87 | |
| Total from investment operations | | | 2.12 | | | | 4.45 | | | | 2.08 | | | | 1.30 | | | | 1.96 | |
| | | | | | | | | | | | | | | | | | | | | |
| Less distributions: | | | | | | | | | | | | | | | | | | | | |
| Dividends from net investment income | | | (0.16 | ) | | | (0.15 | ) | | | (0.15 | ) | | | (0.11 | ) | | | (0.09 | ) |
| Distributions from net realized gains | | | (2.52 | ) | | | (1.43 | ) | | | (0.06 | ) | | | — | | | | — | |
| Total distributions | | | (2.68 | ) | | | (1.58 | ) | | | (0.21 | ) | | | (0.11 | ) | | | (0.09 | ) |
| | | | | | | | | | | | | | | | | | | | | |
| Net asset value at end of year | | $ | 21.91 | | | $ | 22.47 | | | $ | 19.60 | | | $ | 17.73 | | | $ | 16.54 | |
| | | | | | | | | | | | | | | | | | | | | |
Total return (a) | | | 10.14 | % | | | 23.55 | % | | | 11.84 | % | | | 7.89 | % | | | 13.48 | % |
| | | | | | | | | | | | | | | | | | | | | |
| Net assets at end of year (000’s) | | $ | 29,596 | | | $ | 30,746 | | | $ | 28,316 | | | $ | 27,703 | | | $ | 28,359 | |
| | | | | | | | | | | | | | | | | | | | | |
| Ratio of total expenses to average net assets | | | 1.09 | % | | | 1.07 | % | | | 1.11 | % | | | 1.11 | % | | | 1.13 | % |
| | | | | | | | | | | | | | | | | | | | | |
Ratio of net expenses to average net assets (b) | | | 1.05 | % | | | 1.03 | % | | | 1.06 | % | | | 1.06 | % | | | 1.09 | % |
| | | | | | | | | | | | | | | | | | | | | |
Ratio of net investment income to average net assets (b) | | | 0.71 | % | | | 0.72 | % | | | 0.81 | % | | | 0.56 | % | | | 0.56 | % |
| | | | | | | | | | | | | | | | | | | | | |
| Portfolio turnover rate | | | 29 | % | | | 21 | % | | | 28 | % | | | 28 | % | | | 49 | % |
| (a) | Total return is a measure of the change in value of an investment in the Fund over the year covered, which assumes any dividends or capital gains distributions are reinvested in shares of the Fund. Returns do not reflect the deduction of taxes a shareholder would pay on Fund distributions or the redemption of Fund shares. |
| (b) | Ratios were determined based on net expenses after expense reimbursements through a directed brokerage arrangement (Note 5). |
See accompanying notes to financial statements.
THE JAMESTOWN TAX EXEMPT VIRGINIA FUND
FINANCIAL HIGHLIGHTS
| Selected Per Share Data and Ratios for a Share Outstanding Throughout Each Year | |
| | | Years Ended March 31, | |
| | 2015 | | | 2014 | | | 2013 | | | 2012 | | | 2011 | |
| Net asset value at beginning of year | | $ | 10.16 | | | $ | 10.47 | | | $ | 10.57 | | | $ | 10.25 | | | $ | 10.33 | |
| | | | | | | | | | | | | | | | | | | | | |
| Income (loss) from investment operations: | | | | | | | | | | | | | | | | | | | | |
| Net investment income | | | 0.24 | | | | 0.26 | | | | 0.26 | | | | 0.29 | | | | 0.29 | |
| Net realized and unrealized gains (losses) on investments | | | 0.02 | | | | (0.30 | ) | | | (0.06 | ) | | | 0.32 | | | | (0.06 | ) |
| Total from investment operations | | | 0.26 | | | | (0.04 | ) | | | 0.20 | | | | 0.61 | | | | 0.23 | |
| | | | | | | | | | | | | | | | | | | | | |
| Less distributions: | | | | | | | | | | | | | | | | | | | | |
| Dividends from net investment income | | | (0.24 | ) | | | (0.26 | ) | | | (0.27 | ) | | | (0.29 | ) | | | (0.29 | ) |
| Distributions from net realized gains | | | — | | | | (0.01 | ) | | | (0.03 | ) | | | (0.00 | )(a) | | | (0.02 | ) |
| Total distributions | | | (0.24 | ) | | | (0.27 | ) | | | (0.30 | ) | | | (0.29 | ) | | | (0.31 | ) |
| | | | | | | | | | | | | | | | | | | | | |
| Net asset value at end of year | | $ | 10.18 | | | $ | 10.16 | | | $ | 10.47 | | | $ | 10.57 | | | $ | 10.25 | |
| | | | | | | | | | | | | | | | | | | | | |
Total return (b) | | | 2.61 | % | | | (0.37 | %) | | | 1.88 | % | | | 6.03 | % | | | 2.26 | % |
| | | | | | | | | | | | | | | | | | | | | |
| Net assets at end of year (000’s) | | $ | 26,695 | | | $ | 26,284 | | | $ | 27,782 | | | $ | 30,063 | | | $ | 30,368 | |
| | | | | | | | | | | | | | | | | | | | | |
| Ratio of total expenses to average net assets | | | 0.88 | % | | | 0.88 | % | | | 0.76 | % | | | 0.77 | % | | | 0.76 | % |
| | | | | | | | | | | | | | | | | | | | | |
Ratio of net expenses to average net assets (c) | | | 0.69 | % | | | 0.69 | % | | | 0.69 | % | | | 0.69 | % | | | 0.69 | % |
| | | | | | | | | | | | | | | | | | | | | |
Ratio of net investment income to average net assets (c) | | | 2.38 | % | | | 2.59 | % | | | 2.50 | % | | | 2.75 | % | | | 2.78 | % |
| | | | | | | | | | | | | | | | | | | | | |
| Portfolio turnover rate | | | 16 | % | | | 1 | % | | | 15 | % | | | 2 | % | | | 8 | % |
| (a) | Amount rounds to less than a penny per share. |
| (b) | Total return is a measure of the change in value of an investment in the Fund over the year covered, which assumes any dividends or capital gains distributions are reinvested in shares of the Fund. Returns do not reflect the deduction of taxes a shareholder would pay on Fund distributions or the redemption of Fund shares. |
| (c) | Ratios were determined after voluntary advisory fee waivers by the Adviser (Note 4). |
See accompanying notes to financial statements.
THE JAMESTOWN FUNDS
NOTES TO FINANCIAL STATEMENTS
March 31, 2015
1. Organization
The Jamestown Balanced Fund, The Jamestown Equity Fund and The Jamestown Tax Exempt Virginia Fund (individually, a “Fund,” and, collectively, the “Funds”) are each a no-load series of Williamsburg Investment Trust (the “Trust”), an open-end management investment company registered under the Investment Company Act of 1940. The Jamestown Balanced Fund and The Jamestown Equity Fund are each a diversified fund and The Jamestown Tax Exempt Virginia Fund is a non-diversified fund. The Trust was organized as a Massachusetts business trust on July 18, 1988. Other series of the Trust are not included in this report.
The Jamestown Balanced Fund’s investment objectives are long-term growth of capital and income.
The Jamestown Equity Fund’s investment objective is long-term growth of capital.
The Jamestown Tax Exempt Virginia Fund’s investment objectives are to provide current income exempt from federal income taxes and from the personal income taxes of Virginia, to preserve capital, to limit credit risk and to take advantage of opportunities to increase and enhance the value of a shareholder’s investment.
2. Significant Accounting Policies
As an investment company, as defined in Financial Accounting Standards Board (“FASB”) Accounting Standards Update 2013-08, the Funds follow accounting and reporting guidance under FASB Accounting Standards Codification Topic 946, “Financial Services – Investment Companies.” The following is a summary of the Funds’ significant accounting policies. These policies are in conformity with accounting principles generally accepted in the United States of America (“GAAP”).
Securities valuation — The Funds’ portfolio securities are each valued as of the close of business of the regular session of the New York Stock Exchange (normally 4:00 p.m., Eastern time). Securities traded on a national stock exchange are generally valued based upon the closing price on the principal exchange where the security is traded, if available, otherwise, at the last quoted bid price. Securities which are quoted by NASDAQ are valued at the NASDAQ Official Closing Price. Investments representing shares of other investment companies are valued at their net asset value as reported by such companies.
Fixed income securities are typically valued on the basis of prices provided by an independent pricing service. The prices provided by the pricing service are determined with consideration given to institutional bid and last sale prices and take into account securities prices, yields, maturities, call features, ratings, institutional trading in similar groups of securities and developments related to specific securities.
When market quotations are not readily available, if a pricing service cannot provide a price or the investment adviser believes the price received from the pricing service is not indicative of market value, securities will be valued in good faith at fair value using methods consistent with
THE JAMESTOWN FUNDS
NOTES TO FINANCIAL STATEMENTS (Continued)
procedures adopted by the Board of Trustees and will be classified as Level 2 or 3 within the fair value hierarchy (see below), depending on the inputs used. Such methods of fair valuation may include, but are not limited to: multiple of earnings, multiple of book value, discount from market of a similar freely traded security, purchase price of the security, subsequent private transactions in the security or related securities, or a combination of these and other factors.
GAAP establishes a single authoritative definition of fair value, sets out a framework for measuring fair value and requires additional disclosures about fair value measurements.
Various inputs are used in determining the value of each Fund’s investments. These inputs are summarized in the three broad levels listed below:
| • | Level 1 – quoted prices in active markets for identical securities |
| • | Level 2 – other significant observable inputs |
| • | Level 3 – significant unobservable inputs |
Fixed income securities, including obligations of the U.S. Treasury and U.S. Government agencies, corporate bonds, mortgage-backed securities and municipal bonds, are classified as Level 2 since the values for such securities are based on prices provided by an independent pricing service that utilizes various “other significant observable inputs” including bid and ask quotations, prices of similar securities and interest rates, among other factors.
The inputs or methodology used for valuing securities are not necessarily an indication of the risks associated with investing in those securities. The inputs used to measure fair value may fall into different levels of the fair value hierarchy. In such cases, for disclosure purposes, the level in the fair value hierarchy within which the fair value measurement falls in its entirety is determined based on the lowest level input that is significant to the fair value measurement.
The following is a summary of the inputs used to value each Fund’s investments as of March 31, 2015 by security type:
| The Jamestown Balanced Fund | | Level 1 | | | Level 2 | | | Level 3 | | | Total | |
| Common Stocks | | $ | 11,893,559 | | | $ | — | | | $ | — | | | $ | 11,893,559 | |
| Exchange-Traded Funds | | | 253,448 | | | | — | | | | — | | | | 253,448 | |
| U.S. Treasury Obligations | | | — | | | | 1,369,327 | | | | — | | | | 1,369,327 | |
| U.S. Government Agency Obligations | | | — | | | | 525,374 | | | | — | | | | 525,374 | |
| Corporate Bonds | | | — | | | | 3,119,743 | | | | — | | | | 3,119,743 | |
| Mortgage-Backed Securities | | | — | | | | 225,599 | | | | — | | | | 225,599 | |
| Municipal Bonds | | | — | | | | 106,119 | | | | — | | | | 106,119 | |
| Total | | $ | 12,147,007 | | | $ | 5,346,162 | | | $ | — | | | $ | 17,493,169 | |
| The Jamestown Equity Fund | | Level 1 | | | Level 2 | | | Level 3 | | | Total | |
| Common Stocks | | $ | 27,663,040 | | | $ | — | | | $ | — | | | $ | 27,663,040 | |
| Exchange-Traded Funds | | | 584,880 | | | | — | | | | — | | | | 584,880 | |
| Total | | $ | 28,247,920 | | | $ | — | | | $ | — | | | $ | 28,247,920 | |
THE JAMESTOWN FUNDS
NOTES TO FINANCIAL STATEMENTS (Continued) |
| The Jamestown Tax Exempt Virginia Fund | | Level 1 | | | Level 2 | | | Level 3 | | | Total | |
| Municipal Bonds | | $ | — | | | $ | 25,698,649 | | | $ | — | | | $ | 25,698,649 | |
| Exchange-Traded Funds | | | 121,600 | | | | — | | | | — | | | | 121,600 | |
| Money Market Funds | | | 372,240 | | | | — | | | | — | | | | 372,240 | |
| Total | | $ | 493,840 | | | $ | 25,698,649 | | | $ | — | | | $ | 26,192,489 | |
Refer to The Jamestown Balanced Fund’s and The Jamestown Equity Fund’s Schedules of Investments for a listing of the common stocks and corporate bonds by sector type. As of March 31, 2015, the Funds did not have any transfers into and out of any Level. There were no Level 3 securities or derivative instruments held by the Funds as of March 31, 2015. It is the Funds’ policy to recognize transfers into and out of any Level at the end of the reporting period.
Share valuation — The net asset value per share of each Fund is calculated daily by dividing the total value of its assets, less liabilities, by the number of shares outstanding. The offering price and redemption price per share of each Fund is equal to the net asset value per share.
Investment income — Interest income is accrued as earned. Dividend income is recorded on the ex-dividend date. Discounts and premiums on fixed income securities purchased are amortized using the interest method.
Distributions to shareholders — Dividends arising from net investment income, if any, are declared and paid quarterly to shareholders of The Jamestown Balanced Fund and The Jamestown Equity Fund. Dividends arising from net investment income are declared daily and paid monthly to shareholders of The Jamestown Tax Exempt Virginia Fund. Net realized short-term capital gains, if any, may be distributed throughout the year and net realized long-term capital gains, if any, are distributed at least once each year. The amount of distributions from net investment income and net realized gains are determined in accordance with federal income tax regulations which may differ from GAAP. These “book/tax” differences are permanent in nature and are primarily due to differing treatments of net short-term gains. Dividends and distributions are recorded on the ex-dividend date.
The tax character of distributions paid during the years ended March 31, 2015 and March 31, 2014 was as follows:
| | Years Ended | | Ordinary Income | | | Long-Term Capital Gains | | | Exempt- Interest Dividends | | | Total Distributions | |
| The Jamestown Balanced Fund | 3/31/15 | | $ | 245,662 | | | $ | 1,754,215 | | | $ | — | | | $ | 1,999,877 | |
| | 3/31/14 | | $ | 457,405 | | | $ | 1,097,734 | | | $ | — | | | $ | 1,555,139 | |
| The Jamestown Equity Fund | 3/31/15 | | $ | 317,270 | | | $ | 3,373,549 | | | $ | — | | | $ | 3,690,819 | |
| | 3/31/14 | | $ | 382,664 | | | $ | 1,868,577 | | | $ | — | | | $ | 2,251,241 | |
| The Jamestown Tax Exempt Virginia Fund | 3/31/15 | | $ | — | | | $ | — | | | $ | 628,553 | | | $ | 628,553 | |
| | 3/31/14 | | $ | 23 | | | $ | 12,336 | | | $ | 676,329 | | | $ | 688,688 | |
Security transactions — Security transactions are accounted for on trade date for financial reporting purposes. Gains and losses on securities sold are determined on a specific identification basis.
THE JAMESTOWN FUNDS
NOTES TO FINANCIAL STATEMENTS (Continued)
Securities traded on a “to-be-announced” basis — The Jamestown Balanced Fund may trade securities on a “to-be-announced” (“TBA”) basis. In a TBA transaction, the Fund has committed to purchase securities for which all specific information is not yet known at the time of the trade, particularly the face amount in mortgage-backed securities transactions. Securities purchased on a TBA basis are not settled until they are delivered to the Fund, normally 15 to 45 days later. These transactions are subject to market fluctuations and their current value is determined in the same manner as for other portfolio securities.
Common expenses — Common expenses of the Trust are allocated among the series of the Trust based on relative net assets of each series or the nature of the services performed and the relative applicability to each series.
Estimates — The preparation of financial statements in conformity with GAAP requires management to make estimates and assumptions that affect the reported amounts of assets and liabilities and the disclosure of contingent assets and liabilities as of the date of the financial statements and the reported amounts of income and expenses during the reporting period. Actual results could differ from those estimates.
Federal income tax — Each Fund has qualified and intends to continue to qualify as a regulated investment company under the Internal Revenue Code of 1986 (the “Code”). Qualification generally will relieve the Funds of liability for federal income taxes to the extent 100% of their net investment income and net realized gains are distributed in accordance with the Code. Accordingly, no provision for income taxes has been made.
In order to avoid imposition of the excise tax applicable to regulated investment companies, it is also each Fund’s intention to declare as dividends in each calendar year at least 98% of its net investment income (earned during the calendar year) and 98.2% of its net realized capital gains (earned during the twelve months ended October 31) plus undistributed amounts from prior years.
The tax character of distributable earnings at March 31, 2015 was as follows:
| | | The Jamestown Balanced Fund | | | The Jamestown Equity Fund | | | The Jamestown Tax Exempt Virginia Fund | |
| Cost of portfolio investments | | $ | 12,103,683 | | | $ | 16,209,599 | | | $ | 25,128,101 | |
| Gross unrealized appreciation | | $ | 5,493,924 | | | $ | 12,237,706 | | | $ | 1,082,008 | |
| Gross unrealized depreciation | | | (104,438 | ) | | | (199,385 | ) | | | (17,620 | ) |
| Net unrealized appreciation on investments | | | 5,389,486 | | | | 12,038,321 | | | | 1,064,388 | |
| Undistributed tax exempt income | | | — | | | | — | | | | 5,768 | |
| Undistributed long-term gains | | | 376,696 | | | | 1,405,298 | | | | — | |
| Capital loss carryforwards | | | — | | | | — | | | | (10,847 | ) |
| Other temporary differences | | | (2,739 | ) | | | (1,873 | ) | | | (5,768 | ) |
| Total distributable earnings | | $ | 5,763,443 | | | $ | 13,441,746 | | | $ | 1,053,541 | |
THE JAMESTOWN FUNDS
NOTES TO FINANCIAL STATEMENTS (Continued)
The difference between the federal income tax cost of portfolio investments and the financial statement cost for The Jamestown Balanced Fund and The Jamestown Equity Fund is due to certain timing differences in the recognition of capital gains or losses under income tax regulations and GAAP. These “book/tax” differences are temporary in nature and are primarily due to the tax deferral of losses on wash sales and/or differing methods in the amortization and accretion of premium and discount on fixed income securities.
For the year ended March 31, 2015, the following reclassifications were made as a result of permanent differences between the financial statement and income tax reporting requirements:
| | | The Jamestown Balanced Fund | | | The Jamestown Equity Fund | | | The Jamestown Tax Exempt Virginia Fund | |
| Paid-in capital | | $ | 350,159 | | | $ | — | | | $ | — | |
| Undistributed net investment income | | $ | 8,644 | | | $ | (2,844 | ) | | $ | — | |
| Undistributed net realized gains from security transactions | | $ | (358,803 | ) | | $ | 2,844 | | | $ | — | |
Such reclassifications have no effect on each Fund’s total net assets or its net asset value per share.
During the year ended March 31, 2015, The Jamestown Balanced Fund realized $350,159 of net capital gains resulting from in-kind redemptions (redemptions in which shareholders who redeemed Fund shares received securities held by the Fund rather than cash). The Fund recognizes a gain on in-kind redemptions to the extent that the value of the distributed securities on the date of redemption exceeds the cost of those securities. Such gains are not taxable to the Fund and are not required to be distributed to shareholders. The Fund has reclassified these amounts against paid-in capital as shown in the table above.
During the year ended March 31, 2015, The Jamestown Tax Exempt Virginia Fund utilized long-term capital loss carryforwards in the amount of $9,689 to offset current year gains. As of March 31, 2015, The Jamestown Tax Exempt Virginia Fund had a long-term capital loss carryforward of $10,847 for federal income tax purposes. This capital loss carryforward, which does not expire, may be utilized in future years to offset net realized capital gains, if any, prior to distributing such gains to shareholders.
The Funds recognize the tax benefits or expenses of uncertain tax positions only when the position is “more likely than not” to be sustained assuming examination by tax authorities. Management has reviewed the tax positions taken on Federal income tax returns for all open tax years (tax years ended March 31, 2012 through March 31, 2015) of each Fund and has concluded that no provision for unrecognized tax benefits or expenses is required in these financial statements.
THE JAMESTOWN FUNDS
NOTES TO FINANCIAL STATEMENTS (Continued)
3. Investment Transactions
Investment transactions, other than short-term investments and U.S. government securities, were as follows for the year ended March 31, 2015:
| | | The Jamestown Balanced Fund | | | The Jamestown Equity Fund | | | The Jamestown Tax Exempt Virginia Fund | |
| Purchase of investment securities | | $ | 4,006,108 | | | $ | 8,257,313 | | | $ | 4,946,183 | |
| Proceeds from sales and maturities of investment securities | | $ | 5,128,119 | | | $ | 11,075,124 | | | $ | 4,001,802 | |
4. Transactions with Related Parties
INVESTMENT ADVISORY AGREEMENTS
Each Fund’s investments are managed by Lowe, Brockenbrough & Company, Inc. (the “Adviser”) under the terms of an Investment Advisory Agreement. The Jamestown Balanced Fund pays the Adviser a fee, which is computed and accrued daily and paid monthly, at an annual rate of .65% of its average daily net assets up to $250 million, .60% of the next $250 million of such assets and .55% of such assets in excess of $500 million. The Jamestown Equity Fund pays the Adviser a fee, which is computed and accrued daily and paid monthly, at an annual rate of .65% of its average daily net assets up to $500 million and .55% of such assets in excess of $500 million. The Jamestown Tax Exempt Virginia Fund pays the Adviser a fee, which is computed and accrued daily and paid monthly, at an annual rate of .40% of its average daily net assets up to $250 million, .35% of the next $250 million of such assets and .30% of such assets in excess of $500 million. Certain officers of the Trust are also officers of the Adviser.
In order to reduce the annual operating expenses of The Jamestown Balanced Fund, the Adviser voluntarily waived $11,243 of its investment advisory fees during the year ended March 31, 2015. Additionally, during the year ended March 31, 2015, the Adviser voluntarily limited the total annual operating expenses of The Jamestown Tax Exempt Virginia Fund to .69% of its average daily net assets; accordingly, the Adviser voluntarily waived $50,188 of its investment advisory fees during the year ended March 31, 2015.
OTHER SERVICE PROVIDERS
Ultimus Fund Solutions, LLC (“Ultimus”) provides fund administration, fund accounting, compliance and transfer agent services to the Funds. Pursuant to servicing agreements with Ultimus, the Funds pay Ultimus fees in accordance with such agreements. Certain officers of the Trust are also officers of Ultimus, or of Ultimus Fund Distributors, LLC (the “Distributor”), the principal underwriter of each Fund’s shares and an affiliate of Ultimus. The Distributor is compensated by the Adviser (not the Funds) for acting as principal underwriter.
THE JAMESTOWN FUNDS
NOTES TO FINANCIAL STATEMENTS (Continued)
COMPENSATION OF TRUSTEES
Trustees and officers affiliated with the Adviser or Ultimus are not compensated by the Trust for their services. Each Trustee who is not an affiliated person of the Adviser or Ultimus receives from the Trust an annual retainer of $12,000, payable quarterly; a fee of $1,500 for attendance at each meeting of the Board of Trustees (except that such fee is $2,500 for the independent chairman); and $1,000 for attendance at each meeting of any committee of the Board (except that such fee is $1,500 for the committee chairman); plus reimbursement of travel and other expenses incurred in attending meetings. Prior to July 1, 2014, the annual retainer was $10,000.
5. Brokerage Arrangement
In order to reduce the total operating expenses of The Jamestown Balanced Fund and The Jamestown Equity Fund, a portion of each Fund’s operating expenses have been paid through an arrangement with a third-party broker-dealer who is compensated through commission trades. Payment of expenses by the broker-dealer is based on a percentage of commissions earned. Expenses reimbursed through the brokerage arrangement totaled $6,000 and $12,000 for The Jamestown Balanced Fund and The Jamestown Equity Fund, respectively, for the year ended March 31, 2015.
6. Contingencies and Commitments
The Funds indemnify the Trust’s officers and Trustees for certain liabilities that might arise from their performance of their duties to the Funds. Additionally, in the normal course of business the Funds enter into contracts that contain a variety of representations and warranties and which provide general indemnifications. The Funds’ maximum exposure under these arrangements is unknown, as this would involve future claims that may be made against the Funds that have not yet occurred. However, based on experience, the Funds expect the risk of loss to be remote.
7. Concentration of Credit Risk
The Jamestown Tax Exempt Virginia Fund invests primarily in debt instruments of municipal issuers in the Commonwealth of Virginia. The issuers’ abilities to meet their obligations may be affected by economic developments in the Commonwealth or its region, as well as disruptions in the credit markets and the economy, generally.
8. Subsequent Events
The Funds are required to recognize in the financial statements the effects of all subsequent events that provide additional evidence about conditions that existed as of the date of the Statements of Assets and Liabilities. For non-recognized subsequent events that must be disclosed to keep the financial statements from being misleading, the Funds are required to disclose the nature of the event as well as an estimate of its financial effect, or a statement that such an estimate cannot be made. Management has evaluated subsequent events through the issuance of these financial statements and has noted no such events except as reflected in the following paragraph.
THE JAMESTOWN FUNDS
NOTES TO FINANCIAL STATEMENTS (Continued)
On May 19, 2015, the Board of Trustees of the Trust unanimously approved an Agreement and Plan of Reorganization (the “Agreement”) pursuant to which The Jamestown Equity Fund would acquire all of the assets and known liabilities of The Jamestown Balanced Fund in exchange for shares of the Jamestown Equity Fund. The Agreement requires approval by the shareholders of the Jamestown Balanced Fund and will be submitted for their consideration at a meeting to be held on or about July 17, 2015.
THE JAMESTOWN FUNDS
REPORT OF INDEPENDENT REGISTERED
PUBLIC ACCOUNTING FIRM
The Board of Trustees and Shareholders of
The Jamestown Balanced Fund,
The Jamestown Equity Fund, and
The Jamestown Tax Exempt Virginia Fund, each a series of the Williamsburg Investment Trust
We have audited the accompanying statements of assets and liabilities of The Jamestown Balanced Fund, The Jamestown Equity Fund, and The Jamestown Tax Exempt Virginia Fund (collectively referred to as the “Funds”) (each a series of the Williamsburg Investment Trust), including the schedules of investments, as of March 31, 2015, and the related statements of operations for the year then ended, the statements of changes in net assets for each of the two years in the period then ended, and the financial highlights for each of the five years in the period then ended. These financial statements and financial highlights are the responsibility of the Funds’ management. Our responsibility is to express an opinion on these financial statements and financial highlights based on our audits.
We conducted our audits in accordance with the standards of the Public Company Accounting Oversight Board (United States). Those standards require that we plan and perform the audits to obtain reasonable assurance about whether the financial statements and financial highlights are free of material misstatement. We were not engaged to perform an audit of the Funds’ internal control over financial reporting. Our audits included consideration of internal control over financial reporting as a basis for designing audit procedures that are appropriate in the circumstances, but not for the purpose of expressing an opinion on the effectiveness of the Funds’ internal control over financial reporting. Accordingly, we express no such opinion. An audit also includes examining, on a test basis, evidence supporting the amounts and disclosures in the financial statements and financial highlights, assessing the accounting principles used and significant estimates made by management, and evaluating the overall financial statement presentation. Our procedures included confirmation of securities owned as of March 31, 2015, by correspondence with the custodian. We believe that our audits provide a reasonable basis for our opinion.
In our opinion, the financial statements and financial highlights referred to above present fairly, in all material respects, the financial position of each of the respective Funds comprising the Williamsburg Investment Trust at March 31, 2015, the results of their operations for the year then ended, the changes in their net assets for each of the two years in the period then ended, and the financial highlights for each of the five years in the period then ended, in conformity with U.S. generally accepted accounting principles.
Cincinnati, Ohio
May 22, 2015
THE JAMESTOWN FUNDS
BOARD OF TRUSTEES AND EXECUTIVE OFFICERS
(Unaudited)
Overall responsibility for management of the Funds rests with the Board of Trustees. The Trustees serve during the lifetime of the Trust and until its termination, or until death, resignation, retirement or removal. The Trustees, in turn, elect the officers of the Funds. The officers have been elected for an annual term. The following are the Trustees and executive officers of the Funds:
| | Trustee | Address | Year of Birth | Position Held
with the Trust | Length of
Time Served |
| | Robert S. Harris, Ph.D. | 100 Darden Boulevard
Charlottesville, VA | 1949 | Chairman and Trustee | Since
January 2007 |
| * | John P. Ackerly, IV | One James Center
901 E. Cary Street
Richmond, VA | 1963 | Trustee and President of Davenport Funds | Since
November 1997 |
| * | John T. Bruce | 800 Main Street
Lynchburg, VA | 1953 | Trustee and President of FBP Funds | Since
September 1988 |
| | George K. Jennison | 5101 Stratford Crescent
Richmond, VA | 1957 | Trustee | Since
January 2015 |
| | J. Finley Lee, Jr., Ph.D. | 448 Pond Apple Drive North
Naples, FL | 1939 | Trustee | Since
September 1988 |
| | Harris V. Morrissette | 100 Jacintoport Boulevard
Saraland, AL | 1959 | Trustee | Since
March 1993 |
| | Elizabeth W. Robertson | 8908 Norwick Road
Richmond, VA | 1953 | Trustee | Since
February 2014 |
| | Austin Brockenbrough, III | 1802 Bayberry Court, Suite 400
Richmond, VA | 1937 | Vice President, The Jamestown Funds | Since
September 1988 |
| | Charles M. Caravati, III | 1802 Bayberry Court, Suite 400
Richmond, VA | 1965 | President, The Jamestown Balanced Fund and The Jamestown Equity Fund | Since
January 1996 |
| | Joseph A. Jennings, III | 1802 Bayberry Court, Suite 400
Richmond, VA | 1962 | President, The Jamestown Tax Exempt Virginia Fund | Since
July 2005 |
| | Lawrence B. Whitlock, Jr. | 1802 Bayberry Court, Suite 400
Richmond, VA | 1948 | Vice President, The Jamestown Balanced Fund and The Jamestown Equity Fund | Since
February 2002 |
| | Robert G. Dorsey | 225 Pictoria Drive, Suite 450
Cincinnati, OH | 1957 | Vice President | Since
November 2000 |
| | Mark J. Seger | 225 Pictoria Drive, Suite 450
Cincinnati, OH | 1962 | Treasurer | Since
November 2000 |
| | Tina H. Bloom | 225 Pictoria Drive, Suite 450
Cincinnati, OH | 1968 | Chief Compliance Officer and Secretary | Since
August 2006 |
| * | Messrs. Ackerly and Bruce, as affiliated persons of investment advisers to the Trust, are “interested persons” of the Trust within the meaning of Section 2(a)(19) of the Investment Company Act of 1940. |
THE JAMESTOWN FUNDS
BOARD OF TRUSTEES AND EXECUTIVE OFFICERS
(Unaudited) (Continued)
Each Trustee oversees twelve portfolios of the Trust, including the Funds. The principal occupations of the Trustees and executive officers of the Funds during the past five years and public directorships held by the Trustees are set forth below:
Robert S. Harris, Ph.D. is the C. Stewart Sheppard Professor of Business Administration at The Darden Graduate School of Business Administration at the University of Virginia. He was previously the dean at Darden. Professor Harris has published widely on corporate finance, financial markets and mergers and acquisitions and has served as a consultant to corporations and government agencies.
John P. Ackerly, IV is Senior Vice President and Portfolio Manager of Davenport & Company LLC.
John T. Bruce is a President, Director and member of the Executive Committee of Flippin, Bruce & Porter, Inc. (an investment advisory firm).
George K. Jennison is President of Oyster Consulting, LLC (a financial consulting firm). He previously was a financial adviser with Wells Fargo Advisors, LLC.
J. Finley Lee, Jr., Ph.D. is the retired Julian Price Professor Emeritus at the University of North Carolina.
Harris V. Morrissette is President of China Doll Rice and Beans, Inc. and Dixie Lily Foods. He is also a Director of International Shipholding Corporation (cargo transportation); and Director of Trustmark National Bank (bank holding company). Previously, he was Chairman of Azalea Aviation, Inc. (airplane fueling) until January 2012.
Elizabeth W. Robertson has been Chief Financial Officer for Monument Restaurants LLC (restaurant franchises) since 2011 and a Director of Franklin Financial Corporation and Franklin Federal Savings Bank since 1996.
Austin Brockenbrough III is President and Managing Director of the Adviser. He is a member of the Board of Directors of Tredegar Corporation (a plastics manufacturer) and Wilkinson O’Grady & Co., Inc. (a global asset manager).
Charles M. Caravati, III is a Managing Director of the Adviser.
Joseph A. Jennings, III is a Managing Director of the Adviser.
Lawrence B. Whitlock, Jr. is a Managing Director of the Adviser.
Robert G. Dorsey is a Managing Director of Ultimus Fund Solutions, LLC and Ultimus Fund Distributors, LLC.
Mark J. Seger is a Managing Director of Ultimus Fund Solutions, LLC and Ultimus Fund Distributors, LLC.
Tina H. Bloom is Director of Fund Administration of Ultimus Fund Solutions, LLC.
Additional information about members of the Board of Trustees and executive officers is available in the Statement of Additional Information (“SAI”). To obtain a free copy of the SAI, please call 1-800-281-3217.
THE JAMESTOWN FUNDS
FEDERAL TAX INFORMATION (Unaudited)
In accordance with federal tax requirements, the following provides shareholders with information concerning distributions from ordinary income and net realized gains made by the Funds during the year ended March 31, 2015. Certain dividends paid by the Funds may be subject to a maximum tax rate of 23.8%. The Jamestown Balanced Fund and The Jamestown Equity Fund intend to designate up to a maximum amount of $268,473 and $373,828, respectively, as taxed at a maximum rate of 23.8%. For the fiscal year ended March 31, 2015, all of the dividends paid from ordinary income by The Jamestown Balanced and The Jamestown Equity Fund, qualified for the dividends received deduction for corporations. During the year ended March 31, 2015, The Jamestown Balanced Fund and The Jamestown Equity Fund paid long-term capital gain distributions of $1,731,404 and $3,316,991, respectively.
As required by federal regulations, complete information will be computed and reported in conjunction with your 2015 Form 1099-DIV.
THE JAMESTOWN FUNDS
ABOUT YOUR FUNDS’ EXPENSES (Unaudited)
We believe it is important for you to understand the impact of costs on your investment. All mutual funds have operating expenses. As a shareholder of the Funds, you incur ongoing costs, including management fees and other expenses. The following examples are intended to help you understand your ongoing costs (in dollars) of investing in the Funds and to compare these costs with the ongoing costs of investing in other mutual funds.
A mutual fund’s ongoing costs are expressed as a percentage of its average net assets. This figure is known as the expense ratio. The expenses in the table below are based on an investment of $1,000 made at the beginning of the period shown and held for the entire period (October 1, 2014 through March 31, 2015).
The table below illustrates each Fund’s costs in two ways:
Actual fund return – This section helps you to estimate the actual expenses that you paid over the period. The “Ending Account Value” shown is derived from each Fund’s actual return, and the third column shows the dollar amount of operating expenses that would have been paid by an investor who started with $1,000 in the Funds. You may use the information here, together with the amount you invested, to estimate the expenses that you paid over the period.
To do so, simply divide your account value by $1,000 (for example, an $8,600 account value divided by $1,000 = 8.6), then multiply the result by the number given for the Funds under the heading “Expenses Paid During Period.”
Hypothetical 5% return – This section is intended to help you compare the Funds’ ongoing costs with those of other mutual funds. It assumes that each Fund had an annual return of 5% before expenses during the period shown, but that the expense ratio is unchanged. In this case, because the returns used are not the Funds’ actual returns, the results do not apply to your investment. The example is useful in making comparisons because the Securities and Exchange Commission (“SEC”) requires all mutual funds to calculate expenses based on a 5% return. You can assess each Fund’s ongoing costs by comparing this hypothetical example with the hypothetical examples that appear in shareholder reports of other funds.
Note that expenses shown in the table are meant to highlight and help you compare ongoing costs only. The Funds do not charge sales loads or redemption fees.
The calculations assume no shares were bought or sold during the period. Your actual costs may have been higher or lower, depending on the amount of your investment and the timing of any purchases or redemptions.
More information about the Funds’ expenses, including annual expense ratios for the prior five fiscal years, can be found in this report. For additional information on operating expenses and other shareholder costs, please refer to the Funds’ prospectus.
THE JAMESTOWN FUNDS
ABOUT YOUR FUNDS’ EXPENSES (Unaudited) (Continued) |
| | Beginning
Account Value
October 1, 2014 | Ending
Account Value
March 31, 2015 | Net
Expense Ratio(a) | Expenses
Paid During Period(b) |
| The Jamestown Balanced Fund |
| Based on Actual Fund Return | $1,000.00 | $1,032.50 | 1.28% | $6.49 |
| Based on Hypothetical 5% Return (before expenses) | $1,000.00 | $1,018.55 | 1.28% | $6.44 |
| The Jamestown Equity Fund |
| Based on Actual Fund Return | $1,000.00 | $1,043.00 | 1.07% | $5.45 |
| Based on Hypothetical 5% Return (before expenses) | $1,000.00 | $1,019.60 | 1.07% | $5.39 |
| The Jamestown Tax Exempt Virginia Fund |
| Based on Actual Fund Return | $1,000.00 | $1,009.40 | 0.69% | $3.46 |
| Based on Hypothetical 5% Return (before expenses) | $1,000.00 | $1,021.49 | 0.69% | $3.48 |
| (a) | Annualized, based on the Fund’s most recent one-half year expenses. |
| (b) | Expenses are equal to the Fund’s annualized expense ratio multiplied by the average account value over the period, multiplied by 182/365 (to reflect the one-half year period). |
THE JAMESTOWN FUNDS
OTHER INFORMATION (Unaudited)
A description of the policies and procedures that the Funds use to vote proxies relating to portfolio securities is available without charge upon request by calling toll-free 1-866-738-1126, or on the SEC’s website at http://www.sec.gov. Information regarding how the Funds voted proxies relating to portfolio securities during the most recent 12-month period ended June 30 is also available without charge upon request by calling toll-free 1-866-738-1126, or on the SEC’s website at http://www.sec.gov.
The Trust files a complete listing of portfolio holdings of the Funds with the SEC as of the end of the first and third quarters of each fiscal year on Form N-Q. The filings are available upon request, by calling 1-866-738-1126. Furthermore, you may obtain a copy of these filings on the SEC’s website at http://www.sec.gov. The Trust’s Forms N-Q may also be reviewed and copied at the SEC’s Public Reference Room in Washington, DC, and information on the operation of the Public Reference Room may be obtained by calling 1-800-SEC-0330.
THE JAMESTOWN FUNDS
DISCLOSURE REGARDING APPROVAL OF INVESTMENT
ADVISORY AGREEMENTS (Unaudited)
At an in-person meeting held on February 24, 2015, the Board of Trustees, including a majority of the Independent Trustees, approved the continuance for a one-year period of the Investment Advisory Agreements with the Adviser on behalf of The Jamestown Balanced Fund, The Jamestown Equity Fund and The Jamestown Tax Exempt Virginia Fund. Below is a discussion of the factors considered by the Board of Trustees along with its conclusions with respect thereto that formed the basis for the Board’s approvals.
In selecting the Adviser and approving the continuance of the Investment Advisory Agreements, the Trustees considered all information they deemed reasonably necessary to evaluate the terms of the Agreements. The principal areas of review by the Trustees were the nature, extent and quality of the services provided by the Adviser and the reasonableness of the fees charged for those services. These matters were considered by the Independent Trustees consulting with experienced counsel for the Independent Trustees, who is independent of the Adviser.
The Trustees’ evaluation of the quality of the Adviser’s services took into account their knowledge and experience gained through meetings with and reports of the Adviser’s senior management over the course of the preceding year. Both short-term and long-term investment performance of the Funds was considered. Each Fund’s performance was compared to its performance benchmark and to that of competitive funds with similar investment objectives and to the Adviser’s comparably managed private accounts. The Trustees also considered the scope and quality of the in-house capabilities of the Adviser and other resources dedicated to performing services for the Funds. The quality of administrative and other services, including the Adviser’s role in coordinating the activities of the Funds’ other service providers, were considered in light of the Funds’ compliance with investment policies and applicable laws and regulations and of related reports by management and the Funds’ independent public accounting firm in periodic meetings with the Trust’s Audit Committee. The Trustees also considered the business reputation of the Adviser, the qualifications of its key investment and compliance personnel, and its financial resources.
In reviewing the fees payable under the Investment Advisory Agreements, the Trustees compared the advisory fees and overall expense levels of each Fund with those of competitive funds with similar investment objectives as well as the private accounts managed by the Adviser. The Trustees considered information provided by the Adviser concerning the Adviser’s profitability with respect to each Fund, including the assumptions and methodology used in preparing the profitability information, in light of applicable case law relating to advisory fees. For these purposes, the Trustees took into account not only the fees paid by the Funds, but also so-called “fallout” benefits to the Adviser. The Trustees also reviewed the revenue sharing arrangements relating to the Funds, whereby fees are paid by the Adviser to various intermediaries that direct assets to the Funds. In evaluating the Funds’ advisory fees, the Trustees took into account the complexity and quality of the investment management of the Funds.
THE JAMESTOWN FUNDS
DISCLOSURE REGARDING APPROVAL OF INVESTMENT
ADVISORY AGREEMENTS (Unaudited) (Continued)
Based upon their review of this information, the Independent Trustees concluded that: (i) upon consideration of the one-year and longer term performance of each Fund, the effectiveness of the Adviser in achieving each Fund’s investment objective, as well as the services provided to shareholders, the Adviser has provided satisfactory services to the Funds; (ii) the investment advisory fees of each Fund are competitive with comparably managed funds and each Fund’s total operating expense ratio is competitive with (and, in the case of The Jamestown Equity Fund and The Jamestown Tax Exempt Virginia Fund, lower than) the average expense ratio for comparably managed funds, according to statistics derived from Morningstar, Inc.; (iii) the Adviser’s commitment to limit overall operating expenses of The Jamestown Balanced Fund and The Jamestown Tax-Exempt Virginia Fund by voluntarily waiving a portion of its investment advisory fees has enabled such Funds to increase returns for their shareholders and to maintain an overall expense ratio that is competitive with the average for similarly managed funds, despite the small size of the Funds; and (iv) the Adviser’s profitability with respect to The Jamestown Funds is reasonable. Given the current size of each Fund and its expected growth, the Independent Trustees did not believe that at the present time it would be relevant to consider the extent to which economies of scale would be realized as the Funds grow, and whether fee levels reflect these economies of scale. The Independent Trustees also considered the “fallout” benefits to the Adviser with respect to the Funds, but given the amounts involved viewed these as secondary factors in connection with the evaluation of the reasonableness of the advisory fees paid by the Funds.
No single factor was considered in isolation or to be determinative to the decision of the Trustees to approve continuance of the Investment Advisory Agreements. Rather the Trustees concluded, in light of a weighing and balancing of all factors considered, that it was in the best interests of each Fund and its shareholders to continue its Investment Advisory Agreement without modification to its terms, including the fees charged for services thereunder.
| | | | | | | | |
| | | | | | | | | |
| | | | | | | | | |
| | | | | THE JAMESTOWN FUNDS
www.jamestownfunds.com
Investment Adviser Lowe, Brockenbrough & Company, Inc. 1802 Bayberry Court Suite 400 Richmond, Virginia 23226
Administrator Ultimus Fund Solutions, LLC P.O. Box 46707 Cincinnati, Ohio 45246-0707 (Toll-Free) 1-866-738-1126
Independent Registered
Public Accounting Firm Ernst & Young LLP 1900 Scripps Center 312 Walnut Street Cincinnati, Ohio 45202
Legal Counsel Sullivan & Worcester LLP One Post Office Square Boston, Massachusetts 02109
Board of Trustees John P. Ackerly, IV John T. Bruce George K. Jennison Robert S. Harris, Ph.D. J. Finley Lee, Jr., Ph.D. Harris V. Morrissette Elizabeth W. Robertson | | | | |
| | | | | | | | | |
| | | | | | | | | |
| | | | | | | | |
As of the end of the period covered by this report, the registrant has adopted a code of ethics that applies to the registrant’s principal executive officer, principal financial officer, principal accounting officer or controller, or persons performing similar functions, regardless of whether these individuals are employed by the registrant or a third party. Pursuant to Item 12(a)(1), a copy of registrant’s code of ethics is filed as an exhibit to this Form N-CSR. During the period covered by this report, the code of ethics has not been amended, and the registrant has not granted any waivers, including implicit waivers, from the provisions of the code of ethics.
| Item 3. | Audit Committee Financial Expert. |
The registrant’s board of trustees has determined that the registrant has two audit committee financial experts serving on its audit committee. The name of the audit committee financial experts are Dr. Robert S. Harris and Elizabeth W. Robertson. Dr. Harris and Ms. Robertson are “independent” for purposes of this Item.
| Item 4. | Principal Accountant Fees and Services. |
| (a) | Audit Fees. The aggregate fees billed for professional services rendered by the principal accountant for the audit of the registrant’s annual financial statements or for services that are normally provided by the accountant in connection with statutory and regulatory filings or engagements were $181,440 and $160,500 with respect to the registrant’s fiscal years ended March 31, 2015 and 2014, respectively. |
| (b) | Audit-Related Fees. No fees were billed in either of the last two fiscal years for assurance and related services by the principal accountant that are reasonably related to the performance of the audit of the registrant’s financial statements and are not reported under paragraph (a) of this Item. |
| (c) | Tax Fees. The aggregate fees billed for professional services rendered by the principal accountant for tax compliance, tax advice, and tax planning were $17,925 and $0 with respect to the registrant’s fiscal years ended March 31, 2015 and 2014, respectively. The services comprising these fees are the preparation of the registrant’s federal income and excise tax returns and technical consultations regarding redemptions in kind. |
| (d) | All Other Fees. No fees were billed in either of the last two fiscal years for products and services provided by the principal accountant, other than the services reported in paragraphs (a) through (c) of this Item. |
| (e)(1) | The audit committee has adopted pre-approval policies and procedures described in paragraph (c)(7) of Rule 2-01 of Regulation S-X. Pursuant to the pre-approval policies and procedures, the audit committee has pre-approved certain audit, audit-related and tax services and has established, with respect to each fiscal year of the registrant, the following maximum fee levels for services covered under the pre-approval policies and procedures: |
| · | Services, relating to a new series or class of a series, associated with SEC registration statements, periodic reports and other documents filed by the registrant with the SEC or other documents issued by the registrant in connection with securities offerings and assistance in responding to SEC comment letters—$5,000 |
| · | Consultations with management of the registrant, not in connection with an audit, as to the accounting or disclosure treatment of transactions or events and/or the actual or potential impact of final or proposed rules, standards or interpretations by the SEC, FASB or other regulatory or standard setting bodies—$5,000 |
| · | All tax services provided to the registrant in the aggregate—$5,000 |
| (e)(2) | None of the services described in paragraph (b) through (d) of this Item were approved by the audit committee pursuant to paragraph (c)(7)(i)(C) of Rule 2-01 of Regulation S-X. |
| (f) | Less than 50% of hours expended on the principal accountant’s engagement to audit the registrant’s financial statements for the most recent fiscal year were attributed to work performed by persons other than the principal accountant’s full-time, permanent employees. |
| (g) | With respect to the fiscal years ended March 31, 2015 and 2014, aggregate non-audit fees of $17,925 and $0, respectively, were billed by the registrant’s principal accountant for services rendered to the registrant. No non-audit fees were billed in either of the last two fiscal years by the registrant’s principal accountant for services rendered to the registrant’s investment adviser (not including any sub-adviser whose role is primarily portfolio management and is subcontracted with or overseen by another investment adviser), and any entity controlling, controlled by, or under common control with the adviser that provides ongoing services to the registrant. |
| (h) | The principal accountant has not provided any non-audit services to the registrant’s investment adviser (not including any sub-adviser whose role is primarily portfolio management and is subcontracted with or overseen by another investment adviser), and any entity controlling, controlled by, or under common control with the investment adviser that provides ongoing services to the registrant. |
| Item 5. | Audit Committee of Listed Registrants. |
Not applicable
| Item 6. | Schedule of Investments. |
| (a) | Not applicable [schedule filed with Item 1] |
| Item 7. | Disclosure of Proxy Voting Policies and Procedures for Closed-End Management Investment Companies. |
Not applicable
| Item 8. | Portfolio Managers of Closed-End Management Investment Companies. |
Not applicable
| Item 9. | Purchases of Equity Securities by Closed-End Management Investment Company and Affiliated Purchasers. |
Not applicable
| Item 10. | Submission of Matters to a Vote of Security Holders. |
The registrant’s Nominating Committee shall review shareholder recommendations to fill vacancies on the registrant’s board of trustees if such recommendations are submitted in writing, addressed to the Committee at the registrant’s offices and meet any minimum qualifications adopted by the Committee. The Committee may adopt, by resolution, a policy regarding its procedures for considering candidates for the board of trustees, including any recommended by shareholders.
| Item 11. | Controls and Procedures. |
(a) Based on their evaluation of the registrant’s disclosure controls and procedures (as defined in Rule 30a-3(c) under the Investment Company Act of 1940) as of a date within 90 days of the filing date of this report, the registrant’s principal executive officers and principal financial officer have concluded that such disclosure controls and procedures are reasonably designed and are operating effectively to ensure that material information relating to the registrant, including its consolidated subsidiaries, is made known to them by others within those entities, particularly during the period in which this report is being prepared, and that the information required in filings on Form N-CSR is recorded, processed, summarized, and reported on a timely basis.
(b) There were no changes in the registrant’s internal control over financial reporting (as defined in Rule 30a-3(d) under the Investment Company Act of 1940) that occurred during the second fiscal quarter of the period covered by this report that have materially affected, or are reasonably likely to materially affect, the registrant’s internal control over financial reporting.
File the exhibits listed below as part of this Form. Letter or number the exhibits in the sequence indicated.
(a)(1) Any code of ethics, or amendment thereto, that is the subject of the disclosure required by Item 2, to the extent that the registrant intends to satisfy the Item 2 requirements through filing of an exhibit: Attached hereto
(a)(2) A separate certification for each principal executive officer and principal financial officer of the registrant as required by Rule 30a-2(a) under the Act (17 CFR 270.30a-2(a)): Attached hereto
(a)(3) Any written solicitation to purchase securities under Rule 23c-1 under the Act (17 CFR 270.23c-1) sent or given during the period covered by the report by or on behalf of the registrant to 10 or more persons: Not applicable
(b) Certifications required by Rule 30a-2(b) under the Act (17 CFR 270.30a-2(b)): Attached hereto
| Exhibit 99.CODE ETH | Code of Ethics |
| Exhibit 99.CERT | Certifications required by Rule 30a-2(a) under the Act |
| Exhibit 99.906CERT | Certifications required by Rule 30a-2(b) under the Act |
SIGNATURES
Pursuant to the requirements of the Securities Exchange Act of 1934 and the Investment Company Act of 1940, the registrant has duly caused this report to be signed on its behalf by the undersigned, thereunto duly authorized.
| (Registrant) | Williamsburg Investment Trust | | |
| | | | |
| By (Signature and Title)* | /s/ Tina H. Bloom | |
| | | Tina H. Bloom, Secretary and Chief Compliance Officer | |
| | | | |
| Date | June 3, 2015 | | |
| | | | |
| Pursuant to the requirements of the Securities Exchange Act of 1934 and the Investment Company Act of 1940, this report has been signed below by the following persons on behalf of the registrant and in the capacities and on the dates indicated. |
| | | | |
| By (Signature and Title)* | /s/ John T. Bruce | |
| | | John T. Bruce, President | |
| | | (FBP Equity & Dividend Plus Fund and FBP Appreciation & Income Opportunities Fund) | |
| | | | |
| Date | June 3, 2015 | | |
| | | | |
| By (Signature and Title)* | /s/ Thomas W. Leavell | |
| | | Thomas W. Leavell, President | |
| | | (The Government Street Equity Fund, The Government Street Mid-Cap Fund and The Alabama Tax Free Bond Fund) | |
| | | | |
| Date | June 3, 2015 | | |
| | | | |
| By (Signature and Title)* | /s/ Charles M. Caravati III | |
| | | Charles M. Caravati III, President | |
| | | (The Jamestown Balanced Fund and The Jamestown Equity Fund) | |
| | | | |
| Date | June 3, 2015 | | |
| | | | |
| By (Signature and Title)* | /s/ Joseph A. Jennings III | |
| | | Joseph A. Jennings III, President | |
| | | (The Jamestown Tax Exempt Virginia Fund) | |
| | | | |
| Date | June 3, 2015 | | |
| | | | |
| By (Signature and Title)* | /s/ John P. Ackerly IV | |
| | | John P. Ackerly IV, President | |
| | | (The Davenport Core Fund, Davenport Value & Income Fund, Davenport Equity Opportunities Fund and Davenport Small Cap Focus Fund) | |
| | | | |
| Date | June 3, 2015 | | |
| | | | |
| By (Signature and Title)* | /s/ Mark J. Seger | |
| | | Mark J. Seger, Treasurer | |
| | | | |
| Date | June 3, 2015 | | |
* Print the name and title of each signing officer under his or her signature.