| | OMB APPROVAL |
| | OMB Number: 3235-0570 Expires: August 31, 2020 Estimated average burden hours per response: 20.6 |
UNITED STATES
SECURITIES AND EXCHANGE COMMISSION
Washington, D.C. 20549
FORM N-CSR
CERTIFIED SHAREHOLDER REPORT OF REGISTERED
MANAGEMENT INVESTMENT COMPANIES
| Investment Company Act file number | 811-05685 | |
| Williamsburg Investment Trust |
| (Exact name of registrant as specified in charter) |
| 225 Pictoria Drive, Suite 450 Cincinnati, Ohio | 45246 |
| (Address of principal executive offices) | (Zip code) |
John H. Chilton Esq.
| Sullivan & Worcester LLP 1666 K Street NW Washington, D.C. 20006 |
| (Name and address of agent for service) |
| Registrant's telephone number, including area code: | (513) 587-3400 | |
| Date of fiscal year end: | March 31 | |
| | | |
| Date of reporting period: | March 31, 2018 | |
Form N-CSR is to be used by management investment companies to file reports with the Commission not later than 10 days after the transmission to stockholders of any report that is required to be transmitted to stockholders under Rule 30e-1 under the Investment Company Act of 1940 (17 CFR 270.30e-1). The Commission may use the information provided on Form N-CSR in its regulatory, disclosure review, inspection, and policymaking roles.
A registrant is required to disclose the information specified by Form N-CSR, and the Commission will make this information public. A registrant is not required to respond to the collection of information contained in Form N-CSR unless the Form displays a currently valid Office of Management and Budget ("OMB") control number. Please direct comments concerning the accuracy of the information collection burden estimate and any suggestions for reducing the burden to the Secretary, Securities and Exchange Commission, 450 Fifth Street, NW, Washington, DC 20549-0609. The OMB has reviewed this collection of information under the clearance requirements of 44 U.S.C. § 3507.
Item 1. Reports to Stockholders.
ANNUAL REPORT
March 31, 2018 |
THE DAVENPORT FUNDS
LETTER TO SHAREHOLDERS | April 30, 2018 |
Dear Shareholders,
The final quarter of fiscal 2018 brought some long overdue volatility to equity markets. Indeed, the S&P’s 500 Index relatively modest decline of 0.76% belies the underlying tumult during the quarter. Markets started where they left off in the previous 3 quarters, with the S&P 500 Index gaining 5.73% in January and cruising to new all-time highs. However, things quickly changed in February as the S&P 500 Index declined 3.69% and snapped its longest monthly winning streak since 1959 according to CNBC.
At one point, the S&P 500 Index was down 10.30% (intraday) for the month in early February. On February 5, the Dow Jones Industrial Average experienced its largest percentage decline since 2011 (down 4.60%). We suspect ground zero for this correction was money flows centered around volatility. Betting against volatility, mainly through derivatives, has been an increasingly popular “easy money” trade over the last few years as markets have steadily ascended. When volatility began to dramatically increase, it triggered margin calls and covering, ultimately creating a supernova moment for these levered players. We noted at calendar year-end, some turbulence was to be expected following an extended period of uninterrupted calm. Still, the violence of this event was no doubt unnerving.
March was not quite as wild; however, stocks remained under pressure. The trifecta of tighter Fed policy (the Federal Reserve raised interest rates on 3/21), Trump-induced fears of a trade war and troubles in the momentum-fueled tech sector created more uncertainty and pushed the S&P 500 Index down 2.54%. Interest rates remain low, and while stocks have been floating on cheap money for years, we don’t think we are at a point where rates threaten economic growth. On trade, history shows that trade battles and tariffs are negative for global economic growth. We aren’t dismissive of recent headlines, but hope the President’s bark is bigger than his bite (as has been the case on some other issues). Finally on Technology, the weakness was prompted by user privacy concerns at Facebook (FB) and more recently the President’s comments targeting Amazon (AMZN). As noted in our last writing, tech stocks appeared somewhat overbought; hence, all it took was one misstep for the sector to crack.
So now what? With the recent weakness, stocks are trading at levels seen prior to tax reform. In fact, the S&P 500 Index is trading for 16x Earnings Per Share (EPS) estimates over the next 12 months, which looks quite fair in the context of low interest rates and improving growth. While wage inflation and rising transportation costs are partly offsetting the benefits of lower domestic taxes, corporate earnings are nonetheless improving and we continue to see signs that lower taxes may help prompt an uptick in corporate capital expenditures. We aren’t dismissive of recent negative headlines and acknowledge an outright trade war would be very problematic, but we also don’t think the economy is signaling a downturn.
All told, it may actually be a plus for the market to take a breather after last year’s gains. This period of consolidation could be setting the stage for further gains given what now appear to be reasonable valuations. That said, we maintain our view that forward returns should be more moderate following annualized returns of 11.26% for the S&P 500 Index from fiscal 2014-2018. Thank you for your trust and please see our Fund letters for a discussion of recent investment ideas.
1
Davenport Core Fund
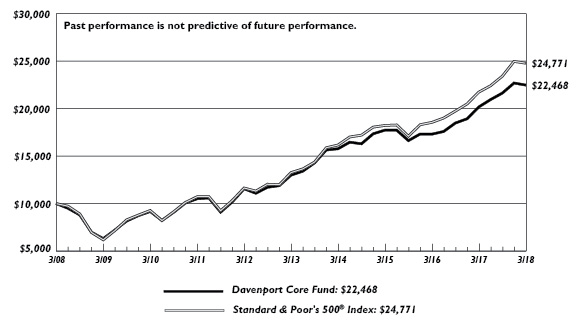
The following chart represents Davenport Core Fund’s (DAVPX) performance and the performance of the S&P 500 Index*, the Core Fund’s primary benchmark, for the periods ended March 31, 2018.
| | Fiscal
Q4 2018 | 1 Year | 3 Years** | 5 Years** | 10 Years** | Since
Inception
1/15/98** | Fiscal
Year 2018
Expense
Ratio |
Core Fund | -0.95% | 11.38% | 8.22% | 11.56% | 8.43% | 6.81% | 0.90% |
S&P 500 Index* | -0.76% | 13.99% | 10.78% | 13.31% | 9.49% | 7.19% | |
30-Day SEC Yield: 0.20%; Expense Ratio in current prospectus: 0.90%
Past performance is no guarantee of future results. Investment return and principal value of an investment will fluctuate so that an investor’s shares, when redeemed, may be worth more or less than their original cost. Current performance may be lower or higher than the performance data quoted. Performance data, current to the most recent month end, may be obtained by calling 1-800-281-3217.
* | The S&P 500 Index is comprised of 500 U.S. stocks and is an indicator of the performance of the overall U.S. stock market. An investor cannot invest in an index and its returns are not indicative of the performance of any specific investment. |
** | Returns greater than one year are annualized. |
The Core Fund finished the final quarter of the fiscal year down 0.95%, slightly lagging the S&P 500 Index’s 0.76% loss. For the year, the Fund gained 11.38% compared to the S&P 500 Index’s advance of 13.99%. The close of the fiscal year was very busy for the Fund. Top attributors to performance during the year were Adobe (ADBE), Marathon Petroleum (MPC), Visa (V), Mastercard (MA), and Accenture (ACN). Detractors included Celgene (CELG), Schlumberger (SLB), Johnson Controls (JCI), Merck (MRK), and Martin Marietta (MLM). Of these names, we sold Celgene and Johnson Controls, and chipped Adobe and Marathon.
Following a year of relative calmness, the return of broader volatility in the market prompted significant price swings and we were more active than usual in an attempt to capitalize on some of these short-term price movements. We sold AmerisourceBergen (ABC), Disney (DIS), Celgene (CELG) and Priceline (PCLN). ABC has been a solid performer for us over the past few years as Walgreen’s has taken an ownership stake in the company and expanded its growth prospects. We sold the shares on a spike as the investors had baked in significant benefits to ABC from the corporate tax cuts. We have long admired Disney for its creative content and its ability to effectively monetize its characters and stories. Recently the company’s cable division, led by ESPN, has been under “cord cutting” pressure and Disney’s plan to buy 21st Century Fox appears to be a quality downgrade from its existing franchise. Given our less favorable outlook and a strong recovery in the stock, we elected to take profits. CELG has been a frustrating name with some drug failures and management missteps leading to a selloff. We elected to sell the position as we lost confidence in management. Finally, PCLN is facing incremental competitive headwinds, primarily from Google and the direct travel providers (hoteliers and airlines).
2
We used the proceeds from these sales to add to names in the Fund where we have higher conviction in the risk/reward setup. Examples include Sherwin Williams (SHW), Anheuser Busch Inbev (BUD) and FedEx (FDX). In addition to bolstering existing positions, we also added a few new names to the Fund, including Glencore (GLNCY) and Alibaba (BABA).
GLNCY is one of the world’s largest diversified commodity miners, based out of Switzerland. Relative to its diversified peers, GLNCY offers the highest exposure to electric vehicles (EVs), which appear poised to take significant market share from combustion engines in the 2020s and drive incremental metals demand for copper, cobalt and nickel, in particular. Unlike peers, GLNCY began as a commodities trading firm (remains 25% of EBITDA today) and therefore has a differentiated capital allocation perspective relative to traditional mining peers. In addition, management and insiders own nearly 30% of the firm, aligning their interests with public shareholders. We see room for EBITDA to rise to 45% as GLNCY grows its volumes by 30% over the next three years. GLNCY is trading at a discount to peers and its historical average multiple, and we see room for valuation expansion as we get closer to mass adoption for EVs.
BABA got caught up in the tech sector’s recent selloff in fiscal Q4, and we used the weakness in the stock to add this dominant Chinese e-commerce player to the Fund. We think that BABA can sustain heady revenue growth (currently growing 50% per annum), which we view as the key driver of stock performance. Similar to Amazon, BABA’s core marketplace e-commerce business is thriving, and the company is aggressively investing in promising new areas, such as digital payments, cloud computing and artificial intelligence. The Chinese consumer is the world’s most embracing of digital technologies and we see a long runway for BABA.
All told, we believe our recent transactions strengthen the Fund’s positioning as we continue through fiscal 2019. We look forward to reporting on our progress next year.
The following are transactions performed in the Core Fund for the quarter ended March 31, 2018.
Recent Purchases
Alibaba Group Holding Ltd. (BABA) We decided to use recent weakness in BABA to add this high-quality, Chinese, e-commerce player.
Anheuser-Busch InBev S.A./N.V. (BUD) We remain confident in management’s ability to extract synergies from the SABMiller deal, adding to the position during the quarter.
Berkshire Hathaway, Inc. – Class B (BRK.B) We fortified our position in BRK.B during the quarter, reflecting our view that the company will continue to compound shareholder value at an attractive rate going forward.
Broadcom Ltd. (AVGO) We elected to initiate a position in this leading designer, developer, and global supplier of a broad range of semiconductor devices.
FedEx Corporation (FDX) We saw an attractive buying opportunity in this quality provider of high dollar value transportation.
Glencore plc (GLNCY) We initiated a position in GLNCY, one of the world’s largest diversified commodities miners, based out of Switzerland.
Home Depot, Inc. (The) (HD) We decided to use recent weakness to start a position in this well-known, blue chip growth stock.
3
Honeywell International, Inc. (HON) We took the opportunity to initiate a position in one of the highest quality, multi-industry, industrial companies in the world.
Oracle Corporation (ORCL) With high switching costs, a profitable business model, and strong free cash flow (FCF) generation, we took the opportunity to add to our position in this leading enterprise software provider during the quarter.
Sherwin-Williams Company (The) (SHW) SHW has demonstrated pricing power over the long-term. We continue to see solid earnings power and added to the name during the quarter.
Recent Sales
Adobe Systems, Inc. (ADBE) ADBE has been one of the better tech performers since our ownership dating back to early 2016, and we elected to take some profits as the position had become a bit outsized.
AmerisourceBergen Corporation (ABC) As fears around deflation and Amazon.com (AMZN) subsided and investors have appreciated the tax bill impacts on ABC’s primarily domestic business, we felt ABC had become more fairly valued and sold our position.
Capital One Financial Corporation (COF) Although we remain confident in the consumer credit cycle and believe earnings should get a lift from lower reserve intensity as loan growth moderates, we elected to take some profits in COF during the quarter.
Celgene Corporation (CELG) We sold our position in CELG, as we think the stock will remain in the penalty box for quite some time until management can show progress to replace the looming revenue decline from several failed drug launches.
Johnson Controls International plc (JCI) While we continue to believe that the ultimate outcome of JCI’s portfolio repositioning may result in a higher stock price, the transition has taken much longer than we originally anticipated. We elected to sell our position in the company.
Marathon Petroleum Corporation (MPC) Although we still see additional upside, driven by improving cash flows and new organic projects, we think the risk-reward for MPC is more balanced at the current share price and elected to trim the position.
Priceline Group, Inc. (The) (PCLN) Now known as Booking Holdings (BKNG), shares have bounced nicely off their recent lows and while we continue to believe the company is likely to benefit from favorable long-term travel trends, we see the near-term as more challenging.
Walt Disney Company (The) (DIS) For reasons mentioned above along with concerns over recent transactions, we elected to sell the position.
Weyerhaeuser Company (WY) We think lumber prices are unsustainably high given recent trade disputes with Canada and a decline could eventually pressure margins. With the potential for rising interest rates, we are also happy with one less real-estate-investment trust (REIT), and sold our position during the quarter.
4
Davenport Value & Income Fund
The following chart represents Davenport Value & Income Fund (DVIPX) performance and the performance of the S&P 500 Index*, the Value & Income Fund’s primary benchmark, and the Lipper Equity Income Index for the periods ended March 31, 2018.
| | Fiscal
Q4 2018 | 1 Year | 3 Years** | 5 Years** | Since
Inception
12/31/10** | Fiscal
Year 2018
Expense
Ratio |
Value & Income Fund | -3.64% | 10.67% | 7.76% | 10.62% | 12.34% | 0.88% |
S&P 500 Index* | -0.76% | 13.99% | 10.78% | 13.31% | 13.14% | |
Russell 1000 Value Index | -2.83% | 6.95% | 7.88% | 10.78% | 11.57% | |
Lipper Equity Income Index* | -2.63% | 8.98% | 7.95% | 10.13% | 10.71% | |
30-Day SEC Yield: 1.69%; Expense Ratio in current prospectus: 0.89%
Past performance is no guarantee of future results. Investment return and principal value of an investment will fluctuate so that an investor’s shares, when redeemed, may be worth more or less than their original cost. Current performance may be lower or higher than the performance data quoted. Performance data, current to the most recent month end, may be obtained by calling 1-800-281-3217.
* | The S&P 500 Index is comprised of 500 U.S. stocks and is an indicator of the performance of the overall U.S. stock market. The S&P 500 Index is comprised of 500 U.S. stocks and is an indicator of the performance of the overall U.S. stock market. The Lipper Equity Income Index is an unmanaged index of the 30 largest funds in the Lipper Equity Income fund category. |
| An investor cannot invest in an index and its returns are not indicative of the performance of any specific investment. |
** | Returns greater than one year are annualized. |
The Value & Income Fund declined 3.64% in the final quarter of the fiscal year, lagging the 2.83% decline for the Russell 1000 Value Index and the S&P 500 Index’s 0.76% decline. For the year ended March 31, 2018, the Fund returned 10.67%, outpacing the Russell 1000 Value Index’s 6.95% return. The S&P 500 index increased 13.99% as growth stocks continued to outperform value stocks as they have the last several years.
For the year, our top two performers were Boeing (BA) and Marathon Petroleum (MPC). BA benefited, as investors became believers in the cash flow generation story, near-term trends in the business improved, and estimates ticked higher. MPC continues to benefit from improving refinery fundamentals, including attractive export opportunities to Latin America. HVAC distributor, Watsco (WSO), was also a key contributor during the year. Recently, the company announced a 16% dividend increase, continuing a 40-year track record of dividend payments to shareholders. Over the last three years, the company has grown the dividend at a near 30% annual pace, helping to create the powerful combination of capital appreciation and income growth that we seek to emphasize in this strategy. Key detractors during the year were General Electric (GE) and Enbridge (ENB). GE struggled during the year as the company cut its earnings forecast several times, mostly due to significant declines in its power business. New management has initiated a major restructuring program and cut the dividend to conserve cash. Given the business risk and lack of visibility for the company, we sold the position during the third quarter. ENB’s shares were negatively impacted by a Federal Energy Regulatory Commission policy reversal that could modestly impair asset-level returns for certain master limited partnerships (MLPs). Note
5
that while ENB is a traditional C-Corp, it does have an ownership stake in a “daughter” MLP that will feel the negative impact. Though these developments were surprising and disappointing, we believe the company is equipped to weather industry challenges.
We exited positions in McDonald’s (MCD) and VF Corp (VFC) during the fourth quarter, two standout performers that experienced meaningful valuation lifts during our holding period. We reallocated the money to a few new positions with a more visible path to income generation and capital appreciation: United Parcel Service (UPS), Invesco (IVZ ) and DowDuPont (DWDP). Shares of UPS, the world’s largest parcel delivery carrier, declined dramatically as the company announced a ramp up in capital investment to improve its network. While we agree UPS has a lot of work to do to bring its network up to today’s exacting standards (driven by increasing e-commerce demands), we see significant value in its infrastructure network that has been built up over decades. UPS’ forward P/E multiple has been cut from 18x to just 14.5x today, a level we haven’t really seen outside of the Great Recession. We think this is an attractive price to pay for a business with high returns on capital, high barriers to entry (DHL tried and failed to enter the US market in the 2000s), a long-term secular e-commerce tailwind and a sustainable 3.4% dividend yield.
IVZ is a diversified asset manager with close to $1 trillion under management, offering both active and passive strategies. IVZ has achieved nine consecutive years of positive net inflows alongside solid performance numbers. The share price came under pressure during the quarter due to organic growth fears, which presented an attractive entry point into this inexpensive asset manager with a 3.7% yield.
Lastly, we initiated a position in DowDuPont (DWDP), the world’s largest chemical company. DWDP was formed in August 2017 following the merger of Dow Chemical and DuPont, and the company plans to split into three separate companies in 2019. CEO Ed Breen has had tremendous success with breakups in the past and is targeting a massive $3 billion synergy opportunity. We see the ultimate split of the company as a value- enhancing move and see significant sum-of-the-parts upside in addition to continued capital return via share buybacks and the dividend (yields approximately 2.3%).
In summary, we are pleased with fiscal 2018 results and continue to believe our focus on quality businesses with meaningful, growing dividends will deliver value in the long run. While we hesitate to predict when a shift in market leadership (from growth to value) may occur, we remain confident that our value orientation can deliver differentiated returns as it has throughout a number of market cycles in the past.
Recent Purchases
Anheuser-Busch InBev S.A./N.V. (BUD) We think investors may be overlooking a recovery in emerging markets and underestimating the synergy opportunity from the SAB Miller acquisition. We therefore added to our position during the quarter.
Brookfield Asset Management, Inc. (BAM) We took the opportunity to beef up our position as we feel the shares are attractively valued relative to their net asset value and funds from operations. We think the shares may benefit as fees from the asset management franchise ramp up and become a more meaningful component of the company’s cash flow stream.
Delta Air Lines, Inc. (DAL) We continue to take a longer-term view towards Delta and added to our position as we think it remains undervalued, for a solidly-profitable and growing business.
6
Dominion Energy, Inc. (D) D’s shares have sold off in the wake of its proposed announcement to purchase Scana (SCG). We think this creates an attractive buying opportunity in one of the nation’s best regulated utilities
DowDuPont, Inc. (DWDP) As the largest chemical company in the world (albeit temporarily), we’ve had our eye on DWDP for quite some time and felt that recent China-related weakness offered an attractive entry point in this high-quality stock.
Eaton Corporation plc (ETN) Encouraged by recent results at ETN, we added to our position during the quarter.
Fairfax Financial Holdings Ltd. (FRFHF) Considering the combination of underwriting profitability, rising interest rates, realized gains from affiliates and slightly better equity performance, we added to our position in FRFHF during the quarter.
iShares MSCI Europe Financials ETF (EUFN) Akin to the “XLF of Europe,” we added to our position in EUFN, which owns large European banks and insurance companies.
Invesco Ltd. (IVZ) We initiated a position in this international asset manager with close to $1T in Assets Under Management.
United Parcel Service, Inc. (UPS) We initiated a position in UPS, an attractive contrarian value investment for a business with high returns on capital, high barriers to entry, a long-term secular e-commerce tailwind and a sustainable dividend yield.
Recent Sales
AmerisourceBergen Corporation (ABC) We elected to take advantage of the recent strength in ABC to book some profits.
Capital One Financial Corporation (COF) We decided to take a bit off the table following the recent rebound in the stock.
General Electric Company (GE) We sold the stock during the quarter and elected to use the proceeds to buy another beaten-up name with less business risk and greater visibility.
McDonald’s Corporation (MCD) As one of our best performing stocks in 2017, we felt the shares were fairly valued and sold our position during the quarter.
VF Corporation (VFC) With the shares up over 40% since our purchase in March of 2017, shares had re-rated to the high end of its historical valuation, and we elected to take profits.
Wells Fargo & Company (WFC) We sold our position as we think WFC has a long road going forward in regaining investor confidence.
7
Davenport Equity Opportunities Fund
The following chart represents Davenport Equity Opportunities Fund (DEOPX) performance and the performance of the Russell Midcap Index*, the Fund’s primary benchmark, and the S&P 500 Index* for the periods ended March 31, 2018.
| | Fiscal
Q4 2018 | 1 Year | 3 Years** | 5 Years** | Since
Inception
12/31/10** | Fiscal
Year 2018
Expense
Ratio |
Equity Opportunities Fund | -1.77% | 13.49% | 4.30% | 9.98% | 12.14% | 0.91% |
Russell Midcap Index | -0.46% | 12.20% | 8.01% | 12.09% | 12.23% | |
S&P 500 Index* | -0.76% | 13.99% | 10.78% | 13.31% | 13.14% | |
30-Day SEC Yield: -0.20%; Expense Ratio in current prospectus: 0.92%
Past performance is no guarantee of future results. Investment return and principal value of an investment will fluctuate so that an investor’s shares, when redeemed, may be worth more or less than their original cost. Current performance may be lower or higher than the performance data quoted. Performance data, current to the most recent month end, may be obtained by calling 1-800-281-3217.
* | The Russell Midcap® Index measures the performance of the 800 smallest companies in the Russell 1000, which represent approximately 25% of the total market capitalization of the Russell 1000®. Frank Russell Company is the source and owner of the trademarks, service marks, and copyrights related to the Russell Indexes. Russell® is a trademark of Frank Russell Company. The S&P 500 Index is comprised of 500 U.S. stocks and is an indicator of the performance of the overall U.S. stock market. An investor cannot invest in an index and its returns are not indicative of the performance of any specific investment. |
** | Returns greater than one year are annualized. |
The Equity Opportunities Fund closed the year on a more subdued note in the final quarter of fiscal 2018. After weathering significant market swings and a spike in volatility, the Fund posted a 1.77% decline for the quarter ended March 31, 2018, lagging the 0.46% decline for the Russell Midcap Index. However, the Fund outpaced the index for the year ended March 31, 2018, increasing 13.49% compared to the Russell Midcap Index’s 12.20% return.
Our leading contributors to performance for the year were Live Nation (LYV), Zoetis (ZTS), and Intuit (INTU). Live Nation has been a steady performer as concert attendance has reached new records and the company’s advertising and ticketing businesses have grown. Zoetis is the world’s largest animal health pharmaceutical company. Sheltered from the regulatory focus on the human pharmaceutical space, ZTS has been successful in launching new products, improving its operations and participating in compelling secular themes such as the “humanization of pets” and increasing global protein demand. These factors have allowed results to exceed expectations and the stock to re-rate higher. One of our longest tenured positions, Intuit’s shares responded to ongoing strength in QuickBooks online subscribers in addition to a solid start to the tax season. Following this strength, we elected to chip the position in order to add to a newly initiated position in Autodesk (ADSK), which we believe has similar long-term growth characteristics, but is in an earlier phase of this progression (See below for more). The Consumer Discretionary and Industrials sectors were key drivers of relative underperformance. Dish Network (DISH),
8
Colfax (CFX) and TripAdvisor (TRIP) were key detractors in these categories. The combination of weakness in these stocks and the continued outperformance of Technology (where we are underweight) served to soften the impact of strength elsewhere in the portfolio.
As mentioned above, we initiated a new position in Autodesk (ADSK), the leading design software and digital content provider for architectural design and a variety of other industries. Unlike many business models within tech that we tend to shy away from, ADSK has leading market share, pricing power, a sticky customer base and a clear path to significant cash flow generation. The company is currently in the midst of a transition to a subscription-based business model (much like that of Adobe - ADBE) that generates recurring and predictable cash flows, while increasing customer lifetime value due to the stickiness of the company’s software. Quarterly results have yielded significant volatility in the stock amid this transition, allowing us to enter the name during a period of weakness. As mentioned above, we increased the position and were rewarded nicely with a strong earnings report that sent the shares meaningfully higher.
We recently added to our position in Fairfax Financial (FRFHF). FRFHF has been an underperformer over the past few years due mainly to an overly conservative investment stance that caused the company to miss much of the market’s rally. While we have been disappointed in legendary CEO Prem Watsa’s recent investment performance, we feel the stock has spent enough time in the penalty box and that there are several drivers of future upside for the shares. For one, the company’s insurance franchises continue to operate profitably, producing inexpensive capital that the firm is beginning to invest more aggressively. We also believe that the company should benefit from the tailwind of rising interest rates in the investment portfolio given the short duration of the bond portfolio and a heavy cash weighting (nearly 50% of the investment portfolio is in cash). With the stock trading at roughly 1.1x book value, we think Fairfax is particularly timely and look for Watsa to regain some of the “mojo” that has resulted in compounded book value per share growth of 19.5% per year since the company’s inception.
In sum, we remain as focused as ever on thoughtfully allocating funds to the most attractive risk/reward opportunities available. While we have yet to see the shift in market leadership that favors our opportunistic approach, we continue to believe the Fund carries an element of timeliness without taking on unnecessary risks.
The following are transactions performed in the Equity Opportunities Fund for the quarter ended March 31, 2018.
Recent Purchases
Autodesk, Inc. (ADSK) We initiated a position in ADSK, the leading design-software and digital content provider for architectural design and land development, manufacturing, utilities, telecom, media, and entertainment companies.
Black Knight, Inc. (BKI) We added to our position in BKI, the leading mortgage servicing and origination technology supplier.
CarMax, Inc. (KMX) After a strong start to the year, the stock weakened considerably alongside a broad market pullback and we added to our position.
CBOE Global Markets, Inc. (CBOE) We think the market’s knee-jerk reaction to the spike in volatility presented an attractive entry point into CBOE, a highly profitable business with meaningful barriers-to-entry
9
DISH Network Corporation (DISH) Dish’s spectrum assets are akin to a beachfront property in the world of increased mobility and wireless data usage, with a fixed supply of spectrum and ever-increasing demand. With the recent dip in the stock, we felt this to be an opportune time to increase our position.
Fairfax Financial Holdings Ltd. (FRFHF) We added to our position during the quarter, as we feel the stock has spent enough time in the penalty box and that there are several drivers of future upside for the shares.
Wabco Holdings, Inc. (WBC) We added to our position as over the long term, we continue to have confidence in the company’s ability to out-grow its end markets.
Recent Sales
Capital One Financial Corporation (COF) COF appreciated nicely into the new year and became an outsized position. We elected to use the recent strength to take some profits.
Colfax Corporation (CFX) We believe the risk/reward profile has become more balanced and thought it prudent to reduce the position size, following recent strength.
Dollar Tree, Inc. (DLTR) As an improving consumer backdrop and continued execution with the integration of Family Dollar have resulted in higher earnings estimates and a more favorable valuation, we elected to take some profits and chip our position.
Intuit, Inc. (INTU) While we continue to hold management in high regard and remain confident in the growth outlook for both the QuickBooks and TurboTax franchises, we elected to use recent strength to pare back an oversized position to more normal levels.
LKQ Corporation (LKQ) We sold our position, reducing our exposure to the automotive sector and freeing up cash to redeploy into opportunities with better risk/reward characteristics.
TripAdvisor, Inc. (TRIP) We elected to take advantage of recent strength, selling our position and redeploying the funds into higher conviction opportunities.
Davenport Small Cap Focus Fund
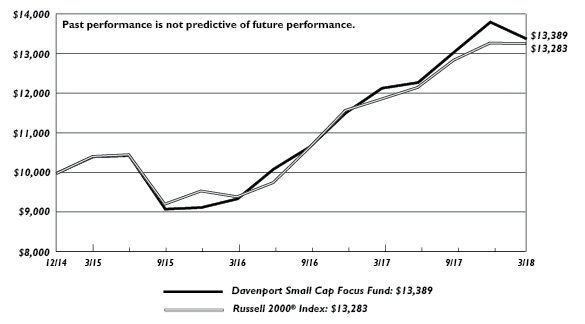
The following chart represents performance of the Davenport Small Cap Focus Fund (DSCPX) and the performance of the Fund’s primary benchmark, the Russell 2000 Index*, for the periods ended March 31, 2018.
| | Fiscal
Q4 2018 | 1 Year | 3 Year | Since
Inception
12/31/14** | Fiscal
Year 2018
Expense
Ratio |
Small Cap Focus Fund | -3.06% | 10.28% | 8.75% | 9.41% | 1.00% |
Russell 2000 Index* | -0.08% | 11.79% | 8.39% | 9.14% | |
30-Day SEC Yield: 0.22%; Expense Ratio in current prospectus: 1.06%
Past performance is no guarantee of future results. Investment return and principal value of an investment will fluctuate so that an investor’s shares, when redeemed, may be worth more or less than their original cost. Current performance may be lower or higher than the performance data quoted. Performance data, current to the most recent month end, may be obtained by calling 1-800-281-3217.
10
* | The Russell 2000® Index measures the performance of the 2,000 smallest companies in the Russell 3000 Index, measures the performance of the 3,000 largest U.S. companies based on total market capitalization, which represents approximately 98% of the investable U.S. equity market. Frank Russell Company is the source and owner of the trademarks, service marks, and copyrights related to the Russell Indexes. Russell® is a trademark of Frank Russell Company. An investor cannot invest in an index and its returns are not indicative of the performance of any specific investment. |
** | Returns greater than one year are annualized. |
After an extended period of outperformance, the Davenport Small Cap Focus Fund gave back some of its relative gains to close fiscal 2018. The Fund declined 3.06% during the last quarter, which lagged the 0.08% decline for the Russell 2000 Index. For the year ended March 31, 2018, the Fund gained 10.28%, slightly lagging the Russell 2000 Index’s 11.79% return.
Fund results benefitted from solid gains in FRP Holdings (FRPH), Etsy, Inc. (ETSY) and Kinsale Capital (KNSL). Unfortunately, what we did not own influenced relative results just as much as what we did own, with our underweight stances in Health Care and Information Technology accounting for roughly half of our shortfall relative to the benchmark. While we do not ignore these sectors, our preference for investing in profitable companies with defensible business models run by thoughtful capital allocators precludes us from investing in many businesses in the small-cap software and biotechnology arenas. Hence, when these momentum-oriented areas are hot, we will likely lag. Instead of chasing the hot dot, we are inclined to double back on businesses that meet our investment criteria that we believe are facing temporary headwinds. One such example recently is American Woodmark (AMWD). Following stellar performance in the first three quarters of the year, AMWD pulled back meaningfully to close the year as results showed a slight slowdown in organic growth. Generally negative sentiment towards the housing sector added further fuel to the fire and the stock erased all of the gains achieved following the announcement of its highly accretive takeover of stock cabinetmaker RSI Holdings. While we had trimmed the position near all-time highs, we feel the sell-off is overdone and have rebuilt the position to a more meaningful weighting. Put simply, we remain sanguine on the housing theme and continue to believe the combination of modest organic growth and deal synergies can result in earnings power approaching $10 per share by the end of the decade.
Amid the selloff in housing related stocks, we took the opportunity to add a new housing-related name to the Fund: SiteOne Landscape Supply (SITE). As the largest (and only) national wholesale distributor of landscape supplies, the company has significant “white space” to consolidate smaller, local operations. SITE has a solid balance sheet and a proven track record of successful M&A, having completed 24 acquisitions since 2014, adding 157 branches and $630 million in revenue. The company targets another 250 acquisitions over the next 10-15 years, which should also be accompanied by organic growth in the mid-to-high single-digit range. In addition to impressive top line growth, we note that the company has made significant strides on profitability, taking EBITDA margins from 6.3% in 2014 to 8.4% in 2017. Going forward, management targets 10% EBITDA margins for 2019 (longer-term goal of 15%), which should help leverage top-line growth even further. With the stock down alongside a negative housing tape, we took the opportunity to build a position in this quality compounder.
We also initiated a position in Evoqua Water Technologies (AQUA). We have followed the company since its IPO in November of 2017, and recently initiated a position after weakness from a follow-on equity offering. Evoqua is the North American leader (with ~11% share) in industrial water treatment, offering systems, services, and technologies to industrial, commercial, and
11
municipal customers. We believe AQUA operates in an attractive niche with distinct competitive advantages (their service network is nearly 4x that of their largest competitor). AQUA should be well equipped to take advantage of secular trends such as the continued outsourcing of water treatment. In addition to an attractive growth profile, the company has a highly recurring revenue model (82% of sales recurring or in backlog each year), a self-help opportunity (EBITDA margins have improved 600 bps since 2016) and takeout optionality.
To close, we continue to uncover what we believe to be differentiated and relatively undiscovered ideas that can compound value for the long-term. While we would have preferred a better close to the year, we remain confident in the Fund’s positioning and believe opportunistic actions taken in the quarter will bear fruit over time.
Davenport Balanced Income Fund
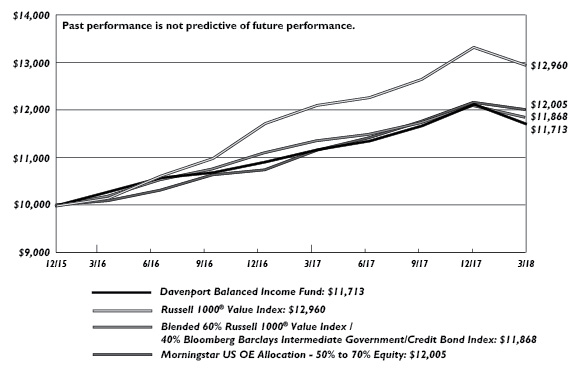
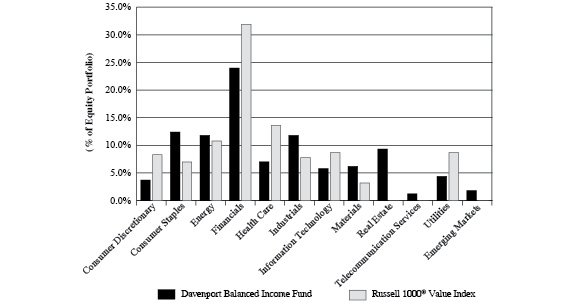
The following chart represents Davenport Balanced Income Fund (DBALX) performance, and performance of the Fund’s primary benchmark, the Russell 1000® Value Index, along with the Morningstar Allocation 50-70% Equity Index, and the blended 60% Russell 1000® Value Index / 40% Bloomberg Barclays Intermediate Government /Credit Bond Index for the period ended March 31, 2018.
| | Fiscal
Q4 2018 | 1 Year | Since
Inception
12/31/15** | Fiscal
Year 2018
Expense
Ratio |
Balanced Income Fund | -3.43% | 4.81% | 7.28% | 0.97% |
Russell 1000® Value* | -2.83% | 6.95% | 12.22% | |
Morningstar Allocation 50-70% Equity* | -1.26% | 7.67% | 8.47% | |
60% Russell 1000® Value/40% BBIGC | -2.04% | 4.36% | 7.91% | |
30-Day SEC Yield: 2.05%; Expense Ratio in current prospectus: 1.13%
Past performance is no guarantee of future results. Investment return and principal value of an investment will fluctuate so that an investor’s shares, when redeemed, may be worth more or less than their original cost. Current performance may be lower or higher than the performance data quoted. Performance data, current to the most recent month end, may be obtained by calling 1-800-281-3217.
* | The Russell 1000® Value Index measures the performance of the Russell 1000 companies with lower price-to-book ratios and lower forecasted growth values. The Morningstar US OE Allocation 50-70% Equity Index is composed of funds which seek to provide both income and capital appreciation by investing in multiple asset classes, including stocks, bonds, and cash. These portfolios are dominated by domestic holdings and have equity exposure between 50% and 70%. The blended 60% Russell 1000 Value/40% Bloomberg Barclay’s Intermediate Government/Credit (BBIGC) Index is included as an additional comparative index because it is representative of a balanced portfolio consisting of 60% equity and 40% fixed income securities. The BBIGC measures the non-securitized component of the U.S. Aggregate Index. It includes investment grade, U.S. dollar-denominated, fixed-rate Treasuries, government-related and corporate rate securities. Intermediate maturity bonds include bonds with maturities of 1 to 9.999 years. An investor cannot invest in an index and its returns are not indicative of the performance of any specific investment. |
** | Returns greater than one year are annualized. |
The Davenport Balanced Income Fund declined 3.43% in the final quarter of the fiscal year, versus a 2.83% decrease for the Russell 1000® Value Index and 1.26% decrease for the Morningstar US OE Allocation 50-70% Equity Index. The Fund lagged the blended 60% Russell 1000® Value
12
Index and 40% Bloomberg Barclays Intermediate Government/Credit Index return of -2.04% for the quarter. For the year ended March 31, 2018, the Fund returned 4.81% compared to 6.95% for the Russell 1000® Value Index, 7.67% for the Morningstar US OE Equity Index, and 4.36% for the blended 60% Russell 1000® Value Index and 40% Bloomberg Barclays Intermediate Government/Credit Index.
After a year of relatively calm markets, equities witnessed the return of volatility during the final quarter of fiscal 2018. Industrials proved to be our best attributor to sector performance thanks to strong returns for the likes of Watsco, Inc. (WSO) and Boeing (BA). Our overall top contributor to performance was Watsco (WSO), who recently announced a 16% dividend increase, continuing a 40-year track record of dividend payments to shareholders. Over the last three years, the company has grown the dividend at a near 30% annual pace, helping to create the powerful combination of capital appreciation and income growth that we seek to emphasize in this strategy. Our biggest performance detractor was Enbrdige (ENB), whose shares were negatively impacted by a Federal Energy Regulatory Commission policy reversal that could modestly impair asset-level returns for certain master limited partnerships (MLPs). Note that while ENB is a traditional C-Corp, it does have an ownership stake in a “daughter” MLP that will feel the negative impact. Though these developments were surprising and disappointing, we believe the company is equipped to weather industry challenges.
During the final quarter, we initiated a position in United Parcel Service (UPS), the world’s largest parcel delivery carrier. UPS shares declined after the company announced a ramp up in capital investment to improve its distribution network. While many viewed the news negatively, we feel the capital investment will ultimately lead to strong capacity growth. Additionally, UPS is a business with high returns on capital, high barriers to entry, a long-term secular e-commerce tailwind, and a sustainable 3.4% dividend yield. With UPS’ forward price-to-earnings (P/E) multiple falling to 14.5x today, a level not seen since the recent recession, we believe this is an attractive price to pay for a high quality business with a sustainable 3.4% dividend yield.
The increase in market volatility was no friend to the bond market either in the final quarter. It was tough sledding as yields across the entire Treasury complex rose and corporate spreads widened negatively impacting bond returns. Due to increased Treasury issuance, a result of tax reform and fiscal deficit funding, and rate hike expectation from the Fed, short-term rates rose more than longer-dated Treasury’s. The yield on the 2-year Treasury rose 37 basis points, the 10-year Treasury rose 33bps, and the 30-year Treasury rose 23bps. That being said, fixed income returns suffered with the Bloomberg Barclays Intermediate Government/Credit Index down -0.98%. Shorter duration indices were less impacted but remain negative on the year. The only indices in the high-grade space that posted positive returns were short corporate floating rate bonds, where the Bloomberg Barclays US FRN <5-year Index was up 0.47% to start the year.
The bond assets of the Fund consist of 43 high-quality corporate issues across eight economic sectors with the top allocation to Financials at 28%, Consumer Staples at 19%, and Energy at 13%. The credit quality remains high with an overall credit rating of “A3,” an effective maturity of 4.5 years, and a duration 3.0 years. During the first quarter, we increased the defensive nature of the bond allocation by lightening up some of our longer positions, selling Applied Materials 2027, and initiating new positions in corporate floating rate notes. We bought Campbell Soup, CVS, Vulcan Materials, and ConocoPhillips floating rate notes. Overall, this took our floating rate exposure from 26% at the end of 2017 to 33% at the end of fiscal Q4 2018. In a rising rate
13
environment, the income levels for the floating rate notes change quarterly based on the level of LIBOR (London Inter-bank Offered Rate). This rate closed out the quarter at 2.13% up from 1.69% at the end of calendar 2017, increasing the yield component of our portfolio.
We are very pleased with our outperformance during the year compared to the balanced benchmark, and continue to see value in a balanced approach as we continue to weather uncertain and potentially volatile market conditions. Our allocation to quality value stocks and defensive positioning in the bond portion of the portfolio may continue to provide a volatility buffer in the near future, while focusing on current income and long-term capital appreciation.
In conclusion, we are pleased that the Davenport Funds are off to a good start thus far in 2018. We thank you for your trust and look forward to reporting back as we proceed through the year.
Sincerely,
John P. Ackerly IV, CFA
President, The Davenport Funds
14
DAVENPORT CORE FUND
PERFORMANCE INFORMATION (Unaudited)
Comparison of the Change in Value of a $10,000 Investment in
Davenport Core Fund and the Standard & Poor’s 500® Index
| | Average Annual Total Returns
(for periods ended March 31, 2018) | |
| | 1 Year | 5 Years | 10 Years | |
Davenport Core Fund(a) | 11.38% | 11.56% | 8.43% | |
Standard & Poor’s 500® Index | 13.99% | 13.31% | 9.49% | |
(a) | The total returns shown do not reflect the deduction of taxes that a shareholder would pay on Fund distributions or the redemption of Fund shares. |
15
DAVENPORT VALUE & INCOME FUND
PERFORMANCE INFORMATION (Unaudited)
Comparison of the Change in Value of a $10,000 Investment in
Davenport Value & Income Fund, the Russell 1000® Value Index
and the Lipper Equity Income Index

| | Average Annual Total Returns
(for periods ended March 31, 2018) | |
| | 1 Year | 5 Years | Since
Inception(b) | |
Davenport Value & Income Fund(a) | 10.67% | 10.62% | 12.34% | |
Russell 1000® Value Index | 6.95% | 10.78% | 11.57% | |
Lipper Equity Income Index | 8.98% | 10.13% | 10.71% | |
(a) | The total returns shown do not reflect the deduction of taxes that a shareholder would pay on Fund distributions or the redemption of Fund shares. |
(b) | Commencement of operations was December 31, 2010. |
16
DAVENPORT EQUITY OPPORTUNITIES FUND
PERFORMANCE INFORMATION (Unaudited)
Comparison of the Change in Value of a $10,000 Investment in
Davenport Equity Opportunities Fund and the Russell Midcap® Index

| | Average Annual Total Returns
(for periods ended March 31, 2018) | |
| | 1 Year | 5 Years | Since
Inception(b) | |
Davenport Equity Opportunities Fund(a) | 13.49% | 9.98% | 12.14% | |
Russell Midcap® Index | 12.20% | 12.09% | 12.23% | |
(a) | The total returns shown do not reflect the deduction of taxes that a shareholder would pay on Fund distributions or the redemption of Fund shares. |
(b) | Commencement of operations was December 31, 2010. |
17
DAVENPORT SMALL CAP FOCUS FUND
PERFORMANCE INFORMATION (Unaudited)
Comparison of the Change in Value of a $10,000 Investment in
Davenport Small Cap Focus Fund and the Russell 2000® Index
| | Average Annual Total Returns
(for periods ended March 31, 2018) | |
| | 1 Year | 3 Years | Since
Inception(b) | |
Davenport Small Cap Focus Fund(a) | 10.28% | 8.75% | 9.41% | |
Russell 2000® Index | 11.79% | 8.39% | 9.14% | |
(a) | The total returns shown do not reflect the deduction of taxes that a shareholder would pay on Fund distributions or the redemption of Fund shares. |
(b) | Commencement of operations was December 31, 2014. |
18
DAVENPORT BALANCED INCOME FUND
PERFORMANCE INFORMATION (Unaudited)
Comparison of the Change in Value of a $10,000 Investment in Davenport Balanced
Income Fund, the Russell 1000® Value Index, a Blended 60% Russell 1000® Value
Index / 40% Bloomberg Barclays Intermediate Government/Credit Bond Index
and the Morningstar US OE Allocation — 50% to 70% Equity
| | Average Annual Total Returns
(for periods ended March 31, 2018) | |
| | 1 Year | Since Inception(b) | |
Davenport Balanced Income Fund(a) | 4.81% | 7.28% | |
Russell 1000® Value Index | 6.95% | 12.22% | |
Blended 60% Russell 1000® Value Index / 40% Bloomberg Barclays Intermediate Government/Credit Bond Index | 4.36% | 7.91% | |
Morningstar US OE Allocation - 50% to 70% Equity | 7.67% | 8.47% | |
(a) | The total returns shown do not reflect the deduction of taxes that a shareholder would pay on Fund distributions or the redemption of Fund shares. |
(b) | Commencement of operations was December 31, 2015. |
19
DAVENPORT CORE FUND
PORTFOLIO INFORMATION
March 31, 2018 (Unaudited)
Sector Allocation vs. the Standard & Poor’s 500® Index

Top Ten Equity Holdings
Security Description | % of Net Assets |
Markel Corporation | 3.7% |
Visa, Inc. - Class A | 3.5% |
Berkshire Hathaway, Inc. - Class B | 3.4% |
American Tower Corporation | 3.2% |
Brookfield Asset Management, Inc. - Class A | 3.0% |
Capital One Financial Corporation | 3.0% |
Accenture plc - Class A | 2.9% |
Adobe Systems, Inc. | 2.8% |
FedEx Corporation | 2.8% |
Danaher Corporation | 2.7% |
20
DAVENPORT VALUE & INCOME FUND
PORTFOLIO INFORMATION
March 31, 2018 (Unaudited)
Sector Allocation vs. the Russell 1000® Value Index

Top Ten Equity Holdings
Security Description | % of Net Assets |
JPMorgan Chase & Company | 3.2% |
Markel Corporation | 3.0% |
Johnson & Johnson | 3.0% |
Watsco, Inc. | 2.9% |
FNF Group | 2.7% |
Capital One Financial Corporation | 2.7% |
Royal Dutch Shell plc - Class B - ADR | 2.6% |
Citigroup, Inc. | 2.6% |
Cisco Systems, Inc. | 2.4% |
iShares MSCI Europe Financials ETF | 2.4% |
21
DAVENPORT EQUITY OPPORTUNITIES FUND
PORTFOLIO INFORMATION
March 31, 2018 (Unaudited)
Sector Allocation vs. the Russell Midcap® Index

Top Ten Equity Holdings
Security Description | % of Net Assets |
American Tower Corporation | 6.0% |
WABCO Holdings, Inc. | 5.6% |
CarMax, Inc. | 5.3% |
Brookfield Asset Management, Inc. - Class A | 5.0% |
Markel Corporation | 4.7% |
Capital One Financial Corporation | 4.6% |
Live Nation Entertainment, Inc. | 4.5% |
Sherwin-Williams Company (The) | 4.5% |
Martin Marietta Materials, Inc. | 4.4% |
Intuit, Inc. | 4.1% |
22
DAVENPORT SMALL CAP FOCUS FUND
PORTFOLIO INFORMATION
March 31, 2018 (Unaudited)
Sector Allocation vs. the Russell 2000® Index

Top Ten Equity Holdings
Security Description | % of Net Assets |
Cable One, Inc. | 3.9% |
Diamond Hill Investment Group, Inc. | 3.6% |
American Woodmark Corporation | 3.5% |
Trupanion, Inc. | 3.4% |
Knight-Swift Transportation Holdings, Inc. | 3.2% |
Monarch Casino & Resort, Inc. | 3.0% |
Marten Transport Ltd. | 3.0% |
Cohen & Steers, Inc. | 2.9% |
Black Knight, Inc. | 2.9% |
Builders FirstSource, Inc. | 2.8% |
23
DAVENPORT BALANCED INCOME FUND
PORTFOLIO INFORMATION
March 31, 2018 (Unaudited)
Asset Allocation (% of Net Assets) | | Ten Largest Equity Holdings | % of Net Assets |

| | JPMorgan Chase & Company | 1.7% |
Markel Corporation | 1.6% |
Johnson & Johnson | 1.6% |
Watsco, Inc. | 1.6% |
FNF Group | 1.4% |
Capital One Financial Corporation | 1.4% |
Royal Dutch Shell plc - Class B - ADR | 1.4% |
Citigroup, Inc. | 1.4% |
Cisco Systems, Inc. | 1.3% |
Diageo plc - ADR | 1.3% |
| |
Equity Sector Concentration vs. the Russell 1000 Value Index (60.7% of Net Assets) |
Corporate Bond Portfolio (37.0% of Net Assets) | | Credit Quality | Composite Quality |
Number of Fixed-Income Securities | 43 | | AAA | 0.0% |
Average Quality | A3 | | AA | 2.6% |
Effective Maturity | 4.5 yrs. | | A | 47.9% |
Average Effective Duration | 3.0 yrs. | | BBB | 46.9% |
| | | | Ba | 2.6% |
Sector Breakdown | % of Corporate
Bond Portfolio |
Consumer Discretionary | 8.4% |
Consumer Staples | 19.3% |
Energy | 12.5% |
Financials | 28.3% |
Health Care | 8.4% |
Industrials | 5.8% |
Information Technology | 6.2% |
Materials | 2.7% |
Telecommunication Services | 4.9% |
Utilities | 3.5% |
24
DAVENPORT CORE FUND
SCHEDULE OF INVESTMENTS
March 31, 2018 |
| COMMON STOCKS — 95.7% | | Shares | | | Value | |
| Consumer Discretionary — 10.8% | | | | | | |
Amazon.com, Inc. (a) | | | 5,958 | | | $ | 8,623,252 | |
CarMax, Inc. (a) | | | 148,968 | | | | 9,227,078 | |
| Home Depot, Inc. (The) | | | 39,686 | | | | 7,073,633 | |
Liberty Broadband Corporation - Series C (a) | | | 54,649 | | | | 4,682,873 | |
Liberty Media Corporation - Liberty SiriusXM - Series C (a) | | | 141,684 | | | | 5,787,791 | |
| NIKE, Inc. - Class B | | | 115,837 | | | | 7,696,210 | |
| Starbucks Corporation | | | 119,377 | | | | 6,910,734 | |
| | | | | | | | 50,001,571 | |
| Consumer Staples — 6.5% | | | | | | | | |
| Anheuser-Busch InBev S.A./N.V. - ADR | | | 77,649 | | | | 8,536,731 | |
| Mondelēz International, Inc. - Class A | | | 146,710 | | | | 6,122,208 | |
| Nestlé S.A. - ADR | | | 117,457 | | | | 9,284,976 | |
| PepsiCo, Inc. | | | 58,966 | | | | 6,436,139 | |
| | | | | | | | 30,380,054 | |
| Energy — 6.2% | | | | | | | | |
| Chevron Corporation | | | 66,037 | | | | 7,530,859 | |
| Exxon Mobil Corporation | | | 75,578 | | | | 5,638,875 | |
| Marathon Petroleum Corporation | | | 104,712 | | | | 7,655,494 | |
| Schlumberger Ltd. | | | 123,015 | | | | 7,968,912 | |
| | | | | | | | 28,794,140 | |
| Financials — 19.4% | | | | | | | | |
Berkshire Hathaway, Inc. - Class B (a) | | | 78,192 | | | | 15,597,740 | |
| Brookfield Asset Management, Inc. - Class A | | | 354,654 | | | | 13,831,506 | |
| Capital One Financial Corporation | | | 143,229 | | | | 13,724,203 | |
| Citigroup, Inc. | | | 182,362 | | | | 12,309,435 | |
| CME Group, Inc. | | | 49,857 | | | | 8,063,871 | |
| JPMorgan Chase & Company | | | 88,652 | | | | 9,749,060 | |
Markel Corporation (a) | | | 14,638 | | | | 17,130,120 | |
| | | | | | | | 90,405,935 | |
| Health Care — 7.9% | | | | | | | | |
| Amgen, Inc. | | | 31,781 | | | | 5,418,025 | |
| Danaher Corporation | | | 128,757 | | | | 12,606,598 | |
| Johnson & Johnson | | | 94,987 | | | | 12,172,584 | |
| Merck & Company, Inc. | | | 123,720 | | | | 6,739,028 | |
| | | | | | | | 36,936,235 | |
| Industrials — 10.3% | | | | | | | | |
| FedEx Corporation | | | 53,698 | | | | 12,893,427 | |
| General Dynamics Corporation | | | 39,439 | | | | 8,712,075 | |
| Honeywell International, Inc. | | | 47,637 | | | | 6,884,023 | |
| Southwest Airlines Company | | | 153,531 | | | | 8,794,256 | |
| Union Pacific Corporation | | | 79,079 | | | | 10,630,590 | |
| | | | | | | | 47,914,371 | |
25
DAVENPORT CORE FUND
SCHEDULE OF INVESTMENTS (Continued) |
| COMMON STOCKS — 95.7% (Continued) | | Shares | | | Value | |
| Information Technology — 22.5% | | | | | | |
| Accenture plc - Class A | | | 88,461 | | | $ | 13,578,763 | |
Adobe Systems, Inc. (a) | | | 61,279 | | | | 13,241,166 | |
Alibaba Group Holding Ltd. - ADR (a) | | | 38,627 | | | | 7,089,600 | |
Alphabet, Inc. - Class A (a) | | | 7,625 | | | | 7,908,193 | |
Alphabet, Inc. - Class C (a) | | | 6,677 | | | | 6,889,262 | |
| Apple, Inc. | | | 40,822 | | | | 6,849,115 | |
| Broadcom Ltd. | | | 28,036 | | | | 6,606,683 | |
Facebook, Inc. - Class A (a) | | | 49,977 | | | | 7,985,825 | |
| MasterCard, Inc. - Class A | | | 55,275 | | | | 9,681,969 | |
| Oracle Corporation | | | 183,067 | | | | 8,375,315 | |
| Visa, Inc. - Class A | | | 137,296 | | | | 16,423,348 | |
| | | | | | | | 104,629,239 | |
| Materials — 8.9% | | | | | | | | |
| Ecolab, Inc. | | | 62,069 | | | | 8,507,798 | |
| Glencore plc - ADR | | | 882,774 | | | | 8,792,429 | |
| Martin Marietta Materials, Inc. | | | 38,301 | | | | 7,939,797 | |
| Sherwin-Williams Company (The) | | | 24,691 | | | | 9,681,835 | |
| Vulcan Materials Company | | | 56,195 | | | | 6,415,783 | |
| | | | | | | | 41,337,642 | |
| Real Estate — 3.2% | | | | | | | | |
| American Tower Corporation | | | 100,937 | | | | 14,670,184 | |
| | | | | | | | | |
Total Common Stocks (Cost $298,603,925) | | | | | | $ | 445,069,371 | |
| EXCHANGE-TRADED FUNDS — 1.7% | | | Shares | | | | Value | |
| iShares U.S. Home Construction ETF (Cost $5,566,529) | | | 195,909 | | | $ | 7,736,446 | |
26
DAVENPORT CORE FUND
SCHEDULE OF INVESTMENTS (Continued) |
| MONEY MARKET FUNDS — 1.4% | | Shares | | | Value | |
First American Treasury Obligations Fund - Class Z, 1.51% (b) (Cost $6,611,819) | | | 6,611,819 | | | $ | 6,611,819 | |
Total Investments at Value — 98.8% (Cost $310,782,273) | | | | | | $ | 459,417,636 | |
Other Assets in Excess of Liabilities — 1.2% | | | | | | | 5,501,759 | |
Net Assets — 100.0% | | | | | | $ | 464,919,395 | |
ADR - American Depositary Receipt.
(a) | Non-income producing security. |
(b) | The rate shown is the 7-day effective yield as of March 31, 2018. |
See accompanying notes to financial statements.
27
DAVENPORT VALUE & INCOME FUND
SCHEDULE OF INVESTMENTS
March 31, 2018 |
| COMMON STOCKS — 93.3% | | Shares | | | Value | |
| Consumer Discretionary — 4.3% | | | | | | |
| Carnival Corporation | | | 152,370 | | | $ | 9,992,425 | |
| Comcast Corporation - Class A | | | 269,125 | | | | 9,196,001 | |
| General Motors Company | | | 234,515 | | | | 8,522,275 | |
| | | | | | | | 27,710,701 | |
| Consumer Staples — 12.4% | | | | | | | | |
| Altria Group, Inc. | | | 120,541 | | | | 7,512,115 | |
| Anheuser-Busch InBev S.A./N.V. - ADR | | | 122,280 | | | | 13,443,463 | |
| Coca-Cola Company (The) | | | 251,250 | | | | 10,911,788 | |
| CVS Health Corporation | | | 181,245 | | | | 11,275,251 | |
| Diageo plc - ADR | | | 116,600 | | | | 15,789,972 | |
| PepsiCo, Inc. | | | 96,805 | | | | 10,566,266 | |
| Philip Morris International, Inc. | | | 111,620 | | | | 11,095,028 | |
| | | | | | | | 80,593,883 | |
| Energy — 10.3% | | | | | | | | |
| Chevron Corporation | | | 68,366 | | | | 7,796,459 | |
| Enbridge, Inc. | | | 301,622 | | | | 9,492,044 | |
| Exxon Mobil Corporation | | | 85,975 | | | | 6,414,595 | |
| Marathon Petroleum Corporation | | | 169,430 | | | | 12,387,027 | |
| Occidental Petroleum Corporation | | | 204,105 | | | | 13,258,661 | |
| Royal Dutch Shell plc - Class B - ADR | | | 260,545 | | | | 17,073,514 | |
| | | | | | | | 66,422,300 | |
| Financials — 21.4% | | | | | | | | |
| Brookfield Asset Management, Inc. - Class A | | | 336,440 | | | | 13,121,160 | |
| Capital One Financial Corporation | | | 180,355 | | | | 17,281,616 | |
| Citigroup, Inc. | | | 252,780 | | | | 17,062,650 | |
| Fairfax Financial Holdings Ltd. | | | 26,755 | | | | 13,618,295 | |
| FNF Group | | | 435,885 | | | | 17,444,118 | |
| Invesco Ltd. | | | 300,250 | | | | 9,611,003 | |
| JPMorgan Chase & Company | | | 186,385 | | | | 20,496,758 | |
Markel Corporation (a) | | | 16,890 | | | | 19,765,522 | |
| Synchrony Financial | | | 315,130 | | | | 10,566,309 | |
| | | | | | | | 138,967,431 | |
| Health Care — 8.6% | | | | | | | | |
| Bristol-Myers Squibb Company | | | 226,420 | | | | 14,321,065 | |
| Johnson & Johnson | | | 151,165 | | | | 19,371,795 | |
| Medtronic plc | | | 122,070 | | | | 9,792,455 | |
| Merck & Company, Inc. | | | 227,735 | | | | 12,404,726 | |
| | | | | | | | 55,890,041 | |
| Industrials — 13.4% | | | | | | | | |
| 3M Company | | | 43,445 | | | | 9,537,046 | |
| Boeing Company (The) | | | 36,075 | | | | 11,828,271 | |
| Delta Air Lines, Inc. | | | 248,415 | | | | 13,615,626 | |
| Eaton Corporation plc | | | 171,192 | | | | 13,679,953 | |
28
DAVENPORT VALUE & INCOME FUND
SCHEDULE OF INVESTMENTS (Continued) |
| COMMON STOCKS — 93.3% (Continued) | | Shares | | | Value | |
| Industrials — 13.4% (Continued) | | | | | | |
| Illinois Tool Works, Inc. | | | 60,510 | | | $ | 9,479,497 | |
| United Parcel Service, Inc. - Class B | | | 93,520 | | | | 9,787,803 | |
| Watsco, Inc. | | | 105,115 | | | | 19,022,662 | |
| | | | | | | | 86,950,858 | |
| Information Technology — 6.6% | | | | | | | | |
| Cisco Systems, Inc. | | | 369,930 | | | | 15,866,298 | |
| Microsoft Corporation | | | 172,493 | | | | 15,743,436 | |
| TE Connectivity Ltd. | | | 112,225 | | | | 11,211,277 | |
| | | | | | | | 42,821,011 | |
| Materials — 6.7% | | | | | | | | |
| DowDuPont, Inc. | | | 149,605 | | | | 9,531,335 | |
| International Paper Company | | | 199,185 | | | | 10,642,454 | |
| Nutrien Ltd. | | | 206,776 | | | | 9,772,234 | |
| PPG Industries, Inc. | | | 122,945 | | | | 13,720,662 | |
| | | | | | | | 43,666,685 | |
| Real Estate — 6.4% | | | | | | | | |
| Equity LifeStyle Properties, Inc. | | | 101,180 | | | | 8,880,569 | |
| Gaming and Leisure Properties, Inc. | | | 269,164 | | | | 9,008,919 | |
| Lamar Advertising Company - Class A | | | 189,120 | | | | 12,039,379 | |
| W.P. Carey, Inc. | | | 181,794 | | | | 11,269,410 | |
| | | | | | | | 41,198,277 | |
| Telecommunication Services — 1.4% | | | | | | | | |
| Verizon Communications, Inc. | | | 183,215 | | | | 8,761,341 | |
| | | | | | | | | |
| Utilities — 1.8% | | | | | | | | |
| Dominion Energy, Inc. | | | 174,140 | | | | 11,742,260 | |
| | | | | | | | | |
Total Common Stocks (Cost $490,446,870) | | | | | | $ | 604,724,788 | |
| EXCHANGE-TRADED FUNDS — 4.5% | | Shares | | | Value | |
| iShares MSCI Europe Financials ETF | | | 686,535 | | | $ | 15,858,958 | |
| Vanguard FTSE Emerging Markets ETF | | | 286,910 | | | | 13,479,032 | |
Total Exchange-Traded Funds (Cost $27,686,271) | | | | | | $ | 29,337,990 | |
29
DAVENPORT VALUE & INCOME FUND
SCHEDULE OF INVESTMENTS (Continued) |
| MONEY MARKET FUNDS — 3.5% | | Shares | | | Value | |
First American Treasury Obligations Fund - Class Z, 1.51% (b) (Cost $22,960,685) | | | 22,960,685 | | | $ | 22,960,685 | |
Total Investments at Value — 101.3% (Cost $541,093,826) | | | | | | $ | 657,023,463 | |
Liabilities in Excess of Other Assets — (1.3%) | | | | | | | (8,567,642 | ) |
Net Assets — 100.0% | | | | | | $ | 648,455,821 | |
ADR - American Depositary Receipt.
(a) | Non-income producing security. |
(b) | The rate shown is the 7-day effective yield as of March 31, 2018. |
See accompanying notes to financial statements.
30
DAVENPORT EQUITY OPPORTUNITIES FUND
SCHEDULE OF INVESTMENTS
March 31, 2018 |
| COMMON STOCKS — 97.2% | | Shares | | | Value | |
| Consumer Discretionary — 23.5% | | | | | | |
CarMax, Inc. (a) | | | 343,525 | | | $ | 21,277,938 | |
DISH Network Corporation - Class A (a) | | | 422,845 | | | | 16,021,597 | |
Dollar Tree, Inc. (a) | | | 168,871 | | | | 16,025,858 | |
Liberty Broadband Corporation - Series C (a) | | | 120,340 | | | | 10,311,935 | |
Live Nation Entertainment, Inc. (a) | | | 430,244 | | | | 18,130,482 | |
O'Reilly Automotive, Inc. (a) | | | 48,406 | | | | 11,974,676 | |
| | | | | | | | 93,742,486 | |
| Consumer Staples — 1.9% | | | | | | | | |
| Church & Dwight Company, Inc. | | | 152,715 | | | | 7,690,727 | |
| | | | | | | | | |
| Financials — 23.1% | | | | | | | | |
| Brookfield Asset Management, Inc. - Class A | | | 516,652 | | | | 20,149,428 | |
| Capital One Financial Corporation | | | 193,274 | | | | 18,519,515 | |
| Cboe Global Markets, Inc. | | | 73,560 | | | | 8,393,196 | |
| Fairfax Financial Holdings Ltd. | | | 29,283 | | | | 14,905,047 | |
| FNF Group | | | 283,975 | | | | 11,364,679 | |
Markel Corporation (a) | | | 16,067 | | | | 18,802,407 | |
| | | | | | | | 92,134,272 | |
| Health Care — 4.0% | | | | | | | | |
| Zoetis, Inc. | | | 192,150 | | | | 16,046,447 | |
| | | | | | | | | |
| Industrials — 17.5% | | | | | | | | |
Colfax Corporation (a) | | | 416,431 | | | | 13,284,149 | |
Genesee & Wyoming, Inc. - Class A (a) | | | 200,395 | | | | 14,185,962 | |
WABCO Holdings, Inc. (a) | | | 166,945 | | | | 22,348,927 | |
| Watsco, Inc. | | | 50,820 | | | | 9,196,896 | |
| Xylem, Inc. | | | 141,385 | | | | 10,875,334 | |
| | | | | | | | 69,891,268 | |
| Information Technology — 12.3% | | | | | | | | |
Autodesk, Inc. (a) | | | 125,945 | | | | 15,816,173 | |
Black Knight, Inc. (a) | | | 219,700 | | | | 10,347,870 | |
| Intuit, Inc. | | | 93,504 | | | | 16,208,919 | |
| MercadoLibre, Inc. | | | 19,416 | | | | 6,919,668 | |
| | | | | | | | 49,292,630 | |
| Materials — 8.9% | | | | | | | | |
| Martin Marietta Materials, Inc. | | | 84,677 | | | | 17,553,542 | |
| Sherwin-Williams Company (The) | | | 45,620 | | | | 17,888,515 | |
| | | | | | | | 35,442,057 | |
| Real Estate — 6.0% | | | | | | | | |
| American Tower Corporation | | | 164,410 | | | | 23,895,349 | |
| | | | | | | | | |
Total Common Stocks (Cost $302,950,214) | | | | | | $ | 388,135,236 | |
31
DAVENPORT EQUITY OPPORTUNITIES FUND
SCHEDULE OF INVESTMENTS (Continued) |
| MONEY MARKET FUNDS — 2.8% | | Shares | | | Value | |
First American Treasury Obligations Fund - Class Z, 1.51% (b) (Cost $11,352,787) | | | 11,352,787 | | | $ | 11,352,787 | |
Total Investments at Value — 100.0% (Cost $314,303,001) | | | | | | $ | 399,488,023 | |
Liabilities in Excess of Other Assets — (0.0%) (c) | | | | | | | (28,270 | ) |
Net Assets — 100.0% | | | | | | $ | 399,459,753 | |
(a) | Non-income producing security. |
(b) | The rate shown is the 7-day effective yield as of March 31, 2018. |
(c) | Percentage rounds to less than 0.1%. |
See accompanying notes to financial statements.
32
DAVENPORT SMALL CAP FOCUS FUND
SCHEDULE OF INVESTMENTS
March 31, 2018 |
| COMMON STOCKS — 93.1% | | Shares | | | Value | |
| Consumer Discretionary — 15.1% | | | | | | |
| Cable One, Inc. | | | 6,514 | | | $ | 4,475,835 | |
| Core-Mark Holding Company, Inc. | | | 112,066 | | | | 2,382,523 | |
Drive Shack, Inc. (a) | | | 170,053 | | | | 812,853 | |
Live Nation Entertainment, Inc. (a) | | | 62,321 | | | | 2,626,207 | |
Monarch Casino & Resort, Inc. (a) | | | 81,373 | | | | 3,441,264 | |
| Pool Corporation | | | 15,900 | | | | 2,324,898 | |
| Red Rock Resorts, Inc. - Class A | | | 49,900 | | | | 1,461,072 | |
| | | | | | | | 17,524,652 | |
| Consumer Staples — 5.6% | | | | | | | | |
Boston Beer Company, Inc. (The) - Class A (a) | | | 10,371 | | | | 1,960,637 | |
| Seaboard Corporation | | | 627 | | | | 2,674,155 | |
| Universal Corporation | | | 40,000 | | | | 1,940,000 | |
| | | | | | | | 6,574,792 | |
| Energy — 4.2% | | | | | | | | |
| Alliance Holdings GP, L.P. | | | 62,974 | | | | 1,574,980 | |
| CONSOL Coal Resources, L.P. | | | 90,800 | | | | 1,266,660 | |
| Green Plains, Inc. | | | 120,000 | | | | 2,016,000 | |
| | | | | | | | 4,857,640 | |
| Financials — 12.0% | | | | | | | | |
| Cohen & Steers, Inc. | | | 83,575 | | | | 3,398,159 | |
| Diamond Hill Investment Group, Inc. | | | 20,510 | | | | 4,236,546 | |
| Kinsale Capital Group, Inc. | | | 63,062 | | | | 3,236,972 | |
| TowneBank | | | 109,001 | | | | 3,117,429 | |
| | | | | | | | 13,989,106 | |
| Health Care — 7.6% | | | | | | | | |
Aratana Therapeutics, Inc. (a) | | | 372,707 | | | | 1,643,638 | |
Heska Corporation (a) | | | 41,426 | | | | 3,275,554 | |
Trupanion, Inc. (a) | | | 131,000 | | | | 3,915,590 | |
| | | | | | | | 8,834,782 | |
| Industrials — 27.9% | | | | | | | | |
| AMERCO | | | 2,689 | | | | 927,974 | |
American Woodmark Corporation (a) | | | 41,384 | | | | 4,074,255 | |
Builders FirstSource, Inc. (a) | | | 166,118 | | | | 3,295,781 | |
Casella Waste Systems, Inc. - Class A (a) | | | 125,200 | | | | 2,927,176 | |
Colfax Corporation (a) | | | 65,468 | | | | 2,088,429 | |
Evoqua Water Technologies Corporation (a) | | | 124,700 | | | | 2,654,863 | |
Genesee & Wyoming, Inc. - Class A (a) | | | 42,968 | | | | 3,041,705 | |
| Knight-Swift Transportation Holdings, Inc. | | | 80,008 | | | | 3,681,168 | |
| Marten Transport Ltd. | | | 150,551 | | | | 3,432,563 | |
SiteOne Landscape Supply, Inc. (a) | | | 30,000 | | | | 2,311,200 | |
WABCO Holdings, Inc. (a) | | | 15,019 | | | | 2,010,593 | |
| Watsco, Inc. | | | 11,340 | | | | 2,052,200 | |
| | | | | | | | 32,497,907 | |
33
DAVENPORT SMALL CAP FOCUS FUND
SCHEDULE OF INVESTMENTS (Continued) |
| COMMON STOCKS — 93.1% (Continued) | | Shares | | | Value | |
| Information Technology — 6.6% | | | | | | |
Black Knight, Inc. (a) | | | 71,652 | | | $ | 3,374,809 | |
Etsy, Inc. (a) | | | 80,000 | | | | 2,244,800 | |
| QIWI plc - ADR | | | 105,000 | | | | 2,006,550 | |
| | | | | | | | 7,626,159 | |
| Materials — 5.9% | | | | | | | | |
MAG Silver Corporation (a) | | | 202,005 | | | | 1,969,549 | |
| NewMarket Corporation | | | 4,637 | | | | 1,862,590 | |
Summit Materials, Inc. - Class A (a) | | | 98,581 | | | | 2,985,033 | |
| | | | | | | | 6,817,172 | |
| Real Estate — 6.6% | | | | | | | | |
| Brookfield Property Partners, L.P. | | | 108,119 | | | | 2,074,804 | |
FRP Holdings, Inc. (a) | | | 50,556 | | | | 2,831,136 | |
| Lamar Advertising Company - Class A | | | 43,278 | | | | 2,755,077 | |
| | | | | | | | 7,661,017 | |
| Telecommunication Services — 1.6% | | | | | | | | |
| Shenandoah Telecommunications Company | | | 50,760 | | | | 1,827,360 | |
| | | | | | | | | |
Total Common Stocks (Cost $94,237,633) | | | | | | $ | 108,210,587 | |
| MONEY MARKET FUNDS — 6.7% | | Shares | | | Value | |
First American Treasury Obligations Fund - Class Z, 1.51% (b) (Cost $7,835,124) | | | 7,835,124 | | | $ | 7,835,124 | |
Total Investments at Value — 99.8% (Cost $102,072,757) | | | | | | $ | 116,045,711 | |
Other Assets in Excess of Liabilities — 0.2% | | | | | | | 193,019 | |
Net Assets — 100.0% | | | | | | $ | 116,238,730 | |
ADR - American Depositary Receipt.
(a) | Non-income producing security. |
(b) | The rate shown is the 7-day effective yield as of March 31, 2018. |
See accompanying notes to financial statements.
34
DAVENPORT BALANCED INCOME FUND
SCHEDULE OF INVESTMENTS
March 31, 2018 |
| COMMON STOCKS — 58.3% | | Shares | | | Value | |
| Consumer Discretionary — 2.3% | | | | | | |
| Carnival Corporation | | | 16,155 | | | $ | 1,059,445 | |
| Comcast Corporation - Class A | | | 28,510 | | | | 974,187 | |
| General Motors Company | | | 24,880 | | | | 904,139 | |
| | | | | | | | 2,937,771 | |
| Consumer Staples — 7.5% | | | | | | | | |
| Altria Group, Inc. | | | 12,795 | | | | 797,385 | |
| Anheuser-Busch InBev S.A./N.V. - ADR | | | 12,990 | | | | 1,428,121 | |
| Coca-Cola Company (The) | | | 26,645 | | | | 1,157,192 | |
| CVS Health Corporation | | | 19,225 | | | | 1,195,987 | |
| Diageo plc - ADR | | | 12,365 | | | | 1,674,468 | |
| PepsiCo, Inc. | | | 10,265 | | | | 1,120,425 | |
| Philip Morris International, Inc. | | | 11,810 | | | | 1,173,914 | |
| Universal Corporation | | | 24,220 | | | | 1,174,670 | |
| | | | | | | | 9,722,162 | |
| Energy — 7.1% | | | | | | | | |
| Alliance Resource Partners, L.P. | | | 45,520 | | | | 803,428 | |
| Chevron Corporation | | | 7,260 | | | | 827,930 | |
| Dominion Energy Midstream Partners, L.P. | | | 31,155 | | | | 478,229 | |
| Enbridge, Inc. | | | 31,918 | | | | 1,004,460 | |
| Exxon Mobil Corporation | | | 9,120 | | | | 680,443 | |
| Marathon Petroleum Corporation | | | 17,970 | | | | 1,313,787 | |
| MPLX, L.P. | | | 27,385 | | | | 904,801 | |
| Occidental Petroleum Corporation | | | 21,645 | | | | 1,406,059 | |
| Royal Dutch Shell plc - Class B - ADR | | | 27,630 | | | | 1,810,594 | |
| | | | | | | | 9,229,731 | |
| Financials — 13.3% | | | | | | | | |
| Blackstone Group, LP (The) | | | 35,775 | | | | 1,143,011 | |
| Brookfield Asset Management, Inc. - Class A | | | 35,740 | | | | 1,393,860 | |
| Capital One Financial Corporation | | | 19,250 | | | | 1,844,535 | |
| Citigroup, Inc. | | | 26,805 | | | | 1,809,338 | |
| Cohen & Steers, Inc. | | | 25,830 | | | | 1,050,248 | |
| Fairfax Financial Holdings Ltd. | | | 2,865 | | | | 1,458,285 | |
| FNF Group | | | 46,230 | | | | 1,850,125 | |
| Invesco Ltd. | | | 39,230 | | | | 1,255,752 | |
| JPMorgan Chase & Company | | | 19,765 | | | | 2,173,557 | |
Markel Corporation (a) | | | 1,802 | | | | 2,108,790 | |
| Synchrony Financial | | | 33,430 | | | | 1,120,908 | |
| | | | | | | | 17,208,409 | |
| Health Care — 4.6% | | | | | | | | |
| Bristol-Myers Squibb Company | | | 24,015 | | | | 1,518,948 | |
| Johnson & Johnson | | | 16,020 | | | | 2,052,963 | |
35
DAVENPORT BALANCED INCOME FUND
SCHEDULE OF INVESTMENTS (Continued) |
| COMMON STOCKS — 58.3% (Continued) | | Shares | | | Value | |
| Health Care — 4.6% (Continued) | | | | | | |
| Medtronic plc | | | 12,945 | | | $ | 1,038,448 | |
| Merck & Company, Inc. | | | 24,155 | | | | 1,315,723 | |
| | | | | | | | 5,926,082 | |
| Industrials — 7.1% | | | | | | | | |
| 3M Company | | | 4,590 | | | | 1,007,597 | |
| Boeing Company (The) | | | 3,815 | | | | 1,250,862 | |
| Delta Air Lines, Inc. | | | 26,320 | | | | 1,442,599 | |
| Eaton Corporation plc | | | 18,260 | | | | 1,459,157 | |
| Illinois Tool Works, Inc. | | | 6,415 | | | | 1,004,974 | |
| United Parcel Service, Inc. - Class B | | | 9,905 | | | | 1,036,657 | |
| Watsco, Inc. | | | 11,145 | | | | 2,016,911 | |
| | | | | | | | 9,218,757 | |
| Information Technology — 3.5% | | | | | | | | |
| Cisco Systems, Inc. | | | 39,235 | | | | 1,682,789 | |
| Microsoft Corporation | | | 18,300 | | | | 1,670,241 | |
| TE Connectivity Ltd. | | | 11,890 | | | | 1,187,811 | |
| | | | | | | | 4,540,841 | |
| Materials — 3.8% | | | | | | | | |
| DowDuPont, Inc. | | | 19,740 | | | | 1,257,635 | |
| International Paper Company | | | 21,125 | | | | 1,128,709 | |
| Nutrien Ltd. | | | 21,932 | | | | 1,036,506 | |
| PPG Industries, Inc. | | | 13,035 | | | | 1,454,706 | |
| | | | | | | | 4,877,556 | |
| Real Estate — 5.7% | | | | | | | | |
| Brookfield Property Partners, L.P. | | | 57,180 | | | | 1,097,284 | |
| Equity LifeStyle Properties, Inc. | | | 10,715 | | | | 940,455 | |
| Gaming and Leisure Properties, Inc. | | | 28,545 | | | | 955,401 | |
| Lamar Advertising Company - Class A | | | 20,060 | | | | 1,277,020 | |
| Outfront Media, Inc. | | | 37,955 | | | | 711,277 | |
| Tanger Factory Outlet Centers, Inc. | | | 50,875 | | | | 1,119,250 | |
| W.P. Carey, Inc. | | | 19,280 | | | | 1,195,167 | |
| | | | | | | | 7,295,854 | |
| Telecommunication Services — 0.7% | | | | | | | | |
| Verizon Communications, Inc. | | | 19,440 | | | | 929,621 | |
| | | | | | | | | |
| Utilities — 2.7% | | | | | | | | |
| Brookfield Infrastructure Partners, L.P. | | | 27,705 | | | | 1,153,636 | |
| Brookfield Renewable Partners, L.P. | | | 34,200 | | | | 1,064,646 | |
| Dominion Energy, Inc. | | | 18,460 | | | | 1,244,758 | |
| | | | | | | | 3,463,040 | |
| | | | | | | | | |
Total Common Stocks (Cost $70,301,439) | | | | | | $ | 75,349,824 | |
36
DAVENPORT BALANCED INCOME FUND
SCHEDULE OF INVESTMENTS (Continued) |
| FIXED RATE CORPORATE BONDS — 24.8% | | Par Value | | | Value | |
| Consumer Discretionary — 3.1% | | | | | | |
| Amazon.com, Inc., 3.30%, due 12/05/2021 | | $ | 1,750,000 | | | $ | 1,773,504 | |
| Ford Motor Company, 4.346%, due 12/08/2026 | | | 1,750,000 | | | | 1,731,076 | |
| Home Depot, Inc. (The), 4.40%, due 04/01/2021 | | | 500,000 | | | | 519,549 | |
| | | | | | | | 4,024,129 | |
| Consumer Staples — 6.0% | | | | | | | | |
| Altria Group, Inc., 4.75%, due 05/05/2021 | | | 1,500,000 | | | | 1,567,870 | |
| Anheuser-Busch InBev S.A./N.V., 3.30%, due 02/01/2023 | | | 1,750,000 | | | | 1,751,286 | |
| J.M. Smucker Company (The), 3.50%, due 10/15/2021 | | | 1,500,000 | | | | 1,513,527 | |
| PepsiCo, Inc., 2.75%, due 03/05/2022 | | | 1,200,000 | | | | 1,192,013 | |
| Sysco Corporation, 2.60%, due 10/01/2020 | | | 1,700,000 | | | | 1,685,842 | |
| | | | | | | | 7,710,538 | |
| Energy — 3.6% | | | | | | | | |
| Boardwalk Pipelines, L.P., 4.45%, due 07/15/2027 | | | 1,250,000 | | | | 1,215,275 | |
| MPLX, L.P., 4.125%, due 03/01/2027 | | | 1,750,000 | | | | 1,733,903 | |
| Occidental Petroleum Corporation, 3.50%, due 06/15/2025 | | | 1,750,000 | | | | 1,753,364 | |
| | | | | | | | 4,702,542 | |
| Financials — 3.6% | | | | | | | | |
| BlackRock, Inc., 3.50%, due 03/18/2024 | | | 1,150,000 | | | | 1,158,754 | |
| Capital One Financial Corporation, 2.50%, due 05/12/2020 | | | 1,750,000 | | | | 1,722,648 | |
| General Motors Financial Company, 5.25%, due 03/01/2026 | | | 1,750,000 | | | | 1,848,354 | |
| | | | | | | | 4,729,756 | |
| Health Care — 1.9% | | | | | | | | |
| AbbVie, Inc., 2.50%, due 05/14/2020 | | | 1,300,000 | | | | 1,283,179 | |
| Becton Dickinson & Company, 3.25%, due 11/12/2020 | | | 1,250,000 | | | | 1,246,962 | |
| | | | | | | | 2,530,141 | |
| Industrials — 2.2% | | | | | | | | |
| Burlington Northern Santa Fe, LLC, 4.70%, due 10/01/2019 | | | 350,000 | | | | 359,801 | |
| Deere & Company, 4.375%, due 10/16/2019 | | | 500,000 | | | | 511,795 | |
| General Electric Capital Corporation, 4.65%, due 10/17/2021 | | | 1,000,000 | | | | 1,044,095 | |
| United Technologies Corporation, 4.50%, due 04/15/2020 | | | 850,000 | | | | 878,724 | |
| | | | | | | | 2,794,415 | |
| Information Technology — 1.8% | | | | | | | | |
| Apple, Inc., 3.20%, due 05/13/2025 | | | 750,000 | | | | 742,079 | |
| Oracle Corporation, 3.625%, due 07/15/2023 | | | 1,500,000 | | | | 1,529,977 | |
| | | | | | | | 2,272,056 | |
| Telecommunication Services — 1.3% | | | | | | | | |
| AT&T, Inc., 3.40%, due 08/14/2024 | | | 1,000,000 | | | | 1,007,291 | |
| Verizon Communications, Inc., | | | | | | | | |
| 3.00%, due 11/1/2021 | | | 500,000 | | | | 496,126 | |
| 3.50%, due 11/1/2021 | | | 200,000 | | | | 201,575 | |
| | | | | | | | 1,704,992 | |
37
DAVENPORT BALANCED INCOME FUND
SCHEDULE OF INVESTMENTS (Continued) |
| FIXED RATE CORPORATE BONDS — 24.8% (Continued) | | Par Value | | | Value | |
| Utilities — 1.3% | | | | | | |
| Southern Company (The), 3.25%, due 07/01/2026 | | $ | 1,750,000 | | | $ | 1,662,900 | |
| | | | | | | | | |
Total Fixed Rate Corporate Bonds (Cost $32,956,323) | | | | | | $ | 32,131,469 | |
VARIABLE RATE CORPORATE BONDS (b) — 12.2% | | Par Value | | | Value | |
| Consumer Staples — 1.2% | | | | | | |
| Campbell Soup Company, 2.774% (3MO LIBOR + 63), due 03/15/2021 | | $ | 750,000 | | | $ | 750,845 | |
| CVS Health Corporation, 2.687% (3MO LIBOR + 63), due 03/09/2020 | | | 765,000 | | | | 767,869 | |
| | | | | | | | 1,518,714 | |
| Energy — 1.0% | | | | | | | | |
| ConocoPhillips Company, 2.738% (3MO LIBOR + 90), due 05/15/2022 | | | 1,250,000 | | | | 1,273,857 | |
| | | | | | | | | |
| Financials — 6.8% | | | | | | | | |
| American Express Credit Corporation, 2.566% (3MO LIBOR + 78), due 11/05/2018 | | | 1,250,000 | | | | 1,253,370 | |
| Bank of New York Mellon (The), 2.333% (3MO LIBOR + 56), due 08/01/2018 | | | 400,000 | | | | 400,483 | |
| BP Capital Markets plc, 2.827% (3MO LIBOR + 65), due 09/19/2022 | | | 1,750,000 | | | | 1,767,594 | |
| Goldman Sachs Group, Inc., 3.008% (3MO LIBOR + 117), due 11/15/2021 | | | 945,000 | | | | 956,549 | |
| JPMorgan Chase & Company, 3.788% (3MO LIBOR + 148), due 03/01/2021 | | | 1,500,000 | | | | 1,542,806 | |
| Morgan Stanley, 2.633% (3MO LIBOR + 80), due 02/14/2020 | | | 1,250,000 | | | | 1,253,792 | |
| Royal Bank of Canada, 2.306% (3MO LIBOR + 54), due 07/30/2018 | | | 471,000 | | | | 471,565 | |
| Toronto-Dominion Bank (The), 2.584% (3MO LIBOR + 84), due 01/22/2019 | | | 500,000 | | | | 502,775 | |
| Wells Fargo & Company, 3.044% (3MO LIBOR + 101), due 12/07/2020 | | | 679,000 | | | | 687,146 | |
| | | | | | | | 8,836,080 | |
| Health Care — 1.2% | | | | | | | | |
| Amgen, Inc., 2.503% (3MO LIBOR + 60), due 05/22/2019 | | | 1,500,000 | | | | 1,507,290 | |
| | | | | | | | | |
| Information Technology — 0.5% | | | | | | | | |
| Cisco Systems, Inc., 2.541% (3MO LIBOR + 34), due 09/20/2019 | | | 670,000 | | | | 672,651 | |
38
DAVENPORT BALANCED INCOME FUND
SCHEDULE OF INVESTMENTS (Continued) |
VARIABLE RATE CORPORATE BONDS (b) — 12.2% (Continued) | | Par Value | | | Value | |
| Materials — 1.0% | | | | | | |
| Vulcan Materials Company, 2.569% (3MO LIBOR + 65), due 03/01/2021 | | $ | 1,275,000 | | | $ | 1,275,374 | |
| | | | | | | | | |
| Telecommunication Services — 0.5% | | | | | | | | |
| AT&T, Inc., 3.232% (3MO LIBOR + 93), due 06/30/2020 | | | 450,000 | | | | 454,733 | |
| Verizon Communications, Inc., 3.856% (3MO LIBOR + 175), due 09/14/2018 | | | 200,000 | | | | 201,205 | |
| | | | | | | | 655,938 | |
| | | | | | | | | |
Total Variable Rate Corporate Bonds (Cost $15,719,798) | | | | | | $ | 15,739,904 | |
| EXCHANGE-TRADED FUNDS — 2.4% | | Shares | | | Value | |
| iShares MSCI Europe Financials ETF | | | 72,395 | | | $ | 1,672,325 | |
| Vanguard FTSE Emerging Markets ETF | | | 30,430 | | | | 1,429,601 | |
Total Exchange-Traded Funds (Cost $2,953,947) | | | | | | $ | 3,101,926 | |
| MONEY MARKET FUNDS — 2.5% | | Shares | | | Value | |
First American Treasury Obligations Fund - Class Z, 1.51% (c) (Cost $3,182,498) | | | 3,182,498 | | | $ | 3,182,498 | |
Total Investments at Value — 100.2% (Cost $125,114,005) | | | | | | $ | 129,505,621 | |
Liabilities in Excess of Other Assets — (0.2%) | | | | | | | (237,971 | ) |
Net Assets — 100.0% | | | | | | $ | 129,267,650 | |
ADR - American Depositary Receipt.
LIBOR - London Interbank Offered Rate.
(a) | Non-income producing security. |
(b) | Variable rate security. Interest rate resets periodically. The rate shown is the effective rate as of March 31, 2018. The reference rate and spread (in basis points) are indicated parenthetically. |
(c) | The rate shown is the 7-day effective yield as of March 31, 2018. |
See accompanying notes to financial statements.
39
THE DAVENPORT FUNDS
STATEMENTS OF ASSETS AND LIABILITIES
March 31, 2018 |
| | | Davenport
Core
Fund | | | Davenport
Value &
Income
Fund | | | Davenport
Equity
Opportunities
Fund | |
| ASSETS | | | | | | | | | |
| Investments in securities: | | | | | | | | | |
| At cost | | $ | 310,782,273 | | | $ | 541,093,826 | | | $ | 314,303,001 | |
| At value (Note 2) | | $ | 459,417,636 | | | $ | 657,023,463 | | | $ | 399,488,023 | |
| Cash | | | 14,475,179 | | | | 251,590 | | | | 151,066 | |
| Receivable for capital shares sold | | | 318,273 | | | | 456,455 | | | | 323,503 | |
| Receivable for investment securities sold | | | 4,704,001 | | | | — | | | | — | |
| Dividends receivable | | | 292,728 | | | | 1,175,864 | | | | 12,675 | |
| Other assets | | | 16,097 | | | | 14,956 | | | | 14,478 | |
| TOTAL ASSETS | | | 479,223,914 | | | | 658,922,328 | | | | 399,989,745 | |
| | | | | | | | | | | | | |
| LIABILITIES | | | | | | | | | | | | |
| Payable for capital shares redeemed | | | 115,351 | | | | 427,331 | | | | 225,055 | |
| Payable for investment securities purchased | | | 13,833,540 | | | | 9,548,090 | | | | — | |
| Accrued investment advisory fees (Note 4) | | | 300,391 | | | | 417,132 | | | | 256,416 | |
| Payable to administrator (Note 4) | | | 46,600 | | | | 58,600 | | | | 42,850 | |
| Other accrued expenses | | | 8,637 | | | | 15,354 | | | | 5,671 | |
| TOTAL LIABILITIES | | | 14,304,519 | | | | 10,466,507 | | | | 529,992 | |
| | | | | | | | | | | | | |
| NET ASSETS | | $ | 464,919,395 | | | $ | 648,455,821 | | | $ | 399,459,753 | |
| | | | | | | | | | | | | |
| Net assets consist of: | | | | | | | | | | | | |
| Paid-in capital | | $ | 300,618,396 | | | $ | 517,353,833 | | | $ | 316,572,919 | |
| Accumulated net investment income (loss) | | | (17,861 | ) | | | 239,145 | | | | (222,138 | ) |
| Accumulated net realized gains (losses) from investment transactions | | | 15,683,497 | | | | 14,933,206 | | | | (2,076,050 | ) |
| Net unrealized appreciation on investments | | | 148,635,363 | | | | 115,929,637 | | | | 85,185,022 | |
| Net assets | | $ | 464,919,395 | | | $ | 648,455,821 | | | $ | 399,459,753 | |
| | | | | | | | | | | | | |
| Shares of beneficial interest outstanding (unlimited number of shares authorized, $0.01 par value) | | | 20,251,630 | | | | 38,477,135 | | | | 22,498,489 | |
| | | | | | | | | | | | | |
| Net asset value, offering price and redemption price per share (Note 2) | | $ | 22.96 | | | $ | 16.85 | | | $ | 17.75 | |
See accompanying notes to financial statements.
40
THE DAVENPORT FUNDS
STATEMENTS OF ASSETS AND LIABILITIES (Continued)
March 31, 2018 |
| | | Davenport
Small Cap
Focus
Fund | | | Davenport
Balanced
Income
Fund | |
| ASSETS | | | | | | |
| Investments in securities: | | | | | | |
| At cost | | $ | 102,072,757 | | | $ | 125,114,005 | |
| At value (Note 2) | | $ | 116,045,711 | | | $ | 129,505,621 | |
| Cash | | | 57,499 | | | | 84,848 | |
| Receivable for capital shares sold | | | 286,294 | | | | 664,808 | |
| Dividends and interest receivable | | | 28,744 | | | | 497,456 | |
| Other assets | | | 12,107 | | | | 10,081 | |
| TOTAL ASSETS | | | 116,430,355 | | | | 130,762,814 | |
| | | | | | | | | |
| LIABILITIES | | | | | | | | |
| Payable for capital shares redeemed | | | 96,019 | | | | 130,793 | |
| Payable for investment securities purchased | | | — | | | | 1,259,846 | |
| Accrued investment advisory fees (Note 4) | | | 74,144 | | | | 81,571 | |
| Payable to administrator (Note 4) | | | 14,725 | | | | 14,600 | |
| Other accrued expenses | | | 6,737 | | | | 8,354 | |
| TOTAL LIABILITIES | | | 191,625 | | | | 1,495,164 | |
| | | | | | | | | |
| NET ASSETS | | $ | 116,238,730 | | | $ | 129,267,650 | |
| | | | | | | | | |
| Net assets consist of: | | | | | | | | |
| Paid-in capital | | $ | 100,540,281 | | | $ | 123,527,398 | |
| Undistributed net investment income | | | 239,015 | | | | 475,747 | |
| Accumulated net realized gains from investment transactions | | | 1,486,480 | | | | 872,889 | |
| Net unrealized appreciation on investments | | | 13,972,954 | | | | 4,391,616 | |
Net assets | | $ | 116,238,730 | | | $ | 129,267,650 | |
| | | | | | | | | |
| Shares of beneficial interest outstanding (unlimited number of shares authorized, $0.01 par value) | | | 8,937,635 | | | | 11,463,754 | |
| | | | | | | | | |
| Net asset value, offering price and redemption price per share (Note 2) | | $ | 13.01 | | | $ | 11.28 | |
See accompanying notes to financial statements.
41
THE DAVENPORT FUNDS
STATEMENTS OF OPERATIONS
Year Ended March 31, 2018 |
| | | Davenport
Core
Fund | | | Davenport
Value &
Income
Fund | | | Davenport
Equity
Opportunities
Fund | |
| INVESTMENT INCOME | | | | | | | | | |
| Dividends | | $ | 5,889,726 | | | $ | 16,690,506 | | | $ | 2,678,266 | |
| Foreign withholding taxes on dividends | | | (101,760 | ) | | | (147,645 | ) | | | (75,346 | ) |
| TOTAL INVESTMENT INCOME | | | 5,787,966 | | | | 16,542,861 | | | | 2,602,920 | |
| | | | | | | | | | | | | |
| EXPENSES | | | | | | | | | | | | |
| Investment advisory fees (Note 4) | | | 3,313,568 | | | | 4,636,759 | | | | 2,887,649 | |
| Administration fees (Note 4) | | | 492,664 | | | | 628,190 | | | | 463,168 | |
| Custodian and bank service fees | | | 29,654 | | | | 41,323 | | | | 25,988 | |
| Compliance service fees (Note 4) | | | 26,295 | | | | 35,078 | | | | 23,510 | |
| Registration and filing fees | | | 27,543 | | | | 30,636 | | | | 25,192 | |
| Professional fees | | | 21,416 | | | | 21,416 | | | | 21,416 | |
| Insurance expense | | | 10,098 | | | | 13,943 | | | | 9,054 | |
| Printing of shareholder reports | | | 9,660 | | | | 11,898 | | | | 10,803 | |
| Trustees’ fees and expenses (Note 4) | | | 10,452 | | | | 10,452 | | | | 10,452 | |
| Postage and supplies | | | 9,422 | | | | 10,781 | | | | 10,420 | |
| Other expenses | | | 9,259 | | | | 11,809 | | | | 8,855 | |
| TOTAL EXPENSES | | | 3,960,031 | | | | 5,452,285 | | | | 3,496,507 | |
| | | | | | | | | | | | | |
| NET INVESTMENT INCOME (LOSS) | | | 1,827,935 | | | | 11,090,576 | | | | (893,587 | ) |
| | | | | | | | | | | | | |
| REALIZED AND UNREALIZED GAINS (LOSSES) ON INVESTMENTS AND FOREIGN CURRENCIES | | | | | | | | | | | | |
| Net realized gains (losses) from: | | | | | | | | | | | | |
| Investments | | | 18,131,241 | | | | 25,670,551 | | | | 6,190,759 | |
| Foreign currency transactions (Note 2) | | | — | | | | (3,074 | ) | | | — | |
| Net change in unrealized appreciation (depreciation) on investments | | | 26,314,576 | | | | 23,552,203 | | | | 41,890,913 | |
| NET REALIZED AND UNREALIZED GAINS ON INVESTMENTS AND FOREIGN CURRENCIES | | | 44,445,817 | | | | 49,219,680 | | | | 48,081,672 | |
| | | | | | | | | | | | | |
| NET INCREASE IN NET ASSETS FROM OPERATIONS | | $ | 46,273,752 | | | $ | 60,310,256 | | | $ | 47,188,085 | |
See accompanying notes to financial statements.
42
THE DAVENPORT FUNDS
STATEMENTS OF OPERATIONS (Continued)
Year Ended March 31, 2018 |
| | | Davenport
Small Cap
Focus
Fund | | | Davenport
Balanced
Income
Fund | |
| INVESTMENT INCOME | | | | | | |
| Dividends | | $ | 1,181,024 | | | $ | 2,112,599 | |
| Foreign withholding taxes on dividends | | | (6,172 | ) | | | (23,792 | ) |
| Interest | | | — | | | | 979,331 | |
| TOTAL INVESTMENT INCOME | | | 1,174,852 | | | | 3,068,138 | |
| | | | | | | | | |
| EXPENSES | | | | | | | | |
| Investment advisory fees (Note 4) | | | 698,566 | | | | 813,731 | |
| Administration fees (Note 4) | | | 134,260 | | | | 137,797 | |
| Registration and filing fees | | | 26,115 | | | | 23,379 | |
| Professional fees | | | 21,416 | | | | 22,916 | |
| Custodian and bank service fees | | | 11,111 | | | | 10,915 | |
| Trustees’ fees and expenses (Note 4) | | | 10,452 | | | | 10,452 | |
| Compliance service fees (Note 4) | | | 9,027 | | | | 9,822 | |
| Postage and supplies | | | 5,457 | | | | 4,390 | |
| Printing of shareholder reports | | | 4,752 | | | | 4,328 | |
| Insurance expense | | | 2,353 | | | | 2,626 | |
| Other expenses | | | 6,977 | | | | 12,849 | |
| TOTAL EXPENSES | | | 930,486 | | | | 1,053,205 | |
| | | | | | | | | |
| NET INVESTMENT INCOME | | | 244,366 | | | | 2,014,933 | |
| | | | | | | | | |
| REALIZED AND UNREALIZED GAINS (LOSSES) ON INVESTMENTS AND FOREIGN CURRENCIES | | | | | | | | |
| Net realized gains (losses) from: | | | | | | | | |
| Investments | | | 2,987,414 | | | | 1,426,553 | |
| Foreign currency transactions (Note 2) | | | — | | | | (313 | ) |
| Net change in unrealized appreciation (depreciation) on investments | | | 4,792,699 | | | | 729,395 | |
| NET REALIZED AND UNREALIZED GAINS ON INVESTMENTS AND FOREIGN CURRENCIES | | | 7,780,113 | | | | 2,155,635 | |
| | | | | | | | | |
| NET INCREASE IN NET ASSETS FROM OPERATIONS | | $ | 8,024,479 | | | $ | 4,170,568 | |
See accompanying notes to financial statements.
43
DAVENPORT CORE FUND
STATEMENTS OF CHANGES IN NET ASSETS |
| | | Year
Ended
March 31,
2018 | | | Year
Ended
March 31,
2017 | |
| FROM OPERATIONS | | | | | | |
| Net investment income | | $ | 1,827,935 | | | $ | 2,026,335 | |
| Net realized gains from investment transactions | | | 18,131,241 | | | | 12,476,423 | |
| Net change in unrealized appreciation (depreciation) on investments | | | 26,314,576 | | | | 41,702,580 | |
| Net increase in net assets from operations | | | 46,273,752 | | | | 56,205,338 | |
| | | | | | | | | |
| DISTRIBUTIONS TO SHAREHOLDERS (Note 2) | | | | | | | | |
| From net investment income | | | (2,062,810 | ) | | | (1,831,251 | ) |
| From net realized gains from investment transactions | | | (8,953,509 | ) | | | (10,298,009 | ) |
| Decrease in net assets from distributions to shareholders | | | (11,016,319 | ) | | | (12,129,260 | ) |
| | | | | | | | | |
| FROM CAPITAL SHARE TRANSACTIONS | | | | | | | | |
| Proceeds from shares sold | | | 51,436,059 | | | | 39,405,923 | |
| Net asset value of shares issued in reinvestment of distributions to shareholders | | | 10,570,642 | | | | 11,675,046 | |
| Payments for shares redeemed | | | (31,776,792 | ) | | | (32,954,445 | ) |
| Net increase in net assets from capital share transactions | | | 30,229,909 | | | | 18,126,524 | |
| | | | | | | | | |
| TOTAL INCREASE IN NET ASSETS | | | 65,487,342 | | | | 62,202,602 | |
| | | | | | | | | |
| NET ASSETS | | | | | | | | |
| Beginning of year | | | 399,432,053 | | | | 337,229,451 | |
| End of year | | $ | 464,919,395 | | | $ | 399,432,053 | |
| | | | | | | | | |
| UNDISTRIBUTED (DISTRIBUTIONS IN EXCESS OF) NET INVESTMENT INCOME | | $ | (17,861 | ) | | $ | 217,014 | |
| | | | | | | | | |
| CAPITAL SHARE ACTIVITY | | | | | | | | |
| Shares sold | | | 2,301,979 | | | | 1,984,210 | |
| Shares reinvested | | | 483,529 | | | | 608,762 | |
| Shares redeemed | | | (1,417,821 | ) | | | (1,663,594 | ) |
| Net increase in shares outstanding | | | 1,367,687 | | | | 929,378 | |
| Shares outstanding at beginning of year | | | 18,883,943 | | | | 17,954,565 | |
| Shares outstanding at end of year | | | 20,251,630 | | | | 18,883,943 | |
See accompanying notes to financial statements.
44
DAVENPORT VALUE & INCOME FUND
STATEMENTS OF CHANGES IN NET ASSETS |
| | | Year
Ended
March 31,
2018 | | | Year
Ended
March 31,
2017 | |
| FROM OPERATIONS | | | | | | |
| Net investment income | | $ | 11,090,576 | | | $ | 9,982,919 | |
| Net realized gains (losses) from: | | | | | | | | |
| Investments | | | 25,670,551 | | | | 16,183,568 | |
| Foreign currency transactions | | | (3,074 | ) | | | — | |
| Net change in unrealized appreciation (depreciation) on investments | | | 23,552,203 | | | | 38,662,873 | |
| Increase in net assets from operations | | | 60,310,256 | | | | 64,829,360 | |
| | | | | | | | | |
| DISTRIBUTIONS TO SHAREHOLDERS (Note 2) | | | | | | | | |
| From net investment income | | | (10,955,224 | ) | | | (10,351,557 | ) |
| From net realized gains from investment transactions | | | (18,625,911 | ) | | | (2,019,752 | ) |
| Decrease in net assets from distributions to shareholders | | | (29,581,135 | ) | | | (12,371,309 | ) |
| | | | | | | | | |
| FROM CAPITAL SHARE TRANSACTIONS | | | | | | | | |
| Proceeds from shares sold | | | 78,456,849 | | | | 93,632,084 | |
| Net asset value of shares issued in reinvestment of distributions to shareholders | | | 27,437,503 | | | | 11,182,949 | |
| Payments for shares redeemed | | | (50,163,072 | ) | | | (45,724,605 | ) |
| Net increase in net assets from capital share transactions | | | 55,731,280 | | | | 59,090,428 | |
| | | | | | | | | |
| TOTAL INCREASE IN NET ASSETS | | | 86,460,401 | | | | 111,548,479 | |
| | | | | | | | | |
| NET ASSETS | | | | | | | | |
| Beginning of year | | | 561,995,420 | | | | 450,446,941 | |
| End of year | | $ | 648,455,821 | | | $ | 561,995,420 | |
| | | | | | | | | |
| UNDISTRIBUTED NET INVESTMENT INCOME | | $ | 239,145 | | | $ | 106,867 | |
| | | | | | | | | |
| CAPITAL SHARE ACTIVITY | | | | | | | | |
| Shares sold | | | 4,644,008 | | | | 6,158,551 | |
| Shares reinvested | | | 1,628,277 | | | | 732,233 | |
| Shares redeemed | | | (2,982,055 | ) | | | (2,988,790 | ) |
| Net increase in shares outstanding | | | 3,290,230 | | | | 3,901,994 | |
| Shares outstanding at beginning of year | | | 35,186,905 | | | | 31,284,911 | |
| Shares outstanding at end of year | | | 38,477,135 | | | | 35,186,905 | |
See accompanying notes to financial statements.
45
DAVENPORT EQUITY OPPORTUNITIES FUND
STATEMENTS OF CHANGES IN NET ASSETS |
| | | Year
Ended
March 31,
2018 | | | Year
Ended
March 31,
2017 | |
| FROM OPERATIONS | | | | | | |
| Net investment income (loss) | | $ | (893,587 | ) | | $ | 11,025 | |
| Net realized gains (losses) from investment transactions | | | 6,190,759 | | | | (7,505,581 | ) |
| Net change in unrealized appreciation (depreciation) on investments | | | 41,890,913 | | | | 32,069,088 | |
| Net increase in net assets from operations | | | 47,188,085 | | | | 24,574,532 | |
| | | | | | | | | |
| DISTRIBUTIONS TO SHAREHOLDERS (Note 2) | | | | | | | | |
| From net realized gains from investment transactions | | | — | | | | (4,091,481 | ) |
| | | | | | | | | |
| FROM CAPITAL SHARE TRANSACTIONS | | | | | | | | |
| Proceeds from shares sold | | | 40,397,057 | | | | 44,607,738 | |
| Net asset value of shares issued in reinvestment of distributions to shareholders | | | — | | | | 3,934,296 | |
| Payments for shares redeemed | | | (39,879,119 | ) | | | (34,059,381 | ) |
| Net increase in net assets from capital share transactions | | | 517,938 | | | | 14,482,653 | |
| | | | | | | | | |
| TOTAL INCREASE IN NET ASSETS | | | 47,706,023 | | | | 34,965,704 | |
| | | | | | | | | |
| NET ASSETS | | | | | | | | |
| Beginning of year | | | 351,753,730 | | | | 316,788,026 | |
| End of year | | $ | 399,459,753 | | | $ | 351,753,730 | |
| | | | | | | | | |
| ACCUMULATED NET INVESTMENT LOSS | | $ | (222,138 | ) | | $ | (61,798 | ) |
| | | | | | | | | |
| CAPITAL SHARE ACTIVITY | | | | | | | | |
| Shares sold | | | 2,345,472 | | | | 2,965,904 | |
| Shares reinvested | | | — | | | | 273,025 | |
| Shares redeemed | | | (2,332,638 | ) | | | (2,258,343 | ) |
| Net increase in shares outstanding | | | 12,834 | | | | 980,586 | |
| Shares outstanding at beginning of year | | | 22,485,655 | | | | 21,505,069 | |
| Shares outstanding at end of year | | | 22,498,489 | | | | 22,485,655 | |
See accompanying notes to financial statements.
46
DAVENPORT SMALL CAP FOCUS FUND
STATEMENTS OF CHANGES IN NET ASSETS |
| | | Year
Ended
March 31,
2018 | | | Year
Ended
March 31,
2017 | |
| FROM OPERATIONS | | | | | | |
| Net investment income | | $ | 244,366 | | | $ | 48,148 | |
| Net realized gains from investment transactions | | | 2,987,414 | | | | 3,550,036 | |
| Net change in unrealized appreciation (depreciation) on investments | | | 4,792,699 | | | | 10,113,696 | |
| Net increase in net assets from operations | | | 8,024,479 | | | | 13,711,880 | |
| | | | | | | | | |
| DISTRIBUTIONS TO SHAREHOLDERS (Note 2) | | | | | | | | |
| From net realized gains from investment transactions | | | (2,522,386 | ) | | | — | |
| | | | | | | | | |
| FROM CAPITAL SHARE TRANSACTIONS | | | | | | | | |
| Proceeds from shares sold | | | 39,158,303 | | | | 25,623,926 | |
| Net asset value of shares issued in reinvestment of distributions to shareholders | | | 2,449,992 | | | | — | |
| Payments for shares redeemed | | | (5,818,002 | ) | | | (4,025,524 | ) |
| Net increase in net assets from capital share transactions | | | 35,790,293 | | | | 21,598,402 | |
| | | | | | | | | |
| TOTAL INCREASE IN NET ASSETS | | | 41,292,386 | | | | 35,310,282 | |
| | | | | | | | | |
| NET ASSETS | | | | | | | | |
| Beginning of year | | | 74,946,344 | | | | 39,636,062 | |
| End of year | | $ | 116,238,730 | | | $ | 74,946,344 | |
| | | | | | | | | |
| UNDISTRIBUTED NET INVESTMENT INCOME | | $ | 239,015 | | | $ | 72,245 | |
| | | | | | | | | |
| CAPITAL SHARE ACTIVITY | | | | | | | | |
| Shares sold | | | 3,026,417 | | | | 2,310,823 | |
| Shares reinvested | | | 191,961 | | | | — | |
| Shares redeemed | | | (458,935 | ) | | | (378,052 | ) |
| Net increase in shares outstanding | | | 2,759,443 | | | | 1,932,771 | |
| Shares outstanding at beginning of year | | | 6,178,192 | | | | 4,245,421 | |
| Shares outstanding at end of year | | | 8,937,635 | | | | 6,178,192 | |
See accompanying notes to financial statements.
47
DAVENPORT BALANCED INCOME FUND
STATEMENTS OF CHANGES IN NET ASSETS |
| | | Year
Ended
March 31,
2018 | | | Year
Ended
March 31,
2017 | |
| FROM OPERATIONS | | | | | | |
| Net investment income | | $ | 2,014,933 | | | $ | 776,273 | |
| Net realized gains (losses) from: | | | | | | | | |
| Investments | | | 1,426,553 | | | | 406,386 | |
| Foreign currency transactions | | | (313 | ) | | | — | |
| Net change in unrealized appreciation (depreciation) on investments | | | 729,395 | | | | 3,029,684 | |
| Net increase in net assets from operations | | | 4,170,568 | | | | 4,212,343 | |
| | | | | | | | | |
| DISTRIBUTIONS TO SHAREHOLDERS (Note 2) | | | | | | | | |
| From net investment income | | | (1,619,327 | ) | | | (669,199 | ) |
| From net realized gains from investment transactions | | | (965,917 | ) | | | — | |
| Decrease in net assets from distributions to shareholders | | | (2,585,244 | ) | | | (669,199 | ) |
| | | | | | | | | |
| FROM CAPITAL SHARE TRANSACTIONS | | | | | | | | |
| Proceeds from shares sold | | | 53,925,631 | | | | 67,653,140 | |
| Net asset value of shares issued in reinvestment of distributions to shareholders | | | 2,427,962 | | | | 615,079 | |
| Payments for shares redeemed | | | (12,089,899 | ) | | | (6,278,207 | ) |
| Net increase in net assets from capital share transactions | | | 44,263,694 | | | | 61,990,012 | |
| | | | | | | | | |
| TOTAL INCREASE IN NET ASSETS | | | 45,849,018 | | | | 65,533,156 | |
| | | | | | | | | |
| NET ASSETS | | | | | | | | |
| Beginning of year | | | 83,418,632 | | | | 17,885,476 | |
| End of year | | $ | 129,267,650 | | | $ | 83,418,632 | |
| | | | | | | | | |
| UNDISTRIBUTED NET INVESTMENT INCOME | | $ | 475,747 | | | $ | 99,145 | |
| | | | | | | | | |
| CAPITAL SHARE ACTIVITY | | | | | | | | |
| Shares sold | | | 4,740,739 | | | | 6,359,948 | |
| Shares reinvested | | | 213,171 | | | | 57,130 | |
| Shares redeemed | | | (1,063,184 | ) | | | (585,286 | ) |
| Net increase in shares outstanding | | | 3,890,726 | | | | 5,831,792 | |
| Shares outstanding at beginning of year | | | 7,573,028 | | | | 1,741,236 | |
| Shares outstanding at end of year | | | 11,463,754 | | | | 7,573,028 | |
See accompanying notes to financial statements.
48
DAVENPORT CORE FUND
FINANCIAL HIGHLIGHTS |
| Selected Per Share Data and Ratios for a Share Outstanding Throughout Each Year |
| | | Years Ended March 31, | |
| | 2018 | | | 2017 | | | 2016 | | | 2015 | | | | 2014 | |
| Net asset value at beginning of year | | $ | 21.15 | | | $ | 18.78 | | | $ | 20.02 | | | $ | 19.30 | | | $ | 16.75 | |
| | | | | | | | | | | | | | | | | | | | | |
| Income (loss) from investment operations: | | | | | | | | | | | | | | | | | | | | |
| Net investment income | | | 0.09 | | | | 0.11 | | | | 0.11 | | | | 0.10 | | | | 0.12 | |
| Net realized and unrealized gains (losses) on investments | | | 2.29 | | | | 2.92 | | | | (0.56 | ) | | | 2.20 | | | | 3.39 | |
| Total from investment operations | | | 2.38 | | | | 3.03 | | | | (0.45 | ) | | | 2.30 | | | | 3.51 | |
| | | | | | | | | | | | | | | | | | | | | |
| Less distributions: | | | | | | | | | | | | | | | | | | | | |
| Dividends from net investment income | | | (0.11 | ) | | | (0.10 | ) | | | (0.11 | ) | | | (0.10 | ) | | | (0.12 | ) |
| Distributions from net realized gains | | | (0.46 | ) | | | (0.56 | ) | | | (0.68 | ) | | | (1.48 | ) | | | (0.84 | ) |
| Total distributions | | | (0.57 | ) | | | (0.66 | ) | | | (0.79 | ) | | | (1.58 | ) | | | (0.96 | ) |
| | | | | | | | | | | | | | | | | | | | | |
| Net asset value at end of year | | $ | 22.96 | | | $ | 21.15 | | | $ | 18.78 | | | $ | 20.02 | | | $ | 19.30 | |
| | | | | | | | | | | | | | | | | | | | | |
Total return (a) | | | 11.38 | % | | | 16.56 | % | | | (2.39 | %) | | | 12.42 | % | | | 21.32 | % |
| | | | | | | | | | | | | | | | | | | | | |
| Net assets at end of year (000’s) | | $ | 464,919 | | | $ | 399,432 | | | $ | 337,229 | | | $ | 330,687 | | | $ | 281,231 | |
| | | | | | | | | | | | | | | | | | | | | |
| Ratio of total expenses to average net assets | | | 0.90 | % | | | 0.90 | % | | | 0.92 | % | | | 0.93 | % | | | 0.94 | % |
| | | | | | | | | | | | | | | | | | | | | |
| Ratio of net investment income to average net assets | | | 0.41 | % | | | 0.56 | % | | | 0.56 | % | | | 0.49 | % | | | 0.64 | % |
| | | | | | | | | | | | | | | | | | | | | |
| Portfolio turnover rate | | | 22 | % | | | 23 | % | | | 23 | % | | | 21 | % | | | 29 | % |
(a) | Total return is a measure of the change in value of an investment in the Fund over the periods covered, which assumes any dividends or capital gains distributions are reinvested in shares of the Fund. Returns shown do not reflect the deduction of taxes a shareholder would pay on Fund distributions or the redemption of Fund shares. |
See accompanying notes to financial statements.
49
DAVENPORT VALUE & INCOME FUND
FINANCIAL HIGHLIGHTS |
| Selected Per Share Data and Ratios for a Share Outstanding Throughout Each Year |
| | | Years Ended March 31, | |
| | 2018 | | | 2017 | | | 2016 | | | 2015 | | | | 2014 | |
| Net asset value at beginning of year | | $ | 15.97 | | | $ | 14.40 | | | $ | 15.46 | | | $ | 14.71 | | | $ | 13.18 | |
| | | | | | | | | | | | | | | | | | | | | |
| Income (loss) from investment operations: | | | | | | | | | | | | | | | | | | | | |
| Net investment income | | | 0.30 | | | | 0.30 | | | | 0.29 | | | | 0.25 | | | | 0.30 | |
| Net realized and unrealized gains (losses) on investments and foreign currencies | | | 1.39 | | | | 1.64 | | | | (0.36 | ) | | | 1.45 | | | | 2.04 | |
| Total from investment operations | | | 1.69 | | | | 1.94 | | | | (0.07 | ) | | | 1.70 | | | | 2.34 | |
| | | | | | | | | | | | | | | | | | | | | |
| Less distributions: | | | | | | | | | | | | | | | | | | | | |
| Dividends from net investment income | | | (0.30 | ) | | | (0.31 | ) | | | (0.29 | ) | | | (0.25 | ) | | | (0.29 | ) |
| Distributions from net realized gains | | | (0.51 | ) | | | (0.06 | ) | | | (0.70 | ) | | | (0.70 | ) | | | (0.52 | ) |
| Total distributions | | | (0.81 | ) | | | (0.37 | ) | | | (0.99 | ) | | | (0.95 | ) | | | (0.81 | ) |
| | | | | | | | | | | | | | | | | | | | | |
| Net asset value at end of year | | $ | 16.85 | | | $ | 15.97 | | | $ | 14.40 | | | $ | 15.46 | | | $ | 14.71 | |
| | | | | | | | | | | | | | | | | | | | | |
Total return (a) | | | 10.67 | % | | | 13.60 | % | | | (0.46 | %) | | | 11.92 | % | | | 18.25 | % |
| | | | | | | | | | | | | | | | | | | | | |
| Net assets at end of year (000’s) | | $ | 648,456 | | | $ | 561,995 | | | $ | 450,447 | | | $ | 407,777 | | | $ | 304,288 | |
| | | | | | | | | | | | | | | | | | | | | |
| Ratio of total expenses to average net assets | | | 0.88 | % | | | 0.89 | % | | | 0.91 | % | | | 0.92 | % | | | 0.94 | % |
| | | | | | | | | | | | | | | | | | | | | |
| Ratio of net investment income to average net assets | | | 1.79 | % | | | 1.96 | % | | | 2.03 | % | | | 1.66 | % | | | 2.22 | % |
| | | | | | | | | | | | | | | | | | | | | |
| Portfolio turnover rate | | | 22 | % | | | 26 | % | | | 25 | % | | | 23 | % | | | 32 | % |
(a) | Total return is a measure of the change in value of an investment in the Fund over the periods covered, which assumes any dividends or capital gains distributions are reinvested in shares of the Fund. Returns shown do not reflect the deduction of taxes a shareholder would pay on Fund distributions or the redemption of Fund shares. |
See accompanying notes to financial statements.
50
DAVENPORT EQUITY OPPORTUNITIES FUND
FINANCIAL HIGHLIGHTS |
| Selected Per Share Data and Ratios for a Share Outstanding Throughout Each Year |
| | | Years Ended March 31, | |
| | 2018 | | | 2017 | | | 2016 | | | 2015 | | | | 2014 | |
| Net asset value at beginning of year | | $ | 15.64 | | | $ | 14.73 | | | $ | 16.61 | | | $ | 15.91 | | | $ | 13.86 | |
| | | | | | | | | | | | | | | | | | | | | |
| Income (loss) from investment operations: | | | | | | | | | | | | | | | | | | | | |
| Net investment income (loss) | | | (0.04 | ) | | | 0.00 | (a) | | | 0.00 | (a) | | | 0.04 | | | | 0.24 | |
| Net realized and unrealized gains (losses) on investments | | | 2.15 | | | | 1.10 | | | | (1.14 | ) | | | 2.42 | | | | 2.65 | |
| Total from investment operations | | | 2.11 | | | | 1.10 | | | | (1.14 | ) | | | 2.46 | | | | 2.89 | |
| | | | | | | | | | | | | | | | | | | | | |
| Less distributions: | | | | | | | | | | | | | | | | | | | | |
| Dividends from net investment income | | | — | | | | — | | | | (0.01 | ) | | | (0.26 | ) | | | (0.02 | ) |
| Distributions from net realized gains | | | — | | | | (0.19 | ) | | | (0.73 | ) | | | (1.50 | ) | | | (0.82 | ) |
| Total distributions | | | — | | | | (0.19 | ) | | | (0.74 | ) | | | (1.76 | ) | | | (0.84 | ) |
| | | | | | | | | | | | | | | | | | | | | |
| Net asset value at end of year | | $ | 17.75 | | | $ | 15.64 | | | $ | 14.73 | | | $ | 16.61 | | | $ | 15.91 | |
| | | | | | | | | | | | | | | | | | | | | |
Total return (b) | | | 13.49 | % | | | 7.57 | % | | | (7.07 | %) | | | 16.67 | % | | | 21.57 | % |
| | | | | | | | | | | | | | | | | | | | | |
| Net assets at end of year (000’s) | | $ | 399,460 | | | $ | 351,754 | | | $ | 316,788 | | | $ | 277,703 | | | $ | 174,489 | |
| | | | | | | | | | | | | | | | | | | | | |
| Ratio of total expenses to average net assets | | | 0.91 | % | | | 0.92 | % | | | 0.93 | % | | | 0.96 | % | | | 0.97 | % |
| | | | | | | | | | | | | | | | | | | | | |
| Ratio of net investment income (loss) to average net assets | | | (0.23 | %) | | | 0.00 | %(c) | | | 0.02 | % | | | 0.33 | % | | | 1.96 | % |
| | | | | | | | | | | | | | | | | | | | | |
| Portfolio turnover rate | | | 21 | % | | | 23 | % | | | 29 | % | | | 31 | % | | | 49 | % |
(a) | Amount rounds to less than $0.01 per share. |
(b) | Total return is a measure of the change in value of an investment in the Fund over the periods covered, which assumes any dividends or capital gains distributions are reinvested in shares of the Fund. Returns shown do not reflect the deduction of taxes a shareholder would pay on Fund distributions or the redemption of Fund shares. |
(c) | Amount rounds to less than 0.01%. |
See accompanying notes to financial statements.
51
DAVENPORT SMALL CAP FOCUS FUND
FINANCIAL HIGHLIGHTS |
| Selected Per Share Data and Ratios for a Share Outstanding Throughout Each Period |
| | | Year
Ended
March 31,
2018 | | | Year
Ended
March 31,
2017 | | | Year
Ended
March 31,
2016 | | | Period
Ended
March 31,
2015 (a) | |
| Net asset value at beginning of period | | $ | 12.13 | | | $ | 9.34 | | | $ | 10.41 | | | $ | 10.00 | |
| | | | | | | | | | | | | | | | | |
| Income (loss) from investment operations: | | | | | | | | | | | | | | | | |
| Net investment income (loss) | | | 0.02 | | | | 0.02 | | | | 0.01 | | | | (0.01 | ) |
| Net realized and unrealized gains (losses) on investments | | | 1.22 | | | | 2.77 | | | | (1.07 | ) | | | 0.42 | |
| Total from investment operations | | | 1.24 | | | | 2.79 | | | | (1.06 | ) | | | 0.41 | |
| | | | | | | | | | | | | | | | | |
| Less distributions: | | | | | | | | | | | | | | | | |
| Distributions from net realized gains | | | (0.36 | ) | | | — | | | | (0.01 | ) | | | — | |
| | | | | | | | | | | | | | | | | |
| Net asset value at end of period | | $ | 13.01 | | | $ | 12.13 | | | $ | 9.34 | | | $ | 10.41 | |
| | | | | | | | | | | | | | | | | |
Total return (b) | | | 10.28 | % | | | 29.87 | % | | | (10.19 | %) | | | 4.10 | %(c) |
| | | | | | | | | | | | | | | | | |
| Net assets at end of period (000’s) | | $ | 116,239 | | | $ | 74,946 | | | $ | 39,636 | | | $ | 31,291 | |
| | | | | | | | | | | | | | | | | |
| Ratio of net expenses to average net assets | | | 1.00 | % | | | 1.06 | % | | | 1.15 | % | | | 1.25 | %(d)(e) |
| | | | | | | | | | | | | | | | | |
| Ratio of net investment income (loss) to average net assets | | | 0.26 | % | | | 0.09 | % | | | 0.14 | % | | | (0.30 | %)(d)(f) |
| | | | | | | | | | | | | | | | | |
| Portfolio turnover rate | | | 48 | % | | | 37 | % | | | 48 | % | | | 15 | %(c) |
(a) | Represents the period from commencement of operations (December 31, 2014) through March 31, 2015. |
(b) | Total return is a measure of the change in value of an investment in the Fund over the periods covered, which assumes any dividends or capital gains distributions are reinvested in shares of the Fund. Returns shown do not reflect the deduction of taxes a shareholder would pay on Fund distributions or the redemption of Fund shares. |
(e) | Absent advisory fee reductions, the ratio of total expenses to average net assets would have been 1.42%(d) for the period ended March 31, 2015 (Note 4). |
(f) | Ratio was determined after advisory fee reductions. |
See accompanying notes to financial statements.
52
DAVENPORT BALANCED INCOME FUND
FINANCIAL HIGHLIGHTS |
| Selected Per Share Data and Ratios for a Share Outstanding Throughout Each Period |
| | | Year
Ended
March 31,
2018 | | | Year
Ended
March 31,
2017 | | | Period
Ended
March 31,
2016 (a) | |
| Net asset value at beginning of period | | $ | 11.02 | | | $ | 10.27 | | | $ | 10.00 | |
| | | | | | | | | | | | | |
| Income from investment operations: | | | | | | | | | | | | |
| Net investment income | | | 0.20 | | | | 0.14 | | | | 0.03 | |
| Net realized and unrealized gains on investments and foreign currencies | | | 0.33 | (b) | | | 0.74 | | | | 0.26 | |
| Total from investment operations | | | 0.53 | | | | 0.88 | | | | 0.29 | |
| | | | | | | | | | | | | |
| Less distributions: | | | | | | | | | | | | |
| Dividends from net investment income | | | (0.17 | ) | | | (0.13 | ) | | | (0.02 | ) |
| Distributions from net realized gains | | | (0.10 | ) | | | — | | | | — | |
| Total distributions | | | (0.27 | ) | | | (0.13 | ) | | | (0.02 | ) |
| | | | | | | | | | | | | |
| Net asset value at end of period | | $ | 11.28 | | | $ | 11.02 | | | $ | 10.27 | |
| | | | | | | | | | | | | |
Total return (c) | | | 4.81 | % | | | 8.59 | % | | | 2.90 | %(d) |
| | | | | | | | | | | | | |
| Net assets at end of period (000’s) | | $ | 129,268 | | | $ | 83,419 | | | $ | 17,885 | |
| | | | | | | | | | | | | |
| Ratio of net expenses to average net assets | | | 0.97 | % | | | 1.13 | %(e) | | | 1.25 | %(f)(g) |
| | | | | | | | | | | | | |
| Ratio of net investment income to average net assets | | | 1.85 | % | | | 1.55 | % | | | 1.65 | %(f)(h) |
| | | | | | | | | | | | | |
| Portfolio turnover rate | | | 23 | % | | | 16 | % | | | 7 | %(d) |
(a) | Represents the period from commencement of operations (December 31, 2015) through March 31, 2016. |
(b) | Realized and unrealized gains per share in this caption are balancing amounts necessary to reconcile the change in net asset value per share for the period, and may not reconcile with the aggregate gains (losses) in the Statement of Operations due to share transactions for the period. |
(c) | Total return is a measure of the change in value of an investment in the Fund over the periods covered, which assumes any dividends or capital gains distributions are reinvested in shares of the Fund. Returns shown do not reflect the deduction of taxes a shareholder would pay on Fund distributions or the redemption of Fund shares. |
(e) | Absent advisory fee reductions and expense reimbursements recouped by the Adviser, the ratio of net expenses to average net assets would have been 1.08% for the year ended March 31, 2017 (Note 4). |
(g) | Absent advisory fee reductions and expense reimbursements, the ratio of total expenses to average net assets would have been 2.25%(d) for the period ended March 31, 2016 (Note 4). |
(h) | Ratio was determined after advisory fee reductions and expense reimbursements. |
See accompanying notes to financial statements.
53
THE DAVENPORT FUNDS
NOTES TO FINANCIAL STATEMENTS
March 31, 2018
1. Organization
Davenport Core Fund, Davenport Value & Income Fund, Davenport Equity Opportunities Fund, Davenport Small Cap Focus Fund and Davenport Balanced Income Fund (individually, a “Fund,” and, collectively, the “Funds”) are each a no-load series of the Williamsburg Investment Trust (the “Trust”), an open-end management investment company registered under the Investment Company Act of 1940, as amended (the “1940 Act”). The Trust was organized as a Massachusetts business trust on July 18, 1988. Other series of the Trust are not incorporated in this report.
Davenport Core Fund’s investment objective is long term growth of capital.
Davenport Value & Income Fund’s investment objective is to achieve long term growth while generating current income through dividend payments on portfolio securities.
Davenport Equity Opportunities Fund’s investment objective is long term capital appreciation.
Davenport Small Cap Focus Fund’s investment objective is long term capital appreciation.
Davenport Balanced Income Fund’s investment objective is current income and an opportunity for long term growth.
Davenport Core Fund, Davenport Value & Income Fund and Davenport Balanced Income Fund are each classified as a diversified fund. Davenport Equity Opportunities Fund and Davenport Small Cap Focus Fund are each classified as a non-diversified fund.
2. Significant Accounting Policies
In October 2016, the U.S. Securities and Exchange Commission (the “SEC”) adopted amendments to Regulation S-X, which impact financial statement presentation, particularly the presentation of derivative investments. The Funds have adopted these amendments, which were effective August 1, 2017, with these financial statements.
Each Fund follows accounting and reporting guidance under Financial Accounting Standards Board Accounting Standards Codification Topic 946, “Financial Services – Investment Companies.” The following is a summary of the Funds’ significant accounting policies. The policies are in conformity with accounting principles generally accepted in the United States of America (“GAAP”).
Securities valuation — The Funds’ portfolio securities are valued as of the close of business of the regular session of the New York Stock Exchange (the “NYSE”) (normally 4:00 p.m. Eastern time). Securities traded on a national stock exchange, including common stocks and exchange-traded funds (“ETFs”), are valued based upon the closing price on the principal exchange where the security is traded, if available, otherwise, at the last quoted bid price. Securities that are quoted by NASDAQ are valued at the NASDAQ Official Closing Price. Investments representing shares of other open-end investment companies, including money market funds, are valued at their net
54
THE DAVENPORT FUNDS
NOTES TO FINANCIAL STATEMENTS (Continued)
asset value (“NAV”) as reported by such companies. When using a quoted price and when the market is considered active, securities will be classified as Level 1 within the fair value hierarchy (see below).
Fixed income securities, including corporate bonds, are typically valued on the basis of prices provided by an independent pricing service. The prices provided by the pricing service are determined with consideration given to institutional bid and last sale prices and take into account securities prices, yields, maturities, call features, ratings, institutional trading in similar groups of securities, and developments related to specific securities. Given the inputs used by the pricing service, these securities are classified as Level 2 within the fair value hierarchy.
When market quotations are not readily available, if a pricing service cannot provide a price, or if the investment adviser believes the price received from the pricing service is not indicative of market value, securities will be valued in good faith at fair value using methods consistent with procedures adopted by the Board of Trustees and will be classified as Level 2 or 3 within the fair value hierarchy, depending on the inputs used. Such methods of fair valuation may include, but are not limited to: multiple of earnings, multiple of book value, discount from market of a similar freely traded security, purchase price of the security, subsequent private transactions in the security or related securities, or a combination of these and other factors.
GAAP establishes a single authoritative definition of fair value, sets out a framework for measuring fair value and requires additional disclosures about fair value measurements.
Various inputs are used in determining the value of the Funds’ investments. These inputs are summarized in the three broad levels listed below:
| | ● | Level 1 – quoted prices in active markets for identical securities |
| | ● | Level 2 – other significant observable inputs |
| | ● | Level 3 – significant unobservable inputs |
The inputs or methodology used for valuing securities are not necessarily an indication of the risks associated with investing in those securities. The inputs used to measure fair value may fall into different levels of the fair value hierarchy. In such cases, for disclosure purposes, the level in the fair value hierarchy within which the fair value measurement falls in its entirety is determined based on the lowest level input that is significant to the fair value measurement.
The following is a summary of the inputs used to value the Funds’ investments as of March 31, 2018, by security type:
| Davenport Core Fund | | Level 1 | | | Level 2 | | | Level 3 | | | Total | |
| Common Stocks | | $ | 445,069,371 | | | $ | — | | | $ | — | | | $ | 445,069,371 | |
| Exchange-Traded Funds | | | 7,736,446 | | | | — | | | | — | | | | 7,736,446 | |
| Money Market Funds | | | 6,611,819 | | | | — | | | | — | | | | 6,611,819 | |
| Total | | $ | 459,417,636 | | | $ | — | | | $ | — | | | $ | 459,417,636 | |
55
THE DAVENPORT FUNDS
NOTES TO FINANCIAL STATEMENTS (Continued)
| Davenport Value & Income Fund | | Level 1 | | | Level 2 | | | Level 3 | | | Total | |
| Common Stocks | | $ | 604,724,788 | | | $ | — | | | $ | — | | | $ | 604,724,788 | |
| Exchange-Traded Funds | | | 29,337,990 | | | | — | | | | — | | | | 29,337,990 | |
| Money Market Funds | | | 22,960,685 | | | | — | | | | — | | | | 22,960,685 | |
| Total | | $ | 657,023,463 | | | $ | — | | | $ | — | | | $ | 657,023,463 | |
| Davenport Equity Opportunities Fund | | Level 1 | | | Level 2 | | | Level 3 | | | Total | |
| Common Stocks | | $ | 388,135,236 | | | $ | — | | | $ | — | | | $ | 388,135,236 | |
| Money Market Funds | | | 11,352,787 | | | | — | | | | — | | | | 11,352,787 | |
| Total | | $ | 399,488,023 | | | $ | — | | | $ | — | | | $ | 399,488,023 | |
| Davenport Small Cap Focus Fund | | Level 1 | | | Level 2 | | | Level 3 | | | Total | |
| Common Stocks | | $ | 108,210,587 | | | $ | — | | | $ | — | | | $ | 108,210,587 | |
| Money Market Funds | | | 7,835,124 | | | | — | | | | — | | | | 7,835,124 | |
| Total | | $ | 116,045,711 | | | $ | — | | | $ | — | | | $ | 116,045,711 | |
| Davenport Balanced Income Fund | | Level 1 | | | Level 2 | | | Level 3 | | | Total | |
| Common Stocks | | $ | 75,349,824 | | | $ | — | | | $ | — | | | $ | 75,349,824 | |
| Fixed Rate Corporate Bonds | | | — | | | | 32,131,469 | | | | — | | | | 32,131,469 | |
| Variable Rate Corporate Bonds | | | — | | | | 15,739,904 | | | | — | | | | 15,739,904 | |
| Exchange-Traded Funds | | | 3,101,926 | | | | — | | | | — | | | | 3,101,926 | |
| Money Market Funds | | | 3,182,498 | | | | — | | | | — | | | | 3,182,498 | |
| Total | | $ | 81,634,248 | | | $ | 47,871,373 | | | $ | — | | | $ | 129,505,621 | |
Refer to each Fund’s Schedule of Investments for a listing of the securities by sector type. As of March 31, 2018, the Funds did not have any transfers into or out of any Level. There were no Level 3 securities or derivative instruments held by the Funds as of March 31, 2018. It is the Funds’ policy to recognize transfers into or out of any Level at the end of the reporting period.
Foreign currency translation — Investment securities and other assets and liabilities denominated in or expected to settle in foreign currencies, if any, are translated into U.S. dollars based on exchange rates on the following basis:
| | A. | The fair values of investment securities and other assets and liabilities are translated as of the close of the NYSE each day. |
| | B. | Purchases and sales of investment securities and income and expenses are translated at the rate of exchange prevailing as of 4:00 p.m. Eastern time on the respective date of such transactions. |
56
THE DAVENPORT FUNDS
NOTES TO FINANCIAL STATEMENTS (Continued)
| | C. | The Funds do not isolate that portion of the results of operations caused by changes in foreign exchange rates on investments from those caused by changes in market prices of securities held. Such fluctuations are included with the net realized and unrealized gains or losses on investments. |
Reported net realized foreign exchange gains or losses arise from 1) purchases and sales of foreign currencies and 2) the difference between the amounts of dividends and foreign withholding taxes recorded on the Fund’s books and the U.S. dollar equivalent of the amounts actually received or paid. Reported net unrealized foreign exchange gains and losses arise from changes in the value of assets and liabilities that result from changes in exchange rates.
Share valuation — The NAV per share of each Fund is calculated daily by dividing the total value of its assets, less liabilities, by the number of shares outstanding. The offering price and redemption price per share of each Fund is equal to the NAV per share.
Investment income — Interest income is accrued as earned. Discounts and premiums on fixed-income securities are amortized using the interest method. Dividend income is recorded on the ex-dividend date. The Funds record distribrutions received from investments in real estate investment trusts (also known as “REITs”) in excess of income from underlying investments as a reduction of cost of investments and/or realized gain. These amounts are recorded once the issuers provide information about the actual composition of the distributions. Withholding taxes on foreign dividends have been recorded in accordance with the Funds’ understanding of the applicable country’s rules and tax rates.
Investment transactions — Investment transactions are accounted for on trade date for financial reporting purposes. Realized gains and losses on investment securities sold are determined on a specific identification basis.
Common expenses — Common expenses of the Trust are allocated among the series of the Trust based on relative net assets of each series or the nature of the services performed and the relative applicability to each series.
Distributions to shareholders — Dividends arising from net investment income, if any, are declared and paid quarterly to shareholders of Davenport Core Fund, Davenport Value & Income Fund, Davenport Small Cap Focus Fund and Davenport Balanced Income Fund; and declared and paid semi-annually to shareholders of Davenport Equity Opportunities Fund. Net realized short-term capital gains, if any, may be distributed throughout the year and net realized long-term capital gains, if any, are distributed at least once each year. The amount of distributions from net investment income and net realized capital gains are determined in accordance with federal income tax regulations, which may differ from GAAP. Dividends and distributions are recorded on the ex-dividend date.
57
THE DAVENPORT FUNDS
NOTES TO FINANCIAL STATEMENTS (Continued)
The tax character of distributions paid during the years ended March 31, 2018 and 2017 was as follows:
| | | Year
Ended | | | Ordinary
Income | | | Long-Term
Capital Gains | | | Total
Distributions | |
| Davenport Core Fund | | | 03/31/18 | | | $ | 2,062,810 | | | $ | 8,953,509 | | | $ | 11,016,319 | |
| | | | 03/31/17 | | | $ | 1,831,251 | | | $ | 10,298,009 | | | $ | 12,129,260 | |
| Davenport Value & Income Fund | | | 03/31/18 | | | $ | 10,955,224 | | | $ | 18,625,911 | | | $ | 29,581,135 | |
| | | | 03/31/17 | | | $ | 10,351,557 | | | $ | 2,019,752 | | | $ | 12,371,309 | |
| Davenport Equity Opportunities Fund | | | 03/31/18 | | | $ | — | | | $ | — | | | $ | — | |
| | | | 03/31/17 | | | $ | 56 | | | $ | 4,091,425 | | | $ | 4,091,481 | |
| Davenport Small Cap Focus Fund | | | 03/31/18 | | | $ | — | | | $ | 2,522,386 | | | $ | 2,522,386 | |
| | | | 03/31/17 | | | $ | — | | | $ | — | | | $ | — | |
| Davenport Balanced Income Fund | | | 03/31/18 | | | $ | 1,967,387 | | | $ | 617,857 | | | $ | 2,585,244 | |
| | | | 03/31/17 | | | $ | 669,199 | | | $ | — | | | $ | 669,199 | |
Estimates — The preparation of financial statements in conformity with GAAP requires management to make estimates and assumptions that affect the reported amounts of assets and liabilities and disclosure of contingent assets and liabilities as of the date of the financial statements and the reported amounts of income and expenses during the reporting period. Actual results could differ from those estimates.
Federal income tax — Each Fund has qualified and intends to continue to qualify as a regulated investment company under the Internal Revenue Code of 1986, as amended (the “Code”). Qualification generally will relieve the Funds of liability for federal income taxes to the extent 100% of their net investment income and net realized capital gains are distributed in accordance with the Code.
In order to avoid imposition of the excise tax applicable to regulated investment companies, it is also each Fund’s intention to declare as dividends in each calendar year at least 98% of its net investment income (earned during the calendar year) and 98.2% of its net realized capital gains (earned during the twelve months ended October 31) plus undistributed amounts from prior years.
58
THE DAVENPORT FUNDS
NOTES TO FINANCIAL STATEMENTS (Continued)
The following information is computed on a tax basis for each item as of March 31, 2018:
| | | Davenport
Core Fund | | | Davenport
Value &
Income Fund | | | Davenport
Equity
Opportunities
Fund | |
| Cost of portfolio investments | | $ | 310,794,751 | | | $ | 541,093,826 | | | $ | 314,303,676 | |
| Gross unrealized appreciation | | $ | 156,572,964 | | | $ | 132,628,784 | | | $ | 96,913,676 | |
| Gross unrealized depreciation | | | (7,950,079 | ) | | | (16,699,147 | ) | | | (11,729,329 | ) |
| Net unrealized appreciation | | | 148,622,885 | | | | 115,929,637 | | | | 85,184,347 | |
| Undistributed ordinary income | | | — | | | | 631,216 | | | | — | |
| Undistributed long-term gains | | | 15,695,975 | | | | 14,541,135 | | | | — | |
| Accumulated capital and other losses | | | (17,861 | ) | | | — | | | | (2,297,513 | ) |
| Total distributable earnings | | $ | 164,300,999 | | | $ | 131,101,988 | | | $ | 82,886,834 | |
| | | Davenport
Small Cap
Focus Fund | | | Davenport
Balanced
Income Fund | |
| Cost of portfolio investments | | $ | 101,903,617 | | | $ | 124,831,958 | |
| Gross unrealized appreciation | | $ | 19,047,593 | | | $ | 8,335,524 | |
| Gross unrealized depreciation | | | (4,905,499 | ) | | | (3,661,861 | ) |
| Net unrealized appreciation | | | 14,142,094 | | | | 4,673,663 | |
| Undistributed ordinary income | | | — | | | | 463,662 | |
| Undistributed long-term gains | | | 1,596,116 | | | | 602,927 | |
| Accumulated capital and other losses | | | (39,761 | ) | | | — | |
| Total distributable earnings | | $ | 15,698,449 | | | $ | 5,740,252 | |
The difference between the federal income tax cost of portfolio investments and the financial statement cost for each Fund is due to certain timing differences in the recognition of capital gains and losses under income tax regulations and GAAP. These timing differences are temporary in nature and are due to the tax deferral of losses on wash sales and adjustments to basis on publicly traded partnerships and passive foreign investment companies.
Net qualified late year ordinary losses represent losses incurred after December 31, 2017 and specified capital losses incurred after October 31, 2017. These losses are deemed to arise on the first day of the Funds’ next taxable year. For the year ended March 31, 2018, Davenport Core Fund deferred until April 1, 2018 qualified late year ordinary losses of $17,861; Davenport Equity Opportunities Fund deferred until April 1, 2018 qualified late year ordinary losses of $222,138 and long-term post-October capital losses of $315,658 and Davenport Small Cap Focus Fund deferred until April 1, 2018 qualified late year ordinary losses of $39,761.
During the year ended March 31, 2018, Davenport Equity Opportunities Fund utilized $365,206 of short-term capital loss carryforwards and $6,141,211 of long-term capital loss carryforwards for federal income tax purposes. As of March 31, 2018, Davenport Equity Opportunities Fund
59
THE DAVENPORT FUNDS
NOTES TO FINANCIAL STATEMENTS (Continued)
had a short-term capital loss carryforward of $1,457,453 and a long-term capital loss carryforward of $302,264 for federal income tax purposes, which may be carried forward indefinitely. These capital loss carryforwards are available to offset net realized capital gains in future years, thereby reducing future taxable gains distributions.
During the year ended March 31, 2018, the following reclassifications were made as a result of permanent differences between the financial statements and income tax reporting requirements:
| | | Increase
(decrease) in
accumulated
net investment
income (loss) | | | Increase in
accumulated
net realized
gains
(losses) from
investment
transactions | | | Decrease in
paid-in capital | |
| Davenport Core Fund | | $ | — | | | $ | — | | | $ | — | |
| Davenport Value & Income Fund | | | (3,074 | ) | | | 3,074 | | | | — | |
| Davenport Equity Opportunities Fund | | | 733,247 | | | | — | | | | (733,247 | ) |
| Davenport Small Cap Focus Fund | | | (77,596 | ) | | | 79,198 | | | | (1,602 | ) |
| Davenport Balanced Income Fund | | | (19,004 | ) | | | 20,441 | | | | (1,437 | ) |
Such reclassifications have no effect on each Fund’s total net assets or NAV per share.
The Funds recognize the tax benefits or expenses of uncertain tax positions only when the position is “more likely than not” to be sustained assuming examination by tax authorities. Management has reviewed the tax positions taken on Federal income tax returns for each Fund for all applicable open tax years (tax years ended March 31, 2015 through March 31, 2018) and has concluded that no provision for unrecognized tax benefits or expenses is required in these financial statements.
3. Investment Transactions
Investment transactions, other than short-term investments and U.S. government securities, were as follows for the year ended March 31, 2018:
| | | Davenport
Core Fund | | | Davenport
Value &
Income Fund | | | Davenport Equity Opportunities Fund | |
| Purchases of investment securities | | $ | 111,179,768 | | | $ | 177,463,099 | | | $ | 80,452,487 | |
| Proceeds from sales and maturities of investment securities | | $ | 94,972,078 | | | $ | 128,026,394 | | | $ | 84,580,870 | |
| | | Davenport
Small Cap
Focus Fund | | | Davenport
Balanced
Income Fund | |
| Purchases of investment securities | | $ | 70,034,694 | | | $ | 68,858,479 | |
| Proceeds from sales and maturities of investment securities | | $ | 42,824,919 | | | $ | 22,733,768 | |
60
THE DAVENPORT FUNDS
NOTES TO FINANCIAL STATEMENTS (Continued)
4. Transactions with Related Parties
INVESTMENT ADVISORY AGREEMENTS
Each Fund’s investments are managed by Davenport & Company LLC (the “Adviser”) under the terms of an Investment Advisory Agreement. Under the Investment Advisory Agreement, each Fund pays the Adviser a fee, which is computed and accrued daily and paid monthly, at an annual rate of 0.75% of its average daily net assets. Certain officers and a Trustee of the Trust are also officers of the Adviser.
With respect to Davenport Small Cap Focus Fund and Davenport Balanced Income Fund, the Adviser has agreed, until August 1, 2018, to reduce its investment advisory fees and to reimburse other operating expenses to the extent necessary to limit total annual operating expenses (excluding acquired fund fees and expenses) of each such Fund to an amount not exceeding 1.25% of average daily net assets. Any such fee reductions by the Adviser, or payments by the Adviser of expenses which are a Fund’s obligation, are subject to repayment by the Funds for a period of three years from the end of the fiscal year when such fee reductions or expense reimbursements occurred, provided a Fund is able to affect such repayment and remain in compliance with the undertaking by the Adviser to limit expenses of the Fund. During the year ended March 31, 2018, the Adviser was not required to reduce its advisory fees for Davenport Small Cap Focus Fund or Davenport Balanced Income Fund. As of March 31, 2018, the Adviser has recouped all prior fee reductions or expense reimbursements from Davenport Small Cap Focus Fund and Davenport Balanced Income Fund.
A significant portion of the Funds’ investment trades are executed through an affiliated broker-dealer of the Adviser. No commissions are paid by the Funds to the Adviser or the affiliate for these trades.
OTHER SERVICE PROVIDERS
Ultimus Fund Solutions, LLC (“Ultimus”) provides administration, fund accounting, compliance and transfer agent services to the Funds. The Funds pay Ultimus fees in accordance with the agreements for such services. In addition, the Funds pay out-of-pocket expenses including, but not limited to, postage, supplies, and costs of pricing the Funds’ portfolio securities. Certain officers of the Trust are also officers of Ultimus, or of Ultimus Fund Distributors, LLC (the “Distributor”), the principal underwriter of each Fund’s shares and an affiliate of Ultimus. The Distributor is compensated by the Adviser (not the Funds) for acting as principal underwriter.
COMPENSATION OF TRUSTEES
Trustees and officers affiliated with the Adviser or Ultimus are not compensated by the Trust for their services. Each Trustee who is not an affiliated person of the Adviser or Ultimus received from the Trust an annual retainer of $15,000, payable quarterly; a fee of $1,500 for attendance at each meeting of the Board of Trustees (except that such fee was $2,500 for the independent chair); and a fee of $1,000 for attendance at each meeting of any committee of the Board (except that such fee was $1,500 for the committee chair); plus reimbursement of travel and other expenses incurred in attending meetings. Effective April 1, 2018, each Trustee who is not an affiliated person of the Adviser or Ultimus will receive from the Trust an annual retainer of $20,000, payable quarterly; a fee of $2,000 for attendance at each meeting of the Board of Trustees (except that such fee will be $3,000 for the independent chair); and a fee of $1,000 for attendance at each
61
THE DAVENPORT FUNDS
NOTES TO FINANCIAL STATEMENTS (Continued)
meeting of any committee of the Board (except that such fee will be $1,500 for the committee chair); plus reimbursement of travel and other expenses incurred in attending meetings. Each series of the Trust pays its proportionate share of such fees.
5. Sector Risk
If a Fund has significant investments in the securities of issuers in industries within a particular sector, any development affecting that sector will have a greater impact on the value of the net assets of the Fund than would be the case if the Fund did not have significant investments in that sector. In addition, this may increase the risk of loss of an investment in the Fund and increase the volatility of the Fund’s NAV per share. From time to time, circumstances may affect a particular sector and the companies within such sector. For instance, economic or market factors, regulation or deregulation, or other developments may negatively impact all companies in a particular sector and therefore the value of a Fund’s portfolio would be adversely affected. As of March 31, 2018, Davenport Small Cap Focus Fund had 27.9% of the value of its net assets invested in common stocks within the Industrials sector and Davenport Balanced Income Fund had 25.0% of the value of its net assets invested in common stocks, ETFs and corporate bonds within the Financials sector.
6. Contingencies and Commitments
The Funds indemnify the Trust’s officers and Trustees for certain liabilities that might arise from the performance of their duties to the Funds. Additionally, in the normal course of business the Funds enter into contracts that contain a variety of representations and warranties and which provide general indemnifications. The Funds’ maximum exposure under these arrangements is unknown, as this would involve future claims that may be made against the Funds that have not yet occurred. However, based on experience, the Funds expect the risk of loss to be remote.
7. Subsequent Events
The Funds are required to recognize in the financial statements the effects of all subsequent events that provide additional evidence about conditions that existed as of the date of the Statements of Assets and Liabilities. For non-recognized subsequent events that must be disclosed to keep the financial statements from being misleading, the Funds are required to disclose the nature of the event as well as an estimate of its financial effect, or a statement that such an estimate cannot be made. Management has evaluated subsequent events through the issuance of these financial statements and has noted no such events other than the following:
At a meeting held on May 2, 2018, the Board approved to change the classification of Davenport Small Cap Focus Fund from a non-diversified fund to a diversified fund. This change will be effective August 1, 2018.
62
THE DAVENPORT FUNDS
REPORT OF INDEPENDENT REGISTERED
PUBLIC ACCOUNTING FIRM
To the Shareholders of The Davenport Funds and
Board of Trustees of Williamsburg Investment Trust
Opinion on the Financial Statements
We have audited the accompanying statements of assets and liabilities, including the schedules of investments, of The Davenport Funds, comprising Davenport Core Fund, Davenport Value & Income Fund, Davenport Equity Opportunities Fund, Davenport Small Cap Focus Fund, and Davenport Balanced Income Fund (the “Funds”), each a series of Williamsburg Investment Trust, as of March 31, 2018, and the related statements of operations for the year then ended, the statements of changes in net assets for each of the two years in the period then ended, including the related notes, and the financial highlights for each of the three periods in the period then ended (collectively referred to as the “financial statements”). In our opinion, the financial statements present fairly, in all material respects, the financial position of each of the Funds as of March 31, 2018, the results of their operations for the year then ended, the changes in their net assets for each of the two years in the period then ended, and the financial highlights for each of the three periods in the period then ended, in conformity with accounting principles generally accepted in the United States of America.
The Funds’ financial highlights for the periods ended March 31, 2015 and prior, were audited by other auditors whose report dated May 22, 2015, expressed an unqualified opinion on those financial highlights.
Basis for Opinion
These financial statements are the responsibility of the Funds’ management. Our responsibility is to express an opinion on the Funds’ financial statements based on our audits. We are a public accounting firm registered with the Public Company Accounting Oversight Board (United States) (“PCAOB”) and are required to be independent with respect to the Funds in accordance with the U.S. federal securities laws and the applicable rules and regulations of the Securities and Exchange Commission and the PCAOB.
We conducted our audits in accordance with the standards of the PCAOB. Those standards require that we plan and perform the audit to obtain reasonable assurance about whether the financial statements are free of material misstatement, whether due to error or fraud.
Our audits include performing procedures to assess the risks of material misstatement of the financial statements, whether due to error or fraud, and performing procedures that respond to those risks. Such procedures include examining, on a test basis, evidence regarding the amounts and disclosures in the financial statements and confirmation of securities owned as of March 31, 2018, by correspondence with the custodian and broker. Our audits also included evaluating the accounting principles used and significant estimates made by management, as well as evaluating the overall presentation of the financial statements. We believe that our audits provide a reasonable basis for our opinion.
We have served as the Funds’ auditor since 2016.
COHEN & COMPANY, LTD.
Cleveland, Ohio
May 11, 2018
63
THE DAVENPORT FUNDS
BOARD OF TRUSTEES AND EXECUTIVE OFFICERS
(Unaudited)
Overall responsibility for management of the Funds rests with the Board of Trustees. The Trustees serve during the lifetime of the Trust and until its termination, or until death, resignation, retirement or removal. The Trustees, in turn, elect the officers of the Funds. The officers have been elected for an annual term. The following are the Trustees and executive officers of the Funds:
| Trustees
and Officers | Address | Year of
Birth | Position Held
with the Trust | Length of
Time Served |
| Robert S. Harris, Ph.D. | 225 Pictoria Drive, Suite 450
Cincinnati, OH | 1949 | Chairman and Trustee | Since
January 2007 |
* | John P. Ackerly, IV | One James Center
901 E. Cary Street
Richmond, VA | 1963 | Trustee and President of Davenport Funds | Since
November 1997 |
* | John T. Bruce | 800 Main Street
Lynchburg, VA | 1953 | Trustee and President of
FBP Funds | Since
September 1988 |
| | George K. Jennison | 225 Pictoria Drive, Suite 450
Cincinnati, OH | 1957 | Trustee | Since
January 2015 |
| Harris V. Morrissette | 225 Pictoria Drive, Suite 450
Cincinnati, OH | 1959 | Trustee | Since
March 1993 |
| | Elizabeth W. Robertson | 225 Pictoria Drive, Suite 450
Cincinnati, OH | 1953 | Trustee | Since
February 2014 |
| | George L. Smith, III | One James Center
901 E. Cary Street
Richmond, VA | 1976 | Vice President | Since
February 2011 |
| Robert G. Dorsey | 225 Pictoria Drive, Suite 450
Cincinnati, OH | 1957 | Vice President | Since
November 2000 |
| Mark J. Seger | 225 Pictoria Drive, Suite 450
Cincinnati, OH | 1962 | Treasurer | Since
November 2000 |
| | Diana A. Tantra | 225 Pictoria Drive, Suite 450
Cincinnati, OH | 1969 | Secretary | Since
May 2018 |
| | Simon H. Berry | 225 Pictoria Drive, Suite 450
Cincinnati, OH | 1971 | Chief Compliance Officer | Since
May 2017 |
* | Messrs. Ackerly and Bruce, as affiliated persons of investment advisers to the Trust, are “interested persons” of the Trust within the meaning of Section 2(a)(19) of the 1940 Act. |
64
THE DAVENPORT FUNDS
BOARD OF TRUSTEES AND EXECUTIVE OFFICERS
(Unaudited) (Continued)
Each Trustee oversees twelve portfolios of the Trust, including the Funds. The principal occupations of the Trustees and executive officers of the Funds during the past five years and public directorships held by the Trustees are set forth below:
Robert S. Harris, Ph.D. is the C. Stewart Sheppard Professor of Business Administration at The Darden Graduate School of Business Administration at the University of Virginia. He was previously the dean at Darden. Professor Harris has published widely on corporate finance, financial markets and mergers and acquisitions and has served as a consultant to corporations and government agencies.
John P. Ackerly, IV is Senior Vice President and Portfolio Manager of the Adviser.
John T. Bruce is President, Director and member of the Executive Committee of Flippin, Bruce & Porter, Inc. (an investment advisory firm).
George K. Jennison is President of Oyster Consulting, LLC (a management consulting firm). He previously was a financial adviser with Wells Fargo Advisors, LLC.
Harris V. Morrissette is President of China Doll Rice and Beans, Inc. and Dixie Lily Foods. He is also a Director of Trustmark Corporation (bank holding company).
Elizabeth W. Robertson is Chief Financial Officer for Monument Restaurants LLC (restaurant franchises) and a Director of Towne Bank.
George L. Smith, III is Senior Vice President and Portfolio Manager of the Adviser.
Robert G. Dorsey is a Managing Director of Ultimus Fund Solutions, LLC and Ultimus Fund Distributors, LLC.
Mark J. Seger is a Managing Director of Ultimus Fund Solutions, LLC and Ultimus Fund Distributors, LLC.
Dina A. Tantra is an Executive Vice President and Director of Fund Administration and Compliance of Ultimus Fund Solutions, LLC (2017 to present). She previously was Managing Director of Foreside Financial Group, LLC (2016 to 2017); Trustee and President of Advisers Investment Trust (2012 to 2017); Managing Director, Secretary and General Counsel of Beacon Hill Fund Services, Inc. (2008 to 2016) and Secretary and General Counsel of BHL Distributors, Inc. (2008 to 2016).
Simon H. Berry is a Senior Attorney of Ultimus Fund Solutions, LLC (2016 to present). He previously was an Attorney at the Kentucky Department of Financial Institutions (2009 to 2016).
Additional information about members of the Board of Trustees and executive officers is available in the Statement of Additional Information (“SAI”). To obtain a free copy of the SAI, please call 1-800-281-3217.
65
THE DAVENPORT FUNDS
YOUR FUNDS’ EXPENSES (Unaudited)
We believe it is important for you to understand the impact of costs on your investment. All mutual funds have operating expenses. As a shareholder of the Funds, you incur ongoing costs, including management fees and other expenses. These ongoing costs, which are deducted from each Fund’s gross income, directly reduce the investment return of the Funds.
A mutual fund’s ongoing costs are expressed as a percentage of its average net assets. This figure is known as the expense ratio. The following examples are intended to help you understand the ongoing costs (in dollars) of investing in the Funds and to compare these costs with the ongoing costs of investing in other mutual funds. The examples below are based on an investment of $1,000 made at the beginning of the period shown and held for the entire period (October 1, 2017 and held through March 31, 2018).
The table below illustrates each Fund’s ongoing costs in two ways:
Actual fund return – This section helps you to estimate the actual expenses that you paid over the period. The “Ending Account Value” shown is derived from each Fund’s actual return, and the fourth column shows the dollar amount of operating expenses that would have been paid by an investor who started with $1,000 in the Funds. You may use the information here, together with the amount you invested, to estimate the expenses that you paid over the period.
To do so, simply divide your account value by $1,000 (for example, an $8,600 account value divided by $1,000 = 8.6), then multiply the result by the number given for the applicable Fund under the heading “Expenses Paid During Period.”
Hypothetical 5% return – This section is intended to help you compare each Fund’s ongoing costs with those of other mutual funds. It assumes that each Fund had an annual return of 5% before expenses during the period shown, but that the expense ratio is unchanged. In this case, because the return used is not each Fund’s actual return, the results do not apply to your investment. The example is useful in making comparisons because the SEC requires all mutual funds to calculate expenses based on a 5% return. You can assess each Fund’s ongoing costs by comparing this hypothetical example with the hypothetical examples that appear in shareholder reports of other funds.
Note that expenses shown in the table are meant to highlight and help you compare ongoing costs only. The Funds do not charge sales loads or redemption fees.
The calculations assume no shares were bought or sold during the period. Your actual costs may have been higher or lower, depending on the amount of your investment and the timing of any purchases or redemptions.
More information about each Fund’s expenses, including historical annual expense ratios, can be found in this report. For additional information on operating expenses and other shareholder costs, please refer to the Funds’ prospectus.
66
THE DAVENPORT FUNDS
YOUR FUNDS’ EXPENSES (Unaudited) (Continued)
| Beginning
Account Value
October 1,
2017 | Ending
Account Value
March 31,
2018 | Expense
Ratio(a) | Expenses Paid
During Period(b) |
Davenport Core Fund | | | | |
Based on Actual Fund Return | $1,000.00 | $1,039.00 | 0.90% | $4.58 |
Based on Hypothetical 5% Return (before expenses) | $1,000.00 | $1,020.44 | 0.90% | $4.53 |
Davenport Value & Income Fund |
Based on Actual Fund Return | $1,000.00 | $1,027.00 | 0.88% | $4.45 |
Based on Hypothetical 5% Return (before expenses) | $1,000.00 | $1,020.54 | 0.88% | $4.43 |
Davenport Equity Opportunities Fund |
Based on Actual Fund Return | $1,000.00 | $1,018.40 | 0.90% | $4.53 |
Based on Hypothetical 5% Return (before expenses) | $1,000.00 | $1,020.44 | 0.90% | $4.53 |
Davenport Small Cap Focus Fund |
Based on Actual Fund Return | $1,000.00 | $1,025.50 | 1.00% | $5.05 |
Based on Hypothetical 5% Return (before expenses) | $1,000.00 | $1,019.95 | 1.00% | $5.04 |
Davenport Balanced Income Fund |
Based on Actual Fund Return | $1,000.00 | $1,003.10 | 0.96% | $4.79 |
Based on Hypothetical 5% Return (before expenses) | $1,000.00 | $1,020.14 | 0.96% | $4.84 |
(a) | Annualized, based on the Fund’s most recent one-half year expenses. |
(b) | Expenses are equal to the Fund’s annualized expense ratio multiplied by the average account value over the period, multiplied by 182/365 (to reflect the one-half year period). |
67
THE DAVENPORT FUNDS
OTHER INFORMATION (Unaudited) |
A description of the policies and procedures that the Funds use to vote proxies relating to portfolio securities is available without charge upon request by calling toll-free 1-800-281-3217, or on the SEC’s website at http://www.sec.gov. Information regarding how the Funds voted proxies relating to portfolio securities during the most recent 12-month period ended June 30 is also available without charge upon request by calling toll-free 1-800-281-3217, or on the SEC’s website at http://www.sec.gov.
The Trust files a complete listing of portfolio holdings for each Fund with the SEC as of the end of the first and third quarters of each fiscal year on Form N-Q. These filings are available upon request by calling 1-800-281-3217. Furthermore, you may obtain a copy of these filings on the SEC’s website at http://www.sec.gov. The Trust’s Forms N-Q may also be reviewed and copied at the SEC’s Public Reference Room in Washington, DC, and information on the operation of the Public Reference Room may be obtained by calling 1-800-SEC-0330.
A complete listing of portfolio holdings for each Fund is updated daily and can be reviewed at the Funds’ website at http://www.investdavenport.com.
FEDERAL TAX INFORMATION (Unaudited)
For the fiscal year ended March 31, 2018, Davenport Core Fund, Davenport Value & Income Fund, Davenport Small Cap Focus Fund and Davenport Balanced Income Fund designated $8,953,509, $18,625,911, $2,522,386 and $617,857, respectively, as long-term capital gain distributions subject to a maximum tax rate of 20%.
Qualified Dividend Income – Davenport Core Fund, Davenport Value & Income Fund and Davenport Balanced Income Fund designated 100%, 100% and 64.46%, respectively, of ordinary income distributions, or up to the maximum amount of such dividends allowable pursuant to the Internal Revenue Code, as qualified dividend income eligible for the reduced tax rate of 15%.
Dividends Received Deduction – Corporate shareholders are generally entitled to take the dividends received deduction on the portion of a Fund’s dividend distributions that qualify under tax law. For the fiscal year ended March 31, 2018, Davenport Core Fund, Davenport Value & Income Fund and Davenport Balanced Income Fund, 100%, 100% and 57.15%, respectively, of ordinary income distributions, qualifies for the corporate dividends received deduction.
68
DAVENPORT FUNDS
DISCLOSURE REGARDING APPROVAL OF
INVESTMENT ADVISORY AGREEMENT
(Unaudited)
At an in-person meeting held on February 20, 2018, the Board of Trustees, including a majority of the Independent Trustees, approved the continuance for a one-year period of the Investment Advisory Agreements with the Adviser on behalf of the Davenport Core Fund, the Davenport Value & Income Fund, the Davenport Equity Opportunities Fund, the Davenport Small Cap Focus Fund and the Davenport Balanced Income Fund. Below is a discussion of the factors considered by the Board of Trustees along with the conclusions with respect thereto that formed the basis for the Board’s approval.
In approving the continuance of the Investment Advisory Agreements, the Independent Trustees considered all information they deemed reasonably necessary to evaluate the terms of the Agreements. The principal areas of review by the Independent Trustees were the nature, extent and quality of the services provided by the Adviser and the reasonableness of the fees charged for those services. These matters were considered by the Independent Trustees consulting with experienced counsel for the Independent Trustees, who is independent of the Adviser.
The Independent Trustees’ evaluation of the quality of the Adviser’s services considered their knowledge and experience gained through meetings with and reports of the Adviser’s senior management over the course of the preceding year. Both short-term and long-term investment performance of the Funds were considered. Each Fund’s performance was compared to its performance benchmark, a competitive peer group of funds with similar investment objectives and strategies, and to the Adviser’s comparably managed private accounts. The Independent Trustees also considered: the scope and quality of the in-house capabilities of the Adviser and other resources that it dedicated to performing services for the Funds; the quality of administrative and other services, including the Adviser’s role in coordinating the activities of the Funds’ other service providers; the Adviser’s compliance with investment policies of the Funds and applicable laws and regulations; information provided by management and the Funds’ independent public accounting firm in periodic meetings with the Trust’s Audit Committee; the business reputation of the Adviser; the qualifications of the Adviser’s key investment and compliance personnel; and the Adviser’s financial resources.
In reviewing the fees payable under the Investment Advisory Agreements, the Independent Trustees compared the advisory fees and overall expense levels of each Fund with those of competitive funds with similar investment objectives as well as the private accounts managed by the Adviser. The Independent Trustees considered information provided by the Adviser concerning the Adviser’s profitability with respect to each Fund, including the assumptions and methodology used in preparing the profitability information, in light of applicable case law relating to advisory fees. For these purposes, the Independent Trustees considered not only the fees paid by the Funds, but also so-called “fallout” benefits to the Adviser. The Independent Trustees also considered the fact that the Funds’ portfolio trades for equity securities were executed by the Adviser at no cost to the Funds. In evaluating each Fund’s advisory fees, the Independent Trustees considered the complexity and quality of the investment management of the Funds.
69
DAVENPORT FUNDS
DISCLOSURE REGARDING APPROVAL OF
INVESTMENT ADVISORY AGREEMENT
(Unaudited) (Continued)
Based upon their review of this information, the Independent Trustees concluded that: (i) although the performance of the Davenport Core Fund during 2017 lagged the returns of the S&P 500 Index and the Lipper average for Large Cap Core Funds, its 10-year performance has exceeded the returns of the Lipper Large Cap Core Fund average, demonstrating the Fund’s ability to achieve good risk-adjusted returns over a full market cycle; (ii) the performance of the Davenport Equity Opportunities Fund and Davenport Small Cap Focus Fund during 2017 exceeded the returns of each Fund’s respective benchmark index and Lipper category average, demonstrating Davenport & Co.’s commitment to long-term investing and its team oriented management approach; (iii) although the performance of the Davenport Value & Income Fund during 2017 placed below the returns of the Russell 1000 Value Index, its 3-year, 5-year and since inception performance results have exceeded the performance of the Russell 1000 Value Index; (iv) although the performance of the Davenport Balanced Income Fund during 2017 placed below the Morningstar average for comparably managed funds, the Fund’s mix of equity and fixed-income investments provided an investment option that complemented the risk tolerance of many investors; (v) the advisory fees payable by each Fund to Davenport & Co. are competitive with fees for comparably managed funds and the Independent Trustees believe the fees to be reasonable given the scope and quality of services provided by Davenport & Co. and the resources that are dedicated to its investment process; (vi) the total operating expense ratio of each Fund is lower than the average expense ratio for comparably managed funds, according to statistics derived from Morningstar, Inc. and each Fund’s total operating expense ratio declined over the 2017 calendar year; (vii) Davenport & Co., a dually registered investment adviser and broker dealer, has further benefited the Funds’ shareholders by executing portfolio transactions at no cost to the Funds; and (viii) the profits of Davenport & Co. with respect to its management of the Funds are reasonable.
The Independent Trustees considered the extent to which economies of scale are being realized as the Funds grow, and they noted that the operating expenses of each of the Davenport Funds have decreased during each of the past three calendar years. The Independent Trustees also considered the “fallout” benefits to Davenport & Co. with respect to the Davenport Funds, but given the amounts involved viewed these as secondary factors in connection with the evaluation of the reasonableness of the advisory fees paid by the Funds.
No single factor was considered in isolation or to be determinative to the decision of the Independent Trustees to approve the continuance of the Investment Advisory Agreements. Rather the Independent Trustees concluded, after weighing and balancing of all factors considered, that it was in the best interests of each Fund and its shareholders to continue the Investment Advisory Agreements without modification to its terms, including the fees charged for services thereunder.
70
This page intentionally left blank.
This page intentionally left blank.
| | THE DAVENPORT FUNDS Investment Adviser
Davenport & Company LLC
One James Center
901 East Cary Street
Richmond, Virginia 23219-4037 Administrator
Ultimus Fund Solutions, LLC
P.O. Box 46707
Cincinnati, Ohio 45246-0707
1-800-281-3217 Custodian
U.S. Bank, N.A.
425 Walnut Street
Cincinnati, Ohio 45202 Independent Registered Public
Accounting Firm
Cohen & Company, Ltd.
1350 Euclid Avenue
Suite 800
Cleveland, Ohio 44115 Legal Counsel
Sullivan & Worcester LLP
1666 K Street, N.W.
Washington, DC 20006 Board of Trustees
Robert S. Harris, Ph.D., Chairman
John P. Ackerly, IV
John T. Bruce
George K. Jennison
Harris V. Morrissette
Elizabeth W. Robertson Officers
John P. Ackerly, IV, President
George L. Smith, III, Vice President | |

One James Center
901 East Cary Street
Richmond, VA 23219
Davenport & Company LLC
Member: NYSE ● SIPC
Toll Free: (800) 846-6666
www.investdavenport.com
 FBP Equity & Dividend Plus Fund FBP Appreciation & Income Opportunities Fund Annual Report March 31, 2018 No-Load Funds |
| Letter to Shareholders | April 24, 2018 |
We are pleased to report on your Funds and their investments for the annual period ended March 31, 2018 and to provide some additional information since we last communicated with you.
Economic and Market Update
Most broad domestic equity indices posted mildly negative results for the first quarter of 2018 with the S&P 500 coming in at -0.76% and the Russell 1000 Value at -2.83%. It was the first time since 2015 that large-cap stocks fell during a calendar quarter. While the negative numbers for the period were relatively modest, that tells only part of the story. After a long hiatus, equity market volatility came roaring back during the first three months of the year. Stocks surged in January, with the year-to-date return for the S&P 500 peaking at more than 7.55% through the twenty-sixth of that month. From there, it took only nine trading days for those gains to be erased and for the S&P 500 to slip into correction territory, down 10% from its previous high. Many investors were shaken by the decline, as it had been more than two years since the market had experienced any meaningful selloff. After stabilizing and recovering during much of February and March, another sharp decline near quarter end took the markets into red territory for the period. Approximately 37% of the market value gained by the S&P 500 since the presidential election in November 2016 was evaporated in the correction, according to calculations by financial firm Raymond James.
Wall Street pundits point to two main factors that triggered the negative sentiment shift for stocks: rising interest rates due to inflation worries and fears of an international trade war. These risks certainly bear monitoring. Jerome Powell’s appointment as chairman of the Federal Reserve became effective during the quarter. New leadership adds an element of uncertainty regarding the magnitude and pace of forthcoming hikes to the fed funds rate expected for 2018. We believe the FOMC is likely to maintain its plan for three additional incremental increases this year. If so, we would expect gradual rate increases across the yield curve which should not cause significant disruptions to equity markets, especially considering the underlying strength of the economy. The bigger wild card is how White House trade policy will play out. Certainly, major disruptions to the global trading system would not be good for the U.S., China, Mexico or any other economy. Our hope is that the initial trade tariffs and the trade-related tweets by President Trump are meant to strengthen the U.S. position as negotiations continue.
We remain favorably disposed toward the equity markets even as volatility has increased. Falling stock prices and rising earnings expectations, primarily due to the tax cut enacted in December, have changed valuation calculations such that stocks are now more reasonably priced. S&P 500 earnings per share are estimated to grow almost 18% this year and another 8% in 2019, resulting in a price/earnings ratio of 17 times earnings for 2018 and 15.6 times for next year. Your Funds offer even more attractive valuation, trading at roughly 13.5 times earnings. While it is difficult to predict short-term moves in the market, we believe the potential has improved for solid returns from these levels over the longer term.
FBP Equity & Dividend Plus Fund Review
The FBP Equity & Dividend Plus Fund returned 7.91% for the fiscal year ended March 31, 2018. The S&P 500 Index (the “Index”) returned 13.99% and the Russell 1000 Value Index returned 6.95% over the same period. The Fund was 96.1% equity and 3.9% cash at fiscal year-end.
1
Since our last report to you for the period ended September 30, 2017, stocks were strong through late January, then began a correction over the balance of the period. For the semiannual period ended March 31, 2018, the Fund has gained 3.17% versus 5.84% for the Index and 2.34% for the Russell 1000 Value Index. During this period, the Fund’s holdings in the Energy and Consumer Discretionary sectors produced the strongest returns, while Financials and Industrials were laggards. Individual standouts were Kohl’s, Intel, Cisco Systems and Tapestry. General Electric, which is going through a difficult but needed restructuring, performed poorly. CVS Health, PPL Corp. and Ventas also held back returns.
New stock additions since our last report are Kellogg, PepsiCo and CenturyLink, all with attractive dividend yields. Kellogg is a dominant player in breakfast cereal, but the snack food segment, with brands like Pringles, Keebler and Kashi, is also important. The stock peaked in mid-2016, then sold off due to concerns about its decision to change a key segment of its business from direct-store delivery service to warehouse-based delivery. We believe the transition will result in improved operations over time. PepsiCo’s stock, similar to many other branded food/beverage companies, came under pressure earlier this year and we established the Fund’s holding after the decline. Its snack foods division is tremendously strong with brands such as Fritos, Lay’s, Doritos and Quaker Oats, among others. And its beverage business is more than Pepsi and Mountain Dew. Aquafina, Tropicana and Gatorade help provide exposure to non-carbonated beverages, which are growing more quickly than carbonated drinks. We find the 3% dividend attractive and believe the company has the ability to increase the dividend later this year. We also added CenturyLink to the Fund. This telecommunications company recently completed an acquisition of Level 3, which should provide needed stability for earnings and cash flow metrics for CenturyLink. The stock is truly out of favor with investors, primarily given its exposure to traditional landline telephone customers.
Royal Philips and Manulife Financial were both eliminated from the Fund during the period. Each of the stocks had performed well and reached our price objectives. The Fund also eliminated Mosaic. The stock was sold following a surprise decision by the company to lower its dividend to fund an acquisition. The resulting dividend yield did not meet the minimum level we desire for the Fund.
The Fund does utilize as part of its investment discipline the use of covered call options as individual securities approach the top of the Adviser’s growth and price expectations. The Fund’s purpose in selling the call option is to generate additional cash flow to the Fund and to hedge the possibility the security may not achieve its price objective. In very strong stock markets, this discipline may limit the upside of the securities where options have been written, but in flat to negative markets, it may provide additional return. During the fiscal year ended March 31, 2018, the amount of premiums generated from selling covered call options was $388,597.
FBP Appreciation & Income Opportunities Fund Review
The FBP Appreciation & Income Opportunities Fund also returned 7.91% for the fiscal year ended March 31, 2018. The S&P 500 Index (the “Index”) returned 13.99%, the Russell 1000 Value Index returned 6.95% and the Bloomberg Barclays U.S. Government/Credit Index returned 1.39% over the same period. The Fund was 76.5% equity, 14.4% fixed income and 9.1% cash at fiscal year-end.
For the semiannual period ended March 31, 2018, the Fund returned 4.05% versus 5.84% for the Index, 2.34% for the Russell 1000 Value Index and -1.10% for the Bloomberg Barclays U.S. Government/Credit Index. During this period, the Fund’s holdings in Financials and Consumer Discretionary sectors produced solid returns, while Industrials and Materials were laggards. Individual standouts
2
in Financials were Bank of America and JPMorgan. Kohl’s, Bloomin’ Brands, Cisco Systems and Tapestry also did well. Just as in our other Fund, General Electric, CVS Health, PPL Corp. and Ventas also held back returns.
Fund activity since our last report included establishing new positions in CenturyLink, Schlumberger and CBS. CenturyLink, a large telecommunications company, recently completed an acquisition of Level 3 which should provide needed stability for earnings and cash flow metrics going forward. The stock is truly out of favor with investors, primarily given its exposure to traditional landline telephone customers. Schlumberger was acquired as part of a portfolio decision to eliminate Baker Hughes GE. We saw an opportunity to upgrade to a higher quality stock with similar characteristics and exposures. CBS was purchased following a steep stock price decline over the last year. The company is currently in talks to merge with Viacom, not unexpected given that the Redstone family has sizable positions in each company. We believe CBS’s media assets are strong, which puts it in a slightly favorable position as negotiations progress. Royal Philips was eliminated as it had performed well and reached the Fund’s price objective.
The Fund does utilize as part of its investment discipline the use of covered call options as individual securities approach the top of the Adviser’s growth and price expectations. The Fund’s purpose in selling the call option is to generate additional income to the Fund and to hedge the possibility the security may not achieve its price objective. In very strong stock markets, this discipline may limit the upside of the securities where options have been written, but in modest to negative markets, it may provide additional return. During the fiscal year ended March 31, 2018, the amount of premiums generated from selling covered call options was $94,865
We want to thank you for your continued support and investment in the Flippin, Bruce & Porter Funds. Please visit our website at www.fbpfunds.com for information on your Funds and the investment philosophy and process we utilize to achieve their investment objectives.

John T. Bruce, CFA
President - Portfolio Manager
April 24, 2018
Data presented reflects past performance, which is no guarantee of future results. Investment results and principal value will fluctuate so that shares, when redeemed, may be worth more or less than their original cost. Due to market volatility, current performance may be higher or lower than the performance shown. Updated performance information, current through the most recent month-end, is available by contacting the Funds at 1-866-738-1127.
This report is submitted for the general information of the shareholders of the Funds. It reflects our views, opinions and portfolio holdings as of the date of this letter. These views are subject to change at any time based upon market or other conditions. For more current information throughout the year please visit www.fbpfunds.com or call the Funds at 1-866-738-1127. This report is not authorized for distribution to prospective investors in the Funds unless accompanied by a current prospectus.
3
THE FLIPPIN, BRUCE & PORTER FUNDS
COMPARATIVE PERFORMANCE CHARTS
(Unaudited)
Performance for each Fund is compared to the most appropriate broad-based index, the Standard and Poor’s 500® Index, an unmanaged index of 500 large common stocks. Results are also compared to the Consumer Price Index, a measure of inflation.
FBP Equity & Dividend Plus Fund
Comparison of the Change in Value of a $10,000 Investment in FBP Equity & Dividend Plus Fund,
the Standard & Poor’s 500® Index, the Consumer Price Index and the Russell 1000 Value Index

4
THE FLIPPIN, BRUCE & PORTER FUNDS
COMPARATIVE PERFORMANCE CHARTS
(Unaudited) (Continued)
FBP Appreciation & Income Opportunities Fund
Comparison of the Change in Value of a $10,000 Investment in FBP Appreciation & Income
Opportunities Fund, the Standard & Poor’s 500® Index, the Consumer Price Index,
the Russell 1000 Value Index and the Bloomberg Barclays U.S. Government/Credit Index

Average Annual Total Returns (for periods ended March 31, 2018) |
| | 1 Year | 5 Years | 10 Years |
| FBP Equity & Dividend Plus Fund(a) | 7.91% | 8.45% | 5.20% |
| FBP Appreciation & Income Opportunities Fund(a) | 7.91% | 7.27% | 5.64% |
| Standard & Poor’s 500® Index | 13.99% | 13.31% | 9.49% |
| Consumer Price Index | 2.21% | 1.41% | 1.63% |
| Russell 1000 Value Index | 6.95% | 10.78% | 7.78% |
| Bloomberg Barclays U.S. Government/Credit Index | 1.39% | 1.84% | 3.65% |
| (a) | Total returns are a measure of the change in value of an investment in the Funds over the periods covered, which assumes any dividends or capital gains distributions are reinvested in shares of the Funds. Returns do not reflect the deduction of taxes a shareholder would pay on the Funds’ distributions or the redemption of Fund shares. |
5
FBP EQUITY & DIVIDEND PLUS FUND
PORTFOLIO INFORMATION
March 31, 2018 (Unaudited)
| General Information | | | |
| Net Asset Value Per Share | | $ | 25.68 | |
| Total Net Assets ( Millions ) | | $ | 26.3 | |
| Current Expense Ratio | | | 1.07 | % |
| Portfolio Turnover | | | 18 | % |
| Fund Inception Date | | | 7/30/1993 | |
| Stock Characteristics | | Fund | | | S&P 500®
Index | |
| Number of Stocks | | | 53 | | | | 500 | |
| Weighted Avg Market Capitalization ( Billions ) | | $ | 133.3 | | | $ | 199.5 | |
| Price-to-Earnings Ratio (Bloomberg 1 Yr. Forecast EPS) | | | 13.5 | | | | 16.4 | |
| Price-to-Book Value | | | 2.3 | | | | 3.2 | |
| Asset Allocation (% of Net Assets) |
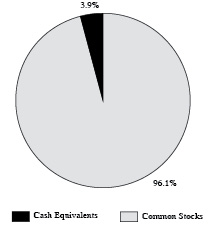 |
| Sector Diversification vs. the S&P 500® Index |
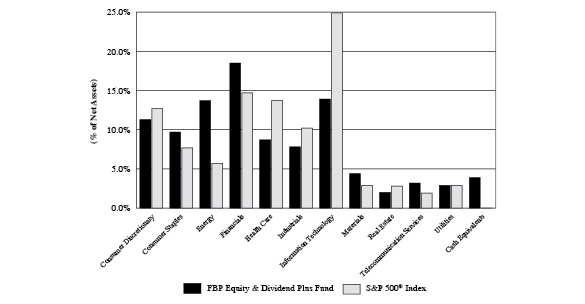
| Ten Largest Equity Holdings | % of Net Assets |
| International Business Machines Corporation | 3.4% |
| Cisco Systems, Inc. | 3.3% |
| Kohl's Corporation | 3.2% |
| BB&T Corporation | 3.1% |
| U.S. Bancorp | 2.7% |
| JPMorgan Chase & Company | 2.7% |
| Procter & Gamble Company (The) | 2.7% |
| ConocoPhilips | 2.7% |
| Wells Fargo & Company | 2.6% |
| Target Corporation | 2.5% |
6
FBP APPRECIATION & INCOME OPPORTUNITIES FUND
PORTFOLIO INFORMATION
March 31, 2018 (Unaudited)
| General Information |
| Net Asset Value Per Share | | $ | 18.99 | |
| Total Net Assets ( Millions ) | | $ | 34.6 | |
| Current Expense Ratio | | | 1.00 | % |
| Portfolio Turnover | | | 10 | % |
| Fund Inception Date | | | 7/3/1989 | |
| Asset Allocation (% of Net Assets) |
 |
| Common Stock Portfolio (76.5% of Net Assets) |
| Number of Stocks | | | 48 | |
| Weighted Avg Market Capitalization ( Billions ) | | $ | 162.9 | |
| Price-to-Earnings Ratio (Bloomberg 1 Yr. Forecast EPS) | | | 13.1 | |
| Price-to-Book Value | | | 2.1 | |
| Ten Largest Equity Holdings | % of Net Assets |
| Bank of America Corporation | 3.9% |
| JPMorgan Chase & Company | 3.8% |
| Cisco Systems, Inc. | 3.3% |
| Apple, Inc. | 3.0% |
| Lincoln National Corporation | 3.0% |
| Kohl's Corporation | 2.8% |
| Microsoft Corporation | 2.6% |
| International Business Machines Corporation | 2.3% |
| Travelers Companies, Inc. (The) | 2.2% |
| Pfizer, Inc. | 2.1% |
| Five Largest Sectors | % of Net Assets |
| Financials | 19.5% |
| Information Technology | 15.3% |
| Energy | 10.0% |
| Consumer Discretionary | 8.8% |
| Industrials | 6.5% |
| Fixed-Income Portfolio (13.6% of Net Assets) | |
| Number of Fixed-Income Securities | 9 |
| Average Quality | BBB+ |
| Average Weighted Maturity | 2.8 yrs. |
| Average Effective Duration | 2.6 yrs. |
| Sector Breakdown | % of Net Assets |
| U.S. Government & Agency Obligations | 1.4% |
| Consumer Discretionary | 1.4% |
| Energy | 2.9% |
| Financials | 4.3% |
| Industrials | 2.1% |
| Utilities | 1.5% |
7
FBP EQUITY & DIVIDEND PLUS FUND
SCHEDULE OF INVESTMENTS
March 31, 2018 |
| COMMON STOCKS — 96.1% | | Shares | | | Value | |
| Consumer Discretionary — 11.3% | | | | | | |
| Ford Motor Company | | | 35,000 | | | $ | 387,800 | |
| Kohl's Corporation (a) | | | 13,000 | | | | 851,630 | |
| Nordstrom, Inc. (a) | | | 8,900 | | | | 430,849 | |
| Tapestry, Inc. (a) | | | 6,500 | | | | 341,965 | |
| Target Corporation (a) | | | 9,500 | | | | 659,585 | |
| Williams-Sonoma, Inc. (a) | | | 5,500 | | | | 290,180 | |
| | | | | | | | 2,962,009 | |
| Consumer Staples — 9.7% | | | | | | | | |
| Coca-Cola Company (The) (a) | | | 6,000 | | | | 260,580 | |
| CVS Health Corporation | | | 7,300 | | | | 454,133 | |
| Kellogg Company | | | 6,200 | | | | 403,062 | |
| PepsiCo, Inc. | | | 3,500 | | | | 382,025 | |
| Procter & Gamble Company (The) (a) | | | 9,000 | | | | 713,520 | |
| Wal-Mart, Inc. (a) | | | 3,700 | | | | 329,189 | |
| | | | | | | | 2,542,509 | |
| Energy — 13.7% | | | | | | | | |
| Chevron Corporation (a) | | | 4,800 | | | | 547,392 | |
| ConocoPhillips (a) | | | 12,000 | | | | 711,480 | |
| Exxon Mobil Corporation | | | 8,400 | | | | 626,724 | |
| Occidental Petroleum Corporation (a) | | | 8,300 | | | | 539,168 | |
| Royal Dutch Shell plc - Class B - ADR | | | 9,500 | | | | 622,535 | |
| Schlumberger Ltd. (a) | | | 8,700 | | | | 563,586 | |
| | | | | | | | 3,610,885 | |
| Financials — 18.5% | | | | | | | | |
| BB&T Corporation | | | 15,500 | | | | 806,620 | |
| JPMorgan Chase & Company (a) | | | 6,500 | | | | 714,805 | |
| KeyCorp | | | 19,940 | | | | 389,827 | |
| MetLife, Inc. | | | 10,200 | | | | 468,078 | |
| People's United Financial, Inc. | | | 25,000 | | | | 466,500 | |
| Prudential Financial, Inc. | | | 6,000 | | | | 621,300 | |
| U.S. Bancorp | | | 14,200 | | | | 717,100 | |
| Wells Fargo & Company | | | 13,000 | | | | 681,330 | |
| | | | | | | | 4,865,560 | |
| Health Care — 8.7% | | | | | | | | |
| Amgen, Inc. (a) | | | 2,400 | | | | 409,152 | |
| Eli Lilly & Company | | | 5,500 | | | | 425,535 | |
| Johnson & Johnson (a) | | | 2,600 | | | | 333,190 | |
| Merck & Company, Inc. | | | 9,400 | | | | 512,018 | |
| Pfizer, Inc. | | | 17,000 | | | | 603,330 | |
| | | | | | | | 2,283,225 | |
8
FBP EQUITY & DIVIDEND PLUS FUND
SCHEDULE OF INVESTMENTS (Continued) |
| COMMON STOCKS — 96.1% (Continued) | | Shares | | | Value | |
| Industrials — 7.8% | | | | | | |
| Eaton Corporation plc (a) | | | 8,000 | | | $ | 639,280 | |
| Emerson Electric Company | | | 4,000 | | | | 273,200 | |
| General Electric Company | | | 29,000 | | | | 390,920 | |
| United Parcel Service, Inc. - Class B (a) | | | 4,400 | | | | 460,504 | |
| United Technologies Corporation | | | 2,200 | | | | 276,804 | |
| | | | | | | | 2,040,708 | |
| Information Technology — 13.9% | | | | | | | | |
| Apple, Inc. | | | 2,200 | | | | 369,116 | |
| Cisco Systems, Inc. (a) | | | 20,000 | | | | 857,800 | |
| HP, Inc. (a) | | | 27,500 | | | | 602,800 | |
| Intel Corporation (a) | | | 5,000 | | | | 260,400 | |
| International Business Machines Corporation | | | 5,800 | | | | 889,894 | |
| Microsoft Corporation (a) | | | 4,500 | | | | 410,715 | |
| Western Union Company (The) (a) | | | 14,000 | | | | 269,220 | |
| | | | | | | | 3,659,945 | |
| Materials — 4.4% | | | | | | | | |
| Compass Minerals International, Inc. | | | 4,100 | | | | 247,230 | |
| LyondellBasell Industries N.V. - Class A (a) | | | 3,100 | | | | 327,608 | |
| Nucor Corporation | | | 4,600 | | | | 281,014 | |
| Rio Tinto plc - ADR (a) | | | 5,600 | | | | 288,568 | |
| | | | | | | | 1,144,420 | |
| Real Estate — 2.0% | | | | | | | | |
| Public Storage | | | 1,200 | | | | 240,468 | |
| Ventas, Inc. | | | 6,000 | | | | 297,180 | |
| | | | | | | | 537,648 | |
| Telecommunication Services — 3.2% | | | | | | | | |
| AT&T, Inc. | | | 12,800 | | | | 456,320 | |
| CenturyLink, Inc. | | | 24,000 | | | | 394,320 | |
| | | | | | | | 850,640 | |
| Utilities — 2.9% | | | | | | | | |
| FirstEnergy Corporation | | | 15,000 | | | | 510,150 | |
| PPL Corporation | | | 8,500 | | | | 240,465 | |
| | | | | | | | 750,615 | |
| | | | | | | | | |
| Total Common Stocks (Cost $19,908,746) | | | | | | $ | 25,248,164 | |
9
FBP EQUITY & DIVIDEND PLUS FUND
SCHEDULE OF INVESTMENTS (Continued) |
| MONEY MARKET FUNDS — 5.8% | | Shares | | | Value | |
| Fidelity Institutional Money Market Government Portfolio - Class I, 1.49% (b) (Cost $1,535,039) | | | 1,535,039 | | | $ | 1,535,039 | |
| | | | | | | | | |
| Total Investments at Value — 101.9% (Cost $21,443,785) | | | | | | $ | 26,783,203 | |
| | | | | | | | | |
| Liabilities in Excess of Other Assets — (1.9%) | | | | | | | (504,699 | ) |
| | | | | | | | | |
| Net Assets — 100.0% | | | | | | $ | 26,278,504 | |
| ADR - American Depositary Receipt. |
| (a) | Security covers a written call option. |
| (b) | The rate shown is the 7-day effective yield as of March 31, 2018. |
| See accompanying notes to financial statements. |
10
FBP EQUITY & DIVIDEND PLUS FUND
SCHEDULE OF OPEN OPTION CONTRACTS
March 31, 2018 |
COVERED WRITTEN
CALL OPTIONS | | Contracts | | Notional
Value | | | Strike
Price | | | Expiration
Date | | Value of
Options | |
| Amgen, Inc. | | 10 | | $ | 170,480 | | | $ | 210.00 | | | 09/21/18 | | $ | 1,390 | |
| Chevron Corporation | | 20 | | | 228,080 | | | | 120.00 | | | 09/21/18 | | | 7,920 | |
| Cisco Systems, Inc. | | 60 | | | 257,340 | | | | 39.00 | | | 06/15/18 | | | 24,900 | |
| Coca-Cola Company (The) | | 60 | | | 260,580 | | | | 48.00 | | | 08/17/18 | | | 2,160 | |
| ConocoPhillips | | 60 | | | 355,740 | | | | 55.00 | | | 05/18/18 | | | 32,340 | |
| Eaton Corporation plc | | 31 | | | 247,721 | | | | 82.50 | | | 04/20/18 | | | 2,418 | |
| HP, Inc. | | 125 | | | 274,000 | | | | 24.00 | | | 05/18/18 | | | 2,625 | |
| Intel Corporation | | 50 | | | 260,400 | | | | 49.00 | | | 04/20/18 | | | 17,500 | |
| Johnson & Johnson | | 10 | | | 128,150 | | | | 150.00 | | | 06/15/18 | | | 150 | |
| JPMorgan Chase & Company | | 10 | | | 109,970 | | | | 110.00 | | | 06/15/18 | | | 4,950 | |
| Kohl's Corporation | | 30 | | | 196,530 | | | | 55.00 | | | 07/20/18 | | | 37,500 | |
| Kohl's Corporation | | 40 | | | 262,040 | | | | 62.50 | | | 07/20/18 | | | 28,800 | |
| LyondellBasell Industries N.V. - Class A | | 31 | | | 327,608 | | | | 110.00 | | | 06/15/18 | | | 9,703 | |
| Microsoft Corporation | | 22 | | | 200,794 | | | | 90.00 | | | 06/15/18 | | | 12,100 | |
| Nordstrom, Inc. | | 48 | | | 232,368 | | | | 55.00 | | | 07/20/18 | | | 7,200 | |
| Occidental Petroleum Corporation | | 33 | | | 214,368 | | | | 70.00 | | | 06/15/18 | | | 3,465 | |
| Procter & Gamble Company (The) | | 45 | | | 356,760 | | | | 95.00 | | | 04/20/18 | | | 270 | |
| Rio Tinto plc - ADR | | 56 | | | 288,568 | | | | 50.00 | | | 07/20/18 | | | 22,960 | |
| Schlumberger Ltd. | | 30 | | | 194,340 | | | | 85.00 | | | 08/17/18 | | | 840 | |
| Tapestry, Inc. | | 65 | | | 341,965 | | | | 55.00 | | | 08/17/18 | | | 17,680 | |
| Target Corporation | | 30 | | | 208,290 | | | | 75.00 | | | 07/20/18 | | | 6,240 | |
| United Parcel Service, Inc. - Class B | | 16 | | | 167,456 | | | | 120.00 | | | 04/20/18 | | | 64 | |
| Wal-Mart, Inc. | | 25 | | | 222,425 | | | | 92.50 | | | 06/15/18 | | | 5,350 | |
| Western Union Company (The) | | 140 | | | 269,220 | | | | 21.00 | | | 05/18/18 | | | 3,500 | |
| Williams-Sonoma, Inc. | | 25 | | | 131,900 | | | | 60.00 | | | 05/18/18 | | | 875 | |
Total Covered Written Call Options
(Premiums received $211,599) | | | | $ | 5,907,093 | | | | | | | | | $ | 252,900 | |
| ADR - American Depositary Receipt. |
See accompanying notes to financial statements. |
11
FBP APPRECIATION & INCOME OPPORTUNITIES FUND
SCHEDULE OF INVESTMENTS
March 31, 2018 |
| COMMON STOCKS — 76.5% | | Shares | | | Value | |
| Consumer Discretionary — 8.8% | | | | | | |
| Bloomin' Brands, Inc. | | | 14,000 | | | $ | 339,920 | |
| CBS Corporation - Class B | | | 5,100 | | | | 262,089 | |
| Ford Motor Company | | | 40,000 | | | | 443,200 | |
| Kohl's Corporation (a) | | | 15,000 | | | | 982,650 | |
| Tapestry, Inc. | | | 7,000 | | | | 368,270 | |
| Target Corporation (a) | | | 9,500 | | | | 659,585 | |
| | | | | | | | 3,055,714 | |
| Consumer Staples — 3.9% | | | | | | | | |
| CVS Health Corporation | | | 7,500 | | | | 466,575 | |
| PepsiCo, Inc. | | | 2,500 | | | | 272,875 | |
| Wal-Mart, Inc. (a) | | | 7,000 | | | | 622,790 | |
| | | | | | | | 1,362,240 | |
| Energy — 10.0% | | | | | | | | |
| Chevron Corporation | | | 5,000 | | | | 570,200 | |
| ConocoPhillips | | | 11,000 | | | | 652,190 | |
| Devon Energy Corporation | | | 17,000 | | | | 540,430 | |
| Occidental Petroleum Corporation | | | 8,200 | | | | 532,672 | |
| Royal Dutch Shell plc - Class B - ADR | | | 10,000 | | | | 655,300 | |
| Schlumberger Ltd. | | | 8,000 | | | | 518,240 | |
| | | | | | | | 3,469,032 | |
| Financials — 19.5% | | | | | | | | |
| Bank of America Corporation | | | 45,000 | | | | 1,349,550 | |
| Bank of New York Mellon Corporation (The) | | | 13,500 | | | | 695,655 | |
| Capital One Financial Corporation | | | 6,000 | | | | 574,920 | |
| JPMorgan Chase & Company | | | 12,000 | | | | 1,319,640 | |
| KeyCorp | | | 16,320 | | | | 319,056 | |
| Lincoln National Corporation | | | 14,000 | | | | 1,022,840 | |
| MetLife, Inc. | | | 15,000 | | | | 688,350 | |
| Travelers Companies, Inc. (The) | | | 5,500 | | | | 763,730 | |
| | | | | | | | 6,733,741 | |
| Health Care — 5.7% | | | | | | | | |
| Eli Lilly & Company | | | 6,000 | | | | 464,220 | |
| Johnson & Johnson | | | 2,000 | | | | 256,300 | |
| Merck & Company, Inc. | | | 10,000 | | | | 544,700 | |
| Pfizer, Inc. | | | 20,000 | | | | 709,800 | |
| | | | | | | | 1,975,020 | |
| Industrials — 6.5% | | | | | | | | |
| Eaton Corporation plc | | | 7,200 | | | | 575,352 | |
| FedEx Corporation | | | 1,700 | | | | 408,187 | |
| General Electric Company | | | 25,000 | | | | 337,000 | |
| Ingersoll-Rand plc | | | 4,700 | | | | 401,897 | |
| United Technologies Corporation | | | 4,200 | | | | 528,444 | |
| | | | | | | | 2,250,880 | |
12
FBP APPRECIATION & INCOME OPPORTUNITIES FUND
SCHEDULE OF INVESTMENTS (Continued) |
| COMMON STOCKS — 76.5% (Continued) | | Shares | | | Value | |
| Information Technology — 15.3% | | | | | | |
| Apple, Inc. (a) | | | 6,200 | | | $ | 1,040,236 | |
| Cisco Systems, Inc. (a) | | | 27,000 | | | | 1,158,030 | |
| HP, Inc. (a) | | | 20,000 | | | | 438,400 | |
| International Business Machines Corporation | | | 5,200 | | | | 797,836 | |
| Microsoft Corporation (a) | | | 10,000 | | | | 912,700 | |
| Nokia Corporation - ADR | | | 67,000 | | | | 366,490 | |
| Western Union Company (The) (a) | | | 30,000 | | | | 576,900 | |
| | | | | | | | 5,290,592 | |
| Materials — 2.6% | | | | | | | | |
| Freeport-McMoRan, Inc. (b) | | | 11,000 | | | | 193,270 | |
| Mosaic Company (The) | | | 8,000 | | | | 194,240 | |
| Nucor Corporation | | | 4,500 | | | | 274,905 | |
| Rio Tinto plc - ADR | | | 4,500 | | | | 231,885 | |
| | | | | | | | 894,300 | |
| Real Estate — 0.7% | | | | | | | | |
| Ventas, Inc. | | | 4,500 | | | | 222,885 | |
| | | | | | | | | |
| Telecommunication Services — 2.0% | | | | | | | | |
| AT&T, Inc. | | | 8,000 | | | | 285,200 | |
| CenturyLink, Inc. | | | 25,000 | | | | 410,750 | |
| | | | | | | | 695,950 | |
| Utilities — 1.5% | | | | | | | | |
| FirstEnergy Corporation | | | 8,000 | | | | 272,080 | |
| PPL Corporation | | | 9,000 | | | | 254,610 | |
| | | | | | | | 526,690 | |
| | | | | | | | | |
| Total Common Stocks (Cost $17,111,163) | | | | | | $ | 26,477,044 | |
| U.S. GOVERNMENT AGENCY OBLIGATIONS — 1.4% | | Par Value | | | Value | |
| Federal National Mortgage Association — 1.4% | | | | | | |
| 1.20%, due 07/17/2020 (Cost $500,000) | | $ | 500,000 | | | $ | 486,977 | |
13
FBP APPRECIATION & INCOME OPPORTUNITIES FUND
SCHEDULE OF INVESTMENTS (Continued) |
| CORPORATE BONDS — 12.2% | | Par Value | | | Value | |
| Consumer Discretionary — 1.4% | | | | | | |
| Mattel, Inc., 2.35%, due 05/06/2019 | | $ | 500,000 | | | $ | 488,750 | |
| | | | | | | | | |
| Energy — 2.9% | | | | | | | | |
| Dominion Resources, Inc., 2.50%, due 12/01/2019 | | | 500,000 | | | | 494,174 | |
| Pioneer Natural Resources Company, 3.95%, due 07/15/2022 | | | 500,000 | | | | 508,236 | |
| | | | | | | | 1,002,410 | |
| Financials — 4.3% | | | | | | | | |
| Citigroup, Inc., 2.90%, due 12/08/2021 | | | 500,000 | | | | 492,383 | |
| Unum Group, 3.00%, due 05/15/2021 | | | 500,000 | | | | 495,750 | |
| Wells Fargo & Company, 3.50%, due 03/08/2022 | | | 500,000 | | | | 501,336 | |
| | | | | | | | 1,489,469 | |
| Industrials — 2.1% | | | | | | | | |
| Ryder System, Inc., 2.50%, due 05/11/2020 | | | 750,000 | | | | 740,512 | |
| | | | | | | | | |
| Utilities — 1.5% | | | | | | | | |
| PSEG Power LLC, 3.00%, due 06/15/2021 | | | 500,000 | | | | 498,217 | |
| | | | | | | | | |
| Total Corporate Bonds (Cost $4,261,250) | | | | | | $ | 4,219,358 | |
| CLOSED-END FUNDS — 0.8% | | Shares | | | Value | |
| Prudential Short Duration High Yield Fund, Inc. (Cost $291,069) | | | 20,000 | | | $ | 282,600 | |
| MONEY MARKET FUNDS — 9.4% | | Shares | | | Value | |
| Fidelity Institutional Money Market Government Portfolio - Class I, 1.49% (c) (Cost $3,240,823) | | | 3,240,823 | | | $ | 3,240,823 | |
| | | | | | | | | |
| Total Investments at Value — 100.3% (Cost $25,404,305) | | | | | | $ | 34,706,802 | |
| | | | | | | | | |
| Liabilities in Excess of Other Assets — (0.3%) | | | | | | | (92,646 | ) |
| | | | | | | | | |
| Net Assets — 100.0% | | | | | | $ | 34,614,156 | |
| ADR - American Depositary Receipt. |
| |
| (a) | Security covers a written call option. |
| | |
| (b) | Non-income producing security. |
| | |
| (c) | The rate shown is the 7-day effective yield as of March 31, 2018. |
| | |
| See accompanying notes to financial statements. |
14
FBP APPRECIATION & INCOME OPPORTUNITIES FUND
SCHEDULE OF OPEN OPTION CONTRACTS
March 31, 2018 |
COVERED WRITTEN
CALL OPTIONS | | Contracts | | Notional
Value | | | Strike
Price | | | Expiration
Date | | Value of
Options | |
| Apple, Inc. | | 14 | | $ | 234,892 | | | $ | 190.00 | | | 04/20/18 | | $ | 154 | |
| Cisco Systems, Inc. | | 60 | | | 257,340 | | | | 39.00 | | | 06/15/18 | | | 24,900 | |
| HP, Inc. | | 100 | | | 219,200 | | | | 24.00 | | | 05/18/18 | | | 2,100 | |
| Kohl's Corporation | | 50 | | | 327,550 | | | | 55.00 | | | 07/20/18 | | | 62,500 | |
| Kohl's Corporation | | 50 | | | 327,550 | | | | 62.50 | | | 07/20/18 | | | 36,000 | |
| Microsoft Corporation | | 30 | | | 273,810 | | | | 90.00 | | | 06/15/18 | | | 16,500 | |
| Target Corporation | | 30 | | | 208,290 | | | | 75.00 | | | 07/20/18 | | | 6,240 | |
| Wal-Mart, Inc. | | 15 | | | 133,455 | | | | 100.00 | | | 06/15/18 | | | 855 | |
| Western Union Company (The) | | 15 | | | 28,845 | | | | 21.00 | | | 05/18/18 | | | 375 | |
Total Covered Written Call Options
(Premiums received $68,735) | | | | $ | 2,010,932 | | | | | | | | | $ | 149,624 | |
| See accompanying notes to financial statements. |
15
THE FLIPPIN, BRUCE & PORTER FUNDS
STATEMENTS OF ASSETS AND LIABILITIES
March 31, 2018 |
| | | FBP Equity
& Dividend
Plus Fund | | | FBP
Appreciation
& Income
Opportunities
Fund | |
| ASSETS | | | | | | |
| Investments in securities: | | | | | | |
| At cost | | $ | 21,443,785 | | | $ | 25,404,305 | |
| At value (Note 2) | | $ | 26,783,203 | | | $ | 34,706,802 | |
| Cash | | | 2,660 | | | | 19,187 | |
| Dividends and interest receivable | | | 55,094 | | | | 87,584 | |
| Receivable for capital shares sold | | | 2,150 | | | | — | |
| Other assets | | | 3,826 | | | | 4,160 | |
| TOTAL ASSETS | | | 26,846,933 | | | | 34,817,733 | |
| | | | | | | | | |
| LIABILITIES | | | | | | | | |
| Written call options, at value (Notes 2 and 5) (premiums received $211,599 and $68,735, respectively) | | | 252,900 | | | | 149,624 | |
| Distributions payable | | | 2,021 | | | | 10,836 | |
| Payable for capital shares redeemed | | | 4,455 | | | | 15,127 | |
| Payable for investment securities purchased | | | 287,182 | | | | — | |
| Accrued investment advisory fees (Note 4) | | | 14,386 | | | | 20,335 | |
| Payable to administrator (Note 4) | | | 5,700 | | | | 5,700 | |
| Other accrued expenses and liabilities | | | 1,785 | | | | 1,955 | |
| TOTAL LIABILITIES | | | 568,429 | | | | 203,577 | |
| | | | | | | | | |
| NET ASSETS | | $ | 26,278,504 | | | $ | 34,614,156 | |
| | | | | | | | | |
| Net assets consist of: | | | | | | | | |
| Paid-in capital | | $ | 20,287,688 | | | $ | 25,471,382 | |
| Undistributed (distributions in excess of) net investment income | | | 2,581 | | | | (1,981 | ) |
| Accumulated net realized gains (losses) from investment transactions and written option contracts | | | 690,118 | | | | (76,853 | ) |
| Net unrealized appreciation (depreciation) on: | | | | | | | | |
| Investments | | | 5,339,418 | | | | 9,302,497 | |
| Written option contracts | | | (41,301 | ) | | | (80,889 | ) |
| Net assets | | $ | 26,278,504 | | | $ | 34,614,156 | |
| | | | | | | | | |
| Shares of beneficial interest outstanding (unlimited number of shares authorized, $0.01 par value) | | | 1,023,364 | | | | 1,822,753 | |
| | | | | | | | | |
| Net asset value, offering price and redemption price per share (Note 2) | | $ | 25.68 | | | $ | 18.99 | |
| See accompanying notes to financial statements. |
16
THE FLIPPIN, BRUCE & PORTER FUNDS
STATEMENTS OF OPERATIONS
Year Ended March 31, 2018 |
| | | FBP Equity
& Dividend
Plus Fund | | | FBP Appreciation
& Income
Opportunities
Fund | |
| INVESTMENT INCOME | | | | | | |
| Dividends | | $ | 875,113 | | | $ | 962,764 | |
| Foreign withholding taxes on dividends | | | (1,853 | ) | | | (4,140 | ) |
| Interest | | | — | | | | 123,862 | |
| TOTAL INVESTMENT INCOME | | | 873,260 | | | | 1,082,486 | |
| | | | | | | | | |
| EXPENSES | | | | | | | | |
| Investment advisory fees (Note 4) | | | 187,627 | | | | 240,126 | |
| Administration fees (Note 4) | | | 60,000 | | | | 60,000 | |
| Professional fees | | | 22,916 | | | | 22,916 | |
| Trustees’ fees and expenses (Note 4) | | | 10,452 | | | | 10,452 | |
| Registration and filing fees | | | 10,810 | | | | 8,077 | |
| Compliance service fees (Note 4) | | | 8,400 | | | | 8,400 | |
| Custodian and bank service fees | | | 8,082 | | | | 6,899 | |
| Postage and supplies | | | 6,477 | | | | 4,592 | |
| Printing of shareholder reports | | | 6,560 | | | | 4,150 | |
| Account maintenance fees | | | 1,414 | | | | 2,706 | |
| Insurance expense | | | 1,131 | | | | 1,280 | |
| Other expenses | | | 7,211 | | | | 8,655 | |
| TOTAL EXPENSES | | | 331,080 | | | | 378,253 | |
| Fees voluntarily waived by the Adviser (Note 4) | | | (44,279 | ) | | | (35,216 | ) |
| NET EXPENSES | | | 286,801 | | | | 343,037 | |
| | | | | | | | | |
| NET INVESTMENT INCOME | | | 586,459 | | | | 739,449 | |
| | | | | | | | | |
| REALIZED AND UNREALIZED GAINS (LOSSES) ON INVESTMENTS | | | | | | | | |
| Net realized gains from: | | | | | | | | |
| Investment transactions | | | 1,141,946 | | | | 791,841 | |
| Written option contracts (Note 5) | | | 122,178 | | | | 39,716 | |
| Net realized gains from in-kind redemptions (Note 2) | | | 498,179 | | | | — | |
| Net change in unrealized appreciation (depreciation) on: | | | | | | | | |
| Investments | | | (230,632 | ) | | | 1,095,760 | |
| Written option contracts (Note 5) | | | (77,199 | ) | | | (83,560 | ) |
| NET REALIZED AND UNREALIZED GAINS ON INVESTMENTS | | | 1,454,472 | | | | 1,843,757 | |
| | | | | | | | | |
| NET INCREASE IN NET ASSETS FROM OPERATIONS | | $ | 2,040,931 | | | $ | 2,583,206 | |
| See accompanying notes to financial statements. |
17
FBP EQUITY & DIVIDEND PLUS FUND
STATEMENTS OF CHANGES IN NET ASSETS |
| | | Year Ended
March 31,
2018 | | | Year Ended
March 31,
2017 | |
| FROM OPERATIONS | | | | | | |
| Net investment income | | $ | 586,459 | | | $ | 535,532 | |
| Net realized gains (losses) from: | | | | | | | | |
| Investment transactions | | | 1,141,946 | | | | 1,606,222 | |
| Written option contracts (Note 5) | | | 122,178 | | | | (15,969 | ) |
| Net realized gains from in-kind redemptions (Note 2) | | | 498,179 | | | | — | |
| Net change in unrealized appreciation (depreciation) on: | | | | | | | | |
| Investments | | | (230,632 | ) | | | 1,920,752 | |
| Written option contracts (Note 5) | | | (77,199 | ) | | | 81,002 | |
| Net increase in net assets from operations | | | 2,040,931 | | | | 4,127,539 | |
| | | | | | | | | |
| DISTRIBUTIONS TO SHAREHOLDERS (Note 2) | | | | | | | | |
| From net investment income | | | (586,581 | ) | | | (534,664 | ) |
| From net realized gains from investment transactions | | | (1,700,035 | ) | | | (65,593 | ) |
| Decrease in net assets from distributions to shareholders | | | (2,286,616 | ) | | | (600,257 | ) |
| | | | | | | | | |
| FROM CAPITAL SHARE TRANSACTIONS | | | | | | | | |
| Proceeds from shares sold | | | 415,812 | | | | 823,184 | |
| Net asset value of shares issued in reinvestment of distributions to shareholders | | | 2,251,859 | | | | 589,831 | |
| Payments for shares redeemed | | | (3,558,200 | ) | | | (2,289,634 | ) |
| Net decrease in net assets from capital share transactions | | | (890,529 | ) | | | (876,619 | ) |
| | | | | | | | | |
| TOTAL INCREASE (DECREASE) IN NET ASSETS | | | (1,136,214 | ) | | | 2,650,663 | |
| | | | | | | | | |
| NET ASSETS | | | | | | | | |
| Beginning of year | | | 27,414,718 | | | | 24,764,055 | |
| End of year | | $ | 26,278,504 | | | $ | 27,414,718 | |
| | | | | | | | | |
| UNDISTRIBUTED NET INVESTMENT INCOME | | $ | 2,581 | | | $ | 2,703 | |
| | | | | | | | | |
| CAPITAL SHARE ACTIVITY | | | | | | | | |
| Shares sold | | | 16,167 | | | | 33,608 | |
| Shares reinvested | | | 89,387 | | | | 24,107 | |
| Shares redeemed | | | (138,180 | ) | | | (95,151 | ) |
| Net decrease in shares outstanding | | | (32,626 | ) | | | (37,436 | ) |
| Shares outstanding, beginning of year | | | 1,055,990 | | | | 1,093,426 | |
| Shares outstanding, end of year | | | 1,023,364 | | | | 1,055,990 | |
| See accompanying notes to financial statements. |
18
FBP APPRECIATION & INCOME OPPORTUNITIES FUND
STATEMENTS OF CHANGES IN NET ASSETS |
| | | Year Ended
March 31,
2018 | | | Year Ended
March 31,
2017 | |
| FROM OPERATIONS | | | | | | |
| Net investment income | | $ | 739,449 | | | $ | 514,941 | |
| Net realized gains from: | | | | | | | | |
| Investment transactions | | | 791,841 | | | | 925,796 | |
| Written option contracts (Note 5) | | | 39,716 | | | | 1,635 | |
| Net change in unrealized appreciation (depreciation) on: | | | | | | | | |
| Investments | | | 1,095,760 | | | | 3,253,840 | |
| Written option contracts (Note 5) | | | (83,560 | ) | | | 17,747 | |
| Net increase in net assets from operations | | | 2,583,206 | | | | 4,713,959 | |
| | | | | | | | | |
| DISTRIBUTIONS TO SHAREHOLDERS (Note 2) | | | | | | | | |
| From net investment income | | | (740,853 | ) | | | (522,350 | ) |
| From net realized gains from investment transactions | | | (1,510,840 | ) | | | (30,246 | ) |
| Decrease in net assets from distributions to shareholders | | | (2,251,693 | ) | | | (552,596 | ) |
| | | | | | | | | |
| FROM CAPITAL SHARE TRANSACTIONS | | | | | | | | |
| Proceeds from shares sold | | | 470,661 | | | | 1,579,250 | |
| Net asset value of shares issued in reinvestment of distributions to shareholders | | | 2,180,127 | | | | 513,848 | |
| Payments for shares redeemed | | | (2,436,914 | ) | | | (3,854,197 | ) |
| Net increase (decrease) in net assets from capital share transactions | | | 213,874 | | | | (1,761,099 | ) |
| | | | | | | | | |
| TOTAL INCREASE IN NET ASSETS | | | 545,387 | | | | 2,400,264 | |
| | | | | | | | | |
| NET ASSETS | | | | | | | | |
| Beginning of year | | | 34,068,769 | | | | 31,668,505 | |
| End of year | | $ | 34,614,156 | | | $ | 34,068,769 | |
| | | | | | | | | |
| DISTRIBUTIONS IN EXCESS OF NET INVESTMENT INCOME | | $ | (1,981 | ) | | $ | (492 | ) |
| | | | | | | | | |
| CAPITAL SHARE ACTIVITY | | | | | | | | |
| Shares sold | | | 24,569 | | | | 85,200 | |
| Shares reinvested | | | 115,761 | | | | 28,901 | |
| Shares redeemed | | | (128,348 | ) | | | (216,526 | ) |
| Net increase (decrease) in shares outstanding | | | 11,982 | | | | (102,425 | ) |
| Shares outstanding, beginning of year | | | 1,810,771 | | | | 1,913,196 | |
| Shares outstanding, end of year | | | 1,822,753 | | | | 1,810,771 | |
| See accompanying notes to financial statements. |
19
FBP EQUITY & DIVIDEND PLUS FUND
FINANCIAL HIGHLIGHTS |
| Selected Per Share Data and Ratios for a Share Outstanding Throughout Each Year |
| | | Years Ended March 31, | |
| | | 2018 | | | 2017 | | | 2016 | | | 2015 | | | 2014 | |
| Net asset value at beginning of year | | $ | 25.96 | | | $ | 22.65 | | | $ | 24.89 | | | $ | 24.78 | | | $ | 21.67 | |
| | | | | | | | | | | | | | | | | | | | | |
| Income (loss) from investment operations: | | | | | | | | | | | | | | | | | | | | |
| Net investment income | | | 0.57 | | | | 0.50 | | | | 0.61 | | | | 0.50 | | | | 0.42 | |
| Net realized and unrealized gains (losses) on investments | | | 1.38 | | | | 3.37 | | | | (1.21 | ) | | | 0.57 | | | | 3.11 | |
| Total from investment operations | | | 1.95 | | | | 3.87 | | | | (0.60 | ) | | | 1.07 | | | | 3.53 | |
| | | | | | | | | | | | | | | | | | | | | |
| Less distributions: | | | | | | | | | | | | | | | | | | | | |
| Dividends from net investment income | | | (0.57 | ) | | | (0.50 | ) | | | (0.61 | ) | | | (0.51 | ) | | | (0.42 | ) |
| Distributions from net realized gains | | | (1.66 | ) | | | (0.06 | ) | | | (1.03 | ) | | | (0.45 | ) | | | — | |
| Total distributions | | | (2.23 | ) | | | (0.56 | ) | | | (1.64 | ) | | | (0.96 | ) | | | (0.42 | ) |
| | | | | | | | | | | | | | | | | | | | | |
| Net asset value at end of year | | $ | 25.68 | | | $ | 25.96 | | | $ | 22.65 | | | $ | 24.89 | | | $ | 24.78 | |
| | | | | | | | | | | | | | | | | | | | | |
| Total return (a) | | | 7.91 | % | | | 17.29 | % | | | (2.31 | %) | | | 4.23 | % | | | 16.40 | % |
| | | | | | | | | | | | | | | | | | | | | |
| Net assets at end of year (000’s) | | $ | 26,279 | | | $ | 27,415 | | | $ | 24,764 | | | $ | 28,782 | | | $ | 27,794 | |
| | | | | | | | | | | | | | | | | | | | | |
| Ratio of total expenses to average net assets | | | 1.24 | % | | | 1.25 | % | | | 1.19 | % | | | 1.17 | % | | | 1.21 | % |
| | | | | | | | | | | | | | | | | | | | | |
| Ratio of net expenses to average net assets (b) | | | 1.07 | % | | | 1.07 | % | | | 1.07 | % | | | 1.07 | % | | | 1.07 | % |
| | | | | | | | | | | | | | | | | | | | | |
| Ratio of net investment income to average net assets (b) | | | 2.19 | % | | | 2.07 | % | | | 2.60 | % | | | 1.98 | % | | | 1.82 | % |
| | | | | | | | | | | | | | | | | | | | | |
| Portfolio turnover rate | | | 18 | % | | | 19 | % | | | 21 | % | | | 19 | % | | | 24 | % |
| (a) | Total return is a measure of the change in value of an investment in the Fund over the periods covered, which assumes any dividends or capital gains distributions are reinvested in shares of the Fund. Returns shown do not reflect the deduction of taxes a shareholder would pay on Fund distributions or the redemption of Fund shares. |
| | |
| (b) | Ratios were determined after voluntary advisory fee waivers by the Adviser (Note 4). |
| | |
| See accompanying notes to financial statements. |
20
FBP APPRECIATION & INCOME OPPORTUNITIES FUND
FINANCIAL HIGHLIGHTS |
| Selected Per Share Data and Ratios for a Share Outstanding Throughout Each Year |
| | | Years Ended March 31, | |
| | | 2018 | | | 2017 | | | 2016 | | | 2015 | | | 2014 | |
| Net asset value at beginning of year | | $ | 18.81 | | | $ | 16.55 | | | $ | 18.53 | | | $ | 18.97 | | | $ | 17.16 | |
| | | | | | | | | | | | | | | | | | | | | |
| Income (loss) from investment operations: | | | | | | | | | | | | | | | | | | | | |
| Net investment income | | | 0.41 | | | | 0.28 | | | | 0.31 | | | | 0.26 | | | | 0.25 | |
| Net realized and unrealized gains (losses) on investments | | | 1.03 | | | | 2.28 | | | | (1.11 | ) | | | 0.19 | | | | 2.50 | |
| Total from investment operations | | | 1.44 | | | | 2.56 | | | | (0.80 | ) | | | 0.45 | | | | 2.75 | |
| | | | | | | | | | | | | | | | | | | | | |
| Less distributions: | | | | | | | | | | | | | | | | | | | | |
| Dividends from net investment income | | | (0.41 | ) | | | (0.28 | ) | | | (0.32 | ) | | | (0.26 | ) | | | (0.26 | ) |
| Distributions from net realized gains | | | (0.85 | ) | | | (0.02 | ) | | | (0.86 | ) | | | (0.63 | ) | | | (0.68 | ) |
| Total distributions | | | (1.26 | ) | | | (0.30 | ) | | | (1.18 | ) | | | (0.89 | ) | | | (0.94 | ) |
| | | | | | | | | | | | | | | | | | | | | |
| Net asset value at end of year | | $ | 18.99 | | | $ | 18.81 | | | $ | 16.55 | | | $ | 18.53 | | | $ | 18.97 | |
| | | | | | | | | | | | | | | | | | | | | |
| Total return (a) | | | 7.91 | % | | | 15.58 | % | | | (4.48 | %) | | | 2.36 | % | | | 16.50 | % |
| | | | | | | | | | | | | | | | | | | | | |
| Net assets at end of year (000’s) | | $ | 34,614 | | | $ | 34,069 | | | $ | 31,669 | | | $ | 38,991 | | | $ | 39,951 | |
| | | | | | | | | | | | | | | | | | | | | |
| Ratio of total expenses to average net assets | | | 1.10 | % | | | 1.12 | % | | | 1.05 | % | | | 1.04 | % | | | 1.03 | % |
| | | | | | | | | | | | | | | | | | | | | |
| Ratio of net expenses to average net assets (b) | | | 1.00 | % | | | 1.00 | % | | | 1.00 | % | | | 1.00 | % | | | 1.00 | % |
| | | | | | | | | | | | | | | | | | | | | |
| Ratio of net investment income to average net assets (b) | | | 2.16 | % | | | 1.57 | % | | | 1.75 | % | | | 1.36 | % | | | 1.36 | % |
| | | | | | | | | | | | | | | | | | | | | |
| Portfolio turnover rate | | | 10 | % | | | 18 | % | | | 23 | % | | | 12 | % | | | 10 | % |
| (a) | Total return is a measure of the change in value of an investment in the Fund over the periods covered, which assumes any dividends or capital gains distributions are reinvested in shares of the Fund. Returns shown do not reflect the deduction of taxes a shareholder would pay on Fund distributions or the redemption of Fund shares. |
| | |
| (b) | Ratios were determined after voluntary advisory fee waivers by the Adviser (Note 4). |
| | |
| See accompanying notes to financial statements. |
21
THE FLIPPIN, BRUCE & PORTER FUNDS
NOTES TO FINANCIAL STATEMENTS
March 31, 2018 |
1. Organization
FBP Equity & Dividend Plus Fund and FBP Appreciation & Income Opportunities Fund (the “Funds”) are no-load, diversified series of Williamsburg Investment Trust (the “Trust”), an open-end management investment company registered under the Investment Company Act of 1940, as amended (the “1940 Act”). The Trust was organized as a Massachusetts business trust on July 18, 1988. Other series of the Trust are not included in this report.
FBP Equity & Dividend Plus Fund seeks to provide above-average and growing income while also achieving long-term growth of capital.
FBP Appreciation & Income Opportunities Fund seeks long term capital appreciation and current income, assuming a moderate level of investment risk.
2. Significant Accounting Policies
In October 2016, the U.S. Securities and Exchange Commission (the “SEC”) adopted amendments to Regulation S-X, which impact financial statement presentation, particularly the presentation of derivative investments. The Funds have adopted these amendments, which were effective August 1, 2017, with these financial statements.
Each Fund follows accounting and reporting guidance under Financial Accounting Standards Board Accounting Standards Codification Topic 946, “Financial Services – Investment Companies.” The following is a summary of the Funds’ significant accounting policies. These policies are in conformity with accounting principles generally accepted in the United States of America (“GAAP”).
Securities valuation — The Funds’ portfolio securities are valued as of the close of business of the regular session of the New York Stock Exchange (normally 4:00 p.m. Eastern time). Securities traded on a national stock exchange, including common stocks and closed-end investment companies, are valued based upon the closing price on the principal exchange where the security is traded, if available, otherwise, at the last quoted bid price. Securities that are quoted by NASDAQ are valued at the NASDAQ Official Closing Price. Covered call options written by the Funds are valued at the last quoted sale price or, in the absence of a sale, at the ask price on the principal exchanges on which they are traded. Investments representing shares of other open-end investment companies, including money market funds, are valued at their net asset value (“NAV”) as reported by such companies. When using a quoted price and when the market is considered active, securities will be classified as Level 1 within the fair value hierarchy (see below).
Fixed income securities, including U.S. government agency obligations and corporate bonds, are typically valued on the basis of prices provided by an independent pricing service. The prices provided by the pricing service are determined with consideration given to institutional bid and last sale prices and take into account securities prices, yields, maturities, call features, ratings, institutional trading in similar groups of securities, and developments related to specific securities. Given the inputs used by the pricing service, these securities are classified as Level 2 within the fair value hierarchy.
22
THE FLIPPIN, BRUCE & PORTER FUNDS
NOTES TO FINANCIAL STATEMENTS (Continued) |
When market quotations are not readily available, if a pricing service cannot provide a price, or if the investment adviser believes the price received from the pricing service is not indicative of market value, securities will be valued in good faith at fair value using methods consistent with procedures adopted by the Board of Trustees and will be classified as Level 2 or 3 within the fair value hierarchy, depending on the inputs used. Such methods of fair valuation may include, but are not limited to: multiple of earnings, multiple of book value, discount from market of a similar freely traded security, purchase price of the security, subsequent private transactions in the security or related securities, or a combination of these and other factors.
GAAP establishes a single authoritative definition of fair value, sets out a framework for measuring fair value and requires additional disclosures about fair value measurements. Various inputs are used in determining the value of each Fund’s investments. These inputs are summarized in the three broad levels listed below:
| ● | Level 1 – quoted prices in active markets for identical securities |
| ● | Level 2 – other significant observable inputs |
| ● | Level 3 – significant unobservable inputs |
The inputs or methodology used for valuing securities are not necessarily an indication of the risks associated with investing in those securities. The inputs used to measure fair value may fall into different levels of the fair value hierarchy. In such cases, for disclosure purposes, the level in the fair value hierarchy within which the fair value measurement falls in its entirety is determined based on the lowest level input that is significant to the fair value measurement.
The following is a summary of the inputs used to value each Fund’s investments and other financial instruments as of March 31, 2018, by security type:
| FBP Equity & Dividend Plus Fund | | Level 1 | | | Level 2 | | | Level 3 | | | Total | |
| Investments in Securities: | | | | | | | | | | | | | | | | |
| Common Stocks | | $ | 25,248,164 | | | $ | — | | | $ | — | | | $ | 25,248,164 | |
| Money Market Funds | | | 1,535,039 | | | | — | | | | — | | | | 1,535,039 | |
| Total | | $ | 26,783,203 | | | $ | — | | | $ | — | | | $ | 26,783,203 | |
| | | | | | | | | | | | | | | | | |
| Other Financial Instruments: | | | | | | | | | | | | | | | | |
| Covered Written Call Options | | $ | (252,900 | ) | | $ | — | | | $ | — | | | $ | (252,900 | ) |
| Total | | $ | (252,900 | ) | | $ | — | | | $ | — | | | $ | (252,900 | ) |
23
THE FLIPPIN, BRUCE & PORTER FUNDS
NOTES TO FINANCIAL STATEMENTS (Continued) |
| FBP Appreciation & Income Opportunities Fund | | Level 1 | | | Level 2 | | | Level 3 | | | Total | |
| Investments in Securities: | | | | | | | | | | | | |
| Common Stocks | | $ | 26,477,044 | | | $ | — | | | $ | — | | | $ | 26,477,044 | |
| U.S. Government Agency Obligations | | | — | | | | 486,977 | | | | — | | | | 486,977 | |
| Corporate Bonds | | | — | | | | 4,219,358 | | | | — | | | | 4,219,358 | |
| Closed-End Funds | | | 282,600 | | | | — | | | | — | | | | 282,600 | |
| Money Market Funds | | | 3,240,823 | | | | — | | | | — | | | | 3,240,823 | |
| Total | | $ | 30,000,467 | | | $ | 4,706,335 | | | $ | — | | | $ | 34,706,802 | |
| | | | | | | | | | | | | | | | | |
| Other Financial Instruments: | | | | | | | | | | | | | | | | |
| Covered Written Call Options | | $ | (149,624 | ) | | $ | — | | | $ | — | | | $ | (149,624 | ) |
| Total | | $ | (149,624 | ) | | $ | — | | | $ | — | | | $ | (149,624 | ) |
Refer to each Fund’s Schedule of Investments for a listing of the common stocks and corporate bonds by sector type. As of March 31, 2018, the Funds did not have any transfers into or out of any Level. There were no Level 3 securities held by the Funds as of March 31, 2018. It is the Funds’ policy to recognize transfers into or out of any Level at the end of the reporting period.
Share valuation — The NAV per share of each Fund is calculated daily by dividing the total value of its assets, less liabilities, by the number of shares outstanding. The offering price and redemption price per share of each Fund is equal to its NAV per share.
Investment income — Interest income is accrued as earned. Dividend income is recorded on the ex-dividend date. Discounts and premiums on fixed income securities purchased are amortized using the interest method. Withholding taxes on foreign dividends have been recorded in accordance with the Funds’ understanding of the applicable country’s rules and tax rates.
Distributions to shareholders — Dividends arising from net investment income are declared and paid quarterly to shareholders of each Fund. Net realized short-term capital gains, if any, may be distributed throughout the year and net realized long-term capital gains, if any, are distributed at least once each year. The amount of distributions from net investment income and net realized capital gains are determined in accordance with federal income tax regulations, which may differ from GAAP. These “book/tax” differences are either temporary or permanent in nature. Dividends and distributions are recorded on the ex-dividend date. The tax character of distributions paid during the years ended March 31, 2018 and 2017 was as follows:
| | | Year
Ended | | Ordinary
Income | | | Long-Term
Capital Gains | | | Total
Distributions | |
| FBP Equity & Dividend Plus Fund | | 3/31/2018 | | $ | 636,626 | | | $ | 1,649,990 | | | $ | 2,286,616 | |
| | | 3/31/2017 | | $ | 576,357 | | | $ | 23,900 | | | $ | 600,257 | |
| FBP Appreciation & Income Opportunities Fund | | 3/31/2018 | | $ | 816,087 | | | $ | 1,435,606 | | | $ | 2,251,693 | |
| | | 3/31/2017 | | $ | 552,596 | | | $ | — | | | $ | 552,596 | |
24
THE FLIPPIN, BRUCE & PORTER FUNDS
NOTES TO FINANCIAL STATEMENTS (Continued) |
Investment transactions — Investment transactions are accounted for on trade date for financial reporting purposes. Realized gains and losses on securities sold are determined on a specific identification basis.
Common expenses — Common expenses of the Trust are allocated among the series of the Trust based on relative net assets of each series or the nature of the services performed and the relative applicability to each series.
Options transactions — When the Funds’ investment adviser believes that individual portfolio securities held by the Funds are approaching the top of the adviser’s growth and price expectations, covered call options can be written (sold) against such securities and the Funds will receive a premium in return. The Funds write options only for income generation and hedging purposes and not for speculation. The premiums received from writing the options are recorded as a liability and are subsequently valued daily at the closing prices on their primary exchanges. Premiums received from writing options that expire are treated as realized gains. Premiums received from writing options that are exercised increase the proceeds used to calculate the realized gain or loss on the sale of the underlying security. If a closing purchase transaction is used to terminate a Fund’s obligation on a call option, a gain or loss will be realized, depending upon whether the price of the closing purchase transaction is more or less than the premium previously received on the call option written.
Estimates — The preparation of financial statements in conformity with GAAP requires management to make estimates and assumptions that affect the reported amounts of assets and liabilities and the disclosure of contingent assets and liabilities as of the date of the financial statements and the reported amounts of income and expenses during the reporting period. Actual results could differ from those estimates.
Federal income tax — Each Fund has qualified and intends to continue to qualify as a regulated investment company under the Internal Revenue Code of 1986, as amended (the “Code”). Qualification generally will relieve the Funds of liability for federal income taxes to the extent 100% of their net investment income and any net realized capital gains are distributed in accordance with the Code.
In order to avoid imposition of the excise tax applicable to regulated investment companies, it is also each Fund’s intention to declare as dividends in each calendar year at least 98% of its net investment income (earned during the calendar year) and 98.2% of its net realized capital gains (earned during the twelve months ended October 31) plus undistributed amounts from prior years.
25
THE FLIPPIN, BRUCE & PORTER FUNDS
NOTES TO FINANCIAL STATEMENTS (Continued) |
The following information is computed on a tax basis for each item as of March 31, 2018:
| | | FBP Equity
& Dividend
Plus Fund | | | FBP Appreciation & Income Opportunities
Fund | |
| Cost of portfolio investments and written option contracts | | $ | 21,232,186 | | | $ | 25,339,595 | |
| Gross unrealized appreciation | | $ | 6,064,985 | | | $ | 10,129,704 | |
| Gross unrealized depreciation | | | (766,868 | ) | | | (912,121 | ) |
| Net unrealized appreciation | | | 5,298,117 | | | | 9,217,583 | |
| Undistributed ordinary income | | | 22,220 | | | | 12,880 | |
| Undistributed long-term capital gains | | | 672,500 | | | | — | |
| Accumulated capital and other losses | | | — | | | | (76,853 | ) |
| Distributions payable | | | (2,021 | ) | | | (10,836 | ) |
| Distributable earnings | | $ | 5,990,816 | | | $ | 9,142,774 | |
The difference between the federal income tax cost of portfolio investments and the financial statement cost of portfolio investments for FBP Appreciation & Income Opportunities Fund is due to certain differences in the recognition of capital gains and losses under income tax regulations and GAAP. These “book/tax” differences are temporary in nature and are primarily due to differing methods in the amortization of discounts and premiums on fixed income securities.
Certain capital losses incurred after October 31, and within the current taxable year, are deemed to arise on the first business day of a Fund’s following taxable year. For the tax year ended March 31, 2018, FBP Appreciation & Income Opportunities Fund deferred until April 1, 2018 post-October capital losses in the amount of $76,853.
During the year ended March 31, 2018, FBP Equity & Dividend Plus Fund realized $498,179 of net capital gains resulting from in-kind redemptions (redemptions in which shareholders who redeemed Fund shares received securities held by the Fund rather than cash). The Fund recognizes a gain on in-kind redemptions to the extent that the value of the distributed securities on the date of redemption exceeds the cost of those securities. Such gains are not taxable to the Fund and are not required to be distributed to shareholders. The Fund has reclassified this amount against paid-in capital on the Statements of Assets and Liabilities. Such reclassification, the result of permanent differences between the financial statement and income tax reporting requirements, had no effect on the Fund’s net assets or net asset value per share.
During the year ended March 31, 2018, the following reclassification was made as a result of permanent differences between the financial statements and income tax reporting requirements:
| | | Decrease
in distributions in
excess of net
investment
income | | | Increase in
accumulated
net realized
losses
from investment
transactions | |
| FBP Appreciation & Income Opportunities Fund | | $ | (85 | ) | | $ | 85 | |
26
THE FLIPPIN, BRUCE & PORTER FUNDS
NOTES TO FINANCIAL STATEMENTS (Continued) |
Such reclassification has no effect on the Fund’s total net assets or its NAV per share.
The Funds recognize the tax benefits or expenses of uncertain tax positions only when the position is “more likely than not” to be sustained assuming examination by tax authorities. Management has reviewed the tax positions taken by each Fund on federal income tax returns for all open tax years (tax years ended March 31, 2015 through March 31, 2018) and has concluded that no provision for unrecognized tax benefits or expenses is required in these financial statements.
3. Investment Transactions
Investment transactions, other than short-term investments and U.S. government securities, were as follows for the year ended March 31, 2018:
| | | FBP Equity
& Dividend
Plus Fund | | | FBP Appreciation
& Income
Opportunities
Fund | |
| Purchases of investment securities | | $ | 4,586,961 | | | $ | 3,134,289 | |
| Proceeds from sales and maturities of investment securities | | $ | 5,358,648 | | | $ | 4,345,219 | |
4. Transactions with Related Parties
INVESTMENT ADVISORY AGREEMENTS
Each Fund’s investments are managed by Flippin, Bruce & Porter, Inc. (the “Adviser”) under the terms of an Investment Advisory Agreement. Under the Investment Advisory Agreements, each Fund pays the Adviser a fee, which is computed and accrued daily and paid monthly, at an annual rate of 0.70% of its average daily net assets up to $250 million; 0.65% of the next $250 million of such assets; and 0.50% of such assets in excess of $500 million.
During the year ended March 31, 2018, the Adviser voluntarily waived $44,279 and $35,216 of its investment advisory fees from FBP Equity & Dividend Plus Fund and FBP Appreciation & Income Opportunities Fund, respectively. These amounts are not subject to recapture in future periods.
Certain officers and a Trustee of the Trust are also officers of the Adviser.
OTHER SERVICE PROVIDERS
Ultimus Fund Solutions, LLC (“Ultimus”) provides administration, fund accounting, compliance and transfer agent services to the Funds. The Funds pay Ultimus fees in accordance with the agreements for such services. In addition, the Funds pay out-of-pocket expenses including, but not limited to, postage, supplies, and costs of pricing the Funds’ portfolio securities. Certain officers of the Trust are also officers of Ultimus, or of Ultimus Fund Distributors, LLC (the “Distributor”), the principal underwriter of each Fund’s shares and an affiliate of Ultimus. The Distributor is compensated by the Adviser (not the Funds) for acting as principal underwriter.
27
THE FLIPPIN, BRUCE & PORTER FUNDS
NOTES TO FINANCIAL STATEMENTS (Continued) |
COMPENSATION OF TRUSTEES
Trustees and officers affiliated with the Adviser or Ultimus are not compensated by the Trust for their services. Each Trustee who is not an affiliated person of the Adviser or Ultimus received from the Trust an annual retainer of $15,000, payable quarterly; a fee of $1,500 for attendance at each meeting of the Board of Trustees (except that such fee was $2,500 for the independent chair); and a fee of $1,000 for attendance at each meeting of any committee of the Board (except that such fee was $1,500 for the committee chair); plus reimbursement of travel and other expenses incurred in attending meetings. Effective April 1, 2018, each Trustee who is not an affiliated person of the Adviser or Ultimus will receive from the Trust an annual retainer of $20,000, payable quarterly; a fee of $2,000 for attendance at each meeting of the Board of Trustees (except that such fee will be $3,000 for the independent chair); and a fee of $1,000 for attendance at each meeting of any committee of the Board (except that such fee will be $1,500 for the committee chair); plus reimbursement of travel and other expenses incurred in attending meetings. Each series of the Trust pays its proportionate share of such fees.
5. Derivatives Transactions
The location in the Statements of Assets and Liabilities of the Funds’ derivative positions is as follows:
FBP Equity & Dividend Plus Fund
| Type of Derivative (Risk) | Location | | Fair Value | | | Gross Notional Amount Outstanding March 31, 2018 | |
Asset
Derivatives | | | Liability
Derivatives |
| Call options written (Equity) | Written call options, at value | | $ | — | | | $ | (252,900 | ) | | $ | (5,907,093 | ) |
FBP Appreciation & Income Opportunities Fund
| Type of Derivative (Risk) | Location | | Fair Value | | | Gross Notional Amount Outstanding March 31, 2018 | |
Asset
Derivatives | | | Liability
Derivatives |
| Call options written (Equity) | Written call options, at value | | $ | — | | | $ | (149,624 | ) | | $ | (2,010,932 | ) |
28
THE FLIPPIN, BRUCE & PORTER FUNDS
NOTES TO FINANCIAL STATEMENTS (Continued) |
The Funds’ transactions in derivative instruments during the year ended March 31, 2018 are recorded in the following location in the Statements of Operations:
FBP Equity & Dividend Plus Fund
| Type of Derivative (Risk) | | Location | | Net
Realized
Gains | | | Location | | Change in Unrealized Appreciation (Depreciation) | |
| Call options written (Equity) | | Net realized gains from written option contracts | | $ | 122,178 | | | Net change in unrealized appreciation (depreciation) on written option contracts | | $ | (77,199 | ) |
FBP Appreciation & Income Opportunities Fund
| Type of Derivative (Risk) | | Location | | Net
Realized
Gains | | | Location | | Change in Unrealized Appreciation (Depreciation) | |
| Call options written (Equity) | | Net realized gains from written option contracts | | $ | 39,716 | | | Net change in unrealized appreciation (depreciation) on written option contracts | | $ | (83,560 | ) |
The average monthly notional amount of written call options during the year ended March 31, 2018 is $5,917,489 and $1,236,064 for FBP Equity & Dividend Plus Fund and FBP Appreciation & Income Opportunities Fund, respectively.
6. Contingencies and Commitments
The Funds indemnify the Trust’s officers and Trustees for certain liabilities that might arise from the performance of their duties to the Funds. Additionally, in the normal course of business the Funds enter into contracts that contain a variety of representations and warranties and which provide general indemnifications. The Funds’ maximum exposure under these arrangements is unknown, as this would involve future claims that may be made against the Funds that have not yet occurred. However, based on experience, the Trust expects the risk of loss to be remote.
7. Subsequent Events
The Funds are required to recognize in the financial statements the effects of all subsequent events that provide additional evidence about conditions that existed as of the date of the Statements of Assets and Liabilities. For non-recognized subsequent events that must be disclosed to keep the financial statements from being misleading, the Funds are required to disclose the nature of the event as well as an estimate of its financial effect, or a statement that such an estimate cannot be made. Management has evaluated subsequent events through the issuance of these financial statements and has noted no such events.
29
THE FLIPPIN, BRUCE & PORTER FUNDS
REPORT OF INDEPENDENT REGISTERED
PUBLIC ACCOUNTING FIRM |
To the Shareholders of The Flippin, Bruce & Porter Funds and
Board of Trustees of Williamsburg Investment Trust
Opinion on the Financial Statements
We have audited the accompanying statements of assets and liabilities, including the schedules of investments and open option contracts, of The Flippin, Bruce & Porter Funds, comprising FBP Equity & Dividend Plus Fund and FBP Appreciation & Income Opportunities Fund, (the “Funds”), each a series of Williamsburg Investment Trust, as of March 31, 2018, and the related statements of operations for the year then ended, the statements of changes in net assets for each of the two years in the period then ended, including the related notes, and the financial highlights for each of the three years in the period then ended (collectively referred to as the “financial statements”). In our opinion, the financial statements present fairly, in all material respects, the financial position of each of the Funds as of March 31, 2018, the results of their operations for the year then ended, the changes in their net assets for each of the two years in the period then ended, and the financial highlights for each of the three years in the period then ended, in conformity with accounting principles generally accepted in the United States of America.
The Funds’ financial highlights for the periods ended March 31, 2015 and prior, were audited by other auditors whose report dated May 22, 2015, expressed an unqualified opinion on those financial highlights.
Basis for Opinion
These financial statements are the responsibility of the Funds’ management. Our responsibility is to express an opinion on the Funds’ financial statements based on our audits. We are a public accounting firm registered with the Public Company Accounting Oversight Board (United States) (“PCAOB”) and are required to be independent with respect to the Funds in accordance with the U.S. federal securities laws and the applicable rules and regulations of the Securities and Exchange Commission and the PCAOB.
We conducted our audits in accordance with the standards of the PCAOB. Those standards require that we plan and perform the audit to obtain reasonable assurance about whether the financial statements are free of material misstatement, whether due to error or fraud.
Our audits include performing procedures to assess the risks of material misstatement of the financial statements, whether due to error or fraud, and performing procedures that respond to those risks. Such procedures include examining, on a test basis, evidence regarding the amounts and disclosures in the financial statements and confirmation of securities owned as of March 31, 2018, by correspondence with the custodian and brokers. Our audits also included evaluating the accounting principles used and significant estimates made by management, as well as evaluating the overall presentation of the financial statements. We believe that our audits provide a reasonable basis for our opinion.
We have served as the Funds’ auditor since 2016.
COHEN & COMPANY, LTD.
Cleveland, Ohio
May 11, 2018
30
THE FLIPPIN, BRUCE & PORTER FUNDS
BOARD OF TRUSTEES AND EXECUTIVE OFFICERS
(Unaudited) |
Overall responsibility for management of the Funds rests with the Board of Trustees. The Trustees serve during the lifetime of the Trust and until its termination, or until death, resignation, retirement or removal. The Trustees, in turn, elect the officers of the Funds. The officers have been elected for an annual term. The following are the Trustees and executive officers of the Funds:
| | Trustees
and Officers | Address | Year of Birth | Position Held
with the Trust | Length of
Time Served |
| | Robert S. Harris, Ph.D. | 225 Pictoria Drive, Suite 450
Cincinnati, OH | 1949 | Chairman and Trustee | Since
January 2007 |
| * | John P. Ackerly, IV | One James Center
901 E. Cary Street
Richmond, VA | 1963 | Trustee and President of Davenport Funds | Since
July 2012 |
| * | John T. Bruce | 800 Main Street
Lynchburg, VA | 1953 | Trustee and
President of FBP Funds | Since
September 1988 |
| | George K. Jennison | 225 Pictoria Drive, Suite 450
Cincinnati, OH | 1957 | Trustee | Since
January 2015 |
| | Harris V. Morrissette | 225 Pictoria Drive, Suite 450
Cincinnati, OH | 1959 | Trustee | Since
March 1993 |
| | Elizabeth W. Robertson | 225 Pictoria Drive, Suite 450
Cincinnati, OH | 1953 | Trustee | Since
February 2014 |
| | Norman D. Darden, III | 800 Main Street
Lynchburg, VA | 1965 | Vice President | Since
February 2018 |
| | John H. Hanna, IV | 800 Main Street
Lynchburg, VA | 1955 | Vice President | Since
February 2007 |
| | David J. Marshall | 800 Main Street
Lynchburg, VA | 1956 | Vice President | Since
February 2007 |
| | Robert G. Dorsey | 225 Pictoria Drive, Suite 450
Cincinnati, OH | 1957 | Vice President | Since
November 2000 |
| | Mark J. Seger | 225 Pictoria Drive, Suite 450
Cincinnati, OH | 1962 | Treasurer | Since
November 2000 |
| | Dina A. Tantra | 225 Pictoria Drive, Suite 450
Cincinnati, OH | 1969 | Secretary | Since
May 2018 |
| | Simon H. Berry | 225 Pictoria Drive, Suite 450
Cincinnati, OH | 1971 | Chief Compliance Officer | Since
May 2017 |
| * | Messrs. Ackerly and Bruce, as affiliated persons of investment advisers to the Trust, are “interested persons” of the Trust within the meaning of Section 2(a)(19) of the 1940 Act. |
31
THE FLIPPIN, BRUCE & PORTER FUNDS
BOARD OF TRUSTEES AND EXECUTIVE OFFICERS
(Unaudited) (Continued) |
Each Trustee oversees twelve portfolios of the Trust, including the Funds. The principal occupations of the Trustees and executive officers of the Funds during the past five years and public directorships held by the Trustees are set forth below:
Robert S. Harris, Ph.D. is the C. Stewart Sheppard Professor of Business Administration at The Darden Graduate School of Business Administration at the University of Virginia. He was previously the dean at Darden. Professor Harris has published widely on corporate finance, financial markets and mergers and acquisitions and has served as a consultant to corporations and government agencies.
John P. Ackerly, IV is Senior Vice President and Portfolio Manager of Davenport & Company LLC (a broker-dealer and investment advisory firm).
John T. Bruce is President, Director and member of the Executive Committee of the Adviser.
George K. Jennison is President of Oyster Consulting, LLC (a management consulting firm). He previously was a financial adviser with Wells Fargo Advisors, LLC.
Harris V. Morrissette is President of China Doll Rice and Beans, Inc. and Dixie Lily Foods. He is also a Director of Trustmark Corporation (bank holding company).
Elizabeth W. Robertson is Chief Financial Officer for Monument Restaurants LLC (restaurant franchises) and a Director of Towne Bank.
Norman D. Darden, III is Senior Portfolio Manager, Analyst and Principal of the Adviser.
John H. Hanna, IV is Vice President, Director and member of the Executive Committee of the Adviser.
David J. Marshall is Secretary, Director and member of the Executive Committee of the Adviser.
Robert G. Dorsey is a Managing Director of Ultimus Fund Solutions, LLC and Ultimus Fund Distributors, LLC.
Mark J. Seger is a Managing Director of Ultimus Fund Solutions, LLC and Ultimus Fund Distributors, LLC.
Dina A. Tantra is an Executive Vice President and Director of Fund Administration and Compliance of Ultimus Fund Solutions, LLC (2017 to present). She previously was Managing Director of Foreside Financial Group, LLC (2016 to 2017); Trustee and President of Advisers Investment Trust (2012 to 2017); Managing Director, Secretary and General Counsel of Beacon Hill Fund Services, Inc. (2008 to 2016) and Secretary and General Counsel of BHL Distributors, Inc. (2008 to 2016).
Simon H. Berry is a Senior Attorney of Ultimus Fund Solutions, LLC (2016 to present). He previously was an Attorney at the Kentucky Department of Financial Institutions (2009-2016).
Additional information about members of the Board of Trustees and executive officers is available in the Statement of Additional Information (“SAI”). To obtain a free copy of the SAI, please call 1-800-327-9375.
32
THE FLIPPIN, BRUCE & PORTER FUNDS
ABOUT YOUR FUNDS’ EXPENSES (Unaudited) |
We believe it is important for you to understand the impact of costs on your investment. All mutual funds have operating expenses. As a shareholder of the Funds, you incur ongoing costs, including management fees and other operating expenses. These ongoing costs, which are deducted from each Fund’s gross income, directly reduce the investment return of the Funds.
A mutual fund’s ongoing costs are expressed as a percentage of its average net assets. This figure is known as the expense ratio. The following examples are intended to help you understand the ongoing costs (in dollars) of investing in the Funds and to compare these costs with the ongoing costs of investing in other mutual funds. The examples below are based on an investment of $1,000 made at the beginning of the period shown and held for the entire period (October 1, 2017 through March 31, 2018).
The table below illustrates each Fund’s ongoing costs in two ways:
Actual fund return – This section helps you to estimate the actual expenses that you paid over the period. The “Ending Account Value” shown is derived from each Fund’s actual return, and the fourth column shows the dollar amount of operating expenses that would have been paid by an investor who started with $1,000 in the Funds. You may use the information here, together with the amount you invested, to estimate the expenses that you paid over the period.
To do so, simply divide your account value by $1,000 (for example, an $8,600 account value divided by $1,000 = 8.6), then multiply the result by the number given for the Funds under the heading “Expenses Paid During Period.”
Hypothetical 5% return – This section is intended to help you compare the Funds’ ongoing costs with those of other mutual funds. It assumes that each Fund had an annual return of 5% before expenses during the period shown, but that the expense ratio is unchanged. In this case, because the returns used are not the Funds’ actual returns, the results do not apply to your investment. The example is useful in making comparisons because the SEC requires all mutual funds to calculate expenses based on a 5% return. You can assess each Fund’s ongoing costs by comparing this hypothetical example with the hypothetical examples that appear in shareholder reports of other funds.
Note that expenses shown in the table are meant to highlight and help you compare ongoing costs only. The Funds do not charge sales loads or redemption fees.
The calculations assume no shares were bought or sold during the period. Your actual costs may have been higher or lower, depending on the amount of your investment and the timing of any purchases or redemptions.
More information about the Funds’ expenses, including annual expense ratios for the past five fiscal years, can be found in this report. For additional information on operating expenses and other shareholder costs, please refer to the Funds’ prospectus.
33
THE FLIPPIN, BRUCE & PORTER FUNDS
ABOUT YOUR FUNDS’ EXPENSES (Unaudited) (Continued) |
| | Beginning
Account Value
October 1,
2017 | Ending
Account Value
March 31,
2018 | Net
Expense Ratio(a) | Expenses Paid
During Period(b) |
| FBP Equity & Dividend Plus Fund | | | |
| Based on Actual Fund Return | $1,000.00 | $1,031.70 | 1.07% | $5.42 |
| Based on Hypothetical 5% Return (before expenses) | $1,000.00 | $1,019.60 | 1.07% | $5.39 |
| FBP Appreciation & Income Opportunities Fund | | | |
| Based on Actual Fund Return | $1,000.00 | $1,040.50 | 1.00% | $5.09 |
| Based on Hypothetical 5% Return (before expenses) | $1,000.00 | $1,019.95 | 1.00% | $5.04 |
| (a) | Annualized, based on the Fund’s most recent one-half year expenses. |
| | |
| (b) | Expenses are equal to the Fund’s net expense ratio multiplied by the average account value over the period, multiplied by 182/365 (to reflect the one-half year period). |
34
THE FLIPPIN, BRUCE & PORTER FUNDS
OTHER INFORMATION (Unaudited) |
The Trust files a complete listing of portfolio holdings for the Funds with the SEC as of the end of the first and third quarters of each fiscal year on Form N-Q. The filings are available upon request, by calling 1-800-327-9375. Furthermore, you may obtain a copy of these filings on the SEC’s website at http://www.sec.gov. The Trust’s Forms N-Q may also be reviewed and copied at the SEC’s Public Reference Room in Washington, DC, and information on the operation of the Public Reference Room may be obtained by calling 1-800-SEC-0330.
A description of the policies and procedures that the Funds use to determine how to vote proxies relating to portfolio securities is available without charge upon request by calling toll-free 1-800-327-9375, or on the SEC’s website at http://www.sec.gov. Information regarding how the Funds voted proxies relating to portfolio securities during the most recent 12-month period ended June 30 is also available without charge upon request by calling toll-free 1-800-327-9375, or on the SEC’s website at http://www.sec.gov.
| FEDERAL TAX INFORMATION (Unaudited) |
For the fiscal year ended March 31, 2018, FBP Equity & Dividend Plus Fund and FBP Appreciation & Income Opportunities Fund designated $1,700,035 and $1,435,606, respectively, as 20% long-term capital gain distributions.
Qualified Dividend Income – FBP Equity & Dividend Plus Fund and FBP Appreciation & Income Opportunities Fund each designates 100%, or up to the maximum amount of such dividends allowable pursuant to the Internal Revenue Code, as qualified dividend income eligible for the reduced tax rate of 15%.
Dividends Received Deduction – Corporate shareholders are generally entitled to take the dividends received deduction on the portion of a fund’s dividend distribution that qualifies under tax law. For FBP Equity & Dividend Plus Fund and FBP Appreciation & Income Opportunities Fund’s fiscal year 2018 ordinary income dividends, 100% qualifies for the corporate dividends received deduction.
35
THE FLIPPIN, BRUCE & PORTER FUNDS
DISCLOSURE REGARDING APPROVAL OF
INVESTMENT ADVISORY AGREEMENTS
(Unaudited) |
At an in-person meeting held on February 20, 2018, the Board of Trustees, including a majority of the Independent Trustees, approved the continuance for a one-year period of the Investment Advisory Agreements with the Adviser on behalf of the FBP Equity & Dividend Plus Fund and the FBP Appreciation & Income Opportunities Fund. Below is a discussion of the factors considered by the Board of Trustees along with the conclusions with respect thereto that formed the basis for the Board’s approval.
In approving the continuance of the Investment Advisory Agreements, the Independent Trustees considered all information they deemed reasonably necessary to evaluate the terms of the Agreements. The principal areas of review by the Independent Trustees were the nature, extent and quality of the services provided by the Adviser and the reasonableness of the fees charged for those services. These matters were considered by the Independent Trustees consulting with experienced counsel for the Independent Trustees, who is independent of the Adviser.
The Independent Trustees’ evaluation of the quality of the Adviser’s services considered their knowledge and experience gained through meetings with and reports of the Adviser’s senior management over the course of the preceding year. Both short-term and long-term investment performance of the Funds were considered. Each Fund’s performance was compared to its performance benchmark, a competitive peer group of funds with similar investment objectives and strategies, and to the Adviser’s comparably managed private accounts. The Independent Trustees also considered: the scope and quality of the in-house capabilities of the Adviser and other resources that it dedicated to performing services for the Funds; the quality of administrative and other services, including the Adviser’s role in coordinating the activities of the Funds’ other service providers; the Adviser’s compliance with investment policies of the Funds and applicable laws and regulations; information provided by management and the Funds’ independent public accounting firm in periodic meetings with the Trust’s Audit Committee; the business reputation of the Adviser; the qualifications of the Adviser’s key investment and compliance personnel; and the Adviser’s financial resources.
In reviewing the fees payable under the Investment Advisory Agreements, the Independent Trustees compared the advisory fees and overall expense levels of each Fund with those of competitive funds with similar investment objectives as well as the private accounts managed by the Adviser. The Independent Trustees considered information provided by the Adviser concerning the Adviser’s profitability with respect to each Fund, including the assumptions and methodology used in preparing the profitability information, in light of applicable case law relating to advisory fees. For these purposes, the Independent Trustees considered not only the fees paid by the Funds, but also so-called “fallout” benefits to the Adviser. The Independent Trustees also considered the Adviser’s representations that the Funds’ portfolio trades were executed based on the best available price and execution, and that the Adviser does not participate in any soft dollar or directed brokerage arrangements. The Independent Trustees further considered that the Adviser does not participate in any revenue sharing arrangements relating to the Funds. In evaluating the Funds’ advisory fees, the Trustees considered the complexity and quality of the investment management of the Funds.
36
THE FLIPPIN, BRUCE & PORTER FUNDS
DISCLOSURE REGARDING APPROVAL OF
INVESTMENT ADVISORY AGREEMENTS
(Unaudited) (Continued) |
Based upon their review of this information, the Independent Trustees concluded that: (i) based upon the performance of the FBP Dividend Fund and the FBP Appreciation Fund during 2017, as compared to the S&P 500 Index and each Fund’s respective Morningstar peer group average, the Adviser has provided satisfactory services to the FBP Funds; (ii) the underperformance of each FBP Fund in recent years is largely attributable to the Fund’s value-oriented investment approach and use of covered call options, strategies that have limited the FBP Funds’ returns amidst rising equity markets; (iii) the advisory fees for each Fund, after fee waivers, are competitive with (and in the case of the FBP Dividend Plus Fund, lower than) similarly managed funds; (iv) the total operating expense ratio of each Fund, after fee waivers, is competitive with the average expense ratio for comparably managed funds, according to statistics derived from Morningstar, Inc.; (v) the Adviser’s decision to cap overall operating expenses of the FBP Funds by voluntarily waiving a portion of its investment advisory fees has enabled each Fund to increase returns for its shareholders and to maintain an overall expense ratio that is competitive with the average for similarly managed funds, despite the small size of the Funds; and (vi) the Adviser did not realize any profits with respect to its management of the FBP Funds.
Given the current size of the FBP Funds and their expected growth, the Independent Trustees did not believe that it was relevant to consider the extent to which economies of scale would be realized as the Funds grow, and whether fee levels reflect these economies of scale. The Independent Trustees did consider the “fallout” benefits to FBP with respect to the FBP Funds, but given the amounts involved viewed these as secondary factors in connection with the evaluation of the reasonableness of the advisory fees paid by the Funds.
No single factor was considered in isolation or to be determinative to the decision of the Independent Trustees to approve the continuance of the Investment Advisory Agreements. Rather the Independent Trustees concluded, after weighing and balancing of all factors considered, that it was in the best interests of each Fund and its shareholders to continue the Investment Advisory Agreements without modification to its terms, including the fees charged for services thereunder.
37
 |
| | Investment Adviser Flippin, Bruce & Porter, Inc. 800 Main Street, Second Floor P.O. Box 6138 Lynchburg, Virginia 24505 Toll-Free 1-800-851-3804 www.fbpfunds.com Administrator Ultimus Fund Solutions, LLC P.O. Box 46707 Cincinnati, Ohio 45246-0707 Toll-Free 1-866-738-1127 Custodian U.S. Bank, N.A. 425 Walnut Street Cincinnati, Ohio 45202 Independent Registered
Public Accounting Firm Cohen & Company, Ltd.
1350 Euclid Avenue, Suite 800 Cleveland, Ohio 44115 | Legal Counsel Sullivan & Worcester LLP 1666 K Street, N.W. Washington, DC 20006 Officers John T. Bruce, President and Portfolio Manager Norman D. Darden, III,
Vice President John H. Hanna, IV, Vice President
David J. Marshall, Vice President Trustees Robert S. Harris, Ph.D., Chairman John P. Ackerly, IV John T. Bruce George K. Jennison Harris V. Morrissette Elizabeth W. Robertson | |
THE GOVERNMENT STREET FUNDS No-Load Mutual Funds Annual Report
March 31, 2018
|

|
The Government Street Equity Fund The Government Street Mid-Cap Fund The Alabama Tax Free Bond Fund |
LETTER FROM THE PRESIDENT | April 16, 2018 |
Dear Fellow Shareholders:
We are enclosing for your review the audited Annual Reports of The Government Street Funds for the fiscal year ended March 31, 2018.
The Government Street Equity Fund
The Government Street Equity Fund had a positive 15.08% total return for the fiscal year ended March 31, 2018. By comparison, the S&P 500® Index and the Morningstar Large Blend categories returned 13.99% and 12.82%, respectively.
The 12-month period had very good absolute returns with the 4th quarter of calendar 2017 providing the best results. The following table depicts the fiscal quarter total returns of our three related measures.
| Government
Street Equity | S&P 500 | Morningstar
Large Blend |
1 Qtr 2018 | (0.74%) | (0.76%) | (0.98%) |
4 Qtr 2017 | 6.01% | 6.64% | 6.41% |
3 Qtr 2017 | 5.31% | 4.48% | 4.19% |
2 Qtr 2017 | 3.85% | 3.09% | 2.92% |
The results of the last twelve months of equity performance were extremely good on an absolute and relative basis. The absolute 15.08% total return was significantly above the 5%-6% return levels being discussed for long term expected equity results touted by many market prognosticators. The event of producing a greater relative return over the S&P 500 is always a welcome accomplishment at 15.08% versus 13.99%.
It can be argued that the overall results were a direct response to pro-business policies of the new Administration in Washington. There can be little doubt that the exorcism of many anti-business regulations, new competitive tax brackets and the expectation of repatriation of domestic companies’ earnings held offshore, should act as catalysts.
In fact, the primary concern should probably be whether the market moved too rapidly to the higher levels. It will take some time to see the positive economic results that are expected from the new policies. And, there is still the gigantic debt burden of $20+ trillion our greatest creditor nation status has to address. GDP will have to accelerate to accommodate lower tax rates, service our debt and reduce deficit Government spending to be successful policy change.
We may have seen the manifestation of doubts in the market’s first quarter results of the S&P 500. The investment performance of (0.74%) total return was the first negative quarter result since the 3rd calendar quarter of 2015 for the index.
A monthly review of the 1st calendar quarter 2018, performance of the S&P 500 is even more interesting. January results soared 5.73% to break many all-time record levels. However, the months of February and March followed with (3.69%) and (2.54%) respectively to take the quarterly results into negative territory. These actions and reactions portend interesting times in the upcoming fiscal year.
1
We are generally positive on the future market environment. The enhanced business climate is almost palpable. Advances in Information Technology, Health Care and Energy sectors are exciting prospects for business. The key ingredient of success, in our opinion, now becomes utilization of all the positive developments to increase productivity. Without that improvement, the current results will be short lived.
The top 10 holdings in The Government Street Equity Fund as of March 31, 2018 were:
Security Description | % of Net Assets |
Apple, Inc. | 5.4% |
JPMorgan Chase & Company | 5.1% |
Lockheed Martin Corporation | 4.0% |
Visa, Inc. – Class A | 3.6% |
NVIDIA Corporation | 3.5% |
United Technologies Corporation | 2.7% |
Vanguard Mid-Cap ETF | 2.4% |
Accenture plc – Class A | 2.3% |
Intercontinental Exchange, Inc. | 2.3% |
Honeywell International, Inc. | 2.3% |
Exchange-traded funds (“ETFs”) have continued a prominent role in the Fund’s investment holdings, as evidenced by 1 of the top 10 holdings. Each ETF represents a composite holding of an extensive number of securities that have some common characteristic.
As an example, the Vanguard Mid-Cap ETF represents an investment in over 450 individual securities that meet Vanguard’s definition of mid capitalization corporate equities. The inclusion of this one security in the portfolio provided the Fund with broad diversification that would be impossible to achieve individually in a fund with the total value of The Government Street Equity. The ability to achieve diversification utilizing ETF’s has allowed us an opportunity for risk control that would be otherwise unattainable.
There were significant individual performances during the fiscal year. The five highest returns, held for the entire fiscal year, as measured by the internal rate of return for the entire period were:
Security Description | 1 Year Performance |
NVIDIA Corporation | 113.61% |
MasterCard, Inc. – Class A | 57.68% |
Tencent Holdings Ltd. - ADR | 52.86% |
Bio-Techne Corporation | 50.09% |
AbbVie, Inc. | 49.92% |
2
The five worst individual performances, held for the entire fiscal year, as measured by internal rate of return for the entire period were:
Security Description | 1 Year Performance |
Regeneron Pharmaceuticals, Inc. | (11.09%) |
Albemarle Corporation | (11.11%) |
Henry Schein, Inc. | (20.92%) |
Cardinal Health, Inc. | (21.24%) |
Enbridge, Inc. | (21.39%) |
The Fund’s best performing economic sector for the fiscal year was Information Technology, up 33.9%. The second-best sector was Financials up 23.9%. The worst performing sector was Real Estate down (7.19%).
Note: The investment performances listed for economic sectors and securities in the two preceding paragraphs are extracted from an in-house independent time weighted rate of return computation by the Addepar portfolio accounting system. The calculations are gross investment returns. Total investment returns are for the fiscal year April 1, 2017 through March 31, 2018.
The following comments are drawn from previous newsletters, but continue to reflect our current thoughts on the future investment prospects.
We believe that continued upward movement of markets and economies worldwide are highly dependent on governments getting their financial balance sheets in order. There has been unparalleled deficit spending around the world. Those economies not directly participating in the credit shortfalls will be indirectly impacted by lower import/export activities brought on by significant debt imposed slowdown. This will occur domestically and internationally as economies have become more highly correlated in their economic cycles.
In response to this perceived scenario; risk management takes precedent over return pursuits in the near term. Your Fund remains invested to capture returns, but highly diversified to mitigate the risks associated with that position. We believe that the future transition to a sound economic scenario will determine the continuation of current positive performances. We are not totally convinced of that outcome.
While significant risks exist, we continue to believe that investors have potential for one of the greatest investment environments for generations. There are over 7 billion people in the world today (the U.S. population is approximately 325 million). Many of these potential consumers are moving into middle class ranks. In our opinion, the demand for goods and services for the future is tremendous. Remember that, in our own economy, approximately 60% of GDP is tied to consumer spending on goods and services. With the business advantages that the U.S. enjoys in manufacturing know-how, technology, intellectual content, productivity, and numerous other characteristics, if government will provide a competitive framework for operating, the benefits could be the best ever. We just need government policies that foster growth in profits and wages domestically and internationally.
There are many additional moving parts in our economy and exogenous factors such as the geopolitical instabilities that will always cause uneven effects. However, it is our thought that keeping our fiscal house in order is basic to all considerations. The
3
irresponsible spending activities of our government continue to unnerve us. It remains to be seen if the economy can overcome the negative influence of government policies and have a successful impact on market values.
As of March 31, 2018, the Fund’s net assets were $62.7 million; net asset value per share was $74.60; and the ratio of expenses to net average assets was 0.88%. Portfolio turnover rate was 13%. Income dividends of $0.6543 per share and capital gain distributions of $1.8094 per share were distributed to shareholders during the year.
The Government Street Mid-Cap Fund
The Government Street Mid-Cap Fund produced a total return of 14.67% during the fiscal year ended March 31, 2018. By comparison the S&P 400® Index and the Morningstar Mid Cap Blended Index, used as relative performance benchmarks, returned 10.97% and 10.13%, respectively.
The mid-capitalization category of individual companies is usually represented by the S&P 400, whose issuers have a market capitalization ranging from approximately $1.1 billion to $10.0 billion. Generally, these companies are considered to have slightly higher risk and return characteristics than the S&P 500 companies, which includes issuers with large capitalization. As you would guess, the mid-cap companies in the index are primarily domestically oriented.
Your Fund has a slightly different range of capitalizations than the S&P 400. The Fund’s upper and lower limits are generally $8.0 billion and $500 million, respectively. There are 2 provisions that allow the makeup of the Fund to exceed those limits. Firstly, to the extent securities originally purchased within the limits have grown to greater capitalizations, they may be retained without limitation. Secondly, the Fund manager has latitude to purchase and hold up to 20% of the Fund’s value outside the limitations.
The exceptions to the guidelines for your Fund worked to its advantage in fiscal 2018. Several companies, particularly in the Information Technology sector, with higher capitalizations provided extraordinary returns for the period. The greatest contribution, NVIDIA up 113.25% in the period, was purchased when its capitalization was within the basic guidelines, but has grown to mega cap proportions.
The top 10 holdings in The Government Street Mid-Cap Fund as of March 31, 2018 were:
Security Description | % of Net Assets |
NVIDIA Corporation | 3.0% |
Lam Research Corporation | 2.9% |
Mid-America Apartment Communities, Inc. | 2.7% |
Vanguard Mid-Cap ETF | 2.3% |
Guggenheim Mid-Cap Core ETF | 2.2% |
Vanguard FTSE All-World ex-US Small-Cap ETF | 2.0% |
Teleflex, Inc. | 2.0% |
Harris Corporation | 1.9% |
Graco, Inc. | 1.9% |
Schwab International Small-Cap Equity ETF | 1.9% |
4
ETFs represent significant holdings in the Fund. Vanguard, Guggenheim and Schwab ETFs are all constituted differently but cover the market capitalization ranges mentioned earlier. Since the mid-cap universe contains a much greater number of companies than its larger index counterparts, we like to broaden your portfolios exposure across the range to govern risk control through diversification.
There were significant individual performances during the fiscal year. The five highest returns, held for the entire period, as measured by the time weighted rate of return, were:
Security Description | 1 Year Performance |
NVIDIA Corporation | 113.25% |
Broadridge Financial Solutions, Inc. | 64.06% |
Lam Research Corporation | 59.56% |
National Instruments Corporation | 58.46% |
Chemed Corporation | 50.08% |
The five worst individual performances, held for the entire period, as measured by time weighted rate of return, were:
Security Description | 1 Year Performance |
Albemarle Corporation | (11.20%) |
Hasbro, Inc. | (13.56%) |
Oil States International, Inc. | (21.65%) |
Patterson-UTI Energy, Inc. | (27.71%) |
SCANA Corporation | (39.39%) |
The Fund’s best performing economic sector for the fiscal year was Information Technology, up 43.4%. The second-best sector was Health Care, up 28.2%. The worst performing sector was Real Estate, down (10.4%).
Note: The investment performances listed for economic sectors and securities in the two preceding paragraphs are extracted from an in-house independent time weighted rate of return computation by the Addepar portfolio accounting system. The calculations are gross investment returns. Total investment returns are for the fiscal year April 1, 2017 through March 31, 2018.
We believe that mid-cap stocks offer an attractive combination of growth and safety as they have successfully overcome startup challenges yet remain nimble enough to generate stronger growth than large cap stocks. Mid-cap stocks have been able to match the performance of large-cap stocks in down markets while exceeding large-cap performance in up markets, leading to long-term outperformance.
Additionally, we believe the regulatory reductions by Government along with reduced corporate tax rates will be very positive profit benefits to mid cap companies versus their larger capitalization counterparts. Large capitalization companies with the breadth of legal and accounting resources available to them generally do not pay taxes at the maximum rates. On average, mid cap companies have historically paid taxes at the higher relative rates.
5
It may be interesting for the readers to compare the Global Industry Classification Standard (“GICS”) sectors between the larger capitalization S&P 500 and the smaller capitalization S&P 400. The approximate weights based on component’s capitalizations change daily, but are reasonably stable over short periods. As of April, 2018 they are:
GICS | S&P 500 | S&P 400 |
Energy | 5.74% | 3.81% |
Materials | 2.86% | 7.23% |
Industrial | 10.21% | 15.32% |
Consumer Discretionary | 12.67% | 12.02% |
Consumer Staples | 7.65% | 3.68% |
Health Care | 13.71% | 8.08% |
Financials | 14.73% | 17.93% |
Information Technology | 24.87% | 18.46% |
Telecommunication Services | 1.92% | 0.15% |
Utilities | 2.86% | 4.93% |
Real Estate | 2.78% | 8.40% |
The Government Street Mid Cap Fund uses the S&P 400 sector weights for guidance in its portfolio diversification.
As of March 31, 2018, the net assets of The Government Street Mid Cap Fund were $50.1 million and the net asset value per share was $26.64. The portfolio turnover rate for the year was 12% and the total number of holdings was 89 as of March 31, 2018. The net expense ratio for the Fund was 1.06%.
The Alabama Tax Free Bond Fund
Investors in the municipal bond market over the course of the last year have had to deal with the impact of several increases in the federal funds rate as a result of tightening by the U. S. Federal Reserve (the “Fed”). Additionally, market participants had to contend with prospects for changes in tax policy and the resulting impact on municipal bonds. Early in 2018, higher than expected U. S. wage inflation unnerved markets and investors began to worry that inflation may be rising more rapidly than expected, thereby suggesting the Fed would tighten policy more aggressively than the consensus had been expecting. Fears that the economy may be getting a bit too strong, with a tight labor market finally causing rising wage growth and broader inflationary pressures, led to increased concern among fixed income investors about the pace of future rate increases.
In addition to raising the federal funds rate, the Fed has been unwinding its balance sheet by selling bonds it purchased during quantitative easing. They have done this in a gradual, deliberate, and well telegraphed manner and so far fixed income markets have shown little reaction. The inflationary potential of the new fiscal stimulus does cause some concern. The Fed will walk a fine line in balancing the mandate to control inflation with the desire to maintain economic growth at an acceptable pace.
The recently implemented changes in U.S. tax policy have thus far had little impact on the municipal bond market. There was wide concern initially about which proposals would be included in the new law and how municipal bond prices would be
6
affected. Clearly there were changes that would suggest reduced demand for municipal bonds on the part of corporations which saw their tax rates slashed. On the other hand, a reduction in allowable tax deductions for individuals (such as state and local tax deductions) would seem to create more demand for tax-exempt securities. Also, the elimination of new issuance for advance refunding of municipal bonds may lead to lower supply in the market.
The Alabama Tax Free Bond Fund maintained its focus on the shorter end of the maturity range and the higher end of the quality spectrum. The duration of the Fund on March 31, 2018 was 3.1 years, as compared to 2.8 years at the end of the last fiscal year. All of the bonds purchased for the Fund are rated in the highest three categories of bond ratings (A, AA, AAA by Moody’s or Standard & Poor’s) when acquired or, if unrated, are considered to be of similar quality. The Fund is defensively positioned with a laddered portfolio of short and intermediate Alabama bonds.
For the fiscal year ended March 31, 2018, the Fund had a total return of (0.09%) as compared to returns of 0.40% for the Bloomberg Barclays 3-Year Municipal Bond Index and 1.26% for the Bloomberg Barclays 7-Year Municipal Bond Index. It should be noted that The Alabama Tax Free Bond Fund has a shorter average maturity than the unmanaged Bloomberg Barclays 7-Year Municipal Bond Index and consistently maintains a portfolio of higher rated securities, on average, than the holdings comprising the comparable indices. While the Fund holds bonds with maturities ranging from one to seven years, the Bloomberg Barclays 3-Year Municipal Bond Index holds only securities with maturities of approximately three years and the Bloomberg Barclays 7-Year Municipal Bond Index holds only securities with maturities ranging between six and eight years. Also, these indices include zero coupon bonds as well as bonds subject to the alternative minimum tax. The Fund holds neither of these types of securities.
As of March 31, 2018, the average maturity of the Fund was 3.4 years, up from 3.1 years at the end of the last fiscal year. The net assets of the Fund as of March 31, 2018, were $23.3 million and the net asset value per share was $10.21. The ratio of net investment income to average net assets during the fiscal year was 1.17% and the net expense ratio was 0.65%.
Thank you for your continued confidence in The Government Street Funds. Please call us if we can be of further service to you.
Very truly yours,

Thomas W. Leavell
President
Leavell Investment Management, Inc.
The Government Street Funds
7
Data presented reflects past performance, which is no guarantee of future results. Investment results and principal value will fluctuate so that shares, when redeemed, may be worth more or less than their original cost. Due to market volatility, current performance may be higher or lower than the performance shown.
This report is submitted for the general information of the shareholders of the Funds. The report is not authorized for distribution to prospective investors in the Funds unless it is accompanied by a current prospectus.
This report reflects our views, opinions and portfolio holdings as of March 31, 2018, the end of the reporting period. These views are subject to change at any time based upon market or other conditions. For more current information throughout the year please visit www.leavellinvestments.com.
8
THE GOVERNMENT STREET EQUITY FUND
PERFORMANCE INFORMATION (Unaudited) |
The Government Street Equity Fund
Comparison of the Change in Value of a $10,000 Investment in
The Government Street Equity Fund and the Standard & Poor’s 500® Index

| Average Annual Total Returns (for periods ended March 31, 2018) |
| 1 Year | 5 Years | 10 Years |
The Government Street Equity Fund(a) | 15.08% | 10.79% | 8.09% |
Standard & Poor’s 500® Index | 13.99% | 13.31% | 9.49% |
(a) | Total return is a measure of the change in value of an investment in the Fund over the periods covered, which assumes any dividends or capital gains distributions are reinvested in shares of the Fund. Returns do not reflect the deduction of taxes a shareholder would pay on Fund distributions or the redemption of Fund shares. |
9
THE GOVERNMENT STREET MID-CAP FUND
PERFORMANCE INFORMATION (Unaudited) |
The Government Street Mid-Cap Fund
Comparison of the Change in Value of a $10,000 Investment in
The Government Street Mid-Cap Fund and the Standard & Poor’s 400® Index

| Average Annual Total Returns (for periods ended March 31, 2018) |
| 1 Year | 5 Years | 10 Years |
The Government Street Mid-Cap Fund(a) | 14.67% | 12.15% | 10.47% |
Standard & Poor’s 400® Index | 10.97% | 11.97% | 10.90% |
(a) | Total return is a measure of the change in value of an investment in the Fund over the periods covered, which assumes any dividends or capital gains distributions are reinvested in shares of the Fund. Returns do not reflect the deduction of taxes a shareholder would pay on Fund distributions or the redemption of Fund shares. |
10
THE ALABAMA TAX FREE BOND FUND
PERFORMANCE INFORMATION (Unaudited) |
The Alabama Tax Free Bond Fund
Comparison of the Change in Value of a $10,000 Investment in The Alabama Tax Free Bond Fund,
the Bloomberg Barclays 7-Year Municipal Bond Index and the Bloomberg Barclays 3-Year Municipal Bond Index

| Average Annual Total Returns (for periods ended March 31, 2018) |
| 1 Year | 5 Years | 10 Years |
The Alabama Tax Free Bond Fund(a) | (0.09%) | 0.48% | 1.64% |
Bloomberg Barclays 7-Year Municipal Bond Index | 1.26% | 2.10% | 4.04% |
Bloomberg Barclays 3-Year Municipal Bond Index | 0.40% | 0.98% | 2.15% |
(a) | Total return is a measure of the change in value of an investment in the Fund over the periods covered, which assumes any dividends or capital gains distributions are reinvested in shares of the Fund. Returns do not reflect the deduction of taxes a shareholder would pay on Fund distributions or the redemption of Fund shares. |
11
THE GOVERNMENT STREET EQUITY FUND PORTFOLIO INFORMATION
March 31, 2018 (Unaudited)
Asset Allocation
(% of Net Assets)

Top Ten Equity Holdings
Security Description | % of Net Assets |
Apple, Inc. | 5.4% |
JPMorgan Chase & Company | 5.1% |
Lockheed Martin Corporation | 4.0% |
Visa, Inc. - Class A | 3.6% |
NVIDIA Corporation | 3.5% |
United Technologies Corporation | 2.7% |
Vanguard Mid-Cap ETF | 2.4% |
Accenture plc - Class A | 2.3% |
Intercontinental Exchange, Inc. | 2.3% |
Honeywell International, Inc. | 2.3% |
12
THE GOVERNMENT STREET MID-CAP FUND PORTFOLIO INFORMATION
March 31, 2018 (Unaudited)
Asset Allocation
(% of Net Assets)
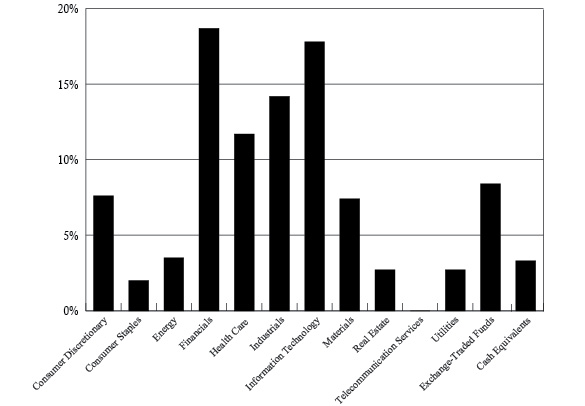
Top Ten Equity Holdings
Security Description | % of Net Assets |
NVIDIA Corporation | 3.0% |
Lam Research Corporation | 2.9% |
Mid-America Apartment Communities, Inc. | 2.7% |
Vanguard Mid-Cap ETF | 2.3% |
Guggenheim Mid-Cap Core ETF | 2.2% |
Vanguard FTSE All World ex-US Small-Cap ETF | 2.0% |
Teleflex, Inc. | 2.0% |
Harris Corporation | 1.9% |
Graco, Inc. | 1.9% |
Schwab International Small-Cap Equity ETF | 1.9% |
13
THE ALABAMA TAX FREE BOND FUND
PORTFOLIO INFORMATION
March 31, 2018 (Unaudited)
Asset Allocation
(% of Net Assets)

Distribution by Rating |
Rating | | % of Holdings |
AAA | | 13.0% |
AA | | 72.0% |
A | | 4.0% |
Not Rated | | 11.0% |
14
THE GOVERNMENT STREET EQUITY FUND
SCHEDULE OF INVESTMENTS
March 31, 2018 |
| COMMON STOCKS — 93.5% | | Shares | | | Value | |
| Consumer Discretionary — 9.0% | | | | | | |
| BorgWarner, Inc. | | | 8,000 | | | $ | 401,840 | |
| Comcast Corporation - Class A | | | 41,000 | | | | 1,400,970 | |
| Home Depot, Inc. (The) | | | 6,500 | | | | 1,158,560 | |
| Lowe's Companies, Inc. | | | 8,000 | | | | 702,000 | |
| McDonald's Corporation | | | 5,000 | | | | 781,900 | |
| NIKE, Inc. - Class B | | | 11,000 | | | | 730,840 | |
NVR, Inc. (a) | | | 100 | | | | 280,000 | |
| Vail Resorts, Inc. | | | 1,000 | | | | 221,700 | |
| | | | | | | | 5,677,810 | |
| Consumer Staples — 3.7% | | | | | | | | |
| Coca-Cola Company (The) | | | 12,000 | | | | 521,160 | |
| McCormick & Company, Inc. | | | 7,000 | | | | 744,730 | |
| Procter & Gamble Company (The) | | | 3,000 | | | | 237,840 | |
| Walmart, Inc. | | | 9,000 | | | | 800,730 | |
| | | | | | | | 2,304,460 | |
| Energy — 5.6% | | | | | | | | |
| Enbridge, Inc. | | | 22,664 | | | | 713,236 | |
| Marathon Petroleum Corporation | | | 10,000 | | | | 731,100 | |
| Pioneer Natural Resources Company | | | 7,500 | | | | 1,288,350 | |
| Valero Energy Corporation | | | 8,500 | | | | 788,545 | |
| | | | | | | | 3,521,231 | |
| Financials — 14.8% | | | | | | | | |
| Aflac, Inc. | | | 23,130 | | | | 1,012,169 | |
| BB&T Corporation | | | 5,000 | | | | 260,200 | |
Berkshire Hathaway, Inc. - Class B (a) | | | 3,500 | | | | 698,180 | |
| Brookfield Asset Management, Inc. - Class A | | | 33,500 | | | | 1,306,500 | |
| CME Group, Inc. | | | 8,500 | | | | 1,374,790 | |
| Intercontinental Exchange, Inc. | | | 20,000 | | | | 1,450,400 | |
| JPMorgan Chase & Company | | | 29,000 | | | | 3,189,130 | |
| | | | | | | | 9,291,369 | |
| Health Care — 10.1% | | | | | | | | |
| Abbott Laboratories | | | 9,000 | | | | 539,280 | |
| AbbVie, Inc. | | | 11,500 | | | | 1,088,475 | |
| Bio-Techne Corporation | | | 9,000 | | | | 1,359,360 | |
| Cardinal Health, Inc. | | | 7,000 | | | | 438,760 | |
Centene Corporation (a) | | | 7,000 | | | | 748,090 | |
Cerner Corporation (a) | | | 8,000 | | | | 464,000 | |
Henry Schein, Inc. (a) | | | 9,000 | | | | 604,890 | |
| Pfizer, Inc. | | | 24,000 | | | | 851,760 | |
Regeneron Pharmaceuticals, Inc. (a) | | | 670 | | | | 230,721 | |
| | | | | | | | 6,325,336 | |
15
THE GOVERNMENT STREET EQUITY FUND
SCHEDULE OF INVESTMENTS (Continued) |
| COMMON STOCKS — 93.5% (Continued) | | Shares | | | Value | |
| Industrials — 12.9% | | | | | | |
| 3M Company | | | 900 | | | $ | 197,568 | |
| Emerson Electric Company | | | 13,000 | | | | 887,900 | |
| General Dynamics Corporation | | | 5,200 | | | | 1,148,680 | |
| Honeywell International, Inc. | | | 10,000 | | | | 1,445,100 | |
| Lockheed Martin Corporation | | | 7,500 | | | | 2,534,475 | |
| United Parcel Service, Inc. - Class B | | | 2,000 | | | | 209,320 | |
| United Technologies Corporation | | | 13,500 | | | | 1,698,570 | |
| | | | | | | | 8,121,613 | |
| Information Technology — 26.8% | | | | | | | | |
| Accenture plc - Class A | | | 9,500 | | | | 1,458,250 | |
Alphabet, Inc. - Class A (a) | | | 800 | | | | 829,712 | |
Alphabet, Inc. - Class C (a) | | | 1,302 | | | | 1,343,391 | |
| Apple, Inc. | | | 20,000 | | | | 3,355,600 | |
| Intel Corporation | | | 8,000 | | | | 416,640 | |
| MasterCard, Inc. - Class A | | | 2,350 | | | | 411,626 | |
| Microsoft Corporation | | | 11,000 | | | | 1,003,970 | |
| NVIDIA Corporation | | | 9,500 | | | | 2,200,105 | |
| Skyworks Solutions, Inc. | | | 2,000 | | | | 200,520 | |
| TE Connectivity Ltd. | | | 11,000 | | | | 1,098,900 | |
| Tencent Holdings Ltd. - ADR | | | 6,000 | | | | 319,740 | |
| Texas Instruments, Inc. | | | 10,500 | | | | 1,090,845 | |
| Visa, Inc. - Class A | | | 18,700 | | | | 2,236,894 | |
| Western Digital Corporation | | | 9,000 | | | | 830,430 | |
| | | | | | | | 16,796,623 | |
| Materials — 6.5% | | | | | | | | |
| Albemarle Corporation | | | 8,500 | | | | 788,290 | |
| DowDuPont, Inc. | | | 11,000 | | | | 700,810 | |
| Ecolab, Inc. | | | 6,000 | | | | 822,420 | |
| Packaging Corporation of America | | | 2,000 | | | | 225,400 | |
| Praxair, Inc. | | | 5,000 | | | | 721,500 | |
| Vulcan Materials Company | | | 7,000 | | | | 799,190 | |
| | | | | | | | 4,057,610 | |
| Real Estate — 1.7% | | | | | | | | |
| Mid-America Apartment Communities, Inc. | | | 11,394 | | | | 1,039,589 | |
| | | | | | | | | |
| Utilities — 2.4% | | | | | | | | |
| Duke Energy Corporation | | | 8,250 | | | | 639,127 | |
| WEC Energy Group, Inc. | | | 14,000 | | | | 877,800 | |
| | | | | | | | 1,516,927 | |
| | | | | | | | | |
Total Common Stocks (Cost $30,428,732) | | | | | | $ | 58,652,568 | |
16
THE GOVERNMENT STREET EQUITY FUND
SCHEDULE OF INVESTMENTS (Continued) |
| EXCHANGE-TRADED FUNDS — 4.9% | | Shares | | | Value | |
| Schwab Emerging Markets Equity ETF | | | 27,000 | | | $ | 774,900 | |
| Vanguard FTSE Emerging Markets ETF | | | 16,700 | | | | 784,566 | |
| Vanguard Mid-Cap ETF | | | 9,750 | | | | 1,503,547 | |
Total Exchange-Traded Funds (Cost $2,014,736) | | | | | | $ | 3,063,013 | |
| |
| MONEY MARKET FUNDS — 1.7% | | Shares | | | Value | |
Fidelity Institutional Money Market Government Portfolio - Class I, 1.49% (b) (Cost $1,067,355) | | | 1,067,355 | | | $ | 1,067,355 | |
| | | | | | | | | |
Total Investments at Value — 100.1% (Cost $33,510,823) | | | | | | $ | 62,782,936 | |
| | | | | | | | | |
Liabilities in Excess of Other Assets — (0.1%) | | | | | | | (76,376 | ) |
| | | | | | | | | |
Net Assets — 100.0% | | | | | | $ | 62,706,560 | |
ADR - American Depositary Receipt. |
(a) | Non-income producing security. |
(b) | The rate shown is the 7-day effective yield as of March 31, 2018. |
See accompanying notes to financial statements. |
��
17
THE GOVERNMENT STREET MID-CAP FUND
SCHEDULE OF INVESTMENTS
March 31, 2018 |
| COMMON STOCKS — 88.3% | | Shares | | | Value | |
| Consumer Discretionary — 7.6% | | | | | | |
| Cracker Barrel Old Country Store, Inc. | | | 1,500 | | | $ | 238,800 | |
| Gildan Activewear, Inc. | | | 14,400 | | | | 416,016 | |
| Hasbro, Inc. | | | 7,000 | | | | 590,100 | |
| Leggett & Platt, Inc. | | | 7,000 | | | | 310,520 | |
NVR, Inc. (a) | | | 200 | | | | 560,000 | |
| Service Corporation International | | | 17,200 | | | | 649,128 | |
| Tiffany & Company | | | 3,475 | | | | 339,369 | |
| Vail Resorts, Inc. | | | 1,600 | | | | 354,720 | |
| VF Corporation | | | 4,700 | | | | 348,364 | |
| | | | | | | | 3,807,017 | |
| Consumer Staples — 2.0% | | | | | | | | |
| Church & Dwight Company, Inc. | | | 9,000 | | | | 453,240 | |
| Energizer Holdings, Inc. | | | 5,000 | | | | 297,900 | |
| Tyson Foods, Inc. - Class A | | | 3,000 | | | | 219,570 | |
| | | | | | | | 970,710 | |
| Energy — 3.5% | | | | | | | | |
| Andeavor | | | 1,740 | | | | 174,974 | |
CNX Resources Corporation (a) | | | 2,000 | | | | 30,860 | |
Oil States International, Inc. (a) | | | 8,000 | | | | 209,600 | |
| ONEOK, Inc. | | | 11,000 | | | | 626,120 | |
| Patterson-UTI Energy, Inc. | | | 24,000 | | | | 420,240 | |
RSP Permian, Inc. (a) | | | 6,000 | | | | 281,280 | |
| | | | | | | | 1,743,074 | |
| Financials — 18.7% | | | | | | | | |
| Alleghany Corporation | | | 865 | | | | 531,491 | |
| American Financial Group, Inc. | | | 7,600 | | | | 852,872 | |
| Arthur J. Gallagher & Company | | | 9,250 | | | | 635,752 | |
| Bank of Hawaii Corporation | | | 4,000 | | | | 332,400 | |
| Berkley (W.R.) Corporation | | | 7,450 | | | | 541,615 | |
| Brown & Brown, Inc. | | | 20,000 | | | | 508,800 | |
| CME Group, Inc. | | | 5,735 | | | | 927,579 | |
| Cohen & Steers, Inc. | | | 5,000 | | | | 203,300 | |
| Cullen/Frost Bankers, Inc. | | | 6,000 | | | | 636,420 | |
| Eaton Vance Corporation | | | 13,000 | | | | 723,710 | |
| Intercontinental Exchange, Inc. | | | 11,000 | | | | 797,720 | |
| Nasdaq, Inc. | | | 11,000 | | | | 948,420 | |
| Old Republic International Corporation | | | 24,400 | | | | 523,380 | |
| ProAssurance Corporation | | | 8,000 | | | | 388,400 | |
| SEI Investments Company | | | 10,500 | | | | 786,555 | |
| | | | | | | | 9,338,414 | |
18
THE GOVERNMENT STREET MID-CAP FUND
SCHEDULE OF INVESTMENTS (Continued) |
| COMMON STOCKS — 88.3% (Continued) | | Shares | | | Value | |
| Health Care — 11.7% | | | | | | | | |
Bio-Rad Laboratories, Inc. - Class A (a) | | | 1,700 | | | $ | 425,136 | |
| Bio-Techne Corporation | | | 5,000 | | | | 755,200 | |
Centene Corporation (a) | | | 6,000 | | | | 641,220 | |
Charles River Laboratories International, Inc. (a) | | | 4,500 | | | | 480,330 | |
| Chemed Corporation | | | 3,000 | | | | 818,580 | |
| Computer Programs & Systems, Inc. | | | 3,000 | | | | 87,600 | |
Laboratory Corporation of America Holdings (a) | | | 2,574 | | | | 416,345 | |
Penumbra, Inc. (a) | | | 2,000 | | | | 231,300 | |
| ResMed, Inc. | | | 6,000 | | | | 590,820 | |
| Teleflex, Inc. | | | 3,950 | | | | 1,007,171 | |
Waters Corporation (a) | | | 2,000 | | | | 397,300 | |
| | | | | | | | 5,851,002 | |
| Industrials — 14.2% | | | | | | | | |
| AMETEK, Inc. | | | 2,350 | | | | 178,530 | |
| C.H. Robinson Worldwide, Inc. | | | 4,000 | | | | 374,840 | |
| Donaldson Company, Inc. | | | 13,000 | | | | 585,650 | |
| Expeditors International of Washington, Inc. | | | 8,000 | | | | 506,400 | |
| Fastenal Company | | | 10,000 | | | | 545,900 | |
| Graco, Inc. | | | 21,000 | | | | 960,120 | |
| Harris Corporation | | | 6,000 | | | | 967,680 | |
| Jacobs Engineering Group, Inc. | | | 6,475 | | | | 382,996 | |
| L3 Technologies, Inc. | | | 3,000 | | | | 624,000 | |
| MSC Industrial Direct Company, Inc. - Class A | | | 6,000 | | | | 550,260 | |
| Pentair plc | | | 2,900 | | | | 197,577 | |
| Snap-on, Inc. | | | 1,475 | | | | 217,621 | |
| Waste Connections, Inc. | | | 10,500 | | | | 753,270 | |
| Woodward, Inc. | | | 4,150 | | | | 297,389 | |
| | | | | | | | 7,142,233 | |
| Information Technology — 17.8% | | | | | | | | |
| Analog Devices, Inc. | | | 3,671 | | | | 334,538 | |
ANSYS, Inc. (a) | | | 3,500 | | | | 548,415 | |
Arrow Electronics, Inc. (a) | | | 10,100 | | | | 777,902 | |
| Broadridge Financial Solutions, Inc. | | | 3,500 | | | | 383,915 | |
| DST Systems, Inc. | | | 10,200 | | | | 853,230 | |
| Jack Henry & Associates, Inc. | | | 7,700 | | | | 931,315 | |
| Lam Research Corporation | | | 7,200 | | | | 1,462,752 | |
| Microchip Technology, Inc. | | | 6,000 | | | | 548,160 | |
| National Instruments Corporation | | | 12,000 | | | | 606,840 | |
| NVIDIA Corporation | | | 6,500 | | | | 1,505,335 | |
Tech Data Corporation (a) | | | 3,500 | | | | 297,955 | |
| Western Digital Corporation | | | 1,693 | | | | 156,213 | |
| Xilinx, Inc. | | | 7,000 | | | | 505,680 | |
| | | | | | | | 8,912,250 | |
19
THE GOVERNMENT STREET MID-CAP FUND
SCHEDULE OF INVESTMENTS (Continued) |
| COMMON STOCKS — 88.3% (Continued) | | Shares | | | Value | |
| Materials — 7.4% | | | | | | |
| Albemarle Corporation | | | 6,700 | | | $ | 621,358 | |
| Ashland Global Holdings, Inc. | | | 6,000 | | | | 418,740 | |
Berry Global Group, Inc. (a) | | | 5,000 | | | | 274,050 | |
| Graphic Packaging Holding Company | | | 12,000 | | | | 184,200 | |
| Martin Marietta Materials, Inc. | | | 3,000 | | | | 621,900 | |
| Packaging Corporation of America | | | 6,000 | | | | 676,200 | |
| Scotts Miracle-Gro Company (The) | | | 2,500 | | | | 214,375 | |
| Steel Dynamics, Inc. | | | 12,000 | | | | 530,640 | |
| Valvoline, Inc. | | | 8,236 | | | | 182,263 | |
| | | | | | | | 3,723,726 | |
| Real Estate — 2.7% | | | | | | | | |
| Mid-America Apartment Communities, Inc. | | | 15,000 | | | | 1,368,600 | |
| | | | | | | | | |
| Utilities — 2.7% | | | | | | | | |
| AmeriGas Partners, L.P. | | | 6,500 | | | | 259,805 | |
| ONE Gas, Inc. | | | 500 | | | | 33,010 | |
| SCANA Corporation | | | 8,530 | | | | 320,301 | |
| Vectren Corporation | | | 11,600 | | | | 741,472 | |
| | | | | | | | 1,354,588 | |
| | | | | | | | | |
Total Common Stocks (Cost $20,584,760) | | | | | | $ | 44,211,614 | |
| |
| EXCHANGE-TRADED FUNDS — 8.4% | | Shares | | | Value | |
| Guggenheim Mid-Cap Core ETF | | | 17,100 | | | $ | 1,110,645 | |
| Schwab International Small-Cap Equity ETF | | | 26,000 | | | | 949,260 | |
| Vanguard FTSE All World ex-US Small-Cap ETF | | | 8,600 | | | | 1,025,464 | |
| Vanguard Mid-Cap ETF | | | 7,350 | | | | 1,133,444 | |
Total Exchange-Traded Funds (Cost $2,996,436) | | | | | | $ | 4,218,813 | |
20
THE GOVERNMENT STREET MID-CAP FUND
SCHEDULE OF INVESTMENTS (Continued) |
| MONEY MARKET FUNDS — 3.5% | | Shares | | | Value | |
Fidelity Institutional Money Market Government Portfolio - Class I, 1.49% (b) (Cost $1,745,576) | | | 1,745,576 | | | $ | 1,745,576 | |
| | | | | | | | | |
Total Investments at Value — 100.2% (Cost $25,326,772) | | | | | | $ | 50,176,003 | |
| | | | | | | | | |
Liabilities in Excess of Other Assets — (0.2%) | | | | | | | (117,026 | ) |
| | | | | | | | | |
Net Assets — 100.0% | | | | | | $ | 50,058,977 | |
(a) | Non-income producing security. |
(b) | The rate shown is the 7-day effective yield as of March 31, 2018. |
See accompanying notes to financial statements. |
21
THE ALABAMA TAX FREE BOND FUND
SCHEDULE OF INVESTMENTS
March 31, 2018 |
| ALABAMA FIXED RATE REVENUE AND GENERAL OBLIGATION (GO) BONDS — 98.0% | | Par Value | | | Value | |
| Alabama Drinking Water Financing Auth., Series A, Rev., | | | | | | |
| 3.00%, due 08/15/2019 | | $ | 530,000 | | | $ | 539,407 | |
| Alabama State Public School & College Auth., Capital Improvements, Series D, Rev., | | | | | | | | |
| 2.00%, due 09/01/2018 | | | 565,000 | | | | 566,124 | |
| Alabama State, Series A, GO, | | | | | | | | |
| 5.00%, due 08/01/2023 | | | 400,000 | | | | 457,736 | |
| 5.00%, due 08/01/2024 | | | 500,000 | | | | 581,300 | |
| Athens, AL, Electric Rev., Warrants, | | | | | | | | |
| 3.00%, due 06/01/2019 | | | 375,000 | | | | 380,749 | |
| Athens, AL, GO, Warrants, | | | | | | | | |
| 4.00%, due 09/01/2018 | | | 300,000 | | | | 302,997 | |
| 5.00%, due 04/01/2024 | | | 500,000 | | | | 569,485 | |
| Athens, AL, Water & Sewer, Rev., | | | | | | | | |
| 3.50%, due 05/01/2023 | | | 350,000 | | | | 369,670 | |
| Auburn University, AL, General Fee Rev., | | | | | | | | |
| 5.00%, due 06/01/2018 | | | 315,000 | | | | 316,770 | |
| 5.00%, due 06/01/2020 | | | 350,000 | | | | 374,476 | |
| 5.00%, due 06/01/2021 | | | 200,000 | | | | 219,576 | |
| Auburn, AL, Refunding & Capital Improvements, Series B, GO, Warrants, | | | | | | | | |
| 4.00%, due 08/01/2018 | | | 200,000 | | | | 201,618 | |
| Auburn, AL, School, Series A, GO, Warrants, | | | | | | | | |
| 5.00%, due 08/01/2018 | | | 500,000 | | | | 505,670 | |
| Baldwin Co., AL, GO, Warrants, | | | | | | | | |
| 4.00%, due 06/01/2019 | | | 200,000 | | | | 205,450 | |
| Birmingham, AL, Waterworks Board, Water Rev., | | | | | | | | |
| 3.625%, due 07/01/2018 | | | 250,000 | | | | 251,297 | |
| Chambers Co., AL, Gasoline Tax Anticipation, Rev., Warrants, | | | | | | | | |
| 2.00%, due 11/01/2019 | | | 290,000 | | | | 290,015 | |
| Cullman, AL, Board of Education, Special Tax School Warrants, Rev., | | | | | | | | |
| 2.00%, due 03/01/2023 | | | 325,000 | | | | 321,389 | |
| Daphne, AL, GO, Warrants, | | | | | | | | |
| 2.10%, due 04/01/2023 | | | 400,000 | | | | 396,432 | |
| Decatur, AL, Sewer Rev., Warrants, | | | | | | | | |
| 3.00%, due 08/15/2019 | | | 500,000 | | | | 508,875 | |
| Elmore Co., AL, GO, Warrants, | | | | | | | | |
| 5.00%, due 10/01/2022 | | | 415,000 | | | | 462,024 | |
| Florence, AL, GO, Warrants, | | | | | | | | |
| 4.00%, due 08/01/2018 | | | 575,000 | | | | 579,594 | |
22
THE ALABAMA TAX FREE BOND FUND
SCHEDULE OF INVESTMENTS (Continued) |
| ALABAMA FIXED RATE REVENUE AND GENERAL OBLIGATION (GO) BONDS — 98.0% (Continued) | | Par Value | | | Value | |
| Foley, AL, Utilities Board, Utilities Rev., | | | | | | |
| 4.00%, due 11/01/2018 | | $ | 710,000 | | | $ | 720,004 | |
| 4.00%, due 11/01/2019 | | | 225,000 | | | | 233,091 | |
| Hoover City, AL, Board of Education, Special Tax School Warrants, | | | | | | | | |
| 4.00%, due 02/15/2020 | | | 470,000 | | | | 489,594 | |
| Huntsville, AL, GO, | | | | | | | | |
| 5.00%, due 11/01/2024 | | | 265,000 | | | | 308,969 | |
| Huntsville, AL, GO, Refunding and Capital Improvement Warrants, | | | | | | | | |
| 4.00%, due 09/01/2018 | | | 500,000 | | | | 505,095 | |
| Huntsville, AL, Series A, GO, Warrants, | | | | | | | | |
| 5.00%, due 05/01/2024 | | | 665,000 | | | | 769,146 | |
| Huntsville, AL, Series C, GO, School Warrants, | | | | | | | | |
| 5.00%, due 11/01/2023 | | | 400,000 | | | | 458,932 | |
| Huntsville, AL, Series C, GO, Warrants, | | | | | | | | |
| 4.00%, due 05/01/2022 | | | 500,000 | | | | 538,560 | |
| Huntsville, AL, Series E, GO, Warrants, | | | | | | | | |
| 5.00%, due 11/01/2022 | | | 240,000 | | | | 270,559 | |
| Lee Co., AL, Board of Education Warrants, Rev., | | | | | | | | |
| 4.00%, due 02/01/2025 | | | 500,000 | | | | 544,825 | |
| Limestone Co., AL, Board of Education, Special Tax Warrants, | | | | | | | | |
| 3.00%, due 11/01/2019 | | | 560,000 | | | | 570,052 | |
| Madison Co., AL, Board of Education, Rev., Tax Anticipation Warrants, | | | | | | | | |
| 2.00%, due 09/01/2019 | | | 220,000 | | | | 220,854 | |
| Madison Co., AL, GO, School Warrants, | | | | | | | | |
| 5.00%, due 03/01/2025 | | | 500,000 | | | | 577,845 | |
| Madison Co., AL, GO, Warrants, | | | | | | | | |
| 4.00%, due 09/01/2021 | | | 465,000 | | | | 494,244 | |
| Madison Co., AL, Water & Wastewater Board, Rev., | | | | | | | | |
| 3.00%, due 12/01/2019 | | | 430,000 | | | | 439,185 | |
| Mobile, AL, Board of School Commissioners, GO, Warrants, | | | | | | | | |
| 5.00%, due 03/01/2025 | | | 250,000 | | | | 287,042 | |
| Mobile, AL, Board of Water and Sewer, Rev., | | | | | | | | |
| 5.00%, due 01/01/2025 | | | 500,000 | | | | 560,570 | |
| Mobile Co., AL, GO, Refunding, | | | | | | | | |
| 5.00%, due 06/01/2023 | | | 520,000 | | | | 590,112 | |
| Montgomery, AL, GO, Warrants, | | | | | | | | |
| 2.50%, due 04/01/2021 | | | 500,000 | | | | 500,145 | |
23
THE ALABAMA TAX FREE BOND FUND
SCHEDULE OF INVESTMENTS (Continued) |
| ALABAMA FIXED RATE REVENUE AND GENERAL OBLIGATION (GO) BONDS — 98.0% (Continued) | | Par Value | | | Value | |
| Montgomery, AL, Series A, GO, Warrants, | | | | | | |
| 5.00%, due 02/01/2024 | | $ | 220,000 | | | $ | 232,148 | |
| Morgan Co., AL, Board of Education, Capital Outlay Warrants, Rev., | | | | | | | | |
| 4.00%, due 03/01/2019 | | | 165,000 | | | | 168,460 | |
| Mountain Brook, AL, City Board of Education, GO, Warrants, | | | | | | | | |
| 3.00%, due 03/01/2020 | | | 300,000 | | | | 307,185 | |
| North Alabama Gas District, Rev., | | | | | | | | |
| 3.00%, due 06/01/2020 | | | 420,000 | | | | 420,546 | |
| Northport, AL, GO, Warrants, | | | | | | | | |
| 3.00%, due 09/01/2024 | | | 385,000 | | | | 395,872 | |
| Opelika, AL, Utilities Board, Series B, Rev., | | | | | | | | |
| 3.00%, due 06/01/2018 | | | 215,000 | | | | 215,510 | |
| Prattville, AL, GO, Warrants, | | | | | | | | |
| 5.00%, due 11/01/2022 | | | 400,000 | | | | 447,588 | |
| Russellville, AL, Rev., | | | | | | | | |
| 3.00%, due 03/01/2025 | | | 475,000 | | | | 481,944 | |
| Shelby Co., AL, Special Tax, School Warrants, | | | | | | | | |
| 3.00%, due 02/01/2023 | | | 300,000 | | | | 307,740 | |
| Sylacauga, AL, Utilities Board, Rev., | | | | | | | | |
| 3.00%, due 05/01/2021 | | | 310,000 | | | | 318,739 | |
| Trussville, AL, GO, | | | | | | | | |
| 5.00%, due 10/01/2019 | | | 400,000 | | | | 419,580 | |
| Tuscaloosa, AL, Series B, GO, Warrants, | | | | | | | | |
| 4.00%, due 01/01/2020 | | | 500,000 | | | | 519,850 | |
| Vestavia Hills, AL, GO, Warrants, | | | | | | | | |
| 4.00%, due 02/01/2021 | | | 500,000 | | | | 528,480 | |
| 4.00%, due 02/01/2025 | | | 500,000 | | | | 551,085 | |
| | | | | | | | | |
Total Alabama Fixed Rate Revenue and General Obligation (GO) Bonds (Cost $23,023,027) | | | | | | $ | 22,794,205 | |
24
THE ALABAMA TAX FREE BOND FUND
SCHEDULE OF INVESTMENTS (Continued) |
| MONEY MARKET FUNDS — 1.1% | | Shares | | | Value | |
Federated Government Obligations Fund - Institutional Class, 1.51% (a) (Cost $256,268) | | | 256,268 | | | $ | 256,268 | |
| | | | | | | | | |
Total Investments at Value — 99.1% (Cost $23,279,295) | | | | | | $ | 23,050,473 | |
| | | | | | | | | |
Other Assets in Excess of Liabilities — 0.9% | | | | | | | 200,781 | |
| | | | | | | | | |
Net Assets — 100.0% | | | | | | $ | 23,251,254 | |
(a) | The rate shown is the 7-day effective yield as of March 31, 2018. |
See accompanying notes to financial statements. |
25
THE GOVERNMENT STREET FUNDS
STATEMENTS OF ASSETS AND LIABILITIES
March 31, 2018 |
| | | Government
Street
Equity
Fund | | | Government
Street
Mid-Cap
Fund | | | Alabama
Tax Free
Bond
Fund | |
| ASSETS | | | | | | | | | |
| Investments in securities: | | | | | | | | | |
| At cost | | $ | 33,510,823 | | | $ | 25,326,772 | | | $ | 23,279,295 | �� |
| At value (Note 2) | | $ | 62,782,936 | | | $ | 50,176,003 | | | $ | 23,050,473 | |
| Cash | | | 4,271 | | | | 8,944 | | | | — | |
| Receivable for capital shares sold | | | — | | | | 100 | | | | — | |
| Dividends and interest receivable | | | 28,690 | | | | 29,718 | | | | 229,341 | |
| Other assets | | | 3,238 | | | | 3,190 | | | | 2,945 | |
| TOTAL ASSETS | | | 62,819,135 | | | | 50,217,955 | | | | 23,282,759 | |
| | | | | | | | | | | | | |
| LIABILITIES | | | | | | | | | | | | |
| Distributions payable | | | 3,832 | | | | — | | | | 592 | |
| Payable for capital shares redeemed | | | 64,356 | | | | 1,891 | | | | 18,084 | |
| Payable for investment securities purchased | | | — | | | | 115,889 | | | | — | |
| Accrued investment advisory fees (Note 4) | | | 32,712 | | | | 32,032 | | | | 2,794 | |
| Payable to administrator (Note 4) | | | 7,775 | | | | 6,650 | | | | 5,575 | |
| Other accrued expenses | | | 3,900 | | | | 2,516 | | | | 4,460 | |
| TOTAL LIABILITIES | | | 112,575 | | | | 158,978 | | | | 31,505 | |
| | | | | | | | | | | | | |
| NET ASSETS | | $ | 62,706,560 | | | $ | 50,058,977 | | | $ | 23,251,254 | |
| | | | | | | | | | | | | |
| Net assets consist of: | | | | | | | | | | | | |
| Paid-in capital | | $ | 31,702,609 | | | $ | 24,257,105 | | | $ | 23,538,019 | |
| Undistributed net investment income | | | 1,586 | | | | 77,352 | | | | — | |
| Accumulated net realized gains (losses) from investment transactions | | | 1,730,252 | | | | 875,289 | | | | (57,943 | ) |
| Net unrealized appreciation (depreciation) on investments | | | 29,272,113 | | | | 24,849,231 | | | | (228,822 | ) |
Net assets | | $ | 62,706,560 | | | $ | 50,058,977 | | | $ | 23,251,254 | |
| | | | | | | | | | | | | |
| Shares of beneficial interest outstanding (unlimited number of shares authorized, $0.01 par value) | | | 840,593 | | | | 1,879,042 | | | | 2,277,881 | |
| | | | | | | | | | | | | |
| Net asset value, offering price and redemption price per share (Note 2) | | $ | 74.60 | | | $ | 26.64 | | | $ | 10.21 | |
See accompanying notes to financial statements. |
26
THE GOVERNMENT STREET FUNDS
STATEMENTS OF OPERATIONS
Year Ended March 31, 2018 |
| | | Government
Street
Equity
Fund | | | Government
Street
Mid-Cap
Fund | | | Alabama
Tax Free
Bond
Fund | |
| INVESTMENT INCOME | | | | | | | | | |
| Dividends | | $ | 1,152,063 | | | $ | 898,808 | | | $ | 9,710 | |
| Foreign withholding taxes on dividends | | | (11,523 | ) | | | (1,730 | ) | | | — | |
| Interest | | | — | | | | — | | | | 458,408 | |
| TOTAL INVESTMENT INCOME | | | 1,140,540 | | | | 897,078 | | | | 468,118 | |
| | | | | | | | | | | | | |
| EXPENSES | | | | | | | | | | | | |
| Investment advisory fees (Note 4) | | | 385,730 | | | | 364,987 | | | | 89,992 | |
| Administration fees (Note 4) | | | 83,105 | | | | 67,171 | | | | 60,000 | |
| Professional fees | | | 21,416 | | | | 21,416 | | | | 22,916 | |
| Account maintenance fees | | | 19,601 | | | | 15,178 | | | | 6,360 | |
| Trustees’ fees and expenses (Note 4) | | | 10,452 | | | | 10,452 | | | | 10,452 | |
| Registration and filing fees | | | 8,678 | | | | 8,234 | | | | 6,629 | |
| Compliance fees (Note 4) | | | 8,007 | | | | 7,585 | | | | 6,902 | |
| Custodian and bank service fees | | | 7,614 | | | | 5,968 | | | | 4,629 | |
| Pricing costs | | | 1,360 | | | | 1,734 | | | | 10,866 | |
| Printing of shareholder reports | | | 5,071 | | | | 3,966 | | | | 4,523 | |
| Postage and supplies | | | 4,867 | | | | 4,178 | | | | 2,839 | |
| Other expenses | | | 6,600 | | | | 6,056 | | | | 3,246 | |
| TOTAL EXPENSES | | | 562,501 | | | | 516,925 | | | | 229,354 | |
| Fees voluntarily waived by the Adviser (Note 4) | | | — | | | | — | | | | (62,225 | ) |
| NET EXPENSES | | | 562,501 | | | | 516,925 | | | | 167,129 | |
| | | | | | | | | | | | | |
| NET INVESTMENT INCOME | | | 578,039 | | | | 380,153 | | | | 300,989 | |
| | | | | | | | | | | | | |
| REALIZED AND UNREALIZED GAINS (LOSSES) ON INVESTMENTS AND FOREIGN CURRENCIES | | | | | | | | | | | | |
| Net realized gains (losses) from: | | | | | | | | | | | | |
| Investments | | | 2,435,751 | | | | 2,081,238 | | | | 3,546 | |
| Foreign currency transactions | | | (625 | ) | | | — | | | | — | |
| Net realized gains from in-kind redemptions (Note 2) | | | 3,177,769 | | | | 1,836,225 | | | | — | |
| Net change in unrealized appreciation (depreciation) on investments | | | 2,815,559 | | | | 2,321,664 | | | | (317,921 | ) |
NET REALIZED AND UNREALIZED GAINS (LOSSES) ON INVESTMENTS AND FOREIGN CURRENCIES | | | 8,428,454 | | | | 6,239,127 | | | | (314,375 | ) |
| | | | | | | | | | | | | |
| NET INCREASE (DECREASE) IN NET ASSETS FROM OPERATIONS | | $ | 9,006,493 | | | $ | 6,619,280 | | | $ | (13,386 | ) |
See accompanying notes to financial statements. |
27
THE GOVERNMENT STREET FUNDS
STATEMENTS OF CHANGES IN NET ASSETS |
| | | Government Street
Equity Fund | | | Government Street
Mid-Cap Fund | |
| | | Year
Ended
March 31,
2018 | | | | Year
Ended
March 31,
2017 | | | | Year
Ended
March 31,
2018 | | | | Year
Ended
March 31,
2017 | |
| FROM OPERATIONS | | | | | | | | | | | | | | | | |
| Net investment income | | $ | 578,039 | | | $ | 732,201 | | | $ | 380,153 | | | $ | 309,384 | |
| Net realized gains (losses) from: | | | | | | | | | | | | | | | | |
| Investments | | | 2,435,751 | | | | 1,862,279 | | | | 2,081,238 | | | | 2,283,935 | |
| Foreign currency transactions | | | (625 | ) | | | — | | | | — | | | | — | |
| Net realized gains from in-kind redemptions (Note 2) | | | 3,177,769 | | | | 10,343,370 | | | | 1,836,225 | | | | 3,182,906 | |
| Net change in unrealized appreciation (depreciation) on investments | | | 2,815,559 | | | | (5,131,632 | ) | | | 2,321,664 | | | | 1,368,966 | |
| Net increase in net assets from operations | | | 9,006,493 | | | | 7,806,218 | | | | 6,619,280 | | | | 7,145,191 | |
| | | | | | | | | | | | | | | | | |
| DISTRIBUTIONS TO SHAREHOLDERS (Note 2) | | | | | | | | | | | | | | | | |
| From net investment income | | | (571,972 | ) | | | (739,136 | ) | | | (374,355 | ) | | | (274,923 | ) |
| From net realized capital gains on investment transactions | | | (1,608,883 | ) | | | (1,531,140 | ) | | | (2,066,212 | ) | | | (1,814,748 | ) |
| Decrease in net assets from distributions to shareholders | | | (2,180,855 | ) | | | (2,270,276 | ) | | | (2,440,567 | ) | | | (2,089,671 | ) |
| | | | | | | | | | | | | | | | | |
| FROM CAPITAL SHARE TRANSACTIONS | | | | | | | | | | | | | | | | |
| Proceeds from shares sold | | | 365,782 | | | | 886,334 | | | | 1,717,988 | | | | 1,887,134 | |
| Net asset value of shares issued in reinvestment of distributions to shareholders | | | 2,093,287 | | | | 2,225,420 | | | | 2,350,450 | | | | 2,043,991 | |
| Payments for shares redeemed | | | (11,985,459 | ) | | | (23,547,269 | ) | | | (6,728,252 | ) | | | (8,993,493 | ) |
| Net decrease in net assets from capital share transactions | | | (9,526,390 | ) | | | (20,435,515 | ) | | | (2,659,814 | ) | | | (5,062,368 | ) |
| | | | | | | | | | | | | | | | | |
| TOTAL INCREASE (DECREASE) IN NET ASSETS | | | (2,700,752 | ) | | | (14,899,573 | ) | | | 1,518,899 | | | | (6,848 | ) |
| | | | | | | | | | | | | | | | | |
| NET ASSETS | | | | | | | | | | | | | | | | |
| Beginning of year | | | 65,407,312 | | | | 80,306,885 | | | | 48,540,078 | | | | 48,546,926 | |
| End of year | | $ | 62,706,560 | | | $ | 65,407,312 | | | $ | 50,058,977 | | | $ | 48,540,078 | |
| | | | | | | | | | | | | | | | | |
| UNDISTRIBUTED (DISTRIBUTIONS IN EXCESS OF) NET INVESTMENT INCOME | | $ | 1,586 | | | $ | (3,817 | ) | | $ | 77,352 | | | $ | 71,554 | |
| | | | | | | | | | | | | | | | | |
| CAPITAL SHARE ACTIVITY | | | | | | | | | | | | | | | | |
| Shares sold | | | 4,995 | | | | 14,017 | | | | 64,603 | | | | 81,656 | |
| Shares reinvested | | | 29,289 | | | | 35,450 | | | | 91,019 | | | | 90,190 | |
| Shares redeemed | | | (168,824 | ) | | | (375,543 | ) | | | (264,296 | ) | | | (396,115 | ) |
| Net decrease in shares outstanding | | | (134,540 | ) | | | (326,076 | ) | | | (108,674 | ) | | | (224,269 | ) |
| Shares outstanding, beginning of year | | | 975,133 | | | | 1,301,209 | | | | 1,987,716 | | | | 2,211,985 | |
| Shares outstanding, end of year | | | 840,593 | | | | 975,133 | | | | 1,879,042 | | | | 1,987,716 | |
See accompanying notes to financial statements. |
28
THE GOVERNMENT STREET FUNDS
STATEMENTS OF CHANGES IN NET ASSETS (Continued) |
| | | Alabama Tax Free
Bond Fund | |
| | | Year
Ended
March 31,
2018 | | | | Year
Ended
March 31,
2017 | |
| FROM OPERATIONS | | | | | | | | |
| Net investment income | | $ | 300,989 | | | $ | 342,231 | |
| Net realized gains from investment transactions | | | 3,546 | | | | 97 | |
| Net change in unrealized appreciation (depreciation) on investments | | | (317,921 | ) | | | (417,234 | ) |
| Net decrease in net assets from operations | | | (13,386 | ) | | | (74,906 | ) |
| | | | | | | | | |
| DISTRIBUTIONS TO SHAREHOLDERS (Note 2) | | | | | | | | |
| From net investment income | | | (300,989 | ) | | | (342,231 | ) |
| | | | | | | | | |
| FROM CAPITAL SHARE TRANSACTIONS | | | | | | | | |
| Proceeds from shares sold | | | 24,063 | | | | 822,818 | |
| Net asset value of shares issued in reinvestment of distributions to shareholders | | | 282,902 | | | | 322,063 | |
| Payments for shares redeemed | | | (3,424,283 | ) | | | (2,908,873 | ) |
| Net decrease in net assets from capital share transactions | | | (3,117,318 | ) | | | (1,763,992 | ) |
| | | | | | | | | |
| TOTAL DECREASE IN NET ASSETS | | | (3,431,693 | ) | | | (2,181,129 | ) |
| | | | | | | | | |
| NET ASSETS | | | | | | | | |
| Beginning of year | | | 26,682,947 | | | | 28,864,076 | |
| End of year | | $ | 23,251,254 | | | $ | 26,682,947 | |
| | | | | | | | | |
| UNDISTRIBUTED NET INVESTMENT INCOME | | $ | — | | | $ | — | |
| | | | | | | | | |
| CAPITAL SHARE ACTIVITY | | | | | | | | |
| Shares sold | | | 2,325 | | | | 78,870 | |
| Shares reinvested | | | 27,385 | | | | 30,911 | |
| Shares redeemed | | | (332,528 | ) | | | (279,772 | ) |
| Net decrease in shares outstanding | | | (302,818 | ) | | | (169,991 | ) |
| Shares outstanding, beginning of year | | | 2,580,699 | | | | 2,750,690 | |
| Shares outstanding, end of year | | | 2,277,881 | | | | 2,580,699 | |
See accompanying notes to financial statements. |
29
THE GOVERNMENT STREET EQUITY FUND
FINANCIAL HIGHLIGHTS |
| Selected Per Share Data and Ratios for a Share Outstanding Throughout Each Year |
| | | Years Ended March 31, | |
| | | 2018 | | | | 2017 | | | | 2016 | | | | 2015 | | | | 2014 | |
| Net asset value at beginning of year | | $ | 67.08 | | | $ | 61.72 | | | $ | 65.95 | | | $ | 62.78 | | | $ | 53.61 | |
| | | | | | | | | | | | | | | | | | | | | |
| Income (loss) from investment operations: | | | | | | | | | | | | | | | | | | | | |
| Net investment income | | | 0.66 | | | | 0.68 | | | | 0.61 | | | | 0.67 | | | | 0.62 | |
| Net realized and unrealized gains (losses) on investments and foreign currencies | | | 9.32 | | | | 6.76 | | | | (2.17 | ) | | | 6.55 | | | | 9.17 | |
| Total from investment operations | | | 9.98 | | | | 7.44 | | | | (1.56 | ) | | | 7.22 | | | | 9.79 | |
| | | | | | | | | | | | | | | | | | | | | |
| Less distributions: | | | | | | | | | | | | | | | | | | | | |
| Dividends from net investment income | | | (0.65 | ) | | | (0.68 | ) | | | (0.64 | ) | | | (0.64 | ) | | | (0.61 | ) |
| Distributions from net realized gains | | | (1.81 | ) | | | (1.40 | ) | | | (2.03 | ) | | | (3.41 | ) | | | (0.01 | ) |
| Total distributions | | | (2.46 | ) | | | (2.08 | ) | | | (2.67 | ) | | | (4.05 | ) | | | (0.62 | ) |
| | | | | | | | | | | | | | | | | | | | | |
| Net asset value at end of year | | $ | 74.60 | | | $ | 67.08 | | | $ | 61.72 | | | $ | 65.95 | | | $ | 62.78 | |
| | | | | | | | | | | | | | | | | | | | | |
Total return (a) | | | 15.08 | % | | | 12.32 | % | | | (2.46 | %) | | | 11.87 | % | | | 18.34 | % |
| | | | | | | | | | | | | | | | | | | | | |
| Net assets at end of year (000’s) | | $ | 62,707 | | | $ | 65,407 | | | $ | 80,307 | | | $ | 93,778 | | | $ | 94,287 | |
| | | | | | | | | | | | | | | | | | | | | |
| Ratio of total expenses to average net assets | | | 0.88 | % | | | 0.87 | % | | | 0.85 | % | | | 0.84 | % | | | 0.84 | % |
| | | | | | | | | | | | | | | | | | | | | |
| Ratio of net investment income to average net assets | | | 0.90 | % | | | 1.03 | % | | | 0.95 | % | | | 1.02 | % | | | 1.06 | % |
| | | | | | | | | | | | | | | | | | | | | |
| Portfolio turnover rate | | | 13 | % | | | 20 | % | | | 17 | % | | | 26 | % | | | 36 | % |
(a) | Total return is a measure of the change in value of an investment in the Fund over the periods covered, which assumes any dividends or capital gains distributions are reinvested in shares of the Fund. Returns shown do not reflect the deduction of taxes a shareholder would pay on Fund distributions or the redemption of Fund shares. |
See accompanying notes to financial statements. |
30
THE GOVERNMENT STREET MID-CAP FUND
FINANCIAL HIGHLIGHTS |
| Selected Per Share Data and Ratios for a Share Outstanding Throughout Each Year |
| | | Years Ended March 31, | |
| | | 2018 | | | 2017 | | | 2016 | | | 2015 | | | 2014 | |
| Net asset value at beginning of year | | $ | 24.42 | | | $ | 21.95 | | | $ | 22.96 | | | $ | 21.68 | | | $ | 18.26 | |
| | | | | | | | | | | | | | | | | | | | | |
| Income from investment operations: | | | | | | | | | | | | | | | | | | | | |
| Net investment income | | | 0.20 | | | | 0.16 | | | | 0.10 | | | | 0.10 | | | | 0.09 | |
| Net realized and unrealized gains on investments | | | 3.32 | | | | 3.36 | | | | 0.11 | | | | 2.02 | | | | 3.46 | |
| Total from investment operations | | | 3.52 | | | | 3.52 | | | | 0.21 | | | | 2.12 | | | | 3.55 | |
| | | | | | | | | | | | | | | | | | | | | |
| Less distributions: | | | | | | | | | | | | | | | | | | | | |
| Dividends from net investment income | | | (0.20 | ) | | | (0.14 | ) | | | (0.10 | ) | | | (0.07 | ) | | | (0.11 | ) |
| Distributions from net realized gains | | | (1.10 | ) | | | (0.91 | ) | | | (1.12 | ) | | | (0.77 | ) | | | (0.02 | ) |
| Total distributions | | | (1.30 | ) | | | (1.05 | ) | | | (1.22 | ) | | | (0.84 | ) | | | (0.13 | ) |
| | | | | | | | | | | | | | | | | | | | | |
| Net asset value at end of year | | $ | 26.64 | | | $ | 24.42 | | | $ | 21.95 | | | $ | 22.96 | | | $ | 21.68 | |
| | | | | | | | | | | | | | | | | | | | | |
Total return (a) | | | 14.67 | % | | | 16.44 | % | | | 1.04 | % | | | 10.14 | % | | | 19.43 | % |
| | | | | | | | | | | | | | | | | | | | | |
| Net assets at end of year (000’s) | | $ | 50,059 | | | $ | 48,540 | | | $ | 48,547 | | | $ | 51,898 | | | $ | 54,875 | |
| | | | | | | | | | | | | | | | | | | | | |
| Ratio of total expenses to average net assets | | | 1.06 | % | | | 1.07 | % | | | 1.07 | % | | | 1.05 | % | | | 1.06 | % |
| | | | | | | | | | | | | | | | | | | | | |
| Ratio of net investment income to average net assets | | | 0.78 | % | | | 0.66 | % | | | 0.46 | % | | | 0.47 | % | | | 0.43 | % |
| | | | | | | | | | | | | | | | | | | | | |
| Portfolio turnover rate | | | 12 | % | | | 14 | % | | | 20 | % | | | 16 | % | | | 10 | % |
(a) | Total return is a measure of the change in value of an investment in the Fund over the periods covered, which assumes any dividends or capital gains distributions are reinvested in shares of the Fund. Returns shown do not reflect the deduction of taxes a shareholder would pay on Fund distributions or the redemption of Fund shares. |
See accompanying notes to financial statements. |
31
THE ALABAMA TAX FREE BOND FUND
FINANCIAL HIGHLIGHTS |
| Selected Per Share Data and Ratios for a Share Outstanding Throughout Each Year |
| | | Years Ended March 31, | |
| | | 2018 | | | | 2017 | | | | 2016 | | | | 2015 | | | | 2014 | |
| Net asset value at beginning of year | | $ | 10.34 | | | $ | 10.49 | | | $ | 10.49 | | | $ | 10.51 | | | $ | 10.63 | |
| | | | | | | | | | | | | | | | | | | | | |
| Income (loss) from investment operations: | | | | | | | | | | | | | | | | | | | | |
| Net investment income | | | 0.12 | | | | 0.13 | | | | 0.13 | | | | 0.14 | | | | 0.15 | |
| Net realized and unrealized gains (losses) on investments | | | (0.13 | ) | | | (0.15 | ) | | | 0.00 | (a) | | | (0.02 | ) | | | (0.12 | ) |
| Total from investment operations | | | (0.01 | ) | | | (0.02 | ) | | | 0.13 | | | | 0.12 | | | | 0.03 | |
| | | | | | | | | | | | | | | | | | | | | |
| Less dividends from net investment income | | | (0.12 | ) | | | (0.13 | ) | | | (0.13 | ) | | | (0.14 | ) | | | (0.15 | ) |
| | | | | | | | | | | | | | | | | | | | | |
| Net asset value at end of year | | $ | 10.21 | | | $ | 10.34 | | | $ | 10.49 | | | $ | 10.49 | | | $ | 10.51 | |
| | | | | | | | | | | | | | | | | | | | | |
Total return (b) | | | (0.09 | %) | | | (0.21 | %) | | | 1.28 | % | | | 1.14 | % | | | 0.28 | % |
| | | | | | | | | | | | | | | | | | | | | |
| Net assets at end of year (000’s) | | $ | 23,251 | | | $ | 26,683 | | | $ | 28,864 | | | $ | 29,969 | | | $ | 32,630 | |
| | | | | | | | | | | | | | | | | | | | | |
| Ratio of total expenses to average net assets | | | 0.89 | % | | | 0.86 | % | | | 0.82 | % | | | 0.79 | % | | | 0.76 | % |
| | | | | | | | | | | | | | | | | | | | | |
Ratio of net expenses to average net assets (c) | | | 0.65 | % | | | 0.65 | % | | | 0.65 | % | | | 0.65 | % | | | 0.65 | % |
| | | | | | | | | | | | | | | | | | | | | |
Ratio of net investment income to average
net assets (c) | | | 1.17 | % | | | 1.23 | % | | | 1.27 | % | | | 1.32 | % | | | 1.41 | % |
| | | | | | | | | | | | | | | | | | | | | |
| Portfolio turnover rate | | | 16 | % | | | 12 | % | | | 13 | % | | | 6 | % | | | 10 | % |
(a) | Amount rounds to less than $0.01 per share. |
(b) | Total return is a measure of the change in value of an investment in the Fund over the periods covered, which assumes any dividends or capital gains distributions are reinvested in shares of the Fund. Returns shown do not reflect the deduction of taxes a shareholder would pay on Fund distributions or the redemption of Fund shares. |
(c) | Ratios were determined after voluntary advisory fee waivers by the Adviser (Note 4). |
See accompanying notes to financial statements. |
32
THE GOVERNMENT STREET FUNDS
NOTES TO FINANCIAL STATEMENTS
March 31, 2018
1. Organization
The Government Street Equity Fund, The Government Street Mid-Cap Fund and The Alabama Tax Free Bond Fund (the “Funds”) are each a no-load series of the Williamsburg Investment Trust (the “Trust”), an open-end management investment company registered under the Investment Company Act of 1940, as amended (the “1940 Act”). The Government Street Equity Fund and The Government Street Mid-Cap Fund are each a diversified fund and The Alabama Tax Free Bond Fund is a non-diversified fund. The Trust was organized as a Massachusetts business trust on July 18, 1988. Other series of the Trust are not included in this report.
The Government Street Equity Fund’s investment objective is to seek capital appreciation.
The Government Street Mid-Cap Fund’s investment objective is to seek capital appreciation.
The Alabama Tax Free Bond Fund’s investment objectives are to provide current income exempt from federal income taxes and from the personal income taxes of Alabama and to preserve capital.
2. Significant Accounting Policies
In October 2016, the U.S. Securities and Exchange Commission (the “SEC”) adopted amendments to Regulation S-X, which impact financial statement presentation, particularly the presentation of derivative investments. The Funds have adopted these amendments, which were effective August 1, 2017, with these financial statements.
Each Fund follows accounting and reporting guidance under Financial Accounting Standards Board Accounting Standards Codification Topic 946, “Financial Services – Investment Companies.” The following is a summary of the Funds’ significant accounting policies. The policies are in conformity with accounting principles generally accepted in the United States of America (“GAAP”).
Securities valuation — The Funds’ portfolio securities are valued as of the close of business of the regular session of the New York Stock Exchange (“NYSE”) (normally 4:00 p.m. Eastern time). Securities traded on a national stock exchange, including common stocks and exchange-traded funds, are valued based upon the closing price on the principal exchange where the security is traded, if available, otherwise, at the last quoted bid price. Securities that are quoted by NASDAQ are valued at the NASDAQ Official Closing Price. Investments representing shares of other open-end investment companies, including money market funds, are valued at their net asset value (“NAV”) as reported by such companies. When using a quoted price and when the market is considered active, securities will be classified as Level 1 within the fair value hierarchy (see below).
33
THE GOVERNMENT STREET FUNDS
NOTES TO FINANCIAL STATEMENTS (Continued)
Fixed income securities, including municipal bonds, are typically valued on the basis of prices provided by an independent pricing service. The prices provided by the pricing service are determined with consideration given to institutional bid and last sale prices and take into account securities prices, yields, maturities, call features, ratings, institutional trading in similar groups of securities, and developments related to specific securities. Given the inputs used by the pricing service, these securities are classified as Level 2 within the fair value hierarchy.
When market quotations are not readily available, if a pricing service cannot provide a price, or if the investment adviser believes the price received from the pricing service is not indicative of market value, securities will be valued in good faith at fair value using methods consistent with procedures adopted by the Board of Trustees and will be classified as Level 2 or 3 within the fair value hierarchy, depending on the inputs used. Such methods of fair valuation may include, but are not limited to: multiple of earnings, multiple of book value, discount from market of a similar freely traded security, purchase price of the security, subsequent private transactions in the security or related securities, or a combination of these and other factors.
GAAP establishes a single authoritative definition of fair value, sets out a framework for measuring fair value and requires additional disclosures about fair value measurements.
Various inputs are used in determining the value of each Fund’s investments. These inputs are summarized in the three broad levels listed below:
● | Level 1 – quoted prices in active markets for identical securities |
● | Level 2 – other significant observable inputs |
● | Level 3 – significant unobservable inputs |
The inputs or methodology used for valuing securities are not necessarily an indication of the risks associated with investing in those securities. The inputs used to measure fair value may fall into different levels of the fair value hierarchy. In such cases, for disclosure purposes, the level in the fair value hierarchy within which the fair value measurement falls in its entirety is determined based on the lowest level input that is significant to the fair value measurement.
The following is a summary of the inputs used to value each Fund’s investments as of March 31, 2018, by security type:
| The Government Street Equity Fund | | Level 1 | | | Level 2 | | | Level 3 | | | Total | |
| Common Stocks | | $ | 58,652,568 | | | $ | — | | | $ | — | | | $ | 58,652,568 | |
| Exchange-Traded Funds | | | 3,063,013 | | | | — | | | | — | | | | 3,063,013 | |
| Money Market Funds | | | 1,067,355 | | | | — | | | | — | | | | 1,067,355 | |
| Total | | $ | 62,782,936 | | | $ | — | | | $ | — | | | $ | 62,782,936 | |
34
THE GOVERNMENT STREET FUNDS
NOTES TO FINANCIAL STATEMENTS (Continued)
| The Government Street Mid-Cap Fund: | | Level 1 | | | Level 2 | | | Level 3 | | | Total | |
| Common Stocks | | $ | 44,211,614 | | | $ | — | | | $ | — | | | $ | 44,211,614 | |
| Exchange-Traded Funds | | | 4,218,813 | | | | — | | | | — | | | | 4,218,813 | |
| Money Market Funds | | | 1,745,576 | | | | — | | | | — | | | | 1,745,576 | |
| Total | | $ | 50,176,003 | | | $ | — | | | $ | — | | | $ | 50,176,003 | |
| The Alabama Tax Free Bond Fund: | | Level 1 | | | Level 2 | | | Level 3 | | | Total | |
| Revenue and General Obligation Municipal Bonds | | $ | — | | | $ | 22,794,205 | | | $ | — | | | $ | 22,794,205 | |
| Money Market Funds | | | 256,268 | | | | — | | | | — | | | | 256,268 | |
| Total | | $ | 256,268 | | | $ | 22,794,205 | | | $ | — | | | $ | 23,050,473 | |
Refer to The Government Street Equity Fund’s and The Government Street Mid-Cap Fund’s Schedules of Investments for a listing of the common stocks by sector type. As of March 31, 2018, the Funds did not have any transfers into or out of any Level. There were no Level 3 securities or derivative instruments held by the Funds as of March 31, 2018. It is the Funds’ policy to recognize transfers into or out of any Level at the end of the reporting period.
Foreign currency translation — Investment securities and other assets and liabilities denominated in or expected to settle in foreign currencies, if any, are translated into U.S. dollars based on exchange rates on the following basis:
A. | The fair values of investment securities and other assets and liabilities are translated as of the close of the NYSE each day. |
B. | Purchases and sales of investment securities and income and expenses are translated at the rate of exchange prevailing as of 4:00 p.m. Eastern time on the respective date of such transactions. |
C. | The Fund does not isolate that portion of the results of operations caused by changes in foreign exchange rates on investments from those caused by changes in market prices of investment securities held. Such fluctuations are included with the net realized and unrealized gains or losses on investments. |
Reported net realized foreign exchange gains or losses arise from 1) purchases and sales of foreign currencies and 2) the difference between the amounts of dividends and foreign withholding taxes recorded on the Fund’s books and the U.S. dollar equivalent of the amounts actually received or paid. Reported net unrealized foreign exchange gains and losses arise from changes in the value of assets and liabilities that result from changes in exchange rates.
35
THE GOVERNMENT STREET FUNDS
NOTES TO FINANCIAL STATEMENTS (Continued)
Share valuation — The NAV per share of each Fund is calculated daily by dividing the total value of its assets, less liabilities, by the number of shares outstanding. The offering price and redemption price per share of each Fund is equal to the NAV per share.
Investment income — Interest income is accrued as earned. Discounts and premiums on fixed-income securities purchased are amortized using the interest method. Dividend income is recorded on the ex-dividend date. Withholding taxes on foreign dividends for The Government Street Equity Fund and The Government Street Mid-Cap Fund have been recorded in accordance with the Trust’s understanding of the applicable country’s rules and tax rates.
Distributions to shareholders — Dividends arising from net investment income are declared and paid quarterly to shareholders of The Government Street Equity Fund; declared and paid annually to shareholders of The Government Street Mid-Cap Fund; and declared daily and paid monthly to shareholders of The Alabama Tax Free Bond Fund. Net realized short-term capital gains, if any, may be distributed throughout the year and net realized long-term capital gains, if any, are distributed at least once each year. Dividends and distributions are recorded on the ex-dividend date. The amount of distributions from net investment income and net realized capital gains are determined in accordance with federal income tax regulations, which may differ from GAAP. These “book/tax” differences are either temporary or permanent in nature.
The tax character of distributions paid during the years ended March 31, 2018 and 2017 was as follows:
| | | Years
Ended | | | Ordinary
Income | | | Exempt- Interest
Dividends | | | Long-Term
Capital Gains | | | Total
Distributions | |
| The Government Street Equity Fund | | | 03/31/18 | | | $ | 678,883 | | | $ | — | | | $ | 1,501,972 | | | $ | 2,180,855 | |
| | | | 03/31/17 | | | $ | 739,136 | | | $ | — | | | $ | 1,531,140 | | | $ | 2,270,276 | |
| The Government Street Mid-Cap Fund | | | 03/31/18 | | | $ | 374,355 | | | $ | — | | | $ | 2,066,212 | | | $ | 2,440,567 | |
| | | | 03/31/17 | | | $ | 274,923 | | | $ | — | | | $ | 1,814,748 | | | $ | 2,089,671 | |
| The Alabama Tax Free Bond Fund | | | 03/31/18 | | | $ | 7,903 | | | $ | 293,086 | | | $ | — | | | $ | 300,989 | |
| | | | 03/31/17 | | | $ | — | | | $ | 342,231 | | | $ | — | | | $ | 342,231 | |
Investment transactions — Investment transactions are accounted for on trade date for financial reporting purposes. Realized gains and losses on investment securities sold are determined on a specific identification basis.
Common expenses — Common expenses of the Trust are allocated among the series of the Trust based on relative net assets of each series or the nature of the services performed and the relative applicability to each series.
36
THE GOVERNMENT STREET FUNDS
NOTES TO FINANCIAL STATEMENTS (Continued)
Estimates — The preparation of financial statements in conformity with GAAP requires management to make estimates and assumptions that affect the reported amounts of assets and liabilities and the disclosure of contingent assets and liabilities as of the date of the financial statements and the reported amounts of income and expenses during the reporting period. Actual results could differ from those estimates.
Federal income tax — Each Fund has qualified and intends to continue to qualify as a regulated investment company under the Internal Revenue Code of 1986, as amended (the “Code”). Qualification generally will relieve the Funds of liability for federal income taxes to the extent 100% of their net investment income and any net realized capital gains are distributed in accordance with the Code.
In order to avoid imposition of the excise tax applicable to regulated investment companies, it is also each Fund’s intention to declare as dividends in each calendar year at least 98% of its net investment income (earned during the calendar year) and 98.2% of its net realized capital gains (earned during the twelve months ended October 31) plus undistributed amounts from prior years.
The following information is computed on a tax basis for each item as of March 31, 2018:
| | | The Government
Street Equity
Fund | | | The Government
Street Mid-Cap
Fund | | | The Alabama
Tax Free Bond
Fund | |
| Cost of portfolio investments | | $ | 33,510,823 | | | $ | 25,280,123 | | | $ | 23,279,295 | |
| Gross unrealized appreciation | | $ | 29,593,545 | | | $ | 25,143,441 | | | $ | 23,560 | |
| Gross unrealized depreciation | | | (321,432 | ) | | | (247,561 | ) | | | (252,382 | ) |
| Net unrealized appreciation (depreciation) | | | 29,272,113 | | | | 24,895,880 | | | | (228,822 | ) |
| Undistributed ordinary income | | | 5,418 | | | | 30,703 | | | | — | |
| Undistributed tax-exempt income | | | — | | | | — | | | | 592 | |
| Undistributed long-term gains | | | 1,730,252 | | | | 875,289 | | | | — | |
| Accumulated capital and other losses | | | — | | | | — | | | | (57,943 | ) |
| Distributions payable | | | (3,832 | ) | | | — | | | | (592 | ) |
| Total distibutable earnings (deficit) | | $ | 31,003,951 | | | $ | 25,801,872 | | | $ | (286,765 | ) |
The difference between the federal income tax cost of portfolio investments and the financial statement cost of portfolio investments for The Government Street Mid-Cap Fund is due to certain timing differences in the recognition of capital gains or losses under income tax regulations and GAAP. These “book/tax” differences are temporary in nature and are primarily due to adjustments to basis on publicly traded partnerships.
During the year ended March 31, 2018, The Government Street Equity Fund reclassified $664 of net realized losses against net investment income on the Statements of Assets and Liabilities due to losses on foreign currencies and distributions in
37
THE GOVERNMENT STREET FUNDS
NOTES TO FINANCIAL STATEMENTS (Continued)
excess of net realized gains. Such reclassification, the result of permanent differences between the financial statements and income tax reporting requirements, had no effect on the Fund’s net assets or NAV per share.
During the year ended March 31, 2018, The Alabama Tax Free Bond Fund utilized long-term capital loss carryforwards in the amount of $3,546 to offset current year gains. As of March 31, 2018, The Alabama Tax Free Bond Fund had a short-term capital loss carryforward for federal income tax purposes of $24,704 and a long-term capital loss carryforward for federal income tax purposes of $33,239, both of which may be carried forward indefinitely. These capital loss carryforwards are available to offset realized capital gains in future years, thereby reducing future taxable gains distributions.
During the year ended March 31, 2018, The Government Street Equity Fund and The Government Street Mid-Cap Fund realized $3,177,769 and $1,836,225, respectively, of net capital gains resulting from in-kind redemptions (redemptions in which shareholders who redeemed Fund shares received investment securities held by the Fund rather than cash). The Funds recognize a gain on in-kind redemptions to the extent that the value of the distributed investment securities on the date of redemption exceeds the cost of those investment securities. Such gains are not taxable to the Funds and are not required to be distributed to shareholders. The Funds have reclassified these amounts against paid-in capital on the Statements of Assets and Liabilities. Such reclassifications, the result of permanent differences between the financial statement and income tax reporting requirements, had no effect on each Fund’s net assets or NAV per share.
The Funds recognize the tax benefits or expenses of uncertain tax positions only when the position is “more likely than not” to be sustained assuming examination by tax authorities. Management has reviewed the tax positions taken on federal income tax returns for all open tax years (tax years ended March 31, 2015 through March 31, 2018) of each Fund and has concluded that no provision for unrecognized tax benefits or expenses is required in these financial statements.
3. Investment Transactions
Investment transactions, other than short-term investments and U.S. government securities, were as follows for the year ended March 31, 2018:
| | | The Government
Street Equity
Fund | | | The Government
Street Mid-Cap
Fund | | | The Alabama
Tax Free Bond
Fund | |
| Purchases of investment securities | | $ | 8,327,475 | | | $ | 5,543,830 | | | $ | 3,973,266 | |
| Proceeds from sales and maturities of investment securities | | $ | 16,173,205 | | | $ | 8,728,245 | | | $ | 6,491,066 | |
38
THE GOVERNMENT STREET FUNDS
NOTES TO FINANCIAL STATEMENTS (Continued)
4. Transactions with Related Parties
INVESTMENT ADVISORY AGREEMENT
Each Fund’s investments are managed by Leavell Investment Management, Inc. (the “Adviser”) under the terms of an Investment Advisory Agreement. The Government Street Equity Fund pays the Adviser a fee, which is computed and accrued daily and paid monthly, at annual rates of 0.60% of its average daily net assets up to $100 million and 0.50% of such assets in excess of $100 million. The Government Street Mid-Cap Fund pays the Adviser a fee, which is computed and accrued daily and paid monthly, at an annual rate of 0.75% of its average daily net assets. The Alabama Tax Free Bond Fund pays the Adviser a fee, which is computed and accrued daily and paid monthly, at annual rates of 0.35% of its average daily net assets up to $100 million and 0.25% of such assets in excess of $100 million.
During the year ended March 31, 2018, the Adviser voluntarily limited the total annual operating expenses of The Alabama Tax Free Bond Fund to 0.65% of the Fund’s average daily net assets. Accordingly, the Adviser waived $62,225 of its investment advisory fees from The Alabama Tax Free Bond Fund during the year ended March 31, 2018. This amount is not subject to recapture in future periods.
Certain officers of the Trust are also officers of the Adviser.
OTHER SERVICE PROVIDERS
Ultimus Fund Solutions, LLC (“Ultimus”) provides administration, fund accounting, compliance and transfer agent services to the Funds. The Funds pay Ultimus fees in accordance with the agreements for such services. In addition, the Funds pay out-of-pocket expenses including, but not limited to, postage, supplies, and costs of pricing the Funds’ portfolio securities. Certain officers of the Trust are also officers of Ultimus, or of Ultimus Fund Distributors, LLC (the “Distributor”), the principal underwriter of each Fund’s shares and an affiliate of Ultimus. The Distributor is compensated by the Adviser (not the Funds) for acting as principal underwriter.
COMPENSATION OF TRUSTEES
Trustees and officers affiliated with the Adviser or Ultimus are not compensated by the Trust for their services. Each Trustee who is not an affiliated person of the Adviser or Ultimus received from the Trust an annual retainer of $15,000, payable quarterly; a fee of $1,500 for attendance at each meeting of the Board of Trustees (except that such fee was $2,500 for the independent chair); and a fee of $1,000 for attendance at each meeting of any committee of the Board (except that such fee was $1,500 for the committee chair); plus reimbursement of travel and other expenses incurred in attending meetings. Effective April 1, 2018, each Trustee who is not an affiliated person of the Adviser or Ultimus will receive from the Trust an annual retainer of $20,000, payable quarterly; a fee of $2,000 for attendance at each meeting of the Board of Trustees (except that such fee will be $3,000 for the independent chair); and a fee of $1,000 for attendance at each meeting of any committee of the Board (except
39
THE GOVERNMENT STREET FUNDS
NOTES TO FINANCIAL STATEMENTS (Continued)
that such fee will be $1,500 for the committee chair); plus reimbursement of travel and other expenses incurred in attending meetings. Each series of the Trust pays its proportionate share of such fees.
5. Contingencies and Commitments
The Funds indemnify the Trust’s officers and Trustees for certain liabilities that might arise from their performance of their duties to the Funds. Additionally, in the normal course of business the Funds enter into contracts that contain a variety of representations and warranties and which provide general indemnifications. The Funds’ maximum exposure under these arrangements is unknown, as this would involve future claims that may be made against the Funds that have not yet occurred. However, based on experience, the Trust expects the risk of loss to be remote.
6. Sector Risk
If a Fund has significant investments in the securities of issuers in industries within a particular sector, any development affecting that sector will have a greater impact on the value of the net assets of the Fund than would be the case if the Fund did not have significant investments in that sector. In addition, this may increase the risk of loss of an investment in the Fund and increase the volatility of the Fund’s NAV per share. From time to time, circumstances may affect a particular sector and the companies within such sector. For instance, economic or market factors, regulation or deregulation, and technological or other developments may negatively impact all companies in a particular sector and therefore the value of a Fund’s portfolio will be adversely affected. As of March 31, 2018, The Government Street Equity Fund had 26.8% of the value of its net assets invested in stocks within the Information Technology sector.
7. Concentration of Credit Risk
The Alabama Tax Free Bond Fund invests primarily in debt instruments of municipal issuers in the state of Alabama. The issuers’ abilities to meet their obligations may be affected by economic developments in the state or its region, as well as disruptions in the credit markets and the economy, generally.
8. Subsequent Events
The Funds are required to recognize in the financial statements the effects of all subsequent events that provide additional evidence about conditions that existed as of the date of the Statements of Assets and Liabilities. For non-recognized subsequent events that must be disclosed to keep the financial statements from being misleading, the Funds are required to disclose the nature of the event as well as an estimate of its financial effect, or a statement that such an estimate cannot be made. Management has evaluated subsequent events through the issuance of these financial statements and has noted no such events.
40
THE GOVERNMENT STREET FUNDS
REPORT OF INDEPENDENT REGISTERED
PUBLIC ACCOUNTING FIRM
To the Shareholders of The Government Street Funds and
Board of Trustees of Williamsburg Investment Trust
Opinion on the Financial Statements
We have audited the accompanying statements of assets and liabilities, including the schedules of investments, of The Government Street Funds, comprising The Government Street Equity Fund, The Government Street Mid-Cap Fund, and The Alabama Tax Free Bond Fund (the “Funds”), each a series of Williamsburg Investment Trust, as of March 31, 2018, and the related statements of operations for the year then ended, the statements of changes in net assets for each of the two years in the period then ended, including the related notes, and the financial highlights for each of the three years in the period then ended (collectively referred to as the “financial statements”). In our opinion, the financial statements present fairly, in all material respects, the financial position of the each of the Funds as of March 31, 2018, the results of their operations for the year then ended, the changes in their net assets for each of the two years in the period then ended, and the financial highlights for each of the three years in the period then ended, in conformity with accounting principles generally accepted in the United States of America.
The Funds’ financial highlights for the periods ended March 31, 2015 and prior, were audited by other auditors whose report dated May 22, 2015, expressed an unqualified opinion on those financial highlights.
Basis for Opinion
These financial statements are the responsibility of the Funds’ management. Our responsibility is to express an opinion on the Funds’ financial statements based on our audits. We are a public accounting firm registered with the Public Company Accounting Oversight Board (United States) (“PCAOB”) and are required to be independent with respect to the Funds in accordance with the U.S. federal securities laws and the applicable rules and regulations of the Securities and Exchange Commission and the PCAOB.
We conducted our audits in accordance with the standards of the PCAOB. Those standards require that we plan and perform the audit to obtain reasonable assurance about whether the financial statements are free of material misstatement, whether due to error or fraud.
Our audits include performing procedures to assess the risks of material misstatement of the financial statements, whether due to error or fraud, and performing procedures that respond to those risks. Such procedures include examining, on a test basis, evidence regarding the amounts and disclosures in the financial statements and confirmation of securities owned as of March 31, 2018, by correspondence with the custodian and broker. Our audits also included evaluating the accounting principles
41
THE GOVERNMENT STREET FUNDS
REPORT OF INDEPENDENT REGISTERED
PUBLIC ACCOUNTING FIRM (Continued)
used and significant estimates made by management, as well as evaluating the overall presentation of the financial statements. We believe that our audits provide a reasonable basis for our opinion.
We have served as the Funds’ auditor since 2016.
COHEN & COMPANY, LTD.
Cleveland, Ohio
May 11, 2018
42
THE GOVERNMENT STREET FUNDS
ABOUT YOUR FUNDS’ EXPENSES (Unaudited)
We believe it is important for you to understand the impact of costs on your investment. All mutual funds have operating expenses. As a shareholder of the Funds, you incur ongoing costs, including management fees and other expenses. These ongoing costs, which are deducted from each Fund’s gross income, directly reduce the investment returns of the Funds.
A mutual fund’s ongoing costs are expressed as a percentage of its average net assets. This figure is known as the expense ratio. The following examples are intended to help you understand the ongoing costs (in dollars) of investing in the Funds and to compare these costs with the ongoing costs of investing in other mutual funds. The examples below are based on an investment of $1,000 made at the beginning of the period shown and held for the entire period (October 1, 2017 through March 31, 2018).
The table below illustrates each Fund’s ongoing costs in two ways:
Actual fund return – This section helps you to estimate the actual expenses that you paid over the period. The “Ending Account Value” shown is derived from each Fund’s actual return, and the fourth column shows the dollar amount of operating expenses that would have been paid by an investor who started with $1,000 in the Funds. You may use the information here, together with the amount you invested, to estimate the expenses that you paid over the period.
To do so, simply divide your account value by $1,000 (for example, an $8,600 account value divided by $1,000 = 8.6), then multiply the result by the number given for the Funds under the heading “Expenses Paid During Period.”
Hypothetical 5% return – This section is intended to help you compare the Funds’ ongoing costs with those of other mutual funds. It assumes that each Fund had an annual return of 5% before expenses during the period shown, but that the expense ratio is unchanged. In this case, because the returns used are not the Funds’ actual returns, the results do not apply to your investment. The example is useful in making comparisons because the SEC requires all mutual funds to calculate expenses based on a 5% return. You can assess each Fund’s ongoing costs by comparing this hypothetical example with the hypothetical examples that appear in shareholder reports of other funds.
Note that expenses shown in the table are meant to highlight and help you compare ongoing costs only. The Funds do not charge sales loads or redemption fees.
The calculations assume no shares were bought or sold during the period. Your actual costs may have been higher or lower, depending on the amount of your investment and the timing of any purchases or redemptions.
43
THE GOVERNMENT STREET FUNDS
ABOUT YOUR FUNDS’ EXPENSES (Unaudited) (Continued)
More information about the Funds’ expenses, including historical expense ratios, can be found in this report. For additional information on operating expenses and other shareholder costs, please refer to the Funds’ prospectus.
| | Beginning
Account Value
Oct. 1, 2017 | Ending
Account Value
March 31, 2018 | Net
Expense
Ratio(a) | Expenses
Paid During
Period(b) |
The Government Street Equity Fund |
Based on Actual Fund Return | $1,000.00 | $ 1,052.30 | 0.88% | $4.50 |
Based on Hypothetical 5% Return (before expenses) | $1,000.00 | $ 1,020.54 | 0.88% | $4.43 |
The Government Street Mid-Cap Fund |
Based on Actual Fund Return | $1,000.00 | $ 1,064.30 | 1.06% | $5.46 |
Based on Hypothetical 5% Return (before expenses) | $1,000.00 | $ 1,019.65 | 1.06% | $5.34 |
The Alabama Tax Free Bond Fund |
Based on Actual Fund Return | $1,000.00 | $ 990.40 | 0.65% | $3.23 |
Based on Hypothetical 5% Return (before expenses) | $1,000.00 | $ 1,021.69 | 0.65% | $3.28 |
(a) | Annualized, based on the Fund's most recent one-half year expenses. |
(b) | Expenses are equal to the Fund’s annualized net expense ratio multiplied by the average account value over the period, muliplied by 182/365 (to reflect the one-half year period). |
44
THE GOVERNMENT STREET FUNDS
BOARD OF TRUSTEES AND EXECUTIVE OFFICERS
(Unaudited)
Overall responsibility for management of the Funds rests with the Board of Trustees. The Trustees serve during the lifetime of the Trust and until its termination, or until death, resignation, retirement or removal. The Trustees, in turn, elect the officers of the Funds. The officers have been elected for an annual term. The following are the Trustees and executive officers of the Funds:
Trustees and Officers | Address | Year of Birth | Position Held
with the Trust | Length of
Time Served |
| | Robert S. Harris, Ph.D. | 225 Pictoria Drive, Suite 450
Cincinnati, OH | 1949 | Chairman and Trustee | Since
January 2007 |
* | John P. Ackerly, IV | One James Center
901 E. Cary Street
Richmond, VA | 1963 | Trustee and President of Davenport Funds | Since
July 2012 |
* | John T. Bruce | 800 Main Street
Lynchburg, VA | 1953 | Trustee and President of FBP Funds | Since
September 1988 |
| | George K. Jennison | 225 Pictoria Drive, Suite 450
Cincinnati, OH | 1957 | Trustee | Since
January 2015 |
| Harris V. Morrissette | 225 Pictoria Drive, Suite 450
Cincinnati, OH | 1959 | Trustee | Since
March 1993 |
| | Elizabeth W. Robertson | 225 Pictoria Drive, Suite 450
Cincinnati, OH | 1953 | Trustee | Since
February 2014 |
| | Thomas W. Leavell | 210 St. Joseph Street
Mobile, AL | 1943 | President | Since
February 2004 |
| | Mary Shannon Hope | 210 St. Joseph Street
Mobile, AL | 1963 | Vice President | Since
August 2008 |
| | Timothy S. Healey | 2712 18th Place South
Birmingham, AL | 1953 | Vice President of The Government Street Mid-Cap Fund and The Alabama Tax Free Bond Fund | Since
January 1995 |
| Robert G. Dorsey | 225 Pictoria Drive, Suite 450
Cincinnati, OH | 1957 | Vice President | Since
November 2000 |
| Mark J. Seger | 225 Pictoria Drive, Suite 450
Cincinnati, OH | 1962 | Treasurer | Since
November 2000 |
| | Dina A. Tantra | 225 Pictoria Drive, Suite 450
Cincinnati, OH | 1969 | Secretary | Since
May 2018 |
| | Simon H. Berry | 225 Pictoria Drive, Suite 450
Cincinnati, OH | 1971 | Chief Compliance Officer | Since
May 2017 |
* | Messrs. Ackerly and Bruce, as affiliated persons of investment advisers to the Trust, are “interested persons” of the Trust within the meaning of Section 2(a)(19) of the 1940 Act. |
45
THE GOVERNMENT STREET FUNDS
BOARD OF TRUSTEES AND EXECUTIVE OFFICERS
(Unaudited) (Continued)
Each Trustee oversees twelve portfolios of the Trust, including the Funds. The principal occupations of the Trustees and executive officers of the Funds during the past five years and public directorships held by the Trustees are set forth below:
Robert S. Harris, Ph.D. is the C. Stewart Sheppard Professor of Business Administration at The Darden Graduate School of Business Administration at the University of Virginia. He was previously the dean at Darden. Professor Harris has published widely on corporate finance, financial markets and mergers and acquisitions and has served as a consultant to corporations and government agencies.
John P. Ackerly, IV, is Senior Vice President and Portfolio Manager of Davenport & Company, LLC (a broker-dealer and investment advisory firm).
John T. Bruce is President, Director and member of the Executive Committee of Flippin, Bruce & Porter, Inc. (an investment advisory firm).
George K. Jennison is President of Oyster Consulting, LLC (a management consulting firm). He previously was a financial adviser with Wells Fargo Advisors, LLC.
Harris V. Morrissette is President of China Doll Rice and Beans, Inc. and Dixie Lily Foods. He is also a Director of Trustmark Corporation (bank holding company).
Elizabeth W. Robertson is Chief Financial Officer for Monument Restaurants LLC (restaurant franchises) and a Director of Towne Bank.
Thomas W. Leavell is Portfolio Manager of the Adviser.
Mary Shannon Hope is Operations Director and Portfolio Manager of the Adviser.
Timothy S. Healey is Chief Investment Officer and Portfolio Manager of the Adviser.
Robert G. Dorsey is a Managing Director of Ultimus Fund Solutions, LLC and Ultimus Fund Distributors, LLC.
Mark J. Seger is a Managing Director of Ultimus Fund Solutions, LLC and Ultimus Fund Distributors, LLC.
Dina A. Tantra is an Executive Vice President and Director of Fund Administration and Compliance of Ultimus Fund Solutions, LLC (2017 to present). She previously was Managing Director of Foreside Financial Group, LLC (2016 to 2017); Trustee and President of Advisers Investment Trust (2012 to 2017); Managing Director, Secretary and General Counsel of Beacon Hill Fund Services, Inc. (2008 to 2016) and Secretary and General Counsel of BHL Distributors, Inc. (2008 to 2016).
Simon H. Berry is a Senior Attorney at Ultimus Fund Solutions, LLC (2016 to present). He previously was an Attorney at the Kentucky Department of Financial Institutions (2009 to 2016).
46
THE GOVERNMENT STREET FUNDS
BOARD OF TRUSTEES AND EXECUTIVE OFFICERS
(Unaudited) (Continued)
Additional information about members of the Board of Trustees and executive officers is available in the Statement of Additional Information (“SAI”). To obtain a free copy of the SAI, please call 1-866-738-1125.
47
THE GOVERNMENT STREET FUNDS
DISCLOSURE REGARDING APPROVAL OF INVESTMENT ADVISORY AGREEMENTS
(Unaudited)
At an in-person meeting held on February 20, 2018, the Board of Trustees, including a majority of the Independent Trustees, approved the continuance for a one-year period of the Investment Advisory Agreements with the Adviser on behalf of The Government Street Equity Fund, The Government Street Mid-Cap Fund, and The Alabama Tax Free Bond Fund (“Alabama Fund”). Below is a discussion of the factors considered by the Board of Trustees along with the conclusions with respect thereto that formed the basis for the Board’s approval.
In approving the continuance of the Investment Advisory Agreements, the Independent Trustees considered all information they deemed reasonably necessary to evaluate the terms of the Agreements. The principal areas of review by the Independent Trustees were the nature, extent and quality of the services provided by the Adviser and the reasonableness of the fees charged for those services. These matters were considered by the Independent Trustees consulting with experienced counsel for the Independent Trustees, who is independent of the Adviser.
The Independent Trustees’ evaluation of the quality of the Adviser’s services considered their knowledge and experience gained through meetings with and reports of the Adviser’s senior management over the course of the preceding year. Both short-term and long-term investment performance of the Funds were considered. Each Fund’s performance was compared to its performance benchmark, a competitive peer group of funds with similar investment objectives and strategies, and to the Adviser’s comparably managed private accounts. The Independent Trustees also considered: the scope and quality of the in-house capabilities of the Adviser and other resources that it dedicated to performing services for the Funds; the quality of administrative and other services, including the Adviser’s role in coordinating the activities of the Funds’ other service providers; the Adviser’s compliance with investment policies of the Funds and applicable laws and regulations; information provided by management and the Funds’ independent public accounting firm in periodic meetings with the Trust’s Audit Committee; the business reputation of the Adviser; the qualifications of the Adviser’s key investment and compliance personnel; and the Adviser’s financial resources.
In reviewing the fees payable under the Investment Advisory Agreements, the Independent Trustees compared the advisory fees and overall expense levels of each Fund with those of competitive funds with similar investment objectives. The Independent Trustees considered information provided by the Adviser concerning the Adviser’s profitability with respect to each Fund, including the assumptions and methodology used in preparing the profitability information, in light of applicable case law relating to advisory fees. For these purposes, the Independent Trustees considered not only the fees paid by the Funds, but also so-called “fallout” benefits to the Adviser. The Independent Trustees also considered the Adviser’s representations that the Funds’ portfolio trades were executed based on the best available price and execution,
48
THE GOVERNMENT STREET FUNDS
DISCLOSURE REGARDING APPROVAL OF INVESTMENT ADVISORY AGREEMENTS
(Unaudited) (Continued)
and that the Adviser does not participate in any soft dollar or directed brokerage arrangements. The Independent Trustees further considered that the Adviser does not participate in any revenue sharing arrangements relating to the Funds. In evaluating the Funds’ advisory fees, the Trustees considered the complexity and quality of the investment management of the Funds.
Based upon their review of this information, the Independent Trustees concluded that: : (i) during calendar year 2017, the performance of each of The Government Street Equity Fund and The Government Street Mid-Cap Fund exceeded the return of its respective index and the performance of The Government Street Mid-Cap Fund exceeded the average return for comparably managed funds; (ii) the Adviser has been effective in implementing an investment program that is based upon managing risk and has provided good services to The Government Street Equity Fund and The Government Street Mid-Cap Fund; (iii) although the short-term and long-term performance of The Alabama Fund as of December 31, 2017 has lagged the return of its benchmark index and the average returns for comparably managed funds, the Fund is managed in a conservative investment style and has satisfactorily met the goal of providing tax-exempt income with limited exposure to credit and maturity risks; (iv) the investment advisory fees payable to the Adviser by each Fund are competitive with similarly managed funds, and the Independent Trustees believe the fees to be reasonable given the scope and quality of investment advisory services provided by the Adviser and other services provided to shareholders; (v) the total operating expense ratio of each Fund is less than the average expense ratio for comparably managed funds, according to statistics derived from Morningstar, Inc.; (vi) the Adviser’s voluntary commitment to cap overall operating expenses of The Alabama Fund through advisory fee waivers has enabled that Fund to further increase returns for shareholders; and (vii) the level of the Adviser’s profitability with respect to its management of the Funds is reasonable.
Given the current size of the Funds and their expected growth, the Independent Trustees did not believe that it was relevant to consider the extent to which economies of scale would be realized as the Funds grow, and whether fee levels reflect these economies of scale. The Independent Trustees did consider the “fallout” benefits to the Adviser with respect to the Funds but viewed this as a secondary factor in connection with the evaluation of the reasonableness of the advisory fees paid by the Funds.
No single factor was considered in isolation or to be determinative to the decision of the Independent Trustees to approve the continuance of the Investment Advisory Agreements. Rather the Independent Trustees concluded, after weighing and balancing of all factors considered, that it was in the best interests of each Fund and its shareholders to continue the Investment Advisory Agreements without modification to its terms, including the fees charged for services thereunder.
49
THE GOVERNMENT STREET FUNDS
OTHER INFORMATION (Unaudited)
A description of the policies and procedures that the Funds use to vote proxies relating to portfolio securities is available without charge upon request by calling toll-free 1-866-738-1125, or on the SEC’s website at http://www.sec.gov. Information regarding how the Funds voted proxies relating to portfolio securities during the most recent 12-month period ended June 30 is also available without charge upon request by calling toll-free 1-866-738-1125 or on the SEC’s website at http://www.sec.gov.
The Trust files a complete listing of portfolio holdings for the Funds with the SEC as of the end of the first and third quarters of each fiscal year on Form N-Q. The filings are available upon request, by calling 1-866-738-1125. Furthermore, you may obtain a copy of these filings on the SEC’s website at http://www.sec.gov. The Trust’s Forms N-Q may also be reviewed and copied at the SEC’s Public Reference Room in Washington, DC, and information on the operation of the Public Reference Room may be obtained by calling 1-800-SEC-0330.
FEDERAL TAX INFORMATION (Unaudited)
For the fiscal year ended March 31, 2018, The Government Street Equity Fund and The Government Street Mid-Cap Fund designated $1,501,972 and $2,066,212, respectively, as long-term capital gain distributions subject to a maximum tax rate of 20%.
Qualified Dividend Income – The Government Street Equity Fund and The Government Street Mid-Cap Fund each designates 100% of its ordinary income distributions, or up to the maximum amount of such dividends allowable pursuant to the Internal Revenue Code, as qualified dividend income eligible for the reduced tax rate of 15%.
Dividends Received Deduction – Corporate shareholders are generally entitled to take the dividends received deduction on the portion of a Fund’s dividend distributions that qualify under tax law. For the fiscal year ended March 31, 2018, 100% of The Government Street Equity Fund’s and The Government Street Mid-Cap Fund’s ordinary income dividends qualifies for the corporate dividends received deduction.
Tax Exempt Income – For the fiscal year ended March 31, 2018, 97% of The Alabama Tax Free Bond Fund’s income dividends were free from federal income tax and 0% of the Fund’s income dividends were subject to the federal alternative minimum tax.
50
This page intentionally left blank.
This page intentionally left blank.
This page intentionally left blank.
| | The Government Street Funds | |
| | No-Load Mutual Funds Investment Adviser Leavell Investment Management, Inc. 210 St. Joseph Street Mobile, AL 36602 Administrator Ultimus Fund Solutions, LLC P.O. Box 46707 Cincinnati, OH 45246-0707 1-866-738-1125 Legal Counsel Sullivan & Worcester LLP 1666 K Street, N.W. Washington, DC 20006 Independent Registered Public Accounting Firm Cohen & Company, Ltd. 1350 Euclid Avenue Suite 800 Cleveland, Ohio 44115 Board of Trustees Robert S. Harris, Ph.D., Chairman John P. Ackerly, IV John T. Bruce George K. Jennison Harris V. Morrissette Elizabeth W. Robertson Portfolio Managers Thomas W. Leavell, The Government Street Equity Fund The Government Street Mid-Cap Fund Timothy S. Healey, The Alabama Tax Free Bond Fund | |
| THE
JAMESTOWN
FUNDS No-Load Funds The Jamestown Equity Fund
The Jamestown Tax Exempt Virginia Fund ANNUAL REPORT March 31, 2018
Investment Adviser Lowe, Brockenbrough & Company, Inc. Richmond, Virginia |
LETTER TO SHAREHOLDERS | April 26, 2018 |
The Jamestown Equity Fund
For the fiscal year ended March 31, 2018, The Jamestown Equity Fund (the “Fund”) returned 13.35% compared to 13.99% for the S&P 500 Index. Stock selection was a minor drag on relative performance, while sector selection was slightly positive.
The modest cash position negatively impacted relative returns during the year given the strong market performance. Outside of the impact of cash, sector selection was positive during the fiscal year. The Fund benefited by being underweight Telecommunication Services, Utilities, Consumer Staples and Real Estate. The Fund remains underweight many of the “safety” sectors like Utilities, Real Estate and Consumer Staples sectors as valuations across these sectors remain elevated compared to their historical averages despite their recent underperformance. Stocks in these sectors are also more susceptible to rising interest rates. While we do not forecast a really significant move up in interest rates given structural growth challenges across many developed economies, we do believe that the trend in rates is up as the Federal Reserve (the “Fed”), and eventually other Central Banks, normalize monetary policies.
Security selection was a slight drag on relative performance during the fiscal year as strong selection in the Consumer Staples, Energy, Materials, and Real Estate sectors was more than offset by challenging selection in the Industrials and Information Technology sectors. The best performing stocks in the Fund for the year were Amazon, Apple, J.P. Morgan, Aetna, and TE Connectivity, all of which remained in the portfolio at the end of the fiscal year. The worst performing stocks were General Electric, Allergan, Walt Disney, Nielsen Holdings, and Merck. Only Disney was sold out of the portfolio during the fiscal year.
The S&P 500 trades at approximately 16.5X forward 12 month earnings compared to a longer term average closer to 15X. The multiple does not appear excessive in the context of continued low rates and inflation, but it likely puts the burden on earnings growth (rather than multiple expansion) to drive further equity gains. The current forecast is for strong double digit earnings growth in calendar 2018 due to good underlying company performance and the benefit companies are seeing from lower corporate taxes.
The U.S. economy has grown at a faster rate for the last several quarters as economic growth has been synchronized across global economies. The continued improvement in employment and slightly higher inflation will likely lead the Fed to continue their process to normalize interest rates somewhat by hiking the Federal Funds rate several times in 2018. In most rate hike cycles by the Fed, valuation levels on equities typically compress which will likely offset some of the potential gains from earnings growth.
We’ve counseled that investors should expect lower prospective returns. You can expect good returns when valuations are low, margins are depressed and the Fed is easing. That’s simply not where we are right now. The easy money’s probably been made. You won’t find many pundits willing to argue that point. But there’s a critical time element implied that, perhaps, isn’t in big enough print: we’re talking about years, not quarters. Equity markets stumble along a path roughly marked by corporate earnings growth. It’s a strong relationship, but only when viewed long-term. Quarter-to-quarter and even year-to-year, the correlation is harder to see. When you look back
1
from, let’s say, five years in the future, returns will likely have been more muted. Between now and then, however, there will have been a whole lot of sunshine and rain. That’s guaranteed. For sanity’s sake, keep in mind it’s a long game we’re playing.
The Jamestown Tax Exempt Virginia Fund
For the fiscal year ended March 31, 2018, The Jamestown Tax Exempt Virginia Fund (the “Fund”) returned 0.04%. By comparison, the Bloomberg Barclays 1-10 Year Municipal Blend Index returned 1.19%. In brief, the net investment income from coupon interest was mostly offset by the decline in market value of bonds due to rising interest rates. The Fund remains conservatively positioned with regard to interest rate risk and credit quality. At the end of the period, the Fund’s 30-day SEC yield was 1.97%, which is a taxable equivalent yield of 3.33% for investors subject to the maximum 40.8% federal income tax bracket.
U.S. economic growth improved as real GDP expanded 2.6% in 2017 versus 1.8% in 2016. Inflation crept higher with the GDP price deflator up 1.8% in 2017, compared to 1.3% in 2016. The Consumer Price Index edged up 2.1% year-over-year as of December 2017. Monetary policy was less accommodative with the Federal Reserve (the “Fed”) continuing on its path of normalizing interest rates. It raised short-term rates by a quarter percentage point three times during the period, in June and December 2017 and again in March 2018, lifting the federal funds rate to a range of 1.50% to 1.75%. Additionally the central bank began to unwind its quantitative easing program by allowing a portion of its maturing bonds to run off.
As a consequence of the Fed’s rate hikes, yields increased significantly in short maturities, which climbed about 100 basis points during the period. In contrast, the yield on the 30-year Treasury bond was barely changed at the end of the period, resulting in a markedly flatter yield curve. The 10-year Treasury note yield moved to 2.74% at March 31, 2018 from 2.39% at March 31, 2017. Municipal yields generally followed the bear flattening trend of the Treasury yield curve. During the fiscal year, the tax-exempt yield of AAA-rated general obligations with a 5-year maturity increased 49 basis points to 2.04%, while the 10-year maturity rose 17 basis points to 2.42%, according to Municipal Market Data. The Fund’s net asset value declined as bond yields increased, especially in the second half of the fiscal year as yields increased rapidly on short maturities.
The Fund’s duration, yield curve positioning, and sector distributions were little changed during the period. At March 31, 2018, the effective duration was 3.8 years, unchanged from the start of the period. Shorter maturity bonds in the 1 to 5 year range saw the weakest performance in total return for the twelve-month period, while longer maturity bonds experienced higher returns. The Fund’s weight in shorter maturity bonds detracted from relative performance for the fiscal year. Higher quality bonds underperformed lower quality bonds as investors continued to reach for extra yield. The Fund’s holdings are predominantly in the top two credit ratings categories. The Fund’s allocation to cash equivalents was additive for the period.
Uncertainty over tax reform resulted in a surge of supply in the 4th quarter of 2017 as issuers pulled forward deals slated for 2018. Thus new issuance is expected to decrease in 2018. The legislation enacted in December lowered marginal tax rates for individuals and corporations. Certain corporate entities, especially banks and property/casualty insurance companies, were net sellers of tax-exempt bonds in early 2018 because of the diminished value of tax-exempt income
2
at a tax rate of 21%. At the top individual income tax effective rate of 40.8%, tax-exempt bonds continue to be attractive investments for individual investors compared to high quality taxable bonds.
Data presented reflects past performance, which is no guarantee of future results. Investment results and principal value will fluctuate so that shares, when redeemed, may be worth more or less than their original cost. Due to market volatility, current performance may be higher or lower than the performance shown.
This report is submitted for the general information of the shareholders of the Funds. The report is not authorized for distribution to prospective investors in the Funds unless it is accompanied by a current prospectus.
This report reflects our views, opinions and portfolio holdings as of March 31, 2018, the end of the reporting period. These views are subject to change at any time based upon market or other conditions. For more current information throughout the year, please visit www.jamestownfunds.com. The Funds are distributed by Ultimus Fund Distributors, LLC.
3
THE JAMESTOWN EQUITY FUND
PERFORMANCE INFORMATION (Unaudited)
Comparison of the Change in Value of a $10,000 Investment in
The Jamestown Equity Fund
and the Standard & Poor’s 500® Index
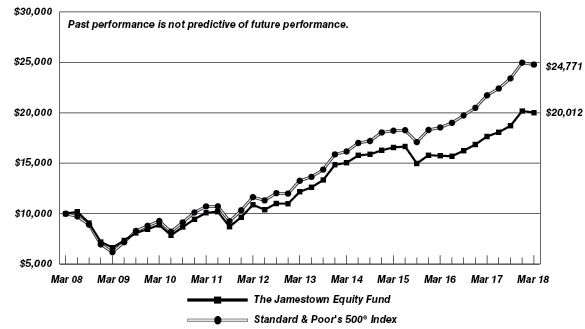
| | Average Annual Total Returns
(for periods ended March 31, 2018) | |
| | 1 Year | 5 Years | 10 Years | |
The Jamestown Equity Fund(a) | 13.35% | 10.45% | 7.18% | |
Standard & Poor’s 500® Index | 13.99% | 13.31% | 9.49% | |
| | | | | |
(a) | Total return is a measure of the change in value of an investment in the Fund over the periods covered, which assumes any dividends or capital gains distributions are reinvested in shares of the Fund. Returns shown do not reflect the deduction of taxes a shareholder would pay on Fund distributions or the redemption of Fund shares. |
4
THE JAMESTOWN TAX EXEMPT VIRGINIA FUND
PERFORMANCE INFORMATION (Unaudited)
Comparison of the Change in Value of a $10,000 Investment in
The Jamestown Tax Exempt Virginia Fund
and the Bloomberg Barclays 1-10 Year Municipal Blend Index*
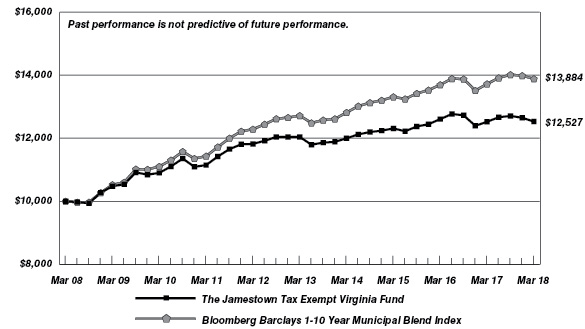
| | Average Annual Total Returns
(for periods ended March 31, 2018) | |
| | 1 Year | 5 Years | 10 Years | |
The Jamestown Tax Exempt Virginia Fund(a) | 0.04% | 0.79% | 2.28% | |
Bloomberg Barclays 1-10 Year Municipal Blend Index | 1.19% | 1.77% | 3.34% | |
| | | | | |
* | The Bloomberg Barclays 1-10 Year Municipal Blend Index is an unmanaged, market value-weighted index which covers the short and intermediate components of the U.S. investment-grade tax-exempt bond market. |
| | |
(a) | Total return is a measure of the change in value of an investment in the Fund over the periods covered, which assumes any dividends or capital gains distributions are reinvested in shares of the Fund. Returns shown do not reflect the deduction of taxes a shareholder would pay on Fund distributions or the redemption of Fund shares. |
5
THE JAMESTOWN EQUITY FUND
PORTFOLIO INFORMATION
March 31, 2018 (Unaudited)
Asset Allocation (% of Net Assets) | | Ten Largest Equity Holdings | % of
Net Assets |

| | Apple, Inc. | 3.2% |
JPMorgan Chase & Company | 3.1% |
Amazon.com, Inc. | 2.7% |
Cisco Systems, Inc. | 2.7% |
Discover Financial Services | 2.4% |
Chevron Corporation | 2.3% |
Eastman Chemical Company | 2.3% |
Aetna, Inc. | 2.2% |
Microsoft Corporation | 2.2% |
PNC Financial Services Group, Inc. (The) | 2.1% |
| |
Sector Concentration vs. the S&P 500® Index |
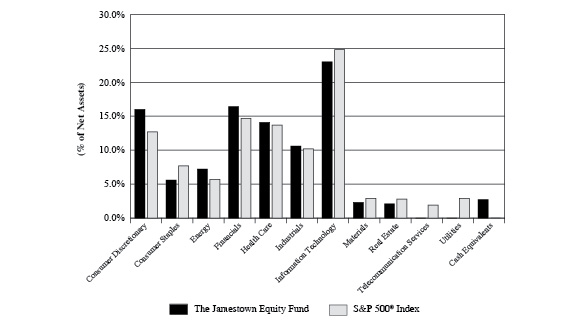
6
THE JAMESTOWN TAX EXEMPT VIRGINIA FUND
PORTFOLIO INFORMATION
March 31, 2018 (Unaudited)
Characteristics
(Portfolio) | | Maturity Breakdown
(% of Bonds) |
30-day SEC Yield | 1.97% | | 
|
Tax-Equivalent Yield* | 3.33% | |
Weighted Average Maturity (years) | 4.8 | |
Weighted Average Duration (years) | 3.8 | |
Average Quality | AA+ | |
Number of Issues | 60 | |
* Assumes a maximum 40.8% federal tax rate. | |
Credit Quality (% of Bonds) | | Sector Diversification (% of Bonds) |

| | 
|
7
THE JAMESTOWN EQUITY FUND
SCHEDULE OF INVESTMENTS
March 31, 2018 |
| COMMON STOCKS — 94.7% | | Shares | | | Value | |
| Consumer Discretionary — 16.0% | | | | | | |
Amazon.com, Inc. (a) | | | 700 | | | $ | 1,013,138 | |
Booking Holdings, Inc. (a) | | | 235 | | | | 488,892 | |
| BorgWarner, Inc. | | | 11,000 | | | | 552,530 | |
| Comcast Corporation - Class A | | | 18,300 | | | | 625,311 | |
Dollar Tree, Inc. (a) | | | 7,000 | | | | 664,300 | |
| Home Depot, Inc. (The) | | | 3,200 | | | | 570,368 | |
| Lennar Corporation - Class A | | | 12,300 | | | | 724,962 | |
| Lowe's Companies, Inc. | | | 8,700 | | | | 763,425 | |
| TJX Companies, Inc. (The) | | | 7,400 | | | | 603,544 | |
| | | | | | | | 6,006,470 | |
| Consumer Staples — 4.7% | | | | | | | | |
| J.M. Smucker Company (The) | | | 2,800 | | | | 347,228 | |
| PepsiCo, Inc. | | | 6,000 | | | | 654,900 | |
| Walmart, Inc. | | | 8,500 | | | | 756,245 | |
| | | | | | | | 1,758,373 | |
| Energy — 7.2% | | | | | | | | |
| Chevron Corporation | | | 7,700 | | | | 878,108 | |
| Exxon Mobil Corporation | | | 5,700 | | | | 425,277 | |
| Hess Corporation | | | 13,200 | | | | 668,184 | |
| Total S.A. - ADR | | | 12,700 | | | | 732,663 | |
| | | | | | | | 2,704,232 | |
| Financials — 16.4% | | | | | | | | |
| Ameriprise Financial, Inc. | | | 5,200 | | | | 769,288 | |
| Chubb Ltd. | | | 2,800 | | | | 382,956 | |
| Discover Financial Services | | | 12,500 | | | | 899,125 | |
| Invesco Ltd. | | | 18,500 | | | | 592,185 | |
| JPMorgan Chase & Company | | | 10,700 | | | | 1,176,679 | |
| KeyCorp | | | 38,000 | | | | 742,900 | |
| Morgan Stanley | | | 14,600 | | | | 787,816 | |
| PNC Financial Services Group, Inc. (The) | | | 5,300 | | | | 801,572 | |
| | | | | | | | 6,152,521 | |
| Health Care — 14.1% | | | | | | | | |
| Aetna, Inc. | | | 4,900 | | | | 828,100 | |
| Allergan plc | | | 2,500 | | | | 420,725 | |
| Amgen, Inc. | | | 2,200 | | | | 375,056 | |
| Gilead Sciences, Inc. | | | 7,800 | | | | 588,042 | |
| McKesson Corporation | | | 2,600 | | | | 366,262 | |
| Merck & Company, Inc. | | | 11,000 | | | | 599,170 | |
| Pfizer, Inc. | | | 15,695 | | | | 557,016 | |
| Thermo Fisher Scientific, Inc. | | | 3,800 | | | | 784,548 | |
| UnitedHealth Group, Inc. | | | 3,650 | | | | 781,100 | |
| | | | | | | | 5,300,019 | |
8
THE JAMESTOWN EQUITY FUND
SCHEDULE OF INVESTMENTS (Continued) |
| COMMON STOCKS — 94.7% (Continued) | | Shares | | | Value | |
| Industrials — 10.6% | | | | | | |
| Delta Air Lines, Inc. | | | 14,000 | | | $ | 767,340 | |
| Eaton Corporation plc | | | 9,500 | | | | 759,145 | |
| General Electric Company | | | 22,700 | | | | 305,996 | |
| Ingersoll-Rand plc | | | 4,500 | | | | 384,795 | |
| Nielsen Holdings plc | | | 11,000 | | | | 349,690 | |
| Norfolk Southern Corporation | | | 5,230 | | | | 710,129 | |
| United Technologies Corporation | | | 5,700 | | | | 717,174 | |
| | | | | | | | 3,994,269 | |
| Information Technology — 21.3% | | | | | | | | |
Alphabet, Inc. - Class A (a) | | | 550 | | | | 570,427 | |
Alphabet, Inc. - Class C (a) | | | 700 | | | | 722,253 | |
| Apple, Inc. | | | 7,200 | | | | 1,208,016 | |
| Cisco Systems, Inc. | | | 23,500 | | | | 1,007,915 | |
eBay, Inc. (a) | | | 17,500 | | | | 704,200 | |
| Intel Corporation | | | 8,840 | | | | 460,387 | |
| International Business Machines Corporation | | | 2,500 | | | | 383,575 | |
| Microsoft Corporation | | | 9,000 | | | | 821,430 | |
| Oracle Corporation | | | 14,800 | | | | 677,100 | |
| QUALCOMM, Inc. | | | 11,600 | | | | 642,756 | |
| TE Connectivity Ltd. | | | 8,000 | | | | 799,200 | |
| | | | | | | | 7,997,259 | |
| Materials — 2.3% | | | | | | | | |
| Eastman Chemical Company | | | 8,300 | | | | 876,314 | |
| | | | | | | | | |
| Real Estate — 2.1% | | | | | | | | |
| American Tower Corporation | | | 5,500 | | | | 799,370 | |
| | | | | | | | | |
Total Common Stocks (Cost $21,184,183) | | | | | | $ | 35,588,827 | |
| EXCHANGE-TRADED FUNDS — 2.6% | | Shares | | | Value | |
Consumer Staples Select Sector SPDR® Fund | | | 6,450 | | | $ | 339,463 | |
| Vanguard Information Technology ETF | | | 3,600 | | | | 615,600 | |
Total Exchange-Traded Funds (Cost $794,978) | | | | | | $ | 955,063 | |
9
THE JAMESTOWN EQUITY FUND
SCHEDULE OF INVESTMENTS (Continued) |
| MONEY MARKET FUNDS — 2.8% | | Shares | | | Value | |
Federated Government Obligations Fund - Institutional Class, 1.51% (b) (Cost $1,047,137) | | | 1,047,137 | | | $ | 1,047,137 | |
| | | | | | | | | |
Total Investments at Value — 100.1% (Cost $23,026,298) | | | | | | $ | 37,591,027 | |
| | | | | | | | | |
| Liabilities in Excess of Other Assets — (0.1%) | | | | | | | (21,129 | ) |
| | | | | | | | | |
| Net Assets — 100.0% | | | | | | $ | 37,569,898 | |
ADR - American Depositary Receipt. |
| |
(a) | Non-income producing security. |
| | |
(b) | The rate shown is the 7-day effective yield as of March 31, 2018. |
| | |
See accompanying notes to financial statements. |
10
THE JAMESTOWN TAX EXEMPT VIRGINIA FUND
SCHEDULE OF INVESTMENTS
March 31, 2018 |
| VIRGINIA REVENUE AND GENERAL OBLIGATION (GO) BONDS — 92.7% | | Par Value | | | Value | |
| Albemarle Co., Virginia, Economic Dev. Authority, Revenue, | | | | | | |
| 5.00%, due 06/01/2026 | | $ | 350,000 | | | $ | 415,929 | |
| Chesterfield Co., Virginia, GO, | | | | | | | | |
| 5.00%, due 01/01/2024 | | | 250,000 | | | | 276,920 | |
| 5.00%, due 01/01/2025 | | | 460,000 | | | | 530,472 | |
| 4.00%, due 01/01/2030 | | | 400,000 | | | | 441,888 | |
| Fairfax Co., Virginia, Economic Dev., Revenue, | | | | | | | | |
1.59%, due 12/01/2033 (a) | | | 350,000 | | | | 350,000 | |
1.61%, due 12/01/2033 (a) | | | 350,000 | | | | 350,000 | |
| Fairfax Co., Virginia, Industrial Dev. Authority, Revenue, | | | | | | | | |
| 5.00%, due 05/15/2022, | | | | | | | | |
| prerefunded 05/15/2019 @ 100 | | | 750,000 | | | | 777,675 | |
| Fairfax Co., Virginia, Sewer, Revenue, | | | | | | | | |
| 4.50%, due 07/15/2030, | | �� | | | | | | |
| prerefunded 07/15/2021 @ 100 | | | 250,000 | | | | 271,255 | |
| Fairfax Co., Virginia, Water, Revenue, | | | | | | | | |
| 5.00%, due 04/01/2027 | | | 500,000 | | | | 556,905 | |
| Hampton Roads Sanitation District, Virginia, Wastewater, Revenue, | | | | | | | | |
| 5.00%, due 07/01/2026 | | | 500,000 | | | | 577,150 | |
| Hampton Roads Sanitation District, Virginia, Wastewater, Series A, Revenue, | | | | | | | | |
| 5.00%, due 01/01/2027, | | | | | | | | |
| prerefunded 01/01/2021 @ 100 | | | 400,000 | | | | 433,780 | |
| Hampton, Virginia, GO, | | | | | | | | |
| 5.00%, due 04/01/2025 | | | 500,000 | | | | 557,310 | |
| Harrisonburg, Virginia, GO, | | | | | | | | |
| 5.00%, due 07/15/2022 | | | 350,000 | | | | 392,276 | |
| Henrico Co., Virginia, Public Improvements, GO, | | | | | | | | |
| 5.00%, due 08/01/2027 | | | 350,000 | | | | 425,309 | |
| Henrico Co., Virginia, Water & Sewer, Revenue, | | | | | | | | |
| 5.00%, due 05/01/2020, | | | | | | | | |
| prerefunded 05/01/2019 @ 100 | | | 350,000 | | | | 362,660 | |
| 5.00%, due 05/01/2022, | | | | | | | | |
| prerefunded 05/01/2019 @ 100 | | | 430,000 | | | | 445,553 | |
| James City, Virginia, Water & Sewer, Revenue, | | | | | | | | |
| 5.00%, due 01/15/2026 | | | 250,000 | | | | 295,110 | |
| Louisa, Virginia, Industrial Dev. Authority, Pollution Control, Revenue, | | | | | | | | |
| 2.15%, due 11/01/2035 | | | 200,000 | | | | 199,252 | |
11
THE JAMESTOWN TAX EXEMPT VIRGINIA FUND
SCHEDULE OF INVESTMENTS (Continued) |
| VIRGINIA REVENUE AND GENERAL OBLIGATION (GO) BONDS — 92.7% (Continued) | | Par Value | | | Value | |
| Lynchburg, Virginia, GO, | | | | | | |
| 5.00%, due 08/01/2024 | | $ | 310,000 | | | $ | 361,999 | |
| Lynchburg, Virginia, Public Improvement, Series A, GO, | | | | | | | | |
| 5.00%, due 08/01/2019 | | | 625,000 | | | | 652,537 | |
| Manassas, Virginia, Public Improvement, Series D, GO, | | | | | | | | |
| 5.00%, due 07/01/2019 | | | 250,000 | | | | 260,395 | |
| Newport News, Virginia, GO, | | | | | | | | |
| 5.00%, due 07/15/2025 | | | 350,000 | | | | 411,744 | |
| Norfolk, Virginia, Series A, GO, | | | | | | | | |
| 5.00%, due 10/01/2026 | | | 200,000 | | | | 238,220 | |
| Northern Virginia Transportation Authority, Special Tax, Revenue, | | | | | | | | |
| 5.00%, due 06/01/2026 | | | 400,000 | | | | 460,952 | |
| Prince William Co., Virginia, Lease Participation Certificates, | | | | | | | | |
| 5.00%, due 10/01/2020 | | | 500,000 | | | | 536,195 | |
| Rappahannock, Virginia, Regional Jail Authority, Revenue, | | | | | | | | |
| 5.00%, due 10/01/2024 | | | 300,000 | | | | 347,037 | |
| Roanoke, Virginia, Public Improvement, Series A, GO, | | | | | | | | |
| 5.00%, due 07/15/2025 | | | 400,000 | | | | 455,776 | |
| Spotsylvania Co., Virginia, Economic Dev. Authority, Revenue, | | | | | | | | |
| 5.00%, due 06/01/2021 | | | 300,000 | | | | 328,008 | |
| Spotsylvania Co., Virginia, GO, | | | | | | | | |
| 5.00%, due 01/15/2023 | | | 400,000 | | | | 453,100 | |
| Stafford Co., Virginia, Public Improvement, GO, | | | | | | | | |
| 5.00%, due 08/01/2026 | | | 375,000 | | | | 442,354 | |
| Suffolk, Virginia, Public Improvement, GO, | | | | | | | | |
| 5.00%, due 02/01/2022 | | | 400,000 | | | | 444,936 | |
| Suffolk, Virginia, Public Improvement, Series A, GO, | | | | | | | | |
| 4.00%, due 08/01/2018 | | | 250,000 | | | | 252,030 | |
| Upper Occoquan, Virginia, Sewer Authority, Revenue, | | | | | | | | |
| 5.15%, due 07/01/2020 | | | 160,000 | | | | 166,149 | |
| 5.00%, due 07/01/2027 | | | 350,000 | | | | 410,168 | |
| Virginia Beach, Virginia, Dev. Authority, Series A, Revenue, | | | | | | | | |
| 5.00%, due 11/01/2020 | | | 300,000 | | | | 323,991 | |
| Virginia Beach, Virginia, GO, | | | | | | | | |
| 5.00%, due 03/01/2023 | | | 300,000 | | | | 340,692 | |
| Virginia Beach, Virginia, Public Improvement, GO, | | | | | | | | |
| 5.00%, due 06/01/2021, | | | | | | | | |
| prerefunded 06/01/2019 @ 100 | | | 250,000 | | | | 259,705 | |
12
THE JAMESTOWN TAX EXEMPT VIRGINIA FUND
SCHEDULE OF INVESTMENTS (Continued) |
| VIRGINIA REVENUE AND GENERAL OBLIGATION (GO) BONDS — 92.7% (Continued) | | Par Value | | | Value | |
| Virginia Beach, Virginia, Public Improvement, Series A, GO, | | | | | | |
| 4.00%, due 04/01/2027 | | $ | 205,000 | | | $ | 221,074 | |
| Virginia Biotechnology Research Partnership Authority, Lease Revenue, | | | | | | | | |
| 5.00%, due 09/01/2020 | | | 500,000 | | | | 537,580 | |
| Virginia College Building Authority, Educational Facilities, Revenue, | | | | | | | | |
| 5.00%, due 03/01/2019 | | | 250,000 | | | | 257,562 | |
| 4.00%, due 09/01/2026 | | | 500,000 | | | | 536,325 | |
| Virginia Commonwealth Transportation Board, Federal Grant Anticipation Notes, Revenue, | | | | | | | | |
| 5.00%, due 03/15/2025 | | | 375,000 | | | | 438,634 | |
| Virginia Commonwealth Transportation Board, Federal Grant Anticipation Notes, Series A, Revenue, | | | | | | | | |
| 5.00%, due 03/15/2023 | | | 500,000 | | | | 557,700 | |
| 5.00%, due 03/15/2025 | | | 500,000 | | | | 568,585 | |
| Virginia Commonwealth University Health System, Revenue, | | | | | | | | |
| 5.00%, due 07/01/2031 | | | 400,000 | | | | 465,556 | |
| Virginia State Housing Dev. Authority, Revenue, | | | | | | | | |
| 3.05%, due 07/01/2021 | | | 200,000 | | | | 206,562 | |
| Virginia State Public Building Authority, Revenue, | | | | | | | | |
| 5.00%, due 08/01/2029 | | | 400,000 | | | | 476,492 | |
| Virginia State Public School Authority, Revenue, | | | | | | | | |
| 5.00%, due 08/01/2023 | | | 500,000 | | | | 560,330 | |
| 5.00%, due 07/15/2026 | | | 300,000 | | | | 344,667 | |
| Virginia State Public School Authority, Series B-1, Revenue, | | | | | | | | |
| 5.00%, due 08/01/2018 | | | 500,000 | | | | 505,670 | |
| Virginia State Resources Authority, Clean Water, Revenue, | | | | | | | | |
| 5.00%, due 10/01/2021, | | | | | | | | |
| prerefunded 10/01/2019 @ 100 | | | 500,000 | | | | 524,625 | |
| Virginia State Resources Authority, Infrastructure, Revenue, | | | | | | | | |
| 5.00%, due 11/01/2024, | | | | | | | | |
| prerefunded 11/01/2018 @ 100 | | | 405,000 | | | | 413,072 | |
| 5.00%, due 11/01/2024 | | | 60,000 | | | | 61,192 | |
| Virginia State Resources Authority, Infrastructure, Series B, Revenue, | | | | | | | | |
| 5.00%, due 11/01/2024, | | | | | | | | |
| prerefunded 11/01/2018 @ 100 | | | 35,000 | | | | 35,698 | |
| 5.00%, due 11/01/2024 | | | 150,000 | | | | 169,590 | |
13
THE JAMESTOWN TAX EXEMPT VIRGINIA FUND
SCHEDULE OF INVESTMENTS (Continued) |
| VIRGINIA REVENUE AND GENERAL OBLIGATION (GO) BONDS — 92.7% (Continued) | | Par Value | | | Value | |
| Washington Co., Virginia, Revenue, | | | | | | |
| 4.00%, due 12/01/2025 | | $ | 350,000 | | | $ | 386,390 | |
| Western Virginia Regional Jail Authority, Revenue, | | | | | | | | |
| 5.00%, due 12/01/2023 | | | 250,000 | | | | 285,488 | |
| Winchester, Virginia, GO, | | | | | | | | |
| 5.00%, due 09/01/2027 | | | 125,000 | | | | 144,284 | |
| 4.00%, due 09/01/2029 | | | 250,000 | | | | 275,970 | |
| | | | | | | | | |
Total Virginia Revenue and General Obligation (GO) Bonds (Cost $22,715,780) | | | | | | $ | 22,778,478 | |
| WASHINGTON, D.C. REVENUE BONDS — 2.1% | | Par Value | | | Value | |
| Metropolitan Washington Airports Authority, Series C, Revenue, | | | | | | | | |
| 5.00%, due 10/01/2022 (Cost $500,728) | | $ | 500,000 | | | $ | 508,315 | |
| EXCHANGE-TRADED FUNDS — 1.3% | | | Shares | | | | Value | |
| VanEck Vectors AMT-Free Intermediate Municipal Index ETF (Cost $347,250) | | | 14,000 | | | $ | 329,420 | |
| MONEY MARKET FUNDS — 3.0% | | Shares | | | Value | |
Federated Government Obligations Fund - Institutional Class, 1.51% (b) (Cost $724,890) | | | 724,890 | | | $ | 724,890 | |
| | | | | | | | | |
Total Investments at Value — 99.1% (Cost $24,288,648) | | | | | | $ | 24,341,103 | |
| | | | | | | | | |
| Other Assets in Excess of Liabilities — 0.9% | | | | | | | 220,959 | |
| | | | | | | | | |
| Net Assets — 100.0% | | | | | | $ | 24,562,062 | |
(a) | Variable rate security. Interest rate resets weekly. The weekly rate for each succeeding interest period during a weekly rate mode shall be established by the respective remarketing agents on the business day preceding the first day of such interest period and shall be the lowest rate of interest which will, in the sole judgement of the respective remarketing agents having due regard for prevailing financial market conditions, permit the bonds to be remarketed at par on the first day of such interest period. |
| | |
(b) | The rate shown is the 7-day effective yield as of March 31, 2018. |
| | |
See accompanying notes to financial statements. |
14
THE JAMESTOWN FUNDS
STATEMENTS OF ASSETS AND LIABILITIES
March 31, 2018 |
| | | The Jamestown
Equity
Fund | | | The
Jamestown
Tax Exempt
Virginia
Fund | |
| ASSETS | | | | | | |
| Investments in securities: | | | | | | |
| At cost | | $ | 23,026,298 | | | $ | 24,288,648 | |
| At value (Note 2) | | $ | 37,591,027 | | | $ | 24,341,103 | |
| Cash | | | 6,751 | | | | — | |
| Receivable for capital shares sold | | | 100 | | | | 85 | |
| Dividends and interest receivable | | | 29,989 | | | | 265,269 | |
| Other assets | | | 3,251 | | | | 1,138 | |
| TOTAL ASSETS | | | 37,631,118 | | | | 24,607,595 | |
| | | | | | | | | |
| LIABILITIES | | | | | | | | |
| Distributions payable | | | 2,053 | | | | 881 | |
| Payable for capital shares redeemed | | | 27,903 | | | | 32,619 | |
| Accrued investment advisory fees (Note 4) | | | 19,605 | | | | 2,505 | |
| Payable to administrator (Note 4) | | | 5,700 | | | | 5,700 | |
| Other accrued expenses | | | 5,959 | | | | 3,828 | |
| TOTAL LIABILITIES | | | 61,220 | | | | 45,533 | |
| | | | | | | | | |
| NET ASSETS | | $ | 37,569,898 | | | $ | 24,562,062 | |
| | | | | | | | | |
| Net assets consist of: | | | | | | | | |
| Paid-in capital | | $ | 21,281,609 | | | $ | 24,509,058 | |
| Undistributed net investment income | | | 1,137 | | | | 549 | |
| Accumulated net realized gains from investment transactions | | | 1,722,423 | | | | — | |
| Net unrealized appreciation on investments | | | 14,564,729 | | | | 52,455 | |
| Net assets | | $ | 37,569,898 | | | $ | 24,562,062 | |
| | | | | | | | | |
| Shares of beneficial interest outstanding (unlimited number of shares authorized, $0.01 par value) | | | 1,700,256 | | | | 2,508,791 | |
| | | | | | | | | |
| Net asset value, offering price and redemption price per share (Note 2) | | $ | 22.10 | | | $ | 9.79 | |
See accompanying notes to financial statements. |
15
THE JAMESTOWN FUNDS
STATEMENTS OF OPERATIONS
Year Ended March 31, 2018 |
| | | The Jamestown Equity
Fund | | | The Jamestown Tax Exempt Virginia
Fund | |
| INVESTMENT INCOME | | | | | | |
| Dividends | | $ | 699,008 | | | $ | 15,848 | |
| Foreign withholding taxes on dividends | | | (6,724 | ) | | | — | |
| Interest | | | — | | | | 593,041 | |
| TOTAL INVESTMENT INCOME | | | 692,284 | | | | 608,889 | |
| | | | | | | | | |
| EXPENSES | | | | | | | | |
| Investment advisory fees (Note 4) | | | 246,925 | | | | 100,195 | |
| Administration fees (Note 4) | | | 60,000 | | | | 60,000 | |
| Professional fees | | | 21,416 | | | | 22,916 | |
| Trustees’ fees and expenses (Note 4) | | | 10,452 | | | | 10,452 | |
| Compliance service fees (Note 4) | | | 8,400 | | | | 8,400 | |
| Custodian and bank service fees | | | 7,346 | | | | 5,400 | |
| Pricing costs | | | 1,031 | | | | 10,607 | |
| Account maintenance fees | | | 4,679 | | | | 6,860 | |
| Registration and filing fees | | | 6,372 | | | | 3,007 | |
| Postage and supplies | | | 6,310 | | | | 2,941 | |
| Printing of shareholder reports | | | 6,880 | | | | 2,287 | |
| Insurance expense | | | 1,443 | | | | 1,085 | |
| Other expenses | | | 10,631 | | | | 8,822 | |
| TOTAL EXPENSES | | | 391,885 | | | | 242,972 | |
| Fees voluntarily waived by the Adviser (Note 4) | | | (18,995 | ) | | | (70,136 | ) |
| Expenses reimbursed through a directed brokerage arrangement (Note 5) | | | (12,000 | ) | | | — | |
| NET EXPENSES | | | 360,890 | | | | 172,836 | |
| | | | | | | | | |
| NET INVESTMENT INCOME | | | 331,394 | | | | 436,053 | |
| | | | | | | | | |
| REALIZED AND UNREALIZED GAINS (LOSSES) ON INVESTMENTS | | | | | | | | |
| Net realized gains on investment transactions | | | 2,945,830 | | | | 8,369 | |
| Net change in unrealized appreciation (depreciation) on investments | | | 1,471,878 | | | | (418,320 | ) |
NET REALIZED AND UNREALIZED GAINS (LOSSES) ON INVESTMENTS | | | 4,417,708 | | | | (409,951 | ) |
| | | | | | | | | |
| NET INCREASE IN NET ASSETS FROM OPERATIONS | | $ | 4,749,102 | | | $ | 26,102 | |
See accompanying notes to financial statements. |
16
THE JAMESTOWN EQUITY FUND
STATEMENTS OF CHANGES IN NET ASSETS |
| | | Year
Ended
March 31,
2018 | | | Year
Ended
March 31,
2017 | |
| FROM OPERATIONS | | | | | | | | |
| Net investment income | | $ | 331,394 | | | $ | 357,284 | |
| Net realized gains on investment transactions | | | 2,945,830 | | | | 2,455,790 | |
| Net change in unrealized appreciation (depreciation) on investments | | | 1,471,878 | | | | 1,444,898 | |
| Net increase in net assets from operations | | | 4,749,102 | | | | 4,257,972 | |
| | | | | | | | | |
| DISTRIBUTIONS TO SHAREHOLDERS (Note 2) | | | | | | | | |
| From net investment income | | | (332,082 | ) | | | (365,171 | ) |
| From net realized gains from investment transactions | | | (2,266,488 | ) | | | (1,430,817 | ) |
| Decrease in net assets from distributions to shareholders | | | (2,598,570 | ) | | | (1,795,988 | ) |
| | | | | | | | | |
| FROM CAPITAL SHARE TRANSACTIONS | | | | | | | | |
| Proceeds from shares sold | | | 511,589 | | | | 452,515 | |
| Net asset value of shares issued in reinvestment of distributions to shareholders | | | 2,454,310 | | | | 1,689,646 | |
| Payments for shares redeemed | | | (5,006,101 | ) | | | (4,826,314 | ) |
| Net decrease in net assets from capital share transactions | | | (2,040,202 | ) | | | (2,684,153 | ) |
| | | | | | | | | |
| TOTAL INCREASE (DECREASE) IN NET ASSETS | | | 110,330 | | | | (222,169 | ) |
| | | | | | | | | |
| NET ASSETS | | | | | | | | |
| Beginning of year | | | 37,459,568 | | | | 37,681,737 | |
| End of year | | $ | 37,569,898 | | | $ | 37,459,568 | |
| | | | | | | | | |
| UNDISTRIBUTED NET INVESTMENT INCOME | | $ | 1,137 | | | $ | 1,825 | |
| | | | | | | | | |
| CAPITAL SHARE ACTIVITY | | | | | | | | |
| Shares sold | | | 23,196 | | | | 22,627 | |
| Shares reinvested | | | 114,954 | | | | 85,744 | |
| Shares redeemed | | | (231,056 | ) | | | (240,820 | ) |
| Net decrease in shares outstanding | | | (92,906 | ) | | | (132,449 | ) |
| Shares outstanding, beginning of year | | | 1,793,162 | | | | 1,925,611 | |
| Shares outstanding, end of year | | | 1,700,256 | | | | 1,793,162 | |
See accompanying notes to financial statements. |
17
THE JAMESTOWN TAX EXEMPT VIRGINIA FUND
STATEMENTS OF CHANGES IN NET ASSETS |
| | | Year
Ended
March 31,
2018 | | | Year
Ended
March 31,
2017 | |
| FROM OPERATIONS | | | | | | |
| Net investment income | | $ | 436,053 | | | $ | 462,616 | |
| Net realized gains on investment transactions | | | 8,369 | | | | 6,214 | |
| Capital gain distributions from regulated investment companies | | | — | | | | 629 | |
| Net change in unrealized appreciation (depreciation) on investments | | | (418,320 | ) | | | (659,062 | ) |
| Net increase (decrease) in net assets from operations | | | 26,102 | | | | (189,603 | ) |
| | | | | | | | | |
| DISTRIBUTIONS TO SHAREHOLDERS (Note 2) | | | | | | | | |
| From net investment income | | | (436,053 | ) | | | (462,616 | ) |
| From net realized gains from investment transactions | | | (4,768 | ) | | | — | |
| Decrease in net assets from distributions to shareholders | | | (440,821 | ) | | | (462,616 | ) |
| | | | | | | | | |
| FROM CAPITAL SHARE TRANSACTIONS | | | | | | | | |
| Proceeds from shares sold | | | 1,274,197 | | | | 1,884,458 | |
| Net asset value of shares issued in reinvestment of distributions to shareholders | | | 416,116 | | | | 417,898 | |
| Payments for shares redeemed | | | (1,914,264 | ) | | | (2,096,136 | ) |
| Net increase (decrease) in net assets from capital share transactions | | | (223,951 | ) | | | 206,220 | |
| | | | | | | | | |
| TOTAL DECREASE IN NET ASSETS | | | (638,670 | ) | | | (445,999 | ) |
| | | | | | | | | |
| NET ASSETS | | | | | | | | |
| Beginning of year | | | 25,200,732 | | | | 25,646,731 | |
| End of year | | $ | 24,562,062 | | | $ | 25,200,732 | |
| | | | | | | | | |
| UNDISTRIBUTED NET INVESTMENT INCOME | | $ | 549 | | | $ | — | |
| | | | | | | | | |
| CAPITAL SHARE ACTIVITY | | | | | | | | |
| Shares sold | | | 127,364 | | | | 186,315 | |
| Shares reinvested | | | 41,784 | | | | 41,367 | |
| Shares redeemed | | | (191,198 | ) | | | (209,390 | ) |
| Net increase (decrease) in shares outstanding | | | (22,050 | ) | | | 18,292 | |
| Shares outstanding, beginning of year | | | 2,530,841 | | | | 2,512,549 | |
| Shares outstanding, end of year | | | 2,508,791 | | | | 2,530,841 | |
See accompanying notes to financial statements. |
18
THE JAMESTOWN EQUITY FUND
FINANCIAL HIGHLIGHTS |
Selected Per Share Data and Ratios for a Share Outstanding Throughout Each Year |
| |
| | | Years Ended March 31, | |
| | | 2018 | | | 2017 | | | 2016 | | | 2015 | | | 2014 | |
| Net asset value at beginning of year | | $ | 20.89 | | | $ | 19.57 | | | $ | 21.91 | | | $ | 22.47 | | | $ | 19.60 | |
| | | | | | | | | | | | | | | | | | | | | |
| Income (loss) from investment operations: | | | | | | | | | | | | | | | | | | | | |
| Net investment income | | | 0.19 | | | | 0.19 | | | | 0.16 | | | | 0.16 | | | | 0.15 | |
Net realized and unrealized gains (losses)
on investments | | | 2.51 | | | | 2.12 | | | | (1.18 | ) | | | 1.96 | | | | 4.30 | |
| Total from investment operations | | | 2.70 | | | | 2.31 | | | | (1.02 | ) | | | 2.12 | | | | 4.45 | |
| | | | | | | | | | | | | | | | | | | | | |
| Less distributions: | | | | | | | | | | | | | | | | | | | | |
| Dividends from net investment income | | | (0.19 | ) | | | (0.20 | ) | | | (0.16 | ) | | | (0.16 | ) | | | (0.15 | ) |
| Distributions from net realized gains | | | (1.30 | ) | | | (0.79 | ) | | | (1.16 | ) | | | (2.52 | ) | | | (1.43 | ) |
| Total distributions | | | (1.49 | ) | | | (0.99 | ) | | | (1.32 | ) | | | (2.68 | ) | | | (1.58 | ) |
| | | | | | | | | | | | | | | | | | | | | |
| Net asset value at end of year | | $ | 22.10 | | | $ | 20.89 | | | $ | 19.57 | | | $ | 21.91 | | | $ | 22.47 | |
| | | | | | | | | | | | | | | | | | | | | |
Total return (a) | | | 13.35 | % | | | 12.14 | % | | | (4.96 | %) | | | 10.14 | % | | | 23.55 | % |
| | | | | | | | | | | | | | | | | | | | | |
| Net assets at end of year (000’s) | | $ | 37,570 | | | $ | 37,460 | | | $ | 37,682 | | | $ | 29,596 | | | $ | 30,746 | |
| | | | | | | | | | | | | | | | | | | | | |
| Ratio of total expenses to average net assets | | | 1.03 | % | | | 1.03 | % | | | 1.03 | % | | | 1.09 | % | | | 1.07 | % |
| | | | | | | | | | | | | | | | | | | | | |
Ratio of net expenses to average net assets (b) | | | 0.95 | %(c) | | | 0.95 | %(c) | | | 1.00 | % | | | 1.05 | % | | | 1.03 | % |
| | | | | | | | | | | | | | | | | | | | | |
Ratio of net investment income to average net assets (b) | | | 0.87 | %(c) | | | 0.96 | %(c) | | | 0.82 | % | | | 0.71 | % | | | 0.72 | % |
| | | | | | | | | | | | | | | | | | | | | |
| Portfolio turnover rate | | | 18 | % | | | 27 | % | | | 50 | % | | | 29 | % | | | 21 | % |
(a) | Total return is a measure of the change in value of an investment in the Fund over the periods covered, which assumes any dividends or realized capital gains distributions are reinvested in shares of the Fund. Returns do not reflect the deduction of taxes a shareholder would pay on Fund distributions or the redemption of Fund shares. |
| | |
(b) | Ratios were determined based on net expenses after expense reimbursements through a directed brokerage arrangement (Note 5). |
| | |
(c) | Ratio was determined after voluntary advisory fee waivers by the Adviser (Note 4). |
| | |
See accompanying notes to financial statements. |
19
THE JAMESTOWN TAX EXEMPT VIRGINIA FUND
FINANCIAL HIGHLIGHTS |
Selected Per Share Data and Ratios for a Share Outstanding Throughout Each Year |
| |
| | | Years Ended March 31, | |
| | | 2018 | | | 2017 | | | 2016 | | | 2015 | | | 2014 | |
| Net asset value at beginning of year | | $ | 9.96 | | | $ | 10.21 | | | $ | 10.18 | | | $ | 10.16 | | | $ | 10.47 | |
| | | | | | | | | | | | | | | | | | | | | |
| Income (loss) from investment operations: | | | | | | | | | | | | | | | | | | | | |
| Net investment income | | | 0.17 | | | | 0.18 | | | | 0.21 | | | | 0.24 | | | | 0.26 | |
Net realized and unrealized gains (losses) on
investments | | | (0.17 | ) | | | (0.25 | ) | | | 0.03 | | | | 0.02 | | | | (0.30 | ) |
| Total from investment operations | | | 0.00 | (a) | | | (0.07 | ) | | | 0.24 | | | | 0.26 | | | | (0.04 | ) |
| | | | | | | | | | | | | | | | | | | | | |
| Less distributions: | | | | | | | | | | | | | | | | | | | | |
| Dividends from net investment income | | | (0.17 | ) | | | (0.18 | ) | | | (0.21 | ) | | | (0.24 | ) | | | (0.26 | ) |
| Distributions from net realized gains | | | (0.00 | )(a) | | | — | | | | — | | | | — | | | | (0.01 | ) |
| Total distributions | | | (0.17 | ) | | | (0.18 | ) | | | (0.21 | ) | | | (0.24 | ) | | | (0.27 | ) |
| | | | | | | | | | | | | | | | | | | | | |
| Net asset value at end of year | | $ | 9.79 | | | $ | 9.96 | | | $ | 10.21 | | | $ | 10.18 | | | $ | 10.16 | |
| | | | | | | | | | | | | | | | | | | | | |
Total return (b) | | | 0.04 | % | | | (0.66 | %) | | | 2.40 | % | | | 2.61 | % | | | (0.37 | %) |
| | | | | | | | | | | | | | | | | | | | | |
| Net assets at end of year (000’s) | | $ | 24,562 | | | $ | 25,201 | | | $ | 25,647 | | | $ | 26,695 | | | $ | 26,284 | |
| | | | | | | | | | | | | | | | | | | | | |
| Ratio of total expenses to average net assets | | | 0.97 | % | | | 0.94 | % | | | 0.90 | % | | | 0.88 | % | | | 0.88 | % |
| | | | | | | | | | | | | | | | | | | | | |
Ratio of net expenses to average net assets (c) | | | 0.69 | % | | | 0.69 | % | | | 0.69 | % | | | 0.69 | % | | | 0.69 | % |
| | | | | | | | | | | | | | | | | | | | | |
Ratio of net investment income to average net assets (c) | | | 1.74 | % | | | 1.82 | % | | | 2.08 | % | | | 2.38 | % | | | 2.59 | % |
| | | | | | | | | | | | | | | | | | | | | |
| Portfolio turnover rate | | | 8 | % | | | 13 | % | | | 11 | % | | | 16 | % | | | 1 | % |
(a) | Amount rounds to less than $0.01 per share. |
| | |
(b) | Total return is a measure of the change in value of an investment in the Fund over the periods covered, which assumes any dividends or realized capital gains distributions are reinvested in shares of the Fund. Returns do not reflect the deduction of taxes a shareholder would pay on Fund distributions or the redemption of Fund shares. |
| | |
(c) | Ratios were determined after voluntary advisory fee waivers by the Adviser (Note 4). |
| | |
See accompanying notes to financial statements. |
20
THE JAMESTOWN FUNDS
NOTES TO FINANCIAL STATEMENTS
March 31, 2018
1. Organization
The Jamestown Equity Fund and The Jamestown Tax Exempt Virginia Fund (individually, a “Fund,” and, collectively, the “Funds”) are each a no-load series of Williamsburg Investment Trust (the “Trust”), an open-end management investment company registered under the Investment Company Act of 1940, as amended (“the “1940 Act”). The Jamestown Equity Fund is a diversified fund and The Jamestown Tax Exempt Virginia Fund is a non-diversified fund. The Trust was organized as a Massachusetts business trust on July 18, 1988. Other series of the Trust are not included in this report.
The Jamestown Equity Fund’s investment objective is long-term growth of capital.
The Jamestown Tax Exempt Virginia Fund’s investment objectives are to provide current income exempt from federal income taxes and from the personal income taxes of Virginia, to preserve capital, to limit credit risk and to take advantage of opportunities to increase and enhance the value of a shareholder’s investment.
2. Significant Accounting Policies
In October 2016, the U.S. Securities and Exchange Commission (the “SEC”) adopted amendments to Regulation S-X, which impact financial statement presentation, particularly the presentation of derivative investments. The Funds have adopted these amendments, which were effective August 1, 2017, with these financial statements.
Each Fund follows accounting and reporting guidance under Financial Accounting Standards Board Accounting Standards Codification Topic 946, “Financial Services – Investment Companies.” The following is a summary of the Funds’ significant accounting policies. These policies are in conformity with accounting principles generally accepted in the United States of America (“GAAP”).
Securities valuation — The Funds’ portfolio securities are valued as of the close of business of the regular session of the New York Stock Exchange (normally 4:00 p.m., Eastern time). Securities traded on a national stock exchange, including common stocks and exchange-traded funds, are generally valued based upon the closing price on the principal exchange where the security is traded, if available, otherwise, at the last quoted bid price. Securities that are quoted by NASDAQ are valued at the NASDAQ Official Closing Price. Investments representing shares of other open-end investment companies, including money market funds, are valued at their net asset value (“NAV”) as reported by such companies. When using a quoted price and when the market is considered active, securities will be classified as Level 1 within the fair value hierarchy (see below).
Fixed income securities, including municipal bonds, are typically valued on the basis of prices provided by an independent pricing service. The prices provided by the pricing service are determined with consideration given to institutional bid and last sale prices and take into account
21
THE JAMESTOWN FUNDS
NOTES TO FINANCIAL STATEMENTS (Continued)
securities prices, yields, maturities, call features, ratings, institutional trading in similar groups of securities, and developments related to specific securities. Given the inputs used by the pricing service, these securities are classified as Level 2 within the fair value hierarchy.
When market quotations are not readily available, if a pricing service cannot provide a price, or if the investment adviser believes the price received from the pricing service is not indicative of market value, securities will be valued in good faith at fair value using methods consistent with procedures adopted by the Board of Trustees and will be classified as Level 2 or 3 within the fair value hierarchy, depending on the inputs used. Such methods of fair valuation may include, but are not limited to: multiple of earnings, multiple of book value, discount from market of a similar freely traded security, purchase price of the security, subsequent private transactions in the security or related securities, or a combination of these and other factors.
GAAP establishes a single authoritative definition of fair value, sets out a framework for measuring fair value and requires additional disclosures about fair value measurements.
Various inputs are used in determining the value of each Fund’s investments. These inputs are summarized in the three broad levels listed below:
● | Level 1 – quoted prices in active markets for identical securities |
● | Level 2 – other significant observable inputs |
● | Level 3 – significant unobservable inputs |
The inputs or methodology used for valuing securities are not necessarily an indication of the risks associated with investing in those securities. The inputs used to measure fair value may fall into different levels of the fair value hierarchy. In such cases, for disclosure purposes, the level in the fair value hierarchy within which the fair value measurement falls in its entirety is determined based on the lowest level input that is significant to the fair value measurement.
The following is a summary of the inputs used to value each Fund’s investments as of March 31, 2018, by security type:
| The Jamestown Equity Fund | | Level 1 | | | Level 2 | | | Level 3 | | | Total | |
| Common Stocks | | $ | 35,588,827 | | | $ | — | | | $ | — | | | $ | 35,588,827 | |
| Exchange-Traded Funds | | | 955,063 | | | | — | | | | — | | | | 955,063 | |
| Money Market Funds | | | 1,047,137 | | | | — | | | | — | | | | 1,047,137 | |
| Total | | $ | 37,591,027 | | | $ | — | | | $ | — | | | $ | 37,591,027 | |
| The Jamestown Tax Exempt Virginia Fund | | Level 1 | | | Level 2 | | | Level 3 | | | Total | |
| Revenue and General Obligation Municipal Bonds | | $ | — | | | $ | 23,286,793 | | | $ | — | | | $ | 23,286,793 | |
| Exchange-Traded Funds | | | 329,420 | | | | — | | | | — | | | | 329,420 | |
| Money Market Funds | | | 724,890 | | | | — | | | | — | | | | 724,890 | |
| Total | | $ | 1,054,310 | | | $ | 23,286,793 | | | $ | — | | | $ | 24,341,103 | |
22
THE JAMESTOWN FUNDS
NOTES TO FINANCIAL STATEMENTS (Continued)
Refer to The Jamestown Equity Fund’s Schedule of Investments for a listing of the common stocks by sector type. As of March 31, 2018, the Funds did not have any transfers into or out of any Level. There were no Level 3 securities or derivative instruments held by the Funds as of March 31, 2018. It is the Funds’ policy to recognize transfers into or out of any Level at the end of the reporting period.
Share valuation — The NAV per share of each Fund is calculated daily by dividing the total value of its assets, less liabilities, by the number of shares outstanding. The offering price and redemption price per share of each Fund is equal to the NAV per share.
Investment income — Interest income is accrued as earned. Discounts and premiums on fixed income securities purchased are amortized using the interest method. Dividend income is recorded on the ex-dividend date. Withholding taxes on foreign dividends received by The Jamestown Equity Fund, if any, have been recorded in accordance with the Trust’s understanding of the applicable country’s rules and tax rates.
Distributions to shareholders — Dividends arising from net investment income, if any, are declared and paid quarterly to shareholders of The Jamestown Equity Fund. Dividends arising from net investment income are declared daily and paid monthly to shareholders of The Jamestown Tax Exempt Virginia Fund. Net realized short-term capital gains, if any, may be distributed throughout the year and net realized long-term capital gains, if any, are distributed at least once each year. The amount of distributions from net investment income and net realized capital gains are determined in accordance with federal income tax regulations, which may differ from GAAP. These “book/tax” differences are permanent in nature and are primarily due to differing treatments of net short-term capital gains. Dividends and distributions are recorded on the ex-dividend date.
The tax character of distributions paid during the years ended March 31, 2018 and 2017 was as follows:
| | | Years
Ended | | | Ordinary
Income | | | Long-Term
Capital Gains | | | Exempt-
Interest
Dividends | | | Total
Distributions | |
| The Jamestown Equity Fund | | | 3/31/2018 | | | $ | 402,813 | | | $ | 2,195,757 | | | $ | — | | | $ | 2,598,570 | |
| | | | 3/31/2017 | | | $ | 365,171 | | | $ | 1,430,817 | | | $ | — | | | $ | 1,795,988 | |
| The Jamestown Tax Exempt Virginia Fund | | | 3/31/2018 | | | $ | 13,114 | | | $ | 4,744 | | | $ | 422,963 | | | $ | 440,821 | |
| | | | 3/31/2017 | | | $ | — | | | $ | — | | | $ | 462,616 | | | $ | 462,616 | |
Investment transactions — Investment transactions are accounted for on trade date for financial reporting purposes. Realized gains and losses on investment securities sold are determined on a specific identification basis.
Common expenses — Common expenses of the Trust are allocated among the series of the Trust based on relative net assets of each series or the nature of the services performed and the relative applicability to each series.
23
THE JAMESTOWN FUNDS
NOTES TO FINANCIAL STATEMENTS (Continued)
Estimates — The preparation of financial statements in conformity with GAAP requires management to make estimates and assumptions that affect the reported amounts of assets and liabilities and the disclosure of contingent assets and liabilities as of the date of the financial statements and the reported amounts of income and expenses during the reporting period. Actual results could differ from those estimates.
Federal income tax — Each Fund has qualified and intends to continue to qualify as a regulated investment company under the Internal Revenue Code of 1986, as amended (the “Code”). Qualification generally will relieve the Funds of liability for federal income taxes to the extent 100% of their net investment income and net realized capital gains are distributed in accordance with the Code.
In order to avoid imposition of the excise tax applicable to regulated investment companies, it is also each Fund’s intention to declare as dividends in each calendar year at least 98% of its net investment income (earned during the calendar year) and 98.2% of its net realized capital gains (earned during the twelve months ended October 31) plus undistributed amounts from prior years.
The tax character of accumulated earnings at March 31, 2018 was as follows:
| | | The Jamestown Equity Fund | | | The Jamestown Tax Exempt Virginia Fund | |
| Tax cost of portfolio investments | | $ | 23,100,850 | | | $ | 24,288,648 | |
| Gross unrealized appreciation | | $ | 14,907,345 | | | $ | 218,679 | |
| Gross unrealized depreciation | | | (417,168 | ) | | | (166,224 | ) |
| Net unrealized appreciation | | | 14,490,177 | | | | 52,455 | |
| Undistributed ordinary income | | | 14,835 | | | | — | |
| Undistributed tax exempt income | | | — | | | | 1,430 | |
| Undistributed long-term capital gains | | | 1,785,330 | | | | — | |
| Distributions payable | | | (2,053 | ) | | | (881 | ) |
| Accumulated earnings | | $ | 16,288,289 | | | $ | 53,004 | |
The difference between the federal income tax cost of portfolio investments and the financial statement cost for The Jamestown Equity Fund is due to certain timing differences in the recognition of capital gains or losses under income tax regulations and GAAP. These “book/tax” differences are temporary in nature and are primarily due to the tax deferral of losses on wash sales.
During the year ended March 31, 2018, The Jamestown Tax Exempt Virginia Fund reclassified $549 of distributions in excess of net realized gains against undistributed net investment income on the Statements of Assets and Liabilities. Such reclassification, the result of permanent differences between the financial statements and income tax reporting requirements, had no effect on the Fund’s net assets or NAV per share.
24
THE JAMESTOWN FUNDS
NOTES TO FINANCIAL STATEMENTS (Continued)
During the year ended March 31, 2018, The Jamestown Tax Exempt Virginia Fund utilized $3,625 of long-term capital loss carryforwards to offset current year realized gains.
The Funds recognize the tax benefits or expenses of uncertain tax positions only when the position is “more likely than not” to be sustained assuming examination by tax authorities. Management has reviewed the tax positions taken on Federal income tax returns for all open tax years (tax years ended March 31, 2015 through March 31, 2018) of each Fund and has concluded that no provision for unrecognized tax benefits or expenses is required in these financial statements.
3. Investment Transactions
Investment transactions, other than short-term investments and U.S. government securities, were as follows for the year ended March 31, 2018:
| | | The Jamestown Equity Fund | | | The Jamestown Tax Exempt Virginia Fund | |
| Purchase of investment securities | | $ | 6,595,318 | | | $ | 2,527,086 | |
| Proceeds from sales and maturities of investment securities | | $ | 8,671,451 | | | $ | 1,848,983 | |
4. Transactions with Related Parties
INVESTMENT ADVISORY AGREEMENTS
Each Fund’s investments are managed by Lowe, Brockenbrough & Company, Inc. (the “Adviser”) under the terms of an Investment Advisory Agreement. The Jamestown Equity Fund pays the Adviser a fee, which is computed and accrued daily and paid monthly, at annual rates of 0.65% of its average daily net assets up to $500 million and 0.55% of such assets in excess of $500 million. The Jamestown Tax Exempt Virginia Fund pays the Adviser a fee, which is computed and accrued daily and paid monthly, at annual rates of 0.40% of its average daily net assets up to $250 million, 0.35% of the next $250 million of such assets and 0.30% of such assets in excess of $500 million. Certain officers of the Trust are also officers of the Adviser.
During the year ended March 31, 2018, the Adviser voluntarily limited the total annual operating expenses of The Jamestown Equity Fund and The Jamestown Tax Exempt Virginia Fund to 0.95% and 0.69%, respectively, of each Fund’s average daily net assets; accordingly, the Adviser voluntarily waived $18,995 and $70,136 of its investment advisory fees during the year ended March 31, 2018 for The Jamestown Equity Fund and The Jamestown Tax Exempt Virginia Fund, respectively. These amounts are not subject to recapture in future periods.
OTHER SERVICE PROVIDERS
Ultimus Fund Solutions, LLC (“Ultimus”) provides administration, fund accounting, compliance and transfer agent services to the Funds. The Funds pay Ultimus fees in accordance with the agreements for such services. Certain officers of the Trust are also officers of Ultimus, or of
25
THE JAMESTOWN FUNDS
NOTES TO FINANCIAL STATEMENTS (Continued)
Ultimus Fund Distributors, LLC (the “Distributor”), the principal underwriter of the Funds and an affiliate of Ultimus. The Distributor is compensated by the Adviser (not the Funds) for acting as principal underwriter.
COMPENSATION OF TRUSTEES
Trustees and officers affiliated with the Adviser or Ultimus are not compensated by the Trust for their services. Each Trustee who is not an affiliated person of the Adviser or Ultimus received from the Trust an annual retainer of $15,000, payable quarterly; a fee of $1,500 for attendance at each meeting of the Board of Trustees (except that such fee was $2,500 for the independent chair); and a fee of $1,000 for attendance at each meeting of any committee of the Board (except that such fee was $1,500 for the committee chair); plus reimbursement of travel and other expenses incurred in attending meetings. Effective April 1, 2018, each Trustee who is not an affiliated person of the Adviser or Ultimus will receive from the Trust an annual retainer of $20,000, payable quarterly; a fee of $2,000 for attendance at each meeting of the Board of Trustees (except that such fee will be $3,000 for the independent chair); and a fee of $1,000 for attendance at each meeting of any committee of the Board (except that such fee will be $1,500 for the committee chair); plus reimbursement of travel and other expenses incurred in attending meetings. Each series of the Trust pays its proportionate share of such fees.
5. Brokerage Arrangement
In order to reduce the total operating expenses of The Jamestown Equity Fund, a portion of the Fund’s operating expenses have been paid through an arrangement with a third-party broker-dealer who is compensated through commission trades. Payment of expenses by the broker-dealer is based on a percentage of commissions earned. Expenses reimbursed through the brokerage arrangement totaled $12,000 for The Jamestown Equity Fund for the year ended March 31, 2018.
6. Contingencies and Commitments
The Funds indemnify the Trust’s officers and Trustees for certain liabilities that might arise from the performance of their duties to the Funds. Additionally, in the normal course of business the Funds enter into contracts that contain a variety of representations and warranties and which provide general indemnifications. The Funds’ maximum exposure under these arrangements is unknown, as this would involve future claims that may be made against the Funds that have not yet occurred. However, based on experience, the Trust expects the risk of loss to be remote.
7. Concentration of Credit Risk
The Jamestown Tax Exempt Virginia Fund invests primarily in debt instruments of municipal issuers in the Commonwealth of Virginia. The issuers’ abilities to meet their obligations may be affected by economic developments in the Commonwealth of Virginia or its region, as well as disruptions in the credit markets and the economy, generally.
26
THE JAMESTOWN FUNDS
NOTES TO FINANCIAL STATEMENTS (Continued)
8. Subsequent Events
The Funds are required to recognize in the financial statements the effects of all subsequent events that provide additional evidence about conditions that existed as of the date of the Statements of Assets and Liabilities. For non-recognized subsequent events that must be disclosed to keep the financial statements from being misleading, the Funds are required to disclose the nature of the event as well as an estimate of its financial effect, or a statement that such an estimate cannot be made. Management has evaluated subsequent events through the issuance of these financial statements and has noted no such events.
27
THE JAMESTOWN FUNDS
REPORT OF INDEPENDENT REGISTERED
PUBLIC ACCOUNTING FIRM
To the Shareholders of The Jamestown Funds and
Board of Trustees of Williamsburg Investment Trust
Opinion on the Financial Statements
We have audited the accompanying statements of assets and liabilities, including the schedules of investments, of The Jamestown Funds, comprising The Jamestown Equity Fund and The Jamestown Tax Exempt Virginia Fund (the “Funds”), each a series of Williamsburg Investment Trust, as of March 31, 2018, and the related statements of operations for the year then ended, the statements of changes in net assets for each of the two years in the period then ended, including the related notes, and the financial highlights for each of the three years in the period then ended (collectively referred to as the “financial statements”). In our opinion, the financial statements present fairly, in all material respects, the financial position of the each of the Funds as of March 31, 2018, the results of their operations for the year then ended, the changes in their net assets for each of the two years in the period then ended, and the financial highlights for each of the three years in the period then ended, in conformity with accounting principles generally accepted in the United States of America.
The Funds’ financial highlights for the periods ended March 31, 2015 and prior, were audited by other auditors whose report dated May 22, 2015, expressed an unqualified opinion on those financial highlights.
Basis for Opinion
These financial statements are the responsibility of the Funds’ management. Our responsibility is to express an opinion on the Funds’ financial statements based on our audits. We are a public accounting firm registered with the Public Company Accounting Oversight Board (United States) (“PCAOB”) and are required to be independent with respect to the Funds in accordance with the U.S. federal securities laws and the applicable rules and regulations of the Securities and Exchange Commission and the PCAOB.
We conducted our audits in accordance with the standards of the PCAOB. Those standards require that we plan and perform the audit to obtain reasonable assurance about whether the financial statements are free of material misstatement, whether due to error or fraud.
Our audits include performing procedures to assess the risks of material misstatement of the financial statements, whether due to error or fraud, and performing procedures that respond to those risks. Such procedures include examining, on a test basis, evidence regarding the amounts and disclosures in the financial statements and confirmation of securities owned as of March 31, 2018, by correspondence with the custodian. Our audits also included evaluating the accounting principles used and significant estimates made by management, as well as evaluating the overall presentation of the financial statements. We believe that our audits provide a reasonable basis for our opinion.
We have served as the Funds’ auditor since 2016.
COHEN & COMPANY, LTD.
Cleveland, Ohio
May 11, 2018
28
THE JAMESTOWN FUNDS
BOARD OF TRUSTEES AND EXECUTIVE OFFICERS
(Unaudited) |
Overall responsibility for management of the Funds rests with the Board of Trustees. The Trustees serve during the lifetime of the Trust and until its termination, or until death, resignation, retirement or removal. The Trustees, in turn, elect the officers of the Funds. The officers have been elected for an annual term. The following are the Trustees and executive officers of the Funds:
| Trustees
and Officers | Address | Year of Birth | Position Held
with the Trust | Length of
Time Served |
| Robert S. Harris, Ph.D. | 225 Pictoria Drive, Suite 450
Cincinnati, OH | 1949 | Chairman and Trustee | Since
January 2007 |
* | John P. Ackerly, IV | One James Center
901 E. Cary Street
Richmond, VA | 1963 | Trustee and President of Davenport Funds | Since
November 1997 |
* | John T. Bruce | 800 Main Street
Lynchburg, VA | 1953 | Trustee and President of FBP Funds | Since
September 1988 |
| | George K. Jennison | 225 Pictoria Drive, Suite 450
Cincinnati, OH | 1957 | Trustee | Since
January 2015 |
| Harris V. Morrissette | 225 Pictoria Drive, Suite 450
Cincinnati, OH | 1959 | Trustee | Since
March 1993 |
| | Elizabeth W. Robertson | 225 Pictoria Drive, Suite 450
Cincinnati, OH | 1953 | Trustee | Since
February 2014 |
| | Charles M. Caravati, III | 1802 Bayberry Court, Suite 400
Richmond, VA | 1965 | President, The Jamestown Equity Fund; Vice President, The Jamestown Tax Exempt Virginia Fund | Since
January 1996 |
| | Joseph A. Jennings, III | 1802 Bayberry Court, Suite 400
Richmond, VA | 1962 | President, The Jamestown Tax Exempt Virginia Fund | Since
July 2005 |
| Robert G. Dorsey | 225 Pictoria Drive, Suite 450
Cincinnati, OH | 1957 | Vice President | Since
November 2000 |
| Mark J. Seger | 225 Pictoria Drive, Suite 450
Cincinnati, OH | 1962 | Treasurer | Since
November 2000 |
| | Dina A. Tantra | 225 Pictoria Drive, Suite 450
Cincinnati, OH | 1969 | Secretary | Since
May 2018 |
| | Simon H. Berry | 225 Pictoria Drive, Suite 450
Cincinnati, OH | 1971 | Chief Compliance Officer | Since
May 2017 |
* | Messrs. Ackerly and Bruce, as affiliated persons of investment advisers to the Trust, are “interested persons” of the Trust within the meaning of Section 2(a)(19) of the 1940 Act. |
29
THE JAMESTOWN FUNDS
BOARD OF TRUSTEES AND EXECUTIVE OFFICERS
(Unaudited) (Continued) |
Each Trustee oversees twelve portfolios of the Trust, including the Funds. The principal occupations of the Trustees and executive officers of the Funds during the past five years and public directorships held by the Trustees are set forth below:
Robert S. Harris, Ph.D. is the C. Stewart Sheppard Professor of Business Administration at The Darden Graduate School of Business Administration at the University of Virginia. He was previously the dean at Darden. Professor Harris has published widely on corporate finance, financial markets and mergers and acquisitions and has served as a consultant to corporations and government agencies.
John P. Ackerly, IV is Senior Vice President and Portfolio Manager of Davenport & Company LLC. (a broker-dealer and investment adviser)
John T. Bruce is President, Director and member of the Executive Committee of Flippin, Bruce & Porter, Inc. (an investment advisory firm).
George K. Jennison is President of Oyster Consulting, LLC (a management consulting firm). He previously was a financial adviser with Wells Fargo Advisors, LLC.
Harris V. Morrissette is President of China Doll Rice and Beans, Inc. and Dixie Lily Foods. He is also a Director of Trustmark Corporation (bank holding company).
Elizabeth W. Robertson is Chief Financial Officer for Monument Restaurants LLC (restaurant franchises) and a Director of Towne Bank.
Charles M. Caravati, III is a Managing Director of the Adviser.
Joseph A. Jennings, III is a Managing Director of the Adviser.
Robert G. Dorsey is a Managing Director of Ultimus Fund Solutions, LLC and Ultimus Fund Distributors, LLC.
Mark J. Seger is a Managing Director of Ultimus Fund Solutions, LLC and Ultimus Fund Distributors, LLC.
Dina A. Tantra is an Executive Vice President and Director of Fund Administration and Compliance of Ultimus Fund Solutions, LLC (2017 to present). She previously was Managing Director of Foreside Financial Group, LLC (2016 to 2017); Trustee and President of Advisers Investment Trust (2012 to 2017); Managing Director, Secretary and General Counsel of Beacon Hill Fund Services, Inc. (2008 to 2016) and Secretary and General Counsel of BHL Distributors, Inc. (2008 to 2016).
Simon H. Berry is a Senior Attorney at Ultimus Fund Solutions, LLC (2016 to present). He previously was an Attorney at the Kentucky Department of Financial Institutions (2009 to 2016).
Additional information about members of the Board of Trustees and executive officers is available in the Statement of Additional Information (“SAI”). To obtain a free copy of the SAI, please call 1-866-738-1126.
30
THE JAMESTOWN FUNDS
ABOUT YOUR FUNDS’ EXPENSES (Unaudited)
We believe it is important for you to understand the impact of costs on your investment. All mutual funds have operating expenses. As a shareholder of the Funds, you incur ongoing costs, including management fees and other expenses. The following examples are intended to help you understand your ongoing costs (in dollars) of investing in the Funds and to compare these costs with the ongoing costs of investing in other mutual funds.
A mutual fund’s ongoing costs are expressed as a percentage of its average net assets. This figure is known as the expense ratio. The expenses in the table below are based on an investment of $1,000 made at the beginning of the period shown and held for the entire period (October 1, 2017 through March 31, 2018).
The table below illustrates each Fund’s costs in two ways:
Actual fund return – This section helps you to estimate the actual expenses that you paid over the period. The “Ending Account Value” shown is derived from each Fund’s actual return, and the fourth column shows the dollar amount of operating expenses that would have been paid by an investor who started with $1,000 in the Funds. You may use the information here, together with the amount you invested, to estimate the expenses that you paid over the period.
To do so, simply divide your account value by $1,000 (for example, an $8,600 account value divided by $1,000 = 8.6), then multiply the result by the number given for the Funds under the heading “Expenses Paid During Period.”
Hypothetical 5% return – This section is intended to help you compare each Fund’s ongoing costs with those of other mutual funds. It assumes that each Fund had an annual return of 5% before expenses during the period shown, but that the expense ratio is unchanged. In this case, because the returns used are not the Funds’ actual returns, the results do not apply to your investment. The example is useful in making comparisons because the SEC requires all mutual funds to calculate expenses based on a 5% return. You can assess each Fund’s ongoing costs by comparing this hypothetical example with the hypothetical examples that appear in shareholder reports of other funds.
Note that expenses shown in the table are meant to highlight and help you compare ongoing costs only. The Funds do not charge sales loads or redemption fees.
The calculations assume no shares were bought or sold during the period. Your actual costs may have been higher or lower, depending on the amount of your investment and the timing of any purchases or redemptions.
More information about the Funds’ expenses, including annual expense ratios for the prior five fiscal years, can be found in this report. For additional information on operating expenses and other shareholder costs, please refer to the Funds’ prospectus.
31
THE JAMESTOWN FUNDS
ABOUT YOUR FUNDS’ EXPENSES (Unaudited) (Continued)
| | Beginning
Account Value
October 1, 2017 | Ending
Account Value
March 31, 2018 | Net
Expense Ratio(a) | Expenses Paid
During Period(b) |
The Jamestown Equity Fund |
Based on Actual Fund Return | $1,000.00 | $ 1,069.70 | 0.95% | $4.90 |
Based on Hypothetical 5% Return (before expenses) | $1,000.00 | $ 1,020.19 | 0.95% | $4.78 |
The Jamestown Tax Exempt Virginia Fund |
Based on Actual Fund Return | $1,000.00 | $ 985.90 | 0.69% | $3.42 |
Based on Hypothetical 5% Return (before expenses) | $1,000.00 | $ 1,021.49 | 0.69% | $3.48 |
(a) | Annualized, based on the Fund's most recent one-half year expenses. |
| | |
(b) | Expenses are equal to each Fund's annualized net expense ratio multiplied by the average account value over the period, multiplied by 182/365 (to reflect the one-half year period). |
32
THE JAMESTOWN FUNDS
OTHER INFORMATION (Unaudited)
A description of the policies and procedures that the Funds use to vote proxies relating to portfolio securities is available without charge upon request by calling toll-free 1-866-738-1126, or on the SEC’s website at http://www.sec.gov. Information regarding how the Funds voted proxies relating to portfolio securities during the most recent 12-month period ended June 30 is also available without charge upon request by calling toll-free 1-866-738-1126, or on the SEC’s website at http://www.sec.gov.
The Trust files a complete listing of portfolio holdings of the Funds with the SEC as of the end of the first and third quarters of each fiscal year on Form N-Q. The filings are available upon request, by calling 1-866-738-1126. Furthermore, you may obtain a copy of these filings on the SEC’s website at http://www.sec.gov. The Trust’s Forms N-Q may also be reviewed and copied at the SEC’s Public Reference Room in Washington, DC, and information on the operation of the Public Reference Room may be obtained by calling 1-800-SEC-0330.
FEDERAL TAX INFORMATION (Unaudited)
For the fiscal year ended March 31, 2018, The Jamestown Equity Fund and the Jamestown Tax Exempt Virginia Fund designated $2,195,757 and $4,744, respectively, as long-term capital gain distributions subject to a maximum tax rate of 20%.
Qualified Dividend Income — The Jamestown Equity Fund designates 99.95% of its ordinary income distributions, or up to the maximum amount of such dividends allowable pursuant to the Internal Revenue Code, as qualified dividend income eligible for the reduced tax rate of 15%.
Dividends Received Deduction — Corporate shareholders are generally entitled to take the dividends received deduction on the portion of a Fund’s dividend distributions that qualify under tax law. For the fiscal year ended March 31, 2018, 99.95% of The Jamestown Equity Fund’s ordinary income dividends qualifies for the corporate dividends received deduction.
Tax Exempt Income — For the fiscal year ended March 31, 2018, 97% of the Jamestown Tax Exempt Virginia Fund’s income dividends were free from federal income tax and 0% of the Fund’s income dividends were subject to the federal alternative minimum tax.
33
THE JAMESTOWN FUNDS
DISCLOSURE REGARDING APPROVAL OF INVESTMENT
ADVISORY AGREEMENTS (Unaudited)
At an in-person meeting held on February 20, 2018, the Board of Trustees, including a majority of the Independent Trustees, approved the continuance for a one-year period of the Investment Advisory Agreements with the Adviser on behalf of The Jamestown Equity Fund and The Jamestown Tax Exempt Virginia Fund (“The Jamestown Virginia Fund”). Below is a discussion of the factors considered by the Board of Trustees along with the conclusions with respect thereto that formed the basis for the Board’s approval.
In approving the continuance of the Investment Advisory Agreements, the Independent Trustees considered all information they deemed reasonably necessary to evaluate the terms of the Agreements. The principal areas of review by the Independent Trustees were the nature, extent and quality of the services provided by the Adviser and the reasonableness of the fees charged for those services. These matters were considered by the Independent Trustees consulting with experienced counsel for the Independent Trustees, who is independent of the Adviser.
The Independent Trustees’ evaluation of the quality of the Adviser’s services considered their knowledge and experience gained through meetings with and reports of the Adviser’s senior management over the course of the preceding year. Both short-term and long-term investment performance of the Funds were considered. Each Fund’s performance was compared to its performance benchmark, a competitive peer group of funds with similar investment objectives and strategies, and to the Adviser’s comparably managed private accounts. The Independent Trustees also considered: the scope and quality of the in-house capabilities of the Adviser and other resources that it dedicated to performing services for the Funds; the quality of administrative and other services, including the Adviser’s role in coordinating the activities of the Funds’ other service providers; the Adviser’s compliance with investment policies of the Funds and applicable laws and regulations; information provided by management and the Funds’ independent public accounting firm in periodic meetings with the Trust’s Audit Committee; the business reputation of the Adviser; the qualifications of the Adviser’s key investment and compliance personnel; and the Adviser’s financial resources.
In reviewing the fees payable under the Investment Advisory Agreements, the Independent Trustees compared the advisory fees and overall expense levels of each Fund with those of competitive funds with similar investment objectives as well as the private accounts managed by the Adviser. The Independent Trustees considered information provided by the Adviser concerning the Adviser’s profitability with respect to each Fund, including the assumptions and methodology used in preparing the profitability information, in light of applicable case law relating to advisory fees. For these purposes, the Independent Trustees considered not only the fees paid by the Funds, but also so-called “fallout” benefits to the Adviser. The Independent Trustees also considered the Adviser’s representations that the Funds’ portfolio trades were executed based on the best available price and execution, and that the Adviser does not participate in any soft dollar or directed brokerage arrangements. The Independent Trustees further considered that the Adviser does not participate in any revenue sharing arrangements relating to the Funds. In evaluating the Funds’ advisory fees, the Trustees considered the complexity and quality of the investment management of the Funds.
34
THE JAMESTOWN FUNDS
DISCLOSURE REGARDING APPROVAL OF INVESTMENT
ADVISORY AGREEMENTS (Unaudited) (Continued)
Based upon their review of this information, the Independent Trustees concluded that: : (i) upon consideration of the one-year and longer-term performance of each Fund, the effectiveness of the Adviser in achieving the investment objectives of The Jamestown Funds, as well as the collection of services provided to shareholders, the Adviser has provided satisfactory services to the Funds; (ii) the investment advisory fees and total operating expense ratio of The Jamestown Equity Fund are competitive with comparably managed funds and the investment advisory fees and total operating expense ratio (net of fee waivers) of The Jamestown Virginia Fund are lower than the average advisory fee and expense ratio for comparably managed funds, according to statistics derived from Morningstar, Inc.; (iii) the Adviser’s commitment to limit overall operating expenses of The Jamestown Virginia Fund by voluntarily waiving a portion of its investment advisory fees has enabled the Fund to increase returns for its shareholders and to maintain an overall expense ratio that is lower than the average for similarly managed funds, despite the small size of the Fund; and (iv) the Adviser’s profitability with respect to The Jamestown Funds is reasonable.
Given the current size of The Jamestown Funds and their expected growth, the Independent Trustees did not believe that, it was relevant to consider the extent to which economies of scale would be realized as the Funds grow, and whether fee levels reflect these economies of scale. The Independent Trustees also considered the “fallout” benefits to the Adviser for its management of The Jamestown Funds, but given the amounts involved viewed these as secondary factors in connection with the evaluation of the reasonableness of the advisory fees paid by the Funds.
No single factor was considered in isolation or to be determinative to the decision of the Independent Trustees to approve the continuance of the Investment Advisory Agreements. Rather the Independent Trustees concluded, after weighing and balancing of all factors considered, that it was in the best interests of each Fund and its shareholders to continue the Investment Advisory Agreements without modification to its terms, including the fees charged for services thereunder.
35
This page intentionally left blank.
This page intentionally left blank.
| | THE JAMESTOWN FUNDS www.jamestownfunds.com Investment Adviser Lowe, Brockenbrough & Company, Inc. 1802 Bayberry Court Suite 400 Richmond, Virginia 23226 Administrator Ultimus Fund Solutions, LLC P.O. Box 46707 Cincinnati, Ohio 45246-0707 (Toll-Free) 1-866-738-1126 Independent Registered
Public Accounting Firm Cohen & Company, Ltd. 1350 Euclid Avenue Suite 800 Cleveland, Ohio 44115 Legal Counsel Sullivan & Worcester LLP 1666 K Street, N.W. Washington, DC 20006 Board of Trustees John P. Ackerly, IV John T. Bruce George K. Jennison Robert S. Harris, Ph.D. Harris V. Morrissette Elizabeth W. Robertson | |
As of the end of the period covered by this report, the registrant has adopted a code of ethics that applies to the registrant’s principal executive officer, principal financial officer, principal accounting officer or controller, or persons performing similar functions, regardless of whether these individuals are employed by the registrant or a third party. Pursuant to Item 12(a)(1), a copy of registrant’s code of ethics is filed as an exhibit to this Form N-CSR. During the period covered by this report, the code of ethics has not been amended, and the registrant has not granted any waivers, including implicit waivers, from the provisions of the code of ethics.
| Item 3. | Audit Committee Financial Expert. |
The registrant’s board of trustees has determined that the registrant has two audit committee financial experts serving on its audit committee. The names of the audit committee financial experts are Dr. Robert S. Harris and Elizabeth W. Robertson. Dr. Harris and Ms. Robertson are “independent” for purposes of this Item.
| Item 4. | Principal Accountant Fees and Services. |
| (a) | Audit Fees. The aggregate fees billed for professional services rendered by the principal accountant for the audit of the registrant’s annual financial statements or for services that are normally provided by the accountant in connection with statutory and regulatory filings or engagements were $151,500 and $151,500 with respect to the registrant’s fiscal years ended March 31, 2018 and 2017, respectively. |
| (b) | Audit-Related Fees. No fees were billed in either of the last two fiscal years for assurance and related services by the principal accountant that are reasonably related to the performance of the audit of the registrant’s financial statements and are not reported under paragraph (a) of this Item. |
| (c) | Tax Fees. The aggregate fees billed for professional services rendered by the principal accountant for tax compliance, tax advice, and tax planning were $36,000 and $36,000 with respect to the registrant’s fiscal years ended March 31, 2018 and 2017, respectively. The services comprising these fees are the preparation of the registrant’s federal income and excise tax returns. |
| (d) | All Other Fees. No fees were billed in either of the last two fiscal years for products and services provided by the principal accountant, other than the services reported in paragraphs (a) through (c) of this Item. |
| (e)(1) | The audit committee has adopted pre-approval policies and procedures described in paragraph (c)(7) of Rule 2-01 of Regulation S-X. Pursuant to the pre-approval policies and procedures, the audit committee has pre-approved certain audit, audit-related and tax services and has established, with respect to each fiscal year of the registrant, the following maximum fee levels for services covered under the pre-approval policies and procedures: |
| • | Services, relating to a new series or class of a series, associated with SEC registration statements, periodic reports and other documents filed by the registrant with the SEC or other documents issued by the registrant in connection with securities offerings and assistance in responding to SEC comment letters—$5,000 |
| • | Consultations with management of the registrant, not in connection with an audit, as to the accounting or disclosure treatment of transactions or events and/or the actual or potential impact of final or proposed rules, standards or interpretations by the SEC, FASB or other regulatory or standard setting bodies—$5,000 |
| • | All tax services provided to the registrant in the aggregate—$5,000 |
| (e)(2) | None of the services described in paragraph (b) through (d) of this Item were approved by the audit committee pursuant to paragraph (c)(7)(i)(C) of Rule 2-01 of Regulation S-X. |
| (f) | Less than 50% of hours expended on the principal accountant’s engagement to audit the registrant’s financial statements for the most recent fiscal year were attributed to work performed by persons other than the principal accountant’s full-time, permanent employees. |
| (g) | With respect to the fiscal years ended March 31, 2018 and 2017, aggregate non-audit fees of $36,000 and $36,000, respectively, were billed by the registrant’s principal accountant for services rendered to the registrant. No non-audit fees were billed in either of the last two fiscal years by the registrant’s principal accountant for services rendered to the registrant’s investment adviser (not including any sub-adviser whose role is primarily portfolio management and is subcontracted with or overseen by another investment adviser), and any entity controlling, controlled by, or under common control with the adviser that provides ongoing services to the registrant. |
| (h) | The principal accountant has not provided any non-audit services to the registrant’s investment adviser (not including any sub-adviser whose role is primarily portfolio management and is subcontracted with or overseen by another investment adviser), and any entity controlling, controlled by, or under common control with the investment adviser that provides ongoing services to the registrant. |
| Item 5. | Audit Committee of Listed Registrants. |
Not applicable
| Item 6. | Schedule of Investments. |
| (a) | Not applicable [schedule filed with Item 1] |
| Item 7. | Disclosure of Proxy Voting Policies and Procedures for Closed-End Management Investment Companies. |
Not applicable
| Item 8. | Portfolio Managers of Closed-End Management Investment Companies. |
Not applicable
| Item 9. | Purchases of Equity Securities by Closed-End Management Investment Company and Affiliated Purchasers. |
Not applicable
| Item 10. | Submission of Matters to a Vote of Security Holders. |
The registrant’s Governance, Nominating, Compensation and QLCC Committee shall review shareholder recommendations to fill vacancies on the registrant’s board of trustees if such recommendations are submitted in writing, addressed to the Committee at the registrant’s offices and meet any minimum qualifications adopted by the Committee. The Committee may adopt, by resolution, a policy regarding its procedures for considering candidates for the board of trustees, including any recommended by shareholders.
| Item 11. | Controls and Procedures. |
(a) Based on their evaluation of the registrant’s disclosure controls and procedures (as defined in Rule 30a-3(c) under the Investment Company Act of 1940) as of a date within 90 days of the filing date of this report, the registrant’s principal executive officers and principal financial officer have concluded that such disclosure controls and procedures are reasonably designed and are operating effectively to ensure that material information relating to the registrant, including its consolidated subsidiaries, is made known to them by others within those entities, particularly during the period in which this report is being prepared, and that the information required in filings on Form N-CSR is recorded, processed, summarized, and reported on a timely basis.
(b) There were no changes in the registrant’s internal control over financial reporting (as defined in Rule 30a-3(d) under the Investment Company Act of 1940) that occurred during the second fiscal quarter of the period covered by this report that have materially affected, or are reasonably likely to materially affect, the registrant’s internal control over financial reporting.
| Item 12. | Disclosure of Securities Lending Activities for Closed-End Management Investment Companies. |
Not applicable
(a)(4) Change in the registrant’s independent public accountants: Not applicable
File the exhibits listed below as part of this Form. Letter or number the exhibits in the sequence indicated.
(a)(1) Any code of ethics, or amendment thereto, that is the subject of the disclosure required by Item 2, to the extent that the registrant intends to satisfy the Item 2 requirements through filing of an exhibit: Attached hereto
(a)(2) A separate certification for each principal executive officer and principal financial officer of the registrant as required by Rule 30a-2(a) under the Act (17 CFR 270.30a-2(a)): Attached hereto
(a)(3) Any written solicitation to purchase securities under Rule 23c-1 under the Act (17 CFR 270.23c-1) sent or given during the period covered by the report by or on behalf of the registrant to 10 or more persons: Not applicable
(b) Certifications required by Rule 30a-2(b) under the Act (17 CFR 270.30a-2(b)): Attached hereto
| Exhibit 99.CODE ETH | Code of Ethics |
| Exhibit 99.CERT | Certifications required by Rule 30a-2(a) under the Act |
| Exhibit 99.906CERT | Certifications required by Rule 30a-2(b) under the Act |
SIGNATURES
Pursuant to the requirements of the Securities Exchange Act of 1934 and the Investment Company Act of 1940, the registrant has duly caused this report to be signed on its behalf by the undersigned, thereunto duly authorized.
| (Registrant) | Williamsburg Investment Trust | | |
| | | | |
| By (Signature and Title)* | /s/ Elizabeth A. Santen | |
| | Elizabeth A. Santen, Assistant Secretary | |
| | | | |
| Date | June 1, 2018 | | |
| | | | |
| Pursuant to the requirements of the Securities Exchange Act of 1934 and the Investment Company Act of 1940, this report has been signed below by the following persons on behalf of the registrant and in the capacities and on the dates indicated. |
| | | | |
| By (Signature and Title)* | /s/ John T. Bruce | |
| | | John T. Bruce, President | |
| | | (FBP Equity & Dividend Plus Fund and FBP Appreciation & Income Opportunities Fund) |
| | | | |
| Date | June 1, 2018 | | |
| | | | |
| By (Signature and Title)* | /s/ Thomas W. Leavell | |
| | | Thomas W. Leavell, President | |
| | | (The Government Street Equity Fund, The Government Street Mid-Cap Fund and The Alabama Tax Free Bond Fund) |
| | | | |
| Date | June 1, 2018 | | |
| | | | |
| By (Signature and Title)* | /s/ Charles M. Caravati III | |
| | | Charles M. Caravati III, President | |
| | | (The Jamestown Equity Fund) | |
| | | | |
| Date | June 1, 2018 | | |
| | | | |
| By (Signature and Title)* | /s/ Joseph A. Jennings III | |
| | | Joseph A. Jennings III, President | |
| | | (The Jamestown Tax Exempt Virginia Fund) | |
| | | | |
| Date | June 1, 2018 | | |
| | | | |
| By (Signature and Title)* | /s/ John P. Ackerly IV | |
| | | John P. Ackerly IV, President | |
| | | (The Davenport Core Fund, Davenport Value & Income Fund, Davenport Equity Opportunities Fund, Davenport Small Cap Focus Fund and the Davenport Balanced Income Fund) |
| | | | |
| Date | June 1, 2018 | | |
| | | | |
| By (Signature and Title)* | /s/ Mark J. Seger | |
| | | Mark J. Seger, Treasurer and Principal Financial Officer | |
| | | | |
| Date | June 1, 2018 | | |
| * | Print the name and title of each signing officer under his or her signature. |