| OMB APPROVAL |
OMB Number: 3235-0570 Expires: July 31, 2022 Estimated average burden hours per response: 20.6 |
UNITED STATES
SECURITIES AND EXCHANGE COMMISSION
Washington, D.C. 20549
FORM N-CSR
CERTIFIED SHAREHOLDER REPORT OF REGISTERED
MANAGEMENT INVESTMENT COMPANIES
| Investment Company Act file number | 811-05685 | |
| Williamsburg Investment Trust |
| (Exact name of registrant as specified in charter) |
| 225 Pictoria Drive, Suite 450 Cincinnati, Ohio | 45246 |
| (Address of principal executive offices) | (Zip code) |
John H. Chilton, Esq.
| Sullivan & Worcester LLP 1666 K Street NW Washington, D.C. 20006 |
| (Name and address of agent for service) |
| Registrant's telephone number, including area code: | (513) 587-3400 | |
| Date of fiscal year end: | March 31 | |
| | | |
| Date of reporting period: | March 31, 2021 | |
Form N-CSR is to be used by management investment companies to file reports with the Commission not later than 10 days after the transmission to stockholders of any report that is required to be transmitted to stockholders under Rule 30e-1 under the Investment Company Act of 1940 (17 CFR 270.30e-1). The Commission may use the information provided on Form N-CSR in its regulatory, disclosure review, inspection, and policymaking roles.
A registrant is required to disclose the information specified by Form N-CSR, and the Commission will make this information public. A registrant is not required to respond to the collection of information contained in Form N-CSR unless the Form displays a currently valid Office of Management and Budget ("OMB") control number. Please direct comments concerning the accuracy of the information collection burden estimate and any suggestions for reducing the burden to the Secretary, Securities and Exchange Commission, 450 Fifth Street, NW, Washington, DC 20549-0609. The OMB has reviewed this collection of information under the clearance requirements of 44 U.S.C. § 3507.
Item 1. Reports to Stockholders.
(a)
 | Davenport Core Fund (DAVPX) |
| | Davenport Value & Income Fund (DVIPX) |
| | |
| | Davenport Equity Opportunities Fund (DEOPX) |
| | |
| | Davenport Small Cap Focus Fund (DSCPX) |
| | |
| | Davenport Balanced Income Fund (DBALX) |
ANNUAL REPORT
March 31, 2021
| THE DAVENPORT FUNDS | |
| LETTER TO SHAREHOLDERS (Unaudited) | May 2021 |
Dear Shareholders,
Equity markets continued their remarkable run in the fiscal fourth quarter as risk taking was in full swing. The S&P 500® Index and Russell 2000® Index gained 6.17% and 12.70%, respectively. It’s hard to fathom how far we’ve come since early last year when COVID fears gripped the globe, businesses were shutting down and markets were in turmoil. Today, the narrative is markedly different as we are making significant vaccination progress, economies are re-opening and equity markets are near all-time highs.
The “re-opening trade” was in full swing for much of the quarter. That is, investors have been embracing areas of the market that were severely hurt by the pandemic and could see a meaningful recovery as pent-up demand is unleashed. These include consumer-facing companies in areas like retail, restaurants and travel, as well as more cyclical concerns such as industrials and banks. Concurrently, shares of many COVID beneficiaries (e.g., stay-at-home stories) have struggled. In recent quarters, we have been shifting our emphasis towards recovery stories within our funds and were pleased to see them show strong performance. While the earnings recovery for such stories is just beginning and may actually exceed expectations, we think many of them have quickly discounted significant improvement and now offer much more balanced risk/reward profiles.
In addition to prospects for a robust economic recovery, aggressive fiscal and monetary stimulus has clearly continued to support markets. Whether it is zero percent interest rate policy or stimulus checks, stocks and many other asset classes are floating on cheap and abundant money. A tidal wave of liquidity has given rise to fears of excessive inflation. Prices for many commodities are spiking. Moreover, the yield on a 10-year Treasury jumped from 0.92% to 1.73% during the quarter as investors demanded a greater return to offset higher inflation risks. The Federal Reserve seems to think inflationary pressures brought on by the economic re-opening may prove transient, and remains committed to using cheap money to promote full employment and sustainable growth. However, any change in their stance could prove disruptive to stocks, which have clearly become accustomed to supportive monetary policy.
In addition to unwanted inflation, persistent economic stimulus can also fuel risky speculation. As noted in our intra-quarter update, there has been evidence of speculative froth in corners of the market such as chat room stocks (e.g., the GameStop frenzy), SPACs (special purpose acquisition companies), bitcoin and high-growth “story stocks.” In select cases, “price” and “value” seem to have become disconnected. Some have drawn comparisons to 1999 and the tech bubble. There are clearly areas of excess, but there are some key differences to consider. For one, interest rates are much lower now and supportive of higher equity values (fed funds rate was near 5% in 1999 versus zero now). Two, the equity risk premium (the spread between the S&P’s earnings yield and interest rates) is actually above historical norms and implies stocks remain a relative deal versus bonds. The equity risk premium went negative in 1999, implying no incremental reward for the risk of owning stocks. To that end, we continue to see good value in a number of our holdings, including some recent purchases.
So where does all of this leave us? It’s hard not to be excited about the near-term “Goldilocks” scenario of strong economic growth and supportive fiscal/monetary policy. And, we continue to see value in parts of the market that haven’t been quite as “hot” in recent months. That said, we are aware of heightened risks and recognize that even a slight shift in monetary policy could hurt markets. We still think it makes sense to expect more modest returns for many asset classes, including stocks, over a longer period. As noted in our calendar year-end letter, we base this on elevated starting points/valuations relative to historical norms.
Davenport Core Fund
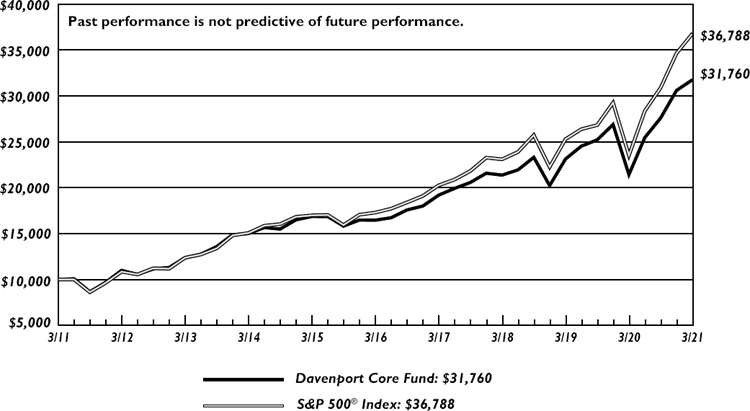
The following chart represents Davenport Core Fund’s (DAVPX) performance and the performance of the S&P 500 Index*, the Core Fund’s primary benchmark, for the periods ended March 31, 2021.
| | | | | | | | Fiscal |
| | | | | | | Since | Year 2021 |
| | Fiscal Q4 | | | | | Inception | Expense |
| | 2020 | 1 Year | 3 Years** | 5 Years** | 10 Years** | 1/15/98** | Ratio |
| Core Fund | 3.79% | 48.20% | 14.10% | 14.04% | 12.25% | 7.72% | 0.87% |
| S&P 500 Index* | 6.17% | 56.35% | 16.78% | 16.29% | 13.91% | 8.38% | |
30-Day SEC Yield: -0.23%; Expense Ratio in current prospectus: 0.89%
Past performance is no guarantee of future results. Investment return and principal value of an investment will fluctuate so that an investor’s shares, when redeemed, may be worth more or less than their original cost. Current performance may be lower or higher than the performance data quoted. Performance data, current to the most recent month-end, may be obtained by calling 1-800-281-3217.
| * | The S&P 500 Index is comprised of 500 U.S. stocks and is an indicator of the performance of the overall U.S. stock market. Standard & Poor’s Financial Services LLC, a division of S&P Global, is the source and owner of the registered trademarks related to the S&P 500 Index. An investor cannot invest in an index and its returns are not indicative of the performance of any specific investment. |
| ** | Returns greater than one year are annualized. |
The Davenport Core Fund (DAVPX) gained 3.79% in the final quarter of fiscal 2021, building upon last year’s gains while the S&P 500® Index was up 6.17%. While we didn’t match the S&P’s return over the period, we are pleased to continue to deliver strong absolute returns. The Fund returned 48.20% for the year ended March 31, 2021, when investors were grappling with the uncertainty of the initial stages of the COVID-19 pandemic. The S&P returned 56.35% for the same period.
As noted in the introductory letter, the dominant theme of the markets in fiscal Q4 was the “re-opening trade.” The Fund benefitted from this dynamic with our overweight position in Financials, but much of that benefit was offset by our lack of exposure to the Energy sector, which bounced back during the quarter. In terms of individual stocks, CarMax, Inc. (KMX) was our best performer for both the quarter and fiscal year, benefitting from the boom in the used car market. Other top performers during the quarter included Charles Schwab Corp. (SCHW) and JPMorgan Chase & Co. (JPM). Aggregates provider Martin Marietta Materials, Inc. (MLM) benefitted from a positive infrastructure outlook, and Alphabet, Inc. (GOOG) moved higher on exposure to
advertising dollars from the travel industry. On the other side of the ledger, several of our durable growth holdings were down 5-7% to close the fiscal year as money flows rotated out of these names and into more overt re-opening names.
Given the market dynamics, we were fairly active in repositioning the Fund during fiscal Q4. Taking advantage of the strength in Financials, we reduced position sizes in Berkshire Hathaway, Inc. (BRK’B), SCHW, and JPM. We added to some of our durable growth names that had pulled back, including Microsoft Corp. (MSFT), Amazon.com, Inc. (AMZN), and MercadoLibre, Inc. (MELI). We exchanged our position in PepsiCo, Inc. (PEP) for Constellation Brand, Inc. (STZ), which offers better growth in its core business and exposure to the growing theme of cannabis.
In the first half of the quarter, we purchased Facebook, Inc. (FB). Facebook needs little introduction with 2.6 billion daily active users across its Facebook, Instagram, and WhatsApp platforms. We are impressed with Facebook’s unmatched ability to monetize its social platform. FB’s financial metrics are extremely attractive, including a net cash balance sheet of ~$40bn, operating margins north of 35% and revenue growth in excess of 20%. Due to some negative headlines and an upcoming privacy change on Apple iOS, FB’s shares pulled back and allowed us to buy Facebook at a valuation discount to the broader market despite a much better-than-average business model. We are cognizant of potential regulatory risk but believe the risk is manageable (an unlikely breakup could actually be good for shareholders). Furthermore, we are impressed with recent innovation efforts at the company, including the launch of an e-commerce platform and a leading position in augmented/virtual reality technology.
In Health Care, we sold our position in the iShares NASDAQ Biotechnology ETF (IBB) to purchase UnitedHealth Group, Inc. (UNH). Since purchasing the IBB, we have added two individual biotech names to the Fund, Illumina, Inc. (ILMN) and Vertex Pharmaceuticals, Inc. (VRTX), thereby retaining our exposure to the promising field of genetics. In UnitedHealth we are buying a very well-run healthcare provider. United is a Managed Care Organization with leading market share and vertically integrated with its Optum health services business. This vertical integration allows the company to offer great outcomes for patients and deliver strong returns for shareholders, with mid-teens EPS growth per annum.
As you can see, we were active in the quarter. We took advantage of some short-term market rotations to reposition the Fund slightly, with an eye towards improving the multiyear risk/return profile. We look forward to reporting back in a few months, when hopefully most of the U.S. adult population will be vaccinated against COVID-19.
The following are transactions performed in the Core Fund for the quarter ended March 31, 2021.
Recent Purchases
Alibaba Group Holding Ltd. (BABA) - Despite the near-term headline risk, we think this an attractive opportunity to purchase one of the best businesses in emerging markets. While we should likely continue to see some volatility in the short term, we think the selloff has gone a long ways towards discounting the risks.
Amazon.com, Inc. (AMZN) - We added to our position in AMZN. AMZN’s cash flows were held back some in 2020 with higher pandemic-related costs but are expected to move much higher in the next three years. Expectations are for Free Cash Flow (FCF) to grow from $31 billion in 2020 to $78 billion in 2023. In 2021, AMZN is currently trading at a level we find attractive for the industry leader in e-commerce and cloud computing.
Aon PLC (AON) - We added to our position in AON as we continue to see the rising insurance pricing cycle having legs, and, as a broker, AON benefits without the risks of payouts that underwriters face.
Constellation Brands, Inc. (STZ) - Recent efforts to optimize the portfolio, such as selling the low-margin E&J Gallo wine business, strike us as value-creating. While the Company’s investment in Canopy Growth (CGC) (currently a 39% stake) has been challenged to date, if the U.S. legalizes cannabis, it should position STZ quite well for a massive growth opportunity and therefore elected to purchase the position.
Facebook, Inc. (FB) - We elected to purchase a position in FB as we think the shares are an attractive value at current levels, and we see continued, highly profitable growth in the years ahead.
MercadoLibre, Inc. (MELI) - We continue to believe the platform is under-monetized and see the potential for 40%+ revenue growth going forward. Over the next several years, we expect additional revenues will flow to the bottom line and see the potential for $5 billion+ in Free Cash Flow (FCF) generation and elected to add to our position.
Microsoft Corp. (MSFT) - We added to our position in MSFT as we continue to see a bright outlook with ~15% revenue growth, a AAA balance sheet, 40%+ operating margins, and a multi-decade growth runway with its Azure cloud computing business.
Recent Sales
Becton Dickinson & Co. (BDX) - We continue to think of BDX as a high-quality company with defensive characteristics. That being said, the company has faced some operational challenges, including the removal of a key product, the Alaris infusion pump, from the market. The new CEO has been quite conservative in his communications with investors and we elected to sell the position.
Berkshire Hathaway, Inc. (BRK’B) - We continue to think highly of BRK’B, and are pleased to see insurance underwriting results improve across the industry as premium pricing has moved higher following meaningful industry losses.
Charles Schwab Corp. (SCHW) - SCHW shares have been on a tear as investors have begun pricing in the possibility of higher interest rates recently. With the shares up roughly 90% since the lows this fall, we elect to reduce the position somewhat.
JPMorgan Chase & Co. (JPM) - While we continue to view JPM as “best of breed” and continue to have a favorable view going forward, we elected to take some profits as the recent move may take some time to digest and valuations have re-rated well above their historical range (although still a significant discount to the market).
Illumina, Inc. (ILMN) - The business is still suffering due to COVID, and as a result of the sharp move higher, the valuation has expanded significantly. While we don’t think forward Price Earnings (P/E) is the best way to value this asset, we remain mindful of valuation and elect to dial the position back some.
Liberty Broadband Corp. (LBRDK) - We chipped our position in LBRDK. We continue to like LBRDK and its key holding Charter (CHTR) but do see incremental headwinds for the cable space as the COVID pandemic hopefully subsides and incremental competition could emerge in the formed of fixed 5G wireless.
Nestle S.A. (NSRGY) - We elected to sell the position to make room for Facebook (FB), a name we think can provide greater returns for the portfolio going forward.
Pepsi Co, Inc. (PEP) - PEP has been a long-time holding for the portfolio. We continue to think highly of the company and its brands. That being said, we are trading it in for another high-quality branded beverage company, Constellation Brands.
Walt Disney Co. (DIS) - We continue to think extremely highly of Disney’s creativity engine and are optimistic about their monetization strategy shift into recurring revenue streaming services. We also like the company’s exposure to an improving travel dynamic in 2021 and 2022. That being said, shares have made a large move in a short period of time and we elected to trim our position slightly.
Davenport Equity Opportunities Fund
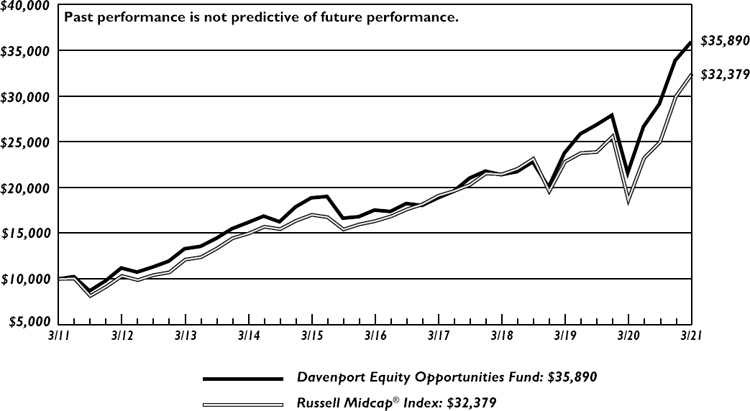
The following chart represents Davenport Equity Opportunities Fund (DEOPX) performance and the performance of the Russell Midcap Index*, the Fund’s primary benchmark, and the S&P 500 Index* for the periods ended March 31, 2021.
| | | | | | | Since | Fiscal |
| | Fiscal Q4 | | | | | Year 2021 |
| | | | | | Inception | Expense |
| | 2020 | 1 Year | 3 Years** | 5 Years** | 10 Years** | 12/31/10** | Ratio |
| Equity Opportunities Fund | 5.91% | 66.20% | 18.80% | 15.40% | 13.63% | 14.05% | 0.88% |
| Russell Midcap Index | 8.14% | 73.64% | 14.73% | 14.67% | 12.47% | 12.96% | |
| S&P 500 Index* | 6.17% | 56.35% | 16.78% | 16.29% | 13.91% | 14.19% | |
30-Day SEC Yield: -0.89%; Expense Ratio in current prospectus: 0.91%
Past performance is no guarantee of future results. Investment return and principal value of an investment will fluctuate so that an investor’s shares, when redeemed, may be worth more or less than their original cost. Current performance may be lower or higher than the performance data quoted. Performance data, current to the most recent month-end, may be obtained by calling 1-800-281-3217.
| * | The Russell Midcap® Index measures the performance of the 800 smallest companies in the Russell 1000, which represent approximately 25% of the total market capitalization of the Russell 1000®. London Stock Exchange Group PLC and its group undertakings (collectively, the “LSE Group”). © LSE Group 2020. FTSE Russell is a trading name of certain LSE Group companies. “Russell®” is a trademark of the relevant LSE Group companies and is used by any other LSE Group company under license. All rights in the FTSE Russell indexes or data vest in relevant LSE Group company which owns the index or the data. Neither LSE Group nor its licensors accept any liability for any errors or omissions in the indexes or data and no party may rely on any indexes or data contained in this communication. No further distribution of data from LSE Group is permitted without the relevant LSE Group company’s express written consent. The LSE Group does not promote/sponsor/endorse the content of this communication. The S&P 500 Index is comprised of 500 U.S. stocks and is an indicator of the performance of the overall U.S. stock market. Standard & Poor’s Financial Services LLC, a division of S&P Global, is the source and owner of the registered trademarks related to the S&P 500 Index. An investor cannot invest in an index and its returns are not indicative of the performance of any specific investment. |
| ** | Returns greater than one year are annualized. |
The Davenport Equity Opportunities Fund (DEOPX) enjoyed a strong close to the fiscal year, advancing 5.91% in the fourth quarter. This result slightly lagged the 8.14% return for the Russell Midcap® Index; however, we were pleased to keep pace with such strong market momentum while remaining vigilant with respect to risk and quality. For the fiscal year ended March 31, 2021, the Fund returned 66.20% compared to the benchmark’s 73.64% return.
Performance was broad-based, highlighting the healthy balance between growth and value within the Fund. Used car retailer CarMax, Inc. (KMX) was a top performer for the period, rising north of 40% amid firming sales trends, optimism surrounding stimulus, and ongoing tight conditions in the used car market. Playing a bit of catch-up and benefiting from a rotation to value stocks, insurer Fairfax Financial Holdings Ltd. (FRFHF) jumped north of 30% during the quarter and remains attractive, in our opinion, given its discount to stated book value. Despite headwinds for many growth stocks and perceived COVID beneficiaries during the quarter, Etsy, Inc. (ETSY) continued to shine alongside blowout results. Other top performers from 2020, such as MercadoLibre, Inc. (MELI) and Take-Two Interactive Software, Inc. (TTWO), did not fare so well in the market’s recent rotation into more cyclical/value-oriented names and served as a drag on performance. Despite the pullback in share prices, each of these entities continues to post phenomenal results and remains attractive to us on a longer-term basis.
Amid the frenzy of re-opening enthusiasm, stimulus, and the promise of further fiscal support, cyclical recovery plays, and momentum-fueled story stocks have understandably garnered their fair share of investor attention. While much of this has come at the expense of durable growth names, we have also observed a subset of high-quality names that don’t fit neatly into one of these boxes getting left behind. We think this has created attractive buying opportunities in names such as American Tower Corp. (AMT), Markel Corp. (MKL), and O’Reilly Automotive, Inc. (ORLY). AMT’s underperformance to begin the calendar year created an attractive setup in front of wireless carriers accelerating 5G deployments in calendar 2021. With the stock trading as cheaply as we have seen it in years, we elected to buy more of this quality compounder. Following a tumultuous calendar 2020, we think MKL can get back to a high single-digit to low double-digit book value growth rate in coming years without taking an inordinate amount of risk. While this type of return might illicit a yawn from growth investors of the day, we feel like the risk/reward for the stock is quite attractive, and the valuation fails to reflect improving industry fundamentals as well as ongoing momentum among the privately owned businesses with its Markel Ventures segment.
O’Reilly Automotive has been a tremendous stock for us over time, offering a steady combination of solid same-store sales growth, new store openings, margin expansion, and generous return of capital to shareholders. It has also proven relatively defensive in tougher environments. While the stock is near a 52-week high, it has actually lagged other consumer stocks for fear of tougher comparisons in the near term. This comes despite the fact earnings estimates have moved nicely higher, and near-term results could exceed expectations given favorable weather and stimulus checks itching to be spent. We also note the company has gained market share through the pandemic given its superior distribution and inventory. The stock is now trading at just over 18x estimates for next year, a relative deal for a company with prospects for ongoing earnings growth in the low-to-mid teens. Management seems to agree, as evidenced by over $500 million of share repurchases YTD through late February.
In closing, we are pleased to end the fiscal year on solid footing and remain confident in the Fund’s positioning for the future. Though some of our more recent transactions could be construed as boring, we are always excited to put money to work in what we consider quality businesses at reasonable prices.
The following are transactions performed in the Equity Opportunities Fund for the quarter ended March 31, 2021.
Recent Purchases
American Tower Corp. (AMT) - AMT has been a solid performer over the long term but has been left behind in the market’s most recent rally. The stock’s underperformance in recent months has created an attractive setup in front of carriers accelerating 5G deployments in 2021. If the stock holds its current multiple (we think it could re-rate higher), this will allow for solid double-digit returns alongside free cash flow growth, therefore we elected to add to the position.
Black Knight, Inc. (BKI) - We added to our position in BKI as the company’s scale, efficiency, and breadth of solutions leads to high client retention, high returns on capital (EBITDA margins near 50%), strong pricing power and recurring growth that is not transactional in nature. Recent momentum in the company’s mortgage origination and data and analytics segments should provide an additional growth driver over time.
Cannae Holdings, Inc. (CNNE) - Our NAV analysis conservatively measures the after-tax liquidation value of the company’s holdings to be in the mid-$50 range. As such, we elected to add to our position as we feel the risk reward is quite compelling at current levels.
Evoqua Water Technologies Corp. (AQUA) - We elected to add to our position and use recent weakness following quarterly results to make our position more meaningful. While near-term results will face continued headwinds from COVID, management has executed well in a difficult environment, and order trends continue to support a constructive intermediate-term outlook for the business. We continue to believe there are strong long-term secular drivers in place, which should help drive strong organic growth and margin improvement and potentially help close the stock’s valuation discount relative to peers.Markel Corp. (MKL) - Putting the pieces together, we think MKL can get back to a high single-digit to low double-digit book value growth rate in coming years without taking an inordinate amount of risk. While this type of return might illicit a yawn from growth investors of the day, we feel like the risk/reward for the stock is quite attractive and elected to add to the position.
O’Reilly Automotive, Inc. (ORLY) - We added to our position in ORLY as it has been a tremendous stock for us over time, offering a steady combination of solid same-store sales growth, new store openings, margin expansion, and generous return of capital to shareholders. It has also proven relatively defensive in tougher environments. We also note the company has gained market share through the pandemic given its superior distribution and inventory.
Recent Sales
Altice USA, Inc. (ATUS) - We continue to like the story, which should benefit from continued broadband momentum, aggressive buyback activity, and takeout potential; however, we chose to take some profits and chipped the position given the recent strength as well as the possibility for heightened regulatory scrutiny from the new administration. Looking ahead, we think tougher comparisons, potential for heightened regulatory pressure from a new administration, and the
blossoming threat of fixed wireless offerings from mobile operators may cause the shares to lose some appeal. The valuation is still attractive versus peers, and we think there is a good chance that larger peer Charter (CHTR) makes a run at ATUS, but here again, the risk/reward looks more balanced now.
Colfax Corp. (CFX) - While we are encouraged by the execution and improvement in each segment and believe the separation will unlock additional value, the stock looks more reasonably priced relative to our sum of the parts analysis. As such, we elected to trim the position with an eye towards allocating the funds to more compelling risk/reward opportunities.
Etsy, Inc. (ETSY) - We have chipped the position on its way up as part of our risk management process. We continue to think ETSY has a bright future in front of it and continue to see upside for the stock over the next several years. Despite these positives, we elected to reduce the position weight some given recent strong performance and difficult upcoming 2021 compares, as the company laps the stay-at-home boom period of 2020.
Fidelity National Financial, Inc. (FNF) - While we remain positive on the outlook for housing, we acknowledge the potential for the stock to take a breather if rates continue to rise. That said we feel the long-term industry set up, balance sheet, valuation and capital return features outweigh these near term concerns and elected to chip the position.
Hilton Worldwide Holdings, Inc. (HLT) - We chipped our position in HLT and still believe there is pent-up demand for travel that will ultimately surprise investors. However, this story has become more widely accepted and the stock’s risk/reward profile now looks more balanced. HLT is a very high quality compounder that should benefit from rising demand, improved margins (due to cost reductions over the past year), unit growth (both new builds and independent operators converting to Hilton brands) and significant return of capital resuming in 2022. We also like the company’s capital-light/fee-oriented business model.
Lamar Advertising Co. (LAMR) - We chipped our position in LAMR. We established a position in LAMR just over six months ago at depressed prices and viewed it as a high-quality recovery/ re-opening play. The shares have rallied sharply since that time and have recently hit all-time highs. The company should benefit from a recovery in many ad verticals, including events, restaurants, and entertainment/events, and should see robust growth through next year.
Live Nation Entertainment, Inc. (LYV) - LYV is a dominant (near monopoly) franchise that should benefit from tremendous pent-up demand for live events as well as a significant supply (touring is artists’ primary source of income, and they will be heavily motivated to get back on stage). However, the stock’s risk/reward looks more balanced after a sharp rally, and we elected to chip the position.
Davenport Value & Income Fund
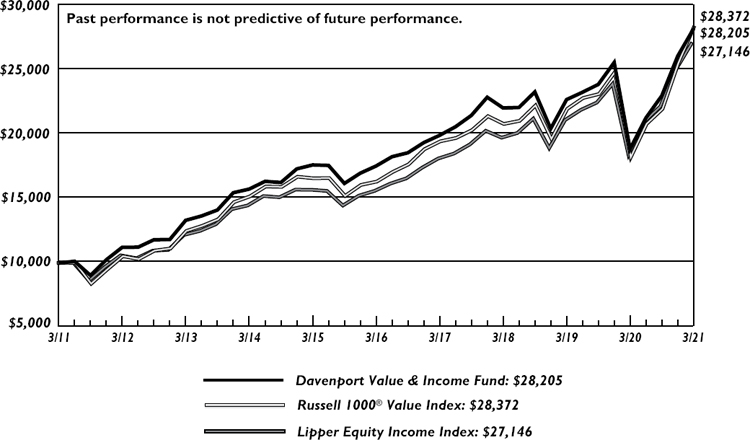
The following chart represents Davenport Value & Income Fund (DVIPX) performance and the performance of the Russell 1000 Value Index*, the Value & Income Fund’s primary benchmark, the S&P 500 and the Lipper Equity Income Index for the periods ended March 31, 2021.
| | | | | | | Since | Fiscal |
| | Fiscal Q4 | | | | | Year 2021 |
| | | | | | Inception | Expense |
| | 2020 | 1 Year | 3 Years** | 5 Years** | 10 Years** | 12/31/10** | Ratio |
| Value & Income Fund | 8.13% | 49.55% | 8.53% | 9.96% | 10.93% | 11.21% | 0.87% |
| Russell 1000 Value Index | 11.25% | 56.09% | 10.96% | 11.74% | 10.99% | 11.39% | |
| S&P 500 Index* | 6.17% | 56.35% | 16.78% | 16.29% | 13.91% | 14.19% | |
| Lipper Equity Income Index* | 8.24% | 47.41% | 11.17% | 11.69% | 10.50% | 11.57% | |
30-Day SEC Yield: 1.33%; Expense Ratio in current prospectus: 0.89%
Past performance is no guarantee of future results. Investment return and principal value of an investment will fluctuate so that an investor’s shares, when redeemed, may be worth more or less than their original cost. Current performance may be lower or higher than the performance data quoted. Performance data, current to the most recent month-end, may be obtained by calling 1-800-281-3217.
| * | The Russell 1000® Value Index measures the performance of the Russell 1000 companies with lower price-to-book ratios and lower forecasted growth values. London Stock Exchange Group PLC and its group undertakings (collectively, the “LSE Group”). © LSE Group 2020. FTSE Russell is a trading name of certain LSE Group companies. “Russell®” is a trademark of the relevant LSE Group companies and is used by any other LSE Group company under license. All rights in the FTSE Russell indexes or data vest in relevant LSE Group company which owns the index or the data. Neither LSE Group nor its licensors accept any liability for any errors or omissions in the indexes or data and no party may rely on any indexes or data contained in this communication. No further distribution of data from LSE Group is permitted without the relevant LSE Group company’s express written consent. The LSE Group does not promote/sponsor/endorse the content of this communication. The S&P 500 Index is comprised of 500 U.S. stocks and is an indicator of the performance of the overall U.S. stock market. The S&P 500 Index is comprised of 500 U.S. stocks and is an indicator of the performance of the overall U.S. stock market. Standard & Poor’s Financial Services LLC, a division of S&P Global, is the source and owner of the registered trademarks related to the S&P 500 Index. The Lipper Equity Income Index is an unmanaged index of the 30 largest Funds in the Lipper Equity Income Fund category. An investor cannot invest in an index and its returns are not indicative of the performance of any specific investment. |
| ** | Returns greater than one year are annualized. |
The Davenport Value & Income Fund (DVIPX) increased 8.13% in the fiscal fourth quarter. This compares to the Fund’s primary benchmark, the Russell 1000 Value® Index, which increased 11.25% in the quarter as well as the S&P 500® Index, which increased 6.17%. For the fiscal year ended March 31, 2021, the Fund increased 49.55%, compared to the 56.09% and 56.35% increase for the Russell and S&P benchmarks, respectively.
As we noted last quarter, we thought calendar 2021 could set up to be a good year for value stocks as the world recovers from the pandemic and investors rotate into more economically sensitive stocks. This played out during the fiscal fourth quarter as “value” continued its outperformance vs. “growth.” While the Fund enjoyed a solid absolute return, it struggled to keep up with the benchmark. This was due to less exposure to the deep value/highly cyclical areas of the market that outperformed as the “recovery trade” was in full swing. Throughout the COVID pandemic we have tried to maintain balance in the Fund with some deep value as well as less cyclical situations.
Fiscal fourth quarter performance was led by Capital One Financial Corp. (COF), J.P. Morgan Chase & Co. (JPM), Deere & Co. (DE) and Fairfax Financial Holdings Ltd. (FRFHF). Moreover, Capital One was our top performer for the fiscal year. The banks benefited from rising interest rates and improving credit metrics. Deere was a standout performer as agricultural commodity prices reached levels not seen in many years, boosting farm income and thus equipment purchases. The Fund also benefited from underweights in the Health Care and Communications sectors as they underperformed the benchmark return. Key detractors in the quarter include QUALCOMM, Inc. (QCOM), which was one of our top performers in calendar 2020, as well as Anheuser-Busch InBev S.A./N.V. (BUD), which has seen solid volume growth but is being hampered by transitory cost pressure.
We introduced four new positions during the final quarter in BP plc (BP), Coca-Cola Co. (KO), Digital Realty Trust, Inc. (DLR), and Walgreens Boots Alliance, Inc. (WBA). On the deep value end of the spectrum is Walgreens, which should need little introduction as the second-largest retail pharmacy chain in the U.S. The stock has struggled in recent years but we believe the tide is turning and it offers compelling value at ~10x earnings. In January, WBA announced that it was selling its drug wholesale business for $6.5B, providing the company significant opportunity to deploy cash in ways that shareholders are likely to benefit. In the near-term, the company should benefit from COVID-19 vaccine administration as customers are drawn into its stores. The shares currently trade at a 55% discount to the S&P 500, close to the lowest relative level the stock has ever seen. WBA currently has a 3.7% dividend yield, and we think is an attractive fit in the Value & Income Fund. Digital Realty, which is more of a steady growth situation, is a REIT that owns and operates data centers and has a leading market share in North America. With the exponential growth in data comes the need for growth in the infrastructure required to create, process, transmit, and store all of it. DLR trades at a valuation well below its closest peer, which we think provides an opportunity as recent development projects come online and earnings growth accelerates. DLR currently yields 3.2% and has increased its dividend at an 11% rate for 14 straight years.
During the final quarter, we exited positions in WP Carey, Inc. (WPC), Verizon Communications, Inc. (VZ), and PepsiCo, Inc. (PEP). These had been good performers for the Fund, but we felt risk/ reward was more favorable in other ideas.
In summary, we are pleased with the absolute performance in the fiscal fourth quarter and the emerging investment landscape where value stocks may finally have their time to shine after a decade of underperformance. We continue to remain focused on finding individual ideas that represent attractive risk/reward opportunities and are optimistic about the Fund going forward.
The following are transactions performed in Value & Income Fund for the quarter ended March 31, 2021.
Recent Purchases
BP plc (BP) - We initiated a position in BP as we believe things are looking more positive for the company since the pandemic began. We are attracted to BP due to its inexpensive valuation, attractive income, and the potential for a step change upward in earnings as oil demand jumps with the economy and a resumption in travel. We also added to the position later in the quarter. Our confidence in a recovery for BP shares continues to increase as oil prices reach new 52-week highs, economies reopen, and OPEC restrains supply.
Cannae Holdings, Inc. (CNNE) - Despite several value-enhancing transactions, shares have underperformed the broader market to start the year and the stock trades at its widest discount to Net Asset Value (NAV). For this reason, we added to this diversified holding company this quarter.
Coca-Cola Co. (KO) - We believe KO is a great fit with its business quality, defensiveness, and relatively new CEO James Quincy. The recent pullback in the stock represents an attractive entry point with its relative valuation vs. the S&P 500 near a multi-decade low, so we initiated a position.
Digital Realty Trust, Inc. (DLR) - DLR is a Real Estate Investment Trust (REIT) that owns, acquires, develops, and operates data centers (DCs). DLR is dedicated to the full customer spectrum from enterprise colocation to hyperscale cloud computing across the globe. Given the potential for accelerating earnings growth and the company’s leading market share in its markets, we feel the stock is currently undervalued so we initiated a position. We also added to our position later in the quarter. The data center REIT pulled back following Q4 2020 earnings as management commentaries and guidance raised a couple concerns that spooked investors.
Truist Financial Corp. (TFC) - We believe TFC offers a low-risk re-opening play that should benefit from a broader cyclical recovery beyond COVID. For this reason, we added to our position to make it more meaningful.
Walgreens Boots Alliance, Inc. (WBA) - WBA should need little introduction as the second-largest retail pharmacy chain in the U.S. In the near-term, the company should benefit from COVID-19 vaccine administration as customers are drawn into its stores. Current Street estimates seem to have been reset to a conservative level and we think the company could be on the cusp of a beat/raise cycle. Taken together, we think WBA is an attractive fit so we initiated a position.
Recent Sales
Comcast Corp. (CMCSA) - Shares of CMCSA are at an all-time high as the company remains well-positioned for both continued strength in its dominant cable business and as a beneficiary of economies reopening. As such, we decided to reduce our position.
Deere & Co. (DE) - DE has been a fantastic performer for the portfolio since our initial purchase in July 2020 as the agriculture economy rebounded from several years of tough times. The stock is now trading at ~22x forward earnings, which was the peak multiple last cycle. As such, we elected to chip our position.
Diageo plc (DEO) - While we continue to like DEO’s long-term story and believe it’s reasonable to expect Mid Single Digit (MSD) growth post-COVID as spirits continue to take share from beer and wine, DEO has become a larger position within the portfolio and we elected to chip the position on the recent strength and redeploy the funds elsewhere.
Fidelity National Financial, Inc. (FNF) - Shares have recovered nicely as the housing market remains strong, although the stock is likely to face headwinds if rates continue to rise. So, we elected to take a bit off the table to fund our BP plc purchase, where we currently see more favorable risk/reward.
JPMorgan Chase & Co. (JPM) - JPM and all the banks have had a strong start to 2021 amidst the “value rotation,” higher rates, additional stimulus, and prospects for bright economic growth. While we continue to view JPM as “best of breed,” we elect to take some profits.
Lamar Advertising Co. (LAMR) - As the vaccines became available and travel started to resume, the shares have re-rated higher and now trade close to their pre-COVID level. We continue to like the LAMR story and believe fundamentals should continue to improve, however we think risk/reward is more balanced and elected to take profits twice this quarter.
PepsiCo, Inc. (PEP) - We continue to think highly of PEP but believe current risk/reward is better in Walgreens. Pepsi hasn’t grown profits for three years (including acquisitions) and free cash flow hasn’t grown since 2013. Walgreens Boots Alliance Inc (WBA) sports a higher dividend yield, lower valuation, and attractive catalyst path. As such we elected to make the swap.
Verizon Communications, Inc. (VZ) - Despite an attractive dividend yield, we have grown increasingly concerned about VZ’s growth prospects as it faces intensifying competition. Net/net we think VZ shares are likely to remain range-bound and elected to sell our position
W.P. Carey, Inc. (WPC) - While WPC has been a solid holding over the years, we think the firm could struggle to grow in the current environment and may face headwinds from rent compression, as such we elected to sell our position.
Davenport Small Cap Focus Fund
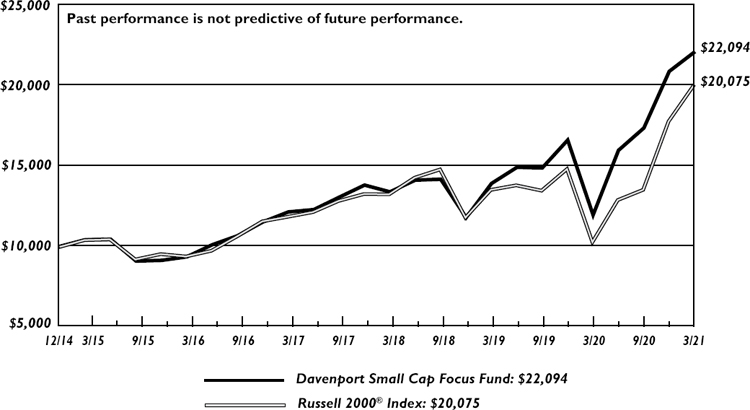
The following chart represents performance of the Davenport Small Cap Focus Fund (DSCPX) and the performance of the Fund’s primary benchmark, the Russell 2000 Index*, for the periods ended March 31, 2021.
| | | | | | Since | Fiscal |
| | Fiscal Q4 | | | | Year 2021 |
| | 1 Year | 3 Years** | 5 Years** | Inception | Expense |
| | 2020 | 12/31/14** | Ratio |
| Small Cap Focus Fund | 5.79% | 84.84% | 18.17% | 18.77% | 13.53% | 0.91% |
| Russell 2000 Index* | 12.70% | 94.85% | 14.76% | 16.35% | 11.80% | |
30-Day SEC Yield: 0.21%; Expense Ratio in current prospectus: 0.97%
Past performance is no guarantee of future results. Investment return and principal value of an investment will fluctuate so that an investor’s shares, when redeemed, may be worth more or less than their original cost. Current performance may be lower or higher than the performance data quoted. Performance data, current to the most recent month-end, may be obtained by calling 1-800-281-3217.
| * | The Russell 2000 Index measures the performance of the 2000 smallest companies in the Russell 3000® Index. Frank Russell Company (“Russell”) is the source and owner of the registered trademarks, service marks, and copyrights related to the Russell Indexes. Russell® is a trademark of Frank Russell Company. An investor cannot invest in an index and index returns are not indicative of the performance of any specific investment. London Stock Exchange Group PLC and its group undertakings (collectively, the “LSE Group”). © LSE Group 2020. FTSE Russell is a trading name of certain LSE Group companies. “Russell®” is a trade-mark of the relevant LSE Group companies and is used by any other LSE Group company under license. All rights in the FTSE Russell indexes or data vest in relevant LSE Group company which owns the index or the data. Neither LSE Group nor its licensors accept any liability for any errors or omissions in the indexes or data and no party may rely on any indexes or data contained in this communication. No further distribution of data from LSE Group is permitted without the relevant LSE Group company’s express written consent. The LSE Group does not promote/sponsor/endorse the content of this communication. An investor cannot invest in an index and its returns are not indicative of the performance of any specific investment. |
| ** | Returns greater than one year are annualized. |
The Davenport Small Cap Focus Fund (DSCPX) carried strong momentum into the final quarter of fiscal 2021, posting a 5.79% return for the period. In similar fashion to the previous quarter, this result failed to keep pace with a torrid 12.70% gain for the Russell 2000® Index. While the powerful cocktail of low interest rates, fiscal stimulus and improving economic conditions seems
likely to continue to support risk assets, we are a bit concerned that indiscriminate risk taking in certain pockets of the small cap universe may prove unsustainable. In fact, we saw some of the froth come off more speculative corners of the market as the quarter drew near its close. During these “risk-off” periods, we were pleased to see the strategy prove more resilient than the index. For the fiscal year ended March 31, 2021, the Fund returned 84.84% compared to the 94.85% return for the index.
The strategy’s top performer for the final quarter was connected speaker pioneer Sonos, Inc. (SONO), a name that we purchased in fiscal Q2 and have yet to discuss. Shares soared north of 60% during the quarter on the heels of strong demand, great execution, exciting new product introductions and positive developments in the company’s patent portfolio. The stock has nearly tripled since our initial purchase and we have taken some profits of late; however, we still hold a meaningful position given our belief that the inflection in the revenue and margin profile of the business (along with other looming catalysts) justify the appreciation we have seen. Two names we highlighted last quarter, Live Oak Bancshares, Inc. (LOB) and Chart Industries, Inc. (GTLS), were also top performers. We are pleased that each of these names has gotten off to such a strong start for the Fund. The Fund’s biggest detractor during the period was our top position, Cannae Holdings, Inc. (CNNE), where a combination of underperformance and a large position size weighed on results. While we are disappointed that the stock has failed to gain traction to end the fiscal year, our conviction in the risk/reward profile at CNNE has only grown. Management seems to agree as evidenced by sizeable insider purchase activity in addition to the recent institution of a share buyback.
We initiated a new position in a tech enabled specialty insurance broker called BRP Group, Inc. (BRP) during the final quarter. We were drawn to this name given our favorable view of the insurance pricing cycle (brokers tend to participate in pricing upside without taking on the underwriting risk) as well as company specific factors such as industry leading organic growth (company targets 10-15%) and significant greenspace for accretive M&A. The founding Baldwin family maintains over 40% voting interest in the company and CEO Trevor Baldwin has built an entrepreneurial culture that uses the company’s differentiated tech stack to take market share and recruit new talent. Ultimately, we believe the combination of mid-teens organic growth, margin expansion toward peer averages and continued M&A can drive the share price meaningfully higher in coming years.
In our intro, we alluded to the fact that some of the frothier areas of the market began to run out of steam near the end of the quarter. This was evident in a variety of Special Purpose Acquisition Company (SPAC) issues where hot money turned cool rather quickly. Though we believe a pause in “SPAC-ulation” was overdue in many cases, we believe the mass exodus resulted in some attractive opportunities to invest in a couple SPACs set to imminently acquire some very attractive businesses. As such, we built meaningful positions in Juniper Industrial Holdings, Inc. (JIH) and Foley Trasimene Acquisition Corp. (WPF), which are in the final stages of closing transactions with public storage equipment supplier Janus International and human capital management software provider Alight Solutions, respectively. Both of these businesses have solid barriers to entry, strong management teams, attractive cash generation and plenty of runway for growth. Due to technical factors surrounding hot money flows from the SPAC world, we believe we are getting a chance to buy each business at a very attractive price.
In closing, we are pleased with a solid end to the fiscal year. Though it has been frustrating at times to see more speculative corners of the market outperform our holdings, we are encouraged by the strategy’s resilience during pullbacks and remain confident that our commitment to quality will stand the test of time. Furthermore, we are excited about the newer additions to the strategy and remain confident that the seeds planted in recent times will bear fruit.
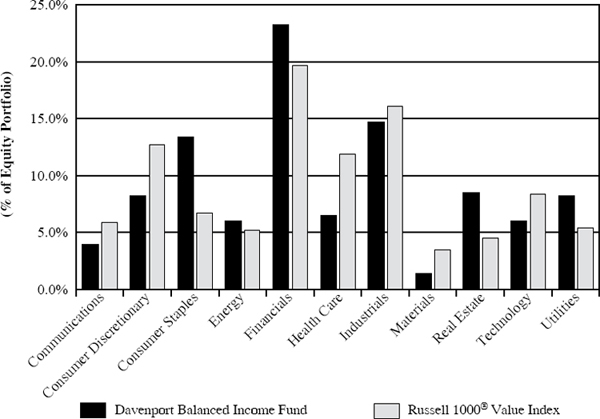
Davenport Balanced Income Fund
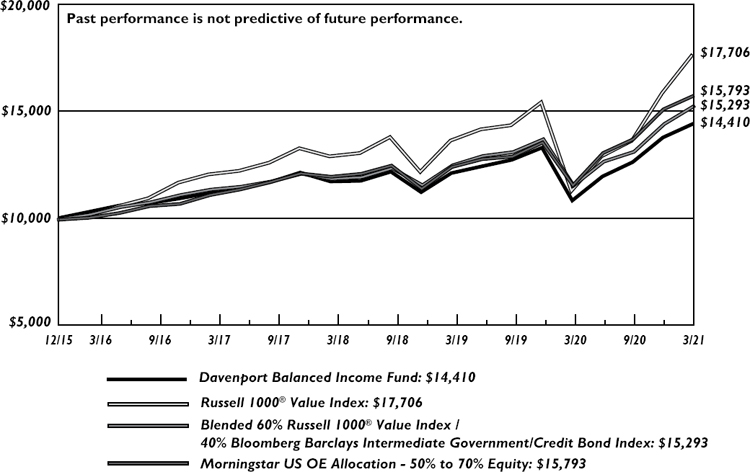
The following chart represents Davenport Balanced Income Fund (DBALX) performance, and performance of the Fund’s primary benchmark, the Russell 1000® Value Index, along with the Morningstar Allocation 50-70% Equity Index, and the blended 60% Russell 1000® Value Index / 40% Bloomberg Barclays Intermediate Government/Credit Bond (BBIGC) Index for the periods ended March 31, 2021.
| | | | | | Since | Fiscal |
| | Fiscal Q4 | | | | Year 2021 |
| | 1 Year | 3 Years** | 5 Years** | Inception | Expense |
| | 2020 | 12/31/15** | Ratio |
| Balanced Income Fund | 4.66% | 33.14% | 7.15% | 6.97% | 7.21% | 0.93% |
| Russell 1000® Value* | 11.25% | 56.09% | 10.96% | 11.74 | 11.50% | |
| Morningstar Allocation 50-70% Equity* | 4.20% | 36.15% | 9.59% | 9.38 | 7.67% | |
| 60% Russell 1000® Value/40% BBIGC | 5.92% | 32.26% | 8.82% | 8.42% | 8.43% | |
30-Day SEC Yield: 0.93%; Expense Ratio in current prospectus: 0.96%
Past performance is no guarantee of future results. Investment return and principal value of an investment will fluctuate so that an investor’s shares, when redeemed, may be worth more or less than their original cost. Current performance may be lower or higher than the performance data quoted. Performance data, current to the most recent month-end, may be obtained by calling 1-800-281-3217.
| * | The Russell 1000® Value Index measures the performance of the Russell 1000 companies with lower price-to-book ratios and lower forecasted growth values. London Stock Exchange Group PLC and its group undertakings (collectively, the “LSE Group”). © LSE Group 2020. FTSE Russell is a trading name of certain LSE Group companies. “Russell®” is a trademark of the relevant LSE Group companies and is used by any other LSE Group company under license. All rights in the FTSE Russell indexes or data vest in relevant LSE Group company which owns the index or the data. Neither LSE Group nor its licensors accept any liability for any errors or omissions in the indexes or data and no party may rely on any indexes or data contained in this communication. No further distribution of data from LSE Group is permitted without the relevant LSE Group company’s express written consent. The LSE Group does not promote/sponsor/endorse the content of this communication. The Morningstar US OE Allocation 50-70% Equity Index is composed of funds which seek to provide both income and capital appreciation by investing in multiple asset classes, including stocks, bonds, and cash. These portfolios are dominated by domestic holdings and have equity exposure between 50% and 70%. The blended 60% Russell 1000 Value/40% Bloomberg Barclay’s Intermediate Government/Credit (BBIGC) Index is included as an additional comparative index because it is representative of a balanced portfolio consisting of 60% equity and 40% fixed income securities. The BBIGC measures the non-securitized component of the U.S. Aggregate Index. It includes investment grade, U.S. dollar-denominated, fixed-rate Treasuries, government-related and corporate rate securities. Intermediate maturity bonds include bonds with maturities of 1 to 9.999 years. An investor cannot invest in an index and its returns are not indicative of the performance of any specific investment. |
| ** | Returns greater than one year are annualized. |
The Davenport Balanced Income Fund (DBALX) increased 4.66% during the fiscal fourth quarter of 2021, slightly behind the 5.92% increase for the blended 60% Russell 1000® Value and 40% Bloomberg Barclays Intermediate Government/Credit Index. For the fiscal year ended March 31, 2021, the Fund increased 33.14%, slightly outpacing the 32.26% return for the blended benchmark.
As we discussed in our last letter, during the fiscal third quarter we began to see a rotation to value stocks as evidenced by the Russell 1000 Value Index outpacing the Russell 1000® Growth Index by nearly 5 percentage points. This rotation continued in the fiscal Q4 with the value index handily beating the growth index by more than 10 percentage points, as investors favored more economically sensitive and “re-opening” stocks. With value in vogue, the equity portion of the Fund benefited given our value bias and we continue to believe we are positioned well as the world recovers from the COVID-19 pandemic.
Our top contributors to equity performance during the quarter included Capital One Financial Corp. (COF), JPMorgan Chase & Co. (JPM), and Deere & Co. (DE). Capital One and JPMorgan benefited from rising interest rates alongside economic recovery, as well as continued fiscal stimulus. Deere & Co. had a stellar quarter as agricultural commodity prices reached levels not seen in years, which in turn, lifted farm income and led to equipment purchases. Detractors to fiscal Q4 performance included QUALCOMM, Inc. (QCOM) and Anheuser-Busch InBev S.A./N.V. (BUD). After a strong 2020, shares of QUALCOMM sold off on fears of supply constraints affecting the company’s ability to meet customer demand. We believe these concerns are overblown and continue to see significant upside for the company in areas such as 5G smart phones, autonomous vehicles, and the internet of things. Anheuser-Busch has seen strong volume growth but has been affected by temporary cost pressure.
During the final quarter, we introduced a position in Digital Realty Trust, Inc. (DLR), a REIT that owns, acquires, develops, and operates data centers. With the exponential growth in data that is expected over the coming years comes the need for growth in the infrastructure required to create, process, transmit, and store all of this data. DLR maintains strong market share in all of the geographies in which it operates but has traded at a discount to some of its peers. We see this as a value opportunity and the potential for the shares to re-rate as recent developments come online and earnings growth accelerates. Additionally, the shares offer a nice 3.20% yield.
The bond allocation of the Balanced Income Fund consists of 23 high-quality bonds across eight sectors with the top allocations to U.S. Treasuries at 22.62%, Energy at 20.32% and Consumer Discretionary at 16.93%. The credit quality of the Fund is A/A with an effective maturity of 3.98 years and a duration of 3.61 years. Our floating-rate exposure continues to reduce itself as we are letting these bonds mature without the intention to reinvest in floating positions as the Federal Reserve has indicated Fed Funds will remain near zero through 2023. The income levels for the floating-rate notes change quarterly based on the level of 3-month LIBOR, which is currently around 19 basis points. With the accommodation of the Fed, we will be looking to add exposure to corporate credit if we are compensated for taking either duration or credit risk. During the quarter, we conducted two corporate transactions. We purchased the Comcast 2028 issue due to its strong rating, business model and the favorable underlying Treasury rate trajectory. Later in the quarter, we also purchased the newly issued AT&T 24s, which came at a favorable spread with low duration. The new issue market favored long tenor bonds that came with too much duration risk for the Fund. In the secondary market, we remain selective, as credit spreads are expensive, in our opinion.
In closing, after a turbulent fiscal 2021, we think this is a good reminder of the value in a balanced investing approach. We believe our allocation to dividend-paying value-oriented equities should position the Fund nicely for long-term capital appreciation as the world emerges from the pandemic and economic growth resumes. Additionally, our defensive fixed income positioning should continue to provide current income and a volatility buffer in the near-term.
On behalf of Davenport’s almost 500 employees, we want to thank you for your trust, confidence, and patience over the past twelve months. During this time, we saw the market set a record for the fastest drop into a bear market but then the fastest recovery to a bull market. Now COVID-19 adds yet another milestone to the wars, recessions, a depression, and the Spanish Flu that our firm has successfully navigated since we were established in 1863. Each experience has taught us the importance of being a good steward of our client’s wealth. In our case, clients include not only family and friends, but also our Davenport team members, who have entrusted us to invest their retirement assets using the same investment philosophy as our five mutual funds.
Working in a COVID environment, presented new challenges, but our team’s passion for investing and managing money never wavered. We believe our investment process and philosophy was stronger than ever during the Covid lockdown and is well positioned for the future. We are pleased to report our team is back in the office with renewed vigor and excitement to find attractive investment opportunities. We welcome you to reach out to us with your questions and comments. Thank you again for being a fellow shareholder of our funds.
Sincerely,
John P. Ackerly IV, CFA
President, The Davenport Funds
| DAVENPORT CORE FUND |
| PERFORMANCE INFORMATION (Unaudited) |
Comparison of the Change in Value of a $10,000 Investment in
Davenport Core Fund and the S&P 500® Index
| | | | |
| | | Average Annual Total Returns | |
| | | (for periods ended March 31, 2021) | |
| | | | |
| | | 1 Year | | 5 Years | | 10 Years | |
| Davenport Core Fund(a) | | 48.20% | | 14.04% | | 12.25% | |
| S&P 500® Index | | 56.35% | | 16.29% | | 13.91% | |
| | | | | | | | |
| (a) | The total returns shown do not reflect the deduction of taxes that a shareholder would pay on Fund distributions or the redemption of Fund shares. |
| DAVENPORT VALUE & INCOME FUND |
| PERFORMANCE INFORMATION (Unaudited) |
Comparison of the Change in Value of a $10,000 Investment in
Davenport Value & Income Fund, the Russell 1000® Value Index
and the Lipper Equity Income Index
| | | | |
| | | Average Annual Total Returns | |
| | | (for periods ended March 31, 2021) | |
| | | | |
| | | 1 Year | | 5 Years | | 10 Years | |
| Davenport Value & Income Fund(a) | | 49.55% | | 9.96% | | 10.93% | |
| Russell 1000® Value Index | | 56.09% | | 11.74% | | 10.99% | |
| Lipper Equity Income Index | | 47.43% | | 11.69% | | 10.50% | |
| | | | | | | | |
| (a) | The total returns shown do not reflect the deduction of taxes that a shareholder would pay on Fund distributions or the redemption of Fund shares. |
| DAVENPORT EQUITY OPPORTUNITIES FUND |
| PERFORMANCE INFORMATION (Unaudited) |
Comparison of the Change in Value of a $10,000 Investment in
Davenport Equity Opportunities Fund and the Russell Midcap® Index
| | | |
| | | Average Annual Total Returns |
| | | (for periods ended March 31, 2021) |
| | | |
| | | 1 Year | | 5 Years | | 10 Years | |
| Davenport Equity Opportunities Fund(a) | | 66.20% | | 15.40% | | 13.63% | |
| Russell Midcap® Index | | 73.64% | | 14.67% | | 12.47% | |
| | | | | | | | |
| (a) | The total returns shown do not reflect the deduction of taxes that a shareholder would pay on Fund distributions or the redemption of Fund shares. |
| DAVENPORT SMALL CAP FOCUS FUND |
| PERFORMANCE INFORMATION (Unaudited) |
Comparison of the Change in Value of a $10,000 Investment in
Davenport Small Cap Focus Fund and the Russell 2000® Index
| | | | |
| | | Average Annual Total Returns | |
| | | (for periods ended March 31, 2021) | |
| | | | |
| | | | | | | Since | |
| | | 1 Year | | 5 Years | | Inception(b) | |
| Davenport Small Cap Focus Fund(a) | | 84.84% | | 18.77% | | 13.53% | |
| Russell 2000® Index | | 94.85% | | 16.35% | | 11.80% | |
| | | | | | | | |
| (a) | The total returns shown do not reflect the deduction of taxes that a shareholder would pay on Fund distributions or the redemption of Fund shares. |
| (b) | Commencement of operations was December 31, 2014. |
| DAVENPORT BALANCED INCOME FUND |
| PERFORMANCE INFORMATION (Unaudited) |
Comparison of the Change in Value of a $10,000 Investment in Davenport Balanced
Income Fund, the Russell 1000® Value Index, a Blended 60% Russell 1000® Value
Index / 40% Bloomberg Barclays Intermediate Government/Credit Bond Index
and the Morningstar US OE Allocation – 50% to 70% Equity
| | | | |
| | | Average Annual Total Returns | |
| | | (for periods ended March 31, 2021) | |
| | | | |
| | | | | | | Since | |
| | | 1 Year | | 5 Years | | Inception(b) | |
| Davenport Balanced Income Fund(a) | | 33.14% | | 6.97% | | 7.21% | |
| Russell 1000® Value Index | | 56.09% | | 11.74% | | 11.50% | |
| Blended 60% Russell 1000® Value Index / 40% Bloomberg Barclays Intermediate Government/Credit Bond Index | | 32.26% | | 8.42% | | 8.43% | |
| Morningstar US OE Allocation - 50% to 70% Equity | | 36.13% | | 9.38% | | 9.10% | |
| | | | | | | | |
| (a) | The total returns shown do not reflect the deduction of taxes that a shareholder would pay on Fund distributions or the redemption of Fund shares. |
| (b) | Commencement of operations was December 31, 2015. |
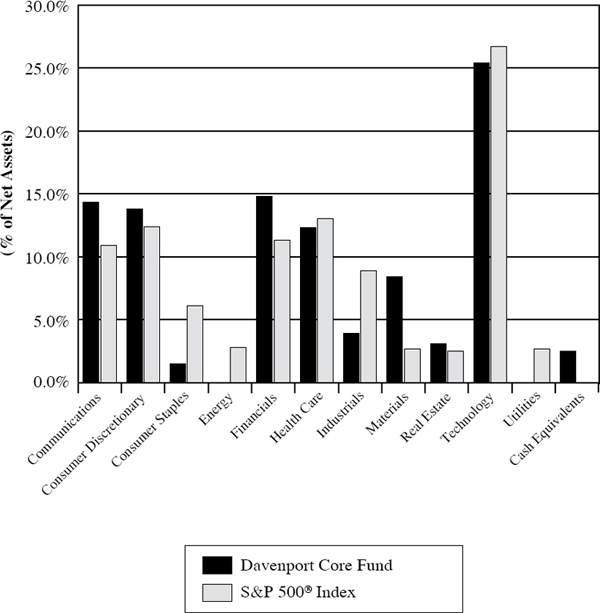
| DAVENPORT CORE FUND |
| PORTFOLIO INFORMATION |
| March 31, 2021 (Unaudited) |
Sector Allocation vs. the S&P 500® Index
Top Ten Equity Holdings
| Security Description | | % of Net Assets |
| Alphabet, Inc. - Classes A and C | | 4.2% |
| Microsoft Corporation | | 3.9% |
| Brookfield Asset Management, Inc. - Class A | | 3.6% |
| Danaher Corporation | | 3.5% |
| Adobe, Inc. | | 3.2% |
| Amazon.com, Inc. | | 3.1% |
| American Tower Corporation | | 3.1% |
| Accenture plc - Class A | | 2.9% |
| Mastercard, Inc. - Class A | | 2.9% |
| Apple, Inc. | | 2.8% |
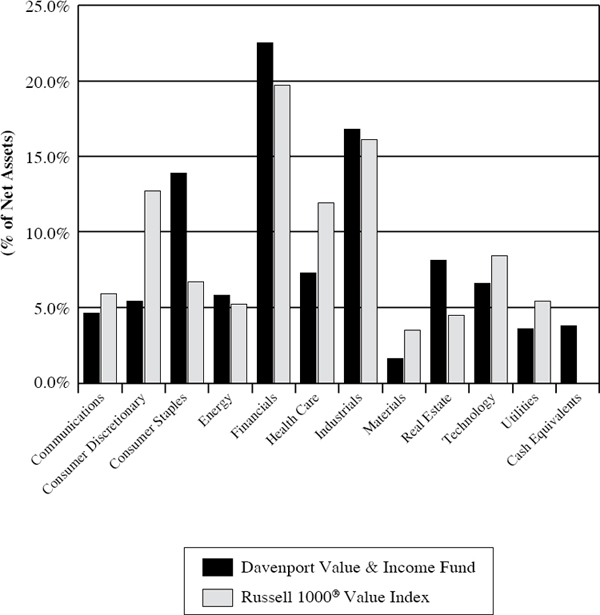
| DAVENPORT VALUE & INCOME FUND |
| PORTFOLIO INFORMATION |
| March 31, 2021 (Unaudited) |
Sector Allocation vs. the Russell 1000® Value Index
Top Ten Equity Holdings
| Security Description | | % of Net Assets |
| Brookfield Asset Management, Inc. - Class A | | 3.9% |
| Johnson & Johnson | | 3.2% |
| Watsco, Inc. | | 3.1% |
| JPMorgan Chase & Company | | 3.0% |
| Capital One Financial Corporation | | 3.0% |
| Fidelity National Financial, Inc. | | 2.9% |
| United Parcel Service, Inc. - Class B | | 2.9% |
| Comcast Corporation - Class A | | 2.9% |
| Bunge Ltd. | | 2.7% |
| Berkshire Hathaway, Inc. - Class B | | 2.7% |
| DAVENPORT EQUITY OPPORTUNITIES FUND |
| PORTFOLIO INFORMATION |
| March 31, 2021 (Unaudited) |
Sector Allocation vs. the Russell Midcap® Index

Top Ten Equity Holdings
| Security Description | | % of Net Assets |
| DISH Network Corporation - Class A | | 6.2% |
| Brookfield Asset Management, Inc. - Class A | | 5.3% |
| American Tower Corporation | | 5.0% |
| Markel Corporation | | 4.9% |
| O’Reilly Automotive, Inc. | | 4.3% |
| CarMax, Inc. | | 4.1% |
| Cannae Holdings, Inc. | | 3.9% |
| Etsy, Inc. | | 3.8% |
| Fidelity National Financial, Inc. | | 3.7% |
| Sherwin-Williams Company (The) | | 3.7% |
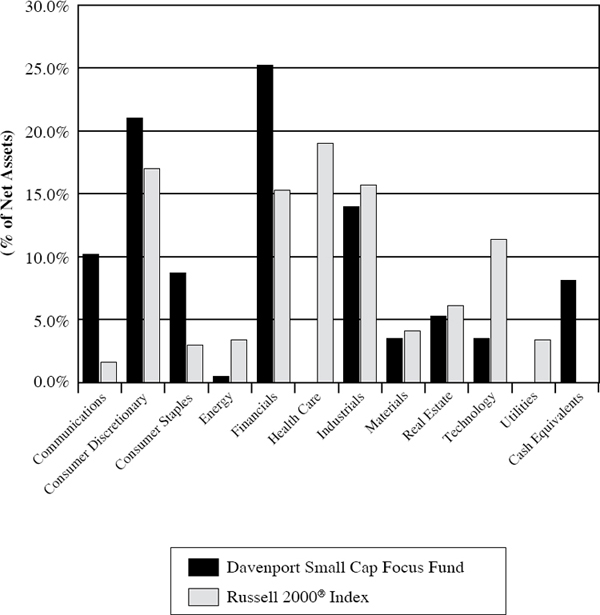
| DAVENPORT SMALL CAP FOCUS FUND |
| PORTFOLIO INFORMATION |
| March 31, 2021 (Unaudited) |
Sector Allocation vs. the Russell 2000® Index
Top Ten Equity Holdings
| Security Description | | % of Net Assets |
| Cannae Holdings, Inc. | | 5.2% |
| Evoqua Water Technologies Corporation | | 5.0% |
| Stewart Information Services Corporation | | 3.9% |
| Foley Trasimene Acquisition Corporation - Class A | | 3.9% |
| Builders FirstSource, Inc. | | 3.7% |
| Liberty Latin America Ltd. - Class C | | 3.5% |
| Juniper Industrial Holdings, Inc. | | 3.4% |
| Monarch Casino & Resort, Inc. | | 3.4% |
| Live Oak Bancshares, Inc. | | 3.3% |
| Lamar Advertising Company - Class A | | 3.1% |
| | | |
| DAVENPORT BALANCED INCOME FUND |
| PORTFOLIO INFORMATION |
| March 31, 2021 (Unaudited) |
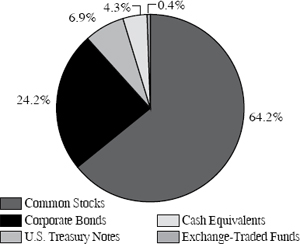
Asset Allocation (% of Net Assets)
| Ten Largest Equity Holdings | % of Net Assets |
| Brookfield Asset Management, Inc. - Class A | 2.2% |
| Cannae Holdings, Inc. | 2.1% |
| Johnson & Johnson | 1.8% |
| Watsco, Inc. | 1.8% |
| JPMorgan Chase & Company | 1.7% |
| Brookfield Renewable Partners, L.P. | 1.7% |
| Capital One Financial Corporation | 1.6% |
| Fidelity National Financial, Inc. | 1.6% |
| Bunge Ltd. | 1.6% |
| United Parcel Service, Inc. - Class B | 1.5% |
Equity Sector Concentration vs. the Russell 1000 Value Index (64.6% of Net Assets)
| Bond Portfolio (31.1% of Net Assets) | | | Credit Quality | Composite Quality |
| Number of Fixed-Income Securities | 24 | | AAA | 30.78 |
| Average Quality | A+/A1 | | AA | 1.96 |
| Effective Maturity | 3.70 yrs. | | A | 38.13 |
| Average Effective Duration | 3.39 yrs. | | BBB | 29.13 |
| | | | | |
| Sector Breakdown | % of Bond
Portfolio | | | |
| Communications | 13.4% | | | |
| Consumer Staples | 7.1% | | | |
| Energy | 19.8% | | | |
| Financials | 6.1% | | | |
| Health Care | 8.0% | | | |
| Industrials | 9.3% | | | |
| Materials | 3.6% | | | |
| Technology | 10.6% | | | |
| U.S. Treasury | 22.1% | | | |
| DAVENPORT CORE FUND |
| SCHEDULE OF INVESTMENTS |
| March 31, 2021 |
| COMMON STOCKS — 97.5% | | Shares | | | Value | |
| Communications — 14.3% | | | | | | | | |
| Alphabet, Inc. - Class A (a) | | | 8,290 | | | $ | 17,098,291 | |
| Alphabet, Inc. - Class C (a) | | | 7,036 | | | | 14,554,881 | |
| DISH Network Corporation - Class A (a) | | | 288,707 | | | | 10,451,193 | |
| Facebook, Inc. - Class A (a) | | | 41,118 | | | | 12,110,485 | |
| Liberty Broadband Corporation - Series C (a) | | | 61,713 | | | | 9,266,207 | |
| T-Mobile US, Inc. (a) | | | 160,897 | | | | 20,158,785 | |
| Uber Technologies, Inc. (a) | | | 185,382 | | | | 10,105,173 | |
| Walt Disney Company (The) (a) | | | 75,789 | | | | 13,984,586 | |
| | | | | | | | 107,729,601 | |
| Consumer Discretionary — 13.8% | | | | | | | | |
| Alibaba Group Holding Ltd. - ADR (a) | | | 44,707 | | | | 10,136,418 | |
| Amazon.com, Inc. (a) | | | 7,598 | | | | 23,508,820 | |
| CarMax, Inc. (a) | | | 151,983 | | | | 20,162,065 | |
| Home Depot, Inc. (The) | | | 35,678 | | | | 10,890,709 | |
| MercadoLibre, Inc. (a) | | | 7,743 | | | | 11,398,780 | |
| NIKE, Inc. - Class B | | | 102,450 | | | | 13,614,580 | |
| TJX Companies, Inc. (The) | | | 220,904 | | | | 14,612,800 | |
| | | | | | | | 104,324,172 | |
| Consumer Staples — 1.5% | | | | | | | | |
| Constellation Brands, Inc. - Class A | | | 49,590 | | | | 11,306,520 | |
| | | | | | | | | |
| Financials — 14.8% | | | | | | | | |
| Aon plc - Class A | | | 74,895 | | | | 17,234,088 | |
| Berkshire Hathaway, Inc. - Class B (a) | | | 68,270 | | | | 17,440,937 | |
| Brookfield Asset Management, Inc. - Class A | | | 612,403 | | | | 27,251,934 | |
| Charles Schwab Corporation (The) | | | 230,874 | | | | 15,048,367 | |
| JPMorgan Chase & Company | | | 104,842 | | | | 15,960,098 | |
| Markel Corporation (a) | | | 16,857 | | | | 19,210,574 | |
| | | | | | | | 112,145,998 | |
| Health Care — 12.3% | | | | | | | | |
| Abbott Laboratories | | | 105,732 | | | | 12,670,923 | |
| Danaher Corporation | | | 117,041 | | | | 26,343,588 | |
| Illumina, Inc. (a) | | | 22,916 | | | | 8,801,119 | |
| Johnson & Johnson | | | 100,855 | | | | 16,575,519 | |
| Medtronic plc | | | 92,610 | | | | 10,940,020 | |
| UnitedHealth Group, Inc. | | | 30,261 | | | | 11,259,210 | |
| Vertex Pharmaceuticals, Inc. (a) | | | 30,632 | | | | 6,582,511 | |
| | | | | | | | 93,172,890 | |
| Industrials — 3.9% | | | | | | | | |
| Honeywell International, Inc. | | | 67,995 | | | | 14,759,675 | |
| Union Pacific Corporation | | | 65,908 | | | | 14,526,782 | |
| | | | | | | | 29,286,457 | |
| DAVENPORT CORE FUND |
| SCHEDULE OF INVESTMENTS (Continued) |
| COMMON STOCKS — 97.5% (Continued) | | Shares | | | Value | |
| Materials — 8.4% | | | | | | | | |
| Air Products & Chemicals, Inc. | | | 66,360 | | | $ | 18,669,723 | |
| Ball Corporation | | | 115,660 | | | | 9,801,028 | |
| Martin Marietta Materials, Inc. | | | 45,798 | | | | 15,379,884 | |
| Sherwin-Williams Company (The) | | | 26,614 | | | | 19,641,398 | |
| | | | | | | | 63,492,033 | |
| Real Estate — 3.1% | | | | | | | | |
| American Tower Corporation | | | 96,990 | | | | 23,186,430 | |
| | | | | | | | | |
| Technology — 25.4% | | | | | | | | |
| Accenture plc - Class A | | | 80,315 | | | | 22,187,019 | |
| Adobe, Inc. (a) | | | 50,572 | | | | 24,040,412 | |
| Apple, Inc. | | | 174,470 | | | | 21,311,510 | |
| Broadcom, Inc. | | | 28,113 | | | | 13,034,874 | |
| FleetCor Technologies, Inc. (a) | | | 56,200 | | | | 15,097,006 | |
| Mastercard, Inc. - Class A | | | 61,147 | | | | 21,771,389 | |
| Microsoft Corporation | | | 125,765 | | | | 29,651,614 | |
| Moody’s Corporation | | | 37,574 | | | | 11,219,972 | |
| Sony Group Corporation - ADR | | | 122,035 | | | | 12,936,930 | |
| Visa, Inc. - Class A | | | 99,286 | | | | 21,021,825 | |
| | | | | | | | 192,272,551 | |
| | | | | | | | | |
| Total Common Stocks (Cost $408,092,617) | | | | | | $ | 736,916,652 | |
| MONEY MARKET FUNDS — 1.5% | | Shares | | | Value | |
| First American Treasury Obligations Fund - Class Z, 0.03% (b) (Cost $11,196,059) | | | 11,196,059 | | | $ | 11,196,059 | |
| | | | | | | | | |
| Total Investments at Value — 99.0% (Cost $419,288,676) | | | | | | $ | 748,112,711 | |
| | | | | | | | | |
| Other Assets in Excess of Liabilities — 1.0% | | | | | | | 7,937,041 | |
| | | | | | | | | |
| Net Assets — 100.0% | | | | | | $ | 756,049,752 | |
ADR - American Depositary Receipt.
| (a) | Non-income producing security. |
| (b) | The rate shown is the 7-day effective yield as of March 31, 2021. |
See accompanying notes to financial statements.
| DAVENPORT VALUE & INCOME FUND |
| SCHEDULE OF INVESTMENTS |
| March 31, 2021 |
| COMMON STOCKS — 96.2% | | Shares | | | Value | |
| Communications — 4.6% | | | | | | | | |
| Alphabet, Inc. - Class A (a) | | | 6,504 | | | $ | 13,414,630 | |
| Comcast Corporation - Class A | | | 416,324 | | | | 22,527,292 | |
| | | | | | | | 35,941,922 | |
| Consumer Discretionary — 5.4% | | | | | | | | |
| Cannae Holdings, Inc. (a) | | | 360,297 | | | | 14,274,967 | |
| Lowe��s Companies, Inc. | | | 62,548 | | | | 11,895,379 | |
| McDonald’s Corporation | | | 74,202 | | | | 16,631,636 | |
| | | | | | | | 42,801,982 | |
| Consumer Staples — 13.9% | | | | | | | | |
| Anheuser-Busch InBev S.A./N.V. - ADR | | | 300,915 | | | | 18,912,508 | |
| Bunge Ltd. | | | 271,802 | | | | 21,545,745 | |
| Coca-Cola Company (The) | | | 222,212 | | | | 11,712,795 | |
| Diageo plc - ADR | | | 88,403 | | | | 14,516,656 | |
| Philip Morris International, Inc. | | | 196,772 | | | | 17,461,547 | |
| Tyson Foods, Inc. - Class A | | | 176,565 | | | | 13,118,779 | |
| Walgreen Boots Alliance, Inc. | | | 225,845 | | | | 12,398,890 | |
| | | | | | | | 109,666,920 | |
| Energy — 5.8% | | | | | | | | |
| BP plc - ADR | | | 760,554 | | | | 18,519,490 | |
| Chevron Corporation | | | 121,084 | | | | 12,688,392 | |
| Enbridge, Inc. | | | 406,546 | | | | 14,798,275 | |
| | | | | | | | 46,006,157 | |
| Financials — 22.5% | | | | | | | | |
| Berkshire Hathaway, Inc. - Class B (a) | | | 83,352 | | | | 21,293,935 | |
| Brookfield Asset Management, Inc. - Class A | | | 689,088 | | | | 30,664,416 | |
| Capital One Financial Corporation | | | 184,229 | | | | 23,439,456 | |
| Fairfax Financial Holdings Ltd. | | | 41,967 | | | | 18,269,914 | |
| Fidelity National Financial, Inc. | | | 555,668 | | | | 22,593,461 | |
| JPMorgan Chase & Company | | | 157,862 | | | | 24,031,332 | |
| Markel Corporation (a) | | | 17,063 | | | | 19,445,336 | |
| Truist Financial Corporation | | | 301,897 | | | | 17,606,633 | |
| | | | | | | | 177,344,483 | |
| Health Care — 7.3% | | | | | | | | |
| Bristol-Myers Squibb Company | | | 226,358 | | | | 14,289,980 | |
| Johnson & Johnson | | | 151,911 | | | | 24,966,573 | |
| Medtronic plc | | | 158,815 | | | | 18,760,816 | |
| | | | | | | | 58,017,369 | |
| Industrials — 16.8% | | | | | | | | |
| 3M Company | | | 106,157 | | | | 20,454,331 | |
| Deere & Company | | | 36,687 | | | | 13,726,074 | |
| L3Harris Technologies, Inc. | | | 71,660 | | | | 14,524,049 | |
| Norfolk Southern Corporation | | | 68,159 | | | | 18,302,055 | |
| TE Connectivity Ltd. | | | 145,015 | | | | 18,722,887 | |
| DAVENPORT VALUE & INCOME FUND |
| SCHEDULE OF INVESTMENTS (Continued) |
| COMMON STOCKS — 96.2% (Continued) | | Shares | | | Value | |
| Industrials — 16.8% (Continued) | | | | | | | | |
| United Parcel Service, Inc. - Class B | | | 132,650 | | | $ | 22,549,173 | |
| Watsco, Inc. | | | 93,164 | | | | 24,292,513 | |
| | | | | | | | 132,571,082 | |
| Materials — 1.6% | | | | | | | | |
| Newmont Corporation | | | 204,308 | | | | 12,313,643 | |
| | | | | | | | | |
| Real Estate — 8.1% | | | | | | | | |
| Crown Castle International Corporation | | | 91,918 | | | | 15,821,845 | |
| Digital Realty Trust, Inc. | | | 103,525 | | | | 14,580,461 | |
| Gaming and Leisure Properties, Inc. | | | 374,418 | | | | 15,886,556 | |
| Lamar Advertising Company - Class A | | | 191,230 | | | | 17,960,322 | |
| | | | | | | | 64,249,184 | |
| Technology — 6.6% | | | | | | | | |
| Microsoft Corporation | | | 82,296 | | | | 19,402,928 | |
| QUALCOMM, Inc. | | | 123,088 | | | | 16,320,238 | |
| Sony Group Corporation - ADR | | | 155,347 | | | | 16,468,336 | |
| | | | | | | | 52,191,502 | |
| Utilities — 3.6% | | | | | | | | |
| Dominion Energy, Inc. | | | 225,731 | | | | 17,146,527 | |
| NextEra Energy, Inc. | | | 151,076 | | | | 11,422,856 | |
| | | | | | | | 28,569,383 | |
| | | | | | | | | |
| Total Common Stocks (Cost $566,400,992) | | | | | | $ | 759,673,627 | |
| MONEY MARKET FUNDS — 3.8% | | Shares | | | Value | |
| First American Treasury Obligations Fund - Class Z, 0.03% (b) (Cost $30,123,198) | | | 30,123,198 | | | $ | 30,123,198 | |
| | | | | | | | | |
| Total Investments at Value — 100.0% (Cost $596,524,190) | | | | | | $ | 789,796,825 | |
| | | | | | | | | |
| Liabilities in Excess of Other Assets — (0.0%) (c) | | | | | | | (144,983 | ) |
| | | | | | | | | |
| Net Assets — 100.0% | | | | | | $ | 789,651,842 | |
ADR - American Depositary Receipt.
| (a) | Non-income producing security. |
| (b) | The rate shown is the 7-day effective yield as of March 31, 2021. |
| (c) | Percentage rounds to less than 0.1%. |
See accompanying notes to financial statements.
| DAVENPORT EQUITY OPPORTUNITIES FUND |
| SCHEDULE OF INVESTMENTS |
| March 31, 2021 |
| COMMON STOCKS — 93.3% | | Shares | | | Value | |
| Communications — 9.7% | | | | | | | | |
| DISH Network Corporation - Class A (a) | | | 1,137,787 | | | $ | 41,187,889 | |
| Take-Two Interactive Software, Inc. (a) | | | 128,233 | | | | 22,658,771 | |
| | | | | | | | 63,846,660 | |
| Consumer Discretionary — 25.9% | | | | | | | | |
| Cannae Holdings, Inc. (a) | | | 651,711 | | | | 25,820,790 | |
| CarMax, Inc. (a) | | | 203,830 | | | | 27,040,088 | |
| DraftKings, Inc. - Class A (a) | | | 282,846 | | | | 17,346,945 | |
| Etsy, Inc. (a) | | | 125,017 | | | | 25,212,178 | |
| Hilton Worldwide Holdings, Inc. (a) | | | 120,245 | | | | 14,540,025 | |
| Live Nation Entertainment, Inc. (a) | | | 161,143 | | | | 13,640,755 | |
| MercadoLibre, Inc. (a) | | | 13,071 | | | | 19,242,342 | |
| O’Reilly Automotive, Inc. (a) | | | 55,384 | | | | 28,093,534 | |
| | | | | | | | 170,936,657 | |
| Financials — 17.4% | | | | | | | | |
| Brookfield Asset Management, Inc. - Class A | | | 791,144 | | | | 35,205,908 | |
| Fairfax Financial Holdings Ltd. | | | 51,278 | | | | 22,323,365 | |
| Fidelity National Financial, Inc. | | | 606,676 | | | | 24,667,446 | |
| Markel Corporation (a) | | | 28,316 | | | | 32,269,480 | |
| | | | | | | | 114,466,199 | |
| Health Care — 3.0% | | | | | | | | |
| Align Technology, Inc. (a) | | | 36,156 | | | | 19,579,559 | |
| | | | | | | | | |
| Industrials — 14.0% | | | | | | | | |
| Colfax Corporation (a) | | | 520,188 | | | | 22,789,436 | |
| Evoqua Water Technologies Corporation (a) | | | 891,519 | | | | 23,446,950 | |
| Watsco, Inc. | | | 87,416 | | | | 22,793,722 | |
| Xylem, Inc. | | | 224,492 | | | | 23,612,069 | |
| | | | | | | | 92,642,177 | |
| Materials — 7.4% | | | | | | | | |
| Martin Marietta Materials, Inc. | | | 71,088 | | | | 23,872,772 | |
| Sherwin-Williams Company (The) | | | 33,411 | | | | 24,657,652 | |
| | | | | | | | 48,530,424 | |
| Real Estate — 7.4% | | | | | | | | |
| American Tower Corporation | | | 138,822 | | | | 33,186,788 | |
| Lamar Advertising Company - Class A | | | 165,997 | | | | 15,590,438 | |
| | | | | | | | 48,777,226 | |
| Technology — 8.5% | | | | | | | | |
| Autodesk, Inc. (a) | | | 67,113 | | | | 18,600,368 | |
| Black Knight, Inc. (a) | | | 270,559 | | | | 20,018,660 | |
| Intuit, Inc. | | | 45,549 | | | | 17,448,000 | |
| | | | | | | | 56,067,028 | |
| | | | | | | | | |
| Total Common Stocks (Cost $393,312,952) | | | | | | $ | 614,845,930 | |
| DAVENPORT EQUITY OPPORTUNITIES FUND |
| SCHEDULE OF INVESTMENTS (Continued) |
| MONEY MARKET FUNDS — 4.9% | | Shares | | | Value | |
| First American Treasury Obligations Fund - Class Z, 0.03% (b) (Cost $32,122,044) | | | 32,122,044 | | | $ | 32,122,044 | |
| | | | | | | | | |
| Total Investments at Value — 98.2% (Cost $425,434,996) | | | | | | $ | 646,967,974 | |
| | | | | | | | | |
| Other Assets in Excess of Liabilities — 1.8% | | | | | | | 12,146,269 | |
| | | | | | | | | |
| Net Assets — 100.0% | | | | | | $ | 659,114,243 | |
| (a) | Non-income producing security. |
| (b) | The rate shown is the 7-day effective yield as of March 31, 2021. |
See accompanying notes to financial statements.
| DAVENPORT SMALL CAP FOCUS FUND |
| SCHEDULE OF INVESTMENTS |
| March 31, 2021 |
| COMMON STOCKS — 91.8% | | Shares | | | Value | |
| Communications — 10.2% | | | | | | | | |
| Cable One, Inc. | | | 3,357 | | | $ | 6,137,804 | |
| Liberty Latin America Ltd. - Class C (a) | | | 1,319,576 | | | | 17,128,096 | |
| Shenandoah Telecommunications Company | | | 282,423 | | | | 13,785,067 | |
| Switch, Inc. - Class A | | | 803,796 | | | | 13,069,723 | |
| | | | | | | | 50,120,690 | |
| Consumer Discretionary — 21.0% | | | | | | | | |
| American Woodmark Corporation (a) | | | 65,328 | | | | 6,440,034 | |
| Builders FirstSource, Inc. (a) | | | 391,598 | | | | 18,158,399 | |
| Cannae Holdings, Inc. (a) | | | 650,613 | | | | 25,777,287 | |
| GAN Ltd. (a) | | | 369,308 | | | | 6,721,406 | |
| Hanesbrands, Inc. | | | 676,701 | | | | 13,310,709 | |
| Monarch Casino & Resort, Inc. (a) | | | 275,355 | | | | 16,692,020 | |
| OneSpaWorld Holdings Ltd. (a) | | | 849,026 | | | | 9,042,127 | |
| Westport Fuel Systems, Inc. (a) | | | 950,000 | | | | 6,830,500 | |
| | | | | | | | 102,972,482 | |
| Consumer Staples — 8.7% | | | | | | | | |
| Bunge Ltd. | | | 110,000 | | | | 8,719,700 | |
| J & J Snack Foods Corporation | | | 77,538 | | | | 12,175,792 | |
| Seaboard Corporation | | | 3,254 | | | | 12,007,227 | |
| Village Farms International, Inc. (a) | | | 725,000 | | | | 9,591,750 | |
| | | | | | | | 42,494,469 | |
| Energy — 0.5% | | | | | | | | |
| Aemetis, Inc. (a) | | | 100,000 | | | | 2,452,000 | |
| | | | | | | | | |
| Financials — 25.1% | | | | | | | | |
| BRP Group, Inc. - Class A (a) | | | 516,086 | | | | 14,063,343 | |
| Diamond Hill Investment Group, Inc. | | | 76,614 | | | | 11,952,550 | |
| Foley Trasimene Acquisition Corporation - Class A (a) | | | 1,900,000 | | | | 19,076,000 | |
| Juniper Industrial Holdings, Inc. (a) | | | 1,366,046 | | | | 16,938,970 | |
| Kinsale Capital Group, Inc. | | | 31,917 | | | | 5,259,922 | |
| Live Oak Bancshares, Inc. | | | 237,953 | | | | 16,297,401 | |
| Silver Spike Acquisition Corporation - Class A (a) | | | 297,000 | | | | 5,452,920 | |
| Stewart Information Services Corporation | | | 369,184 | | | | 19,208,644 | |
| TowneBank | | | 327,479 | | | | 9,955,362 | |
| Trebia Acquisition Corporation (a) | | | 500,000 | | | | 5,225,000 | |
| | | | | | | | 123,430,112 | |
| Industrials — 14.0% | | | | | | | | |
| Casella Waste Systems, Inc. - Class A (a) | | | 159,012 | | | | 10,108,393 | |
| Chart Industries, Inc. (a) | | | 91,476 | | | | 13,021,609 | |
| Colfax Corporation (a) | | | 316,992 | | | | 13,887,419 | |
| Evoqua Water Technologies Corporation (a) | | | 927,579 | | | | 24,395,328 | |
| Watsco, Inc. | | | 27,896 | | | | 7,273,882 | |
| | | | | | | | 68,686,631 | |
| DAVENPORT SMALL CAP FOCUS FUND |
| SCHEDULE OF INVESTMENTS (Continued) |
| COMMON STOCKS — 91.8% (Continued) | | Shares | | | Value | |
| Materials — 3.5% | | | | | | | | |
| MAG Silver Corporation (a) | | | 279,502 | | | $ | 4,195,325 | |
| NewMarket Corporation | | | 34,680 | | | | 13,183,949 | |
| | | | | | | | 17,379,274 | |
| Real Estate — 5.3% | | | | | | | | |
| FRP Holdings, Inc. (a) | | | 118,860 | | | | 5,850,289 | |
| Lamar Advertising Company - Class A | | | 162,359 | | | | 15,248,757 | |
| Radius Global Infrastructure, Inc. - Class A (a) | | | 334,257 | | | | 4,913,578 | |
| | | | | | | | 26,012,624 | |
| Technology — 3.5% | | | | | | | | |
| Sonos, Inc. (a) | | | 246,970 | | | | 9,253,966 | |
| Verra Mobility Corporation (a) | | | 599,260 | | | | 8,110,984 | |
| | | | | | | | 17,364,950 | |
| | | | | | | | | |
| Total Common Stocks (Cost $348,870,067) | | | | | | $ | 450,913,232 | |
| WARRANTS — 0.1% | | Shares | | | Value | |
| Foley Trasimene Acquisition Corporation - Class A (a) (Cost $650,621) | | | 283,333 | | | $ | 453,333 | |
| MONEY MARKET FUNDS — 8.1% | | Shares | | | Value | |
| First American Treasury Obligations Fund - Class Z, 0.03% (b) (Cost $39,882,946) | | | 39,882,946 | | | $ | 39,882,946 | |
| | | | | | | | | |
| Total Investments at Value — 100.0% (Cost $389,403,634) | | | | | | $ | 491,249,511 | |
| | | | | | | | | |
| Other Assets in Excess of Liabilities — 0.0% (c) | | | | | | | 6,109 | |
| | | | | | | | | |
| Net Assets — 100.0% | | | | | | $ | 491,255,620 | |
| (a) | Non-income producing security. |
| (b) | The rate shown is the 7-day effective yield as of March 31, 2021. |
| (c) | Percentage rounds to less than 0.1%. |
See accompanying notes to financial statements.
| DAVENPORT BALANCED INCOME FUND |
| SCHEDULE OF INVESTMENTS |
| March 31, 2021 |
| COMMON STOCKS — 64.2% | | Shares | | | Value | |
| Communications — 2.5% | | | | | | | | |
| Alphabet, Inc. - Class A (a) | | | 925 | | | $ | 1,907,831 | |
| Comcast Corporation - Class A | | | 54,420 | | | | 2,944,666 | |
| | | | | | | | 4,852,497 | |
| Consumer Discretionary — 5.3% | | | | | | | | |
| Cannae Holdings, Inc. (a) | | | 101,304 | | | | 4,013,665 | |
| Hanesbrands, Inc. | | | 112,905 | | | | 2,220,841 | |
| Lowe’s Companies, Inc. | | | 8,846 | | | | 1,682,332 | |
| McDonald’s Corporation | | | 10,246 | | | | 2,296,538 | |
| | | | | | | | 10,213,376 | |
| Consumer Staples — 8.7% | | | | | | | | |
| Anheuser-Busch InBev S.A./N.V. - ADR | | | 42,376 | | | | 2,663,332 | |
| Bunge Ltd. | | | 39,012 | | | | 3,092,481 | |
| Coca-Cola Company (The) | | | 31,604 | | | | 1,665,847 | |
| Diageo plc - ADR | | | 12,545 | | | | 2,060,014 | |
| Ingredion, Inc. | | | 13,155 | | | | 1,182,898 | |
| Philip Morris International, Inc. | | | 27,471 | | | | 2,437,776 | |
| Tyson Foods, Inc. - Class A | | | 24,894 | | | | 1,849,624 | |
| Walgreen Boots Alliance, Inc. | | | 31,983 | | | | 1,755,867 | |
| | | | | | | | 16,707,839 | |
| Energy — 3.9% | | | | | | | | |
| BP plc - ADR | | | 106,338 | | | | 2,589,331 | |
| Chevron Corporation | | | 16,932 | | | | 1,774,304 | |
| Enbridge, Inc. | | | 57,275 | | | | 2,084,810 | |
| Enterprise Products Partners, L.P. | | | 45,067 | | | | 992,375 | |
| | | | | | | | 7,440,820 | |
| Financials — 15.0% | | | | | | | | |
| Berkshire Hathaway, Inc. - Class B (a) | | | 11,473 | | | | 2,931,007 | |
| Brookfield Asset Management, Inc. - Class A | | | 97,228 | | | | 4,326,646 | |
| Capital One Financial Corporation | | | 24,967 | | | | 3,176,552 | |
| Diamond Hill Investment Group, Inc. | | | 11,715 | | | | 1,827,657 | |
| Fairfax Financial Holdings Ltd. | | | 5,756 | | | | 2,505,817 | |
| Fidelity National Financial, Inc. | | | 77,691 | | | | 3,158,916 | |
| JPMorgan Chase & Company | | | 22,045 | | | | 3,355,910 | |
| Markel Corporation (a) | | | 2,366 | | | | 2,696,341 | |
| Stewart Information Services Corporation | | | 50,417 | | | | 2,623,197 | |
| Truist Financial Corporation | | | 41,862 | | | | 2,441,392 | |
| | | | | | | | 29,043,435 | |
| Health Care — 4.2% | | | | | | | | |
| Bristol-Myers Squibb Company | | | 32,006 | | | | 2,020,539 | |
| Johnson & Johnson | | | 21,433 | | | | 3,522,514 | |
| Medtronic plc | | | 22,304 | | | | 2,634,771 | |
| | | | | | | | 8,177,824 | |
| DAVENPORT BALANCED INCOME FUND |
| SCHEDULE OF INVESTMENTS (Continued) |
| COMMON STOCKS — 64.2% (Continued) | | Shares | | | Value | |
| Industrials — 9.5% | | | | | | | | |
| 3M Company | | | 15,092 | | | $ | 2,907,927 | |
| Deere & Company | | | 5,099 | | | | 1,907,740 | |
| L3Harris Technologies, Inc. | | | 10,096 | | | | 2,046,257 | |
| Norfolk Southern Corporation | | | 9,678 | | | | 2,598,737 | |
| TE Connectivity Ltd. | | | 19,630 | | | | 2,534,429 | |
| United Parcel Service, Inc. - Class B | | | 17,565 | | | | 2,985,874 | |
| Watsco, Inc. | | | 13,056 | | | | 3,404,352 | |
| | | | | | | | 18,385,316 | |
| Materials — 0.9% | | | | | | | | |
| Newmont Corporation | | | 28,611 | | | | 1,724,385 | |
| | | | | | | | | |
| Real Estate — 5.5% | | | | | | | | |
| Crown Castle International Corporation | | | 12,840 | | | | 2,210,149 | |
| Digital Realty Trust, Inc. | | | 13,709 | | | | 1,930,776 | |
| Gaming and Leisure Properties, Inc. | | | 53,117 | | | | 2,253,754 | |
| Lamar Advertising Company - Class A | | | 26,732 | | | | 2,510,669 | |
| SL Green Realty Corporation | | | 24,215 | | | | 1,694,808 | |
| | | | | | | | 10,600,156 | |
| Technology — 3.9% | | | | | | | | |
| Microsoft Corporation | | | 11,293 | | | | 2,662,551 | |
| QUALCOMM, Inc. | | | 17,205 | | | | 2,281,211 | |
| Sony Group Corporation - ADR | | | 24,392 | | | | 2,585,796 | |
| | | | | | | | 7,529,558 | |
| Utilities — 4.8% | | | | | | | | |
| Brookfield Infrastructure Partners, L.P. | | | 41,245 | | | | 2,196,296 | |
| Brookfield Renewable Partners, L.P. | | | 76,999 | | | | 3,280,158 | |
| Dominion Energy, Inc. | | | 30,720 | | | | 2,333,491 | |
| NextEra Energy, Inc. | | | 20,584 | | | | 1,556,356 | |
| | | | | | | | 9,366,301 | |
| | | | | | | | | |
| Total Common Stocks (Cost $97,625,276) | | | | | | $ | 124,041,507 | |
| EXCHANGE-TRADED FUNDS — 0.4% | | Shares | | | Value | |
| Utilities Select Sector SPDR Fund (The) (Cost $656,257) | | | 13,027 | | | $ | 834,249 | |
| DAVENPORT BALANCED INCOME FUND |
| SCHEDULE OF INVESTMENTS (Continued) |
| FIXED RATE CORPORATE BONDS — 22.4% | | Par Value | | | Value | |
| Communications — 4.2% | | | | | | | | |
| AT&T, Inc., 0.90%, due 03/25/2024 | | $ | 2,655,000 | | | $ | 2,660,666 | |
| Comcast Corporation, 3.15%, due 02/15/2028 | | | 2,500,000 | | | | 2,695,644 | |
| Walt Disney Company (The), 3.35%, due 03/24/2025 | | | 2,505,000 | | | | 2,711,946 | |
| | | | | | | | 8,068,256 | |
| Consumer Staples — 2.2% | | | | | | | | |
| Altria Group, Inc., 4.75%, due 05/05/2021 | | | 1,500,000 | | | | 1,505,463 | |
| J.M. Smucker Company (The), 3.50%, due 10/15/2021 | | | 1,500,000 | | | | 1,524,965 | |
| PepsiCo, Inc., 2.75%, due 03/05/2022 | | | 1,200,000 | | | | 1,228,044 | |
| | | | | | | | 4,258,472 | |
| Energy — 4.3% | | | | | | | | |
| Boardwalk Pipelines, L.P., 4.45%, due 07/15/2027 | | | 2,000,000 | | | | 2,211,724 | |
| Halliburton Company, 3.80%, due 11/15/2025 | | | 2,325,000 | | | | 2,555,911 | |
| MPLX, L.P., 4.13%, due 03/01/2027 | | | 3,250,000 | | | | 3,606,128 | |
| | | | | | | | 8,373,763 | |
| Financials — 1.9% | | | | | | | | |
| BlackRock, Inc., 3.50%, due 03/18/2024 | | | 1,150,000 | | | | 1,250,635 | |
| Citigroup, Inc., 3.30%, due 04/27/2025 | | | 2,250,000 | | | | 2,422,854 | |
| | | | | | | | 3,673,489 | |
| Health Care — 2.5% | | | | | | | | |
| Amgen, Inc., 2.20%, due 02/21/2027 | | | 2,000,000 | | | | 2,050,513 | |
| CVS Health Corporation, 3.00%, due 08/15/2026 | | | 2,600,000 | | | | 2,777,324 | |
| | | | | | | | 4,827,837 | |
| Industrials — 2.9% | | | | | | | | |
| General Dynamics Corporation, 3.38%, due 05/15/2023 | | | 3,250,000 | | | | 3,445,833 | |
| John Deere Capital Corporation, 2.60%, due 03/07/2024 | | | 2,000,000 | | | | 2,118,061 | |
| | | | | | | | 5,563,894 | |
| Materials — 1.1% | | | | | | | | |
| Sherwin-Williams Company (The), 3.45%, due 06/01/2027 | | | 2,000,000 | | | | 2,181,876 | |
| | | | | | | | | |
| Technology — 3.3% | | | | | | | | |
| Fiserv, Inc., 3.20%, due 07/01/2026 | | | 2,225,000 | | | | 2,398,389 | |
| Oracle Corporation, 3.63%, due 07/15/2023 | | | 1,500,000 | | | | 1,599,890 | |
| PayPal Holdings, Inc., 2.40%, due 10/01/2024 | | | 2,250,000 | | | | 2,361,199 | |
| | | | | | | | 6,359,478 | |
| | | | | | | | | |
| Total Fixed Rate Corporate Bonds (Cost $41,619,790) | | | | | | $ | 43,307,065 | |
| DAVENPORT BALANCED INCOME FUND |
| SCHEDULE OF INVESTMENTS (Continued) |
| VARIABLE RATE CORPORATE BONDS (b) — 1.8% | | Par Value | | | Value | |
| Energy — 1.8% | | | | | | | | |
| BP Capital Markets plc, 0.840% | | | | | | | | |
| (3MO LIBOR + 65), due 09/19/2022 | | $ | 1,750,000 | | | $ | 1,757,751 | |
| ConocoPhillips Company, 1.098% | | | | | | | | |
| (3MO LIBOR + 90), due 05/15/2022 | | | 1,750,000 | | | | 1,763,286 | |
| Total Variable Rate Corporate Bonds (Cost $3,516,199) | | | | | | $ | 3,521,037 | |
| U.S. TREASURY OBLIGATIONS — 6.9% | | Par Value | | | Value | |
| U.S. Treasury Notes — 6.9% | | | | | | | | |
| 3.125%, due 05/15/2021 | | $ | 2,750,000 | | | $ | 2,760,208 | |
| 2.75%, due 06/30/2025 | | | 4,810,000 | | | | 5,216,595 | |
| 2.875%, due 08/15/2028 | | | 4,785,000 | | | | 5,259,762 | |
| Total U.S. Treasury Obligations (Cost $12,350,379) | | | | | | $ | 13,236,565 | |
| MONEY MARKET FUNDS — 6.2% | | Shares | | | Value | |
| First American Treasury Obligations Fund - Class Z, 0.03% (c) (Cost $11,936,603) | | | 11,936,603 | | | $ | 11,936,603 | |
| | | | | | | | | |
| Total Investments at Value — 101.9% (Cost $167,704,504) | | | | | | $ | 196,877,026 | |
| | | | | | | | | |
| Liabilities in Excess of Other Assets — (1.9%) | | | | | | | (3,691,039 | ) |
| | | | | | | | | |
| Net Assets — 100.0% | | | | | | $ | 193,185,987 | |
ADR - American Depositary Receipt.
LIBOR - London Interbank Offered Rate.
| (a) | Non-income producing security. |
| (b) | Variable rate security. Interest rate resets periodically. The rate shown is the effective interest rate as of March 31, 2021. The reference rate and spread (in basis points) are indicated parenthetically. |
| (c) | The rate shown is the 7-day effective yield as of March 31, 2021. |
See accompanying notes to financial statements.
| THE DAVENPORT FUNDS |
| STATEMENTS OF ASSETS AND LIABILITIES |
| March 31, 2021 |
| | | | | | Davenport | | | Davenport | |
| | | Davenport | | | Value & | | | Equity | |
| | | Core | | | Income | | | Opportunities | |
| | | Fund | | | Fund | | | Fund | |
| ASSETS | | | | | | | | | | | | |
| Investments in securities: | | | | | | | | | | | | |
| At cost | | $ | 419,288,676 | | | $ | 596,524,190 | | | $ | 425,434,996 | |
| At value (Note 2) | | $ | 748,112,711 | | | $ | 789,796,825 | | | $ | 646,967,974 | |
| Cash | | | 8,087,870 | | | | 76,144 | | | | 87,421 | |
| Receivable for capital shares sold | | | 124,232 | | | | 181,822 | | | | 347,484 | |
| Receivable for investment securities sold | | | 11,637,865 | | | | — | | | | 12,608,163 | |
| Dividends receivable | | | 232,912 | | | | 736,783 | | | | 798 | |
| Other assets | | | 16,035 | | | | 14,514 | | | | 15,728 | |
| TOTAL ASSETS | | | 768,211,625 | | | | 790,806,088 | | | | 660,027,568 | |
| | | | | | | | | | | | | |
| LIABILITIES | | | | | | | | | | | | |
| Payable for capital shares redeemed | | | 248,509 | | | | 533,235 | | | | 377,976 | |
| Payable for investment securities purchased | | | 11,313,752 | | | | — | | | | — | |
| Accrued investment advisory fees (Note 4) | | | 474,757 | | | | 494,216 | | | | 414,164 | |
| Payable to administrator (Note 4) | | | 112,945 | | | | 117,990 | | | | 106,165 | |
| Other accrued expenses | | | 11,910 | | | | 8,805 | | | | 15,020 | |
| TOTAL LIABILITIES | | | 12,161,873 | | | | 1,154,246 | | | | 913,325 | |
| | | | | | | | | | | | | |
| NET ASSETS | | $ | 756,049,752 | | | $ | 789,651,842 | | | $ | 659,114,243 | |
| | | | | | | | | | | | | |
| Net assets consist of: | | | | | | | | | | | | |
| Paid-in capital | | $ | 397,821,894 | | | $ | 586,067,356 | | | $ | 410,007,990 | |
| Accumulated earnings | | | 358,227,858 | | | | 203,584,486 | | | | 249,106,253 | |
| Net assets | | $ | 756,049,752 | | | $ | 789,651,842 | | | $ | 659,114,243 | |
| | | | | | | | | | | | | |
| Shares of beneficial interest outstanding (unlimited number of shares authorized, $0.01 par value) | | | 24,020,261 | | | | 42,496,260 | | | | 26,857,073 | |
| | | | | | | | | | | | | |
| Net asset value, offering price and redemption price per share (Note 2) | | $ | 31.48 | | | $ | 18.58 | | | $ | 24.54 | |
See accompanying notes to financial statements.
| THE DAVENPORT FUNDS |
| STATEMENTS OF ASSETS AND LIABILITIES (Continued) |
| March 31, 2021 |
| | | Davenport | | | Davenport | |
| | | Small Cap | | | Balanced | |
| | | Focus | | | Income | |
| | | Fund | | | Fund | |
| ASSETS | | | | | | | | |
| Investments in securities: | | | | | | | | |
| At cost | | $ | 389,403,634 | | | $ | 167,704,504 | |
| At value (Note 2) | | $ | 491,249,511 | | | $ | 196,877,026 | |
| Cash | | | — | | | | 50,557 | |
| Receivable for capital shares sold | | | 371,676 | | | | 356,016 | |
| Receivable for investment securities sold | | | 1,202,977 | | | | — | |
| Dividends and interest receivable | | | 170,383 | | | | 498,862 | |
| Other assets | | | 15,385 | | | | 10,219 | |
| TOTAL ASSETS | | | 493,009,932 | | | | 197,792,680 | |
| | | | | | | | | |
| LIABILITIES | | | | | | | | |
| Payable for capital shares redeemed | | | 595,652 | | | | 54,923 | |
| Payable for investment securities purchased | | | 740,530 | | | | 4,390,118 | |
| Accrued investment advisory fees (Note 4) | | | 313,100 | | | | 121,217 | |
| Payable to administrator (Note 4) | | | 82,530 | | | | 35,840 | |
| Other accrued expenses | | | 22,500 | | | | 4,595 | |
| TOTAL LIABILITIES | | | 1,754,312 | | | | 4,606,693 | |
| | | | | | | | | |
| NET ASSETS | | $ | 491,255,620 | | | $ | 193,185,987 | |
| | | | | | | | | |
| Net assets consist of: | | | | | | | | |
| Paid-in capital | | $ | 360,888,558 | | | $ | 165,990,719 | |
| Accumulated earnings | | | 130,367,062 | | | | 27,195,268 | |
| Net assets | | $ | 491,255,620 | | | $ | 193,185,987 | |
| | | | | | | | | |
| Shares of beneficial interest outstanding (unlimited number of shares authorized, $0.01 par value) | | | 25,360,311 | | | | 15,038,262 | |
| | | | | | | | | |
| Net asset value, offering price and redemption price per share (Note 2) | | $ | 19.37 | | | $ | 12.85 | |
See accompanying notes to financial statements.
| THE DAVENPORT FUNDS |
| STATEMENTS OF OPERATIONS |
| Year Ended March 31, 2021 |
| | | | | | Davenport | | | Davenport | |
| | | Davenport | | | Value & | | | Equity | |
| | | Core | | | Income | | | Opportunities | |
| | | Fund | | | Fund | | | Fund | |
| INVESTMENT INCOME | | | | | | | | | | | | |
| Dividends | | $ | 6,876,327 | | | $ | 18,029,256 | | | $ | 4,147,684 | |
| Foreign withholding taxes on dividends | | | (159,015 | ) | | | (268,868 | ) | | | (132,457 | ) |
| TOTAL INVESTMENT INCOME | | | 6,717,312 | | | | 17,760,388 | | | | 4,015,227 | |
| | | | | | | | | | | | | |
| EXPENSES | | | | | | | | | | | | |
| Investment advisory fees (Note 4) | | | 4,843,663 | | | | 5,006,722 | | | | 4,007,261 | |
| Administration fees (Note 4) | | | 611,658 | | | | 644,684 | | | | 558,122 | |
| Registration and filing fees | | | 37,014 | | | | 32,931 | | | | 41,036 | |
| Custodian and bank service fees | | | 36,041 | | | | 37,539 | | | | 29,975 | |
| Compliance service fees (Note 4) | | | 28,526 | | | | 29,359 | | | | 24,288 | |
| Audit and tax services fees | | | 16,500 | | | | 16,500 | | | | 16,500 | |
| Trustees’ fees (Note 4) | | | 15,900 | | | | 15,900 | | | | 15,900 | |
| Insurance expense | | | 11,232 | | | | 15,255 | | | | 9,688 | |
| Printing of shareholder reports | | | 11,041 | | | | 13,419 | | | | 11,568 | |
| Postage and supplies | | | 9,542 | | | | 10,324 | | | | 9,847 | |
| Legal fees | | | 5,285 | | | | 5,285 | | | | 5,285 | |
| Other expenses | | | 7,776 | | | | 8,265 | | | | 6,114 | |
| TOTAL EXPENSES | | | 5,634,178 | | | | 5,836,183 | | | | 4,735,584 | |
| | | | | | | | | | | | | |
| NET INVESTMENT INCOME (LOSS) | | | 1,083,134 | | | | 11,924,205 | | | | (720,357 | ) |
| | | | | | | | | | | | | |
| REALIZED AND UNREALIZED GAINS ON INVESTMENTS AND FOREIGN CURRENCIES | | | | | | | | | | | | |
| Net realized gains from: | | | | | | | | | | | | |
| Investments | | | 51,936,626 | | | | 9,866,725 | | | | 56,691,001 | |
| Foreign currency transactions | | | — | | | | 9,661 | | | | — | |
| Net change in unrealized appreciation (depreciation) on investments | | | 185,517,997 | | | | 242,664,502 | | | | 199,310,818 | |
| NET REALIZED AND UNREALIZED GAINS ON INVESTMENTS AND FOREIGN CURRENCIES | | | 237,454,623 | | | | 252,540,888 | | | | 256,001,819 | |
| | | | | | | | | | | | | |
| NET INCREASE IN NET ASSETS FROM OPERATIONS | | $ | 238,537,757 | | | $ | 264,465,093 | | | $ | 255,281,462 | |
See accompanying notes to financial statements.
| THE DAVENPORT FUNDS |
| STATEMENTS OF OPERATIONS (Continued) |
| Year Ended March 31, 2021 |
| | | Davenport | | | Davenport | |
| | | Small Cap | | | Balanced | |
| | | Focus | | | Income | |
| | | Fund | | | Fund | |
| INVESTMENT INCOME | | | | | | | | |
| Dividends | | $ | 3,304,736 | | | $ | 3,140,958 | |
| Foreign withholding taxes on dividends | | | — | | | | (56,333 | ) |
| Interest | | | — | | | | 1,414,880 | |
| TOTAL INVESTMENT INCOME | | | 3,304,736 | | | | 4,499,505 | |
| | | | | | | | | |
| EXPENSES | | | | | | | | |
| Investment advisory fees (Note 4) | | | 2,407,297 | | | | 1,265,350 | |
| Administration fees (Note 4) | | | 360,730 | | | | 189,556 | |
| Registration and filing fees | | | 51,248 | | | | 31,202 | |
| Audit and tax services fees | | | 16,500 | | | | 18,000 | |
| Custodian and bank service fees | | | 21,597 | | | | 10,845 | |
| Trustees’ fees (Note 4) | | | 15,900 | | | | 15,900 | |
| Compliance service fees (Note 4) | | | 15,831 | | | | 10,536 | |
| Postage and supplies | | | 8,489 | | | | 5,561 | |
| Printing of shareholder reports | | | 6,976 | | | | 4,681 | |
| Legal fees | | | 5,285 | | | | 5,285 | |
| Insurance expense | | | 4,260 | | | | 3,910 | |
| Other expenses | | | 4,973 | | | | 7,603 | |
| TOTAL EXPENSES | | | 2,919,086 | | | | 1,568,429 | |
| | | | | | | | | |
| NET INVESTMENT INCOME | | | 385,650 | | | | 2,931,076 | |
| | | | | | | | | |
| REALIZED AND UNREALIZED GAINS (LOSSES) ON INVESTMENTS AND FOREIGN CURRENCIES | | | | | | | | |
| Net realized gains (losses) from: | | | | | | | | |
| Investments | | | 50,921,601 | | | | (1,672,521 | ) |
| Foreign currency transactions | | | — | | | | 1,304 | |
| Net change in unrealized appreciation (depreciation) on investments | | | 120,221,304 | | | | 45,859,081 | |
| NET REALIZED AND UNREALIZED GAINS ON INVESTMENTS AND FOREIGN CURRENCIES | | | 171,142,905 | | | | 44,187,864 | |
| | | | | | | | | |
| NET INCREASE IN NET ASSETS FROM OPERATIONS | | $ | 171,528,555 | | | $ | 47,118,940 | |
See accompanying notes to financial statements.
| DAVENPORT CORE FUND |
| STATEMENTS OF CHANGES IN NET ASSETS |
| | | Year | | | Year | |
| | | Ended | | | Ended | |
| | | March 31, | | | March 31, | |
| | | 2021 | | | 2020 | |
| FROM OPERATIONS | | | | | | | | |
| Net investment income | | $ | 1,083,134 | | | $ | 3,080,120 | |
| Net realized gains (losses) from investment transactions | | | 51,936,626 | | | | (7,699,360 | ) |
| Net change in unrealized appreciation (depreciation) on investments | | | 185,517,997 | | | | (35,959,215 | ) |
| Net increase (decrease) in net assets from operations | | | 238,537,757 | | | | (40,578,455 | ) |
| | | | | | | | | |
| DISTRIBUTIONS TO SHAREHOLDERS (Note 2) | | | (7,580,285 | ) | | | (13,553,767 | ) |
| | | | | | | | | |
| FROM CAPITAL SHARE TRANSACTIONS | | | | | | | | |
| Proceeds from shares sold | | | 81,704,747 | | | | 54,999,660 | |
| Net asset value of shares issued in reinvestment of distributions to shareholders | | | 7,144,032 | | | | 12,838,833 | |
| Payments for shares redeemed | | | (50,325,007 | ) | | | (43,365,603 | ) |
| Net increase in net assets from capital share transactions | | | 38,523,772 | | | | 24,472,890 | |
| | | | | | | | | |
| TOTAL INCREASE (DECREASE) IN NET ASSETS | | | 269,481,244 | | | | (29,659,332 | ) |
| | | | | | | | | |
| NET ASSETS | | | | | | | | |
| Beginning of year | | | 486,568,508 | | | | 516,227,840 | |
| End of year | | $ | 756,049,752 | | | $ | 486,568,508 | |
| | | | | | | | | |
| CAPITAL SHARE ACTIVITY | | | | | | | | |
| Shares sold | | | 2,916,187 | | | | 2,182,947 | |
| Shares reinvested | | | 245,190 | | | | 502,726 | |
| Shares redeemed | | | (1,798,302 | ) | | | (1,763,953 | ) |
| Net increase in shares outstanding | | | 1,363,075 | | | | 921,720 | |
| Shares outstanding at beginning of year | | | 22,657,186 | | | | 21,735,466 | |
| Shares outstanding at end of year | | | 24,020,261 | | | | 22,657,186 | |
See accompanying notes to financial statements.
| DAVENPORT VALUE & INCOME FUND |
| STATEMENTS OF CHANGES IN NET ASSETS |
| | | Year | | | Year | |
| | | Ended | | | Ended | |
| | | March 31, | | | March 31, | |
| | | 2021 | | | 2020 | |
| FROM OPERATIONS | | | | | | | | |
| Net investment income | | $ | 11,924,205 | | | $ | 14,392,938 | |
| Net realized gains (losses) from: | | | | | | | | |
| Investments | | | 9,866,725 | | | | 31,723,502 | |
| Foreign currency transactions | | | 9,661 | | | | (2,226 | ) |
| Net change in unrealized appreciation (depreciation) on investments | | | 242,664,502 | | | | (161,093,770 | ) |
| Net increase (decrease) in net assets from operations | | | 264,465,093 | | | | (114,979,556 | ) |
| | | | | | | | | |
| DISTRIBUTIONS TO SHAREHOLDERS (Note 2) | | | (30,159,305 | ) | | | (28,599,834 | ) |
| | | | | | | | | |
| FROM CAPITAL SHARE TRANSACTIONS | | | | | | | | |
| Proceeds from shares sold | | | 55,557,815 | | | | 64,226,968 | |
| Net asset value of shares issued in reinvestment of distributions to shareholders | | | 27,765,720 | | | | 26,096,159 | |
| Payments for shares redeemed | | | (77,089,040 | ) | | | (70,586,528 | ) |
| Net increase in net assets from capital share transactions | | | 6,234,495 | | | | 19,736,599 | |
| | | | | | | | | |
| TOTAL INCREASE (DECREASE) IN NET ASSETS | | | 240,540,283 | | | | (123,842,791 | ) |
| | | | | | | | | |
| NET ASSETS | | | | | | | | |
| Beginning of year | | | 549,111,559 | | | | 672,954,350 | |
| End of year | | $ | 789,651,842 | | | $ | 549,111,559 | |
| | | | | | | | | |
| CAPITAL SHARE ACTIVITY | | | | | | | | |
| Shares sold | | | 3,396,437 | | | | 3,853,987 | |
| Shares reinvested | | | 1,887,043 | | | | 1,597,248 | |
| Shares redeemed | | | (4,911,525 | ) | | | (4,406,389 | ) |
| Net increase in shares outstanding | | | 371,955 | | | | 1,044,846 | |
| Shares outstanding at beginning of year | | | 42,124,305 | | | | 41,079,459 | |
| Shares outstanding at end of year | | | 42,496,260 | | | | 42,124,305 | |
See accompanying notes to financial statements.
| DAVENPORT EQUITY OPPORTUNITIES FUND |
| STATEMENTS OF CHANGES IN NET ASSETS |
| | | Year | | | Year | |
| | | Ended | | | Ended | |
| | | March 31, | | | March 31, | |
| | | 2021 | | | 2020 | |
| FROM OPERATIONS | | | | | | | | |
| Net investment loss | | $ | (720,357 | ) | | $ | (78,050 | ) |
| Net realized gains from investment transactions | | | 56,691,001 | | | | 33,664,952 | |
| Net change in unrealized appreciation (depreciation) on investments | | | 199,310,818 | | | | (74,592,493 | ) |
| Net increase (decrease) in net assets from operations | | | 255,281,462 | | | | (41,005,591 | ) |
| | | | | | | | | |
| DISTRIBUTIONS TO SHAREHOLDERS (Note 2) | | | (57,836,135 | ) | | | (18,269,665 | ) |
| | | | | | | | | |
| FROM CAPITAL SHARE TRANSACTIONS | | | | | | | | |
| Proceeds from shares sold | | | 64,622,341 | | | | 81,385,180 | |
| Net asset value of shares issued in reinvestment of distributions to shareholders | | | 55,111,668 | | | | 17,525,692 | |
| Payments for shares redeemed | | | (43,227,779 | ) | | | (63,475,317 | ) |
| Net increase in net assets from capital share transactions | | | 76,506,230 | | | | 35,435,555 | |
| | | | | | | | | |
| TOTAL INCREASE (DECREASE) IN NET ASSETS | | | 273,951,557 | | | | (23,839,701 | ) |
| | | | | | | | | |
| NET ASSETS | | | | | | | | |
| Beginning of year | | | 385,162,686 | | | | 409,002,387 | |
| End of year | | $ | 659,114,243 | | | $ | 385,162,686 | |
| | | | | | | | | |
| CAPITAL SHARE ACTIVITY | | | | | | | | |
| Shares sold | | | 2,938,614 | | | | 3,965,405 | |
| Shares reinvested | | | 2,696,462 | | | | 874,454 | |
| Shares redeemed | | | (2,034,334 | ) | | | (3,128,179 | ) |
| Net increase in shares outstanding | | | 3,600,742 | | | | 1,711,680 | |
| Shares outstanding at beginning of year | | | 23,256,331 | | | | 21,544,651 | |
| Shares outstanding at end of year | | | 26,857,073 | | | | 23,256,331 | |
See accompanying notes to financial statements.
| DAVENPORT SMALL CAP FOCUS FUND |
| STATEMENTS OF CHANGES IN NET ASSETS |
| | | Year | | | Year | |
| | | Ended | | | Ended | |
| | | March 31, | | | March 31, | |
| | | 2021 | | | 2020 | |
| FROM OPERATIONS | | | | | | | | |
| Net investment income | | $ | 385,650 | | | $ | 759,028 | |
| Net realized gains from investment transactions | | | 50,921,601 | | | | 1,787,177 | |
| Net change in unrealized appreciation (depreciation) on investments | | | 120,221,304 | | | | (33,622,447 | ) |
| Net increase (decrease) in net assets from operations | | | 171,528,555 | | | | (31,076,242 | ) |
| | | | | | | | | |
| DISTRIBUTIONS TO SHAREHOLDERS (Note 2) | | | (21,680,576 | ) | | | (4,283,969 | ) |
| | | | | | | | | |
| FROM CAPITAL SHARE TRANSACTIONS | | | | | | | | |
| Proceeds from shares sold | | | 171,495,764 | | | | 81,570,070 | |
| Net asset value of shares issued in reinvestment of distributions to shareholders | | | 20,862,759 | | | | 4,127,892 | |
| Payments for shares redeemed | | | (31,027,912 | ) | | | (22,323,610 | ) |
| Net increase in net assets from capital share transactions | | | 161,330,611 | | | | 63,374,352 | |
| | | | | | | | | |
| TOTAL INCREASE IN NET ASSETS | | | 311,178,590 | | | | 28,014,141 | |
| | | | | | | | | |
| NET ASSETS | | | | | | | | |
| Beginning of year | | | 180,077,030 | | | | 152,062,889 | |
| End of year | | $ | 491,255,620 | | | $ | 180,077,030 | |
| | | | | | | | | |
| CAPITAL SHARE ACTIVITY | | | | | | | | |
| Shares sold | | | 9,838,043 | | | | 5,996,677 | |
| Shares reinvested | | | 1,189,765 | | | | 280,868 | |
| Shares redeemed | | | (1,836,903 | ) | | | (1,584,623 | ) |
| Net increase in shares outstanding | | | 9,190,905 | | | | 4,692,922 | |
| Shares outstanding at beginning of year | | | 16,169,406 | | | | 11,476,484 | |
| Shares outstanding at end of year | | | 25,360,311 | | | | 16,169,406 | |
See accompanying notes to financial statements.
| DAVENPORT BALANCED INCOME FUND |
| STATEMENTS OF CHANGES IN NET ASSETS |
| | | Year | | | Year | |
| | | Ended | | | Ended | |
| | | March 31, | | | March 31, | |
| | | 2021 | | | 2020 | |
| FROM OPERATIONS | | | | | | | | |
| Net investment income | | $ | 2,931,076 | | | $ | 3,404,637 | |
| Net realized gains (losses) from: | | | | | | | | |
| Investments | | | (1,672,521 | ) | | | 1,057,558 | |
| Foreign currency transactions | | | 1,304 | | | | (258 | ) |
| Net change in unrealized appreciation (depreciation) on investments | | | 45,859,081 | | | | (23,327,826 | ) |
| Net increase (decrease) in net assets from operations | | | 47,118,940 | | | | (18,865,889 | ) |
| | | | | | | | | |
| DISTRIBUTIONS TO SHAREHOLDERS (Note 2) | | | | | | | | |
| From distributable earnings | | | (3,387,277 | ) | | | (4,232,642 | ) |
| Return of capital | | | — | | | | (415,129 | ) |
| Decrease in net assets from distributions to shareholders | | | (3,387,277 | ) | | | (4,647,771 | ) |
| | | | | | | | | |
| FROM CAPITAL SHARE TRANSACTIONS | | | | | | | | |
| Proceeds from shares sold | | | 24,102,431 | | | | 42,349,095 | |
| Net asset value of shares issued in reinvestment of distributions to shareholders | | | 3,129,373 | | | | 4,325,997 | |
| Payments for shares redeemed | | | (21,674,331 | ) | | | (21,463,883 | ) |
| Net increase in net assets from capital share transactions | | | 5,557,473 | | | | 25,211,209 | |
| | | | | | | | | |
| TOTAL INCREASE IN NET ASSETS | | | 49,289,136 | | | | 1,697,549 | |
| | | | | | | | | |
| NET ASSETS | | | | | | | | |
| Beginning of year | | | 143,896,851 | | | | 142,199,302 | |
| End of year | | $ | 193,185,987 | | | $ | 143,896,851 | |
| | | | | | | | | |
| CAPITAL SHARE ACTIVITY | | | | | | | | |
| Shares sold | | | 2,042,099 | | | | 3,606,559 | |
| Shares reinvested | | | 262,264 | | | | 380,947 | |
| Shares redeemed | | | (1,884,408 | ) | | | (1,913,131 | ) |
| Net increase in shares outstanding | | | 419,955 | | | | 2,074,375 | |
| Shares outstanding at beginning of year | | | 14,618,307 | | | | 12,543,932 | |
| Shares outstanding at end of year | | | 15,038,262 | | | | 14,618,307 | |
See accompanying notes to financial statements.
| DAVENPORT CORE FUND |
| FINANCIAL HIGHLIGHTS |
Selected Per Share Data and Ratios for a Share Outstanding Throughout Each Year
| | | | |
| | | Years Ended March 31, | |
| | | 2021 | | | 2020 | | | 2019 | | | 2018 | | | 2017 | |
| Net asset value at beginning of year | | $ | 21.48 | | | $ | 23.75 | | | $ | 22.96 | | | $ | 21.15 | | | $ | 18.78 | |
| | | | | | | | | | | | | | | | | | | | | |
| Income (loss) from investment operations: | | | | | | | | | | | | | | | | | | | | |
| Net investment income | | | 0.05 | | | | 0.14 | | | | 0.11 | | | | 0.09 | | | | 0.11 | |
| Net realized and unrealized gains (losses) on investments | | | 10.27 | | | | (1.80 | ) | | | 1.74 | | | | 2.29 | | | | 2.92 | |
| Total from investment operations | | | 10.32 | | | | (1.66 | ) | | | 1.85 | | | | 2.38 | | | | 3.03 | |
| | | | | | | | | | | | | | | | | | | | | |
| Less distributions from: | | | | | | | | | | | | | | | | | | | | |
| Net investment income | | | (0.07 | ) | | | (0.14 | ) | | | (0.11 | ) | | | (0.11 | ) | | | (0.10 | ) |
| Net realized gains | | | (0.25 | ) | | | (0.47 | ) | | | (0.95 | ) | | | (0.46 | ) | | | (0.56 | ) |
| Total distributions | | | (0.32 | ) | | | (0.61 | ) | | | (1.06 | ) | | | (0.57 | ) | | | (0.66 | ) |
| | | | | | | | | | | | | | | | | | | | | |
| Net asset value at end of year | | $ | 31.48 | | | $ | 21.48 | | | $ | 23.75 | | | $ | 22.96 | | | $ | 21.15 | |
| | | | | | | | | | | | | | | | | | | | | |
| Total return (a) | | | 48.20 | % | | | (7.36 | %) | | | 8.21 | % | | | 11.38 | % | | | 16.56 | % |
| | | | | | | | | | | | | | | | | | | | | |
| Net assets at end of year (000’s) | | $ | 756,050 | | | $ | 486,569 | | | $ | 516,228 | | | $ | 464,919 | | | $ | 399,432 | |
| | | | | | | | | | | | | | | | | | | | | |
| Ratio of total expenses to average net assets | | | 0.87 | % | | | 0.89 | % | | | 0.89 | % | | | 0.90 | % | | | 0.90 | % |
| | | | | | | | | | | | | | | | | | | | | |
| Ratio of net investment income to average net assets | | | 0.17 | % | | | 0.55 | % | | | 0.48 | % | | | 0.41 | % | | | 0.56 | % |
| | | | | | | | | | | | | | | | | | | | | |
| Portfolio turnover rate | | | 30 | % | | | 12 | % | | | 21 | % | | | 22 | % | | | 23 | % |
| (a) | Total return is a measure of the change in value of an investment in the Fund over the periods covered, which assumes any dividends or capital gains distributions are reinvested in shares of the Fund. Returns shown do not reflect the deduction of taxes a shareholder would pay on Fund distributions or the redemption of Fund shares. |
See accompanying notes to financial statements.
| DAVENPORT VALUE & INCOME FUND |
| FINANCIAL HIGHLIGHTS |
Selected Per Share Data and Ratios for a Share Outstanding Throughout Each Year
| | | | |
| | | Years Ended March 31, | |
| | | 2021 | | | 2020 | | | 2019 | | | 2018 | | | 2017 | |
| Net asset value at beginning of year | | $ | 13.04 | | | $ | 16.38 | | | $ | 16.85 | | | $ | 15.97 | | | $ | 14.40 | |
| | | | | | | | | | | | | | | | | | | | | |
| Income (loss) from investment operations: | | | | | | | | | | | | | | | | | | | | |
| Net investment income | | | 0.28 | | | | 0.35 | | | | 0.36 | | | | 0.30 | | | | 0.30 | |
| Net realized and unrealized gains (losses) on investments and foreign currencies | | | 5.98 | | | | (3.00 | ) | | | 0.12 | | | | 1.39 | | | | 1.64 | |
| Total from investment operations | | | 6.26 | | | | (2.65 | ) | | | 0.48 | | | | 1.69 | | | | 1.94 | |
| | | | | | | | | | | | | | | | | | | | | |
| Less distributions from: | | | | | | | | | | | | | | | | | | | | |
| Net investment income | | | (0.27 | ) | | | (0.36 | ) | | | (0.36 | ) | | | (0.30 | ) | | | (0.31 | ) |
| Net realized gains | | | (0.45 | ) | | | (0.33 | ) | | | (0.59 | ) | | | (0.51 | ) | | | (0.06 | ) |
| Total distributions | | | (0.72 | ) | | | (0.69 | ) | | | (0.95 | ) | | | (0.81 | ) | | | (0.37 | ) |
| | | | | | | | | | | | | | | | | | | | | |
| Net asset value at end of year | | $ | 18.58 | | | $ | 13.04 | | | $ | 16.38 | | | $ | 16.85 | | | $ | 15.97 | |
| | | | | | | | | | | | | | | | | | | | | |
| Total return (a) | | | 49.55 | % | | | (16.97 | %) | | | 2.96 | % | | | 10.67 | % | | | 13.60 | % |
| | | | | | | | | | | | | | | | | | | | | |
| Net assets at end of year (000’s) | | $ | 789,652 | | | $ | 549,112 | | | $ | 672,954 | | | $ | 648,456 | | | $ | 561,995 | |
| | | | | | | | | | | | | | | | | | | | | |
| Ratio of total expenses to average net assets | | | 0.87 | % | | | 0.88 | % | | | 0.88 | % | | | 0.88 | % | | | 0.89 | % |
| | | | | | | | | | | | | | | | | | | | | |
| Ratio of net investment income to average net assets | | | 1.78 | % | | | 2.07 | % | | | 2.21 | % | | | 1.79 | % | | | 1.96 | % |
| | | | | | | | | | | | | | | | | | | | | |
| Portfolio turnover rate | | | 34 | % | | | 28 | % | | | 18 | % | | | 22 | % | | | 26 | % |
| (a) | Total return is a measure of the change in value of an investment in the Fund over the periods covered, which assumes any dividends or capital gains distributions are reinvested in shares of the Fund. Returns shown do not reflect the deduction of taxes a shareholder would pay on Fund distributions or the redemption of Fund shares. |
See accompanying notes to financial statements.
| DAVENPORT EQUITY OPPORTUNITIES FUND |
| FINANCIAL HIGHLIGHTS |
Selected Per Share Data and Ratios for a Share Outstanding Throughout Each Year
| | | | |
| | | Years Ended March 31, | |
| | | 2021 | | | 2020 | | | 2019 | | | 2018 | | | 2017 | |
| Net asset value at beginning of year | | $ | 16.56 | | | $ | 18.98 | | | $ | 17.75 | | | $ | 15.64 | | | $ | 14.73 | |
| | | | | | | | | | | | | | | | | | | | | |
| Income (loss) from investment operations: | | | | | | | | | | | | | | | | | | | | |
| Net investment income (loss) | | | (0.03 | ) | | | (0.00 | )(a) | | | (0.02 | ) | | | (0.04 | ) | | | 0.00 | (a) |
| Net realized and unrealized gains (losses) on investments | | | 10.42 | | | | (1.59 | ) | | | 1.91 | | | | 2.15 | | | | 1.10 | |
| Total from investment operations | | | 10.39 | | | | (1.59 | ) | | | 1.89 | | | | 2.11 | | | | 1.10 | |
| | | | | | | | | | | | | | | | | | | | | |
| Less distributions from: | | | | | | | | | | | | | | | | | | | | |
| Net realized gains | | | (2.41 | ) | | | (0.83 | ) | | | (0.66 | ) | | | — | | | | (0.19 | ) |
| Net asset value at end of year | | $ | 24.54 | | | $ | 16.56 | | | $ | 18.98 | | | $ | 17.75 | | | $ | 15.64 | |
| Total return (b) | | | 66.20 | % | | | (9.13 | %) | | | 11.02 | % | | | 13.49 | % | | | 7.57 | % |
| | | | | | | | | | | | | | | | | | | | | |
| Net assets at end of year (000’s) | | $ | 659,114 | | | $ | 385,163 | | | $ | 409,002 | | | $ | 399,460 | | | $ | 351,754 | |
| | | | | | | | | | | | | | | | | | | | | |
| Ratio of total expenses to average net assets | | | 0.88 | % | | | 0.90 | % | | | 0.91 | % | | | 0.91 | % | | | 0.92 | % |
| | | | | | | | | | | | | | | | | | | | | |
| Ratio of net investment income (loss) to average net assets | | | (0.13 | %) | | | (0.02 | %) | | | (0.13 | %) | | | (0.23 | %) | | | 0.00 | %(c) |
| | | | | | | | | | | | | | | | | | | | | |
| Portfolio turnover rate | | | 31 | % | | | 21 | % | | | 19 | % | | | 21 | % | | | 23 | % |
| (a) | Amount rounds to less than $0.01 per share. |
| (b) | Total return is a measure of the change in value of an investment in the Fund over the periods covered, which assumes any dividends or capital gains distributions are reinvested in shares of the Fund. Returns shown do not reflect the deduction of taxes a shareholder would pay on Fund distributions or the redemption of Fund shares. |
| (c) | Amount rounds to less than 0.01%. |
See accompanying notes to financial statements.
| DAVENPORT SMALL CAP FOCUS FUND |
| FINANCIAL HIGHLIGHTS |
Selected Per Share Data and Ratios for a Share Outstanding Throughout Each Year
| | | | |
| | | Years Ended March 31, | |
| | | 2021 | | | 2020 | | | 2019 | | | 2018 | | | 2017 | |
| Net asset value at beginning of year | | $ | 11.14 | | | $ | 13.25 | | | $ | 13.01 | | | $ | 12.13 | | | $ | 9.34 | |
| | | | | | | | | | | | | | | | | | | | | |
| Income (loss) from investment operations: | | | | | | | | | | | | | | | | | | | | |
| Net investment income | | | 0.04 | | | | 0.05 | | | | 0.06 | | | | 0.02 | | | | 0.02 | |
| Net realized and unrealized gains (losses) on investments | | | 9.28 | | | | (1.84 | ) | | | 0.44 | | | | 1.22 | | | | 2.77 | |
| Total from investment operations | | | 9.32 | | | | (1.79 | ) | | | 0.50 | | | | 1.24 | | | | 2.79 | |
| | | | | | | | | | | | | | | | | | | | | |
| Less distributions from: | | | | | | | | | | | | | | | | | | | | |
| Net investment income | | | (0.20 | ) | | | (0.10 | ) | | | — | | | | — | | | | — | |
| Net realized gains | | | (0.89 | ) | | | (0.22 | ) | | | (0.26 | ) | | | (0.36 | ) | | | — | |
| Total distributions | | | (1.09 | ) | | | (0.32 | ) | | | (0.26 | ) | | | (0.36 | ) | | | — | |
| | | | | | | | | | | | | | | | | | | | | |
| Net asset value at end of year | | $ | 19.37 | | | $ | 11.14 | | | $ | 13.25 | | | $ | 13.01 | | | $ | 12.13 | |
| | | | | | | | | | | | | | | | | | | | | |
| Total return (a) | | | 84.84 | % | | | (14.08 | %) | | | 3.90 | % | | | 10.28 | % | | | 29.87 | % |
| | | | | | | | | | | | | | | | | | | | | |
| Net assets at end of year (000’s) | | $ | 491,256 | | | $ | 180,077 | | | $ | 152,063 | | | $ | 116,239 | | | $ | 74,946 | |
| | | | | | | | | | | | | | | | | | | | | |
| Ratio of total expenses to average net assets | | | 0.91 | % | | | 0.95 | % | | | 0.97 | % | | | 1.00 | % | | | 1.06 | % |
| | | | | | | | | | | | | | | | | | | | | |
| Ratio of net investment income to average net assets | | | 0.12 | % | | | 0.40 | % | | | 0.51 | % | | | 0.26 | % | | | 0.09 | % |
| | | | | | | | | | | | | | | | | | | | | |
| Portfolio turnover rate | | | 54 | % | | | 66 | % | | | 60 | % | | | 48 | % | | | 37 | % |
| (a) | Total return is a measure of the change in value of an investment in the Fund over the periods covered, which assumes any dividends or capital gains distributions are reinvested in shares of the Fund. Returns shown do not reflect the deduction of taxes a shareholder would pay on Fund distributions or the redemption of Fund shares. |
See accompanying notes to financial statements.
| DAVENPORT BALANCED INCOME FUND |
| FINANCIAL HIGHLIGHTS |
Selected Per Share Data and Ratios for a Share Outstanding Throughout Each Year
| | | | |
| | | Years Ended March 31, | |
| | | 2021 | | | 2020 | | | 2019 | | | 2018 | | | 2017 | |
| Net asset value at beginning of year | | $ | 9.84 | | | $ | 11.34 | | | $ | 11.28 | | | $ | 11.02 | | | $ | 10.27 | |
| | | | | | | | | | | | | | | | | | | | | |
| Income (loss) from investment operations: | | | | | | | | | | | | | | | | | | | | |
| Net investment income | | | 0.20 | | | | 0.25 | | | | 0.25 | | | | 0.20 | | | | 0.14 | |
| Net realized and unrealized gains (losses) on investments and foreign currencies | | | 3.04 | | | | (1.41 | ) | | | 0.12 | | | | 0.33 | | | | 0.74 | |
| Total from investment operations | | | 3.24 | | | | (1.16 | ) | | | 0.37 | | | | 0.53 | | | | 0.88 | |
| | | | | | | | | | | | | | | | | | | | | |
| Less distributions from: | | | | | | | | | | | | | | | | | | | | |
| Net investment income | | | (0.23 | ) | | | (0.23 | ) | | | (0.24 | ) | | | (0.17 | ) | | | (0.13 | ) |
| Net realized gains | | | — | | | | (0.08 | ) | | | (0.07 | ) | | | (0.10 | ) | | | — | |
| Return of capital | | | — | | | | (0.03 | ) | | | — | | | | — | | | | — | |
| Total distributions | | | (0.23 | ) | | | (0.34 | ) | | | (0.31 | ) | | | (0.27 | ) | | | (0.13 | ) |
| | | | | | | | | | | | | | | | | | | | | |
| Net asset value at end of year | | $ | 12.85 | | | $ | 9.84 | | | $ | 11.34 | | | $ | 11.28 | | | $ | 11.02 | |
| | | | | | | | | | | | | | | | | | | | | |
| Total return (a) | | | 33.14 | % | | | (10.59 | %) | | | 3.35 | % | | | 4.81 | % | | | 8.59 | % |
| | | | | | | | | | | | | | | | | | | | | |
| Net assets at end of year (000’s) | | $ | 193,186 | | | $ | 143,897 | | | $ | 142,199 | | | $ | 129,268 | | | $ | 83,419 | |
| | | | | | | | | | | | | | | | | | | | | |
| Ratio of net expenses to average net assets | | | 0.93 | % | | | 0.95 | % | | | 0.96 | % | | | 0.97 | % | | | 1.13 | %(b) |
| | | | | | | | | | | | | | | | | | | | | |
| Ratio of net investment income to average net assets | | | 1.73 | % | | | 2.18 | % | | | 2.28 | % | | | 1.85 | % | | | 1.55 | % |
| | | | | | | | | | | | | | | | | | | | | |
| Portfolio turnover rate | | | 29 | % | | | 29 | % | | | 30 | % | | | 23 | % | | | 16 | % |
| (a) | Total return is a measure of the change in value of an investment in the Fund over the periods covered, which assumes any dividends or capital gains distributions are reinvested in shares of the Fund. Returns shown do not reflect the deduction of taxes a shareholder would pay on Fund distributions or the redemption of Fund shares. |
| (b) | Absent advisory fee reductions and expense reimbursements recouped by the Adviser, the ratio of net expenses to average net assets would have been 1.08% for the year ended March 31, 2017. |
See accompanying notes to financial statements.
| THE DAVENPORT FUNDS |
| NOTES TO FINANCIAL STATEMENTS |
| March 31, 2021 |
Davenport Core Fund, Davenport Value & Income Fund, Davenport Equity Opportunities Fund, Davenport Small Cap Focus Fund and Davenport Balanced Income Fund (individually, a “Fund,” and, collectively, the “Funds”) are each a no-load series of the Williamsburg Investment Trust (the “Trust”), an open-end management investment company registered under the Investment Company Act of 1940, as amended. The Trust was organized as a Massachusetts business trust on July 18, 1988. Other series of the Trust are not incorporated in this report.
Davenport Core Fund’s investment objective is long-term growth of capital.
Davenport Value & Income Fund’s investment objective is to achieve long-term growth while generating current income through dividend payments on portfolio securities.
Davenport Equity Opportunities Fund’s investment objective is long-term capital appreciation.
Davenport Small Cap Focus Fund’s investment objective is long-term capital appreciation.
Davenport Balanced Income Fund’s investment objective is current income and an opportunity for long-term growth.
Davenport Core Fund, Davenport Value & Income Fund, Davenport Small Cap Focus Fund and Davenport Balanced Income Fund are each classified as a diversified fund. Davenport Equity Opportunities Fund is classified as a non-diversified fund.
| 2. | Significant Accounting Policies |
Each Fund follows accounting and reporting guidance under Financial Accounting Standards Board (“FASB”) Accounting Standards Codification Topic 946, “Financial Services – Investment Companies.” The following is a summary of the Funds’ significant accounting policies. The policies are in conformity with accounting principles generally accepted in the United States of America (“GAAP”).
New Accounting Pronouncement — In March 2020, the FASB issued Accounting Standards Update No. 2020-04 (“ASU 2020-04”), “Reference Rate Reform (Topic 840): Facilitation of the Effects of Reference Rate Reform on Financial Reporting.” ASU 2020-04 provides entities with guidance to ease the potential accounting burden associated with transitioning away from reference rates (e.g., LIBOR) that are expected to be discontinued. ASU 2020-04 allows, among other things, certain contract modifications to be accounted as a continuation of the existing contract. This ASU was effective upon the issuance and its optional relief can be applied through December 31, 2022. Management is currently assessing the impact of the ASU on the Funds.
Securities valuation — The Funds’ portfolio securities are valued as of the close of business of the regular session of the New York Stock Exchange (the “NYSE”) (normally 4:00 p.m. Eastern time). Securities traded on a national stock exchange, including common stocks and exchange-traded funds (“ETFs”), are valued based upon the closing price on the principal exchange where the security is traded, if available, otherwise, at the last quoted bid price. Securities that are quoted
| THE DAVENPORT FUNDS |
| NOTES TO FINANCIAL STATEMENTS (Continued) |
by NASDAQ are valued at the NASDAQ Official Closing Price. Investments representing shares of money market funds and other open-end investment companies, other than ETFs, are valued at their net asset value (“NAV”) as reported by such companies. When using a quoted price and when the market is considered active, securities will be classified as Level 1 within the fair value hierarchy (see below).
Fixed income securities, including corporate bonds and U.S. Treasury obligations, are typically valued on the basis of prices provided by an independent pricing service. The prices provided by the pricing service are determined with consideration given to institutional bid and last sale prices and take into account securities prices, yields, maturities, call features, ratings, institutional trading in similar groups of securities, and developments related to specific securities. Given the inputs used by the pricing service, these securities are classified as Level 2 within the fair value hierarchy.
When market quotations are not readily available, if a pricing service cannot provide a price, or if the investment adviser believes the price received from the pricing service is not indicative of market value, securities will be valued in good faith at fair value using methods consistent with procedures adopted by the Board of Trustees and will be classified as Level 2 or 3 within the fair value hierarchy, depending on the inputs used. Such methods of fair valuation may include, but are not limited to: multiple of earnings, multiple of book value, discount from market of a similar freely traded security, purchase price of the security, subsequent private transactions in the security or related securities, or a combination of these and other factors.
GAAP establishes a single authoritative definition of fair value, sets out a framework for measuring fair value and requires additional disclosures about fair value measurements.
Various inputs are used in determining the value of the Funds’ investments. These inputs are summarized in the three broad levels listed below:
| ● | Level 1 – quoted prices in active markets for identical securities |
| ● | Level 2 – other significant observable inputs |
| ● | Level 3 – significant unobservable inputs |
The inputs or methodology used for valuing securities are not necessarily an indication of the risks associated with investing in those securities. The inputs used to measure fair value may fall into different levels of the fair value hierarchy. In such cases, for disclosure purposes, the level in the fair value hierarchy within which the fair value measurement falls in its entirety is determined based on the lowest level input that is significant to the fair value measurement.
| THE DAVENPORT FUNDS |
| NOTES TO FINANCIAL STATEMENTS (Continued) |
The following is a summary of the Funds’ investments based on the inputs used to value the investments as of March 31, 2021, by security type:
| Davenport Core Fund | | Level 1 | | | Level 2 | | | Level 3 | | | Total | |
| | | | | | | | | | | | | |
| Common Stocks | | $ | 736,916,652 | | | $ | — | | | $ | — | | | $ | 736,916,652 | |
| Money Market Funds | | | 11,196,059 | | | | — | | | | — | | | | 11,196,059 | |
| Total | | $ | 748,112,711 | | | $ | — | | | $ | — | | | $ | 748,112,711 | |
| | | | | | | | | | | | | | | | | |
| | | | | | | | | | | | | | | | | |
| Davenport Value & Income Fund | | Level 1 | | | Level 2 | | | Level 3 | | | Total | |
| | | | | | | | | | | | | |
| Common Stocks | | $ | 759,673,627 | | | $ | — | | | $ | — | | | $ | 759,673,627 | |
| Money Market Funds | | | 30,123,198 | | | | — | | | | — | | | | 30,123,198 | |
| Total | | $ | 789,796,825 | | | $ | — | | | $ | — | | | $ | 789,796,825 | |
| | | | | | | | | | | | | | | | | |
| | | | | | | | | | | | | | | | | |
| Davenport Equity Opportunities Fund | | Level 1 | | | Level 2 | | | Level 3 | | | Total | |
| | | | | | | | | | | | | |
| Common Stocks | | $ | 614,845,930 | | | $ | — | | | $ | — | | | $ | 614,845,930 | |
| Money Market Funds | | | 32,122,044 | | | | — | | | | — | | | | 32,122,044 | |
| Total | | $ | 646,967,974 | | | $ | — | | | $ | — | | | $ | 646,967,974 | |
| | | | | | | | | | | | | | | | | |
| | | | | | | | | | | | | | | | | |
| Davenport Small Cap Focus Fund | | Level 1 | | | Level 2 | | | Level 3 | | | Total | |
| | | | | | | | | | | | | |
| Common Stocks | | $ | 450,913,232 | | | $ | — | | | $ | — | | | $ | 450,913,232 | |
| Warrants | | | 453,333 | | | | — | | | | — | | | | 453,333 | |
| Money Market Funds | | | 39,882,946 | | | | — | | | | — | | | | 39,882,946 | |
| Total | | $ | 491,249,511 | | | $ | — | | | $ | — | | | $ | 491,249,511 | |
| | | | | | | | | | | | | | | | | |
| | | | | | | | | | | | | | | | | |
| Davenport Balanced Income Fund | | Level 1 | | | Level 2 | | | Level 3 | | | Total | |
| | | | | | | | | | | | | |
| Common Stocks | | $ | 124,041,507 | | | $ | — | | | $ | — | | | $ | 124,041,507 | |
| Exchange-Traded Funds | | | 834,249 | | | | — | | | | — | | | | 834,249 | |
| Fixed Rate Corporate Bonds | | | — | | | | 43,307,065 | | | | — | | | | 43,307,065 | |
| Variable Rate Corporate Bonds | | | — | | | | 3,521,037 | | | | — | | | | 3,521,037 | |
| U.S. Treasury Obligations | | | — | | | | 13,236,565 | | | | — | | | | 13,236,565 | |
| Money Market Funds | | | 11,936,603 | | | | — | | | | — | | | | 11,936,603 | |
| Total | | $ | 136,812,359 | | | $ | 60,064,667 | | | $ | — | | | $ | 196,877,026 | |
| | | | | | | | | | | | | | | | | |
Refer to each Fund’s Schedule of Investments for a listing of the securities by sector type. There were no Level 3 securities or derivative instruments held by the Funds as of or during the year ended March 31, 2021.
| THE DAVENPORT FUNDS |
| NOTES TO FINANCIAL STATEMENTS (Continued) |
Foreign currency translation — Investment securities and other assets and liabilities denominated in or expected to settle in foreign currencies, if any, are translated into U.S. dollars based on exchange rates on the following basis:
| A. | The fair values of investment securities and other assets and liabilities are translated as of the close of the NYSE each day. |
| B. | Purchases and sales of investment securities and income and expenses are translated at the rate of exchange prevailing as of 4:00 p.m. Eastern time on the respective date of such transactions. |
| C. | The Funds do not isolate that portion of the results of operations caused by changes in foreign exchange rates on investments from those caused by changes in market prices of securities held. Such fluctuations are included with the net realized and unrealized gains or losses on investments. |
Reported net realized foreign exchange gains or losses arise from 1) purchases and sales of foreign currencies and 2) the difference between the amounts of dividends and foreign withholding taxes recorded on the Fund’s books and the U.S. dollar equivalent of the amounts actually received or paid. Reported net unrealized foreign exchange gains and losses arise from changes in the value of assets and liabilities that result from changes in exchange rates.
Share valuation — The NAV per share of each Fund is calculated daily by dividing the total value of its assets, less liabilities, by the number of shares outstanding. The offering price and redemption price per share of each Fund is equal to the NAV per share.
Investment income — Interest income is accrued as earned. Discounts and premiums on fixed-income securities are amortized using the interest method. Dividend income is recorded on the ex-dividend date. Non-cash dividends included in dividend income, if any, are recorded at the fair market value of the security received. The Funds record distributions received from investments in real estate investment trusts (also known as “REITs”) in excess of income from underlying investments as a reduction of cost of investments and/or realized gain. These amounts are recorded once the issuers provide information about the actual composition of the distributions. Withholding taxes on foreign dividends have been recorded in accordance with the Funds’ understanding of the applicable country’s rules and tax rates.
Investment transactions — Investment transactions are accounted for on trade date for financial reporting purposes. Realized gains and losses on investment securities sold are determined on a specific identification basis.
Common expenses — Common expenses of the Trust are allocated among the Funds and the other series of the Trust based on relative net assets of each series or the nature of the services performed and the relative applicability to each series.
Distributions to shareholders — Dividends arising from net investment income, if any, are declared and paid quarterly to shareholders of Davenport Core Fund, Davenport Value & Income Fund, Davenport Small Cap Focus Fund and Davenport Balanced Income Fund; and declared and paid semi-annually to shareholders of Davenport Equity Opportunities Fund. Net realized
| THE DAVENPORT FUNDS |
| NOTES TO FINANCIAL STATEMENTS (Continued) |
short-term capital gains, if any, may be distributed throughout the year and net realized long-term capital gains, if any, are distributed at least once each year. The amount of distributions from net investment income and net realized capital gains are determined in accordance with federal income tax regulations, which may differ from GAAP. Dividends and distributions are recorded on the ex-dividend date.
The tax character of distributions paid during the years ended March 31, 2021 and 2020 was as follows:
| | | Year | | Ordinary | | | Long-Term | | | Return of | | | Total | |
| | | Ended | | Income | | | Capital Gains | | | Capital | | | Distributions | |
| Davenport Core Fund | | 03/31/21 | | $ | 1,295,840 | | | $ | 6,284,445 | | | $ | — | | | $ | 7,580,285 | |
| | | 03/31/20 | | $ | 3,136,527 | | | $ | 10,417,240 | | | $ | — | | | $ | 13,553,767 | |
| Davenport Value & Income Fund | | 03/31/21 | | $ | 11,488,740 | | | $ | 18,670,565 | | | $ | — | | | $ | 30,159,305 | |
| | | 03/31/20 | | $ | 14,608,026 | | | $ | 13,991,808 | | | $ | — | | | $ | 28,599,834 | |
| Davenport Equity Opportunities Fund | | 03/31/21 | | $ | 2,417,261 | | | $ | 55,418,874 | | | $ | — | | | $ | 57,836,135 | |
| | | 03/31/20 | | $ | — | | | $ | 18,269,665 | | | $ | — | | | $ | 18,269,665 | |
| Davenport Small Cap Focus Fund | | 03/31/21 | | $ | 14,887,481 | | | $ | 6,793,095 | | | $ | — | | | $ | 21,680,576 | |
| | | 03/31/20 | | $ | 1,256,060 | | | $ | 3,027,909 | | | $ | — | | | $ | 4,283,969 | |
| Davenport Balanced Income Fund | | 03/31/21 | | $ | 3,260,204 | | | $ | — | | | $ | 127,073 | | | $ | 3,387,277 | |
| | | 03/31/20 | | $ | 3,164,526 | | | $ | 1,068,116 | | | $ | 415,129 | | | $ | 4,647,771 | |
Estimates — The preparation of financial statements in conformity with GAAP requires management to make estimates and assumptions that affect the reported amounts of assets and liabilities and disclosure of contingent assets and liabilities, each as of the date of the financial statements, and the reported amounts of increase (decrease) in net assets from operations during the reporting period. Actual results could differ from those estimates.
Federal income tax — Each Fund has qualified and intends to continue to qualify as a regulated investment company under the Internal Revenue Code of 1986, as amended (the “Code”). Qualification generally will relieve the Funds of liability for federal income taxes to the extent 100% of their net investment income and net realized capital gains are distributed in accordance with the Code.
In order to avoid imposition of the excise tax applicable to regulated investment companies, it is also each Fund’s intention to declare as dividends in each calendar year at least 98% of its net investment income (earned during the calendar year) and 98.2% of its net realized capital gains (earned during the twelve months ended October 31) plus undistributed amounts from prior years.
| THE DAVENPORT FUNDS |
| NOTES TO FINANCIAL STATEMENTS (Continued) |
The following information is computed on a tax basis for each item as of March 31, 2021:
| | | | | | | | | Davenport | |
| | | | | | Davenport | | | Equity | |
| | | Davenport | | | Value & | | | Opportunities | |
| | | Core Fund | | | Income Fund | | | Fund | |
| | | | | | | | | | |
| Cost of portfolio investments | | $ | 419,295,167 | | | $ | 596,593,963 | | | $ | 425,989,236 | |
| Gross unrealized appreciation | | $ | 330,793,337 | | | $ | 207,851,157 | | | $ | 230,900,466 | |
| Gross unrealized depreciation | | | (1,975,793 | ) | | | (14,648,295 | ) | | | (9,921,728 | ) |
| Net unrealized appreciation | | | 328,817,544 | | | | 193,202,862 | | | | 220,978,738 | |
| Undistributed ordinary income | | | — | | | | 5,819,722 | | | | 4,545,351 | |
| Undistributed long-term gains | | | 29,597,596 | | | | 4,561,902 | | | | 23,582,164 | |
| Accumulated capital and other losses | | | (187,282 | ) | | | — | | | | — | |
| Accumulated earnings | | $ | 358,227,858 | | | $ | 203,584,486 | | | $ | 249,106,253 | |
| | | | | | | | | | | | | |
| | | Davenport | | | Davenport | |
| | | Small Cap | | | Balanced | |
| | | Focus Fund | | | Income Fund | |
| | | | | | | |
| Cost of portfolio investments | | $ | 391,438,863 | | | $ | 167,511,245 | |
| Gross unrealized appreciation | | $ | 111,090,703 | | | $ | 31,961,276 | |
| Gross unrealized depreciation | | | (11,280,055 | ) | | | (2,595,495 | ) |
| Net unrealized appreciation | | | 99,810,648 | | | | 29,365,781 | |
| Undistributed ordinary income | | | 25,670,489 | | | | — | |
| Undistributed long-term gains | | | 5,097,396 | | | | — | |
| Accumulated capital and other losses | | | (211,471 | ) | | | (2,170,513 | ) |
| Accumulated earnings | | $ | 130,367,062 | | | $ | 27,195,268 | |
| | | | | | | | | |
The difference between the federal income tax cost of portfolio investments and the financial statement cost of portfolio investments for each Fund is due to certain timing differences in the recognition of capital gains and losses under income tax regulations and GAAP. These timing differences are temporary in nature and are due to the tax deferral of losses on wash sales, adjustments to basis on publicly traded partnerships, and passive foreign investment companies.
As of March 31, 2021, Davenport Balanced Income Fund had a short-term capital loss carryforward of $711,497 and a long-term capital loss carryforward of $1,459,016 for federal income tax purposes, which may be carried forward indefinitely. These capital loss carryforwards are available to offset net realized capital gains in future years, thereby reducing taxable gains distributions.
Net qualified late year losses, incurred after December 31, 2020 and within the current taxable year, are deemed to arise on the first day of a Fund’s next taxable year. For the year ended March 31, 2021, Davenport Core Fund and Davenport Small Cap Focus Fund deferred $187,282 and $211,471, respectively, of late year ordinary losses to April 1, 2021 for federal income tax purposes.
| THE DAVENPORT FUNDS |
| NOTES TO FINANCIAL STATEMENTS (Continued) |
For the year ended March 31, 2021, the following reclassifications were made as a result of permanent differences between the financial statements and income tax reporting requirements:
| | | | | | | | | Davenport | | | | | | | |
| | | | | | Davenport | | | Equity | | | Davenport | | | Davenport | |
| | | Davenport | | | Value & | | | Opportunities | | | Small Cap | | | Balanced | |
| | | Core Fund | | | Income Fund | | | Fund | | | Focus Fund | | | Income Fund | |
| Paid-in capital | | $ | — | | | $ | — | | | $ | — | | | $ | (1 | ) | | $ | (150,959 | ) |
| Accumulated earnings | | $ | — | | | $ | — | | | $ | — | | | $ | 1 | | | $ | 150,959 | |
| | | | | | | | | | | | | | | | | | | | | |
Such reclassifications have no effect on each Fund’s total net assets or NAV per share.
The Funds recognize the tax benefits or expenses of uncertain tax positions only when the position is “more likely than not” to be sustained assuming examination by tax authorities. Management has reviewed the tax positions taken on Federal income tax returns for each Fund for all open tax years (generally, three years) and has concluded that no provision for unrecognized tax benefits or expenses is required in these financial statements.
| 3. | Investment Transactions |
Investment transactions, other than short-term investments and U.S. government securities, were as follows for the year ended March 31, 2021:
| | | | | | | | | Davenport | |
| | | | | | Davenport | | | Equity | |
| | | Davenport | | | Value & | | | Opportunities | |
| | | Core Fund | | | Income Fund | | | Fund | |
| Purchases of investment securities | | $ | 221,925,325 | | | $ | 219,303,373 | | | $ | 158,577,706 | |
| Proceeds from sales of investment securities | | $ | 189,193,155 | | | $ | 238,655,703 | | | $ | 168,264,821 | |
| | | | | | | | | | | | | |
| | | Davenport | | | Davenport | |
| | | Small Cap | | | Balanced | |
| | | Focus Fund | | | Income Fund | |
| Purchases of investment securities | | $ | 280,100,082 | | | $ | 49,166,844 | |
| Proceeds from sales and maturities of investment securities | | $ | 157,211,565 | | | $ | 46,837,237 | |
| | | | | | | | | |
| 4. | Transactions with Related Parties |
INVESTMENT ADVISORY AGREEMENTS
Each Fund’s investments are managed by Davenport & Company LLC (the “Adviser”) under the terms of an Investment Advisory Agreement. Under the Investment Advisory Agreement, each Fund pays the Adviser a fee, which is computed and accrued daily and paid monthly, at an annual rate of 0.75% of its average daily net assets. Certain officers and a Trustee of the Trust are also officers of the Adviser.
| THE DAVENPORT FUNDS |
| NOTES TO FINANCIAL STATEMENTS (Continued) |
A significant portion of the Funds’ investment trades are executed through an affiliated broker-dealer of the Adviser. No commissions are paid by the Funds to the Adviser or the affiliate for these trades.
OTHER SERVICE PROVIDERS
Ultimus Fund Solutions, LLC (“Ultimus”) provides administration, fund accounting, compliance and transfer agent services to the Funds. The Funds pay Ultimus fees in accordance with the agreements for such services. In addition, the Funds pay out-of-pocket expenses including, but not limited to, postage, supplies, and certain costs related to the pricing of the Funds’ portfolio securities. Certain officers of the Trust are also officers of Ultimus, or of Ultimus Fund Distributors, LLC (the “Distributor”), the principal underwriter of each Fund’s shares and an affiliate of Ultimus. The Distributor is compensated by the Adviser (not the Funds) for acting as principal underwriter.
COMPENSATION OF TRUSTEES
Trustees and officers affiliated with the Adviser or Ultimus are not compensated by the Trust for their services. Each Trustee who is not an affiliated person of the Adviser or Ultimus received from the Trust an annual retainer of $24,000, payable quarterly; a fee of $2,000 for attendance at each meeting of the Board of Trustees (except that such fee is $3,000 for the independent chair); and a fee of $1,000 for attendance at each meeting of any committee of the Board (except that such fee is $1,500 for the committee chair); plus reimbursement of travel and other expenses incurred in attending meetings. Each Fund pays its proportionate share of such fees along with the other series of the Trust.
5. Sector Risk
If a Fund has significant investments in the securities of issuers in industries within a particular business sector, any development affecting that sector will have a greater impact on the value of the net assets of the Fund than would be the case if the Fund did not have significant investments in that sector. In addition, this may increase the risk of loss of an investment in the Fund and increase the volatility of the Fund’s NAV per share. From time to time, circumstances may affect a particular sector and the companies within such sector. For instance, economic or market factors, regulation or deregulation, or other developments may negatively impact all companies in a particular sector and therefore the value of a Fund’s portfolio would be adversely affected. As of March 31, 2021, Davenport Core Fund had 25.4% of the value of its net assets invested in common stocks within the Technology sector, Davenport Equity Opportunities Fund had 25.9% of the value of its net assets invested in common stocks within the Consumer Discretionary sector and Davenport Small Cap Focus Fund had 25.1% of the value of its net assets invested in common stocks within the Financials sector.
| THE DAVENPORT FUNDS |
| NOTES TO FINANCIAL STATEMENTS (Continued) |
| 6. | Contingencies and Commitments |
The Funds indemnify the Trust’s officers and Trustees for certain liabilities that might arise from the performance of their duties to the Funds. Additionally, in the normal course of business the Funds enter into contracts that contain a variety of representations and warranties and which provide general indemnifications. The Funds’ maximum exposure under these arrangements is unknown, as this would involve future claims that may be made against the Funds that have not yet occurred. However, based on experience, the Funds expect the risk of loss to be remote.
The Funds are required to recognize in the financial statements the effects of all subsequent events that provide additional evidence about conditions that existed as of the date of the Statements of Assets and Liabilities. For non-recognized subsequent events that must be disclosed to keep the financial statements from being misleading, the Funds are required to disclose the nature of the event as well as an estimate of its financial effect, or a statement that such an estimate cannot be made. Management has evaluated subsequent events through the issuance of these financial statements and has noted no such events.
| THE DAVENPORT FUNDS |
| REPORT OF INDEPENDENT REGISTERED |
| PUBLIC ACCOUNTING FIRM |
To the Shareholders of The Davenport Funds and
Board of Trustees of Williamsburg Investment Trust
Opinion on the Financial Statements
We have audited the accompanying statements of assets and liabilities, including the schedules of investments, of The Davenport Funds, comprising Davenport Core Fund, Davenport Value & Income Fund, Davenport Equity Opportunities Fund, Davenport Small Cap Focus Fund, and Davenport Balanced Income Fund (the “Funds”), each a series of Williamsburg Investment Trust, as of March 31, 2021, the related statements of operations for the year then ended, the statements of changes in net assets for each of the two years in the period then ended, the related notes, and the financial highlights for each of the five years in the period then ended (collectively referred to as the “financial statements”). In our opinion, the financial statements present fairly, in all material respects, the financial position of each of the Funds as of March 31, 2021, the results of their operations for the year then ended, the changes in net assets for each of the two years in the period then ended, and the financial highlights for each of the five years in the period then ended, in conformity with accounting principles generally accepted in the United States of America.
Basis for Opinion
These financial statements are the responsibility of the Funds’ management. Our responsibility is to express an opinion on the Funds’ financial statements based on our audits. We are a public accounting firm registered with the Public Company Accounting Oversight Board (United States) (“PCAOB”) and are required to be independent with respect to the Funds in accordance with the U.S. federal securities laws and the applicable rules and regulations of the Securities and Exchange Commission and the PCAOB.
We conducted our audits in accordance with the standards of the PCAOB. Those standards require that we plan and perform the audit to obtain reasonable assurance about whether the financial statements are free of material misstatement whether due to error or fraud.
Our audits included performing procedures to assess the risks of material misstatement of the financial statements, whether due to error or fraud, and performing procedures that respond to those risks. Such procedures included examining, on a test basis, evidence regarding the amounts and disclosures in the financial statements. Our procedures included confirmation of securities owned as of March 31, 2021, by correspondence with the custodian and brokers. Our audits also included evaluating the accounting principles used and significant estimates made by management, as well as evaluating the overall presentation of the financial statements. We believe that our audits provide a reasonable basis for our opinion.
We have served as the Funds’ auditor since 2016.

COHEN & COMPANY, LTD.
Milwaukee, Wisconsin
May 24, 2021
| THE DAVENPORT FUNDS |
BOARD OF TRUSTEES AND EXECUTIVE OFFICERS
(Unaudited) |
Overall responsibility for management of the Funds rests with the Board of Trustees. The Trustees serve during the lifetime of the Trust and until its termination, or until death, resignation, retirement or removal. The Trustees, in turn, elect the officers of the Funds. The officers have been elected for an annual term. The following are the Trustees and executive officers of the Funds:
| | Trustees and Officers | Address | Year of
Birth | Position Held
with the Trust | Length of
Time Served |
| | Robert S. Harris, Ph.D. | 225 Pictoria Drive, Suite 450 Cincinnati, OH | 1949 | Chairman and Trustee | Since January 2007 |
| * | John P. Ackerly, IV | One James Center 901 E. Cary Street Richmond, VA | 1963 | Trustee and President of The Davenport Funds | Since July 2012 |
| * | John T. Bruce | 800 Main Street Lynchburg, VA | 1953 | Trustee and President of The FBP Funds | Since September 1988 |
| | George K. Jennison | 225 Pictoria Drive, Suite 450 Cincinnati, OH | 1957 | Trustee | Since January 2015 |
| | Harris V. Morrissette | 225 Pictoria Drive, Suite 450 Cincinnati, OH | 1959 | Trustee | Since March 1993 |
| | Elizabeth W. Robertson | 225 Pictoria Drive, Suite 450 Cincinnati, OH | 1953 | Trustee | Since February 2014 |
| | Cheryl A. Hatcher | One James Center 901 E. Cary Street Richmond, VA | 1957 | Vice President | Since March 2021 |
| | George L. Smith, III | One James Center 901 E. Cary Street Richmond, VA | 1975 | Vice President | Since February 2011 |
| | Mark J. Seger | 225 Pictoria Drive, Suite 450 Cincinnati, OH | 1962 | Treasurer | Since November 2000 |
| | David K. James | 225 Pictoria Drive, Suite 450 Cincinnati, OH | 1970 | Secretary | Since November 2018 |
| | Michael J. Nanosky | 225 Pictoria Drive, Suite 450 Cincinnati, OH | 1966 | Chief Compliance Officer | Since March 2020 |
| * | Messrs. Ackerly and Bruce, as affiliated persons of investment advisers to the Trust, are “interested persons” of the Trust within the meaning of Section 2(a)(19) of the 1940 Act. |
| THE DAVENPORT FUNDS |
BOARD OF TRUSTEES AND EXECUTIVE OFFICERS
(Unaudited) (Continued) |
Each Trustee oversees ten portfolios of the Trust, including the Funds. The principal occupations of the Trustees and executive officers of the Funds during the past five years and public directorships held by the Trustees are set forth below:
Robert S. Harris, Ph.D. is the C. Stewart Sheppard Professor of Business Administration at The Darden Graduate School of Business Administration at the University of Virginia. He was previously the dean at Darden. Professor Harris has published widely on corporate finance, financial markets and mergers and acquisitions and has served as a consultant to corporations and government agencies.
John P. Ackerly, IV, is Senior Vice President and Portfolio Manager of Davenport & Company, LLC (a broker-dealer and investment advisory firm).
John T. Bruce is President, Director and member of the Executive Committee of Flippin, Bruce & Porter, Inc. (an investment advisory firm).
George K. Jennison is retired. He was President of Oyster Consulting, LLC (a management consulting firm) and a financial adviser with Wells Fargo Advisors, LLC.
Harris V. Morrissette is President of China Doll Rice and Beans, Inc. and Dixie Lily Foods. He is also a Director of Trustmark Corporation (bank holding company).
Elizabeth W. Robertson serves as a Trustee of TowneBank Foundation, TowneBank Corporate Board, TowneBank Audit Committee Chair and TowneBank Community Board since 2015. She previously was Chief Financial Officer of Monument Restaurants LLC.
Cheryl A. Hatcher is Senior Vice President of Davenport & Company LLC and Senior Administrative Officer of Davenport Asset Management.
George L. Smith, III is Senior Vice President and Portfolio Manager of the Adviser.
Mark J. Seger is a Vice Chairman of Ultimus Fund Solutions, LLC and Ultimus Fund Distributors, LLC. He previously was Co-CEO of Ultimus Fund Solutions, LLC (1999 to 2019).
David K. James is an Executive Vice President and Chief Legal and Risk Officer of Ultimus Fund Solutions, LLC (2018 to present). He previously was Managing Director and Managing Counsel at State Street Bank and Trust Company (2009 to 2018).
Michael J. Nanosky is a Senior Compliance Officer of Ultimus Fund Solutions, LLC (2020 to present). He previously was Senior Vice President & Chief Compliance Officer of PNC Funds (2014 to 2019).
Additional information about members of the Board of Trustees and executive officers is available in the Statement of Additional Information (“SAI”). To obtain a free copy of the SAI, please call 1-800-281-3217.
| THE DAVENPORT FUNDS |
| YOUR FUNDS’ EXPENSES (Unaudited) |
We believe it is important for you to understand the impact of costs on your investment. All mutual funds have operating expenses. As a shareholder of the Funds, you incur ongoing costs, including management fees and other expenses. These ongoing costs, which are deducted from each Fund’s gross income, directly reduce the investment return of the Funds.
A mutual fund’s ongoing costs are expressed as a percentage of its average net assets. This figure is known as the expense ratio. The following examples are intended to help you understand the ongoing costs (in dollars) of investing in the Funds and to compare these costs with the ongoing costs of investing in other mutual funds. The examples below are based on an investment of $1,000 made at the beginning of the period shown and held for the entire period (October 1, 2020 through March 31, 2021).
The table below illustrates each Fund’s ongoing costs in two ways:
Actual fund return – This section helps you to estimate the actual expenses that you paid over the period. The “Ending Account Value” shown is derived from each Fund’s actual return, and the fourth column shows the dollar amount of operating expenses that would have been paid by an investor who started with $1,000 in the Funds. You may use the information here, together with the amount you invested, to estimate the expenses that you paid over the period.
To do so, simply divide your account value by $1,000 (for example, an $8,600 account value divided by $1,000 = 8.6), then multiply the result by the number given for the applicable Fund under the heading “Expenses Paid During Period.”
Hypothetical 5% return – This section is intended to help you compare each Fund’s ongoing costs with those of other mutual funds. It assumes that each Fund had an annual return of 5% before expenses during the period shown, but that the expense ratio is unchanged. In this case, because the return used is not each Fund’s actual return, the results do not apply to your investment. The example is useful in making comparisons because the U.S. Securities and Exchange Commission (the “SEC”) requires all mutual funds to calculate expenses based on a 5% return. You can assess each Fund’s ongoing costs by comparing this hypothetical example with the hypothetical examples that appear in shareholder reports of other funds.
Note that expenses shown in the table are meant to highlight and help you compare ongoing costs only. The Funds do not charge sales loads or redemption fees.
The calculations assume no shares were bought or sold during the period. Your actual costs may have been higher or lower, depending on the amount of your investment and the timing of any purchases or redemptions.
More information about each Fund’s expenses, including historical annual expense ratios, can be found in this report. For additional information on operating expenses and other shareholder costs, please refer to the Funds’ prospectus.
| THE DAVENPORT FUNDS |
| YOUR FUNDS’ EXPENSES (Unaudited) (Continued) |
| | | Beginning | | Ending | | | | |
| | | Account Value | | Account Value | | | | |
| | | October 1, | | March 31, | | Expense | | Expenses Paid |
| | | 2020 | | 2021 | | Ratio(a) | | During Period(b) |
| Davenport Core Fund | | | | | | | | |
| Based on Actual Fund Return | | $1,000.00 | | $1,150.70 | | 0.86% | | $4.61 |
| Based on Hypothetical 5% Return (before expenses) | | $1,000.00 | | $1,020.64 | | 0.86% | | $4.33 |
| Davenport Value & Income Fund | | | | | | | | |
| Based on Actual Fund Return | | $1,000.00 | | $1,225.90 | | 0.87% | | $4.83 |
| Based on Hypothetical 5% Return (before expenses) | | $1,000.00 | | $1,020.59 | | 0.87% | | $4.38 |
| Davenport Equity Opportunities Fund | | | | | | | | |
| Based on Actual Fund Return | | $1,000.00 | | $1,232.10 | | 0.88% | | $4.90 |
| Based on Hypothetical 5% Return (before expenses) | | $1,000.00 | | $1,020.54 | | 0.88% | | $4.43 |
| Davenport Small Cap Focus Fund | | | | | | | | |
| Based on Actual Fund Return | | $1,000.00 | | $1,272.50 | | 0.89% | | $5.04 |
| Based on Hypothetical 5% Return (before expenses) | | $1,000.00 | | $1,020.49 | | 0.89% | | $4.48 |
| Davenport Balanced Income Fund | | | | | | | | |
| Based on Actual Fund Return | | $1,000.00 | | $1.142.00 | | 0.92% | | $4.91 |
| Based on Hypothetical 5% Return (before expenses) | | $1,000.00 | | $1,020.34 | | 0.92% | | $4.63 |
| (a) | Annualized, based on each Fund’s most recent one-half year expenses. |
| (b) | Expenses are equal to each Fund’s annualized expense ratio multiplied by the average account value over the period, multiplied by 182/365 (to reflect the one-half year period). |
| THE DAVENPORT FUNDS |
| OTHER INFORMATION (Unaudited) |
A description of the policies and procedures that the Funds use to vote proxies relating to portfolio securities is available without charge upon request by calling toll-free 1-800-281-3217, or on the SEC’s website at www.sec.gov. Information regarding how the Funds voted proxies relating to portfolio securities during the most recent 12-month period ended June 30 is also available without charge upon request by calling toll-free 1-800-281-3217, or on the SEC’s website at www.sec.gov.
The Trust files a complete listing of portfolio holdings for each Fund with the SEC as of the end of the first and third quarters of each fiscal year as an exhibit to its reports on Form N-PORT. These filings are available upon request by calling 1-800-281-3217. Furthermore, you may obtain a copy of these filings on the SEC’s website at www.sec.gov.
A complete listing of portfolio holdings for each Fund is updated daily and can be reviewed at the Funds’ website at www.investdavenport.com.
| FEDERAL TAX INFORMATION (Unaudited) |
For the fiscal year ended March 31, 2021, Davenport Core Fund, Davenport Value & Income Fund, Davenport Equity Opportunities Fund and Davenport Small Cap Focus Fund designated $6,284,445, $18,670,565, $55,418,874 and $6,793,095, respectively, as long-term capital gain distributions.
Qualified Dividend Income – Davenport Core Fund, Davenport Value & Income Fund, Davenport Equity Opportunities Fund, Davenport Small Cap Focus Fund and Davenport Balanced Income Fund designated 100%, 84.66%, 47.27%, 9.16% and 72.68%, respectively, of ordinary income distributions, or up to the maximum amount of such dividends allowable pursuant to the Internal Revenue Code, as qualified dividend income.
Dividends Received Deduction – Corporate shareholders are generally entitled to take the dividends received deduction on the portion of a Fund’s dividend distributions that qualify under tax law. For the fiscal year ended March 31, 2021, Davenport Core Fund, Davenport Value & Income Fund, Davenport Equity Opportunities Fund, Davenport Small Cap Focus Fund and Davenport Balanced Income Fund, 100%, 71.82%, 42.31%, 9.43% and 63.35%, respectively, of ordinary income distributions, qualifies for the corporate dividends received deduction.
Qualified Business Income – Davenport Value & Income Fund designates 7.81% of its ordinary income dividends, or up to the maximum amount of such dividends allowable pursuant to the Internal Revenue Code, as qualified business income.
| DAVENPORT FUNDS |
DISCLOSURE REGARDING APPROVAL OF
INVESTMENT ADVISORY AGREEMENT
(Unaudited) |
At a meeting held on February 23, 2021, the Board of Trustees, including a majority of the Independent Trustees, approved the continuance for a one-year period of the Investment Advisory Agreements with the Adviser on behalf of the Davenport Core Fund, the Davenport Value & Income Fund, the Davenport Equity Opportunities Fund, the Davenport Small Cap Focus Fund and the Davenport Balanced Income Fund. Below is a discussion of the factors considered by the Board of Trustees along with the conclusions with respect thereto that formed the basis for the Board’s approval.
In approving the continuance of the Investment Advisory Agreements, the Independent Trustees considered all information they deemed reasonably necessary to evaluate the terms of the Agreements. The principal areas of review by the Independent Trustees were the nature, extent and quality of the services provided by the Adviser and the reasonableness of the fees charged for those services. These matters were considered by the Independent Trustees consulting with experienced counsel for the Independent Trustees, who is independent of the Adviser.
The Independent Trustees’ evaluation of the quality of the Adviser’s services took into consideration their knowledge gained through presentations and reports from the Adviser over the course of the preceding year. The Independent Trustees considered that the Adviser had provided its views on the overall conditions of the economy and the markets, including the factors that may have influenced the markets, investor preferences and market sentiment during the past year. The Independent Trustees also considered the security selection process that is applied in the management of the Funds and the adjustments that were made by the Adviser over the past year in an effort to protect the portfolios from declines in companies that were adversely affected by the pandemic while favoring companies that the Adviser believed were likely to benefit as the economy recovered. Both short-term and long-term investment performance of the Funds were considered. Each Fund’s performance was compared to its performance benchmark, a peer group of funds with similar investment objectives and strategies, and to the Adviser’s comparably managed private accounts, as applicable. The Independent Trustees also considered: the scope and quality of the in-house capabilities of the Adviser and other resources that are dedicated towards management of the Funds; the experience of the Adviser’s Investment Policy Committee members and their collaboration, the quality of administrative and other services, including the Adviser’s role in coordinating the activities of the Funds’ other service providers; the Adviser’s compliance with investment policies of the Funds and applicable laws and regulations; information provided by management and the Funds’ independent public accounting firm in periodic meetings with the Trust’s Audit Committee; the business reputation of the Adviser; the qualifications of the Adviser’s key investment and compliance personnel; and the Adviser’s financial resources.
In reviewing the fees payable under the Investment Advisory Agreements, the Independent Trustees compared the advisory fees and overall expense levels of each Fund with those of funds with similar investment objectives and strategies as well as the private accounts managed by the Adviser, as applicable. The Independent Trustees considered information provided by the Adviser concerning the Adviser’s profitability with respect to each Fund, including the assumptions and
| DAVENPORT FUNDS |
DISCLOSURE REGARDING APPROVAL OF
INVESTMENT ADVISORY AGREEMENT
(Unaudited) (Continued) |
methodology used in preparing the profitability information, in light of applicable case law relating to advisory fees. For these purposes, the Independent Trustees considered not only the fees paid by the Funds, but also so-called “fallout” benefits to the Adviser. The Independent Trustees also considered the fact that the Funds’ portfolio trades for equity securities were executed by the Adviser at no cost to the Funds. In evaluating the Funds’ advisory fees, the Trustees considered the complexity and quality of the investment process that is applied in the management of the Funds.
Based on the consideration of the foregoing and such other information as was deemed relevant, including the factors and conclusions below, the Independent Trustees concluded that: (i) the performance of each of the Davenport Core Fund, Davenport Value & Income Fund, the Davenport Balanced Income Fund, the Davenport Equity Opportunities Fund and the Davenport Small Cap Focus Fund is satisfactory given each Fund’s investment strategy in comparison to the performance to its respective primary and secondary benchmark, and peer group average, and after considering the services provided by Davenport & Co. to each respective Fund; (ii) the advisory fee for each of the Davenport Core Fund, the Davenport Equity Opportunities Fund, the Davenport Value & Income Fund and the Davenport Balanced Income Fund is higher when compared to the average for similarly managed funds according to statistics derived from Morningstar, Inc., the advisory fee for the Davenport Small Cap Focus Fund is the same when compared to the average for similarly managed funds according to statistics derived from Morningstar, Inc., and the advisory fees payable by the Davenport Funds are reasonable in relation to the services provided by Davenport & Co.; (iii) the total operating expense ratio of each of the Davenport Core Fund, the Davenport Equity Opportunities Fund, the Davenport Value & Income Fund, the Davenport Small Cap Focus Fund and Davenport Balanced Income Fund was lower than the average expense ratio for comparably managed funds, according to statistics derived from Morningstar, Inc.; and (iv) Davenport & Co., a dually registered investment adviser and broker dealer, has further benefited the Funds’ shareholders by executing all equity trades at no cost to the Funds; and (vii) the profits of Davenport & Co. with respect to its management of the Funds are reasonable.
The Independent Trustees considered the extent to which economies of scale are being realized as the Funds grow, and they noted that the operating expenses of each of the Davenport Funds, with the exception of the Davenport Value & Income Fund, have either decreased or remained the same during the past calendar year. The Independent Trustees also considered the “fallout” benefits to Davenport & Co. with respect to the Davenport Funds, but given the amounts involved viewed these as secondary factors in connection with the evaluation of the reasonableness of the advisory fees paid by the Funds.
No single factor was considered in isolation or to be determinative to the decision of the Independent Trustees to approve the continuance of the Investment Advisory Agreements. Rather the Independent Trustees concluded, after weighing and balancing of all factors considered, that it was in the best interests of each Fund and its shareholders to continue the Investment Advisory Agreements without modification to its terms, including the fees charged for services thereunder.
| DAVENPORT FUNDS’ |
| LIQUIDITY RISK MANAGEMENT PROGRAM (Unaudited) |
The Funds have adopted and implemented a written liquidity risk management program as required by Rule 22e-4 (the “Liquidity Rule”) under the Investment Company Act. The program is reasonably designed to assess and manage each Fund’s liquidity risk, taking into consideration, among other factors, the Fund’s investment strategy and the liquidity of its portfolio investments during normal and reasonably foreseeable stressed conditions; its short and long-term cash flow projections; and its cash holdings and access to other funding sources. The Funds’ Board of Trustees approved the appointment of a Liquidity Risk Committee, which includes representatives from Davenport & Company LLC, the Funds’ investment adviser, and Ultimus Fund Solutions, LLC, the Funds’ Administrator. The Liquidity Risk Committee is responsible for the program’s administration and oversight and for reporting to the Board on at least an annual basis regarding the program’s operation and effectiveness. The Liquidity Risk Committee updated its assessment of each Fund’s liquidity risk profile, considering additional data gathered in the 12 months ended November 30, 2020 and the adequacy and effectiveness of the liquidity risk management program’s operations since its inception on December 1, 2018 (the “Review Period”) in order to prepare a written report for the Board of Trustees (the “Report”) for consideration at its meeting held on February 23, 2021. During the Review Period, none of the Funds experienced unusual stress or disruption to its operations related to purchase and redemption activity. Also, during the Review Period the Funds held adequate levels of cash and highly liquid investments to meet shareholder redemption activities in accordance with applicable requirements. The Report concluded that (i) the Funds’ liquidity risk management program is reasonably designed to prevent violations of the Liquidity Rule and (ii) the Funds’ liquidity risk management program has been effectively implemented.
THE DAVENPORT FUNDS
Investment Adviser
Davenport & Company LLC
One James Center
901 East Cary Street
Richmond, Virginia 23219-4037
Administrator
Ultimus Fund Solutions, LLC
P.O. Box 46707
Cincinnati, Ohio 45246-0707
1-800-281-3217
Custodian
U.S. Bank, N.A.
425 Walnut Street
Cincinnati, Ohio 45202
Independent Registered Public
Accounting Firm
Cohen & Company, Ltd.
342 N Water Street,
Suite 830
Milwaukee, WI 53202
Legal Counsel
Sullivan & Worcester LLP
1666 K Street, N.W.
Washington, DC 20006
Board of Trustees
Robert S. Harris, Ph.D., Chairman
John P. Ackerly, IV
John T. Bruce
George K. Jennison
Harris V. Morrissette
Elizabeth W. Robertson
Officers
John P. Ackerly, IV, President
Cheryl A. Hatcher, Vice President
George L. Smith, III, Vice President
Davenport-AR-21
| |
| |
| |
| |
| |
 |
| |
| FBP Equity & Dividend Plus Fund |
| FBP Appreciation & Income Opportunities Fund |
| |
| |
| |
| |
| |
| Annual Report |
| March 31, 2021 |
| |
| |
| |
| |
| |
| |
| |
| |
| |
| |
| |
| |
| |
| |
| |
| |
| No-Load Funds |
| |
| |
| |
| |
| |
Letter to Shareholders | May 14, 2021 |
We are pleased to report on your Funds and their investments for the annual period ended March 31, 2021, and to provide some additional information since we last communicated with you. First, we will review the recent market environment and share with you some exciting news for our company and the FBP Funds. Finally, we will comment on the Funds’ fiscal year results.
Economic and Market Update
The last twelve months will be remembered as one of the most unusual years we as investors have ever experienced. Coming off the lows of last year’s bear market, which was created by fears over the effects of the coronavirus, one-year returns ended March 31 were some of the highest on record for the Funds and for the markets. Equity markets in the U.S. and globally responded positively as progress on fighting the coronavirus pandemic became more evident. Investors drove prices higher in anticipation of much stronger economies and corporate earnings. Growth stocks and other beneficiaries of stay-at-home trends were early leaders. But just as we thought might happen, as the economy began to reopen and growth in GDP and earnings estimates accelerated late in 2020, economically sensitive stocks began to significantly outperform the rest of the market. These outperforming stocks tended to be value-oriented, which has greatly benefited your Fund’s returns.
Late last year brought a Presidential election and, in January, a new administration in Washington to consider. In the first three months in office, the Biden team passed a stimulus bill, numerous executive orders and is currently working on a very large infrastructure bill. The administration is also negotiating a revenue-generating bill with a broad range of tax hikes being proposed. The impact of those orders and legislation on the markets is difficult to project. More spending will drive growth, while higher taxes will be a hindrance to corporate earnings and may well affect investor behavior. As a result of these and prior government actions, borrowings have escalated. The added debt appears manageable with the low-interest rates we have today, however, at some point, the rising cost of this debt could become problematic if interest rates continue to move higher over time.
The strong economic growth recently experienced and the likelihood of it continuing is creating a very real concern over inflation. Production cutbacks in 2020 due to Covid, coupled with the strength of consumer demand fueled by government stimulus, have created a supply/demand imbalance. Higher inflation at both the consumer and producer level has been the result. And while the Federal Reserve has wanted inflation to move back to its 2% target for several years, inflation is currently running well above that level. Time will tell if this is a significant change or just transitory, as the Fed believes. The markets are currently acting as if a more permanent change is in the works. Recently this has negatively affected the prices of higher growth companies (longer duration assets) and benefited higher dividend-paying equities (lower duration assets). A similar effect is playing out in the fixed income markets as yields on longer-dated maturities have risen. For example, the yield on the 10-year U.S. Treasury bond has increased from under 1% a year ago to approximately 1.65% today.
We are very pleased to inform you that Flippin, Bruce & Porter has entered into an agreement with Cantor Fitzgerald Investment Advisors, L.P., (“Cantor Fitzgerald”) a registered investment adviser, to have its business assets be acquired by Cantor Fitzgerald. It is anticipated that June 1, 2021, FBP’s business will become a division of Cantor Fitzgerald (the “Transaction”). We believe this change will provide FBP’s business and the FBP Funds with enhanced resources in many areas, including finance, technology, trading, and marketing. The offices of FBP’s business will remain in Lynchburg, Virginia, and our investment staff, philosophy, and processes we use to manage the Funds will remain the same. We believe this Transaction
helps to ensure that FBP’s business has the support and resources to continue to serve the Funds’ shareholders well into the future. Furthermore, it should provide the opportunity for growth in the Funds’ shareholder base and assets, which should be a benefit to all shareholders. The Transaction will result in a proposed new advisory agreement with Cantor Fitzgerald and will require shareholder approval at a shareholder meeting being planned for July 16, 2021. You will receive a proxy statement in June, which will provide more information regarding the Transaction.
FBP Equity & Dividend Plus Fund Review
The FBP Equity & Dividend Plus Fund returned 58.15% for the fiscal year ended March 31, 2021. The S&P 500 Index (the “Index”) returned 56.35% over the same period. The Fund was 99.0% equity and 1.0% cash at fiscal year-end.
As previously discussed, this past year was an excellent one for investment returns. All sectors in the Fund had positive results. Financials, Consumer Discretionary, and Materials were the strongest sectors relative to the Index, recovering from the levels seen a year ago as these were some of the sectors most negatively affected by the coronavirus. Health Care, Technology and Consumer Staples were lagging sectors on a relative basis. Individual stocks that provided nice returns for the Fund were Tapestry, Kohl’s, Broadcom, United Parcel Service and ViacomCBS. International Business Machines, AT&T, Merck, Royal Dutch Shell and Cisco Systems were relative laggards. Recent additions to the Fund are Bank of New York Mellon, Mondelez International and Verizon Communications, all large well managed companies with above-average dividends. HP, Archer-Daniels-Midland and Emerson Electric are recent reductions from the Fund as a result of call options being exercised at attractive price levels.
Cash flow generation from dividends is a primary focus of your Equity & Dividend Plus Fund, as well as cash generated from option premiums. We were keenly focused on the ability of the stocks the Fund held to maintain dividend payments through the downturn and while the Fund did have some companies that altered dividend policies, dividend payments for the year held up fairly well. The Fund utilizes as part of its investment discipline the use of covered call options as individual securities approach the top of the Adviser’s growth and price expectations. The Fund’s purpose in selling the call option is to generate additional cash flow to the Fund and to hedge the possibility the security may not achieve its price objective. In very strong stock markets, this discipline may limit the upside of the securities where options have been written, but in flat to negative markets, it may provide an additional return. During the fiscal year ended March 31, 2021, the amount of premiums generated from selling covered call options was $776,765, much larger than previous years as the strong gains and increased volitality provided more attractive option writing opportunities.
FBP Appreciation & Income Opportunities Fund Review
The FBP Appreciation & Income Opportunities Fund returned 52.63% for the fiscal year ended March 31, 2021. The S&P 500 Index (the “Index”) returned 56.35% and the Bloomberg Barclays Intermediate U.S. Government/Credit Index returned 2.01% over the same period. The Fund was 72.2% equity, 11.7% fixed income and 16.1% cash at fiscal year-end.
This past twelve months was a very positive period for the Appreciation & Income Opportunities Fund as well. The Fund’s allocation to equities produced strong returns as all sectors were positive and companies that had cyclical exposure were especially strong. Financials, Consumer Discretionary and Materials were the strongest sectors while Health Care, Consumer Staples and Technology lagged the Index on a relative basis Viacom CBS, Tapestry, Kohl’s and Freeport-Mcmoran were standout performers, while Royal Dutch Shell, Merck, AT&T, First Energy and Occidental Petroleum lagged on a relative basis. The fixed income portion and cash weighting, whose purpose in the Fund is to provide stability and income, did hold back
returns. However, their shorter duration allowed them to perform better than longer-dated fixed-income assets. Recently the Fund has been more active with sales, reducing positions in ViacomCBS, Archer-Daniels-Midland and Nokia.
The Fund does utilize as part of its investment discipline the use of covered call options as individual securities approach the top of the Adviser’s growth and price expectations. The Fund’s purpose in selling the call option is to generate additional income to the Fund and to hedge the possibility the security may not achieve its price objective. In very strong stock markets, this discipline may limit the upside of the securities where options have been written, but in modest to negative markets, it may provide additional return. During the fiscal year ended March 31, 2021, the amount of premiums generated from selling covered call options was $193,811.
We want to thank you for your continued support and investment in the Flippin, Bruce & Porter Funds. Please visit our website at www.fbpfunds.com for information on your Funds and the investment philosophy and process we utilize to achieve their investment objectives.

John T. Bruce, CFA
President - Portfolio Manager
May 14, 2021
Data presented reflects past performance, which is no guarantee of future results. Investment results and principal value will fluctuate so that shares, when redeemed, may be worth more or less than their original cost. Due to market volatility, current performance may be higher or lower than the performance shown. Updated performance information, current through the most recent month-end, is available by contacting the Funds at 1-866-738-1127.
This report is submitted for the general information of the shareholders of the Funds. It reflects our views, opinions and portfolio holdings as of the date of this letter. These views are subject to change at any time based upon market or other conditions. For more current information throughout the year please visit www.fbpfunds.com or call the Funds at 1-866-738-1127. This report is not authorized for distribution to prospective investors in the Funds unless accompanied by a current prospectus.
THE FLIPPIN, BRUCE & PORTER FUNDS
COMPARATIVE PERFORMANCE CHARTS
(Unaudited) |
Performance for each Fund is compared to the most appropriate broad-based index, the S&P 500® Index, an unmanaged index of 500 large common stocks. Each Fund’s performance results are also compared to the Consumer Price Index, a measure of inflation; the Bloomberg Barclays Intermediate U.S. Government/ Credit Index is also compared for the FBP Appreciation & Income Opportunities Fund.
FBP Equity & Dividend Plus Fund
Comparison of the Change in Value of a $10,000 Investment in FBP Equity & Dividend Plus Fund, the S&P 500® Index and the Consumer Price Index

THE FLIPPIN, BRUCE & PORTER FUNDS
COMPARATIVE PERFORMANCE CHARTS
(Unaudited) (Continued) |
FBP Appreciation & Income Opportunities Fund
Comparison of the Change in Value of a $10,000 Investment in FBP Appreciation & Income Opportunities Fund, the S&P 500® Index, the Consumer Price Index and the Bloomberg Barclays Intermediate U.S. Government/Credit Index
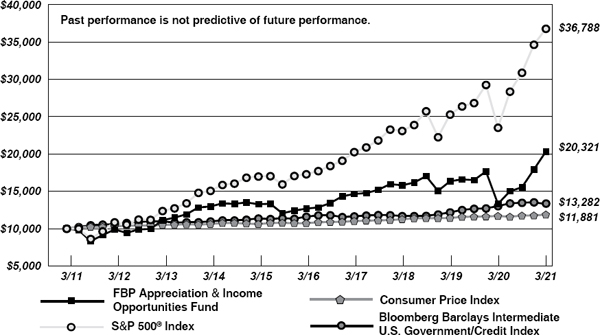
| Average Annual Total Returns |
| (for periods ended March 31, 2021) |
| |
| | 1 Year | | 5 Years | | 10 Years | |
| FBP Equity & Dividend Plus Fund (a) | 58.15% | | 10.43% | | 7.78% | |
| FBP Appreciation & Income Opportunities Fund (a) | 52.63% | | 9.91% | | 7.35% | |
| S&P 500® Index | 56.35% | | 16.29% | | 13.91% | |
| Consumer Price Index | 1.66% | | 2.09% | | 1.74% | |
| Bloomberg Barclays Intermediate U.S. Government/Credit Index | 2.01% | | 2.75% | | 2.88% | |
| (a) | Total returns are a measure of the change in value of an investment in the Fund over the periods covered, which assumes any dividends or capital gains distributions are reinvested in shares of the Fund. Returns do not reflect the deduction of taxes a shareholder would pay on the Fund’s distributions or the redemption of Fund shares. |
| FBP EQUITY & DIVIDEND PLUS FUND |
| PORTFOLIO INFORMATION |
| March 31, 2021 (Unaudited) |
| General Information | | | |
| Net Asset Value Per Share | | $ | 28.19 | |
| Total Net Assets (Millions) | | $ | 28.5 | |
| Current Expense Ratio | | | 1.12% | |
| Portfolio Turnover | | | 21% | |
| Fund Inception Date | | | 7/30/1993 | |
| | | | | | S&P 500® | |
| Stock Characteristics | | Fund | | | Index | |
| Number of Stocks | | | 52 | | | | 500 | |
| Weighted Avg Market Capitalization (Billions) | | $ | 110.9 | | | $ | 468.9 | |
| Price-to-Earnings Ratio (Bloomberg 1 Yr. Forecast EPS) | | | 13.3 | | | | 21.9 | |
| Price-to-Book Value | | | 2.0 | | | | 4.3 | |
| Asset Allocation (% of Net Assets) |
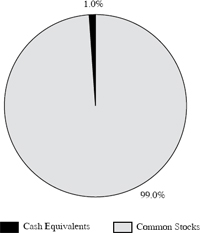
| Sector Diversification vs. the S&P 500® Index |
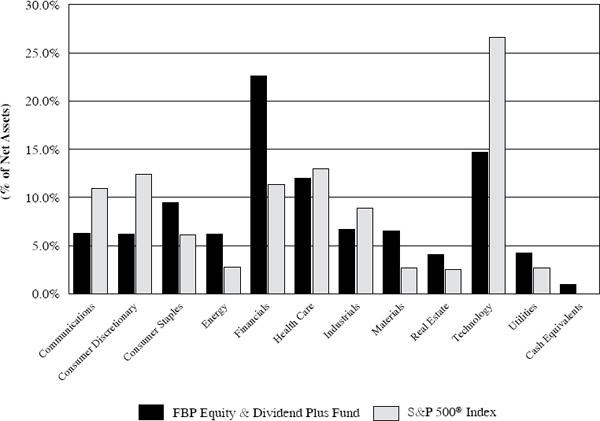
| Ten Largest Equity Holdings | | % of Net Assets |
| Broadcom, Inc. | | 4.6% |
| Nucor Corporation | | 3.2% |
| Truist Financial Corporation | | 3.2% |
| ViacomCBS, Inc. - Class B | | 3.1% |
| JPMorgan Chase & Company | | 2.9% |
| U.S. Bancorp | | 2.8% |
| Cisco Systems, Inc. | | 2.7% |
| International Business Machines Corporation | | 2.6% |
| Merck & Company, Inc. | | 2.5% |
| Raytheon Technologies Corporation | | 2.5% |
| FBP APPRECIATION & INCOME OPPORTUNITIES FUND |
| PORTFOLIO INFORMATION |
| March 31, 2021 (Unaudited) |
| General Information | | | |
| Net Asset Value Per Share | | $ | 21.67 | |
| Total Net Assets (Millions) | | $ | 35.6 | |
| Current Expense Ratio | | | 1.05% | |
| Portfolio Turnover | | | 11% | |
| Fund Inception Date | | | 7/3/1989 | |
| Asset Allocation (% of Net Assets) |
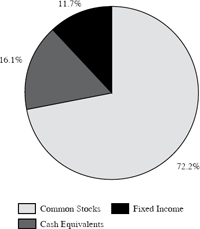
| Common Stock Portfolio (72.2% of Net Assets ) |
| Number of Stocks | | | 49 | |
| Weighted Avg Market Capitalization (Billions) | | $ | 124.0 | |
| Price-to-Earnings Ratio (Bloomberg 1 Yr.Forecast EPS) | | | 13.6 | |
| Price-to-Book Value | | | 2.1 | |
| Five Largest Sectors | | % of Net Assets |
| Financials | | 19.5% |
| Technology | | 15.7% |
| Health Care | | 8.0% |
| Industrials | | 6.3% |
| Consumer Discretionary | | 5.7% |
| Ten Largest Equity Holdings | | % of Net Assets |
| JPMorgan Chase & Company | | 4.3% |
| Bank of America Corporation | | 4.1% |
| Broadcom, Inc. | | 3.1% |
| Cisco Systems, Inc. | | 2.5% |
| HP, Inc. | | 2.5% |
| Microsoft Corporation | | 2.3% |
| Lincoln National Corporation | | 2.2% |
| Apple, Inc. | | 2.1% |
| Capital One Financial Corporation | | 2.1% |
| MetLife, Inc. | | 2.1% |
| Fixed-Income Portfolio (11.7% of Net Assets) |
| Number of Fixed-Income Securities | 8 |
| Average Quality | BBB+ |
| Average Weighted Maturity | 1.5 yrs. |
| Average Effective Duration | 1.4 yrs. |
| Sector Breakdown | | % of Net Assets |
| U.S. Treasury Obligations | | 1.4% |
| Energy | | 1.5% |
| Financials | | 5.9% |
| Industrials | | 1.5% |
| Utilities | | 1.4% |
| FBP EQUITY & DIVIDEND PLUS FUND |
| SCHEDULE OF INVESTMENTS |
| March 31, 2021 |
| COMMON STOCKS — 99.0% | | Shares | | | Value | |
| Communications — 6.3% | | | | | | | | |
| AT&T, Inc. | | | 16,000 | | | $ | 484,320 | |
| Verizon Communications, Inc. | | | 7,500 | | | | 436,125 | |
| ViacomCBS, Inc. - Class B (a) | | | 19,500 | | | | 879,450 | |
| | | | | | | | 1,799,895 | |
| Consumer Discretionary — 6.2% | | | | | | | | |
| Genuine Parts Company | | | 5,500 | | | | 635,745 | |
| Kohl’s Corporation (a) | | | 8,500 | | | | 506,685 | |
| Tapestry, Inc. (b) | | | 15,000 | | | | 618,150 | |
| | | | | | | | 1,760,580 | |
| Consumer Staples — 9.5% | | | | | | | | |
| Archer-Daniels-Midland Company (a) | | | 6,000 | | | | 342,000 | |
| J.M. Smucker Company (The) (a) | | | 5,200 | | | | 657,956 | |
| Kellogg Company | | | 10,500 | | | | 664,650 | |
| Mondelēz International, Inc. - Class A | | | 5,000 | | | | 292,650 | |
| Philip Morris International, Inc. | | | 5,300 | | | | 470,322 | |
| Tyson Foods, Inc. - Class A | | | 3,600 | | | | 267,480 | |
| | | | | | | | 2,695,058 | |
| Energy — 6.2% | | | | | | | | |
| Chevron Corporation | | | 4,800 | | | | 502,992 | |
| ConocoPhillips (a) | | | 8,500 | | | | 450,245 | |
| Exxon Mobil Corporation | | | 8,000 | | | | 446,640 | |
| Royal Dutch Shell plc - Class B - ADR | | | 10,000 | | | | 368,300 | |
| | | | | | | | 1,768,177 | |
| Financials — 22.6% | | | | | | | | |
| Bank of New York Mellon Corporation (The) | | | 6,000 | | | | 283,740 | |
| First Horizon Corporation | | | 18,000 | | | | 304,380 | |
| JPMorgan Chase & Company | | | 5,500 | | | | 837,265 | |
| KeyCorp (a) | | | 30,200 | | | | 603,396 | |
| Lincoln National Corporation | | | 9,500 | | | | 591,565 | |
| MetLife, Inc. | | | 10,200 | | | | 620,058 | |
| People’s United Financial, Inc. (a) | | | 25,000 | | | | 447,500 | |
| Prudential Financial, Inc. | | | 6,000 | | | | 546,600 | |
| Truist Financial Corporation | | | 15,500 | | | | 903,960 | |
| U.S. Bancorp | | | 14,200 | | | | 785,402 | |
| Wells Fargo & Company | | | 13,500 | | | | 527,445 | |
| | | | | | | | 6,451,311 | |
| FBP EQUITY & DIVIDEND PLUS FUND |
| SCHEDULE OF INVESTMENTS (Continued) |
| COMMON STOCKS — 99.0% (Continued) | | Shares | | | Value | |
| Health Care — 12.0% | | | | | | | | |
| Bristol-Myers Squibb Company | | | 7,800 | | | $ | 492,414 | |
| CVS Health Corporation | | | 9,000 | | | | 677,070 | |
| Johnson & Johnson (a) | | | 4,100 | | | | 673,835 | |
| Medtronic plc | | | 2,000 | | | | 236,260 | |
| Merck & Company, Inc. | | | 9,400 | | | | 724,646 | |
| Pfizer, Inc. | | | 17,000 | | | | 615,910 | |
| | | | | | | | 3,420,135 | |
| Industrials — 6.7% | | | | | | | | |
| Emerson Electric Company | | | 3,500 | | | | 315,770 | |
| Lockheed Martin Corporation | | | 800 | | | | 295,600 | |
| Raytheon Technologies Corporation | | | 9,200 | | | | 710,884 | |
| United Parcel Service, Inc. - Class B (a) | | | 3,500 | | | | 594,965 | |
| | | | | | | | 1,917,219 | |
| Materials — 6.5% | | | | | | | | |
| Compass Minerals International, Inc. | | | 4,000 | | | | 250,880 | |
| Dow, Inc. (a) | | | 10,600 | | | | 677,764 | |
| Nucor Corporation (a) | | | 11,500 | | | | 923,105 | |
| | | | | | | | 1,851,749 | |
| Real Estate — 4.1% | | | | | | | | |
| Public Storage (a) | | | 1,500 | | | | 370,140 | |
| Simon Property Group, Inc. | | | 3,800 | | | | 432,326 | |
| Ventas, Inc. (a) | | | 6,900 | | | | 368,046 | |
| | | | | | | | 1,170,512 | |
| Technology — 14.7% | | | | | | | | |
| Amdocs Ltd. | | | 4,000 | | | | 280,600 | |
| Broadcom, Inc. (a) | | | 2,800 | | | | 1,298,248 | |
| Cisco Systems, Inc. | | | 15,000 | | | | 775,650 | |
| HP, Inc. (a) | | | 20,700 | | | | 657,225 | |
| Intel Corporation (a) | | | 7,000 | | | | 448,000 | |
| International Business Machines Corporation | | | 5,500 | | | | 732,930 | |
| | | | | | | | 4,192,653 | |
| Utilities — 4.2% | | | | | | | | |
| Duke Energy Corporation (a) | | | 7,000 | | | | 675,710 | |
| National Fuel Gas Company | | | 5,500 | | | | 274,945 | |
| PPL Corporation | | | 8,500 | | | | 245,140 | |
| | | | | | | | 1,195,795 | |
| | | | | | | | | |
| Total Common Stocks (Cost $20,799,168) | | | | | | $ | 28,223,084 | |
| FBP EQUITY & DIVIDEND PLUS FUND |
| SCHEDULE OF INVESTMENTS (Continued) |
| MONEY MARKET FUNDS — 2.2% | | Shares | | | Value | |
| Fidelity Institutional Money Market Government Portfolio -Class I, 0.01% (c) (Cost $631,495) | | | 631,495 | | | $ | 631,495 | |
| | | | | | | | | |
| Total Investments at Value — 101.2% | | | | | | | | |
| (Cost $21,430,663) | | | | | | $ | 28,854,579 | |
| | | | | | | | | |
| Liabilities in Excess of Other Assets — (1.2%) | | | | | | | (337,108 | ) |
| | | | | | | | | |
| Net Assets — 100.0% | | | | | | $ | 28,517,471 | |
ADR - American Depositary Receipt.
| (a) | Security covers a written call option. |
| (b) | Non-income producing security. |
| (c) | The rate shown is the 7-day effective yield as of March 31, 2021. |
See accompanying notes to financial statements.
| FBP EQUITY & DIVIDEND PLUS FUND |
| SCHEDULE OF OPEN OPTION CONTRACTS |
| March 31, 2021 |
| COVERED WRITTEN | | | | Notional | | | Strike | | Expiration | | Value of | |
| CALL OPTIONS | | Contracts | | Value | | | Price | | Date | | Options | |
| Archer-Daniels-Midland Company | | 60 | | $ | 342,000 | | | $ | 65.00 | | 09/17/21 | | $ | 7,500 | |
| Broadcom, Inc. | | 14 | | | 649,124 | | | | 470.00 | | 10/15/21 | | | 57,820 | |
| ConocoPhillips | | 55 | | | 291,335 | | | | 70.00 | | 08/20/21 | | | 5,170 | |
| Dow, Inc. | | 35 | | | 223,790 | | | | 60.00 | | 06/18/21 | | | 21,350 | |
| Duke Energy Corporation .. | | 35 | | | 337,855 | | | | 100.00 | | 04/16/21 | | | 560 | |
| HP, Inc. | | 2 | | | 6,350 | | | | 22.00 | | 04/16/21 | | | 2,420 | |
| Intel Corporation | | 35 | | | 224,000 | | | | 65.00 | | 06/18/21 | | | 11,130 | |
| J.M. Smucker Company (The) | | 25 | | | 316,325 | | | | 130.00 | | 04/16/21 | | | 3,125 | |
| Johnson & Johnson | | 10 | | | 164,350 | | | | 170.00 | | 06/18/21 | | | 2,750 | |
| KeyCorp | | 165 | | | 329,670 | | | | 22.00 | | 09/17/21 | | | 18,150 | |
| Kohl’s Corporation | | 40 | | | 238,440 | | | | 57.50 | | 04/16/21 | | | 15,560 | |
| Kohl’s Corporation | | 45 | | | 268,245 | | | | 47.50 | | 07/16/21 | | | 66,600 | |
| Nucor Corporation | | 55 | | | 441,485 | | | | 75.00 | | 07/16/21 | | | 53,075 | |
| People’s United Financial, Inc. | | 250 | | | 447,500 | | | | 20.00 | | 08/20/21 | | | 13,750 | |
| Public Storage | | 15 | | | 370,140 | | | | 250.00 | | 09/17/21 | | | 19,200 | |
| United Parcel Service, Inc. –Class B | | 35 | | | 594,965 | | | | 170.00 | | 07/16/21 | | | 32,165 | |
| Ventas, Inc. | | 29 | | | 154,686 | | | | 60.00 | | 05/21/21 | | | 1,508 | |
| ViacomCBS, Inc. – Class B | | 65 | | | 293,150 | | | | 60.00 | | 06/18/21 | | | 13,130 | |
| ViacomCBS, Inc. – Class B | | 75 | | | 338,250 | | | | 85.00 | | 06/18/21 | | | 3,750 | |
| Total Covered Written Call Options | | | | | | | | | | | | | | | |
| (Premiums received $381,626) | | | | $ | 6,031,660 | | | | | | | | $ | 348,713 | |
See accompanying notes to financial statements.
| FBP APPRECIATION & INCOME OPPORTUNITIES FUND |
| SCHEDULE OF INVESTMENTS |
| March 31, 2021 |
| COMMON STOCKS — 72.2% | | Shares | | | Value | |
| Communications — 2.2% | | | | | | |
| AT&T, Inc. | | | 5,000 | | | $ | 151,350 | |
| Lumen Technologies, Inc. | | | 15,000 | | | | 200,250 | |
| ViacomCBS, Inc. - Class B (a) | | | 10,000 | | | | 451,000 | |
| | | | | | | | 802,600 | |
| Consumer Discretionary — 5.7% | | | | | | | | |
| Carnival Corporation (b) | | | 5,000 | | | | 132,700 | |
| Ford Motor Company (b) | | | 26,000 | | | | 318,500 | |
| Kohl’s Corporation (a) | | | 10,000 | | | | 596,100 | |
| Tapestry, Inc. (b) | | | 17,000 | | | | 700,570 | |
| TJX Companies, Inc. (The) | | | 4,000 | | | | 264,600 | |
| | | | | | | | 2,012,470 | |
| Consumer Staples — 5.1% | | | | | | | | |
| Archer-Daniels-Midland Company | | | 4,500 | | | | 256,500 | |
| Kellogg Company | | | 8,500 | | | | 538,050 | |
| Philip Morris International, Inc. | | | 3,300 | | | | 292,842 | |
| Target Corporation | | | 1,500 | | | | 297,105 | |
| Walmart, Inc. | | | 3,100 | | | | 421,073 | |
| | | | | | | | 1,805,570 | |
| Energy — 4.5% | | | | | | | | |
| Chevron Corporation | | | 4,000 | | | | 419,160 | |
| ConocoPhillips | | | 6,000 | | | | 317,820 | |
| Devon Energy Corporation | | | 18,000 | | | | 393,300 | |
| Royal Dutch Shell plc - Class B - ADR | | | 13,000 | | | | 478,790 | |
| | | | | | | | 1,609,070 | |
| Financials — 19.5% | | | | | | | | |
| Bank of America Corporation | | | 38,000 | | | | 1,470,220 | |
| Bank of New York Mellon Corporation (The) | | | 6,000 | | | | 283,740 | |
| Capital One Financial Corporation | | | 6,000 | | | | 763,380 | |
| JPMorgan Chase & Company | | | 10,000 | | | | 1,522,299 | |
| KeyCorp | | | 16,320 | | | | 326,074 | |
| Lincoln National Corporation | | | 12,500 | | | | 778,375 | |
| MetLife, Inc. | | | 12,000 | | | | 729,480 | |
| Travelers Companies, Inc. (The) | | | 3,600 | | | | 541,440 | |
| Wells Fargo & Company | | | 13,000 | | | | 507,910 | |
| | | | | | | | 6,922,918 | |
| Health Care — 8.0% | | | | | | | | |
| Bristol-Myers Squibb Company | | | 8,000 | | | | 505,040 | |
| CVS Health Corporation | | | 7,500 | | | | 564,225 | |
| Johnson & Johnson (a) | | | 4,000 | | | | 657,400 | |
| Merck & Company, Inc. | | | 8,000 | | | | 616,720 | |
| Pfizer, Inc. | | | 13,500 | | | | 489,105 | |
| | | | | | | | 2,832,490 | |
| FBP APPRECIATION & INCOME OPPORTUNITIES FUND |
| SCHEDULE OF INVESTMENTS (Continued) |
| COMMON STOCKS — 72.2% (Continued) | | Shares | | | Value | |
| Industrials — 6.3% | | | | | | |
| Eaton Corporation plc | | | 4,500 | | | $ | 622,260 | |
| FedEx Corporation | | | 2,500 | | | | 710,100 | |
| General Electric Company | | | 15,000 | | | | 196,950 | |
| Raytheon Technologies Corporation | | | 4,000 | | | | 309,080 | |
| Trane Technologies plc | | | 2,400 | | | | 397,344 | |
| | | | | | | | 2,235,734 | |
| Materials — 4.5% | | | | | | | | |
| Compass Minerals International, Inc. | | | 5,000 | | | | 313,600 | |
| Freeport-McMoRan, Inc. (b) | | | 8,000 | | | | 263,440 | |
| Mosaic Company (The) | | | 11,000 | | | | 347,710 | |
| Nucor Corporation (a) | | | 8,500 | | | | 682,295 | |
| | | | | | | | 1,607,045 | |
| Technology — 15.7% | | | | | | | | |
| Apple, Inc. | | | 6,000 | | | | 732,900 | |
| Broadcom, Inc. (a) | | | 2,400 | | | | 1,112,784 | |
| Cisco Systems, Inc. | | | 17,000 | | | | 879,070 | |
| HP, Inc. | | | 28,000 | | | | 889,000 | |
| Intel Corporation (a) | | | 4,500 | | | | 288,000 | |
| International Business Machines Corporation | | | 5,200 | | | | 692,952 | |
| Microsoft Corporation | | | 3,500 | | | | 825,195 | |
| Western Union Company (The) | | | 7,000 | | | | 172,620 | |
| | | | | | | | 5,592,521 | |
| Utilities — 0.7% | | | | | | | | |
| PPL Corporation | | | 9,000 | | | | 259,560 | |
| | | | | | | | | |
| Total Common Stocks (Cost $12,856,077) | | | | | | $ | 25,679,978 | |
| | | | | | | | | |
| CORPORATE BONDS — 10.3% | | Par Value | | | Value | |
| Energy — 1.5% | | | | | | | | |
| Pioneer Natural Resources Company,3.95%, due 07/15/2022 | | $ | 500,000 | | | $ | 515,197 | |
| | | | | | | | | |
| Financials — 5.9% | | | | | | | | |
| America Express Company, 3.4%, due 02/27/2023 | | | 500,000 | | | | 526,239 | |
| Citigroup, Inc., 2.9%, due 12/08/2021 | | | 500,000 | | | | 507,945 | |
| UNUM Group, 4%, due 03/15/2024 | | | 500,000 | | | | 543,479 | |
| Wells Fargo & Company, 3.5%, due 03/08/2022 | | | 500,000 | | | | 514,964 | |
| | | | | | | | 2,092,627 | |
| FBP APPRECIATION & INCOME OPPORTUNITIES FUND |
| SCHEDULE OF INVESTMENTS (Continued) |
| CORPORATE BONDS — 10.3% (Continued) | | Par Value | | | Value | |
| Industrials — 1.5% | | | | | | |
| Norfolk Sothern Corporation, 3.85%, due 01/15/2024 | | $ | 500,000 | | | $ | 539,183 | |
| | | | | | | | | |
| Utilities — 1.4% | | | | | | | | |
| PSEG Power, LLC, 3%, due 06/15/2021 | | | 500,000 | | | | 501,214 | |
| | | | | | | | | |
| Total Corporate Bonds (Cost $3,537,092) | | | | | | $ | 3,648,221 | |
| | | | | | | | | |
| U.S. TREASURY OBLIGATIONS — 1.4% | | Par Value | | | Value | |
| U.S. Treasury Notes — 1.4% | | | | | | | | |
| 2.125%, due 05/15/2022 (Cost $502,505) | | $ | 500,000 | | | $ | 511,309 | |
| | | | | | | | | |
| MONEY MARKET FUNDS — 16.3% | | Shares | | | Value | |
| Fidelity Institutional Money Market Government Portfolio - Class I, 0.01% (c) | | | 3,515,546 | | | $ | 3,515,546 | |
| First American Government Obligations Fund - Class Z, 0.03% (c) | | | 2,290,406 | | | | 2,290,406 | |
| Total Money Market Funds (Cost $5,805,952) | | | | | | $ | 5,805,952 | |
| | | | | | | | | |
| Total Investments at Value — 100.2% (Cost $22,701,626) | | | | | | $ | 35,645,460 | |
| | | | | | | | | |
| Liabilities in Excess of Other Assets — (0.2%) | | | | | | | (77,869 | ) |
| | | | | | | | | |
| Net Assets — 100.0% | | | | | | $ | 35,567,591 | |
ADR - American Depositary Receipt.
| (a) | Security covers a written call option. |
| (b) | Non-income producing security. |
| (c) | The rate shown is the 7-day effective yield as of March 31, 2021. |
See accompanying notes to financial statements.
| FBP APPRECIATION & INCOME OPPORTUNITIES FUND |
| SCHEDULE OF OPEN OPTION CONTRACTS |
| March 31, 2021 |
| COVERED WRITTEN | | | | | Notional | | | Strike | | | Expiration | | Value of | |
| CALL OPTIONS | | Contracts | | | Value | | | Price | | | Date | | Options | |
| Broadcom, Inc. | | | 10 | | | $ | 463,660 | | | $ | 470.00 | | | 10/15/21 | | $ | 41,300 | |
| Intel Corporation | | | 20 | | | | 128,000 | | | | 65.00 | | | 06/18/21 | | | 6,360 | |
| Johnson & Johnson | | | 10 | | | | 164,350 | | | | 170.00 | | | 06/18/21 | | | 2,750 | |
| Kohl’s Corporation | | | 50 | | | | 298,050 | | | | 57.50 | | | 04/16/21 | | | 19,450 | |
| Kohl’s Corporation | | | 25 | | | | 149,025 | | | | 47.50 | | | 07/16/21 | | | 37,000 | |
| Nucor Corporation | | | 30 | | | | 240,810 | | | | 75.00 | | | 07/16/21 | | | 28,950 | |
| ViacomCBS, Inc. – Class B | | | 50 | | | | 225,500 | | | | 60.00 | | | 06/18/21 | | | 10,100 | |
| Total Covered Written Call Options (Premiums received $100,829) | | | | | | $ | 1,669,395 | | | | | | | | | $ | 145,910 | |
See accompanying notes to financial statements.
| THE FLIPPIN, BRUCE & PORTER FUNDS |
| STATEMENTS OF ASSETS AND LIABILITIES |
| March 31, 2021 |
| | | | | | FBP | |
| | | | | | Appreciation | |
| | | FBP Equity | | | & Income | |
| | | & Dividend | | | Opportunities | |
| | | Plus Fund | | | Fund | |
| ASSETS | | | | | | |
| Investments in securities: | | | | | | | | |
| At cost | | $ | 21,430,663 | | | $ | 22,701,626 | |
| At value (Note 2) | | $ | 28,854,579 | | | $ | 35,645,460 | |
| Cash | | | — | | | | 1,416 | |
| Receivable for capital shares sold | | | 3,000 | | | | 70,000 | |
| Dividends and interest receivable | | | 56,049 | | | | 56,513 | |
| Other assets | | | 4,120 | | | | 4,041 | |
| TOTAL ASSETS | | | 28,917,748 | | | | 35,777,430 | |
| | | | | | | | | |
| LIABILITIES | | | | | | | | |
| Written call options, at value (Notes 2 and 5) (premiums received $381,626 and $100,829, respectively) | | | 348,713 | | | | 145,910 | |
| Distributions payable | | | 2,233 | | | | 8,978 | |
| Payable for capital shares redeemed | | | 13,560 | | | | 14,995 | |
| Accrued investment advisory fees (Note 4) | | | 21,451 | | | | 25,176 | |
| Payable to administrator (Note 4) | | | 11,160 | | | | 11,160 | |
| Other accrued expenses | | | 3,160 | | | | 3,620 | |
| TOTAL LIABILITIES | | | 400,277 | | | | 209,839 | |
| | | | | | | | | |
| NET ASSETS | | $ | 28,517,471 | | | $ | 35,567,591 | |
| NET ASSETS CONSIST OF: | | | | | | | | |
| Paid-in capital | | $ | 20,423,107 | | | $ | 22,240,329 | |
| Distributable earnings | | | 8,094,364 | | | | 13,327,262 | |
| Net assets | | $ | 28,517,471 | | | $ | 35,567,591 | |
| | | | | | | | | |
| Shares of beneficial interest outstanding (unlimited number of shares authorized, $0.01 par value) | | | 1,011,643 | | | | 1,641,340 | |
| | | | | | | | | |
| Net asset value, offering price and redemption price per share (Note 2) | | $ | 28.19 | | | $ | 21.67 | |
See accompanying notes to financial statements.
| THE FLIPPIN, BRUCE & PORTER FUNDS |
| STATEMENTS OF OPERATIONS |
| For the Year Ended March 31, 2021 |
| | | | | | FBP | |
| | | | | | Appreciation | |
| | | FBP Equity | | | & Income | |
| | | & Dividend | | | Opportunities | |
| | | Plus Fund | | | Fund | |
| INVESTMENT INCOME | | | | | | | | |
| Dividends | | $ | 887,553 | | | $ | 658,058 | |
| Interest | | | — | | | | 130,946 | |
| TOTAL INVESTMENT INCOME | | | 887,553 | | | | 789,004 | |
| | | | | | | | | |
| EXPENSES | | | | | | | | |
| Investment advisory fees (Note 4) | | | 170,811 | | | | 208,852 | |
| Administration fees (Note 4) | | | 60,000 | | | | 60,000 | |
| Audit and tax services fees | | | 18,000 | | | | 18,000 | |
| Registration and filing fees | | | 17,995 | | | | 17,499 | |
| Trustees’ fees (Note 4) | | | 15,900 | | | | 15,900 | |
| Custodian and bank service fees | | | 7,253 | | | | 7,365 | |
| Compliance service fees (Note 4) | | | 6,993 | | | | 6,993 | |
| Printing of shareholder reports | | | 8,024 | | | | 4,917 | |
| Legal fees | | | 5,584 | | | | 5,584 | |
| Postage and supplies | | | 4,477 | | | | 3,797 | |
| Account maintenance fees | | | 1,691 | | | | 2,432 | |
| Insurance expense | | | 1,016 | | | | 1,033 | |
| Other expenses | | | 4,253 | | | | 6,285 | |
| TOTAL EXPENSES | | | 321,997 | | | | 358,657 | |
| Fees reduced by the Adviser (Note 4) | | | (52,478 | ) | | | (49,983 | ) |
| NET EXPENSES | | | 269,519 | | | | 308,674 | |
| | | | | | | | | |
| NET INVESTMENT INCOME | | | 618,034 | | | | 480,330 | |
| | | | | | | | | |
| REALIZED AND UNREALIZED GAINS (LOSSES) ON INVESTMENTS AND WRITTEN OPTION CONTRACTS | | | | | | | | |
| Net realized gains (losses) from: | | | | | | | | |
| Investment transactions | | | 776,235 | | | | 558,676 | |
| Written option contracts (Note 5) | | | (64,664 | ) | | | 11,357 | |
| Net change in unrealized appreciation (depreciation) on: | | | | | | | | |
| Investment transactions | | | 9,959,773 | | | | 11,695,503 | |
| Written option contracts (Note 5) | | | (59,315 | ) | | | (87,423 | ) |
| NET REALIZED AND UNREALIZED GAINS ON INVESTMENTS AND WRITTEN OPTION CONTRACTS | | | 10,612,029 | | | | 12,178,113 | |
| | | | | | | | | |
| NET INCREASE IN NET ASSETS FROM OPERATIONS | | $ | 11,230,063 | | | $ | 12,658,443 | |
See accompanying notes to financial statements.
| FBP EQUITY & DIVIDEND PLUS FUND |
| STATEMENTS OF CHANGES IN NET ASSETS |
| | | Year Ended | | | Year Ended | |
| | | March 31, | | | March 31, | |
| | | 2021 | | | 2020 | |
| FROM OPERATIONS | | | | | | | | |
| Net investment income | | $ | 618,034 | | | $ | 753,622 | |
| Net realized gains (losses) from: | | | | | | | | |
| Investment transactions | | | 776,235 | | | | 866,361 | |
| Written option contracts (Note 5) | | | (64,664 | ) | | | 5,965 | |
| Net change in unrealized appreciation (depreciation) on: | | | | | | | | |
| Investment transactions | | | 9,959,773 | | | | (7,770,619 | ) |
| Written option contracts (Note 5) | | | (59,315 | ) | | | 148,826 | |
| Net increase (decrease) in net assets from operations | | | 11,230,063 | | | | (5,995,845 | ) |
| | | | | | | | | |
| DISTRIBUTIONS TO SHAREHOLDERS (Note 2) | | | (618,292 | ) | | | (1,862,805 | ) |
| | | | | | | | | |
| FROM CAPITAL SHARE TRANSACTIONS | | | | | | | | |
| Proceeds from shares sold | | | 676,714 | | | | 706,131 | |
| Net asset value of shares issued in reinvestment of distributions to shareholders | | | 608,106 | | | | 1,835,780 | |
| Payments for shares redeemed | | | (4,297,795 | ) | | | (2,379,340 | ) |
| Net increase (decrease) in net assets from capital share transactions | | | (3,012,975 | ) | | | 162,571 | |
| | | | | | | | | |
| TOTAL INCREASE (DECREASE) IN NET ASSETS | | | 7,598,796 | | | | (7,696,079 | ) |
| | | | | | | | | |
| NET ASSETS | | | | | | | | |
| Beginning of year | | | 20,918,675 | | | | 28,614,754 | |
| End of year | | $ | 28,517,471 | | | $ | 20,918,675 | |
| | | | | | | | | |
| CAPITAL SHARE ACTIVITY | | | | | | | | |
| Shares sold | | | 30,088 | | | | 29,464 | |
| Shares reinvested | | | 26,398 | | | | 75,041 | |
| Shares redeemed | | | (189,001 | ) | | | (96,146 | ) |
| Net increase (decrease) in shares outstanding | | | (132,515 | ) | | | 8,359 | |
| Shares outstanding, beginning of year | | | 1,144,158 | | | | 1,135,799 | |
| Shares outstanding, end of year | | | 1,011,643 | | | | 1,144,158 | |
See accompanying notes to financial statements.
| FBP APPRECIATION & INCOME OPPORTUNITIES FUND |
| STATEMENTS OF CHANGES IN NET ASSETS |
| | | Year Ended | | | Year Ended | |
| | | March 31, | | | March 31, | |
| | | 2021 | | | 2020 | |
| FROM OPERATIONS | | | | | | | | |
| Net investment income | | $ | 480,330 | | | $ | 653,523 | |
| Net realized gains (losses) from: | | | | | | | | |
| Investment transactions | | | 558,676 | | | | 918,263 | |
| Written option contracts (Note 5) | | | 11,357 | | | | (82,368 | ) |
| Net change in unrealized appreciation (depreciation) on: | | | | | | | | |
| Investment transactions | | | 11,695,503 | | | | (7,297,718 | ) |
| Written option contracts (Note 5) | | | (87,423 | ) | | | 42,342 | |
| Net increase (decrease) in net assets from operations | | | 12,658,443 | | | | (5,765,958 | ) |
| | | | | | | | | |
| DISTRIBUTIONS TO SHAREHOLDERS (Note 2) | | | (492,477 | ) | | | (2,084,951 | ) |
| | | | | | | | | |
| FROM CAPITAL SHARE TRANSACTIONS | | | | | | | | |
| Proceeds from shares sold | | | 612,477 | | | | 506,506 | |
| Net asset value of shares issued in reinvestment of distributions to shareholders | | | 452,999 | | | | 2,020,586 | |
| Payments for shares redeemed | | | (2,950,990 | ) | | | (2,765,454 | ) |
| Net decrease in net assets from capital share transactions | | | (1,885,514 | ) | | | (238,362 | ) |
| | | | | | | | | |
| TOTAL INCREASE (DECREASE) IN NET ASSETS | | | 10,280,452 | | | | (8,089,271 | ) |
| | | | | | | | | |
| NET ASSETS | | | | | | | | |
| Beginning of year | | | 25,287,139 | | | | 33,376,410 | |
| End of year | | $ | 35,567,591 | | | $ | 25,287,139 | |
| | | | | | | | | |
| CAPITAL SHARE ACTIVITY | | | | | | | | |
| Shares sold | | | 32,756 | | | | 28,002 | |
| Shares reinvested | | | 25,131 | | | | 109,664 | |
| Shares redeemed | | | (168,480 | ) | | | (150,760 | ) |
| Net decrease in shares outstanding | | | (110,593 | ) | | | (13,094 | ) |
| Shares outstanding, beginning of year | | | 1,751,933 | | | | 1,765,027 | |
| Shares outstanding, end of year | | | 1,641,340 | | | | 1,751,933 | |
See accompanying notes to financial statements.
| FBP EQUITY & DIVIDEND PLUS FUND |
| FINANCIAL HIGHLIGHTS |
Selected Per Share Data for a Share Outstanding Throughout Each Year
| | | Years Ended March 31, | |
| | | 2021 | | | 2020 | | | 2019 | | | 2018 | | | 2017 | |
| Net asset value at beginning of year | | $ | 18.28 | | | $ | 25.19 | | | $ | 25.68 | | | $ | 25.96 | | | $ | 22.65 | |
| Income (loss) from investment operations: | | | | | | | | | | | | | | | | | | | | |
| Net investment income | | | 0.59 | | | | 0.67 | | | | 0.60 | | | | 0.57 | | | | 0.50 | |
| Net realized and unrealized gains (losses) on investments and written option contracts | | | 9.90 | | | | (5.90 | ) | | | 0.83 | | | | 1.38 | | | | 3.37 | |
| Total from investment operations | | | 10.49 | | | | (5.23 | ) | | | 1.43 | | | | 1.95 | | | | 3.87 | |
| Less distributions from: | | | | | | | | | | | | | | | | | | | | |
| Net investment income | | | (0.58 | ) | | | (0.67 | ) | | | (0.60 | ) | | | (0.57 | ) | | | (0.50 | ) |
| Net realized gains | | | — | | | | (1.01 | ) | | | (1.32 | ) | | | (1.66 | ) | | | (0.06 | ) |
| Total distributions | | | (0.58 | ) | | | (1.68 | ) | | | (1.92 | ) | | | (2.23 | ) | | | (0.56 | ) |
| Net asset value at end of year | | $ | 28.19 | | | $ | 18.28 | | | $ | 25.19 | | | $ | 25.68 | | | $ | 25.96 | |
| Total return (a) | | | 58.15 | % | | | (22.33 | %) | | | 5.64 | % | | | 7.91 | % | | | 17.29 | % |
| Net assets at end of year (000’s) | | $ | 28,517 | | | $ | 20,919 | | | $ | 28,615 | | | $ | 26,279 | | | $ | 27,415 | |
| Ratio of total expenses to average net assets | | | 1.32 | % | | | 1.25 | % | | | 1.23 | % | | | 1.24 | % | | | 1.25 | % |
| Ratio of net expenses to average net assets (b) | | | 1.10 | % | | | 1.07 | % | | | 1.07 | % | | | 1.07 | % | | | 1.07 | % |
| Ratio of net investment income to average net assets (b) | | | 2.53 | % | | | 2.70 | % | | | 2.35 | % | | | 2.19 | % | | | 2.07 | % |
| Portfolio turnover rate | | | 21 | % | | | 38 | % | | | 18 | % | | | 18 | % | | | 19 | % |
| (a) | Total return is a measure of the change in value of an investment in the Fund over the periods covered, which assumes any dividends or capital gains distributions are reinvested in shares of the Fund. The returns shown do not reflect the deduction of taxes a shareholder would pay on Fund distributions or the redemption of Fund shares. The total returns would have been lower if the Adviser had not waived/reduced advisory fees. |
| (b) | Ratios were determined after advisory fee waivers/reductions by the Adviser (Note 4). |
See accompanying notes to financial statements.
| FBP APPRECIATION & INCOME OPPORTUNITIES FUND |
| FINANCIAL HIGHLIGHTS |
Selected Per Share Data for a Share Outstanding Throughout Each Year
| | | Years Ended March 31, | |
| | | 2021 | | | 2020 | | | 2019 | | | 2018 | | | 2017 | |
| Net asset value at beginning of year | | $ | 14.43 | | | $ | 18.91 | | | $ | 18.99 | | | $ | 18.81 | | | $ | 16.55 | |
| Income (loss) from investment operations: | | | | | | | | | | | | | | | | | | | | |
| Net investment income | | | 0.29 | | | | 0.38 | | | | 0.37 | | | | 0.41 | | | | 0.28 | |
| Net realized and unrealized gains (losses) on investments and written option contracts | | | 7.24 | | | | (3.65 | ) | | | 0.28 | | | | 1.03 | | | | 2.28 | |
| Total from investment operations | | | 7.53 | | | | (3.27 | ) | | | 0.65 | | | | 1.44 | | | | 2.56 | |
| Less distributions from: | | | | | | | | | | | | | | | | | | | | �� |
| Net investment income | | | (0.29 | ) | | | (0.38 | ) | | | (0.37 | ) | | | (0.41 | ) | | | (0.28 | ) |
| Net realized gains | | | — | | | | (0.83 | ) | | | (0.36 | ) | | | (0.85 | ) | | | (0.02 | ) |
| Total distributions | | | (0.29 | ) | | | (1.21 | ) | | | (0.73 | ) | | | (1.26 | ) | | | (0.30 | ) |
| Net asset value at end of year | | $ | 21.67 | | | $ | 14.43 | | | $ | 18.91 | | | $ | 18.99 | | | $ | 18.81 | |
| Total return (a) | | | 52.63 | % | | | (18.56 | %) | | | 3.44 | % | | | 7.91 | % | | | 15.58 | % |
| Net assets at end of year (000’s) | | $ | 35,568 | | | $ | 25,287 | | | $ | 33,376 | | | $ | 34,614 | | | $ | 34,069 | |
| Ratio of total expenses to average net assets | | | 1.20 | % | | | 1.16 | % | | | 1.12 | % | | | 1.10 | % | | | 1.12 | % |
| Ratio of net expenses to average net assets (b) | | | 1.03 | % | | | 1.00 | % | | | 1.00 | % | | | 1.00 | % | | | 1.00 | % |
| Ratio of net investment income to average net assets (b) | | | 1.61 | % | | | 2.03 | % | | | 1.89 | % | | | 2.16 | % | | | 1.57 | % |
| Portfolio turnover rate | | | 11 | % | | | 18 | % | | | 21 | % | | | 10 | % | | | 18 | % |
| (a) | Total return is a measure of the change in value of an investment in the Fund over the periods covered, which assumes any dividends or capital gains distributions are reinvested in shares of the Fund. The returns shown do not reflect the deduction of taxes a shareholder would pay on Fund distributions or the redemption of Fund shares. The total returns would have been lower if the Adviser had not waived/reduced advisory fees. |
| (b) | Ratios were determined after advisory fee waivers/reductions by the Adviser (Note 4). |
See accompanying notes to financial statements.
| THE FLIPPIN, BRUCE & PORTER FUNDS |
| NOTES TO FINANCIAL STATEMENTS |
| March 31, 2021 |
FBP Equity & Dividend Plus Fund and FBP Appreciation & Income Opportunities Fund (each a “Fund” and collectively the “Funds”) are no-load, diversified series of Williamsburg Investment Trust (the “Trust”), an open-end management investment company registered under the Investment Company Act of 1940, as amended (the “1940 Act”). The Trust was organized as a Massachusetts business trust on July 18, 1988. Other series of the Trust are not included in this report.
The investment objective of FBP Equity & Dividend Plus Fund is to provide above-average and growing income while also achieving long-term growth of capital.
The investment objectives of FBP Appreciation & Income Opportunities Fund are long term capital appreciation and current income, assuming a moderate level of investment risk.
| 2. | Significant Accounting Policies |
Each Fund follows accounting and reporting guidance under Financial Accounting Standards Board (“FASB”) Accounting Standards Codification Topic 946, “Financial Services – Investment Companies.” The following is a summary of the Funds’ significant accounting policies. These policies are in conformity with accounting principles generally accepted in the United States of America (“GAAP”).
Securities valuation — The Funds’ portfolio securities are valued as of the close of business of the regular session of the New York Stock Exchange (normally 4:00 p.m. Eastern time). Securities traded on a national stock exchange, including common stocks and closed-end investment companies, if any, are valued based upon the closing price on the principal exchange where the security is traded, if available, otherwise, at the last quoted bid price. Securities that are quoted by NASDAQ are valued at the NASDAQ Official Closing Price. Covered call options written by the Funds are valued at the last quoted sale price or, in the absence of a sale, at the ask price on the principal exchanges on which they are traded. Investments representing shares of money market funds and other open-end investment companies are valued at their net asset value (“NAV”) as reported by such companies. When using a quoted price and when the market is considered active, securities will be classified as Level 1 within the fair value hierarchy (see below).
Fixed income securities, including U.S. Treasury obligations and corporate bonds, are typically valued on the basis of prices provided by an independent pricing service. The prices provided by the pricing service are determined with consideration given to institutional bid and last sale prices and take into account securities prices, yields, maturities, call features, ratings, institutional trading in similar groups of securities, and developments related to specific securities. Given the inputs used by the pricing service, these securities are classified as Level 2 within the fair value hierarchy.
When market quotations are not readily available, if a pricing service cannot provide a price, or if the investment adviser believes the price received from the pricing service is not indicative of market value, securities will be valued in good faith at fair value using methods consistent with procedures adopted by the Board of Trustees and will be classified as Level 2 or 3 within the fair value hierarchy, depending on the inputs used. Such methods of fair valuation may include, but are not limited to: multiple of earnings,
| THE FLIPPIN, BRUCE & PORTER FUNDS |
| NOTES TO FINANCIAL STATEMENTS (Continued) |
multiple of book value, discount from market of a similar freely traded security, purchase price of the security, subsequent private transactions in the security or related securities, or a combination of these and other factors.
GAAP establishes a single authoritative definition of fair value, sets out a framework for measuring fair value and requires additional disclosures about fair value measurements. Various inputs are used in determining the value of each Fund’s investments. These inputs are summarized in the three broad levels listed below:
| ● | Level 1 – quoted prices in active markets for identical securities |
| ● | Level 2 – other significant observable inputs |
| ● | Level 3 – significant unobservable inputs |
The inputs or methodology used for valuing securities are not necessarily an indication of the risks associated with investing in those securities. The inputs used to measure fair value may fall into different levels of the fair value hierarchy. In such cases, for disclosure purposes, the level in the fair value hierarchy within which the fair value measurement falls in its entirety is determined based on the lowest level input that is significant to the fair value measurement.
The following is a summary of each Fund’s investments and other financial instruments based on the inputs used to value the investments and other financial instruments as of March 31, 2021, by security type:
| FBP Equity & Dividend Plus Fund | | Level 1 | | | Level 2 | | | Level 3 | | | Total | |
| Investments in Securities: | | | | | | | | | | | | | | | | |
| Common Stocks | | $ | 28,223,084 | | | $ | — | | | $ | — | | | $ | 28,223,084 | |
| Money Market Funds | | | 631,495 | | | | — | | | | — | | | | 631,495 | |
| Total | | $ | 28,854,579 | | | $ | — | | | $ | — | | | $ | 28,854,579 | |
| | | | | | | | | | | | | | | | | |
| Other Financial Instruments: | | | | | | | | | | | | | | | | |
| Covered Written Call Options | | $ | (195,173 | ) | | $ | (153,540 | ) | | $ | — | | | $ | (348,713 | ) |
| Total | | $ | (195,173 | ) | | $ | (153,540 | ) | | $ | — | | | $ | (348,713 | ) |
| | | | | | | | | | | | | | | | | |
| | | | | | | | | | | | | | | | | |
| FBP Appreciation & Income Opportunities Fund | | Level 1 | | | Level 2 | | | Level 3 | | | Total | |
| Investments in Securities: | | | | | | | | | | | | | | | | |
| Common Stocks | | $ | 25,679,978 | | | $ | — | | | $ | — | | | $ | 25,679,978 | |
| Corporate Bonds | | | — | | | | 3,648,221 | | | | — | | | | 3,648,221 | |
| U.S. Treasury Obligations | | | — | | | | 511,309 | | | | — | | | | 511,309 | |
| Money Market Funds | | | 5,805,952 | | | | — | | | | — | | | | 5,805,952 | |
| Total | | $ | 31,485,930 | | | $ | 4,159,530 | | | $ | — | | | $ | 35,645,460 | |
| | | | | | | | | | | | | | | | | |
| Other Financial Instruments: | | | | | | | | | | | | | | | | |
| Covered Written Call Options | | $ | (67,610 | ) | | $ | (78,300 | ) | | $ | — | | | $ | (145,910 | ) |
| Total | | $ | (67,610 | ) | | $ | (78,300 | ) | | $ | — | | | $ | (145,910 | ) |
| | | | | | | | | | | | | | | | | |
| THE FLIPPIN, BRUCE & PORTER FUNDS |
| NOTES TO FINANCIAL STATEMENTS (Continued) |
Refer to each Fund’s Schedule of Investments for a listing of the common stocks and corporate bonds by sector type. There were no Level 3 investments held by the Funds as of or during the year ended March 31, 2021.
Share valuation — The NAV per share of each Fund is calculated daily by dividing the total value of its assets, less liabilities, by the number of shares outstanding. The offering price and redemption price per share of each Fund is equal to its NAV per share.
Investment income — Dividend income is recorded on the ex-dividend date. Non-cash dividends included in dividend income, if any, are recorded at the fair market value of the security received. Interest income is accrued as earned. Discounts and premiums on fixed income securities purchased are amortized using the interest method. Withholding taxes on foreign dividends have been recorded in accordance with the Funds’ understanding of the applicable country’s rules and tax rates.
Distributions to shareholders — Dividends arising from net investment income are declared and paid quarterly to shareholders of each Fund. Net realized short-term capital gains, if any, may be distributed throughout the year and net realized long-term capital gains, if any, are distributed at least once each year. The amount of distributions from net investment income and net realized capital gains are determined in accordance with federal income tax regulations, which may differ from GAAP. These “book/tax” differences are either temporary or permanent in nature. Dividends and distributions are recorded on the ex-dividend date. The tax character of distributions paid during the years ended March 31, 2021 and 2020 was as follows:
| | | Year | | Ordinary | | | Long-Term | | | Total | |
| | | Ended | | Income | | | Capital Gains | | | Distributions | |
| FBP Equity & Dividend Plus Fund | | 03/31/21 | | $ | 618,869 | | | $ | — | | | $ | 618,869 | |
| | | 03/31/20 | | $ | 823,397 | | | $ | 1,038,197 | | | $ | 1,861,594 | |
| FBP Appreciation & Income | | 03/31/21 | | $ | 495,316 | | | $ | — | | | $ | 495,316 | |
| Opportunities Fund | | 03/31/20 | | $ | 662,167 | | | $ | 1,423,747 | | | $ | 2,085,914 | |
Investment transactions — Investment transactions are accounted for on trade date for financial reporting purposes. Realized gains and losses on investments sold are determined on a specific identification basis.
Common expenses — Common expenses of the Trust are allocated among the Funds and the other series of the Trust based on relative net assets of each series or the nature of the services performed and the relative applicability to each series.
Options transactions — When the Funds’ investment adviser believes that individual portfolio investment securities held by the Funds are approaching the top of the adviser’s growth and price expectations, covered call options can be written (sold) against such securities and the Funds will receive a premium in return. The Funds write options only for income generation and hedging purposes and not for speculation. The premiums received from writing the options are recorded as a liability and are subsequently valued daily at the closing prices on their primary exchanges. Premiums received from writing options that expire are treated as realized gains. Premiums received from writing options that are exercised increase the proceeds used to calculate the realized gain or loss on the sale of the underlying security. If a closing purchase transaction is used to
| THE FLIPPIN, BRUCE & PORTER FUNDS |
| NOTES TO FINANCIAL STATEMENTS (Continued) |
terminate a Fund’s obligation on a call option, a gain or loss will be realized, depending upon whether the price of the closing purchase transaction is more or less than the premium previously received on the call option written.
Estimates — The preparation of financial statements in conformity with GAAP requires management to make estimates and assumptions that affect the reported amounts of assets and liabilities and the disclosure of contingent assets and liabilities, each as of the date of the financial statements, and the reported amounts of increase (decrease) in net assets from operation during the reporting period. Actual results could differ from those estimates.
Federal income tax — Each Fund has qualified and intends to continue to qualify as a regulated investment company under the Internal Revenue Code of 1986, as amended (the “Code”). Qualification generally will relieve the Funds of liability for federal income taxes to the extent 100% of their net investment income and any net realized capital gains are distributed in accordance with the Code.
In order to avoid imposition of the excise tax applicable to regulated investment companies, it is also each Fund’s intention to declare as dividends in each calendar year at least 98% of its net investment income (earned during the calendar year) and 98.2% of its net realized capital gains (earned during the twelve months ended October 31) plus undistributed amounts from prior years.
The following information is computed on a tax basis for each item as of March 31, 2021:
| | | | | | FBP Appreciation | |
| | | FBP Equity | | | & Income | |
| | | & Dividend | | | Opportunities | |
| | | Plus Fund | | | Fund | |
| Tax cost of portfolio investments and written option contracts | | $ | 21,049,043 | | | $ | 22,617,851 | |
| Gross unrealized appreciation | | $ | 8,119,026 | | | $ | 13,162,290 | |
| Gross unrealized depreciation | | | (662,203 | ) | | | (280,591 | ) |
| Net unrealized appreciation | | | 7,456,823 | | | | 12,881,699 | |
| Undistributed ordinary income | | | 9,074 | | | | 13,223 | |
| Undistributed long-term capital gains | | | 630,700 | | | | 441,318 | |
| Distributions payable | | | (2,233 | ) | | | (8,978 | ) |
| Distributable earnings | | $ | 8,094,364 | | | $ | 13,327,262 | |
| | | | | | | | | |
The difference between the federal income tax cost of portfolio investments and the financial statement cost of portfolio investments for the Funds is due to certain differences in the recognition of capital gains and losses under income tax regulations and GAAP. These “book/tax” differences are temporary in nature and are primarily due to losses deferred due to wash sales and differing methods in the amortization of discounts and premiums on fixed income securities.
The Funds recognize the tax benefits or expenses of uncertain tax positions only when the position is “more likely than not” to be sustained assuming examination by tax authorities. Management has reviewed the tax positions taken by each Fund on federal income tax returns for all open tax years (generally, three years) and has concluded that no provision for unrecognized tax benefits or expenses is required in these financial statements.
| THE FLIPPIN, BRUCE & PORTER FUNDS |
| NOTES TO FINANCIAL STATEMENTS (Continued) |
| 3. | Investment Transactions |
Investment transactions, other than short-term investments and U.S. government securities, were as follows for the year ended March 31, 2021:
| | | | | | FBP Appreciation | |
| | | FBP Equity | | | & Income | |
| | | & Dividend | | | Opportunities | |
| | | Plus Fund | | | Fund | |
| Purchases of investment securities | | $ | 4,903,676 | | | $ | 2,883,178 | |
| Proceeds from sales and maturities of investment securities | | $ | 6,494,537 | | | $ | 7,802,561 | |
| | | | | | | | | |
| 4. | Transactions with Related Parties |
INVESTMENT ADVISORY AGREEMENTS
Each Fund’s investments are managed by Flippin, Bruce & Porter, Inc. (the “Adviser”) under the terms of an Investment Advisory Agreement. Under the Investment Advisory Agreements, each Fund pays the Adviser a fee, which is computed and accrued daily and paid monthly, at an annual rate of 0.70% of its average daily net assets up to $250 million; 0.65% of the next $250 million of such assets; and 0.50% of such assets in excess of $500 million.
Effective August 1, 2020, pursuant to Expense Limitation Agreements (“ELAs”) between each Fund and the Adviser, the Adviser has contractually agreed, until August 1, 2021, to reduce advisory fees and/or reimburse expenses to the extent necessary to limit total annual fund operating expenses (excluding brokerage costs, taxes, interest, Acquired Fund Fees and Expenses and extraordinary expenses) to an amount not exceeding 1.12% and 1.05% of the average daily net assets of FBP Equity & Dividend Plus Fund and FBP Appreciation & Income Opportunities Fund, respectively.
Prior to August 1, 2020, pursuant to Expense Limitation Agreements (“ELAs”) between each Fund and the Adviser, the Adviser contractually agreed, until August 1, 2020, to reduce advisory fees and/or reimburse other expenses to the extent necessary to limit total annual fund operating expenses (excluding brokerage costs, taxes, interest, Acquired Fund Fees and Expenses and extraordinary expenses) to an amount not exceeding 1.07% and 1.00% of the average daily net assets of FBP Equity & Dividend Plus Fund and FBP Appreciation & Income Opportunities Fund, respectively.
Accordingly, during the year ended March 31, 2021, the Adviser reduced its advisory fees in the amounts of $52,478 and $49,983 for FBP Equity & Dividend Plus Fund and FBP Appreciation & Income Opportunities Fund, respectively.
Under the terms of the ELAs, investment advisory fee reductions and expense reimbursements by the Adviser are subject to recoupment by the Adviser for a period of three years after such fees and expenses were incurred, provided the recoupments do not cause total annual fund operating expenses to exceed the
| THE FLIPPIN, BRUCE & PORTER FUNDS |
| NOTES TO FINANCIAL STATEMENTS (Continued) |
lesser of (i) the expense limitation then in effect, if any, or (ii) the expense limitation in effect at the time the expenses to be recouped were incurred. As of March 31, 2021, the Adviser may seek recoupment of investment advisory fee reductions and expense reimbursements no later than the dates as stated below:
| | | | | | FBP Appreciation | |
| | | FBP Equity | | | & Income | |
| | | & Dividend | | | Opportunities | |
| | | Plus Fund | | | Fund | |
| March 31, 2023 | | $ | 31,428 | | | $ | 33,267 | |
| March 31, 2024 | | | 52,478 | | | | 49,983 | |
| Total | | $ | 83,906 | | | $ | 83,250 | |
| | | | | | | | | |
Certain officers and a Trustee of the Trust are also officers of the Adviser.
OTHER SERVICE PROVIDERS
Ultimus Fund Solutions, LLC (“Ultimus”) provides administration, fund accounting, compliance and transfer agent services to the Funds. The Funds pay Ultimus fees in accordance with the agreements for such services. In addition, the Funds pay out-of-pocket expenses including, but not limited to, postage, supplies, and certain costs related to the pricing of the Funds’ portfolio securities. Certain officers of the Trust are also officers of Ultimus, or of Ultimus Fund Distributors, LLC (the “Distributor”), the principal underwriter of each Fund’s shares and an affiliate of Ultimus. The Distributor is compensated by the Adviser (not the Funds) for acting as principal underwriter.
COMPENSATION OF TRUSTEES
Trustees and officers affiliated with the Adviser or Ultimus are not compensated by the Trust for their services. Each Trustee who is not an affiliated person of the Adviser or Ultimus received from the Trust an annual retainer of $24,000, payable quarterly; a fee of $2,000 for attendance at each meeting of the Board of Trustees (except that such fee is $3,000 for the independent chair); and a fee of $1,000 for attendance at each meeting of any committee of the Board (except that such fee is $1,500 for the committee chair); plus reimbursement of travel and other expenses incurred in attending meetings. Each Fund pays its proportionate share of such fees along with the other series of the Trust.
| 5. | Derivatives Transactions |
The location on the Statements of Assets and Liabilities of the Funds’ derivative positions as of March 31, 2021 is as follows:
FBP Equity & Dividend Plus Fund
| | | | | | | | | | Gross Notional | |
| | | | | | | | | | Amount | |
| | | | | | | Fair Value | | | Outstanding | |
| | | | | | | Asset | | | Liability | | | March 31, | |
| Type of Derivative (Risk) | | | Location | | | Derivatives | | | Derivatives | | | 2021 | |
| Call options written (Equity) | | | Written call options, at value | | | $ | — | | | $ | (348,713 | ) | | $ | (6,031,660 | ) |
| THE FLIPPIN, BRUCE & PORTER FUNDS |
| NOTES TO FINANCIAL STATEMENTS (Continued) |
FBP Appreciation & Income Opportunities Fund
| | | | | | | | | | Gross Notional | |
| | | | | | | | | | Amount | |
| | | | | | | Fair Value | | | Outstanding | |
| | | | | | | Asset | | | Liability | | | March 31, | |
| Type of Derivative (Risk) | | | Location | | | Derivatives | | | Derivatives | | | 2021 | |
| Call options written (Equity) | | | Written call options, at value | | | $ | — | | | $ | (145,910 | ) | | $ | (1,669,395 | ) |
The Funds’ transactions in derivative instruments during the year ended March 31, 2021 are recorded in the following locations on the Statements of Operations:
FBP Equity & Dividend Plus Fund
| | | | | | | | | | | | | Change in | |
| | | | | | | Net | | | | | | Unrealized | |
| | | | | | | Realized | | | | | | Appreciation | |
| Type of Derivative (Risk) | | | Location | | | Losses | | | Location | | | (Depreciation) | |
| Call options written (Equity) | | | Net realized gains (losses) from written option contracts | | | $ | (64,664 | ) | | Net change in unrealized appreciation (depreciation) on written option contracts | | | $ | (59,315 | ) |
FBP Appreciation & Income Opportunities Fund
| | | | | | | | | | | | | Change in | |
| | | | | | | Net | | | | | | Unrealized | |
| | | | | | | Realized | | | | | | Appreciation | |
| Type of Derivative (Risk) | | | Location | | | Gains | | | Location | | | (Depreciation) | |
| Call options written (Equity) | | | Net realized gains (losses) from written option contracts | | | $ | 11,357 | | | Net change in unrealized appreciation (depreciation) on written option contracts | | | $ | (87,423 | ) |
The average monthly notional amount of written call options during the year ended March 31, 2021 is $5,434,843 and $1,327,669 for FBP Equity & Dividend Plus Fund and FBP Appreciation & Income Opportunities Fund, respectively.
| 6. | Contingencies and Commitments |
The Funds indemnify the Trust’s officers and Trustees for certain liabilities that might arise from the performance of their duties to the Funds. Additionally, in the normal course of business the Funds enter into contracts that contain a variety of representations and warranties and which provide general indemnifications. The Funds’ maximum exposure under these arrangements is unknown, as this would involve future claims that may be made against the Funds that have not yet occurred. However, based on experience, the Trust expects the risk of loss to be remote.
| THE FLIPPIN, BRUCE & PORTER FUNDS |
| NOTES TO FINANCIAL STATEMENTS (Continued) |
The Funds are required to recognize in the financial statements the effects of all subsequent events that provide additional evidence about conditions that existed as of the date of the Statements of Assets and Liabilities. For non-recognized subsequent events that must be disclosed to keep the financial statements from being misleading, the Funds are required to disclose the nature of the event as well as an estimate of its financial effect, or a statement that such an estimate cannot be made. Management has evaluated subsequent events through the issuance of these financial statements and has noted no such events other than the following:
On April 8, 2021, the Adviser entered into an agreement with Cantor Fitzgerald Investment Advisors, L.P. (“Cantor Fitzgerald”), a registered investment adviser, to have its business assets acquired by Cantor Fitzgerald, subject to customary closing conditions (the “Transaction”). Following the closing of the Transaction, which is expected on or about June 1, 2021, the Adviser’s business will become a division of Cantor Fitzgerald.
On May 18, 2021, the Board of Trustees of the Trust, including a majority of the Trustees who are not “interested persons” (as defined in the Investment Company Act of 1940, as amended) of the Trust, approved interim advisory agreements between the Trust and Cantor Fitzgerald with respect to the Funds. The Board also approved new investments advisory agreements between the Trust and Cantor Fitzgerald with respect to the Funds, which will be submitted to the respective Fund’s shareholders for approval at a shareholder meeting to be held on July 16, 2021. The Funds’ shareholders will receive a proxy statement in late June 2021 related to the Transaction.
| THE FLIPPIN, BRUCE & PORTER FUNDS |
REPORT OF INDEPENDENT REGISTERED
PUBLIC ACCOUNTING FIRM |
To the Shareholders of The Flippin, Bruce & Porter Funds and
Board of Trustees of Williamsburg Investment Trust
Opinion on the Financial Statements
We have audited the accompanying statements of assets and liabilities, including the schedules of investments and open option contracts, of The Flippin, Bruce & Porter Funds, comprising FBP Equity & Dividend Plus Fund, and FBP Appreciation & Income Opportunities Fund (the “Funds”), each a series of Williamsburg Investment Trust, as of March 31, 2021, the related statements of operations for the year then ended, the statements of changes in net assets for each of the two years in the period then ended, the related notes, and the financial highlights for each of the five years in the period then ended (collectively referred to as the “financial statements”). In our opinion, the financial statements present fairly, in all material respects, the financial position of each of the Funds as of March 31, 2021, the results of their operations for the year then ended, the changes in net assets for each of the two years in the period then ended, and the financial highlights for each of the five years in the period then ended, in conformity with accounting principles generally accepted in the United States of America.
Basis for Opinion
These financial statements are the responsibility of the Funds’ management. Our responsibility is to express an opinion on the Funds’ financial statements based on our audits. We are a public accounting firm registered with the Public Company Accounting Oversight Board (United States) (“PCAOB”) and are required to be independent with respect to the Funds in accordance with the U.S. federal securities laws and the applicable rules and regulations of the Securities and Exchange Commission and the PCAOB.
We conducted our audits in accordance with the standards of the PCAOB. Those standards require that we plan and perform the audit to obtain reasonable assurance about whether the financial statements are free of material misstatement whether due to error or fraud.
Our audits included performing procedures to assess the risks of material misstatement of the financial statements, whether due to error or fraud, and performing procedures that respond to those risks. Such procedures included examining, on a test basis, evidence regarding the amounts and disclosures in the financial statements. Our procedures included confirmation of securities owned as of March 31, 2021, by correspondence with the custodian and brokers. Our audits also included evaluating the accounting principles used and significant estimates made by management, as well as evaluating the overall presentation of the financial statements. We believe that our audits provide a reasonable basis for our opinion.
We have served as the Funds’ auditor since 2016.

COHEN & COMPANY, LTD.
Milwaukee, Wisconsin
May 24, 2021
| THE FLIPPIN, BRUCE & PORTER FUNDS |
BOARD OF TRUSTEES AND EXECUTIVE OFFICERS
(Unaudited) |
Overall responsibility for management of the Funds rests with the Board of Trustees. The Trustees serve during the lifetime of the Trust and until its termination, or until death, resignation, retirement or removal. The Trustees, in turn, elect the officers of the Funds. The officers have been elected for an annual term. The following are the Trustees and executive officers of the Funds:
| | Trustees
and Officers | Address | Year
of
Birth | Position Held
with the Trust | Length of
Time Served |
| | Robert S. Harris, Ph.D. | 225 Pictoria Drive, Suite 450 Cincinnati, OH | 1949 | Chairman and Trustee | Since January 2007 |
| * | John P. Ackerly, IV | One James Center 901 E. Cary Street Richmond, VA | 1963 | Trustee and President of The Davenport Funds | Since July 2012 |
| * | John T. Bruce | 800 Main Street Lynchburg, VA | 1953 | Trustee and President of The FBP Funds | Since September 1988 |
| | George K. Jennison | 225 Pictoria Drive, Suite 450 Cincinnati, OH | 1957 | Trustee | Since January 2015 |
| | Harris V. Morrissette | 225 Pictoria Drive, Suite 450 Cincinnati, OH | 1959 | Trustee | Since March 1993 |
| | Elizabeth W. Robertson | 225 Pictoria Drive, Suite 450 Cincinnati, OH | 1953 | Trustee | Since February 2014 |
| | Norman D. Darden, III | 800 Main Street Lynchburg, VA | 1965 | Vice President of The FBP Funds | Since February 2018 |
| | John H. Hanna, IV | 800 Main Street Lynchburg, VA | 1955 | Vice President of The FBP Funds | Since February 2007 |
| | David J. Marshall | 800 Main Street Lynchburg, VA | 1956 | Vice President of The FBP Funds | Since February 2007 |
| | Mark J. Seger | 225 Pictoria Drive, Suite 450 Cincinnati, OH | 1962 | Treasurer | Since November 2000 |
| | David K. James | 225 Pictoria Drive, Suite 450 Cincinnati, OH | 1970 | Secretary | Since November 2018 |
| | Michael J. Nanosky | 225 Pictoria Drive, Suite 450 Cincinnati, OH | 1966 | Chief Compliance Officer | Since March 2020 |
| * | Messrs. Ackerly and Bruce, as affiliated persons of investment advisers to the Trust, are “interested persons” of the Trust within the meaning of Section 2(a)(19) of the 1940 Act. |
| THE FLIPPIN, BRUCE & PORTER FUNDS |
BOARD OF TRUSTEES AND EXECUTIVE OFFICERS
(Unaudited) (Continued) |
Each Trustee oversees ten portfolios of the Trust, including the Funds. The principal occupations of the Trustees and executive officers of the Funds during the past five years and public directorships held by the Trustees are set forth below:
Robert S. Harris, Ph.D. is the C. Stewart Sheppard Professor of Business Administration at The Darden Graduate School of Business Administration at the University of Virginia. He was previously the dean at Darden. Professor Harris has published widely on corporate finance, financial markets and mergers and acquisitions and has served as a consultant to corporations and government agencies.
John P. Ackerly, IV is Senior Vice President and Portfolio Manager of Davenport & Company LLC (a broker-dealer and investment advisory firm).
John T. Bruce is President, Director and member of the Executive Committee of the Adviser.
George K. Jennison is retired. He previously was President of Oyster Consulting, LLC (a management consulting firm) and a financial adviser with Wells Fargo Advisors, LLC.
Harris V. Morrissette is President of China Doll Rice and Beans, Inc. and Dixie Lily Foods. He is also a Director of Trustmark Corporation (bank holding company).
Elizabeth W. Robertson serves as a Trustee of TowneBank Foundation, TowneBank Corporate Board, TowneBank Audit Committee Chair and TowneBank Community Board since 2015. She previously was Chief Financial Officer of Monument Restaurants LLC.
Norman D. Darden, III is Senior Portfolio Manager, Analyst and Principal of the Adviser.
John H. Hanna, IV is Vice President, Director and member of the Executive Committee of the Adviser.
David J. Marshall is Secretary, Director and member of the Executive Committee of the Adviser.
Mark J. Seger is a Vice Chairman of Ultimus Fund Solutions, LLC and Ultimus Fund Distributors, LLC. He previously was Co-CEO of Ultimus Fund Solutions, LLC (1999-2019).
David K. James is an Executive Vice President and Chief Legal and Risk Officer of Ultimus Fund Solutions, LLC (2018 to present). He previously was Managing Director and Managing Counsel at State Street Bank and Trust Company (2009 to 2018).
Michael J. Nanosky is a Senior Compliance Officer of Ultimus Fund Solutions, LLC (2020 to present). He previously was Senior Vice President & Chief Compliance Officer of PNC Funds (2014 to 2019).
Additional information about members of the Board of Trustees and executive officers is available in the Statement of Additional Information (“SAI”). To obtain a free copy of the SAI, please call 1-866-738-1127.
| THE FLIPPIN, BRUCE & PORTER FUNDS |
| ABOUT YOUR FUNDS’ EXPENSES (Unaudited) |
We believe it is important for you to understand the impact of costs on your investment. All mutual funds have operating expenses. As a shareholder of a Fund, you incur ongoing costs, including management fees and other operating expenses. These ongoing costs, which are deducted from each Fund’s gross income, directly reduce the investment return of the Funds.
A mutual fund’s ongoing costs are expressed as a percentage of its average net assets. This figure is known as the expense ratio. The following examples are intended to help you understand the ongoing costs (in dollars) of investing in the Funds and to compare these costs with the ongoing costs of investing in other mutual funds. The examples below are based on an investment of $1,000 made at the beginning of the period shown and held for the entire period (October 1, 2020 through March 31, 2021).
The table below illustrates each Fund’s ongoing costs in two ways:
Actual fund return – This section helps you to estimate the actual expenses that you paid over the period. The “Ending Account Value” shown is derived from each Fund’s actual return, and the fourth column shows the dollar amount of operating expenses that would have been paid by an investor who started with $1,000 in the Funds. You may use the information here, together with the amount you invested, to estimate the expenses that you paid over the period.
To do so, simply divide your account value by $1,000 (for example, an $8,600 account value divided by $1,000 = 8.6), then multiply the result by the number given for the Funds under the heading “Expenses Paid During Period.”
Hypothetical 5% return – This section is intended to help you compare the Funds’ ongoing costs with those of other mutual funds. It assumes that each Fund had an annual return of 5% before expenses during the period shown, but that the expense ratio is unchanged. In this case, because the returns used are not the Funds’ actual returns, the results do not apply to your investment. The example is useful in making comparisons because the U.S. Securities and Exchange Commission (the “SEC”) requires all mutual funds to calculate expenses based on a 5% return. You can assess each Fund’s ongoing costs by comparing this hypothetical example with the hypothetical examples that appear in shareholder reports of other funds.
Note that expenses shown in the table are meant to highlight and help you compare ongoing costs only. The Funds do not charge sales loads or redemption fees.
The calculations assume no shares were bought or sold during the period. Your actual costs may have been higher or lower, depending on the amount of your investment and the timing of any purchases or redemptions.
More information about the Funds’ expenses, including annual expense ratios for the past five fiscal years, can be found in this report. For additional information on operating expenses and other shareholder costs, please refer to the Funds’ prospectus.
| THE FLIPPIN, BRUCE & PORTER FUNDS |
| ABOUT YOUR FUNDS’ EXPENSES (Unaudited) (Continued) |
| | | Beginning | | Ending | | | | Expenses |
| | | Account Value | | Account Value | | Net | | Paid |
| | | October 1, | | March 31, | | Expense | | During |
| | | 2020 | | 2021 | | Ratio(a) | | Period(b) |
| FBP Equity & Dividend Plus Fund | | | | | | | | |
| Based on Actual Fund Return | | $1,000.00 | | $1,346.10 | | 1.13% | | $6.61 |
| Based on Hypothetical 5%Return (before expenses) | | $1,000.00 | | $1,019.30 | | 1.13% | | $5.69 |
| FBP Appreciation & Income Opportunities Fund | | | | | | | | |
| Based on Actual Fund Return | | $1,000.00 | | $1,308.20 | | 1.06% | | $6.10 |
| Based on Hypothetical 5%Return (before expenses) | | $1,000.00 | | $1,019.65 | | 1.06% | | $5.34 |
| (a) | Annualized, based on each Fund’s most recent one-half year expenses. |
| (b) | Expenses are equal to each Fund’s annualized net expense ratio multiplied by the average account value over the period, multiplied by 182/365 (to reflect the one-half year period). |
| THE FLIPPIN, BRUCE & PORTER FUNDS |
| OTHER INFORMATION (Unaudited) |
The Trust files a complete listing of portfolio holdings for the Funds with the SEC as of the end of the first and third quarters of each fiscal year as an exhibit to its reports on Form N-PORT. The filings are available upon request, by calling 1-866-738-1127. Furthermore, you may obtain a copy of these filings on the SEC’s website at www.sec.gov.
A description of the policies and procedures that the Funds use to determine how to vote proxies relating to portfolio securities is available without charge upon request by calling toll-free 1-800-327-9375, or on the SEC’s website at www.sec.gov. Information regarding how the Funds voted proxies relating to portfolio securities during the most recent 12-month period ended June 30 is also available without charge upon request by calling toll-free 1-866-738-1127, or on the SEC’s website at www.sec.gov.
| FEDERAL TAX INFORMATION (Unaudited) |
Qualified Dividend Income – FBP Equity & Dividend Plus Fund and FBP Appreciation & Income Opportunities Fund each designates 100%, or up to the maximum amount of such dividends allowable pursuant to the Internal Revenue Code, as qualified dividend income eligible for the reduced tax rate of 15%.
Dividends Received Deduction – Corporate shareholders are generally entitled to take the dividends received deduction on the portion of a fund’s dividend distribution that qualifies under tax law. For FBP Equity & Dividend Plus Fund and FBP Appreciation & Income Opportunities Fund’s fiscal year 2021 ordinary income dividends, 100% qualifies for the corporate dividends received deduction.
| THE FLIPPIN, BRUCE & PORTER FUNDS |
DISCLOSURE REGARDING APPROVAL OF
INVESTMENT ADVISORY AGREEMENTS
(Unaudited) |
At a meeting held on February 23, 2021, the Board of Trustees, including a majority of the Independent Trustees, approved the continuance for a one-year period of the Investment Advisory Agreements with the Adviser on behalf of the FBP Equity & Dividend Plus Fund and the FBP Appreciation & Income Opportunities Fund (individually, a “Fund,” collectively, the “Funds”). Below is a discussion of the factors considered by the Board of Trustees along with the conclusions with respect thereto that formed the basis for the Board’s approval.
In approving the continuance of the Investment Advisory Agreements, the Independent Trustees considered all information they deemed reasonably necessary to evaluate the terms of the Agreements. The principal areas of review by the Independent Trustees were the nature, extent and quality of the services provided by the Adviser and the reasonableness of the fees charged for those services. These matters were considered by the Independent Trustees consulting with experienced counsel for the Independent Trustees, who is independent of the Adviser.
The Independent Trustees’ evaluation of the quality of the Adviser’s services took into consideration their knowledge gained through presentations and reports from the Adviser over the course of the preceding year. The Independent Trustees considered that the Adviser had provided its views on the overall conditions of the economy and the markets, including the factors that may have influenced the markets, investor preferences and market sentiment during the past year. The Independent Trustees also considered the security selection process that is applied in the management of the Funds and took into account that value stocks generally had been underperforming growth stocks for a number of years. Both short-term and long-term investment performance of the Funds were considered, as well as the investment process applied to the Funds which seeks to generate income and to protect against volatility. Each Fund’s performance was compared to its performance benchmark, a peer group of funds with similar investment objectives and strategies, and to the Adviser’s comparably managed private accounts. The Independent Trustees also considered: the scope and quality of the in-house capabilities of the Adviser and other resources that it dedicates to performing services for the Funds; the quality of administrative and other services, including the Adviser’s role in coordinating the activities of the Funds’ other service providers; the Adviser’s strong compliance culture and each Fund’s compliance with its investment policies and applicable laws and regulations; information provided by management and the Funds’ independent public accounting firm in periodic meetings with the Trust’s Audit Committee; the business reputation of the Adviser; the qualifications of the Adviser’s key investment and compliance personnel; and the Adviser’s financial resources.
In reviewing the fees payable under the Investment Advisory Agreements, the Independent Trustees compared the advisory fees and overall expense levels of each Fund with those of funds with similar investment objectives and strategies as well as the private accounts managed by the Adviser. The Independent Trustees considered information provided by the Adviser concerning the Adviser’s profitability with respect to each Fund, including the assumptions and methodology used in preparing the profitability information, in light of applicable case law relating to advisory fees. For these purposes, the Independent Trustees considered not only the fees paid by the Funds, but also so-called “fallout” benefits to the Adviser. The Independent Trustees also considered the Adviser’s representations that the Funds’ portfolio trades were executed based on the best
| THE FLIPPIN, BRUCE & PORTER FUNDS |
DISCLOSURE REGARDING APPROVAL OF
INVESTMENT ADVISORY AGREEMENTS
(Unaudited) (Continued) |
available price and execution, and that the Adviser does not participate in any revenue sharing arrangements relating to the Funds. In evaluating the Funds’ advisory fees, the Trustees considered the complexity and quality of the investment process that is applied in the management of the Funds.
Based on the consideration of the foregoing and such other information as was deemed relevant, including the factors and conclusions below, the Independent Trustees concluded that: (i) the performance of the FBP Equity & Dividend Plus Fund and the FBP Appreciation & Income Opportunities Fund is satisfactory given each Fund’s investment strategy in comparison to the performance to primary and secondary benchmarks, and each Fund’s respective peer group average, and after considering the services provided by FBP to the FBP Equity & Dividend Plus Fund and FBP Appreciation & Income Opportunities Fund; (ii) the advisory fees for the FBP Appreciation & Income Opportunities Fund, after fee waivers, while higher than the average for similarly managed funds according to statistics derived from Morningstar, Inc., remain competitive, the advisory fees for the FBP Equity & Dividend Plus Fund, after fee waivers, were lower than the average for similarly managed funds according to statistics derived from Morningstar, Inc. and the advisory fees payable by the Funds are reasonable in relation to the services provided by FBP; (iii) the total operating expense ratio of each Fund, after fee waivers, while higher than similarly managed funds, remain competitive with the average expense ratio for comparably managed funds, according to statistics derived from Morningstar, Inc.; (iv) FBP’s decision to cap overall operating expenses of the FBP Funds by contractually waiving a portion of its investment advisory fees has enabled each Fund to increase returns for its shareholders and to maintain an overall expense ratio that is competitive with the average for similarly managed funds, despite the small size of the Funds; and (v) FBP did not realize any profits with respect to its management of the FBP Funds.
Given the current size of the FBP Funds and their expected growth, the Independent Trustees did not believe that, at the present time, it would be relevant to consider the extent to which economies of scale would be realized as the Funds grow, and whether fee levels reflect these economies of scale. The Independent Trustees also considered the “fallout” benefits to FBP with respect to the FBP Funds, but given the amounts involved viewed these as secondary factors in connection with the evaluation of the reasonableness of the advisory fees paid by the Funds.
No single factor was considered in isolation or to be determinative to the decision of the Independent Trustees to approve the continuance of the Investment Advisory Agreements. Rather the Independent Trustees concluded, after weighing and balancing of all factors considered, that it was in the best interests of each Fund and its shareholders to continue the Investment Advisory Agreements without modification to its terms, including the fees charged for services thereunder.
| Investment Adviser | Legal Counsel |
| Flippin, Bruce & Porter, Inc. | Sullivan & Worcester LLP |
| 800 Main Street, Second Floor | 1666 K Street, N.W. |
| P.O. Box 6138 | Washington, DC 20006 |
| Lynchburg, Virginia 24505 | |
| Toll-Free 1-800-851-3804 | |
| www.fbpfunds.com | Officers |
| | John T. Bruce, President |
| Administrator | and Portfolio Manager |
| Ultimus Fund Solutions, LLC | Norman D. Darden, III, |
| P.O. Box 46707 | Vice President |
| Cincinnati, Ohio 45246-0707 | John H. Hanna, IV, Vice President |
| Toll-Free 1-866-738-1127 | David J. Marshall, Vice President |
| | |
| Custodian | Trustees |
| U.S. Bank, N.A. | Robert S. Harris, Ph.D., Chairman |
| 425 Walnut Street | John P. Ackerly, IV |
| Cincinnati, Ohio 45202 | John T. Bruce |
| | George K. Jennison |
| | Harris V. Morrissette |
Independent Registered
Public Accounting Firm | Elizabeth W. Robertson |
| Cohen & Company, Ltd. | |
| 342 N. Water Street, Suite 830 | |
| Milwaukee, Wisconsin 53202 | |
FBP-AR-21
| |
| |
| THE |
| GOVERNMENT STREET |
| FUNDS |
| |
| |
| No-Load Mutual Funds |
| |
| Annual Report |
| March 31, 2021 |
| |
| |
| |
| |
| |
| |
 |
| |
| |
| |
| |
| |
| |
The Government Street Equity Fund
The Government Street Mid-Cap Fund |
| |
| |
| |
| LETTER FROM THE PRESIDENT (Unaudited) | April 2021 |
Dear Fellow Shareholders:
We are enclosing for your review the audited Annual Reports of The Government Street Funds for the fiscal year ended March 31, 2021.
The Government Street Equity Fund
The Government Street Equity Fund had a total return of 55.46% for the fiscal year ended March 31, 2021. By comparison, the S&P 500® Index and the Morningstar Large Blend categories returned 56.35% and 55.32%, respectively.
The following table depicts the fiscal quarter total returns of our three related measures.
| | Government | | Morningstar |
| | Street Equity | S&P 500 | Large Blend |
| 1 Qtr 2021 | 5.42% | 6.17% | 6.74% |
| 4 Qtr 2020 | 10.73% | 12.15% | 12.78% |
| 3 Qtr 2020 | 10.48% | 8.93% | 8.05% |
| 2 Qtr 2020 | 20.54% | 20.54% | 19.42% |
The opening paragraph of the April 2020 letter to shareholders stated:
“After 3 quarters of excellent relative and absolute equity performance, the annual result was entirely erased by the reaction to the pandemic effects of coronavirus and plummeting energy prices. Investors were unnerved by the speed and depth of the decline that was historic in nature. The real damage, which is yet to be assessed, provided investors another experience in markets reaction to uncertainty.”
Well, now we know. The ensuing fiscal year ended March 31, 2021 saw some of the greatest annual equity returns ever experienced. Record stock market levels were restated several times during the twelve-month period.
The fact that the COVID pandemic raged far and wide during the time frame made the accomplishments of stock markets ever more stunning. The results are truly amazing.
So, how do we explain the experience, and what does it all portend for the future as we proceed from the current extraordinary levels. To explain what happened, it seems reasonable to begin by recognizing what changed during the pandemic induced economic shutdown, which resulted in major parts of the population restricted to working, if remaining employed, from home.
First, the digital revolution that we were experiencing before the dislocation was catapulted years ahead of what would have been a normal development timeline. Zoom, teledoc, social media, home entertainment, and a myriad of other digital-based products and services became everyday fare. Second, medical technology, in the works for decades, materialized to confront the virus and many related research considerations. Again, DNA and mRNA, protein folding, vaccines, and medical equipment became standard media presentations. Of course, the events of the past
year extend into many other areas of life and the economy, but the two areas cited seem to be major catalysts for the foreseeable future. They set the stage for numerous developments that follow.
The stock market responded, as usually happens, to what is positive and negative in predictable fashion. Service industries, in general, which were negatively affected by stay-at-home restrictions, social distancing, and the evolving pandemic-related concerns, regressed and in some cases completely collapsed. High tech, in the form of communication software and hardware, medical research, vaccine producers and home entertainment products excelled. Many commentators referred to the year as a “k” type recovery with value-related companies on the down leg and growth type companies on the up leg. The situation was reflected in stock returns, as many times, growth stock results were 30% to 40% greater than value stock results. For much of the period, value stocks resided around a zero to slightly up or down performance for the year.
The entire experience was set in a political circus of a disputed Presidential election, Federal Reserve and U.S. Treasury money creation, historically low-interest rates, and a housing boom that challenged records in their respective areas. The situation could be compared to a “sugar high” that will probably take years to fully realize the resulting impact on American lives and the economy, both pro and con.
Your Fund rode the roller coaster with extremely good absolute and relative performances. As seen in the opening comment it was up 55.46% which slightly bested the Morningstar Large Blend category. The internals of the Fund followed along the growth and value performance achievements previously cited.
As this letter is being written, value stocks are starting to assert their absolute and relative performance against growth stocks, which in general seem to be retreating. That is to be expected. The real question for market returns in the future will be less predictable as the monetary, Governmental, and regulatory experiments play out. “We live in interesting times.”
The top 10 holdings in The Government Street Equity Fund as of March 31, 2021 were:
| Security Description | % of Net Assets |
| JPMorgan Chase & Company | 4.78% |
| NVIDIA Corporation | 4.60% |
| Bio-Techne Corporation | 4.36% |
| Apple, Inc. | 4.21% |
| Amazon.com, Inc. | 3.76% |
| Lockheed Martin Corporation | 3.69% |
| Honeywell International, Inc. | 3.41% |
| Microsoft Corporation | 3.37% |
| Skyworks Solutions, Inc. | 2.62% |
| Walmart, Inc. | 2.62% |
The top 10 holdings are large well-known companies. There seems to be a tendency across the components to represent growthier elements of their respective industries. However, the breadth of diversification is evident. This runs throughout the
balance of the portfolio as each of the 11 economic sector classifications of the market is represented. The Government Street Equity Fund is managed to represent a large capitalization collection of blended growth and value companies.
There were significant individual performances during the fiscal year. The five highest returns, held for the entire fiscal year, as measured by the internal rate of return for the entire period were:
| | 1 Year |
| Security Description | Performance |
| Twitter, Inc. | 154.39% |
| Taiwan Semiconductor Manufacturing Company Ltd. - ADR | 149.10% |
| Freeport-McMoRan, Inc. | 130.25% |
| Lowes Companies, Inc. | 124.52% |
| TE Connectivity Ltd. | 108.68% |
The five worst individual performances, held for the entire fiscal year, as measured by internal rate of return for the entire period were:
| | 1 Year |
| Security Description | Performance |
| WEC Energy Group, Inc. | 9.24% |
| Phillips 66 | 7.72% |
| Vulcan Materials Company | 6.77% |
| Chevron Corporation | (1.89%) |
| Barrick Gold Corporation | (19.09%) |
The Fund’s best performing economic sector for the fiscal year was Materials, up 100.1%. The second-best sector was Technology up 83.1%. The worst performing sector was Utilities up 12.3%.
Note: The investment performances listed for economic sectors and securities in the two preceding paragraphs are extracted from an in-house independent time-weighted rate of return computation by the Addepar portfolio accounting system. The calculations are gross investment returns. Total investment returns are for the fiscal year April 1, 2020 through March 31, 2021.
The following comments are drawn from previous newsletters but continue to reflect our current thoughts on the future investment prospects. These previous comments never anticipated an outside influence, such as a pandemic, would accelerate the global consideration of debt levels. We believe that the current remedies, all increasing the debt burden of future generations, brings us closer to the ultimate financial tipping point. We believe it must be addressed directly or financial systems around the world will have to be modified to confront the staggering obligations of governments, corporations and individuals.
We believe that continued upward movement of markets and economies worldwide are highly dependent on governments getting their financial balance sheets in order. There has been unparalleled deficit spending around the world. Those economies not directly participating in the credit shortfalls will be indirectly impacted
by lower import/export activities brought on by a significant debt-imposed slowdown. This will occur domestically and internationally as economies have become more highly correlated in their economic cycles.
In response to this perceived scenario, risk management takes precedence over return pursuits in the near term. Your Fund remains invested to capture returns but highly diversified to mitigate the risks associated with that position. We believe that the future transition to a sound economic scenario will determine the continuation of current positive performances. We are not totally convinced of that outcome.
While significant risks exist, we continue to believe that investors have the potential for one of the greatest investment environments for generations. There are over 7 billion people in the world today (the U.S. population is approximately 325 million). Many of these potential consumers are moving into middle-class ranks. In our opinion, the demand for goods and services for the future is tremendous. Remember that, in our own economy, approximately 60% of GDP is tied to consumer spending on goods and services. With the business advantages that the U.S. enjoys in manufacturing know-how, technology, intellectual content, productivity, and numerous other characteristics, if the government will provide a competitive framework for operating, the benefits could be the best ever. We just need government policies that foster growth in profits and wages domestically and internationally.
There are many additional moving parts in our economy and exogenous factors such as the geopolitical instabilities that will always cause uneven effects. However, it is our thought that keeping our fiscal house in order is basic to all considerations. The irresponsible spending activities of our government continue to unnerve us. It remains to be seen if the economy can overcome the negative influence of government policies and have a successful impact on market values.
As of March 31, 2021, the Fund’s net assets were $69.9 million; net asset value per share was $98.83; and the ratio of expenses to net average assets was 0.86%. Portfolio turnover rate was 17%. Income dividends of $0.64 per share and capital gain distributions of $5.80 per share were distributed to shareholders during the year.
The Government Street Mid-Cap Fund
The Government Street Mid-Cap Fund produced a total return of 57.00% during the fiscal year ended March 31, 2021. By comparison the S&P MidCap 400® Index and the Morningstar Mid-Cap Blend category, used as relative performance benchmarks, returned 83.46% and 73.66%, respectively.
The mid-capitalization category of individual companies is usually represented by the S&P MidCap 400®, whose issuers have a market capitalization ranging from approximately $0.3 billion to $12.5 billion. Generally, these companies are considered to have slightly higher risk and return characteristics than the S&P 500® companies, which includes issuers with large capitalization. As you would guess, the mid-cap companies in the index are primarily domestically oriented.
The Fund has a slightly different range of capitalizations than the S&P MidCap 400®. There are two provisions that allow the market caps of the companies held by the Fund to exceed the general limits. First, to the extent securities originally
purchased within the limits have grown to greater capitalizations, they may be retained by the Fund without limitation. Second, the Fund’s portfolio manager has the latitude to purchase and hold up to 20% of the Fund’s value outside the market cap limitations.
The exceptions to the guidelines for your Fund worked to its advantage in fiscal 2021. Several companies, particularly in the Technology sector, with higher capitalizations provided extraordinary returns for the period. One contributor, NVIDIA, up 102.3% in the period, was purchased when its capitalization was within the mid-cap range but has grown to mega-cap proportions.
The top 10 holdings in The Government Street Mid-Cap Fund as of March 31, 2021 were:
| Security Description | % of Net Assets |
| Mid-America Apartment Communities, Inc. | 3.71% |
| Bio-Techne Corporation | 3.27% |
| Teleflex, Inc. | 2.81% |
| NVIDIA Corporation | 2.38% |
| Chemed Corporation | 2.36% |
| Charles River Laboratories International, Inc. | 2.24% |
| Nasdaq, Inc. | 2.15% |
| Lam Research Corporation | 2.10% |
| ANSYS, Inc. | 2.04% |
| Waste Connections, Inc. | 1.94% |
There were significant individual performances during the fiscal year. The five highest returns, held for the entire period, as measured by the time weighted rate of return, were:
| | 1 Year |
| Security Description | Performance |
| AMETEK, Inc. | 435.46% |
| Gildan Activewear, Inc. | 235.19% |
| MSC Industrial Direct Company, Inc. | 191.13% |
| Arrow Electronics, Inc. | 168.23% |
| Steel Dynamics, Inc. | 163.08% |
The five worst individual performances, held for the entire period, as measured by time weighted rate of return, were:
| | 1 Year |
| Security Description | Performance |
| Brown & Brown, Inc. | (3.87%) |
| Waste Connections, Inc. | (8.89%) |
| Celsius Holdings, Inc. | (15.65%) |
| Graco, Inc. | (15.80%) |
| Bunge Ltd. | (44.14%) |
The Fund’s best performing economic sector for the fiscal year was Energy, up 143.6%. The second-best sector was Technology, up 96.6%. The worst performing sector was Utilities, up 16.7%.
Note: The investment performances listed for economic sectors and securities in the two preceding paragraphs are extracted from an in-house independent time-weighted rate of return computation by the Addepar portfolio accounting system. The calculations are gross investment returns. Total investment returns are for the fiscal year April 1, 2020 through March 31, 2021.
We believe that mid-cap stocks offer an attractive combination of growth and safety as they have successfully overcome startup challenges yet remain nimble enough to generate stronger growth than large-cap stocks. Mid-cap stocks have been able to match the performance of large-cap stocks in down markets while exceeding large-cap performance in up markets, leading to long-term outperformance.
It may be interesting for the readers to compare the Global Industry Classification Standard (“GICS”) sectors between the larger capitalization S&P 500® and the smaller capitalization S&P MidCap 400®. The approximate weights based on the component’s capitalizations change daily but are reasonably stable over short periods. As of May 2021, they are:
| GICS | S&P 500 | S&P 400 |
| Energy | 2.77% | 2.10% |
| Materials | 2.41% | 4.57% |
| Industrial | 9.22% | 15.89% |
| Consumer Discretionary | 12.25% | 13.93% |
| Consumer Staples | 6.45% | 4.56% |
| Health Care | 13.10% | 11.76% |
| Financials | 14.55% | 14.52% |
| Information Technology | 23.03% | 17.96% |
| Telecommunication Services | 11.07% | 4.42% |
| Utilities | 2.64% | 2.99% |
| Real Estate | 2.51% | 7.28% |
The Government Street Mid-Cap Fund uses the S&P MidCap 400® sector weights for guidance in its portfolio diversification.
As of March 31, 2021, the net assets of The Government Street Mid-Cap Fund were $58.3 million and the net asset value per share was $35.73. The portfolio turnover rate for the year was 13% and the total number of holdings was 86 as of March 31, 2021. The net expense ratio for the Fund was 1.07%.
Thank you for your continued confidence in The Government Street Funds. Please call us if we can be of further service to you.
Very truly yours,

Thomas W. Leavell
President
Leavell Investment Management, Inc.
The Government Street Funds
Data presented reflects past performance, which is no guarantee of future results. Investment results and principal value will fluctuate so that shares, when redeemed, may be worth more or less than their original cost. Due to market volatility, current performance may be higher or lower than the performance shown.
This report is submitted for the general information of the shareholders of the Funds. The report is not authorized for distribution to prospective investors in the Funds unless it is accompanied by a current prospectus.
This report reflects our views, opinions and portfolio holdings as of March 31, 2021, the end of the reporting period. These views are subject to change at any time based upon market or other conditions. For more current information throughout the year please visit www.leavellinvestments.com.
THE GOVERNMENT STREET EQUITY FUND
PERFORMANCE INFORMATION (Unaudited) |
The Government Street Equity Fund
Comparison of the Change in Value of a $10,000 Investment in
The Government Street Equity Fund and the S&P 500® Index
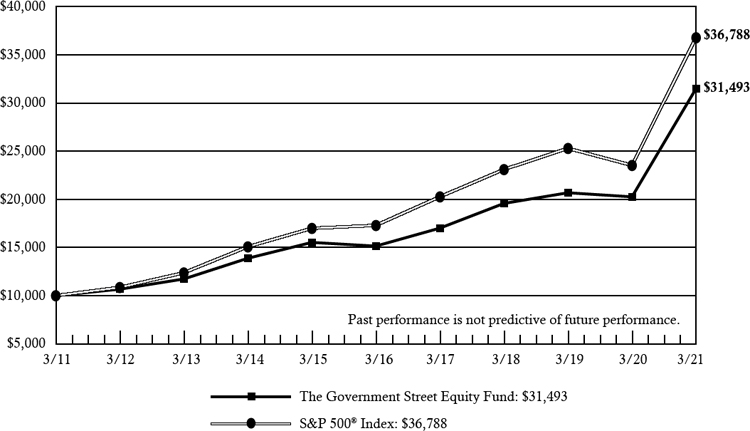
| | Average Annual Total Returns |
| | (for periods ended March 31, 2021) |
| | |
| | 1 Year | 5 Years | 10 Years |
| The Government Street Equity Fund(a) | 55.46% | 15.77% | 12.16% |
| S&P 500® Index | 56.35% | 16.29% | 13.91% |
| (a) | Total return is a measure of the change in value of an investment in the Fund over the periods covered, which assumes any dividends or capital gains distributions are reinvested in shares of the Fund. Returns do not reflect the deduction of taxes a shareholder would pay on Fund distributions or the redemption of Fund shares. |
THE GOVERNMENT STREET MID-CAP FUND
PERFORMANCE INFORMATION (Unaudited) |
The Government Street Mid-Cap Fund
Comparison of the Change in Value of a $10,000 Investment in
The Government Street Mid-Cap Fund and the S&P MidCap 400® Index
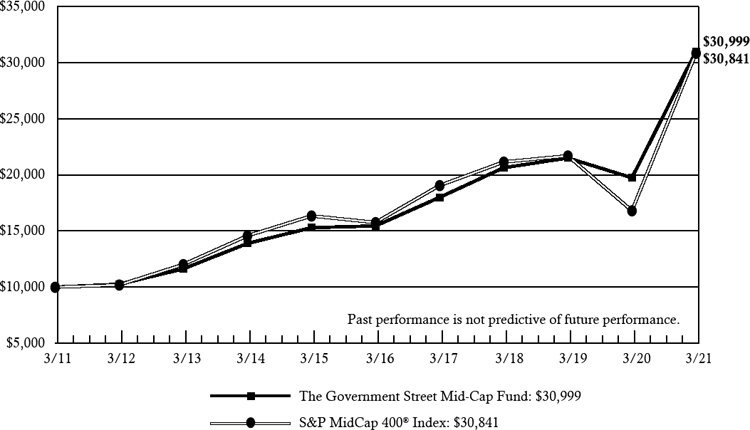
| | Average Annual Total Returns |
| | (for periods ended March 31, 2021) |
| | |
| | 1 Year | 5 Years | 10 Years |
| The Government Street Mid-Cap Fund(a) | 57.00% | 14.94% | 11.98% |
| S&P MidCap 400® Index | 83.46% | 14.37% | 11.92% |
| (a) | Total return is a measure of the change in value of an investment in the Fund over the periods covered, which assumes any dividends or capital gains distributions are reinvested in shares of the Fund. Returns do not reflect the deduction of taxes a shareholder would pay on Fund distributions or the redemption of Fund shares. |
THE GOVERNMENT STREET EQUITY FUND
PORTFOLIO INFORMATION
March 31, 2021 (Unaudited) |
Asset Allocation
(% of Net Assets)
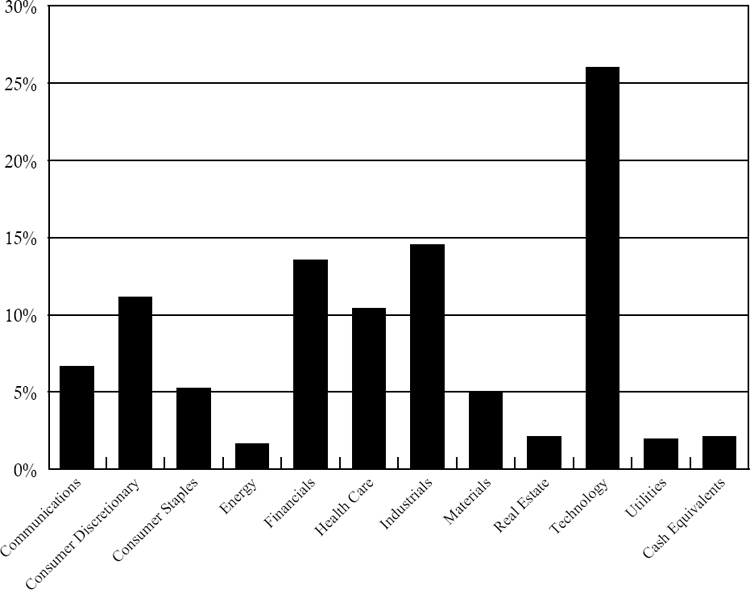
Top Ten Equity Holdings
| Security Description | % of Net Assets |
| JPMorgan Chase & Company | 4.8% |
| NVIDIA Corporation | 4.6% |
| Bio-Techne Corporation | 4.4% |
| Apple, Inc. | 4.2% |
| Amazon.com, Inc. | 3.8% |
| Lockheed Martin Corporation | 3.7% |
| Honeywell International, Inc. | 3.4% |
| Microsoft Corporation | 3.4% |
| Skyworks Solutions, Inc. | 2.6% |
| Walmart, Inc. | 2.6% |
THE GOVERNMENT STREET MID-CAP FUND
PORTFOLIO INFORMATION
March 31, 2021 (Unaudited) |
Asset Allocation
(% of Net Assets)
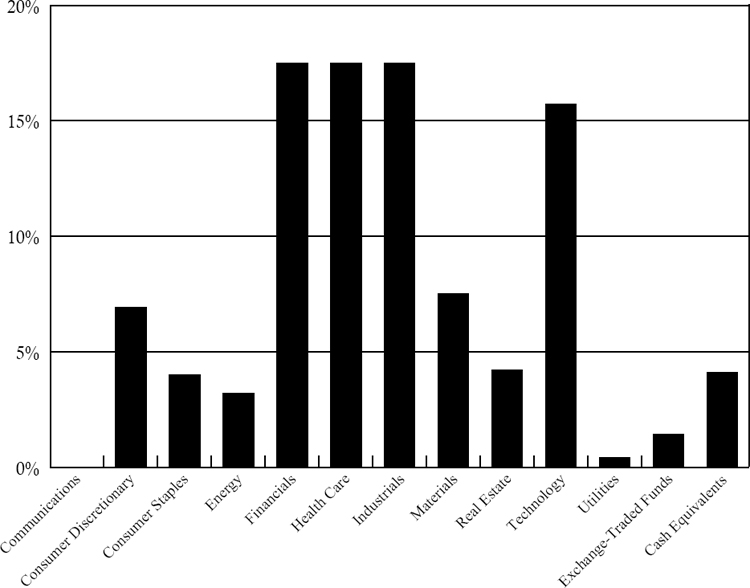
Top Ten Equity Holdings
| Security Description | % of Net Assets |
| Mid-America Apartment Communities, Inc. | 3.7% |
| Bio-Techne Corporation | 3.3% |
| Teleflex, Inc. | 2.8% |
| NVIDIA Corporation | 2.4% |
| Chemed Corporation | 2.4% |
| Charles River Laboratories International, Inc. | 2.2% |
| Nasdaq, Inc. | 2.2% |
| Lam Research Corporation | 2.1% |
| ANSYS, Inc. | 2.0% |
| Waste Connections, Inc. | 1.9% |
| THE GOVERNMENT STREET EQUITY FUND |
| SCHEDULE OF INVESTMENTS |
| March 31, 2021 |
| COMMON STOCKS — 98.0% | | Shares | | | Value | |
| Communications — 6.7% | | | | | | |
| Alphabet, Inc. - Class A (a) | | | 700 | | | $ | 1,443,764 | |
| Alphabet, Inc. - Class C (a) | | | 642 | | | | 1,328,060 | |
| Comcast Corporation - Class A | | | 30,000 | | | | 1,623,300 | |
| Twitter, Inc. (a) | | | 4,000 | | | | 254,520 | |
| | | | | | | | 4,649,644 | |
| Consumer Discretionary — 11.1% | | | | | | | | |
| Amazon.com, Inc. (a) | | | 850 | | | | 2,629,968 | |
| Home Depot, Inc. (The) | | | 5,000 | | | | 1,526,250 | |
| Lowe’s Companies, Inc. | | | 6,000 | | | | 1,141,080 | |
| McDonald’s Corporation | | | 5,000 | | | | 1,120,700 | |
| NIKE, Inc. - Class B | | | 10,000 | | | | 1,328,900 | |
| | | | | | | | 7,746,898 | |
| Consumer Staples — 5.2% | | | | | | | | |
| Coca-Cola Company (The) | | | 7,000 | | | | 368,970 | |
| Costco Wholesale Corporation | | | 1,000 | | | | 352,480 | |
| McCormick & Company, Inc. | | | 6,000 | | | | 534,960 | |
| Procter & Gamble Company (The) | | | 4,000 | | | | 541,720 | |
| Walmart, Inc. | | | 13,500 | | | | 1,833,705 | |
| | | | | | | | 3,631,835 | |
| Energy — 1.6% | | | | | | | | |
| Chevron Corporation | | | 6,000 | | | | 628,740 | |
| ONEOK, Inc. | | | 5,000 | | | | 253,300 | |
| Phillips 66 | | | 3,250 | | | | 265,005 | |
| | | | | | | | 1,147,045 | |
| Financials — 13.5% | | | | | | | | |
| Aflac, Inc. | | | 16,000 | | | | 818,880 | |
| Ares Management Corporation - Class A | | | 5,000 | | | | 280,150 | |
| Blackstone Group, Inc. (The) | | | 13,000 | | | | 968,890 | |
| Brookfield Asset Management, Inc. - Class A | | | 28,000 | | | | 1,246,000 | |
| CME Group, Inc. | | | 4,000 | | | | 816,920 | |
| Intercontinental Exchange, Inc. | | | 10,000 | | | | 1,116,800 | |
| JPMorgan Chase & Company | | | 22,000 | | | | 3,349,060 | |
| Truist Financial Corporation | | | 15,000 | | | | 874,800 | |
| | | | | | | | 9,471,500 | |
| Health Care — 10.4% | | | | | | | | |
| Abbott Laboratories | | | 9,500 | | | | 1,138,480 | |
| AbbVie, Inc. | | | 11,500 | | | | 1,244,530 | |
| Bio-Techne Corporation | | | 8,000 | | | | 3,055,440 | |
| Bristol-Myers Squibb Company | | | 5,000 | | | | 315,650 | |
| Edwards Lifesciences Corporation (a) | | | 4,800 | | | | 401,472 | |
| Johnson & Johnson | | | 2,250 | | | | 369,788 | |
| Pfizer, Inc. | | | 4,000 | | | | 144,920 | |
| THE GOVERNMENT STREET EQUITY FUND |
| SCHEDULE OF INVESTMENTS (Continued) |
| COMMON STOCKS — 98.0% (Continued) | | Shares | | | Value | |
| Health Care — 10.4% (Continued) | | | | | | | | |
| Thermo Fisher Scientific, Inc. | | | 900 | | | $ | 410,742 | |
| UnitedHealth Group, Inc. | | | 600 | | | | 223,242 | |
| | | | | | | | 7,304,264 | |
| Industrials — 14.5% | | | | | | | | |
| Caterpillar, Inc. | | | 3,000 | | | | 695,610 | |
| Deere & Company | | | 2,000 | | | | 748,280 | |
| Emerson Electric Company | | | 6,500 | | | | 586,430 | |
| General Dynamics Corporation | | | 5,200 | | | | 944,112 | |
| Honeywell International, Inc. | | | 11,000 | | | | 2,387,770 | |
| Lockheed Martin Corporation | | | 7,000 | | | | 2,586,500 | |
| Raytheon Technologies Corporation | | | 13,500 | | | | 1,043,145 | |
| TE Connectivity Ltd. | | | 9,000 | | | | 1,161,990 | |
| | | | | | | | 10,153,837 | |
| Materials — 5.0% | | | | | | | | |
| Albemarle Corporation | | | 4,500 | | | | 657,495 | |
| Barrick Gold Corporation | | | 12,000 | | | | 237,600 | |
| Freeport-McMoRan, Inc. (a) | | | 25,000 | | | | 823,250 | |
| Glencore plc - ADR (a) | | | 20,000 | | | | 156,800 | |
| International Paper Company | | | 7,000 | | | | 378,490 | |
| Linde plc | | | 2,300 | | | | 644,322 | |
| Mosaic Company (The) | | | 6,000 | | | | 189,660 | |
| Vulcan Materials Company | | | 2,300 | | | | 388,125 | |
| | | | | | | | 3,475,742 | |
| Real Estate — 2.1% | | | | | | | | |
| Mid-America Apartment Communities, Inc. | | | 10,000 | | | | 1,443,600 | |
| | | | | | | | | |
| Technology — 26.0% | | | | | | | | |
| Accenture plc - Class A | | | 5,650 | | | | 1,560,813 | |
| Apple, Inc. | | | 24,100 | | | | 2,943,815 | |
| ASML Holding N.V. | | | 850 | | | | 524,756 | |
| Mastercard, Inc. - Class A | | | 2,000 | | | | 712,100 | |
| Microsoft Corporation | | | 10,000 | | | | 2,357,700 | |
| NVIDIA Corporation | | | 6,025 | | | | 3,216,928 | |
| ON Semiconductor Corporation (a) | | | 3,500 | | | | 145,635 | |
| Palantir Technologies, Inc. - Class A (a) | | | 10,000 | | | | 232,900 | |
| PayPal Holdings, Inc. (a) | | | 2,000 | | | | 485,680 | |
| QUALCOMM, Inc. | | | 6,000 | | | | 795,540 | |
| S&P Global, Inc. | | | 500 | | | | 176,435 | |
| Skyworks Solutions, Inc. | | | 10,000 | | | | 1,834,800 | |
| Taiwan Semiconductor Manufacturing Company Ltd. - ADR | | | 6,000 | | | | 709,680 | |
| Texas Instruments, Inc. | | | 6,200 | | | | 1,171,738 | |
| Visa, Inc. - Class A | | | 6,300 | | | | 1,333,899 | |
| | | | | | | | 18,202,419 | |
| THE GOVERNMENT STREET EQUITY FUND |
| SCHEDULE OF INVESTMENTS (Continued) |
| COMMON STOCKS — 98.0% (Continued) | | Shares | | | Value | |
| Utilities — 1.9% | | | | | | |
| WEC Energy Group, Inc. | | | 14,000 | | | $ | 1,310,260 | |
| | | | | | | | | |
| Total Common Stocks (Cost $28,085,358) | | | | | | $ | 68,537,044 | |
| | | | | | | | | |
| MONEY MARKET FUNDS — 2.1% | | Shares | | | Value | |
| Fidelity Institutional Money Market Government Portfolio - Class I, 0.01% (b) (Cost $1,441,143) | | | 1,441,143 | | | $ | 1,441,143 | |
| | | | | | | | | |
| Total Investments at Value — 100.1% (Cost $29,526,501) | | | | | | $ | 69,978,187 | |
| | | | | | | | | |
| Liabilities in Excess of Other Assets — (0.1%) | | | | | | | (29,913 | ) |
| | | | | | | | | |
| Net Assets — 100.0% | | | | | | $ | 69,948,274 | |
ADR - American Depositary Receipt.
| (a) | Non-income producing security. |
| (b) | The rate shown is the 7-day effective yield as of March 31, 2021. |
See accompanying notes to financial statements.
| THE GOVERNMENT STREET MID-CAP FUND |
| SCHEDULE OF INVESTMENTS |
| March 31, 2021 |
| COMMON STOCKS — 94.5% | | Shares | | | Value | |
| Consumer Discretionary — 6.9% | | | | | | | | |
| Gildan Activewear, Inc. | | | 13,400 | | | $ | 410,844 | |
| Hasbro, Inc. | | | 5,000 | | | | 480,600 | |
| Kontoor Brands, Inc. | | | 1,671 | | | | 81,094 | |
| Macy’s, Inc. (a) | | | 5,000 | | | | 80,950 | |
| Melco Resorts & Entertainment Ltd. - ADR (a) | | | 5,000 | | | | 99,550 | |
| NVR, Inc. (a) | | | 135 | | | | 635,975 | |
| Scotts Miracle-Gro Company (The) | | | 2,500 | | | | 612,425 | |
| Service Corporation International | | | 16,200 | | | | 827,010 | |
| Tempur Sealy International, Inc. | | | 12,000 | | | | 438,720 | |
| VF Corporation | | | 4,700 | | | | 375,624 | |
| | | | | | | | 4,042,792 | |
| Consumer Staples — 4.0% | | | | | | | | |
| Bunge Ltd. | | | 3,000 | | | | 237,810 | |
| Celsius Holdings, Inc. (a) | | | 12,000 | | | | 576,600 | |
| Church & Dwight Company, Inc. | | | 9,000 | | | | 786,150 | |
| Energizer Holdings, Inc. | | | 5,000 | | | | 237,300 | |
| Glucose Health, Inc. (a) | | | 15,000 | | | | 68,850 | |
| Hain Celestial Group, Inc. (The) (a) | | | 3,500 | | | | 152,600 | |
| Ollie’s Bargain Outlet Holdings, Inc. (a) | | | 3,300 | | | | 287,100 | |
| | | | | | | | 2,346,410 | |
| Energy — 3.2% | | | | | | | | |
| Continental Resources, Inc. (a) | | | 7,000 | | | | 181,090 | |
| Devon Energy Corporation | | | 10,000 | | | | 218,500 | |
| Enphase Energy, Inc. (a) | | | 6,000 | | | | 972,960 | |
| Marathon Oil Corporation | | | 15,000 | | | | 160,200 | |
| ONEOK, Inc. | | | 6,000 | | | | 303,960 | |
| | | | | | | | 1,836,710 | |
| Financials — 17.5% | | | | | | | | |
| Alleghany Corporation (a) | | | 1,190 | | | | 745,285 | |
| American Financial Group, Inc. | | | 8,600 | | | | 981,260 | |
| Ares Management Corporation - Class A | | | 6,500 | | | | 364,195 | |
| Arthur J. Gallagher & Company | | | 8,000 | | | | 998,160 | |
| Berkley (W.R.) Corporation | | | 11,175 | | | | 842,036 | |
| Brown & Brown, Inc. | | | 20,000 | | | | 914,200 | |
| Carlyle Group, Inc. (The) | | | 7,000 | | | | 257,320 | |
| CME Group, Inc. | | | 5,000 | | | | 1,021,150 | |
| Intercontinental Exchange, Inc. | | | 9,500 | | | | 1,060,960 | |
| Morgan Stanley | | | 8,565 | | | | 665,158 | |
| Nasdaq, Inc. | | | 8,500 | | | | 1,253,410 | |
| Old Republic International Corporation | | | 24,400 | | | | 532,896 | |
| SEI Investments Company | | | 5,500 | | | | 335,115 | |
| THE GOVERNMENT STREET MID-CAP FUND |
| SCHEDULE OF INVESTMENTS (Continued) |
| COMMON STOCKS — 94.5% (Continued) | | Shares | | | Value | |
| Financials — 17.5% (Continued) | | | | | | | | |
| Voya Financial, Inc. | | | 4,000 | | | $ | 254,560 | |
| | | | | | | | 10,225,705 | |
| Health Care — 17.6% | | | | | | | | |
| Bio-Rad Laboratories, Inc. - Class A (a) | | | 1,700 | | | | 970,989 | |
| Bio-Techne Corporation | | | 5,000 | | | | 1,909,650 | |
| Centene Corporation (a) | | | 6,000 | | | | 383,460 | |
| Charles River Laboratories International, Inc. (a) | | | 4,500 | | | | 1,304,235 | |
| Chemed Corporation | | | 3,000 | | | | 1,379,460 | |
| Globus Medical, Inc. - Class A (a) | | | 3,000 | | | | 185,010 | |
| Laboratory Corporation of America Holdings (a) | | | 2,574 | | | | 656,447 | |
| Penumbra, Inc. (a) | | | 2,500 | | | | 676,450 | |
| ResMed, Inc. | | | 3,000 | | | | 582,060 | |
| Teleflex, Inc. | | | 3,950 | | | | 1,641,067 | |
| Waters Corporation (a) | | | 2,000 | | | | 568,340 | |
| | | | | | | | 10,257,168 | |
| Industrials — 17.5% | | | | | | | | |
| AMETEK, Inc. | | | 2,350 | | | | 300,166 | |
| C.H. Robinson Worldwide, Inc. | | | 4,000 | | | | 381,720 | |
| Donaldson Company, Inc. | | | 13,000 | | | | 756,080 | |
| Expeditors International of Washington, Inc. | | | 8,000 | | | | 861,520 | |
| Fastenal Company | | | 18,000 | | | | 905,040 | |
| Graco, Inc. | | | 13,000 | | | | 931,060 | |
| Jacobs Engineering Group, Inc. | | | 8,475 | | | | 1,095,563 | |
| L3Harris Technologies, Inc. | | | 5,400 | | | | 1,094,472 | |
| MasTec, Inc. (a) | | | 5,700 | | | | 534,090 | |
| MSC Industrial Direct Company, Inc. - Class A | | | 6,000 | | | | 541,140 | |
| National Instruments Corporation | | | 12,000 | | | | 518,220 | |
| nVent Electric plc | | | 2,900 | | | | 80,939 | |
| Pentair plc | | | 2,900 | | | | 180,728 | |
| Snap-on, Inc. | | | 1,475 | | | | 340,341 | |
| Waste Connections, Inc. | | | 10,500 | | | | 1,133,790 | |
| Woodward, Inc. | | | 4,400 | | | | 530,772 | |
| | | | | | | | 10,185,641 | |
| Materials — 7.5% | | | | | | | | |
| Albemarle Corporation | | | 6,700 | | | | 978,937 | |
| Ashland Global Holdings, Inc. | | | 6,000 | | | | 532,620 | |
| Danimer Scientific, Inc. (a) | | | 3,000 | | | | 113,250 | |
| Martin Marietta Materials, Inc. | | | 3,000 | | | | 1,007,460 | |
| Packaging Corporation of America | | | 6,000 | | | | 806,880 | |
| Steel Dynamics, Inc. | | | 13,500 | | | | 685,260 | |
| Valvoline, Inc. | | | 9,236 | | | | 240,783 | |
| | | | | | | | 4,365,190 | |
| THE GOVERNMENT STREET MID-CAP FUND |
| SCHEDULE OF INVESTMENTS (Continued) |
| COMMON STOCKS — 94.5% (Continued) | | Shares | | | Value | |
| Real Estate — 4.2% | | | | | | | | |
| Mid-America Apartment Communities, Inc. | | | 15,000 | | | $ | 2,165,400 | |
| New Residential Investment Corporation | | | 25,000 | | | | 281,250 | |
| | | | | | | | 2,446,650 | |
| Technology — 15.7% | | | | | | | | |
| Analog Devices, Inc. | | | 3,671 | | | | 569,299 | |
| ANSYS, Inc. (a) | | | 3,500 | | | | 1,188,460 | |
| Arrow Electronics, Inc. (a) | | | 10,100 | | | | 1,119,282 | |
| Broadridge Financial Solutions, Inc. | | | 3,500 | | | | 535,850 | |
| FLIR Systems, Inc. | | | 3,000 | | | | 169,410 | |
| InterDigital, Inc. | | | 2,500 | | | | 158,625 | |
| Lam Research Corporation | | | 2,050 | | | | 1,220,242 | |
| Microchip Technology, Inc. | | | 6,000 | | | | 931,320 | |
| MicroStrategy, Inc. - Class A (a) | | | 500 | | | | 339,400 | |
| NVIDIA Corporation | | | 2,600 | | | | 1,388,218 | |
| Okta, Inc. (a) | | | 3,500 | | | | 771,505 | |
| Xilinx, Inc. | | | 6,000 | | | | 743,400 | |
| | | | | | | | 9,135,011 | |
| Utilities — 0.4% | | | | | | | | |
| NRG Energy, Inc. | | | 3,000 | | | | 113,190 | |
| UGI Corporation | | | 3,038 | | | | 124,589 | |
| | | | | | | | 237,779 | |
| | | | | | | | | |
| Total Common Stocks (Cost $18,915,492) | | | | | | $ | 55,079,056 | |
| | | | | | | | | |
| EXCHANGE-TRADED FUNDS — 1.5% | | Shares | | | Value | |
| iShares Silver Trust (a) (Cost $698,745) | | | 37,000 | | | $ | 839,900 | |
| THE GOVERNMENT STREET MID-CAP FUND |
| SCHEDULE OF INVESTMENTS (Continued) |
| MONEY MARKET FUNDS — 4.1% | | Shares | | | Value | |
| Fidelity Institutional Money Market Government Portfolio - Class I, 0.01% (b) (Cost $2,398,117) | | | 2,398,117 | | | $ | 2,398,117 | |
| | | | | | | | | |
| Total Investments at Value — 100.1% (Cost $22,012,354) | | | | | | $ | 58,317,073 | |
| | | | | | | | | |
| Liabilities in Excess of Other Assets — (0.1%) | | | | | | | (29,139 | ) |
| | | | | | | | | |
| Net Assets — 100.0% | | | | | | $ | 58,287,934 | |
ADR - American Depositary Receipt.
| (a) | Non-income producing security. |
| (b) | The rate shown is the 7-day effective yield as of March 31, 2021. |
See accompanying notes to financial statements.
| THE GOVERNMENT STREET FUNDS |
| STATEMENTS OF ASSETS AND LIABILITIES |
| March 31, 2021 |
| | | The | | | The | |
| | | Government | | | Government | |
| | | Street | | | Street | |
| | | Equity | | | Mid-Cap | |
| | | Fund | | | Fund | |
| ASSETS | | | | | | |
| Investments in securities: | | | | | | | | |
| At cost | | $ | 29,526,501 | | | $ | 22,012,354 | |
| At value (Note 2) | | $ | 69,978,187 | | | $ | 58,317,073 | |
| Cash | | | 3,094 | | | | — | |
| Dividends receivable | | | 21,109 | | | | 19,867 | |
| Receivable for capital shares sold | | | — | | | | 100 | |
| Other assets | | | 3,765 | | | | 3,281 | |
| TOTAL ASSETS | | | 70,006,155 | | | | 58,340,321 | |
| | | | | | | | | |
| LIABILITIES | | | | | | | | |
| Distributions payable | | | 2,090 | | | | — | |
| Payable for capital shares redeemed | | | 3,441 | | | | — | |
| Accrued investment advisory fees (Note 4) | | | 35,075 | | | | 36,592 | |
| Payable to administrator (Note 4) | | | 12,385 | | | | 11,160 | |
| Other accrued expenses | | | 4,890 | | | | 4,635 | |
| TOTAL LIABILITIES | | | 57,881 | | | | 52,387 | |
| | | | | | | | | |
| NET ASSETS | | $ | 69,948,274 | | | $ | 58,287,934 | |
| | | | | | | | | |
| Net assets consists of: | | | | | | | | |
| Paid-in capital | | $ | 26,285,129 | | | $ | 20,472,380 | |
| Accumulated earnings | | | 43,663,145 | | | | 37,815,554 | |
| Net assets | | $ | 69,948,274 | | | $ | 58,287,934 | |
| | | | | | | | | |
| Shares of beneficial interest outstanding (unlimited number of shares authorized, $0.01 par value) | | | 707,740 | | | | 1,631,135 | |
| | | | | | | | | |
| Net asset value, offering price and redemption price per share (Note 2) | | $ | 98.83 | | | $ | 35.73 | |
See accompanying notes to financial statements.
| THE GOVERNMENT STREET FUNDS |
| STATEMENTS OF OPERATIONS |
| For the Year Ended March 31, 2021 |
| | | The | | | The | |
| | | Government | | | Government | |
| | | Street | | | Street | |
| | | Equity | | | Mid-Cap | |
| | | Fund | | | Fund | |
| INVESTMENT INCOME | | | | | | | | |
| Dividends | | $ | 1,017,009 | | | $ | 705,938 | |
| Foreign withholding taxes on dividends | | | (4,434 | ) | | | (1,329 | ) |
| TOTAL INVESTMENT INCOME | | | 1,012,575 | | | | 704,609 | |
| | | | | | | | | |
| EXPENSES | | | | | | | | |
| Investment advisory fees (Note 4) | | | 384,273 | | | | 381,203 | |
| Administration fees (Note 4) | | | 64,842 | | | | 59,900 | |
| Account maintenance fees | | | 19,561 | | | | 16,855 | |
| Registration and filing fees | | | 17,045 | | | | 17,688 | |
| Audit and tax services fees | | | 16,500 | | | | 16,500 | |
| Trustees’ fees (Note 4) | | | 15,900 | | | | 15,900 | |
| Custodian and bank service fees | | | 7,335 | | | | 6,674 | |
| Compliance fees (Note 4) | | | 6,956 | | | | 6,964 | |
| Legal fees | | | 6,112 | | | | 7,041 | |
| Printing of shareholder reports | | | 4,671 | | | | 4,442 | |
| Postage and supplies | | | 4,135 | | | | 4,138 | |
| Other expenses | | | 6,740 | | | | 5,903 | |
| TOTAL EXPENSES | | | 554,070 | | | | 543,208 | |
| | | | | | | | | |
| NET INVESTMENT INCOME | | | 458,505 | | | | 161,401 | |
| | | | | | | | | |
| REALIZED AND UNREALIZED GAINS ON INVESTMENTS | | | | | | | | |
| Net realized gains from investments | | | 6,239,187 | | | | 3,140,103 | |
| Net realized gains from in-kind redemptions (Note 2) | | | 1,972,527 | | | | 686,630 | |
| Net change in unrealized appreciation (depreciation) on investments | | | 18,331,665 | | | | 18,189,473 | |
| NET REALIZED AND UNREALIZED GAINS ON INVESTMENTS | | | 26,543,379 | | | | 22,016,206 | |
| | | | | | | | | |
| NET INCREASE IN NET ASSETS RESULTING FROM OPERATIONS | | $ | 27,001,884 | | | $ | 22,177,607 | |
See accompanying notes to financial statements.
| THE GOVERNMENT STREET EQUITY FUND |
| STATEMENTS OF CHANGES IN NET ASSETS |
| | | Year | | | Year | |
| | | Ended | | | Ended | |
| | | March 31, | | | March 31, | |
| | | 2021 | | | 2020 | |
| FROM OPERATIONS | | | | | | | | |
| Net investment income | | $ | 458,505 | | | $ | 588,300 | |
| Net realized gains from investments | | | 6,239,187 | | | | 2,828,555 | |
| Net realized gains from in-kind redemptions (Note 2) | | | 1,972,527 | | | | 999,929 | |
| Net change in unrealized appreciation (depreciation) on investments | | | 18,331,665 | | | | (5,017,527 | ) |
| Net increase (decrease) in net assets resulting from operations | | | 27,001,884 | | | | (600,743 | ) |
| | | | | | | | | |
| DISTRIBUTIONS TO SHAREHOLDERS (Note 2) | | | (4,669,253 | ) | | | (2,979,301 | ) |
| | | | | | | | | |
| FROM CAPITAL SHARE TRANSACTIONS | | | | | | | | |
| Proceeds from shares sold | | | 271,578 | | | | 225,208 | |
| Net asset value of shares issued in reinvestment of distributions to shareholders | | | 4,577,361 | | | | 2,900,422 | |
| Payments for shares redeemed | | | (7,213,957 | ) | | | (5,744,573 | ) |
| Net decrease in net assets from capital share transactions | | | (2,365,018 | ) | | | (2,618,943 | ) |
| | | | | | | | | |
| TOTAL INCREASE (DECREASE) IN NET ASSETS | | | 19,967,613 | | | | (6,198,987 | ) |
| | | | | | | | | |
| NET ASSETS | | | | | | | | |
| Beginning of year | | | 49,980,661 | | | | 56,179,648 | |
| End of year | | $ | 69,948,274 | | | $ | 49,980,661 | |
| | | | | | | | | |
| CAPITAL SHARE ACTIVITY | | | | | | | | |
| Shares sold | | | 3,063 | | | | 2,893 | |
| Shares reinvested | | | 51,915 | | | | 36,909 | |
| Shares redeemed | | | (79,055 | ) | | | (73,663 | ) |
| Net decrease in shares outstanding | | | (24,077 | ) | | | (33,861 | ) |
| Shares outstanding, beginning of year | | | 731,817 | | | | 765,678 | |
| Shares outstanding, end of year | | | 707,740 | | | | 731,817 | |
See accompanying notes to financial statements.
| THE GOVERNMENT STREET MID-CAP FUND |
| STATEMENTS OF CHANGES IN NET ASSETS |
| | | Year | | | Year | |
| | | Ended | | | Ended | |
| | | March 31, | | | March 31, | |
| | | 2021 | | | 2020 | |
| FROM OPERATIONS | | | | | | | | |
| Net investment income | | $ | 161,401 | | | $ | 272,370 | |
| Net realized gains from investments | | | 3,140,103 | | | | 917,145 | |
| Net realized gains from in-kind redemptions (Note 2) | | | 686,630 | | | | 428,697 | |
| Net change in unrealized appreciation (depreciation) on investments | | | 18,189,473 | | | | (4,884,827 | ) |
| Net increase (decrease) in net assets resulting from operations | | | 22,177,607 | | | | (3,266,615 | ) |
| | | | | | | | | |
| DISTRIBUTIONS TO SHAREHOLDERS (Note 2) | | | (1,863,967 | ) | | | (2,059,713 | ) |
| | | | | | | | | |
| FROM CAPITAL SHARE TRANSACTIONS | | | | | | | | |
| Proceeds from shares sold | | | 443,216 | | | | 496,731 | |
| Net asset value of shares issued in reinvestment of distributions to shareholders | | | 1,824,410 | | | | 2,011,302 | |
| Payments for shares redeemed | | | (3,715,335 | ) | | | (4,053,012 | ) |
| Net decrease in net assets from capital share transactions | | | (1,447,709 | ) | | | (1,544,979 | ) |
| | | | | | | | | |
| TOTAL INCREASE (DECREASE) IN NET ASSETS | | | 18,865,931 | | | | (6,871,307 | ) |
| | | | | | | | | |
| NET ASSETS | | | | | | | | |
| Beginning of year | | | 39,422,003 | | | | 46,293,310 | |
| End of year | | $ | 58,287,934 | | | $ | 39,422,003 | |
| | | | | | | | | |
| CAPITAL SHARE ACTIVITY | | | | | | | | |
| Shares sold | | | 16,139 | | | | 17,789 | |
| Shares reinvested | | | 57,068 | | | | 70,826 | |
| Shares redeemed | | | (115,670 | ) | | | (143,976 | ) |
| Net decrease in shares outstanding | | | (42,463 | ) | | | (55,361 | ) |
| Shares outstanding, beginning of year | | | 1,673,598 | | | | 1,728,959 | |
| Shares outstanding, end of year | | | 1,631,135 | | | | 1,673,598 | |
See accompanying notes to financial statements.
| THE GOVERNMENT STREET EQUITY FUND |
| FINANCIAL HIGHLIGHTS |
Selected Per Share Data for a Share Outstanding Throughout Each Year:
| | | Years Ended March 31, | |
| | | 2021 | | | 2020 | | | 2019 | | | 2018 | | | 2017 | |
| Net asset value at beginning of year | | $ | 68.30 | | | $ | 73.37 | | | $ | 74.60 | | | $ | 67.08 | | | $ | 61.72 | |
| Income (loss) from investment operations: | | | | | | | | | | | | | | | | | | | | |
| Net investment income | | | 0.64 | | | | 0.80 | | | | 0.69 | | | | 0.66 | | | | 0.68 | |
| Net realized and unrealized gains (losses) on investments and foreign currencies | | | 36.33 | | | | (1.82 | ) | | | 3.37 | | | | 9.32 | | | | 6.76 | |
| Total from investment operations | | | 36.97 | | | | (1.02 | ) | | | 4.06 | | | | 9.98 | | | | 7.44 | |
| Less distributions from: | | | | | | | | | | | | | | | | | | | | |
| Net investment income | | | (0.64 | ) | | | (0.80 | ) | | | (0.68 | ) | | | (0.65 | ) | | | (0.68 | ) |
| Net realized gains | | | (5.80 | ) | | | (3.25 | ) | | | (4.61 | ) | | | (1.81 | ) | | | (1.40 | ) |
| Total distributions | | | (6.44 | ) | | | (4.05 | ) | | | (5.29 | ) | | | (2.46 | ) | | | (2.08 | ) |
| Net asset value at end of year | | $ | 98.83 | | | $ | 68.30 | | | $ | 73.37 | | | $ | 74.60 | | | $ | 67.08 | |
| Total return (a) | | | 55.46 | % | | | (2.04 | %) | | | 5.65 | % | | | 15.08 | % | | | 12.32 | % |
| Net assets at end of year (000’s) | | $ | 69,948 | | | $ | 49,981 | | | $ | 56,180 | | | $ | 62,707 | | | $ | 65,407 | |
| Ratio of total expenses to average net assets | | | 0.86 | % | | | 0.91 | % | | | 0.89 | % | | | 0.88 | % | | | 0.87 | % |
| Ratio of net investment income to average net assets | | | 0.71 | % | | | 1.01 | % | | | 0.92 | % | | | 0.90 | % | | | 1.03 | % |
| Portfolio turnover rate | | | 17 | % | | | 14 | % | | | 9 | % | | | 13 | % | | | 20 | % |
| (a) | Total return is a measure of the change in value of an investment in the Fund over the periods covered, which assumes any dividends or capital gains distributions are reinvested in shares of the Fund. The returns shown do not reflect the deduction of taxes a shareholder would pay on Fund distributions or the redemption of Fund shares. |
See accompanying notes to financial statements.
| THE GOVERNMENT STREET MID-CAP FUND |
| FINANCIAL HIGHLIGHTS |
Selected Per Share Data for a Share Outstanding Throughout Each Year:
| | | Years Ended March 31, | |
| | | 2021 | | | 2020 | | | 2019 | | | 2018 | | | 2017 | |
| Net asset value at beginning of year | | $ | 23.56 | | | $ | 26.78 | | | $ | 26.64 | | | $ | 24.42 | | | $ | 21.95 | |
| Income (loss) from investment operations: | | | | | | | | | | | | | | | | | | | | |
| Net investment income | | | 0.10 | | | | 0.16 | | | | 0.18 | | | | 0.20 | | | | 0.16 | |
| Net realized and unrealized gains (losses) on investments | | | 13.19 | | | | (2.16 | ) | | | 0.90 | | | | 3.32 | | | | 3.36 | |
| Total from investment operations | | | 13.29 | | | | (2.00 | ) | | | 1.08 | | | | 3.52 | | | | 3.52 | |
| Less distributions from: | | | | | | | | | | | | | | | | | | | | |
| Net investment income | | | (0.10 | ) | | | (0.16 | ) | | | (0.14 | ) | | | (0.20 | ) | | | (0.14 | ) |
| Net realized gains | | | (1.02 | ) | | | (1.06 | ) | | | (0.80 | ) | | | (1.10 | ) | | | (0.91 | ) |
| Total distributions | | | (1.12 | ) | | | (1.22 | ) | | | (0.94 | ) | | | (1.30 | ) | | | (1.05 | ) |
| Net asset value at end of year | | $ | 35.73 | | | $ | 23.56 | | | $ | 26.78 | | | $ | 26.64 | | | $ | 24.42 | |
| Total return (a) | | | 57.00 | % | | | (8.18 | %) | | | 4.21 | % | | | 14.67 | % | | | 16.44 | % |
| Net assets at end of year (000’s) | | $ | 58,288 | | | $ | 39,422 | | | $ | 46,293 | | | $ | 50,059 | | | $ | 48,540 | |
| Ratio of total expenses to average net assets | | | 1.07 | % | | | 1.09 | % | | | 1.08 | % | | | 1.06 | % | | | 1.07 | % |
| Ratio of net investment income to average net assets | | | 0.32 | % | | | 0.57 | % | | | 0.64 | % | | | 0.78 | % | | | 0.66 | % |
| Portfolio turnover rate | | | 13 | % | | | 2 | % | | | 6 | % | | | 12 | % | | | 14 | % |
| (a) | Total return is a measure of the change in value of an investment in the Fund over the periods covered, which assumes any dividends or capital gains distributions are reinvested in shares of the Fund. The returns shown do not reflect the deduction of taxes a shareholder would pay on Fund distributions or the redemption of Fund shares. |
See accompanying notes to financial statements.
| THE GOVERNMENT STREET FUNDS |
| NOTES TO FINANCIAL STATEMENTS |
| March 31, 2021 |
The Government Street Equity Fund and The Government Street Mid-Cap Fund (the “Funds”) are each a diversified, no-load series of the Williamsburg Investment Trust (the “Trust”), an open-end management investment company registered under the Investment Company Act of 1940, as amended (the “1940 Act”). The Trust was organized as a Massachusetts business trust on July 18, 1988. Other series of the Trust are not included in this report.
The investment objective of The Government Street Equity is to seek capital appreciation.
The investment objective of The Government Street Mid-Cap is to seek capital appreciation.
| 2. | Significant Accounting Policies |
Each Fund follows accounting and reporting guidance under Financial Accounting Standards Board Accounting Standards Codification Topic 946, “Financial Services – Investment Companies.” The following is a summary of the Funds’ significant accounting policies. The policies are in conformity with accounting principles generally accepted in the United States of America (“GAAP”).
Securities valuation — The Funds’ portfolio securities are valued as of the close of business of the regular session of the New York Stock Exchange (“NYSE”) (normally 4:00 p.m. Eastern time). Securities traded on a national stock exchange, including common stocks and exchange-traded funds (“ETFs”), if any, are valued based upon the closing price on the principal exchange where the security is traded, if available, otherwise, at the last quoted bid price. Securities that are quoted by NASDAQ are valued at the NASDAQ Official Closing Price. Investments representing shares of other open-end investment companies, other than ETFs but including money market funds, are valued at their net asset value (“NAV”) as reported by such companies. When using a quoted price and when the market is considered active, securities will be classified as Level 1 within the fair value hierarchy (see below).
When market quotations are not readily available, if a pricing service cannot provide a price, or if the investment adviser believes the price received from the pricing service is not indicative of market value, securities will be valued in good faith at fair value using methods consistent with procedures adopted by the Board of Trustees and will be classified as Level 2 or 3 within the fair value hierarchy, depending on the inputs used. Such methods of fair valuation may include, but are not limited to: multiple of earnings, multiple of book value, discount from market of a similar freely traded security, purchase price of the security, subsequent private transactions in the security
| THE GOVERNMENT STREET FUNDS |
| NOTES TO FINANCIAL STATEMENTS (Continued) |
or related securities, or a combination of these and other factors. GAAP establishes a single authoritative definition of fair value, sets out a framework for measuring fair value and requires additional disclosures about fair value measurements.
Various inputs are used in determining the value of each Fund’s investments. These inputs are summarized in the three broad levels listed below:
| ● | Level 1 – quoted prices in active markets for identical securities |
| ● | Level 2 – other significant observable inputs |
| ● | Level 3 – significant unobservable inputs |
The inputs or methodology used for valuing securities are not necessarily an indication of the risks associated with investing in those securities. The inputs used to measure fair value may fall into different levels of the fair value hierarchy. In such cases, for disclosure purposes, the level in the fair value hierarchy within which the fair value measurement falls in its entirety is determined based on the lowest level input that is significant to the fair value measurement.
The following is a summary of the Funds’ investments based on the inputs used to value the investments as of March 31, 2021, by asset type:
| The Government Street Equity Fund: | | Level 1 | | | Level 2 | | | Level 3 | | | Total | |
| Common Stocks | | $ | 68,537,044 | | | $ | — | | | $ | — | | | $ | 68,537,044 | |
| Money Market Funds | | | 1,441,143 | | | | — | | | | — | | | | 1,441,143 | |
| Total | | $ | 69,978,187 | | | $ | — | | | $ | — | | | $ | 69,978,187 | |
| | | | | | | | | | | | | | | | | |
| | | | | | | | | | | | | | | | | |
| The Government Street Mid-Cap Fund: | | Level 1 | | | Level 2 | | | Level 3 | | | Total | |
| Common Stocks | | $ | 55,079,056 | | | $ | — | | | $ | — | | | $ | 55,079,056 | |
| Exchange-Traded Funds | | | 839,900 | | | | — | | | | — | | | | 839,900 | |
| Money Market Funds | | | 2,398,117 | | | | — | | | | — | | | | 2,398,117 | |
| Total | | $ | 58,317,073 | | | $ | — | | | $ | — | | | $ | 58,317,073 | |
| | | | | | | | | | | | | | | | | |
Refer to each Fund’s Schedule of Investments for a listing of the common stocks by sector type. There were no Level 3 securities or derivative instruments held by the Funds as of or during the year ended March 31, 2021.
Foreign currency translation — Investment securities and other assets and liabilities denominated in or expected to settle in foreign currencies, if any, are translated into U.S. dollars based on exchange rates on the following basis:
| A. | The fair values of investment securities and other assets and liabilities are translated as of the close of the NYSE each day. |
| THE GOVERNMENT STREET FUNDS |
| NOTES TO FINANCIAL STATEMENTS (Continued) |
| B. | Purchases and sales of investment securities and income and expenses are translated at the rate of exchange prevailing as of 4:00 p.m. Eastern time on the respective date of such transactions. |
| C. | The Fund does not isolate that portion of the results of operations caused by changes in foreign exchange rates on investments from those caused by changes in market prices of investment securities held. Such fluctuations are included with the net realized and unrealized gains or losses on investments. |
Reported net realized foreign exchange gains or losses arise from 1) purchases and sales of foreign currencies and 2) the difference between the amounts of dividends and foreign withholding taxes recorded on a Fund’s books and the U.S. dollar equivalent of the amounts actually received or paid. Reported net unrealized foreign exchange gains and losses arise from changes in the value of assets and liabilities that result from changes in exchange rates.
Share valuation — The NAV per share of each Fund is calculated daily by dividing the total value of its assets, less liabilities, by the number of shares outstanding. The offering price and redemption price per share of each Fund is equal to the NAV per share.
Investment income — Interest income is accrued as earned. Discounts and premiums on fixed-income securities purchased, if any, are amortized using the interest method. Dividend income is recorded on the ex-dividend date. Non-cash dividends included in dividend income, if any, are recorded at the fair market value of the security received. Withholding taxes on foreign dividends have been recorded in accordance with the Trust’s understanding of the applicable country’s rules and tax rates.
Distributions to shareholders — Dividends arising from net investment income are declared and paid quarterly to shareholders of The Government Street Equity Fund and declared and paid annually to shareholders of The Government Street Mid-Cap Fund. Net realized short-term capital gains, if any, may be distributed throughout the year and net realized long-term capital gains, if any, are distributed at least once each year. Dividends and distributions are recorded on the ex-dividend date. The amount of distributions from net investment income and net realized capital gains are determined in accordance with federal income tax regulations, which may differ from GAAP. These “book/tax” differences are either temporary or permanent in nature.
| THE GOVERNMENT STREET FUNDS |
| NOTES TO FINANCIAL STATEMENTS (Continued) |
The tax character of distributions paid during the years ended March 31, 2021 and 2020 was as follows:
| | | Years | | Ordinary | | | Long-Term | | | Total | |
| | | Ended | | Income | | | Capital Gains | | | Distributions | |
| The Government Street Equity Fund | | 03/31/21 | | $ | 462,537 | | | $ | 4,207,840 | | | $ | 4,670,377 | |
| | | 03/31/20 | | $ | 589,910 | | | $ | 2,390,603 | | | $ | 2,980,513 | |
| The Government Street Mid-Cap Fund | | 03/31/21 | | $ | 178,349 | | | $ | 1,685,618 | | | $ | 1,863,967 | |
| | | 03/31/20 | | $ | 270,308 | | | $ | 1,789,405 | | | $ | 2,059,713 | |
Investment transactions — Investment transactions are accounted for on trade date for financial reporting purposes. Realized gains and losses on investment securities sold are determined on a specific identification basis.
Common expenses — Common expenses of the Trust are allocated among the Funds and the other series of the Trust based on relative net assets of each series or the nature of the services performed and the relative applicability to each series.
Estimates — The preparation of financial statements in conformity with GAAP requires management to make estimates and assumptions that affect the reported amounts of assets and liabilities and the disclosure of contingent assets and liabilities as of the date of the financial statements and the reported amounts of increase (decrease) in net assets from operations during the reporting period. Actual results could differ from those estimates.
Federal income tax — Each Fund has qualified and intends to continue to qualify as a regulated investment company under the Internal Revenue Code of 1986, as amended (the “Code”). Qualification generally will relieve the Funds of liability for federal income taxes to the extent 100% of their net investment income and any net realized capital gains are distributed in accordance with the Code.
In order to avoid imposition of the excise tax applicable to regulated investment companies, it is also each Fund’s intention to declare as dividends in each calendar year at least 98% of its net investment income (earned during the calendar year) and 98.2% of its net realized capital gains (earned during the twelve months ended October 31) plus undistributed amounts from prior years.
| THE GOVERNMENT STREET FUNDS |
| NOTES TO FINANCIAL STATEMENTS (Continued) |
The following information is computed on a tax basis for each item as of March 31, 2021:
| | | The Government | | | The Government | |
| | | Street Equity | | | Street Mid-Cap | |
| | | Fund | | | Fund | |
| Cost of portfolio investments | | $ | 29,526,501 | | | $ | 22,009,612 | |
| Gross unrealized appreciation | | $ | 40,583,081 | | | $ | 36,519,326 | |
| Gross unrealized depreciation | | | (131,395 | ) | | | (211,865 | ) |
| Net unrealized appreciation | | | 40,451,686 | | | | 36,307,461 | |
| Undistributed ordinary income | | | 3,189 | | | | 144,953 | |
| Undistributed long-term capital gains | | | 3,210,360 | | | | 1,373,022 | |
| Accumulated capital and other losses | | | — | | | | (9,882 | ) |
| Distributions payable | | | (2,090 | ) | | | — | |
| Total accumulated earnings | | $ | 43,663,145 | | | $ | 37,815,554 | |
| | | | | | | | | |
During the year ended March 31, 2021, The Government Street Equity Fund and The Government Street Mid-Cap Fund realized $1,972,527 and $686,630, respectively, of net capital gains resulting from in-kind redemptions (redemptions in which shareholders who redeemed Fund shares received investment securities held by the Fund rather than cash). The Funds recognize a gain on in-kind redemptions to the extent that the value of the distributed investment securities on the date of redemption exceeds the cost of those investment securities. Such gains are not taxable to the Funds and are not required to be distributed to shareholders. The Funds have reclassified these gains against paid-in capital on the Statements of Assets and Liabilities. Such reclassification, the result of permanent differences between the financial statement and income tax reporting requirements, had no effect on each Fund’s net assets or NAV per share.
Net qualified late year losses, incurred after December 31, 2020 and within the current taxable year, are deemed to arise on the first day of a Fund’s next taxable year. For the year ended March 31, 2021, The Government Street Mid-Cap Fund deferred $9,882 of late year ordinary losses to April 1, 2021 for federal income tax purposes.
The Funds recognize the tax benefits or expenses of uncertain tax positions only when the position is “more likely than not” to be sustained assuming examination by tax authorities. Management has reviewed the tax positions taken on federal income tax returns for all open tax years (generally, three years) of each Fund and has concluded that no provision for unrecognized tax benefits or expenses is required in these financial statements.
| THE GOVERNMENT STREET FUNDS |
| NOTES TO FINANCIAL STATEMENTS (Continued) |
| 3. | Investment Transactions |
Investment transactions, other than short-term investments and U.S. government securities, were as follows for the year ended March 31, 2021:
| | | The Government | | | The Government | |
| | | Street Equity | | | Street Mid-Cap | |
| | | Fund | | | Fund | |
| Purchases of investment securities | | $ | 10,300,075 | | | $ | 6,099,726 | |
| Proceeds from sales of investment securities | | $ | 16,497,272 | | | $ | 7,016,514 | |
| | | | | | | | | |
| 4. | Transactions with Related Parties |
INVESTMENT ADVISORY AGREEMENT
Each Fund’s investments are managed by Leavell Investment Management, Inc. (the “Adviser”) under the terms of an Investment Advisory Agreement. The Government Street Equity Fund pays the Adviser a fee, which is computed and accrued daily and paid monthly, at annual rates of 0.60% of its average daily net assets up to $100 million and 0.50% of such assets in excess of $100 million. The Government Street Mid-Cap Fund pays the Adviser a fee, which is computed and accrued daily and paid monthly, at an annual rate of 0.75% of its average daily net assets.
Certain officers of the Trust are also officers of the Adviser.
OTHER SERVICE PROVIDERS
Ultimus Fund Solutions, LLC (“Ultimus”) provides administration, fund accounting, compliance and transfer agent services to the Funds. The Funds pay Ultimus fees in accordance with the agreements for such services. In addition, the Funds pay out-of-pocket expenses including, but not limited to, postage, supplies, and certain costs related to the pricing of the Funds’ portfolio securities. Certain officers of the Trust are also officers of Ultimus, or of Ultimus Fund Distributors, LLC (the “Distributor”), the principal underwriter of each Fund’s shares and an affiliate of Ultimus. The Distributor is compensated by the Adviser (not the Funds) for acting as principal underwriter.
COMPENSATION OF TRUSTEES
Trustees and officers affiliated with the Adviser or Ultimus are not compensated by the Trust for their services. Each Trustee who is not an affiliated person of the Adviser or Ultimus receives from the Trust an annual retainer of $24,000, payable quarterly; a fee of $2,000 for attendance at each meeting of the Board of Trustees (except that such fee is $3,000 for the independent chair); and a fee of $1,000 for attendance at each meeting of any committee of the Board (except that such fee is $1,500 for the committee chair); plus reimbursement of travel and other expenses incurred in attending meetings. Each series of the Trust pays its proportionate share of such fees.
| THE GOVERNMENT STREET FUNDS |
| NOTES TO FINANCIAL STATEMENTS (Continued) |
| 5. | Contingencies and Commitments |
The Funds indemnify the Trust’s officers and Trustees for certain liabilities that might arise from their performance of their duties to the Funds. Additionally, in the normal course of business the Funds enter into contracts that contain a variety of representations and warranties and which provide general indemnifications. The Funds’ maximum exposure under these arrangements is unknown, as this would involve future claims that may be made against the Funds that have not yet occurred. However, based on experience, the Trust expects the risk of loss to be remote.
If a Fund has significant investments in the securities of issuers in industries within a particular business sector, any development affecting that sector will have a greater impact on the value of the net assets of the Fund than would be the case if the Fund did not have significant investments in that sector. In addition, this may increase the risk of loss of an investment in the Fund and increase the volatility of the Fund’s NAV per share. From time to time, circumstances may affect a particular sector and companies within such sector. For instance, economic or market factors, regulation or deregulation, or other developments may negatively impact all companies in a particular sector and therefore the value of a Fund’s portfolio would be adversely affected. As of March 31, 2021, The Government Street Equity Fund had 26.0% of the value of its net assets invested in common stocks within the Technology sector.
The Funds are required to recognize in the financial statements the effects of all subsequent events that provide additional evidence about conditions that existed as of the date of the Statements of Assets and Liabilities. For non-recognized subsequent events that must be disclosed to keep the financial statements from being misleading, the Funds are required to disclose the nature of the event as well as an estimate of its financial effect, or a statement that such an estimate cannot be made. Management has evaluated subsequent events through the issuance of these financial statements and has noted no such events.
| THE GOVERNMENT STREET FUNDS |
REPORT OF INDEPENDENT REGISTERED
PUBLIC ACCOUNTING FIRM |
To the Shareholders of The Government Street Funds and
Board of Trustees of Williamsburg Investment Trust
Opinion on the Financial Statements
We have audited the accompanying statements of assets and liabilities, including the schedules of investments, of The Government Street Funds, comprising The Government Street Equity Fund and The Government Street Mid-Cap Fund (the “Funds”), each a series of Williamsburg Investment Trust, as of March 31, 2021, the related statements of operations for the year then ended, the statements of changes in net assets for each of the two years in the period then ended, the related notes, and the financial highlights for each of the five years in the period then ended (collectively referred to as the “financial statements”). In our opinion, the financial statements present fairly, in all material respects, the financial position of each of the Funds as of March 31, 2021, the results of their operations for the year then ended, the changes in net assets for each of the two years in the period then ended, and the financial highlights for each of the five years in the period then ended, in conformity with accounting principles generally accepted in the United States of America.
Basis for Opinion
These financial statements are the responsibility of the Funds’ management. Our responsibility is to express an opinion on the Funds’ financial statements based on our audits. We are a public accounting firm registered with the Public Company Accounting Oversight Board (United States) (“PCAOB”) and are required to be independent with respect to the Funds in accordance with the U.S. federal securities laws and the applicable rules and regulations of the Securities and Exchange Commission and the PCAOB.
We conducted our audits in accordance with the standards of the PCAOB. Those standards require that we plan and perform the audit to obtain reasonable assurance about whether the financial statements are free of material misstatement whether due to error or fraud.
| THE GOVERNMENT STREET FUNDS |
REPORT OF INDEPENDENT REGISTERED
PUBLIC ACCOUNTING FIRM (Continued) |
Our audits included performing procedures to assess the risks of material misstatement of the financial statements, whether due to error or fraud, and performing procedures that respond to those risks. Such procedures included examining, on a test basis, evidence regarding the amounts and disclosures in the financial statements. Our procedures included confirmation of securities owned as of March 31, 2021, by correspondence with the custodian and brokers. Our audits also included evaluating the accounting principles used and significant estimates made by management, as well as evaluating the overall presentation of the financial statements. We believe that our audits provide a reasonable basis for our opinion.
We have served as the Funds’ auditor since 2016.

COHEN & COMPANY, LTD.
Milwaukee, Wisconsin
May 24, 2021
| THE GOVERNMENT STREET FUNDS |
| ABOUT YOUR FUNDS’ EXPENSES (Unaudited) |
We believe it is important for you to understand the impact of costs on your investment. All mutual funds have operating expenses. As a shareholder of the Funds, you incur ongoing costs, including management fees and other expenses. These ongoing costs, which are deducted from each Fund’s gross income, directly reduce the investment returns of the Funds.
A mutual fund’s ongoing costs are expressed as a percentage of its average net assets. This figure is known as the expense ratio. The following examples are intended to help you understand the ongoing costs (in dollars) of investing in the Funds and to compare these costs with the ongoing costs of investing in other mutual funds. The examples below are based on an investment of $1,000 made at the beginning of the period shown and held for the entire period (October 1, 2020 through March 31, 2021).
The table below illustrates each Fund’s ongoing costs in two ways:
Actual fund return – This section helps you to estimate the actual expenses that you paid over the period. The “Ending Account Value” shown is derived from each Fund’s actual return, and the fourth column shows the dollar amount of operating expenses that would have been paid by an investor who started with $1,000 in the Funds. You may use the information here, together with the amount you invested, to estimate the expenses that you paid over the period.
To do so, simply divide your account value by $1,000 (for example, an $8,600 account value divided by $1,000 = 8.6), then multiply the result by the number given for the Funds under the heading “Expenses Paid During Period.”
Hypothetical 5% return – This section is intended to help you compare the Funds’ ongoing costs with those of other mutual funds. It assumes that each Fund had an annual return of 5% before expenses during the period shown, but that the expense ratio is unchanged. In this case, because the returns used are not the Funds’ actual returns, the results do not apply to your investment. The example is useful in making comparisons because the U.S. Securities and Exchange Commission (the “SEC”) requires all mutual funds to calculate expenses based on a 5% return. You can assess each Fund’s ongoing costs by comparing this hypothetical example with the hypothetical examples that appear in shareholder reports of other funds.
Note that expenses shown in the table are meant to highlight and help you compare ongoing costs only. The Funds do not charge sales loads or redemption fees.
The calculations assume no shares were bought or sold during the period. Your actual costs may have been higher or lower, depending on the amount of your investment and the timing of any purchases or redemptions.
| THE GOVERNMENT STREET FUNDS |
ABOUT YOUR FUNDS’ EXPENSES (Unaudited)
(Continued) |
More information about the Funds’ expenses, including historical expense ratios, can be found in this report. For additional information on operating expenses and other shareholder costs, please refer to the Funds’ prospectus.
| | | Beginning | | Ending | | | | Expenses |
| | | Account Value | | Account Value | | Expense | | Paid During |
| | | Oct. 1, 2020 | | March 31, 2021 | | Ratio(a) | | Period(b) |
| The Government Street Equity Fund | | | | | | | | |
| Based on Actual Fund Return | | $1,000.00 | | $1,167.40 | | 0.85% | | $4.59 |
| Based on Hypothetical 5% Return (before expenses) | | $1,000.00 | | $1,020.69 | | 0.85% | | $4.28 |
| The Government Street Mid-Cap Fund | | | | | | | | |
| Based on Actual Fund Return | | $1,000.00 | | $1,249.80 | | 1.04% | | $5.83 |
| Based on Hypothetical 5% Return (before expenses) | | $1,000.00 | | $1,019.75 | | 1.04% | | $5.24 |
| (a) | Annualized, based on each Fund’s most recent one-half year expenses. |
| (b) | Expenses are equal to each Fund’s annualized expense ratio multiplied by the average account value over the period, multiplied by 182/365 (to reflect the one-half year period). |
| THE GOVERNMENT STREET FUNDS |
BOARD OF TRUSTEES AND EXECUTIVE OFFICERS
(Unaudited) |
Overall responsibility for management of the Funds rests with the Board of Trustees. The Trustees serve during the lifetime of the Trust and until its termination, or until death, resignation, retirement or removal. The Trustees, in turn, elect the officers of the Funds. The officers have been elected for an annual term. The following are the Trustees and executive officers of the Funds:
| Trustees and Officers | Address | Year of
Birth | Position Held
with the Trust | Length of
Time Served |
| | Robert S. Harris, Ph.D. | 225 Pictoria Drive, Suite 450 Cincinnati, OH | 1949 | Chairman and Trustee | Since January 2007 |
| * | John P. Ackerly, IV | One James Center 901 E. Cary Street Richmond, VA | 1963 | Trustee and President of The Davenport Funds | Since July 2012 |
| * | John T. Bruce | 800 Main Street Lynchburg, VA | 1953 | Trustee and President of The FBP Funds | Since September 1988 |
| | George K. Jennison | 225 Pictoria Drive, Suite 450 Cincinnati, OH | 1957 | Trustee | Since January 2015 |
| | Harris V. Morrissette | 225 Pictoria Drive, Suite 450 Cincinnati, OH | 1959 | Trustee | Since March 1993 |
| | Elizabeth W. Robertson | 225 Pictoria Drive, Suite 450 Cincinnati, OH | 1953 | Trustee | Since February 2014 |
| | Thomas W. Leavell | 210 St. Joseph Street Mobile, AL | 1943 | President of The Government Street Funds | Since February 2004 |
| | Mary Shannon Hope | 210 St. Joseph Street Mobile, AL | 1963 | Vice President of The Government Street Funds | Since August 2008 |
| | Timothy S. Healey | 2712 18th Place South Birmingham, AL | 1953 | Vice President of The Government Street Funds | Since January 1995 |
| | Mark J. Seger | 225 Pictoria Drive, Suite 450 Cincinnati, OH | 1962 | Treasurer | Since November 2000 |
| | David K. James | 225 Pictoria Drive, Suite 450 Cincinnati, OH | 1970 | Secretary | Since November 2018 |
| | Michael J. Nanosky | 225 Pictoria Drive, Suite 450 Cincinnati, OH | 1966 | Chief Compliance Officer | Since March 2020 |
| * | Messrs. Ackerly and Bruce, as affiliated persons of investment advisers to the Trust, are “interested persons” of the Trust within the meaning of Section 2(a)(19) of the 1940 Act. |
| THE GOVERNMENT STREET FUNDS |
BOARD OF TRUSTEES AND EXECUTIVE OFFICERS
(Unaudited) (Continued) |
Each Trustee oversees ten portfolios of the Trust, including the Funds. The principal occupations of the Trustees and executive officers of the Funds during the past five years and public directorships held by the Trustees are set forth below:
Robert S. Harris, Ph.D. is the C. Stewart Sheppard Professor of Business Administration at The Darden Graduate School of Business Administration at the University of Virginia. He was previously the dean at Darden. Professor Harris has published widely on corporate finance, financial markets and mergers and acquisitions and has served as a consultant to corporations and government agencies.
John P. Ackerly, IV, is Senior Vice President and Portfolio Manager of Davenport & Company, LLC (a broker-dealer and investment advisory firm).
John T. Bruce is President, Director and member of the Executive Committee of Flippin, Bruce & Porter, Inc. (an investment advisory firm).
George K. Jennison is retired. He previously was President of Oyster Consulting, LLC (a management consulting firm) and a financial adviser with Wells Fargo Advisors, LLC.
Harris V. Morrissette is President of China Doll Rice and Beans, Inc. and Dixie Lily Foods. He is also a Director of Trustmark Corporation (bank holding company).
Elizabeth W. Robertson serves as a Trustee of TowneBank Foundation, TowneBank Corporate Board, TowneBank Audit Committee Chair and TowneBank Community Board since 2015. She previously was Chief Financial Officer of Monument Restaurants LLC.
Thomas W. Leavell is Portfolio Manager of the Adviser.
Mary Shannon Hope is Operations Director and Portfolio Manager of the Adviser.
Timothy S. Healey is Chief Investment Officer and Portfolio Manager of the Adviser.
Mark J. Seger is a Vice Chairman of Ultimus Fund Solutions, LLC and Ultimus Fund Distributors, LLC. He previously was Co-CEO of Ultimus Fund Solutions, LLC (1999 to 2019).
David K. James is an Executive Vice President and Chief Legal and Risk Officer of Ultimus Fund Solutions, LLC (2018 to present). He previously was Managing Director and Managing Counsel at State Street Bank and Trust Company (2009 to 2018).
Michael J. Nanosky is a Senior Compliance Officer of Ultimus Fund Solutions, LLC (2020 to present). He previously was Senior Vice President & Chief Compliance Officer of PNC Funds (2014 to 2019).
Additional information about members of the Board of Trustees and executive officers is available in the Statement of Additional Information (“SAI”). To obtain a free copy of the SAI, please call 1-866-738-1125.
| THE GOVERNMENT STREET FUNDS |
DISCLOSURE REGARDING APPROVAL OF
INVESTMENT ADVISORY AGREEMENTS
(Unaudited) |
At a meeting held on February 23, 2021, the Board of Trustees, including a majority of the Independent Trustees, approved the continuance for a one-year period of the Investment Advisory Agreements with the Adviser on behalf of The Government Street Equity Fund and The Government Street Mid-Cap Fund (individually, a “Fund,” collectively, the “Funds”). Below is a discussion of the factors considered by the Board of Trustees along with the conclusions with respect thereto that formed the basis for the Board’s approval.
In approving the continuance of the Investment Advisory Agreements, the Independent Trustees considered all information they deemed reasonably necessary to evaluate the terms of the Agreements. The principal areas of review by the Independent Trustees were the nature, extent and quality of the services provided by the Adviser and the reasonableness of the fees charged for those services. These matters were considered by the Independent Trustees consulting with experienced counsel for the Independent Trustees, who is independent of the Adviser.
The Independent Trustees’ evaluation of the quality of the Adviser’s services took into consideration their knowledge gained through presentations and reports from the Adviser over the course of the preceding year. The Independent Trustees considered that the Adviser had provided its views on the overall conditions of the economy and the markets, including the factors that may have influenced the markets, investor preferences and market sentiment during the past year. The Independent Trustees also considered the security selection process that is applied in the management of the Fund and noted that the Funds generally had benefitted from the growth of certain technology stocks that had appreciated with the accelerated pace of technological innovation during the COVID-19 pandemic. Both short-term and long-term investment performance of the Funds were considered. Each Fund’s performance was compared to its performance benchmark and a peer group of funds with similar investment objectives and strategies. The Independent Trustees also considered: the scope and quality of the in-house capabilities of the Adviser and other resources that are dedicated to performing services for the Funds; the quality of administrative and other services, including the Adviser’s role in coordinating the activities of the Funds’ other service providers; the Adviser’s compliance with investment policies of the Funds and applicable laws and regulations; information provided by management and the Funds’ independent public accounting firm in periodic meetings with the Trust’s Audit Committee; the business reputation of the Adviser; the qualifications of the Adviser’s key investment and compliance personnel; and the Adviser’s financial resources.
In reviewing the fees payable under the Investment Advisory Agreements, the Independent Trustees compared the advisory fees and overall expense levels of each Fund with those of funds with similar investment objectives and strategies. The
| THE GOVERNMENT STREET FUNDS |
DISCLOSURE REGARDING APPROVAL OF
INVESTMENT ADVISORY AGREEMENTS
(Unaudited) (Continued) |
Independent Trustees considered information provided by the Adviser concerning the Adviser’s profitability with respect to each Fund, including the assumptions and methodology used in preparing the profitability information, in light of applicable case law relating to advisory fees. For these purposes, the Independent Trustees considered not only the fees paid by the Funds, but also so-called “fallout” benefits to the Adviser. The Independent Trustees also considered the Adviser’s representations that the Funds’ portfolio trades were executed based on the best available price and execution, and that the Adviser does not participate in any soft dollar or directed brokerage arrangements. The Independent Trustees further considered that the Adviser does not participate in any revenue sharing arrangements relating to the Funds. In evaluating the Funds’ advisory fees, the Trustees considered the complexity and quality of the investment process that is applied in the management of the Funds.
Based on the consideration of the foregoing and such other information as was deemed relevant, including the factors and conclusions below, the Independent Trustees concluded that: (i) the performance of each of The Government Street Equity Fund and The Government Street Mid-Cap Fund is satisfactory given each Fund’s investment strategy in comparison to the performance to its respective primary and peer group average, and after considering the services provided by LIM to each respective Fund; (ii) the advisory fee for The Government Street Equity Fund is lower when compared to the average for similarly managed funds according to statistics derived from Morningstar, Inc., the advisory fee for The Government Street Mid-Cap Fund is higher when compared to the average for similarly managed funds according to statistics derived from Morningstar, Inc., and both Funds’ advisory fees’ are reasonable in relation to the services provided by LIM; (iii) the total operating expense ratio of The Government Street Equity Fund while higher than the average expense ratio for comparable managed funds, according to statistics derived from Morningstar, Inc., remains competitive, and the total operating expense ratio of The Government Street Mid-Cap Fund was lower when compared to the average expense ratio for comparable managed funds, according to statistics derived from Morningstar, Inc., and (iv) the level of LIM’s profitability with respect to its management of the Funds is reasonable.
Given the current size of the Funds and their expected growth, the Independent Trustees did not believe that it was relevant to consider the extent to which economies of scale would be realized as the Funds grow, and whether fee levels reflect these economies of scale. The Independent Trustees did consider the “fallout” benefits to the Adviser with respect to the Funds but viewed this as a secondary factor in connection with the evaluation of the reasonableness of the advisory fees paid by the Funds.
| THE GOVERNMENT STREET FUNDS |
DISCLOSURE REGARDING APPROVAL OF
INVESTMENT ADVISORY AGREEMENTS
(Unaudited) (Continued) |
No single factor was considered in isolation or to be determinative to the decision of the Independent Trustees to approve the continuance of the Investment Advisory Agreements. Rather the Independent Trustees concluded, after weighing and balancing of all factors considered, that it was in the best interests of each Fund and its shareholders to continue its Investment Advisory Agreement without modification to its terms, including the fees charged for services thereunder.
| THE GOVERNMENT STREET FUNDS |
| OTHER INFORMATION (Unaudited) |
A description of the policies and procedures that the Funds use to vote proxies relating to portfolio securities is available without charge upon request by calling toll-free 1-866-738-1125, or on the SEC’s website at www.sec.gov. Information regarding how the Funds voted proxies relating to portfolio securities during the most recent 12-month period ended June 30 is also available without charge upon request by calling toll-free 1-866-738-1125 or on the SEC’s website at www.sec.gov.
The Trust files a complete listing of portfolio holdings for the Funds with the SEC as of the end of the first and third quarters of each fiscal year as an exhibit to its reports on Form N-PORT. The filings are available upon request, by calling 1-866-738-1125. Furthermore, you may obtain a copy of these filings on the SEC’s website at www.sec.gov.
| FEDERAL TAX INFORMATION (Unaudited) |
For the fiscal year ended March 31, 2021, The Government Street Equity Fund and The Government Street Mid-Cap Fund designated $4,207,840 and $1,685,618, respectively, as long-term capital gain distributions.
Qualified Dividend Income – The Funds each designate 100%, or up to the maximum amount of such dividends allowable pursuant to the Internal Revenue Code, as qualified dividend income eligible for the reduced tax rate of 15%.
Dividends Received Deduction – Corporate shareholders are generally entitled to take the dividends received deduction on the portion of a Fund’s dividend distribution that qualifies under tax law. For the fiscal year ended March 31, 2021, 100% of The Government Street Equity Fund and The Government Street Mid-Cap Fund’s ordinary income dividends qualifies for the corporate dividends received deduction.
The Government Street Funds
No-Load Mutual Funds
Investment Adviser
Leavell Investment Management, Inc.
210 St. Joseph Street
Mobile, AL 36602
Administrator
Ultimus Fund Solutions, LLC
P.O. Box 46707
Cincinnati, OH 45246-0707
1-866-738-1125
Legal Counsel
Sullivan & Worcester LLP
1666 K Street, N.W.
Washington, DC 20006
Independent Registered Public Accounting Firm
Cohen & Company, Ltd.
342 N Water Street,
Suite 830
Milwaukee, WI 53202
Board of Trustees
Robert S. Harris, Ph.D., Chairman
John P. Ackerly, IV
John T. Bruce
George K. Jennison
Harris V. Morrissette
Elizabeth W. Robertson
Portfolio Manager
Thomas W. Leavell,
The Government Street Equity Fund
The Government Street Mid-Cap Fund
Government Street-AR-21
| | | |
| | | |
| | | |
| | | |
| | | |
| | THE | |
| | JAMESTOWN | |
| | EQUITY FUND | |
| | | |
| | | |
| | No-Load Fund | |
| | | |
| | | |
| | | |
| | | |
| | | |
| | | |
| | | |
| | | |
| | | |
| | ANNUAL REPORT | |
| | | |
| | | |
| | | |
| | March 31, 2021 | |
| | | |
| | | |
| | | |
| | | |
| | | |
| | | |
| | | |
| | | |
| | | |
| | | |
| | | |
| | | |
| | | |
| | | |
| | | |
| | | |
| | | |
| | | |
| | Investment Adviser | |
| | Lowe, Brockenbrough & Company, Inc. | |
| | Richmond, Virginia | |
| | | |
| | | |
| | �� | |
| LETTER TO SHAREHOLDERS | May 6, 2021 |
For the fiscal year ended March 31, 2021, The Jamestown Equity Fund (the “Fund”) returned 60.23% compared to 56.35% for the S&P 500 Index. The remarkable recovery in equities from the COVID 19 selloff early in 2020 was driven by rapidly recovering global economies and massive support around the globe from fiscal and monetary policy. The economic recovery is translating into a significant, broad-based recovery in corporate earnings in 2021 that is forecast to last at least into next year.
Growth-oriented equities outperformed over the past 12 months with the Russell 1000 Growth Index up 62.74% and the Russell 1000 Value Index up 56.09%. However, markets began to shift in late 2020 as the first news of the efficacy of the Pfizer and Moderna vaccines was released. The shift continued in the first calendar quarter of 2021, as the Russell 1000 Value Index’s return of 11.25% dramatically outperformed the 0.94% return from the Russell 1000 Growth Index.
The Fund managed to navigate the shift in styles fairly well as we added more recovery plays like Disney, Booking Holdings and Truist in the second half of 2020. Stock selection was the primary driver of the relative outperformance for the year as sector allocation was essentially neutral during the year. Security selection was particularly strong in the Financials, Communications and Materials sectors, while selection lagged modestly in Technology and Energy. The best-performing stocks in the Fund for the year were Eastman Chemical, Morgan Stanley, Ameriprise, Lowe’s, and Target, all of which remained in the portfolio at the end of the fiscal year. The worst-performing stocks were Intel, Merck, Lockheed Martin, and Pepsi, all of which remain in the portfolio except for Intel.
With the likelihood of a period of very strong economic growth and the possibility of it lasting for a couple of years, the markets are expecting strong, perhaps explosive, earnings growth from an overheated economy. Normally, there’d be concern about the Federal Reserve tightening monetary policy, but they’ve repeatedly stressed their desire for the economy to run hot. They’ve even pondered, perhaps rhetorically, forcing rates down, essentially green-lighting the surging stock market. Investors have rightly focused on recovery plays of late, as the earnings surge there could be historic. This isn’t to say that some tech stocks won’t continue to do well, but their earnings won’t look nearly as lustrous by comparison. And some COVID-19 winners will find that they were just lucky and suffer a fade in business as we re-reorient our consumption habits. Unhelpfully, many of the aforementioned are still quite expensive. We believe all of this continues to favor the reopening trade, but this won’t be a smooth ride.
The fiscal and monetary authorities are experimenting on a scale rarely, if ever, attempted. There are already serious bottlenecks in the global supply chain, and, of course, this has raised inflation concerns, as it seems inevitable that stuff in short supply will be rationed through price hikes. But can temporary supply issues really cause longer-lasting inflation? Our reasoned bet is no. Shortages aren’t embargos and will be solved, but it simply won’t be possible to spend all the excess savings and stimulus in a quarter or two. Jamie Dimon, the CEO of JP Morgan and arguably the most respected voice on Wall Street, believes the boom “could easily run into 2023.” There will certainly be surprises, but we hope Mr. Dimon is correct and the Fed hasn’t miscalculated.
The Fund remains focused on owning high-quality securities across all sectors and ended the March 2021 quarter overweight in the Financials and Consumer Discretionary sectors as we believe they will continue to benefit from the improving economic environment. The Fund is underweight more defensive sectors including Consumer Staples, Health Care and Utilities.
THE JAMESTOWN EQUITY FUND PERFORMANCE INFORMATION (Unaudited) |
Comparison of the Change in Value of a $10,000 Investment in
The Jamestown Equity Fund
and the S&P 500® Index
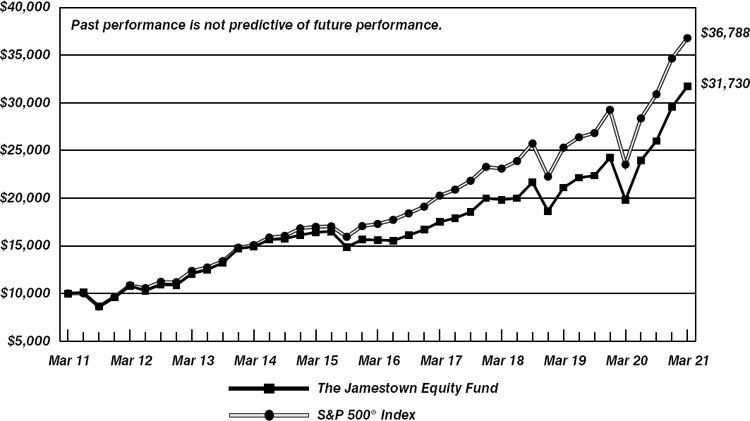
| | Average Annual Total Returns | |
| | (for periods ended March 31, 2021) | |
| | | |
| | 1 Year | | 5 Years | | 10 Years | |
| The Jamestown Equity Fund (a) | 60.23% | | 15.25% | | 12.24% | |
| S&P 500® Index | 56.35% | | 16.29% | | 13.91% | |
| (a) | Total return is a measure of the change in value of an investment in the Fund over the periods covered, which assumes any dividends or capital gains distributions are reinvested in shares of the Fund. Returns shown do not reflect the deduction of taxes a shareholder would pay on Fund distributions or the redemption of Fund shares. |
THE JAMESTOWN EQUITY FUND PORTFOLIO INFORMATION March 31, 2021 |
| Asset Allocation (% of Net Assets) |
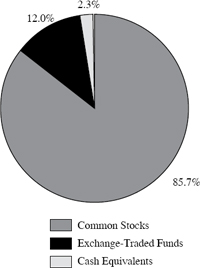
| | % of |
| Ten Largest Equity Holdings | Net Assets |
| Apple, Inc. | 4.9% |
| Alphabet, Inc. | 4.4% |
| Microsoft Corporation | 4.1% |
| Amazon.com, Inc. | 3.9% |
| Facebook, Inc. - Class A | 3.5% |
| JPMorgan Chase & Company | 3.0% |
| Vanguard Information Technology ETF | 2.8% |
| Truist Financial Corporation | 2.5% |
| SPDR Portfolio S&P 500 Value ETF | 2.5% |
| Morgan Stanley | 2.3% |
| Sector Concentration vs. the S&P 500® Index |
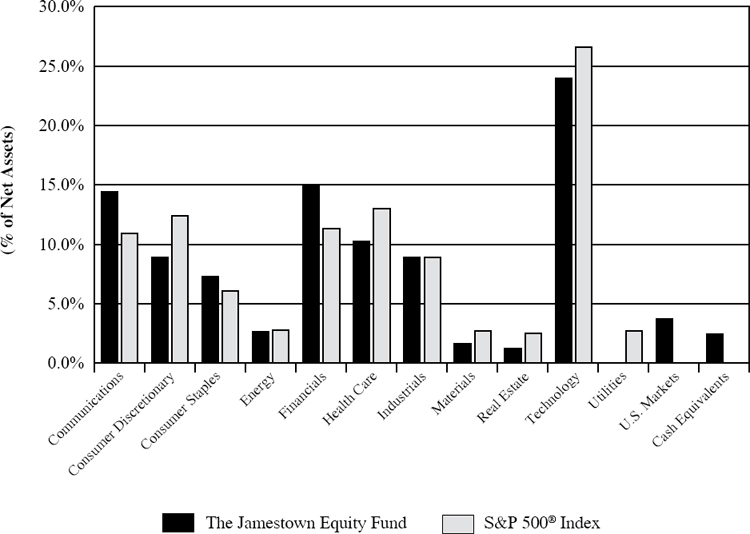
| THE JAMESTOWN EQUITY FUND |
| SCHEDULE OF INVESTMENTS |
| March 31, 2021 |
| COMMON STOCKS — 85.7% | | Shares | | Value |
| Communications — 13.7% | | | | |
| Alphabet, Inc. - Class A (a) | | | 500 | | | $ | 1,031,260 | |
| Alphabet, Inc. - Class C (a) | | | 500 | | | | 1,034,315 | |
| Booking Holdings, Inc. (a) | | | 450 | | | | 1,048,428 | |
| Comcast Corporation - Class A | | | 16,000 | | | | 865,760 | |
| Facebook, Inc. - Class A (a) | | | 5,600 | | | | 1,649,368 | |
| Walt Disney Company (The) (a) | | | 4,550 | | | | 839,566 | |
| | | | | | | | 6,468,697 | |
| Consumer Discretionary — 8.9% | | | | | | | | |
| Amazon.com, Inc. (a) | | | 600 | | | | 1,856,448 | |
| Home Depot, Inc. (The) | | | 2,400 | | | | 732,600 | |
| Lowe’s Companies, Inc. | | | 4,695 | | | | 892,895 | |
| TJX Companies, Inc. (The) | | | 11,000 | | | | 727,650 | |
| | | | | | | | 4,209,593 | |
| Consumer Staples — 5.9% | | | | | | | | |
| Dollar Tree, Inc. (a) | | | 6,000 | | | | 686,760 | |
| PepsiCo, Inc. | | | 5,200 | | | | 735,540 | |
| Target Corporation | | | 4,960 | | | | 982,427 | |
| Walmart, Inc. | | | 3,000 | | | | 407,490 | |
| | | | | | | | 2,812,217 | |
| Energy — 2.7% | | | | | | | | |
| Chevron Corporation | | | 7,700 | | | | 806,883 | |
| Total SE - ADR | | | 9,500 | | | | 442,130 | |
| | | | | | | | 1,249,013 | |
| Financials — 14.9% | | | | | | | | |
| Ameriprise Financial, Inc. | | | 4,250 | | | | 987,913 | |
| Chubb Ltd. | | | 2,500 | | | | 394,925 | |
| Goldman Sachs Group, Inc. (The) | | | 3,300 | | | | 1,079,100 | |
| JPMorgan Chase & Company | | | 9,200 | | | | 1,400,516 | |
| Morgan Stanley | | | 14,000 | | | | 1,087,240 | |
| PNC Financial Services Group, Inc. (The) | | | 5,200 | | | | 912,132 | |
| Truist Financial Corporation | | | 20,625 | | | | 1,202,850 | |
| | | | | | | | 7,064,676 | |
| Health Care — 10.2% | | | | | | | | |
| Amgen, Inc. | | | 1,800 | | | | 447,858 | |
| Anthem, Inc. | | | 2,000 | | | | 717,900 | |
| CVS Health Corporation | | | 10,800 | | | | 812,484 | |
| Merck & Company, Inc. | | | 9,500 | | | | 732,355 | |
| Pfizer, Inc. | | | 14,500 | | | | 525,335 | |
| Thermo Fisher Scientific, Inc. | | | 1,900 | | | | 867,122 | |
| UnitedHealth Group, Inc. | | | 2,000 | | | | 744,140 | |
| | | | | | | | 4,847,194 | |
| THE JAMESTOWN EQUITY FUND |
| SCHEDULE OF INVESTMENTS (Continued) |
| COMMON STOCKS — 85.7% (Continued) | | Shares | | | Value | |
| Industrials — 8.9% | | | | | | |
| Eaton Corporation plc | | | 7,300 | | | $ | 1,009,444 | |
| Lockheed Martin Corporation | | | 1,000 | | | | 369,500 | |
| Norfolk Southern Corporation | | | 3,700 | | | | 993,524 | |
| Raytheon Technologies Corporation | | | 5,800 | | | | 448,166 | |
| Trane Technologies plc | | | 4,300 | | | | 711,908 | |
| United Parcel Service, Inc. - Class B | | | 4,000 | | | | 679,960 | |
| | | | | | | | 4,212,502 | |
| Materials — 1.6% | | | | | | | | |
| Eastman Chemical Company | | | 7,000 | | | | 770,840 | |
| | | | | | | | | |
| Real Estate — 1.2% | | | | | | | | |
| American Tower Corporation | | | 2,400 | | | | 573,744 | |
| | | | | | | | | |
| Technology — 17.7% | | | | | | | | |
| Apple, Inc. | | | 19,000 | | | | 2,320,850 | |
| Applied Materials, Inc. | | | 6,245 | | | | 834,332 | |
| Broadcom, Inc. | | | 1,400 | | | | 649,124 | |
| Cisco Systems, Inc. | | | 19,500 | | | | 1,008,345 | |
| Microsoft Corporation | | | 8,200 | | | | 1,933,314 | |
| Oracle Corporation | | | 11,500 | | | | 806,955 | |
| Visa, Inc. - Class A | | | 4,000 | | | | 846,920 | |
| | | | | | | | 8,399,840 | |
| | | | | | | | | |
| Total Common Stocks (Cost $16,345,407) | | | | | | $ | 40,608,316 | |
| | | | | | | | | |
| | | | | | | | | |
| EXCHANGE-TRADED FUNDS — 12.0% | | | Shares | | | | Value | |
| Communication Services Select Sector SPDR Fund | | | 4,500 | | | $ | 329,940 | |
| Consumer Staples Select Sector SPDR Fund | | | 9,500 | | | | 648,945 | |
| iShares Expanded Tech-Software Sector ETF | | | 2,700 | | | | 921,834 | |
| iShares PHLX Semiconductor ETF | | | 1,700 | | | | 720,783 | |
| SPDR Portfolio S&P 500 Growth ETF | | | 8,000 | | | | 451,200 | |
| SPDR Portfolio S&P 500 Value ETF | | | 31,265 | | | | 1,184,943 | |
| Vanguard Information Technology ETF | | | 3,700 | | | | 1,326,413 | |
| Vanguard S&P 500 ETF | | | 350 | | | | 127,505 | |
| Total Exchange-Traded Funds (Cost $3,138,556) | | | | | | $ | 5,711,563 | |
| THE JAMESTOWN EQUITY FUND |
| SCHEDULE OF INVESTMENTS (Continued) |
| MONEY MARKET FUNDS — 2.4% | | Shares | | | Value | |
| Federated Hermes Government Obligations Fund - Institutional Class, 0.02% (b) (Cost $1,149,650) | | | 1,149,650 | | | $ | 1,149,650 | |
| | | | | | | | | |
| Total Investments at Value — 100.1% | | | | | | | | |
| (Cost $20,633,613) | | | | | | $ | 47,469,529 | |
| | | | | | | | | |
| Liabilities in Excess of Other Assets — (0.1%) | | | | | | | (70,220 | ) |
| | | | | | | | | |
| Net Assets — 100.0% | | | | | | $ | 47,399,309 | |
ADR - American Depositary Receipt.
| (a) | Non-income producing security. |
| (b) | The rate shown is the 7-day effective yield as of March 31, 2021. |
See accompanying notes to financial statements.
| THE JAMESTOWN EQUITY FUND |
| STATEMENT OF ASSETS AND LIABILITIES |
| March 31, 2021 |
| ASSETS | | | |
| Investments in securities: | | | | |
| At cost | | $ | 20,633,613 | |
| At value (Note 2) | | $ | 47,469,529 | |
| Cash | | | 2,537 | |
| Dividends receivable | | | 21,296 | |
| Other assets | | | 3,580 | |
| TOTAL ASSETS | | | 47,496,942 | |
| | | | | |
| LIABILITIES | | | | |
| Distributions payable | | | 4,543 | |
| Payable for capital shares redeemed | | | 50,218 | |
| Accrued investment advisory fees (Note 4) | | | 27,337 | |
| Payable to administrator (Note 4) | | | 12,000 | |
| Other accrued expenses | | | 3,535 | |
| TOTAL LIABILITIES | | | 97,633 | |
| | | | | |
| NET ASSETS | | $ | 47,399,309 | |
| | | | | |
| Net assets consist of: | | | | |
| Paid-in capital | | $ | 19,976,992 | |
| Accumulated earnings | | | 27,422,317 | |
| Net assets | | $ | 47,399,309 | |
| | | | | |
| Shares of beneficial interest outstanding (unlimited number of shares authorized, $0.01 par value) | | | 1,636,489 | |
| | | | | |
| Net asset value, offering price and redemption price per share (Note 2) | | $ | 28.96 | |
See accompanying notes to financial statements.
| THE JAMESTOWN EQUITY FUND |
| STATEMENT OF OPERATIONS |
| Year Ended March 31, 2021 |
| INVESTMENT INCOME | | | |
| Dividends | | $ | 670,096 | |
| Foreign withholding taxes on dividends | | | (6,382 | ) |
| TOTAL INVESTMENT INCOME | | | 663,714 | |
| | | | | |
| EXPENSES | | | | |
| Investment advisory fees (Note 4) | | | 261,076 | |
| Administration fees (Note 4) | | | 60,000 | |
| Audit and tax services fees | | | 16,500 | |
| Trustees’ fees (Note 4) | | | 15,900 | |
| Registration and filing fees | | | 15,829 | |
| Compliance service fees (Note 4) | | | 12,000 | |
| Custodian and bank service fees | | | 8,889 | |
| Legal fees | | | 7,663 | |
| Printing of shareholder reports | | | 6,543 | |
| Postage and supplies | | | 5,027 | |
| Account maintenance fees | | | 3,738 | |
| Insurance expense | | | 1,234 | |
| Other expenses | | | 6,996 | |
| TOTAL EXPENSES | | | 421,395 | |
| Fees voluntarily waived by the Adviser (Note 4) | | | (39,821 | ) |
| NET EXPENSES | | | 381,574 | |
| | | | | |
| NET INVESTMENT INCOME | | | 282,140 | |
| | | | | |
| REALIZED AND UNREALIZED GAINS ON INVESTMENTS | | | | |
| Net realized gains on investment transactions | | | 1,585,087 | |
| Net change in unrealized appreciation (depreciation) on investments | | | 16,297,627 | |
| NET REALIZED AND UNREALIZED GAINS ON INVESTMENTS | | | 17,882,714 | |
| | | | | |
| NET INCREASE IN NET ASSETS RESULTING FROM OPERATIONS | | $ | 18,164,854 | |
See accompanying notes to financial statements.
| THE JAMESTOWN EQUITY FUND |
| STATEMENTS OF CHANGES IN NET ASSETS |
| | | Year | | | Year | |
| | | Ended | | | Ended | |
| | | March 31, | | | March 31, | |
| | | 2021 | | | 2020 | |
| FROM OPERATIONS | | | | | | | | |
| Net investment income | | $ | 282,140 | | | $ | 357,046 | |
| Net realized gains on investment transactions | | | 1,585,087 | | | | 2,267,311 | |
| Net change in unrealized appreciation (depreciation) on investments | | | 16,297,627 | | | | (4,447,825 | ) |
| Net increase (decrease) in net assets resulting from operations | | | 18,164,854 | | | | (1,823,468 | ) |
| | | | | | | | | |
| DISTRIBUTIONS TO SHAREHOLDERS (Note 2) | | | (2,137,346 | ) | | | (2,585,429 | ) |
| | | | | | | | | |
| FROM CAPITAL SHARE TRANSACTIONS | | | | | | | | |
| Proceeds from shares sold | | | 652,616 | | | | 405,362 | |
| Net asset value of shares issued in reinvestment of distributions to shareholders | | | 1,984,995 | | | | 2,409,578 | |
| Payments for shares redeemed | | | (2,327,927 | ) | | | (4,001,840 | ) |
| Net increase (decrease) in net assets from capital share transactions | | | 309,684 | | | | (1,186,900 | ) |
| | | | | | | | | |
| TOTAL INCREASE (DECREASE) IN NET ASSETS | | | 16,337,192 | | | | (5,595,797 | ) |
| | | | | | | | | |
| NET ASSETS | | | | | | | | |
| Beginning of year | | | 31,062,117 | | | | 36,657,914 | |
| End of year | | $ | 47,399,309 | | | $ | 31,062,117 | |
| | | | | | | | | |
| CAPITAL SHARE ACTIVITY | | | | | | | | |
| Shares sold | | | 25,392 | | | | 17,643 | |
| Shares reinvested | | | 81,726 | | | | 107,138 | |
| Shares redeemed | | | (98,486 | ) | | | (179,068 | ) |
| Net increase (decrease) in shares outstanding | | | 8,632 | | | | (54,287 | ) |
| Shares outstanding, beginning of year | | | 1,627,857 | | | | 1,682,144 | |
| Shares outstanding, end of year | | | 1,636,489 | | | | 1,627,857 | |
See accompanying notes to financial statements.
| THE JAMESTOWN EQUITY FUND |
| FINANCIAL HIGHLIGHTS |
Selected Per Share Data for a Share Outstanding Throughout Each Year:
| | | Years Ended March 31, | |
| | | 2021 | | | 2020 | | | 2019 | | | 2018 | | | 2017 | |
| Net asset value at beginning of year | | $ | 19.08 | | | $ | 21.79 | | | $ | 22.10 | | | $ | 20.89 | | | $ | 19.57 | |
| | | | | | | | | | | | | | | | | | | | | |
| Income (loss) from investment operations: | | | | | | | | | | | | | | | | | | | | |
| Net investment income (a) | | | 0.17 | | | | 0.22 | | | | 0.24 | | | | 0.19 | | | | 0.19 | |
| Net realized and unrealized gains (losses) on investments | | | 11.05 | | | | (1.35 | ) | | | 1.10 | | | | 2.51 | | | | 2.12 | |
| Total from investment operations | | | 11.22 | | | | (1.13 | ) | | | 1.34 | | | | 2.70 | | | | 2.31 | |
| | | | | | | | | | | | | | | | | | | | | |
| Less distributions from | | | | | | | | | | | | | | | | | | | | |
| Net investment income | | | (0.18 | ) | | | (0.22 | ) | | | (0.24 | ) | | | (0.19 | ) | | | (0.20 | ) |
| Net realized gains | | | (1.16 | ) | | | (1.36 | ) | | | (1.41 | ) | | | (1.30 | ) | | | (0.79 | ) |
| Total distributions | | | (1.34 | ) | | | (1.58 | ) | | | (1.65 | ) | | | (1.49 | ) | | | (0.99 | ) |
| | | | | | | | | | | | | | | | | | | | | |
| Net asset value at end of year | | $ | 28.96 | | | $ | 19.08 | | | $ | 21.79 | | | $ | 22.10 | | | $ | 20.89 | |
| | | | | | | | | | | | | | | | | | | | | |
| Total return (b) | | | 60.23 | % | | | (6.17 | %) | | | 6.40 | % | | | 13.35 | % | | | 12.14 | % |
| | | | | | | | | | | | | | | | | | | | | |
| Net assets at end of year (000’s) | | $ | 47,399 | | | $ | 31,062 | | | $ | 36,658 | | | $ | 37,570 | | | $ | 37,460 | |
| | | | | | | | | | | | | | | | | | | | | |
| Ratio of total expenses to average net assets (c) | | | 1.05 | % | | | 1.08 | % | | | 1.03 | % | | | 1.03 | % | | | 1.03 | % |
| | | | | | | | | | | | | | | | | | | | | |
| Ratio of net expenses to average net assets (c)(d) | | | 0.95 | % | | | 0.95 | % | | | 0.95 | % | | | 0.95 | % | | | 0.95 | % |
| | | | | | | | | | | | | | | | | | | | | |
| Ratio of net investment income to | | | | | | | | | | | | | | | | | | | | |
| average net assets (a)(c)(d) | | | 0.70 | % | | | 0.96 | % | | | 1.10 | % | | | 0.87 | % | | | 0.96 | % |
| | | | | | | | | | | | | | | | | | | | | |
| Portfolio turnover rate | | | 10 | % | | | 18 | % | | | 18 | % | | | 18 | % | | | 27 | % |
| (a) | Recognition of net investment income by the Fund is affected by the timing of the declarations of dividends by the underlying investment companies in which the Fund invests. |
| (b) | Total return is a measure of the change in value of an investment in the Fund over the periods covered, which assumes any dividends or capital gains distributions are reinvested in shares of the Fund. Returns shown do not reflect the deduction of taxes a shareholder would pay on Fund distributions or the redemption of Fund shares. |
| (c) | The ratios of expenses and net investment income to average net assets do not reflect the Fund’s proportionate share of expenses of the underlying investment companies in which the Fund invests. Ratios were also determined based on net expenses after expense reimbursements through a previous directed brokerage arrangement. |
| (d) | Ratio was determined after voluntary advsiory fee waivers by the Adviser and reimbursed expenses (Note 4). |
See accompanying notes to financial statements.
| THE JAMESTOWN EQUITY FUND |
| NOTES TO FINANCIAL STATEMENTS |
| March 31, 2021 |
The Jamestown Equity Fund (the “Fund”) is a diversified, no-load series of Williamsburg Investment Trust (the “Trust”), an open-end management investment company registered under the Investment Company Act of 1940, as amended (the “1940 Act”). The Trust was organized as a Massachusetts business trust on July 18, 1988. Other series of the Trust are not included in this report.
The investment objective of the Fund is long-term growth of capital.
| 2. | Significant Accounting Policies |
The following is a summary of the Fund’s significant accounting policies. These policies are in conformity with accounting principles generally accepted in the United States of America (“GAAP”). The Fund follows accounting and reporting guidance under Financial Accounting Standards Board Accounting Standards Codification Topic 946, “Financial Services – Investment Companies.”
Securities valuation — The Fund’s portfolio securities are valued as of the close of business of the regular session of the New York Stock Exchange (normally 4:00 p.m., Eastern time). Securities traded on a national stock exchange, including common stocks and exchange-traded funds (“ETFs”), are generally valued based upon the closing price on the principal exchange where the security is traded, if available, otherwise, at the last quoted bid price. Securities that are quoted by NASDAQ are valued at the NASDAQ Official Closing Price. Investments representing shares of other open-end investment companies, other than ETFs but including money market funds, are valued at their net asset value (“NAV”) as reported by such companies. When using a quoted price and when the market is considered active, securities will be classified as Level 1 within the fair value hierarchy (see below).
When market quotations are not readily available, if a pricing service cannot provide a price, or if the investment adviser believes the price received from the pricing service is not indicative of market value, securities will be valued in good faith at fair value using methods consistent with procedures adopted by the Board of Trustees and will be classified as Level 2 or 3 within the fair value hierarchy, depending on the inputs used. Such methods of fair valuation may include, but are not limited to: multiple of earnings, multiple of book value, discount from market of a similar freely traded security, purchase price of the security, subsequent private transactions in the security or related securities, or a combination of these and other factors.
GAAP establishes a single authoritative definition of fair value, sets out a framework for measuring fair value and requires additional disclosures about fair value measurements.
Various inputs are used in determining the value of the Fund’s investments. These inputs are summarized in the three broad levels listed below:
| ● | Level 1 – quoted prices in active markets for identical securities |
| ● | Level 2 – other significant observable inputs |
| ● | Level 3 – significant unobservable inputs |
| THE JAMESTOWN EQUITY FUND |
| NOTES TO FINANCIAL STATEMENTS (Continued) |
The inputs or methodology used for valuing securities are not necessarily an indication of the risks associated with investing in those securities. The inputs used to measure fair value may fall into different levels of the fair value hierarchy. In such cases, for disclosure purposes, the level in the fair value hierarchy within which the fair value measurement falls in its entirety is determined based on the lowest level input that is significant to the fair value measurement.
The following is a summary of the Fund’s investments based on the inputs used to value the investments as of March 31, 2021, by security type:
| | | Level 1 | | | Level 2 | | | Level 3 | | | Total | |
| Common Stocks | | $ | 40,608,316 | | | $ | — | | | $ | — | | | $ | 40,608,316 | |
| Exchange-Traded Funds | | | 5,711,563 | | | | — | | | | — | | | | 5,711,563 | |
| Money Market Funds | | | 1,149,650 | | | | — | | | | — | | | | 1,149,650 | |
| Total | | $ | 47,469,529 | | | $ | — | | | $ | — | | | $ | 47,469,529 | |
| | | | | | | | | | | | | | | | | |
Refer to the Fund’s Schedule of Investments for a listing of the common stocks by sector type. There were no Level 3 securities or derivative instruments held by the Fund as of or during the year ended March 31, 2021.
Share valuation — The NAV per share of the Fund is calculated daily by dividing the total value of its assets, less liabilities, by the number of shares outstanding. The offering price and redemption price per share of the Fund is equal to the NAV per share.
Investment income — Dividend income is recorded on the ex-dividend date. Non-cash dividends included in dividend income, if any, are recorded at the fair market value of the security received. Withholding taxes on foreign dividends received by the Fund, if any, have been recorded in accordance with the Trust’s understanding of the applicable country’s rules and tax rates.
Distributions to shareholders — Dividends arising from net investment income, if any, are declared and paid quarterly to shareholders of the Fund. Net realized short-term capital gains, if any, may be distributed throughout the year and net realized long-term capital gains, if any, are distributed at least once each year. The amount of distributions from net investment income and net realized capital gains are determined in accordance with federal income tax regulations, which may differ from GAAP. Dividends and distributions are recorded on the ex-dividend date.
The tax character of distributions paid during the years ended March 31, 2021 and 2020 was as follows:
| Years | | Ordinary | | | Long-Term | | | Total | |
| Ended | | Income | | | Capital Gains | | | Distributions | |
| 3/31/2021 | | $ | 390,903 | | | $ | 1,746,789 | | | $ | 2,137,692 | |
| 3/31/2020 | | $ | 357,284 | | | $ | 2,227,772 | | | $ | 2,585,056 | |
| THE JAMESTOWN EQUITY FUND |
| NOTES TO FINANCIAL STATEMENTS (Continued) |
Investment transactions — Investment transactions are accounted for on trade date for financial reporting purposes. Realized gains and losses on investment securities sold are determined on a specific identification basis.
Common expenses — Common expenses of the Trust are allocated among the series of the Trust based on relative net assets of each series or the nature of the services performed and the relative applicability to each series.
Estimates — The preparation of financial statements in conformity with GAAP requires management to make estimates and assumptions that affect the reported amounts of assets and liabilities and the disclosure of contingent assets and liabilities, each as of the date of the financial statements, and the reported amounts of increase (decrease) in net assets from operations during the reporting period. Actual results could differ from those estimates.
Federal income tax — The Fund has qualified and intends to continue to qualify as a regulated investment company under the Internal Revenue Code of 1986, as amended (the “Code”). Qualification generally will relieve the Fund of liability for federal income taxes to the extent 100% of its net investment income and net realized capital gains are distributed in accordance with the Code.
In order to avoid imposition of the excise tax applicable to regulated investment companies, it is also the Fund’s intention to declare as dividends in each calendar year at least 98% of its net investment income (earned during the calendar year) and 98.2% of its net realized capital gains (earned during the twelve months ended October 31) plus undistributed amounts from prior years.
The tax character of accumulated earnings at March 31, 2021 was as follows:
| | | | |
| Tax cost of portfolio investments | | $ | 20,697,455 | |
| Gross unrealized appreciation | | $ | 26,781,475 | |
| Gross unrealized depreciation | | | (9,401 | ) |
| Net unrealized appreciation | | | 26,772,074 | |
| Undistributed ordinary income | | | 10,292 | |
| Undistributed long-term capital gains | | | 644,494 | |
| Distributions payable | | | (4,543 | ) |
| Accumulated earnings | | $ | 27,422,317 | |
| | | | | |
The difference between the federal income tax cost of portfolio investments and the financial statement cost of portfolio investments for the Fund is due to certain timing differences in the recognition of capital gains or losses under income tax regulations and GAAP. These “book/tax” differences are temporary in nature and are primarily due to the tax deferral of losses on wash sales.
| THE JAMESTOWN EQUITY FUND |
| NOTES TO FINANCIAL STATEMENTS (Continued) |
The Fund recognizes the tax benefits or expenses of uncertain tax positions only when the position is “more likely than not” to be sustained assuming examination by tax authorities. Management has reviewed the tax positions taken on Federal income tax returns for all open tax years (generally three years) of the Fund and has concluded that no provision for unrecognized tax benefits or expenses is required in these financial statements.
| 3. | Investment Transactions |
Investment transactions, other than short-term investments and U.S. government securities, were as follows for the year ended March 31, 2021:
| | | | | |
| Purchase of investment securities | | $ | 4,586,113 | |
| Proceeds from sales of investment securities | | $ | 3,783,700 | |
| | | | | |
| 4. | Transactions with Related Parties |
INVESTMENT ADVISORY AGREEMENT
The Fund’s investments are managed by Lowe, Brockenbrough & Company, Inc. (the “Adviser”) under the terms of an Investment Advisory Agreement. The Fund pays the Adviser a fee, which is computed and accrued daily and paid monthly, at annual rates of 0.65% of its average daily net assets up to $500 million and 0.55% of such assets in excess of $500 million. Certain officers of the Trust are also officers of the Adviser.
During the year ended March 31, 2021, the Adviser voluntarily limited the total annual operating expenses of the Fund to 0.95% of average daily net assets; accordingly, the Adviser voluntarily waived $39,821 of its investment advisory fees during the year ended March 31, 2021. This amount is not subject to recapture in future periods.
OTHER SERVICE PROVIDERS
Ultimus Fund Solutions, LLC (“Ultimus”) provides administration, fund accounting, compliance and transfer agent services to the Fund. The Fund pays Ultimus fees in accordance with the agreements for such services. In addition, the Fund pays out-of-pocket expenses including, but not limited to, postage, supplies, and certain costs related to the pricing of the Fund’s portfolio securities. Certain officers of the Trust are also officers of Ultimus, or of Ultimus Fund Distributors, LLC (the “Distributor”), the principal underwriter of the Fund and an affiliate of Ultimus. The Distributor is compensated by the Adviser (not the Fund) for acting as principal underwriter.
| THE JAMESTOWN EQUITY FUND |
| NOTES TO FINANCIAL STATEMENTS (Continued) |
COMPENSATION OF TRUSTEES
Trustees and officers affiliated with the Adviser or Ultimus are not compensated by the Trust for their services. Each Trustee who is not an affiliated person of the Adviser or Ultimus received from the Trust an annual retainer of $24,000, payable quarterly; a fee of $2,000 for attendance at each meeting of the Board of Trustees (except that such fee is $3,000 for the independent chair); and a fee of $1,000 for attendance at each meeting of any committee of the Board (except that such fee is $1,500 for the committee chair); plus reimbursement of travel and other expenses incurred in attending meetings. Each series of the Trust pays its proportionate share of such fees.
| 5. | Contingencies and Commitments |
The Fund indemnifies the Trust’s officers and Trustees for certain liabilities that might arise from the performance of their duties to the Fund. Additionally, in the normal course of business the Fund enters into contracts that contain a variety of representations and warranties and which provide general indemnifications. The Fund’s maximum exposure under these arrangements is unknown, as this would involve future claims that may be made against the Fund that have not yet occurred. However, based on experience, the Trust expects the risk of loss to be remote.
The Fund is required to recognize in the financial statements the effects of all subsequent events that provide additional evidence about conditions that existed as of the date of the Statement of Assets and Liabilities. For non-recognized subsequent events that must be disclosed to keep the financial statements from being misleading, the Fund is required to disclose the nature of the event as well as an estimate of its financial effect, or a statement that such an estimate cannot be made. Management has evaluated subsequent events through the issuance of these financial statements and has noted no such events.
| THE JAMESTOWN EQUITY FUND |
| REPORT OF INDEPENDENT REGISTERED PUBLIC ACCOUNTING FIRM |
To the Shareholders of The Jamestown Equity Fund and
Board of Trustees of Williamsburg Investment Trust
Opinion on the Financial Statements
We have audited the accompanying statement of assets and liabilities, including the schedule of investments, of The Jamestown Equity Fund (the “Fund”), a series of Williamsburg Investment Trust, as of March 31, 2021, the related statement of operations for the year then ended, the statements of changes in net assets for each of the two years in the period then ended, the related notes, and the financial highlights for each of the five years in the period then ended (collectively referred to as the “financial statements”). In our opinion, the financial statements present fairly, in all material respects, the financial position of the Fund as of March 31, 2021, the results of its operations for the year then ended, the changes in its net assets for each of the two years in the period then ended, and the financial highlights for each of the five years in the period then ended, in conformity with accounting principles generally accepted in the United States of America.
Basis for Opinion
These financial statements are the responsibility of the Fund’s management. Our responsibility is to express an opinion on the Fund’s financial statements based on our audits. We are a public accounting firm registered with the Public Company Accounting Oversight Board (United States) (“PCAOB”) and are required to be independent with respect to the Fund in accordance with the U.S. federal securities laws and the applicable rules and regulations of the Securities and Exchange Commission and the PCAOB.
We conducted our audits in accordance with the standards of the PCAOB. Those standards require that we plan and perform the audit to obtain reasonable assurance about whether the financial statements are free of material misstatement whether due to error or fraud.
Our audits included performing procedures to assess the risks of material misstatement of the financial statements, whether due to error or fraud, and performing procedures that respond to those risks. Such procedures included examining, on a test basis, evidence regarding the amounts and disclosures in the financial statements. Our procedures included confirmation of securities owned as of March 31, 2021, by correspondence with the custodian and brokers. Our audit also included evaluating the accounting principles used and significant estimates made by management, as well as evaluating the overall presentation of the financial statements. We believe that our audits provide a reasonable basis for our opinion.
We have served as the Fund’s auditor since 2016.

COHEN & COMPANY, LTD.
Milwaukee, Wisconsin
May 24, 2021
| THE JAMESTOWN EQUITY FUND |
| BOARD OF TRUSTEES AND EXECUTIVE OFFICERS (Unaudited) |
Overall responsibility for management of the Fund rests with the Board of Trustees. The Trustees serve during the lifetime of the Trust and until its termination, or until death, resignation, retirement or removal. The Trustees, in turn, elect the officers of the Fund. The officers have been elected for an annual term. The following are the Trustees and executive officers of the Fund:
| | Trustees
and Officers | Address | Year of
Birth | Position Held
with the Trust | Length of
Time Served |
| | Robert S. Harris, Ph.D. | 225 Pictoria Drive, Suite 450 Cincinnati, OH | 1949 | Chairman and Trustee | Since January 2007 |
| * | John P. Ackerly, IV | One James Center 901 E. Cary Street Richmond, VA | 1963 | Trustee and President of The Davenport Funds | Since July 2012 |
| * | John T. Bruce | 800 Main Street Lynchburg, VA | 1953 | Trustee and President of The FBP Funds | Since September 1988 |
| | George K. Jennison | 225 Pictoria Drive, Suite 450 Cincinnati, OH | 1957 | Trustee | Since January 2015 |
| | Harris V. Morrissette | 225 Pictoria Drive, Suite 450 Cincinnati, OH | 1959 | Trustee | Since March 1993 |
| | Elizabeth W. Robertson | 225 Pictoria Drive, Suite 450 Cincinnati, OH | 1953 | Trustee | Since February 2014 |
| | Charles M. Caravati, III | 1802 Bayberry Court, Suite 400 Richmond, VA | 1965 | President, The Jamestown Equity Fund | Since January 1996 |
| | Mark J. Seger | 225 Pictoria Drive, Suite 450 Cincinnati, OH | 1962 | Treasurer | Since November 2000 |
| | David K. James | 225 Pictoria Drive, Suite 450 Cincinnati, OH | 1970 | Secretary | Since November 2018 |
| | Michael J. Nanosky | 225 Pictoria Drive, Suite 450 Cincinnati, OH | 1966 | Chief Compliance Officer | Since March 2020 |
| * | Messrs. Ackerly and Bruce, as affiliated persons of investment advisers to the Trust, are “interested persons” of the Trust within the meaning of Section 2(a)(19) of the 1940 Act. |
| THE JAMESTOWN EQUITY FUND |
| BOARD OF TRUSTEES AND EXECUTIVE OFFICERS (Unaudited) (Continued) |
Each Trustee oversees ten portfolios of the Trust, including the Fund. The principal occupations of the Trustees and executive officers of the Funds during the past five years and public directorships held by the Trustees are set forth below:
Robert S. Harris, Ph.D. is the C. Stewart Sheppard Professor of Business Administration at The Darden Graduate School of Business Administration at the University of Virginia. He was previously the dean at Darden. Professor Harris has published widely on corporate finance, financial markets and mergers and acquisitions and has served as a consultant to corporations and government agencies.
John P. Ackerly, IV is Senior Vice President and Portfolio Manager of Davenport & Company LLC. (a broker-dealer and investment adviser)
John T. Bruce is President, Director and member of the Executive Committee of Flippin, Bruce & Porter, Inc. (an investment advisory firm).
George K. Jennison is retired. He previously was President of Oyster Consulting, LLC (a management consulting firm) and a financial adviser with Wells Fargo Advisors, LLC.
Harris V. Morrissette is President of China Doll Rice and Beans, Inc. and Dixie Lily Foods. He is also a Director of Trustmark Corporation (bank holding company).
Elizabeth W. Robertson serves as a Trustee of TowneBank Foundation, TowneBank Corporate Board, TowneBank Audit Committee Chair and TowneBank Community Board since 2015. She previously was Chief Financial Officer of Monument Restaurants LLC.
Charles M. Caravati, III is a Managing Director of the Adviser.
Mark J. Seger is a Vice Chairman of Ultimus Fund Solutions, LLC and Ultimus Fund Distributors, LLC. He previously was Co-CEO of Ultimus Fund Solutions, LLC (1999 to 2019).
David K. James is an Executive Vice President and Chief Legal and Risk Officer of Ultimus Fund Solutions, LLC (2018 to present). He previously was Managing Director and Managing Counsel at State Street Bank and Trust Company (2009 to 2018).
Michael J. Nanosky is a Senior Compliance Officer of Ultimus Fund Solutions, LLC (2020 to present). He previously was Senior Vice President & Chief Compliance Officer of PNC Funds (2014 to 2019).
Additional information about members of the Board of Trustees and executive officers is available in the Statement of Additional Information (“SAI”). To obtain a free copy of the SAI, please call 1-866-738-1126.
| THE JAMESTOWN EQUITY FUND |
| ABOUT YOUR FUND’S EXPENSES (Unaudited) |
We believe it is important for you to understand the impact of costs on your investment. All mutual funds have operating expenses. As a shareholder of the Fund, you incur ongoing costs, including management fees and other expenses. The following examples are intended to help you understand your ongoing costs (in dollars) of investing in the Fund and to compare these costs with the ongoing costs of investing in other mutual funds.
A mutual fund’s ongoing costs are expressed as a percentage of its average net assets. This figure is known as the expense ratio. The expenses in the table below are based on an investment of $1,000 made at the beginning of the period shown and held for the entire period (October 1, 2020 through March 31, 2021).
The table below illustrates the Fund’s costs in two ways:
Actual fund return – This section helps you to estimate the actual expenses that you paid over the period. The “Ending Account Value” shown is derived from the Fund’s actual return, and the fourth column shows the dollar amount of operating expenses that would have been paid by an investor who started with $1,000 in the Fund. You may use the information here, together with the amount you invested, to estimate the expenses that you paid over the period.
To do so, simply divide your account value by $1,000 (for example, an $8,600 account value divided by $1,000 = 8.6), then multiply the result by the number given for the Fund under the heading “Expenses Paid During Period.”
Hypothetical 5% return – This section is intended to help you compare the Fund’s ongoing costs with those of other mutual funds. It assumes that the Fund had an annual return of 5% before expenses during the period shown, but that the expense ratio is unchanged. In this case, because the returns used are not the Fund’s actual returns, the results do not apply to your investment. The example is useful in making comparisons because the U.S. Securities and Exchange Commission (the “SEC”) requires all mutual funds to calculate expenses based on a 5% return. You can assess the Fund’s ongoing costs by comparing this hypothetical example with the hypothetical examples that appear in shareholder reports of other funds.
Note that expenses shown in the table are meant to highlight and help you compare ongoing costs only. The Fund does not charge sales loads or redemption fees.
The calculations assume no shares were bought or sold during the period. Your actual costs may have been higher or lower, depending on the amount of your investment and the timing of any purchases or redemptions.
More information about the Fund’s expenses, including annual expense ratios for the prior five fiscal years, can be found in this report. For additional information on operating expenses and other shareholder costs, please refer to the Fund’s prospectus.
| THE JAMESTOWN EQUITY FUND |
| ABOUT YOUR FUND’S EXPENSES (Unaudited) (Continued) |
| | | Beginning | | Ending | | Net | | Expenses |
| | | Account Value | | Account Value | | Expense | | Paid During |
| | | October 1, 2020 | | March 31, 2021 | | Ratio(a) | | Period(b) |
| Based on Actual Fund Return | | $1,000.00 | | $1,220.50 | | 0.95% | | $5.26 |
| Based on Hypothetical 5% Return (before expenses) | | $1,000.00 | | $1,020.19 | | 0.95% | | $4.78 |
| | | | | | | | | |
| (a) | Annualized, based on the Fund’s most recent one-half year expenses. |
| (b) | Expenses are equal to the Fund’s annualized net expense ratio multiplied by the average account value over the period, multiplied by 182/365 (to reflect the one-half year period). |
| OTHER INFORMATION (Unaudited) |
A description of the policies and procedures that the Fund uses to vote proxies relating to portfolio securities is available without charge upon request by calling toll-free 1-866-738-1126, or on the SEC’s website at www.sec.gov. Information regarding how the Fund voted proxies relating to portfolio securities during the most recent 12-month period ended June 30 is also available without charge upon request by calling toll-free 1-866-738-1126, or on the SEC’s website at www.sec.gov.
The Trust files a complete listing of portfolio holdings of the Fund with the SEC as of the end of the first and third quarters of each fiscal year as an exhibit to its reports on Form N-PORT. The filings are available upon request, by calling 1-866-738-1126. Furthermore, you may obtain a copy of these filings on the SEC’s website at www.sec.gov.
| FEDERAL TAX INFORMATION (Unaudited) |
For the fiscal year ended March 31, 2021, the Fund designated $1,746,789 as long-term capital gain distributions.
Qualified Dividend Income — The Fund designates 100% of its ordinary income distributions, or up to the maximum amount of such dividends allowable pursuant to the Internal Revenue Code, as qualified dividend income eligible for the reduced tax rate of 15%.
Dividends Received Deduction — Corporate shareholders are generally entitled to take the dividends received deduction on the portion of a Fund’s dividend distributions that qualify under tax law. For the fiscal year ended March 31, 2021, 100% of the Fund’s ordinary income dividends qualifies for the corporate dividends received deduction.
| THE JAMESTOWN EQUITY FUND |
| DISCLOSURE REGARDING APPROVAL OF INVESTMENT ADVISORY AGREEMENT (Unaudited) |
At a meeting held on February 23, 2021, the Board of Trustees, including a majority of the Independent Trustees, approved the continuance for a one-year period of the Investment Advisory Agreement with the Adviser on behalf of The Jamestown Equity Fund (the “Fund”). Below is a discussion of the factors considered by the Board of Trustees along with the conclusions with respect thereto that formed the basis for the Board’s approval.
In approving the continuance of the Investment Advisory Agreement, the Independent Trustees considered all information they deemed reasonably necessary to evaluate the terms of the Agreement. The principal areas of review by the Independent Trustees were the nature, extent and quality of the services provided by the Adviser and the reasonableness of the fees charged for those services. These matters were considered by the Independent Trustees consulting with experienced counsel for the Independent Trustees, who is independent of the Adviser.
The Independent Trustees’ evaluation of the quality of the Adviser’s services took into consideration their knowledge gained through presentations and reports from the Adviser over the course of the preceding year. The Independent Trustees considered that the Adviser had provided its views on the overall conditions of the economy and the markets during the 2020 calendar year and how this has impacted the investment management process of the Fund. Both short-term and long-term investment performance of the Fund were considered. The Fund’s performance was compared to the performance of its benchmark, a peer group of funds with similar investment objectives and strategies, and to the Adviser’s comparably managed private accounts. The Independent Trustees also considered: the scope and quality of the in-house capabilities of the Adviser and other resources that it dedicates to performing services for the Fund; the quality of administrative and other services, including the Adviser’s role in coordinating the activities of the Fund’s other service providers; the Adviser’s compliance with investment policies of the Fund and applicable laws and regulations; information provided by management and the Fund’s independent public accounting firm in periodic meetings with the Trust’s Audit Committee; the business reputation of the Adviser; the qualifications of the Adviser’s key investment and compliance personnel; and the Adviser’s financial resources.
In reviewing the fees payable under the Investment Advisory Agreement, the Independent Trustees compared the advisory fees and overall expenses of the Fund with those of funds with similar investment objectives and strategies as well as the private accounts managed by the Adviser. The Independent Trustees considered information provided by the Adviser concerning the Adviser’s profitability with respect to the Fund, including the assumptions and methodology used in preparing the profitability information, in light of applicable case law relating to advisory fees. For these purposes, the Independent Trustees considered not only the fees paid by the Fund, but also so-called “fallout” benefits to the Adviser. The Independent Trustees also considered the Adviser’s representations that the Fund’s portfolio trades were executed based on the best available price and execution, and that the Adviser does not participate in any revenue sharing arrangements relating to the Fund. In evaluating the Fund’s advisory fees, the Trustees considered the complexity and quality of the investment process that is applied in the management of the Fund.
| THE JAMESTOWN EQUITY FUND |
| DISCLOSURE REGARDING APPROVAL OF INVESTMENT ADVISORY AGREEMENT (Unaudited) (Continued) |
Based on the consideration of the foregoing and such other information as was deemed relevant, including the factors and conclusions below, the Independent Trustees concluded that: (i) the performance of the Fund is satisfactory given the Fund’s investment strategy in comparison to the performance to its benchmark and peer group average, and after considering the services provided by LB&C to the Fund; (ii) the advisory fee for Fund is higher when compared to the average for similarly managed funds according to statistics derived from Morningstar, Inc., and is reasonable in relation to the services provided by LB&C; (iii) the total operating expense ratio of Fund while higher, remains competitive, when compared to the average expense ratio for comparable managed funds, according to statistics derived from Morningstar, Inc., and (iv) the level of LB&C’s profitability with respect to its management of the Fund is reasonable.
Given the current size of the Fund and its expected growth, the Independent Trustees did not believe that, it was relevant to consider the extent to which economies of scale would be realized as the Fund grows, and whether fee levels reflect these economies of scale. The Independent Trustees also considered the “fallout” benefits to the Adviser for its management of the Fund, but given the amounts involved viewed these as secondary factors in connection with the evaluation of the reasonableness of the advisory fees paid by the Fund.
No single factor was considered in isolation or to be determinative to the decision of the Independent Trustees to approve the continuance of the Investment Advisory Agreement. Rather the Independent Trustees concluded, after weighing and balancing all factors considered, that it was in the best interests of the Fund and its shareholders to continue the Investment Advisory Agreement without modification to its terms, including the fees charged for services thereunder.
This page intentionally left blank.
This page intentionally left blank.
This page intentionally left blank.
THE JAMESTOWN EQUITY FUND
www.jamestownfunds.com
Investment Adviser
Lowe, Brockenbrough & Company, Inc.
1802 Bayberry Court
Suite 400
Richmond, Virginia 23226
Administrator
Ultimus Fund Solutions, LLC
P.O. Box 46707
Cincinnati, Ohio 45246-0707
(Toll-Free) 1-866-738-1126
Independent Registered
Public Accounting Firm
Cohen & Company, Ltd.
342 N. Water Street
Suite 830
Milwaukee, Wisconsin 53202
Legal Counsel
Sullivan & Worcester LLP
1666 K Street, N.W.
Washington, DC 20006
Board of Trustees
John P. Ackerly, IV
John T. Bruce
George K. Jennison
Robert S. Harris, Ph.D.
Harris V. Morrissette
Elizabeth W. Robertson
Jamestown-AR-21
(b) Not applicable
As of the end of the period covered by this report, the registrant has adopted a code of ethics that applies to the registrant’s principal executive officer, principal financial officer, principal accounting officer or controller, or persons performing similar functions, regardless of whether these individuals are employed by the registrant or a third party. Pursuant to Item 13(a)(1), a copy of registrant’s code of ethics is filed as an exhibit to this Form N-CSR. During the period covered by this report, the code of ethics has not been amended, and the registrant has not granted any waivers, including implicit waivers, from the provisions of the code of ethics.
| Item 3. | Audit Committee Financial Expert. |
The registrant’s board of trustees has determined that the registrant has two audit committee financial experts serving on its audit committee. The names of the audit committee financial experts are Dr. Robert S. Harris and Elizabeth W. Robertson. Dr. Harris and Ms. Robertson are “independent” for purposes of this Item.
| Item 4. | Principal Accountant Fees and Services. |
| (a) | Audit Fees. The aggregate fees billed for professional services rendered by the principal accountant for the audit of the registrant’s annual financial statements or for services that are normally provided by the accountant in connection with statutory and regulatory filings or engagements were $129,500 and $129,500 with respect to the registrant’s fiscal years ended March 31, 2021 and 2020, respectively. |
| (b) | Audit-Related Fees. No fees were billed in either of the last two fiscal years for assurance and related services by the principal accountant that are reasonably related to the performance of the audit of the registrant’s financial statements and are not reported under paragraph (a) of this Item. |
| (c) | Tax Fees. The aggregate fees billed for professional services rendered by the principal accountant for tax compliance, tax advice, and tax planning were $30,000 and $30,000 with respect to the registrant’s fiscal years ended March 31, 2021 and 2020, respectively. The services comprising these fees are the preparation of the registrant’s federal income and excise tax returns. |
| (d) | All Other Fees. No fees were billed in either of the last two fiscal years for products and services provided by the principal accountant, other than the services reported in paragraphs (a) through (c) of this Item. |
| (e)(1) | The audit committee has adopted pre-approval policies and procedures described in paragraph (c)(7) of Rule 2-01 of Regulation S-X. Pursuant to the pre-approval policies and procedures, the audit committee has pre-approved certain audit, audit-related and tax services and has established, with respect to each fiscal year of the registrant, the following maximum fee levels for services covered under the pre-approval policies and procedures: |
| · | Services, relating to a new series or class of a series, associated with SEC registration statements, periodic reports and other documents filed by the registrant with the SEC or other documents issued by the registrant in connection with securities offerings and assistance in responding to SEC comment letters—$5,000 |
| · | Consultations with management of the registrant, not in connection with an audit, as to the accounting or disclosure treatment of transactions or events and/or the actual or potential impact of final or proposed rules, standards or interpretations by the SEC, FASB or other regulatory or standard setting bodies—$5,000 |
| · | All tax services provided to the registrant in the aggregate—$5,000 |
| (e)(2) | None of the services described in paragraph (b) through (d) of this Item were approved by the audit committee pursuant to paragraph (c)(7)(i)(C) of Rule 2-01 of Regulation S-X. |
| (f) | Less than 50% of hours expended on the principal accountant’s engagement to audit the registrant’s financial statements for the most recent fiscal year were attributed to work performed by persons other than the principal accountant’s full-time, permanent employees. |
| (g) | With respect to the fiscal years ended March 31, 2021 and 2020, aggregate non-audit fees of $30,000 and $30,000, respectively, were billed by the registrant’s principal accountant for services rendered to the registrant. No non-audit fees were billed in either of the last two fiscal years by the registrant’s principal accountant for services rendered to the registrant’s investment adviser (not including any sub-adviser whose role is primarily portfolio management and is subcontracted with or overseen by another investment adviser), and any entity controlling, controlled by, or under common control with the adviser that provides ongoing services to the registrant. |
| (h) | The principal accountant has not provided any non-audit services to the registrant’s investment adviser (not including any sub-adviser whose role is primarily portfolio management and is subcontracted with or overseen by another investment adviser), and any entity controlling, controlled by, or under common control with the investment adviser that provides ongoing services to the registrant. |
| Item 5. | Audit Committee of Listed Registrants. |
Not applicable
| Item 6. | Schedule of Investments. |
| (a) | Not applicable [schedule filed with Item 1] |
| Item 7. | Disclosure of Proxy Voting Policies and Procedures for Closed-End Management Investment Companies. |
Not applicable
| Item 8. | Portfolio Managers of Closed-End Management Investment Companies. |
Not applicable
| Item 9. | Purchases of Equity Securities by Closed-End Management Investment Company and Affiliated Purchasers. |
Not applicable
| Item 10. | Submission of Matters to a Vote of Security Holders. |
The registrant’s Governance, Nominating, Compensation and QLCC Committee shall review shareholder recommendations to fill vacancies on the registrant’s board of trustees if such recommendations are submitted in writing, addressed to the Committee at the registrant’s offices and meet any minimum qualifications adopted by the Committee. The Committee may adopt, by resolution, a policy regarding its procedures for considering candidates for the board of trustees, including any recommended by shareholders.
| Item 11. | Controls and Procedures. |
(a) Based on their evaluation of the registrant’s disclosure controls and procedures (as defined in Rule 30a-3(c) under the Investment Company Act of 1940) as of a date within 90 days of the filing date of this report, the registrant’s principal executive officers and principal financial officer have concluded that such disclosure controls and procedures are reasonably designed and are operating effectively to ensure that material information relating to the registrant, including its consolidated subsidiaries, is made known to them by others within those entities, particularly during the period in which this report is being prepared, and that the information required in filings on Form N-CSR is recorded, processed, summarized, and reported on a timely basis.
(b) There were no changes in the registrant’s internal control over financial reporting (as defined in Rule 30a-3(d) under the Investment Company Act of 1940) that occurred during the period covered by this report that have materially affected, or are reasonably likely to materially affect, the registrant’s internal control over financial reporting.
Item 12. Disclosure of Securities Lending Activities for Closed-End Management Investment Companies.
Not applicable
File the exhibits listed below as part of this Form. Letter or number the exhibits in the sequence indicated.
(a)(1) Any code of ethics, or amendment thereto, that is the subject of the disclosure required by Item 2, to the extent that the registrant intends to satisfy the Item 2 requirements through filing of an exhibit: Attached hereto
(a)(2) A separate certification for each principal executive officer and principal financial officer of the registrant as required by Rule 30a-2(a) under the Act (17 CFR 270.30a-2(a)): Attached hereto
(a)(3) Any written solicitation to purchase securities under Rule 23c-1 under the Act (17 CFR 270.23c-1) sent or given during the period covered by the report by or on behalf of the registrant to 10 or more persons: Not applicable
(a)(4) Change in the registrant’s independent public accountants: Not applicable
(b) Certifications required by Rule 30a-2(b) under the Act (17 CFR 270.30a-2(b)): Attached hereto
Exhibit 99.CODE ETH Code of Ethics
Exhibit 99.CERT Certifications required by Rule 30a-2(a) under the Act
Exhibit 99.906CERT Certifications required by Rule 30a-2(b) under the Act
SIGNATURES
Pursuant to the requirements of the Securities Exchange Act of 1934 and the Investment Company Act of 1940, the registrant has duly caused this report to be signed on its behalf by the undersigned, thereunto duly authorized.
| (Registrant) | Williamsburg Investment Trust | | |
| | | | |
| By (Signature and Title)* | /s/ David James | |
| | | David James, Secretary | |
| | | | |
| Date | June 2, 2021 | | |
| | | | |
| Pursuant to the requirements of the Securities Exchange Act of 1934 and the Investment Company Act of 1940, this report has been signed below by the following persons on behalf of the registrant and in the capacities and on the dates indicated. |
| | | | |
| By (Signature and Title)* | /s/ John T. Bruce | |
| | | John T. Bruce, President | |
| | | (FBP Equity & Dividend Plus Fund and FBP Appreciation & Income Opportunities Fund) | |
| | | | |
| Date | June 2, 2021 | | |
| | | | |
| By (Signature and Title)* | /s/ Thomas W. Leavell | |
| | | Thomas W. Leavell, President | |
| | | (The Government Street Equity Fund, The Government Street Mid-Cap Fund) | |
| | | | |
| Date | June 2, 2021 | | |
| | | | |
| By (Signature and Title)* | /s/ Charles M. Caravati III | |
| | | Charles M. Caravati III, President | |
| | | (The Jamestown Equity Fund) | |
| | | | |
| Date | June 2, 2021 | | |
| | | | |
| By (Signature and Title)* | /s/ John P. Ackerly IV | |
| | | John P. Ackerly IV, President | |
| | | (The Davenport Core Fund, Davenport Value & Income Fund, Davenport Equity Opportunities Fund, Davenport Small Cap Focus Fund and the Davenport Balanced Income Fund) | |
| | | | |
| Date | June 2, 2021 | | |
| | | | |
| By (Signature and Title)* | /s/ Mark J. Seger | |
| | | Mark J. Seger, Treasurer and Principal Financial Officer | |
| | | | |
| Date | June 2, 2021 | | |
* Print the name and title of each signing officer under his or her signature.