UNITED STATES
SECURITIES AND EXCHANGE COMMISSION
Washington, D.C. 20549
FORM N-CSR
CERTIFIED SHAREHOLDER REPORT OF REGISTERED
MANAGEMENT INVESTMENT COMPANIES
| Investment Company Act file number | 811-05685 | |
| Williamsburg Investment Trust |
| (Exact name of registrant as specified in charter) |
| 225 Pictoria Drive, Suite 450 Cincinnati, Ohio | 45246 |
| (Address of principal executive offices) | (Zip code) |
John H. Chilton, Esq.
| Sullivan & Worcester LLP 1666 K Street NW Washington, D.C. 20006 |
| (Name and address of agent for service) |
| Registrant's telephone number, including area code: | (513) 587-3400 | |
| Date of fiscal year end: | March 31 | |
| | | |
| Date of reporting period: | March 31, 2023 | |
Form N-CSR is to be used by management investment companies to file reports with the Commission not later than 10 days after the transmission to stockholders of any report that is required to be transmitted to stockholders under Rule 30e-1 under the Investment Company Act of 1940 (17 CFR 270.30e-1). The Commission may use the information provided on Form N-CSR in its regulatory, disclosure review, inspection, and policymaking roles.
A registrant is required to disclose the information specified by Form N-CSR, and the Commission will make this information public. A registrant is not required to respond to the collection of information contained in Form N-CSR unless the Form displays a currently valid Office of Management and Budget ("OMB") control number. Please direct comments concerning the accuracy of the information collection burden estimate and any suggestions for reducing the burden to the Secretary, Securities and Exchange Commission, 450 Fifth Street, NW, Washington, DC 20549-0609. The OMB has reviewed this collection of information under the clearance requirements of 44 U.S.C. § 3507.
Item 1. Reports to Stockholders.
(a)
| | |
| | |
| | |
| | |
| | |
| | |
| | |
| | |
| | |
| | |
 | Davenport Core Leaders Fund (DAVPX) |
| | |
| | Davenport Value & Income Fund (DVIPX) |
| | |
| | Davenport Equity Opportunities Fund (DEOPX) |
| | |
| | Davenport Small Cap Focus Fund (DSCPX) |
| | |
| | Davenport Balanced Income Fund (DBALX) |
| | |
| | |
| | |
| | |
| ANNUAL REPORT |
| | |
| | |
| March 31, 2023 |
| | |
| | |
| | |
| | |
| | |
| | |
| | |
| | |
| | |
| | |
| | |
| | |
| | |
| | |
| | |
| | |
| | |
| | |
| THE DAVENPORT FUNDS | |
| LETTER TO SHAREHOLDERS (Unaudited) | March 31, 2023 |
Dear Shareholders,
Stocks managed to perform surprisingly well in the fiscal fourth quarter despite the double whammy of hawkish talk from the Federal Reserve (the “Fed”) and turbulence in the banking system. However, it wasn’t always smooth sailing. In early February, the S&P 500® Index was up 9% and looked to be on its way to a swift recovery from 2022 losses. However, this proved too good to be true, as recession fears ultimately resurfaced and prompted stocks to decline from early February to mid-March. After a late-March rally, the S&P 500 and Russell 2000® Index finished the final quarter up 7.50% and 2.74%, respectively. Growth-oriented areas like technology (up 21.82%) dramatically outperformed more cyclical sectors such as energy (down 4.67%) and financials (down 5.56%) as recession risks grew.
What caused the wild ride? Stocks started the fiscal fourth quarter with a bang as hopes for an economic “soft landing” sprung eternal. But, inflationary pressure proved more persistent than hoped and prompted the Fed to renew its commitment to containing price increases with interest rate hikes. “Hawkish” policy aimed at subduing inflation naturally raises the risk of economic slowdown. As an important aside, higher interest rates have also made fixed income vehicles (Treasuries, CDs, money market funds etc.) more competitive when compared to stocks. For sure, it makes more sense to consider a 6-month T-bill when yielding nearly 5% as compared to roughly 1% a year ago.
Later in the final quarter, stress in our banking system took center stage. Silicon Valley Bank (“SVB”) collapsed after large investment losses and deposit flight caused its equity value to evaporate. While a somewhat unusual situation, SVB’s failure gave way to pressure elsewhere in the regional banking system and created fear of broader financial contagion. The mess appears to have been contained with the help of the federal government. Nonetheless, it has brought about an incremental threat to the economy. Indeed, deposit flight and heightened regulation may impair the ability for many banks to lend, and capital could become more expensive. This is not to mention the negative impact to consumer confidence created by these recent headlines.
Recession risks have clearly risen as a result of the banking debacle and most economists now believe there’s greater than a 50% chance economic growth turns negative before year end. However, there is a positive flipside to this coin that supported stocks late in the quarter. While still focused on quelling inflation, the Fed now seems more attuned to heightened economic risks and may start to slowly back away from restrictive policy if inflation subsides alongside economic duress. At a minimum, it already appears the pace of interest rate hikes is peaking. Some are even predicting interest rate cuts within the next 12 months. Barring a severe recession, “looser” policy and lower interest rates should be a positive for asset classes such as stocks.
Putting it all together creates a tricky conundrum for investors. On one hand, we clearly have ongoing inflation pressures as well as heightened economic risk. On the other hand, the interest rate hikes that were the primary headwind for stocks in 2022 may be coming to an end. Acknowledging these fighting forces, we reiterate our comments from year end. We noted that
the stock market’s overall valuation level seemed fair (i.e. not overly cheap or expensive) and returns should moderate when compared to the turbo-charged “cheap money” era. Adding to that, we also think investing in high quality business models with durable growth and low debt levels makes more sense than ever. We continue to seek out such opportunities at reasonable prices and have added some new names to our Funds.
In further news, we are pleased to announce we have moved to a team management structure for both the Core Leaders and Value & Income Funds as of March 31, 2023. Individual Fund decisions will be made at a team level similar to the Equity Opportunities Fund and Small Cap Focus Fund. We believe having dedicated teams will allow for greater flexibility, focus and accountability when managing the Funds. The new Fund teams are as follows:
| ● | Davenport Core Leaders Fund: George Smith, Chris Pearson, Jeff Omohundro |
| ● | Davenport Value & Income Fund: George Smith, Adam Bergman, Mike Beall |
While the new teams will take on the responsibility of daily investment decisions, it is important to acknowledge the Investment Policy Committee (“IPC”), which includes the members of the Fund teams, will remain an integral part of Davenport Asset Management. The IPC will continue to provide guidance, ideas and market perspective on a weekly basis.
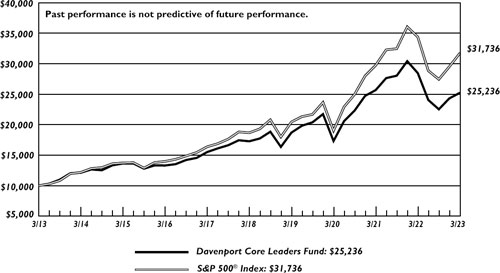
Davenport Core Leaders Fund
The following chart represents Davenport Core Leaders Fund’s (DAVPX) performance and the performance of the S&P 500® Index*, the Core Leaders Fund’s primary benchmark, for the periods ended March 31, 2023.
| | | | | | | | Fiscal Year |
| | | | | | | Since | 2023 |
| | Fiscal Q4 | | | | | Inception | Expense |
| | 2022 | 1 Year | 3 Years** | 5 Years** | 10 Years** | 1/15/98** | Ratio |
| Core Leaders Fund | 3.77% | -11.37% | 13.36% | 7.86% | 9.70% | 7.02% | 0.87% |
| S&P 500® Index* | 7.50% | -7.73% | 18.60% | 11.19% | 12.24% | 7.97% | |
30-Day SEC Yield: 0.67%; Expense Ratio in current prospectus: 0.86%
Past performance is no guarantee of future results. Investment return and principal value of an investment will fluctuate so that an investor’s shares, when redeemed, may be worth more or less than their original cost. Current performance may be lower or higher than the performance data quoted. Performance data, current to the most recent month-end, may be obtained by calling 1-800-281-3217.
| * | The S&P 500® Index is comprised of 500 U.S. stocks and is an indicator of the performance of the overall U.S. stock market. Standard & Poor’s Financial Services LLC, a division of S&P Global, is the source and owner of the registered trademarks related to the S&P 500® Index. An investor cannot invest in an index and its returns are not indicative of the performance of any specific investment. |
| ** | Returns greater than one year are annualized. |
The Davenport Core Leaders Fund (DAVPX) appreciated 3.77% during the final fiscal quarter of 2023, lagging the 7.50% advance for the S&P 500® Index. For the fiscal year, the Fund declined 11.37% compared to the 7.73% decline for the Index. Frustratingly, this quarter’s shortfall had
much to do with what we didn’t own (or were underweight), as investors rotated into the perceived safety of the largest growth/tech index constituents amid concerns of slowing growth and financial instability (more on this below).
Before digging into the specifics of performance and activity, we wanted to address our decision to change the Fund’s name from the Core Fund to the Core Leaders Fund effective March 31st. It’s important to note that this change does not signify a shift in strategy or approach. Rather, we feel “Core Leaders” better reflects the Fund’s mission to be a one-stop shop for the world’s most established, dominant and durable franchises. While our discipline around quality, returns on capital, valuation and risk may cause deviations from the S&P 500® at times, we believe our approach will be a positive differentiator over time.
With respect to performance, underweight stances in Apple, Inc. (AAPL) and Microsoft Corp. (MSFT), combined with a lack of exposure to highflyers such as Tesla, Inc. (TSLA) and NVIDIA Corp. (NVDA) accounted for more than half of the Fund’s relative shortfall. Despite serving as headwinds to relative results, AAPL and MSFT were among the Fund’s top contributors. Combined, these two companies represented nearly 14% of the S&P 500®at quarter end. Microsoft is our largest position and we remain sanguine on the stock given its diversified cash flow streams, recurring revenue model and reasonable valuation. Meta Platforms, Inc. (META) was the Fund’s top contributor, increasing more than 76% alongside strong results aided by significant cost-cutting initiatives. We are pleased to have added to the position at a timely juncture early in the year. Financial services firm Charles Schwab Corp. (SCHW), a new addition, was the Fund’s biggest detractor. Though we continue to believe in the durability of Schwab’s operating model, recent banking turmoil and interest rate volatility have cast a pall of uncertainty over the firm’s near-term earnings power. Elsewhere, energy exposure served as a detractor with holdings in Pioneer Natural Resources Co. (PXD) and EOG Resources, Inc. (EOG) posting declines. We elected to add to our position in EOG on weakness given its status as a low-cost domestic operator with a long reserve life, strong balance sheet and high returns on capital.
Early in the quarter we initiated a new position in Intercontinental Exchange, Inc. (“ICE”), a global provider of market infrastructure (e.g. security exchanges), data/analytics, and mortgage technology solutions. Shares underperformed following the announced acquisition of mortgage software provider Black Knight, Inc. (BKI). The FTC moved to block the acquisition on the basis of consumer protection. We view the recent weakness as an opportunity to gain access to a high return, wide moat business at a discounted valuation. Regardless of the transaction’s outcome, we believe any resolution will eliminate a key headline headwind for the stock. If the deal goes through, ICE will increase its reach within the mortgage technology industry. If the deal is blocked, ICE could immediately resume share repurchases, pay down debt, and re-focus on its core businesses. Ultimately, ICE is well positioned to benefit from secular tailwinds including elevated market volatility, demand for risk management products, increasing “datafication” and “electronification” within financial services, and passive investing.
In March, we established a position in Republic Services, Inc. (RSG), the #2 provider of solid waste disposal services in the U.S. Solid waste is a very wide-moat, defensive business. New landfill capacity requires significant regulatory permitting, allowing annuity-like revenue streams that are resilient through a variety of economic cycles. The recent investor rotation into more pro-cyclical names resulted in relative weakness in solid waste company valuations. We initiated a position in RSG at a discount to both peers and its own historical valuation. The combination of
strong pricing power and modest volume growth should allow RSG to compound free cash flow at a low-double-digit rate. Including the ~1.5% dividend yield, we think the stock can produce a 10%-15% annual total return with very good visibility.
In closing, we were disappointed to have encountered unfavorable market dynamics during the quarter, but remain optimistic about the quality and positioning of the Fund. We continue to add world-class businesses at what we believe to be attractive prices. Ultimately, we feel this differentiated collection of “Core Leaders” will deliver attractive returns with an eye towards minimizing risk.
The following are transactions performed in the Core Leaders Fund for the quarter ended March 31, 2023.
Recent Purchases:
Accenture PLC (ACN) - We expect ACN to extend its track record of predictable growth, strong cash generation and prudent capital allocation. With the stock trading below long-term averages, we thought it was timely to add exposure and elected to add to our position.
Charles Schwab Corp. (SCHW) - SCHW is a financial services company offering banking, investing, consulting, and wealth management advisory services to both retail and institutional clients. We feel the company has many “levers” to pull that should drive high-teens earnings growth and decided to establish a position in a high quality, defensive, market leader.
Charles Schwab Corp. (SCHW) – Aside from the failure of Silicon Valley Bank (SVB) and Signature Bank, we believe SCHW’s size, diversified retail client base, and access to external funding sources insulate it. We believe SCHW’s operating model remains intact, and elected to increase the portfolio’s position.
Costco Wholesale Corp. (COST) - We believe COST is a great business that not only provides above-average growth, but also defensive characteristics given its membership model that drives predictable sales and cash flow. We elected to beef up the position on the continued weakness and at a valuation significantly below its historical average.
EOG Resources, Inc. (EOG) - EOG has pulled back from the highs seen in November alongside falling oil prices and general softness in the energy sector. We believe this weakness offers an attractive opportunity to increase our energy exposure and elected to add to our position.
EOG Resources, Inc. (EOG) - EOG has been a tremendous value creator over time and has a great set of low-cost, low-risk U.S. shale assets. We think this is a good time to add to our position again.
Intercontinental Exchange, Inc. (ICE) - Investors have often misunderstood some of ICE’s acquisitions in the past and we think any regulatory resolution, regardless of the outcome, would remove ICE from the penalty box and allow for price appreciation and multiple expansion. We think this offers an opportunity to purchase a position in the dominant, well-run, bellwether franchise.
Meta Platforms, Inc. (META) - META has recently shown signs of improved cost discipline and we expect the company to remain focused on further cost controls going forward. Due to this, we elected to add to our position.
Republic Services, Inc. (RSG) – RSG is the #2 provider of solid waste disposal services in the U.S. with 14MM customers across 47 states. Long-term, we expect there is potential upside to estimates from renewable natural gas, motivating our decision to initiate a position.
Walt Disney Co. (DIS) - We expect the CEO will help DIS to reinvigorate growth, refocus its strategy across all segments, and return the company back to its former glory. For this reason, we elected to add to our position.
Walt Disney Co. (DIS) - Following our earlier add in the quarter, the CEO inferred that DIS may be open to selling its stake in Hulu which would allow the company to pay off much of its debt and focus on the core businesses. We are confident in management’s ability to deliver on its initiatives and elected to add again.
Recent Sales:
Alphabet, Inc. (GOOG/GOOGL) - GOOG/GOOGL is currently navigating a challenging ad environment, slowing Cloud growth, and yet another lawsuit from the Department of Justice. We think it’s prudent to take some off the table.
Apple, Inc. (AAPL) - We are becoming concerned about AAPL’s ability to continue to grow off of such a large base, and the company’s growth/financials may be pressured throughout the year. We elected to chip the position, but feel comfortable maintaining a smaller position for the longer-term.
Booking Holdings, Inc. (BKNG) - We feel the shares are fairly valued at current levels given the company does face potential headwinds. All told, we think risk/reward profile is more balanced at current levels and elected to sell our position.
CarMax, Inc. (KMX) - It is difficult to part ways with a long-standing holding and a quality business that we believe will continue to take share within the used car industry. However, we feel the stock carries more downside than upside potential.
T-Mobile US, Inc. (TMUS) - After the outsized performance of late, we feel the profile is more balanced given the possibility for an industry-wide slowdown in subscriber growth. We think the upside from here is limited and elected to exit the position.
Union Pacific Corp. (UNP) – Mid-quarter, UNP provided an update on the timing of its active leadership succession planning. While there is speculation that the former UNP Chief Operating Officer could be the front-runner, it would likely be well received so we elected to chip our position on near-term strength.
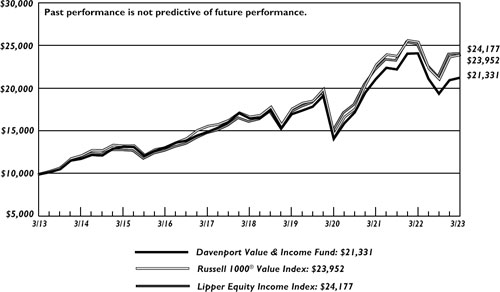
Davenport Value & Income Fund
The following chart represents Davenport Value & Income Fund (DVIPX) performance and the performance of the Russell 1000® Value Index*, the Value & Income Fund’s primary benchmark, the S&P 500® and the Lipper Equity Income Index for the periods ended March 31, 2023.
| | | | | | | | Fiscal |
| | | | | | | Since | Year 2023 |
| | Fiscal Q4 | | | | | Inception | Expense |
| | 2022 | 1 Year | 3 Years** | 5 Years** | 10 Years** | 12/31/10** | Ratio |
| Value & Income Fund | 1.38% | -11.81% | 14.64% | 5.19% | 7.87% | 9.37% | 0.87% |
| Russell 1000® Value Index | 1.01% | -5.91% | 17.93% | 7.50% | 9.13% | 9.89% | |
| S&P 500® Index* | 7.50% | -7.73% | 18.60% | 11.19% | 12.24% | 12.34% | |
| Lipper Equity Income Index* | 0.23% | -4.53% | 16.99% | 8.34% | 9.23% | 7.68% | |
30-Day SEC Yield: 2.07%; Expense Ratio in current prospectus: 0.87%
Past performance is no guarantee of future results. Investment return and principal value of an investment will fluctuate so that an investor’s shares, when redeemed, may be worth more or less than their original cost. Current performance may be lower or higher than the performance data quoted. Performance data, current to the most recent month-end, may be obtained by calling 1-800-281-3217.
| * | The Russell 1000® Value Index measures the performance of the Russell 1000 companies with lower price-to-book ratios and lower forecasted growth values. London Stock Exchange Group PLC and its group undertakings (collectively, the “LSE Group”). © LSE Group 2023. FTSE Russell is a trading name of certain LSE Group companies. “Russell®” is a trademark of the relevant LSE Group companies and is used by any other LSE Group company under license. All rights in the FTSE Russell indexes or data vest in relevant LSE Group company which owns the index or the data. Neither LSE Group nor its licensors accept any liability for any errors or omissions in the indexes or data and no party may rely on any indexes or data contained in this communication. No further distribution of data from LSE Group is permitted without the relevant LSE Group company’s express written consent. The LSE Group does not promote/sponsor/endorse the content of this communication. The S&P 500® Index is comprised of 500 U.S. stocks and is an indicator of the performance of the overall U.S. stock market. The S&P 500® Index is comprised of 500 U.S. stocks and is an indicator of the performance of the overall U.S. stock market. Standard & Poor’s Financial Services LLC, a division of S&P Global, is the source and owner of the registered trademarks related to the S&P 500® Index. The Lipper Equity Income Index is an unmanaged index of the 30 largest Funds in the Lipper Equity Income Fund category. An investor cannot invest in an index and its returns are not indicative of the performance of any specific investment. |
| ** | Returns greater than one year are annualized. |
The Davenport Value & Income Fund (DVIPX) increased 1.38% in the fiscal fourth quarter. This compares to the Fund’s primary benchmark, the Russell 1000® Value Index, which increased 1.01% in the quarter as well as the S&P 500® Index, which increased 7.50%. For the fiscal year, the Fund declined 11.81%, behind the Russell 1000 Value® Index’s 5.91% decline. The S&P 500® Index declined 7.73% in fiscal 2023.
After playing relatively decent defense in 2022, value stocks took a breather in the fiscal fourth quarter as heightened economic uncertainty led to a repositioning into more durable growth names (NASDAQ® +16.8% in the quarter). This can be attributed to several related factors, including the failure of several bespoke banks that spooked investors about banks generally. Banks comprise a sizable percentage of most value indices. Further, the late-quarter decline in intermediate- and
longer-term interest rates tended to benefit longer-duration (high-growth technology) assets the most. Despite this backdrop, we were pleased to outperform our benchmark in the quarter and continue to believe the Fund is well positioned.
Our Fund’s performance for the fiscal fourth quarter was led by an eclectic mix of names including Watsco Inc. (WSO), Fairfax Financial Holdings Ltd. (FRFHF), Capital One Financial Corp. (COF), and QUALCOMM, Inc. (QCOM). Similarly, key detractors spanned multiple sectors, led by SL Green Realty Corp. (SLG), Johnson & Johnson (JNJ), Fidelity National Information Systems, Inc. (FIS), and Norfolk Southern Corp. (NSC). Many of the moves by these stocks were due to company specific events (such as the NSC train derailment in Ohio) as opposed to sector-based influences. Heightened volatility during the quarter gave us attractive opportunities to improve the portfolio’s positioning.
We initiated a position in Sanofi S.A. (SNY), one of the world’s largest drug and vaccine makers. Sanofi’s business is comprised of pharmaceuticals, including blockbuster Dupixent (dermatology/asthma uses), vaccines (including flu and polio/pertussis), and consumer products (including brands such as Allegra, Aspercreme, and IcyHot). Sanofi is in the middle of a margin enhancement program designed to drive its operating margin from 30% to 32% by 2025. If successful, which we think it will be, the program would drive an incremental 8% to profits and cash flow. The company has grown its dividend for 28 consecutive years and yields ~2.5%. At the time of our purchase, SNY traded at ~10x earnings, which we consider attractive on the current portfolio, not to mention the potential of 3-5 products in the pipeline.
We also made two transactions that we view as reducing the balance sheet risk and improving the overall risk/reward of the Fund. First, while a bit early, we initiated a position in Fidelity National Information Services, Inc. (FIS), the largest payments processing company in the world. Several temporary headwinds afforded us the ability to buy the stock at low double-digit earnings multiple, near a generational low. With an activist involved and a 10% dividend growth rate, we see the opportunity for solid shareholder returns as the headwinds abate. Relatedly, we sold our position in Capital One Financial Corp. (COF) as the stock spiked amid a view that the company would be among those that would benefit the most from a potential “soft landing” of the economy. Second, we sold our position in Kraft Heinz Co. (KHC) to fund our purchase of J.M. Smucker Co. (SJM). Kraft has struggled amidst high input costs and a years-long business turnaround. Smucker, a leading food and beverage producer in attractive end markets such as coffee, consumer food/snacks, and pet food, is also undergoing a portfolio transformation, but one we think has a high likelihood of success. The company has increased its dividend for 21 consecutive years and yields ~2.7%.
There were several other chips and additions during the quarter with the most notable being increasing our position in Elevance Health, Inc. (ELV). Shares of Elevance and other managed care companies lagged in the final quarter as investors focused on higher-beta names. The company continues to evolve its business model in the mold of peer UnitedHealth Group Inc. (UNH), which should drive double-digit earnings growth over the next several years. With the stock trading at 14x earnings, we used the weakness to add to our position.
In sum, the volatile markets in the fiscal fourth quarter offered opportunity to upgrade the risk/ reward profile of the Fund at attractive prices. With a mix of traditional value and dividend payers, as well as a renewed focus on dividend growth, we like the collection of businesses we own.
The average constituent in the Value & Income Fund has raised its dividend approximately 9% year-over-year, providing shareholders with a “pay raise” well in excess of the prevailing level of inflation.
The following are transactions performed in Value & Income Fund for the quarter ended March 31, 2023.
Recent Purchases:
Diageo PLC (DEO) - As sales normalize, we think DEO should regain its 5%-7% organic growth range. This, if coupled with continued margin expansion and share repurchases could drive solid double-digit earnings per share (EPS) growth. For these reasons, we elected to add to our position.
Elevance Health, Inc. (ELV) – ELV (formerly Anthem) continues to evolve its business model in the mold of larger peer United Health (UNH). Thus, we elected to add to our position.
Elevance Health, Inc. (ELV) – Shares of ELV and other managed care companies have lagged this year as investors have focused on higher-beta names and new proposed Medicare Advantage rates were less than expected. We believe this sell-off has given us a prime opportunity to add to our position.
Fidelity National Information Services, Inc. (FIS) - Our purchase comes at a time when FIS shares are trading near 10x earnings and a 40% discount to the S&P 500®, both generational lows. FIS’ discount reflects a recent flattening in the company’s earnings trajectory, which we believe largely owes to temporary factors.
J.M. Smucker Co. (SJM) – SJM is a leading food and beverage producer. SJM is undergoing a portfolio transformation, including the recently announced sale of some low-margin pet food businesses, to focus on attractive long-term end markets. We are attracted to the company’s 21 consecutive years of dividend increases and elected to initiate a position.
L3Harris Technologies. Inc. (LHX) - We last transacted in LHX in March of 2022, chipping our position following the Russian invasion of Ukraine. Recently, defense stocks have sold off on headline budgetary concerns. We think now is a good time to bring LHX to a more normal sized position by adding to it.
NextEra Energy, Inc. (NEE) - Last year it was disclosed that Florida Power & Light (FPL) is being investigated for potential violations of campaign finance laws in Florida. The company launched an internal investigation and disclosed that nothing illegal was found. However, at the same time they announced the abrupt retirement of the CEO, Eric Silagy, which worried investors that there is another shoe to drop. The monetary risk seems small, but the bigger risk, in our opinion, is potentially souring relations with the extremely favorable Florida regulators. We believe the stock reaction is overdone and elected to use the weakness to add to our position in the nation’s premier utility.
Oracle Corp. (ORCL) – ORCL is one of the largest software companies in the world providing software and services that address critical functions across the enterprise IT environment. It is our view that if ORCL achieves its financial targets, the company can grow revenue high-single digits, expand margins roughly 300 basis points, and deliver greater than 10% annual EPS growth. We believe the risk reward is favorable and elected to initiate a position.
Sanofi S.A. (SNY) – We elected to initiate a position in the France-based company, SNY. They are one of the world’s largest drug and vaccine makers, and its largest drug is Dupixent, which is annualizing at nearly 10 billion Euros in revenue. Beyond pharmaceuticals, SNY is also a world leader in vaccines and has grown its dividend (in Euros) for 28 consecutive years. In our opinion, we feel the company’s balance sheet is strong and points to ample firepower for further dividend increases, as well as potential acquisitions.
Recent Sales:
Bunge Ltd. (BG) - Shares of BG advanced following news that the stock will be included in the S&P 500® Index. We elected to take advantage of the short-term move and chipped our position.
Capital One Financial Corp. (COF) - We think the stock is on the riskier end of the spectrum given its subprime exposure. As such, we reduced the overall risk of the portfolio by chipping our position.
Cannae Holdings, Inc. (CNNE) - CNNE has been a frustrating stock as the market has failed to close the massive discount to CNNE’s sum-of-the parts. CNNE’s lack of a dividend and current market cap make it less of a fit in this Fund. Given trading liquidity, our chip was smaller than typical.
Coterra Energy, Inc. (CTRA) - While we continue to be believers in the long-term structural case for natural gas and the company is returning significant cash to shareholders, we think the stock could be range bound for the foreseeable future. Thus, we elected to reduce our above-average position to a more normal.
Digital Realty Trust, Inc. (DLR) – Shares of DLR have struggled under our ownership despite fairly robust industry demand and pricing trends. While we never enjoy selling a position for a loss, we feel there is risk of further deterioration in the business fundamentals and elected to sell the position.
Gaming & Leisure Properties, Inc. (GLPI) - Shares of GLPI have been a stellar performer over the last year. The gaming REIT asset class has proven more resilient than others and while we continue to like the business, the upward rerating in the stock has made the yield less attractive vs. other alternatives. Therefore, we elected to chip our position.
Kraft Heinz Co. (KHC) – Despite the attractive dividend yield, KHC has been an underwhelming stock since our purchase nearly a year ago. As such, we elected to sell the position.
SL Green Realty Corp. (SLG) – We initially purchased SLG as a play on the “return to office” in New York City. Unfortunately, this did not play out as quickly as we anticipated and the Fed’s tightening cycle pressured cap rates and made it tougher to monetize properties. As such, we elected to take the loss and sold our position.
Watsco, Inc. (WSO) – We continue to have a favorable long-term view of WSO as its high cash generation and recession resistant business model, coupled with structural industry drivers, should drive long-term growth and returns. As such, we elected to take some profits and chip our position.
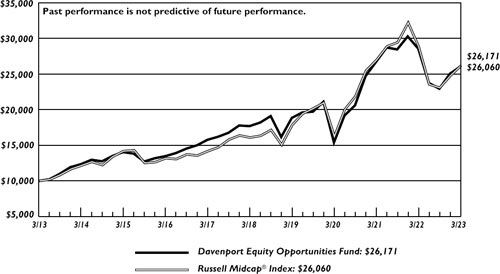
Davenport Equity Opportunities Fund
The following chart represents Davenport Equity Opportunities Fund (DEOPX) performance and the performance of the Russell Midcap® Index*, the Fund’s primary benchmark, and the S&P 500® Index* for the periods ended March 31, 2023.
| | | | | | | | Fiscal |
| | | | | | | Since | Year 2023 |
| | Fiscal Q4 | | | | | Inception | Expense |
| | 2022 | 1 Year | 3 Years** | 5 Years** | 10 Years** | 12/31/10** | Ratio |
| Equity Opportunities Fund | 5.72% | -9.25% | 17.26% | 10.22% | 10.10% | 11.35% | 0.87% |
| Russell Midcap® Index | 4.06% | -8.78% | 19.20% | 8.05% | 10.05% | 10.51% | |
| S&P 500® Index* | 7.50% | -7.73% | 18.60% | 11.19% | 12.24% | 12.34% | |
30-Day SEC Yield: 0.30%; Expense Ratio in current prospectus: 0.88%
Past performance is no guarantee of future results. Investment return and principal value of an investment will fluctuate so that an investor’s shares, when redeemed, may be worth more or less than their original cost. Current performance may be lower or higher than the performance data quoted. Performance data, current to the most recent month-end, may be obtained by calling 1-800-281-3217.
| * | The Russell Midcap® Index measures the performance of the 800 smallest companies in the Russell 1000, which represent approximately 25% of the total market capitalization of the Russell 1000®. London Stock Exchange Group PLC and its group undertakings (collectively, the “LSE Group”). © LSE Group 2023. FTSE Russell is a trading name of certain LSE Group companies. “Russell®” is a trademark of the relevant LSE Group companies and is used by any other LSE Group company under license. All rights in the FTSE Russell indexes or data vest in relevant LSE Group company which owns the index or the data. Neither LSE Group nor its licensors accept any liability for any errors or omissions in the indexes or data and no party may rely on any indexes or data contained in this communication. No further distribution of data from LSE Group is permitted without the relevant LSE Group company’s express written consent. The LSE Group does not promote/sponsor/endorse the content of this communication. The S&P 500® Index is comprised of 500 U.S. stocks and is an indicator of the performance of the overall U.S. stock market. Standard & Poor’s Financial Services LLC, a division of S&P global, is the source and owner of the registered trademarks related to the S&P 500® Index. An investor cannot invest in an index and its returns are not indicative of the performance of any specific investment. |
| ** | Returns greater than one year are annualized. |
The Davenport Equity Opportunities Fund (DEOPX) enjoyed a solid end to the year, advancing 5.72% and outpacing the 4.06% gain for the Russell Mid Cap® Index in the fiscal fourth quarter. For the fiscal year, the Fund declined 9.25% compared to the 8.78% decline for the benchmark.
Performance was fueled by an eclectic mix of companies that benefited from idiosyncratic drivers. DraftKings, Inc. (DKNG) was the Fund’s top contributor as the shares gained north of 65% alongside improved results and better messaging around the company’s path to profitability. Fairfax Financial Holdings Ltd. (FRFHF), Watsco, Inc. (WSO) and Evoqua Water Technologies Corp. (AQUA) were also key contributors. In the case of Evoqua, the company announced an agreement to be acquired by another Fund holding, Xylem, Inc. (XYL), in an all-stock deal. While we used recent strength to take some profits, we elected to retain a modest position given our comfort with the risk/reward profile at XYL. Dish Network Corp. (DISH), Sherwin-Williams Co. (SHW) and Black Knight, Inc. (BKI) were among the Fund’s top detractors. In addition, our
recent introduction of J.B. Hunt Transportation Services, Inc. (JBHT) into the strategy proved to be somewhat ill-timed in the short term. However, as we highlight below, we are quite optimistic about the company’s longer-term prospects.
As mentioned above, we built a position in J.B. Hunt during the fiscal fourth quarter. We think J.B. Hunt is a best-in-class transportation and logistics solutions provider with industry leading scale across a diversified portfolio. The company is the market share leader in both intermodal (freight on trains) and dedicated businesses which we expect to account for the majority of company revenue and earnings growth over the next several years. We believe both segments can grow in 2023 and are well positioned to benefit from multi-year secular growth drivers in their respective end-markets. At the same time, J.B. Hunt has company specific catalysts set to augment industry growth, which, in our opinion sets the stage for an attractive compounding growth story. The company maintains a conservative balance sheet and the management team has a solid track record of being prudent capital allocators with a returns-focused mindset. While the company must navigate near-term weakness in the freight market and possible pressure on intermodal pricing, we believe the long-term runway for growth is compelling and there could be upside to consensus earnings estimates over the next few years.
We initiated a position in Mobileye Global, Inc. (MBLY) at year end 2022 and added to it during the fiscal fourth quarter. Mobileye Global Inc. is a leader in developing driver assistance technologies that range from base Advanced Driver Assistance Systems (ADAS) functions like lane departure warnings and assisted braking, to fully autonomous applications with little to no human involvement. Mobileye has an estimated 70% share of the ADAS market today. We note that less than 60% of new vehicles are equipped with some form of ADAS technology, leaving ample runway for growth across the company’s core business. As more premium ADAS solutions begin to ramp over the next few years, the content per vehicle story becomes quite compelling with the company’s more advanced solutions carrying ~30x more revenue per vehicle than its legacy solutions. We think successful adoption of Mobileye’s premium ADAS solutions, particularly with the new SuperVision product, will lay the foundation for the next stage of scalable, autonomous applications. We are also encouraged by recent design wins and backlog announcements which have begun to outline a path to powerful earnings growth and cash generation over the next several years.
To close, we are pleased to have ended the fiscal year on a good note and remain excited about the Fund’s positioning. Though market conditions have been challenging of late, we have used recent volatility to take advantage of rare entry points in exceptional businesses with exciting long-term value creation opportunities.
The following are transactions performed in the Equity Opportunities Fund for the quarter ended March 31, 2023.
Recent Purchases:
J.B. Hunt Transport Services, Inc. (JBHT) – We think JBHT is a best in class transportation and logistics solutions provider with industry leading scale across a diversified portfolio. The company is the market share leader in both intermodal and dedicated businesses which we expect to account for the majority of company revenue and earnings growth over the next several years. We elected to establish a position in this high-quality transport operator.
J.B. Hunt Transport Services, Inc. (JBHT) – JBHT maintains a conservative balance sheet and the management team has a solid track record of being prudent capital allocators with a returns focused mindset. As a kicker, if JBHT is able to reaccelerate intermodal volumes we could see valuation re-rate higher over time. The shares have pulled back modestly from our initial purchase and we elect to increase our position size on recent weakness.
J.B. Hunt Transport Services, Inc. (JBHT) – We continue to think JBHT is a best in class transportation and logistics solutions provider. While the company must navigate some near-term challenges such as the recent weakness in the freight market and possible near-term pressure on intermodal pricing, we believe the long-term runway for growth is compelling. The shares have pulled back modestly again and we elected to increase our position for a second time.
Live Nation Entertainment, Inc. (LYV) – The stock is essentially unchanged since our last add in the wake of news of a Department of Justice investigation into potential anti-competitive practices within the Ticketmaster platform. We expect the company to echo its commentary at the Liberty Media investor day, where management increased its guidance and alluded to sustained momentum and visibility across the business. Ultimately, we continue to view LYV as a dominant business, and elected to add to our position.
Mobileye Global, Inc. (MBLY) – MBLY’s co-founder and CEO, Amnon Shashua, recently presented at the Consumer Electronics Show in Las Vegas, and we came away with increased conviction in the company’s multi-year growth strategy. The new SuperVision platform, MBLY’s consumer autopilot driving system, was a key highlight at the event. We think this technology and platform can be a natural bride to self-driving vehicles on the consumer side as well as commercial applications like robo-taxis. Shares of MBLY have pulled back modestly since our initial purchase and we elected to add to our position in the stock.
Recent Sales:
Coterra Energy, Inc. (CTRA) – CTRA still offers attractive return of capital via a dividend; however, natural gas prices have declined precipitously and could put a lid on the stock. We still believe in the structural long-term case for natural gas; however, the near-to-intermediate outlook is muddied so we elected to sell our position.
DraftKings, Inc. (DKNG) – We elected to use recent strength in the shares to take some profits. We think the company is likely to be a long-term winner in the sports betting industry and the stock should continue to work as the path to profitability gets closer.
Evoqua Water Technologies Corp. (AQUA) – Xylem (XYL, which we also own in the portfolio), announced that it would acquire AQUA in a $7.5B all-stock deal. We had thought this deal was a possibility since our initial purchase and believe it makes great strategic sense for the two companies. However, the combined position was larger than we would like, hence our decision to chip.
Fairfax Financial Holdings Ltd. (FRFHF) – FRFHF was a top performer for the strategy in 2022. The position size had grown to a value north of 7.5% at which point we felt it appropriate to dial back its weighting. We think the stock still looks exceedingly cheap despite its recent run so we elected to chip our position.
Fairfax Financial Holdings Ltd. (FRFHF) – In light of recent outperformance and the resulting large weighting, we elected to additionally trim the position modestly. We continue to think the stock exhibits attractive risk/reward characteristics given its modest premium to book value.
Watsco, Inc. (WSO) – WSO’s high cash generative and recession resistant business model, coupled with structural industry drivers could drive long-term growth and returns. We elected to use recent strength in the shares to take some profits and view risk/reward as more fair at current levels.
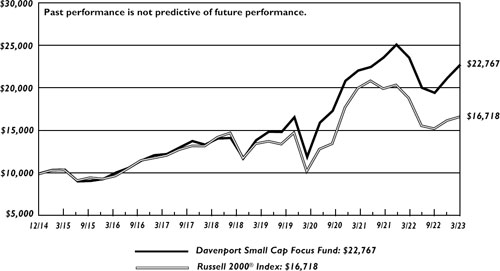
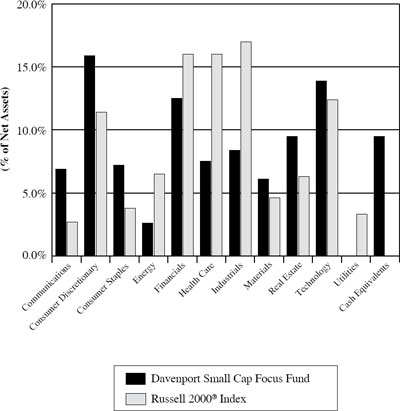
Davenport Small Cap Focus Fund
The following chart represents performance of the Davenport Small Cap Focus Fund (DSCPX) and the performance of the Fund’s primary benchmark, the Russell 2000® Index*, for the periods ended March 31, 2023.
| | | | | | | Fiscal |
| | | | | | Since | Year 2023 |
| | Fiscal Q4 | | | | Inception | Expense |
| | 2022 | 1 Year | 3 Years** | 5 Years** | 12/31/14** | Ratio |
| Small Cap Focus Fund | 7.26% | -3.56% | 23.96% | 11.20% | 10.49% | 0.89% |
| Russell 2000® Index* | 2.74% | -11.61% | 17.51% | 4.71% | 6.43% | |
30-Day SEC Yield: 1.34%; Expense Ratio in current prospectus: 0.89%
Past performance is no guarantee of future results. Investment return and principal value of an investment will fluctuate so that an investor’s shares, when redeemed, may be worth more or less than their original cost. Current performance may be lower or higher than the performance data quoted. Performance data, current to the most recent month-end, may be obtained by calling 1-800-281-3217.
| * | The Russell 2000® Index measures the performance of the 2000 smallest companies in the Russell 3000® Index. Frank Russell Company (“Russell”) is the source and owner of the registered trademarks, service marks, and copyrights related to the Russell Indexes. Russell® is a trademark of Frank Russell Company. An investor cannot invest in an index and index returns are not indicative of the performance of any specific investment. London Stock Exchange Group PLC and its group undertakings (collectively, the “LSE Group”). © LSE Group 2023. FTSE Russell is a trading name of certain LSE Group companies. “Russell®” is a trademark of the relevant LSE Group companies and is used by any other LSE Group company under license. All rights in the FTSE Russell indexes or data vest in relevant LSE Group company which owns the index or the data. Neither LSE Group nor its licensors accept any liability for any errors or omissions in the indexes or data and no party may rely on any indexes or data contained in this communication. No further distribution of data from LSE Group is permitted without the relevant LSE Group company’s express written consent. The LSE Group does not promote/sponsor/endorse the content of this communication. An investor cannot invest in an index and its returns are not indicative of the performance of any specific investment. |
| ** | Returns greater than one year are annualized. |
The Davenport Small Cap Focus Fund (DSCPX) ended on a strong note with a 7.26% gain during the fiscal fourth quarter. This compared favorably to the 2.74% gain for the Russell 2000® Index. After a hot end in January, small cap stocks were hit harder in the latter half of the quarter as investors rotated into durable growth and large cap technology names. More specifically, the Russell 2000 declined 4.78% during March while the S&P 500® Index increased 3.67%. While uncertainty in the broader economy could serve as a near term headwind for some smaller companies, we still see many attractive opportunities to put capital to work. Furthermore, we
continue to view the asset class as timely with valuations at the low end of historical ranges following recent underperformance. For the fiscal year, the Fund declined 3.56% compared to the 11.61% decline for the index.
DraftKings, Inc. (DKNG) was the Fund’s top contributor as the shares gained north of 65% alongside improved results and better messaging around the company’s path to profitability. We elected to trim the position on strength, but continue to think there is more upside as markets mature, new states are added and the company reaches the break-even-point later this year. Elsewhere, the Fund benefited from the announcement of M&A transactions involving two of our companies, Radius Global Infrastructure, Inc. (RADI) and Evoqua Water Technologies Corp. (AQUA). RADI is one of our smaller positions, yet provided a nice benefit nonetheless. AQUA has been a great performer over time. We think the all-stock offer from Xylem should result in further value creation over time. However, we have begun to slowly exit the position in anticipation of the market cap exceeding the Fund’s upper limits when the deal closes in Q1 of next year. Key detractors for the period were Diamond Hill Investment Group, Inc. (DHIL), Peyto Exploration & Development Corp. (PEYUF), TowneBank (TOWN) and Stewart Information Services Corp. (STC). Despite the choppy outlook for housing transactions in the near term, we continued to add to STC during the fiscal fourth quarter alongside some meaningful insider purchases from executive management.
Petroleum additives leader NewMarket Corp. (NEU) is now a top 5 position. We added to the stock in the face of margin headwinds related to higher prices for base oil (a key input for NEU) throughout last year. We believed the company would aggressively raise prices and that input costs would moderate, thereby unleashing higher margins and significant earnings power. We got a preview of said earnings power in the most recent quarter, when the company earned over $9/ share in a seasonally soft period. We think earnings per share (EPS) of $35-$40/share is possible and think the stock could reach the $450-$500 price range. Meanwhile, the company is actively returning capital to shareholders as evidenced by $200 million of buybacks last year (6% of shares) and a dividend of 2.5% for total cash return of 8.5%. This under-followed, deep value play continues to offer an appealing risk reward at current levels.
Elsewhere in the Fund, we continued to spread cash across a variety of existing holdings on an opportunistic basis. One name of recent emphasis has been Liberty Latin America Ltd. (LILAK), the tracking stock for Liberty Media’s Latin American media assets. Though complex and esoteric, we are attracted to company’s lead share in underpenetrated duopolistic markets such as Puerto Rico, Panama, Costa Rica, Chile and other Caribbean Islands. While the business screens as highly levered, the majority of the debt is non-recourse to the parent and the company has many opportunities to pay down debt with asset sales and strong cash generation. Ultimately, we think the business is set to hit an inflection in free cash flow (FCF) generation this year and can generate more than $2.00 per share in FCF in coming years (shares closed the quarter just over $8.00). As such, we think there is potential for significant upside here as earnings power comes into focus and further balance sheet actions are taken.
In closing, we are pleased to have ended the year with strong momentum for next. While we have been actively deploying funds into exciting opportunities, we continue to have flexibility with a cash balance of ~9.5%. As noted last quarter, this could result in a bout of underperformance in a strong “risk on” environment. That said, we will continue to follow the valuation discipline that has served us well over time.
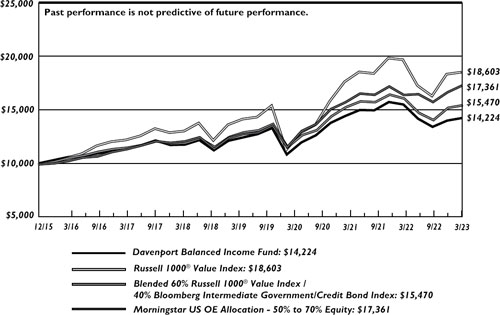
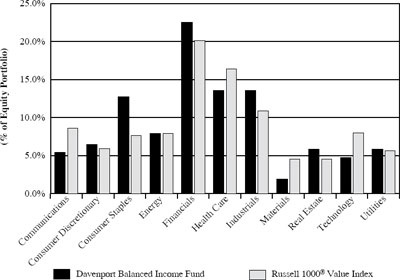
Davenport Balanced Income Fund
The following chart represents Davenport Balanced Income Fund (DBALX) performance, and performance of the Fund’s primary benchmark, the Russell 1000® Value Index, along with the Morningstar Allocation 50-70% Equity Index, and the blended 60% Russell 1000® Value Index / 40% Bloomberg Intermediate Government/Credit Bond Index for the periods ended March 31, 2023.
| | | | | | | Fiscal |
| | | | | | Since | Year 2023 |
| | Fiscal Q4 | | | | Inception | Expense |
| | 2022 | 1 Year | 3 Years** | 5 Years** | 12/31/15** | Ratio |
| Balanced Income Fund | 1.69% | -8.18% | 9.54% | 3.96% | 4.98% | 0.93% |
| Russell 1000® Value* | 1.01% | -5.91% | 17.93% | 7.50% | 8.94% | |
| Morningstar Allocation 50-70% Equity* | 3.80% | 5.40% | 14.38% | 7.66% | 7.91% | |
| 60% Russell 1000® Value/40% BIGC | 1.56% | -3.89% | 10.19% | 5.44% | 6.20% | |
30-Day SEC Yield: 2.98%; Expense Ratio in current prospectus: 0.93%
Past performance is no guarantee of future results. Investment return and principal value of an investment will fluctuate so that an investor’s shares, when redeemed, may be worth more or less than their original cost. Current performance may be lower or higher than the performance data quoted. Performance data, current to the most recent month-end, may be obtained by calling 1-800-281-3217.
| * | The Russell 1000® Value Index measures the performance of the Russell 1000 companies with lower price-to-book ratios and lower forecasted growth values. London Stock Exchange Group PLC and its group undertakings (collectively, the “LSE Group”). © LSE Group 2023. FTSE Russell is a trading name of certain LSE Group companies. “Russell®” is a trademark of the relevant LSE Group companies and is used by any other LSE Group company under license. All rights in the FTSE Russell indexes or data vest in relevant LSE Group company which owns the index or the data. Neither LSE Group nor its licensors accept any liability for any errors or omissions in the indexes or data and no party may rely on any indexes or data contained in this communication. No further distribution of data from LSE Group is permitted without the relevant LSE Group company’s express written consent. The LSE Group does not promote/sponsor/endorse the content of this communication. The Morningstar U.S. OE Allocation 50-70% Equity Index is composed of funds which seek to provide both income and capital appreciation by investing in multiple asset classes, including stocks, bonds, and cash. These portfolios are dominated by domestic holdings and have equity exposure between 50% and 70%. The blended 60% Russell 1000® Value/40% Bloomberg Intermediate Government/Credit Index is included as an additional comparative index because it is representative of a balanced portfolio consisting of 60% equity and 40% fixed income securities. The Bloomberg Intermediate Government/Credit Index measures the non-securitized component of the U.S. Aggregate Bond Index. It includes investment grade, U.S. dollar-denominated, fixed-rate Treasuries, government-related and corporate rate securities. Intermediate maturity bonds include bonds with maturities of 1 to 9.999 years. An investor cannot invest in an index and its returns are not indicative of the performance of any specific investment. |
| ** | Returns greater than one year are annualized. |
The Davenport Balanced Income Fund (DBALX) increased 1.69% during the fiscal fourth quarter of 2023 compared to the 1.56% for the blended 60% Russell 1000 Value® Index and 40% Bloomberg Intermediate Government/Credit® Index. After a tough ride for most asset classes in 2022, the fiscal year ended on a positive note for both equities and fixed income. Looking forward, we are encouraged by the higher rate environment and potential upside for value stocks. For the fiscal year, the fund declined 8.18% compared to the 3.89% decline for the blended benchmark.
The Fund’s equity contributors during the final quarter came from a variety of names, such as Watsco Inc. (WSO), Fairfax Financial Holdings Ltd. (FRFHF), Capital One Financial Corp. (COF), and QUALCOMM, Inc. (QCOM). Some of the detractors were unique in their own right: SL Green Realty Corp. (SLG), Johnson & Johnson (JNJ), Fidelity National Information Systems, Inc. (FIS), and Norfolk Southern Corp. (NSC). Most of these situations were results of company specific events as opposed to general sector-based sentiment.
We initiated a position in Sanofi S.A. (SNY), one of the world’s largest drug and vaccine makers. Sanofi’s business is comprised of pharmaceuticals, including blockbuster Dupixent (dermatology/ asthma uses), vaccines (including flu and polio/pertussis), and consumer products (including brands such as Allegra, Aspercreme, and IcyHot). The company has grown its dividend for 28 consecutive years and yields ~2.5%. At the time of our purchase, SNY traded at ~10x earnings, which we consider attractive on the current portfolio, not to mention the potential of 3-5 products in the pipeline.
Several temporary headwinds afforded us the ability to buy Fidelity National Information Services, Inc. (FIS), the largest payments processing company in the world, at a low double-digit earnings multiple, near a generational low. We sold our position in Kraft Heinz Co. (KHC) to fund our purchase of J.M. Smucker Co. (SJM). Kraft has struggled amidst high input costs and a years-long business turnaround. Smucker, a leading food and beverage producer in attractive end markets such as coffee, consumer food/snacks, and pet food, is also undergoing a portfolio transformation, but one we think has a high likelihood of success. The company has increased its dividend for 21 consecutive years and yields ~2.7%.
Market volatility in the fiscal fourth quarter offered opportunities to upgrade the risk/reward profile of the Fund at attractive prices. With a mix of traditional value and dividend payers, as well as a renewed focus on dividend growth, we like the collection of businesses we own.
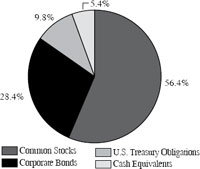
The Fund’s fixed income allocation consists of 33 high quality bonds diversified across ten sectors with the top allocations including U.S. Treasuries at 25.43%, Consumer Non-Cyclical at 15.49%, Financials at 14.05%, and Consumer Cyclical at 11.03%. The credit quality of the fixed portion remains high investment grade, A2/A/A+, with an effective maturity of 2.89 years, yield to worst of 4.75%, and duration of 2.57 years, up from 2.17 years at the end of the 2022.
Our allocation to floating rate notes within the fixed income portion of the Fund decreased to just 1.18% from 11.64% at the end of 2022. This material allocation change is based on our view that the Fed is more apt to pause rate hikes in the near term and potentially pivot, cutting Fed Fund rates, down the road. Our floating rate exposure has added positive performance over the last year, but we have taken the opportunity to trade into newly issued, higher coupon fixed rate corporate bonds, as the market has rerated in response to the Fed’s hiking cycle.
The Fed continued tightening monetary policy during the fiscal fourth quarter, as economic (inflation) data points remain above targeted levels. Taking its foot slightly off the peddle, the Federal Open Market Committee raised the fed funds rate two times in the final quarter by 25 basis points (bps) at each meeting, compared to 75 bps a meeting in the second half of 2022. Treasury rates with maturities longer than three months declined during the quarter causing the curve to flatten. The difference between the 30-year bond and the 3-month bill dropped to -115bps at the end of March, compared to starting the year around -44 bps. We used this drop in rates as an opportunity to reduce our floating rate positions and exit some of our fixed positions on strength
(sold PayPal 24’s, Citigroup 25’s, Canadian Pacific Railway 24’s, Disney 25’s, and Stryker 25’s). Having dry powder going into the new fiscal year will allow us the opportunity to deploy capital in higher coupon bonds, in keeping with our short duration/high quality preference.
In closing, our stocks, consisting primarily of high-quality dividend payers/growers, remain well positioned to provide investors with a stream of dividends that grows in excess of inflation. Meanwhile, the rise in short-term interest rates should enable our bond holdings to provide income at higher rates compared to previous years. We have the ability to extend duration if and when the risk/reward opportunity (yield compensation/duration risk) presents itself. For now, we feel comfortable picking up high income with low interest rate risk, which the market is providing. These strategies should position the Fund as a relatively low volatility, income-producing option for our clients.
As a fellow shareholder of the Davenport Funds, we want to thank you for your continued trust and confidence. Each year the market seems to present new challenges with increased volatility. It is during times of market stress, it may help to remind shareholders that the 500 employees of Davenport & Company are invested alongside our mutual funds. Our team is always available to share with you our thoughts and strategy and we welcome your questions and comments.
Sincerely,
John P. Ackerly IV, CFA
President, The Davenport Funds
DAVENPORT CORE LEADERS FUND
PERFORMANCE INFORMATION (Unaudited) |
Comparison of the Change in Value of a $10,000 Investment in
Davenport Core Leaders Fund and the S&P 500® Index
| | | | | | | |
| | Average Annual Total Returns
(for the year ended March 31, 2023) | |
| | | | | | | |
| | 1 Year | | 5 Years | | 10 Years | |
| Davenport Core Leaders Fund (a) | -11.37% | | 7.86% | | 9.70% | |
| S&P 500® Index | -7.73% | | 11.19% | | 12.24% | |
| | | | | | | |
| (a) | The total returns shown do not reflect the deduction of taxes that a shareholder would pay on Fund distributions or the redemption of Fund shares. |
| DAVENPORT VALUE & INCOME FUND |
| PERFORMANCE INFORMATION (Unaudited) |
Comparison of the Change in Value of a $10,000 Investment in
Davenport Value & Income Fund, the Russell 1000® Value Index
and the Lipper Equity Income Index
| | | | | | | |
| | Average Annual Total Returns
(for the year ended March 31, 2023) | |
| | | | | | | |
| | 1 Year | | 5 Years | | 10 Years | |
| Davenport Value & Income Fund (a) | -11.81% | | 5.19% | | 7.87% | |
| Russell 1000® Value Index | -5.91% | | 7.50% | | 9.13% | |
| Lipper Equity Income Index | -4.53% | | 8.34% | | 9.23% | |
| | | | | | | |
| (a) | The total returns shown do not reflect the deduction of taxes that a shareholder would pay on Fund distributions or the redemption of Fund shares. |
| DAVENPORT EQUITY OPPORTUNITIES FUND |
| PERFORMANCE INFORMATION (Unaudited) |
Comparison of the Change in Value of a $10,000 Investment in
Davenport Equity Opportunities Fund and the Russell Midcap® Index
| | | | | | | |
| | Average Annual Total Returns | |
| | (for the year ended March 31, 2023) | |
| | | |
| | 1 Year | | 5 Years | | 10 Years | |
| Davenport Equity Opportunities Fund (a) | -9.25% | | 10.22% | | 10.10% | |
| Russell Midcap® Index | -8.78% | | 8.05% | | 10.05% | |
| | | | | | | |
| (a) | The total returns shown do not reflect the deduction of taxes that a shareholder would pay on Fund distributions or the redemption of Fund shares. |
| DAVENPORT SMALL CAP FOCUS FUND |
| PERFORMANCE INFORMATION (Unaudited) |
Comparison of the Change in Value of a $10,000 Investment in
Davenport Small Cap Focus Fund and the Russell 2000® Index
| | | | | | | |
| | Average Annual Total Returns | |
| | (for the year ended March 31, 2023) | |
| | | | | | | |
| | | | | | Since | |
| | 1 Year | | 5 Years | | Inception(b) | |
| Davenport Small Cap Focus Fund (a) | -3.56% | | 11.20% | | 10.49% | |
| Russell 2000® Index | -11.61% | | 4.71% | | 6.43% | |
| | | | | | | |
| (a) | The total returns shown do not reflect the deduction of taxes that a shareholder would pay on Fund distributions or the redemption of Fund shares. |
| (b) | Commencement of operations was December 31, 2014. |
| DAVENPORT BALANCED INCOME FUND |
| PERFORMANCE INFORMATION (Unaudited) |
Comparison of the Change in Value of a $10,000 Investment in Davenport Balanced
Income Fund, the Russell 1000® Value Index, a Blended 60% Russell 1000® Value
Index / 40% Bloomberg Intermediate Government/Credit Bond Index
and the Morningstar US OE Allocation - 50% to 70% Equity
| | | | | | | |
| | Average Annual Total Returns | |
| | (for the year ended March 31, 2023) | |
| | | | | | | |
| | | | | | Since | |
| | 1 Year | | 5 Years | | Inception(b) | |
| Davenport Balanced Income Fund (a) | -8.18% | | 3.96% | | 4.98% | |
| Russell 1000® Value Index | -5.91% | | 7.50% | | 8.94% | |
| Blended 60% Russell 1000® Value Index /40% Bloomberg Intermediate Government/Credit Bond Index | -3.89% | | 5.44% | | 6.20% | |
| Morningstar US OE Allocation - 50% to 70% Equity | 5.40% | | 7.66% | | 7.91% | |
| | | | | | | |
| (a) | The total returns shown do not reflect the deduction of taxes that a shareholder would pay on Fund distributions or the redemption of Fund shares. |
| (b) | Commencement of operations was December 31, 2015. |
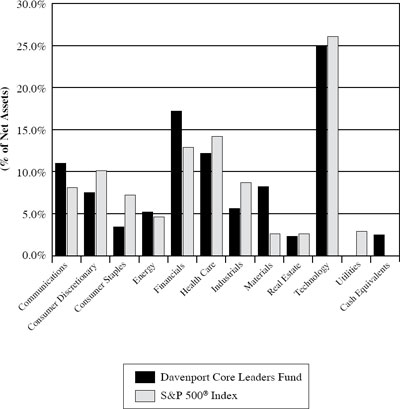
| DAVENPORT CORE LEADERS FUND |
| PORTFOLIO INFORMATION |
| March 31, 2023 (Unaudited) |
Sector Allocation vs. the S&P 500® Index
Top 10 Holdings
| Security Description | % of Net Assets |
| Microsoft Corporation | 3.8% |
| Markel Corporation | 3.5% |
| Danaher Corporation | 3.4% |
| Amazon.com, Inc. | 3.2% |
| Accenture plc - Class A | 3.1% |
| Air Products & Chemicals, Inc. | 3.1% |
| Adobe, Inc. | 3.1% |
| Mastercard, Inc. - Class A | 3.0% |
| Alphabet, Inc. - Classes A and C | 3.0% |
| Johnson & Johnson | 3.0% |
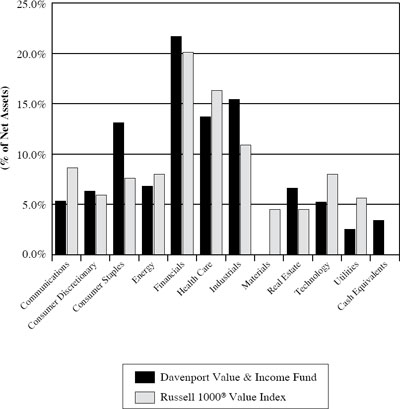
| DAVENPORT VALUE & INCOME FUND |
| PORTFOLIO INFORMATION |
| March 31, 2023 (Unaudited) |
Sector Allocation vs. the Russell 1000® Value Index
Top 10 Holdings
| Security Description | % of Net Assets |
| Fairfax Financial Holdings Ltd. | 4.5% |
| Johnson & Johnson | 4.0% |
| Berkshire Hathaway, Inc. - Class B | 3.8% |
| Comcast Corporation - Class A | 3.1% |
| Lamar Advertising Company - Class A | 3.0% |
| McDonald’s Corporation | 2.9% |
| Elevance Health, Inc. | 2.9% |
| Markel Corporation | 2.8% |
| Watsco, Inc. | 2.8% |
| United Parcel Service, Inc. - Class B | 2.7% |
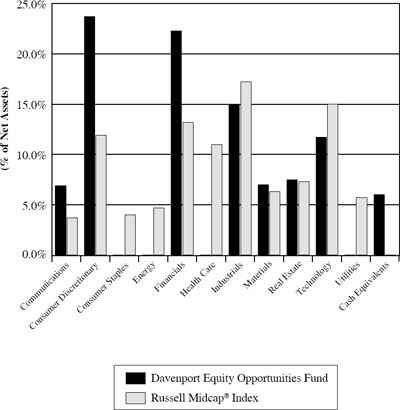
| DAVENPORT EQUITY OPPORTUNITIES FUND |
| PORTFOLIO INFORMATION |
| March 31, 2023 (Unaudited) |
Sector Allocation vs. the Russell Midcap® Index
Top 10 Holdings
| Security Description | % of Net Assets |
| Fairfax Financial Holdings Ltd. | 6.4% |
| Markel Corporation | 6.2% |
| O’Reilly Automotive, Inc. | 6.1% |
| Take-Two Interactive Software, Inc. | 5.2% |
| Brookfield Corporation | 4.6% |
| Alight, Inc. - Class A | 4.3% |
| Martin Marietta Materials, Inc. | 3.9% |
| Live Nation Entertainment, Inc. | 3.8% |
| Lamar Advertising Company - Class A | 3.8% |
| American Tower Corporation | 3.7% |
| DAVENPORT SMALL CAP FOCUS FUND |
| PORTFOLIO INFORMATION |
| March 31, 2023 (Unaudited) |
Sector Allocation vs. the Russell 2000® Index
Top 10 Holdings
| Security Description | % of Net Assets |
| Monarch Casino & Resort, Inc. | 6.7% |
| NewMarket Corporation | 6.0% |
| Alight, Inc. - Class A | 5.6% |
| J & J Snack Foods Corporation | 4.7% |
| Verra Mobility Corporation | 4.6% |
| Perrigo Company plc | 4.4% |
| Stewart Information Services Corporation | 4.1% |
| Liberty Latin America Ltd. - Class C | 4.0% |
| Janus International Group, Inc. | 3.9% |
| Cannae Holdings, Inc. | 3.8% |
| DAVENPORT BALANCED INCOME FUND |
| PORTFOLIO INFORMATION |
| March 31, 2023 (Unaudited) |
| Asset Allocation (% of Net Assets) |
| Ten Largest Equity Holdings | % of Net Assets |
| Fairfax Financial Holdings Ltd. | 2.2% |
| Johnson & Johnson | 1.9% |
| Perrigo Company plc | 1.9% |
| Berkshire Hathaway, Inc. - Class B | 1.9% |
| Comcast Corporation - Class A | 1.5% |
| Lamar Advertising Company - Class A | 1.5% |
| Elevance Health, Inc. | 1.5% |
| Watsco, Inc. | 1.5% |
| McDonald’s Corporation | 1.4% |
| Markel Corporation | 1.4% |
| Equity Sector Concentration vs. the Russell 1000® Value Index (56.4% of Net Assets) |
| Bond Portfolio (38.2% of Net Assets) | | | Credit Quality | Composite Quality |
| Number of Fixed-Income Securities | 33 | | AAA | 25.4% |
| Average Quality | A+/A | | AA | 7.9% |
| Effective Maturity | 2.9 yrs. | | A | 13.3% |
| Average Effective Duration | 2.57 yrs. | | BBB | 53.4% |
| | | | Ba | 0.0% |
| | % of Bond | | | |
| Sector Breakdown | Portfolio | | | |
| Consumer Discretionary | 7.2% | | | |
| Consumer Staples | 11.2% | | | |
| Energy | 11.1% | | | |
| Financials | 7.2% | | | |
| Health Care | 11.9% | | | |
| Industrials | 3.2% | | | |
| Materials | 2.7% | | | |
| Real Estate | 6.9% | | | |
| Technology | 6.3% | | | |
| Utilities | 6.6% | | | |
| U.S. Treasury | 25.7% | | | |
| DAVENPORT CORE LEADERS FUND |
| SCHEDULE OF INVESTMENTS |
| March 31, 2023 |
| COMMON STOCKS — 97.5% | | Shares | | | Value | |
| Communications — 11.0% | | | | | | | | |
| Alphabet, Inc. - Class A (a) | | | 154,042 | | | $ | 15,978,777 | |
| Alphabet, Inc. - Class C (a) | | | 54,011 | | | | 5,617,144 | |
| Electronic Arts, Inc. | | | 124,376 | | | | 14,981,089 | |
| Meta Platforms, Inc. - Class A (a) | | | 100,251 | | | | 21,247,197 | |
| Walt Disney Company (The) (a) | | | 209,443 | | | | 20,971,527 | |
| | | | | | | | 78,795,734 | |
| Consumer Discretionary — 7.5% | | | | | | | | |
| Amazon.com, Inc. (a) | | | 220,251 | | | | 22,749,726 | |
| Home Depot, Inc. (The) | | | 34,124 | | | | 10,070,675 | |
| TJX Companies, Inc. (The) | | | 267,332 | | | | 20,948,135 | |
| | | | | | | | 53,768,536 | |
| Consumer Staples — 3.4% | | | | | | | | |
| Constellation Brands, Inc. - Class A | | | 47,764 | | | | 10,789,410 | |
| Costco Wholesale Corporation | | | 27,992 | | | | 13,908,385 | |
| | | | | | | | 24,697,795 | |
| Energy — 5.2% | | | | | | | | |
| EOG Resources, Inc. | | | 141,151 | | | | 16,180,139 | |
| Pioneer Natural Resources Company | | | 102,612 | | | | 20,957,475 | |
| | | | | | | | 37,137,614 | |
| Financials — 17.2% | | | | | | | | |
| Aon plc - Class A | | | 46,396 | | | | 14,628,195 | |
| Bank of America Corporation | | | 277,993 | | | | 7,950,600 | |
| Berkshire Hathaway, Inc. - Class B (a) | | | 65,801 | | | | 20,317,375 | |
| Brookfield Asset Management Ltd. - Class A | | | 128,193 | | | | 4,194,475 | |
| Brookfield Corporation | | | 518,639 | | | | 16,902,445 | |
| Charles Schwab Corporation (The) | | | 197,801 | | | | 10,360,816 | |
| Intercontinental Exchange, Inc. | | | 102,761 | | | | 10,716,945 | |
| JPMorgan Chase & Company | | | 101,659 | | | | 13,247,184 | |
| Markel Corporation (a) | | | 19,507 | | | | 24,918,437 | |
| | | | | | | | 123,236,472 | |
| Health Care — 12.2% | | | | | | | | |
| Abbott Laboratories | | | 135,969 | | | | 13,768,221 | |
| Danaher Corporation | | | 98,233 | | | | 24,758,646 | |
| Johnson & Johnson | | | 138,200 | | | | 21,421,000 | |
| Novo Nordisk A/S - ADR | | | 88,416 | | | | 14,070,522 | |
| UnitedHealth Group, Inc. | | | 28,612 | | | | 13,521,745 | |
| | | | | | | | 87,540,134 | |
| Industrials — 5.6% | | | | | | | | |
| Honeywell International, Inc. | | | 84,040 | | | | 16,061,725 | |
| Republic Services, Inc. | | | 77,394 | | | | 10,465,217 | |
| Union Pacific Corporation | | | 66,055 | | | | 13,294,229 | |
| | | | | | | | 39,821,171 | |
| DAVENPORT CORE LEADERS FUND |
| SCHEDULE OF INVESTMENTS (Continued) |
| COMMON STOCKS — 97.5% (Continued) | | Shares | | | Value | |
| Materials — 8.2% | | | | | | | | |
| Air Products & Chemicals, Inc. | | | 77,092 | | | $ | 22,141,593 | |
| Martin Marietta Materials, Inc. | | | 56,231 | | | | 19,965,379 | |
| Sherwin-Williams Company (The) | | | 75,045 | | | | 16,867,865 | |
| | | | | | | | 58,974,837 | |
| Real Estate — 2.3% | | | | | | | | |
| American Tower Corporation | | | 78,910 | | | | 16,124,469 | |
| | | | | | | | | |
| Technology — 24.9% | | | | | | | | |
| Accenture plc - Class A | | | 78,124 | | | | 22,328,620 | |
| Adobe, Inc. (a) | | | 57,114 | | | | 22,010,022 | |
| Apple, Inc. | | | 100,674 | | | | 16,601,143 | |
| Broadcom, Inc. | | | 27,275 | | | | 17,498,003 | |
| Intuit, Inc. | | | 26,850 | | | | 11,970,536 | |
| Mastercard, Inc. - Class A | | | 59,462 | | | | 21,609,085 | |
| Microsoft Corporation | | | 95,412 | | | | 27,507,280 | |
| Moody’s Corporation | | | 36,747 | | | | 11,245,317 | |
| ServiceNow, Inc. (a) | | | 22,372 | | | | 10,396,716 | |
| Visa, Inc. - Class A | | | 77,337 | | | | 17,436,400 | |
| | | | | | | | 178,603,122 | |
| | | | | | | | | |
| Total Common Stocks (Cost $479,485,112) | | | | | | $ | 698,699,884 | |
| | | | | | | | | |
| MONEY MARKET FUNDS — 1.5% | | Shares | | | Value | |
| First American Treasury Obligations Fund - Class Z, 4.67% (b) (Cost $10,593,309) | | | 10,593,309 | | | $ | 10,593,309 | |
| | | | | | | | | |
| Total Investments at Value — 99.0% (Cost $490,078,421) | | | | | | $ | 709,293,193 | |
| Other Assets in Excess of Liabilities — 1.0% | | | | | | | 7,524,783 | |
| Net Assets — 100.0% | | | | | | $ | 716,817,976 | |
ADR - American Depositary Receipt.
| (a) | Non-income producing security. |
| (b) | The rate shown is the 7-day effective yield as of March 31, 2023. |
See accompanying notes to financial statements.
| DAVENPORT VALUE & INCOME FUND |
| SCHEDULE OF INVESTMENTS |
| March 31, 2023 |
| COMMON STOCKS — 96.6% | | Shares | | | Value | |
| Communications — 5.3% | | | | | | | | |
| Alphabet, Inc. - Class A (a) | | | 173,065 | | | $ | 17,952,032 | |
| Comcast Corporation - Class A | | | 660,148 | | | | 25,026,211 | |
| | | | | | | | 42,978,243 | |
| Consumer Discretionary — 6.3% | | | | | | | | |
| Cannae Holdings, Inc. (a) | | | 422,939 | | | | 8,534,909 | |
| Lowe’s Companies, Inc. | | | 93,313 | | | | 18,659,800 | |
| McDonald’s Corporation | | | 83,188 | | | | 23,260,197 | |
| | | | | | | | 50,454,906 | |
| Consumer Staples — 13.1% | | | | | | | | |
| Bunge Ltd. | | | 128,040 | | | | 12,230,381 | |
| Diageo plc - ADR | | | 118,039 | | | | 21,386,306 | |
| J.M. Smucker Company (The) | | | 78,023 | | | | 12,278,479 | |
| Philip Morris International, Inc. | | | 202,763 | | | | 19,718,702 | |
| Sysco Corporation | | | 174,159 | | | | 13,450,300 | |
| Target Corporation | | | 75,015 | | | | 12,424,734 | |
| Walmart, Inc. | | | 95,166 | | | | 14,032,227 | |
| | | | | | | | 105,521,129 | |
| Energy — 6.8% | | | | | | | | |
| Chevron Corporation | | | 125,492 | | | | 20,475,275 | |
| Coterra Energy, Inc. | | | 712,573 | | | | 17,486,541 | |
| Enbridge, Inc. | | | 433,180 | | | | 16,525,817 | |
| | | | | | | | 54,487,633 | |
| Financials — 21.7% | | | | | | | | |
| Berkshire Hathaway, Inc. - Class B (a) | | | 100,068 | | | | 30,897,996 | |
| Brookfield Asset Management Ltd. - Class A | | | 321,630 | | | | 10,523,734 | |
| Brookfield Corporation | | | 641,892 | | | | 20,919,260 | |
| Citigroup, Inc. | | | 211,627 | | | | 9,923,190 | |
| Fairfax Financial Holdings Ltd. | | | 54,415 | | | | 36,192,554 | |
| Fidelity National Financial, Inc. | | | 346,344 | | | | 12,097,796 | |
| JPMorgan Chase & Company | | | 138,488 | | | | 18,046,371 | |
| Markel Corporation (a) | | | 17,818 | | | | 22,760,892 | |
| Wells Fargo & Company | | | 340,290 | | | | 12,720,040 | |
| | | | | | | | 174,081,833 | |
| Health Care — 13.7% | | | | | | | | |
| Elevance Health, Inc. | | | 50,279 | | | | 23,118,787 | |
| Johnson & Johnson | | | 206,662 | | | | 32,032,610 | |
| Medtronic plc | | | 265,903 | | | | 21,437,100 | |
| Perrigo Company plc | | | 524,618 | | | | 18,818,048 | |
| Sanofi - ADR | | | 271,069 | | | | 14,751,575 | |
| | | | | | | | 110,158,120 | |
| DAVENPORT VALUE & INCOME FUND |
| SCHEDULE OF INVESTMENTS (Continued) |
| COMMON STOCKS — 96.6% (Continued) | | Shares | | | Value | |
| Industrials — 15.4% | | | | | | | | |
| 3M Company | | | 113,515 | | | $ | 11,931,562 | |
| Deere & Company | | | 38,997 | | | | 16,101,081 | |
| L3Harris Technologies, Inc. | | | 80,839 | | | | 15,863,845 | |
| Norfolk Southern Corporation | | | 74,214 | | | | 15,733,368 | |
| TE Connectivity Ltd. | | | 151,609 | | | | 19,883,520 | |
| United Parcel Service, Inc. - Class B | | | 111,010 | | | | 21,534,830 | |
| Watsco, Inc. | | | 71,310 | | | | 22,687,990 | |
| | | | | | | | 123,736,196 | |
| Real Estate — 6.6% | | | | | | | | |
| Crown Castle, Inc. | | | 122,339 | | | | 16,373,852 | |
| Gaming and Leisure Properties, Inc. | | | 233,623 | | | | 12,162,413 | |
| Lamar Advertising Company - Class A | | | 244,472 | | | | 24,420,308 | |
| | | | | | | | 52,956,573 | |
| Technology — 5.2% | | | | | | | | |
| Fidelity National Information Services, Inc. | | | 174,485 | | | | 9,479,770 | |
| Oracle Corporation | | | 130,710 | | | | 12,145,573 | |
| QUALCOMM, Inc. | | | 160,725 | | | | 20,505,296 | |
| | | | | | | | 42,130,639 | |
| Utilities — 2.5% | | | | | | | | |
| NextEra Energy, Inc. | | | 255,784 | | | | 19,715,831 | |
| | | | | | | | | |
| Total Common Stocks (Cost $632,512,263) | | | | | | $ | 776,221,103 | |
| | | | | | | | | |
| MONEY MARKET FUNDS — 3.4% | | Shares | | | Value | |
| First American Treasury Obligations Fund - Class Z, 4.67% (b) (Cost $27,664,681) | | | 27,664,681 | | | $ | 27,664,681 | |
| | | | | | | | | |
| Total Investments at Value — 100.0% (Cost $660,176,944) | | | | | | $ | 803,885,784 | |
| Other Assets in Excess of Liabilities — 0.0% (c) | | | | | | | 43,833 | |
| Net Assets — 100.0% | | | | | | $ | 803,929,617 | |
ADR - American Depositary Receipt.
| (a) | Non-income producing security. |
| (b) | The rate shown is the 7-day effective yield as of March 31, 2023. |
| (c) | Percentage rounds to less than 0.1%. |
See accompanying notes to financial statements.
| DAVENPORT EQUITY OPPORTUNITIES FUND |
| SCHEDULE OF INVESTMENTS |
| March 31, 2023 |
| COMMON STOCKS — 94.0% | | Shares | | | Value | |
| Communications — 6.9% | | | | | | | | |
| DISH Network Corporation - Class A (a) | | | 1,175,074 | | | $ | 10,963,441 | |
| Take-Two Interactive Software, Inc. (a) | | | 285,371 | | | | 34,044,760 | |
| | | | | | | | 45,008,201 | |
| Consumer Discretionary — 23.7% | | | | | | | | |
| Cannae Holdings, Inc. (a) | | | 1,018,253 | | | | 20,548,346 | |
| DraftKings Inc. - Class A (a) | | | 1,199,690 | | | | 23,225,998 | |
| Etsy, Inc. (a) | | | 87,791 | | | | 9,773,772 | |
| Live Nation Entertainment, Inc. (a) | | | 354,332 | | | | 24,803,240 | |
| Mobileye Global, Inc. - Class A (a) | | | 470,037 | | | | 20,338,501 | |
| O’Reilly Automotive, Inc. (a) | | | 47,142 | | | | 40,022,615 | |
| Pool Corporation | | | 47,361 | | | | 16,218,301 | |
| | | | | | | | 154,930,773 | |
| Financials — 22.3% | | | | | | | | |
| Brookfield Asset Management Ltd. - Class A | | | 450,370 | | | | 14,736,106 | |
| Brookfield Corporation | | | 924,295 | | | | 30,122,774 | |
| Fairfax Financial Holdings Ltd. | | | 63,222 | | | | 42,050,274 | |
| Fidelity National Financial, Inc. | | | 516,896 | | | | 18,055,177 | |
| Markel Corporation (a) | | | 31,953 | | | | 40,817,082 | |
| | | | | | | | 145,781,413 | |
| Industrials — 14.9% | | | | | | | | |
| Enovis Corporation (a) | | | 209,524 | | | | 11,207,439 | |
| ESAB Corporation | | | 209,524 | | | | 12,376,582 | |
| Evoqua Water Technologies Corporation (a) | | | 286,376 | | | | 14,238,615 | |
| J.B. Hunt Transport Services, Inc. | | | 110,027 | | | | 19,305,337 | |
| Watsco, Inc. | | | 69,061 | | | | 21,972,448 | |
| Xylem, Inc. | | | 176,563 | | | | 18,486,146 | |
| | | | | | | | 97,586,567 | |
| Materials — 7.0% | | | | | | | | |
| Martin Marietta Materials, Inc. | | | 71,088 | | | | 25,240,505 | |
| Sherwin-Williams Company (The) | | | 91,710 | | | | 20,613,657 | |
| | | | | | | | 45,854,162 | |
| Real Estate — 7.5% | | | | | | | | |
| American Tower Corporation | | | 117,804 | | | | 24,072,070 | |
| Lamar Advertising Company - Class A | | | 248,061 | | | | 24,778,813 | |
| | | | | | | | 48,850,883 | |
| DAVENPORT EQUITY OPPORTUNITIES FUND |
| SCHEDULE OF INVESTMENTS (Continued) |
| COMMON STOCKS — 94.0% (Continued) | | Shares | | | Value | |
| Technology — 11.7% | | | | | | | | |
| Alight, Inc. - Class A (a) | | | 3,087,455 | | | $ | 28,435,461 | |
| Autodesk, Inc. (a) | | | 72,539 | | | | 15,099,718 | |
| Black Knight, Inc. (a) | | | 340,534 | | | | 19,601,137 | |
| PTC, Inc. (a) | | | 105,431 | | | | 13,519,417 | |
| | | | | | | | 76,655,733 | |
| | | | | | | | | |
| Total Common Stocks (Cost $539,569,671) | | | | | | $ | 614,667,732 | |
| | | | | | | | | |
| MONEY MARKET FUNDS — 6.0% | | Shares | | | Value | |
| First American Treasury Obligations Fund - Class Z, 4.67% (b) (Cost $39,437,695) | | | 39,437,695 | | | $ | 39,437,695 | |
| | | | | | | | | |
| Total Investments at Value — 100.0% (Cost $579,007,366) | | | | | | $ | 654,105,427 | |
| Liabilities in Excess of Other Assets — (0.0%) (c) | | | | | | | (239,943 | ) |
| Net Assets — 100.0% | | | | | | $ | 653,865,484 | |
| (a) | Non-income producing security. |
| (b) | The rate shown is the 7-day effective yield as of March 31, 2023. |
| (c) | Percentage rounds to less than 0.1%. |
See accompanying notes to financial statements.
| DAVENPORT SMALL CAP FOCUS FUND |
| SCHEDULE OF INVESTMENTS |
| March 31, 2023 |
| COMMON STOCKS — 87.4% | | Shares | | | Value | |
| Communications — 6.9% | | | | | | | | |
| Liberty Latin America Ltd. - Class C (a) | | | 2,875,275 | | | $ | 23,749,772 | |
| Shenandoah Telecommunications Company | | | 889,307 | | | | 16,914,619 | |
| | | | | | | | 40,664,391 | |
| Consumer Discretionary — 15.9% | | | | | | | | |
| Cannae Holdings, Inc. (a) | | | 1,115,479 | | | | 22,510,366 | |
| DraftKings Inc. - Class A (a) | | | 817,006 | | | | 15,817,236 | |
| Monarch Casino & Resort, Inc. | | | 529,396 | | | | 39,254,714 | |
| OneSpaWorld Holdings Ltd. (a) | | | 1,320,970 | | | | 15,838,430 | |
| | | | | | | | 93,420,746 | |
| Consumer Staples — 7.2% | | | | | | | | |
| J & J Snack Foods Corporation | | | 184,874 | | | | 27,402,024 | |
| Seaboard Corporation | | | 4,035 | | | | 15,211,991 | |
| | | | | | | | 42,614,015 | |
| Energy — 2.6% | | | | | | | | |
| Peyto Exploration & Development Corporation | | | 1,719,782 | | | | 15,546,829 | |
| | | | | | | | | |
| Financials — 12.5% | | | | | | | | |
| Diamond Hill Investment Group, Inc. | | | 102,730 | | | | 16,907,304 | |
| Kinsale Capital Group, Inc. | | | 74,834 | | | | 22,461,425 | |
| Stewart Information Services Corporation | | | 597,446 | | | | 24,106,946 | |
| TowneBank | | | 372,743 | | | | 9,933,601 | |
| | | | | | | | 73,409,276 | |
| Health Care — 4.4% | | | | | | | | |
| Perrigo Company plc | | | 723,996 | | | | 25,969,736 | |
| | | | | | | | | |
| Industrials — 8.4% | | | | | | | | |
| Enovis Corporation (a) | | | 389,566 | | | | 20,837,885 | |
| ESAB Corporation | | | 290,511 | | | | 17,160,485 | |
| Evoqua Water Technologies Corporation (a) | | | 223,652 | | | | 11,119,978 | |
| | | | | | | | 49,118,348 | |
| Materials — 6.1% | | | | | | | | |
| NewMarket Corporation | | | 97,447 | | | | 35,566,206 | |
| Trex Company, Inc. (a) | | | 6,400 | | | | 311,488 | |
| | | | | | | | 35,877,694 | |
| Real Estate — 9.5% | | | | | | | | |
| FRP Holdings, Inc. (a) | | | 132,183 | | | | 7,650,752 | |
| Janus International Group, Inc. (a) | | | 2,357,662 | | | | 23,246,547 | |
| Lamar Advertising Company - Class A | | | 197,722 | | | | 19,750,451 | |
| Radius Global Infrastructure, Inc. - Class A (a) | | | 348,764 | | | | 5,116,368 | |
| | | | | | | | 55,764,118 | |
| DAVENPORT SMALL CAP FOCUS FUND |
| SCHEDULE OF INVESTMENTS (Continued) |
| COMMON STOCKS — 87.4% (Continued) | | Shares | | | Value | |
| Technology — 13.9% | | | | | | |
| Alight, Inc. - Class A (a) | | | 3,552,817 | | | $ | 32,721,445 | |
| Avid Technology, Inc. (a) | | | 688,626 | | | | 22,022,259 | |
| Verra Mobility Corporation (a) | | | 1,587,835 | | | | 26,866,168 | |
| | | | | | | | 81,609,872 | |
| | | | | | | | | |
| Total Common Stocks (Cost $496,073,268) | | | | | | $ | 513,995,025 | |
| | | | | | | | | |
| EXCHANGE-TRADED FUNDS — 3.1% | | Shares | | | Value | |
| ALPS Medical Breakthroughs ETF (a) (Cost $20,662,458) | | | 670,000 | | | $ | 18,213,682 | |
| | | | | | | | | |
| MONEY MARKET FUNDS — 9.4% | | Shares | | | Value | |
| First American Treasury Obligations Fund - Class Z, 4.67% (b) (Cost $55,527,345) | | | 55,527,345 | | | $ | 55,527,345 | |
| | | | | | | | | |
| Total Investments at Value — 99.9% (Cost $572,263,071) | | | | | | $ | 587,736,052 | |
| Other Assets in Excess of Liabilities — 0.1% | | | | | | | 423,912 | |
| Net Assets — 100.0% | | | | | | $ | 588,159,964 | |
| (a) | Non-income producing security. |
| (b) | The rate shown is the 7-day effective yield as of March 31, 2023. |
See accompanying notes to financial statements.
| DAVENPORT BALANCED INCOME FUND |
| SCHEDULE OF INVESTMENTS |
| March 31, 2023 |
| COMMON STOCKS — 56.4% | | Shares | | | Value | |
| Communications — 3.1% | | | | | | | | |
| Alphabet, Inc. - Class A (a) | | | 23,040 | | | $ | 2,389,939 | |
| AT&T, Inc. | | | 50,749 | | | | 976,918 | |
| Comcast Corporation - Class A | | | 88,029 | | | | 3,337,180 | |
| | | | | | | | 6,704,037 | |
| Consumer Discretionary — 3.6% | | | | | | | | |
| Cannae Holdings, Inc. (a) | | | 112,125 | | | | 2,262,683 | |
| Lowe’s Companies, Inc. | | | 12,587 | | | | 2,517,022 | |
| McDonald’s Corporation | | | 11,056 | | | | 3,091,368 | |
| | | | | | | | 7,871,073 | |
| Consumer Staples — 7.2% | | | | | | | | |
| Bunge Ltd. | | | 17,964 | | | | 1,715,921 | |
| Diageo plc - ADR | | | 16,048 | | | | 2,907,577 | |
| Ingredion, Inc. | | | 13,155 | | | | 1,338,258 | |
| J.M. Smucker Company (The) | | | 10,946 | | | | 1,722,572 | |
| Philip Morris International, Inc. | | | 27,471 | | | | 2,671,555 | |
| Sysco Corporation | | | 23,135 | | | | 1,786,716 | |
| Target Corporation | | | 10,007 | | | | 1,657,459 | |
| Walmart, Inc. | | | 12,557 | | | | 1,851,530 | |
| | | | | | | | 15,651,588 | |
| Energy — 4.4% | | | | | | | | |
| Chevron Corporation | | | 16,932 | | | | 2,762,625 | |
| Coterra Energy, Inc. | | | 100,391 | | | | 2,463,595 | |
| Enbridge, Inc. | | | 57,275 | | | | 2,185,042 | |
| Enterprise Products Partners, L.P. | | | 87,000 | | | | 2,253,300 | |
| | | | | | | | 9,664,562 | |
| Financials — 12.7% | | | | | | | | |
| Berkshire Hathaway, Inc. - Class B (a) | | | 13,379 | | | | 4,131,034 | |
| Brookfield Asset Management Ltd. - Class A | | | 61,650 | | | | 2,017,188 | |
| Brookfield Corporation | | | 84,137 | | | | 2,742,025 | |
| Citigroup, Inc. | | | 27,793 | | | | 1,303,214 | |
| Diamond Hill Investment Group, Inc. | | | 11,715 | | | | 1,928,055 | |
| Fairfax Financial Holdings Ltd. | | | 7,238 | | | | 4,814,145 | |
| Fidelity National Financial, Inc. | | | 46,907 | | | | 1,638,461 | |
| JPMorgan Chase & Company | | | 18,345 | | | | 2,390,537 | |
| Markel Corporation (a) | | | 2,366 | | | | 3,022,352 | |
| Stewart Information Services Corporation | | | 50,417 | | | | 2,034,326 | |
| Wells Fargo & Company | | | 45,275 | | | | 1,692,379 | |
| | | | | | | | 27,713,716 | |
| Health Care — 7.6% | | | | | | | | |
| Elevance Health, Inc. | | | 7,066 | | | | 3,249,017 | |
| DAVENPORT BALANCED INCOME FUND |
| SCHEDULE OF INVESTMENTS (Continued) |
| COMMON STOCKS — 56.4% (Continued) | | Shares | | | Value | |
| Health Care — 7.6% (Continued) | | | | | | | | |
| Johnson & Johnson | | | 27,374 | | | $ | 4,242,970 | |
| Medtronic plc | | | 35,449 | | | | 2,857,898 | |
| Perrigo Company plc | | | 116,716 | | | | 4,186,603 | |
| Sanofi - ADR | | | 36,854 | | | | 2,005,595 | |
| | | | | | | | 16,542,083 | |
| Industrials — 7.6% | | | | | | | | |
| 3M Company | | | 15,092 | | | | 1,586,320 | |
| Deere & Company | | | 5,099 | | | | 2,105,275 | |
| L3Harris Technologies, Inc. | | | 11,390 | | | | 2,235,174 | |
| Norfolk Southern Corporation | | | 9,678 | | | | 2,051,736 | |
| TE Connectivity Ltd. | | | 19,630 | | | | 2,574,474 | |
| United Parcel Service, Inc. - Class B | | | 14,971 | | | | 2,904,224 | |
| Watsco, Inc. | | | 10,079 | | | | 3,206,735 | |
| | | | | | | | 16,663,938 | |
| Materials — 1.1% | | | | | | | | |
| NewMarket Corporation | | | 6,465 | | | | 2,359,596 | |
| | | | | | | | | |
| Real Estate — 3.2% | | | | | | | | |
| Crown Castle, Inc. | | | 16,385 | | | | 2,192,969 | |
| Gaming and Leisure Properties, Inc. | | | 31,539 | | | | 1,641,920 | |
| Lamar Advertising Company - Class A | | | 32,689 | | | | 3,265,304 | |
| | | | | | | | 7,100,193 | |
| Technology — 2.6% | | | | | | | | |
| Fidelity National Information Services, Inc. | | | 23,556 | | | | 1,279,797 | |
| Oracle Corporation | | | 18,398 | | | | 1,709,542 | |
| QUALCOMM, Inc. | | | 21,446 | | | | 2,736,081 | |
| | | | | | | | 5,725,420 | |
| Utilities — 3.3% | | | | | | | | |
| Brookfield Infrastructure Partners, L.P. | | | 61,867 | | | | 2,089,249 | |
| Brookfield Renewable Partners, L.P. | | | 76,999 | | | | 2,426,238 | |
| NextEra Energy, Inc. | | | 34,775 | | | | 2,680,457 | |
| | | | | | | | 7,195,944 | |
| | | | | | | | | |
| Total Common Stocks (Cost $104,988,407) | | | | | | $ | 123,192,150 | |
| DAVENPORT BALANCED INCOME FUND |
| SCHEDULE OF INVESTMENTS (Continued) |
| FIXED RATE CORPORATE BONDS — 28.4% | | Par Value | | | Value | |
| Consumer Discretionary — 2.7% | | | | | | | | |
| Amazon.com, Inc., 1.000%, due 05/12/2026 | | $ | 3,250,000 | | | $ | 2,944,133 | |
| General Motors Financial Company, Inc, 1.500%, due 06/10/2026 | | | 3,425,000 | | | | 3,045,887 | |
| | | | | | | | 5,990,020 | |
| Consumer Staples — 4.3% | | | | | | | | |
| Lowe’s Companies, Inc., 4.400%, due 09/08/2025 | | | 1,525,000 | | | | 1,516,557 | |
| Phillip Morris International, Inc., 5.375%, due 02/15/2033 | | | 2,995,000 | | | | 3,058,303 | |
| Walgreens Boots Alliance, Inc., 3.800%, due 11/18/2024 | | | 2,245,000 | | | | 2,198,610 | |
| Walmart, Inc., 1.050%, due 09/17/2026 | | | 2,835,000 | | | | 2,550,746 | |
| | | | | | | | 9,324,216 | |
| Energy — 4.2% | | | | | | | | |
| Boardwalk Pipelines, L.P., 4.450%, due 07/15/2027 | | | 2,200,000 | | | | 2,145,100 | |
| BP Capital Markets America, 4.812%, due 02/13/2033 | | | 2,990,000 | | | | 3,034,027 | |
| Halliburton Company, 3.800%, due 11/15/2025 | | | 937,000 | | | | 917,019 | |
| MPLX, L.P., 4.125%, due 03/01/2027 | | | 3,250,000 | | | | 3,145,019 | |
| | | | | | | | 9,241,165 | |
| Financials — 2.8% | | | | | | | | |
| American Express Company, 3.375%, due 05/03/2024 | | | 2,995,000 | | | | 2,934,743 | |
| BlackRock, Inc., 3.500%, due 03/18/2024 | | | 1,150,000 | | | | 1,134,153 | |
| Brookfield Finance, Inc., 4.000%, due 04/01/2024 | | | 2,000,000 | | | | 1,959,417 | |
| | | | | | | | 6,028,313 | |
| Health Care — 4.6% | | | | | | | | |
| Amgen, Inc., 2.200%, due 02/21/2027 | | | 2,400,000 | | | | 2,209,360 | |
| CVS Health Corporation, 3.000%, due 08/15/2026 | | | 2,600,000 | | | | 2,478,166 | |
| McKesson Corporation, 1.300%, due 08/15/2026 | | | 2,490,000 | | | | 2,228,455 | |
| Zoetis, Inc., 5.400%, due 11/14/2025 | | | 2,990,000 | | | | 3,038,585 | |
| | | | | | | | 9,954,566 | |
| Industrials — 1.2% | | | | | | | | |
| Canadian Pacific Railway Ltd., 1.350%, due 12/02/2024 | | | 2,865,000 | | | | 2,698,540 | |
| | | | | | | | | |
| Materials — 1.1% | | | | | | | | |
| Sherwin-Williams Company (The), 3.450%, due 06/01/2027 | | | 2,400,000 | | | | 2,295,852 | |
| | | | | | | | | |
| Real Estate — 2.6% | | | | | | | | |
| American Tower Corporation, 1.450%, due 09/15/2026 | | | 2,990,000 | | | | 2,653,029 | |
| Public Storage, 1.500%, due 11/09/2026 | | | 3,490,000 | | | | 3,128,363 | |
| | | | | | | | 5,781,392 | |
| DAVENPORT BALANCED INCOME FUND |
| SCHEDULE OF INVESTMENTS (Continued) |
| FIXED RATE CORPORATE BONDS — 28.4% (Continued) | | Par Value | | | Value | |
| Technology — 2.4% | | | | | | |
| Fiserv, Inc., 3.200%, due 07/01/2026 | | $ | 2,325,000 | | | $ | 2,205,214 | |
| Oracle Corporation, 5.800%, due 11/10/2025 | | | 2,990,000 | | | | 3,061,410 | |
| | | | | | | | 5,266,624 | |
| Utilities — 2.5% | | | | | | | | |
| Dominion Energy, Inc., 1.450%, due 04/15/2026 | | | 2,740,000 | | | | 2,471,866 | |
| NextEra Energy Capital Holdings, Inc., 6.051%, due 03/01/2025 | | | 2,995,000 | | | | 3,045,289 | |
| | | | | | | | 5,517,155 | |
| | | | | | | | | |
| Total Fixed Rate Corporate Bonds (Cost $65,481,655) | | | | | | $ | 62,097,843 | |
| | | | | | | | | |
| U.S. TREASURY OBLIGATIONS — 9.8% | | Par Value | | | Value | |
| U.S. Treasury Bills — 4.4%(b) | | | | | | | | |
| 4.655%, due 06/15/2023 | | $ | 1,795,000 | | | $ | 1,778,142 | |
| 4.819%, due 07/27/2023 | | | 2,000,000 | | | | 1,970,068 | |
| 3.285%, due 08/10/2023 | | | 3,990,000 | | | | 3,923,266 | |
| 4.046%, due 09/07/2023 | | | 2,000,000 | | | | 1,959,322 | |
| | | | | | | | 9,630,798 | |
| U.S. Treasury Notes — 5.4% | | | | | | | | |
| 5.131%, due 01/31/2024 (c) | | | 990,000 | | | | 989,575 | |
| 1.500%, due 02/29/2024 | | | 1,995,000 | | | | 1,938,813 | |
| 0.250%, due 06/15/2024 | | | 4,500,000 | | | | 4,278,164 | |
| 2.750%, due 06/30/2025 | | | 4,810,000 | | | | 4,678,289 | |
| | | | | | | | 11,884,841 | |
| | | | | | | | | |
| Total U.S. Treasury Obligations (Cost $21,934,062) | | | | | | $ | 21,515,639 | |
| DAVENPORT BALANCED INCOME FUND |
| SCHEDULE OF INVESTMENTS (Continued) |
| MONEY MARKET FUNDS — 3.5% | | Shares | | | Value | |
| First American Treasury Obligations Fund - Class Z, 4.67% (d) (Cost $7,684,793) | | | 7,684,793 | | | $ | 7,684,793 | |
| | | | | | | | | |
| Total Investments at Value — 98.1% (Cost $200,088,917) | | | | | | $ | 214,490,425 | |
| Other Assets in Excess of Liabilities — 1.9% | | | | | | | 4,157,106 | |
| Net Assets — 100.0% | | | | | | $ | 218,647,531 | |
ADR - American Depositary Receipt.
| (a) | Non-income producing security. |
| (b) | The rate shown is the annualized yield at the time of purchase. |
| (c) | Variable rate security. The rate shown is the effective interest rate as of March 31, 2023. |
| (d) | The rate shown is the 7-day effective yield as of March 31, 2023. |
See accompanying notes to financial statements.
| THE DAVENPORT FUNDS |
| STATEMENTS OF ASSETS AND LIABILITIES |
| March 31, 2023 |
| | | | | | Davenport | | | Davenport | |
| | | Davenport | | | Value & | | | Equity | |
| | | Core Leaders | | | Income | | | Opportunities | |
| | | Fund | | | Fund | | | Fund | |
| ASSETS | | | | | | | | | | | | |
| Investments in securities: | | | | | | | | | | | | |
| At cost | | $ | 490,078,421 | | | $ | 660,176,944 | | | $ | 579,007,366 | |
| At value (Note 2) | | $ | 709,293,193 | | | $ | 803,885,784 | | | $ | 654,105,427 | |
| Cash | | | 7,669,923 | | | | 38,192 | | | | 54,995 | |
| Receivable for capital shares sold | | | 164,038 | | | | 30,231 | | | | 54,811 | |
| Dividends receivable | | | 310,598 | | | | 808,891 | | | | 160,365 | |
| Tax reclaims receivable | | | 14,017 | | | | — | | | | — | |
| Other assets | | | 14,319 | | | | 15,503 | | | | 15,908 | |
| TOTAL ASSETS | | | 717,466,088 | | | | 804,778,601 | | | | 654,391,506 | |
| | | | | | | | | | | | | |
| LIABILITIES | | | | | | | | | | | | |
| Payable for capital shares redeemed | | | 142,343 | | | | 267,135 | | | | 50,341 | |
| Accrued investment advisory fees (Note 4) | | | 440,764 | | | | 504,904 | | | | 407,546 | |
| Payable to administrator (Note 4) | | | 57,570 | | | | 64,300 | | | | 57,360 | |
| Other accrued expenses | | | 7,435 | | | | 12,645 | | | | 10,775 | |
| TOTAL LIABILITIES | | | 648,112 | | | | 848,984 | | | | 526,022 | |
| | | | | | | | | | | | | |
| NET ASSETS | | $ | 716,817,976 | | | $ | 803,929,617 | | | $ | 653,865,484 | |
| | | | | | | | | | | | | |
| Net assets consist of: | | | | | | | | | | | | |
| Paid-in capital | | $ | 475,158,979 | | | $ | 679,607,833 | | | $ | 559,230,598 | |
| Distributable earnings | | | 241,658,997 | | | | 124,321,784 | | | | 94,634,886 | |
| Net assets | | $ | 716,817,976 | | | $ | 803,929,617 | | | $ | 653,865,484 | |
| | | | | | | | | | | | | |
| Shares of beneficial interest outstanding (unlimited number of shares authorized, $0.01 par value) | | | 26,434,565 | | | | 47,507,269 | | | | 33,352,220 | |
| | | | | | | | | | | | | |
| Net asset value, offering price and redemption price per share (Note 2) | | $ | 27.12 | | | $ | 16.92 | | | $ | 19.60 | |
See accompanying notes to financial statements.
| THE DAVENPORT FUNDS |
| STATEMENTS OF ASSETS AND LIABILITIES (Continued) |
| March 31, 2023 |
| | | Davenport | | | Davenport | |
| | | Small Cap | | | Balanced | |
| | | Focus | | | Income | |
| | | Fund | | | Fund | |
| ASSETS | | | | | | | | |
| Investments in securities: | | | | | | | | |
| At cost | | $ | 572,263,071 | | | $ | 200,088,917 | |
| At value (Note 2) | | $ | 587,736,052 | | | $ | 214,490,425 | |
| Cash | | | — | | | | 27,095 | |
| Receivable for capital shares sold | | | 247,902 | | | | 432,412 | |
| Receivable for investment securities sold | | | 1,327,909 | | | | 3,359,244 | |
| Dividends and interest receivable | | | 806,674 | | | | 716,812 | |
| Other assets | | | 14,120 | | | | 10,522 | |
| TOTAL ASSETS | | | 590,132,657 | | | | 219,036,510 | |
| | | | | | | | | |
| LIABILITIES | | | | | | | | |
| Payable for capital shares redeemed | | | 159,163 | | | | 222,380 | |
| Payable investment securities purchased | | | 1,379,927 | | | | — | |
| Accrued investment advisory fees (Note 4) | | | 369,058 | | | | 138,374 | |
| Payable to administrator (Note 4) | | | 52,060 | | | | 21,980 | |
| Other accrued expenses | | | 12,485 | | | | 6,245 | |
| TOTAL LIABILITIES | | | 1,972,693 | | | | 388,979 | |
| | | | | | | | | |
| NET ASSETS | | $ | 588,159,964 | | | $ | 218,647,531 | |
| | | | | | | | | |
| Net assets consist of: | | | | | | | | |
| Paid-in capital | | $ | 557,137,463 | | | $ | 208,835,701 | |
| Distributable earnings | | | 31,022,501 | | | | 9,811,830 | |
| Net assets | | $ | 588,159,964 | | | $ | 218,647,531 | |
| | | | | | | | | |
| Shares of beneficial interest outstanding (unlimited number of shares authorized, $0.01 par value) | | | 36,682,825 | | | | 18,275,264 | |
| | | | | | | | | |
| Net asset value, offering price and redemption price per share (Note 2) | | $ | 16.03 | | | $ | 11.96 | |
See accompanying notes to financial statements.
| THE DAVENPORT FUNDS |
| STATEMENTS OF OPERATIONS |
| For the Year Ended March 31, 2023 |
| | | | | | Davenport | | | Davenport | |
| | | Davenport | | | Value & | | | Equity | |
| | | Core Leaders | | | Income | | | Opportunities | |
| | | Fund | | | Fund | | | Fund | |
| INVESTMENT INCOME | | | | | | | | | | | | |
| Dividends | | $ | 11,256,991 | | | $ | 24,067,014 | | | $ | 8,488,656 | |
| Foreign withholding taxes on dividends | | | (75,302 | ) | | | (308,429 | ) | | | (190,866 | ) |
| TOTAL INVESTMENT INCOME | | | 11,181,689 | | | | 23,758,585 | | | | 8,297,790 | |
| | | | | | | | | | | | | |
| EXPENSES | | | | | | | | | | | | |
| Investment advisory fees (Note 4) | | | 5,486,159 | | | | 6,209,772 | | | | 4,868,707 | |
| Administration fees (Note 4) | | | 670,930 | | | | 739,089 | | | | 650,515 | |
| Custodian and bank service fees | | | 41,803 | | | | 47,052 | | | | 37,374 | |
| Registration and filing fees | | | 31,360 | | | | 35,583 | | | | 35,372 | |
| Compliance service fees (Note 4) | | | 29,657 | | | | 33,060 | | | | 26,782 | |
| Postage and supplies | | | 22,767 | | | | 24,873 | | | | 25,058 | |
| Trustees’ fees and expenses (Note 4) | | | 19,654 | | | | 19,631 | | | | 19,631 | |
| Audit and tax services fees | | | 15,911 | | | | 15,911 | | | | 15,911 | |
| Insurance expense | | | 13,455 | | | | 14,832 | | | | 12,018 | |
| Legal fees | | | 12,437 | | | | 12,437 | | | | 12,437 | |
| Shareholder reporting expenses | | | 6,765 | | | | 7,154 | | | | 6,955 | |
| Other expenses | | | 9,112 | | | | 10,212 | | | | 9,446 | |
| TOTAL EXPENSES | | | 6,360,010 | | | | 7,169,606 | | | | 5,720,206 | |
| | | | | | | | | | | | | |
| NET INVESTMENT INCOME | | | 4,821,679 | | | | 16,588,979 | | | | 2,577,584 | |
| | | | | | | | | | | | | |
| REALIZED AND UNREALIZED GAINS (LOSSES) ON INVESTMENTS AND FOREIGN CURRENCIES | | | | | | | | | | | | |
| Net realized gains (losses) from: | | | | | | | | | | | | |
| Investments | | | 22,404,942 | | | | (14,205,769 | ) | | | 28,229,925 | |
| Foreign currency transactions | | | — | | | | (8,145 | ) | | | — | |
| Net change in unrealized appreciation (depreciation) on investments | | | (124,093,570 | ) | | | (110,973,394 | ) | | | (100,269,606 | ) |
| NET REALIZED AND UNREALIZED LOSSES ON INVESTMENTS AND FOREIGN CURRENCIES | | | (101,688,628 | ) | | | (125,187,308 | ) | | | (72,039,681 | ) |
| | | | | | | | | | | | | |
| NET DECREASE IN NET ASSETS FROM OPERATIONS | | $ | (96,866,949 | ) | | $ | (108,598,329 | ) | | $ | (69,462,097 | ) |
See accompanying notes to financial statements.
| THE DAVENPORT FUNDS |
| STATEMENTS OF OPERATIONS (Continued) |
| For the Year Ended March 31, 2023 |
| | | Davenport | | | Davenport | |
| | | Small Cap | | | Balanced | |
| | | Focus | | | Income | |
| | | Fund | | | Fund | |
| INVESTMENT INCOME | | | | | | | | |
| Dividends | | $ | 10,417,152 | | | $ | 4,164,460 | |
| Foreign withholding taxes on dividends | | | (105,381 | ) | | | (54,000 | ) |
| Interest | | | — | | | | 2,134,171 | |
| TOTAL INVESTMENT INCOME | | | 10,311,771 | | | | 6,244,631 | |
| | | | | | | | | |
| EXPENSES | | | | | | | | |
| Investment advisory fees (Note 4) | | | 4,126,274 | | | | 1,666,937 | |
| Administration fees (Note 4) | | | 567,681 | | | | 250,834 | |
| Registration and filing fees | | | 37,454 | | | | 30,242 | |
| Custodian and bank service fees | | | 33,272 | | | | 14,294 | |
| Trustees’ fees and expenses (Note 4) | | | 19,631 | | | | 19,631 | |
| Compliance service fees (Note 4) | | | 23,319 | | | | 11,802 | |
| Audit and tax services fees | | | 15,911 | | | | 17,411 | |
| Postage and supplies | | | 21,896 | | | | 8,760 | |
| Legal fees | | | 12,627 | | | | 12,437 | |
| Insurance expense | | | 9,542 | | | | 4,558 | |
| Shareholder reporting expenses | | | 6,081 | | | | 5,256 | |
| Other expenses | | | 10,244 | | | | 15,545 | |
| TOTAL EXPENSES | | | 4,883,932 | | | | 2,057,707 | |
| | | | | | | | | |
| NET INVESTMENT INCOME | | | 5,427,839 | | | | 4,186,924 | |
| | | | | | | | | |
| REALIZED AND UNREALIZED GAINS (LOSSES) ON INVESTMENTS AND FOREIGN CURRENCIES | | | | | | | | |
| Net realized gains from: | | | | | | | | |
| Investments | | | 17,628,605 | | | | (4,782,134 | ) |
| Foreign currency transactions | | | — | | | | (1,075 | ) |
| Net change in unrealized appreciation (depreciation) on investments | | | (42,892,149 | ) | | | (19,079,430 | ) |
| NET REALIZED AND UNREALIZED LOSSES ON INVESTMENTS AND FOREIGN CURRENCIES | | | (25,263,544 | ) | | | (23,862,639 | ) |
| | | | | | | | | |
| NET DECREASE IN NET ASSETS FROM OPERATIONS | | $ | (19,835,705 | ) | | $ | (19,675,715 | ) |
See accompanying notes to financial statements.
| DAVENPORT CORE LEADERS FUND |
| STATEMENTS OF CHANGES IN NET ASSETS |
| | | Year | | | Year | |
| | | Ended | | | Ended | |
| | | March 31, | | | March 31, | |
| | | 2023 | | | 2022 | |
| FROM OPERATIONS | | | | | | | | |
| Net investment income | | $ | 4,821,679 | | | $ | 333,130 | |
| Net realized gains from investments transactions | | | 22,404,942 | | | | 67,370,002 | |
| Net change in unrealized appreciation (depreciation) on investments | | | (124,093,570 | ) | | | 14,484,307 | |
| Net increase (decrease) in net assets from operations | | | (96,866,949 | ) | | | 82,187,439 | |
| | | | | | | | | |
| DISTRIBUTIONS TO SHAREHOLDERS (Note 2) | | | (33,421,621 | ) | | | (68,467,730 | ) |
| | | | | | | | | |
| FROM CAPITAL SHARE TRANSACTIONS | | | | | | | | |
| Proceeds from shares sold | | | 38,523,003 | | | | 67,141,323 | |
| Net asset value of shares issued in reinvestment of distributions to shareholders | | | 31,599,447 | | | | 64,819,874 | |
| Payments for shares redeemed | | | (68,665,707 | ) | | | (56,080,855 | ) |
| Net increase in net assets from capital share transactions | | | 1,456,743 | | | | 75,880,342 | |
| | | | | | | | | |
| TOTAL INCREASE (DECREASE) IN NET ASSETS | | | (128,831,827 | ) | | | 89,600,051 | |
| | | | | | | | | |
| NET ASSETS | | | | | | | | |
| Beginning of year | | | 845,649,803 | | | | 756,049,752 | |
| End of year | | $ | 716,817,976 | | | $ | 845,649,803 | |
| | | | | | | | | |
| CAPITAL SHARE ACTIVITY | | | | | | | | |
| Shares sold | | | 1,410,655 | | | | 2,023,456 | |
| Shares reinvested | | | 1,204,906 | | | | 2,003,986 | |
| Shares redeemed | | | (2,535,484 | ) | | | (1,693,215 | ) |
| Net increase in shares outstanding | | | 80,077 | | | | 2,334,227 | |
| Shares outstanding at beginning of year | | | 26,354,488 | | | | 24,020,261 | |
| Shares outstanding at end of year | | | 26,434,565 | | | | 26,354,488 | |
See accompanying notes to financial statements.
| DAVENPORT VALUE & INCOME FUND |
| STATEMENTS OF CHANGES IN NET ASSETS |
| | | Year | | | Year | |
| | | Ended | | | Ended | |
| | | March 31, | | | March 31, | |
| | | 2023 | | | 2022 | |
| FROM OPERATIONS | | | | | | | | |
| Net investment income | | $ | 16,588,979 | | | $ | 12,685,480 | |
| Net realized gains (losses) from: | | | | | | | | |
| Investments | | | (14,205,769 | ) | | | 38,935,093 | |
| Foreign currency transactions | | | (8,145 | ) | | | (4,099 | ) |
| Net change in unrealized appreciation (depreciation) on investments | | | (110,973,394 | ) | | | 61,409,599 | |
| Net increase (decrease) in net assets from operations | | | (108,598,329 | ) | | | 113,026,073 | |
| | | | | | | | | |
| DISTRIBUTIONS TO SHAREHOLDERS (Note 2) | | | (44,814,541 | ) | | | (38,881,727 | ) |
| | | | | | | | | |
| FROM CAPITAL SHARE TRANSACTIONS | | | | | | | | |
| Proceeds from shares sold | | | 64,176,770 | | | | 77,470,391 | |
| Net asset value of shares issued in reinvestment of distributions to shareholders | | | 41,332,927 | | | | 35,920,894 | |
| Payments for shares redeemed | | | (68,222,589 | ) | | | (57,132,094 | ) |
| Net increase in net assets from capital share transactions | | | 37,287,108 | | | | 56,259,191 | |
| | | | | | | | | |
| TOTAL INCREASE (DECREASE) IN NET ASSETS | | | (116,125,762 | ) | | | 130,403,537 | |
| | | | | | | | | |
| NET ASSETS | | | | | | | | |
| Beginning of year | | | 920,055,379 | | | | 789,651,842 | |
| End of year | | $ | 803,929,617 | | | $ | 920,055,379 | |
| | | | | | | | | |
| CAPITAL SHARE ACTIVITY | | | | | | | | |
| Shares sold | | | 3,639,179 | | | | 3,906,031 | |
| Shares reinvested | | | 2,406,658 | | | | 1,826,825 | |
| Shares redeemed | | | (3,885,746 | ) | | | (2,881,938 | ) |
| Net increase in shares outstanding | | | 2,160,091 | | | | 2,850,918 | |
| Shares outstanding at beginning of year | | | 45,347,178 | | | | 42,496,260 | |
| Shares outstanding at end of year | | | 47,507,269 | | | | 45,347,178 | |
See accompanying notes to financial statements.
| DAVENPORT EQUITY OPPORTUNITIES FUND |
| STATEMENTS OF CHANGES IN NET ASSETS |
| | | Year | | | Year | |
| | | Ended | | | Ended | |
| | | March 31, | | | March 31, | |
| | | 2023 | | | 2022 | |
| FROM OPERATIONS | | | | | | | | |
| Net investment income (loss) | | $ | 2,577,584 | | | $ | (1,468,762 | ) |
| Net realized gains from investments transactions | | | 28,229,925 | | | | 91,925,124 | |
| Net change in unrealized appreciation (depreciation) on investments | | | (100,269,606 | ) | | | (46,165,311 | ) |
| Net increase (decrease) in net assets from operations | | | (69,462,097 | ) | | | 44,291,051 | |
| | | | | | | | | |
| DISTRIBUTIONS TO SHAREHOLDERS (Note 2) | | | (51,814,659 | ) | | | (77,485,662 | ) |
| | | | | | | | | |
| FROM CAPITAL SHARE TRANSACTIONS | | | | | | | | |
| Proceeds from shares sold | | | 46,895,501 | | | | 84,066,849 | |
| Net asset value of shares issued in reinvestment of distributions to shareholders | | | 49,644,736 | | | | 74,107,221 | |
| Payments for shares redeemed | | | (62,893,747 | ) | | | (42,597,952 | ) |
| Net increase in net assets from capital share transactions | | | 33,646,490 | | | | 115,576,118 | |
| | | | | | | | | |
| TOTAL INCREASE (DECREASE) IN NET ASSETS | | | (87,630,266 | ) | | | 82,381,507 | |
| | | | | | | | | |
| NET ASSETS | | | | | | | | |
| Beginning of year | | | 741,495,750 | | | | 659,114,243 | |
| End of year | | $ | 653,865,484 | | | $ | 741,495,750 | |
| | | | | | | | | |
| CAPITAL SHARE ACTIVITY | | | | | | | | |
| Shares sold | | | 2,374,908 | | | | 3,324,671 | |
| Shares reinvested | | | 2,703,999 | | | | 3,003,498 | |
| Shares redeemed | | | (3,226,344 | ) | | | (1,685,585 | ) |
| Net increase in shares outstanding | | | 1,852,563 | | | | 4,642,584 | |
| Shares outstanding at beginning of year | | | 31,499,657 | | | | 26,857,073 | |
| Shares outstanding at end of year | | | 33,352,220 | | | | 31,499,657 | |
See accompanying notes to financial statements.
| DAVENPORT SMALL CAP FOCUS FUND |
| STATEMENTS OF CHANGES IN NET ASSETS |
| | | Year | | | Year | |
| | | Ended | | | Ended | |
| | | March 31, | | | March 31, | |
| | | 2023 | | | 2022 | |
| FROM OPERATIONS | | | | | | | | |
| Net investment income | | $ | 5,427,839 | | | $ | 2,702,467 | |
| Net realized gains from investments transactions | | | 17,628,605 | | | | 75,763,509 | |
| Net change in unrealized appreciation (depreciation) on investments | | | (42,892,149 | ) | | | (43,480,747 | ) |
| Net increase (decrease) in net assets from operations | | | (19,835,705 | ) | | | 34,985,229 | |
| | | | | | | | | |
| DISTRIBUTIONS TO SHAREHOLDERS (Note 2) | | | (36,020,543 | ) | | | (78,479,634 | ) |
| | | | | | | | | |
| FROM CAPITAL SHARE TRANSACTIONS | | | | | | | | |
| Proceeds from shares sold | | | 92,278,471 | | | | 120,005,269 | |
| Net asset value of shares issued in reinvestment of distributions to shareholders | | | 34,375,030 | | | | 75,165,724 | |
| Payments for shares redeemed | | | (70,204,863 | ) | | | (55,364,634 | ) |
| Net increase in net assets from capital share transactions | | | 56,448,638 | | | | 139,806,359 | |
| | | | | | | | | |
| TOTAL INCREASE IN NET ASSETS | | | 592,390 | | | | 96,311,954 | |
| | | | | | | | | |
| NET ASSETS | | | | | | | | |
| Beginning of year | | | 587,567,574 | | | | 491,255,620 | |
| End of year | | $ | 588,159,964 | | | $ | 587,567,574 | |
| | | | | | | | | |
| CAPITAL SHARE ACTIVITY | | | | | | | | |
| Shares sold | | | 5,901,765 | | | | 6,432,111 | |
| Shares reinvested | | | 2,356,513 | | | | 4,063,842 | |
| Shares redeemed | | | (4,487,809 | ) | | | (2,943,908 | ) |
| Net increase in shares outstanding | | | 3,770,469 | | | | 7,552,045 | |
| Shares outstanding at beginning of year | | | 32,912,356 | | | | 25,360,311 | |
| Shares outstanding at end of year | | | 36,682,825 | | | | 32,912,356 | |
See accompanying notes to financial statements.
| DAVENPORT BALANCED INCOME FUND |
| STATEMENTS OF CHANGES IN NET ASSETS |
| | | Year | | | Year | |
| | | Ended | | | Ended | |
| | | March 31, | | | March 31, | |
| | | 2023 | | | 2022 | |
| FROM OPERATIONS | | | | | | | | |
| Net investment income | | $ | 4,186,924 | | | $ | 3,087,974 | |
| Net realized gains (losses) from: | | | | | | | | |
| Investments | | | (4,782,134 | ) | | | 7,678,961 | |
| Foreign currency transactions | | | (1,075 | ) | | | (566 | ) |
| Net change in unrealized appreciation (depreciation) on investments | | | (19,079,430 | ) | | | 4,308,416 | |
| Net increase (decrease) in net assets from operations | | | (19,675,715 | ) | | | 15,074,785 | |
| | | | | | | | | |
| DISTRIBUTIONS TO SHAREHOLDERS (Note 2) | | | (9,515,808 | ) | | | (3,301,414 | ) |
| | | | | | | | | |
| FROM CAPITAL SHARE TRANSACTIONS | | | | | | | | |
| Proceeds from shares sold | | | 30,313,838 | | | | 46,064,469 | |
| Net asset value of shares issued in reinvestment of distributions to shareholders | | | 8,893,677 | | | | 3,043,589 | |
| Payments for shares redeemed | | | (27,627,245 | ) | | | (17,808,632 | ) |
| Net increase in net assets from capital share transactions | | | 11,580,270 | | | | 31,299,426 | |
| | | | | | | | | |
| TOTAL INCREASE (DECREASE) IN NET ASSETS | | | (17,611,253 | ) | | | 43,072,797 | |
| | | | | | | | | |
| NET ASSETS | | | | | | | | |
| Beginning of year | | | 236,258,784 | | | | 193,185,987 | |
| End of year | | $ | 218,647,531 | | | $ | 236,258,784 | |
| | | | | | | | | |
| CAPITAL SHARE ACTIVITY | | | | | | | | |
| Shares sold | | | 2,463,615 | | | | 3,411,188 | |
| Shares reinvested | | | 739,617 | | | | 224,285 | |
| Shares redeemed | | | (2,281,226 | ) | | | (1,320,477 | ) |
| Net increase in shares outstanding | | | 922,006 | | | | 2,314,996 | |
| Shares outstanding at beginning of year | | | 17,353,258 | | | | 15,038,262 | |
| Shares outstanding at end of year | | | 18,275,264 | | | | 17,353,258 | |
See accompanying notes to financial statements.
| DAVENPORT CORE LEADERS FUND |
| FINANCIAL HIGHLIGHTS |
Selected Per Share Data and Ratios for a Share Outstanding Throughout Each Year:
| | | Year Ended | | | Year Ended | | | Year Ended | | | Year Ended | | | Year Ended | |
| | | March 31, | | | March 31, | | | March 31, | | | March 31, | | | March 31, | |
| | | 2023 | | | 2022 | | | 2021 | | | 2020 | | | 2019 | |
| Net asset value at beginning of year | | $ | 32.09 | | | $ | 31.48 | | | $ | 21.48 | | | $ | 23.75 | | | $ | 22.96 | |
| | | | | | | | | | | | | | | | | | | | | |
| Income (loss) from investment operations: | | | | | | | | | | | | | | | | | | | | |
| Net investment income | | | 0.18 | | | | 0.01 | | | | 0.05 | | | | 0.14 | | | | 0.11 | |
| Net realized and unrealized gains (losses) on investments | | | (3.88 | ) | | | 3.38 | | | | 10.27 | | | | (1.80 | ) | | | 1.74 | |
| Total from investment operations | | | (3.70 | ) | | | 3.39 | | | | 10.32 | | | | (1.66 | ) | | | 1.85 | |
| | | | | | | | | | | | | | | | | | | | | |
| Less distributions from: | | | | | | | | | | | | | | | | | | | | |
| Net investment income | | | (0.18 | ) | | | (0.00 | ) (a) | | | (0.07 | ) | | | (0.14 | ) | | | (0.11 | ) |
| Net realized gains | | | (1.09 | ) | | | (2.78 | ) | | | (0.25 | ) | | | (0.47 | ) | | | (0.95 | ) |
| Total distributions | | | (1.27 | ) | | | (2.78 | ) | | | (0.32 | ) | | | (0.61 | ) | | | (1.06 | ) |
| | | | | | | | | | | | | | | | | | | | | |
| Net asset value at end of year | | $ | 27.12 | | | $ | 32.09 | | | $ | 31.48 | | | $ | 21.48 | | | $ | 23.75 | |
| | | | | | | | | | | | | | | | | | | | | |
| Total return (b) | | | (11.37 | %) | | | 10.89 | % | | | 48.20 | % | | | (7.36 | %) | | | 8.21 | % |
| | | | | | | | | | | | | | | | | | | | | |
| Net assets at end of year (000’s) | | $ | 716,818 | | | $ | 845,650 | | | $ | 756,050 | | | $ | 486,569 | | | $ | 516,228 | |
| | | | | | | | | | | | | | | | | | | | | |
| Ratio of total expenses to average net assets | | | 0.87 | % | | | 0.86 | % | | | 0.87 | % | | | 0.89 | % | | | 0.89 | % |
| | | | | | | | | | | | | | | | | | | | | |
| Ratio of net investment income to average net assets | | | 0.66 | % | | | 0.04 | % | | | 0.17 | % | | | 0.55 | % | | | 0.48 | % |
| | | | | | | | | | | | | | | | | | | | | |
| Portfolio turnover rate | | | 19 | % | | | 20 | % | | | 30 | % | | | 12 | % | | | 21 | % |
| (a) | Amount rounds to less than $0.01 per share. |
| (b) | Total return is a measure of the change in value of an investment in the Fund over the periods covered, which assumes any dividends or capital gains distributions are reinvested in shares of the Fund. Returns shown do not reflect the deduction of taxes a shareholder would pay on Fund distributions or the redemption of Fund shares. |
See accompanying notes to financial statements.
| DAVENPORT VALUE & INCOME FUND |
| FINANCIAL HIGHLIGHTS |
Selected Per Share Data and Ratios for a Share Outstanding Throughout Each Year:
| | | Year Ended | | | Year Ended | | | Year Ended | | | Year Ended | | | Year Ended | |
| | | March 31, | | | March 31, | | | March 31, | | | March 31, | | | March 31, | |
| | | 2023 | | | 2022 | | | 2021 | | | 2020 | | | 2019 | |
| Net asset value at beginning of year | | $ | 20.29 | | | $ | 18.58 | | | $ | 13.04 | | | $ | 16.38 | | | $ | 16.85 | |
| | | | | | | | | | | | | | | | | | | | | |
| Income (loss) from investment operations: | | | | | | | | | | | | | | | | | | | | |
| Net investment income | | | 0.35 | | | | 0.29 | | | | 0.28 | | | | 0.35 | | | | 0.36 | |
| Net realized and unrealized gains (losses) on investments and foreign currencies | | | (2.75 | ) | | | 2.32 | | | | 5.98 | | | | (3.00 | ) | | | 0.12 | |
| Total from investment operations | | | (2.40 | ) | | | 2.61 | | | | 6.26 | | | | (2.65 | ) | | | 0.48 | |
| | | | | | | | | | | | | | | | | | | | | |
| Less distributions from: | | | | | | | | | | | | | | | | | | | | |
| Net investment income | | | (0.35 | ) | | | (0.30 | ) | | | (0.27 | ) | | | (0.36 | ) | | | (0.36 | ) |
| Net realized gains | | | (0.62 | ) | | | (0.60 | ) | | | (0.45 | ) | | | (0.33 | ) | | | (0.59 | ) |
| Total distributions | | | (0.97 | ) | | | (0.90 | ) | | | (0.72 | ) | | | (0.69 | ) | | | (0.95 | ) |
| | | | | | | | | | | | | | | | | | | | | |
| Net asset value at end of year | | $ | 16.92 | | | $ | 20.29 | | | $ | 18.58 | | | $ | 13.04 | | | $ | 16.38 | |
| | | | | | | | | | | | | | | | | | | | | |
| Total return (a) | | | (11.81 | %) | | | 14.24 | % | | | 49.55 | % | | | (16.97 | %) | | | 2.96 | % |
| | | | | | | | | | | | | | | | | | | | | |
| Net assets at end of year (000’s) | | $ | 803,930 | | | $ | 920,055 | | | $ | 789,652 | | | $ | 549,112 | | | $ | 672,954 | |
| | | | | | | | | | | | | | | | | | | | | |
| Ratio of total expenses to average net assets | | | 0.87 | % | | | 0.86 | % | | | 0.87 | % | | | 0.88 | % | | | 0.88 | % |
| | | | | | | | | | | | | | | | | | | | | |
| Ratio of net investment income to average net assets | | | 2.00 | % | | | 1.46 | % | | | 1.78 | % | | | 2.07 | % | | | 2.21 | % |
| | | | | | | | | | | | | | | | | | | | | |
| Portfolio turnover rate | | | 21 | % | | | 20 | % | | | 34 | % | | | 28 | % | | | 18 | % |
| (a) | Total return is a measure of the change in value of an investment in the Fund over the periods covered, which assumes any dividends or capital gains distributions are reinvested in shares of the Fund. Returns shown do not reflect the deduction of taxes a shareholder would pay on Fund distributions or the redemption of Fund shares. |
See accompanying notes to financial statements.
| DAVENPORT EQUITY OPPORTUNITIES FUND |
| FINANCIAL HIGHLIGHTS |
Selected Per Share Data and Ratios for a Share Outstanding Throughout Each Year:
| | | Year Ended | | | Year Ended | | | Year Ended | | | Year Ended | | | Year Ended | |
| | | March 31, | | | March 31, | | | March 31, | | | March 31, | | | March 31, | |
| | | 2023 | | | 2022 | | | 2021 | | | 2020 | | | 2019 | |
| Net asset value at beginning of year | | $ | 23.54 | | | $ | 24.54 | | | $ | 16.56 | | | $ | 18.98 | | | $ | 17.75 | |
| | | | | | | | | | | | | | | | | | | | | |
| Income (loss) from investment operations: | | | | | | | | | | | | | | | | | | | | |
| Net investment income (loss) | | | 0.08 | | | | (0.05 | ) | | | (0.03 | ) | | | (0.00 | )(a) | | | (0.02 | ) |
| Net realized and unrealized gains (losses) on investments | | | (2.39 | ) | | | 1.80 | | | | 10.42 | | | | (1.59 | ) | | | 1.91 | |
| Total from investment operations | | | (2.31 | ) | | | 1.75 | | | | 10.39 | | | | (1.59 | ) | | | 1.89 | |
| | | | | | | | | | | | | | | | | | | | | |
| Less distributions from: | | | | | | | | | | | | | | | | | | | | |
| Net investment income | | | (0.06 | ) | | | — | | | | — | | | | — | | | | — | |
| Net realized gains | | | (1.57 | ) | | | (2.75 | ) | | | (2.41 | ) | | | (0.83 | ) | | | (0.66 | ) |
| Total distributions | | | (1.63 | ) | | | (2.75 | ) | | | (2.41 | ) | | | (0.83 | ) | | | (0.66 | ) |
| | | | | | | | | | | | | | | | | | | | | |
| Net asset value at end of year | | $ | 19.60 | | | $ | 23.54 | | | $ | 24.54 | | | $ | 16.56 | | | $ | 18.98 | |
| | | | | | | | | | | | | | | | | | | | | |
| Total return (b) | | | (9.25 | %) | | | 6.89 | % | | | 66.20 | % | | | (9.13 | %) | | | 11.02 | % |
| | | | | | | | | | | | | | | | | | | | | |
| Net assets at end of year (000’s) | | $ | 653,865 | | | $ | 741,496 | | | $ | 659,114 | | | $ | 385,163 | | | $ | 409,002 | |
| | | | | | | | | | | | | | | | | | | | | |
| Ratio of total expenses to average net assets | | | 0.88 | % | | | 0.87 | % | | | 0.88 | % | | | 0.90 | % | | | 0.91 | % |
| | | | | | | | | | | | | | | | | | | | | |
| Ratio of net investment income (loss) to average net assets | | | 0.40 | % | | | (0.20 | %) | | | (0.13 | %) | | | (0.02 | %) | | | (0.13 | %) |
| | | | | | | | | | | | | | | | | | | | | |
| Portfolio turnover rate | | | 26 | % | | | 22 | % | | | 31 | % | | | 21 | % | | | 19 | % |
| (a) | Amount rounds to less than $0.01 per share. |
| (b) | Total return is a measure of the change in value of an investment in the Fund over the periods covered, which assumes any dividends or capital gains distributions are reinvested in shares of the Fund. Returns shown do not reflect the deduction of taxes a shareholder would pay on Fund distributions or the redemption of Fund shares. |
See accompanying notes to financial statements.
| DAVENPORT SMALL CAP FOCUS FUND |
| FINANCIAL HIGHLIGHTS |
Selected Per Share Data and Ratios for a Share Outstanding Throughout Each Year:
| | | Year Ended | | | Year Ended | | | Year Ended | | | Year Ended | | | Year Ended | |
| | | March 31, | | | March 31, | | | March 31, | | | March 31, | | | March 31, | |
| | | 2023 | | | 2022 | | | 2021 | | | 2020 | | | 2019 | |
| Net asset value at beginning of year | | $ | 17.85 | | | $ | 19.37 | | | $ | 11.14 | | | $ | 13.25 | | | $ | 13.01 | |
| | | | | | | | | | | | | | | | | | | | | |
| Income (loss) from investment operations: | | | | | | | | | | | | | | | | | | | | |
| Net investment income (a) | | | 0.15 | | | | 0.11 | | | | 0.04 | | | | 0.05 | | | | 0.06 | |
| Net realized and unrealized gains (losses) on investments | | | (0.90 | ) | | | 1.20 | | | | 9.28 | | | | (1.84 | ) | | | 0.44 | |
| Total from investment operations | | | (0.75 | ) | | | 1.31 | | | | 9.32 | | | | (1.79 | ) | | | 0.50 | |
| | | | | | | | | | | | | | | | | | | | | |
| Less distributions from: | | | | | | | | | | | | | | | | | | | | |
| Net investment income | | | (0.13 | ) | | | (0.13 | ) | | | (0.20 | ) | | | (0.10 | ) | | | — | |
| Net realized gains | | | (0.94 | ) | | | (2.70 | ) | | | (0.89 | ) | | | (0.22 | ) | | | (0.26 | ) |
| Total distributions | | | (1.07 | ) | | | (2.83 | ) | | | (1.09 | ) | | | (0.32 | ) | | | (0.26 | ) |
| | | | | | | | | | | | | | | | | | | | | |
| Net asset value at end of year | | $ | 16.03 | | | $ | 17.85 | | | $ | 19.37 | | | $ | 11.14 | | | $ | 13.25 | |
| | | | | | | | | | | | | | | | | | | | | |
| Total return (b) | | | (3.56 | %) | | | 6.85 | % | | | 84.84 | % | | | (14.08 | %) | | | 3.90 | % |
| | | | | | | | | | | | | | | | | | | | | |
| Net assets at end of year (000’s) | | $ | 588,160 | | | $ | 587,568 | | | $ | 491,256 | | | $ | 180,077 | | | $ | 152,063 | |
| | | | | | | | | | | | | | | | | | | | | |
| Ratio of total expenses to average net assets (c) | | | 0.89 | % | | | 0.88 | % | | | 0.91 | % | | | 0.95 | % | | | 0.97 | % |
| | | | | | | | | | | | | | | | | | | | | |
| Ratio of net investment income to average net assets (c) | | | 0.99 | % | | | 0.49 | % | | | 0.12 | % | | | 0.40 | % | | | 0.51 | % |
| | | | | | | | | | | | | | | | | | | | | |
| Portfolio turnover rate | | | 36 | % | | | 44 | % | | | 54 | % | | | 66 | % | | | 60 | % |
| (a) | Recognition of net investment income by the Fund is affected by the timing of declarations of dividends by the underlying investment companies in which the Fund invests. |
| (b) | Total return is a measure of the change in value of an investment in the Fund over the periods covered, which assumes any dividends or capital gains distributions are reinvested in shares of the Fund. Returns shown do not reflect the deduction of taxes a shareholder would pay on Fund distributions or the redemption of Fund shares. |
| (c) | The ratios of expenses and net investment income to average net assets do not reflect the Fund’s proportionate share of expenses of the underlying investment companies in which the Fund invests. |
See accompanying notes to financial statements.
| DAVENPORT BALANCED INCOME FUND |
| FINANCIAL HIGHLIGHTS |
Selected Per Share Data and Ratios for a Share Outstanding Throughout Each Year:
| | | Year Ended | | | Year Ended | | | Year Ended | | | Year Ended | | | Year Ended | |
| | | March 31, | | | March 31, | | | March 31, | | | March 31, | | | March 31, | |
| | | 2023 | | | 2022 | | | 2021 | | | 2020 | | | 2019 | |
| Net asset value at beginning of year | | $ | 13.61 | | | $ | 12.85 | | | $ | 9.84 | | | $ | 11.34 | | | $ | 11.28 | |
| | | | | | | | | | | | | | | | | | | | | |
| Income (loss) from investment operations: | | | | | | | | | | | | | | | | | | | | |
| Net investment income (a) | | | 0.23 | | | | 0.19 | | | | 0.20 | | | | 0.25 | | | | 0.25 | |
| Net realized and unrealized gains (losses) on investments and foreign currencies | | | (1.35 | ) | | | 0.77 | | | | 3.04 | | | | (1.41 | ) | | | 0.12 | |
| Total from investment operations | | | (1.12 | ) | | | 0.96 | | | | 3.24 | | | | (1.16 | ) | | | 0.37 | |
| | | | | | | | | | | | | | | | | | | | | |
| Less distributions from: | | | | | | | | | | | | | | | | | | | | |
| Net investment income | | | (0.22 | ) | | | (0.18 | ) | | | (0.23 | ) | | | (0.23 | ) | | | (0.24 | ) |
| Net realized gains | | | (0.31 | ) | | | (0.02 | ) | | | — | | | | (0.08 | ) | | | (0.07 | ) |
| Return of capital | | | — | | | | — | | | | — | | | | (0.03 | ) | | | — | |
| Total distributions | | | (0.53 | ) | | | (0.20 | ) | | | (0.23 | ) | | | (0.34 | ) | | | (0.31 | ) |
| | | | | | | | | | | | | | | | | | | | | |
| Net asset value at end of year | | $ | 11.96 | | | $ | 13.61 | | | $ | 12.85 | | | $ | 9.84 | | | $ | 11.34 | |
| | | | | | | | | | | | | | | | | | | | | |
| Total return (b) | | | (8.18 | %) | | | 7.50 | % | | | 33.14 | % | | | (10.59 | %) | | | 3.35 | % |
| | | | | | | | | | | | | | | | | | | | | |
| Net assets at end of year (000’s) | | $ | 218,648 | | | $ | 236,259 | | | $ | 193,186 | | | $ | 143,897 | | | $ | 142,199 | |
| | | | | | | | | | | | | | | | | | | | | |
| Ratio of total expenses to average net assets (c) | | | 0.93 | % | | | 0.92 | % | | | 0.93 | % | | | 0.95 | % | | | 0.96 | % |
| | | | | | | | | | | | | | | | | | | | | |
| Ratio of net investment income to average net assets (c) | | | 1.88 | % | | | 1.42 | % | | | 1.73 | % | | | 2.18 | % | | | 2.28 | % |
| | | | | | | | | | | | | | | | | | | | | |
| Portfolio turnover rate | | | 24 | % | | | 23 | % | | | 29 | % | | | 29 | % | | | 30 | % |
| (a) | Recognition of net investment income by the Fund is affected by the timing of declarations of dividends by the underlying investment companies in which the Fund invests. |
| (b) | Total return is a measure of the change in value of an investment in the Fund over the periods covered, which assumes any dividends or capital gains distributions are reinvested in shares of the Fund. Returns shown do not reflect the deduction of taxes a shareholder would pay on Fund distributions or the redemption of Fund shares. |
| (c) | The ratios of expenses and net investment income to average net assets do not reflect the Fund’s proportionate share of expenses of the underlying investment companies in which the Fund invests. |
See accompanying notes to financial statements.
| THE DAVENPORT FUNDS |
| NOTES TO FINANCIAL STATEMENTS |
| March 31, 2023 |
1. Organization
Davenport Core Leaders Fund (formerly Davenport Core Fund), Davenport Value & Income Fund, Davenport Equity Opportunities Fund, Davenport Small Cap Focus Fund and Davenport Balanced Income Fund (individually, a “Fund,” and, collectively, the “Funds”) are each a no-load series of the Williamsburg Investment Trust (the “Trust”), an open-end management investment company registered under the Investment Company Act of 1940, as amended (the “1940 Act”). The Trust was organized as a Massachusetts business trust on July 18, 1988. Other series of the Trust are not incorporated in this report.
Davenport Core Leaders Fund’s investment objective is long-term growth of capital.
Davenport Value & Income Fund’s investment objective is to achieve long-term growth while generating current income through dividend payments on portfolio securities.
Davenport Equity Opportunities Fund’s investment objective is long-term capital appreciation.
Davenport Small Cap Focus Fund’s investment objective is long-term capital appreciation.
Davenport Balanced Income Fund’s investment objective is current income and an opportunity for long-term growth.
Davenport Core Leaders Fund, Davenport Value & Income Fund, Davenport Small Cap Focus Fund and Davenport Balanced Income Fund are each classified as a diversified fund. Davenport Equity Opportunities Fund is classified as a non-diversified fund.
2. Significant Accounting Policies
Each Fund follows accounting and reporting guidance under Financial Accounting Standards Board (“FASB”) Accounting Standards Codification Topic 946, “Financial Services – Investment Companies.” The following is a summary of the Funds’ significant accounting policies. The policies are in conformity with accounting principles generally accepted in the United States of America (“GAAP”).
Regulatory update — In March 2020, FASB issued Accounting Standards Update 2020-04, Reference Rate Reform: Facilitation of the Effects of Reference Rate Reform on Financial Reporting (“ASU 2020-04”), in January 2021, the FASB issued Accounting Standards Update 2021-01, Reference Rate Reform (Topic 848): Scope (“ASU 2021-01”), and in December 2022, the FASB issued Accounting Standards Update ASU 2022-06, Reference Rate Reform (Topic 848): Deferral of the Sunset Date of Topic 848 (“ASU 2022-06”), which provides optional, temporary relief with respect to the financial reporting of contracts subject to certain types of modifications due to the planned discontinuation of the London Interbank Offered Rate (“LIBOR”) and other interbank offered rates as of the end of 2021. The temporary relief provided by ASU 2020-04, ASU 2021-01, and ASU 2022-06 are effective for certain reference rate-related contract modifications that occur during the period from March 12, 2020 through December 31, 2024. Management is evaluating the impact of ASU 2020-04, ASU 2021-01, and ASU 2022-06
| THE DAVENPORT FUNDS |
| NOTES TO FINANCIAL STATEMENTS (Continued) |
on the Funds’ investments, derivatives, debt, and other contracts that will undergo reference rate elated modifications as a result of the reference rate reform. Management is also currently actively working with other financial institutions and counterparties to modify contracts as required by applicable regulation and within the regulatory deadlines.
Securities valuation — The Funds’ portfolio securities are valued as of the close of business of the regular session of the New York Stock Exchange (the “NYSE”) (normally 4:00 p.m. Eastern time). Securities traded on a national stock exchange, including common stocks and exchange-traded funds (“ETFs”), if any, are valued based upon the closing price on the principal exchange where the security is traded, if available, otherwise, at the last quoted bid price. Securities that are quoted by NASDAQ are valued at the NASDAQ Official Closing Price. Investments representing shares of money market funds and other open-end investment companies, other than ETFs, are valued at their net asset value (“NAV”) as reported by such companies. When using a quoted price and when the market is considered active, securities will be classified as Level 1 within the fair value hierarchy (see below).
Fixed income securities, including corporate bonds and U.S. Treasury obligations, are typically valued on the basis of prices provided by an independent pricing service. The prices provided by the pricing service are determined with consideration given to institutional bid and last sale prices and take into account securities prices, yields, maturities, call features, ratings, institutional trading in similar groups of securities, and developments related to specific securities. Given the inputs used by the pricing service, these securities are classified as Level 2 within the fair value hierarchy.
When market quotations are not readily available, if a pricing service cannot provide a price, or if the investment adviser believes the price received from the pricing service is not indicative of fair value, securities will be valued in good faith at fair value as determined by Davenport & Company LLC (the “Adviser”) as the Funds’ valuation designee, in accordance with procedures adopted by the Board of Trustees (the “Board”) pursuant to Rule 2a-5 under the 1940 Act. Under these procedures, the securities will be classified as Level 2 or 3 within the fair value hierarchy, depending on the inputs used. Such methods of fair valuation may include, but are not limited to: multiple of earnings, multiple of book value, discount from market of a similar freely traded security, purchase price of the security, subsequent private transactions in the security or related securities, or a combination of these and other factors.
GAAP establishes a single authoritative definition of fair value, sets out a framework for measuring fair value and requires additional disclosures about fair value measurements.
Various inputs are used in determining the value of the Funds’ investments. These inputs are summarized in the three broad levels listed below:
| ● | Level 1 – quoted prices in active markets for identical securities |
| ● | Level 2 – other significant observable inputs |
| ● | Level 3 – significant unobservable inputs |
| THE DAVENPORT FUNDS |
| NOTES TO FINANCIAL STATEMENTS (Continued) |
The inputs or methodology used for valuing securities are not necessarily an indication of the risks associated with investing in those securities. The inputs used to measure fair value may fall into different levels of the fair value hierarchy. In such cases, for disclosure purposes, the level in the fair value hierarchy within which the fair value measurement falls in its entirety is determined based on the lowest level input that is significant to the fair value measurement.
The following is a summary of the Funds’ investments based on the inputs used to value the investments as of March 31, 2023, by security type:
| Davenport Core Leaders Fund | | Level 1 | | | Level 2 | | | Level 3 | | | Total | |
| Common Stocks | | $ | 698,699,884 | | | $ | — | | | $ | — | | | $ | 698,699,884 | |
| Money Market Funds | | | 10,593,309 | | | | — | | | | — | | | | 10,593,309 | |
| Total | | $ | 709,293,193 | | | $ | — | | | $ | — | | | $ | 709,293,193 | |
| | | | | | | | | | | | | | | | | |
| | | | | | | | | | | | | | | | | |
| Davenport Value & Income Fund | | Level 1 | | | Level 2 | | | Level 3 | | | Total | |
| Common Stocks | | $ | 776,221,103 | | | $ | — | | | $ | — | | | $ | 776,221,103 | |
| Money Market Funds | | | 27,664,681 | | | | — | | | | — | | | | 27,664,681 | |
| Total | | $ | 803,885,784 | | | $ | — | | | $ | — | | | $ | 803,885,784 | |
| | | | | | | | | | | | | | | | | |
| | | | | | | | | | | | | | | | | |
| Davenport Equity Opportunities Fund | | Level 1 | | | Level 2 | | | Level 3 | | | Total | |
| Common Stocks | | $ | 614,667,732 | | | $ | — | | | $ | — | | | $ | 614,667,732 | |
| Money Market Funds | | | 39,437,695 | | | | — | | | | — | | | | 39,437,695 | |
| Total | | $ | 654,105,427 | | | $ | — | | | $ | — | | | $ | 654,105,427 | |
| | | | | | | | | | | | | | | | | |
| | | | | | | | | | | | | | | | | |
| Davenport Small Cap Focus Fund | | Level 1 | | | Level 2 | | | Level 3 | | | Total | |
| Common Stocks | | $ | 513,995,025 | | | $ | — | | | $ | — | | | $ | 513,995,025 | |
| Exchange-Traded Funds | | | 18,213,682 | | | | — | | | | — | | | | 18,213,682 | |
| Money Market Funds | | | 55,527,345 | | | | — | | | | — | | | | 55,527,345 | |
| Total | | $ | 587,736,052 | | | $ | — | | | $ | — | | | $ | 587,736,052 | |
| | | | | | | | | | | | | | | | | |
| | | | | | | | | | | | | | | | | |
| Davenport Balanced Income Fund | | Level 1 | | | Level 2 | | | Level 3 | | | Total | |
| Common Stocks | | $ | 123,192,150 | | | $ | — | | | $ | — | | | $ | 123,192,150 | |
| Fixed Rate Corporate Bonds | | | — | | | | 62,097,843 | | | | — | | | | 62,097,843 | |
| U.S. Treasury Obligations | | | — | | | | 21,515,639 | | | | — | | | | 21,515,639 | |
| Money Market Funds | | | 7,684,793 | | | | — | | | | — | | | | 7,684,793 | |
| Total | | $ | 130,876,943 | | | $ | 83,613,482 | | | $ | — | | | $ | 214,490,425 | |
| | | | | | | | | | | | | | | | | |
Refer to each Fund’s Schedule of Investments for a listing of the securities by sector type. There were no Level 3 securities or derivative instruments held by the Funds as of or during the year ended March 31, 2023.
| THE DAVENPORT FUNDS |
| NOTES TO FINANCIAL STATEMENTS (Continued) |
Foreign currency translation — Investment securities and other assets and liabilities denominated in or expected to settle in foreign currencies, if any, are translated into U.S. dollars based on exchange rates on the following basis:
| A. | The fair values of investment securities and other assets and liabilities are translated as of the close of the NYSE each day. |
| B. | Purchases and sales of investment securities and income and expenses are translated at the rate of exchange prevailing as of 4:00 p.m. Eastern time on the respective date of such transactions. |
| C. | The Funds do not isolate that portion of the results of operations caused by changes in foreign exchange rates on investments from those caused by changes in market prices of securities held. Such fluctuations are included with the net realized and unrealized gains or losses on investments. |
Reported net realized foreign exchange gains or losses arise from 1) purchases and sales of foreign currencies and 2) the difference between the amounts of dividends and foreign withholding taxes recorded on the Fund’s books and the U.S. dollar equivalent of the amounts actually received or paid. Reported net unrealized foreign exchange gains and losses arise from changes in the value of assets and liabilities that result from changes in exchange rates.
Cash — Each Fund’s cash position, if any, is held in a bank account with balances which, at times, may exceed United States federally insured limits set by the amount covered by federal deposit insurance. The Funds maintain these balances with a high quality financial institution and may incur charges on cash overdrafts.
Share valuation — The NAV per share of each Fund is calculated daily by dividing the total value of its assets, less liabilities, by the number of shares outstanding. The offering price and redemption price per share of each Fund is equal to the NAV per share.
Investment income — Interest income is accrued as earned. Discounts and premiums on fixed-income securities are amortized using the effective interest method. Dividend income is recorded on the ex-dividend date. Non-cash dividends included in dividend income, if any, are recorded at the fair market value of the security received. The Funds record distributions received from investments in real estate investment trusts (also known as “REITs”) in excess of income from underlying investments as a reduction of cost of investments and/or realized gain. These amounts are recorded once the issuers provide information about the actual classification of the distributions. Withholding taxes on foreign dividends have been recorded in accordance with the Funds’ understanding of the applicable country’s rules and tax rates.
Investment transactions — Investment transactions are accounted for on trade date for financial reporting purposes. Realized gains and losses on investment securities sold are determined on a specific identification basis.
Common expenses — Common expenses of the Trust are allocated among the Funds and the other series of the Trust based on relative net assets of each series or the nature of the services performed and the relative applicability to each series.
| THE DAVENPORT FUNDS |
| NOTES TO FINANCIAL STATEMENTS (Continued) |
Distributions to shareholders — Dividends arising from net investment income, if any, are declared and paid quarterly to shareholders of Davenport Core Leaders Fund, Davenport Value & Income Fund, Davenport Small Cap Focus Fund and Davenport Balanced Income Fund; and declared and paid semi-annually to shareholders of Davenport Equity Opportunities Fund. Net realized short-term capital gains, if any, may be distributed throughout the year and net realized long-term capital gains, if any, are distributed at least once each year. The amount of distributions from net investment income and net realized capital gains are determined in accordance with federal income tax regulations, which may differ from GAAP. Dividends and distributions are recorded on the ex-dividend date.
The tax character of distributions paid during the years ended March 31, 2023 and 2022 was as follows:
| | | Years | | Ordinary | | | Long-Term | | | Total | |
| | | Ended | | Income | | | Capital Gains | | | Distributions | |
| Davenport Core Leaders Fund | | 03/31/23 | | $ | 8,616,867 | | | $ | 24,804,754 | | | $ | 33,421,621 | |
| | | 03/31/22 | | $ | 947,615 | | | $ | 67,520,115 | | | $ | 68,467,730 | |
| Davenport Value & Income Fund | | 03/31/23 | | $ | 16,633,912 | | | $ | 28,180,629 | | | $ | 44,814,541 | |
| | | 03/31/22 | | $ | 18,460,705 | | | $ | 20,421,022 | | | $ | 38,881,727 | |
| Davenport Equity Opportunities Fund | | 03/31/23 | | $ | 6,817,160 | | | $ | 44,997,499 | | | $ | 51,814,659 | |
| | | 03/31/22 | | $ | 4,545,459 | | | $ | 72,940,203 | | | $ | 77,485,662 | |
| Davenport Small Cap Focus Fund | | 03/31/23 | | $ | 4,649,484 | | | $ | 31,371,059 | | | $ | 36,020,543 | |
| | | 03/31/22 | | $ | 36,919,188 | | | $ | 41,560,446 | | | $ | 78,479,634 | |
| Davenport Balanced Income Fund | | 03/31/23 | | $ | 5,034,146 | | | $ | 4,481,662 | | | $ | 9,515,808 | |
| | | 03/31/22 | | $ | 2,938,628 | | | $ | 362,786 | | | $ | 3,301,414 | |
Estimates — The preparation of financial statements in conformity with GAAP requires management to make estimates and assumptions that affect the reported amounts of assets and liabilities and disclosure of contingent assets and liabilities, each as of the date of the financial statements, and the reported amounts of increase (decrease) in net assets from operations during the reporting period. Actual results could differ from those estimates.
Federal income tax — Each Fund has qualified and intends to continue to qualify as a regulated investment company under the Internal Revenue Code of 1986, as amended (the “Code”). Qualification generally will relieve the Funds of liability for federal income taxes to the extent 100% of their net investment income and net realized capital gains are distributed in accordance with the Code.
In order to avoid imposition of the excise tax applicable to regulated investment companies, it is also each Fund’s intention to declare as dividends in each calendar year at least 98% of its net investment income (earned during the calendar year) and 98.2% of its net realized capital gains (earned during the twelve months ended October 31) plus undistributed amounts from prior years.
| THE DAVENPORT FUNDS |
| NOTES TO FINANCIAL STATEMENTS (Continued) |
The following information is computed on a tax basis for each item as of March 31 2023:
| | | | | | | | | Davenport | |
| | | Davenport | | | Davenport | | | Equity | |
| | | Core Leaders | | | Value & | | | Opportunities | |
| | | Fund | | | Income Fund | | | Fund | |
| Cost of investments | | $ | 490,125,453 | | | $ | 660,246,717 | | | $ | 579,007,366 | |
| Gross unrealized appreciation | | $ | 245,092,294 | | | $ | 177,281,373 | | | $ | 146,781,888 | |
| Gross unrealized depreciation | | | (25,924,554 | ) | | | (33,642,306 | ) | | | (71,683,827 | ) |
| Net unrealized appreciation | | | 219,167,740 | | | | 143,639,067 | | | | 75,098,061 | |
| Undistributed ordinary income | | | 39,386 | | | | — | | | | 702,406 | |
| Undistributed long-term gains | | | 22,451,871 | | | | — | | | | 18,834,419 | |
| Accumulated capital and other losses | | | — | | | | (19,317,283 | ) | | | — | |
| Distributable earnings | | $ | 241,658,997 | | | $ | 124,321,784 | | | $ | 94,634,886 | |
| | | | | | | | | | | | | |
| | | | | | | | | | | | | |
| | | | | | | Davenport | | | Davenport | |
| | | | | | | Small Cap | | | Balanced | |
| | | | | | | Focus Fund | | | Income Fund | |
| Cost of investments | | | | | | $ | 572,528,489 | | | $ | 199,641,042 | |
| Gross unrealized appreciation | | | | | | $ | 64,673,098 | | | $ | 25,209,523 | |
| Gross unrealized depreciation | | | | | | | (49,465,535 | ) | | | (10,360,140 | ) |
| Net unrealized appreciation | | | | | | | 15,207,563 | | | | 14,849,383 | |
| Undistributed ordinary income | | | | | | | 121,663 | | | | — | |
| Undistributed long-term gains | | | | | | | 15,693,275 | | | | — | |
| Accumulated capital and other losses | | | | | | | — | | | | (5,037,553 | ) |
| Distributable earnings | | | | | | $ | 31,022,501 | | | $ | 9,811,830 | |
| | | | | | | | | | | | | |
The difference between the federal income tax cost of investments and the financial statement cost of investments for Davenport Core Leaders Fund, Davenport Value & Income Fund, Davenport Small Cap Focus Fund and Davenport Balanced Income Fund is due to certain timing differences in the recognition of capital gains and losses under income tax regulations and GAAP. These timing differences are temporary in nature and are due to the tax deferral of losses on wash sales, and adjustments to basis on partnerships.
Post-October losses, incurred after October 31, 2022 and within the current taxable year, are deemed to arise on the first day of a Fund’s next taxable year. For the year ended March 31, 2023, Davenport Value & Income Fund and Davenport Balanced Income Fund deferred $19,317,283 and $5,037,553 of post-October losses, respectively, to April 1, 2023 for federal income tax purposes.
| THE DAVENPORT FUNDS |
| NOTES TO FINANCIAL STATEMENTS (Continued) |
For the year ended March 31, 2023, the following reclassifications were made as a result of permanent differences between the financial statements and income tax reporting requirements:
| | | | | | | | | Davenport | | | | | | | |
| | | Davenport | | | Davenport | | | Equity | | | Davenport | | | Davenport | |
| | | Core Leaders | | | Value & | | | Opportunities | | | Small Cap | | | Balanced | |
| | | Fund | | | Income Fund | | | Fund | | | Focus Fund | | | Income Fund | |
| Paid-in capital | | $ | — | | | $ | (5,822 | ) | | $ | — | | | $ | — | | | $ | (34,476 | ) |
| Distributable earnings | | $ | — | | | $ | 5,822 | | | $ | — | | | $ | — | | | $ | 34,476 | |
Such reclassifications have no effect on each Fund’s total net assets or NAV per share.
The Funds recognize the tax benefits or expenses of uncertain tax positions only when the position is “more likely than not” to be sustained assuming examination by tax authorities. Management has reviewed the tax positions taken on Federal income tax returns for each Fund for all open tax years (generally, three years) and has concluded that no provision for unrecognized tax benefits or expenses is required in these financial statements.
The Funds recognize interest and penalties, if any, related to unrecognized tax benefits as income tax expense on the Statements of Operations. During the year ended March 31, 2023, the Funds did not incur any interest or penalties.
3. Investment Transactions
Investment transactions, other than short-term investments and U.S. government securities, were as follows for the year ended March 31, 2023:
| | | | | | | | | Davenport | |
| | | Davenport | | | Davenport | | | Equity | |
| | | Core Leaders | | | Value & | | | Opportunities | |
| | | Fund | | | Income Fund | | | Fund | |
| Purchases of investment securities | | $ | 133,401,093 | | | $ | 193,777,515 | | | $ | 156,823,721 | |
| Proceeds from sales of investment securities | | $ | 154,419,097 | | | $ | 164,828,722 | | | $ | 156,627,581 | |
| | | | | | | | | | | | | |
| | | | | | | | | | | | | |
| | | | | | | Davenport | | | Davenport | |
| | | | | | | Small Cap | | | Balanced | |
| | | | | | | Focus Fund | | | Income Fund | |
| Purchases of investment securities | | | | | | $ | 194,589,152 | | | $ | 51,288,060 | |
| Proceeds from sales and maturities of investment securities | | | | | | $ | 180,320,964 | | | $ | 54,508,382 | |
| | | | | | | | | | | | | |
| THE DAVENPORT FUNDS |
| NOTES TO FINANCIAL STATEMENTS (Continued) |
4. Transactions with Related Parties
INVESTMENT ADVISORY AGREEMENTS
Each Fund’s investments are managed by the Adviser under the terms of an Investment Advisory Agreement. Under the Investment Advisory Agreement, each Fund pays the Adviser a fee, which is computed and accrued daily and paid monthly, at an annual rate of 0.75% of its average daily net assets. Certain officers and a Trustee of the Trust are also officers of the Adviser.
A significant portion of the Funds’ investment trades are executed through an affiliated broker-dealer of the Adviser. No commissions are paid by the Funds to the Adviser or the affiliate for these trades.
OTHER SERVICE PROVIDERS
Ultimus Fund Solutions, LLC (“Ultimus”) provides administration, fund accounting, compliance and transfer agent services to the Funds. The Funds pay Ultimus fees in accordance with the agreements for such services. In addition, the Funds pay out-of-pocket expenses including, but not limited to, postage, supplies, and certain costs related to the pricing of the Funds’ portfolio securities. Certain officers of the Trust are also officers of Ultimus, or of Ultimus Fund Distributors, LLC (the “Distributor”), the principal underwriter of each Fund’s shares and an affiliate of Ultimus. The Distributor is compensated by the Adviser (not the Funds) for acting as principal underwriter.
COMPENSATION OF TRUSTEES
Trustees and officers affiliated with the Adviser or Ultimus are not compensated by the Trust for their services. Each Trustee who is not an affiliated person of the Adviser or Ultimus receives from the Trust an annual retainer of $30,000, payable quarterly; a fee of $2,000 for attendance at each meeting of the Board of Trustees (except that such fee is $3,000 for the independent chair); and a fee of $1,000 for attendance at each meeting of any committee of the Board (except that such fee is $1,500 for the committee chair); plus reimbursement of travel and other expenses incurred in attending meetings. Each series of the Trust pays its proportionate share of such fees.
5. Sector Risk
If a Fund has significant investments in the securities of issuers in industries within a particular business sector, any development affecting that sector will have a greater impact on the value of the net assets of the Fund than would be the case if the Fund did not have significant investments in that sector. In addition, this may increase the risk of loss of an investment in the Fund and increase the volatility of the Fund’s NAV per share. From time to time, circumstances may affect a particular sector and the companies within such sector. For instance, economic or market factors, regulation or deregulation, or other developments may negatively impact all companies in a particular sector and therefore the value of a Fund’s portfolio would be adversely affected. As of March 31, 2023, none of the Funds had over 25% of their net assets invested in any one sector.
| THE DAVENPORT FUNDS |
| NOTES TO FINANCIAL STATEMENTS (Continued) |
6. Contingencies and Commitments
The Funds indemnify the Trust’s officers and Trustees for certain liabilities that might arise from the performance of their duties to the Funds. Additionally, in the normal course of business the Funds enter into contracts that contain a variety of representations and warranties and which provide general indemnifications. The Funds’ maximum exposure under these arrangements is unknown, as this would involve future claims that may be made against the Funds that have not yet occurred. However, based on experience, the Funds expect the risk of loss to be remote.
7. Subsequent Events
The Funds are required to recognize in the financial statements the effects of all subsequent events that provide additional evidence about conditions that existed as of the date of the Statements of Assets and Liabilities. For non-recognized subsequent events that must be disclosed to keep the financial statements from being misleading, the Funds are required to disclose the nature of the event as well as an estimate of its financial effect, or a statement that such an estimate cannot be made. Management has evaluated subsequent events through the issuance of these financial statements and has noted no such events.
| THE DAVENPORT FUNDS |
| REPORT OF INDEPENDENT REGISTERED |
| PUBLIC ACCOUNTING FIRM |
To the Shareholders of The Davenport Funds and
Board of Trustees of Williamsburg Investment Trust
Opinion on the Financial Statements
We have audited the accompanying statements of assets and liabilities, including the schedules of investments, of The Davenport Funds, comprising Davenport Core Leaders Fund (formerly Davenport Core Fund), Davenport Value & Income Fund, Davenport Equity Opportunities Fund, Davenport Small Cap Focus Fund, and Davenport Balanced Income Fund (the “Funds”), each a series of Williamsburg Investment Trust, as of March 31, 2023, the related statements of operations for the year then ended, the statements of changes in net assets for each of the two years in the period then ended, the related notes, and the financial highlights for each of the five years in the period then ended (collectively referred to as the “financial statements”). In our opinion, the financial statements present fairly, in all material respects, the financial position of each of the Funds as of March 31, 2023, the results of their operations for the year then ended, the changes in net assets for each of the two years in the period then ended, and the financial highlights for each of the five years in the period then ended, in conformity with accounting principles generally accepted in the United States of America.
Basis for Opinion
These financial statements are the responsibility of the Funds’ management. Our responsibility is to express an opinion on the Funds’ financial statements based on our audits. We are a public accounting firm registered with the Public Company Accounting Oversight Board (United States) (“PCAOB”) and are required to be independent with respect to the Funds in accordance with the U.S. federal securities laws and the applicable rules and regulations of the Securities and Exchange Commission and the PCAOB.
We conducted our audits in accordance with the standards of the PCAOB. Those standards require that we plan and perform the audit to obtain reasonable assurance about whether the financial statements are free of material misstatement whether due to error or fraud.
Our audits included performing procedures to assess the risks of material misstatement of the financial statements, whether due to error or fraud, and performing procedures that respond to those risks. Such procedures included examining, on a test basis, evidence regarding the amounts and disclosures in the financial statements. Our procedures included confirmation of securities owned as of March 31, 2023, by correspondence with the custodian and brokers. Our audits also included evaluating the accounting principles used and significant estimates made by management, as well as evaluating the overall presentation of the financial statements. We believe that our audits provide a reasonable basis for our opinion.
We have served as the Funds’ auditor since 2016.

COHEN & COMPANY, LTD.
Milwaukee, Wisconsin
May 23, 2023
| THE DAVENPORT FUNDS |
| BOARD OF TRUSTEES AND EXECUTIVE OFFICERS (Unaudited) |
Overall responsibility for management of the Funds rests with the Board of Trustees. The Trustees serve during the lifetime of the Trust and until its termination, or until death, resignation, retirement or removal. The Trustees, in turn, elect the officers of the Funds. The officers have been elected for an annual term. The following are the Trustees and executive officers of the Funds:
| Trustees and Officers | Address | Year of Birth | Position Held
with the Trust | Length of
Time Served |
| Robert S. Harris, Ph.D. | 225 Pictoria Drive, Suite 450 Cincinnati, OH | 1949 | Chairman and Trustee | Since January 2007 |
| * John P. Ackerly, IV | One James Center 901 E. Cary Street Richmond, VA | 1963 | Trustee and President of The Davenport Funds | Since July 2012 |
| * John T. Bruce | 800 Main Street Lynchburg, VA | 1953 | Trustee and President of The Cantor FBP Mutual Funds | Since September 1988 |
| George K. Jennison | 225 Pictoria Drive, Suite 450 Cincinnati, OH | 1957 | Trustee | Since January 2015 |
| Harris V. Morrissette | 225 Pictoria Drive, Suite 450 Cincinnati, OH | 1959 | Trustee | Since March 1993 |
| Elizabeth W. Robertson | 225 Pictoria Drive, Suite 450 Cincinnati, OH | 1953 | Trustee | Since February 2014 |
| Cheryl B. Hatcher | One James Center 901 E. Cary Street Richmond, VA | 1957 | Vice President | Since March 2021 |
| George L. Smith, III | One James Center 901 E. Cary Street Richmond, VA | 1975 | Vice President | Since February 2011 |
| Mark J. Seger | 225 Pictoria Drive, Suite 450 Cincinnati, OH | 1962 | Treasurer | Since November 2000 |
| David K. James | 225 Pictoria Drive, Suite 450 Cincinnati, OH | 1970 | Secretary | Since November 2018 |
| Michael J. Nanosky | 225 Pictoria Drive, Suite 450 Cincinnati, OH | 1966 | Chief Compliance Officer | Since March 2020 |
| * | Messrs. Ackerly and Bruce, as affiliated persons of investment advisers to the Trust, are “interested persons” of the Trust within the meaning of Section 2(a)(19) of the 1940 Act. |
| THE DAVENPORT FUNDS |
| BOARD OF TRUSTEES AND EXECUTIVE OFFICERS (Unaudited) |
Each Trustee oversees ten portfolios of the Trust, including the Funds. The principal occupations of the Trustees and executive officers of the Funds during the past five years and public directorships held by the Trustees are set forth below:
Robert S. Harris, Ph.D. is the C. Stewart Sheppard Professor of Business Administration at The Darden Graduate School of Business Administration at the University of Virginia. He was previously the dean at Darden. Professor Harris has published widely on corporate finance, financial markets and mergers and acquisitions and has served as a consultant to corporations and government agencies.
John P. Ackerly, IV, is Senior Vice President and Portfolio Manager of Davenport & Company, LLC (a broker-dealer and investment advisory firm).
John T. Bruce is Senior Managing Director of Cantor Fitzgerald Investment Advisors, L.P. He previously was President, Director and member of the Executive Committee of Flippen, Bruce & Porter, Inc. (1985 to 2021).
George K. Jennison is retired. He was President of Oyster Consulting, LLC (a management consulting firm) and a financial adviser with Wells Fargo Advisors, LLC.
Harris V. Morrissette is President of China Doll Rice and Beans, Inc. and Dixie Lily Foods. He is also a Director of Trustmark Corporation (bank holding company).
Elizabeth W. Robertson serves as a Trustee of TowneBank Foundation, TowneBank Corporate Board, TowneBank Audit Committee Chair and TowneBank Community Board since 2015. She previously was Chief Financial Officer of Monument Restaurants LLC.
Cheryl B. Hatcher is Senior Vice President of Davenport & Company LLC and Senior Administrative Officer of Davenport Asset Management.
George L. Smith, III is Senior Vice President and Portfolio Manager of the Adviser.
Mark J. Seger is a Vice Chairman of Ultimus Fund Solutions, LLC and Ultimus Fund Distributors, LLC. He previously was Co-CEO of Ultimus Fund Solutions, LLC (1999 to 2019).
David K. James is an Executive Vice President and Chief Legal and Risk Officer of Ultimus Fund Solutions, LLC (2018 to present). He previously was Managing Director and Managing Counsel at State Street Bank and Trust Company (2009 to 2018).
Michael J. Nanosky is a Senior Compliance Officer of Ultimus Fund Solutions, LLC (2020 to present). He previously was Senior Vice President & Chief Compliance Officer of PNC Funds (2014 to 2019).
Additional information about members of the Board of Trustees and executive officers is available in the Statement of Additional Information (“SAI”). To obtain a free copy of the SAI, please call 1-800-281-3217.
| THE DAVENPORT FUNDS |
| YOUR FUNDS’ EXPENSES (Unaudited) |
We believe it is important for you to understand the impact of costs on your investment. All mutual funds have operating expenses. As a shareholder of the Funds, you incur ongoing costs, including management fees and other expenses. These ongoing costs, which are deducted from each Fund’s gross income, directly reduce the investment return of the Funds.
A mutual fund’s ongoing costs are expressed as a percentage of its average net assets. This figure is known as the expense ratio. The following examples are intended to help you understand the ongoing costs (in dollars) of investing in the Funds and to compare these costs with the ongoing costs of investing in other mutual funds. The examples below are based on an investment of $1,000 made at the beginning of the period shown and held for the entire period (October 1, 2022 through March 31, 2023).
The table below illustrates each Fund’s ongoing costs in two ways:
Actual fund return – This section helps you to estimate the actual expenses that you paid over the period. The “Ending Account Value” shown is derived from each Fund’s actual return, and the fourth column shows the dollar amount of operating expenses that would have been paid by an investor who started with $1,000 in the Funds. You may use the information here, together with the amount you invested, to estimate the expenses that you paid over the period.
To do so, simply divide your account value by $1,000 (for example, an $8,600 account value divided by $1,000 = 8.6), then multiply the result by the number given for the applicable Fund under the heading “Expenses Paid During Period.”
Hypothetical 5% return – This section is intended to help you compare each Fund’s ongoing costs with those of other mutual funds. It assumes that each Fund had an annual return of 5% before expenses during the period shown, but that the expense ratio is unchanged. In this case, because the return used is not each Fund’s actual return, the results do not apply to your investment. The example is useful in making comparisons because the U.S. Securities and Exchange Commission (the “SEC”) requires all mutual funds to calculate expenses based on a 5% return. You can assess each Fund’s ongoing costs by comparing this hypothetical example with the hypothetical examples that appear in shareholder reports of other funds.
Note that expenses shown in the table are meant to highlight and help you compare ongoing costs only. The Funds do not charge sales loads or redemption fees.
The calculations assume no shares were bought or sold during the period. Your actual costs may have been higher or lower, depending on the amount of your investment and the timing of any purchases or redemptions.
More information about each Fund’s expenses, including historical annual expense ratios, can be found in this report. For additional information on operating expenses and other shareholder costs, please refer to the Funds’ prospectus.
| THE DAVENPORT FUNDS |
| YOUR FUNDS’ EXPENSES (Unaudited) (Continued) |
| | | Beginning | | Ending | | | | |
| | | Account Value | | Account Value | | | | |
| | | October 1, | | March 31, | | Expense | | Expenses Paid |
| | | 2022 | | 2023 | | Ratio(a) | | During Period(b) |
| Davenport Core Leaders Fund | | | | | | | | |
| Based on Actual Fund Return | | $1,000.00 | | $1,120.10 | | 0.87% | | $4.60 |
| Based on Hypothetical 5% Return (before expenses) | | $1,000.00 | | $1,020.59 | | 0.87% | | $4.38 |
| Davenport Value & Income Fund | | | | | | | | |
| Based on Actual Fund Return | | $1,000.00 | | $1,096.20 | | 0.87% | | $4.55 |
| Based on Hypothetical 5% Return (before expenses) | | $1,000.00 | | $1,020.59 | | 0.87% | | $4.38 |
| Davenport Equity Opportunities Fund | | | | | | | | |
| Based on Actual Fund Return | | $1,000.00 | | $1,133.70 | | 0.88% | | $4.68 |
| Based on Hypothetical 5% Return (before expenses) | | $1,000.00 | | $1,020.54 | | 0.88% | | $4.43 |
| Davenport Small Cap Focus Fund | | | | | | | | |
| Based on Actual Fund Return | | $1,000.00 | | $1,168.70 | | 0.88% | | $4.76 |
| Based on Hypothetical 5% Return (before expenses) | | $1,000.00 | | $1,020.54 | | 0.88% | | $4.43 |
| Davenport Balanced Income Fund | | | | | | | | |
| Based on Actual Fund Return | | $1,000.00 | | $1,061.40 | | 0.93% | | $4.78 |
| Based on Hypothetical 5% Return (before expenses) | | $1,000.00 | | $1,020.29 | | 0.93% | | $4.68 |
| (a) | Annualized, based on each Fund’s most recent one-half year expenses. |
| (b) | Expenses are equal to each Fund’s annualized expense ratio multiplied by the average account value over the period, multiplied by 182/365 (to reflect the one-half year period). |
| THE DAVENPORT FUNDS |
| OTHER INFORMATION (Unaudited) |
A description of the policies and procedures that the Funds use to vote proxies relating to portfolio securities is available without charge upon request by calling toll-free 1-800-281-3217, or on the SEC’s website at www.sec.gov. Information regarding how the Funds voted proxies relating to portfolio securities during the most recent 12-month period ended June 30 is also available without charge upon request by calling toll-free 1-800-281-3217, or on the SEC’s website at www.sec.gov.
The Trust files a complete listing of portfolio holdings for each Fund with the SEC as of the end of the first and third quarters of each fiscal year as an exhibit to its reports on Form N-PORT. These filings are available upon request by calling 1-800-281-3217. Furthermore, you may obtain a copy of these filings on the SEC’s website at www.sec.gov.
A complete listing of portfolio holdings for each Fund is updated daily and can be reviewed at the Funds’ website at www.investdavenport.com.
| FEDERAL TAX INFORMATION (Unaudited) |
For the fiscal year ended March 31, 2023, Davenport Core Leaders Fund, Davenport Value & Income Fund, Davenport Equity Opportunities Fund, Davenport Small Cap Focused Fund and Davenport Balanced Income Fund designated $24,804,754, $28,180,629, $44,997,499, $31,371,059, and $4,481,662, respectively, as long-term capital gain distributions.
Qualified Dividend Income – Davenport Core Leaders Fund, Davenport Value & Income Fund, Davenport Equity Opportunities Fund, Davenport Small Cap Focus Fund and Davenport Balanced Income Fund designated 100%, 100%, 66.41%, 100% and 71.15%, respectively, of ordinary income distributions, or up to the maximum amount of such dividends allowable pursuant to the Internal Revenue Code, as qualified dividend income.
Dividends Received Deduction – Corporate shareholders are generally entitled to take the dividends received deduction on the portion of a Fund’s dividend distributions that qualify under tax law. For the fiscal year ended March 31, 2022, Davenport Core Leaders Fund, Davenport Value & Income Fund, Davenport Equity Opportunities Fund, Davenport Small Cap Focus Fund and Davenport Balanced Income Fund, 100%, 87.58%, 60.02%, 100% and 58.37%, respectively, of ordinary income distributions, qualifies for the corporate dividends received deduction.
| THE DAVENPORT FUNDS |
| DISCLOSURE REGARDING APPROVAL OF |
| INVESTMENT ADVISORY AGREEMENT |
| (Unaudited) |
At a meeting held on November 15, 2022, the Board of Trustees, including a majority of the Independent Trustees, approved the continuance for a one-year period of the Investment Advisory Agreements with the Adviser on behalf of the Davenport Core Leaders Fund, the Davenport Value & Income Fund, the Davenport Equity Opportunities Fund, the Davenport Small Cap Focus Fund and the Davenport Balanced Income Fund (individually, a “Fund,” collectively, the “Funds”). Below is a discussion of the factors considered by the Board of Trustees along with the conclusions with respect thereto that formed the basis for the Board’s approval of the continuation of the Investment Advisory Agreements for an additional one-year period.
Prior to the Board meeting, the Adviser provided a response to a letter sent by the counsel to the Independent Trustees, on their behalf, requesting various information relevant to the Independent Trustees’ consideration of the renewal of the Investment Advisory Agreements with respect to each Fund. In approving the continuance of the Investment Advisory Agreements, the Independent Trustees considered all information they deemed reasonably necessary to evaluate the terms of the Agreements. The principal areas of review by the Independent Trustees were the nature, extent and quality of the services provided by the Adviser and the reasonableness of the fees charged for those services. During a meeting of the Governance, Nomination, Compensation and Qualified Legal Compliance Committee held prior to the Board meeting, the Independent Trustees reviewed the proposed renewal of the Investment Advisory Agreements with experienced independent legal counsel outside the presence of representatives of the Adviser and received materials from such counsel discussing the legal standards for their consideration of the proposed renewal of the Investment Advisory Agreements.
The Independent Trustees’ evaluation of the quality of the Adviser’s services took into consideration their knowledge gained through presentations and reports from the Adviser over the course of the preceding year. The Independent Trustees considered that the Adviser had provided its views on the overall conditions of the economy and the markets, including the factors that may have influenced the markets, investor preferences and market sentiment during the past year. The Independent Trustees also considered the security selection process that is applied in the management of the Funds and the adjustments that were made by the Adviser over the past year in response to prevailing market conditions. Both short-term and long-term investment performance of the Funds were considered. Each Fund’s performance was compared to its performance benchmark, a peer group of funds with similar investment objectives and strategies, and to the Adviser’s comparably managed private accounts, as applicable. The Independent Trustees also considered: the scope and quality of the in-house capabilities of the Adviser and other resources that are dedicated towards management of the Funds; the experience of the Adviser’s Investment Policy Committee members and their collaboration; the quality of administrative and other services, including the Adviser’s role in coordinating the activities of the Funds’ other service providers; the Adviser’s compliance with investment policies of the Funds and applicable laws and regulations; information provided by management and the Funds’ independent public
| THE DAVENPORT FUNDS |
| DISCLOSURE REGARDING APPROVAL OF |
| INVESTMENT ADVISORY AGREEMENT |
| (Unaudited) (Continued) |
accounting firm in periodic meetings with the Trust’s Audit Committee; the business reputation of the Adviser; the qualifications of the Adviser’s key investment and compliance personnel; and the Adviser’s financial resources.
In reviewing the fees payable under the Investment Advisory Agreements, the Independent Trustees compared the advisory fees and overall expense levels of each Fund with those of funds with similar investment objectives and strategies as well as the private accounts managed by the Adviser, as applicable. The Independent Trustees considered information provided by the Adviser concerning the Adviser’s profitability with respect to each Fund, including the assumptions and methodology used in preparing the profitability information, in light of applicable case law relating to advisory fees. For these purposes, the Independent Trustees considered not only the fees paid by the Funds, but also so-called “fallout” benefits to the Adviser. The Independent Trustees also considered the fact that the Funds’ portfolio trades for equity securities were executed by the Adviser at no cost to the Funds. In evaluating the Funds’ advisory fees, the Trustees considered the complexity and quality of the investment process that is applied in the management of the Funds.
The Independent Trustees considered each Fund’s investment strategy in comparison to the performance to its respective primary and secondary benchmark, as applicable, and peer group average, and the services provided by Davenport & Company LLC to the respective Fund. Based on the consideration of the foregoing and such other information as was deemed relevant, including the factors and conclusions below, the Independent Trustees concluded that: (i) the overall performance of each of the Davenport Core Leaders Fund, Davenport Equity Opportunities Fund, Davenport Value & Income Fund and Davenport Balanced Income Fund is satisfactory considering each Fund’s investment strategy; (ii) the overall performance of the Davenport Small Cap Focus Fund is good, considering its relative performance results over selected periods ended September 30, 2022; (iii) the advisory fees and total operating expenses for the Davenport Funds are reasonable in relation to the services provided by Davenport & Company LLC; (iv) Davenport & Company LLC., a dually registered investment adviser and broker dealer, has further benefited the Funds’ shareholders by executing all equity trades at no cost to the Funds and paying the compensation to financial intermediaries for the provision of administrative support services; and (v) the profits of Davenport & Company LLC with respect to its management of the Funds are reasonable.
| THE DAVENPORT FUNDS |
| DISCLOSURE REGARDING APPROVAL OF |
| INVESTMENT ADVISORY AGREEMENT |
| (Unaudited) (Continued) |
The Independent Trustees considered the extent to which economies of scale are being realized as the Funds grow, and they noted that Davenport & Company LLC has provided shareholders with opportunities to participate in economies of scale by increasing the exposure of the Davenport Funds through various marketing and distribution efforts which has had the effect of decreasing the operating expenses of each of the Funds over the years as expenses are spread over a larger asset base. The Independent Trustees also considered the “fallout” benefits to Davenport & Company LLC with respect to the Davenport Funds, but given the amounts involved viewed these as secondary factors in connection with the evaluation of the reasonableness of the advisory fees paid by the Funds.
No single factor was considered in isolation or to be determinative to the decision of the Independent Trustees to approve the continuance of the Investment Advisory Agreements. Rather the Independent Trustees concluded, after weighing and balancing of all factors considered, that it was in the best interests of each Fund and its respective shareholders to continue the Investment Advisory Agreements without modification to their terms, including the fees charged for services thereunder, for an additional one-year period.
| THE DAVENPORT FUNDS |
| LIQUIDITY RISK MANAGEMENT PROGRAM (Unaudited) |
The Funds have adopted and implemented a written liquidity risk management program as required by Rule 22e-4 (the “Liquidity Rule”) under the Investment Company Act. The program is reasonably designed to assess and manage each Fund’s liquidity risk, taking into consideration, among other factors, the Fund’s investment strategy and the liquidity of its portfolio investments during normal and reasonably foreseeable stressed conditions; its short and long-term cash flow projections; and its cash holdings and access to other funding sources. The Funds’ Board of Trustees approved the appointment of a Liquidity Risk Committee, which includes representatives from Davenport & Company LLC, the Funds’ investment adviser, and Ultimus Fund Solutions, LLC, the Funds’ Administrator. The Liquidity Risk Committee is responsible for the program’s administration and oversight and for reporting to the Board on at least an annual basis regarding the program’s operation and effectiveness. The Liquidity Risk Committee updated its assessment of each Fund’s liquidity risk profile, considering additional data gathered in the 12 months ended November 30, 2022 and the adequacy and effectiveness of the liquidity risk management program’s operation from December 1, 2021 until November 30, 2022 (the “Review Period”) in order to prepare a written report for the Board of Trustees (the “Report”) for consideration at its meeting held on February 21, 2023. During the Review Period, none of the Funds experienced unusual stress or disruption to its operations related to purchase and redemption activity. Also,during the Review Period the Funds held adequate levels of cash and highly liquid investments to meet shareholder redemption activities in accordance with applicable requirements. The Report concluded that (i) the Funds’ liquidity risk management program is reasonably designed to prevent violations of the Liquidity Rule and (ii) the Funds’ liquidity risk management program has been effectively implemented.
This page intentionally left blank.
| |
| |
| |
| |
| |
| THE DAVENPORT FUNDS |
| |
| Investment Adviser |
| Davenport & Company LLC |
| One James Center |
| 901 East Cary Street |
| Richmond, Virginia 23219-4037 |
| |
| Administrator |
| Ultimus Fund Solutions, LLC |
| P.O. Box 46707 |
| Cincinnati, Ohio 45246-0707 |
| 1-800-281-3217 |
| |
| Custodian |
| U.S. Bank, N.A. |
| 425 Walnut Street |
| Cincinnati, Ohio 45202 |
| |
| Independent Registered Public |
| Accounting Firm |
| Cohen & Company, Ltd. |
| 342 N Water Street, |
| Suite 830 |
| Milwaukee, WI 53202 |
| |
| Legal Counsel |
| Sullivan & Worcester LLP |
| 1666 K Street, N.W. |
| Washington, DC 20006 |
| |
| Board of Trustees |
| Robert S. Harris, Ph.D., Chairman |
| John P. Ackerly, IV |
| John T. Bruce |
| George K. Jennison |
| Harris V. Morrissette |
| Elizabeth W. Robertson |
| |
| Officers |
| John P. Ackerly, IV, President |
| Cheryl B. Hatcher, Vice President |
| George L. Smith, III, Vice President |
| |
| |
| |
| |
| Davenport-AR-23 |
| |
| | | | | | | | |
| | | | | | | | |
| | | | | | | | |
| | | | | | | | |
| | | | | | | | |
| | | | | | | | |
| | | | | | | | |
| | | | | | | |
| | | |  | | | |
 | | | | |
| | | | | | | | | |
| | | | | | | | | | |
| | | | | | | | | | |
| | | | | | | | | | |
| | | Cantor FBP Equity & Dividend Plus Fund Cantor FBP Appreciation & Income Opportunities Fund Annual Report March 31, 2023 No-Load Funds | | |
| | | | | | | | |
| | | | | | | | |
| | | | | | | | |
| | | | | | | |
| | | | | | | |
| | | | | | | | |
| | | | | | | | |
| | | | | | | | |
| Letter to Shareholders | May 12, 2023 |
We are pleased to report on your Funds and their investments for the annual period ended March 31, 2023, and to provide some additional information since we last communicated with you. First, we will review the recent market environment, then comment briefly on the upcoming proxy vote related to making important changes to the Funds, and finally, we will comment on the Funds’ fiscal year results.
Economic and Market Update
Stock markets rallied in the final days of March, capping a volatile quarter and year on a positive note. Much of the market volatility was prompted by the sudden collapse of two mid-sized banks in early March, which set off panicked selling in bank stocks. Silicon Valley Bank (SVB) and Signature Bank were shuttered following a run on deposits at those institutions, causing increased investor fears that these failures were just the tip of the iceberg. The shotgun marriage with UBS that “saved” Credit Suisse in Europe didn’t help investor sentiment for the sector either. There is little doubt that management miscues at these institutions played a part in their collapses. But it must be noted that the dramatic rise in interest rates this year created large losses in their bond portfolios such that when depositors demanded their funds, these banks were short of capital to fund the withdrawals. These two domestic regional banks also had some unusual characteristics that make their situations unique: a concentrated deposit base of venture capital clients at SVB and an emphasis on cryptocurrency banking at Signature. Federal regulators, rightly or wrongly, acted quickly to guarantee all deposits at these firms, implicitly providing an implied backstop for the entire system in an attempt to prevent further bank runs. Regulators also created a special lending program that allowed banks access to funds if needed for withdrawals. Regional bank stock prices temporarily stabilized, but since have continued to show weakness as investors remain uncertain about the stability of deposits and condition of balance sheets. Ongoing challenges to the banking sector include the potential for increased regulation, higher costs for deposits and the impact that a weakening economy may have on loan quality. The result is likely to be lower earnings potential for the sector than originally expected. Having said that, it appears to us that the U.S. banking system overall is well-capitalized and strong enough to withstand this banking crisis.
Considering the recent credit shock, the Federal Reserve’s Federal Open Markets Committee (“FOMC”) followed through with a fed funds rate increase of 25 basis points in May. In a change, it signaled that it will pause rate hikes, possibly bringing an end to this hiking cycle after 10 rate increases. The latest inflation figures, including both core inflation and the Personal Consumption Expenditure index, give hope that inflation is moderating. The labor market, which has been strong for some time, is showing mixed signals. The latest weekly initial jobless claims reports have moved modestly higher, while continuing unemployment claims, at 1.8 million, are well above the 1.3 million level seen last May and are at levels last seen in late 2021. Conversely, the unemployment rate held steady at 3.4% in April, stronger than many analysts had expected. Consensus forecasts from most economists point to slower growth over the balance of this 2023, as higher interest rates, a stretched consumer, and tighter lending standards work their way through the system.
As we have notified you previously, the Funds will be asking you to vote on an Agreement and Plan of Reorganization this summer, providing for the reorganization of each of the Cantor FBP Appreciation & Income Opportunities Fund and the Cantor FBP Equity & Dividend Plus Fund into the Cantor FBP Equity & Dividend Plus Fund (the “Combined Fund”), a new series of The Cantor Select Portfolios Trust (the “Reorganization”). The Reorganization will consolidate the assets of the Cantor FBP Equity & Dividend Plus Fund and the Cantor FBP Appreciation & Income Opportunities Fund and allow the Combined Fund
to, among other things, provide for improved operating efficiencies due to the spreading of fixed costs over a larger pool of assets. You will receive a detailed explanation of these changes in the proxy that will be mailed to you by the end of May, and if you have questions, please contact us for clarification.
Cantor FBP Equity & Dividend Plus Fund Review
The Cantor FBP Equity & Dividend Plus Fund returned -8.92% for the fiscal year ended March 31, 2023. The S&P 500® Index (the “Index”) returned -7.73% over the same period. The Fund was 91.3% equity and 8.7% cash at fiscal year-end.
This past year was a challenging one for investment returns. Your Fund performed very well early in the period, giving up some of that in the most recent quarter as growth stocks outperformed value and dividend-paying stocks. Market performance has also narrowed, with a small number of larger technology-oriented companies doing well and the broader marker performing much worse. For the fiscal year, Energy and Consumer Staples were the strongest sectors for the Fund, helped in particular by Genuine Parts, Exxon Mobil, Tapestry and JM Smucker. Financials and Health Care were the lowest returning sectors, with Lincoln Financial, Kohl’s, Fidelity National Information Services and KeyCorp dragging down results. Some recent additions to the Fund are Dominion Energy, Johnson & Johnson, Advance Auto Parts and Pfizer. Nucor and Genuine Parts are recent reductions from the Fund as a result of call options being exercised at attractive price levels. The Fund also sold KeyCorp and Hanesbrands.
Cash flow generation from dividends is a primary focus of your Equity & Dividend Plus Fund as well as cash generated from option premiums. The Fund utilizes as part of its investment discipline the use of covered call options as individual securities approach the top of the Adviser’s growth and price expectations. The Fund’s purpose in selling the call option is to generate additional cash flow to the Fund and to hedge the possibility the security may not achieve its price objective. In very strong stock markets, this discipline may limit the upside of the securities where options have been written, but in flat to negative markets, it may provide additional return. During the fiscal year ended March 31, 2023, the amount of premiums generated from selling covered call options was $500,228.
Cantor FBP Appreciation & Income Opportunities Fund Review
The Cantor FBP Appreciation & Income Opportunities Fund returned -6.43% for the fiscal year ended March 31, 2023. The S&P 500® Index (the “Index”) returned -7.73% and the Bloomberg Intermediate U.S. Government/Credit Index returned -1.66% over the same period. The Fund was 76.4% equity, 16.3% fixed income and 7.3% cash at fiscal year-end.
This past year was a challenging one for investment returns. Your Fund performed very well early in the period, giving up some of that in the most recent quarter as growth stocks outperformed value and dividend-paying stocks. Market performance has also narrowed, with a small number of larger technology-oriented companies doing well and the broader marker performing much worse. The Fund’s strongest sectors were Energy and Industrials, while Financials and Information Technology lagged. Merck, TJX Companies, Quanta Services and Trane Technologies were the better performers, while Lincoln Financial, Kohl’s, Carnival, and Compass Minerals lagged. The short-duration fixed-income holdings and cash weighting, whose purpose in the Fund is to provide stability and income, worked to protect the fixed portion of the Fund as interest rates rose this past year. Recent purchases to the Fund are Advance Auto Parts, Dominion Energy and Stanley Black and Decker, with BWX Technologies, Dollar Tree and Quanta Services being sold.
The Fund does utilize as part of its investment discipline the use of covered call options as individual securities approach the top of the Adviser’s growth and price expectations. The Fund’s purpose in selling the call option is to generate additional income to the Fund and to hedge the possibility the security may not
achieve its price objective. In very strong stock markets, this discipline may limit the upside of the securities where options have been written, but in modest to negative markets, it may provide additional return. During the fiscal year ended March 31, 2023, the amount of premiums generated from selling covered call options was $91,380.
We want to thank you for your continued support and investment in the Cantor Flippin, Bruce & Porter Funds. Please visit our website at www.fbpfunds.com for information on your Funds and the investment philosophy and process we utilize to achieve their investment objectives.

John T. Bruce, CFA
President - Portfolio Manager
May 12, 2023
Data presented reflects past performance, which is no guarantee of future results. Investment results and principal value will fluctuate so that shares, when redeemed, may be worth more or less than their original cost. Due to market volatility, current performance may be higher or lower than the performance shown. Updated performance information, current through the most recent month-end, is available by contacting the Funds at 1-866-738-1127.
This report is submitted for the general information of the shareholders of the Funds. It reflects our views, opinions and portfolio holdings as of the date of this letter. These views are subject to change at any time based upon market or other conditions. For more current information throughout the year please visit www.fbpfunds.com or call the Funds at 1-866-738-1127. This report is not authorized for distribution to prospective investors in the Funds unless accompanied by a current prospectus.
| THE CANTOR FBP MUTUAL FUNDS |
| COMPARATIVE PERFORMANCE CHARTS |
| (Unaudited) |
Performance for each Fund is compared to the most appropriate broad-based index, the S&P 500® Index, an unmanaged index of 500 large common stocks. Each Fund’s performance results are also compared to the Consumer Price Index, a measure of inflation; the Bloomberg Intermediate U.S. Government/Credit Index is also compared for the Cantor FBP Appreciation & Income Opportunities Fund.
Cantor FBP Equity & Dividend Plus Fund
Comparison of the Change in Value of a $10,000 Investment in
Cantor FBP Equity & Dividend Plus Fund, the S&P 500® Index and the Consumer Price Index
| THE CANTOR FBP MUTUAL FUNDS |
| COMPARATIVE PERFORMANCE CHARTS |
| (Unaudited) (Continued) |
Cantor FBP Appreciation & Income Opportunities Fund
Comparison of the Change in Value of a $10,000 Investment in
Cantor FBP Appreciation & Income Opportunities Fund, the S&P 500® Index,
the Consumer Price Index and the Bloomberg Intermediate U.S. Government/Credit Index
| | | | | | | |
Average Annual Total Returns
(for years ended March 31, 2023) | |
| | | | | | | |
| | 1 Year | | 5 Years | | 10 Years | |
| Cantor FBP Equity & Dividend Plus Fund (a) | -8.92% | | 6.74% | | 7.59% | |
| Cantor FBP Appreciation & Income Opportunities Fund (a) | -6.43% | | 6.74% | | 7.01% | |
| S&P 500® Index | -7.73% | | 11.19% | | 12.24% | |
| Consumer Price Index | 6.03% | | 3.85% | | 2.62% | |
| Bloomberg Intermediate U.S. Government/Credit Index | -1.66% | | 1.40% | | 1.32% | |
| | | | | | | |
| (a) | Total returns are a measure of the change in value of an investment in the Fund over the periods covered, which assumes any dividends or capital gains distributions are reinvested in shares of the Fund. Returns do not reflect the deduction of taxes a shareholder would pay on the Fund’s distributions or the redemption of Fund shares. |
| CANTOR FBP |
| EQUITY & DIVIDEND PLUS FUND |
| PORTFOLIO INFORMATION |
| March 31, 2023 (Unaudited) |
| General Information | | | | | | | |
| Net Asset Value Per Share | | | | | | $ | 25.78 | |
| Total Net Assets (Millions) | | | | | | $ | 30.6 | |
| Current Expense Ratio | | | | | | | 1.12% | |
| Portfolio Turnover | | | | | | | 16% | |
| Fund Inception Date | | | | | | | 7/30/1993 | |
| | | | | | | | | |
| | | | | | S&P 500® | |
| Stock Characteristics | | Fund | | | Index | |
| Number of Stocks | | | 52 | | | | 500 | |
| Weighted Avg Market Capitalization (Billions) | | $ | 138.7 | | | $ | 462.2 | |
| Price-to-Earnings Ratio (Bloomberg 1 Yr. Forecast EPS) | | | 11.3 | | | | 18.1 | |
| Price-to-Book Value | | | 2.2 | | | | 4.1 | |
| Asset Allocation (% of Net Assets) |
| Sector Diversification vs. the S&P 500® Index |
| Ten Largest Equity Holdings | | % of Net Assets |
| Broadcom, Inc. | | 3.8% |
| Merck & Company, Inc. | | 3.3% |
| Raytheon Technologies Corporation | | 2.9% |
| International Business Machines Corporation | | 2.7% |
| Chevron Corporation | | 2.6% |
| Exxon Mobile Corporation | | 2.5% |
| Johnson & Johnson | | 2.5% |
| Cisco Systems, Inc. | | 2.5% |
| CVS Health Corporation | | 2.4% |
| JPMorgan Chase & Company | | 2.3% |
| CANTOR FBP |
| APPRECIATION & INCOME OPPORTUNITIES FUND |
| PORTFOLIO INFORMATION |
| March 31, 2023 (Unaudited) |
| General Information | | | |
| Net Asset Value Per Share | | $ | 19.84 | |
| Total Net Assets (Millions) | | $ | 29.7 | |
| Current Expense Ratio | | | 1.05% | |
| Portfolio Turnover | | | 26% | |
| Fund Inception Date | | | 7/3/1989 | |
| Asset Allocation (% of Net Assets) |
| Common Stock Portfolio (76.4% of Net Assets) |
| Number of Stocks | | | 55 | |
| Weighted Avg Market Capitalization (Billions) | | $ | 224.0 | |
| Price-to-Earnings Ratio (Bloomberg 1 Yr.Forecast EPS) | | | 11.2 | |
| Price-to-Book Value | | | 2.2 | |
| | | | | |
| Five Largest Sectors | | % of Net Assets | |
| Financials | | | 14.7 | % |
| Technology | | | 13.5 | % |
| Health Care | | | 10.9 | % |
| Energy | | | 7.5 | % |
| Industrials | | | 6.9 | % |
| Ten Largest Equity Holdings | % of Net Assets |
| Apple, Inc. | 3.3% |
| Broadcom, Inc. | 2.8% |
| JPMorgan Chase & Company | 2.7% |
| Tapestry, Inc. | 2.5% |
| Shell plc - ADR | 2.3% |
| Merck & Company, Inc. | 2.3% |
| HP, Inc. | 2.1% |
| Johnson & Johnson | 2.0% |
| Bank of America Corporation | 2.0% |
| Eaton Corporation plc | 2.0% |
| Fixed-Income Portfolio (16.3% of Net Assets) |
| Number of Fixed-Income Securities | | 9 |
| Average Quality | | BBB+ |
| Average Weighted Maturity | | 3.5 yrs. |
| Average Effective Duration | | 3.2 yrs. |
| Sector Breakdown | | % of Net Assets |
| U.S. Treasury Obligations | | 5.0% |
| Consumer Staples | | 1.6% |
| Financials | | 1.6% |
| Health Care | | 1.6% |
| Industrials | | 4.9% |
| Utilities | | 1.6% |
| CANTOR FBP |
| EQUITY & DIVIDEND PLUS FUND |
| SCHEDULE OF INVESTMENTS |
| March 31, 2023 |
| COMMON STOCKS — 91.3% | | Shares | | | Value | |
| Communications — 5.6% | | | | | | | | |
| AT&T, Inc. | | | 24,000 | | | $ | 462,000 | |
| Comcast Corporation - Class A | | | 8,500 | | | | 322,235 | |
| Paramount Global - Class B (a) | | | 19,500 | | | | 435,045 | |
| Verizon Communications, Inc. | | | 13,000 | | | | 505,570 | |
| | | | | | | | 1,724,850 | |
| Consumer Discretionary — 5.7% | | | | | | | | |
| Advance Auto Parts, Inc. | | | 4,300 | | | | 522,923 | |
| Home Depot, Inc. (The) | | | 1,000 | | | | 295,120 | |
| Kohl’s Corporation | | | 11,500 | | | | 270,710 | |
| Tapestry, Inc. (a) | | | 15,000 | | | | 646,650 | |
| | | | | | | | 1,735,403 | |
| Consumer Staples — 9.1% | | | | | | | | |
| J.M. Smucker Company (The) (a) | | | 2,700 | | | | 424,899 | |
| Kellogg Company | | | 7,000 | | | | 468,720 | |
| Kimberly-Clark Corporation (a) | | | 3,500 | | | | 469,770 | |
| Mondelez International, Inc. - Class A (a) | | | 8,000 | | | | 557,760 | |
| Philip Morris International, Inc. (a) | | | 5,300 | | | | 515,425 | |
| Target Corporation | | | 2,000 | | | | 331,260 | |
| | | | | | | | 2,767,834 | |
| Energy — 8.7% | | | | | | | | |
| Chevron Corporation | | | 4,800 | | | | 783,168 | |
| ConocoPhillips | | | 5,200 | | | | 515,892 | |
| Exxon Mobil Corporation (a) | | | 7,000 | | | | 767,620 | |
| Shell plc - ADR | | | 10,250 | | | | 589,785 | |
| | | | | | | | 2,656,465 | |
| Financials — 14.0% | | | | | | | | |
| Bank of New York Mellon Corporation (The) | | | 12,500 | | | | 568,000 | |
| JPMorgan Chase & Company | | | 5,500 | | | | 716,705 | |
| Lincoln National Corporation | | | 11,000 | | | | 247,170 | |
| M&T Bank Corporation (a) | | | 2,950 | | | | 352,732 | |
| MetLife, Inc. (a) | | | 9,000 | | | | 521,460 | |
| Prudential Financial, Inc. (a) | | | 6,000 | | | | 496,440 | |
| Truist Financial Corporation | | | 11,000 | | | | 375,100 | |
| U.S. Bancorp | | | 14,200 | | | | 511,910 | |
| Wells Fargo & Company | | | 13,500 | | | | 504,630 | |
| | | | | | | | 4,294,147 | |
| Health Care — 15.0% | | | | | | | | |
| Bristol-Myers Squibb Company | | | 7,800 | | | | 540,618 | |
| CVS Health Corporation | | | 10,000 | | | | 743,100 | |
| Johnson & Johnson | | | 4,900 | | | | 759,500 | |
| Medtronic plc | | | 7,500 | | | | 604,650 | |
| Merck & Company, Inc. (a) | | | 9,400 | | | | 1,000,065 | |
| Organon & Company | | | 10,500 | | | | 246,960 | |
| CANTOR FBP |
| EQUITY & DIVIDEND PLUS FUND |
| SCHEDULE OF INVESTMENTS (Continued) |
| COMMON STOCKS — 91.3% (Continued) | | Shares | | | Value | |
| Health Care — 15.0% (Continued) | | | | | | | | |
| Pfizer, Inc. | | | 17,000 | | | $ | 693,600 | |
| | | | | | | | 4,588,493 | |
| Industrials — 7.6% | | | | | | | | |
| Emerson Electric Company (a) | | | 7,500 | | | | 653,550 | |
| Lockheed Martin Corporation | | | 800 | | | | 378,184 | |
| Raytheon Technologies Corporation (a) | | | 9,200 | | | | 900,956 | |
| Stanley Black & Decker, Inc. | | | 5,000 | | | | 402,900 | |
| | | | | | | | 2,335,590 | |
| Materials — 1.9% | | | | | | | | |
| Dow, Inc. | | | 10,850 | | | | 594,797 | |
| | | | | | | | | |
| Real Estate — 3.1% | | | | | | | | |
| Simon Property Group, Inc. (a) | | | 5,750 | | | | 643,828 | |
| Ventas, Inc. (a) | | | 6,900 | | | | 299,115 | |
| | | | | | | | 942,943 | |
| Technology — 14.5% | | | | | | | | |
| Broadcom, Inc. | | | 1,800 | | | | 1,154,771 | |
| Cisco Systems, Inc. | | | 14,500 | | | | 757,988 | |
| Fidelity National Information Services, Inc. | | | 7,000 | | | | 380,310 | |
| HP, Inc. | | | 20,500 | | | | 601,675 | |
| Intel Corporation (a) | | | 9,500 | | | | 310,365 | |
| International Business Machines Corporation | | | 6,250 | | | | 819,313 | |
| Skyworks Solutions, Inc. (a) | | | 3,500 | | | | 412,930 | |
| | | | | | | | 4,437,352 | |
| Utilities — 6.1% | | | | | | | | |
| Atmos Energy Corporation (a) | | | 4,500 | | | | 505,620 | |
| Dominion Energy, Inc. | | | 10,500 | | | | 587,055 | |
| Duke Energy Corporation | | | 4,300 | | | | 414,821 | |
| National Fuel Gas Company | | | 6,000 | | | | 346,440 | |
| | | | | | | | 1,853,936 | |
| | | | | | | | | |
| Total Common Stocks (Cost $23,502,438) | | | | | | $ | 27,931,810 | |
| CANTOR FBP |
| EQUITY & DIVIDEND PLUS FUND |
| SCHEDULE OF INVESTMENTS (Continued) |
| MONEY MARKET FUNDS — 9.1% | | Shares | | | Value | |
| Fidelity Institutional Money Market Government Portfolio -Class I, 4.72% (b) (Cost $2,783,585) | | | 2,783,585 | | | $ | 2,783,585 | |
| | | | | | | | | |
| Total Investments at Value — 100.4% | | | | | | | | |
| (Cost $26,286,023) | | | | | | $ | 30,715,395 | |
| | | | | | | | | |
| Liabilities in Excess of Other Assets — (0.4%) | | | | | | | (128,253 | ) |
| | | | | | | | | |
| Net Assets — 100.0% | | | | | | $ | 30,587,142 | |
ADR - American Depositary Receipt.
| (a) | Security covers a written call option. The total value of securities as of March 31, 2023 was $7,532,473. |
| (b) | The rate shown is the 7-day effective yield as of March 31, 2023. |
See accompanying notes to financial statements.
| CANTOR FBP |
| EQUITY & DIVIDEND PLUS FUND |
| SCHEDULE OF OPEN OPTION CONTRACTS |
| March 31, 2023 |
| COVERED WRITTEN | | | | | Notional | | | Strike | | | Expiration | | | Value of | |
| CALL OPTIONS | | Contracts | | | Value | | | Price | | | Date | | | Options | |
| Atmos Energy Corporation | | | 22 | | | $ | 247,192 | | | $ | 120.00 | | | | 04/24/23 | | | $ | 1,980 | |
| Emerson Electric Company | | | 24 | | | | 209,136 | | | | 105.00 | | | | 06/20/23 | | | | 360 | |
| Exxon Mobil Corporation | | | 33 | | | | 361,878 | | | | 125.00 | | | | 04/24/23 | | | | 198 | |
| Intel Corporation | | | 95 | | | | 310,365 | | | | 30.00 | | | | 07/24/23 | | | | 40,660 | |
| J.M. Smucker Company (The) | | | 27 | | | | 424,899 | | | | 160.00 | | | | 07/24/23 | | | | 15,660 | |
| Kimberly-Clark Corporation | | | 35 | | | | 469,770 | | | | 150.00 | | | | 06/20/23 | | | | 1,575 | |
| M&T Bank Corporation | | | 29 | | | | 346,753 | | | | 210.00 | | | | 04/24/23 | | | | 2,175 | |
| Merck & Company, Inc. | | | 50 | | | | 531,950 | | | | 105.00 | | | | 04/24/23 | | | | 15,500 | |
| Merck & Company, Inc. | | | 44 | | | | 468,116 | | | | 115.00 | | | | 04/24/23 | | | | 396 | |
| MetLife, Inc. | | | 56 | | | | 324,464 | | | | 77.50 | | | | 06/20/23 | | | | 336 | |
| Mondelez International, Inc. – Class A | | | 80 | | | | 557,760 | | | | 72.50 | | | | 09/18/23 | | | | 20,400 | |
| Paramount Global - Class B | | | 195 | | | | 435,045 | | | | 30.00 | | | | 06/20/23 | | | | 4,875 | |
| Philip Morris International, Inc. | | | 24 | | | | 233,400 | | | | 110.00 | | | | 06/20/23 | | | | 600 | |
| Prudential Financial, Inc. | | | 60 | | | | 496,440 | | | | 115.00 | | | | 09/18/23 | | | | 2,400 | |
| Raytheon Technologies Corporation | | | 42 | | | | 411,306 | | | | 105.00 | | | | 05/22/23 | | | | 2,436 | |
| Simon Property Group, Inc. | | | 34 | | | | 380,698 | | | | 140.00 | | | | 07/24/23 | | | | 1,054 | |
| Skyworks Solutions, Inc. | | | 32 | | | | 377,536 | | | | 135.00 | | | | 08/21/23 | | | | 14,080 | |
| Tapestry, Inc. | | | 77 | | | | 331,947 | | | | 47.50 | | | | 05/22/23 | | | | 6,160 | |
| Tapestry, Inc. | | | 73 | | | | 314,703 | | | | 52.50 | | | | 08/21/23 | | | | 8,030 | |
| Ventas, Inc. | | | 69 | | | | 299,115 | | | | 55.00 | | | | 08/21/23 | | | | 3,795 | |
| Total Covered Written Call Options | | | | | | | | | | | | | | | | | | | | |
| (Premiums received $289,766) | | | | | | $ | 7,532,473 | | | | | | | | | | | $ | 142,670 | |
See accompanying notes to financial statements.
| CANTOR FBP |
| APPRECIATION & INCOME OPPORTUNITIES FUND |
| SCHEDULE OF INVESTMENTS |
| March 31, 2023 |
| COMMON STOCKS — 76.4% | | Shares | | | Value | |
| Communications — 2.3% | | | | | | | | |
| Comcast Corporation - Class A | | | 10,000 | | | $ | 379,100 | |
| Paramount Global - Class B | | | 13,000 | | | | 290,030 | |
| | | | | | | | 669,130 | |
| Consumer Discretionary — 6.2% | | | | | | | | |
| Advance Auto Parts, Inc. | | | 1,700 | | | | 206,737 | |
| Ford Motor Company | | | 23,000 | | | | 289,800 | |
| Home Depot, Inc. (The) | | | 1,000 | | | | 295,120 | |
| Kohl’s Corporation | | | 5,000 | | | | 117,700 | |
| Tapestry, Inc. (a) | | | 17,000 | | | | 732,870 | |
| TJX Companies, Inc. (The) | | | 2,500 | | | | 195,900 | |
| | | | | | | | 1,838,127 | |
| Consumer Staples — 5.6% | | | | | | | | |
| J.M. Smucker Company (The) | | | 1,500 | | | | 236,055 | |
| Kellogg Company | | | 7,000 | | | | 468,720 | |
| Kimberly-Clark Corporation | | | 1,500 | | | | 201,330 | |
| Mondelez International, Inc. - Class A | | | 3,000 | | | | 209,160 | |
| Philip Morris International, Inc. | | | 3,000 | | | | 291,750 | |
| Target Corporation | | | 1,500 | | | | 248,445 | |
| | | | | | | | 1,655,460 | |
| Energy — 7.5% | | | | | | | | |
| Chevron Corporation | | | 3,600 | | | | 587,376 | |
| ConocoPhillips | | | 5,000 | | | | 496,050 | |
| Devon Energy Corporation | | | 9,000 | | | | 455,490 | |
| Shell plc - ADR | | | 12,000 | | | | 690,480 | |
| | | | | | | | 2,229,396 | |
| Financials — 14.7% | | | | | | | | |
| Bank of America Corporation | | | 21,000 | | | | 600,600 | |
| Bank of New York Mellon Corporation (The) | | | 10,000 | | | | 454,400 | |
| Capital One Financial Corporation | | | 4,700 | | | | 451,952 | |
| JPMorgan Chase & Company | | | 6,100 | | | | 794,891 | |
| Lincoln National Corporation | | | 9,000 | | | | 202,230 | |
| MetLife, Inc. (a) | | | 9,000 | | | | 521,460 | |
| Travelers Companies, Inc. (The) | | | 2,800 | | | | 479,948 | |
| Truist Financial Corporation | | | 6,500 | | | | 221,650 | |
| U.S. Bancorp | | | 6,300 | | | | 227,115 | |
| Wells Fargo & Company | | | 11,000 | | | | 411,180 | |
| | | | | | | | 4,365,426 | |
| Health Care — 10.9% | | | | | | | | |
| Bristol-Myers Squibb Company | | | 6,300 | | | | 436,653 | |
| CVS Health Corporation | | | 6,000 | | | | 445,860 | |
| Johnson & Johnson | | | 3,900 | | | | 604,500 | |
| CANTOR FBP |
| APPRECIATION & INCOME OPPORTUNITIES FUND |
| SCHEDULE OF INVESTMENTS (Continued) |
| COMMON STOCKS — 76.4% (Continued) | | Shares | | | Value | |
| Health Care — 10.9% (Continued) | | | | | | | | |
| Medtronic plc | | | 3,200 | | | $ | 257,984 | |
| Merck & Company, Inc. (a) | | | 6,300 | | | | 670,257 | |
| Organon & Company | | | 13,800 | | | | 324,576 | |
| Pfizer, Inc. | | | 12,000 | | | | 489,600 | |
| | | | | | | | 3,229,430 | |
| Industrials — 6.9% | | | | | | | | |
| Eaton Corporation plc | | | 3,500 | | | | 599,690 | |
| Emerson Electric Company | | | 2,700 | | | | 235,278 | |
| FedEx Corporation | | | 1,700 | | | | 388,433 | |
| Lockheed Martin Corporation | | | 500 | | | | 236,365 | |
| Raytheon Technologies Corporation | | | 3,600 | | | | 352,548 | |
| Stanley Black & Decker, Inc. | | | 3,000 | | | | 241,740 | |
| | | | | | | | 2,054,054 | |
| Materials — 2.9% | | | | | | | | |
| Compass Minerals International, Inc. | | | 5,000 | | | | 171,450 | |
| Dow, Inc. | | | 4,000 | | | | 219,280 | |
| Nucor Corporation | | | 3,100 | | | | 478,857 | |
| | | | | | | | 869,587 | |
| Real Estate — 1.7% | | | | | | | | |
| Simon Property Group, Inc. (a) | | | 4,500 | | | | 503,865 | |
| | | | | | | | | |
| Technology — 13.5% | | | | | | | | |
| Apple, Inc. | | | 6,000 | | | | 989,400 | |
| Broadcom, Inc. | | | 1,300 | | | | 834,002 | |
| Cisco Systems, Inc. | | | 11,000 | | | | 575,025 | |
| HP, Inc. | | | 21,000 | | | | 616,350 | |
| Intel Corporation (a) | | | 10,500 | | | | 343,035 | |
| International Business Machines Corporation | | | 4,200 | | | | 550,578 | |
| Microsoft Corporation | | | 300 | | | | 86,490 | |
| | | | | | | | 3,994,880 | |
| Utilities — 4.2% | | | | | | | | |
| Atmos Energy Corporation (a) | | | 4,000 | | | | 449,440 | |
| Dominion Energy, Inc. | | | 8,500 | | | | 475,235 | |
| Duke Energy Corporation | | | 3,500 | | | | 337,645 | |
| | | | | | | | 1,262,320 | |
| | | | | | | | | |
| Total Common Stocks (Cost $14,384,317) | | | | | | $ | 22,671,675 | |
| CANTOR FBP |
| APPRECIATION & INCOME OPPORTUNITIES FUND |
| SCHEDULE OF INVESTMENTS (Continued) |
| CORPORATE BONDS — 11.3% | | Par Value | | | Value | |
| Consumer Staples — 1.6% | | | | | | | | |
| Kroger Company, 3.70%, due 08/01/2027 | | $ | 500,000 | | | $ | 480,311 | |
| | | | | | | | | |
| Financials — 1.6% | | | | | | | | |
| PNC Financial Services Group, Inc. (The), 3.45%, due 04/23/2029 | | | 500,000 | | | | 464,944 | |
| | | | | | | | | |
| Health Care — 1.6% | | | | | | | | |
| Elevance Health, Inc., 4.10%, due 03/01/2028 | | | 500,000 | | | | 488,052 | |
| | | | | | | | | |
| Industrials — 4.9% | | | | | | | | |
| Hubbell, Inc., 3.35%, due 03/01/2026 | | | 500,000 | | | | 482,516 | |
| Norfolk Southern Corporation, 3.85%, due 01/15/2024 | | | 500,000 | | | | 492,320 | |
| Republic Services, Inc., 3.38%, due 11/15/2027 | | | 500,000 | | | | 476,881 | |
| | | | | | | | 1,451,717 | |
| Utilities — 1.6% | | | | | | | | |
| American Water Capital Corporation, 3.75%, due 09/01/2028 | | | 500,000 | | | | 477,133 | |
| | | | | | | | | |
| Total Corporate Bonds (Cost $3,357,805) | | | | | | $ | 3,362,157 | |
| U.S. TREASURY OBLIGATIONS — 5.0% | | Par Value | | | Value | |
| U.S. Treasury Notes — 5.0% | | | | | | | | |
| 4.25%, due 09/30/2024 | | $ | 750,000 | | | $ | 748,858 | |
| 3.50%, due 09/15/2025 | | | 750,000 | | | | 742,324 | |
| Total U.S. Treasury Obligations (Cost $1,485,898) | | | | | | $ | 1,491,182 | |
| CANTOR FBP |
| APPRECIATION & INCOME OPPORTUNITIES FUND |
| SCHEDULE OF INVESTMENTS (Continued) |
| MONEY MARKET FUNDS — 9.8% | | Shares | | | Value | |
| Fidelity Institutional Money Market Government Portfolio -Class I, 4.72% (b) (Cost $2,907,185) | | $ | 2,907,185 | | | $ | 2,907,185 | |
| Total Investments at Value — 102.5% | | | | | | | | |
| (Cost $22,135,205) | | | | | | $ | 30,432,199 | |
| | | | | | | | | |
| Liabilities in Excess of Other Assets — (2.5%) | | | | | | | (735,245 | ) |
| | | | | | | | | |
| Net Assets — 100.0% | | | | | | $ | 29,696,954 | |
ADR - American Depositary Receipt.
| (a) | Security covers a written call option. The total value of securities as of March 31, 2023 was $1,494,895. |
| (b) | The rate shown is the 7-day effective yield as of March 31, 2023. |
See accompanying notes to financial statements.
| CANTOR FBP |
| APPRECIATION & INCOME OPPORTUNITIES FUND |
| SCHEDULE OF OPEN OPTION CONTRACTS |
| March 31, 2023 |
| COVERED WRITTEN | | | | | Notional | | | Strike | | | Expiration | | | Value of | |
| CALL OPTIONS | | Contracts | | | Value | | | Price | | | Date | | | Options | |
| Atmos Energy Corporation | | | 20 | | | $ | 224,720 | | | $ | 120.00 | | | | 04/24/23 | | | $ | 1,800 | |
| Intel Corporation | | | 105 | | | | 343,035 | | | | 30.00 | | | | 07/24/23 | | | | 44,940 | |
| Merck & Company, Inc. | | | 20 | | | | 212,780 | | | | 115.00 | | | | 04/24/23 | | | | 180 | |
| MetLife, Inc. | | | 40 | | | | 231,760 | | | | 77.50 | | | | 06/20/23 | | | | 240 | |
| Simon Property Group, Inc. | | | 20 | | | | 223,940 | | | | 140.00 | | | | 07/24/23 | | | | 620 | |
| Tapestry, Inc. | | | 60 | | | | 258,660 | | | | 47.50 | | | | 05/22/23 | | | | 4,800 | |
| Total Covered Written Call Options | | | | | | | | | | | | | | | | | | | | |
| (Premiums received $53,625) | | | | | | $ | 1,494,895 | | | | | | | | | | | $ | 52,580 | |
See accompanying notes to financial statements.
| THE CANTOR FLIPPIN, BRUCE & PORTER FUNDS |
| STATEMENTS OF ASSETS AND LIABILITIES |
| March 31, 2023 |
| | | | | | Cantor FBP | |
| | | Cantor FBP | | | Appreciation | |
| | | Equity & | | | & Income | |
| | | Dividend | | | Opportunities | |
| | | Plus Fund | | | Fund | |
| ASSETS | | | | | | | | |
| Investments in securities: | | | | | | | | |
| At cost | | $ | 26,286,023 | | | $ | 22,135,205 | |
| At value (Note 2) | | $ | 30,715,395 | | | $ | 30,432,199 | |
| Receivable for capital shares sold | | | 3,567 | | | | — | |
| Dividends and interest receivable | | | 60,976 | | | | 66,739 | |
| Other assets | | | 4,699 | | | | 4,147 | |
| TOTAL ASSETS | | | 30,784,637 | | | | 30,503,085 | |
| | | | | | | | | |
| LIABILITIES | | | | | | | | |
| Written call options, at value (Notes 2 and 5) (premiums received $289,766 and $53,625, respectively) | | | 142,670 | | | | 52,580 | |
| Distributions payable | | | 4,304 | | | | 18,777 | |
| Payable for capital shares redeemed | | | 22,365 | | | | 21,607 | |
| Payable investment securities purchased | | | — | | | | 686,082 | |
| Accrued investment advisory fees (Note 4) | | | 19,076 | | | | 18,125 | |
| Payable to administrator (Note 4) | | | 5,580 | | | | 5,580 | |
| Other accrued expenses | | | 3,500 | | | | 3,380 | |
| TOTAL LIABILITIES | | | 197,495 | | | | 806,131 | |
| | | | | | | | | |
| NET ASSETS | | $ | 30,587,142 | | | $ | 29,696,954 | |
| | | | | | | | | |
| NET ASSETS CONSIST OF: | | | | | | | | |
| Paid-in capital | | $ | 25,232,219 | | | $ | 20,358,569 | |
| Distributable earnings | | | 5,354,923 | | | | 9,338,385 | |
| Net assets | | $ | 30,587,142 | | | $ | 29,696,954 | |
| | | | | | | | | |
| Shares of beneficial interest outstanding (unlimited number of shares authorized, $0.01 par value) | | | 1,186,612 | | | | 1,497,065 | |
| | | | | | | | | |
| Net asset value, offering price and redemption price per share (Note 2) | | $ | 25.78 | | | $ | 19.84 | |
See accompanying notes to financial statements.
| THE CANTOR FLIPPIN, BRUCE & PORTER FUNDS |
| STATEMENTS OF OPERATIONS |
| For the Year Ended March 31, 2023 |
| | | | | | Cantor FBP | |
| | | Cantor FBP | | | Appreciation | |
| | | Equity & | | | & Income | |
| | | Dividend | | | Opportunities | |
| | | Plus Fund | | | Fund | |
| INVESTMENT INCOME | | | | | | | | |
| Dividends | | $ | 1,074,633 | | | $ | 816,997 | |
| Interest | | | — | | | | 140,606 | |
| TOTAL INVESTMENT INCOME | | | 1,074,633 | | | | 957,603 | |
| | | | | | | | | |
| EXPENSES | | | | | | | | |
| Investment advisory fees (Note 4) | | | 218,324 | | | | 226,409 | |
| Administration fees (Note 4) | | | 60,000 | | | | 60,000 | |
| Trustees’ fees and expenses (Note 4) | | | 19,632 | | | | 19,632 | |
| Audit and tax services fees | | | 17,411 | | | | 17,411 | |
| Registration and filing fees | | | 18,262 | | | | 16,476 | |
| Legal fees | | | 13,182 | | | | 13,182 | |
| Shareholder reporting expenses | | | 10,569 | | | | 7,081 | |
| Shareholder servicing fees (Note 4) | | | 13,914 | | | | 2,965 | |
| Custodian and bank service fees | | | 7,065 | | | | 7,065 | |
| Compliance service fees (Note 4) | | | 7,000 | | | | 7,000 | |
| Postage and supplies | | | 5,060 | | | | 3,976 | |
| Insurance expense | | | 1,079 | | | | 1,245 | |
| Other expenses | | | 8,186 | | | | 9,070 | |
| TOTAL EXPENSES | | | 399,684 | | | | 391,512 | |
| Fees reduced by the Adviser (Note 4) | | | (50,366 | ) | | | (51,899 | ) |
| NET EXPENSES | | | 349,318 | | | | 339,613 | |
| | | | | | | | | |
| NET INVESTMENT INCOME | | | 725,315 | | | | 617,990 | |
| | | | | | | | | |
| REALIZED AND UNREALIZED GAINS (LOSSES) ON INVESTMENTS AND WRITTEN OPTION CONTRACTS | | | | | | | | |
| Net realized gains from: | | | | | | | | |
| Investment transactions | | | 498,363 | | | | 961,776 | |
| Written option contracts (Note 5) | | | 455,470 | | | | 108,401 | |
| Net realized gains from in-kind redemptions (Note 2) | | | — | | | | 1,635,884 | |
| Net change in unrealized appreciation (depreciation) on: | | | | | | | | |
| Investment transactions | | | (4,689,497 | ) | | | (5,595,499 | ) |
| Written option contracts (Note 5) | | | 93,249 | | | | (45,756 | ) |
| NET REALIZED AND UNREALIZED LOSSES ON INVESTMENTS AND WRITTEN OPTION CONTRACTS | | | (3,642,415 | ) | | | (2,935,194 | ) |
| | | | | | | | | |
| NET DECREASE IN NET ASSETS RESULTING FROM OPERATIONS | | $ | (2,917,100 | ) | | $ | (2,317,204 | ) |
See accompanying notes to financial statements.
| CANTOR FBP |
| EQUITY & DIVIDEND PLUS FUND |
| STATEMENTS OF CHANGES IN NET ASSETS |
| | | Year Ended | | | Year Ended | |
| | | March 31, | | | March 31, | |
| | | 2023 | | | 2022 | |
| FROM OPERATIONS | | | | | | | | |
| Net investment income | | $ | 725,315 | | | $ | 599,689 | |
| Net realized gains from: | | | | | | | | |
| Investment transactions | | | 498,363 | | | | 2,328,708 | |
| Written option contracts (Note 5) | | | 455,470 | | | | 147,353 | |
| Net change in unrealized appreciation (depreciation) on: | | | | | | | | |
| Investments | | | (4,689,497 | ) | | | 1,694,953 | |
| Written option contracts (Note 5) | | | 93,249 | | | | 20,934 | |
| Net increase (decrease) in net assets resulting from operations | | | (2,917,100 | ) | | | 4,791,637 | |
| | | | | | | | | |
| DISTRIBUTIONS TO SHAREHOLDERS (Note 2) | | | (2,132,667 | ) | | | (2,481,311 | ) |
| | | | | | | | | |
| FROM CAPITAL SHARE TRANSACTIONS | | | | | | | | |
| Proceeds from shares sold | | | 6,938,679 | | | | 2,275,948 | |
| Net asset value of shares issued in reinvestment of distributions to shareholders | | | 2,089,689 | | | | 2,433,606 | |
| Payments for shares redeemed | | | (6,006,938 | ) | | | (2,921,872 | ) |
| Net increase in net assets from capital share transactions | | | 3,021,430 | | | | 1,787,682 | |
| | | | | | | | | |
| TOTAL INCREASE (DECREASE) IN NET ASSETS | | | (2,028,337 | ) | | | 4,098,008 | |
| | | | | | | | | |
| NET ASSETS | | | | | | | | |
| Beginning of year | | | 32,615,479 | | | | 28,517,471 | |
| End of year | | $ | 30,587,142 | | | $ | 32,615,479 | |
| | | | | | | | | |
| CAPITAL SHARE ACTIVITY | | | | | | | | |
| Shares sold | | | 252,943 | | | | 76,044 | |
| Shares reinvested | | | 79,178 | | | | 86,021 | |
| Shares redeemed | | | (219,190 | ) | | | (100,027 | ) |
| Net increase in shares outstanding | | | 112,931 | | | | 62,038 | |
| Shares outstanding, beginning of year | | | 1,073,681 | | | | 1,011,643 | |
| Shares outstanding, end of year | | | 1,186,612 | | | | 1,073,681 | |
See accompanying notes to financial statements.
| CANTOR FBP |
| APPRECIATION & INCOME OPPORTUNITIES FUND |
| STATEMENTS OF CHANGES IN NET ASSETS |
| | | Year Ended | | | Year Ended | |
| | | March 31, | | | March 31, | |
| | | 2023 | | | 2022 | |
| FROM OPERATIONS | | | | | | | | |
| Net investment income | | $ | 617,990 | | | $ | 419,149 | |
| Net realized gains from: | | | | | | | | |
| Investment transactions | | | 961,776 | | | | 3,590,346 | |
| Written option contracts (Note 5) | | | 108,401 | | | | 981 | |
| Net realized gains from in-kind redemptions (Note 2) | | | 1,635,884 | | | | — | |
| Net change in unrealized appreciation (depreciation) on: | | | | | | | | |
| Investments | | | (5,595,499 | ) | | | 948,659 | |
| Written option contracts (Note 5) | | | (45,756 | ) | | | 91,882 | |
| Net increase (decrease) in net assets resulting from operations | | | (2,317,204 | ) | | | 5,051,017 | |
| | | | | | | | | |
| DISTRIBUTIONS TO SHAREHOLDERS (Note 2) | | | (3,431,299 | ) | | | (1,655,507 | ) |
| | | | | | | | | |
| FROM CAPITAL SHARE TRANSACTIONS | | | | | | | | |
| Proceeds from shares sold | | | 980,017 | | | | 995,004 | |
| Net asset value of shares issued in reinvestment of distributions to shareholders | | | 3,365,897 | | | | 1,615,223 | |
| Payments for shares redeemed | | | (4,193,478 | ) | | | (6,280,307 | ) |
| Net increase (decrease) in net assets from capital share transactions | | | 152,436 | | | | (3,670,080 | ) |
| | | | | | | | | |
| TOTAL DECREASE IN NET ASSETS | | | (5,596,067 | ) | | | (274,570 | ) |
| | | | | | | | | |
| NET ASSETS | | | | | | | | |
| Beginning of year | | | 35,293,021 | | | | 35,567,591 | |
| End of year | | $ | 29,696,954 | | | $ | 35,293,021 | |
| | | | | | | | | |
| CAPITAL SHARE ACTIVITY | | | | | | | | |
| Shares sold | | | 49,684 | | | | 43,385 | |
| Shares reinvested | | | 173,770 | | | | 71,739 | |
| Shares redeemed | | | (209,623 | ) | | | (273,230 | ) |
| Net increase (decrease) in shares outstanding | | | 13,831 | | | | (158,106 | ) |
| Shares outstanding, beginning of year | | | 1,483,234 | | | | 1,641,340 | |
| Shares outstanding, end of year | | | 1,497,065 | | | | 1,483,234 | |
See accompanying notes to financial statements.
| CANTOR FBP |
| EQUITY & DIVIDEND PLUS FUND |
| FINANCIAL HIGHLIGHTS |
Selected Per Share Data for a Share Outstanding Throughout Each Year:
| | | Year Ended | | | Year Ended | | | Year Ended | | | Year Ended | | | Year Ended | |
| | | March 31, | | | March 31, | | | March 31, | | | March 31, | | | March 31, | |
| | | 2023 | | | 2022 | | | 2021 | | | 2020 | | | 2019 | |
| Net asset value at beginning of year | | $ | 30.38 | | | $ | 28.19 | | | $ | 18.28 | | | $ | 25.19 | | | $ | 25.68 | |
| | | | | | | | | | | | | | | | | | | | | |
| Income (loss) from investment operations: | | | | | | | | | | | | | | | | | | | | |
| Net investment income | | | 0.63 | | | | 0.58 | | | | 0.59 | | | | 0.67 | | | | 0.60 | |
| Net realized and unrealized gains (losses) on investments and written option contracts | | | (3.33 | ) | | | 4.03 | | | | 9.90 | | | | (5.90 | ) | | | 0.83 | |
| Total from investment operations | | | (2.70 | ) | | | 4.61 | | | | 10.49 | | | | (5.23 | ) | | | 1.43 | |
| | | | | | | | | | | | | | | | | | | | | |
| Less distributions from: | | | | | | | | | | | | | | | | | | | | |
| Net investment income | | | (0.63 | ) | | | (0.59 | ) | | | (0.58 | ) | | | (0.67 | ) | | | (0.60 | ) |
| Net realized gains | | | (1.27 | ) | | | (1.83 | ) | | | — | | | | (1.01 | ) | | | (1.32 | ) |
| Total distributions | | | (1.90 | ) | | | (2.42 | ) | | | (0.58 | ) | | | (1.68 | ) | | | (1.92 | ) |
| | | | | | | | | | | | | | | | | | | | | |
| Net asset value at end of year | | $ | 25.78 | | | $ | 30.38 | | | $ | 28.19 | | | $ | 18.28 | | | $ | 25.19 | |
| | | | | | | | | | | | | | | | | | | | | |
| Total return (a) | | | (8.92 | %) | | | 17.23 | % | | | 58.15 | % | | | (22.33 | %) | | | 5.64 | % |
| | | | | | | | | | | | | | | | | | | | | |
| Net assets at end of year (000’s) | | $ | 30,587 | | | $ | 32,615 | | | $ | 28,517 | | | $ | 20,919 | | | $ | 28,615 | |
| | | | | | | | | | | | | | | | | | | | | |
| Ratio of total expenses to average net assets | | | 1.28 | % | | | 1.23 | % | | | 1.32 | % | | | 1.25 | % | | | 1.23 | % |
| | | | | | | | | | | | | | | | | | | | | |
| Ratio of net expenses to average net assets (b) | | | 1.12 | % | | | 1.12 | % | | | 1.10 | % | | | 1.07 | % | | | 1.07 | % |
| | | | | | | | | | | | | | | | | | | | | |
| Ratio of net investment income to average net assets (b) | | | 2.33 | % | | | 1.97 | % | | | 2.53 | % | | | 2.70 | % | | | 2.35 | % |
| | | | | | | | | | | | | | | | | | | | | |
| Portfolio turnover rate | | | 16 | % | | | 16 | % | | | 21 | % | | | 38 | % | | | 18 | % |
| (a) | Total return is a measure of the change in value of an investment in the Fund over the periods covered, which assumes any dividends or capital gains distributions are reinvested in shares of the Fund. The returns shown do not reflect the deduction of taxes a shareholder would pay on Fund distributions or the redemption of Fund shares. The total returns would have been lower if the Adviser had not waived/reduced advisory fees. |
| (b) | Ratios were determined after advisory fee waivers/reductions by the Adviser (Note 4). |
See accompanying notes to financial statements.
| CANTOR FBP |
| APPRECIATION & INCOME OPPORTUNITIES FUND |
| FINANCIAL HIGHLIGHTS |
Selected Per Share Data for a Share Outstanding Throughout Each Year:
| | | Year Ended | | | Year Ended | | | Year Ended | | | Year Ended | | | Year Ended | |
| | | March 31, | | | March 31, | | | March 31, | | | March 31, | | | March 31, | |
| | | 2023 | | | 2022 | | | 2021 | | | 2020 | | | 2019 | |
| Net asset value at beginning of year | | $ | 23.79 | | | $ | 21.67 | | | $ | 14.43 | | | $ | 18.91 | | | $ | 18.99 | |
| | | | | | | | | | | | | | | | | | | | | |
| Income (loss) from investment operations: | | | | | | | | | | | | | | | | | | | | |
| Net investment income | | | 0.40 | | | | 0.27 | | | | 0.29 | | | | 0.38 | | | | 0.37 | |
| Net realized and unrealized gains (losses) on investments and written option contracts | | | (2.03 | ) | | | 2.94 | | | | 7.24 | | | | (3.65 | ) | | | 0.28 | |
| Total from investment operations | | | (1.63 | ) | | | 3.21 | | | | 7.53 | | | | (3.27 | ) | | | 0.65 | |
| | | | | | | | | | | | | | | | | | | | | |
| Less distributions from: | | | | | | | | | | | | | | | | | | | | |
| Net investment income | | | (0.41 | ) | | | (0.29 | ) | | | (0.29 | ) | | | (0.38 | ) | | | (0.37 | ) |
| Net realized gains | | | (1.91 | ) | | | (0.80 | ) | | | — | | | | (0.83 | ) | | | (0.36 | ) |
| Total distributions | | | (2.32 | ) | | | (1.09 | ) | | | (0.29 | ) | | | (1.21 | ) | | | (0.73 | ) |
| | | | | | | | | | | | | | | | | | | | | |
| Net asset value at end of year | | $ | 19.84 | | | $ | 23.79 | | | $ | 21.67 | | | $ | 14.43 | | | $ | 18.91 | |
| | | | | | | | | | | | | | | | | | | | | |
| Total return (a) | | | (6.43 | %) | | | 15.16 | % | | | 52.63 | % | | | (18.56 | %) | | | 3.44 | % |
| | | | | | | | | | | | | | | | | | | | | |
| Net assets at end of year (000’s) | | $ | 29,697 | | | $ | 35,293 | | | $ | 35,568 | | | $ | 25,287 | | | $ | 33,376 | |
| | | | | | | | | | | | | | | | | | | | | |
| Ratio of total expenses to average net assets | | | 1.21 | % | | | 1.14 | % | | | 1.20 | % | | | 1.16 | % | | | 1.12 | % |
| | | | | | | | | | | | | | | | | | | | | |
| Ratio of net expenses to average net assets (b) | | | 1.05 | % | | | 1.05 | % | | | 1.03 | % | | | 1.00 | % | | | 1.00 | % |
| | | | | | | | | | | | | | | | | | | | | |
| Ratio of net investment income to average net assets (b) | | | 1.91 | % | | | 1.17 | % | | | 1.61 | % | | | 2.03 | % | | | 1.89 | % |
| | | | | | | | | | | | | | | | | | | | | |
| Portfolio turnover rate | | | 26 | % | | | 10 | % | | | 11 | % | | | 18 | % | | | 21 | % |
| (a) | Total return is a measure of the change in value of an investment in the Fund over the periods covered, which assumes any dividends or capital gains distributions are reinvested in shares of the Fund. The returns shown do not reflect the deduction of taxes a shareholder would pay on Fund distributions or the redemption of Fund shares. The total returns would have been lower if the Adviser had not waived/reduced advisory fees. |
| (b) | Ratios were determined after advisory fee waivers/reductions by the Adviser (Note 4). |
See accompanying notes to financial statements.
| THE CANTOR FBP MUTUAL FUNDS |
| NOTES TO FINANCIAL STATEMENTS |
| March 31, 2023 |
1. Organization
Cantor FBP Equity & Dividend Plus Fund and Cantor FBP Appreciation & Income Opportunities Fund (each a “Fund” and collectively the “Funds”) are no-load, diversified series of Williamsburg Investment Trust (the “Trust”), an open-end management investment company registered under the Investment Company Act of 1940, as amended (the “1940 Act”). The Trust was organized as a Massachusetts business trust on July 18, 1988. Other series of the Trust are not included in this report.
The investment objective of Cantor FBP Equity & Dividend Plus Fund is to provide above-average and growing income while also achieving long-term growth of capital.
The investment objectives of Cantor FBP Appreciation & Income Opportunities Fund are long term capital appreciation and current income, assuming a moderate level of investment risk.
2. Significant Accounting Policies
Each Fund follows accounting and reporting guidance under Financial Accounting Standards Board (“FASB”) Accounting Standards Codification Topic 946, “Financial Services – Investment Companies.” The following is a summary of the Funds’ significant accounting policies. These policies are in conformity with accounting principles generally accepted in the United States of America (“GAAP”).
Regulatory update — In October 2020, the Securities and Exchange Commission (the “SEC”) adopted new regulations governing the use of derivatives by registered investment companies (“Rule 18f-4”). The Funds were required to comply with Rule 18f-4 by August 19, 2022. Rule 18f-4 imposes limits on the amount of derivatives a fund can enter into, eliminates the asset segregation framework currently used by funds to comply with Section 18 of the 1940 Act, treats derivatives as senior securities and requires funds whose use of derivatives is more than a limited specified exposure amount to establish and maintain a comprehensive derivatives risk management program and appoint a derivatives risk manager. The Funds have adopted Rule 18f-4 and are currently adhering to the requirements.
Securities valuation — The Funds’ portfolio securities are valued as of the close of business of the regular session of the New York Stock Exchange (normally 4:00 p.m. Eastern time). Securities traded on a national stock exchange, including common stocks and closed-end investment companies, if any, are valued based upon the closing price on the principal exchange where the security is traded, if available, otherwise, at the last quoted bid price. Securities that are quoted by NASDAQ are valued at the NASDAQ Official Closing Price. Covered call options written by the Funds are valued at the last quoted sale price or, in the absence of a sale, at the ask price on the principal exchanges on which they are traded. Investments representing shares of money market funds and other open-end investment companies are valued at their net asset value (“NAV”) as reported by such companies. When using a quoted price and when the market is considered active, securities will be classified as Level 1 within the fair value hierarchy (see below).
Fixed income securities, including U.S. Treasury obligations and corporate bonds, are typically valued on the basis of prices provided by an independent pricing service. The prices provided by the pricing service are determined with consideration given to institutional bid and last sale prices and take into account securities
| THE CANTOR FBP MUTUAL FUNDS |
| NOTES TO FINANCIAL STATEMENTS (Continued) |
prices, yields, maturities, call features, ratings, institutional trading in similar groups of securities, and developments related to specific securities. Given the inputs used by the pricing service, these securities are classified as Level 2 within the fair value hierarchy.
When market quotations are not readily available, if a pricing service cannot provide a price, or if the investment adviser believes the price received from the pricing service is not indicative of fair value, securities will be valued in good faith at fair value as determined by Cantor Fitzgerald Investment Advisors, L.P. (the “Adviser”), as the Fund’s valuation designee, in accordance with procedures adopted by the Board of Trustees (the “Board”) pursuant to Rule 2a-5 under the 1940 Act. Under the procedures, the securities will be classified as Level 2 or 3 within the fair value hierarchy, depending on the inputs used. Such methods of fair valuation may include, but are not limited to: multiple of earnings, multiple of book value, discount from market of a similar freely traded security, purchase price of the security, subsequent private transactions in the security or related securities, or a combination of these and other factors.
GAAP establishes a single authoritative definition of fair value, sets out a framework for measuring fair value and requires additional disclosures about fair value measurements. Various inputs are used in determining the value of each Fund’s investments. These inputs are summarized in the three broad levels listed below:
| ● | Level 1 – quoted prices in active markets for identical securities |
| ● | Level 2 – other significant observable inputs |
| ● | Level 3 – significant unobservable inputs |
The inputs or methodology used for valuing securities are not necessarily an indication of the risks associated with investing in those securities. The inputs used to measure fair value may fall into different levels of the fair value hierarchy. In such cases, for disclosure purposes, the level in the fair value hierarchy within which the fair value measurement falls in its entirety is determined based on the lowest level input that is significant to the fair value measurement.
The following is a summary of each Fund’s investments and other financial instruments based on the inputs used to value the investments and other financial instruments as of March 31, 2023, by security type:
| Cantor FBP Equity & Dividend Plus Fund | | Level 1 | | | Level 2 | | | Level 3 | | | Total | |
| Investments in Securities: | | | | | | | | | | | | | | | | |
| Common Stocks | | $ | 27,931,810 | | | $ | — | | | $ | — | | | $ | 27,931,810 | |
| Money Market Funds | | | 2,783,585 | | | | — | | | | — | | | | 2,783,585 | |
| Total | | $ | 30,715,395 | | | $ | — | | | $ | — | | | $ | 30,715,395 | |
| | | | | | | | | | | | | | | | | |
| Other Financial Instruments: | | | | | | | | | | | | | | | | |
| Covered Written Call Options | | $ | (92,615 | ) | | $ | (50,055 | ) | | $ | — | | | $ | (142,670 | ) |
| Total | | $ | (92,615 | ) | | $ | (50,055 | ) | | $ | — | | | $ | (142,670 | ) |
| | | | | | | | | | | | | | | | | |
| THE CANTOR FBP MUTUAL FUNDS |
| NOTES TO FINANCIAL STATEMENTS (Continued) |
| Cantor FBP Appreciation & Income Opportunities Fund | | Level 1 | | | Level 2 | | | Level 3 | | | Total | |
| Investments in Securities: | | | | | | | | | | | | | | | | |
| Common Stocks | | $ | 22,671,675 | | | $ | — | | | $ | — | | | $ | 22,671,675 | |
| Corporate Bonds | | | — | | | | 3,362,157 | | | | — | | | | 3,362,157 | |
| U.S. Treasury Obligations | | | — | | | | 1,491,182 | | | | — | | | | 1,491,182 | |
| Money Market Funds | | | 2,907,185 | | | | — | | | | — | | | | 2,907,185 | |
| Total | | $ | 25,578,860 | | | $ | 4,853,339 | | | $ | — | | | $ | 30,432,199 | |
| | | | | | | | | | | | | | | | | |
| Other Financial Instruments: | | | | | | | | | | | | | | | | |
| Covered Written Call Options | | $ | (50,780 | ) | | $ | (1,800 | ) | | $ | — | | | $ | (52,580 | ) |
| Total | | $ | (50,780 | ) | | $ | (1,800 | ) | | $ | — | | | $ | (52,580 | ) |
| | | | | | | | | | | | | | | | | |
Refer to each Fund’s Schedule of Investments for a listing of the common stocks and corporate bonds by sector type. There were no Level 3 investments held by the Funds as of or during the year ended March 31, 2023.
Share valuation — The NAV per share of each Fund is calculated daily by dividing the total value of its assets, less liabilities, by the number of shares outstanding. The offering price and redemption price per share of each Fund is equal to its NAV per share.
Investment income — Dividend income is recorded on the ex-dividend date. Non-cash dividends included in dividend income, if any, are recorded at the fair market value of the security received. Interest income is accrued as earned. Discounts and premiums on fixed income securities purchased are amortized using the effective interest method. Withholding taxes, if any, on foreign dividends have been recorded in accordance with the Funds’ understanding of the applicable country’s rules and tax rates.
Distributions to shareholders — Dividends arising from net investment income are declared and paid quarterly to shareholders of each Fund. Net realized short-term capital gains, if any, may be distributed throughout the year and net realized long-term capital gains, if any, are distributed at least once each year. The amount of distributions from net investment income and net realized capital gains are determined in accordance with federal income tax regulations, which may differ from GAAP. These “book/tax” differences are either temporary or permanent in nature. Dividends and distributions are recorded on the ex-dividend date. The tax character of distributions paid during the years ended March 31, 2023 and 2022 was as follows:
| | | Year | | Ordinary | | | Long-Term | | | Total | |
| | | Ended | | Income | | | Capital Gains | | | Distributions | |
| Cantor FBP Equity & Dividend Plus Fund | | 03/31/23 | | $ | 731,087 | | | $ | 1,400,459 | | | $ | 2,131,546 | |
| | | 03/31/22 | | $ | 791,326 | | | $ | 1,689,035 | | | $ | 2,480,361 | |
| Cantor FBP Appreciation & Income Opportunities Fund | | 03/31/23 | | $ | 625,730 | | | $ | 2,795,802 | | | $ | 3,421,532 | |
| | | 03/31/22 | | $ | 440,215 | | | $ | 1,215,260 | | | $ | 1,655,475 | |
Investment transactions — Investment transactions are accounted for on trade date for financial reporting purposes. Realized gains and losses on investments sold are determined on a specific identification basis.
| THE CANTOR FBP MUTUAL FUNDS |
| NOTES TO FINANCIAL STATEMENTS (Continued) |
Common expenses — Common expenses of the Trust are allocated among the Funds and the other series of the Trust based on relative net assets of each series or the nature of the services performed and the relative applicability to each series.
Options transactions — When the Funds’ investment adviser believes that individual portfolio investment securities held by the Funds are approaching the top of the Adviser’s growth and price expectations, covered call options can be written (sold) against such securities and the Funds will receive a premium in return. The Funds write options only for income generation and hedging purposes and not for speculation. The premiums received from writing the options are recorded as a liability and are subsequently valued daily at the closing prices on their primary exchanges. Premiums received from writing options that expire are treated as realized gains. Premiums received from writing options that are exercised increase the proceeds used to calculate the realized gain or loss on the sale of the underlying security. If a closing purchase transaction is used to terminate a Fund’s obligation on a call option, a gain or loss will be realized, depending upon whether the price of the closing purchase transaction is more or less than the premium previously received on the call option written.
Estimates — The preparation of financial statements in conformity with GAAP requires management to make estimates and assumptions that affect the reported amounts of assets and liabilities and the disclosure of contingent assets and liabilities, each as of the date of the financial statements, and the reported amounts of increase (decrease) in net assets from operation during the reporting period. Actual results could differ from those estimates.
Federal income tax — Each Fund has qualified and intends to continue to qualify as a regulated investment company under the Internal Revenue Code of 1986, as amended (the “Code”). Qualification generally will relieve the Funds of liability for federal income taxes to the extent 100% of their net investment income and any net realized capital gains are distributed in accordance with the Code.
In order to avoid imposition of the excise tax applicable to regulated investment companies, it is also each Fund’s intention to declare as dividends in each calendar year at least 98% of its net investment income (earned during the calendar year) and 98.2% of its net realized capital gains (earned during the twelve months ended October 31) plus undistributed amounts from prior years.
| THE CANTOR FBP MUTUAL FUNDS |
| NOTES TO FINANCIAL STATEMENTS (Continued) |
The following information is computed on a tax basis for each item as of March 31, 2023:
| | | | | | Cantor FBP | |
| | | | | | Appreciation | |
| | | Cantor FBP Equity | | | & Income | |
| | | & Dividend | | | Opportunities | |
| | | Plus Fund | | | Fund | |
| Tax cost of portfolio investments and written option contracts | | $ | 25,996,257 | | | $ | 22,066,920 | |
| Gross unrealized appreciation | | $ | 6,982,118 | | | $ | 9,162,813 | |
| Gross unrealized depreciation | | | (2,405,650 | ) | | | (850,114 | ) |
| Net unrealized appreciation | | $ | 4,576,468 | | | $ | 8,312,699 | |
| Undistributed ordinary income | | | 4,198 | | | | 60,691 | |
| Undistributed long-term capital gains | | | 778,561 | | | | 983,772 | |
| Distribution payable | | | (4,304 | ) | | | (18,777 | ) |
| Distributable earnings | | $ | 5,354,923 | | | $ | 9,338,385 | |
| | | | | | | | | |
The difference between the federal income tax cost of investments and the financial statement cost of investments for Cantor FBP Appreciation & Income Opportunities Fund is due to certain differences in the recognition of capital gains and losses under income tax regulations and GAAP. These “book/tax” differences are temporary in nature and are primarily due to differing methods in the amortization of discounts and premiums on fixed income securities.
During the year ended March 31, 2023, FBP Appreciation & Income Opportunities Fund realized $1,635,884 of net capital gains resulting from in-kind redemptions (redemptions in which shareholders who redeemed Fund shares received securities held by the Fund rather than cash). The Fund recognizes a gain on in-kind redemptions to the extent that the value of the distributed securities on the date of redemption exceeds the cost of those securities. Such gains are not taxable to the Fund and are not required to be distributed to shareholders. The Fund has reclassified this amount against paid-in capital on the Statement of Assets and Liabilities. Such reclassification, the result of permanent differences between the financial statement and income tax reporting requirements, has no effect on the Fund’s net assets or net asset value per share.
The Funds recognize the tax benefits or expenses of uncertain tax positions only when the position is “more likely than not” to be sustained assuming examination by tax authorities. Management has reviewed the tax positions taken by each Fund on federal income tax returns for all open tax years (generally, three years) and has concluded that no provision for unrecognized tax benefits or expenses is required in these financial statements.
The Funds recognize interest and penalties, if any, related to unrecognized tax benefits as income tax expense on the Statements of Operations. During the year ended March 31, 2023, the Funds did not incur any interest or penalties.
| THE CANTOR FBP MUTUAL FUNDS |
| NOTES TO FINANCIAL STATEMENTS (Continued) |
3. Investment Transactions
Investment transactions, other than short-term investments and U.S. government securities, were as follows for the year ended March 31, 2023:
| | | | | | Cantor FBP | |
| | | | | | Appreciation | |
| | | Cantor FBP Equity | | | & Income | |
| | | & Dividend | | | Opportunities | |
| | | Plus Fund | | | Fund | |
| Purchases of investment securities | | $ | 5,983,162 | | | $ | 7,932,335 | |
| Proceeds from sales and maturities of investment securities | | $ | 4,755,703 | | | $ | 6,723,131 | |
| | | | | | | | | |
For the year ended March 31, 2023, cost of purchases and proceeds from maturities of U.S. government long-term securities for Cantor FBP Appreciation & Income Opportunities Fund were $1,485,898 and $500,000, respectively.
4. Transactions with Related Parties
INVESTMENT ADVISORY AGREEMENTS
Each Fund’s investments are managed by Cantor Fitzgerald Investment Advisors, L.P. (the “Adviser”) under the terms of an Investment Advisory Agreement. Under the Investment Advisory Agreements, each Fund pays the Adviser a fee, which is computed and accrued daily and paid monthly, at an annual rate of 0.70% of its average daily net assets up to $250 million; 0.65% of the next $250 million of such assets; and 0.50% of such assets in excess of $500 million.
Pursuant to Expense Limitation Agreements (“ELAs”) between each Fund and the Adviser, the Adviser has contractually agreed, until August 1, 2024, to reduce advisory fees and/or reimburse expenses to the extent necessary to limit total annual fund operating expenses (excluding brokerage costs, taxes, interest, Acquired Fund Fees and Expenses and extraordinary expenses) to an amount not exceeding 1.12% and 1.05% of the average daily net assets of Cantor FBP Equity & Dividend Plus Fund and Cantor FBP Appreciation & Income Opportunities Fund, respectively.
Accordingly, during the year ended March 31, 2023, the Adviser reduced its advisory fees in the amounts of $50,366 and $51,899 for Cantor FBP Equity & Dividend Plus Fund and Cantor FBP Appreciation & Income Opportunities Fund, respectively.
Under the terms of the ELAs, investment advisory fee reductions and expense reimbursements by the Adviser are subject to recoupment by the Adviser for a period of three years after such fees and expenses were incurred, provided the recoupments do not cause total annual fund operating expenses to exceed the
| THE CANTOR FBP MUTUAL FUNDS |
| NOTES TO FINANCIAL STATEMENTS (Continued) |
lesser of (i) the expense limitation then in effect, if any, or (ii) the expense limitation in effect at the time the expenses to be recouped were incurred. As of March 31, 2023, the Adviser may seek recoupment of investment advisory fee reductions and expense reimbursements no later than the dates as stated below:
| | | | | | Cantor FBP | |
| | | | | | Appreciation | |
| | | Cantor FBP Equity | | | & Income | |
| | | & Dividend | | | Opportunities | |
| | | Plus Fund | | | Fund | |
| March 31, 2024 | | $ | 52,478 | | | $ | 49,983 | |
| March 31, 2025 | | | 34,723 | | | | 31,024 | |
| March 31, 2026 | | | 50,366 | | | | 51,899 | |
| Total | | $ | 137,567 | | | $ | 132,906 | |
| | | | | | | | | |
Certain officers and a Trustee of the Trust are also officers of the Adviser.
OTHER SERVICE PROVIDERS
Ultimus Fund Solutions, LLC (“Ultimus”) provides administration, fund accounting, compliance and transfer agent services to the Funds. The Funds pay Ultimus fees in accordance with the agreements for such services. In addition, the Funds pay out-of-pocket expenses including, but not limited to, postage, supplies, and certain costs related to the pricing of the Funds’ portfolio securities. Certain officers of the Trust are also officers of Ultimus, or of Ultimus Fund Distributors, LLC (the “Distributor”), the principal underwriter of each Fund’s shares and an affiliate of Ultimus. The Distributor is compensated by the Adviser (not the Funds) for acting as principal underwriter.
SHAREHOLDER SERVICING PLAN
The Funds have adopted a Shareholder Servicing Plan (the “Plan”), which allows each Fund to make payments to financial organizations (including payments directly to the Adviser and the distributor) for providing account administration and account maintenance services to Fund shareholders. The annual service fee may not exceed an amount equal to 0.25% of each Fund’s average daily net assets. During the year ended March 31, 2023, Cantor FBP Equity & Dividend Plus Fund and Cantor FBP Appreciation & Income Opportunities Fund incurred fees of $13,914 and $2,965, respectively, under the Plan.
COMPENSATION OF TRUSTEES
Trustees and officers affiliated with the Adviser or Ultimus are not compensated by the Trust for their services. Each Trustee who is not an affiliated person of the Adviser or Ultimus receives from the Trust an annual retainer of $30,000, payable quarterly; a fee of $2,000 for attendance at each meeting of the Board of Trustees (except that such fee is $3,000 for the independent chair); and a fee of $1,000 for attendance at each meeting of any committee of the Board (except that such fee is $1,500 for the committee chair); plus reimbursement of travel and other expenses incurred in attending meetings. Each series of the Trust pays its proportionate share of such fees.
| THE CANTOR FBP MUTUAL FUNDS |
| NOTES TO FINANCIAL STATEMENTS (Continued) |
5. Derivatives Transactions
The location on the Statements of Assets and Liabilities of the Funds’ derivative positions as of March 31, 2023 is as follows:
| Cantor FBP Equity & Dividend Plus Fund | |
| | |
| | | | | | | | | | | Gross Notional | |
| | | | | | | | Amount | |
| | | | | Fair Value | | | Outstanding | |
| | | | | Asset | | | Liability | | | March 31, | |
| Type of Derivative (Risk) | | Location | | Derivatives | | | Derivatives | | | 2023 | |
| Call options written (Equity) | | Written call options, at value | | $ | — | | | $ | (142,670 | ) | | $ | (7,532,473 | ) |
| | | | | | | | | | | | | | | |
| Cantor FBP Appreciation & Income Opportunities Fund | |
| | |
| | | | | | | | | | | Gross Notional | |
| | | | | | | | Amount | |
| | | | | Fair Value | | | Outstanding | |
| | | | | Asset | | | Liability | | | March 31, | |
| Type of Derivative (Risk) | | Location | | Derivatives | | | Derivatives | | | 2023 | |
| Call options written (Equity) | | Written call options, at value | | $ | — | | | $ | (52,580 | ) | | $ | (1,494,895 | ) |
The Funds’ transactions in derivative instruments during the year ended March 31, 2023 are recorded in the following locations on the Statements of Operations:
Cantor FBP Equity & Dividend Plus Fund
| | | | | | | | | | | | Change in | |
| | | | | | Net | | | | | | Unrealized | |
| | | | | | Realized | | | | | | Appreciation | |
| Type of Derivative (Risk) | | | Location | | Gains | | | Location | | | (Depreciation) | |
| Call options written (Equity) | | | Net realized gains from written option contracts | | $ | 455,470 | | | Net change in unrealized appreciation (depreciation) on written option contracts | | | $ | 93,249 | |
| | | | | | | | | | | | | | | |
| Cantor FBP Appreciation & Income Opportunities Fund | |
| | | | | | | |
| | | | | | | | | | | | Change in | |
| | | | | | Net | | | | | | Unrealized | |
| | | | | | Realized | | | | | | Appreciation | |
| Type of Derivative (Risk) | | | Location | | Gains | | | Location | | | (Depreciation) | |
| Call options written (Equity) | | | Net realized gains from written option contracts | | $ | 108,401 | | | Net change in unrealized appreciation (depreciation) on written option contracts | | | $ | (45,756 | ) |
| THE CANTOR FBP MUTUAL FUNDS |
| NOTES TO FINANCIAL STATEMENTS (Continued) |
The average monthly notional amount of written call options during the year ended March 31, 2023 is $6,082,197 and $1,046,794 for Cantor FBP Equity & Dividend Plus Fund and Cantor FBP Appreciation & Income Opportunities Fund, respectively.
6. Contingencies and Commitments
The Funds indemnify the Trust’s officers and Trustees for certain liabilities that might arise from the performance of their duties to the Funds. Additionally, in the normal course of business the Funds enter into contracts that contain a variety of representations and warranties and which provide general indemnifications. The Funds’ maximum exposure under these arrangements is unknown, as this would involve future claims that may be made against the Funds that have not yet occurred. However, based on experience, the Trust expects the risk of loss to be remote.
7. Subsequent Events
The Funds are required to recognize in the financial statements the effects of all subsequent events that provide additional evidence about conditions that existed as of the date of the Statements of Assets and Liabilities. For non-recognized subsequent events that must be disclosed to keep the financial statements from being misleading, the Funds are required to disclose the nature of the event as well as an estimate of its financial effect, or a statement that such an estimate cannot be made. Management has evaluated subsequent events through the issuance of these financial statements and has noted no such events, except for the following:
Subject to shareholder approval, the Board has approved an Agreement and Plan of Reorganization (the “Agreement”) providing for the reorganization of each of the Cantor FBP Appreciation & Income Opportunities Fund and the Cantor FBP Equity & Dividend Plus Fund into the Cantor FBP Equity & Dividend Plus Fund (the “Combined Fund”), a new series of The Cantor Select Portfolios Trust (the “Reorganization”). The Reorganization will consolidate the assets of the Cantor FBP Equity & Dividend Plus Fund and the Cantor FBP Appreciation & Income Opportunities Fund and allow the Combined Fund to, among other things, provide for improved operating efficiencies due to the spreading costs over a larger pool of assets.
The Reorganization is expected to close on July 14, 2023, subject to approval of the Agreement by shareholders of the Cantor FBP Equity & Dividend Plus Fund and the Cantor FBP Appreciation & Income Opportunities Fund. Shareholders of record each of the Cantor FBP Equity & Dividend Plus Fund and the Cantor FBP Appreciation & Income Opportunities Fund will receive a Prospectus/Proxy Statement in connection with the solicitation of proxies for use at a Special Meeting of Shareholders to be held on or about July 7, 2023. Following the closing of the Reorganization, all of the assets and known liabilities of the Cantor FBP Equity & Dividend Plus Fund and the Cantor FBP Appreciation & Income Opportunities Fund will be acquired by the Combined Fund in exchange for shares of the Combined Fund. Those shares of the Combined Fund will then be distributed by the Cantor FBP Equity & Dividend Plus Fund and the Cantor FBP Appreciation & Income Opportunities Fund to their respective shareholders in connection with the liquidation of the Cantor FBP Equity & Dividend Plus Fund and the Cantor FBP Appreciation & Income Opportunities Fund, all upon the terms and conditions set forth in the Agreement.
| THE CANTOR FBP MUTUAL FUNDS |
| NOTES TO FINANCIAL STATEMENTS (Continued) |
Shareholders of the Cantor FBP Equity & Dividend Plus Fund and the Cantor FBP Appreciation & Income Opportunities Fund may continue to purchase and redeem their shares in accordance with the instructions in the Prospectus. The Reorganization is expected to qualify as a tax-free reorganization under the Internal Revenue Code of 1986, as amended, for federal income tax purposes.
| THE CANTOR FBP MUTUAL FUNDS |
| REPORT OF INDEPENDENT REGISTERED |
| PUBIC ACCOUNTING FIRM |
To the Shareholders of The Cantor FBP Mutual Funds and
Board of Trustees of Williamsburg Investment Trust
Opinion on the Financial Statements
We have audited the accompanying statements of assets and liabilities, including the schedules of investments and open option contracts, of The Cantor FBP Mutual Funds, comprising Cantor FBP Equity & Dividend Plus Fund and Cantor FBP Appreciation & Income Opportunities Fund (the “Funds”), each a series of Williamsburg Investment Trust, as of March 31, 2023, the related statements of operations for the year then ended, the statements of changes in net assets for each of the two years in the period then ended, the related notes, and the financial highlights for each of the five years in the period then ended (collectively referred to as the “financial statements”). In our opinion, the financial statements present fairly, in all material respects, the financial position of each of the Funds as of March 31, 2023, the results of their operations for the year then ended, the changes in net assets for each of the two years in the period then ended, and the financial highlights for each of the five years in the period then ended, in conformity with accounting principles generally accepted in the United States of America.
Basis for Opinion
These financial statements are the responsibility of the Funds’ management. Our responsibility is to express an opinion on the Funds’ financial statements based on our audits. We are a public accounting firm registered with the Public Company Accounting Oversight Board (United States) (“PCAOB”) and are required to be independent with respect to the Funds in accordance with the U.S. federal securities laws and the applicable rules and regulations of the Securities and Exchange Commission and the PCAOB.
We conducted our audits in accordance with the standards of the PCAOB. Those standards require that we plan and perform the audit to obtain reasonable assurance about whether the financial statements are free of material misstatement whether due to error or fraud.
Our audits included performing procedures to assess the risks of material misstatement of the financial statements, whether due to error or fraud, and performing procedures that respond to those risks. Such procedures included examining, on a test basis, evidence regarding the amounts and disclosures in the financial statements. Our procedures included confirmation of securities owned as of March 31, 2023, by correspondence with the custodian and brokers. Our audits also included evaluating the accounting principles used and significant estimates made by management, as well as evaluating the overall presentation of the financial statements. We believe that our audits provide a reasonable basis for our opinion.
We have served as the Funds’ auditor since 2016.
COHEN & COMPANY, LTD.
Milwaukee, Wisconsin
May 23, 2023
| THE CANTOR FBP MUTUAL FUNDS |
| BOARD OF TRUSTEES AND EXECUTIVE OFFICERS |
| (Unaudited) |
Overall responsibility for management of the Funds rests with the Board of Trustees. The Trustees serve during the lifetime of the Trust and until its termination, or until death, resignation, retirement or removal. The Trustees, in turn, elect the officers of the Funds. The officers have been elected for an annual term. The following are the Trustees and executive officers of the Funds:
| Trustees and Officers | Address | Year
of
Birth | Position Held
with the Trust | Length of
Time Served |
| Robert S. Harris, Ph.D. | 225 Pictoria Drive, Suite 450 Cincinnati, OH | 1949 | Chairman and Trustee | Since January 2007 |
| * John P. Ackerly, IV | One James Center 901 E. Cary Street Richmond, VA | 1963 | Trustee and President of The Davenport Funds | Since July 2012 |
| * John T. Bruce | 800 Main Street Lynchburg, VA | 1953 | Trustee and President of The Cantor FBP Mutual Funds | Since September 1988 |
| George K. Jennison | 225 Pictoria Drive, Suite 450 Cincinnati, OH | 1957 | Trustee | Since January 2015 |
| Harris V. Morrissette | 225 Pictoria Drive, Suite 450 Cincinnati, OH | 1959 | Trustee | Since March 1993 |
| Elizabeth W. Robertson | 225 Pictoria Drive, Suite 450 Cincinnati, OH | 1953 | Trustee | Since February 2014 |
| Norman D. Darden, III | 800 Main Street Lynchburg, VA | 1965 | Vice President of The Cantor FBP Mutual Funds | Since February 2018 |
| Eileen B. Sebold | 800 Main Street Lynchburg, VA | 1968 | Vice President of The Cantor FBP Mutual Funds | Since February 2022 |
| David J. Marshall | 800 Main Street Lynchburg, VA | 1956 | Vice President of The Cantor FBP Mutual Funds | Since February 2007 |
| Mark J. Seger | 225 Pictoria Drive, Suite 450 Cincinnati, OH | 1962 | Treasurer | Since November 2000 |
| David K. James | 225 Pictoria Drive, Suite 450 Cincinnati, OH | 1970 | Secretary | Since November 2018 |
| Michael J. Nanosky | 225 Pictoria Drive, Suite 450 Cincinnati, OH | 1966 | Chief Compliance Officer | Since March 2020 |
| * | Messrs. Ackerly and Bruce, as affiliated persons of investment advisers to the Trust, are “interested persons” of the Trust within the meaning of Section 2(a)(19) of the 1940 Act. |
| THE CANTOR FBP MUTUAL FUNDS |
| BOARD OF TRUSTEES AND EXECUTIVE OFFICERS |
| (Unaudited) (Continued) |
Each Trustee oversees ten portfolios of the Trust, including the Funds. The principal occupations of the Trustees and executive officers of the Funds during the past five years and public directorships held by the Trustees are set forth below:
Robert S. Harris, Ph.D. is the C. Stewart Sheppard Professor of Business Administration at The Darden Graduate School of Business Administration at the University of Virginia. He was previously the dean at Darden. Professor Harris has published widely on corporate finance, financial markets and mergers and acquisitions and has served as a consultant to corporations and government agencies.
John P. Ackerly, IV is Senior Vice President and Portfolio Manager of Davenport & Company LLC (a broker-dealer and investment advisory firm).
John T. Bruce is Senior Managing Director of the Adviser. He previously was President, Director and member of the Executive Committee of Flippen, Bruce & Porter, Inc. (1985 to 2021).
George K. Jennison is retired. He previously was President of Oyster Consulting, LLC (a management consulting firm) and a financial adviser with Wells Fargo Advisors, LLC.
Harris V. Morrissette is President of China Doll Rice and Beans, Inc. and Dixie Lily Foods. He is also a Director of Trustmark Corporation (bank holding company).
Elizabeth W. Robertson serves as a Trustee of TowneBank Foundation, TowneBank Corporate Board, TowneBank Audit Committee Chair and TowneBank Community Board since 2015. She previously was Chief Financial Officer of Monument Restaurants LLC.
Norman D. Darden, III is Senior Managing Director, Portfolio Manager of the Adviser. He previously was Senior Portfolio Manager, Analyst and Principal of Flippen, Bruce & Porter, Inc. (1999 to 2021).
Eileen B. Sebold is Managing Director, Head of Distribution of the Adviser (2021 to present). Previously she was Head of Intermediary Relationships at Easterly Partners Group (2020 to 2021) and Director of National Accounts at William Blair & Company (2011 to 2020). David J. Marshall is Secretary, Director and member of the Executive Committee of the Adviser.
David J. Marshall is Senior Managing Director, Portfolio Manager of the Adviser. He previously was Secretary, Director and member of the Executive Committee of Flippen, Bruce & Porter, Inc. (1994 to 2021).
Mark J. Seger is a Vice Chairman of Ultimus Fund Solutions, LLC and Ultimus Fund Distributors, LLC. He previously was Co-CEO of Ultimus Fund Solutions, LLC (1999-2019).
David K. James is an Executive Vice President and Chief Legal and Risk Officer of Ultimus Fund Solutions, LLC (2018 to present). He previously was Managing Director and Managing Counsel at State Street Bank and Trust Company (2009 to 2018).
Michael J. Nanosky is a Senior Compliance Officer of Ultimus Fund Solutions, LLC (2020 to present). He previously was Senior Vice President & Chief Compliance Officer of PNC Funds (2014 to 2019).
Additional information about members of the Board of Trustees and executive officers is available in the Statement of Additional Information (“SAI”). To obtain a free copy of the SAI, please call 1-866-738-1127.
| THE CANTOR FBP MUTUAL FUNDS |
| ABOUT YOUR FUNDS’ EXPENSES (Unaudited) |
We believe it is important for you to understand the impact of costs on your investment. All mutual funds have operating expenses. As a shareholder of a Fund, you incur ongoing costs, including management fees and other operating expenses. These ongoing costs, which are deducted from each Fund’s gross income, directly reduce the investment return of the Funds.
A mutual fund’s ongoing costs are expressed as a percentage of its average net assets. This figure is known as the expense ratio. The following examples are intended to help you understand the ongoing costs (in dollars) of investing in the Funds and to compare these costs with the ongoing costs of investing in other mutual funds. The examples below are based on an investment of $1,000 made at the beginning of the period shown and held for the entire period (October 1, 2022 through March 31, 2023).
The table below illustrates each Fund’s ongoing costs in two ways:
Actual fund return – This section helps you to estimate the actual expenses that you paid over the period. The “Ending Account Value” shown is derived from each Fund’s actual return, and the fourth column shows the dollar amount of operating expenses that would have been paid by an investor who started with $1,000 in the Funds. You may use the information here, together with the amount you invested, to estimate the expenses that you paid over the period.
To do so, simply divide your account value by $1,000 (for example, an $8,600 account value divided by $1,000 = 8.6), then multiply the result by the number given for the Funds under the heading “Expenses Paid During Period.”
Hypothetical 5% return – This section is intended to help you compare the Funds’ ongoing costs with those of other mutual funds. It assumes that each Fund had an annual return of 5% before expenses during the period shown, but that the expense ratio is unchanged. In this case, because the returns used are not the Funds’ actual returns, the results do not apply to your investment. The example is useful in making comparisons because the U.S. Securities and Exchange Commission (the “SEC”) requires all mutual funds to calculate expenses based on a 5% return. You can assess each Fund’s ongoing costs by comparing this hypothetical example with the hypothetical examples that appear in shareholder reports of other funds.
Note that expenses shown in the table are meant to highlight and help you compare ongoing costs only. The Funds do not charge sales loads or redemption fees.
The calculations assume no shares were bought or sold during the period. Your actual costs may have been higher or lower, depending on the amount of your investment and the timing of any purchases or redemptions.
More information about the Funds’ expenses, including annual expense ratios for the past five fiscal years, can be found in this report. For additional information on operating expenses and other shareholder costs, please refer to the Funds’ prospectus.
| THE CANTOR FBP MUTUAL FUNDS |
| ABOUT YOUR FUNDS’ EXPENSES (Unaudited) (Continued) |
| | | Beginning | | Ending | | | | Expenses |
| | | Account Value | | Account Value | | Net | | Paid |
| | | October 1, | | March 31, | | Expense | | During |
| | | 2022 | | 2023 | | Ratio(a) | | Period(b) |
| Cantor FBP Equity & Dividend Plus Fund | | | | | | | | |
| Based on Actual Fund Return | | $1,000.00 | | $1,083,80 | | 1.12% | | $5.82 |
| Based on Hypothetical 5%Return (before expenses) | | $1,000.00 | | $1,019.35 | | 1.12% | | $5.64 |
| Cantor FBP Appreciation & Income Opportunities Fund | | | | | | | | |
| Based on Actual Fund Return | | $1,000.00 | | $1,099.60 | | 1.05% | | $5.50 |
| Based on Hypothetical 5%Return (before expenses) | | $1,000.00 | | $1,019.70 | | 1.05% | | $5.29 |
| (a) | Annualized, based on each Fund’s most recent one-half year expenses. |
| (b) | Expenses are equal to each Fund’s annualized net expense ratio multiplied by the average account value over the period, multiplied by 182/365 (to reflect the one-half year period). |
| THE CANTOR FBP MUTUAL FUNDS |
| OTHER INFORMATION (Unaudited) |
The Trust files a complete listing of portfolio holdings for the Funds with the SEC as of the end of the first and third quarters of each fiscal year as an exhibit to its reports on Form N-PORT. The filings are available upon request, by calling 1-866-738-1127. Furthermore, you may obtain a copy of these filings on the SEC’s website at www.sec.gov and the Funds’ website www.fbpfunds.com.
A description of the policies and procedures that the Funds use to determine how to vote proxies relating to portfolio securities is available without charge upon request by calling toll-free 1-866-738-1127, or on the SEC’s website at www.sec.gov. Information regarding how the Funds voted proxies relating to portfolio securities during the most recent 12-month period ended June 30 is also available without charge upon request by calling toll-free 1-866-738-1127, or on the SEC’s website at www.sec.gov.
| FEDERAL TAX INFORMATION (Unaudited) |
For the fiscal year ended March 31, 2023, Cantor FBP Equity & Dividend Plus Fund and Cantor FBP Appreciation & Income Opportunities Fund designated $1,400,459 and $2,795,802, respectively, as long-term capital gain distributions.
Qualified Dividend Income – Cantor FBP Equity & Dividend Plus Fund and Cantor FBP Appreciation & Income Opportunities Fund each designates 100%, or up to the maximum amount of such dividends allowable pursuant to the Internal Revenue Code, as qualified dividend income eligible for the reduced tax rate.
Dividends Received Deduction – Corporate shareholders are generally entitled to take the dividends received deduction on the portion of a fund’s dividend distribution that qualifies under tax law. For Cantor FBP Equity & Dividend Plus Fund and Cantor FBP Appreciation & Income Opportunities Fund’s fiscal year 2023 ordinary income dividends, 100% qualifies for the corporate dividends received deduction.
| THE CANTOR FBP MUTUAL FUNDS |
| DISCLOSURE REGARDING APPROVAL OF INVESTMENT ADVISORY |
| AGREEMENTS (Unaudited) |
At a meeting held on November 15, 2022, the Board of Trustees, including a majority of the Independent Trustees, approved the continuance for a one-year period of the Investment Advisory Agreements with the Adviser on behalf of the Cantor-FBP Equity & Dividend Plus Fund and the Cantor-FBP Appreciation & Income Opportunities Fund (individually, a “Fund,” collectively, the “Funds”). Below is a discussion of the factors considered by the Board of Trustees along with the conclusions with respect thereto that formed the basis for the Board’s approval of the continuation of the Investment Advisory Agreements for an additional one-year period.
Prior to the Board meeting, the Adviser provided a response to a letter sent by the counsel to the Independent Trustees, on their behalf, requesting various information relevant to the Independent Trustees’ consideration of the renewal of the Investment Advisory Agreements with respect to each Fund. In approving the continuance of the Investment Advisory Agreements, the Independent Trustees considered all information they deemed reasonably necessary to evaluate the terms of the Agreements. The principal areas of review by the Independent Trustees were the nature, extent and quality of the services provided by the Adviser and the reasonableness of the fees charged for those services. During a meeting of the Governance, Nomination, Compensation and Qualified Legal Compliance Committee held prior to the Board meeting, the Independent Trustees reviewed the proposed renewal of the Investment Advisory Agreements with experienced independent legal counsel outside the presence of representatives of the Adviser and received materials from such counsel discussing the legal standards for their consideration of the proposed renewal of the Investment Advisory Agreements.
The Independent Trustees’ evaluation of the quality of the Adviser’s services took into consideration their knowledge gained through presentations and reports from the Adviser over the course of the preceding year. The Independent Trustees considered that the Adviser had provided its views on the overall conditions of the economy and the markets, including the factors that may have influenced the markets, investor preferences and market sentiment during the past year. The Independent Trustees also considered the security selection process that is applied in the management of the Funds and took into account that the Cantor-FBP Funds were not designed to track the performance of the S&P 500® Index and their tilt towards value has allowed them to appreciate as value-oriented stocks have come back into favor. Both short-term and long-term investment performance of the Funds were considered, as well as the investment process applied to the Funds which seeks to generate income and to protect against volatility. Each Fund’s performance was compared to its performance benchmark, a peer group of funds with similar investment objectives and strategies, and to the Adviser’s comparably managed private accounts. The Independent Trustees also considered: the scope and quality of the in-house capabilities of the Adviser and other resources that it dedicates to performing services for the Funds; the quality of administrative and other services, including the Adviser’s role in coordinating the activities of the Funds’ other service providers; the Adviser’s strong compliance culture and each Fund’s compliance with its investment policies and applicable laws and regulations; information provided by management and the Funds’ independent public accounting firm in periodic meetings with the Trust’s Audit Committee; the business reputation of the Adviser; the qualifications of the Adviser’s key investment and compliance personnel; and the Adviser’s financial resources.
In reviewing the fees payable under the Investment Advisory Agreements, the Independent Trustees compared the advisory fees and overall expense levels of each Fund (both before and after contractual advisory fee waivers) with those of funds with similar investment objectives and strategies as well as the private accounts
| THE CANTOR FBP MUTUAL FUNDS |
| DISCLOSURE REGARDING APPROVAL OF INVESTMENT ADVISORY |
| AGREEMENTS (Unaudited) (Continued) |
managed by the Adviser. The Independent Trustees considered information provided by the Adviser concerning the Adviser’s profitability with respect to each Fund, including the assumptions and methodology used in preparing the profitability information, in light of applicable case law relating to advisory fees. For these purposes, the Independent Trustees considered not only the fees paid by the Funds, but also so-called “fallout” benefits to the Adviser. The Independent Trustees also considered the Adviser’s representations that the Funds’ portfolio trades were executed based on the best available price and execution, and that the Adviser does not participate in any revenue sharing arrangements relating to the Funds. In evaluating the Funds’ advisory fees, the Trustees considered the complexity and quality of the investment process that is applied in the management of the Funds.
Based on the consideration of the foregoing and such other information as was deemed relevant, including the factors and conclusions below, the Independent Trustees concluded that: (i) the short-term performance of each of the Cantor-FBP Funds is good in comparison to the performance of the S&P 500® Index and Cantor-FBP’s emphasis on value has been additive as value-oriented stocks have come back into favor; (ii) although the performance of each of the Cantor-FBP Appreciation & Income Opportunities Fund and the Cantor-FBP Equity & Dividend Plus Fund as of September 30, 2022 has lagged the S&P 500® Index and the average returns for comparably managed funds over longer-term periods, each Fund has been managed in accordance with its stated investment objectives and strategies and has satisfactorily met its goal of seeking investments in undervalued securities; (iii) the advisory fee for the Cantor-FBP Funds, while higher than the average for similarly managed funds according to statistics derived from Morningstar, Inc., is reasonable in relation to the services provided by Cantor-FBP; (iv) although the total operating expense ratio of each Cantor-FBP Fund is higher than the average expense ratio for comparably managed funds, according to statistics derived from Morningstar, Inc., the Trustees were mindful that many of the mutual fund offerings in the Morningstar balanced and blended categories are target-date funds that operate in a “fund-of-funds” management structure and have significantly lower advisory fee rates; (v) Cantor-FBP’s contractual commitment to cap the overall operating expenses of each Fund through advisory fee waivers may enable each Fund to further increase returns for shareholders; and (vi) the level of Cantor-FBP’s expected profitability with respect to its management of the Cantor-FBP Funds is reasonable.
Given the current size of the FBP Funds and their expected growth, the Independent Trustees did not believe that, at the present time, it would be relevant to consider the extent to which economies of scale would be realized as the Funds grow, and whether fee levels reflect these economies of scale. However, the Independent Trustees noted the advisory fee schedules for both Funds contain breakpoints that would reduce the advisory fee rate on assets above specified levels as the respective Fund’s assets increased. The Independent Trustees also considered the “fallout” benefits to FBP with respect to the FBP Funds, but given the amounts involved viewed these as secondary factors in connection with the evaluation of the reasonableness of the advisory fees paid by the Funds.
No single factor was considered in isolation or to be determinative to the decision of the Independent Trustees to approve the continuance of the Investment Advisory Agreements. Rather the Independent Trustees concluded, after weighing and balancing of all factors considered, that it was in the best interests of each Fund and its shareholders to continue the Investment Advisory Agreements without modification to their terms, including the fees charged for services thereunder.
This page intentionally left blank.
| | | | | | | | |
| | | | | | | | |
| | | | | | | | |
| | | | | | | | |
| | | | | | | | |
| | | | | | | | |
| | | | | | | |
| | | | | | | |
| | | | | | | | |
| | | | | | | | | |
| | | | | | | | | | |
| | | | | | | | | | |
| | | | | | | | | | |
| | | | Investment Adviser Cantor Fitzgerald Investment Advisors, L.P. 800 Main Street, Second Floor P.O. Box 6138 Lynchburg, Virginia 24505 Toll-Free 1-800-851-3804 www.fbpinc.com Administrator Ultimus Fund Solutions, LLC P.O. Box 46707 Cincinnati, Ohio 45246-0707 Toll-Free 1-866-738-1127 Custodian U.S. Bank, N.A. 425 Walnut Street Cincinnati, Ohio 45202 Independent Registered Public Accounting Firm Cohen & Company, Ltd. 342 N. Water Street, Suite 830 Milwaukee, Wisconsin 53202 | Legal Counsel Sullivan & Worcester LLP 1666 K Street, N.W. Washington, DC 20006 Officers John T. Bruce, President Norman D. Darden, III, Vice President Eileen B. Sebold, Vice President David J. Marshall, Vice President Teresa L. Sanderson, Compliance Officer Trustees Robert S. Harris, Ph.D., Chairman John P. Ackerly, IV John T. Bruce George K. Jennison Harris V. Morrissette Elizabeth W. Robertson | | | |
| | | | | | | | | | |
| | | | | | | | |
| | | | | | | | |
| | | | | | | | |
| | | | | FBP-AR-23 | | |
| | | | | | | |
| | | | | | | | |
| | | | | | | | |
| | | | | | | | |
| |
| |
| |
| |
| THE |
| GOVERNMENT STREET |
| FUNDS |
| |
| |
| No-Load Mutual Funds |
| |
| Annual Report |
| March 31, 2023 |
| |
| |
| |
| |
| |
| |
| |
| |
 |
| |
| |
| |
| |
| |
| |
| |
| |
The Government Street Equity Fund
The Government Street Opportunities Fund |
| |
| |
| LETTER FROM THE PRESIDENT | April 2023 |
Dear Fellow Shareholders:
We enclose for your review the audited Annual Reports of The Government Street Funds for the fiscal year ended March 31, 2023.
The Government Street Equity Fund
The Government Street Equity Fund (the “Equity Fund”) achieved a total return of -8.68% for the fiscal year ended March 31, 2023. By comparison, the S&P 500® Index and the Morningstar Large Blend categories returned -7.73% and -7.35%, respectively.
The following table depicts the fiscal quarter total returns of our three related measures.
| | Government | | Morningstar |
| | Street Equity Fund | S&P 500® | Large Blend |
| 1 Qtr 2023 | 5.72% | 7.50% | 5.81% |
| 4 Qtr 2022 | 8.73% | 7.56% | 8.33% |
| 3 Qtr 2022 | -5.15% | -4.88% | -5.03% |
| 2 Qtr 2022 | -16.25% | -16.10% | -14.89% |
In fiscal year 2023, the confluence of rising interest rates, inflation, rising national debt, international unrest and a myriad of other negative factors gave rise to a negative investment performance in your Fund and across equity markets. Fortunately, it appears the worst of the experience occurred in the first quarter of the fiscal year and has subsequently been mitigated. While any negative experience is never welcome, it is heartening that the future seems to be moving in a positive direction. There are substantial problems still to be addressed, but as they come into focus hopefully the correct responses will prevail.
The uncertainties presented above will most likely result in a more volatile than average investment environment. As presented later in this letter, your Fund is addressing these issues with a continued elevation of cash reserves and extensive diversification of securities. We believe these two strategies give the best prospect of recovering the current losses and return to positive results. Our goal is to control investment risk and return in order to produce solid positive compounded returns which over time builds cumulative wealth.
As we move forward, the cash reserves will be used to add to existing holdings, introduce new companies and return to a more normal liquidity position.
The top 10 holdings in the Equity Fund as of March 31, 2023 were:
| Security Description | % of Net Assets |
| NVIDIA Corporation | 5.78% |
| Lockheed Martin Corporation | 4.21% |
| JPMorgan Chase & Company | 3.87% |
| Microsoft Corporation | 3.43% |
| Apple, Inc. | 3.19% |
| Bio-Techne Corporation | 3.03% |
| AbbVie, Inc. | 2.72% |
| Alphabet, Inc. – Classes A and C | 2.68% |
| Honeywell International, Inc. | 2.56% |
| Mid-America Apartment Communities, Inc. | 2.24% |
While you recognize the top 10 holdings as large well-known companies, there is diversification within the holdings. The Equity Fund represents a large capitalization collection of blended growth and value companies.
The Fund’s best performing economic sector for the fiscal year was Energy, up 2.20%. The second-best sector was Industrials, up 1.70%. The worst performing sector was Real Estate, -25.8%.
There were significant individual performances during the fiscal year. The holdings with the five highest returns, held for the entire fiscal year, as measured by the internal rate of return for the entire period were:
| | 1 Year |
| Security Description | Performance |
| Nucor Corporation | 46.46% |
| ON Semiconductor Corporation | 30.99% |
| Quanta Services, Inc. | 26.26% |
| Phillips 66 Corporation | 20.14% |
| McDonalds Corporation | 15.64% |
The holdings with the five lowest returns, held for the entire fiscal year, as measured by internal rate of return for the entire period were:
| | 1 Year |
| Security Description | Performance |
| Blackstone Group, Inc. | -27.57% |
| Mosaic Corporation | -29.68% |
| Edwards Lifesciences Corporation | -29.72% |
| Bo-Techne Corporation | -31.21% |
| Amazon.com Inc. | -36.90% |
Note: The investment performances listed for economic sectors and securities in the three preceding paragraphs are extracted from an in-house independent time-weighted rate of return computation by the Addepar portfolio accounting system. The calculations are gross investment returns. Total investment returns are for the fiscal year April 1, 2022 through March 31, 2023.
This newsletter begins with three paragraphs lifted from the letter sent one year ago for fiscal year 2022. They are current, in the sense that the same problems still exist and still represent significant investment risks. Maybe, even more so with the continuing Ukranian-Russian conflict, the impending debt ceiling question, pending Federal Reserve interest rate decisions, inflation pressures, etc.
“The following comments, along with new observations, are drawn from previous newsletters to reflect current thoughts on future investment prospects. At the heart of the ultimate outcome is the argument that continued Government borrowing, to finance increasing social and uneconomic ventures, brings us closer to the ultimate financial tipping point. We believe that irrational political-financial decisions will have to be modified significantly to confront the staggering obligations of Government, corporations and individuals. As indicated earlier in this report, it appears that the myriad of irrational decisions is being manifested in what may become, one of the most virulent inflationary experiences of decades. If so, the circumstances may call for increasing defensive and conservative investment activity.
We believe that continued upward movement of markets and economies worldwide are highly dependent on governments getting their financial balance sheets in order. There has been unparalleled deficit spending around the world. Those economies not directly participating in the credit shortfalls will be indirectly impacted by lower import/export activities brought on by a significant debt-imposed slowdown. This will occur domestically and internationally as economies have become more highly correlated in their economic cycles.
In response to this perceived scenario, risk management takes precedence over return pursuits in the near term. Your Fund remains invested to capture returns but highly diversified to mitigate the risks associated with that position. We believe that the future transition to a sound economic scenario will determine the continuation of current positive performances. We are not totally convinced of that outcome.”
There was an old cartoon series which one time had an analysis of a difficult situation summed up by the leading character, Pogo, stating, “We have met the enemy and he is us.” That perspective seems very appropriate today.
The number of negative considerations: inflation levels, rising interest rates, tax policies, civil unrest, national debt levels, unfilled job openings, international wars, nuclear threats, economic sanctions, expiring debt ceiling, illegal immigrants, to name a few, have created uncertainties for investments. Collectively, they form the basis of extensive and heated arguments over the forecasts for the economic setting of the near future. The answers (forecasts) range from business as usual, to a serious recession and everything in-between. There are more than a few “experts” opining at every stop along the continuum. It seems the perfect example for the Pogo quote.
For your Equity Fund, the response to the uncertainties has been to be very defensive until the future becomes clearer. The cash equivalent position of the Fund is approximately 9.7%. There are 74 security positions that cut across the eleven (all) Government Industrial Sector classifications for diversification. These strategies should mitigate volatility and provide investment reserves if the worst of the forecasts materialize.
The future certainly is not negative in its entirety. We continue to look for opportunities in individual stocks. There are tremendous advances being made in healthcare, artificial intelligence, distribution systems, electric vehicles and more. Hopefully, the current uncertain investment environment will settle more swiftly than expected and we can focus on the positive elements.
Thank you for your continued confidence in pursuing those opportunities on your behalf.
As of March 31, 2023, the Equity Fund’s net assets were $67.3 million; net asset value per share was $92.34; and the ratio of expenses to net average assets was 0.87%. Portfolio turnover rate was 14%. Income dividends of $0.9754 per share and capital gain distributions of $1.9981 per share were distributed to shareholders during the fiscal year.
The Government Street Opportunities Fund
The Government Street Opportunities Fund (the “Opportunities Fund”) produced a total return of -4.91% during the fiscal year ended March 31, 2023. By comparison the S&P MidCap 400® Index and the Morningstar Mid-Cap Blend category, used as relative performance benchmarks, returned -5.12% and -6.48%, respectively.
The following table depicts the fiscal quarter total returns of our three related measures.
| | Government Street | | |
| | Opportunities | | Morningstar |
| | Fund | S&P MidCap 400® | Mid Cap Blend |
| 1 Qtr 2023 | 4.19% | 3.81% | 3.41% |
| 4 Qtr 2022 | 7.93% | 10.78% | 9.67% |
| 3 Qtr 2022 | -2.78% | -2.46% | -3.81% |
| 2 Qtr 2022 | -13.03% | -15.42% | -14.27% |
The mid-capitalization category of individual companies is usually represented by the S&P MidCap 400®, whose issuers have a market capitalization ranging from approximately $0.3 billion to $12.5 billion. Generally, these companies are considered to have slightly higher risk and return characteristics than the S&P 500® companies, which includes issuers with large capitalization. The mid-cap companies in the index are primarily domestically oriented.
The top 10 holdings in The Government Street Opportunities Fund as of March 31, 2023 were:
| Security Description | % of Net Assets |
| NVIDIA Corporation | 4.59% |
| Mid-America Apartment Communities, Inc. | 3.74% |
| Steel Dynamics, Inc. | 2.61% |
| Arthur J. Gallagher & Company | 2.53% |
| Albemarle Corporation | 2.44% |
| Waste Connections, Inc. | 2.41% |
| Chemed Corporation | 2.22% |
| Nasdaq, Inc. | 2.17% |
| Enphase Energy, Inc. | 2.08% |
| Bio-Techne Corporation | 1.96% |
There were significant individual performances during the fiscal year. The holdings with the five highest returns, held for the entire period, as measured by the time weighted rate of return, were:
| | 1 Year |
| Security Description | Performance |
| Nasdaq, Inc. | 68.43% |
| Livent Corporation | 37.70% |
| Northern Oil and Gas, Inc. | 32.69% |
| Broadridge Financial Solutions, Inc. | 27.95% |
| APA Corporation | 25.89% |
The five holdings with the lowest returns, held for the entire period, as measured by time weighted rate of return, were:
| | 1 Year |
| Security Description | Performance |
| National Instruments Corporation | -28.93% |
| Teleflex, Inc. | -30.97% |
| Bio-Rad Laboratories, Inc. | -31.21% |
| Arthur J. Gallagher & Company | -31.78% |
| Graco, Inc. | -55.83% |
The Opportunity Fund’s best performing economic sector for the fiscal year was Consumer Staples, up 15.2%. The second-best sector was Information Technology, up 4.4%. The worst performing sector was Real Estate, -25.8%.
Note: The investment performances listed for economic sectors and securities in the three preceding paragraphs are extracted from an in-house independent time-weighted rate of return computation by the Addepar portfolio accounting system. The calculations are gross investment returns. Total investment returns are for the fiscal year April 1, 2022 through March 31, 2023.
We believe that mid-cap stocks offer an attractive combination of growth and safety as they have successfully overcome startup challenges yet remain nimble enough to generate stronger growth than large-cap stocks. Mid-cap stocks have been able to match the performance of large-cap stocks in down markets while exceeding large-cap performance in up markets, leading to long-term outperformance.
As of March 31, 2023, the net assets of The Opportunities Fund were $60.6 million and the net asset value per share was $36.04. The portfolio turnover rate for the year was 9% and the total number of holdings was 81 as of March 31, 2023. The net expense ratio for the Fund was 1.05%. income dividends of $0.1928 per share and capital gain distributions of $1.3388 per share were distributed to shareholders during the year.
Thank you for your continued confidence in The Government Street Funds. Please call us if we can be of further service to you.
Very truly yours,

Thomas W. Leavell
President
Leavell Investment Management, Inc.
The Government Street Funds
Data presented reflects past performance, which is no guarantee of future results. Investment results and principal value will fluctuate so that shares, when redeemed, may be worth more or less than their original cost. Due to market volatility, current performance may be higher or lower than the performance shown.
This report is submitted for the general information of the shareholders of the Funds. The report is not authorized for distribution to prospective investors in the Funds unless it is accompanied by a current prospectus.
This report reflects our views, opinions and portfolio holdings as of March 31, 2023, the end of the reporting period. These views are subject to change at any time based upon market or other conditions. For more current information throughout the year please visit www.leavellinvestments.com.
The Government Street Equity Fund and The Government Street Opportunities Fund (the “Funds”) are not sponsored, endorsed, sold or promoted by Morningstar, Inc. or any of its affiliates (all such entities, collectively, “Morningstar Entities”). The Morningstar Entities make no representation or warranty, express or implied, to the owners of the Funds or any member of the public regarding the advisability of investing in equity securities generally or in the Funds in particular or the ability of the Funds to track general equity market performance. THE MORNINGSTAR ENTITIES DO NOT GUARANTEE THE ACCURACY AND/OR THE COMPLETENESS OF THE FUNDS OR ANY DATA INCLUDED THEREIN AND MORNINGSTAR ENTITIES SHALL HAVE NO LIABILITY FOR ANY ERRORS, OMISSIONS, OR INTERRUPTIONS THEREIN.
| THE GOVERNMENT STREET EQUITY FUND |
| PERFORMANCE INFORMATION (Unaudited) |
The Government Street Equity Fund
Comparison of the Change in Value of a $10,000 Investment in
The Government Street Equity Fund and the S&P 500® Index
| | |
| | Average Annual Total Returns |
| | (for the year ended March 31, 2023) |
| | |
| | 1 Year | 5 Years | 10 Years |
| | | | |
| The Government Street Equity Fund(a) | -8.68% | 11.54% | 11.16% |
| S&P 500® Index | -7.73% | 11.19% | 12.24% |
| | | | |
| (a) | Total return is a measure of the change in value of an investment in the Fund over the periods covered, which assumes any dividends or capital gains distributions are reinvested in shares of the Fund. Returns do not reflect the deduction of taxes a shareholder would pay on Fund distributions or the redemption of Fund shares. |
| THE GOVERNMENT STREET OPPORTUNITIES FUND |
| PERFORMANCE INFORMATION (Unaudited) |
The Government Street Opportunities Fund
Comparison of the Change in Value of a $10,000 Investment in
The Government Street Opportunities Fund and the S&P MidCap 400® Index
| | |
| | Average Annual Total Returns |
| | (for the year ended March 31, 2023) |
| | |
| | 1 Year | 5 Years | 10 Years |
| | | | |
| The Government Street Opportunities Fund(a) | -4.91% | 10.46% | 11.30% |
| S&P MidCap 400® Index | -5.12% | 7.67% | 9.80% |
| | | | |
| (a) | Total return is a measure of the change in value of an investment in the Fund over the periods covered, which assumes any dividends or capital gains distributions are reinvested in shares of the Fund. Returns do not reflect the deduction of taxes a shareholder would pay on Fund distributions or the redemption of Fund shares. |
| THE GOVERNMENT STREET EQUITY FUND |
| PORTFOLIO INFORMATION |
| March 31, 2023 (Unaudited) |
Asset Allocation
(% of Net Assets)
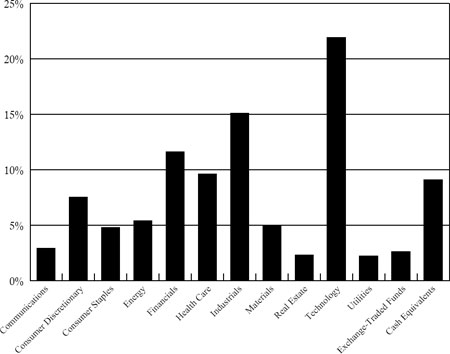
Top 10 Equity Holdings
| Security Description | % of Net Assets |
| NVIDIA Corporation | 5.8% |
| Lockheed Martin Corporation | 4.2% |
| JPMorgan Chase & Company | 3.9% |
| Microsoft Corporation | 3.4% |
| Apple, Inc. | 3.2% |
| Bio-Techne Corporation | 3.0% |
| AbbVie, Inc. | 2.7% |
| Alphabet, Inc. - Class A and C | 2.7% |
| Honeywell International, Inc. | 2.6% |
| Mid-America Apartment Communities, Inc. | 2.3% |
| THE GOVERNMENT STREET OPPORTUNITIES FUND |
| PORTFOLIO INFORMATION |
| March 31, 2023 (Unaudited) |
Asset Allocation
(% of Net Assets)
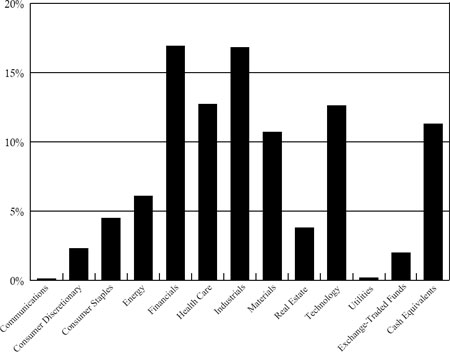
Top 10 Equity Holdings
| Security Description | % of Net Assets |
| NVIDIA Corporation | 4.6% |
| Mid-America Apartment Communities, Inc. | 3.8% |
| Steel Dynamics, Inc. | 2.6% |
| Arthur J. Gallagher & Company | 2.5% |
| Albemarle Corporation | 2.4% |
| Waste Connections, Inc. | 2.4% |
| Chemed Corporation | 2.2% |
| Nasdaq, Inc. | 2.2% |
| Enphase Energy, Inc. | 2.1% |
| Bio-Techne Corporation | 2.0% |
| THE GOVERNMENT STREET EQUITY FUND |
| SCHEDULE OF INVESTMENTS |
| March 31, 2023 |
| COMMON STOCKS — 88.3% | | Shares | | | Value | |
| Communications — 2.9% | | | | | | |
| Alphabet, Inc. - Class A (a) | | | 4,000 | | | $ | 414,920 | |
| Alphabet, Inc. - Class C (a) | | | 13,340 | | | | 1,387,360 | |
| Booking Holdings, Inc. (a) | | | 60 | | | | 159,145 | |
| | | | | | | | 1,961,425 | |
| Consumer Discretionary — 7.5% | | | | | | | | |
| Amazon.com, Inc. (a) | | | 4,000 | | | | 413,160 | |
| BorgWarner, Inc. | | | 2,500 | | | | 122,775 | |
| Home Depot, Inc. (The) | | | 4,500 | | | | 1,328,040 | |
| Lowe’s Companies, Inc. | | | 5,000 | | | | 999,850 | |
| McDonald’s Corporation | | | 5,000 | | | | 1,398,050 | |
| NIKE, Inc. - Class B | | | 6,500 | | | | 797,160 | |
| | | | | | | | 5,059,035 | |
| Consumer Staples — 4.8% | | | | | | | | |
| Archer-Daniels-Midland Company | | | 1,500 | | | | 119,490 | |
| Bunge Ltd. | | | 1,000 | | | | 95,520 | |
| Cal-Maine Foods, Inc. | | | 1,000 | | | | 60,890 | |
| Coca-Cola Company (The) | | | 3,500 | | | | 217,105 | |
| Colgate-Palmolive Company | | | 2,500 | | | | 187,875 | |
| Ingles Markets, Inc. - Class A | | | 1,500 | | | | 133,050 | |
| Kroger Company (The) | | | 10,000 | | | | 493,700 | |
| Procter & Gamble Company (The) | | | 4,000 | | | | 594,760 | |
| Walmart, Inc. | | | 9,000 | | | | 1,327,050 | |
| | | | | | | | 3,229,440 | |
| Energy — 5.4% | | | | | | | | |
| Cheniere Energy, Inc. | | | 6,000 | | | | 945,600 | |
| Chevron Corporation | | | 3,500 | | | | 571,060 | |
| Devon Energy Corporation | | | 13,500 | | | | 683,235 | |
| Marathon Petroleum Corporation | | | 2,000 | | | | 269,660 | |
| ONEOK, Inc. | | | 7,000 | | | | 444,780 | |
| Phillips 66 | | | 3,500 | | | | 354,830 | |
| Shell plc - ADR | | | 6,600 | | | | 379,764 | |
| | | | | | | | 3,648,929 | |
| Financials — 11.6% | | | | | | | | |
| Aflac, Inc. | | | 16,000 | | | | 1,032,320 | |
| Ares Management Corporation - Class A | | | 5,000 | | | | 417,200 | |
| Blackstone, Inc. | | | 14,500 | | | | 1,273,680 | |
| Brookfield Corporation | | | 28,000 | | | | 912,520 | |
| Charles Schwab Corporation (The) | | | 6,000 | | | | 314,280 | |
| CME Group, Inc. | | | 3,500 | | | | 670,320 | |
| Intercontinental Exchange, Inc. | | | 1,500 | | | | 156,435 | |
| JPMorgan Chase & Company | | | 20,000 | | | | 2,606,200 | |
| Marsh & McLennan Companies, Inc. | | | 2,500 | | | | 416,375 | |
| | | | | | | | 7,799,330 | |
| THE GOVERNMENT STREET EQUITY FUND |
| SCHEDULE OF INVESTMENTS (Continued) |
| COMMON STOCKS — 88.3% (Continued) | | Shares | | | Value | |
| Health Care — 9.6% | | | | | | | | |
| Abbott Laboratories | | | 9,500 | | | $ | 961,970 | |
| AbbVie, Inc. | | | 11,500 | | | | 1,832,755 | |
| Bio-Techne Corporation | | | 27,500 | | | | 2,040,225 | |
| Edwards Lifesciences Corporation (a) | | | 4,800 | | | | 397,104 | |
| GE HealthCare Technologies, Inc. (a) | | | 4,000 | | | | 328,120 | |
| Thermo Fisher Scientific, Inc. | | | 900 | | | | 518,733 | |
| UnitedHealth Group, Inc. | | | 800 | | | | 378,072 | |
| | | | | | | | 6,456,979 | |
| Industrials — 15.1% | | | | | | | | |
| Boeing Company (The) (a) | | | 2,500 | | | | 531,075 | |
| Caterpillar, Inc. | | | 1,250 | | | | 286,050 | |
| Deere & Company | | | 750 | | | | 309,660 | |
| Emerson Electric Company | | | 3,500 | | | | 304,990 | |
| General Dynamics Corporation | | | 5,200 | | | | 1,186,692 | |
| Honeywell International, Inc. | | | 9,000 | | | | 1,720,080 | |
| Lockheed Martin Corporation | | | 6,000 | | | | 2,836,380 | |
| Quanta Services, Inc. | | | 3,000 | | | | 499,920 | |
| Raytheon Technologies Corporation | | | 13,500 | | | | 1,322,055 | |
| TE Connectivity Ltd. | | | 9,000 | | | | 1,180,350 | |
| | | | | | | | 10,177,252 | |
| Materials — 5.0% | | | | | | | | |
| Albemarle Corporation | | | 5,000 | | | | 1,105,200 | |
| Corteva, Inc. | | | 3,300 | | | | 199,023 | |
| Freeport-McMoRan, Inc. | | | 25,000 | | | | 1,022,750 | |
| Glencore plc - ADR | | | 25,000 | | | | 286,000 | |
| Linde plc | | | 800 | | | | 284,352 | |
| Mosaic Company (The) | | | 6,000 | | | | 275,280 | |
| Nucor Corporation | | | 1,000 | | | | 154,470 | |
| | | | | | | | 3,327,075 | |
| Real Estate — 2.3% | | | | | | | | |
| Mid-America Apartment Communities, Inc. | | | 10,000 | | | | 1,510,400 | |
| | | | | | | | | |
| Technology — 21.9% | | | | | | | | |
| Accenture plc - Class A | | | 4,000 | | | | 1,143,240 | |
| Apple, Inc. | | | 13,000 | | | | 2,143,700 | |
| ASML Holding N.V. | | | 400 | | | | 272,284 | |
| Mastercard, Inc. - Class A | | | 2,000 | | | | 726,820 | |
| Microsoft Corporation | | | 8,000 | | | | 2,306,400 | |
| NVIDIA Corporation | | | 14,000 | | | | 3,888,780 | |
| ON Semiconductor Corporation (a) | | | 4,500 | | | | 370,440 | |
| QUALCOMM, Inc. | | | 6,000 | | | | 765,480 | |
| Skyworks Solutions, Inc. | | | 8,000 | | | | 943,840 | |
| Texas Instruments, Inc. | | | 5,700 | | | | 1,060,257 | |
| Visa, Inc. - Class A | | | 5,000 | | | | 1,127,300 | |
| | | | | | | | 14,748,541 | |
| THE GOVERNMENT STREET EQUITY FUND |
| SCHEDULE OF INVESTMENTS (Continued) |
| COMMON STOCKS — 88.3% (Continued) | | Shares | | | Value | |
| Utilities — 2.2% | | | | | | | | |
| Southern Company (The) | | | 3,500 | | | $ | 243,530 | |
| WEC Energy Group, Inc. | | | 13,000 | | | | 1,232,270 | |
| | | | | | | | 1,475,800 | |
| | | | | | | | | |
| Total Common Stocks (Cost $24,297,337) | | | | | | $ | 59,394,206 | |
| | | | | | | | | |
| EXCHANGE-TRADED FUNDS — 2.6% | | Shares | | | Value | |
| Invesco S&P 500 Equal Weight ETF | | | 6,500 | | | $ | 940,030 | |
| Schwab U.S. Dividend Equity ETF | | | 11,000 | | | | 804,760 | |
| Total Exchange-Traded Funds (Cost $1,763,235) | | | | | | $ | 1,744,790 | |
| | | | | | | | | |
| MONEY MARKET FUNDS — 9.6% | | Shares | | | Value | |
| Fidelity Institutional Money Market Government Portfolio - Class I, 4.73% (b) (Cost $6,489,092) | | | 6,489,092 | | | $ | 6,489,092 | |
| | | | | | | | | |
| Total Investments at Value —100.5% | | | | | | | | |
| (Cost $32,549,664) | | | | | | $ | 67,628,088 | |
| | | | | | | | | |
| Liabilities in Excess of Other Assets — (0.5%) | | | | | | | (332,777 | ) |
| | | | | | | | | |
| Net Assets — 100.0% | | | | | | $ | 67,295,311 | |
| (a) | Non-income producing security. |
| (b) | The rate shown is the 7-day effective yield as of March 31, 2023. |
See accompanying notes to financial statements.
| THE GOVERNMENT STREET OPPORTUNITIES FUND |
| SCHEDULE OF INVESTMENTS |
| March 31, 2023 |
| COMMON STOCKS — 86.7% | | Shares | | | Value | |
| Communications — 0.1% | | | | | | |
| Fox Corporation - Class A - Class A | | | 2,000 | | | $ | 68,100 | |
| | | | | | | | | |
| Consumer Discretionary — 2.3% | | | | | | | | |
| Gildan Activewear, Inc. | | | 10,000 | | | | 331,900 | |
| Hasbro, Inc. | | | 3,000 | | | | 161,070 | |
| Service Corporation International | | | 13,000 | | | | 894,140 | |
| | | | | | | | 1,387,110 | |
| Consumer Staples — 4.5% | | | | | | | | |
| Bunge Ltd. | | | 3,000 | | | | 286,560 | |
| Cal-Maine Foods, Inc. | | | 2,800 | | | | 170,492 | |
| Celsius Holdings, Inc. (a) | | | 12,000 | | | | 1,115,280 | |
| Church & Dwight Company, Inc. | | | 9,000 | | | | 795,690 | |
| Ingles Markets, Inc. - Class A | | | 1,500 | | | | 133,050 | |
| Molson Coors Beverage Company - Class B | | | 4,500 | | | | 232,560 | |
| | | | | | | | 2,733,632 | |
| Energy — 6.1% | | | | | | | | |
| APA Corporation | | | 9,000 | | | | 324,540 | |
| Denbury, Inc. (a) | | | 1,500 | | | | 131,445 | |
| Devon Energy Corporation | | | 10,000 | | | | 506,100 | |
| Enphase Energy, Inc. (a) | | | 6,000 | | | | 1,261,680 | |
| Marathon Oil Corporation | | | 21,000 | | | | 503,160 | |
| Northern Oil and Gas, Inc. | | | 6,000 | | | | 182,100 | |
| ONEOK, Inc. | | | 3,500 | | | | 222,390 | |
| Ovintiv, Inc. | | | 7,000 | | | | 252,560 | |
| Targa Resources Corporation | | | 1,750 | | | | 127,662 | |
| Vertex Energy, Inc. (a) | | | 20,000 | | | | 197,600 | |
| | | | | | | | 3,709,237 | |
| Financials — 16.9% | | | | | | | | |
| American Financial Group, Inc. | | | 8,600 | | | | 1,044,900 | |
| Ares Management Corporation - Class A | | | 6,500 | | | | 542,360 | |
| Arthur J. Gallagher & Company | | | 8,000 | | | | 1,530,480 | |
| B. Riley Financial, Inc. | | | 3,000 | | | | 85,170 | |
| Berkley (W.R.) Corporation | | | 16,762 | | | | 1,043,602 | |
| Brown & Brown, Inc. | | | 20,000 | | | | 1,148,400 | |
| CME Group, Inc. | | | 5,000 | | | | 957,600 | |
| Intercontinental Exchange, Inc. | | | 9,000 | | | | 938,610 | |
| Morgan Stanley | | | 8,565 | | | | 752,007 | |
| Nasdaq, Inc. | | | 24,000 | | | | 1,312,080 | |
| Old Republic International Corporation | | | 24,400 | | | | 609,268 | |
| Voya Financial, Inc. | | | 4,000 | | | | 285,840 | |
| | | | | | | | 10,250,317 | |
| Health Care — 12.7% | | | | | | | | |
| Bio-Rad Laboratories, Inc. - Class A (a) | | | 1,500 | | | | 718,530 | |
| THE GOVERNMENT STREET OPPORTUNITIES FUND |
| SCHEDULE OF INVESTMENTS (Continued) |
| COMMON STOCKS — 86.7% (Continued) | | Shares | | | Value | |
| Health Care — 12.7% (Continued) | | | | | | | | |
| Bio-Techne Corporation | | | 16,000 | | | $ | 1,187,040 | |
| Centene Corporation (a) | | | 4,000 | | | | 252,840 | |
| Charles River Laboratories International, Inc. (a) | | | 4,500 | | | | 908,190 | |
| Chemed Corporation | | | 2,500 | | | | 1,344,375 | |
| GE HealthCare Technologies, Inc. (a) | | | 3,300 | | | | 270,699 | |
| Laboratory Corporation of America Holdings | | | 2,574 | | | | 590,527 | |
| Penumbra, Inc. (a) | | | 2,000 | | | | 557,380 | |
| ResMed, Inc. | | | 1,200 | | | | 262,788 | |
| Teleflex, Inc. | | | 3,950 | | | | 1,000,575 | |
| Waters Corporation (a) | | | 2,000 | | | | 619,260 | |
| | | | | | | | 7,712,204 | |
| Industrials — 16.8% | | | | | | | | |
| C.H. Robinson Worldwide, Inc. | | | 4,000 | | | | 397,480 | |
| Donaldson Company, Inc. | | | 13,000 | | | | 849,420 | |
| Expeditors International of Washington, Inc. | | | 8,000 | | | | 880,960 | |
| Fastenal Company | | | 18,000 | | | | 970,920 | |
| Graco, Inc. | | | 13,000 | | | | 949,130 | |
| Jacobs Solutions, Inc. | | | 8,475 | | | | 995,897 | |
| L3Harris Technologies, Inc. | | | 5,250 | | | | 1,030,260 | |
| MasTec, Inc. (a) | | | 5,700 | | | | 538,308 | |
| MSC Industrial Direct Company, Inc. - Class A | | | 5,000 | | | | 420,000 | |
| National Instruments Corporation | | | 12,000 | | | | 628,920 | |
| nVent Electric plc | | | 3,200 | | | | 137,408 | |
| Pentair plc | | | 3,200 | | | | 176,864 | |
| Snap-on, Inc. | | | 1,475 | | | | 364,163 | |
| Waste Connections, Inc. | | | 10,500 | | | | 1,460,235 | |
| Woodward, Inc. | | | 3,900 | | | | 379,743 | |
| | | | | | | | 10,179,708 | |
| Materials — 10.7% | | | | | | | | |
| Albemarle Corporation | | | 6,700 | | | | 1,480,968 | |
| American Vanguard Corporation | | | 6,000 | | | | 131,280 | |
| Ashland, Inc. | | | 6,000 | | | | 616,260 | |
| ATI, Inc. (a) | | | 2,200 | | | | 86,812 | |
| CF Industries Holdings, Inc. | | | 2,000 | | | | 144,980 | |
| ICL Group Ltd. | | | 17,000 | | | | 115,600 | |
| Livent Corporation (a) | | | 5,000 | | | | 108,600 | |
| Martin Marietta Materials, Inc. | | | 3,000 | | | | 1,065,180 | |
| Packaging Corporation of America | | | 6,000 | | | | 832,980 | |
| Steel Dynamics, Inc. | | | 14,000 | | | | 1,582,840 | |
| Valvoline, Inc. | | | 9,236 | | | | 322,706 | |
| | | | | | | | 6,488,206 | |
| Real Estate — 3.8% | | | | | | | | |
| Mid-America Apartment Communities, Inc. | | | 15,000 | | | | 2,265,600 | |
| THE GOVERNMENT STREET OPPORTUNITIES FUND |
| SCHEDULE OF INVESTMENTS (Continued) |
| COMMON STOCKS — 86.7% (Continued) | | Shares | | | Value | |
| Technology — 12.6% | | | | | | | | |
| Advanced Micro Devices, Inc. (a) | | | 1,964 | | | $ | 192,492 | |
| Analog Devices, Inc. | | | 3,671 | | | | 723,994 | |
| ANSYS, Inc. (a) | | | 3,000 | | | | 998,400 | |
| Arrow Electronics, Inc. (a) | | | 9,100 | | | | 1,136,317 | |
| Broadridge Financial Solutions, Inc. | | | 3,500 | | | | 512,995 | |
| Lam Research Corporation | | | 1,075 | | | | 569,879 | |
| Microchip Technology, Inc. | | | 8,800 | | | | 737,264 | |
| NVIDIA Corporation | | | 10,000 | | | | 2,777,700 | |
| | | | | | | | 7,649,041 | |
| Utilities — 0.2% | | | | | | | | |
| Atmos Energy Corporation | | | 900 | | | | 101,124 | |
| | | | | | | | | |
| Total Common Stocks (Cost $17,018,584) | | | | | | $ | 52,544,279 | |
| | | | | | | | | |
| EXCHANGE-TRADED FUNDS — 2.0% | | Shares | | | Value | |
| Invesco S&P MidCap 400 Equal Weight ETF | | | 7,500 | | | $ | 652,432 | |
| Vanguard Mid-Cap Value ETF | | | 4,000 | | | | 536,280 | |
| Total Exchange-Traded Funds (Cost $1,208,507) | | | | | | $ | 1,188,712 | |
| | | | | | | | | |
| MONEY MARKET FUNDS — 11.3% | | Shares | | | Value | |
| Fidelity Institutional Money Market Government Portfolio - Class I, 4.73% (b) (Cost $6,833,930) | | | 6,833,930 | | | $ | 6,833,930 | |
| | | | | | | | | |
| Total Investments at Value — 100.0% | | | | | | | | |
| (Cost $25,061,021) | | | | | | $ | 60,566,921 | |
| | | | | | | | | |
| Other Assets in Excess of Liabilities — 0.0% (c) | | | | | | | 12,315 | |
| | | | | | | | | |
| Net Assets — 100.0% | | | | | | $ | 60,579,236 | |
| (a) | Non-income producing security. |
| (b) | The rate shown is the 7-day effective yield as of March 31, 2023. |
| (c) | Percentage rounds to less than 0.1%. |
See accompanying notes to financial statements.
| THE GOVERNMENT STREET FUNDS |
| STATEMENTS OF ASSETS AND LIABILITIES |
| March 31, 2023 |
| | | The | | | The | |
| | | Government | | | Government | |
| | | Street | | | Street | |
| | | Equity | | | Opportunities | |
| | | Fund | | | Fund | |
| ASSETS | | | | | | | | |
| Investments in securities: | | | | | | | | |
| At cost | | $ | 32,549,664 | | | $ | 25,061,021 | |
| At value (Note 2) | | $ | 67,628,088 | | | $ | 60,566,921 | |
| Cash | | | 1,666 | | | | — | |
| Dividends receivable | | | 38,506 | | | | 53,980 | |
| Receivable for securities sold | | | 214,494 | | | | — | |
| Receivable for capital shares purchased | | | — | | | | 3,576 | |
| Other assets | | | 3,731 | | | | 4,423 | |
| TOTAL ASSETS | | | 67,886,485 | | | | 60,628,900 | |
| | | | | | | | | |
| LIABILITIES | | | | | | | | |
| Distributions payable | | | 2,605 | | | | — | |
| Payable for securities sold | | | 525,182 | | | | — | |
| Payable for capital shares redeemed | | | 17,586 | | | | — | |
| Accrued investment advisory fees (Note 4) | | | 33,302 | | | | 37,744 | |
| Payable to administrator (Note 4) | | | 6,120 | | | | 5,580 | |
| Other accrued expenses | | | 6,379 | | | | 6,340 | |
| TOTAL LIABILITIES | | | 591,174 | | | | 49,664 | |
| | | | | | | | | |
| NET ASSETS | | $ | 67,295,311 | | | $ | 60,579,236 | |
| | | | | | | | | |
| Net assets consists of: | | | | | | | | |
| Paid-in capital | | $ | 30,731,051 | | | $ | 24,317,005 | |
| Distributable earnings | | | 36,564,260 | | | | 36,262,231 | |
| Net assets | | $ | 67,295,311 | | | $ | 60,579,236 | |
| | | | | | | | | |
| Shares of beneficial interest outstanding (unlimited number of shares authorized, $0.01 par value) | | | 728,750 | | | | 1,680,903 | |
| | | | | | | | | |
| Net asset value, offering price and redemption price per share (Note 2) | | $ | 92.34 | | | $ | 36.04 | |
See accompanying notes to financial statements.
| THE GOVERNMENT STREET FUNDS |
| STATEMENTS OF OPERATIONS |
| For the Year Ended March 31, 2023 |
| | | The | | | The | |
| | | Government | | | Government | |
| | | Street | | | Street | |
| | | Equity | | | Opportunities | |
| | | Fund | | | Fund | |
| INVESTMENT INCOME | | | | | | | | |
| Dividends | | $ | 1,292,399 | | | $ | 1,089,026 | |
| Foreign withholding taxes on dividends | | | (5,538 | ) | | | (5,077 | ) |
| TOTAL INVESTMENT INCOME | | | 1,286,861 | | | | 1,083,949 | |
| | | | | | | | | |
| EXPENSES | | | | | | | | |
| Investment advisory fees (Note 4) | | | 397,906 | | | | 444,127 | |
| Administration fees (Note 4) | | | 66,378 | | | | 60,563 | |
| Shareholder servicing fees (Note 4) | | | 21,536 | | | | 20,407 | |
| Trustees’ fees (Note 4) | | | 19,632 | | | | 19,632 | |
| Registration and filing fees | | | 16,210 | | | | 17,184 | |
| Audit and tax services fees | | | 15,911 | | | | 15,911 | |
| Legal fees | | | 12,014 | | | | 14,040 | |
| Compliance fees (Note 4) | | | 7,000 | | | | 7,000 | |
| Custodian and bank service fees | | | 6,970 | | | | 6,932 | |
| Shareholder reporting expenses | | | 5,765 | | | | 5,955 | |
| Postage and supplies | | | 3,818 | | | | 3,633 | |
| Other expenses | | | 6,137 | | | | 6,156 | |
| TOTAL EXPENSES | | | 579,277 | | | | 621,540 | |
| | | | | | | | | |
| NET INVESTMENT INCOME | | | 707,584 | | | | 462,409 | |
| | | | | | | | | |
| REALIZED AND UNREALIZED GAINS (LOSSES) ON INVESTMENTS | | | | | | | | |
| Net realized gains from investments | | | 2,034,589 | | | | 1,548,765 | |
| Net realized gains from in-kind redemptions (Note 2) | | | 370,072 | | | | 281,100 | |
| Net change in unrealized appreciation (depreciation) on investments | | | (9,799,062 | ) | | | (5,411,530 | ) |
| NET REALIZED AND UNREALIZED LOSSES ON INVESTMENTS | | | (7,394,401 | ) | | | (3,581,665 | ) |
| | | | | | | | | |
| NET DECREASE IN NET ASSETS RESULTING FROM OPERATIONS | | $ | (6,686,817 | ) | | $ | (3,119,256 | ) |
See accompanying notes to financial statements.
| THE GOVERNMENT STREET EQUITY FUND |
| STATEMENTS OF CHANGES IN NET ASSETS |
| | | Year | | | Year | |
| | | Ended | | | Ended | |
| | | March 31, | | | March 31, | |
| | | 2023 | | | 2022 | |
| FROM OPERATIONS | | | | | | | | |
| Net investment income | | $ | 707,584 | | | $ | 412,746 | |
| Net realized gains from investments | | | 2,034,589 | | | | 5,106,081 | |
| Net realized gains from in-kind redemptions (Note 2) | | | 370,072 | | | | 1,999,879 | |
| Net change in unrealized appreciation (depreciation) on investments | | | (9,799,062 | ) | | | 4,425,800 | |
| Net increase (decrease) in net assets resulting from operations | | | (6,686,817 | ) | | | 11,944,506 | |
| | | | | | | | | |
| DISTRIBUTIONS TO SHAREHOLDERS (Note 2) | | | (2,156,116 | ) | | | (7,830,507 | ) |
| | | | | | | | | |
| FROM CAPITAL SHARE TRANSACTIONS | | | | | | | | |
| Proceeds from shares sold | | | 318,339 | | | | 187,886 | |
| Net asset value of shares issued in reinvestment of distributions to shareholders | | | 2,123,213 | | | | 7,692,565 | |
| Payments for shares redeemed | | | (2,749,595 | ) | | | (5,496,437 | ) |
| Net increase (decrease) in net assets from capital share transactions | | | (308,043 | ) | | | 2,384,014 | |
| | | | | | | | | |
| TOTAL INCREASE (DECREASE) IN NET ASSETS | | | (9,150,976 | ) | | | 6,498,013 | |
| | | | | | | | | |
| NET ASSETS | | | | | | | | |
| Beginning of year | | | 76,446,287 | | | | 69,948,274 | |
| End of year | | $ | 67,295,311 | | | $ | 76,446,287 | |
| | | | | | | | | |
| CAPITAL SHARE ACTIVITY | | | | | | | | |
| Shares sold | | | 3,537 | | | | 1,769 | |
| Shares reinvested | | | 24,135 | | | | 73,460 | |
| Shares redeemed | | | (29,882 | ) | | | (52,009 | ) |
| Net increase (decrease) in shares outstanding | | | (2,210 | ) | | | 23,220 | |
| Shares outstanding, beginning of year | | | 730,960 | | | | 707,740 | |
| Shares outstanding, end of year | | | 728,750 | | | | 730,960 | |
See accompanying notes to financial statements.
| THE GOVERNMENT STREET OPPORTUNITIES FUND |
| STATEMENTS OF CHANGES IN NET ASSETS |
| | | Year | | | Year | |
| | | Ended | | | Ended | |
| | | March 31, | | | March 31, | |
| | | 2023 | | | 2022 | |
| FROM OPERATIONS | | | | | | | | |
| Net investment income | | $ | 462,409 | | | $ | 278,275 | |
| Net realized gains from investments | | | 1,548,765 | | | | 1,832,823 | |
| Net realized gains from in-kind redemptions (Note 2) | | | 281,100 | | | | 1,856,180 | |
| Net change in unrealized appreciation (depreciation) on investments | | | (5,411,530 | ) | | | 4,612,711 | |
| Net increase (decrease) in net assets resulting from operations | | | (3,119,256 | ) | | | 8,579,989 | |
| | | | | | | | | |
| DISTRIBUTIONS TO SHAREHOLDERS (Note 2) | | | (2,505,818 | ) | | | (2,370,958 | ) |
| | | | | | | | | |
| FROM CAPITAL SHARE TRANSACTIONS | | | | | | | | |
| Proceeds from shares sold | | | 1,730,992 | | | | 1,467,336 | |
| Net asset value of shares issued in reinvestment of distributions to shareholders .. | | | 2,458,112 | | | | 2,320,422 | |
| Payments for shares redeemed | | | (2,397,436 | ) | | | (3,872,081 | ) |
| Net increase (decrease) in net assets from capital share transactions | | | 1,791,668 | | | | (84,323 | ) |
| | | | | | | | | |
| TOTAL INCREASE (DECREASE) IN NET ASSETS | | | (3,833,406 | ) | | | 6,124,708 | |
| | | | | | | | | |
| NET ASSETS | | | | | | | | |
| Beginning of year | | | 64,412,642 | | | | 58,287,934 | |
| End of year | | $ | 60,579,236 | | | $ | 64,412,642 | |
| | | | | | | | | |
| CAPITAL SHARE ACTIVITY | | | | | | | | |
| Shares sold | | | 50,213 | | | | 36,359 | |
| Shares reinvested | | | 71,446 | | | | 59,110 | |
| Shares redeemed | | | (66,782 | ) | | | (100,578 | ) |
| Net increase (decrease) in shares outstanding | | | 54,877 | | | | (5,109 | ) |
| Shares outstanding, beginning of year | | | 1,626,026 | | | | 1,631,135 | |
| Shares outstanding, end of year | | | 1,680,903 | | | | 1,626,026 | |
See accompanying notes to financial statements.
| THE GOVERNMENT STREET EQUITY FUND |
| FINANCIAL HIGHLIGHTS |
Selected Per Share Data for a Share Outstanding Throughout Each Year:
| | | Years Ended March 31, | |
| | | 2023 | | | 2022 | | | 2021 | | | 2020 | | | 2019 | |
| Net asset value at beginning of year | | $ | 104.58 | | | $ | 98.83 | | | $ | 68.30 | | | $ | 73.37 | | | $ | 74.60 | |
| | | | | | | | | | | | | | | | | | | | | |
| Income (loss) from investment operations: | | | | | | | | | | | | | | | | | | | | |
| Net investment income (a) | | | 0.97 | | | | 0.58 | | | | 0.64 | | | | 0.80 | | | | 0.69 | |
| Net realized and unrealized gains (losses) on investments | | | (10.23 | ) | | | 16.42 | | | | 36.33 | | | | (1.82 | ) | | | 3.37 | |
| Total from investment operations | | | (9.26 | ) | | | 17.00 | | | | 36.97 | | | | (1.02 | ) | | | 4.06 | |
| | | | | | | | | | | | | | | | | | | | | |
| Less distributions from: | | | | | | | | | | | | | | | | | | | | |
| Net investment income | | | (0.98 | ) | | | (0.58 | ) | | | (0.64 | ) | | | (0.80 | ) | | | (0.68 | ) |
| Net realized gains | | | (2.00 | ) | | | (10.67 | ) | | | (5.80 | ) | | | (3.25 | ) | | | (4.61 | ) |
| Total distributions | | | (2.98 | ) | | | (11.25 | ) | | | (6.44 | ) | | | (4.05 | ) | | | (5.29 | ) |
| | | | | | | | | | | | | | | | | | | | | |
| Net asset value at end of year | | $ | 92.34 | | | $ | 104.58 | | | $ | 98.83 | | | $ | 68.30 | | | $ | 73.37 | |
| | | | | | | | | | | | | | | | | | | | | |
| Total return (b) | | | (8.68 | %) | | | 17.51 | % | | | 55.46 | % | | | (2.04 | %) | | | 5.65 | % |
| | | | | | | | | | | | | | | | | | | | | |
| Net assets at end of year (000’s) | | $ | 67,295 | | | $ | 76,446 | | | $ | 69,948 | | | $ | 49,981 | | | $ | 56,180 | |
| | | | | | | | | | | | | | | | | | | | | |
| Ratio of total expenses to average net assets (c) | | | 0.87 | % | | | 0.84 | % | | | 0.86 | % | | | 0.91 | % | | | 0.89 | % |
| | | | | | | | | | | | | | | | | | | | | |
| Ratio of net investment income to average net assets (c) | | | 1.07 | % | | | 0.55 | % | | | 0.71 | % | | | 1.01 | % | | | 0.92 | % |
| | | | | | | | | | | | | | | | | | | | | |
| Portfolio turnover rate | | | 14 | % | | | 14 | % | | | 17 | % | | | 14 | % | | | 9 | % |
| (a) | Recognition of net investment income by the Fund is affected by the timing of declarations of dividends by the underlying investment companies in which the Fund invests, if any. |
| (b) | Total return is a measure of the change in value on an investment in the Fund over the periods covered, which assumes any dividends or capital gains distributions are reinvested in shares of the Fund. The returns shown do not reflect the deductions of taxes a shareholder would pay on Fund distributions or the redemption of Fund Shares. |
| (c) | The ratios of expenses and net investment income to average net assets do not reflect the Fund’s proportionate share of expenses of the underlying investment companies in which the Fund invests, if any. |
See accompanying notes to financial statements.
| THE GOVERNMENT STREET OPPORTUNITIES FUND |
| FINANCIAL HIGHLIGHTS |
Selected Per Share Data for a Share Outstanding Throughout Each Year:
| | | Years Ended March 31, | |
| | | 2023 | | | 2022 | | | 2021 | | | 2020 | | | 2019 | |
| Net asset value at beginning of year | | $ | 39.61 | | | $ | 35.73 | | | $ | 23.56 | | | $ | 26.78 | | | $ | 26.64 | |
| | | | | | | | | | | | | | | | | | | | | |
| Income (loss) from investment operations: | | | | | | | | | | | | | | | | | | | | |
| Net investment income (a) | | | 0.27 | | | | 0.17 | | | | 0.10 | | | | 0.16 | | | | 0.18 | |
| Net realized and unrealized gains (losses) on investments | | | (2.31 | ) | | | 5.20 | | | | 13.19 | | | | (2.16 | ) | | | 0.90 | |
| Total from investment operations | | | (2.04 | ) | | | 5.37 | | | | 13.29 | | | | (2.00 | ) | | | 1.08 | |
| | | | | | | | | | | | | | | | | | | | | |
| Less distributions from: | | | | | | | | | | | | | | | | | | | | |
| Net investment income | | | (0.19 | ) | | | (0.18 | ) | | | (0.10 | ) | | | (0.16 | ) | | | (0.14 | ) |
| Net realized gains | | | (1.34 | ) | | | (1.31 | ) | | | (1.02 | ) | | | (1.06 | ) | | | (0.80 | ) |
| Total distributions | | | (1.53 | ) | | | (1.49 | ) | | | (1.12 | ) | | | (1.22 | ) | | | (0.94 | ) |
| | | | | | | | | | | | | | | | | | | | | |
| Net asset value at end of year | | $ | 36.04 | | | $ | 39.61 | | | $ | 35.73 | | | $ | 23.56 | | | $ | 26.78 | |
| | | | | | | | | | | | | | | | | | | | | |
| Total return (b) | | | (4.91 | %) | | | 15.11 | % | | | 57.00 | % | | | (8.18 | %) | | | 4.21 | % |
| | | | | | | | | | | | | | | | | | | | | |
| Net assets at end of year (000’s) | | $ | 60,579 | | | $ | 64,413 | | | $ | 58,288 | | | $ | 39,422 | | | $ | 46,293 | |
| | | | | | | | | | | | | | | | | | | | | |
| Ratio of total expenses to average net assets (c) | | | 1.05 | % | | | 1.02 | % | | | 1.07 | % | | | 1.09 | % | | | 1.08 | % |
| | | | | | | | | | | | | | | | | | | | | |
| Ratio of net investment income to average net assets (c) | | | 0.78 | % | | | 0.44 | % | | | 0.32 | % | | | 0.57 | % | | | 0.64 | % |
| | | | | | | | | | | | | | | | | | | | | |
| Portfolio turnover rate | | | 9 | % | | | 8 | % | | | 13 | % | | | 2 | % | | | 6 | % |
| (a) | Recognition of net investment income by the Fund is affected by the timing of declarations of dividends by the underlying investment companies in which the Fund invests, if any. |
| (b) | Total return is a measure of the change in value on an investment in the Fund over the periods covered, which assumes any dividends or capital gains distributions are reinvested in shares of the Fund. The returns shown do not reflect the deductions of taxes a shareholder would pay on Fund distributions or the redemption of Fund Shares. |
| (c) | The ratios of expenses and net investment income to average net assets do not reflect the Fund’s proportionate share of expenses of the underlying investment companies in which the Fund invests, if any. |
See accompanying notes to financial statements.
| THE GOVERNMENT STREET FUNDS |
| NOTES TO FINANCIAL STATEMENTS |
| March 31, 2023 |
1. Organization
The Government Street Equity Fund and The Government Street Opportunities Fund (formerly, The Government Street Mid-Cap Fund) (the “Funds”) are each a diversified, no-load series of the Williamsburg Investment Trust (the “Trust”), an open-end management investment company registered under the Investment Company Act of 1940, as amended (the “1940 Act”). The Trust was organized as a Massachusetts business trust on July 18, 1988. Other series of the Trust are not included in this report.
The investment objective of The Government Street Equity Fund is to seek capital appreciation.
The investment objective of The Government Street Opportunities Fund is to seek capital appreciation.
2. Significant Accounting Policies
Each Fund follows accounting and reporting guidance under Financial Accounting Standards Board Accounting Standards Codification Topic 946, “Financial Services – Investment Companies.” The following is a summary of the Funds’ significant accounting policies. The policies are in conformity with accounting principles generally accepted in the United States of America (“GAAP”).
Securities valuation — The Funds’ portfolio securities are valued as of the close of business of the regular session of the New York Stock Exchange (“NYSE”) (normally 4:00 p.m. Eastern time). Securities traded on a national stock exchange, including common stocks and exchange-traded funds (“ETFs”), if any, are valued based upon the closing price on the principal exchange where the security is traded, if available, otherwise, at the last quoted bid price. Securities that are quoted by NASDAQ are valued at the NASDAQ Official Closing Price. Investments representing shares of other open-end investment companies, other than ETFs but including money market funds, are valued at their net asset value (“NAV”) as reported by such companies. When using a quoted price and when the market is considered active, securities will be classified as Level 1 within the fair value hierarchy (see below).
When market quotations are not readily available, if a pricing service cannot provide a price, or if the investment adviser believes the price received from the pricing service is not indicative of fair value, securities will be valued in good faith at fair value as determined by Leavell Investment Management, Inc. (the “Adviser”), as the Fund’s valuation designee, in accordance with procedures adopted by the Board of Trustees (the “Board”) pursuant to Rule 2a-5 under the 1940 Act. Under these procedures, the securities will be classified as Level 2 or 3 within the fair value hierarchy, depending on the inputs used. Such methods of fair valuation may include, but are not limited to: multiple of earnings, multiple of book value, discount from market of a similar
| THE GOVERNMENT STREET FUNDS |
| NOTES TO FINANCIAL STATEMENTS (Continued) |
freely traded security, purchase price of the security, subsequent private transactions in the security or related securities, or a combination of these and other factors. GAAP establishes a single authoritative definition of fair value, sets out a framework for measuring fair value and requires additional disclosures about fair value measurements.
Various inputs are used in determining the value of each Fund’s investments. These inputs are summarized in the three broad levels listed below:
| ● | Level 1 – quoted prices in active markets for identical securities |
| ● | Level 2 – other significant observable inputs |
| ● | Level 3 – significant unobservable inputs |
The inputs or methodology used for valuing securities are not necessarily an indication of the risks associated with investing in those securities. The inputs used to measure fair value may fall into different levels of the fair value hierarchy. In such cases, for disclosure purposes, the level in the fair value hierarchy within which the fair value measurement falls in its entirety is determined based on the lowest level input that is significant to the fair value measurement.
The following is a summary of the Funds’ investments based on the inputs used to value the investments as of March 31, 2023, by asset type:
| The Government Street Equity Fund: | | Level 1 | | | Level 2 | | | Level 3 | | | Total | |
| Common Stocks | | $ | 59,394,206 | | | $ | — | | | $ | — | | | $ | 59,394,206 | |
| Exchange-Traded Funds | | | 1,744,790 | | | | — | | | | — | | | | 1,744,790 | |
| Money Market Funds | | | 6,489,092 | | | | — | | | | — | | | | 6,489,092 | |
| Total | | $ | 67,628,088 | | | $ | — | | | $ | — | | | $ | 67,628,088 | |
| | | | | | | | | | | | | | | | | |
| | | | | | | | | | | | | | | | | |
| The Government Street Opportunities Fund: | | Level 1 | | | Level 2 | | | Level 3 | | | Total | |
| Common Stocks | | $ | 52,544,279 | | | $ | — | | | $ | — | | | $ | 52,544,279 | |
| Exchange-Traded Funds | | | 1,188,712 | | | | — | | | | — | | | | 1,188,712 | |
| Money Market Funds | | | 6,833,930 | | | | — | | | | — | | | | 6,833,930 | |
| Total | | $ | 60,566,921 | | | $ | — | | | $ | — | | | $ | 60,566,921 | |
| | | | | | | | | | | | | | | | | |
| THE GOVERNMENT STREET FUNDS |
| NOTES TO FINANCIAL STATEMENTS (Continued) |
Refer to each Fund’s Schedule of Investments for a listing of the common stocks by sector type. There were no Level 3 securities or derivative instruments held by the Funds as of or during the year ended March 31, 2023.
Share valuation — The NAV per share of each Fund is calculated daily by dividing the total value of its assets, less liabilities, by the number of shares outstanding. The offering price and redemption price per share of each Fund is equal to the NAV per share.
Investment income — Interest income is accrued as earned. Discounts and premiums on fixed-income securities purchased, if any, are amortized using the effective interest method. Dividend income is recorded on the ex-dividend date. Non-cash dividends included in dividend income, if any, are recorded at the fair market value of the security received. Withholding taxes on foreign dividends have been recorded in accordance with the Trust’s understanding of the applicable country’s rules and tax rates.
Distributions to shareholders — Dividends arising from net investment income are declared and paid quarterly to shareholders of The Government Street Equity Fund and declared and paid annually to shareholders of The Government Street Opportunities Fund. Net realized short-term capital gains, if any, may be distributed throughout the year and net realized long-term capital gains, if any, are distributed at least once each year. Dividends and distributions are recorded on the ex-dividend date. The amount of distributions from net investment income and net realized capital gains are determined in accordance with federal income tax regulations, which may differ from GAAP. These “book/tax” differences are either temporary or permanent in nature.
The tax character of distributions paid during the years ended March 31, 2023 and 2022 was as follows:
| | | Periods | | Ordinary | | | Long-Term | | | Total | |
| | | Ended | | Income | | | Capital Gains | | | Distributions | |
| The Government Street Equity Fund | | 03/31/23 | | $ | 708,660 | | | $ | 1,446,322 | | | $ | 2,154,982 | |
| | | 03/31/22 | | $ | 414,011 | | | $ | 7,417,115 | | | $ | 7,831,126 | |
| The Government Street Opportunities Fund | | 03/31/23 | | $ | 326,581 | | | $ | 2,179,237 | | | $ | 2,505,818 | |
| | | 03/31/22 | | $ | 555,791 | | | $ | 1,815,167 | | | $ | 2,370,958 | |
Investment transactions — Investment transactions are accounted for on trade date for financial reporting purposes. Realized gains and losses on investment securities sold are determined on a specific identification basis.
Common expenses — Common expenses of the Trust are allocated among the Funds and the other series of the Trust based on relative net assets of each series or the nature of the services performed and the relative applicability to each series.
| THE GOVERNMENT STREET FUNDS |
| NOTES TO FINANCIAL STATEMENTS (Continued) |
Estimates — The preparation of financial statements in conformity with GAAP requires management to make estimates and assumptions that affect the reported amounts of assets and liabilities and the disclosure of contingent assets and liabilities as of the date of the financial statements and the reported amounts of increase (decrease) in net assets from operations during the reporting period. Actual results could differ from those estimates.
Federal income tax — Each Fund has qualified and intends to continue to qualify as a regulated investment company under the Internal Revenue Code of 1986, as amended (the “Code”). Qualification generally will relieve the Funds of liability for federal income taxes to the extent 100% of their net investment income and any net realized capital gains are distributed in accordance with the Code. In order to avoid imposition of the excise tax applicable to regulated investment companies, it is also each Fund’s intention to declare as dividends in each calendar year at least 98% of its net investment income (earned during the calendar year) and 98.2% of its net realized capital gains (earned during the twelve months ended October 31) plus undistributed amounts from prior years.
The following information is computed on a tax basis for each item as of March 31, 2023:
| | | The Government | | | The Government | |
| | | Street Equity | | | Street Opportunities | |
| | | Fund | | | Fund | |
| Cost of portfolio investments | | $ | 32,549,664 | | | $ | 25,061,021 | |
| Gross unrealized appreciation | | $ | 35,341,577 | | | $ | 35,937,252 | |
| Gross unrealized depreciation | | | (263,153 | ) | | | (431,352 | ) |
| Net unrealized appreciation | | | 35,078,424 | | | | 35,505,900 | |
| Undistributed ordinary income | | | 806 | | | | 111,450 | |
| Undistributed long-term capital gains | | | 1,487,635 | | | | 644,881 | |
| Distributions payable | | | (2,605 | ) | | | — | |
| Total distributable earnings | | $ | 36,564,260 | | | $ | 36,262,231 | |
| | | | | | | | | |
During the year ended March 31, 2023, The Government Street Equity Fund and The Government Street Opportunities Fund realized $370,072 and $281,100, respectively, of net capital gains resulting from in-kind redemptions (redemptions in which shareholders who redeemed Fund shares receive investment securities held by the Fund rather than cash). The Funds recognize a gain on in-kind redemptions to the extent that the value of the distributed investment securities on the date of redemption exceeds the cost of those investment securities. Such gains are not taxable to the Funds and are not required to be distributed to shareholders. The Funds have reclassified these gains against paid-in capital on the Statements of Assets and Liabilities. Such
| THE GOVERNMENT STREET FUNDS |
| NOTES TO FINANCIAL STATEMENTS (Continued) |
reclassifications, the result of permanent differences between the financial statement and income tax reporting requirements, had no effect on each Fund’s net assets or NAV per share.
The Funds recognize the tax benefits or expenses of uncertain tax positions only when the position is “more likely than not��� to be sustained assuming examination by tax authorities. Management has reviewed the tax positions taken on federal income tax returns for all open tax years (generally, three years) of each Fund and has concluded that no provision for unrecognized tax benefits or expenses is required in these financial statements.
The Funds recognize interest and penalties, if any, related to unrecognized tax benefits as income tax expense on the Statements of Operations. During the year ended March 31, 2023, the Funds did not incur any interest or penalties.
3. Investment Transactions
Investment transactions, other than short-term investments and U.S. government securities, were as follows for the year ended March 31, 2023:
| | | | | | The Government | |
| | | The Government | | | Street | |
| | | Street Equity | | | Opportunities | |
| | | Fund | | | Fund | |
| Purchases of investment securities | | $ | 8,164,871 | | | $ | 4,800,019 | |
| Proceeds from sales of investment securities. | | $ | 8,817,434 | | | $ | 5,019,371 | |
| | | | | | | | | |
4. Transactions with Related Parties
INVESTMENT ADVISORY AGREEMENT
Each Fund’s investments are managed by the Adviser under the terms of an Investment Advisory Agreement. The Government Street Equity Fund pays the Adviser a fee, which is computed and accrued daily and paid monthly, at annual rates of 0.60% of its average daily net assets up to $100 million and 0.50% of such assets in excess of $100 million. The Government Street Opportunities Fund pays the Adviser a fee, which is computed and accrued daily and paid monthly, at an annual rate of 0.75% of its average daily net assets.
Certain officers of the Trust are also officers of the Adviser.
OTHER SERVICE PROVIDERS
Ultimus Fund Solutions, LLC (“Ultimus”) provides administration, fund accounting, compliance and transfer agent services to the Funds. The Funds pay Ultimus fees in accordance with the agreements for such services. In addition, the Funds pay out-of-pocket expenses including, but not limited to, postage, supplies, and certain costs related to the pricing of the Funds’ portfolio securities. Certain officers of the Trust
| THE GOVERNMENT STREET FUNDS |
| NOTES TO FINANCIAL STATEMENTS (Continued) |
are also officers of Ultimus, or of Ultimus Fund Distributors, LLC (the “Distributor”), the principal underwriter of each Fund’s shares and an affiliate of Ultimus. The Distributor is compensated by the Adviser (not the Funds) for acting as principal underwriter.
SHAREHOLDER SERVICING PLAN
The Funds have adopted a Shareholder Servicing Plan (the “Plan”), which allows each Fund to make payments to financial organizations (including payments directly to the Adviser and the distributor) for providing account administration and account maintenance services to Fund shareholders. The annual service fee may not exceed an amount equal to 0.25% of each Fund’s average daily net assets. During the year ended March 31, 2023, The Government Street Equity Fund and The Government Street Opportunities Fund incurred fees of $21,536 and $20,407, respectively, under the Plan.
COMPENSATION OF TRUSTEES
Trustees and officers affiliated with the Adviser or Ultimus are not compensated by the Trust for their services. Each Trustee who is not an affiliated person of the Adviser or Ultimus receives from the Trust an annual retainer of $30,000, payable quarterly; a fee of $2,000 for attendance at each meeting of the Board of Trustees (except that such fee is $3,000 for the independent chair); and a fee of $1,000 for attendance at each meeting of any committee of the Board (except that such fee is $1,500 for the committee chair); plus reimbursement of travel and other expenses incurred in attending meetings. Each series of the Trust pays its proportionate share of such fees.
5. Contingencies and Commitments
The Funds indemnify the Trust’s officers and Trustees for certain liabilities that might arise from their performance of their duties to the Funds. Additionally, in the normal course of business the Funds enter into contracts that contain a variety of representations and warranties and which provide general indemnifications. The Funds’ maximum exposure under these arrangements is unknown, as this would involve future claims that may be made against the Funds that have not yet occurred. However, based on experience, the Trust expects the risk of loss to be remote.
6. Sector Risk
If a Fund has significant investments in the securities of issuers in industries within a particular business sector, any development affecting that sector will have a greater impact on the value of the net assets of the Fund than would be the case if the Fund did not have significant investments in that sector. In addition, this may increase the risk of loss of an investment in the Fund and increase the volatility of the Fund’s NAV per share. From time to time, circumstances may affect a particular sector and companies within such sector. For instance, economic or market factors, regulation or deregulation, or other developments may negatively impact all companies in a
| THE GOVERNMENT STREET FUNDS |
| NOTES TO FINANCIAL STATEMENTS (Continued) |
particular sector and therefore the value of the Fund’s portfolio would be adversely affected. As of March 31, 2023, neither Fund had 25% or more of their net assets invested in securities within any particular sector.
7. Subsequent Events
The Funds are required to recognize in the financial statements the effects of all subsequent events that provide additional evidence about conditions that existed as of the date of the Statements of Assets and Liabilities. For non-recognized subsequent events that must be disclosed to keep the financial statements from being misleading, the Funds are required to disclose the nature of the event as well as an estimate of its financial effect, or a statement that such an estimate cannot be made. Management has evaluated subsequent events through the issuance of these financial statements and has noted no such events.
| THE GOVERNMENT STREET FUNDS |
| REPORT OF INDEPENDENT REGISTERED |
| PUBLIC ACCOUNTING FIRM |
To the Shareholders of The Government Street Funds and
Board of Trustees of Williamsburg Investment Trust
Opinion on the Financial Statements
We have audited the accompanying statements of assets and liabilities, including the schedules of investments, of The Government Street Funds, comprising The Government Street Equity Fund and The Government Street Opportunities Fund (formerly The Government Street Mid-Cap Fund) (the “Funds”), each a series of Williamsburg Investment Trust, as of March 31, 2023, the related statements of operations for the year then ended, the statements of changes in net assets for each of the two years in the period then ended, the related notes, and the financial highlights for each of the five years in the period then ended (collectively referred to as the “financial statements”). In our opinion, the financial statements present fairly, in all material respects, the financial position of each of the Funds as of March 31, 2023, the results of their operations for the year then ended, the changes in net assets for each of the two years in the period then ended, and the financial highlights for each of the five years in the period then ended, in conformity with accounting principles generally accepted in the United States of America.
Basis for Opinion
These financial statements are the responsibility of the Funds’ management. Our responsibility is to express an opinion on the Funds’ financial statements based on our audits. We are a public accounting firm registered with the Public Company Accounting Oversight Board (United States) (“PCAOB”) and are required to be independent with respect to the Funds in accordance with the U.S. federal securities laws and the applicable rules and regulations of the Securities and Exchange Commission and the PCAOB.
We conducted our audits in accordance with the standards of the PCAOB. Those standards require that we plan and perform the audit to obtain reasonable assurance about whether the financial statements are free of material misstatement whether due to error or fraud.
Our audits included performing procedures to assess the risks of material misstatement of the financial statements, whether due to error or fraud, and performing procedures that respond to those risks. Such procedures included examining, on a test basis, evidence regarding the amounts and disclosures in the financial statements. Our procedures included confirmation of securities owned as of March 31, 2023, by correspondence with the custodian and brokers; when replies were not received from brokers, we performed other auditing procedures. Our audits also included evaluating
| THE GOVERNMENT STREET FUNDS |
| REPORT OF INDEPENDENT REGISTERED |
| PUBLIC ACCOUNTING FIRM (Continued) |
the accounting principles used and significant estimates made by management, as well as evaluating the overall presentation of the financial statements. We believe that our audits provide a reasonable basis for our opinion.
We have served as the Funds’ auditor since 2016.
COHEN & COMPANY, LTD.
Milwaukee, Wisconsin
May 23, 2023
| THE GOVERNMENT STREET FUNDS |
| ABOUT YOUR FUNDS’ EXPENSES (Unaudited) |
We believe it is important for you to understand the impact of costs on your investment. All mutual funds have operating expenses. As a shareholder of the Funds, you incur ongoing costs, including management fees and other expenses. These ongoing costs, which are deducted from each Fund’s gross income, directly reduce the investment returns of the Funds.
A mutual fund’s ongoing costs are expressed as a percentage of its average net assets. This figure is known as the expense ratio. The following examples are intended to help you understand the ongoing costs (in dollars) of investing in the Funds and to compare these costs with the ongoing costs of investing in other mutual funds. The examples below are based on an investment of $1,000 made at the beginning of the period shown and held for the entire period (October 1, 2022 through March 31, 2023).
The table below illustrates each Fund’s ongoing costs in two ways:
Actual fund return – This section helps you to estimate the actual expenses that you paid over the period. The “Ending Account Value” shown is derived from each Fund’s actual return, and the fourth column shows the dollar amount of operating expenses that would have been paid by an investor who started with $1,000 in the Funds. You may use the information here, together with the amount you invested, to estimate the expenses that you paid over the period.
To do so, simply divide your account value by $1,000 (for example, an $8,600 account value divided by $1,000 = 8.6), then multiply the result by the number given for the Funds under the heading “Expenses Paid During Period.”
Hypothetical 5% return – This section is intended to help you compare the Funds’ ongoing costs with those of other mutual funds. It assumes that each Fund had an annual return of 5% before expenses during the period shown, but that the expense ratio is unchanged. In this case, because the returns used are not the Funds’ actual returns, the results do not apply to your investment. The example is useful in making comparisons because the U.S. Securities and Exchange Commission (the “SEC”) requires all mutual funds to calculate expenses based on a 5% return. You can assess each Fund’s ongoing costs by comparing this hypothetical example with the hypothetical examples that appear in shareholder reports of other funds.
Note that expenses shown in the table are meant to highlight and help you compare ongoing costs only. The Funds do not charge sales loads or redemption fees.
The calculations assume no shares were bought or sold during the period. Your actual costs may have been higher or lower, depending on the amount of your investment and the timing of any purchases or redemptions.
| THE GOVERNMENT STREET FUNDS |
| ABOUT YOUR FUNDS’ EXPENSES (Unaudited) (Continued) |
More information about the Funds’ expenses, including historical expense ratios, can be found in this report. For additional information on operating expenses and other shareholder costs, please refer to the Funds’ prospectus.
| | | Beginning | | Ending | | | | Expenses |
| | | Account Value | | Account Value | | Expense | | Paid During |
| | | October 1, 2022 | | March 31, 2023 | | Ratio(a) | | Period(b) |
| The Government Street Equity Fund | | | | | | | | |
| Based on Actual Fund Return | | $1,000.00 | | $1,149.50 | | 0.87% | | $4.66 |
| Based on Hypothetical 5% Return (before expenses) | | $1,000.00 | | $1,020.59 | | 0.87% | | $4.38 |
| The Government Street Opportunities Fund | | | | | | | | |
| Based on Actual Fund Return | | $1,000.00 | | $1,124.60 | | 1.04% | | $5.51 |
| Based on Hypothetical 5% Return (before expenses) | | $1,000.00 | | $1,019.75 | | 1.04% | | $5.24 |
| (a) | Annualized, based on each Fund’s most recent one-half year expenses. |
| (b) | Expenses are equal to each Fund’s annualized expense ratio multiplied by the average account value over the period, multiplied by 182/365 (to reflect the one-half year period). |
| THE GOVERNMENT STREET FUNDS |
| BOARD OF TRUSTEES AND EXECUTIVE OFFICERS (Unaudited) |
Overall responsibility for management of the Funds rests with the Board of Trustees. The Trustees serve during the lifetime of the Trust and until its termination, or until death, resignation, retirement or removal. The Trustees, in turn, elect the officers of the Funds. The officers have been elected for an annual term. The following are the Trustees and executive officers of the Funds:
| Trustees and Officers | Address | Year of
Birth | Position Held
with the Trust | Length of
Time Served |
| Robert S. Harris, Ph.D. | 225 Pictoria Drive, Suite 450 Cincinnati, OH | 1949 | Chairman and Trustee | Since January 2007 |
| * John P. Ackerly, IV | One James Center 901 E. Cary Street Richmond, VA | 1963 | Trustee and President of The Davenport Funds | Since July 2012 |
| * John T. Bruce | 800 Main Street Lynchburg, VA | 1953 | Trustee and President of The Cantor FBP Mutual Funds | Since September 1988 |
| George K. Jennison | 225 Pictoria Drive, Suite 450 Cincinnati, OH | 1957 | Trustee | Since January 2015 |
| Harris V. Morrissette | 225 Pictoria Drive, Suite 450 Cincinnati, OH | 1959 | Trustee | Since March 1993 |
| Elizabeth W. Robertson | 225 Pictoria Drive, Suite 450 Cincinnati, OH | 1953 | Trustee | Since February 2014 |
| Thomas W. Leavell | 210 St. Joseph Street Mobile, AL | 1943 | President of The Government Street Funds | Since February 2004 |
| Mary Shannon Hope | 210 St. Joseph Street Mobile, AL | 1963 | Vice President of The Government Street Funds | Since August 2008 |
| Timothy S. Healey | 2712 18th Place South Birmingham, AL | 1953 | Vice President of The Government Street Funds | Since January 1995 |
| Mark J. Seger | 225 Pictoria Drive, Suite 450 Cincinnati, OH | 1962 | Treasurer | Since November 2000 |
| David K. James | 225 Pictoria Drive, Suite 450 Cincinnati, OH | 1970 | Secretary | Since November 2018 |
| Michael J. Nanosky | 225 Pictoria Drive, Suite 450 Cincinnati, OH | 1966 | Chief Compliance Officer | Since March 2020 |
| * | Messrs. Ackerly and Bruce, as affiliated persons of investment advisers to the Trust, are “interested persons” of the Trust within the meaning of Section 2(a)(19) of the 1940 Act. |
| THE GOVERNMENT STREET FUNDS |
| BOARD OF TRUSTEES AND EXECUTIVE OFFICERS |
| (Unaudited) (Continued) |
Each Trustee oversees ten portfolios of the Trust, including the Funds. The principal occupations of the Trustees and executive officers of the Funds during the past five years and public directorships held by the Trustees are set forth below:
Robert S. Harris, Ph.D. is the C. Stewart Sheppard Professor of Business Administration at The Darden Graduate School of Business Administration at the University of Virginia. He was previously the dean at Darden. Professor Harris has published widely on corporate finance, financial markets and mergers and acquisitions and has served as a consultant to corporations and government agencies.
John P. Ackerly, IV, is Senior Vice President and Portfolio Manager of Davenport & Company, LLC (a broker-dealer and investment advisory firm).
John T. Bruce is Senior Managing Director of Cantor Fitzgerald Investment Advisors, L.P. He previously was President, Director and Member of the Executive Committee of Flippen, Bruce & Porter, Inc. (1985 to 2021).
George K. Jennison is retired. He previously was President of Oyster Consulting, LLC (a management consulting firm) and a financial adviser with Wells Fargo Advisors, LLC.
Harris V. Morrissette is President of China Doll Rice and Beans, Inc. and Dixie Lily Foods. He is also a Director of Trustmark Corporation (bank holding company).
Elizabeth W. Robertson serves as a Trustee of TowneBank Foundation, TowneBank Corporate Board, TowneBank Audit Committee Chair and TowneBank Community Board since 2015. She previously was Chief Financial Officer of Monument Restaurants LLC.
Thomas W. Leavell is Portfolio Manager of the Adviser.
Mary Shannon Hope is Operations Director and Portfolio Manager of the Adviser.
Timothy S. Healey is Chief Investment Officer and Portfolio Manager of the Adviser.
Mark J. Seger is a Vice Chairman of Ultimus Fund Solutions, LLC and Ultimus Fund Distributors, LLC. He previously was Co-CEO of Ultimus Fund Solutions, LLC (1999 to 2019).
David K. James is an Executive Vice President and Chief Legal and Risk Officer of Ultimus Fund Solutions, LLC (2018 to present). He previously was Managing Director and Managing Counsel at State Street Bank and Trust Company (2009 to 2018).
Michael J. Nanosky is a Senior Compliance Officer of Ultimus Fund Solutions, LLC (2020 to present). He previously was Senior Vice President & Chief Compliance Officer of PNC Funds (2014 to 2019).
Additional information about members of the Board of Trustees and executive officers is available in the Statement of Additional Information (“SAI”). To obtain a free copy of the SAI, please call 1-866-738-1125.
| THE GOVERNMENT STREET FUNDS |
| DISCLOSURE REGARDING APPROVAL OF |
| INVESTMENT ADVISORY AGREEMENTS (Unaudited) |
At a meeting held on November 15, 2022, the Board of Trustees, including a majority of the Independent Trustees, approved the continuance for a one-year period of the Investment Advisory Agreements with the Adviser on behalf of The Government Street Equity Fund and The Government Street Opportunities Fund (individually, a “Fund,” collectively, the “Funds”). Below is a discussion of the factors considered by the Board of Trustees along with the conclusions with respect thereto that formed the basis for the Board’s approval of the continuation of the Investment Advisory Agreements for an additional one-year period.
Prior to the Board meeting, the Adviser provided a response to a letter sent by the counsel to the Independent Trustees, on their behalf, requesting various information relevant to the Independent Trustees’ consideration of the renewal of the Investment Advisory Agreements with respect to each Fund. In approving the continuance of the Investment Advisory Agreements, the Independent Trustees considered all information they deemed reasonably necessary to evaluate the terms of the Agreements. The principal areas of review by the Independent Trustees were the nature, extent and quality of the services provided by the Adviser and the reasonableness of the fees charged for those services. During a meeting of the Governance, Nomination, Compensation and Qualified Legal Compliance Committee held prior to the Board meeting, the Independent Trustees reviewed the proposed renewal of the Investment Advisory Agreements with experienced independent legal counsel outside the presence of representatives of the Adviser and received materials from such counsel discussing the legal standards for their consideration of the proposed renewal of the Investment Advisory Agreements.
The Independent Trustees’ evaluation of the quality of the Adviser’s services took into consideration their knowledge gained through presentations and reports from the Adviser over the course of the preceding year. The Independent Trustees considered that the Adviser had provided its views on the overall conditions of the economy and the markets, including the factors that may have influenced the markets, investor preferences and market sentiment during the past year. The Independent Trustees also considered the security selection process that is applied in the management of the Funds. Both short-term and long-term investment performance of the Funds were considered. Each Fund’s performance was compared to its performance benchmark and a peer group of funds with similar investment objectives and strategies. The Independent Trustees also considered: the scope and quality of the in-house capabilities of the Adviser and other resources that are dedicated to performing services for the Funds; the quality of administrative and other services, including the Adviser’s role in coordinating the activities of the Funds’ other service providers; the Adviser’s compliance with investment policies of the Funds and applicable laws and regulations; information provided by management and the Funds’ independent public
| THE GOVERNMENT STREET FUNDS |
| DISCLOSURE REGARDING APPROVAL OF |
| INVESTMENT ADVISORY AGREEMENTS (Unaudited) (Continued) |
accounting firm in periodic meetings with the Trust’s Audit Committee; the business reputation of the Adviser; the qualifications of the Adviser’s key investment and compliance personnel; and the Adviser’s financial resources.
In reviewing the fees payable under the Investment Advisory Agreements, the Independent Trustees compared the advisory fees and overall expense levels of each Fund with those of funds with similar investment objectives and strategies. The Independent Trustees considered information provided by the Adviser concerning the Adviser’s profitability with respect to each Fund, including the assumptions and methodology used in preparing the profitability information, in light of applicable case law relating to advisory fees. For these purposes, the Independent Trustees considered not only the fees paid by the Funds, but also so-called “fallout” benefits to the Adviser. The Independent Trustees also considered the Adviser’s representations that the Funds’ portfolio trades were executed based on the best available price and execution, and that the Adviser does not participate in any soft dollar or directed brokerage arrangements. The Independent Trustees further considered that the Adviser does not participate in any revenue sharing arrangements relating to the Funds. In evaluating the Funds’ advisory fees, the Trustees considered the complexity and quality of the investment process that is applied in the management of the Funds.
The Independent Trustees considered each Fund’s investment strategy in comparison to the performance to its respective benchmark and peer group, and the services provided by LIM to the respective Fund. Based on the consideration of the foregoing and such other information as was deemed relevant, including the factors and conclusions below, the Independent Trustees concluded that: (i) the performance of each of The Government Street Equity Fund and The Government Street Opportunities Fund outperformed the returns of its respective index and the average return for comparably managed funds during the 1-year, 3-year, and 5-year periods ended September 30, 2022 and the performance of the Government Street Opportunities Fund also exceeded the returns of its respective index during the 10-year period ended September 30, 2022; (ii) the advisory fees for The Government Street Equity Fund and The Government Street Opportunities Fund are reasonable in relation to the quality of services provided by LIM; (iii) the total operating expense ratios of The Government Street Equity Fund and The Government Street Opportunities Fund are reasonable in relation to the average expense ratio for comparably managed funds, according to statistics derived from Morningstar, Inc., and (iv) the level of LIM’s profitability with respect to its management of the Funds is reasonable.
Given the current size of the Funds and their expected growth, the Independent Trustees did not believe that it was relevant to consider the extent to which economies of scale would be realized as the Funds grow, and whether fee levels reflect these economies of scale. The Independent Trustees did consider the “fallout” benefits
| THE GOVERNMENT STREET FUNDS |
| DISCLOSURE REGARDING APPROVAL OF |
| INVESTMENT ADVISORY AGREEMENTS (Unaudited) (Continued) |
to the Adviser with respect to the Funds but viewed this as a secondary factor in connection with the evaluation of the reasonableness of the advisory fees paid by the Funds.
No single factor was considered in isolation or to be determinative to the decision of the Independent Trustees to approve the continuance of the Investment Advisory Agreements. Rather the Independent Trustees concluded, after weighing and balancing of all factors considered, that it was in the best interests of each Fund and its respective shareholders to continue its Investment Advisory Agreement without modification to their terms, including the fees charged for services thereunder, for an additional one-year period.
| THE GOVERNMENT STREET FUNDS |
| OTHER INFORMATION (Unaudited) |
A description of the policies and procedures that the Funds use to vote proxies relating to portfolio securities is available without charge upon request by calling toll-free 1-866-738-1125, or on the SEC’s website at www.sec.gov. Information regarding how the Funds voted proxies relating to portfolio securities during the most recent 12-month period ended June 30 is also available without charge upon request by calling toll-free 1-866-738-1125 or on the SEC’s website at www.sec.gov.
The Trust files a complete listing of portfolio holdings for the Funds with the SEC as of the end of the first and third quarters of each fiscal year as an exhibit to its reports on Form N-PORT. The filings are available upon request, by calling 1-866-738-1125. Furthermore, you may obtain a copy of these filings on the SEC’s website at www.sec.gov and the Funds’ website https://funddocs.filepoint.com/govstreet/.
| FEDERAL TAX INFORMATION (Unaudited) |
For the fiscal year ended March 31, 2023, the Government Street Equity Fund and the Government Street Opportunities Fund designated $1,446,322 and $2,179,237 respectively, as long-term capital gain distributions.
Qualified Dividend Income — The Funds each designate 100%, or up to the maximum amount of such dividends allowable pursuant to the Internal Revenue Code, as qualified dividend income eligible for the reduced tax rate.
Dividends Received Deduction — Corporate shareholders are generally entitled to take the dividends received deduction on the portion of a Fund’s dividend distributions that qualify under tax law. For the fiscal year ended March 31, 2023, 100% of the Government Street Equity Fund and The Government Street Opportunities Fund’s ordinary income dividends qualifies for the corporate dividends received deduction.
This page intentionally left blank.
This page intentionally left blank.
| | | | | | | |
| | | | | | | |
| | | | | | | |
| | | | | | | |
| | | | | | | |
| | | | The Government Street Funds | | | |
| | | | | | | |
| | | | | | | |
| | | | No-Load Mutual Funds | | | |
| | | | | | | |
| | | | | | | |
| | | | Investment Adviser Leavell Investment Management, Inc. 210 St. Joseph Street Mobile, AL 36602 Administrator Ultimus Fund Solutions, LLC P.O. Box 46707 Cincinnati, OH 45246-0707 1-866-738-1125 Legal Counsel Sullivan & Worcester LLP 1666 K Street, N.W. Washington, DC 20006 Independent Registered Public Accounting Firm Cohen & Company, Ltd. 342 N Water Street, Suite 830 Milwaukee, WI 53202 Board of Trustees Robert S. Harris, Ph.D., Chairman John P. Ackerly, IV John T. Bruce George K. Jennison Harris V. Morrissette Elizabeth W. Robertson Portfolio Manager Thomas W. Leavell, The Government Street Equity Fund The Government Street Opportunities Fund | | | |
| | | | | | | |
| | | | | | | |
| | | | | | | |
| | | | | | | |
| | | | Government Street-AR-23 | | |
| | | | | | | |
| | | | | | | |
| | | | | | | |
| | | | | | | |
| | | | | |
| | | | |
| | | | | |
| | | | | |
| | | | | |
| | | | | |
| | | THE | | |
| | | JAMESTOWN | | |
| | | EQUITY FUND | | |
| | | | | |
| | | | | |
| | | | | |
| | | | | |
| | | No-Load Fund | | |
| | | | | |
| | | | | |
| | | | | |
| | | | | |
| | | | | |
| | | ANNUAL REPORT | | |
| | | | | |
| | | | | |
| | | | | |
| | | | | |
| | | | | |
| | | | | |
| | | March 31, 2023 | | |
| | | | | |
| | | | | |
| | | | | |
| | | | | |
| | | | | |
| | |  | | |
| | | | | |
| | | | | |
| | | Investment Adviser | | |
| | | Lowe, Brockenbrough & Company, Inc. | | |
| | | Richmond, Virginia | | |
| | | | | |
| | | | | |
| | | | | |
| | | | | |
| LETTER TO SHAREHOLDERS | March 31, 2023 |
For the fiscal year ended March 31, 2023, The Jamestown Equity Fund (the “Fund”) returned -5.89% compared to -7.73% for the S&P 500® Index. The fiscal year was a tale of two halves as equity and bond markets sold off in the first half of the fiscal year. Equity markets rebounded nicely in the second half of the fiscal year, while yields on longer term bonds were fairly flat and shorter term yields continued to rise as the Federal Reserve continued to hike the Federal Funds Rate.
Growth-oriented equities recovered some relative performance late in the fiscal year, but underperformed for the 12 months after a period of significant outperformance for the previous several years. The S&P 500® Growth Index return of -15.30% lagged the S&P 500 ® Value Index return of -0.16% during the fiscal year. Capitalization performance was mixed for the fiscal year as the S&P 500’s -7.73% return outperformed the S&P 600® SmallCap return of -8.82% but trailed the S&P MidCap’s return of -5.12%. Developed international markets outperformed the S&P 500 as the MSCI All Country World ex USA Index fell -5.07%, while the MSCI Emerging Market Index lagged with a return of -10.70% for the twelve months.
The Fund outperformed during the fiscal year as both sector allocation and stock selection added value on a relative basis. The Fund benefitted from having cash during a down year for the equity market. Being slightly overweight the Consumer Staples and Energy sector and underweight the Real Estate sector were also helpful to relative performance during the fiscal year. Positive stock selection in the Consumer Discretionary, Finance, Information Technology and Industrial sectors more than offset negative stock selection in the Healthcare and Materials sectors. The worst five performing stocks during the fiscal year were Amazon, Alphabet, Truist, Meta Platforms, and PNC Financial Services. All of those remain in the portfolio with the exception of Truist. The five top performing stocks during the fiscal year were TJX, Merck, Oracle, Trane Technologies, and Eaton Corporation, all of which remain in the portfolio.
The economy has remained fairly resilient in the face of significant increases in the Federal Funds Rate, as consumers still have excess savings from payments made by the government during COVID and the unemployment rate remains low. Spending patterns have shifted as spending on durable goods has downshifted after outsized spending during COVID, while spending on travel and other services has recovered from depressed levels during the pandemic.
Equity markets were challenged during the fiscal year as rates were increased by the Federal Reserve (the “Fed”) putting pressure on valuation levels for equities, especially longer duration growth-oriented stocks. We believe that going forward the more important question will be how the economy performs, as this will drive corporate earnings and cash flow. A number of historically successful indicators suggest that we are not out of the woods on the economic front. An inverted yield curve and declining Leading Economic Indicators are still pointing toward economic risk. The strong employment picture may be the final determinant of whether or not the economy slips into recession. To date unemployment rates are near historical lows and it is hard to have a recession of any magnitude if most folks are working.
10-year Treasury yields peaked just above 4% in early March but nosedived under 3.5% when the Fed’s extreme rate hiking finally broke something important: Silicon Valley Bank (SVB). SVB was an integral cog in the tech incubation ecosystem and found itself running short of cash as the difficult funding markets last year forced start-ups to tap cash reserves and lines of credit. It did
| LETTER TO SHAREHOLDERS | March 31, 2023 |
have a large portfolio of government bonds to sell, but there were big imbedded losses because of the Fed’s historic rate hiking (when rates go up, bond values go down) and SVB’s failure to hedge the interest rate risk. Word got out that SVB was in trouble, and an epic run on the bank forced its closure three working days later—the second largest bank failure in our history…in three days. The less well-known Signature Bank in New York also failed that same weekend, the third largest bank failure in U.S. history. Rarely do you see the flames before you smell smoke, but panic happens fast these days. Markets wasted no time in their pitiless hunt for the next victim (most banks hold government securities with at least some imbedded losses), and the Fed was forced to guarantee ALL deposits at both banks and authorize an emergency lending vehicle so banks could avoid taking losses on their bond holdings. This eventually quieted things, but the fact remains that money market rates are attractive for the first time in quite a while and are pulling time deposits out of banks. Banking stress will continue; the odds of a recession have risen.
Stocks have essentially been in a trading range for the past year; they’re waiting to see which way the economy and earnings break. Fair to say we are doing the same – at the end of March 2023, the Fund was 91.87% invested in a diversified portfolio of equities, while the Fund had 8.13% in cash. The Fund was slightly overweight the Communications, Consumer Staples, Energy and Technology sectors and underweight Consumer Discretionary, Financials, Health Care, Materials, Utility and Real Estate sectors at the end of the quarter.
The above performance is presented net of fees. Current performance may be higher or lower than the performance quoted above. You may obtain performance data current to the most recent month-end by calling our toll free telephone number: 1-800-787-7414. Any performance data quoted represents past performance and the investment return and principal value of an investment in the Fund will fluctuate so that an investor’s shares, when redeemed, may be worth more or less than their original cost. Past performance does not guarantee future results. Current and future portfolio holdings are subject to risk.
The opinions expressed are those of Brockenbrough. The opinions referenced are as of the date of publication and are subject to change due to changes in the market of economic conditions and may not necessarily come to pass. Forward-looking statements cannot be guaranteed. Brockenbrough is an investment adviser registered with the U.S. Securities and Exchange Commission. Registration does not imply a certain level of skill or training. More information about Brockenbrough’s investment advisory services can be found in its Form ADV Part 2, which is available upon request.
| THE JAMESTOWN EQUITY FUND |
| PERFORMANCE INFORMATION (Unaudited) |
Comparison of the Change in Value of a $10,000 Investment in
The Jamestown Equity Fund
and the S&P 500® Index
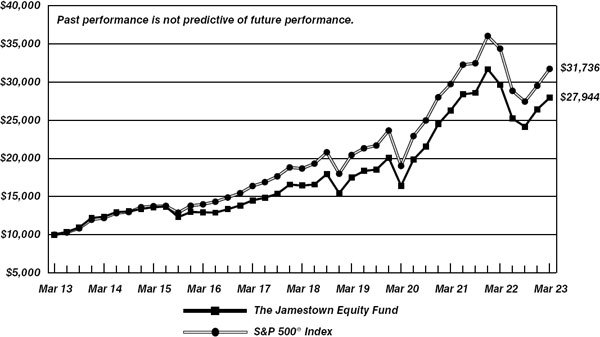
| | | | | | | | |
| | | Average Annual Total Returns | |
| | | (for periods ended March 31, 2023) | |
| | | 1 Year | | 5 Years | | 10 Years | |
| | The Jamestown Equity Fund (a) | -5.89% | | 11.19% | | 10.82% | |
| | S&P 500® Index | -7.73% | | 11.19% | | 12.24% | |
| | | | | | | | |
| (a) | Total return is a measure of the change in value of an investment in the Fund over the periods covered, which assumes any dividends or capital gains distributions are reinvested in shares of the Fund. Returns shown do not reflect the deduction of taxes a shareholder would pay on Fund distributions or the redemption of Fund shares. |
| THE JAMESTOWN EQUITY FUND |
| PORTFOLIO INFORMATION |
| March 31, 2023 (Unaudited) |
| Asset Allocation (% of Net Assets) |
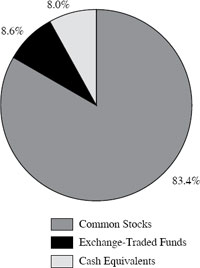
| | % of |
| Ten Largest Equity Holdings | Net Assets |
| Apple, Inc. | 5.8% |
| Microsoft Corporation | 4.5% |
| Vanguard Information Technology ETF | 3.3% |
| Alphabet, Inc. - Class A and C | 3.2% |
| Meta Platforms, Inc. - Class A | 3.1% |
| Chevron Corporation | 2.7% |
| Amazon.com, Inc. | 2.6% |
| JPMorgan Chase & Company | 2.5% |
| Eaton Corporation plc | 2.3% |
| Bookings Holdings, Inc. | 2.3% |
| Sector Concentration vs. the S&P 500® Index |
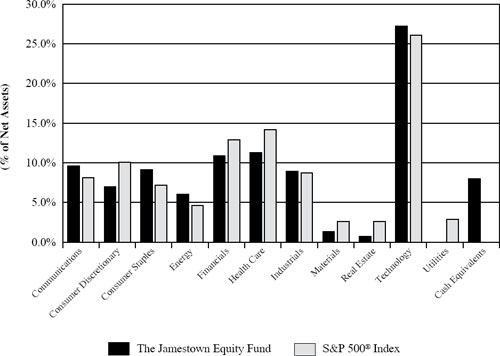
| THE JAMESTOWN EQUITY FUND |
| SCHEDULE OF INVESTMENTS |
| March 31, 2023 |
| COMMON STOCKS — 83.4% | | Shares | | | Value | |
| Communications — 9.6% | | | | | | | | |
| Alphabet, Inc. - Class A (a) | | | 3,320 | | | $ | 344,384 | |
| Alphabet, Inc. - Class C (a) | | | 10,000 | | | | 1,040,000 | |
| Booking Holdings, Inc. (a) | | | 380 | | | | 1,007,916 | |
| Meta Platforms, Inc. - Class A (a) | | | 6,260 | | | | 1,326,744 | |
| Walt Disney Company (The) (a) | | | 4,300 | | | | 430,559 | |
| | | | | | | | 4,149,603 | |
| Consumer Discretionary — 7.0% | | | | | | | | |
| Amazon.com, Inc. (a) | | | 10,700 | | | | 1,105,203 | |
| Ford Motor Company | | | 26,500 | | | | 333,900 | |
| Home Depot, Inc. (The) | | | 1,350 | | | | 398,412 | |
| Lowe’s Companies, Inc. | | | 2,300 | | | | 459,931 | |
| TJX Companies, Inc. (The) | | | 9,100 | | | | 713,076 | |
| | | | | | | | 3,010,522 | |
| Consumer Staples — 7.8% | | | | | | | | |
| PepsiCo, Inc. | | | 2,690 | | | | 490,387 | |
| Procter & Gamble Company (The) | | | 5,100 | | | | 758,319 | |
| Target Corporation | | | 4,300 | | | | 712,209 | |
| Unilever plc - ADR | | | 18,505 | | | | 960,965 | |
| Walmart, Inc. | | | 3,000 | | | | 442,350 | |
| | | | | | | | 3,364,230 | |
| Energy — 6.0% | | | | | | | | |
| Chevron Corporation | | | 7,200 | | | | 1,174,752 | |
| Exxon Mobil Corporation | | | 2,250 | | | | 246,735 | |
| Schlumberger Ltd. | | | 12,545 | | | | 615,960 | |
| TotalEnergies SE - ADR | | | 9,500 | | | | 560,975 | |
| | | | | | | | 2,598,422 | |
| Financials — 9.7% | | | | | | | | |
| Ameriprise Financial, Inc. | | | 2,950 | | | | 904,175 | |
| Chubb Ltd. | | | 1,800 | | | | 349,524 | |
| Goldman Sachs Group, Inc. (The) | | | 1,800 | | | | 588,798 | |
| JPMorgan Chase & Company | | | 8,300 | | | | 1,081,573 | |
| Morgan Stanley | | | 7,500 | | | | 658,500 | |
| PNC Financial Services Group, Inc. (The) | | | 4,800 | | | | 610,080 | |
| | | | | | | | 4,192,650 | |
| Health Care — 11.3% | | | | | | | | |
| Amgen, Inc. | | | 1,300 | | | | 314,275 | |
| CVS Health Corporation | | | 8,500 | | | | 631,635 | |
| Elevance Health, Inc. | | | 1,650 | | | | 758,686 | |
| Johnson & Johnson | | | 4,000 | | | | 620,000 | |
| Merck & Company, Inc. | | | 4,000 | | | | 425,560 | |
| Pfizer, Inc. | | | 13,000 | | | | 530,400 | |
| THE JAMESTOWN EQUITY FUND |
| SCHEDULE OF INVESTMENTS (Continued) |
| COMMON STOCKS — 83.4% (Continued) | | Shares | | | Value | |
| Health Care — 11.3% (Continued) | | | | | | | | |
| Thermo Fisher Scientific, Inc. | | | 1,400 | | | $ | 806,918 | |
| UnitedHealth Group, Inc. | | | 1,600 | | | | 756,144 | |
| | | | | | | | 4,843,618 | |
| Industrials — 8.9% | | | | | | | | |
| Eaton Corporation plc | | | 5,900 | | | | 1,010,906 | |
| Lockheed Martin Corporation | | | 825 | | | | 390,002 | |
| Norfolk Southern Corporation | | | 3,400 | | | | 720,800 | |
| Raytheon Technologies Corporation | | | 4,600 | | | | 450,478 | |
| Trane Technologies plc | | | 3,900 | | | | 717,522 | |
| United Parcel Service, Inc. - Class B | | | 2,800 | | | | 543,172 | |
| | | | | | | | 3,832,880 | |
| Materials — 1.3% | | | | | | | | |
| Eastman Chemical Company | | | 6,700 | | | | 565,078 | |
| | | | | | | | | |
| Real Estate — 0.7% | | | | | | | | |
| American Tower Corporation | | | 1,410 | | | | 288,119 | |
| | | | | | | | | |
| Technology — 21.1% | | | | | | | | |
| Adobe, Inc. (a) | | | 1,400 | | | | 539,518 | |
| Apple, Inc. | | | 15,100 | | | | 2,489,990 | |
| Applied Materials, Inc. | | | 5,790 | | | | 711,186 | |
| Broadcom, Inc. | | | 1,300 | | | | 834,002 | |
| Cisco Systems, Inc. | | | 17,750 | | | | 927,881 | |
| Microsoft Corporation | | | 6,700 | | | | 1,931,610 | |
| Oracle Corporation | | | 10,000 | | | | 929,200 | |
| Visa, Inc. - Class A | | | 3,175 | | | | 715,835 | |
| | | | | | | | 9,079,222 | |
| | | | | | | | | |
| Total Common Stocks (Cost $16,058,538) | | | | | | $ | 35,924,344 | |
| | | | | | | | | |
| EXCHANGE-TRADED FUNDS — 8.6% | | Shares | | | Value | |
| Consumer Staples Select Sector SPDR Fund | | | 7,550 | | | $ | 564,061 | |
| Invesco KBW Bank ETF | | | 12,165 | | | | 510,565 | |
| iShares Expanded Tech-Software Sector ETF | | | 1,630 | | | | 496,661 | |
| iShares Semiconductor ETF | | | 1,600 | | | | 711,472 | |
| Vanguard Information Technology ETF | | | 3,700 | | | | 1,426,239 | |
| Total Exchange-Traded Funds (Cost $1,968,766) | | | | | | $ | 3,708,998 | |
| THE JAMESTOWN EQUITY FUND |
| SCHEDULE OF INVESTMENTS (Continued) |
| MONEY MARKET FUNDS — 8.1% | | Shares | | | Value | |
| Federated Hermes Government Obligations Fund -Institutional Class, 4.65% (b) (Cost $3,498,226) | | | 3,498,226 | | | $ | 3,498,226 | |
| | | | | | | | | |
| Total Investments at Value — 100.1% | | | | | | | | |
| (Cost $21,525,530) | | | | | | $ | 43,131,568 | |
| | | | | | | | | |
| Liabilities in Excess of Other Assets — (0.1%) | | | | | | | (52,935 | ) |
| | | | | | | | | |
| Net Assets — 100.0% | | | | | | $ | 43,078,633 | |
ADR - American Depositary Receipt.
| (a) | Non-income producing security. |
| (b) | The rate shown is the 7-day effective yield as of March 31, 2023. |
See accompanying notes to financial statements.
| THE JAMESTOWN EQUITY FUND |
| STATEMENT OF ASSETS AND LIABILITIES |
| March 31, 2023 |
| ASSETS | | | | |
| Investments in securities: | | | | |
| At cost | | $ | 21,525,530 | |
| At value (Note 2) | | $ | 43,131,568 | |
| Receivable for capital shares purchased | | | 622 | |
| Dividends receivable | | | 33,875 | |
| Other assets | | | 3,288 | |
| TOTAL ASSETS | | | 43,169,353 | |
| | | | | |
| LIABILITIES | | | | |
| Distributions payable | | | 3,020 | |
| Payable for capital shares redeemed | | | 52,017 | |
| Accrued investment advisory fees (Note 4) | | | 26,198 | |
| Payable to administrator (Note 4) | | | 6,000 | |
| Other accrued expenses | | | 3,485 | |
| TOTAL LIABILITIES | | | 90,720 | |
| | | | | |
| NET ASSETS | | $ | 43,078,633 | |
| | | | | |
| Net assets consist of: | | | | |
| Paid-in capital | | $ | 20,491,831 | |
| Distributable earnings | | | 22,586,802 | |
| Net assets | | $ | 43,078,633 | |
| | | | | |
| Shares of beneficial interest outstanding (unlimited number of shares authorized, $0.01 par value) | | | 1,674,306 | |
| | | | | |
| Net asset value, offering price and redemption price per share (Note 2) | | $ | 25.73 | |
See accompanying notes to financial statements.
| THE JAMESTOWN EQUITY FUND |
| STATEMENT OF OPERATIONS |
| Year Ended March 31, 2023 |
| INVESTMENT INCOME | | | |
| Dividends | | $ | 879,539 | |
| Foreign withholding taxes on dividends | | | (5,747 | ) |
| TOTAL INVESTMENT INCOME | | | 873,792 | |
| | | | | |
| EXPENSES | | | | |
| Investment advisory fees (Note 4) | | | 280,284 | |
| Administration fees (Note 4) | | | 60,000 | |
| Trustees’ fees and expenses (Note 4) | | | 19,632 | |
| Audit and tax services fees | | | 15,911 | |
| Registration and filing fees | | | 14,512 | |
| Compliance service fees (Note 4) | | | 12,000 | |
| Legal fees | | | 11,349 | |
| Shareholder reporting expense | | | 7,758 | |
| Custodian and bank service fees | | | 7,542 | |
| Postage and supplies | | | 4,482 | |
| Shareholder servicing fees (Note 4) | | | 4,271 | |
| Insurance expense | | | 1,448 | |
| Other expenses | | | 7,857 | |
| TOTAL EXPENSES | | | 447,046 | |
| Fees voluntarily waived by the Adviser (Note 4) | | | (37,400 | ) |
| NET EXPENSES | | | 409,646 | |
| | | | | |
| NET INVESTMENT INCOME | | | 464,146 | |
| | | | | |
| REALIZED AND UNREALIZED GAINS (LOSSES) ON INVESTMENTS | | | | |
| Net realized gains on investment transactions | | | 3,251,417 | |
| Net change in unrealized appreciation (depreciation) on investments | | | (6,891,866 | ) |
| NET REALIZED AND UNREALIZED LOSSES ON INVESTMENTS | | | (3,640,449 | ) |
| | | | | |
| NET DECREASE IN NET ASSETS RESULTING FROM OPERATIONS | | $ | (3,176,303 | ) |
See accompanying notes to financial statements.
| THE JAMESTOWN EQUITY FUND |
| STATEMENTS OF CHANGES IN NET ASSETS |
| | | Year | | | Year | |
| | | Ended | | | Ended | |
| | | March 31, | | | March 31, | |
| | | 2023 | | | 2022 | |
| FROM OPERATIONS | | | | | | | | |
| Net investment income | | $ | 464,146 | | | $ | 261,336 | |
| Net realized gains on investment transactions | | | 3,251,417 | | | | 4,239,158 | |
| Net change in unrealized appreciation (depreciation) on investments | | | (6,891,866 | ) | | | 1,661,988 | |
| Net increase (decrease) in net assets resulting from operations | | | (3,176,303 | ) | | | 6,162,482 | |
| | | | | | | | | |
| DISTRIBUTIONS TO SHAREHOLDERS (Note 2) | | | (5,789,948 | ) | | | (2,031,746 | ) |
| | | | | | | | | |
| FROM CAPITAL SHARE TRANSACTIONS | | | | | | | | |
| Proceeds from shares sold | | | 341,376 | | | | 632,455 | |
| Net asset value of shares issued in reinvestment of distributions to shareholders | | | 5,648,746 | | | | 1,946,154 | |
| Payments for shares redeemed | | | (4,136,511 | ) | | | (3,917,381 | ) |
| Net increase (decrease) in net assets from capital share transactions | | | 1,853,611 | | | | (1,338,772 | ) |
| | | | | | | | | |
| TOTAL INCREASE (DECREASE) IN NET ASSETS | | | (7,112,640 | ) | | | 2,791,964 | |
| | | | | | | | | |
| NET ASSETS | | | | | | | | |
| Beginning of year | | | 50,191,273 | | | | 47,399,309 | |
| End of year | | $ | 43,078,633 | | | $ | 50,191,273 | |
| | | | | | | | | |
| CAPITAL SHARE ACTIVITY | | | | | | | | |
| Shares sold | | | 13,459 | | | | 20,108 | |
| Shares reinvested | | | 225,428 | | | | 61,648 | |
| Shares redeemed | | | (161,336 | ) | | | (121,490 | ) |
| Net increase (decrease) in shares outstanding | | | 77,551 | | | | (39,734 | ) |
| Shares outstanding, beginning of year | | | 1,596,755 | | | | 1,636,489 | |
| Shares outstanding, end of year | | | 1,674,306 | | | | 1,596,755 | |
See accompanying notes to financial statements.
| THE JAMESTOWN EQUITY FUND |
| FINANCIAL HIGHLIGHTS |
Selected Per Share Data for a Share Outstanding Throughout Each Year:
| | | Years Ended March 31, | |
| | | 2023 | | | 2022 | | | 2021 | | | 2020 | | | 2019 | |
| Net asset value at beginning of year | | $ | 31.43 | | | $ | 28.96 | | | $ | 19.08 | | | $ | 21.79 | | | $ | 22.10 | |
| | | | | | | | | | | | | | | | | | | | | |
| Income (loss) from investment operations: | | | | | | | | | | | | | | | | | | | | |
| Net investment income (a) | | | 0.28 | | | | 0.16 | | | | 0.17 | | | | 0.22 | | | | 0.24 | |
| Net realized and unrealized gains (losses) on investments | | | (2.38 | ) | | | 3.57 | | | | 11.05 | | | | (1.35 | ) | | | 1.10 | |
| Total from investment operations | | | (2.10 | ) | | | 3.73 | | | | 11.22 | | | | (1.13 | ) | | | 1.34 | |
| | | | | | | | | | | | | | | | | | | | | |
| Less distributions from: | | | | | | | | | | | | | | | | | | | | |
| Net investment income | | | (0.28 | ) | | | (0.16 | ) | | | (0.18 | ) | | | (0.22 | ) | | | (0.24 | ) |
| Net realized gains | | | (3.32 | ) | | | (1.10 | ) | | | (1.16 | ) | | | (1.36 | ) | | | (1.41 | ) |
| Total distributions | | | (3.60 | ) | | | (1.26 | ) | | | (1.34 | ) | | | (1.58 | ) | | | (1.65 | ) |
| | | | | | | | | | | | | | | | | | | | | |
| Net asset value at end of year | | $ | 25.73 | | | $ | 31.43 | | | $ | 28.96 | | | $ | 19.08 | | | $ | 21.79 | |
| | | | | | | | | | | | | | | | | | | | | |
| Total return (b) | | | (5.89 | %) | | | 12.91 | % | | | 60.23 | % | | | (6.17 | %) | | | 6.40 | % |
| | | | | | | | | | | | | | | | | | | | | |
| Net assets at end of year (000’s) | | $ | 43,078 | | | $ | 50,191 | | | $ | 47,399 | | | $ | 31,062 | | | $ | 36,658 | |
| | | | | | | | | | | | | | | | | | | | | |
| Ratio of total expenses to average net assets (c) | | | 1.04 | % | | | 0.96 | % | | | 1.05 | % | | | 1.08 | % | | | 1.03 | % |
| | | | | | | | | | | | | | | | | | | | | |
| Ratio of net expenses to average net assets (c)(d) | | | 0.95 | % | | | 0.95 | % | | | 0.95 | % | | | 0.95 | % | | | 0.95 | % |
| | | | | | | | | | | | | | | | | | | | | |
| Ratio of net investment income to average net assets (a)(c)(d) | | | 1.08 | % | | | 0.51 | % | | | 0.70 | % | | | 0.96 | % | | | 1.10 | % |
| | | | | | | | | | | | | | | | | | | | | |
| Portfolio turnover rate | | | 6 | % | | | 8 | % | | | 10 | % | | | 18 | % | | | 18 | % |
| (a) | Recognition of net investment income by the Fund is affected by the timing of the declarations of dividends by the underlying investment companies in which the Fund invests. |
| (b) | Total return is a measure of the change in value of an investment in the Fund over the periods covered, which assumes any dividends or capital gains distributions are reinvested in shares of the Fund. Returns shown do not reflect the deduction of taxes a shareholder would pay on Fund distributions or the redemption of Fund shares. |
| (c) | The ratios of expenses and net investment income to average net assets do not reflect the Fund’s proportionate share of expenses of the underlying investment companies in which the Fund invests. Ratios were also determined based on net expenses after expense reimbursements through a previously directed brokerage arrangement. |
| (d) | Ratio was determined after voluntary advisory fee waivers by the Adviser and reimbursed expenses (Note 4). |
See accompanying notes to financial statements.
| THE JAMESTOWN EQUITY FUND |
| NOTES TO FINANCIAL STATEMENTS |
| March 31, 2023 |
1. Organization
The Jamestown Equity Fund (the “Fund”) is a diversified, no-load series of Williamsburg Investment Trust (the “Trust”), an open-end management investment company registered under the Investment Company Act of 1940, as amended (the “1940 Act”). The Trust was organized as a Massachusetts business trust on July 18, 1988. Other series of the Trust are not included in this report.
The investment objective of the Fund is long-term growth of capital.
2. Significant Accounting Policies
The following is a summary of the Fund’s significant accounting policies. These policies are in conformity with accounting principles generally accepted in the United States of America (“GAAP”). The Fund follows accounting and reporting guidance under Financial Accounting Standards Board Accounting Standards Codification Topic 946, “Financial Services – Investment Companies.”
Securities valuation — The Fund’s portfolio securities are valued as of the close of business of the regular session of the New York Stock Exchange (normally 4:00 p.m., Eastern time). Securities traded on a national stock exchange, including common stocks and exchange-traded funds (“ETFs”), are generally valued based upon the closing price on the principal exchange where the security is traded, if available, otherwise, at the last quoted bid price. Securities that are quoted by NASDAQ are valued at the NASDAQ Official Closing Price. Investments representing shares of other open-end investment companies, other than ETFs but including money market funds, are valued at their net asset value (“NAV”) as reported by such companies. When using a quoted price and when the market is considered active, securities will be classified as Level 1 within the fair value hierarchy (see below).
When market quotations are not readily available, if a pricing service cannot provide a price, or if the investment adviser believes the price received from the pricing service is not indicative of fair value, securities will be valued in good faith at fair value as determined by Lowe, Brockenbrough & Company, Inc., d/b/a Brockenbrough (the “Adviser”), as the Fund’s valuation designee, in accordance with procedures adopted by the Board of Trustees (the “Board”) pursuant to Rule 2a-5 under the 1940 Act. Under these procedures, the securities will be classified as Level 2 or 3 within the fair value hierarchy, depending on the inputs used. Such methods of fair valuation may include, but are not limited to: multiple of earnings, multiple of book value, discount from market of a similar freely traded security, purchase price of the security, subsequent private transactions in the security or related securities, or a combination of these and other factors.
GAAP establishes a single authoritative definition of fair value, sets out a framework for measuring fair value and requires additional disclosures about fair value measurements.
Various inputs are used in determining the value of the Fund’s investments. These inputs are summarized in the three broad levels listed below:
| ● | Level 1 – quoted prices in active markets for identical securities |
| ● | Level 2 – other significant observable inputs |
| ● | Level 3 – significant unobservable inputs |
| THE JAMESTOWN EQUITY FUND |
| NOTES TO FINANCIAL STATEMENTS (Continued) |
The inputs or methodology used for valuing securities are not necessarily an indication of the risks associated with investing in those securities. The inputs used to measure fair value may fall into different levels of the fair value hierarchy. In such cases, for disclosure purposes, the level in the fair value hierarchy within which the fair value measurement falls in its entirety is determined based on the lowest level input that is significant to the fair value measurement.
The following is a summary of the Fund’s investments based on the inputs used to value the investments as of March 31, 2023, by security type:
| | | Level 1 | | | Level 2 | | | Level 3 | | | Total | |
| Common Stocks | | $ | 35,924,344 | | | $ | — | | | $ | — | | | $ | 35,924,344 | |
| Exchange-Traded Funds | | | 3,708,998 | | | | — | | | | — | | | | 3,708,998 | |
| Money Market Funds | | | 3,498,226 | | | | — | | | | — | | | | 3,498,226 | |
| Total | | $ | 43,131,568 | | | $ | — | | | $ | — | | | $ | 43,131,568 | |
| | | | | | | | | | | | | | | | | |
Refer to the Fund’s Schedule of Investments for a listing of the common stocks by sector type. There were no Level 3 securities or derivative instruments held by the Fund as of or during the year ended March 31, 2023.
Share valuation — The NAV per share of the Fund is calculated daily by dividing the total value of its assets, less liabilities, by the number of shares outstanding. The offering price and redemption price per share of the Fund is equal to the NAV per share.
Investment income — Dividend income is recorded on the ex-dividend date. Non-cash dividends included in dividend income, if any, are recorded at the fair market value of the security received. Withholding taxes on foreign dividends received by the Fund, if any, have been recorded in accordance with the Trust’s understanding of the applicable country’s rules and tax rates.
Distributions to shareholders — Dividends arising from net investment income, if any, are declared and paid quarterly to shareholders of the Fund. Net realized short-term capital gains, if any, may be distributed throughout the year and net realized long-term capital gains, if any, are distributed at least once each year. The amount of distributions from net investment income and net realized capital gains are determined in accordance with federal income tax regulations, which may differ from GAAP. Dividends and distributions are recorded on the ex-dividend date.
The tax character of distributions paid during the years ended March 31, 2023 and 2022 was as follows:
| Years | | Ordinary | | | Long-Term | | | Total | |
| Ended | | Income | | | Capital Gains | | | Distributions | |
| 3/31/2023 | | $ | 508,007 | | | $ | 5,280,591 | | | $ | 5,788,598 | |
| 3/31/2022 | | $ | 288,603 | | | $ | 1,746,016 | | | $ | 2,034,619 | |
| THE JAMESTOWN EQUITY FUND |
| NOTES TO FINANCIAL STATEMENTS (Continued) |
Investment transactions — Investment transactions are accounted for on trade date for financial reporting purposes. Realized gains and losses on investment securities sold are determined on a specific identification basis.
Common expenses — Common expenses of the Trust are allocated among the series of the Trust based on relative net assets of each series or the nature of the services performed and the relative applicability to each series.
Estimates — The preparation of financial statements in conformity with GAAP requires management to make estimates and assumptions that affect the reported amounts of assets and liabilities and the disclosure of contingent assets and liabilities, each as of the date of the financial statements, and the reported amounts of increase (decrease) in net assets from operations during the reporting period. Actual results could differ from those estimates.
Federal income tax — The Fund has qualified and intends to continue to qualify as a regulated investment company under the Internal Revenue Code of 1986, as amended (the “Code”). Qualification generally will relieve the Fund of liability for federal income taxes to the extent 100% of its net investment income and net realized capital gains are distributed in accordance with the Code.
In order to avoid imposition of the excise tax applicable to regulated investment companies, it is also the Fund’s intention to declare as dividends in each calendar year at least 98% of its net investment income (earned during the calendar year) and 98.2% of its net realized capital gains (earned during the twelve months ended October 31) plus undistributed amounts from prior years.
The tax character of accumulated earnings at March 31, 2023 was as follows:
| | | | | |
| Tax cost of investments | | $ | 21,589,159 | |
| Gross unrealized appreciation | | $ | 21,788,293 | |
| Gross unrealized depreciation | | | (245,884 | ) |
| Net unrealized appreciation | | | 21,542,409 | |
| Undistributed ordinary income | | | 2,781 | |
| Undistributed long-term capital gains | | | 1,044,632 | |
| Distributions payable | | | (3,020 | ) |
| Distributable earnings | | $ | 22,586,802 | |
| | | | | |
The difference between the federal income tax cost of investments and the financial statement cost of investments for the Fund is due to certain timing differences in the recognition of capital gains or losses under income tax regulations and GAAP. These “book/tax” differences are temporary in nature and are primarily due to the tax deferral of losses on wash sales.
The Fund recognizes the tax benefits or expenses of uncertain tax positions only when the position is “more likely than not” to be sustained assuming examination by tax authorities. Management has reviewed the tax positions taken on Federal income tax returns for all open tax years (generally three years) of the Fund and has concluded that no provision for unrecognized tax benefits or expenses is required in these financial statements.
| THE JAMESTOWN EQUITY FUND |
| NOTES TO FINANCIAL STATEMENTS (Continued) |
The Fund recognizes interest and penalties, if any, related to unrecognized tax benefits as income tax expense on the Statement of Operations. During the year ended March 31, 2023, the Fund did not incur any interest or penalties.
3. Investment Transactions
Investment transactions, other than short-term investments and U.S. government securities, were as follows for the year ended March 31, 2023:
| | | | | |
| Purchase of investment securities | | $ | 2,538,753 | |
| Proceeds from sales of investment securities | | $ | 7,853,846 | |
| | | | | |
4. Transactions with Related Parties
INVESTMENT ADVISORY AGREEMENT
The Fund’s investments are managed by the Adviser under the terms of an Investment Advisory Agreement. The Fund pays the Adviser a fee, which is computed and accrued daily and paid monthly, at annual rates of 0.65% of its average daily net assets up to $500 million and 0.55% of such assets in excess of $500 million. Certain officers of the Trust are also officers of the Adviser.
During the year ended March 31, 2023, the Adviser voluntarily limited the total annual operating expenses of the Fund to 0.95% of average daily net assets; accordingly, the Adviser voluntarily waived $37,400 of its investment advisory fees during the year ended March 31, 2023. This amount is not subject to recapture in future periods.
OTHER SERVICE PROVIDERS
Ultimus Fund Solutions, LLC (“Ultimus”) provides administration, fund accounting, compliance and transfer agent services to the Fund. The Fund pays Ultimus fees in accordance with the agreements for such services. In addition, the Fund pays out-of-pocket expenses including, but not limited to, postage, supplies, and certain costs related to the pricing of the Fund’s portfolio securities. Certain officers of the Trust are also officers of Ultimus, or of Ultimus Fund Distributors, LLC (the “Distributor”), the principal underwriter of the Fund and an affiliate of Ultimus. The Distributor is compensated by the Adviser (not the Fund) for acting as principal underwriter.
SHAREHOLDER SERVICING PLAN
The Fund has adopted a Shareholder Servicing Plan (the “Plan”), which allows the Fund to make payments to financial organizations (including payments directly to the Adviser and the distributor) for providing account administration and account maintenance services to Fund shareholders. The annual service fee may not exceed an amount equal to 0.25% of the Fund’s average daily net assets. During the year ended March 31, 2023, the Fund incurred fees of $4,271 under the Plan.
COMPENSATION OF TRUSTEES
Trustees and officers affiliated with the Adviser or Ultimus are not compensated by the Trust for their services. Each Trustee who is not an affiliated person of the Adviser or Ultimus receives from the Trust an annual retainer of $30,000, payable quarterly; a fee of $2,000 for attendance at
| THE JAMESTOWN EQUITY FUND |
| NOTES TO FINANCIAL STATEMENTS (Continued) |
each meeting of the Board of Trustees (except that such fee is $3,000 for the independent chair); and a fee of $1,000 for attendance at each meeting of any committee of the Board (except that such fee is $1,500 for the committee chair); plus reimbursement of travel and other expenses incurred in attending meetings. Each series of the Trust pays its proportionate share of such fees.
5. Sector Risk
If a Fund has significant investments in the securities of issuers in industries within a particular business sector, any development affecting that sector will have a greater impact on the value of the net assets of the Fund than would be the case if the Fund did not have significant investments in that sector. In addition, this may increase the risk of loss of an investment in the Fund and increase the volatility of the Fund’s NAV per share. From time to time, circumstances may affect a particular sector and companies within such sector. For instance, economic or market factors, regulation or deregulation, or other developments may negatively impact all companies in a particular sector and therefore the value of a Fund’s portfolio would be adversely affected. As of March 31, 2023, The Jamestown Equity Fund had 27.2% of the value of its net assets invested in common stocks and ETFs within the Technology sector.
6. Contingencies and Commitments
The Fund indemnifies the Trust’s officers and Trustees for certain liabilities that might arise from the performance of their duties to the Fund. Additionally, in the normal course of business the Fund enters into contracts that contain a variety of representations and warranties and which provide general indemnifications. The Fund’s maximum exposure under these arrangements is unknown, as this would involve future claims that may be made against the Fund that have not yet occurred. However, based on experience, the Trust expects the risk of loss to be remote.
7. Subsequent Events
The Fund is required to recognize in the financial statements the effects of all subsequent events that provide additional evidence about conditions that existed as of the date of the Statement of Assets and Liabilities. For non-recognized subsequent events that must be disclosed to keep the financial statements from being misleading, the Fund is required to disclose the nature of the event as well as an estimate of its financial effect, or a statement that such an estimate cannot be made. Management has evaluated subsequent events through the issuance of these financial statements and has noted no such events.
| THE JAMESTOWN EQUITY FUND |
| REPORT OF INDEPENDENT REGISTERED |
| PUBLIC ACCOUNTING FIRM |
To the Shareholders of The Jamestown Equity Fund and
Board of Trustees of Williamsburg Investment Trust
Opinion on the Financial Statements
We have audited the accompanying statement of assets and liabilities, including the schedule of investments, of The Jamestown Equity Fund (the “Fund”), a series of Williamsburg Investment Trust, as of March 31, 2023, the related statement of operations for the year then ended, the statements of changes in net assets for each of the two years in the period then ended, the related notes, and the financial highlights for each of the five years in the period then ended (collectively referred to as the “financial statements”). In our opinion, the financial statements present fairly, in all material respects, the financial position of the Fund as of March 31, 2023, the results of its operations for the year then ended, the changes in net assets for each of the two years in the period then ended, and the financial highlights for each of the five years in the period then ended, in conformity with accounting principles generally accepted in the United States of America.
Basis for Opinion
These financial statements are the responsibility of the Fund’s management. Our responsibility is to express an opinion on the Fund’s financial statements based on our audits. We are a public accounting firm registered with the Public Company Accounting Oversight Board (United States) (“PCAOB”) and are required to be independent with respect to the Fund in accordance with the U.S. federal securities laws and the applicable rules and regulations of the Securities and Exchange Commission and the PCAOB.
We conducted our audits in accordance with the standards of the PCAOB. Those standards require that we plan and perform the audit to obtain reasonable assurance about whether the financial statements are free of material misstatement whether due to error or fraud.
Our audits included performing procedures to assess the risks of material misstatement of the financial statements, whether due to error or fraud, and performing procedures that respond to those risks. Such procedures included examining, on a test basis, evidence regarding the amounts and disclosures in the financial statements. Our procedures included confirmation of securities owned as of March 31, 2023, by correspondence with the custodian. Our audits also included evaluating the accounting principles used and significant estimates made by management, as well as evaluating the overall presentation of the financial statements. We believe that our audits provide a reasonable basis for our opinion.
We have served as the Fund’s auditor since 2016.
COHEN & COMPANY, LTD.
Milwaukee, Wisconsin
May 23, 2023
| THE JAMESTOWN EQUITY FUND |
| BOARD OF TRUSTEES AND EXECUTIVE OFFICERS |
| (Unaudited) |
Overall responsibility for management of the Fund rests with the Board of Trustees. The Trustees serve during the lifetime of the Trust and until its termination, or until death, resignation, retirement or removal. The Trustees, in turn, elect the officers of the Fund. The officers have been elected for an annual term. The following are the Trustees and executive officers of the Fund:
Trustees
and Officers | Address | Year of
Birth | Position Held
with the Trust | Length of
Time Served |
| Robert S. Harris, Ph.D. | 225 Pictoria Drive, Suite 450 Cincinnati, OH | 1949 | Chairman and Trustee | Since January 2007 |
| * John P. Ackerly, IV | One James Center 901 E. Cary Street Richmond, VA | 1963 | Trustee and President of The Davenport Funds | Since July 2012 |
| * John T. Bruce | 800 Main Street Lynchburg, VA | 1953 | Trustee and President of The Cantor FBP Mutual Funds | Since September 1988 |
| George K. Jennison | 225 Pictoria Drive, Suite 450 Cincinnati, OH | 1957 | Trustee | Since January 2015 |
| Harris V. Morrissette | 225 Pictoria Drive, Suite 450 Cincinnati, OH | 1959 | Trustee | Since March 1993 |
| Elizabeth W. Robertson | 225 Pictoria Drive, Suite 450 Cincinnati, OH | 1953 | Trustee | Since February 2014 |
| Charles M. Caravati, III | 1802 Bayberry Court, Suite 400 Richmond, VA | 1965 | President, The Jamestown Equity Fund | Since January 1996 |
| Mark J. Seger | 225 Pictoria Drive, Suite 450 Cincinnati, OH | 1962 | Treasurer | Since November 2000 |
| David K. James | 225 Pictoria Drive, Suite 450 Cincinnati, OH | 1970 | Secretary | Since November 2018 |
| Michael J. Nanosky | 225 Pictoria Drive, Suite 450 Cincinnati, OH | 1966 | Chief Compliance Officer | Since March 2020 |
| * | Messrs. Ackerly and Bruce, as affiliated persons of investment advisers to the Trust, are “interested persons” of the Trust within the meaning of Section 2(a)(19) of the 1940 Act. |
| THE JAMESTOWN EQUITY FUND |
| BOARD OF TRUSTEES AND EXECUTIVE OFFICERS |
| (Unaudited) (Continued) |
Each Trustee oversees ten portfolios of the Trust, including the Fund. The principal occupations of the Trustees and executive officers of the Funds during the past five years and public directorships held by the Trustees are set forth below:
Robert S. Harris, Ph.D. is the C. Stewart Sheppard Professor of Business Administration at The Darden Graduate School of Business Administration at the University of Virginia. He was previously the dean at Darden. Professor Harris has published widely on corporate finance, financial markets and mergers and acquisitions and has served as a consultant to corporations and government agencies.
John P. Ackerly, IV is Senior Vice President and Portfolio Manager of Davenport & Company LLC. (a broker-dealer and investment adviser)
John T. Bruce is Senior Managing Director of Cantor Fitzgerald Investment Advisors, L.P. He previously was President, Director and member of the Executive Committee of Flippen, Bruce & Porter, Inc. (1985 to 2021).
George K. Jennison is retired. He previously was President of Oyster Consulting, LLC (a management consulting firm) and a financial adviser with Wells Fargo Advisors, LLC.
Harris V. Morrissette is President of China Doll Rice and Beans, Inc. and Dixie Lily Foods. He is also a Director of Trustmark Corporation (bank holding company).
Elizabeth W. Robertson serves as a Trustee of TowneBank Foundation, TowneBank Corporate Board, TowneBank Audit Committee Chair and TowneBank Community Board since 2015. She previously was Chief Financial Officer of Monument Restaurants LLC.
Charles M. Caravati, III is a Managing Director of the Adviser.
Mark J. Seger is a Vice Chairman of Ultimus Fund Solutions, LLC and Ultimus Fund Distributors, LLC. He previously was Co-CEO of Ultimus Fund Solutions, LLC (1999 to 2019).
David K. James is an Executive Vice President and Chief Legal and Risk Officer of Ultimus Fund Solutions, LLC (2018 to present). He previously was Managing Director and Managing Counsel at State Street Bank and Trust Company (2009 to 2018).
Michael J. Nanosky is a Senior Compliance Officer of Ultimus Fund Solutions, LLC (2020 to present). He previously was Senior Vice President & Chief Compliance Officer of PNC Funds (2014 to 2019).
Additional information about members of the Board of Trustees and executive officers is available in the Statement of Additional Information (“SAI”). To obtain a free copy of the SAI, please call 1-866-738-1126.
| THE JAMESTOWN EQUITY FUND |
| ABOUT YOUR FUND’S EXPENSES (Unaudited) |
We believe it is important for you to understand the impact of costs on your investment. All mutual funds have operating expenses. As a shareholder of the Fund, you incur ongoing costs, including management fees and other expenses. The following examples are intended to help you understand your ongoing costs (in dollars) of investing in the Fund and to compare these costs with the ongoing costs of investing in other mutual funds.
A mutual fund’s ongoing costs are expressed as a percentage of its average net assets. This figure is known as the expense ratio. The expenses in the table below are based on an investment of $1,000 made at the beginning of the period shown and held for the entire period (October 1, 2022 through March 31, 2023).
The table below illustrates the Fund’s costs in two ways:
Actual fund return – This section helps you to estimate the actual expenses that you paid over the period. The “Ending Account Value” shown is derived from the Fund’s actual return, and the fourth column shows the dollar amount of operating expenses that would have been paid by an investor who started with $1,000 in the Fund. You may use the information here, together with the amount you invested, to estimate the expenses that you paid over the period.
To do so, simply divide your account value by $1,000 (for example, an $8,600 account value divided by $1,000 = 8.6), then multiply the result by the number given for the Fund under the heading “Expenses Paid During Period.”
Hypothetical 5% return – This section is intended to help you compare the Fund’s ongoing costs with those of other mutual funds. It assumes that the Fund had an annual return of 5% before expenses during the period shown, but that the expense ratio is unchanged. In this case, because the returns used are not the Fund’s actual returns, the results do not apply to your investment. The example is useful in making comparisons because the U.S. Securities and Exchange Commission (the “SEC”) requires all mutual funds to calculate expenses based on a 5% return. You can assess the Fund’s ongoing costs by comparing this hypothetical example with the hypothetical examples that appear in shareholder reports of other funds.
Note that expenses shown in the table are meant to highlight and help you compare ongoing costs only. The Fund does not charge sales loads or redemption fees.
The calculations assume no shares were bought or sold during the period. Your actual costs may have been higher or lower, depending on the amount of your investment and the timing of any purchases or redemptions.
More information about the Fund’s expenses, including annual expense ratios for the prior five fiscal years, can be found in this report. For additional information on operating expenses and other shareholder costs, please refer to the Fund’s prospectus.
| THE JAMESTOWN EQUITY FUND |
| ABOUT YOUR FUND’S EXPENSES (Unaudited) (Continued) |
| | | Beginning | | Ending | | Net | | Expenses |
| | | Account Value | | Account Value | | Expense | | Paid During |
| | | October 1, 2022 | | March 31, 2023 | | Ratio(a) | | Period(b) |
| Based on Actual Fund Return | | $1,000.00 | | $1,156.40 | | 0.95% | | $5.11 |
| Based on Hypothetical 5% Return (before expenses) | | $1,000.00 | | $1,020.19 | | 0.95% | | $4.78 |
| (a) | Annualized, based on the Fund’s most recent one-half year expenses. |
| (b) | Expenses are equal to the Fund’s annualized net expense ratio multiplied by the average account value over the period, multiplied by 182/365 (to reflect the one-half year period). |
| OTHER INFORMATION (Unaudited) |
A description of the policies and procedures that the Fund uses to vote proxies relating to portfolio securities is available without charge upon request by calling toll-free 1-866-738-1126, or on the SEC’s website at www.sec.gov. Information regarding how the Fund voted proxies relating to portfolio securities during the most recent 12-month period ended June 30 is also available without charge upon request by calling toll-free 1-866-738-1126, or on the SEC’s website at www.sec.gov.
The Trust files a complete listing of portfolio holdings of the Fund with the SEC as of the end of the first and third quarters of each fiscal year as an exhibit to its reports on Form N-PORT. The filings are available upon request, by calling 1-866-738-1126. Furthermore, you may obtain a copy of these filings on the SEC’s website at www.sec.gov and on the Fund’s website www.jamestownfunds.com.
| FEDERAL TAX INFORMATION (Unaudited) |
For the fiscal year ended March 31, 2023, the Fund designated $5,280,591 as long-term capital gain distributions.
Qualified Dividend Income — The Fund designates 100% of its ordinary income distributions, or up to the maximum amount of such dividends allowable pursuant to the Internal Revenue Code, as qualified dividend income eligible for the reduced tax rate.
Dividends Received Deduction — Corporate shareholders are generally entitled to take the dividends received deduction on the portion of a Fund’s dividend distributions that qualify under tax law. For the fiscal year ended March 31, 2023, 100% of the Fund’s ordinary income dividends qualifies for the corporate dividends received deduction.
| THE JAMESTOWN EQUITY FUND |
| DISCLOSURE REGARDING APPROVAL OF INVESTMENT |
| ADVISORY AGREEMENT (Unaudited) |
At a meeting held on November 15, 2022, the Board of Trustees, including a majority of the Independent Trustees, approved the continuance for a one-year period of the Investment Advisory Agreement with the Adviser on behalf of The Jamestown Equity Fund (the “Fund”). Below is a discussion of the factors considered by the Board of Trustees along with the conclusions with respect thereto that formed the basis for the Board’s approval of the continuation of the Investment Advisory Agreement for an additional one-year period.
Prior to the Board meeting, the Adviser provided a response to a letter sent by the counsel to the Independent Trustees, on their behalf, requesting various information relevant to the Independent Trustees’ consideration of the renewal of the Investment Advisory Agreement with respect to the Fund. In approving the continuance of the Investment Advisory Agreement, the Independent Trustees considered all information they deemed reasonably necessary to evaluate the terms of the Agreement. The principal areas of review by the Independent Trustees were the nature, extent and quality of the services provided by the Adviser and the reasonableness of the fees charged for those services. During a meeting of the Governance, Nomination, Compensation and Qualified Legal Compliance Committee held prior to the Board meeting, the Independent Trustees reviewed the proposed renewal of the Investment Advisory Agreement with experienced independent legal counsel outside the presence of representatives of the Adviser and received materials from such counsel discussing the legal standards for their consideration of the proposed renewal of the Investment Advisory Agreement.
The Independent Trustees’ evaluation of the quality of the Adviser’s services took into consideration their knowledge gained through presentations and reports from the Adviser over the course of the preceding year. The Independent Trustees considered that the Adviser had provided its views on the overall conditions of the economy and the markets during the 2022 calendar year. The Independent Trustees also considered the performance of the Fund for the 1-year, 3-year, 5-year, and 10-year periods ended September 30, 2022, compared to the Fund’s benchmark and peer group and noted that the Fund exceeded the performance of the S&P 500 Index over the 3-year and 5-year periods and had underperformed against the S&P 500 Index over 1-year and the 10-year periods. The Board noted that the Fund exceeded the performance of its Morningstar Large Cap Blend Peer Group over the 1-year, 3-year and 5-year periods, but had underperformed against its Morningstar Peer Group for the 10-year period. The Fund’s short-term and long-term performance was compared to the performance of its benchmark, a peer group of funds with similar investment objectives and strategies, and to the Adviser’s comparably managed private account. The Independent Trustees also considered: the scope and quality of the in-house capabilities of the Adviser and other resources that it dedicates to performing services for the Fund; the quality of administrative and other services, including the Adviser’s role in coordinating the activities of the Fund’s other service providers; the Adviser’s compliance with investment policies of the Fund and applicable laws and regulations; information provided by management and the Fund’s independent public accounting firm in periodic meetings with the Trust’s Audit Committee; the business reputation of the Adviser; the qualifications of the Adviser’s key investment and compliance personnel; and the Adviser’s financial resources.
| THE JAMESTOWN EQUITY FUND |
| DISCLOSURE REGARDING APPROVAL OF INVESTMENT |
| ADVISORY AGREEMENT (Unaudited) (Continued) |
In reviewing the fees payable under the Investment Advisory Agreement, the Independent Trustees compared the advisory fees and overall expenses of the Fund (both before and after voluntary advisory fee waivers) with those of funds with similar investment objectives and strategies. The Independent Trustees considered information provided by the Adviser concerning the Adviser’s profitability with respect to the Fund, including the assumptions and methodology used in preparing the profitability information, in light of applicable case law relating to advisory fees. For these purposes, the Independent Trustees considered not only the fees paid by the Fund, but also so-called “fallout” benefits to the Adviser. The Independent Trustees also considered the Adviser’s representations that the Fund’s portfolio trades were executed based on the best available price and execution, and that the Adviser does not participate in any revenue sharing arrangements relating to the Fund. In evaluating the Fund’s advisory fees, the Trustees considered the complexity and quality of the investment process that is applied in the management of the Fund.
The Trustees considered the Fund’s investment strategy in comparison to the performance of its benchmark and peer group average, and the quality of services provided by LB&C to the Fund. Based on the consideration of the foregoing and such other information as was deemed relevant, including the factors and conclusions below, the Independent Trustees concluded that: (i) both the short- and long-term performance of The Jamestown Fund is good in comparison to the performance to its benchmark, and LB&C has provided quality services to the Fund; (ii) the advisory fee for the Fund, while higher than the average for similarly managed funds according to statistics derived from Morningstar, Inc., is reasonable in relation to the quality and level of services provided by LB&C; (iii) the total operating expense ratio of the Fund while higher, remains competitive when compared to the average expense ratio for comparable managed funds, according to statistics derived from Morningstar, Inc., (iv) LB&C’s commitment to limit overall operating expenses of the Fund by voluntarily waiving a portion of its investment advisory fees has enabled the Fund to increase returns for shareholders; and (v) the level of LB&C’s profitability with respect to its management of the Fund is reasonable.
Given the current size of the Fund and its expected growth, the Independent Trustees did not believe that, it was relevant to consider the extent to which economies of scale would be realized as the Fund grows, and whether fee levels reflect these economies of scale. However, the Independent Trustees noted the advisory fee schedule for the Fund contains a breakpoint that would reduce the advisory fee rate on assets above the specified level as the Fund’s assets increased. The Independent Trustees also considered the “fallout” benefits to the Adviser for its management of the Fund, but given the amounts involved viewed these as secondary factors in connection with the evaluation of the reasonableness of the advisory fees paid by the Fund.
No single factor was considered in isolation or to be determinative to the decision of the Independent Trustees to approve the continuance of the Investment Advisory Agreement. Rather the Independent Trustees concluded, after weighing and balancing all factors considered, that it
| THE JAMESTOWN EQUITY FUND |
| DISCLOSURE REGARDING APPROVAL OF INVESTMENT |
| ADVISORY AGREEMENT (Unaudited) (Continued) |
was in the best interests of the Fund and its shareholders to continue the Investment Advisory Agreement without modification to its terms, including the fees charged for services thereunder, for an additional one-year period.
This page intentionally left blank.
| | | | | | |
| | | | | | |
| | | | | | |
| | | | | | |
| | | | | | |
| | | | | | |
| | | | | | |
| | | | | | |
| | | | | | |
| | | | | | |
| | | | THE JAMESTOWN EQUITY FUND www.jamestownfunds.com | | |
| | | | | | |
| | | | Investment Adviser | | |
| | | | Lowe, Brockenbrough & Company, Inc. | | |
| | | | d/b/a Brockenbrough | | |
| | | | 1802 Bayberry Court | | |
| | | | Suite 400 | | |
| | | | Richmond, Virginia 23226 | | |
| | | | | | |
| | | | Administrator | | |
| | | | Ultimus Fund Solutions, LLC | | |
| | | | P.O. Box 46707 | | |
| | | | Cincinnati, Ohio 45246-0707 | | |
| | | | (Toll-Free) 1-866-738-1126 | | |
| | | | | | |
| | | | Independent Registered | | |
| | | | Public Accounting Firm | | |
| | | | Cohen & Company, Ltd. | | |
| | | | 342 N. Water Street | | |
| | | | Suite 830 | | |
| | | | Milwaukee, Wisconsin 53202 | | |
| | | | | | |
| | | | Legal Counsel | | |
| | | | Sullivan & Worcester LLP | | |
| | | | 1666 K Street, N.W. | | |
| | | | Washington, DC 20006 | | |
| | | | | | |
| | | | Board of Trustees | | |
| | | | John P. Ackerly, IV | | |
| | | | John T. Bruce | | |
| | | | George K. Jennison | | |
| | | | Robert S. Harris, Ph.D. | | |
| | | | Harris V. Morrissette | | |
| | | | Elizabeth W. Robertson | | |
| | | | | | |
| | | | | | |
| | | | | | |
| | | | | | |
| | | | | | |
| | | | | | |
| | | | | | |
| | | | Jamestown-AR-23 | | |
| | | | | | |
| | | | | | |
| | | | | | |
| | | | | | |
| | | | | | |
(b) Not applicable
As of the end of the period covered by this report, the registrant has adopted a code of ethics that applies to the registrant’s principal executive officer, principal financial officer, principal accounting officer or controller, or persons performing similar functions, regardless of whether these individuals are employed by the registrant or a third party. Pursuant to Item 13(a)(1), a copy of registrant’s code of ethics is filed as an exhibit to this Form N-CSR. During the period covered by this report, the code of ethics has not been amended, and the registrant has not granted any waivers, including implicit waivers, from the provisions of the code of ethics.
| Item 3. | Audit Committee Financial Expert. |
The registrant’s board of trustees has determined that the registrant has two audit committee financial experts serving on its audit committee. The names of the audit committee financial experts are Dr. Robert S. Harris and Elizabeth W. Robertson. Dr. Harris and Ms. Robertson are “independent” for purposes of this Item.
| Item 4. | Principal Accountant Fees and Services. |
| (a) | Audit Fees. The aggregate fees billed for professional services rendered by the principal accountant for the audit of the registrant’s annual financial statements or for services that are normally provided by the accountant in connection with statutory and regulatory filings or engagements were $137,000 and $129,500 with respect to the registrant’s fiscal years ended March 31, 2023 and 2022, respectively. |
| (b) | Audit-Related Fees. No fees were billed in either of the last two fiscal years for assurance and related services by the principal accountant that are reasonably related to the performance of the audit of the registrant’s financial statements and are not reported under paragraph (a) of this Item. |
| (c) | Tax Fees. The aggregate fees billed for professional services rendered by the principal accountant for tax compliance, tax advice, and tax planning were $32,500 and $30,000 with respect to the registrant’s fiscal years ended March 31, 2023 and 2022, respectively. The services comprising these fees are the preparation of the registrant’s federal income and excise tax returns. |
| (d) | All Other Fees. No fees were billed in either of the last two fiscal years for products and services provided by the principal accountant, other than the services reported in paragraphs (a) through (c) of this Item. |
| (e)(1) | The audit committee has adopted pre-approval policies and procedures described in paragraph (c)(7) of Rule 2-01 of Regulation S-X. Pursuant to the pre-approval policies and procedures, the audit committee has pre-approved certain audit, audit-related and tax services and has established, with respect to each fiscal year of the registrant, the following maximum fee levels for services covered under the pre-approval policies and procedures: |
| · | Services, relating to a new series or class of a series, associated with SEC registration statements, periodic reports and other documents filed by the registrant with the SEC or other documents issued by the registrant in connection with securities offerings and assistance in responding to SEC comment letters—$5,000 |
| · | Consultations with management of the registrant, not in connection with an audit, as to the accounting or disclosure treatment of transactions or events and/or the actual or potential impact of final or proposed rules, standards or interpretations by the SEC, FASB or other regulatory or standard setting bodies—$5,000 |
| · | All tax services provided to the registrant in the aggregate—$5,000 |
| (e)(2) | None of the services described in paragraph (b) through (d) of this Item were approved by the audit committee pursuant to paragraph (c)(7)(i)(C) of Rule 2-01 of Regulation S-X. |
| (f) | Less than 50% of hours expended on the principal accountant’s engagement to audit the registrant’s financial statements for the most recent fiscal year were attributed to work performed by persons other than the principal accountant’s full-time, permanent employees. |
| (g) | With respect to the fiscal years ended March 31, 2023 and 2022, aggregate non-audit fees of $32,500 and $30,000, respectively, were billed by the registrant’s principal accountant for services rendered to the registrant. No non-audit fees were billed in either of the last two fiscal years by the registrant’s principal accountant for services rendered to the registrant’s investment adviser (not including any sub-adviser whose role is primarily portfolio management and is subcontracted with or overseen by another investment adviser), and any entity controlling, controlled by, or under common control with the adviser that provides ongoing services to the registrant. |
| (h) | The principal accountant has not provided any non-audit services to the registrant’s investment adviser (not including any sub-adviser whose role is primarily portfolio management and is subcontracted with or overseen by another investment adviser), and any entity controlling, controlled by, or under common control with the investment adviser that provides ongoing services to the registrant. |
(j) Not applicable
| Item 5. | Audit Committee of Listed Registrants. |
Not applicable
| Item 6. | Schedule of Investments. |
| (a) | Not applicable [schedule filed with Item 1] |
| Item 7. | Disclosure of Proxy Voting Policies and Procedures for Closed-End Management Investment Companies. |
Not applicable
| Item 8. | Portfolio Managers of Closed-End Management Investment Companies. |
Not applicable
| Item 9. | Purchases of Equity Securities by Closed-End Management Investment Company and Affiliated Purchasers. |
Not applicable
| Item 10. | Submission of Matters to a Vote of Security Holders. |
The registrant’s Governance, Nominating, Compensation and QLCC Committee shall review shareholder recommendations to fill vacancies on the registrant’s board of trustees if such recommendations are submitted in writing, addressed to the Committee at the registrant’s offices and meet any minimum qualifications adopted by the Committee. The Committee may adopt, by resolution, a policy regarding its procedures for considering candidates for the board of trustees, including any recommended by shareholders.
| Item 11. | Controls and Procedures. |
(a) Based on their evaluation of the registrant’s disclosure controls and procedures (as defined in Rule 30a-3(c) under the Investment Company Act of 1940) as of a date within 90 days of the filing date of this report, the registrant’s principal executive officers and principal financial officer have concluded that such disclosure controls and procedures are reasonably designed and are operating effectively to ensure that material information relating to the registrant, including its consolidated subsidiaries, is made known to them by others within those entities, particularly during the period in which this report is being prepared, and that the information required in filings on Form N-CSR is recorded, processed, summarized, and reported on a timely basis.
(b) There were no changes in the registrant’s internal control over financial reporting (as defined in Rule 30a-3(d) under the Investment Company Act of 1940) that occurred during the period covered by this report that have materially affected, or are reasonably likely to materially affect, the registrant’s internal control over financial reporting.
Item 12. Disclosure of Securities Lending Activities for Closed-End Management Investment Companies.
Not applicable
File the exhibits listed below as part of this Form. Letter or number the exhibits in the sequence indicated.
(a)(1) Any code of ethics, or amendment thereto, that is the subject of the disclosure required by Item 2, to the extent that the registrant intends to satisfy the Item 2 requirements through filing of an exhibit: Attached hereto
(a)(2) A separate certification for each principal executive officer and principal financial officer of the registrant as required by Rule 30a-2(a) under the Act (17 CFR 270.30a-2(a)): Attached hereto
(1) Not applicable
(2) Change in the registrant’s independent public accountants: Not applicable
(b) Certifications required by Rule 30a-2(b) under the Act (17 CFR 270.30a-2(b)): Attached hereto
Exhibit 99.CODE ETH Code of Ethics
Exhibit 99.CERT Certifications required by Rule 30a-2(a) under the Act
Exhibit 99.906CERT Certifications required by Rule 30a-2(b) under the Act
SIGNATURES
Pursuant to the requirements of the Securities Exchange Act of 1934 and the Investment Company Act of 1940, the registrant has duly caused this report to be signed on its behalf by the undersigned, thereunto duly authorized.
| (Registrant) | Williamsburg Investment Trust | | |
| | | | |
| By (Signature and Title)* | /s/ David K. James | |
| | | David James, Secretary | |
| | | | |
| Date | June 2, 2023 | | |
| | | | |
| Pursuant to the requirements of the Securities Exchange Act of 1934 and the Investment Company Act of 1940, this report has been signed below by the following persons on behalf of the registrant and in the capacities and on the dates indicated. |
| | | | |
| By (Signature and Title)* | /s/ John T. Bruce | |
| | | John T. Bruce, President | |
| | | (Cantor FBP Equity & Dividend Plus Fund and Cantor FBP Appreciation & Income Opportunities Fund) | |
| | | | |
| Date | June 2, 2023 | | |
| | | | |
| By (Signature and Title)* | /s/ Thomas W. Leavell | |
| | | Thomas W. Leavell, President | |
| | | (The Government Street Equity Fund, The Government Street Mid-Cap Fund) | |
| | | | |
| Date | June 2, 2023 | | |
| | | | |
| By (Signature and Title)* | /s/ Charles M. Caravati III | |
| | | Charles M. Caravati III, President | |
| | | (The Jamestown Equity Fund) | |
| | | | |
| Date | June 2, 2023 | | |
| | | | |
| By (Signature and Title)* | /s/ John P. Ackerly IV | |
| | | John P. Ackerly IV, President | |
| | | (The Davenport Core Leaders Fund, Davenport Value & Income Fund, Davenport Equity Opportunities Fund, Davenport Small Cap Focus Fund and the Davenport Balanced Income Fund) | |
| | | | |
| Date | June 2, 2023 | | |
| | | | |
| By (Signature and Title)* | /s/ Mark J. Seger | |
| | | Mark J. Seger, Treasurer and Principal Financial Officer | |
| | | | |
| Date | June 2, 2023 | | |
* Print the name and title of each signing officer under his or her signature.