| OMB APPROVAL |
OMB Number: 3235-0570 Expires: August 31, 2020 Estimated average burden hours per response: 20.6 |
UNITED STATES
SECURITIES AND EXCHANGE COMMISSION
Washington, D.C. 20549
FORM N-CSR
CERTIFIED SHAREHOLDER REPORT OF REGISTERED
MANAGEMENT INVESTMENT COMPANIES
| Investment Company Act file number | 811-05685 | |
| Williamsburg Investment Trust |
| (Exact name of registrant as specified in charter) |
| 225 Pictoria Drive, Suite 450 Cincinnati, Ohio | 45246 |
| (Address of principal executive offices) | (Zip code) |
John H. Chilton, Esq.
| Sullivan & Worcester LLP 1666 K Street NW Washington, D.C. 20006 |
| (Name and address of agent for service) |
| Registrant's telephone number, including area code: | (513) 587-3400 | |
| Date of fiscal year end: | March 31 | |
| | | |
| Date of reporting period: | March 31, 2020 | |
Form N-CSR is to be used by management investment companies to file reports with the Commission not later than 10 days after the transmission to stockholders of any report that is required to be transmitted to stockholders under Rule 30e-1 under the Investment Company Act of 1940 (17 CFR 270.30e-1). The Commission may use the information provided on Form N-CSR in its regulatory, disclosure review, inspection, and policymaking roles.
A registrant is required to disclose the information specified by Form N-CSR, and the Commission will make this information public. A registrant is not required to respond to the collection of information contained in Form N-CSR unless the Form displays a currently valid Office of Management and Budget ("OMB") control number. Please direct comments concerning the accuracy of the information collection burden estimate and any suggestions for reducing the burden to the Secretary, Securities and Exchange Commission, 450 Fifth Street, NW, Washington, DC 20549-0609. The OMB has reviewed this collection of information under the clearance requirements of 44 U.S.C. § 3507.
Item 1. Reports to Stockholders.
ANNUAL REPORT
March 31, 2020
Beginning on January 1, 2021, as permitted by regulations adopted by the U.S. Securities and Exchange Commission, paper copies of the Funds’ shareholder reports like this one will no longer be sent by mail, unless you specifically request paper copies of the reports from the Funds or from your financial intermediary, such as a broker-dealer or bank. Instead, the reports will be made available on a website, and you will be notified by mail each time a report is posted and provided with a website link to access the report.
If you already elected to receive shareholder reports electronically, you will not be affected by this change and you need not take any action. You may elect to receive shareholder reports and other communications from the Funds electronically by contacting the Funds at 1-800-281-3217 or, if you own these shares through a financial intermediary, by contacting your financial intermediary.
You may elect to receive all future reports in paper free of charge. You can inform the Funds that you wish to continue receiving paper copies of your shareholder reports by contacting the Funds at 1-800-281-3217. If you own shares through a financial intermediary, you may contact your financial intermediary or follow instructions included with this document to elect to continue to receive paper copies of your shareholder reports. Your election to receive reports in paper will apply to all Funds held with the Fund complex or at your financial intermediary.
THE DAVENPORT FUNDS
LETTER TO SHAREHOLDERS | April 20, 2020 |
Dear Shareholders,
These are frightening and unusual times. Economies, financial markets, and people around the world are gripped with coronavirus fears. We’ve gone from a buoyant economy that was supported by a very healthy consumer to a full-blown crisis. The S&P 500® Index declined 19.60% in the fiscal fourth quarter and experienced the fastest move into bear market territory in history. The Russell 2000® Index declined 30.61% and the Dow Jones Industrial Average had its worst calendar first quarter ever. The market’s swoon has been nauseating and very few stocks have been defensive.
Suffice it to say, the world is a different place than it was at the time of our last quarterly update. There’s significant social change that accompanies change in financial markets. Much of America is closed. We are working from home, wearing masks to the grocery store, spraying packages with Lysol, doing puzzles, binging on Netflix, and developing a newfound appreciation for delicacies fromChef Boyardee. Meanwhile, our kids are being treated to “virtual learning.” Personal space has indeed taken on a completely new meaning. How long will this last, and what should we be doing as investors?
We don’t have a crystal ball, and the virus outcome involves wide extremes. However, it’s clear we are experiencing an unprecedented economic shock. Surely, there will be lasting effects, including heightened risk aversion in terms of both debt and germs. We will also see unrivaled monetary and fiscal stimulus to offset the virus’ impact. Already, the Federal Reserve has lowered interest rates to zero, and the government has passed the $2 trillion CARES Act meant to provide relief to businesses and individuals.
Different companies have varying degrees of exposure to the virus and its effects. Some may see business temporarily improve, some will see a muted impact, and some will see deep declines. Another camp, most notably travel & leisure companies with significant debt, will see their existence threatened if this pandemic persists. The situation could also accelerate the structural decline of challenged areas such as brick & mortar retail and old media, while furthering trends such as cloud computing and online retailing.
Generally, we’ve been trying to upgrade the durability of our Funds while also taking advantage of opportunities. Years from now, we think the current pricing of some very high-quality franchises will look quite attractive. Our mission is to have our best players on the field. There are cases where we can sell a depressed stock and buy an equally depressed name of superior quality. We don’t want to run too far from risk when fear is rampant, but we also want survivors and are paying keen attention to the balance sheet health of our holdings.
By definition, something horrible has to be happening for prices to be where they are. Such panics are typically caused by something new, different and totally unanticipated… this time is no exception. In fact, it feels worse and less controllable than other crises. While the situation does appear to entail extreme outcomes, we are placing a higher probability on a return to normalcy at some point in the not too distant future (albeit after a period of pain). Investors may ultimately be rewarded should that prove to be the case.
1
Davenport Core Fund
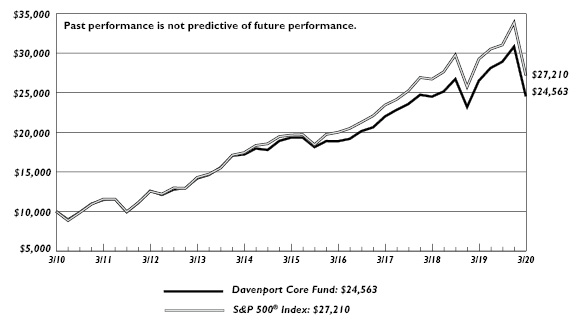
The following chart represents Davenport Core Fund’s (DAVPX) performance and the performance of the S&P 500 Index*, the Core Fund’s primary benchmark, for the periods ended March 31, 2020.
| Fiscal Q4
2019 | 1 Year | 3 Years** | 5 Years** | 10 Years** | Since
Inception
1/15/98** | Fiscal
Year 2020
Expense
Ratio |
Core Fund | -20.31% | -7.36% | 3.74% | 4.90% | 9.40% | 6.19% | 0.89% |
S&P 500 Index* | -19.60% | -6.98% | 5.10% | 6.73% | 10.53% | 6.61% | |
30-Day SEC Yield: 0.49%; Expense Ratio in current prospectus: 0.89%
Past performance is no guarantee of future results. Investment return and principal value of an investment will fluctuate so that an investor’s shares, when redeemed, may be worth more or less than their original cost. Current performance may be lower or higher than the performance data quoted. Performance data, current to the most recent month-end, may be obtained by calling 1-800-281-3217.
* | The S&P 500 Index is comprised of 500 U.S. stocks and is an indicator of the performance of the overall U.S. stock market. Standard & Poor’s Financial Services LLC, a division of S&P Global, is the source and owner of the registered trademarks related to the S&P 500 Index. An investor cannot invest in an index and its returns are not indicative of the performance of any specific investment. |
** | Returns greater than one year are annualized. |
The Davenport Core Fund (DAVPX), along with the broader market, suffered a setback in the final quarter of fiscal 2020. The Fund fell 20.31%, relative to a 19.60% decline for the S&P 500® Index. For the fiscal year, the Fund declined 7.36% compared to the 6.98% decline for the Index. As mentioned in the above macro letter, the COVID-19 virus wreaked havoc across equity markets late in the fourth quarter, as precautions taken to slow the spread of the virus heavily disrupted economic activity.
Being underweight in the Information Technology hurt performance to end the year, as tech stocks held up better than the market. In addition, our Consumer Staples sector performance was dragged down by a sharp selloff in Anheuser-Busch Inbev (BUD), which we sold during the quarter. On the positive side, the Real Estate and Communication Services sectors helped us during the fiscal fourth quarter and full year, with strong relative performance from American Tower Corporation (AMT) and connectivity names such as T-Mobile US, Inc. (TMUS) and Liberty Broadband Corporation (LBRDK).
While we never like to see sharp declines, we take great comfort in the quality and durability of the companies we own in the Core Fund. When looked at as a whole, we believe these are large, well-capitalized companies that have survived and profitably grown for many decades.
Transaction activity was very modest in the first two months of the fiscal fourth quarter, but as the pandemic spread, we took the opportunity to make some changes, improving quality and reacting to this new world. We sold some economically sensitive names, such as FedEx Corporation (FDX) and Vulcan Materials Company (VMC). We also changed horses in the Financials sector by selling Wells Fargo & Company (WFC) to purchase Moody’s Corporation (MCO).
2
Moody’s is a leading provider of global credit ratings and has a strong data analysis business. The asset-light business model is excellent, leading to very high margins and free cash flow generation. Barriers-to-entry are high with Moody’s operating largely in a duopoly with Standard & Poor’s. In addition, Moody’s is not exposed to credit concerns and interest margin compression that traditional banks currently face. The stock had pulled back sharply alongside the market and we were able to purchase this high-quality business at an attractive valuation.
With some of the cyclical proceeds, we purchased shares in Abbott Laboratories (ABT). ABT, founded in 1888, is a global, diversified health care leader with operations in four operating divisions that include Nutritionals, Diagnostics, Established Pharmaceuticals, and Medical Devices. The 2017 acquisition of St. Jude Medical brought ABT an array of advanced cardiac products. The balance sheet has been de-levered from that deal, and ABT is benefiting from the late-stage R&D pipeline delivering next-generation Medtech products to market. As a result, we view ABT as well-positioned to sustain sector leading, high single-digit organic sales growth along with enhanced operating margins through supply chain and manufacturing efficiencies from its global network that drives double-digit EPS growth into 2023.
In addition, we added to our existing positions in Microsoft Corporation (MSFT), Amazon.com, Inc. (AMZN) and T-Mobile US, Inc. (TMUS). These businesses are very well insulated from the economic fallout of the virus. MSFT and AMZN are both benefiting from increased uptake of cloud computing in this virtual, work-from-home world. Secular trends in their favor are only accelerated by the pandemic, and they have outstanding balance sheets. TMUS has a great story in the wake of the recently-closed Sprint deal. TMUS should continue to take market share with its value offering and marketing prowess. The Sprint deal offers ample savings on marketing costs and allows TMUS to take advantage of Sprint’s fallow spectrum, providing a durable double-digit earnings growth outlook.
In sum, it was a tough close to the year for performance. We were quite active as the market volatility increased, working to both improve the Fund’s resilience if the COVID-driven economic weakness continues and also to further improve the Fund’s upside potential for when the pandemic wanes and the economy rebounds. We feel good about the changes made in the fourth quarter and will remain vigilant as volatility is likely to continue into the next fiscal year.
The following are transactions performed in the Core Fund for the quarter ended March 31, 2020.
Recent Purchases
Abbott Laboratories (ABT)We initiated a new position in ABT, a diversified health care leader with operations in four operating divisions that include Nutritionals, Diagnostics, Established Pharmaceuticals and Medical Devices. Although ABT has not adjusted its earnings guidance provided before coronavirus came on the scene, we note that revenues generated from product sales to China represent less than 8% of company totals, and the supply chain does not rely on sourcing from China – suggesting likely minimal initial impact to the 2020 outlook from this factor.
Microsoft Corporation (MSFT)We added to our position, believing that MSFT is well-positioned to be a key beneficiary of increasing cloud computing, due to its monopoly on operating systems and cross-selling opportunities. Additionally, MSFT has a net cash balance sheet, trades for a reasonable valuation, and should be relatively insulated from the economic fallout of COVID-19 given its digital focus.
3
Moody’s Corporation (MCO) We initiated a position in MCO on weakness, attracted to this leading provider of global credit ratings, research, and analysis. With ~$4.8 billion in 2019 revenue and strong mid-to-upper 40’s operating margins, we were pleased to add this name to our holdings.
Recent Sales
Anheuser-Busch Inbev S.A./N.V. (BUD)While BUD remains a market leader with best-in-class scale and operating margins, on premise sales (such as bars, restaurants, stadiums, etc.) will be impacted by the coronavirus, and we, therefore, elected to sell the shares in favor of other higher-quality businesses on sale.
Brookfield Asset Management, Inc. (BAM) Despite our decision to trim the position, we continue to regard BAM as one of the highest quality companies we own. While the stock looks more fairly valued, we still believe the company can compound value in the low-to-mid teens for years to come.
FedEx Corporation (FDX) FDX has been a struggle for quite some time, as numerous issues have cropped up. Although a great deal of damage has been done, the company remains in a highly cyclical industry and results could deteriorate further in a prolonged global slowdown. Given this uncertain outlook, we elected to sell the shares and move to a higher quality business with greater visibility.
Vulcan Materials Company (VMC) Despite being good businesses, the aggregates stocks have not been immune to the market turmoil as a recession represents the biggest risk the companies face. VMC has a good balance sheet and no liquidity concerns but was our smallest position in an already overweight Materials sector and we, therefore, elected to sell the shares.
Wells Fargo & Company (WFC) Shares of WFC and its banking peers have struggled in the declining interest rate environment. With the Fed Funds rate now near zero, and bank earnings expected to decline over the near-term due to net interest margin compression, we elected to sell the position in favor of a financial stock with a stronger growth outlook.
Davenport Value & Income Fund
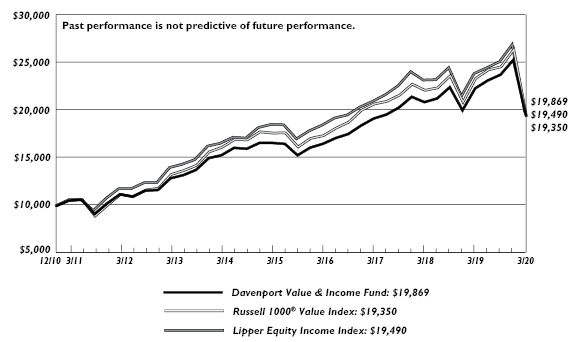
The following chart represents Davenport Value & Income Fund (DVIPX) performance and the performance of the Russell 1000 Value Index*, the Value & Income Fund’s primary benchmark, the S&P 500 and the Lipper Equity Income Index for the periods ended March 31, 2020.
| | Fiscal Q4
2019 | 1 Year | 3 Years** | 5 Years** | Since
Inception
12/31/10** | Fiscal
Year 2020
Expense
Ratio |
Value & Income Fund | -26.32% | -16.97% | -1.83% | 1.36% | 7.71% | 0.88% |
Russell 1000 Value Index | -26.73% | -17.17% | -2.18% | 1.90% | 7.40% | |
S&P 500 Index* | -19.60% | -6.98% | 5.10% | 6.73% | 10.38% | |
Lipper Equity Income Index* | -23.11% | -12.85% | 0.52% | 3.23% | 7.48% | |
30-Day SEC Yield: 2.46%; Expense Ratio in current prospectus: 0.89%
4
Past performance is no guarantee of future results. Investment return and principal value of an investment will fluctuate so that an investor’s shares, when redeemed, may be worth more or less than their original cost. Current performance may be lower or higher than the performance data quoted. Performance data, current to the most recent month-end, may be obtained by calling 1-800-281-3217.
* | The Russell 1000® Value Index measures the performance of the Russell 1000 companies with lower price-to-book ratios and lower forecasted growth values. London Stock Exchange Group PLC and its group undertakings (collectively, the “LSE Group”).© LSE Group 2020. FTSE Russell is a trading name of certain LSE Group companies. “Russell®” is a trademark of the relevant LSE Group companies and is used by any other LSE Group company under license. All rights in the FTSE Russell indexes or data vest in relevant LSE Group company which owns the index or the data. Neither LSE Group nor its licensors accept any liability for any errors or omissions in the indexes or data and no party may rely on any indexes or data contained in this communication. No further distribution of data from LSE Group is permitted without the relevant LSE Group company’s express written consent. The LSE Group does not promote/sponsor/endorse the content of this communication. The S&P 500 Index is comprised of 500 U.S. stocks and is an indicator of the performance of the overall U.S. stock market. The S&P 500 Index is comprised of 500 U.S. stocks and is an indicator of the performance of the overall U.S. stock market. Standard & Poor’s Financial Services LLC, a division of S&P Global, is the source and owner of the registered trademarks related to the S&P 500 Index. The Lipper Equity Income Index is an unmanaged index of the 30 largest Funds in the Lipper Equity Income Fund category. An investor cannot invest in an index and its returns are not indicative of the performance of any specific investment. |
** | Returns greater than one year are annualized. |
The Davenport Value & Income Fund (DVIPX) declined 26.32% in the final quarter of the fiscal year. This was largely in line with the Fund’s primary benchmark, the Russell 1000 Value® Index, which decreased 26.73%. The S&P 500® Index decreased 19.60% in the quarter. For the fiscal year, the Fund declined 16.97% compared to declines of 17.17% and 6.98% for the Russell 1000 Value and S&P 500, respectively. The Fund started the final quarter on a positive note with the Russell 1000 Value Index hitting record highs in mid-February, before succumbing to the market volatility attributed to the coronavirus pandemic and declining precipitously in March. We are disappointed that the Fund did not prove more defensive during the drawdown, but in reality, there was nowhere to hide as all sectors registered sharp and significant declines. This included traditionally defensive areas such as Real Estate, Utilities, and Consumer Staples.
The key positive contributors to performance for both the quarter and fiscal year were the timely addition of Lowe’s Companies, Inc. (LOW) (more on this below) as well as our ownership of Microsoft Corporation (MSFT), which held up well thanks to its resilient cloud and enterprise software business. Our roughly 4% cash position also helped. On the negative side, the Fund’s overweight in Financials and Energy stocks were key detractors with names such as Fidelity National Financial, Inc. (FNF), Capital One Financial Corporation (COF), and Marathon Petroleum Corporation (MPC) declining over 40%. Additional detractors included some of our travel/leisure holdings, such as Delta Air Lines, Inc. (DAL) and Carnival Corporation (CCL).
Our Fund activity was higher than normal in the fourth quarter as we took the opportunity provided by significant market volatility to attempt to reduce risk to the downside while retaining the upside potential, with a focus on strong balance sheets and businesses that we think should perform well when the pandemic is over. This included adding to our positions in Berkshire Hathaway, Inc. (BRK’B), 3M Company (MMM), McDonald’s Corporation (MCD) and PepsiCo, Inc. (PEP).
5
Early in the quarter, we swapped our position in Intel Corporation (INTC) for International Business Machines Corporation (IBM). Intel was a solid holding as early actions under a new CEO were rewarded by the market and the stock’s valuation re-rated to a more normal range. IBM has struggled to grow for years while trying several different paths to success in the new digital world. We think the company may finally have gotten it right with the acquisition of Red Hat, Inc. in 2019 and a shifting focus to be the leading hybrid cloud provider. IBM has an investment-grade balance sheet, low beta, and less business risk due to the recurring nature of its service business. We felt investor sentiment was overdone to the downside, offering an attractive entry point, and in the meantime, get to enjoy the nearly 5% dividend yield.
Additionally, late in the quarter we initiated a new position in Lowe’s Companies, Inc. (LOW). LOW is the world’s second-largest home improvement retailer and is a retail self-help situation led by a management team with a proven track record of execution, trading at its lowest valuation in 20 years. Additionally, we view the home improvement retail landscape favorably given above-average household formation, strong housing turnover, and aging of the housing stock (75% of homes are >20 yrs old). We also think that LOW could be a near-term beneficiary in the work from home age as people stuck at home can catch up on house projects.
During the quarter we sold several of our more cyclical businesses and those with somewhat elevated balance sheet risk including Carnival Corporation (CCL), Dow, Inc. (DOW), Freeport-McMoRan, Inc. (FCX), Altria Group, Inc. (MO), and Citigroup, Inc. (C).
In summary, the final quarter was difficult for almost all equity funds and the Value & Income Fund was no exception. However, we are optimistic that recent changes should position the Fund to “survive and thrive” in this new world. We also think the Fund’s current yield of 2.46% is compelling in a low-interest rate environment.
The following are transactions performed in Value & Income Fund for the quarter ended March 31, 2020.
Recent Purchases
3M Company (MMM)We added to our position, believing that downward estimate revisions are nearing an end and the stock’s valuation more than prices in potential liabilities. While it may take some time to play out, we expect MMM to return to growth.
Berkshire Hathaway, Inc. (BRK’B) We added to our position as we continue to believe the shares offer significant value at current levels and should act defensively during more volatile and uncertain economic times.
Bunge Ltd. (BG)BG is one of the largest agribusinesses and grain processing companies in the world. With a new management team focused on cutting costs, shedding non-core assets and increasing the earnings power of the company, we elected to initiate a position in the name.
Chevron Corporation (CVX) With a AA-rated balance sheet, diversified asset base and disciplined management team, we elected to add to CVX during the quarter, as it remains one of the more solid ways to play the volatile energy sector.
Comcast Corporation (CMCSA)With the shares trading lower after recent earnings release, we elected to add to CMCSA believing the market is overlooking the bigger picture and the strategic moves the company is making.
6
Delta Air Lines, Inc. (DAL) We used proceeds from our sale of CCL and added to DAL, as flying is more essential than cruising and shares should rebound faster when concerns over the coronavirus begin to abate.
International Business Machines Corporation (IBM) We initiated a position in IBM, as it fits into our defensive category with a solid balance sheet, low beta, minimal business risk, and negative sentiment. After years of struggling to grow, we believe their shift in focus to the cloud and artificial intelligence may pay off in the time to come.
Lamar Advertising Company (LAMR)We added to the shares on weakness, as we remain attracted to the company’s free cash flow dynamics and structural tailwinds and believe LAMR should benefit from the upcoming political season.
McDonald’s Corporation (MCD)While MCD is not immune to COVID-19, we added to the shares given that approximately 75% of sales are “off-premise” (65% drive-thru), and results should hold up much better than many other stocks in the current environment.
Medtronic PLC (MDT)We added to MDT shares on weakness, as we remain impressed with the robust new product pipeline including recently launched leadless Micra AV pacer in the EU and pending roll-out of the next generation closed-loop diabetes monitor/pump.
Lowe’s Companies, Inc. (LOW) Trading at a 20-year low valuation, we initiated a position in the world’s 2nd largest home improvement retailer, given macro tailwinds and favorable view on management’s ability to execute amid COVID-19 concerns.
PepsiCo, Inc. (PEP)We added to the shares on weakness, as we remain attracted to the strong balance sheet and believe PEP represents one of the best combinations of defense and offense in the consumer staples sector.
Tyson Foods, Inc. (TSN)After our initial purchase of TSN during the quarter, we added again to the shares on weakness due to the coronavirus outbreak in China and continued operational issues in its chicken business. TSN is one of the world’s leading processors and marketers of chicken, beef and pork products and stands to benefit from long-term secular growth from higher global protein demand.
United Parccel Service, Inc. (UPS) We added to the shares as they approached a 5-year low due to recessionary fears. We believe this is a high-quality business with a solid balance sheet and are attracted to its more domestic orientation and solid long-term growth plan.
Recent Sales
Altria Group, Inc. (MO)While we believe the dividend is safe, trends in cigarette consumption appear to be on the decline. Alongside what appears to be a poor investment in Juul (and potentially Cronos), we elected to sell the position.
Allstate Corporation (ALL)While we remain attracted to ALL from a long-term perspective, we elected to sell the shares as the stock has appreciated significantly since our initial purchase and near-term potential risks outweigh the upside potential.
Bristol-Meyers Squibb Company (BMY)Given recent strength in the stock following the closing of the Celgene deal, we elected to sell some of our position but retain the bulk of the shares as the combined company still trades at an undemanding valuation, has a promising late-stage pipeline, and generates significant free cash flow.
7
Brookfield Asset Management, Inc (BAM) Despite our decision to trim the position on recent strength, we continue to regard BAM as one of the highest quality companies we own and believe the company can compound value for years to come.
Carnival Corporation (CCL)While CCL shares may ultimately recover, we opted to sell our position, believing our capital can be deployed into better risk/reward opportunities.
Citigroup, Inc. (C)C shares have struggled in the declining interest rate environment. Alongside risks associated with the company’s international exposure (broadest of the major money center banks), we decided to sell the position.
Dow, Inc. (DOW) With the stock struggling since our initial purchase in May 2019 we elected to sell the shares, believing it will be tough for the stock to work absent an acceleration in global growth, which looks increasingly unlikely given coronavirus concerns.
Fidelity National Financial, Inc. (FNF)While we remain attracted to FNF and management’s strong track record of increasing shareholder value, we elected to chip the position on recent strength in the shares.
Freeport-McMoRan, Inc. (FCX)Copper prices have fallen precipitously from their recent high due to the coronavirus and fears of a recession. Given we have other cyclical stocks that are likely to perform well should global growth improve, we elected to sell the position.
Intel Corporation (INTC) We sold our position on strength during the quarter, as early actions from the new CEO have been rewarded, shares have responded favorably and our thesis has played out sooner than anticipated.
Microsoft Corporation (MSFT) While we remain very positive on the outlook for MSFT, which has undergone a tremendous transformation in its business and culture and is gaining market share in the critical public cloud space, we opted to chip some of the position on recent strength in the stock.
Davenport Equity Opportunities Fund
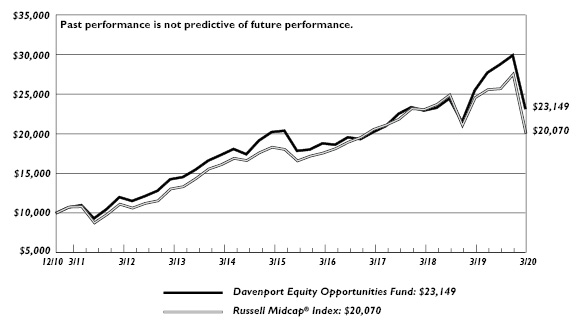
The following chart represents Davenport Equity Opportunities Fund (DEOPX) performance and the performance of the Russell Midcap Index*, the Fund’s primary benchmark, and the S&P 500 Index* for the periods ended March 31, 2020.
| | Fiscal Q4
2019 | 1 Year | 3 Years** | 5 Years** | Since
Inception
12/31/10** | Fiscal
Year 2020
Expense
Ratio |
Equity Opportunities Fund | -22.62% | -9.13% | 4.62% | 2.74% | 9.50% | 0.90% |
Russell Midcap Index | -27.07% | -18.31% | -0.81% | 1.85% | 7.82% | |
S&P 500 Index* | -19.60% | -6.98% | 5.10% | 6.73% | 10.38% | |
30-Day SEC Yield: -0.09%; Expense Ratio in current prospectus: 0.91%
Past performance is no guarantee of future results. Investment return and principal value of an investment will fluctuate so that an investor’s shares, when redeemed, may be worth more or less than their original cost. Current performance may be lower or higher than the performance data quoted. Performance data, current to the most recent month-end, may be obtained by calling 1-800-281-3217.
8
* | The Russell Midcap® Index measures the performance of the 800 smallest companies in the Russell 1000, which represent approximately 25% of the total market capitalization of the Russell 1000®. London Stock Exchange Group PLC and its group undertakings (collectively, the “LSE Group”).© LSE Group 2020. FTSE Russell is a trading name of certain LSE Group companies. “Russell®” is a trademark of the relevant LSE Group companies and is used by any other LSE Group company under license. All rights in the FTSE Russell indexes or data vest in relevant LSE Group company which owns the index or the data. Neither LSE Group nor its licensors accept any liability for any errors or omissions in the indexes or data and no party may rely on any indexes or data contained in this communication. No further distribution of data from LSE Group is permitted without the relevant LSE Group company’s express written consent. The LSE Group does not promote/sponsor/endorse the content of this communication. The S&P 500 Index is comprised of 500 U.S. stocks and is an indicator of the performance of the overall U.S. stock market. Standard & Poor’s Financial Services LLC, a division of S&P Global, is the source and owner of the registered trademarks related to the S&P 500 Index. An investor cannot invest in an index and its returns are not indicative of the performance of any specific investment. |
** | Returns greater than one year are annualized. |
The Davenport Equity Opportunities Fund (DEOPX) endured a challenging fiscal fourth quarter, experiencing a 22.62% decline for the period and a 9.13% decline for the fiscal year. Though the drawdown for the strategy proved resilient relative to the 27.07% decline and 18.31% decline for the Russell Midcap® Index during the quarter and year respectively, it was painful nonetheless.
Simplistically, the fiscal fourth quarter can be thought of as two distinct periods: pre-crisis and post. In each period, we took several actions aimed at improving the risk-reward profile of the strategy; however, the new reality of the latter stages of the quarter made profit-taking exercises seem timely while rendering decisions to add to or introduce new positions “too early” at best.
Earlier in the quarter, we took profits in larger positions that had performed well such as Brookfield Asset Management, Inc. (BAM), CarMax, Inc. (KMX), and Martin Marietta Materials, Inc. (MLM). We also continued to reduce stakes in growth-oriented names such as Autodesk, Inc. (ADSK), Intuit, Inc. (INTU) and MercadoLibre, Inc. (MELI) as the tech sector continued its outperformance. With the funds, we added to positions in Fairfax Financial Holdings Ltd. (FRFHF) and Markel Corporation (MKL) given what appeared to be reasonable valuations in light of an improving industry backdrop and ongoing investment momentum. We also added to our position in auto parts retailer and quality compounder, O’Reilly Automotive, Inc. (ORLY). While we wish we had waited on each of these decisions as the stocks declined in the market’s swoon, we continue to believe in the long-term prospects of these franchises and take comfort in their solid liquidity and defensible businesses that should be able to weather the storm.
We also introduced two new names to the strategy earlier in the quarter in Altice USA, Inc. (ATUS) and Colfax Corporation (CFX). ATUS is the fourth-largest cable operator in the U.S. and appears well-positioned to benefit from increased data consumption over the long term. CFX is a name we have known for some time that, following recent business repositioning, had reduced the cyclicality of its operations and seemed well-positioned for cash generation, continuous improvement, and capital allocation. While we remain attracted to both of these businesses, they carry higher degrees of leverage, thereby making the near-term outlook a bit more nebulous. As such, amid the market drawdown, we elected to emphasize other names that we highlight below.
Two of our top-performing holdings during the quarter and full-year were American Tower Corporation (AMT) and Take-Two Interactive Software, Inc. (TTWO), with each becoming outsized positions due to their relatively sturdy performance amid the market’s drawdown. In the case of AMT, we continue to regard the company as one of the highest quality businesses we know of, with predictable revenue streams from secular growth in mobile connectivity.
9
However, with the position size approaching 9%, we felt it prudent to re-allocate funds to some more distressed ideas that exhibit more attractive risk/reward profiles. In the case of TTWO, the stock had received a flight to safety bid alongside other game publishers as investors viewed the business model as being resilient during this unprecedented period of self-quarantine and social distancing. While we agree with this notion and like the company’s strong balance sheet, astute management team and top-quality content, its weighting had also increased dramatically. With the funds from these two reductions, we elected to add to holdings in Live Nation Entertainment, Inc. (LYV), Fidelity National Financial, Inc. (FNF), CarMax, Inc. (KMX) and Liberty Broadband Corporation (LBRDK) at what have turned out to be attractive prices at the time of this writing.
In summary, we note that both entering the crisis and at year-end, our strategy has been anchored by quality businesses with strong balance sheets led by capable management teams. As we hope to have illustrated, we took opportunistic actions during the final quarter that we feel helped to bolster the quality while also not abandoning risk (or the opportunity for a bounce-back on the other side). We believe these characteristics along with actions taken during the latest period of volatility will not only help the strategy survive whatever comes next but thrive on the other end.
The following are transactions performed in the Equity Opportunities Fund for the quarter ended March 31, 2020.
Recent Purchases
Altice USA, Inc. (ATUS)We initiated a position in ATUS, the fourth-largest cable operator in the U.S. Later in Q1, we added to our position as we think there is potential for significant upside over the next 2-3 years and the risk/reward looks attractive.
CarMax, Inc. (KMX)We elected to add to our position in KMX late in the quarter. Like many consumer discretionary stocks, shares of KMX have plummeted in recent trading, but with its strong balance sheet and limited credit risk on its auto loan fund, we felt the shares were oversold.
Colfax Corporation (CFX)We initiated a new position in CFX after selling our position in October 2018. Since that time, the company has undergone a significant transformation that has resulted in a higher margin, less cyclical company with better cash flow.
Etsy, Inc. (ETSY)While we suspect that demand for items on ETSY’s marketplace will be negatively affected by the current economic contraction, we think this can be offset by a reduction in in-store shopping and could drive additional buyers to ETSY’s e-commerce marketplace. As such we remain confident in ETSY and elected to add to our position.
Fairfax Financial Holdings Ltd. (FRFHF)We added multiple times to FRFHF during the quarter, as the shares continue to trade at a discount to our estimation of year-end book value despite much-improved returns in the investment fund and continued momentum in the insurance business. We note that FRFHF enjoys a strong capital position and has an impressive track record of capital allocation.
Fidelity National Financial, Inc. (FNF)Still sporting a solid balance sheet and attractive dividend yield, we elected to add to FNF shares during the quarter as the stock sold off dramatically alongside the rest of the housing sector with bond spreads widening and mortgage rates ticking up in recent trading.
10
Liberty Broadband Corporation (LBRDK)As a reminder, LBRDK is a holding company that owns shares of cable concern Charter Communications (CHTR). We chose to add to these shares as the company’s business should prove very resilient during a market slowdown. The value of CHTR’s broadband/data service and “connectivity” in general should only increase as people stay home and watch Netflix and other content providers.
Markel Corporation (MKL)Although MKL has been an underperformer of late, we feel the shares represent a decent value given solid insurance pricing, strong investment results and ongoing momentum in MKL Ventures. We note that MKL enjoys a strong capital position and has an impressive track record of capital allocation. As such, we decided to add to our position.
O’Reilly Automotive, Inc. (ORLY) We added to our position as we are impressed by the company’s defensive business model evidenced by consistent growth during the last recession and should offer protection during more volatile economic times.
Live Nation Entertainment, Inc. (LYV) Due to the coronavirus, shares of LYV pulled back considerably during the quarter as investors were quick to fear that live events/concerts could be impacted. While logical, even a sharp reduction to this year’s earnings would not dramatically impact the long-term value of the company and as such, we elected to add multiple times to our position.
Recent Sales
American Tower Corporation (AMT)We chipped our position in AMT as it had become outsized due to its relatively sturdy performance amid the market’s drawdown. However, it remains one of our larger positions and is still one of the highest quality businesses we know.
AutoDesk, Inc. (ADSK)We continue to have strong long-term conviction in the name but felt it prudent to lock in some gains following the strong up move and reduce our exposure to the more volatile software industry.
Black Knight, Inc. (BKI)This stock has been a stellar performer for the strategy as investors have rewarded the company for superior business models, visible growth opportunities and strong execution. Whereas we continue to like the long-term prospects, we felt valuations left little margin for error and elected to take some profits.
Brookfield Asset Management, Inc. (BAM) BAM posted solid returns in 2019 and was a big contributor to the Fund’s relative outperformance last year. Given the strong run-up, we elected to take some profits with shares more accurately reflecting the company’s business momentum and long-term prospects.
CarMax, Inc. (KMX)With shares approaching all-time highs and rumors of strengthening same-store sales rippling through buy-side expectations, we elected to chip the position on strength early in the quarter, choosing to reduce the outsized position and move to more attractive risk/reward opportunities.
Dollar Tree, Inc. (DLTR)While DLTR generated decent returns since our purchase, the experience has been volatile and frustrating at times. Results have been inconsistent; the integration of Family Dollar has been tougher than originally expected, and we, therefore, opted to sell the remainder of our shares for higher conviction ideas.
Intuit, Inc. (INTU) While we appreciate INTU’s high return business model, strong cash generation and predictable double-digit growth, we elected to chip our position on recent strength, concerned that the significant re-rating in the shares is more the result of macro fund flows than anything fundamental or company-specific.
11
Martin Marietta Materials, Inc. (MLM)While MLM continues to exceed quarterly expectations and provides a favorable 2020 outlook, after the strong run in 2019, we felt it prudent to chip our position and reduce our exposure to housing and infrastructure.
MercadoLibre, Inc. (MELI) We continue to like the long-term opportunity for MELI’s marketplace and payments businesses in South America. However, after the stock’s recent and impressive run, the shares more accurately reflect the opportunity, and we, therefore, elected to chip the position.
Take-Two Interactive Software, Inc. (TTWO)We elected to chip the position as it had become outsized due to its relatively sturdy performance amid the market’s drawdown and investors’ attraction to game publishers in this period of self-quarantine and social distancing.
Zoetis, Inc. (ZTS) This stock has been a stellar performer for the strategy as investors have rewarded the company for superior business models, visible growth opportunities and strong execution. Whereas we continue to like the long-term prospects, we felt valuations left little margin for error and elected to take some profits.
Davenport Small Cap Focus Fund
The following chart represents performance of the Davenport Small Cap Focus Fund (DSCPX) and the performance of the Fund’s primary benchmark, the Russell 2000 Index*, for the periods ended March 31, 2020.
| | Fiscal Q4
2019 | 1 Year | 3 Years** | 5 Years** | Since
Inception
12/31/14** | Fiscal
Year 2020
Expense
Ratio |
Small Cap Focus Fund | -28.04% | -14.08% | -0.52% | 2.80% | 3.46% | 0.95% |
Russell 2000 Index* | -30.61% | -23.99% | -4.64% | -0.25% | 0.57% | |
30-Day SEC Yield: 0.73%; Expense Ratio in current prospectus: 0.98%
Past performance is no guarantee of future results. Investment return and principal value of an investment will fluctuate so that an investor’s shares, when redeemed, may be worth more or less than their original cost. Current performance may be lower or higher than the performance data quoted. Performance data, current to the most recent month-end, may be obtained by calling 1-800-281-3217.
* | The Russell 2000 Index measures the performance of the 2000 smallest companies in the Russell 3000® Index. Frank Russell Company (“Russell”) is the source and owner of the registered trademarks, service marks, and copyrights related to the Russell Indexes. Russell® is a trademark of Frank Russell Company. An investor cannot invest in an index and index returns are not indicative of the performance of any specific investment. London Stock Exchange Group PLC and its group undertakings (collectively, the “LSE Group”).© LSE Group 2020. FTSE Russell is a trading name of certain LSE Group companies. “Russell®” is a trade-mark of the relevant LSE Group companies and is used by any other LSE Group company under license. All rights in the FTSE Russell indexes or data vest in relevant LSE Group company which owns the index or the data. Neither LSE Group nor its licensors accept any liability for any errors or omissions in the indexes or data and no party may rely on any indexes or data contained in this communication. No further distribution of data from LSE Group is permitted without the relevant LSE Group company’s express written consent. The LSE Group does not promote/sponsor/endorse the content of this communication. An investor cannot invest in an index and its returns are not indicative of the performance of any specific investment. |
** | Returns greater than one year are annualized. |
12
The Davenport Small Cap Focus Fund (DSCPX) saw its strong momentum from the beginning of fiscal 2020 reverse sharply in the final quarter as small cap stocks were hit particularly hard during the market’s swoon. The Russell 2000® Index declined 30.61% during the period, faring much worse than the S&P 500® Index with its 19.60% drop. Whereas the Fund’s 28.04% decline bested the Russell 2000, the drawdown was painful and unsettling. For the fiscal year, the Fund declined 14.08%, compared to the 23.99% and 6.98% declines for the Russell 2000 and S&P 500, respectively. Despite the turbulent close to the year, we feel this period of pain has unearthed buying opportunities in names we know well. Ultimately, we view the strategy (and the asset class) to be quite timely at the moment.
Starting with the positives: we were fortunate to have a position in one of the only beneficiaries of this crisis in telehealth leader Teladoc Health, Inc. (TDOC). The company saw its share price soar over 85% during the fiscal fourth quarter as key impediments to the adoption of telehealth were removed in light of the important role telemedicine will play in helping to diagnose and contain the outbreak. While we trimmed the position modestly, we have held on to a meaningful position given our belief that the value creation timeline has been pulled forward. Shenandoah Telecommunications Company (SHEN) was also a meaningful contributor to results as the approval of the Sprint/T-Mobile merger provided a positive catalyst. Cable provider Cable One, Inc. (CABO) was another resilient performer during the quarter. The stock’s contribution to results was augmented by our ability to purchase the shares cheaply during a period of volatility.
Unfortunately, there were more negatives than positives in the quarter. The rapidly intensifying impact of the virus (and the effort to combat it) has upended the global economy, disrupted business models and presented new realities that no one could have anticipated. The world is simply different now and, as a result, we were forced to make some tough decisions regarding businesses that in a pre-COVID-19 world were otherwise resilient and sturdy. Amid the chaos, we elected to exit or dramatically reduce holdings in businesses we once held in high regard that now are seeing their existence threatened. Key examples of this are in travel and leisure facing companies such as Eldorado Resorts, Inc. (ERI), a regional casino operator in the midst of a major acquisition, and OneSpaWorld Holdings Ltd. (OSW), the leading operator of wellness facilities on cruise ships. In the case of the former, deal leverage threatens to dramatically impair the company assuming the complete shutdown of its operations persists. In terms of the latter, the company has some time on its debt maturities, but we are worried that the cruise industry may be one of the last to make a recovery. In each case, the set of potential outcomes has become extreme.
We directed money towards more clear-cut survivors that can also do well on the other side. In that vein, we added to our position in Monarch Casino & Resort, Inc. (MCRI) at depressed levels. With minimal debt, ample cash on the balance sheet and access to a credit facility, MCRI can survive its two casinos being closed for a long time. It could also be one of few companies positioned to opportunistically make an acquisition if others in the industry become distressed sellers. Furthermore, the stock looks cheap even if one assumes cash flow is down 30-40% for a while upon re-opening. This is a case where we could make a lot of money if the world returns to normal and the risk seems manageable in the meantime.
In closing, we are disappointed by the magnitude of the Fund’s drawdown to end the fiscal year. However, we are confident in the Fund’s positioning and feel efforts to take advantage of recent volatility have improved the risk/reward profile of the Fund. We also note that we continue to carry an above average cash balance that should allow us to take advantage of future volatility.
13
Davenport Balanced Income Fund
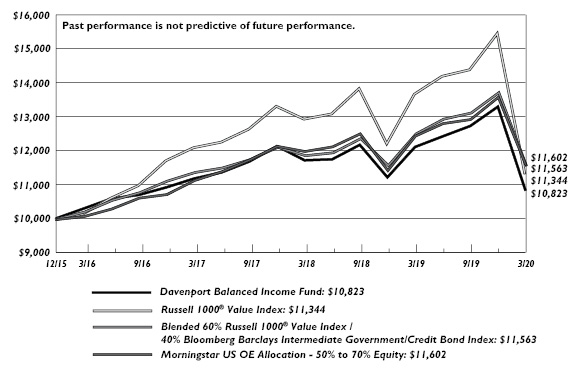
The following chart represents Davenport Balanced Income Fund (DBALX) performance, and performance of the Fund’s primary benchmark, the Russell 1000® Value Index, along with the Morningstar Allocation 50-70% Equity Index, and the blended 60% Russell 1000® Value Index / 40% Bloomberg Barclays Intermediate Government/Credit Bond (BBIGC) Index for the period ended March 31, 2020.
| | Fiscal Q4
2019 | 1 Year | 3 Years** | Since
Inception
12/31/15** | Fiscal
Year 2020
Expense
Ratio |
Balanced Income Fund | -18.57% | -10.59% | -1.06% | 1.88% | 0.95% |
Russell 1000® Value* | -26.73% | -17.17% | -2.18% | 3.01% | |
Morningstar Allocation 50-70% Equity* | -14.71% | -6.89% | 1.33% | 3.56% | |
60% Russell 1000® Value/40% BBIGC | -15.74% | -7.56% | 0.56% | 3.48% | |
30-Day SEC Yield: 2.42%; Expense Ratio in current prospectus: 0.96%
Past performance is no guarantee of future results. Investment return and principal value of an investment will fluctuate so that an investor’s shares, when redeemed, may be worth more or less than their original cost. Current performance may be lower or higher than the performance data quoted. Performance data, current to the most recent month-end, may be obtained by calling 1-800-281-3217.
* | The Russell 1000® Value Index measures the performance of the Russell 1000 companies with lower price-to-book ratios and lower forecasted growth values. London Stock Exchange Group PLC and its group undertakings (collectively, the “LSE Group”).© LSE Group 2020. FTSE Russell is a trading name of certain LSE Group companies. “Russell®” is a trademark of the relevant LSE Group companies and is used by any other LSE Group company under license. All rights in the FTSE Russell indexes or data vest in relevant LSE Group company which owns the index or the data. Neither LSE Group nor its licensors accept any liability for any errors or omissions in the indexes or data and no party may rely on any indexes or data contained in this communication. No further distribution of data from LSE Group is permitted without the relevant LSE Group company’s express written consent. The LSE Group does not promote/sponsor/endorse the content of this communication. The Morningstar US OE Allocation 50-70% Equity Index is composed of funds which seek to provide both income and capital appreciation by investing in multiple asset classes, including stocks, bonds, and cash. These portfolios are dominated by domestic holdings and have equity exposure between 50% and 70%. The blended 60% Russell 1000 Value/40% Bloomberg Barclay’s Intermediate Government/Credit (BBIGC) Index is included as an additional comparative index because it is representative of a balanced portfolio consisting of 60% equity and 40% fixed income securities. The BBIGC measures the non-securitized component of the U.S. Aggregate Index. It includes investment grade, U.S. dollar-denominated, fixed-rate Treasuries, government-related and corporate rate securities. Intermediate maturity bonds include bonds with maturities of 1 to 9.999 years. An investor cannot invest in an index and its returns are not indicative of the performance of any specific investment. |
** | Returns greater than one year are annualized. |
The Davenport Balanced Income Fund (DBALX) declined 18.57% during the final quarter of the year compared to a 15.74% decline for the blended 60% Russell 1000® Value Index and 40% Bloomberg Barclays Intermediate Government/Credit Index. For the fiscal year, the fund declined 10.59% compared to the 7.56% decline for the blended benchmark. Following three quarters of outsized performance to start the fiscal year, the year ended on a sour note as financial markets were turned upside down as the novel coronavirus spread globally, causing unprecedented economic shock.
14
To close the fiscal year, equity indices tumbled into bear market territory at a record pace with seemingly no industries or stocks acting defensive. During this pullback, we’ve taken steps to upgrade the durability of the equity portion of the Fund and have taken advantage of buying opportunities in names we feel are oversold. One example of this is Lowe’s Companies, Inc. (LOW), the world’s second-largest home retailer. We view the home improvement retail landscape favorably given above-average household formations, strong housing turnover, and aging of the housing stock. Moreover, Lowe’s is led by a management team with a proven track record of execution and maintains a healthy balance sheet while generating significant cash, some of which the company returns to shareholders via dividends and buybacks. Lowe’s is a dividend aristocrat (3.2% yield at time of purchase) and has increased its dividend for 56 years. While there may be near term impacts from the coronavirus, we felt this was reflected in the stock price and valuation and argue homeowners may use their increased time at home to catch up on house projects.
The world is clearly a different landscape than at the end of the fiscal third quarter and there will be lasting effects from the virus both in the short-term and well into the future. Each industry and company will experience varying degrees of impacts from the virus, and some businesses we’ve previously been bullish on now have less enthusiastic outlooks. Carnival Corporation (CCL) is one name that falls in this camp, and we elected to sell the position during the quarter. At the time of our initial purchase, we believed the cruise industry outlook was bright with demand-driven primarily by gaining baby boomers, a rising middle class in emerging markets, and rising incomes and economic growth globally. The current economic conditions have altered our thesis and we’ve become increasingly concerned that a rebound in the business is likely to take longer than originally expected, as evidenced by dramatic declines in future bookings. Ultimately, we believe the industry will bounce back, but we felt our capital could be deployed in better risk/reward opportunities such as Lowe’s.
The bond market in fiscal Q4 2020 experienced quite a shock as central banks provided unprecedented accommodations to markets due to the coronavirus. Between the COVID-19 global health pandemic and the escalation of an international oil price war, Treasuries and cash were the true safe haven as corporate credit came under pressure. As former Fed governor Kevin Warsh said, “If you’ve seen one financial crisis, you’ve seen one financial crisis.” Along those lines, this isn’t 2008 2.0; we have already seen dramatically different fiscal and monetary actions to buffer the economy and capital markets.
The bond allocation of the Balanced Income Fund consists of 30 high-quality bonds across eight sectors with the top allocations to Consumer Discretionary at 23.99%, U.S. Treasuries at 23.87%, and Energy at 17.05%. The credit quality of the Fund is at A+/A1 with an effective maturity of 4.21 years and a duration of 3.63 years.
During the quarter, we increased our Deere & Company (DE), General Dynamics Corporation (GD), and MPLX LP (MPLX) fixed-income holdings and initiated a position in Amgen, Inc. (AMGN) 2.2% notes due in 2027. In January we exited our Boeing Company (BA) 2027 2.7% notes, luckily unscathed, as the direction of the company became too unclear on many fronts. Our exposure to floating rate notes remains around 18%. We were pleased to see 3-month LIBOR rebound almost back to pre-virus levels even with all of the rate cuts by the Federal Reserve. Going forward, we will be looking to opportunistically increase our corporate exposure, as spreads become more attractive.
15
In closing, with a turbulent end to fiscal 2020, we believe this is a good reminder of the value in a balanced investing approach. Our allocation to dividend-paying, value-oriented equities with strong balance sheets that can weather economic uncertainty and defensive positioning in fixed income should continue to provide a volatility buffer in the near term as well as current income and long-term capital appreciation.
During the last two months of the quarter, there was no shortage of volatility and fear in the market which was an abrupt reversal from the preceding ten months. The drop in stock prices was fast and unprecedented and while questions remain about the strength of the economy, we have confidence in the companies we own. We have always sought durable companies, with solid management teams that we believe will navigate difficult environments and emerge on the other side stronger. We will continue to look for opportunities to upgrade the portfolio and own the best companies we can while maintaining a careful eye on risk. We thank you for your continued trust and confidence in this difficult market. Please stay safe.
Sincerely,
George L. Smith, III
Vice President, The Davenport Funds
16
DAVENPORT CORE FUND
PERFORMANCE INFORMATION (Unaudited)
Comparison of the Change in Value of a $10,000 Investment in
Davenport Core Fund and the S&P 500® Index
| | Average Annual Total Returns
(for periods ended March 31, 2020) | |
| | 1 Year | 5 Years | 10 Years | |
Davenport Core Fund(a) | (7.36%) | 4.90% | 9.40% | |
S&P 500® Index | (6.98%) | 6.73% | 10.53% | |
(a) | The total returns shown do not reflect the deduction of taxes that a shareholder would pay on Fund distributions or the redemption of Fund shares. |
17
DAVENPORT VALUE & INCOME FUND
PERFORMANCE INFORMATION (Unaudited)
Comparison of the Change in Value of a $10,000 Investment in
Davenport Value & Income Fund, the Russell 1000® Value Index
and the Lipper Equity Income Index
| | Average Annual Total Returns
(for periods ended March 31, 2020) | |
| | 1 Year | 5 Years | Since
Inception(b) | |
Davenport Value & Income Fund(a) | (16.97%) | 1.36% | 7.71% | |
Russell 1000® Value Index | (17.17%) | 1.90% | 7.40% | |
Lipper Equity Income Index | (12.85%) | 3.23% | 7.48% | |
(a) | The total returns shown do not reflect the deduction of taxes that a shareholder would pay on Fund distributions or the redemption of Fund shares. |
(b) | Commencement of operations was December 31, 2010. |
18
DAVENPORT EQUITY OPPORTUNITIES FUND
PERFORMANCE INFORMATION (Unaudited)
Comparison of the Change in Value of a $10,000 Investment in
Davenport Equity Opportunities Fund and the Russell Midcap® Index
| | Average Annual Total Returns
(for periods ended March 31, 2020) | |
| | 1 Year | 5 Years | Since
Inception(b) | |
Davenport Equity Opportunities Fund(a) | (9.13%) | 2.74% | 9.50% | |
Russell Midcap® Index | (18.31%) | 1.85% | 7.82% | |
(a) | The total returns shown do not reflect the deduction of taxes that a shareholder would pay on Fund distributions or the redemption of Fund shares. |
(b) | Commencement of operations was December 31, 2010. |
19
DAVENPORT SMALL CAP FOCUS FUND
PERFORMANCE INFORMATION (Unaudited)
Comparison of the Change in Value of a $10,000 Investment in
Davenport Small Cap Focus Fund and the Russell 2000® Index

| | Average Annual Total Returns
(for periods ended March 31, 2020) | |
| | 1 Year | 5 Years | Since
Inception(b) | |
Davenport Small Cap Focus Fund(a) | (14.08%) | 2.80% | 3.46% | |
Russell 2000® Index | (23.99%) | (0.25%) | 0.57% | |
(a) | The total returns shown do not reflect the deduction of taxes that a shareholder would pay on Fund distributions or the redemption of Fund shares. |
(b) | Commencement of operations was December 31, 2014. |
20
DAVENPORT BALANCED INCOME FUND
PERFORMANCE INFORMATION (Unaudited)
Comparison of the Change in Value of a $10,000 Investment in Davenport Balanced
Income Fund, the Russell 1000® Value Index, a Blended 60% Russell 1000® Value
Index / 40% Bloomberg Barclays Intermediate Government/Credit Bond Index
and the Morningstar US OE Allocation — 50% to 70% Equity
| | Average Annual Total Returns
(for periods ended March 31, 2020) | |
| | 1 Year | 3 Years | Since
Inception(b) | |
Davenport Balanced Income Fund(a) | (10.59%) | (1.06%) | 1.88% | |
Russell 1000® Value Index | (17.17%) | (2.18%) | 3.01% | |
Blended 60% Russell 1000® ValueIndex / 40% Bloomberg Barclays Intermediate Government/Credit Bond Index | (7.56%) | 0.56% | 3.48% | |
Morningstar US OE Allocation - 50% to 70% Equity | (6.89%) | 1.33% | 3.56% | |
(a) | The total returns shown do not reflect the deduction of taxes that a shareholder would pay on Fund distributions or the redemption of Fund shares. |
(b) | Commencement of operations was December 31, 2015. |
21
DAVENPORT CORE FUND
PORTFOLIO INFORMATION
March 31, 2020 (Unaudited)
Sector Allocation vs. the S&P 500® Index

Top Ten Equity Holdings
Security Description | % of Net Assets |
American Tower Corporation | 4.7% |
Adobe, Inc. | 4.1% |
Danaher Corporation | 3.9% |
Microsoft Corporation | 3.5% |
Accenture plc - Class A | 3.1% |
Berkshire Hathaway, Inc. - Class B | 3.1% |
Visa, Inc. - Class A | 3.1% |
Markel Corporation | 2.9% |
Brookfield Asset Management, Inc. - Class A | 2.9% |
Mastercard, Inc. - Class A | 2.9% |
22
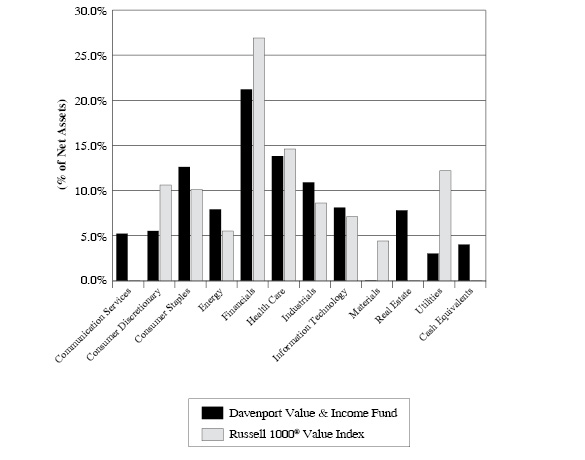
DAVENPORT VALUE & INCOME FUND
PORTFOLIO INFORMATION
March 31, 2020 (Unaudited)
Sector Allocation vs. the Russell 1000® Value Index
Top Ten Equity Holdings
Security Description | % of Net Assets |
Johnson & Johnson | 3.8% |
Comcast Corporation - Class A | 3.3% |
Brookfield Asset Management, Inc. - Class A | 3.3% |
Watsco, Inc. | 3.2% |
JPMorgan Chase & Company | 3.1% |
Dominion Energy, Inc. | 3.0% |
Markel Corporation | 3.0% |
Berkshire Hathaway, Inc. - Class B | 2.9% |
Medtronic plc | 2,8% |
PepsiCo, Inc. | 2.7% |
23
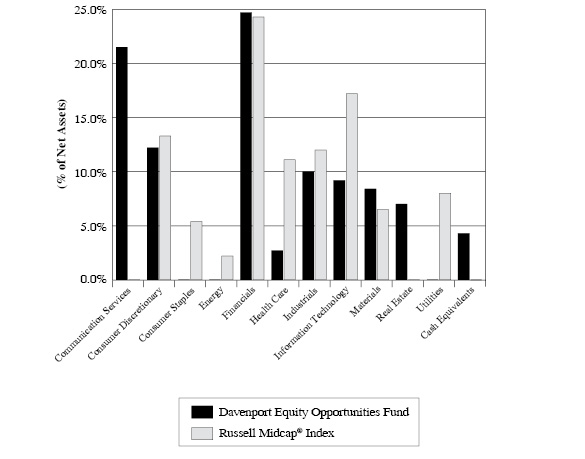
DAVENPORT EQUITY OPPORTUNITIES FUND
PORTFOLIO INFORMATION
March 31, 2020 (Unaudited)
Sector Allocation vs. the Russell Midcap® Index
Top Ten Equity Holdings
Security Description | % of Net Assets |
American Tower Corporation | 7.0% |
Markel Corporation | 6.0% |
Liberty Broadband Corporation - Series C | 5.5% |
Fairfax Financial Holdings Ltd. | 5.4% |
Live Nation Entertainment, Inc. | 5.2% |
Brookfield Asset Management, Inc. - Class A | 4.9% |
Sherwin-Williams Company (The) | 4.9% |
Watsco, Inc. | 4.4% |
Take-Two Interactive Software, Inc. | 4.0% |
Xylem, Inc. | 3.8% |
24
DAVENPORT SMALL CAP FOCUS FUND
PORTFOLIO INFORMATION
March 31, 2020 (Unaudited)
Sector Allocation vs. the Russell 2000® Index

Top Ten Equity Holdings
Security Description | % of Net Assets |
Monarch Casino & Resort, Inc. | 9.3% |
Cannae Holdings, Inc. | 7.8% |
Seaboard Corporation | 4.5% |
Shenandoah Telecommunications Company | 4.4% |
Diamond Hill Investment Group, Inc. | 4.0% |
Watsco, Inc. | 3.8% |
Etsy, Inc. | 3.7% |
NewMarket Corporation | 3.7% |
Switch, Inc. - Class A | 3.6% |
Hanesbrands, Inc. | 3.4% |
25
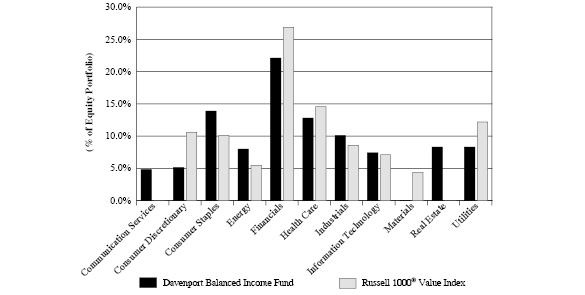
DAVENPORT BALANCED INCOME FUND
PORTFOLIO INFORMATION
March 31, 2020 (Unaudited)
Asset Allocation (% of Net Assets) | | Ten Largest Equity Holdings | % of Net Assets |

| | Johnson & Johnson | 1.9% |
Brookfield Asset Management, Inc. - Class A | 1.6% |
Comcast Corporation - Class A | 1.6% |
Watsco, Inc. | 1.6% |
JPMorgan Chase & Company | 1.5% |
Dominion Energy, Inc. | 1.5% |
Markel Corporation | 1.5% |
Brookfield Renewable Partners, L.P. | 1.4% |
Berkshire Hathaway, Inc. - Class B | 1.4% |
Medtronic plc | 1.4% |
| |
Equity Sector Concentration vs. the Russell 1000 Value Index (53.8% of Net Assets) |
Bond Portfolio (42.6% of Net Assets) | | Credit Quality | Composite Quality |
Number of Fixed-Income Securities | 30 | | AAA | 22.6% |
Average Quality | A+/A1 | | AA | 3.5% |
Effective Maturity | 4.2 yrs. | | A | 43.0% |
Average Effective Duration | 3.6 yrs. | | BBB | 30.9% |
Sector Breakdown | % of
Bond Portfolio |
Communication Services | 1.5% |
Consumer Staples | 11.7% |
Energy | 14.8% |
Financials | 19.5% |
Health Care | 9.6% |
Industrials | 8.7% |
Information Technology | 6.2% |
Materials | 5.3% |
U.S. Treasury | 22.7% |
26
DAVENPORT CORE FUND
SCHEDULE OF INVESTMENTS
March 31, 2020 |
| COMMON STOCKS — 95.9% | | Shares | | | Value | |
| Communication Services — 9.1% | | | | | | |
Alphabet, Inc. - Class A(a) | | | 7,961 | | | $ | 9,250,284 | |
Alphabet, Inc. - Class C(a) | | | 6,941 | | | | 8,071,064 | |
Liberty Broadband Corporation - Series C(a) | | | 103,475 | | | | 11,456,752 | |
T-Mobile USA, Inc.(a) | | | 104,414 | | | | 8,760,335 | |
| Walt Disney Company (The) | | | 69,634 | | | | 6,726,644 | |
| | | | | | | | 44,265,079 | |
| Consumer Discretionary — 10.3% | | | | | | | | |
Amazon.com, Inc.(a) | | | 6,395 | | | | 12,468,459 | |
CarMax, Inc.(a) | | | 181,587 | | | | 9,774,828 | |
| Home Depot, Inc. (The) | | | 56,232 | | | | 10,499,077 | |
| NIKE, Inc. - Class B | | | 94,083 | | | | 7,784,428 | |
| TJX Companies, Inc. (The) | | | 201,130 | | | | 9,616,025 | |
| | | | | | | | 50,142,817 | |
| Consumer Staples — 5.7% | | | | | | | | |
| Mondelēz International, Inc. - Class A | | | 154,758 | | | | 7,750,281 | |
| Nestlé S.A. - ADR | | | 121,554 | | | | 12,518,846 | |
| PepsiCo, Inc. | | | 62,225 | | | | 7,473,223 | |
| | | | | | | | 27,742,350 | |
| Energy — 2.7% | | | | | | | | |
| Chevron Corporation | | | 67,744 | | | | 4,908,730 | |
| EOG Resources, Inc. | | | 95,470 | | | | 3,429,282 | |
| Marathon Petroleum Corporation | | | 204,933 | | | | 4,840,518 | |
| | | | | | | | 13,178,530 | |
| Financials — 17.5% | | | | | | | | |
Berkshire Hathaway, Inc. - Class B(a) | | | 82,053 | | | | 15,001,750 | |
| Brookfield Asset Management, Inc. - Class A | | | 320,514 | | | | 14,182,744 | |
| Capital One Financial Corporation | | | 150,286 | | | | 7,577,420 | |
| Charles Schwab Corporation (The) | | | 207,471 | | | | 6,975,175 | |
| CME Group, Inc. | | | 52,565 | | | | 9,089,014 | |
| JPMorgan Chase & Company | | | 116,788 | | | | 10,514,424 | |
Markel Corporation(a) | | | 15,355 | | | | 14,247,751 | |
| Moody’s Corporation | | | 36,170 | | | | 7,649,955 | |
| | | | | | | | 85,238,233 | |
| Health Care — 13.8% | | | | | | | | |
| Abbott Laboratories | | | 103,075 | | | | 8,133,648 | |
| Becton, Dickinson and Company | | | 43,084 | | | | 9,899,411 | |
| CVS Health Corporation | | | 130,146 | | | | 7,721,562 | |
| Danaher Corporation | | | 135,736 | | | | 18,787,220 | |
| Johnson & Johnson | | | 97,740 | | | | 12,816,646 | |
| Merck & Company, Inc. | | | 130,354 | | | | 10,029,437 | |
| | | | | | | | 67,387,924 | |
27
DAVENPORT CORE FUND
SCHEDULE OF INVESTMENTS (Continued) |
COMMON STOCKS — 95.9% (Continued) | | Shares | | | Value | |
Industrials — 4.8% | | | | | | | | |
General Dynamics Corporation | | | 41,578 | | | $ | 5,501,185 | |
Honeywell International, Inc. | | | 63,353 | | | | 8,475,998 | |
Union Pacific Corporation | | | 65,235 | | | | 9,200,745 | |
| | | | | | | | 23,177,928 | |
Information Technology — 20.4% | | | | | | | | |
Accenture plc - Class A | | | 93,234 | | | | 15,221,383 | |
Adobe, Inc.(a) | | | 62,835 | | | | 19,996,610 | |
Apple, Inc. | | | 43,769 | | | | 11,130,019 | |
Broadcom, Inc. | | | 29,532 | | | | 7,002,037 | |
Mastercard, Inc. - Class A | | | 58,230 | | | | 14,066,039 | |
Microsoft Corporation | | | 107,581 | | | | 16,966,600 | |
Visa, Inc. - Class A | | | 92,686 | | | | 14,933,568 | |
| | | | | | | | 99,316,256 | |
Materials — 6.9% | | | | | | | | |
Air Products & Chemicals, Inc. | | | 37,095 | | | | 7,404,533 | |
Ecolab, Inc. | | | 42,886 | | | | 6,682,925 | |
Martin Marietta Materials, Inc. | | | 40,356 | | | | 7,636,566 | |
Sherwin-Williams Company (The) | | | 25,365 | | | | 11,655,725 | |
| | | | | | | | 33,379,749 | |
Real Estate — 4.7% | | | | | | | | |
American Tower Corporation | | | 105,272 | | | | 22,922,978 | |
| | | | | | | | | |
Total Common Stocks (Cost $323,445,806) | | | | | | $ | 466,751,844 | |
|
MONEY MARKET FUNDS — 1.4% | | Shares | | | Value | |
First American Treasury Obligations Fund - Class Z, 0.28%(b) (Cost $6,917,059) | | | 6,917,059 | | | $ | 6,917,059 | |
| | | | | | | | | |
Total Investments at Value — 97.3%(Cost $330,362,865) | | | | | | $ | 473,668,903 | |
| | | | | | | | | |
Other Assets in Excess of Liabilities — 2.7% | | | | | | | 12,899,605 | |
| | | | | | | | | |
Net Assets — 100.0% | | | | | | $ | 486,568,508 | |
ADR - American Depositary Receipt.
(a) | Non-income producing security. |
(b) | The rate shown is the 7-day effective yield as of March 31, 2020. |
See accompanying notes to financial statements.
28
DAVENPORT VALUE & INCOME FUND
SCHEDULE OF INVESTMENTS
March 31, 2020 |
| COMMON STOCKS — 96.0% | | Shares | | | Value | |
| Communication Services — 5.2% | | | | | | |
| Comcast Corporation - Class A | | | 532,184 | | | $ | 18,296,486 | |
| Verizon Communications, Inc. | | | 191,041 | | | | 10,264,633 | |
| | | | | | | | 28,561,119 | |
| Consumer Discretionary — 5.5% | | | | | | | | |
| Las Vegas Sands Corporation | | | 182,121 | | | | 7,734,679 | |
| Lowe’s Companies, Inc. | | | 114,621 | | | | 9,863,137 | |
| McDonald’s Corporation | | | 77,366 | | | | 12,792,468 | |
| | | | | | | | 30,390,284 | |
| Consumer Staples — 12.6% | | | | | | | | |
| Anheuser-Busch InBev S.A./N.V. - ADR | | | 251,853 | | | | 11,111,754 | |
| Bunge Ltd. | | | 212,790 | | | | 8,730,774 | |
| Diageo plc - ADR | | | 91,794 | | | | 11,668,853 | |
| PepsiCo, Inc. | | | 125,110 | | | | 15,025,711 | |
| Philip Morris International, Inc. | | | 160,926 | | | | 11,741,161 | |
| Tyson Foods, Inc. - Class A | | | 186,312 | | | | 10,781,876 | |
| | | | | | | | 69,060,129 | |
| Energy — 7.9% | | | | | | | | |
| Chevron Corporation | | | 126,117 | | | | 9,138,438 | |
| Enbridge, Inc. | | | 312,446 | | | | 9,089,054 | |
| Exxon Mobil Corporation | | | 197,166 | | | | 7,486,393 | |
| Marathon Petroleum Corporation | | | 288,265 | | | | 6,808,819 | |
| Royal Dutch Shell plc - Class B - ADR | | | 322,917 | | | | 10,546,469 | |
| | | | | | | | 43,069,173 | |
| Financials — 21.2% | | | | | | | | |
| Bank of America Corporation | | | 358,777 | | | | 7,616,836 | |
Berkshire Hathaway, Inc. - Class B(a) | | | 86,816 | | | | 15,872,569 | |
| Brookfield Asset Management, Inc. - Class A | | | 413,202 | | | | 18,284,189 | |
| Capital One Financial Corporation | | | 187,291 | | | | 9,443,212 | |
| Fairfax Financial Holdings Ltd. | | | 43,231 | | | | 13,270,188 | |
| Fidelity National Financial, Inc. | | | 482,804 | | | | 12,012,164 | |
| JPMorgan Chase & Company | | | 191,015 | | | | 17,197,080 | |
Markel Corporation(a) | | | 17,671 | | | | 16,396,744 | |
| Wells Fargo & Company | | | 219,359 | | | | 6,295,603 | |
| | | | | | | | 116,388,585 | |
| Health Care — 13.8% | | | | | | | | |
| Bristol-Myers Squibb Company | | | 241,264 | | | | 13,448,055 | |
| CVS Health Corporation | | | 239,641 | | | | 14,217,900 | |
| Johnson & Johnson | | | 159,565 | | | | 20,923,758 | |
| Medtronic plc | | | 168,420 | | | | 15,188,116 | |
| Merck & Company, Inc. | | | 158,157 | | | | 12,168,600 | |
| | | | | | | | 75,946,429 | |
29
DAVENPORT VALUE & INCOME FUND
SCHEDULE OF INVESTMENTS (Continued) |
COMMON STOCKS — 96.0% (Continued) | | Shares | | | Value | |
Industrials — 10.9% | | | | | | | | |
3M Company | | | 92,075 | | | $ | 12,569,158 | |
Delta Air Lines, Inc. | | | 327,058 | | | | 9,330,965 | |
Norfolk Southern Corporation | | | 55,813 | | | | 8,148,698 | |
United Parcel Service, Inc. - Class B | | | 132,420 | | | | 12,370,677 | |
Watsco, Inc. | | | 110,372 | | | | 17,442,087 | |
| | | | | | | | 59,861,585 | |
Information Technology — 8.1% | | | | | | | | |
Cisco Systems, Inc. | | | 315,038 | | | | 12,384,144 | |
International Business Machines Corporation | | | 83,584 | | | | 9,271,973 | |
Microsoft Corporation | | | 85,360 | | | | 13,462,126 | |
TE Connectivity Ltd. | | | 147,598 | | | | 9,295,722 | |
| | | | | | | | 44,413,965 | |
Real Estate — 7.8% | | | | | | | | |
Crown Castle International Corporation | | | 96,688 | | | | 13,961,747 | |
Gaming and Leisure Properties, Inc. | | | 292,729 | | | | 8,111,521 | |
Lamar Advertising Company - Class A | | | 241,630 | | | | 12,390,786 | |
W.P. Carey, Inc. | | | 141,244 | | | | 8,203,452 | |
| | | | | | | | 42,667,506 | |
Utilities — 3.0% | | | | | | | | |
Dominion Energy, Inc. | | | 228,989 | | | | 16,530,716 | |
| | | | | | | | | |
Total Common Stocks(Cost $576,281,358) | | | | | | $ | 526,889,491 | |
|
MONEY MARKET FUNDS — 4.1% | | Shares | | | Value | |
First American Treasury Obligations Fund - Class Z, 0.28%(b) (Cost $22,669,201) | | | 22,669,201 | | | $ | 22,669,201 | |
| | | | | | | | | |
Total Investments at Value — 100.1% (Cost $598,950,559) | | | | | | $ | 549,558,692 | |
| | | | | | | | | |
Liabilities in Excess of Other Assets — (0.1%) | | | | | | | (447,133 | ) |
| | | | | | | | | |
Net Assets — 100.0% | | | | | | $ | 549,111,559 | |
ADR - American Depositary Receipt.
(a) | Non-income producing security. |
(b) | The rate shown is the 7-day effective yield as of March 31, 2020. |
See accompanying notes to financial statements.
30
DAVENPORT EQUITY OPPORTUNITIES FUND
SCHEDULE OF INVESTMENTS
March 31, 2020 |
| COMMON STOCKS — 95.7% | | Shares | | | Value | |
| Communication Services — 21.5% | | | | | | |
Altice USA, Inc. - Class A(a) | | | 555,409 | | | $ | 12,380,067 | |
DISH Network Corporation - Class A(a) | | | 672,416 | | | | 13,441,596 | |
Liberty Broadband Corporation - Series C(a) | | | 192,940 | | | | 21,362,317 | |
Live Nation Entertainment, Inc.(a) | | | 444,212 | | | | 20,193,877 | |
Take-Two Interactive Software, Inc.(a) | | | 129,558 | | | | 15,366,874 | |
| | | | | | | | 82,744,731 | |
| Consumer Discretionary — 12.2% | | | | | | | | |
CarMax, Inc.(a) | | | 271,488 | | | | 14,614,199 | |
Etsy, Inc.(a) | | | 302,891 | | | | 11,643,130 | |
MercadoLibre, Inc.(a) | | | 13,071 | | | | 6,386,229 | |
O’Reilly Automotive, Inc.(a) | | | 47,551 | | | | 14,315,229 | |
| | | | | | | | 46,958,787 | |
| Financials — 24.7% | | | | | | | | |
| Brookfield Asset Management, Inc. - Class A | | | 430,812 | | | | 19,063,431 | |
| Capital One Financial Corporation | | | 185,970 | | | | 9,376,607 | |
| Cboe Global Markets, Inc. | | | 110,758 | | | | 9,885,151 | |
| Fairfax Financial Holdings Ltd. | | | 67,386 | | | | 20,684,807 | |
| Fidelity National Financial, Inc. | | | 526,841 | | | | 13,107,804 | |
Markel Corporation(a) | | | 24,847 | | | | 23,055,283 | |
| | | | | | | | 95,173,083 | |
| Health Care — 2.7% | | | | | | | | |
| Zoetis, Inc. | | | 87,976 | | | | 10,353,895 | |
| | | | | | | | | |
| Industrials — 10.0% | | | | | | | | |
Colfax Corporation(a) | | | 355,844 | | | | 7,045,711 | |
| Watsco, Inc. | | | 107,276 | | | | 16,952,827 | |
| Xylem, Inc. | | | 224,492 | | | | 14,621,164 | |
| | | | | | | | 38,619,702 | |
| Information Technology — 9.2% | | | | | | | | |
Autodesk, Inc.(a) | | | 80,623 | | | | 12,585,250 | |
Black Knight, Inc.(a) | | | 182,917 | | | | 10,620,161 | |
| Intuit, Inc. | | | 52,899 | | | | 12,166,770 | |
| | | | | | | | 35,372,181 | |
| Materials — 8.4% | | | | | | | | |
| Martin Marietta Materials, Inc. | | | 71,088 | | | | 13,451,982 | |
| Sherwin-Williams Company (The) | | | 41,395 | | | | 19,021,831 | |
| | | | | | | | 32,473,813 | |
| Real Estate — 7.0% | | | | | | | | |
| American Tower Corporation | | | 123,333 | | | | 26,855,761 | |
| | | | | | | | | |
Total Common Stocks (Cost $346,329,793) | | | | | | $ | 368,551,953 | |
31
DAVENPORT EQUITY OPPORTUNITIES FUND
SCHEDULE OF INVESTMENTS (Continued) |
MONEY MARKET FUNDS — 4.4% | | Shares | | | Value | |
First American Treasury Obligations Fund - Class Z, 0.28%(b) (Cost $17,061,584) | | | 17,061,584 | | | $ | 17,061,584 | |
| | | | | | | | | |
Total Investments at Value — 100.1% (Cost $363,391,377) | | | | | | $ | 385,613,537 | |
| | | | | | | | | |
Liabilities in Excess of Other Assets — (0.1%) | | | | | | | (450,851 | ) |
| | | | | | | | | |
Net Assets — 100.0% | | | | | | $ | 385,162,686 | |
(a) | Non-income producing security. |
(b) | The rate shown is the 7-day effective yield as of March 31, 2020. |
See accompanying notes to financial statements.
32
DAVENPORT SMALL CAP FOCUS FUND
SCHEDULE OF INVESTMENTS
March 31, 2020 |
| COMMON STOCKS — 87.5% | | Shares | | | Value | |
| Communication Services — 7.6% | | | | | | |
| Cable One, Inc. | | | 3,560 | | | $ | 5,852,676 | |
| Shenandoah Telecommunications Company | | | 160,368 | | | | 7,898,124 | |
| | | | | | | | 13,750,800 | |
| Consumer Discretionary — 17.9% | | | | | | | | |
Eldorado Resorts, Inc.(a) | | | 188,447 | | | | 2,713,637 | |
Etsy, Inc.(a) | | | 174,629 | | | | 6,712,739 | |
| Hanesbrands, Inc. | | | 776,701 | | | | 6,112,637 | |
Monarch Casino & Resort, Inc.(a) | | | 593,996 | | | | 16,673,467 | |
| | | | | | | | 32,212,480 | |
| Consumer Staples — 4.5% | | | | | | | | |
| Seaboard Corporation | | | 2,854 | | | | 8,027,731 | |
| | | | | | | | | |
| Financials — 21.4% | | | | | | | | |
Cannae Holdings, Inc.(a) | | | 418,866 | | | | 14,027,822 | |
| Diamond Hill Investment Group, Inc. | | | 79,614 | | | | 7,184,367 | |
| Kinsale Capital Group, Inc. | | | 33,917 | | | | 3,545,344 | |
| OneSpaWorld Holdings Ltd. | | | 371,200 | | | | 1,507,072 | |
| Stewart Information Services Corporation | | | 103,560 | | | | 2,761,945 | |
| TowneBank | | | 283,732 | | | | 5,132,712 | |
Trupanion, Inc.(a) | | | 164,581 | | | | 4,284,044 | |
| | | | | | | | 38,443,306 | |
| Health Care — 2.1% | | | | | | | | |
Teladoc Health, Inc.(a) | | | 24,315 | | | | 3,769,068 | |
| | | | | | | | | |
| Industrials — 17.0% | | | | | | | | |
| Atlas Corporation | | | 368,351 | | | | 2,832,619 | |
Builders FirstSource, Inc.(a) | | | 311,598 | | | | 3,810,843 | |
Casella Waste Systems, Inc. - Class A(a) | | | 139,012 | | | | 5,429,809 | |
Colfax Corporation(a) | | | 306,992 | | | | 6,078,442 | |
Evoqua Water Technologies Corporation(a) | | | 514,579 | | | | 5,768,430 | |
| Watsco, Inc. | | | 42,896 | | | | 6,778,855 | |
| | | | | | | | 30,698,998 | |
| Information Technology — 5.1% | | | | | | | | |
| Switch, Inc. - Class A | | | 453,796 | | | | 6,548,276 | |
Verra Mobility Corporation(a) | | | 379,260 | | | | 2,707,917 | |
| | | | | | | | 9,256,193 | |
| Materials — 7.6% | | | | | | | | |
Fortuna Silver Mines, Inc.(a) | | | 1,377,351 | | | | 3,181,681 | |
MAG Silver Corporation(a) | | | 506,234 | | | | 3,887,877 | |
| NewMarket Corporation | | | 17,246 | | | | 6,602,976 | |
| | | | | | | | 13,672,534 | |
33
DAVENPORT SMALL CAP FOCUS FUND
SCHEDULE OF INVESTMENTS (Continued) |
COMMON STOCKS — 87.5% (Continued) | | Shares | | | Value | |
Real Estate — 4.3% | | | | | | | | |
FRP Holdings, Inc.(a) | | | 78,050 | | | $ | 3,356,150 | |
Lamar Advertising Company - Class A | | | 85,095 | | | | 4,363,672 | |
| | | | | | | | 7,719,822 | |
| | | | | | | | | |
Total Common Stocks (Cost $175,926,359) | | | | | | $ | 157,550,932 | |
|
MONEY MARKET FUNDS — 10.2% | | Shares | | | Value | |
First American Treasury Obligations Fund - Class Z, 0.28%(b) (Cost $18,411,008) | | | 18,411,008 | | | $ | 18,411,008 | |
| | | | | | | | | |
Total Investments at Value — 97.7% (Cost $194,337,367) | | | | | | $ | 175,961,940 | |
| | | | | | | | | |
Other Assets in Excess of Liabilities — 2.3% | | | | | | | 4,115,090 | |
| | | | | | | | | |
Net Assets — 100.0% | | | | | | $ | 180,077,030 | |
(a) | Non-income producing security. |
(b) | The rate shown is the 7-day effective yield as of March 31, 2020. |
See accompanying notes to financial statements.
34
DAVENPORT BALANCED INCOME FUND
SCHEDULE OF INVESTMENTS
March 31, 2020 |
| COMMON STOCKS — 53.3% | | Shares | | | Value | |
| Communication Services — 2.5% | | | | | | |
| Comcast Corporation - Class A | | | 67,901 | | | $ | 2,334,436 | |
| Verizon Communications, Inc. | | | 24,509 | | | | 1,316,869 | |
| | | | | | | | 3,651,305 | |
| Consumer Discretionary — 2.7% | | | | | | | | |
| Las Vegas Sands Corporation | | | 23,415 | | | | 994,435 | |
| Lowe’s Companies, Inc. | | | 14,624 | | | | 1,258,395 | |
| McDonald’s Corporation | | | 9,878 | | | | 1,633,328 | |
| | | | | | | | 3,886,158 | |
| Consumer Staples — 7.4% | | | | | | | | |
| Anheuser-Busch InBev S.A./N.V. - ADR | | | 32,331 | | | | 1,426,444 | |
| Bunge Ltd. | | | 27,143 | | | | 1,113,677 | |
| Diageo plc - ADR | | | 11,835 | | | | 1,504,465 | |
| Ingredion, Inc. | | | 13,155 | | | | 993,202 | |
| PepsiCo, Inc. | | | 15,997 | | | | 1,921,240 | |
| Philip Morris International, Inc. | | | 20,666 | | | | 1,507,791 | |
| Tyson Foods, Inc. - Class A | | | 24,278 | | | | 1,404,968 | |
| Universal Corporation | | | 18,093 | | | | 799,892 | |
| | | | | | | | 10,671,679 | |
| Energy — 4.3% | | | | | | | | |
| Chevron Corporation | | | 16,142 | | | | 1,169,649 | |
| Enbridge, Inc. | | | 40,154 | | | | 1,168,080 | |
| Enterprise Products Partners, L.P. | | | 43,487 | | | | 621,864 | |
| Exxon Mobil Corporation | | | 25,316 | | | | 961,248 | |
| Marathon Petroleum Corporation | | | 37,051 | | | | 875,145 | |
| Royal Dutch Shell plc - Class B - ADR | | | 41,580 | | | | 1,358,003 | |
| | | | | | | | 6,153,989 | |
| Financials — 11.8% | | | | | | | | |
| Bank of America Corporation | | | 46,208 | | | | 980,996 | |
Berkshire Hathaway, Inc. - Class B(a) | | | 11,066 | | | | 2,023,197 | |
| Brookfield Asset Management, Inc. - Class A | | | 52,905 | | | | 2,341,046 | |
| Capital One Financial Corporation | | | 24,059 | | | | 1,213,055 | |
| Diamond Hill Investment Group, Inc. | | | 11,393 | | | | 1,028,104 | |
| Fairfax Financial Holdings Ltd. | | | 5,545 | | | | 1,702,093 | |
| Fidelity National Financial, Inc. | | | 61,519 | | | | 1,530,593 | |
| JPMorgan Chase & Company | | | 24,606 | | | | 2,215,278 | |
| Lazard Ltd. - Class A | | | 43,728 | | | | 1,030,232 | |
Markel Corporation(a) | | | 2,267 | | | | 2,103,527 | |
| Wells Fargo & Company | | | 28,059 | | | | 805,293 | |
| | | | | | | | 16,973,414 | |
35
DAVENPORT BALANCED INCOME FUND
SCHEDULE OF INVESTMENTS (Continued) |
| COMMON STOCKS — 53.3% (Continued) | | Shares | | | Value | |
| Health Care — 6.8% | | | | | | |
| Bristol-Myers Squibb Company | | | 30,813 | | | $ | 1,717,517 | |
| CVS Health Corporation | | | 30,973 | | | | 1,837,628 | |
| Johnson & Johnson | | | 20,564 | | | | 2,696,557 | |
| Medtronic plc | | | 21,944 | | | | 1,978,910 | |
| Merck & Company, Inc. | | | 20,367 | | | | 1,567,037 | |
| | | | | | | | 9,797,649 | |
| Industrials — 5.4% | | | | | | | | |
| 3M Company | | | 11,998 | | | | 1,637,847 | |
| Delta Air Lines, Inc. | | | 42,009 | | | | 1,198,517 | |
| Norfolk Southern Corporation | | | 7,212 | | | | 1,052,952 | |
| United Parcel Service, Inc. - Class B | | | 17,256 | | | | 1,612,055 | |
| Watsco, Inc. | | | 14,200 | | | | 2,244,026 | |
| | | | | | | | 7,745,397 | |
| Information Technology — 4.0% | | | | | | | | |
| Cisco Systems, Inc. | | | 40,495 | | | | 1,591,858 | |
| International Business Machines Corporation | | | 10,716 | | | | 1,188,726 | |
| Microsoft Corporation | | | 10,886 | | | | 1,716,831 | |
| TE Connectivity Ltd. | | | 18,974 | | | | 1,194,983 | |
| | | | | | | | 5,692,398 | |
| Real Estate — 4.4% | | | | | | | | |
| Brookfield Property Partners, L.P. | | | 105,175 | | | | 847,711 | |
| Crown Castle International Corporation | | | 12,441 | | | | 1,796,480 | |
| Gaming and Leisure Properties, Inc. | | | 37,772 | | | | 1,046,662 | |
| Lamar Advertising Company - Class A | | | 31,487 | | | | 1,614,653 | |
| W.P. Carey, Inc. | | | 18,101 | | | | 1,051,306 | |
| | | | | | | | 6,356,812 | |
| Utilities — 4.0% | | | | | | | | |
| Brookfield Infrastructure Partners, L.P. | | | 39,460 | | | | 1,419,376 | |
Brookfield Infrastructure Corporation - Class A(a) | | | 4,384 | | | | 142,670 | |
| Brookfield Renewable Partners, L.P. | | | 48,539 | | | | 2,062,422 | |
| Dominion Energy, Inc. | | | 29,532 | | | | 2,131,915 | |
| | | | | | | | 5,756,383 | |
| | | | | | | | | |
Total Common Stocks (Cost $92,524,807) | | | | | | $ | 76,685,184 | |
36
DAVENPORT BALANCED INCOME FUND
SCHEDULE OF INVESTMENTS (Continued) |
| FIXED RATE CORPORATE BONDS — 25.2% | | Par Value | | | Value | |
| Consumer Staples — 4.2% | | | | | | |
| Altria Group, Inc., 4.75%, due 05/05/2021 | | $ | 1,500,000 | | | $ | 1,532,344 | |
| J.M. Smucker Company (The), 3.50%, due 10/15/2021 | | | 1,500,000 | | | | 1,522,794 | |
| PepsiCo, Inc., 2.75%, due 03/05/2022 | | | 1,200,000 | | | | 1,247,615 | |
| Sysco Corporation, 2.60%, due 10/01/2020 | | | 1,700,000 | | | | 1,683,929 | |
| | | | | | | | 5,986,682 | |
| Energy — 5.1% | | | | | | | | |
| Boardwalk Pipelines, L.P., 4.45%, due 07/15/2027 | | | 2,000,000 | | | | 1,499,377 | |
| Halliburton Company, 3.80%, due 11/15/2025 | | | 2,325,000 | | | | 2,194,381 | |
| MPLX, L.P., 4.125%, due 03/01/2027 | | | 3,250,000 | | | | 2,769,310 | |
| Occidental Petroleum Corporation, 3.50%, due 06/15/2025 | | | 1,750,000 | | | | 895,412 | |
| | | | | | | | 7,358,480 | |
| Financials — 4.1% | | | | | | | | |
| BlackRock, Inc., 3.50%, due 03/18/2024 | | | 1,150,000 | | | | 1,236,709 | |
| Citigroup, Inc., 3.30%, due 04/27/2025 | | | 2,250,000 | | | | 2,275,448 | |
| Fiserv, Inc., 3.20%, due 07/01/2026 | | | 2,225,000 | | | | 2,298,131 | |
| | | | | | | | 5,810,288 | |
| Health Care — 4.1% | | | | | | | | |
| AbbVie, Inc., 2.50%, due 05/14/2020 | | | 1,300,000 | | | | 1,300,090 | |
| Amgen, Inc., 2.20%, due 02/21/2027 | | | 2,000,000 | | | | 1,979,902 | |
| CVS Health Corporation, 3.00%, due 08/15/2026 | | | 2,600,000 | | | | 2,630,794 | |
| | | | | | | | 5,910,786 | |
| Industrials — 3.7% | | | | | | | | |
| General Dynamics Corporation, 3.375%, due 05/15/2023 | | | 3,250,000 | | | | 3,333,369 | |
| John Deere Capital Corporation, 2.60%, due 03/07/2024 | | | 2,000,000 | | | | 2,011,854 | |
| | | | | | | | 5,345,223 | |
| Information Technology — 2.6% | | | | | | | | |
| Oracle Corporation, 3.625%, due 07/15/2023 | | | 1,500,000 | | | | 1,591,891 | |
| PayPal Holdings, Inc., 2.40%, due 10/01/2024 | | | 2,250,000 | | | | 2,199,037 | |
| | | | | | | | 3,790,928 | |
| Materials — 1.4% | | | | | | | | |
| Sherwin-Williams Company (The), 3.45%, due 06/01/2027 | | | 2,000,000 | | | | 2,049,729 | |
| | | | | | | | | |
Total Fixed Rate Corporate Bonds (Cost $38,450,477) | | | | | | $ | 36,252,116 | |
37
DAVENPORT BALANCED INCOME FUND
SCHEDULE OF INVESTMENTS (Continued) |
VARIABLE RATE CORPORATE BONDS(b) — 7.8% | | Par Value | | | Value | |
| Communication Services — 0.7% | | | | | | |
| AT&T, Inc., 2.305% (3MO LIBOR + 93), due 06/30/2020 | | $ | 950,000 | | | $ | 943,805 | |
| | | | | | | | | |
| Consumer Staples — 0.8% | | | | | | | | |
| Campbell Soup Company, 1.371% (3MO LIBOR + 63), due 03/15/2021 | | | 1,250,000 | | | | 1,210,246 | |
| | | | | | | | | |
| Energy — 1.2% | | | | | | | | |
| ConocoPhillips Company, 2.592% (3MO LIBOR + 90), due 05/15/2022 | | | 1,750,000 | | | | 1,698,647 | |
| | | | | | | | | |
| Financials — 4.3% | | | | | | | | |
| BP Capital Markets plc, 1.702% (3MO LIBOR + 65), due 09/19/2022 | | | 1,750,000 | | | | 1,746,886 | |
| Goldman Sachs Group, Inc., 2.862% (3MO LIBOR + 117), due 11/15/2021 | | | 2,000,000 | | | | 1,960,000 | |
| JPMorgan Chase & Company, 3.060% (3MO LIBOR + 148), due 03/01/2021 | | | 1,500,000 | | | | 1,504,143 | |
| Wells Fargo & Company, 2.009% (3MO LIBOR + 101), due 12/07/2020 | | | 929,000 | | | | 923,990 | |
| | | | | | | | 6,135,019 | |
| Materials — 0.8% | | | | | | | | |
| Vulcan Materials Company, 2.230% (3MO LIBOR + 65), due 03/01/2021 | | | 1,275,000 | | | | 1,226,420 | |
| | | | | | | | | |
Total Variable Rate Corporate Bonds (Cost $11,454,440) | | | | | | $ | 11,214,137 | |
|
U.S. TREASURY OBLIGATIONS —9.6% | | Par Value | | | Value | |
U.S. Treasury Notes — 9.6% | | | | | | | | |
3.125%, due 05/15/2021 | | $ | 2,750,000 | | | $ | 2,842,168 | |
2.75%, due 06/30/2025 | | | 4,810,000 | | | | 5,391,334 | |
2.875%, due 08/15/2028 | | | 4,785,000 | | | | 5,658,262 | |
Total U.S. Treasury Obligations (Cost $12,363,880) | | | | | | $ | 13,891,764 | |
38
DAVENPORT BALANCED INCOME FUND
SCHEDULE OF INVESTMENTS (Continued) |
EXCHANGE-TRADED FUNDS — 0.5% | | Shares | | | Value | |
Utilities Select Sector SPDR® Fund (The) (Cost $614,929) | | | 12,250 | | | $ | 678,773 | |
|
MONEY MARKET FUNDS — 3.3% | | Shares | | | Value | |
First American Treasury Obligations Fund - Class Z, 0.28%(c) (Cost $4,686,688) | | | 4,686,688 | | | $ | 4,686,688 | |
| | | | | | | | | |
Total Investments at Value — 99.7%(Cost $160,095,221) | | | | | | $ | 143,408,662 | |
| | | | | | | | | |
Other Assets in Excess of Liabilities — 0.3% | | | | | | | 488,189 | |
| | | | | | | | | |
Net Assets — 100.0% | | | | | | $ | 143,896,851 | |
ADR - American Depositary Receipt.
LIBOR - London Interbank Offered Rate.
(a) | Non-income producing security. |
(b) | Variable rate security. Interest rate resets periodically. The rate shown is the effective interest rate as of March 31, 2020. The reference rate and spread (in basis points) are indicated parenthetically. |
(c) | The rate shown is the 7-day effective yield as of March 31, 2020. |
See accompanying notes to financial statements.
39
THE DAVENPORT FUNDS
STATEMENTS OF ASSETS AND LIABILITIES
March 31, 2020 |
| | Davenport
Core
Fund | | | Davenport
Value &
Income
Fund | | | Davenport
Equity
Opportunities
Fund | |
ASSETS | | | | | | | | | | | | |
Investments in securities: | | | | | | | | | | | | |
At cost | | $ | 330,362,865 | | | $ | 598,950,559 | | | $ | 363,391,377 | |
At value (Note 2) | | $ | 473,668,903 | | | $ | 549,558,692 | | | $ | 385,613,537 | |
Cash | | | 12,950,742 | | | | — | | | | — | |
Receivable for capital shares sold | | | 163,167 | | | | 92,979 | | | | 235,579 | |
Dividends receivable | | | 281,483 | | | | 799,729 | | | | 12,532 | |
Other assets | | | 16,622 | | | | 14,247 | | | | 15,852 | |
TOTAL ASSETS | | | 487,080,917 | | | | 550,465,647 | | | | 385,877,500 | |
| | | | | | | | | | | | | |
LIABILITIES | | | | | | | | | | | | |
Payable for capital shares redeemed | | | 127,739 | | | | 913,592 | | | | 393,939 | |
Accrued investment advisory fees (Note 4) | | | 322,430 | | | | 370,896 | | | | 263,585 | |
Payable to administrator (Note 4) | | | 50,770 | | | | 57,290 | | | | 45,710 | |
Other accrued expenses | | | 11,470 | | | | 12,310 | | | | 11,580 | |
TOTAL LIABILITIES | | | 512,409 | | | | 1,354,088 | | | | 714,814 | |
| | | | | | | | | | | | | |
NET ASSETS | | $ | 486,568,508 | | | $ | 549,111,559 | | | $ | 385,162,686 | |
| | | | | | | | | | | | | |
Net assets consist of: | | | | | | | | | | | | |
Paid-in capital | | $ | 359,298,122 | | | $ | 579,832,861 | | | $ | 333,501,760 | |
Accumulated earnings (deficit) | | | 127,270,386 | | | | (30,721,302 | ) | | | 51,660,926 | |
Net assets | | $ | 486,568,508 | | | $ | 549,111,559 | | | $ | 385,162,686 | |
| | | | | | | | | | | | | |
Shares of beneficial interest outstanding (unlimited number of shares authorized, $0.01 par value) | | | 22,657,186 | | | | 42,124,305 | | | | 23,256,331 | |
| | | | | | | | | | | | | |
Net asset value, offering price and redemption price per share (Note 2) | | $ | 21.48 | | | $ | 13.04 | | | $ | 16.56 | |
See accompanying notes to financial statements.
40
THE DAVENPORT FUNDS
STATEMENTS OF ASSETS AND LIABILITIES (Continued)
March 31, 2020 |
| | Davenport
Small Cap
Focus
Fund | | | Davenport
Balanced
Income
Fund | |
ASSETS | | | | | | | | |
Investments in securities: | | | | | | | | |
At cost | | $ | 194,337,367 | | | $ | 160,095,221 | |
At value (Note 2) | | $ | 175,961,940 | | | $ | 143,408,662 | |
Cash | | | — | | | | 60,575 | |
Receivable for capital shares sold | | | 184,289 | | | | 232,806 | |
Receivable for investment securities sold | | | 4,308,935 | | | | — | |
Dividends and interest receivable | | | 84,167 | | | | 563,004 | |
Other assets | | | 12,299 | | | | 10,416 | |
TOTAL ASSETS | | | 180,551,630 | | | | 144,275,463 | |
| | | | | | | | | |
LIABILITIES | | | | | | | | |
Payable for capital shares redeemed | | | 322,248 | | | | 255,003 | |
Accrued investment advisory fees (Note 4) | | | 115,582 | | | | 96,044 | |
Payable to administrator (Note 4) | | | 22,900 | | | | 17,720 | |
Other accrued expenses | | | 13,870 | | | | 9,845 | |
TOTAL LIABILITIES | | | 474,600 | | | | 378,612 | |
| | | | | | | | | |
NET ASSETS | | $ | 180,077,030 | | | $ | 143,896,851 | |
| | | | | | | | | |
Net assets consist of: | | | | | | | | |
Paid-in capital | | $ | 199,557,948 | | | $ | 160,584,205 | |
Accumulated deficit | | | (19,480,918 | ) | | | (16,687,354 | ) |
Net assets | | $ | 180,077,030 | | | $ | 143,896,851 | |
| | | | | | | | | |
Shares of beneficial interest outstanding (unlimited number of shares authorized, $0.01 par value) | | | 16,169,406 | | | | 14,618,307 | |
| | | | | | | | | |
Net asset value, offering price and redemption price per share (Note 2) | | $ | 11.14 | | | $ | 9.84 | |
See accompanying notes to financial statements.
41
THE DAVENPORT FUNDS
STATEMENTS OF OPERATIONS
Year Ended March 31, 2020 |
| | Davenport
Core
Fund | | | Davenport
Value &
Income
Fund | | | Davenport
Equity
Opportunities
Fund | |
INVESTMENT INCOME | | | | | | | | | | | | |
Dividends | | $ | 8,171,198 | | | $ | 20,791,654 | | | $ | 4,285,108 | |
Foreign withholding taxes on dividends | | | (99,734 | ) | | | (281,629 | ) | | | (154,637 | ) |
TOTAL INVESTMENT INCOME | | | 8,071,464 | | | | 20,510,025 | | | | 4,130,471 | |
| | | | | | | | | | | | | |
EXPENSES | | | | | | | | | | | | |
Investment advisory fees (Note 4) | | | 4,227,914 | | | | 5,229,382 | | | | 3,506,542 | |
Administration fees (Note 4) | | | 583,189 | | | | 682,056 | | | | 532,278 | |
Registration and filing fees | | | 36,135 | | | | 37,450 | | | | 38,202 | |
Custodian and bank service fees | | | 35,824 | | | | 44,418 | | | | 30,238 | |
Compliance service fees (Note 4) | | | 29,539 | | | | 35,484 | | | | 25,238 | |
Audit and tax services fees | | | 16,500 | | | | 16,500 | | | | 16,500 | |
Trustees’ fees and expenses (Note 4) | | | 15,508 | | | | 15,508 | | | | 15,508 | |
Postage and supplies | | | 11,606 | | | | 13,719 | | | | 11,758 | |
Insurance expense | | | 10,896 | | | | 14,037 | | | | 8,931 | |
Printing of shareholder reports | | | 9,476 | | | | 11,858 | | | | 9,765 | |
Legal fees | | | 5,037 | | | | 5,037 | | | | 5,037 | |
Other expenses | | | 9,720 | | | | 11,638 | | | | 8,524 | |
TOTAL EXPENSES | | | 4,991,344 | | | | 6,117,087 | | | | 4,208,521 | |
| | | | | | | | | | | | | |
NET INVESTMENT INCOME (LOSS) | | | 3,080,120 | | | | 14,392,938 | | | | (78,050 | ) |
| | | | | | | | | | | | | |
REALIZED AND UNREALIZED GAINS (LOSSES) ON INVESTMENTS AND FOREIGN CURRENCIES | | | | | | | | | | | | |
Net realized gains (losses) from: | | | | | | | | | | | | |
Investments | | | (7,699,360 | ) | | | 31,723,502 | | | | 33,664,952 | |
Foreign currency transactions | | | — | | | | (2,226 | ) | | | — | |
Net change in unrealized appreciation (depreciation) on investments | | | (35,959,215 | ) | | | (161,093,770 | ) | | | (74,592,493 | ) |
NET REALIZED AND UNREALIZED LOSSES ON INVESTMENTS AND FOREIGN CURRENCIES | | | (43,658,575 | ) | | | (129,372,494 | ) | | | (40,927,541 | ) |
| | | | | | | | | | | | | |
NET DECREASE IN NET ASSETS FROM OPERATIONS | | $ | (40,578,455 | ) | | $ | (114,979,556 | ) | | $ | (41,005,591 | ) |
See accompanying notes to financial statements.
42
THE DAVENPORT FUNDS
STATEMENTS OF OPERATIONS (Continued)
Year Ended March 31, 2020 |
| | Davenport
Small Cap
Focus
Fund | | | Davenport
Balanced
Income
Fund | |
INVESTMENT INCOME | | | | | | | | |
Dividends | | $ | 2,556,976 | | | $ | 3,362,864 | |
Foreign withholding taxes on dividends | | | — | | | | (44,874 | ) |
Interest | | | — | | | | 1,575,925 | |
TOTAL INVESTMENT INCOME | | | 2,556,976 | | | | 4,893,915 | |
| | | | | | | | | |
EXPENSES | | | | | | | | |
Investment advisory fees (Note 4) | | | 1,417,196 | | | | 1,174,740 | |
Administration fees (Note 4) | | | 250,238 | | | | 194,593 | |
Registration and filing fees | | | 39,585 | | | | 33,101 | |
Audit and tax services fees | | | 16,500 | | | | 18,000 | |
Trustees’ fees and expenses (Note 4) | | | 15,508 | | | | 15,508 | |
Custodian and bank service fees | | | 18,253 | | | | 11,177 | |
Compliance service fees (Note 4) | | | 12,834 | | | | 11,349 | |
Postage and supplies | | | 7,247 | | | | 5,377 | |
Legal fees | | | 5,037 | | | | 5,037 | |
Printing of shareholder reports | | | 5,575 | | | | 4,458 | |
Insurance expense | | | 3,805 | | | | 3,625 | |
Other expenses | | | 6,170 | | | | 12,313 | |
TOTAL EXPENSES | | | 1,797,948 | | | | 1,489,278 | |
| | | | | | | | | |
NET INVESTMENT INCOME | | | 759,028 | | | | 3,404,637 | |
| | | | | | | | | |
REALIZED AND UNREALIZED GAINS (LOSSES) ON INVESTMENTS AND FOREIGN CURRENCIES | | | | | | | | |
Net realized gains (losses) from: | | | | | | | | |
Investments | | | 1,787,177 | | | | 1,057,558 | |
Foreign currency transactions | | | — | | | | (258 | ) |
Net change in unrealized appreciation (depreciation) on investments | | | (33,622,447 | ) | | | (23,327,826 | ) |
NET REALIZED AND UNREALIZED LOSSES ON INVESTMENTS AND FOREIGN CURRENCIES | | | (31,835,270 | ) | | | (22,270,526 | ) |
| | | | | | | | | |
NET DECREASE IN NET ASSETS FROM OPERATIONS | | $ | (31,076,242 | ) | | $ | (18,865,889 | ) |
See accompanying notes to financial statements.
43
DAVENPORT CORE FUND
STATEMENTS OF CHANGES IN NET ASSETS |
| | Year
Ended
March 31,
2020 | | | Year
Ended
March 31,
2019 | |
FROM OPERATIONS | | | | | | | | |
Net investment income | | $ | 3,080,120 | | | $ | 2,357,447 | |
Net realized gains (losses) from investment transactions | | | (7,699,360 | ) | | | 5,883,146 | |
Net change in unrealized appreciation (depreciation) on investments | | | (35,959,215 | ) | | | 30,629,890 | |
Net increase (decrease) in net assets from operations | | | (40,578,455 | ) | | | 38,870,483 | |
| | | | | | | | | |
DISTRIBUTIONS TO SHAREHOLDERS (Note 2) | | | (13,553,767 | ) | | | (21,768,874 | ) |
| | | | | | | | | |
FROM CAPITAL SHARE TRANSACTIONS | | | | | | | | |
Proceeds from shares sold | | | 54,999,660 | | | | 47,157,117 | |
Net asset value of shares issued in reinvestment of distributions to shareholders | | | 12,838,833 | | | | 20,895,848 | |
Payments for shares redeemed | | | (43,365,603 | ) | | | (33,846,129 | ) |
Net increase in net assets from capital share transactions | | | 24,472,890 | | | | 34,206,836 | |
| | | | | | | | | |
TOTAL INCREASE (DECREASE) IN NET ASSETS | | | (29,659,332 | ) | | | 51,308,445 | |
| | | | | | | | | |
NET ASSETS | | | | | | | | |
Beginning of year | | | 516,227,840 | | | | 464,919,395 | |
End of year | | $ | 486,568,508 | | | $ | 516,227,840 | |
| | | | | | | | | |
CAPITAL SHARE ACTIVITY | | | | | | | | |
Shares sold | | | 2,182,947 | | | | 2,058,367 | |
Shares reinvested | | | 502,726 | | | | 905,013 | |
Shares redeemed | | | (1,763,953 | ) | | | (1,479,544 | ) |
Net increase in shares outstanding | | | 921,720 | | | | 1,483,836 | |
Shares outstanding at beginning of year | | | 21,735,466 | | | | 20,251,630 | |
Shares outstanding at end of year | | | 22,657,186 | | | | 21,735,466 | |
See accompanying notes to financial statements.
44
DAVENPORT VALUE & INCOME FUND
STATEMENTS OF CHANGES IN NET ASSETS |
| | Year
Ended
March 31,
2020 | | | Year
Ended
March 31,
2019 | |
FROM OPERATIONS | | | | | | | | |
Net investment income | | $ | 14,392,938 | | | $ | 14,460,384 | |
Net realized gains (losses) from: | | | | | | | | |
Investments | | | 31,723,502 | | | | 9,004,922 | |
Foreign currency transactions | | | (2,226 | ) | | | (2,897 | ) |
Net change in unrealized appreciation (depreciation) on investments | | | (161,093,770 | ) | | | (4,227,734 | ) |
Net increase (decrease) in net assets from operations | | | (114,979,556 | ) | | | 19,234,675 | |
| | | | | | | | | |
DISTRIBUTIONS TO SHAREHOLDERS (Note 2) | | | (28,599,834 | ) | | | (37,478,575 | ) |
| | | | | | | | | |
FROM CAPITAL SHARE TRANSACTIONS | | | | | | | | |
Proceeds from shares sold | | | 64,226,968 | | | | 68,940,134 | |
Net asset value of shares issued in reinvestment of distributions to shareholders | | | 26,096,159 | | | | 34,718,152 | |
Payments for shares redeemed | | | (70,586,528 | ) | | | (60,915,857 | ) |
Net increase in net assets from capital share transactions | | | 19,736,599 | | | | 42,742,429 | |
| | | | | | | | | |
TOTAL INCREASE (DECREASE) IN NET ASSETS | | | (123,842,791 | ) | | | 24,498,529 | |
| | | | | | | | | |
NET ASSETS | | | | | | | | |
Beginning of year | | | 672,954,350 | | | | 648,455,821 | |
End of year | | $ | 549,111,559 | | | $ | 672,954,350 | |
| | | | | | | | | |
CAPITAL SHARE ACTIVITY | | | | | | | | |
Shares sold | | | 3,853,987 | | | | 4,212,521 | |
Shares reinvested | | | 1,597,248 | | | | 2,115,148 | |
Shares redeemed | | | (4,406,389 | ) | | | (3,725,345 | ) |
Net increase in shares outstanding | | | 1,044,846 | | | | 2,602,324 | |
Shares outstanding at beginning of year | | | 41,079,459 | | | | 38,477,135 | |
Shares outstanding at end of year | | | 42,124,305 | | | | 41,079,459 | |
See accompanying notes to financial statements.
45
DAVENPORT EQUITY OPPORTUNITIES FUND
STATEMENTS OF CHANGES IN NET ASSETS |
| | Year
Ended
March 31,
2020 | | | Year
Ended
March 31,
2019 | |
FROM OPERATIONS | | | | | | | | |
Net investment loss | | $ | (78,050 | ) | | $ | (517,031 | ) |
Net realized gains from investment transactions | | | 33,664,952 | | | | 30,117,103 | |
Net change in unrealized appreciation (depreciation) on investments | | | (74,592,493 | ) | | | 11,629,631 | |
Net increase (decrease) in net assets from operations | | | (41,005,591 | ) | | | 41,229,703 | |
| | | | | | | | | |
DISTRIBUTIONS TO SHAREHOLDERS (Note 2) | | | (18,269,665 | ) | | | (13,919,524 | ) |
| | | | | | | | | |
FROM CAPITAL SHARE TRANSACTIONS | | | | | | | | |
Proceeds from shares sold | | | 81,385,180 | | | | 26,095,613 | |
Net asset value of shares issued in reinvestment of distributions to shareholders | | | 17,525,692 | | | | 13,397,687 | |
Payments for shares redeemed | | | (63,475,317 | ) | | | (57,260,845 | ) |
Net increase (decrease) in net assets from capital share transactions | | | 35,435,555 | | | | (17,767,545 | ) |
| | | | | | | | | |
TOTAL INCREASE (DECREASE) IN NET ASSETS | | | (23,839,701 | ) | | | 9,542,634 | |
| | | | | | | | | |
NET ASSETS | | | | | | | | |
Beginning of year | | | 409,002,387 | | | | 399,459,753 | |
End of year | | $ | 385,162,686 | | | $ | 409,002,387 | |
| | | | | | | | | |
CAPITAL SHARE ACTIVITY | | | | | | | | |
Shares sold | | | 3,965,405 | | | | 1,463,115 | |
Shares reinvested | | | 874,454 | | | | 778,031 | |
Shares redeemed | | | (3,128,179 | ) | | | (3,194,984 | ) |
Net increase (decrease) in shares outstanding | | | 1,711,680 | | | | (953,838 | ) |
Shares outstanding at beginning of year | | | 21,544,651 | | | | 22,498,489 | |
Shares outstanding at end of year | | | 23,256,331 | | | | 21,544,651 | |
See accompanying notes to financial statements.
46
DAVENPORT SMALL CAP FOCUS FUND
STATEMENTS OF CHANGES IN NET ASSETS |
| | Year
Ended
March 31,
2020 | | | Year
Ended
March 31,
2019 | |
FROM OPERATIONS | | | | | | | | |
Net investment income | | $ | 759,028 | | | $ | 730,910 | |
Net realized gains from investment transactions | | | 1,787,177 | | | | 1,144,874 | |
Net change in unrealized appreciation (depreciation) on investments | | | (33,622,447 | ) | | | 1,274,066 | |
Net increase (decrease) in net assets from operations | | | (31,076,242 | ) | | | 3,149,850 | |
| | | | | | | | | |
DISTRIBUTIONS TO SHAREHOLDERS (Note 2) | | | (4,283,969 | ) | | | (2,926,287 | ) |
| | | | | | | | | |
FROM CAPITAL SHARE TRANSACTIONS | | | | | | | | |
Proceeds from shares sold | | | 81,570,070 | | | | 58,704,586 | |
Net asset value of shares issued in reinvestment of distributions to shareholders | | | 4,127,892 | | | | 2,851,040 | |
Payments for shares redeemed | | | (22,323,610 | ) | | | (25,955,030 | ) |
Net increase in net assets from capital share transactions | | | 63,374,352 | | | | 35,600,596 | |
| | | | | | | | | |
TOTAL INCREASE IN NET ASSETS | | | 28,014,141 | | | | 35,824,159 | |
| | | | | | | | | |
NET ASSETS | | | | | | | | |
Beginning of year | | | 152,062,889 | | | | 116,238,730 | |
End of year | | $ | 180,077,030 | | | $ | 152,062,889 | |
| | | | | | | | | |
CAPITAL SHARE ACTIVITY | | | | | | | | |
Shares sold | | | 5,996,677 | | | | 4,406,141 | |
Shares reinvested | | | 280,868 | | | | 219,280 | |
Shares redeemed | | | (1,584,623 | ) | | | (2,086,572 | ) |
Net increase in shares outstanding | | | 4,692,922 | | | | 2,538,849 | |
Shares outstanding at beginning of year | | | 11,476,484 | | | | 8,937,635 | |
Shares outstanding at end of year | | | 16,169,406 | | | | 11,476,484 | |
See accompanying notes to financial statements.
47
DAVENPORT BALANCED INCOME FUND
STATEMENTS OF CHANGES IN NET ASSETS |
| | Year
Ended
March 31,
2020 | | | Year
Ended
March 31,
2019 | |
FROM OPERATIONS | | | | | | | | |
Net investment income | | $ | 3,404,637 | | | $ | 3,093,736 | |
Net realized gains (losses) from: | | | | | | | | |
Investments | | | 1,057,558 | | | | (936,430 | ) |
Foreign currency transactions | | | (258 | ) | | | (310 | ) |
Net change in unrealized appreciation (depreciation) on investments | | | (23,327,826 | ) | | | 2,249,651 | |
Net increase (decrease) in net assets from operations | | | (18,865,889 | ) | | | 4,406,647 | |
| | | | | | | | | |
DISTRIBUTIONS TO SHAREHOLDERS (Note 2) | | | | | | | | |
From distributable earnings | | | (4,232,642 | ) | | | (3,736,702 | ) |
Return of capital | | | (415,129 | ) | | | — | |
Decrease in net assets from distributions to shareholders | | | (4,647,771 | ) | | | (3,736,702 | ) |
| | | | | | | | | |
FROM CAPITAL SHARE TRANSACTIONS | | | | | | | | |
Proceeds from shares sold | | | 42,349,095 | | | | 27,209,013 | |
Net asset value of shares issued in reinvestment of distributions to shareholders | | | 4,325,997 | | | | 3,497,522 | |
Payments for shares redeemed | | | (21,463,883 | ) | | | (18,444,828 | ) |
Net increase in net assets from capital share transactions | | | 25,211,209 | | | | 12,261,707 | |
| | | | | | | | | |
TOTAL INCREASE IN NET ASSETS | | | 1,697,549 | | | | 12,931,652 | |
| | | | | | | | | |
NET ASSETS | | | | | | | | |
Beginning of year | | | 142,199,302 | | | | 129,267,650 | |
End of year | | $ | 143,896,851 | | | $ | 142,199,302 | |
| | | | | | | | | |
CAPITAL SHARE ACTIVITY | | | | | | | | |
Shares sold | | | 3,606,559 | | | | 2,422,911 | |
Shares reinvested | | | 380,947 | | | | 312,892 | |
Shares redeemed | | | (1,913,131 | ) | | | (1,655,625 | ) |
Net increase in shares outstanding | | | 2,074,375 | | | | 1,080,178 | |
Shares outstanding at beginning of year | | | 12,543,932 | | | | 11,463,754 | |
Shares outstanding at end of year | | | 14,618,307 | | | | 12,543,932 | |
See accompanying notes to financial statements.
48
DAVENPORT CORE FUND
FINANCIAL HIGHLIGHTS |
Selected Per Share Data and Ratios for a Share Outstanding Throughout Each Year |
| | |
Years Ended March 31,
| |
| | 2020 | | | 2019 | | | 2018 | | | 2017 | | | 2016 | |
Net asset value at beginning of year | | $ | 23.75 | | | $ | 22.96 | | | $ | 21.15 | | | $ | 18.78 | | | $ | 20.02 | |
| | | | | | | | | | | | | | | | | | | | | |
Income (loss) from investment operations: | | | | | | | | | | | | | | | | | | | | |
Net investment income | | | 0.14 | | | | 0.11 | | | | 0.09 | | | | 0.11 | | | | 0.11 | |
Net realized and unrealized gains (losses) on investments | | | (1.80 | ) | | | 1.74 | | | | 2.29 | | | | 2.92 | | | | (0.56 | ) |
Total from investment operations | | | (1.66 | ) | | | 1.85 | | | | 2.38 | | | | 3.03 | | | | (0.45 | ) |
| | | | | | | | | | | | | | | | | | | | | |
Less distributions: | | | | | | | | | | | | | | | | | | | | |
Dividends from net investment income | | | (0.14 | ) | | | (0.11 | ) | | | (0.11 | ) | | | (0.10 | ) | | | (0.11 | ) |
Distributions from net realized gains | | | (0.47 | ) | | | (0.95 | ) | | | (0.46 | ) | | | (0.56 | ) | | | (0.68 | ) |
Total distributions | | | (0.61 | ) | | | (1.06 | ) | | | (0.57 | ) | | | (0.66 | ) | | | (0.79 | ) |
| | | | | | | | | | | | | | | | | | | | | |
Net asset value at end of year | | $ | 21.48 | | | $ | 23.75 | | | $ | 22.96 | | | $ | 21.15 | | | $ | 18.78 | |
| | | | | | | | | | | | | | | | | | | | | |
Total return(a) | | | (7.36 | %) | | | 8.21 | % | | | 11.38 | % | | | 16.56 | % | | | (2.39 | %) |
| | | | | | | | | | | | | | | | | | | | | |
Net assets at end of year (000’s) | | $ | 486,569 | | | $ | 516,228 | | | $ | 464,919 | | | $ | 399,432 | | | $ | 337,229 | |
| | | | | | | | | | | | | | | | | | | | | |
Ratio of total expenses to average net assets | | | 0.89 | % | | | 0.89 | % | | | 0.90 | % | | | 0.90 | % | | | 0.92 | % |
| | | | | | | | | | | | | | | | | | | | | |
Ratio of net investment income to average net assets | | | 0.55 | % | | | 0.48 | % | | | 0.41 | % | | | 0.56 | % | | | 0.56 | % |
| | | | | | | | | | | | | | | | | | | | | |
Portfolio turnover rate | | | 12 | % | | | 21 | % | | | 22 | % | | | 23 | % | | | 23 | % |
(a) | Total return is a measure of the change in value of an investment in the Fund over the periods covered, which assumes any dividends or capital gains distributions are reinvested in shares of the Fund. Returns shown do not reflect the deduction of taxes a shareholder would pay on Fund distributions or the redemption of Fund shares. |
See accompanying notes to financial statements.
49
DAVENPORT VALUE & INCOME FUND
FINANCIAL HIGHLIGHTS |
Selected Per Share Data and Ratios for a Share Outstanding Throughout Each Year |
| | |
Years Ended March 31,
| |
| | 2020 | | | 2019 | | | 2018 | | | 2017 | | | 2016 | |
Net asset value at beginning of year | | $ | 16.38 | | | $ | 16.85 | | | $ | 15.97 | | | $ | 14.40 | | | $ | 15.46 | |
| | | | | | | | | | | | | | | | | | | | | |
Income (loss) from investment operations: | | | | | | | | | | | | | | | | | | | | |
Net investment income | | | 0.35 | | | | 0.36 | | | | 0.30 | | | | 0.30 | | | | 0.29 | |
Net realized and unrealized gains (losses) on investments and foreign currencies | | | (3.00 | ) | | | 0.12 | | | | 1.39 | | | | 1.64 | | | | (0.36 | ) |
Total from investment operations | | | (2.65 | ) | | | 0.48 | | | | 1.69 | | | | 1.94 | | | | (0.07 | ) |
| | | | | | | | | | | | | | | | | | | | | |
Less distributions: | | | | | | | | | | | | | | | | | | | | |
Dividends from net investment income | | | (0.36 | ) | | | (0.36 | ) | | | (0.30 | ) | | | (0.31 | ) | | | (0.29 | ) |
Distributions from net realized gains | | | (0.33 | ) | | | (0.59 | ) | | | (0.51 | ) | | | (0.06 | ) | | | (0.70 | ) |
Total distributions | | | (0.69 | ) | | | (0.95 | ) | | | (0.81 | ) | | | (0.37 | ) | | | (0.99 | ) |
| | | | | | | | | | | | | | | | | | | | | |
Net asset value at end of year | | $ | 13.04 | | | $ | 16.38 | | | $ | 16.85 | | | $ | 15.97 | | | $ | 14.40 | |
| | | | | | | | | | | | | | | | | | | | | |
Total return(a) | | | (16.97 | %) | | | 2.96 | % | | | 10.67 | % | | | 13.60 | % | | | (0.46 | %) |
| | | | | | | | | | | | | | | | | | | | | |
Net assets at end of year (000’s) | | $ | 549,112 | | | $ | 672,954 | | | $ | 648,456 | | | $ | 561,995 | | | $ | 450,447 | |
| | | | | | | | | | | | | | | | | | | | | |
Ratio of total expenses to average net assets | | | 0.88 | % | | | 0.88 | % | | | 0.88 | % | | | 0.89 | % | | | 0.91 | % |
| | | | | | | | | | | | | | | | | | | | | |
Ratio of net investment income to average net assets | | | 2.07 | % | | | 2.21 | % | | | 1.79 | % | | | 1.96 | % | | | 2.03 | % |
| | | | | | | | | | | | | | | | | | | | | |
Portfolio turnover rate | | | 28 | % | | | 18 | % | | | 22 | % | | | 26 | % | | | 25 | % |
(a) | Total return is a measure of the change in value of an investment in the Fund over the periods covered, which assumes any dividends or capital gains distributions are reinvested in shares of the Fund. Returns shown do not reflect the deduction of taxes a shareholder would pay on Fund distributions or the redemption of Fund shares. |
See accompanying notes to financial statements.
50
DAVENPORT EQUITY OPPORTUNITIES FUND
FINANCIAL HIGHLIGHTS |
Selected Per Share Data and Ratios for a Share Outstanding Throughout Each Year |
| | |
Years Ended March 31,
| |
| | 2020 | | | 2019 | | | 2018 | | | 2017 | | | 2016 | |
Net asset value at beginning of year | | $ | 18.98 | | | $ | 17.75 | | | $ | 15.64 | | | $ | 14.73 | | | $ | 16.61 | |
| | | | | | | | | | | | | | | | | | | | | |
Income (loss) from investment operations: | | | | | | | | | | | | | | | | | | | | |
Net investment income (loss) | | | (0.00 | )(a) | | | (0.02 | ) | | | (0.04 | ) | | | 0.00 | (a) | | | 0.00 | (a) |
Net realized and unrealized gains (losses) on investments | | | (1.59 | ) | | | 1.91 | | | | 2.15 | | | | 1.10 | | | | (1.14 | ) |
Total from investment operations | | | (1.59 | ) | | | 1.89 | | | | 2.11 | | | | 1.10 | | | | (1.14 | ) |
| | | | | | | | | | | | | | | | | | | | | |
Less distributions: | | | | | | | | | | | | | | | | | | | | |
Dividends from net investment income | | | — | | | | — | | | | — | | | | — | | | | (0.01 | ) |
Distributions from net realized gains | | | (0.83 | ) | | | (0.66 | ) | | | — | | | | (0.19 | ) | | | (0.73 | ) |
Total distributions | | | (0.83 | ) | | | (0.66 | ) | | | — | | | | (0.19 | ) | | | (0.74 | ) |
| | | | | | | | | | | | | | | | | | | | | |
Net asset value at end of year | | $ | 16.56 | | | $ | 18.98 | | | $ | 17.75 | | | $ | 15.64 | | | $ | 14.73 | |
| | | | | | | | | | | | | | | | | | | | | |
Total return(b) | | | (9.13 | %) | | | 11.02 | % | | | 13.49 | % | | | 7.57 | % | | | (7.07 | %) |
| | | | | | | | | | | | | | | | | | | | | |
Net assets at end of year (000’s) | | $ | 385,163 | | | $ | 409,002 | | | $ | 399,460 | | | $ | 351,754 | | | $ | 316,788 | |
| | | | | | | | | | | | | | | | | | | | | |
Ratio of total expenses to average net assets | | | 0.90 | % | | | 0.91 | % | | | 0.91 | % | | | 0.92 | % | | | 0.93 | % |
| | | | | | | | | | | | | | | | | | | | | |
Ratio of net investment income (loss) to average net assets | | | (0.02 | %) | | | (0.13 | %) | | | (0.23 | %) | | | 0.00 | %(c) | | | 0.02 | % |
| | | | | | | | | | | | | | | | | | | | | |
Portfolio turnover rate | | | 21 | % | | | 19 | % | | | 21 | % | | | 23 | % | | | 29 | % |
(a) | Amount rounds to less than $0.01 per share. |
(b) | Total return is a measure of the change in value of an investment in the Fund over the periods covered, which assumes any dividends or capital gains distributions are reinvested in shares of the Fund. Returns shown do not reflect the deduction of taxes a shareholder would pay on Fund distributions or the redemption of Fund shares. |
(c) | Amount rounds to less than 0.01%. |
See accompanying notes to financial statements.
51
DAVENPORT SMALL CAP FOCUS FUND
FINANCIAL HIGHLIGHTS |
Selected Per Share Data and Ratios for a Share Outstanding Throughout Each Year |
| | |
Years Ended March 31,
| |
| | 2020 | | | 2019 | | | 2018 | | | 2017 | | | 2016 | |
Net asset value at beginning of year | | $ | 13.25 | | | $ | 13.01 | | | $ | 12.13 | | | $ | 9.34 | | | $ | 10.41 | |
| | | | | | | | | | | | | | | | | | | | | |
Income (loss) from investment operations: | | | | | | | | | | | | | | | | | | | | |
Net investment income | | | 0.05 | | | | 0.06 | | | | 0.02 | | | | 0.02 | | | | 0.01 | |
Net realized and unrealized gains (losses) on investments | | | (1.84 | ) | | | 0.44 | | | | 1.22 | | | | 2.77 | | | | (1.07 | ) |
Total from investment operations | | | (1.79 | ) | | | 0.50 | | | | 1.24 | | | | 2.79 | | | | (1.06 | ) |
| | | | | | | | | | | | | | | | | | | | | |
Less distributions: | | | | | | | | | | | | | | | | | | | | |
Dividends from net investment income | | | (0.10 | ) | | | — | | | | — | | | | — | | | | — | |
Distributions from net realized gains | | | (0.22 | ) | | | (0.26 | ) | | | (0.36 | ) | | | — | | | | (0.01 | ) |
Total distributions | | | (0.32 | ) | | | (0.26 | ) | | | (0.36 | ) | | | — | | | | (0.01 | ) |
| | | | | | | | | | | | | | | | | | | | | |
Net asset value at end of year | | $ | 11.14 | | | $ | 13.25 | | | $ | 13.01 | | | $ | 12.13 | | | $ | 9.34 | |
| | | | | | | | | | | | | | | | | | | | | |
Total return(a) | | | (14.08 | %) | | | 3.90 | % | | | 10.28 | % | | | 29.87 | % | | | (10.19 | %) |
| | | | | | | | | | | | | | | | | | | | | |
Net assets at end of year (000’s) | | $ | 180,077 | | | $ | 152,063 | | | $ | 116,239 | | | $ | 74,946 | | | $ | 39,636 | |
| | | | | | | | | | | | | | | | | | | | | |
Ratio of net expenses to average net assets | | | 0.95 | % | | | 0.97 | % | | | 1.00 | % | | | 1.06 | % | | | 1.15 | % |
| | | | | | | | | | | | | | | | | | | | | |
Ratio of net investment income to average net assets | | | 0.40 | % | | | 0.51 | % | | | 0.26 | % | | | 0.09 | % | | | 0.14 | % |
| | | | | | | | | | | | | | | | | | | | | |
Portfolio turnover rate | | | 66 | % | | | 60 | % | | | 48 | % | | | 37 | % | | | 48 | % |
(a) | Total return is a measure of the change in value of an investment in the Fund over the periods covered, which assumes any dividends or capital gains distributions are reinvested in shares of the Fund. Returns shown do not reflect the deduction of taxes a shareholder would pay on Fund distributions or the redemption of Fund shares. |
See accompanying notes to financial statements.
52
DAVENPORT BALANCED INCOME FUND
FINANCIAL HIGHLIGHTS |
Selected Per Share Data and Ratios for a Share Outstanding Throughout Each Period |
| | Year
Ended
March 31,
2020 | | | Year
Ended
March 31,
2019 | | | Year
Ended
March 31,
2018 | | | Year
Ended
March 31,
2017 | | | Period
Ended
March 31,
2016(a) | |
Net asset value at beginning of period | | $ | 11.34 | | | $ | 11.28 | | | $ | 11.02 | | | $ | 10.27 | | | $ | 10.00 | |
| | | | | | | | | | | | | | | | | | | | | |
Income (loss) from investment operations: | | | | | | | | | | | | | | | | | | | | |
Net investment income | | | 0.25 | | | | 0.25 | | | | 0.20 | | | | 0.14 | | | | 0.03 | |
Net realized and unrealized gains (losses) on investments and foreign currencies | | | (1.41 | ) | | | 0.12 | | | | 0.33 | | | | 0.74 | | | | 0.26 | |
Total from investment operations | | | (1.16 | ) | | | 0.37 | | | | 0.53 | | | | 0.88 | | | | 0.29 | |
| | | | | | | | | | | | | | | | | | | | | |
Less distributions: | | | | | | | | | | | | | | | | | | | | |
Dividends from net investment income | | | (0.23 | ) | | | (0.24 | ) | | | (0.17 | ) | | | (0.13 | ) | | | (0.02 | ) |
Distributions from net realized gains | | | (0.08 | ) | | | (0.07 | ) | | | (0.10 | ) | | | — | | | | — | |
Return of capital | | | (0.03 | ) | | | — | | | | — | | | | — | | | | — | |
Total distributions | | | (0.34 | ) | | | (0.31 | ) | | | (0.27 | ) | | | (0.13 | ) | | | (0.02 | ) |
| | | | | | | | | | | | | | | | | | | | | |
Net asset value at end of period | | $ | 9.84 | | | $ | 11.34 | | | $ | 11.28 | | | $ | 11.02 | | | $ | 10.27 | |
| | | | | | | | | | | | | | | | | | | | | |
Total return(b) | | | (10.59 | %) | | | 3.35 | % | | | 4.81 | % | | | 8.59 | % | | | 2.90 | %(c) |
| | | | | | | | | | | | | | | | | | | | | |
Net assets at end of period (000’s) | | $ | 143,897 | | | $ | 142,199 | | | $ | 129,268 | | | $ | 83,419 | | | $ | 17,885 | |
| | | | | | | | | | | | | | | | | | | | | |
Ratio of net expenses to average net assets | | | 0.95 | % | | | 0.96 | % | | | 0.97 | % | | | 1.13 | %(d) | | | 1.25 | %(e)(f) |
| | | | | | | | | | | | | | | | | | | | | |
Ratio of net investment income to average net assets | | | 2.18 | % | | | 2.28 | % | | | 1.85 | % | | | 1.55 | % | | | 1.65 | %(e)(g) |
| | | | | | | | | | | | | | | | | | | | | |
Portfolio turnover rate | | | 29 | % | | | 30 | % | | | 23 | % | | | 16 | % | | | 7 | %(c) |
(a) | Represents the period from commencement of operations (December 31, 2015) through March 31, 2016. |
(b) | Total return is a measure of the change in value of an investment in the Fund over the periods covered, which assumes any dividends or capital gains distributions are reinvested in shares of the Fund. Returns shown do not reflect the deduction of taxes a shareholder would pay on Fund distributions or the redemption of Fund shares. |
(d) | Absent advisory fee reductions and expense reimbursements recouped by the Adviser, the ratio of net expenses to average net assets would have been 1.08% for the year ended March 31, 2017. |
(f) | Absent advisory fee reductions and expense reimbursements, the ratio of total expenses to average net assets would have been 2.25%(d) for the period ended March 31, 2016 (Note 4). |
(g) | Ratio was determined after advisory fee reductions and expense reimbursements. |
See accompanying notes to financial statements.
53
THE DAVENPORT FUNDS
NOTES TO FINANCIAL STATEMENTS
March 31, 2020
1. Organization
Davenport Core Fund, Davenport Value & Income Fund, Davenport Equity Opportunities Fund, Davenport Small Cap Focus Fund and Davenport Balanced Income Fund (individually, a “Fund,” and, collectively, the “Funds”) are each a no-load series of the Williamsburg Investment Trust (the “Trust”), an open-end management investment company registered under the Investment Company Act of 1940, as amended. The Trust was organized as a Massachusetts business trust on July 18, 1988. Other series of the Trust are not incorporated in this report.
Davenport Core Fund’s investment objective is long-term growth of capital.
Davenport Value & Income Fund’s investment objective is to achieve long-term growth while generating current income through dividend payments on portfolio securities.
Davenport Equity Opportunities Fund’s investment objective is long-term capital appreciation.
Davenport Small Cap Focus Fund’s investment objective is long-term capital appreciation.
Davenport Balanced Income Fund’s investment objective is current income and an opportunity for long-term growth.
Davenport Core Fund, Davenport Value & Income Fund, Davenport Small Cap Focus Fund and Davenport Balanced Income Fund are each classified as a diversified fund. Davenport Equity Opportunities Fund is classified as a non-diversified fund.
2. Significant Accounting Policies
Each Fund follows accounting and reporting guidance under Financial Accounting Standards Board Accounting Standards Codification Topic 946, “Financial Services – Investment Companies.” The following is a summary of the Funds’ significant accounting policies. The policies are in conformity with accounting principles generally accepted in the United States of America (“GAAP”).
New accounting pronouncement — In March 2017, FASB issued Accounting Standards Update No. 2017-08 (“ASU 2017-08”), “Receivables – Nonrefundable Fees and Other Costs (Subtopic 310-20): Premium Amortization on Purchased Callable Debt Securities.” ASU 2017-08 shortens the amortization period for certain callable debt securities, held at a premium, to be amortized to the earliest call date. ASU 2017-08 does not require an accounting change for securities held at a discount, which continues to accrete to maturity. ASU 2017-08 is effective for fiscal years and interim periods within those fiscal years beginning after December 15, 2018. As of and for the year ended March 31, 2020, there are no securities held by the Funds that are applicable to ASU 2017-08.
Securities valuation — The Funds’ portfolio securities are valued as of the close of business of the regular session of the New York Stock Exchange (the “NYSE”) (normally 4:00 p.m. Eastern time). Securities traded on a national stock exchange, including common stocks and exchange-traded funds (“ETFs”), are valued based upon the closing price on the principal exchange where
54
THE DAVENPORT FUNDS
NOTES TO FINANCIAL STATEMENTS (Continued)
the security is traded, if available, otherwise, at the last quoted bid price. Securities that are quoted by NASDAQ are valued at the NASDAQ Official Closing Price. Investments representing shares of money market funds and other open-end investment companies, other than ETFs, are valued at their net asset value (“NAV”) as reported by such companies. When using a quoted price and when the market is considered active, securities will be classified as Level 1 within the fair value hierarchy (see below).
Fixed income securities, including corporate bonds and U.S. Treasury obligations, are typically valued on the basis of prices provided by an independent pricing service. The prices provided by the pricing service are determined with consideration given to institutional bid and last sale prices and take into account securities prices, yields, maturities, call features, ratings, institutional trading in similar groups of securities, and developments related to specific securities. Given the inputs used by the pricing service, these securities are classified as Level 2 within the fair value hierarchy.
When market quotations are not readily available, if a pricing service cannot provide a price, or if the investment adviser believes the price received from the pricing service is not indicative of market value, securities will be valued in good faith at fair value using methods consistent with procedures adopted by the Board of Trustees and will be classified as Level 2 or 3 within the fair value hierarchy, depending on the inputs used. Such methods of fair valuation may include, but are not limited to: multiple of earnings, multiple of book value, discount from market of a similar freely traded security, purchase price of the security, subsequent private transactions in the security or related securities, or a combination of these and other factors.
GAAP establishes a single authoritative definition of fair value, sets out a framework for measuring fair value and requires additional disclosures about fair value measurements.
Various inputs are used in determining the value of the Funds’ investments. These inputs are summarized in the three broad levels listed below:
| | ● | Level 1 – quoted prices in active markets for identical securities |
| | ● | Level 2 – other significant observable inputs |
| | ● | Level 3 – significant unobservable inputs |
The inputs or methodology used for valuing securities are not necessarily an indication of the risks associated with investing in those securities. The inputs used to measure fair value may fall into different levels of the fair value hierarchy. In such cases, for disclosure purposes, the level in the fair value hierarchy within which the fair value measurement falls in its entirety is determined based on the lowest level input that is significant to the fair value measurement.
55
THE DAVENPORT FUNDS
NOTES TO FINANCIAL STATEMENTS (Continued)
The following is a summary of the inputs used to value the Funds’ investments as of March 31, 2020, by security type:
Davenport Core Fund | | Level 1 | | | Level 2 | | | Level 3 | | | Total | |
Common Stocks | | $ | 466,751,844 | | | $ | — | | | $ | — | | | $ | 466,751,844 | |
Money Market Funds | | | 6,917,059 | | | | — | | | | — | | | | 6,917,059 | |
Total | | $ | 473,668,903 | | | $ | — | | | $ | — | | | $ | 473,668,903 | |
Davenport Value & Income Fund | | Level 1 | | | Level 2 | | | Level 3 | | | Total | |
Common Stocks | | $ | 526,889,491 | | | $ | — | | | $ | — | | | $ | 526,889,491 | |
Money Market Funds | | | 22,669,201 | | | | — | | | | — | | | | 22,669,201 | |
Total | | $ | 549,558,692 | | | $ | — | | | $ | — | | | $ | 549,558,692 | |
Davenport Equity Opportunities Fund | | Level 1 | | | Level 2 | | | Level 3 | | | Total | |
Common Stocks | | $ | 368,551,953 | | | $ | — | | | $ | — | | | $ | 368,551,953 | |
Money Market Funds | | | 17,061,584 | | | | — | | | | — | | | | 17,061,584 | |
Total | | $ | 385,613,537 | | | $ | — | | | $ | — | | | $ | 385,613,537 | |
Davenport Small Cap Focus Fund | | Level 1 | | | Level 2 | | | Level 3 | | | Total | |
Common Stocks | | $ | 157,550,932 | | | $ | — | | | $ | — | | | $ | 157,550,932 | |
Money Market Funds | | | 18,411,008 | | | | — | | | | — | | | | 18,411,008 | |
Total | | $ | 175,961,940 | | | $ | — | | | $ | — | | | $ | 175,961,940 | |
Davenport Balanced Income Fund | | Level 1 | | | Level 2 | | | Level 3 | | | Total | |
Common Stocks | | $ | 76,685,184 | | | $ | — | | | $ | — | | | $ | 76,685,184 | |
Fixed Rate Corporate Bonds | | | — | | | | 36,252,116 | | | | — | | | | 36,252,116 | |
Variable Rate Corporate Bonds | | | — | | | | 11,214,137 | | | | — | | | | 11,214,137 | |
U.S. Treasury Obligations | | | — | | | | 13,891,764 | | | | — | | | | 13,891,764 | |
Exchange-Traded Funds | | | 678,773 | | | | — | | | | — | | | | 678,773 | |
Money Market Funds | | | 4,686,688 | | | | — | | | | — | | | | 4,686,688 | |
Total | | $ | 82,050,645 | | | $ | 61,358,017 | | | $ | — | | | $ | 143,408,662 | |
Refer to each Fund’s Schedule of Investments for a listing of the securities by sector type. There were no Level 3 securities or derivative instruments held by the Funds as of or during the year ended March 31, 2020.
56
THE DAVENPORT FUNDS
NOTES TO FINANCIAL STATEMENTS (Continued)
Foreign currency translation — Investment securities and other assets and liabilities denominated in or expected to settle in foreign currencies, if any, are translated into U.S. dollars based on exchange rates on the following basis:
| | A. | The fair values of investment securities and other assets and liabilities are translated as of the close of the NYSE each day. |
| | B. | Purchases and sales of investment securities and income and expenses are translated at the rate of exchange prevailing as of 4:00 p.m. Eastern time on the respective date of such transactions. |
| | C. | The Funds do not isolate that portion of the results of operations caused by changes in foreign exchange rates on investments from those caused by changes in market prices of securities held. Such fluctuations are included with the net realized and unrealized gains or losses on investments. |
Reported net realized foreign exchange gains or losses arise from 1) purchases and sales of foreign currencies and 2) the difference between the amounts of dividends and foreign withholding taxes recorded on the Fund’s books and the U.S. dollar equivalent of the amounts actually received or paid. Reported net unrealized foreign exchange gains and losses arise from changes in the value of assets and liabilities that result from changes in exchange rates.
Share valuation — The NAV per share of each Fund is calculated daily by dividing the total value of its assets, less liabilities, by the number of shares outstanding. The offering price and redemption price per share of each Fund is equal to the NAV per share.
Investment income — Interest income is accrued as earned. Discounts and premiums on fixed-income securities are amortized using the interest method. Dividend income is recorded on the ex-dividend date. Non-cash dividends included in dividend income, if any, are recorded at the fair market value of the security received. The Funds record distributions received from investments in real estate investment trusts (also known as “REITs”) in excess of income from underlying investments as a reduction of cost of investments and/or realized gain. These amounts are recorded once the issuers provide information about the actual composition of the distributions. Withholding taxes on foreign dividends have been recorded in accordance with the Funds’ understanding of the applicable country’s rules and tax rates.
Investment transactions— Investment transactions are accounted for on trade date for financial reporting purposes. Realized gains and losses on investment securities sold are determined on a specific identification basis.
Common expenses — Common expenses of the Trust are allocated among the Funds and the other series of the Trust based on relative net assets of each series or the nature of the services performed and the relative applicability to each series.
Distributions to shareholders — Dividends arising from net investment income, if any, are declared and paid quarterly to shareholders of Davenport Core Fund, Davenport Value & Income Fund, Davenport Small Cap Focus Fund and Davenport Balanced Income Fund; and declared and paid semi-annually to shareholders of Davenport Equity Opportunities Fund. Net realized
57
THE DAVENPORT FUNDS
NOTES TO FINANCIAL STATEMENTS (Continued)
short-term capital gains, if any, may be distributed throughout the year and net realized long-term capital gains, if any, are distributed at least once each year. The amount of distributions from net investment income and net realized capital gains are determined in accordance with federal income tax regulations, which may differ from GAAP. Dividends and distributions are recorded on the ex-dividend date.
The tax character of distributions paid during the years ended March 31, 2020 and 2019 was as follows:
| Year
Ended | | Ordinary
Income | | | Long-Term
Capital Gains | | | Return of
Capital | | | Total
Distributions | |
Davenport Core Fund | 03/31/20 | | $ | 3,136,527 | | | $ | 10,417,240 | | | $ | — | | | $ | 13,553,767 | |
| | 03/31/19 | | $ | 2,257,754 | | | $ | 19,511,120 | | | $ | — | | | $ | 21,768,874 | |
Davenport Value & Income Fund | 03/31/20 | | $ | 14,608,026 | | | $ | 13,991,808 | | | $ | — | | | $ | 28,599,834 | |
| | 03/31/19 | | $ | 14,871,389 | | | $ | 22,607,186 | | | $ | — | | | $ | 37,478,575 | |
Davenport Equity Opportunities Fund | 03/31/20 | | $ | — | | | $ | 18,269,665 | | | $ | — | | | $ | 18,269,665 | |
| | 03/31/19 | | $ | — | | | $ | 13,919,524 | | | $ | — | | | $ | 13,919,524 | |
Davenport Small Cap Focus Fund | 03/31/20 | | $ | 1,256,060 | | | $ | 3,027,909 | | | $ | — | | | $ | 4,283,969 | |
| | 03/31/19 | | $ | — | | | $ | 2,926,287 | | | $ | — | | | $ | 2,926,287 | |
Davenport Balanced Income Fund | 03/31/20 | | $ | 3,164,526 | | | $ | 1,068,116 | | | $ | 415,129 | | | $ | 4,647,771 | |
| | 03/31/19 | | $ | 3,133,775 | | | $ | 602,927 | | | $ | — | | | $ | 3,736,702 | |
Estimates — The preparation of financial statements in conformity with GAAP requires management to make estimates and assumptions that affect the reported amounts of assets and liabilities and disclosure of contingent assets and liabilities as of the date of the financial statements and the reported amounts of income and expenses during the reporting period. Actual results could differ from those estimates.
Federal income tax— Each Fund has qualified and intends to continue to qualify as a regulated investment company under the Internal Revenue Code of 1986, as amended (the “Code”). Qualification generally will relieve the Funds of liability for federal income taxes to the extent 100% of their net investment income and net realized capital gains are distributed in accordance with the Code.
In order to avoid imposition of the excise tax applicable to regulated investment companies, it is also each Fund’s intention to declare as dividends in each calendar year at least 98% of its net investment income (earned during the calendar year) and 98.2% of its net realized capital gains (earned during the twelve months ended October 31) plus undistributed amounts from prior years.
58
THE DAVENPORT FUNDS
NOTES TO FINANCIAL STATEMENTS (Continued)
The following information is computed on a tax basis for each item as of March 31, 2020:
| | Davenport
Core Fund | | | Davenport
Value &
Income Fund | | | Davenport
Equity
Opportunities
Fund | |
Cost of portfolio investments | | $ | 330,375,342 | | | $ | 598,950,559 | | | $ | 363,392,052 | |
Gross unrealized appreciation | | $ | 169,052,159 | | | $ | 59,318,355 | | | $ | 80,980,693 | |
Gross unrealized depreciation | | | (25,758,598 | ) | | | (108,710,222 | ) | | | (58,759,208 | ) |
Net unrealized appreciation (depreciation) | | | 143,293,561 | | | | (49,391,867 | ) | | | 22,221,485 | |
Undistributed ordinary income | | | 25,424 | | | | — | | | | 239,886 | |
Undistributed long-term gains | | | — | | | | 18,670,565 | | | | 29,199,555 | |
Accumulated capital and other losses | | | (16,048,599 | ) | | | — | | | | — | |
Accumulated earnings (deficit) | | $ | 127,270,386 | | | $ | (30,721,302 | ) | | $ | 51,660,926 | |
| | Davenport
Small Cap
Focus Fund | | | Davenport
Balanced
Income Fund | |
Cost of portfolio investments | | $ | 196,501,841 | | | $ | 159,943,280 | |
Gross unrealized appreciation | | $ | 22,801,301 | | | $ | 6,113,600 | |
Gross unrealized depreciation | | | (43,341,202 | ) | | | (22,648,218 | ) |
Net unrealized appreciation (depreciation) | | | (20,539,901 | ) | | | (16,534,618 | ) |
Undistributed ordinary income | | | 321,689 | | | | — | |
Undistributed long-term capital gains | | | 737,294 | | | | — | |
Accumulated capital and other losses | | | — | | | | (152,736 | ) |
Accumulated earnings (deficit) | | $ | (19,480,918 | ) | | $ | (16,687,354 | ) |
The difference between the federal income tax cost of portfolio investments and the financial statement cost of portfolio investments for each Fund is due to certain timing differences in the recognition of capital gains and losses under income tax regulations and GAAP. These timing differences are temporary in nature and are due to the tax deferral of losses on wash sales, adjustments to basis on publicly traded partnerships and passive foreign investment companies.
During the year ended March 31, 2020, Davenport Balanced Income Fund utilized $361,568 of short-term capital loss carryforwards for federal income tax purposes.
Capital losses incurred after October 31, 2019 are deemed to arise on the first day of a Fund’s next taxable year. For the year ended March 31, 2020, Davenport Core Fund and Davenport Balanced Income Fund intend to defer $16,048,599 and $152,736, respectively, of post-October capital losses to April 1, 2020 for income tax purposes.
59
THE DAVENPORT FUNDS
NOTES TO FINANCIAL STATEMENTS (Continued)
During the year ended March 31, 2020, the following reclassifications were made as a result of permanent differences between the financial statements and income tax reporting requirements due to adjustments for publicly traded partnerships:
| | Davenport
Core Fund | | | Davenport
Value &
Income Fund | | | Davenport
Equity
Opportunities
Fund | | | Davenport
Small Cap
Focus Fund | | | Davenport
Balanced
Income Fund | |
Paid-in capital | | $ | — | | | $ | — | | | $ | — | | | $ | (1,036 | ) | | $ | (298 | ) |
Accumulated earnings | | $ | — | | | $ | — | | | $ | — | | | $ | 1,036 | | | $ | 298 | |
Such reclassifications have no effect on each Fund’s total net assets or NAV per share.
The Funds recognize the tax benefits or expenses of uncertain tax positions only when the position is “more likely than not” to be sustained assuming examination by tax authorities. Management has reviewed the tax positions taken on Federal income tax returns for each Fund for all open tax years (generally, three years) and has concluded that no provision for unrecognized tax benefits or expenses is required in these financial statements.
3. Investment Transactions
Investment transactions, other than short-term investments and U.S. government securities, were as follows for the year ended March 31, 2020:
| | Davenport
Core Fund | | | Davenport
Value &
Income Fund | | | Davenport
Equity
Opportunities
Fund | |
Purchases of investment securities | | $ | 81,130,182 | | | $ | 213,742,178 | | | $ | 112,706,548 | |
Proceeds from sales of investment securities | | $ | 65,372,701 | | | $ | 184,041,613 | | | $ | 90,474,031 | |
| | Davenport
Small Cap
Focus Fund | | | Davenport
Balanced
Income Fund | |
Purchases of investment securities | | $ | 164,528,615 | | | $ | 69,281,943 | |
Proceeds from sales and maturities of investment securities | | $ | 110,709,174 | | | $ | 42,186,761 | |
4. Transactions with Related Parties
INVESTMENT ADVISORY AGREEMENTS
Each Fund’s investments are managed by Davenport & Company LLC (the “Adviser”) under the terms of an Investment Advisory Agreement. Under the Investment Advisory Agreement, each Fund pays the Adviser a fee, which is computed and accrued daily and paid monthly, at an annual rate of 0.75% of its average daily net assets. Certain officers and a Trustee of the Trust are also officers of the Adviser.
60
THE DAVENPORT FUNDS
NOTES TO FINANCIAL STATEMENTS (Continued)
With respect to Davenport Small Cap Focus Fund and Davenport Balanced Income Fund, the Adviser has agreed, until August 1, 2020, to reduce its investment advisory fees and to reimburse other operating expenses to the extent necessary to limit total annual operating expenses (excluding acquired fund fees and expenses) of each such Fund to an amount not exceeding 1.25% of average daily net assets. Any such fee reductions by the Adviser, or payments by the Adviser of expenses which are a Fund’s obligation, are subject to repayment by the Funds for a period of three years from the end of the fiscal year when such fee reductions or expense reimbursements occurred, provided a Fund was able to affect such repayment and remain in compliance with the undertaking by the Adviser to limit expenses of the Fund. During the year ended March 31, 2020, the Adviser was not required to reduce its advisory fees for Davenport Small Cap Focus Fund or Davenport Balanced Income Fund. As of March 31, 2020, the Adviser has recouped all prior fee reductions or expense reimbursements from Davenport Small Cap Focus Fund and Davenport Balanced Income Fund.
A significant portion of the Funds’ investment trades are executed through an affiliated broker-dealer of the Adviser. No commissions are paid by the Funds to the Adviser or the affiliate for these trades.
OTHER SERVICE PROVIDERS
Ultimus Fund Solutions, LLC (“Ultimus”) provides administration, fund accounting, compliance and transfer agent services to the Funds. The Funds pay Ultimus fees in accordance with the agreements for such services. In addition, the Funds pay out-of-pocket expenses including, but not limited to, postage, supplies, and costs related to the pricing of the Funds’ portfolio securities. Certain officers of the Trust are also officers of Ultimus, or of Ultimus Fund Distributors, LLC (the “Distributor”), the principal underwriter of each Fund’s shares and an affiliate of Ultimus. The Distributor is compensated by the Adviser (not the Funds) for acting as principal underwriter.
COMPENSATION OF TRUSTEES
Trustees and officers affiliated with the Adviser or Ultimus are not compensated by the Trust for their services. Each Trustee who is not an affiliated person of the Adviser or Ultimus received from the Trust an annual retainer of $20,000, payable quarterly; a fee of $2,000 for attendance at each meeting of the Board of Trustees (except that such fee is $3,000 for the independent chair); and a fee of $1,000 for attendance at each meeting of any committee of the Board (except that such fee is $1,500 for the committee chair); plus reimbursement of travel and other expenses incurred in attending meetings. Each Fund pays its proportionate share of such fees along with the other series of the Trust.
Effective April 1, 2020, each Trustee not affiliated with the Adviser or Ultimus will receive from the Trust an annual retainer of $24,000, payable quarterly; a fee of $2,000 for attendance at each meeting of the Board of Trustees (except that such fee is $3,000 for the independent chair); and a fee of $1,000 for attendance at each meeting of any committee of the Board (except that such fee is $1,500 for the committee chair); plus reimbursement of travel and other expenses incurred in attending meetings.
61
THE DAVENPORT FUNDS
NOTES TO FINANCIAL STATEMENTS (Continued)
5. Contingencies and Commitments
The Funds indemnify the Trust’s officers and Trustees for certain liabilities that might arise from the performance of their duties to the Funds. Additionally, in the normal course of business the Funds enter into contracts that contain a variety of representations and warranties and which provide general indemnifications. The Funds’ maximum exposure under these arrangements is unknown, as this would involve future claims that may be made against the Funds that have not yet occurred. However, based on experience, the Funds expect the risk of loss to be remote.
6. Subsequent Events
The Funds are required to recognize in the financial statements the effects of all subsequent events that provide additional evidence about conditions that existed as of the date of the Statements of Assets and Liabilities. For non-recognized subsequent events that must be disclosed to keep the financial statements from being misleading, the Funds are required to disclose the nature of the event as well as an estimate of its financial effect, or a statement that such an estimate cannot be made. Management has evaluated subsequent events through the issuance of these financial statements and has noted no such events.
62
THE DAVENPORT FUNDS
REPORT OF INDEPENDENT REGISTERED
PUBLIC ACCOUNTING FIRM
To the Shareholders of The Davenport Funds and
Board of Trustees of Williamsburg Investment Trust
Opinion on the Financial Statements
We have audited the accompanying statements of assets and liabilities, including the schedules of investments, of The Davenport Funds, comprising Davenport Core Fund, Davenport Value & Income Fund, Davenport Equity Opportunities Fund, Davenport Small Cap Focus Fund, and Davenport Balanced Income Fund (the “Funds”), each a series of Williamsburg Investment Trust, as of March 31, 2020, and the related statements of operations for the year then ended, the statements of changes in net assets for each of the two years in the period then ended, including the related notes, and the financial highlights for each of the five periods in the period then ended (collectively referred to as the “financial statements”). In our opinion, the financial statements present fairly, in all material respects, the financial position of each of the Funds as of March 31, 2020, the results of their operations for the year then ended, the changes in their net assets for each of the two years in the period then ended, and the financial highlights for each of the five periods in the period then ended, in conformity with accounting principles generally accepted in the United States of America.
Basis for Opinion
These financial statements are the responsibility of the Funds’ management. Our responsibility is to express an opinion on the Funds’ financial statements based on our audits. We are a public accounting firm registered with the Public Company Accounting Oversight Board (United States) (“PCAOB”) and are required to be independent with respect to the Funds in accordance with the U.S. federal securities laws and the applicable rules and regulations of the Securities and Exchange Commission and the PCAOB.
We conducted our audits in accordance with the standards of the PCAOB. Those standards require that we plan and perform the audit to obtain reasonable assurance about whether the financial statements are free of material misstatement whether due to error or fraud.
Our audits included performing procedures to assess the risks of material misstatement of the financial statements, whether due to error or fraud, and performing procedures that respond to those risks. Such procedures included examining, on a test basis, evidence regarding the amounts and disclosures in the financial statements. Our procedures included confirmation of securities owned as of March 31, 2020, by correspondence with the custodian and brokers. Our audits also included evaluating the accounting principles used and significant estimates made by management, as well as evaluating the overall presentation of the financial statements. We believe that our audits provide a reasonable basis for our opinion.
We have served as the Funds’ auditor since 2016.
COHEN & COMPANY, LTD.
Cleveland, Ohio
May 18, 2020
63
THE DAVENPORT FUNDS
BOARD OF TRUSTEES AND EXECUTIVE OFFICERS
(Unaudited)
Overall responsibility for management of the Funds rests with the Board of Trustees. The Trustees serve during the lifetime of the Trust and until its termination, or until death, resignation, retirement or removal. The Trustees, in turn, elect the officers of the Funds. The officers have been elected for an annual term. The following are the Trustees and executive officers of the Funds:
Trustees and Officers | Address | Year of
Birth | Position Held
with the Trust | Length of
Time Served |
| | Robert S. Harris, Ph.D. | 225 Pictoria Drive, Suite 450
Cincinnati, OH | 1949 | Chairman and Trustee | Since
January 2007 |
* | John P. Ackerly, IV | One James Center
901 E. Cary Street
Richmond, VA | 1963 | Trustee and President of The Davenport Funds | Since
July 2012 |
* | John T. Bruce | 800 Main Street
Lynchburg, VA | 1953 | Trustee and President of The FBP Funds | Since
September 1988 |
| | George K. Jennison | 225 Pictoria Drive, Suite 450
Cincinnati, OH | 1957 | Trustee | Since
January 2015 |
| Harris V. Morrissette | 225 Pictoria Drive, Suite 450
Cincinnati, OH | 1959 | Trustee | Since
March 1993 |
| | Elizabeth W. Robertson | 225 Pictoria Drive, Suite 450
Cincinnati, OH | 1953 | Trustee | Since
February 2014 |
| | George L. Smith, III | One James Center
901 E. Cary Street
Richmond, VA | 1975 | Vice President | Since
February 2011 |
| Robert G. Dorsey | 225 Pictoria Drive, Suite 450
Cincinnati, OH | 1957 | Vice President | Since
November 2000 |
| Mark J. Seger | 225 Pictoria Drive, Suite 450
Cincinnati, OH | 1962 | Treasurer | Since
November 2000 |
| | David K. James | 225 Pictoria Drive, Suite 450
Cincinnati, OH | 1970 | Secretary | Since
November 2018 |
| | Michael J. Nanosky | 225 Pictoria Drive, Suite 450
Cincinnati, OH | 1966 | Chief Compliance Officer | Since
March 2020 |
* | Messrs. Ackerly and Bruce, as affiliated persons of investment advisers to the Trust, are “interested persons” of the Trust within the meaning of Section 2(a)(19) of the 1940 Act. |
64
THE DAVENPORT FUNDS
BOARD OF TRUSTEES AND EXECUTIVE OFFICERS
(Unaudited) (Continued)
Each Trustee oversees ten portfolios of the Trust, including the Funds. The principal occupations of the Trustees and executive officers of the Funds during the past five years and public directorships held by the Trustees are set forth below:
Robert S. Harris, Ph.D. is the C. Stewart Sheppard Professor of Business Administration at The Darden Graduate School of Business Administration at the University of Virginia. He was previously the dean at Darden. Professor Harris has published widely on corporate finance, financial markets and mergers and acquisitions and has served as a consultant to corporations and government agencies.
John P. Ackerly, IV, is Senior Vice President and Portfolio Manager of Davenport & Company, LLC (a broker-dealer and investment advisory firm).
John T. Bruce is President, Director and member of the Executive Committee of Flippin, Bruce & Porter, Inc. (an investment advisory firm).
George K. Jennison is retired. He was President of Oyster Consulting, LLC (a management consulting firm) and a financial adviser with Wells Fargo Advisors, LLC.
Harris V. Morrissette is President of China Doll Rice and Beans, Inc. and Dixie Lily Foods. He is also a Director of Trustmark Corporation (bank holding company).
Elizabeth W. Robertson serves as a Trustee of TowneBank Foundation, TowneBank Corporate Board, TowneBank Audit Committee Chair and TowneBank Community Board since 2015. She previously was Chief Financial Officer of Monument Restaurants LLC.
George L. Smith, III is Senior Vice President and Portfolio Manager of the Adviser.
Robert G. Dorsey is a Vice Chairman of Ultimus Fund Solutions, LLC and Ultimus Fund Distributors, LLC. He previously was Co-CEO of Ultimus Fund Solutions, LLC (1999 to 2019).
Mark J. Seger is a Vice Chairman of Ultimus Fund Solutions, LLC and Ultimus Fund Distributors, LLC. He previously was Co-CEO of Ultimus Fund Solutions, LLC (1999 to 2019).
David K. James is an Executive Vice President and Chief Legal and Risk Officer of Ultimus Fund Solutions, LLC (2018 to present). He previously was Managing Director and Managing Counsel at State Street Bank and Trust Company (2009 to 2018).
Michael J. Nanosky is a Senior Compliance Officer of Ultimus Fund Solutions, LLC (2020 to present). He previously was Senior Vice President & Chief Compliance Officer of PNC Funds (2014 to 2019).
Additional information about members of the Board of Trustees and executive officers is available in the Statement of Additional Information (“SAI”). To obtain a free copy of the SAI, please call 1-800-281-3217.
65
THE DAVENPORT FUNDS
YOUR FUNDS’ EXPENSES (Unaudited)
We believe it is important for you to understand the impact of costs on your investment. All mutual funds have operating expenses. As a shareholder of the Funds, you incur ongoing costs, including management fees and other expenses. These ongoing costs, which are deducted from each Fund’s gross income, directly reduce the investment return of the Funds.
A mutual fund’s ongoing costs are expressed as a percentage of its average net assets. This figure is known as the expense ratio. The following examples are intended to help you understand the ongoing costs (in dollars) of investing in the Funds and to compare these costs with the ongoing costs of investing in other mutual funds. The examples below are based on an investment of $1,000 made at the beginning of the period shown and held for the entire period (October 1, 2019 and held through March 31, 2020).
The table below illustrates each Fund’s ongoing costs in two ways:
Actual fund return – This section helps you to estimate the actual expenses that you paid over the period. The “Ending Account Value” shown is derived from each Fund’s actual return, and the fourth column shows the dollar amount of operating expenses that would have been paid by an investor who started with $1,000 in the Funds. You may use the information here, together with the amount you invested, to estimate the expenses that you paid over the period.
To do so, simply divide your account value by $1,000 (for example, an $8,600 account value divided by $1,000 = 8.6), then multiply the result by the number given for the applicable Fund under the heading “Expenses Paid During Period.”
Hypothetical 5% return – This section is intended to help you compare each Fund’s ongoing costs with those of other mutual funds. It assumes that each Fund had an annual return of 5% before expenses during the period shown, but that the expense ratio is unchanged. In this case, because the return used is not each Fund’s actual return, the results do not apply to your investment. The example is useful in making comparisons because the U.S. Securities and Exchange Commission (the “SEC”) requires all mutual funds to calculate expenses based on a 5% return. You can assess each Fund’s ongoing costs by comparing this hypothetical example with the hypothetical examples that appear in shareholder reports of other funds.
Note that expenses shown in the table are meant to highlight and help you compare ongoing costs only. The Funds do not charge sales loads or redemption fees.
The calculations assume no shares were bought or sold during the period. Your actual costs may have been higher or lower, depending on the amount of your investment and the timing of any purchases or redemptions.
More information about each Fund’s expenses, including historical annual expense ratios, can be found in this report. For additional information on operating expenses and other shareholder costs, please refer to the Funds’ prospectus.
66
THE DAVENPORT FUNDS
YOUR FUNDS’ EXPENSES (Unaudited) (Continued)
| Beginning
Account Value
October 1,
2019 | Ending
Account Value
March 31,
2020 | Expense
Ratio(a) | Expenses Paid
During Period(b) |
Davenport Core Fund | | | | |
Based on Actual Fund Return | $1,000.00 | $ 849.70 | 0.88% | $4.07 |
Based on Hypothetical 5% Return (before expenses) | $1,000.00 | $ 1,020.60 | 0.88% | $4.45 |
Davenport Value & Income Fund |
Based on Actual Fund Return | $1,000.00 | $ 789.30 | 0.88% | $3.94 |
Based on Hypothetical 5% Return (before expenses) | $1,000.00 | $ 1,020.60 | 0.88% | $4.45 |
Davenport Equity Opportunities Fund |
Based on Actual Fund Return | $1,000.00 | $ 804.80 | 0.90% | $4.06 |
Based on Hypothetical 5% Return (before expenses) | $1,000.00 | $ 1,020.50 | 0.90% | $4.55 |
Davenport Small Cap Focus Fund |
Based on Actual Fund Return | $1,000.00 | $ 803.20 | 0.95% | $4.28 |
Based on Hypothetical 5% Return (before expenses) | $1,000.00 | $ 1,020.25 | 0.95% | $4.80 |
Davenport Balanced Income Fund |
Based on Actual Fund Return | $1,000.00 | $ 850.70 | 0.95% | $4.40 |
Based on Hypothetical 5% Return (before expenses) | $1,000.00 | $ 1,020.25 | 0.95% | $4.80 |
(a) | Annualized, based on each Fund’s most recent one-half year expenses. |
(b) | Expenses are equal to each Fund’s annualized expense ratio multiplied by the average account value over the period, multiplied by 183/366 (to reflect the one-half year period). |
67
THE DAVENPORT FUNDS
OTHER INFORMATION (Unaudited) |
A description of the policies and procedures that the Funds use to vote proxies relating to portfolio securities is available without charge upon request by calling toll-free 1-800-281-3217, or on the SEC’s website at www.sec.gov. Information regarding how the Funds voted proxies relating to portfolio securities during the most recent 12-month period ended June 30 is also available without charge upon request by calling toll-free 1-800-281-3217, or on the SEC’s website at www.sec.gov.
The Trust files a complete listing of portfolio holdings for each Fund with the SEC as of the end of the first and third quarters of each fiscal year on Form N-Q or as an exhibit to its reports on Form N-Q’s successor form, Form N-PORT. These filings are available upon request by calling 1-800-281-3217. Furthermore, you may obtain a copy of these filings on the SEC’s website at www.sec.gov.
A complete listing of portfolio holdings for each Fund is updated daily and can be reviewed at the Funds’ website at www.investdavenport.com.
FEDERAL TAX INFORMATION (Unaudited)
For the fiscal year ended March 31, 2020, Davenport Core Fund, Davenport Value & Income Fund, Davenport Equity Opportunities Fund, Davenport Small Cap Focus Fund and Davenport Balanced Income Fund designated $10,417,240, $13,658,368, $18,269,665, $3,027,909 and $1,068,116, respectively, as long-term capital gain distributions.
Qualified Dividend Income– Davenport Core Fund, Davenport Value & Income Fund, Davenport Small Cap Focus Fund and Davenport Balanced Income Fund designated 100%, 100%, 100% and 79.0%, respectively, of ordinary income distributions, or up to the maximum amount of such dividends allowable pursuant to the Internal Revenue Code, as qualified dividend income.
Dividends Received Deduction – Corporate shareholders are generally entitled to take the dividends received deduction on the portion of a Fund’s dividend distributions that qualify under tax law. For the fiscal year ended March 31, 2020, Davenport Core Fund, Davenport Value & Income Fund, Davenport Small Cap Focus Fund and Davenport Balanced Income Fund, 100%, 94.7%, 100% and 65.9%, respectively, of ordinary income distributions, qualifies for the corporate dividends received deduction.
68
DAVENPORT FUNDS
DISCLOSURE REGARDING APPROVAL OF
INVESTMENT ADVISORY AGREEMENT
(Unaudited)
At an in-person meeting held on February 25, 2020, the Board of Trustees, including a majority of the Independent Trustees, approved the continuance for a one-year period of the Investment Advisory Agreements with the Adviser on behalf of the Davenport Core Fund, the Davenport Value & Income Fund, the Davenport Equity Opportunities Fund, the Davenport Small Cap Focus Fund and the Davenport Balanced Income Fund. Below is a discussion of the factors considered by the Board of Trustees along with the conclusions with respect thereto that formed the basis for the Board’s approval.
In approving the continuance of the Investment Advisory Agreements, the Independent Trustees considered all information they deemed reasonably necessary to evaluate the terms of the Agreements. The principal areas of review by the Independent Trustees were the nature, extent and quality of the services provided by the Adviser and the reasonableness of the fees charged for those services. These matters were considered by the Independent Trustees consulting with experienced counsel for the Independent Trustees, who is independent of the Adviser.
The Independent Trustees’ evaluation of the quality of the Adviser’s services took into consideration their knowledge gained through presentations and reports from the Adviser over the course of the preceding year. The Independent Trustees considered that the Adviser had provided its views on the overall conditions of the economy and the markets, including the factors that may have influenced the markets, investor preferences and market sentiment during the past year. Both short-term and long-term investment performance of the Funds were considered. Each Fund’s performance was compared to its performance benchmark, a peer group of funds with similar investment objectives and strategies, and to the Adviser’s comparably managed private accounts, as applicable. The Independent Trustees also considered: the scope and quality of the in-house capabilities of the Adviser and other resources that are dedicated towards management of the Funds; the experience of the Adviser’s Investment Policy Committee members and their collaboration, the quality of administrative and other services, including the Adviser’s role in coordinating the activities of the Funds’ other service providers; the Adviser’s compliance with investment policies of the Funds and applicable laws and regulations; information provided by management and the Funds’ independent public accounting firm in periodic meetings with the Trust’s Audit Committee; the business reputation of the Adviser; the qualifications of the Adviser’s key investment and compliance personnel; and the Adviser’s financial resources.
In reviewing the fees payable under the Investment Advisory Agreements, the Independent Trustees compared the advisory fees and overall expense levels of each Fund with those of funds with similar investment objectives and strategies as well as the private accounts managed by the Adviser, as applicable. The Independent Trustees considered information provided by the Adviser concerning the Adviser’s profitability with respect to each Fund, including the assumptions and methodology used in preparing the profitability information, in light of applicable case law relating to advisory fees. For these purposes, the Independent Trustees considered not only the fees paid by the Funds, but also so-called “fallout” benefits to the Adviser. The Independent Trustees also considered the fact that the Funds’ portfolio trades for equity securities were
69
DAVENPORT FUNDS
DISCLOSURE REGARDING APPROVAL OF
INVESTMENT ADVISORY AGREEMENT
(Unaudited) (Continued)
executed by the Adviser at no cost to the Funds. In evaluating the Funds’ advisory fees, the Trustees considered the complexity and quality of the investment process that is applied in the management of the Funds.
Based on the consideration of the foregoing and such other information as was deemed relevant, including the factors and conclusions below, the Independent Trustees concluded that: (i) the performance of each Davenport Fund is satisfactory (a) given each Fund’s investment strategy in comparison to the performance to its respective primary and secondary benchmark, and peer group average, and (b) after considering the services provided by Davenport & Co. to each respective Fund; (ii) the advisory fee for the Davenport Balanced Income Fund is lower when compared to the average for similarly managed funds according to statistics derived from Morningstar, Inc., the advisory fee for the Davenport Equity Opportunities Fund and the Davenport Small Cap Focus Fund are the same when compared to the average for similarly managed funds according to statistics derived from Morningstar, Inc., the advisory fees for the Davenport Core Fund and the Davenport Value & Income Fund are higher when compared to the average for similarly managed funds according to statistics derived from Morningstar, Inc., and the advisory fees payable by the Davenport Funds are reasonable in relation to the services provided by Davenport & Co.; (iii) the total operating expense ratio of the Davenport Core Fund, Davenport Equity Opportunities Fund, Davenport Small Cap Focus Fund and Davenport Value & Income Fund were lower than the average expense ratio for comparably managed funds, according to statistics derived from Morningstar, Inc. and the total operating expense ratio for the Davenport Balanced Income Fund while higher, remains competitive, when compared to the average expense ratio for comparably managed funds, according to statistics derived from Morningstar, Inc.; and (iv) Davenport & Co., a dually registered investment adviser and broker dealer, has further benefited the Funds’ shareholders by executing all equity trades at no cost to the Funds; and (vii) the profits of Davenport & Co. with respect to its management of the Funds are reasonable.
The Independent Trustees considered the extent to which economies of scale are being realized as the Funds grow, and they noted that the operating expenses of each of the Davenport Funds have decreased during the past calendar year. The Independent Trustees also considered the “fallout” benefits to Davenport & Co. with respect to the Davenport Funds, but given the amounts involved viewed these as secondary factors in connection with the evaluation of the reasonableness of the advisory fees paid by the Funds.
No single factor was considered in isolation or to be determinative to the decision of the Independent Trustees to approve the continuance of the Investment Advisory Agreements. Rather the Independent Trustees concluded, after weighing and balancing of all factors considered, that it was in the best interests of each Fund and its shareholders to continue the Investment Advisory Agreements without modification to its terms, including the fees charged for services thereunder.
70
DAVENPORT FUNDS’
LIQUIDITY RISK MANAGEMENT PROGRAM (Unaudited)
The Funds have adopted and implemented a written liquidity risk management program as required by Rule 22e-4 (the “Liquidity Rule”) under the Investment Company Act. The program is reasonably designed to assess and manage each Fund’s liquidity risk, taking into consideration, among other factors, the Fund’s investment strategy and the liquidity of its portfolio investments during normal and reasonably foreseeable stressed conditions; its short and long-term cash flow projections; and its cash holdings and access to other funding sources. The Funds’ Board of Trustees approved the appointment of a Liquidity Risk Committee, which includes representatives from Davenport & Co., the Funds’ investment adviser, and Ultimus Fund Solutions, LLC, the Funds’ Administrator. The Liquidity Risk Committee is responsible for the program’s administration and oversight and for reporting to the Board on at least an annual basis regarding the program’s operation and effectiveness. The Liquidity Risk Committee updated its assessment of each Fund’s liquidity risk profile, considering additional data gathered in the 12 months ended November 30, 2019 and the adequacy and effectiveness of the liquidity risk management program’s operations since its inception on December 1, 2018 (the “Review Period”) in order to prepare a written report for the Board of Trustees (the “Report”) for consideration at its meeting held on February 25, 2020. During the Review Period, none of the Funds experienced unusual stress or disruption to its operations related to purchase and redemption activity. Also, during the Review Period the Funds held adequate levels of cash and highly liquid investments to meet shareholder redemption activities in accordance with applicable requirements. The Report concluded that (i) the Funds’ liquidity risk management program is reasonably designed to prevent violations of the Liquidity Rule and (ii) the Funds’ liquidity risk management program has been effectively implemented.
71
This page intentionally left blank.
THE DAVENPORT FUNDS
Investment Adviser
Davenport & Company LLC
One James Center
901 East Cary Street
Richmond, Virginia 23219-4037
Administrator
Ultimus Fund Solutions, LLC
P.O. Box 46707
Cincinnati, Ohio 45246-0707
1-800-281-3217
Custodian
U.S. Bank, N.A.
425 Walnut Street
Cincinnati, Ohio 45202
Independent Registered Public
AccountingFirm
Cohen & Company, Ltd.
1350 Euclid Avenue
Suite 800
Cleveland, Ohio 44115
LegalCounsel
Sullivan & Worcester LLP
1666 K Street, N.W.
Washington, DC 20006
Board of Trustees
Robert S. Harris, Ph.D., Chairman
John P. Ackerly, IV
John T. Bruce
George K. Jennison
Harris V. Morrissette
Elizabeth W. Robertson
Officers
John P. Ackerly, IV, President
George L. Smith, III, Vice President

One James Center
901 East Cary Street
Richmond, VA 23219
Davenport & Company LLC
Member: NYSE ● SIPC
Toll Free: (800) 846-6666
www.investdavenport.com
FBP Equity & Dividend Plus Fund
FBP Appreciation & Income Opportunities Fund
Annual Report
March 31, 2020
No-Load Funds
Beginning on January 1, 2021, as permitted by regulations adopted by the U.S. Securities and Exchange Commission, paper copies of the Funds’ shareholder reports like this one will no longer be sent by mail, unless you specifically request paper copies of the reports from the Funds or from your financial intermediary, such as a broker-dealer or bank. Instead, the reports will be made available on a website, and you will be notified by mail each time a report is posted and provided with a website link to access the report.
If you have already elected to receive shareholder reports electronically, you will not be affected by this change and you need not take any action. You may elect to receive shareholder reports and other communications from the Funds electronically by contacting the Funds at 1-866-738-1127 or, if you own these shares through a financial intermediary, by contacting your financial intermediary.
You may elect to receive all future reports in paper free of charge. You can inform the Funds that you wish to continue receiving paper copies of your shareholder reports by contacting the Funds at 1-866-738-1127. If you own shares through a financial intermediary, you may contact your financial intermediary or follow instructions included with this document to elect to continue to receive paper copies of your shareholder reports. Your election to receive reports in paper will apply to all Funds held with the Fund complex or at your financial intermediary.
Letter to Shareholders | April 27, 2020 |
We are pleased to report on your Funds and their investments for the annual period ended March 31, 2020 and to provide some additional information since we last communicated with you.
All of us at Flippin Bruce & Porter hope you and your family are healthy and adapting to the required changes to your daily lives. Our firm, like many others, has been taking steps to increase employee safety and efficiency, with employees primarily working from home. Rest assured that we remain fully functional using business disruption protocols and our electronic systems. Fortunately, all our employees are healthy, with no infections to date.
Economic and Market Update
The first quarter brought about an unprecedented situation for our lives, the economy, and the financial markets. While the market panic brought about by the novel coronavirus bears some resemblance to past crises such as wars, natural disasters, and economic contractions; it is wholly different in other ways. We have never had our governments intentionally trigger a recession by imposing stay-at-home orders and forcing otherwise profitable businesses to close. In response, the government instituted a stimulus package of a magnitude never seen before. Despite the challenges individuals and businesses face, we as investors are focused on what we can control: making sound portfolio management decisions, working to improve the underlying positioning in our portfolios, while at the same time addressing your concerns and questions. We do not know how long the fear-driven market may last, but we do know that the effects of the virus will not last forever. Business confidence and consumer confidence will be restored, and financial markets will recover.
With the social distancing orders, economies around the world came to a sudden and abrupt stop. Businesses in the U.S., both large and small, closed their doors almost in unison. Retail, travel and other service industries were the most directly impacted. It is clear to everyone that the next couple of quarters will be very difficult economically. The sky-rocketing unemployment claims we have already seen are a precursor. Monetary and fiscal policy measures are being taken to help counteract the negative effects of the shutdown. The Federal Reserve has acted in numerous ways to keep capital flowing among banks and businesses. Fortunately, the banking system is much better capitalized than it was during the severe recession of 2008. The CARES Act, which is currently being rolled out, provides business and worker assistance programs intended to prevent lasting damage to the economy. In recent interviews, Treasury Secretary Stephen Mnuchin indicated that the administration stands ready to enact additional relief programs if needed. But the key to the economic and market recovery will be better news on the spread of COVID-19. Most likely, the social distancing measures will prove effective and the number of cases will peak soon, depending on locality. Furthermore, additional availability of test kits, faster response times for tests, improved treatment protocols, antibody testing and progress on effective vaccines will all play a part in controlling the virus. That, in turn, will reduce fear and produce a powerful recovery in financial markets. While the recovery may happen in stages, history tells us that it is likely to occur well before all the bad news filters through economic and earnings reports.
The unusual stress on corporations today was exacerbated by the low-interest rate policies that monetary authorities have been following for years. Many companies took on much higher levels of debt relative to cash generation. If the slowdown is extended, companies with too much debt, or with large short-term debt maturities, could be especially pressured. A major focus of our investment team has been analyzing balance sheet risk, especially regarding financial obligations over the next couple of years. In response, we have reduced exposure to stocks that appear over-leveraged. Fortunately, the market sell-off has been relatively
1
indiscriminate. Strong companies with solid balance sheets have seen their stocks decline along with the market. This has given us an opportunity in our opinion to upgrade and strengthen the holdings in the Funds, while also preserving return potential when the recovery comes.
FBP Equity & Dividend Plus Fund Review
The FBP Equity & Dividend Plus Fund returned -22.33% for the fiscal year ended March 31, 2020. The S&P 500 Index (the “Index”) returned -6.98% over the same period. The Fund was 92.0% equity and 8.0% cash at fiscal year-end.
It was a difficult year, particularly with the market sell-off in the final quarter of the fiscal year. Companies that had cyclical exposure were especially hard hit, while high-growth technology stocks and consumer staples issues held up better. In the Fund, Financials, Energy, and Consumer Discretionary were the weakest sectors. Sectors which performed much better were Health Care, Consumer Staples, and Industrials. Individual stocks that provided nice returns for the Fund were Target, JM Smucker, Eaton and Hershey, while Kohl’s, Tapestry, Ventas, and Viacom CBS were laggards.
Cash flow generation from dividends is a primary focus of your Equity & Dividend Plus Fund as well as cash generated from option premiums. We are keenly focused on the ability of the stocks the Fund holds to maintain dividend payments through the downturn, therefore stocks which in our opinion were weaker from a cash flow standpoint have been sold. These include Carnival, Occidental Petroleum, CenturyLink, and Schlumberger. The Fund added Home Depot, Texas Instruments, ConocoPhillips, and Archer-Daniels-Midland, which in our opinion have stronger balance sheets and nice recovery potential. The current environment may present fewer opportunities to sell call options, but we expect that to be temporary. As individual stocks recover, the Fund will continue to selectively deploy its strategy of selling covered call options to enhance portfolio cash flow.
The Fund utilizes as part of its investment discipline the use of covered call options as individual securities approach the top of the Adviser’s growth and price expectations. The Fund’s purpose in selling the call option is to generate additional cash flow to the Fund and to hedge the possibility the security may not achieve its price objective. In very strong stock markets, this discipline may limit the upside of the securities where options have been written, but in flat to negative markets, it may provide additional return. During the fiscal year ended March 31, 2020, the amount of premiums generated from selling covered call options was $370,720.
FBP Appreciation & Income Opportunities Fund Review
The FBP Appreciation & Income Opportunities Fund returned -18.56% for the fiscal year ended March 31, 2020. The S&P 500 Index (the “Index”) returned -6.98% and the Bloomberg Barclays Intermediate U.S. Government/Credit Index returned 6.88% over the same period. The Fund was 68.1% equity, 21.0% fixed income and 10.9% cash at fiscal year-end.
As previously discussed, this past twelve months was difficult for the Appreciation & Income Opportunities Fund as well. The fixed income and cash weighting did act to partially cushion the drop in equity values, however the equity market sell-off in the final quarter of the fiscal year clearly drove returns. Companies that had cyclical exposure were especially hard hit, while high-growth technology stocks and consumer staples issues held up better. In the Fund, Financials, Energy, and Consumer Discretionary were the weakest sectors. Sectors which performed much better were Industrials, Consumer Staples, and Health Care. Eaton, Target, Walmart, and Ingersoll Rand, now Trane Technologies, provided nice returns for the Fund. Viacom CBS, Kohl’s, Lincoln National, and Tapestry were laggards.
2
In the recent market weakness, the Fund took advantage of price weakness to add positions in Archer-Daniels-Midland and TJX Companies, which in the advisor’s opinion are high-quality companies with strong businesses that should endure the economic downturn. Archer is a global leader in agricultural processing and TJX is the parent company operating TJ Maxx, Marshall’s, and HomeGoods stores. The Fund sold Bloomin’ Brands, operator of Outback Steakhouse, Fleming’s, Carrabba’s and Bonefish Grill, given the direct impact to its business from social distancing restaurant closings. The Fund also sold Halliburton, moving the proceeds into Devon Energy, which in our opinion, is better positioned to survive the dramatic decline of oil prices this past quarter. Additionally, we shifted more money into Nucor, an industrial company with, in our opinion, a very strong balance sheet.
The Fund does utilize as part of its investment discipline the use of covered call options as individual securities approach the top of the Adviser’s growth and price expectations. The Fund’s purpose in selling the call option is to generate additional income to the Fund and to hedge the possibility the security may not achieve its price objective. In very strong stock markets, this discipline may limit the upside of the securities where options have been written, but in modest to negative markets, it may provide additional return. During the fiscal year ended March 31, 2020, the amount of premiums generated from selling covered call options was $143,069.
We want to thank you for your continued support and investment in the Flippin, Bruce & Porter Funds. Please visit our website at www.fbpfunds.com for information on your Funds and the investment philosophy and process we utilize to achieve their investment objectives.

John T. Bruce, CFA
President - Portfolio Manager
April 27, 2020
Data presented reflects past performance, which is no guarantee of future results. Investment results and principal value will fluctuate so that shares, when redeemed, may be worth more or less than their original cost. Due to market volatility, current performance may be higher or lower than the performance shown. Updated performance information, current through the most recent month-end, is available by contacting the Funds at 1-866-738-1127.
This report is submitted for the general information of the shareholders of the Funds. It reflects our views, opinions and portfolio holdings as of the date of this letter. These views are subject to change at any time based upon market or other conditions. For more current information throughout the year please visit www.fbpfunds.com or call the Funds at 1-866-738-1127. This report is not authorized for distribution to prospective investors in the Funds unless accompanied by a current prospectus.
3
THE FLIPPIN, BRUCE & PORTER FUNDS
COMPARATIVE PERFORMANCE CHARTS
(Unaudited)
Performance for each Fund is compared to the most appropriate broad-based index, the Standard and Poor’s 500® Index, an unmanaged index of 500 large common stocks. Each Fund’s performance results are also compared to the Consumer Price Index, a measure of inflation; the Bloomberg Barclays Intermediate U.S. Government/Credit Index is also compared for the FBP Appreciation & Income Opportunities Fund.
FBP Equity & Dividend Plus Fund
Comparison of the Change in Value of a $10,000 Investment in FBP Equity & Dividend Plus Fund, the Standard & Poor’s 500®Index and the Consumer Price Index

4
THE FLIPPIN, BRUCE & PORTER FUNDS
COMPARATIVE PERFORMANCE CHARTS
(Unaudited) (Continued)
FBP Appreciation & Income Opportunities Fund
Comparison of the Change in Value of a $10,000 Investment in FBP Appreciation & Income Opportunities Fund, the Standard & Poor’s 500® Index, the Consumer Price Index and the Bloomberg Barclays Intermediate U.S. Government/Credit Index

Average Annual Total Returns (for periods ended March 31, 2020) |
| 1 Year | 5 Years | 10 Years | |
FBP Equity & Dividend Plus Fund(a) | (22.33%) | 0.29% | 3.69% | |
FBP Appreciation & Income Opportunities Fund(a) | (18.56%) | 0.07% | 3.64% | |
Standard & Poor’s 500® Index | (6.98%) | 6.73% | 10.53% | |
Consumer Price Index | 2.33% | 1.96% | 1.78% | |
Bloomberg Barclays Intermediate U.S. Government/Credit Index | 6.88% | 2.76% | 3.14% | |
(a) | Total returns are a measure of the change in value of an investment in the Fund over the periods covered, which assumes any dividends or capital gains distributions are reinvested in shares of the Fund. Returns do not reflect the deduction of taxes a shareholder would pay on the Fund’s distributions or the redemption of Fund shares. |
5
FBP EQUITY & DIVIDEND PLUS FUND
PORTFOLIO INFORMATION
March 31, 2020 (Unaudited)
General Information | | | |
Net Asset Value Per Share | | $ | 18.28 | |
Total Net Assets (Millions) | | $ | 20.9 | |
Current Net Expense Ratio | | | 1.07 | % |
Portfolio Turnover | | | 38 | % |
Fund Inception Date | | | 7/30/1993 | |
Stock Characteristics | | Fund | | | S&P 500®
Index | |
Number of Stocks | | | 49 | | | | 500 | |
Weighted Avg Market Capitalization (Billions) | | $ | 110.1 | | | $ | 121.6 | |
Price-to-Earnings Ratio (Bloomberg 1 Yr. Forecast EPS) | | | 9.9 | | | | 15.8 | |
Price-to-Book Value | | | 1.4 | | | | 2.8 | |
Asset Allocation (% of Net Assets) |
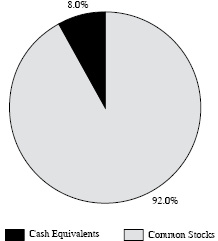
|
Sector Diversification vs. the S&P 500® Index |

Ten Largest Equity Holdings | % of Net Assets |
Merck & Company, Inc. | 3.5% |
United Parcel Service, Inc. - Class B | 3.4% |
International Business Machines Corporation | 3.3% |
Broadcom, Inc. | 3.2% |
CVS Health Corporation | 3.1% |
Intel Corporation | 2.8% |
AT&T, Inc. | 2.8% |
Cisco Systems, Inc. | 2.8% |
JPMorgan Chase & Company | 2.8% |
J.M. Smucker Company (The) | 2.8% |
6
FBP APPRECIATION & INCOME OPPORTUNITIES FUND
PORTFOLIO INFORMATION
March 31, 2020 (Unaudited)
General Information |
Net Asset Value Per Share | | $ | 14.43 | |
Total Net Assets (Millions) | | $ | 25.3 | |
Current Net Expense Ratio | | | 1.00 | % |
Portfolio Turnover | | | 18 | % |
Fund Inception Date | | | 7/3/1989 | |
Asset Allocation (% of Net Assets) |

|
Common Stock Portfolio (68.1% of Net Assets) |
Number of Stocks | | | 54 | |
Weighted Avg Market Capitalization (Billions) | | $ | 190.3 | |
Price-to-Earnings Ratio (Bloomberg 1 Yr. Forecast EPS) | | | 10.0 | |
Price-to-Book Value | | | 1.3 | |
Ten Largest Equity Holdings | % of Net Assets |
JPMorgan Chase & Company | 3.6% |
Bank of America Corporation | 3.2% |
Microsoft Corporation | 3.1% |
Cisco Systems, Inc. | 2.6% |
Apple, Inc. | 2.5% |
Merck & Company, Inc. | 2.4% |
International Business Machines Corporation | 2.3% |
Broadcom, Inc. | 2.3% |
Johnson & Johnson | 2.1% |
Walmart, Inc. | 2.0% |
Five Largest Sectors | % of Net Assets |
Information Technology | 15.1% |
Financials | 14.9% |
Health Care | 9.7% |
Consumer Staples | 6.2% |
Industrials | 5.8% |
Fixed-Income Portfolio (21.0% of Net Assets) |
Number of Fixed-Income Securities | 10 | |
Average Quality | BBB+ | |
Average Weighted Maturity | 1.7 | yrs. |
Average Effective Duration | 1.6 | yrs. |
Sector Breakdown | % of Net Assets |
U.S. Treasury Obligations | 2.1% |
U.S. Government Agency Obligations | 2.0% |
Consumer Staples | 2.0% |
Energy | 1.9% |
Financials | 6.0% |
Industrials | 5.0% |
Utilities | 2.0% |
7
FBP EQUITY & DIVIDEND PLUS FUND
SCHEDULE OF INVESTMENTS
March 31, 2020 |
COMMON STOCKS — 92.0% | | Shares | | | Value | |
Communication Services — 4.1% | | | | | | | | |
AT&T, Inc. | | | 20,300 | | | $ | 591,745 | |
ViacomCBS, Inc. - Class B | | | 19,500 | | | | 273,195 | |
| | | | | | | | 864,940 | |
Consumer Discretionary — 5.9% | | | | | | | | |
Ford Motor Company | | | 35,000 | | | | 169,050 | |
Genuine Parts Company | | | 5,500 | | | | 370,315 | |
Home Depot, Inc. (The)(a) | | | 1,500 | | | | 280,065 | |
Kohl’s Corporation(a) | | | 11,000 | | | | 160,490 | |
Tapestry, Inc. | | | 20,000 | | | | 259,000 | |
| | | | | | | | 1,238,920 | |
Consumer Staples — 13.9% | | | | | | | | |
Archer-Daniels-Midland Company | | | 12,500 | | | | 439,750 | |
J.M. Smucker Company (The)(a) | | | 5,200 | | | | 577,200 | |
Kellogg Company | | | 9,500 | | | | 569,905 | |
Molson Coors Beverage Company - Class B | | | 10,600 | | | | 413,506 | |
Philip Morris International, Inc. | | | 6,800 | | | | 496,128 | |
Walmart, Inc.(a) | | | 3,700 | | | | 420,394 | |
| | | | | | | | 2,916,883 | |
Energy — 5.9% | | | | | | | | |
Chevron Corporation | | | 4,800 | | | | 347,808 | |
ConocoPhillips | | | 8,500 | | | | 261,800 | |
Exxon Mobil Corporation | | | 8,400 | | | | 318,948 | |
Royal Dutch Shell plc - Class B - ADR | | | 9,500 | | | | 310,270 | |
| | | | | | | | 1,238,826 | |
Financials — 16.2% | | | | | | | | |
JPMorgan Chase & Company(a) | | | 6,500 | | | | 585,195 | |
KeyCorp | | | 34,200 | | | | 354,654 | |
Lincoln National Corporation | | | 7,000 | | | | 184,240 | |
MetLife, Inc. | | | 10,200 | | | | 311,814 | |
People’s United Financial, Inc. | | | 25,000 | | | | 276,250 | |
Prudential Financial, Inc. | | | 6,000 | | | | 312,840 | |
Truist Financial Corporation | | | 15,500 | | | | 478,020 | |
U.S. Bancorp | | | 14,200 | | | | 489,190 | |
Wells Fargo & Company(a) | | | 13,500 | | | | 387,450 | |
| | | | | | | | 3,379,653 | |
Health Care — 13.3% | | | | | | | | |
Bristol-Myers Squibb Company(a) | | | 5,800 | | | | 323,292 | |
CVS Health Corporation(a) | | | 11,000 | | | | 652,630 | |
Johnson & Johnson | | | 4,100 | | | | 537,633 | |
Merck & Company, Inc.(a) | | | 9,400 | | | | 723,236 | |
Pfizer, Inc. | | | 17,000 | | | | 554,880 | |
| | | | | | | | 2,791,671 | |
8
FBP EQUITY & DIVIDEND PLUS FUND
SCHEDULE OF INVESTMENTS (Continued) |
COMMON STOCKS — 92.0% | | Shares | | | Value | |
Industrials — 8.1% | | | | | | | | |
Eaton Corporation plc(a) | | | 6,800 | | | $ | 528,292 | |
Emerson Electric Company | | | 4,000 | | | | 190,600 | |
United Parcel Service, Inc. - Class B | | | 7,700 | | | | 719,334 | |
United Technologies Corporation | | | 2,700 | | | | 254,691 | |
| | | | | | | | 1,692,917 | |
Information Technology — 14.3% | | | | | | | | |
Broadcom, Inc. | | | 2,800 | | | | 663,880 | |
Cisco Systems, Inc. | | | 15,000 | | | | 589,650 | |
HP, Inc. | | | 13,500 | | | | 234,360 | |
Intel Corporation(a) | | | 11,000 | | | | 595,320 | |
International Business Machines Corporation | | | 6,300 | | | | 698,859 | |
Texas Instruments, Inc. | | | 2,000 | | | | 199,860 | |
| | | | | | | | 2,981,929 | |
Materials — 4.5% | | | | | | | | |
Compass Minerals International, Inc. | | | 5,500 | | | | 211,585 | |
Dow, Inc. | | | 10,600 | | | | 309,944 | |
Nucor Corporation | | | 11,500 | | | | 414,230 | |
| | | | | | | | 935,759 | |
Real Estate — 3.4% | | | | | | | | |
Public Storage | | | 1,500 | | | | 297,915 | |
Simon Property Group, Inc. | | | 2,500 | | | | 137,150 | |
Ventas, Inc. | | | 9,900 | | | | 265,320 | |
| | | | | | | | 700,385 | |
Utilities — 2.4% | | | | | | | | |
Dominion Energy, Inc. | | | 4,000 | | | | 288,760 | |
PPL Corporation | | | 8,500 | | | | 209,780 | |
| | | | | | | | 498,540 | |
| | | | | | | | | |
Total Common Stocks (Cost $21,776,280) | | | | | | $ | 19,240,423 | |
9
FBP EQUITY & DIVIDEND PLUS FUND
SCHEDULE OF INVESTMENTS (Continued) |
MONEY MARKET FUNDS — 8.5% | | Shares | | | Value | |
Fidelity Institutional Money Market Government Portfolio - Class I, 0.30%(b) (Cost $1,776,351) | | | 1,776,351 | | | $ | 1,776,351 | |
| | | | | | | | | |
Total Investments at Value — 100.5% (Cost $23,552,631) | | | | | | $ | 21,016,774 | |
| | | | | | | | | |
Liabilities in Excess of Other Assets —(0.5%) | | | | | | | (98,099 | ) |
| | | | | | | | | |
Net Assets — 100.0% | | | | | | $ | 20,918,675 | |
ADR - American Depositary Receipt. |
(a) | Security covers a written call option. |
(b) | The rate shown is the 7-day effective yield as of March 31, 2020. |
See accompanying notes to financial statements. |
10
FBP EQUITY & DIVIDEND PLUS FUND
SCHEDULE OF OPEN OPTION CONTRACTS
March 31, 2020 |
COVERED WRITTEN
CALL OPTIONS | | Contracts | | | Notional
Value | | | Strike
Price | | | Expiration
Date | | | Value of
Options | |
Bristol-Myers Squibb Company | | | 58 | | | $ | 323,292 | | | $ | 72.50 | | | | 09/18/20 | | | $ | 2,610 | |
CVS Health Corporation | | | 35 | | | | 207,655 | | | | 80.00 | | | | 05/15/20 | | | | 350 | |
Eaton Corporation plc | | | 20 | | | | 155,380 | | | | 92.50 | | | | 04/17/20 | | | | 1,000 | |
Eaton Corporation plc | | | 48 | | | | 372,912 | | | | 110.00 | | | | 07/17/20 | | | | 5,280 | |
Home Depot, Inc. (The) | | | 15 | | | | 280,065 | | | | 220.00 | | | | 09/18/20 | | | | 12,150 | |
Intel Corporation | | | 60 | | | | 324,720 | | | | 57.50 | | | | 04/17/20 | | | | 7,020 | |
Intel Corporation | | | 50 | | | | 270,600 | | | | 75.00 | | | | 09/18/20 | | | | 5,000 | |
J.M. Smucker Company (The) | | | 25 | | | | 277,500 | | | | 130.00 | | | | 07/17/20 | | | | 11,750 | |
JPMorgan Chase & Company | | | 15 | | | | 135,045 | | | | 145.00 | | | | 06/19/20 | | | | 195 | |
Kohl’s Corporation | | | 50 | | | | 72,950 | | | | 55.00 | | | | 04/17/20 | | | | 150 | |
Kohl’s Corporation | | | 60 | | | | 87,540 | | | | 52.50 | | | | 07/17/20 | | | | 600 | |
Merck & Company, Inc. | | | 38 | | | | 292,372 | | | | 90.00 | | | | 05/15/20 | | | | 836 | |
Merck & Company, Inc. | | | 32 | | | | 246,208 | | | | 92.50 | | | | 06/19/20 | | | | 1,248 | |
Walmart, Inc. | | | 37 | | | | 420,394 | | | | 120.00 | | | | 06/19/20 | | | | 16,650 | |
Wells Fargo & Company | | | 65 | | | | 186,550 | | | | 55.00 | | | | 04/17/20 | | | | 130 | |
Total Covered Written Call Options(Premiums received $157,197) | | $ | 3,653,183 | | | | | | | | | | | $ | 64,969 | |
See accompanying notes to financial statements. |
11
FBP APPRECIATION & INCOME OPPORTUNITIES FUND
SCHEDULE OF INVESTMENTS
March 31, 2020 |
COMMON STOCKS — 68.1% | | Shares | | | Value | |
Communication Services — 2.8% | | | | | | | | |
AT&T, Inc. | | | 8,000 | | | $ | 233,200 | |
CenturyLink, Inc. | | | 20,000 | | | | 189,200 | |
ViacomCBS, Inc. - Class B | | | 20,100 | | | | 281,601 | |
| | | | | | | | 704,001 | |
Consumer Discretionary — 4.0% | | | | | | | | |
Carnival Corporation | | | 8,500 | | | | 111,945 | |
Ford Motor Company | | | 30,000 | | | | 144,900 | |
Kohl’s Corporation(a) | | | 10,000 | | | | 145,900 | |
Tapestry, Inc. | | | 17,000 | | | | 220,150 | |
Target Corporation | | | 2,000 | | | | 185,940 | |
TJX Companies, Inc. (The) | | | 4,000 | | | | 191,240 | |
| | | | | | | | 1,000,075 | |
Consumer Staples — 6.2% | | | | | | | | |
Archer-Daniels-Midland Company | | | 9,000 | | | | 316,620 | |
Kellogg Company | | | 8,500 | | | | 509,915 | |
Philip Morris International, Inc. | | | 3,300 | | | | 240,768 | |
Walmart, Inc.(a) | | | 4,500 | | | | 511,290 | |
| | | | | | | | 1,578,593 | |
Energy — 4.4% | | | | | | | | |
Chevron Corporation | | | 4,000 | | | | 289,840 | |
ConocoPhillips | | | 6,000 | | | | 184,800 | |
Devon Energy Corporation | | | 30,000 | | | | 207,300 | |
Occidental Petroleum Corporation | | | 8,500 | | | | 98,430 | |
Royal Dutch Shell plc - Class B - ADR | | | 10,000 | | | | 326,600 | |
| | | | | | | | 1,106,970 | |
Financials — 14.9% | | | | | | | | |
Bank of America Corporation(a) | | | 38,000 | | | | 806,740 | |
Bank of New York Mellon Corporation (The) | | | 12,000 | | | | 404,160 | |
Capital One Financial Corporation | | | 6,000 | | | | 302,520 | |
JPMorgan Chase & Company(a) | | | 10,000 | | | | 900,300 | |
KeyCorp | | | 16,320 | | | | 169,238 | |
Lincoln National Corporation | | | 12,500 | | | | 329,000 | |
MetLife, Inc. | | | 12,000 | | | | 366,840 | |
Travelers Companies, Inc. (The) | | | 3,600 | | | | 357,660 | |
Wells Fargo & Company | | | 5,000 | | | | 143,500 | |
| | | | | | | | 3,779,958 | |
Health Care — 9.7% | | | | | | | | |
Amgen, Inc. | | | 800 | | | | 162,184 | |
Bristol-Myers Squibb Company | | | 5,000 | | | | 278,700 | |
CVS Health Corporation(a) | | | 7,500 | | | | 444,975 | |
Johnson & Johnson | | | 4,000 | | | | 524,520 | |
Merck & Company, Inc.(a) | | | 8,000 | | | | 615,520 | |
Pfizer, Inc. | | | 13,500 | | | | 440,640 | |
| | | | | | | | 2,466,539 | |
12
FBP APPRECIATION & INCOME OPPORTUNITIES FUND
SCHEDULE OF INVESTMENTS (Continued) |
COMMON STOCKS — 68.1% (Continued) | | Shares | | | Value | |
Industrials — 5.8% | | | | | | | | |
Eaton Corporation plc(a) | | | 6,500 | | | $ | 504,985 | |
FedEx Corporation | | | 2,500 | | | | 303,150 | |
General Electric Company | | | 25,000 | | | | 198,500 | |
Ingersoll Rand, Inc.(b) | | | 2,117 | | | | 52,502 | |
Trane Technologies plc | | | 2,400 | | | | 198,216 | |
United Technologies Corporation | | | 2,200 | | | | 207,526 | |
| | | | | | | | 1,464,879 | |
Information Technology — 15.1% | | | | | | | | |
Apple, Inc. | | | 2,500 | | | | 635,725 | |
Broadcom, Inc. | | | 2,400 | | | | 569,040 | |
Cisco Systems, Inc. | | | 17,000 | | | | 668,270 | |
HP, Inc. | | | 10,000 | | | | 173,600 | |
International Business Machines Corporation | | | 5,200 | | | | 576,836 | |
Microsoft Corporation | | | 5,000 | | | | 788,550 | |
Nokia Corporation - ADR | | | 87,000 | | | | 269,700 | |
Western Union Company (The) | | | 7,000 | | | | 126,910 | |
| | | | | | | | 3,808,631 | |
Materials — 2.7% | | | | | | | | |
Compass Minerals International, Inc. | | | 5,000 | | | | 192,350 | |
Freeport-McMoRan, Inc. | | | 11,000 | | | | 74,250 | |
Mosaic Company (The) | | | 11,000 | | | | 119,020 | |
Nucor Corporation | | | 8,500 | | | | 306,170 | |
| | | | | | | | 691,790 | |
Real Estate — 0.5% | | | | | | | | |
Simon Property Group, Inc. | | | 2,200 | | | | 120,692 | |
| | | | | | | | | |
Utilities — 2.0% | | | | | | | | |
Dominion Energy, Inc. | | | 4,000 | | | | 288,760 | |
PPL Corporation | | | 9,000 | | | | 222,120 | |
| | | | | | | | 510,880 | |
| | | | | | | | | |
Total Common Stocks (Cost $16,032,014) | | | | | | $ | 17,233,008 | |
13
FBP APPRECIATION & INCOME OPPORTUNITIES FUND
SCHEDULE OF INVESTMENTS (Continued) |
CORPORATE BONDS — 16.9% | | Par Value | | | Value | |
Consumer Staples — 2.0% | | | | | | | | |
Kroger Company (The), 2.60%, due 02/01/2021 | | $ | 500,000 | | | $ | 500,125 | |
| | | | | | | | | |
Energy — 1.9% | | | | | | | | |
Pioneer Natural Resources Company, 3.95%, due 07/15/2022 | | | 500,000 | | | | 481,659 | |
| | | | | | | | | |
Financials — 6.0% | | | | | | | | |
American Express Company, 3.40%, due 02/27/2023 | | | 500,000 | | | | 512,257 | |
Citigroup, Inc., 2.90%, due 12/08/2021 | | | 500,000 | | | | 503,847 | |
Wells Fargo & Company, 3.50%, due 03/08/2022 | | | 500,000 | | | | 509,718 | |
| | | | | | | | 1,525,822 | |
Industrials — 5.0% | | | | | | | | |
Norfolk Southern Corporation, 3.85%, due 01/15/2024 | | | 500,000 | | | | 520,444 | |
Ryder System, Inc., 2.50%, due 05/11/2020 | | | 750,000 | | | | 749,803 | |
| | | | | | | | 1,270,247 | |
Utilities — 2.0% | | | | | | | | |
PSEG Power, LLC, 3.00%, due 06/15/2021 | | | 500,000 | | | | 501,493 | |
| | | | | | | | | |
Total Corporate Bonds(Cost $4,248,712) | | | | | | $ | 4,279,346 | |
|
U.S. TREASURY OBLIGATIONS — 2.1% | | Par Value | | | Value | |
U.S. Treasury Notes — 2.1% | | | | | | | | |
2.125%, due 05/15/2022 (Cost $504,702) | | $ | 500,000 | | | $ | 520,059 | |
|
U.S. GOVERNMENT AGENCY
OBLIGATIONS — 2.0% | | Par Value | | | Value | |
Federal National Mortgage Association — 2.0% | | | | | | | | |
1.20%, due 07/17/2020 (Cost $500,000) | | $ | 500,000 | | | $ | 501,346 | |
14
FBP APPRECIATION & INCOME OPPORTUNITIES FUND
SCHEDULE OF INVESTMENTS (Continued) |
MONEY MARKET FUNDS — 11.2% | | Shares | | | Value | |
Fidelity Institutional Money Market Government Portfolio - Class I, 0.30%(c) | | | 2,217,386 | | | $ | 2,217,386 | |
First American Government Obligations Fund - Class Z, 0.39%(c) | | | 621,419 | | | | 621,419 | |
Total Money Market Funds (Cost $2,838,805) | | | | | | $ | 2,838,805 | |
| | | | | | | | | |
Total Investments at Value — 100.3% (Cost $24,124,233) | | | | | | $ | 25,372,564 | |
| | | | | | | | | |
Liabilities in Excess of Other Assets —(0.3%) | | | | | | | (85,425 | ) |
| | | | | | | | | |
Net Assets — 100.0% | | | | | | $ | 25,287,139 | |
ADR - American Depositary Receipt. |
(a) | Security covers a written call option. |
(b) | Non-income producing security. |
(c) | The rate shown is the 7-day effective yield as of March 31, 2020. |
See accompanying notes to financial statements. |
15
FBP APPRECIATION & INCOME OPPORTUNITIES FUND
SCHEDULE OF OPEN OPTION CONTRACTS
March 31, 2020 |
COVERED WRITTEN
CALL OPTIONS | | Contracts | | | Notional
Value | | | Strike
Price | | Expiration
Date | | Value of
Options | |
Bank of America Corporation | | | 80 | | | $ | 169,840 | | | $ | 36.00 | | 04/17/20 | | $ | 240 | |
CVS Health Corporation | | | 30 | | | | 177,990 | | | | 80.00 | | 05/15/20 | | | 300 | |
Eaton Corporation plc | | | 20 | | | | 155,380 | | | | 92.50 | | 04/17/20 | | | 1,000 | |
Eaton Corporation plc | | | 30 | | | | 233,070 | | | | 110.00 | | 07/17/20 | | | 3,300 | |
JPMorgan Chase & Company | | | 15 | | | | 135,045 | | | | 145.00 | | 06/19/20 | | | 195 | |
Kohl’s Corporation | | | 50 | | | | 72,950 | | | | 52.50 | | 07/17/20 | | | 500 | |
Merck & Company, Inc. | | | 20 | | | | 153,880 | | | | 92.50 | | 06/19/20 | | | 780 | |
Walmart, Inc. | | | 15 | | | | 170,430 | | | | 120.00 | | 06/19/20 | | | 6,750 | |
Total Covered Written Call Options(Premiums received $55,407) | | $ | 1,268,585 | | | | | | | | $ | 13,065 | |
See accompanying notes to financial statements. |
16
THE FLIPPIN, BRUCE & PORTER FUNDS
STATEMENTS OF ASSETS AND LIABILITIES
March 31, 2020 |
| | FBP Equity
& Dividend
Plus Fund | | | FBP
Appreciation
& Income
Opportunities
Fund | |
ASSETS | | | | | | | | |
Investments in securities: | | | | | | | | |
At cost | | $ | 23,552,631 | | | $ | 24,124,233 | |
At value (Note 2) | | $ | 21,016,774 | | | $ | 25,372,564 | |
Cash | | | — | | | | 1,272 | |
Receivable for capital shares sold | | | 3,132 | | | | 500 | |
Receivable for investment securities sold | | | 76,890 | | | | 38,445 | |
Dividends and interest receivable | | | 67,883 | | | | 77,359 | |
Other assets | | | 3,104 | | | | 4,771 | |
TOTAL ASSETS | | | 21,167,783 | | | | 25,494,911 | |
| | | | | | | | | |
LIABILITIES | | | | | | | | |
Written call options, at value (Notes 2 and 5) (premiums received $157,197 and $55,407, respectively) | | | 64,969 | | | | 13,065 | |
Distributions payable | | | 2,810 | | | | 11,817 | |
Payable for capital shares redeemed | | | 71,268 | | | | 16,015 | |
Payable for investment securities purchased | | | 90,230 | | | | 144,368 | |
Accrued investment advisory fees (Note 4) | | | 9,151 | | | | 11,377 | |
Payable to administrator (Note 4) | | | 5,700 | | | | 5,700 | |
Other accrued expenses | | | 4,980 | | | | 5,430 | |
TOTAL LIABILITIES | | | 249,108 | | | | 207,772 | |
| | | | | | | | | |
NET ASSETS | | $ | 20,918,675 | | | $ | 25,287,139 | |
| | | | | | | | | |
NET ASSETS CONSIST OF: | | | | | | | | |
Paid-in capital | | $ | 23,436,082 | | | $ | 24,125,843 | |
Accumulated earnings (deficit) | | | (2,517,407 | ) | | | 1,161,296 | |
Net assets | | $ | 20,918,675 | | | $ | 25,287,139 | |
| | | | | | | | | |
Shares of beneficial interest outstanding (unlimited number of shares authorized, $0.01 par value) | | | 1,144,158 | | | | 1,751,933 | |
| | | | | | | | | |
Net asset value, offering price and redemption price per share (Note 2) | | $ | 18.28 | | | $ | 14.43 | |
See accompanying notes to financial statements. |
17
THE FLIPPIN, BRUCE & PORTER FUNDS
STATEMENTS OF OPERATIONS
For the Year Ended March 31, 2020 |
| | FBP Equity
& Dividend
Plus Fund | | | FBP
Appreciation
& Income
Opportunities
Fund | |
INVESTMENT INCOME | | | | | | | | |
Dividends | | $ | 1,052,908 | | | $ | 820,523 | |
Foreign withholding taxes on dividends | | | — | | | | (1,797 | ) |
Interest | | | — | | | | 158,812 | |
TOTAL INVESTMENT INCOME | | | 1,052,908 | | | | 977,538 | |
| | | | | | | | | |
EXPENSES | | | | | | | | |
Investment advisory fees (Note 4) | | | 195,794 | | | | 226,811 | |
Administration fees (Note 4) | | | 60,000 | | | | 60,000 | |
Audit and tax services fees | | | 18,000 | | | | 18,000 | |
Trustees’ fees and expenses (Note 4) | | | 15,508 | | | | 15,508 | |
Registration and filing fees | | | 14,882 | | | | 14,522 | |
Compliance service fees (Note 4) | | | 8,400 | | | | 8,400 | |
Custodian and bank service fees | | | 8,525 | | | | 7,155 | |
Printing of shareholder reports | | | 7,101 | | | | 4,365 | |
Legal fees | | | 5,037 | | | | 5,037 | |
Postage and supplies | | | 5,654 | | | | 4,159 | |
Account maintenance fees | | | 1,362 | | | | 2,599 | |
Insurance expense | | | 1,112 | | | | 1,199 | |
Other expenses | | | 6,752 | | | | 8,284 | |
TOTAL EXPENSES | | | 348,127 | | | | 376,039 | |
Fees waived by the Adviser (Note 4) | | | (48,841 | ) | | | (52,024 | ) |
NET EXPENSES | | | 299,286 | | | | 324,015 | |
| | | | | | | | | |
NET INVESTMENT INCOME | | | 753,622 | | | | 653,523 | |
| | | | | | | | | |
REALIZED AND UNREALIZED GAINS (LOSSES) ON INVESTMENTS AND WRITTEN OPTION CONTRACTS | | | | | | | | |
Net realized gains (losses) from: | | | | | | | | |
Investment transactions | | | 866,361 | | | | 918,263 | |
Written option contracts (Note 5) | | | 5,965 | | | | (82,368 | ) |
Net change in unrealized appreciation (depreciation) on: | | | | | | | | |
Investment transactions | | | (7,770,619 | ) | | | (7,297,718 | ) |
Written option contracts (Note 5) | | | 148,826 | | | | 42,342 | |
NET REALIZED AND UNREALIZED LOSSES ON INVESTMENTS AND WRITTEN OPTION CONTRACTS | | | (6,749,467 | ) | | | (6,419,481 | ) |
| | | | | | | | | |
NET DECREASE IN NET ASSETS FROM OPERATIONS | | $ | (5,995,845 | ) | | $ | (5,765,958 | ) |
See accompanying notes to financial statements. |
18
FBP EQUITY & DIVIDEND PLUS FUND
STATEMENTS OF CHANGES IN NET ASSETS |
| | Year Ended
March 31,
2020 | | | Year Ended
March 31,
2019 | |
FROM OPERATIONS | | | | | | | | |
Net investment income | | $ | 753,622 | | | $ | 660,905 | |
Net realized gains from: | | | | | | | | |
Investment transactions | | | 866,361 | | | | 746,525 | |
Written option contracts (Note 5) | | | 5,965 | | | | 125,606 | |
Net change in unrealized appreciation (depreciation) on: | | | | | | | | |
Investment transactions | | | (7,770,619 | ) | | | (104,656 | ) |
Written option contracts (Note 5) | | | 148,826 | | | | (15,297 | ) |
Net increase (decrease) in net assets from operations | | | (5,995,845 | ) | | | 1,413,083 | |
| | | | | | | | | |
DISTRIBUTIONS TO SHAREHOLDERS (Note 2) | | | (1,862,805 | ) | | | (2,062,656 | ) |
| | | | | | | | | |
FROM CAPITAL SHARE TRANSACTIONS | | | | | | | | |
Proceeds from shares sold | | | 706,131 | | | | 3,064,232 | |
Net asset value of shares issued in reinvestment of distributions to shareholders | | | 1,835,780 | | | | 2,041,105 | |
Payments for shares redeemed | | | (2,379,340 | ) | | | (2,119,514 | ) |
Net increase in net assets from capital share transactions | | | 162,571 | | | | 2,985,823 | |
| | | | | | | | | |
TOTAL INCREASE (DECREASE) IN NET ASSETS | | | (7,696,079 | ) | | | 2,336,250 | |
| | | | | | | | | |
NET ASSETS | | | | | | | | |
Beginning of year | | | 28,614,754 | | | | 26,278,504 | |
End of year | | $ | 20,918,675 | | | $ | 28,614,754 | |
| | | | | | | | | |
CAPITAL SHARE ACTIVITY | | | | | | | | |
Shares sold | | | 29,464 | | | | 116,050 | |
Shares reinvested | | | 75,041 | | | | 79,830 | |
Shares redeemed | | | (96,146 | ) | | | (83,445 | ) |
Net increase in shares outstanding | | | 8,359 | | | | 112,435 | |
Shares outstanding, beginning of year | | | 1,135,799 | | | | 1,023,364 | |
Shares outstanding, end of year | | | 1,144,158 | | | | 1,135,799 | |
See accompanying notes to financial statements. |
19
FBP APPRECIATION & INCOME OPPORTUNITIES FUND
STATEMENTS OF CHANGES IN NET ASSETS |
| | Year Ended
March 31,
2020 | | | Year Ended
March 31,
2019 | |
FROM OPERATIONS | | | | | | | | |
Net investment income | | $ | 653,523 | | | $ | 657,651 | |
Net realized gains (losses) from: | | | | | | | | |
Investment transactions | | | 918,263 | | | | 1,239,712 | |
Written option contracts (Note 5) | | | (82,368 | ) | | | (52,718 | ) |
Net change in unrealized appreciation (depreciation) on: | | | | | | | | |
Investment transactions | | | (7,297,718 | ) | | | (756,448 | ) |
Written option contracts (Note 5) | | | 42,342 | | | | 80,889 | |
Net increase (decrease) in net assets from operations | | | (5,765,958 | ) | | | 1,169,086 | |
| | | | | | | | | |
DISTRIBUTIONS TO SHAREHOLDERS (Note 2) | | | (2,084,951 | ) | | | (1,299,655 | ) |
| | | | | | | | | |
FROM CAPITAL SHARE TRANSACTIONS | | | | | | | | |
Proceeds from shares sold | | | 506,506 | | | | 859,694 | |
Net asset value of shares issued in reinvestment of distributions to shareholders | | | 2,020,586 | | | | 1,237,225 | |
Payments for shares redeemed | | | (2,765,454 | ) | | | (3,204,096 | ) |
Net decrease in net assets from capital share transactions | | | (238,362 | ) | | | (1,107,177 | ) |
| | | | | | | | | |
TOTAL DECREASE IN NET ASSETS | | | (8,089,271 | ) | | | (1,237,746 | ) |
| | | | | | | | | |
NET ASSETS | | | | | | | | |
Beginning of year | | | 33,376,410 | | | | 34,614,156 | |
End of year | | $ | 25,287,139 | | | $ | 33,376,410 | |
| | | | | | | | | |
CAPITAL SHARE ACTIVITY | | | | | | | | |
Shares sold | | | 28,002 | | | | 44,797 | |
Shares reinvested | | | 109,664 | | | | 64,997 | |
Shares redeemed | | | (150,760 | ) | | | (167,520 | ) |
Net decrease in shares outstanding | | | (13,094 | ) | | | (57,726 | ) |
Shares outstanding, beginning of year | | | 1,765,027 | | | | 1,822,753 | |
Shares outstanding, end of year | | | 1,751,933 | | | | 1,765,027 | |
See accompanying notes to financial statements. |
20
FBP EQUITY & DIVIDEND PLUS FUND
FINANCIAL HIGHLIGHTS |
Selected Per Share Data for a Share Outstanding Throughout Each Year |
| | | Years Ended March 31, | |
| | 2020 | | | 2019 | | | 2018 | | | 2017 | | | 2016 | |
Net asset value at beginning of year | | $ | 25.19 | | | $ | 25.68 | | | $ | 25.96 | | | $ | 22.65 | | | $ | 24.89 | |
| | | | | | | | | | | | | | | | | | | | | |
Income (loss) from investment operations: | | | | | | | | | | | | | | | | | | | | |
Net investment income | | | 0.67 | | | | 0.60 | | | | 0.57 | | | | 0.50 | | | | 0.61 | |
Net realized and unrealized gains (losses) on investments and written option contracts | | | (5.90 | ) | | | 0.83 | | | | 1.38 | | | | 3.37 | | | | (1.21 | ) |
Total from investment operations | | | (5.23 | ) | | | 1.43 | | | | 1.95 | | | | 3.87 | | | | (0.60 | ) |
| | | | | | | | | | | | | | | | | | | | | |
Less distributions: | | | | | | | | | | | | | | | | | | | | |
From net investment income | | | (0.67 | ) | | | (0.60 | ) | | | (0.57 | ) | | | (0.50 | ) | | | (0.61 | ) |
From net realized gains | | | (1.01 | ) | | | (1.32 | ) | | | (1.66 | ) | | | (0.06 | ) | | | (1.03 | ) |
Total distributions | | | (1.68 | ) | | | (1.92 | ) | | | (2.23 | ) | | | (0.56 | ) | | | (1.64 | ) |
| | | | | | | | | | | | | | | | | | | | | |
Net asset value at end of year | | $ | 18.28 | | | $ | 25.19 | | | $ | 25.68 | | | $ | 25.96 | | | $ | 22.65 | |
| | | | | | | | | | | | | | | | | | | | | |
Total return(a) | | | (22.33 | %) | | | 5.64 | % | | | 7.91 | % | | | 17.29 | % | | | (2.31 | %) |
| | | | | | | | | | | | | | | | | | | | | |
Net assets at end of year (000’s) | | $ | 20,919 | | | $ | 28,615 | | | $ | 26,279 | | | $ | 27,415 | | | $ | 24,764 | |
| | | | | | | | | | | | | | | | | | | | | |
Ratio of total expenses to average net assets | | | 1.25 | % | | | 1.23 | % | | | 1.24 | % | | | 1.25 | % | | | 1.19 | % |
| | | | | | | | | | | | | | | | | | | | | |
Ratio of net expenses to average net assets(b) | | | 1.07 | % | | | 1.07 | % | | | 1.07 | % | | | 1.07 | % | | | 1.07 | % |
| | | | | | | | | | | | | | | | | | | | | |
Ratio of net investment income to average net assets(b) | | | 2.70 | % | | | 2.35 | % | | | 2.19 | % | | | 2.07 | % | | | 2.60 | % |
| | | | | | | | | | | | | | | | | | | | | |
Portfolio turnover rate | | | 38 | % | | | 18 | % | | | 18 | % | | | 19 | % | | | 21 | % |
(a) | Total return is a measure of the change in value of an investment in the Fund over the periods covered, which assumes any dividends or capital gains distributions are reinvested in shares of the Fund. The returns shown do not reflect the deduction of taxes a shareholder would pay on Fund distributions or the redemption of Fund shares. The total returns would have been lower if the Adviser had not waived advisory fees. |
(b) | Ratios were determined after advisory fee waivers by the Adviser (Note 4). |
See accompanying notes to financial statements. |
21
FBP APPRECIATION & INCOME OPPORTUNITIES FUND
FINANCIAL HIGHLIGHTS |
Selected Per Share Data for a Share Outstanding Throughout Each Year |
| | | Years Ended March 31, | |
| | 2020 | | | 2019 | | | 2018 | | | 2017 | | | 2016 | |
Net asset value at beginning of year | | $ | 18.91 | | | $ | 18.99 | | | $ | 18.81 | | | $ | 16.55 | | | $ | 18.53 | |
| | | | | | | | | | | | | | | | | | | | | |
Income (loss) from investment operations: | | | | | | | | | | | | | | | | | | | | |
Net investment income | | | 0.38 | | | | 0.37 | | | | 0.41 | | | | 0.28 | | | | 0.31 | |
Net realized and unrealized gains (losses) on investments and written option contracts | | | (3.65 | ) | | | 0.28 | | | | 1.03 | | | | 2.28 | | | | (1.11 | ) |
Total from investment operations | | | (3.27 | ) | | | 0.65 | | | | 1.44 | | | | 2.56 | | | | (0.80 | ) |
| | | | | | | | | | | | | | | | | | | | | |
Less distributions: | | | | | | | | | | | | | | | | | | | | |
From net investment income | | | (0.38 | ) | | | (0.37 | ) | | | (0.41 | ) | | | (0.28 | ) | | | (0.32 | ) |
From net realized gains | | | (0.83 | ) | | | (0.36 | ) | | | (0.85 | ) | | | (0.02 | ) | | | (0.86 | ) |
Total distributions | | | (1.21 | ) | | | (0.73 | ) | | | (1.26 | ) | | | (0.30 | ) | | | (1.18 | ) |
| | | | | | | | | | | | | | | | | | | | | |
Net asset value at end of year | | $ | 14.43 | | | $ | 18.91 | | | $ | 18.99 | | | $ | 18.81 | | | $ | 16.55 | |
| | | | | | | | | | | | | | | | | | | | | |
Total return(a) | | | (18.56 | %) | | | 3.44 | % | | | 7.91 | % | | | 15.58 | % | | | (4.48 | %) |
| | | | | | | | | | | | | | | | | | | | | |
Net assets at end of year (000’s) | | $ | 25,287 | | | $ | 33,376 | | | $ | 34,614 | | | $ | 34,069 | | | $ | 31,669 | |
| | | | | | | | | | | | | | | | | | | | | |
Ratio of total expenses to average net assets | | | 1.16 | % | | | 1.12 | % | | | 1.10 | % | | | 1.12 | % | | | 1.05 | % |
| | | | | | | | | | | | | | | | | | | | | |
Ratio of net expenses to average net assets(b) | | | 1.00 | % | | | 1.00 | % | | | 1.00 | % | | | 1.00 | % | | | 1.00 | % |
| | | | | | | | | | | | | | | | | | | | | |
Ratio of net investment income to average net assets(b) | | | 2.03 | % | | | 1.89 | % | | | 2.16 | % | | | 1.57 | % | | | 1.75 | % |
| | | | | | | | | | | | | | | | | | | | | |
Portfolio turnover rate | | | 18 | % | | | 21 | % | | | 10 | % | | | 18 | % | | | 23 | % |
(a) | Total return is a measure of the change in value of an investment in the Fund over the periods covered, which assumes any dividends or capital gains distributions are reinvested in shares of the Fund. The returns shown do not reflect the deduction of taxes a shareholder would pay on Fund distributions or the redemption of Fund shares. The total returns would have been lower if the Adviser had not waived advisory fees. |
(b) | Ratios were determined after advisory fee waivers by the Adviser (Note 4). |
See accompanying notes to financial statements. |
22
THE FLIPPIN, BRUCE & PORTER FUNDS
NOTES TO FINANCIAL STATEMENTS
March 31, 2020 |
1. Organization
FBP Equity & Dividend Plus Fund and FBP Appreciation & Income Opportunities Fund (each a “Fund” and collectively the “Funds”) are no-load, diversified series of Williamsburg Investment Trust (the “Trust”), an open-end management investment company registered under the Investment Company Act of 1940, as amended (the “1940 Act”). The Trust was organized as a Massachusetts business trust on July 18, 1988. Other series of the Trust are not included in this report.
The investment objective of FBP Equity & Dividend Plus Fund is to provide above-average and growing income while also achieving long-term growth of capital.
The investment objectives of FBP Appreciation & Income Opportunities Fund are long term capital appreciation and current income, assuming a moderate level of investment risk.
2. Significant Accounting Policies
Each Fund follows accounting and reporting guidance under Financial Accounting Standards Board (“FASB”) Accounting Standards Codification Topic 946, “Financial Services – Investment Companies.” The following is a summary of the Funds’ significant accounting policies. These policies are in conformity with accounting principles generally accepted in the United States of America (“GAAP”).
New accounting pronouncement — In March 2017, FASB issued Accounting Standards Update No. 2017-08 (“ASU 2017-08”), “Receivables – Nonrefundable Fees and Other Costs (Subtopic 310-20): Premium Amortization on Purchased Callable Debt Securities.” ASU 2017-08 shortens the amortization period for certain callable debt securities, held at a premium, to be amortized to the earliest call date. ASU 2017-08 does not require an accounting change for securities held at a discount, which continues to accrete to maturity. ASU 2017-08 is effective for fiscal years and interim periods within those fiscal years beginning after December 15, 2018. As of and for the year ended March 31, 2020, there are no securities held by the Funds that are applicable to ASU 2017-08.
Securities valuation— The Funds’ portfolio securities are valued as of the close of business of the regular session of the New York Stock Exchange (normally 4:00 p.m. Eastern time). Securities traded on a national stock exchange, including common stocks and closed-end investment companies, if any, are valued based upon the closing price on the principal exchange where the security is traded, if available, otherwise, at the last quoted bid price. Securities that are quoted by NASDAQ are valued at the NASDAQ Official Closing Price. Covered call options written by the Funds are valued at the last quoted sale price or, in the absence of a sale, at the ask price on the principal exchanges on which they are traded. Investments representing shares of money market funds and other open-end investment companies are valued at their net asset value (“NAV”) as reported by such companies. When using a quoted price and when the market is considered active, securities will be classified as Level 1 within the fair value hierarchy (see below).
Fixed income securities, including U.S. Treasury obligations, U.S. government agency obligations and corporate bonds, are typically valued on the basis of prices provided by an independent pricing service. The prices provided by the pricing service are determined with consideration given to institutional bid and
23
THE FLIPPIN, BRUCE & PORTER FUNDS
NOTES TO FINANCIAL STATEMENTS (Continued) |
last sale prices and take into account securities prices, yields, maturities, call features, ratings, institutional trading in similar groups of securities, and developments related to specific securities. Given the inputs used by the pricing service, these securities are classified as Level 2 within the fair value hierarchy.
When market quotations are not readily available, if a pricing service cannot provide a price, or if the investment adviser believes the price received from the pricing service is not indicative of market value, securities will be valued in good faith at fair value using methods consistent with procedures adopted by the Board of Trustees and will be classified as Level 2 or 3 within the fair value hierarchy, depending on the inputs used. Such methods of fair valuation may include, but are not limited to: multiple of earnings, multiple of book value, discount from market of a similar freely traded security, purchase price of the security, subsequent private transactions in the security or related securities, or a combination of these and other factors.
GAAP establishes a single authoritative definition of fair value, sets out a framework for measuring fair value and requires additional disclosures about fair value measurements. Various inputs are used in determining the value of each Fund’s investments. These inputs are summarized in the three broad levels listed below:
● | Level 1 – quoted prices in active markets for identical securities |
● | Level 2 – other significant observable inputs |
● | Level 3 – significant unobservable inputs |
The inputs or methodology used for valuing securities are not necessarily an indication of the risks associated with investing in those securities. The inputs used to measure fair value may fall into different levels of the fair value hierarchy. In such cases, for disclosure purposes, the level in the fair value hierarchy within which the fair value measurement falls in its entirety is determined based on the lowest level input that is significant to the fair value measurement.
The following is a summary of the inputs used to value each Fund’s investments and other financial instruments as of March 31, 2020, by security type:
FBP Equity & Dividend Plus Fund | | Level 1 | | | Level 2 | | | Level 3 | | | Total | |
Investments in Securities: | | | | | | | | | | | | | | | | |
Common Stocks | | $ | 19,240,423 | | | $ | — | | | $ | — | | | $ | 19,240,423 | |
Money Market Funds | | | 1,776,351 | | | | — | | | | — | | | | 1,776,351 | |
Total | | $ | 21,016,774 | | | $ | — | | | $ | — | | | $ | 21,016,774 | |
| | | | | | | | | | | | | | | | | |
Other Financial Instruments: | | | | | | | | | | | | | | | | |
Covered Written Call Options | | $ | (26,449 | ) | | $ | (38,520 | ) | | $ | — | | | $ | (64,969 | ) |
Total | | $ | (26,449 | ) | | $ | (38,520 | ) | | $ | — | | | $ | (64,969 | ) |
24
THE FLIPPIN, BRUCE & PORTER FUNDS
NOTES TO FINANCIAL STATEMENTS (Continued) |
FBP Appreciation & Income Opportunities Fund | | Level 1 | | | Level 2 | | | Level 3 | | | Total | |
Investments in Securities: | | | | | | | | | | | | | | | | |
Common Stocks | | $ | 17,233,008 | | | $ | — | | | $ | — | | | $ | 17,233,008 | |
Corporate Bonds | | | — | | | | 4,279,346 | | | | — | | | | 4,279,346 | |
U.S. Treasury Obligations | | | — | | | | 520,059 | | | | — | | | | 520,059 | |
U.S. Government Agency Obligations | | | — | | | | 501,346 | | | | — | | | | 501,346 | |
Money Market Funds | | | 2,838,805 | | | | — | | | | — | | | | 2,838,805 | |
Total | | $ | 20,071,813 | | | $ | 5,300,751 | | | $ | — | | | $ | 25,372,564 | |
| | | | | | | | | | | | | | | | | |
Other Financial Instruments: | | | | | | | | | | | | | | | | |
Covered Written Call Options | | $ | (8,025 | ) | | $ | (5,040 | ) | | $ | — | | | $ | (13,065 | ) |
Total | | $ | (8,025 | ) | | $ | (5,040 | ) | | $ | — | | | $ | (13,065 | ) |
Refer to each Fund’s Schedule of Investments for a listing of the common stocks and corporate bonds by sector type. There were no Level 3 investments held by the Funds as of or during the year ended March 31, 2020.
Share valuation— The NAV per share of each Fund is calculated daily by dividing the total value of its assets, less liabilities, by the number of shares outstanding. The offering price and redemption price per share of each Fund is equal to its NAV per share.
Investment income — Dividend income is recorded on the ex-dividend date. Non-cash dividends included in dividend income, if any, are recorded at the fair market value of the security received. Interest income is accrued as earned. Discounts and premiums on fixed income securities purchased are amortized using the interest method. Withholding taxes on foreign dividends have been recorded in accordance with the Funds’ understanding of the applicable country’s rules and tax rates.
Distributions to shareholders — Dividends arising from net investment income are declared and paid quarterly to shareholders of each Fund. Net realized short-term capital gains, if any, may be distributed throughout the year and net realized long-term capital gains, if any, are distributed at least once each year. The amount of distributions from net investment income and net realized capital gains are determined in accordance with federal income tax regulations, which may differ from GAAP. These “book/tax” differences are either temporary or permanent in nature. Dividends and distributions are recorded on the ex-dividend date. The tax character of distributions paid during the years ended March 31, 2020 and 2019 was as follows:
| | Year
Ended | | | Ordinary
Income | | | Long-Term
Capital Gains | | | Total
Distributions | |
FBP Equity & Dividend Plus Fund | | | 03/31/20 | | | $ | 823,397 | | | $ | 1,038,197 | | | $ | 1,861,594 | |
| | | | 03/31/19 | | | $ | 676,801 | | | $ | 1,385,855 | | | $ | 2,062,656 | |
FBP Appreciation & Income | | | 03/31/20 | | | $ | 662,167 | | | $ | 1,423,747 | | | $ | 2,085,914 | |
Opportunities Fund | | | 03/31/19 | | | $ | 650,647 | | | $ | 649,008 | | | $ | 1,299,655 | |
25
THE FLIPPIN, BRUCE & PORTER FUNDS
NOTES TO FINANCIAL STATEMENTS (Continued) |
Investment transactions — Investment transactions are accounted for on trade date for financial reporting purposes. Realized gains and losses on investments sold are determined on a specific identification basis.
Common expenses — Common expenses of the Trust are allocated among the Funds and the other series of the Trust based on relative net assets of each series or the nature of the services performed and the relative applicability to each series.
Options transactions — When the Funds’ investment adviser believes that individual portfolio investment securities held by the Funds are approaching the top of the adviser’s growth and price expectations, covered call options can be written (sold) against such securities and the Funds will receive a premium in return. The Funds write options only for income generation and hedging purposes and not for speculation. The premiums received from writing the options are recorded as a liability and are subsequently valued daily at the closing prices on their primary exchanges. Premiums received from writing options that expire are treated as realized gains. Premiums received from writing options that are exercised increase the proceeds used to calculate the realized gain or loss on the sale of the underlying security. If a closing purchase transaction is used to terminate a Fund’s obligation on a call option, a gain or loss will be realized, depending upon whether the price of the closing purchase transaction is more or less than the premium previously received on the call option written.
Estimates — The preparation of financial statements in conformity with GAAP requires management to make estimates and assumptions that affect the reported amounts of assets and liabilities and the disclosure of contingent assets and liabilities as of the date of the financial statements and the reported amounts of income and expenses during the reporting period. Actual results could differ from those estimates.
Federal income tax— Each Fund has qualified and intends to continue to qualify as a regulated investment company under the Internal Revenue Code of 1986, as amended (the “Code”). Qualification generally will relieve the Funds of liability for federal income taxes to the extent 100% of their net investment income and any net realized capital gains are distributed in accordance with the Code.
In order to avoid imposition of the excise tax applicable to regulated investment companies, it is also each Fund’s intention to declare as dividends in each calendar year at least 98% of its net investment income (earned during the calendar year) and 98.2% of its net realized capital gains (earned during the twelve months ended October 31) plus undistributed amounts from prior years.
The following information is computed on a tax basis for each item as of March 31, 2020:
| | FBP Equity
& Dividend
Plus Fund | | | FBP Appreciation
& Income
Opportunities
Fund | |
Tax cost of portfolio investments and written option contracts | | $ | 23,395,440 | | | $ | 24,174,876 | |
Gross unrealized appreciation | | $ | 2,282,541 | | | $ | 5,033,874 | |
Gross unrealized depreciation | | | (4,726,176 | ) | | | (3,849,251 | ) |
Net unrealized appreciation (depreciation) | | | (2,443,635 | ) | | | 1,184,623 | |
Undistributed ordinary income | | | 9,909 | | | | 11,451 | |
Accumulated capital and other losses | | | (80,871 | ) | | | (22,961 | ) |
Distributions payable | | | (2,810 | ) | | | (11,817 | ) |
Accumulated earnings (deficit) | | $ | (2,517,407 | ) | | $ | 1,161,296 | |
26
THE FLIPPIN, BRUCE & PORTER FUNDS
NOTES TO FINANCIAL STATEMENTS (Continued) |
The difference between the federal income tax cost of portfolio investments and the financial statement cost of portfolio investments for the Funds is due to certain differences in the recognition of capital gains and losses under income tax regulations and GAAP. These “book/tax” differences are temporary in nature and are primarily due to losses deferred due to wash sales and differing methods in the amortization of discounts and premiums on fixed income securities.
Capital losses incurred after October 31, 2019 are deemed to arise on the first day of a Fund’s next taxable year. For the year ended March 31, 2020, FBP Equity & Dividend Plus Fund and FBP Appreciation & Income Opportunities Fund intend to defer $80,871 and $22,961, respectively, of post-October capital losses to April 1, 2020 for income tax purposes.
The Funds recognize the tax benefits or expenses of uncertain tax positions only when the position is “more likely than not” to be sustained assuming examination by tax authorities. Management has reviewed the tax positions taken by each Fund on federal income tax returns for all open tax years (generally, three years) and has concluded that no provision for unrecognized tax benefits or expenses is required in these financial statements.
3. Investment Transactions
Investment transactions, other than short-term investments and U.S. government securities, were as follows for the year ended March 31, 2020:
| | FBP Equity
& Dividend
Plus Fund | | | FBP Appreciation
& Income
Opportunities
Fund | |
Purchases of investment securities | | $ | 9,855,091 | | | $ | 5,228,678 | |
Proceeds from sales and maturities of investment securities | | $ | 9,716,130 | | | $ | 6,685,050 | |
4. Transactions with Related Parties
INVESTMENT ADVISORY AGREEMENTS
Each Fund’s investments are managed by Flippin, Bruce & Porter, Inc. (the “Adviser”) under the terms of an Investment Advisory Agreement. Under the Investment Advisory Agreements, each Fund pays the Adviser a fee, which is computed and accrued daily and paid monthly, at an annual rate of 0.70% of its average daily net assets up to $250 million; 0.65% of the next $250 million of such assets; and 0.50% of such assets in excess of $500 million.
Effective August 1, 2019, pursuant to Expense Limitation Agreements (“ELAs”) between each Fund and the Adviser, the Adviser has contractually agreed, until August 1, 2020, to reduce advisory fees and/or reimburse other expenses to the extent necessary to limit total annual fund operating expenses (excluding brokerage costs, taxes, interest, Acquired Fund Fees and Expenses and extraordinary expenses) to an amount not exceeding 1.07% and 1.00% of the average daily net assets of FBP Equity & Dividend Plus Fund and
27
THE FLIPPIN, BRUCE & PORTER FUNDS
NOTES TO FINANCIAL STATEMENTS (Continued) |
FBP Appreciation & Income Opportunities Fund, respectively. Accordingly, during the eight months ended March 31, 2020, the Adviser reduced its advisory fees in the amounts of $31,428 and $33,267 for FBP Equity & Dividend Plus Fund and FBP Appreciation & Income Opportunities Fund, respectively.
Under the terms of the ELAs, investment advisory fee reductions and expense reimbursements by the Adviser are subject to recoupment by the Adviser for a period of three years after such fees and expenses were incurred, provided the recoupments do not cause total annual fund operating expenses to exceed the lesser of (i) the expense limitation then in effect, if any, or (ii) the expense limitation in effect at the time the expenses to be recouped were incurred. As of March 31, 2020, the Adviser may seek recoupment of investment advisory fee reductions and expense reimbursements no later than the dates as stated below:
| | FBP Equity
& Dividend
Plus Fund | | | FBP Appreciation
& Income
Opportunities
Fund | |
March 31, 2023 | | $ | 31,428 | | | $ | 33,267 | |
Total | | $ | 31,428 | | | $ | 33,267 | |
Prior to August 1, 2019, the Adviser voluntarily limited the total annual operating expenses of FBP Equity & Dividend Plus Fund and FBP Appreciation & Income Opportunities Fund to 1.07% and 1.00%, respectively, of average net assets; accordingly, the Adviser voluntarily waived $17,413 and $18,757 of its investment advisory fees from FBP Equity & Dividend Plus Fund and FBP Appreciation & Income Opportunities Fund, respectively. These amounts are not subject to recapture in future periods.
Certain officers and a Trustee of the Trust are also officers of the Adviser.
OTHER SERVICE PROVIDERS
Ultimus Fund Solutions, LLC (“Ultimus”) provides administration, fund accounting, compliance and transfer agent services to the Funds. The Funds pay Ultimus fees in accordance with the agreements for such services. In addition, the Funds pay out-of-pocket expenses including, but not limited to, postage, supplies, and certain costs related to the pricing of the Funds’ portfolio securities. Certain officers of the Trust are also officers of Ultimus, or of Ultimus Fund Distributors, LLC (the “Distributor”), the principal underwriter of each Fund’s shares and an affiliate of Ultimus. The Distributor is compensated by the Adviser (not the Funds) for acting as principal underwriter.
COMPENSATION OF TRUSTEES
Trustees and officers affiliated with the Adviser or Ultimus are not compensated by the Trust for their services. Each Trustee who is not an affiliated person of the Adviser or Ultimus received from the Trust an annual retainer of $20,000, payable quarterly; a fee of $2,000 for attendance at each meeting of the Board of Trustees (except that such fee is $3,000 for the independent chair); and a fee of $1,000 for attendance at each meeting of any committee of the Board (except that such fee is $1,500 for the committee chair); plus reimbursement of travel and other expenses incurred in attending meetings. Each Fund pays its proportionate share of such fees along with the other series of the Trust.
28
THE FLIPPIN, BRUCE & PORTER FUNDS
NOTES TO FINANCIAL STATEMENTS (Continued) |
Effective April 1, 2020, each Trustee not affiliated with the Adviser or Ultimus will receive from the Trust an annual retainer of $24,000, payable quarterly; a fee of $2,000 for attendance at each meeting of the Board of Trustees (except that such fee is $3,000 for the independent chair); and a fee of $1,000 for attendance at each meeting of any committee of the Board (except that such fee is $1,500 for the committee chair); plus reimbursement of travel and other expenses incurred in attending meetings.
5. Derivatives Transactions
The location on the Statements of Assets and Liabilities of the Funds’ derivative positions as of March 31, 2020 is as follows:
FBP Equity & Dividend Plus Fund
| | | |
Fair Value
| | | Gross Notional
Amount
Outstanding | |
Type of Derivative (Risk) | Location | | Asset
Derivatives | | | Liability
Derivatives | | | March 31,
2020 | |
Call options written (Equity) | Written call options, at value | | $ | — | | | $ | (64,969 | ) | | $ | (3,653,183 | ) |
FBP Appreciation & Income Opportunities Fund
| | | |
Fair Value
| | | Gross Notional
Amount
Outstanding | |
Type of Derivative (Risk) | Location | | Asset
Derivatives | | | Liability
Derivatives | | | March 31,
2020 | |
Call options written (Equity) | Written call options, at value | | $ | — | | | $ | (13,065 | ) | | $ | (1,268,585 | ) |
The Funds’ transactions in derivative instruments during the year ended March 31, 2020 are recorded in the following locations on the Statements of Operations:
FBP Equity & Dividend Plus Fund
Type of Derivative (Risk) | Location | | Net
Realized
Gains | | Location | | Change in
Unrealized
Appreciation
(Depreciation) | |
Call options written (Equity) | Net realized gains (losses) from written option contracts | | $ | 5,965 | | Net change in unrealized appreciation (depreciation) on written option contracts | | $ | 148,826 | |
29
THE FLIPPIN, BRUCE & PORTER FUNDS
NOTES TO FINANCIAL STATEMENTS (Continued) |
FBP Appreciation & Income Opportunities Fund
Type of Derivative (Risk) | Location | | Net
Realized
Losses | | Location | | Change in
Unrealized
Appreciation
(Depreciation) | |
Call options written (Equity) | Net realized gains (losses) from written option contracts | | $ | (82,368 | ) | Net change in unrealized appreciation (depreciation) on written option contracts | | $ | 42,342 | |
The average monthly notional amount of written call options during the year ended March 31, 2020 is $5,943,375 and $1,741,282 for FBP Equity & Dividend Plus Fund and FBP Appreciation & Income Opportunities Fund, respectively.
6. Contingencies and Commitments
The Funds indemnify the Trust’s officers and Trustees for certain liabilities that might arise from the performance of their duties to the Funds. Additionally, in the normal course of business the Funds enter into contracts that contain a variety of representations and warranties and which provide general indemnifications. The Funds’ maximum exposure under these arrangements is unknown, as this would involve future claims that may be made against the Funds that have not yet occurred. However, based on experience, the Trust expects the risk of loss to be remote.
7. Subsequent Events
The Funds are required to recognize in the financial statements the effects of all subsequent events that provide additional evidence about conditions that existed as of the date of the Statements of Assets and Liabilities. For non-recognized subsequent events that must be disclosed to keep the financial statements from being misleading, the Funds are required to disclose the nature of the event as well as an estimate of its financial effect, or a statement that such an estimate cannot be made. Management has evaluated subsequent events through the issuance of these financial statements and has noted no such events, except as reflected in the following paragraph.
Effective August 1, 2020, pursuant to Expense Limitation Agreements between each Fund and the Adviser, the Adviser has contractually agreed, until August 1, 2021, to reduce advisory fees and/or reimburse expenses to the extent necessary to limit total annual fund operating expenses (excluding brokerage costs, taxes, interest, Acquired Fund Fees and Expenses and extraordinary expenses) to an amount not exceeding 1.12% and 1.05% of the average daily net assets of FBP Equity & Dividend Plus Fund and FBP Appreciation & Income Opportunities Fund, respectively.
30
THE FLIPPIN, BRUCE & PORTER FUNDS
REPORT OF INDEPENDENT REGISTERED
PUBLIC ACCOUNTING FIRM |
To the Shareholders of The Flippin, Bruce & Porter Funds and
Board of Trustees of Williamsburg Investment Trust
Opinion on the Financial Statements
We have audited the accompanying statements of assets and liabilities, including the schedules of investments and open option contracts, of The Flippin, Bruce & Porter Funds, comprising FBP Equity & Dividend Plus Fund and FBP Appreciation & Income Opportunities Fund (the “Funds”), each a series of Williamsburg Investment Trust, as of March 31, 2020, and the related statements of operations for the year then ended, the statements of changes in net assets for each of the two years in the period then ended, including the related notes, and the financial highlights for each of the five years in the period then ended (collectively referred to as the “financial statements”). In our opinion, the financial statements present fairly, in all material respects, the financial position of each of the Funds as of March 31, 2020, the results of their operations for the year then ended, the changes in their net assets for each of the two years in the period then ended, and the financial highlights for each of the five years in the period then ended, in conformity with accounting principles generally accepted in the United States of America.
Basis for Opinion
These financial statements are the responsibility of the Funds’ management. Our responsibility is to express an opinion on the Funds’ financial statements based on our audits. We are a public accounting firm registered with the Public Company Accounting Oversight Board (United States) (“PCAOB”) and are required to be independent with respect to the Funds in accordance with the U.S. federal securities laws and the applicable rules and regulations of the Securities and Exchange Commission and the PCAOB.
We conducted our audits in accordance with the standards of the PCAOB. Those standards require that we plan and perform the audit to obtain reasonable assurance about whether the financial statements are free of material misstatement whether due to error or fraud.
Our audits included performing procedures to assess the risks of material misstatement of the financial statements, whether due to error or fraud, and performing procedures that respond to those risks. Such procedures included examining, on a test basis, evidence regarding the amounts and disclosures in the financial statements. Our procedures included confirmation of securities owned as of March 31, 2020, by correspondence with the custodian and brokers, or by other auditing procedures when replies from brokers were not received. Our audits also included evaluating the accounting principles used and significant estimates made by management, as well as evaluating the overall presentation of the financial statements. We believe that our audits provide a reasonable basis for our opinion.
We have served as the Funds’ auditor since 2016.
COHEN & COMPANY, LTD.
Cleveland, Ohio
May 18, 2020
31
THE FLIPPIN, BRUCE & PORTER FUNDS
BOARD OF TRUSTEES AND EXECUTIVE OFFICERS
(Unaudited) |
Overall responsibility for management of the Funds rests with the Board of Trustees. The Trustees serve during the lifetime of the Trust and until its termination, or until death, resignation, retirement or removal. The Trustees, in turn, elect the officers of the Funds. The officers have been elected for an annual term. The following are the Trustees and executive officers of the Funds:
| | Trustees
and Officers | Address | Year
of
Birth | Position Held
with the Trust | Length of
Time Served |
| | Robert S. Harris, Ph.D. | 225 Pictoria Drive, Suite 450
Cincinnati, OH | 1949 | Chairman and Trustee | Since
January 2007 |
* | John P. Ackerly, IV | One James Center
901 E. Cary Street
Richmond, VA | 1963 | Trustee and President of The Davenport Funds | Since
July 2012 |
* | John T. Bruce | 800 Main Street
Lynchburg, VA | 1953 | Trustee and
President of The FBP Funds | Since
September 1988 |
| | George K. Jennison | 225 Pictoria Drive, Suite 450
Cincinnati, OH | 1957 | Trustee | Since
January 2015 |
| Harris V. Morrissette | 225 Pictoria Drive, Suite 450
Cincinnati, OH | 1959 | Trustee | Since
March 1993 |
| | Elizabeth W. Robertson | 225 Pictoria Drive, Suite 450
Cincinnati, OH | 1953 | Trustee | Since
February 2014 |
| | Norman D. Darden, III | 800 Main Street
Lynchburg, VA | 1965 | Vice President of The FBP Funds | Since
February 2018 |
| | John H. Hanna, IV | 800 Main Street
Lynchburg, VA | 1955 | Vice President of The FBP Funds | Since
February 2007 |
| | David J. Marshall | 800 Main Street
Lynchburg, VA | 1956 | Vice President of The FBP Funds | Since
February 2007 |
| Robert G. Dorsey | 225 Pictoria Drive, Suite 450
Cincinnati, OH | 1957 | Vice President | Since
November 2000 |
| Mark J. Seger | 225 Pictoria Drive, Suite 450
Cincinnati, OH | 1962 | Treasurer | Since
November 2000 |
| | David K. James | 225 Pictoria Drive, Suite 450
Cincinnati, OH | 1970 | Secretary | Since
November 2018 |
| | Michael J. Nanosky | 225 Pictoria Drive, Suite 450
Cincinnati, OH | 1966 | Chief Compliance Officer | Since
March 2020 |
* | Messrs. Ackerly and Bruce, as affiliated persons of investment advisers to the Trust, are “interested persons” of the Trust within the meaning of Section 2(a)(19) of the 1940 Act. |
32
THE FLIPPIN, BRUCE & PORTER FUNDS
BOARD OF TRUSTEES AND EXECUTIVE OFFICERS
(Unaudited) (Continued) |
Each Trustee oversees ten portfolios of the Trust, including the Funds. The principal occupations of the Trustees and executive officers of the Funds during the past five years and public directorships held by the Trustees are set forth below:
Robert S. Harris, Ph.D. is the C. Stewart Sheppard Professor of Business Administration at The Darden Graduate School of Business Administration at the University of Virginia. He was previously the dean at Darden. Professor Harris has published widely on corporate finance, financial markets and mergers and acquisitions and has served as a consultant to corporations and government agencies.
John P. Ackerly, IV is Senior Vice President and Portfolio Manager of Davenport & Company LLC (a broker-dealer and investment advisory firm).
John T. Bruce is President, Director and member of the Executive Committee of the Adviser.
George K. Jennison is retired. He previously was President of Oyster Consulting, LLC (a management consulting firm) and a financial adviser with Wells Fargo Advisors, LLC.
Harris V. Morrissette is President of China Doll Rice and Beans, Inc. and Dixie Lily Foods. He is also a Director of Trustmark Corporation (bank holding company).
Elizabeth W. Robertson serves as a Trustee of TowneBank Foundation, TowneBank Corporate Board, TowneBank Audit Committee Chair and TowneBank Community Board since 2015. She previously was Chief Financial Officer of Monument Restaurants LLC.
Norman D. Darden, III is Senior Portfolio Manager, Analyst and Principal of the Adviser.
John H. Hanna, IV is Vice President, Director and member of the Executive Committee of the Adviser.
David J. Marshall is Secretary, Director and member of the Executive Committee of the Adviser.
Robert G. Dorsey is a Vice Chairman of Ultimus Fund Solutions, LLC and Ultimus Fund Distributors, LLC. He previously was Co-CEO of Ultimus Fund Solutions, LLC (1999-2019).
Mark J. Seger is a Vice Chairman of Ultimus Fund Solutions, LLC and Ultimus Fund Distributors, LLC. He previously was Co-CEO of Ultimus Fund Solutions, LLC (1999-2019).
David K. James is an Executive Vice President and Chief Legal and Risk Officer of Ultimus Fund Solutions, LLC (2018 to present). He previously was Managing Director and Managing Counsel at State Street Bank and Trust Company (2009 to 2018).
Michael J. Nanosky is a Senior Compliance Officer of Ultimus Fund Solutions, LLC (2020 to present). He previously was Senior Vice President & Chief Compliance Officer of PNC Funds (2014 to 2019).
Additional information about members of the Board of Trustees and executive officers is available in the Statement of Additional Information (“SAI”). To obtain a free copy of the SAI, please call 1-866-738-1127.
33
THE FLIPPIN, BRUCE & PORTER FUNDS
ABOUT YOUR FUNDS’ EXPENSES (Unaudited) |
We believe it is important for you to understand the impact of costs on your investment. All mutual funds have operating expenses. As a shareholder of a Fund, you incur ongoing costs, including management fees and other operating expenses. These ongoing costs, which are deducted from each Fund’s gross income, directly reduce the investment return of the Funds.
A mutual fund’s ongoing costs are expressed as a percentage of its average net assets. This figure is known as the expense ratio. The following examples are intended to help you understand the ongoing costs (in dollars) of investing in the Funds and to compare these costs with the ongoing costs of investing in other mutual funds. The examples below are based on an investment of $1,000 made at the beginning of the period shown and held for the entire period (October 1, 2019 through March 31, 2020).
The table below illustrates each Fund’s ongoing costs in two ways:
Actual fund return – This section helps you to estimate the actual expenses that you paid over the period. The “Ending Account Value” shown is derived from each Fund’s actual return, and the fourth column shows the dollar amount of operating expenses that would have been paid by an investor who started with $1,000 in the Funds. You may use the information here, together with the amount you invested, to estimate the expenses that you paid over the period.
To do so, simply divide your account value by $1,000 (for example, an $8,600 account value divided by $1,000 = 8.6), then multiply the result by the number given for the Funds under the heading “Expenses Paid During Period.”
Hypothetical 5% return – This section is intended to help you compare the Funds’ ongoing costs with those of other mutual funds. It assumes that each Fund had an annual return of 5% before expenses during the period shown, but that the expense ratio is unchanged. In this case, because the returns used are not the Funds’ actual returns, the results do not apply to your investment. The example is useful in making comparisons because the U.S. Securities and Exchange Commission (the “SEC”) requires all mutual funds to calculate expenses based on a 5% return. You can assess each Fund’s ongoing costs by comparing this hypothetical example with the hypothetical examples that appear in shareholder reports of other funds.
Note that expenses shown in the table are meant to highlight and help you compare ongoing costs only. The Funds do not charge sales loads or redemption fees.
The calculations assume no shares were bought or sold during the period. Your actual costs may have been higher or lower, depending on the amount of your investment and the timing of any purchases or redemptions.
More information about the Funds’ expenses, including annual expense ratios for the past five fiscal years, can be found in this report. For additional information on operating expenses and other shareholder costs, please refer to the Funds’ prospectus.
34
THE FLIPPIN, BRUCE & PORTER FUNDS
ABOUT YOUR FUNDS’ EXPENSES (Unaudited) (Continued) |
| Beginning
Account Value
October 1,
2019 | Ending
Account Value
March 31,
2020 | Net
Expense
Ratio(a) | Expenses
Paid
During
Period(b) |
FBP Equity & Dividend Plus Fund | | | |
Based on Actual Fund Return | $1,000.00 | $ 755.40 | 1.07% | $4.70 |
Based on Hypothetical 5% Return (before expenses) | $1,000.00 | $ 1,019.65 | 1.07% | $5.40 |
FBP Appreciation & Income Opportunities Fund | | | |
Based on Actual Fund Return | $1,000.00 | $ 806.80 | 1.00% | $4.52 |
Based on Hypothetical 5% Return (before expenses) | $1,000.00 | $ 1,020.00 | 1.00% | $5.05 |
(a) | Annualized, based on each Fund’s most recent one-half year expenses. |
(b) | Expenses are equal to each Fund’s annualized net expense ratio multiplied by the average account value over the period, multiplied by 183/366 (to reflect the one-half year period). |
35
THE FLIPPIN, BRUCE & PORTER FUNDS
OTHER INFORMATION (Unaudited) |
The Trust files a complete listing of portfolio holdings for the Funds with the SEC as of the end of the first and third quarters of each fiscal year on Form N-Q or as an exhibit to the reports on Form N-Q’s successor form, Form N-PORT. The filings are available upon request, by calling 1-866-738-1127. Furthermore, you may obtain a copy of these filings on the SEC’s website at www.sec.gov.
A description of the policies and procedures that the Funds use to determine how to vote proxies relating to portfolio securities is available without charge upon request by calling toll-free 1-800-327-9375, or on the SEC’s website at www.sec.gov. Information regarding how the Funds voted proxies relating to portfolio securities during the most recent 12-month period ended June 30 is also available without charge upon request by calling toll-free 1-866-738-1127, or on the SEC’s website at www.sec.gov.
FEDERAL TAX INFORMATION (Unaudited)
For the fiscal year ended March 31, 2020, FBP Equity & Dividend Plus Fund and FBP Appreciation & Income Opportunities Fund designated $1,038,198 and $1,423,791, respectively, as 20% long-term capital gain distributions.
Qualified Dividend Income – FBP Equity & Dividend Plus Fund and FBP Appreciation & Income Opportunities Fund each designates 100%, or up to the maximum amount of such dividends allowable pursuant to the Internal Revenue Code, as qualified dividend income eligible for the reduced tax rate of 15%.
Dividends Received Deduction– Corporate shareholders are generally entitled to take the dividends received deduction on the portion of a fund’s dividend distribution that qualifies under tax law. For FBP Equity & Dividend Plus Fund and FBP Appreciation & Income Opportunities Fund’s fiscal year 2020 ordinary income dividends, 100% qualifies for the corporate dividends received deduction.
36
THE FLIPPIN, BRUCE & PORTER FUNDS
DISCLOSURE REGARDING APPROVAL OF INVESTMENT ADVISORY AGREEMENTS
(Unaudited) |
At an in-person meeting held on February 25, 2020, the Board of Trustees, including a majority of the Independent Trustees, approved the continuance for a one-year period of the Investment Advisory Agreements with the Adviser on behalf of the FBP Equity & Dividend Plus Fund and the FBP Appreciation & Income Opportunities Fund (individually, a “Fund,” collectively, the “Funds”). Below is a discussion of the factors considered by the Board of Trustees along with the conclusions with respect thereto that formed the basis for the Board’s approval.
In approving the continuance of the Investment Advisory Agreements, the Independent Trustees considered all information they deemed reasonably necessary to evaluate the terms of the Agreements. The principal areas of review by the Independent Trustees were the nature, extent and quality of the services provided by the Adviser and the reasonableness of the fees charged for those services. These matters were considered by the Independent Trustees consulting with experienced counsel for the Independent Trustees, who is independent of the Adviser.
The Independent Trustees’ evaluation of the quality of the Adviser’s services took into consideration their knowledge gained through presentations and reports from the Adviser over the course of the preceding year. The Independent Trustees considered that the Adviser had provided its views on the overall conditions of the economy and the markets, including the factors that may have influenced the markets, investor preferences and market sentiment during the past year. Both short-term and long-term investment performance of the Funds were considered, as well as the investment process applied to the Funds which seeks to generate income and to protect against volatility. Each Fund’s performance was compared to its performance benchmark, a peer group of funds with similar investment objectives and strategies, and to the Adviser’s comparably managed private accounts. The Independent Trustees also considered: the scope and quality of the in-house capabilities of the Adviser and other resources that it dedicates to performing services for the Funds; the quality of administrative and other services, including the Adviser’s role in coordinating the activities of the Funds’ other service providers; the Adviser’s strong compliance culture and each Fund’s compliance with its investment policies and applicable laws and regulations; information provided by management and the Funds’ independent public accounting firm in periodic meetings with the Trust’s Audit Committee; the business reputation of the Adviser; the qualifications of the Adviser’s key investment and compliance personnel; and the Adviser’s financial resources.
In reviewing the fees payable under the Investment Advisory Agreements, the Independent Trustees compared the advisory fees and overall expense levels of each Fund with those of funds with similar investment objectives and strategies as well as the private accounts managed by the Adviser. The Independent Trustees considered information provided by the Adviser concerning the Adviser’s profitability with respect to each Fund, including the assumptions and methodology used in preparing the profitability information, in light of applicable case law relating to advisory fees. For these purposes, the Independent Trustees considered not only the fees paid by the Funds, but also so-called “fallout” benefits to the Adviser. The Independent Trustees also considered the Adviser’s representations that the Funds’ portfolio trades were executed based on the best available price and execution, and that the Adviser does not participate in any revenue sharing arrangements relating to the Funds. In evaluating the Funds’ advisory fees, the Trustees considered the complexity and quality of the investment process that is applied in the management of the Funds.
37
THE FLIPPIN, BRUCE & PORTER FUNDS
DISCLOSURE REGARDING APPROVAL OF INVESTMENT ADVISORY AGREEMENTS
(Unaudited) (Continued) |
Based on the consideration of the foregoing and such other information as was deemed relevant, including the factors and conclusions below, the Independent Trustees concluded that: (i) the performance of the FBP Equity & Dividend Plus Fund and the FBP Appreciation & Income Opportunities Fund is satisfactory (a) given each Fund’s investment strategy in comparison to the performance to primary and secondary benchmarks, and each Fund’s respective peer group average, and (b) after considering the services provided by FBP to the FBP Equity & Dividend Plus Fund and FBP Appreciation & Income Opportunities Fund; (ii) the advisory fees for the FBP Appreciation & Income Opportunities Fund, after fee waivers, while higher than average for similarly managed funds according to statistics derived from Morningstar, Inc., remain competitive, the advisory fees for the FBP Equity & Dividend Plus Fund, after fee waivers, were lower than the average for similarly managed funds according to statistics derived from Morningstar, Inc. and the advisory fees payable by the Funds are reasonable in relation to the services provided by FBP; (iii) the total operating expense ratio of each Fund, after fee waivers, while higher than similarly managed funds remain competitive with the average expense ratio for comparably managed funds, according to statistics derived from Morningstar, Inc.; (iv) FBP’s decision to cap overall operating expenses of the FBP Funds by contractually waiving a portion of its investment advisory fees has enabled each Fund to increase returns for its shareholders and to maintain an overall expense ratio that is competitive with the average for similarly managed funds, despite the small size of the Funds; and (v) FBP did not realize any profits with respect to its management of the FBP Funds.
Given the current size of the FBP Funds and their expected growth, the Independent Trustees did not believe that, at the present time, it would be relevant to consider the extent to which economies of scale would be realized as the Funds grow, and whether fee levels reflect these economies of scale. The Independent Trustees also considered the “fallout” benefits to FBP with respect to the FBP Funds, but given the amounts involved viewed these as secondary factors in connection with the evaluation of the reasonableness of the advisory fees paid by the Funds.
No single factor was considered in isolation or to be determinative to the decision of the Independent Trustees to approve the continuance of the Investment Advisory Agreements. Rather the Independent Trustees concluded, after weighing and balancing of all factors considered, that it was in the best interests of each Fund and its shareholders to continue the Investment Advisory Agreements without modification to its terms, including the fees charged for services thereunder.
38
This page intentionally left blank.
This page intentionally left blank.
This page intentionally left blank.
Investment Adviser Flippin, Bruce & Porter, Inc. 800 Main Street, Second Floor P.O. Box 6138 Lynchburg, Virginia 24505 Toll-Free 1-800-851-3804 www.fbpfunds.com Administrator Ultimus Fund Solutions, LLC P.O. Box 46707 Cincinnati, Ohio 45246-0707 Toll-Free 1-866-738-1127 Custodian U.S. Bank, N.A. 425 Walnut Street Cincinnati, Ohio 45202 Independent Registered
Public Accounting Firm Cohen & Company, Ltd.
1350 Euclid Avenue, Suite 800 Cleveland, Ohio 44115 | Legal Counsel Sullivan & Worcester LLP 1666 K Street, N.W. Washington, DC 20006 Officers John T. Bruce, President and Portfolio Manager Norman D. Darden, III,
Vice President John H. Hanna, IV, Vice President
David J. Marshall, Vice President Trustees Robert S. Harris, Ph.D., Chairman John P. Ackerly, IV John T. Bruce George K. Jennison Harris V. Morrissette Elizabeth W. Robertson |
42
THE GOVERNMENT STREET FUNDS No-Load Mutual Funds Annual Report
March 31, 2020
|

|
The Government Street Equity Fund The Government Street Mid-Cap Fund |
Beginning on January 1, 2021, as permitted by regulations adopted by the U.S. Securities and Exchange Commission, paper copies of the Funds’ shareholder reports like this one will no longer be sent by mail, unless you specifically request paper copies of the reports from the Funds or from your financial intermediary, such as a broker-dealer or bank. Instead, the reports will be made available on a website, and you will be notified by mail each time a report is posted and provided with a website link to access the report.
If you already elected to receive shareholder reports electronically, you will not be affected by this change and you need not take any action. You may elect to receive shareholder reports and other communications from the Funds electronically by contacting the Funds at 1-866-738-1125 or, if you own these shares through a financial intermediary, by contacting your financial intermediary.
You may elect to receive all future reports in paper free of charge. You can inform the Funds that you wish to continue receiving paper copies of your shareholder reports by contacting the Funds at 1-866-738-1125. If you own shares through a financial intermediary, you may contact your financial intermediary or follow instructions included with this document to elect to continue to receive paper copies of your shareholder reports. Your election to receive reports in paper will apply to all Funds held with the Fund complex or at your financial intermediary.
LETTER FROM THE PRESIDENT | April 2020 |
Dear Fellow Shareholders:
We are enclosing for your review the audited Annual Report of The Government Street Funds for the fiscal year ended March 31, 2020.
The Government Street Equity Fund
The Government Street Equity Fund had a total return of (2.04%) for the fiscal year ended March 31, 2020. By comparison, the S&P 500® Index and the Morningstar Large Blend categories returned negative (6.98%) and (9.88%), respectively.
The 12-month period had modest returns with the 4th quarter of calendar 2019 providing the best results. The following table depicts the fiscal quarter total returns of our three related measures.
| Government
Street Equity | S&P 500® | Morningstar
Large Blend |
1 Qtr 2020 | (17.08%) | (19.60%) | (20.89%) |
4 Qtr 2019 | 8.17% | 9.07% | 8.13% |
3 Qtr 2019 | 3.54% | 1.70% | 1.46% |
2 Qtr 2019 | 5.48% | 4.30% | 3.83% |
After 3 quarters of excellent relative and absolute equity performance, the annual result was entirely erased by the reaction to the pandemic effects of coronavirus and plummeting energy prices. Investors were unnerved by the speed and depth of the decline that was historic in nature. The real damage, which is yet to be assessed, provided investors another experience in markets reaction to uncertainty.
As this letter is being written, it is still too early to contemplate the recovery of stability in the economy as negative events continue to mount. We have seen massive efforts by the Federal Reserve (the “Fed”) to mitigate damage with the injection of funds into financial markets through its historic methods. They have gone even further than past history, as they have introduced new direct purchase/guaranty of corporate bonds of all credit ratings. The Fed’s new actions seemed to shore up financial liquidity in markets at a critical time, as it appeared that a critical break in valuations was in the making. It is anticipated that the Fed will have to continue these steps in the future as well as the possible consideration of direct investments into equities.
The action then shifted to fiscal policy, as the need for the White House and Congress to provide funds to alleviate historic increases of unemployment, potential loan defaults, and support for overwhelmed medical systems and personnel. The environment of all these factors was described as a “War,” as the critical nature of all the components evolved at unbelievable speeds. The initial, staggering response of $2.2 trillion was timely. Crass polemic politics raised hurdles which slowed and “porked” up the response. It is believed that additional funds will be needed in the near future.
It is difficult, if not impossible, to evaluate the ongoing effects of recent events. It seems that the corrective actions are positive in their immediate effects. However, the funds being spent and the loosening of monetary conditions are all either direct or
1
indirect borrowings from future economies. Current debt increases from the activities have secured the USA’s position as the largest creditor nation on the planet for now and perhaps forever.
The Fund rode the roller-coaster results in direct correlation to the general market. Its absolute results were better the S&P 500®. This was attributable to more defensive components within the portfolio’s investments and slightly higher cash reserves in anticipation of the continuation of the negative factors at the beginning of fiscal 2020. We will continue to be defensive in the investments of the Fund until it becomes clearer as to the results of the factors outlined above.
The top 10 holdings in The Government Street Equity Fund as of March 31, 2020 were:
Security Description | % of Net Assets |
Apple, Inc. | 5.6% |
Lockheed Martin Corporation | 4.7% |
Nvidia Corporation | 4.6% |
JPMorgan Chase & Company | 4.3% |
Microsoft Corporation | 3.5% |
Bio-Techne Corporation | 3.2% |
Visa, Inc. - Class A | 3.2% |
Amazon.com, Inc. | 3.1% |
Comcast Corporation - Class A | 2.9% |
Walmart, Inc. | 2.8% |
The top 10 holdings are large well-known companies. There seems to be a tendency across the components to represent growthier elements of their respective industries. However, the breadth of diversification is evident. This runs throughout the balance of the portfolio as each of the 11 economic sector classifications of the market is represented. The Government Street Equity Fund is managed to represent a large capitalization collection of blended growth and value companies.
There were significant individual performances during the fiscal year. The five highest returns, held for the entire fiscal year, as measured by the internal rate of return for the entire period were:
Security Description | 1 Year
Performance |
Sysco Corporation | 30.15% |
NVIDIA Corporation | 21.33% |
NIKE, Inc. - Class B | 18.41% |
Lowes Companies, Inc. | 16.61% |
Skyworks Solutions, Inc. | 14.91% |
2
The five worst individual performances, held for the entire fiscal year, as measured by internal rate of return for the entire period were:
Security Description | 1 Year
Performance |
Mid-America Apartment Communities, Inc. | (8.96%) |
Comcast Corporation - Class A | (9.45%) |
Dominion Resources, Inc. | (10.10%) |
Clorox Company | (12.45%) |
WEC Energy Group, Inc. | (13.99%) |
The Fund’s best performing economic sector for the fiscal year was Information Technology, up 18.2%. The second-best sector was Utilities, up 6.1%. The worst performing sector was Energy, down (55.5%).
Note: The investment performances listed for economic sectors and securities in the two preceding paragraphs are extracted from an in-house independent time-weighted rate of return computation by the Addepar portfolio accounting system. The calculations are gross investment returns. Total investment returns are for the fiscal year April 1, 2019 through March 31, 2020.
The following comments are drawn from previous newsletters but continue to reflect our current thoughts on the future investment prospects. These previous comments never anticipated an outside influence, such as a pandemic, would accelerate the global consideration of debt levels. We believe that the current remedies, all increasing the debt burden of future generations, brings us closer to the ultimate financial tipping point. We believe it must be addressed directly or financial systems around the world will have to be modified to confront the staggering obligations of governments, corporations and individuals.
We believe that continued upward movement of markets and economies worldwide are highly dependent on governments getting their financial balance sheets in order. There has been unparalleled deficit spending around the world. Those economies not directly participating in the credit shortfalls will be indirectly impacted by lower import/export activities brought on by a significant debt-imposed slowdown. This will occur domestically and internationally as economies have become more highly correlated in their economic cycles.
In response to this perceived scenario, risk management takes precedence over return pursuits in the near term. Your Fund remains invested to capture returns but highly diversified to mitigate the risks associated with that position. We believe that the future transition to a sound economic scenario will determine the continuation of current positive performances. We are not totally convinced of that outcome.
While significant risks exist, we continue to believe that investors have the potential for one of the greatest investment environments for generations. There are over 7 billion people in the world today (the U.S. population is approximately 325 million). Many of these potential consumers are moving into middle-class ranks. In our opinion, the demand for goods and services for the future is tremendous. Remember that, in our own economy, approximately 60% of GDP is tied to consumer spending on goods and services. With the business advantages that the U.S. enjoys in manufacturing know-how, technology, intellectual content, productivity,
3
and numerous other characteristics, if the government will provide a competitive framework for operating, the benefits could be the best ever. We just need government policies that foster growth in profits and wages domestically and internationally.
There are many additional moving parts in our economy and exogenous factors such as the geopolitical instabilities that will always cause uneven effects. However, it is our thought that keeping our fiscal house in order is basic to all considerations. The irresponsible spending activities of our government continue to unnerve us. It remains to be seen if the economy can overcome the negative influence of government policies and have a successful impact on market values.
As of March 31, 2020, the Fund’s net assets were $50.0 million; net asset value per share was $68.30; and the ratio of expenses to net average assets was 0.91%. Portfolio turnover rate was 14%. Income dividends of $0.7973 per share and capital gain distributions of $3.2504 per share were distributed to shareholders during the year.
The Government Street Mid-Cap Fund
The Government Street Mid-Cap Fund produced a total return of (8.18%) during the fiscal year ended March 31, 2020. By comparison the S&P MidCap 400® Index and the Morningstar Mid-Cap Blend category, used as relative performance benchmarks, returned (22.51%) and (20.94%), respectively.
The mid-capitalization category of individual companies is usually represented by the S&P MidCap 400®, whose issuers have a market capitalization ranging from approximately $0.3 billion to $12.5 billion. Generally, these companies are considered to have slightly higher risk and return characteristics than the S&P 500® companies, which includes issuers with large capitalization. As you would guess, the mid-cap companies in the index are primarily domestically oriented.
The Fund has a slightly different range of capitalizations than the S&P MidCap 400®. The Fund’s upper and lower limits are generally $8.0 billion and $500 million, respectively. There are two provisions that allow the market caps of the companies held by the Fund to exceed those limits. First, to the extent securities originally purchased within the limits have grown to greater capitalizations, they may be retained by the Fund without limitation. Second, the Fund’s portfolio manager has the latitude to purchase and hold up to 20% of the Fund’s value outside the market cap limitations.
The exceptions to the guidelines for the Fund worked to its advantage in fiscal 2020. Several companies, particularly in the Information Technology sector, with higher capitalizations provided extraordinary returns for the period. One contributor, NVIDIA, up 47.3% in the period, was purchased when its capitalization was just outside the mid-cap range but has grown to mega-cap proportions.
4
The top 10 holdings in The Government Street Mid-Cap Fund as of March 31, 2020 were:
Security Description | % of Net Assets |
Mid-America Apartment Communities, Inc. | 3.9% |
NVIDIA Corporation | 3.3% |
Chemed Corporation | 3.3% |
Teleflex, Inc. | 2.9% |
L3Harris Technologies, Inc. | 2.9% |
Nasdaq, Inc. | 2.4% |
Bio-Techne Corporation | 2.4% |
Intercontinental Exchange, Inc. | 2.3% |
CME Group, Inc. | 2.2% |
Lam Research Corporation | 2.1% |
There were significant individual performances during the fiscal year. The five highest returns, held for the entire period, as measured by the time weighted rate of return, were:
Security Description | 1 Year
Performance |
Okta, Inc. | 47.78% |
NVIDIA Corporation | 47.31% |
ResMed, Inc. | 43.29% |
Lam Research Corporation | 37.15% |
Chemed Corporation | 35.79% |
The five worst individual performances, held for the entire period, as measured by time weighted rate of return, were:
Security Description | 1 Year
Performance |
Cracker Barrel Old Country Store, Inc. | (45.94%) |
Ollie’s Bargain Outlet Holdings, Inc. | (50.55%) |
Marathon Petroleum Corporation | (58.66%) |
Gildan Activewear, Inc. | (63.76%) |
ONEOK, Inc. | (67.14%) |
The Fund’s best performing economic sector for the fiscal year was Health Care, up 5.7%. The second-best sector was Information Technology, up 3.7%. The worst performing sector was Energy, down (70.7%).
Note: The investment performances listed for economic sectors and securities in the two preceding paragraphs are extracted from an in-house independent time weighted rate of return computation by the Addepar portfolio accounting system. The calculations are gross investment returns. Total investment returns are for the fiscal year April 1, 2019 through March 31, 2020.
We believe that mid-cap stocks offer an attractive combination of growth and safety as they have successfully overcome startup challenges yet remain nimble enough to generate stronger growth than large-cap stocks. Mid-cap stocks have been able to match the performance of large-cap stocks in down markets while exceeding large-cap performance in up markets, leading to long-term outperformance.
5
Additionally, we believe the regulatory reductions by the federal government along with reduced corporate tax rates will have a positive impact on the profits of mid-cap companies versus their larger capitalization counterparts. Large capitalization companies with the breadth of legal and accounting resources available to them generally do not pay taxes at the maximum rates. On average, mid-cap companies have historically paid taxes at higher relative rates.
It may be interesting for the readers to compare the Global Industry Classification Standard (“GICS”) sectors between the larger capitalization S&P 500® and the smaller capitalization S&P MidCap 400®. The approximate weights based on the component’s capitalizations change daily but are reasonably stable over short periods. As of April 2020, they are:
GICS | S&P 500® | S&P
MidCap 400® |
Energy | 2.58% | 1.91% |
Materials | 2.09% | 4.38% |
Industrial | 8.20% | 16.02% |
Consumer Discretionary | 10.09% | 13.86% |
Consumer Staples | 8.28% | 3.91% |
Health Care | 15.99% | 10.42% |
Financials | 12.87% | 16.45% |
Information Technology | 22.67% | 15.90% |
Telecommunication Services | 10.75% | 2.29% |
Utilities | 3.49% | 4.00% |
Real Estate | 2.99% | 10.84% |
The Government Street Mid-Cap Fund uses the S&P MidCap 400® sector weights for guidance in its portfolio diversification.
As of March 31, 2020, the net assets of The Government Street Mid-Cap Fund were $39.4 million and the net asset value per share was $23.56. The portfolio turnover rate for the year was 2% and the total number of holdings was 79 as of March 31, 2020. The net expense ratio for the Fund was 1.09%.
Thank you for your continued confidence in The Government Street Funds. Please call us if we can be of further service to you.
Very truly yours,

Thomas W. Leavell
President
The Government Street Funds
6
Data presented reflects past performance, which is no guarantee of future results. Investment results and principal value will fluctuate so that shares, when redeemed, may be worth more or less than their original cost. Due to market volatility, current performance may be higher or lower than the performance shown.
This report is submitted for the general information of the shareholders of the Funds. The report is not authorized for distribution to prospective investors in the Funds unless it is accompanied by a current prospectus.
This report reflects our views, opinions, and portfolio holdings as of March 31, 2020, the end of the reporting period. These views are subject to change at any time based upon market or other conditions. For more current information throughout the year, please visit www.leavellinvestments.com.
7
THE GOVERNMENT STREET EQUITY FUND
PERFORMANCE INFORMATION (Unaudited) |
The Government Street Equity Fund
Comparison of the Change in Value of a $10,000 Investment in
The Government Street Equity Fund and the S&P 500® Index
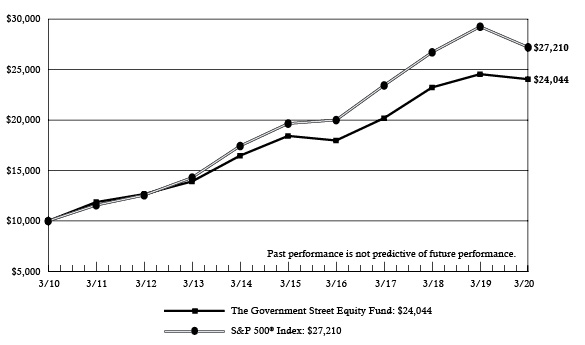
| Average Annual Total Returns (for periods ended March 31, 2020) | |
| 1 Year | 5 Years | 10 Years | |
The Government Street Equity Fund(a) | (2.04%) | 5.47% | 9.17% | |
S&P 500® Index | (6.98%) | 6.73% | 10.53% | |
(a) | Total return is a measure of the change in value of an investment in the Fund over the periods covered, which assumes any dividends or capital gains distributions are reinvested in shares of the Fund. Returns do not reflect the deduction of taxes a shareholder would pay on Fund distributions or the redemption of Fund shares. |
8
THE GOVERNMENT STREET MID-CAP FUND
PERFORMANCE INFORMATION (Unaudited) |
The Government Street Mid-Cap Fund
Comparison of the Change in Value of a $10,000 Investment in
The Government Street Mid-Cap Fund and the S&P MidCap 400® Index

| Average Annual Total Returns (for periods ended March 31, 2020) | |
| 1 Year | 5 Years | 10 Years | |
The Government Street Mid-Cap Fund(a) | (8.18%) | 5.24% | 9.35% | |
S&P MidCap 400® Index | (22.51%) | 0.56% | 7.88% | |
(a) | Total return is a measure of the change in value of an investment in the Fund over the periods covered, which assumes any dividends or capital gains distributions are reinvested in shares of the Fund. Returns do not reflect the deduction of taxes a shareholder would pay on Fund distributions or the redemption of Fund shares. |
9
THE GOVERNMENT STREET EQUITY FUND PORTFOLIO INFORMATION
March 31, 2020 (Unaudited)
Asset Allocation
(% of Net Assets)
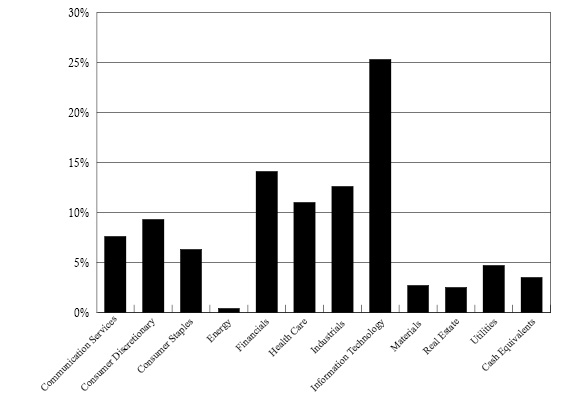
Top Ten Equity Holdings
Security Description | % of Net Assets |
Apple, Inc. | 5.6% |
Lockheed Martin Corporation | 4.7% |
NVIDIA Corporation | 4.6% |
JPMorgan Chase & Company | 4.3% |
Microsoft Corporation | 3.5% |
Bio-Techne Corporation | 3.2% |
Visa, Inc. - Class A | 3.2% |
Amazon.com, Inc. | 3.1% |
Comcast Corporation - Class A | 2.9% |
Walmart, Inc. | 2.8% |
10
THE GOVERNMENT STREET MID-CAP FUND PORTFOLIO INFORMATION
March 31, 2020 (Unaudited)
Asset Allocation
(% of Net Assets)
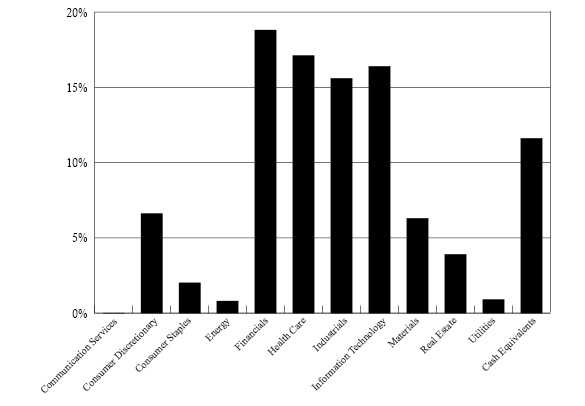
Top Ten Equity Holdings
Security Description | % of Net Assets |
Mid-America Apartment Communities, Inc. | 3.9% |
NVIDIA Corporation | 3.3% |
Chemed Corporation | 3.3% |
Teleflex, Inc. | 2.9% |
L3Harris Technologies, Inc. | 2.9% |
Nasdaq, Inc. | 2.4% |
Bio-Techne Corporation | 2.4% |
Intercontinental Exchange, Inc. | 2.3% |
CME Group, Inc. | 2.2% |
Lam Research Corporation | 2.1% |
11
THE GOVERNMENT STREET EQUITY FUND
SCHEDULE OF INVESTMENTS
March 31, 2020 |
COMMON STOCKS — 96.5% | | Shares | | | Value | |
Communication Services — 7.6% | | | | | | | | |
Alphabet, Inc. - Class A(a) | | | 850 | | | $ | 987,658 | |
Alphabet, Inc. - Class C(a) | | | 1,067 | | | | 1,240,718 | |
Comcast Corporation - Class A | | | 42,000 | | | | 1,443,960 | |
DISH Network Corporation - Class A(a) | | | 2,000 | | | | 39,980 | |
Twitter, Inc.(a) | | | 3,000 | | | | 73,680 | |
| | | | | | | | 3,785,996 | |
Consumer Discretionary — 9.3% | | | | | | | | |
Amazon.com, Inc.(a) | | | 800 | | | | 1,559,776 | |
Home Depot, Inc. (The) | | | 5,000 | | | | 933,550 | |
Lowe’s Companies, Inc. | | | 6,000 | | | | 516,300 | |
McDonald’s Corporation | | | 5,000 | | | | 826,750 | |
NIKE, Inc. - Class B | | | 10,000 | | | | 827,400 | |
| | | | | | | | 4,663,776 | |
Consumer Staples — 6.3% | | | | | | | | |
Clorox Company (The) | | | 1,000 | | | | 173,250 | |
Coca-Cola Company (The) | | | 12,000 | | | | 531,000 | |
Costco Wholesale Corporation | | | 500 | | | | 142,565 | |
McCormick & Company, Inc. | | | 4,000 | | | | 564,840 | |
Procter & Gamble Company (The) | | | 2,000 | | | | 220,000 | |
Sysco Corporation | | | 2,000 | | | | 91,260 | |
Walmart, Inc. | | | 12,500 | | | | 1,420,250 | |
| | | | | | | | 3,143,165 | |
Energy — 0.4% | | | | | | | | |
Phillips 66 | | | 4,000 | | | | 214,600 | |
| | | | | | | | | |
Financials — 14.1% | | | | | | | | |
Aflac, Inc. | | | 16,000 | | | | 547,840 | |
Ares Management Corporation - Class A | | | 5,000 | | | | 154,650 | |
Blackstone Group, Inc. (The) - Class A | | | 12,000 | | | | 546,840 | |
Brookfield Asset Management, Inc. - Class A | | | 24,000 | | | | 1,062,000 | |
CME Group, Inc. | | | 6,000 | | | | 1,037,460 | |
Intercontinental Exchange, Inc. | | | 16,000 | | | | 1,292,000 | |
JPMorgan Chase & Company | | | 24,000 | | | | 2,160,720 | |
S&P Global, Inc. | | | 1,000 | | | | 245,050 | |
| | | | | | | | 7,046,560 | |
Health Care — 11.0% | | | | | | | | |
Abbott Laboratories | | | 9,500 | | | | 749,645 | |
AbbVie, Inc. | | | 11,500 | | | | 876,185 | |
AstraZeneca plc - ADR | | | 4,000 | | | | 178,640 | |
Bio-Techne Corporation | | | 8,500 | | | | 1,611,770 | |
Bristol-Myers Squibb Company | | | 12,000 | | | | 668,880 | |
Edwards Lifesciences Corporation(a) | | | 1,600 | | | | 301,792 | |
12
THE GOVERNMENT STREET EQUITY FUND
SCHEDULE OF INVESTMENTS (Continued) |
COMMON STOCKS — 96.5% (Continued) | | Shares | | | Value | |
Health Care — 11.0% (Continued) | | | | | | | | |
Johnson & Johnson | | | 1,500 | | | $ | 196,695 | |
Merck & Company, Inc. | | | 3,000 | | | | 230,820 | |
Pfizer, Inc. | | | 6,000 | | | | 195,840 | |
Roche Holding AG - ADR | | | 5,000 | | | | 202,850 | |
Thermo Fisher Scientific, Inc. | | | 900 | | | | 255,240 | |
| | | | | | | | 5,468,357 | |
Industrials — 12.6% | | | | | | | | |
Emerson Electric Company | | | 13,000 | | | | 619,450 | |
General Dynamics Corporation | | | 5,200 | | | | 688,012 | |
Honeywell International, Inc. | | | 10,000 | | | | 1,337,900 | |
Lockheed Martin Corporation | | | 7,000 | | | | 2,372,650 | |
United Technologies Corporation | | | 13,500 | | | | 1,273,455 | |
| | | | | | | | 6,291,467 | |
Information Technology — 25.3% | | | | | | | | |
Accenture plc - Class A | | | 6,650 | | | | 1,085,679 | |
Apple, Inc. | | | 11,000 | | | | 2,797,190 | |
Mastercard, Inc. - Class A | | | 2,000 | | | | 483,120 | |
Microsoft Corporation | | | 11,000 | | | | 1,734,810 | |
NVIDIA Corporation | | | 8,650 | | | | 2,280,140 | |
QUALCOMM, Inc. | | | 6,000 | | | | 405,900 | |
Skyworks Solutions, Inc. | | | 10,000 | | | | 893,800 | |
Taiwan Semiconductor Manufacturing Company Ltd. - ADR | | | 4,000 | | | | 191,160 | |
TE Connectivity Ltd. | | | 9,000 | | | | 566,820 | |
Texas Instruments, Inc. | | | 6,200 | | | | 619,566 | |
Visa, Inc. - Class A | | | 9,800 | | | | 1,578,976 | |
| | | | | | | | 12,637,161 | |
Materials — 2.7% | | | | | | | | |
Corteva, Inc. | | | 3,666 | | | | 86,151 | |
Ecolab, Inc. | | | 4,000 | | | | 623,320 | |
Linde plc | | | 2,300 | | | | 397,900 | |
Wheaton Precious Metals Corporation | | | 9,000 | | | | 247,770 | |
| | | | | | | | 1,355,141 | |
Real Estate — 2.5% | | | | | | | | |
Life Storage, Inc. | | | 1,000 | | | | 94,550 | |
Mid-America Apartment Communities, Inc. | | | 11,394 | | | | 1,173,924 | |
| | | | | | | | 1,268,474 | |
Utilities — 4.7% | | | | | | | | |
Dominion Energy, Inc. | | | 6,000 | | | | 433,140 | |
Duke Energy Corporation | | | 8,250 | | | | 667,260 | |
WEC Energy Group, Inc. | | | 14,000 | | | | 1,233,820 | |
| | | | | | | | 2,334,220 | |
| | | | | | | | | |
Total Common Stocks (Cost $26,088,896) | | | | | | $ | 48,208,917 | |
13
THE GOVERNMENT STREET EQUITY FUND
SCHEDULE OF INVESTMENTS (Continued) |
MONEY MARKET FUNDS — 3.7% | | Shares | | | Value | |
Fidelity Institutional Money Market Government Portfolio - Class I, 0.30%(b) (Cost $1,849,150) | | | 1,849,150 | | | $ | 1,849,150 | |
| | | | | | | | | |
Total Investments at Value — 100.2% (Cost $27,938,046) | | | | | | $ | 50,058,067 | |
| | | | | | | | | |
Liabilities in Excess of Other Assets — (0.2%) | | | | | | | (77,406 | ) |
| | | | | | | | | |
Net Assets — 100.0% | | | | | | $ | 49,980,661 | |
ADR - American Depositary Receipt. |
(a) | Non-income producing security. |
(b) | The rate shown is the 7-day effective yield as of March 31, 2020. |
See accompanying notes to financial statements. |
14
THE GOVERNMENT STREET MID-CAP FUND
SCHEDULE OF INVESTMENTS
March 31, 2020 |
COMMON STOCKS — 88.4% | | Shares | | | Value | |
Consumer Discretionary — 6.6% | | | | | | | | |
Cracker Barrel Old Country Store, Inc. | | | 1,500 | | | $ | 124,830 | |
Gildan Activewear, Inc. | | | 13,400 | | | | 170,984 | |
Hasbro, Inc. | | | 5,000 | | | | 357,750 | |
Kontoor Brands, Inc. | | | 1,671 | | | | 32,033 | |
Melco Resorts & Entertainment Ltd. - ADR | | | 5,000 | | | | 62,000 | |
NVR, Inc.(a) | | | 100 | | | | 256,911 | |
Ollie’s Bargain Outlet Holdings, Inc.(a) | | | 2,500 | | | | 115,850 | |
Service Corporation International | | | 16,200 | | | | 633,582 | |
Tempur Sealy International, Inc.(a) | | | 3,000 | | | | 131,130 | |
Tiffany & Company | | | 3,475 | | | | 450,013 | |
VF Corporation | | | 4,700 | | | | 254,176 | |
| | | | | | | | 2,589,259 | |
Consumer Staples — 2.0% | | | | | | | | |
Church & Dwight Company, Inc. | | | 9,000 | | | | 577,620 | |
Energizer Holdings, Inc. | | | 5,000 | | | | 151,250 | |
Hain Celestial Group, Inc. (The)(a) | | | 3,000 | | | | 77,910 | |
| | | | | | | | 806,780 | |
Energy — 0.8% | | | | | | | | |
Marathon Petroleum Corporation | | | 2,830 | | | | 66,845 | |
ONEOK, Inc. | | | 11,000 | | | | 239,910 | |
| | | | | | | | 306,755 | |
Financials — 18.8% | | | | | | | | |
Alleghany Corporation | | | 865 | | | | 477,783 | |
American Financial Group, Inc. | | | 7,600 | | | | 532,608 | |
Ares Management Corporation - Class A | | | 2,750 | | | | 85,057 | |
Arthur J. Gallagher & Company | | | 9,250 | | | | 753,968 | |
Bank of Hawaii Corporation | | | 4,000 | | | | 220,960 | |
Brown & Brown, Inc. | | | 20,000 | | | | 724,400 | |
CME Group, Inc. | | | 5,000 | | | | 864,550 | |
Eaton Vance Corporation | | | 13,000 | | | | 419,250 | |
Intercontinental Exchange, Inc. | | | 11,000 | | | | 888,250 | |
Nasdaq, Inc. | | | 10,000 | | | | 949,500 | |
Old Republic International Corporation | | | 24,400 | | | | 372,100 | |
SEI Investments Company | | | 10,500 | | | | 486,570 | |
Voya Financial, Inc. | | | 1,500 | | | | 60,825 | |
W.R. Berkley Corporation | | | 11,175 | | | | 583,000 | |
| | | | | | | | 7,418,821 | |
Health Care — 17.1% | | | | | | | | |
Bio-Rad Laboratories, Inc. - Class A(a) | | | 1,700 | | | | 595,952 | |
Bio-Techne Corporation | | | 5,000 | | | | 948,100 | |
Centene Corporation(a) | | | 6,000 | | | | 356,460 | |
Charles River Laboratories International, Inc.(a) | | | 4,500 | | | | 567,945 | |
15
THE GOVERNMENT STREET MID-CAP FUND
SCHEDULE OF INVESTMENTS (Continued) |
COMMON STOCKS — 88.4% (Continued) | | Shares | | | Value | |
Health Care — 17.1% (Continued) | | | | | | | | |
Chemed Corporation | | | 3,000 | | | $ | 1,299,600 | |
Computer Programs & Systems, Inc. | | | 2,000 | | | | 44,500 | |
Laboratory Corporation of America Holdings(a) | | | 2,574 | | | | 325,328 | |
Penumbra, Inc.(a) | | | 2,500 | | | | 403,325 | |
ResMed, Inc. | | | 4,700 | | | | 692,263 | |
Teleflex, Inc. | | | 3,950 | | | | 1,156,797 | |
Waters Corporation(a) | | | 2,000 | | | | 364,100 | |
| | | | | | | | 6,754,370 | |
Industrials — 15.6% | | | | | | | | |
AMETEK, Inc. | | | 2,350 | | | | 169,247 | |
C.H. Robinson Worldwide, Inc. | | | 4,000 | | | | 264,800 | |
Donaldson Company, Inc. | | | 13,000 | | | | 502,190 | |
Expeditors International of Washington, Inc. | | | 8,000 | | | | 533,760 | |
Fastenal Company | | | 20,000 | | | | 625,000 | |
Graco, Inc. | | | 13,000 | | | | 633,490 | |
Jacobs Engineering Group, Inc. | | | 6,475 | | | | 513,273 | |
L3Harris Technologies, Inc. | | | 6,400 | | | | 1,152,768 | |
MasTec, Inc.(a) | | | 2,000 | | | | 65,460 | |
MSC Industrial Direct Company, Inc. - Class A | | | 6,000 | | | | 329,820 | |
nVent Electric plc | | | 2,900 | | | | 48,923 | |
Pentair plc | | | 2,900 | | | | 86,304 | |
Snap-on, Inc. | | | 1,475 | | | | 160,510 | |
Waste Connections, Inc. | | | 10,500 | | | | 813,750 | |
Woodward, Inc. | | | 4,150 | | | | 246,676 | |
| | | | | | | | 6,145,971 | |
Information Technology — 16.4% | | | | | | | | |
Analog Devices, Inc. | | | 3,671 | | | | 329,105 | |
ANSYS, Inc.(a) | | | 3,500 | | | | 813,645 | |
Arrow Electronics, Inc.(a) | | | 10,100 | | | | 523,887 | |
Broadridge Financial Solutions, Inc. | | | 3,500 | | | | 331,905 | |
InterDigital, Inc. | | | 1,200 | | | | 53,556 | |
Lam Research Corporation | | | 3,500 | | | | 840,000 | |
Microchip Technology, Inc. | | | 6,000 | | | | 406,800 | |
National Instruments Corporation | | | 12,000 | | | | 396,960 | |
NVIDIA Corporation | | | 5,000 | | | | 1,318,000 | |
Okta, Inc.(a) | | | 3,500 | | | | 427,910 | |
Tech Data Corporation(a) | | | 3,500 | | | | 457,975 | |
Xilinx, Inc. | | | 7,000 | | | | 545,580 | |
| | | | | | | | 6,445,323 | |
Materials — 6.3% | | | | | | | | |
Albemarle Corporation | | | 6,700 | | | | 377,679 | |
Ashland Global Holdings, Inc. | | | 6,000 | | | | 300,420 | |
Graphic Packaging Holding Company | | | 10,000 | | | | 122,000 | |
16
THE GOVERNMENT STREET MID-CAP FUND
SCHEDULE OF INVESTMENTS (Continued) |
COMMON STOCKS — 88.4% (Continued) | | Shares | | | Value | |
Materials — 6.3% (Continued) | | | | | | | | |
Martin Marietta Materials, Inc. | | | 3,000 | | | $ | 567,690 | |
Packaging Corporation of America | | | 6,000 | | | | 520,980 | |
Scotts Miracle-Gro Company (The) | | | 2,000 | | | | 204,800 | |
Steel Dynamics, Inc. | | | 12,000 | | | | 270,480 | |
Valvoline, Inc. | | | 8,236 | | | | 107,809 | |
| | | | | | | | 2,471,858 | |
Real Estate — 3.9% | | | | | | | | |
Mid-America Apartment Communities, Inc. | | | 15,000 | | | | 1,545,450 | |
| | | | | | | | | |
Utilities — 0.9% | | | | | | | | |
ONE Gas, Inc. | | | 3,500 | | | | 292,670 | |
UGI Corporation | | | 3,038 | | | | 81,023 | |
| | | | | | | | 373,693 | |
| | | | | | | | | |
Total Common Stocks(Cost $16,743,034) | | | | | | $ | 34,858,280 | |
|
MONEY MARKET FUNDS — 11.6% | | Shares | | | Value | |
Fidelity Institutional Money Market Government Portfolio - Class I, 0.30%(b) (Cost $4,570,514) | | | 4,570,514 | | | $ | 4,570,514 | |
| | | | | | | | | |
Total Investments at Value — 100.0% (Cost $21,313,548) | | | | | | $ | 39,428,794 | |
| | | | | | | | | |
Liabilities in Excess of Other Assets— (0.0%)(c) | | | | | | | (6,791 | ) |
| | | | | | | | | |
Net Assets — 100.0% | | | | | | $ | 39,422,003 | |
ADR - American Depositary Receipt. |
(a) | Non-income producing security. |
(b) | The rate shown is the 7-day effective yield as of March 31, 2020. |
(c) | Percentage rounds to less than 0.1%. |
See accompanying notes to financial statements. |
17
THE GOVERNMENT STREET FUNDS
STATEMENTS OF ASSETS AND LIABILITIES
March 31, 2020 |
| | The
Government
Street
Equity
Fund | | | The
Government
Street
Mid-Cap
Fund | |
ASSETS | | | | | | | | |
Investments in securities: | | | | | | | | |
At cost | | $ | 27,938,046 | | | $ | 21,313,548 | |
At value (Note 2) | | $ | 50,058,067 | | | $ | 39,428,794 | |
Cash | | | 3,672 | | | | — | |
Receivable for capital shares sold | | | 201 | | | | 227 | |
Receivable for investment securities sold | | | 327,209 | | | | — | |
Dividends receivable | | | 30,816 | | | | 24,216 | |
Other assets | | | 2,990 | | | | 6,594 | |
TOTAL ASSETS | | | 50,422,955 | | | | 39,459,831 | |
| | | | | | | | | |
LIABILITIES | | | | | | | | |
Distributions payable | | | 3,214 | | | | — | |
Payable for capital shares redeemed | | | 84,755 | | | | — | |
Payable for investment securities purchased | | | 314,749 | | | | — | |
Accrued investment advisory fees (Note 4) | | | 26,226 | | | | 26,008 | |
Payable to administrator (Note 4) | | | 6,860 | | | | 5,800 | |
Other accrued expenses | | | 6,490 | | | | 6,020 | |
TOTAL LIABILITIES | | | 442,294 | | | | 37,828 | |
| | | | | | | | | |
NET ASSETS | | $ | 49,980,661 | | | $ | 39,422,003 | |
| | | | | | | | | |
Net assets consist of: | | | | | | | | |
Paid-in capital | | $ | 26,677,620 | | | $ | 21,233,459 | |
Accumulated earnings | | | 23,303,041 | | | | 18,188,544 | |
Net assets | | $ | 49,980,661 | | | $ | 39,422,003 | |
| | | | | | | | | |
Shares of beneficial interest outstanding (unlimited number of shares authorized, $0.01 par value) | | | 731,817 | | | | 1,673,598 | |
| | | | | | | | | |
Net asset value, offering price and redemption price per share (Note 2) | | $ | 68.30 | | | $ | 23.56 | |
See accompanying notes to financial statements. |
18
THE GOVERNMENT STREET FUNDS
STATEMENTS OF OPERATIONS
For the Year Ended March 31, 2020 |
| | The
Government
Street
Equity
Fund | | | The
Government
Street
Mid-Cap
Fund | |
INVESTMENT INCOME | | | | | | | | |
Dividends | | $ | 1,124,326 | | | $ | 791,472 | |
Foreign withholding taxes on dividends | | | (6,140 | ) | | | (2,365 | ) |
TOTAL INVESTMENT INCOME | | | 1,118,186 | | | | 789,107 | |
| | | | | | | | | |
EXPENSES | | | | | | | | |
Investment advisory fees (Note 4) | | | 350,200 | | | | 356,140 | |
Administration fees (Note 4) | | | 77,412 | | | | 65,884 | |
Account maintenance fees | | | 17,892 | | | | 15,867 | |
Audit and tax services fees | | | 16,500 | | | | 16,500 | |
Trustees’ fees and expenses (Note 4) | | | 15,508 | | | | 15,508 | |
Registration and filing fees | | | 14,205 | | | | 13,515 | |
Compliance fees (Note 4) | | | 8,752 | | | | 8,671 | |
Custodian and bank service fees | | | 7,290 | | | | 5,935 | |
Legal fees | | | 5,037 | | | | 5,037 | |
Printing of shareholder reports | | | 4,409 | | | | 4,751 | |
Postage and supplies | | | 3,855 | | | | 3,633 | |
Pricing costs | | | 1,782 | | | | 1,740 | |
Other expenses | | | 7,044 | | | | 3,556 | |
TOTAL EXPENSES | | | 529,886 | | | | 516,737 | |
| | | | | | | | | |
NET INVESTMENT INCOME | | | 588,300 | | | | 272,370 | |
| | | | | | | | | |
REALIZED AND UNREALIZED GAINS (LOSSES) ON INVESTMENTS | | | | | | | | |
Net realized gains from investments | | | 2,828,555 | | | | 917,145 | |
Net realized gains from in-kind redemptions (Note 2) | | | 999,929 | | | | 428,697 | |
Net change in unrealized appreciation (depreciation) on investments | | | (5,017,527 | ) | | | (4,884,827 | ) |
NET REALIZED AND UNREALIZED LOSSES ON INVESTMENTS | | | (1,189,043 | ) | | | (3,538,985 | ) |
| | | | | | | | | |
NET DECREASE IN NET ASSETS RESULTING FROM OPERATIONS | | $ | (600,743 | ) | | $ | (3,266,615 | ) |
See accompanying notes to financial statements. |
19
THE GOVERNMENT STREET EQUITY FUND
STATEMENTS OF CHANGES IN NET ASSETS |
| | Year
Ended
March 31,
2020 | | | Year
Ended
March 31,
2019 | |
FROM OPERATIONS | | | | | | | | |
Net investment income | | $ | 588,300 | | | $ | 548,406 | |
Net realized gains from investments | | | 2,828,555 | | | | 2,732,000 | |
Net realized gains from in-kind redemptions (Note 2) | | | 999,929 | | | | 2,034,125 | |
Net change in unrealized appreciation (depreciation) on investments | | | (5,017,527 | ) | | | (2,134,565 | ) |
Net increase (decrease) in net assets resulting from operations | | | (600,743 | ) | | | 3,179,966 | |
| | | | | | | | | |
DISTRIBUTIONS TO SHAREHOLDERS (Note 2) | | | (2,979,301 | ) | | | (4,266,778 | ) |
| | | | | | | | | |
FROM CAPITAL SHARE TRANSACTIONS | | | | | | | | |
Proceeds from shares sold | | | 225,208 | | | | 359,836 | |
Net asset value of shares issued in reinvestment of distributions to shareholders | | | 2,900,422 | | | | 4,106,733 | |
Payments for shares redeemed | | | (5,744,573 | ) | | | (9,906,669 | ) |
Net decrease in net assets from capital share transactions | | | (2,618,943 | ) | | | (5,440,100 | ) |
| | | | | | | | | |
TOTAL DECREASE IN NET ASSETS | | | (6,198,987 | ) | | | (6,526,912 | ) |
| | | | | | | | | |
NET ASSETS | | | | | | | | |
Beginning of year | | | 56,179,648 | | | | 62,706,560 | |
End of year | | $ | 49,980,661 | | | $ | 56,179,648 | |
| | | | | | | | | |
CAPITAL SHARE ACTIVITY | | | | | | | | |
Shares sold | | | 2,893 | | | | 4,813 | |
Shares reinvested | | | 36,909 | | | | 56,406 | |
Shares redeemed | | | (73,663 | ) | | | (136,134 | ) |
Net decrease in shares outstanding | | | (33,861 | ) | | | (74,915 | ) |
Shares outstanding, beginning of year | | | 765,678 | | | | 840,593 | |
Shares outstanding, end of year | | | 731,817 | | | | 765,678 | |
See accompanying notes to financial statements. |
20
THE GOVERNMENT STREET MID-CAP FUND
STATEMENTS OF CHANGES IN NET ASSETS |
| | Year
Ended
March 31,
2020 | | | Year
Ended
March 31,
2019 | |
FROM OPERATIONS | | | | | | | | |
Net investment income | | $ | 272,370 | | | $ | 306,757 | |
Net realized gains from investments | | | 917,145 | | | | 1,398,108 | |
Net realized gains from in-kind redemptions (Note 2) | | | 428,697 | | | | 2,097,878 | |
Net change in unrealized appreciation (depreciation) on investments | | | (4,884,827 | ) | | | (1,849,158 | ) |
Net increase (decrease) in net assets resulting from operations | | | (3,266,615 | ) | | | 1,953,585 | |
| | | | | | | | | |
DISTRIBUTIONS TO SHAREHOLDERS (Note 2) | | | (2,059,713 | ) | | | (1,714,010 | ) |
| | | | | | | | | |
FROM CAPITAL SHARE TRANSACTIONS | | | | | | | | |
Proceeds from shares sold | | | 496,731 | | | | 1,300,844 | |
Net asset value of shares issued in reinvestment of distributions to shareholders | | | 2,011,302 | | | | 1,647,714 | |
Payments for shares redeemed | | | (4,053,012 | ) | | | (6,953,800 | ) |
Net decrease in net assets from capital share transactions | | | (1,544,979 | ) | | | (4,005,242 | ) |
| | | | | | | | | |
TOTAL DECREASE IN NET ASSETS | | | (6,871,307 | ) | | | (3,765,667 | ) |
| | | | | | | | | |
NET ASSETS | | | | | | | | |
Beginning of year | | | 46,293,310 | | | | 50,058,977 | |
End of year | | $ | 39,422,003 | | | $ | 46,293,310 | |
| | | | | | | | | |
CAPITAL SHARE ACTIVITY | | | | | | | | |
Shares sold | | | 17,789 | | | | 48,280 | |
Shares reinvested | | | 70,826 | | | | 63,397 | |
Shares redeemed | | | (143,976 | ) | | | (261,760 | ) |
Net decrease in shares outstanding | | | (55,361 | ) | | | (150,083 | ) |
Shares outstanding, beginning of year | | | 1,728,959 | | | | 1,879,042 | |
Shares outstanding, end of year | | | 1,673,598 | | | | 1,728,959 | |
See accompanying notes to financial statements. |
21
THE GOVERNMENT STREET EQUITY FUND
FINANCIAL HIGHLIGHTS |
Selected Per Share Data for a Share Outstanding Throughout Each Year: |
| | Years Ended March 31, | |
| | 2020 | | | 2019 | | | 2018 | | | 2017 | | | 2016 | |
Net asset value at beginning of year | | $ | 73.37 | | | $ | 74.60 | | | $ | 67.08 | | | $ | 61.72 | | | $ | 65.95 | |
| | | | | | | | | | | | | | | | | | | | | |
Income (loss) from investment operations: | | | | | | | | | | | | | | | | | | | | |
Net investment income | | | 0.80 | | | | 0.69 | | | | 0.66 | | | | 0.68 | | | | 0.61 | |
Net realized and unrealized gains (losses) on investments and foreign currencies | | | (1.82 | ) | | | 3.37 | | | | 9.32 | | | | 6.76 | | | | (2.17 | ) |
Total from investment operations | | | (1.02 | ) | | | 4.06 | | | | 9.98 | | | | 7.44 | | | | (1.56 | ) |
| | | | | | | | | | | | | | | | | | | | | |
Less distributions: | | | | | | | | | | | | | | | | | | | | |
From net investment income | | | (0.80 | ) | | | (0.68 | ) | | | (0.65 | ) | | | (0.68 | ) | | | (0.64 | ) |
From net realized gains | | | (3.25 | ) | | | (4.61 | ) | | | (1.81 | ) | | | (1.40 | ) | | | (2.03 | ) |
Total distributions | | | (4.05 | ) | | | (5.29 | ) | | | (2.46 | ) | | | (2.08 | ) | | | (2.67 | ) |
| | | | | | | | | | | | | | | | | | | | | |
Net asset value at end of year | | $ | 68.30 | | | $ | 73.37 | | | $ | 74.60 | | | $ | 67.08 | | | $ | 61.72 | |
| | | | | | | | | | | | | | | | | | | | | |
Total return(a) | | | (2.04 | %) | | | 5.65 | % | | | 15.08 | % | | | 12.32 | % | | | (2.46 | %) |
| | | | | | | | | | | | | | | | | | | | | |
Net assets at end of year (000’s) | | $ | 49,981 | | | $ | 56,180 | | | $ | 62,707 | | | $ | 65,407 | | | $ | 80,307 | |
| | | | | | | | | | | | | | | | | | | | | |
Ratio of total expenses to average net assets | | | 0.91 | % | | | 0.89 | % | | | 0.88 | % | | | 0.87 | % | | | 0.85 | % |
| | | | | | | | | | | | | | | | | | | | | |
Ratio of net investment income to average net assets | | | 1.01 | % | | | 0.92 | % | | | 0.90 | % | | | 1.03 | % | | | 0.95 | % |
| | | | | | | | | | | | | | | | | | | | | |
Portfolio turnover rate | | | 14 | % | | | 9 | % | | | 13 | % | | | 20 | % | | | 17 | % |
(a) | Total return is a measure of the change in value of an investment in the Fund over the periods covered, which assumes any dividends or capital gains distributions are reinvested in shares of the Fund. The returns shown do not reflect the deduction of taxes a shareholder would pay on Fund distributions or the redemption of Fund shares. |
See accompanying notes to financial statements. |
22
THE GOVERNMENT STREET MID-CAP FUND
FINANCIAL HIGHLIGHTS |
Selected Per Share Data for a Share Outstanding Throughout Each Year: |
| | Years Ended March 31, | |
| | 2020 | | | 2019 | | | 2018 | | | 2017 | | | 2016 | |
Net asset value at beginning of year | | $ | 26.78 | | | $ | 26.64 | | | $ | 24.42 | | | $ | 21.95 | | | $ | 22.96 | |
| | | | | | | | | | | | | | | | | | | | | |
Income (loss) from investment operations: | | | | | | | | | | | | | | | | | | | | |
Net investment income | | | 0.16 | | | | 0.18 | | | | 0.20 | | | | 0.16 | | | | 0.10 | |
Net realized and unrealized gains (losses) on investments | | | (2.16 | ) | | | 0.90 | | | | 3.32 | | | | 3.36 | | | | 0.11 | |
Total from investment operations | | | (2.00 | ) | | | 1.08 | | | | 3.52 | | | | 3.52 | | | | 0.21 | |
| | | | | | | | | | | | | | | | | | | | | |
Less distributions: | | | | | | | | | | | | | | | | | | | | |
From net investment income | | | (0.16 | ) | | | (0.14 | ) | | | (0.20 | ) | | | (0.14 | ) | | | (0.10 | ) |
From net realized gains | | | (1.06 | ) | | | (0.80 | ) | | | (1.10 | ) | | | (0.91 | ) | | | (1.12 | ) |
Total distributions | | | (1.22 | ) | | | (0.94 | ) | | | (1.30 | ) | | | (1.05 | ) | | | (1.22 | ) |
| | | | | | | | | | | | | | | | | | | | | |
Net asset value at end of year | | $ | 23.56 | | | $ | 26.78 | | | $ | 26.64 | | | $ | 24.42 | | | $ | 21.95 | |
| | | | | | | | | | | | | | | | | | | | | |
Total return(a) | | | (8.18 | %) | | | 4.21 | % | | | 14.67 | % | | | 16.44 | % | | | 1.04 | % |
| | | | | | | | | | | | | | | | | | | | | |
Net assets at end of year (000’s) | | $ | 39,422 | | | $ | 46,293 | | | $ | 50,059 | | | $ | 48,540 | | | $ | 48,547 | |
| | | | | | | | | | | | | | | | | | | | | |
Ratio of total expenses to average net assets | | | 1.09 | % | | | 1.08 | % | | | 1.06 | % | | | 1.07 | % | | | 1.07 | % |
| | | | | | | | | | | | | | | | | | | | | |
Ratio of net investment income to average net assets | | | 0.57 | % | | | 0.64 | % | | | 0.78 | % | | | 0.66 | % | | | 0.46 | % |
| | | | | | | | | | | | | | | | | | | | | |
Portfolio turnover rate | | | 2 | % | | | 6 | % | | | 12 | % | | | 14 | % | | | 20 | % |
(a) | Total return is a measure of the change in value of an investment in the Fund over the periods covered, which assumes any dividends or capital gains distributions are reinvested in shares of the Fund. The returns shown do not reflect the deduction of taxes a shareholder would pay on Fund distributions or the redemption of Fund shares. |
See accompanying notes to financial statements. |
23
THE GOVERNMENT STREET FUNDS
NOTES TO FINANCIAL STATEMENTS
March 31, 2020
1. Organization
The Government Street Equity Fund and The Government Street Mid-Cap Fund (the “Funds”) are each a diversified, no-load series of the Williamsburg Investment Trust (the “Trust”), an open-end management investment company registered under the Investment Company Act of 1940, as amended (the “1940 Act”). The Trust was organized as a Massachusetts business trust on July 18, 1988. Other series of the Trust are not included in this report.
The investment objective of The Government Street Equity is to seek capital appreciation.
The investment objective of The Government Street Mid-Cap is to seek capital appreciation.
2. Significant Accounting Policies
Each Fund follows accounting and reporting guidance under Financial Accounting Standards Board Accounting Standards Codification Topic 946, “Financial Services – Investment Companies.” The following is a summary of the Funds’ significant accounting policies. The policies are in conformity with accounting principles generally accepted in the United States of America (“GAAP”).
Securities valuation — The Funds’ portfolio securities are valued as of the close of business of the regular session of the New York Stock Exchange (“NYSE”) (normally 4:00 p.m. Eastern time). Securities traded on a national stock exchange, including common stocks and exchange-traded funds (“ETFs”), if any, are valued based upon the closing price on the principal exchange where the security is traded, if available, otherwise, at the last quoted bid price. Securities that are quoted by NASDAQ are valued at the NASDAQ Official Closing Price. Investments representing shares of other open-end investment companies, other than ETFs but including money market funds, are valued at their net asset value (“NAV”) as reported by such companies. When using a quoted price and when the market is considered active, securities will be classified as Level 1 within the fair value hierarchy (see below).
When market quotations are not readily available, if a pricing service cannot provide a price, or if the investment adviser believes the price received from the pricing service is not indicative of market value, securities will be valued in good faith at fair value using methods consistent with procedures adopted by the Board of Trustees and will be classified as Level 2 or 3 within the fair value hierarchy, depending on the inputs used. Such methods of fair valuation may include, but are not limited to: multiple of earnings, multiple of book value, discount from market of a similar freely traded security, purchase price of the security, subsequent private transactions in the security
24
THE GOVERNMENT STREET FUNDS
NOTES TO FINANCIAL STATEMENTS (Continued)
or related securities, or a combination of these and other factors. GAAP establishes a single authoritative definition of fair value, sets out a framework for measuring fair value and requires additional disclosures about fair value measurements.
Various inputs are used in determining the value of each Fund’s investments. These inputs are summarized in the three broad levels listed below:
● | Level 1 – quoted prices in active markets for identical securities |
● | Level 2 – other significant observable inputs |
● | Level 3 – significant unobservable inputs |
The inputs or methodology used for valuing securities are not necessarily an indication of the risks associated with investing in those securities. The inputs used to measure fair value may fall into different levels of the fair value hierarchy. In such cases, for disclosure purposes, the level in the fair value hierarchy within which the fair value measurement falls in its entirety is determined based on the lowest level input that is significant to the fair value measurement.
The following is a summary of the inputs used to value each Fund’s investments as of March 31, 2020, by asset type:
The Government Street Equity Fund: | | Level 1 | | | Level 2 | | | Level 3 | | | Total | |
Common Stocks | | $ | 48,208,917 | | | $ | — | | | $ | — | | | $ | 48,208,917 | |
Money Market Funds | | | 1,849,150 | | | | — | | | | — | | | | 1,849,150 | |
Total | | $ | 50,058,067 | | | $ | — | | | $ | — | | | $ | 50,058,067 | |
The Government Street Mid-Cap Fund: | | Level 1 | | | Level 2 | | | Level 3 | | | Total | |
Common Stocks | | $ | 34,858,280 | | | $ | — | | | $ | — | | | $ | 34,858,280 | |
Money Market Funds | | | 4,570,514 | | | | — | | | | — | | | | 4,570,514 | |
Total | | $ | 39,428,794 | | | $ | — | | | $ | — | | | $ | 39,428,794 | |
Refer to each Fund’s Schedule of Investments for a listing of the common stocks by sector type. There were no Level 3 securities or derivative instruments held by the Funds as of or during the year ended March 31, 2020.
Foreign currency translation — Investment securities and other assets and liabilities denominated in or expected to settle in foreign currencies, if any, are translated into U.S. dollars based on exchange rates on the following basis:
A. | The fair values of investment securities and other assets and liabilities are translated as of the close of the NYSE each day. |
B. | Purchases and sales of investment securities and income and expenses are translated at the rate of exchange prevailing as of 4:00 p.m. Eastern time on the respective date of such transactions. |
25
THE GOVERNMENT STREET FUNDS
NOTES TO FINANCIAL STATEMENTS (Continued)
C. | The Fund does not isolate that portion of the results of operations caused by changes in foreign exchange rates on investments from those caused by changes in market prices of investment securities held. Such fluctuations are included with the net realized and unrealized gains or losses on investments. |
Reported net realized foreign exchange gains or losses arise from 1) purchases and sales of foreign currencies and 2) the difference between the amounts of dividends and foreign withholding taxes recorded on a Fund’s books and the U.S. dollar equivalent of the amounts actually received or paid. Reported net unrealized foreign exchange gains and losses arise from changes in the value of assets and liabilities that result from changes in exchange rates.
Share valuation — The NAV per share of each Fund is calculated daily by dividing the total value of its assets, less liabilities, by the number of shares outstanding. The offering price and redemption price per share of each Fund is equal to the NAV per share.
Investment income — Interest income is accrued as earned. Discounts and premiums on fixed-income securities purchased, if any, are amortized using the interest method. Dividend income is recorded on the ex-dividend date. Non-cash dividends included in dividend income, if any, are recorded at the fair market value of the security received. Withholding taxes on foreign dividends have been recorded in accordance with the Trust’s understanding of the applicable country’s rules and tax rates.
Distributions to shareholders — Dividends arising from net investment income are declared and paid quarterly to shareholders of The Government Street Equity Fund and declared and paid annually to shareholders of The Government Street Mid-Cap Fund. Net realized short-term capital gains, if any, may be distributed throughout the year and net realized long-term capital gains, if any, are distributed at least once each year. Dividends and distributions are recorded on the ex-dividend date. The amount of distributions from net investment income and net realized capital gains are determined in accordance with federal income tax regulations, which may differ from GAAP. These “book/tax” differences are either temporary or permanent in nature.
The tax character of distributions paid during the years ended March 31, 2020 and 2019 was as follows:
| | Years
Ended | | | Ordinary
Income | | | Long-Term
Capital Gains | | | Total
Distributions | |
The Government Street Equity Fund | | | 03/31/20 | | | $ | 589,910 | | | $ | 2,390,603 | | | $ | 2,980,513 | |
| | | | 03/31/19 | | | $ | 543,217 | | | $ | 3,723,561 | | | $ | 4,266,778 | |
The Government Street Mid-Cap Fund | | | 03/31/20 | | | $ | 270,308 | | | $ | 1,789,405 | | | $ | 2,059,713 | |
| | | | 03/31/19 | | | $ | 335,646 | | | $ | 1,378,364 | | | $ | 1,714,010 | |
26
THE GOVERNMENT STREET FUNDS
NOTES TO FINANCIAL STATEMENTS (Continued)
Investment transactions — Investment transactions are accounted for on trade date for financial reporting purposes. Realized gains and losses on investment securities sold are determined on a specific identification basis.
Common expenses — Common expenses of the Trust are allocated among the Funds and the other series of the Trust based on relative net assets of each series or the nature of the services performed and the relative applicability to each series.
Estimates — The preparation of financial statements in conformity with GAAP requires management to make estimates and assumptions that affect the reported amounts of assets and liabilities and the disclosure of contingent assets and liabilities as of the date of the financial statements and the reported amounts of income and expenses during the reporting period. Actual results could differ from those estimates.
Federal income tax — Each Fund has qualified and intends to continue to qualify as a regulated investment company under the Internal Revenue Code of 1986, as amended (the “Code”). Qualification generally will relieve the Funds of liability for federal income taxes to the extent 100% of their net investment income and any net realized capital gains are distributed in accordance with the Code.
In order to avoid imposition of the excise tax applicable to regulated investment companies, it is also each Fund’s intention to declare as dividends in each calendar year at least 98% of its net investment income (earned during the calendar year) and 98.2% of its net realized capital gains (earned during the twelve months ended October 31) plus undistributed amounts from prior years.
The following information is computed on a tax basis for each item as of March 31, 2020:
| | The Government
Street Equity
Fund | | | The Government
Street Mid-Cap
Fund | |
Cost of portfolio investments | | $ | 27,938,046 | | | $ | 21,313,548 | |
Gross unrealized appreciation | | $ | 22,991,715 | | | $ | 19,084,987 | |
Gross unrealized depreciation | | | (871,694 | ) | | | (969,741 | ) |
Net unrealized appreciation | | | 22,120,021 | | | | 18,115,246 | |
Undistributed ordinary income | | | 9,591 | | | | — | |
Undistributed long-term capital gains | | | 1,176,643 | | | | 73,298 | |
Distributions payable | | | (3,214 | ) | | | — | |
Total accumulated earnings | | $ | 23,303,041 | | | $ | 18,188,544 | |
During the year ended March 31, 2020, The Government Street Equity Fund and The Government Street Mid-Cap Fund realized $999,929 and $428,697, respectively, of net capital gains resulting from in-kind redemptions (redemptions in which shareholders who redeemed Fund shares received investment securities held by the
27
THE GOVERNMENT STREET FUNDS
NOTES TO FINANCIAL STATEMENTS (Continued)
Fund rather than cash). The Funds recognize a gain on in-kind redemptions to the extent that the value of the distributed investment securities on the date of redemption exceeds the cost of those investment securities. Such gains are not taxable to the Funds and are not required to be distributed to shareholders. The Funds have reclassified these gains against paid-in capital on the Statements of Assets and Liabilities. Such reclassifications, the result of permanent differences between the financial statement and income tax reporting requirements, had no effect on each Fund’s net assets or NAV per share.
The Funds recognize the tax benefits or expenses of uncertain tax positions only when the position is “more likely than not” to be sustained assuming examination by tax authorities. Management has reviewed the tax positions taken on federal income tax returns for all open tax years (generally, three years) of each Fund and has concluded that no provision for unrecognized tax benefits or expenses is required in these financial statements.
3. Investment Transactions
Investment transactions, other than short-term investments and U.S. government securities, were as follows for the year ended March 31, 2020:
| | The Government
Street Equity
Fund | | | The Government
Street Mid-Cap
Fund | |
Purchases of investment securities | | $ | 7,533,801 | | | $ | 892,979 | |
Proceeds from sales of investment securities | | $ | 11,979,941 | | | $ | 5,796,665 | |
4. Transactions with Related Parties
INVESTMENT ADVISORY AGREEMENT
Each Fund’s investments are managed by Leavell Investment Management, Inc. (the “Adviser”) under the terms of an Investment Advisory Agreement. The Government Street Equity Fund pays the Adviser a fee, which is computed and accrued daily and paid monthly, at annual rates of 0.60% of its average daily net assets up to $100 million and 0.50% of such assets in excess of $100 million. The Government Street Mid-Cap Fund pays the Adviser a fee, which is computed and accrued daily and paid monthly, at an annual rate of 0.75% of its average daily net assets.
Certain officers of the Trust are also officers of the Adviser.
OTHER SERVICE PROVIDERS
Ultimus Fund Solutions, LLC (“Ultimus”) provides administration, fund accounting, compliance and transfer agent services to the Funds. The Funds pay Ultimus fees in accordance with the agreements for such services. In addition, the Funds pay out-of-pocket expenses including, but not limited to, postage, supplies, and certain costs
28
THE GOVERNMENT STREET FUNDS
NOTES TO FINANCIAL STATEMENTS (Continued)
related to the pricing of the Funds’ portfolio securities. Certain officers of the Trust are also officers of Ultimus, or of Ultimus Fund Distributors, LLC (the “Distributor”), the principal underwriter of each Fund’s shares and an affiliate of Ultimus. The Distributor is compensated by the Adviser (not the Funds) for acting as principal underwriter.
COMPENSATION OF TRUSTEES
Trustees and officers affiliated with the Adviser or Ultimus are not compensated by the Trust for their services. Each Trustee who is not an affiliated person of the Adviser or Ultimus received from the Trust an annual retainer of $20,000, payable quarterly; a fee of $2,000 for attendance at each meeting of the Board of Trustees (except that such fee is $3,000 for the independent chair); and a fee of $1,000 for attendance at each meeting of any committee of the Board (except that such fee is $1,500 for the committee chair); plus reimbursement of travel and other expenses incurred in attending meetings. Each series of the Trust pays its proportionate share of such fees.
Effective April 1, 2020, each Trustee not affiliated with the Adviser or Ultimus will receive from the Trust an annual retainer of $24,000, payable quarterly; a fee of $2,000 for attendance at each meeting of the Board of Trustees (except that such fee is $3,000 for the independent chair); and a fee of $1,000 for attendance at each meeting of any committee of the Board (except that such fee is $1,500 for the committee chair); plus reimbursement of travel and other expenses incurred in attending meetings.
5. Contingencies and Commitments
The Funds indemnify the Trust’s officers and Trustees for certain liabilities that might arise from their performance of their duties to the Funds. Additionally, in the normal course of business the Funds enter into contracts that contain a variety of representations and warranties and which provide general indemnifications. The Funds’ maximum exposure under these arrangements is unknown, as this would involve future claims that may be made against the Funds that have not yet occurred. However, based on experience, the Trust expects the risk of loss to be remote.
6. Sector Risk
If a Fund has significant investments in the securities of issuers in industries within a particular business sector, any development affecting that sector will have a greater impact on the value of the net assets of the Fund than would be the case if the Fund did not have significant investments in that sector. In addition, this may increase the risk of loss of an investment in the Fund and increase the volatility of the Fund’s NAV per share. From time to time, circumstances may affect a particular sector and companies within such sector. For instance, economic or market factors, regulation or deregulation, or other developments may negatively impact all companies in a particular sector and therefore the value of a Fund’s portfolio would be adversely
29
THE GOVERNMENT STREET FUNDS
NOTES TO FINANCIAL STATEMENTS (Continued)
affected. As of March 31, 2020, The Government Street Equity Fund had 25.3% of the value of its net assets invested in common stocks within the Information Technology sector.
7. Subsequent Events
The Funds are required to recognize in the financial statements the effects of all subsequent events that provide additional evidence about conditions that existed as of the date of the Statements of Assets and Liabilities. For non-recognized subsequent events that must be disclosed to keep the financial statements from being misleading, the Funds are required to disclose the nature of the event as well as an estimate of its financial effect, or a statement that such an estimate cannot be made. Management has evaluated subsequent events through the issuance of these financial statements and has noted no such events.
30
THE GOVERNMENT STREET FUNDS
REPORT OF INDEPENDENT REGISTERED
PUBLIC ACCOUNTING FIRM
To the Shareholders of The Government Street Funds and
Board of Trustees of Williamsburg Investment Trust
Opinion on the Financial Statements
We have audited the accompanying statements of assets and liabilities, including the schedules of investments, of The Government Street Funds, comprising The Government Street Equity Fund and The Government Street Mid-Cap Fund (the “Funds”), each a series of Williamsburg Investment Trust, as of March 31, 2020, and the related statements of operations for the year then ended, the statements of changes in net assets for each of the two years in the period then ended, including the related notes, and the financial highlights for each of the five years in the period then ended (collectively referred to as the “financial statements”). In our opinion, the financial statements present fairly, in all material respects, the financial position of each of the Funds as of March 31, 2020, the results of their operations for the year then ended, the changes in their net assets for each of the two years in the period then ended, and the financial highlights for each of the five years in the period then ended, in conformity with accounting principles generally accepted in the United States of America.
Basis for Opinion
These financial statements are the responsibility of the Funds’ management. Our responsibility is to express an opinion on the Funds’ financial statements based on our audits. We are a public accounting firm registered with the Public Company Accounting Oversight Board (United States) (“PCAOB”) and are required to be independent with respect to the Funds in accordance with the U.S. federal securities laws and the applicable rules and regulations of the Securities and Exchange Commission and the PCAOB.
We conducted our audits in accordance with the standards of the PCAOB. Those standards require that we plan and perform the audit to obtain reasonable assurance about whether the financial statements are free of material misstatement whether due to error or fraud.
31
THE GOVERNMENT STREET FUNDS
REPORT OF INDEPENDENT REGISTERED
PUBLIC ACCOUNTING FIRM (Continued)
Our audits included performing procedures to assess the risks of material misstatement of the financial statements, whether due to error or fraud, and performing procedures that respond to those risks. Such procedures included examining, on a test basis, evidence regarding the amounts and disclosures in the financial statements. Our procedures included confirmation of securities owned as of March 31, 2020, by correspondence with the custodian and brokers, or by other auditing procedures when replies from brokers were not received. Our audits also included evaluating the accounting principles used and significant estimates made by management, as well as evaluating the overall presentation of the financial statements. We believe that our audits provide a reasonable basis for our opinion.
We have served as the Funds’ auditor since 2016.
COHEN & COMPANY, LTD.
Cleveland, Ohio
May 18, 2020
32
THE GOVERNMENT STREET FUNDS
ABOUT YOUR FUNDS’ EXPENSES (Unaudited)
We believe it is important for you to understand the impact of costs on your investment. All mutual funds have operating expenses. As a shareholder of the Funds, you incur ongoing costs, including management fees and other expenses. These ongoing costs, which are deducted from each Fund’s gross income, directly reduce the investment returns of the Funds.
A mutual fund’s ongoing costs are expressed as a percentage of its average net assets. This figure is known as the expense ratio. The following examples are intended to help you understand the ongoing costs (in dollars) of investing in the Funds and to compare these costs with the ongoing costs of investing in other mutual funds. The examples below are based on an investment of $1,000 made at the beginning of the period shown and held for the entire period (October 1, 2019 through March 31, 2020).
The table below illustrates each Fund’s ongoing costs in two ways:
Actual fund return – This section helps you to estimate the actual expenses that you paid over the period. The “Ending Account Value” shown is derived from each Fund’s actual return, and the fourth column shows the dollar amount of operating expenses that would have been paid by an investor who started with $1,000 in the Funds. You may use the information here, together with the amount you invested, to estimate the expenses that you paid over the period.
To do so, simply divide your account value by $1,000 (for example, an $8,600 account value divided by $1,000 = 8.6), then multiply the result by the number given for the Funds under the heading “Expenses Paid During Period.”
Hypothetical 5% return – This section is intended to help you compare the Funds’ ongoing costs with those of other mutual funds. It assumes that each Fund had an annual return of 5% before expenses during the period shown, but that the expense ratio is unchanged. In this case, because the returns used are not the Funds’ actual returns, the results do not apply to your investment. The example is useful in making comparisons because the U.S. Securities and Exchange Commission (the “SEC”) requires all mutual funds to calculate expenses based on a 5% return. You can assess each Fund’s ongoing costs by comparing this hypothetical example with the hypothetical examples that appear in shareholder reports of other funds.
Note that expenses shown in the table are meant to highlight and help you compare ongoing costs only. The Funds do not charge sales loads or redemption fees.
The calculations assume no shares were bought or sold during the period. Your actual costs may have been higher or lower, depending on the amount of your investment and the timing of any purchases or redemptions.
33
THE GOVERNMENT STREET FUNDS
ABOUT YOUR FUNDS’ EXPENSES (Unaudited) (Continued)
More information about the Funds’ expenses, including historical expense ratios, can be found in this report. For additional information on operating expenses and other shareholder costs, please refer to the Funds’ prospectus.
| | Beginning
Account Value
Oct. 1, 2019 | Ending
Account Value
March 31, 2020 | Expense
Ratio(a) | Expenses
Paid During
Period(b) |
The Government Street Equity Fund |
Based on Actual Fund Return | $1,000.00 | $ 897.00 | 0.90% | $4.27 |
Based on Hypothetical 5% Return (before expenses) | $1,000.00 | $1,020.50 | 0.90% | $4.55 |
The Government Street Mid-Cap Fund |
Based on Actual Fund Return | $1,000.00 | $ 851.50 | 1.09% | $5.05 |
Based on Hypothetical 5% Return (before expenses) | $1,000.00 | $1,019.55 | 1.09% | $5.50 |
(a) | Annualized, based on the Fund’s most recent one-half year expenses. |
(b) | Expenses are equal to the Funds’ annualized expense ratio multiplied by the average account value over the period, multiplied by 183/366 (to reflect the one-half year period). |
34
THE GOVERNMENT STREET FUNDS
BOARD OF TRUSTEES AND EXECUTIVE OFFICERS
(Unaudited)
Overall responsibility for management of the Funds rests with the Board of Trustees. The Trustees serve during the lifetime of the Trust and until its termination, or until death, resignation, retirement or removal. The Trustees, in turn, elect the officers of the Funds. The officers have been elected for an annual term. The following are the Trustees and executive officers of the Funds:
Trustees and Officers | Address | Year of
Birth | Position Held
with the Trust | Length of
Time Served |
| | Robert S. Harris, Ph.D. | 225 Pictoria Drive, Suite 450
Cincinnati, OH | 1949 | Chairman and Trustee | Since
January 2007 |
* | John P. Ackerly, IV | One James Center
901 E. Cary Street
Richmond, VA | 1963 | Trustee and President of The Davenport Funds | Since
July 2012 |
* | John T. Bruce | 800 Main Street
Lynchburg, VA | 1953 | Trustee and President of The FBP Funds | Since
September 1988 |
| | George K. Jennison | 225 Pictoria Drive, Suite 450
Cincinnati, OH | 1957 | Trustee | Since
January 2015 |
| Harris V. Morrissette | 225 Pictoria Drive, Suite 450
Cincinnati, OH | 1959 | Trustee | Since
March 1993 |
| | Elizabeth W. Robertson | 225 Pictoria Drive, Suite 450
Cincinnati, OH | 1953 | Trustee | Since
February 2014 |
| | Thomas W. Leavell | 210 St. Joseph Street
Mobile, AL | 1943 | President of The Government Street Funds | Since
February 2004 |
| | Mary Shannon Hope | 210 St. Joseph Street
Mobile, AL | 1963 | Vice President of The Government Street Funds | Since
August 2008 |
| | Timothy S. Healey | 2712 18th Place South
Birmingham, AL | 1953 | Vice President of The Government Street Funds | Since
January 1995 |
| Robert G. Dorsey | 225 Pictoria Drive, Suite 450
Cincinnati, OH | 1957 | Vice President | Since
November 2000 |
| Mark J. Seger | 225 Pictoria Drive, Suite 450
Cincinnati, OH | 1962 | Treasurer | Since
November 2000 |
| | David K. James | 225 Pictoria Drive, Suite 450
Cincinnati, OH | 1970 | Secretary | Since
November 2018 |
| | Michael J. Nanosky | 225 Pictoria Drive, Suite 450
Cincinnati, OH | 1966 | Chief Compliance Officer | Since
March 2020 |
* | Messrs. Ackerly and Bruce, as affiliated persons of investment advisers to the Trust, are “interested persons” of the Trust within the meaning of Section 2(a)(19) of the 1940 Act. |
35
THE GOVERNMENT STREET FUNDS
BOARD OF TRUSTEES AND EXECUTIVE OFFICERS
(Unaudited) (Continued)
Each Trustee oversees ten portfolios of the Trust, including the Funds. The principal occupations of the Trustees and executive officers of the Funds during the past five years and public directorships held by the Trustees are set forth below:
Robert S. Harris, Ph.D. is the C. Stewart Sheppard Professor of Business Administration at The Darden Graduate School of Business Administration at the University of Virginia. He was previously the dean at Darden. Professor Harris has published widely on corporate finance, financial markets and mergers and acquisitions and has served as a consultant to corporations and government agencies.
John P. Ackerly, IV, is Senior Vice President and Portfolio Manager of Davenport & Company, LLC (a broker-dealer and investment advisory firm).
John T. Bruce is President, Director and member of the Executive Committee of Flippin, Bruce & Porter, Inc. (an investment advisory firm).
George K. Jennison is retired. He previously was President of Oyster Consulting, LLC (a management consulting firm) and a financial adviser with Wells Fargo Advisors, LLC.
Harris V. Morrissette is President of China Doll Rice and Beans, Inc. and Dixie Lily Foods. He is also a Director of Trustmark Corporation (bank holding company).
Elizabeth W. Robertson serves as a Trustee of TowneBank Foundation, TowneBank Corporate Board, TowneBank Audit Committee Chair and TowneBank Community Board since 2015. She previously was Chief Financial Officer of Monument Restaurants LLC.
Thomas W. Leavell is Portfolio Manager of the Adviser.
Mary Shannon Hope is Operations Director and Portfolio Manager of the Adviser.
Timothy S. Healey is Chief Investment Officer and Portfolio Manager of the Adviser.
Robert G. Dorsey is a Vice Chairman of Ultimus Fund Solutions, LLC and Ultimus Fund Distributors, LLC. He previously was Co-CEO of Ultimus Fund Solutions, LLC (1999 to 2019).
Mark J. Seger is a Vice Chairman of Ultimus Fund Solutions, LLC and Ultimus Fund Distributors, LLC. He previously was Co-CEO of Ultimus Fund Solutions, LLC (1999 to 2019).
David K. James is an Executive Vice President and Chief Legal and Risk Officer of Ultimus Fund Solutions, LLC (2018 to present). He previously was Managing Director and Managing Counsel at State Street Bank and Trust Company (2009 to 2018).
36
THE GOVERNMENT STREET FUNDS
BOARD OF TRUSTEES AND EXECUTIVE OFFICERS
(Unaudited) (Continued)
Michael J. Nanosky is a Senior Compliance Officer of Ultimus Fund Solutions, LLC (2020 to present). He previously was Senior Vice President & Chief Compliance Officer of PNC Funds (2014 to 2019).
Additional information about members of the Board of Trustees and executive officers is available in the Statement of Additional Information (“SAI”). To obtain a free copy of the SAI, please call 1-866-738-1125.
37
THE GOVERNMENT STREET FUNDS
DISCLOSURE REGARDING APPROVAL OF INVESTMENT ADVISORY AGREEMENTS
(Unaudited)
At an in-person meeting held on February 25, 2020, the Board of Trustees, including a majority of the Independent Trustees, approved the continuance for a one-year period of the Investment Advisory Agreements with the Adviser on behalf of The Government Street Equity Fund and The Government Street Mid-Cap Fund (individually, a “Fund,” collectively, the “Funds”). Below is a discussion of the factors considered by the Board of Trustees along with the conclusions with respect thereto that formed the basis for the Board’s approval.
In approving the continuance of the Investment Advisory Agreements, the Independent Trustees considered all information they deemed reasonably necessary to evaluate the terms of the Agreements. The principal areas of review by the Independent Trustees were the nature, extent and quality of the services provided by the Adviser and the reasonableness of the fees charged for those services. These matters were considered by the Independent Trustees consulting with experienced counsel for the Independent Trustees, who is independent of the Adviser.
The Independent Trustees’ evaluation of the quality of the Adviser’s services took into consideration their knowledge gained through presentations and reports from the Adviser over the course of the preceding year. The Independent Trustees considered that the Adviser had provided its views on the overall conditions of the economy and the markets, including the factors that may have influenced the markets, investor preferences and market sentiment during the past year. The Independent Trustees next considered the security selection process that is applied in the management of the Fund and noted that the Adviser looks for securities with growth potential and is willing to hold a security for the time that is needed for it to appreciate. Both short-term and long-term investment performance of the Funds were considered. Each Fund’s performance was compared to its performance benchmark and a peer group of funds with similar investment objectives and strategies. The Independent Trustees also considered: the scope and quality of the in-house capabilities of the Adviser and other resources that it dedicated to performing services for the Funds; the quality of administrative and other services, including the Adviser’s role in coordinating the activities of the Funds’ other service providers; the Adviser’s compliance with investment policies of the Funds and applicable laws and regulations; information provided by management and the Funds’ independent public accounting firm in periodic meetings with the Trust’s Audit Committee; the business reputation of the Adviser; the qualifications of the Adviser’s key investment and compliance personnel; and the Adviser’s financial resources.
In reviewing the fees payable under the Investment Advisory Agreements, the Independent Trustees compared the advisory fees and overall expense levels of each Fund with those of funds with similar investment objectives and strategies. The Independent Trustees considered information provided by the Adviser concerning the Adviser’s profitability with respect to each Fund, including the assumptions and
38
THE GOVERNMENT STREET FUNDS
DISCLOSURE REGARDING APPROVAL OF INVESTMENT ADVISORY AGREEMENTS
(Unaudited) (Continued)
methodology used in preparing the profitability information, in light of applicable case law relating to advisory fees. For these purposes, the Independent Trustees considered not only the fees paid by the Funds, but also so-called “fallout” benefits to the Adviser. The Independent Trustees also considered the Adviser’s representations that the Funds’ portfolio trades were executed based on the best available price and execution, and that the Adviser does not participate in any soft dollar or directed brokerage arrangements. The Independent Trustees further considered that the Adviser does not participate in any revenue sharing arrangements relating to the Funds. In evaluating the Funds’ advisory fees, the Trustees considered the complexity and quality of the investment process that is applied in the management of the Funds.
Based on the consideration of the foregoing and such other information as was deemed relevant, including the factors and conclusions below, the Independent Trustees concluded that: (i) the performance of each the Funds is satisfactory (a) given each Fund’s investment strategy in comparison to the performance to its respective primary and peer group average, and (b) after considering the services provided by LIM to each respective Fund; (ii) the advisory fee for the Equity Fund is lower when compared to the average for similarly managed funds according to statistics derived from Morningstar, Inc., the advisory fee for the Mid-Cap Fund is higher when compared to the average for similarly managed funds according to statistics derived from Morningstar, Inc., and both Funds’ advisory fees’ are reasonable in relation to the services provided by LIM; (iii) the total operating expense ratio of the Equity Fund was lower the average expense ratio for comparable managed funds, according to statistics derived from Morningstar, Inc., and the total operating expense ratio of the Mid-Cap Fund while higher, remains competitive, when compared to the average expense ratio for comparably managed funds, according to statistics derived from Morningstar, Inc., and (iv) the level of LIM’s profitability with respect to its management of the Funds is reasonable.
Given the current size of the Funds and their expected growth, the Independent Trustees did not believe that it was relevant to consider the extent to which economies of scale would be realized as the Funds grow, and whether fee levels reflect these economies of scale. The Independent Trustees did consider the “fallout” benefits to the Adviser with respect to the Funds but viewed this as a secondary factor in connection with the evaluation of the reasonableness of the advisory fees paid by the Funds.
No single factor was considered in isolation or to be determinative to the decision of the Independent Trustees to approve the continuance of the Investment Advisory Agreements. Rather the Independent Trustees concluded, after weighing and balancing of all factors considered, that it was in the best interests of each Fund and its shareholders to continue its Investment Advisory Agreement without modification to its terms, including the fees charged for services thereunder.
39
THE GOVERNMENT STREET FUNDS
OTHER INFORMATION (Unaudited)
A description of the policies and procedures that the Funds use to vote proxies relating to portfolio securities is available without charge upon request by calling toll-free 1-866-738-1125, or on the SEC’s website at www.sec.gov. Information regarding how the Funds voted proxies relating to portfolio securities during the most recent 12-month period ended June 30 is also available without charge upon request by calling toll-free 1-866-738-1125 or on the SEC’s website at www.sec.gov.
The Trust files a complete listing of portfolio holdings for the Funds with the SEC as of the end of the first and third quarters of each fiscal year on Form N-Q or as an exhibit to its reports on Form N-Q’s successor form, Form N-PORT. The filings are available upon request, by calling 1-866-738-1125. Furthermore, you may obtain a copy of these filings on the SEC’s website at www.sec.gov.
FEDERAL TAX INFORMATION (Unaudited)
For the fiscal year ended March 31, 2020, The Government Street Equity Fund and The Government Street Mid-Cap Fund designated $2,390,603 and $1,721,707, respectively, as long-term capital gain distributions.
Qualified Dividend Income – The Funds each designate 100%, or up to the maximum amount of such dividends allowable pursuant to the Internal Revenue Code, as qualified dividend income eligible for the reduced tax rate of 15%.
Dividends Received Deduction – Corporate shareholders are generally entitled to take the dividends received deduction on the portion of a Fund’s dividend distribution that qualifies under tax law. For the fiscal year ended March 31, 2020, 100% of The Government Street Equity Fund and The Government Street Mid-Cap Fund’s ordinary income dividends qualifies for the corporate dividends received deduction.
40
This page intentionally left blank.
The Government Street Funds
No-Load Mutual Funds
Investment Adviser
Leavell Investment Management, Inc.
210 St. Joseph Street
Mobile, AL 36602
Administrator
Ultimus Fund Solutions, LLC
P.O. Box 46707
Cincinnati, OH 45246-0707
1-866-738-1125
Legal Counsel
Sullivan & Worcester LLP
1666 K Street, N.W.
Washington, DC 20006
Independent Registered Public Accounting Firm
Cohen & Company, Ltd.
1350 Euclid Avenue
Suite 800
Cleveland, Ohio 44115
Board of Trustees
Robert S. Harris, Ph.D., Chairman
John P. Ackerly, IV
John T. Bruce
George K. Jennison
Harris V. Morrissette
Elizabeth W. Robertson
Portfolio Manager
Thomas W. Leavell,
The Government Street Equity Fund
The Government Street Mid-Cap Fund
THE
JAMESTOWN
EQUITY FUND
No-Load Fund
ANNUAL REPORT
March 31, 2020
Investment Adviser
Lowe, Brockenbrough & Company, Inc.
Richmond, Virginia
Beginning on January 1, 2021, as permitted by regulations adopted by the U.S. Securities and Exchange Commission, paper copies of the Fund’s shareholder reports like this one will no longer be sent by mail, unless you specifically request paper copies of the reports from the Fund or from your financial intermediary, such as a broker-dealer or bank. Instead, the reports will be made available on a website, and you will be notified by mail each time a report is posted and prsovided with a website link to access the report.
If you already elected to receive shareholder reports electronically, you will not be affected by this change and you need not take any action. You may elect to receive shareholder reports and other communications from the Fund electronically by contacting the Fund at 1-866-738-1126 or, if you own these shares through a financial intermediary, by contacting your financial intermediary.
You may elect to receive all future reports in paper free of charge. You can inform the Fund that you wish to continue receiving paper copies of your shareholder reports by contacting the Fund at 1-866-738-1126. If you own shares through a financial intermediary, you may contact your financial intermediary or follow instructions included with this document to elect to continue to receive paper copies of your shareholder reports. Your election to receive reports in paper will apply to all Funds held with the Fund complex or at your financial intermediary.
LETTER TO SHAREHOLDERS | April 27, 2020 |
The Jamestown Equity Fund
For the fiscal year ended March 31, 2020, The Jamestown Equity Fund (the “Fund”) returned -6.17% compared to -6.98% for the S&P 500® Index. The dramatic outperformance of growth stocks continued during the fiscal year, as the Russell 1000 Growth Index rose 0.91% while the Russell 1000 Value Index declined -17.17%.
Portfolio sector and stock selection were both modestly additive to relative performance for the year. Positive sector selection was largely due to the impact of holding some cash in the Fund during the year. Better relative security returns resulted from good selection in the Energy and Real Estate sectors, which more than offset negative selection in the Materials and Health Care sectors. The best performing stocks in the Fund for the year were Apple, Microsoft, Broadcom, Walmart and KeyCorp all of which remained in the portfolio at the end of the fiscal year, except for KeyCorp. The worst performing stocks were Boeing, Exxon, Discover Financial, Chevron, and Eastman Chemical. Boeing and Discover Financial were sold out of the Fund during the fiscal year.
After solid gains for equity prices through December, investor sentiment changed from exuberance to fear in the last quarter of the fiscal year, as Covid-19 spread around the globe. As Jim Grant of the Grant Observer stated, “plenty of governments have sabotaged prosperity by accident. Few, prior to the coronavirus lockdown, have done it by design.” Yet here is where we find ourselves across much of the world – battling a global pandemic with unprecedented healthcare, economic and financial implications. The virus that originated in China has become a severe global setback unlike anything seen in decades.
Early on, we took some defensive actions in the Fund as it became apparent that Covid-19 was likely to be a global phenomenon. We sold several positions including travel-related stocks Booking Holdings, Delta and Boeing. We also sold KeyCorp and Discover Financial because their profits will be pressured by lower interest rates and higher credit costs. In addition, we exited JM Smucker and Gilead Sciences as their stocks rose in the face of overall declining stock prices. We added a few stocks in March on price weakness, including UPS, Lockheed Martin and Broadcom, as we judge their businesses are well positioned to manage through the recession and take market share coming out the other side.
Governments and central banks around the world have raced to step into the void created by a historically bad economic situation. Here in the U.S., the Federal Reserve has dusted off its playbook from the Financial Crisis (and then some) to provide massive liquidity support for repo markets, commercial paper and just about every other credit market. Congress has passed three rounds of fiscal support to help fight the crisis, providing stop-gap payments for millions of workers most impacted by the fallout of the virus, and financial support for businesses. In addition, we are seeing the global scientific community come together like never before to develop treatments and eventually a vaccine. We can all pray for their speedy success.
Equity markets experienced the fastest move ever from all-time highs to a bear market during February and March. Markets have rallied more recently with support from the fiscal and monetary policies and less dire news on the spread of the virus. Some of the earliest hit countries
1
have begun to move out of the lockdown phase, and the U.S. is likely not far behind. However, barring a major breakthrough on the scientific side, the recovery is likely to be modest and challenging until there are effective treatments and hopefully a vaccine.
Despite these unprecedented circumstances, we remain focused on constructing a portfolio of high quality businesses that can withstand the pressures of several quarters of an extraordinarily difficult operating environment. We thank the shareholders for your continued support of the Jamestown Equity Fund.
2
THE JAMESTOWN EQUITY FUND
PERFORMANCE INFORMATION (Unaudited)
Comparison of the Change in Value of a $10,000 Investment in
The Jamestown Equity Fund
and the S&P 500® Index
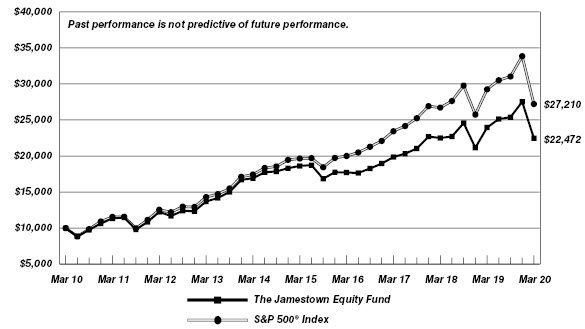
| | Average Annual Total Returns
(for periods ended March 31, 2020) | |
| | 1 Year | 5 Years | 10 Years | |
The Jamestown Equity Fund(a) | (6.17%) | 3.82% | 8.43% | |
S&P 500® Index | (6.98%) | 6.73% | 10.53% | |
(a) | Total return is a measure of the change in value of an investment in the Fund over the periods covered, which assumes any dividends or capital gains distributions are reinvested in shares of the Fund. Returns shown do not reflect the deduction of taxes a shareholder would pay on Fund distributions or the redemption of Fund shares. |
3
THE JAMESTOWN EQUITY FUND
PORTFOLIO INFORMATION
March 31, 2020 (Unaudited)
Asset Allocation (% of Net Assets)
|
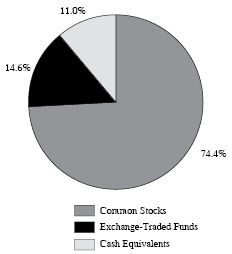
|
Ten Largest Equity Holdings | % of
Net Assets |
Apple, Inc. | 4.9% |
Amazon.com, Inc. | 4.4% |
Microsoft Corporation | 4.3% |
Facebook, Inc. - Class A | 2.9% |
SPDR Portfolio S&P 500 Value ETF | 2.6% |
Vanguard S&P 500 ETF | 2.6% |
Vanguard Information Technology ETF | 2.5% |
JPMorgan Chase & Company | 2.5% |
Cisco Systems, Inc. | 2.5% |
Merck & Company, Inc. | 2.4% |
Sector Concentration vs. the S&P 500® Index |
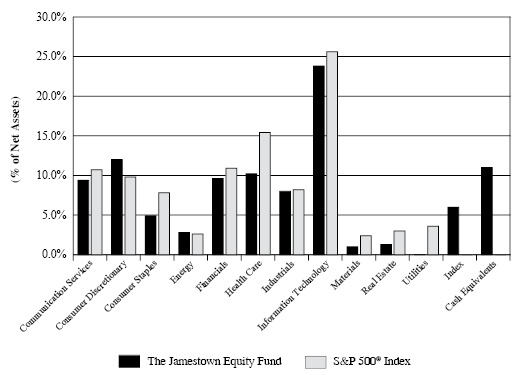
4
THE JAMESTOWN EQUITY FUND
SCHEDULE OF INVESTMENTS
March 31, 2020 |
COMMON STOCKS — 74.4% | | Shares | | | Value | |
Communication Services — 8.5% | | | | | | | | |
Alphabet, Inc. - Class A(a) | | | 500 | | | $ | 580,975 | |
Alphabet, Inc. - Class C(a) | | | 500 | | | | 581,405 | |
Comcast Corporation - Class A | | | 16,300 | | | | 560,394 | |
Facebook, Inc. - Class A(a) | | | 5,490 | | | | 915,732 | |
| | | | | | | | 2,638,506 | |
Consumer Discretionary — 12.0% | | | | | | | | |
Amazon.com, Inc.(a) | | | 700 | | | | 1,364,804 | |
Dollar Tree, Inc.(a) | | | 5,400 | | | | 396,738 | |
Home Depot, Inc. (The) | | | 2,400 | | | | 448,104 | |
Lowe’s Companies, Inc. | | | 6,300 | | | | 542,115 | |
Target Corporation | | | 4,960 | | | | 461,131 | |
TJX Companies, Inc. (The) | | | 11,000 | | | | 525,910 | |
| | | | | | | | 3,738,802 | |
Consumer Staples — 3.2% | | | | | | | | |
PepsiCo, Inc. | | | 5,200 | | | | 624,520 | |
Walmart, Inc. | | | 3,200 | | | | 363,584 | |
| | | | | | | | 988,104 | |
Energy — 2.8% | | | | | | | | |
Chevron Corporation | | | 7,900 | | | | 572,434 | |
Total S.A. - ADR | | | 8,000 | | | | 297,920 | |
| | | | | | | | 870,354 | |
Financials — 9.6% | | | | | | | | |
Ameriprise Financial, Inc. | | | 4,400 | | | | 450,912 | |
Chubb Ltd. | | | 2,500 | | | | 279,225 | |
Goldman Sachs Group, Inc. (The) | | | 3,300 | | | | 510,147 | |
JPMorgan Chase & Company | | | 8,700 | | | | 783,261 | |
Morgan Stanley | | | 14,000 | | | | 476,000 | |
PNC Financial Services Group, Inc. (The) | | | 5,000 | | | | 478,600 | |
| | | | | | | | 2,978,145 | |
Health Care — 10.2% | | | | | | | | |
Amgen, Inc. | | | 2,200 | | | | 446,006 | |
Anthem, Inc. | | | 2,000 | | | | 454,080 | |
Merck & Company, Inc. | | | 9,500 | | | | 730,930 | |
Pfizer, Inc. | | | 15,000 | | | | 489,600 | |
Thermo Fisher Scientific, Inc. | | | 1,900 | | | | 538,840 | |
UnitedHealth Group, Inc. | | | 2,000 | | | | 498,760 | |
| | | | | | | | 3,158,216 | |
5
THE JAMESTOWN EQUITY FUND
SCHEDULE OF INVESTMENTS (Continued) |
COMMON STOCKS — 74.4%(Continued) | | Shares | | | Value | |
Industrials — 8.0% | | | | | | | | |
Eaton Corporation plc | | | 7,000 | | | $ | 543,830 | |
Lockheed Martin Corporation | | | 845 | | | | 286,413 | |
Norfolk Southern Corporation | | | 3,600 | | | | 525,600 | |
Trane Technologies plc | | | 5,000 | | | | 412,950 | |
United Parcel Service, Inc. - Class B | | | 2,805 | | | | 262,043 | |
United Technologies Corporation | | | 5,000 | | | | 471,650 | |
| | | | | | | | 2,502,486 | |
Information Technology — 17.8% | | | | | | | | |
Apple, Inc. | | | 6,000 | | | | 1,525,740 | |
Broadcom, Inc. | | | 1,290 | | | | 305,859 | |
Cisco Systems, Inc. | | | 19,500 | | | | 766,545 | |
Intel Corporation | | | 7,035 | | | | 380,734 | |
Microsoft Corporation | | | 8,500 | | | | 1,340,535 | |
Oracle Corporation | | | 12,700 | | | | 613,791 | |
Visa, Inc. - Class A | | | 3,800 | | | | 612,256 | |
| | | | | | | | 5,545,460 | |
Materials — 1.0% | | | | | | | | |
Eastman Chemical Company | | | 6,500 | | | | 302,770 | |
| | | | | | | | | |
Real Estate — 1.3% | | | | | | | | |
American Tower Corporation | | | 1,810 | | | | 394,128 | |
| | | | | | | | | |
Total Common Stocks (Cost $12,999,073) | | | | | | $ | 23,116,971 | |
|
EXCHANGE-TRADED FUNDS — 14.6% | | Shares | | | Value | |
Communication Services Select Sector SPDR Fund | | | 6,300 | | | $ | 278,712 | |
Consumer Staples Select Sector SPDR Fund | | | 9,500 | | | | 517,465 | |
iShares Expanded Tech-Software Sector ETF | | | 3,200 | | | | 672,928 | |
iShares PHLX Semiconductor ETF | | | 1,885 | | | | 386,821 | |
SPDR Portfolio S&P 500 Growth ETF | | | 7,545 | | | | 269,658 | |
SPDR Portfolio S&P 500 Value ETF | | | 31,265 | | | | 807,888 | |
Vanguard Information Technology ETF | | | 3,700 | | | | 784,030 | |
Vanguard S&P 500 ETF | | | 3,400 | | | | 805,188 | |
Total Exchange-Traded Funds (Cost $4,102,299) | | | | | | $ | 4,522,690 | |
6
THE JAMESTOWN EQUITY FUND
SCHEDULE OF INVESTMENTS (Continued) |
MONEY MARKET FUNDS — 12.0% | | Shares | | | Value | |
Federated Government Obligations Fund - Institutional Class, 0.33%(b) (Cost $3,719,605) | | | 3,719,605 | | | $ | 3,719,605 | |
| | | | | | | | | |
Total Investments at Value — 101.0% (Cost $20,820,977) | | | | | | $ | 31,359,266 | |
| | | | | | | | | |
Liabilities in Excess of Other Assets — (1.0%) | | | | | | | (297,149 | ) |
| | | | | | | | | |
Net Assets — 100.0% | | | | | | $ | 31,062,117 | |
ADR - American Depositary Receipt. |
(a) | Non-income producing security. |
(b) | The rate shown is the 7-day effective yield as of March 31, 2020. |
See accompanying notes to financial statements. |
7
THE JAMESTOWN EQUITY FUND
STATEMENT OF ASSETS AND LIABILITIES
March 31, 2020 |
ASSETS | | | | |
Investments in securities: | | | | |
At cost | | $ | 20,820,977 | |
At value (Note 2) | | $ | 31,359,266 | |
Cash | | | 2,650 | |
Receivable for capital shares sold | | | 845 | |
Receivable for investment securities sold | | | 257,500 | |
Dividends receivable | | | 26,810 | |
Other assets | | | 3,338 | |
TOTAL ASSETS | | | 31,650,409 | |
| | | | | |
LIABILITIES | | | | |
Distributions payable | | | 4,888 | |
Payable for capital shares redeemed | | | 27,409 | |
Payable for investment securities purchased | | | 528,408 | |
Accrued investment advisory fees (Note 4) | | | 16,027 | |
Payable to administrator (Note 4) | | | 6,250 | |
Other accrued expenses | | | 5,310 | |
TOTAL LIABILITIES | | | 588,292 | |
| | | | | |
NET ASSETS | | $ | 31,062,117 | |
| | | | | |
Net assets consist of: | | | | |
Paid-in capital | | $ | 19,667,308 | |
Accumulated earnings | | | 11,394,809 | |
Net assets | | $ | 31,062,117 | |
| | | | | |
Shares of beneficial interest outstanding (unlimited number of shares authorized, $0.01 par value) | | | 1,627,857 | |
| | | | | |
Net asset value, offering price and redemption price per share (Note 2) | | $ | 19.08 | |
See accompanying notes to financial statements. |
8
THE JAMESTOWN EQUITY FUND
STATEMENT OF OPERATIONS
Year Ended March 31, 2020 |
INVESTMENT INCOME | | | | |
Dividends | | $ | 717,422 | |
Foreign withholding taxes on dividends | | | (6,003 | ) |
TOTAL INVESTMENT INCOME | | | 711,419 | |
| | | | | |
EXPENSES | | | | |
Investment advisory fees (Note 4) | | | 242,465 | |
Administration fees (Note 4) | | | 60,000 | |
Audit and tax services fees | | | 16,500 | |
Trustees’ fees and expenses (Note 4) | | | 15,508 | |
Compliance service fees (Note 4) | | | 15,000 | |
Registration and filing fees | | | 12,908 | |
Custodian and bank service fees | | | 8,506 | |
Printing of shareholder reports | | | 6,286 | |
Legal fees | | | 5,037 | |
Postage and supplies | | | 4,916 | |
Account maintenance fees | | | 3,993 | |
Insurance expense | | | 1,357 | |
Pricing costs | | | 1,104 | |
Other expenses | | | 6,786 | |
TOTAL EXPENSES | | | 400,366 | |
Fees voluntarily waived by the Adviser (Note 4) | | | (41,493 | ) |
Expenses reimbursed through a directed brokerage arrangement (Note 5) | | | (4,500 | ) |
NET EXPENSES | | | 354,373 | |
| | | | | |
NET INVESTMENT INCOME | | | 357,046 | |
| | | | | |
REALIZED AND UNREALIZED GAINS (LOSSES) ON INVESTMENTS | | | | |
Net realized gains on investment transactions | | | 2,267,311 | |
Net change in unrealized appreciation (depreciation) on investments | | | (4,447,825 | ) |
NET REALIZED AND UNREALIZED LOSSES ON INVESTMENTS | | | (2,180,514 | ) |
| | | | | |
NET DECREASE IN NET ASSETS RESULTING FROM OPERATIONS | | $ | (1,823,468 | ) |
See accompanying notes to financial statements. |
9
THE JAMESTOWN EQUITY FUND
STATEMENTS OF CHANGES IN NET ASSETS |
| | Year
Ended
March 31,
2020 | | | Year
Ended
March 31,
2019 | |
FROM OPERATIONS | | | | | | | | |
Net investment income | | $ | 357,046 | | | $ | 405,868 | |
Net realized gains on investment transactions | | | 2,267,311 | | | | 1,457,217 | |
Net change in unrealized appreciation (depreciation) on investments | | | (4,447,825 | ) | | | 421,385 | |
Net increase (decrease) in net assets resulting from operations | | | (1,823,468 | ) | | | 2,284,470 | |
| | | | | | | | | |
DISTRIBUTIONS TO SHAREHOLDERS (Note 2) | | | (2,585,429 | ) | | | (2,769,053 | ) |
| | | | | | | | | |
FROM CAPITAL SHARE TRANSACTIONS | | | | | | | | |
Proceeds from shares sold | | | 405,362 | | | | 297,049 | |
Net asset value of shares issued in reinvestment of distributions to shareholders | | | 2,409,578 | | | | 2,603,952 | |
Payments for shares redeemed | | | (4,001,840 | ) | | | (3,328,402 | ) |
Net decrease in net assets from capital share transactions | | | (1,186,900 | ) | | | (427,401 | ) |
| | | | | | | | | |
TOTAL DECREASE IN NET ASSETS | | | (5,595,797 | ) | | | (911,984 | ) |
| | | | | | | | | |
NET ASSETS | | | | | | | | |
Beginning of year | | | 36,657,914 | | | | 37,569,898 | |
End of year | | $ | 31,062,117 | | | $ | 36,657,914 | |
| | | | | | | | | |
CAPITAL SHARE ACTIVITY | | | | | | | | |
Shares sold | | | 17,643 | | | | 13,911 | |
Shares reinvested | | | 107,138 | | | | 122,969 | |
Shares redeemed | | | (179,068 | ) | �� | | (154,992 | ) |
Net decrease in shares outstanding | | | (54,287 | ) | | | (18,112 | ) |
Shares outstanding, beginning of year | | | 1,682,144 | | | | 1,700,256 | |
Shares outstanding, end of year | | | 1,627,857 | | | | 1,682,144 | |
See accompanying notes to financial statements. |
10
THE JAMESTOWN EQUITY FUND
FINANCIAL HIGHLIGHTS |
Selected Per Share Data for a Share Outstanding Throughout Each Year: |
| | Years Ended March 31, | |
| | 2020 | | | 2019 | | | 2018 | | | 2017 | | | 2016 | |
Net asset value at beginning of year | | $ | 21.79 | | | $ | 22.10 | | | $ | 20.89 | | | $ | 19.57 | | | $ | 21.91 | |
| | | | | | | | | | | | | | | | | | | | | |
Income (loss) from investment operations: | | | | | | | | | | | | | | | | | | | | |
Net investment income | | | 0.22 | | | | 0.24 | | | | 0.19 | | | | 0.19 | | | | 0.16 | |
Net realized and unrealized gains (losses) on investments | | | (1.35 | ) | | | 1.10 | | | | 2.51 | | | | 2.12 | | | | (1.18 | ) |
Total from investment operations | | | (1.13 | ) | | | 1.34 | | | | 2.70 | | | | 2.31 | | | | (1.02 | ) |
| | | | | | | | | | | | | | | | | | | | | |
Less distributions: | | | | | | | | | | | | | | | | | | | | |
From net investment income | | | (0.22 | ) | | | (0.24 | ) | | | (0.19 | ) | | | (0.20 | ) | | | (0.16 | ) |
From net realized gains | | | (1.36 | ) | | | (1.41 | ) | | | (1.30 | ) | | | (0.79 | ) | | | (1.16 | ) |
Total distributions | | | (1.58 | ) | | | (1.65 | ) | | | (1.49 | ) | | | (0.99 | ) | | | (1.32 | ) |
| | | | | | | | | | | | | | | | | | | | | |
Net asset value at end of year | | $ | 19.08 | | | $ | 21.79 | | | $ | 22.10 | | | $ | 20.89 | | | $ | 19.57 | |
| | | | | | | | | | | | | | | | | | | | | |
Total return(a) | | | (6.17 | %) | | | 6.40 | % | | | 13.35 | % | | | 12.14 | % | | | (4.96 | %) |
| | | | | | | | | | | | | | | | | | | | | |
Net assets at end of year (000’s) | | $ | 31,062 | | | $ | 36,658 | | | $ | 37,570 | | | $ | 37,460 | | | $ | 37,682 | |
| | | | | | | | | | | | | | | | | | | | | |
Ratio of total expenses to average net assets(b) | | | 1.08 | % | | | 1.03 | % | | | 1.03 | % | | | 1.03 | % | | | 1.03 | % |
| | | | | | | | | | | | | | | | | | | | | |
Ratio of net expenses to average net assets(b) | | | 0.95 | %(c) | | | 0.95 | %(c) | | | 0.95 | %(c) | | | 0.95 | %(c) | | | 1.00 | % |
| | | | | | | | | | | | | | | | | | | | | |
Ratio of net investment income to average net assets(b)(d) | | | 0.96 | %(c) | | | 1.10 | %(c) | | | 0.87 | %(c) | | | 0.96 | %(c) | | | 0.82 | % |
| | | | | | | | | | | | | | | | | | | | | |
Portfolio turnover rate | | | 18 | % | | | 18 | % | | | 18 | % | | | 27 | % | | | 50 | % |
(a) | Total return is a measure of the change in value of an investment in the Fund over the periods covered, which assumes any dividends or capital gains distributions are reinvested in shares of the Fund. Returns shown do not reflect the deduction of taxes a shareholder would pay on Fund distributions or the redemption of Fund shares. |
(b) | The ratios of expenses and net investment income to average net assets do not reflect the Fund’s proportionate share of expenses of the underlying investment companies in which the Fund invests. Ratios were also determined based on net expenses after expense reimbursements through a directed brokerage arrangement (Note 5). |
(c) | Ratio was determined after voluntary advisory fee waivers by the Adviser and reimbursed expenses (Notes 4 and 5). |
(d) | Recognition of net investment income by the Fund is affected by the timing of the declarations of dividends by the underlying investment companies in which the Fund invests. |
See accompanying notes to financial statements. |
11
THE JAMESTOWN EQUITY FUND
NOTES TO FINANCIAL STATEMENTS
March 31, 2020
1. Organization
The Jamestown Equity Fund (the “Fund”) is a diversified, no-load series of Williamsburg Investment Trust (the “Trust”), an open-end management investment company registered under the Investment Company Act of 1940, as amended (the “1940 Act”). The Trust was organized as a Massachusetts business trust on July 18, 1988. Other series of the Trust are not included in this report.
The investment objective of the Fund is long-term growth of capital.
2. Significant Accounting Policies
The Fund follows accounting and reporting guidance under Financial Accounting Standards Board Accounting Standards Codification Topic 946, “Financial Services – Investment Companies.” The following is a summary of the Fund’s significant accounting policies. These policies are in conformity with accounting principles generally accepted in the United States of America (“GAAP”).
Securities valuation — The Fund’s portfolio securities are valued as of the close of business of the regular session of the New York Stock Exchange (normally 4:00 p.m., Eastern time). Securities traded on a national stock exchange, including common stocks and exchange-traded funds (“ETFs”), are generally valued based upon the closing price on the principal exchange where the security is traded, if available, otherwise, at the last quoted bid price. Securities that are quoted by NASDAQ are valued at the NASDAQ Official Closing Price. Investments representing shares of other open-end investment companies, other than ETFs but including money market funds, are valued at their net asset value (“NAV”) as reported by such companies. When using a quoted price and when the market is considered active, securities will be classified as Level 1 within the fair value hierarchy (see below).
When market quotations are not readily available, if a pricing service cannot provide a price, or if the investment adviser believes the price received from the pricing service is not indicative of market value, securities will be valued in good faith at fair value using methods consistent with procedures adopted by the Board of Trustees and will be classified as Level 2 or 3 within the fair value hierarchy, depending on the inputs used. Such methods of fair valuation may include, but are not limited to: multiple of earnings, multiple of book value, discount from market of a similar freely traded security, purchase price of the security, subsequent private transactions in the security or related securities, or a combination of these and other factors.
GAAP establishes a single authoritative definition of fair value, sets out a framework for measuring fair value and requires additional disclosures about fair value measurements.
Various inputs are used in determining the value of the Fund’s investments. These inputs are summarized in the three broad levels listed below:
● | Level 1 – quoted prices in active markets for identical securities |
● | Level 2 – other significant observable inputs |
12
THE JAMESTOWN EQUITY FUND
NOTES TO FINANCIAL STATEMENTS (Continued)
● | Level 3 – significant unobservable inputs |
The inputs or methodology used for valuing securities are not necessarily an indication of the risks associated with investing in those securities. The inputs used to measure fair value may fall into different levels of the fair value hierarchy. In such cases, for disclosure purposes, the level in the fair value hierarchy within which the fair value measurement falls in its entirety is determined based on the lowest level input that is significant to the fair value measurement.
The following is a summary of the inputs used to value the Fund’s investments as of March 31, 2020, by security type:
| | Level 1 | | | Level 2 | | | Level 3 | | | Total | |
Common Stocks | | $ | 23,116,971 | | | $ | — | | | $ | — | | | $ | 23,116,971 | |
Exchange-Traded Funds | | | 4,522,690 | | | | — | | | | — | | | | 4,522,690 | |
Money Market Funds | | | 3,719,605 | | | | — | | | | — | | | | 3,719,605 | |
Total | | $ | 31,359,266 | | | $ | — | | | $ | — | | | $ | 31,359,266 | |
Refer to the Fund’s Schedule of Investments for a listing of the common stocks by sector type. There were no Level 3 securities or derivative instruments held by the Fund as of or during the year ended March 31, 2020.
Share valuation — The NAV per share of the Fund is calculated daily by dividing the total value of its assets, less liabilities, by the number of shares outstanding. The offering price and redemption price per share of the Fund is equal to the NAV per share.
Investment income — Dividend income is recorded on the ex-dividend date. Non-cash dividends included in dividend income, if any, are recorded at the fair market value of the security received. Withholding taxes on foreign dividends received by the Fund, if any, have been recorded in accordance with the Trust’s understanding of the applicable country’s rules and tax rates.
Distributions to shareholders — Dividends arising from net investment income, if any, are declared and paid quarterly to shareholders of the Fund. Net realized short-term capital gains, if any, may be distributed throughout the year and net realized long-term capital gains, if any, are distributed at least once each year. The amount of distributions from net investment income and net realized capital gains are determined in accordance with federal income tax regulations, which may differ from GAAP. Dividends and distributions are recorded on the ex-dividend date.
The tax character of distributions paid during the years ended March 31, 2020 and 2019 was as follows:
Years
Ended | | Ordinary
Income | | | Long-Term
Capital Gains | | | Total
Distributions | |
3/31/2020 | | $ | 357,284 | | | $ | 2,227,772 | | | $ | 2,585,056 | |
3/31/2019 | | $ | 415,079 | | | $ | 2,353,974 | | | $ | 2,769,053 | |
13
THE JAMESTOWN EQUITY FUND
NOTES TO FINANCIAL STATEMENTS (Continued)
Investment transactions — Investment transactions are accounted for on trade date for financial reporting purposes. Realized gains and losses on investment securities sold are determined on a specific identification basis.
Common expenses — Common expenses of the Trust are allocated among the series of the Trust based on relative net assets of each series or the nature of the services performed and the relative applicability to each series.
Estimates — The preparation of financial statements in conformity with GAAP requires management to make estimates and assumptions that affect the reported amounts of assets and liabilities and the disclosure of contingent assets and liabilities as of the date of the financial statements and the reported amounts of income and expenses during the reporting period. Actual results could differ from those estimates.
Federal income tax— The Fund has qualified and intends to continue to qualify as a regulated investment company under the Internal Revenue Code of 1986, as amended (the “Code”). Qualification generally will relieve the Fund of liability for federal income taxes to the extent 100% of its net investment income and net realized capital gains are distributed in accordance with the Code.
In order to avoid imposition of the excise tax applicable to regulated investment companies, it is also the Fund’s intention to declare as dividends in each calendar year at least 98% of its net investment income (earned during the calendar year) and 98.2% of its net realized capital gains (earned during the twelve months ended October 31) plus undistributed amounts from prior years.
The tax character of accumulated earnings at March 31, 2020 was as follows:
Tax cost of portfolio investments | | $ | 20,885,705 | |
Gross unrealized appreciation | | $ | 11,403,188 | |
Gross unrealized depreciation | | | (929,627 | ) |
Net unrealized appreciation | | | 10,473,561 | |
Undistributed ordinary income | | | 113,127 | |
Undistributed long-term capital gains | | | 813,009 | |
Distributions payable | | | (4,888 | ) |
Accumulated earnings | | $ | 11,394,809 | |
The difference between the federal income tax cost of portfolio investments and the financial statement cost of portfolio investments for the Fund is due to certain timing differences in the recognition of capital gains or losses under income tax regulations and GAAP. These “book/tax” differences are temporary in nature and are primarily due to the tax deferral of losses on wash sales.
14
THE JAMESTOWN EQUITY FUND
NOTES TO FINANCIAL STATEMENTS (Continued)
The Fund recognizes the tax benefits or expenses of uncertain tax positions only when the position is “more likely than not” to be sustained assuming examination by tax authorities. Management has reviewed the tax positions taken on Federal income tax returns for all open tax years (generally, three years) of the Fund and has concluded that no provision for unrecognized tax benefits or expenses is required in these financial statements.
3. Investment Transactions
Investment transactions, other than short-term investments and U.S. government securities, were as follows for the year ended March 31, 2020:
Purchase of investment securities | | $ | 6,198,167 | |
Proceeds from sales of investment securities | | $ | 12,509,135 | |
4. Transactions with Related Parties
INVESTMENT ADVISORY AGREEMENT
The Fund’s investments are managed by Lowe, Brockenbrough & Company, Inc. (the “Adviser”) under the terms of an Investment Advisory Agreement. The Fund pays the Adviser a fee, which is computed and accrued daily and paid monthly, at annual rates of 0.65% of its average daily net assets up to $500 million and 0.55% of such assets in excess of $500 million. Certain officers of the Trust are also officers of the Adviser.
During the year ended March 31, 2020, the Adviser voluntarily limited the total annual operating expenses of the Fund to 0.95% of average daily net assets; accordingly, the Adviser voluntarily waived $41,493 of its investment advisory fees during the fiscal year ended March 31, 2020. This amount is not subject to recapture in future periods.
OTHER SERVICE PROVIDERS
Ultimus Fund Solutions, LLC (“Ultimus”) provides administration, fund accounting, compliance and transfer agent services to the Fund. The Fund pays Ultimus fees in accordance with the agreements for such services. In addition, the Fund pays out-of-pocket expenses including, but not limited to, postage, supplies, and certain costs related to the pricing of the Fund’s portfolio securities. Certain officers of the Trust are also officers of Ultimus, or of Ultimus Fund Distributors, LLC (the “Distributor”), the principal underwriter of the Fund and an affiliate of Ultimus. The Distributor is compensated by the Adviser (not the Fund) for acting as principal underwriter.
COMPENSATION OF TRUSTEES
Trustees and officers affiliated with the Adviser or Ultimus are not compensated by the Trust for their services. Each Trustee who is not an affiliated person of the Adviser or Ultimus received from the Trust an annual retainer of $20,000, payable quarterly; a fee of $2,000 for attendance at each meeting of the Board of Trustees (except that such fee is $3,000 for the independent chair);
15
THE JAMESTOWN EQUITY FUND
NOTES TO FINANCIAL STATEMENTS (Continued)
and a fee of $1,000 for attendance at each meeting of any committee of the Board (except that such fee is $1,500 for the committee chair); plus reimbursement of travel and other expenses incurred in attending meetings. Each series of the Trust pays its proportionate share of such fees.
Effective April 1, 2020, each Trustee not affiliated with the Adviser or Ultimus will receive from the Trust an annual retainer of $24,000, payable quarterly; a fee of $2,000 for attendance at each meeting of the Board of Trustees (except that such fee is $3,000 for the independent chair); and a fee of $1,000 for attendance at each meeting of any committee of the Board (except that such fee is $1,500 for the committee chair); plus reimbursement of travel and other expenses incurred in attending meetings.
5. Brokerage Arrangement
In order to reduce the total operating expenses of the Fund, a portion of the Fund’s operating expenses had been paid through an arrangement with a third-party broker-dealer who was compensated through commission trades. Payment of expenses by the broker-dealer was based on a percentage of commissions earned. Expenses reimbursed through the brokerage arrangement totaled $4,500 for the nine months ended December 31, 2019. Effective January 1, 2020, this arrangement has been discontinued.
6. Contingencies and Commitments
The Fund indemnifies the Trust’s officers and Trustees for certain liabilities that might arise from the performance of their duties to the Fund. Additionally, in the normal course of business the Fund enters into contracts that contain a variety of representations and warranties and which provide general indemnifications. The Fund’s maximum exposure under these arrangements is unknown, as this would involve future claims that may be made against the Fund that have not yet occurred. However, based on experience, the Trust expects the risk of loss to be remote.
7. Subsequent Events
The Fund is required to recognize in the financial statements the effects of all subsequent events that provide additional evidence about conditions that existed as of the date of the Statement of Assets and Liabilities. For non-recognized subsequent events that must be disclosed to keep the financial statements from being misleading, the Fund is required to disclose the nature of the event as well as an estimate of its financial effect, or a statement that such an estimate cannot be made. Management has evaluated subsequent events through the issuance of these financial statements and has noted no such events.
16
THE JAMESTOWN EQUITY FUND
REPORT OF INDEPENDENT REGISTERED
PUBLIC ACCOUNTING FIRM
To the Shareholders of The Jamestown Equity Fund and
Board of Trustees of Williamsburg Investment Trust
Opinion on the Financial Statements
We have audited the accompanying statement of assets and liabilities, including the schedule of investments, of The Jamestown Equity Fund (the “Fund”), a series of Williamsburg Investment Trust, as of March 31, 2020, the related statement of operations for the year then ended, the statements of changes in net assets for each of the two years in the period then ended, including the related notes, and the financial highlights for each of the five years in the period then ended (collectively referred to as the “financial statements”). In our opinion, the financial statements present fairly, in all material respects, the financial position of the Fund as of March 31, 2020, the results of its operations for the year then ended, the changes in its net assets for each of the two years in the period then ended, and the financial highlights for each of the five years in the period then ended, in conformity with accounting principles generally accepted in the United States of America.
Basis for Opinion
These financial statements are the responsibility of the Fund’s management. Our responsibility is to express an opinion on the Fund’s financial statements based on our audits. We are a public accounting firm registered with the Public Company Accounting Oversight Board (United States) (“PCAOB”) and are required to be independent with respect to the Fund in accordance with the U.S. federal securities laws and the applicable rules and regulations of the Securities and Exchange Commission and the PCAOB.
We conducted our audits in accordance with the standards of the PCAOB. Those standards require that we plan and perform the audit to obtain reasonable assurance about whether the financial statements are free of material misstatement whether due to error or fraud.
Our audits included performing procedures to assess the risks of material misstatement of the financial statements, whether due to error or fraud, and performing procedures that respond to those risks. Such procedures included examining, on a test basis, evidence regarding the amounts and disclosures in the financial statements. Our procedures included confirmation of securities owned as of March 31, 2020, by correspondence with the custodian and brokers. Our audits also included evaluating the accounting principles used and significant estimates made by management, as well as evaluating the overall presentation of the financial statements. We believe that our audits provide a reasonable basis for our opinion.
We have served as the Fund’s auditor since 2016.
COHEN & COMPANY, LTD.
Cleveland, Ohio
May 18, 2020
17
THE JAMESTOWN EQUITY FUND
BOARD OF TRUSTEES AND EXECUTIVE OFFICERS
(Unaudited) |
Overall responsibility for management of the Fund rests with the Board of Trustees. The Trustees serve during the lifetime of the Trust and until its termination, or until death, resignation, retirement or removal. The Trustees, in turn, elect the officers of the Fund. The officers have been elected for an annual term. The following are the Trustees and executive officers of the Fund:
| Trustees
and Officers | Address | Year of
Birth | Position Held
with the Trust | Length of
Time Served |
| Robert S. Harris, Ph.D. | 225 Pictoria Drive, Suite 450
Cincinnati, OH | 1949 | Chairman and Trustee | Since
January 2007 |
* | John P. Ackerly, IV | One James Center
901 E. Cary Street
Richmond, VA | 1963 | Trustee and President of The Davenport Funds | Since
July 2012 |
* | John T. Bruce | 800 Main Street
Lynchburg, VA | 1953 | Trustee and President of The FBP Funds | Since
September 1988 |
| | George K. Jennison | 225 Pictoria Drive, Suite 450
Cincinnati, OH | 1957 | Trustee | Since
January 2015 |
| Harris V. Morrissette | 225 Pictoria Drive, Suite 450
Cincinnati, OH | 1959 | Trustee | Since
March 1993 |
| | Elizabeth W. Robertson | 225 Pictoria Drive, Suite 450
Cincinnati, OH | 1953 | Trustee | Since
February 2014 |
| | Charles M. Caravati, III | 1802 Bayberry Court, Suite 400
Richmond, VA | 1965 | President, The Jamestown Equity Fund | Since
January 1996 |
| Robert G. Dorsey | 225 Pictoria Drive, Suite 450
Cincinnati, OH | 1957 | Vice President | Since
November 2000 |
| Mark J. Seger | 225 Pictoria Drive, Suite 450
Cincinnati, OH | 1962 | Treasurer | Since
November 2000 |
| | David K. James | 225 Pictoria Drive, Suite 450
Cincinnati, OH | 1970 | Secretary | Since
November 2018 |
| | Michael J. Nanosky | 225 Pictoria Drive, Suite 450
Cincinnati, OH | 1966 | Chief Compliance Officer | Since
March 2020 |
* | Messrs. Ackerly and Bruce, as affiliated persons of investment advisers to the Trust, are “interested persons” of the Trust within the meaning of Section 2(a)(19) of the 1940 Act. |
18
THE JAMESTOWN EQUITY FUND
BOARD OF TRUSTEES AND EXECUTIVE OFFICERS
(Unaudited) (Continued) |
Each Trustee oversees ten portfolios of the Trust, including the Fund. The principal occupations of the Trustees and executive officers of the Funds during the past five years and public directorships held by the Trustees are set forth below:
Robert S. Harris, Ph.D. is the C. Stewart Sheppard Professor of Business Administration at The Darden Graduate School of Business Administration at the University of Virginia. He was previously the dean at Darden. Professor Harris has published widely on corporate finance, financial markets and mergers and acquisitions and has served as a consultant to corporations and government agencies.
John P. Ackerly, IV is Senior Vice President and Portfolio Manager of Davenport & Company LLC. (a broker-dealer and investment adviser)
John T. Bruce is President, Director and member of the Executive Committee of Flippin, Bruce & Porter, Inc. (an investment advisory firm).
George K. Jennison is retired. He previously was President of Oyster Consulting, LLC (a management consulting firm) and a financial adviser with Wells Fargo Advisors, LLC.
Harris V. Morrissette is President of China Doll Rice and Beans, Inc. and Dixie Lily Foods. He is also a Director of Trustmark Corporation (bank holding company).
Elizabeth W. Robertson serves as a Trustee of TowneBank Foundation, TowneBank Corporate Board, TowneBank Audit Committee Chair and TowneBank Community Board since 2015. She previously was Chief Financial Officer of Monument Restaurants LLC.
Charles M. Caravati, III is a Managing Director of the Adviser.
Robert G. Dorsey is a Vice Chairman of Ultimus Fund Solutions, LLC and Ultimus Fund Distributors, LLC. He previously was Co-CEO of Ultimus Fund Solutions, LLC (1999 to 2019).
Mark J. Seger is a Vice Chairman of Ultimus Fund Solutions, LLC and Ultimus Fund Distributors, LLC. He previously was Co-CEO of Ultimus Fund Solutions, LLC (1999 to 2019).
David K. James is an Executive Vice President and Chief Legal and Risk Officer of Ultimus Fund Solutions, LLC (2018 to present). He previously was Managing Director and Managing Counsel at State Street Bank and Trust Company (2009 to 2018).
Michael J. Nanosky is a Senior Compliance Officer of Ultimus Fund Solutions, LLC (2020 to present). He previously was Senior Vice President & Chief Compliance Officer of PNC Funds (2014 to 2019).
Additional information about members of the Board of Trustees and executive officers is available in the Statement of Additional Information (“SAI”). To obtain a free copy of the SAI, please call 1-866-738-1126.
19
THE JAMESTOWN EQUITY FUND
ABOUT YOUR FUND’S EXPENSES (Unaudited)
We believe it is important for you to understand the impact of costs on your investment. All mutual funds have operating expenses. As a shareholder of the Fund, you incur ongoing costs, including management fees and other expenses. The following examples are intended to help you understand your ongoing costs (in dollars) of investing in the Fund and to compare these costs with the ongoing costs of investing in other mutual funds.
A mutual fund’s ongoing costs are expressed as a percentage of its average net assets. This figure is known as the expense ratio. The expenses in the table below are based on an investment of $1,000 made at the beginning of the period shown and held for the entire period (October 1, 2019 through March 31, 2020).
The table below illustrates the Fund’s costs in two ways:
Actual fund return – This section helps you to estimate the actual expenses that you paid over the period. The “Ending Account Value” shown is derived from the Fund’s actual return, and the fourth column shows the dollar amount of operating expenses that would have been paid by an investor who started with $1,000 in the Fund. You may use the information here, together with the amount you invested, to estimate the expenses that you paid over the period.
To do so, simply divide your account value by $1,000 (for example, an $8,600 account value divided by $1,000 = 8.6), then multiply the result by the number given for the Fund under the heading “Expenses Paid During Period.”
Hypothetical 5% return – This section is intended to help you compare the Fund’s ongoing costs with those of other mutual funds. It assumes that the Fund had an annual return of 5% before expenses during the period shown, but that the expense ratio is unchanged. In this case, because the returns used are not the Fund’s actual returns, the results do not apply to your investment. The example is useful in making comparisons because the U.S. Securities and Exchange Commission (the “SEC”) requires all mutual funds to calculate expenses based on a 5% return. You can assess the Fund’s ongoing costs by comparing this hypothetical example with the hypothetical examples that appear in shareholder reports of other funds.
Note that expenses shown in the table are meant to highlight and help you compare ongoing costs only. The Fund does not charge sales loads or redemption fees.
The calculations assume no shares were bought or sold during the period. Your actual costs may have been higher or lower, depending on the amount of your investment and the timing of any purchases or redemptions.
More information about the Fund’s expenses, including annual expense ratios for the prior five fiscal years, can be found in this report. For additional information on operating expenses and other shareholder costs, please refer to the Fund’s prospectus.
20
THE JAMESTOWN EQUITY FUND
ABOUT YOUR FUND’S EXPENSES (Unaudited) (Continued)
| | Beginning
Account Value
October 1, 2019 | Ending
Account Value
March 31, 2020 | Net
Expense
Ratio(a) | Expenses
Paid During
Period(b) |
Based on Actual Fund Return | $1,000.00 | $ 885.50 | 0.95% | $4.48 |
Based on Hypothetical 5% Return (before expenses) | $1,000.00 | $ 1,020.25 | 0.95% | $4.80 |
(a) | Annualized, based on the Fund’s most recent one-half year expenses. |
(b) | Expenses are equal to the Fund’s annualized net expense ratio multiplied by the average account value over the period, muliplied by 183/366 (to reflect the one-half year period). |
21
THE JAMESTOWN EQUITY FUND
OTHER INFORMATION (Unaudited)
A description of the policies and procedures that the Fund uses to vote proxies relating to portfolio securities is available without charge upon request by calling toll-free 1-866-738-1126, or on the SEC’s website at www.sec.gov. Information regarding how the Fund voted proxies relating to portfolio securities during the most recent 12-month period ended June 30 is also available without charge upon request by calling toll-free 1-866-738-1126, or on the SEC’s website at www.sec.gov.
The Trust files a complete listing of portfolio holdings of the Fund with the SEC as of the end of the first and third quarters of each fiscal year on Form N-Q or as an exhibit to its reports on Form N-Q’s successor form, Form N-PORT. The filings are available upon request, by calling 1-866-738-1126. Furthermore, you may obtain a copy of these filings on the SEC’s website at www.sec.gov.
FEDERAL TAX INFORMATION (Unaudited)
For the fiscal year ended March 31, 2020, the Fund designated $2,227,772 as long-term capital gain distributions.
Qualified Dividend Income — The Fund designates 100% of its ordinary income distributions, or up to the maximum amount of such dividends allowable pursuant to the Internal Revenue Code, as qualified dividend income eligible for the reduced tax rate of 15%.
Dividends Received Deduction — Corporate shareholders are generally entitled to take the dividends received deduction on the portion of a Fund’s dividend distributions that qualify under tax law. For the fiscal year ended March 31, 2020, 100% of the Fund’s ordinary income dividends qualifies for the corporate dividends received deduction.
22
THE JAMESTOWN EQUITY FUND
DISCLOSURE REGARDING APPROVAL OF INVESTMENT
ADVISORY AGREEMENT (Unaudited)
At an in-person meeting held on February 25, 2020, the Board of Trustees, including a majority of the Independent Trustees, approved the continuance for a one-year period of the Investment Advisory Agreement with the Adviser on behalf of The Jamestown Equity Fund (the “Fund”). Below is a discussion of the factors considered by the Board of Trustees along with the conclusions with respect thereto that formed the basis for the Board’s approval.
In approving the continuance of the Investment Advisory Agreement, the Independent Trustees considered all information they deemed reasonably necessary to evaluate the terms of the Agreement. The principal areas of review by the Independent Trustees were the nature, extent and quality of the services provided by the Adviser and the reasonableness of the fees charged for those services. These matters were considered by the Independent Trustees consulting with experienced counsel for the Independent Trustees, who is independent of the Adviser.
The Independent Trustees’ evaluation of the quality of the Adviser’s services took into consideration their knowledge gained through presentations and reports from the Adviser over the course of the preceding year. The Independent Trustees considered that the Adviser had provided its views on the overall conditions of the economy and the markets, including a discussion of the reasons for the increase in market valuations during the 2019 calendar year and how this has impacted the earning-driven strategy that is applied in the investment management process of the Fund. Both short-term and long-term investment performance of the Fund were considered. The Fund’s performance was compared to the performance of its benchmark, a peer group of funds with similar investment objectives and strategies, and to the Adviser’s comparably managed private accounts. The Independent Trustees also considered: the scope and quality of the in-house capabilities of the Adviser and other resources that it dedicates to performing services for the Fund; the quality of administrative and other services, including the Adviser’s role in coordinating the activities of the Fund’s other service providers; the Adviser’s compliance with investment policies of the Fund and applicable laws and regulations; information provided by management and the Fund’s independent public accounting firm in periodic meetings with the Trust’s Audit Committee; the business reputation of the Adviser; the qualifications of the Adviser’s key investment and compliance personnel; and the Adviser’s financial resources.
In reviewing the fees payable under the Investment Advisory Agreement, the Independent Trustees compared the advisory fees and overall expenses of the Fund with those of funds with similar investment objectives and strategies as well as the private accounts managed by the Adviser. The Independent Trustees considered information provided by the Adviser concerning the Adviser’s profitability with respect to the Fund, including the assumptions and methodology used in preparing the profitability information, in light of applicable case law relating to advisory fees. For these purposes, the Independent Trustees considered not only the fees paid by the Fund, but also so-called “fallout” benefits to the Adviser. The Independent Trustees also considered the Adviser’s representations that the Fund’s portfolio trades were executed based on the best available price and execution, and that the Adviser does not participate in any revenue sharing
23
THE JAMESTOWN EQUITY FUND
DISCLOSURE REGARDING APPROVAL OF INVESTMENT
ADVISORY AGREEMENT (Unaudited) (Continued)
arrangements relating to the Fund. In evaluating the Fund’s advisory fees, the Trustees considered the complexity and quality of the investment process that is applied in the management of the Fund.
Based on the consideration of the foregoing and such other information as was deemed relevant, including the factors and conclusions below, the Independent Trustees concluded that: (i) the performance of Fund is satisfactory (a) given the Fund’s investment strategy in comparison to the performance to its benchmark and peer group average, and (b) after considering the services provided by LB&C to the Fund; (ii) the advisory fee for Fund is higher when compared to the average for similarly managed funds according to statistics derived from Morningstar, Inc., and is reasonable in relation to the services provided by LB&C; (iii) the total operating expense ratio of Fund while slightly higher, remains competitive, when compared to the average expense ratio for comparable managed funds, according to statistics derived from Morningstar, Inc., and (iv) the level of LB&C’s profitability with respect to its management of the Fund is reasonable.
Given the current size of the Fund and its expected growth, the Independent Trustees did not believe that, it was relevant to consider the extent to which economies of scale would be realized as the Fund grows, and whether fee levels reflect these economies of scale. The Independent Trustees also considered the “fallout” benefits to the Adviser for its management of the Fund, but given the amounts involved viewed these as secondary factors in connection with the evaluation of the reasonableness of the advisory fees paid by the Fund.
No single factor was considered in isolation or to be determinative to the decision of the Independent Trustees to approve the continuance of the Investment Advisory Agreement. Rather the Independent Trustees concluded, after weighing and balancing all factors considered, that it was in the best interests of the Fund and its shareholders to continue the Investment Advisory Agreement without modification to its terms, including the fees charged for services thereunder.
24
This page intentionally left blank.
THE JAMESTOWN EQUITY FUND
www.jamestownfunds.com
Investment Adviser
Lowe, Brockenbrough & Company, Inc.
1802 Bayberry Court
Suite 400
Richmond, Virginia 23226
Administrator
Ultimus Fund Solutions, LLC
P.O. Box 46707
Cincinnati, Ohio 45246-0707
(Toll-Free) 1-866-738-1126
Independent Registered
Public Accounting Firm
Cohen & Company, Ltd.
1350 Euclid Avenue
Suite 800
Cleveland, Ohio 44115
Legal Counsel
Sullivan & Worcester LLP
1666 K Street, N.W.
Washington, DC 20006
Board of Trustees
John P. Ackerly, IV
John T. Bruce
George K. Jennison
Robert S. Harris, Ph.D.
Harris V. Morrissette
Elizabeth W. Robertson
As of the end of the period covered by this report, the registrant has adopted a code of ethics that applies to the registrant’s principal executive officer, principal financial officer, principal accounting officer or controller, or persons performing similar functions, regardless of whether these individuals are employed by the registrant or a third party. Pursuant to Item 13(a)(1), a copy of registrant’s code of ethics is filed as an exhibit to this Form N-CSR. During the period covered by this report, the code of ethics has not been amended, and the registrant has not granted any waivers, including implicit waivers, from the provisions of the code of ethics.
| Item 3. | Audit Committee Financial Expert. |
The registrant’s board of trustees has determined that the registrant has two audit committee financial experts serving on its audit committee. The names of the audit committee financial experts are Dr. Robert S. Harris and Elizabeth W. Robertson. Dr. Harris and Ms. Robertson are “independent” for purposes of this Item.
| Item 4. | Principal Accountant Fees and Services. |
| (a) | Audit Fees. The aggregate fees billed for professional services rendered by the principal accountant for the audit of the registrant’s annual financial statements or for services that are normally provided by the accountant in connection with statutory and regulatory filings or engagements were $129,500 and $129,500 with respect to the registrant’s fiscal years ended March 31, 2020 and 2019, respectively. |
| (b) | Audit-Related Fees. No fees were billed in either of the last two fiscal years for assurance and related services by the principal accountant that are reasonably related to the performance of the audit of the registrant’s financial statements and are not reported under paragraph (a) of this Item. |
| (c) | Tax Fees. The aggregate fees billed for professional services rendered by the principal accountant for tax compliance, tax advice, and tax planning were $30,000 and $36,000 with respect to the registrant’s fiscal years ended March 31, 2020 and 2019, respectively. The services comprising these fees are the preparation of the registrant’s federal income and excise tax returns. |
| (d) | All Other Fees. No fees were billed in either of the last two fiscal years for products and services provided by the principal accountant, other than the services reported in paragraphs (a) through (c) of this Item. |
| (e)(1) | The audit committee has adopted pre-approval policies and procedures described in paragraph (c)(7) of Rule 2-01 of Regulation S-X. Pursuant to the pre-approval policies and procedures, the audit committee has pre-approved certain audit, audit-related and tax services and has established, with respect to each fiscal year of the registrant, the following maximum fee levels for services covered under the pre-approval policies and procedures: |
| • | Services, relating to a new series or class of a series, associated with SEC registration statements, periodic reports and other documents filed by the registrant with the SEC or other documents issued by the registrant in connection with securities offerings and assistance in responding to SEC comment letters—$5,000 |
| • | Consultations with management of the registrant, not in connection with an audit, as to the accounting or disclosure treatment of transactions or events and/or the actual or potential impact of final or proposed rules, standards or interpretations by the SEC, FASB or other regulatory or standard setting bodies—$5,000 |
| • | All tax services provided to the registrant in the aggregate—$5,000 |
| (e)(2) | None of the services described in paragraph (b) through (d) of this Item were approved by the audit committee pursuant to paragraph (c)(7)(i)(C) of Rule 2-01 of Regulation S-X. |
| (f) | Less than 50% of hours expended on the principal accountant’s engagement to audit the registrant’s financial statements for the most recent fiscal year were attributed to work performed by persons other than the principal accountant’s full-time, permanent employees. |
| (g) | With respect to the fiscal years ended March 31, 2020 and 2019, aggregate non-audit fees of $30,000 and $36,000, respectively, were billed by the registrant’s principal accountant for services rendered to the registrant. No non-audit fees were billed in either of the last two fiscal years by the registrant’s principal accountant for services rendered to the registrant’s investment adviser (not including any sub-adviser whose role is primarily portfolio management and is subcontracted with or overseen by another investment adviser), and any entity controlling, controlled by, or under common control with the adviser that provides ongoing services to the registrant. |
| (h) | The principal accountant has not provided any non-audit services to the registrant’s investment adviser (not including any sub-adviser whose role is primarily portfolio management and is subcontracted with or overseen by another investment adviser), and any entity controlling, controlled by, or under common control with the investment adviser that provides ongoing services to the registrant. |
| Item 5. | Audit Committee of Listed Registrants. |
Not applicable
| Item 6. | Schedule of Investments. |
| (a) | Not applicable [schedule filed with Item 1] |
| Item 7. | Disclosure of Proxy Voting Policies and Procedures for Closed-End Management Investment Companies. |
Not applicable
| Item 8. | Portfolio Managers of Closed-End Management Investment Companies. |
Not applicable
| Item 9. | Purchases of Equity Securities by Closed-End Management Investment Company and Affiliated Purchasers. |
Not applicable
| Item 10. | Submission of Matters to a Vote of Security Holders. |
The registrant’s Governance, Nominating, Compensation and QLCC Committee shall review shareholder recommendations to fill vacancies on the registrant’s board of trustees if such recommendations are submitted in writing, addressed to the Committee at the registrant’s offices and meet any minimum qualifications adopted by the Committee. The Committee may adopt, by resolution, a policy regarding its procedures for considering candidates for the board of trustees, including any recommended by shareholders.
| Item 11. | Controls and Procedures. |
(a) Based on their evaluation of the registrant’s disclosure controls and procedures (as defined in Rule 30a-3(c) under the Investment Company Act of 1940) as of a date within 90 days of the filing date of this report, the registrant’s principal executive officers and principal financial officer have concluded that such disclosure controls and procedures are reasonably designed and are operating effectively to ensure that material information relating to the registrant, including its consolidated subsidiaries, is made known to them by others within those entities, particularly during the period in which this report is being prepared, and that the information required in filings on Form N-CSR is recorded, processed, summarized, and reported on a timely basis.
(b) There were no changes in the registrant’s internal control over financial reporting (as defined in Rule 30a-3(d) under the Investment Company Act of 1940) that occurred during the second fiscal quarter of the period covered by this report that have materially affected, or are reasonably likely to materially affect, the registrant’s internal control over financial reporting.
Item 12. Disclosure of Securities Lending Activities for Closed-End Management Investment Companies.
Not applicable
(a)(4) Change in the registrant’s independent public accountants: Not applicable
File the exhibits listed below as part of this Form. Letter or number the exhibits in the sequence indicated.
(a)(1) Any code of ethics, or amendment thereto, that is the subject of the disclosure required by Item 2, to the extent that the registrant intends to satisfy the Item 2 requirements through filing of an exhibit: Attached hereto
(a)(2) A separate certification for each principal executive officer and principal financial officer of the registrant as required by Rule 30a-2(a) under the Act (17 CFR 270.30a-2(a)): Attached hereto
(a)(3) Any written solicitation to purchase securities under Rule 23c-1 under the Act (17 CFR 270.23c-1) sent or given during the period covered by the report by or on behalf of the registrant to 10 or more persons: Not applicable
(a)(4) Change in the registrant’s independent public accountants: Not applicable
(b) Certifications required by Rule 30a-2(b) under the Act (17 CFR 270.30a-2(b)): Attached hereto
SIGNATURES
Pursuant to the requirements of the Securities Exchange Act of 1934 and the Investment Company Act of 1940, the registrant has duly caused this report to be signed on its behalf by the undersigned, thereunto duly authorized.
| (Registrant) | Williamsburg Investment Trust | | |
| | | | |
| By (Signature and Title)* | /s/ David James | |
| | | David James, Secretary | |
| | | | |
| Date | May 28, 2020 | | |
| | | | |
| Pursuant to the requirements of the Securities Exchange Act of 1934 and the Investment Company Act of 1940, this report has been signed below by the following persons on behalf of the registrant and in the capacities and on the dates indicated. |
| | | | |
| By (Signature and Title)* | /s/ John T. Bruce | |
| | | John T. Bruce, President | |
| | | (FBP Equity & Dividend Plus Fund and FBP Appreciation & Income Opportunities Fund) |
| | | | |
| Date | May 28, 2020 | | |
| | | | |
| By (Signature and Title)* | /s/ Thomas W. Leavell | |
| | | Thomas W. Leavell, President | |
| | | (The Government Street Equity Fund, The Government Street Mid-Cap Fund) |
| | | | |
| Date | May 28, 2020 | | |
| | | | |
| By (Signature and Title)* | /s/ Charles M. Caravati III | |
| | | Charles M. Caravati III, President | |
| | | (The Jamestown Equity Fund) | |
| | | | |
| Date | May 28, 2020 | | |
| | | | |
| By (Signature and Title)* | /s/ John P. Ackerly IV | |
| | | John P. Ackerly IV, President | |
| | | (The Davenport Core Fund, Davenport Value & Income Fund, Davenport Equity Opportunities Fund, Davenport Small Cap Focus Fund and the Davenport Balanced Income Fund) |
| | | | |
| Date | May 28, 2020 | | |
| | | | |
| By (Signature and Title)* | /s/ Mark J. Seger | |
| | | Mark J. Seger, Treasurer and Principal Financial Officer | |
| | | | |
| Date | May 28, 2020 | | |
| * | Print the name and title of each signing officer under his or her signature. |