| OMB APPROVAL |
OMB Number: 3235-0570 Expires: August 31, 2020 Estimated average burden hours per response: 20.6 |
UNITED STATES
SECURITIES AND EXCHANGE COMMISSION
Washington, D.C. 20549
FORM N-CSR
CERTIFIED SHAREHOLDER REPORT OF REGISTERED
MANAGEMENT INVESTMENT COMPANIES
| Investment Company Act file number | 811-05685 | |
| Williamsburg Investment Trust |
| (Exact name of registrant as specified in charter) |
| 225 Pictoria Drive, Suite 450 Cincinnati, Ohio | 45246 |
| (Address of principal executive offices) | (Zip code) |
John H. Chilton, Esq.
| Sullivan & Worcester LLP 1666 K Street NW Washington, D.C. 20006 |
| (Name and address of agent for service) |
| Registrant's telephone number, including area code: | (513) 587-3400 | |
| Date of fiscal year end: | March 31 | |
| | | |
| Date of reporting period: | March 31, 2019 | |
Form N-CSR is to be used by management investment companies to file reports with the Commission not later than 10 days after the transmission to stockholders of any report that is required to be transmitted to stockholders under Rule 30e-1 under the Investment Company Act of 1940 (17 CFR 270.30e-1). The Commission may use the information provided on Form N-CSR in its regulatory, disclosure review, inspection, and policymaking roles.
A registrant is required to disclose the information specified by Form N-CSR, and the Commission will make this information public. A registrant is not required to respond to the collection of information contained in Form N-CSR unless the Form displays a currently valid Office of Management and Budget ("OMB") control number. Please direct comments concerning the accuracy of the information collection burden estimate and any suggestions for reducing the burden to the Secretary, Securities and Exchange Commission, 450 Fifth Street, NW, Washington, DC 20549-0609. The OMB has reviewed this collection of information under the clearance requirements of 44 U.S.C. § 3507.
Item 1. Reports to Stockholders.
ANNUAL REPORT
March 31, 2019
Beginning on January 1, 2021, as permitted by regulations adopted by the U.S. Securities and Exchange Commission, paper copies of the Funds’ shareholder reports like this one will no longer be sent by mail, unless you specifically request paper copies of the reports from the Funds or from your financial intermediary, such as a broker-dealer or bank. Instead, the reports will be made available on a website, and you will be notified by mail each time a report is posted and provided with a website link to access the report.
If you already elected to receive shareholder reports electronically, you will not be affected by this change and you need not take any action. You may elect to receive shareholder reports and other communications from the Funds electronically by contacting the Funds at 1-800-281-3217 or, if you own these shares through a financial intermediary, by contacting your financial intermediary.
You may elect to receive all future reports in paper free of charge. You can inform the Funds that you wish to continue receiving paper copies of your shareholder reports by contacting the Funds at 1-800-281-3217. If you own shares through a financial intermediary, you may contact your financial intermediary or follow instructions included with this document to elect to continue to receive paper copies of your shareholder reports. Your election to receive reports in paper will apply to all Funds held with the Fund complex or at your financial intermediary.
THE DAVENPORT FUNDS
LETTER TO SHAREHOLDERS | May 1, 2019 |
Dear Shareholders,
Stocks surged higher to close out fiscal 2019. For the 3 months ended March 31, 2019, the S&P 500 Index gained 13.65% while the Russell 2000 Index was up 14.58%. Of note, this was the best quarter for the S&P 500 since 2009 and the best calendar first quarter since 1998. Clearly, this advance represented a dramatic turn of events from calendar Q4 2018, when stocks declined dramatically and the S&P 500 experienced its worst December since 1931. For the fiscal year ended March 31, 2019, the S&P 500 and Russell 2000 gained 9.50% and 2.05%, respectively.
What sparked this turn? For one, by late calendar 2018 it seemed investors had generally accepted signs of moderating economic growth. Shares of many companies, especially more economically sensitive concerns, even seemed to be discounting a full blow recession. With market expectations reset, it only took decent fourth quarter earnings reports from corporate America for stocks to rally. Also, fears of a trade war with China showed signs of diminishing as the Trump Administration appeared to make progress with Chinese leadership.
Perhaps most notable, the Federal Reserve (“Fed”) backed off its tightening agenda. The Fed had been raising interest rates and seemed intent on continuing to do so in response to low unemployment, economic growth (prompted in part by fiscal stimulus/tax cuts) and the threat of inflation. As signs of slowing growth became apparent, many feared the Fed’s agenda was misguided and Fed Chairman Jerome Powell gained some vocal critics. Ultimately, Powell acknowledged the case for raising rates had weakened and noted rate hikes were less likely. Investors promptly cheered a continuation of the “cheap money” environment that has buoyed stock valuations for much of the last decade. Many investors are going so far as to predict the Fed’s next move may actually be an interest rate cut.
Going forward, we continue to expect more moderate equity returns when compared to the heady returns of 2013-2017. However, as shown by the wild swings of fiscal Q3 and Q4 of this year, this clearly won’t happen in a smooth fashion. Our outlook is based on a fairly balanced risk/reward profile for the market. Although we think odds of a recession are low, we remain mindful of slowing earnings growth (partly a function of lapping corporate tax reductions) and “peakish” conditions for gauges such as unemployment and consumer credit. On the other hand, it appears the Fed still “has the market’s back” and valuations aren’t unreasonable. The S&P 500’s current P/E of 17x on 2019 earnings is only slightly above the average of the last 25 years.
In terms of the Davenport Funds, we were pleased with both absolute and relative performance in the first quarter. We continue to find new ideas, although the market’s impressive bounce has made it a little more difficult to find value. We are currently carrying some cash in the Funds and look to take advantage of any market pullbacks. Thank you for your trust and read on for a discussion of individual Fund themes and ideas.
1
Davenport Core Fund
The following chart represents Davenport Core Fund’s (DAVPX) performance and the performance of the S&P 500 Index*, the Core Fund’s primary benchmark, for the periods ended March 31, 2019.
| Fiscal
Q4
2018 | 1 Year | 3 Years** | 5 Years** | 10 Years** | Since
Inception
1/15/98** | Fiscal
Year 2019
Expense
Ratio |
Core Fund | 14.31% | 8.21% | 12.00% | 9.04% | 14.43% | 6.87% | 0.89% |
S&P 500 Index* | 13.65% | 9.50% | 13.51% | 10.91% | 15.92% | 7.29% | |
30-Day SEC Yield: 0.25%; Expense Ratio in current prospectus: 0.90%
Past performance is no guarantee of future results. Investment return and principal value of an investment will fluctuate so that an investor’s shares, when redeemed, may be worth more or less than their original cost. Current performance may be lower or higher than the performance data quoted. Performance data, current to the most recent month end, may be obtained by calling 1-800-281-3217.
* | The S&P 500 Index is comprised of 500 U.S. stocks and is an indicator of the performance of the overall U.S. stock market. An investor cannot invest in an index and its returns are not indicative of the performance of any specific investment. |
** | Returns greater than one year are annualized. |
The Core Fund put up a strong showing in the final quarter of the fiscal year, returning 14.31%, ahead of the S&P 500’s 13.65% increase. For the full fiscal year, the Fund returned 8.21% compared to the benchmark’s 9.50% increase. We were pleased to see such a sharp snapback after fiscal Q3’s declines. Top performers in the quarter include Danaher (DHR), American Tower (AMT), Monster Beverage (MNST), Brookfield Asset Management (BAM) and Southwest Airlines (LUV), which were all up >20%. Detractors include insurers Markel (MKL) and Berkshire Hathaway (BRK.B), who continue to suffer from lackluster underwriting results, CME Group (CME), which suffered from the lack of volatility vs 1Q18, and CVS Health (CVS), which has experienced increasing headwinds in its pharmacy and pharmacy benefit manager businesses. For the full year, our top contributors included American Tower (AMT), Visa (V), and Danaher (DHR), while FedEx (FDX), CVS Health (CVS), and Markel (MKL) were our biggest detractors.
Amidst all the volatility, we were more active transacting in the Fund during the end of the fiscal year. Early in the quarter, we sold Starbucks (SBUX) after the stock had a massive move higher in 2H18 due to a modest increase in same-store sales. Midway through the quarter we had a timely sale of Southwest Airlines (LUV) as the stock had bounced off of its December lows and we wanted to reposition into a higher quality business, Air Products & Chemicals (APD – more below). Another timely sale was Monster Beverage (MNST), which we sold after an earnings spike. Competitive threats and valuation caused us to take profits. Towards the end of the quarter, we sold our position in Facebook (FB). FB has become a controversial name due to its disregard for properly managing customer data. While we continue to appreciate the excellent financial characteristics of the business, after a large move up in the share price during the quarter, we elected to take profits given the increased regulatory risk.
2
As former owners of Praxair, we have long been impressed with the global industry dynamics of industrial gas, characterized by limited competition and high customer switching costs. While we sold Praxair a couple years ago due to a complex merger with a European peer, we have continued to monitor the industry and in fiscal Q4 bought a position in Air Products (APD). APD historically has been an industry laggard, but in 2014 a management change led to a dramatic change in operations that resulted in a ten percentage point increase in margins. In late 2017, APD announced a large $15B capital investment program, which is centered around “gasification,” a new (but related) business line that converts low quality feedstocks such as coal or refinery residue into synthetic gas, which can be used to create chemicals or diesel. Gasification is already a well-established technology and reminds us of the gas processors’ step out into helium in the 1980s, which created substantial shareholder value. Early results have been encouraging. Should the investment work out as expected, earnings should grow by 50% over the next five years. The stock was also trading at a discount to its peer group despite industry leading margins, returns on capital and expected growth rate.
We also bought a stake in Walt Disney (DIS). DIS is known throughout the world for its creative and (often) family-friendly entertainment content. We have owned DIS in the Core Fund in the past but sold it over a year ago as the company was entering an investment cycle. While the company continues to invest in new initiatives, numerous uncertainties have cleared up since our sale, such as the terms for the Twenty-First Century Fox (FOX) acquisition as well as the initial outline for DIS’s direct streaming offering, Disney+. We have long viewed DIS as a core holding and have been particularly impressed with Michael Eisner’s stewardship and the execution of outstanding deals including Pixar, Marvel and Lucas Films. Now that some of the risk regarding new investments has declined, we decided to reinstate DIS into the Fund.
In addition to APD and DIS, we added to numerous Fund holdings that appeared particularly attractive during the quarter, such as Home Depot (HD), Anheuser-Busch InBev (BUD), CVS Health (CVS), Becton Dickinson (BDX), CarMax (KMX), and EOG Resources (EOG). Despite these additions, we still have an above-average level of cash, which we hope to deploy should attractive opportunities present themselves going forward.
The following are transactions performed in the Core Fund for the quarter ended March 31, 2019.
Recent Purchases
Air Products & Chemicals, Inc. (APD) The global industrial gas industry is currently a global oligopoly with three main players (Air Liquide, Linde, Air Products) and many local players, depending on end market and geography. We initiated a position in APD, the #3 player in the global industrial gas industry.
Anheuser-Busch InBev S.A./N.V. (BUD) BUD struggled last year, and we took the opportunity to add to our position. We note the stock is trading at a sharp discount to historical norms even after a nice rally this year.
Becton, Dickinson and Company (BDX)We added to our position as we continue to believe BDX is a high-quality company that has been an excellent value creator over time within the health care space.
3
CarMax, Inc. (KMX) We took the opportunity to increase the position in KMX, a business with plenty of room for internally funded store growth (and further market share gains), with a buyback program to boot.
EOG Resources, Inc. (EOG) We saw an attractive entry point due to recent weakness and added to our energy exposure in a company with low-risk assets.
CVS Health Corporation (CVS) We added to our position in CVS as we think there should be a resolution to the Aetna integration, and growth could improve significantly over the next several years, as CVS becomes an integrated health care company.
Home Depot, Inc. (The) (HD) We added to our position as HD remains a best-of-breed retailer with strong returns on capital, high free cash flow conversion, and scale/network advantages.
Walt Disney Company (The) (DIS)We initiated a position in DIS, a controversial stock given significant competition from the likes of Netflix and other over the top (OTT) content providers that have promoted additional cord cutting. In response, DIS is in the midst of a significant investment spend related to its own direct-to-consumer (DTC) offering, DIS+, which is set to launch late 2019 - early 2020. While we wait, Disney’s parks and resorts continue to grow nicely, and post the closing of the Fox deal, the company will control over 50% of the domestic box office.
Recent Sales
Ecolab, Inc. (ECL) The stock has performed very well and the valuation has expanded to record levels. As such, we elected to take some profits.
Electronic Arts, Inc. (EA)We continue to believe in the positive outlook for the video game industry but believe EA’s near-term headwinds may outweigh the longer-term positives. We elected to sell our position as shares rallied off their December lows.
Facebook, Inc. (FB) Despite having been a solid performer for us over our 2.5-year holding period, we sold our position in FB. While we continue to respect and admire the financial performance of this business model, regulatory risk to this profit stream is increasing, and ultimately we feel it is enough of a risk to take profits in the name.
iShares U.S. Home Construction ETF (ITB) While we continue to have a constructive outlook on the housing industry, we elected to sell our exposure given the recent run.
Monster Beverage Corporation (MNST) MNST has been a great stock for us since our purchase last May. While we remain positive on the outlook for MNST, we took the opportunity to take profits and reduce the risk of the portfolio.
Southwest Airlines Company (LUV) While we continue to like the prospects for LUV, we decided to sell one of our cyclical stocks to fund more appealing risk/reward opportunities.
Starbucks Corporation (SBUX)We sold the rest of our position, as the stock seemed fair-to-fully valued. Given the mixed performance at the operating level, we are more price sensitive than usual with this name and elected to take profits after a period of multiple expansion.
4
Davenport Value & Income Fund
The following chart represents Davenport Value & Income Fund (DVIPX) performance and the performance of the Russell 1000 Value Index*, the Value & Income Fund’s primary benchmark, the S&P 500 and the Lipper Equity Income Index for the periods ended March 31, 2019.
| Fiscal
Q4
2018 | 1 Year | 3 Years** | 5 Years** | Since
Inception
12/31/10** | Fiscal
Year 2019
Expense
Ratio |
Value & Income Fund | 11.05% | 2.96% | 8.98% | 7.60% | 11.16% | 0.88% |
Russell 1000 Value Index | 11.93% | 5.67% | 10.45% | 7.72% | 10.84% | |
S&P 500 Index* | 13.65% | 9.50% | 13.51% | 10.91% | 12.69% | |
Lipper Equity Income Index* | 11.50% | 6.94% | 10.60% | 7.85% | 10.25% | |
30-Day SEC Yield: 2.02%; Expense Ratio in current prospectus: 0.90%
Past performance is no guarantee of future results. Investment return and principal value of an investment will fluctuate so that an investor’s shares, when redeemed, may be worth more or less than their original cost. Current performance may be lower or higher than the performance data quoted. Performance data, current to the most recent month end, may be obtained by calling 1-800-281-3217.
* | The S&P 500 Index is comprised of 500 U.S. stocks and is an indicator of the performance of the overall U.S. stock market. The S&P 500 Index is comprised of 500 U.S. stocks and is an indicator of the performance of the overall U.S. stock market. The Lipper Equity Income Index is an unmanaged index of the 30 largest Funds in the Lipper Equity Income Fund category. The Russell 1000® Value Index measures the performance of the Russell 1000 companies with lower price-to-book ratios and lower forecasted growth values. |
An investor cannot invest in an index and its returns are not indicative of the performance of any specific investment.
** | Returns greater than one year are annualized. |
The Value & Income Fund enjoyed a strong close to the fiscal year, increasing 11.05% in the quarter. This was slightly behind the Fund’s primary benchmark, the Russell 1000 Value Index, which increased 11.93%. The S&P 500 increased 13.65% in the final quarter. For the fiscal year, the Fund returned 2.96% compared to 5.67% and 9.50% for the Russell and S&P, respectively. We are encouraged to be in close proximity to the Russell given its strong run to close the year and our slightly higher than normal cash balance, which created some drag in a strong period.
Consumer Staples and Financials were the biggest contributors to performance in the final quarter. Staples stocks performed well as interest rates declined and their strong dividend yields became more attractive. Philip Morris International (PM), Anheuser-Busch InBev (BUD), and Mondelēz International (MDLZ) all increased more than 25% during the first quarter. Within Financials, Brookfield Asset Management (BAM) and Fidelity National Financial (FNF) performed well. BAM is one of our largest positions and seems to be firing on all cylinders. The company’s fundraising continues to exceed expectations and management is finding attractive new investments. Fidelity National has benefited from lower rates as mortgage applications have improved to start the year. For the year, Merck (MRK) and Microsoft (MSFT) were our biggest contributors to performance with each returning more than 30%.
Key detractors in the quarter were CVS Health (CVS) and Bristol-Myers Squibb (BMY). Shares of CVS have struggled as headwinds in the company’s core business have overshadowed the attractive opportunity from the Aetna acquisition. We continue to believe that CVS is building a
5
premier integrated health care company and that near-term issues are more than priced into the stock at the current valuation. BMY shares sold off on news it was acquiring Celgene (CELG) as investors worried about the debt necessary to complete the deal. We believe the massive cash flow from the combined company will allow for quick de-leveraging and that several drugs in CELG’s pipeline have significant potential. For the year, BMY was our biggest detractor to performance for the same reasons mentioned above.
We initiated a new position in Allstate (ALL) in the quarter. ALL is the second largest personal lines insurer in the U.S. and the 18th largest life insurer. The company has an excellent long-term record of underwriting at profitable levels and has rewarded shareholders through thoughtful capital allocation. Since 2012, the company has reduced shares outstanding by 35%, and the dividend has compounded at a 13% growth rate over the past five years. Additionally, we are attracted to the company’s strong brand and scale in a highly competitive industry. Lastly, we felt shares of ALL were attractively valued vs. peers and at a discount to its own trading history.
We had minimal Fund turnover in the final quarter as the only other trades included adding to our position in Marathon Petroleum (MPC), reducing our stake in W.P. Carey (WPC), and selling our position in Equity LifeStyle Properties (ELS). The latter two are REITS, which enjoyed very strong performance once the market realized that the Fed was unlikely to raise interest rates in 2019. We elected to take advantage of the strength as both names were close to our view of fair value.
In summary, we were pleased with the strong performance in the final quarter of the fiscal year. While we don’t expect 10% returns on a quarterly basis going forward, we do think the environment sets up well for value/income investing with moderate growth and low interest rates. Our cash balance remains modestly higher than normal, which we think puts us in an attractive position should the market’s recent run cool off. In the meantime, we continue to scour the investment universe for attractive opportunities to put capital to work.
Recent Purchases
Allstate Corp (ALL)ALL is the second largest personal lines insurer in the U.S. and the 18th largest life insurer. We believe the current valuation is attractive for a company with a strong brand and scale in a very competitive industry.
Comcast Corporation (CMCSA) Now that CMCSA has closed the acquisition of Sky and the Twenty-First Century Fox (FOX) deal is off the table, we believe that investors can again focus on CMCSA’s stable business fundamentals. We view the current valuation of the company as attractive and elected to increase our position.
Marathon Petroleum Corporation (MPC) A longtime favorite, we believe expectations could be far too low for MPC’s refining segment over the next few years. We added to our position.
Recent Sales
Equity Lifestyle Properties, Inc. (ELS) Though we view these assets as high quality and predictable, we feel the shares are fully valued and elected to take profits.
W.P. Carey, Inc. (WPC)WPC has made a nice move over the past year and we elected to reduce the position some as the valuation looks fairer at these levels. We remain attracted to WPC’s portfolio of “mission-critical” assets and its appealing dividend yield.
6
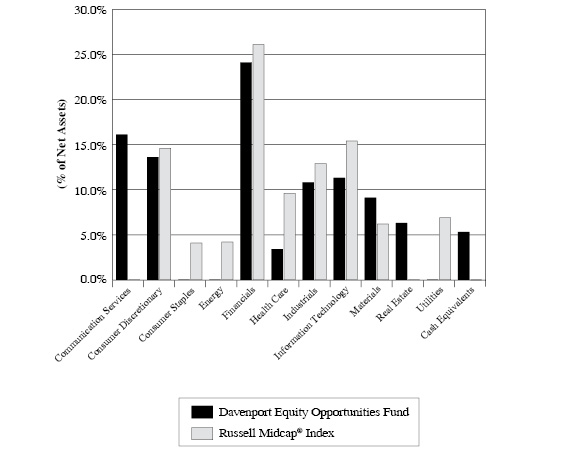
Davenport Equity Opportunities Fund
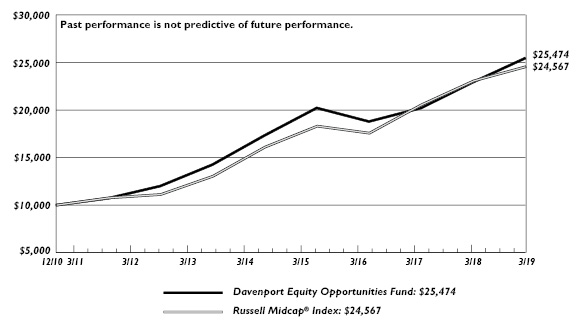
The following chart represents Davenport Equity Opportunities Fund (DEOPX) performance and the performance of the Russell Midcap Index*, the Fund’s primary benchmark, and the S&P 500 Index* for the periods ended March 31, 2019.
| Fiscal
Q4
2018 | 1 Year | 3 Years** | 5 Years** | Since
Inception
12/31/10** | Fiscal
Year 2019
Expense
Ratio |
Equity Opportunities Fund | 18.55% | 11.02% | 10.67% | 8.00% | 12.01% | 0.91% |
Russell Midcap Index | 16.54% | 6.47% | 11.82% | 8.81% | 11.52% | |
S&P 500 Index* | 13.65% | 9.50% | 13.51% | 10.91% | 12.69% | |
30-Day SEC Yield: -0.25%; Expense Ratio in current prospectus: 0.91%
Past performance is no guarantee of future results. Investment return and principal value of an investment will fluctuate so that an investor’s shares, when redeemed, may be worth more or less than their original cost. Current performance may be lower or higher than the performance data quoted. Performance data, current to the most recent month end, may be obtained by calling 1-800-281-3217.
* | The Russell Midcap® Index measures the performance of the 800 smallest companies in the Russell 1000, which represent approximately 25% of the total market capitalization of the Russell 1000®. Frank Russell Company is the source and owner of the trademarks, service marks, and copyrights related to the Russell Indexes. Russell® is a trademark of Frank Russell Company. The S&P 500 Index is comprised of 500 U.S. stocks and is an indicator of the performance of the overall U.S. stock market. An investor cannot invest in an index and its returns are not indicative of the performance of any specific investment. |
** | Returns greater than one year are annualized. |
The Equity Opportunities Fund closed the fiscal year on a strong note. After proving resilient amid a significant market wide drawdown to end calendar 2018, we were pleased to see the Fund’s fiscal fourth quarter return of 18.55% come in nicely ahead of the 16.54% gain for the Russell Midcap Index. For the full fiscal year, the Fund returned 11.02% compared to the Russell’s 6.47%. Whereas our valuation discipline and avoidance of momentum have made it difficult to keep up during previous periods of intense market appreciation, the more broad-based nature of the fiscal fourth-quarter rally allowed our roster of companies to shine.
Latin American e-commerce leader, MercadoLibre (MELI), was a top performer during the last year, advancing nearly 75% in the fourth quarter. While the stock started the year with a nice bounce from oversold levels, the company’s late February earnings report sent the shares into overdrive as the market latched on to a meaningful acceleration in the company’s payments business (think PayPal of South America). Other key contributors included cyclical entities such as cabinet maker American Woodmark (AMWD) and trucking equipment manufacturer WABCO Holdings (WBC), which struggled during calendar 2018 but rewarded our patience with sharp rallies to start the year. AMWD advanced nearly 50% during Q4 in response to better housing sentiment and a solid earnings report. WBC announced it had agreed to be acquired by a competitor near quarter end, resulting in a 23% premium to the 90-day trading average prior to the deal speculation. While the deal will not close until early 2020, we elected to take profits due to the stock’s close proximity to the takeout value in addition to the low likelihood of another bidder emerging.
7
The Fund’s two largest positions, American Tower (AMT) and Brookfield Asset Management (BAM) were also top performers to close the year, each advancing north of 20%. AMT was our top contributor to performance for the full fiscal year, returning nearly 40%. While the stock remains a top position, we elected to trim our exposure. Elsewhere, we trimmed positions in high fliers such as Live Nation Entertainment (LYV) and Autodesk (ADSK), which have been significant contributors and grew to be above-average positions. LYV was our second leading contributor to performance during the full year, returning over 50%. These actions allowed us to continue to build positions in Fidelity National Financial (FNF) and Watsco (WSO), two high-quality names highlighted last quarter that failed to fully participate in the market’s recent rally. In addition, we added a new position in video game publisher and developer Take-Two Interactive (TTWO), a company we have followed for some time that we believe has become quite cheap amid industry volatility.
TTWO is a leading video game developer and publisher, best known for its wholly-owned labels Rockstar Games and 2K. The company is known for putting out the fewest annual releases with the least consistent release cadence, instead choosing to only produce high quality intellectual property and continuing to monetize games long after initial release. We believe TTWO’s strategy of “fewer, bigger, better” releases has led the company to release strong, immersive, and sticky franchises which is borne out in higher average review scores compared to peers. These blockbuster titles continue to provide a long revenue tail well after initial release thanks to online modes that include downloadable content such as bonus levels and “micro-transactions” such as purchasing cosmetic items to personalize characters. TTWO has a debt-free balance sheet and ample cash on hand to invest in the business and repurchase shares. The stock has weakened alongside the video game publishers of late and is significantly off its highs. When adjusting for the company’s ~$14 per share of cash on hand, the stock now trades at a multiple of free cash flow comparable to legacy media companies, who don’t enjoy the same structural industry tailwinds as TTWO. We believe this represents a meaningful misevaluation given the company’s leading franchises, rich pipeline, and a history of successful game launches. Lastly, we believe the company is the most attractive publisher for a takeout given its size and valuable intellectual property.
In sum, we are pleased with the end to the year and remain confident in the Fund’s positioning. As discussed above, we were quite active as the year ended with respect to reallocating funds from top performers/larger positions to better risk/reward opportunities. This process along with the takeout of a meaningful position (WBC) allowed the Fund to build a slightly above-average cash balance during the final quarter. While we never intend to make “market calls” with our cash balance, we like having a bit more dry powder around to take advantage of new opportunities should they present themselves.
The following are transactions performed in the Equity Opportunities Fund for the quarter ended March 31, 2019.
Recent Purchases
Fidelity National Financial, Inc. (FNF)The position size is slightly below average and recent weakness afforded us the opportunity to continue building our stake. FNF appears to offer significant value in a market where deals have recently been harder to come by.
8
Take-Two Interactive Software, Inc. (TTWO)We initiated a position in TTWO and added to the position during the quarter. The company is a leading video game developer and publisher, and we feel it may be a prime candidate for a takeout given its leading franchises, strong pipeline and history of successful game launches.
Watsco, Inc. (WSO)We added to WSO as it appears to offer significant value in a market where deals have been harder to come by. We also like the stock’s yield. We note that the company fits the “owner-operator” theme given material inside ownership.
Recent Sales
American Tower Corporation (AMT) We really like the long-term outlook here, but the valuation is full relative to history and the stock could take a breather. Therefore, we elected to take some profits.
Autodesk, Inc. (ADSK) With the stock hitting new all-time highs, we used the recent strength to peel back the position. We still love the Autodesk story and believe the on-going shift to a subscription model will continue to drive annual recurring revenue (ARR) and annual revenue per subscriber (ARPS) to new highs.
Dollar Tree, Inc. (DLTR)The stock had a recent lift from news of involvement by activist investor Starboard. We are holding on to the majority of our position as activist involvement should put a floor on the stock and modest improvement in results could drive the shares higher.
Genesee & Wyoming, Inc. (GWR)With the shares seemingly fairly valued, we chipped our position and may look to continue to wind the position down amid further appreciation.
Live Nation Entertainment, Inc. (LYV)LYV has been an excellent performer over the past couple years and has added to gains this year. We are maintaining a sizeable position because we think the company’s dominant position in live events may yield many years of growth for ticketing volume, ticket pricing, advertising/sponsorship and venue management.
O’Reilly Automotive, Inc. (ORLY) We chipped our position in ORLY after the stock posted a sharp move higher and seemed fully valued at estimates for next year. We love ORLY’s management and consistent growth, but upside has become more limited.
WABCO Holdings, Inc. (WBC) We sold our position following the announcement that the company had agreed to be acquired. WBC was a solid performer for the Fund, and while we preferred a better outcome, we are still pleased to receive liquidity at a meaningful premium to our average cost.
Davenport Small Cap Focus Fund
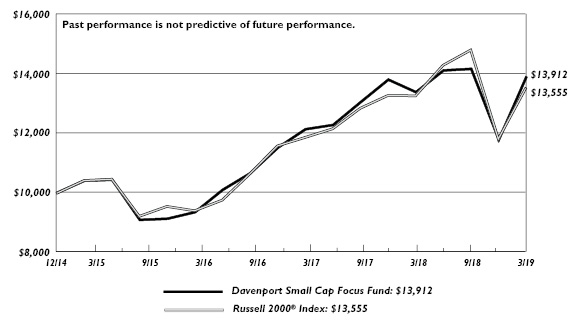
The following chart represents performance of the Davenport Small Cap Focus Fund (DSCPX) and the performance of the Fund’s primary benchmark, the Russell 2000 Index*, for the periods ended March 31, 2019.
| Fiscal
Q4
2018 | 1 Year | 3 Year | Since
Inception
12/31/14** | Fiscal
Year 2019
Expense
Ratio |
Small Cap Focus Fund | 17.99% | 3.90% | 14.17% | 8.08% | 0.97% |
Russell 2000 Index* | 14.58% | 2.05% | 12.92% | 7.43% | |
9
30-Day SEC Yield: 0.05%; Expense Ratio in current prospectus: 1.00%
Past performance is no guarantee of future results. Investment return and principal value of an investment will fluctuate so that an investor’s shares, when redeemed, may be worth more or less than their original cost. Current performance may be lower or higher than the performance data quoted. Performance data, current to the most recent month end, may be obtained by calling 1-800-281-3217.
* | The Russell 1000 Value Index measures the performance of the Russell 1000 companies with lower price-to-book ratios and lower forecasted growth values. Frank Russell Company is the source and owner of the trademarks, service marks, and copyrights related to the Russell Indexes. Russell® is a trademark of Frank Russell Company. An investor cannot invest in an index and its returns are not indicative of the performance of any specific investment. |
** | Returns greater than one year are annualized. |
The Davenport Small Cap Focus Fund (DSCPX) enjoyed a strong fiscal fourth quarter. The Fund gained 17.99% relative to a 14.58% advance for the Russell 2000. Small caps rebounded impressively from their fiscal third-quarter swoon, and outsized gains from a few key positions allowed us to outperform the benchmark. We are pleased with how we fared during this upswing, especially when considering the Fund’s relative resilience during the previous quarter’s selloff. For the fiscal year, the Fund gained 3.90% compared to the Russell’s gain of 2.05%.
A rather eclectic mix of names supported our fourth quarter performance. A few of these names were holdings that struggled during the beginning of the year and bounced back very sharply. The most notable example is cabinetmaker American Woodmark (AMWD), which gained 48% alongside a recovery in deeply depressed housing-related stocks. We added to our position during the stock’s late year swoon and are pleased our resolve paid off. Another example is Eldorado Resorts (ERI). Shares of the casino operator dropped sharply to finish calendar 2018. Here again, we added to our stake at very attractive prices and have seen the shares stage an impressive recovery. In both of these cases (as well as a few others), we have used recent surges to slightly reduce our positions. Etsy (ETSY) was our biggest contributor to performance for the full fiscal year, following a successful transition period during which the company was able to unlock the value of its differentiated marketplace business model through cost reduction and use experience improvements.
As our investors know, we have a concentrated approach (currently only 33 holdings) and love to find unique and underfollowed situations that appear to offer uncommon value. One recent example is OneSpaWorld (OSW), which has gotten off to a strong start for us and is currently our top position. OSW operates spas and fitness centers on cruise ships. The company has a 90%+ market share and exclusive contracts with all major cruise lines. We view the cruise industry as attractive with passenger counts growing consistently over the past 20 years and capacity projected to expand at a mid-single-digit rate over the new few years. OWS’s financials are enviable given low capital requirements (the cruise lines Fund the buildout of the spas) and a very low tax rate. This leads to significant free cash flow generation, which we think may ultimately lead to an attractive dividend stream. There are several initiatives underway that could drive double-digit EPS growth including price increases, targeted marketing and additional “medi-spa” services (Botox, CoolSculpting, etc.). When we began looking at the stock in late calendar 2018, it was a confusing situation (due to an acquisition) that was under the Street’s radar. Since then, we’ve been pleased to see the stock get some support.
10
Asset manager Diamond Hill Investment Group (DHIL) is another name we’ve been emphasizing. This relatively unknown (no analyst coverage) company appears to offer tremendous value following the stock’s recent weakness. DHIL manages roughly $21 billion for individuals and institutions across a suite of value-oriented mutual funds. While the company has an admirable long-term track record, recent results have been less impressive and DHIL has seen a modest decline in assets under management (AUM). The stock has traded down sharply and seems to have disconnected from company fundamentals. DHIL is generating $15/share of free cash flow (relative to a $138 stock price), has no debt and has roughly $60/share of cash & investments. Furthermore, it is actively returning capital to shareholders via a special dividend ($8/share last year) and a recently announced $50 million stock buyback (more than 10% of the total market cap). We also note employees own 20% of the company; hence, it squarely fits our owner-operator bias. We acknowledge that fund outflows may pressure near-term results, but a slight uptick in performance could produce solid upside and we are being paid nicely while we wait.
In sum, we are pleased with both the fiscal fourth quarter and full year gains, as well as our performance since inception. That said, we recognize the magnitude of Q4 gains is a bit unusual and not likely to be sustained. We anticipate returns will moderate and have raised cash alongside recent gains. We think this cash will come in handy if markets cool. We also aim to demonstrate less risk than our benchmark should turbulence resume. Our concentrated approach can yield substantial deviations from our benchmark, but our value bias and focus on profitable companies should dampen risk over time, as has been the case so far.
Davenport Balanced Income Fund
The following chart represents Davenport Balanced Income Fund (DBALX) performance, and performance of the Fund’s primary benchmark, the Russell 1000® Value Index, along with the Morningstar Allocation 50-70% Equity Index, and the blended 60% Russell 1000® Value Index / 40% Bloomberg Barclays Intermediate Government /Credit Bond Index for the period ended March 31, 2019.
| Fiscal
Q4
2018 | 1 Year | Since
Inception
12/31/15** | Fiscal
Year 2019
Expense
Ratio |
Balanced Income Fund | 7.96% | 3.35% | 6.06% | 0.96% |
Russell 1000® Value* | 11.93% | 5.67% | 10.16% | |
Morningstar Allocation 50-70% Equity* | 8.91% | 3.83% | 6.43% | |
60% Russell 1000® Value/40% BBIGC | 8.05% | 5.40% | 7.13% | |
30-Day SEC Yield: 2.06%; Expense Ratio in current prospectus: 0.97%
Past performance is no guarantee of future results. Investment return and principal value of an investment will fluctuate so that an investor’s shares, when redeemed, may be worth more or less than their original cost. Current performance may be lower or higher than the performance data quoted. Performance data, current to the most recent month end, may be obtained by calling 1-800-281-3217.
* | TheRussell 1000® Value Index measures the performance of the Russell 1000 companies with lower price-to-book ratios and lower forecasted growth values. The Morningstar US OE Allocation 50-70% Equity Index is composed of Funds which seek to provide both income and capital appreciation by investing in multiple asset classes, including stocks, bonds, and cash. These portfolios are dominated by domestic holdings and have equity exposure between |
11
50% and 70%. The blended 60% Russell 1000 Value/40%Bloomberg Barclay’s Intermediate Government/Credit (BBIGC) Index is included as an additional comparative index because it is representative of a balanced portfolio consisting of 60% equity and 40% fixed income securities. The BBIGC measures the non-securitized component of the U.S. Aggregate Index. It includes investment grade, U.S. dollar-denominated, fixed-rate Treasuries, government-related and corporate rate securities. Intermediate maturity bonds include bonds with maturities of 1 to 9.999 years. An investor cannot invest in an index and its returns are not indicative of the performance of any specific investment.
** | Returns greater than one year are annualized. |
The Davenport Balanced Income Fund increased 7.96% during fiscal Q4, versus an 11.93% return for the Russell 1000® Value and 13.65% for the S&P 500 Index. The Fund just lagged the blended 60% Russell 1000® Value and 40% Bloomberg Barclays Intermediate Government/Credit Index return of 8.05% for the quarter. For the full fiscal year, the Fund returned 3.35%. The Russell 1000® Value, S&P 500 and blended benchmark returned 5.67%, 9.50%, and 5.40%, respectively.
After a volatile end to the third quarter, equities returned to favor and wiped out the losses seen in the previous quarter. Financials and Consumer Staples were the greatest contributors to the equity portion of the Fund during the quarter. Consumer Staples regained popularity as interest rates declined and their dividend yields became more compelling. Of our holdings within the sector, Philip Morris International (PM), Anheuser-Busch InBev (BUD), Mondelēz International (MDLZ) all posted returns greater than 25% during the period. Within our Financials exposure, Brookfield Asset Management (BAM) and Fidelity National Financial (FNF) were our top contributors to performance. BAM’s fundraising continues to thrive and find attractive investment opportunities. FNF is a provider of various services to the real estate and mortgage industry and has benefited from lower interest rates and an uptick in mortgage applications so far this year. For the year, Merck (MRK) and Universal Corp (UVV) were our top contributors to performance. Our two biggest detractors to Q4 performance fell within the Health Care sector. CVS Health (CVS) struggled as investors focused on the disappointing results from the core business that overshadowed the potential opportunities born from the Aetna acquisition. We believe these near-term issues have been fully priced into the stock. Bristol-Myers Squibb (BMY) was a key detractor during both the Q4 and full year periods, following the news it would be acquiring Celgene (CELG) as investors worried about the level of debt that would be needed to fund the purchase. We believe the combined entity will generate significant cash flow and allow for rapid de-leveraging.
During the fourth quarter, we initiated a position in Lazard Ltd. (LAZ), a leading financial advisory and asset management firm. Lazard’s advisory activities are relatively more stable than capital markets activity directed towards raising equity or fixed income capital. Additionally, the restructuring segment provides stability during tougher economic times. The company is managed by a top-notch team focused on long-term margin improvement and returns to shareholders through dividends and stock repurchases.
After a volatile ending to fiscal Q3, the bond market settled down, posting positive returns across the majority of U.S. bond indices for Q4. After a more dovish message from the Fed in March, U.S. Treasuries caught a bid ending the quarter with yields lower (prices higher) than where we began the year. The yield on the 2-yr Treasury fell 23bps, while the rates on the 10-yr Treasury and the 30-yr Treasury fell 28bps (2.41%) and 20bps (2.82%), respectively. The Bloomberg Barclays Intermediate Government/Credit Index returned 2.32% and the Bloomberg Barclays US FRN <5-yr Index recouped fiscal Q3 losses posting a 1.47% gain for Q4.
12
The bond allocation of the Balanced Fund consists of 29 high-quality bonds across eight sectors with the top allocations to U.S. Governments at 28.62%, Consumer Discretionary at 21.86%, Energy at 16.43%, and Financials at 15.68%. The credit quality of the Fund has improved to A+/A while having an effective maturity of 4.12 years and a duration of 3.15 years. During Q4, we took advantage of strong corporate credit demand to exit Becton Dickinson, Anheuser-Busch InBev, and Verizon locking in gains while we could. With the proceeds we initiated and added to our Treasury exposure in the two- six- and ten -year maturities and bought Citigroup 3.3% 2025. Our transactions during the end of the year are consistent with our theme of trading up in credit quality while remaining defensive, taking our U.S. Treasury exposure to 28.62% up from 18% at the end of Q3. Our floating-rate exposure decreased to 34% from 39% due to positions maturing. The income levels for the floating-rate notes change quarterly based on the level of 3-month LIBOR (London Inter-bank Offered Rate). This rate ended Q4 at 2.6% down from 2.8% in 2018 due to the decrease in Fed hike expectations. Going forward, we will gradually decrease our floating-rate exposure, but we are not outright sellers at the moment.
We were pleased with our performance to end the year and continue to see value in a balanced approach in a turbulent market with continuous headlines surrounding trade negotiations, interest rates, and Washington policy uncertainty. We believe our allocation to value-based equity and defensive positioning in fixed income may provide a volatility buffer in the near future, while focusing on current income and long-term capital appreciation.
In conclusion, we are pleased that the Davenport Funds are off to a good start thus far in 2019. We thank you for your trust and look forward to reporting back as we proceed through the year.
Sincerely,
John P. Ackerly IV, CFA
President, The Davenport Funds
13
DAVENPORT CORE FUND
PERFORMANCE INFORMATION (Unaudited)
Comparison of the Change in Value of a $10,000 Investment in
Davenport Core Fund and the Standard & Poor’s 500® Index

| | Average Annual Total Returns
(for periods ended March 31, 2019) | |
| | 1 Year | 5 Years | 10 Years | |
Davenport Core Fund(a) | 8.21% | 9.04% | 14.43% | |
Standard & Poor’s 500® Index | 9.50% | 10.91% | 15.92% | |
(a) | The total returns shown do not reflect the deduction of taxes that a shareholder would pay on Fund distributions or the redemption of Fund shares. |
14
DAVENPORT VALUE & INCOME FUND
PERFORMANCE INFORMATION (Unaudited)
Comparison of the Change in Value of a $10,000 Investment in
Davenport Value & Income Fund, the Russell 1000® Value Index
and the Lipper Equity Income Index

| | Average Annual Total Returns
(for periods ended March 31, 2019) | |
| | 1 Year | 5 Years | Since
Inception(b) | |
Davenport Value & Income Fund(a) | 2.96% | 7.60% | 11.16% | |
Russell 1000® Value Index | 5.67% | 7.72% | 10.84% | |
Lipper Equity Income Index | 6.94% | 7.85% | 10.25% | |
(a) | The total returns shown do not reflect the deduction of taxes that a shareholder would pay on Fund distributions or the redemption of Fund shares. |
(b) | Commencement of operations was December 31, 2010. |
15
DAVENPORT EQUITY OPPORTUNITIES FUND
PERFORMANCE INFORMATION (Unaudited)
Comparison of the Change in Value of a $10,000 Investment in
Davenport Equity Opportunities Fund and the Russell Midcap® Index
| | Average Annual Total Returns
(for periods ended March 31, 2019) | |
| | 1 Year | 5 Years | Since
Inception(b) | |
Davenport Equity Opportunities Fund(a) | 11.02% | 8.00% | 12.01% | |
Russell Midcap® Index | 6.47% | 8.81% | 11.52% | |
(a) | The total returns shown do not reflect the deduction of taxes that a shareholder would pay on Fund distributions or the redemption of Fund shares. |
(b) | Commencement of operations was December 31, 2010. |
16
DAVENPORT SMALL CAP FOCUS FUND
PERFORMANCE INFORMATION (Unaudited)
Comparison of the Change in Value of a $10,000 Investment in
Davenport Small Cap Focus Fund and the Russell 2000® Index
| | Average Annual Total Returns
(for periods ended March 31, 2019) | |
| | 1 Year | 3 Years | Since
Inception(b) | |
Davenport Small Cap Focus Fund(a) | 3.90% | 14.17% | 8.08% | |
Russell 2000® Index | 2.05% | 12.92% | 7.43% | |
(a) | The total returns shown do not reflect the deduction of taxes that a shareholder would pay on Fund distributions or the redemption of Fund shares. |
(b) | Commencement of operations was December 31, 2014. |
17
DAVENPORT BALANCED INCOME FUND
PERFORMANCE INFORMATION (Unaudited)
Comparison of the Change in Value of a $10,000 Investment in Davenport Balanced
Income Fund, the Russell 1000® Value Index, a Blended 60% Russell 1000® Value
Index / 40% Bloomberg Barclays Intermediate Government/Credit Bond Index
and the Morningstar US OE Allocation — 50% to 70% Equity

| | Average Annual Total Returns
(for periods ended March 31, 2019) | |
| | 1 Year | 3 Years | Since
Inception(b) | |
Davenport Balanced Income Fund(a) | 3.35% | 5.56% | 6.06% | |
Russell 1000® Value Index | 5.67% | 10.45% | 10.16% | |
Blended 60% Russell 1000® ValueIndex / 40% Bloomberg Barclays Intermediate Government/Credit Bond Index | 5.40% | 7.02% | 7.13% | |
Morningstar US OE Allocation - 50% to 70% Equity | 3.79% | 7.29% | 7.01% | |
(a) | The total returns shown do not reflect the deduction of taxes that a shareholder would pay on Fund distributions or the redemption of Fund shares. |
(b) | Commencement of operations was December 31, 2015. |
18
DAVENPORT CORE FUND
PORTFOLIO INFORMATION
March 31, 2019 (Unaudited)
Sector Allocation vs. the Standard & Poor’s 500® Index

Top Ten Equity Holdings
Security Description | % of Net Assets |
American Tower Corporation | 4.1% |
Visa, Inc. - Class A | 3.8% |
Danaher Corporation | 3.5% |
Brookfield Asset Management, Inc. - Class A | 3.4% |
Adobe, Inc. | 3.3% |
Berkshire Hathaway, Inc. - Class B | 3.2% |
Accenture plc - Class A | 3.2% |
Markel Corporation | 3.0% |
Johnson & Johnson | 2.7% |
Union Pacific Corporation | 2.7% |
19
DAVENPORT VALUE & INCOME FUND
PORTFOLIO INFORMATION
March 31, 2019 (Unaudited)
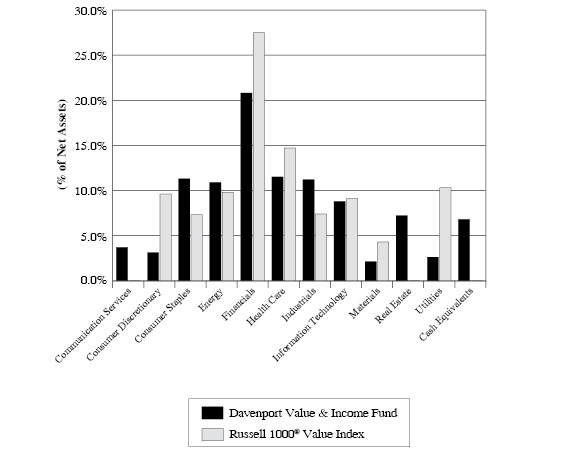
Sector Allocation vs. the Russell 1000® Value Index
Top Ten Equity Holdings
Security Description | % of Net Assets |
Brookfield Asset Management, Inc. - Class A | 3.2% |
Johnson & Johnson | 3.1% |
Microsoft Corporation | 3.0% |
Royal Dutch Shell plc - Class B - ADR | 3.0% |
Cisco Systems, Inc. | 3.0% |
Fidelity National Financial, Inc. | 2.9% |
Merck & Company, Inc. | 2.8% |
JPMorgan Chase & Company | 2.8% |
Dominion Energy, Inc. | 2.6% |
Markel Corporation | 2.5% |
20
DAVENPORT EQUITY OPPORTUNITIES FUND
PORTFOLIO INFORMATION
March 31, 2019 (Unaudited)
Sector Allocation vs. the Russell Midcap® Index
Top Ten Equity Holdings
Security Description | % of Net Assets |
Brookfield Asset Management, Inc. - Class A | 6.6% |
American Tower Corporation | 6.3% |
Live Nation Entertainment, Inc. | 4.9% |
CarMax, Inc. | 4.6% |
Martin Marietta Materials, Inc. | 4.6% |
Sherwin-Williams Company (The) | 4.5% |
Markel Corporation | 4.5% |
Intuit, Inc. | 4.0% |
Autodesk, Inc. | 4.0% |
DISH Network Corporation - Class A | 3.9% |
21
DAVENPORT SMALL CAP FOCUS FUND
PORTFOLIO INFORMATION
March 31, 2019 (Unaudited)
Sector Allocation vs. the Russell 2000® Index

Top Ten Equity Holdings
Security Description | % of Net Assets |
OneSpaWorld Holdings Ltd. | 4.8% |
Diamond Hill Investment Group, Inc. | 4.1% |
American Woodmark Corporation | 4.0% |
Colfax Corporation | 3.7% |
Trupanion, Inc. | 3.7% |
Kinsale Capital Group, Inc. | 3.7% |
Black Knight, Inc. | 3.5% |
Evoqua Water Technologies Corporation | 3.3% |
Lamar Advertising Company - Class A | 3.3% |
Monarch Casino & Resort, Inc. | 3.3% |
22
DAVENPORT BALANCED INCOME FUND
PORTFOLIO INFORMATION
March 31, 2019 (Unaudited)
Asset Allocation (% of Net Assets) | | Ten Largest Equity Holdings | % of Net Assets |

| | Brookfield Asset Management, Inc. - Class A | 1.8% |
Johnson & Johnson | 1.7% |
Microsoft Corporation | 1.7% |
Royal Dutch Shell plc - Class B - ADR | 1.6% |
Cisco Systems, Inc. | 1.6% |
Fidelity National Financial, Inc. | 1.6% |
Merck & Company, Inc. | 1.5% |
JPMorgan Chase & Company | 1.5% |
Dominion Energy, Inc. | 1.4% |
Markel Corporation | 1.4% |
Equity Sector Concentration vs. the Russell 1000 Value Index (59.4% of Net Assets) |

Bond Portfolio (35.0% of Net Assets) | | Credit Quality | Composite Quality |
Number of Fixed-Income Securities | 29 | | AAA | 29.2% |
Average Quality | A1 | | AA | 2.3% |
Effective Maturity | 4.1 yrs. | | A | 42.4% |
Average Effective Duration | 3.1 yrs. | | BBB | 26.1% |
| | | | Ba | 0.0% |
Sector Breakdown | % of Corporate
Bond Portfolio |
Communication Services | 1.9% |
Consumer Discretionary | 0.0% |
Consumer Staples | 14.5% |
Energy | 13.1% |
Financials | 23.1% |
Health Care | 7.7% |
Industrials | 3.6% |
Information Technology | 4.5% |
Materials | 2.5% |
Utilities | 0.0% |
U.S. Treasury | 29.1% |
23
DAVENPORT CORE FUND
SCHEDULE OF INVESTMENTS
March 31, 2019 |
COMMON STOCKS — 95.8% | | Shares | | | Value | |
Communication Services — 6.2% | | | | | | | | |
Alphabet, Inc. - Class A(a) | | | 7,961 | | | $ | 9,369,221 | |
Alphabet, Inc. - Class C(a) | | | 7,141 | | | | 8,378,607 | |
Liberty Broadband Corporation - Series C(a) | | | 103,475 | | | | 9,492,797 | |
Walt Disney Company (The) | | | 45,171 | | | | 5,015,336 | |
| | | | | | | | 32,255,961 | |
Consumer Discretionary — 9.8% | | | | | | | | |
Alibaba Group Holding Ltd. - ADR(a) | | | 40,475 | | | | 7,384,664 | |
Amazon.com, Inc.(a) | | | 6,395 | | | | 11,387,896 | |
CarMax, Inc.(a) | | | 184,187 | | | | 12,856,253 | |
Home Depot, Inc. (The) | | | 56,232 | | | | 10,790,358 | |
NIKE, Inc. - Class B | | | 94,083 | | | | 7,922,729 | |
| | | | | | | | 50,341,900 | |
Consumer Staples — 7.1% | | | | | | | | |
Anheuser-Busch InBev S.A./N.V. - ADR | | | 113,732 | | | | 9,550,076 | |
Mondelēz International, Inc. - Class A | | | 154,758 | | | | 7,725,519 | |
Nestlé S.A. - ADR | | | 123,854 | | | | 11,805,763 | |
PepsiCo, Inc. | | | 62,225 | | | | 7,625,674 | |
| | | | | | | | 36,707,032 | |
Energy — 5.1% | | | | | | | | |
Chevron Corporation | | | 69,694 | | | | 8,584,907 | |
EOG Resources, Inc. | | | 95,470 | | | | 9,086,835 | |
Marathon Petroleum Corporation | | | 148,825 | | | | 8,907,176 | |
| | | | | | | | 26,578,918 | |
Financials — 17.7% | | | | | | | | |
Berkshire Hathaway, Inc. - Class B(a) | | | 82,053 | | | | 16,483,627 | |
Brookfield Asset Management, Inc. - Class A | | | 373,978 | | | | 17,446,074 | |
Capital One Financial Corporation | | | 150,286 | | | | 12,276,863 | |
Citigroup, Inc. | | | 192,296 | | | | 11,964,657 | |
CME Group, Inc. | | | 52,565 | | | | 8,651,148 | |
JPMorgan Chase & Company | | | 93,517 | | | | 9,466,726 | |
Markel Corporation(a) | | | 15,355 | | | | 15,297,265 | |
| | | | | | | | 91,586,360 | |
Health Care — 11.7% | | | | | | | | |
Becton, Dickinson and Company | | | 43,084 | | | | 10,759,367 | |
CVS Health Corporation | | | 130,146 | | | | 7,018,774 | |
Danaher Corporation | | | 135,736 | | | | 17,919,867 | |
Johnson & Johnson | | | 100,240 | | | | 14,012,550 | |
Merck & Company, Inc. | | | 130,354 | | | | 10,841,542 | |
| | | | | | | | 60,552,100 | |
Industrials — 7.6% | | | | | | | | |
FedEx Corporation | | | 56,307 | | | | 10,214,653 | |
General Dynamics Corporation | | | 41,578 | | | | 7,038,324 | |
Honeywell International, Inc. | | | 49,524 | | | | 7,870,354 | |
24
DAVENPORT CORE FUND
SCHEDULE OF INVESTMENTS (Continued) |
COMMON STOCKS — 95.8% (Continued) | | Shares | | | Value | |
Industrials — 7.6% (Continued) | | | | | | | | |
Union Pacific Corporation | | | 83,365 | | | $ | 13,938,628 | |
| | | | | | | | 39,061,959 | |
Information Technology — 18.0% | | | | | | | | |
Accenture plc - Class A | | | 93,234 | | | | 16,411,049 | |
Adobe, Inc.(a) | | | 63,835 | | | | 17,011,389 | |
Apple, Inc. | | | 43,769 | | | | 8,313,921 | |
Broadcom, Inc. | | | 29,532 | | | | 8,880,568 | |
Mastercard, Inc. - Class A | | | 58,230 | | | | 13,710,253 | |
Microsoft Corporation | | | 75,568 | | | | 8,912,490 | |
Visa, Inc. - Class A | | | 125,494 | | | | 19,600,908 | |
| | | | | | | | 92,840,578 | |
Materials — 8.5% | | | | | | | | |
Air Products & Chemicals, Inc. | | | 45,394 | | | | 8,668,438 | |
Ecolab, Inc. | | | 50,016 | | | | 8,829,825 | |
Martin Marietta Materials, Inc. | | | 40,356 | | | | 8,118,820 | |
Sherwin-Williams Company (The) | | | 25,865 | | | | 11,140,314 | |
Vulcan Materials Company | | | 59,065 | | | | 6,993,296 | |
| | | | | | | | 43,750,693 | |
Real Estate — 4.1% | | | | | | | | |
American Tower Corporation | | | 106,472 | | | | 20,981,372 | |
| | | | | | | | | |
Total Common Stocks (Cost $315,391,620) | | | | | | $ | 494,656,873 | |
|
MONEY MARKET FUNDS — 1.4% | | Shares | | | Value | |
First American Treasury Obligations Fund - Class Z, 2.33%(b) (Cost $7,366,819) | | | 7,366,819 | | | $ | 7,366,819 | |
| | | | | | | | | |
Total Investments at Value — 97.2% (Cost $322,758,439) | | | | | | $ | 502,023,692 | |
| | | | | | | | | |
Other Assets in Excess of Liabilities — 2.8% | | | | | | | 14,204,148 | |
| | | | | | | | | |
Net Assets — 100.0% | | | | | | $ | 516,227,840 | |
ADR - American Depositary Receipt.
(a) | Non-income producing security. |
(b) | The rate shown is the 7-day effective yield as of March 31, 2019. |
See accompanying notes to financial statements.
25
DAVENPORT VALUE & INCOME FUND
SCHEDULE OF INVESTMENTS
March 31, 2019 |
COMMON STOCKS — 93.2% | | Shares | | | Value | |
Communication Services — 3.7% | | | | | | | | |
Comcast Corporation - Class A | | | 350,355 | | | $ | 14,007,193 | |
Verizon Communications, Inc. | | | 183,215 | | | | 10,833,503 | |
| | | | | | | | 24,840,696 | |
Consumer Discretionary — 3.1% | | | | | | | | |
Carnival Corporation | | | 205,680 | | | | 10,432,090 | |
Las Vegas Sands Corporation | | | 175,890 | | | | 10,722,254 | |
| | | | | | | | 21,154,344 | |
Consumer Staples — 11.3% | | | | | | | | |
Altria Group, Inc. | | | 178,636 | | | | 10,259,065 | |
Anheuser-Busch InBev S.A./N.V. - ADR | | | 157,460 | | | | 13,221,916 | |
Diageo plc - ADR | | | 90,780 | | | | 14,852,516 | |
Mondelēz International, Inc. - Class A | | | 246,890 | | | | 12,324,749 | |
PepsiCo, Inc. | | | 96,805 | | | | 11,863,453 | |
Philip Morris International, Inc. | | | 155,720 | | | | 13,764,091 | |
| | | | | | | | 76,285,790 | |
Energy — 10.9% | | | | | | | | |
Chevron Corporation | | | 68,366 | | | | 8,421,324 | |
Enbridge, Inc. | | | 301,622 | | | | 10,936,814 | |
Exxon Mobil Corporation | | | 85,975 | | | | 6,946,780 | |
Marathon Petroleum Corporation | | | 221,120 | | | | 13,234,032 | |
Occidental Petroleum Corporation | | | 204,105 | | | | 13,511,751 | |
Royal Dutch Shell plc - Class B - ADR | | | 313,175 | | | | 20,027,541 | |
| | | | | | | | 73,078,242 | |
Financials — 20.8% | | | | | | | | |
Allstate Corporation (The) | | | 110,620 | | | | 10,418,192 | |
Bank of America Corporation | | | 355,000 | | | | 9,794,450 | |
Brookfield Asset Management, Inc. - Class A | | | 467,865 | | | | 21,825,902 | |
Capital One Financial Corporation | | | 180,355 | | | | 14,733,200 | |
Citigroup, Inc. | | | 252,780 | | | | 15,727,972 | |
Fairfax Financial Holdings Ltd. | | | 26,755 | | | | 12,444,018 | |
Fidelity National Financial, Inc. | | | 532,110 | | | | 19,448,620 | |
JPMorgan Chase & Company | | | 186,385 | | | | 18,867,753 | |
Markel Corporation(a) | | | 16,890 | | | | 16,826,494 | |
| | | | | | | | 140,086,601 | |
Health Care — 11.5% | | | | | | | | |
Bristol-Myers Squibb Company | | | 288,780 | | | | 13,777,694 | |
CVS Health Corporation | | | 232,380 | | | | 12,532,253 | |
Johnson & Johnson | | | 151,165 | | | | 21,131,355 | |
Medtronic plc | | | 122,070 | | | | 11,118,136 | |
Merck & Company, Inc. | | | 227,735 | | | | 18,940,720 | |
| | | | | | | | 77,500,158 | |
26
DAVENPORT VALUE & INCOME FUND
SCHEDULE OF INVESTMENTS (Continued) |
COMMON STOCKS — 93.2% (Continued) | | Shares | | | Value | |
Industrials — 11.2% | | | | | | | | |
3M Company | | | 43,445 | | | $ | 9,027,002 | |
Boeing Company (The) | | | 36,075 | | | | 13,759,726 | |
Delta Air Lines, Inc. | | | 248,415 | | | | 12,830,635 | |
Eaton Corporation plc | | | 171,192 | | | | 13,791,228 | |
United Parcel Service, Inc. - Class B | | | 93,520 | | | | 10,449,925 | |
Watsco, Inc. | | | 109,050 | | | | 15,617,050 | |
| | | | | | | | 75,475,566 | |
Information Technology — 8.8% | | | | | | | | |
Cisco Systems, Inc. | | | 369,930 | | | | 19,972,521 | |
DXC Technology Company | | | 116,345 | | | | 7,482,147 | |
Microsoft Corporation | | | 172,493 | | | | 20,343,824 | |
TE Connectivity Ltd. | | | 145,775 | | | | 11,771,331 | |
| | | | | | | | 59,569,823 | |
Materials — 2.1% | | | | | | | | |
PPG Industries, Inc. | | | 122,945 | | | | 13,876,802 | |
| | | | | | | | | |
Real Estate — 7.2% | | | | | | | | |
Crown Castle International Corporation | | | 94,335 | | | | 12,074,880 | |
Gaming and Leisure Properties, Inc. | | | 269,164 | | | | 10,381,656 | |
Lamar Advertising Company - Class A | | | 189,120 | | | | 14,989,651 | |
W.P. Carey, Inc. | | | 139,374 | | | | 10,917,165 | |
| | | | | | | | 48,363,352 | |
Utilities — 2.6% | | | | | | | | |
Dominion Energy, Inc. | | | 225,465 | | | | 17,284,147 | |
| | | | | | | | | |
Total Common Stocks(Cost $515,813,618) | | | | | | $ | 627,515,521 | |
|
MONEY MARKET FUNDS — 6.7% | | Shares | | | Value | |
First American Treasury Obligations Fund - Class Z, 2.33%(b) (Cost $44,755,752) | | | 44,755,752 | | | $ | 44,755,752 | |
| | | | | | | | | |
Total Investments at Value — 99.9% (Cost $560,569,370) | | | | | | $ | 672,271,273 | |
| | | | | | | | | |
Other Assets in Excess of Liabilities — 0.1% | | | | | | | 683,077 | |
| | | | | | | | | |
Net Assets — 100.0% | | | | | | $ | 672,954,350 | |
ADR - American Depositary Receipt.
(a) | Non-income producing security. |
(b) | The rate shown is the 7-day effective yield as of March 31, 2019. |
See accompanying notes to financial statements.
27
DAVENPORT EQUITY OPPORTUNITIES FUND
SCHEDULE OF INVESTMENTS
March 31, 2019 |
COMMON STOCKS — 94.7% | | Shares | | | Value | |
Communication Services — 16.1% | | | | | | | | |
DISH Network Corporation - Class A(a) | | | 505,910 | | | $ | 16,032,288 | |
Liberty Broadband Corporation - Series C(a) | | | 171,035 | | | | 15,690,751 | |
Live Nation Entertainment, Inc.(a) | | | 317,209 | | | | 20,155,460 | |
Take-Two Interactive Software, Inc.(a) | | | 150,274 | | | | 14,181,357 | |
| | | | | | | | 66,059,856 | |
Consumer Discretionary — 13.6% | | | | | | | | |
CarMax, Inc.(a) | | | 270,745 | | | | 18,898,001 | |
Dollar Tree, Inc.(a) | | | 117,981 | | | | 12,392,724 | |
MercadoLibre, Inc.(a) | | | 30,241 | | | | 15,354,263 | |
O'Reilly Automotive, Inc.(a) | | | 22,880 | | | | 8,884,304 | |
| | | | | | | | 55,529,292 | |
Financials — 24.1% | | | | | | | | |
Brookfield Asset Management, Inc. - Class A | | | 581,227 | | | | 27,114,240 | |
Capital One Financial Corporation | | | 178,274 | | | | 14,563,203 | |
Cboe Global Markets, Inc. | | | 104,840 | | | | 10,005,930 | |
Fairfax Financial Holdings Ltd. | | | 27,203 | | | | 12,652,387 | |
Fidelity National Financial, Inc. | | | 430,940 | | | | 15,750,857 | |
Markel Corporation(a) | | | 18,427 | | | | 18,357,714 | |
| | | | | | | | 98,444,331 | |
Health Care — 3.4% | | | | | | | | |
Zoetis, Inc. | | | 138,935 | | | | 13,986,587 | |
| | | | | | | | | |
Industrials — 10.8% | | | | | | | | |
American Woodmark Corporation(a) | | | 170,450 | | | | 14,084,284 | |
Genesee & Wyoming, Inc. - Class A(a) | | | 81,510 | | | | 7,102,781 | |
Watsco, Inc. | | | 88,125 | | | | 12,620,381 | |
Xylem, Inc. | | | 131,400 | | | | 10,385,856 | |
| | | | | | | | 44,193,302 | |
Information Technology — 11.3% | | | | | | | | |
Autodesk, Inc.(a) | | | 104,575 | | | | 16,294,876 | |
Black Knight, Inc.(a) | | | 244,200 | | | | 13,308,900 | |
Intuit, Inc. | | | 62,899 | | | | 16,442,428 | |
| | | | | | | | 46,046,204 | |
Materials — 9.1% | | | | | | | | |
Martin Marietta Materials, Inc. | | | 92,382 | | | | 18,585,411 | |
Sherwin-Williams Company (The) | | | 42,950 | | | | 18,498,995 | |
| | | | | | | | 37,084,406 | |
Real Estate — 6.3% | | | | | | | | |
American Tower Corporation | | | 131,450 | | | | 25,903,537 | |
| | | | | | | | | |
Total Common Stocks (Cost $290,432,862) | | | | | | $ | 387,247,515 | |
28
DAVENPORT EQUITY OPPORTUNITIES FUND
SCHEDULE OF INVESTMENTS (Continued) |
MONEY MARKET FUNDS — 1.8% | | Shares | | | Value | |
First American Treasury Obligations Fund - Class Z, 2.33%(b) (Cost $7,498,616) | | | 7,498,616 | | | $ | 7,498,616 | |
| | | | | | | | | |
Total Investments at Value — 96.5%(Cost $297,931,478) | | | | | | $ | 394,746,131 | |
| | | | | | | | | |
Other Assets in Excess of Liabilities — 3.5% | | | | | | | 14,256,256 | |
| | | | | | | | | |
Net Assets — 100.0% | | | | | | $ | 409,002,387 | |
(a) | Non-income producing security. |
(b) | The rate shown is the 7-day effective yield as of March 31, 2019. |
See accompanying notes to financial statements.
29
DAVENPORT SMALL CAP FOCUS FUND
SCHEDULE OF INVESTMENTS
March 31, 2019 |
COMMON STOCKS — 89.2% | | Shares | | | Value | |
Communication Services — 6.3% | | | | | | | | |
Cable One, Inc. | | | 4,238 | | | $ | 4,159,089 | |
Meredith Corporation | | | 50,000 | | | | 2,763,000 | |
Shenandoah Telecommunications Company | | | 57,790 | | | | 2,563,564 | |
| | | | | | | | 9,485,653 | |
Consumer Discretionary — 13.3% | | | | | | | | |
Drive Shack, Inc.(a) | | | 516,437 | | | | 2,318,802 | |
Eldorado Resorts, Inc.(a) | | | 99,381 | | | | 4,640,099 | |
Etsy, Inc.(a) | | | 38,969 | | | | 2,619,496 | |
Monarch Casino & Resort, Inc.(a) | | | 113,893 | | | | 5,002,181 | |
Pool Corporation | | | 20,461 | | | | 3,375,451 | |
Red Rock Resorts, Inc. - Class A | | | 89,899 | | | | 2,323,889 | |
| | | | | | | | 20,279,918 | |
Consumer Staples — 2.7% | | | | | | | | |
Seaboard Corporation | | | 968 | | | | 4,147,590 | |
| | | | | | | | | |
Energy — 2.2% | | | | | | | | |
Alliance Resource Partners, L.P. | | | 57,309 | | | | 1,166,811 | |
CONSOL Coal Resources, L.P. | | | 125,800 | | | | 2,222,886 | |
| | | | | | | | 3,389,697 | |
Financials — 25.2% | | | | | | | | |
Cannae Holdings, Inc.(a) | | | 200,000 | | | | 4,852,000 | |
Cohen & Steers, Inc. | | | 108,350 | | | | 4,579,955 | |
Diamond Hill Investment Group, Inc. | | | 44,953 | | | | 6,293,420 | |
Kinsale Capital Group, Inc. | | | 81,151 | | | | 5,564,524 | |
OneSpaWorld Holdings Ltd.(a) | | | 531,932 | | | | 7,266,191 | |
TowneBank | | | 170,268 | | | | 4,214,133 | |
Trupanion, Inc.(a) | | | 170,562 | | | | 5,584,200 | |
| | | | | | | | 38,354,423 | |
Health Care — 3.0% | | | | | | | | |
Aratana Therapeutics, Inc.(a) | | | 599,956 | | | | 2,159,841 | |
Teladoc Health, Inc.(a) | | | 43,273 | | | | 2,405,979 | |
| | | | | | | | 4,565,820 | |
Industrials — 22.6% | | | | | | | | |
American Woodmark Corporation(a) | | | 73,641 | | | | 6,084,956 | |
Builders FirstSource, Inc.(a) | | | 210,886 | | | | 2,813,219 | |
Casella Waste Systems, Inc. - Class A(a) | | | 109,921 | | | | 3,908,791 | |
Colfax Corporation(a) | | | 190,000 | | | | 5,639,200 | |
Evoqua Water Technologies Corporation(a) | | | 401,576 | | | | 5,051,826 | |
Marten Transport Ltd. | | | 134,636 | | | | 2,400,560 | |
SiteOne Landscape Supply, Inc.(a) | | | 62,842 | | | | 3,591,420 | |
Watsco, Inc. | | | 33,593 | | | | 4,810,854 | |
| | | | | | | | 34,300,826 | |
30
DAVENPORT SMALL CAP FOCUS FUND
SCHEDULE OF INVESTMENTS (Continued) |
COMMON STOCKS — 89.2% (Continued) | | Shares | | | Value | |
Information Technology — 3.5% | | | | | | | | |
Black Knight, Inc.(a) | | | 98,267 | | | $ | 5,355,551 | |
| | | | | | | | | |
Materials — 5.5% | | | | | | | | |
MAG Silver Corporation(a) | | | 429,950 | | | | 4,583,267 | |
NewMarket Corporation | | | 8,641 | | | | 3,746,392 | |
| | | | | | | | 8,329,659 | |
Real Estate — 4.9% | | | | | | | | |
FRP Holdings, Inc.(a) | | | 50,556 | | | | 2,404,949 | |
Lamar Advertising Company - Class A | | | 63,300 | | | | 5,017,158 | |
| | | | | | | | 7,422,107 | |
| | | | | | | | | |
Total Common Stocks(Cost $120,384,224) | | | | | | $ | 135,631,244 | |
|
MONEY MARKET FUNDS — 8.5% | | Shares | | | Value | |
First American Treasury Obligations Fund - Class Z, 2.33%(b) (Cost $12,926,695) | | | 12,926,695 | | | $ | 12,926,695 | |
| | | | | | | | | |
Total Investments at Value — 97.7% (Cost $133,310,919) | | | | | | $ | 148,557,939 | |
| | | | | | | | | |
Other Assets in Excess of Liabilities — 2.3% | | | | | | | 3,504,950 | |
| | | | | | | | | |
Net Assets — 100.0% | | | | | | $ | 152,062,889 | |
(a) | Non-income producing security. |
(b) | The rate shown is the 7-day effective yield as of March 31, 2019. |
See accompanying notes to financial statements.
31
DAVENPORT BALANCED INCOME FUND
SCHEDULE OF INVESTMENTS
March 31, 2019 |
COMMON STOCKS — 59.4% | | Shares | | | Value | |
Communication Services — 2.1% | | | | | | | | |
Comcast Corporation - Class A | | | 41,880 | | | $ | 1,674,362 | |
Verizon Communications, Inc. | | | 21,190 | | | | 1,252,965 | |
| | | | | | | | 2,927,327 | |
Consumer Discretionary — 1.7% | | | | | | | | |
Carnival Corporation | | | 23,610 | | | | 1,197,499 | |
Las Vegas Sands Corporation | | | 20,380 | | | | 1,242,365 | |
| | | | | | | | 2,439,864 | |
Consumer Staples — 6.8% | | | | | | | | |
Altria Group, Inc. | | | 20,565 | | | | 1,181,048 | |
Anheuser-Busch InBev S.A./N.V. - ADR | | | 18,025 | | | | 1,513,559 | |
Diageo plc - ADR | | | 10,400 | | | | 1,701,544 | |
Mondelēz International, Inc. - Class A | | | 28,255 | | | | 1,410,490 | |
PepsiCo, Inc. | | | 11,200 | | | | 1,372,560 | |
Philip Morris International, Inc. | | | 18,275 | | | | 1,615,327 | |
Universal Corporation | | | 14,230 | | | | 820,075 | |
| | | | | | | | 9,614,603 | |
Energy — 6.7% | | | | | | | | |
Chevron Corporation | | | 7,910 | | | | 974,354 | |
Enbridge, Inc. | | | 34,808 | | | | 1,262,138 | |
Exxon Mobil Corporation | | | 9,960 | | | | 804,768 | |
Marathon Petroleum Corporation | | | 25,735 | | | | 1,540,240 | |
MPLX, L.P. | | | 30,425 | | | | 1,000,678 | |
Occidental Petroleum Corporation | | | 23,610 | | | | 1,562,982 | |
Royal Dutch Shell plc - Class B - ADR | | | 36,150 | | | | 2,311,792 | |
| | | | | | | | 9,456,952 | |
Financials — 14.9% | | | | | | | | |
Allstate Corporation (The) | | | 13,225 | | | | 1,245,530 | |
Bank of America Corporation | | | 41,400 | | | | 1,142,226 | |
Blackstone Group, L.P. (The) | | | 39,400 | | | | 1,377,818 | |
Brookfield Asset Management, Inc. - Class A | | | 53,770 | | | | 2,508,371 | |
Capital One Financial Corporation | | | 20,810 | | | | 1,699,969 | |
Citigroup, Inc. | | | 29,240 | | | | 1,819,313 | |
Cohen & Steers, Inc. | | | 28,405 | | | | 1,200,679 | |
Fairfax Financial Holdings Ltd. | | | 3,075 | | | | 1,430,213 | |
Fidelity National Financial, Inc. | | | 61,060 | | | | 2,231,743 | |
JPMorgan Chase & Company | | | 21,565 | | | | 2,183,025 | |
Lazard Ltd. - Class A | | | 34,100 | | | | 1,232,374 | |
Markel Corporation(a) | | | 1,967 | | | | 1,959,604 | |
MetLife, Inc. | | | 27,870 | | | | 1,186,426 | |
| | | | | | | | 21,217,291 | |
Health Care — 6.3% | | | | | | | | |
Bristol-Myers Squibb Company | | | 33,030 | | | | 1,575,862 | |
CVS Health Corporation | | | 26,585 | | | | 1,433,729 | |
32
DAVENPORT BALANCED INCOME FUND
SCHEDULE OF INVESTMENTS (Continued) |
COMMON STOCKS — 59.4% (Continued) | | Shares | | | Value | |
Health Care — 6.3% (Continued) | | | | | | | | |
Johnson & Johnson | | | 17,485 | | | $ | 2,444,228 | |
Medtronic plc | | | 14,125 | | | | 1,286,505 | |
Merck & Company, Inc. | | | 26,335 | | | | 2,190,282 | |
| | | | | | | | 8,930,606 | |
Industrials — 6.1% | | | | | | | | |
3M Company | | | 5,010 | | | | 1,040,978 | |
Boeing Company (The) | | | 4,165 | | | | 1,588,614 | |
Delta Air Lines, Inc. | | | 28,700 | | | | 1,482,355 | |
Eaton Corporation plc | | | 19,760 | | | | 1,591,866 | |
United Parcel Service, Inc. - Class B | | | 10,795 | | | | 1,206,233 | |
Watsco, Inc. | | | 12,605 | | | | 1,805,162 | |
| | | | | | | | 8,715,208 | |
Information Technology — 4.8% | | | | | | | | |
Cisco Systems, Inc. | | | 42,805 | | | | 2,311,042 | |
DXC Technology Company | | | 13,380 | | | | 860,468 | |
Microsoft Corporation | | | 19,970 | | | | 2,355,262 | |
TE Connectivity Ltd. | | | 16,710 | | | | 1,349,332 | |
| | | | | | | | 6,876,104 | |
Materials — 1.1% | | | | | | | | |
PPG Industries, Inc. | | | 14,225 | | | | 1,605,576 | |
| | | | | | | | | |
Real Estate — 5.7% | | | | | | | | |
Brookfield Property Partners, L.P. | | | 62,920 | | | | 1,294,265 | |
Crown Castle International Corporation | | | 10,795 | | | | 1,381,760 | |
Gaming and Leisure Properties, Inc. | | | 31,155 | | | | 1,201,648 | |
Lamar Advertising Company - Class A | | | 21,880 | | | | 1,734,209 | |
Tanger Factory Outlet Centers, Inc. | | | 56,140 | | | | 1,177,817 | |
W.P. Carey, Inc. | | | 16,275 | | | | 1,274,821 | |
| | | | | | | | 8,064,520 | |
Utilities — 3.2% | | | | | | | | |
Brookfield Infrastructure Partners, L.P. | | | 30,685 | | | | 1,284,781 | |
Brookfield Renewable Partners, L.P. | | | 37,660 | | | | 1,203,237 | |
Dominion Energy, Inc. | | | 26,770 | | | | 2,052,188 | |
| | | | | | | | 4,540,206 | |
| | | | | | | | | |
Total Common Stocks(Cost $77,949,773) | | | | | | $ | 84,388,257 | |
33
DAVENPORT BALANCED INCOME FUND
SCHEDULE OF INVESTMENTS (Continued) |
FIXED RATE CORPORATE BONDS — 14.5% | | Par Value | | | Value | |
Consumer Staples — 4.2% | | | | | | | | |
Altria Group, Inc., 4.75%, due 05/05/2021 | | $ | 1,500,000 | | | $ | 1,558,559 | |
J.M. Smucker Company (The), 3.50%, due 10/15/2021 | | | 1,500,000 | | | | 1,519,480 | |
PepsiCo, Inc., 2.75%, due 03/05/2022 | | | 1,200,000 | | | | 1,211,453 | |
Sysco Corporation, 2.60%, due 10/01/2020 | | | 1,700,000 | | | | 1,697,323 | |
| | | | | | | | 5,986,815 | |
Energy — 3.4% | | | | | | | | |
Boardwalk Pipelines, L.P., 4.45%, due 07/15/2027 | | | 1,250,000 | | | | 1,219,066 | |
MPLX, L.P., 4.125%, due 03/01/2027 | | | 1,750,000 | | | | 1,761,023 | |
Occidental Petroleum Corporation, 3.50%, due 06/15/2025 | | | 1,750,000 | | | | 1,797,961 | |
| | | | | | | | 4,778,050 | |
Financials — 3.7% | | | | | | | | |
BlackRock, Inc., 3.50%, due 03/18/2024 | | | 1,150,000 | | | | 1,195,469 | |
Citigroup, Inc., 3.30%, due 04/27/2025 | | | 2,250,000 | | | | 2,244,530 | |
General Motors Financial Company, 5.25%, due 03/01/2026 | | | 1,750,000 | | | | 1,806,052 | |
| | | | | | | | 5,246,051 | |
Health Care — 0.9% | | | | | | | | |
AbbVie, Inc., 2.50%, due 05/14/2020 | | | 1,300,000 | | | | 1,296,164 | |
| | | | | | | | | |
Industrials — 1.2% | | | | | | | | |
General Dynamics Corporation, 3.375%, due 05/15/2023 | | | 1,750,000 | | | | 1,798,322 | |
| | | | | | | | | |
Information Technology — 1.1% | | | | | | | | |
Oracle Corporation, 3.625%, due 07/15/2023 | | | 1,500,000 | | | | 1,556,288 | |
| | | | | | | | | |
Total Fixed Rate Corporate Bonds(Cost $20,767,126) | | | | | | $ | 20,661,690 | |
|
VARIABLE RATE CORPORATE BONDS (b)— 10.3% | | Par Value | | | Value | |
Communication Services — 0.7% | | | | | | | | |
AT&T, Inc., 3.531% (3MO LIBOR + 93), due 06/30/2020 | | $ | 950,000 | | | $ | 956,808 | |
| | | | | | | | | |
Consumer Staples— 0.9% | | | | | | | | |
Campbell Soup Company, 3.241% (3MO LIBOR + 63), due 03/15/2021 | | | 1,250,000 | | | | 1,241,250 | |
| | | | | | | | | |
Energy — 1.2% | | | | | | | | |
ConocoPhillips Company, 3.584% (3MO LIBOR + 90), due 05/15/2022 | | | 1,750,000 | | | | 1,769,239 | |
34
DAVENPORT BALANCED INCOME FUND
SCHEDULE OF INVESTMENTS (Continued) |
VARIABLE RATE CORPORATE BONDS (b)— 10.3%
(Continued) | | Par Value | | | Value | |
Financials — 4.4% | | | | | | | | |
BP Capital Markets plc, 3.275% (3MO LIBOR + 65), due 09/19/2022 | | $ | 1,750,000 | | | $ | 1,755,932 | |
Goldman Sachs Group, Inc., 3.854% (3MO LIBOR + 117), due 11/15/2021 | | | 2,000,000 | | | | 2,018,600 | |
JPMorgan Chase & Company, 4.106% (3MO LIBOR + 148), due 03/01/2021 | | | 1,500,000 | | | | 1,527,887 | |
Wells Fargo & Company, 3.617% (3MO LIBOR + 101), due 12/07/2020 | | | 929,000 | | | | 939,943 | |
| | | | | | | | 6,242,362 | |
Health Care — 1.7% | | | | | | | | |
Amgen, Inc., 3.263% (3MO LIBOR + 60), due 05/22/2019 | | | 1,500,000 | | | | 1,501,247 | |
CVS Health Corporation, 3.231% (3MO LIBOR + 63), due 03/09/2020 | | | 1,015,000 | | | | 1,017,309 | |
| | | | | | | | 2,518,556 | |
Information Technology — 0.5% | | | | | | | | |
Cisco Systems, Inc., 2.973% (3MO LIBOR + 34), due 09/20/2019 | | | 670,000 | | | | 670,925 | |
| | | | | | | | | |
Materials — 0.9% | | | | | | | | |
Vulcan Materials Company, 3.276% (3MO LIBOR + 65), due 03/01/2021 | | | 1,275,000 | | | | 1,273,725 | |
| | | | | | | | | |
Total Variable Rate Corporate Bonds (Cost $14,687,346) | | | | | | $ | 14,672,865 | |
|
U.S. TREASURY OBLIGATIONS— 10.2% | | Par Value | | | Value | |
U.S. Treasury Notes — 10.2% | | | | | | | | |
2.473%, (3MO USTMMR + 4.80) due 10/31/2019(b) | | $ | 1,280,000 | | | $ | 1,279,993 | |
2.425%, (3MO USTMMR) due 01/31/2020(b) | | | 1,250,000 | | | | 1,249,363 | |
3.125%, due 05/15/2021 | | | 2,000,000 | | | | 2,034,062 | |
2.75%, due 06/30/2025 | | | 4,810,000 | | | | 4,934,008 | |
2.875%, due 08/15/2028 | | | 4,785,000 | | | | 4,971,540 | |
Total U.S. Treasury Obligations(Cost $14,146,266) | | | | | | $ | 14,468,966 | |
35
DAVENPORT BALANCED INCOME FUND
SCHEDULE OF INVESTMENTS (Continued) |
MONEY MARKET FUNDS — 5.3% | | Shares | | | Value | |
First American Treasury Obligations Fund - Class Z, 2.33%(c) (Cost $7,513,577) | | | 7,513,577 | | | $ | 7,513,577 | |
| | | | | | | | | |
Total Investments at Value — 99.7% (Cost $135,064,088) | | | | | | $ | 141,705,355 | |
| | | | | | | | | |
Other Assets in Excess of Liabilities — 0.3% | | | | | | | 493,947 | |
| | | | | | | | | |
Net Assets — 100.0% | | | | | | $ | 142,199,302 | |
ADR - American Depositary Receipt.
LIBOR - London Interbank Offered Rate.
USTMMR - U.S. Treasury Money Market Rate
(a) | Non-income producing security. |
(b) | Variable rate security. Interest rate resets periodically. The rate shown is the effective interest rate as of March 31, 2019. The reference rate and spread (in basis points) are indicated parenthetically. |
(c) | The rate shown is the 7-day effective yield as of March 31, 2019. |
See accompanying notes to financial statements.
36
THE DAVENPORT FUNDS
STATEMENTS OF ASSETS AND LIABILITIES
March 31, 2019 |
| | Davenport
Core
Fund | | | Davenport
Value &
Income
Fund | | | Davenport
Equity
Opportunities
Fund | |
ASSETS | | | | | | | | | | | | |
Investments in securities: | | | | | | | | | | | | |
At cost | | $ | 322,758,439 | | | $ | 560,569,370 | | | $ | 297,931,478 | |
At value (Note 2) | | $ | 502,023,692 | | | $ | 672,271,273 | | | $ | 394,746,131 | |
Cash | | | 15,079,568 | | | | 63,630 | | | | 79,047 | |
Receivable for capital shares sold | | | 100,152 | | | | 177,279 | | | | 115,977 | |
Receivable for investment securities sold | | | — | | | | — | | | | 14,634,481 | |
Dividends receivable | | | 280,975 | | | | 1,153,783 | | | | 17,693 | |
Other assets | | | 15,949 | | | | 17,128 | | | | 16,536 | |
TOTAL ASSETS | | | 517,500,336 | | | | 673,683,093 | | | | 409,609,865 | |
| | | | | | | | | | | | | |
LIABILITIES | | | | | | | | | | | | |
Payable for capital shares redeemed | | | 891,377 | | | | 233,725 | | | | 305,102 | |
Accrued investment advisory fees (Note 4) | | | 323,014 | | | | 425,038 | | | | 254,541 | |
Payable to administrator (Note 4) | | | 48,950 | | | | 59,200 | | | | 41,975 | |
Other accrued expenses | | | 9,155 | | | | 10,780 | | | | 5,860 | |
TOTAL LIABILITIES | | | 1,272,496 | | | | 728,743 | | | | 607,478 | |
| | | | | | | | | | | | | |
NET ASSETS | | $ | 516,227,840 | | | $ | 672,954,350 | | | $ | 409,002,387 | |
| | | | | | | | | | | | | |
Net assets consist of: | | | | | | | | | | | | |
Paid-in capital | | $ | 334,825,232 | | | $ | 560,096,262 | | | $ | 298,066,205 | |
Accumulated earnings | | | 181,402,608 | | | | 112,858,088 | | | | 110,936,182 | |
Net assets | | $ | 516,227,840 | | | $ | 672,954,350 | | | $ | 409,002,387 | |
| | | | | | | | | | | | | |
Shares of beneficial interest outstanding (unlimited number of shares authorized, $0.01 par value) | | | 21,735,466 | | | | 41,079,459 | | | | 21,544,651 | |
| | | | | | | | | | | | | |
Net asset value, offering price and redemption price per share (Note 2) | | $ | 23.75 | | | $ | 16.38 | | | $ | 18.98 | |
See accompanying notes to financial statements.
37
THE DAVENPORT FUNDS
STATEMENTS OF ASSETS AND LIABILITIES (Continued)
March 31, 2019 |
| | Davenport
Small Cap
Focus
Fund | | | Davenport
Balanced
Income
Fund | |
ASSETS | | | | | | | | |
Investments in securities: | | | | | | | | |
At cost | | $ | 133,310,919 | | | $ | 135,064,088 | |
At value (Note 2) | | $ | 148,557,939 | | | $ | 141,705,355 | |
Cash | | | — | | | | 40,975 | |
Receivable for capital shares sold | | | 349,225 | | | | 144,658 | |
Receivable for investment securities sold | | | 4,013,763 | | | | — | |
Dividends and interest receivable | | | 67,318 | | | | 483,004 | |
Other assets | | | 12,269 | | | | 9,971 | |
TOTAL ASSETS | | | 153,000,514 | | | | 142,383,963 | |
| | | | | | | | | |
LIABILITIES | | | | | | | | |
Payable for capital shares redeemed | | | 54,734 | | | | 73,496 | |
Payable for investment securities purchased | | | 764,703 | | | | — | |
Accrued investment advisory fees (Note 4) | | | 94,678 | | | | 90,064 | |
Payable to administrator (Note 4) | | | 18,050 | | | | 15,950 | |
Other accrued expenses | | | 5,460 | | | | 5,151 | |
TOTAL LIABILITIES | | | 937,625 | | | | 184,661 | |
| | | | | | | | | |
NET ASSETS | | $ | 152,062,889 | | | $ | 142,199,302 | |
| | | | | | | | | |
Net assets consist of: | | | | | | | | |
Paid-in capital | | $ | 136,184,632 | | | $ | 135,788,423 | |
Accumulated earnings | | | 15,878,257 | | | | 6,410,879 | |
Net assets | | $ | 152,062,889 | | | $ | 142,199,302 | |
| | | | | | | | | |
Shares of beneficial interest outstanding (unlimited number of shares authorized, $0.01 par value) | | | 11,476,484 | | | | 12,543,932 | |
| | | | | | | | | |
Net asset value, offering price and redemption price per share (Note 2) | | $ | 13.25 | | | $ | 11.34 | |
See accompanying notes to financial statements.
38
THE DAVENPORT FUNDS
STATEMENTS OF OPERATIONS
Year Ended March 31, 2019 |
| | Davenport
Core
Fund | | | Davenport
Value &
Income
Fund | | | Davenport
Equity
Opportunities
Fund | |
INVESTMENT INCOME | | | | | | | | | | | | |
Dividends | | $ | 6,904,795 | | | $ | 20,485,125 | | | $ | 3,134,205 | |
Foreign withholding taxes on dividends | | | (193,417 | ) | | | (258,716 | ) | | | (92,780 | ) |
TOTAL INVESTMENT INCOME | | | 6,711,378 | | | | 20,226,409 | | | | 3,041,425 | |
| | | | | | | | | | | | | |
EXPENSES | | | | | | | | | | | | |
Investment advisory fees (Note 4) | | | 3,652,899 | | | | 4,915,550 | | | | 2,937,129 | |
Administration fees (Note 4) | | | 532,887 | | | | 654,549 | | | | 468,485 | |
Custodian and bank service fees | | | 32,312 | | | | 42,044 | | | | 26,426 | |
Registration and filing fees | | | 31,929 | | | | 32,274 | | | | 29,501 | |
Compliance service fees (Note 4) | | | 27,327 | | | | 35,210 | | | | 22,747 | |
Professional fees | | | 22,661 | | | | 22,661 | | | | 22,661 | |
Trustees’ fees and expenses (Note 4) | | | 13,600 | | | | 13,600 | | | | 13,600 | |
Postage and supplies | | | 10,590 | | | | 13,661 | | | | 10,839 | |
Insurance expense | | | 10,143 | | | | 13,887 | | | | 8,905 | |
Printing of shareholder reports | | | 9,742 | | | | 12,269 | | | | 10,354 | |
Other expenses | | | 9,841 | | | | 10,320 | | | | 7,809 | |
TOTAL EXPENSES | | | 4,353,931 | | | | 5,766,025 | | | | 3,558,456 | |
| | | | | | | | | | | | | |
NET INVESTMENT INCOME (LOSS) | | | 2,357,447 | | | | 14,460,384 | | | | (517,031 | ) |
| | | | | | | | | | | | | |
REALIZED AND UNREALIZED GAINS (LOSSES) ON INVESTMENTS AND FOREIGN CURRENCIES | | | | | | | | | | | | |
Net realized gains (losses) from: | | | | | | | | | | | | |
Investments | | | 5,883,146 | | | | 9,004,922 | | | | 30,117,103 | |
Foreign currency transactions (Note 2) | | | — | | | | (2,897 | ) | | | — | |
Net change in unrealized appreciation (depreciation) on investments | | | 30,629,890 | | | | (4,227,734 | ) | | | 11,629,631 | |
NET REALIZED AND UNREALIZED GAINS ON INVESTMENTS AND FOREIGN CURRENCIES | | | 36,513,036 | | | | 4,774,291 | | | | 41,746,734 | |
| | | | | | | | | | | | | |
NET INCREASE IN NET ASSETS FROM OPERATIONS | | $ | 38,870,483 | | | $ | 19,234,675 | | | $ | 41,229,703 | |
See accompanying notes to financial statements.
39
THE DAVENPORT FUNDS
STATEMENTS OF OPERATIONS (Continued)
Year Ended March 31, 2019 |
| | Davenport
Small Cap
Focus
Fund | | | Davenport
Balanced
Income
Fund | |
INVESTMENT INCOME | | | | | | | | |
Dividends | | $ | 2,108,280 | | | $ | 3,009,411 | |
Foreign withholding taxes on dividends | | | (4,010 | ) | | | (31,942 | ) |
Interest | | | — | | | | 1,417,585 | |
TOTAL INVESTMENT INCOME | | | 2,104,270 | | | | 4,395,054 | |
| | | | | | | | | |
EXPENSES | | | | | | | | |
Investment advisory fees (Note 4) | | | 1,065,259 | | | | 1,017,757 | |
Administration fees (Note 4) | | | 193,358 | | | | 169,828 | |
Registration and filing fees | | | 29,425 | | | | 26,362 | |
Professional fees | | | 22,661 | | | | 24,161 | |
Trustees’ fees and expenses (Note 4) | | | 13,600 | | | | 13,600 | |
Custodian and bank service fees | | | 14,609 | | | | 10,516 | |
Compliance service fees (Note 4) | | | 11,134 | | | | 10,841 | |
Postage and supplies | | | 8,485 | | | | 6,592 | |
Printing of shareholder reports | | | 5,579 | | | | 4,830 | |
Insurance expense | | | 3,139 | | | | 3,388 | |
Other expenses | | | 6,111 | | | | 13,443 | |
TOTAL EXPENSES | | | 1,373,360 | | | | 1,301,318 | |
| | | | | | | | | |
NET INVESTMENT INCOME | | | 730,910 | | | | 3,093,736 | |
| | | | | | | | | |
REALIZED AND UNREALIZED GAINS (LOSSES)ON INVESTMENTS AND FOREIGN CURRENCIES | | | | | | | | |
Net realized gains (losses) from: | | | | | | | | |
Investments | | | 1,144,874 | | | | (936,430 | ) |
Foreign currency transactions (Note 2) | | | — | | | | (310 | ) |
Net change in unrealized appreciation (depreciation) on investments | | | 1,274,066 | | | | 2,249,651 | |
NET REALIZED AND UNREALIZED GAINS ON INVESTMENTS AND FOREIGN CURRENCIES | | | 2,418,940 | | | | 1,312,911 | |
| | | | | | | | | |
NET INCREASE IN NET ASSETS FROM OPERATIONS | | $ | 3,149,850 | | | $ | 4,406,647 | |
See accompanying notes to financial statements.
40
DAVENPORT CORE FUND
STATEMENTS OF CHANGES IN NET ASSETS |
| | Year
Ended
March 31,
2019 | | | Year
Ended
March 31,
2018 (a) | |
FROM OPERATIONS | | | | | | | | |
Net investment income | | $ | 2,357,447 | | | $ | 1,827,935 | |
Net realized gains from investment transactions | | | 5,883,146 | | | | 18,131,241 | |
Net change in unrealized appreciation (depreciation) on investments | | | 30,629,890 | | | | 26,314,576 | |
Net increase in net assets from operations | | | 38,870,483 | | | | 46,273,752 | |
| | | | | | | | | |
DISTRIBUTIONS TO SHAREHOLDERS (Note 2) | | | (21,768,874 | ) | | | (11,016,319 | ) |
| | | | | | | | | |
FROM CAPITAL SHARE TRANSACTIONS | | | | | | | | |
Proceeds from shares sold | | | 47,157,117 | | | | 51,436,059 | |
Net asset value of shares issued in reinvestment of distributions to shareholders | | | 20,895,848 | | | | 10,570,642 | |
Payments for shares redeemed | | | (33,846,129 | ) | | | (31,776,792 | ) |
Net increase in net assets from capital share transactions | | | 34,206,836 | | | | 30,229,909 | |
| | | | | | | | | |
TOTAL INCREASE IN NET ASSETS | | | 51,308,445 | | | | 65,487,342 | |
| | | | | | | | | |
NET ASSETS | | | | | | | | |
Beginning of year | | | 464,919,395 | | | | 399,432,053 | |
End of year | | $ | 516,227,840 | | | $ | 464,919,395 | |
| | | | | | | | | |
CAPITAL SHARE ACTIVITY | | | | | | | | |
Shares sold | | | 2,058,367 | | | | 2,301,979 | |
Shares reinvested | | | 905,013 | | | | 483,529 | |
Shares redeemed | | | (1,479,544 | ) | | | (1,417,821 | ) |
Net increase in shares outstanding | | | 1,483,836 | | | | 1,367,687 | |
Shares outstanding at beginning of year | | | 20,251,630 | | | | 18,883,943 | |
Shares outstanding at end of year | | | 21,735,466 | | | | 20,251,630 | |
(a) | The presentation of Distributions to Shareholders has been updated to reflect the changes prescribed in amendments to Regulation S-X, effective November 5, 2018 (Note 2). For the year ended March 31, 2018, distributions to shareholders consisted of $2,062,810 from net investment income and $8,953,509 from net realized gains from investment transactions. As of March 31, 2018, distributions in excess of net investment income was ($17,861). |
See accompanying notes to financial statements.
41
DAVENPORT VALUE & INCOME FUND
STATEMENTS OF CHANGES IN NET ASSETS |
| | Year
Ended
March 31,
2019 | | | Year
Ended
March 31,
2018 (a) | |
FROM OPERATIONS | | | | | | | | |
Net investment income | | $ | 14,460,384 | | | $ | 11,090,576 | |
Net realized gains (losses) from: | | | | | | | | |
Investments | | | 9,004,922 | | | | 25,670,551 | |
Foreign currency transactions | | | (2,897 | ) | | | (3,074 | ) |
Net change in unrealized appreciation (depreciation) on investments | | | (4,227,734 | ) | | | 23,552,203 | |
Net increase in net assets from operations | | | 19,234,675 | | | | 60,310,256 | |
| | | | | | | | | |
DISTRIBUTIONS TO SHAREHOLDERS (Note 2) | | | (37,478,575 | ) | | | (29,581,135 | ) |
| | | | | | | | | |
FROM CAPITAL SHARE TRANSACTIONS | | | | | | | | |
Proceeds from shares sold | | | 68,940,134 | | | | 78,456,849 | |
Net asset value of shares issued in reinvestment of distributions to shareholders | | | 34,718,152 | | | | 27,437,503 | |
Payments for shares redeemed | | | (60,915,857 | ) | | | (50,163,072 | ) |
Net increase in net assets from capital share transactions | | | 42,742,429 | | | | 55,731,280 | |
| | | | | | | | | |
TOTAL INCREASE IN NET ASSETS | | | 24,498,529 | | | | 86,460,401 | |
| | | | | | | | | |
NET ASSETS | | | | | | | | |
Beginning of year | | | 648,455,821 | | | | 561,995,420 | |
End of year | | $ | 672,954,350 | | | $ | 648,455,821 | |
| | | | | | | | | |
CAPITAL SHARE ACTIVITY | | | | | | | | |
Shares sold | | | 4,212,521 | | | | 4,644,008 | |
Shares reinvested | | | 2,115,148 | | | | 1,628,277 | |
Shares redeemed | | | (3,725,345 | ) | | | (2,982,055 | ) |
Net increase in shares outstanding | | | 2,602,324 | | | | 3,290,230 | |
Shares outstanding at beginning of year | | | 38,477,135 | | | | 35,186,905 | |
Shares outstanding at end of year | | | 41,079,459 | | | | 38,477,135 | |
(a) | The presentation of Distributions to Shareholders has been updated to reflect the changes prescribed in amendments to Regulation S-X, effective November 5, 2018 (Note 2). For the year ended March 31, 2018, distributions to shareholders consisted of $10,955,224 from net investment income and $18,625,911 from net realized gains from investment transactions. As of March 31, 2018, undistributed net investment income was $239,145. |
See accompanying notes to financial statements.
42
DAVENPORT EQUITY OPPORTUNITIES FUND
STATEMENTS OF CHANGES IN NET ASSETS |
| | Year
Ended
March 31,
2019 | | | Year
Ended
March 31,
2018 (a) | |
FROM OPERATIONS | | | | | | | | |
Net investment loss | | $ | (517,031 | ) | | $ | (893,587 | ) |
Net realized gains from investment transactions | | | 30,117,103 | | | | 6,190,759 | |
Net change in unrealized appreciation (depreciation) on investments | | | 11,629,631 | | | | 41,890,913 | |
Net increase in net assets from operations | | | 41,229,703 | | | | 47,188,085 | |
| | | | | | | | | |
DISTRIBUTIONS TO SHAREHOLDERS (Note 2) | | | (13,919,524 | ) | | | — | |
| | | | | | | | | |
FROM CAPITAL SHARE TRANSACTIONS | | | | | | | | |
Proceeds from shares sold | | | 26,095,613 | | | | 40,397,057 | |
Net asset value of shares issued in reinvestment of distributions to shareholders | | | 13,397,687 | | | | — | |
Payments for shares redeemed | | | (57,260,845 | ) | | | (39,879,119 | ) |
Net increase (decrease) in net assets from capital share transactions | | | (17,767,545 | ) | | | 517,938 | |
| | | | | | | | | |
TOTAL INCREASE IN NET ASSETS | | | 9,542,634 | | | | 47,706,023 | |
| | | | | | | | |
NET ASSETS | | | | | | | | |
Beginning of year | | | 399,459,753 | | | | 351,753,730 | |
End of year | | $ | 409,002,387 | | | $ | 399,459,753 | |
| | | | | | | | | |
CAPITAL SHARE ACTIVITY | | | | | | | | |
Shares sold | | | 1,463,115 | | | | 2,345,472 | |
Shares reinvested | | | 778,031 | | | | — | |
Shares redeemed | | | (3,194,984 | ) | | | (2,332,638 | ) |
Net increase (decrease) in shares outstanding | | | (953,838 | ) | | | 12,834 | |
Shares outstanding at beginning of year | | | 22,498,489 | | | | 22,485,655 | |
Shares outstanding at end of year | | | 21,544,651 | | | | 22,498,489 | |
(a) | As of March 31, 2018, accumulated net investment loss was ($222,138). |
See accompanying notes to financial statements.
43
DAVENPORT SMALL CAP FOCUS FUND
STATEMENTS OF CHANGES IN NET ASSETS |
| | Year
Ended
March 31,
2019 | | | Year
Ended
March 31,
2018 (a) | |
FROM OPERATIONS | | | | | | | | |
Net investment income | | $ | 730,910 | | | $ | 244,366 | |
Net realized gains from investment transactions | | | 1,144,874 | | | | 2,987,414 | |
Net change in unrealized appreciation (depreciation) on investments | | | 1,274,066 | | | | 4,792,699 | |
Net increase in net assets from operations | | | 3,149,850 | | | | 8,024,479 | |
| | | | | | | | | |
DISTRIBUTIONS TO SHAREHOLDERS (Note 2) | | | (2,926,287 | ) | | | (2,522,386 | ) |
| | | | | | | | | |
FROM CAPITAL SHARE TRANSACTIONS | | | | | | | | |
Proceeds from shares sold | | | 58,704,586 | | | | 39,158,303 | |
Net asset value of shares issued in reinvestment of distributions to shareholders | | | 2,851,040 | | | | 2,449,992 | |
Payments for shares redeemed | | | (25,955,030 | ) | | | (5,818,002 | ) |
Net increase in net assets from capital share transactions | | | 35,600,596 | | | | 35,790,293 | |
| | | | | | | | | |
TOTAL INCREASE IN NET ASSETS | | | 35,824,159 | | | | 41,292,386 | |
| | | | | | | | | |
NET ASSETS | | | | | | | | |
Beginning of year | | | 116,238,730 | | | | 74,946,344 | |
End of year | | $ | 152,062,889 | | | $ | 116,238,730 | |
| | | | | | | | | |
CAPITAL SHARE ACTIVITY | | | | | | | | |
Shares sold | | | 4,406,141 | | | | 3,026,417 | |
Shares reinvested | | | 219,280 | | | | 191,961 | |
Shares redeemed | | | (2,086,572 | ) | | | (458,935 | ) |
Net increase in shares outstanding | | | 2,538,849 | | | | 2,759,443 | |
Shares outstanding at beginning of year | | | 8,937,635 | | | | 6,178,192 | |
Shares outstanding at end of year | | | 11,476,484 | | | | 8,937,635 | |
(a) | The presentation of Distributions to Shareholders has been updated to reflect the changes prescribed in amendments to Regulation S-X, effective November 5, 2018 (Note 2). For the year ended March 31, 2018, distributions to shareholder consisted of $2,522,386 from net realized gains from investment transactions. As of March 31, 2018, undistributed net investment income was $239,015. |
See accompanying notes to financial statements.
44
DAVENPORT BALANCED INCOME FUND
STATEMENTS OF CHANGES IN NET ASSETS |
| | Year
Ended
March 31,
2019 | | | Year
Ended
March 31,
2018 (a) | |
FROM OPERATIONS | | | | | | | | |
Net investment income | | $ | 3,093,736 | | | $ | 2,014,933 | |
Net realized gains (losses) from: | | | | | | | | |
Investments | | | (936,430 | ) | | | 1,426,553 | |
Foreign currency transactions | | | (310 | ) | | | (313 | ) |
Net change in unrealized appreciation (depreciation) on investments | | | 2,249,651 | | | | 729,395 | |
Net increase in net assets from operations | | | 4,406,647 | | | | 4,170,568 | |
| | | | | | | | | |
DISTRIBUTIONS TO SHAREHOLDERS (Note 2) | | | (3,736,702 | ) | | | (2,585,244 | ) |
| | | | | | | | | |
FROM CAPITAL SHARE TRANSACTIONS | | | | | | | | |
Proceeds from shares sold | | | 27,209,013 | | | | 53,925,631 | |
Net asset value of shares issued in reinvestment of distributions to shareholders | | | 3,497,522 | | | | 2,427,962 | |
Payments for shares redeemed | | | (18,444,828 | ) | | | (12,089,899 | ) |
Net increase in net assets from capital share transactions | | | 12,261,707 | | | | 44,263,694 | |
| | | | | | | | | |
TOTAL INCREASE IN NET ASSETS | | | 12,931,652 | | | | 45,849,018 | |
| | | | | | | | | |
NET ASSETS | | | | | | | | |
Beginning of year | | | 129,267,650 | | | | 83,418,632 | |
End of year | | $ | 142,199,302 | | | $ | 129,267,650 | |
| | | | | | | | | |
CAPITAL SHARE ACTIVITY | | | | | | | | |
Shares sold | | | 2,422,911 | | | | 4,740,739 | |
Shares reinvested | | | 312,892 | | | | 213,171 | |
Shares redeemed | | | (1,655,625 | ) | | | (1,063,184 | ) |
Net increase in shares outstanding | | | 1,080,178 | | | | 3,890,726 | |
Shares outstanding at beginning of year | | | 11,463,754 | | | | 7,573,028 | |
Shares outstanding at end of year | | | 12,543,932 | | | | 11,463,754 | |
(a) | The presentation of Distributions to Shareholders has been updated to reflect the changes prescribed in amendments to Regulation S-X, effective November 5, 2018 (Note 2). For the year ended March 31, 2018, distributions to shareholders consisted of $1,619,327 from net investment income and $965,917 from net realized gains from net investment transactions. As of March 31, 2018, undistributed net investment income was $475,747. |
See accompanying notes to financial statements.
45
DAVENPORT CORE FUND
FINANCIAL HIGHLIGHTS |
Selected Per Share Data and Ratios for a Share Outstanding Throughout Each Year |
| | |
Years Ended March 31,
| |
| | 2019 | | | 2018 | | | 2017 | | | 2016 | | | 2015 | |
Net asset value at beginning of year | | $ | 22.96 | | | $ | 21.15 | | | $ | 18.78 | | | $ | 20.02 | | | $ | 19.30 | |
| | | | | | | | | | | | | | | | | | | | | |
Income (loss) from investment operations: | | | | | | | | | | | | | | | | | | | | |
Net investment income | | | 0.11 | | | | 0.09 | | | | 0.11 | | | | 0.11 | | | | 0.10 | |
Net realized and unrealized gains (losses) on investments | | | 1.74 | | | | 2.29 | | | | 2.92 | | | | (0.56 | ) | | | 2.20 | |
Total from investment operations | | | 1.85 | | | | 2.38 | | | | 3.03 | | | | (0.45 | ) | | | 2.30 | |
| | | | | | | | | | | | | | | | | | | | | |
Less distributions: | | | | | | | | | | | | | | | | | | | | |
Dividends from net investment income | | | (0.11 | ) | | | (0.11 | ) | | | (0.10 | ) | | | (0.11 | ) | | | (0.10 | ) |
Distributions from net realized gains | | | (0.95 | ) | | | (0.46 | ) | | | (0.56 | ) | | | (0.68 | ) | | | (1.48 | ) |
Total distributions | | | (1.06 | ) | | | (0.57 | ) | | | (0.66 | ) | | | (0.79 | ) | | | (1.58 | ) |
| | | | | | | | | | | | | | | | | | | | | |
Net asset value at end of year | | $ | 23.75 | | | $ | 22.96 | | | $ | 21.15 | | | $ | 18.78 | | | $ | 20.02 | |
| | | | | | | | | | | | | | | | | | | | | |
Total return(a) | | | 8.21 | % | | | 11.38 | % | | | 16.56 | % | | | (2.39 | %) | | | 12.42 | % |
| | | | | | | | | | | | | | | | | | | | | |
Net assets at end of year (000’s) | | $ | 516,228 | | | $ | 464,919 | | | $ | 399,432 | | | $ | 337,229 | | | $ | 330,687 | |
| | | | | | | | | | | | | | | | | | | | | |
Ratio of total expenses to average net assets | | | 0.89 | % | | | 0.90 | % | | | 0.90 | % | | | 0.92 | % | | | 0.93 | % |
| | | | | | | | | | | | | | | | | | | | | |
Ratio of net investment income to average net assets | | | 0.48 | % | | | 0.41 | % | | | 0.56 | % | | | 0.56 | % | | | 0.49 | % |
| | | | | | | | | | | | | | | | | | | | | |
Portfolio turnover rate | | | 21 | % | | | 22 | % | | | 23 | % | | | 23 | % | | | 21 | % |
(a) | Total return is a measure of the change in value of an investment in the Fund over the periods covered, which assumes any dividends or capital gains distributions are reinvested in shares of the Fund. Returns shown do not reflect the deduction of taxes a shareholder would pay on Fund distributions or the redemption of Fund shares. |
See accompanying notes to financial statements.
46
DAVENPORT VALUE & INCOME FUND
FINANCIAL HIGHLIGHTS |
Selected Per Share Data and Ratios for a Share Outstanding Throughout Each Year |
| | |
Years Ended March 31,
| |
| | 2019 | | | 2018 | | | 2017 | | | 2016 | | | 2015 | |
Net asset value at beginning of year | | $ | 16.85 | | | $ | 15.97 | | | $ | 14.40 | | | $ | 15.46 | | | $ | 14.71 | |
| | | | | | | | | | | | | | | | | | | | | |
Income (loss) from investment operations: | | | | | | | | | | | | | | | | | | | | |
Net investment income | | | 0.36 | | | | 0.30 | | | | 0.30 | | | | 0.29 | | | | 0.25 | |
Net realized and unrealized gains (losses) on investments and foreign currencies | | | 0.12 | | | | 1.39 | | | | 1.64 | | | | (0.36 | ) | | | 1.45 | |
Total from investment operations | | | 0.48 | | | | 1.69 | | | | 1.94 | | | | (0.07 | ) | | | 1.70 | |
| | | | | | | | | | | | | | | | | | | | |
Less distributions: | | | | | | | | | | | | | | | | | | | | |
Dividends from net investment income | | | (0.36 | ) | | | (0.30 | ) | | | (0.31 | ) | | | (0.29 | ) | | | (0.25 | ) |
Distributions from net realized gains | | | (0.59 | ) | | | (0.51 | ) | | | (0.06 | ) | | | (0.70 | ) | | | (0.70 | ) |
Total distributions | | | (0.95 | ) | | | (0.81 | ) | | | (0.37 | ) | | | (0.99 | ) | | | (0.95 | ) |
| | | | | | | | | | | | | | | | | | | | | |
Net asset value at end of year | | $ | 16.38 | | | $ | 16.85 | | | $ | 15.97 | | | $ | 14.40 | | | $ | 15.46 | |
| | | | | | | | | | | | | | | | | | | | | |
Total return(a) | | | 2.96 | % | | | 10.67 | % | | | 13.60 | % | | | (0.46 | %) | | | 11.92 | % |
| | | | | | | | | | | | | | | | | | | | | |
Net assets at end of year (000’s) | | $ | 672,954 | | | $ | 648,456 | | | $ | 561,995 | | | $ | 450,447 | | | $ | 407,777 | |
| | | | | | | | | | | | | | | | | | | | | |
Ratio of total expenses to average net assets | | | 0.88 | % | | | 0.88 | % | | | 0.89 | % | | | 0.91 | % | | | 0.92 | % |
| | | | | | | | | | | | | | | | | | | | | |
Ratio of net investment income to average net assets | | | 2.21 | % | | | 1.79 | % | | | 1.96 | % | | | 2.03 | % | | | 1.66 | % |
| | | | | | | | | | | | | | | | | | | | | |
Portfolio turnover rate | | | 18 | % | | | 22 | % | | | 26 | % | | | 25 | % | | | 23 | % |
(a) | Total return is a measure of the change in value of an investment in the Fund over the periods covered, which assumes any dividends or capital gains distributions are reinvested in shares of the Fund. Returns shown do not reflect the deduction of taxes a shareholder would pay on Fund distributions or the redemption of Fund shares. |
See accompanying notes to financial statements.
47
DAVENPORT EQUITY OPPORTUNITIES FUND
FINANCIAL HIGHLIGHTS |
Selected Per Share Data and Ratios for a Share Outstanding Throughout Each Year |
| | |
Years Ended March 31,
| |
| | 2019 | | | 2018 | | | 2017 | | | 2016 | | | 2015 | |
Net asset value at beginning of year | | $ | 17.75 | | | $ | 15.64 | | | $ | 14.73 | | | $ | 16.61 | | | $ | 15.91 | |
| | | | | | | | | | | | | | | | | | | | | |
Income (loss) from investment operations: | | | | | | | | | | | | | | | | | | | | |
Net investment income (loss) | | | (0.02 | ) | | | (0.04 | ) | | | 0.00 | (a) | | | 0.00 | (a) | | | 0.04 | |
Net realized and unrealized gains (losses) on investments | | | 1.91 | | | | 2.15 | | | | 1.10 | | | | (1.14 | ) | | | 2.42 | |
Total from investment operations | | | 1.89 | | | | 2.11 | | | | 1.10 | | | | (1.14 | ) | | | 2.46 | |
| | | | | | | | | | | | | | | | | | | | | |
Less distributions: | | | | | | | | | | | | | | | | | | | | |
Dividends from net investment income | | | — | | | | — | | | | — | | | | (0.01 | ) | | | (0.26 | ) |
Distributions from net realized gains | | | (0.66 | ) | | | — | | | | (0.19 | ) | | | (0.73 | ) | | | (1.50 | ) |
Total distributions | | | (0.66 | ) | | | — | | | | (0.19 | ) | | | (0.74 | ) | | | (1.76 | ) |
| | | | | | | | | | | | | | | | | | | | | |
Net asset value at end of year | | $ | 18.98 | | | $ | 17.75 | | | $ | 15.64 | | | $ | 14.73 | | | $ | 16.61 | |
| | | | | | | | | | | | | | | | | | | | | |
Total return(b) | | | 11.02 | % | | | 13.49 | % | | | 7.57 | % | | | (7.07 | %) | | | 16.67 | % |
| | | | | | | | | | | | | | | | | | | | | |
Net assets at end of year (000’s) | | $ | 409,002 | | | $ | 399,460 | | | $ | 351,754 | | | $ | 316,788 | | | $ | 277,703 | |
| | | | | | | | | | | | | | | | | | | | | |
Ratio of total expenses to average net assets | | | 0.91 | % | | | 0.91 | % | | | 0.92 | % | | | 0.93 | % | | | 0.96 | % |
| | | | | | | | | | | | | | | | | | | | | |
Ratio of net investment income (loss) to average net assets | | | (0.13 | %) | | | (0.23 | %) | | | 0.00 | %(c) | | | 0.02 | % | | | 0.33 | % |
| | | | | | | | | | | | | | | | | | | | | |
Portfolio turnover rate | | | 19 | % | | | 21 | % | | | 23 | % | | | 29 | % | | | 31 | % |
(a) | Amount rounds to less than $0.01 per share. |
(b) | Total return is a measure of the change in value of an investment in the Fund over the periods covered, which assumes any dividends or capital gains distributions are reinvested in shares of the Fund. Returns shown do not reflect the deduction of taxes a shareholder would pay on Fund distributions or the redemption of Fund shares. |
(c) | Amount rounds to less than 0.01% |
See accompanying notes to financial statements.
48
DAVENPORT SMALL CAP FOCUS FUND
FINANCIAL HIGHLIGHTS |
Selected Per Share Data and Ratios for a Share Outstanding Throughout Each Period |
| | Year
Ended
March 31,
2019 | | | Year
Ended
March 31,
2018 | | | Year
Ended
March 31,
2017 | | | Year
Ended
March 31,
2016 | | | Period
Ended
March 31,
2015(a) | |
Net asset value at beginning of period | | $ | 13.01 | | | $ | 12.13 | | | $ | 9.34 | | | $ | 10.41 | | | $ | 10.00 | |
| | | | | | | | | | | | | | | | | | | | | |
Income (loss) from investment operations: | | | | | | | | | | | | | | | | | | | | |
Net investment income (loss) | | | 0.06 | | | | 0.02 | | | | 0.02 | | | | 0.01 | | | | (0.01 | ) |
Net realized and unrealized gains (losses) on investments | | | 0.44 | | | | 1.22 | | | | 2.77 | | | | (1.07 | ) | | | 0.42 | |
Total from investment operations | | | 0.50 | | | | 1.24 | | | | 2.79 | | | | (1.06 | ) | | | 0.41 | |
| | | | | | | | | | | | | | | | | | | | | |
Less distributions: | | | | | | | | | | | | | | | | | | | | |
Distributions from net realized gains | | | (0.26 | ) | | | (0.36 | ) | | | — | | | | (0.01 | ) | | | — | |
| | | | | | | | | | | | | | | | | | | | | |
Net asset value at end of period | | $ | 13.25 | | | $ | 13.01 | | | $ | 12.13 | | | $ | 9.34 | | | $ | 10.41 | |
| | | | | | | | | | | | | | | | | | | | | |
Total return(b) | | | 3.90 | % | | | 10.28 | % | | | 29.87 | % | | | (10.19 | %) | | | 4.10 | %(c) |
| | | | | | | | | | | | | | | | | | | | | |
Net assets at end of period (000’s) | | $ | 152,063 | | | $ | 116,239 | | | $ | 74,946 | | | $ | 39,636 | | | $ | 31,291 | |
| | | | | | | | | | | | | | | | | | | | | |
Ratio of net expenses to average net assets | | | 0.97 | % | | | 1.00 | % | | | 1.06 | % | | | 1.15 | % | | | 1.25 | %(d)(e) |
| | | | | | | | | | | | | | | | | | | | | |
Ratio of net investment income (loss) to average net assets | | | 0.51 | % | | | 0.26 | % | | | 0.09 | % | | | 0.14 | % | | | (0.30 | %)(d)(f) |
| | | | | | | | | | | | | | | | | | | | | |
Portfolio turnover rate | | | 60 | % | | | 48 | % | | | 37 | % | | | 48 | % | | | 15 | %(c) |
(a) | Represents the period from commencement of operations (December 31, 2014) through March 31, 2015. |
(b) | Total return is a measure of the change in value of an investment in the Fund over the periods covered, which assumes any dividends or capital gains distributions are reinvested in shares of the Fund. Returns shown do not reflect the deduction of taxes a shareholder would pay on Fund distributions or the redemption of Fund shares. |
(e) | Absent advisory fee reductions, the ratio of total expenses to average net assets would have been 1.42%(d) for the period ended March 31, 2015. |
(f) | Ratio was determined after advisory fee reductions. |
See accompanying notes to financial statements.
49
DAVENPORT BALANCED INCOME FUND
FINANCIAL HIGHLIGHTS |
Selected Per Share Data and Ratios for a Share Outstanding Throughout Each Period |
| | Year
Ended
March 31,
2019 | | | Year
Ended
March 31,
2018 | | | Year
Ended
March 31,
2017 | | | Period
Ended
March 31,
2016(a) | |
Net asset value at beginning of period | | $ | 11.28 | | | $ | 11.02 | | | $ | 10.27 | | | $ | 10.00 | |
| | | | | | | | | | | | | | | | | |
Income from investment operations: | | | | | | | | | | | | | | | | |
Net investment income | | | 0.25 | | | | 0.20 | | | | 0.14 | | | | 0.03 | |
Net realized and unrealized gains on investments and foreign currencies | | | 0.12 | | | | 0.33 | | | | 0.74 | | | | 0.26 | |
Total from investment operations | | | 0.37 | | | | 0.53 | | | | 0.88 | | | | 0.29 | |
| | | | | | | | | | | | | | | | |
Less distributions: | | | | | | | | | | | | | | | | |
Dividends from net investment income | | | (0.24 | ) | | | (0.17 | ) | | | (0.13 | ) | | | (0.02 | ) |
Distributions from net realized gains | | | (0.07 | ) | | | (0.10 | ) | | | — | | | | — | |
Total distributions | | | (0.31 | ) | | | (0.27 | ) | | | (0.13 | ) | | | (0.02 | ) |
| | | | | | | | | | | | | | | | | |
Net asset value at end of period | | $ | 11.34 | | | $ | 11.28 | | | $ | 11.02 | | | $ | 10.27 | |
| | | | | | | | | | | | | | | | | |
Total return(b) | | | 3.35 | % | | | 4.81 | % | | | 8.59 | % | | | 2.90 | %(c) |
| | | | | | | | | | | | | | | | | |
Net assets at end of period (000’s) | | $ | 142,199 | | | $ | 129,268 | | | $ | 83,419 | | | $ | 17,885 | |
| | | | | | | | | | | | | | | | | |
Ratio of net expenses to average net assets | | | 0.96 | % | | | 0.97 | % | | | 1.13 | %(d) | | | 1.25 | %(e)(f) |
| | | | | | | | | | | | | | | | | |
Ratio of net investment income to average net assets | | | 2.28 | % | | | 1.85 | % | | | 1.55 | % | | | 1.65 | %(e)(g) |
| | | | | | | | | | | | | | | | | |
Portfolio turnover rate | | | 30 | % | | | 23 | % | | | 16 | % | | | 7 | %(c) |
(a) | Represents the period from commencement of operations (December 31, 2015) through March 31, 2016. |
(b) | Total return is a measure of the change in value of an investment in the Fund over the periods covered, which assumes any dividends or capital gains distributions are reinvested in shares of the Fund. Returns shown do not reflect the deduction of taxes a shareholder would pay on Fund distributions or the redemption of Fund shares. |
(d) | Absent advisory fee reductions and expense reimbursements recouped by the Adviser, the ratio of net expenses to average net assets would have been 1.08% for the year ended March 31, 2017. |
(f) | Absent advisory fee reductions and expense reimbursements, the ratio of total expenses to average net assets would have been 2.25%(d) for the period ended March 31, 2016 (Note 4). |
(g) | Ratio was determined after advisory fee reductions and expense reimbursements. |
See accompanying notes to financial statements.
50
THE DAVENPORT FUNDS
NOTES TO FINANCIAL STATEMENTS
March 31, 2019
1. Organization
Davenport Core Fund, Davenport Value & Income Fund, Davenport Equity Opportunities Fund, Davenport Small Cap Focus Fund and Davenport Balanced Income Fund (individually, a “Fund,” and, collectively, the “Funds”) are each a no-load series of the Williamsburg Investment Trust (the “Trust”), an open-end management investment company registered under the Investment Company Act of 1940, as amended. The Trust was organized as a Massachusetts business trust on July 18, 1988. Other series of the Trust are not incorporated in this report.
Davenport Core Fund’s investment objective is long term growth of capital.
Davenport Value & Income Fund’s investment objective is to achieve long term growth while generating current income through dividend payments on portfolio securities.
Davenport Equity Opportunities Fund’s investment objective is long term capital appreciation.
Davenport Small Cap Focus Fund’s investment objective is long term capital appreciation.
Davenport Balanced Income Fund’s investment objective is current income and an opportunity for long term growth.
Davenport Core Fund, Davenport Value & Income Fund, Davenport Small Cap Focus Fund and Davenport Balanced Income Fund are each classified as a diversified fund. Davenport Equity Opportunities Fund is classified as a non-diversified fund.
2. Significant Accounting Policies
In August 2018, the U.S. Securities and Exchange Commission (the “SEC”) adopted regulations that eliminated or amended disclosure requirements that were redundant or outdated in light of changes in the SEC requirements, accounting principles generally accepted in the United States of America (“GAAP”), International Financial Reporting Standards or changes in technology or the business environment. These regulations were effective November 5, 2018, and the Funds are complying with them effective with these financial statements.
Each Fund follows accounting and reporting guidance under Financial Accounting Standards Board (“FASB”) Accounting Standards Codification (“ASC”) Topic 946, “Financial Services – Investment Companies.” The following is a summary of the Funds’ significant accounting policies. The policies are in conformity with GAAP.
New accounting pronouncement — In August 2018, FASB issued Accounting Standards Update No. 2018-13 (“ASU 2018-13”), “Disclosure Framework – Changes to the Disclosure Requirements for Fair Value Measurement,” which amends the fair value measurement disclosure requirements of ASC Topic 820 (“ASC 820”), “Fair Value Measurement.” ASU 2018-13 includes new, eliminated, and modified disclosure requirements for ASC 820. In addition, ASU 2018-13 clarifies that materiality is an appropriate consideration when evaluating disclosure requirements.
51
THE DAVENPORT FUNDS
NOTES TO FINANCIAL STATEMENTS (Continued)
ASU 2018-13 is effective for fiscal years beginning after December 15, 2019, including interim periods therein. Early adoption is permitted, and the Funds have adopted ASU 2018-13 with these financial statements.
Securities valuation — The Funds’ portfolio securities are valued as of the close of business of the regular session of the New York Stock Exchange (the “NYSE”) (normally 4:00 p.m. Eastern time). Securities traded on a national stock exchange, including common stocks and exchange-traded funds (“ETFs”), are valued based upon the closing price on the principal exchange where the security is traded, if available, otherwise, at the last quoted bid price. Securities that are quoted by NASDAQ are valued at the NASDAQ Official Closing Price. Investments representing shares of money market funds and other open-end investment companies, other than ETFs, are valued at their net asset value (“NAV”) as reported by such companies. When using a quoted price and when the market is considered active, securities will be classified as Level 1 within the fair value hierarchy (see below).
Fixed income securities, including corporate bonds and U.S. Treasury obligations, are typically valued on the basis of prices provided by an independent pricing service. The prices provided by the pricing service are determined with consideration given to institutional bid and last sale prices and take into account securities prices, yields, maturities, call features, ratings, institutional trading in similar groups of securities, and developments related to specific securities. Given the inputs used by the pricing service, these securities are classified as Level 2 within the fair value hierarchy.
When market quotations are not readily available, if a pricing service cannot provide a price, or if the investment adviser believes the price received from the pricing service is not indicative of market value, securities will be valued in good faith at fair value using methods consistent with procedures adopted by the Board of Trustees and will be classified as Level 2 or 3 within the fair value hierarchy, depending on the inputs used. Such methods of fair valuation may include, but are not limited to: multiple of earnings, multiple of book value, discount from market of a similar freely traded security, purchase price of the security, subsequent private transactions in the security or related securities, or a combination of these and other factors.
GAAP establishes a single authoritative definition of fair value, sets out a framework for measuring fair value and requires additional disclosures about fair value measurements.
Various inputs are used in determining the value of the Funds’ investments. These inputs are summarized in the three broad levels listed below:
| | ● | Level 1 – quoted prices in active markets for identical securities |
| | ● | Level 2 – other significant observable inputs |
| | ● | Level 3 – significant unobservable inputs |
52
THE DAVENPORT FUNDS
NOTES TO FINANCIAL STATEMENTS (Continued)
The inputs or methodology used for valuing securities are not necessarily an indication of the risks associated with investing in those securities. The inputs used to measure fair value may fall into different levels of the fair value hierarchy. In such cases, for disclosure purposes, the level in the fair value hierarchy within which the fair value measurement falls in its entirety is determined based on the lowest level input that is significant to the fair value measurement.
The following is a summary of the inputs used to value the Funds’ investments as of March 31, 2019, by security type:
Davenport Core Fund | | Level 1 | | | Level 2 | | | Level 3 | | | Total | |
Common Stocks | | $ | 494,656,873 | | | $ | — | | | $ | — | | | $ | 494,656,873 | |
Money Market Funds | | | 7,366,819 | | | | — | | | | — | | | | 7,366,819 | |
Total | | $ | 502,023,692 | | | $ | — | | | $ | — | | | $ | 502,023,692 | |
Davenport Value & Income Fund | | Level 1 | | | Level 2 | | | Level 3 | | | Total | |
Common Stocks | | $ | 627,515,521 | | | $ | — | | | $ | — | | | $ | 627,515,521 | |
Money Market Funds | | | 44,755,752 | | | | — | | | | — | | | | 44,755,752 | |
Total | | $ | 672,271,273 | | | $ | — | | | $ | — | | | $ | 672,271,273 | |
Davenport Equity Opportunities Fund | | Level 1 | | | Level 2 | | | Level 3 | | | Total | |
Common Stocks | | $ | 387,247,515 | | | $ | — | | | $ | — | | | $ | 387,247,515 | |
Money Market Funds | | | 7,498,616 | | | | — | | | | — | | | | 7,498,616 | |
Total | | $ | 394,746,131 | | | $ | — | | | $ | — | | | $ | 394,746,131 | |
Davenport Small Cap Focus Fund | | Level 1 | | | Level 2 | | | Level 3 | | | Total | |
Common Stocks | | $ | 135,631,244 | | | $ | — | | | $ | — | | | $ | 135,631,244 | |
Money Market Funds | | | 12,926,695 | | | | — | | | | — | | | | 12,926,695 | |
Total | | $ | 148,557,939 | | | $ | — | | | $ | — | | | $ | 148,557,939 | |
Davenport Balanced Income Fund | | Level 1 | | | Level 2 | | | Level 3 | | | Total | |
Common Stocks | | $ | 84,388,257 | | | $ | — | | | $ | — | | | $ | 84,388,257 | |
Fixed Rate Corporate Bonds | | | — | | | | 20,661,690 | | | | — | | | | 20,661,690 | |
Variable Rate Corporate Bonds | | | — | | | | 14,672,865 | | | | — | | | | 14,672,865 | |
U.S. Treasury Obligations | | | — | | | | 14,468,966 | | | | — | | | | 14,468,966 | |
Money Market Funds | | | 7,513,577 | | | | — | | | | — | | | | 7,513,577 | |
Total | | $ | 91,901,834 | | | $ | 49,803,521 | | | $ | — | | | $ | 141,705,355 | |
Refer to each Fund’s Schedule of Investments for a listing of the securities by sector type. There were no Level 3 securities or derivative instruments held by the Funds as of March 31, 2019.
53
THE DAVENPORT FUNDS
NOTES TO FINANCIAL STATEMENTS (Continued)
Foreign currency translation — Investment securities and other assets and liabilities denominated in or expected to settle in foreign currencies, if any, are translated into U.S. dollars based on exchange rates on the following basis:
| | A. | The fair values of investment securities and other assets and liabilities are translated as of the close of the NYSE each day. |
| | B. | Purchases and sales of investment securities and income and expenses are translated at the rate of exchange prevailing as of 4:00 p.m. Eastern time on the respective date of such transactions. |
| | C. | The Funds do not isolate that portion of the results of operations caused by changes in foreign exchange rates on investments from those caused by changes in market prices of securities held. Such fluctuations are included with the net realized and unrealized gains or losses on investments. |
Reported net realized foreign exchange gains or losses arise from 1) purchases and sales of foreign currencies and 2) the difference between the amounts of dividends and foreign withholding taxes recorded on the Fund’s books and the U.S. dollar equivalent of the amounts actually received or paid. Reported net unrealized foreign exchange gains and losses arise from changes in the value of assets and liabilities that result from changes in exchange rates.
Share valuation — The NAV per share of each Fund is calculated daily by dividing the total value of its assets, less liabilities, by the number of shares outstanding. The offering price and redemption price per share of each Fund is equal to the NAV per share.
Investment income — Interest income is accrued as earned. Discounts and premiums on fixed-income securities are amortized using the interest method. Dividend income is recorded on the ex-dividend date. The Funds record distributions received from investments in real estate investment trusts (also known as “REITs”) in excess of income from underlying investments as a reduction of cost of investments and/or realized gain. These amounts are recorded once the issuers provide information about the actual composition of the distributions. Withholding taxes on foreign dividends have been recorded in accordance with the Funds’ understanding of the applicable country’s rules and tax rates.
Investment transactions — Investment transactions are accounted for on trade date for financial reporting purposes. Realized gains and losses on investment securities sold are determined on a specific identification basis.
Common expenses — Common expenses of the Trust are allocated among the Funds and the other series of the Trust based on relative net assets of each series or the nature of the services performed and the relative applicability to each series.
Distributions to shareholders — Dividends arising from net investment income, if any, are declared and paid quarterly to shareholders of Davenport Core Fund, Davenport Value & Income Fund, Davenport Small Cap Focus Fund and Davenport Balanced Income Fund; and declared and paid semi-annually to shareholders of Davenport Equity Opportunities Fund. Net realized short-term capital gains, if any, may be distributed throughout the year and net realized long-term
54
THE DAVENPORT FUNDS
NOTES TO FINANCIAL STATEMENTS (Continued)
capital gains, if any, are distributed at least once each year. The amount of distributions from net investment income and net realized capital gains are determined in accordance with federal income tax regulations, which may differ from GAAP. Dividends and distributions are recorded on the ex-dividend date.
The tax character of distributions paid during the years ended March 31, 2019 and 2018 was as follows:
| Year
Ended | | Ordinary
Income | | | Long-Term
Capital Gains | | | Total
Distributions | |
Davenport Core Fund | 03/31/19 | | $ | 2,257,754 | | | $ | 19,511,120 | | | $ | 21,768,874 | |
| | 03/31/18 | | $ | 2,062,810 | | | $ | 8,953,509 | | | $ | 11,016,319 | |
Davenport Value & Income Fund | 03/31/19 | | $ | 14,871,389 | | | $ | 22,607,186 | | | $ | 37,478,575 | |
| | 03/31/18 | | $ | 10,955,224 | | | $ | 18,625,911 | | | $ | 29,581,135 | |
Davenport Equity Opportunities Fund | 03/31/19 | | $ | — | | | $ | 13,919,524 | | | $ | 13,919,524 | |
| | 03/31/18 | | $ | — | | | $ | — | | | $ | — | |
Davenport Small Cap Focus Fund | 03/31/19 | | $ | — | | | $ | 2,926,287 | | | $ | 2,926,287 | |
| | 03/31/18 | | $ | — | | | $ | 2,522,386 | | | $ | 2,522,386 | |
Davenport Balanced Income Fund | 03/31/19 | | $ | 3,133,775 | | | $ | 602,927 | | | $ | 3,736,702 | |
| | 03/31/18 | | $ | 1,967,387 | | | $ | 617,857 | | | $ | 2,585,244 | |
Estimates — The preparation of financial statements in conformity with GAAP requires management to make estimates and assumptions that affect the reported amounts of assets and liabilities and disclosure of contingent assets and liabilities as of the date of the financial statements and the reported amounts of income and expenses during the reporting period. Actual results could differ from those estimates.
Federal income tax — Each Fund has qualified and intends to continue to qualify as a regulated investment company under the Internal Revenue Code of 1986, as amended (the “Code”). Qualification generally will relieve the Funds of liability for federal income taxes to the extent 100% of their net investment income and net realized capital gains are distributed in accordance with the Code.
In order to avoid imposition of the excise tax applicable to regulated investment companies, it is also each Fund’s intention to declare as dividends in each calendar year at least 98% of its net investment income (earned during the calendar year) and 98.2% of its net realized capital gains (earned during the twelve months ended October 31) plus undistributed amounts from prior years.
55
THE DAVENPORT FUNDS
NOTES TO FINANCIAL STATEMENTS (Continued)
The following information is computed on a tax basis for each item as of March 31, 2019:
| | Davenport
Core Fund | | | Davenport
Value &
Income Fund | | | Davenport
Equity
Opportunities
Fund | |
Cost of portfolio investments | | $ | 322,770,917 | | | $ | 560,569,370 | | | $ | 297,932,153 | |
Gross unrealized appreciation | | $ | 186,990,394 | | | $ | 130,364,098 | | | $ | 110,119,635 | |
Gross unrealized depreciation | | | (7,737,619 | ) | | | (18,662,195 | ) | | | (13,305,657 | ) |
Net unrealized appreciation | | | 179,252,775 | | | | 111,701,903 | | | | 96,813,978 | |
Undistributed ordinary income | | | 81,832 | | | | 217,315 | | | | — | |
Undistributed long-term capital gains | | | 2,068,001 | | | | 938,870 | | | | 14,122,204 | |
Accumulated earnings | | $ | 181,402,608 | | | $ | 112,858,088 | | | $ | 110,936,182 | |
| | Davenport
Small Cap
Focus Fund | | | Davenport
Balanced
Income Fund | |
Cost of portfolio investments | | $ | 133,714,514 | | | $ | 134,818,510 | |
Gross unrealized appreciation | | $ | 24,524,043 | | | $ | 10,565,631 | |
Gross unrealized depreciation | | | (9,680,618 | ) | | | (3,678,786 | ) |
Net unrealized appreciation | | | 14,843,425 | | | | 6,886,845 | |
Undistributed ordinary income | | | 793,201 | | | | 262,456 | |
Undistributed long-term capital gains | | | 241,631 | | | | — | |
Accumulated capital and other losses | | | — | | | | (738,422 | ) |
Accumulated earnings | | $ | 15,878,257 | | | $ | 6,410,879 | |
The difference between the federal income tax cost of portfolio investments and the financial statement cost of portfolio investments for each Fund, except Davenport Value & Income Fund, is due to certain timing differences in the recognition of capital gains and losses under income tax regulations and GAAP. These timing differences are temporary in nature and are due to the tax deferral of losses on wash sales and adjustments to basis on publicly traded partnerships and passive foreign investment companies.
During the year ended March 31, 2019, Davenport Equity Opportunities Fund utilized $1,457,453 of short-term capital loss carryforwards and $302,264 of long-term capital loss carryforwards for federal income tax purposes.
As of March 31, 2019, Davenport Balanced Income Fund had a short-term capital loss carryforward of $361,568 for federal income tax purposes, which may be carried forward indefinitely. This capital loss carryforward is available to offset net realized capital gains in future years, thereby reducing future taxable gains distributions.
56
THE DAVENPORT FUNDS
NOTES TO FINANCIAL STATEMENTS (Continued)
Qualified late year capital losses incurred after October 31, 2018 and within the current taxable year are deemed to arise on the first day of a Fund’s next taxable year. For the year ended March 31, 2019, Davenport Balanced Income Fund deferred $376,854 of late year capital losses to April 1, 2019 for federal income tax purposes.
During the year ended March 31, 2019, the following reclassifications were made as a result of permanent differences between the financial statements and income tax reporting requirements due to adjustments for net operating losses, utilization of earnings and profits on shareholder redemptions and publicly traded partnerships:
| | Davenport
Core Fund | | | Davenport
Value &
Income Fund | | | Davenport
Equity
Opportunities
Fund | | | Davenport
Small Cap
Focus Fund | | | Davenport
Balanced
Income Fund | |
Paid-in capital | | $ | — | | | $ | — | | | $ | (739,169 | ) | | $ | 43,755 | | | $ | (682 | ) |
Accumulated earnings | | $ | — | | | $ | — | | | $ | 739,169 | | | $ | (43,755 | ) | | $ | 682 | |
Such reclassifications have no effect on each Fund’s total net assets or NAV per share.
The Funds recognize the tax benefits or expenses of uncertain tax positions only when the position is “more likely than not” to be sustained assuming examination by tax authorities. Management has reviewed the tax positions taken on Federal income tax returns for each Fund for all open tax years (generally, three years) and has concluded that no provision for unrecognized tax benefits or expenses is required in these financial statements.
3. Investment Transactions
Investment transactions, other than short-term investments and U.S. government securities, were as follows for the year ended March 31, 2019:
| | Davenport
Core Fund | | | Davenport
Value &
Income Fund | | | Davenport
Equity
Opportunities
Fund | |
Purchases of investment securities | | $ | 102,252,228 | | | $ | 111,401,071 | | | $ | 72,095,890 | |
Proceeds from sales and maturities of investment securities | | $ | 96,907,322 | | | $ | 122,273,257 | | | $ | 114,730,345 | |
| | Davenport
Small Cap
Focus Fund | | | Davenport
Balanced
Income Fund | |
Purchases of investment securities | | $ | 105,085,628 | | | $ | 31,037,474 | |
Proceeds from sales and maturities of investment securities | | $ | 80,047,713 | | | $ | 38,321,632 | |
57
THE DAVENPORT FUNDS
NOTES TO FINANCIAL STATEMENTS (Continued)
4. Transactions with Related Parties
INVESTMENT ADVISORY AGREEMENTS
Each Fund’s investments are managed by Davenport & Company LLC (the “Adviser”) under the terms of an Investment Advisory Agreement. Under the Investment Advisory Agreement, each Fund pays the Adviser a fee, which is computed and accrued daily and paid monthly, at an annual rate of 0.75% of its average daily net assets. Certain officers and a Trustee of the Trust are also officers of the Adviser.
With respect to Davenport Small Cap Focus Fund and Davenport Balanced Income Fund, the Adviser has agreed, until August 1, 2019, to reduce its investment advisory fees and to reimburse other operating expenses to the extent necessary to limit total annual operating expenses (excluding acquired fund fees and expenses) of each such Fund to an amount not exceeding 1.25% of average daily net assets. Any such fee reductions by the Adviser, or payments by the Adviser of expenses which are a Fund’s obligation, are subject to repayment by the Funds for a period of three years from the end of the fiscal year when such fee reductions or expense reimbursements occurred, provided a Fund is able to affect such repayment and remain in compliance with the undertaking by the Adviser to limit expenses of the Fund. During the year ended March 31, 2019, the Adviser was not required to reduce its advisory fees for Davenport Small Cap Focus Fund or Davenport Balanced Income Fund. As of March 31, 2019, the Adviser has recouped all prior fee reductions or expense reimbursements from Davenport Small Cap Focus Fund and Davenport Balanced Income Fund.
A significant portion of the Funds’ investment trades are executed through an affiliated broker-dealer of the Adviser. No commissions are paid by the Funds to the Adviser or the affiliate for these trades.
OTHER SERVICE PROVIDERS
Ultimus Fund Solutions, LLC (“Ultimus”) provides administration, fund accounting, compliance and transfer agent services to the Funds. The Funds pay Ultimus fees in accordance with the agreements for such services. In addition, the Funds pay out-of-pocket expenses including, but not limited to, postage, supplies, and costs of pricing the Funds’ portfolio securities. Certain officers of the Trust are also officers of Ultimus, or of Ultimus Fund Distributors, LLC (the “Distributor”), the principal underwriter of each Fund’s shares and an affiliate of Ultimus. The Distributor is compensated by the Adviser (not the Funds) for acting as principal underwriter.
COMPENSATION OF TRUSTEES
Trustees and officers affiliated with the Adviser or Ultimus are not compensated by the Trust for their services. Each Trustee who is not an affiliated person of the Adviser or Ultimus receives from the Trust an annual retainer of $20,000, payable quarterly; a fee of $2,000 for attendance at each meeting of the Board of Trustees (except that such fee is $3,000 for the independent chair); and a fee of $1,000 for attendance at each meeting of any committee of the Board (except that
58
THE DAVENPORT FUNDS
NOTES TO FINANCIAL STATEMENTS (Continued)
such fee is $1,500 for the committee chair); plus reimbursement of travel and other expenses incurred in attending meetings. Each Fund pays its proportionate share of such fees along with the other series of the Trust.
5. Sector Risk
If a Fund has significant investments in the securities of issuers in industries within a particular business sector, any development affecting that sector will have a greater impact on the value of the net assets of the Fund than would be the case if the Fund did not have significant investments in that sector. In addition, this may increase the risk of loss of an investment in the Fund and increase the volatility of the Fund’s NAV per share. From time to time, circumstances may affect a particular sector and the companies within such sector. For instance, economic or market factors, regulation or deregulation, or other developments may negatively impact all companies in a particular sector and therefore the value of a Fund’s portfolio would be adversely affected. As of March 31, 2019, Davenport Small Cap Focus Fund had 25.2% of the value of its net assets invested in common stocks within the Financials sector.
6. Contingencies and Commitments
The Funds indemnify the Trust’s officers and Trustees for certain liabilities that might arise from the performance of their duties to the Funds. Additionally, in the normal course of business the Funds enter into contracts that contain a variety of representations and warranties and which provide general indemnifications. The Funds’ maximum exposure under these arrangements is unknown, as this would involve future claims that may be made against the Funds that have not yet occurred. However, based on experience, the Funds expect the risk of loss to be remote.
7. Subsequent Events
The Funds are required to recognize in the financial statements the effects of all subsequent events that provide additional evidence about conditions that existed as of the date of the Statements of Assets and Liabilities. For non-recognized subsequent events that must be disclosed to keep the financial statements from being misleading, the Funds are required to disclose the nature of the event as well as an estimate of its financial effect, or a statement that such an estimate cannot be made. Management has evaluated subsequent events through the issuance of these financial statements and has noted no such events.
59
THE DAVENPORT FUNDS
REPORT OF INDEPENDENT REGISTERED
PUBLIC ACCOUNTING FIRM
To the Shareholders of The Davenport Funds and
Board of Trustees of Williamsburg Investment Trust
Opinion on the Financial Statements
We have audited the accompanying statements of assets and liabilities, including the schedules of investments, of The Davenport Funds, comprising Davenport Core Fund, Davenport Value & Income Fund, Davenport Equity Opportunities Fund, Davenport Small Cap Focus Fund, and Davenport Balanced Income Fund (the “Funds”), each a series of Williamsburg Investment Trust, as of March 31, 2019, and the related statements of operations for the year then ended, the statements of changes in net assets for each of the two years in the period then ended, including the related notes, and the financial highlights for each of the four periods in the period then ended (collectively referred to as the “financial statements”). In our opinion, the financial statements present fairly, in all material respects, the financial position of each of the Funds as of March 31, 2019, the results of their operations for the year then ended, the changes in their net assets for each of the two years in the period then ended, and the financial highlights for each of the four periods in the period then ended, in conformity with accounting principles generally accepted in the United States of America.
The Funds’ financial highlights for the period ended March 31, 2015, were audited by other auditors whose report dated May 22, 2015, expressed an unqualified opinion on those financial highlights.
Basis for Opinion
These financial statements are the responsibility of the Funds’ management. Our responsibility is to express an opinion on the Funds’ financial statements based on our audits. We are a public accounting firm registered with the Public Company Accounting Oversight Board (United States) (“PCAOB”) and are required to be independent with respect to the Funds in accordance with the U.S. federal securities laws and the applicable rules and regulations of the Securities and Exchange Commission and the PCAOB.
We conducted our audits in accordance with the standards of the PCAOB. Those standards require that we plan and perform the audit to obtain reasonable assurance about whether the financial statements are free of material misstatement, whether due to error or fraud.
Our audits included performing procedures to assess the risks of material misstatement of the financial statements, whether due to error or fraud, and performing procedures that respond to those risks. Such procedures included examining, on a test basis, evidence regarding the amounts and disclosures in the financial statements. Our procedures included confirmation of securities owned as of March 31, 2019, by correspondence with the custodian and brokers. Our audits also included evaluating the accounting principles used and significant estimates made by management, as well as evaluating the overall presentation of the financial statements. We believe that our audits provide a reasonable basis for our opinion.
We have served as the Funds’ auditor since 2016.
COHEN & COMPANY, LTD.
Cleveland, Ohio
May 22, 2019
60
THE DAVENPORT FUNDS
BOARD OF TRUSTEES AND EXECUTIVE OFFICERS
(Unaudited)
Overall responsibility for management of the Funds rests with the Board of Trustees. The Trustees serve during the lifetime of the Trust and until its termination, or until death, resignation, retirement or removal. The Trustees, in turn, elect the officers of the Funds. The officers have been elected for an annual term. The following are the Trustees and executive officers of the Funds:
Trustees and Officers | Address | Year of
Birth | Position Held
with the Trust | Length of
Time Served |
| | Robert S. Harris, Ph.D. | 225 Pictoria Drive, Suite 450
Cincinnati, OH | 1949 | Chairman and Trustee | Since
January 2007 |
* | John P. Ackerly, IV | One James Center
901 E. Cary Street
Richmond, VA | 1963 | Trustee and President of Davenport Funds | Since
July 2012 |
* | John T. Bruce | 800 Main Street
Lynchburg, VA | 1953 | Trustee and President of FBP Funds | Since
September 1988 |
| | George K. Jennison | 225 Pictoria Drive, Suite 450
Cincinnati, OH | 1957 | Trustee | Since
January 2015 |
| Harris V. Morrissette | 225 Pictoria Drive, Suite 450
Cincinnati, OH | 1959 | Trustee | Since
March 1993 |
| | Elizabeth W. Robertson | 225 Pictoria Drive, Suite 450
Cincinnati, OH | 1953 | Trustee | Since
February 2014 |
| | Greg L. Smith, III | One James Center
901 E. Cary Street
Richmond, VA | 1976 | Vice President | Since
February 2011 |
| Robert G. Dorsey | 225 Pictoria Drive, Suite 450
Cincinnati, OH | 1957 | Vice President | Since
November 2000 |
| Mark J. Seger | 225 Pictoria Drive, Suite 450
Cincinnati, OH | 1962 | Treasurer | Since
November 2000 |
| | David K. James | 225 Pictoria Drive, Suite 450
Cincinnati, OH | 1970 | Secretary | Since
September 2018 |
| | Simon H. Berry | 225 Pictoria Drive, Suite 450
Cincinnati, OH | 1971 | Chief Compliance Officer | Since
May 2017 |
* | Messrs. Ackerly and Bruce, as affiliated persons of investment advisers to the Trust, are “interested persons” of the Trust within the meaning of Section 2(a)(19) of the 1940 Act. |
61
THE DAVENPORT FUNDS
BOARD OF TRUSTEES AND EXECUTIVE OFFICERS
(Unaudited) (Continued)
Each Trustee oversees ten portfolios of the Trust, including the Funds. The principal occupations of the Trustees and executive officers of the Funds during the past five years and public directorships held by the Trustees are set forth below:
Robert S. Harris, Ph.D. is the C. Stewart Sheppard Professor of Business Administration at The Darden Graduate School of Business Administration at the University of Virginia. He was previously the dean at Darden. Professor Harris has published widely on corporate finance, financial markets and mergers and acquisitions and has served as a consultant to corporations and government agencies.
John P. Ackerly, IV, is Senior Vice President and Portfolio Manager of Davenport & Company, LLC (a broker-dealer and investment advisory firm).
John T. Bruce is President, Director and member of the Executive Committee of Flippin, Bruce & Porter, Inc. (an investment advisory firm).
George K. Jennison is President of Oyster Consulting, LLC (a management consulting firm). He previously was a financial adviser with Wells Fargo Advisors, LLC.
Harris V. Morrissette is President of China Doll Rice and Beans, Inc. and Dixie Lily Foods. He is also a Director of Trustmark Corporation (bank holding company).
Elizabeth W. Robertson serves as a Trustee of TowneBank Foundation, TowneBank Corporate Board, TowneBank Audit Committee Chair and TowneBank Community Board since 2015. She previously was Chief Financial Officer of Monument Restaurants LLC.
George L. Smith, III is Senior Vice President and Portfolio Manager of the Adviser.
Robert G. Dorsey is a Vice Chairman of Ultimus Fund Solutions, LLC and Ultimus Fund Distributors, LLC. He previously was Co-CEO of Ultimus Fund Solutions, LLC (1999 to 2019).
Mark J. Seger is a Vice Chairman of Ultimus Fund Solutions, LLC and Ultimus Fund Distributors, LLC. He previously was Co-CEO of Ultimus Fund Solutions, LLC (1999 to 2019).
David K. James is an Executive Vice President and Chief Legal and Risk Officer of Ultimus Fund Solutions, LLC (2018 to present). He previously was Managing Director and Managing Counsel at State Street Bank and Trust Company (2009 to 2018).
Simon H. Berry is a Senior Attorney at Ultimus Fund Solutions, LLC (2016 to present). He previously was an Attorney at the Kentucky Department of Financial Institutions (2009 to 2016)
62
THE DAVENPORT FUNDS
YOUR FUNDS’ EXPENSES (Unaudited)
We believe it is important for you to understand the impact of costs on your investment. All mutual funds have operating expenses. As a shareholder of the Funds, you incur ongoing costs, including management fees and other expenses. These ongoing costs, which are deducted from each Fund’s gross income, directly reduce the investment return of the Funds.
A mutual fund’s ongoing costs are expressed as a percentage of its average net assets. This figure is known as the expense ratio. The following examples are intended to help you understand the ongoing costs (in dollars) of investing in the Funds and to compare these costs with the ongoing costs of investing in other mutual funds. The examples below are based on an investment of $1,000 made at the beginning of the period shown and held for the entire period (October 1, 2018 and held through March 31, 2019).
The table below illustrates each Fund’s ongoing costs in two ways:
Actual fund return – This section helps you to estimate the actual expenses that you paid over the period. The “Ending Account Value” shown is derived from each Fund’s actual return, and the fourth column shows the dollar amount of operating expenses that would have been paid by an investor who started with $1,000 in the Funds. You may use the information here, together with the amount you invested, to estimate the expenses that you paid over the period.
To do so, simply divide your account value by $1,000 (for example, an $8,600 account value divided by $1,000 = 8.6), then multiply the result by the number given for the applicable Fund under the heading “Expenses Paid During Period.”
Hypothetical 5% return – This section is intended to help you compare each Fund’s ongoing costs with those of other mutual funds. It assumes that each Fund had an annual return of 5% before expenses during the period shown, but that the expense ratio is unchanged. In this case, because the return used is not each Fund’s actual return, the results do not apply to your investment. The example is useful in making comparisons because the SEC requires all mutual funds to calculate expenses based on a 5% return. You can assess each Fund’s ongoing costs by comparing this hypothetical example with the hypothetical examples that appear in shareholder reports of other funds.
Note that expenses shown in the table are meant to highlight and help you compare ongoing costs only. The Funds do not charge sales loads or redemption fees.
The calculations assume no shares were bought or sold during the period. Your actual costs may have been higher or lower, depending on the amount of your investment and the timing of any purchases or redemptions.
More information about each Fund’s expenses, including historical annual expense ratios, can be found in this report. For additional information on operating expenses and other shareholder costs, please refer to the Funds’ prospectus.
63
THE DAVENPORT FUNDS
YOUR FUNDS’ EXPENSES (Unaudited) (Continued)
| Beginning
Account Value
October 1,
2018 | Ending
Account Value
March 31,
2019 | Expense
Ratio(a) | Expenses Paid
During Period(b) |
Davenport Core Fund | | | | |
Based on Actual Fund Return | $1,000.00 | $ 992.10 | 0.89% | $4.42 |
Based on Hypothetical 5% Return
(before expenses) | $1,000.00 | $ 1,020.49 | 0.89% | $4.48 |
Davenport Value & Income Fund |
Based on Actual Fund Return | $1,000.00 | $ 974.60 | 0.88% | $4.33 |
Based on Hypothetical 5% Return
(before expenses) | $1,000.00 | $ 1,020.54 | 0.88% | $4.43 |
Davenport Equity Opportunities Fund |
Based on Actual Fund Return | $1,000.00 | $1,041.50 | 0.91% | $4.63 |
Based on Hypothetical 5% Return
(before expenses) | $1,000.00 | $1,020.39 | 0.91% | $4.58 |
Davenport Small Cap Focus Fund |
Based on Actual Fund Return | $1,000.00 | $ 981.50 | 0.96% | $4.74 |
Based on Hypothetical 5% Return
(before expenses) | $1,000.00 | $ 1,020.14 | 0.96% | $4.84 |
Davenport Balanced Income Fund |
Based on Actual Fund Return | $1,000.00 | $ 994.80 | 0.96% | $4.77 |
Based on Hypothetical 5% Return
(before expenses) | $1,000.00 | $ 1,020.14 | 0.96% | $4.84 |
(a) | Annualized, based on each Fund’s most recent one-half year expenses. |
(b) | Expenses are equal to each Fund’s annualized expense ratio multiplied by the average account value over the period, multiplied by 182/365 (to reflect the one-half year period). |
64
THE DAVENPORT FUNDS
OTHER INFORMATION (Unaudited) |
A description of the policies and procedures that the Funds use to vote proxies relating to portfolio securities is available without charge upon request by calling toll-free 1-800-281-3217, or on the SEC’s website at http://www.sec.gov. Information regarding how the Funds voted proxies relating to portfolio securities during the most recent 12-month period ended June 30 is also available without charge upon request by calling toll-free 1-800-281-3217, or on the SEC’s website at http://www.sec.gov.
The Trust files a complete listing of portfolio holdings for each Fund with the SEC as of the end of the first and third quarters of each fiscal year on Form N-Q or as an exhibit to its reports on Form N-Q’s successor form, Form N-PORT. These filings are available upon request by calling 1-800-281-3217. Furthermore, you may obtain a copy of these filings on the SEC’s website at http://www.sec.gov.
A complete listing of portfolio holdings for each Fund is updated daily and can be reviewed at the Funds’ website at http://www.investdavenport.com.
FEDERAL TAX INFORMATION (Unaudited)
For the fiscal year ended March 31, 2019, Davenport Core Fund, Davenport Value & Income Fund, Davenport Equity Opportunities Fund, Davenport Small Cap Focus Fund and Davenport Balanced Income Fund designated $19,511,120, $22,607,186, $13,919,524, $2,926,287 and $602,927, respectively, as long-term capital gain distributions.
Qualified Dividend Income – Davenport Core Fund, Davenport Value & Income Fund and Davenport Balanced Income Fund designated 100%, 100% and 68.0%, respectively, of ordinary income distributions, or up to the maximum amount of such dividends allowable pursuant to the Internal Revenue Code, as qualified dividend income.
Dividends Received Deduction – Corporate shareholders are generally entitled to take the dividends received deduction on the portion of a Fund’s dividend distributions that qualify under tax law. For the fiscal year ended March 31, 2019, Davenport Core Fund, Davenport Value & Income Fund and Davenport Balanced Income Fund, 100%, 90.7% and 56.6%, respectively, of ordinary income distributions, qualifies for the corporate dividends received deduction.
65
DAVENPORT FUNDS
DISCLOSURE REGARDING APPROVAL OF
INVESTMENT ADVISORY AGREEMENT
(Unaudited)
At an in-person meeting held on February 26, 2019, the Board of Trustees, including a majority of the Independent Trustees, approved the continuance for a one-year period of the Investment Advisory Agreements with the Adviser on behalf of the Davenport Core Fund, the Davenport Value & Income Fund, the Davenport Equity Opportunities Fund, the Davenport Small Cap Focus Fund and the Davenport Balanced Income Fund. Below is a discussion of the factors considered by the Board of Trustees along with the conclusions with respect thereto that formed the basis for the Board’s approval.
In approving the continuance of the Investment Advisory Agreements, the Independent Trustees considered all information they deemed reasonably necessary to evaluate the terms of the Agreements. The principal areas of review by the Independent Trustees were the nature, extent and quality of the services provided by the Adviser and the reasonableness of the fees charged for those services. These matters were considered by the Independent Trustees consulting with experienced counsel for the Independent Trustees, who is independent of the Adviser.
The Independent Trustees’ evaluation of the quality of the Adviser’s services took into consideration their knowledge gained through presentations and reports from the Adviser over the course of the preceding year. The Independent Trustees considered that the Adviser had provided its views on the overall conditions of the economy and the markets, including the factors that may have influenced the markets, investor preferences and market sentiment during the past year. Both short-term and long-term investment performance of the Funds were considered. Each Fund’s performance was compared to its performance benchmark, a peer group of funds with similar investment objectives and strategies, and to the Adviser’s comparably managed private accounts. The Independent Trustees also considered: the scope and quality of the in-house capabilities of the Adviser and other resources that are dedicated towards management of the Funds; the quality of administrative and other services, including the Adviser’s role in coordinating the activities of the Funds’ other service providers; the Adviser’s compliance with investment policies of the Funds and applicable laws and regulations; information provided by management and the Funds’ independent public accounting firm in periodic meetings with the Trust’s Audit Committee; the business reputation of the Adviser; the qualifications of the Adviser’s key investment and compliance personnel; and the Adviser’s financial resources.
In reviewing the fees payable under the Investment Advisory Agreements, the Independent Trustees compared the advisory fees and overall expense levels of each Fund with those of funds with similar investment objectives and strategies as well as the private accounts managed by the Adviser. The Independent Trustees considered information provided by the Adviser concerning the Adviser’s profitability with respect to each Fund, including the assumptions and methodology used in preparing the profitability information, in light of applicable case law relating to advisory fees. For these purposes, the Independent Trustees considered not only the fees paid by the Funds, but also so-called “fallout” benefits to the Adviser. The Independent Trustees also considered the fact that the Funds’ portfolio trades for equity securities were executed by the Adviser at no cost to the Funds. In evaluating the Funds’ advisory fees, the Trustees considered the complexity and quality of the investment process that is applied in the management of the Funds.
66
DAVENPORT FUNDS
DISCLOSURE REGARDING APPROVAL OF
INVESTMENT ADVISORY AGREEMENT
(Unaudited) (Continued)
Based upon their review of this information, the Independent Trustees concluded that: (i) although the performance of each of the Davenport Core Fund and the Davenport Value & Income Fund lagged the returns of its respective benchmark index and Lipper category average during the 2018 calendar year, the Trustees considered that each Fund is managed with a value-sensitive bias and that growth stocks have been favored over value stocks for a number of years; (ii) the performance of the Equity Opportunities Fund exceeded the returns of the Russell MidCap Index and the Lipper category average for Mid Cap Core Funds and Mid Cap Value Funds during the December 31, 2018 calendar year and the period since inception; (iii) the performance of the Davenport Small Cap Focus Fund lagged the returns of the Russell 2000 Index and Lipper category average for Small Cap Core Funds during the 2018 calendar year, but exceeded the returns of the Index and Lipper category average over the three-year period ending December 31, 2018; (iv) although the performance of the Balanced Income Fund placed below the return of the S&P 500 Index and the Morningstar 50% -70% equity allocation category average during the 2018 calendar year, the Trustees considered that the equity portion of the Fund is managed with a value-sensitive bias and that growth stocks have been favored over value stocks for a number of years; (v) the advisory fees payable by each Fund to Davenport & Co. are competitive with fees for comparably managed funds and the Independent Trustees believe the fees to be reasonable given the scope and quality of services provided by Davenport & Co. and the resources that are dedicated to its investment process; (vi) the total operating expense ratio of each of the Davenport Core Fund, the Davenport Value & Income Fund, the Davenport Equity Opportunities Fund and the Davenport Small Cap Focus Fund is lower than the average expense ratio for comparably managed funds, according to statistics derived from Morningstar, Inc.; (vii) Davenport & Co., a dually registered investment adviser and broker dealer, has further benefited the Funds’ shareholders by executing all equity trades at no cost to the Funds; and (viii) the profits of Davenport & Co. with respect to its management of the Funds are reasonable.
The Independent Trustees considered the extent to which economies of scale are being realized as the Funds grow, and they noted that the operating expenses of each of the Davenport Funds have decreased during each of the past three calendar years, except that the operating expenses for the Davenport Core Fund were unchanged over that period. The Independent Trustees also considered the “fallout” benefits to Davenport & Co. with respect to the Davenport Funds, but given the amounts involved viewed these as secondary factors in connection with the evaluation of the reasonableness of the advisory fees paid by the Funds.
No single factor was considered in isolation or to be determinative to the decision of the Independent Trustees to approve the continuance of the Investment Advisory Agreements. Rather the Independent Trustees concluded, after weighing and balancing of all factors considered, that it was in the best interests of each Fund and its shareholders to continue the Investment Advisory Agreements without modification to its terms, including the fees charged for services thereunder.
67
This page intentionally left blank.
THE DAVENPORT FUNDS
Investment Adviser
Davenport & Company LLC
One James Center
901 East Cary Street
Richmond, Virginia 23219-4037
Administrator
Ultimus Fund Solutions, LLC
P.O. Box 46707
Cincinnati, Ohio 45246-0707
1-800-281-3217
Custodian
U.S. Bank, N.A.
425 Walnut Street
Cincinnati, Ohio 45202
Independent Registered Public
AccountingFirm
Cohen & Company, Ltd.
1350 Euclid Avenue
Suite 800
Cleveland, Ohio 44115
LegalCounsel
Sullivan & Worcester LLP
1666 K Street, N.W.
Washington, DC 20006
Board of Trustees
Robert S. Harris, Ph.D., Chairman
John P. Ackerly, IV
John T. Bruce
George K. Jennison
Harris V. Morrissette
Elizabeth W. Robertson
Officers
John P. Ackerly, IV, President
George L. Smith, III, Vice President

One James Center
901 East Cary Street
Richmond, VA 23219
Davenport & Company LLC
Member: NYSE ● SIPC
Toll Free: (800) 846-6666
www.investdavenport.com
FBP Equity & Dividend Plus Fund
FBP Appreciation & Income Opportunities Fund
Annual Report
March 31, 2019
No-Load Funds
Beginning on January 1, 2021, as permitted by regulations adopted by the U.S. Securities and Exchange Commission, paper copies of the Funds’ shareholder reports like this one will no longer be sent by mail, unless you specifically request paper copies of the reports from the Funds or from your financial intermediary, such as a broker-dealer or bank. Instead, the reports will be made available on a website, and you will be notified by mail each time a report is posted and provided with a website link to access the report.
If you already elected to receive shareholder reports electronically, you will not be affected by this change and you need not take any action. You may elect to receive shareholder reports and other communications from the Funds electronically by contacting the Funds at 1-866-738-1127 or, if you own these shares through a financial intermediary, by contacting your financial intermediary.
You may elect to receive all future reports in paper free of charge. You can inform the Funds that you wish to continue receiving paper copies of your shareholder reports by contacting the Funds at 1-866-738-1127. If you own shares through a financial intermediary, you may contact your financial intermediary or follow instructions included with this document to elect to continue to receive paper copies of your shareholder reports. Your election to receive reports in paper will apply to all Funds held with the Fund complex or at your financial intermediary.
Letter to Shareholders | May 1, 2019 |
We are pleased to report on your Funds and their investments for the annual period ended March 31, 2019, and to provide some additional information since we last communicated with you.
Economic and Market Update
Equity markets have been quite volatile since our last semi-annual report to you. Stocks experienced a sharp correction during the final calendar quarter of 2018 that erased gains generated earlier during the year. The sell-off was especially acute in December, giving investors a holiday that only Scrooge could enjoy. The downturn was marked by wild trading, some days experiencing 1,000-point intraday swings for the Dow Jones Industrial Average.
Several factors were at work that brought about the sharp change in investor sentiment. The most likely spark that lit the flame of worry was Fed Chairman Jerome Powell’s comments in October in which he implied that the Fed was “a long way” from normalizing interest rates to neutral levels. The idea that we could get much higher rates in a shorter amount of time clearly spooked investors. In December, despite public criticism from President Trump, the FOMC made good on its telegraphed plan to raise interest rates one more time in 2018, taking the fed funds rate to near 2.5%. With the ten-year Treasury then yielding 2.7%, the yield curve became quite flat. Trade fears also came back into focus with news that the U.S. and China were at odds over tariffs. Oil prices tanked. Commodity investors seemed to realize all at once that with loosened sanctions on Iranian crude and global economic growth slumping, there could be a glut of supply on the market. The mid-term election, impeachment rumors, Brexit and the government shutdown, were all factors that worked to pressure consumer confidence and equity markets.
Then on December 26th, investors came back from the holiday in the mood for bargains. Corporate earnings surged more than 20% last year, in large part due to the 2017 corporate tax rate cut and regulatory reform. With earnings up and stock prices down, the price to forward earnings ratio for the S&P 500, at 14.4 times, looked more attractive at the end of calendar 2018 than it had in more than five years. We believe the significantly more attractive valuation played a major role in moving stocks higher. Additionally, many of the prior concerns were mitigated after the Fed backed off its hawkish posture, trade negotiations with China seemed to be progressing, and GDP, while slowing, continued to show steady growth. The stage was set for positive stock market performance.
As 2019 started, the S&P 500 produced its strongest quarterly return since 2009 and its best first quarter return in twenty years. International markets rebounded strongly as well. Recession, trade and interest rate fears, which were rampant in the fourth quarter, seemed to fade away as investor sentiment improved markedly. Simply put, we believe there was emotional selling of stocks in the fourth quarter of last year, which was exacerbated by lack of liquidity in late December. As reason returned and investors correctly viewed stock valuations relative to inflation and earnings growth, the sell-off proved to be short-lived.
March marked the ten-year anniversary of the beginning of the current bull market. After years of economic growth and nice stock market gains, it is natural to be concerned about the next recession and the timing of when it may happen. Recessions normally occur when excesses build up in the economy, and the Fed is forced to raise interest rates to slow growth and control inflation. We are far from that situation today. While the cycle is long at ten years, the current expansion has been characterized by slower growth than prior cycles. Inflation appears under control, interest rates remain low, and very few capacity constraints are evident. With the strong market so far in calendar 2019, valuations have moved higher to just over 16.5 times
1
earnings. We believe the stock market remains reasonably valued with earnings projected to grow 5-7% this year and with interest rates still very low. In our opinion, with the economy still showing resiliency, stocks should continue to outperform other asset classes going forward.
FBP Equity & Dividend Plus Fund Review
The FBP Equity & Dividend Plus Fund returned 5.64% for the fiscal year ended March 31, 2019. The Russell 1000 Value Index and the S&P 500 Index (the “Index”) returned 5.67% and 9.50%, respectively, over the same period. The Fund was 91.7% equity and 8.3% cash at fiscal year-end.
Since our last report to you, the more defensive sectors of the Fund have provided better returns. Real Estate and Utilities, relatively small sectors by weight, performed especially well as interest rates fell and concerns over slower growth surfaced. Consumer Staples generally produced positive returns with Procter & Gamble leading the way. The stock should benefit from the company having improved pricing power and better earnings. Merck and Pfizer in Health Care also performed well. Broadcom, a newer addition to the Fund continued to act well, as did Cisco Systems. Weakness in AT&T and CenturyLink dragged down the Communication Services sector for the Fund, while Tapestry and Nordstrom held back returns in the Consumer Discretionary sector. Financials were negatively affected by the growth scare and the flattening of the yield curve, putting pressure on bank net interest margins. The Fund added to existing positions in DowDuPont, Broadcom and United Parcel Service. New stocks added were Carnival and Intel. Conoco Phillips, General Electric and Eli Lilly were eliminated from the Fund.
The Fund does utilize as part of its investment discipline the use of covered call options as individual securities approach the top of the Adviser’s growth and price expectations. The Fund’s purpose in selling the call option is to generate additional cash flow to the Fund and to hedge the possibility that the security may not achieve its price objective. In very strong stock markets, this discipline may limit the upside of the securities where options have been written, but in flat to negative markets, it may provide additional return. During the fiscal year ended March 31, 2019, the amount of premiums generated from selling covered call options was $481,633.
FBP Appreciation & Income Opportunities Fund Review
The FBP Appreciation & Income Opportunities Fund returned 3.44% for the fiscal year ended March 31, 2019. The Russell 1000 Value and the S&P 500 Index (the “Index”) returned 5.67% and 9.50% respectively, while the Bloomberg Barclays U.S. Government/Credit Index returned 4.48% over the same period. The Fund was 74.0% equity, 17.4% fixed income and 8.6% cash at fiscal year-end.
Just as with the Equity & Dividend Plus Fund, defensive sectors were the better performers for the Fund since our last report. Utilities, Real Estate, and the Consumer Staples sectors did well. Individually, Ventas, Broadcom, Cisco Systems, Travelers and Merck helped returns. The Fund’s returns were held back by weakness in CenturyLink and AT&T in the Communication Services sector, Schlumberger in the Energy sector and both Freeport-McMoRan and Compass Minerals in the Materials sector. The Industrials sector also had a tough period as investors became concerned about possible slowing economic growth. New positions in the Fund were Kellogg, Haliburton and Carnival. Halliburton was a replacement for Schlumberger, which was eliminated from the Fund. The Fund increased positions in CBS and Broadcom, while reducing positions in successful investments in Eli Lilly, ConocoPhillips, Apple, and Ventas, which was eliminated.
The Fund does utilize as part of its investment discipline the use of covered call options as individual securities approach the top of the Adviser’s growth and price expectations. The Fund’s purpose in selling the call option is to generate additional income to the Fund and to hedge the possibility that the security may not achieve its price objective. In very strong stock markets, this discipline may limit the upside of the
2
securities where options have been written, but in modest to negative markets, it may provide additional return. During the fiscal year ended March 31, 2019, the amount of premiums generated from selling covered call options was $83,192.
We want to thank you for your continued support and investment in the Flippin, Bruce & Porter Funds. Please visit our website at www.fbpfunds.com for information on your Funds and the investment philosophy and process we utilize to achieve their investment objectives.

John T. Bruce, CFA
President - Portfolio Manager
May 1, 2019
Data presented reflects past performance, which is no guarantee of future results. Investment results and principal value will fluctuate so that shares, when redeemed, may be worth more or less than their original cost. Due to market volatility, current performance may be higher or lower than the performance shown. Updated performance information, current through the most recent month-end, is available by contacting the Funds at 1-866-738-1127.
This report is submitted for the general information of the shareholders of the Funds. It reflects our views, opinions and portfolio holdings as of the date of this letter. These views are subject to change at any time based upon market or other conditions. For more current information throughout the year, please visit www.fbpfunds.com or call the Funds at 1-866-738-1127. This report is not authorized for distribution to prospective investors in the Funds unless accompanied by a current prospectus.
3
THE FLIPPIN, BRUCE & PORTER FUNDS
COMPARATIVE PERFORMANCE CHARTS
(Unaudited)
Performance for each Fund is compared to the most appropriate broad-based index, the Standard and Poor’s 500® Index, an unmanaged index of 500 large common stocks. Each Fund’s performance results are also compared to the Russell 1000 Value Index and the Consumer Price Index, a measure of inflation.
FBP Equity & Dividend Plus Fund
Comparison of the Change in Value of a $10,000 Investment in FBP Equity & Dividend Plus Fund,
the Standard & Poor’s 500®Index, the Consumer Price Index and the Russell 1000 Value Index
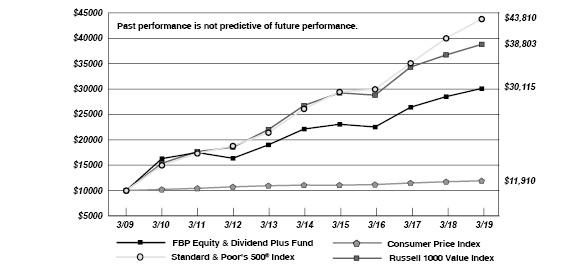
4
THE FLIPPIN, BRUCE & PORTER FUNDS
COMPARATIVE PERFORMANCE CHARTS
(Unaudited) (Continued)
FBP Appreciation & Income Opportunities Fund
Comparison of the Change in Value of a $10,000 Investment in FBP Appreciation & Income
Opportunities Fund, the Standard & Poor’s 500® Index, the Consumer Price Index,
the Russell 1000 Value Index and the Bloomberg Barclays U.S. Government/Credit Index

Average Annual Total Returns (for periods ended March 31, 2019) |
| 1 Year | 5 Years | 10 Years | |
FBP Equity & Dividend Plus Fund(a) | 5.64% | 6.37% | 11.65% | |
FBP Appreciation & Income Opportunities Fund(a) | 3.44% | 4.75% | 9.71% | |
Standard & Poor’s 500® Index | 9.50% | 10.91% | 15.92% | |
Consumer Price Index | 1.52% | 1.49% | 1.76% | |
Russell 1000 Value Index | 5.67% | 7.72% | 14.52% | |
Bloomberg Barclays U.S. Government/Credit Index | 4.48% | 2.79% | 3.92% | |
(a) | Total returns are a measure of the change in value of an investment in the Fund over the periods covered, which assumes any dividends or capital gains distributions are reinvested in shares of the Fund. Returns do not reflect the deduction of taxes a shareholder would pay on the Fund’s distributions or the redemption of Fund shares. |
5
FBP EQUITY & DIVIDEND PLUS FUND
PORTFOLIO INFORMATION
March 31, 2019 (Unaudited)
General Information | | | |
Net Asset Value Per Share | | $ | 25.19 | |
Total Net Assets (Millions) | | $ | 28.6 | |
Current Expense Ratio | | | 1.07 | % |
Portfolio Turnover | | | 18 | % |
Fund Inception Date | | | 7/30/1993 | |
Stock Characteristics | | Fund | | | S&P 500®
Index | |
Number of Stocks | | | 53 | | | | 500 | |
Weighted Average Market Capitalization (Billions) | | | 141.0 | | | | 230.3 | |
Price-to-Earnings Ratio (Bloomberg 1 Year Forecast EPS) | | | 12.7 | | | | 16.5 | |
Price-to-Book Value | | | 2.3 | | | | 3.4 | |
Asset Allocation (% of Net Assets) |
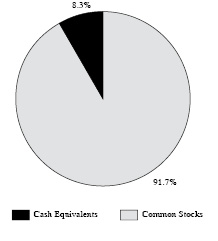
|
Sector Diversification vs. the S&P 500® Index |

Ten Largest Equity Holdings | % of Net Assets |
Procter & Gamble Company (The) | 3.3% |
International Business Machines Corporation | 3.0% |
Merck & Company, Inc. | 2.7% |
Cisco Systems, Inc. | 2.6% |
United Parcel Service, Inc. - Class B | 2.5% |
Pfizer, Inc. | 2.5% |
BB&T Corporation | 2.5% |
Broadcom, Inc. | 2.4% |
U.S. Bancorp | 2.4% |
Exxon Mobil Corporation | 2.4% |
6
FBP APPRECIATION & INCOME OPPORTUNITIES FUND
PORTFOLIO INFORMATION
March 31, 2019 (Unaudited)
General Information |
Net Asset Value Per Share | | $ | 18.91 | |
Total Net Assets (Millions) | | $ | 33.4 | |
Current Expense Ratio | | | 1.00 | % |
Portfolio Turnover | | | 21 | % |
Fund Inception Date | | | 7/3/1989 | |
Asset Allocation (% of Net Assets) |

|
Common Stock Portfolio (74.0% of Net Assets) |
Number of Stocks | | | 52 | |
Weighted Average Market Capitalization (Billions) | | | 165.5 | |
Price-to-Earnings Ratio (Bloomberg 1 Year Forecast EPS) | | | 12.1 | |
Price-to-Book Value | | | 2.1 | |
Ten Largest Equity Holdings | % of Net Assets |
JPMorgan Chase & Company | 3.6% |
Bank of America Corporation | 3.3% |
Cisco Systems, Inc. | 3.1% |
Microsoft Corporation | 2.5% |
Lincoln National Corporation | 2.5% |
Travelers Companies, Inc. (The) | 2.3% |
Apple, Inc. | 2.2% |
International Business Machines Corporation | 2.2% |
Merck & Company, Inc. | 2.0% |
Bank of New York Mellon Corporation (The) | 2.0% |
Five Largest Sectors | % of Net Assets |
Financials | 17.5% |
Information Technology | 14.8% |
Energy | 9.1% |
Health Care | 8.0% |
Industrials | 6.8% |
Fixed-Income Portfolio (17.4% of Net Assets) |
Number of Fixed-Income Securities | 11 |
Average Quality | BBB+ |
Average Weighted Maturity | 2.37 yrs. |
Average Effective Duration | 2.23 yrs. |
Sector Breakdown | % of Net Assets |
U.S. Government & Agency Obligations | 1.5% |
Consumer Staples | 1.5% |
Energy | 1.5% |
Financials | 6.1% |
Health Care | 1.5% |
Industrials | 3.8% |
Utilities | 1.5% |
7
FBP EQUITY & DIVIDEND PLUS FUND
SCHEDULE OF INVESTMENTS
March 31, 2019 |
COMMON STOCKS — 91.7% | | Shares | | | Value | |
Communication Services — 3.2% | | | | | | | | |
AT&T, Inc. | | | 20,300 | | | $ | 636,608 | |
CenturyLink, Inc.(a) | | | 24,000 | | | | 287,760 | |
| | | | | | | | 924,368 | |
Consumer Discretionary — 10.1% | | | | | | | | |
Carnival Corporation | | | 8,700 | | | | 441,264 | |
Ford Motor Company | | | 35,000 | | | | 307,300 | |
Kohl's Corporation(a) | | | 6,000 | | | | 412,620 | |
Nordstrom, Inc.(a) | | | 8,900 | | | | 394,982 | |
Tapestry, Inc. | | | 8,300 | | | | 269,667 | |
Target Corporation(a) | | | 8,000 | | | | 642,080 | |
Williams-Sonoma, Inc.(a) | | | 7,400 | | | | 416,398 | |
| | | | | | | | 2,884,311 | |
Consumer Staples — 10.2% | | | | | | | | |
Coca-Cola Company (The)(a) | | | 6,000 | | | | 281,160 | |
Hershey Company (The)(a) | | | 4,100 | | | | 470,803 | |
Kellogg Company | | | 7,500 | | | | 430,350 | |
PepsiCo, Inc.(a) | | | 3,500 | | | | 428,925 | |
Procter & Gamble Company (The)(a) | | | 9,000 | | | | 936,450 | |
Walmart, Inc. | | | 3,700 | | | | 360,861 | |
| | | | | | | | 2,908,549 | |
Energy — 10.0% | | | | | | | | |
Chevron Corporation(a) | | | 4,800 | | | | 591,264 | |
Exxon Mobil Corporation | | | 8,400 | | | | 678,720 | |
Occidental Petroleum Corporation | | | 7,200 | | | | 476,640 | |
Royal Dutch Shell plc - Class B - ADR | | | 9,500 | | | | 607,525 | |
Schlumberger Ltd. | | | 11,800 | | | | 514,126 | |
| | | | | | | | 2,868,275 | |
Financials — 16.0% | | | | | | | | |
BB&T Corporation | | | 15,500 | | | | 721,215 | |
JPMorgan Chase & Company | | | 6,500 | | | | 657,995 | |
KeyCorp | | | 30,200 | | | | 475,650 | |
MetLife, Inc. | | | 10,200 | | | | 434,214 | |
People's United Financial, Inc. | | | 25,000 | | | | 411,000 | |
Prudential Financial, Inc. | | | 6,000 | | | | 551,280 | |
U.S. Bancorp | | | 14,200 | | | | 684,298 | |
Wells Fargo & Company | | | 13,000 | | | | 628,160 | |
| | | | | | | | 4,563,812 | |
Health Care — 8.8% | | | | | | | | |
Amgen, Inc. | | | 1,400 | | | | 265,972 | |
CVS Health Corporation(a) | | | 7,300 | | | | 393,689 | |
Johnson & Johnson(a) | | | 2,600 | | | | 363,454 | |
Merck & Company, Inc.(a) | | | 9,400 | | | | 781,798 | |
Pfizer, Inc. | | | 17,000 | | | | 721,990 | |
| | | | | | | | 2,526,903 | |
8
FBP EQUITY & DIVIDEND PLUS FUND
SCHEDULE OF INVESTMENTS (Continued) |
COMMON STOCKS — 91.7% (Continued) | | Shares | | | Value | |
Industrials — 6.7% | | | | | | | | |
Eaton Corporation plc(a) | | | 8,000 | | | $ | 644,480 | |
Emerson Electric Company(a) | | | 4,000 | | | | 273,880 | |
United Parcel Service, Inc. - Class B | | | 6,500 | | | | 726,310 | |
United Technologies Corporation | | | 2,200 | | | | 283,558 | |
| | | | | | | | 1,928,228 | |
Information Technology — 15.5% | | | | | | | | |
Apple, Inc.(a) | | | 2,200 | | | | 417,890 | |
Broadcom, Inc. | | | 2,300 | | | | 691,633 | |
Cisco Systems, Inc.(a) | | | 14,000 | | | | 755,860 | |
HP, Inc.(a) | | | 27,500 | | | | 534,325 | |
Intel Corporation(a) | | | 6,200 | | | | 332,940 | |
International Business Machines Corporation | | | 6,100 | | | | 860,710 | |
Microsoft Corporation(a) | | | 2,700 | | | | 318,438 | |
Western Union Company (The) | | | 28,000 | | | | 517,160 | |
| | | | | | | | 4,428,956 | |
Materials — 4.5% | | | | | | | | |
Compass Minerals International, Inc. | | | 5,500 | | | | 299,035 | |
DowDuPont, Inc. | | | 8,900 | | | | 474,459 | |
Nucor Corporation(a) | | | 9,000 | | | | 525,150 | |
| | | | | | | | 1,298,644 | |
Real Estate — 2.5% | | | | | | | | |
Public Storage | | | 1,500 | | | | 326,670 | |
Ventas, Inc.(a) | | | 6,000 | | | | 382,860 | |
| | | | | | | | 709,530 | |
Utilities — 4.2% | | | | | | | | |
Dominion Energy, Inc. | | | 4,000 | | | | 306,640 | |
FirstEnergy Corporation(a) | | | 15,000 | | | | 624,150 | |
PPL Corporation | | | 8,500 | | | | 269,790 | |
| | | | | | | | 1,200,580 | |
| | | | | | | | | |
Total Common Stocks (Cost $21,007,394) | | | | | | $ | 26,242,156 | |
9
FBP EQUITY & DIVIDEND PLUS FUND
SCHEDULE OF INVESTMENTS (Continued) |
MONEY MARKET FUNDS — 9.3% | | Shares | | | Value | |
Fidelity Institutional Money Market Government Portfolio - Class I, 2.30%(b) (Cost $2,646,658) | | | 2,646,658 | | | $ | 2,646,658 | |
| | | | | | | | | |
Total Investments at Value — 101.0%(Cost $23,654,052) | | | | | | $ | 28,888,814 | |
| | | | | | | | | |
Liabilities in Excess of Other Assets — (1.0%) | | | | | | | (274,060 | ) |
| | | | | | | | | |
Net Assets — 100.0% | | | | | | $ | 28,614,754 | |
ADR - American Depositary Receipt. |
(a) | Security covers a written call option. |
(b) | The rate shown is the 7-day effective yield as of March 31, 2019. |
See accompanying notes to financial statements. |
10
FBP EQUITY & DIVIDEND PLUS FUND
SCHEDULE OF OPEN OPTION CONTRACTS
March 31, 2019 |
COVERED WRITTEN
CALL OPTIONS | | Contracts | | | Notional
Value | | | Strike
Price | | Expiration
Date | | Value of
Options | |
Apple, Inc. | | | 22 | | | $ | 417,890 | | | $ | 185.00 | | 07/19/19 | | $ | 27,940 | |
CenturyLink, Inc. | | | 124 | | | | 148,676 | | | | 14.00 | | 07/19/19 | | | 2,976 | |
Chevron Corporation | | | 24 | | | | 295,632 | | | | 130.00 | | 09/20/19 | | | 7,440 | |
Cisco Systems, Inc. | | | 55 | | | | 296,945 | | | | 50.00 | | 06/21/19 | | | 25,850 | |
Coca-Cola Company (The) | | | 60 | | | | 281,160 | | | | 48.00 | | 08/16/19 | | | 6,720 | |
CVS Health Corporation | | | 28 | | | | 151,004 | | | | 90.00 | | 05/17/19 | | | 28 | |
Eaton Corporation plc | | | 36 | | | | 290,016 | | | | 82.50 | | 04/18/19 | | | 1,440 | |
Emerson Electric Company | | | 40 | | | | 273,880 | | | | 75.00 | | 09/20/19 | | | 4,560 | |
FirstEnergy Corporation | | | 80 | | | | 332,880 | | | | 41.00 | | 04/18/19 | | | 7,200 | |
Hershey Company (The) | | | 41 | | | | 470,803 | | | | 115.00 | | 08/16/19 | | | 22,673 | |
HP, Inc. | | | 275 | | | | 534,325 | | | | 20.00 | | 08/16/19 | | | 26,125 | |
Intel Corporation | | | 62 | | | | 332,940 | | | | 55.00 | | 06/21/19 | | | 11,160 | |
Johnson & Johnson | | | 11 | | | | 153,769 | | | | 160.00 | | 06/21/19 | | | 132 | |
Kohl's Corporation | | | 60 | | | | 412,620 | | | | 80.00 | | 07/19/19 | | | 9,000 | |
Merck & Company, Inc. | | | 34 | | | | 282,778 | | | | 80.00 | | 04/18/19 | | | 12,410 | |
Merck & Company, Inc. | | | 27 | | | | 224,559 | | | | 85.00 | | 07/19/19 | | | 5,400 | |
Microsoft Corporation | | | 27 | | | | 318,438 | | | | 120.00 | | 10/18/19 | | | 18,441 | |
Nordstrom, Inc. | | | 50 | | | | 221,900 | | | | 70.00 | | 04/18/19 | | | 150 | |
Nucor Corporation | | | 38 | | | | 221,730 | | | | 70.00 | | 04/18/19 | | | 114 | |
PepsiCo, Inc. | | | 13 | | | | 159,315 | | | | 125.00 | | 04/18/19 | | | 1,040 | |
Procter & Gamble Company (The) | | | 45 | | | | 468,225 | | | | 92.50 | | 06/21/19 | | | 51,750 | |
Procter & Gamble Company (The) | | | 45 | | | | 468,225 | | | | 100.00 | | 07/19/19 | | | 25,200 | |
Target Corporation | | | 37 | | | | 296,962 | | | | 85.00 | | 10/18/19 | | | 14,615 | |
Ventas, Inc. | | | 60 | | | | 382,860 | | | | 65.00 | | 05/17/19 | | | 7,500 | |
Williams-Sonoma, Inc. | | | 25 | | | | 140,675 | | | | 62.50 | | 08/16/19 | | | 4,750 | |
Williams-Sonoma, Inc. | | | 49 | | | | 275,723 | | | | 65.00 | | 08/16/19 | | | 6,076 | |
Total Covered Written Call Options (Premiums received $244,092) | | $ | 7,853,930 | | | | | | | | $ | 300,690 | |
See accompanying notes to financial statements. |
11
FBP APPRECIATION & INCOME OPPORTUNITIES FUND
SCHEDULE OF INVESTMENTS
March 31, 2019 |
COMMON STOCKS — 74.0% | | Shares | | | Value | |
Communication Services — 2.6% | | | | | | | | |
AT&T, Inc. | | | 8,000 | | | $ | 250,880 | |
CBS Corporation - Class B | | | 9,500 | | | | 451,535 | |
CenturyLink, Inc. | | | 15,000 | | | | 179,850 | |
| | | | | | | | 882,265 | |
Consumer Discretionary — 6.6% | | | | | | | | |
Bloomin' Brands, Inc. | | | 13,000 | | | | 265,850 | |
Carnival Corporation | | | 8,500 | | | | 431,120 | |
Ford Motor Company | | | 26,000 | | | | 228,280 | |
Kohl's Corporation | | | 5,000 | | | | 343,850 | |
Tapestry, Inc. | | | 13,500 | | | | 438,615 | |
Target Corporation | | | 6,000 | | | | 481,560 | |
| | | | | | | | 2,189,275 | |
Consumer Staples — 3.4% | | | | | | | | |
Kellogg Company | | | 6,200 | | | | 355,756 | |
PepsiCo, Inc. | | | 2,500 | | | | 306,375 | |
Walmart, Inc. | | | 5,000 | | | | 487,650 | |
| | | | | | | | 1,149,781 | |
Energy — 9.1% | | | | | | | | |
Chevron Corporation | | | 4,500 | | | | 554,310 | |
ConocoPhillips | | | 6,000 | | | | 400,440 | |
Devon Energy Corporation | | | 17,000 | | | | 536,520 | |
Halliburton Company | | | 13,000 | | | | 380,900 | |
Occidental Petroleum Corporation | | | 8,200 | | | | 542,840 | |
Royal Dutch Shell plc - Class B - ADR | | | 10,000 | | | | 639,500 | |
| | | | | | | | 3,054,510 | |
Financials — 17.5% | | | | | | | | |
Bank of America Corporation | | | 40,000 | | | | 1,103,600 | |
Bank of New York Mellon Corporation (The) | | | 13,500 | | | | 680,805 | |
Capital One Financial Corporation | | | 6,000 | | | | 490,140 | |
JPMorgan Chase & Company | | | 12,000 | | | | 1,214,760 | |
KeyCorp | | | 16,320 | | | | 257,040 | |
Lincoln National Corporation | | | 14,000 | | | | 821,800 | |
MetLife, Inc. | | | 12,000 | | | | 510,840 | |
Travelers Companies, Inc. (The) | | | 5,500 | | | | 754,380 | |
| | | | | | | | 5,833,365 | |
Health Care — 8.0% | | | | | | | | |
Amgen, Inc. | | | 2,400 | | | | 455,952 | |
CVS Health Corporation | | | 7,500 | | | | 404,475 | |
Johnson & Johnson | | | 4,000 | | | | 559,160 | |
Merck & Company, Inc. | | | 8,200 | | | | 681,994 | |
Pfizer, Inc. | | | 13,500 | | | | 573,345 | |
| | | | | | | | 2,674,926 | |
12
FBP APPRECIATION & INCOME OPPORTUNITIES FUND
SCHEDULE OF INVESTMENTS (Continued) |
COMMON STOCKS — 74.0% (Continued) | | Shares | | | Value | |
Industrials — 6.8% | | | | | | | | |
Eaton Corporation plc | | | 7,200 | | | $ | 580,032 | |
FedEx Corporation | | | 2,500 | | | | 453,525 | |
General Electric Company | | | 17,000 | | | | 169,830 | |
Ingersoll-Rand plc | | | 4,700 | | | | 507,365 | |
United Technologies Corporation | | | 4,200 | | | | 541,338 | |
Westinghouse Air Brake Technologies Corporation | | | 134 | | | | 9,879 | |
| | | | | | | | 2,261,969 | |
Information Technology — 14.8% | | | | | | | | |
Apple, Inc. | | | 3,900 | | | | 740,805 | |
Broadcom, Inc. | | | 2,200 | | | | 661,562 | |
Cisco Systems, Inc. | | | 19,000 | | | | 1,025,810 | |
HP, Inc. | | | 20,000 | | | | 388,600 | |
International Business Machines Corporation | | | 5,200 | | | | 733,720 | |
Microsoft Corporation | | | 7,000 | | | | 825,580 | |
Nokia Corporation - ADR | | | 67,000 | | | | 383,240 | |
Western Union Company (The) | | | 10,000 | | | | 184,700 | |
| | | | | | | | 4,944,017 | |
Materials — 2.4% | | | | | | | | |
Compass Minerals International, Inc. | | | 3,000 | | | | 163,110 | |
Freeport-McMoRan, Inc. | | | 11,000 | | | | 141,790 | |
Mosaic Company (The) | | | 8,000 | | | | 218,480 | |
Nucor Corporation | | | 4,500 | | | | 262,575 | |
| | | | | | | | 785,955 | |
Utilities — 2.8% | | | | | | | | |
Dominion Energy, Inc. | | | 4,000 | | | | 306,640 | |
FirstEnergy Corporation | | | 8,000 | | | | 332,880 | |
PPL Corporation | | | 9,000 | | | | 285,660 | |
| | | | | | | | 925,180 | |
| | | | | | | | | |
Total Common Stocks (Cost $16,193,563) | | | | | | $ | 24,701,243 | |
|
U.S. GOVERNMENT AGENCY OBLIGATIONS — 1.5% | | Par Value | | | Value | |
Federal National Mortgage Association — 1.5% | | | | | | | | |
1.20%, due 07/17/2020 (Cost $500,000) | | $ | 500,000 | | | $ | 492,495 | |
13
FBP APPRECIATION & INCOME OPPORTUNITIES FUND
SCHEDULE OF INVESTMENTS (Continued) |
CORPORATE BONDS — 15.9% | | Par Value | | | Value | |
Consumer Staples — 1.5% | | | | | | | | |
Kroger Company (The), 2.60%, due 02/01/2021 | | $ | 500,000 | | | $ | 497,478 | |
| | | | | | | | | |
Energy — 1.5% | | | | | | | | |
Pioneer Natural Resources Company, 3.95%, due 07/15/2022 | | | 500,000 | | | | 514,417 | |
| | | | | | | | | |
Financials — 6.1% | | | | | | | | |
American Express Company, 3.40%, due 02/27/2023 | | | 500,000 | | | | 507,619 | |
Citigroup, Inc., 2.90%, due 12/08/2021 | | | 500,000 | | | | 499,868 | |
Unum Group, 3.00%, due 05/15/2021 | | | 500,000 | | | | 499,837 | |
Wells Fargo & Company, 3.50%, due 03/08/2022 | | | 500,000 | | | | 509,329 | |
| | | | | | | | 2,016,653 | |
Health Care — 1.5% | | | | | | | | |
Anthem, Inc., 2.25%, due 08/15/2019 | | | 500,000 | | | | 499,067 | |
| | | | | | | | | |
Industrials — 3.8% | | | | | | | | |
Norfolk Southern Corporation, 3.85%, due 01/15/2024 | | | 500,000 | | | | 519,779 | |
Ryder System, Inc., 2.50%, due 05/11/2020 | | | 750,000 | | | | 747,756 | |
| | | | | | | | 1,267,535 | |
Utilities — 1.5% | | | | | | | | |
PSEG Power, LLC, 3.00%, due 06/15/2021 | | | 500,000 | | | | 497,665 | |
| | | | | | | | | |
Total Corporate Bonds (Cost $5,246,941) | | | | | | $ | 5,292,815 | |
|
MONEY MARKET FUNDS — 8.6% | | Shares | | | Value | |
Fidelity Institutional Money Market Government Portfolio - Class I, 2.30%(a) (Cost $2,883,392) | | | 2,883,392 | | | $ | 2,883,392 | |
| | | | | | | | | |
Total Investments at Value — 100.0%(Cost $24,823,896) | | | | | | $ | 33,369,945 | |
| | | | | | | | | |
Other Assets in Excess of Liabilities — 0.0%(b) | | | | | | | 6,465 | |
| | | | | | | | | |
Net Assets — 100.0% | | | | | | $ | 33,376,410 | |
ADR- American Depositary Receipt. |
(a) | The rate shown is the 7-day effective yield as of March 31, 2019. |
(b) | Percentage rounds to less than 0.1%. |
See accompanying notes to financial statements. |
14
THE FLIPPIN, BRUCE & PORTER FUNDS
STATEMENTS OF ASSETS AND LIABILITIES
March 31, 2019 |
| | FBP Equity
& Dividend
Plus Fund | | | FBP
Appreciation
& Income
Opportunities
Fund | |
ASSETS | | | | | | | | |
Investments in securities: | | | | | | | | |
At cost | | $ | 23,654,052 | | | $ | 24,823,896 | |
At value (Note 2) | | $ | 28,888,814 | | | $ | 33,369,945 | |
Cash | | | — | | | | 2,491 | |
Receivable for capital shares sold | | | 2,698 | | | | — | |
Dividends and interest receivable | | | 54,590 | | | | 77,363 | |
Other assets | | | 3,640 | | | | 5,162 | |
TOTAL ASSETS | | | 28,949,742 | | | | 33,454,961 | |
| | | | | | | | | |
LIABILITIES | | | | | | | | |
Written call options, at value (Notes 2 and 5) (premiums received $244,092) | | | 300,690 | | | | — | |
Distributions payable | | | 1,599 | | | | 12,780 | |
Payable for capital shares redeemed | | | 10,391 | | | | 40,150 | |
Accrued investment advisory fees (Note 4) | | | 13,723 | | | | 17,151 | |
Payable to administrator (Note 4) | | | 5,700 | | | | 5,700 | |
Other accrued expenses | | | 2,885 | | | | 2,770 | |
TOTAL LIABILITIES | | | 334,988 | | | | 78,551 | |
| | | | | | | | | |
NET ASSETS | | $ | 28,614,754 | | | $ | 33,376,410 | |
| | | | | | | | | |
Net assets consist of: | | | | | | | | |
Paid-in capital | | $ | 23,273,511 | | | $ | 24,364,205 | |
Accumulated earnings | | | 5,341,243 | | | | 9,012,205 | |
Net assets | | $ | 28,614,754 | | | $ | 33,376,410 | |
| | | | | | | | | |
Shares of beneficial interest outstanding (unlimited number of shares authorized, $0.01 par value) | | | 1,135,799 | | | | 1,765,027 | |
| | | | | | | | | |
Net asset value, offering price and redemption price per share (Note 2) | | $ | 25.19 | | | $ | 18.91 | |
See accompanying notes to financial statements. |
15
THE FLIPPIN, BRUCE & PORTER FUNDS
STATEMENTS OF OPERATIONS
For the Year Ended March 31, 2019 |
| | FBP Equity
& Dividend
Plus Fund | | | FBP
Appreciation
& Income
Opportunities
Fund | |
INVESTMENT INCOME | | | | | | | | |
Dividends | | $ | 961,566 | | | $ | 842,669 | |
Foreign withholding taxes on dividends | | | — | | | | (2,579 | ) |
Interest | | | — | | | | 162,928 | |
TOTAL INVESTMENT INCOME | | | 961,566 | | | | 1,003,018 | |
| | | | | | | | | |
EXPENSES | | | | | | | | |
Investment advisory fees (Note 4) | | | 196,694 | | | | 241,757 | |
Administration fees (Note 4) | | | 60,000 | | | | 60,000 | |
Professional fees | | | 24,161 | | | | 24,161 | |
Trustees' fees and expenses (Note 4) | | | 13,652 | | | | 13,652 | |
Registration and filing fees | | | 9,755 | | | | 8,117 | |
Compliance service fees (Note 4) | | | 8,400 | | | | 8,400 | |
Custodian and bank service fees | | | 8,596 | | | | 6,891 | |
Postage and supplies | | | 7,020 | | | | 5,427 | |
Printing of shareholder reports | | | 6,561 | | | | 4,159 | |
Account maintenance fees | | | 1,416 | | | | 3,134 | |
Insurance expense | | | 1,194 | | | | 1,036 | |
Other expenses | | | 7,367 | | | | 8,850 | |
TOTAL EXPENSES | | | 344,816 | | | | 385,584 | |
Fees voluntarily waived by the Adviser (Note 4) | | | (44,155 | ) | | | (40,217 | ) |
NET EXPENSES | | | 300,661 | | | | 345,367 | |
| | | | | | | | | |
NET INVESTMENT INCOME | | | 660,905 | | | | 657,651 | |
| | | | | | | | | |
REALIZED AND UNREALIZED GAINS (LOSSES) ON INVESTMENTS AND WRITTEN OPTION CONTRACTS | | | | | | | | |
Net realized gains (losses) from: | | | | | | | | |
Investment transactions | | | 746,525 | | | | 1,239,712 | |
Written option contracts (Note 5) | | | 125,606 | | | | (52,718 | ) |
Net change in unrealized appreciation (depreciation) on: | | | | | | | | |
Investment transactions | | | (104,656 | ) | | | (756,448 | ) |
Written option contracts (Note 5) | | | (15,297 | ) | | | 80,889 | |
NET REALIZED AND UNREALIZED GAINS ON INVESTMENTS AND WRITTEN OPTION CONTRACTS | | | 752,178 | | | | 511,435 | |
| | | | | | | | | |
NET INCREASE IN NET ASSETSFROM OPERATIONS | | $ | 1,413,083 | | | $ | 1,169,086 | |
See accompanying notes to financial statements. |
16
FBP EQUITY & DIVIDEND PLUS FUND
STATEMENTS OF CHANGES IN NET ASSETS |
| | Year Ended
March 31,
2019 | | | Year Ended
March 31,
2018(a) | |
FROM OPERATIONS | | | | | | | | |
Net investment income | | $ | 660,905 | | | $ | 586,459 | |
Net realized gains from: | | | | | | | | |
Investment transactions | | | 746,525 | | | | 1,141,946 | |
Written option contracts (Note 5) | | | 125,606 | | | | 122,178 | |
Net realized gains from in-kind redemptions | | | — | | | | 498,179 | |
Net change in unrealized appreciation (depreciation) on: | | | | | | | | |
Investments | | | (104,656 | ) | | | (230,632 | ) |
Written option contracts (Note 5) | | | (15,297 | ) | | | (77,199 | ) |
Net increase in net assets resulting from operations | | | 1,413,083 | | | | 2,040,931 | |
| | | | | | | | | |
DISTRIBUTIONS TO SHAREHOLDERS (Note 2) | | | (2,062,656 | ) | | | (2,286,616 | ) |
| | | | | | | | | |
FROM CAPITAL SHARE TRANSACTIONS | | | | | | | | |
Proceeds from shares sold | | | 3,064,232 | | | | 415,812 | |
Net asset value of shares issued in reinvestment of distributions to shareholders | | | 2,041,105 | | | | 2,251,859 | |
Payments for shares redeemed | | | (2,119,514 | ) | | | (3,558,200 | ) |
Net increase (decrease) in net assets from capital share transactions | | | 2,985,823 | | | | (890,529 | ) |
| | | | | | | | | |
TOTAL INCREASE (DECREASE) IN NET ASSETS | | | 2,336,250 | | | | (1,136,214 | ) |
| | | | | | | | | |
NET ASSETS | | | | | | | | |
Beginning of year | | | 26,278,504 | | | | 27,414,718 | |
End of year | | $ | 28,614,754 | | | $ | 26,278,504 | |
| | | | | | | | | |
CAPITAL SHARE ACTIVITY | | | | | | | | |
Shares sold | | | 116,050 | | | | 16,167 | |
Shares reinvested | | | 79,830 | | | | 89,387 | |
Shares redeemed | | | (83,445 | ) | | | (138,180 | ) |
Net increase (decrease) in shares outstanding | | | 112,435 | | | | (32,626 | ) |
Shares outstanding, beginning of year | | | 1,023,364 | | | | 1,055,990 | |
Shares outstanding, end of year | | | 1,135,799 | | | | 1,023,364 | |
(a) | The presentation of Distributions to Shareholders has been updated to reflect the changes prescribed in amendments to Regulation S-X, effective November 5, 2018 (Note 2). For the year ended March 31, 2018, distributions to shareholders consisted of $586,581 and $1,700,035 from net investment income and from net realized gains from investment transactions, respectively. Undistributed net investment income as of March 31, 2018 was $2,581. |
See accompanying notes to financial statements. |
17
FBP APPRECIATION & INCOME OPPORTUNITIES FUND
STATEMENTS OF CHANGES IN NET ASSETS |
| | Year Ended
March 31,
2019 | | | Year Ended
March 31,
2018(a) | |
FROM OPERATIONS | | | | | | | | |
Net investment income | | $ | 657,651 | | | $ | 739,449 | |
Net realized gains (losses) from: | | | | | | | | |
Investment transactions | | | 1,239,712 | | | | 791,841 | |
Written option contracts (Note 5) | | | (52,718 | ) | | | 39,716 | |
Net change in unrealized appreciation (depreciation) on: | | | | | | | | |
Investments | | | (756,448 | ) | | | 1,095,760 | |
Written option contracts (Note 5) | | | 80,889 | | | | (83,560 | ) |
Net increase in net assets resulting from operations | | | 1,169,086 | | | | 2,583,206 | |
| | | | | | | | | |
DISTRIBUTIONS TO SHAREHOLDERS (Note 2) | | | (1,299,655 | ) | | | (2,251,693 | ) |
| | | | | | | | | |
FROM CAPITAL SHARE TRANSACTIONS | | | | | | | | |
Proceeds from shares sold | | | 859,694 | | | | 470,661 | |
Net asset value of shares issued in reinvestment of distributions to shareholders | | | 1,237,225 | | | | 2,180,127 | |
Payments for shares redeemed | | | (3,204,096 | ) | | | (2,436,914 | ) |
Net increase (decrease) in net assets from capital share transactions | | | (1,107,177 | ) | | | 213,874 | |
| | | | | | | | | |
TOTAL INCREASE (DECREASE) IN NET ASSETS | | | (1,237,746 | ) | | | 545,387 | |
| | | | | | | | | |
NET ASSETS | | | | | | | | |
Beginning of year | | | 34,614,156 | | | | 34,068,769 | |
End of year | | $ | 33,376,410 | | | $ | 34,614,156 | |
| | | | | | | | | |
CAPITAL SHARE ACTIVITY | | | | | | | | |
Shares sold | | | 44,797 | | | | 24,569 | |
Shares reinvested | | | 64,997 | | | | 115,761 | |
Shares redeemed | | | (167,520 | ) | | | (128,348 | ) |
Net increase (decrease) in shares outstanding | | | (57,726 | ) | | | 11,982 | |
Shares outstanding, beginning of year | | | 1,822,753 | | | | 1,810,771 | |
Shares outstanding, end of year | | | 1,765,027 | | | | 1,822,753 | |
(a) | The presentation of Distributions to Shareholders has been updated to reflect the changes prescribed in amendments to Regulation S-X, effective November 5, 2018 (Note 2). For the year ended March 31, 2018, distributions to shareholders consisted of $740,853 and $1,510,840 from net investment income and from net realized gains from investment transactions, respectively. Distributions in excess of net investment income as of March 31, 2018 was ($1,981). |
See accompanying notes to financial statements. |
18
FBP EQUITY & DIVIDEND PLUS FUND
FINANCIAL HIGHLIGHTS |
Selected Per Share Data and Ratios for a Share Outstanding Throughout Each Year |
| | | Years Ended March 31, | |
| | 2019 | | | 2018 | | | 2017 | | | 2016 | | | 2015 | |
Net asset value at beginning of year | | $ | 25.68 | | | $ | 25.96 | | | $ | 22.65 | | | $ | 24.89 | | | $ | 24.78 | |
| | | | | | | | | | | | | | | | | | | | | |
Income (loss) from investment operations: | | | | | | | | | | | | | | | | | | | | |
Net investment income | | | 0.60 | | | | 0.57 | | | | 0.50 | | | | 0.61 | | | | 0.50 | |
Net realized and unrealized gains (losses) on investments | | | 0.83 | | | | 1.38 | | | | 3.37 | | | | (1.21 | ) | | | 0.57 | |
Total from investment operations | | | 1.43 | | | | 1.95 | | | | 3.87 | | | | (0.60 | ) | | | 1.07 | |
| | | | | | | | | | | | | | | | | | | | | |
Less distributions: | | | | | | | | | | | | | | | | | | | | |
Dividends from net investment income | | | (0.60 | ) | | | (0.57 | ) | | | (0.50 | ) | | | (0.61 | ) | | | (0.51 | ) |
Distributions from net realized gains | | | (1.32 | ) | | | (1.66 | ) | | | (0.06 | ) | | | (1.03 | ) | | | (0.45 | ) |
Total distributions | | | (1.92 | ) | | | (2.23 | ) | | | (0.56 | ) | | | (1.64 | ) | | | (0.96 | ) |
| | | | | | | | | | | | | | | | | | | | | |
Net asset value at end of year | | $ | 25.19 | | | $ | 25.68 | | | $ | 25.96 | | | $ | 22.65 | | | $ | 24.89 | |
| | | | | | | | | | | | | | | | | | | | | |
Total return(a) | | | 5.64 | % | | | 7.91 | % | | | 17.29 | % | | | (2.31 | %) | | | 4.23 | % |
| | | | | | | | | | | | | | | | | | | | | |
Net assets at end of year (000’s) | | $ | 28,615 | | | $ | 26,279 | | | $ | 27,415 | | | $ | 24,764 | | | $ | 28,782 | |
| | | | | | | | | | | | | | | | | | | | | |
Ratio of total expenses to average net assets | | | 1.23 | % | | | 1.24 | % | | | 1.25 | % | | | 1.19 | % | | | 1.17 | % |
| | | | | | | | | | | | | | | | | | | | | |
Ratio of net expenses to average net assets(b) | | | 1.07 | % | | | 1.07 | % | | | 1.07 | % | | | 1.07 | % | | | 1.07 | % |
| | | | | | | | | | | | | | | | | | | | | |
Ratio of net investment income to average net assets(b) | | | 2.35 | % | | | 2.19 | % | | | 2.07 | % | | | 2.60 | % | | | 1.98 | % |
| | | | | | | | | | | | | | | | | | | | | |
Portfolio turnover rate | | | 18 | % | | | 18 | % | | | 19 | % | | | 21 | % | | | 19 | % |
(a) | Total return is a measure of the change in value of an investment in the Fund over the periods covered, which assumes any dividends or capital gains distributions are reinvested in shares of the Fund. The returns shown do not reflect the deduction of taxes a shareholder would pay on Fund distributions or the redemption of Fund shares. The total returns would have been lower if the Adviser had not waived advisory fees. |
(b) | Ratios were determined after voluntary advisory fee waivers by the Adviser (Note 4). |
See accompanying notes to financial statements. |
19
FBP APPRECIATION & INCOME OPPORTUNITIES FUND
FINANCIAL HIGHLIGHTS |
Selected Per Share Data and Ratios for a Share Outstanding Throughout Each Year |
| | | Years Ended March 31, | |
| | 2019 | | | 2018 | | | 2017 | | | 2016 | | | 2015 | |
Net asset value at beginning of year | | $ | 18.99 | | | $ | 18.81 | | | $ | 16.55 | | | $ | 18.53 | | | $ | 18.97 | |
| | | | | | | | | | | | | | | | | | | | | |
Income (loss) from investment operations: | | | | | | | | | | | | | | | | | | | | |
Net investment income | | | 0.37 | | | | 0.41 | | | | 0.28 | | | | 0.31 | | | | 0.26 | |
Net realized and unrealized gains (losses) on investments | | | 0.28 | | | | 1.03 | | | | 2.28 | | | | (1.11 | ) | | | 0.19 | |
Total from investment operations | | | 0.65 | | | | 1.44 | | | | 2.56 | | | | (0.80 | ) | | | 0.45 | |
| | | | | | | | | | | | | | | | | | | | | |
Less distributions: | | | | | | | | | | | | | | | | | | | | |
Dividends from net investment income | | | (0.37 | ) | | | (0.41 | ) | | | (0.28 | ) | | | (0.32 | ) | | | (0.26 | ) |
Distributions from net realized gains | | | (0.36 | ) | | | (0.85 | ) | | | (0.02 | ) | | | (0.86 | ) | | | (0.63 | ) |
Total distributions | | | (0.73 | ) | | | (1.26 | ) | | | (0.30 | ) | | | (1.18 | ) | | | (0.89 | ) |
| | | | | | | | | | | | | | | | | | | | | |
Net asset value at end of year | | $ | 18.91 | | | $ | 18.99 | | | $ | 18.81 | | | $ | 16.55 | | | $ | 18.53 | |
| | | | | | | | | | | | | | | | | | | | | |
Total return(a) | | | 3.44 | % | | | 7.91 | % | | | 15.58 | % | | | (4.48 | %) | | | 2.36 | % |
| | | | | | | | | | | | | | | | | | | | | |
Net assets at end of year (000’s) | | $ | 33,376 | | | $ | 34,614 | | | $ | 34,069 | | | $ | 31,669 | | | $ | 38,991 | |
| | | | | | | | | | | | | | | | | | | | | |
Ratio of total expenses to average net assets | | | 1.12 | % | | | 1.10 | % | | | 1.12 | % | | | 1.05 | % | | | 1.04 | % |
| | | | | | | | | | | | | | | | | | | | | |
Ratio of net expenses to average net assets(b) | | | 1.00 | % | | | 1.00 | % | | | 1.00 | % | | | 1.00 | % | | | 1.00 | % |
| | | | | | | | | | | | | | | | | | | | | |
Ratio of net investment income to average net assets(b) | | | 1.89 | % | | | 2.16 | % | | | 1.57 | % | | | 1.75 | % | | | 1.36 | % |
| | | | | | | | | | | | | | | | | | | | | |
Portfolio turnover rate | | | 21 | % | | | 10 | % | | | 18 | % | | | 23 | % | | | 12 | % |
(a) | Total return is a measure of the change in value of an investment in the Fund over the periods covered, which assumes any dividends or capital gains distributions are reinvested in shares of the Fund. The returns shown do not reflect the deduction of taxes a shareholder would pay on Fund distributions or the redemption of Fund shares. The total returns would have been lower if the Adviser had not waived advisory fees. |
(b) | Ratios were determined after voluntary advisory fee waivers by the Adviser (Note 4). |
See accompanying notes to financial statements. |
20
THE FLIPPIN, BRUCE & PORTER FUNDS
NOTES TO FINANCIAL STATEMENTS
March 31, 2019 |
1. Organization
FBP Equity & Dividend Plus Fund and FBP Appreciation & Income Opportunities Fund (each a “Fund” and collectively the “Funds”) are no-load, diversified series of Williamsburg Investment Trust (the “Trust”), an open-end management investment company registered under the Investment Company Act of 1940, as amended (the “1940 Act”). The Trust was organized as a Massachusetts business trust on July 18, 1988. Other series of the Trust are not included in this report.
FBP Equity & Dividend Plus Fund seeks to provide above-average and growing income while also achieving long-term growth of capital.
FBP Appreciation & Income Opportunities Fund seeks long term capital appreciation and current income, assuming a moderate level of investment risk.
2. Significant Accounting Policies
In August 2018, the U.S. Securities and Exchange Commission (the “SEC”) adopted regulations that eliminated or amended disclosure requirements that were redundant or outdated in light of changes in the SEC requirements, accounting principles generally accepted in the United States of America (“GAAP”), International Financial Reporting Standards or changes in technology or the business environment. These regulations were effective November 5, 2018, and the Funds are complying with them effective with these financial statements.
Each Fund follows accounting and reporting guidance under Financial Accounting Standards Board (“FASB”) Accounting Standards Codification (“ASC”) Topic 946, “Financial Services – Investment Companies.” The following is a summary of the Funds’ significant accounting policies. These policies are in conformity with GAAP.
New accounting pronouncements — In March 2017, FASB issued Accounting Standards Update No. 2017-08 (“ASU 2017-08”), “Receivables – Nonrefundable Fees and Other Costs (Subtopic 310-20): Premium Amortization on Purchased Callable Debt Securities.” ASU 2017-08 shortens the amortization period for certain callable debt securities, held at a premium, to be amortized to the earliest call date. ASU 2017-08 does not require an accounting change for securities held at a discount, which continues to accrete to maturity. ASU 2017-08 is effective for fiscal years and interim periods within those fiscal years beginning after December 15, 2018. Management is currently evaluating the impact, if any, of applying ASU 2017-08
In August 2018, FASB issued Accounting Standards Update No. 2018-13 (“ASU 2018-13”), “Disclosure Framework – Changes to the Disclosure Requirements for Fair Value Measurement,” which amends the fair value measurement disclosure requirements of ASC Topic 820 (“ASC 820”), “Fair Value Measurement.” ASU 2018-13 includes new, eliminated, and modified disclosure requirements for ASC 820. In addition, ASU 2018-13 clarifies that materiality is an appropriate consideration when evaluating disclosure requirements. ASU 2018-13 is effective for fiscal years beginning after December 15, 2019, including interim periods therein. Early adoption is permitted, and the Funds have adopted ASU 2018-13 with these financial statements.
21
THE FLIPPIN, BRUCE & PORTER FUNDS
NOTES TO FINANCIAL STATEMENTS (Continued) |
Securities valuation — The Funds’ portfolio securities are valued as of the close of business of the regular session of the New York Stock Exchange (normally 4:00 p.m. Eastern time). Securities traded on a national stock exchange, including common stocks and closed-end investment companies, if any, are valued based upon the closing price on the principal exchange where the security is traded, if available, otherwise, at the last quoted bid price. Securities that are quoted by NASDAQ are valued at the NASDAQ Official Closing Price. Covered call options written by the Funds are valued at the last quoted sale price or, in the absence of a sale, at the ask price on the principal exchanges on which they are traded. Investments representing shares of money market funds and other open-end investment companies are valued at their net asset value (“NAV”) as reported by such companies. When using a quoted price and when the market is considered active, securities will be classified as Level 1 within the fair value hierarchy (see below).
Fixed income securities, including U.S. government agency obligations and corporate bonds, are typically valued on the basis of prices provided by an independent pricing service. The prices provided by the pricing service are determined with consideration given to institutional bid and last sale prices and take into account securities prices, yields, maturities, call features, ratings, institutional trading in similar groups of securities, and developments related to specific securities. Given the inputs used by the pricing service, these securities are classified as Level 2 within the fair value hierarchy.
When market quotations are not readily available, if a pricing service cannot provide a price, or if the investment adviser believes the price received from the pricing service is not indicative of market value, securities will be valued in good faith at fair value using methods consistent with procedures adopted by the Board of Trustees and will be classified as Level 2 or 3 within the fair value hierarchy, depending on the inputs used. Such methods of fair valuation may include, but are not limited to: multiple of earnings, multiple of book value, discount from market of a similar freely traded security, purchase price of the security, subsequent private transactions in the security or related securities, or a combination of these and other factors.
GAAP establishes a single authoritative definition of fair value, sets out a framework for measuring fair value and requires additional disclosures about fair value measurements. Various inputs are used in determining the value of each Fund’s investments. These inputs are summarized in the three broad levels listed below:
● | Level 1 – quoted prices in active markets for identical securities |
● | Level 2 – other significant observable inputs |
● | Level 3 – significant unobservable inputs |
The inputs or methodology used for valuing securities are not necessarily an indication of the risks associated with investing in those securities. The inputs used to measure fair value may fall into different levels of the fair value hierarchy. In such cases, for disclosure purposes, the level in the fair value hierarchy within which the fair value measurement falls in its entirety is determined based on the lowest level input that is significant to the fair value measurement.
22
THE FLIPPIN, BRUCE & PORTER FUNDS
NOTES TO FINANCIAL STATEMENTS (Continued) |
The following is a summary of the inputs used to value each Fund’s investments and other financial instruments as of March 31, 2019, by security type:
FBP Equity & Dividend Plus Fund | | Level 1 | | | Level 2 | | | Level 3 | | | Total | |
Investments in Securities: | | | | | | | | | | | | | | | | |
Common Stocks | | $ | 26,242,156 | | | $ | — | | | $ | — | | | $ | 26,242,156 | |
Money Market Funds | | | 2,646,658 | | | | — | | | | — | | | | 2,646,658 | |
Total | | $ | 28,888,814 | | | $ | — | | | $ | — | | | $ | 28,888,814 | |
| | | | | | | | | | | | | | | | | |
Other Financial Instruments: | | | | | | | | | | | | | | | | |
Covered Written Call Options | | $ | (300,690 | ) | | $ | — | | | $ | — | | | $ | (300,690 | ) |
Total | | $ | (300,690 | ) | | $ | — | | | $ | — | | | $ | (300,690 | ) |
FBP Appreciation & Income
Opportunities Fund | | Level 1 | | | Level 2 | | | Level 3 | | | Total | |
Investments in Securities: | | | | | | | | | | | | | | | | |
Common Stocks | | $ | 24,701,243 | | | $ | — | | | $ | — | | | $ | 24,701,243 | |
U.S. Government Agency Obligations | | | — | | | | 492,495 | | | | — | | | | 492,495 | |
Corporate Bonds | | | — | | | | 5,292,815 | | | | — | | | | 5,292,815 | |
Money Market Funds | | | 2,883,392 | | | | — | | | | — | | | | 2,883,392 | |
Total | | $ | 27,584,635 | | | $ | 5,785,310 | | | $ | — | | | $ | 33,369,945 | |
Refer to each Fund’s Schedule of Investments for a listing of the common stocks and corporate bonds by sector type. There were no Level 3 investments held by the Funds as of March 31, 2019.
Share valuation— The NAV per share of each Fund is calculated daily by dividing the total value of its assets, less liabilities, by the number of shares outstanding. The offering price and redemption price per share of each Fund is equal to its NAV per share.
Investment income — Interest income is accrued as earned. Dividend income is recorded on the ex-dividend date. Discounts and premiums on fixed income securities purchased are amortized using the interest method. Withholding taxes on foreign dividends have been recorded in accordance with the Funds’ understanding of the applicable country’s rules and tax rates.
23
THE FLIPPIN, BRUCE & PORTER FUNDS
NOTES TO FINANCIAL STATEMENTS (Continued) |
Distributions to shareholders— Dividends arising from net investment income are declared and paid quarterly to shareholders of each Fund. Net realized short-term capital gains, if any, may be distributed throughout the year and net realized long-term capital gains, if any, are distributed at least once each year. The amount of distributions from net investment income and net realized capital gains are determined in accordance with federal income tax regulations, which may differ from GAAP. These “book/tax” differences are either temporary or permanent in nature. Dividends and distributions are recorded on the ex-dividend date. The tax character of distributions paid during the years ended March 31, 2019 and 2018 was as follows:
| Year
Ended | | Ordinary
Income | | | Long-Term
Capital Gains | | | Total
Distributions | |
FBP Equity & Dividend Plus Fund | 03/31/19 | | $ | 676,801 | | | $ | 1,385,855 | | | $ | 2,062,656 | |
| | 03/31/18 | | $ | 636,626 | | | $ | 1,649,990 | | | $ | 2,286,616 | |
FBP Appreciation & Income | 03/31/19 | | $ | 650,647 | | | $ | 649,008 | | | $ | 1,299,655 | |
Opportunities Fund | 03/31/18 | | $ | 816,087 | | | $ | 1,435,606 | | | $ | 2,251,693 | |
Investment transactions— Investment transactions are accounted for on trade date for financial reporting purposes. Realized gains and losses on investments sold are determined on a specific identification basis.
Common expenses— Common expenses of the Trust are allocated among the Funds and the other series of the Trust based on relative net assets of each series or the nature of the services performed and the relative applicability to each series.
Options transactions— When the Funds’ investment adviser believes that individual portfolio investment securities held by the Funds are approaching the top of the adviser’s growth and price expectations, covered call options can be written (sold) against such securities and the Funds will receive a premium in return. The Funds write options only for income generation and hedging purposes and not for speculation. The premiums received from writing the options are recorded as a liability and are subsequently valued daily at the closing prices on their primary exchanges. Premiums received from writing options that expire are treated as realized gains. Premiums received from writing options that are exercised increase the proceeds used to calculate the realized gain or loss on the sale of the underlying security. If a closing purchase transaction is used to terminate a Fund’s obligation on a call option, a gain or loss will be realized, depending upon whether the price of the closing purchase transaction is more or less than the premium previously received on the call option written.
Estimates — The preparation of financial statements in conformity with GAAP requires management to make estimates and assumptions that affect the reported amounts of assets and liabilities and the disclosure of contingent assets and liabilities as of the date of the financial statements and the reported amounts of income and expenses during the reporting period. Actual results could differ from those estimates.
24
THE FLIPPIN, BRUCE & PORTER FUNDS
NOTES TO FINANCIAL STATEMENTS (Continued) |
Federal income tax — Each Fund has qualified and intends to continue to qualify as a regulated investment company under the Internal Revenue Code of 1986, as amended (the “Code”). Qualification generally will relieve the Funds of liability for federal income taxes to the extent 100% of their net investment income and any net realized capital gains are distributed in accordance with the Code.
In order to avoid imposition of the excise tax applicable to regulated investment companies, it is also each Fund’s intention to declare as dividends in each calendar year at least 98% of its net investment income (earned during the calendar year) and 98.2% of its net realized capital gains (earned during the twelve months ended October 31) plus undistributed amounts from prior years.
The following information is computed on a tax basis for each item as of March 31, 2019:
| | FBP Equity
& Dividend
Plus Fund | | | FBP Appreciation
& Income
Opportunities
Fund | |
Tax cost of portfolio investments and written option contracts | | $ | 23,409,960 | | | $ | 24,824,272 | |
Gross unrealized appreciation | | $ | 6,347,053 | | | $ | 9,178,922 | |
Gross unrealized depreciation | | | (1,168,889 | ) | | | (633,249 | ) |
Net unrealized appreciation | | | 5,178,164 | | | | 8,545,673 | |
Undistributed ordinary income | | | 79,684 | | | | 18,179 | |
Undistributed long-term capital gains | | | 84,994 | | | | 476,304 | |
Accumulated other losses | | | — | | | | (15,171 | ) |
Distributions payable | | | (1,599 | ) | | | (12,780 | ) |
Accumulated distributable earnings | | $ | 5,341,243 | | | $ | 9,012,205 | |
The difference between the federal income tax cost of portfolio investments and the financial statement cost of portfolio investments for FBP Appreciation & Income Opportunities Fund is due to certain differences in the recognition of capital gains and losses under income tax regulations and GAAP. These “book/tax” differences are temporary in nature and are primarily due to differing methods in the amortization of discounts and premiums on fixed income securities.
Qualified late year capital losses incurred after October 31, 2018 and within the current taxable year are deemed to arise on the first day of a Fund’s next taxable year. For the year ended March 31, 2019, FBP Appreciation & Income Opportunities Fund deferred $15,171 of post-October capital losses to April 1, 2019 for federal income tax purposes.
The Funds recognize the tax benefits or expenses of uncertain tax positions only when the position is “more likely than not” to be sustained assuming examination by tax authorities. Management has reviewed the tax positions taken by each Fund on federal income tax returns for all open tax years (generally, three years) and has concluded that no provision for unrecognized tax benefits or expenses is required in these financial statements.
25
THE FLIPPIN, BRUCE & PORTER FUNDS
NOTES TO FINANCIAL STATEMENTS (Continued) |
3. Investment Transactions
Investment transactions, other than short-term investments and U.S. government securities, were as follows for the year ended March 31, 2019:
| | FBP Equity
& Dividend
Plus Fund | | | FBP Appreciation
& Income
Opportunities
Fund | |
Purchases of investment securities | | $ | 5,285,624 | | | $ | 6,446,914 | |
Proceeds from sales and maturities of investment securities | | $ | 4,749,235 | | | $ | 7,818,497 | |
4. Transactions with Related Parties
INVESTMENT ADVISORY AGREEMENTS
Each Fund’s investments are managed by Flippin, Bruce & Porter, Inc. (the “Adviser”) under the terms of an Investment Advisory Agreement. Under the Investment Advisory Agreements, each Fund pays the Adviser a fee, which is computed and accrued daily and paid monthly, at an annual rate of 0.70% of its average daily net assets up to $250 million; 0.65% of the next $250 million of such assets; and 0.50% of such assets in excess of $500 million.
During the year ended March 31, 2019, the Adviser voluntarily limited the total annual operating expenses of FBP Equity & Dividend Plus Fund and FBP Appreciation & Income Opportunities Fund to 1.07% and 1.00%, respectively, of average net assets; accordingly, the Adviser voluntarily waived $44,155 and $40,217 of its investment advisory fees from FBP Equity & Dividend Plus Fund and FBP Appreciation & Income Opportunities Fund, respectively. These amounts are not subject to recapture in future periods.
Certain officers and a Trustee of the Trust are also officers of the Adviser.
OTHER SERVICE PROVIDERS
Ultimus Fund Solutions, LLC (“Ultimus”) provides administration, fund accounting, compliance and transfer agent services to the Funds. The Funds pay Ultimus fees in accordance with the agreements for such services. In addition, the Funds pay out-of-pocket expenses including, but not limited to, postage, supplies, and costs of pricing the Funds’ portfolio securities. Certain officers of the Trust are also officers of Ultimus, or of Ultimus Fund Distributors, LLC (the “Distributor”), the principal underwriter of each Fund’s shares and an affiliate of Ultimus. The Distributor is compensated by the Adviser (not the Funds) for acting as principal underwriter.
COMPENSATION OF TRUSTEES
Trustees and officers affiliated with the Adviser or Ultimus are not compensated by the Trust for their services. Each Trustee who is not an affiliated person of the Adviser or Ultimus receives from the Trust an annual retainer of $20,000, payable quarterly; a fee of $2,000 for attendance at each meeting of the Board of Trustees (except that such fee is $3,000 for the independent chair); and a fee of $1,000 for attendance at each meeting of any committee of the Board (except that such fee is $1,500 for the committee chair); plus reimbursement of travel and other expenses incurred in attending meetings. Each Fund pays its proportionate share of such fees along with the other series of the Trust.
26
THE FLIPPIN, BRUCE & PORTER FUNDS
NOTES TO FINANCIAL STATEMENTS (Continued) |
5. Derivatives Transactions
FBP Appreciation & Income Opportunities Fund had no open derivative positions as of March 31, 2019.
The location in the Statements of Assets and Liabilities of FBP Equity & Dividend Plus Fund’s derivative positions as of March 31, 2019 is as follows:
FBP Equity & Dividend Plus Fund
| | | |
Fair Value
| | | Gross Notional
Amount
Outstanding | |
Type of Derivative (Risk) | Location | | Asset
Derivatives | | | Liability
Derivatives | | | March 31,
2019 | |
Call options written (Equity) | Written call options, at value | | $ | — | | | $ | (300,690 | ) | | $ | (7,853,930 | ) |
The Funds’ transactions in derivative instruments during the year ended March 31, 2019 are recorded in the following locations in the Statements of Operations:
FBP Equity & Dividend Plus Fund
Type of Derivative (Risk) | Location | | Net
Realized
Gains | | Location | | Change in
Unrealized
Appreciation
(Depreciation) | |
Call options written (Equity) | Net realized gains (losses) from written option contracts | | $ | 125,606 | | Net change in unrealized appreciation (depreciation) on written option contracts | | $ | (15,297 | ) |
FBP Appreciation & Income Opportunities Fund
Type of Derivative (Risk) | Location | | Net
Realized
Losses | | Location | | Change in
Unrealized
Appreciation
(Depreciation) | |
Call options written (Equity) | Net realized gains (losses) from written option contracts | | $ | (52,718 | ) | Net change in unrealized appreciation (depreciation) on written option contracts | | $ | 80,889 | |
The average monthly notional amount of written call options during the year ended March 31, 2019 is $6,097,918 and $1,199,436 for FBP Equity & Dividend Plus Fund and FBP Appreciation & Income Opportunities Fund, respectively.
27
THE FLIPPIN, BRUCE & PORTER FUNDS
NOTES TO FINANCIAL STATEMENTS (Continued) |
6. Contingencies and Commitments
The Funds indemnify the Trust’s officers and Trustees for certain liabilities that might arise from the performance of their duties to the Funds. Additionally, in the normal course of business the Funds enter into contracts that contain a variety of representations and warranties and which provide general indemnifications. The Funds’ maximum exposure under these arrangements is unknown, as this would involve future claims that may be made against the Funds that have not yet occurred. However, based on experience, the Trust expects the risk of loss to be remote.
7. Subsequent Events
The Funds are required to recognize in the financial statements the effects of all subsequent events that provide additional evidence about conditions that existed as of the date of the Statements of Assets and Liabilities. For non-recognized subsequent events that must be disclosed to keep the financial statements from being misleading, the Funds are required to disclose the nature of the event as well as an estimate of its financial effect, or a statement that such an estimate cannot be made. Management has evaluated subsequent events through the issuance of these financial statements and has noted no such events.
28
THE FLIPPIN, BRUCE & PORTER FUNDS
REPORT OF INDEPENDENT REGISTERED
PUBLIC ACCOUNTING FIRM |
To the Shareholders of The Flippin, Bruce & Porter Funds and
Board of Trustees of Williamsburg Investment Trust
Opinion on the Financial Statements
We have audited the accompanying statements of assets and liabilities, including the schedules of investments and open option contracts, of The Flippin, Bruce & Porter Funds, comprising FBP Equity & Dividend Plus Fund and FBP Appreciation & Income Opportunities Fund, (the “Funds”), each a series of Williamsburg Investment Trust, as of March 31, 2019, and the related statements of operations for the year then ended, the statements of changes in net assets for each of the two years in the period then ended, including the related notes, and the financial highlights for each of the four years in the period then ended (collectively referred to as the “financial statements”). In our opinion, the financial statements present fairly, in all material respects, the financial position of each of the Funds as of March 31, 2019, the results of their operations for the year then ended, the changes in their net assets for each of the two years in the period then ended, and the financial highlights for each of the four years in the period then ended, in conformity with accounting principles generally accepted in the United States of America.
The Funds’ financial highlights for the period ended March 31, 2015, were audited by other auditors whose report dated May 22, 2015, expressed an unqualified opinion on those financial highlights.
Basis for Opinion
These financial statements are the responsibility of the Funds’ management. Our responsibility is to express an opinion on the Funds’ financial statements based on our audits. We are a public accounting firm registered with the Public Company Accounting Oversight Board (United States) (“PCAOB”) and are required to be independent with respect to the Funds in accordance with the U.S. federal securities laws and the applicable rules and regulations of the Securities and Exchange Commission and the PCAOB.
We conducted our audits in accordance with the standards of the PCAOB. Those standards require that we plan and perform the audit to obtain reasonable assurance about whether the financial statements are free of material misstatement, whether due to error or fraud.
Our audits include performing procedures to assess the risks of material misstatement of the financial statements, whether due to error or fraud, and performing procedures that respond to those risks. Such procedures include examining, on a test basis, evidence regarding the amounts and disclosures in the financial statements. Our procedures included confirmation of securities owned as of March 31, 2019, by correspondence with the custodian and brokers. Our audits also included evaluating the accounting principles used and significant estimates made by management, as well as evaluating the overall presentation of the financial statements. We believe that our audits provide a reasonable basis for our opinion.
We have served as the Funds’ auditor since 2016.
COHEN & COMPANY, LTD.
Cleveland, Ohio
May 22, 2019
29
THE FLIPPIN, BRUCE & PORTER FUNDS
BOARD OF TRUSTEES AND EXECUTIVE OFFICERS
(Unaudited) |
Overall responsibility for management of the Funds rests with the Board of Trustees. The Trustees serve during the lifetime of the Trust and until its termination, or until death, resignation, retirement or removal. The Trustees, in turn, elect the officers of the Funds. The officers have been elected for an annual term. The following are the Trustees and executive officers of the Funds:
| | Trustees
and Officers | Address | Year
of
Birth | Position Held
with the Trust | Length of
Time Served |
| | Robert S. Harris, Ph.D. | 225 Pictoria Drive, Suite 450
Cincinnati, OH | 1949 | Chairman and Trustee | Since
January 2007 |
* | John P. Ackerly, IV | One James Center
901 E. Cary Street
Richmond, VA | 1963 | Trustee and President of Davenport Funds | Since
July 2012 |
* | John T. Bruce | 800 Main Street
Lynchburg, VA | 1953 | Trustee and
President of FBP Funds | Since
September 1988 |
| | George K. Jennison | 225 Pictoria Drive, Suite 450
Cincinnati, OH | 1957 | Trustee | Since
January 2015 |
| Harris V. Morrissette | 225 Pictoria Drive, Suite 450
Cincinnati, OH | 1959 | Trustee | Since
March 1993 |
| | Elizabeth W. Robertson | 225 Pictoria Drive, Suite 450
Cincinnati, OH | 1953 | Trustee | Since
February 2014 |
| | Norman D. Darden, III | 800 Main Street
Lynchburg, VA | 1965 | Vice President | Since
February 2018 |
| | John H. Hanna, IV | 800 Main Street
Lynchburg, VA | 1955 | Vice President | Since
February 2007 |
| | David J. Marshall | 800 Main Street
Lynchburg, VA | 1956 | Vice President | Since
February 2007 |
| Robert G. Dorsey | 225 Pictoria Drive, Suite 450
Cincinnati, OH | 1957 | Vice President | Since
November 2000 |
| Mark J. Seger | 225 Pictoria Drive, Suite 450
Cincinnati, OH | 1962 | Treasurer | Since
November 2000 |
| | David K. James | 225 Pictoria Drive, Suite 450
Cincinnati, OH | 1970 | Secretary | Since
September 2018 |
| | Simon H. Berry | 225 Pictoria Drive, Suite 450
Cincinnati, OH | 1971 | Chief Compliance Officer | Since
May 2017 |
* | Messrs. Ackerly and Bruce, as affiliated persons of investment advisers to the Trust, are “interested persons” of the Trust within the meaning of Section 2(a)(19) of the 1940 Act. |
30
THE FLIPPIN, BRUCE & PORTER FUNDS
BOARD OF TRUSTEES AND EXECUTIVE OFFICERS
(Unaudited) (Continued) |
Each Trustee oversees ten portfolios of the Trust, including the Funds. The principal occupations of the Trustees and executive officers of the Funds during the past five years and public directorships held by the Trustees are set forth below:
Robert S. Harris, Ph.D. is the C. Stewart Sheppard Professor of Business Administration at The Darden Graduate School of Business Administration at the University of Virginia. He was previously the dean at Darden. Professor Harris has published widely on corporate finance, financial markets and mergers and acquisitions and has served as a consultant to corporations and government agencies.
John P. Ackerly, IV is Senior Vice President and Portfolio Manager of Davenport & Company LLC (a broker-dealer and investment advisory firm).
John T. Bruce is President, Director and member of the Executive Committee of the Adviser.
George K. Jennison is President of Oyster Consulting, LLC (a management consulting firm). He previously was a financial adviser with Wells Fargo Advisors, LLC.
Harris V. Morrissette is President of China Doll Rice and Beans, Inc. and Dixie Lily Foods. He is also a Director of Trustmark Corporation (bank holding company).
Elizabeth W. Robertson serves as a Trustee of TowneBank Foundation, TowneBank Corporate Board, TowneBank Audit Committee Chair and TowneBank Community Board since 2015. She previously was Chief Financial Officer of Monument Restaurants LLC.
Norman D. Darden, III is Senior Portfolio Manager, Analyst and Principal of the Adviser.
John H. Hanna, IV is Vice President, Director and member of the Executive Committee of the Adviser.
David J. Marshall is Secretary, Director and member of the Executive Committee of the Adviser.
Robert G. Dorsey is a Vice Chairman of Ultimus Fund Solutions, LLC and Ultimus Fund Distributors, LLC. He previously was Co-CEO of Ultimus Fund Solutions, LLC (1999-2019).
Mark J. Seger is a Vice Chairman of Ultimus Fund Solutions, LLC and Ultimus Fund Distributors, LLC. He previously was Co-CEO of Ultimus Fund Solutions, LLC (1999-2019).
David K. James is an Executive Vice President and Chief Legal and Risk Officer of Ultimus Fund Solutions, LLC (2018 to present). He previously was Managing Director and Managing Counsel at State Street Bank and Trust Company (2009 to 2018).
Simon H. Berry is a Senior Attorney of Ultimus Fund Solutions, LLC (2016 to present). He previously was an Attorney at the Kentucky Department of Financial Institutions (2009-2016).
Additional information about members of the Board of Trustees and executive officers is available in the Statement of Additional Information (“SAI”). To obtain a free copy of the SAI, please call 1-866-738-1127.
31
THE FLIPPIN, BRUCE & PORTER FUNDS
ABOUT YOUR FUNDS’ EXPENSES (Unaudited) |
We believe it is important for you to understand the impact of costs on your investment. All mutual funds have operating expenses. As a shareholder of a Fund, you incur ongoing costs, including management fees and other operating expenses. These ongoing costs, which are deducted from each Fund’s gross income, directly reduce the investment return of the Funds.
A mutual fund’s ongoing costs are expressed as a percentage of its average net assets. This figure is known as the expense ratio. The following examples are intended to help you understand the ongoing costs (in dollars) of investing in the Funds and to compare these costs with the ongoing costs of investing in other mutual funds. The examples below are based on an investment of $1,000 made at the beginning of the period shown and held for the entire period (October 1, 2018 through March 31, 2019).
The table below illustrates each Fund’s ongoing costs in two ways:
Actual fund return – This section helps you to estimate the actual expenses that you paid over the period. The “Ending Account Value” shown is derived from each Fund’s actual return, and the fourth column shows the dollar amount of operating expenses that would have been paid by an investor who started with $1,000 in the Funds. You may use the information here, together with the amount you invested, to estimate the expenses that you paid over the period.
To do so, simply divide your account value by $1,000 (for example, an $8,600 account value divided by $1,000 = 8.6), then multiply the result by the number given for the Funds under the heading “Expenses Paid During Period.”
Hypothetical 5% return – This section is intended to help you compare the Funds’ ongoing costs with those of other mutual funds. It assumes that each Fund had an annual return of 5% before expenses during the period shown, but that the expense ratio is unchanged. In this case, because the returns used are not the Funds’ actual returns, the results do not apply to your investment. The example is useful in making comparisons because the SEC requires all mutual funds to calculate expenses based on a 5% return. You can assess each Fund’s ongoing costs by comparing this hypothetical example with the hypothetical examples that appear in shareholder reports of other funds.
Note that expenses shown in the table are meant to highlight and help you compare ongoing costs only. The Funds do not charge sales loads or redemption fees.
The calculations assume no shares were bought or sold during the period. Your actual costs may have been higher or lower, depending on the amount of your investment and the timing of any purchases or redemptions.
More information about the Funds’ expenses, including annual expense ratios for the past five fiscal years, can be found in this report. For additional information on operating expenses and other shareholder costs, please refer to the Funds’ prospectus.
32
THE FLIPPIN, BRUCE & PORTER FUNDS
ABOUT YOUR FUNDS’ EXPENSES (Unaudited) (Continued) |
| Beginning
Account Value
October 1,
2018 | Ending
Account Value
March 31,
2019 | Net
Expense
Ratio(a) | Expenses
Paid
During
Period(b) |
FBP Equity & Dividend Plus Fund | | | |
Based on Actual Fund Return | $1,000.00 | $ 962.40 | 1.07% | $5.24 |
Based on Hypothetical 5% Return (before expenses) | $1,000.00 | $ 1,019.60 | 1.07% | $5.39 |
FBP Appreciation & Income Opportunities Fund | | | |
Based on Actual Fund Return | $1,000.00 | $ 959.80 | 1.00% | $4.89 |
Based on Hypothetical 5% Return (before expenses) | $1,000.00 | $ 1,019.95 | 1.00% | $5.04 |
(a) | Annualized, based on each Fund’s most recent one-half year expenses. |
(b) | Expenses are equal to each Fund’s annualized net expense ratio multiplied by the average account value over the period, multiplied by 182/365 (to reflect the one-half year period). |
33
THE FLIPPIN, BRUCE & PORTER FUNDS
OTHER INFORMATION (Unaudited) |
The Trust files a complete listing of portfolio holdings for the Funds with the SEC as of the end of the first and third quarters of each fiscal year on Form N-Q. The filings are available upon request, by calling 1-866-738-1127. Furthermore, you may obtain a copy of these filings on the SEC’s website at http://www.sec.gov.
A description of the policies and procedures that the Funds use to determine how to vote proxies relating to portfolio securities is available without charge upon request by calling toll-free 1-800-327-9375, or on the SEC’s website at http://www.sec.gov. Information regarding how the Funds voted proxies relating to portfolio securities during the most recent 12-month period ended June 30 is also available without charge upon request by calling toll-free 1-866-738-1127, or on the SEC’s website at http://www.sec.gov.
FEDERAL TAX INFORMATION (Unaudited)
For the fiscal year ended March 31, 2019, FBP Equity & Dividend Plus Fund and FBP Appreciation & Income Opportunities Fund designated $1,385,855 and $649,008, respectively, as 20% long-term capital gain distributions.
Qualified Dividend Income – FBP Equity & Dividend Plus Fund and FBP Appreciation & Income Opportunities Fund each designates 100%, or up to the maximum amount of such dividends allowable pursuant to the Internal Revenue Code, as qualified dividend income eligible for the reduced tax rate of 15%.
Dividends Received Deduction – Corporate shareholders are generally entitled to take the dividends received deduction on the portion of a fund’s dividend distribution that qualifies under tax law. For FBP Equity & Dividend Plus Fund and FBP Appreciation & Income Opportunities Fund’s fiscal year 2019 ordinary income dividends, 100% qualifies for the corporate dividends received deduction.
34
THE FLIPPIN, BRUCE & PORTER FUNDS
DISCLOSURE REGARDING APPROVAL OF INVESTMENT ADVISORY AGREEMENTS
(Unaudited) |
At an in-person meeting held on February 26, 2019, the Board of Trustees, including a majority of the Independent Trustees, approved the continuance for a one-year period of the Investment Advisory Agreements with the Adviser on behalf of the FBP Equity & Dividend Plus Fund and the FBP Appreciation & Income Opportunities Fund (individually, a “Fund,” collectively, the “Funds”). Below is a discussion of the factors considered by the Board of Trustees along with the conclusions with respect thereto that formed the basis for the Board’s approval.
In approving the continuance of the Investment Advisory Agreements, the Independent Trustees considered all information they deemed reasonably necessary to evaluate the terms of the Agreements. The principal areas of review by the Independent Trustees were the nature, extent and quality of the services provided by the Adviser and the reasonableness of the fees charged for those services. These matters were considered by the Independent Trustees consulting with experienced counsel for the Independent Trustees, who is independent of the Adviser.
The Independent Trustees’ evaluation of the quality of the Adviser’s services took into consideration their knowledge gained through presentations and reports from the Adviser over the course of the preceding year. The Independent Trustees considered that the Adviser had provided its views on the overall conditions of the economy and the markets, including the factors that may have influenced the markets, investor preferences and market sentiment during the past year. Both short-term and long-term investment performance of the Funds were considered. Each Fund’s performance was compared to its performance benchmark, a peer group of funds with similar investment objectives and strategies, and to the Adviser’s comparably managed private accounts. The Independent Trustees also considered: the scope and quality of the in-house capabilities of the Adviser and other resources that it dedicates to performing services for the Funds; the quality of administrative and other services, including the Adviser’s role in coordinating the activities of the Funds’ other service providers; the Adviser’s compliance with investment policies of the Funds and applicable laws and regulations; information provided by management and the Funds’ independent public accounting firm in periodic meetings with the Trust’s Audit Committee; the business reputation of the Adviser; the qualifications of the Adviser’s key investment and compliance personnel; and the Adviser’s financial resources.
In reviewing the fees payable under the Investment Advisory Agreements, the Independent Trustees compared the advisory fees and overall expense levels of each Fund with those of funds with similar investment objectives and strategies as well as the private accounts managed by the Adviser. The Independent Trustees considered information provided by the Adviser concerning the Adviser’s profitability with respect to each Fund, including the assumptions and methodology used in preparing the profitability information, in light of applicable case law relating to advisory fees. For these purposes, the Independent Trustees considered not only the fees paid by the Funds, but also so-called “fallout” benefits to the Adviser. The Independent Trustees also considered the Adviser’s representations that the Funds’ portfolio trades were executed based on the best available price and execution, and that the Adviser does not participate in any revenue sharing arrangements relating to the Funds. In evaluating the Funds’ advisory fees, the Trustees considered the complexity and quality of the investment process that is applied in the management of the Funds.
35
THE FLIPPIN, BRUCE & PORTER FUNDS
DISCLOSURE REGARDING APPROVAL OF INVESTMENT ADVISORY AGREEMENTS
(Unaudited) (Continued) |
Based upon their review of this information, the Independent Trustees concluded that: (i) during the 2018 calendar year, each Fund placed below the return of the S&P 500 Index but above its Morningstar peer group average, and the Adviser has provided satisfactory services to each Fund; (ii) the advisory fees for each Fund, after fee waivers, are competitive with (and in the case of the FBP Dividend Plus Fund, lower than) similarly managed funds; (iii) the total operating expense ratio of each Fund, after fee waivers, is competitive with the average expense ratio for comparably managed funds, according to statistics derived from Morningstar, Inc.; (iv) the Adviser’s decision to cap overall operating expenses of each Fund by voluntarily waiving a portion of its investment advisory fees has enabled the Funds to increase returns for their shareholders and to maintain an overall expense ratio that is competitive with the average for similarly managed funds, despite the small size of the Funds; and (v) the Adviser did not realize any profits with respect to its management of the Funds.
Given the current size of the Funds and their expected growth, the Independent Trustees did not believe that it was relevant to consider the extent to which economies of scale would be realized as the Funds grow, and whether fee levels reflect these economies of scale. The Independent Trustees did consider the “fallout” benefits to FBP with respect to the Funds, but given the amounts involved viewed these as secondary factors in connection with the evaluation of the reasonableness of the advisory fees paid by the Funds.
No single factor was considered in isolation or to be determinative to the decision of the Independent Trustees to approve the continuance of the Investment Advisory Agreements. Rather the Independent Trustees concluded, after weighing and balancing of all factors considered, that it was in the best interests of each Fund and its shareholders to continue the Investment Advisory Agreements without modification to its terms, including the fees charged for services thereunder.
36
This page intentionally left blank.

Investment Adviser Flippin, Bruce & Porter, Inc. 800 Main Street, Second Floor P.O. Box 6138 Lynchburg, Virginia 24505 Toll-Free 1-800-851-3804 www.fbpfunds.com Administrator Ultimus Fund Solutions, LLC P.O. Box 46707 Cincinnati, Ohio 45246-0707 Toll-Free 1-866-738-1127 Custodian U.S. Bank, N.A. 425 Walnut Street Cincinnati, Ohio 45202 Independent Registered
Public Accounting Firm Cohen & Company, Ltd.
1350 Euclid Avenue, Suite 800 Cleveland, Ohio 44115 | Legal Counsel Sullivan & Worcester LLP 1666 K Street, N.W. Washington, DC 20006 Officers John T. Bruce, President and Portfolio Manager Norman D. Darden, III,
Vice President John H. Hanna, IV, Vice President
David J. Marshall, Vice President Trustees Robert S. Harris, Ph.D., Chairman John P. Ackerly, IV John T. Bruce George K. Jennison Harris V. Morrissette Elizabeth W. Robertson |
THE GOVERNMENT STREET FUNDS No-Load Mutual Funds Annual Report
March 31, 2019 |
The Government Street Equity Fund The Government Street Mid-Cap Fund |
Beginning on January 1, 2021, as permitted by regulations adopted by the U.S. Securities and Exchange Commission, paper copies of the Funds’ shareholder reports like this one will no longer be sent by mail, unless you specifically request paper copies of the reports from the Funds or from your financial intermediary, such as a broker-dealer or bank. Instead, the reports will be made available on a website, and you will be notified by mail each time a report is posted and provided with a website link to access the report.
If you already elected to receive shareholder reports electronically, you will not be affected by this change and you need not take any action. You may elect to receive shareholder reports and other communications from the Funds electronically by contacting the Funds at 1-866-738-1125 or, if you own these shares through a financial intermediary, by contacting your financial intermediary.
You may elect to receive all future reports in paper free of charge. You can inform the Funds that you wish to continue receiving paper copies of your shareholder reports by contacting the Funds at 1-866-738-1125. If you own shares through a financial intermediary, you may contact your financial intermediary or follow instructions included with this document to elect to continue to receive paper copies of your shareholder reports. Your election to receive reports in paper will apply to all Funds held with the Fund complex or at your financial intermediary.
LETTER FROM THE PRESIDENT | April 24, 2019 |
Dear Fellow Shareholders:
We are enclosing for your review the audited Annual Reports of The Government Street Funds for the fiscal year ended March 31, 2019.
The Government Street Equity Fund
The Government Street Equity Fund had a positive 5.65% total return for the fiscal year ended March 31, 2019. By comparison, the S&P 500® Index and the Morningstar Large Blend categories returned 9.50% and 6.90%, respectively.
The 12-month period had modest returns with the 1st quarter of calendar 2019 providing the best results. The following table depicts the fiscal quarter total returns of our three related measures.
| Government
Street Equity | S&P 500 | Morningstar
Large Blend |
1 Qtr 2019 | 11.58% | 13.65% | 12.94% |
4 Qtr 2018 | (14.60%) | (13.52%) | (13.53%) |
3 Qtr 2018 | 8.75% | 7.71% | 6.67% |
2 Qtr 2018 | 1.95% | 3.43% | 2.68% |
The results of the last twelve months equity performance had a little of everything for quarterly returns. The one ingredient that cannot be argued, is that volatility is definitely back.
The first two quarters of the fiscal year had good, maybe even by historical standards, robust returns. It is believed that this was primarily caused by investors seeing increasingly better corporate earnings as the impact of the lower tax rates, declining unemployment, rising consumer confidence, stock buy-backs and reasonable levels of interest rates prevailed.
The second half of the fiscal year was a fireworks display of investment return shifts. After posting the worst December since 1931, U.S. stocks surged to their best January since 1987, followed by further gains in February and March. One can pick from numerous options as to the significant reasons for the results.
Among those, the Federal Reserve raised interest rates in December for a fourth time in calendar 2018 in the face of myriad reasons to stand pat after its third increase. Then, in the first quarter of calendar 2019, the Fed reversed course and announced a move to a modest or dovish position on further interest rate increases with a slowdown/cessation of shrinking its balance sheet of previous stimulative bond purchases.
The rise of volatility is easier to understand by looking at the following events in the second half of our fiscal year: disruption from the change in control of the majority in the U.S. House of Representatives, daily prognostications regarding the outcome of the Mueller report, impasses of International trade agreements and a federal government shut down.
1
Thankfully, the fiscal year ended on a robust note as investors flooded the market with purchases. Almost every negative cited for the closing year-end 2018 negativism was mitigated or reversed in the final three months of the period.
Your Fund rode the roller coaster results in direct correlation to the general market. Its absolute results trailed the S&P 500. This was attributable to more defensive components within the portfolio’s investments and slightly higher cash reserves in anticipation of the continuation of the negative factors at year-end 2018.
While we are extremely pleased with the market rebound, it is not believed that the myriad of moderate/negative financial forecasts have significantly improved. Many economic indicators continue to erode, both domestically and internationally. There is little question that the beginning of a slowdown is emerging. It appears that calendar 2019 will be a period of modest economic improvements with calendar 2020 being the year of possible reversals. Short-term forecasts are always difficult, but the length and strength of the longest bull market in history is definitely aging.
The top 10 holdings in The Government Street Equity Fund as of March 31, 2019 were:
Security Description | % of Net Assets |
JPMorgan Chase & Company | 4.86% |
Apple, Inc. | 4.56% |
Lockheed Martin Corporation | 4.00% |
Bio-Techne Corporation | 3.17% |
Comcast Corporation – Class A | 3.12% |
Visa, Inc. – Class A | 3.11% |
United Technologies Corporation | 3.09% |
Honeywell International, Inc. | 2.82% |
NVIDIA Corporation | 2.76% |
Alphabet, Inc. – Class C | 2.71% |
The top 10 holdings are large well-known companies. There seems to be a tendency across the components to represent growthier elements of their respective industries. However, the breadth of diversification is evident. This runs throughout the balance of the portfolio as each of the 11 economic sector classifications of the market is represented. The Government Street Equity Fund is managed to represent a large capitalization collection of blended growth and value companies.
There were significant individual performances during the fiscal year. The five highest returns, held for the entire fiscal year, as measured by the internal rate of return for the entire period were:
Security Description | 1 Year
Performance |
McCormick and Company, Inc. | 44.04% |
Abbott Laboratories | 35.57% |
Mastercard, Inc. | 33.95% |
Bio-Techne Corporation | 32.44% |
Microsoft Corporation | 31.31% |
2
The five worst individual performances, held for the entire fiscal year, as measured by internal rate of return for the entire period were:
Security Description | 1 Year
Performance |
TE Connectivity Ltd. | (17.48%) |
Micron Technology, Inc. | (19.54%) |
General Dynamics Corporation | (21.84%) |
QUALCOMM, Inc. | (22.08%) |
NVIDIA Corporation | (22.18%) |
The Fund’s best performing economic sector for the fiscal year was Utilities, up 26.5%. The second-best sector was Real Estate up 24.5%. The worst performing sector was Energy down (10.6%).
Note: The investment performances listed for economic sectors and securities in the two preceding paragraphs are extracted from an in-house independent time-weighted rate of return computation by the Addepar portfolio accounting system. The calculations are gross investment returns. Total investment returns are for the fiscal year April 1, 2018 through March 31, 2019.
The following comments are drawn from previous newsletters but continue to reflect our current thoughts on the future investment prospects.
We believe that continued upward movement of markets and economies worldwide are highly dependent on governments getting their financial balance sheets in order. There has been unparalleled deficit spending around the world. Those economies not directly participating in the credit shortfalls will be indirectly impacted by lower import/export activities brought on by a significant debt imposed slowdown. This will occur domestically and internationally as economies have become more highly correlated in their economic cycles.
In response to this perceived scenario, risk management takes precedence over return pursuits in the near term. Your Fund remains invested to capture returns but highly diversified to mitigate the risks associated with that position. We believe that the future transition to a sound economic scenario will determine the continuation of current positive performances. We are not totally convinced of that outcome.
While significant risks exist, we continue to believe that investors have the potential for one of the greatest investment environments for generations. There are over 7 billion people in the world today (the U.S. population is approximately 325 million). Many of these potential consumers are moving into middle-class ranks. In our opinion, the demand for goods and services for the future is tremendous. Remember that, in our own economy, approximately 60% of GDP is tied to consumer spending on goods and services. With the business advantages that the U.S. enjoys in manufacturing know-how, technology, intellectual content, productivity, and numerous other characteristics, if the government will provide a competitive framework for operating, the benefits could be the best ever. We just need government policies that foster growth in profits and wages domestically and internationally.
3
There are many additional moving parts in our economy and exogenous factors such as the geopolitical instabilities that will always cause uneven effects. However, it is our thought that keeping our fiscal house in order is basic to all considerations. The irresponsible spending activities of our government continue to unnerve us. It remains to be seen if the economy can overcome the negative influence of government policies and have a successful impact on market values.
As of March 31, 2019, the Fund’s net assets were $56.2 million; net asset value per share was $73.37; and the ratio of expenses to net average assets was 0.89%. Portfolio turnover rate was 9%. Income dividends of $0.68 per share and capital gain distributions of $4.61 per share were distributed to shareholders during the year.
The Government Street Mid-Cap Fund
The Government Street Mid-Cap Fund produced a total return of 4.21% during the fiscal year ended March 31, 2019. By comparison the S&P 400® Index and the Morningstar Mid-Cap Blended Index, used as relative performance benchmarks, returned 2.59% and 2.19%, respectively.
The mid-capitalization category of individual companies is usually represented by the S&P 400, whose issuers have a market capitalization ranging from approximately $1.02 billion to $13.7 billion. Generally, these companies are considered to have slightly higher risk and return characteristics than the S&P 500 companies, which includes issuers with large capitalization. As you would guess, the mid-cap companies in the index are primarily domestically oriented.
There are 2 provisions that allow the market caps of the companies held by the Fund to exceed those limits. First, to the extent securities originally purchased within the limits have grown to greater capitalizations, they may be retained by the Fund without limitation. Second, the Fund’s portfolio manager has the latitude to purchase and hold up to 20% of the Fund’s value outside the market cap limitations.
The exceptions to the guidelines for your Fund worked to its advantage in fiscal 2019. Several companies, particularly in the Information Technology sector, with higher capitalizations provided extraordinary returns for the period. The greatest contributor, Xilinx, up 78.47% in the period, was purchased when its capitalization was within the mid-cap range, but has grown to mega-cap proportions.
4
The top 10 holdings in The Government Street Mid-Cap Fund as of March 31, 2019 were:
Security Description | % of Net Assets |
Mid-America Apartment Communities, Inc. | 3.54% |
Teleflex, Inc. | 2.58% |
Vanguard Mid-Cap ETF | 2.55% |
Lam Research Corporation | 2.31% |
Bio-Techne Corporation | 2.14% |
Nasdaq, Inc. | 2.08% |
Invesco Zacks Mid-Cap ETF | 2.07% |
Chemed Corporation | 2.07% |
CME Group, Inc. | 2.04% |
Waste Connections, Inc. | 2.01% |
ETFs represent significant holdings in the Fund. Vanguard and Guggenheim are all constituted differently but cover the market capitalization ranges mentioned earlier. Since the mid-cap universe contains a much greater number of companies than its larger index counterparts, we like to broaden your portfolios exposure across the range to govern risk control through diversification.
There were significant individual performances during the fiscal year. The five highest returns, held for the entire period, as measured by the time weighted rate of return, were:
Security Description | 1 Year
Performance |
Xilinx, Inc. | 78.47% |
Church & Dwight Company | 43.60% |
One Gas, Inc. | 37.67% |
Charles River Lab. Intl., Inc. | 36.08% |
Woodward, Inc. | 33.36% |
The five worst individual performances, held for the entire period, as measured by time weighted rate of return, were:
Security Description | 1 Year
Performance |
Energizer Holdings, Inc. | (22.92%) |
Eaton Vance Corporation | (25.54%) |
SEI Investments Company | (29.43%) |
CNX Resources Corporation | (30.20%) |
Oil States International, Inc. | (35.23%) |
The Fund’s best performing economic sector for the fiscal year was Real Estate, up 24.5%. The second-best sector was Health Care, up 19.5%. The worst performing sector was Energy, down (4.1%).
5
Note: The investment performances listed for economic sectors and securities in the two preceding paragraphs are extracted from an in-house independent time weighted rate of return computation by the Addepar portfolio accounting system. The calculations are gross investment returns. Total investment returns are for the fiscal year April 1, 2018 through March 31, 2019.
We believe that mid-cap stocks offer an attractive combination of growth and safety as they have successfully overcome startup challenges yet remain nimble enough to generate stronger growth than large-cap stocks. Mid-cap stocks have been able to match the performance of large-cap stocks in down markets while exceeding large-cap performance in up markets, leading to long-term outperformance.
Additionally, we believe the regulatory reductions by the federal government along with reduced corporate tax rates will have a positive impact on the profits of mid-cap companies versus their larger capitalization counterparts. Large capitalization companies with the breadth of legal and accounting resources available to them generally do not pay taxes at the maximum rates. On average, mid-cap companies have historically paid taxes at -higher relative rates.
It may be interesting for the readers to compare the Global Industry Classification Standard (“GICS”) sectors between the larger capitalization S&P 500 and the smaller capitalization S&P 400. The approximate weights based on the component’s capitalizations change daily but are reasonably stable over short periods. As of April 2019, they are:
GICS | S&P 500 | S&P 400 |
Energy | 5.43% | 3.84% |
Materials | 2.64% | 6.91% |
Industrial | 9.48% | 15.15% |
Consumer Discretionary | 10.35% | 11.88% |
Consumer Staples | 7.33% | 2.83% |
Health Care | 14.57% | 9.73% |
Financials | 12.69% | 16.01% |
Information Technology | 21.19% | 16.32% |
Telecommunication Services | 10.11% | 2.57% |
Utilities | 3.33% | 4.64% |
Real Estate | 3.09% | 10.12% |
The Government Street Mid-Cap Fund uses the S&P 400 sector weights for guidance in its portfolio diversification.
As of March 31, 2019, the net assets of The Government Street Mid-Cap Fund were $46.3 million and the net asset value per share was $26.78. The portfolio turnover rate for the year was 6% and the total number of holdings was 90 as of March 31, 2019. The net expense ratio for the Fund was 1.08%.
6
Thank you for your continued confidence in The Government Street Funds. Please call us if we can be of further service to you.
Very truly yours,

Thomas W. Leavell
President
Leavell Investment Management, Inc.
The Government Street Funds
Data presented reflects past performance, which is no guarantee of future results. Investment results and principal value will fluctuate so that shares, when redeemed, may be worth more or less than their original cost. Due to market volatility, current performance may be higher or lower than the performance shown.
This report is submitted for the general information of the shareholders of the Funds. The report is not authorized for distribution to prospective investors in the Funds unless it is accompanied by a current prospectus.
This report reflects our views, opinions and portfolio holdings as of March 31, 2019, the end of the reporting period. These views are subject to change at any time based upon market or other conditions. For more current information throughout the year please visit www.leavellinvestments.com.
7
THE GOVERNMENT STREET EQUITY FUND
PERFORMANCE INFORMATION (Unaudited) |
The Government Street Equity Fund
Comparison of the Change in Value of a $10,000 Investment in
The Government Street Equity Fund and the Standard & Poor’s 500® Index
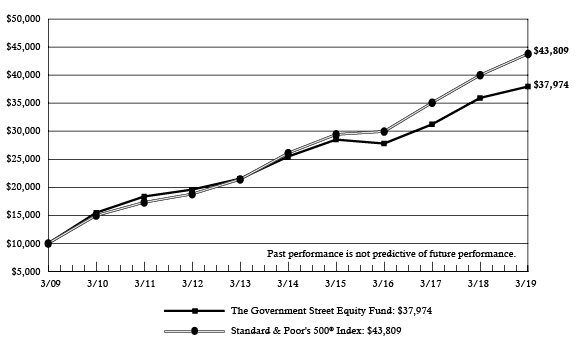
| Average Annual Total Returns (for periods ended March 31, 2019) | |
| 1 Year | 5 Years | 10 Years | |
The Government Street Equity Fund(a) | 5.65% | 8.31% | 14.27% | |
Standard & Poor’s 500® Index | 9.50% | 10.91% | 15.92% | |
(a) | Total return is a measure of the change in value of an investment in the Fund over the periods covered, which assumes any dividends or capital gains distributions are reinvested in shares of the Fund. Returns do not reflect the deduction of taxes a shareholder would pay on Fund distributions or the redemption of Fund shares. |
8
THE GOVERNMENT STREET MID-CAP FUND
PERFORMANCE INFORMATION (Unaudited) |
The Government Street Mid-Cap Fund
Comparison of the Change in Value of a $10,000 Investment in
The Government Street Mid-Cap Fund and the Standard & Poor’s 400® Index
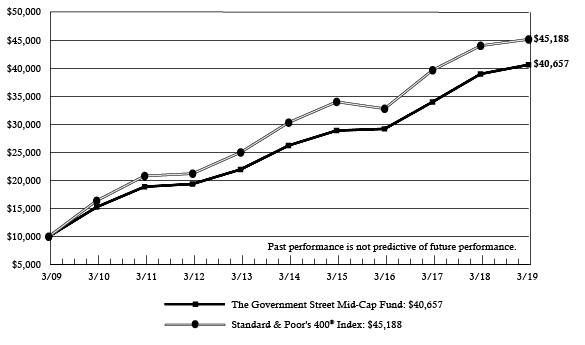
| Average Annual Total Returns (for periods ended March 31, 2019) | |
| 1 Year | 5 Years | 10 Years | |
The Government Street Mid-Cap Fund(a) | 4.21% | 9.14% | 15.06% | |
Standard & Poor’s 400® Index | 2.59% | 8.29% | 16.28% | |
(a) | Total return is a measure of the change in value of an investment in the Fund over the periods covered, which assumes any dividends or capital gains distributions are reinvested in shares of the Fund. Returns do not reflect the deduction of taxes a shareholder would pay on Fund distributions or the redemption of Fund shares. |
9
THE GOVERNMENT STREET EQUITY FUND PORTFOLIO INFORMATION
March 31, 2019 (Unaudited)
Asset Allocation
(% of Net Assets)

Top Ten Equity Holdings
Security Description | % of Net Assets |
JPMorgan Chase & Company | 4.9% |
Apple, Inc. | 4.6% |
Lockheed Martin Corporation | 4.0% |
Bio-Techne Corporation | 3.2% |
Comcast Corporation - Class A | 3.1% |
Visa, Inc. - Class A | 3.1% |
United Technologies Corporation | 3.1% |
Honeywell International, Inc. | 2.8% |
NVIDIA Corporation | 2.8% |
Alphabet, Inc. - Class C | 2.7% |
10
THE GOVERNMENT STREET MID-CAP FUND PORTFOLIO INFORMATION
March 31, 2019 (Unaudited)
Asset Allocation
(% of Net Assets)
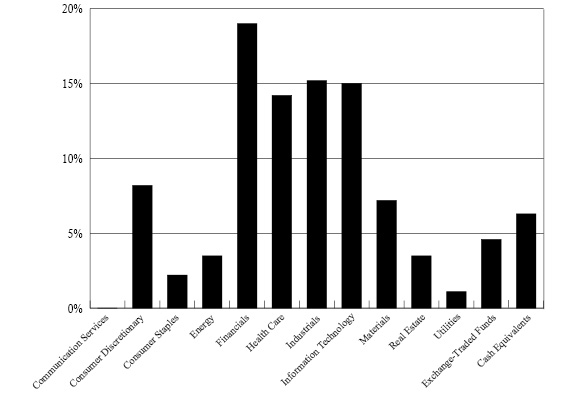
Top Ten Equity Holdings
Security Description | % of Net Assets |
Mid-America Apartment Communities, Inc. | 3.5% |
Teleflex, Inc. | 2.6% |
Vanguard Mid-Cap ETF | 2.5% |
Lam Research Corporation | 2.3% |
Bio-Techne Corporation | 2.1% |
Nasdaq, Inc. | 2.1% |
Invesco Zacks Mid-Cap ETF | 2.1% |
Chemed Corporation | 2.1% |
CME Group, Inc. | 2.0% |
Waste Connections, Inc. | 2.0% |
11
THE GOVERNMENT STREET EQUITY FUND
SCHEDULE OF INVESTMENTS
March 31, 2019 |
COMMON STOCKS— 95.9% | | Shares | | | Value | |
Communication Services — 9.2% | | | | | | | | |
Alphabet, Inc. - Class A(a) | | | 800 | | | $ | 941,512 | |
Alphabet, Inc. - Class C(a) | | | 1,302 | | | | 1,527,650 | |
Baidu, Inc. - ADR(a) | | | 2,200 | | | | 362,670 | |
China Telecom Corporation Ltd. - ADR | | | 5,000 | | | | 280,050 | |
Comcast Corporation - Class A | | | 44,000 | | | | 1,759,120 | |
Tencent Holdings Ltd. - ADR | | | 7,000 | | | | 321,860 | |
| | | | | | | | 5,192,862 | |
Consumer Discretionary — 9.6% | | | | | | | | |
Alibaba Group Holding Ltd. - ADR(a) | | | 2,700 | | | | 492,615 | |
Amazon.com, Inc.(a) | | | 550 | | | | 979,412 | |
Home Depot, Inc. (The) | | | 6,500 | | | | 1,247,285 | |
Lowe's Companies, Inc. | | | 8,000 | | | | 875,760 | |
McDonald's Corporation | | | 5,000 | | | | 949,500 | |
NIKE, Inc. - Class B | | | 10,000 | | | | 842,100 | |
| | | | | | | | 5,386,672 | |
Consumer Staples — 5.1% | | | | | | | | |
Coca-Cola Company (The) | | | 12,000 | | | | 562,320 | |
McCormick & Company, Inc. | | | 7,000 | | | | 1,054,410 | |
Walmart, Inc. | | | 12,500 | | | | 1,219,125 | |
| | | | | | | | 2,835,855 | |
Energy — 4.4% | | | | | | | | |
Marathon Petroleum Corporation | | | 10,000 | | | | 598,500 | |
Pioneer Natural Resources Company | | | 7,500 | | | | 1,142,100 | |
Valero Energy Corporation | | | 8,500 | | | | 721,055 | |
| | | | | | | | 2,461,655 | |
Financials — 14.9% | | | | | | | | |
Aflac, Inc. | | | 23,130 | | | | 1,156,500 | |
BB&T Corporation | | | 7,000 | | | | 325,710 | |
Brookfield Asset Management, Inc. - Class A | | | 24,000 | | | | 1,119,600 | |
CME Group, Inc. | | | 8,500 | | | | 1,398,930 | |
Intercontinental Exchange, Inc. | | | 20,000 | | | | 1,522,800 | |
JPMorgan Chase & Company | | | 27,000 | | | | 2,733,210 | |
U.S. Bancorp | | | 2,000 | | | | 96,380 | |
| | | | | | | | 8,353,130 | |
Health Care — 10.0% | | | | | | | | |
Abbott Laboratories | | | 9,500 | | | | 759,430 | |
AbbVie, Inc. | | | 11,500 | | | | 926,785 | |
Bio-Techne Corporation | | | 9,000 | | | | 1,786,950 | |
Centene Corporation(a) | | | 7,000 | | | | 371,700 | |
Covetrus, Inc.(a) | | | 3,600 | | | | 114,660 | |
12
THE GOVERNMENT STREET EQUITY FUND
SCHEDULE OF INVESTMENTS (Continued) |
COMMON STOCKS— 95.9% (Continued) | | Shares | | | Value | |
Health Care — 10.0% (Continued) | | | | | | | | |
Henry Schein, Inc.(a) | | | 9,000 | | | $ | 540,990 | |
Pfizer, Inc. | | | 24,000 | | | | 1,019,280 | |
UnitedHealth Group, Inc. | | | 500 | | | | 123,630 | |
| | | | | | | | 5,643,425 | |
Industrials — 13.1% | | | | | | | | |
Emerson Electric Company | | | 13,000 | | | | 890,110 | |
General Dynamics Corporation | | | 5,200 | | | | 880,256 | |
Honeywell International, Inc. | | | 10,000 | | | | 1,589,200 | |
Lockheed Martin Corporation | | | 7,500 | | | | 2,251,200 | |
United Technologies Corporation | | | 13,500 | | | | 1,740,015 | |
| | | | | | | | 7,350,781 | |
Information Technology — 21.2% | | | | | | | | |
Accenture plc - Class A | | | 8,150 | | | | 1,434,563 | |
Apple, Inc. | | | 13,500 | | | | 2,564,325 | |
Mastercard, Inc. - Class A | | | 2,000 | | | | 470,900 | |
Micron Technology, Inc.(a) | | | 6,000 | | | | 247,980 | |
Microsoft Corporation | | | 11,000 | | | | 1,297,340 | |
NVIDIA Corporation | | | 8,650 | | | | 1,553,194 | |
QUALCOMM, Inc. | | | 4,000 | | | | 228,120 | |
Skyworks Solutions, Inc. | | | 6,000 | | | | 494,880 | |
TE Connectivity Ltd. | | | 9,000 | | | | 726,750 | |
Texas Instruments, Inc. | | | 10,500 | | | | 1,113,735 | |
Visa, Inc. - Class A | | | 11,200 | | | | 1,749,328 | |
| | | | | | | | 11,881,115 | |
Materials — 2.9% | | | | | | | | |
DowDuPont, Inc. | | | 11,000 | | | | 586,410 | |
Ecolab, Inc. | | | 6,000 | | | | 1,059,240 | |
| | | | | | | | 1,645,650 | |
Real Estate — 2.2% | | | | | | | | |
Mid-America Apartment Communities, Inc. | | | 11,394 | | | | 1,245,706 | |
| | | | | | | | | |
Utilities — 3.3% | | | | | | | | |
Duke Energy Corporation | | | 8,250 | | | | 742,500 | |
WEC Energy Group, Inc. | | | 14,000 | | | | 1,107,120 | |
| | | | | | | | 1,849,620 | |
| | | | | | | | | |
Total Common Stocks (Cost $26,708,923) | | | | | | $ | 53,846,471 | |
13
THE GOVERNMENT STREET EQUITY FUND
SCHEDULE OF INVESTMENTS (Continued) |
MONEY MARKET FUNDS— 4.3% | | Shares | | | Value | |
Fidelity Institutional Money Market Government Portfolio - Class I, 2.30%(b) (Cost $2,419,960) | | | 2,419,960 | | | $ | 2,419,960 | |
| | | | | | | | | |
Total Investments at Value — 100.2%(Cost $29,128,883) | | | | | | $ | 56,266,431 | |
| | | | | | | | | |
Liabilities in Excess of Other Assets — (0.2%) | | | | | | | (86,783 | ) |
| | | | | | | | | |
Net Assets — 100.0% | | | | | | $ | 56,179,648 | |
ADR - American Depositary Receipt. |
(a) | Non-income producing security. |
(b) | The rate shown is the 7-day effective yield as of March 31, 2019. |
See accompanying notes to financial statements. |
14
THE GOVERNMENT STREET MID-CAP FUND
SCHEDULE OF INVESTMENTS
March 31, 2019 |
COMMON STOCKS— 89.1% | | Shares | | | Value | |
Consumer Discretionary — 8.2% | | | | | | | | |
Cracker Barrel Old Country Store, Inc. | | | 1,500 | | | $ | 242,415 | |
Gildan Activewear, Inc. | | | 14,400 | | | | 517,968 | |
Hasbro, Inc. | | | 7,000 | | | | 595,140 | |
Leggett & Platt, Inc. | | | 7,000 | | | | 295,540 | |
Melco Resorts & Entertainment Ltd. - ADR | | | 5,000 | | | | 112,950 | |
NVR, Inc.(a) | | | 100 | | | | 276,700 | |
PulteGroup, Inc. | | | 10,000 | | | | 279,600 | |
Service Corporation International | | | 17,200 | | | | 690,580 | |
Tiffany & Company | | | 3,475 | | | | 366,786 | |
VF Corporation | | | 4,700 | | | | 408,477 | |
| | | | | | | | 3,786,156 | |
Consumer Staples — 2.2% | | | | | | | | |
Church & Dwight Company, Inc. | | | 9,000 | | | | 641,070 | |
Edgewell Personal Care Company(a) | | | 2,000 | | | | 87,780 | |
Energizer Holdings, Inc. | | | 5,000 | | | | 224,650 | |
Hain Celestial Group, Inc. (The)(a) | | | 3,000 | | | | 69,360 | |
| | | | | | | | 1,022,860 | |
Energy — 3.5% | | | | | | | | |
CNX Resources Corporation(a) | | | 2,000 | | | | 21,540 | |
Concho Resources, Inc. | | | 1,920 | | | | 213,043 | |
Diamondback Energy, Inc. | | | 966 | | | | 98,078 | |
Marathon Petroleum Corporation | | | 2,830 | | | | 169,376 | |
Oil States International, Inc.(a) | | | 9,000 | | | | 152,640 | |
ONEOK, Inc. | | | 11,000 | | | | 768,240 | |
U.S. Silica Holdings, Inc. | | | 4,000 | | | | 69,440 | |
WPX Energy, Inc.(a) | | | 10,000 | | | | 131,100 | |
| | | | | | | | 1,623,457 | |
Financials — 19.0% | | | | | | | | |
Alleghany Corporation(a) | | | 865 | | | | 529,726 | |
American Financial Group, Inc. | | | 7,600 | | | | 731,196 | |
Arthur J. Gallagher & Company | | | 9,250 | | | | 722,425 | |
Bank of Hawaii Corporation | | | 4,000 | | | | 315,480 | |
Berkley (W.R.) Corporation | | | 7,450 | | | | 631,164 | |
Brown & Brown, Inc. | | | 20,000 | | | | 590,200 | |
CME Group, Inc. | | | 5,735 | | | | 943,866 | |
Cullen/Frost Bankers, Inc. | | | 8,000 | | | | 776,560 | |
Eaton Vance Corporation | | | 13,000 | | | | 524,030 | |
Intercontinental Exchange, Inc. | | | 11,000 | | | | 837,540 | |
Nasdaq, Inc. | | | 11,000 | | | | 962,390 | |
15
THE GOVERNMENT STREET MID-CAP FUND
SCHEDULE OF INVESTMENTS (Continued) |
COMMON STOCKS — 89.1% (Continued) | | Shares | | | Value | |
Financials — 19.0% (Continued) | | | | | | | | |
Old Republic International Corporation | | | 24,400 | | | $ | 510,448 | |
SEI Investments Company | | | 10,500 | | | | 548,625 | |
Umpqua Holdings Corporation | | | 5,000 | | | | 82,500 | |
Voya Financial, Inc. | | | 1,500 | | | | 74,940 | |
| | | | | | | | 8,781,090 | |
Health Care — 14.2% | | | | | | | | |
Bio-Rad Laboratories, Inc. - Class A(a) | | | 1,700 | | | | 519,656 | |
Bio-Techne Corporation | | | 5,000 | | | | 992,750 | |
Centene Corporation(a) | | | 6,000 | | | | 318,600 | |
Charles River Laboratories International, Inc.(a) | | | 4,500 | | | | 653,625 | |
Chemed Corporation | | | 3,000 | | | | 960,210 | |
Computer Programs & Systems, Inc. | | | 2,000 | | | | 59,380 | |
Laboratory Corporation of America Holdings(a) | | | 2,574 | | | | 393,771 | |
Penumbra, Inc.(a) | | | 2,500 | | | | 367,525 | |
ResMed, Inc. | | | 6,000 | | | | 623,820 | |
Teleflex, Inc. | | | 3,950 | | | | 1,193,532 | |
Waters Corporation(a) | | | 2,000 | | | | 503,420 | |
| | | | | | | | 6,586,289 | |
Industrials — 15.2% | | | | | | | | |
AMETEK, Inc. | | | 2,350 | | | | 194,980 | |
C.H. Robinson Worldwide, Inc. | | | 4,000 | | | | 347,960 | |
Donaldson Company, Inc. | | | 13,000 | | | | 650,780 | |
Expeditors International of Washington, Inc. | | | 8,000 | | | | 607,200 | |
Fastenal Company | | | 10,000 | | | | 643,100 | |
Graco, Inc. | | | 13,000 | | | | 643,760 | |
Harris Corporation | | | 3,500 | | | | 558,985 | |
Jacobs Engineering Group, Inc. | | | 6,475 | | | | 486,855 | |
L3 Technologies, Inc. | | | 3,000 | | | | 619,110 | |
MSC Industrial Direct Company, Inc. - Class A | | | 6,000 | | | | 496,260 | |
nVent Electric plc | | | 2,900 | | | | 78,242 | |
Pentair plc | | | 2,900 | | | | 129,079 | |
Snap-on, Inc. | | | 1,475 | | | | 230,867 | |
Waste Connections, Inc. | | | 10,500 | | | | 930,195 | |
Woodward, Inc. | | | 4,150 | | | | 393,793 | |
| | | | | | | | 7,011,166 | |
Information Technology — 15.0% | | | | | | | | |
Analog Devices, Inc. | | | 3,671 | | | | 386,446 | |
ANSYS, Inc.(a) | | | 3,500 | | | | 639,485 | |
Arrow Electronics, Inc.(a) | | | 10,100 | | | | 778,306 | |
Broadridge Financial Solutions, Inc. | | | 3,500 | | | | 362,915 | |
InterDigital, Inc. | | | 1,200 | | | | 79,176 | |
16
THE GOVERNMENT STREET MID-CAP FUND
SCHEDULE OF INVESTMENTS (Continued) |
COMMON STOCKS — 89.1% (Continued) | | Shares | | | Value | |
Information Technology — 15.0% (Continued) | | | | | | | | |
Lam Research Corporation | | | 5,950 | | | $ | 1,065,110 | |
Microchip Technology, Inc. | | | 6,000 | | | | 497,760 | |
National Instruments Corporation | | | 12,000 | | | | 532,320 | |
NVIDIA Corporation | | | 5,000 | | | | 897,800 | |
Okta, Inc.(a) | | | 3,500 | | | | 289,555 | |
Tech Data Corporation(a) | | | 3,500 | | | | 358,435 | |
Versum Materials, Inc. | | | 3,000 | | | | 150,930 | |
Xilinx, Inc. | | | 7,000 | | | | 887,530 | |
| | | | | | | | 6,925,768 | |
Materials — 7.2% | | | | | | | | |
Albemarle Corporation | | | 6,700 | | | | 549,266 | |
Ashland Global Holdings, Inc. | | | 6,000 | | | | 468,780 | |
Berry Global Group, Inc.(a) | | | 5,000 | | | | 269,350 | |
Graphic Packaging Holding Company | | | 6,000 | | | | 75,780 | |
Martin Marietta Materials, Inc. | | | 3,000 | | | | 603,540 | |
Packaging Corporation of America | | | 6,000 | | | | 596,280 | |
Scotts Miracle-Gro Company (The) | | | 2,500 | | | | 196,450 | |
Steel Dynamics, Inc. | | | 12,000 | | | | 423,240 | |
Valvoline, Inc. | | | 8,236 | | | | 152,860 | |
| | | | | | | | 3,335,546 | |
Real Estate — 3.5% | | | | | | | | |
Mid-America Apartment Communities, Inc. | | | 15,000 | | | | 1,639,950 | |
| | | | | | | | | |
Utilities — 1.1% | | | | | | | | |
AmeriGas Partners, L.P. | | | 6,500 | | | | 200,655 | |
ONE Gas, Inc. | | | 3,500 | | | | 311,605 | |
| | | | | | | | 512,260 | |
| | | | | | | | | |
Total Common Stocks(Cost $19,358,929) | | | | | | $ | 41,224,542 | |
|
EXCHANGE-TRADED FUNDS — 4.6% | | Shares | | | Value | |
Invesco Zacks Mid-Cap ETF | | | 14,100 | | | $ | 960,426 | |
Vanguard Mid-Cap ETF | | | 7,350 | | | | 1,181,512 | |
Total Exchange-Traded Funds(Cost $1,007,478) | | | | | | $ | 2,141,938 | |
17
THE GOVERNMENT STREET MID-CAP FUND
SCHEDULE OF INVESTMENTS (Continued) |
MONEY MARKET FUNDS — 6.3% | | Shares | | | Value | |
Fidelity Institutional Money Market Government Portfolio - Class I, 2.30%(b) (Cost $2,924,009) | | | 2,924,009 | | | $ | 2,924,009 | |
| | | | | | | | | |
Total Investments at Value— 100.0% (Cost $23,290,416) | | | | | | $ | 46,290,489 | |
| | | | | | | | | |
Other Assets in Excess of Liabilities — 0.0%(c) | | | | | | | 2,821 | |
| | | | | | | | | |
Net Assets — 100.0% | | | | | | $ | 46,293,310 | |
ADR - American Depositary Receipt. |
(a) | Non-income producing security. |
(b) | The rate shown is the 7-day effective yield as of March 31, 2019. |
(c) | Percentage rounds to less than 0.1%. |
See accompanying notes to financial statements. |
18
THE GOVERNMENT STREET FUNDS
STATEMENTS OF ASSETS AND LIABILITIES
March 31, 2019 |
| | The
Government
Street
Equity
Fund | | | The
Government
Street
Mid-Cap
Fund | |
ASSETS | | | | | | | | |
Investments in securities: | | | | | | | | |
At cost | | $ | 29,128,883 | | | $ | 23,290,416 | |
At value (Note 2) | | $ | 56,266,431 | | | $ | 46,290,489 | |
Cash | | | 3,264 | | | | — | |
Receivable for capital shares sold | | | 737 | | | | 515 | |
Dividends receivable | | | 24,367 | | | | 37,689 | |
Other assets | | | 3,992 | | | | 3,126 | |
TOTAL ASSETS | | | 56,298,791 | | | | 46,331,819 | |
| | | | | | | | | |
LIABILITIES | | | | | | | | |
Distributions payable | | | 4,426 | | | | — | |
Payable for capital shares redeemed | | | 76,002 | | | | — | |
Accrued investment advisory fees (Note 4) | | | 28,345 | | | | 29,244 | |
Payable to administrator (Note 4) | | | 6,900 | | | | 6,000 | |
Other accrued expenses | | | 3,470 | | | | 3,265 | |
TOTAL LIABILITIES | | | 119,143 | | | | 38,509 | |
| | | | | | | | | |
NET ASSETS | | $ | 56,179,648 | | | $ | 46,293,310 | |
| | | | | | | | | |
Net assets consist of: | | | | | | | | |
Paid-in capital | | $ | 28,296,634 | | | $ | 22,349,741 | |
Accumulated earnings | | | 27,883,014 | | | | 23,943,569 | |
Net assets | | $ | 56,179,648 | | | $ | 46,293,310 | |
| | | | | | | | | |
Shares of beneficial interest outstanding (unlimited number of shares authorized, $0.01 par value) | | | 765,678 | | | | 1,728,959 | |
| | | | | | | | | |
Net asset value, offering price and redemption price per share (Note 2) | | $ | 73.37 | | | $ | 26.78 | |
See accompanying notes to financial statements. |
19
THE GOVERNMENT STREET FUNDS
STATEMENTS OF OPERATIONS
For the Year Ended March 31, 2019 |
| | The
Government
Street
Equity
Fund | | | The
Government
Street
Mid-Cap
Fund | |
INVESTMENT INCOME | | | | | | | | |
Dividends | | $ | 1,084,975 | | | $ | 827,859 | |
Foreign withholding taxes on dividends | | | (2,355 | ) | | | (2,139 | ) |
TOTAL INVESTMENT INCOME | | | 1,082,620 | | | | 825,720 | |
| | | | | | | | | |
EXPENSES | | | | | | | | |
Investment advisory fees (Note 4) | | | 359,485 | | | | 360,401 | |
Administration fees (Note 4) | | | 78,566 | | | | 66,196 | |
Professional fees | | | 22,661 | | | | 22,661 | |
Account maintenance fees | | | 17,977 | | | | 15,388 | |
Trustees' fees and expenses (Note 4) | | | 13,600 | | | | 13,600 | |
Registration and filing fees | | | 8,645 | | | | 8,432 | |
Compliance fees (Note 4) | | | 7,578 | | | | 7,310 | |
Custodian and bank service fees | | | 6,707 | | | | 5,721 | |
Printing of shareholder reports | | | 4,461 | | | | 5,161 | |
Pricing costs | | | 2,505 | | | | 2,097 | |
Postage and supplies | | | 5,377 | | | | 5,122 | |
Other expenses | | | 6,652 | | | | 6,874 | |
TOTAL EXPENSES | | | 534,214 | | | | 518,963 | |
| | | | | | | | | |
NET INVESTMENT INCOME | | | 548,406 | | | | 306,757 | |
| | | | | | | | | |
REALIZED AND UNREALIZED GAINS (LOSSES) ON INVESTMENTS | | | | | | | | |
Net realized gains from investments | | | 2,732,000 | | | | 1,398,108 | |
Net realized gains from in-kind redemptions (Note 2) | | | 2,034,125 | | | | 2,097,878 | |
Net change in unrealized appreciation (depreciation) on investments | | | (2,134,565 | ) | | | (1,849,158 | ) |
NETREALIZED AND UNREALIZED GAINS ON INVESTMENTS | | | 2,631,560 | | | | 1,646,828 | |
| | | | | | | | | |
NET INCREASE IN NET ASSETS RESULTING FROM OPERATIONS | | $ | 3,179,966 | | | $ | 1,953,585 | |
See accompanying notes to financial statements. |
20
THE GOVERNMENT STREET EQUITY FUND
STATEMENTS OF CHANGES IN NET ASSETS |
| | Year
Ended
March 31,
2019 | | | Year
Ended
March 31,
2018(a) | |
FROM OPERATIONS | | | | | | | | |
Net investment income | | $ | 548,406 | | | $ | 578,039 | |
Net realized gains (losses) from: | | | | | | | | |
Investments | | | 2,732,000 | | | | 2,435,751 | |
Foreign currency transactions | | | — | | | | (625 | ) |
Net realized gains from in-kind redemptions (Note 2) | | | 2,034,125 | | | | 3,177,769 | |
Net change in unrealized appreciation (depreciation) on investments | | | (2,134,565 | ) | | | 2,815,559 | |
Net increase in net assets resulting from operations | | | 3,179,966 | | | | 9,006,493 | |
| | | | | | | | | |
DISTRIBUTIONS TO SHAREHOLDERS (Note 2) | | | (4,266,778 | ) | | | (2,180,855 | ) |
| | | | | | | | | |
FROM CAPITAL SHARE TRANSACTIONS | | | | | | | | |
Proceeds from shares sold | | | 359,836 | | | | 365,782 | |
Net asset value of shares issued in reinvestment of distributions to shareholders | | | 4,106,733 | | | | 2,093,287 | |
Payments for shares redeemed | | | (9,906,669 | ) | | | (11,985,459 | ) |
Net decrease in net assets from capital share transactions | | | (5,440,100 | ) | | | (9,526,390 | ) |
| | | | | | | | | |
TOTAL DECREASE IN NET ASSETS | | | (6,526,912 | ) | | | (2,700,752 | ) |
| | | | | | | | | |
NET ASSETS | | | | | | | | |
Beginning of year | | | 62,706,560 | | | | 65,407,312 | |
End of year | | $ | 56,179,648 | | | $ | 62,706,560 | |
| | | | | | | | | |
CAPITAL SHARE ACTIVITY | | | | | | | | |
Shares sold | | | 4,813 | | | | 4,995 | |
Shares reinvested | | | 56,406 | | | | 29,289 | |
Shares redeemed | | | (136,134 | ) | | | (168,824 | ) |
Net decrease in shares outstanding | | | (74,915 | ) | | | (134,540 | ) |
Shares outstanding, beginning of year | | | 840,593 | | | | 975,133 | |
Shares outstanding, end of year | | | 765,678 | | | | 840,593 | |
(a) | The presentation of Distributions to Shareholders has been updated to reflect the changes prescribed in amendments to Regulation S-X, effective November 5, 2018 (Note 2). For the year ended March 31, 2018, distributions to shareholders consisted of $571,972 from net investment income and $1,608,883 from net realized capital gains on investment transactions. As of March 31, 2018, undistributed net investment income was $1,586. |
See accompanying notes to financial statements. |
21
THE GOVERNMENT STREET MID-CAP FUND
STATEMENTS OF CHANGES IN NET ASSETS |
| | Year
Ended
March 31,
2019 | | | Year
Ended
March 31,
2018(a) | |
FROM OPERATIONS | | | | | | | | |
Net investment income | | $ | 306,757 | | | $ | 380,153 | |
Net realized gains from investments | | | 1,398,108 | | | | 2,081,238 | |
Net realized gains from in-kind redemptions (Note 2) | | | 2,097,878 | | | | 1,836,225 | |
Net change in unrealized appreciation (depreciation) on investments | | | (1,849,158 | ) | | | 2,321,664 | |
Net increase in net assets resulting from operations | | | 1,953,585 | | | | 6,619,280 | |
| | | | | | | | | |
DISTRIBUTIONS TO SHAREHOLDERS (Note 2) | | | (1,714,010 | ) | | | (2,440,567 | ) |
| | | | | | | | | |
FROM CAPITAL SHARE TRANSACTIONS | | | | | | | | |
Proceeds from shares sold | | | 1,300,844 | | | | 1,717,988 | |
Net asset value of shares issued in reinvestment of distributions to shareholders | | | 1,647,714 | | | | 2,350,450 | |
Payments for shares redeemed | | | (6,953,800 | ) | | | (6,728,252 | ) |
Net decrease in net assets from capital share transactions | | | (4,005,242 | ) | | | (2,659,814 | ) |
| | | | | | | | | |
TOTAL INCREASE (DECREASE) IN NET ASSETS | | | (3,765,667 | ) | | | 1,518,899 | |
| | | | | | | | | |
NET ASSETS | | | | | | | | |
Beginning of year | | | 50,058,977 | | | | 48,540,078 | |
End of year | | $ | 46,293,310 | | | $ | 50,058,977 | |
| | | | | | | | | |
CAPITAL SHARE ACTIVITY | | | | | | | | |
Shares sold | | | 48,280 | | | | 64,603 | |
Shares reinvested | | | 63,397 | | | | 91,019 | |
Shares redeemed | | | (261,760 | ) | | | (264,296 | ) |
Net decrease in shares outstanding | | | (150,083 | ) | | | (108,674 | ) |
Shares outstanding, beginning of year | | | 1,879,042 | | | | 1,987,716 | |
Shares outstanding, end of year | | | 1,728,959 | | | | 1,879,042 | |
(a) | The presentation of Distributions to Shareholders has been updated to reflect the changes prescribed in amendments to Regulation S-X, effective November 5, 2018 (Note 2). For the year ended March 31, 2018, distributions to shareholders consisted of $374,355 from net investment income and $2,066,212 from net realized capital gains on investment transactions. As of March 31, 2018, undistributed net investment income was $77,352. |
See accompanying notes to financial statements. |
22
THE GOVERNMENT STREET EQUITY FUND
FINANCIAL HIGHLIGHTS |
Selected Per Share Data for a Share Outstanding Throughout Each Year: |
| | Years Ended March 31, | |
| | 2019 | | | 2018 | | | 2017 | | | 2016 | | | 2015 | |
Net asset value at beginning of year | | $ | 74.60 | | | $ | 67.08 | | | $ | 61.72 | | | $ | 65.95 | | | $ | 62.78 | |
| | | | | | | | | | | | | | | | | | | | | |
Income (loss) from investment operations: | | | | | | | | | | | | | | | | | | | | |
Net investment income | | | 0.69 | | | | 0.66 | | | | 0.68 | | | | 0.61 | | | | 0.67 | |
Net realized and unrealized gains (losses) on investments and foreign currencies | | | 3.37 | | | | 9.32 | | | | 6.76 | | | | (2.17 | ) | | | 6.55 | |
Total from investment operations | | | 4.06 | | | | 9.98 | | | | 7.44 | | | | (1.56 | ) | | | 7.22 | |
| | | | | | | | | | | | | | | | | | | | | |
Less distributions: | | | | | | | | | | | | | | | | | | | | |
Dividends from net investment income | | | (0.68 | ) | | | (0.65 | ) | | | (0.68 | ) | | | (0.64 | ) | | | (0.64 | ) |
Distributions from net realized gains | | | (4.61 | ) | | | (1.81 | ) | | | (1.40 | ) | | | (2.03 | ) | | | (3.41 | ) |
Total distributions | | | (5.29 | ) | | | (2.46 | ) | | | (2.08 | ) | | | (2.67 | ) | | | (4.05 | ) |
| | | | | | | | | | | | | | | | | | | | | |
Net asset value at end of year | | $ | 73.37 | | | $ | 74.60 | | | $ | 67.08 | | | $ | 61.72 | | | $ | 65.95 | |
| | | | | | | | | | | | | | | | | | | | | |
Total return(a) | | | 5.65 | % | | | 15.08 | % | | | 12.32 | % | | | (2.46 | %) | | | 11.87 | % |
| | | | | | | | | | | | | | | | | | | | | |
Net assets at end of year (000's) | | $ | 56,180 | | | $ | 62,707 | | | $ | 65,407 | | | $ | 80,307 | | | $ | 93,778 | |
| | | | | | | | | | | | | | | | | | | | | |
Ratio of total expenses to average net assets | | | 0.89 | % | | | 0.88 | % | | | 0.87 | % | | | 0.85 | % | | | 0.84 | % |
| | | | | | | | | | | | | | | | | | | | | |
Ratio of net investment income to average net assets | | | 0.92 | % | | | 0.90 | % | | | 1.03 | % | | | 0.95 | % | | | 1.02 | % |
| | | | | | | | | | | | | | | | | | | | | |
Portfolio turnover rate | | | 9 | % | | | 13 | % | | | 20 | % | | | 17 | % | | | 26 | % |
(a) | Total return is a measure of the change in value of an investment in the Fund over the periods covered, which assumes any dividends or capital gains distributions are reinvested in shares of the Fund. The returns shown do not reflect the deduction of taxes a shareholder would pay on Fund distributions or the redemption of Fund shares. |
See accompanying notes to financial statements. |
23
THE GOVERNMENT STREET MID-CAP FUND
FINANCIAL HIGHLIGHTS |
Selected Per Share Data for a Share Outstanding Throughout Each Year: |
| | Years Ended March 31, | |
| | 2019 | | | 2018 | | | 2017 | | | 2016 | | | 2015 | |
Net asset value at beginning of year | | $ | 26.64 | | | $ | 24.42 | | | $ | 21.95 | | | $ | 22.96 | | | $ | 21.68 | |
| | | | | | | | | | | | | | | | | | | | | |
Income from investment operations: | | | | | | | | | | | | | | | | | | | | |
Net investment income | | | 0.18 | | | | 0.20 | | | | 0.16 | | | | 0.10 | | | | 0.10 | |
Net realized and unrealized gains on investments | | | 0.90 | | | | 3.32 | | | | 3.36 | | | | 0.11 | | | | 2.02 | |
Total from investment operations | | | 1.08 | | | | 3.52 | | | | 3.52 | | | | 0.21 | | | | 2.12 | |
| | | | | | | | | | | | | | | | | | | | | |
Less distributions: | | | | | | | | | | | | | | | | | | | | |
Dividends from net investment income | | | (0.14 | ) | | | (0.20 | ) | | | (0.14 | ) | | | (0.10 | ) | | | (0.07 | ) |
Distributions from net realized gains | | | (0.80 | ) | | | (1.10 | ) | | | (0.91 | ) | | | (1.12 | ) | | | (0.77 | ) |
Total distributions | | | (0.94 | ) | | | (1.30 | ) | | | (1.05 | ) | | | (1.22 | ) | | | (0.84 | ) |
| | | | | | | | | | | | | | | | | | | | | |
Net asset value at end of year | | $ | 26.78 | | | $ | 26.64 | | | $ | 24.42 | | | $ | 21.95 | | | $ | 22.96 | |
| | | | | | | | | | | | | | | | | | | | | |
Total return(a) | | | 4.21 | % | | | 14.67 | % | | | 16.44 | % | | | 1.04 | % | | | 10.14 | % |
| | | | | | | | | | | | | | | | | | | | | |
Net assets at end of year (000's) | | $ | 46,293 | | | $ | 50,059 | | | $ | 48,540 | | | $ | 48,547 | | | $ | 51,898 | |
| | | | | | | | | | | | | | | | | | | | | |
Ratio of total expenses to average net assets | | | 1.08 | % | | | 1.06 | % | | | 1.07 | % | | | 1.07 | % | | | 1.05 | % |
| | | | | | | | | | | | | | | | | | | | | |
Ratio of net investment income to average net assets | | | 0.64 | % | | | 0.78 | % | | | 0.66 | % | | | 0.46 | % | | | 0.47 | % |
| | | | | | | | | | | | | | | | | | | | | |
Portfolio turnover rate | | | 6 | % | | | 12 | % | | | 14 | % | | | 20 | % | | | 16 | % |
(a) | Total return is a measure of the change in value of an investment in the Fund over the periods covered, which assumes any dividends or capital gains distributions are reinvested in shares of the Fund. The returns shown do not reflect the deduction of taxes a shareholder would pay on Fund distributions or the redemption of Fund shares. |
See accompanying notes to financial statements. |
24
THE GOVERNMENT STREET FUNDS
NOTES TO FINANCIAL STATEMENTS
March 31, 2019
1. Organization
The Government Street Equity Fund and The Government Street Mid-Cap Fund (the “Funds”) are each a diversified, no-load series of the Williamsburg Investment Trust (the “Trust”), an open-end management investment company registered under the Investment Company Act of 1940, as amended (the “1940 Act”). The Trust was organized as a Massachusetts business trust on July 18, 1988. Other series of the Trust are not included in this report.
The Government Street Equity Fund’s investment objective is to seek capital appreciation.
The Government Street Mid-Cap Fund’s investment objective is to seek capital appreciation.
2. Significant Accounting Policies
In August 2018, the U.S. Securities and Exchange Commission (the “SEC”) adopted regulations that eliminated or amended disclosure requirements that were redundant or outdated in light of changes in SEC requirements, accounting principles generally accepted in the United States of America (“GAAP”), International Financial Reporting Standards or changes in technology or the business environment. These regulations were effective November 5, 2018, and the Funds are complying with them effective with these financial statements.
Each Fund follows accounting and reporting guidance under Financial Accounting Standards Board (“FASB”) Accounting Standards Codification (“ASC”) Topic 946, “Financial Services – Investment Companies.” The following is a summary of the Funds’ significant accounting policies. The policies are in conformity with GAAP.
New accounting pronouncement — On August 28, 2018, FASB issued Accounting Standards Update No. 2018-13 (“ASU 2018-13”), “Disclosure Framework – Changes to the Disclosure Requirements for Fair Value Measurement,” which amends the fair value measurement disclosure requirements of ASC Topic 820 (“ASC 820”), “Fair Value Measurement.” ASU 2018-13 includes new, eliminated, and modified disclosure requirements for ASC 820. In addition, ASU 2018-13 clarifies that materiality is an appropriate consideration of entities when evaluating disclosure requirements. ASU 2018-13 is effective for all entities for fiscal years beginning after December 15, 2019, including interim periods therein. Early adoption is permitted and the Funds have adopted ASU 2018-13 with these financial statements.
Securities valuation — The Funds’ portfolio securities are valued as of the close of business of the regular session of the New York Stock Exchange (“NYSE”) (normally 4:00 p.m. Eastern time). Securities traded on a national stock exchange, including common stocks and exchange-traded funds (“ETFs”), are valued based upon the
25
THE GOVERNMENT STREET FUNDS
NOTES TO FINANCIAL STATEMENTS (Continued)
closing price on the principal exchange where the security is traded, if available, otherwise, at the last quoted bid price. Securities that are quoted by NASDAQ are valued at the NASDAQ Official Closing Price. Investments representing shares of other open-end investment companies, other than ETFs but including money market funds, are valued at their net asset value (“NAV”) as reported by such companies. When using a quoted price and when the market is considered active, securities will be classified as Level 1 within the fair value hierarchy (see below).
When market quotations are not readily available, if a pricing service cannot provide a price, or if the investment adviser believes the price received from the pricing service is not indicative of market value, securities will be valued in good faith at fair value using methods consistent with procedures adopted by the Board of Trustees and will be classified as Level 2 or 3 within the fair value hierarchy, depending on the inputs used. Such methods of fair valuation may include, but are not limited to: multiple of earnings, multiple of book value, discount from market of a similar freely traded security, purchase price of the security, subsequent private transactions in the security or related securities, or a combination of these and other factors.
GAAP establishes a single authoritative definition of fair value, sets out a framework for measuring fair value and requires additional disclosures about fair value measurements.
Various inputs are used in determining the value of each Fund’s investments. These inputs are summarized in the three broad levels listed below:
● | Level 1 – quoted prices in active markets for identical securities |
● | Level 2 – other significant observable inputs |
● | Level 3 – significant unobservable inputs |
The inputs or methodology used for valuing securities are not necessarily an indication of the risks associated with investing in those securities. The inputs used to measure fair value may fall into different levels of the fair value hierarchy. In such cases, for disclosure purposes, the level in the fair value hierarchy within which the fair value measurement falls in its entirety is determined based on the lowest level input that is significant to the fair value measurement.
The following is a summary of the inputs used to value each Fund’s investments as of March 31, 2019, by security type:
The Government Street Equity Fund: | | Level 1 | | | Level 2 | | | Level 3 | | | Total | |
Common Stocks | | $ | 53,846,471 | | | $ | — | | | $ | — | | | $ | 53,846,471 | |
Money Market Funds | | | 2,419,960 | | | | — | | | | — | | | | 2,419,960 | |
Total | | $ | 56,266,431 | | | $ | — | | | $ | — | | | $ | 56,266,431 | |
26
THE GOVERNMENT STREET FUNDS
NOTES TO FINANCIAL STATEMENTS (Continued)
The Government Street Mid-Cap Fund: | | Level 1 | | | Level 2 | | | Level 3 | | | Total | |
Common Stocks | | $ | 41,224,542 | | | $ | — | | | $ | — | | | $ | 41,224,542 | |
Exchange-Traded Funds | | | 2,141,938 | | | | — | | | | — | | | | 2,141,938 | |
Money Market Funds | | | 2,924,009 | | | | — | | | | — | | | | 2,924,009 | |
Total | | $ | 46,290,489 | | | $ | — | | | $ | — | | | $ | 46,290,489 | |
Refer to each Fund’s Schedule of Investments for a listing of the common stocks by sector type. As of March 31, 2019, there were no Level 3 securities or derivative instruments held by the Funds.
Foreign currency translation — Investment securities and other assets and liabilities denominated in or expected to settle in foreign currencies, if any, are translated into U.S. dollars based on exchange rates on the following basis:
A. | The fair values of investment securities and other assets and liabilities are translated as of the close of the NYSE each day. |
B. | Purchases and sales of investment securities and income and expenses are translated at the rate of exchange prevailing as of 4:00 p.m. Eastern time on the respective date of such transactions. |
C. | The Fund does not isolate that portion of the results of operations caused by changes in foreign exchange rates on investments from those caused by changes in market prices of investment securities held. Such fluctuations are included with the net realized and unrealized gains or losses on investments. |
Reported net realized foreign exchange gains or losses arise from 1) purchases and sales of foreign currencies and 2) the difference between the amounts of dividends and foreign withholding taxes recorded on a Fund’s books and the U.S. dollar equivalent of the amounts actually received or paid. Reported net unrealized foreign exchange gains and losses arise from changes in the value of assets and liabilities that result from changes in exchange rates.
Share valuation — The NAV per share of each Fund is calculated daily by dividing the total value of its assets, less liabilities, by the number of shares outstanding. The offering price and redemption price per share of each Fund is equal to the NAV per share.
Investment income — Interest income is accrued as earned. Discounts and premiums on fixed-income securities purchased, if any, are amortized using the interest method. Dividend income is recorded on the ex-dividend date. Withholding taxes on foreign dividends have been recorded in accordance with the Trust’s understanding of the applicable country’s rules and tax rates.
Distributions to shareholders — Dividends arising from net investment income are declared and paid quarterly to shareholders of The Government Street Equity Fund and declared and paid annually to shareholders of The Government Street Mid-Cap
27
THE GOVERNMENT STREET FUNDS
NOTES TO FINANCIAL STATEMENTS (Continued)
Fund. Net realized short-term capital gains, if any, may be distributed throughout the year and net realized long-term capital gains, if any, are distributed at least once each year. Dividends and distributions are recorded on the ex-dividend date. The amount of distributions from net investment income and net realized capital gains are determined in accordance with federal income tax regulations, which may differ from GAAP. These “book/tax” differences are either temporary or permanent in nature.
The tax character of distributions paid during the years ended March 31, 2019 and 2018 was as follows:
| | Years
Ended | | | Ordinary
Income | | | Long-Term
Capital
Gains | | | Total
Distributions | |
The Government Street Equity Fund | | | 03/31/19 | | | $ | 543,217 | | | $ | 3,723,561 | | | $ | 4,266,778 | |
| | | | 03/31/18 | | | $ | 678,883 | | | $ | 1,501,972 | | | $ | 2,180,855 | |
The Government Street Mid-Cap Fund | | | 03/31/19 | | | $ | 335,646 | | | $ | 1,378,364 | | | $ | 1,714,010 | |
| | | | 03/31/18 | | | $ | 374,355 | | | $ | 2,066,212 | | | $ | 2,440,567 | |
Investment transactions — Investment transactions are accounted for on trade date for financial reporting purposes. Realized gains and losses on investment securities sold are determined on a specific identification basis.
Common expenses— Common expenses of the Trust are allocated among the Funds and the other series of the Trust based on relative net assets of each series or the nature of the services performed and the relative applicability to each series.
Estimates— The preparation of financial statements in conformity with GAAP requires management to make estimates and assumptions that affect the reported amounts of assets and liabilities and the disclosure of contingent assets and liabilities as of the date of the financial statements and the reported amounts of income and expenses during the reporting period. Actual results could differ from those estimates.
Federal income tax— Each Fund has qualified and intends to continue to qualify as a regulated investment company under the Internal Revenue Code of 1986, as amended (the “Code”). Qualification generally will relieve the Funds of liability for federal income taxes to the extent 100% of their net investment income and any net realized capital gains are distributed in accordance with the Code.
In order to avoid imposition of the excise tax applicable to regulated investment companies, it is also each Fund’s intention to declare as dividends in each calendar year at least 98% of its net investment income (earned during the calendar year) and 98.2% of its net realized capital gains (earned during the twelve months ended October 31) plus undistributed amounts from prior years.
28
THE GOVERNMENT STREET FUNDS
NOTES TO FINANCIAL STATEMENTS (Continued)
The following information is computed on a tax basis for each item as of March 31, 2019:
| | The Government
Street Equity
Fund | | | The Government
Street Mid-Cap
Fund | |
Cost of portfolio investments | | $ | 29,128,883 | | | $ | 23,219,067 | |
Gross unrealized appreciation | | $ | 27,663,511 | | | $ | 23,571,602 | |
Gross unrealized depreciation | | | (525,963 | ) | | | (500,180 | ) |
Net unrealized appreciation | | | 27,137,548 | | | | 23,071,422 | |
Undistributed ordinary income | | | 11,201 | | | | 62,304 | |
Undistributed long-term gains | | | 738,691 | | | | 809,843 | |
Distributions payable | | | (4,426 | ) | | | — | |
Total accumulated earnings | | $ | 27,883,014 | | | $ | 23,943,569 | |
The difference between the federal income tax cost of portfolio investments and the financial statement cost of portfolio investments for The Government Street Mid-Cap Fund is due to certain timing differences in the recognition of capital gains or losses under income tax regulations and GAAP. These “book/tax” differences are temporary in nature and are primarily due to adjustments to basis on publicly traded partnerships.
During the year ended March 31, 2019, The Government Street Equity Fund and The Government Street Mid-Cap Fund realized $2,034,125 and $2,097,878, respectively, of net capital gains resulting from in-kind redemptions (redemptions in which shareholders who redeemed Fund shares received investment securities held by the Fund rather than cash). The Funds recognize a gain on in-kind redemptions to the extent that the value of the distributed investment securities on the date of redemption exceeds the cost of those investment securities. Such gains are not taxable to the Funds and are not required to be distributed to shareholders. The Funds have reclassified these gains against paid-in capital on the Statements of Assets and Liabilities. Such reclassifications, the result of permanent differences between the financial statement and income tax reporting requirements, had no effect on each Fund’s net assets or NAV per share.
The Funds recognize the tax benefits or expenses of uncertain tax positions only when the position is “more likely than not” to be sustained assuming examination by tax authorities. Management has reviewed the tax positions taken on federal income tax returns for all open tax years (generally, three years) of each Fund and has concluded that no provision for unrecognized tax benefits or expenses is required in these financial statements.
29
THE GOVERNMENT STREET FUNDS
NOTES TO FINANCIAL STATEMENTS (Continued)
3. Investment Transactions
Investment transactions, other than short-term investments and U.S. government securities, were as follows for the year ended March 31, 2019:
| | The Government
Street Equity
Fund | | | The Government
Street Mid-Cap
Fund | |
Purchases of investment securities | | $ | 5,089,822 | | | $ | 2,541,507 | |
Proceeds from sales of investment securities | | $ | 15,574,818 | | | $ | 9,251,447 | |
4. Transactions with Related Parties
INVESTMENT ADVISORY AGREEMENT
Each Fund’s investments are managed by Leavell Investment Management, Inc. (the “Adviser”) under the terms of an Investment Advisory Agreement. The Government Street Equity Fund pays the Adviser a fee, which is computed and accrued daily and paid monthly, at annual rates of 0.60% of its average daily net assets up to $100 million and 0.50% of such assets in excess of $100 million. The Government Street Mid-Cap Fund pays the Adviser a fee, which is computed and accrued daily and paid monthly, at an annual rate of 0.75% of its average daily net assets.
Certain officers of the Trust are also officers of the Adviser.
OTHER SERVICE PROVIDERS
Ultimus Fund Solutions, LLC (“Ultimus”) provides administration, fund accounting, compliance and transfer agent services to the Funds. The Funds pay Ultimus fees in accordance with the agreements for such services. In addition, the Funds pay out-of-pocket expenses including, but not limited to, postage, supplies, and costs of pricing the Funds’ portfolio securities. Certain officers of the Trust are also officers of Ultimus, or of Ultimus Fund Distributors, LLC (the “Distributor”), the principal underwriter of each Fund’s shares and an affiliate of Ultimus. The Distributor is compensated by the Adviser (not the Funds) for acting as principal underwriter.
COMPENSATION OF TRUSTEES
Trustees and officers affiliated with the Adviser or Ultimus are not compensated by the Trust for their services. Each Trustee who is not an affiliated person of the Adviser or Ultimus receives from the Trust an annual retainer of $20,000, payable quarterly; a fee of $2,000 for attendance at each meeting of the Board of Trustees (except that such fee is $3,000 for the independent chair); and a fee of $1,000 for attendance at each meeting of any committee of the Board (except that such fee is $1,500 for the committee chair); plus reimbursement of travel and other expenses incurred in attending meetings. Each series of the Trust pays its proportionate share of such fees.
30
THE GOVERNMENT STREET FUNDS
NOTES TO FINANCIAL STATEMENTS (Continued)
5. Contingencies and Commitments
The Funds indemnify the Trust’s officers and Trustees for certain liabilities that might arise from their performance of their duties to the Funds. Additionally, in the normal course of business the Funds enter into contracts that contain a variety of representations and warranties and which provide general indemnifications. The Funds’ maximum exposure under these arrangements is unknown, as this would involve future claims that may be made against the Funds that have not yet occurred. However, based on experience, the Trust expects the risk of loss to be remote.
6. Subsequent Events
The Funds are required to recognize in the financial statements the effects of all subsequent events that provide additional evidence about conditions that existed as of the date of the Statements of Assets and Liabilities. For non-recognized subsequent events that must be disclosed to keep the financial statements from being misleading, the Funds are required to disclose the nature of the event as well as an estimate of its financial effect, or a statement that such an estimate cannot be made. Management has evaluated subsequent events through the issuance of these financial statements and has noted no such events.
31
THE GOVERNMENT STREET FUNDS
REPORT OF INDEPENDENT REGISTERED
PUBLIC ACCOUNTING FIRM
To the Shareholders of The Government Street Funds and
Board of Trustees of Williamsburg Investment Trust
Opinion on the Financial Statements
We have audited the accompanying statements of assets and liabilities, including the schedules of investments, of The Government Street Funds, comprising The Government Street Equity Fund and The Government Street Mid-Cap Fund (the “Funds”), each a series of Williamsburg Investment Trust, as of March 31, 2019, and the related statements of operations for the year then ended, the statements of changes in net assets for each of the two years in the period then ended, including the related notes, and the financial highlights for each of the four years in the period then ended (collectively referred to as the “financial statements”). In our opinion, the financial statements present fairly, in all material respects, the financial position of the each of the Funds as of March 31, 2019, the results of their operations for the year then ended, the changes in their net assets for each of the two years in the period then ended, and the financial highlights for each of the four years in the period then ended, in conformity with accounting principles generally accepted in the United States of America.
The Funds’ financial highlights for the period ended March 31, 2015, were audited by other auditors whose report dated May 22, 2015, expressed an unqualified opinion on those financial highlights.
Basis for Opinion
These financial statements are the responsibility of the Funds’ management. Our responsibility is to express an opinion on the Funds’ financial statements based on our audits. We are a public accounting firm registered with the Public Company Accounting Oversight Board (United States) (“PCAOB”) and are required to be independent with respect to the Funds in accordance with the U.S. federal securities laws and the applicable rules and regulations of the Securities and Exchange Commission and the PCAOB.
We conducted our audits in accordance with the standards of the PCAOB. Those standards require that we plan and perform the audit to obtain reasonable assurance about whether the financial statements are free of material misstatement, whether due to error or fraud.
32
THE GOVERNMENT STREET FUNDS
REPORT OF INDEPENDENT REGISTERED
PUBLIC ACCOUNTING FIRM (Continued)
Our audits include performing procedures to assess the risks of material misstatement of the financial statements, whether due to error or fraud, and performing procedures that respond to those risks. Such procedures include examining, on a test basis, evidence regarding the amounts and disclosures in the financial statements. Our procedures included confirmation of securities owned as of March 31, 2019, by correspondence with the custodian. Our audits also included evaluating the accounting principles used and significant estimates made by management, as well as evaluating the overall presentation of the financial statements. We believe that our audits provide a reasonable basis for our opinion.
We have served as the Funds’ auditor since 2016.
COHEN & COMPANY, LTD.
Cleveland, Ohio
May 22, 2019
33
THE GOVERNMENT STREET FUNDS
ABOUT YOUR FUNDS’ EXPENSES (Unaudited)
We believe it is important for you to understand the impact of costs on your investment. All mutual funds have operating expenses. As a shareholder of the Funds, you incur ongoing costs, including management fees and other expenses. These ongoing costs, which are deducted from each Fund’s gross income, directly reduce the investment returns of the Funds.
A mutual fund’s ongoing costs are expressed as a percentage of its average net assets. This figure is known as the expense ratio. The following examples are intended to help you understand the ongoing costs (in dollars) of investing in the Funds and to compare these costs with the ongoing costs of investing in other mutual funds. The examples below are based on an investment of $1,000 made at the beginning of the period shown and held for the entire period (October 1, 2018 through March 31, 2019).
The table below illustrates each Fund’s ongoing costs in two ways:
Actual fund return – This section helps you to estimate the actual expenses that you paid over the period. The “Ending Account Value” shown is derived from each Fund’s actual return, and the fourth column shows the dollar amount of operating expenses that would have been paid by an investor who started with $1,000 in the Funds. You may use the information here, together with the amount you invested, to estimate the expenses that you paid over the period.
To do so, simply divide your account value by $1,000 (for example, an $8,600 account value divided by $1,000 = 8.6), then multiply the result by the number given for the Funds under the heading “Expenses Paid During Period.”
Hypothetical 5% return – This section is intended to help you compare the Funds’ ongoing costs with those of other mutual funds. It assumes that each Fund had an annual return of 5% before expenses during the period shown, but that the expense ratio is unchanged. In this case, because the returns used are not the Funds’ actual returns, the results do not apply to your investment. The example is useful in making comparisons because the SEC requires all mutual funds to calculate expenses based on a 5% return. You can assess each Fund’s ongoing costs by comparing this hypothetical example with the hypothetical examples that appear in shareholder reports of other funds.
Note that expenses shown in the table are meant to highlight and help you compare ongoing costs only. The Funds do not charge sales loads or redemption fees.
The calculations assume no shares were bought or sold during the period. Your actual costs may have been higher or lower, depending on the amount of your investment and the timing of any purchases or redemptions.
34
THE GOVERNMENT STREET FUNDS
ABOUT YOUR FUNDS’ EXPENSES (Unaudited) (Continued)
More information about the Funds’ expenses, including historical expense ratios, can be found in this report. For additional information on operating expenses and other shareholder costs, please refer to the Funds’ prospectus.
| | Beginning
Account Value
Oct. 1, 2018 | Ending
Account Value
March 31, 2019 | Expense
Ratio(a) | Expenses
Paid During
Period(b) |
The Government Street Equity Fund |
Based on Actual Fund Return | $1,000.00 | $ 952.90 | 0.90% | $4.38 |
Based on Hypothetical 5% Return (before expenses) | $1,000.00 | $1,020.44 | 0.90% | $4.53 |
The Government Street Mid-Cap Fund |
Based on Actual Fund Return | $1,000.00 | $ 981.70 | 1.08% | $5.34 |
Based on Hypothetical 5% Return (before expenses) | $1,000.00 | $1,019.55 | 1.08% | $5.44 |
(a) | Annualized, based on the Fund’s most recent one-half year expenses. |
(b) | Expenses are equal to the Funds’ annualized expense ratio multiplied by the average account value over the period, multiplied by 182/365 (to reflect the one-half year period). |
35
THE GOVERNMENT STREET FUNDS
BOARD OF TRUSTEES AND EXECUTIVE OFFICERS
(Unaudited)
Overall responsibility for management of the Funds rests with the Board of Trustees. The Trustees serve during the lifetime of the Trust and until its termination, or until death, resignation, retirement or removal. The Trustees, in turn, elect the officers of the Funds. The officers have been elected for an annual term. The following are the Trustees and executive officers of the Funds:
Trustees and Officers | Address | Year of
Birth | Position Held
with the Trust | Length of
Time Served |
| | Robert S. Harris, Ph.D. | 225 Pictoria Drive, Suite 450
Cincinnati, OH | 1949 | Chairman and Trustee | Since
January 2007 |
* | John P. Ackerly, IV | One James Center
901 E. Cary Street
Richmond, VA | 1963 | Trustee and President of Davenport Funds | Since
July 2012 |
* | John T. Bruce | 800 Main Street
Lynchburg, VA | 1953 | Trustee and President of FBP Funds | Since
September 1988 |
| | George K. Jennison | 225 Pictoria Drive, Suite 450
Cincinnati, OH | 1957 | Trustee | Since
January 2015 |
| Harris V. Morrissette | 225 Pictoria Drive, Suite 450
Cincinnati, OH | 1959 | Trustee | Since
March 1993 |
| | Elizabeth W. Robertson | 225 Pictoria Drive, Suite 450
Cincinnati, OH | 1953 | Trustee | Since
February 2014 |
| | Thomas W. Leavell | 210 St. Joseph Street
Mobile, AL | 1943 | President of The Government Street Funds | Since
February 2004 |
| | Mary Shannon Hope | 210 St. Joseph Street
Mobile, AL | 1963 | Vice President of The Government Street Funds | Since
August 2008 |
| | Timothy S. Healey | 2712 18th Place South
Birmingham, AL | 1953 | Vice President of The Government Street Funds | Since
January 1995 |
| Robert G. Dorsey | 225 Pictoria Drive, Suite 450
Cincinnati, OH | 1957 | Vice President | Since
November 2000 |
| Mark J. Seger | 225 Pictoria Drive, Suite 450
Cincinnati, OH | 1962 | Treasurer | Since
November 2000 |
| | David K. James | 225 Pictoria Drive, Suite 450
Cincinnati, OH | 1970 | Secretary | Since
September 2018 |
| | Simon H. Berry | 225 Pictoria Drive, Suite 450
Cincinnati, OH | 1971 | Chief Compliance Officer | Since
May 2017 |
* | Messrs. Ackerly and Bruce, as affiliated persons of investment advisers to the Trust, are “interested persons” of the Trust within the meaning of Section 2(a)(19) of the 1940 Act. |
36
THE GOVERNMENT STREET FUNDS
BOARD OF TRUSTEES AND EXECUTIVE OFFICERS
(Unaudited) (Continued)
Each Trustee oversees ten portfolios of the Trust, including the Funds. The principal occupations of the Trustees and executive officers of the Funds during the past five years and public directorships held by the Trustees are set forth below:
Robert S. Harris, Ph.D. is the C. Stewart Sheppard Professor of Business Administration at The Darden Graduate School of Business Administration at the University of Virginia. He was previously the dean at Darden. Professor Harris has published widely on corporate finance, financial markets and mergers and acquisitions and has served as a consultant to corporations and government agencies.
John P. Ackerly, IV, is Senior Vice President and Portfolio Manager of Davenport & Company, LLC (a broker-dealer and investment advisory firm).
John T. Bruce is President, Director and member of the Executive Committee of Flippin, Bruce & Porter, Inc. (an investment advisory firm).
George K. Jennison is President of Oyster Consulting, LLC (a management consulting firm). He previously was a financial adviser with Wells Fargo Advisors, LLC.
Harris V. Morrissette is President of China Doll Rice and Beans, Inc. and Dixie Lily Foods. He is also a Director of Trustmark Corporation (bank holding company).
Elizabeth W. Robertson serves as a Trustee of TowneBank Foundation, TowneBank Corporate Board, TowneBank Audit Committee Chair and TowneBank Community Board since 2015. She previously was Chief Financial Officer of Monument Restaurants LLC.
Thomas W. Leavell is Portfolio Manager of the Adviser.
Mary Shannon Hope is Operations Director and Portfolio Manager of the Adviser.
Timothy S. Healey is Chief Investment Officer and Portfolio Manager of the Adviser.
Robert G. Dorsey is a Vice Chairman of Ultimus Fund Solutions, LLC and Ultimus Fund Distributors, LLC. He previously was Co-CEO of Ultimus Fund Solutions, LLC (1999 to 2019).
Mark J. Seger is a Vice Chairman of Ultimus Fund Solutions, LLC and Ultimus Fund Distributors, LLC. He previously was Co-CEO of Ultimus Fund Solutions, LLC (1999 to 2019).
David K. James is an Executive Vice President and Chief Legal and Risk Officer of Ultimus Fund Solutions, LLC (2018 to present). He previously was Managing Director and Managing Counsel at State Street Bank and Trust Company (2009 to 2018).
37
THE GOVERNMENT STREET FUNDS
BOARD OF TRUSTEES AND EXECUTIVE OFFICERS
(Unaudited) (Continued)
Simon H. Berry is a Senior Attorney at Ultimus Fund Solutions, LLC (2016 to present). He previously was an Attorney at the Kentucky Department of Financial Institutions (2009 to 2016).
Additional information about members of the Board of Trustees and executive officers is available in the Statement of Additional Information (“SAI”). To obtain a free copy of the SAI, please call 1-866-738-1125.
38
THE GOVERNMENT STREET FUNDS
DISCLOSURE REGARDING APPROVAL OF INVESTMENT ADVISORY AGREEMENTS
(Unaudited)
At an in-person meeting held on February 26, 2019, the Board of Trustees, including a majority of the Independent Trustees, approved the continuance for a one-year period of the Investment Advisory Agreements with the Adviser on behalf of The Government Street Equity Fund and The Government Street Mid-Cap Fund (individually, a “Fund,” collectively, the “Funds”). Below is a discussion of the factors considered by the Board of Trustees along with the conclusions with respect thereto that formed the basis for the Board’s approval.
In approving the continuance of the Investment Advisory Agreements, the Independent Trustees considered all information they deemed reasonably necessary to evaluate the terms of the Agreements. The principal areas of review by the Independent Trustees were the nature, extent and quality of the services provided by the Adviser and the reasonableness of the fees charged for those services. These matters were considered by the Independent Trustees consulting with experienced counsel for the Independent Trustees, who is independent of the Adviser.
The Independent Trustees’ evaluation of the quality of the Adviser’s services took into consideration their knowledge gained through presentations and reports from the Adviser over the course of the preceding year. The Independent Trustees considered that the Adviser had provided its views on the overall conditions of the economy and the markets, including the factors that may have influenced the markets, investor preferences and market sentiment during the past year. Both short-term and long-term investment performance of the Funds were considered. Each Fund’s performance was compared to its performance benchmark, a peer group of funds with similar investment objectives and strategies, and to the Adviser’s comparably managed private accounts. The Independent Trustees also considered: the scope and quality of the in-house capabilities of the Adviser and other resources that it dedicated to performing services for the Funds; the quality of administrative and other services, including the Adviser’s role in coordinating the activities of the Funds’ other service providers; the Adviser’s compliance with investment policies of the Funds and applicable laws and regulations; information provided by management and the Funds’ independent public accounting firm in periodic meetings with the Trust’s Audit Committee; the business reputation of the Adviser; the qualifications of the Adviser’s key investment and compliance personnel; and the Adviser’s financial resources.
In reviewing the fees payable under the Investment Advisory Agreements, the Independent Trustees compared the advisory fees and overall expense levels of each Fund with those of funds with similar investment objectives and strategies. The Independent Trustees considered information provided by the Adviser concerning the Adviser’s profitability with respect to each Fund, including the assumptions and methodology used in preparing the profitability information, in light of applicable case law relating to advisory fees. For these purposes, the Independent Trustees considered
39
THE GOVERNMENT STREET FUNDS
DISCLOSURE REGARDING APPROVAL OF INVESTMENT ADVISORY AGREEMENTS
(Unaudited) (Continued)
not only the fees paid by the Funds, but also so-called “fallout” benefits to the Adviser. The Independent Trustees also considered the Adviser’s representations that the Funds’ portfolio trades were executed based on the best available price and execution, and that the Adviser does not participate in any soft dollar or directed brokerage arrangements. The Independent Trustees further considered that the Adviser does not participate in any revenue sharing arrangements relating to the Funds. In evaluating the Funds’ advisory fees, the Trustees considered the complexity and quality of the investment process that is applied in the management of the Funds.
Based upon their review of this information, the Independent Trustees concluded that: (i) during the one-, three- and five-year periods ending December 31, 2018, the performance of The Government Street Mid-Cap Fund exceeded the returns of the S&P 400 Index and the Morningstar category average for comparably managed funds; (ii) during the one-year period ending December 31, 2018 The Government Street Equity Fund placed below the returns of the S&P 500 Index and the average return for comparably managed funds; (iii) the Adviser has been effective in implementing an investment program that is based upon managing risk and has provided a collection of good services to shareholders; (iv) the investment advisory fees payable to the Adviser by each Fund are competitive with similarly managed funds, and the Independent Trustees believe the fees to be reasonable given the scope and quality of investment advisory services provided by the Adviser and other services provided to shareholders; (v) the total operating expense ratio of each Fund is less than the average expense ratio for comparably managed funds, according to statistics derived from Morningstar, Inc.; and (vi) the level of the Adviser’s profitability with respect to its management of the Funds is reasonable.
Given the current size of the Funds and their expected growth, the Independent Trustees did not believe that it was relevant to consider the extent to which economies of scale would be realized as the Funds grow, and whether fee levels reflect these economies of scale. The Independent Trustees did consider the “fallout” benefits to the Adviser with respect to the Funds but viewed this as a secondary factor in connection with the evaluation of the reasonableness of the advisory fees paid by the Funds.
No single factor was considered in isolation or to be determinative to the decision of the Independent Trustees to approve the continuance of the Investment Advisory Agreements. Rather the Independent Trustees concluded, after weighing and balancing of all factors considered, that it was in the best interests of each Fund and its shareholders to continue its Investment Advisory Agreement without modification to its terms, including the fees charged for services thereunder.
40
THE GOVERNMENT STREET FUNDS
OTHER INFORMATION (Unaudited)
A description of the policies and procedures that the Funds use to vote proxies relating to portfolio securities is available without charge upon request by calling toll-free 1-866-738-1125, or on the SEC’s website at http://www.sec.gov. Information regarding how the Funds voted proxies relating to portfolio securities during the most recent 12-month period ended June 30 is also available without charge upon request by calling toll-free 1-866-738-1125 or on the SEC’s website at http://www.sec.gov.
The Trust files a complete listing of portfolio holdings for the Funds with the SEC as of the end of the first and third quarters of each fiscal year on Form N-Q. The filings are available upon request, by calling 1-866-738-1125. Furthermore, you may obtain a copy of these filings on the SEC’s website at http://www.sec.gov.
FEDERAL TAX INFORMATION (Unaudited)
For the fiscal year ended March 31, 2019, The Government Street Equity Fund and The Government Street Mid-Cap Fund designated $3,723,561 and $1,378,364, respectively, as long-term capital gain distributions.
Qualified Dividend Income – The Funds each designates 100%, or up to the maximum amount of such dividends allowable pursuant to the Internal Revenue Code, as qualified dividend income eligible for the reduced tax rate of 15%.
Dividends Received Deduction– Corporate shareholders are generally entitled to take the dividends received deduction on the portion of a Fund’s dividend distribution that qualifies under tax law. For the fiscal year ended March 31, 2019, 100% of The Government Street Equity Fund and The Government Street Mid-Cap Fund’s ordinary income dividends qualifies for the corporate dividends received deduction.
41
The Government Street Funds
No-Load Mutual Funds
Investment Adviser
Leavell Investment Management, Inc.
210 St. Joseph Street
Mobile, AL 36602
Administrator
Ultimus Fund Solutions, LLC
P.O. Box 46707
Cincinnati, OH 45246-0707
1-866-738-1125
Legal Counsel
Sullivan & Worcester LLP
1666 K Street, N.W.
Washington, DC 20006
Independent Registered Public Accounting Firm
Cohen & Company, Ltd.
1350 Euclid Avenue
Suite 800
Cleveland, Ohio 44115
Board of Trustees
Robert S. Harris, Ph.D., Chairman
John P. Ackerly, IV
John T. Bruce
George K. Jennison
Harris V. Morrissette
Elizabeth W. Robertson
Portfolio Managers
Thomas W. Leavell,
The Government Street Equity Fund
The Government Street Mid-Cap Fund
THE
JAMESTOWN
EQUITY FUND
No-Load Fund
ANNUAL REPORT
March 31, 2019
Investment Adviser
Lowe, Brockenbrough & Company, Inc.
Richmond, Virginia
Beginning on January 1, 2021, as permitted by regulations adopted by the U.S. Securities and Exchange Commission, paper copies of the Fund’s shareholder reports like this one will no longer be sent by mail, unless you specifically request paper copies of the reports from the Fund or from your financial intermediary, such as a broker-dealer or bank. Instead, the reports will be made available on a website, and you will be notified by mail each time a report is posted and provided with a website link to access the report.
If you already elected to receive shareholder reports electronically, you will not be affected by this change and you need not take any action. You may elect to receive shareholder reports and other communications from the Fund electronically by contacting the Fund at 1-866-738-1126 or, if you own these shares through a financial intermediary, by contacting your financial intermediary.
You may elect to receive all future reports in paper free of charge. You can inform the Fund that you wish to continue receiving paper copies of your shareholder reports by contacting the Fund at 1-866-738-1126. If you own shares through a financial intermediary, you may contact your financial intermediary or follow instructions included with this document to elect to continue to receive paper copies of your shareholder reports. Your election to receive reports in paper will apply to all Funds held with the Fund complex or at your financial intermediary.
LETTER TO SHAREHOLDERS | April 24, 2019 |
The Jamestown Equity Fund
For the fiscal year ended March 31, 2019, The Jamestown Equity Fund (the “Fund”) returned 6.40% compared to 9.48% for the S&P 500 Index. Stock selection was essentially in-line during the fiscal year, while negative sector selection led to the underperformance.
The modest cash position negatively impacted returns during the year. Outside of the impact of cash, sector selection was hurt by the Fund’s underweight in the Utility sector and by being overweight in the Financial and Energy sectors. The Fund continues to invest in companies with attractive free cash flow yields, and is currently overweight the Consumer Discretionary, Energy, and Finance sectors, while underweight the Consumer Staples, Telecommunications, Healthcare, and Utilities sectors.
Security selection was essentially in-line during the fiscal year as strong selection in the Industrial, Healthcare, Energy and Communications Services sectors was offset by weaker performance in the Financial, Consumer Discretionary, Materials, and Technology sectors. The best performing stocks in the Fund for the year were Merck, Norfolk Southern, Cisco Systems, American Tower, and Thermo Fischer Scientific, all of which remained in the portfolio at the end of the fiscal year. The worst performing stocks were Invesco, Borg Warner, EBay, Eastman Chemical, and TE Connectivity. Of those, only Invesco and Eastman Chemical were still held at fiscal year-end.
Volatility returned to the equity markets during the fiscal year. After four rate hikes in 2018, equity markets around the globe stumbled in the fourth calendar quarter of 2018 as concerns about future economic and earnings growth increased. In January 2019, the Federal Reserve unexpectedly pivoted to a neutral position and projected no further rate increases this year. Equities markets recovered off the Christmas Eve low and ended the fiscal year a few percentage points below the previous high for the S&P 500. Bond yields also declined and corporate credit spreads narrowed. The 10-year note fell to 2.4% by the end of the fiscal year.
The S&P 500 trades at approximately 16.4X forward 12-month earnings compared to a longer-term average closer to 15X. The multiple does not appear excessive in the context of continued low rates and inflation, but it likely puts the burden on earnings growth (rather than multiple expansion) to drive further equity gains. The current forecast is for modest earnings growth in calendar 2019 due to tough comparisons, a stronger U.S. dollar and slower economic growth.
We have counseled that investors should expect lower prospective returns. Favorable returns can be expected when valuations are low, margins are depressed and the Fed is easing. That is simply not the environment we find ourselves in currently, and there aren’t many pundits willing to argue that point. But there is a critical time element implied that, perhaps, isn’t in big enough print: the end of this cycle could take years, not quarters, to play out. Equity markets stumble along a path roughly marked by corporate earnings growth. It’s a strong relationship, but only when viewed long-term. Quarter-to-quarter and even year-to-year, the correlation is harder to see. When looking back from, say, five years in the future, returns will likely have been more muted. Between now and then, however, there will have been a lot of sunshine and rain. That’s guaranteed. However, for sanity’s sake, keep in mind it’s a long game we’re playing.
1
THE JAMESTOWN EQUITY FUND
PERFORMANCE INFORMATION (Unaudited)
Comparison of the Change in Value of a $10,000 Investment in
The Jamestown Equity Fund
and the Standard & Poor’s 500® Index
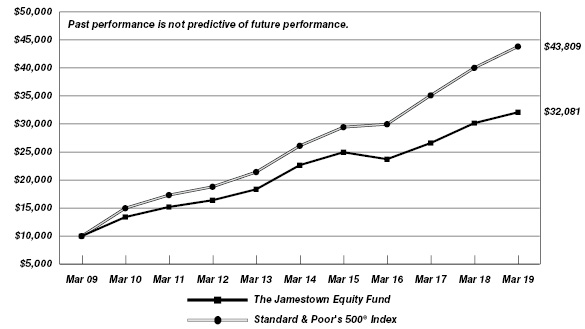
| | Average Annual Total Returns
(for periods ended March 31, 2019) | |
| | 1 Year | 5 Years | 10 Years | |
The Jamestown Equity Fund(a) | 6.40% | 7.20% | 12.36% | |
Standard & Poor’s 500® Index | 9.50% | 10.91% | 15.92% | |
(a) | Total return is a measure of the change in value of an investment in the Fund over the periods covered, which assumes any dividends or capital gains distributions are reinvested in shares of the Fund. Returns shown do not reflect the deduction of taxes a shareholder would pay on Fund distributions or the redemption of Fund shares. |
2
THE JAMESTOWN EQUITY FUND
PORTFOLIO INFORMATION
March 31, 2019 (Unaudited)
Asset Allocation (% of Net Assets)
|

|
Ten Largest Equity Holdings | % of
Net Assets |
Apple, Inc. | 3.6% |
Amazon.com, Inc. | 3.4% |
Cisco Systems, Inc. | 3.4% |
JPMorgan Chase & Company | 2.8% |
Microsoft Corporation | 2.7% |
Thermo Fisher Scientific, Inc. | 2.6% |
Norfolk Southern Corporation | 2.5% |
Discover Financial Services | 2.4% |
Ingersoll-Rand plc | 2.4% |
Chevron Corporation | 2.4% |
Sector Concentration vs. the S&P 500® Index |
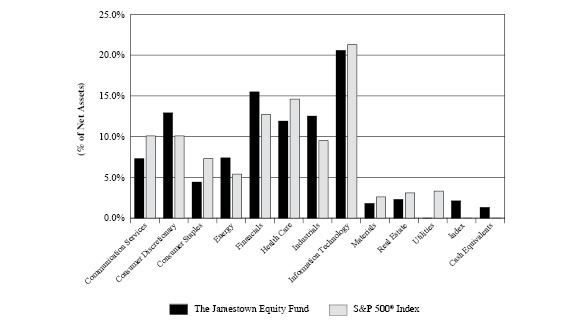
3
THE JAMESTOWN EQUITY FUND
SCHEDULE OF INVESTMENTS
March 31, 2019 |
COMMON STOCKS — 88.1% | | Shares | | | Value | |
Communication Services — 5.4% | | | | | | | | |
Alphabet, Inc. - Class A(a) | | | 500 | | | $ | 588,445 | |
Alphabet, Inc. - Class C(a) | | | 600 | | | | 703,986 | |
Comcast Corporation - Class A | | | 17,200 | | | | 687,656 | |
| | | | | | | | 1,980,087 | |
Consumer Discretionary — 12.9% | | | | | | | | |
Amazon.com, Inc.(a) | | | 700 | | | | 1,246,525 | |
Booking Holdings, Inc.(a) | | | 390 | | | | 680,515 | |
Dollar Tree, Inc.(a) | | | 6,500 | | | | 682,760 | |
Home Depot, Inc. (The) | | | 3,000 | | | | 575,670 | |
Lowe's Companies, Inc. | | | 7,800 | | | | 853,866 | |
TJX Companies, Inc. (The) | | | 13,000 | | | | 691,730 | |
| | | | | | | | 4,731,066 | |
Consumer Staples — 3.0% | | | | | | | | |
J.M. Smucker Company (The) | | | 500 | | | | 58,250 | |
PepsiCo, Inc. | | | 5,800 | | | | 710,790 | |
Walmart, Inc. | | | 3,400 | | | | 331,602 | |
| | | | | | | | 1,100,642 | |
Energy — 7.4% | | | | | | | | |
Chevron Corporation | | | 7,000 | | | | 862,260 | |
Exxon Mobil Corporation | | | 5,000 | | | | 404,000 | |
Hess Corporation | | | 12,500 | | | | 752,875 | |
Total S.A. - ADR | | | 12,200 | | | | 678,930 | |
| | | | | | | | 2,698,065 | |
Financials — 15.5% | | | | | | | | |
Ameriprise Financial, Inc. | | | 5,400 | | | | 691,740 | |
Chubb Ltd. | | | 2,700 | | | | 378,216 | |
Discover Financial Services | | | 12,200 | | | | 868,152 | |
Goldman Sachs Group, Inc. (The) | | | 2,705 | | | | 519,333 | |
Invesco Ltd. | | | 17,500 | | | | 337,925 | |
JPMorgan Chase & Company | | | 10,000 | | | | 1,012,300 | |
KeyCorp | | | 37,500 | | | | 590,625 | |
Morgan Stanley | | | 15,500 | | | | 654,100 | |
PNC Financial Services Group, Inc. (The) | | | 5,300 | | | | 650,098 | |
| | | | | | | | 5,702,489 | |
Health Care — 11.9% | | | | | | | | |
Amgen, Inc. | | | 2,200 | | | | 417,956 | |
CVS Health Corporation | | | 3,853 | | | | 207,792 | |
Gilead Sciences, Inc. | | | 8,000 | | | | 520,080 | |
Merck & Company, Inc. | | | 10,000 | | | | 831,700 | |
Pfizer, Inc. | | | 15,000 | | | | 637,050 | |
Thermo Fisher Scientific, Inc. | | | 3,500 | | | | 958,020 | |
UnitedHealth Group, Inc. | | | 3,200 | | | | 791,232 | |
| | | | | | | | 4,363,830 | |
4
THE JAMESTOWN EQUITY FUND
SCHEDULE OF INVESTMENTS (Continued) |
COMMON STOCKS — 88.1% (Continued) | | Shares | | | Value | |
Industrials — 12.5% | | | | | | | | |
Boeing Company (The) | | | 1,435 | | | $ | 547,338 | |
Delta Air Lines, Inc. | | | 14,500 | | | | 748,925 | |
Eaton Corporation plc | | | 9,200 | | | | 741,152 | |
Ingersoll-Rand plc | | | 8,000 | | | | 863,600 | |
Norfolk Southern Corporation | | | 5,000 | | | | 934,450 | |
United Technologies Corporation | | | 5,800 | | | | 747,562 | |
| | | | | | | | 4,583,027 | |
Information Technology — 15.4% | | | | | | | | |
Apple, Inc. | | | 7,000 | | | | 1,329,650 | |
Cisco Systems, Inc. | | | 23,000 | | | | 1,241,770 | |
Intel Corporation | | | 7,035 | | | | 377,780 | |
Microsoft Corporation | | | 8,500 | | | | 1,002,490 | |
Oracle Corporation | | | 12,700 | | | | 682,117 | |
QUALCOMM, Inc. | | | 6,780 | | | | 386,663 | |
Visa, Inc. - Class A | | | 4,000 | | | | 624,760 | |
| | | | | | | | 5,645,230 | |
Materials — 1.8% | | | | | | | | |
Eastman Chemical Company | | | 8,500 | | | | 644,980 | |
| | | | | | | | | |
Real Estate — 2.3% | | | | | | | | |
American Tower Corporation | | | 4,300 | | | | 847,358 | |
| | | | | | | | | |
Total Common Stocks (Cost $17,773,735) | | | | | | $ | 32,296,774 | |
|
EXCHANGE-TRADED FUNDS — 10.6% | | Shares | | | Value | |
Communication Services Select Sector SPDR® Fund | | | 14,925 | | | $ | 698,042 | |
Consumer Staples Select Sector SPDR® Fund | | | 9,250 | | | | 519,018 | |
iShares Expanded Tech-Software ETF | | | 3,485 | | | | 734,708 | |
iShares PHLX Semiconductor ETF | | | 1,885 | | | | 357,283 | |
Vanguard Information Technology ETF | | | 4,000 | | | | 802,520 | |
Vanguard S&P 500 ETF | | | 2,900 | | | | 752,666 | |
Total Exchange-Traded Funds (Cost $3,401,162) | | | | | | $ | 3,864,237 | |
5
THE JAMESTOWN EQUITY FUND
SCHEDULE OF INVESTMENTS (Continued) |
MONEY MARKET FUNDS — 1.4% | | Shares | | | Value | |
Federated Government Obligations Fund - Institutional Class, 2.29%(b) (Cost $527,601) | | | 527,601 | | | $ | 527,601 | |
| | | | | | | | | |
Total Investments at Value — 100.1%(Cost $21,702,498) | | | | | | $ | 36,688,612 | |
| | | | | | | | | |
Liabilities in Excess of Other Assets — (0.1%) | | | | | | | (30,698 | ) |
| | | | | | | | | |
Net Assets — 100.0% | | | | | | $ | 36,657,914 | |
ADR - American Depositary Receipt. |
(a) | Non-income producing security. |
(b) | The rate shown is the 7-day effective yield as of March 31, 2019. |
See accompanying notes to financial statements. |
6
THE JAMESTOWN EQUITY FUND
STATEMENT OF ASSETS AND LIABILITIES
March 31, 2019 |
ASSETS | | | | |
Investments in securities: | | | | |
At cost | | $ | 21,702,498 | |
At value (Note 2) | | $ | 36,688,612 | |
Cash | | | 4,240 | |
Receivable for capital shares sold | | | 891 | |
Dividends receivable | | | 23,707 | |
Other assets | | | 3,584 | |
TOTAL ASSETS | | | 36,721,034 | |
| | | | | |
LIABILITIES | | | | |
Distributions payable | | | 4,515 | |
Payable for capital shares redeemed | | | 30,376 | |
Accrued investment advisory fees (Note 4) | | | 19,204 | |
Payable to administrator (Note 4) | | | 6,250 | |
Other accrued expenses | | | 2,775 | |
TOTAL LIABILITIES | | | 63,120 | |
| | | | | |
NET ASSETS | | $ | 36,657,914 | |
| | | | | |
Net assets consist of: | | | | |
Paid-in capital | | $ | 20,854,208 | |
Accumulated earnings | | | 15,803,706 | |
Net assets | | $ | 36,657,914 | |
| | | | | |
Shares of beneficial interest outstanding (unlimited number of shares authorized, $0.01 par value) | | | 1,682,144 | |
| | | | | |
Net asset value, offering price and redemption price per share (Note 2) | | $ | 21.79 | |
See accompanying notes to financial statements. |
7
THE JAMESTOWN EQUITY FUND
STATEMENT OF OPERATIONS
Year Ended March 31, 2019 |
INVESTMENT INCOME | | | | |
Dividends | | $ | 763,017 | |
Foreign withholding taxes on dividends | | | (6,018 | ) |
TOTAL INVESTMENT INCOME | | | 756,999 | |
| | | | | |
EXPENSES | | | | |
Investment advisory fees (Note 4) | | | 240,248 | |
Administration fees (Note 4) | | | 60,000 | |
Professional fees | | | 22,661 | |
Trustees’ fees and expenses (Note 4) | | | 13,600 | |
Compliance service fees (Note 4) | | | 10,050 | |
Custodian and bank service fees | | | 7,093 | |
Postage and supplies | | | 6,724 | |
Printing of shareholder reports | | | 6,028 | |
Registration and filing fees | | | 5,989 | |
Account maintenance fees | | | 4,325 | |
Pricing costs | | | 1,440 | |
Insurance expense | | | 1,340 | |
Other expenses | | | 2,225 | |
TOTAL EXPENSES | | | 381,723 | |
Fees voluntarily waived by the Adviser (Note 4) | | | (21,092 | ) |
Expenses reimbursed through a directed brokerage arrangement (Note 5) | | | (9,500 | ) |
NET EXPENSES | | | 351,131 | |
| | | | | |
NET INVESTMENT INCOME | | | 405,868 | |
| | | | | |
REALIZED AND UNREALIZED GAINS ON INVESTMENTS | | | | |
Net realized gains on investment transactions | | | 1,457,217 | |
Net change in unrealized appreciation (depreciation) on investments | | | 421,385 | |
NET REALIZED AND UNREALIZED GAINS ON INVESTMENTS | | | 1,878,602 | |
| | | | | |
NET INCREASE IN NET ASSETS FROM OPERATIONS | | $ | 2,284,470 | |
See accompanying notes to financial statements. |
8
THE JAMESTOWN EQUITY FUND
STATEMENTS OF CHANGES IN NET ASSETS |
| | Year
Ended
March 31,
2019 | | | Year
Ended
March 31,
2018(a) | |
FROM OPERATIONS | | | | | | | | |
Net investment income | | $ | 405,868 | | | $ | 331,394 | |
Net realized gains on investment transactions | | | 1,457,217 | | | | 2,945,830 | |
Net change in unrealized appreciation (depreciation) on investments | | | 421,385 | | | | 1,471,878 | |
Net increase in net assets from operations | | | 2,284,470 | | | | 4,749,102 | |
| | | | | | | | | |
DISTRIBUTIONS TO SHAREHOLDERS (Note 2) | | | (2,769,053 | ) | | | (2,598,570 | ) |
| | | | | | | | | |
FROM CAPITAL SHARE TRANSACTIONS | | | | | | | | |
Proceeds from shares sold | | | 297,049 | | | | 511,589 | |
Net asset value of shares issued in reinvestment of distributions to shareholders | | | 2,603,952 | | | | 2,454,310 | |
Payments for shares redeemed | | | (3,328,402 | ) | | | (5,006,101 | ) |
Net decrease in net assets from capital share transactions | | | (427,401 | ) | | | (2,040,202 | ) |
| | | | | | | | | |
TOTAL INCREASE (DECREASE) IN NET ASSETS | | | (911,984 | ) | | | 110,330 | |
| | | | | | | | | |
NET ASSETS | | | | | | | | |
Beginning of year | | | 37,569,898 | | | | 37,459,568 | |
End of year | | $ | 36,657,914 | | | $ | 37,569,898 | |
| | | | | | | | | |
CAPITAL SHARE ACTIVITY | | | | | | | | |
Shares sold | | | 13,911 | | | | 23,196 | |
Shares reinvested | | | 122,969 | | | | 114,954 | |
Shares redeemed | | | (154,992 | ) | | | (231,056 | ) |
Net decrease in shares outstanding | | | (18,112 | ) | | | (92,906 | ) |
Shares outstanding, beginning of year | | | 1,700,256 | | | | 1,793,162 | |
Shares outstanding, end of year | | | 1,682,144 | | | | 1,700,256 | |
(a) | The presentation of Distributions to Shareholders has been updated to reflect the changes prescribed in amendments to Regulation S-X, effective November 5, 2018 (Note 2). For the year ended March 31, 2018, distributions to shareholders consisted of $332,082 from net investment income and $2,266,488 from net realized gains from investment transactions. As of March 31, 2018, undistributed net investment income was $1,137. |
See accompanying notes to financial statements. |
9
THE JAMESTOWN EQUITY FUND
FINANCIAL HIGHLIGHTS |
Selected Per Share Data and Ratios for a Share Outstanding Throughout Each Year |
| | Years Ended March 31, | |
| | 2019 | | | 2018 | | | 2017 | | | 2016 | | | 2015 | |
Net asset value at beginning of year | | $ | 22.10 | | | $ | 20.89 | | | $ | 19.57 | | | $ | 21.91 | | | $ | 22.47 | |
| | | | | | | | | | | | | | | | | | | | | |
Income (loss) from investment operations: | | | | | | | | | | | | | | | | | | | | |
Net investment income | | | 0.24 | | | | 0.19 | | | | 0.19 | | | | 0.16 | | | | 0.16 | |
Net realized and unrealized gains (losses) on investments | | | 1.10 | | | | 2.51 | | | | 2.12 | | | | (1.18 | ) | | | 1.96 | |
Total from investment operations | | | 1.34 | | | | 2.70 | | | | 2.31 | | | | (1.02 | ) | | | 2.12 | |
| | | | | | | | | | | | | | | | | | | | | |
Less distributions: | | | | | | | | | | | | | | | | | | | | |
Dividends from net investment income | | | (0.24 | ) | | | (0.19 | ) | | | (0.20 | ) | | | (0.16 | ) | | | (0.16 | ) |
Distributions from net realized gains | | | (1.41 | ) | | | (1.30 | ) | | | (0.79 | ) | | | (1.16 | ) | | | (2.52 | ) |
Total distributions | | | (1.65 | ) | | | (1.49 | ) | | | (0.99 | ) | | | (1.32 | ) | | | (2.68 | ) |
| | | | | | | | | | | | | | | | | | | | | |
Net asset value at end of year | | $ | 21.79 | | | $ | 22.10 | | | $ | 20.89 | | | $ | 19.57 | | | $ | 21.91 | |
| | | | | | | | | | | | | | | | | | | | | |
Total return(a) | | | 6.40 | % | | | 13.35 | % | | | 12.14 | % | | | (4.96 | %) | | | 10.14 | % |
| | | | | | | | | | | | | | | | | | | | | |
Net assets at end of year (000’s) | | $ | 36,658 | | | $ | 37,570 | | | $ | 37,460 | | | $ | 37,682 | | | $ | 29,596 | |
| | | | | | | | | | | | | | | | | | | | | |
Ratio of total expenses to average net assets | | | 1.03 | % | | | 1.03 | % | | | 1.03 | % | | | 1.03 | % | | | 1.09 | % |
| | | | | | | | | | | | | | | | | | | | | |
Ratio of net expenses to average net assets(b) | | | 0.95 | %(c) | | | 0.95 | %(c) | | | 0.95 | %(c) | | | 1.00 | % | | | 1.05 | % |
| | | | | | | | | | | | | | | | | | | | | |
Ratio of net investment income to average net assets(b) | | | 1.10 | %(c) | | | 0.87 | %(c) | | | 0.96 | %(c) | | | 0.82 | % | | | 0.71 | % |
| | | | | | | | | | | | | | | | | | | | | |
Portfolio turnover rate | | | 18 | % | | | 18 | % | | | 27 | % | | | 50 | % | | | 29 | % |
(a) | Total return is a measure of the change in value of an investment in the Fund over the periods covered, which assumes any dividends or realized capital gains distributions are reinvested in shares of the Fund. Returns do not reflect the deduction of taxes a shareholder would pay on Fund distributions or the redemption of Fund shares. |
(b) | Ratios were determined based on net expenses after expense reimbursements through a directed brokerage arrangement (Note 5). |
(c) | Ratio was determined after voluntary advisory fee waivers by the Adviser and reimbursed expenses (Notes 4 and 5). |
See accompanying notes to financial statements. |
10
THE JAMESTOWN EQUITY FUND
NOTES TO FINANCIAL STATEMENTS
March 31, 2019
1. Organization
The Jamestown Equity Fund (the “Fund”) is a diversified, no-load series of Williamsburg Investment Trust (the “Trust”), an open-end management investment company registered under the Investment Company Act of 1940, as amended (the “1940 Act”). The Trust was organized as a Massachusetts business trust on July 18, 1988. Other series of the Trust are not included in this report.
The Fund’s investment objective is long-term growth of capital.
2. Significant Accounting Policies
In August 2018, the U.S. Securities and Exchange Commission (the “SEC”) adopted regulations that eliminated or amended disclosure requirements that were redundant or outdated in light of changes in SEC requirements, accounting principles generally accepted in the United States of America (“GAAP”), International Financial Reporting Standards or changes in technology or the business environment. These regulations were effective November 5, 2018, and the Fund is complying with them effective with these financial statements.
The Fund follows accounting and reporting guidance under Financial Accounting Standards Board (“FASB”) Accounting Standards Codification (“ASC”) Topic 946, “Financial Services – Investment Companies.” The following is a summary of the Fund’s significant accounting policies. These policies are in conformity with GAAP.
New accounting pronouncement — On August 28, 2018, FASB issued Accounting Standards Update No. 2018-13 (“ASU 2018-13”), “Disclosure Framework – Changes to the Disclosure Requirements for Fair Value Measurement,” which amends the fair value measurement disclosure requirements of ASC Topic 820 (“ASC 820”), “Fair Value Measurement.” ASU 2018-13 includes new, eliminated, and modified disclosure requirements for ASC 820. In addition, ASU 2018-13 clarifies that materiality is an appropriate consideration of entities when evaluating disclosure requirements. ASU 2018-13 is effective for all entities for fiscal years beginning after December 15, 2019, including interim periods therein. Early adoption is permitted and the Fund has adopted ASU 2018-13 with these financial statements.
Securities valuation — The Fund’s portfolio securities are valued as of the close of business of the regular session of the New York Stock Exchange (normally 4:00 p.m., Eastern time). Securities traded on a national stock exchange, including common stocks and exchange-traded funds (“ETFs”), are generally valued based upon the closing price on the principal exchange where the security is traded, if available, otherwise, at the last quoted bid price. Securities that are quoted by NASDAQ are valued at the NASDAQ Official Closing Price. Investments representing shares of other open-end investment companies, other than ETFs but including money market funds, are valued at their net asset value (“NAV”) as reported by such companies. When using a quoted price and when the market is considered active, securities will be classified as Level 1 within the fair value hierarchy (see below).
11
THE JAMESTOWN EQUITY FUND
NOTES TO FINANCIAL STATEMENTS (Continued)
When market quotations are not readily available, if a pricing service cannot provide a price, or if the investment adviser believes the price received from the pricing service is not indicative of market value, securities will be valued in good faith at fair value using methods consistent with procedures adopted by the Board of Trustees and will be classified as Level 2 or 3 within the fair value hierarchy, depending on the inputs used. Such methods of fair valuation may include, but are not limited to: multiple of earnings, multiple of book value, discount from market of a similar freely traded security, purchase price of the security, subsequent private transactions in the security or related securities, or a combination of these and other factors.
GAAP establishes a single authoritative definition of fair value, sets out a framework for measuring fair value and requires additional disclosures about fair value measurements.
Various inputs are used in determining the value of the Fund’s investments. These inputs are summarized in the three broad levels listed below:
● | Level 1 – quoted prices in active markets for identical securities |
● | Level 2 – other significant observable inputs |
● | Level 3 – significant unobservable inputs |
The inputs or methodology used for valuing securities are not necessarily an indication of the risks associated with investing in those securities. The inputs used to measure fair value may fall into different levels of the fair value hierarchy. In such cases, for disclosure purposes, the level in the fair value hierarchy within which the fair value measurement falls in its entirety is determined based on the lowest level input that is significant to the fair value measurement.
The following is a summary of the inputs used to value the Fund’s investments as of March 31, 2019, by security type:
The Jamestown Equity Fund | | Level 1 | | | Level 2 | | | Level 3 | | | Total | |
Common Stocks | | $ | 32,296,774 | | | $ | — | | | $ | — | | | $ | 32,296,774 | |
Exchange-Traded Funds | | | 3,864,237 | | | | — | | | | — | | | | 3,864,237 | |
Money Market Funds | | | 527,601 | | | | — | | | | — | | | | 527,601 | |
Total | | $ | 36,688,612 | | | $ | — | | | $ | — | | | $ | 36,688,612 | |
Refer to the Fund’s Schedule of Investments for a listing of the common stocks by sector type. As of March 31, 2019, there were no Level 3 securities or derivative instruments held by the Fund.
Share valuation — The NAV per share of the Fund is calculated daily by dividing the total value of its assets, less liabilities, by the number of shares outstanding. The offering price and redemption price per share of the Fund is equal to the NAV per share.
Investment income — Dividend income is recorded on the ex-dividend date. Withholding taxes on foreign dividends received by the Fund, if any, have been recorded in accordance with the Trust’s understanding of the applicable country’s rules and tax rates.
12
THE JAMESTOWN EQUITY FUND
NOTES TO FINANCIAL STATEMENTS (Continued)
Distributions to shareholders — Dividends arising from net investment income, if any, are declared and paid quarterly to shareholders of the Fund. Net realized short-term capital gains, if any, may be distributed throughout the year and net realized long-term capital gains, if any, are distributed at least once each year. The amount of distributions from net investment income and net realized capital gains are determined in accordance with federal income tax regulations, which may differ from GAAP. Dividends and distributions are recorded on the ex-dividend date.
The tax character of distributions paid during the years ended March 31, 2019 and 2018 was as follows:
Year
Ended | | Ordinary
Income | | | Long-Term
Capital Gains | | | Total
Distributions | |
3/31/2019 | | $ | 415,079 | | | $ | 2,353,974 | | | $ | 2,769,053 | |
3/31/2018 | | $ | 402,813 | | | $ | 2,195,757 | | | $ | 2,598,570 | |
Investment transactions — Investment transactions are accounted for on trade date for financial reporting purposes. Realized gains and losses on investment securities sold are determined on a specific identification basis.
Common expenses— Common expenses of the Trust are allocated among the series of the Trust based on relative net assets of each series or the nature of the services performed and the relative applicability to each series.
Estimates — The preparation of financial statements in conformity with GAAP requires management to make estimates and assumptions that affect the reported amounts of assets and liabilities and the disclosure of contingent assets and liabilities as of the date of the financial statements and the reported amounts of income and expenses during the reporting period. Actual results could differ from those estimates.
Federal income tax — The Fund has qualified and intends to continue to qualify as a regulated investment company under the Internal Revenue Code of 1986, as amended (the “Code”). Qualification generally will relieve the Fund of liability for federal income taxes to the extent 100% of its net investment income and net realized capital gains are distributed in accordance with the Code.
In order to avoid imposition of the excise tax applicable to regulated investment companies, it is also the Fund’s intention to declare as dividends in each calendar year at least 98% of its net investment income (earned during the calendar year) and 98.2% of its net realized capital gains (earned during the twelve months ended October 31) plus undistributed amounts from prior years.
13
THE JAMESTOWN EQUITY FUND
NOTES TO FINANCIAL STATEMENTS (Continued)
The tax character of accumulated earnings at March 31, 2019 was as follows:
Tax cost of portfolio investments | | $ | 21,777,050 | |
Gross unrealized appreciation | | $ | 15,413,537 | |
Gross unrealized depreciation | | | (501,975 | ) |
Net unrealized appreciation | | | 14,911,562 | |
Undistributed ordinary income | | | 8,086 | |
Undistributed long-term capital gains | | | 888,573 | |
Distributions payable | | | (4,515 | ) |
Accumulated earnings | | $ | 15,803,706 | |
The difference between the federal income tax cost of portfolio investments and the financial statement cost of portfolio investments for the Fund is due to certain timing differences in the recognition of capital gains or losses under income tax regulations and GAAP. These “book/tax” differences are temporary in nature and are primarily due to the tax deferral of losses on wash sales.
The Fund recognizes the tax benefits or expenses of uncertain tax positions only when the position is “more likely than not” to be sustained assuming examination by tax authorities. Management has reviewed the tax positions taken on Federal income tax returns for all open tax years (generally, three years) of the Fund and has concluded that no provision for unrecognized tax benefits or expenses is required in these financial statements.
3. Investment Transactions
Investment transactions, other than short-term investments and U.S. government securities, were as follows for the year ended March 31, 2019:
Purchase of investment securities | | $ | 6,568,451 | |
Proceeds from sales of investment securities | | $ | 8,775,170 | |
4. Transactions with Related Parties
INVESTMENT ADVISORY AGREEMENTS
The Fund’s investments are managed by Lowe, Brockenbrough & Company, Inc. (the “Adviser”) under the terms of an Investment Advisory Agreement. The Fund pays the Adviser a fee, which is computed and accrued daily and paid monthly, at annual rates of 0.65% of its average daily net assets up to $500 million and 0.55% of such assets in excess of $500 million. Certain officers of the Trust are also officers of the Adviser.
During the year ended March 31, 2019, the Adviser voluntarily limited the total annual operating expenses of the Fund to 0.95% of average daily net assets; accordingly, the Adviser voluntarily waived $21,092 of its investment advisory fees during the year ended March 31, 2019. This amount is not subject to recapture in future periods.
14
THE JAMESTOWN EQUITY FUND
NOTES TO FINANCIAL STATEMENTS (Continued)
OTHER SERVICE PROVIDERS
Ultimus Fund Solutions, LLC (“Ultimus”) provides administration, fund accounting, compliance and transfer agent services to the Fund. The Fund pays Ultimus fees in accordance with the agreements for such services. Certain officers of the Trust are also officers of Ultimus, or of Ultimus Fund Distributors, LLC (the “Distributor”), the principal underwriter of the Fund and an affiliate of Ultimus. The Distributor is compensated by the Adviser (not the Fund) for acting as principal underwriter.
COMPENSATION OF TRUSTEES
Trustees and officers affiliated with the Adviser or Ultimus are not compensated by the Trust for their services. Each Trustee who is not an affiliated person of the Adviser or Ultimus receives from the Trust an annual retainer of $20,000, payable quarterly; a fee of $2,000 for attendance at each meeting of the Board of Trustees (except that such fee is $3,000 for the independent chair); and a fee of $1,000 for attendance at each meeting of any committee of the Board (except that such fee is $1,500 for the committee chair); plus reimbursement of travel and other expenses incurred in attending meetings. Each series of the Trust pays its proportionate share of such fees.
5. Brokerage Arrangement
In order to reduce the total operating expenses of the Fund, a portion of the Fund’s operating expenses have been paid through an arrangement with a third-party broker-dealer who is compensated through commission trades. Payment of expenses by the broker-dealer is based on a percentage of commissions earned. Expenses reimbursed through the brokerage arrangement totaled $9,500 for the year ended March 31, 2019.
6. Contingencies and Commitments
The Fund indemnifies the Trust’s officers and Trustees for certain liabilities that might arise from the performance of their duties to the Fund. Additionally, in the normal course of business the Fund enters into contracts that contain a variety of representations and warranties and which provide general indemnifications. The Fund’s maximum exposure under these arrangements is unknown, as this would involve future claims that may be made against the Fund that have not yet occurred. However, based on experience, the Trust expects the risk of loss to be remote.
15
THE JAMESTOWN EQUITY FUND
NOTES TO FINANCIAL STATEMENTS (Continued)
7. Subsequent Events
The Fund is required to recognize in the financial statements the effects of all subsequent events that provide additional evidence about conditions that existed as of the date of the Statement of Assets and Liabilities. For non-recognized subsequent events that must be disclosed to keep the financial statements from being misleading, the Fund is required to disclose the nature of the event as well as an estimate of its financial effect, or a statement that such an estimate cannot be made. Management has evaluated subsequent events through the issuance of these financial statements and has noted no such events.
16
THE JAMESTOWN EQUITY FUND
REPORT OF INDEPENDENT REGISTERED
PUBLIC ACCOUNTING FIRM
To the Shareholders of The Jamestown Equity Fund and
Board of Trustees of Williamsburg Investment Trust
Opinion on the Financial Statements
We have audited the accompanying statement of assets and liabilities, including the schedule of investments, of The Jamestown Equity Fund (the “Fund”), a series of Williamsburg Investment Trust, as of March 31, 2019, and the related statement of operations for the year then ended, the statements of changes in net assets for each of the two years in the period then ended, including the related notes, and the financial highlights for each of the four years in the period then ended (collectively referred to as the “financial statements”). In our opinion, the financial statements present fairly, in all material respects, the financial position of the Fund as of March 31, 2019, the results of its operations for the year then ended, the changes in its net assets for each of the two years in the period then ended, and the financial highlights for each of the four years in the period then ended, in conformity with accounting principles generally accepted in the United States of America.
The Fund’s financial highlights for the period ended March 31, 2015, were audited by other auditors whose report dated May 22, 2015, expressed an unqualified opinion on those financial highlights.
Basis for Opinion
These financial statements are the responsibility of the Fund’s management. Our responsibility is to express an opinion on the Fund’s financial statements based on our audits. We are a public accounting firm registered with the Public Company Accounting Oversight Board (United States) (“PCAOB”) and are required to be independent with respect to the Fund in accordance with the U.S. federal securities laws and the applicable rules and regulations of the Securities and Exchange Commission and the PCAOB.
We conducted our audits in accordance with the standards of the PCAOB. Those standards require that we plan and perform the audit to obtain reasonable assurance about whether the financial statements are free of material misstatement, whether due to error or fraud.
Our audits included performing procedures to assess the risks of material misstatement of the financial statements, whether due to error or fraud, and performing procedures that respond to those risks. Such procedures included examining, on a test basis, evidence regarding the amounts and disclosures in the financial statements. Our procedures included confirmation of securities owned as of March 31, 2019, by correspondence with the custodian. Our audits also included evaluating the accounting principles used and significant estimates made by management, as well as evaluating the overall presentation of the financial statements. We believe that our audits provide a reasonable basis for our opinion.
We have served as the Fund’s auditor since 2016.
COHEN & COMPANY, LTD.
Cleveland, Ohio
May 22, 2019
17
THE JAMESTOWN EQUITY FUND
BOARD OF TRUSTEES AND EXECUTIVE OFFICERS
(Unaudited) |
Overall responsibility for management of the Fund rests with the Board of Trustees. The Trustees serve during the lifetime of the Trust and until its termination, or until death, resignation, retirement or removal. The Trustees, in turn, elect the officers of the Fund. The officers have been elected for an annual term. The following are the Trustees and executive officers of the Fund:
| Trustees
and Officers | Address | Year of
Birth | Position Held
with the Trust | Length of
Time Served |
| Robert S. Harris, Ph.D. | 225 Pictoria Drive, Suite 450
Cincinnati, OH | 1949 | Chairman and Trustee | Since
January 2007 |
* | John P. Ackerly, IV | One James Center
901 E. Cary Street
Richmond, VA | 1963 | Trustee and President of Davenport Funds | Since
November 1997 |
* | John T. Bruce | 800 Main Street
Lynchburg, VA | 1953 | Trustee and President of FBP Funds | Since
September 1988 |
| | George K. Jennison | 225 Pictoria Drive, Suite 450
Cincinnati, OH | 1957 | Trustee | Since
January 2015 |
| Harris V. Morrissette | 225 Pictoria Drive, Suite 450
Cincinnati, OH | 1959 | Trustee | Since
March 1993 |
| | Elizabeth W. Robertson | 225 Pictoria Drive, Suite 450
Cincinnati, OH | 1953 | Trustee | Since
February 2014 |
| | Charles M. Caravati, III | 1802 Bayberry Court, Suite 400
Richmond, VA | 1965 | President, The Jamestown Funds | Since
January 1996 |
| Robert G. Dorsey | 225 Pictoria Drive, Suite 450
Cincinnati, OH | 1957 | Vice President | Since
November 2000 |
| Mark J. Seger | 225 Pictoria Drive, Suite 450
Cincinnati, OH | 1962 | Treasurer | Since
November 2000 |
| | David K. James | 225 Pictoria Drive, Suite 450
Cincinnati, OH | 1970 | Secretary | Since
September 2018 |
| | Simon H. Berry | 225 Pictoria Drive, Suite 450
Cincinnati, OH | 1971 | Chief Compliance Officer | Since
May 2017 |
* | Messrs. Ackerly and Bruce, as affiliated persons of investment advisers to the Trust, are “interested persons” of the Trust within the meaning of Section 2(a)(19) of the 1940 Act. |
18
THE JAMESTOWN EQUITY FUND
BOARD OF TRUSTEES AND EXECUTIVE OFFICERS
(Unaudited) (Continued) |
Each Trustee oversees ten portfolios of the Trust, including the Fund. The principal occupations of the Trustees and executive officers of the Funds during the past five years and public directorships held by the Trustees are set forth below:
Robert S. Harris, Ph.D. is the C. Stewart Sheppard Professor of Business Administration at The Darden Graduate School of Business Administration at the University of Virginia. He was previously the dean at Darden. Professor Harris has published widely on corporate finance, financial markets and mergers and acquisitions and has served as a consultant to corporations and government agencies.
John P. Ackerly, IV is Senior Vice President and Portfolio Manager of Davenport & Company LLC. (a broker-dealer and investment adviser)
John T. Bruce is President, Director and member of the Executive Committee of Flippin, Bruce & Porter, Inc. (an investment advisory firm).
George K. Jennison is President of Oyster Consulting, LLC (a management consulting firm). He previously was a financial adviser with Wells Fargo Advisors, LLC.
Harris V. Morrissette is President of China Doll Rice and Beans, Inc. and Dixie Lily Foods. He is also a Director of Trustmark Corporation (bank holding company).
Elizabeth W. Robertson serves as a Trustee of TowneBank Foundation, TowneBank Corporate Board, TowneBank Audit Committee Chair and TowneBank Community Board since 2015. She previously was Chief Financial Officer of Monument Restaurants LLC.
Charles M. Caravati, III is a Managing Director of the Adviser.
Robert G. Dorsey is a Vice Chairman of Ultimus Fund Solutions, LLC and Ultimus Fund Distributors, LLC. He previously was Co-CEO of Ultimus Fund Solutions, LLC (1999 to 2019).
Mark J. Seger is a Vice Chairman of Ultimus Fund Solutions, LLC and Ultimus Fund Distributors, LLC. He previously was Co-CEO of Ultimus Fund Solutions, LLC (1999 to 2019).
David K. James is an Executive Vice President and Chief Legal and Risk Officer of Ultimus Fund Solutions, LLC (2018 to present). He previously was Managing Director and Managing Counsel at State Street Bank and Trust Company (2009 to 2018).
Simon H. Berry is a Senior Attorney at Ultimus Fund Solutions, LLC (2016 to present). He previously was an Attorney at the Kentucky Department of Financial Institutions (2009 to 2016).
Additional information about members of the Board of Trustees and executive officers is available in the Statement of Additional Information (“SAI”). To obtain a free copy of the SAI, please call 1-866-738-1126.
19
THE JAMESTOWN EQUITY FUND
ABOUT YOUR FUND’S EXPENSES (Unaudited)
We believe it is important for you to understand the impact of costs on your investment. All mutual funds have operating expenses. As a shareholder of the Fund, you incur ongoing costs, including management fees and other expenses. The following examples are intended to help you understand your ongoing costs (in dollars) of investing in the Fund and to compare these costs with the ongoing costs of investing in other mutual funds.
A mutual fund’s ongoing costs are expressed as a percentage of its average net assets. This figure is known as the expense ratio. The expenses in the table below are based on an investment of $1,000 made at the beginning of the period shown and held for the entire period (October 1, 2018 through March 31, 2019).
The table below illustrates the Fund’s costs in two ways:
Actual fund return – This section helps you to estimate the actual expenses that you paid over the period. The “Ending Account Value” shown is derived from the Fund’s actual return, and the fourth column shows the dollar amount of operating expenses that would have been paid by an investor who started with $1,000 in the Fund. You may use the information here, together with the amount you invested, to estimate the expenses that you paid over the period.
To do so, simply divide your account value by $1,000 (for example, an $8,600 account value divided by $1,000 = 8.6), then multiply the result by the number given for the Fund under the heading “Expenses Paid During Period.”
Hypothetical 5% return – This section is intended to help you compare the Fund’s ongoing costs with those of other mutual funds. It assumes that the Fund had an annual return of 5% before expenses during the period shown, but that the expense ratio is unchanged. In this case, because the returns used are not the Fund’s actual returns, the results do not apply to your investment. The example is useful in making comparisons because the SEC requires all mutual funds to calculate expenses based on a 5% return. You can assess the Fund’s ongoing costs by comparing this hypothetical example with the hypothetical examples that appear in shareholder reports of other funds.
Note that expenses shown in the table are meant to highlight and help you compare ongoing costs only. The Fund does not charge sales loads or redemption fees.
The calculations assume no shares were bought or sold during the period. Your actual costs may have been higher or lower, depending on the amount of your investment and the timing of any purchases or redemptions.
More information about the Fund’s expenses, including annual expense ratios for the prior five fiscal years, can be found in this report. For additional information on operating expenses and other shareholder costs, please refer to the Fund’s prospectus.
20
THE JAMESTOWN EQUITY FUND
ABOUT YOUR FUND’S EXPENSES (Unaudited) (Continued)
| | Beginning
Account Value
October 1, 2018 | Ending
Account Value
March 31, 2019 | Net
Expense
Ratio(a) | Expenses
Paid During
Period(b) |
Based on Actual Fund Return | $1,000.00 | $ 974.40 | 0.95% | $4.68 |
Based on Hypothetical 5% Return (before expenses) | $1,000.00 | $ 1,020.19 | 0.95% | $4.78 |
(a) | Annualized, based on the Fund’s most recent one-half year expenses. |
(b) | Expenses are equal to the Fund’s annualized net expense ratio multiplied by the average account value over the period, multiplied by 182/365 (to reflect the one-half year period). |
21
THE JAMESTOWN EQUITY FUND
OTHER INFORMATION (Unaudited)
A description of the policies and procedures that the Fund uses to vote proxies relating to portfolio securities is available without charge upon request by calling toll-free 1-866-738-1126, or on the SEC’s website at http://www.sec.gov. Information regarding how the Fund voted proxies relating to portfolio securities during the most recent 12-month period ended June 30 is also available without charge upon request by calling toll-free 1-866-738-1126, or on the SEC’s website at http://www.sec.gov.
The Trust files a complete listing of portfolio holdings of the Fund with the SEC as of the end of the first and third quarters of each fiscal year on Form N-Q. The filings are available upon request, by calling 1-866-738-1126. Furthermore, you may obtain a copy of these filings on the SEC’s website at http://www.sec.gov.
FEDERAL TAX INFORMATION (Unaudited)
For the fiscal year ended March 31, 2019, the Fund designated $2,353,974 as long-term capital gain distributions.
Qualified Dividend Income — The Fund designates100% of its ordinary income distributions, or up to the maximum amount of such dividends allowable pursuant to the Internal Revenue Code, as qualified dividend income eligible for the reduced tax rate of 15%.
Dividends Received Deduction — Corporate shareholders are generally entitled to take the dividends received deduction on the portion of a Fund’s dividend distributions that qualify under tax law. For the fiscal year ended March 31, 2019,100% of the Fund’s ordinary income dividends qualifies for the corporate dividends received deduction.
22
THE JAMESTOWN EQUITY FUND
DISCLOSURE REGARDING APPROVAL OF INVESTMENT
ADVISORY AGREEMENTS (Unaudited)
At an in-person meeting held on February 26, 2019, the Board of Trustees, including a majority of the Independent Trustees, approved the continuance for a one-year period of the Investment Advisory Agreement with the Adviser on behalf of The Jamestown Equity Fund (the “Fund”). Below is a discussion of the factors considered by the Board of Trustees along with the conclusions with respect thereto that formed the basis for the Board’s approval.
In approving the continuance of the Investment Advisory Agreement, the Independent Trustees considered all information they deemed reasonably necessary to evaluate the terms of the Agreement. The principal areas of review by the Independent Trustees were the nature, extent and quality of the services provided by the Adviser and the reasonableness of the fees charged for those services. These matters were considered by the Independent Trustees consulting with experienced counsel for the Independent Trustees, who is independent of the Adviser.
The Independent Trustees’ evaluation of the quality of the Adviser’s services took into consideration their knowledge gained through presentations and reports from the Adviser over the course of the preceding year. The Independent Trustees considered that the Adviser had provided its views on the overall conditions of the economy and the markets, including the factors that may have influenced the markets, investor preferences and market sentiment during the past year. Both short-term and long-term investment performance of the Fund were considered. The Fund’s performance was compared to the performance of its benchmark, a peer group of funds with similar investment objectives and strategies, and to the Adviser’s comparably managed private accounts. The Independent Trustees also considered: the scope and quality of the in-house capabilities of the Adviser and other resources that it dedicates to performing services for the Fund; the quality of administrative and other services, including the Adviser’s role in coordinating the activities of the Fund’s other service providers; the Adviser’s compliance with investment policies of the Fund and applicable laws and regulations; information provided by management and the Fund’s independent public accounting firm in periodic meetings with the Trust’s Audit Committee; the business reputation of the Adviser; the qualifications of the Adviser’s key investment and compliance personnel; and the Adviser’s financial resources.
In reviewing the fees payable under the Investment Advisory Agreement, the Independent Trustees compared the advisory fees and overall expenses of the Fund with those of funds with similar investment objectives and strategies as well as the private accounts managed by the Adviser. The Independent Trustees considered information provided by the Adviser concerning the Adviser’s profitability with respect to the Fund, including the assumptions and methodology used in preparing the profitability information, in light of applicable case law relating to advisory fees. For these purposes, the Independent Trustees considered not only the fees paid by the Fund, but also so-called “fallout” benefits to the Adviser. The Independent Trustees also considered the Adviser’s representations that the Fund’s portfolio trades were executed based on the best available price and execution, and that the Adviser does not participate in any revenue sharing arrangements relating to the Fund. In evaluating the Fund’s advisory fees, the Trustees considered the complexity and quality of the investment process that is applied in the management of the Fund.
23
THE JAMESTOWN EQUITY FUND
DISCLOSURE REGARDING APPROVAL OF INVESTMENT
ADVISORY AGREEMENTS (Unaudited) (Continued)
Based upon their review of this information, the Independent Trustees concluded that: (i) upon consideration of the one-year and longer-term performance of the Fund, the effectiveness of the Adviser in achieving the investment objectives of the Fund, as well as the collection of services provided to shareholders, the Adviser has provided satisfactory services to the Fund; (ii) the investment advisory fees and total operating expense ratio of the Fund are competitive with comparably managed funds, according to statistics derived from Morningstar, Inc.; and (iii) the Adviser’s profitability with respect to the Fund is reasonable.
Given the current size of the Fund and its expected growth, the Independent Trustees did not believe that, it was relevant to consider the extent to which economies of scale would be realized as the Fund grows, and whether fee levels reflect these economies of scale. The Independent Trustees also considered the “fallout” benefits to the Adviser for its management of the Fund, but given the amounts involved viewed these as secondary factors in connection with the evaluation of the reasonableness of the advisory fees paid by the Fund.
No single factor was considered in isolation or to be determinative to the decision of the Independent Trustees to approve the continuance of the Investment Advisory Agreement. Rather the Independent Trustees concluded, after weighing and balancing all factors considered, that it was in the best interests of the Fund and its shareholders to continue the Investment Advisory Agreement without modification to its terms, including the fees charged for services thereunder.
24
This page intentionally left blank.
THE JAMESTOWN EQUITY FUND
www.jamestownfunds.com
Investment Adviser
Lowe, Brockenbrough & Company, Inc.
1802 Bayberry Court
Suite 400
Richmond, Virginia 23226
Administrator
Ultimus Fund Solutions, LLC
P.O. Box 46707
Cincinnati, Ohio 45246-0707
(Toll-Free) 1-866-738-1126
Independent Registered
Public Accounting Firm
Cohen & Company, Ltd.
1350 Euclid Avenue
Suite 800
Cleveland, Ohio 44115
Legal Counsel
Sullivan & Worcester LLP
1666 K Street, N.W.
Washington, DC 20006
Board of Trustees
John P. Ackerly, IV
John T. Bruce
George K. Jennison
Robert S. Harris, Ph.D.
Harris V. Morrissette
Elizabeth W. Robertson
As of the end of the period covered by this report, the registrant has adopted a code of ethics that applies to the registrant’s principal executive officer, principal financial officer, principal accounting officer or controller, or persons performing similar functions, regardless of whether these individuals are employed by the registrant or a third party. Pursuant to Item 13(a)(1), a copy of registrant’s code of ethics is filed as an exhibit to this Form N-CSR. During the period covered by this report, the code of ethics has not been amended, and the registrant has not granted any waivers, including implicit waivers, from the provisions of the code of ethics.
| Item 3. | Audit Committee Financial Expert. |
The registrant’s board of trustees has determined that the registrant has two audit committee financial experts serving on its audit committee. The names of the audit committee financial experts are Dr. Robert S. Harris and Elizabeth W. Robertson. Dr. Harris and Ms. Robertson are “independent” for purposes of this Item.
| Item 4. | Principal Accountant Fees and Services. |
| (a) | Audit Fees. The aggregate fees billed for professional services rendered by the principal accountant for the audit of the registrant’s annual financial statements or for services that are normally provided by the accountant in connection with statutory and regulatory filings or engagements were $129,500 and $151,500 with respect to the registrant’s fiscal years ended March 31, 2019 and 2018, respectively. |
| (b) | Audit-Related Fees. No fees were billed in either of the last two fiscal years for assurance and related services by the principal accountant that are reasonably related to the performance of the audit of the registrant’s financial statements and are not reported under paragraph (a) of this Item. |
| (c) | Tax Fees. The aggregate fees billed for professional services rendered by the principal accountant for tax compliance, tax advice, and tax planning were $36,000 and $36,000 with respect to the registrant’s fiscal years ended March 31, 2019 and 2018, respectively. The services comprising these fees are the preparation of the registrant’s federal income and excise tax returns. |
| (d) | All Other Fees. No fees were billed in either of the last two fiscal years for products and services provided by the principal accountant, other than the services reported in paragraphs (a) through (c) of this Item. |
| (e)(1) | The audit committee has adopted pre-approval policies and procedures described in paragraph (c)(7) of Rule 2-01 of Regulation S-X. Pursuant to the pre-approval policies and procedures, the audit committee has pre-approved certain audit, audit-related and tax services and has established, with respect to each fiscal year of the registrant, the following maximum fee levels for services covered under the pre-approval policies and procedures: |
| • | Services, relating to a new series or class of a series, associated with SEC registration statements, periodic reports and other documents filed by the registrant with the SEC or other documents issued by the registrant in connection with securities offerings and assistance in responding to SEC comment letters—$5,000 |
| • | Consultations with management of the registrant, not in connection with an audit, as to the accounting or disclosure treatment of transactions or events and/or the actual or potential impact of final or proposed rules, standards or interpretations by the SEC, FASB or other regulatory or standard setting bodies—$5,000 |
| • | All tax services provided to the registrant in the aggregate—$5,000 |
| (e)(2) | None of the services described in paragraph (b) through (d) of this Item were approved by the audit committee pursuant to paragraph (c)(7)(i)(C) of Rule 2-01 of Regulation S-X. |
| (f) | Less than 50% of hours expended on the principal accountant’s engagement to audit the registrant’s financial statements for the most recent fiscal year were attributed to work performed by persons other than the principal accountant’s full-time, permanent employees. |
| (g) | With respect to the fiscal years ended March 31, 2019 and 2018, aggregate non-audit fees of $36,000 and $36,000, respectively, were billed by the registrant’s principal accountant for services rendered to the registrant. No non-audit fees were billed in either of the last two fiscal years by the registrant’s principal accountant for services rendered to the registrant’s investment adviser (not including any sub-adviser whose role is primarily portfolio management and is subcontracted with or overseen by another investment adviser), and any entity controlling, controlled by, or under common control with the adviser that provides ongoing services to the registrant. |
| (h) | The principal accountant has not provided any non-audit services to the registrant’s investment adviser (not including any sub-adviser whose role is primarily portfolio management and is subcontracted with or overseen by another investment adviser), and any entity controlling, controlled by, or under common control with the investment adviser that provides ongoing services to the registrant. |
| Item 5. | Audit Committee of Listed Registrants. |
Not applicable
| Item 6. | Schedule of Investments. |
| (a) | Not applicable [schedule filed with Item 1] |
| Item 7. | Disclosure of Proxy Voting Policies and Procedures for Closed-End Management Investment Companies. |
Not applicable
| Item 8. | Portfolio Managers of Closed-End Management Investment Companies. |
Not applicable
| Item 9. | Purchases of Equity Securities by Closed-End Management Investment Company and Affiliated Purchasers. |
Not applicable
| Item 10. | Submission of Matters to a Vote of Security Holders. |
The registrant’s Governance, Nominating, Compensation and QLCC Committee shall review shareholder recommendations to fill vacancies on the registrant’s board of trustees if such recommendations are submitted in writing, addressed to the Committee at the registrant’s offices and meet any minimum qualifications adopted by the Committee. The Committee may adopt, by resolution, a policy regarding its procedures for considering candidates for the board of trustees, including any recommended by shareholders.
| Item 11. | Controls and Procedures. |
(a) Based on their evaluation of the registrant’s disclosure controls and procedures (as defined in Rule 30a-3(c) under the Investment Company Act of 1940) as of a date within 90 days of the filing date of this report, the registrant’s principal executive officers and principal financial officer have concluded that such disclosure controls and procedures are reasonably designed and are operating effectively to ensure that material information relating to the registrant, including its consolidated subsidiaries, is made known to them by others within those entities, particularly during the period in which this report is being prepared, and that the information required in filings on Form N-CSR is recorded, processed, summarized, and reported on a timely basis.
(b) There were no changes in the registrant’s internal control over financial reporting (as defined in Rule 30a-3(d) under the Investment Company Act of 1940) that occurred during the second fiscal quarter of the period covered by this report that have materially affected, or are reasonably likely to materially affect, the registrant’s internal control over financial reporting.
| Item 12. | Disclosure of Securities Lending Activities for Closed-End Management Investment Companies. |
Not applicable
(a)(4) Change in the registrant’s independent public accountants: Not applicable
File the exhibits listed below as part of this Form. Letter or number the exhibits in the sequence indicated.
(a)(1) Any code of ethics, or amendment thereto, that is the subject of the disclosure required by Item 2, to the extent that the registrant intends to satisfy the Item 2 requirements through filing of an exhibit: Attached hereto
(a)(2) A separate certification for each principal executive officer and principal financial officer of the registrant as required by Rule 30a-2(a) under the Act (17 CFR 270.30a-2(a)): Attached hereto
(a)(3) Any written solicitation to purchase securities under Rule 23c-1 under the Act (17 CFR 270.23c-1) sent or given during the period covered by the report by or on behalf of the registrant to 10 or more persons: Not applicable
(a)(4) Change in the registrant’s independent public accountants: Not applicable
(b) Certifications required by Rule 30a-2(b) under the Act (17 CFR 270.30a-2(b)): Attached hereto
| Exhibit 99.CODE ETH | Code of Ethics | |
| Exhibit 99.CERT | Certifications required by Rule 30a-2(a) under the Act | |
| Exhibit 99.906CERT | Certifications required by Rule 30a-2(b) under the Act | |
SIGNATURES
Pursuant to the requirements of the Securities Exchange Act of 1934 and the Investment Company Act of 1940, the registrant has duly caused this report to be signed on its behalf by the undersigned, thereunto duly authorized.
| (Registrant) | Williamsburg Investment Trust | | |
| | | | |
| By (Signature and Title)* | /s/ David James | |
| | | David James, Secretary | |
| | | | |
| Date | May 31, 2019 | | |
| | | | |
| Pursuant to the requirements of the Securities Exchange Act of 1934 and the Investment Company Act of 1940, this report has been signed below by the following persons on behalf of the registrant and in the capacities and on the dates indicated. |
| | | | |
| By (Signature and Title)* | /s/ John T. Bruce | |
| | | John T. Bruce, President | |
| | | (FBP Equity & Dividend Plus Fund and FBP Appreciation & Income Opportunities Fund) | |
| | | | |
| Date | May 31, 2019 | | |
| | | | |
| By (Signature and Title)* | /s/ Thomas W. Leavell | |
| | | Thomas W. Leavell, President | |
| | | (The Government Street Equity Fund, The Government Street Mid-Cap Fund) | |
| | | | |
| Date | May 31, 2019 | | |
| | | | |
| By (Signature and Title)* | /s/ Charles M. Caravati III | |
| | | Charles M. Caravati III, President | |
| | | (The Jamestown Equity Fund) | |
| | | | |
| Date | May 31, 2019 | | |
| | | | |
| By (Signature and Title)* | /s/ John P. Ackerly IV | |
| | | John P. Ackerly IV, President | |
| | | (The Davenport Core Fund, Davenport Value & Income Fund, Davenport Equity Opportunities Fund, Davenport Small Cap Focus Fund and the Davenport Balanced Income Fund) | |
| | | | |
| Date | May 31, 2019 | | |
| | | | |
| By (Signature and Title)* | /s/ Mark J. Seger | |
| | | Mark J. Seger, Treasurer and Principal Financial Officer | |
| | | | |
| Date | May 31, 2019 | | |
| * | Print the name and title of each signing officer under his or her signature. |
