| OMB APPROVAL |
OMB Number: 3235-0570 Expires: January 31, 2017 Estimated average burden hours per response: 20.6 |
UNITED STATES
SECURITIES AND EXCHANGE COMMISSION
Washington, D.C. 20549
FORM N-CSR
CERTIFIED SHAREHOLDER REPORT OF REGISTERED
MANAGEMENT INVESTMENT COMPANIES
| Investment Company Act file number | 811-05685 | |
| Williamsburg Investment Trust |
| (Exact name of registrant as specified in charter) |
| 225 Pictoria Drive, Suite 450 Cincinnati, Ohio | 45246 |
| (Address of principal executive offices) | (Zip code) |
W. Lee H. Dunham, Esq.
| Sullivan & Worcester LLP One Post Office Square Boston, Massachusetts 02109 |
| (Name and address of agent for service) |
| Registrant's telephone number, including area code: | (513) 587-3400 | |
| Date of fiscal year end: | March 31 | |
| | | |
| Date of reporting period: | March 31, 2016 | |
Form N-CSR is to be used by management investment companies to file reports with the Commission not later than 10 days after the transmission to stockholders of any report that is required to be transmitted to stockholders under Rule 30e-1 under the Investment Company Act of 1940 (17 CFR 270.30e-1). The Commission may use the information provided on Form N-CSR in its regulatory, disclosure review, inspection, and policymaking roles.
A registrant is required to disclose the information specified by Form N-CSR, and the Commission will make this information public. A registrant is not required to respond to the collection of information contained in Form N-CSR unless the Form displays a currently valid Office of Management and Budget ("OMB") control number. Please direct comments concerning the accuracy of the information collection burden estimate and any suggestions for reducing the burden to the Secretary, Securities and Exchange Commission, 450 Fifth Street, NW, Washington, DC 20549-0609. The OMB has reviewed this collection of information under the clearance requirements of 44 U.S.C. § 3507.
Item 1. Reports to Stockholders.
ANNUAL REPORT March 31, 2016 |
THE DAVENPORT FUNDS
LETTER TO SHAREHOLDERS | May 25, 2016 |
Dear Shareholders,
What a ride. The first quarter of 2016 started off with the sharpest January sell-off since 2009, before sharply reversing course in mid-February to finish the quarter in positive territory. All told, the S&P 500 Index fell 11.44% before rallying 13.79% to finish the quarter with a modest 1.35% gain. Investors started the year full of pessimism, worrying over a potential recession, a tightening in domestic monetary policy, and continued weakness abroad. These fears created an oversold condition with many investors underinvested or caught short, which led to a buying panic in February, fueling the strongest intra-quarter recovery in the Dow (DIJA Index) since 1933.
As we highlighted last quarter, “growth” vs. “value” remained a key theme in the markets during Q1. We witnessed a strong reversal in the performance of the two styles with Value (+0.84%) performing much better than Growth (-4.24%). Last year’s high fliers (think FANG – Facebook, Amazon, Netflix & Google (now Alphabet)) sold off sharply and market leadership rotated to more defensive sectors: utilities, telecoms and consumer staples all performed well. Also of note, many industrials and commodity-related names reversed course and helped to lead the bounce higher in the second half of the quarter. The Davenport Funds have benefitted from both of these trends, as we have put money to work in downtrodden and oversold sectors, rather than try to chase the market’s latest darlings.
With many in the marketplace viewing the current economic recovery as fragile, the obsessive focus on monetary policy continues. Overseas counterparts enacted further easing measures during the quarter (e.g. the Bank of Japan experimenting with negative interest rates on new commercial banking deposits). More importantly for U.S. equity investors, the Federal Reserve continues to react in real-time to financial markets, and just a couple months after their initial 25bp rate hike, have returned to cooing dovishly. Thus far, the easy-money messaging appears to be working (once again) for stocks.
Earnings season is upon us, and Q1 earnings are forecasted to be down by 8.5%, significantly worse than the year-over-year declines we have witnessed for the past three quarters. These negative estimate revisions certainly played a role in the selloff, but encouragingly, stocks have been able to rally in the face of further cuts to numbers, indicating the market has adequately discounted Q1’s weakness and is looking toward improvement throughout the rest of the year. Importantly for earnings, oil has bounced sharply off its lows (benefitting the energy and materials sectors), and the U.S. Dollar has backed off its highs (aiding large multinational corporations).
We remain in a dynamic, uncertain macroeconomic landscape, and this year’s presidential election certainly isn’t reassuring nervous investors. While we continue to reiterate our view that we have entered a lower-return period for stocks after the uninterrupted gains of 2009-2014, the Davenport Funds’ portfolio holdings are performing well in today’s environment, and many are thriving. The violent selloff and subsequent rally in Q1 serve as a reminder for us not to cave into emotion when things look bleak and to continue our investment course, which has served us well over time.
Please read on for a discussion of Fund themes and ideas. We thank you for your trust and look forward to reporting back to you later in the year.
1
Davenport Core Fund
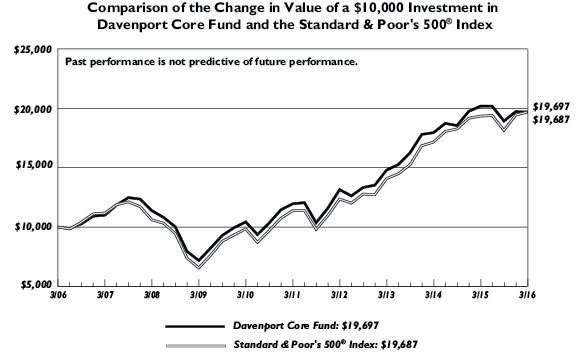
The following chart represents Davenport Core Fund (DAVPX) performance and the performance of the S&P 500 Index*, the Core Fund’s primary benchmark, for the periods ended March 31, 2016.
| Q1 2016 | 1 Year | 3 Years** | 5 Years** | 10 Years** | Since Inception** 1/15/98 | Fiscal Year 2016 Expense Ratio |
Core Fund | -0.08% | -2.39% | 10.01% | 10.49% | 7.01% | 6.05% | 0.92% |
S&P 500 Index* | 1.35% | 1.78% | 11.82% | 11.58% | 7.01% | 6.30% | — |
30-Day SEC Yield: 0.87%; Expense Ratio in current prospectus: 0.93%.
Past performance is no guarantee of future results. Investment return and principal value of an investment will fluctuate so that an investor’s shares, when redeemed, may be worth more or less than their original cost. Current performance may be lower or higher than the performance data quoted. Performance data, current to the most recent month end, may be obtained by calling 1-800-281-3217.
* | The S&P 500 Index is comprised of 500 U.S. stocks and is an indicator of the performance of the overall U.S. stock market. An investor cannot invest in an index and its returns are not indicative of the performance of any specific investment. |
After five years of strong returns for both the market and the Core Fund, returns took a breather in fiscal year 2016, with the Core Fund down 2.39% and the S&P 500 Index up 1.78%. As noted in last year’s letter, we had begun to implement slightly more contrarian moves in the portfolio, as the market’s “haves” (especially momentum-oriented companies with high growth) became increasingly popular. We chose to remain steadfast in our search for high quality businesses at reasonable valuations, and missed out on some of the impressive returns of the market’s high fliers, causing the portfolio to lag. Nevertheless, we remind investors of the usual consequences when the market gets overenthusiastic; already, some of the hot stocks of 2015 have started to crack. We remain confident that the portfolio’s positioning remains prudent.
On the plus side, our financial stocks performed much better than the index, and our underweight positioning in the energy sector paid off while oil prices cratered. Within financials, Brookfield Asset Management (BAM), American Tower (AMT), CME Group (CME) and Markel (MKL) all had strong years. Technology was another bright spot with Amazon (AMZN), Accenture (ACN) and Alphabet, the company formerly known as Google (GOOG), all having great years.
We spent the year with an underweight position in the energy sector, and we concentrated our holdings on market-leading companies with strong balance sheets, such as ExxonMobil (XOM), Chevron (CVX) and Schlumberger (SLB). This defensive positioning aided performance in what was a tough year for oil producers. Going forward, we are incrementally more positive on the direction for oil prices as the market rebalances, and in mid-March added Marathon Petroleum (MPC) to the portfolio (discussed briefly below), bringing us to an overweight stance in the sector for the first time in several years.
2
While we don’t fashion ourselves strictly as “value” investors, we are always looking to pay reasonable prices for our investments. Our additions to the portfolio in the most recent quarter are evidence of this valuation-centric lens. To wit, we added to out-of-favor names that had fallen to attractive valuation levels in the financial sector: Capital One Financial (COF) and Wells Fargo (WFC). We also added to industrial blue chip Praxair (PX) at an attractive price. Finally, we purchased domestic oil & gas transporter and refiner MPC after it fell nearly 50% in just three months, pressured by short term concerns. Although a crude measure of value, we note that on average these four stocks traded at a 12.5x price / 2016 earnings ratio at quarter-end, well below the S&P 500’s 17.1x.
In sum, it was a challenging fiscal year after several years of uninterrupted gains. Similar to our last update, we stayed true to our convictions and continued to focus on paying reasonable valuations for high quality businesses. Some of the trends that caused us to underperform in the prior year have started to reverse, with some of 2015’s favorites underperforming in 2016 and meaningful rallies in downtrodden sectors such as materials, industrials and energy. We like the portfolio’s positioning going into fiscal year 2017 and view the risk-reward of the portfolio as attractive.
The following are transactions performed in the Core Fund for the quarter ended March 31, 2016.
Recent Purchases
Adobe Systems Inc (ADBE) Due to a rapidly growing recurring cash flow stream, 20% top line growth rate and outstanding incremental margins, we initiated a position in this leading software provider.
Adobe Systems Inc (ADBE) Following a strong Q1 with impressive top line revenue growth, margin expansion and increased full year guidance, we chose to add to our position.
Capital One Financial Corp (COF) Concerns over recent increases in expense growth and provisioning rates weighed on the shares, allowing us to add to this name which we believe carries one of the more attractive risk/reward profiles within the financial sector.
Marathon Petroleum Corp. (MPC) With the stock down a third from its highs in early December 2015, we felt company specific concerns were adequately discounted into the shares of this high quality refiner (4th largest in the nation) and we therefore initiated a position.
Oracle Corp. (ORCL) We initiated a position in this leading integrated technology (hardware and software) provider, encouraged by its wide business moat and room for multiple expansion, given its recent shift from a license model to a revenue model.
Praxair, Inc. (PX) Due to broad weakness across the industrial sector and emerging markets, PX shares fell to a four year low, prompting us to add to this high quality industrial with an ‘A’ rated balance sheet and 2.9% dividend yield.
PVH Corp. (PVH) We added to our holdings in this high quality operator as currency headwinds and weather disruptions weighed on the shares; both factors we view as short term in nature, masking a longer term growth story.
Wells Fargo & Co. (WFC) We took advantage of recent weakness and added to our position as fears around negative interest rates, economic growth expectations and exposure to the energy sector weighed on shares.
3
Recent Sales
Amazon.com, Inc. (AMZN) While we remain impressed by the company’s execution and widening business moat, we chose to take some profits and reduce our holding to a more normal weighting amid such universally positive sentiment (shares were up 117% in 2015).
Cisco Systems, Inc. (CSCO) While we remain attracted to the valuation and dividend yield (stock still owned by Davenport Value & Income Fund), we opted to sell the position amid lower expectations for enterprise I.T. spending and intensifying competitive threats to the core networking hardware business. We will look to direct proceeds toward names with a faster growth outlook.
Dish Network Corp. (DISH) As the timing and execution of spectrum monetization became less clear, we elected to sell our position and allocate proceeds into other names with more favorable risk/reward profiles.
Express Scripts Holding Co. (ESRX) While ESRX has been a solid performer since our initial purchase in 2013, we elected to sell the name and lock in gains due to concerns over generic drug price re-negotiations with their largest customer.
Parker Hannifin (PH) Given the stock’s rapid rally from lows experienced earlier in the year, we opted to sell this position as we have recently grown less confident in the company’s key end markets.
Starbucks Corp. (SBUX) While we remain impressed with the company’s execution, shares have performed well and experienced a sizable multiple rerating since our initial purchase and we therefore opted to reduce our position slightly.
Davenport Equity Opportunities Fund
The following chart represents Davenport Equity Opportunities Fund (DEOPX) performance and the performance of the Russell Midcap Index, the Fund’s primary benchmark, and the S&P 500 Index for the periods ended March 31, 2016.
| Q1 2016 | 1 Year | 3 Years** | 5 Years** | Since Inception** 12/31/2010 | Fiscal
Year 2016 Expense Ratio |
Equity Opportunities Fund | 4.32% | -7.07% | 9.64% | 11.89% | 12.78% | 0.93% |
Russell Midcap Index* | 2.24% | -4.04% | 10.45% | 10.30% | 11.34% | — |
S&P 500 Index* | 1.35% | 1.78% | 11.82% | 11.58% | 12.23% | — |
30-Day SEC Yield: 0.87%; Expense Ratio in current prospectus: 1.02%.
Past performance is no guarantee of future results. Investment return and principal value of an investment will fluctuate so that an investor’s shares, when redeemed, may be worth more or less than their original cost. Current performance may be lower or higher than the performance data quoted. Performance data, current to the most recent month end, may be obtained by calling 1-800-281-3217.
* | The Russell Midcap Index measures the performance of the 800 smallest companies in the Russell 1000, which represent approximately 25% of the total market capitalization of the Russell 1000. The S&P 500 Index is comprised of 500 U.S. stocks and is an indicator of the performance of the overall U.S. stock market. An investor cannot invest in an index and its returns are not indicative of the performance of any specific investment. |
4
Despite a solid close to the year, fiscal year 2016 was a challenging period for the Equity Opportunities Fund (DEOPX). For the full year, it returned -7.07% as compared to -4.04% and 1.78% for the Russell Midcap Index and S&P 500 Index, respectively. While the Fund fared well in the first and fourth quarters, it struggled during quarters two and three as a handful of key holdings posted meaningful declines and the broader market’s advance became confined to a shrinking handful of stocks.
We have recently witnessed a reversal of many 2015 trends. During the second half of calendar 2015, we struggled as investors became infatuated with a small subset of momentum-oriented growth stocks and shunned almost everything else. As such, it didn’t pay to zig when others were zagging as the gap between the markets haves and have-nots only widened. We suspected this trend would reverse course and are glad we stuck to our guns. During Q4, the performance of formerly “hot” stocks waned as investors finally gravitated to more depressed names.
Colfax (CFX) and Genesee & Wyoming (GWR) were among our biggest detractors for the full year; however, each reversed course as the year came to a close. We believe these well run companies were overly punished alongside the broad meltdown in commodity prices. While each has ties to commodities, they are well run businesses and their prices at year-end failed to reflect their long-term earnings power. Fortunately, the stocks recovered nicely in Q4 as investor sensed headwinds were more than adequately discounted. CFX was particularly strong with a 22% gain. We added to our position in this name in January and, while it has bounced sharply, we continue to think it’s reasonably valued.
Gaming & Leisure Properties (GLPI) also recovered impressively with a 14% gain in Q4. This casino REIT, which owns the land and buildings of casinos and charges rent to the operator, had been trading at a sharp discount to the broader REIT universe. Part of this discount may have also been associated with the company’s need to issue equity to fund its purchase of Pinnacle Entertainment’s (PNK) real estate. With this behind us, investors should focus on the merits of the deal including a more diversified tenant base, enhanced scale and a higher dividend. The stock continues to yield over 7% and has meaningful runway for growth via acquisitions. Furthermore, CEO Peter Carlino is a savvy value creator and very much an owner-operator (he and his family own nearly 10% of the company).
We increased a few positions recently. Among these were Fidelity National (FNF) and Live Nation (LYV). FNF, along with other title insurers, has struggled as slowing refinancing transactions and regulatory compliance costs have pressured near term results. We think this creates an attractive price to add to our position in the nation’s leading title insurer. After backing out FNF’s stake in the mortgage servicer Black Knight Financial Services (BKFS), FNF is trading at just less than 11x P/E multiple on its core title insurance business. We think this is too cheap for the highest margin title insurer, especially given the company’s solid dividend (2.6% yield), share buyback and considering the supportive housing market backdrop. In the case of LYV, the stock has languished despite solid results and prospects for ongoing double digit cash flow growth. Last year, we highlighted the company’s dominance in the concert business and ability to use such dominance to drive ticketing and advertising revenue. Since then, we have also grown incrementally excited about its ability to drive customer spending inside live events and view this as another source of upside. TripAdvisor (TRIP), which is a newer position, has been a laggard of late. The shares declined alongside fears that efforts to transition to more of a trip booking platform (i.e. more of a transaction than advertising model) would create short-term earnings disruption. While we recognize this risk, we underestimated the extent to which investors would
5
harp on it. We remain confident this transition will drive higher visitation to the site and solidify TRIP as a one-stop shop for both researching and booking travel. We also think the company has room for significant margin expansion as growth in marketing spend abates and new verticals (restaurants, attractions and vacation rentals) gain footing.
In sum, we were pleased to see some of the year’s weaker performers show much improved results in recent periods. Given our focus on opportunistic entry points and reasonable valuations, the current market environment favors us more than the “narrow”, momentum-fueled environment that characterized much of the year. While recent performance has improved, we continue to feel our Fund’s overall timeliness is very appealing given the attractive risk/reward profiles of our top holdings.
The following are transactions performed in the Equity Opportunities Fund for the quarter ended March 31, 2016.
Recent Purchases
Colfax Corp. (CFX) We added to our holdings as industrial sector and oil price weakness continued to pressure shares. While end-market headwinds remain, the margin profile of the business continues to improve, leaving the company well positioned for a rebound in global growth and increasingly attractive from a risk/reward standpoint.
Fidelity National Financial, Inc. (FNF) We elected to add to our position in this high-margin title insurer as shares softened alongside concerns over reduced activity in the refinance and commercial origination businesses.
Live Nation Entertainment, Inc. (LYV) With recent weakness in the broader equity markets weighing on shares (down ~35% from recent highs), we chose to add to this high quality operator, which possesses a variety of long term growth drivers, significant operating leverage and has shown savvy capital allocation practices over time. While continuing to believe LYV is in the early stages of a secular growth story, we chose to add again to this dominant concert operator during the month, following solid Q4 results and an incrementally positive outlook for 2016.
TripAdvisor, Inc. (TRIP) Impressed by company fundamentals, we chose to add to our holdings as broad market weakness led trading in the shares to levels not seen since the company’s announcement of its transformational deal with Priceline (PCLN).
WABCO Holdings, Inc. (WBC) Up modestly from our initial purchase, we chose to add to this industry leader on weakness given its solid growth outlook, strong balance sheet and commendable history of capital allocation over time.
Recent Sales
Amazon.com, Inc. (AMZN) While still attracted to the company’s strong competitive positioning and future growth prospects, we initially trimmed our position before selling the entire position given its significant appreciation over the past year. Proceeds were moved to high-conviction positions that we feel provide a more promising risk/reward perspective.
NRG Energy, Inc. (NRG) While still positive on many aspects of the business, we opted to use the recent bounce in share price to chip our holding and move proceeds into opportunities with a lower risk profile.
6
Penn National Gaming, Inc. (PENN) With the stock up over 30% from lows earlier in the year, we elected to chip the position, allocating proceeds toward more favorable risk-return opportunities.
Davenport Value & Income Fund
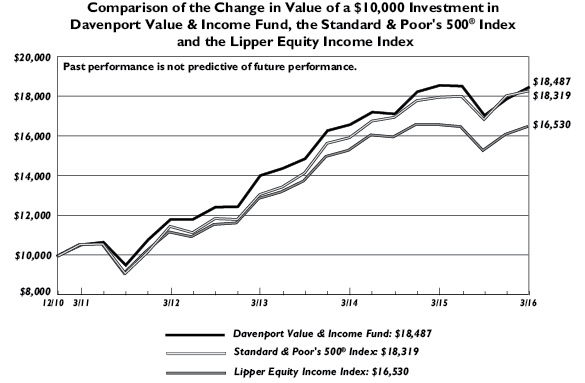
The following chart represents Davenport Value & Income Fund (DVIPX) performance and the performance of the S&P 500 Index, the Value & Income Fund’s primary benchmark, and the Lipper Equity Income Index for the periods ended March 31, 2016.
| Q1 2016 | 1 Year | 3 Years** | 5 Years** | Since Inception** 12/31/2010 | Fiscal
Year 2016
Expense Ratio |
Value & Income Fund | 3.29% | -0.46% | 9.62% | 11.90% | 12.42% | 0.91% |
S&P 500 Index* | 1.35% | 1.78% | 11.82% | 11.58% | 12.23% | — |
Lipper Equity Income Index* | 2.46% | -0.56% | 8.59% | 9.32% | 9.41% | — |
30-Day SEC Yield: 2.38%; Expense Ratio in current prospectus: 0.95%.
Past performance is no guarantee of future results. Investment return and principal value of an investment will fluctuate so that an investor’s shares, when redeemed, may be worth more or less than their original cost. Current performance may be lower or higher than the performance data quoted. Performance data, current to the most recent month end, may be obtained by calling 1-800-281-3217.
* | The S&P 500 Index is comprised of 500 U.S. stocks and is an indicator of the performance of the overall U.S. stock market. The Lipper Equity Income Index is an unmanaged index of the 30 largest funds in the Lipper Equity Income fund category. An investor cannot invest in an index and its returns are not indicative of the performance of any specific investment. |
After the strong performance of the last fiscal year, the Value & Income Fund returned -0.46%, trailing the S&P 500 Index but slightly outpacing the Lipper Equity Income’s 0.56% loss. Broadly, the year saw lackluster economic data and, at the margin, investors chose to hide in two opposite ends of the spectrum: highly defensive companies and high-growth darlings. Going forward, we feel the Fund is well positioned, as we have been emphasizing beaten-up, out of favor names that appear to offer superior risk/reward profiles.
In terms of performance, most of the Fund’s top performers were household blue chips such as General Electric (GE), McDonald’s (MCD), Philip Morris (PM), Altria (MO) and Microsoft (MSFT). Our top performer for the year was a lesser-known manufactured housing and recreational vehicle (RV) REIT Equity Lifestyle Properties (ELS), which continued to post strong growth in net operating income and raised its dividend by 13%. Rounding out the 30%+ return group was Spectra Energy (SE), a well-managed natural gas pipeline company.
On the other side of the ledger, our underweight positioning in utilities and telecommunication services hurt performance. At the start of the year, these sectors were already near the high end of their historical valuations, but investors bid them up even further in a flight to stability and perceived safety. Going forward, we believe the elevated valuations of these defensive companies leaves them more vulnerable to corrections than is normally the case. Additionally, we did not
7
escape the global economic slowdown unscathed, with competitive utility provider NRG Energy (NRG) and grain processor Archer Daniels Midland (ADM) examples of cyclical concerns that hurt performance.
Rather than chase the market’s latest favorites, we continued to search for income-producing securities trading for reasonable valuations in overlooked areas. In financials, we took advantage of weakness to add to title insurer Fidelity National (FNF) and megabank Citigroup (C). In the materials world we purchased paper and packaging company International Paper (IP) and have added to Potash Corp (POT), a low cost fertilizer provider with a solid balance sheet and sizeable dividend. Our defensive stance within the energy sector boosted performance for the year and we added to market leaders such as ExxonMobil (XOM) and Chevron (CVX) on weakness.
In conclusion, we are pleased with performance in light of the challenging macro environment over the preceding twelve months. Throughout the year, we have worked diligently to identify areas of market dislocations, and the elevated volatility has yielded above-average opportunities for us to harvest and redeploy funds. We think our actions have continued to sharpen the Fund’s risk/reward profile.
The following are transactions performed in the Value & Income Fund for the quarter ended March 31, 2016.
Recent Purchases
AT&T, Inc. (T) We initiated a position in T(2nd largest U.S. wireless carrier), believing recent M&A activity should allow the company to grow its earnings and cash flow at a higher than expected rate and lead to an increase to its annual dividend.
Boeing (BA) We initiated a position in the company, attracted to their dominant position within the commercial aerospace industry and ability to capitalize on a currently profitable airline industry generating funds to reinvest into newer, more efficient aircraft.
Capital One Financial Corp. (COF) Concerns over recent increases in expense growth and provisioning rates weighed on the shares, allowing us to add to this name which we believe carries one of the more attractive risk/reward profiles within the financial sector.
Citigroup, Inc. (C) We added to shares on weakness, as concerns over international markets and lowered expectations for further rate hikes outweighed the company’s well-capitalized balance sheet and shareholder-focused plan of future share buybacks and dividend increases.
Fidelity National Financial, Inc. (FNF) We elected to add to our position in this high-margin title insurer, as shares softened alongside concerns over reduced activity in the refinance and commercial origination businesses.
International Paper Co. (IP) A global leader in paper and packaging products, shares of IP have continued to decline (over 60% since early 2015) alongside currency headwinds, weakening containerboard prices, overcapacity and fears of slowing global growth. With current valuation giving little credit to this well managed, high margin, high barrier-to-entry business, we elected to initiate a position.
Procter & Gamble Co. (PG) Given the defensive nature of its business, positive signs on the turnaround front and a relatively attractive valuation, we increased our position, as PG still trades at a modest discount to its peer group.
8
Ralph Lauren Corp. (RL) Shares of RL weakened as currency fluctuations and weather disruptions weighed on the shares. While both are shorter-term headwinds in our view, we elected to add to our exposure in this iconic portfolio of brands.
Recent Sales
Equity Lifestyle Properties, Inc. (ELS) While we continue to view ELS as a best-in-class REIT with end market tailwinds, a proven management team, strong balance sheet and low payout ratio, we chose to chip the position and take profits with the stock hitting new highs and trading above its historical valuation.
NRG Energy, Inc. (NRG) While still attracted to many aspects of the business, we opted to use the recent bounce in share price to sell our holding and move proceeds into opportunities with a lower risk profile.
SPDR Euro Stoxx 50 ETF (FEZ) With the timeline on a European economic turnaround looking less clear, we elected to sell our position and move into closer-to-home opportunities with more dependable income streams.
Teva Pharmaceuticals Industry Ltd. (TEVA) A deep value situation when initially purchased, the company has since re-rated significantly alongside cost cutting initiatives and improved investor sentiment. Recent acquisition concerns and resulting debt have however increased the risk profile of the company and we therefore opted to move to the sidelines, selling the position.
Davenport Small Cap Focus Fund
The following chart represents Davenport Small Cap Focus Fund (DSCPX) performance and the performance of the Russell 2000 Index, the Small Cap Focus Fund’s primary benchmark, for the periods ended March 31, 2016.
| Q1 2016 | 1 Year | Since Inception** 12/31/2014 | Fiscal
Year 2016 Net Expense Ratio |
Small Cap Focus Fund | 2.41% | -10.19% | -5.26% | 1.15%1 |
Russell 2000 Index* | -1.52% | -9.76% | -4.73% | — |
30-Day SEC Yield: 0.36%; Gross Expense Ratio in current prospectus: 1.44%; Net Expense Ratio in current prospectus: 1.27%.
Past performance is no guarantee of future results. Investment return and principal value of an investment will fluctuate so that an investor’s shares, when redeemed, may be worth more or less than their original cost. Current performance may be lower or higher than the performance data quoted. Performance data, current to the most recent month end, may be obtained by calling 1-800-281-3217.
* | The Russell 2000 Index measures the performance of the 2000 smallest companies in the Russell 3000 Index, which represents approximately 8% of the total market. An investor cannot invest in an index and its returns are not indicative of the performance of any specific investment. |
1 | Davenport & Company LLC (the “Adviser”) has contractually agreed, until August 31, 2016, to reduce Management Fees and to reimburse Other Expenses to the extent necessary to limit total annual ordinary operating expenses (excluding acquired fund fees and expenses) to an amount not exceeding 1.25% of the Fund’s average daily net assets. |
9
The Small Cap Focus Fund (DSCPX) finished the fiscal year down 10.19%, relative to the 9.76% decline for the Russell 2000 Index. Though this was a disappointing full year result, we were pleased to see results turn in the fiscal fourth quarter, as our strategy posted a 2.41% gain versus the 1.52% decline for the Russell 2000 Index.
Reflecting for a moment, it’s fair to say that very little went our way in 2015. Small caps generally struggled, value underperformed growth (we have a value bias) and a few opportunistic investments in commodity-related areas (where we expect to typically be underweight) hurt performance. In a way, we consider ourselves fortunate to now be only slightly lagging the Russell 2000 since inception given these challenges. We think our absolute and relative performance profiles could change for the better as recent investments begin to pay off.
At the risk of stating the obvious, we think a lot of pain has been discounted and that small caps as a whole have become more attractive. We are particularly excited about some of our largest holdings, which similar to the Russell 2000 have been under pressure (in some cases with very little in the way of fundamental reasons). As you know, we have a concentrated approach in the Fund, which stands out in a small cap world characterized by funds that oftentimes hold hundreds of stocks. We believe it is best to invest with conviction, even in small caps that can sometimes exhibit above-average volatility. This has yet to bear fruit and can cause large month-to-month performance swings, but hopefully will yield meaningful outperformance over time.
Thus far, we’ve been planting seeds that have only recently begun to germinate. Value-oriented investments, particularly in the under-followed small cap space, can take a long time to bear fruit, but when they do it can be especially gratifying. In looking at some of our key holdings, which we have built at favorable prices, we believe there could be significant pent-up energy. Take Monarch Casino (MCRI), Stewart Information Services (STC) and Outfront Media (OUT), for example. Each business possesses a solid fundamental outlook, generates prodigious free cash flow and possesses manageable (if not below-average) business risk. Yet, we believe each stock is very cheap and could re-rate much higher alongside steady results.
We also remind investors that merger & acquisition activity can sometimes be a nice fringe benefit of small-cap investing. Logically, small companies with solid market positions are often targeted by larger brethren pursuing new growth opportunities. We don’t invest in companies based on M&A activity, but it does sometimes represent a cherry on top of our thesis. Thus far in the Fund’s brief existence, we’ve benefitted very little from such activity. At some point this could change.
Recent Purchases:
FMC Corp (FMC) We are attracted to this specialty chemical company’s asset-light, decentralized manufacturing process and believe management’s focus on higher-value technology-based offerings can yield above-market growth over time.
Isle of Capri Casinos (ISLE) We have been encouraged by improvements in the regional casino operator’s balance sheet, margins and capital stewardship recently. With the stock trading close to half recent highs and sporting an attractive valuation, we found the risk/reward compelling.
Raymond James Financial (RJF) During a period of stress among interest rate sensitive financials, we saw an opportunity to gain exposure to a high quality financial services platform with a strong balance sheet, solid track record of returns and significant growth potential at an attractive valuation.
10
Recent Sales:
Echostar Corp (SATS) Given uneven results, risks associated with satellite launches and less confidence in the value of other businesses that comprised a sum of the parts valuation, we elected to exit the position.
Fidelity National Financial (FNFV) Following the monetization and separation of many of the company’s key assets, we became less enthusiastic with the remaining businesses and the strategy for future capital deployment and chose to sell the position.
Peyto Energy (PEYUF) The stock bounced sharply in the middle of the quarter alongside the rest of the energy complex. We used this strength to exit the position and add to higher conviction ideas.
Scripps Networks Interactive (SNI) Shares of SNI rallied after a prolonged period of weakness in media stocks. Though we remain attracted to the company’s content portfolio, we elected to use recent strength to sell and move proceeds to higher conviction ideas.
Sunoco LP (SUN) Following a strong rally in the MLP sector, we elected to use strength in the name to exit the position. Though we remain attracted to the quality of the company’s assets, concerns over the company’s aggressive pace of dividend increases eventually led to the decision to redeploy funds elsewhere.
Westmoreland Coal (WLB) We exited the position as the shares rallied alongside other coal related entities. Though we believe the company’s contracted volumes and close proximity to customers will result in more predictable cash flows relative to others in the industry, an inconsistent message from management in addition to high debt levels compelled us to use recent strength to exit the position.
Davenport Balanced Income Fund
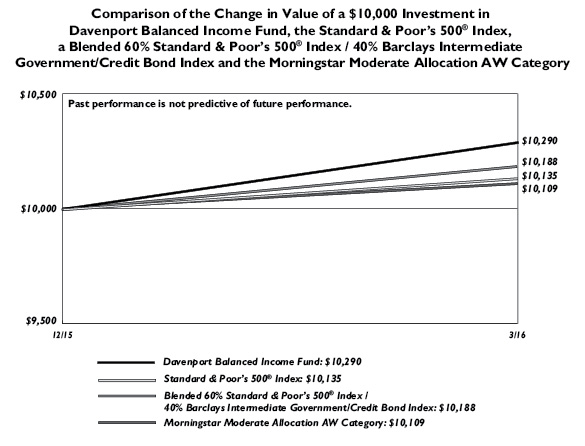
The following chart represents the performance of Davenport Balanced Income Fund (the “Balanced Fund”), Morningstar Moderate Allocation, S&P 500 Index, and Barclays Intermediate Government/Credit Index for the period ended March 31, 2016.
| Q1 2016 | Since Inception** 12/31/2015 | Fiscal
Year 2016 Net Expense Ratio |
Balanced Fund | 2.90% | 2.90% | 1.25%1 |
S&P 500 Index* | 1.35% | 1.35% | — |
Barclays Intermediate Gov/Credit Index | 2.45% | 2.45% | — |
Morningstar Moderate Allocation AW Category | 1.08% | 1.08% | — |
30-Day SEC Yield: 1.50%; Gross Expense Ratio in current prospectus: 1.82%; Net Expense Ratio in current prospectus: 1.25%.
Past performance is no guarantee of future results. Investment return and principal value of an investment will fluctuate so that an investor’s shares, when redeemed, may be worth more or less than their original cost. Current performance may be lower or higher than the performance data quoted. Performance data, current to the most recent month end, may be obtained by calling 1-800-281-3217.
* | The S&P 500 Index is comprised of 500 U.S. stocks and is an indicator of the performance of the overall U.S. stock market. An investor cannot invest in an index and its returns are not indicative of the performance of any specific investment. |
11
Barclays Capital Intermediate Government/Credit Index is an unmanaged index based on publicly issued intermediate government debt securities. The index has an average maturity of 4 years. This index represents asset types which are subject to risk, including loss of principal.
The Morningstar Moderate Allocation AW Category is comprised of portfolios seeking to provide both capital appreciation and income by investing in three major areas: stocks, bonds, and cash. These portfolios tend to hold larger positions in stocks than conservative-allocation portfolios. These portfolios typically have 50% to 70% of assets in equities and the remainder in fixed income and cash.
1 | Davenport & Company LLC has contractually agreed, until August 31, 2017, to reduce Management Fees and to reimburse Other Expenses to the extent necessary to limit total annual ordinary operating expenses (excluding acquired fund fees and expenses) to an amount not exceeding 1.25% of the Balanced Fund’s average daily net assets. |
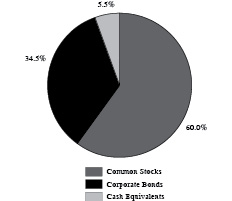
The Balanced Fund commenced operations 12/31/2015. The Fund compliments the other Davenport Funds by offering investors a lower volatility vehicle focused on current income and long term growth. The allocation range for stocks and bonds is 25-75% of Fund assets. The Fund’s allocation at the end of the quarter was 60.0% stocks, 34.5% bonds, and 5.5% cash.
The validity of the structure was demonstrated during the Fund’s first full quarter of operations as equity volatility increased while the bond allocation reduced the portfolio’s price sensitivity. Stocks suffered a decline during the first six weeks of 2016 while bonds rallied. Treasury yields fell during the first quarter of 2016 as the “risk off” trade dominated activity in the US bond market. Catalysts for the strong bid for U.S. Treasuries were: 1) a selloff in global equities, 2) fears of an accelerating global economic slowdown, and 3) continued low inflation. The fact that domestic equities sold off by 11.4% caused many investors to seek the safety of U.S. Treasury issues with the result of Treasury yields falling by 40 or more basis points for maturities of three years and longer.
The bond allocation of the Balanced Fund emphasized intermediate maturities with holdings invested across nine economic sectors. The effective maturity at the end of the quarter was 4.2 years with a duration of 3.8 years. The average credit rating was A2/A, a high quality profile.
The equity portion of the Balanced Fund advanced 3.29% during the Balanced Fund’s first quarter, versus the 2.5% gain for the Lipper Equity Income Index. Following a period of relative underperformance, we were pleased to see “value” stocks outperform “growth” stocks during the period. We also note that following a swoon to start the year in the wake of the Federal Reserve’s first interest rate hike, yield oriented investments rallied nicely alongside more dovish central bank posturing.
Spectra Energy (SE), was the portfolio’s top performer to start the year. The shares benefitted from a flight to quality within REITs and utilities, rewarding the company for its above average balance sheet strength and more stable client base. Johnson & Johnson (JNJ), was another beneficiary of a flight to quality within a challenged sector. Whereas above average dividend paying sectors such as REITS, Utilities and MLPs benefitted from the Federal Reserve’s more dovish tone, bank stocks (which benefit from higher rates) struggled. As such, Citigroup (C), Regions Financial (RF), JP Morgan (JPM) and Wells Fargo (WFC) were among our biggest detractors. Though the Balanced Fund is well represented in the group, we elected to add to the Fund’s position in Citigroup during the period, as the stock’s 30% discount to tangible book value seems excessive in light of the company’s improving capital position and potential for increased capital return in the future.
12
We believe the Balanced Fund demonstrated the strength of the concept of dampening market volatility for our shareholders. The strong stock performance, combined with positive bond returns, is an encouraging start to our entry into the balanced fund discipline. Accordingly, we see shareholders being the beneficiaries of this investment vehicle.
In conclusion, we are pleased that The Davenport Funds are off to a good start thus far in 2016. We thank you for your trust and look forward to reporting back as we proceed through the year.
Sincerely,
John P. Ackerly, IV
President, The Davenport Funds
13
DAVENPORT CORE FUND
PERFORMANCE INFORMATION (Unaudited)
| | Average Annual Total Returns(a)
(for years ended March 31, 2016) |
| | 1 Year | 5 Years | 10 Years |
Davenport Core Fund | (2.39%) | 10.49% | 7.01% |
Standard & Poor’s 500® Index | 1.78% | 11.58% | 7.01% |
(a) | The total returns shown do not reflect the deduction of taxes that a shareholder would pay on Fund distributions or the redemption of Fund shares. |
14
DAVENPORT VALUE & INCOME FUND
PERFORMANCE INFORMATION (Unaudited)
| | Average Annual Total Returns(a)
(for periods ended March 31, 2016) |
| | 1 Year | 5 Years | Since
Inception(b) |
Davenport Value & Income Fund | (0.46%) | 11.90% | 12.42% |
Standard & Poor’s 500® Index | 1.78% | 11.58% | 12.23% |
Lipper Equity Income Index | (0.56%) | 9.32% | 9.41% |
(a) | The total returns shown do not reflect the deduction of taxes that a shareholder would pay on Fund distributions or the redemption of Fund shares. |
(b) | Commencement of operations was December 31, 2010. |
15
DAVENPORT EQUITY OPPORTUNITIES FUND
PERFORMANCE INFORMATION (Unaudited)

| | Average Annual Total Returns(a)
(for periods ended March 31, 2016) |
| | 1 Year | 5 Years | Since
Inception(b) |
Davenport Equity Opportunities Fund | (7.07%) | 11.89% | 12.78% |
Russell Midcap® Index | (4.04%) | 10.30% | 11.34% |
(a) | The total returns shown do not reflect the deduction of taxes that a shareholder would pay on Fund distributions or the redemption of Fund shares. |
(b) | Commencement of operations was December 31, 2010. |
16
DAVENPORT SMALL CAP FOCUS FUND
PERFORMANCE INFORMATION (Unaudited)

| | Average Annual Total Returns(a)
(for periods ended March 31, 2016) |
| | 1 Year | Since Inception(b) |
Davenport Small Cap Focus Fund | (10.19%) | (5.26%) |
Russell 2000® Index | (9.76%) | (4.73%) |
(a) | The total returns shown do not reflect the deduction of taxes that a shareholder would pay on Fund distributions or the redemption of Fund shares. |
(b) | Commencement of operations was December 31, 2014. |
17
DAVENPORT BALANCED INCOME FUND
PERFORMANCE INFORMATION (Unaudited)
| | Total Returns(a)
(for period ended March 31, 2016) Since Inception(b) |
| |
Davenport Balanced Income Fund | 2.90% |
Standard & Poor’s 500® Index | 1.35% |
Blended 60% Standard & Poor’s 500® Index / 40% Barclays Intermediate Government/Credit Bond Index | 1.88% |
Morningstar Moderate Allocation AW Category | 1.09% |
(a) | The total return shown does not reflect the deduction of taxes that a shareholder would pay on Fund distributions or the redemption of Fund shares. |
(b) | Commencement of operations was December 31, 2015. |
18
DAVENPORT CORE FUND
PORTFOLIO INFORMATION
March 31, 2016 (Unaudited)
Top Ten Equity Holdings
Security Description | % of Net Assets |
Markel Corporation | 3.7% |
Brookfield Asset Management, Inc. - Class A | 3.5% |
Danaher Corporation | 3.4% |
Capital One Financial Corporation | 3.2% |
Johnson & Johnson | 2.9% |
American Tower Corporation | 2.9% |
Accenture plc - Class A | 2.9% |
PVH Corporation | 2.6% |
Berkshire Hathaway, Inc. - Class B | 2.6% |
Nestlé S.A. - ADR | 2.5% |
19
DAVENPORT VALUE & INCOME FUND
PORTFOLIO INFORMATION
March 31, 2016 (Unaudited)

Top Ten Equity Holdings
Security Description | % of Net Assets |
Johnson & Johnson | 3.2% |
Markel Corporation | 3.0% |
Capital One Financial Corporation | 3.0% |
FNF Group | 2.9% |
Watsco, Inc. | 2.8% |
W.P. Carey, Inc. | 2.7% |
General Electric Company | 2.7% |
JPMorgan Chase & Company | 2.6% |
Wells Fargo & Company | 2.4% |
Coca-Cola Company (The) | 2.3% |
20
DAVENPORT EQUITY OPPORTUNITIES FUND
PORTFOLIO INFORMATION
March 31, 2016 (Unaudited)

Top Ten Equity Holdings
Security Description | % of Net Assets |
Discovery Communications, Inc. - Series C | 5.8% |
Brookfield Asset Management, Inc. - Class A | 5.5% |
American Tower Corporation | 5.1% |
Gaming and Leisure Properties, Inc. | 5.1% |
Dollar Tree, Inc. | 5.0% |
Colfax Corporation | 5.0% |
Capital One Financial Corporation | 4.8% |
Markel Corporation | 4.4% |
WABCO Holdings, Inc. | 4.0% |
CarMax, Inc. | 4.0% |
21
DAVENPORT SMALL CAP FOCUS FUND
PORTFOLIO INFORMATION
March 31, 2016 (Unaudited)

Top Ten Equity Holdings
Security Description | % of Net Assets |
Monarch Casino & Resort, Inc. | 4.1% |
Stewart Information Services Corporation | 4.1% |
Fortuna Silver Mines, Inc. | 4.0% |
VCA, Inc. | 3.6% |
Live Nation Entertainment, Inc. | 3.5% |
Colfax Corporation | 3.5% |
Genesee & Wyoming, Inc. - Class A | 3.5% |
Watsco, Inc. | 3.2% |
Liberty Broadband Corporation - Series C | 3.2% |
VWR Corporation | 3.2% |
22
DAVENPORT BALANCED INCOME FUND
PORTFOLIO INFORMATION
March 31, 2016 (Unaudited)
Asset Allocation (% of Net Assets) | | Ten Largest Equity Holdings | % of Net Assets |
| | Johnson & Johnson | 2.0% |
Markel Corporation | 1.8% |
Capital One Financial Corporation | 1.8% |
FNF Group | 1.8% |
Watsco, Inc. | 1.7% |
W.P. Carey, Inc. | 1.7% |
General Electric Company | 1.6% |
JPMorgan Chase & Company | 1.6% |
Wells Fargo & Company | 1.5% |
Coca-Cola Company (The) | 1.4% |
| |
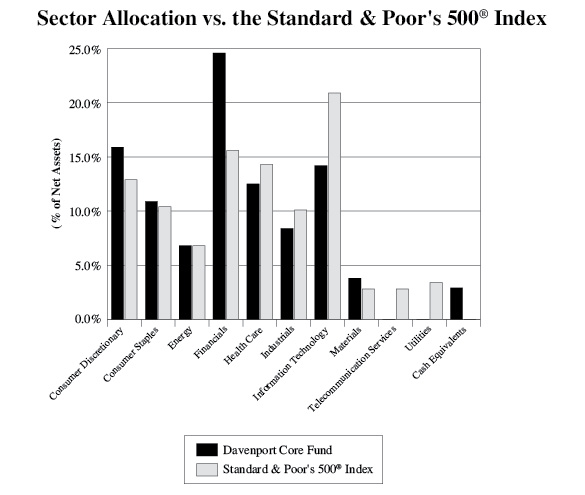
Equity Sector Concentration vs. the S&P 500® Index (60.0% of Net Assets) |
|
Corporate Bond Portfolio (34.5% of Net Assets) | | Credit Quality | Composite Quality |
Number of Fixed-Income Securities | 26 | | AA | 14% |
Average Quality | A | | A | 53% |
Effective Maturity | 4.2 yrs | | BBB | 33% |
Average Effective Duration | 3.8 yrs | | | |
Sector Breakdown | % of Corporate
Bond Portfolio |
Financials | 32.8% |
Consumer Staples | 20.9% |
Industrials | 17.0% |
Information Technology | 10.4% |
Consumer Discretionary | 8.9% |
Telecommunication Services | 6.6% |
Health Care | 3.4% |
23
DAVENPORT CORE FUND
SCHEDULE OF INVESTMENTS
March 31, 2016 |
COMMON STOCKS — 97.1% | | Shares | | | Value | |
Consumer Discretionary — 15.9% | | | | | | |
Amazon.com, Inc. (a) | | | 7,751 | | | $ | 4,601,304 | |
CarMax, Inc. (a) | | | 139,964 | | | | 7,152,160 | |
Discovery Communications, Inc. - Series C (a) | | | 185,986 | | | | 5,021,622 | |
Liberty Broadband Corporation - Series A (a) | | | 12,624 | | | | 734,212 | |
Liberty Broadband Corporation - Series C (a) | | | 51,714 | | | | 2,996,826 | |
Liberty Media Corporation - Series A (a) | | | 45,012 | | | | 1,738,813 | |
Liberty Media Corporation - Series C (a) | | | 133,979 | | | | 5,103,260 | |
Priceline Group, Inc. (The) (a) | | | 5,897 | | | | 7,600,997 | |
PVH Corporation | | | 89,081 | | | | 8,824,364 | |
Starbucks Corporation | | | 79,107 | | | | 4,722,688 | |
Walt Disney Company (The) | | | 52,531 | | | | 5,216,854 | |
| | | | | | | | 53,713,100 | |
Consumer Staples — 10.9% | | | | | | | | |
Anheuser-Busch InBev SA/NV - ADR | | | 40,875 | | | | 5,095,477 | |
Hershey Company (The) | | | 49,165 | | | | 4,527,605 | |
J.M. Smucker Company (The) | | | 57,907 | | | | 7,518,645 | |
Mondelēz International, Inc. - Class A | | | 138,640 | | | | 5,562,237 | |
Nestlé S.A. - ADR | | | 111,137 | | | | 8,291,932 | |
PepsiCo, Inc. | | | 55,701 | | | | 5,708,238 | |
| | | | | | | | 36,704,134 | |
Energy — 6.8% | | | | | | | | |
Chevron Corporation | | | 43,157 | | | | 4,117,178 | |
Exxon Mobil Corporation | | | 89,392 | | | | 7,472,277 | |
Marathon Petroleum Corporation | | | 134,208 | | | | 4,989,853 | |
Schlumberger Ltd. | | | 85,200 | | | | 6,283,500 | |
| | | | | | | | 22,862,808 | |
Financials — 24.6% | | | | | | | | |
American Tower Corporation | | | 95,322 | | | | 9,758,113 | |
Berkshire Hathaway, Inc. - Class B (a) | | | 61,801 | | | | 8,768,326 | |
Brookfield Asset Management, Inc. - Class A | | | 335,279 | | | | 11,664,356 | |
Capital One Financial Corporation | | | 157,324 | | | | 10,904,127 | |
Citigroup, Inc. | | | 172,367 | | | | 7,196,322 | |
CME Group, Inc. | | | 82,336 | | | | 7,908,373 | |
JPMorgan Chase & Company | | | 116,428 | | | | 6,894,866 | |
Markel Corporation (a) | | | 13,893 | | | | 12,386,582 | |
Wells Fargo & Company | | | 156,604 | | | | 7,573,370 | |
| | | | | | | | 83,054,435 | |
Health Care — 12.5% | | | | | | | | |
AmerisourceBergen Corporation | | | 67,785 | | | | 5,866,792 | |
Amgen, Inc. | | | 30,306 | | | | 4,543,779 | |
Anthem, Inc. | | | 30,048 | | | | 4,176,372 | |
Celgene Corporation (a) | | | 69,648 | | | | 6,971,068 | |
Johnson & Johnson | | | 91,542 | | | | 9,904,844 | |
24
DAVENPORT CORE FUND
SCHEDULE OF INVESTMENTS (Continued) |
COMMON STOCKS — 97.1% (Continued) | | Shares | | | Value | |
Health Care — 12.5% (Continued) | | | | | | |
Merck & Company, Inc. | | | 116,920 | | | $ | 6,186,237 | |
Perrigo Company plc | | | 34,744 | | | | 4,444,800 | |
| | | | | | | | 42,093,892 | |
Industrials — 8.4% | | | | | | | | |
American Airlines Group, Inc. | | | 141,130 | | | | 5,787,741 | |
Danaher Corporation | | | 121,722 | | | | 11,546,549 | |
General Electric Company | | | 159,750 | | | | 5,078,453 | |
Union Pacific Corporation | | | 74,744 | | | | 5,945,885 | |
| | | | | | | | 28,358,628 | |
Information Technology — 14.2% | | | | | | | | |
Accenture plc - Class A | | | 83,686 | | | | 9,657,364 | |
Adobe Systems, Inc. (a) | | | 54,468 | | | | 5,109,098 | |
Alphabet, Inc. - Class A (a) | | | 7,045 | | | | 5,374,631 | |
Alphabet, Inc. - Class C (a) | | | 6,387 | | | | 4,757,996 | |
Apple, Inc. | | | 39,672 | | | | 4,323,851 | |
Check Point Software Technologies Ltd. (a) | | | 62,562 | | | | 5,472,298 | |
Oracle Corporation | | | 121,082 | | | | 4,953,465 | |
Visa, Inc. - Class A | | | 106,801 | | | | 8,168,140 | |
| | | | | | | | 47,816,843 | |
Materials — 3.8% | | | | | | | | |
Monsanto Company | | | 70,788 | | | | 6,210,939 | |
Praxair, Inc. | | | 57,852 | | | | 6,621,162 | |
| | | | | | | | 12,832,101 | |
| | | | | | | | | |
Total Common Stocks (Cost $246,817,734) | | | | | | $ | 327,435,941 | |
MONEY MARKET FUNDS — 2.5% | | Shares | | | Value | |
First American Treasury Obligations Fund - Class Z, 0.17% (b) (Cost $8,300,704) | | | 8,300,704 | | | $ | 8,300,704 | |
| | | | | | | | | |
Total Investments at Value — 99.6% (Cost $255,118,438) | | | | | | $ | 335,736,645 | |
| | | | | | | | | |
Other Assets in Excess of Liabilities — 0.4% | | | | | | | 1,492,806 | |
| | | | | | | | | |
Net Assets — 100.0% | | | | | | $ | 337,229,451 | |
ADR - American Depositary Receipt.
(a) | Non-income producing security. |
(b) | The rate shown is the 7-day effective yield as of March 31, 2016. |
See accompanying notes to financial statements.
25
DAVENPORT VALUE & INCOME FUND
SCHEDULE OF INVESTMENTS
March 31, 2016 | |
COMMON STOCKS — 95.7% | | Shares | | | Value | |
Consumer Discretionary — 9.2% | | | | | | |
Las Vegas Sands Corporation | | | 164,085 | | | $ | 8,479,913 | |
McDonald's Corporation | | | 72,800 | | | | 9,149,504 | |
Ralph Lauren Corporation | | | 68,784 | | | | 6,621,148 | |
Six Flags Entertainment Corporation | | | 154,510 | | | | 8,573,760 | |
Time Warner, Inc. | | | 118,585 | | | | 8,603,341 | |
| | | | | | | | 41,427,666 | |
Consumer Staples — 15.2% | | | | | | | | |
Altria Group, Inc. | | | 136,026 | | | | 8,523,389 | |
Anheuser-Busch InBev SA/NV - ADR | | | 63,130 | | | | 7,869,786 | |
Archer-Daniels-Midland Company | | | 159,630 | | | | 5,796,165 | |
Coca-Cola Company (The) | | | 223,235 | | | | 10,355,872 | |
Diageo plc - ADR | | | 74,885 | | | | 8,077,845 | |
PepsiCo, Inc. | | | 85,975 | | | | 8,810,718 | |
Philip Morris International, Inc. | | | 101,900 | | | | 9,997,409 | |
Procter & Gamble Company (The) | | | 112,615 | | | | 9,269,341 | |
| | | | | | | | 68,700,525 | |
Energy — 7.1% | | | | | | | | |
California Resources Corporation | | | 11,899 | | | | 12,256 | |
Chevron Corporation | | | 60,856 | | | | 5,805,663 | |
Exxon Mobil Corporation | | | 104,365 | | | | 8,723,870 | |
Occidental Petroleum Corporation | | | 129,960 | | | | 8,893,163 | |
Spectra Energy Corporation | | | 274,045 | | | | 8,385,777 | |
| | | | | | | | 31,820,729 | |
Financials — 28.8% | | | | | | | | |
Capital One Financial Corporation | | | 192,620 | | | | 13,350,492 | |
Citigroup, Inc. | | | 224,955 | | | | 9,391,871 | |
Equity LifeStyle Properties, Inc. | | | 132,270 | | | | 9,619,997 | |
FNF Group | | | 388,405 | | | | 13,166,929 | |
Gaming and Leisure Properties, Inc. | | | 315,734 | | | | 9,762,495 | |
JPMorgan Chase & Company | | | 194,705 | | | | 11,530,430 | |
Lamar Advertising Company - Class A | | | 162,190 | | | | 9,974,685 | |
Markel Corporation (a) | | | 15,054 | | | | 13,421,695 | |
Regions Financial Corporation | | | 871,335 | | | | 6,839,980 | |
Sun Communities, Inc. | | | 133,655 | | | | 9,571,035 | |
W.P. Carey, Inc. | | | 198,114 | | | | 12,330,615 | |
Wells Fargo & Company | | | 223,710 | | | | 10,818,616 | |
| | | | | | | | 129,778,840 | |
Health Care — 6.6% | | | | | | | | |
Johnson & Johnson | | | 134,320 | | | | 14,533,424 | |
Merck & Company, Inc. | | | 151,385 | | | | 8,009,780 | |
Sanofi - ADR | | | 176,785 | | | | 7,099,686 | |
| | | | | | | | 29,642,890 | |
26
DAVENPORT VALUE & INCOME FUND
SCHEDULE OF INVESTMENTS (Continued) |
COMMON STOCKS — 95.7% (Continued) | | Shares | | | Value | |
Industrials — 13.9% | | | | | | |
3M Company | | | 54,030 | | | $ | 9,003,019 | |
Boeing Company (The) | | | 52,895 | | | | 6,714,491 | |
Eaton Corporation plc | | | 111,857 | | | | 6,997,774 | |
General Electric Company | | | 383,055 | | | | 12,177,319 | |
Illinois Tool Works, Inc. | | | 72,135 | | | | 7,389,509 | |
Raytheon Company | | | 62,656 | | | | 7,683,505 | |
Watsco, Inc. | | | 93,465 | | | | 12,593,474 | |
| | | | | | | | 62,559,091 | |
Information Technology — 3.4% | | | | | | | | |
Cisco Systems, Inc. | | | 247,880 | | | | 7,057,144 | |
Microsoft Corporation | | | 153,183 | | | | 8,460,297 | |
| | | | | | | | 15,517,441 | |
Materials — 6.1% | | | | | | | | |
Eastman Chemical Company | | | 129,865 | | | | 9,380,149 | |
International Paper Company | | | 176,880 | | | | 7,259,155 | |
Nucor Corporation | | | 119,155 | | | | 5,636,032 | |
Potash Corporation of Saskatchewan, Inc. | | | 302,010 | | | | 5,140,210 | |
| | | | | | | | 27,415,546 | |
Telecommunication Services — 3.5% | | | | | | | | |
AT&T, Inc. | | | 172,520 | | | | 6,757,609 | |
Verizon Communications, Inc. | | | 162,665 | | | | 8,796,923 | |
| | | | | | | | 15,554,532 | |
Utilities — 1.9% | | | | | | | | |
Dominion Resources, Inc. | | | 114,890 | | | | 8,630,537 | |
| | | | | | | | | |
Total Common Stocks (Cost $377,333,236) | | | | | | $ | 431,047,797 | |
MONEY MARKET FUNDS — 3.6% | | Shares | | | Value | |
First American Treasury Obligations Fund - Class Z, 0.17% (b) (Cost $16,339,652) | | | 16,339,652 | | | $ | 16,339,652 | |
| | | | | | | | | |
Total Investments at Value — 99.3% (Cost $393,672,888) | | | | | | $ | 447,387,449 | |
| | | | | | | | | |
Other Assets in Excess of Liabilities — 0.7% | | | | | | | 3,059,492 | |
| | | | | | | | | |
Net Assets — 100.0% | | | | | | $ | 450,446,941 | |
ADR - American Depositary Receipt.
(a) | Non-income producing security. |
(b) | The rate shown is the 7-day effective yield as of March 31, 2016. |
See accompanying notes to financial statements.
27
DAVENPORT EQUITY OPPORTUNITIES FUND
SCHEDULE OF INVESTMENTS
March 31, 2016 |
COMMON STOCKS — 94.5% | | Shares | | | Value | |
Consumer Discretionary — 33.3% | | | | | | |
CarMax, Inc. (a) | | | 247,160 | | | $ | 12,629,876 | |
Discovery Communications, Inc. - Series A (a) | | | 116,935 | | | | 3,347,849 | |
Discovery Communications, Inc. - Series C (a) | | | 677,491 | | | | 18,292,257 | |
Dollar Tree, Inc. (a) | | | 190,991 | | | | 15,749,118 | |
Hanesbrands, Inc. | | | 363,380 | | | | 10,298,189 | |
Liberty Broadband Corporation - Series C (a) | | | 199,235 | | | | 11,545,668 | |
Live Nation Entertainment, Inc. (a) | | | 547,154 | | | | 12,207,006 | |
LKQ Corporation (a) | | | 333,316 | | | | 10,642,780 | |
Penn National Gaming, Inc. (a) | | | 252,337 | | | | 4,211,504 | |
TripAdvisor, Inc. (a) | | | 99,450 | | | | 6,613,425 | |
| | | | | | | | 105,537,672 | |
Consumer Staples — 3.7% | | | | | | | | |
Church & Dwight Company, Inc. | | | 127,540 | | | | 11,756,637 | |
| | | | | | | | | |
Financials — 32.7% | | | | | | | | |
American Tower Corporation | | | 158,970 | | | | 16,273,759 | |
Brookfield Asset Management, Inc. - Class A | | | 496,297 | | | | 17,266,173 | |
Capital One Financial Corporation | | | 220,579 | | | | 15,288,331 | |
Fairfax Financial Holdings Ltd. | | | 19,718 | | | | 11,042,080 | |
FNF Group | | | 215,950 | | | | 7,320,705 | |
Gaming and Leisure Properties, Inc. | | | 521,394 | | | | 16,121,502 | |
Markel Corporation (a) | | | 15,695 | | | | 13,993,191 | |
PRA Group, Inc. (a) | | | 212,308 | | | | 6,239,732 | |
| | | | | | | | 103,545,473 | |
Health Care — 2.8% | | | | | | | | |
Henry Schein, Inc. (a) | | | 50,685 | | | | 8,749,752 | |
| | | | | | | | | |
Industrials — 16.7% | | | | | | | | |
American Airlines Group, Inc. | | | 216,350 | | | | 8,872,513 | |
Colfax Corporation (a) | | | 549,221 | | | | 15,702,228 | |
Genesee & Wyoming, Inc. - Class A (a) | | | 139,035 | | | | 8,717,495 | |
WABCO Holdings, Inc. (a) | | | 119,135 | | | | 12,737,914 | |
Watsco, Inc. | | | 50,820 | | | | 6,847,487 | |
| | | | | | | | 52,877,637 | |
Information Technology — 3.5% | | | | | | | | |
Intuit, Inc. | | | 105,665 | | | | 10,990,217 | |
| | | | | | | | | |
Utilities — 1.8% | | | | | | | | |
NRG Energy, Inc. | | | 441,520 | | | | 5,744,175 | |
| | | | | | | | | |
Total Common Stocks (Cost $287,976,542) | | | | | | $ | 299,201,563 | |
28
DAVENPORT EQUITY OPPORTUNITIES FUND
SCHEDULE OF INVESTMENTS (Continued) |
MONEY MARKET FUNDS — 5.6% | | Shares | | | Value | |
First American Treasury Obligations Fund - Class Z, 0.17% (b) (Cost $17,824,702) | | | 17,824,702 | | | $ | 17,824,702 | |
| | | | | | | | | |
Total Investments at Value — 100.1% (Cost $305,801,244) | | | | | | $ | 317,026,265 | |
| | | | | | | | | |
Liabilities in Excess of Other Assets — (0.1%) | | | | | | | (238,239 | ) |
| | | | | | | | | |
Net Assets — 100.0% | | | | | | $ | 316,788,026 | |
(a) | Non-income producing security. |
(b) | The rate shown is the 7-day effective yield as of March 31, 2016. |
See accompanying notes to financial statements.
29
DAVENPORT SMALL CAP FOCUS FUND
SCHEDULE OF INVESTMENTS
March 31, 2016 |
COMMON STOCKS — 98.4% | | Shares | | | Value | |
Consumer Discretionary — 28.4% | | | | | | |
Cable One, Inc. | | | 1,500 | | | $ | 655,695 | |
Core-Mark Holding Company, Inc. | | | 13,571 | | | | 1,106,851 | |
Eldorado Resorts, Inc. (a) | | | 102,310 | | | | 1,170,426 | |
Isle of Capri Casinos, Inc. (a) | | | 50,000 | | | | 700,000 | |
Liberty Broadband Corporation - Series C (a) | | | 21,918 | | | | 1,270,148 | |
Liberty TripAdvisor Holdings, Inc. - Series A (a) | | | 36,000 | | | | 797,760 | |
Lions Gate Entertainment Corporation | | | 51,000 | | | | 1,114,350 | |
Live Nation Entertainment, Inc. (a) | | | 62,179 | | | | 1,387,214 | |
Monarch Casino & Resort, Inc. (a) | | | 83,925 | | | | 1,633,181 | |
Pool Corporation | | | 11,457 | | | | 1,005,237 | |
Unifi, Inc. (a) | | | 18,107 | | | | 414,831 | |
| | | | | | | | 11,255,693 | |
Consumer Staples — 7.4% | | | | | | | | |
Boston Beer Company, Inc. (The) - Class A (a) | | | 6,500 | | | | 1,202,955 | |
Seaboard Corporation (a) | | | 353 | | | | 1,060,063 | |
Snyder's-Lance, Inc. | | | 21,617 | | | | 680,503 | |
| | | | | | | | 2,943,521 | |
Energy — 0.9% | | | | | | | | |
CNX Coal Resources LP | | | 46,400 | | | | 333,152 | |
| | | | | | | | | |
Financials — 26.8% | | | | | | | | |
Cohen & Steers, Inc. | | | 20,500 | | | | 797,860 | |
Diamond Hill Investment Group, Inc. | | | 5,044 | | | | 894,604 | |
Encore Capital Group, Inc. (a) | | | 37,579 | | | | 967,283 | |
FRP Holdings, Inc. (a) | | | 21,893 | | | | 779,391 | |
Gaming and Leisure Properties, Inc. | | | 33,198 | | | | 1,026,482 | |
Lamar Advertising Company - Class A | | | 14,500 | | | | 891,750 | |
Outfront Media, Inc. | | | 54,289 | | | | 1,145,498 | |
PRA Group, Inc. (a) | | | 21,302 | | | | 626,066 | |
Raymond James Financial, Inc. | | | 14,000 | | | | 666,540 | |
Stewart Information Services Corporation | | | 44,529 | | | | 1,615,512 | |
TowneBank | | | 63,359 | | | | 1,215,859 | |
| | | | | | | | 10,626,845 | |
Health Care — 6.8% | | | | | | | | |
VCA, Inc. (a) | | | 25,155 | | | | 1,451,192 | |
VWR Corporation (a) | | | 46,361 | | | | 1,254,529 | |
| | | | | | | | 2,705,721 | |
Industrials — 18.3% | | | | | | | | |
Colfax Corporation (a) | | | 48,514 | | | | 1,387,015 | |
Covenant Transportation Group, Inc. - Class A (a) | | | 44,057 | | | | 1,065,739 | |
Genesee & Wyoming, Inc. - Class A (a) | | | 21,870 | | | | 1,371,249 | |
Marten Transport Ltd. | | | 60,178 | | | | 1,126,532 | |
30
DAVENPORT SMALL CAP FOCUS FUND
SCHEDULE OF INVESTMENTS (Continued) |
COMMON STOCKS — 98.4% (Continued) | | Shares | | | Value | |
Industrials — 18.3% (Continued) | | | | | | |
Mistras Group, Inc. (a) | | | 40,033 | | | $ | 991,618 | |
Watsco, Inc. | | | 9,558 | | | | 1,287,845 | |
| | | | | | | | 7,229,998 | |
Information Technology — 2.0% | | | | | | | | |
Black Knight Financial Services, Inc. - Class A (a) | | | 26,000 | | | | 806,780 | |
| | | | | | | | | |
Materials — 7.8% | | | | | | | | |
FMC Corporation | | | 21,000 | | | | 847,770 | |
Fortuna Silver Mines, Inc. (a) | | | 410,580 | | | | 1,601,262 | |
NewMarket Corporation | | | 1,636 | | | | 648,281 | |
| | | | | | | | 3,097,313 | |
| | | | | | | | | |
Total Common Stocks (Cost $39,932,464) | | | | | | $ | 38,999,023 | |
MONEY MARKET FUNDS — 1.5% | | Shares | | | Value | |
First American Treasury Obligations Fund - Class Z, 0.17% (b) (Cost $604,635) | | | 604,635 | | | $ | 604,635 | |
| | | | | | | | | |
Total Investments at Value — 99.9% (Cost $40,537,099) | | | | | | $ | 39,603,658 | |
| | | | | | | | | |
Other Assets in Excess of Liabilities — 0.1% | | | | | | | 32,404 | |
| | | | | | | | | |
Net Assets — 100.0% | | | | | | $ | 39,636,062 | |
(a) | Non-income producing security. |
(b) | The rate shown is the 7-day effective yield as of March 31, 2016. |
See accompanying notes to financial statements.
31
DAVENPORT BALANCED INCOME FUND
SCHEDULE OF INVESTMENTS
March 31, 2016 |
COMMON STOCKS — 60.0% | | Shares | | | Value | |
Consumer Discretionary — 5.6% | | | | | | |
Las Vegas Sands Corporation | | | 3,960 | | | $ | 204,653 | |
McDonald's Corporation | | | 1,750 | | | | 219,940 | |
Ralph Lauren Corporation | | | 1,650 | | | | 158,829 | |
Six Flags Entertainment Corporation | | | 3,730 | | | | 206,977 | |
Time Warner, Inc. | | | 2,860 | | | | 207,493 | |
| | | | | | | | 997,892 | |
Consumer Staples — 9.3% | | | | | | | | |
Altria Group, Inc. | | | 3,285 | | | | 205,838 | |
Anheuser-Busch InBev SA/NV - ADR | | | 1,520 | | | | 189,483 | |
Archer-Daniels-Midland Company | | | 3,850 | | | | 139,793 | |
Coca-Cola Company (The) | | | 5,380 | | | | 249,578 | |
Diageo plc - ADR | | | 1,800 | | | | 194,166 | |
PepsiCo, Inc. | | | 2,070 | | | | 212,134 | |
Philip Morris International, Inc. | | | 2,460 | | | | 241,351 | |
Procter & Gamble Company (The) | | | 2,715 | | | | 223,472 | |
| | | | | | | | 1,655,815 | |
Energy — 4.3% | | | | | | | | |
California Resources Corporation | | | 198 | | | | 204 | |
Chevron Corporation | | | 1,470 | | | | 140,238 | |
Exxon Mobil Corporation | | | 2,515 | | | | 210,229 | |
Occidental Petroleum Corporation | | | 3,135 | | | | 214,528 | |
Spectra Energy Corporation | | | 6,610 | | | | 202,266 | |
| | | | | | | | 767,465 | |
Financials — 18.4% | | | | | | | | |
Capital One Financial Corporation | | | 4,640 | | | | 321,598 | |
Citigroup, Inc. | | | 5,410 | | | | 225,867 | |
Equity Lifestyle Properties, Inc. | | | 3,205 | | | | 233,100 | |
FNF Group | | | 9,340 | | | | 316,626 | |
Gaming and Leisure Properties, Inc. | | | 7,610 | | | | 235,301 | |
JPMorgan Chase & Company | | | 4,690 | | | | 277,742 | |
Lamar Advertising Company - Class A | | | 3,915 | | | | 240,773 | |
Markel Corporation (a) | | | 362 | | | | 322,748 | |
Outfront Media, Inc. | | | 7,905 | | | | 166,796 | |
Regions Financial Corporation | | | 21,475 | | | | 168,579 | |
Sun Communities, Inc. | | | 3,220 | | | | 230,584 | |
W.P. Carey, Inc. | | | 4,770 | | | | 296,885 | |
Wells Fargo & Company | | | 5,390 | | | | 260,660 | |
| | | | | | | | 3,297,259 | |
Health Care — 4.0% | | | | | | | | |
Johnson & Johnson | | | 3,245 | | | | 351,109 | |
Merck & Company, Inc. | | | 3,650 | | | | 193,122 | |
Sanofi - ADR | | | 4,270 | | | | 171,483 | |
| | | | | | | | 715,714 | |
32
DAVENPORT BALANCED INCOME FUND
SCHEDULE OF INVESTMENTS (Continued) |
COMMON STOCKS — 60.0% (Continued) | | Shares | | | Value | |
Industrials — 8.4% | | | | | | |
3M Company | | | 1,305 | | | $ | 217,452 | |
Boeing Company (The) | | | 1,280 | | | | 162,483 | |
Eaton Corporation plc | | | 2,695 | | | | 168,599 | |
General Electric Company | | | 9,235 | | | | 293,581 | |
Illinois Tool Works, Inc. | | | 1,735 | | | | 177,733 | |
Raytheon Company | | | 1,515 | | | | 185,785 | |
Watsco, Inc. | | | 2,250 | | | | 303,165 | |
| | | | | | | | 1,508,798 | |
Information Technology — 2.1% | | | | | | | | |
Cisco Systems, Inc. | | | 5,980 | | | | 170,250 | |
Microsoft Corporation | | | 3,695 | | | | 204,075 | |
| | | | | | | | 374,325 | |
Materials — 3.7% | | | | | | | | |
Eastman Chemical Company | | | 3,135 | | | | 226,441 | |
International Paper Company | | | 4,270 | | | | 175,241 | |
Nucor Corporation | | | 2,870 | | | | 135,751 | |
Potash Corporation of Saskatchewan, Inc. | | | 7,285 | | | | 123,991 | |
| | | | | | | | 661,424 | |
Telecommunication Services — 2.1% | | | | | | | | |
AT&T, Inc. | | | 4,165 | | | | 163,143 | |
Verizon Communications, Inc. | | | 3,925 | | | | 212,264 | |
| | | | | | | | 375,407 | |
Utilities — 2.1% | | | | | | | | |
Brookfield Renewable Energy Partners LP | | | 5,590 | | | | 167,421 | |
Dominion Resources, Inc. | | | 2,770 | | | | 208,082 | |
| | | | | | | | 375,503 | |
| | | | | | | | | |
Total Common Stocks (Cost $10,156,558) | | | | | | $ | 10,729,602 | |
FIXED RATE CORPORATE BONDS — 28.2% | | Par Value | | | Value | |
Consumer Discretionary — 3.1% | | | | | | |
Amazon, Inc., 3.30%, due 12/05/2021 | | $ | 200,000 | | | $ | 213,704 | |
Home Depot, Inc., 4.40%, due 04/01/2021 | | | 300,000 | | | | 335,901 | |
| | | | | | | | 549,605 | |
Consumer Staples — 7.2% | | | | | | | | |
Altria Group, Inc., 4.75%, due 05/05/2021 | | | 350,000 | | | | 396,958 | |
CVS Health Corporation, 3.875%, due 07/20/2025 | | | 200,000 | | | | 215,825 | |
J.M. Smucker Company, 3.50%, due 10/15/2021 | | | 150,000 | | | | 158,857 | |
PepsiCo, Inc., 2.75%, due 03/05/2022 | | | 300,000 | | | | 314,818 | |
Sysco Corporation, 2.60%, due 10/01/2020 | | | 200,000 | | | | 203,903 | |
| | | | | | | | 1,290,361 | |
33
DAVENPORT BALANCED INCOME FUND
SCHEDULE OF INVESTMENTS (Continued) |
FIXED RATE CORPORATE BONDS — 28.2% (Continued) | | Par Value | | | Value | |
Financials — 6.1% | | | | | | |
Bank of America Corporation, 2.65%, due 04/01/2019 | | | 50,000 | | | $ | 50,877 | |
BlackRock, Inc., 3.50%, due 03/18/2024 | | | 200,000 | | | | 211,993 | |
General Electric Capital Corporation, 4.65%, due 10/17/2021 | | | 200,000 | | | | 228,167 | |
Goldman Sachs Group, Inc., 2.90%, due 07/19/2018 | | | 300,000 | | | | 307,005 | |
Morgan Stanley, 2.125%, due 04/25/2018 | | | 200,000 | | | | 201,387 | |
SunTrust Banks, Inc., 3.50%, due 01/20/2017 | | | 100,000 | | | | 101,564 | |
| | | | | | | | 1,100,993 | |
Health Care — 1.2% | | | | | | | | |
Becton Dickinson & Company, 3.25%, due 11/12/2020 | | | 200,000 | | | | 208,735 | |
| | | | | | | | | |
Industrials — 5.9% | | | | | | | | |
Burlington Northern Santa Fe, LLC, 4.70%, due 10/01/2019 | | | 350,000 | | | | 386,778 | |
Deere & Company, 4.375%, due 10/16/2019 | | | 300,000 | | | | 330,467 | |
United Technologies Corporation, 4.50%, due 04/15/2020 | | | 300,000 | | | | 331,547 | |
| | | | | | | | 1,048,792 | |
Information Technology — 3.6% | | | | | | | | |
Apple, Inc., 3.20%, due 05/13/2025 | | | 200,000 | | | | 209,532 | |
Oracle Corporation, 3.625%, due 07/15/2023 | | | 400,000 | | | | 433,265 | |
| | | | | | | | 642,797 | |
Telecommunication Services — 1.1% | | | | | | | | |
AT&T, Inc., 2.30%, due 03/11/2019 | | | 200,000 | | | | 204,200 | |
| | | | | | | | | |
Total Fixed Rate Corporate Bonds (Cost $4,986,650) | | | | | | $ | 5,045,483 | |
VARIABLE RATE CORPORATE BONDS (b) — 6.3% | | Par Value | | | Value | |
Financials — 5.2% | | | | | | |
American Express Credit Corporation, 1.401%, due 11/05/2018 | | $ | 250,000 | | | $ | 248,602 | |
Bank of America Corporation, 1.239%, due 08/25/2017 | | | 150,000 | | | | 149,417 | |
Bank of New York Mellon, 1.176%, due 08/01/2018 | | | 200,000 | | | | 199,521 | |
Citigroup, Inc., 1.175%, due 03/10/2017 | | | 200,000 | | | | 199,744 | |
JPMorgan Chase & Company, 1.519%, due 01/25/2018 | | | 125,000 | | | | 125,387 | |
| | | | | | | | 922,671 | |
Telecommunication Services — 1.1% | | | | | | | | |
Verizon Communications, Inc., 2.382%, due 09/14/2018 | | | 200,000 | | | | 204,894 | |
| | | | | | | | | |
Total Variable Rate Corporate Bonds (Cost $1,126,905) | | | | | | $ | 1,127,565 | |
34
DAVENPORT BALANCED INCOME FUND
SCHEDULE OF INVESTMENTS (Continued) |
MONEY MARKET FUNDS — 9.0% | | Shares | | | Value | |
First American Treasury Obligations Fund - Class Z, 0.17% (c) (Cost $1,617,573) | | | 1,617,573 | | | $ | 1,617,573 | |
| | | | | | | | | |
Total Investments at Value — 103.5% (Cost $17,887,686) | | | | | | $ | 18,520,223 | |
| | | | | | | | | |
Liabilities in Excess of Other Assets — (3.5%) | | | | | | | (634,747 | ) |
| | | | | | | | | |
Net Assets — 100.0% | | | | | | $ | 17,885,476 | |
ADR - American Depositary Receipt.
(a) | Non-income producing security. |
(b) | The rates shown are the effective interest rates as of March 31, 2016. |
(c) | The rate shown is the 7-day effective yield as of March 31, 2016. |
See accompanying notes to financial statements.
35
THE DAVENPORT FUNDS
STATEMENTS OF ASSETS AND LIABILITIES
March 31, 2016 |
| | Davenport Core Fund | | | Davenport Value & Income
Fund | | | Davenport Equity Opportunities Fund | |
ASSETS | | | | | | | | | |
Investments in securities: | | | | | | | | | |
At acquisition cost | | $ | 255,118,438 | | | $ | 393,672,888 | | | $ | 305,801,244 | |
At value (Note 2) | | $ | 335,736,645 | | | $ | 447,387,449 | | | $ | 317,026,265 | |
Cash | | | 1,714,025 | | | | — | | | | 54,841 | |
Dividends receivable | | | 177,221 | | | | 1,175,712 | | | | 1,892 | |
Receivable for investment securities sold | | | — | | | | — | | | | 1,451,000 | |
Receivable for capital shares sold | | | 264,505 | | | | 2,480,101 | | | | 551,751 | |
Other assets | | | 14,410 | | | | 12,986 | | | | 13,412 | |
TOTAL ASSETS | | | 337,906,806 | | | | 451,056,248 | | | | 319,099,161 | |
| | | | | | | | | | | | | |
LIABILITIES | | | | | | | | | | | | |
Payable for investment securities purchased | | | — | | | | — | | | | 1,847,241 | |
Payable for capital shares redeemed | | | 423,780 | | | | 272,177 | | | | 221,740 | |
Accrued investment advisory fees (Note 4) | | | 210,629 | | | | 279,065 | | | | 195,549 | |
Payable to administrator (Note 4) | | | 36,100 | | | | 45,200 | | | | 35,100 | |
Other accrued expenses | | | 6,846 | | | | 12,865 | | | | 11,505 | |
TOTAL LIABILITIES | | | 677,355 | | | | 609,307 | | | | 2,311,135 | |
| | | | | | | | | | | | | |
NET ASSETS | | $ | 337,229,451 | | | $ | 450,446,941 | | | $ | 316,788,026 | |
| | | | | | | | | | | | | |
Net assets consist of: | | | | | | | | | | | | |
Paid-in capital | | $ | 252,261,963 | | | $ | 402,532,125 | | | $ | 302,305,575 | |
Undistributed (distributions in excess of) net investment income | | | 21,930 | | | | 452,698 | | | | (72,767 | ) |
Accumulated net realized gains (losses) from security transactions | | | 4,327,351 | | | | (6,252,443 | ) | | | 3,330,197 | |
Net unrealized appreciation on investments | | | 80,618,207 | | | | 53,714,561 | | | | 11,225,021 | |
Net assets | | $ | 337,229,451 | | | $ | 450,446,941 | | | $ | 316,788,026 | |
| | | | | | | | | | | | | |
Shares of beneficial interest outstanding (unlimited number of shares authorized, $0.01 par value) | | | 17,954,565 | | | | 31,284,911 | | | | 21,505,069 | |
| | | | | | | | | | | | | |
Net asset value, offering price and redemption price per share (Note 2) | | $ | 18.78 | | | $ | 14.40 | | | $ | 14.73 | |
See accompanying notes to financial statements.
36
THE DAVENPORT FUNDS
STATEMENTS OF ASSETS AND LIABILITIES (Continued)
March 31, 2016 |
| | Davenport Small Cap Focus Fund | | | Davenport Balanced Income Fund | |
ASSETS | | | | | | |
Investments in securities: | | | | | | |
At acquisition cost | | $ | 40,537,099 | | | $ | 17,887,686 | |
At value (Note 2) | | $ | 39,603,658 | | | $ | 18,520,223 | |
Cash | | | — | | | | 1,412 | |
Dividends and interest receivable | | | 20,488 | | | | 83,140 | |
Receivable for capital shares sold | | | 53,278 | | | | 799,573 | |
Other assets | | | 9,248 | | | | 8,860 | |
TOTAL ASSETS | | | 39,686,672 | | | | 19,413,208 | |
| | | | | | | | | |
LIABILITIES | | | | | | | | |
Payable for investment securities purchased | | | — | | | | 1,501,441 | |
Payable for capital shares redeemed | | | 17,515 | | | | 10,000 | |
Accrued investment advisory fees (Note 4) | | | 24,362 | | | | 5,511 | |
Payable to administrator (Note 4) | | | 6,161 | | | | 5,500 | |
Other accrued expenses and liabilities | | | 2,572 | | | | 5,280 | |
TOTAL LIABILITIES | | | 50,610 | | | | 1,527,732 | |
| | | | | | | | | |
NET ASSETS | | $ | 39,636,062 | | | $ | 17,885,476 | |
| | | | | | | | | |
Net assets consist of: | | | | | | | | |
Paid-in capital | | $ | 43,218,207 | | | $ | 17,257,998 | |
Undistributed (distributions in excess of) net investment income | | | (122,472 | ) | | | 9,202 | |
Accumulated net realized losses from security transactions | | | (2,526,232 | ) | | | (14,261 | ) |
Net unrealized appreciation (depreciation) on investments | | | (933,441 | ) | | | 632,537 | |
Net assets | | $ | 39,636,062 | | | $ | 17,885,476 | |
| | | | | | | | | |
Shares of beneficial interest outstanding (unlimited number of shares authorized, $0.01 par value) | | | 4,245,421 | | | | 1,741,236 | |
| | | | | | | | | |
Net asset value, offering price and redemption price per share (Note 2) | | $ | 9.34 | | | $ | 10.27 | |
See accompanying notes to financial statements.
37
THE DAVENPORT FUNDS
STATEMENTS OF OPERATIONS
Year Ended March 31, 2016 |
| | Davenport Core Fund | | | Davenport Value & Income Fund | | | Davenport Equity Opportunities Fund | |
INVESTMENT INCOME | | | | | | | | | |
Dividends | | $ | 4,998,347 | | | $ | 12,686,683 | | | $ | 2,928,723 | |
Foreign withholding taxes on dividends | | | (74,338 | ) | | | (242,678 | ) | | | (64,694 | ) |
TOTAL INVESTMENT INCOME | | | 4,924,009 | | | | 12,444,005 | | | | 2,864,029 | |
| | | | | | | | | | | | | |
EXPENSES | | | | | | | | | | | | |
Investment advisory fees (Note 4) | | | 2,502,099 | | | | 3,179,479 | | | | 2,273,982 | |
Administration fees (Note 4) | | | 399,769 | | | | 488,484 | | | | 384,737 | |
Registration and filing fees | | | 25,592 | | | | 32,230 | | | | 32,400 | |
Custodian and bank service fees | | | 24,948 | | | | 32,344 | | | | 23,731 | |
Compliance service fees (Note 4) | | | 25,558 | | | | 30,954 | | | | 23,592 | |
Professional fees | | | 26,350 | | | | 28,350 | | | | 25,050 | |
Printing of shareholder reports | | | 10,287 | | | | 12,340 | | | | 10,805 | |
Insurance expense | | | 10,764 | | | | 13,097 | | | | 9,414 | |
Trustees’ fees and expenses (Note 4) | | | 10,283 | | | | 10,283 | | | | 10,283 | |
Postage and supplies | | | 5,383 | | | | 6,056 | | | | 5,777 | |
Other expenses | | | 8,407 | | | | 8,719 | | | | 7,682 | |
TOTAL EXPENSES | | | 3,049,440 | | | | 3,842,336 | | | | 2,807,453 | |
| | | | | | | | | | | | | |
NET INVESTMENT INCOME | | | 1,874,569 | | | | 8,601,669 | | | | 56,576 | |
| | | | | | | | | | | | | |
REALIZED AND UNREALIZED GAINS (LOSSES) ON INVESTMENTS | | | | | | | | | | | | |
Net realized gains from security transactions | | | 9,641,359 | | | | 2,292,583 | | | | 11,981,326 | |
Net change in unrealized appreciation/ depreciation on investments | | | (19,512,860 | ) | | | (12,356,435 | ) | | | (35,252,070 | ) |
| | | | | | | | | | | | | |
NET REALIZED AND UNREALIZED LOSSES ON INVESTMENTS | | | (9,871,501 | ) | | | (10,063,852 | ) | | | (23,270,744 | ) |
| | | | | | | | | | | | | |
NET DECREASE IN NET ASSETS FROM OPERATIONS | | $ | (7,996,932 | ) | | $ | (1,462,183 | ) | | $ | (23,214,168 | ) |
See accompanying notes to financial statements.
38
THE DAVENPORT FUNDS
STATEMENTS OF OPERATIONS (Continued)
Year Ended March 31, 2016(a) |
| | Davenport Small Cap Focus Fund | | | Davenport Balanced Income Fund | |
INVESTMENT INCOME | | | | | | |
Dividends | | $ | 518,196 | | | $ | 53,405 | |
Foreign withholding taxes on dividends | | | (10,481 | ) | | | (505 | ) |
Interest | | | - | | | | 14,412 | |
TOTAL INVESTMENT INCOME | | | 507,715 | | | | 67,312 | |
| | | | | | | | | |
EXPENSES | | | | | | | | |
Investment advisory fees (Note 4) | | | 306,639 | (b) | | | 17,398 | |
Administration fees (Note 4) | | | 66,316 | | | | 15,000 | |
Registration and filing fees | | | 22,621 | | | | 5,441 | |
Professional fees | | | 18,550 | | | | 1,404 | |
Trustees’ fees and expenses (Note 4) | | | 10,283 | | | | 2,528 | |
Custodian and bank service fees | | | 6,917 | | | | 4,990 | |
Compliance service fees (Note 4) | | | 7,372 | | | | 1,310 | |
Printing of shareholder reports | | | 4,061 | | | | 1,050 | |
Postage and supplies | | | 3,457 | | | | 1,474 | |
Insurance expense | | | 1,488 | | | | — | |
Other expenses | | | 4,555 | | | | 1,530 | |
TOTAL EXPENSES | | | 452,259 | | | | 52,125 | |
Less fee reductions and expense reimbursements by the Adviser (Note 4) | | | — | | | | (23,128 | ) |
NET EXPENSES | | | 452,259 | | | | 28,997 | |
| | | | | | | | | |
NET INVESTMENT INCOME | | | 55,456 | | | | 38,315 | |
| | | | | | | | | |
REALIZED AND UNREALIZED GAINS
(LOSSES) ON INVESTMENTS | | | | | | | | |
Net realized losses from security transactions | | | (2,710,990 | ) | | | (14,261 | ) |
Net change in unrealized appreciation/depreciation on investments | | | (2,068,369 | ) | | | 632,537 | |
| | | | | | | | | |
NET REALIZED AND UNREALIZED GAINS (LOSSES) ON INVESTMENTS | | | (4,779,359 | ) | | | 618,276 | |
| | | | | | | | | |
NET INCREASE (DECREASE) IN NET ASSETS FROM OPERATIONS | | $ | (4,723,903 | ) | | $ | 656,591 | |
(a) | Except for Davenport Balanced Income Fund, which represents the period from the commencement of operations (December 31, 2015) through March 31, 2016. |
(b) | Includes previous investment advisory fee reductions recouped by the Adviser of $10,744 (Note 4). |
See accompanying notes to financial statements.
39
DAVENPORT CORE FUND
STATEMENTS OF CHANGES IN NET ASSETS |
| | Year
Ended
March 31,
2016 | | | Year
Ended
March 31,
2015 | |
FROM OPERATIONS | | | | | | |
Net investment income | | $ | 1,874,569 | | | $ | 1,488,043 | |
Net realized gains from security transactions | | | 9,641,359 | | | | 14,551,320 | |
Net change in unrealized appreciation/depreciation on investments | | | (19,512,860 | ) | | | 19,717,017 | |
Net increase (decrease) in net assets from operations | | | (7,996,932 | ) | | | 35,756,380 | |
| | | | | | | | | |
DISTRIBUTIONS TO SHAREHOLDERS (Note 2) | | | | | | | | |
From net investment income | | | (1,852,639 | ) | | | (1,509,705 | ) |
From net realized gains from security transactions | | | (11,534,728 | ) | | | (22,409,339 | ) |
Decrease in net assets from distributions to shareholders | | | (13,387,367 | ) | | | (23,919,044 | ) |
| | | | | | | | | |
FROM CAPITAL SHARE TRANSACTIONS | | | | | | | | |
Proceeds from shares sold | | | 43,745,136 | | | | 43,532,772 | |
Net asset value of shares issued in reinvestment of distributions to shareholders | | | 12,948,950 | | | | 23,153,291 | |
Payments for shares redeemed | | | (28,766,990 | ) | | | (29,067,963 | ) |
Net increase in net assets from capital share transactions | | | 27,927,096 | | | | 37,618,100 | |
| | | | | | | | | |
TOTAL INCREASE IN NET ASSETS | | | 6,542,797 | | | | 49,455,436 | |
| | | | | | | | | |
NET ASSETS | | | | | | | | |
Beginning of year | | | 330,686,654 | | | | 281,231,218 | |
End of year | | $ | 337,229,451 | | | $ | 330,686,654 | |
| | | | | | | | | |
UNDISTRIBUTED NET INVESTMENT INCOME | | $ | 21,930 | | | $ | — | |
| | | | | | | | | |
CAPITAL SHARE ACTIVITY | | | | | | | | |
Shares sold | | | 2,282,460 | | | | 2,233,700 | |
Shares reinvested | | | 661,768 | | | | 1,207,808 | |
Shares redeemed | | | (1,508,906 | ) | | | (1,495,763 | ) |
Net increase in shares outstanding | | | 1,435,322 | | | | 1,945,745 | |
Shares outstanding at beginning of year | | | 16,519,243 | | | | 14,573,498 | |
Shares outstanding at end of year | | | 17,954,565 | | | | 16,519,243 | |
See accompanying notes to financial statements.
40
DAVENPORT VALUE & INCOME FUND
STATEMENTS OF CHANGES IN NET ASSETS |
| | Year
Ended
March 31,
2016 | | | Year
Ended
March 31,
2015 | |
FROM OPERATIONS | | | | | | |
Net investment income | | $ | 8,601,669 | | | $ | 5,877,403 | |
Net realized gains from security transactions | | | 2,292,583 | | | | 18,731,719 | |
Net change in unrealized appreciation/depreciation on investments | | | (12,356,435 | ) | | | 14,874,206 | |
Net increase (decrease) in net assets from operations | | | (1,462,183 | ) | | | 39,483,328 | |
| | | | | | | | | |
DISTRIBUTIONS TO SHAREHOLDERS (Note 2) | | | | | | | | |
From net investment income | | | (8,403,091 | ) | | | (5,878,113 | ) |
From net realized gains from security transactions | | | (19,689,392 | ) | | | (15,874,061 | ) |
Decrease in net assets from distributions to shareholders | | | (28,092,483 | ) | | | (21,752,174 | ) |
| | | | | | | | | |
FROM CAPITAL SHARE TRANSACTIONS | | | | | | | | |
Proceeds from shares sold | | | 86,973,081 | | | | 93,258,289 | |
Net asset value of shares issued in reinvestment of distributions to shareholders | | | 25,982,187 | | | | 20,026,663 | |
Payments for shares redeemed | | | (40,730,457 | ) | | | (27,526,918 | ) |
Net increase in net assets from capital share transactions | | | 72,224,811 | | | | 85,758,034 | |
| | | | | | | | | |
TOTAL INCREASE IN NET ASSETS | | | 42,670,145 | | | | 103,489,188 | |
| | | | | | | | | |
NET ASSETS | | | | | | | | |
Beginning of year | | | 407,776,796 | | | | 304,287,608 | |
End of year | | $ | 450,446,941 | | | $ | 407,776,796 | |
| | | | | | | | | |
UNDISTRIBUTED NET INVESTMENT INCOME | | $ | 452,698 | | | $ | 254,321 | |
| | | | | | | | | |
CAPITAL SHARE ACTIVITY | | | | | | | | |
Shares sold | | | 5,971,001 | | | | 6,192,254 | |
Shares reinvested | | | 1,775,907 | | | | 1,332,807 | |
Shares redeemed | | | (2,844,498 | ) | | | (1,830,740 | ) |
Net increase in shares outstanding | | | 4,902,410 | | | | 5,694,321 | |
Shares outstanding at beginning of year | | | 26,382,501 | | | | 20,688,180 | |
Shares outstanding at end of year | | | 31,284,911 | | | | 26,382,501 | |
See accompanying notes to financial statements.
41
DAVENPORT EQUITY OPPORTUNITIES FUND
STATEMENTS OF CHANGES IN NET ASSETS |
| | Year
Ended
March 31,
2016 | | | Year
Ended
March 31,
2015 | |
FROM OPERATIONS | | | | | | |
Net investment income | | $ | 56,576 | | | $ | 730,888 | |
Net realized gains from security transactions | | | 11,981,326 | | | | 15,756,298 | |
Net change in unrealized appreciation/depreciation on investments | | | (35,252,070 | ) | | | 18,256,256 | |
Net increase (decrease) in net assets from operations | | | (23,214,168 | ) | | | 34,743,442 | |
| | | | | | | | | |
DISTRIBUTIONS TO SHAREHOLDERS (Note 2) | | | | | | | | |
From net investment income | | | (129,343 | ) | | | (3,196,404 | ) |
From net realized gains from security transactions | | | (14,359,968 | ) | | | (18,954,387 | ) |
Decrease in net assets from distributions to shareholders | | | (14,489,311 | ) | | | (22,150,791 | ) |
| | | | | | | | | |
FROM CAPITAL SHARE TRANSACTIONS | | | | | | | | |
Proceeds from shares sold | | | 94,157,195 | | | | 86,334,585 | |
Net asset value of shares issued in reinvestment of distributions to shareholders | | | 13,877,514 | | | | 21,241,419 | |
Payments for shares redeemed | | | (31,246,686 | ) | | | (16,954,232 | ) |
Net increase in net assets from capital share transactions | | | 76,788,023 | | | | 90,621,772 | |
| | | | | | | | | |
TOTAL INCREASE IN NET ASSETS | | | 39,084,544 | | | | 103,214,423 | |
| | | | | | | | | |
NET ASSETS | | | | | | | | |
Beginning of year | | | 277,703,482 | | | | 174,489,059 | |
End of year | | $ | 316,788,026 | | | $ | 277,703,482 | |
| | | | | | | | | |
UNDISTRIBUTED (DISTRIBUTIONS IN EXCESS OF) NET INVESTMENT INCOME | | $ | (72,767 | ) | | $ | — | |
| | | | | | | | | |
CAPITAL SHARE ACTIVITY | | | | | | | | |
Shares sold | | | 6,016,951 | | | | 5,452,269 | |
Shares reinvested | | | 898,633 | | | | 1,376,196 | |
Shares redeemed | | | (2,132,071 | ) | | | (1,074,814 | ) |
Net increase in shares outstanding | | | 4,783,513 | | | | 5,753,651 | |
Shares outstanding at beginning of year | | | 16,721,556 | | | | 10,967,905 | |
Shares outstanding at end of year | | | 21,505,069 | | | | 16,721,556 | |
See accompanying notes to financial statements.
42
DAVENPORT SMALL CAP FOCUS FUND
STATEMENTS OF CHANGES IN NET ASSETS |
| | Year
Ended
March 31,
2016 | | | Period
Ended
March 31,
2015 (a) | |
FROM OPERATIONS | | | | | | |
Net investment income (loss) | | $ | 55,456 | | | $ | (18,535 | ) |
Net realized gains (losses) from security transactions | | | (2,710,990 | ) | | | 63,308 | |
Net change in unrealized appreciation/depreciation on investments | | | (2,068,369 | ) | | | 1,134,928 | |
Net increase (decrease) in net assets from operations | | | (4,723,903 | ) | | | 1,179,701 | |
| | | | | | | | | |
DISTRIBUTIONS TO SHAREHOLDERS (Note 2) | | | | | | | | |
From net realized gains from security transactions | | | (37,962 | ) | | | — | |
| | | | | | | | | |
FROM CAPITAL SHARE TRANSACTIONS | | | | | | | | |
Proceeds from shares sold | | | 21,401,677 | | | | 30,137,020 | |
Net asset value of shares issued in reinvestment of distributions to shareholders | | | 36,932 | | | | — | |
Payments for shares redeemed | | | (8,332,057 | ) | | | (25,346 | ) |
Net increase in net assets from capital share transactions | | | 13,106,552 | | | | 30,111,674 | |
| | | | | | | | | |
TOTAL INCREASE IN NET ASSETS | | | 8,344,687 | | | | 31,291,375 | |
| | | | | | | | | |
NET ASSETS | | | | | | | | |
Beginning of period | | | 31,291,375 | | | | — | |
End of period | | $ | 39,636,062 | | | $ | 31,291,375 | |
| | | | | | | | | |
UNDISTRIBUTED (DISTRIBUTIONS IN EXCESS OF) NET INVESTMENT INCOME | | $ | (122,472 | ) | | $ | 6,827 | |
| | | | | | | | | |
CAPITAL SHARE ACTIVITY | | | | | | | | |
Shares sold | | | 2,145,270 | | | | 3,008,657 | |
Shares reinvested | | | 3,504 | | | | — | |
Shares redeemed | | | (909,485 | ) | | | (2,525 | ) |
Net increase in shares outstanding | | | 1,239,289 | | | | 3,006,132 | |
Shares outstanding at beginning of period | | | 3,006,132 | | | | — | |
Shares outstanding at end of period | | | 4,245,421 | | | | 3,006,132 | |
(a) | Represents the period from the commencement of operations (December 31, 2014) through March 31, 2015. |
See accompanying notes to financial statements.
43
DAVENPORT BALANCED INCOME FUND
STATEMENT OF CHANGES IN NET ASSETS |
| | Period
Ended
March 31,
2016 (a) | |
FROM OPERATIONS | | | |
Net investment income | | $ | 38,315 | |
Net realized losses from security transactions | | | (14,261 | ) |
Net change in unrealized appreciation/depreciation on investments | | | 632,537 | |
Net increase in net assets from operations | | | 656,591 | |
| | | | | |
DISTRIBUTIONS TO SHAREHOLDERS (Note 2) | | | | |
From net investment income | | | (29,113 | ) |
| | | | | |
FROM CAPITAL SHARE TRANSACTIONS | | | | |
Proceeds from shares sold | | | 17,274,414 | |
Net asset value of shares issued in reinvestment of distributions to shareholders | | | 27,366 | |
Payments for shares redeemed | | | (43,782 | ) |
Net increase in net assets from capital share transactions | | | 17,257,998 | |
| | | | | |
TOTAL INCREASE IN NET ASSETS | | | 17,885,476 | |
| | | | | |
NET ASSETS | | | | |
Beginning of period | | | — | |
End of period | | $ | 17,885,476 | |
| | | | | |
UNDISTRIBUTED NET INVESTMENT INCOME | | $ | 9,202 | |
| | | | | |
CAPITAL SHARE ACTIVITY | | | | |
Shares sold | | | 1,742,964 | |
Shares reinvested | | | 2,704 | |
Shares redeemed | | | (4,432 | ) |
Net increase in shares outstanding | | | 1,741,236 | |
Shares outstanding at beginning of period | | | — | |
Shares outstanding at end of period | | | 1,741,236 | |
(a) | Represents the period from the commencement of operations (December 31, 2015) through March 31, 2016. |
See accompanying notes to financial statements.
44
DAVENPORT CORE FUND
FINANCIAL HIGHLIGHTS |
Selected Per Share Data and Ratios for a Share Outstanding Throughout Each Year | |
| | Years Ended March 31, | |
| | 2016 | | | 2015 | | | 2014 | | | 2013 | | | 2012 | |
Net asset value at beginning of year | | $ | 20.02 | | | $ | 19.30 | | | $ | 16.75 | | | $ | 15.00 | | | $ | 13.73 | |
| | | | | | | | | | | | | | | | | | | | | |
Income (loss) from investment operations: | | | | | | | | | | | | | | | | | | | | |
Net investment income | | | 0.11 | | | | 0.10 | | | | 0.12 | | | | 0.11 | | | | 0.09 | |
Net realized and unrealized gains (losses) on investments | | | (0.56 | ) | | | 2.20 | | | | 3.39 | | | | 1.75 | | | | 1.27 | |
Total from investment operations | | | (0.45 | ) | | | 2.30 | | | | 3.51 | | | | 1.86 | | | | 1.36 | |
| | | | | | | | | | | | | | | | | | | | | |
Less distributions: | | | | | | | | | | | | | | | | | | | | |
Dividends from net investment income | | | (0.11 | ) | | | (0.10 | ) | | | (0.12 | ) | | | (0.11 | ) | | | (0.09 | ) |
Distributions from net realized gains | | | (0.68 | ) | | | (1.48 | ) | | | (0.84 | ) | | | — | | | | — | |
Total distributions | | | (0.79 | ) | | | (1.58 | ) | | | (0.96 | ) | | | (0.11 | ) | | | (0.09 | ) |
| | | | | | | | | | | | | | | | | | | | | |
Net asset value at end of year | | $ | 18.78 | | | $ | 20.02 | | | $ | 19.30 | | | $ | 16.75 | | | $ | 15.00 | |
| | | | | | | | | | | | | | | | | | | | | |
Total return (a) | | | (2.39 | %) | | | 12.42 | % | | | 21.32 | % | | | 12.47 | % | | | 9.99 | % |
| | | | | | | | | | | | | | | | | | | | | |
Net assets at end of year (000’s) | | $ | 337,229 | | | $ | 330,687 | | | $ | 281,231 | | | $ | 210,899 | | | $ | 174,898 | |
| | | | | | | | | | | | | | | | | | | | | |
Ratio of total expenses to average net assets | | | 0.92 | % | | | 0.93 | % | | | 0.94 | % | | | 0.95 | % | | | 0.96 | % |
| | | | | | | | | | | | | | | | | | | | | |
Ratio of net investment income to average net assets | | | 0.56 | % | | | 0.49 | % | | | 0.64 | % | | | 0.71 | % | | | 0.66 | % |
| | | | | | | | | | | | | | | | | | | | | |
Portfolio turnover rate | | | 23 | % | | | 21 | % | | | 29 | % | | | 26 | % | | | 19 | % |
(a) | Total return is a measure of the change in value of an investment in the Fund over the years covered, which assumes any dividends or capital gains distributions are reinvested in shares of the Fund. Returns shown do not reflect the deduction of taxes a shareholder would pay on Fund distributions or the redemption of Fund shares. |
See accompanying notes to financial statements.
45
DAVENPORT VALUE & INCOME FUND
FINANCIAL HIGHLIGHTS |
Selected Per Share Data and Ratios for a Share Outstanding Throughout Each Year | |
| | Years Ended March 31, | |
| | 2016 | | | 2015 | | | 2014 | | | 2013 | | | 2012 | |
Net asset value at beginning of year | | $ | 15.46 | | | $ | 14.71 | | | $ | 13.18 | | | $ | 11.51 | | | $ | 10.50 | |
| | | | | | | | | | | | | | | | | | | | | |
Income (loss) from investment operations: | | | | | | | | | | | | | | | | | | | | |
Net investment income | | | 0.29 | | | | 0.25 | | | | 0.30 | | | | 0.28 | | | | 0.23 | |
Net realized and unrealized gains (losses) on investments | | | (0.36 | ) | | | 1.45 | | | | 2.04 | | | | 1.81 | | | | 1.02 | |
Total from investment operations | | | (0.07 | ) | | | 1.70 | | | | 2.34 | | | | 2.09 | | | | 1.25 | |
| | | | | | | | | | | | | | | | | | | | | |
Less distributions: | | | | | | | | | | | | | | | | | | | | |
Dividends from net investment income | | | (0.29 | ) | | | (0.25 | ) | | | (0.29 | ) | | | (0.27 | ) | | | (0.23 | ) |
Distributions from net realized gains | | | (0.70 | ) | | | (0.70 | ) | | | (0.52 | ) | | | (0.15 | ) | | | (0.01 | ) |
Total distributions | | | (0.99 | ) | | | (0.95 | ) | | | (0.81 | ) | | | (0.42 | ) | | | (0.24 | ) |
| | | | | | | | | | | | | | | | | | | | | |
Net asset value at end of year | | $ | 14.40 | | | $ | 15.46 | | | $ | 14.71 | | | $ | 13.18 | | | $ | 11.51 | |
| | | | | | | | | | | | | | | | | | | | | |
Total return (a) | | | (0.46 | %) | | | 11.92 | % | | | 18.25 | % | | | 18.69 | % | | | 12.23 | % |
| | | | | | | | | | | | | | | | | | | | | |
Net assets at end of year (000’s) | | $ | 450,447 | | | $ | 407,777 | | | $ | 304,288 | | | $ | 196,890 | | | $ | 98,757 | |
| | | | | | | | | | | | | | | | | | | | | |
Ratio of total expenses to average net assets | | | 0.91 | % | | | 0.92 | % | | | 0.94 | % | | | 0.96 | % | | | 1.04 | % |
| | | | | | | | | | | | | | | | | | | | | |
Ratio of net investment income to average net assets | | | 2.03 | % | | | 1.66 | % | | | 2.22 | % | | | 2.37 | % | | | 2.30 | % |
| | | | | | | | | | | | | | | | | | | | | |
Portfolio turnover rate | | | 25 | % | | | 23 | % | | | 32 | % | | | 29 | % | | | 27 | % |
(a) | Total return is a measure of the change in value of an investment in the Fund over the years covered, which assumes any dividends or capital gains distributions are reinvested in shares of the Fund. Returns shown do not reflect the deduction of taxes a shareholder would pay on Fund distributions or the redemption of Fund shares. |
See accompanying notes to financial statements.
46
DAVENPORT EQUITY OPPORTUNITIES FUND
FINANCIAL HIGHLIGHTS |
Selected Per Share Data and Ratios for a Share Outstanding Throughout Each Year | |
| | Years Ended March 31, | |
| | 2016 | | | 2015 | | | 2014 | | | 2013 | | | 2012 | |
Net asset value at beginning of year | | $ | 16.61 | | | $ | 15.91 | | | $ | 13.86 | | | $ | 11.96 | | | $ | 10.72 | |
| | | | | | | | | | | | | | | | | | | | | |
Income (loss) from investment operations: | | | | | | | | | | | | | | | | | | | | |
Net investment income (loss) | | | 0.00 | (a) | | | 0.04 | | | | 0.24 | | | | 0.03 | | | | (0.02 | ) |
Net realized and unrealized gains (losses) on investments | | | (1.14 | ) | | | 2.42 | | | | 2.65 | | | | 2.17 | | | | 1.30 | |
Total from investment operations | | | (1.14 | ) | | | 2.46 | | | | 2.89 | | | | 2.20 | | | | 1.28 | |
| | | | | | | | | | | | | | | | | | | | | |
Less distributions: | | | | | | | | | | | | | | | | | | | | |
Dividends from net investment income | | | (0.01 | ) | | | (0.26 | ) | | | (0.02 | ) | | | (0.02 | ) | | | — | |
Distributions from net realized gains | | | (0.73 | ) | | | (1.50 | ) | | | (0.82 | ) | | | (0.28 | ) | | | (0.04 | ) |
Total distributions | | | (0.74 | ) | | | (1.76 | ) | | | (0.84 | ) | | | (0.30 | ) | | | (0.04 | ) |
| | | | | | | | | | | | | | | | | | | | | |
Net asset value at end of year | | $ | 14.73 | | | $ | 16.61 | | | $ | 15.91 | | | $ | 13.86 | | | $ | 11.96 | |
| | | | | | | | | | | | | | | | | | | | | |
Total return (b) | | | (7.07 | %) | | | 16.67 | % | | | 21.57 | % | | | 18.77 | % | | | 12.00 | % |
| | | | | | | | | | | | | | | | | | | | | |
Net assets at end of year (000’s) | | $ | 316,788 | | | $ | 277,703 | | | $ | 174,489 | | | $ | 102,679 | | | $ | 59,135 | |
| | | | | | | | | | | | | | | | | | | | | |
Ratio of total expenses to average net assets | | | 0.93 | % | | | 0.96 | % | | | 0.97 | % | | | 1.01 | % | | | 1.10 | % |
| | | | | | | | | | | | | | | | | | | | | |
Ratio of net investment income (loss) to average net assets | | | 0.02 | % | | | 0.33 | % | | | 1.96 | % | | | 0.23 | % | | | (0.22 | %) |
| | | | | | | | | | | | | | | | | | | | | |
Portfolio turnover rate | | | 29 | % | | | 31 | % | | | 49 | % | | | 41 | % | | | 35 | % |
(a) | Amount rounds to less than a penny per share. |
(b) | Total return is a measure of the change in value of an investment in the Fund over the years covered, which assumes any dividends or capital gains distributions are reinvested in shares of the Fund. Returns shown do not reflect the deduction of taxes a shareholder would pay on Fund distributions or the redemption of Fund shares. |
See accompanying notes to financial statements.
47
DAVENPORT SMALL CAP FOCUS FUND
FINANCIAL HIGHLIGHTS |
Selected Per Share Data and Ratios for a Share Outstanding Throughout Each Period | |
| | Year
Ended March 31, 2016 | | | Period Ended
March 31,
2015 (a) | |
Net asset value at beginning of period | | $ | 10.41 | | | $ | 10.00 | |
| | | | | | | | | |
Income (loss) from investment operations: | | | | | | | | |
Net investment income (loss) | | | 0.01 | | | | (0.01 | ) |
Net realized and unrealized gains (losses) on investments | | | (1.07 | ) | | | 0.42 | |
Total from investment operations | | | (1.06 | ) | | | 0.41 | |
| | | | | | | | | |
Less distributions: | | | | | | | | |
Distributions from net realized gains | | | (0.01 | ) | | | — | |
| | | | | | | | | |
Net asset value at end of period | | $ | 9.34 | | | $ | 10.41 | |
| | | | | | | | | |
Total return (b) | | | (10.19 | %) | | | 4.10 | %(c) |
| | | | | | | | | |
Net assets at end of period (000’s) | | $ | 39,636 | | | $ | 31,291 | |
| | | | | | | | | |
Ratio of net expenses to average net assets | | | 1.15 | % | | | 1.25 | %(d)(e) |
| | | | | | | | | |
Ratio of net investment income (loss) to average net assets | | | 0.14 | % | | | (0.30% | )(d)(f) |
| | | | | | | | | |
Portfolio turnover rate | | | 48 | % | | | 15 | %(c) |
(a) | Represents the period from commencement of operations (December 31, 2014) through March 31, 2015. |
(b) | Total return is a measure of the change in value of an investment in the Fund over the periods covered, which assumes any dividends or capital gains distributions are reinvested in shares of the Fund. Returns shown do not reflect the deduction of taxes a shareholder would pay on Fund distributions or the redemption of Fund shares. |
(e) | Absent advisory fee reductions, the ratio of total expenses to average net assets would have been 1.42%(d) for the period ended March 31, 2015 (Note 4). |
(f) | Ratio was determined after advisory fee reductions. |
See accompanying notes to financial statements.
48
DAVENPORT BALANCED INCOME FUND
FINANCIAL HIGHLIGHTS |
Selected Per Share Data and Ratios for a Share Outstanding Throughout the Period | |
| | Period
Ended
March 31,
2016 (a) | |
Net asset value at beginning of period | | $ | 10.00 | |
| | | | | |
Income from investment operations: | | | | |
Net investment income | | | 0.03 | |
Net realized and unrealized gains on investments | | | 0.26 | |
Total from investment operations | | | 0.29 | |
| | | | | |
Less distributions: | | | | |
Dividends from net investment income | | | (0.02 | ) |
| | | | | |
Net asset value at end of period | | $ | 10.27 | |
| | | | | |
Total return (b) | | | 2.90 | %(c) |
| | | | | |
Net assets at end of period (000’s) | | $ | 17,885 | |
| | | | | |
Ratio of total expenses to average net assets | | | 2.25 | %(d) |
| | | | | |
Ratio of net expenses to average net assets | | | 1.25 | %(d)(e) |
| | | | | |
Ratio of net investment income to average net assets | | | 1.65 | %(d)(e) |
| | | | | |
Portfolio turnover rate | | | 7 | %(c) |
(a) | Represents the period from commencement of operations (December 31, 2015) through March 31, 2016. |
(b) | Total return is a measure of the change in value of an investment in the Fund over the period covered, which assumes any dividends or capital gains distributions are reinvested in shares of the Fund. The return shown does not reflect the deduction of taxes a shareholder would pay on Fund distributions or the redemption of Fund shares. |
(e) | Ratio was determined after advisory fee reductions and expense reimbursements (Note 4). |
See accompanying notes to financial statements.
49
THE DAVENPORT FUNDS
NOTES TO FINANCIAL STATEMENTS
March 31, 2016
1. Organization
Davenport Core Fund, Davenport Value & Income Fund, Davenport Equity Opportunities Fund, Davenport Small Cap Focus Fund and Davenport Balanced Income Fund (individually, a “Fund,” and, collectively, the “Funds”) are each a no-load series of the Williamsburg Investment Trust (the “Trust”), an open-end management investment company registered under the Investment Company Act of 1940. The Trust was organized as a Massachusetts business trust on July 18, 1988. Other series of the Trust are not incorporated in this report. Davenport Core Fund began operations on January 15, 1998. Davenport Value & Income Fund and Davenport Equity Opportunities Fund each began operations on December 31, 2010. Davenport Small Cap Focus Fund began operations on December 31, 2014. Davenport Balanced Income Fund began operations on December 31, 2015.
Davenport Core Fund’s investment objective is long term growth of capital.
Davenport Value & Income Fund’s investment objective is to achieve long term growth while generating current income through dividend payments on portfolio securities.
Davenport Equity Opportunities Fund’s investment objective is long term capital appreciation.
Davenport Small Cap Focus Fund’s investment objective is long term capital appreciation.
Davenport Balanced Income Fund’s investment objective is current income and an opportunity for long term growth.
Davenport Core Fund, Davenport Value & Income Fund and Davenport Balanced Income Fund are each classified as a diversified fund. Davenport Equity Opportunities Fund and Davenport Small Cap Focus Fund are each classified as a non-diversified fund.
2. Significant Accounting Policies
As an investment company, as defined in Financial Accounting Standards Board (“FASB”) Accounting Standards Update 2013-08, each Fund follows accounting and reporting guidance under FASB Accounting Standards Codification Topic 946, “Financial Services – Investment Companies.” The following is a summary of the Funds’ significant accounting policies. The policies are in conformity with accounting principles generally accepted in the United States of America (“GAAP”).
Securities valuation — The Funds’ portfolio securities are valued as of the close of business of the regular session of the New York Stock Exchange (normally 4:00 p.m., Eastern time). Securities traded on a national stock exchange, including common stocks, are valued based upon the closing price on the principal exchange where the security is traded, if available, otherwise, at the last quoted bid price. Securities which are quoted by NASDAQ are valued at the NASDAQ Official Closing Price. Investments representing shares of other investment companies, including money market funds, are valued at their net asset value as reported by such companies.
50
THE DAVENPORT FUNDS
NOTES TO FINANCIAL STATEMENTS (Continued)
Fixed income securities, including corporate bonds, are typically valued on the basis of prices provided by an independent pricing service. The prices provided by the pricing service are determined with consideration given to institutional bid and last sale prices and take into account securities prices, yields, maturities, call features, ratings, institutional trading in similar groups of securities and developments related to specific securities.
When market quotations are not readily available, if a pricing service cannot provide a price or the investment adviser believes the price received from the pricing service is not indicative of market value, securities will be valued in good faith at fair value using methods consistent with procedures adopted by the Board of Trustees and will be classified as Level 2 or 3 within the fair value hierarchy (see below), depending on the inputs used. Such methods of fair valuation may include, but are not limited to: multiple of earnings, multiple of book value, discount from market of a similar freely traded security, purchase price of the security, subsequent private transactions in the security or related securities, or a combination of these and other factors.
GAAP establishes a single authoritative definition of fair value, sets out a framework for measuring fair value and requires additional disclosures about fair value measurements.
Various inputs are used in determining the value of the Funds’ investments. These inputs are summarized in the three broad levels listed below:
● Level 1 – quoted prices in active markets for identical securities
● Level 2 – other significant observable inputs
● Level 3 – significant unobservable inputs
Fixed income securities, including corporate bonds, held by Davenport Balanced Income Fund are classified as Level 2 since the values for such securities are based on prices provided by an independent pricing service that utilizes various “other significant observable inputs” including bid and ask quotations, prices of similar securities and interest rates, among other factors.
The inputs or methodology used for valuing securities are not necessarily an indication of the risks associated with investing in those securities. The inputs used to measure fair value may fall into different levels of the fair value hierarchy. In such cases, for disclosure purposes, the level in the fair value hierarchy within which the fair value measurement falls in its entirety is determined based on the lowest level input that is significant to the fair value measurement.
The following is a summary of the inputs used to value the Funds’ investments as of March 31, 2016, by security type:
Davenport Core Fund | | Level 1 | | | Level 2 | | | Level 3 | | | Total | |
Common Stocks | | $ | 327,435,941 | | | $ | — | | | $ | — | | | $ | 327,435,941 | |
Money Market Funds | | | 8,300,704 | | | | — | | | | — | | | | 8,300,704 | |
Total | | $ | 335,736,645 | | | $ | — | | | $ | — | | | $ | 335,736,645 | |
51
THE DAVENPORT FUNDS
NOTES TO FINANCIAL STATEMENTS (Continued)
Davenport Value & Income Fund | | Level 1 | | | Level 2 | | | Level 3 | | | Total | |
Common Stocks | | $ | 431,047,797 | | | $ | — | | | $ | — | | | $ | 431,047,797 | |
Money Market Funds | | | 16,339,652 | | | | — | | | | — | | | | 16,339,652 | |
Total | | $ | 447,387,449 | | | $ | — | | | $ | — | | | $ | 447,387,449 | |
Davenport Equity Opportunities Fund | | Level 1 | | | Level 2 | | | Level 3 | | | Total | |
Common Stocks | | $ | 299,201,563 | | | $ | — | | | $ | — | | | $ | 299,201,563 | |
Money Market Funds | | | 17,824,702 | | | | — | | | | — | | | | 17,824,702 | |
Total | | $ | 317,026,265 | | | $ | — | | | $ | — | | | $ | 317,026,265 | |
Davenport Small Cap Focus Fund | | Level 1 | | | Level 2 | | | Level 3 | | | Total | |
Common Stocks | | $ | 38,999,023 | | | $ | — | | | $ | — | | | $ | 38,999,023 | |
Money Market Funds | | | 604,635 | | | | — | | | | — | | | | 604,635 | |
Total | | $ | 39,603,658 | | | $ | — | | | $ | — | | | $ | 39,603,658 | |
Davenport Balanced Income Fund | | Level 1 | | | Level 2 | | | Level 3 | | | Total | |
Common Stocks | | $ | 10,729,602 | | | $ | — | | | $ | — | | | $ | 10,729,602 | |
Fixed Rate Corporate Bonds | | | — | | | | 5,045,483 | | | | — | | | | 5,045,483 | |
Variable Rate Corporate Bonds | | | — | | | | 1,127,565 | | | | — | | | | 1,127,565 | |
Money Market Funds | | | 1,617,573 | | | | — | | | | — | | | | 1,617,573 | |
Total | | $ | 12,347,175 | | | $ | 6,173,048 | | | $ | — | | | $ | 18,520,223 | |
Refer to each Fund’s Schedule of Investments for a listing of the securities by sector type. As of March 31, 2016, the Funds did not have any transfers into and out of any Level. There were no Level 3 securities or derivative instruments held by the Funds as of March 31, 2016. It is the Funds’ policy to recognize transfers into and out of any Level at the end of the reporting period.
Share valuation — The net asset value per share of each Fund is calculated daily by dividing the total value of its assets, less liabilities, by the number of shares outstanding. The offering price and redemption price per share of each Fund is equal to the net asset value per share.
Investment income — Interest income is accrued as earned. Dividend income is recorded on the ex-dividend date. Discounts and premiums on fixed-income securities are amortized using the interest method. Withholding taxes on foreign dividends have been recorded in accordance with the Funds’ understanding of the appropriate country’s rules and tax rates.
Security transactions — Security transactions are accounted for on trade date for financial reporting purposes. Gains and losses on securities sold are determined on a specific identification basis.
52
THE DAVENPORT FUNDS
NOTES TO FINANCIAL STATEMENTS (Continued)
Common expenses — Common expenses of the Trust are allocated among the series of the Trust based on relative net assets of each series or the nature of the services performed and the relative applicability to each series.
Distributions to shareholders — Dividends arising from net investment income, if any, are declared and paid quarterly to shareholders of Davenport Core Fund, Davenport Value & Income Fund, Davenport Small Cap Focus Fund and Davenport Balanced Income Fund; and declared and paid semi-annually to shareholders of Davenport Equity Opportunities Fund. Net realized short-term capital gains, if any, may be distributed throughout the year and net realized long-term capital gains, if any, are distributed at least once each year. The amount of distributions from net investment income and net realized gains are determined in accordance with federal income tax regulations which may differ from GAAP. Dividends and distributions are recorded on the ex-dividend date.
The tax character of distributions paid during the periods ended March 31, 2016 and March 31, 2015, is as follows:
| Period
Ended | Ordinary
Income | Long-Term
Capital Gains | Total
Distributions |
Davenport Core Fund | 03/31/16 | $ 1,852,639 | $ 11,534,728 | $ 13,387,367 |
| | 03/31/15 | $ 2,802,392 | $ 21,116,652 | $ 23,919,044 |
Davenport Value & Income Fund | 03/31/16 | $ 8,850,088 | $ 19,242,395 | $ 28,092,483 |
| | 03/31/15 | $ 7,486,896 | $ 14,265,278 | $ 21,752,174 |
Davenport Equity Opportunities Fund | 03/31/16 | $ 562,406 | $ 13,926,905 | $ 14,489,311 |
| | 03/31/15 | $ 10,493,395 | $ 11,657,396 | $ 22,150,791 |
Davenport Small Cap Focus Fund | 03/31/16 | $ 37,962 | $ — | $ 37,962 |
| | 03/31/15 | $ — | $ — | $ — |
Davenport Balanced Income Fund | 03/31/16 | $ 29,113 | $ — | $ 29,113 |
Estimates — The preparation of financial statements in conformity with GAAP requires management to make estimates and assumptions that affect the reported amounts of assets and liabilities and disclosure of contingent assets and liabilities as of the date of the financial statements and the reported amounts of income and expenses during the reporting period. Actual results could differ from those estimates.
Federal income tax — Each Fund has qualified and intends to continue to qualify as a regulated investment company under the Internal Revenue Code of 1986 (the “Code”). Qualification generally will relieve the Funds of liability for federal income taxes to the extent 100% of their net investment income and net realized capital gains are distributed in accordance with the Code.
In order to avoid imposition of the excise tax applicable to regulated investment companies, it is also each Fund’s intention to declare as dividends in each calendar year at least 98% of its net investment income (earned during the calendar year) and 98.2% of its net realized capital gains (earned during the twelve months ended October 31) plus undistributed amounts from prior years.
53
THE DAVENPORT FUNDS
NOTES TO FINANCIAL STATEMENTS (Continued)
The following information is computed on a tax basis for each item as of March 31, 2016:
| | Davenport Core Fund | | | Davenport Value & Income Fund | | | Davenport Equity Opportunities Fund | |
Cost of portfolio investments | | $ | 255,130,927 | | | $ | 393,695,903 | | | $ | 305,801,919 | |
Gross unrealized appreciation | | $ | 90,984,384 | | | $ | 72,908,238 | | | $ | 42,507,419 | |
Gross unrealized depreciation | | | (10,378,666 | ) | | | (19,216,692 | ) | | | (31,283,073 | ) |
Net unrealized appreciation | | | 80,605,718 | | | | 53,691,546 | | | | 11,224,346 | |
Undistributed ordinary income | | | 21,930 | | | | 475,505 | | | | — | |
Undistributed long-term gains | | | 4,339,840 | | | | — | | | | 4,091,425 | |
Accumulated capital and other losses | | | — | | | | (6,252,235 | ) | | | (833,320 | ) |
Total distibutable earnings | | $ | 84,967,488 | | | $ | 47,914,816 | | | $ | 14,482,451 | |
| | Davenport Small Cap Focus Fund | | | Davenport Balanced Income Fund | |
Cost of portfolio investments | | $ | 40,625,399 | | | $ | 17,886,274 | |
Gross unrealized appreciation | | $ | 3,410,197 | | | $ | 689,470 | |
Gross unrealized depreciation | | | (4,431,938 | ) | | | (55,521 | ) |
Net unrealized appreciation (depreciation) | | | (1,021,741 | ) | | | 633,949 | |
Undistributed ordinary income | | | — | | | | 7,790 | |
Accumulated capital and other losses | | | (2,560,404 | ) | | | (14,261 | ) |
Total distibutable earnings (accumulated deficit) | | $ | (3,582,145 | ) | | $ | 627,478 | |
The difference between the federal income tax cost of portfolio investments and the financial statement cost for each Fund is due to certain timing differences in the recognition of capital gains and losses under income tax regulations and GAAP. These timing differences are temporary in nature and are due to the tax deferral of losses on wash sales, adjustments to basis on publicly traded partnerships.
Certain capital losses incurred after October 31, 2015 and within the current taxable year, are deemed to arise on the first business day of the Fund’s following taxable year. For the tax year ended March 31, 2016, Davenport Value & Income Fund, Davenport Equity Opportunities Fund, Davenport Small Cap Focus Fund and Davenport Balanced Income Fund deferred until April 1, 2016, post-October capital losses in the amount of $6,252,235, $760,553, $2,310,498 and $14,261, respectively.
Net qualified ordinary late year losses, incurred after December 31, 2015 and within the taxable year, are deemed to arise on the first day of the Funds following taxable year. For the tax year ended March 31, 2016, Davenport Equity Opportunities Fund and Davenport Small Cap Focus Fund deferred until April 1, 2016, qualified ordinary late year losses of $72,767, and $47,439, respectively.
54
THE DAVENPORT FUNDS
NOTES TO FINANCIAL STATEMENTS (Continued)
As of March 31, 2016, Davenport Small Cap Focus Fund had a short-term capital loss carryforward for federal income tax purposes of $202,467, which may be carried forward indefinitely. This capital loss carryforward is available to offset realized capital gains in future years, thereby reducing future taxable gains distributions.
During the year ended March 31, 2016, Davenport Value & Income Fund reclassified $201 of distributions in excess of net realized gains against accumulated net investment income on the Statements of Assets and Liabilities. Also during the year ended March 31, 2016, Davenport Small Cap Focus Fund reclassified $184,774 of net realized losses against distributions in excess of net investment income and $19 of distributions in excess of net investment income against paid-in capital on the Statement of Assets and Liabilities. Such reclassifications, the result of permanent differences between the financial statement and income tax reporting requirements, have no effect on each Fund’s net assets or net asset value per share.
The Funds recognize the tax benefits or expenses of uncertain tax positions only when the position is “more likely than not” to be sustained assuming examination by tax authorities. Management has reviewed the tax positions taken on Federal income tax returns for all applicable open tax years (tax years ended March 31, 2013 through March 31, 2016) of each Fund and has concluded that no provision for unrecognized tax benefits or expenses is required in these financial statements.
3. Investment Transactions
Investment transactions, other than short-term investments and U.S. government securities, were as follows for the period ended March 31, 2016:
| | Davenport
Core Fund | | | Davenport
Value &
Income Fund | | | Davenport Equity Opportunities Fund | |
Purchases of investment securities | | $ | 92,007,284 | | | $ | 145,879,377 | | | $ | 138,711,393 | |
Proceeds from sales and maturities of investment securities | | $ | 72,042,705 | | | $ | 99,857,314 | | | $ | 84,679,872 | |
| | Davenport Small Cap Focus Fund | | | Davenport Balanced Income Fund | |
Purchases of investment securities | | $ | 34,787,222 | | | $ | 16,851,274 | |
Proceeds from sales and maturities of investment securities | | $ | 17,338,047 | | | $ | 612,374 | |
55
THE DAVENPORT FUNDS
NOTES TO FINANCIAL STATEMENTS (Continued)
4. Transactions with Related Parties
INVESTMENT ADVISORY AGREEMENTS
Each Fund’s investments are managed by Davenport & Company LLC (the “Adviser”) under the terms of an Investment Advisory Agreement. Under the Investment Advisory Agreement, each Fund pays the Adviser a fee, which is computed and accrued daily and paid monthly, at an annual rate of .75% on its average daily net assets. Certain officers and a Trustee of the Trust are also officers of the Adviser.
The Adviser has agreed, until August 1, 2017 for Davenport Small Cap Focus Fund and Davenport Balanced Income Fund, to reduce its investment advisory fees and to reimburse other operating expenses to the extent necessary to limit total annual operating expenses (excluding acquired fund fees and expenses) of each such Fund to an amount not exceeding 1.25% of average daily net assets. Any such fee reductions by the Adviser, or payments by the Adviser of expenses which are Davenport Small Cap Focus Fund’s and Davenport Balanced Income Fund’s obligation, are subject to repayment by the Funds for a period of three years from the end of the fiscal year when such fee reductions or reimbursements occurred, provided the Funds are able to effect such repayment and remain in compliance with the undertaking by the Adviser to limit expenses of the Funds. During the year ended March 31, 2016, the Adviser recouped from Davenport Small Cap Focus Fund $10,744 of previous advisory fee reductions. As of March 31, 2016, all advisory fee reductions and expense reimbursements have been repaid to the Adviser by Davenport Small Cap Focus Fund. During the period ended March 31, 2016, the Adviser did not collect any of its advisory fees from Davenport Balanced Income Fund and reimbursed such Fund for $5,730 of other operating expenses. The Adviser may seek repayment of such advisory fee reductions and expense reimbursements in the amount of $23,128 no later than March 31, 2019.
OTHER SERVICE PROVIDERS
Ultimus Fund Solutions, LLC (“Ultimus”) provides fund administration, fund accounting, compliance and transfer agent services to the Funds. The Funds pay Ultimus fees in accordance with the agreements for such services. In addition, the Funds pay out-of-pocket expenses including, but not limited to, postage, supplies, and costs of pricing the Funds’ portfolio securities. Certain officers of the Trust are also officers of Ultimus, or of Ultimus Fund Distributors, LLC (the “Distributor”), the principal underwriter of each Fund’s shares and an affiliate of Ultimus. The Distributor is compensated by the Adviser (not the Funds) for acting as principal underwriter.
COMPENSATION OF TRUSTEES
Trustees and officers affiliated with an investment adviser to the Trust or Ultimus are not compensated by the Trust for their services. Each Trustee who is not an affiliated person of an investment adviser or Ultimus receives from the Trust an annual retainer of $12,000, payable quarterly; a fee of $1,500 for attendance at each meeting of the Board of Trustees (except that such fee is $2,500 for the independent chairman); and a fee of $1,000 for attendance at each meeting of any committee of the Board (except that such fee is $1,500 for the committee chairman); plus
56
THE DAVENPORT FUNDS
NOTES TO FINANCIAL STATEMENTS (Continued)
reimbursement of travel and other expenses incurred in attending meetings. Each Fund in the Trust pays its proportionate share of such fees. Effective April 1, 2016, the annual retainer will increase to $15,000, payable quarterly.
5. Sector Risk
If a Fund has significant investments in the securities of issuers in industries within a particular sector, any development affecting that sector will have a greater impact on the value of the net assets of the Fund than would be the case if the Fund did not have significant investments in that sector. In addition, this may increase the risk of loss of an investment in the Fund and increase the volatility of the Fund’s net asset value per share. From time to time, circumstances may affect a particular sector and the companies within such sector. For instance, economic or market factors, regulation or deregulation, or other developments may negatively impact all companies in a particular sector and therefore the value of a Fund’s portfolio would be adversely affected. As of March 31, 2016, Davenport Value & Income Fund had 28.8% of the value of its net assets invested in stocks within the Financials sector; Davenport Equity Opportunities Fund had 33.3% and 32.7% of the value of its net assets invested in stocks within the Consumer Discretionary sector and Financials sector, respectively; Davenport Small Cap Focus Fund had 28.4% and 26.8% of the value of its net assets invested in stocks within the Consumer Discretionary sector and Financials sector, respectively; and Davenport Balanced Income Fund had 29.7% of the value of its net assets invested in stocks and bonds within the Financials sector.
6. Contingencies and Commitments
The Funds indemnify the Trust’s officers and Trustees for certain liabilities that might arise from their performance of their duties to the Funds. Additionally, in the normal course of business the Funds enter into contracts that contain a variety of representations and warranties and which provide general indemnifications. The Funds’ maximum exposure under these arrangements is unknown, as this would involve future claims that may be made against the Funds that have not yet occurred. However, based on experience, the Funds expect the risk of loss to be remote.
7. Subsequent Events
The Funds are required to recognize in the financial statements the effects of all subsequent events that provide additional evidence about conditions that existed as of the date of the Statements of Assets and Liabilities. For non-recognized subsequent events that must be disclosed to keep the financial statements from being misleading, the Funds are required to disclose the nature of the event as well as an estimate of its financial effect, or a statement that such an estimate cannot be made. Management has evaluated subsequent events through the issuance of these financial statements and has noted no such events.
57
THE DAVENPORT FUNDS
REPORT OF INDEPENDENT REGISTERED
PUBLIC ACCOUNTING FIRM
To the Shareholders of The Davenport Funds and
Board of Trustees of Williamsburg Investment Trust
We have audited the accompanying statements of assets and liabilities, including the schedules of investments, of Davenport Core Fund, Davenport Value & Income Fund, Davenport Equity Opportunities Fund, Davenport Small Cap Focus Fund and Davenport Balanced Income Fund (“The Davenport Funds” or “Funds”), each a series of Williamsburg Investment Trust, as of March 31, 2016, and the related statements of operations and changes in net assets and the financial highlights for the year then ended for Davenport Core Fund, Davenport Value & Income Fund, Davenport Equity Opportunities Fund, and Davenport Small Cap Focus Fund, and for the period December 31, 2015 (commencement of operations) through March 31, 2016 for Davenport Balanced Income Fund. These financial statements and financial highlights are the responsibility of the Funds’ management. Our responsibility is to express an opinion on these financial statements and financial highlights based on our audit. The Funds’ financial statements and financial highlights for the years ended prior to March 31, 2016, were audited by other auditors, whose report dated May 22, 2015, expressed an unqualified opinion on those statements and financial highlights.
We conducted our audit in accordance with the standards of the Public Company Accounting Oversight Board (United States). Those standards require that we plan and perform the audit to obtain reasonable assurance about whether the financial statements and financial highlights are free of material misstatement. An audit includes examining, on a test basis, evidence supporting the amounts and disclosures in the financial statements. Our procedures included confirmation of securities owned as of March 31, 2016, by correspondence with the custodian and brokers. An audit also includes assessing the accounting principles used and significant estimates made by management, as well as evaluating the overall financial statement presentation. We believe that our audit provides a reasonable basis for our opinion.
In our opinion, the financial statements and financial highlights referred to above present fairly, in all material respects, the financial position of each of the Funds as of March 31, 2016, the results of their operations, the changes in their net assets, and the financial highlights for the year or period then ended, in conformity with accounting principles generally accepted in the United States of America.
COHEN FUND AUDIT SERVICES, LTD.
Cleveland, Ohio
May 26, 2016
58
THE DAVENPORT FUNDS
BOARD OF TRUSTEES AND EXECUTIVE OFFICERS
(Unaudited)
Overall responsibility for management of the Funds rests with the Board of Trustees. The Trustees serve during the lifetime of the Trust and until its termination, or until death, resignation, retirement or removal. The Trustees, in turn, elect the officers of the Funds. The officers have been elected for an annual term. The following are the Trustees and executive officers of the Funds:
| Trustees
and Officers | Address | Year of Birth | Position Held
with the Trust | Length of
Time Served |
| Robert S. Harris, Ph.D. | 100 Darden Boulevard
Charlottesville, VA | 1949 | Chairman and Trustee | Since
January 2007 |
* | John P. Ackerly, IV | One James Center
901 E. Cary Street
Richmond, VA | 1963 | Trustee and President of Davenport Funds | Since
November 1997 |
* | John T. Bruce | 800 Main Street
Lynchburg, VA | 1953 | Trustee and President of
FBP Funds | Since
September 1988 |
| | George K. Jennison | 5101 Stratford Crescent Richmond, VA 23226 | 1957 | Trustee | Since
January 2015 |
| Harris V. Morrissette | 100 Jacintoport Boulevard
Saraland, AL | 1959 | Trustee | Since
March 1993 |
| | Elizabeth W. Robertson | 305 Marston Lane
Richmond, VA | 1953 | Trustee | Since
February 2014 |
| | George L. Smith, III | One James Center
901 E. Cary Street
Richmond, VA | 1976 | Vice President | Since
February 2011 |
| Robert G. Dorsey | 225 Pictoria Drive,
Suite 450
Cincinnati, OH | 1957 | Vice President | Since
November 2000 |
| Mark J. Seger | 225 Pictoria Drive,
Suite 450
Cincinnati, OH | 1962 | Treasurer | Since
November 2000 |
| Tina H. Bloom | 225 Pictoria Drive,
Suite 450
Cincinnati, OH | 1968 | Chief Compliance Officer and
Secretary | Since
August 2006 |
* | Messrs. Ackerly and Bruce, as affiliated persons of investment advisers to the Trust, are “interested persons” of the Trust within the meaning of Section 2(a)(19) of the Investment Company Act of 1940. |
59
THE DAVENPORT FUNDS
BOARD OF TRUSTEES AND EXECUTIVE OFFICERS
(Unaudited) (Continued)
Each Trustee oversees twelve portfolios of the Trust, including the Funds. The principal occupations of the Trustees and executive officers of the Funds during the past five years and public directorships held by the Trustees are set forth below:
Robert S. Harris, Ph.D. is the C. Stewart Sheppard Professor of Business Administration at The Darden Graduate School of Business Administration at the University of Virginia. He was previously the dean at Darden. Professor Harris has published widely on corporate finance, financial markets and mergers and acquisitions and has served as a consultant to corporations and government agencies.
John P. Ackerly, IV is Senior Vice President and Portfolio Manager of the Adviser.
John T. Bruce is President, Director and member of the Executive Committee of Flippin, Bruce & Porter, Inc. (an investment advisory firm).
George K. Jennison is President of Oyster Consulting, LLC (a financial consulting firm). He previously was a financial adviser with Wells Fargo Advisors, LLC.
Harris V. Morrissette is President of China Doll Rice and Beans, Inc. and Dixie Lily Foods. He is also a Director of International Shipholding Corporation (cargo transportation) and a Director of Trustmark National Bank (bank holding company). Previously, he was Chairman of Azalea Aviation, Inc. (airplane fueling) until January 2012.
Elizabeth W. Robertson is Chief Financial Officer for Monument Restaurants LLC (restaurant franchises) and a Director of Towne Bank.
George L. Smith, III is Senior Vice President and Portfolio Manager of the Adviser.
Robert G. Dorsey is a Managing Director of Ultimus Fund Solutions, LLC and Ultimus Fund Distributors, LLC.
Mark J. Seger is a Managing Director of Ultimus Fund Solutions, LLC and Ultimus Fund Distributors, LLC.
Tina H. Bloom is Director of Fund Administration of Ultimus Fund Solutions, LLC.
Additional information about members of the Board of Trustees and executive officers is available in the Statement of Additional Information (“SAI”). To obtain a free copy of the SAI, please call 1-800-281-3217.
60
THE DAVENPORT FUNDS
YOUR FUNDS’ EXPENSES (Unaudited)
We believe it is important for you to understand the impact of costs on your investment. All mutual funds have operating expenses. As a shareholder of the Funds, you incur ongoing costs, including management fees and other expenses. These ongoing costs, which are deducted from each Fund’s gross income, directly reduce the investment return of the Funds.
A mutual fund’s ongoing costs are expressed as a percentage of its average net assets. This figure is known as the expense ratio. The following examples are intended to help you understand the ongoing costs (in dollars) of investing in the Funds and to compare these costs with the ongoing costs of investing in other mutual funds. The examples below are based on an investment of $1,000 made at the beginning of the period shown and held for the entire period (October 1, 2015 for Davenport Core Fund, Davenport Value & Income Fund, Davenport Equity Opportunities Fund and Davenport Small Cap Focus Fund and December 31, 2015 for Davenport Balanced Income Fund) and held through March 31, 2016).
The table below illustrates each Fund’s ongoing costs in two ways:
Actual fund return – This section helps you to estimate the actual expenses that you paid over the period. The “Ending Account Value” shown is derived from each Fund’s actual return, and the fourth column shows the dollar amount of operating expenses that would have been paid by an investor who started with $1,000 in the Funds. You may use the information here, together with the amount you invested, to estimate the expenses that you paid over the period.
To do so, simply divide your account value by $1,000 (for example, an $8,600 account value divided by $1,000 = 8.6), then multiply the result by the number given for the applicable Fund under the heading “Expenses Paid During Period.”
Hypothetical 5% return – This section is intended to help you compare each Fund’s ongoing costs with those of other mutual funds. It assumes that each Fund had an annual return of 5% before expenses during the period shown, but that the expense ratio is unchanged. In this case, because the return used is not each Fund’s actual return, the results do not apply to your investment. The example is useful in making comparisons because the Securities and Exchange Commission (“SEC”) requires all mutual funds to calculate expenses based on a 5% return. You can assess each Fund’s ongoing costs by comparing this hypothetical example with the hypothetical examples that appear in shareholder reports of other funds.
Note that expenses shown in the table are meant to highlight and help you compare ongoing costs only. The Funds do not charge sales loads or redemption fees.
The calculations assume no shares were bought or sold during the period. Your actual costs may have been higher or lower, depending on the amount of your investment and the timing of any purchases or redemptions.
More information about each Fund’s expenses, including historical annual expense ratios, can be found in this report. For additional information on operating expenses and other shareholder costs, please refer to the Funds’ prospectus.
61
THE DAVENPORT FUNDS
YOUR FUNDS’ EXPENSES (Unaudited) (Continued)
| Beginning
Account Value
October 1, 2015 | Ending
Account Value
March 31, 2016 | Expense
Ratio(a) | Expenses Paid
During Period(b) |
Davenport Core Fund | | | | |
Based on Actual Fund Return | $1,000.00 | $1,040.80 | 0.92% | $4.69 |
Based on Hypothetical 5% Return (before expenses) | $1,000.00 | $1,020.40 | 0.92% | $4.65 |
Davenport Value & Income Fund | | | | |
Based on Actual Fund Return | $1,000.00 | $1,083.80 | 0.91% | $4.74 |
Based on Hypothetical 5% Return (before expenses) | $1,000.00 | $1,020.45 | 0.91% | $4.60 |
Davenport Equity Opportunities Fund | | | |
Based on Actual Fund Return | $1,000.00 | $1,053.00 | 0.93% | $4.77 |
Based on Hypothetical 5% Return (before expenses) | $1,000.00 | $1,020.35 | 0.93% | $4.70 |
Davenport Small Cap Focus Fund |
Based on Actual Fund Return | $1,000.00 | $1,028.60 | 1.11% | $5.63 |
Based on Hypothetical 5% Return (before expenses) | $1,000.00 | $1,019.45 | 1.11% | $5.60 |
(a) | Annualized, based on the Fund’s most recent one-half year expenses. |
(b) | Expenses are equal to the Fund’s annualized expense ratio multiplied by the average account value over the period, multiplied by 183/366 (to reflect the one-half year period). |
| Beginning
Account Value
October 1, 2015(a) | Ending
Account Value
March 31, 2016 | Net Expense
Ratio(b) | Expenses Paid
During Period(c) |
Davenport Balanced Income Fund | | | | |
Based on Actual Fund Return | $1,000.00 | $1,029.00 | 1.25% | $3.19 |
Based on Hypothetical 5% Return (before expenses) | $1,000.00 | $1,018.75 | 1.25% | $6.31 |
(a) | Beginning Account Value is as of December 31, 2015 (date of commencement of operations) for the Actual Fund Return information. |
(b) | Annualized, based on the Fund’s net expenses for the period since the commencement of operations (December 31, 2015). |
(c) | Expenses are equal to the Fund’s annualized net expense ratio multiplied by the average account value over the period, multiplied by 92/366 (to reflect the period since inception) and 183/366 (to reflect the one-half year period), for Actual Fund Return and Hypothectical 5% Return information, respectively. |
62
THE DAVENPORT FUNDS
OTHER INFORMATION (Unaudited) |
A description of the policies and procedures that the Funds use to vote proxies relating to portfolio securities is available without charge upon request by calling toll-free 1-800-281-3217, or on the SEC’s website at http://www.sec.gov. Information regarding how the Funds voted proxies relating to portfolio securities during the most recent 12-month period ended June 30 is also available without charge upon request by calling toll-free 1-800-281-3217, or on the SEC’s website at http://www.sec.gov.
The Trust files a complete listing of portfolio holdings for each Fund with the SEC as of the end of the first and third quarters of each fiscal year on Form N-Q. These filings are available upon request by calling 1-800-281-3217. Furthermore, you may obtain a copy of these filings on the SEC’s website at http://www.sec.gov. The Trust’s Forms N-Q may also be reviewed and copied at the SEC’s Public Reference Room in Washington, DC, and information on the operation of the Public Reference Room may be obtained by calling 1-800-SEC-0330.
A complete listing of portfolio holdings for each Fund is updated daily and can be reviewed at the Funds’ website at http://www.investdavenport.com.
CHANGE IN INDEPENDENT AUDITOR
On February 23, 2016, Cohen Fund Audit Services, Ltd. (“Cohen”) was selected as the Funds’ new independent auditor, replacing Ernst & Young LLP (“EY”) as independent auditor of the Funds. The Funds’ selection of Cohen as independent auditor was recommended and approved by the Trust’s Audit Committee and was ratified by the Trust’s Board of Trustees.
EY’s reports on the Funds’ financial statements for the prior two fiscal years did not contain an adverse opinion or a disclaimer of opinion, and were not qualified or modified as to uncertainty, audit scope or accounting principles. During such fiscal years, and through the date of EY’s replacement, there were no disagreements between the Trust and EY on any matter of accounting principles or practices, financial statement disclosure, or auditing scope or procedures, which disagreements, if not resolved to the satisfaction of EY, would have caused it to make reference to the subject matter of the disagreements in connection with its reports on the financial statements for such years. Prior to February 23, 2016, Cohen was not contacted during the prior two fiscal years regarding the application of accounting principles to any particular financial matter.
63
THE DAVENPORT FUNDS
FEDERAL TAX INFORMATION (Unaudited) |
In accordance with federal tax requirements, the following provides shareholders with information concerning distributions from ordinary income and net realized capital gains made by the Funds during the year ended March 31, 2016. During the year ended March 31, 2016, Davenport Core Fund, Davenport Value & Income Fund and Davenport Equity Opportunities Fund paid long-term capital gain distributions of $11,534,728, $19,242,395 and $13,926,905, respectively. Certain dividends paid by the Funds may be subject to a maximum rate of 23.8%. Davenport Core Fund, Davenport Value & Income Fund, Davenport Equity Opportunities Fund, Davenport Small Cap Focus Fund and Davenport Balanced Income Fund intend to designate up to a maximum amount of $1,852,639, $8,850,088, $562,406, $37,962 and $29,113, respectively, as taxed at a maximum rate of 23.8%. For the fiscal year ended March 31, 2016, 100% of the dividends paid from ordinary income by each Fund qualified for the dividends received deduction for corporations.
As required by federal regulations, complete information will be computed and reported in conjunction with your 2016 1099-DIV.
64
THE DAVENPORT FUNDS
DISCLOSURE REGARDING APPROVAL OF
INVESTMENT ADVISORY AGREEMENT (Unaudited)
At an in-person meeting held on February 23, 2016, the Board of Trustees, including a majority of the Independent Trustees, approved the continuance for a one-year period of the Investment Advisory Agreements with the Adviser on behalf of Davenport Core Fund, the Davenport Value & Income Fund, the Davenport Equity Opportunities Fund and the Davenport Small Cap Focus Fund. Below is a discussion of the factors considered by the Board of Trustees along with the conclusions with respect thereto that formed the basis for the Board’s approval.
In selecting the Adviser and approving the continuance of the Investment Advisory Agreements, the Trustees considered all information they deemed reasonably necessary to evaluate the terms of the Agreements. The principal areas of review by the Trustees were the nature, extent and quality of the services provided by the Adviser and the reasonableness of the fees charged for those services. These matters were considered by the Independent Trustees consulting with experienced counsel for the Independent Trustees, who is independent of the Adviser.
The Trustees’ evaluation of the quality of the Adviser’s services took into account their knowledge and experience gained through meetings with and reports of the Adviser’s senior management over the course of the preceding year. Both short-term and long-term investment performance of the Funds was considered. Each Fund’s performance was compared to its performance benchmark and to that of competitive funds with similar investment objectives and to the Adviser’s comparably managed private accounts. The Trustees also considered the scope and quality of the in-house capabilities of the Adviser and other resources dedicated to performing services for the Funds. The quality of administrative and other services, including the Adviser’s role in coordinating the activities of the Funds’ other service providers, were considered in light of the Funds’ compliance with investment policies and applicable laws and regulations and of related reports by management and the Funds’ independent public accounting firm in periodic meetings with the Trust’s Audit Committee. The Trustees also considered the business reputation of the Adviser, the qualifications of its key investment and compliance personnel, and its financial resources.
In reviewing the fees payable under the Investment Advisory Agreements, the Trustees compared the advisory fees and overall expense levels of each Fund with those of competitive funds with similar investment objectives as well as the private accounts managed by the Adviser. The Trustees considered information provided by the Adviser concerning the Adviser’s profitability with respect to each Fund, including the assumptions and methodology used in preparing the profitability information, in light of applicable case law relating to advisory fees. For these purposes, the Trustees took into account not only the fees paid by the Funds, but also so-called “fallout” benefits to the Adviser. The Trustees also considered the fact that all of the Funds’ portfolio trades were executed by the Adviser at no cost to the Funds. In evaluating each Fund’s advisory fees, the Trustees took into account the complexity and quality of the investment management of the Fund.
65
THE DAVENPORT FUNDS
DISCLOSURE REGARDING APPROVAL OF
INVESTMENT ADVISORY AGREEMENT (Unaudited)
(Continued)
Based upon their review of this information, the Independent Trustees concluded that: (i) based on the performance of each of the Funds, the Adviser’s demonstrated commitment to long-term investing and its team-oriented management approach, the Adviser has provided quality services to the Funds; (ii) the advisory fees payable by each Fund to the Adviser are competitive with fees for comparably managed funds and the Independent Trustees believe the fees to be reasonable given the scope and quality of services provided by the Adviser and the resources that are dedicated to its investment process; (iii) the total operating expense ratio of each Fund is lower than the average expense ratio for comparably managed funds, according to statistics derived from Morningstar, Inc.; (iv) the Adviser has further benefited the Funds’ shareholders by executing portfolio transactions at no cost to the Funds; and (v) the profits of the Adviser with respect to its management of the Funds are reasonable.
The Independent Trustees considered the extent to which economies of scale are being realized as the Funds grow and whether fee levels reflect these economies of scale. The Independent Trustees also considered the “fallout” benefits to the Adviser with respect to the Funds, but given the amounts involved viewed these as secondary factors in connection with the evaluation of the reasonableness of the advisory fees paid by the Funds.
No single factor was considered in isolation or to be determinative to the decision of the Trustees to approve continuance of the Investment Advisory Agreements. Rather the Trustees concluded, in light of a weighing and balancing of all factors considered, that it was in the best interests of each Fund and its shareholders to continue the Investment Advisory Agreements without modification to its terms, including the fees charged for services thereunder.
66
This page intentionally left blank.
This page intentionally left blank.
| | THE DAVENPORT FUNDS Investment Adviser
Davenport & Company LLC
One James Center
901 East Cary Street
Richmond, Virginia 23219-4037 Administrator
Ultimus Fund Solutions, LLC
P.O. Box 46707
Cincinnati, Ohio 45246-0707
1-800-281-3217 Custodian
U.S. Bank, N.A.
425 Walnut Street
Cincinnati, Ohio 45202 Independent Registered Public
Accounting Firm
Cohen Fund Audit Services, Ltd.
1350 Euclid Avenue
Suite 800
Cleveland, Ohio 44115 Legal Counsel
Sullivan & Worcester LLP
One Post Office Square
Boston, Massachusetts 02109 Board of Trustees
Robert S. Harris, Ph.D., Chairman
John P. Ackerly, IV
John T. Bruce
George K. Jennison
Harris V. Morrissette
Elizabeth W. Robertson Officers
John P. Ackerly, IV, President
George L. Smith, III, Vice President
|

One James Center
901 East Cary Street
Richmond, VA 23219
Davenport & Company LLC
Member: NYSE ● SIPC
Toll Free: (800) 846-6666
www.investdavenport.com
FBP Equity & Dividend Plus Fund FBP Appreciation & Income Opportunities Fund Annual Report March 31, 2016 No-Load Funds |
Letter to Shareholders | May 19, 2016 |
We are pleased to report on your Funds and their investments for the annual period ended March 31, 2016 and to provide some additional information since we last communicated with you.
Economic and Market Update
The markets have had a very nice recovery since our last report to you, which was for the period ended September 30, 2015. For the six months ended March 31, 2016, the FBP Equity & Dividend Plus Fund gained 8.06% and the FBP Appreciation & Income Opportunities Fund gained 5.10%. As we discussed in that last report, with the selloff in stocks in September, the reward versus risk profile of stocks had improved. Others saw that as well and investors drove stock prices higher into yearend 2015. Calendar 2016 started with a bumpy ride, as stocks fell nearly 11% through early February before enjoying a strong rally to close the quarter and the fiscal year.
Slowing economic growth in China would have to be near the top of the list of factors for the market weakness early in 2016. Policy makers in Beijing were obviously concerned enough about softening economic growth to initiate another wave of currency devaluation in early January. Later that month, a surprise announcement by the Bank of Japan to adopt a negative interest rate policy also worried investors. Furthermore, commodity price weakness, geopolitical tensions, looming interest rate increases and election year uncertainty contributed to the elevated levels of fear in the equity markets. Bank stocks were particularly weak and momentum stocks, biotechs for example, collapsed. Amid that backdrop, some analysts began lowering U.S. GDP projections, and recessionary fears began to surface.
While China deserves much of the blame for the downturn in January, U.S. Federal Reserve (the “Fed”) Chair Janet Yellen gets at least some credit for this recent market rally. Congressional testimony by Yellen in February and the actual FOMC statement in March made it clear that future Fed actions to raise interest rates would be measured and take into consideration ongoing data points, including financial market conditions. As U.S. economic reports were released during the quarter, the domestic economy continued to show modest strength even in the face of the headwinds noted above. Payrolls increased by more than 200,000, and the unemployment rate ticked lower to 4.9% in January and February before ending the quarter unchanged at 5%. Even the labor participation rate moved up, advancing for the fourth straight month as more Americans joined the workforce. Another positive was evident in commodity prices, which moved higher late in the quarter. A number of oil and gas exploration companies announced further cuts to their capital expenditure plans, and subsequently crude oil prices staged a significant rally. In a sign of confidence, Jamie Dimon, CEO of JPMorgan, bought a significant stake in his company’s stock on February 11, the market low, helping to arrest the bank stock panic. Reassuring language from Chinese officials concerning their economy also reduced some of the previous bearish sentiment. What we witnessed this quarter was a growth scare that has now passed. The U.S. economy remains in a slow growth mode, and is accompanied by low inflation and low interest rates.
With the Fed softening its plan to raise the fed funds rate multiple times in 2016 and with volatile equity prices contributing to a “flight to quality” environment, interest rates for U.S. government bonds fell sharply during the most recent quarter. The ten-year bond yield fell to 1.78% from 2.27% at the end of calendar 2015, touching low levels not seen since 2012.
As we look forward, the slow growth environment certainly gives us concern about the strength of corporate profits. Current expectations are for very modest increases. While the last two quarters displayed weak GDP growth, some recent indicators may well be pointing to an improved environment. The Federal Reserve Bank
1
of Atlanta’s GDP Now growth tracker estimates the U.S. economy is expanding at a 2.5% clip in the second quarter, and U.S. crude-oil prices have extended their sharp rebound, hitting levels last seen in November. While not gangbuster growth, improved earnings from energy and industrial companies combined with slightly higher growth may well be a surprise and produce earning growth above expectations. With the S&P 500 Index trading at approximately 16 times estimated earnings, valuation is elevated but not extreme, especially when considering the level of interest rates. In this environment, we expect to see continued restructuring by companies, acquisitions to increase growth opportunities and stock buybacks. Our focus continues to be on investing in undervalued companies that are returning cash to shareholders through above average and increasing dividends and through share repurchases. Our use of covered call options is an additional enhancement to increase the cash flow received by the Funds.
FBP Equity & Dividend Plus Fund Review
The FBP Equity & Dividend Plus Fund returned -2.31% for the fiscal year ended March 31, 2016. The S&P 500 Index (the “Index”) returned 1.78% over the same period. The Fund was 94.4% equity and 5.6% cash at fiscal year end. Returns were weak over the first half of the reporting period and improved in the second half. In the earlier period, a concentrated number of large, fast growing technology and healthcare companies (Facebook, Amazon, Netflix, Google and Allergan) led the market. Value and dividend focused strategies, similar to those used to manage the Funds, lagged. The Funds relative returns were also held back by exposure to more cyclical Energy, Materials and Consumer Discretionary investments. Since our last report to you for the period ended September 30, 2015, the Fund has gained 8.06% versus 8.49% for the Index. Sentiment shifted during this period and stocks displaying value characteristics benefited. Higher dividend yielding sectors such as Healthcare, Telecommunications and Utilities were positive contributors. In addition, a number of cyclically-oriented stocks, which were heavily discounted during the market selloff due to recessionary fears, saw strong stock price rebounds. The Information Technology, Industrials and Consumer Staples sectors aided results. Materials continued to be a drag on the Fund due to low commodity prices while Financials were weighted down by dovish talk from the Fed. We sold shares of Potash Corp. and Noble Corp. over growing concerns about their ability to sustain dividend payout rates and reduced the size of the Coca Cola holding based on valuation. The Fund purchased a new position in Mosaic Corp., a major global supplier of agricultural fertilizer which could be viewed as a replacement for Potash. Mosaic has an attractive dividend yield and trades at a significant discount to its long-term replacement value. The Fund also purchased KeyCorp, a Cleveland-based regional bank, which trades at attractive valuation levels and has an expected above-average earnings growth rate.
FBP Appreciation & Income Opportunities Fund Review
The FBP Appreciation & Income Opportunities Fund returned -4.48% for the fiscal year ended March 31, 2016. The S&P 500 Index (the “Index”) returned 1.78% and the Barclays U.S. Government/Credit Index returned 1.75% over the same period. The Fund was 75.5% equity, 10.7% fixed income and 13.8% cash at fiscal year end. Returns were especially weak over the first half of the reporting period with some improvement over the second half. Value strategies lagged over the earlier period as momentum and growth oriented strategies did well with market leadership concentrated in a small number of large, fast growing technology and healthcare names (Facebook, Amazon, Netflix, Google and Allergan). The Funds relative returns were also held back by exposure to more cyclical Energy, Materials and Consumer Discretionary sectors.
However, since our last report to you for the period ended September 30, 2015, the Fund has gained 5.10% versus 8.49% for the Index and 2.70% for the Barclays U.S. Government/Credit Index. Sentiment shifted during this period and stocks displaying value characteristics benefited. Higher dividend yielding sectors such as Telecommunications and Utilities were positive contributors. In addition, a number of cyclically-
2
oriented stocks, which were heavily discounted during the market selloff due to recessionary fears, saw strong stock price rebounds. Information Technology and Industrials did especially well. Energy, while recovering near the end of the period, continued to be a drag on the Fund due to low commodity prices while Financials were weighted down by dovish talk from the Fed. The Fund recently increased its ownership in Bloomin’ Brands, operator of Outback Steakhouse, Fleming’s Prime Steakhouse, Carrabba’s Italian Grill and Bonefish Grill. The first purchase of Bloomin’ Brands was last fall and we believe its formats offer significant growth opportunities, trading at an especially attractive valuation of less than 12 times forward earnings. The Fund also made an opportunistic purchase of a Pioneer Natural Resources bond when spreads had widened over energy concerns. Additionally, the Fund made its first purchase of a closed-end high yield fund last September, when the fund was trading at an attractive yield and significant discount to its net asset value.
We want to thank you for your continued support and investment in the Flippin, Bruce & Porter Funds. Please visit our website at www.fbpfunds.com for information on your Funds and the investment philosophy and process we utilize to achieve their investment objectives.

John T. Bruce, CFA
President - Portfolio Manager
May 18, 2016
Data presented reflects past performance, which is no guarantee of future results. Investment results and principal value will fluctuate so that shares, when redeemed, may be worth more or less than their original cost. Due to market volatility, current performance may be higher or lower than the performance shown. Updated performance information, current through the most recent month-end, is available by contacting the Funds at 1-866-738-1127.
This report is submitted for the general information of the shareholders of the Funds. It reflects our views, opinions and portfolio holdings as of the date of this letter. These views are subject to change at any time based upon market or other conditions. For more current information throughout the year please visit www.fbpfunds.com or call the Funds at 1-866-738-1127. This report is not authorized for distribution to prospective investors in the Funds unless accompanied by a current prospectus.
3
THE FLIPPIN, BRUCE & PORTER FUNDS
COMPARATIVE PERFORMANCE CHARTS
(Unaudited)
Performance for each Fund is compared to the most appropriate broad-based index, the Standard and Poor’s 500® Index, an unmanaged index of 500 large common stocks. Results are also compared to the Consumer Price Index, a measure of inflation.

4
THE FLIPPIN, BRUCE & PORTER FUNDS
COMPARATIVE PERFORMANCE CHARTS
(Unaudited) (Continued)
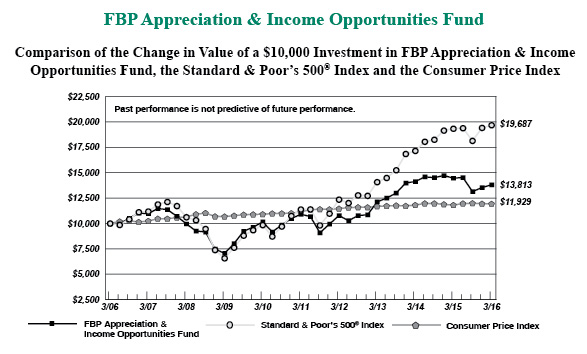
Average Annual Total Returns(a) (for periods ended March 31, 2016) |
| 1 Year | 5 Years | 10 Years |
FBP Equity & Dividend Plus Fund | (2.31%) | 5.19% | 2.04% |
FBP Appreciation & Income Opportunities Fund | (4.48%) | 4.85% | 3.28% |
Standard & Poor’s 500® Index | 1.78% | 11.58% | 7.01% |
Consumer Price Index | 1.02% | 1.39% | 1.78% |
(a) | Total returns are a measure of the change in value of an investment in the Funds over the periods covered, which assumes any dividends or capital gains distributions are reinvested in shares of the Funds. Returns do not reflect the deduction of taxes a shareholder would pay on the Funds’ distributions or the redemption of Fund shares. |
5
FBP EQUITY & DIVIDEND PLUS FUND
PORTFOLIO INFORMATION
March 31, 2016 (Unaudited)
General Information | | | |
Net Asset Value Per Share | | $ | 22.65 | |
Total Net Assets (Millions) | | $ | 24.8 | |
Current Expense Ratio | | | 1.07 | % |
Portfolio Turnover | | | 21 | % |
Fund Inception Date | | 7/30/1993 | |
Stock Characteristics | | Fund | | | S&P 500® Index | |
Number of Stocks | | | 53 | | | | 500 | |
Weighted Avg Market Capitalization (Billions) | | $ | 123.9 | | | $ | 127.9 | |
Price-to-Earnings Ratio (Bloomberg 1 Yr. Forecast EPS) | | | 13.9 | | | | 15.2 | |
Price-to-Book Value | | | 1.8 | | | | 2.6 | |
Asset Allocation (% of Net Assets) |
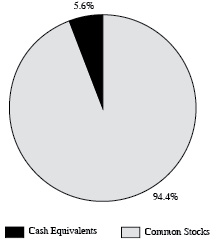
|
Sector Diversification vs. the S&P 500® Index |
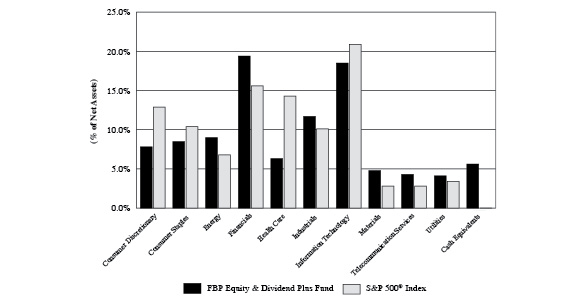
Ten Largest Equity Holdings | % of Net Assets |
JPMorgan Chase & Company | 3.7% |
Procter & Gamble Company (The) | 3.3% |
Cisco Systems, Inc. | 3.1% |
Merck & Company, Inc. | 2.7% |
Apple, Inc. | 2.7% |
General Electric Company | 2.7% |
AT&T, Inc. | 2.5% |
Western Union Company (The) | 2.5% |
FirstEnergy Corporation | 2.5% |
Microsoft Corporation | 2.5% |
6
FBP APPRECIATION & INCOME OPPORTUNITIES FUND
PORTFOLIO INFORMATION
March 31, 2016 (Unaudited)
General Information | |
Net Asset Value Per Share | | $ | 16.55 | |
Total Net Assets (Millions) | | $ | 31.7 | |
Current Expense Ratio | | | 1.00 | % |
Portfolio Turnover | | | 23 | % |
Fund Inception Date | | 7/3/1989 | |
Asset Allocation (% of Net Assets) |
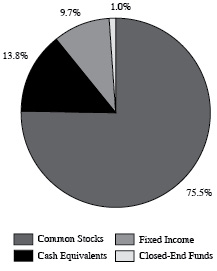
|
Common Stock Portfolio (75.5% of Fund ) |
Number of Stocks | | | 56 | |
Weighted Avg Market Capitalization (Billions) | | $ | 110.6 | |
Price-to-Earnings Ratio (Bloomberg 1 Yr. Forecast EPS) | | | 14.1 | |
Price-to-Book Value | | | 1.7 | |
Five Largest Sectors | % of Net Assets |
Financials | 16.3% |
Information Technology | 14.5% |
Energy | 8.9% |
Industrials | 8.1% |
Consumer Discretionary | 8.1% |
Fixed-Income Portfolio (9.7% of Fund) |
Number of Fixed-Income Securities | 6 |
Average Quality | BBB |
Average Weighted Maturity | 3.2 yrs. |
Average Effective Duration | 2.9 yrs. |
Sector Breakdown | % of Net Assets |
Energy | 3.2% |
Industrials | 2.3% |
Consumer Discretionary | 1.6% |
Financials | 1.6% |
Municipal Bond | 1.0% |
Ten Largest Equity Holdings | % of Net Assets |
Cisco Systems, Inc. | 3.1% |
Microsoft Corporation | 3.0% |
Bank of America Corporation | 2.5% |
Travelers Companies, Inc. (The) | 2.4% |
Merck & Company, Inc. | 2.3% |
JPMorgan Chase & Company | 2.2% |
MetLife, Inc. | 2.1% |
Western Union Company (The) | 2.1% |
Wal-Mart Stores, Inc. | 1.9% |
Apple, Inc. | 1.9% |
7
FBP EQUITY & DIVIDEND PLUS FUND
SCHEDULE OF INVESTMENTS
March 31, 2016 |
COMMON STOCKS — 94.4% | | Shares | | | Value | |
Consumer Discretionary — 7.8% | | | | | | |
Best Buy Company, Inc. (a) | | | 10,000 | | | $ | 324,400 | |
Coach, Inc. (a) | | | 11,000 | | | | 440,990 | |
Ford Motor Company | | | 34,400 | | | | 464,400 | |
Kohl's Corporation (a) | | | 8,000 | | | | 372,880 | |
Staples, Inc. | | | 31,000 | | | | 341,930 | |
| | | | | | | | 1,944,600 | |
Consumer Staples — 8.5% | | | | | | | | |
Coca-Cola Company (The) (a) | | | 6,000 | | | | 278,340 | |
PepsiCo, Inc. (a) | | | 4,000 | | | | 409,920 | |
Procter & Gamble Company (The) (a) | | | 10,000 | | | | 823,100 | |
Wal-Mart Stores, Inc. (a) | | | 8,700 | | | | 595,863 | |
| | | | | | | | 2,107,223 | |
Energy — 9.0% | | | | | | | | |
California Resources Corporation | | | 552 | | | | 569 | |
Chevron Corporation | | | 6,000 | | | | 572,400 | |
ConocoPhillips | | | 12,200 | | | | 491,294 | |
Exxon Mobil Corporation | | | 3,500 | | | | 292,565 | |
Occidental Petroleum Corporation (a) | | | 5,900 | | | | 403,737 | |
Royal Dutch Shell plc - Class B - ADR | | | 9,500 | | | | 467,305 | |
| | | | | | | | 2,227,870 | |
Financials — 19.4% | | | | | | | | |
BB&T Corporation | | | 15,500 | | | | 515,685 | |
First Niagara Financial Group, Inc. | | | 28,000 | | | | 271,040 | |
HSBC Holdings plc - ADR | | | 12,000 | | | | 373,440 | |
JPMorgan Chase & Company (a) | | | 15,358 | | | | 909,501 | |
KeyCorp | | | 20,900 | | | | 230,736 | |
Manulife Financial Corporation | | | 20,000 | | | | 282,600 | |
MetLife, Inc. | | | 11,200 | | | | 492,128 | |
People's United Financial, Inc. | | | 25,000 | | | | 398,250 | |
Prudential Financial, Inc. | | | 6,900 | | | | 498,318 | |
U.S. Bancorp | | | 14,200 | | | | 576,378 | |
Ventas, Inc. | | | 4,000 | | | | 251,840 | |
| | | | | | | | 4,799,916 | |
Health Care — 6.3% | | | | | | | | |
Johnson & Johnson | | | 2,600 | | | | 281,320 | |
Merck & Company, Inc. | | | 12,800 | | | | 677,248 | |
Pfizer, Inc. | | | 20,000 | | | | 592,800 | |
| | | | | | | | 1,551,368 | |
Industrials — 11.7% | | | | | | | | |
Eaton Corporation plc | | | 8,000 | | | | 500,480 | |
Emerson Electric Company | | | 10,000 | | | | 543,800 | |
General Electric Company (a) | | | 20,800 | | | | 661,232 | |
Koninklijke Philips N.V. | | | 11,000 | | | | 314,050 | |
8
FBP EQUITY & DIVIDEND PLUS FUND
SCHEDULE OF INVESTMENTS (Continued) |
COMMON STOCKS — 94.4% (Continued) | | Shares | | | Value | |
Industrials — 11.7% (Continued) | | | | | | |
R.R. Donnelley & Sons Company (a) | | | 21,000 | | | $ | 344,400 | |
United Parcel Service, Inc. - Class B | | | 2,600 | | | | 274,222 | |
United Technologies Corporation | | | 2,500 | | | | 250,250 | |
| | | | | | | | 2,888,434 | |
Information Technology — 18.5% | | | | | | | | |
Apple, Inc. | | | 6,100 | | | | 664,839 | |
Applied Materials, Inc. (a) | | | 15,000 | | | | 317,700 | |
Cisco Systems, Inc. (a) | | | 27,000 | | | | 768,690 | |
Hewlett Packard Enterprise Company (a) | | | 19,500 | | | | 345,735 | |
HP, Inc. | | | 30,000 | | | | 369,600 | |
Intel Corporation | | | 10,000 | | | | 323,500 | |
International Business Machines Corporation | | | 3,700 | | | | 560,365 | |
Microsoft Corporation (a) | | | 11,000 | | | | 607,530 | |
Western Union Company (The) (a) | | | 32,000 | | | | 617,280 | |
| | | | | | | | 4,575,239 | |
Materials — 4.8% | | | | | | | | |
E.I. du Pont de Nemours and Company (a) | | | 2,500 | | | | 158,300 | |
Mosaic Company (The) | | | 9,000 | | | | 243,000 | |
Nucor Corporation (a) | | | 9,000 | | | | 425,700 | |
Rio Tinto plc - ADR (a) | | | 12,600 | | | | 356,202 | |
| | | | | | | | 1,183,202 | |
Telecommunication Services — 4.3% | | | | | | | | |
AT&T, Inc. (a) | | | 16,000 | | | | 626,720 | |
CenturyLink, Inc. (a) | | | 14,000 | | | | 447,440 | |
| | | | | | | | 1,074,160 | |
Utilities — 4.1% | | | | | | | | |
FirstEnergy Corporation (a) | | | 17,000 | | | | 611,490 | |
PPL Corporation (a) | | | 11,000 | | | | 418,770 | |
| | | | | | | | 1,030,260 | |
| | | | | | | | | |
Total Common Stocks (Cost $19,732,974) | | | | | | $ | 23,382,272 | |
9
FBP EQUITY & DIVIDEND PLUS FUND
SCHEDULE OF INVESTMENTS (Continued) |
MONEY MARKET FUNDS — 6.5% | | Shares | | | Value | |
Fidelity Institutional Money Market Government Portfolio - Class I, 0.23% (b) (Cost $1,614,206) | | | 1,614,206 | | | $ | 1,614,206 | |
| | | | | | | | | |
Total Investments at Value — 100.9% (Cost $21,347,180) | | | | | | $ | 24,996,478 | |
| | | | | | | | | |
Liabilities in Excess of Other Assets — (0.9%) | | | | | | | (232,423 | ) |
| | | | | | | | | |
Net Assets — 100.0% | | | | | | $ | 24,764,055 | |
ADR - American Depositary Receipt. |
(a) | Security covers a written call option. |
(b) | The rate shown is the 7-day effective yield as of March 31, 2016. |
See accompanying notes to financial statements. |
10
FBP EQUITY & DIVIDEND PLUS FUND
SCHEDULE OF WRITTEN OPTION CONTRACTS
March 31, 2016 |
COVERED CALL OPTIONS | | Option Contracts | | | Value of
Options | | | Premiums Received | |
Applied Materials, Inc., | | | | | | | | | |
07/15/2016 at $20 | | | 150 | | | $ | 28,200 | | | $ | 11,843 | |
AT&T, Inc., | | | | | | | | | | | | |
10/21/2016 at $39 | | | 75 | | | | 9,075 | | | | 7,647 | |
Best Buy Company, Inc., | | | | | | | | | | | | |
09/16/2016 at $35.55 | | | 100 | | | | 14,900 | | | | 18,196 | |
CenturyLink, Inc., | | | | | | | | | | | | |
10/21/2016 at $35 | | | 70 | | | | 7,350 | | | | 8,187 | |
Cisco Systems, Inc., | | | | | | | | | | | | |
10/21/2016 at $28 | | | 80 | | | | 14,000 | | | | 9,502 | |
Coach, Inc., | | | | | | | | | | | | |
11/18/2016 at $44 | | | 50 | | | | 10,250 | | | | 9,598 | |
Coca-Cola Company (The), | | | | | | | | | | | | |
05/20/2016 at $45 | | | 60 | | | | 11,400 | | | | 5,877 | |
E.I. du Pont de Nemours and Company, | | | | | | | | | | | | |
04/15/2016 at $60 | | | 25 | | | | 9,375 | | | | 6,174 | |
FirstEnergy Corporation, | | | | | | | | | | | | |
10/21/2016 at $38 | | | 100 | | | | 14,000 | | | | 11,696 | |
General Electric Company, | | | | | | | | | | | | |
09/16/2016 at $33 | | | 82 | | | | 6,150 | | | | 8,360 | |
Hewlett Packard Enterprise Company, | | | | | | | | | | | | |
05/20/2016 at $16 | | | 195 | | | | 42,900 | | | | 14,422 | |
JPMorgan Chase & Company, | | | | | | | | | | | | |
06/17/2016 at $67.5 | | | 10 | | | | 100 | | | | 2,020 | |
Kohl's Corporation, | | | | | | | | | | | | |
07/15/2016 at $60 | | | 38 | | | | 190 | | | | 5,584 | |
Microsoft Corporation, | | | | | | | | | | | | |
06/17/2016 at $57.5 | | | 45 | | | | 5,130 | | | | 7,513 | |
07/15/2016 at $57.5 | | | 65 | | | | 8,840 | | | | 13,127 | |
Nucor Corporation, | | | | | | | | | | | | |
10/21/2016 at $48 | | | 70 | | | | 21,700 | | | | 13,326 | |
Occidental Petroleum Corporation, | | | | | | | | | | | | |
05/20/2016 at $77.5 | | | 25 | | | | 775 | | | | 6,924 | |
PepsiCo, Inc., | | | | | | | | | | | | |
07/15/2016 at $105 | | | 40 | | | | 6,640 | | | | 8,678 | |
PPL Corporation, | | | | | | | | | | | | |
07/15/2016 at $35 | | | 60 | | | | 21,600 | | | | 8,217 | |
Procter & Gamble Company (The), | | | | | | | | | | | | |
07/15/2016 at $85 | | | 50 | | | | 4,800 | | | | 11,148 | |
R.R. Donnelley & Sons Company, | | | | | | | | | | | | |
06/17/2016 at $19 | | | 208 | | | | 3,120 | | | | 11,327 | |
Rio Tinto plc - ADR, | | | | | | | | | | | | |
07/15/2016 at $30 | | | 70 | | | | 12,040 | | | | 10,987 | |
11
FBP EQUITY & DIVIDEND PLUS FUND
SCHEDULE OF WRITTEN OPTION CONTRACTS (Continued) |
COVERED CALL OPTIONS | | Option Contracts | | | Value of
Options | | | Premiums Received | |
Wal-Mart Stores, Inc., | | | | | | | | | |
06/17/2016 at $67.5 | | | 50 | | | $ | 12,900 | | | $ | 5,148 | |
Western Union Company (The), | | | | | | | | | | | | |
05/20/2016 at $20 | | | 220 | | | | 11,000 | | | | 15,830 | |
| | | | | | | $ | 276,435 | | | $ | 231,331 | |
ADR - American Depositary Receipt. |
See accompanying notes to financial statements. |
12
FBP APPRECIATION & INCOME OPPORTUNITIES FUND
SCHEDULE OF INVESTMENTS
March 31, 2016 |
COMMON STOCKS — 75.5% | | Shares | | | Value | |
Consumer Discretionary — 8.1% | | | | | | |
Best Buy Company, Inc. (a) | | | 10,000 | | | $ | 324,400 | |
Bloomin' Brands, Inc. | | | 22,000 | | | | 371,140 | |
Coach, Inc. (a) | | | 12,000 | | | | 481,080 | |
Ford Motor Company | | | 34,000 | | | | 459,000 | |
Kohl's Corporation | | | 9,000 | | | | 419,490 | |
Staples, Inc. | | | 35,000 | | | | 386,050 | |
Target Corporation | | | 1,500 | | | | 123,420 | |
| | | | | | | | 2,564,580 | |
Consumer Staples — 5.8% | | | | | | | | |
Avon Products, Inc. | | | 24,000 | | | | 115,440 | |
CVS Health Corporation | | | 3,800 | | | | 394,174 | |
PepsiCo, Inc. | | | 3,200 | | | | 327,936 | |
Procter & Gamble Company (The) (a) | | | 4,500 | | | | 370,395 | |
Wal-Mart Stores, Inc. | | | 9,000 | | | | 616,410 | |
| | | | | | | | 1,824,355 | |
Energy — 8.9% | | | | | | | | |
Baker Hughes, Inc. | | | 8,000 | | | | 350,640 | |
California Resources Corporation | | | 487 | | | | 501 | |
Chevron Corporation | | | 5,000 | | | | 477,000 | |
ConocoPhillips | | | 12,500 | | | | 503,375 | |
Devon Energy Corporation | | | 14,000 | | | | 384,160 | |
Noble Corporation plc | | | 24,000 | | | | 248,400 | |
Occidental Petroleum Corporation | | | 5,200 | | | | 355,836 | |
Royal Dutch Shell plc - Class B - ADR | | | 10,000 | | | | 491,900 | |
| | | | | | | | 2,811,812 | |
Financials — 16.3% | | | | | | | | |
Bank of America Corporation | | | 59,000 | | | | 797,680 | |
Bank of New York Mellon Corporation (The) | | | 13,500 | | | | 497,205 | |
Capital One Financial Corporation | | | 6,000 | | | | 415,860 | |
Comerica, Inc. | | | 7,000 | | | | 265,090 | |
First Niagara Financial Group, Inc. | | | 24,000 | | | | 232,320 | |
JPMorgan Chase & Company | | | 12,000 | | | | 710,640 | |
Lincoln National Corporation | | | 14,000 | | | | 548,800 | |
MetLife, Inc. | | | 15,000 | | | | 659,100 | |
Travelers Companies, Inc. (The) | | | 6,500 | | | | 758,615 | |
Ventas, Inc. | | | 4,500 | | | | 283,320 | |
| | | | | | | | 5,168,630 | |
Health Care — 4.2% | | | | | | | | |
Merck & Company, Inc. | | | 14,000 | | | | 740,740 | |
Pfizer, Inc. | | | 20,000 | | | | 592,800 | |
| | | | | | | | 1,333,540 | |
13
FBP APPRECIATION & INCOME OPPORTUNITIES FUND
SCHEDULE OF INVESTMENTS (Continued) |
COMMON STOCKS — 75.5% (Continued) | | Shares | | | Value | |
Industrials — 8.1% | | | | | | |
Eaton Corporation plc | | | 8,000 | | | $ | 500,480 | |
FedEx Corporation | | | 1,700 | | | | 276,624 | |
General Electric Company | | | 17,000 | | | | 540,430 | |
Ingersoll-Rand plc | | | 4,700 | | | | 291,447 | |
Koninklijke Philips N.V. | | | 16,025 | | | | 457,514 | |
Norfolk Southern Corporation | | | 3,000 | | | | 249,750 | |
United Technologies Corporation | | | 2,500 | | | | 250,250 | |
| | | | | | | | 2,566,495 | |
Information Technology — 14.5% | | | | | | | | |
Apple, Inc. | | | 5,600 | | | | 610,344 | |
Cisco Systems, Inc. (a) | | | 35,000 | | | | 996,450 | |
EMC Corporation | | | 10,000 | | | | 266,500 | |
Hewlett Packard Enterprise Company | | | 16,000 | | | | 283,680 | |
HP, Inc. | | | 20,000 | | | | 246,400 | |
International Business Machines Corporation | | | 4,000 | | | | 605,800 | |
Microsoft Corporation (a) | | | 17,000 | | | | 938,910 | |
Western Union Company (The) | | | 34,000 | | | | 655,860 | |
| | | | | | | | 4,603,944 | |
Materials — 4.8% | | | | | | | | |
E.I. du Pont de Nemours and Company (a) | | | 8,000 | | | | 506,560 | |
Freeport-McMoRan, Inc. (a) | | | 25,000 | | | | 258,500 | |
Mosaic Company (The) | | | 6,000 | | | | 162,000 | |
Nucor Corporation (a) | | | 6,000 | | | | 283,800 | |
Rio Tinto plc - ADR (a) | | | 11,000 | | | | 310,970 | |
| | | | | | | | 1,521,830 | |
Telecommunication Services — 2.6% | | | | | | | | |
AT&T, Inc. (a) | | | 12,000 | | | | 470,040 | |
CenturyLink, Inc. (a) | | | 11,000 | | | | 351,560 | |
| | | | | | | | 821,600 | |
Utilities — 2.2% | | | | | | | | |
FirstEnergy Corporation (a) | | | 8,000 | | | | 287,760 | |
PPL Corporation (a) | | | 11,000 | | | | 418,770 | |
| | | | | | | | 706,530 | |
| | | | | | | | | |
Total Common Stocks (Cost $19,007,963) | | | | | | $ | 23,923,316 | |
CORPORATE BONDS — 8.7% | | Par Value | | | Value | |
Consumer Discretionary — 1.6% | | | | | | |
Mattel, Inc., 2.35%, due 05/06/2019 | | $ | 500,000 | | | $ | 506,390 | |
| | | | | | | | | |
Energy — 3.2% | | | | | | | | |
Dominion Resources, Inc., 2.50%, due 12/01/2019 | | | 500,000 | | | | 505,661 | |
14
FBP APPRECIATION & INCOME OPPORTUNITIES FUND
SCHEDULE OF INVESTMENTS (Continued) |
CORPORATE BONDS — 8.7%(Continued) | | Par Value | | | Value | |
Energy — 3.2% (Continued) | | | | | | |
Pioneer Natural Resources Company, 3.95%, due 07/15/2022 | | $ | 500,000 | | | $ | 507,734 | |
| | | | | | | | 1,013,395 | |
Financials — 1.6% | | | | | | | | |
Prudential Financial, Inc., 3.00%, due 05/12/2016 | | | 500,000 | | | | 500,998 | |
| | | | | | | | | |
Industrials — 2.3% | | | | | | | | |
Ryder System, Inc., 2.50%, due 05/11/2020 | | | 750,000 | | | | 740,438 | |
| | | | | | | | | |
Total Corporate Bonds (Cost $2,741,198) | | | | | | $ | 2,761,221 | |
MUNICIPAL BONDS — 1.0% | | Par Value | | | Value | |
Wise Co., Virginia, Industrial Dev. Authority, Revenue, 1.70%, due 02/01/2017 (Cost $299,677) | | $ | 300,000 | | | $ | 300,267 | |
CLOSED-END FUNDS — 1.0% | | Shares | | | Value | |
Prudential Short Duration High Yield Fund, Inc. (Cost $291,069) | | | 20,000 | | | $ | 308,000 | |
MONEY MARKET FUNDS — 14.2% | | Shares | | | Value | |
Fidelity Institutional Money Market Government Portfolio - Class I, 0.23% (b) | | | 3,083,901 | | | $ | 3,083,901 | |
First American Government Obligations Fund - Class Z, 0.20% (b) | | | 1,419,534 | | | | 1,419,534 | |
Total Money Market Funds (Cost $4,503,435) | | | | | | $ | 4,503,435 | |
| | | | | | | | | |
Total Investments at Value — 100.4% (Cost $26,843,342) | | | | | | $ | 31,796,239 | |
| | | | | | | | | |
Liabilities in Excess of Other Assets — (0.4%) | | | | | | | (127,734 | ) |
| | | | | | | | | |
Net Assets — 100.0% | | | | | | $ | 31,668,505 | |
ADR - American Depositary Receipt. |
(a) | Security covers a written call option. |
(b) | The rate shown is the 7-day effective yield as of March 31, 2016. |
See accompanying notes to financial statements. |
15
FBP APPRECIATION & INCOME OPPORTUNITIES FUND
SCHEDULE OF WRITTEN OPTION CONTRACTS
March 31, 2016 |
COVERED
CALL OPTIONS | | Option Contracts | | | Value of
Options | | | Premiums Received | |
AT&T, Inc., | | | | | | | | | |
10/21/2016 at $39 | | | 60 | | | $ | 7,260 | | | $ | 6,297 | |
Best Buy Company, Inc., | | | | | | | | | | | | |
09/16/2016 at $35.55 | | | 100 | | | | 14,900 | | | | 18,195 | |
CenturyLink, Inc., | | | | | | | | | | | | |
10/21/2016 at $35 | | | 50 | | | | 5,250 | | | | 5,848 | |
Cisco Systems, Inc., | | | | | | | | | | | | |
10/21/2016 at $28 | | | 100 | | | | 17,500 | | | | 15,196 | |
Coach, Inc., | | | | | | | | | | | | |
11/18/2016 at $44 | | | 60 | | | | 12,300 | | | | 11,517 | |
E.I. du Pont de Nemours and Company, | | | | | | | | | | | | |
04/15/2016 at $60 | | | 40 | | | | 15,000 | | | | 9,908 | |
07/15/2016 at $72.5 | | | 40 | | | | 1,480 | | | | 9,078 | |
FirstEnergy Corporation, | | | | | | | | | | | | |
10/21/2016 at $38 | | | 40 | | | | 5,600 | | | | 4,678 | |
Freeport-McMoRan, Inc., | | | | | | | | | | | | |
08/19/2016 at $12 | | | 250 | | | | 28,500 | | | | 29,239 | |
Microsoft Corporation, | | | | | | | | | | | | |
06/17/2016 at $57.5 | | | 20 | | | | 2,280 | | | | 3,844 | |
Nucor Corporation, | | | | | | | | | | | | |
10/21/2016 at $48 | | | 50 | | | | 15,500 | | | | 9,519 | |
PPL Corporation, | | | | | | | | | | | | |
07/15/2016 at $35 | | | 70 | | | | 25,200 | | | | 10,287 | |
Procter & Gamble Company (The), | | | | | | | | | | | | |
07/15/2016 at $85 | | | 20 | | | | 1,920 | | | | 4,459 | |
Rio Tinto plc - ADR, | | | | | | | | | | | | |
07/15/2016 at $30 | | | 30 | | | | 5,160 | | | | 4,709 | |
| | | | | | | $ | 157,850 | | | $ | 142,774 | |
ADR - American Depositary Receipt. |
See accompanying notes to financial statements. |
16
THE FLIPPIN, BRUCE & PORTER FUNDS
STATEMENTS OF ASSETS AND LIABILITIES
March 31, 2016 |
| | FBP Equity
& Dividend
Plus Fund | | | FBP
Appreciation
& Income
Opportunities
Fund | |
ASSETS | | | | | | |
Investments in securities: | | | | | | |
At acquisition cost | | $ | 21,347,180 | | | $ | 26,843,342 | |
At value (Note 2) | | $ | 24,996,478 | | | $ | 31,796,239 | |
Cash | | | — | | | | 1,504 | |
Dividends and interest receivable | | | 75,293 | | | | 83,715 | |
Receivable for capital shares sold | | | 2,200 | | | | — | |
Other assets | | | 2,945 | | | | 4,486 | |
TOTAL ASSETS | | | 25,076,916 | | | | 31,885,944 | |
| | | | | | | | | |
LIABILITIES | | | | | | | | |
Written call options, at value (Notes 2 and 5)
(premiums received $231,331 and $142,774, respectively) | | | 276,435 | | | | 157,850 | |
Distributions payable | | | 3,269 | | | | 11,954 | |
Payable for capital shares redeemed | | | 6,429 | | | | 15,763 | |
Accrued investment advisory fees (Note 4) | | | 19,502 | | | | 24,722 | |
Payable to administrator (Note 4) | | | 5,700 | | | | 5,700 | |
Other accrued expenses | | | 1,526 | | | | 1,450 | |
TOTAL LIABILITIES | | | 312,861 | | | | 217,439 | |
| | | | | | | | | |
NET ASSETS | | $ | 24,764,055 | | | $ | 31,668,505 | |
| | | | | | | | | |
Net assets consist of: | | | | | | | | |
Paid-in capital | | $ | 21,556,658 | | | $ | 27,018,606 | |
Undistributed (distributions in excess of) net investment income | | | 1,823 | | | | (9,143 | ) |
Accumulated net realized losses from security transactions | | | (398,620 | ) | | | (278,779 | ) |
Net unrealized appreciation (depreciation) on: | | | | | | | | |
Investments | | | 3,649,298 | | | | 4,952,897 | |
Written option contracts | | | (45,104 | ) | | | (15,076 | ) |
Net assets | | $ | 24,764,055 | | | $ | 31,668,505 | |
| | | | | | | | | |
Shares of beneficial interest outstanding (unlimited number of shares authorized, $0.01 par value) | | | 1,093,426 | | | | 1,913,196 | |
| | | | | | | | | |
Net asset value, offering price and redemption price per share (Note 2) | | $ | 22.65 | | | $ | 16.55 | |
See accompanying notes to financial statements. |
17
THE FLIPPIN, BRUCE & PORTER FUNDS
STATEMENTS OF OPERATIONS
Year Ended March 31, 2016 |
| | FBP Equity
& Dividend
Plus Fund | | | FBP Appreciation
& Income
Opportunities
Fund | |
INVESTMENT INCOME | | | | | | |
Dividends | | $ | 968,932 | | | $ | 898,808 | |
Foreign withholding taxes on dividends | | | (12,519 | ) | | | (8,112 | ) |
Interest | | | — | | | | 62,502 | |
TOTAL INVESTMENT INCOME | | | 956,413 | | | | 953,198 | |
| | | | | | | | | |
EXPENSES | | | | | | | | |
Investment advisory fees (Note 4) | | | 182,792 | | | | 242,858 | |
Administration fees (Note 4) | | | 60,000 | | | | 60,000 | |
Trustees’ fees and expenses (Note 4) | | | 10,283 | | | | 10,283 | |
Registration and filing fees | | | 10,875 | | | | 7,844 | |
Compliance service fees (Note 4) | | | 8,400 | | | | 8,400 | |
Custodian and bank service fees | | | 7,847 | | | | 7,506 | |
Professional fees | | | 7,840 | | | | 7,325 | |
Printing of shareholder reports | | | 7,631 | | | | 4,650 | |
Postage and supplies | | | 6,080 | | | | 4,621 | |
Insurance expense | | | 1,357 | | | | 1,732 | |
Other expenses | | | 7,186 | | | | 8,140 | |
TOTAL EXPENSES | | | 310,291 | | | | 363,359 | |
Fees voluntarily waived by the Adviser (Note 4) | | | (30,880 | ) | | | (16,419 | ) |
NET EXPENSES | | | 279,411 | | | | 346,940 | |
| | | | | | | | | |
NET INVESTMENT INCOME | | | 677,002 | | | | 606,258 | |
| | | | | | | | | |
REALIZED AND UNREALIZED GAINS (LOSSES) ON INVESTMENTS | | | | | | | | |
Net realized gains from: | | | | | | | | |
Security transactions | | | 422,266 | | | | 213,815 | |
Written option contracts (Note 5) | | | 165,687 | | | | 107,759 | |
Net realized gains from in-kind redemptions (Note 2) | | | 459,928 | | | | 2,067,015 | |
Net change in unrealized appreciation/depreciation on: | | | | | | | | |
Investments | | | (2,482,528 | ) | | | (4,640,221 | ) |
Written option contracts (Note 5) | | | 33,357 | | | | 10,231 | |
| | | | | | | | | |
NET REALIZED AND UNREALIZED LOSSES ON INVESTMENTS | | | (1,401,290 | ) | | | (2,241,401 | ) |
| | | | | | | | | |
NET DECREASE IN NET ASSETS FROM OPERATIONS | | $ | (724,288 | ) | | $ | (1,635,143 | ) |
See accompanying notes to financial statements. |
18
FBP EQUITY & DIVIDEND PLUS FUND
STATEMENTS OF CHANGES IN NET ASSETS |
| | Year Ended
March 31,
2016 | | | Year Ended
March 31,
2015 | |
FROM OPERATIONS | | | | | | |
Net investment income | | $ | 677,002 | | | $ | 584,102 | |
Net realized gains from: | | | | | | | | |
Security transactions | | | 422,266 | | | | 811,457 | |
Written option contracts (Note 5) | | | 165,687 | | | | 21,232 | |
Net realized gains from in-kind redemptions (Note 2) | | | 459,928 | | | | — | |
Net change in unrealized appreciation/depreciation on: | | | | | | | | |
Investments | | | (2,482,528 | ) | | | (177,321 | ) |
Written option contracts (Note 5) | | | 33,357 | | | | (28,993 | ) |
Net increase (decrease) in net assets from operations | | | (724,288 | ) | | | 1,210,477 | |
| | | | | | | | | |
DISTRIBUTIONS TO SHAREHOLDERS | | | | | | | | |
From net investment income | | | (676,704 | ) | | | (587,146 | ) |
From net realized gains from security transactions | | | (1,124,422 | ) | | | (518,508 | ) |
Decrease in net assets from distributions to shareholders | | | (1,801,126 | ) | | | (1,105,654 | ) |
| | | | | | | | | |
FROM CAPITAL SHARE TRANSACTIONS | | | | | | | | |
Proceeds from shares sold | | | 927,125 | | | | 2,990,599 | |
Net asset value of shares issued in reinvestment of distributions to shareholders | | | 1,773,837 | | | | 1,079,702 | |
Payments for shares redeemed | | | (4,193,387 | ) | | | (3,187,091 | ) |
Net increase (decrease) in net assets from capital share transactions | | | (1,492,425 | ) | | | 883,210 | |
| | | | | | | | | |
TOTAL INCREASE (DECREASE) IN NET ASSETS | | | (4,017,839 | ) | | | 988,033 | |
| | | | | | | | | |
NET ASSETS | | | | | | | | |
Beginning of year | | | 28,781,894 | | | | 27,793,861 | |
End of year | | $ | 24,764,055 | | | $ | 28,781,894 | |
| | | | | | | | | |
UNDISTRIBUTED NET INVESTMENT INCOME | | $ | 1,823 | | | $ | 1,582 | |
| | | | | | | | | |
CAPITAL SHARE ACTIVITY | | | | | | | | |
Shares sold | | | 39,293 | | | | 117,967 | |
Shares reinvested | | | 77,361 | | | | 42,203 | |
Shares redeemed | | | (179,384 | ) | | | (125,668 | ) |
Net increase (decrease) in shares outstanding | | | (62,730 | ) | | | 34,502 | |
Shares outstanding, beginning of year | | | 1,156,156 | | | | 1,121,654 | |
Shares outstanding, end of year | | | 1,093,426 | | | | 1,156,156 | |
See accompanying notes to financial statements. |
19
FBP APPRECIATION & INCOME OPPORTUNITIES FUND
STATEMENTS OF CHANGES IN NET ASSETS |
| | Year Ended
March 31,
2016 | | | Year Ended
March 31,
2015 | |
FROM OPERATIONS | | | | | | |
Net investment income | | $ | 606,258 | | | $ | 546,791 | |
Net realized gains (losses) from: | | | | | | | | |
Security transactions | | | 213,815 | | | | 1,667,644 | |
Written option contracts (Note 5) | | | 107,759 | | | | (13,048 | ) |
Net realized gains from in-kind redemptions (Note 2) | | | 2,067,015 | | | | — | |
Net change in unrealized appreciation/depreciation on: | | | | | | | | |
Investments | | | (4,640,221 | ) | | | (1,283,661 | ) |
Written option contracts (Note 5) | | | 10,231 | | | | 34,663 | |
Net increase (decrease) in net assets from operations | | | (1,635,143 | ) | | | 952,389 | |
| | | | | | | | | |
DISTRIBUTIONS TO SHAREHOLDERS | | | | | | | | |
From net investment income | | | (631,302 | ) | | | (553,302 | ) |
From net realized gains from security transactions | | | (1,742,745 | ) | | | (1,338,239 | ) |
Decrease in net assets from distributions to shareholders | | | (2,374,047 | ) | | | (1,891,541 | ) |
| | | | | | | | | |
FROM CAPITAL SHARE TRANSACTIONS | | | | | | | | |
Proceeds from shares sold | | | 634,129 | | | | 1,229,570 | |
Net asset value of shares issued in reinvestment of distributions to shareholders | | | 2,267,673 | | | | 1,747,129 | |
Payments for shares redeemed | | | (6,214,793 | ) | | | (2,997,545 | ) |
Net decrease in net assets from capital share transactions | | | (3,312,991 | ) | | | (20,846 | ) |
| | | | | | | | | |
TOTAL DECREASE IN NET ASSETS | | | (7,322,181 | ) | | | (959,998 | ) |
| | | | | | | | | |
NET ASSETS | | | | | | | | |
Beginning of year | | | 38,990,686 | | | | 39,950,684 | |
End of year | | $ | 31,668,505 | | | $ | 38,990,686 | |
| | | | | | | | | |
UNDISTRIBUTED (DISTRIBUTIONS IN EXCESS OF) NET INVESTMENT INCOME | | $ | (9,143 | ) | | $ | 15,993 | |
| | | | | | | | | |
CAPITAL SHARE ACTIVITY | | | | | | | | |
Shares sold | | | 36,037 | | | | 64,403 | |
Shares reinvested | | | 130,576 | | | | 91,891 | |
Shares redeemed | | | (358,024 | ) | | | (157,941 | ) |
Net decrease in shares outstanding | | | (191,411 | ) | | | (1,647 | ) |
Shares outstanding, beginning of year | | | 2,104,607 | | | | 2,106,254 | |
Shares outstanding, end of year | | | 1,913,196 | | | | 2,104,607 | |
See accompanying notes to financial statements. |
20
FBP EQUITY & DIVIDEND PLUS FUND
FINANCIAL HIGHLIGHTS |
Selected Per Share Data and Ratios for a Share Outstanding Throughout Each Year | |
| | | Years Ended March 31, | |
| | 2016 | | | 2015 | | | 2014 | | | 2013 | | | 2012 | |
Net asset value at beginning of year | | $ | 24.89 | | | $ | 24.78 | | | $ | 21.67 | | | $ | 19.10 | | | $ | 20.70 | |
| | | | | | | | | | | | | | | | | | | | | |
Income (loss) from investment operations: | | | | | | | | | | | | | | | | | | | | |
Net investment income | | | 0.61 | | | | 0.50 | | | | 0.42 | | | | 0.47 | | | | 0.23 | |
Net realized and unrealized gains (losses) on investments | | | (1.21 | ) | | | 0.57 | | | | 3.11 | | | | 2.56 | | | | (1.59 | ) |
Total from investment operations | | | (0.60 | ) | | | 1.07 | | | | 3.53 | | | | 3.03 | | | | (1.36 | ) |
| | | | | | | | | | | | | | | | | | | | | |
Less distributions: | | | | | | | | | | | | | | | | | | | | |
Dividends from net investment income | | | (0.61 | ) | | | (0.51 | ) | | | (0.42 | ) | | | (0.46 | ) | | | (0.24 | ) |
Distributions from net realized gains | | | (1.03 | ) | | | (0.45 | ) | | | — | | | | — | | | | — | |
Total distributions | | | (1.64 | ) | | | (0.96 | ) | | | (0.42 | ) | | | (0.46 | ) | | | (0.24 | ) |
| | | | | | | | | | | | | | | | | | | | | |
Net asset value at end of year | | $ | 22.65 | | | $ | 24.89 | | | $ | 24.78 | | | $ | 21.67 | | | $ | 19.10 | |
| | | | | | | | | | | | | | | | | | | | | |
Total return (a) | | | (2.31 | %) | | | 4.23 | % | | | 16.40 | % | | | 16.19 | % | | | (6.49 | %) |
| | | | | | | | | | | | | | | | | | | | | |
Net assets at end of year (000’s) | | $ | 24,764 | | | $ | 28,782 | | | $ | 27,794 | | | $ | 22,570 | | | $ | 23,194 | |
| | | | | | | | | | | | | | | | | | | | | |
Ratio of total expenses to average net assets | | | 1.19 | % | | | 1.17 | % | | | 1.21 | % | | | 1.29 | % | | | 1.29 | % |
| | | | | | | | | | | | | | | | | | | | | |
Ratio of net expenses to average net assets (b) | | | 1.07 | % | | | 1.07 | % | | | 1.07 | % | | | 1.07 | % | | | 1.07 | % |
| | | | | | | | | | | | | | | | | | | | | |
Ratio of net investment income to average net assets (b) | | | 2.60 | % | | | 1.98 | % | | | 1.82 | % | | | 2.40 | % | | | 1.24 | % |
| | | | | | | | | | | | | | | | | | | | | |
Portfolio turnover rate | | | 21 | % | | | 19 | % | | | 24 | % | | | 32 | % | | | 46 | % |
(a) | Total return is a measure of the change in value of an investment in the Fund over the years covered, which assumes any dividends or capital gains distributions are reinvested in shares of the Fund. Returns shown do not reflect the deduction of taxes a shareholder would pay on Fund distributions or the redemption of Fund shares. |
(b) | Ratios were determined after voluntary advisory fee waivers by the Adviser (Note 4). |
See accompanying notes to financial statements. |
21
FBP APPRECIATION & INCOME OPPORTUNITIES FUND
FINANCIAL HIGHLIGHTS |
Selected Per Share Data and Ratios for a Share Outstanding Throughout Each Year | |
| | | Years Ended March 31, | |
| | 2016 | | | 2015 | | | 2014 | | | 2013 | | | 2012 | |
Net asset value at beginning of year | | $ | 18.53 | | | $ | 18.97 | | | $ | 17.16 | | | $ | 15.85 | | | $ | 16.35 | |
| | | | | | | | | | | | | | | | | | | | | |
Income (loss) from investment operations: | | | | | | | | | | | | | | | | | | | | |
Net investment income | | | 0.31 | | | | 0.26 | | | | 0.25 | | | | 0.29 | | | | 0.26 | |
Net realized and unrealized gains (losses) on investments | | | (1.11 | ) | | | 0.19 | | | | 2.50 | | | | 1.61 | | | | (0.46 | ) |
Total from investment operations | | | (0.80 | ) | | | 0.45 | | | | 2.75 | | | | 1.90 | | | | (0.20 | ) |
| | | | | | | | | | | | | | | | | | | | | |
Less distributions: | | | | | | | | | | | | | | | | | | | | |
Dividends from net investment income | | | (0.32 | ) | | | (0.26 | ) | | | (0.26 | ) | | | (0.30 | ) | | | (0.30 | ) |
Distributions from net realized gains | | | (0.86 | ) | | | (0.63 | ) | | | (0.68 | ) | | | (0.29 | ) | | | — | |
Total distributions | | | (1.18 | ) | | | (0.89 | ) | | | (0.94 | ) | | | (0.59 | ) | | | (0.30 | ) |
| | | | | | | | | | | | | | | | | | | | | |
Net asset value at end of year | | $ | 16.55 | | | $ | 18.53 | | | $ | 18.97 | | | $ | 17.16 | | | $ | 15.85 | |
| | | | | | | | | | | | | | | | | | | | | |
Total return (a) | | | (4.48 | %) | | | 2.36 | % | | | 16.50 | % | | | 12.51 | % | | | (1.13 | %) |
| | | | | | | | | | | | | | | | | | | | | |
Net assets at end of year (000’s) | | $ | 31,669 | | | $ | 38,991 | | | $ | 39,951 | | | $ | 36,825 | | | $ | 39,520 | |
| | | | | | | | | | | | | | | | | | | | | |
Ratio of total expenses to average net assets | | | 1.05 | % | | | 1.04 | % | | | 1.03 | % | | | 1.06 | % | | | 1.06 | % |
| | | | | | | | | | | | | | | | | | | | | |
Ratio of net expenses to average net assets (b) | | | 1.00 | % | | | 1.00 | % | | | 1.00 | % | | | 1.00 | % | | | 1.00 | % |
| | | | | | | | | | | | | | | | | | | | | |
Ratio of net investment income to average net assets (b) | | | 1.75 | % | | | 1.36 | % | | | 1.36 | % | | | 1.83 | % | | | 1.71 | % |
| | | | | | | | | | | | | | | | | | | | | |
Portfolio turnover rate | | | 23 | % | | | 12 | % | | | 10 | % | | | 15 | % | | | 17 | % |
(a) | Total return is a measure of the change in value of an investment in the Fund over the years covered, which assumes any dividends or capital gains distributions are reinvested in shares of the Fund. Returns shown do not reflect the deduction of taxes a shareholder would pay on Fund distributions or the redemption of Fund shares. |
(b) | Ratios were determined after voluntary advisory fee waivers by the Adviser (Note 4). |
See accompanying notes to financial statements. |
22
THE FLIPPIN, BRUCE & PORTER FUNDS
NOTES TO FINANCIAL STATEMENTS
March 31, 2016 |
1. Organization
FBP Equity & Dividend Plus Fund and FBP Appreciation & Income Opportunities Fund (the “Funds”) are no-load, diversified series of Williamsburg Investment Trust (the “Trust”), an open-end management investment company registered under the Investment Company Act of 1940. The Trust was organized as a Massachusetts business trust on July 18, 1988. Other series of the Trust are not included in this report.
FBP Equity & Dividend Plus Fund seeks to provide above-average and growing income while also achieving long-term growth of capital.
FBP Appreciation & Income Opportunities Fund seeks long term capital appreciation and current income, assuming a moderate level of investment risk.
2. Significant Accounting Policies
As an investment company, as defined in Financial Accounting Standards Board (“FASB”) Accounting Standards Update 2013-08, each Fund follows accounting and reporting guidance under FASB Accounting Standards Codification Topic 946, “Financial Services – Investment Companies.” The following is a summary of the Funds’ significant accounting policies. These policies are in conformity with accounting principles generally accepted in the United States of America (“GAAP”).
Securities valuation — The Funds’ portfolio securities are valued as of the close of business of the regular session of the New York Stock Exchange (normally 4:00 p.m., Eastern time). Securities traded on a national stock exchange, including common stocks, are valued based upon the closing price on the principal exchange where the security is traded, if available, otherwise, at the last quoted bid price. Securities which are quoted by NASDAQ are valued at the NASDAQ Official Closing Price. Covered call options written by the Funds are valued at the last quoted sale price or, in the absence of a sale, at the ask price on the principal exchanges on which they are traded. Investments representing shares of other investment companies, including closed-end funds and money market funds, are valued at their net asset value as reported by such companies.
Fixed income securities, including corporate bonds and municipal bonds, are typically valued on the basis of prices provided by an independent pricing service. The prices provided by the pricing service are determined with consideration given to institutional bid and last sale prices and take into account securities prices, yields, maturities, call features, ratings, institutional trading in similar groups of securities and developments related to specific securities.
When market quotations are not readily available, if a pricing service cannot provide a price or the investment adviser believes the price received from the pricing service is not indicative of market value, securities will be valued in good faith at fair value using methods consistent with procedures adopted by the Board of Trustees and will be classified as Level 2 or 3 within the fair value hierarchy (see below), depending on the inputs used. Such methods of fair valuation may include, but are not limited to: multiple of earnings, multiple of book value, discount from market of a similar freely traded security, purchase price of the security, subsequent private transactions in the security or related securities, or a combination of these and other factors.
23
THE FLIPPIN, BRUCE & PORTER FUNDS
NOTES TO FINANCIAL STATEMENTS (Continued) |
GAAP establishes a single authoritative definition of fair value, sets out a framework for measuring fair value and requires additional disclosures about fair value measurements. Various inputs are used in determining the value of each Fund’s investments. These inputs are summarized in the three broad levels listed below:
● | Level 1 – quoted prices in active markets for identical securities |
● | Level 2 – other significant observable inputs |
● | Level 3 – significant unobservable inputs |
Fixed income securities, including corporate bonds and municipal bonds, held by FBP Appreciation & Income Opportunities Fund are classified as Level 2 since the values for such securities are based on prices provided by an independent pricing service that utilizes various “other significant observable inputs” including bid and ask quotations, prices of similar securities and interest rates, among other factors.
The inputs or methodology used for valuing securities are not necessarily an indication of the risks associated with investing in those securities. The inputs used to measure fair value may fall into different levels of the fair value hierarchy. In such cases, for disclosure purposes, the level in the fair value hierarchy within which the fair value measurement falls in its entirety is determined based on the lowest level input that is significant to the fair value measurement.
The following is a summary of the inputs used to value each Fund’s investments and other financial instruments as of March 31, 2016, by security type:
FBP Equity & Dividend Plus Fund | | Level 1 | | | Level 2 | | | Level 3 | | | Total | |
Investments in Securities: | | | | | | | | | | | | |
Common Stocks | | $ | 23,382,272 | | | $ | — | | | $ | — | | | $ | 23,382,272 | |
Money Market Funds | | | 1,614,206 | | | | — | | | | — | | | | 1,614,206 | |
Total | | $ | 24,996,478 | | | $ | — | | | $ | — | | | $ | 24,996,478 | |
| | | | | | | | | | | | | | | | | |
Other Financial Instruments: | | | | | | | | | | | | | | | | |
Written Call Options | | $ | (276,435 | ) | | $ | — | | | $ | — | | | $ | (276,435 | ) |
Total | | $ | (276,435 | ) | | $ | — | | | $ | — | | | $ | (276,435 | ) |
24
THE FLIPPIN, BRUCE & PORTER FUNDS
NOTES TO FINANCIAL STATEMENTS (Continued) |
FBP Appreciation & Income Opportunities Fund | | Level 1 | | | Level 2 | | | Level 3 | | | Total | |
Investments in Securities: | | | | | | | | | | | | |
Common Stocks | | $ | 23,923,316 | | | $ | — | | | $ | — | | | $ | 23,923,316 | |
Corporate Bonds | | | — | | | | 2,761,221 | | | | — | | | | 2,761,221 | |
Municipal Bonds | | | — | | | | 300,267 | | | | — | | | | 300,267 | |
Closed-End Funds | | | 308,000 | | | | — | | | | — | | | | 308,000 | |
Money Market Funds | | | 4,503,435 | | | | — | | | | — | | | | 4,503,435 | |
Total | | $ | 28,734,751 | | | $ | 3,061,488 | | | $ | — | | | $ | 31,796,239 | |
| | | | | | | | | | | | | | | | | |
Other Financial Instruments: | | | | | | | | | | | | | | | | |
Written Call Options | | $ | (157,850 | ) | | $ | — | | | $ | — | | | $ | (157,850 | ) |
Total | | $ | (157,850 | ) | | $ | — | | | $ | — | | | $ | (157,850 | ) |
Refer to each Fund’s Schedule of Investments for a listing of the common stocks and corporate bonds by sector type. As of March 31, 2016, the Funds did not have any transfers into and out of any Level. There were no Level 3 securities held by the Funds as of March 31, 2016. It is the Funds’ policy to recognize transfers into and out of any Level at the end of the reporting period.
Share valuation — The net asset value per share of each Fund is calculated daily by dividing the total value of its assets, less liabilities, by the number of shares outstanding. The offering price and redemption price per share of each Fund is equal to its net asset value per share.
Investment income — Interest income is accrued as earned. Dividend income is recorded on the ex-dividend date. Discounts and premiums on fixed income securities purchased are amortized using the interest method. Withholding taxes on foreign dividends have been recorded in accordance with the Funds’ understanding of the appropriate country’s rules and tax rates.
Distributions to shareholders — Dividends arising from net investment income are declared and paid quarterly to shareholders of each Fund. Net realized short-term capital gains, if any, may be distributed throughout the year and net realized long-term capital gains, if any, are distributed at least once each year. The amount of distributions from net investment income and net realized capital gains are determined in accordance with federal income tax regulations, which may differ from GAAP. These “book/tax” differences are either temporary or permanent in nature. Dividends and distributions are recorded on the ex-dividend date. The tax character of distributions paid during the years ended March 31, 2016 and March 31, 2015, was as follows:
| Year
Ended | Ordinary Income | Long-Term Capital Gains | Total Distributions |
FBP Equity & Dividend Plus Fund | 3/31/2016 | $ 676,761 | $ 1,124,365 | $ 1,801,126 |
| | 3/31/2015 | $ 587,146 | $ 518,508 | $ 1,105,654 |
FBP Appreciation & Income Opportunities Fund | 3/31/2016 | $ 631,394 | $ 1,742,653 | $ 2,374,047 |
| | 3/31/2015 | $ 553,302 | $ 1,338,239 | $ 1,891,541 |
25
THE FLIPPIN, BRUCE & PORTER FUNDS
NOTES TO FINANCIAL STATEMENTS (Continued) |
Security transactions — Security transactions are accounted for on trade date for financial reporting purposes. Gains and losses on securities sold are determined on a specific identification basis.
Common expenses — Common expenses of the Trust are allocated among the series of the Trust based on relative net assets of each series or the nature of the services performed and the relative applicability to each series.
Options transactions — When the Funds’ investment adviser believes that individual portfolio securities held by the Funds are approaching the top of the adviser’s growth and price expectations, covered call options may be written (sold) against such securities and the Funds will receive a premium in return. The Funds write options only for income generation and hedging purposes and not for speculation. The premiums received from writing the options are recorded as a liability and are subsequently valued daily at the closing prices on their primary exchanges. Premiums received from writing options which expire are treated as realized gains. Premiums received from writing options which are exercised increase the proceeds used to calculate the realized gain or loss on the sale of the security. If a closing purchase transaction is used to terminate a Fund’s obligation on a call option, a gain or loss will be realized, depending upon whether the price of the closing purchase transaction is more or less than the premium previously received on the call option written.
The Funds may also purchase put options on stock indices. By purchasing a put option on a stock index, a Fund could hedge the risk of a general market decline. The value of the put option would be expected to rise as a result of a market decline and thus could offset all or a portion of losses resulting from declines in the prices of individual securities held by a Fund. However, option premiums tend to decrease over time as the expiration date nears. Therefore, because of the cost of the option (in the form of premium and transaction costs), a Fund would suffer a loss on the put option if prices do not decline, or do not decline sufficiently, to offset the deterioration in the value of the option premium. Premiums paid for buying options that expire are treated as realized losses. Premiums paid from buying options which are exercised decrease the proceeds used to calculate the realized gain or loss on the exercise of the options.
Estimates — The preparation of financial statements in conformity with GAAP requires management to make estimates and assumptions that affect the reported amounts of assets and liabilities and the disclosure of contingent assets and liabilities as of the date of the financial statements and the reported amounts of income and expenses during the reporting period. Actual results could differ from those estimates.
Federal income tax — Each Fund has qualified and intends to continue to qualify as a regulated investment company under the Internal Revenue Code of 1986 (the “Code”). Qualification generally will relieve the Funds of liability for federal income taxes to the extent 100% of their net investment income and any net realized capital gains are distributed in accordance with the Code.
In order to avoid imposition of the excise tax applicable to regulated investment companies, it is also each Fund’s intention to declare as dividends in each calendar year at least 98% of its net investment income (earned during the calendar year) and 98.2% of its net realized capital gains (earned during the twelve months ended October 31) plus undistributed amounts from prior years.
26
THE FLIPPIN, BRUCE & PORTER FUNDS
NOTES TO FINANCIAL STATEMENTS (Continued) |
The following information is computed on a tax basis for each item as of March 31, 2016:
| | FBP Equity
& Dividend
Plus Fund | | | FBP Appreciation & Income Opportunities
Fund | |
Tax cost of portfolio investments | | $ | 21,347,180 | | | $ | 26,858,135 | |
Gross unrealized appreciation | | $ | 4,769,314 | | | $ | 6,545,269 | |
Gross unrealized depreciation | | | (1,120,016 | ) | | | (1,607,165 | ) |
Net unrealized appreciation on investments | | | 3,649,298 | | | | 4,938,104 | |
Net unrealized depreciation on written option contracts | | | (45,104 | ) | | | (15,076 | ) |
Undistributed ordinary income | | | 5,092 | | | | 17,604 | |
Accumulated capital and other losses | | | (398,620 | ) | | | (278,779 | ) |
Distributions payable | | | (3,269 | ) | | | (11,954 | ) |
Accumulated earnings | | $ | 3,207,397 | | | $ | 4,649,899 | |
As of March 31, 2016, the tax cost of written option contracts for FBP Equity & Dividend Plus Fund and FBP Appreciation & Income Opportunities Fund was $231,331 and $142,774, respectively.
The difference between the federal income tax cost of portfolio investments and the financial statement cost for FBP Appreciation & Income Opportunities Fund is due to certain differences in the recognition of capital gains and losses under income tax regulations and GAAP. These “book/tax” differences are temporary in nature and are primarily due to differing methods in the amortization of discounts and premiums on fixed income securities.
Certain capital losses incurred after October 31, and within the current taxable year, are deemed to arise on the first business day of each Fund’s following taxable year. For the tax year ended March 31, 2016, FBP Equity & Dividend Plus Fund and FBP Appreciation & Income Opportunities Fund deferred until April 1, 2016, post-October capital losses in the amount of $398,620 and $278,779, respectively.
For the year ended March 31, 2016, FBP Equity & Dividend Plus Fund and FBP Appreciation & Income Opportunities Fund reclassified $57 and $92 of distributions in excess of net realized gains against undistributed net investment income, respectively, on the Statements of Assets and Liabilities. Such reclassifications, the result of permanent differences between the financial statements and income tax reporting requirements, have no effect on each Fund’s net assets or net asset value per share.
During the year ended March 31, 2016, FBP Equity & Dividend Plus Fund and FBP Appreciation & Income Opportunities Fund realized $459,928 and $2,067,015, respectively, of net capital gains resulting from in-kind redemptions (redemptions in which shareholders who redeemed Fund shares received securities held by the Fund rather than cash). The Fund recognizes a gain on in-kind redemptions to the extent that the value of the distributed securities on the date of redemption exceeds the cost of those securities. Such gains are not taxable to the Fund and are not required to be distributed to shareholders. The Funds have reclassified these amounts against paid-in capital on the Statements of Assets and Liabilities. Such reclassifications, the result of permanent differences between the financial statement and income tax reporting requirements, have no effect on each Fund’s net assets or net asset value per share.
27
THE FLIPPIN, BRUCE & PORTER FUNDS
NOTES TO FINANCIAL STATEMENTS (Continued) |
The Funds recognize the tax benefits or expenses of uncertain tax positions only when the position is “more likely than not” to be sustained assuming examination by tax authorities. Management has reviewed the tax positions taken on federal income tax returns for all open tax years (tax years ended March 31, 2013 through March 31, 2016) of each Fund and has concluded that no provision for unrecognized tax benefits or expenses is required in these financial statements.
3. Investment Transactions
Investment transactions, other than short-term investments and U.S. government securities, were as follows for the year ended March 31, 2016:
| | FBP Equity
& Dividend
Plus Fund | | | FBP Appreciation & Income Opportunities
Fund | |
Purchases of investment securities | | $ | 5,290,904 | | | $ | 6,666,748 | |
Proceeds from sales and maturities of investment securities | | $ | 6,727,609 | | | $ | 8,126,507 | |
4. Transactions with Related Parties
INVESTMENT ADVISORY AGREEMENTS
Each Fund’s investments are managed by Flippin, Bruce & Porter, Inc. (the “Adviser”) under the terms of an Investment Advisory Agreement. Under the Investment Advisory Agreements, each Fund pays the Adviser a fee, which is computed and accrued daily and paid monthly, at an annual rate of .70% of its average daily net assets up to $250 million; .65% of the next $250 million of such assets; and .50% of such assets in excess of $500 million.
During the year ended March 31, 2016, the Adviser voluntarily waived $30,880 and $16,419 of its investment advisory fees from FBP Equity & Dividend Plus Fund and FBP Appreciation & Income Opportunities Fund, respectively. These amounts are not subject to recapture in future periods.
Certain officers and a Trustee of the Trust are also officers of the Adviser.
OTHER SERVICE PROVIDERS
Ultimus Fund Solutions, LLC (“Ultimus”) provides fund administration, fund accounting, compliance and transfer agent services to the Funds. The Funds pay Ultimus fees in accordance with the agreements for such services. In addition, the Funds pay out-of-pocket expenses including, but not limited to, postage, supplies, and costs of pricing the Funds’ portfolio securities. Certain officers of the Trust are also officers of Ultimus, or of Ultimus Fund Distributors, LLC (the “Distributor”), the principal underwriter of each Fund’s shares and an affiliate of Ultimus. The Distributor is compensated by the Adviser (not the Funds) for acting as principal underwriter.
28
THE FLIPPIN, BRUCE & PORTER FUNDS
NOTES TO FINANCIAL STATEMENTS (Continued) |
COMPENSATION OF TRUSTEES
Trustees and officers affiliated with the Adviser or Ultimus are not compensated by the Trust for their services. Each Trustee who is not an affiliated person of the Adviser or Ultimus receives from the Trust an annual retainer of $12,000, payable quarterly; a fee of $1,500 for attendance at each meeting of the Board of Trustees (except that such fee is $2,500 for the independent chariman); and a fee of $1,000 for attendance at each meeting of any committee of the Board (except that such fee is $1,500 for the committee chairman); plus reimbursement of travel and other expenses incurred in attending meetings. Each Fund in the Trust pays its proportionate share of such fees. Effective April 1, 2016, the annual retainer will increase to $15,000, payable quarterly.
5. Derivatives Transactions
Transactions in call option contracts written by the Funds during the year ended March 31, 2016, were as follows:
| | |
FBP Equity &
Dividend Plus Fund
| | | FBP Appreciation
& Income
Opportunities Fund | |
| | Option Contracts | | | Option Premiums | | | Option Contracts | | | Option Premiums | |
Options outstanding at beginning of year | | | 1,539 | | | $ | 293,687 | | | | 633 | | | $ | 147,548 | |
Options written | | | 3,112 | | | | 377,011 | | | | 1,050 | | | | 170,809 | |
Options cancelled in a closing purchase transaction | | | (1,206 | ) | | | (217,605 | ) | | | (373 | ) | | | (86,515 | ) |
Options expired | | | (1,198 | ) | | | (162,203 | ) | | | (295 | ) | | | (70,152 | ) |
Options exercised | | | (309 | ) | | | (59,559 | ) | | | (85 | ) | | | (18,916 | ) |
Options outstanding at end of year | | | 1,938 | | | $ | 231,331 | | | | 930 | | | $ | 142,774 | |
The location in the Statements of Assets and Liabilities of the Funds’ derivative positions is as follows:
FBP Equity & Dividend Plus Fund
| | | |
Fair Value
| | | | |
Type of Derivative | Location | | Asset Derivatives | | | Liability Derivatives | | | Gross Notional Amount Outstanding March 31, 2016 | |
Equity call options written | Written call options, at value | | | — | | | $ | (276,435 | ) | | $ | (6,692,331 | ) |
FBP Appreciation & Income Opportunities Fund
| | | |
Fair Value
| | | | |
Type of Derivative | Location | | Asset
Derivatives | | | Liability
Derivatives | | | Gross Notional Amount Outstanding March 31,
2016 | |
Equity call options written | Written call options, at value | | | — | | | $ | (157,850 | ) | | $ | (3,016,280 | ) |
29
THE FLIPPIN, BRUCE & PORTER FUNDS
NOTES TO FINANCIAL STATEMENTS (Continued) |
The average monthly notional amount of option contracts written during the year ended March 31, 2016, was $4,662,305 and $1,277,311 for FBP Equity & Dividend Plus Fund and FBP Appreciation & Income Opportunities Fund, respectively.
Transactions in derivative instruments during the year ended March 31, 2016, by the Funds are recorded in the following location in the Statements of Operations:
FBP Equity & Dividend Plus Fund
Type of Derivative | Location | | Net
Realized
Gains | | Location | | Change in Unrealized Appreciation (Depreciation) | |
Equity Contracts
(Call options written) | Net realized gains from written option contracts | | $ | 165,687 | | Net change in unrealized appreciation/depreciation on written option contracts | | $ | 33,357 | |
FBP Appreciation & Income Opportunities Fund
Type of Derivative | Location | | Net
Realized
Gains | | Location | | Change in Unrealized Appreciation (Depreciation) | |
Equity Contracts
(Call options written) | Net realized gains from written option contracts | | $ | 107,759 | | Net change in unrealized appreciation/depreciation on written option contracts | | $ | 10,231 | |
6. Contingencies and Commitments
The Funds indemnify the Trust’s officers and Trustees for certain liabilities that might arise from their performance of their duties to the Funds. Additionally, in the normal course of business the Funds enter into contracts that contain a variety of representations and warranties and which provide general indemnifications. The Funds’ maximum exposure under these arrangements is unknown, as this would involve future claims that may be made against the Funds that have not yet occurred. However, based on experience, the Funds expect the risk of loss to be remote.
7. Subsequent Events
The Funds are required to recognize in the financial statements the effects of all subsequent events that provide additional evidence about conditions that existed as of the date of the Statements of Assets and Liabilities. For non-recognized subsequent events that must be disclosed to keep the financial statements from being misleading, the Funds are required to disclose the nature of the event as well as an estimate of its financial effect, or a statement that such an estimate cannot be made. Management has evaluated subsequent events through the issuance of these financial statements and has noted no such events.
30
THE FLIPPIN, BRUCE & PORTER FUNDS
REPORT OF INDEPENDENT REGISTERED
PUBLIC ACCOUNTING FIRM |
To the Shareholders of The Flippin, Bruce & Porter Funds and
Board of Trustees of Williamsburg Investment Trust
We have audited the accompanying statements of assets and liabilities, including the schedules of investments and written option contracts, of FBP Equity & Dividend Plus Fund and FBP Appreciation & Income Opportunities Fund (“The Flippin, Bruce & Porter Funds” or “Funds”), each a series of Williamsburg Investment Trust, as of March 31, 2016, and the related statements of operations and changes in net assets and the financial highlights for the year then ended. These financial statements and financial highlights are the responsibility of the Funds’ management. Our responsibility is to express an opinion on these financial statements and financial highlights based on our audit. The Funds’ financial statements and financial highlights for the years ended prior to March 31, 2016, were audited by other auditors, whose report dated May 22, 2015, expressed an unqualified opinion on those statements and financial highlights.
We conducted our audit in accordance with the standards of the Public Company Accounting Oversight Board (United States). Those standards require that we plan and perform the audit to obtain reasonable assurance about whether the financial statements and financial highlights are free of material misstatement. An audit includes examining, on a test basis, evidence supporting the amounts and disclosures in the financial statements. Our procedures included confirmation of securities owned as of March 31, 2016, by correspondence with the custodian. An audit also includes assessing the accounting principles used and significant estimates made by management, as well as evaluating the overall financial statement presentation. We believe that our audit provides a reasonable basis for our opinion.
In our opinion, the financial statements and financial highlights referred to above present fairly, in all material respects, the financial position of each of the Funds as of March 31, 2016, and the results of their operations, the changes in their net assets, and the financial highlights for the year then ended, in conformity with accounting principles generally accepted in the United States of America.
COHEN FUND AUDIT SERVICES, LTD.
Cleveland, Ohio
May 26, 2016
31
THE FLIPPIN, BRUCE & PORTER FUNDS
BOARD OF TRUSTEES AND EXECUTIVE OFFICERS
(Unaudited) |
Overall responsibility for management of the Funds rests with the Board of Trustees. The Trustees serve during the lifetime of the Trust and until its termination, or until death, resignation, retirement or removal. The Trustees, in turn, elect the officers of the Funds. The officers have been elected for an annual term. The following are the Trustees and executive officers of the Funds:
| | Trustees
and Officers | Address | Year of Birth | Position Held
with the Trust | Length of
Time Served |
| | Robert S. Harris, Ph.D. | 100 Darden Boulevard
Charlottesville, VA | 1949 | Chairman and Trustee | Since
January 2007 |
* | John P. Ackerly, IV | One James Center
901 E. Cary Street
Richmond, VA | 1963 | Trustee and President of Davenport Funds | Since
July 2012 |
* | John T. Bruce | 800 Main Street
Lynchburg, VA | 1953 | Trustee and
President of FBP Funds | Since
September 1988 |
| | George K. Jennison | 5101 Stratford Crescent
Richmond, VA | 1957 | Trustee | Since
January 2015 |
| Harris V. Morrissette | 100 Jacintoport Boulevard
Saraland, AL | 1959 | Trustee | Since
March 1993 |
| | Elizabeth W. Robertson | 305 Marston Lane
Richmond, VA | 1953 | Trustee | Since
February 2014 |
| | John H. Hanna IV | 800 Main Street
Lynchburg, VA | 1955 | Vice President | Since
February 2007 |
| | David J. Marshall | 800 Main Street
Lynchburg, VA | 1956 | Vice President | Since
February 2007 |
| | R. Gregory Porter III | 800 Main Street
Lynchburg, VA | 1941 | Vice President | Since
September 1988 |
| Robert G. Dorsey | 225 Pictoria Drive, Suite 450
Cincinnati, OH | 1957 | Vice President | Since
November 2000 |
| Mark J. Seger | 225 Pictoria Drive, Suite 450
Cincinnati, OH | 1962 | Treasurer | Since
November 2000 |
| | Tina H. Bloom | 225 Pictoria Drive, Suite 450
Cincinnati, OH | 1968 | Secretary and Chief Compliance Officer | Since
August 2006 |
* | Messrs. Ackerly and Bruce, as affiliated persons of investment advisers to the Trust, are “interested persons” of the Trust within the meaning of Section 2(a)(19) of the Investment Company Act of 1940. |
32
THE FLIPPIN, BRUCE & PORTER FUNDS
BOARD OF TRUSTEES AND EXECUTIVE OFFICERS
(Unaudited) (Continued)
Each Trustee oversees twelve portfolios of the Trust, including the Funds. The principal occupations of the Trustees and executive officers of the Funds during the past five years and public directorships held by the Trustees are set forth below:
Robert S. Harris, Ph.D. is the C. Stewart Sheppard Professor of Business Administration at The Darden Graduate School of Business Administration at the University of Virginia. He was previously the dean at Darden. Professor Harris has published widely on corporate finance, financial markets and mergers and acquisitions and has served as a consultant to corporations and government agencies.
John P. Ackerly, IV is Senior Vice President and Portfolio Manager of Davenport & Company LLC (an investment advisory firm).
John T. Bruce is President, Director and member of the Executive Committee of the Adviser.
George K. Jennison is President of Oyster Consulting, LLC (a financial consulting firm). He previously was a financial adviser with Wells Fargo Advisors, LLC.
Harris V. Morrissette is President of China Doll Rice and Beans, Inc. and Dixie Lily Foods. He is also a Director of International Shipholding Corporation (cargo transportation) and a Director of Trustmark National Bank (bank holding company). Previously, he was Chairman of Azalea Aviation, Inc. (airplane fueling) until January 2012.
Elizabeth W. Robertson is Chief Financial Officer for Monument Restaurants LLC (restaurant franchises) and a Director of Towne Bank.
John H. Hanna IV is Vice President, Director and member of the Executive Committee of the Adviser.
David J. Marshall is Secretary, Director and member of the Executive Committee of the Adviser.
R. Gregory Porter III is Director of the Adviser.
Robert G. Dorsey is a Managing Director of Ultimus Fund Solutions, LLC and Ultimus Fund Distributors, LLC.
Mark J. Seger is a Managing Director of Ultimus Fund Solutions, LLC and Ultimus Fund Distributors, LLC.
Tina H. Bloom is Director of Fund Administration of Ultimus Fund Solutions, LLC.
Additional information about members of the Board of Trustees and executive officers is available in the Statement of Additional Information (“SAI”). To obtain a free copy of the SAI, please call 1-800-281-3217.
33
THE FLIPPIN, BRUCE & PORTER FUNDS
ABOUT YOUR FUNDS’ EXPENSES (Unaudited) |
We believe it is important for you to understand the impact of costs on your investment. All mutual funds have operating expenses. As a shareholder of the Funds, you incur ongoing costs, including management fees and other operating expenses. These ongoing costs, which are deducted from each Fund’s gross income, directly reduce the investment return of the Funds.
A mutual fund’s ongoing costs are expressed as a percentage of its average net assets. This figure is known as the expense ratio. The following examples are intended to help you understand the ongoing costs (in dollars) of investing in the Funds and to compare these costs with the ongoing costs of investing in other mutual funds. The examples below are based on an investment of $1,000 made at the beginning of the period shown and held for the entire period (October 1, 2015 through March 31, 2016).
The table below illustrates each Fund’s ongoing costs in two ways:
Actual fund return – This section helps you to estimate the actual expenses that you paid over the period. The “Ending Account Value” shown is derived from each Fund’s actual return, and the fourth column shows the dollar amount of operating expenses that would have been paid by an investor who started with $1,000 in the Funds. You may use the information here, together with the amount you invested, to estimate the expenses that you paid over the period.
To do so, simply divide your account value by $1,000 (for example, an $8,600 account value divided by $1,000 = 8.6), then multiply the result by the number given for the Funds under the heading “Expenses Paid During Period.”
Hypothetical 5% return – This section is intended to help you compare the Funds’ ongoing costs with those of other mutual funds. It assumes that each Fund had an annual return of 5% before expenses during the period shown, but that the expense ratio is unchanged. In this case, because the returns used are not the Funds’ actual returns, the results do not apply to your investment. The example is useful in making comparisons because the Securities and Exchange Commission (“SEC”) requires all mutual funds to calculate expenses based on a 5% return. You can assess each Fund’s ongoing costs by comparing this hypothetical example with the hypothetical examples that appear in shareholder reports of other funds.
Note that expenses shown in the table are meant to highlight and help you compare ongoing costs only. The Funds do not charge sales loads or redemption fees.
The calculations assume no shares were bought or sold during the period. Your actual costs may have been higher or lower, depending on the amount of your investment and the timing of any purchases or redemptions.
More information about the Funds’ expenses, including annual expense ratios for the past five fiscal years, can be found in this report. For additional information on operating expenses and other shareholder costs, please refer to the Funds’ prospectus.
34
THE FLIPPIN, BRUCE & PORTER FUNDS
ABOUT YOUR FUNDS’ EXPENSES (Unaudited) (Continued) |
| Beginning
Account Value
October 1, 2015 | Ending
Account Value
March 31, 2016 | Net
Expense Ratio(a) | Expenses Paid
During Period(b) |
FBP Equity & Dividend Plus Fund | | | |
Based on Actual Fund Return | $1,000.00 | $1,080.60 | 1.07% | $5.57 |
Based on Hypothetical 5% Return (before expenses) | $1,000.00 | $1,019.65 | 1.07% | $5.40 |
FBP Appreciation & Income Opportunities Fund | | | |
Based on Actual Fund Return | $1,000.00 | $1,051.00 | 1.00% | $5.13 |
Based on Hypothetical 5% Return (before expenses) | $1,000.00 | $1,020.00 | 1.00% | $5.05 |
(a) | Annualized, based on the Fund’s most recent one-half year expenses. |
(b) | Expenses are equal to the Fund’s net expense ratio multiplied by the average account value over the period, multiplied by 183/366 (to reflect the one-half year period). |
CHANGE IN INDEPENDENT AUDITOR
On February 23, 2016, Cohen Fund Audit Services, Ltd. (“Cohen”) was selected as the Funds’ new independent auditor, replacing Ernst & Young LLP (“EY”) as independent auditor of the Funds. The Funds’ selection of Cohen as independent auditor was recommended and approved by the Trust’s Audit Committee and was ratified by the Trust’s Board of Trustees.
EY’s reports on the Funds’ financial statements for the prior two fiscal years did not contain an adverse opinion or a disclaimer of opinion, and were not qualified or modified as to uncertainty, audit scope or accounting principles. During such fiscal years, and through the date of EY’s replacement, there were no disagreements between the Trust and EY on any matter of accounting principles or practices, financial statement disclosure, or auditing scope or procedures, which disagreements, if not resolved to the satisfaction of EY, would have caused it to make reference to the subject matter of the disagreements in connection with its reports on the financial statements for such years. Prior to February 23, 2016, Cohen was not contacted during the prior two fiscal years regarding the application of accounting principles to any particular financial matter.
35
THE FLIPPIN, BRUCE & PORTER FUNDS
OTHER INFORMATION (Unaudited) |
The Trust files a complete listing of portfolio holdings for the Funds with the SEC as of the end of the first and third quarters of each fiscal year on Form N-Q. The filings are available upon request, by calling 1-800-327-9375. Furthermore, you may obtain a copy of these filings on the SEC’s website at http://www.sec.gov. The Trust’s Forms N-Q may also be reviewed and copied at the SEC’s Public Reference Room in Washington, DC, and information on the operation of the Public Reference Room may be obtained by calling 1-800-SEC-0330.
A description of the policies and procedures that the Funds use to determine how to vote proxies relating to portfolio securities is available without charge upon request by calling toll-free 1-800-327-9375, or on the SEC’s website at http://www.sec.gov. Information regarding how the Funds voted proxies relating to portfolio securities during the most recent 12-month period ended June 30 is also available without charge upon request by calling toll-free 1-800-327-9375, or on the SEC’s website at http://www.sec.gov.
36
THE FLIPPIN, BRUCE & PORTER FUNDS
FEDERAL TAX INFORMATION (Unaudited) |
In accordance with federal tax requirements, the following provides shareholders with information concerning distributions from ordinary income and net realized capital gains made by the Funds during the year ended March 31, 2016. During the year ended March 31, 2016, FBP Equity & Dividend Plus Fund and FBP Appreciation & Income Opportunities Fund paid a long-term capital gain distribution of $1,124,422 and $1,742,745, respectively. Certain dividends paid by the Funds may be subject to a maximum tax rate of 23.8%. FBP Equity & Dividend Plus Fund and FBP Appreciation & Income Opportunities Fund intend to designate up to a maximum amount of $676,704 and $631,302, respectively, as taxed at a maximum rate of 23.8%. Additionally, for the fiscal year ended March 31, 2016, 100% and 100% of the dividends paid from ordinary income by FBP Equity & Dividend Plus Fund and FBP Appreciation & Income Opportunities Fund, respectively, qualified for the dividends received deduction for corporations.
As required by federal regulations, complete information will be computed and reported in conjunction with your 2016 Form 1099-DIV.
37
THE FLIPPIN, BRUCE & PORTER FUNDS
DISCLOSURE REGARDING APPROVAL OF INVESTMENT ADVISORY AGREEMENTS (Unaudited) |
At an in-person meeting held on February 23, 2016, the Board of Trustees, including a majority of the Independent Trustees, approved the continuance for a one-year period of the Investment Advisory Agreements with the Adviser on behalf of the FBP Equity & Dividend Plus Fund and the FBP Appreciation and Income Opportunities Fund. Below is a discussion of the factors considered by the Board of Trustees along with its conclusions with respect thereto that formed the basis for the Board’s approvals.
In selecting the Adviser and approving the continuance of the Investment Advisory Agreements, the Trustees considered all information they deemed reasonably necessary to evaluate the terms of the Agreements. The principal areas of review by the Trustees were the nature, extent and quality of the services provided by the Adviser and the reasonableness of the fees charged for those services. These matters were considered by the Independent Trustees consulting with experienced counsel for the Independent Trustees, who is independent of the Adviser.
The Trustees’ evaluation of the quality of the Adviser’s services took into account their knowledge and experience gained through meetings with and reports of the Adviser’s senior management over the course of the preceding year. Both short-term and long-term investment performance of the Funds was considered. Each Fund’s performance was compared to its performance benchmark and to that of competitive funds with similar investment objectives and to the Adviser’s comparably managed private accounts. The Trustees also considered the scope and quality of the in-house capabilities of the Adviser and other resources dedicated to performing services for the Funds. The quality of administrative and other services, including the Adviser’s role in coordinating the activities of the Funds’ other service providers, were considered in light of the Funds’ compliance with investment policies and applicable laws and regulations and of related reports by management and the Funds’ independent public accounting firm in periodic meetings with the Trust’s Audit Committee. The Trustees also considered the business reputation of the Adviser, the qualifications of its key investment and compliance personnel, and its financial resources.
In reviewing the fees payable under the Investment Advisory Agreements, the Trustees compared the advisory fees and overall expense levels of each Fund with those of competitive funds with similar investment objectives as well as the private accounts managed by the Adviser. The Trustees considered information provided by the Adviser concerning the Adviser’s profitability with respect to each Fund, including the assumptions and methodology used in preparing the profitability information, in light of applicable case law relating to advisory fees. For these purposes, the Trustees took into account not only the fees paid by the Funds, but also so-called “fallout” benefits to the Adviser, such as the benefits of research made available to the Adviser by reason of brokerage commissions generated by the Funds’ securities transactions. In evaluating the Funds’ advisory fees, the Trustees took into account the complexity and quality of the investment management of the Funds.
Based upon their review of this information, the Independent Trustees concluded that: (i) the performance of the Funds has been acceptable in light of the investment approach that is applied in the management of the Funds and the Adviser has provided satisfactory services to the Funds; (ii) the advisory fee rates for each Fund are competitive with similarly managed funds; (iii) the total operating expense ratio of each Fund, after fee waivers, is competitive with (and in the case of the FBP Equity & Dividend Plus Fund, lower than) the average expense ratio for comparably managed funds, according to statistics derived from Morningstar, Inc.; (iv) the Adviser’s decision to cap overall operating expenses of the Funds by voluntarily waiving a portion
38
THE FLIPPIN, BRUCE & PORTER FUNDS
DISCLOSURE REGARDING APPROVAL OF INVESTMENT ADVISORY AGREEMENTS (Unaudited)
(Continued) |
of its advisory fees has enabled each Fund to increase returns for its shareholders and to maintain an overall expense ratio that is competitive with the average for similarly managed funds, despite the small size of the Funds; and (v) the Adviser did not realize any profits with respect to its management of the Funds. Given the current size of the Funds and their expected growth, the Independent Trustees did not believe that at the present time it would be relevant to consider the extent to which economies of scale would be realized as the Funds grow, and whether fee levels reflect these economies of scale. The Independent Trustees also considered the “fallout” benefits to the Adviser with respect to the Funds, but given the amounts involved viewed these as secondary factors in connection with the evaluation of the reasonableness of the advisory fees paid by the Funds.
No single factor was considered in isolation or to be determinative to the decision of the Trustees to approve continuance of the Investment Advisory Agreements. Rather the Trustees concluded, in light of a weighing and balancing of all factors considered, that it was in the best interests of each Fund and its shareholders to continue its Investment Advisory Agreement without modification to its terms, including the fees charged for services thereunder.
39
This page intentionally left blank.
This page intentionally left blank.
|
Investment Adviser Flippin, Bruce & Porter, Inc. 800 Main Street, Second Floor P.O. Box 6138 Lynchburg, Virginia 24505 Toll-Free 1-800-327-9375 www.fbpfunds.com Administrator Ultimus Fund Solutions, LLC P.O. Box 46707 Cincinnati, Ohio 45246-0707 Toll-Free 1-866-738-1127 Custodian U.S. Bank, N.A. 425 Walnut Street Cincinnati, Ohio 45202 Independent Registered
Public Accounting Firm Cohen Fund Audit Services, Ltd.
1350 Euclid Avenue, Suite 800 Cleveland, Ohio 44115 | Legal Counsel Sullivan & Worcester LLP One Post Office Square Boston, Massachusetts 02109 Officers John T. Bruce, President and Portfolio Manager John H. Hanna, IV, Vice President
David J. Marshall, Vice President R. Gregory Porter, III,
Vice President Trustees Robert S. Harris, Ph.D., Chairman John P. Ackerly, IV John T. Bruce George K. Jennison Harris V. Morrissette Elizabeth W. Robertson |
THE GOVERNMENT STREET FUNDS No-Load Mutual Funds Annual Report
March 31, 2016
|
The Government Street Equity Fund The Government Street Mid-Cap Fund The Alabama Tax Free Bond Fund |
LETTER FROM THE PRESIDENT | May 2016 |
Dear Fellow Shareholders:
We are enclosing for your review the audited Annual Report of The Government Street Funds for the fiscal year ended March 31, 2016.
The Government Street Equity Fund
The Government Street Equity Fund had a negative -2.46% total return for the fiscal year ended March 31, 2016. By comparison, the returns for the S&P 500 Index and the Morningstar Large Blend category were positive 1.78% and negative -2.18%, respectively.
The 12 month period was an extremely difficult time for the market. The following table depicts the fiscal quarter total returns of our three related measures.
| Government
Street Equity | S&P 500 | Morningstar
Large Blend |
1 Qtr 2016 | -1.03% | 1.35% | 0.30% |
4 Qtr 2015 | 5.82% | 7.04% | 5.56% |
3 Qtr 2015 | -6.82% | -6.44% | -7.53% |
2 Qtr 2015 | -0.05% | 0.28% | -0.09% |
As dismal as the results were, the trip to get there was somewhere between terrifying and stupefying. Third quarter 2015 took nearly everyone into negative territory.
2015 had labored under the never ending vacillations of a hand wringing Federal Reserve, debating the end of the world, connected to a quarter point possible increase in the Federal Funds rate. Oil and commodities, in general, seemed to have no bottom value that provided a solid floor. The economy turned in overall positive, but uninspiring, results. The two political parties gave us an avowed Socialist and a variety of low energy, lying, sweating, reality TV, etc. presidential candidates to consider.
The first quarter of 2016, the last quarter of the Fund’s fiscal year, was set up perfectly to be the market equivalent of the death defying roller coaster at a theme park. It did not fail to provide the white knuckle ride. The S&P 500 started a slide on January 5, 2016 that continued, almost without relief, until February 11, 2016. It was reported by several market analysts as the largest beginning year slide ever recorded. The decline was between 9% and 10% before the market reversed. By approximately March 17, intraday, the S&P 500 had recovered all its lost ground. With two weeks to go in the quarter, most managers, were shell shocked and listening to a multitude of explanations as to causes for the volatility as they limped across the finish line. The total twelve months result for the S&P 500 Index, as noted previously, was 1.78%.
So, where do we go from here? I think to restate a paragraph from last year’s letter is appropriate: “There are plenty of reasons to question the future size of equity returns. Simply said, the underlying economy of the United States is not currently expanding rapidly enough to support previous double digit returns. The possible sources of negative considerations are myriad. Slow GDP growth, the scope of our
1
national debt, rising wages, stymied Federal Reserve policy, incomprehensible tax policy, diminishing international prestige, record dollar currency strength and aging population are a few examples. The lack of clear policies to deal with any of these issues create an uncomfortable environment for investments. However, hope springs eternal and history has proven that underestimating America’s propensity to respond to adversity must be remembered.” One change has taken place in the Fund’s asset allocation that is worth noting. We finished the year with a cash position of slightly over 6%. That is approximately double our usual operating position. We have not turned into market timers, but it seemed prudent, given the market volatility, to keep some funds in reserve. As markets calm, we will redeploy the cash.
The 10 largest holdings in the Government Street Equity Fund as of March 31, 2016 were:
Security Description | % of Net Assets |
Apple, Inc. | 4.4% |
Visa, Inc. – Class A | 4.0% |
Vanguard Mid-Cap ETF | 3.7% |
MasterCard, Inc. – Class A | 3.1% |
Walt Disney Company (The) | 2.7% |
Comcast Corp. – Class A | 2.3% |
General Dynamics Corp. | 2.2% |
JPMorgan Chase & Co. | 2.1% |
Allergan plc | 1.9% |
United Technologies Corp. | 1.9% |
Exchange-traded funds (“ETFs”) have continued to play a prominent role in the Fund’s investment holdings. Each ETF represents a composite holding of an extensive number of securities that have some common characteristic.
As an example, the Vanguard Mid-Cap ETF represents an investment in over 450 individual securities that meet Vanguard’s definition of mid capitalization corporate equities. The inclusion of this one security in the portfolio provided the Fund with broad diversification that would be impossible to achieve individually in a fund the size of The Government Street Equity Fund. The ability to achieve diversification utilizing ETF’s has allowed us an opportunity for risk control that would be otherwise unattainable.
There were significant individual performances during the fiscal year. The 5 highest returns among securities held for the entire fiscal year, as measured by the internal rate of return for the entire period, were:
Security Description | 1 Year Performance |
Mid-Amer. Apt. Cmntys. | 37.10% |
Philip Morris Intl., Inc. | 36.75% |
AGL Res., Inc. | 35.99% |
McDonald’s Corp. | 32.53% |
Alphabet, Inc. – Class A | 32.02% |
2
The 5 worst individual performances among securities held for the entire fiscal year, as measured by internal rate of return for the entire period, were:
Security Description | 1 Year Performance |
Regeneron Pharma., Inc. | -19.80% |
Quanta Svcs., Inc, | -20.93% |
Shire plc Sponsored ADR | -27.94% |
Cerner Corp. | -29.10% |
ConocoPhillips | -36.05% |
The Fund’s best performing economic sector for the fiscal year was Utilities, up 21.15%. The second best sector was Consumer Staples, up 15.51%. The worst performing sector was Energy, down -12.81%.
Note: The investment performances listed for economic sectors and securities in the two preceding paragraphs are extracted from an in-house independent internal rate of return computation by the Advent Axys portfolio accounting system. The calculations are gross investment returns. Total investment returns are for the fiscal year April 1, 2015 through March 31, 2016.
While the following commentary is redundant across the past 5 years we still believe it relevant. Instead of trying to summarize prospects for the year ahead with new insights, beyond the opening comments, the statement from five years previous still portrays our view. On March 31, 2011 we wrote:
“We believe that continued upward movement of markets and economies worldwide are highly dependent on Governments getting their financial balance sheets in order. There has been unparalleled deficit spending around the world. Those economies not directly participating in the credit shortfalls will be indirectly impacted by lower import/export activities brought on by significant debt imposed slowdown. This will occur domestically and internationally as economies have become more highly correlated in their economic cycles. In response to this perceived scenario; risk management takes precedent over return pursuits in the near term. Your fund remains essentially fully invested to capture returns, but highly diversified to mitigate the risks associated with that position.”
We have to acknowledge we still believe the truth of the 2011 statement. However, we believe that the Federal Reserve actions have created an exogenous influence that has temporarily offset the ultimately destructive nature of excessive deficit financing. We believe that the future transition to a sound economic scenario will determine the continuation of current positive performances.
While significant risks exist, we continue to believe that investors have potential for one of the greatest investment environments for generations. There are over 7 billion people in the world today. (USA population is approximately 320 million.) Many of these potential consumers are moving into middle class ranks. In our opinion, the demand for goods and services for the future is tremendous. Remember that, in our own economy, approximately 60% of GDP is tied to consumers. With the business advantages that the USA enjoys in manufacturing know how, technology, intellectual content, productivity and numerous other characteristics, if Government will provide a competitive framework for operating, the benefits could be the best ever.
3
There are many additional moving parts in our economy and exogenous factors such as the geopolitical instabilities that will always have uneven effects. However, it is our thought that keeping our fiscal house in order is basic to all considerations. The irresponsible spending activities of our Government continue to unnerve us. It remains to be seen if the economy can overcome the negative influence of Government and have a successful impact on market values.
As of March 31, 2016, the Fund’s net assets were $80.3 million, down from $93.8 million at the beginning of the fiscal year; net asset value per share was $61.72; and the ratio of expenses to net average assets was 0.85%. Portfolio turnover rate was 17%. Income dividends of $0.6375 per share and capital gains of $2.0271 per share were distributed to shareholders during the year.
The Government Street Mid-Cap Fund
The Government Street Mid-Cap Fund produced a total return of 1.04% for the fiscal year ended March 31, 2016. By comparison, the Standard & Poor MidCap 400 (“S&P 400”) and the Morningstar Mid Cap Blended Index, used as relative performance benchmarks, were down -3.60% and -6.61%, respectively.
The mid-capitalization category of individual companies is usually proxied by the S&P 400 ranging from approximately $1.1 billion to $10.0 billion of total market value. Generally, these companies are considered to have slightly higher risk and return characteristics than the S&P 500 companies, which start at the upper end of the mid cap values and range to sizes 10 times or greater in terms of capitalization. As you would guess the mid cap companies tend to be primarily domestically oriented.
Your Fund has a slightly different range of capitalizations than the S&P 400. Generally, upper and lower limits for the Fund’s portfolio securities are $8.0 billion and $500 million, respectively. There are 2 provisions that allow the Fund to exceed those limits. To the extent securities originally purchased within the limits have grown to greater capitalizations they may be retained without limitation. Secondly, the Fund manager has latitude to purchase and hold up to 20% of the Fund’s value outside the limitations.
The 10 largest holdings in The Government Street Mid-Cap Fund as of March 31, 2016 were:
Security Description | % of Net Assets |
Mid-Amer. Apt. Communities, Inc. - REIT | 3.1% |
Guggenheim Mid-Cap Core ETF | 2.6% |
Vanguard Mid-Cap ETF | 2.5% |
Hormel Foods Corp | 2.1% |
Henry Jack & Assoc., Inc. | 1.8% |
Nasdaq, Inc. | 1.5% |
Realty Income Corp. | 1.5% |
Jarden Corp. | 1.5% |
Teleflex, Inc. | 1.5% |
Snap-on, Inc. | 1.4% |
4
ETFs represent significant holdings in the Fund. Vanguard and Guggenheim Mid-Cap ETFs are constituted differently, but cover the capitalization ranges mentioned earlier. Since the mid cap universe contains a much greater number of companies than its larger index counterparts, we like to broaden the Fund’s portfolio exposure across the range to govern risk control through diversification.
There were significant individual performances during the fiscal year. The 5 highest returns among securities held for the entire period, as measured by the internal rate of return, were:
Security Description | 1 Year Performance |
Tyson Foods, Inc. | 75.69% |
Hormel Foods Corp. | 54.40% |
Cameron Intl. Corp. | 47.77% |
One Gas, Inc. | 45.84% |
Mid-Amer. Apt. Cmntys. | 38.44% |
The 5 worst individual performances among securities held for the entire period, as measured by internal rate of return, were:
Security Description | 1 Year Performance |
Nordstrom, Inc. | -21.67% |
Liberty Global plc - Series C | -23.14% |
Zebra Technologies Corp. - Class A | -27.01% |
Jones Lang LaSalle, Inc. | -30.88% |
ONEOK, Inc. | -32.35% |
The Fund’s best performing economic sector for the fiscal year was Consumer Staples, up 26.76%. The second best sector was Utilities, up 15.56%. The worst performing sector was Energy, down -8.77%.
Note: The investment performances listed for economic sectors and securities in the two preceding paragraphs are extracted from an in-house independent internal rate of return computation by the Advent Axys portfolio accounting system. The calculations are gross investment returns. Total investment returns are for the fiscal year April 1, 2015 through March 31, 2016.
We believe that mid cap stocks offer an attractive combination of growth and safety as they have successfully overcome startup challenges yet remain nimble enough to generate stronger growth than large cap stocks. Mid cap stocks have historically been able to match the performance of large cap stocks in down markets while exceeding large cap performance in up markets, leading to long-term outperformance.
5
It may be interesting for the readers to compare and contrast the Global Industry Classification Standard (GICS) sectors between the larger capitalization S&P 500 and the lower capitalization S&P 400. The approximate weights based on component’s capitalizations change daily, but are reasonably stable over short periods. As of May 5, 2016 they are:
GICS | S&P 500 | S&P 400 |
Energy | 6.15% | 3.96% |
Materials | 2.61% | 6.74% |
Industrial | 11.61% | 15.09% |
Consumer Discretionary | 14.24% | 16.05% |
Consumer Staples | 9.95% | 4.18% |
Health Care | 15.32% | 10.28% |
Financials | 15.80% | 22.87% |
Information Technology | 19.67% | 15.95% |
Telecommunications | 2.06% | 0.71% |
Utilities | 2.59% | 4.16% |
The Government Street Mid-Cap Fund uses the S&P 400 sector weights for guidance in its diversification of investment holdings.
As of March 31, 2016, the net assets of the Government Street Mid-Cap Fund were $48.5 million and the net asset value per share was $21.95. The turnover rate for the previous twelve months was 20% and the total number of holdings was 128 as of March 31, 2016. The net expense ratio for the fund was 1.07%.
The Alabama Tax Free Bond Fund
In December, 2015, The Federal Reserve Board initiated its long anticipated increase in the federal funds rate. It was the first such increase since 2006. The federal funds rate was cut to near 0% in late 2008 and has remained unchanged since that time. On December 16th the federal funds rate was raised by 0.25% to a target range of 0.25%-0.50%. More important than the impact of a 25 basis point increase, the Federal Reserve emphasized that the pace of future rate increases will likely be very gradual, given their expectation of continued restrained inflation. Specifically, the median Federal Open Market Committee (FOMC) participant forecast at that time was for the fed funds rate to rise one percentage point to 1.375% by the end of 2016, and then to 2.375% by the end of 2017. At its mid-March, 2016 meeting, the Federal Reserve held rates steady and stated that “global economic and financial developments continue to pose risks”. But it also highlighted solid U.S. economic fundamentals. The FOMC also lowered its projection of the number of rate hikes for the rest of the year from four to two. They also communicated to expect a slower pace and lower trajectory than it had projected in December.
The municipal bond market posted positive returns for the past twelve months ended March 31, 2016, though investors in the municipal market continued to deal with extremely low yields across the maturity spectrum. The yield curve flattened during the period as longer dated bonds outperformed short term bonds. Technical conditions in the municipal market were favorable. New issue supply has fallen and demand for tax exempt securities remains very healthy. Investors have been drawn to
6
the municipal market because of the generally high quality level of the securities and the low volatility of bond prices. On a fundamental basis, the market has continued to improve and defaults remain very low. A handful of states and municipalities are working though difficult budget and benefit challenges and Puerto Rico remains embroiled in a debt crisis that is yet to be resolved. Generally speaking however, state and local tax revenues continue to grow, trending upward since 2009, and credit upgrades have exceeded downgrades by the major rating agencies.
The Alabama Tax Free Bond Fund has maintained a defensive posture with a focus on the shorter end of the maturity range and the higher end of the quality spectrum. More than 99% of the Fund’s portfolio is invested in securities rated A, AA, or AAA by either Moody’s or Standard and Poor’s. The duration of the Fund as of March 31, 2016 was 2.9 years, up slightly from 2.8 years at the end of the last fiscal year. The funds construction of a laddered portfolio of short and intermediate term Alabama tax exempt bonds remains in place.
For the year ended March 31, 2016, the Fund had a total return of 1.28%, as compared to returns of 1.54 % for the Barclay’s 3-Year Municipal Bond Index and 3.68% for the Barclay’s 7-year Municipal Bond Index. It should be noted that the Alabama Tax Free Bond Fund has a significantly shorter average maturity than the unmanaged Barclay’s 7-year Municipal Bond Index and consistently maintains a portfolio of higher rated securities, on average, than the holdings comprising the comparable indices. Additionally, while the Fund holds bonds with maturities ranging from less than one year to more than eight years, the Barclay’s 3 year Municipal Bond Index hold only securities with maturities of approximately three years and the Barclay’s 7-year Municipal Bond Index only holds securities with maturities ranging between six and eight years. Also, the Barclay’s indices include zero coupon bonds as well as bonds that are subject to the alternative minimum tax. The Fund holds neither of these types of securities.
As of March 31, 2016, the weighted average maturity of the Fund was 3.2 years, up from 3.1 years at the end of the last fiscal year. The net assets of the Fund as of March 31, 2016 were $28.9 million and the net asset value per share was $10.49. The ratio of net investment income to average net assets during the fiscal year was 1.27% and the net expense ratio was 0.65%.
Thank you for your continued confidence in The Government Street Funds. Please call us if we can be of further service to you.
Very truly yours,

Thomas W. Leavell
President
Leavell Investment Management, Inc.
The Government Street Funds
7
Data presented reflects past performance, which is no guarantee of future results. Investment results and principal value will fluctuate so that shares, when redeemed, may be worth more or less than their original cost. Due to market volatility, current performance may be higher or lower than the performance shown.
This report is submitted for the general information of the shareholders of the Funds. The report is not authorized for distribution to prospective investors in the Funds unless it is accompanied by a current prospectus.
This report reflects our views, opinions and portfolio holdings as of March 31, 2016, the end of the reporting period. These views are subject to change at any time based upon market or other conditions. For more current information throughout the year please visit www.leavellinvestments.com.
8
THE GOVERNMENT STREET EQUITY FUND
PERFORMANCE INFORMATION (Unaudited) |
The Government Street Equity Fund
Comparison of the Change in Value of a $10,000 Investment in
The Government Street Equity Fund and the Standard & Poor’s 500® Index
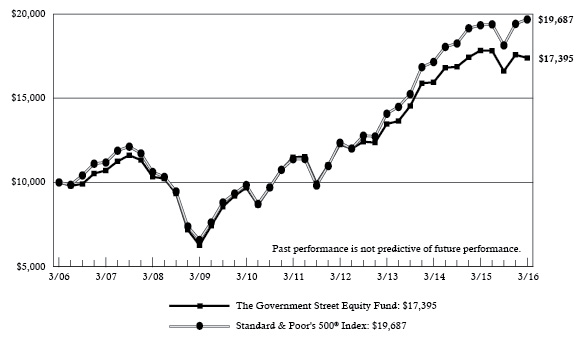
| Average Annual Total Returns(a) (for periods ended March 31, 2016) |
| 1 Year | 5 Years | 10 Years |
The Government Street Equity Fund | (2.46%) | 8.65% | 5.69% |
Standard & Poor’s 500® Index | 1.78% | 11.58% | 7.01% |
(a) | Total return is a measure of the change in value of an investment in the Fund over the periods covered, which assumes any dividends or capital gains distributions are reinvested in shares of the Fund. Returns do not reflect the deduction of taxes a shareholder would pay on Fund distributions or the redemption of Fund shares. |
9
THE GOVERNMENT STREET MID-CAP FUND
PERFORMANCE INFORMATION (Unaudited) |
The Government Street Mid-Cap Fund
Comparison of the Change in Value of a $10,000 Investment in The Government Street
Mid-Cap Fund and the Standard & Poor’s MidCap 400® Index

| Average Annual Total Returns(a) (for periods ended March 31, 2016) |
| 1 Year | 5 Years | 10 Years |
The Government Street Mid-Cap Fund | 1.04% | 9.10% | 7.29% |
Standard & Poor’s MidCap 400® Index | (3.60%) | 9.52% | 7.78% |
(a) | Total return is a measure of the change in value of an investment in the Fund over the periods covered, which assumes any dividends or capital gains distributions are reinvested in shares of the Fund. Returns do not reflect the deduction of taxes a shareholder would pay on Fund distributions or the redemption of Fund shares. |
10
THE ALABAMA TAX FREE BOND FUND
PERFORMANCE INFORMATION (Unaudited) |
The Alabama Tax Free Bond Fund
Comparison of the Change in Value of a $10,000 Investment in The Alabama Tax Free Bond Fund,
the Barclays 7-Year Municipal Bond Index and the Barclays 3-Year Municipal Bond Index
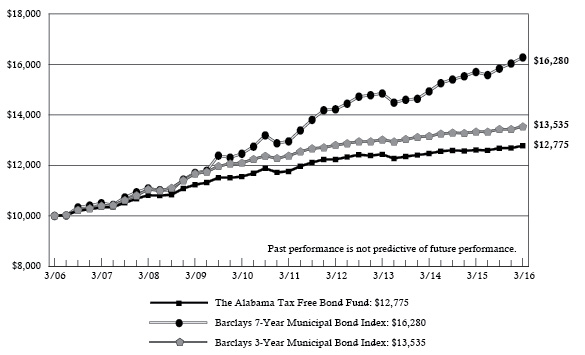
| Average Annual Total Returns(a) (for periods ended March 31, 2016) |
| 1 Year | 5 Years | 10 Years |
The Alabama Tax Free Bond Fund | 1.28% | 1.67% | 2.48% |
Barclays 7-Year Municipal Bond Index | 3.68% | 4.67% | 4.99% |
Barclays 3-Year Municipal Bond Index | 1.54% | 1.80% | 3.07% |
(a) | Total return is a measure of the change in value of an investment in the Fund over the periods covered, which assumes any dividends or capital gains distributions are reinvested in shares of the Fund. Returns do not reflect the deduction of taxes a shareholder would pay on Fund distributions or the redemption of Fund shares. |
11
THE GOVERNMENT STREET EQUITY FUND PORTFOLIO INFORMATION
March 31, 2016 (Unaudited)
Asset Allocation
(% of Net Assets)

Top Ten Equity Holdings
Security Description | % of Net Assets |
Apple, Inc. | 4.4% |
Visa, Inc. - Class A | 4.0% |
Vanguard Mid-Cap ETF | 3.7% |
MasterCard, Inc. - Class A | 3.1% |
Walt Disney Company (The) | 2.7% |
Comcast Corporation - Class A | 2.3% |
General Dynamics Corporation | 2.2% |
JPMorgan Chase & Company | 2.1% |
Allergan plc | 1.9% |
United Technologies Corporation | 1.9% |
12
THE GOVERNMENT STREET MID-CAP FUND PORTFOLIO INFORMATION
March 31, 2016 (Unaudited)
Asset Allocation
(% of Net Assets)
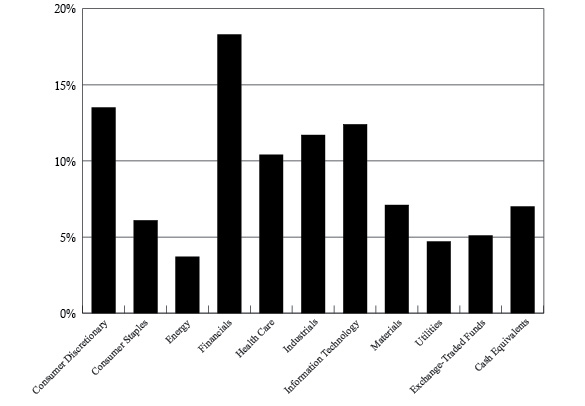
Top Ten Equity Holdings
Security Description | % of Net Assets |
Mid-America Apartment Communities, Inc. | 3.1% |
Guggenheim Mid-Cap Core ETF | 2.6% |
Vanguard Mid-Cap ETF | 2.5% |
Hormel Foods Corporation | 2.1% |
Jack Henry & Associates, Inc. | 1.8% |
Nasdaq, Inc. | 1.5% |
Realty Income Corporation | 1.5% |
Jarden Corporation | 1.5% |
Teleflex, Inc. | 1.5% |
Snap-on, Inc. | 1.4% |
13
THE ALABAMA TAX FREE BOND FUND
PORTFOLIO INFORMATION
March 31, 2016 (Unaudited)
Asset Allocation
(% of Net Assets)

Distribution by Rating |
Rating | | % of Holdings |
AAA | | 7.3% |
AA | | 84.1% |
A | | 7.8% |
Not Rated | | 0.8% |
14
THE GOVERNMENT STREET EQUITY FUND
SCHEDULE OF INVESTMENTS
March 31, 2016 |
COMMON STOCKS — 90.2% | | Shares | | | Value | |
Consumer Discretionary — 12.1% | | | | | | |
Comcast Corporation - Class A | | | 30,000 | | | $ | 1,832,400 | |
Dollar Tree, Inc. (a) | | | 8,000 | | | | 659,680 | |
Home Depot, Inc. (The) | | | 7,200 | | | | 960,696 | |
Lowe's Companies, Inc. | | | 8,000 | | | | 606,000 | |
McDonald's Corporation | | | 5,000 | | | | 628,400 | |
NIKE, Inc. - Class B | | | 12,900 | | | | 792,963 | |
O'Reilly Automotive, Inc. (a) | | | 1,400 | | | | 383,124 | |
Ross Stores, Inc. | | | 7,000 | | | | 405,300 | |
Starbucks Corporation | | | 7,500 | | | | 447,750 | |
Tractor Supply Company | | | 9,000 | | | | 814,140 | |
Walt Disney Company (The) | | | 21,775 | | | | 2,162,475 | |
| | | | | | | | 9,692,928 | |
Consumer Staples — 9.0% | | | | | | | | |
Altria Group, Inc. | | | 11,700 | | | | 733,122 | |
Anheuser-Busch InBev SA/NV — ADR | | | 9,500 | | | | 1,184,270 | |
Coca-Cola Company (The) | | | 12,000 | | | | 556,680 | |
CVS Health Corporation | | | 12,000 | | | | 1,244,760 | |
Kraft Heinz Company (The) | | | 5,378 | | | | 422,496 | |
McCormick & Company, Inc. - Non-Voting Shares | | | 7,000 | | | | 696,360 | |
Mondelēz International, Inc. - Class A | | | 27,836 | | | | 1,116,780 | |
Philip Morris International, Inc. | | | 7,860 | | | | 771,145 | |
Procter & Gamble Company (The) | | | 5,750 | | | | 473,282 | |
| | | | | | | | 7,198,895 | |
Energy — 5.1% | | | | | | | | |
ConocoPhillips | | | 14,500 | | | | 583,915 | |
Exxon Mobil Corporation | | | 8,000 | | | | 668,720 | |
Phillips 66 | | | 14,300 | | | | 1,238,237 | |
Pioneer Natural Resources Company | | | 7,500 | | | | 1,055,550 | |
Spectra Energy Corporation | | | 19,000 | | | | 581,400 | |
| | | | | | | | 4,127,822 | |
Financials — 11.8% | | | | | | | | |
Aflac, Inc. | | | 10,565 | | | | 667,074 | |
American International Group, Inc. | | | 21,000 | | | | 1,135,050 | |
Brookfield Asset Management, Inc. - Class A | | | 33,500 | | | | 1,165,465 | |
CME Group, Inc. | | | 7,500 | | | | 720,375 | |
Intercontinental Exchange, Inc. | | | 4,000 | | | | 940,560 | |
JPMorgan Chase & Company | | | 29,000 | | | | 1,717,380 | |
Mid-America Apartment Communities, Inc. | | | 11,394 | | | | 1,164,581 | |
Realty Income Corporation | | | 4,000 | | | | 250,040 | |
T. Rowe Price Group, Inc. | | | 5,000 | | | | 367,300 | |
U.S. Bancorp | | | 5,500 | | | | 223,245 | |
15
THE GOVERNMENT STREET EQUITY FUND
SCHEDULE OF INVESTMENTS (Continued) |
COMMON STOCKS — 90.2% (Continued) | | Shares | | | Value | |
Financials — 11.8% (Continued) | | | | | | |
Wells Fargo & Company | | | 24,000 | | | $ | 1,160,640 | |
| | | | | | | | 9,511,710 | |
Health Care — 14.5% | | | | | | | | |
Abbott Laboratories | | | 14,000 | | | | 585,620 | |
AbbVie, Inc. | | | 11,500 | | | | 656,880 | |
Allergan plc (a) | | | 5,800 | | | | 1,554,574 | |
Amgen, Inc. | | | 2,000 | | | | 299,860 | |
Becton, Dickinson and Company | | | 621 | | | | 94,280 | |
Bio-Techne Corporation | | | 10,000 | | | | 945,200 | |
Cardinal Health, Inc. | | | 15,000 | | | | 1,229,250 | |
Cerner Corporation (a) | | | 9,000 | | | | 476,640 | |
Gilead Sciences, Inc. | | | 16,000 | | | | 1,469,760 | |
Henry Schein, Inc. (a) | | | 4,500 | | | | 776,835 | |
Merck & Company, Inc. | | | 12,000 | | | | 634,920 | |
Pfizer, Inc. | | | 27,000 | | | | 800,280 | |
Regeneron Pharmaceuticals, Inc. (a) | | | 2,000 | | | | 720,880 | |
Shire plc - ADR | | | 3,000 | | | | 515,700 | |
Waters Corporation (a) | | | 6,475 | | | | 854,182 | |
| | | | | | | | 11,614,861 | |
Industrials — 10.2% | | | | | | | | |
Emerson Electric Company | | | 13,000 | | | | 706,940 | |
General Dynamics Corporation | | | 13,600 | | | | 1,786,632 | |
Honeywell International, Inc. | | | 10,000 | | | | 1,120,500 | |
Lockheed Martin Corporation | | | 7,000 | | | | 1,550,500 | |
Parker-Hannifin Corporation | | | 3,000 | | | | 333,240 | |
Quanta Services, Inc. (a) | | | 11,500 | | | | 259,440 | |
Stericycle, Inc. (a) | | | 7,000 | | | | 883,330 | |
United Technologies Corporation | | | 15,500 | | | | 1,551,550 | |
| | | | | | | | 8,192,132 | |
Information Technology — 21.3% | | | | | | | | |
Accenture plc - Class A | | | 9,500 | | | | 1,096,300 | |
Alphabet, Inc. - Class A (a) | | | 1,800 | | | | 1,373,220 | |
Alphabet, Inc. - Class C (a) | | | 1,902 | | | | 1,416,895 | |
Apple, Inc. | | | 32,445 | | | | 3,536,181 | |
Automatic Data Processing, Inc. | | | 7,500 | | | | 672,825 | |
Facebook, Inc. - Class A (a) | | | 2,000 | | | | 228,200 | |
Intel Corporation | | | 12,000 | | | | 388,200 | |
MasterCard, Inc. - Class A | | | 26,750 | | | | 2,527,875 | |
Microsoft Corporation | | | 10,000 | | | | 552,300 | |
NVIDIA Corporation | | | 11,000 | | | | 391,930 | |
Oracle Corporation | | | 7,000 | | | | 286,370 | |
TE Connectivity Ltd. | | | 12,500 | | | | 774,000 | |
Texas Instruments, Inc. | | | 12,000 | | | | 689,040 | |
16
THE GOVERNMENT STREET EQUITY FUND
SCHEDULE OF INVESTMENTS (Continued) |
COMMON STOCKS — 90.2% (Continued) | | Shares | | | Value | |
Information Technology — 21.3% (Continued) | | | | | | |
Visa, Inc. - Class A | | | 42,000 | | | $ | 3,212,160 | |
| | | | | | | | 17,145,496 | |
Materials — 2.8% | | | | | | | | |
Dow Chemical Company (The) | | | 11,000 | | | | 559,460 | |
Ecolab, Inc. | | | 6,000 | | | | 669,120 | |
Praxair, Inc. | | | 5,000 | | | | 572,250 | |
Vulcan Materials Company | | | 4,000 | | | | 422,280 | |
| | | | | | | | 2,223,110 | |
Telecommunication Services — 0.3% | | | | | | | | |
AT&T, Inc. | | | 6,000 | | | | 235,020 | |
| | | | | | | | | |
Utilities — 3.1% | | | | | | | | |
AGL Resources, Inc. | | | 6,000 | | | | 390,840 | |
Duke Energy Corporation | | | 8,250 | | | | 665,610 | |
Southern Company (The) | | | 12,000 | | | | 620,760 | |
WEC Energy Group, Inc | | | 14,000 | | | | 840,980 | |
| | | | | | | | 2,518,190 | |
| | | | | | | | | |
Total Common Stocks (Cost $42,477,684) | | | | | | $ | 72,460,164 | |
EXCHANGE-TRADED FUNDS — 3.7% | | Shares | | | Value | |
Vanguard Mid-Cap ETF (Cost $1,352,306) | | | 24,400 | | | $ | 2,958,012 | |
MONEY MARKET FUNDS - 6.9% | | Shares | | | Value | |
Fidelity Institutional Money Market Government Portfolio - Class I, 0.23% (b) (Cost $5,533,460) | | | 5,533,460 | | | $ | 5,533,460 | |
| | | | | | | | | |
Total Investments at Value — 100.8% (Cost $49,363,450) | | | | | | $ | 80,951,636 | |
| | | | | | | | | |
Liabilities in Excess of Other Assets — (0.8%) | | | | | | | (644,751 | ) |
| | | | | | | | | |
Net Assets — 100.0% | | | | | | $ | 80,306,885 | |
ADR - American Depositary Receipt. |
(a) | Non-income producing security. |
(b) | The rate shown is the 7-day effective yield as of March 31, 2016. |
See accompanying notes to financial statements. |
17
THE GOVERNMENT STREET MID-CAP FUND
SCHEDULE OF INVESTMENTS
March 31, 2016 |
COMMON STOCKS — 87.9% | | Shares | | | Value | |
Consumer Discretionary — 13.5% | | | | | | |
Buffalo Wild Wings, Inc. (a) | | | 2,035 | | | $ | 301,424 | |
Cracker Barrel Old Country Store, Inc. | | | 2,500 | | | | 381,675 | |
Dollar Tree, Inc. (a) | | | 6,995 | | | | 576,808 | |
Gildan Activewear, Inc. - Class A | | | 13,400 | | | | 408,834 | |
Hasbro, Inc. | | | 7,000 | | | | 560,700 | |
Jarden Corporation (a) | | | 12,137 | | | | 715,476 | |
Leggett & Platt, Inc. | | | 6,000 | | | | 290,400 | |
Liberty Global plc - Series C (a) | | | 4,475 | | | | 168,081 | |
Nordstrom, Inc. | | | 3,900 | | | | 223,119 | |
O'Reilly Automotive, Inc. (a) | | | 2,395 | | | | 655,416 | |
Panera Bread Company - Class A (a) | | | 2,390 | | | | 489,544 | |
Ross Stores, Inc. | | | 11,500 | | | | 665,850 | |
Service Corporation International | | | 15,200 | | | | 375,136 | |
Tiffany & Company | | | 3,475 | | | | 254,995 | |
Vail Resorts, Inc. | | | 1,500 | | | | 200,550 | |
VF Corporation | | | 4,700 | | | | 304,372 | |
| | | | | | | | 6,572,380 | |
Consumer Staples — 6.1% | | | | | | | | |
Church & Dwight Company, Inc. | | | 6,000 | | | | 553,080 | |
Edgewell Personal Care Company | | | 3,000 | | | | 241,590 | |
Energizer Holdings, Inc. | | | 2,500 | | | | 101,275 | |
Hormel Foods Corporation | | | 24,000 | | | | 1,037,760 | |
J.M. Smucker Company (The) | | | 4,500 | | | | 584,280 | |
Tyson Foods, Inc. - Class A | | | 7,000 | | | | 466,620 | |
| | | | | | | | 2,984,605 | |
Energy — 3.7% | | | | | | | | |
Cameron International Corporation (a) | | | 5,010 | | | | 335,921 | |
HollyFrontier Corporation | | | 12,000 | | | | 423,840 | |
ONEOK, Inc. | | | 11,000 | | | | 328,460 | |
Patterson-UTI Energy, Inc. | | | 20,000 | | | | 352,400 | |
Valero Energy Corporation | | | 2,500 | | | | 160,350 | |
World Fuel Services Corporation | | | 4,000 | | | | 194,320 | |
| | | | | | | | 1,795,291 | |
Financials — 18.3% | | | | | | | | |
Alexander & Baldwin, Inc. | | | 4,000 | | | | 146,720 | |
Alleghany Corporation (a) | | | 865 | | | | 429,213 | |
American Financial Group, Inc. | | | 7,100 | | | | 499,627 | |
Arthur J. Gallagher & Company | | | 6,750 | | | | 300,240 | |
Axis Capital Holdings Ltd. | | | 5,000 | | | | 277,300 | |
Bank of Hawaii Corporation | | | 6,000 | | | | 409,680 | |
Berkley (W.R.) Corporation | | | 6,450 | | | | 362,490 | |
Brown & Brown, Inc. | | | 9,500 | | | | 340,100 | |
18
THE GOVERNMENT STREET MID-CAP FUND
SCHEDULE OF INVESTMENTS (Continued) |
COMMON STOCKS — 87.9% (Continued) | | Shares | | | Value | |
Financials — 18.3% (Continued) | | | | | | |
CME Group, Inc. | | | 5,735 | | | $ | 550,847 | |
Eaton Vance Corporation | | | 9,500 | | | | 318,440 | |
Everest Re Group Ltd. | | | 2,750 | | | | 542,932 | |
Intercontinental Exchange, Inc. | | | 2,200 | | | | 517,308 | |
Jones Lang LaSalle, Inc. | | | 2,800 | | | | 328,496 | |
Mid-America Apartment Communities, Inc. | | | 14,800 | | | | 1,512,708 | |
Nasdaq, Inc. | | | 11,000 | | | | 730,180 | |
Old Republic International Corporation | | | 24,400 | | | | 446,032 | |
Realty Income Corporation | | | 11,525 | | | | 720,428 | |
SEI Investments Company | | | 10,500 | | | | 452,025 | |
| | | | | | | | 8,884,766 | |
Health Care — 10.4% | | | | | | | | |
Bio-Rad Laboratories, Inc. - Class A (a) | | | 2,500 | | | | 341,800 | |
Bio-Techne Corporation | | | 4,500 | | | | 425,340 | |
Centene Corporation (a) | | | 11,000 | | | | 677,270 | |
Charles River Laboratories International, Inc. (a) | | | 4,500 | | | | 341,730 | |
Chemed Corporation | | | 3,000 | | | | 406,350 | |
Ensign Group, Inc. (The) | | | 16,000 | | | | 362,240 | |
Henry Schein, Inc. (a) | | | 3,500 | | | | 604,205 | |
Illumina, Inc. (a) | | | 2,000 | | | | 324,220 | |
Laboratory Corporation of America Holdings (a) | | | 2,074 | | | | 242,928 | |
ResMed, Inc. | | | 6,000 | | | | 346,920 | |
Teleflex, Inc. | | | 4,500 | | | | 706,545 | |
Waters Corporation (a) | | | 2,000 | | | | 263,840 | |
| | | | | | | | 5,043,388 | |
Industrials — 11.7% | | | | | | | | |
AMETEK, Inc. | | | 1,350 | | | | 67,473 | |
C.H. Robinson Worldwide, Inc. | | | 6,000 | | | | 445,380 | |
Deluxe Corporation | | | 5,000 | | | | 312,450 | |
Donaldson Company, Inc. | | | 13,000 | | | | 414,830 | |
Expeditors International of Washington, Inc. | | | 8,000 | | | | 390,480 | |
Fastenal Company | | | 11,650 | | | | 570,850 | |
Graco, Inc. | | | 7,000 | | | | 587,720 | |
Jacobs Engineering Group, Inc. (a) | | | 5,475 | | | | 238,436 | |
JetBlue Airways Corporation (a) | | | 8,000 | | | | 168,960 | |
L-3 Communications Holdings, Inc. | | | 3,000 | | | | 355,500 | |
Matson, Inc. | | | 3,000 | | | | 120,510 | |
MSC Industrial Direct Company, Inc. - Class A | | | 6,000 | | | | 457,860 | |
Pentair plc | | | 2,900 | | | | 157,354 | |
Snap-on, Inc. | | | 4,475 | | | | 702,530 | |
Stericycle, Inc. (a) | | | 1,900 | | | | 239,761 | |
Waste Connections, Inc. | | | 7,000 | | | | 452,130 | |
| | | | | | | | 5,682,224 | |
19
THE GOVERNMENT STREET MID-CAP FUND
SCHEDULE OF INVESTMENTS (Continued) |
COMMON STOCKS — 87.9% (Continued) | | Shares | | | Value | |
Information Technology — 12.4% | | | | | | |
ANSYS, Inc. (a) | | | 3,500 | | | $ | 313,110 | |
Arrow Electronics, Inc. (a) | | | 10,100 | | | | 650,541 | |
DST Systems, Inc. | | | 5,100 | | | | 575,127 | |
Harris Corporation | | | 6,000 | | | | 467,160 | |
Jack Henry & Associates, Inc. | | | 10,500 | | | | 887,985 | |
Lam Research Corporation | | | 8,500 | | | | 702,100 | |
Linear Technology Corporation | | | 7,200 | | | | 320,832 | |
Microchip Technology, Inc. | | | 6,000 | | | | 289,200 | |
National Instruments Corporation | | | 12,000 | | | | 361,320 | |
NVIDIA Corporation | | | 4,000 | | | | 142,520 | |
SanDisk Corporation | | | 5,000 | | | | 380,400 | |
Tech Data Corporation (a) | | | 3,500 | | | | 268,695 | |
Xilinx, Inc. | | | 7,000 | | | | 332,010 | |
Zebra Technologies Corporation - Class A (a) | | | 4,500 | | | | 310,500 | |
| | | | | | | | 6,001,500 | |
Materials — 7.1% | | | | | | | | |
Airgas, Inc. | | | 1,650 | | | | 233,706 | |
Albemarle Corporation | | | 9,000 | | | | 575,370 | |
Ashland, Inc. | | | 3,000 | | | | 329,880 | |
Martin Marietta Materials, Inc. | | | 2,500 | | | | 398,775 | |
Packaging Corporation of America | | | 6,500 | | | | 392,600 | |
Scotts Miracle-Gro Company (The) - Class A | | | 5,000 | | | | 363,850 | |
Sonoco Products Company | | | 5,000 | | | | 242,850 | |
Steel Dynamics, Inc. | | | 12,000 | | | | 270,120 | |
Valspar Corporation (The) | | | 6,000 | | | | 642,120 | |
| | | | | | | | 3,449,271 | |
Utilities — 4.7% | | | | | | | | |
AGL Resources, Inc. | | | 9,400 | | | | 612,316 | |
AmeriGas Partners, L.P. | | | 5,500 | | | | 239,085 | |
One Gas, Inc. | | | 4,000 | | | | 244,400 | |
SCANA Corporation | | | 8,530 | | | | 598,379 | |
Vectren Corporation | | | 11,600 | | | | 586,496 | |
| | | | | | | | 2,280,676 | |
| | | | | | | | | |
Total Common Stocks (Cost $22,436,855) | | | | | | $ | 42,694,101 | |
20
THE GOVERNMENT STREET MID-CAP FUND
SCHEDULE OF INVESTMENTS (Continued) |
EXCHANGE-TRADED FUNDS — 5.1% | | Shares | | | Value | |
Guggenheim Mid-Cap Core ETF | | | 26,000 | | | $ | 1,270,880 | |
Vanguard Mid-Cap ETF | | | 9,850 | | | | 1,194,116 | |
Total Exchange-Traded Funds (Cost $1,563,641) | | | | | | $ | 2,464,996 | |
MONEY MARKET FUNDS — 6.9% | | Shares | | | Value | |
Fidelity Institutional Money Market Government Portfolio - Class I, 0.23% (b) (Cost $3,326,507) | | | 3,326,507 | | | $ | 3,326,507 | |
| | | | | | | | | |
Total Investments at Value — 99.9% (Cost $27,327,003) | | | | | | $ | 48,485,604 | |
| | | | | | | | | |
Other Assets in Excess of Liabilities — 0.1% | | | | | | | 61,322 | |
| | | | | | | | | |
Net Assets — 100.0% | | | | | | $ | 48,546,926 | |
(a) | Non-income producing security. |
(b) | The rate shown is the 7-day effective yield as of March 31, 2016. |
See accompanying notes to financial statements. |
21
THE ALABAMA TAX FREE BOND FUND
SCHEDULE OF INVESTMENTS
March 31, 2016 |
ALABAMA FIXED RATE REVENUE AND GENERAL OBLIGATION (GO) BONDS — 96.0% | | Par Value | | | Value | |
Alabama Drinking Water Financing Auth., Series A, Rev., | | | | | | |
3.00%, due 08/15/2019 | | $ | 530,000 | | | $ | 565,563 | |
Alabama State Public School & College Auth., Capital Improvements, Rev., | | | | | | | | |
5.00%, due 12/01/2017 | | | 470,000 | | | | 503,149 | |
Alabama State Public School & College Auth., Capital Improvements, Series A, Rev., | | | | | | | | |
4.00%, due 02/01/2017 | | | 235,000 | | | | 241,596 | |
4.00%, due 02/01/2017 | | | 15,000 | | | | 15,424 | |
3.75%, due 02/01/2018 | | | 190,000 | | | | 200,304 | |
3.75%, due 02/01/2018 | | | 10,000 | | | | 10,541 | |
Alabama State Public School & College Auth., Capital Improvements, Series D, Rev., | | | | | | | | |
2.00%, due 09/01/2018 | | | 565,000 | | | | 580,865 | |
Alabama State, Series A, GO, | | | | | | | | |
5.00%, due 08/01/2023 | | | 400,000 | | | | 498,132 | |
Alabaster, AL, Water Rev., | | | | | | | | |
3.00%, due 09/01/2017 | | | 400,000 | | | | 412,180 | |
Anniston, AL, Waterworks & Sewer
Board, Water & Sewer Rev., | | | | | | | | |
3.50%, due 06/01/2016 | | | 500,000 | | | | 502,315 | |
Athens, AL, Electric Rev., Warrants, | | | | | | | | |
3.00%, due 06/01/2016 | | | 510,000 | | | | 511,938 | |
3.00%, due 06/01/2019 | | | 375,000 | | | | 396,229 | |
Athens, AL, GO, Warrants, | | | | | | | | |
4.00%, due 09/01/2018 | | | 300,000 | | | | 322,128 | |
Auburn University, AL, General Fee Rev., | | | | | | | | |
5.00%, due 06/01/2018 | | | 315,000 | | | | 343,467 | |
5.00%, due 06/01/2020 | | | 350,000 | | | | 404,946 | |
5.00%, due 06/01/2021 | | | 200,000 | | | | 237,096 | |
Auburn, AL, Refunding & Capital Improvements, Series B, GO, Warrants, | | | | | | | | |
4.00%, due 08/01/2018 | | | 200,000 | | | | 214,008 | |
Auburn, AL, School, Series A, GO, Warrants, | | | | | | | | |
5.00%, due 08/01/2018 | | | 500,000 | | | | 548,115 | |
Baldwin Co., AL, Board of Education, Rev., | | | | | | | | |
5.00%, due 07/01/2018 | | | 590,000 | | | | 621,742 | |
Baldwin Co., AL, GO, Warrants, | | | | | | | | |
4.00%, due 06/01/2019 | | | 200,000 | | | | 218,642 | |
Baldwin Co., AL, Series A, GO, Warrants, | | | | | | | | |
5.00%, due 02/01/2017 | | | 320,000 | | | | 331,638 | |
22
THE ALABAMA TAX FREE BOND FUND
SCHEDULE OF INVESTMENTS (Continued) |
ALABAMA FIXED RATE REVENUE AND GENERAL OBLIGATION (GO) BONDS — 96.0% (Continued) | | Par Value | | | Value | |
Birmingham, AL, Waterworks Board, Water Rev., | | | | | | |
5.00%, due 01/01/2017 | | $ | 400,000 | | | $ | 412,900 | |
3.625%, due 07/01/2018 | | | 250,000 | | | | 264,677 | |
Calera, AL, GO, Warrants, | | | | | | | | |
3.00%, due 12/01/2017 | | | 410,000 | | | | 424,637 | |
Chambers Co., AL, Gasoline Tax Anticipation, Rev., Warrants, | | | | | | | | |
2.00%, due 11/01/2019 | | | 290,000 | | | | 293,228 | |
Cullman, AL, Board of Education Special Tax School Warrants, Rev., | | | | | | | | |
2.00%, due 03/01/2023 | | | 325,000 | | | | 330,181 | |
Decatur, AL, Sewer Rev., Warrants, | | | | | | | | |
3.00%, due 08/15/2019 | | | 500,000 | | | | 531,410 | |
Elmore Co., AL, GO, Warrants, | | | | | | | | |
5.00%, due 10/01/2022 | | | 415,000 | | | | 500,000 | |
Florence, AL, Electric Rev., Warrants, | | | | | | | | |
3.50%, due 06/01/2017 | | | 515,000 | | | | 529,446 | |
Florence, AL, GO, Warrants, | | | | | | | | |
4.00%, due 08/01/2018 | | | 575,000 | | | | 613,255 | |
Foley, AL, Utilities Board, Utilities Rev., | | | | | | | | |
4.00%, due 11/01/2018 | | | 710,000 | | | | 765,437 | |
4.00%, due 11/01/2019 | | | 225,000 | | | | 248,305 | |
Homewood, AL, Board of Education, Special Tax School Warrants, | | | | | | | | |
4.00%, due 04/01/2017 | | | 500,000 | | | | 515,625 | |
Hoover City, AL, Board of Education, Special Tax School Warrants, | | | | | | | | |
4.00%, due 02/15/2020 | | | 470,000 | | | | 519,665 | |
Huntsville, AL, Electric Systems, Rev., | | | | | | | | |
3.00%, due 12/01/2016 | | | 375,000 | | | | 380,996 | |
Huntsville, AL, GO, Refunding and Capital Improvement Warrants, | | | | | | | | |
4.00%, due 09/01/2016 | | | 500,000 | | | | 507,415 | |
4.00%, due 09/01/2018 | | | 500,000 | | | | 538,170 | |
Huntsville, AL, Series A, GO, Warrants, | | | | | | | | |
5.00%, due 05/01/2024 | | | 665,000 | | | | 835,805 | |
Limestone Co., AL, Board of Education, Special Tax Warrants, | | | | | | | | |
3.00%, due 11/01/2019 | | | 560,000 | | | | 590,257 | |
23
THE ALABAMA TAX FREE BOND FUND
SCHEDULE OF INVESTMENTS (Continued) |
ALABAMA FIXED RATE REVENUE AND GENERAL OBLIGATION (GO) BONDS — 96.0% (Continued) | | Par Value | | | Value | |
Macon Co., AL, GO, Warrants, | | | | | | |
4.25%, due 10/01/2027, | | | | | | |
Prerefunded 10/01/2017 @ 100 | | $ | 200,000 | | | $ | 210,668 | |
Madison Co., AL, Board of Education, Rev., Tax Anticipation Warrants, | | | | | | | | |
2.00%, due 09/01/2019 | | | 220,000 | | | | 226,294 | |
Madison Co., AL, GO, School Warrants, | | | | | | | | |
5.00%, due 03/01/2025 | | | 500,000 | | | | 620,730 | |
Madison Co., AL, GO, Warrants, | | | | | | | | |
4.00%, due 09/01/2021 | | | 465,000 | | | | 526,808 | |
Madison Co., AL, Series A, Water Rev., Warrants, | | | | | | | | |
2.00%, due 07/01/2017 | | | 250,000 | | | | 253,975 | |
Madison Co., AL, Water & Wastewater Board, Rev., | | | | | | | | |
3.00%, due 12/01/2019 | | | 430,000 | | | | 461,042 | |
Mobile Co., AL, GO, Refunding, | | | | | | | | |
5.00%, due 06/01/2023 | | | 520,000 | | | | 637,447 | |
Mobile, AL, Board of School Commissioners, GO, Warrants, | | | | | | | | |
5.00%, due 03/01/2025 | | | 250,000 | | | | 308,603 | |
Montgomery, AL, GO, Warrants, | | | | | | | | |
2.50%, due 04/01/2021 | | | 500,000 | | | | 510,215 | |
Montgomery, AL, Series A, GO, Warrants, | | | | | | | | |
5.00%, due 02/01/2024 | | | 220,000 | | | | 250,160 | |
Montgomery, AL, Waterworks & Sanitation, Rev., | | | | | | | | |
5.00%, due 09/01/2017 | | | 250,000 | | | | 265,235 | |
Morgan Co., AL, Board of Education, Rev., Capital Outlay Warrants, | | | | | | | | |
4.00%, due 03/01/2019 | | | 250,000 | | | | 270,205 | |
Mountain Brook, AL, City Board of Education, GO, Warrants, | | | | | | | | |
3.00%, due 03/01/2020 | | | 300,000 | | | | 322,749 | |
North Alabama Gas District, Rev., | | | | | | | | |
3.00%, due 06/01/2020 | | | 420,000 | | | | 432,877 | |
Opelika, AL, GO, Warrants, | | | | | | | | |
2.00%, due 11/01/2017 | | | 275,000 | | | | 279,670 | |
Opelika, AL, Utilities Board, Series B, Rev., | | | | | | | | |
3.00%, due 06/01/2016 | | | 475,000 | | | | 476,862 | |
3.00%, due 06/01/2018 | | | 215,000 | | | | 223,830 | |
Orange Beach, AL, GO, Warrants, | | | | | | | | |
4.00%, due 02/01/2018 | | | 200,000 | | | | 211,190 | |
5.00%, due 02/01/2019 | | | 240,000 | | | | 266,261 | |
24
THE ALABAMA TAX FREE BOND FUND
SCHEDULE OF INVESTMENTS (Continued) |
ALABAMA FIXED RATE REVENUE AND GENERAL OBLIGATION (GO) BONDS — 96.0% (Continued) | | Par Value | | | Value | |
Prattville, AL, GO, Warrants, | | | | | | |
5.00%, due 11/01/2022 | | $ | 400,000 | | | $ | 485,016 | |
Prattville, AL, Waterworks Board, Rev., | | | | | | | | |
3.00%, due 08/01/2017 | | | 290,000 | | | | 298,085 | |
Sheffield, AL, Electric Rev., | | | | | | | | |
4.00%, due 07/01/2017 | | | 600,000 | | | | 624,750 | |
Sylacauga, AL, Utilities Board, Rev., | | | | | | | | |
3.00%, due 05/01/2021 | | | 310,000 | | | | 333,941 | |
Trussville, AL, GO, | | | | | | | | |
5.00%, due 10/01/2019 | | | 400,000 | | | | 456,304 | |
Tuscaloosa, AL, Series B, GO, Warrants, | | | | | | | | |
4.00%, due 01/01/2020 | | | 500,000 | | | | 552,535 | |
University of Alabama, AL, Series A, Rev., | | | | | | | | |
3.00%, due 07/01/2016 | | | 340,000 | | | | 342,240 | |
5.00%, due 07/01/2017 | | | 245,000 | | | | 258,245 | |
Vestavia Hills, AL, GO, Warrants, | | | | | | | | |
4.00%, due 02/01/2018 | | | 515,000 | | | | 543,294 | |
Vestavia Hills, AL, Series A, GO, Warrants, | | | | | | | | |
3.00%, due 02/01/2018 | | | 240,000 | | | | 249,593 | |
Wetumpka, AL, Waterworks & Sewer, Rev., | | | | | | | | |
4.00%, due 03/01/2018 | | | 320,000 | | | | 329,872 | |
| | | | | | | | | |
Total Alabama Fixed Rate Revenue and General Obligation (GO) Bonds (Cost $27,203,790) | | | | | | $ | 27,710,123 | |
MONEY MARKET FUNDS — 3.1% | | Shares | | | Value | |
Fidelity Tax Exempt Portfolio - Class I, 0.15% (a) (Cost $906,994) | | | 906,994 | | | $ | 906,994 | |
| | | | | | | | | |
Total Investments at Value — 99.1% (Cost $28,110,784) | | | | | | $ | 28,617,117 | |
| | | | | | | | | |
Other Assets in Excess of Liabilities — 0.9% | | | | | | | 246,959 | |
| | | | | | | | | |
Net Assets — 100.0% | | | | | | $ | 28,864,076 | |
(a) | The rate shown is the 7-day effective yield as of March 31, 2016. |
See accompanying notes to financial statements. |
25
THE GOVERNMENT STREET FUNDS
STATEMENTS OF ASSETS AND LIABILITIES
March 31, 2016 |
| | Government Street Equity
Fund | | | Government
Street
Mid-Cap
Fund | | | Alabama
Tax Free
Bond
Fund | |
ASSETS | | | | | | | | | |
Investments in securities: | | | | | | | | | |
At acquisition cost | | $ | 49,363,450 | | | $ | 27,327,003 | | | $ | 28,110,784 | |
At value (Note 2) | | $ | 80,951,636 | | | $ | 48,485,604 | | | $ | 28,617,117 | |
Cash | | | 3,266 | | | | — | | | | — | |
Dividends and interest receivable | | | 60,203 | | | | 26,667 | | | | 252,423 | |
Receivable for investment securities sold | | | — | | | | 407,757 | | | | — | |
Receivable for capital shares sold | | | 805 | | | | 100 | | | | 29,975 | |
Other assets | | | 2,613 | | | | 3,195 | | | | 2,329 | |
TOTAL ASSETS | | | 81,018,523 | | | | 48,923,323 | | | | 28,901,844 | |
| | | | | | | | | | | | | |
LIABILITIES | | | | | | | | | | | | |
Distributions payable | | | 3,652 | | | | — | | | | 2,005 | |
Payable for investment securities purchased | | | 515,655 | | | | 299,899 | | | | — | |
Payable for capital shares redeemed | | | 104,262 | | | | — | | | | 20,696 | |
Accrued investment advisory fees (Note 4) | | | 73,024 | | | | 65,915 | | | | 5,352 | |
Payable to administrator (Note 4) | | | 9,000 | | | | 6,150 | | | | 5,600 | |
Other accrued expenses | | | 6,045 | | | | 4,433 | | | | 4,115 | |
TOTAL LIABILITIES | | | 711,638 | | | | 376,397 | | | | 37,768 | |
| | | | | | | | | | | | | |
NET ASSETS | | $ | 80,306,885 | | | $ | 48,546,926 | | | $ | 28,864,076 | |
| | | | | | | | | | | | | |
Net assets consist of: | | | | | | | | | | | | |
Paid-in capital | | $ | 48,143,375 | | | $ | 26,960,156 | | | $ | 28,419,329 | |
Undistributed net investment income | | | 10,197 | | | | 37,499 | | | | — | |
Accumulated net realized gains (losses) from security transactions | | | 565,127 | | | | 390,670 | | | | (61,586 | ) |
Net unrealized appreciation on investments | | | 31,588,186 | | | | 21,158,601 | | | | 506,333 | |
| | | | | | | | | | | | | |
Net assets | | $ | 80,306,885 | | | $ | 48,546,926 | | | $ | 28,864,076 | |
| | | | | | | | | | | | | |
Shares of beneficial interest outstanding (unlimited number of shares authorized, $0.01 par value) | | | 1,301,209 | | | | 2,211,985 | | | | 2,750,690 | |
| | | | | | | | | | | | | |
Net asset value, offering price and redemption price per share (Note 2) | | $ | 61.72 | | | $ | 21.95 | | | $ | 10.49 | |
See accompanying notes to financial statements. |
26
THE GOVERNMENT STREET FUNDS
STATEMENTS OF OPERATIONS
Year Ended March 31, 2016 |
| | Government
Street
Equity
Fund | | | Government
Street
Mid-Cap
Fund | | | Alabama
Tax Free
Bond
Fund | |
INVESTMENT INCOME | | | | | | | | | |
Dividends | | $ | 1,540,391 | | | $ | 723,247 | | | $ | 111 | |
Foreign withholding taxes on dividends | | | (17,798 | ) | | | (345 | ) | | | — | |
Interest | | | 1,223 | | | | 1,030 | | | | 556,989 | |
TOTAL INVESTMENT INCOME | | | 1,523,816 | | | | 723,932 | | | | 557,100 | |
| | | | | | | | | | | | | |
EXPENSES | | | | | | | | | | | | |
Investment advisory fees (Note 4) | | | 507,129 | | | | 354,220 | | | | 101,458 | |
Administration fees (Note 4) | | | 103,334 | | | | 65,218 | | | | 60,000 | |
Professional fees | | | 20,250 | | | | 19,150 | | | | 18,550 | |
Account maintenance fees | | | 25,593 | | | | 14,041 | | | | 7,321 | |
Trustees’ fees and expenses (Note 4) | | | 10,283 | | | | 10,283 | | | | 10,283 | |
Custodian and bank service fees | | | 13,019 | | | | 10,238 | | | | 4,681 | |
Compliance fees (Note 4) | | | 9,351 | | | | 7,977 | | | | 7,287 | |
Registration and filing fees | | | 9,126 | | | | 8,329 | | | | 6,217 | |
Pricing costs | | | 2,014 | | | | 2,712 | | | | 11,162 | |
Printing of shareholder reports | | | 6,376 | | | | 3,691 | | | | 2,905 | |
Postage and supplies | | | 4,911 | | | | 4,006 | | | | 3,055 | |
Insurance expense | | | 3,380 | | | | 2,114 | | | | 1,353 | |
Other expenses | | | 5,405 | | | | 3,258 | | | | 3,551 | |
TOTAL EXPENSES | | | 720,171 | | | | 505,237 | | | | 237,823 | |
Fees voluntarily waived by the Adviser (Note 4) | | | — | | | | — | | | | (49,319 | ) |
NET EXPENSES | | | 720,171 | | | | 505,237 | | | | 188,504 | |
| | | | | | | | | | | | | |
NET INVESTMENT INCOME | | | 803,645 | | | | 218,695 | | | | 368,596 | |
| | | | | | | | | | | | | |
REALIZED AND UNREALIZED GAINS (LOSSES) ON INVESTMENTS | | | | | | | | | | | | |
Net realized gains from security transactions | | | 1,606,478 | | | | 1,166,270 | | | | 1,775 | |
Net realized gains from in-kind redemptions (Note 2) | | | 4,095,529 | | | | 1,026,289 | | | | — | |
Net change in unrealized appreciation (depreciation) on investments | | | (8,631,939 | ) | | | (1,931,731 | ) | | | 13,033 | |
| | | | | | | | | | | | | |
NET REALIZED AND UNREALIZED GAINS (LOSSES) ON INVESTMENTS | | | (2,929,932 | ) | | | 260,828 | | | | 14,808 | |
| | | | | | | | | | | | | |
NET INCREASE (DECREASE) IN NET ASSETS FROM OPERATIONS | | $ | (2,126,287 | ) | | $ | 479,523 | | | $ | 383,404 | |
See accompanying notes to financial statements. |
27
THE GOVERNMENT STREET FUNDS
STATEMENTS OF CHANGES IN NET ASSETS |
| | Government Street
Equity Fund | | | Government Street
Mid-Cap Fund | |
| | Year
Ended
March 31, 2016 | | | Year
Ended
March 31, 2015 | | | Year
Ended
March 31, 2016 | | | Year
Ended
March 31, 2015 | |
FROM OPERATIONS | | | | | | | | | | | | |
Net investment income | | $ | 803,645 | | | $ | 957,716 | | | $ | 218,695 | | | $ | 243,475 | |
Net realized gains from security transactions | | | 1,606,478 | | | | 2,980,788 | | | | 1,166,270 | | | | 1,879,231 | |
Net realized gains from in-kind redemptions (Note 2) | | | 4,095,529 | | | | 3,609,846 | | | | 1,026,289 | | | | 3,329,346 | |
Net change in unrealized appreciation (depreciation) on investments | | | (8,631,939 | ) | | | 3,040,301 | | | | (1,931,731 | ) | | | (461,181 | ) |
Net increase (decrease) in net assets from operations | | | (2,126,287 | ) | | | 10,588,651 | | | | 479,523 | | | | 4,990,871 | |
| | | | | | | | | | | | | | | | | |
DISTRIBUTIONS TO SHAREHOLDERS | | | | | | | | | | | | | | | | |
From net investment income | | | (843,753 | ) | | | (919,996 | ) | | | (224,883 | ) | | | (164,104 | ) |
From net realized capital gains on security transactions | | | (2,693,418 | ) | | | (4,883,611 | ) | | | (2,378,680 | ) | | | (1,759,524 | ) |
Decrease in net assets from distributions to shareholders | | | (3,537,171 | ) | | | (5,803,607 | ) | | | (2,603,563 | ) | | | (1,923,628 | ) |
| | | | | | | | | | | | | | | | | |
FROM CAPITAL SHARE TRANSACTIONS | | | | | | | | | | | | | | | | |
Proceeds from shares sold | | | 2,078,093 | | | | 4,442,263 | | | | 3,026,439 | | | | 909,807 | |
Net asset value of shares issued in reinvestment of distributions to shareholders | | | 3,467,306 | | | | 5,687,312 | | | | 2,468,857 | | | | 1,779,485 | |
Payments for shares redeemed | | | (13,353,311 | ) | | | (15,423,430 | ) | | | (6,722,777 | ) | | | (8,733,265 | ) |
Net decrease in net assets from capital share transactions | | | (7,807,912 | ) | | | (5,293,855 | ) | | | (1,227,481 | ) | | | (6,043,973 | ) |
| | | | | | | | | | | | | | | | | |
TOTAL DECREASE IN NET ASSETS | | | (13,471,370 | ) | | | (508,811 | ) | | | (3,351,521 | ) | | | (2,976,730 | ) |
| | | | | | | | | | | | | | | | | |
NET ASSETS | | | | | | | | | | | | | | | | |
Beginning of year | | | 93,778,255 | | | | 94,287,066 | | | | 51,898,447 | | | | 54,875,177 | |
End of year | | $ | 80,306,885 | | | $ | 93,778,255 | | | $ | 48,546,926 | | | $ | 51,898,447 | |
| | | | | | | | | | | | | | | | | |
UNDISTRIBUTED NET INVESTMENT INCOME | | $ | 10,197 | | | $ | 54,060 | | | $ | 37,499 | | | $ | 43,687 | |
| | | | | | | | | | | | | | | | | |
CAPITAL SHARE ACTIVITY | | | | | | | | | | | | | | | | |
Shares sold | | | 33,300 | | | | 68,466 | | | | 141,863 | | | | 40,835 | |
Shares reinvested | | | 54,228 | | | | 89,486 | | | | 113,586 | | | | 83,509 | |
Shares redeemed | | | (208,341 | ) | | | (237,871 | ) | | | (304,039 | ) | | | (395,465 | ) |
Net decrease in shares outstanding | | | (120,813 | ) | | | (79,919 | ) | | | (48,590 | ) | | | (271,121 | ) |
Shares outstanding, beginning of year | | | 1,422,022 | | | | 1,501,941 | | | | 2,260,575 | | | | 2,531,696 | |
Shares outstanding, end of year | | | 1,301,209 | | | | 1,422,022 | | | | 2,211,985 | | | | 2,260,575 | |
See accompanying notes to financial statements. |
28
THE GOVERNMENT STREET FUNDS
STATEMENTS OF CHANGES IN NET ASSETS (Continued) |
| | | Alabama Tax Free
Bond Fund | |
| | Year
Ended
March 31, 2016 | | | Year
Ended
March 31, 2015 | |
FROM OPERATIONS | | | | | | |
Net investment income | | $ | 368,596 | | | $ | 408,871 | |
Net realized gain (losses) from security transactions | | | 1,775 | | | | (10,382 | ) |
Net change in unrealized appreciation (depreciation) on investments | | | 13,033 | | | | (43,213 | ) |
Net increase in net assets from operations | | | 383,404 | | | | 355,276 | |
| | | | | | | | | |
DISTRIBUTIONS TO SHAREHOLDERS | | | | | | | | |
From net investment income | | | (368,599 | ) | | | (408,862 | ) |
| | | | | | | | | |
FROM CAPITAL SHARE TRANSACTIONS | | | | | | | | |
Proceeds from shares sold | | | 1,580,300 | | | | 1,505,115 | |
Net asset value of shares issued in reinvestment of distributions to shareholders | | | 340,322 | | | | 369,143 | |
Payments for shares redeemed | | | (3,040,766 | ) | | | (4,481,199 | ) |
Net decrease in net assets from capital share transactions | | | (1,120,144 | ) | | | (2,606,941 | ) |
| | | | | | | | | |
TOTAL DECREASE IN NET ASSETS | | | (1,105,339 | ) | | | (2,660,527 | ) |
| | | | | | | | | |
NET ASSETS | | | | | | | | |
Beginning of year | | | 29,969,415 | | | | 32,629,942 | |
End of year | | $ | 28,864,076 | | | $ | 29,969,415 | |
| | | | | | | | | |
UNDISTRIBUTED NET INVESTMENT INCOME | | $ | — | | | $ | — | |
| | | | | | | | | |
CAPITAL SHARE ACTIVITY | | | | | | | | |
Shares sold | | | 150,997 | | | | 142,760 | |
Shares reinvested | | | 32,502 | | | | 35,041 | |
Shares redeemed | | | (290,450 | ) | | | (424,837 | ) |
Net decrease in shares outstanding | | | (106,951 | ) | | | (247,036 | ) |
Shares outstanding, beginning of year | | | 2,857,641 | | | | 3,104,677 | |
Shares outstanding, end of year | | | 2,750,690 | | | | 2,857,641 | |
See accompanying notes to financial statements. |
29
THE GOVERNMENT STREET EQUITY FUND
FINANCIAL HIGHLIGHTS |
Selected Per Share Data and Ratios for a Share Outstanding Throughout Each Year | |
| | Years Ended March 31, | |
| | 2016 | | | 2015 | | | 2014 | | | 2013 | | | 2012 | |
Net asset value at beginning of year | | $ | 65.95 | | | $ | 62.78 | | | $ | 53.61 | | | $ | 50.42 | | | $ | 48.00 | |
| | | | | | | | | | | | | | | | | | | | | |
Income (loss) from investment operations: | | | | | | | | | | | | | | | | | | | | |
Net investment income | | | 0.61 | | | | 0.67 | | | | 0.62 | | | | 0.64 | | | | 0.47 | |
Net realized and unrealized gains (losses) on investments | | | (2.17 | ) | | | 6.55 | | | | 9.17 | | | | 4.21 | | | | 2.66 | |
Total from investment operations | | | (1.56 | ) | | | 7.22 | | | | 9.79 | | | | 4.85 | | | | 3.13 | |
| | | | | | | | | | | | | | | | | | | | | |
Less distributions: | | | | | | | | | | | | | | | | | | | | |
Dividends from net investment income | | | (0.64 | ) | | | (0.64 | ) | | | (0.61 | ) | | | (0.64 | ) | | | (0.48 | ) |
Distributions from net realized gains | | | (2.03 | ) | | | (3.41 | ) | | | (0.01 | ) | | | (1.02 | ) | | | (0.23 | ) |
Total distributions | | | (2.67 | ) | | | (4.05 | ) | | | (0.62 | ) | | | (1.66 | ) | | | (0.71 | ) |
| | | | | | | | | | | | | | | | | | | | | |
Net asset value at end of year | | $ | 61.72 | | | $ | 65.95 | | | $ | 62.78 | | | $ | 53.61 | | | $ | 50.42 | |
| | | | | | | | | | | | | | | | | | | | | |
Total return (a) | | | (2.46 | %) | | | 11.87 | % | | | 18.34 | % | | | 9.93 | % | | | 6.67 | % |
| | | | | | | | | | | | | | | | | | | | | |
Net assets at end of year (000’s) | | $ | 80,307 | | | $ | 93,778 | | | $ | 94,287 | | | $ | 81,689 | | | $ | 72,268 | |
| | | | | | | | | | | | | | | | | | | | | |
Ratio of total expenses to average net assets | | | 0.85 | % | | | 0.84 | % | | | 0.84 | % | | | 0.85 | % | | | 0.87 | % |
| | | | | | | | | | | | | | | | | | | | | |
Ratio of net investment income to average net assets | | | 0.95 | % | | | 1.02 | % | | | 1.06 | % | | | 1.29 | % | | | 1.01 | % |
| | | | | | | | | | | | | | | | | | | | | |
Portfolio turnover rate | | | 17 | % | | | 26 | % | | | 36 | % | | | 38 | % | | | 36 | % |
(a) | Total return is a measure of the change in value of an investment in the Fund over the years covered, which assumes any dividends or capital gains distributions are reinvested in shares of the Fund. Returns do not reflect the deduction of taxes a shareholder would pay on Fund distributions or the redemption of Fund shares. |
See accompanying notes to financial statements. |
30
THE GOVERNMENT STREET MID-CAP FUND
FINANCIAL HIGHLIGHTS |
Selected Per Share Data and Ratios for a Share Outstanding Throughout Each Year | |
| | Years Ended March 31, | |
| | 2016 | | | 2015 | | | 2014 | | | 2013 | | | 2012 | |
Net asset value at beginning of year | | $ | 22.96 | | | $ | 21.68 | | | $ | 18.26 | | | $ | 16.26 | | | $ | 15.89 | |
| | | | | | | | | | | | | | | | | | | | | |
Income from investment operations: | | | | | | | | | | | | | | | | | | | | |
Net investment income | | | 0.10 | | | | 0.10 | | | | 0.09 | | | | 0.10 | | | | 0.04 | |
Net realized and unrealized gains on investments | | | 0.11 | | | | 2.02 | | | | 3.46 | | | | 2.05 | | | | 0.37 | |
Total from investment operations | | | 0.21 | | | | 2.12 | | | | 3.55 | | | | 2.15 | | | | 0.41 | |
| | | | | | | | | | | | | | | | | | | | | |
Less distributions: | | | | | | | | | | | | | | | | | | | | |
Dividends from net investment income | | | (0.10 | ) | | | (0.07 | ) | | | (0.11 | ) | | | (0.11 | ) | | | (0.04 | ) |
Distributions from net realized gains | | | (1.12 | ) | | | (0.77 | ) | | | (0.02 | ) | | | (0.04 | ) | | | (0.00 | )(a) |
Total distributions | | | (1.22 | ) | | | (0.84 | ) | | | (0.13 | ) | | | (0.15 | ) | | | (0.04 | ) |
| | | | | | | | | | | | | | | | | | | | | |
Net asset value at end of year | | $ | 21.95 | | | $ | 22.96 | | | $ | 21.68 | | | $ | 18.26 | | | $ | 16.26 | |
| | | | | | | | | | | | | | | | | | | | | |
Total return (b) | | | 1.04 | % | | | 10.14 | % | | | 19.43 | % | | | 13.35 | % | | | 2.59 | % |
| | | | | | | | | | | | | | | | | | | | | |
Net assets at end of year (000’s) | | $ | 48,547 | | | $ | 51,898 | | | $ | 54,875 | | | $ | 45,918 | | | $ | 39,843 | |
| | | | | | | | | | | | | | | | | | | | | |
Ratio of total expenses to average net assets | | | 1.07 | % | | | 1.05 | % | | | 1.06 | % | | | 1.08 | % | | | 1.09 | % |
| | | | | | | | | | | | | | | | | | | | | |
Ratio of net investment income to average net assets | | | 0.46 | % | | | 0.47 | % | | | 0.43 | % | | | 0.63 | % | | | 0.29 | % |
| | | | | | | | | | | | | | | | | | | | | |
Portfolio turnover rate | | | 20 | % | | | 16 | % | | | 10 | % | | | 12 | % | | | 18 | % |
(a) | Amount rounds to less than $0.01 per share. |
(b) | Total return is a measure of the change in value of an investment in the Fund over the years covered, which assumes any dividends or capital gains distributions are reinvested in shares of the Fund. Returns do not reflect the deduction of taxes a shareholder would pay on Fund distributions or the redemption of Fund shares. |
See accompanying notes to financial statements. |
31
THE ALABAMA TAX FREE BOND FUND
FINANCIAL HIGHLIGHTS |
Selected Per Share Data and Ratios for a Share Outstanding Throughout Each Year | |
| | Years Ended March 31, | |
| | 2016 | | | 2015 | | | 2014 | | | 2013 | | | 2012 | |
Net asset value at beginning of year | | $ | 10.49 | | | $ | 10.51 | | | $ | 10.63 | | | $ | 10.64 | | | $ | 10.45 | |
| | | | | | | | | | | | | | | | | | | | | |
Income (loss) from investment operations: | | | | | | | | | | | | | | | | | | | | |
Net investment income | | | 0.13 | | | | 0.14 | | | | 0.15 | | | | 0.18 | | | | 0.23 | |
Net realized and unrealized gains (losses) on investments | | | 0.00 | (a) | | | (0.02 | ) | | | (0.12 | ) | | | (0.01 | ) | | | 0.19 | |
Total from investment operations | | | 0.13 | | | | 0.12 | | | | 0.03 | | | | 0.17 | | | | 0.42 | |
| | | | | | | | | | | | | | | | | | | | | |
Less dividends from net investment income | | | (0.13 | ) | | | (0.14 | ) | | | (0.15 | ) | | | (0.18 | ) | | | (0.23 | ) |
| | | | | | | | | | | | | | | | | | | | | |
Net asset value at end of year | | $ | 10.49 | | | $ | 10.49 | | | $ | 10.51 | | | $ | 10.63 | | | $ | 10.64 | |
| | | | | | | | | | | | | | | | | | | | | |
Total return (b) | | | 1.28 | % | | | 1.14 | % | | | 0.28 | % | | | 1.64 | % | | | 4.04 | % |
| | | | | | | | | | | | | | | | | | | | | |
Net assets at end of year (000’s) | | $ | 28,864 | | | $ | 29,969 | | | $ | 32,630 | | | $ | 33,265 | | | $ | 24,719 | |
| | | | | | | | | | | | | | | | | | | | | |
Ratio of total expenses to average net assets | | | 0.82 | % | | | 0.79 | % | | | 0.76 | % | | | 0.76 | % | | | 0.80 | % |
| | | | | | | | | | | | | | | | | | | | | |
Ratio of net expenses to average net assets (c) | | | 0.65 | % | | | 0.65 | % | | | 0.65 | % | | | 0.65 | % | | | 0.65 | % |
| | | | | | | | | | | | | | | | | | | | | |
Ratio of net investment income to average net assets (c) | | | 1.27 | % | | | 1.32 | % | | | 1.41 | % | | | 1.70 | % | | | 2.17 | % |
| | | | | | | | | | | | | | | | | | | | | |
Portfolio turnover rate | | | 13 | % | | | 6 | % | | | 10 | % | | | 7 | % | | | 18 | % |
(a) | Amount rounds to less than $0.01 per share. |
(b) | Total return is a measure of the change in value of an investment in the Fund over the years covered, which assumes any dividends or capital gains distributions are reinvested in shares of the Fund. Returns do not reflect the deduction of taxes a shareholder would pay on Fund distributions or the redemption of Fund shares. |
(c) | Ratios were determined after voluntary advisory fee waivers by the Adviser (Note 4). |
See accompanying notes to financial statements. |
32
THE GOVERNMENT STREET FUNDS
NOTES TO FINANCIAL STATEMENTS
March 31, 2016
1. Organization
The Government Street Equity Fund, The Government Street Mid-Cap Fund and The Alabama Tax Free Bond Fund (the “Funds”) are each a no-load series of the Williamsburg Investment Trust (the “Trust”), an open-end management investment company registered under the Investment Company Act of 1940. The Government Street Equity Fund and The Government Street Mid-Cap Fund are each a diversified fund and The Alabama Tax Free Bond Fund is a non-diversified fund. The Trust was organized as a Massachusetts business trust on July 18, 1988. Other series of the Trust are not included in this report.
The Government Street Equity Fund’s investment objective is to seek capital appreciation.
The Government Street Mid-Cap Fund’s investment objective is to seek capital appreciation.
The Alabama Tax Free Bond Fund’s investment objectives are to provide current income exempt from federal income taxes and from the personal income taxes of Alabama and to preserve capital.
2. Significant Accounting Policies
As an investment company, as defined in Financial Accounting Standards Board (“FASB”) Accounting Standards Update 2013-08, each Fund follows accounting and reporting guidance under FASB Accounting Standards Codification Topic 946, “Financial Services – Investment Companies.” The following is a summary of the Funds’ significant accounting policies. The policies are in conformity with accounting principles generally accepted in the United States of America (“GAAP”).
Securities valuation — The Funds’ portfolio securities are valued as of the close of business of the regular session of the New York Stock Exchange (normally 4:00 p.m., Eastern time). Securities traded on a national stock exchange, including common stocks, are valued based upon the closing price on the principal exchange where the security is traded, if available, otherwise, at the last quoted bid price. Securities which are quoted by NASDAQ are valued at the NASDAQ Official Closing Price. Investments representing shares of other investment companies, including exchange-traded funds and money market funds, are valued at their net asset value as reported by such companies.
Fixed income securities, including municipal bonds, are typically valued on the basis of prices provided by an independent pricing service. The prices provided by the pricing service are determined with consideration given to institutional bid and last sale prices and take into account securities prices, yields, maturities, call features, ratings, institutional trading in similar groups of securities and developments related to specific securities.
33
THE GOVERNMENT STREET FUNDS
NOTES TO FINANCIAL STATEMENTS (Continued)
When market quotations are not readily available, if a pricing service cannot provide a price or the investment adviser believes the price received from the pricing service is not indicative of market value, securities will be valued in good faith at fair value using methods consistent with procedures adopted by the Board of Trustees and will be classified as Level 2 or 3 within the fair value hierarchy (see below), depending on the inputs used. Such methods of fair valuation may include, but are not limited to: multiple of earnings, multiple of book value, discount from market of a similar freely traded security, purchase price of the security, subsequent private transactions in the security or related securities, or a combination of these and other factors.
GAAP establishes a single authoritative definition of fair value, sets out a framework for measuring fair value and requires additional disclosures about fair value measurements.
Various inputs are used in determining the value of each of the Fund’s investments. These inputs are summarized in the three broad levels listed below:
● | Level 1 – quoted prices in active markets for identical securities |
● | Level 2 – other significant observable inputs |
● | Level 3 – significant unobservable inputs |
Fixed income securities, including municipal bonds, are classified as Level 2 since the values for such securities are based on prices provided by an independent pricing service that utilizes various “other significant observable inputs” including bid and ask quotations, prices of similar securities and interest rates, among other factors.
The inputs or methodology used for valuing securities are not necessarily an indication of the risks associated with investing in those securities. The inputs used to measure fair value may fall into different levels of the fair value hierarchy. In such cases, for disclosure purposes, the level in the fair value hierarchy within which the fair value measurement falls in its entirety is determined based on the lowest level input that is significant to the fair value measurement.
The following is a summary of the inputs used to value each Fund’s investments as of March 31, 2016, by security type:
The Government Street Equity Fund | | Level 1 | | | Level 2 | | | Level 3 | | | Total | |
Common Stocks | | $ | 72,460,164 | | | $ | — | | | $ | — | | | $ | 72,460,164 | |
Exchange-Traded Funds | | | 2,958,012 | | | | — | | | | — | | | | 2,958,012 | |
Money Market Funds | | | 5,533,460 | | | | — | | | | — | | | | 5,533,460 | |
Total | | $ | 80,951,636 | | | $ | — | | | $ | — | | | $ | 80,951,636 | |
34
THE GOVERNMENT STREET FUNDS
NOTES TO FINANCIAL STATEMENTS (Continued)
The Government Street Mid-Cap Fund | | Level 1 | | | Level 2 | | | Level 3 | | | Total | |
Common Stocks | | $ | 42,694,101 | | | $ | — | | | $ | — | | | $ | 42,694,101 | |
Exchange-Traded Funds | | | 2,464,996 | | | | — | | | | — | | | | 2,464,996 | |
Money Market Funds | | | 3,326,507 | | | | — | | | | — | | | | 3,326,507 | |
Total | | $ | 48,485,604 | | | $ | — | | | $ | — | | | $ | 48,485,604 | |
The Alabama Tax Free Bond Fund | | Level 1 | | | Level 2 | | | Level 3 | | | Total | |
Municipal Bonds | | $ | — | | | $ | 27,710,123 | | | $ | — | | | $ | 27,710,123 | |
Money Market Funds | | | 906,994 | | | | — | | | | — | | | | 906,994 | |
Total | | $ | 906,994 | | | $ | 27,710,123 | | | $ | — | | | $ | 28,617,117 | |
Refer to The Government Street Equity Fund’s and The Government Street Mid-Cap Fund’s Schedules of Investments for a listing of the common stocks by sector type. As of March 31, 2016, the Funds did not have any transfers into and out of any Level. There were no Level 3 securities or derivative instruments held by the Funds as of March 31, 2016. It is the Funds’ policy to recognize transfers into and out of any Level at the end of the reporting period.
Share valuation — The net asset value per share of each Fund is calculated daily by dividing the total value of its assets, less liabilities, by the number of shares outstanding. The offering price and redemption price per share of each Fund is equal to the net asset value per share.
Investment income — Interest income is accrued as earned. Dividend income is recorded on the ex-dividend date. Discounts and premiums on fixed-income securities purchased are amortized using the interest method. Withholding taxes on foreign dividends for The Government Street Equity Fund and The Government Street Mid-Cap Fund have been recorded in accordance with the Funds’ understanding of the appropriate country’s rules and tax rates.
Distributions to shareholders — Dividends arising from net investment income are declared and paid quarterly to shareholders of The Government Street Equity Fund; declared and paid annually to shareholders of The Government Street Mid-Cap Fund; and declared daily and paid monthly to shareholders of The Alabama Tax Free Bond Fund. Net realized short-term capital gains, if any, may be distributed throughout the year and net realized long-term capital gains, if any, are distributed at least once each year. Dividends and distributions are recorded on the ex-dividend date. The amount of distributions from net investment income and net realized capital gains are determined in accordance with federal income tax regulations, which may differ from GAAP. These “book/tax” differences are either temporary or permanent in nature.
35
THE GOVERNMENT STREET FUNDS
NOTES TO FINANCIAL STATEMENTS (Continued)
The tax character of distributions paid during the years ended March 31, 2016 and 2015, is as follows:
| Year
Ended | Ordinary Income | Exempt- Interest Dividends | Long-Term Capital Gains | Total Distributions |
The Government Street Equity Fund | 03/31/16 | $ 843,753 | $ — | $ 2,693,418 | $ 3,537,171 |
| | 03/31/15 | $ 919,996 | $ — | $ 4,883,611 | $ 5,803,607 |
The Government Street Mid-Cap Fund | 03/31/16 | $ 263,265 | $ — | $ 2,340,298 | $ 2,603,563 |
| | 03/31/15 | $ 164,104 | $ — | $ 1,759,524 | $ 1,923,628 |
The Alabama Tax Free Bond Fund | 03/31/16 | $ — | $ 368,599 | $ — | $ 368,599 |
| | 03/31/15 | $ — | $ 408,862 | $ — | $ 408,862 |
Security transactions — Security transactions are accounted for on trade date for financial reporting purposes. Gains and losses on securities sold are determined on a specific identification basis.
Common expenses — Common expenses of the Trust are allocated among the series of the Trust based on relative net assets of each series or the nature of the services performed and the relative applicability to each series.
Estimates — The preparation of financial statements in conformity with GAAP requires management to make estimates and assumptions that affect the reported amounts of assets and liabilities and the disclosure of contingent assets and liabilities as of the date of the financial statements and the reported amounts of income and expenses during the reporting period. Actual results could differ from those estimates.
Federal income tax — Each Fund has qualified and intends to continue to qualify as a regulated investment company under the Internal Revenue Code of 1986 (the “Code”). Qualification generally will relieve the Funds of liability for federal income taxes to the extent 100% of their net investment income and any net realized capital gains are distributed in accordance with the Code.
In order to avoid imposition of the excise tax applicable to regulated investment companies, it is also each Fund’s intention to declare as dividends in each calendar year at least 98% of its net investment income (earned during the calendar year) and 98.2% of its net realized capital gains (earned during the twelve months ended October 31) plus undistributed amounts from prior years.
36
THE GOVERNMENT STREET FUNDS
NOTES TO FINANCIAL STATEMENTS (Continued)
The following information is computed on a tax basis for each item as of March 31, 2016:
| | The Government
Street Equity
Fund | | | The Government
Street Mid-Cap
Fund | | | The Alabama
Tax Free Bond
Fund | |
Cost of portfolio investments | | $ | 49,363,450 | | | $ | 27,327,003 | | | $ | 28,110,784 | |
Gross unrealized appreciation | | $ | 31,876,706 | | | $ | 21,342,087 | | | $ | 507,316 | |
Gross unrealized depreciation | | | (288,520 | ) | | | (183,486 | ) | | | (983 | ) |
Net unrealized appreciation | | | 31,588,186 | | | | 21,158,601 | | | | 506,333 | |
Undistributed ordinary income | | | 13,849 | | | | 37,499 | | | | — | |
Undistributed tax-exempt income | | | — | | | | — | | | | 2,005 | |
Undistributed long-term gains | | | 565,127 | | | | 390,670 | | | | — | |
Accumulated capital losses | | | — | | | | — | | | | (61,586 | ) |
Distributions payable | | | (3,652 | ) | | | — | | | | (2,005 | ) |
Total distibutable earnings | | $ | 32,163,510 | | | $ | 21,586,770 | | | $ | 444,747 | |
During the year ended March 31, 2016, The Alabama Tax Free Bond Fund utilized long-term capital loss carryforwards in the amount of $1,775 to offset current year gains. As of March 31, 2016, The Alabama Tax Free Bond Fund had a short-term capital loss carryforward for federal income tax purposes of $24,704 and a long-term capital loss carryforward for federal income tax purposes of $36,882, both of which may be carried forward indefinitely. These capital loss carryforwards are available to offset realized capital gains in future years, thereby reducing future taxable gains distributions.
During the year ended March 31, 2016, The Government Street Equity Fund reclassified $3,779 of net realized gains against undistributed net investment income and $24 of net investment income against paid-in capital; The Alabama Tax Free Bond Fund reclassified $3 of distributions in excess of net investment income against paid-in capital on the Statements of Assets and Liabilities. Such reclassifications, the result of permanent differences between the financial statements and income tax reporting requirements, have no effect on each Fund’s net assets or net asset value per share.
During the year ended March 31, 2016, The Government Street Equity Fund and The Government Street Mid-Cap Fund realized $4,095,529 and $1,026,289, respectively, of net capital gains resulting from in-kind redemptions (redemptions in which shareholders who redeemed Fund shares received securities held by the Fund rather than cash). The Funds recognize a gain on in-kind redemptions to the extent that the value of the distributed securities on the date of redemption exceeds the cost of those securities. Such gains are not taxable to the Funds and are not required to be distributed to shareholders. The Funds have reclassified these amounts against paid-in capital. These reclassifications are reflected on the Statements of Assets and Liabilities. Such reclassifications, the result of permanent differences between the financial statement and income tax reporting requirements, have no effect on each Fund’s net assets or net asset value per share.
37
THE GOVERNMENT STREET FUNDS
NOTES TO FINANCIAL STATEMENTS (Continued)
The Funds recognize the tax benefits or expenses of uncertain tax positions only when the position is “more likely than not” to be sustained assuming examination by tax authorities. Management has reviewed the tax positions taken on federal income tax returns for all open tax years (tax years ended March 31, 2013 through March 31, 2016) of each Fund and has concluded that no provision for unrecognized tax benefits or expenses is required in these financial statements.
3. Investment Transactions
Investment transactions, other than short-term investments and U.S. government securities, were as follows for the year ended March 31, 2016:
| | The Government
Street Equity
Fund | | | The Government
Street Mid-Cap
Fund | | | The Alabama
Tax Free Bond
Fund | |
Purchases of investment securities | | $ | 13,702,936 | | | $ | 9,085,873 | | | $ | 3,769,638 | |
Proceeds from sales and maturities of investment securities | | $ | 27,951,440 | | | $ | 13,934,252 | | | $ | 4,015,911 | |
4. Transactions with Related Parties
INVESTMENT ADVISORY AGREEMENT
Each Fund’s investments are managed by Leavell Investment Management, Inc. (the “Adviser”) under the terms of an Investment Advisory Agreement. The Government Street Equity Fund pays the Adviser a fee, which is computed and accrued daily and paid monthly, at annual rates of .60% of its average daily net assets up to $100 million and .50% of such assets in excess of $100 million. The Government Street Mid-Cap Fund pays the Adviser a fee, which is computed and accrued daily and paid monthly, at an annual rate of .75% of its average daily net assets. The Alabama Tax Free Bond Fund pays the Adviser a fee, which is computed and accrued daily and paid monthly, at annual rates of .35% of its average daily net assets up to $100 million and .25% of such assets in excess of $100 million.
During the year ended March 31, 2016, the Adviser voluntarily limited the total operating expenses of The Alabama Tax Free Bond Fund to .65% of the Fund’s average daily net assets. Accordingly, the Adviser waived $49,319 of its investment advisory fees from The Alabama Tax Free Bond Fund during the year ended March 31, 2016. This amount is not subject to recapture in future periods.
Certain officers of the Trust are also officers of the Adviser.
OTHER SERVICE PROVIDERS
Ultimus Fund Solutions, LLC (“Ultimus”) provides fund administration, fund accounting, compliance and transfer agent services to the Funds. The Funds pay Ultimus fees in accordance with the agreements for such services. In addition, the Funds pay out-
38
THE GOVERNMENT STREET FUNDS
NOTES TO FINANCIAL STATEMENTS (Continued)
of-pocket expenses including, but not limited to, postage, supplies, and costs of pricing the Funds’ portfolio securities. Certain officers of the Trust are also officers of Ultimus, or of Ultimus Fund Distributors, LLC (the “Distributor”), the principal underwriter of each Fund’s shares and an affiliate of Ultimus. The Distributor is compensated by the Adviser (not the Funds) for acting as principal underwriter.
COMPENSATION OF TRUSTEES
Trustees and officers affiliated with the Adviser or Ultimus are not compensated by the Trust for their services. Each Trustee who is not an affiliated person of the Adviser or Ultimus receives from the Trust an annual retainer of $12,000, payable quarterly; a fee of $1,500 for attendance at each meeting of the Board of Trustees (except that such fee is $2,500 for the independent chairman); and a fee of $1,000 for attendance at each meeting of any committee of the Board (except that such fee is $1,500 for the committee chairman); plus reimbursement of travel and other expenses incurred in attending meetings. Each Fund in the Trust pays its proportionate share of such fees. Effective April 1, 2016, the annual retainer will increase to $15,000, payable quarterly.
5. Contingencies and Commitments
The Funds indemnify the Trust’s officers and Trustees for certain liabilities that might arise from their performance of their duties to the Funds. Additionally, in the normal course of business the Funds enter into contracts that contain a variety of representations and warranties and which provide general indemnifications. The Funds’ maximum exposure under these arrangements is unknown, as this would involve future claims that may be made against the Funds that have not yet occurred. However, based on experience, the Funds expect the risk of loss to be remote.
6. Concentration of Credit Risk
The Alabama Tax Free Bond Fund invests primarily in debt instruments of municipal issuers in the state of Alabama. The issuers’ abilities to meet their obligations may be affected by economic developments in the state or its region, as well as disruptions in the credit markets and the economy, generally.
39
THE GOVERNMENT STREET FUNDS
NOTES TO FINANCIAL STATEMENTS (Continued)
7. Subsequent Events
The Funds are required to recognize in the financial statements the effects of all subsequent events that provide additional evidence about conditions that existed as of the date of the Statements of Assets and Liabilities. For non-recognized subsequent events that must be disclosed to keep the financial statements from being misleading, the Funds are required to disclose the nature of the event as well as an estimate of its financial effect, or a statement that such an estimate cannot be made. Management has evaluated subsequent events through the issuance of these financial statements and has noted no such events.
40
THE GOVERNMENT STREET FUNDS
REPORT OF INDEPENDENT REGISTERED
PUBLIC ACCOUNTING FIRM
To the Shareholders of The Government Street Funds and
Board of Trustees of Williamsburg Investment Trust
We have audited the accompanying statements of assets and liabilities, including the schedules of investments, of The Government Street Equity Fund, The Government Street Mid-Cap Fund, and The Alabama Tax Free Bond Fund (“The Government Street Funds” or “Funds”), each a series of Williamsburg Investment Trust, as of March 31, 2016, and the related statements of operations and changes in net assets and the financial highlights for the year then ended. These financial statements and financial highlights are the responsibility of the Funds’ management. Our responsibility is to express an opinion on these financial statements and financial highlights based on our audit. The Funds’ financial statements and financial highlights for the years ended prior to March 31, 2016, were audited by other auditors, whose report dated May 22, 2015, expressed an unqualified opinion on those statements and financial highlights.
We conducted our audit in accordance with the standards of the Public Company Accounting Oversight Board (United States). Those standards require that we plan and perform the audit to obtain reasonable assurance about whether the financial statements and financial highlights are free of material misstatement. An audit includes examining, on a test basis, evidence supporting the amounts and disclosures in the financial statements. Our procedures included confirmation of securities owned as of March 31, 2016, by correspondence with the custodian and brokers. An audit also includes assessing the accounting principles used and significant estimates made by management, as well as evaluating the overall financial statement presentation. We believe that our audit provides a reasonable basis for our opinion.
In our opinion, the financial statements and financial highlights referred to above present fairly, in all material respects, the financial position of each of the Funds as of March 31, 2016, and the results of their operations, the changes in their net assets, and the financial highlights for the year then ended, in conformity with accounting principles generally accepted in the United States of America.
COHEN FUND AUDIT SERVICES, LTD.
Cleveland, Ohio
May 26, 2016
41
THE GOVERNMENT STREET FUNDS
ABOUT YOUR FUNDS’ EXPENSES (Unaudited)
We believe it is important for you to understand the impact of costs on your investment. All mutual funds have operating expenses. As a shareholder of the Funds, you incur ongoing costs, including management fees and other expenses. These ongoing costs, which are deducted from each Fund’s gross income, directly reduce the investment returns of the Funds.
A mutual fund’s ongoing costs are expressed as a percentage of its average net assets. This figure is known as the expense ratio. The following examples are intended to help you understand the ongoing costs (in dollars) of investing in the Funds and to compare these costs with the ongoing costs of investing in other mutual funds. The examples below are based on an investment of $1,000 made at the beginning of the period shown and held for the entire period (October 1, 2015 through March 31, 2016).
The table below illustrates each Fund’s ongoing costs in two ways:
Actual fund return – This section helps you to estimate the actual expenses that you paid over the period. The “Ending Account Value” shown is derived from each Fund’s actual return, and the fourth column shows the dollar amount of operating expenses that would have been paid by an investor who started with $1,000 in the Funds. You may use the information here, together with the amount you invested, to estimate the expenses that you paid over the period.
To do so, simply divide your account value by $1,000 (for example, an $8,600 account value divided by $1,000 = 8.6), then multiply the result by the number given for the Funds under the heading “Expenses Paid During Period.”
Hypothetical 5% return – This section is intended to help you compare the Funds’ ongoing costs with those of other mutual funds. It assumes that each Fund had an annual return of 5% before expenses during the period shown, but that the expense ratio is unchanged. In this case, because the returns used are not the Funds’ actual returns, the results do not apply to your investment. The example is useful in making comparisons because the Securities and Exchange Commission (the “SEC”) requires all mutual funds to calculate expenses based on a 5% return. You can assess each Fund’s ongoing costs by comparing this hypothetical example with the hypothetical examples that appear in shareholder reports of other funds.
Note that expenses shown in the table are meant to highlight and help you compare ongoing costs only. The Funds do not charge sales loads or redemption fees.
The calculations assume no shares were bought or sold during the period. Your actual costs may have been higher or lower, depending on the amount of your investment and the timing of any purchases or redemptions.
More information about the Funds’ expenses, including historical expense ratios, can be found in this report. For additional information on operating expenses and other shareholder costs, please refer to the Funds’ prospectus.
42
THE GOVERNMENT STREET FUNDS
ABOUT YOUR FUNDS’ EXPENSES (Unaudited) (Continued)
| | Beginning
Account Value
Oct. 1, 2015 | Ending
Account Value
March 31, 2016 | Net Expense
Ratio(a) | Expenses
Paid During
Period(b) |
The Government Street Equity Fund |
Based on Actual Fund Return | $1,000.00 | $1,047.30 | 0.85% | $4.35 |
Based on Hypothetical 5% Return (before expenses) | $1,000.00 | $1,020.75 | 0.85% | $4.29 |
The Government Street Mid-Cap Fund |
Based on Actual Fund Return | $1,000.00 | $1,088.10 | 1.07% | $5.59 |
Based on Hypothetical 5% Return (before expenses) | $1,000.00 | $1,019.65 | 1.07% | $5.40 |
The Alabama Tax Free Bond Fund |
Based on Actual Fund Return | $1,000.00 | $1,007.20 | 0.65% | $3.26 |
Based on Hypothetical 5% Return (before expenses) | $1,000.00 | $1,021.75 | 0.65% | $3.29 |
(a) | Annualized, based on the Fund’s most recent one-half year expenses. |
(b) | Expenses are equal to the Fund’s net expense ratio multiplied by the average account value over the period, multiplied by 183/366 (to reflect the one-half year period). |
CHANGE IN INDEPENDENT AUDITOR
On February 23, 2016, Cohen Fund Audit Services, Ltd. (“Cohen”) was selected as the Funds’ new independent auditor, replacing Ernst & Young LLP (“EY”) as independent auditor of the Funds. The Funds’ selection of Cohen as independent auditor was recommended and approved by the Trust’s Audit Committee and was ratified by the Trust’s Board of Trustees.
EY’s reports on the Funds’ financial statements for the prior two fiscal years did not contain an adverse opinion or a disclaimer of opinion, and were not qualified or modified as to uncertainty, audit scope or accounting principles. During such fiscal years, and through the date of EY’s replacement, there were no disagreements between the Trust and EY on any matter of accounting principles or practices, financial statement disclosure, or auditing scope or procedures, which disagreements, if not resolved to the satisfaction of EY, would have caused it to make reference to the subject matter of the disagreements in connection with its reports on the financial statements for such years. Prior to February 23, 2016, Cohen was not contacted during the prior two fiscal years regarding the application of accounting principles to any particular financial matter.
43
THE GOVERNMENT STREET FUNDS
BOARD OF TRUSTEES AND EXECUTIVE OFFICERS
(Unaudited)
Overall responsibility for management of the Funds rests with the Board of Trustees. The Trustees serve during the lifetime of the Trust and until its termination, or until death, resignation, retirement or removal. The Trustees, in turn, elect the officers of the Funds. The officers have been elected for an annual term. The following are the Trustees and executive officers of the Funds:
Trustees and Officers | Address | Year of Birth | Position Held
with the Trust | Length of
Time Served |
| | Robert S. Harris, Ph.D. | 100 Darden Boulevard
Charlottesville, VA | 1949 | Chairman and Trustee | Since
January 2007 |
* | John P. Ackerly, IV | One James Center
901 E. Cary Street
Richmond, VA | 1963 | Trustee and President of Davenport Funds | Since
July 2012 |
* | John T. Bruce | 800 Main Street
Lynchburg, VA | 1953 | Trustee and President of FBP Funds | Since
September 1988 |
| | George K. Jennison | 5101 Stratford Crescent
Richmond, VA 23226 | 1957 | Trustee | Since
January 2015 |
| Harris V. Morrissette | 100 Jacintoport Boulevard
Saraland, AL | 1959 | Trustee | Since
March 1993 |
| | Elizabeth W. Robertson | 305 Marston Lane
Richmond, VA | 1953 | Trustee | Since
February 2014 |
| | Thomas W. Leavell | P.O. Box 1307
Mobile, AL | 1943 | President | Since
February 2004 |
| | Mary Shannon Hope | P.O. Box 1307
Mobile, AL | 1963 | Vice President | Since
August 2008 |
| | Timothy S. Healey | 2712 18th Place South
Birmingham, AL | 1953 | Vice President of The Government Street Mid-Cap Fund and The Alabama Tax Free Bond Fund | Since
January 1995 |
| Robert G. Dorsey | 225 Pictoria Drive, Suite 450
Cincinnati, OH | 1957 | Vice President | Since
November 2000 |
| Mark J. Seger | 225 Pictoria Drive, Suite 450
Cincinnati, OH | 1962 | Treasurer | Since
November 2000 |
| | Tina H. Bloom | 225 Pictoria Drive, Suite 450
Cincinnati, OH | 1968 | Secretary and Chief Compliance Officer | Since
August 2006 |
44
THE GOVERNMENT STREET FUNDS
BOARD OF TRUSTEES AND EXECUTIVE OFFICERS
(Unaudited) (Continued)
Each Trustee oversees twelve portfolios of the Trust, including the Funds. The principal occupations of the Trustees and executive officers of the Funds during the past five years and public directorships held by the Trustees are set forth below:
Robert S. Harris, Ph.D. is the C. Stewart Sheppard Professor of Business Administration at The Darden Graduate School of Business Administration at the University of Virginia. He was previously the dean at Darden. Professor Harris has published widely on corporate finance, financial markets and mergers and acquisitions and has served as a consultant to corporations and government agencies.
John P. Ackerly, IV, is Senior Vice President and Portfolio Manager of Davenport & Company, LLC (an investment advisory firm).
John T. Bruce is President, Director and member of the Executive Committee of Flippin, Bruce & Porter, Inc. (an investment advisory firm).
George K. Jennison is President of Oyster Consulting, LLC (a financial consulting firm). He previously was a financial adviser with Wells Fargo Advisors, LLC.
Harris V. Morrissette is President of China Doll Rice and Beans, Inc. and Dixie Lily Foods. He is also a Director of International Shipholding Corporation (cargo transportation); and a Director of Trustmark National Bank (bank holding company). Previously, he was Chairman of Azalea Aviation, Inc. (airplane fueling) until January 2012.
Elizabeth W. Robertson is Chief Financial Officer for Monument Restaurants LLC (restaurant franchises) and a Director of Towne Bank.
Thomas W. Leavell is President and Chief Executive Officer of the Adviser.
Mary Shannon Hope is a Vice President and Portfolio Manager of the Adviser.
Timothy S. Healey is an Executive Vice President and Chief Investment Officer of the Adviser.
Robert G. Dorsey is a Managing Director of Ultimus Fund Solutions, LLC and Ultimus Fund Distributors, LLC.
Mark J. Seger is a Managing Director of Ultimus Fund Solutions, LLC and Ultimus Fund Distributors, LLC.
Tina H. Bloom is Director of Fund Administration of Ultimus Fund Solutions, LLC.
45
THE GOVERNMENT STREET FUNDS
OTHER INFORMATION (Unaudited)
A description of the policies and procedures that the Funds use to vote proxies relating to portfolio securities is available without charge upon request by calling toll-free 1-866-738-1125, or on the SEC’s website at http://www.sec.gov. Information regarding how the Funds voted proxies relating to portfolio securities during the most recent 12-month period ended June 30 is also available without charge upon request by calling toll-free 1-866-738-1125 or on the SEC’s website at http://www.sec.gov.
The Trust files a complete listing of portfolio holdings for the Funds with the SEC as of the end of the first and third quarters of each fiscal year on Form N-Q. The filings are available upon request, by calling 1-866-738-1125. Furthermore, you may obtain a copy of these filings on the SEC’s website at http://www.sec.gov. The Trust’s Forms N-Q may also be reviewed and copied at the SEC’s Public Reference Room in Washington, DC, and information on the operation of the Public Reference Room may be obtained by calling 1-800-SEC-0330.
FEDERAL TAX INFORMATION (Unaudited)
In accordance with federal tax requirements, the following provides shareholders with information concerning distributions from ordinary income and net realized capital gains made by the Funds during the fiscal year ended March 31, 2016. Certain dividends paid by the Funds may be subject to a maximum tax rate of 23.8%. The Government Street Equity Fund and The Government Street Mid-Cap Fund intend to designate up to a maximum amount of $843,753 and $263,265, respectively, as taxed at a maximum rate of 23.8%. Additionally, The Government Street Equity Fund and The Government Street Mid-Cap Fund intend to designate up to a maximum amount of $2,693,418 and $2,340,298, respectively, as a long-term capital gain distribution. For the fiscal year ended March 31, 2016, 100% of the dividends paid from ordinary income by The Government Street Equity Fund and The Government Street Mid-Cap Fund qualified for the dividends received deduction for corporations.
As required by federal regulations, complete information will be computed and reported in conjunction with your 2015 Form 1099-DIV.
46
THE GOVERNMENT STREET FUNDS
DISCLOSURE REGARDING APPROVAL OF INVESTMENT ADVISORY AGREEMENTS (Unaudited)
At an in-person meeting held on February 23, 2016, the Board of Trustees, including a majority of the Independent Trustees, approved the continuance for a one-year period of the Investment Advisory Agreements with the Adviser on behalf of The Government Street Equity Fund, The Government Street Mid-Cap Fund and The Alabama Tax Free Bond Fund. Below is a discussion of the factors considered by the Board of Trustees along with its conclusions with respect thereto that formed the basis for the Board’s approvals.
In selecting the Adviser and approving the continuance of the Investment Advisory Agreements, the Trustees considered all information they deemed reasonably necessary to evaluate the terms of the Agreements. The principal areas of review by the Trustees were the nature, extent and quality of the services provided by the Adviser and the reasonableness of the fees charged for those services. These matters were considered by the Independent Trustees consulting with experienced counsel for the Independent Trustees, who is independent of the Adviser.
The Trustees’ evaluation of the quality of the Adviser’s services took into account their knowledge and experience gained through meetings with and reports of the Adviser’s senior management over the course of the preceding year. Both short-term and long-term investment performance of the Funds was considered. Each Fund’s performance was compared to its performance benchmark and to that of competitive funds with similar investment objectives. The Trustees also considered the scope and quality of the in-house capabilities of the Adviser and other resources dedicated to performing services for the Funds. The quality of administrative and other services, including the Adviser’s role in coordinating the activities of the Funds’ other service providers, were considered in light of the Funds’ compliance with investment policies and applicable laws and regulations and of related reports by management and the Funds’ independent public accounting firm in periodic meetings with the Trust’s Audit Committee. The Trustees also considered the business reputation of the Adviser, the qualifications of its key investment and compliance personnel, and its financial resources.
In reviewing the fees payable under the Investment Advisory Agreements, the Trustees compared the advisory fees and overall expense levels of each Fund with those of competitive funds with similar investment objectives. The Trustees considered information provided by the Adviser concerning the Adviser’s profitability with respect to each Fund, including the assumptions and methodology used in preparing the profitability information, in light of applicable case law relating to advisory fees. For these purposes, the Trustees took into account not only the fees paid by the Funds, but also so-called “fallout” benefits to the Adviser. The Trustees also considered the Adviser’s representations that all of the Funds’ portfolio trades were executed based on the best price and execution available, and that the Adviser does not participate in any soft dollar or directed brokerage arrangements. The Trustees further considered
47
THE GOVERNMENT STREET FUNDS
DISCLOSURE REGARDING APPROVAL OF INVESTMENT ADVISORY AGREEMENTS (Unaudited) (Continued)
that the Adviser does not participate in any revenue sharing arrangements relating to the Funds. In evaluating the Funds’ advisory fees, the Trustees took into account the complexity and quality of the investment management of the Funds.
Based upon their review of this information, the Independent Trustees concluded that: (i) based upon the portfolio composition and performance of The Government Street Equity Fund and The Government Street Mid-Cap Fund during 2015, as well as the Funds’ longer term performance, the Adviser has been effective in adhering to its investment philosophy of seeking to reduce the variability of returns through diversification and has provided quality services to those Funds; (ii) although the short-term and long-term performance of The Alabama Tax Free Bond Fund has lagged its benchmark index and the average returns for comparably managed funds, the Fund is managed in a conservative investment style and has satisfactorily met the goal of providing tax-exempt income with limited exposure to credit and maturity risks; (iii) the investment advisory fees payable to the Adviser by each Fund are competitive with similarly managed funds, and the Independent Trustees believe the fees to be reasonable given the scope and quality of investment advisory services provided by the Adviser and other services provided to shareholders; (iv) the total operating expense ratio of each Fund is less than the average expense ratio for comparably managed funds, according to statistics derived from Morningstar, Inc.; (v) the Adviser’s voluntary commitment to cap overall operating expenses of The Alabama Tax Free Bond Fund through advisory fee waivers has enabled that Fund to further increase returns for shareholders; and (vi) the level of the Adviser’s profitability with respect to its management of the Funds is reasonable. Given the current size of the Funds and their expected growth, the Independent Trustees did not believe that at the present time it would be relevant to consider the extent to which economies of scale would be realized as the Funds grow, and whether fee levels reflect these economies of scale. The Independent Trustees also considered the “fallout” benefits to the Adviser with respect to the Funds, but given the amounts involved viewed these as secondary factors in connection with the evaluation of the reasonableness of the advisory fees paid by the Funds.
No single factor was considered in isolation or to be determinative to the decision of the Trustees to approve continuance of the Investment Advisory Agreements. Rather the Trustees concluded, in light of a weighing and balancing of all factors considered, that it was in the best interests of each Fund and its shareholders to continue its Investment Advisory Agreement without modification to its terms, including the fees charged for services thereunder.
48
This page intentionally left blank.
The Government Street Funds
No-Load Mutual Funds Investment Adviser Leavell Investment Management, Inc. 210 St. Joseph Street Mobile, AL 36602 Administrator Ultimus Fund Solutions, LLC P.O. Box 46707 Cincinnati, OH 45246-0707 1-866-738-1125 Legal Counsel Sullivan & Worcester LLP One Post Office Square Boston, MA 02109 Independent Registered Public Accounting Firm Cohen Fund Audit Services, Ltd. 1350 Euclid Avenue Suite 800 Cleveland, Ohio 44115 Board of Trustees Robert S. Harris, Ph.D., Chairman John P. Ackerly, IV John T. Bruce George K. Jennison Harris V. Morrissette Elizabeth W. Robertson Portfolio Managers Thomas W. Leavell, The Government Street Equity Fund The Government Street Mid-Cap Fund Timothy S. Healey, The Alabama Tax Free Bond Fund |
THE
JAMESTOWN
FUNDS No-Load Funds The Jamestown Equity Fund
The Jamestown Tax Exempt Virginia Fund ANNUAL REPORT March 31, 2016
Investment Adviser Lowe, Brockenbrough & Company, Inc. Richmond, Virginia |
LETTER TO SHAREHOLDERS | May 19, 2016 |
The Jamestown Equity Fund
For the fiscal year ended March 31, 2016, The Jamestown Equity Fund (the “Fund”) returned -4.96% compared to 1.78% for the S&P 500 Index. During the fiscal year, the S&P 500 was driven by two groups of stocks; the FANG stocks (Facebook, Amazon, Netflix and Google (now Alphabet)) along with defensive, stable sectors of the market including Telecommunications, Utilities and Consumer Staples. The Fund was underweight the higher growth FANG stocks and underweight Utilities and Consumer Staples.
The underperformance of the Fund was driven by stock selection and a negative contribution from sector selection. Sector selection was hurt by the impact of holding some cash reserves in the portfolio during the past twelve months as equity markets rose. In addition, the underweight position in the Utilities and Consumer Staples sectors was a drag on performance. We continue to find the valuations of many of the “safety” sectors like Utilities and Consumer Staples less attractive and remain underweight in the Fund.
Stock selection was the largest drag on relative performance during the fiscal year. The negatives of poor stock selection in the Information Technology, Consumer Staples and Finance sectors more than offset strong stock selection in the Materials sector. The best performing stocks in the Fund for the year were General Electric, Microsoft, Alphabet and AT&T, all of which remained in the portfolio at the end of the fiscal year. The worst performing stocks were Ryder, McKesson, Marathon Oil, Morgan Stanley and Ameriprise Financial. Ryder and Marathon were sold out of the portfolio during the fiscal year.
We currently expect global economic growth to remain positive, but modest, as growth in the U.S. is joined by modest growth in Europe and slower growth in China. Economic growth in China has slowed as leaders there try to achieve a better balance between domestic consumption, and the infrastructure spending that has led the way over the past two decades. Inflation has been running below expectations across the globe, leaving plenty of room for global central banks to maintain very accommodative monetary policies. While the U.S. Federal Reserve raised interest rates once during the year, their path toward normalizing interest rates is likely to be much slower than previously anticipated.
Overall earnings for the S&P 500 fell slightly during the fiscal year, largely impacted by the dramatic decline in earnings from the Energy sector. Earnings were up modestly outside of the energy sector. We anticipate some improvement in corporate earnings as the oil market improves and comparisons against the stronger U.S. dollar are set to ease. Corporate earnings growth will need to accelerate to push equity prices forward as valuations on the S&P 500 remain modestly above long-term averages.
While performance was challenging during the fiscal year, we continue to be excited about the holdings in the Fund going forward. The earnings for the underlying companies are projected to grow faster than the overall S&P 500 earnings and the stocks we own in the Fund are trading at a larger than normal discount on various valuation measures.
1
The Jamestown Tax Exempt Virginia Fund
For the fiscal year ended March 31, 2016, The Jamestown Tax Exempt Virginia Fund (the “Fund”) returned 2.40%. By comparison, the Barclays 1-10 Year Municipal Blend Index returned 2.86%. The Fund remains conservatively positioned with regard to interest rate risk and credit quality. At the end of the period, the Fund’s 30-day SEC yield was 1.41%, which is a taxable equivalent yield of 2.49% for investors subject to the maximum 43.4% federal income tax bracket.
The U.S. economy experienced slower growth with real GDP expanding by 1.9% year-over-year as of March 31, 2016. With the plunge in oil prices, inflation remained subdued with the GDP deflator edging up 1.3% over the same time period. Monetary policy was still considered accommodative even after the Federal Reserve increased short-term rates by a quarter percentage point in December 2015, after seven years of keeping short-term interest rates near zero. Fed officials signaled their intention to normalize interest rates gradually over the next 2 to 3 years, yet volatility in financial markets in early 2016 led them to trim the number of rate hikes projected for 2016 from four to two.
Although short-term yields increased in the period, intermediate-term bond yields stayed in a narrow range for much of the period before moving sharply lower in the first quarter of 2016. The yield on the 10-year Treasury note drifted between 2.00% and 2.50% for the first nine months of the fiscal year and then fell to 1.77% at March 31, 2016. During the same period, the tax-exempt yield of AAA-rated general obligations with a 5-year maturity fell 17 basis points to 1.07%, while the 10-year maturity declined 26 basis points to 1.70%, according to Municipal Market Data. The Fund’s net asset value declined in the second quarter of 2015, was relatively steady for several months, and then increased in the first quarter of 2016, reaching its peak in mid-February.
The Fund’s relative performance can be attributed to its duration, its yield curve positioning, and its emphasis on high credit quality. The portfolio’s average maturity and duration shortened moderately during the course of the twelve-month period. At March 31, 2016, the Fund’s average stated maturity was 5.6 years, compared to 5.9 years at the beginning of the period, and the effective duration was little changed at 4.0 years. Long maturity bonds generally outperformed shorter maturity bonds as the difference between short-term yields and long-term yields narrowed, resulting in a flatter yield curve. The Fund’s allocation to short duration bonds was detrimental to relative performance.
Lower quality bonds outperformed higher quality debt during the reporting period as yield-starved investors continued to reach for extra income in lower quality credits. Virginia is known for its well managed state and local governments, thus the debt of most localities is considered high quality. There is a paucity of low rated municipal credits within Virginia, compared to other states. The Fund remains positioned in predominantly AAA and AA-rated credits from Virginia municipal issuers, both in general obligation debt and essential service revenue bonds. The Fund’s exposure to lower quality credits is less than that of its broader benchmark.
2
The Commonwealth of Virginia completed its fiscal year ended in June 30, 2015 with a record $553 million surplus. Revenue collections increased by 8.1%, led by individual income tax receipts as employment growth in the state accelerated in 2015. By Virginia law, 96% of the surplus is directed to the Revenue Stabilization Fund and the Virginia Water Quality Fund. General obligation bonds issued by the state continue to carry the top credit rating by all three major rating firms, with a stable outlook, despite ongoing concern over the state’s unfunded pension liability.

| 
|
Charles M. Caravati, III, CFA President Jamestown Equity Fund | Joseph A. Jennings, III, CFA President Jamestown Tax Exempt Virginia Fund |
Data presented reflects past performance, which is no guarantee of future results. Investment results and principal value will fluctuate so that shares, when redeemed, may be worth more or less than their original cost. Due to market volatility, current performance may be higher or lower than the performance shown. Performance data, current to the most recent month end, may be obtained by calling 1-866-738-1126.
This report is submitted for the general information of the shareholders of the Funds. The report is not authorized for distribution to prospective investors in the Funds unless it is accompanied by a current prospectus.
This report reflects our views, opinions and portfolio holdings as of March 31, 2016, the end of the reporting period. These views are subject to change at any time based upon market or other conditions. For more current information throughout the year please visit www.jamestownfunds.com. The Funds are distributed by Ultimus Fund Distributors, LLC.
3
THE JAMESTOWN EQUITY FUND
PERFORMANCE INFORMATION (Unaudited)
Comparison of the Change in Value of a $10,000 Investment in
The Jamestown Equity Fund and the Standard & Poor’s 500® Index
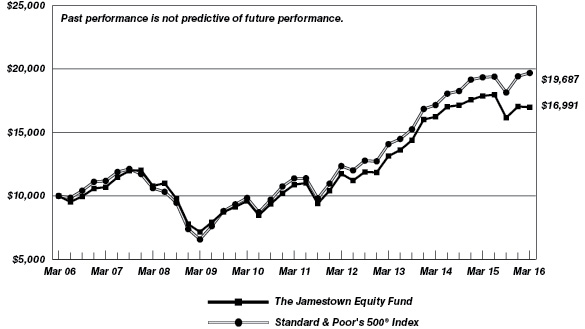
| | Average Annual Total Returns(a)
(for periods ended March 31, 2016) |
| | 1 Year | 5 Years | 10 Years |
The Jamestown Equity Fund | (4.96%) | 9.31% | 5.44% |
Standard & Poor’s 500® Index | 1.78% | 11.58% | 7.01% |
(a) | Total return is a measure of the change in value of an investment in the Fund over the periods covered, which assumes any dividends or capital gains distributions are reinvested in shares of the Fund. Returns shown do not reflect the deduction of taxes a shareholder would pay on Fund distributions or the redemption of Fund shares. |
4
THE JAMESTOWN TAX EXEMPT VIRGINIA FUND
PERFORMANCE INFORMATION (Unaudited)
Comparison of the Change in Value of a $10,000 Investment in
The Jamestown Tax Exempt Virginia Fund and the Barclays 1-10 Year Municipal Blend Index*

| | Average Annual Total Returns(a)
(for periods ended March 31, 2016) |
| | 1 Year | 5 Years | 10 Years |
The Jamestown Tax Exempt Virginia Fund | 2.40% | 2.49% | 3.14% |
Barclays 1-10 Year Municipal Blend Index | 2.86% | 3.68% | 4.21% |
* | The Barclays 1-10 Year Municipal Blend Index is an unmanaged, market value-weighted index which covers the short and intermediate components of the U.S. investment-grade tax-exempt bond market. |
(a) | Total return is a measure of the change in value of an investment in the Fund over the periods covered, which assumes any dividends or capital gains distributions are reinvested in shares of the Fund. Returns shown do not reflect the deduction of taxes a shareholder would pay on Fund distributions or the redemption of Fund shares. |
5
THE JAMESTOWN EQUITY FUND
PORTFOLIO INFORMATION
March 31, 2016 (Unaudited)
Asset Allocation (% of Net Assets) | | Ten Largest Equity Holdings | % of
Net Assets |
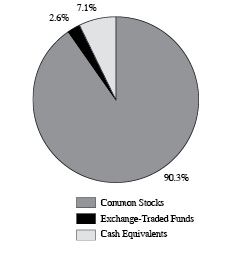
| | Apple, Inc. | 4.6% |
Allergan plc | 2.7% |
Consumer Staples Select Sector SPDR® Fund (The) | 2.6% |
CVS Health Corporation | 2.5% |
Exxon Mobil Corporation | 2.5% |
Discover Financial Services | 2.4% |
Chevron Corporation | 2.3% |
AT&T, Inc. | 2.2% |
JPMorgan Chase & Company | 2.2% |
Nielsen Holdings plc | 2.2% |
| |
Sector Concentration vs. the S&P 500® Index |
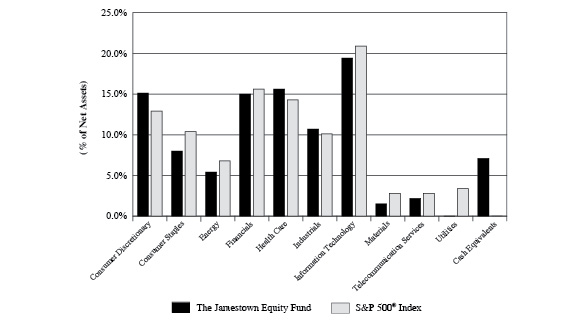
6
THE JAMESTOWN TAX EXEMPT VIRGINIA FUND
PORTFOLIO INFORMATION
March 31, 2016 (Unaudited)
Characteristics
(Weighted Average) | | Maturity Breakdown
(% of Portfolio) |
30-day SEC Yield | 1.41% | | 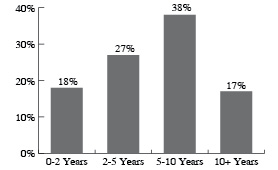
|
Tax-Equivalent Yield | 2.49%* | |
Average Maturity (years) | 5.6 | |
Average Duration (years) | 4.0 | |
Average Quality | AA | |
Number of Issues | 56 | |
| | | |
* Assumes a maximum 43.4% federal tax rate. | |
Credit Quality (% of Portfolio) | | Sector Diversification (% of Portfolio) |
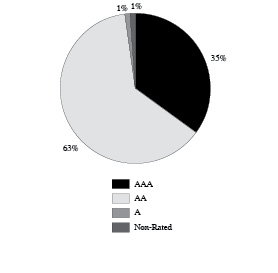
| | 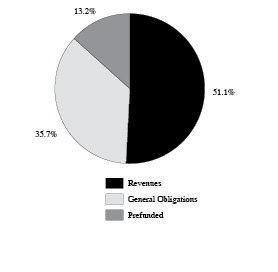
|
7
THE JAMESTOWN EQUITY FUND
SCHEDULE OF INVESTMENTS
March 31, 2016 |
COMMON STOCKS — 90.3% | | Shares | | | Value | |
Consumer Discretionary — 15.1% | | | | | | |
Comcast Corporation - Class A | | | 12,100 | | | $ | 739,068 | |
Dollar Tree, Inc. (a) | | | 6,800 | | | | 560,728 | |
Home Depot, Inc. (The) | | | 5,600 | | | | 747,208 | |
Lennar Corporation - Class A | | | 15,000 | | | | 725,400 | |
Priceline Group, Inc. (The) (a) | | | 525 | | | | 676,704 | |
Royal Caribbean Cruises Ltd. | | | 9,200 | | | | 755,780 | |
TJX Companies, Inc. (The) | | | 10,000 | | | | 783,500 | |
Walt Disney Company (The) | | | 7,000 | | | | 695,170 | |
| | | | | | | | 5,683,558 | |
Consumer Staples — 5.4% | | | | | | | | |
CVS Health Corporation | | | 9,250 | | | | 959,503 | |
PepsiCo, Inc. | | | 6,500 | | | | 666,120 | |
Procter & Gamble Company (The) | | | 4,900 | | | | 403,319 | |
| | | | | | | | 2,028,942 | |
Energy — 5.4% | | | | | | | | |
Chevron Corporation | | | 9,000 | | | | 858,600 | |
Exxon Mobil Corporation | | | 11,200 | | | | 936,208 | |
Hess Corporation | | | 4,200 | | | | 221,130 | |
| | | | | | | | 2,015,938 | |
Financials — 15.0% | | | | | | | | |
Ameriprise Financial, Inc. | | | 7,000 | | | | 658,070 | |
Chubb Ltd. | | | 3,500 | | | | 417,025 | |
Discover Financial Services | | | 17,500 | | | | 891,100 | |
Invesco Ltd. | | | 10,800 | | | | 332,316 | |
JPMorgan Chase & Company | | | 14,000 | | | | 829,080 | |
MetLife, Inc. | | | 14,400 | | | | 632,736 | |
Morgan Stanley | | | 22,000 | | | | 550,220 | |
PNC Financial Services Group, Inc. (The) | | | 8,000 | | | | 676,560 | |
Wells Fargo & Company | | | 14,000 | | | | 677,040 | |
| | | | | | | | 5,664,147 | |
Health Care — 15.6% | | | | | | | | |
Abbott Laboratories | | | 9,600 | | | | 401,568 | |
Aetna, Inc. | | | 7,200 | | | | 808,920 | |
Allergan plc (a) | | | 3,850 | | | | 1,031,915 | |
AmerisourceBergen Corporation | | | 4,200 | | | | 363,510 | |
Amgen, Inc. | | | 5,000 | | | | 749,650 | |
McKesson Corporation | | | 3,800 | | | | 597,550 | |
Merck & Company, Inc. | | | 10,000 | | | | 529,100 | |
Thermo Fisher Scientific, Inc. | | | 5,400 | | | | 764,586 | |
UnitedHealth Group, Inc. | | | 5,000 | | | | 644,500 | |
| | | | | | | | 5,891,299 | |
8
THE JAMESTOWN EQUITY FUND
SCHEDULE OF INVESTMENTS (Continued) |
COMMON STOCKS — 90.3% (Continued) | | Shares | | | Value | |
Industrials — 10.7% | | | | | | |
CSX Corporation | | | 8,500 | | | $ | 218,875 | |
Eaton Corporation plc | | | 9,000 | | | | 563,040 | |
FedEx Corporation | | | 4,800 | | | | 781,056 | |
General Electric Company | | | 25,000 | | | | 794,750 | |
Nielsen Holdings plc | | | 15,500 | | | | 816,230 | |
Norfolk Southern Corporation | | | 5,900 | | | | 491,175 | |
United Technologies Corporation | | | 3,500 | | | | 350,350 | |
| | | | | | | | 4,015,476 | |
Information Technology — 19.4% | | | | | | | | |
Alphabet, Inc. - Class A (a) | | | 975 | | | | 743,828 | |
Alphabet, Inc. - Class C (a) | | | 1,000 | | | | 744,950 | |
Apple, Inc. | | | 15,900 | | | | 1,732,941 | |
Cisco Systems, Inc. | | | 28,500 | | | | 811,395 | |
EMC Corporation | | | 29,000 | | | | 772,850 | |
Microsoft Corporation | | | 11,300 | | | | 624,099 | |
Oracle Corporation | | | 18,000 | | | | 736,380 | |
QUALCOMM, Inc. | | | 8,300 | | | | 424,462 | |
TE Connectivity Ltd. | | | 11,700 | | | | 724,464 | |
| | | | | | | | 7,315,369 | |
Materials — 1.5% | | | | | | | | |
Eastman Chemical Company | | | 8,000 | | | | 577,840 | |
| | | | | | | | | |
Telecommunication Services — 2.2% | | | | | | | | |
AT&T, Inc. | | | 21,500 | | | | 842,155 | |
| | | | | | | | | |
Total Common Stocks (Cost $22,470,552) | | | | | | $ | 34,034,724 | |
EXCHANGE-TRADED FUNDS — 2.6% | | Shares | | | Value | |
Consumer Staples Select Sector SPDR® Fund (The) (Cost $881,729) | | | 18,200 | | | $ | 965,510 | |
| | | | | | | | | |
Total Investments at Value — 92.9% (Cost $23,352,281) | | | | | | $ | 35,000,234 | |
| | | | | | | | | |
Other Assets in Excess of Liabilities — 7.1% | | | | | | | 2,681,503 | |
| | | | | | | | | |
Net Assets — 100.0% | | | | | | $ | 37,681,737 | |
(a) | Non-income producing security. |
See accompanying notes to financial statements. |
9
THE JAMESTOWN TAX EXEMPT VIRGINIA FUND
SCHEDULE OF INVESTMENTS
March 31, 2016 |
VIRGINIA REVENUE AND GENERAL OBLIGATION (GO) BONDS — 92.0% | | Par Value | | | Value | |
Capital Region Airport Commission, Virginia, Airport Revenue, | | | | | | |
4.50%, due 07/01/2016 | | $ | 520,000 | | | $ | 525,122 | |
Chesterfield Co., Virginia, GO, | | | | | | | | |
5.00%, due 01/01/2020 | | | 700,000 | | | | 723,653 | |
5.00%, due 01/01/2024 | | | 250,000 | | | | 300,775 | |
5.00%, due 01/01/2025 | | | 460,000 | | | | 574,319 | |
City of Winchester, Virginia, GO, | | | | | | | | |
5.00%, due 09/01/2027 | | | 125,000 | | | | 156,109 | |
Fairfax Co., Virginia, Industrial Dev. Authority, Revenue, | | | | | | | | |
5.00%, due 05/15/2022 | | | 750,000 | | | | 841,755 | |
Fairfax Co., Virginia, Sewer, Revenue, | | | | | | | | |
4.50%, due 07/15/2030 prerefunded 07/15/2021 @ 100 | | | 250,000 | | | | 283,767 | |
Fairfax Co., Virginia, Water, Revenue, | | | | | | | | |
5.00%, due 04/01/2027 | | | 500,000 | | | | 601,415 | |
Fauquier Co., Virginia, GO, | | | | | | | | |
5.00%, due 07/01/2017, prerefunded 07/01/2016 @ 100 | | | 500,000 | | | | 505,660 | |
Hampton Roads Sanitation District, Virginia, Wastewater, Revenue, | | | | | | | | |
5.00%, due 04/01/2022, prerefunded 04/01/2018 @ 100 | | | 400,000 | | | | 433,392 | |
5.00%, due 07/01/2026 | | | 500,000 | | | | 624,545 | |
Hampton Roads Sanitation District, Virginia, Wastewater, Series A, Revenue, | | | | | | | | |
5.00%, due 01/01/2027 prerefunded 01/01/2021 @ 100 | | | 400,000 | | | | 471,796 | |
Hampton, Virginia, GO, | | | | | | | | |
5.00%, due 04/01/2025 | | | 500,000 | | | | 605,650 | |
Harrisonburg, Virginia, GO, | | | | | | | | |
5.00%, due 07/15/2022 | | | 350,000 | | | | 426,464 | |
Henrico Co., Virginia, Water & Sewer, Revenue, | | | | | | | | |
5.00%, due 05/01/2020 | | | 350,000 | | | | 393,918 | |
5.00%, due 05/01/2022 | | | 430,000 | | | | 483,539 | |
Leesburg, Virginia, GO, | | | | | | | | |
5.00%, due 09/15/2016 | | | 500,000 | | | | 510,445 | |
Louisa, Virginia, Industrial Dev. Authority, Poll Control Revenue, | | | | | | | | |
2.15%, due 11/01/2035 | | | 200,000 | | | | 205,290 | |
Lynchburg, Virginia, Public Improvement, Series A, GO, | | | | | | | | |
5.00%, due 08/01/2019 | | | 625,000 | | | | 707,444 | |
Manassas, Virginia, Public Improvement, Series D, GO, | | | | | | | | |
5.00%, due 07/01/2019 | | | 250,000 | | | | 284,655 | |
10
THE JAMESTOWN TAX EXEMPT VIRGINIA FUND
SCHEDULE OF INVESTMENTS (Continued) |
VIRGINIA REVENUE AND GENERAL OBLIGATION (GO) BONDS — 92.0% (Continued) | | Par Value | | | Value | |
New Kent Co., Virginia, Economic Dev. Authority, Revenue, | | | | | | |
5.00%, due 02/01/2019, prerefunded 02/01/2017 @ 100 | | $ | 500,000 | | | $ | 518,225 | |
Newport News, Virginia, GO, | | | | | | | | |
5.00%, due 07/15/2025 | | | 350,000 | | | | 448,427 | |
Northern Virginia Transportation Authority, Special Tax, Revenue, | | | | | | | | |
5.00%, due 06/01/2026 | | | 400,000 | | | | 493,952 | |
Portsmouth, Virginia, Series D, GO, | | | | | | | | |
4.00%, due 12/01/2017 | | | 215,000 | | | | 226,758 | |
Prince William Co., Virginia, Lease Participation Certificates, | | | | | | | | |
5.00%, due 10/01/2020 | | | 500,000 | | | | 580,190 | |
Rappahannock, Virginia, Regional Jail Authority, Revenue, | | | | | | | | |
5.00%, due 10/01/2024 | | | 300,000 | | | | 375,753 | |
Roanoke, Virginia, Public Improvement, Series A, GO, | | | | | | | | |
5.00%, due 07/15/2025 | | | 400,000 | | | | 492,852 | |
Spotsylvania Co., Virginia, Economic Dev. Authority, Revenue, | | | | | | | | |
5.00%, due 06/01/2021 | | | 300,000 | | | | 354,489 | |
Spotsylvania Co., Virginia, GO, | | | | | | | | |
5.00%, due 01/15/2023 | | | 400,000 | | | | 491,072 | |
Stafford Co., Virginia, Public Improvement, GO, | | | | | | | | |
5.00%, due 08/01/2026 | | | 375,000 | | | | 479,426 | |
Suffolk, Virginia, Public Improvement, GO, | | | | | | | | |
5.00%, due 02/01/2022 | | | 400,000 | | | | 485,376 | |
Suffolk, Virginia, Public Improvement, Series A, GO, | | | | | | | | |
4.00%, due 08/01/2018 | | | 250,000 | | | | 268,685 | |
Upper Occoquan, Virginia, Sewer Authority, Revenue, | | | | | | | | |
5.15%, due 07/01/2020 | | | 250,000 | | | | 273,127 | |
5.00%, due 07/01/2027 | | | 350,000 | | | | 443,335 | |
Virginia Beach, Virginia, Public Improvement, GO, | | | | | | | | |
5.00%, due 06/01/2021, prerefunded 06/01/2019 @ 100 | | | 250,000 | | | | 282,205 | |
5.00%, due 03/01/2023 | | | 300,000 | | | | 372,309 | |
4.00%, due 04/01/2027 | | | 205,000 | | | | 230,978 | |
Virginia Biotechnology Research Partnership Authority, Lease Revenue, | | | | | | | | |
5.00%, due 09/01/2020 | | | 500,000 | | | | 581,720 | |
Virginia College Building Authority, Educational Facilities, Revenue, | | | | | | | | |
5.00%, due 03/01/2019 | | | 250,000 | | | | 279,467 | |
4.00%, due 09/01/2026 | | | 500,000 | | | | 565,290 | |
11
THE JAMESTOWN TAX EXEMPT VIRGINIA FUND
SCHEDULE OF INVESTMENTS (Continued) |
VIRGINIA REVENUE AND GENERAL OBLIGATION (GO) BONDS — 92.0% (Continued) | | Par Value | | | Value | |
Virginia Commonwealth Transportation Board, Federal Highway Reimbursement Anticipation Notes, Revenue, | | | | | | |
5.00%, due 03/15/2023 | | $ | 500,000 | | | $ | 599,910 | |
5.00%, due 03/15/2025 | | | 500,000 | | | | 609,195 | |
Virginia Small Business Financing Authority, Healthcare Facilities, Revenue, | | | | | | | | |
5.00%, due 11/01/2017 | | | 250,000 | | | | 266,745 | |
Virginia State Housing Dev. Authority, Revenue, | | | | | | | | |
3.05%, due 07/01/2021 | | | 200,000 | | | | 214,544 | |
Virginia State Public School Authority, Revenue, | | | | | | | | |
5.00%, due 08/01/2023 | | | 500,000 | | | | 613,540 | |
5.00%, due 07/15/2026 | | | 300,000 | | | | 367,320 | |
Virginia State Public School Authority, Series A, Revenue, | | | | | | | | |
5.00%, due 08/01/2020, prerefunded 08/01/2016 @ 100 | | | 585,000 | | | | 593,793 | |
Virginia State Public School Authority, Series B-1, Revenue, | | | | | | | | |
5.00%, due 08/01/2018 | | | 500,000 | | | | 548,480 | |
Virginia State Resources Authority, Clean Water, Revenue, | | | | | | | | |
5.00%, due 10/01/2021, prerefunded 10/01/2019 @ 100 | | | 500,000 | | | | 570,195 | |
Virginia State Resources Authority, Infrastructure, Revenue, | | | | | | | | |
5.00%, due 11/01/2024, prerefunded 11/01/2018 @ 100 | | | 220,000 | | | | 243,437 | |
5.00%, due 11/01/2024 | | | 35,000 | | | | 38,738 | |
5.00%, due 11/01/2024 | | | 245,000 | | | | 270,402 | |
Virginia State Resources Authority, Infrastructure, Series B, Revenue, | | | | | | | | |
5.00%, due 11/01/2024 | | | 150,000 | | | | 183,897 | |
Virginia State, Series B, GO, | | | | | | | | |
5.00%, due 06/01/2017 | | | 250,000 | | | | 262,808 | |
Western Virginia Regional Jail Authority, Revenue, | | | | | | | | |
5.00%, due 12/01/2023 | | | 250,000 | | | | 308,033 | |
| | | | | | | | | |
Total Virginia Revenue and General Obligation (GO) Bonds (Cost $22,510,568) | | | | | | $ | 23,594,376 | |
12
THE JAMESTOWN TAX EXEMPT VIRGINIA FUND
SCHEDULE OF INVESTMENTS (Continued) |
WASHINGTON, D.C. REVENUE BONDS — 2.1% | | Par Value | | | Value | |
Metropolitan Washington Airports Authority, Series C, Revenue, | | | | | | |
5.00%, due 10/01/2022 (Cost $503,476) | | $ | 500,000 | | | $ | 547,955 | |
EXCHANGE-TRADED FUNDS — 0.5% | | Shares | | | Value | |
SPDR® Nuveen Barclays Short Term Municipal Bond ETF (Cost $120,500) | | | 2,500 | | | $ | 122,050 | |
MONEY MARKET FUNDS — 4.5% | | Shares | | | Value | |
Fidelity Tax Exempt Portfolio - Class I, 0.13% (a) (Cost $1,153,500) | | | 1,153,500 | | | $ | 1,153,500 | |
| | | | | | | | | |
Total Investments at Value — 99.1% (Cost $24,288,044) | | | | | | $ | 25,417,881 | |
| | | | | | | | | |
Other Assets in Excess of Liabilities — 0.9% | | | | | | | 228,850 | |
| | | | | | | | | |
Net Assets — 100.0% | | | | | | $ | 25,646,731 | |
(a) | The rate shown is the 7-day effective yield as of March 31, 2016. |
See accompanying notes to financial statements. |
13
THE JAMESTOWN FUNDS
STATEMENTS OF ASSETS AND LIABILITIES
March 31, 2016 |
| | The Jamestown
Equity
Fund | | | The
Jamestown
Tax Exempt
Virginia
Fund | |
ASSETS | | | | | | |
Investments in securities: | | | | | | |
At acquisition cost | | $ | 23,352,281 | | | $ | 24,288,044 | |
At value (Note 2) | | $ | 35,000,234 | | | $ | 25,417,881 | |
Cash | | | 2,618,351 | | | | — | |
Dividends and interest receivable | | | 25,518 | | | | 276,226 | |
Receivable for investment securities sold | | | 677,336 | | | | — | |
Receivable for capital shares sold | | | 1,164 | | | | — | |
Other assets | | | 2,581 | | | | 1,012 | |
TOTAL ASSETS | | | 38,325,184 | | | | 25,695,119 | |
| | | | | | | | | |
LIABILITIES | | | | | | | | |
Distributions payable | | | 4,243 | | | | 4,566 | |
Payable for investment securities purchased | | | 580,075 | | | | — | |
Payable for capital shares redeemed | | | 31,271 | | | | 33,920 | |
Accrued investment advisory fees (Note 4) | | | 20,399 | | | | 4,123 | |
Payable to administrator (Note 4) | | | 5,700 | | | | 5,700 | |
Other accrued expenses | | | 1,759 | | | | 79 | |
TOTAL LIABILITIES | | | 643,447 | | | | 48,388 | |
| | | | | | | | | |
NET ASSETS | | $ | 37,681,737 | | | $ | 25,646,731 | |
| | | | | | | | | |
Net assets consist of: | | | | | | | | |
Paid-in capital | | $ | 26,005,964 | | | $ | 24,526,789 | |
Undistributed net investment income | | | 9,712 | | | | — | |
Accumulated net realized gains (losses) from security transactions | | | 18,108 | | | | (9,895 | ) |
Net unrealized appreciation on investments | | | 11,647,953 | | | | 1,129,837 | |
Net assets | | $ | 37,681,737 | | | $ | 25,646,731 | |
| | | | | | | | | |
Shares of beneficial interest outstanding (unlimited number of shares authorized, $0.01 par value) | | | 1,925,611 | | | | 2,512,549 | |
| | | | | | | | | |
Net asset value, offering price and redemption price per share (Note 2) | | $ | 19.57 | | | $ | 10.21 | |
See accompanying notes to financial statements. |
14
THE JAMESTOWN FUNDS
STATEMENTS OF OPERATIONS
Year Ended March 31, 2016 |
| | The Jamestown Equity
Fund | | | The Jamestown Tax Exempt Virginia
Fund | |
INVESTMENT INCOME | | | | | | |
Dividends | | $ | 649,589 | | | $ | 1,293 | |
Foreign withholding taxes on dividends | | | (454 | ) | | | — | |
Interest | | | — | | | | 728,238 | |
TOTAL INVESTMENT INCOME | | | 649,135 | | | | 729,531 | |
| | | | | | | | | |
EXPENSES | | | | | | | | |
Investment advisory fees (Note 4) | | | 232,578 | | | | 105,536 | |
Administration fees (Note 4) | | | 60,042 | | | | 60,000 | |
Professional fees | | | 18,550 | | | | 18,450 | |
Trustees’ fees and expenses (Note 4) | | | 10,283 | | | | 10,283 | |
Compliance service fees (Note 4) | | | 7,668 | | | | 7,668 | |
Custodian and bank service fees | | | 9,608 | | | | 5,680 | |
Account maintenance fees | | | 4,053 | | | | 7,655 | |
Pricing costs | | | 1,234 | | | | 9,729 | |
Registration and filing fees | | | 5,683 | | | | 3,222 | |
Printing of shareholder reports | | | 6,776 | | | | 2,059 | |
Postage and supplies | | | 5,570 | | | | 3,192 | |
Other expenses | | | 5,537 | | | | 3,103 | |
TOTAL EXPENSES | | | 367,582 | | | | 236,577 | |
Fees voluntarily waived by the Adviser (Note 4) | | | — | | | | (54,527 | ) |
Expenses reimbursed through a directed brokerage arrangement (Note 5) | | | (12,000 | ) | | | — | |
NET EXPENSES | | | 355,582 | | | | 182,050 | |
| | | | | | | | | |
NET INVESTMENT INCOME | | | 293,553 | | | | 547,481 | |
| | | | | | | | | |
REALIZED AND UNREALIZED GAINS (LOSSES) ON INVESTMENTS | | | | | | | | |
Net realized gains (losses) on security transactions | | | 308,030 | | | | (358 | ) |
Net realized gains from in-kind redemptions (Note 2) | | | 1,079,680 | | | | — | |
Capital gain distributions from regulated investment companies | | | — | | | | 1,310 | |
Net change in unrealized appreciation (depreciation) on investments | | | (3,978,103 | ) | | | 65,449 | |
| | | | | | | | | |
NET REALIZED AND UNREALIZED GAINS (LOSSES) ON INVESTMENTS | | | (2,590,393 | ) | | | 66,401 | |
| | | | | | | | | |
NET INCREASE (DECREASE) IN NET ASSETS FROM OPERATIONS | | $ | (2,296,840 | ) | | $ | 613,882 | |
See accompanying notes to financial statements. |
15
THE JAMESTOWN EQUITY FUND
STATEMENTS OF CHANGES IN NET ASSETS |
| | Year
Ended
March 31, 2016 | | | Year
Ended
March 31, 2015 | |
FROM OPERATIONS | | | | | | |
Net investment income | | $ | 293,553 | | | $ | 217,314 | |
Net realized gains on security transactions | | | 308,030 | | | | 3,030,039 | |
Net realized gains from in-kind redemptions (Note 2) | | | 1,079,680 | | | | — | |
Net change in unrealized appreciation (depreciation) on investments | | | (3,978,103 | ) | | | (316,145 | ) |
Net increase (decrease) in net assets from operations | | | (2,296,840 | ) | | | 2,931,208 | |
| | | | | | | | | |
DISTRIBUTIONS TO SHAREHOLDERS | | | | | | | | |
From net investment income | | | (281,968 | ) | | | (220,231 | ) |
From net realized gains from security transactions | | | (1,610,525 | ) | | | (3,470,588 | ) |
Decrease in net assets from distributions to shareholders | | | (1,892,493 | ) | | | (3,690,819 | ) |
| | | | | | | | | |
FROM CAPITAL SHARE TRANSACTIONS | | | | | | | | |
Net assets received in conjunction with fund merger (Note 1) | | | 15,513,703 | | | | — | |
Proceeds from shares sold | | | 976,998 | | | | 585,424 | |
Net asset value of shares issued in reinvestment of distributions to shareholders | | | 1,798,593 | | | | 3,513,477 | |
Payments for shares redeemed | | | (6,014,160 | ) | | | (4,488,942 | ) |
Net increase (decrease) in net assets from capital share transactions | | | 12,275,134 | | | | (390,041 | ) |
| | | | | | | | | |
TOTAL INCREASE (DECREASE) IN NET ASSETS | | | 8,085,801 | | | | (1,149,652 | ) |
| | | | | | | | | |
NET ASSETS | | | | | | | | |
Beginning of year | | | 29,595,936 | | | | 30,745,588 | |
End of year | | $ | 37,681,737 | | | $ | 29,595,936 | |
| | | | | | | | | |
UNDISTRIBUTED (DISTRIBUTIONS IN EXCESS OF) NET INVESTMENT INCOME | | $ | 9,712 | | | $ | (1,873 | ) |
| | | | | | | | | |
CAPITAL SHARE ACTIVITY | | | | | | | | |
Shares received in connection with fund merger (Note 1) | | | 738,504 | | | | — | |
Shares sold | | | 50,176 | | | | 26,969 | |
Shares reinvested | | | 87,142 | | | | 164,154 | |
Shares redeemed | | | (301,261 | ) | | | (208,164 | ) |
Net increase (decrease) in shares outstanding | | | 574,561 | | | | (17,041 | ) |
Shares outstanding, beginning of year | | | 1,351,050 | | | | 1,368,091 | |
Shares outstanding, end of year | | | 1,925,611 | | | | 1,351,050 | |
See accompanying notes to financial statements. |
16
THE JAMESTOWN TAX EXEMPT VIRGINIA FUND
STATEMENTS OF CHANGES IN NET ASSETS | |
| | Year Ended March 31, 2016 | | | Year
Ended
March 31, 2015 | |
FROM OPERATIONS | | | | | | |
Net investment income | | $ | 547,481 | | | $ | 628,532 | |
Net realized gains (losses) on security transactions | | | (358 | ) | | | 9,689 | |
Capital gain distributions from regulated investment companies | | | 1,310 | | | | — | |
Net change in unrealized appreciation (depreciation) on investments | | | 65,449 | | | | 32,334 | |
Net increase in net assets from operations | | | 613,882 | | | | 670,555 | |
| | | | | | | | | |
DISTRIBUTIONS TO SHAREHOLDERS | | | | | | | | |
From net investment income | | | (547,481 | ) | | | (628,553 | ) |
| | | | | | | | | |
FROM CAPITAL SHARE TRANSACTIONS | | | | | | | | |
Proceeds from shares sold | | | 956,558 | | | | 2,186,736 | |
Net asset value of shares issued in reinvestment of distributions to shareholders | | | 490,264 | | | | 550,371 | |
Payments for shares redeemed | | | (2,561,366 | ) | | | (2,368,257 | ) |
Net increase (decrease) in net assets from capital share transactions | | | (1,114,544 | ) | | | 368,850 | |
| | | | | | | | | |
TOTAL INCREASE (DECREASE) IN NET ASSETS | | | (1,048,143 | ) | | | 410,852 | |
| | | | | | | | | |
NET ASSETS | | | | | | | | |
Beginning of year | | | 26,694,874 | | | | 26,284,022 | |
End of year | | $ | 25,646,731 | | | $ | 26,694,874 | |
| | | | | | | | | |
ACCUMULATED NET INVESTMENT INCOME | | $ | — | | | $ | — | |
| | | | | | | | | |
CAPITAL SHARE ACTIVITY | | | | | | | | |
Shares sold | | | 93,889 | | | | 214,675 | |
Shares reinvested | | | 48,415 | | | | 53,901 | |
Shares redeemed | | | (252,646 | ) | | | (232,059 | ) |
Net increase (decrease) in shares outstanding | | | (110,342 | ) | | | 36,517 | |
Shares outstanding, beginning of year | | | 2,622,891 | | | | 2,586,374 | |
Shares outstanding, end of year | | | 2,512,549 | | | | 2,622,891 | |
See accompanying notes to financial statements. |
17
THE JAMESTOWN EQUITY FUND
FINANCIAL HIGHLIGHTS |
Selected Per Share Data and Ratios for a Share Outstanding Throughout Each Year | |
| | Years Ended March 31, | |
| | 2016 | | | 2015 | | | 2014 | | | 2013 | | | 2012 | |
Net asset value at beginning of year | | $ | 21.91 | | | $ | 22.47 | | | $ | 19.60 | | | $ | 17.73 | | | $ | 16.54 | |
| | | | | | | | | | | | | | | | | | | | | |
Income (loss) from investment operations: | | | | | | | | | | | | | | | | | | | | |
Net investment income | | | 0.16 | | | | 0.16 | | | | 0.15 | | | | 0.15 | | | | 0.09 | |
Net realized and unrealized gains (losses) on investments | | | (1.18 | ) | | | 1.96 | | | | 4.30 | | | | 1.93 | | | | 1.21 | |
Total from investment operations | | | (1.02 | ) | | | 2.12 | | | | 4.45 | | | | 2.08 | | | | 1.30 | |
| | | | | | | | | | | | | | | | | | | | | |
Less distributions: | | | | | | | | | | | | | | | | | | | | |
Dividends from net investment income | | | (0.16 | ) | | | (0.16 | ) | | | (0.15 | ) | | | (0.15 | ) | | | (0.11 | ) |
Distributions from net realized gains | | | (1.16 | ) | | | (2.52 | ) | | | (1.43 | ) | | | (0.06 | ) | | | — | |
Total distributions | | | (1.32 | ) | | | (2.68 | ) | | | (1.58 | ) | | | (0.21 | ) | | | (0.11 | ) |
| | | | | | | | | | | | | | | | | | | | | |
Net asset value at end of year | | $ | 19.57 | | | $ | 21.91 | | | $ | 22.47 | | | $ | 19.60 | | | $ | 17.73 | |
| | | | | | | | | | | | | | | | | | | | | |
Total return (a) | | | (4.96 | %) | | | 10.14 | % | | | 23.55 | % | | | 11.84 | % | | | 7.89 | % |
| | | | | | | | | | | | | | | | | | | | | |
Net assets at end of year (000’s) | | $ | 37,682 | | | $ | 29,596 | | | $ | 30,746 | | | $ | 28,316 | | | $ | 27,703 | |
| | | | | | | | | | | | | | | | | | | | | |
Ratio of total expenses to average net assets | | | 1.03 | % | | | 1.09 | % | | | 1.07 | % | | | 1.11 | % | | | 1.11 | % |
| | | | | | | | | | | | | | | | | | | | | |
Ratio of net expenses to average net assets (b) | | | 1.00 | % | | | 1.05 | % | | | 1.03 | % | | | 1.06 | % | | | 1.06 | % |
| | | | | | | | | | | | | | | | | | | | | |
Ratio of net investment income to average net assets (b) | | | 0.82 | % | | | 0.71 | % | | | 0.72 | % | | | 0.81 | % | | | 0.56 | % |
| | | | | | | | | | | | | | | | | | | | | |
Portfolio turnover rate | | | 50 | % | | | 29 | % | | | 21 | % | | | 28 | % | | | 28 | % |
(a) | Total return is a measure of the change in value of an investment in the Fund over the years covered, which assumes any dividends or realized capital gains distributions are reinvested in shares of the Fund. Returns do not reflect the deduction of taxes a shareholder would pay on Fund distributions or the redemption of Fund shares. |
(b) | Ratios were determined based on net expenses after expense reimbursements through a directed brokerage arrangement (Note 5). |
See accompanying notes to financial statements. |
18
THE JAMESTOWN TAX EXEMPT VIRGINIA FUND
FINANCIAL HIGHLIGHTS |
Selected Per Share Data and Ratios for a Share Outstanding Throughout Each Year | |
| | Years Ended March 31, | |
| | 2016 | | | 2015 | | | 2014 | | | 2013 | | | 2012 | |
Net asset value at beginning of year | | $ | 10.18 | | | $ | 10.16 | | | $ | 10.47 | | | $ | 10.57 | | | $ | 10.25 | |
| | | | | | | | | | | | | | | | | | | | | |
Income (loss) from investment operations: | | | | | | | | | | | | | | | | | | | | |
Net investment income | | | 0.21 | | | | 0.24 | | | | 0.26 | | | | 0.26 | | | | 0.29 | |
Net realized and unrealized gains (losses) on investments | | | 0.03 | | | | 0.02 | | | | (0.30 | ) | | | (0.06 | ) | | | 0.32 | |
Total from investment operations | | | 0.24 | | | | 0.26 | | | | (0.04 | ) | | | 0.20 | | | | 0.61 | |
| | | | | | | | | | | | | | | | | | | | | |
Less distributions: | | | | | | | | | | | | | | | | | | | | |
Dividends from net investment income | | | (0.21 | ) | | | (0.24 | ) | | | (0.26 | ) | | | (0.27 | ) | | | (0.29 | ) |
Distributions from net realized gains | | | — | | | | — | | | | (0.01 | ) | | | (0.03 | ) | | | (0.00 | )(a) |
Total distributions | | | (0.21 | ) | | | (0.24 | ) | | | (0.27 | ) | | | (0.30 | ) | | | (0.29 | ) |
| | | | | | | | | | | | | | | | | | | | | |
Net asset value at end of year | | $ | 10.21 | | | $ | 10.18 | | | $ | 10.16 | | | $ | 10.47 | | | $ | 10.57 | |
| | | | | | | | | | | | | | | | | | | | | |
Total return (b) | | | 2.40 | % | | | 2.61 | % | | | (0.37 | %) | | | 1.88 | % | | | 6.03 | % |
| | | | | | | | | | | | | | | | | | | | | |
Net assets at end of year (000’s) | | $ | 25,647 | | | $ | 26,695 | | | $ | 26,284 | | | $ | 27,782 | | | $ | 30,063 | |
| | | | | | | | | | | | | | | | | | | | | |
Ratio of total expenses to average net assets | | | 0.90 | % | | | 0.88 | % | | | 0.88 | % | | | 0.76 | % | | | 0.77 | % |
| | | | | | | | | | | | | | | | | | | | | |
Ratio of net expenses to average net assets (c) | | | 0.69 | % | | | 0.69 | % | | | 0.69 | % | | | 0.69 | % | | | 0.69 | % |
| | | | | | | | | | | | | | | | | | | | | |
Ratio of net investment income to average net assets (c) | | | 2.08 | % | | | 2.38 | % | | | 2.59 | % | | | 2.50 | % | | | 2.75 | % |
| | | | | | | | | | | | | | | | | | | | | |
Portfolio turnover rate | | | 11 | % | | | 16 | % | | | 1 | % | | | 15 | % | | | 2 | % |
(a) | Amount rounds to less than a $0.01 per share. |
(b) | Total return is a measure of the change in value of an investment in the Fund over the years covered, which assumes any dividends or realized capital gains distributions are reinvested in shares of the Fund. Returns do not reflect the deduction of taxes a shareholder would pay on Fund distributions or the redemption of Fund shares. |
(c) | Ratios were determined after voluntary advisory fee waivers by the Adviser (Note 4). |
See accompanying notes to financial statements. |
19
THE JAMESTOWN FUNDS
NOTES TO FINANCIAL STATEMENTS
March 31, 2016
1. Organization
The Jamestown Equity Fund and The Jamestown Tax Exempt Virginia Fund (individually, a “Fund,” and, collectively, the “Funds”) are each a no-load series of Williamsburg Investment Trust (the “Trust”), an open-end management investment company registered under the Investment Company Act of 1940. The Jamestown Equity Fund is a diversified fund and The Jamestown Tax Exempt Virginia Fund is a non-diversified fund. The Trust was organized as a Massachusetts business trust on July 18, 1988. Other series of the Trust are not included in this report.
The Jamestown Equity Fund’s investment objective is long-term growth of capital.
The Jamestown Tax Exempt Virginia Fund’s investment objectives are to provide current income exempt from federal income taxes and from the personal income taxes of Virginia, to preserve capital, to limit credit risk and to take advantage of opportunities to increase and enhance the value of a shareholder’s investment.
On July 29, 2015, The Jamestown Equity Fund consummated a tax-free merger with The Jamestown Balanced Fund, previously a series of the Trust, as approved by the Board of Trustees on May 19, 2015. Pursuant to the terms of the agreement governing the merger, each share of The Jamestown Balanced Fund was converted into an equivalent dollar amount of shares of The Jamestown Equity Fund, based on the net asset value of The Jamestown Equity Fund and The Jamestown Balanced Fund as of July 28, 2015 ($21.01 and $14.07, respectively), resulting in a conversion ratio of 0.669654 shares of The Jamestown Equity Fund for each share of The Jamestown Balanced Fund. The Jamestown Equity Fund issued 738,504 shares to shareholders of The Jamestown Balanced Fund. The basis of the assets transferred from The Jamestown Balanced Fund reflected the historical basis of the assets as of the date of the tax-free merger. Net assets of The Jamestown Equity Fund and The Jamestown Balanced Fund as of the merger date were $28,889,235 and $15,513,703, respectively, including unrealized appreciation on investments of $11,999,716 and $3,528,216, respectively. The Jamestown Balanced Fund’s net assets at the time of the merger included accumulated realized capital losses of $25,176. Total net assets of The Jamestown Equity Fund immediately after the merger were $44,402,938.
Assuming the acquistion had been completed on April 1, 2015, the beginning of the annual reporting period of The Jamestown Equity Fund, The Jamestown Equity Fund's pro forma results of operation for the year ended March 31, 2016, are as follows:
Net Investment Income | | | Net Realized Losses and
Net Change in Unrealized
Depreciation on Investments | | | Net Decrease in Net Assets
Resulting from Operations | |
$ | 342,730 | | | $ | (2,602,705 | ) | | $ | (2,259,975 | ) |
Because the combined investment portfolios have been managed as a single integrated portfolio since the acquisition was completed, it is not practical to separate the amounts of revenue and earnings of The Jamestown Balanced Fund that has been included in The Jamestown Equity Fund's Statement of Operations since July 29, 2015.
20
THE JAMESTOWN FUNDS
NOTES TO FINANCIAL STATEMENTS (Continued)
2. Significant Accounting Policies
As an investment company, as defined in Financial Accounting Standards Board (“FASB”) Accounting Standards Update 2013-08, each Fund follows accounting and reporting guidance under FASB Accounting Standards Codification Topic 946, “Financial Services – Investment Companies.” The following is a summary of the Funds’ significant accounting policies. These policies are in conformity with accounting principles generally accepted in the United States of America (“GAAP”).
Securities valuation — The Funds’ portfolio securities are valued as of the close of business of the regular session of the New York Stock Exchange (normally 4:00 p.m., Eastern time). Securities traded on a national stock exchange, including common stocks, are generally valued based upon the closing price on the principal exchange where the security is traded, if available, otherwise, at the last quoted bid price. Securities which are quoted by NASDAQ are valued at the NASDAQ Official Closing Price. Investments representing shares of other investment companies, including closed-end funds and money market funds, are valued at their net asset value as reported by such companies.
Fixed income securities, including municipal bonds, are typically valued on the basis of prices provided by an independent pricing service. The prices provided by the pricing service are determined with consideration given to institutional bid and last sale prices and take into account securities prices, yields, maturities, call features, ratings, institutional trading in similar groups of securities and developments related to specific securities.
When market quotations are not readily available, if a pricing service cannot provide a price or the investment adviser believes the price received from the pricing service is not indicative of market value, securities will be valued in good faith at fair value using methods consistent with procedures adopted by the Board of Trustees and will be classified as Level 2 or 3 within the fair value hierarchy (see below), depending on the inputs used. Such methods of fair valuation may include, but are not limited to: multiple of earnings, multiple of book value, discount from market of a similar freely traded security, purchase price of the security, subsequent private transactions in the security or related securities, or a combination of these and other factors.
GAAP establishes a single authoritative definition of fair value, sets out a framework for measuring fair value and requires additional disclosures about fair value measurements.
Various inputs are used in determining the value of each Fund’s investments. These inputs are summarized in the three broad levels listed below:
● | Level 1 – quoted prices in active markets for identical securities |
● | Level 2 – other significant observable inputs |
● | Level 3 – significant unobservable inputs |
21
THE JAMESTOWN FUNDS
NOTES TO FINANCIAL STATEMENTS (Continued)
Fixed income securities, including municipal bonds, are classified as Level 2 since the values for such securities are based on prices provided by an independent pricing service that utilizes various “other significant observable inputs” including bid and ask quotations, prices of similar securities and interest rates, among other factors.
The inputs or methodology used for valuing securities are not necessarily an indication of the risks associated with investing in those securities. The inputs used to measure fair value may fall into different levels of the fair value hierarchy. In such cases, for disclosure purposes, the level in the fair value hierarchy within which the fair value measurement falls in its entirety is determined based on the lowest level input that is significant to the fair value measurement.
The following is a summary of the inputs used to value each Fund’s investments as of March 31, 2016, by security type:
The Jamestown Equity Fund | | Level 1 | | | Level 2 | | | Level 3 | | | Total | |
Common Stocks | | $ | 34,034,724 | | | $ | — | | | $ | — | | | $ | 34,034,724 | |
Exchange-Traded Funds | | | 965,510 | | | | — | | | | — | | | | 965,510 | |
Total | | $ | 35,000,234 | | | $ | — | | | $ | �� | | | $ | 35,000,234 | |
The Jamestown Tax Exempt Virginia Fund | | Level 1 | | | Level 2 | | | Level 3 | | | Total | |
Municipal Bonds | | $ | — | | | $ | 24,142,331 | | | $ | — | | | $ | 24,142,331 | |
Exchange-Traded Funds | | | 122,050 | | | | — | | | | — | | | | 122,050 | |
Money Market Funds | | | 1,153,500 | | | | — | | | | — | | | | 1,153,500 | |
Total | | $ | 1,275,550 | | | $ | 24,142,331 | | | | — | | | $ | 25,417,881 | |
Refer to The Jamestown Equity Fund’s Schedule of Investments for a listing of the common stocks by sector type. As of March 31, 2016, the Funds did not have any transfers into and out of any Level. There were no Level 3 securities or derivative instruments held by the Funds as of March 31, 2016. It is the Funds’ policy to recognize transfers into and out of any Level at the end of the reporting period.
Share valuation — The net asset value per share of each Fund is calculated daily by dividing the total value of its assets, less liabilities, by the number of shares outstanding. The offering price and redemption price per share of each Fund is equal to the net asset value per share.
Investment income — Interest income is accrued as earned. Dividend income and capital gain distributions are recorded on the ex-dividend date. Discounts and premiums on fixed income securities purchased are amortized using the interest method. Withholding taxes on foreign dividends in The Jamestown Equity Fund have been recorded in accordance with the Fund's understanding of the appropriate country's rules and tax rates.
Distributions to shareholders — Dividends arising from net investment income, if any, are declared and paid quarterly to shareholders of The Jamestown Equity Fund. Dividends arising from net investment income are declared daily and paid monthly to shareholders of The Jamestown Tax Exempt Virginia Fund. Net realized short-term capital gains, if any, may be
22
THE JAMESTOWN FUNDS
NOTES TO FINANCIAL STATEMENTS (Continued)
distributed throughout the year and net realized long-term capital gains, if any, are distributed at least once each year. The amount of distributions from net investment income and net realized capital gains are determined in accordance with federal income tax regulations, which may differ from GAAP. These “book/tax” differences are permanent in nature and are primarily due to differing treatments of net short-term capital gains. Dividends and distributions are recorded on the ex-dividend date.
The tax character of distributions paid during the years ended March 31, 2016 and March 31, 2015, was as follows:
| Years Ended | Ordinary Income | Long-Term Capital Gains | Exempt- Interest Dividends | Total Distributions |
The Jamestown Equity Fund | 3/31/16 | $ 281,968 | $ 1,610,525 | $ — | $ 1,892,493 |
| | 3/31/15 | $ 317,270 | $ 3,373,549 | $ — | $ 3,690,819 |
The Jamestown Tax Exempt Virginia Fund | 3/31/16 | $ — | $ — | $ 547,481 | $ 547,481 |
| | 3/31/15 | $ — | $ — | $ 628,553 | $ 628,553 |
Security transactions — Security transactions are accounted for on trade date for financial reporting purposes. Gains and losses on securities sold are determined on a specific identification basis.
Common expenses — Common expenses of the Trust are allocated among the series of the Trust based on relative net assets of each series or the nature of the services performed and the relative applicability to each series.
Estimates — The preparation of financial statements in conformity with GAAP requires management to make estimates and assumptions that affect the reported amounts of assets and liabilities and the disclosure of contingent assets and liabilities as of the date of the financial statements and the reported amounts of income and expenses during the reporting period. Actual results could differ from those estimates.
Federal income tax — Each Fund has qualified and intends to continue to qualify as a regulated investment company under the Internal Revenue Code of 1986 (the “Code”). Qualification generally will relieve the Funds of liability for federal income taxes to the extent 100% of their net investment income and net realized capital gains are distributed in accordance with the Code.
In order to avoid imposition of the excise tax applicable to regulated investment companies, it is also each Fund’s intention to declare as dividends in each calendar year at least 98% of its net investment income (earned during the calendar year) and 98.2% of its net realized capital gains (earned during the twelve months ended October 31) plus undistributed amounts from prior years.
23
THE JAMESTOWN FUNDS
NOTES TO FINANCIAL STATEMENTS (Continued)
The tax character of distributable earnings at March 31, 2016 was as follows:
| | The Jamestown Equity Fund | | | The Jamestown Tax Exempt Virginia Fund | |
Cost of portfolio investments | | $ | 23,448,557 | | | $ | 24,288,044 | |
Gross unrealized appreciation | | $ | 11,985,262 | | | $ | 1,129,837 | |
Gross unrealized depreciation | | | (433,585 | ) | | | — | |
Net unrealized appreciation on investments | | | 11,551,677 | | | | 1,129,837 | |
Undistributed ordinary income | | | 13,955 | | | | — | |
Undistributed tax exempt income | | | — | | | | 4,566 | |
Undistributed long-term capital gains | | | 114,384 | | | | — | |
Accumulated capital and other losses | | | — | | | | (9,895 | ) |
Distributions payable | | | (4,243 | ) | | | (4,566 | ) |
Total distributable earnings | | $ | 11,675,773 | | | $ | 1,119,942 | |
The difference between the federal income tax cost of portfolio investments and the financial statement cost for The Jamestown Equity Fund is due to certain timing differences in the recognition of capital gains or losses under income tax regulations and GAAP. These “book/tax” differences are temporary in nature and are primarily due to the tax deferral of losses on wash sales.
During the year ended March 31, 2016, The Jamestown Equity Fund realized $1,079,680 of net capital gains resulting from in-kind redemptions (redemptions in which shareholders who redeemed Fund shares received securities held by the Fund rather than cash). The Fund recognizes a gain on in-kind redemptions to the extent that the value of the distributed securities on the date of redemption exceeds the cost of those securities. Such gains are not taxable to the Fund and are not required to be distributed to shareholders. The Fund has reclassified this amount against paid-in capital on the Statements of Assets and Liabilities.
During the year ended March 31, 2016, The Jamestown Equity Fund reclassified $25,176 of accumulated realized capital losses, resulting from the merger with The Jamestown Balanced Fund (Note 1), against paid-in capital on the Statements of Assets and Liabilities. Such reclassification, the result of permanent differences between the financial statements and income tax reporting requirements, had no effect on the Fund’s net assets or net asset value per share.
During the year ended March 31, 2016, The Jamestown Tax Exempt Virginia Fund utilized long-term capital loss carryforwards in the amount of $952 to offset current year gains. As of March 31, 2016, The Jamestown Tax Exempt Virginia Fund had a long-term capital loss carryforward of $9,895 for federal income tax purposes. This capital loss carryforward, which does not expire, may be utilized in future years to offset net realized capital gains, if any, prior to distributing such gains to shareholders.
24
THE JAMESTOWN FUNDS
NOTES TO FINANCIAL STATEMENTS (Continued)
The Funds recognize the tax benefits or expenses of uncertain tax positions only when the position is “more likely than not” to be sustained assuming examination by tax authorities. Management has reviewed the tax positions taken on Federal income tax returns for all open tax years (tax years ended March 31, 2013 through March 31, 2016) of each Fund and has concluded that no provision for unrecognized tax benefits or expenses is required in these financial statements.
3. Investment Transactions
Investment transactions, other than short-term investments, U.S. government securities and those related to the Fund merger disclosed in Note 1, were as follows for the year ended March 31, 2016:
| | The Jamestown Equity Fund | | | The Jamestown Tax Exempt Virginia Fund | |
Purchase of investment securities | | $ | 17,209,628 | | | $ | 2,834,008 | |
Proceeds from sales and maturities of investment securities | | $ | 19,241,842 | | | $ | 4,125,000 | |
4. Transactions with Related Parties
INVESTMENT ADVISORY AGREEMENTS
Each Fund’s investments are managed by Lowe, Brockenbrough & Company, Inc. (the “Adviser”) under the terms of an Investment Advisory Agreement. The Jamestown Equity Fund pays the Adviser a fee, which is computed and accrued daily and paid monthly, at annual rates of .65% of its average daily net assets up to $500 million and .55% of such assets in excess of $500 million. The Jamestown Tax Exempt Virginia Fund pays the Adviser a fee, which is computed and accrued daily and paid monthly, at annual rates of .40% of its average daily net assets up to $250 million, .35% of the next $250 million of such assets and .30% of such assets in excess of $500 million. Certain officers of the Trust are also officers of the Adviser.
During the year ended March 31, 2016, the Adviser voluntarily limited the total annual operating expenses of The Jamestown Tax Exempt Virginia Fund to .69% of its average daily net assets; accordingly, the Adviser voluntarily waived $54,527 of its investment advisory fees during the year ended March 31, 2016. This amount is not subject to recapture in future periods.
OTHER SERVICE PROVIDERS
Ultimus Fund Solutions, LLC (“Ultimus”) provides fund administration, fund accounting, compliance and transfer agent services to the Funds. The Funds pay Ultimus fees in accordance with the agreements for such services. Certain officers of the Trust are also officers of Ultimus, or of Ultimus Fund Distributors, LLC (the “Distributor”), the principal underwriter of the Funds and an affiliate of Ultimus. The Distributor is compensated by the Adviser (not the Funds) for acting as principal underwriter.
25
THE JAMESTOWN FUNDS
NOTES TO FINANCIAL STATEMENTS (Continued)
COMPENSATION OF TRUSTEES
Trustees and officers affiliated with the Adviser or Ultimus are not compensated by the Trust for their services. Each Trustee who is not an affiliated person of the Adviser or Ultimus receives from the Trust an annual retainer of $12,000, payable quarterly; a fee of $1,500 for attendance at each meeting of the Board of Trustees (except that such fee is $2,500 for the independent chairman); and $1,000 for attendance at each meeting of any committee of the Board (except that such fee is $1,500 for the committee chairman); plus reimbursement of travel and other expenses incurred in attending meetings. Each Fund in the Trust pays its proportionate share of such fees. Effective April 1, 2016, the annual retainer will increase to $15,000, payable quarterly.
5. Brokerage Arrangement
In order to reduce the total operating expenses of The Jamestown Equity Fund, a portion of the Fund’s operating expenses have been paid through an arrangement with a third-party broker-dealer who is compensated through commission trades. Payment of expenses by the broker-dealer is based on a percentage of commissions earned. Expenses reimbursed through the brokerage arrangement totaled $12,000 for The Jamestown Equity Fund for the year ended March 31, 2016.
6. Contingencies and Commitments
The Funds indemnify the Trust’s officers and Trustees for certain liabilities that might arise from their performance of their duties to the Funds. Additionally, in the normal course of business the Funds enter into contracts that contain a variety of representations and warranties and which provide general indemnifications. The Funds’ maximum exposure under these arrangements is unknown, as this would involve future claims that may be made against the Funds that have not yet occurred. However, based on experience, the Trust expects the risk of loss to be remote.
7. Concentration of Credit Risk
The Jamestown Tax Exempt Virginia Fund invests primarily in debt instruments of municipal issuers in the Commonwealth of Virginia. The issuers’ abilities to meet their obligations may be affected by economic developments in the Commonwealth or its region, as well as disruptions in the credit markets and the economy, generally.
8. Subsequent Events
The Funds are required to recognize in the financial statements the effects of all subsequent events that provide additional evidence about conditions that existed as of the date of the Statements of Assets and Liabilities. For non-recognized subsequent events that must be disclosed to keep the financial statements from being misleading, the Funds are required to disclose the nature of the event as well as an estimate of its financial effect, or a statement that such an estimate cannot be made. Management has evaluated subsequent events through the issuance of these financial statements and has noted no such events.
26
THE JAMESTOWN FUNDS
REPORT OF INDEPENDENT REGISTERED
PUBLIC ACCOUNTING FIRM
To the Shareholders of The Jamestown Funds and
Board of Trustees of Williamsburg Investment Trust
We have audited the accompanying statements of assets and liabilities, including the schedules of investments, of The Jamestown Equity Fund and The Jamestown Tax Exempt Virginia Fund (“The Jamestown Funds” or “Funds”), each a series of Williamsburg Investment Trust, as of March 31, 2016, and the related statements of operations and changes in net assets and the financial highlights for the year then ended. These financial statements and financial highlights are the responsibility of the Funds’ management. Our responsibility is to express an opinion on these financial statements and financial highlights based on our audit. The Funds’ financial statements and financial highlights for the years ended prior to March 31, 2016 were audited by other auditors, whose report dated May 22, 2015, expressed an unqualified opinion on those statements and financial highlights.
We conducted our audit in accordance with the standards of the Public Company Accounting Oversight Board (United States). Those standards require that we plan and perform the audit to obtain reasonable assurance about whether the financial statements and financial highlights are free of material misstatement. An audit includes examining, on a test basis, evidence supporting the amounts and disclosures in the financial statements. Our procedures included confirmation of securities owned as of March 31, 2016, by correspondence with the custodian and brokers. An audit also includes assessing the accounting principles used and significant estimates made by management, as well as evaluating the overall financial statement presentation. We believe that our audit provides a reasonable basis for our opinion.
In our opinion, the financial statements and financial highlights referred to above present fairly, in all material respects, the financial position of each of the Funds as of March 31, 2016, the results of their operations, the changes in their net assets, and the financial highlights for the year then ended, in conformity with accounting principles generally accepted in the United States of America.
COHEN FUND AUDIT SERVICES, LTD.
Cleveland, Ohio
May 26, 2016
27
THE JAMESTOWN FUNDS
BOARD OF TRUSTEES AND EXECUTIVE OFFICERS
(Unaudited) |
Overall responsibility for management of the Funds rests with the Board of Trustees. The Trustees serve during the lifetime of the Trust and until its termination, or until death, resignation, retirement or removal. The Trustees, in turn, elect the officers of the Funds. The officers have been elected for an annual term. The following are the Trustees and executive officers of the Funds:
| Trustees
and Officers | Address | Year of Birth | Position Held
with the Trust | Length of
Time Served |
| Robert S. Harris, Ph.D. | 100 Darden Boulevard
Charlottesville, VA | 1949 | Chairman and Trustee | Since
January 2007 |
* | John P. Ackerly, IV | One James Center
901 E. Cary Street
Richmond, VA | 1963 | Trustee and President of Davenport Funds | Since
November 1997 |
* | John T. Bruce | 800 Main Street
Lynchburg, VA | 1953 | Trustee and President of FBP Funds | Since
September 1988 |
| | George K. Jennison | 5101 Stratford Crescent
Richmond, VA | 1957 | Trustee | Since
January 2015 |
| Harris V. Morrissette | 100 Jacintoport Boulevard
Saraland, AL | 1959 | Trustee | Since
March 1993 |
| | Elizabeth W. Robertson | 305 Marston Lane
Richmond, VA | 1953 | Trustee | Since
February 2014 |
| Austin Brockenbrough, III | 1802 Bayberry Court, Suite 400
Richmond, VA | 1937 | Vice President, The Jamestown Funds | Since
September 1988 |
| | Charles M. Caravati, III | 1802 Bayberry Court, Suite 400
Richmond, VA | 1965 | President, The Jamestown Equity Fund | Since
January 1996 |
| | Joseph A. Jennings, III | 1802 Bayberry Court, Suite 400
Richmond, VA | 1962 | President, The Jamestown Tax Exempt Virginia Fund | Since
July 2005 |
| | Lawrence B. Whitlock, Jr. | 1802 Bayberry Court, Suite 400
Richmond, VA | 1948 | Vice President, The Jamestown Equity Fund | Since
February 2002 |
| Robert G. Dorsey | 225 Pictoria Drive, Suite 450
Cincinnati, OH | 1957 | Vice President | Since
November 2000 |
| Mark J. Seger | 225 Pictoria Drive, Suite 450
Cincinnati, OH | 1962 | Treasurer | Since
November 2000 |
| Tina H. Bloom | 225 Pictoria Drive, Suite 450
Cincinnati, OH | 1968 | Chief Compliance Officer and Secretary | Since
August 2006 |
* | Messrs. Ackerly and Bruce, as affiliated persons of investment advisers to the Trust, are “interested persons” of the Trust within the meaning of Section 2(a)(19) of the Investment Company Act of 1940. |
28
THE JAMESTOWN FUNDS
BOARD OF TRUSTEES AND EXECUTIVE OFFICERS
(Unaudited) (Continued) |
Each Trustee oversees twelve portfolios of the Trust, including the Funds. The principal occupations of the Trustees and executive officers of the Funds during the past five years and public directorships held by the Trustees are set forth below:
Robert S. Harris, Ph.D. is the C. Stewart Sheppard Professor of Business Administration at The Darden Graduate School of Business Administration at the University of Virginia. He was previously the dean at Darden. Professor Harris has published widely on corporate finance, financial markets and mergers and acquisitions and has served as a consultant to corporations and government agencies.
John P. Ackerly, IV is Senior Vice President and Portfolio Manager of Davenport & Company LLC.
John T. Bruce is President, Director and member of the Executive Committee of Flippin, Bruce & Porter, Inc. (an investment advisory firm).
George K. Jennison is President of Oyster Consulting, LLC (a financial consulting firm). He previously was a financial adviser with Wells Fargo Advisors, LLC.
Harris V. Morrissette is President of China Doll Rice and Beans, Inc. and Dixie Lily Foods. He is also a Director of International Shipholding Corporation (cargo transportation); and Director of Trustmark National Bank (bank holding company). Previously, he was Chairman of Azalea Aviation, Inc. (airplane fueling) until January 2012.
Elizabeth W. Robertson is Chief Financial Officer for Monument Restaurants LLC (restaurant franchises) and a Director of Towne Bank.
Austin Brockenbrough III is President and Managing Director of the Adviser. He is a Director of Tredegar Corporation (a plastics manufacturer) and Wilkinson O’Grady & Co., Inc. (a global asset manager).
Charles M. Caravati, III is a Managing Director of the Adviser.
Joseph A. Jennings, III is a Managing Director of the Adviser.
Lawrence B. Whitlock, Jr. is a Managing Director of the Adviser.
Robert G. Dorsey is a Managing Director of Ultimus Fund Solutions, LLC and Ultimus Fund Distributors, LLC.
Mark J. Seger is a Managing Director of Ultimus Fund Solutions, LLC and Ultimus Fund Distributors, LLC.
Tina H. Bloom is Director of Fund Administration of Ultimus Fund Solutions, LLC.
Additional information about members of the Board of Trustees and executive officers is available in the Statement of Additional Information (“SAI”). To obtain a free copy of the SAI, please call 1-800-281-3217.
29
THE JAMESTOWN FUNDS
ABOUT YOUR FUNDS’ EXPENSES (Unaudited)
We believe it is important for you to understand the impact of costs on your investment. All mutual funds have operating expenses. As a shareholder of the Funds, you incur ongoing costs, including management fees and other expenses. The following examples are intended to help you understand your ongoing costs (in dollars) of investing in the Funds and to compare these costs with the ongoing costs of investing in other mutual funds.
A mutual fund’s ongoing costs are expressed as a percentage of its average net assets. This figure is known as the expense ratio. The expenses in the table below are based on an investment of $1,000 made at the beginning of the period shown and held for the entire period (October 1, 2015 through March 31, 2016).
The table below illustrates each Fund’s costs in two ways:
Actual fund return – This section helps you to estimate the actual expenses that you paid over the period. The “Ending Account Value” shown is derived from each Fund’s actual return, and the fourth column shows the dollar amount of operating expenses that would have been paid by an investor who started with $1,000 in the Funds. You may use the information here, together with the amount you invested, to estimate the expenses that you paid over the period.
To do so, simply divide your account value by $1,000 (for example, an $8,600 account value divided by $1,000 = 8.6), then multiply the result by the number given for the Funds under the heading “Expenses Paid During Period.”
Hypothetical 5% return – This section is intended to help you compare each Fund's ongoing costs with those of other mutual funds. It assumes that each Fund had an annual return of 5% before expenses during the period shown, but that the expense ratio is unchanged. In this case, because the returns used are not the Funds’ actual returns, the results do not apply to your investment. The example is useful in making comparisons because the Securities and Exchange Commission (“SEC”) requires all mutual funds to calculate expenses based on a 5% return. You can assess each Fund’s ongoing costs by comparing this hypothetical example with the hypothetical examples that appear in shareholder reports of other funds.
Note that expenses shown in the table are meant to highlight and help you compare ongoing costs only. The Funds do not charge sales loads or redemption fees.
The calculations assume no shares were bought or sold during the period. Your actual costs may have been higher or lower, depending on the amount of your investment and the timing of any purchases or redemptions.
More information about the Funds’ expenses, including annual expense ratios for the prior five fiscal years, can be found in this report. For additional information on operating expenses and other shareholder costs, please refer to the Funds’ prospectus.
30
THE JAMESTOWN FUNDS
ABOUT YOUR FUNDS’ EXPENSES (Unaudited) (Continued)
| | Beginning
Account Value
October 1, 2015 | Ending
Account Value
March 31, 2016 | Net
Expense Ratio(a) | Expenses Paid During Period(b) |
The Jamestown Equity Fund |
Based on Actual Fund Return | $1,000.00 | $1,051.10 | 0.98% | $5.03 |
Based on Hypothetical 5% Return (before expenses) | $1,000.00 | $1,020.10 | 0.98% | $4.95 |
The Jamestown Tax Exempt Virginia Fund |
Based on Actual Fund Return | $1,000.00 | $1,018.90 | 0.69% | $3.48 |
Based on Hypothetical 5% Return (before expenses) | $1,000.00 | $1,021.55 | 0.69% | $3.49 |
(a) | Annualized, based on the Fund’s most recent one-half year expenses. |
(b) | Expenses are equal to the Fund’s annualized expense ratio multiplied by the average account value over the period, multiplied by 183/366 (to reflect the one-half year period). |
CHANGE IN INDEPENDENT AUDITOR
On February 23, 2016, Cohen Fund Audit Services, Ltd. (“Cohen”) was selected as the Funds’ new independent auditor, replacing Ernst & Young LLP (“EY”) as independent auditor of the Funds. The Funds’ selection of Cohen as independent auditor was recommended and approved by the Trust’s Audit Committee and was ratified by the Trust’s Board of Trustees.
EY’s reports on the Funds’ financial statements for the prior two fiscal years did not contain an adverse opinion or a disclaimer of opinion, and were not qualified or modified as to uncertainty, audit scope or accounting principles. During such fiscal years, and through the date of EY’s replacement, there were no disagreements between the Trust and EY on any matter of accounting principles or practices, financial statement disclosure, or auditing scope or procedures, which disagreements, if not resolved to the satisfaction of EY, would have caused it to make reference to the subject matter of the disagreements in connection with its reports on the financial statements for such years. Prior to February 23, 2016, Cohen was not contacted during the prior two fiscal years regarding the application of accounting principles to any particular financial matter.
31
THE JAMESTOWN FUNDS
OTHER INFORMATION (Unaudited)
A description of the policies and procedures that the Funds use to vote proxies relating to portfolio securities is available without charge upon request by calling toll-free 1-866-738-1126, or on the SEC’s website at http://www.sec.gov. Information regarding how the Funds voted proxies relating to portfolio securities during the most recent 12-month period ended June 30 is also available without charge upon request by calling toll-free 1-866-738-1126, or on the SEC’s website at http://www.sec.gov.
The Trust files a complete listing of portfolio holdings of the Funds with the SEC as of the end of the first and third quarters of each fiscal year on Form N-Q. The filings are available upon request, by calling 1-866-738-1126. Furthermore, you may obtain a copy of these filings on the SEC’s website at http://www.sec.gov. The Trust’s Forms N-Q may also be reviewed and copied at the SEC’s Public Reference Room in Washington, DC, and information on the operation of the Public Reference Room may be obtained by calling 1-800-SEC-0330.
FEDERAL TAX INFORMATION (Unaudited)
In accordance with federal tax requirements, the following provides shareholders with information concerning distributions from ordinary income and net realized gains made by the Funds during the year ended March 31, 2016. Certain dividends paid by the Funds may be subject to a maximum tax rate of 23.8%. The Jamestown Equity Fund intends to designate up to a maximum amount of $281,968 as taxed at a maximum rate of 23.8%. For the fiscal year ended March 31, 2016, 100% of the dividends paid from ordinary income by The Jamestown Equity Fund qualified for the dividends received deduction for corporations. During the year ended March 31, 2016, The Jamestown Equity Fund paid long-term capital gain distributions of $1,610,525.
As required by federal regulations, complete information will be computed and reported in conjunction with your 2016 Form 1099-DIV.
32
THE JAMESTOWN FUNDS
DISCLOSURE REGARDING APPROVAL OF INVESTMENT ADVISORY AGREEMENTS (Unaudited)
At an in-person meeting held on February 23, 2016, the Board of Trustees, including a majority of the Independent Trustees, approved the continuance for a one-year period of the Investment Advisory Agreements with the Adviser on behalf of The Jamestown Equity Fund and The Jamestown Tax Exempt Virginia Fund. Below is a discussion of the factors considered by the Board of Trustees along with its conclusions with respect thereto that formed the basis for the Board’s approvals.
In selecting the Adviser and approving the continuance of the Investment Advisory Agreements, the Trustees considered all information they deemed reasonably necessary to evaluate the terms of the Agreements. The principal areas of review by the Trustees were the nature, extent and quality of the services provided by the Adviser and the reasonableness of the fees charged for those services. These matters were considered by the Independent Trustees consulting with experienced counsel for the Independent Trustees, who is independent of the Adviser.
The Trustees’ evaluation of the quality of the Adviser’s services took into account their knowledge and experience gained through meetings with and reports of the Adviser’s senior management over the course of the preceding year. Both short-term and long-term investment performance of the Funds was considered. Each Fund’s performance was compared to its performance benchmark and to that of competitive funds with similar investment objectives and to the Adviser’s comparably managed private accounts. The Trustees also considered the scope and quality of the in-house capabilities of the Adviser and other resources dedicated to performing services for the Funds. The quality of administrative and other services, including the Adviser’s role in coordinating the activities of the Funds’ other service providers, were considered in light of the Funds’ compliance with investment policies and applicable laws and regulations and of related reports by management and the Funds’ independent public accounting firm in periodic meetings with the Trust’s Audit Committee. The Trustees also considered the business reputation of the Adviser, the qualifications of its key investment and compliance personnel, and its financial resources.
In reviewing the fees payable under the Investment Advisory Agreements, the Trustees compared the advisory fees and overall expense levels of each Fund with those of competitive funds with similar investment objectives as well as the private accounts managed by the Adviser. The Trustees considered information provided by the Adviser concerning the Adviser’s profitability with respect to each Fund, including the assumptions and methodology used in preparing the profitability information, in light of applicable case law relating to advisory fees. For these purposes, the Trustees took into account not only the fees paid by the Funds, but also so-called “fallout” benefits to the Adviser. In evaluating the Funds’ advisory fees, the Trustees took into account the complexity and quality of the investment management of the Funds.
33
THE JAMESTOWN FUNDS
DISCLOSURE REGARDING APPROVAL OF INVESTMENT ADVISORY AGREEMENTS (Unaudited) (Continued)
Based upon their review of this information, the Independent Trustees concluded that: (i) upon consideration of the one-year and longer-term performance of each Fund, the effectiveness of the Adviser in achieving each Fund’s investment objective, as well as the collection of services provided to shareholders, the Adviser has provided satisfactory services to the Funds; (ii) the investment advisory fees and total operating expense ratio of The Jamestown Equity Fund are competitive with comparably managed funds and the investment advisory fees and total operating expense ratio (net of fee waivers) of the Jamestown Tax-Exempt Virginia Fund is lower than the average advisory fee and expense ratio for comparably managed funds, according to statistics derived from Morningstar, Inc.; (iii) the Adviser’s commitment to limit overall operating expenses of The Jamestown Tax-Exempt Virginia Fund by voluntarily waiving a portion of its investment advisory fees has enabled the Fund to increase returns for its shareholders and to maintain an overall expense ratio that is lower than the average for similarly managed funds, despite the small size of the Fund; and (iv) the Adviser’s profitability with respect to The Jamestown Funds is reasonable. Given the current size of each Fund and its expected growth, the Independent Trustees did not believe that at the present time it would be relevant to consider the extent to which economies of scale would be realized as the Funds grow, and whether fee levels reflect these economies of scale. The Independent Trustees also considered the “fallout” benefits to the Adviser with respect to the Funds, but given the amounts involved viewed these as secondary factors in connection with the evaluation of the reasonableness of the advisory fees paid by the Funds.
No single factor was considered in isolation or to be determinative to the decision of the Trustees to approve continuance of the Investment Advisory Agreements. Rather the Trustees concluded, in light of a weighing and balancing of all factors considered, that it was in the best interests of each Fund and its shareholders to continue its Investment Advisory Agreement without modification to its terms, including the fees charged for services thereunder.
34
This page intentionally left blank.
This page intentionally left blank.
This page intentionally left blank.
THE JAMESTOWN FUNDS www.jamestownfunds.com Investment Adviser Lowe, Brockenbrough & Company, Inc. 1802 Bayberry Court Suite 400 Richmond, Virginia 23226 Administrator Ultimus Fund Solutions, LLC P.O. Box 46707 Cincinnati, Ohio 45246-0707 (Toll-Free) 1-866-738-1126 Independent Registered
Public Accounting Firm Cohen Fund Audit Services, Ltd. 1350 Euclid Avenue Suite 800 Cleveland, Ohio 44115 Legal Counsel Sullivan & Worcester LLP One Post Office Square Boston, Massachusetts 02109 Board of Trustees John P. Ackerly, IV John T. Bruce George K. Jennison Robert S. Harris, Ph.D. Harris V. Morrissette Elizabeth W. Robertson |
As of the end of the period covered by this report, the registrant has adopted a code of ethics that applies to the registrant’s principal executive officer, principal financial officer, principal accounting officer or controller, or persons performing similar functions, regardless of whether these individuals are employed by the registrant or a third party. Pursuant to Item 12(a)(1), a copy of registrant’s code of ethics is filed as an exhibit to this Form N-CSR. During the period covered by this report, the code of ethics has not been amended, and the registrant has not granted any waivers, including implicit waivers, from the provisions of the code of ethics.
| Item 3. | Audit Committee Financial Expert. |
The registrant’s board of trustees has determined that the registrant has two audit committee financial experts serving on its audit committee. The name of the audit committee financial experts are Dr. Robert S. Harris and Elizabeth W. Robertson. Dr. Harris and Ms. Robertson are “independent” for purposes of this Item.
| Item 4. | Principal Accountant Fees and Services. |
| (a) | Audit Fees. The aggregate fees billed for professional services rendered by the principal accountant for the audit of the registrant’s annual financial statements or for services that are normally provided by the accountant in connection with statutory and regulatory filings or engagements were $151,500 and $181,440 with respect to the registrant’s fiscal years ended March 31, 2016 and 2015, respectively. |
| (b) | Audit-Related Fees. No fees were billed in either of the last two fiscal years for assurance and related services by the principal accountant that are reasonably related to the performance of the audit of the registrant’s financial statements and are not reported under paragraph (a) of this Item. |
| (c) | Tax Fees. The aggregate fees billed for professional services rendered by the principal accountant for tax compliance, tax advice, and tax planning were $36,000 and $17,925 with respect to the registrant’s fiscal years ended March 31, 2016 and 2015, respectively. The services comprising these fees are the preparation of the registrant’s federal income and excise tax returns. |
| (d) | All Other Fees. No fees were billed in either of the last two fiscal years for products and services provided by the principal accountant, other than the services reported in paragraphs (a) through (c) of this Item. |
| (e)(1) | The audit committee has adopted pre-approval policies and procedures described in paragraph (c)(7) of Rule 2-01 of Regulation S-X. Pursuant to the pre-approval policies and procedures, the audit committee has pre-approved certain audit, audit-related and tax services and has established, with respect to each fiscal year of the registrant, the following maximum fee levels for services covered under the pre-approval policies and procedures: |
| · | Services, relating to a new series or class of a series, associated with SEC registration statements, periodic reports and other documents filed by the registrant with the SEC or other documents issued by the registrant in connection with securities offerings and assistance in responding to SEC comment letters—$5,000 |
| · | Consultations with management of the registrant, not in connection with an audit, as to the accounting or disclosure treatment of transactions or events and/or the actual or potential impact of final or proposed rules, standards or interpretations by the SEC, FASB or other regulatory or standard setting bodies—$5,000 |
| · | All tax services provided to the registrant in the aggregate—$5,000 |
| (e)(2) | None of the services described in paragraph (b) through (d) of this Item were approved by the audit committee pursuant to paragraph (c)(7)(i)(C) of Rule 2-01 of Regulation S-X. |
| (f) | Less than 50% of hours expended on the principal accountant’s engagement to audit the registrant’s financial statements for the most recent fiscal year were attributed to work performed by persons other than the principal accountant’s full-time, permanent employees. |
| (g) | With respect to the fiscal years ended March 31, 2016 and 2015, aggregate non-audit fees of $36,000 and $17,925, respectively, were billed by the registrant’s principal accountant for services rendered to the registrant. No non-audit fees were billed in either of the last two fiscal years by the registrant’s principal accountant for services rendered to the registrant’s investment adviser (not including any sub-adviser whose role is primarily portfolio management and is subcontracted with or overseen by another investment adviser), and any entity controlling, controlled by, or under common control with the adviser that provides ongoing services to the registrant. |
| (h) | The principal accountant has not provided any non-audit services to the registrant’s investment adviser (not including any sub-adviser whose role is primarily portfolio management and is subcontracted with or overseen by another investment adviser), and any entity controlling, controlled by, or under common control with the investment adviser that provides ongoing services to the registrant. |
| Item 5. | Audit Committee of Listed Registrants. |
Not applicable
| Item 6. | Schedule of Investments. |
| (a) | Not applicable [schedule filed with Item 1] |
| Item 7. | Disclosure of Proxy Voting Policies and Procedures for Closed-End Management Investment Companies. |
Not applicable
| Item 8. | Portfolio Managers of Closed-End Management Investment Companies. |
Not applicable
| Item 9. | Purchases of Equity Securities by Closed-End Management Investment Company and Affiliated Purchasers. |
Not applicable
| Item 10. | Submission of Matters to a Vote of Security Holders. |
The registrant’s Nominating Committee shall review shareholder recommendations to fill vacancies on the registrant’s board of trustees if such recommendations are submitted in writing, addressed to the Committee at the registrant’s offices and meet any minimum qualifications adopted by the Committee. The Committee may adopt, by resolution, a policy regarding its procedures for considering candidates for the board of trustees, including any recommended by shareholders.
| Item 11. | Controls and Procedures. |
(a) Based on their evaluation of the registrant’s disclosure controls and procedures (as defined in Rule 30a-3(c) under the Investment Company Act of 1940) as of a date within 90 days of the filing date of this report, the registrant’s principal executive officers and principal financial officer have concluded that such disclosure controls and procedures are reasonably designed and are operating effectively to ensure that material information relating to the registrant, including its consolidated subsidiaries, is made known to them by others within those entities, particularly during the period in which this report is being prepared, and that the information required in filings on Form N-CSR is recorded, processed, summarized, and reported on a timely basis.
(b) There were no changes in the registrant’s internal control over financial reporting (as defined in Rule 30a-3(d) under the Investment Company Act of 1940) that occurred during the second fiscal quarter of the period covered by this report that have materially affected, or are reasonably likely to materially affect, the registrant’s internal control over financial reporting.
File the exhibits listed below as part of this Form. Letter or number the exhibits in the sequence indicated.
(a)(1) Any code of ethics, or amendment thereto, that is the subject of the disclosure required by Item 2, to the extent that the registrant intends to satisfy the Item 2 requirements through filing of an exhibit: Attached hereto
(a)(2) A separate certification for each principal executive officer and principal financial officer of the registrant as required by Rule 30a-2(a) under the Act (17 CFR 270.30a-2(a)): Attached hereto
(a)(3) Any written solicitation to purchase securities under Rule 23c-1 under the Act (17 CFR 270.23c-1) sent or given during the period covered by the report by or on behalf of the registrant to 10 or more persons: Not applicable
(b) Certifications required by Rule 30a-2(b) under the Act (17 CFR 270.30a-2(b)): Attached hereto
| Exhibit 99.CODE ETH | Code of Ethics |
| Exhibit 99.CERT | Certifications required by Rule 30a-2(a) under the Act |
| Exhibit 99.906CERT | Certifications required by Rule 30a-2(b) under the Act |
SIGNATURES
Pursuant to the requirements of the Securities Exchange Act of 1934 and the Investment Company Act of 1940, the registrant has duly caused this report to be signed on its behalf by the undersigned, thereunto duly authorized.
| (Registrant) | Williamsburg Investment Trust | | |
| | | | |
| By (Signature and Title)* | /s/ Tina H. Bloom | |
| | | Tina H. Bloom, Secretary and Chief Compliance Officer | |
| | | | |
| Date | June 7, 2016 | | |
| | | | |
| Pursuant to the requirements of the Securities Exchange Act of 1934 and the Investment Company Act of 1940, this report has been signed below by the following persons on behalf of the registrant and in the capacities and on the dates indicated. |
| | | | |
| By (Signature and Title)* | /s/ John T. Bruce | |
| | | John T. Bruce, President | |
| | | (FBP Equity & Dividend Plus Fund and FBP Appreciation & Income Opportunities Fund) | |
| | | | |
| Date | June 7, 2016 | | |
| | | | |
| By (Signature and Title)* | /s/ Thomas W. Leavell | |
| | | Thomas W. Leavell, President | |
| | | (The Government Street Equity Fund, The Government Street Mid-Cap Fund and The Alabama Tax Free Bond Fund) | |
| | | | |
| Date | June 7, 2016 | | |
| | | | |
| By (Signature and Title)* | /s/ Charles M. Caravati III | |
| | | Charles M. Caravati III, President | |
| | | (The Jamestown Equity Fund) | |
| | | | |
| Date | June 7, 2016 | | |
| | | | |
| By (Signature and Title)* | /s/ Joseph A. Jennings III | |
| | | Joseph A. Jennings III, President | |
| | | (The Jamestown Tax Exempt Virginia Fund) | |
| | | | |
| Date | June 7, 2016 | | |
| | | | |
| By (Signature and Title)* | /s/ John P. Ackerly IV | |
| | | John P. Ackerly IV, President | |
| | | (The Davenport Core Fund, Davenport Value & Income Fund, Davenport Equity Opportunities Fund, Davenport Small Cap Focus Fund and the Davenport Balanced Income Fund) | |
| | | | |
| Date | June 7, 2016 | | |
| | | | |
| By (Signature and Title)* | /s/ Mark J. Seger | |
| | | Mark J. Seger, Treasurer and Principal Financial Officer | |
| | | | |
| Date | June 7, 2016 | | |
| * | Print the name and title of each signing officer under his or her signature. |