| | OMB APPROVAL |
| | OMB Number: 3235-0570 Expires: July 31, 2022 Estimated average burden hours per response: 20.6 |
UNITED STATES
SECURITIES AND EXCHANGE COMMISSION
Washington, D.C. 20549
FORM N-CSR
CERTIFIED SHAREHOLDER REPORT OF REGISTERED
MANAGEMENT INVESTMENT COMPANIES
| Investment Company Act file number | 811-05685 | |
| Williamsburg Investment Trust |
| (Exact name of registrant as specified in charter) |
| 225 Pictoria Drive, Suite 450 Cincinnati, Ohio | 45246 |
| (Address of principal executive offices) | (Zip code) |
John H. Chilton, Esq.
| Sullivan & Worcester LLP 1666 K Street NW Washington, D.C. 20006 |
| (Name and address of agent for service) |
| Registrant's telephone number, including area code: | (513) 587-3400 | |
| Date of fiscal year end: | March 31 | |
| | | |
| Date of reporting period: | March 31, 2022 | |
Form N-CSR is to be used by management investment companies to file reports with the Commission not later than 10 days after the transmission to stockholders of any report that is required to be transmitted to stockholders under Rule 30e-1 under the Investment Company Act of 1940 (17 CFR 270.30e-1). The Commission may use the information provided on Form N-CSR in its regulatory, disclosure review, inspection, and policymaking roles.
A registrant is required to disclose the information specified by Form N-CSR, and the Commission will make this information public. A registrant is not required to respond to the collection of information contained in Form N-CSR unless the Form displays a currently valid Office of Management and Budget ("OMB") control number. Please direct comments concerning the accuracy of the information collection burden estimate and any suggestions for reducing the burden to the Secretary, Securities and Exchange Commission, 450 Fifth Street, NW, Washington, DC 20549-0609. The OMB has reviewed this collection of information under the clearance requirements of 44 U.S.C. § 3507.
Item 1. Reports to Stockholders.
(a)
| | |
| | |
| | |
| | |
| | |
| | |
| | |
| | |
| | |
| | |
 | Davenport Core Fund (DAVPX) |
| | |
| | Davenport Value & Income Fund (DVIPX) |
| | |
| | Davenport Equity Opportunities Fund (DEOPX) |
| | |
| | Davenport Small Cap Focus Fund (DSCPX) |
| | |
| | Davenport Balanced Income Fund (DBALX) |
| | |
| | |
| | |
| | |
| ANNUAL REPORT |
| | |
| | |
| March 31, 2022 |
| | |
| | |
| | |
| | |
| | |
| | |
| | |
| | |
| | |
| | |
| | |
| | |
| | |
| | |
| | |
| | |
| | |
| | |
| | |
| | |
| | |
| | |
| | |
| | |
| | |
| | |
| | |
| | |
| THE DAVENPORT FUNDS | |
| LETTER TO SHAREHOLDERS (Unaudited) | April 29, 2022 |
Dear Shareholders,
The fiscal fourth-quarter brought investors yet another curveball with Russia’s invasion of Ukraine. This sent shockwaves through global markets and added to already notable inflation pressures, while also casting a new light on international investing. Meanwhile, the Federal Reserve raised interest rates as policymakers began to reign in monetary stimulus. Markets ultimately proved more resilient than one might expect given these circumstances, with energy and commodity-related stocks leading the way. While the S&P 500® Index and Russell 2000® Index were down 12% and 14% at one point during the quarter, they finished down 4.60% and 7.53%, respectively. It’s worth noting, however, that the major indices belie underlying weakness in the market. Many stocks, especially in riskier corners of the market, have experienced steep declines.
War in Ukraine added a new layer of risk to equity markets. One major consequence of the situation has been a spike in oil prices and many other commodities (Russia is the world’s second-largest producer of oil). The S&P GSCI, an index of commodities, advanced 29% for its biggest gain in over 30 years. This is prompting a variety of pressures ranging from higher prices at the pump to higher input costs for companies. While good for commodity producers, higher prices could squeeze consumers’ pocketbooks, crimp corporate margins, and generally help promote an economic slowdown. Moreover, many corporations have shut down activities in Russia and we seem to be going through a process of de-globalization in the near term. This corporate warfare seems warranted, but could become a slippery slope. What if some companies decide to do less business with China (a huge source of demand for many companies) given ideological differences? Such a scenario seems far-fetched, but less so than it did just a few months ago.
Inflation is now even more of an issue. We were already dealing with significant inflation, given pandemic bounceback demand and associated supply chain challenges. To wit, the consumer price index advanced 7.9% in February, a 40-year high. The geopolitical situation has added fuel to the fire. In turn, the Federal Reserve (the “Fed”) is committed to tighter monetary policy to ensure inflation doesn’t spiral out of control. It just raised interest rates for the first time since 2018 and remains intent on 7 rate hikes this year. True, the emergency stimulus post-pandemic is no longer needed, and inflation does need to be constrained, but many fear excessive tightening could also prompt a slowdown or even a recession.
How likely is a recession? Many sources of inflation pressure could prove ephemeral and higher interest rates may only serve to quell economic activity. Or, we could see a period of stagflation, which is defined as elevated inflation alongside no/low economic growth. Economists continue to forecast decent GDP growth for this year and next, thereby implying that most do not anticipate Fed policy will trigger either scenario, but the risks have risen. On the positive side, the COVID recovery continues unabated. One only needs to look at the results of a casino, concert and/or theme park operator to see there is a thirst to spend, and rising inflation has had limited impact so far. To that end, consumer balance sheets are very healthy with debt relatively low by historical standards, and household disposable income very strong. Corporations are also flush with cash and have significant capacity to spend money.
Putting it all together, we think the risk/reward profile for stocks is relatively balanced. Valuations look more reasonable than they did at the start of the calendar year, but we still find ourselves expecting more moderate returns than in recent years. While a sudden outbreak of peace in Ukraine could prompt a relief rally, rising interest rates and tighter monetary/fiscal policy will remain a headwind and higher input costs could weigh on corporate profitability. Despite a more subdued market outlook, we continue to find exciting individual ideas for our portfolios and have added a number of new positions. Please refer to our portfolio letters for a discussion of recent actions and we look forward to reporting to you next quarter.
Davenport Core Fund
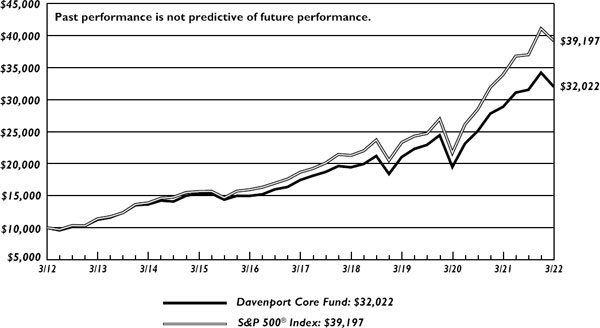
The following chart represents Davenport Core Fund’s (DAVPX) performance and the performance of the S&P 500® Index*, the Core Fund’s primary benchmark, for the periods ended March 31, 2022.
| | Fiscal Q4
2021 | 1 Year | 3 Years** | 5 Years** | 10 Years** | Since
Inception
1/15/98** | Fiscal
Year 2022
Expense
Ratio |
| Core Fund | -6.40% | 10.89% | 15.04% | 12.91% | 12.34% | 7.85 % | 0.86% |
| S&P 500® Index* | -4.60% | 15.65% | 18.92% | 15.99% | 14.64% | 8.67% | |
30-Day SEC Yield: 0.20%; Expense Ratio in current prospectus: 0.86%
Past performance is no guarantee of future results. Investment return and principal value of an investment will fluctuate so that an investor’s shares, when redeemed, may be worth more or less than their original cost. Current performance may be lower or higher than the performance data quoted. Performance data, current to the most recent month-end, may be obtained by calling 1-800-281-3217.
| * | The S&P 500® Index is comprised of 500 US stocks and is an indicator of the performance of the overall US stock market. Standard & Poor’s Financial Services LLC, a division of S&P Global, is the source and owner of the registered trademarks related to the S&P 500® Index. An investor cannot invest in an index and its returns are not indicative of the performance of any specific investment. |
| ** | Returns greater than one year are annualized. |
After a strong start to the fiscal year, The Davenport Core Fund (DAVPX) and the broader market suffered a slight reversal in the final fiscal quarter of 2022. The Fund declined 6.40% while the S&P 500® Index fell 4.60% to start the year. For the fiscal year, the Fund gained 10.89% compared to the 15.65% gain for the index. While we are disappointed to end the year behind the benchmark, we are pleased to see the Fund hold up relatively well given the broader market volatility seen throughout the quarter as investors grappled with spiking inflation, Russia’s invasion of Ukraine, rising interest rates, and waning monetary stimulus.
Our top performer during the quarter and second best performer for the fiscal year was Pioneer Natural Resources Co (PXD), a leading US shale oil & gas producer and the largest producer in the prolific Permian Basin. The stock returned nearly 40%, nearly in lockstep with oil prices which reached multi-year highs following Russia’s invasion of Ukraine. Other top performers in fiscal Q4 included our insurance holdings Markel Corp (MKL) and Berkshire Hathaway Inc. (BRK.B), who saw improved insurance pricing and higher investment returns as a result of rising interest rates. The Consumer Discretionary sector was our biggest detractor to performance,
with Home Depot Inc. (HD), Sherwin-Williams Co (SHW), and CarMax Inc. (KMX) all seeing significant pullbacks after a very strong calendar 2021 as the companies face near-term headwinds from supply chain issues, rising rates, and inflation/elevated prices.
Transaction activity was fairly moderate during the final quarter, but focused on striking a balance between growth and value. Given our expectation for more moderate returns following years of outsized gains, we took advantage of the market volatility by taking profits in some of our big winners and redeploying the proceeds into both new and existing names with attractive risk/reward profiles. In early/mid-February we sold our position in Advanced Micro Devices Inc. (AMD), our top performer for the fiscal year. Under the leadership of CEO Dr. Lisa Su, the company has transitioned from a multi-year turnaround situation to an impressive secular growth story, with AMD taking sizable market share gains across its end-markets. While the story is impressive, we elected to sell the position for a nearly 55% gain since our purchase in 2021, as we felt the continued growth potential was fairly reflected in the stock price. Similarly, towards the end of the quarter we chipped our position in Apple Inc. (AAPL). The stock has had a tremendous run, increasing more than 260% over the last 3 years (nearly 4x the return of the S&P 500). We continue to be fans of Apple’s businesses and maintain a healthy position in the name, but felt valuation had become a bit stretched and elected to take some off the table. We added to our positions in Adobe Inc. (ADBE) and Sherwin Williams Co (SHW), two high-quality compounders that have been beaten up this year due to some of the macro headwinds mentioned at the onset of this letter. We continue to see long-term secular growth upside for both of these names, and elected to add to our positions on the near-term weakness. We also initiated a new position in Bank of America Corp (BAC).
A household name, Bank of America sold off in mid-February alongside US banks in general as the Russia/Ukraine conflict raised concerns of the possibility for fewer rate hikes than initially expected, as well as the potential for Russian sanctions to prompt credit losses at large-cap banks. While these concerns are valid, after the stock’s pullback we felt these uncertainties were more than priced in with the stock trading at the lowest valuation multiple since 2020. We elected to take advantage of the weakness and establish a position in one of the highest quality US banks that continues to invest in technology, expand into new markets, and return cash to shareholders.
In sum, after a fairly volatile end to the fiscal year that saw the market down more than 10% at one point, we continue to believe the risk/reward profile for stocks is relatively balanced. Valuations look far more reasonable than just a few months ago and certain areas of the market offer attractive opportunities. Additionally, we continue to believe that equities should provide an inflation hedge and we’re focused on maintaining a core style portfolio of high-quality companies with attractive long-term outlooks.
The following are transactions performed in the Core Fund for the quarter ended March 31, 2022.
Recent Purchases
Adobe Inc (ADBE) - We think company guidance could prove conservative and view the ~40% pullback in the stock and valuation reset back to pre-pandemic levels as an attractive entry point for this high quality, secular grower in the software industry. We elect to add 0.5%, taking the position to 3.3% of the Fund.
Bank of America Corp (BAC) - We feel that this purchase, alongside our additions to Adobe Inc and Sherwin Williams Co, should help to give the Fund a nice balance on the value/growth spectrum.
Caesars Entertainment Inc (CZR) - We purchased a position in CZR as we think recent weakness has presented an opportunity and view the company as a quality way to lean back into the “re-opening” trade.
Medtronic plc (MDT) - We added to our position in MDT as it maintains a well-positioned pipeline with a strong balance sheet that is set to support its commitment to maintaining a high level of Research and Development (R&D) spend and a stable dividend payout.
Meta Platforms Inc (FB) - Though we regret the timing of adding to FB, we believe the company has the capacity to navigate the current environment and feel the stock exhibits an attractive risk/ reward profile following the recent expectations reset (acknowledging it could spend some time in the penalty box).
Pioneer Natural Resources Co (PXD) - PXD aims to return 80% of free cash flow to shareholders in 2022, and with the new fixed-plus-variable dividend structure, the total 2022 yield should be over 10%-one of the highest yields in the S&P 500. Given our positive outlook for the company, we felt the risk/reward opportunity to be attractive and a good time to increase our energy exposure to the Fund.
Sherwin Williams Co (SHW) - Assuming raw material costs eventually plateau, we think SHW can earn >$12 in EPS in the next two years, which would drive a $300 target (23%+ upside) assuming the current multiple. As such, we elect to add 0.5% to this high-quality compounder, taking the position to 1.9% of the Fund.
T-Mobile US Inc (TMUS) - While the industry could see a deceleration in growth back to more normal levels, we believe that as the disruptor, TMUS will continue to take market share and offset some of the industry-wide deceleration. Analysts estimate that after adjusting for Sprint losses (the migration will complete this year), TMUS is actually winning nearly 50% of net additions this year (similar to 2020) and we believe this is sustainable going forward. All told, we see a path to double-digit earnings and free cash flow growth and elect to add to the position.
Recent Sales
Accenture PLC (ACN) - ACN has been an outstanding performer for the Fund, up 61% in 2021, and returning more than 45% annually over the last 3 years (almost double the S&P). While we continue to believe ACN is a high-quality business with solid outlooks going forward, valuations are now well above their averages and we felt it to be an opportune time to take some profits as part of our risk management process, and chip the position size down to more normal levels.
Advanced Micro Devices Inc (AMD) - Momentum is set to continue in 2022 with management forecasting another strong year of growth across all core business segments, and the market share expansion story is likely still in the early innings. However, we are becoming less confident in underlying demand trends for certain end-markets like PCs, which could add a layer of uncertainty to the company’s growth potential as the year progresses. With a more balanced risk/reward profile, in our opinion, we elect to sell our position in AMD and hope to redeploy capital into other compelling opportunities.
Apple Inc (AAPL) - While we continue to be fans of Apple’s products, services, and innovation, we believe the valuation has become a bit stretched given expectations for mid-to-high single-digit earnings growth, and it could be tough for the shares to generate further outperformance. We continue to maintain a healthy position, but felt it prudent to chip the position and take some profits given a more balanced risk/reward profile.
Mastercard Inc (MA) - The stocks’ multiple has recovered to more typical levels relative to the market and we believe it prudent to reduce our position to more normal levels given our outsized weighting to the payment networks and more balanced risk/reward outlook.
MercadoLibre Inc (MELI) - While we are attracted to the MELI’s strong growth profile in the long-term, we believe the current headwinds are likely to persist for the foreseeable future. While the stock’s recent underperformance reflects these concerns, we also think it is important to consider this action in the context of the fund’s exposure to broader risk factors impacting “growthier” names, and focus on names with more attractive risk/reward profiles.
Microsoft Corp (MSFT) - While we continue to believe MSFT is a high-quality business with solid outlooks going forward, valuations are now well above their averages and we felt it to be an opportune time to take some profits as part of our risk management process.
Visa Inc (V) - The stocks’ multiple has recovered to more typical levels relative to the market, and we believe it prudent to reduce our position to more normal levels given our outsized weighting to the payment networks. We continue to believe the company is a high-quality compounder, with strong runways, and great returns on capital.
Davenport Equity Opportunities Fund
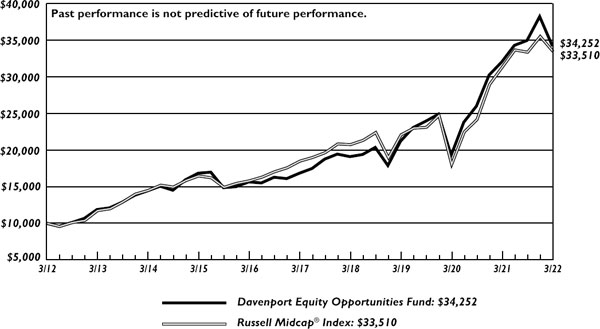
The following chart represents Davenport Equity Opportunities Fund (DEOPX) performance and the performance of the Russell Midcap® Index*, the Fund’s primary benchmark, and the S&P 500® Index* for the periods ended March 31, 2022.
| | Fiscal Q4
2021 | 1 Year | 3 Years** | 5 Years** | 10 Years** | Since
Inception
12/31/10** | Fiscal
Year 2022
Expense
Ratio |
| Equity Opportunities Fund | -10.46% | 6.89% | 17.31% | 15.26% | 13.10% | 13.40% | 0.87% |
| Russell Midcap® Index | -5.68% | 6.92% | 14.89% | 12.62% | 12.85% | 12.41% | |
| S&P 500® Index* | -4.60% | 15.65% | 18.92% | 15.99% | 14.64% | 14.32% | |
30-Day SEC Yield: -0.11%; Expense Ratio in current prospectus: 0.89%
Past performance is no guarantee of future results. Investment return and principal value of an investment will fluctuate so that an investor’s shares, when redeemed, may be worth more or less than their original cost. Current performance may be lower or higher than the performance data quoted. Performance data, current to the most recent month-end, may be obtained by calling 1-800-281-3217.
| * | The Russell Midcap® Index measures the performance of the 800 smallest companies in the Russell 1000, which represent approximately 25% of the total market capitalization of the Russell 1000®. London Stock Exchange Group PLC and its group undertakings (collectively, the “LSE Group”). © LSE Group 2022. FTSE Russell is a trading name of certain LSE Group companies. “Russell®” is a trademark of the relevant LSE Group companies and is used by any other |
LSE Group company under license. All rights in the FTSE Russell indexes or data vest in relevant LSE Group company which owns the index or the data. Neither LSE Group nor its licensors accept any liability for any errors or omissions in the indexes or data and no party may rely on any indexes or data contained in this communication. No further distribution of data from LSE Group is permitted without the relevant LSE Group company’s express written consent. The LSE Group does not promote/sponsor/endorse the content of this communication. The S&P 500® Index is comprised of 500 US stocks and is an indicator of the performance of the overall US stock market. Standard & Poor’s Financial Services LLC, a division of S&P Global, is the source and owner of the registered trademarks related to the S&P 500® Index. An investor cannot invest in an index and its returns are not indicative of the performance of any specific investment.
| ** | Returns greater than one year are annualized. |
The Davenport Equity Opportunities Fund (DEOPX) experienced a 10.46% decline to end the fiscal year, lagging the 5.68% drawdown for the Russell Midcap® Index. For the fiscal year, the Fund increased 6.89% compared to the 6.92% increase for the index.
Despite the overall drawdown to end the fiscal year, the Fund enjoyed strong performance from holdings in the insurance sector, with Markel Corp (MKL) and Fairfax Financial Holdings Ltd (FRFHF) advancing of 19.5% and 12.9%, respectively. Both are top 5 holdings and we remain attracted to each given strong insurance pricing fundamentals, well-positioned investment portfolios and short duration bond portfolios that are poised to benefit from higher interest rates. Another standout performer during the final quarter was oil and gas producer Coterra Energy Inc. (CTRA), a new holding that we believe offers us a high-quality way to participate in what we perceive to be secular tailwinds for hydrocarbon prices (more on this below).
Heading into calendar 2022, we took several actions to de-risk the Fund, selling and/or chipping positions in outperformers that had seen significant valuation expansion and appeared vulnerable. Despite these actions, performance was negatively impacted by a significant drawdown in growthier/interest rate sensitive names such as Etsy Inc. (ETSY), Sherwin Williams Co (SHW), Align Technologies (ALGN) and Autodesk Inc. (ADSK). In some cases, the drawdown in these names has been so severe that they are starting to look attractive again. In fact, we elected to add to our position in ADSK near quarter-end at a price nearly 40% below the level where we trimmed the position last August. Additionally, our position in Cannae Holdings Inc. (CNNE) served as a detractor. Despite significant share repurchases and meaningful asset monetizations, the shares continue to decouple from their net asset value, with the discount now wider than it has ever been (now north of 40%). Though we are clearly frustrated with this name, we feel the risk/reward remains favorable.
We initiated a position in leading online sports betting company Draftkings Inc. (DKNG). The name should be familiar given our recent ownership from mid-2020 through mid-2021. Since our exit, the shares have been more than cut in half as the market shifted from “growth at any cost” to a heightened focus on profitability. While DKNG is not yet profitable, it’s important to remember that this industry is less than four years old and is still in the growth phase. The total addressable market has continued to increase, DKNG has cemented a leading position in most states that have legalized and the company’s playbook (2-3 year path to profitability) has been proven out in the early states. As such, we think current levels offer an attractive entry point.
As mentioned above, we initiated a position in Coterra Energy Inc. (CTRA). The company offers participation in two of the best domestic oil and gas basins (Permian basin oil and Marcellus natural gas), where it holds long-lived, low-cost reserves. We are constructive on the outlook for hydrocarbon prices for the next several years given by producer discipline, years of underinvestment, diversion of capital to renewables and regulatory constraints. With respect to
CTRA, we are attracted to the company’s high-quality assets, strong balance sheet and attractive capital return outlook. We expect total dividends to exceed $2 per share in calendar 2022 (HSD dividend yield) even if oil and natural gas prices retreat from current levels. Furthermore, the company expects to be nearly net debt-free by the end of 2022 and recently approved a $1.25bn buyback authorization, which represented roughly 7% of the market cap at the time. Putting it all together, we see a path to double-digit returns from capital return alone (with the added benefit of participation should oil and gas prices rise). As such, we used a recent pullback in the shares as an opportunity to add diversification and differentiation to the Fund at an attractive risk/reward.
In closing, we are disappointed with the end to the fiscal year; however, believe we have taken many steps to plant the seeds for future outperformance. As such, we feel the Fund carries an element of timeliness in addition to ample flexibility resulting from a slightly above average cash balance.
The following are transactions performed in the Equity Opportunities Fund for the quarter ended March 31, 2022.
Recent Purchases
Autodesk Inc (ADSK) - Despite the near-term headwinds, we feel the sell-off is overdone and the company should continue to see strong growth as the construction and manufacturing industries further embrace digitization and modern cloud tools. Even with FX headwinds, we believe FCF should grow nearly 50% this year and continue to grow at double-digit Compound Annual Growth Rate (CAGR) over the next few years and elect to add to our position.
Alight Inc (ALIT) - We elected to take advantage of recent weakness to build our position further and continue to view the risk/reward profile favorably.
Black Knight Inc (BKI) - We added to our position in BKI as we think the core business is performing extremely well and we struggle to find a business as high quality as Black Knight’s trading at such a reasonable valuation.
Caesars Entertainment Inc (CZR) - The stock has languished recently and is down 35% from its all-time high due to general market weakness, Omicron fears, concerns about difficult comparisons in regional markets (following tremendous results last year) and general negativity towards sports betting plays (a new part of CZR’s business). We think recent weakness has presented an opportunity, adding to our position and view the company as a quality way to lean back into the “re-opening” trade.
Caesars Entertainment Inc (CZR) - Shares of CZR have continued to languish since our initial purchase just over a week ago, and we elect to additionally add to our position on the weakness.
Colfax Corp (CFX) - As a reminder, CFX will split into two companies at the end of 1Q (ESAB - welding business / Enovis - medical device business). Using a conservative sum-of-the-parts valuation, we see upside into the $50+ range. As such, we decided to use market weakness to add to our position.
Coterra Energy Inc. (CTRA) - We purchased a position in CTRA. Though we have typically avoided companies in the commodity space due to historically unpredictable and insufficient returns, we are constructive on the outlook for hydrocarbon prices for the next several years
given by producer discipline, years of underinvestment, diversion of capital to renewables and regulatory constraints. With respect to CTRA, we are attracted to the company’s high-quality assets, strong balance sheet and attractive capital return outlook.
Coterra Energy Inc (CTRA) - With the stock price relatively unchanged, we elect to add to the name and make it a more meaningful position size within the Fund.
DraftKings Inc (DKNG) - We purchased a position in DKNG. Following a significant downward re-rating in the sports betting world, we believe the time is right to revisit the DKNG story. The name should be familiar given our recent ownership from mid-2020 through mid-2021. Since our exit, the shares have been more than cut in half as the market shifted from “growth at any cost” to a heightened focus on profitability. While DKNG is not yet profitable, it’s important to remember that this industry is less than four years old and is still in the growth phase. The Total Addressable Market (TAM) has continued to increase, DKNG has cemented a leading position in most states that have legalized and the company’s playbook (2-3 year path to profitability) has been proven out in the early states.
DraftKings Inc (DKNG) - With the broader market sell-off (and consumer stocks in particular), we decided to make the position a bit more meaningful, adding to the position at an attractive price. We continue to see DKNG as a long-term winner in the sports betting industry and believe risk/reward remains very attractive at current levels.
Recent Sales
American Tower Corp (AMT) - We continue to believe the company operates one of the more attractive business models we are aware of while offering a high-quality way to play the secular theme of connectivity and wireless infrastructure buildout. With this action, we reduce the position size to 3.0% of the Fund.
Hilton Worldwide Holdings Inc (HLT) - While we continue to appreciate the company’s capital light business model and leverage to a recovery in travel demand, we believe the risk/reward profile is balanced with both the share price and valuation hovering near all-time highs and elected to sell the position. Ultimately, we like the flexibility enabled by this degree of “dry powder,” and look forward to deploying funds into attractive opportunities as they arise.
MercadoLibre Inc (MELI) - We sold our position in MELI. While we are still attracted to the company’s strong growth profile and high return business model, we are concerned the shares may continue to struggle amid emerging market economic stress, increased competitive activity, and rising interest rates. While the stock’s recent underperformance reflects these concerns, we also think it is important to consider this action in the context of our Fund’s exposure to broader risk factors impacting “growthier” names, to which we continue to have ample exposure. Ultimately, we feel the strategy maintains a sense of balance and like the optionality that our now elevated cash balance provides.
Davenport Value & Income Fund
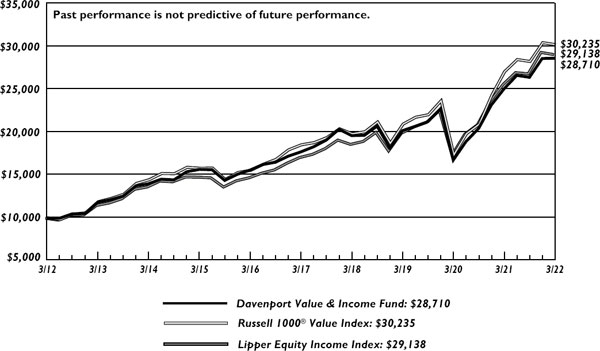
The following chart represents Davenport Value & Income Fund (DVIPX) performance and the performance of the Russell 1000® Value Index*, the Value & Income Fund’s primary benchmark, the S&P 500® and the Lipper Equity Income Index for the periods ended March 31, 2022.
| | Fiscal Q4
2021 | 1 Year | 3 Years** | 5 Years** | 10 Years** | Since
Inception
12/31/10** | Fiscal
Year 2022
Expense
Ratio |
| Value & Income Fund | 0.14% | 14.24% | 12.36% | 10.08% | 11.12% | 11.48% | 0.86% |
| Russell 1000® Value Index | -0.74% | 11.67% | 13.02% | 10.29% | 11.70% | 11.42% | |
| S&P 500® Index* | -4.60% | 15.65% | 18.92% | 15.99% | 14.64% | 14.32% | |
| Lipper Equity Income Index* | -0.86% | 13.76% | 13.49% | 11.24% | 11.29% | 11.77% | |
30-Day SEC Yield: 1.50%; Expense Ratio in current prospectus: 0.87%
Past performance is no guarantee of future results. Investment return and principal value of an investment will fluctuate so that an investor’s shares, when redeemed, may be worth more or less than their original cost. Current performance may be lower or higher than the performance data quoted. Performance data, current to the most recent month-end, may be obtained by calling 1-800-281-3217.
| * | The Russell 1000® Value Index measures the performance of the Russell 1000 companies with lower price-to-book ratios and lower forecasted growth values. London Stock Exchange Group PLC and its group undertakings (collectively, the “LSE Group”). © LSE Group 2022. FTSE Russell is a trading name of certain LSE Group companies. “Russell®” is a trademark of the relevant LSE Group companies and is used by any other LSE Group company under license. All rights in the FTSE Russell indexes or data vest in relevant LSE Group company which owns the index or the data. Neither LSE Group nor its licensors accept any liability for any errors or omissions in the indexes or data and no party may rely on any indexes or data contained in this communication. No further distribution of data from LSE Group is permitted without the relevant LSE Group company’s express written consent. The LSE Group does not promote/sponsor/endorse the content of this communication. The S&P 500® Index is comprised of 500 US stocks and is an indicator of the performance of the overall US stock market. The S&P 500® Index is comprised of 500 US stocks and is an indicator of the performance of the overall US stock market. Standard & Poor’s Financial Services LLC, a division of S&P Global, is the source and owner of the registered trademarks related to the S&P 500® Index. The Lipper Equity Income Index is an unmanaged index of the 30 largest Funds in the Lipper Equity Income Fund category. An investor cannot invest in an index and its returns are not indicative of the performance of any specific investment. |
| ** | Returns greater than one year are annualized. |
The Davenport Value & Income Fund (DVIPX) increased 0.14% in the fiscal fourth quarter. This compares to the Fund’s primary benchmark, the Russell 1000 Value® Index, which declined 0.74% in the quarter as well as the S&P 500® Index, which decreased 4.60%. For the fiscal year, the Fund increased 14.24%, ahead of the Russell 1000 Value® Index’s 11.67% return. The S&P 500® Index gained 15.65% in fiscal 2022.
Value stocks continued to perform well compared to their growth counterparts during the fiscal fourth quarter and we were pleased that the Fund outperformed its benchmark. Energy and material stocks were the top performers as commodity prices reached multi-year highs following Russia’s invasion of Ukraine. Coterra Energy Inc. (CTRA) was our top performer, increasing nearly 45% in the first quarter, followed by a 40% gain in energy giant Chevron Corp (CVX). Agricultural processor Bunge Ltd (BG) was also a top contributor as high commodity prices and supply disruptions drove margins higher. Gold miner Newmont Corp (NEM) increased
nearly 30%. Our insurance holdings also performed well, with nearly 20% gains from Berkshire Hathaway Inc. (BRKB) and Markel Corp (MKL). This was due to improved insurance pricing and higher investment returns as a result of rising interest rates. On the other side, key detractors included Cannae Holdings Inc. (CNNE), Sony Group Corp (SONY), and TE Connectivity Ltd (TEL).
We continue to find good value in lower risk, higher-yielding names, which we think fit well in this Fund given our view of more muted returns ahead. You may recall that we bought Walmart Inc. (WMT) and added to Johnson & Johnson (JNJ) in fiscal Q3. This quarter we added to our position in McDonald’s Corp (MCD) and initiated a new position in Verizon Communications Inc. (VZ). MCD shares were down significantly on fears related to Russia/Ukraine as well as higher input costs. We viewed this as a buying opportunity as the company has proven time and again its ability to raise prices to offset inflation. Verizon continues to improve performance with its 5G initiatives. 5G mobility, nationwide broadband, edge computing, and B2B solutions are expected to improve revenue growth from ~2% to the mid-single-digit range over the next couple of years. Earnings have the potential to grow ahead of revenue given the benefit of improving margins. Additionally, with capital expenditure expected to peak next year, we see the potential for share buybacks in the near future. With the stock at less than 10x forward earnings, we think the valuation is attractive.
We also introduced a position in Sysco Corp (SYY). Sysco is the largest US food service distributor with an estimated 17% market share in a highly-fragmented industry. The company sells over 400K products to restaurants (66% of sales), healthcare (9%), education and government (8%), and several other. Over 80% of sales are from the US While the last two years have been incredibly difficult, we think the company is poised to emerge from the pandemic in a much stronger position and view SYY as a relatively safe way to play a return to normal. Significant investments in its technology, salesforce, and supply chain should allow SYY to grow at 1.5x the industry rate. The company is a dividend aristocrat with a 2.4% yield and trades at a discount to its average valuation.
In summary, despite the many market-moving events that occurred in the fiscal fourth quarter, we were pleased that our Fund held up well and finished slightly ahead of its benchmark. We continue to have a favorable view towards energy and material stocks given our view that commodity prices are likely to remain higher for longer, and we maintain a healthy weighting in several names that touch that theme. We are balancing that with more traditional defensive stocks that have lower risk and solid dividends. The Fund currently yields 2.3% and we note that many of our holdings are raising their dividends at a rate at least commensurate with inflation.
The following are transactions performed in Value & Income Fund for the quarter ended March 31, 2022.
Recent Purchases
Citigroup Inc (C) - With the stock trading at approximately 8.5x earnings-per-share (EPS), well below peers and its historical range, we find the current price offers an attractive entry point and elect to purchase a position.
Comcast Corp (CMCSA) - We added to our position in CMCSA and think it will generate modest subscriber growth over the next few years and also like the re-opening exposure provided via its theme park business. CMCSA trades at a 34% discount to the S&P 500, the widest gap in over a decade, offering tremendous relative value, in our view.
McDonald’s Corp (MCD) - Shares of MCD have declined significantly over the past few weeks on fears relating to Russia/Ukraine as well as higher input costs. We believe the sell-off is overdone as Russia/Ukraine represent <3% of operating income, and the company has proven time and again its ability to balance price with value. As such, we elect to take advantage of the weakness and attractive valuation to add to our position.
Perrigo Company PLC (PRGO) - PRGO shares have given back most of the recent gains generated when it settled many of its outstanding headwinds (i.e. Irish tax case) as supply chain issues, and weak cough/cold trends have been a drag on the Earnings Per Share (EPS) recovery story. With trends expected to normalize as the Omicron wave recedes, we elect to add to our position.
Sysco Corp (SYY) - We purchased a position in SYY. While the last two years have been incredibly difficult, we think the company is poised to emerge from the pandemic in a much stronger position and view SYY as a relatively safe way to play a return to normal. We are also attracted to Sysco’s capital return. The company is a Dividend Aristocrat with a 2.4% yield after raising its dividend by 4% in May. The company also recently restarted its share repurchase program. While near-term results could be choppy due to the impact from the Omicron wave and supply chain/inflation, we think SYY offers attractive risk-reward at current levels.
Verizon Communications Inc (VZ) - While unlikely to be a home run, we think the low-beta, 5% dividend yield, and improving growth profile make VZ an attractive investment. Earnings before interest, taxes, depreciation, and amortization, (EBITDA) has the potential to grow ahead of revenue given the benefit of improving operating leverage. Additionally, with capex expected to peak next year, we see the potential for share buybacks in the not-too-distant future. With the stock at less than 10x forward earnings, we think valuation is attractive.
Recent Sales
Bunge Ltd (BG) - BG has been a standout performer for us as the company’s turnaround took hold and coincided with a strengthening agricultural cycle. Additionally, the development of the renewable diesel industry has proven to be a strong catalyst for the shares. While we continue to be constructive on the stock, it had grown to be one of our biggest positions and, as such, we elect to take some profits.
BP PLC (BP) - Following the recent outperformance of the energy sector as well as the spike in oil prices as a result of the Russia/Ukraine events, we elect to take some profits in the sector. BP has been a good performer for the Fund, but is also the most global of our holdings, including exposure to Russia (which it announced this morning that it plans to divest). As such, it is the position we decided to exit. We continue to have significant exposure to the sector in the form of Chevron, Coterra, and Enbridge, all of which we think look more appealing given their significant capital return programs.
Fidelity National Financial Inc (FNF) - We continue to like the story and believe the stock is cheap, but after a nearly 50% increase over the past year and a half, we elected to take a bit off the table to fund our Sysco Corp (SYY) purchase, where we currently see more favorable risk/reward.
L3harris Technologies Inc (LHX) - L3 and other defense stocks are on a spike due to the tensions in Ukraine and what that might mean for future defense spending. While we continue to like the company and its exposure to high-growth DoD programs, we thought it prudent to take some profits as these stocks traditionally move significantly on headlines and then take some time to work as various government appropriations play out.
Microsoft Corp (MSFT) - While we continue to believe MSFT is one of the highest-quality businesses in the world with significant runway ahead, we no longer think it fits in the Value & Income Fund and thus decide to exit our position.
Truist Financial Corp (TFC) - TFC has had a nice move since our initial purchase in December 2020 as many of the BB&T/SunTrust merger synergies were realized and earnings results came in better than expected. As such, we elect to take some profits.
Truist Financial Corp (TFC) - We chipped our position a second time in TFC given the significant re-rating the stuck has experienced and now elect to sell our remaining stake to fund our purchase of Citi.
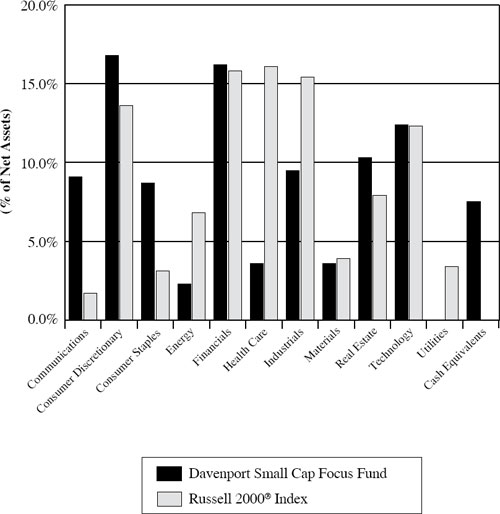
Davenport Small Cap Focus Fund
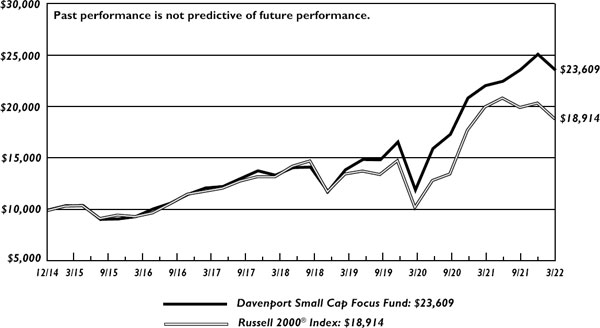
The following chart represents performance of the Davenport Small Cap Focus Fund (DSCPX) and the performance of the Fund’s primary benchmark, the Russell 2000® Index*, for the periods ended March 31, 2022.
| | Fiscal Q4
2021 | 1 Year | 3 Years** | 5 Years** | Since
Inception
12/31/14** | Fiscal
Year 2022
Expense
Ratio |
| Small Cap Focus Fund | -6.10% | 6.85% | 19.28% | 14.22% | 12.59% | 0.88% |
| Russell 2000® Index* | -7.53% | -5.79% | 11.74% | 9.74% | 9.19% | |
30-Day SEC Yield: -0.03%; Expense Ratio in current prospectus: 0.87%
Past performance is no guarantee of future results. Investment return and principal value of an investment will fluctuate so that an investor’s shares, when redeemed, may be worth more or less than their original cost. Current performance may be lower or higher than the performance data quoted. Performance data, current to the most recent month-end, may be obtained by calling 1-800-281-3217.
| * | The Russell 2000® Index measures the performance of the 2000 smallest companies in the Russell 3000® Index. Frank Russell Company (“Russell”) is the source and owner of the registered trademarks, service marks, and copyrights related to the Russell Indexes. Russell® is a trademark of Frank Russell Company. An investor cannot invest in an index and index returns are not indicative of the performance of any specific investment. London Stock Exchange Group PLC and its group undertakings (collectively, the “LSE Group”). © LSE Group 2022. FTSE Russell is a trading name of certain LSE Group companies. “Russell®” is a trademark of the relevant LSE Group companies and is used by any other LSE Group company under license. All rights in the FTSE Russell indexes or data vest in relevant LSE Group company which owns the index or the data. Neither LSE Group nor its licensors accept any liability for any errors or omissions in the indexes or data and no party may rely on any indexes or data contained in this communication. No further distribution of data from LSE Group is permitted without the relevant LSE Group company’s express written consent. The LSE Group does not promote/sponsor/endorse the content of this communication. An investor cannot invest in an index and its returns are not indicative of the performance of any specific investment. |
| ** | Returns greater than one year are annualized. |
The Davenport Small Cap Focus Fund (DSCPX) declined 6.10% in the fiscal fourth quarter, outpacing the 7.53% decline for the Russell 2000® Index. Though the close to the fiscal year was unpleasant for risk assets, we were pleased to see the strategy prove a bit more resilient. For the fiscal year, the fun increased 6.85%, compared to the 5.79% decline for the index.
Speaking of resiliency, top holding Monarch Casino & Resort Inc. (MCRI) was the Fund’s biggest contributor for the fiscal fourth quarter, advancing nearly 18% alongside strong quarterly results. As a reminder, we were adding to the position throughout the second half of calendar 2021 and have been impressed with the significant momentum across the business, especially at the company’s recently renovated property in Black Hawk, CO. Elsewhere, we were pleased to see a few of the “quality reopening” plays we highlighted last quarter outperform. Manhattan commercial real estate REIT SL Green Realty Corp (SLG) and rental car tolling solution provider Verra Mobility Corp (VRRM) posted solid gains during the period as Omicron variant concerns subsided. Cannae Holdings Inc. (CNNE) was the strategy’s biggest detractor during the period. While several of the company’s portfolio investments declined in value alongside the market, shares of CNNE continued to decouple from the intrinsic value of its holdings and stood at a record discount (north of 40%) to net asset value at quarter-end. Despite our frustration and disappointment with this holding, we bolstered the position modestly and continue to exercise patience.
The strategy’s exposure to the renewable energy/energy transition space was a positive standout during the last quarter. The group saw a renewed wave of investor interest alongside strength in energy prices and Russia’s invasion of Ukraine, with the latter calling attention to the growing role of renewable/alternative energy sources. We have discussed our position in “picks and shovels” LNG (liquefied natural gas) and hydrogen equipment provider, Chart Industries Inc. (GTLS), in the past. We still view GTLS as a great way to play the intermediate (LNG) and longer term (hydrogen) themes within energy transition evolution. We have also been building a position in leading RNG (renewable natural gas) player, Archea Energy Inc. (LFG). Archea is the largest RNG operator in the country, with a primary focus on converting landfill methane gas into the chemical equivalent of natural gas. Due to the fact that methane is a much more potent greenhouse gas than carbon dioxide, the sequestration of the gas is highly incentivized by the government, resulting in very attractive economics for producers. Despite being a complicated/early-stage story, we think LFG is a great way to play RNG fundamentals given its strong management team, project backlog and marketing strategy, which locks in a substantial portion of future volumes at attractive prices.
We also added to our position in Colfax Corp (CFX) during the fiscal fourth quarter. Shares of CFX are down more than 20% from their recent highs amidst general market malaise, the Russia/ Ukraine conflict, and the Omicron wave. Early in the quarter, Omicron fears gave way to concerns regarding the potential for further delays in elective procedures in the Med Tech business. As these headwinds began to dissipate, geopolitical turmoil combined with concerns around the economic cycle started to weigh on the shares. While we think the near term could be choppy for the stock, we think CFX shares offer attractive value at current levels. As a reminder, CFX will split into two companies at the beginning of the calendar second quarter (ESAB - welding business / Enovis - medical device business). Using a conservative sum-of-the-parts valuation, we see upside into the $50+ range. As such, we decided to use recent weakness to add to our position.
In closing, we are pleased to have held up modestly better than the index in what was a rocky close to the year. Though we put some cash to work during the quarter in names we are excited about, we still carry meaningful cash balance (roughly 7.5%), which should provide us some flexibility should conditions remain volatile.
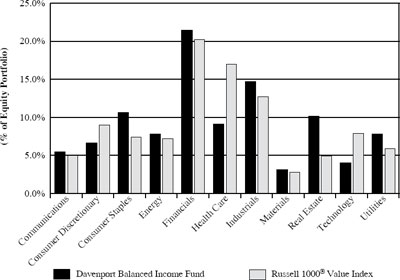
Davenport Balanced Income Fund
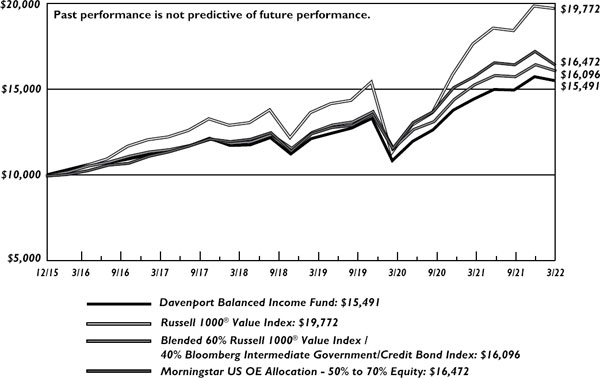
The following chart represents Davenport Balanced Income Fund (DBALX) performance, and performance of the Fund’s primary benchmark, the Russell 1000® Value Index, along with the Morningstar Allocation 50-70% Equity Index, and the blended 60% Russell 1000® Value Index / 40% Bloomberg Intermediate Government/Credit Bond (BIGC) Index for the periods ended March 31, 2022.
| | Fiscal Q4
2021 | 1 Year | 3 Years** | 5 Years** | Since
Inception
12/31/15** | Fiscal
Year 2022
Expense
Ratio |
| Balanced Income Fund | -1.46% | 7.50% | 8.57% | 6.75% | 7.25% | 0.92% |
| Russell 1000® Value* | -0.74% | 11.67% | 13.02% | 10.29% | 11.53% | |
| Morningstar Allocation 50-70% Equity* | -4.60% | 4.30% | 9.75% | 8.12% | 8.31% | |
| 60% Russell 1000® Value/40% BIGC | -2.23% | 5.25% | 8.77% | 7.19% | 7.91% | |
30-Day SEC Yield: 1.54%; Expense Ratio in current prospectus: 0.92%
Past performance is no guarantee of future results. Investment return and principal value of an investment will fluctuate so that an investor’s shares, when redeemed, may be worth more or less than their original cost. Current performance may be lower or higher than the performance data quoted. Performance data, current to the most recent month-end, may be obtained by calling 1-800-281-3217.
| * | The Russell 1000® Value Index measures the performance of the Russell 1000 companies with lower price-to-book ratios and lower forecasted growth values. London Stock Exchange Group PLC and its group undertakings (collectively, the “LSE Group”). © LSE Group 2022. FTSE Russell is a trading name of certain LSE Group companies. “Russell®” is a trademark of the relevant LSE Group companies and is used by any other LSE Group company under license. All rights in the FTSE Russell indexes or data vest in relevant LSE Group company which owns the index or the data. Neither LSE Group nor its licensors accept any liability for any errors or omissions in the indexes or data and no party may rely on any indexes or data contained in this communication. No further distribution of data from LSE Group is permitted without the relevant LSE Group company’s express written consent. The LSE Group does not promote/sponsor/endorse the content of this communication. The Morningstar US OE Allocation 50-70% Equity Index is composed of funds which seek to provide both income and capital appreciation by investing in multiple asset classes, including stocks, bonds, and cash. These portfolios are dominated by domestic holdings and have equity exposure between 50% and 70%. The blended 60% Russell 1000® Value/40% Bloomberg Intermediate Government/Credit (BIGC) Index is included as an additional comparative index because it is representative of a balanced portfolio consisting of 60% equity and 40% fixed income securities. The BIGC measures the non-securitized component of the US Aggregate Bond Index. It includes investment grade, US dollar-denominated, fixed-rate Treasuries, government-related and corporate rate securities. Intermediate maturity bonds include bonds with maturities of 1 to 9.999 years. An investor cannot invest in an index and its returns are not indicative of the performance of any specific investment. |
| ** | Returns greater than one year are annualized. |
The Davenport Balanced Income Fund (DBALX) declined 1.46% during the fiscal fourth quarter of 2022, ahead of the 2.23% decline for the blended 60% Russell 1000® Value and 40% Bloomberg Intermediate Government/Credit Index. For the fiscal year, the fund increased 7.50% compared to the 5.25% increase for the blended benchmark.
After a strong first three quarters of fiscal 2022, the final quarter brought more volatility to the markets. Russia invaded Ukraine leading to spiking commodity prices, inflation soared to levels not seen in roughly 40 years, the Federal Reserve began raising interest rates, and stimulus continued to wane. While many pockets of the equity market saw large intra-quarter declines, value stocks held up fairly well with the Russell 1000® Value index dipping 6% in February compared to the 12% dip for the S&P 500® Index. The Russell ended the quarter down only 0.74% compared to the 4.60% decline for the S&P. Given the Fund’s value bias, we were pleased to see the equity portion of the Fund perform well to close the year.
Given the previously mentioned spike in commodity prices, our energy and materials stocks were our top contributors to equity performance, with our oil themed stocks Coterra Energy Inc. (CTRA) and Chevron Corp (CVX) increasing more than 40% each, and Devon Energy Corp (DVN) increasing nearly 35%. Gold miner Newmont Corp (NEM) also proved resilient, increasing nearly 30%. Our biggest detractors included Cannae Holdings Inc. (CNNE) and Stewart Information Services Corp (STC). Shares of Cannae have continued to decouple from the intrinsic value of its holdings, with the discount to net asset value now at a record 40% as of year-end. While frustrating, we continue to exercise patience as we believe the fundamentals of the underlying businesses are strong at the discount should narrow over time. As a title insurer, Stewart shares have underperformed as investors have grown concerned over rising mortgage rates impacting new home sales and home refinancing. While rising rates are certainly a headwind, we continue to have a favorable housing outlook as demand remains strong and supply remains sparse.
After years of outsized returns in equities, we expect more muted returns moving forward, especially given the macro headwinds outlined above. As such, transactions during the final quarter focused on seeking lower risk and higher yielding names. Shares of McDonald’s Corp (MCD) were down significantly on fears relating to the Russia/Ukraine conflict as well has higher input costs. We used this weakness to add to our position as the company has repeatedly proved its ability to pass through costs and offset inflation. Moreover, the company pays a handsome dividend which has grown at more than 7% annually over the last 10 years. We also purchased a position in Verizon Communications Inc. (VZ), a low volatility name with an improving growth profile and an attractive 5% dividend yield and valuation.
The bond allocation consists of 32 high quality bonds across ten sectors with the top allocation financials at 18.55%, consumer discretionary at 15.37%, US Treasuries at 15.01%, and energy at 12.50%. The credit quality of the fixed portion remains high investment grade with an effective maturity of 3.25 years and a duration of 2.89 years, down from 3.44 years at the beginning of calendar 2022.
Our allocation to floating rate notes within the fixed portion of the fund increased to 12.3% from 4.54% during the final quarter. With the Fed signaling to be more apt to raise rates at a faster clip to stave off inflation, floating rate notes should benefit in a rising rate environment. We initiated floating rate positions in Deere & Co (DE FRN 2025), Charles Schwab Corp (SCHW FRN 2024), and US Treasury 2024. More clarity on the Fed’s intentions to increase Fed Funds also forced the
front end of the yield curve to reprice. Two year Treasuries began the quarter at 0.734%, but sold off enough allowing us the opportunity to initiate a 2-year treasury position at 2.33%, increasing our credit quality.
We decided to exit two of our longer duration positions, Comcast Corp (CMCSA 3.15 2028) and Halliburton Co (HAL 3.8 2025), with the intent to shorten our duration. With the proceeds, we bought Brookfield Asset Management Inc. (BAMACN 4 2024) and DuPont de Nemours Inc. (DD 4.205 2023), both short-duration high coupon positions. So, our main focus is on adding floating rate notes, short-dated treasuries, short-duration high coupon bonds, and exiting longer-duration corporates.
In closing, after a turbulent end to the fiscal year, we think this is a good reminder of the value in a balanced investing approach. We believe our allocation to dividend-paying value-oriented equities should position the fund nicely for long-term capital appreciation. Additionally, our defensive fixed income positioning should continue to provide current income and a volatility buffer in the near-term.
As a fellow shareholder of the Davenport Funds, we would like to thank you for your support, trust and confidence. Together we have overcome numerous and unprecedented market challenges the last couple of years including: An economy that almost ground to a halt by covid restrictions, ghastly pictures of hospitals overrun by sick patients, and more recently images of Russia’s invasion of the Ukraine.
Investors will no doubt always face periods of extreme volatility, but that historically has rewarded patience. During market stress, it may help to remember that for many of our 400 plus employees their single largest investment is invested alongside the Davenport Funds. To say we have a lot of “eyes” overseeing our investment process and philosophy would be an understatement. Our investment team appreciates the fiduciary responsibility we have for our clients, co-workers, families and friends. Rest assured, our passion, motivation and enthusiasm for uncovering attractive investments remains high.
Our team is always willing to share with you our thoughts and strategy and we welcome your questions and comments. Thank you again for being a fellow shareholder of our Fund(s).
Sincerely,
John P. Ackerly IV, CFA
President, The Davenport Funds
| DAVENPORT CORE FUND |
| PERFORMANCE INFORMATION (Unaudited) |
Comparison of the Change in Value of a $10,000 Investment in
Davenport Core Fund and the S&P 500® Index
| | | |
| | Average Annual Total Returns | |
| | (for periods ended March 31, 2022) | |
| | | |
| | 1 Year | | 5 Years | | 10 Years | |
| Davenport Core Fund (a) | 10.89% | | 12.91% | | 12.34% | |
| S&P 500® Index | 15.65% | | 15.99% | | 14.64% | |
| | | | | | | |
| (a) | The total returns shown do not reflect the deduction of taxes that a shareholder would pay on Fund distributions or the redemption of Fund shares. |
| DAVENPORT VALUE & INCOME FUND |
| PERFORMANCE INFORMATION (Unaudited) |
Comparison of the Change in Value of a $10,000 Investment in
Davenport Value & Income Fund, the Russell 1000® Value Index
and the Lipper Equity Income Index
| | | | | | | |
| | Average Annual Total Returns
(for periods ended March 31, 2022) | |
| | | | | | | |
| | 1 Year | | 5 Years | | 10 Years | |
| Davenport Value & Income Fund (a) | 14.24% | | 10.08% | | 11.12% | |
| Russell 1000® Value Index | 11.67% | | 10.29% | | 11.70% | |
| Lipper Equity Income Index | 13.76% | | 11.24% | | 11.29% | |
| | | | | | | |
| (a) | The total returns shown do not reflect the deduction of taxes that a shareholder would pay on Fund distributions or the redemption of Fund shares. |
| DAVENPORT EQUITY OPPORTUNITIES FUND |
| PERFORMANCE INFORMATION (Unaudited) |
Comparison of the Change in Value of a $10,000 Investment in
Davenport Equity Opportunities Fund and the Russell Midcap® Index
| | | |
| | Average Annual Total Returns | |
| | (for periods ended March 31, 2022) | |
| | | |
| | 1 Year | | 5 Years | | 10 Years | |
| Davenport Equity Opportunities Fund (a) | 6.89% | | 15.26% | | 13.10% | |
| Russell Midcap® Index | 6.92% | | 12.62% | | 12.85% | |
| | | | | | | |
| (a) | The total returns shown do not reflect the deduction of taxes that a shareholder would pay on Fund distributions or the redemption of Fund shares. |
| DAVENPORT SMALL CAP FOCUS FUND |
| PERFORMANCE INFORMATION (Unaudited) |
Comparison of the Change in Value of a $10,000 Investment in
Davenport Small Cap Focus Fund and the Russell 2000® Index
| | | | | | | |
| | Average Annual Total Returns | |
| | (for periods ended March 31, 2022) | |
| | | |
| | | | | | Since | |
| | 1 Year | | 5 Years | | Inception(b) | |
| Davenport Small Cap Focus Fund (a) | 6.85% | | 14.22% | | 12.59% | |
| Russell 2000® Index | (5.79%) | | 9.74% | | 9.19% | |
| | | | | | | |
| (a) | The total returns shown do not reflect the deduction of taxes that a shareholder would pay on Fund distributions or the redemption of Fund shares. |
| (b) | Commencement of operations was December 31, 2014. |
| DAVENPORT BALANCED INCOME FUND |
| PERFORMANCE INFORMATION (Unaudited) |
Comparison of the Change in Value of a $10,000 Investment in Davenport Balanced
Income Fund, the Russell 1000® Value Index, a Blended 60% Russell 1000® Value
Index / 40% Bloomberg Intermediate Government/Credit Bond Index
and the Morningstar US OE Allocation – 50% to 70% Equity
| | | |
| | Average Annual Total Returns | |
| | (for periods ended March 31, 2022) | |
| | | |
| | | | | | Since | |
| | 1 Year | | 5 Years | | Inception(b) | |
| Davenport Balanced Income Fund (a) | 7.50% | | 6.75% | | 7.25% | |
| Russell 1000® Value Index | 11.67% | | 10.29% | | 11.53% | |
| Blended 60% Russell 1000® Value Index / 40% Bloomberg Intermediate Government/Credit Bond Index | 5.25% | | 7.19% | | 7.91% | |
| Morningstar US OE Allocation - 50% to 70% Equity | 4.30% | | 8.12% | | 8.31% | |
| | | | | | | |
| (a) | The total returns shown do not reflect the deduction of taxes that a shareholder would pay on Fund distributions or the redemption of Fund shares. |
| (b) | Commencement of operations was December 31, 2015. |
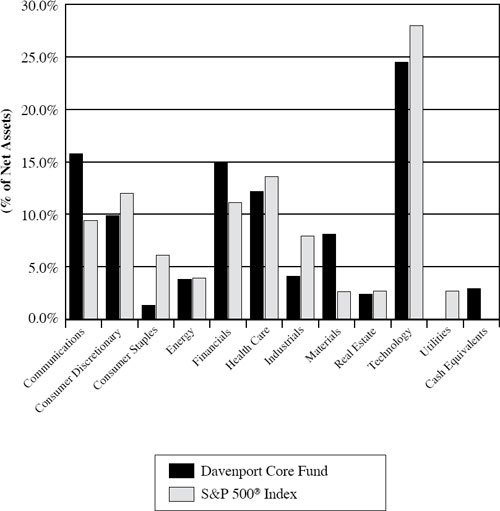
| DAVENPORT CORE FUND |
| PORTFOLIO INFORMATION |
| March 31, 2022 (Unaudited) |
Sector Allocation vs. the S&P 500® Index
Top Ten Equity Holdings
| Security Description | % of Net Assets |
| Alphabet, Inc. - Classes A and C | 5.1% |
| Pioneer Natural Resources Company | 3.8% |
| Amazon.com, Inc. | 3.6% |
| Brookfield Asset Management, Inc. - Class A | 3.6% |
| Microsoft Corporation | 3.6% |
| Markel Corporation | 3.5% |
| Danaher Corporation | 3.5% |
| Adobe, Inc. | 3.3% |
| Apple, Inc. | 3.1% |
| T-Mobile US, Inc. | 3.1% |
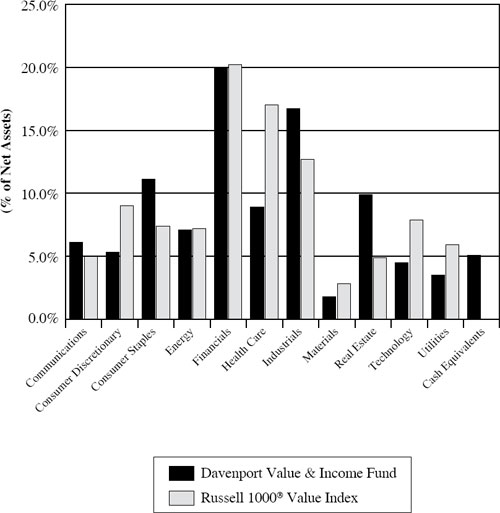
| DAVENPORT VALUE & INCOME FUND |
| PORTFOLIO INFORMATION |
| March 31, 2022 (Unaudited) |
Sector Allocation vs. the Russell 1000® Value Index
Top Ten Equity Holdings
| Security Description | % of Net Assets |
| Brookfield Asset Management, Inc. - Class A | 3.8% |
| Johnson & Johnson | 3.4% |
| Berkshire Hathaway, Inc. - Class B | 3.2% |
| Watsco, Inc. | 3.1% |
| Fairfax Financial Holdings Ltd. | 3.0% |
| United Parcel Service, Inc. - Class B | 2.9% |
| Coterra Energy, Inc. | 2.8% |
| Markel Corporation | 2.7% |
| Comcast Corporation - Class A | 2.6% |
| McDonald’s Corporation | 2.6% |
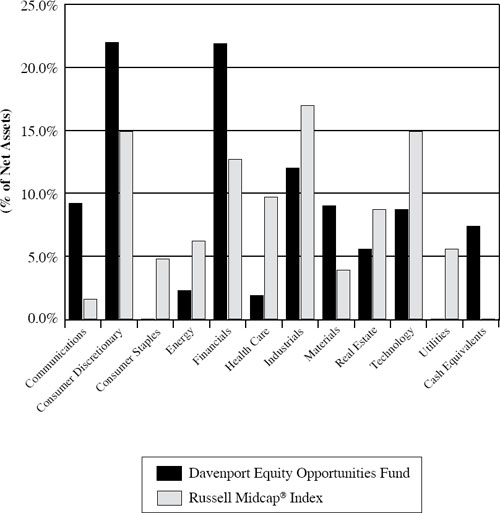
| DAVENPORT EQUITY OPPORTUNITIES FUND |
| PORTFOLIO INFORMATION |
| March 31, 2022 (Unaudited) |
Sector Allocation vs. the Russell Midcap® Index
Top Ten Equity Holdings
| Security Description | % of Net Assets |
| Markel Corporation | 6.3% |
| Brookfield Asset Management, Inc. - Class A | 6.3% |
| Fairfax Financial Holdings Ltd. | 5.9% |
| O’Reilly Automotive, Inc. | 5.1% |
| DISH Network Corporation - Class A | 5.0% |
| Take-Two Interactive Software, Inc. | 4.2% |
| Martin Marietta Materials, Inc. | 3.7% |
| Evoqua Water Technologies Corporation | 3.6% |
| Alight, Inc. - Class A | 3.5% |
| Fidelity National Financial, Inc. | 3.4% |
| DAVENPORT SMALL CAP FOCUS FUND |
| PORTFOLIO INFORMATION |
| March 31, 2022 (Unaudited) |
Sector Allocation vs. the Russell 2000® Index
Top Ten Equity Holdings
| Security Description | % of Net Assets |
| Monarch Casino & Resort, Inc. | 8.5% |
| Alight, Inc. - Class A | 5.9% |
| Cannae Holdings, Inc. | 4.0% |
| Kinsale Capital Group, Inc. | 3.8% |
| Verra Mobility Corporation | 3.8% |
| Perrigo Company plc | 3.6% |
| NewMarket Corporation | 3.6% |
| Evoqua Water Technologies Corporation | 3.5% |
| J & J Snack Foods Corporation | 3.3% |
| SL Green Realty Corporation | 3.2% |
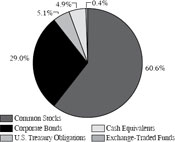
| DAVENPORT BALANCED INCOME FUND |
| PORTFOLIO INFORMATION |
| March 31, 2022 (Unaudited) |
Asset Allocation (% of Net Assets)
| Ten Largest Equity Holdings | % of Net Assets |
| Brookfield Asset Management, Inc. - Class A | 2.0% |
| SL Green Realty Corporation | 1.9% |
| Johnson & Johnson | 1.8% |
| Berkshire Hathaway, Inc. - Class B | 1.7% |
| Watsco, Inc. | 1.7% |
| Perrigo Company plc | 1.7% |
| Fairfax Financial Holdings Ltd. | 1.7% |
| United Parcel Service, Inc. - Class B | 1.6% |
| Coterra Energy, Inc. | 1.5% |
| Markel Corporation | 1.5% |
Equity Sector Concentration vs. the Russell 1000® Value Index (70.0% of Net Assets)
| Bond Portfolio (34.1% of Net Assets) | | Credit Quality | Composite Quality |
| Number of Fixed-Income Securities | 32 | | AAA | 15.0% |
| Average Quality | A- | | AA | 8.5% |
| Effective Maturity | 3.2 yrs. | | A | 29.6% |
| Average Effective Duration | 2.84 yrs. | | BBB | 46.9% |
| | | | Ba | 0.0% |
| | | | | |
| Sector Breakdown | % of Bond
Portfolio | | | |
| Communications | 6.4% | | | |
| Consumer Discretionary | 7.7% | | | |
| Consumer Staples | 3.3% | | | |
| Energy | 12.5% | | | |
| Financials | 11.1% | | | |
| Health Care | 12.4% | | | |
| Industrials | 9.6% | | | |
| Materials | 5.5% | | | |
| Real Estate | 7.5% | | | |
| Technology | 5.8% | | | |
| Utilities | 3.2% | | | |
| U.S. Treasury | 15.0% | | | |
| DAVENPORT CORE FUND |
| SCHEDULE OF INVESTMENTS |
| March 31, 2022 |
| COMMON STOCKS — 97.1% | | Shares | | | Value | |
| Communications — 15.8% | | | | | | |
| Alphabet, Inc. - Class A (a) | | | 8,290 | | | $ | 23,057,391 | |
| Alphabet, Inc. - Class C (a) | | | 7,036 | | | | 19,651,478 | |
| Booking Holdings, Inc. (a) | | | 5,669 | | | | 13,313,363 | |
| DISH Network Corporation - Class A (a) | | | 380,358 | | | | 12,038,331 | |
| Electronic Arts, Inc. | | | 100,594 | | | | 12,726,147 | |
| Meta Platforms, Inc. - Class A (a) | | | 53,477 | | | | 11,891,146 | |
| T-Mobile US, Inc. (a) | | | 201,856 | | | | 25,908,217 | |
| Walt Disney Company (The) (a) | | | 106,750 | | | | 14,641,830 | |
| | | | | | | | 133,227,903 | |
| Consumer Discretionary — 9.9% | | | | | | | | |
| Amazon.com, Inc. (a) | | | 9,449 | | | | 30,803,267 | |
| Caesars Entertainment, Inc. (a) | | | 99,877 | | | | 7,726,485 | |
| CarMax, Inc. (a) | | | 151,983 | | | | 14,663,320 | |
| Home Depot, Inc. (The) | | | 35,678 | | | | 10,679,496 | |
| TJX Companies, Inc. (The) | | | 330,596 | | | | 20,027,506 | |
| | | | | | | | 83,900,074 | |
| Consumer Staples — 1.3% | | | | | | | | |
| Constellation Brands, Inc. - Class A | | | 49,590 | | | | 11,421,569 | |
| | | | | | | | | |
| Energy — 3.8% | | | | | | | | |
| Pioneer Natural Resources Company | | | 127,162 | | | | 31,794,315 | |
| | | | | | | | | |
| Financials — 15.0% | | | | | | | | |
| Aon plc - Class A | | | 49,035 | | | | 15,967,267 | |
| Bank of America Corporation | | | 289,355 | | | | 11,927,213 | |
| Berkshire Hathaway, Inc. - Class B (a) | | | 68,270 | | | | 24,093,166 | |
| Brookfield Asset Management, Inc. - Class A | | | 542,090 | | | | 30,666,031 | |
| JPMorgan Chase & Company | | | 104,842 | | | | 14,292,061 | |
| Markel Corporation (a) | | | 20,348 | | | | 30,018,184 | |
| | | | | | | | 126,963,922 | |
| Health Care — 12.2% | | | | | | | | |
| Abbott Laboratories | | | 105,732 | | | | 12,514,440 | |
| Danaher Corporation | | | 101,875 | | | | 29,882,994 | |
| Illumina, Inc. (a) | | | 22,916 | | | | 8,006,850 | |
| Johnson & Johnson | | | 123,867 | | | | 21,952,948 | |
| Medtronic plc | | | 135,781 | | | | 15,064,902 | |
| UnitedHealth Group, Inc. | | | 30,261 | | | | 15,432,202 | |
| | | | | | | | 102,854,336 | |
| Industrials — 4.1% | | | | | | | | |
| Honeywell International, Inc. | | | 86,581 | | | | 16,846,931 | |
| Union Pacific Corporation | | | 65,908 | | | | 18,006,725 | |
| | | | | | | | 34,853,656 | |
| DAVENPORT CORE FUND |
| SCHEDULE OF INVESTMENTS (Continued) |
| COMMON STOCKS — 97.1% (Continued) | | Shares | | | Value | |
| Materials — 8.1% | | | | | | | | |
| Air Products & Chemicals, Inc. | | | 81,373 | | | $ | 20,335,926 | |
| Ball Corporation | | | 167,580 | | | | 15,082,200 | |
| Martin Marietta Materials, Inc. | | | 45,798 | | | | 17,627,192 | |
| Sherwin-Williams Company (The) | | | 62,711 | | | | 15,653,920 | |
| | | | | | | | 68,699,238 | |
| Real Estate — 2.4% | | | | | | | | |
| American Tower Corporation | | | 82,369 | | | | 20,692,740 | |
| | | | | | | | | |
| Technology — 24.5% | | | | | | | | |
| Accenture plc - Class A | | | 65,677 | | | | 22,148,255 | |
| Adobe, Inc. (a) | | | 60,470 | | | | 27,551,341 | |
| Apple, Inc. | | | 150,747 | | | | 26,321,934 | |
| Broadcom, Inc. | | | 28,113 | | | | 17,702,194 | |
| Mastercard, Inc. - Class A | | | 62,762 | | | | 22,429,883 | |
| Microsoft Corporation | | | 99,418 | | | | 30,651,564 | |
| Moody’s Corporation | | | 37,574 | | | | 12,677,843 | |
| ServiceNow, Inc. (a) | | | 23,684 | | | | 13,189,383 | |
| Sony Group Corporation - ADR | | | 157,462 | | | | 16,172,922 | |
| Visa, Inc. - Class A | | | 81,889 | | | | 18,160,523 | |
| | | | | | | | 207,005,842 | |
| | | | | | | | | |
| Total Common Stocks (Cost $478,105,253) | | | | | | $ | 821,413,595 | |
| MONEY MARKET FUNDS — 1.5% | | Shares | | | Value | |
| First American Treasury Obligations Fund - Class Z, 0.20% (b) (Cost $12,678,253) | | | 12,678,253 | | | $ | 12,678,253 | |
| | | | | | | | | |
| Total Investments at Value — 98.6% (Cost $490,783,506) | | | | | | $ | 834,091,848 | |
| | | | | | | | | |
| Other Assets in Excess of Liabilities — 1.4% | | | | | | | 11,557,955 | |
| | | | | | | | | |
| Net Assets — 100.0% | | | | | | $ | 845,649,803 | |
| ADR | - American Depositary Receipt. |
| (a) | Non-income producing security. |
| (b) | The rate shown is the 7-day effective yield as of March 31, 2022. |
See accompanying notes to financial statements.
| DAVENPORT VALUE & INCOME FUND |
| SCHEDULE OF INVESTMENTS |
| March 31, 2022 |
| COMMON STOCKS — 94.9% | | Shares | | | Value | |
| Communications — 6.1% | | | | | | |
| Alphabet, Inc. - Class A (a) | | | 6,724 | | | $ | 18,701,797 | |
| Comcast Corporation - Class A | | | 515,430 | | | | 24,132,433 | |
| Verizon Communications, Inc. | | | 267,752 | | | | 13,639,287 | |
| | | | | | | | 56,473,517 | |
| Consumer Discretionary — 5.3% | | | | | | | | |
| Cannae Holdings, Inc. (a) | | | 489,230 | | | | 11,702,382 | |
| Lowe’s Companies, Inc. | | | 64,286 | | | | 12,997,986 | |
| McDonald’s Corporation | | | 96,337 | | | | 23,822,213 | |
| | | | | | | | 48,522,581 | |
| Consumer Staples — 11.1% | | | | | | | | |
| Bunge Ltd. | | | 210,394 | | | | 23,313,759 | |
| Coca-Cola Company (The) | | | 227,120 | | | | 14,081,440 | |
| Diageo plc - ADR | | | 89,607 | | | | 18,202,766 | |
| Philip Morris International, Inc. | | | 195,455 | | | | 18,361,043 | |
| Sysco Corporation | | | 174,369 | | | | 14,237,229 | |
| Walmart, Inc. | | | 92,162 | | | | 13,724,765 | |
| | | | | | | | 101,921,002 | |
| Energy — 7.1% | | | | | | | | |
| Chevron Corporation | | | 121,084 | | | | 19,716,108 | |
| Coterra Energy, Inc. | | | 971,916 | | | | 26,212,575 | |
| Enbridge, Inc. | | | 414,682 | | | | 19,112,693 | |
| | | | | | | | 65,041,376 | |
| Financials — 20.0% | | | | | | | | |
| Berkshire Hathaway, Inc. - Class B (a) | | | 82,663 | | | | 29,172,599 | |
| Brookfield Asset Management, Inc. - Class A | | | 616,582 | | | | 34,880,044 | |
| Capital One Financial Corporation | | | 123,371 | | | | 16,197,379 | |
| Citigroup, Inc. | | | 209,478 | | | | 11,186,125 | |
| Fairfax Financial Holdings Ltd. | | | 50,803 | | | | 27,673,918 | |
| Fidelity National Financial, Inc. | | | 446,969 | | | | 21,829,966 | |
| JPMorgan Chase & Company | | | 133,326 | | | | 18,175,000 | |
| Markel Corporation (a) | | | 17,063 | | | | 25,172,020 | |
| | | | | | | | 184,287,051 | |
| Health Care — 8.9% | | | | | | | | |
| Anthem, Inc. | | | 34,246 | | | | 16,822,320 | |
| Johnson & Johnson | | | 176,436 | | | | 31,269,752 | |
| Medtronic plc | | | 164,167 | | | | 18,214,329 | |
| Perrigo Company plc | | | 397,187 | | | | 15,263,897 | |
| | | | | | | | 81,570,298 | |
| Industrials — 16.7% | | | | | | | | |
| 3M Company | | | 109,379 | | | | 16,284,346 | |
| Boeing Company (The) (a) | | | 61,469 | | | | 11,771,313 | |
| Deere & Company | | | 37,216 | | | | 15,461,759 | |
| L3Harris Technologies, Inc. | | | 61,487 | | | | 15,277,675 | |
| DAVENPORT VALUE & INCOME FUND |
| SCHEDULE OF INVESTMENTS (Continued) |
| COMMON STOCKS — 94.9% (Continued) | | Shares | | | Value | |
| Industrials — 16.7% (Continued) | | | | | | | | |
| Norfolk Southern Corporation | | | 70,618 | | | $ | 20,141,666 | |
| TE Connectivity Ltd. | | | 145,015 | | | | 18,994,065 | |
| United Parcel Service, Inc. - Class B | | | 124,506 | | | | 26,701,557 | |
| Watsco, Inc. | | | 93,891 | | | | 28,602,954 | |
| | | | | | | | 153,235,335 | |
| Materials — 1.8% | | | | | | | | |
| Newmont Corporation | | | 210,118 | | | | 16,693,875 | |
| | | | | | | | | |
| Real Estate — 9.9% | | | | | | | | |
| Crown Castle International Corporation | | | 92,736 | | | | 17,119,066 | |
| Digital Realty Trust, Inc. | | | 104,438 | | | | 14,809,308 | |
| Gaming and Leisure Properties, Inc. | | | 380,337 | | | | 17,849,215 | |
| Lamar Advertising Company - Class A | | | 192,816 | | | | 22,401,363 | |
| SL Green Realty Corporation | | | 237,885 | | | | 19,311,504 | |
| | | | | | | | 91,490,456 | |
| Technology — 4.5% | | | | | | | | |
| QUALCOMM, Inc. | | | 124,508 | | | | 19,027,313 | |
| Sony Group Corporation - ADR | | | 219,286 | | | | 22,522,865 | |
| | | | | | | | 41,550,178 | |
| Utilities — 3.5% | | | | | | | | |
| Dominion Energy, Inc. | | | 225,731 | | | | 19,180,363 | |
| NextEra Energy, Inc. | | | 152,862 | | | | 12,948,940 | |
| | | | | | | | 32,129,303 | |
| | | | | | | | | |
| Total Common Stocks (Cost $618,232,738) | | | | | | $ | 872,914,972 | |
| | | | | | | |
| MONEY MARKET FUNDS — 5.8% | | Shares | | | Value | |
| First American Treasury Obligations Fund - Class Z, 0.20% (b) (Cost $53,284,438) | | | 53,284,438 | | | $ | 53,284,438 | |
| | | | | | | | | |
| Total Investments at Value — 100.7% (Cost $671,517,176) | | | | | | $ | 926,199,410 | |
| | | | | | | | | |
| Liabilities in Excess of Other Assets — (0.7%) | | | | | | | (6,144,031 | ) |
| | | | | | | | | |
| Net Assets — 100.0% | | | | | | $ | 920,055,379 | |
| ADR | - American Depositary Receipt. |
| (a) | Non-income producing security. |
| (b) | The rate shown is the 7-day effective yield as of March 31, 2022. |
See accompanying notes to financial statements.
| DAVENPORT EQUITY OPPORTUNITIES FUND |
| SCHEDULE OF INVESTMENTS |
| March 31, 2022 |
| COMMON STOCKS — 92.6% | | Shares | | | Value | |
| Communications — 9.2% | | | | | | | | |
| DISH Network Corporation - Class A (a) | | | 1,175,074 | | | $ | 37,191,092 | |
| Take-Two Interactive Software, Inc. (a) | | | 202,893 | | | | 31,192,770 | |
| | | | | | | | 68,383,862 | |
| Consumer Discretionary — 22.0% | | | | | | | | |
| Builders FirstSource, Inc. (a) | | | 328,149 | | | | 21,178,736 | |
| Caesars Entertainment, Inc. (a) | | | 195,059 | | | | 15,089,764 | |
| Cannae Holdings, Inc. (a) | | | 1,018,253 | | | | 24,356,612 | |
| CarMax, Inc. (a) | | | 208,440 | | | | 20,110,291 | |
| DraftKings, Inc. - Class A (a) | | | 696,724 | | | | 13,565,216 | |
| Etsy, Inc. (a) | | | 95,321 | | | | 11,846,494 | |
| Live Nation Entertainment, Inc. (a) | | | 162,815 | | | | 19,153,557 | |
| O’Reilly Automotive, Inc. (a) | | | 55,633 | | | | 38,106,380 | |
| | | | | | | | 163,407,050 | |
| Energy — 2.3% | | | | | | | | |
| Coterra Energy, Inc. | | | 623,615 | | | | 16,818,897 | |
| | | | | | | | | |
| Financials — 21.9% | | | | | | | | |
| Brookfield Asset Management, Inc. - Class A | | | 821,483 | | | | 46,471,293 | |
| Fairfax Financial Holdings Ltd. | | | 80,192 | | | | 43,682,988 | |
| Fidelity National Financial, Inc. | | | 516,896 | | | | 25,245,201 | |
| Markel Corporation (a) | | | 31,953 | | | | 47,138,344 | |
| | | | | | | | 162,537,826 | |
| Health Care — 1.9% | | | | | | | | |
| Align Technology, Inc. (a) | | | 32,387 | | | | 14,120,732 | |
| | | | | | | | | |
| Industrials — 12.0% | | | | | | | | |
| Colfax Corporation (a) | | | 628,574 | | | | 25,010,960 | |
| Evoqua Water Technologies Corporation (a) | | | 565,052 | | | | 26,546,143 | |
| Watsco, Inc. | | | 72,716 | | | | 22,152,202 | |
| Xylem, Inc. | | | 176,563 | | | | 15,053,761 | |
| | | | | | | | 88,763,066 | |
| Materials — 9.0% | | | | | | | | |
| Ball Corporation | | | 216,340 | | | | 19,470,600 | |
| Martin Marietta Materials, Inc. | | | 71,088 | | | | 27,361,060 | |
| Sherwin-Williams Company (The) | | | 78,506 | | | | 19,596,668 | |
| | | | | | | | 66,428,328 | |
| Real Estate — 5.6% | | | | | | | | |
| American Tower Corporation | | | 87,022 | | | | 21,861,667 | |
| Lamar Advertising Company - Class A | | | 167,029 | | | | 19,405,429 | |
| | | | | | | | 41,267,096 | |
| DAVENPORT EQUITY OPPORTUNITIES FUND |
| SCHEDULE OF INVESTMENTS (Continued) |
| COMMON STOCKS — 92.6% (Continued) | | Shares | | | Value | |
| Technology — 8.7% | | | | | | |
| Alight, Inc. - Class A (a) | | | 2,626,120 | | | $ | 26,129,894 | |
| Autodesk, Inc. (a) | | | 88,206 | | | | 18,906,956 | |
| Black Knight, Inc. (a) | | | 340,534 | | | | 19,747,567 | |
| | | | | | | | 64,784,417 | |
| | | | | | | | | |
| Total Common Stocks (Cost $511,143,607) | | | | | | $ | 686,511,274 | |
| | | | | | | | | |
| MONEY MARKET FUNDS — 7.4% | | Shares | | | Value | |
| First American Treasury Obligations Fund - Class Z, 0.20% (b) (Cost $54,617,080) | | | 54,617,080 | | | $ | 54,617,080 | |
| | | | | | | | | |
| Total Investments at Value — 100.0% (Cost $565,760,687) | | | | | | $ | 741,128,354 | |
| | | | | | | | | |
| Other Assets in Excess of Liabilities — 0.0% (c) | | | | | | | 367,396 | |
| | | | | | | | | |
| Net Assets — 100.0% | | | | | | $ | 741,495,750 | |
| (a) | Non-income producing security. |
| (b) | The rate shown is the 7-day effective yield as of March 31, 2022. |
| (c) | Percentage rounds to less than 0.1%. |
See accompanying notes to financial statements.
| DAVENPORT SMALL CAP FOCUS FUND |
| SCHEDULE OF INVESTMENTS |
| March 31, 2022 |
| COMMON STOCKS — 92.5% | | Shares | | | Value | |
| Communications — 9.1% | | | | | | |
| Liberty Latin America Ltd. - Class C (a) | | | 1,943,882 | | | $ | 18,641,828 | |
| Shenandoah Telecommunications Company | | | 796,446 | | | | 18,780,197 | |
| Switch, Inc. - Class A | | | 514,445 | | | | 15,855,195 | |
| | | | | | | | 53,277,220 | |
| Consumer Discretionary — 16.9% | | | | | | | | |
| Cannae Holdings, Inc. (a) | | | 993,964 | | | | 23,775,619 | |
| Hanesbrands, Inc. | | | 994,359 | | | | 14,806,005 | |
| Monarch Casino & Resort, Inc. (a) | | | 569,375 | | | | 49,666,581 | |
| OneSpaWorld Holdings Ltd. (a) | | | 1,058,343 | | | | 10,795,099 | |
| | | | | | | | 99,043,304 | |
| Consumer Staples — 8.7% | | | | | | | | |
| Boston Beer Company, Inc. (The) - Class A (a) | | | 39,703 | | | | 15,423,424 | |
| J & J Snack Foods Corporation | | | 125,940 | | | | 19,533,294 | |
| Seaboard Corporation | | | 3,818 | | | | 16,056,561 | |
| | | | | | | | 51,013,279 | |
| Energy — 2.3% | | | | | | | | |
| Archaea Energy, Inc. - Class A (a) | | | 623,447 | | | | 13,672,193 | |
| | | | | | | | | |
| Financials — 16.2% | | | | | | | | |
| BRP Group, Inc. - Class A (a) | | | 557,964 | | | | 14,970,174 | |
| Diamond Hill Investment Group, Inc. | | | 94,329 | | | | 17,667,822 | |
| Kinsale Capital Group, Inc. | | | 98,440 | | | | 22,446,289 | |
| Live Oak Bancshares, Inc. | | | 213,431 | | | | 10,861,504 | |
| Stewart Information Services Corporation | | | 312,595 | | | | 18,946,383 | |
| TowneBank | | | 342,158 | | | | 10,244,210 | |
| | | | | | | | 95,136,382 | |
| Health Care — 3.6% | | | | | | | | |
| Perrigo Company plc | | | 553,756 | | | | 21,280,843 | |
| | | | | | | | | |
| Industrials — 9.5% | | | | | | | | |
| Chart Industries, Inc. (a) | | | 95,576 | | | | 16,417,090 | |
| Colfax Corporation (a) | | | 477,475 | | | | 18,998,730 | |
| Evoqua Water Technologies Corporation (a) | | | 434,783 | | | | 20,426,105 | |
| | | | | | | | 55,841,925 | |
| Materials — 3.6% | | | | | | | | |
| NewMarket Corporation | | | 64,445 | | | | 20,904,669 | |
| | | | | | | | | |
| Real Estate — 10.2% | | | | | | | | |
| FRP Holdings, Inc. (a) | | | 121,491 | | | | 7,022,180 | |
| Janus International Group, Inc. (a) | | | 1,936,787 | | | | 17,431,083 | |
| Lamar Advertising Company - Class A | | | 96,499 | | | | 11,211,254 | |
| Radius Global Infrastructure, Inc. - Class A (a) | | | 370,136 | | | | 5,285,542 | |
| SL Green Realty Corporation | | | 234,225 | | | | 19,014,385 | |
| | | | | | | | 59,964,444 | |
| DAVENPORT SMALL CAP FOCUS FUND |
| SCHEDULE OF INVESTMENTS (Continued) |
| COMMON STOCKS — 92.5% (Continued) | | Shares | | | Value | |
| Technology — 12.4% | | | | | | |
| Alight, Inc. - Class A (a) | | | 3,461,285 | | | $ | 34,439,785 | |
| Avid Technology, Inc. (a) | | | 475,394 | | | | 16,576,989 | |
| Verra Mobility Corporation (a) | | | 1,357,496 | | | | 22,100,035 | |
| | | | | | | | 73,116,809 | |
| | | | | | | | | |
| Total Common Stocks (Cost $484,885,938) | | | | | | $ | 543,251,068 | |
| | | | | | | | | |
| MONEY MARKET FUNDS — 7.7% | | Shares | | | Value | |
| First American Treasury Obligations Fund - Class Z, 0.20% (b) (Cost $45,294,136) | | | 45,294,136 | | | $ | 45,294,136 | |
| | | | | | | | | |
| Total Investments at Value — 100.2% (Cost $530,180,074) | | | | | | $ | 588,545,204 | |
| | | | | | | | | |
| Liabilities in Excess of Other Assets — (0.2%) | | | | | | | (977,630 | ) |
| | | | | | | | | |
| Net Assets — 100.0% | | | | | | $ | 587,567,574 | |
| (a) | Non-income producing security. |
| (b) | The rate shown is the 7-day effective yield as of March 31, 2022. |
See accompanying notes to financial statements.
| DAVENPORT BALANCED INCOME FUND |
| SCHEDULE OF INVESTMENTS |
| March 31, 2022 |
| COMMON STOCKS — 60.6% | | Shares | | | Value | |
| Communications — 3.3% | | | | | | |
| Alphabet, Inc. - Class A (a) | | | 925 | | | $ | 2,572,749 | |
| Comcast Corporation - Class A | | | 69,945 | | | | 3,274,825 | |
| Verizon Communications, Inc. | | | 36,308 | | | | 1,849,529 | |
| | | | | | | | 7,697,103 | |
| Consumer Discretionary — 4.0% | | | | | | | | |
| Cannae Holdings, Inc. (a) | | | 117,411 | | | | 2,808,471 | |
| Hanesbrands, Inc. | | | 112,905 | | | | 1,681,155 | |
| Lowe’s Companies, Inc. | | | 8,846 | | | | 1,788,573 | |
| McDonald’s Corporation | | | 12,996 | | | | 3,213,651 | |
| | | | | | | | 9,491,850 | |
| Consumer Staples — 6.4% | | | | | | | | |
| Bunge Ltd. | | | 28,367 | | | | 3,143,347 | |
| Coca-Cola Company (The) | | | 31,604 | | | | 1,959,448 | |
| Diageo plc - ADR | | | 12,545 | | | | 2,548,391 | |
| Ingredion, Inc. | | | 13,155 | | | | 1,146,458 | |
| Philip Morris International, Inc. | | | 27,471 | | | | 2,580,626 | |
| Sysco Corporation | | | 23,135 | | | | 1,888,973 | |
| Walmart, Inc. | | | 12,557 | | | | 1,869,989 | |
| | | | | | | | 15,137,232 | |
| Energy — 4.8% | | | | | | | | |
| Chevron Corporation | | | 16,932 | | | | 2,757,038 | |
| Coterra Energy, Inc. | | | 132,019 | | | | 3,560,552 | |
| Enbridge, Inc. | | | 57,275 | | | | 2,639,805 | |
| Enterprise Products Partners, L.P. | | | 87,000 | | | | 2,245,470 | |
| | | | | | | | 11,202,865 | |
| Financials — 13.0% | | | | | | | | |
| Berkshire Hathaway, Inc. - Class B (a) | | | 11,473 | | | | 4,048,936 | |
| Brookfield Asset Management, Inc. - Class A | | | 84,137 | | | | 4,759,630 | |
| Capital One Financial Corporation | | | 16,976 | | | | 2,228,779 | |
| Citigroup, Inc. | | | 27,793 | | | | 1,484,146 | |
| Diamond Hill Investment Group, Inc. | | | 11,715 | | | | 2,194,220 | |
| Fairfax Financial Holdings Ltd. | | | 7,238 | | | | 3,942,756 | |
| Fidelity National Financial, Inc. | | | 59,303 | | | | 2,896,359 | |
| JPMorgan Chase & Company | | | 18,345 | | | | 2,500,790 | |
| Markel Corporation (a) | | | 2,366 | | | | 3,490,418 | |
| Stewart Information Services Corporation | | | 50,417 | | | | 3,055,774 | |
| | | | | | | | 30,601,808 | |
| Health Care — 5.5% | | | | | | | | |
| Anthem, Inc. | | | 4,673 | | | | 2,295,471 | |
| Johnson & Johnson | | | 24,021 | | | | 4,257,242 | |
| Medtronic plc | | | 22,304 | | | | 2,474,629 | |
| Perrigo Company plc | | | 103,191 | | | | 3,965,630 | |
| | | | | | | | 12,992,972 | |
| DAVENPORT BALANCED INCOME FUND |
| SCHEDULE OF INVESTMENTS (Continued) |
| COMMON STOCKS — 60.6% (Continued) | | Shares | | | Value | |
| Industrials — 8.9% | | | | | | |
| 3M Company | | | 15,092 | | | $ | 2,246,897 | |
| Boeing Company (The) (a) | | | 8,332 | | | | 1,595,578 | |
| Deere & Company | | | 5,099 | | | | 2,118,431 | |
| L3Harris Technologies, Inc. | | | 8,270 | | | | 2,054,847 | |
| Norfolk Southern Corporation | | | 9,678 | | | | 2,760,359 | |
| TE Connectivity Ltd. | | | 19,630 | | | | 2,571,137 | |
| United Parcel Service, Inc. - Class B | | | 17,565 | | | | 3,766,990 | |
| Watsco, Inc. | | | 13,056 | | | | 3,977,380 | |
| | | | | | | | 21,091,619 | |
| Materials — 1.9% | | | | | | | | |
| NewMarket Corporation | | | 6,465 | | | | 2,097,117 | |
| Newmont Corporation | | | 28,611 | | | | 2,273,144 | |
| | | | | | | | 4,370,261 | |
| Real Estate — 6.1% | | | | | | | | |
| Crown Castle International Corporation | | | 12,840 | | | | 2,370,264 | |
| Digital Realty Trust, Inc. | | | 13,709 | | | | 1,943,936 | |
| Gaming and Leisure Properties, Inc. | | | 53,117 | | | | 2,492,781 | |
| Lamar Advertising Company - Class A | | | 26,732 | | | | 3,105,724 | |
| SL Green Realty Corporation | | | 56,541 | | | | 4,589,998 | |
| | | | | | | | 14,502,703 | |
| Technology — 2.4% | | | | | | | | |
| QUALCOMM, Inc. | | | 17,205 | | | | 2,629,268 | |
| Sony Group Corporation - ADR | | | 30,174 | | | | 3,099,171 | |
| | | | | | | | 5,728,439 | |
| Utilities — 4.3% | | | | | | | | |
| Brookfield Infrastructure Partners, L.P. | | | 41,245 | | | | 2,731,656 | |
| Brookfield Renewable Partners, L.P. | | | 76,999 | | | | 3,162,349 | |
| Dominion Energy, Inc. | | | 30,720 | | | | 2,610,278 | |
| NextEra Energy, Inc. | | | 20,584 | | | | 1,743,671 | |
| | | | | | | | 10,247,954 | |
| | | | | | | | | |
| Total Common Stocks (Cost $107,211,211) | | | | | | $ | 143,064,806 | |
| | | | | | | | | |
| EXCHANGE-TRADED FUNDS — 0.4% | | Shares | | | Value | |
| Utilities Select Sector SPDR Fund (The) (Cost $656,257) | | | 13,027 | | | $ | 969,991 | |
| DAVENPORT BALANCED INCOME FUND |
| SCHEDULE OF INVESTMENTS (Continued) |
| FIXED RATE CORPORATE BONDS — 27.5% | | Par Value | | | Value | |
| Communications — 2.2% | | | | | | |
| AT&T, Inc., 0.90%, due 03/25/2024 | | $ | 2,655,000 | | | $ | 2,571,994 | |
| Walt Disney Company (The), 3.35%, due 03/24/2025 | | | 2,505,000 | | | | 2,542,740 | |
| | | | | | | | 5,114,734 | |
| Consumer Discretionary — 2.6% | | | | | | | | |
| Amazon.com, Inc., 1.00%, due 05/12/2026 | | | 3,250,000 | | | | 3,050,360 | |
| General Motors Financial Company, Inc, 1.50%, due 06/10/2026 | | | 3,425,000 | | | | 3,134,557 | |
| | | | | | | | 6,184,917 | |
| Consumer Staples — 1.1% | | | | | | | | |
| Walmart, Inc., 1.05%, due 09/17/2026 | | | 2,835,000 | | | | 2,639,338 | |
| | | | | | | | | |
| Energy — 2.8% | | | | | | | | |
| Boardwalk Pipelines, L.P., 4.45%, due 07/15/2027 | | | 2,200,000 | | | | 2,247,802 | |
| Halliburton Company, 3.80%, due 11/15/2025 | | | 937,000 | | | | 958,064 | |
| MPLX, L.P., 4.13%, due 03/01/2027 | | | 3,250,000 | | | | 3,327,939 | |
| | | | | | | | 6,533,805 | |
| Financials — 3.8% | | | | | | | | |
| BlackRock, Inc., 3.50%, due 03/18/2024 | | | 1,150,000 | | | | 1,174,015 | |
| Brookfield Finance, Inc., 4.00%, due 04/01/2024 | | | 2,000,000 | | | | 2,031,439 | |
| Charles Schwab Corporation, 0.55%, due 03/18/2024 | | | 3,450,000 | | | | 3,440,460 | |
| Citigroup, Inc., 3.30%, due 04/27/2025 | | | 2,250,000 | | | | 2,268,032 | |
| | | | | | | | 8,913,946 | |
| Health Care — 4.2% | | | | | | | | |
| Amgen, Inc., 2.20%, due 02/21/2027 | | | 2,400,000 | | | | 2,314,538 | |
| CVS Health Corporation, 3.00%, due 08/15/2026 | | | 2,600,000 | | | | 2,582,137 | |
| McKesson Corporation, 1.30%, due 08/15/2026 | | | 2,490,000 | | | | 2,289,098 | |
| Styker Corporation, 1.15%, due 06/15/2025 | | | 2,990,000 | | | | 2,814,035 | |
| | | | | | | | 9,999,808 | |
| Industrials — 3.3% | | | | | | | | |
| Canadian Pacific Railway Ltd., 1.35%, due 12/02/2024 | | | 3,490,000 | | | | 3,349,497 | |
| John Deere Capital Corporation, | | | | | | | | |
| 2.60%, due 2024-03-07 | | | 2,400,000 | | | | 2,407,645 | |
| 0.61%, due 2025-03-07 | | | 1,990,000 | | | | 1,997,415 | |
| | | | | | | | 7,754,557 | |
| Materials — 1.9% | | | | | | | | |
| DowDuPont, Inc., 4.21%, due 11/15/2023 | | | 2,000,000 | | | | 2,047,720 | |
| Sherwin-Williams Company (The), 3.45%, due 06/01/2027 | | | 2,400,000 | | | | 2,408,861 | |
| | | | | | | | 4,456,581 | |
| Real Estate — 2.5% | | | | | | | | |
| American Tower Corporation, 1.45%, due 09/15/2026 | | | 2,990,000 | | | | 2,731,713 | |
| Public Storage, 1.50%, due 11/09/2026 | | | 3,490,000 | | | | 3,272,968 | |
| | | | | | | | 6,004,681 | |
| DAVENPORT BALANCED INCOME FUND |
| SCHEDULE OF INVESTMENTS (Continued) |
| FIXED RATE CORPORATE BONDS — 27.5% (Continued) | | Par Value | | | Value | |
| Technology — 2.0% | | | | | | |
| Fiserv, Inc., 3.20%, due 07/01/2026 | | $ | 2,325,000 | | | $ | 2,315,914 | |
| PayPal Holdings, Inc., 2.40%, due 10/01/2024 | | | 2,400,000 | | | | 2,393,359 | |
| | | | | | | | 4,709,273 | |
| Utilities — 1.1% | | | | | | | | |
| Dominion Energy, Inc., 1.45%, due 04/15/2026 | | | 2,740,000 | | | | 2,550,856 | |
| | | | | | | | | |
| Total Fixed Rate Corporate Bonds (Cost $67,395,198) | | | | | | $ | 64,862,496 | |
| | | | | | | | | |
| VARIABLE RATE CORPORATE BONDS (b) — 1.5% | | Par Value | | | Value | |
| Energy — 1.5% | | | | | | |
| BP Capital Markets plc, 1.58%, | | | | | | | | |
| (3MO LIBOR + 65), due 09/19/2022 | | $ | 1,750,000 | | | $ | 1,750,962 | |
| ConocoPhillips Company, 1.41%, | | | | | | | | |
| (3MO LIBOR + 90), due 05/15/2022 | | | 1,750,000 | | | | 1,751,817 | |
| Total Variable Rate Corporate Bonds (Cost $3,502,837) | | | | | | $ | 3,502,779 | |
| | | | | | | |
| U.S. TREASURY OBLIGATIONS — 5.1% | | Par Value | | | Value | |
| U.S. Treasury Notes — 5.1% | | | | | | | | |
| 0.466%, due 01/31/2024 | | $ | 990,000 | | | $ | 991,040 | |
| 1.5%, due 02/29/2024 | | | 1,995,000 | | | | 1,967,335 | |
| 0.25%, due 06/15/2024 | | | 4,500,000 | | | | 4,294,863 | |
| 2.75%, due 06/30/2025 | | | 4,810,000 | | | | 4,846,827 | |
| Total U.S. Treasury Obligations (Cost $12,253,696) | | | | | | $ | 12,100,065 | |
| DAVENPORT BALANCED INCOME FUND | |
| SCHEDULE OF INVESTMENTS (Continued) | |
| MONEY MARKET FUNDS — 4.9% | | Shares | | | Value | |
| First American Treasury Obligations Fund - Class Z, 0.01% (c) (Cost $11,653,577) | | | 11,653,577 | | | $ | 11,653,577 | |
| | | | | | | | | |
| Total Investments at Value — 100.0% (Cost $202,672,776) | | | | | | $ | 236,153,714 | |
| | | | | | | | | |
| Other Assets in Excess of Liabilities — 0.0% (d) | | | | | | | 105,070 | |
| | | | | | | | | |
| Net Assets — 100.0% | | | | | | $ | 236,258,784 | |
ADR - American Depositary Receipt.
LIBOR - London Interbank Offered Rate.
| (a) | Non-income producing security. |
| (b) | Variable rate security. Interest rate resets periodically. The rate shown is the effective interest rate as of March 31, 2022. The reference rate and spread (in basis points) are indicated parenthetically. |
| (c) | The rate shown is the 7-day effective yield as of March 31, 2022. |
| (d) | Percentage rounds to less than 0.1%. |
See accompanying notes to financial statements.
| THE DAVENPORT FUNDS |
| STATEMENTS OF ASSETS AND LIABILITIES |
| March 31, 2022 |
| | | | | | Davenport | | | Davenport | |
| | | Davenport | | | Value & | | | Equity | |
| | | Core | | | Income | | | Opportunities | |
| | | Fund | | | Fund | | | Fund | |
| ASSETS | | | | | | | | | | | | |
| Investments in securities: | | | | | | | | | | | | |
| At cost | | $ | 490,783,506 | | | $ | 671,517,176 | | | $ | 565,760,687 | |
| At value (Note 2) | | $ | 834,091,848 | | | $ | 926,199,410 | | | $ | 741,128,354 | |
| Cash | | | 12,231,601 | | | | 73,373 | | | | 97,756 | |
| Receivable for capital shares sold | | | 628,032 | | | | 1,190,400 | | | | 1,000,183 | |
| Dividends receivable | | | 280,756 | | | | 866,207 | | | | 552 | |
| Other assets | | | 16,595 | | | | 15,636 | | | | 15,636 | |
| TOTAL ASSETS | | | 847,248,832 | | | | 928,345,026 | | | | 742,242,481 | |
| | | | | | | | | | | | | |
| LIABILITIES | | | | | | | | | | | | |
| Payable for capital shares redeemed | | | 998,170 | | | | 60,134 | | | | 204,744 | |
| Payable investment securities purchased | | | — | | | | 7,575,861 | | | | — | |
| Accrued investment advisory fees (Note 4) | | | 522,289 | | | | 571,542 | | | | 463,087 | |
| Payable to administrator (Note 4) | | | 62,730 | | | | 67,750 | | | | 60,350 | |
| Other accrued expenses | | | 15,840 | | | | 14,360 | | | | 18,550 | |
| TOTAL LIABILITIES | | | 1,599,029 | | | | 8,289,647 | | | | 746,731 | |
| | | | | | | | | | | | | |
| NET ASSETS | | $ | 845,649,803 | | | $ | 920,055,379 | | | $ | 741,495,750 | |
| | | | | | | | | | | | | |
| Net assets consist of: | | | | | | | | | | | | |
| Paid-in capital | | $ | 473,702,236 | | | $ | 642,326,547 | | | $ | 525,584,108 | |
| Distributable earnings | | | 371,947,567 | | | | 277,728,832 | | | | 215,911,642 | |
| Net assets | | $ | 845,649,803 | | | $ | 920,055,379 | | | $ | 741,495,750 | |
| | | | | | | | | | | | | |
| Shares of beneficial interest outstanding (unlimited number of shares authorized, $0.01 par value) | | | 26,354,488 | | | | 45,347,178 | | | | 31,499,657 | |
| | | | | | | | | | | | | |
| Net asset value, offering price and redemption price per share (Note 2) | | $ | 32.09 | | | $ | 20.29 | | | $ | 23.54 | |
See accompanying notes to financial statements.
| THE DAVENPORT FUNDS |
| STATEMENTS OF ASSETS AND LIABILITIES (Continued) |
| March 31, 2022 |
| | | Davenport | | | Davenport | |
| | | Small Cap | | | Balanced | |
| | | Focus | | | Income | |
| | | Fund | | | Fund | |
| ASSETS | | | | | | | | |
| Investments in securities: | | | | | | | | |
| At cost | | $ | 530,180,074 | | | $ | 202,672,776 | |
| At value (Note 2) | | $ | 588,545,204 | | | $ | 236,153,714 | |
| Cash | | | — | | | | 52,059 | |
| Receivable for capital shares sold | | | 508,147 | | | | 266,576 | |
| Dividends and interest receivable | | | 356,641 | | | | 546,680 | |
| Other assets | | | 14,795 | | | | 11,045 | |
| TOTAL ASSETS | | | 589,424,787 | | | | 237,030,074 | |
| | | | | | | | | |
| LIABILITIES | | | | | | | | |
| Payable for capital shares redeemed | | | 182,483 | | | | 45,125 | |
| Payable investment securities purchased | | | 1,240,452 | | | | 546,307 | |
| Accrued investment advisory fees (Note 4) | | | 365,308 | | | | 148,803 | |
| Payable to administrator (Note 4) | | | 49,820 | | | | 23,110 | |
| Other accrued expenses | | | 19,150 | | | | 7,945 | |
| TOTAL LIABILITIES | | | 1,857,213 | | | | 771,290 | |
| | | | | | | | | |
| NET ASSETS | | $ | 587,567,574 | | | $ | 236,258,784 | |
| | | | | | | | | |
| Net assets consist of: | | | | | | | | |
| Paid-in capital | | $ | 500,688,825 | | | $ | 197,289,907 | |
| Distributable earnings | | | 86,878,749 | | | | 38,968,877 | |
| Net assets | | $ | 587,567,574 | | | $ | 236,258,784 | |
| | | | | | | | | |
| Shares of beneficial interest outstanding (unlimited number of shares authorized, $0.01 par value) | | | 32,912,356 | | | | 17,353,258 | |
| | | | | | | | | |
| Net asset value, offering price and redemption price per share (Note 2) | | $ | 17.85 | | | $ | 13.61 | |
See accompanying notes to financial statements.
| THE DAVENPORT FUNDS |
| STATEMENTS OF OPERATIONS |
| Year Ended March 31, 2022 |
| | | | | | Davenport | | | Davenport | |
| | | Davenport | | | Value & | | | Equity | |
| | | Core | | | Income | | | Opportunities | |
| | | Fund | | | Fund | | | Fund | |
| INVESTMENT INCOME | | | | | | | | | | | | |
| Dividends | | $ | 7,644,435 | | | $ | 20,596,945 | | | $ | 5,199,048 | |
| Foreign withholding taxes on dividends | | | (95,645 | ) | | | (432,616 | ) | | | (229,516 | ) |
| TOTAL INVESTMENT INCOME | | | 7,548,790 | | | | 20,164,329 | | | | 4,969,532 | |
| | | | | | | | | | | | | |
| EXPENSES | | | | | | | | | | | | |
| Investment advisory fees (Note 4) | | | 6,292,524 | | | | 6,519,483 | | | | 5,554,210 | |
| Administration fees (Note 4) | | | 717,820 | | | | 750,819 | | | | 683,886 | |
| Custodian and bank service fees | | | 45,126 | | | | 46,629 | | | | 40,117 | |
| Registration and filing fees | | | 39,891 | | | | 37,214 | | | | 43,851 | |
| Compliance service fees (Note 4) | | | 32,658 | | | | 33,665 | | | | 29,348 | |
| Postage and supplies | | | 21,804 | | | | 23,963 | | | | 23,139 | |
| Trustees’ fees (Note 4) | | | 16,500 | | | | 16,500 | | | | 16,500 | |
| Audit and tax services fees | | | 16,460 | | | | 16,460 | | | | 16,460 | |
| Insurance expense | | | 12,271 | | | | 13,064 | | | | 10,900 | |
| Printing of shareholder reports | | | 6,447 | | | | 6,596 | | | | 6,627 | |
| Legal fees | | | 4,812 | | | | 4,812 | | | | 4,812 | |
| Other expenses | | | 9,347 | | | | 9,644 | | | | 8,444 | |
| TOTAL EXPENSES | | | 7,215,660 | | | | 7,478,849 | | | | 6,438,294 | |
| | | | | | | | | | | | | |
| NET INVESTMENT INCOME (LOSS) | | | 333,130 | | | | 12,685,480 | | | | (1,468,762 | ) |
| | | | | | | | | | | | | |
| REALIZED AND UNREALIZED GAINS (LOSSES) ON INVESTMENTS AND FOREIGN CURRENCIES | | | | | | | | | | | | |
| Net realized gains (losses) from: | | | | | | | | | | | | |
| Investments | | | 67,370,002 | | | | 38,935,093 | | | | 91,925,124 | |
| Foreign currency transactions | | | — | | | | (4,099 | ) | | | — | |
| Net change in unrealized appreciation (depreciation) on investments | | | 14,484,307 | | | | 61,409,599 | | | | (46,165,311 | ) |
| NET REALIZED AND UNREALIZED GAINS ON INVESTMENTS AND FOREIGN CURRENCIES | | | 81,854,309 | | | | 100,340,593 | | | | 45,759,813 | |
| | | | | | | | | | | | | |
| NET INCREASE IN NET ASSETS FROM OPERATIONS | | $ | 82,187,439 | | | $ | 113,026,073 | | | $ | 44,291,051 | |
See accompanying notes to financial statements.
| THE DAVENPORT FUNDS |
| STATEMENTS OF OPERATIONS (Continued) |
| Year Ended March 31, 2022 |
| | | Davenport | | | Davenport | |
| | | Small Cap | | | Balanced | |
| | | Focus | | | Income | |
| | | Fund | | | Fund | |
| INVESTMENT INCOME | | | | | | | | |
| Dividends | | $ | 7,548,897 | | | $ | 3,826,161 | |
| Foreign withholding taxes on dividends | | | — | | | | (71,545 | ) |
| Interest | | | — | | | | 1,332,114 | |
| TOTAL INVESTMENT INCOME | | | 7,548,897 | | | | 5,086,730 | |
| | | | | | | | | |
| EXPENSES | | | | | | | | |
| Investment advisory fees (Note 4) | | | 4,116,953 | | | | 1,630,864 | |
| Administration fees (Note 4) | | | 544,973 | | | | 242,492 | |
| Registration and filing fees | | | 47,871 | | | | 32,048 | |
| Custodian and bank services fees | | | 32,693 | | | | 13,227 | |
| Audit and tax services fees | | | 16,460 | | | | 17,960 | |
| Compliance service fees (Note 4) | | | 23,065 | | | | 11,322 | |
| Trustees’ fees (Note 4) | | | 16,500 | | | | 16,500 | |
| Postage and supplies | | | 19,646 | | | | 8,140 | |
| Insurance expense | | | 8,214 | | | | 3,834 | |
| Printing of shareholder reports | | | 5,469 | | | | 4,746 | |
| Legal fees | | | 4,812 | | | | 4,812 | |
| Other expenses | | | 9,774 | | | | 12,811 | |
| TOTAL EXPENSES | | | 4,846,430 | | | | 1,998,756 | |
| | | | | | | | | |
| NET INVESTMENT INCOME | | | 2,702,467 | | | | 3,087,974 | |
| | | | | | | | | |
| REALIZED AND UNREALIZED GAINS (LOSSES) ON INVESTMENTS AND FOREIGN CURRENCIES | | | | | | | | |
| Net realized gains (losses) from: | | | | | | | | |
| Investments | | | 75,763,509 | | | | 7,678,961 | |
| Foreign currency transactions | | | — | | | | (566 | ) |
| Net change in unrealized appreciation (depreciation) on investments | | | (43,480,747 | ) | | | 4,308,416 | |
| NET REALIZED AND UNREALIZED GAINS ON INVESTMENTS AND FOREIGN CURRENCIES | | | 32,282,762 | | | | 11,986,811 | |
| | | | | | | | | |
| NET INCREASE IN NET ASSETS FROM OPERATIONS | | $ | 34,985,229 | | | $ | 15,074,785 | |
See accompanying notes to financial statements.
| DAVENPORT CORE FUND |
| STATEMENTS OF CHANGES IN NET ASSETS |
| | | Year | | | Year | |
| | | Ended | | | Ended | |
| | | March 31, | | | March 31, | |
| | | 2022 | | | 2021 | |
| FROM OPERATIONS | | | | | | | | |
| Net investment income | | $ | 333,130 | | | $ | 1,083,134 | |
| Net realized gains from investment transactions | | | 67,370,002 | | | | 51,936,626 | |
| Net change in unrealized appreciation (depreciation) on investments | | | 14,484,307 | | | | 185,517,997 | |
| Net increase in net assets from operations | | | 82,187,439 | | | | 238,537,757 | |
| | | | | | | | | |
| DISTRIBUTIONS TO SHAREHOLDERS (Note 2) | | | (68,467,730 | ) | | | (7,580,285 | ) |
| | | | | | | | | |
| FROM CAPITAL SHARE TRANSACTIONS | | | | | | | | |
| Proceeds from shares sold | | | 67,141,323 | | | | 81,704,747 | |
| Net asset value of shares issued in reinvestment of distributions to shareholders | | | 64,819,874 | | | | 7,144,032 | |
| Payments for shares redeemed | | | (56,080,855 | ) | | | (50,325,007 | ) |
| Net increase in net assets from capital share transactions | | | 75,880,342 | | | | 38,523,772 | |
| | | | | | | | | |
| TOTAL INCREASE IN NET ASSETS | | | 89,600,051 | | | | 269,481,244 | |
| | | | | | | | | |
| NET ASSETS | | | | | | | | |
| Beginning of year | | | 756,049,752 | | | | 486,568,508 | |
| End of year | | $ | 845,649,803 | | | $ | 756,049,752 | |
| | | | | | | | | |
| CAPITAL SHARE ACTIVITY | | | | | | | | |
| Shares sold | | | 2,023,456 | | | | 2,916,187 | |
| Shares reinvested | | | 2,003,986 | | | | 245,190 | |
| Shares redeemed | | | (1,693,215 | ) | | | (1,798,302 | ) |
| Net increase in shares outstanding | | | 2,334,227 | | | | 1,363,075 | |
| Shares outstanding at beginning of year | | | 24,020,261 | | | | 22,657,186 | |
| Shares outstanding at end of year | | | 26,354,488 | | | | 24,020,261 | |
See accompanying notes to financial statements.
| DAVENPORT VALUE & INCOME FUND |
| STATEMENTS OF CHANGES IN NET ASSETS |
| | | Year | | | Year | |
| | | Ended | | | Ended | |
| | | March 31, | | | March 31, | |
| | | 2022 | | | 2021 | |
| FROM OPERATIONS | | | | | | | | |
| Net investment income | | $ | 12,685,480 | | | $ | 11,924,205 | |
| Net realized gains (losses) from: | | | | | | | | |
| Investments | | | 38,935,093 | | | | 9,866,725 | |
| Foreign currency transactions | | | (4,099 | ) | | | 9,661 | |
| Net change in unrealized appreciation (depreciation) on investments | | | 61,409,599 | | | | 242,664,502 | |
| Net increase in net assets from operations | | | 113,026,073 | | | | 264,465,093 | |
| | | | | | | | | |
| DISTRIBUTIONS TO SHAREHOLDERS (Note 2) | | | (38,881,727 | ) | | | (30,159,305 | ) |
| | | | | | | | | |
| FROM CAPITAL SHARE TRANSACTIONS | | | | | | | | |
| Proceeds from shares sold | | | 77,470,391 | | | | 55,557,815 | |
| Net asset value of shares issued in reinvestment of distributions to shareholders | | | 35,920,894 | | | | 27,765,720 | |
| Payments for shares redeemed | | | (57,132,094 | ) | | | (77,089,040 | ) |
| Net increase in net assets from capital share transactions | | | 56,259,191 | | | | 6,234,495 | |
| | | | | | | | | |
| TOTAL INCREASE IN NET ASSETS | | | 130,403,537 | | | | 240,540,283 | |
| | | | | | | | | |
| NET ASSETS | | | | | | | | |
| Beginning of year | | | 789,651,842 | | | | 549,111,559 | |
| End of year | | $ | 920,055,379 | | | $ | 789,651,842 | |
| | | | | | | | | |
| CAPITAL SHARE ACTIVITY | | | | | | | | |
| Shares sold | | | 3,906,031 | | | | 3,396,437 | |
| Shares reinvested | | | 1,826,825 | | | | 1,887,043 | |
| Shares redeemed | | | (2,881,938 | ) | | | (4,911,525 | ) |
| Net increase in shares outstanding | | | 2,850,918 | | | | 371,955 | |
| Shares outstanding at beginning of year | | | 42,496,260 | | | | 42,124,305 | |
| Shares outstanding at end of year | | | 45,347,178 | | | | 42,496,260 | |
See accompanying notes to financial statements.
| DAVENPORT EQUITY OPPORTUNITIES FUND |
| STATEMENTS OF CHANGES IN NET ASSETS |
| | | Year | | | Year | |
| | | Ended | | | Ended | |
| | | March 31, | | | March 31, | |
| | | 2022 | | | 2021 | |
| FROM OPERATIONS | | | | | | | | |
| Net investment loss | | $ | (1,468,762 | ) | | $ | (720,357 | ) |
| Net realized gains from investment transactions | | | 91,925,124 | | | | 56,691,001 | |
| Net change in unrealized appreciation (depreciation) on investments | | | (46,165,311 | ) | | | 199,310,818 | |
| Net increase in net assets from operations | | | 44,291,051 | | | | 255,281,462 | |
| | | | | | | | | |
| DISTRIBUTIONS TO SHAREHOLDERS (Note 2) | | | (77,485,662 | ) | | | (57,836,135 | ) |
| | | | | | | | | |
| FROM CAPITAL SHARE TRANSACTIONS | | | | | | | | |
| Proceeds from shares sold | | | 84,066,849 | | | | 64,622,341 | |
| Net asset value of shares issued in reinvestment of distributions to shareholders | | | 74,107,221 | | | | 55,111,668 | |
| Payments for shares redeemed | | | (42,597,952 | ) | | | (43,227,779 | ) |
| Net increase in net assets from capital share transactions | | | 115,576,118 | | | | 76,506,230 | |
| | | | | | | | | |
| TOTAL INCREASE IN NET ASSETS | | | 82,381,507 | | | | 273,951,557 | |
| | | | | | | | | |
| NET ASSETS | | | | | | | | |
| Beginning of year | | | 659,114,243 | | | | 385,162,686 | |
| End of year | | $ | 741,495,750 | | | $ | 659,114,243 | |
| | | | | | | | | |
| CAPITAL SHARE ACTIVITY | | | | | | | | |
| Shares sold | | | 3,324,671 | | | | 2,938,614 | |
| Shares reinvested | | | 3,003,498 | | | | 2,696,462 | |
| Shares redeemed | | | (1,685,585 | ) | | | (2,034,334 | ) |
| Net increase in shares outstanding | | | 4,642,584 | | | | 3,600,742 | |
| Shares outstanding at beginning of year | | | 26,857,073 | | | | 23,256,331 | |
| Shares outstanding at end of year | | | 31,499,657 | | | | 26,857,073 | |
See accompanying notes to financial statements.
| DAVENPORT SMALL CAP FOCUS FUND |
| STATEMENTS OF CHANGES IN NET ASSETS |
| | | Year | | | Year | |
| | | Ended | | | Ended | |
| | | March 31, | | | March 31, | |
| | | 2022 | | | 2021 | |
| FROM OPERATIONS | | | | | | | | |
| Net investment income | | $ | 2,702,467 | | | $ | 385,650 | |
| Net realized gains from investment transactions | | | 75,763,509 | | | | 50,921,601 | |
| Net change in unrealized appreciation (depreciation) on investments | | | (43,480,747 | ) | | | 120,221,304 | |
| Net increase in net assets from operations | | | 34,985,229 | | | | 171,528,555 | |
| | | | | | | | | |
| DISTRIBUTIONS TO SHAREHOLDERS (Note 2) | | | (78,479,634 | ) | | | (21,680,576 | ) |
| | | | | | | | | |
| FROM CAPITAL SHARE TRANSACTIONS | | | | | | | | |
| Proceeds from shares sold | | | 120,005,269 | | | | 171,495,764 | |
| Net asset value of shares issued in reinvestment of distributions to shareholders | | | 75,165,724 | | | | 20,862,759 | |
| Payments for shares redeemed | | | (55,364,634 | ) | | | (31,027,912 | ) |
| Net increase in net assets from capital share transactions | | | 139,806,359 | | | | 161,330,611 | |
| | | | | | | | | |
| TOTAL INCREASE IN NET ASSETS | | | 96,311,954 | | | | 311,178,590 | |
| | | | | | | | | |
| NET ASSETS | | | | | | | | |
| Beginning of year | | | 491,255,620 | | | | 180,077,030 | |
| End of year | | $ | 587,567,574 | | | $ | 491,255,620 | |
| | | | | | | | | |
| CAPITAL SHARE ACTIVITY | | | | | | | | |
| Shares sold | | | 6,432,111 | | | | 9,838,043 | |
| Shares reinvested | | | 4,063,842 | | | | 1,189,765 | |
| Shares redeemed | | | (2,943,908 | ) | | | (1,836,903 | ) |
| Net increase in shares outstanding | | | 7,552,045 | | | | 9,190,905 | |
| Shares outstanding at beginning of year | | | 25,360,311 | | | | 16,169,406 | |
| Shares outstanding at end of year | | | 32,912,356 | | | | 25,360,311 | |
See accompanying notes to financial statements.
| DAVENPORT BALANCED INCOME FUND |
| STATEMENTS OF CHANGES IN NET ASSETS |
| | | Year | | | Year | |
| | | Ended | | | Ended | |
| | | March 31, | | | March 31, | |
| | | 2022 | | | 2021 | |
| FROM OPERATIONS | | | | | | | | |
| Net investment income | | $ | 3,087,974 | | | $ | 2,931,076 | |
| Net realized gains (losses) from: | | | | | | | | |
| Investments | | | 7,678,961 | | | | (1,672,521 | ) |
| Foreign currency transactions | | | (566 | ) | | | 1,304 | |
| Net change in unrealized appreciation (depreciation) on investments | | | 4,308,416 | | | | 45,859,081 | |
| Net increase in net assets from operations | | | 15,074,785 | | | | 47,118,940 | |
| | | | | | | | | |
| DISTRIBUTIONS TO SHAREHOLDERS (Note 2) | | | (3,301,414 | ) | | | (3,387,277 | ) |
| | | | | | | | | |
| FROM CAPITAL SHARE TRANSACTIONS | | | | | | | | |
| Proceeds from shares sold | | | 46,064,469 | | | | 24,102,431 | |
| Net asset value of shares issued in reinvestment of distributions to shareholders | | | 3,043,589 | | | | 3,129,373 | |
| Payments for shares redeemed | | | (17,808,632 | ) | | | (21,674,331 | ) |
| Net increase in net assets from capital share transactions | | | 31,299,426 | | | | 5,557,473 | |
| | | | | | | | | |
| TOTAL INCREASE IN NET ASSETS | | | 43,072,797 | | | | 49,289,136 | |
| | | | | | | | | |
| NET ASSETS | | | | | | | | |
| Beginning of year | | | 193,185,987 | | | | 143,896,851 | |
| End of year | | $ | 236,258,784 | | | $ | 193,185,987 | |
| | | | | | | | | |
| CAPITAL SHARE ACTIVITY | | | | | | | | |
| Shares sold | | | 3,411,188 | | | | 2,042,099 | |
| Shares reinvested | | | 224,285 | | | | 262,264 | |
| Shares redeemed | | | (1,320,477 | ) | | | (1,884,408 | ) |
| Net increase in shares outstanding | | | 2,314,996 | | | | 419,955 | |
| Shares outstanding at beginning of year | | | 15,038,262 | | | | 14,618,307 | |
| Shares outstanding at end of year | | | 17,353,258 | | | | 15,038,262 | |
See accompanying notes to financial statements.
| DAVENPORT CORE FUND |
| FINANCIAL HIGHLIGHTS |
Selected Per Share Data and Ratios for a Share Outstanding Throughout Each Year:
| | | Years Ended March 31, |
| | | 2022 | | | 2021 | | | 2020 | | | 2019 | | | 2018 | |
| Net asset value at beginning of year | | $ | 31.48 | | | $ | 21.48 | | | $ | 23.75 | | | $ | 22.96 | | | $ | 21.15 | |
| | | | | | | | | | | | | | | | | | | | | |
| Income (loss) from investment operations: | | | | | | | | | | | | | | | | | | | | |
| Net investment income | | | 0.01 | | | | 0.05 | | | | 0.14 | | | | 0.11 | | | | 0.09 | |
| Net realized and unrealized gains (losses) on investments | | | 3.38 | | | | 10.27 | | | | (1.80 | ) | | | 1.74 | | | | 2.29 | |
| Total from investment operations | | | 3.39 | | | | 10.32 | | | | (1.66 | ) | | | 1.85 | | | | 2.38 | |
| | | | | | | | | | | | | | | | | | | | | |
| Less distributions from: | | | | | | | | | | | | | | | | | | | | |
| Net investment income | | | (0.00 | ) (a) | | | (0.07 | ) | | | (0.14 | ) | | | (0.11 | ) | | | (0.11 | ) |
| Net realized gains | | | (2.78 | ) | | | (0.25 | ) | | | (0.47 | ) | | | (0.95 | ) | | | (0.46 | ) |
| Total distributions | | | (2.78 | ) | | | (0.32 | ) | | | (0.61 | ) | | | (1.06 | ) | | | (0.57 | ) |
| | | | | | | | | | | | | | | | | | | | | |
| Net asset value at end of year | | $ | 32.09 | | | $ | 31.48 | | | $ | 21.48 | | | $ | 23.75 | | | $ | 22.96 | |
| | | | | | | | | | | | | | | | | | | | | |
| Total return (b) | | | 10.89 | % | | | 48.20 | % | | | (7.36 | %) | | | 8.21 | % | | | 11.38 | % |
| | | | | | | | | | | | | | | | | | | | | |
| Net assets at end of year (000’s) | | $ | 845,650 | | | $ | 756,050 | | | $ | 486,569 | | | $ | 516,228 | | | $ | 464,919 | |
| | | | | | | | | | | | | | | | | | | | | |
| Ratio of total expenses to average net assets | | | 0.86 | % | | | 0.87 | % | | | 0.89 | % | | | 0.89 | % | | | 0.90 | % |
| | | | | | | | | | | | | | | | | | | | | |
| Ratio of net investment income to average net assets | | | 0.04 | % | | | 0.17 | % | | | 0.55 | % | | | 0.48 | % | | | 0.41 | % |
| | | | | | | | | | | | | | | | | | | | | |
| Portfolio turnover rate | | | 20 | % | | | 30 | % | | | 12 | % | | | 21 | % | | | 22 | % |
| (a) | Amount rounds to less than $0.01 per share. |
| (b) | Total return is a measure of the change in value of an investment in the Fund over the periods covered, which assumes any dividends or capital gains distributions are reinvested in shares of the Fund. Returns shown do not reflect the deduction of taxes a shareholder would pay on Fund distributions or the redemption of Fund shares. |
See accompanying notes to financial statements.
| DAVENPORT VALUE & INCOME FUND |
| FINANCIAL HIGHLIGHTS |
Selected Per Share Data and Ratios for a Share Outstanding Throughout Each Year:
| | | Years Ended March 31, |
| | | 2022 | | | 2021 | | | 2020 | | | 2019 | | | 2018 | |
| Net asset value at beginning of year | | $ | 18.58 | | | $ | 13.04 | | | $ | 16.38 | | | $ | 16.85 | | | $ | 15.97 | |
| | | | | | | | | | | | | | | | | | | | | |
| Income (loss) from investment operations: | | | | | | | | | | | | | | | | | | | | |
| Net investment income | | | 0.29 | | | | 0.28 | | | | 0.35 | | | | 0.36 | | | | 0.30 | |
| Net realized and unrealized gains (losses) on investments and foreign currencies | | | 2.32 | | | | 5.98 | | | | (3.00 | ) | | | 0.12 | | | | 1.39 | |
| Total from investment operations | | | 2.61 | | | | 6.26 | | | | (2.65 | ) | | | 0.48 | | | | 1.69 | |
| | | | | | | | | | | | | | | | | | | | | |
| Less distributions from: | | | | | | | | | | | | | | | | | | | | |
| Net investment income | | | (0.30 | ) | | | (0.27 | ) | | | (0.36 | ) | | | (0.36 | ) | | | (0.30 | ) |
| Net realized gains | | | (0.60 | ) | | | (0.45 | ) | | | (0.33 | ) | | | (0.59 | ) | | | (0.51 | ) |
| Total distributions | | | (0.90 | ) | | | (0.72 | ) | | | (0.69 | ) | | | (0.95 | ) | | | (0.81 | ) |
| | | | | | | | | | | | | | | | | | | | | |
| Net asset value at end of year | | $ | 20.29 | | | $ | 18.58 | | | $ | 13.04 | | | $ | 16.38 | | | $ | 16.85 | |
| | | | | | | | | | | | | | | | | | | | | |
| Total return (a) | | | 14.24 | % | | | 49.55 | % | | | (16.97 | %) | | | 2.96 | % | | | 10.67 | % |
| | | | | | | | | | | | | | | | | | | | | |
| Net assets at end of year (000’s) | | $ | 920,055 | | | $ | 789,652 | | | $ | 549,112 | | | $ | 672,954 | | | $ | 648,456 | |
| | | | | | | | | | | | | | | | | | | | | |
| Ratio of total expenses to average net assets | | | 0.86 | % | | | 0.87 | % | | | 0.88 | % | | | 0.88 | % | | | 0.88 | % |
| | | | | | | | | | | | | | | | | | | | | |
| Ratio of net investment income to average net assets | | | 1.46 | % | | | 1.78 | % | | | 2.07 | % | | | 2.21 | % | | | 1.79 | % |
| | | | | | | | | | | | | | | | | | | | | |
| Portfolio turnover rate | | | 20 | % | | | 34 | % | | | 28 | % | | | 18 | % | | | 22 | % |
| (a) | Total return is a measure of the change in value of an investment in the Fund over the periods covered, which assumes any dividends or capital gains distributions are reinvested in shares of the Fund. Returns shown do not reflect the deduction of taxes a shareholder would pay on Fund distributions or the redemption of Fund shares. |
See accompanying notes to financial statements.
| DAVENPORT EQUITY OPPORTUNITIES FUND |
| FINANCIAL HIGHLIGHTS |
Selected Per Share Data and Ratios for a Share Outstanding Throughout Each Year:
| | | Years Ended March 31, |
| | | 2022 | | | 2021 | | | 2020 | | | 2019 | | | 2018 | |
| Net asset value at beginning of year | | $ | 24.54 | | | $ | 16.56 | | | $ | 18.98 | | | $ | 17.75 | | | $ | 15.64 | |
| | | | | | | | | | | | | | | | | | | | | |
| Income (loss) from investment operations: | | | | | | | | | | | | | | | | | | | | |
| Net investment loss | | | (0.05 | ) | | | (0.03 | ) | | | (0.00 | ) (a) | | | (0.02 | ) | | | (0.04 | ) |
| Net realized and unrealized gains (losses) on investments | | | 1.80 | | | | 10.42 | | | | (1.59 | ) | | | 1.91 | | | | 2.15 | |
| Total from investment operations | | | 1.75 | | | | 10.39 | | | | (1.59 | ) | | | 1.89 | | | | 2.11 | |
| | | | | | | | | | | | | | | | | | | | | |
| Less distribution from: | | | | | | | | | | | | | | | | | | | | |
| Net realized gains | | | (2.75 | ) | | | (2.41 | ) | | | (0.83 | ) | | | (0.66 | ) | | | — | |
| | | | | | | | | | | | | | | | | | | | | |
| Net asset value at end of year | | $ | 23.54 | | | $ | 24.54 | | | $ | 16.56 | | | $ | 18.98 | | | $ | 17.75 | |
| | | | | | | | | | | | | | | | | | | | | |
| Total return (b) | | | 6.89 | % | | | 66.20 | % | | | (9.13 | %) | | | 11.02 | % | | | 13.49 | % |
| | | | | | | | | | | | | | | | | | | | | |
| Net assets at end of year (000’s) | | $ | 741,496 | | | $ | 659,114 | | | $ | 385,163 | | | $ | 409,002 | | | $ | 399,460 | |
| | | | | | | | | | | | | | | | | | | | | |
| Ratio of total expenses to average net assets | | | 0.87 | % | | | 0.88 | % | | | 0.90 | % | | | 0.91 | % | | | 0.91 | % |
| | | | | | | | | | | | | | | | | | | | | |
| Ratio of net investment loss to average net assets | | | (0.20 | %) | | | (0.13 | %) | | | (0.02 | %) | | | (0.13 | %) | | | (0.23 | %) |
| | | | | | | | | | | | | | | | | | | | | |
| Portfolio turnover rate | | | 22 | % | | | 31 | % | | | 21 | % | | | 19 | % | | | 21 | % |
| (a) | Amount rounds to less than $0.01 per share. |
| (b) | Total return is a measure of the change in value of an investment in the Fund over the periods covered, which assumes any dividends or capital gains distributions are reinvested in shares of the Fund. Returns shown do not reflect the deduction of taxes a shareholder would pay on Fund distributions or the redemption of Fund shares. |
See accompanying notes to financial statements.
| DAVENPORT SMALL CAP FOCUS FUND |
| FINANCIAL HIGHLIGHTS |
Selected Per Share Data and Ratios for a Share Outstanding Throughout Each Year:
| | | Years Ended March 31, |
| | | 2022 | | | 2021 | | | 2020 | | | 2019 | | | 2018 | |
| Net asset value at beginning of year | | $ | 19.37 | | | $ | 11.14 | | | $ | 13.25 | | | $ | 13.01 | | | $ | 12.13 | |
| | | | | | | | | | | | | | | | | | | | | |
| Income (loss) from investment operations: | | | | | | | | | | | | | | | | | | | | |
| Net investment income | | | 0.11 | | | | 0.04 | | | | 0.05 | | | | 0.06 | | | | 0.02 | |
| Net realized and unrealized gains (losses) on investments | | | 1.20 | | | | 9.28 | | | | (1.84 | ) | | | 0.44 | | | | 1.22 | |
| Total from investment operations | | | 1.31 | | | | 9.32 | | | | (1.79 | ) | | | 0.50 | | | | 1.24 | |
| | | | | | | | | | | | | | | | | | | | | |
| Less distributions from: | | | | | | | | | | | | | | | | | | | | |
| Net investment income | | | (0.13 | ) | | | (0.20 | ) | | | (0.10 | ) | | | — | | | | — | |
| Net realized gains | | | (2.70 | ) | | | (0.89 | ) | | | (0.22 | ) | | | (0.26 | ) | | | (0.36 | ) |
| Total distributions | | | (2.83 | ) | | | (1.09 | ) | | | (0.32 | ) | | | (0.26 | ) | | | (0.36 | ) |
| | | | | | | | | | | | | | | | | | | | | |
| Net asset value at end of year | | $ | 17.85 | | | $ | 19.37 | | | $ | 11.14 | | | $ | 13.25 | | | $ | 13.01 | |
| | | | | | | | | | | | | | | | | | | | | |
| Total return (a) | | | 6.85 | % | | | 84.84 | % | | | (14.08 | %) | | | 3.90 | % | | | 10.28 | % |
| | | | | | | | | | | | | | | | | | | | | |
| Net assets at end of year (000’s) | | $ | 587,568 | | | $ | 491,256 | | | $ | 180,077 | | | $ | 152,063 | | | $ | 116,239 | |
| | | | | | | | | | | | | | | | | | | | | |
| Ratio of total expenses to average net assets | | | 0.88 | % | | | 0.91 | % | | | 0.95 | % | | | 0.97 | % | | | 1.00 | % |
| | | | | | | | | | | | | | | | | | | | | |
| Ratio of net investment income to average net assets | | | 0.49 | % | | | 0.12 | % | | | 0.40 | % | | | 0.51 | % | | | 0.26 | % |
| | | | | | | | | | | | | | | | | | | | | |
| Portfolio turnover rate | | | 44 | % | | | 54 | % | | | 66 | % | | | 60 | % | | | 48 | % |
| (a) | Total return is a measure of the change in value of an investment in the Fund over the periods covered, which assumes any dividends or capital gains distributions are reinvested in shares of the Fund. Returns shown do not reflect the deduction of taxes a shareholder would pay on Fund distributions or the redemption of Fund shares. |
See accompanying notes to financial statements.
| DAVENPORT BALANCED INCOME FUND |
| FINANCIAL HIGHLIGHTS |
Selected Per Share Data and Ratios for a Share Outstanding Throughout Each Year:
| | | Years Ended March 31, |
| | | 2022 | | | 2021 | | | 2020 | | | 2019 | | | 2018 | |
| Net asset value at beginning of year | | $ | 12.85 | | | $ | 9.84 | | | $ | 11.34 | | | $ | 11.28 | | | $ | 11.02 | |
| | | | | | | | | | | | | | | | | | | | | |
| Income (loss) from investment operations: | | | | | | | | | | | | | | | | | | | | |
| Net investment income (a) | | | 0.19 | | | | 0.20 | | | | 0.25 | | | | 0.25 | | | | 0.20 | |
| Net realized and unrealized gains (losses) on investments and foreign currencies | | | 0.77 | | | | 3.04 | | | | (1.41 | ) | | | 0.12 | | | | 0.33 | |
| Total from investment operations | | | 0.96 | | | | 3.24 | | | | (1.16 | ) | | | 0.37 | | | | 0.53 | |
| | | | | | | | | | | | | | | | | | | | | |
| Less distributions from: | | | | | | | | | | | | | | | | | | | | |
| Net investment income | | | (0.18 | ) | | | (0.23 | ) | | | (0.23 | ) | | | (0.24 | ) | | | (0.17 | ) |
| Net realized gains | | | (0.02 | ) | | | — | | | | (0.08 | ) | | | (0.07 | ) | | | (0.10 | ) |
| Return of capital | | | — | | | | — | | | | (0.03 | ) | | | — | | | | — | |
| Total distributions | | | (0.20 | ) | | | (0.23 | ) | | | (0.34 | ) | | | (0.31 | ) | | | (0.27 | ) |
| | | | | | | | | | | | | | | | | | | | | |
| Net asset value at end of year | | $ | 13.61 | | | $ | 12.85 | | | $ | 9.84 | | | $ | 11.34 | | | $ | 11.28 | |
| | | | | | | | | | | | | | | | | | | | | |
| Total return (b) | | | 7.50 | % | | | 33.14 | % | | | (10.59 | %) | | | 3.35 | % | | | 4.81 | % |
| | | | | | | | | | | | | | | | | | | | | |
| Net assets at end of year (000’s) | | $ | 236,259 | | | $ | 193,186 | | | $ | 143,897 | | | $ | 142,199 | | | $ | 129,268 | |
| | | | | | | | | | | | | | | | | | | | | |
| Ratio of total expenses to average net assets (c) | | | 0.92 | % | | | 0.93 | % | | | 0.95 | % | | | 0.96 | % | | | 0.97 | % |
| | | | | | | | | | | | | | | | | | | | | |
| Ratio of net investment income to average net assets (c) | | | 1.42 | % | | | 1.73 | % | | | 2.18 | % | | | 2.28 | % | | | 1.85 | % |
| | | | | | | | | | | | | | | | | | | | | |
| Portfolio turnover rate | | | 23 | % | | | 29 | % | | | 29 | % | | | 30 | % | | | 23 | % |
| (a) | Recognition of net investment income by the Fund is affected by the timing of declarations of dividends by the underlying investment companies in which the Fund invests. |
| (b) | Total return is a measure of the change in value of an investment in the Fund over the periods covered, which assumes any dividends or capital gains distributions are reinvested in shares of the Fund. Returns shown do not reflect the deduction of taxes a shareholder would pay on Fund distributions or the redemption of Fund shares. |
| (c) | The ratios of expenses and net investment income to average net assets do not reflect the Fund’s proportionate share of expenses of the underlying investment companies in which the Fund invests. |
See accompanying notes to financial statements.
| THE DAVENPORT FUNDS |
| NOTES TO FINANCIAL STATEMENTS |
| March 31, 2022 |
1. Organization
Davenport Core Fund, Davenport Value & Income Fund, Davenport Equity Opportunities Fund, Davenport Small Cap Focus Fund and Davenport Balanced Income Fund (individually, a “Fund,” and, collectively, the “Funds”) are each a no-load series of the Williamsburg Investment Trust (the “Trust”), an open-end management investment company registered under the Investment Company Act of 1940, as amended. The Trust was organized as a Massachusetts business trust on July 18, 1988. Other series of the Trust are not incorporated in this report.
Davenport Core Fund’s investment objective is long-term growth of capital.
Davenport Value & Income Fund’s investment objective is to achieve long-term growth while generating current income through dividend payments on portfolio securities.
Davenport Equity Opportunities Fund’s investment objective is long-term capital appreciation.
Davenport Small Cap Focus Fund’s investment objective is long-term capital appreciation.
Davenport Balanced Income Fund’s investment objective is current income and an opportunity for long-term growth.
Davenport Core Fund, Davenport Value & Income Fund, Davenport Small Cap Focus Fund and Davenport Balanced Income Fund are each classified as a diversified fund. Davenport Equity Opportunities Fund is classified as a non-diversified fund.
2. Significant Accounting Policies
Each Fund follows accounting and reporting guidance under Financial Accounting Standards Board (“FASB”) Accounting Standards Codification Topic 946, “Financial Services – Investment Companies.” The following is a summary of the Funds’ significant accounting policies. The policies are in conformity with accounting principles generally accepted in the United States of America (“GAAP”).
New Accounting Pronouncement — In March 2020, the FASB issued Accounting Standards Update No. 2020-04 (“ASU 2020-04”), “Reference Rate Reform (Topic 840): Facilitation of the Effects of Reference Rate Reform on Financial Reporting.” ASU 2020-04 provides entities with guidance to ease the potential accounting burden associated with transitioning away from reference rates (e.g., LIBOR) that are expected to be discontinued. ASU 2020-04 allows, among other things, certain contract modifications to be accounted as a continuation of the existing contract. This ASU was effective upon the issuance and its optional relief can be applied through December 31, 2022. Management is currently assessing the impact of the ASU on the Funds.
Securities valuation — The Funds’ portfolio securities are valued as of the close of business of the regular session of the New York Stock Exchange (the “NYSE”) (normally 4:00 p.m. Eastern time). Securities traded on a national stock exchange, including common stocks and exchange-traded funds (“ETFs”), are valued based upon the closing price on the principal exchange where the security is traded, if available, otherwise, at the last quoted bid price. Securities that are quoted
| THE DAVENPORT FUNDS |
| NOTES TO FINANCIAL STATEMENTS (Continued) |
by NASDAQ are valued at the NASDAQ Official Closing Price. Investments representing shares of money market funds and other open-end investment companies, other than ETFs, are valued at their net asset value (“NAV”) as reported by such companies. When using a quoted price and when the market is considered active, securities will be classified as Level 1 within the fair value hierarchy (see below).
Fixed income securities, including corporate bonds and U.S. Treasury obligations, are typically valued on the basis of prices provided by an independent pricing service. The prices provided by the pricing service are determined with consideration given to institutional bid and last sale prices and take into account securities prices, yields, maturities, call features, ratings, institutional trading in similar groups of securities, and developments related to specific securities. Given the inputs used by the pricing service, these securities are classified as Level 2 within the fair value hierarchy.
When market quotations are not readily available, if a pricing service cannot provide a price, or if the investment adviser believes the price received from the pricing service is not indicative of fair value, securities will be valued in good faith at fair value using methods consistent with procedures adopted by the Board of Trustees and will be classified as Level 2 or 3 within the fair value hierarchy, depending on the inputs used. Such methods of fair valuation may include, but are not limited to: multiple of earnings, multiple of book value, discount from market of a similar freely traded security, purchase price of the security, subsequent private transactions in the security or related securities, or a combination of these and other factors.
GAAP establishes a single authoritative definition of fair value, sets out a framework for measuring fair value and requires additional disclosures about fair value measurements.
Various inputs are used in determining the value of the Funds’ investments. These inputs are summarized in the three broad levels listed below:
| ● | Level 1 – quoted prices in active markets for identical securities |
| ● | Level 2 – other significant observable inputs |
| ● | Level 3 – significant unobservable inputs |
The inputs or methodology used for valuing securities are not necessarily an indication of the risks associated with investing in those securities. The inputs used to measure fair value may fall into different levels of the fair value hierarchy. In such cases, for disclosure purposes, the level in the fair value hierarchy within which the fair value measurement falls in its entirety is determined based on the lowest level input that is significant to the fair value measurement.
| THE DAVENPORT FUNDS |
| NOTES TO FINANCIAL STATEMENTS (Continued) |
The following is a summary of the Funds’ investments based on the inputs used to value the investments as of March 31, 2022, by security type:
| Davenport Core Fund | | Level 1 | | | Level 2 | | | Level 3 | | | Total | |
| Common Stocks | | $ | 821,413,595 | | | $ | — | | | $ | — | | | $ | 821,413,595 | |
| Money Market Funds | | | 12,678,253 | | | | — | | | | — | | | | 12,678,253 | |
| Total | | $ | 834,091,848 | | | $ | — | | | $ | — | | | $ | 834,091,848 | |
| | | | | | | | | | | | | | | | | |
| | | | | | | | | | | | | | | | | |
| Davenport Value & Income Fund | | Level 1 | | | Level 2 | | | Level 3 | | | Total | |
| Common Stocks | | $ | 872,914,972 | | | $ | — | | | $ | — | | | $ | 872,914,972 | |
| Money Market Funds | | | 53,284,438 | | | | — | | | | — | | | | 53,284,438 | |
| Total | | $ | 926,199,410 | | | $ | — | | | $ | — | | | $ | 926,199,410 | |
| | | | | | | | | | | | | | | | | |
| | | | | | | | | | | | | | | | | |
| Davenport Equity Opportunities Fund | | Level 1 | | | Level 2 | | | Level 3 | | | Total | |
| Common Stocks | | $ | 686,511,274 | | | $ | — | | | $ | — | | | $ | 686,511,274 | |
| Money Market Funds | | | 54,617,080 | | | | — | | | | — | | | | 54,617,080 | |
| Total | | $ | 741,128,354 | | | $ | — | | | $ | — | | | $ | 741,128,354 | |
| | | | | | | | | | | | | | | | | |
| | | | | | | | | | | | | | | | | |
| Davenport Small Cap Focus Fund | | Level 1 | | | Level 2 | | | Level 3 | | | Total | |
| Common Stocks | | $ | 543,251,068 | | | $ | — | | | $ | — | | | $ | 543,251,068 | |
| Money Market Funds | | | 45,294,136 | | | | — | | | | — | | | | 45,294,136 | |
| Total | | $ | 588,545,204 | | | $ | — | | | $ | — | | | $ | 588,545,204 | |
| | | | | | | | | | | | | | | | | |
| | | | | | | | | | | | | | | | | |
| Davenport Balanced Income Fund | | Level 1 | | | Level 2 | | | Level 3 | | | Total | |
| Common Stocks | | $ | 143,064,806 | | | $ | — | | | $ | — | | | $ | 143,064,806 | |
| Exchange-Traded Funds | | | 969,991 | | | | — | | | | — | | | | 969,991 | |
| Fixed Rate Corporate Bonds | | | — | | | | 64,862,496 | | | | — | | | | 64,862,496 | |
| Variable Rate Corporate Bonds | | | — | | | | 3,502,779 | | | | — | | | | 3,502,779 | |
| U.S. Treasury Obligations | | | — | | | | 12,100,065 | | | | — | | | | 12,100,065 | |
| Money Market Funds | | | 11,653,577 | | | | — | | | | — | | | | 11,653,577 | |
| Total | | $ | 155,688,374 | | | $ | 80,465,340 | | | $ | — | | | | 236,153,714 | |
| | | | | | | | | | | | | | | | | |
Refer to each Fund’s Schedule of Investments for a listing of the securities by sector type. There were no Level 3 securities or derivative instruments held by the Funds as of or during the year ended March 31, 2022.
| THE DAVENPORT FUNDS |
| NOTES TO FINANCIAL STATEMENTS (Continued) |
Foreign currency translation — Investment securities and other assets and liabilities denominated in or expected to settle in foreign currencies, if any, are translated into U.S. dollars based on exchange rates on the following basis:
| A. | The fair values of investment securities and other assets and liabilities are translated as of the close of the NYSE each day. |
| B. | Purchases and sales of investment securities and income and expenses are translated at the rate of exchange prevailing as of 4:00 p.m. Eastern time on the respective date of such transactions. |
| C. | The Funds do not isolate that portion of the results of operations caused by changes in foreign exchange rates on investments from those caused by changes in market prices of securities held. Such fluctuations are included with the net realized and unrealized gains or losses on investments. |
Reported net realized foreign exchange gains or losses arise from 1) purchases and sales of foreign currencies and 2) the difference between the amounts of dividends and foreign withholding taxes recorded on the Fund’s books and the U.S. dollar equivalent of the amounts actually received or paid. Reported net unrealized foreign exchange gains and losses arise from changes in the value of assets and liabilities that result from changes in exchange rates.
Cash — Each Fund’s cash position, if any, is held in a bank account with balances which, at times, may exceed United States federally insured limits set by the amount covered by federal deposit insurance. The Funds maintain these balances with a high quality financial institution and may incur charges on cash overdrafts.
Share valuation — The NAV per share of each Fund is calculated daily by dividing the total value of its assets, less liabilities, by the number of shares outstanding. The offering price and redemption price per share of each Fund is equal to the NAV per share.
Investment income — Interest income is accrued as earned. Discounts and premiums on fixed-income securities are amortized using the interest method. Dividend income is recorded on the ex-dividend date. Non-cash dividends included in dividend income, if any, are recorded at the fair market value of the security received. The Funds record distributions received from investments in real estate investment trusts (also known as “REITs”) in excess of income from underlying investments as a reduction of cost of investments and/or realized gain. These amounts are recorded once the issuers provide information about the actual composition of the distributions. Withholding taxes on foreign dividends have been recorded in accordance with the Funds’ understanding of the applicable country’s rules and tax rates.
Investment transactions — Investment transactions are accounted for on trade date for financial reporting purposes. Realized gains and losses on investment securities sold are determined on a specific identification basis.
Common expenses — Common expenses of the Trust are allocated among the Funds and the other series of the Trust based on relative net assets of each series or the nature of the services performed and the relative applicability to each series.
Distributions to shareholders — Dividends arising from net investment income, if any, are declared and paid quarterly to shareholders of Davenport Core Fund, Davenport Value & Income Fund, Davenport Small Cap Focus Fund and Davenport Balanced Income Fund; and declared
| THE DAVENPORT FUNDS |
| NOTES TO FINANCIAL STATEMENTS (Continued) |
and paid semi-annually to shareholders of Davenport Equity Opportunities Fund. Net realized short-term capital gains, if any, may be distributed throughout the year and net realized long-term capital gains, if any, are distributed at least once each year. The amount of distributions from net investment income and net realized capital gains are determined in accordance with federal income tax regulations, which may differ from GAAP. Dividends and distributions are recorded on the ex-dividend date.
The tax character of distributions paid during the years ended March 31, 2022 and 2021 was as follows:
| | | Years | | Ordinary | | | Long-Term | | | Return of | | | Total | |
| | | Ended | | Income | | | Capital Gains | | | Capital | | | Distributions | |
| Davenport Core Fund | | 03/31/22 | | $ | 947,615 | | | $ | 67,520,115 | | | $ | — | | | $ | 68,467,730 | |
| | | 03/31/21 | | $ | 1,295,840 | | | $ | 6,284,445 | | | $ | — | | | $ | 7,580,285 | |
| | | | | | | | | | | | | | | | | | | |
| | | | | | | | | | | | | | | | | | | |
| Davenport Value & Income Fund | | 03/31/22 | | $ | 18,460,705 | | | $ | 20,421,022 | | | $ | — | | | $ | 38,881,727 | |
| | | 03/31/21 | | $ | 11,488,740 | | | $ | 18,670,565 | | | $ | — | | | $ | 30,159,305 | |
| | | | | | | | | | | | | | | | | | | |
| | | | | | | | | | | | | | | | | | | |
| Davenport Equity Opportunities Fund | | 03/31/22 | | $ | 4,545,459 | | | $ | 72,940,203 | | | $ | — | | | $ | 77,485,662 | |
| | | 03/31/21 | | $ | 2,417,261 | | | $ | 55,418,874 | | | $ | — | | | $ | 57,836,135 | |
| | | | | | | | | | | | | | | | | | | |
| | | | | | | | | | | | | | | | | | | |
| Davenport Small Cap Focus Fund | | 03/31/22 | | $ | 36,919,188 | | | $ | 41,560,446 | | | $ | — | | | $ | 78,479,634 | |
| | | 03/31/21 | | $ | 14,887,481 | | | $ | 6,793,095 | | | $ | — | | | $ | 21,680,576 | |
| | | | | | | | | | | | | | | | | | | |
| | | | | | | | | | | | | | | | | | | |
| Davenport Balanced Income Fund | | 03/31/22 | | $ | 2,938,628 | | | $ | 362,786 | | | $ | — | | | $ | 3,301,414 | |
| | | 03/31/21 | | $ | 3,260,204 | | | $ | — | | | $ | 127,073 | | | $ | 3,387,277 | |
| | | | | | | | | | | | | | | | | | | |
Estimates — The preparation of financial statements in conformity with GAAP requires management to make estimates and assumptions that affect the reported amounts of assets and liabilities and disclosure of contingent assets and liabilities, each as of the date of the financial statements, and the reported amounts of increase (decrease) in net assets from operations during the reporting period. Actual results could differ from those estimates.
Federal income tax — Each Fund has qualified and intends to continue to qualify as a regulated investment company under the Internal Revenue Code of 1986, as amended (the “Code”). Qualification generally will relieve the Funds of liability for federal income taxes to the extent 100% of their net investment income and net realized capital gains are distributed in accordance with the Code.
In order to avoid imposition of the excise tax applicable to regulated investment companies, it is also each Fund’s intention to declare as dividends in each calendar year at least 98% of its net investment income (earned during the calendar year) and 98.2% of its net realized capital gains (earned during the twelve months ended October 31) plus undistributed amounts from prior years.
| THE DAVENPORT FUNDS |
| NOTES TO FINANCIAL STATEMENTS (Continued) |
The following information is computed on a tax basis for each item as of March 31, 2022:
| | | | | | | | | Davenport | |
| | | | | | Davenport | | | Equity | |
| | | Davenport | | | Value & | | | Opportunities | |
| | | Core Fund | | | Income Fund | | | Fund | |
| Cost of portfolio investments | | $ | 490,783,506 | | | $ | 671,586,949 | | | $ | 566,314,927 | |
| Gross unrealized appreciation | | $ | 353,565,011 | | | $ | 270,140,551 | | | $ | 208,600,532 | |
| Gross unrealized depreciation | | | (10,256,669 | ) | | | (15,528,090 | ) | | | (33,787,105 | ) |
| Net unrealized appreciation | | | 343,308,342 | | | | 254,612,461 | | | | 174,813,427 | |
| Undistributed ordinary income | | | 3,834,574 | | | | 40,398 | | | | 4,941,982 | |
| Undistributed long-term gains | | | 24,804,651 | | | | 23,075,973 | | | | 36,156,233 | |
| Distributable earnings | | $ | 371,947,567 | | | $ | 277,728,832 | | | $ | 215,911,642 | |
| | | | | | | | | | | | | |
| | | | | | | | | | | | | |
| | | | | | | Davenport | | | Davenport | |
| | | | | | | Small Cap | | | Balanced | |
| | | | | | | Focus Fund | | | Income Fund | |
| Cost of portfolio investments | | | | | | $ | 530,255,016 | | | $ | 202,287,218 | |
| Gross unrealized appreciation | | | | | | $ | 96,097,293 | | | $ | 39,968,634 | |
| Gross unrealized depreciation | | | | | | | (37,807,105 | ) | | | (6,102,138 | ) |
| Net unrealized appreciation | | | | | | | 58,290,188 | | | | 33,866,496 | |
| Undistributed ordinary income | | | | | | | — | | | | 1,017,780 | |
| Undistributed long-term gains | | | | | | | 31,368,127 | | | | 4,084,601 | |
| Accumulated capital and other losses | | | | | | | (2,779,566 | ) | | | — | |
| Distributable earnings | | | | | | $ | 86,878,749 | | | $ | 38,968,877 | |
| | | | | | | | | | | | | |
The difference between the federal income tax cost of portfolio investments and the financial statement cost of portfolio investments for each Fund is due to certain timing differences in the recognition of capital gains and losses under income tax regulations and GAAP. These timing differences are temporary in nature and are due to the tax deferral of losses on wash sales, and adjustments to basis on partnerships.
During the year ended March 31, 2022, Davenport Balanced Income Fund utilized $711,497 of short-term capital loss carryforwards and $1,459,016 of long-term capital loss carryforwards against current year gains.
Post-October losses, incurred after October 31, 2021, and net qualified late year losses, incurred after December 31, 2021, and within the current taxable year, are deemed to arise on the first day of a Fund’s next taxable year. For the year ended March 31, 2022, Davenport Small Cap Focus Fund deferred $2,122,874 and $656,692 of post-October and qualified late year losses, respectively, to April 1, 2022 for federal income tax purposes.
| THE DAVENPORT FUNDS |
| NOTES TO FINANCIAL STATEMENTS (Continued) |
For the year ended March 31, 2022, the following reclassifications were made as a result of permanent differences between the financial statements and income tax reporting requirements:
| | | | | | | | | Davenport | | | | | | | |
| | | | | | Davenport | | | Equity | | | Davenport | | | Davenport | |
| | | Davenport | | | Value & | | | Opportunities | | | Small Cap | | | Balanced | |
| | | Core Fund | | | Income Fund | | | Fund | | | Focus Fund | | | Income Fund | |
| Paid-in capital | | $ | — | | | $ | — | | | $ | — | | | $ | (6,092 | ) | | $ | (238 | ) |
| Distributable earnings | | $ | — | | | $ | — | | | $ | — | | | $ | 6,092 | | | $ | 238 | |
Such reclassifications have no effect on each Fund’s total net assets or NAV per share.
The Funds recognize the tax benefits or expenses of uncertain tax positions only when the position is “more likely than not” to be sustained assuming examination by tax authorities. Management has reviewed the tax positions taken on Federal income tax returns for each Fund for all open tax years (generally, three years) and has concluded that no provision for unrecognized tax benefits or expenses is required in these financial statements.
3. Investment Transactions
Investment transactions, other than short-term investments and U.S. government securities, were as follows for the year ended March 31, 2022:
| | | | | | | | | Davenport | |
| | | | | | Davenport | | | Equity | |
| | | Davenport | | | Value & | | | Opportunities | |
| | | Core Fund | | | Income Fund | | | Fund | |
| Purchases of investment securities | | $ | 165,327,312 | | | $ | 177,161,388 | | | $ | 178,091,465 | |
| Proceeds from sales of investment securities | | $ | 162,680,392 | | | $ | 162,877,160 | | | $ | 152,185,907 | |
| | | | | | | | | | | | | |
| | | | | | | | | | | | | |
| | | | | | | Davenport | | | Davenport | |
| | | | | | | Small Cap | | | Balanced | |
| | | | | | | Focus Fund | | | Income Fund | |
| Purchases of investment securities | | | | | | $ | 284,192,308 | | | $ | 68,206,270 | |
| Proceeds from sales and maturities of investment securities | | | | | | $ | 223,948,671 | | | $ | 39,388,094 | |
| | | | | | | | | | | | | |
For the year ended March 31, 2022, cost of purchases and proceeds from sales and maturities of U.S. government long-term securities for the Davenport Balanced Income Fund were $7,426,693 and $8,124,714, respectively.
| THE DAVENPORT FUNDS |
| NOTES TO FINANCIAL STATEMENTS (Continued) |
4. Transactions with Related Parties
INVESTMENT ADVISORY AGREEMENTS
Each Fund’s investments are managed by Davenport & Company LLC (the “Adviser”) under the terms of an Investment Advisory Agreement. Under the Investment Advisory Agreement, each Fund pays the Adviser a fee, which is computed and accrued daily and paid monthly, at an annual rate of 0.75% of its average daily net assets. Certain officers and a Trustee of the Trust are also officers of the Adviser.
A significant portion of the Funds’ investment trades are executed through an affiliated broker-dealer of the Adviser. No commissions are paid by the Funds to the Adviser or the affiliate for these trades.
OTHER SERVICE PROVIDERS
Ultimus Fund Solutions, LLC (“Ultimus”) provides administration, fund accounting, compliance and transfer agent services to the Funds. The Funds pay Ultimus fees in accordance with the agreements for such services. In addition, the Funds pay out-of-pocket expenses including, but not limited to, postage, supplies, and certain costs related to the pricing of the Funds’ portfolio securities. Certain officers of the Trust are also officers of Ultimus, or of Ultimus Fund Distributors, LLC (the “Distributor”), the principal underwriter of each Fund’s shares and an affiliate of Ultimus. The Distributor is compensated by the Adviser (not the Funds) for acting as principal underwriter.
COMPENSATION OF TRUSTEES
Trustees and officers affiliated with the Adviser or Ultimus are not compensated by the Trust for their services. Effective January 1, 2022, each Trustee who is not an affiliated person of the Adviser or Ultimus receives from the Trust an annual retainer of $30,000, payable quarterly; a fee of $2,000 for attendance at each meeting of the Board of Trustees (except that such fee is $3,000 for the independent chair); and a fee of $1,000 for attendance at each meeting of any committee of the Board (except that such fee is $1,500 for the committee chair); plus reimbursement of travel and other expenses incurred in attending meetings. Prior to January 1, 2022, each Trustee who was not an affiliated person of the Adviser or Ultimus received from the Trust an annual retainer of $24,000, payable quarterly; a fee of $2,000 for attendance at each meeting of the Board of Trustees (except that such fee was $3,000 for the independent chair); and a fee of $1,000 for attendance at each meeting of any committee of the Board (except that such fee was $1,500 for the committee chair); plus reimbursement of travel and other expenses incurred in attending meetings. Each series of the Trust pays its proportionate share of such fees.
5. Sector Risk
If a Fund has significant investments in the securities of issuers in industries within a particular business sector, any development affecting that sector will have a greater impact on the value of the net assets of the Fund than would be the case if the Fund did not have significant investments in that sector. In addition, this may increase the risk of loss of an investment in the Fund and
| THE DAVENPORT FUNDS |
| NOTES TO FINANCIAL STATEMENTS (Continued) |
increase the volatility of the Fund’s NAV per share. From time to time, circumstances may affect a particular sector and the companies within such sector. For instance, economic or market factors, regulation or deregulation, or other developments may negatively impact all companies in a particular sector and therefore the value of a Fund’s portfolio would be adversely affected. As of March 31, 2022, none of the Funds had over 25% of their net assets invested in any one sector.
6. Contingencies and Commitments
The Funds indemnify the Trust’s officers and Trustees for certain liabilities that might arise from the performance of their duties to the Funds. Additionally, in the normal course of business the Funds enter into contracts that contain a variety of representations and warranties and which provide general indemnifications. The Funds’ maximum exposure under these arrangements is unknown, as this would involve future claims that may be made against the Funds that have not yet occurred. However, based on experience, the Funds expect the risk of loss to be remote.
7. Subsequent Events
The Funds are required to recognize in the financial statements the effects of all subsequent events that provide additional evidence about conditions that existed as of the date of the Statements of Assets and Liabilities. For non-recognized subsequent events that must be disclosed to keep the financial statements from being misleading, the Funds are required to disclose the nature of the event as well as an estimate of its financial effect, or a statement that such an estimate cannot be made. Management has evaluated subsequent events through the issuance of these financial statements and has noted no such events.
| THE DAVENPORT FUNDS |
| REPORT OF INDEPENDENT REGISTERED |
| PUBLIC ACCOUNTING FIRM |
To the Shareholders of The Davenport Funds and
Board of Trustees of Williamsburg Investment Trust
Opinion on the Financial Statements
We have audited the accompanying statements of assets and liabilities, including the schedules of investments, of The Davenport Funds, comprising Davenport Core Fund, Davenport Value & Income Fund, Davenport Equity Opportunities Fund, Davenport Small Cap Focus Fund, and Davenport Balanced Income Fund (the “Funds”), each a series of Williamsburg Investment Trust, as of March 31, 2022, the related statements of operations for the year then ended, the statements of changes in net assets for each of the two years in the period then ended, the related notes, and the financial highlights for each of the five years in the period then ended (collectively referred to as the “financial statements”). In our opinion, the financial statements present fairly, in all material respects, the financial position of each of the Funds as of March 31, 2022, the results of their operations for the year then ended, the changes in net assets for each of the two years in the period then ended, and the financial highlights for each of the five years in the period then ended, in conformity with accounting principles generally accepted in the United States of America.
Basis for Opinion
These financial statements are the responsibility of the Funds’ management. Our responsibility is to express an opinion on the Funds’ financial statements based on our audits. We are a public accounting firm registered with the Public Company Accounting Oversight Board (United States) (“PCAOB”) and are required to be independent with respect to the Funds in accordance with the U.S. federal securities laws and the applicable rules and regulations of the Securities and Exchange Commission and the PCAOB.
We conducted our audits in accordance with the standards of the PCAOB. Those standards require that we plan and perform the audit to obtain reasonable assurance about whether the financial statements are free of material misstatement whether due to error or fraud.
Our audits included performing procedures to assess the risks of material misstatement of the financial statements, whether due to error or fraud, and performing procedures that respond to those risks. Such procedures included examining, on a test basis, evidence regarding the amounts and disclosures in the financial statements. Our procedures included confirmation of securities owned as of March 31, 2022, by correspondence with the custodian and brokers. Our audits also included evaluating the accounting principles used and significant estimates made by management, as well as evaluating the overall presentation of the financial statements. We believe that our audits provide a reasonable basis for our opinion.
We have served as the Funds’ auditor since 2016.

COHEN & COMPANY, LTD.
Milwaukee, Wisconsin
May 26, 2022
| THE DAVENPORT FUNDS |
| BOARD OF TRUSTEES AND EXECUTIVE OFFICERS (Unaudited) |
Overall responsibility for management of the Funds rests with the Board of Trustees. The Trustees serve during the lifetime of the Trust and until its termination, or until death, resignation, retirement or removal. The Trustees, in turn, elect the officers of the Funds. The officers have been elected for an annual term. The following are the Trustees and executive officers of the Funds:
| Trustees and Officers | Address | Year of Birth | Position Held
with the Trust | Length of
Time Served |
| Robert S. Harris, Ph.D. | 225 Pictoria Drive, Suite 450 Cincinnati, OH | 1949 | Chairman and Trustee | Since January 2007 |
| * John P. Ackerly, IV | One James Center 901 E. Cary Street Richmond, VA | 1963 | Trustee and President of The Davenport Funds | Since July 2012 |
| * John T. Bruce | 800 Main Street Lynchburg, VA | 1953 | Trustee and President of The Cantor FBP Mutual Funds | Since September 1988 |
| George K. Jennison | 225 Pictoria Drive, Suite 450 Cincinnati, OH | 1957 | Trustee | Since January 2015 |
| Harris V. Morrissette | 225 Pictoria Drive, Suite 450 Cincinnati, OH | 1959 | Trustee | Since March 1993 |
| Elizabeth W. Robertson | 225 Pictoria Drive, Suite 450 Cincinnati, OH | 1953 | Trustee | Since February 2014 |
| Cheryl B. Hatcher | One James Center 901 E. Cary Street Richmond, VA | 1957 | Vice President | Since March 2021 |
| George L. Smith, III | One James Center 901 E. Cary Street Richmond, VA | 1975 | Vice President | Since February 2011 |
| Mark J. Seger | 225 Pictoria Drive, Suite 450 Cincinnati, OH | 1962 | Treasurer | Since November 2000 |
| David K. James | 225 Pictoria Drive, Suite 450 Cincinnati, OH | 1970 | Secretary | Since November 2018 |
| Michael J. Nanosky | 225 Pictoria Drive, Suite 450 Cincinnati, OH | 1966 | Chief Compliance Officer | Since March 2020 |
| * | Messrs. Ackerly and Bruce, as affiliated persons of investment advisers to the Trust, are “interested persons” of the Trust within the meaning of Section 2(a)(19) of the 1940 Act. |
| THE DAVENPORT FUNDS |
| BOARD OF TRUSTEES AND EXECUTIVE OFFICERS (Unaudited) (Continued) |
Each Trustee oversees ten portfolios of the Trust, including the Funds. The principal occupations of the Trustees and executive officers of the Funds during the past five years and public directorships held by the Trustees are set forth below:
Robert S. Harris, Ph.D. is the C. Stewart Sheppard Professor of Business Administration at The Darden Graduate School of Business Administration at the University of Virginia. He was previously the dean at Darden. Professor Harris has published widely on corporate finance, financial markets and mergers and acquisitions and has served as a consultant to corporations and government agencies.
John P. Ackerly, IV, is Senior Vice President and Portfolio Manager of Davenport & Company, LLC (a broker-dealer and investment advisory firm).
John T. Bruce is President, Director and member of the Executive Committee of the Flippin, Bruce & Porter division of Cantor Fitzgerald Investment Advisors, L.P. (an investment advisory firm).
George K. Jennison is retired. He was President of Oyster Consulting, LLC (a management consulting firm) and a financial adviser with Wells Fargo Advisors, LLC.
Harris V. Morrissette is President of China Doll Rice and Beans, Inc. and Dixie Lily Foods. He is also a Director of Trustmark Corporation (bank holding company).
Elizabeth W. Robertson serves as a Trustee of TowneBank Foundation, TowneBank Corporate Board, TowneBank Audit Committee Chair and TowneBank Community Board since 2015. She previously was Chief Financial Officer of Monument Restaurants LLC.
Cheryl B. Hatcher is Senior Vice President of Davenport & Company LLC and Senior Administrative Officer of Davenport Asset Management.
George L. Smith, III is Senior Vice President and Portfolio Manager of the Adviser.
Mark J. Seger is a Vice Chairman of Ultimus Fund Solutions, LLC and Ultimus Fund Distributors, LLC. He previously was Co-CEO of Ultimus Fund Solutions, LLC (1999 to 2019).
David K. James is an Executive Vice President and Chief Legal and Risk Officer of Ultimus Fund Solutions, LLC (2018 to present). He previously was Managing Director and Managing Counsel at State Street Bank and Trust Company (2009 to 2018).
Michael J. Nanosky is a Senior Compliance Officer of Ultimus Fund Solutions, LLC (2020 to present). He previously was Senior Vice President & Chief Compliance Officer of PNC Funds (2014 to 2019).
Additional information about members of the Board of Trustees and executive officers is available in the Statement of Additional Information (“SAI”). To obtain a free copy of the SAI, please call 1-800-281-3217.
| THE DAVENPORT FUNDS |
| YOUR FUNDS’ EXPENSES (Unaudited) |
We believe it is important for you to understand the impact of costs on your investment. All mutual funds have operating expenses. As a shareholder of the Funds, you incur ongoing costs, including management fees and other expenses. These ongoing costs, which are deducted from each Fund’s gross income, directly reduce the investment return of the Funds.
A mutual fund’s ongoing costs are expressed as a percentage of its average net assets. This figure is known as the expense ratio. The following examples are intended to help you understand the ongoing costs (in dollars) of investing in the Funds and to compare these costs with the ongoing costs of investing in other mutual funds. The examples below are based on an investment of $1,000 made at the beginning of the period shown and held for the entire period (October 1, 2021 through March 31, 2022).
The table below illustrates each Fund’s ongoing costs in two ways:
Actual fund return – This section helps you to estimate the actual expenses that you paid over the period. The “Ending Account Value” shown is derived from each Fund’s actual return, and the fourth column shows the dollar amount of operating expenses that would have been paid by an investor who started with $1,000 in the Funds. You may use the information here, together with the amount you invested, to estimate the expenses that you paid over the period.
To do so, simply divide your account value by $1,000 (for example, an $8,600 account value divided by $1,000 = 8.6), then multiply the result by the number given for the applicable Fund under the heading “Expenses Paid During Period.”
Hypothetical 5% return – This section is intended to help you compare each Fund’s ongoing costs with those of other mutual funds. It assumes that each Fund had an annual return of 5% before expenses during the period shown, but that the expense ratio is unchanged. In this case, because the return used is not each Fund’s actual return, the results do not apply to your investment. The example is useful in making comparisons because the U.S. Securities and Exchange Commission (the “SEC”) requires all mutual funds to calculate expenses based on a 5% return. You can assess each Fund’s ongoing costs by comparing this hypothetical example with the hypothetical examples that appear in shareholder reports of other funds.
Note that expenses shown in the table are meant to highlight and help you compare ongoing costs only. The Funds do not charge sales loads or redemption fees.
The calculations assume no shares were bought or sold during the period. Your actual costs may have been higher or lower, depending on the amount of your investment and the timing of any purchases or redemptions.
More information about each Fund’s expenses, including historical annual expense ratios, can be found in this report. For additional information on operating expenses and other shareholder costs, please refer to the Funds’ prospectus.
| THE DAVENPORT FUNDS |
| YOUR FUNDS’ EXPENSES (Unaudited) (Continued) |
| | | Beginning | | | Ending | | | | | |
| | | Account Value | | | Account Value | | | | | |
| | | October 1, | | | March 31, | | | Expense | | Expenses Paid |
| | | 2021 | | | 2022 | | | Ratio(a) | | During Period(b) |
| Davenport Core Fund | | | | | | | | | | | | |
| Based on Actual Fund Return | | $ | 1,000.00 | | | $ | 1,015.50 | | | 0.86% | | $4.32 |
| Based on Hypothetical 5% Return (before expenses) | | $ | 1,000.00 | | | $ | 1,020.64 | | | 0.86% | | $4.33 |
| Davenport Value & Income Fund | | | | | | | | | | | | |
| Based on Actual Fund Return | | $ | 1,000.00 | | | $ | 1,084.40 | | | 0.86% | | $4.47 |
| Based on Hypothetical 5% Return (before expenses) | | $ | 1,000.00 | | | $ | 1,020.64 | | | 0.86% | | $4.33 |
| Davenport Equity Opportunities Fund | | | | | | | | | | | | |
| Based on Actual Fund Return | | $ | 1,000.00 | | | $ | 979.10 | | | 0.87% | | $4.29 |
| Based on Hypothetical 5% Return (before expenses) | | $ | 1,000.00 | | | $ | 1,020.59 | | | 0.87% | | $4.38 |
| Davenport Small Cap Focus Fund | | | | | | | | | | | | |
| Based on Actual Fund Return | | $ | 1,000.00 | | | $ | 999.00 | | | 0.88% | | $4.39 |
| Based on Hypothetical 5% Return (before expenses) | | $ | 1,000.00 | | | $ | 1,020.54 | | | 0.88% | | $4.43 |
| Davenport Balanced Income Fund | | | | | | | | | | | | |
| Based on Actual Fund Return | | $ | 1,000.00 | | | $ | 1,036.40 | | | 0.92% | | $4.67 |
| Based on Hypothetical 5% Return (before expenses) | | $ | 1,000.00 | | | $ | 1,020.34 | | | 0.92% | | $4.63 |
| (a) | Annualized, based on each Fund’s most recent one-half year expenses. |
| (b) | Expenses are equal to each Fund’s annualized expense ratio multiplied by the average account value over the period, multiplied by 182/365 (to reflect the one-half year period). |
| THE DAVENPORT FUNDS |
| OTHER INFORMATION (Unaudited) |
A description of the policies and procedures that the Funds use to vote proxies relating to portfolio securities is available without charge upon request by calling toll-free 1-800-281-3217, or on the SEC’s website at www.sec.gov. Information regarding how the Funds voted proxies relating to portfolio securities during the most recent 12-month period ended June 30 is also available without charge upon request by calling toll-free 1-800-281-3217, or on the SEC’s website at www.sec.gov.
The Trust files a complete listing of portfolio holdings for each Fund with the SEC as of the end of the first and third quarters of each fiscal year as an exhibit to its reports on Form N-PORT. These filings are available upon request by calling 1-800-281-3217. Furthermore, you may obtain a copy of these filings on the SEC’s website at www.sec.gov.
A complete listing of portfolio holdings for each Fund is updated daily and can be reviewed at the Funds’ website at www.investdavenport.com.
| FEDERAL TAX INFORMATION (Unaudited) |
For the fiscal year ended March 31, 2022, Davenport Core Fund, Davenport Value & Income Fund, Davenport Equity Opportunities Fund, Davenport Small Cap Focused Fund and Davenport Balanced Income Fund designated $67,520,115, $20,421,022, $72,940,203, $41,560,446 and $362,786, respectively, as long-term capital gain distributions.
Qualified Dividend Income – Davenport Core Fund, Davenport Value & Income Fund, Davenport Equity Opportunities Fund, Davenport Small Cap Focus Fund and Davenport Balanced Income Fund designated 100%, 95.16%, 41.46%, 23.23% and 71.96%, respectively, of ordinary income distributions, or up to the maximum amount of such dividends allowable pursuant to the Internal Revenue Code, as qualified dividend income.
Dividends Received Deduction – Corporate shareholders are generally entitled to take the dividends received deduction on the portion of a Fund’s dividend distributions that qualify under tax law. For the fiscal year ended March 31, 2022, Davenport Core Fund, Davenport Value & Income Fund, Davenport Equity Opportunities Fund, Davenport Small Cap Focus Fund and Davenport Balanced Income Fund, 100%, 91.12%, 35.95%, 22.43% and 58.65%, respectively, of ordinary income distributions, qualifies for the corporate dividends received deduction.
Qualified Business Income – Davenport Value & Income Fund designates 4.84% of its ordinary income dividends, or up to the maximum amount of such dividends allowable pursuant to the Internal Revenue Code, as qualified business income.
| DAVENPORT FUNDS |
| DISCLOSURE REGARDING APPROVAL OF INVESTMENT ADVISORY AGREEMENT (Unaudited) |
At a meeting held on February 22, 2022, the Board of Trustees, including a majority of the Independent Trustees, approved the continuance for a one-year period of the Investment Advisory Agreements with the Adviser on behalf of the Davenport Core Fund, the Davenport Value & Income Fund, the Davenport Equity Opportunities Fund, the Davenport Small Cap Focus Fund and the Davenport Balanced Income Fund (individually, a “Fund,” collectively, the “Funds”). Below is a discussion of the factors considered by the Board of Trustees along with the conclusions with respect thereto that formed the basis for the Board’s approval.
In approving the continuance of the Investment Advisory Agreements, the Independent Trustees considered all information they deemed reasonably necessary to evaluate the terms of the Agreements. The principal areas of review by the Independent Trustees were the nature, extent and quality of the services provided by the Adviser and the reasonableness of the fees charged for those services. These matters were considered by the Independent Trustees consulting with experienced counsel for the Independent Trustees, who is independent of the Adviser.
The Independent Trustees’ evaluation of the quality of the Adviser’s services took into consideration their knowledge gained through presentations and reports from the Adviser over the course of the preceding year. The Independent Trustees considered that the Adviser had provided its views on the overall conditions of the economy and the markets, including the factors that may have influenced the markets, investor preferences and market sentiment during the past year. The Independent Trustees also considered the security selection process that is applied in the management of the Funds and the adjustments that were made by the Adviser over the past year. Both short-term and long-term investment performance of the Funds were considered. Each Fund’s performance was compared to its performance benchmark, a peer group of funds with similar investment objectives and strategies, and to the Adviser’s comparably managed private accounts, as applicable. The Independent Trustees also considered: the scope and quality of the in-house capabilities of the Adviser and other resources that are dedicated towards management of the Funds; the experience of the Adviser’s Investment Policy Committee members and their collaboration; the quality of administrative and other services, including the Adviser’s role in coordinating the activities of the Funds’ other service providers; the Adviser’s compliance with investment policies of the Funds and applicable laws and regulations; information provided by management and the Funds’ independent public accounting firm in periodic meetings with the Trust’s Audit Committee; the business reputation of the Adviser; the qualifications of the Adviser’s key investment and compliance personnel; and the Adviser’s financial resources.
In reviewing the fees payable under the Investment Advisory Agreements, the Independent Trustees compared the advisory fees and overall expense levels of each Fund with those of funds with similar investment objectives and strategies as well as the private accounts managed by the Adviser, as applicable. The Independent Trustees considered information provided by the Adviser concerning the Adviser’s profitability with respect to each Fund, including the assumptions and methodology used in preparing the profitability information, in light of applicable case law relating to advisory fees. For these purposes, the Independent Trustees considered not only the
| DAVENPORT FUNDS |
| DISCLOSURE REGARDING APPROVAL OF INVESTMENT ADVISORY AGREEMENT (Unaudited) (Continued) |
fees paid by the Funds, but also so-called “fallout” benefits to the Adviser. The Independent Trustees also considered the fact that the Funds’ portfolio trades for equity securities were executed by the Adviser at no cost to the Funds. In evaluating the Funds’ advisory fees, the Trustees considered the complexity and quality of the investment process that is applied in the management of the Funds.
The Independent Trustees considered each Fund’s investment strategy in comparison to the performance to its respective primary and secondary benchmark, as applicable, and peer group average, and the services provided by Davenport & Co. to the respective Fund. Based on the consideration of the foregoing and such other information as was deemed relevant, including the factors and conclusions below, the Independent Trustees concluded that: (i) the overall performance of each of the Davenport Core Fund, Davenport Value & Income Fund and Davenport Balanced Income Fund is satisfactory considering each Fund’s investment strategy and Davenport & Co.’s discussion of the respective Fund’s performance, and the performance of each of the Davenport Equity Opportunities Fund and the Davenport Small Cap Focus Fund is satisfactory; (ii) the advisory fee for each of the Davenport Core Fund, the Davenport Equity Opportunities Fund, the Davenport Value & Income Fund and the Davenport Balanced Income Fund is higher when compared to the median for similarly managed funds according to statistics derived from Morningstar, Inc., the advisory fee for the Davenport Small Cap Focus Fund is at the median for similarly managed funds according to statistics derived from Morningstar, Inc., and the advisory fee payable by each Fund is reasonable in relation to the services provided by Davenport & Co.; (iii) the total operating expense ratio of each Fund is lower than the median expense ratio for similarly managed funds, according to statistics derived from Morningstar, Inc.; and (iv) Davenport & Co., a dually registered investment adviser and broker dealer, has further benefited the Funds’ shareholders by executing all equity trades at no cost to the Funds; and (v) the profits of Davenport & Co. with respect to its management of the Funds are reasonable.
The Independent Trustees considered the extent to which economies of scale are being realized as the Funds grow, and they noted that the net assets of each of the Davenport Funds had increased during the past calendar year and the operating expenses of each of the Davenport Funds also had decreased during the past calendar year. The Independent Trustees also considered the “fallout” benefits to Davenport & Co. with respect to the Davenport Funds, but given the amounts involved viewed these as secondary factors in connection with the evaluation of the reasonableness of the advisory fees paid by the Funds.
No single factor was considered in isolation or to be determinative to the decision of the Independent Trustees to approve the continuance of the Investment Advisory Agreements. Rather the Independent Trustees concluded, after weighing and balancing of all factors considered, that it was in the best interests of each Fund and its respective shareholders to continue the Investment Advisory Agreements without modification to its terms, including the fees charged for services thereunder, for an additional one-year period.
| DAVENPORT FUNDS’ |
| LIQUIDITY RISK MANAGEMENT PROGRAM (Unaudited) |
The Funds have adopted and implemented a written liquidity risk management program as required by Rule 22e-4 (the “Liquidity Rule”) under the Investment Company Act. The program is reasonably designed to assess and manage each Fund’s liquidity risk, taking into consideration, among other factors, the Fund’s investment strategy and the liquidity of its portfolio investments during normal and reasonably foreseeable stressed conditions; its short and long-term cash flow projections; and its cash holdings and access to other funding sources. The Funds’ Board of Trustees approved the appointment of a Liquidity Risk Committee, which includes representatives from Davenport & Company LLC, the Funds’ investment adviser, and Ultimus Fund Solutions, LLC, the Funds’ Administrator. The Liquidity Risk Committee is responsible for the program’s administration and oversight and for reporting to the Board on at least an annual basis regarding the program’s operation and effectiveness. The Liquidity Risk Committee updated its assessment of each Fund’s liquidity risk profile, considering additional data gathered in the 12 months ended November 30, 2021 and the adequacy and effectiveness of the liquidity risk management program’s operation from December 1, 2020 until November 30, 2021 (the “Review Period”) in order to prepare a written report for the Board of Trustees (the “Report”) for consideration at its meeting held on February 22, 2022. During the Review Period, none of the Funds experienced unusual stress or disruption to its operations related to purchase and redemption activity. Also, during the Review Period the Funds held adequate levels of cash and highly liquid investments to meet shareholder redemption activities in accordance with applicable requirements. The Report concluded that (i) the Funds’ liquidity risk management program is reasonably designed to prevent violations of the Liquidity Rule and (ii) the Funds’ liquidity risk management program has been effectively implemented.
This page intentionally left blank.
This page intentionally left blank.
This page intentionally left blank.
| |
| |
| |
| |
| |
| |
| |
| |
| |
| |
| THE DAVENPORT FUNDS |
| |
| Investment Adviser |
| Davenport & Company LLC |
| One James Center |
| 901 East Cary Street |
| Richmond, Virginia 23219-4037 |
| |
| Administrator |
| Ultimus Fund Solutions, LLC |
| P.O. Box 46707 |
| Cincinnati, Ohio 45246-0707 |
| 1-800-281-3217 |
| |
| Custodian |
| U.S. Bank, N.A. |
| 425 Walnut Street |
| Cincinnati, Ohio 45202 |
| |
| Independent Registered Public |
| Accounting Firm |
| Cohen & Company, Ltd. |
| 342 N Water Street, |
| Suite 830 |
| Milwaukee, WI 53202 |
| |
| Legal Counsel |
| Sullivan & Worcester LLP |
| 1666 K Street, N.W. |
| Washington, DC 20006 |
| |
| Board of Trustees |
| Robert S. Harris, Ph.D., Chairman |
| John P. Ackerly, IV |
| John T. Bruce |
| George K. Jennison |
| Harris V. Morrissette |
| Elizabeth W. Robertson |
| |
| Officers |
| John P. Ackerly, IV, President |
| Cheryl B. Hatcher, Vice President |
| George L. Smith, III, Vice President |
| |
| |
| |
| |
| |
| |
| |
| |
| |
| Davenport-AR-22 |
| |
| | | | | | | | |
| | | | | | | | |
| | | | | | | | |
| | | | | | | | |
| | | | | | | | |
| | | | | | | | |
| | | | | | | | |
| | | | | | | |
| | | |  | | | |
 | | | | |
| | | | | | | | | |
| | | | | | | | | | |
| | | | | | | | | | |
| | | | | | | | | | |
| | | Cantor FBP Equity & Dividend Plus Fund Cantor FBP Appreciation & Income Opportunities Fund Annual Report March 31, 2022 No-Load Funds | | |
| | | | | | | | |
| | | | | | | | |
| | | | | | | | |
| | | | | | | | |
| | | | | | | | |
| | | | | | | | |
| | | | | | | | |
| | | | | | | | |
| | | | | | | |
| | | | | | | |
| | | | | | | | |
| | | | | | | | |
| | | | | | | | |
| Letter to Shareholders | May 4, 2022 |
We are pleased to report on your Funds and their investments for the annual period ended March 31, 2022 and to provide some additional information since we last communicated with you. First, we will review the recent market environment and finally we will comment on the Funds’ fiscal year results.
Economic and Market Update
The most recent quarter ending March 31, 2022, was rocked by the start of war in Europe, sky high inflation, and notable monetary policy action, with the S&P 500® Index falling almost 5%. If not for a late March rally, it would have been worse. It was worse for the Nasdaq, which slipped into bear market territory before a rally brought its first quarter return to around negative 9%. Value and dividend focused stocks significantly outperformed in what was the poorest quarter for stocks since the COVID lockdowns in 2020 that plummeted the economy into recession. The “R” word is again at the forefront of investors’ minds as a flattening yield curve has raised anxiety about what lies ahead.
It is now clear that even without the Ukraine invasion and subsequent energy price spikes, the Federal Reserve’s (the “Fed”) Open Market Committee was playing catch up on inflation. With 40-year high levels of inflation hitting consumers’ pocketbooks, the last thing anyone needed was further fuel on that fire. But that is what we got when Putin decided to invade Ukraine, causing oil, natural gas and other commodity prices to soar. It was a perfect storm of limited supplies, likely exacerbated by tightened drilling regulations designed to fight climate change. This supply situation deteriorated when sanctions were imposed on Russian oil and gas by western countries. The Biden Administration has few options as it seeks to mitigate the economic damage that can be wreaked by high energy prices. Furthermore, time is not a friend to the President, as virtually nothing can be done in the near term to fix the problem. If President Biden softens his stance on exploration and production, he risks losing his progressive base. If he maintains restrictive policies, he risks a voter backlash in the mid-term elections this fall. His recent announcement of a release of 180 million barrels of oil from the Strategic Petroleum Reserve is an attempt to find some middle ground on the issue. We believe that short of a ceasefire agreement between Moscow and Kyiv, high energy prices will persist and will be a significant headwind for economic growth.
Additional challenges lie ahead when we consider what the Fed must do to rein in inflation. Its policy has gone from “inflation is transitory” to “expect seven interest rate increases this year” in just a few months. FOMC tightening has begun, and additional increases are a near certainty. That alone is often enough to spook investors. We believe because the rate increases are coming from a level near zero, the impact is not likely to be as significant as it would be if rates were much higher, say 4 or 5% for example. But the short end has moved sharply higher while longer bonds have moved up more modestly, and we are now witnessing a near yield curve inversion. This occurs when yields on short-term bonds rise above those of longer-term bonds, which can be a signal of future economic slowdown.
These factors, along with lingering supply chain pressures, imply slowing economic growth lies ahead. We believe the most likely outcome is a deceleration of the rate of growth, not negative GDP. Consumer spending remains robust and is still reflective of pent-up demand from COVID lockdowns. The latest ISM survey results suggest continued good but moderating economic growth. Inventory levels remain very low, which should lead to increased activity as manufacturers work to meet orders. Furthermore, interest rates, while moving higher, are still relatively low based on historical levels. Even given these favorable factors, we recognize that economic risks have increased this year, and we are building that risk into our thought process as we make adjustments to your Funds.
Cantor FBP Equity & Dividend Plus Fund Review
The Cantor FBP Equity & Dividend Plus Fund returned 17.23% for the fiscal year ended March 31, 2022. The S&P 500® Index (the “Index”) returned 15.65% over the same period. The Fund was 95.0% equity and 5.0% cash at fiscal year-end.
This past year was a good one for investment returns and your Fund performed very well in that environment. All sectors in the Fund except for Communication Services generated positive results. Energy, Health Care and Industrials were the strongest sectors for the Fund, helped in particular by ConocoPhillips, Chevron, CVS Health, Pfizer, Lockheed Martin and Raytheon Technologies. Communication Services and Consumer Discretionary had the lowest returns, with AT&T, Verizon and Tapestry dragging down results. Some recent additions to the Fund are Fidelity National Information Systems, Medtronic, Stanley Black & Decker and Hanesbrands. ConocoPhillips, Archer Daniels Midland and Pfizer are recent reductions from the Fund as a result of call options being exercised at attractive price levels. The Fund also sold First Horizon following a stock price spike accompanying news that the bank had agreed to be acquired.
Cash flow generation from dividends is a primary focus of your Equity & Dividend Plus Fund as well as cash generated from option premiums. The Fund utilizes as part of its investment discipline the use of covered call options as individual securities approach the top of the Adviser’s growth and price expectations. The Fund’s purpose in selling the call option is to generate additional cash flow to the Fund and to hedge the possibility the security may not achieve its price objective. In very strong stock markets, this discipline may limit the upside of the securities where options have been written, but in flat to negative markets, it may provide additional return. During the fiscal year ended March 31, 2022, the amount of premiums generated from selling covered call options was $548,773.
Cantor FBP Appreciation & Income Opportunities Fund Review
The Cantor FBP Appreciation & Income Opportunities Fund returned 15.16% for the fiscal year ended March 31, 2022. The S&P 500® Index (the “Index”) returned 15.65% and the Bloomberg Intermediate U.S. Government/Credit Index returned -4.10% over the same period. The Fund was 73.2% equity, 7.1% fixed income and 19.7% cash at fiscal year-end.
This past twelve months was also a positive period for the Appreciation & Income Opportunities Fund. The Fund’s allocation to equities produced strong returns especially in the Energy, Materials and Health Care sectors while Industrials and Communication Services lagged. Devon Energy, Nucor, ConocoPhillips, Archer Daniels Midland, and Mosaic were standout performers, while Intel, FedEx, Carnival, and Lumen Technology lagged. The short duration fixed income holdings and cash weighting, whose purpose in the Fund is to provide stability and income, worked to protect the fixed portion of the Fund as interest rates rose this past quarter. Recent reductions or sales in the Fund are ConocoPhillips, Devon Energy, Freeport-McMoran and Mosaic.
The Fund does utilize as part of its investment discipline the use of covered call options as individual securities approach the top of the Adviser’s growth and price expectations. The Fund’s purpose in selling the call option is to generate additional income to the Fund and to hedge the possibility the security may not achieve its price objective. In very strong stock markets, this discipline may limit the upside of the securities where options have been written, but in modest to negative markets, it may provide additional return. During the fiscal year ended March 31, 2022, the amount of premiums generated from selling covered call options was $77,801.
We want to thank you for your continued support and investment in the Cantor Flippin, Bruce & Porter Funds. Please visit our website at www.fbpfunds.com for information on your Funds and the investment philosophy and process we utilize to achieve their investment objectives.

John T. Bruce, CFA
President - Portfolio Manager
May 4, 2022
Data presented reflects past performance, which is no guarantee of future results. Investment results and principal value will fluctuate so that shares, when redeemed, may be worth more or less than their original cost. Due to market volatility, current performance may be higher or lower than the performance shown. Updated performance information, current through the most recent month-end, is available by contacting the Funds at 1-866-738-1127.
This report is submitted for the general information of the shareholders of the Funds. It reflects our views, opinions and portfolio holdings as of the date of this letter. These views are subject to change at any time based upon market or other conditions. For more current information throughout the year please visit www.fbpfunds.com or call the Funds at 1-866-738-1127. This report is not authorized for distribution to prospective investors in the Funds unless accompanied by a current prospectus.
THE CANTOR FBP MUTUAL FUNDS
COMPARATIVE PERFORMANCE CHARTS
(Unaudited)
Performance for each Fund is compared to the most appropriate broad-based index, the S&P 500® Index, an unmanaged index of 500 large common stocks. Each Fund’s performance results are also compared to the Consumer Price Index, a measure of inflation; the Bloomberg Barclays Intermediate U.S. Government/ Credit Index is also compared for the Cantor FBP Appreciation & Income Opportunities Fund.
Cantor FBP Equity & Dividend Plus Fund
Comparison of the Change in Value of a $10,000 Investment in
Cantor FBP Equity & Dividend Plus Fund, the S&P 500® Index and the Consumer Price Index
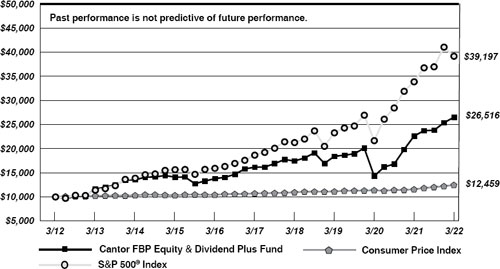
THE CANTOR FBP MUTUAL FUNDS
COMPARATIVE PERFORMANCE CHARTS
(Unaudited) (Continued)
Cantor FBP Appreciation & Income Opportunities Fund
Comparison of the Change in Value of a $10,000 Investment in
Cantor FBP Appreciation & Income Opportunities Fund, the S&P 500® Index,
the Consumer Price Index and the Bloomberg Intermediate U.S. Government/Credit Index
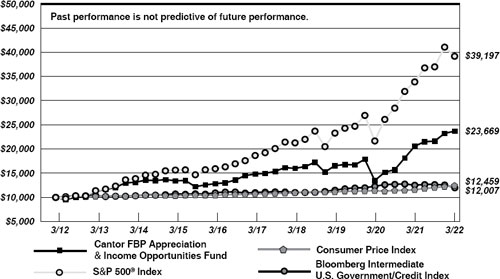
| |
| Average Annual Total Returns |
| (for periods ended March 31, 2022) |
| | | | | | | | |
| | | 1 Year | | 5 Years | | 10 Years | |
| Cantor FBP Equity & Dividend Plus Fund (a) | | 17.23% | | 10.42% | | 10.24% | |
| Cantor FBP Appreciation & Income Opportunities Fund (a) | | 15.16% | | 9.83% | | 9.00% | |
| S&P 500® Index | | 15.65% | | 15.99% | | 14.64% | |
| Consumer Price Index | | 7.87% | | 3.09% | | 2.22% | |
| Bloomberg Intermediate U.S. Government/Credit Index | | -4.10% | | 1.81% | | 1.85% | |
| | | | | | | | |
| (a) | Total returns are a measure of the change in value of an investment in the Fund over the periods covered, which assumes any dividends or capital gains distributions are reinvested in shares of the Fund. Returns do not reflect the deduction of taxes a shareholder would pay on the Fund’s distributions or the redemption of Fund shares. |
CANTOR FBP
EQUITY & DIVIDEND PLUS FUND
PORTFOLIO INFORMATION
March 31, 2022 (Unaudited)
| General Information | | | | |
| Net Asset Value Per Share | | | | $30.38 |
| Total Net Assets (Millions) | | | | $32.6 |
| Current Expense Ratio | | | | 1.12% |
| Portfolio Turnover | | | | 16% |
| Fund Inception Date | | | | 7/30/1993 |
| | | | | |
| | | | | S&P 500® |
| Stock Characteristics | | Fund | | Index |
| Number of Stocks | | 54 | | 500 |
| Weighted Avg Market Capitalization (Billions) | | 116.1 | | 678.6 |
| Price-to-Earnings Ratio (Bloomberg 1 Yr.Forecast EPS) | | 11.96 | | 19.43 |
| Price-to-Book Value | | 2.07 | | 4.53 |
Asset Allocation (% of Net Assets)
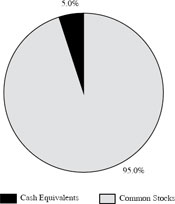
Sector Diversification vs. the S&P 500® Index
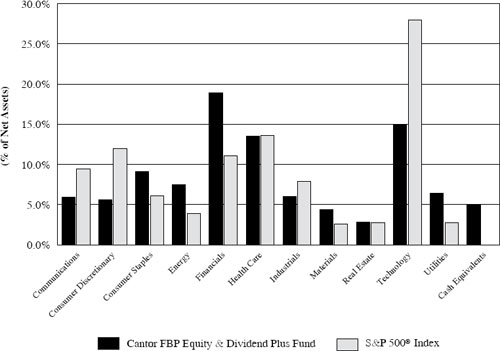
| Ten Largest Equity Holdings | | % of Net Assets |
| Broadcom, Inc. | | 3.5% |
| Raytheon Technologies Corporation | | 2.8% |
| CVS Health Corporation | | 2.8% |
| Chevron Corporation | | 2.4% |
| International Business Machines Corporation | | 2.4% |
| Merck & Company, Inc. | | 2.4% |
| U.S. Bancorp | | 2.3% |
| JPMorgan Chase & Company | | 2.3% |
| HP, Inc. | | 2.3% |
| Paramount Global - Class B | | 2.3% |
CANTOR FBP
APPRECIATION & INCOME OPPORTUNITIES FUND
PORTFOLIO INFORMATION
March 31, 2022 (Unaudited)
| General Information | | |
| Net Asset Value Per Share | | $23.79 |
| Total Net Assets (Millions) | | $35.3 |
| Current Expense Ratio | | 1.05% |
| Portfolio Turnover | | 10% |
| Fund Inception Date | | 7/3/1989 |
Asset Allocation (% of Net Assets)
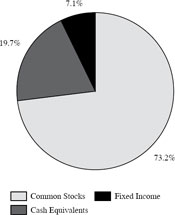
| Common Stock Portfolio (73.2% of Net Assets ) |
| Number of Stocks | | 51 |
| Weighted Avg Market Capitalization (Billions) | | 338.0 |
| Price-to-Earnings Ratio (Bloomberg 1 Yr.Forecast EPS) | | 13.75 |
| Price-to-Book Value | | 2.35 |
| | | |
| Five Largest Sectors | | % of Net Assets |
| Financials | | 16.4% |
| Technology | | 16.3% |
| Health Care | | 9.2% |
| Consumer Staples | | 7.6% |
| Energy | | 6.5% |
| Ten Largest Equity Holdings | | % of Net Assets |
| Bank of America Corporation | | 3.2% |
| JPMorgan Chase & Company | | 3.1% |
| Apple, Inc. | | 3.0% |
| Broadcom, Inc. | | 2.9% |
| Microsoft Corporation | | 2.6% |
| HP, Inc. | | 2.2% |
| Shell plc - ADR | | 1.9% |
| MetLife, Inc. | | 1.8% |
| Tapestry, Inc. | | 1.8% |
| Pfizer, Inc. | | 1.8% |
Fixed-Income Portfolio (7.1% of Net Assets)
| Number of Fixed-Income Securities | | 5 |
| Average Quality | | BBB+ |
| Average Weighted Maturity | | 1.02 yrs. |
| Average Effective Duration | | 0.98 yrs. |
| Sector Breakdown | | % of Net Assets |
| U.S. Treasury Obligations | | 1.4% |
| Energy | | 1.4% |
| Financials | | 2.9% |
| Industrials | | 1.4% |
| CANTOR FBP |
| EQUITY & DIVIDEND PLUS FUND |
| SCHEDULE OF INVESTMENTS |
| March 31, 2022 |
| COMMON STOCKS — 95.0% | | Shares | | | Value | |
| Communications — 5.9% | | | | | | |
| AT&T, Inc. | | | 24,000 | | | $ | 567,120 | |
| Paramount Global - Class B | | | 19,500 | | | | 737,295 | |
| Verizon Communications, Inc. | | | 12,000 | | | | 611,280 | |
| | | | | | | | 1,915,695 | |
| Consumer Discretionary — 5.6% | | | | | | | | |
| Genuine Parts Company (a) | | | 5,500 | | | | 693,110 | |
| Hanesbrands, Inc. | | | 20,500 | | | | 305,245 | |
| Kohl’s Corporation (a) | | | 4,500 | | | | 272,070 | |
| Tapestry, Inc. | | | 15,000 | | | | 557,250 | |
| | | | | | | | 1,827,675 | |
| Consumer Staples — 9.1% | | | | | | | | |
| J.M. Smucker Company (The) (a) | | | 2,700 | | | | 365,607 | |
| Kellogg Company | | | 10,500 | | | | 677,145 | |
| Kimberly-Clark Corporation (a) | | | 3,500 | | | | 431,060 | |
| Mondelez International, Inc. - Class A (a) | | | 5,000 | | | | 313,900 | |
| Philip Morris International, Inc. | | | 5,300 | | | | 497,882 | |
| Tyson Foods, Inc. - Class A (a) | | | 7,600 | | | | 681,188 | |
| | | | | | | | 2,966,782 | |
| Energy — 7.5% | | | | | | | | |
| Chevron Corporation (a) | | | 4,800 | | | | 781,584 | |
| ConocoPhillips (a) | | | 4,500 | | | | 450,000 | |
| Exxon Mobil Corporation | | | 8,000 | | | | 660,720 | |
| Shell plc - ADR | | | 10,000 | | | | 549,300 | |
| | | | | | | | 2,441,604 | |
| Financials — 18.9% | | | | | | | | |
| Bank of New York Mellon Corporation (The) | | | 6,000 | | | | 297,780 | |
| JPMorgan Chase & Company | | | 5,500 | | | | 749,760 | |
| KeyCorp (a) | | | 30,200 | | | | 675,876 | |
| Lincoln National Corporation (a) | | | 8,500 | | | | 555,560 | |
| MetLife, Inc. | | | 9,000 | | | | 632,520 | |
| People’s United Financial, Inc. | | | 25,000 | | | | 499,750 | |
| Prudential Financial, Inc. (a) | | | 6,000 | | | | 709,020 | |
| Truist Financial Corporation | | | 11,000 | | | | 623,700 | |
| U.S. Bancorp | | | 14,200 | | | | 754,730 | |
| Wells Fargo & Company (a) | | | 13,500 | | | | 654,210 | |
| | | | | | | | 6,152,906 | |
| Health Care — 13.5% | | | | | | | | |
| Bristol-Myers Squibb Company | | | 7,800 | | | | 569,634 | |
| CVS Health Corporation (a) | | | 9,000 | | | | 910,890 | |
| Johnson & Johnson | | | 4,100 | | | | 726,643 | |
| Medtronic plc | | | 5,500 | | | | 610,225 | |
| CANTOR FBP |
| EQUITY & DIVIDEND PLUS FUND |
| SCHEDULE OF INVESTMENTS (Continued) |
| COMMON STOCKS — 95.0% (Continued) | | Shares | | | Value | |
| Health Care — 13.5% (Continued) | | | | | | | | |
| Merck & Company, Inc. (a) | | | 9,400 | | | $ | 771,270 | |
| Organon & Company | | | 9,500 | | | | 331,835 | |
| Pfizer, Inc. | | | 9,000 | | | | 465,930 | |
| | | | | | | | 4,386,427 | |
| Industrials — 6.0% | | | | | | | | |
| Emerson Electric Company | | | 3,500 | | | | 343,175 | |
| Lockheed Martin Corporation | | | 800 | | | | 353,120 | |
| Raytheon Technologies Corporation (a) | | | 9,200 | | | | 911,444 | |
| Stanley Black & Decker, Inc. | | | 2,500 | | | | 349,475 | |
| | | | | | | | 1,957,214 | |
| Materials — 4.4% | | | | | | | | |
| Compass Minerals International, Inc. | | | 4,000 | | | | 251,160 | |
| Dow, Inc. | | | 10,600 | | | | 675,432 | |
| Nucor Corporation (a) | | | 3,500 | | | | 520,275 | |
| | | | | | | | 1,446,867 | |
| Real Estate — 2.8% | | | | | | | | |
| Simon Property Group, Inc. | | | 3,800 | | | | 499,928 | |
| Ventas, Inc. (a) | | | 6,900 | | | | 426,144 | |
| | | | | | | | 926,072 | |
| Technology — 14.9% | | | | | | | | |
| Amdocs Ltd. | | | 4,000 | | | | 328,840 | |
| Broadcom, Inc. (a) | | | 1,800 | | | | 1,133,424 | |
| Cisco Systems, Inc. | | | 10,000 | | | | 557,600 | |
| Fidelity National Information Services, Inc. | | | 7,000 | | | | 702,940 | |
| HP, Inc. (a) | | | 20,500 | | | | 744,150 | |
| Intel Corporation | | | 12,500 | | | | 619,500 | |
| International Business Machines Corporation | | | 6,000 | | | | 780,120 | |
| | | | | | | | 4,866,574 | |
| Utilities — 6.4% | | | | | | | | |
| Atmos Energy Corporation (a) | | | 4,500 | | | | 537,705 | |
| Duke Energy Corporation (a) | | | 6,300 | | | | 703,458 | |
| National Fuel Gas Company | | | 5,500 | | | | 377,850 | |
| PPL Corporation | | | 16,800 | | | | 479,808 | |
| | | | | | | | 2,098,821 | |
| | | | | | | | | |
| Total Common Stocks (Cost $21,867,768) | | | | | | $ | 30,986,637 | |
| CANTOR FBP |
| EQUITY & DIVIDEND PLUS FUND |
| SCHEDULE OF INVESTMENTS (Continued) |
| MONEY MARKET FUNDS — 6.6% | | Shares | | | Value | |
| Fidelity Institutional Money Market Government Portfolio - Class I, 0.12% (b) (Cost $2,165,971) | | | 2,165,971 | | | $ | 2,165,971 | |
| | | | | | | | | |
| Total Investments at Value — 101.6% (Cost $24,033,739) | | | | | | $ | 33,152,608 | |
| | | | | | | | | |
| Liabilities in Excess of Other Assets — (1.6%) | | | | | | | (537,129 | ) |
| | | | | | | | | |
| Net Assets — 100.0% | | | | | | $ | 32,615,479 | |
ADR - American Depositary Receipt.
| (a) | Security covers a written call option. |
| (b) | The rate shown is the 7-day effective yield as of March 31, 2022. |
See accompanying notes to financial statements.
| CANTOR FBP |
| EQUITY & DIVIDEND PLUS FUND |
| SCHEDULE OF OPEN OPTION CONTRACTS |
| March 31, 2022 |
| COVERED WRITTEN | | | | Notional | | | Strike | | | Expiration | | Value of | |
| CALL OPTIONS | | Contracts | | Value | | | Price | | | Date | | Options | |
| Atmos Energy Corporation | | 25 | | $ | 298,725 | | | $ | 120.00 | | | 10/24/22 | | $ | 23,750 | |
| Broadcom, Inc. | | 8 | | | 503,744 | | | | 700.00 | | | 07/18/22 | | | 12,080 | |
| Chevron Corporation | | 25 | | | 407,075 | | | | 175.00 | | | 08/22/22 | | | 16,625 | |
| ConocoPhillips | | 25 | | | 250,000 | | | | 110.00 | | | 08/22/22 | | | 12,000 | |
| CVS Health Corporation | | 25 | | | 253,025 | | | | 105.00 | | | 05/23/22 | | | 4,750 | |
| Duke Energy Corporation | | 40 | | | 446,640 | | | | 105.00 | | | 04/18/22 | | | 27,560 | |
| Genuine Parts Company | | 30 | | | 378,060 | | | | 145.00 | | | 05/23/22 | | | 2,250 | |
| HP, Inc. | | 100 | | | 363,000 | | | | 40.00 | | | 05/23/22 | | | 5,900 | |
| J.M. Smucker Company (The) | | 27 | | | 365,607 | | | | 155.00 | | | 07/18/22 | | | 2,970 | |
| KeyCorp | | 115 | | | 257,370 | | | | 28.00 | | | 06/20/22 | | | 1,725 | |
| Kimberly-Clark Corporation | | 35 | | | 431,060 | | | | 150.00 | | | 07/18/22 | | | 1,575 | |
| Kohl’s Corporation | | 45 | | | 272,070 | | | | 75.00 | | | 06/20/22 | | | 2,250 | |
| Lincoln National Corporation | | 65 | | | 424,840 | | | | 85.00 | | | 07/18/22 | | | 4,550 | |
| Merck & Company, Inc. | | 40 | | | 328,200 | | | | 95.00 | | | 04/18/22 | | | 80 | |
| Mondelez International, Inc.- Class A | | 15 | | | 94,170 | | | | 72.50 | | | 06/21/22 | | | 150 | |
| Nucor Corporation | | 35 | | | 520,275 | | | | 125.00 | | | 07/18/22 | | | 101,675 | |
| Prudential Financial, Inc. | | 40 | | | 472,680 | | | | 125.00 | | | 06/20/22 | | | 12,440 | |
| Raytheon Technologies Corporation | | 50 | | | 495,350 | | | | 105.00 | | | 08/22/22 | | | 18,000 | |
| Tyson Foods, Inc. - Class A | | 30 | | | 268,890 | | | | 90.00 | | | 06/20/22 | | | 12,450 | |
| Tyson Foods, Inc. - Class A | | 25 | | | 224,075 | | | | 105.00 | | | 07/18/22 | | | 1,175 | |
| Ventas, Inc. | | 30 | | | 185,280 | | | | 65.00 | | | 08/22/22 | | | 8,700 | |
| Wells Fargo & Company | | 80 | | | 387,680 | | | | 65.00 | | | 07/18/22 | | | 1,760 | |
| Total Covered Written Call Options | | | | | | | | | | | | | | | | |
| (Premiums received $328,262) | | | | $ | 7,627,816 | | | | | | | | | $ | 274,415 | |
See accompanying notes to financial statements.
| CANTOR FBP |
| APPRECIATION & INCOME OPPORTUNITIES FUND |
| SCHEDULE OF INVESTMENTS |
| March 31, 2022 |
| COMMON STOCKS — 73.2% | | Shares | | | Value | |
| Communications — 1.4% | | | | | | |
| Paramount Global - Class B | | | 13,000 | | | $ | 491,530 | |
| | | | | | | | | |
| Consumer Discretionary — 4.6% | | | | | | | | |
| Carnival Corporation (a) | | | 5,000 | | | | 101,100 | |
| Ford Motor Company | | | 23,000 | | | | 388,930 | |
| Kohl’s Corporation | | | 5,000 | | | | 302,300 | |
| Tapestry, Inc. | | | 17,000 | | | | 631,550 | |
| TJX Companies, Inc. (The) | | | 3,500 | | | | 212,030 | |
| | | | | | | | 1,635,910 | |
| Consumer Staples — 7.6% | | | | | | | | |
| Archer-Daniels-Midland Company | | | 4,500 | | | | 406,170 | |
| Dollar Tree, Inc. (a) | | | 2,700 | | | | 432,405 | |
| Kellogg Company | | | 7,000 | | | | 451,430 | |
| Philip Morris International, Inc. | | | 3,000 | | | | 281,820 | |
| Target Corporation | | | 1,500 | | | | 318,330 | |
| Tyson Foods, Inc. - Class A (b) | | | 4,000 | | | | 358,520 | |
| Walmart, Inc. | | | 2,800 | | | | 416,976 | |
| | | | | | | | 2,665,651 | |
| Energy — 6.5% | | | | | | | | |
| Chevron Corporation | | | 3,600 | | | | 586,188 | |
| ConocoPhillips | | | 5,000 | | | | 500,000 | |
| Devon Energy Corporation | | | 9,000 | | | | 532,170 | |
| Shell plc - ADR | | | 12,000 | | | | 659,160 | |
| | | | | | | | 2,277,518 | |
| Financials — 16.4% | | | | | | | | |
| Bank of America Corporation | | | 27,000 | | | | 1,112,940 | |
| Bank of New York Mellon Corporation (The) | | | 6,000 | | | | 297,780 | |
| Capital One Financial Corporation | | | 4,700 | | | | 617,063 | |
| JPMorgan Chase & Company | | | 8,100 | | | | 1,104,192 | |
| KeyCorp (b) | | | 16,320 | | | | 365,242 | |
| Lincoln National Corporation (b) | | | 8,000 | | | | 522,880 | |
| MetLife, Inc. | | | 9,000 | | | | 632,520 | |
| Travelers Companies, Inc. (The) | | | 3,300 | | | | 603,009 | |
| Wells Fargo & Company (b) | | | 11,000 | | | | 533,060 | |
| | | | | | | | 5,788,686 | |
| Health Care — 9.2% | | | | | | | | |
| Bristol-Myers Squibb Company | | | 6,300 | | | | 460,089 | |
| CVS Health Corporation | | | 6,000 | | | | 607,260 | |
| Johnson & Johnson | | | 3,200 | | | | 567,136 | |
| Merck & Company, Inc. | | | 6,300 | | | | 516,915 | |
| Organon & Company | | | 13,800 | | | | 482,034 | |
| CANTOR FBP |
| APPRECIATION & INCOME OPPORTUNITIES FUND |
| SCHEDULE OF INVESTMENTS (Continued) |
| COMMON STOCKS — 73.2% (Continued) | | Shares | | | Value | |
| Health Care — 9.2% (Continued) | | | | | | | | |
| Pfizer, Inc. | | | 12,000 | | | $ | 621,240 | |
| | | | | | | | 3,254,674 | |
| Industrials — 5.8% | | | | | | | | |
| Eaton Corporation plc | | | 4,000 | | | | 607,040 | |
| FedEx Corporation | | | 2,200 | | | | 509,058 | |
| Quanta Services, Inc. | | | 2,000 | | | | 263,220 | |
| Raytheon Technologies Corporation (b) | | | 3,600 | | | | 356,652 | |
| Trane Technologies plc | | | 2,100 | | | | 320,670 | |
| | | | | | | | 2,056,640 | |
| Materials — 3.3% | | | | | | | | |
| Compass Minerals International, Inc. | | | 5,000 | | | | 313,950 | |
| Freeport-McMoRan, Inc. | | | 5,000 | | | | 248,700 | |
| Nucor Corporation | | | 4,100 | | | | 609,465 | |
| | | | | | | | 1,172,115 | |
| Technology — 16.3% | | | | | | | | |
| Apple, Inc. | | | 6,000 | | | | 1,047,660 | |
| Broadcom, Inc. (b) | | | 1,600 | | | | 1,007,488 | |
| Cisco Systems, Inc. | | | 11,000 | | | | 613,360 | |
| HP, Inc. (b) | | | 21,000 | | | | 762,300 | |
| Intel Corporation | | | 10,500 | | | | 520,380 | |
| International Business Machines Corporation | | | 4,200 | | | | 546,084 | |
| Kyndryl Holdings, Inc. (a) | | | 14,000 | | | | 183,680 | |
| Microsoft Corporation | | | 3,000 | | | | 924,930 | |
| Western Union Company (The) | | | 7,000 | | | | 131,180 | |
| | | | | | | | 5,737,062 | |
| Utilities — 2.1% | | | | | | | | |
| Atmos Energy Corporation | | | 4,000 | | | | 477,960 | |
| PPL Corporation | | | 9,000 | | | | 257,040 | |
| | | | | | | | 735,000 | |
| | | | | | | | | |
| Total Common Stocks (Cost $11,921,967) | | | | | | $ | 25,814,786 | |
| CANTOR FBP |
| APPRECIATION & INCOME OPPORTUNITIES FUND |
| SCHEDULE OF INVESTMENTS (Continued) |
| CORPORATE BONDS — 5.7% | | Par Value | | | Value | |
| Energy — 1.4% | | | | | | |
| Pioneer Natural Resources Company, 3.95%, due 07/15/2022 | | $ | 500,000 | | | $ | 500,953 | |
| | | | | | | | | |
| Financials — 2.9% | | | | | | | | |
| American Express Company, 3.40%, due 02/27/2023 | | | 500,000 | | | | 506,069 | |
| UNUM Group, 4.00%, due 03/15/2024 | | | 500,000 | | | | 507,441 | |
| | | | | | | | 1,013,510 | |
| Industrials — 1.4% | | | | | | | | |
| Norfolk Sothern Corporation, 3.85%, due 01/15/2024 | | | 500,000 | | | | 508,233 | |
| | | | | | | | | |
| Total Corporate Bonds (Cost $2,018,570) | | | | | | $ | 2,022,696 | |
| U.S. TREASURY OBLIGATIONS — 1.4% | | Par Value | | | Value | |
| U.S. Treasury Notes — 1.4% | | | | | | | | |
| 2.13%, due 05/15/2022 (Cost 505,547) | | $ | 500,000 | | | $ | 501,095 | |
| MONEY MARKET FUNDS — 19.8% | | Shares | | | Value | |
| Fidelity Institutional Money Market Government Portfolio - Class I, 0.12% (c) | | | 3,564,430 | | | $ | 3,564,430 | |
| First American Government Obligations Fund - Class Z, 0.15% (c) | | | 3,411,061 | | | | 3,411,061 | |
| Total Money Market Funds (Cost $6,975,491) | | | | | | $ | 6,975,491 | |
| | | | | | | | | |
| Total Investments at Value — 100.1% | | | | | | | | |
| (Cost $21,421,575) | | | | | | $ | 35,314,068 | |
| | | | | | | | | |
| Liabilities in Excess of Other Assets — (0.1%) | | | | | | | (21,047 | ) |
| | | | | | | | | |
| Net Assets — 100.0% | | | | | | $ | 35,293,021 | |
ADR - American Depositary Receipt.
| (a) | Non-income producing security. |
| (b) | Security covers a written call option. |
| (c) | The rate shown is the 7-day effective yield as of March 31, 2022. |
See accompanying notes to financial statements.
| CANTOR FBP |
| APPRECIATION & INCOME OPPORTUNITIES FUND |
| SCHEDULE OF OPEN OPTION CONTRACTS |
| March 31, 2022 |
| COVERED WRITTEN | | | | Notional | | | Strike | | | Expiration | | Value of | |
| CALL OPTIONS | | Contracts | | Value | | | Price | | | Date | | Options | |
| Broadcom, Inc. | | 5 | | $ | 314,840 | | | $ | 700.00 | | | 07/18/22 | | $ | 7,550 | |
| HP, Inc. | | 100 | | | 363,000 | | | | 40.00 | | | 05/23/22 | | | 5,900 | |
| KeyCorp | | 50 | | | 111,900 | | | | 28.00 | | | 06/20/22 | | | 750 | |
| Lincoln National Corporation | | 40 | | | 261,440 | | | | 85.00 | | | 07/18/22 | | | 2,800 | |
| Raytheon Technologies Corporation | | 14 | | | 138,698 | | | | 105.00 | | | 08/22/22 | | | 5,040 | |
| Tyson Foods, Inc. - Class A | | 15 | | | 134,445 | | | | 105.00 | | | 07/18/22 | | | 705 | |
| Wells Fargo & Company | | 50 | | | 242,300 | | | | 65.00 | | | 07/18/22 | | | 1,100 | |
| Total Covered Written Call Options | | | | | | | | | | | | | | | | |
| (Premiums received $70,646) | | | | $ | 1,566,623 | | | | | | | | | $ | 23,845 | |
See accompanying notes to financial statements.
| THE CANTOR FBP MUTUAL FUNDS |
| STATEMENTS OF ASSETS AND LIABILITIES |
| March 31, 2022 |
| | | | | | Cantor FBP | |
| | | Cantor FBP | | | Appreciation | |
| | | Equity & | | | & Income | |
| | | Dividend | | | Opportunities | |
| | | Plus Fund | | | Fund | |
| ASSETS | | | | | | |
| Investments in securities: | | | | | | | | |
| At cost | | $ | 24,033,739 | | | $ | 21,421,575 | |
| At value (Note 2) | | $ | 33,152,608 | | | $ | 35,314,068 | |
| Receivable for capital shares sold | | | 28,500 | | | | — | |
| Dividends and interest receivable | | | 59,669 | | | | 46,511 | |
| Other assets | | | 4,987 | | | | 5,400 | |
| TOTAL ASSETS | | | 33,245,764 | | | | 35,365,979 | |
| | | | | | | | | |
| LIABILITIES | | | | | | | | |
| Written call options, at value (Notes 2 and 5) (premiums received $328,262 and $70,646, respectively) | | | 274,415 | | | | 23,845 | |
| Distributions payable | | | 3,183 | | | | 9,010 | |
| Payable for capital shares redeemed | | | 13,740 | | | | 16,707 | |
| Payable for investment securities purchased | | | 314,521 | | | | — | |
| Accrued investment advisory fees (Note 4) | | | 15,496 | | | | 14,361 | |
| Payable to administrator (Note 4) | | | 5,580 | | | | 5,580 | |
| Other accrued expenses | | | 3,350 | | | | 3,455 | |
| TOTAL LIABILITIES | | | 630,285 | | | | 72,958 | |
| | | | | | | | | |
| NET ASSETS | | $ | 32,615,479 | | | $ | 35,293,021 | |
| | | | | | | | | |
| NET ASSETS CONSIST OF: | | | | | | | | |
| Paid-in capital | | $ | 22,210,789 | | | $ | 18,570,249 | |
| Distributable earnings | | | 10,404,690 | | | | 16,722,772 | |
| Net assets | | $ | 32,615,479 | | | $ | 35,293,021 | |
| | | | | | | | | |
| Shares of beneficial interest outstanding (unlimited number of shares authorized, $0.01 par value) | | | 1,073,681 | | | | 1,483,234 | |
| | | | | | | | | |
| Net asset value, offering price and redemption price per share (Note 2) | | $ | 30.38 | | | $ | 23.79 | |
See accompanying notes to financial statements.
| THE CANTOR FBP MUTUAL FUNDS |
| STATEMENTS OF OPERATIONS |
| For the Year Ended March 31, 2022 |
| | | | | | Cantor FBP | |
| | | Cantor FBP | | | Appreciation | |
| | | Equity & | | | & Income | |
| | | Dividend | | | Opportunities | |
| | | Plus Fund | | | Fund | |
| INVESTMENT INCOME | | | | | | | | |
| Dividends | | $ | 940,468 | | | $ | 696,583 | |
| Interest | | | — | | | | 98,179 | |
| TOTAL INVESTMENT INCOME | | | 940,468 | | | | 794,762 | |
| | | | | | | | | |
| EXPENSES | | | | | | | | |
| Investment advisory fees (Note 4) | | | 212,987 | | | | 250,409 | |
| Administration fees (Note 4) | | | 60,000 | | | | 60,000 | |
| Audit and tax services fees | | | 17,960 | | | | 17,960 | |
| Registration and filing fees | | | 17,744 | | | | 16,053 | |
| Trustees’ fees (Note 4) | | | 16,500 | | | | 16,500 | |
| Legal fees | | | 8,762 | | | | 8,762 | |
| Printing of shareholder reports | | | 8,993 | | | | 7,757 | |
| Custodian and bank service fees | | | 7,338 | | | | 7,417 | |
| Compliance service fees (Note 4) | | | 7,003 | | | | 7,003 | |
| Postage and supplies | | | 7,276 | | | | 5,034 | |
| Account maintenance fees | | | 4,942 | | | | 2,924 | |
| Insurance expense | | | 1,027 | | | | 1,034 | |
| Other expenses | | | 4,970 | | | | 5,784 | |
| TOTAL EXPENSES | | | 375,502 | | | | 406,637 | |
| Fees reduced by the Adviser (Note 4) | | | (34,723 | ) | | | (31,024 | ) |
| NET EXPENSES | | | 340,779 | | | | 375,613 | |
| | | | | | | | | |
| NET INVESTMENT INCOME | | | 599,689 | | | | 419,149 | |
| | | | | | | | | |
| REALIZED AND UNREALIZED GAINS ON INVESTMENTS AND WRITTEN OPTION CONTRACTS | | | | | | | | |
| Net realized gains from: | | | | | | | | |
| Investment transactions | | | 2,328,708 | | | | 3,590,346 | |
| Written option contracts (Note 5) | | | 147,353 | | | | 981 | |
| Net change in unrealized appreciation (depreciation) on: | | | | | | | | |
| Investment transactions | | | 1,694,953 | | | | 948,659 | |
| Written option contracts (Note 5) | | | 20,934 | | | | 91,882 | |
| NET REALIZED AND UNREALIZED GAINS ON INVESTMENTS AND WRITTEN OPTION CONTRACTS | | | 4,191,948 | | | | 4,631,868 | |
| | | | | | | | | |
| NET INCREASE IN NET ASSETS FROM OPERATIONS | | $ | 4,791,637 | | | $ | 5,051,017 | |
See accompanying notes to financial statements.
| CANTOR FBP |
| EQUITY & DIVIDEND PLUS FUND |
| STATEMENTS OF CHANGES IN NET ASSETS |
| | | Year Ended | | | Year Ended | |
| | | March 31, | | | March 31, | |
| | | 2022 | | | 2021 | |
| FROM OPERATIONS | | | | | | | | |
| Net investment income | | $ | 599,689 | | | $ | 618,034 | |
| Net realized gains (losses) from: | | | | | | | | |
| Investment transactions | | | 2,328,708 | | | | 776,235 | |
| Written option contracts (Note 5) | | | 147,353 | | | | (64,664 | ) |
| Net change in unrealized appreciation (depreciation) on: | | | | | | | | |
| Investment transactions | | | 1,694,953 | | | | 9,959,773 | |
| Written option contracts (Note 5) | | | 20,934 | | | | (59,315 | ) |
| Net increase in net assets from operations | | | 4,791,637 | | | | 11,230,063 | |
| | | | | | | | | |
| DISTRIBUTIONS TO SHAREHOLDERS (Note 2) | | | (2,481,311 | ) | | | (618,292 | ) |
| | | | | | | | | |
| FROM CAPITAL SHARE TRANSACTIONS | | | | | | | | |
| Proceeds from shares sold | | | 2,275,948 | | | | 676,714 | |
| Net asset value of shares issued in reinvestment of distributions to shareholders | | | 2,433,606 | | | | 608,106 | |
| Payments for shares redeemed | | | (2,921,872 | ) | | | (4,297,795 | ) |
| Net increase (decrease) in net assets from capital share transactions | | | 1,787,682 | | | | (3,012,975 | ) |
| | | | | | | | | |
| TOTAL INCREASE IN NET ASSETS | | | 4,098,008 | | | | 7,598,796 | |
| | | | | | | | | |
| NET ASSETS | | | | | | | | |
| Beginning of year | | | 28,517,471 | | | | 20,918,675 | |
| End of year | | $ | 32,615,479 | | | $ | 28,517,471 | |
| | | | | | | | | |
| CAPITAL SHARE ACTIVITY | | | | | | | | |
| Shares sold | | | 76,044 | | | | 30,088 | |
| Shares reinvested | | | 86,021 | | | | 26,398 | |
| Shares redeemed | | | (100,027 | ) | | | (189,001 | ) |
| Net increase (decrease) in shares outstanding | | | 62,038 | | | | (132,515 | ) |
| Shares outstanding, beginning of year | | | 1,011,643 | | | | 1,144,158 | |
| Shares outstanding, end of year | | | 1,073,681 | | | | 1,011,643 | |
See accompanying notes to financial statements.
| CANTOR FBP |
| APPRECIATION & INCOME OPPORTUNITIES FUND |
| STATEMENTS OF CHANGES IN NET ASSETS |
| | | Year Ended | | | Year Ended | |
| | | March 31, | | | March 31, | |
| | | 2022 | | | 2021 | |
| FROM OPERATIONS | | | | | | | | |
| Net investment income | | $ | 419,149 | | | $ | 480,330 | |
| Net realized gains from: | | | | | | | | |
| Investment transactions | | | 3,590,346 | | | | 558,676 | |
| Written option contracts (Note 5) | | | 981 | | | | 11,357 | |
| Net change in unrealized appreciation (depreciation) on: | | | | | | | | |
| Investment transactions | | | 948,659 | | | | 11,695,503 | |
| Written option contracts (Note 5) | | | 91,882 | | | | (87,423 | ) |
| Net increase in net assets from operations | | | 5,051,017 | | | | 12,658,443 | |
| | | | | | | | | |
| DISTRIBUTIONS TO SHAREHOLDERS (Note 2) | | | (1,655,507 | ) | | | (492,477 | ) |
| | | | | | | | | |
| FROM CAPITAL SHARE TRANSACTIONS | | | | | | | | |
| Proceeds from shares sold | | | 995,004 | | | | 612,477 | |
| Net asset value of shares issued in reinvestment of distributions to shareholders | | | 1,615,223 | | | | 452,999 | |
| Payments for shares redeemed | | | (6,280,307 | ) | | | (2,950,990 | ) |
| Net decrease in net assets from capital share transactions | | | (3,670,080 | ) | | | (1,885,514 | ) |
| | | | | | | | | |
| TOTAL INCREASE (DECREASE) IN NET ASSETS | | | (274,570 | ) | | | 10,280,452 | |
| | | | | | | | | |
| NET ASSETS | | | | | | | | |
| Beginning of year | | | 35,567,591 | | | | 25,287,139 | |
| End of year | | $ | 35,293,021 | | | $ | 35,567,591 | |
| | | | | | | | | |
| CAPITAL SHARE ACTIVITY | | | | | | | | |
| Shares sold | | | 43,385 | | | | 32,756 | |
| Shares reinvested | | | 71,739 | | | | 25,131 | |
| Shares redeemed | | | (273,230 | ) | | | (168,480 | ) |
| Net decrease in shares outstanding | | | (158,106 | ) | | | (110,593 | ) |
| Shares outstanding, beginning of year | | | 1,641,340 | | | | 1,751,933 | |
| Shares outstanding, end of year | | | 1,483,234 | | | | 1,641,340 | |
See accompanying notes to financial statements.
| CANTOR FBP |
| EQUITY & DIVIDEND PLUS FUND |
| FINANCIAL HIGHLIGHTS |
Selected Per Share Data for a Share Outstanding Throughout Each Year
| | | Years Ended March 31, | |
| | | 2022 | | | 2021 | | | 2020 | | | 2019 | | | 2018 | |
| Net asset value at beginning of year | | $ | 28.19 | | | $ | 18.28 | | | $ | 25.19 | | | $ | 25.68 | | | $ | 25.96 | |
| Income (loss) from investment operations: | | | | | | | | | | | | | | | | | | | | |
| Net investment income | | | 0.58 | | | | 0.59 | | | | 0.67 | | | | 0.60 | | | | 0.57 | |
| Net realized and unrealized gains (losses) on investments and written option contracts | | | 4.03 | | | | 9.90 | | | | (5.90 | ) | | | 0.83 | | | | 1.38 | |
| Total from investment operations | | | 4.61 | | | | 10.49 | | | | (5.23 | ) | | | 1.43 | | | | 1.95 | |
| Less distributions from: | | | | | | | | | | | | | | | | | | | | |
| Net investment income | | | (0.59 | ) | | | (0.58 | ) | | | (0.67 | ) | | | (0.60 | ) | | | (0.57 | ) |
| Net realized gains | | | (1.83 | ) | | | — | | | | (1.01 | ) | | | (1.32 | ) | | | (1.66 | ) |
| Total distributions | | | (2.42 | ) | | | (0.58 | ) | | | (1.68 | ) | | | (1.92 | ) | | | (2.23 | ) |
| Net asset value at end of year | | $ | 30.38 | | | $ | 28.19 | | | $ | 18.28 | | | $ | 25.19 | | | $ | 25.68 | |
| Total return (a) | | | 17.23 | % | | | 58.15 | % | | | (22.33 | %) | | | 5.64 | % | | | 7.91 | % |
| Net assets at end of year (000’s) | | $ | 32,615 | | | $ | 28,517 | | | $ | 20,919 | | | $ | 28,615 | | | $ | 26,279 | |
| Ratio of total expenses to average net assets | | | 1.23 | % | | | 1.32 | % | | | 1.25 | % | | | 1.23 | % | | | 1.24 | % |
| Ratio of net expenses to average net assets (b) | | | 1.12 | % | | | 1.10 | % | | | 1.07 | % | | | 1.07 | % | | | 1.07 | % |
| Ratio of net investment income to average net assets (b) | | | 1.97 | % | | | 2.53 | % | | | 2.70 | % | | | 2.35 | % | | | 2.19 | % |
| Portfolio turnover rate | | | 16 | % | | | 21 | % | | | 38 | % | | | 18 | % | | | 18 | % |
| (a) | Total return is a measure of the change in value of an investment in the Fund over the periods covered, which assumes any dividends or capital gains distributions are reinvested in shares of the Fund. The returns shown do not reflect the deduction of taxes a shareholder would pay on Fund distributions or the redemption of Fund shares. The total returns would have been lower if the Adviser had not waived/reduced advisory fees. |
| (b) | Ratios were determined after advisory fee waivers/reductions by the Adviser (Note 4). |
See accompanying notes to financial statements.
| CANTOR FBP |
| APPRECIATION & INCOME OPPORTUNITIES FUND |
| FINANCIAL HIGHLIGHTS |
Selected Per Share Data for a Share Outstanding Throughout Each Year
| | | Years Ended March 31, | |
| | | 2022 | | | 2021 | | | 2020 | | | 2019 | | | 2018 | |
| Net asset value at beginning of year | | $ | 21.67 | | | $ | 14.43 | | | $ | 18.91 | | | $ | 18.99 | | | $ | 18.81 | |
| Income (loss) from investment operations: | | | | | | | | | | | | | | | | | | | | |
| Net investment income | | | 0.27 | | | | 0.29 | | | | 0.38 | | | | 0.37 | | | | 0.41 | |
| Net realized and unrealized gains (losses) on investments and written option contracts | | | 2.94 | | | | 7.24 | | | | (3.65 | ) | | | 0.28 | | | | 1.03 | |
| Total from investment operations | | | 3.21 | | | | 7.53 | | | | (3.27 | ) | | | 0.65 | | | | 1.44 | |
| Less distributions from: | | | | | | | | | | | | | | | | | | | | |
| Net investment income | | | (0.29 | ) | | | (0.29 | ) | | | (0.38 | ) | | | (0.37 | ) | | | (0.41 | ) |
| Net realized gains | | | (0.80 | ) | | | — | | | | (0.83 | ) | | | (0.36 | ) | | | (0.85 | ) |
| Total distributions | | | (1.09 | ) | | | (0.29 | ) | | | (1.21 | ) | | | (0.73 | ) | | | (1.26 | ) |
| Net asset value at end of year | | $ | 23.79 | | | $ | 21.67 | | | $ | 14.43 | | | $ | 18.91 | | | $ | 18.99 | |
| Total return (a) | | | 15.16 | % | | | 52.63 | % | | | (18.56 | %) | | | 3.44 | % | | | 7.91 | % |
| Net assets at end of year (000’s) | | $ | 35,293 | | | $ | 35,568 | | | $ | 25,287 | | | $ | 33,376 | | | $ | 34,614 | |
| Ratio of total expenses to average net assets | | | 1.14 | % | | | 1.20 | % | | | 1.16 | % | | | 1.12 | % | | | 1.10 | % |
| Ratio of net expenses to average net assets (b) | | | 1.05 | % | | | 1.03 | % | | | 1.00 | % | | | 1.00 | % | | | 1.00 | % |
| Ratio of net investment income to average net assets (b) | | | 1.17 | % | | | 1.61 | % | | | 2.03 | % | | | 1.89 | % | | | 2.16 | % |
| Portfolio turnover rate | | | 10 | % | | | 11 | % | | | 18 | % | | | 21 | % | | | 10 | % |
| (a) | Total return is a measure of the change in value of an investment in the Fund over the periods covered, which assumes any dividends or capital gains distributions are reinvested in shares of the Fund. The returns shown do not reflect the deduction of taxes a shareholder would pay on Fund distributions or the redemption of Fund shares. The total returns would have been lower if the Adviser had not waived/reduced advisory fees. |
| (b) | Ratios were determined after advisory fee waivers/reductions by the Adviser (Note 4). |
See accompanying notes to financial statements.
| THE CANTOR FBP MUTUAL FUNDS |
| NOTES TO FINANCIAL STATEMENTS March 31, 2022 |
Cantor FBP Equity & Dividend Plus Fund (formerly FBP Equity & Dividend Plus Fund) and Cantor FBP Appreciation & Income Opportunities Fund (formerly FBP Appreciation & Income Opportunities Fund) (each a “Fund” and collectively the “Funds”) are no-load, diversified series of Williamsburg Investment Trust (the “Trust”), an open-end management investment company registered under the Investment Company Act of 1940, as amended (the “1940 Act”). The Trust was organized as a Massachusetts business trust on July 18, 1988. Other series of the Trust are not included in this report.
The investment objective of Cantor FBP Equity & Dividend Plus Fund is to provide above-average and growing income while also achieving long-term growth of capital.
The investment objectives of Cantor FBP Appreciation & Income Opportunities Fund are long term capital appreciation and current income, assuming a moderate level of investment risk.
| 2. | Significant Accounting Policies |
Each Fund follows accounting and reporting guidance under Financial Accounting Standards Board (“FASB”) Accounting Standards Codification Topic 946, “Financial Services �� Investment Companies.” The following is a summary of the Funds’ significant accounting policies. These policies are in conformity with accounting principles generally accepted in the United States of America (“GAAP”).
New accounting pronouncement — In October 2020, the Securities and Exchange Commission (the “SEC”) adopted new regulations governing the use of derivatives by registered investment companies (“Rule 18f-4”). The Fund will be required to comply with Rule 18f-4 by August 19, 2022. Once implemented, Rule 18f-4 will impose limits on the amount of derivatives a fund can enter into, eliminate the asset segregation framework currently used by funds to comply with Section 18 of the 1940 Act, treat derivatives as senior securities and require funds whose use of derivatives is more than a limited specified exposure amount to establish and maintain a comprehensive derivatives risk management program and appoint a derivatives risk manager. The Funds are currently evaluating the impact, if any, of this provision.
Securities valuation — The Funds’ portfolio securities are valued as of the close of business of the regular session of the New York Stock Exchange (normally 4:00 p.m. Eastern time). Securities traded on a national stock exchange, including common stocks and closed-end investment companies, if any, are valued based upon the closing price on the principal exchange where the security is traded, if available, otherwise, at the last quoted bid price. Securities that are quoted by NASDAQ are valued at the NASDAQ Official Closing Price. Covered call options written by the Funds are valued at the last quoted sale price or, in the absence of a sale, at the ask price on the principal exchanges on which they are traded. Investments representing shares of money market funds and other open-end investment companies are valued at their net asset value (“NAV”) as reported by such companies. When using a quoted price and when the market is considered active, securities will be classified as Level 1 within the fair value hierarchy (see below).
Fixed income securities, including U.S. Treasury obligations and corporate bonds, are typically valued on the basis of prices provided by an independent pricing service. The prices provided by the pricing service are determined with consideration given to institutional bid and last sale prices and take into account securities
| THE CANTOR FBP MUTUAL FUNDS |
| NOTES TO FINANCIAL STATEMENTS (Continued) |
prices, yields, maturities, call features, ratings, institutional trading in similar groups of securities, and developments related to specific securities. Given the inputs used by the pricing service, these securities are classified as Level 2 within the fair value hierarchy.
When market quotations are not readily available, if a pricing service cannot provide a price, or if the investment adviser believes the price received from the pricing service is not indicative of fair value, securities will be valued in good faith at fair value using methods consistent with procedures adopted by the Board of Trustees and will be classified as Level 2 or 3 within the fair value hierarchy, depending on the inputs used. Such methods of fair valuation may include, but are not limited to: multiple of earnings, multiple of book value, discount from market of a similar freely traded security, purchase price of the security, subsequent private transactions in the security or related securities, or a combination of these and other factors.
GAAP establishes a single authoritative definition of fair value, sets out a framework for measuring fair value and requires additional disclosures about fair value measurements. Various inputs are used in determining the value of each Fund’s investments. These inputs are summarized in the three broad levels listed below:
| ● | Level 1 – quoted prices in active markets for identical securities |
| ● | Level 2 – other significant observable inputs |
| ● | Level 3 – significant unobservable inputs |
The inputs or methodology used for valuing securities are not necessarily an indication of the risks associated with investing in those securities. The inputs used to measure fair value may fall into different levels of the fair value hierarchy. In such cases, for disclosure purposes, the level in the fair value hierarchy within which the fair value measurement falls in its entirety is determined based on the lowest level input that is significant to the fair value measurement.
The following is a summary of each Fund’s investments and other financial instruments based on the inputs used to value the investments and other financial instruments as of March 31, 2022, by security type:
| Cantor FBP Equity & Dividend Plus Fund | | Level 1 | | | Level 2 | | | Level 3 | | | Total | |
| Investments in Securities: | | | | | | | | | | | | | | | | |
| Common Stocks | | $ | 30,986,637 | | | $ | — | | | $ | — | | | $ | 30,986,637 | |
| Money Market Funds | | | 2,165,971 | | | | — | | | | — | | | | 2,165,971 | |
| Total | | $ | 33,152,608 | | | $ | — | | | $ | — | | | $ | 33,152,608 | |
| | | | | | | | | | | | | | | | | |
| Other Financial Instruments: | | | | | | | | | | | | | | | | |
| Covered Written Call Options | | $ | (204,815 | ) | | $ | (69,600 | ) | | $ | — | | | $ | (274,415 | ) |
| Total | | $ | (204,815 | ) | | $ | (69,600 | ) | | $ | — | | | $ | (274,415 | ) |
| | | | | | | | | | | | | | | | | |
| THE CANTOR FBP MUTUAL FUNDS |
| NOTES TO FINANCIAL STATEMENTS (Continued) |
Cantor FBP Appreciation & Income
Opportunities Fund | | Level 1 | | | Level 2 | | | Level 3 | | | Total | |
| Investments in Securities: | | | | | | | | | | | | | | | | |
| Common Stocks | | $ | 25,814,786 | | | $ | — | | | $ | — | | | $ | 25,814,786 | |
| Corporate Bonds | | | — | | | | 2,022,696 | | | | — | | | | 2,022,696 | |
| U.S. Treasury Obligations | | | — | | | | 501,095 | | | | — | | | | 501,095 | |
| Money Market Funds | | | 6,975,491 | | | | — | | | | — | | | | 6,975,491 | |
| Total | | $ | 32,790,277 | | | $ | 2,523,791 | | | $ | — | | | $ | 35,314,068 | |
| | | | | | | | | | | | | | | | | |
| Other Financial Instruments: | | | | | | | | | | | | | | | | |
| Covered Written Call Options | | $ | (12,745 | ) | | $ | (11,100 | ) | | $ | — | | | $ | (23,845 | ) |
| Total | | $ | (12,745 | ) | | $ | (11,100 | ) | | $ | — | | | $ | (23,845 | ) |
| | | | | | | | | | | | | | | | | |
Refer to each Fund’s Schedule of Investments for a listing of the common stocks and corporate bonds by sector type. There were no Level 3 investments held by the Funds as of or during the year ended March 31, 2022.
Share valuation — The NAV per share of each Fund is calculated daily by dividing the total value of its assets, less liabilities, by the number of shares outstanding. The offering price and redemption price per share of each Fund is equal to its NAV per share.
Investment income — Dividend income is recorded on the ex-dividend date. Non-cash dividends included in dividend income, if any, are recorded at the fair market value of the security received. Interest income is accrued as earned. Discounts and premiums on fixed income securities purchased are amortized using the interest method. Withholding taxes, if any, on foreign dividends have been recorded in accordance with the Funds’ understanding of the applicable country’s rules and tax rates.
Distributions to shareholders — Dividends arising from net investment income are declared and paid quarterly to shareholders of each Fund. Net realized short-term capital gains, if any, may be distributed throughout the year and net realized long-term capital gains, if any, are distributed at least once each year. The amount of distributions from net investment income and net realized capital gains are determined in accordance with federal income tax regulations, which may differ from GAAP. These “book/tax” differences are either temporary or permanent in nature. Dividends and distributions are recorded on the ex-dividend date. The tax character of distributions paid during the years ended March 31, 2022 and 2021 was as follows:
| | | Year | | Ordinary | | | Long-Term | | | Total | |
| | | Ended | | Income | | | Capital Gains | | | Distributions | |
| Cantor FBP Equity & Dividend Plus Fund | | 03/31/22 | | $ | 791,326 | | | $ | 1,689,035 | | | $ | 2,480,361 | |
| | | 03/31/21 | | $ | 618,869 | | | $ | — | | | $ | 618,869 | |
| | | | | | | | | | | | | | | |
| Cantor FBP Appreciation & Income | | 03/31/22 | | $ | 440,215 | | | $ | 1,215,260 | | | $ | 1,655,475 | |
| Opportunities Fund | | 03/31/21 | | $ | 495,316 | | | $ | — | | | $ | 495,316 | |
Investment transactions — Investment transactions are accounted for on trade date for financial reporting purposes. Realized gains and losses on investments sold are determined on a specific identification basis.
| THE CANTOR FBP MUTUAL FUNDS |
| NOTES TO FINANCIAL STATEMENTS (Continued) |
Common expenses — Common expenses of the Trust are allocated among the Funds and the other series of the Trust based on relative net assets of each series or the nature of the services performed and the relative applicability to each series.
Options transactions — When the Funds’ investment adviser believes that individual portfolio investment securities held by the Funds are approaching the top of the adviser’s growth and price expectations, covered call options can be written (sold) against such securities and the Funds will receive a premium in return. The Funds write options only for income generation and hedging purposes and not for speculation. The premiums received from writing the options are recorded as a liability and are subsequently valued daily at the closing prices on their primary exchanges. Premiums received from writing options that expire are treated as realized gains. Premiums received from writing options that are exercised increase the proceeds used to calculate the realized gain or loss on the sale of the underlying security. If a closing purchase transaction is used to terminate a Fund’s obligation on a call option, a gain or loss will be realized, depending upon whether the price of the closing purchase transaction is more or less than the premium previously received on the call option written.
Estimates — The preparation of financial statements in conformity with GAAP requires management to make estimates and assumptions that affect the reported amounts of assets and liabilities and the disclosure of contingent assets and liabilities, each as of the date of the financial statements, and the reported amounts of increase (decrease) in net assets from operation during the reporting period. Actual results could differ from those estimates.
Federal income tax — Each Fund has qualified and intends to continue to qualify as a regulated investment company under the Internal Revenue Code of 1986, as amended (the “Code”). Qualification generally will relieve the Funds of liability for federal income taxes to the extent 100% of their net investment income and any net realized capital gains are distributed in accordance with the Code.
In order to avoid imposition of the excise tax applicable to regulated investment companies, it is also each Fund’s intention to declare as dividends in each calendar year at least 98% of its net investment income (earned during the calendar year) and 98.2% of its net realized capital gains (earned during the twelve months ended October 31) plus undistributed amounts from prior years.
| THE CANTOR FBP MUTUAL FUNDS |
| NOTES TO FINANCIAL STATEMENTS (Continued) |
The following information is computed on a tax basis for each item as of March 31, 2022:
| | | | | | Cantor FBP | |
| | | | | | Appreciation | |
| | | Cantor FBP Equity | | | & Income | |
| | | & Dividend | | | Opportunities | |
| | | Plus Fund | | | Fund | |
| Tax cost of portfolio investments and written option contracts | | $ | 23,705,477 | | | $ | 21,361,762 | |
| Gross unrealized appreciation | | $ | 9,796,186 | | | $ | 14,202,643 | |
| Gross unrealized depreciation | | | (623,470 | ) | | | (274,182 | ) |
| Net unrealized appreciation | | $ | 9,172,716 | | | $ | 13,928,461 | |
| Undistributed ordinary income | | | 9,970 | | | | 7,635 | |
| Undistibuted long-term capital gains | | | 1,225,187 | | | | 2,795,686 | |
| Distribution payable | | | (3,183 | ) | | | (9,010 | ) |
| Distributable earnings | | $ | 10,404,690 | | | $ | 16,722,772 | |
| | | | | | | | | |
The difference between the federal income tax cost of portfolio investments and the financial statement cost of portfolio investments for Cantor FBP Appreciation & Income Opportunities Fund is due to certain differences in the recognition of capital gains and losses under income tax regulations and GAAP. These “book/tax” differences are temporary in nature and are primarily due to differing methods in the amortization of discounts and premiums on fixed income securities.
The Funds recognize the tax benefits or expenses of uncertain tax positions only when the position is “more likely than not” to be sustained assuming examination by tax authorities. Management has reviewed the tax positions taken by each Fund on federal income tax returns for all open tax years (generally, three years) and has concluded that no provision for unrecognized tax benefits or expenses is required in these financial statements.
| 3. | Investment Transactions |
Investment transactions, other than short-term investments and U.S. government securities, were as follows for the year ended March 31, 2022:
| | | | | | Cantor FBP | |
| | | | | | Appreciation | |
| | | Cantor FBP Equity | | | & Income | |
| | | & Dividend | | | Opportunities | |
| | | Plus Fund | | | Fund | |
| Purchases of investment securities | | $ | 4,633,600 | | | $ | 2,985,227 | |
| Proceeds from sales and maturities of investment securities | | $ | 5,775,350 | | | $ | 8,984,127 | |
| | | | | | | | | |
| THE CANTOR FBP MUTUAL FUNDS |
| NOTES TO FINANCIAL STATEMENTS (Continued) |
| 4. | Transactions with Related Parties |
INVESTMENT ADVISORY AGREEMENTS
Effective June 8, 2021, each Fund’s investments are managed by Cantor Fitzgerald Investment Advisors, L.P. (the “Adviser”) under the terms of an Investment Advisory Agreement. Under the Investment Advisory Agreements, each Fund pays the Adviser a fee, which is computed and accrued daily and paid monthly, at an annual rate of 0.70% of its average daily net assets up to $250 million; 0.65% of the next $250 million of such assets; and 0.50% of such assets in excess of $500 million.
Prior to June 8, 2021, each Fund’s investments were managed by Flippin, Bruce & Porter, Inc. (the “Former Adviser”) under the same terms as the current Investment Advisory Agreements.
On April 8, 2021, the Former Adviser entered into an agreement with the Adviser to have its business assets acquired by the Adviser, subject to customary closing conditions (the “Transaction”). Following the closing of the Transaction on June 8, 2021, the Former Adviser’s business became a division of the Adviser.
On May 18, 2021, the Board of Trustees of the Trust, including a majority of the Trustees who are not “interested persons” (as defined in the 1940 Act) of the Trust, approved interim advisory agreements between the Trust and the Adviser with respect to the Funds. The Board also approved new investments advisory agreements between the Trust and the Adviser with respect to the Funds, which were submitted to and approved by each respective Fund’s shareholders at a shareholder meeting that was held on July 16, 2021.
Pursuant to Expense Limitation Agreements (“ELAs”) between each Fund and the Adviser, the Adviser has contractually agreed, until August 1, 2023, to reduce advisory fees and/or reimburse expenses to the extent necessary to limit total annual fund operating expenses (excluding brokerage costs, taxes, interest, Acquired Fund Fees and Expenses and extraordinary expenses) to an amount not exceeding 1.12% and 1.05% of the average daily net assets of Cantor FBP Equity & Dividend Plus Fund and Cantor FBP Appreciation & Income Opportunities Fund, respectively.
Prior to August 1, 2020, pursuant to ELAs between each Fund and the Former Adviser, the Former Adviser contractually agreed to reduce advisory fees and/or reimburse other expenses to the extent necessary to limit total annual fund operating expenses (excluding brokerage costs, taxes, interest, Acquired Fund Fees and Expenses and extraordinary expenses) to an amount not exceeding 1.07% and 1.00% of the average daily net assets of Cantor FBP Equity & Dividend Plus Fund and Cantor FBP Appreciation & Income Opportunities Fund, respectively.
Accordingly, during the year ended March 31, 2022, the Adviser reduced its advisory fees in the amounts of $34,723 and $31,024 for Cantor FBP Equity & Dividend Plus Fund and Cantor FBP Appreciation & Income Opportunities Fund, respectively.
Under the terms of the ELAs, investment advisory fee reductions and expense reimbursements by the Adviser are subject to recoupment by the Adviser for a period of three years after such fees and expenses were incurred, provided the recoupments do not cause total annual fund operating expenses to exceed the
| THE CANTOR FBP MUTUAL FUNDS |
| NOTES TO FINANCIAL STATEMENTS (Continued) |
lesser of (i) the expense limitation then in effect, if any, or (ii) the expense limitation in effect at the time the expenses to be recouped were incurred. As of March 31, 2022, the Adviser may seek recoupment of investment advisory fee reductions and expense reimbursements no later than the dates as stated below:
| | | | | | Cantor FBP | |
| | | | | | Appreciation | |
| | | Cantor FBP Equity | | | & Income | |
| | | & Dividend | | | Opportunities | |
| | | Plus Fund | | | Fund | |
| March 31, 2023 | | $ | 31,428 | | | $ | 33,267 | |
| March 31, 2024 | | | 52,478 | | | | 49,983 | |
| March 31, 2025 | | | 34,723 | | | | 31,024 | |
| Total | | $ | 118,629 | | | $ | 114,274 | |
| | | | | | | | | |
Certain officers and a Trustee of the Trust are also officers of the Adviser.
OTHER SERVICE PROVIDERS
Ultimus Fund Solutions, LLC (“Ultimus”) provides administration, fund accounting, compliance and transfer agent services to the Funds. The Funds pay Ultimus fees in accordance with the agreements for such services. In addition, the Funds pay out-of-pocket expenses including, but not limited to, postage, supplies, and certain costs related to the pricing of the Funds’ portfolio securities. Certain officers of the Trust are also officers of Ultimus, or of Ultimus Fund Distributors, LLC (the “Distributor”), the principal underwriter of each Fund’s shares and an affiliate of Ultimus. The Distributor is compensated by the Adviser (not the Funds) for acting as principal underwriter.
COMPENSATION OF TRUSTEES
Trustees and officers affiliated with the Adviser or Ultimus are not compensated by the Trust for their services. Effective January 1, 2022, each Trustee who is not an affiliated person of the Adviser or Ultimus receives from the Trust an annual retainer of $30,000, payable quarterly; a fee of $2,000 for attendance at each meeting of the Board of Trustees (except that such fee is $3,000 for the independent chair); and a fee of $1,000 for attendance at each meeting of any committee of the Board (except that such fee is $1,500 for the committee chair); plus reimbursement of travel and other expenses incurred in attending meetings. Prior to January 1, 2022, each Trustee who was not an affiliated person of the Adviser or Ultimus received from the Trust an annual retainer of $24,000, payable quarterly; a fee of $2,000 for attendance at each meeting of the Board of Trustees (except that such fee was $3,000 for the independent chair); and a fee of $1,000 for attendance at each meeting of any committee of the Board (except that such fee was $1,500 for the committee chair); plus reimbursement of travel and other expenses incurred in attending meetings. Each series of the Trust pays its proportionate share of such fees.
| THE CANTOR FBP MUTUAL FUNDS |
| NOTES TO FINANCIAL STATEMENTS (Continued) |
| 5. | Derivatives Transactions |
The location on the Statements of Assets and Liabilities of the Funds’ derivative positions as of March 31, 2022 is as follows:
Cantor FBP Equity & Dividend Plus Fund
| | | | | | | | | | | | | | Gross Notional | |
| | | | | | | | | | | | | | Amount | |
| | | | | | | | Fair Value | | | Outstanding | |
| | | | | | | | Asset | | | Liability | | | March 31, | |
| | Type of Derivative (Risk) | | | Location | | | Derivatives | | | Derivatives | | | 2022 | |
| | Call options written (Equity) | | | Written call options, at value | | | $ | — | | | $ | (274,415 | ) | | $ | (7,627,816 | ) |
Cantor FBP Appreciation & Income Opportunities Fund
| | | | | | | | | | | | | | Gross Notional | |
| | | | | | | | | | | | | | Amount | |
| | | | | | | | Fair Value | | | Outstanding | |
| | | | | | | | Asset | | | Liability | | | March 31, | |
| | Type of Derivative (Risk) | | | Location | | | Derivatives | | | Derivatives | | | 2022 | |
| | Call options written (Equity) | | | Written call options, at value | | | $ | — | | | $ | (23,845 | ) | | $ | (1,566,623 | ) |
The Funds’ transactions in derivative instruments during the year ended March 31, 2022 are recorded in the following locations on the Statements of Operations:
Cantor FBP Equity & Dividend Plus Fund
| | | | | | | | | | | | | | Change in | |
| | | | | | | | Net | | | | | | Unrealized | |
| | | | | | | | Realized | | | | | | Appreciation | |
| | Type of Derivative (Risk) | | | Location | | | Gains | | | Location | | | (Depreciation) | |
| | Call options written (Equity) | | | Net realized gains from written option contracts | | | $ | 147,353 | | | Net change in unrealized appreciation (depreciation) on written option contracts | | | $ | 20,934 | |
Cantor FBP Appreciation & Income Opportunities Fund
| | | | | | | | | | | | | | Change in | |
| | | | | | | | Net | | | | | | Unrealized | |
| | | | | | | | Realized | | | | | | Appreciation | |
| | Type of Derivative (Risk) | | | Location | | | Gains | | | Location | | | (Depreciation) | |
| | Call options written (Equity) | | | Net realized gains from written option contracts | | | $ | 981 | | | Net change in unrealized appreciation (depreciation) on written option contracts | | | $ | 91,882 | |
| THE CANTOR FBP MUTUAL FUNDS |
| NOTES TO FINANCIAL STATEMENTS (Continued) |
The average monthly notional amount of written call options during the year ended March 31, 2022 is $5,815,225 and $908,699 for Cantor FBP Equity & Dividend Plus Fund and Cantor FBP Appreciation & Income Opportunities Fund, respectively.
| 6. | Contingencies and Commitments |
The Funds indemnify the Trust’s officers and Trustees for certain liabilities that might arise from the performance of their duties to the Funds. Additionally, in the normal course of business the Funds enter into contracts that contain a variety of representations and warranties and which provide general indemnifications. The Funds’ maximum exposure under these arrangements is unknown, as this would involve future claims that may be made against the Funds that have not yet occurred. However, based on experience, the Trust expects the risk of loss to be remote.
The Funds are required to recognize in the financial statements the effects of all subsequent events that provide additional evidence about conditions that existed as of the date of the Statements of Assets and Liabilities. For non-recognized subsequent events that must be disclosed to keep the financial statements from being misleading, the Funds are required to disclose the nature of the event as well as an estimate of its financial effect, or a statement that such an estimate cannot be made. Management has evaluated subsequent events through the issuance of these financial statements and has noted no such events.
| THE CANTOR FBP MUTUAL FUNDS |
| REPORT OF INDEPENDENT REGISTERED |
| PUBLIC ACCOUNTING FIRM |
To the Shareholders of The Cantor FBP Mutual Funds and
Board of Trustees of Williamsburg Investment Trust
Opinion on the Financial Statements
We have audited the accompanying statements of assets and liabilities, including the schedules of investments and open option contracts, of The Cantor FBP Mutual Funds, comprising Cantor FBP Equity & Dividend Plus Fund (formerly FBP Equity & Dividend Plus Fund) and Cantor FBP Appreciation & Income Opportunities Fund (formerly FBP Appreciation & Income Opportunities Fund) (the “Funds”), each a series of Williamsburg Investment Trust, as of March 31, 2022, the related statements of operations for the year then ended, the statements of changes in net assets for each of the two years in the period then ended, the related notes, and the financial highlights for each of the five years in the period then ended (collectively referred to as the “financial statements”). In our opinion, the financial statements present fairly, in all material respects, the financial position of each of the Funds as of March 31, 2022, the results of their operations for the year then ended, the changes in net assets for each of the two years in the period then ended, and the financial highlights for each of the five years in the period then ended, in conformity with accounting principles generally accepted in the United States of America.
Basis for Opinion
These financial statements are the responsibility of the Funds’ management. Our responsibility is to express an opinion on the Funds’ financial statements based on our audits. We are a public accounting firm registered with the Public Company Accounting Oversight Board (United States) (“PCAOB”) and are required to be independent with respect to the Funds in accordance with the U.S. federal securities laws and the applicable rules and regulations of the Securities and Exchange Commission and the PCAOB.
We conducted our audits in accordance with the standards of the PCAOB. Those standards require that we plan and perform the audit to obtain reasonable assurance about whether the financial statements are free of material misstatement whether due to error or fraud.
Our audits included performing procedures to assess the risks of material misstatement of the financial statements, whether due to error or fraud, and performing procedures that respond to those risks. Such procedures included examining, on a test basis, evidence regarding the amounts and disclosures in the financial statements. Our procedures included confirmation of securities owned as of March 31, 2022, by correspondence with the custodian and brokers. Our audits also included evaluating the accounting principles used and significant estimates made by management, as well as evaluating the overall presentation of the financial statements. We believe that our audits provide a reasonable basis for our opinion.
We have served as the Funds’ auditor since 2016.
COHEN & COMPANY, LTD.
Milwaukee, Wisconsin
May 26, 2022
| THE CANTOR FBP MUTUAL FUNDS |
| BOARD OF TRUSTEES AND EXECUTIVE OFFICERS (Unaudited) |
Overall responsibility for management of the Funds rests with the Board of Trustees. The Trustees serve during the lifetime of the Trust and until its termination, or until death, resignation, retirement or removal. The Trustees, in turn, elect the officers of the Funds. The officers have been elected for an annual term. The following are the Trustees and executive officers of the Funds:
| Trustees and Officers | Address | Year
of
Birth | Position Held
with the Trust | Length of
Time Served |
| Robert S. Harris, Ph.D. | 225 Pictoria Drive, Suite 450 Cincinnati, OH | 1949 | Chairman and Trustee | Since January 2007 |
| * John P. Ackerly, IV | One James Center 901 E. Cary Street Richmond, VA | 1963 | Trustee and President of The Davenport Funds | Since July 2012 |
| * John T. Bruce | 800 Main Street Lynchburg, VA | 1953 | Trustee and President of The Cantor FBP Mutual Funds | Since September 1988 |
| George K. Jennison | 225 Pictoria Drive, Suite 450 Cincinnati, OH | 1957 | Trustee | Since January 2015 |
| Harris V. Morrissette | 225 Pictoria Drive, Suite 450 Cincinnati, OH | 1959 | Trustee | Since March 1993 |
| Elizabeth W. Robertson | 225 Pictoria Drive, Suite 450 Cincinnati, OH | 1953 | Trustee | Since February 2014 |
| Norman D. Darden, III | 800 Main Street Lynchburg, VA | 1965 | Vice President of The Cantor FBP Mutual Funds | Since February 2018 |
| Eileen B. Sebold | 800 Main Street Lynchburg, VA | 1968 | Vice President of The Cantor FBP Mutual Funds | Since February 2022 |
| David J. Marshall | 800 Main Street Lynchburg, VA | 1956 | Vice President of The Cantor FBP Mutual Funds | Since February 2007 |
| Mark J. Seger | 225 Pictoria Drive, Suite 450 Cincinnati, OH | 1962 | Treasurer | Since November 2000 |
| David K. James | 225 Pictoria Drive, Suite 450 Cincinnati, OH | 1970 | Secretary | Since November 2018 |
| Michael J. Nanosky | 225 Pictoria Drive, Suite 450 Cincinnati, OH | 1966 | Chief Compliance Officer | Since March 2020 |
| * | Messrs. Ackerly and Bruce, as affiliated persons of investment advisers to the Trust, are “interested persons” of the Trust within the meaning of Section 2(a)(19) of the 1940 Act. |
| THE CANTOR FBP MUTUAL FUNDS |
| BOARD OF TRUSTEES AND EXECUTIVE OFFICERS (Unaudited) (Continued) |
Each Trustee oversees ten portfolios of the Trust, including the Funds. The principal occupations of the Trustees and executive officers of the Funds during the past five years and public directorships held by the Trustees are set forth below:
Robert S. Harris, Ph.D. is the C. Stewart Sheppard Professor of Business Administration at The Darden Graduate School of Business Administration at the University of Virginia. He was previously the dean at Darden. Professor Harris has published widely on corporate finance, financial markets and mergers and acquisitions and has served as a consultant to corporations and government agencies.
John P. Ackerly, IV is Senior Vice President and Portfolio Manager of Davenport & Company LLC (a broker-dealer and investment advisory firm).
John T. Bruce is President, Director and member of the Executive Committee of the Adviser.
George K. Jennison is retired. He previously was President of Oyster Consulting, LLC (a management consulting firm) and a financial adviser with Wells Fargo Advisors, LLC.
Harris V. Morrissette is President of China Doll Rice and Beans, Inc. and Dixie Lily Foods. He is also a Director of Trustmark Corporation (bank holding company).
Elizabeth W. Robertson serves as a Trustee of TowneBank Foundation, TowneBank Corporate Board, TowneBank Audit Committee Chair and TowneBank Community Board since 2015. She previously was Chief Financial Officer of Monument Restaurants LLC.
Norman D. Darden, III is Senior Portfolio Manager, Analyst and Principal of the Adviser.
Eileen B. Sebold is Managing Director, Head of Distribution for Cantor Fitzgerald Investment Advisors, L.P (2021 to present). Previously she was Head of Intermediary Relationships at Easterly Partners Group (2020 to 2021) and Director of National Accounts at William Blair & Company (2011 to 2020). David J. Marshall is Secretary, Director and member of the Executive Committee of the Adviser.
David J. Marshall is Secretary, Director and member of the Executive Committee of the Adviser.
Mark J. Seger is a Vice Chairman of Ultimus Fund Solutions, LLC and Ultimus Fund Distributors, LLC. He previously was Co-CEO of Ultimus Fund Solutions, LLC (1999-2019).
David K. James is an Executive Vice President and Chief Legal and Risk Officer of Ultimus Fund Solutions, LLC (2018 to present). He previously was Managing Director and Managing Counsel at State Street Bank and Trust Company (2009 to 2018).
Michael J. Nanosky is a Senior Compliance Officer of Ultimus Fund Solutions, LLC (2020 to present). He previously was Senior Vice President & Chief Compliance Officer of PNC Funds (2014 to 2019).
Additional information about members of the Board of Trustees and executive officers is available in the Statement of Additional Information (“SAI”). To obtain a free copy of the SAI, please call 1-866-738-1127.
| THE CANTOR FBP MUTUAL FUNDS |
| ABOUT YOUR FUNDS’ EXPENSES (Unaudited) |
We believe it is important for you to understand the impact of costs on your investment. All mutual funds have operating expenses. As a shareholder of a Fund, you incur ongoing costs, including management fees and other operating expenses. These ongoing costs, which are deducted from each Fund’s gross income, directly reduce the investment return of the Funds.
A mutual fund’s ongoing costs are expressed as a percentage of its average net assets. This figure is known as the expense ratio. The following examples are intended to help you understand the ongoing costs (in dollars) of investing in the Funds and to compare these costs with the ongoing costs of investing in other mutual funds. The examples below are based on an investment of $1,000 made at the beginning of the period shown and held for the entire period (October 1, 2021 through March 31, 2022).
The table below illustrates each Fund’s ongoing costs in two ways:
Actual fund return – This section helps you to estimate the actual expenses that you paid over the period. The “Ending Account Value” shown is derived from each Fund’s actual return, and the fourth column shows the dollar amount of operating expenses that would have been paid by an investor who started with $1,000 in the Funds. You may use the information here, together with the amount you invested, to estimate the expenses that you paid over the period.
To do so, simply divide your account value by $1,000 (for example, an $8,600 account value divided by $1,000 = 8.6), then multiply the result by the number given for the Funds under the heading “Expenses Paid During Period.”
Hypothetical 5% return – This section is intended to help you compare the Funds’ ongoing costs with those of other mutual funds. It assumes that each Fund had an annual return of 5% before expenses during the period shown, but that the expense ratio is unchanged. In this case, because the returns used are not the Funds’ actual returns, the results do not apply to your investment. The example is useful in making comparisons because the U.S. Securities and Exchange Commission (the “SEC”) requires all mutual funds to calculate expenses based on a 5% return. You can assess each Fund’s ongoing costs by comparing this hypothetical example with the hypothetical examples that appear in shareholder reports of other funds.
Note that expenses shown in the table are meant to highlight and help you compare ongoing costs only. The Funds do not charge sales loads or redemption fees.
The calculations assume no shares were bought or sold during the period. Your actual costs may have been higher or lower, depending on the amount of your investment and the timing of any purchases or redemptions.
More information about the Funds’ expenses, including annual expense ratios for the past five fiscal years, can be found in this report. For additional information on operating expenses and other shareholder costs, please refer to the Funds’ prospectus.
| THE CANTOR FBP MUTUAL FUNDS |
| ABOUT YOUR FUNDS’ EXPENSES (Unaudited) (Continued) |
| | | Beginning | | Ending | | | | Expenses |
| | | Account Value | | Account Value | | Net | | Paid |
| | | October 1, | | March 31, | | Expense | | During |
| | | 2021 | | 2022 | | Ratio(a) | | Period(b) |
| Cantor FBP Equity & Dividend Plus Fund | | | | | | | | |
| Based on Actual Fund Return | | $1,000.00 | | $1,113.40 | | 1.12% | | $5.90 |
| Based on Hypothetical 5% Return (before expenses) | | $1,000.00 | | $1,019.35 | | 1.12% | | $5.64 |
| | | | | | | | | |
| Cantor FBP Appreciation & Income Opportunities Fund | | | | | | | | |
| Based on Actual Fund Return | | $1,000.00 | | $1,095.40 | | 1.05% | | $5.49 |
| Based on Hypothetical 5% Return (before expenses) | | $1,000.00 | | $1,019.70 | | 1.05% | | $5.29 |
| (a) | Annualized, based on each Fund’s most recent one-half year expenses. |
| (b) | Expenses are equal to each Fund’s annualized net expense ratio multiplied by the average account value over the period, muliplied by 182/365 (to reflect the one-half year period). |
| THE CANTOR FBP MUTUAL FUNDS |
| OTHER INFORMATION (Unaudited) |
The Trust files a complete listing of portfolio holdings for the Funds with the SEC as of the end of the first and third quarters of each fiscal year as an exhibit to its reports on Form N-PORT. The filings are available upon request, by calling 1-866-738-1127. Furthermore, you may obtain a copy of these filings on the SEC’s website at www.sec.gov and the Funds’ website www.fbpfunds.com.
A description of the policies and procedures that the Funds use to determine how to vote proxies relating to portfolio securities is available without charge upon request by calling toll-free 1-866-738-1127, or on the SEC’s website at www.sec.gov. Information regarding how the Funds voted proxies relating to portfolio securities during the most recent 12-month period ended June 30 is also available without charge upon request by calling toll-free 1-866-738-1127, or on the SEC’s website at www.sec.gov.
| FEDERAL TAX INFORMATION (Unaudited) |
For the fiscal year ended March 31, 2022, Cantor FBP Equity & Dividend Plus Fund and Cantor FBP Appreciation & Income Opportunities Fund designated $1,689,035 and $1,215,260, respectively, as long-term capital gain distributions.
Qualified Dividend Income – Cantor FBP Equity & Dividend Plus Fund and Cantor FBP Appreciation & Income Opportunities Fund designates 98.85% and 100%, respectively, or up to the maximum amount of such dividends allowable pursuant to the Internal Revenue Code, as qualified dividend income eligible for the reduced tax rate.
Dividends Received Deduction – Corporate shareholders are generally entitled to take the dividends received deduction on the portion of a fund’s dividend distribution that qualifies under tax law. For Cantor FBP Equity & Dividend Plus Fund and Cantor FBP Appreciation & Income Opportunities Fund’s fiscal year 2022 ordinary income dividends, 98.85% and 100%, respectively, qualifies for the corporate dividends received deduction.
This page intentionally left blank.
| | | | | | | | |
| | | | | | | | |
| | | | | | | | |
| | | | | | | | |
| | | | | | | | |
| | | | | | | | |
| | | | | | | | |
| | | | | | | |
| | | | | | | |
| | | | | | | | |
| | | | | | | | | |
| | | | | | | | | | |
| | | | | | | | | | |
| | | | | | | | | | |
| | | | Investment Adviser Cantor Fitzgerald Investment Advisors, L.P. 800 Main Street, Second Floor P.O. Box 6138 Lynchburg, Virginia 24505 Toll-Free 1-800-851-3804 www.fbpinc.com Administrator Ultimus Fund Solutions, LLC P.O. Box 46707 Cincinnati, Ohio 45246-0707 Toll-Free 1-866-738-1127 Custodian U.S. Bank, N.A. 425 Walnut Street Cincinnati, Ohio 45202 Independent Registered Public Accounting Firm Cohen & Company, Ltd. 342 N. Water Street, Suite 830 Milwaukee, Wisconsin 53202 | Legal Counsel Sullivan & Worcester LLP 1666 K Street, N.W. Washington, DC 20006 Officers John T. Bruce, President Norman D. Darden, III, Vice President Eileen B. Sebold, Vice President David J. Marshall, Vice President Teresa L. Sanderson, Compliance Officer Trustees Robert S. Harris, Ph.D., Chairman John P. Ackerly, IV John T. Bruce George K. Jennison Harris V. Morrissette Elizabeth W. Robertson | | | |
| | | | | | | | | | |
| | | | | | | | |
| | | | | | | | |
| | | | | | | | |
| | | | | | | | |
| | | | | | | | |
| | | | | | | | |
| | | | | | | | |
| | | | | | | | |
| | | | | | | | |
| | | | | | | | |
| | | | | FBP-AR-22 | | |
| | | | | | | |
| | | | | | | | |
| | | | | | | | |
| | | | | | | | |
| |
| |
| |
| |
| |
| |
| |
| THE |
| GOVERNMENT STREET |
| FUNDS |
| |
| |
| No-Load Mutual Funds |
| |
| Annual Report |
| March 31, 2022 |
| |
| |
| |
| |
| |
| |
| |
| |
| |
| |
| |
| |
 |
| |
| |
| |
| |
| |
| |
| |
| |
| |
| |
| |
| |
The Government Street Equity Fund
The Government Street Mid-Cap Fund |
| |
| |
| LETTER FROM THE PRESIDENT | April 2022 |
Dear Fellow Shareholders:
We enclose for your review the audited Annual Reports of The Government Street Funds for the fiscal year ended March 31, 2022.
The Government Street Equity Fund
The Government Street Equity Fund achieved a total return of 17.51% for the fiscal year ended March 31, 2022. By comparison, the S&P 500® Index and the Morningstar Large Blend Category returned 15.65% and 11.44%, respectively.
The following table depicts the fiscal quarter returns of our three related measures:
| | Government | | Morningstar |
| | Street Equity Fund | S&P 500® | Large Blend |
| 1 Qtr 2022 | -4.22% | -4.60% | -5.12% |
| 4 Qtr 2021 | 11.31% | 11.03% | 9.45% |
| 3 Qtr 2021 | 0.97% | 0.58% | -0.21% |
| 2 Qtr 2021 | 9.16% | 8.55% | 7.54% |
After achieving total returns of 50+% in fiscal year 2021, the markets showed signs of more normal activity. After a current year performance of 17.51%, the most recent quarter result of -4.22%. This recent performance may indicate the beginning of an anticipated reversion for a myriad of economic, geopolitical, and Covid-related factors.
While there are multiple negative factors to reflect upon, all roads seem to lead to one overriding consideration - inflation. Inflation and the effects it dictates throughout the financial industry will ultimately coalesce in all investment returns. The question for the future is the degree of damage inflation will inflict and for how long.
The effects of inflation continue to be the overriding consideration in the financial industry. The variables that determine the extent of the effects of inflation are many, and they all contribute to massive uncertainties. These variables include: Supply chain delays, Covid shutdowns, employee shortfalls, debt levels of Government, out-of-control Government spending, uncertain tax policies, and unpredictable fiscal and monetary policies. If anything can be predicted for future investment markets, it is that volatility follows uncertainty, and the more uncertainty, the greater volatility. As these uncertainties are largely negative in nature, negative investment results will most likely follow.
With such negative projections, Government, corporations, and individuals will take corrective actions to compensate. We believe it is a time to be defensive and conservative. Toward that goal, your Fund ended the year with 9.5% cash equivalent reserves and continues a shift toward a greater percentage of value type stocks in the portfolio.
The top 10 holdings in The Government Street Equity Fund as of March 31, 2022 were:
| Security Description | % of Net Assets |
| NVIDIA Corporation | 6.15% |
| Microsoft Corporation | 4.03% |
| Bio-Techne Corporation | 3.96% |
| JPMorgan Chase & Company | 3.74% |
| Amazon.com, Inc. | 3.62% |
| Lockheed Martin Corporation | 3.46% |
| Apple, Inc. | 3.42% |
| Alphabet, Inc. – Class A and C | 3.07% |
| Mid-America Apartment Communities, Inc. | 2.74% |
| Honeywell International, Inc. | 2.54% |
While you recognize the top 10 holdings as large well-known companies, there is diversification within the holdings. Eleven economic sector classifications of the market are represented. The Government Street Equity Fund represents a large capitalization collection of blended growth and value companies.
The Fund’s best performing economic sector for the fiscal year was Energy, up 58.0%. The second-best sector was Real Estate, up 48.3%. The worst performing sector was Consumer Discretionary, up 5.5%.
There were significant individual performances during the fiscal year. The holdings with the five highest returns, held for the entire fiscal year, as measured by the internal rate of return for the entire period were:
| | 1 Year |
| Security Description | Performance |
| Mosaic Company (The) | 112.19% |
| NVIDIA Corporation | 104.29% |
| Blackstone, Inc. | 76.78% |
| Glencore plc - ADR | 71.44% |
| AbbVie, Inc. | 56.34% |
The holdings with the five lowest returns, held for the entire fiscal year, as measured by internal rate of return for the entire period were:
| | 1 Year |
| Security Description | Performance |
| Comcast Corporation – Class A | -12.00% |
| Phillips 66 | -12.33% |
| Truist Financial Corporation | -15.00% |
| Goldman Sachs Group, Inc. (The) | -16.93% |
| Skyworks Solutions, Inc. | -26.34% |
Note: The investment performances listed for economic sectors and securities in the three preceding paragraphs are extracted from an in-house independent time-weighted rate of return computation by the Addepar portfolio accounting system. The calculations are gross investment returns. Total investment returns are for the fiscal year April 1, 2021 through March 31, 2022.
The following comments, along with new observations, are drawn from previous newsletters to reflect current thoughts on future investment prospects. At the heart of the ultimate outcome is the argument that continued Government borrowing, to finance increasing social and uneconomic ventures, brings us closer to the ultimate financial tipping point. We believe that irrational political-financial decisions will have to be modified significantly to confront the staggering obligations of Government, corporations, and individuals. As indicated earlier in this report, it appears that the myriad of irrational decisions is being manifested in, what may become, one of the most virulent inflationary experiences of decades. If so, the circumstances may call for increasing defensive and conservative investment activity.
We believe that continued upward movement of markets and economies worldwide are highly dependent on governments getting their financial balance sheets in order. There has been unparalleled deficit spending around the world. Those economies not directly participating in the credit shortfalls will be indirectly impacted by lower import/export activities brought on by a significant debt-imposed slowdown. This will occur domestically and internationally as economies have become more highly correlated in their economic cycles.
In response to this perceived scenario, risk management takes precedence over return pursuits in the near term. Your Fund remains invested to capture returns but highly diversified to mitigate the risks associated with that position. We believe that the future transition to a sound economic scenario will determine the continuation of current positive performances. We are not totally convinced of that outcome.
While significant risks exist, we continue to believe that investors have the potential for one of the greatest investment environments for generations. There are over 7 billion people in the world today (the U.S. population is approximately 325 million). Many of these potential consumers are moving into middle-class ranks. In our opinion, the demand for goods and services for the future is tremendous. Remember that, in our own economy, approximately 60% of GDP is tied to consumer spending on goods and services. With the business advantages that the U.S. enjoys in manufacturing know-how, technology, intellectual content, productivity, and numerous other characteristics, if the Government will provide a competitive framework for operating, the benefits could be the best ever. We just need Government policies that foster growth in profits and wages domestically and internationally.
There are many additional moving parts in our economy and exogenous factors such as the geopolitical instabilities that will always cause uneven effects. However, it is our thought that keeping our fiscal house in order is basic to all considerations. The irresponsible spending activities of our Government continue to unnerve us. It remains to be seen if the economy can overcome the negative influence of Government policies and have a successful impact on market values.
As of March 31, 2022, the Fund’s net assets were $76.4 million; net asset value per share was $104.58; and the ratio of expenses to net average assets was 0.84%. The portfolio turnover rate was 14%. Income dividends of $0.58 per share and capital gain distributions of $10.67 per share were distributed to shareholders during the year.
The Government Street Mid-Cap Fund
The Government Street Mid-Cap Fund produced a total return of 15.11% during the fiscal year ended March 31, 2022. By comparison, the S&P MidCap 400® Index and the Morningstar Mid-Cap Blend category, used as relative performance benchmarks, returned 4.59% and 5.81%, respectively.
The following table depicts the fiscal quarter returns of our three related measures:
| | Government Street | | Morningstar |
| | Mid Cap Fund | S&P MidCap 400® | Mid Cap Blend |
| 1 Qtr 2022 | -5.96% | -4.88% | -5.06% |
| 4 Qtr 2021 | 10.84% | 8.00% | 7.39% |
| 3 Qtr 2021 | 0.73% | -1.76% | -1.65% |
| 2 Qtr 2021 | 9.64% | 3.64% | 5.52% |
The mid-capitalization category of individual companies is usually represented by the S&P MidCap 400®, whose issuers have a market capitalization ranging from approximately $0.3 billion to $12.5 billion. Generally, these companies are considered to have slightly higher risk and return characteristics than the S&P 500® companies, which include issuers with large capitalization. The mid-cap companies in the index are primarily domestically oriented.
The top 10 holdings in The Government Street Mid-Cap Fund as of March 31, 2022 were:
| Security Description | % of Net Assets |
| Mid-America Apartment Communities, Inc. | 4.87% |
| NVIDIA Corporation | 4.40% |
| Bio-Techne Corporation | 2.69% |
| Nasdaq, Inc. | 2.35% |
| Albemarle Corporation | 2.30% |
| Waste Connections, Inc. | 2.28% |
| Brown & Brown, Inc. | 2.24% |
| Teleflex, Inc. | 2.17% |
| Arthur J. Gallagher & Company | 2.17% |
| L3harris Technologies, Inc. | 2.08% |
There were significant individual performances during the fiscal year. The holdings with the five highest returns, held for the entire period, as measured by the time weighted rate of return, were:
| | 1 Year |
| Security Description | Performance |
| Charles River Laboratories International, Inc. | 187.67% |
| Devon Energy Corporation | 140.90% |
| Alleghany Corporation | 137.87% |
| Graco, Inc. | 104.55% |
| National Instruments Corporation | 67.24% |
The five holdings with the lowest returns, held for the entire period, as measured by time-weighted rate of return, were:
| | 1 Year |
| Security Description | Performance |
| B. Riley Financial, Inc. | -14.27% |
| Gildan Activewear, Inc. | -17.65% |
| Expeditors International of Washington, Inc. | -26.48% |
| Ares Management Corporation | -31.52% |
| Macy’s, Inc. | -48.92% |
The Fund’s best performing economic sector for the fiscal year was Energy, up 134.7%. The second-best sector was Real Estate, up 48.3%. The worst performing sector was Health Care, up 1.1%.
Note: The investment performances listed for economic sectors and securities in the three preceding paragraphs are extracted from an in-house independent time-weighted rate of return computation by the Addepar portfolio accounting system. The calculations are gross investment returns. Total investment returns are for the fiscal year April 1, 2021 through March 31, 2022.
We believe that mid-cap stocks offer an attractive combination of growth and safety as they have successfully overcome startup challenges yet remain nimble enough to generate stronger growth than large-cap stocks. Mid-cap stocks have been able to match the performance of large-cap stocks in down markets while exceeding large-cap performance in up markets, leading to long-term outperformance.
As of March 31, 2022, the net assets of The Government Street Mid-Cap Fund were $64.4 million and the net asset value per share was $39.61. The portfolio turnover rate for the year was 8% and the total number of holdings was 78 as of March 31, 2022. The net expense ratio for the Fund was 1.02%. Income dividends of $0.18 per share and capital gain distributions of $1.31 per share were distributed to shareholders during the year.
Thank you for your continued confidence in The Government Street Funds. Please call us if we can be of further service to you.
Very truly yours,

Thomas W. Leavell
President
Leavell Investment Management, Inc.
The Government Street Funds
Data presented reflects past performance, which is no guarantee of future results. Investment results and principal value will fluctuate so that shares, when redeemed, may be worth more or less than their original cost. Due to market volatility, current performance may be higher or lower than the performance shown.
This report is submitted for the general information of the shareholders of the Funds. The report is not authorized for distribution to prospective investors in the Funds unless it is accompanied by a current prospectus.
This report reflects our views, opinions, and portfolio holdings as of March 31, 2022, the end of the reporting period. These views are subject to change at any time based upon market or other conditions. For more current information throughout the year, please visit www.leavellinvestments.com.
| THE GOVERNMENT STREET EQUITY FUND |
| PERFORMANCE INFORMATION (Unaudited) |
The Government Street Equity Fund
Comparison of the Change in Value of a $10,000 Investment in
The Government Street Equity Fund and the S&P 500® Index
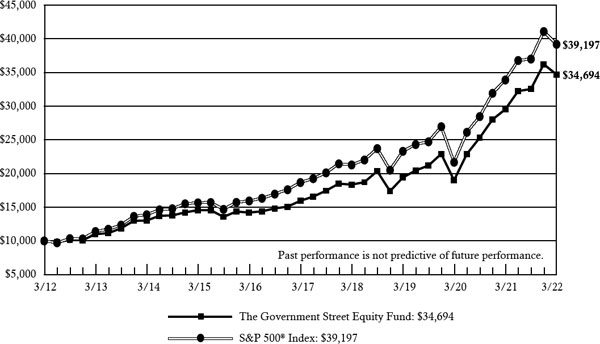
| | |
| | Average Annual Total Returns |
| | (for periods ended March 31, 2022) |
| | |
| | 1 Year | 5 Years | 10 Years |
| The Government Street Equity Fund(a) | 17.51% | 16.82% | 13.25% |
| S&P 500® Index | 15.65% | 15.99% | 14.64% |
| | | | |
| (a) | Total return is a measure of the change in value of an investment in the Fund over the periods covered, which assumes any dividends or capital gains distributions are reinvested in shares of the Fund. Returns do not reflect the deduction of taxes a shareholder would pay on Fund distributions or the redemption of Fund shares. |
| THE GOVERNMENT STREET MID-CAP FUND |
| PERFORMANCE INFORMATION (Unaudited) |
The Government Street Mid-Cap Fund
Comparison of the Change in Value of a $10,000 Investment in
The Government Street Mid-Cap Fund and the S&P MidCap 400® Index
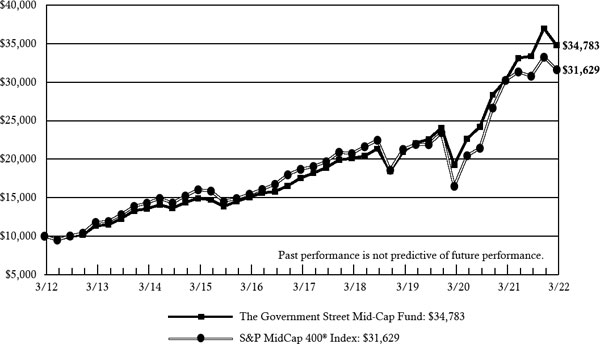
| | |
| | Average Annual Total Returns |
| | (for periods ended March 31, 2022) |
| | |
| | 1 Year | 5 Years | 10 Years |
| The Government Street Mid-Cap Fund(a) | 15.11% | 14.67% | 13.28% |
| S&P MidCap 400® Index | 4.59% | 11.10% | 12.20% |
| | | | |
| (a) | Total return is a measure of the change in value of an investment in the Fund over the periods covered, which assumes any dividends or capital gains distributions are reinvested in shares of the Fund. Returns do not reflect the deduction of taxes a shareholder would pay on Fund distributions or the redemption of Fund shares. |
| THE GOVERNMENT STREET EQUITY FUND |
PORTFOLIO INFORMATION
March 31, 2022 (Unaudited) |
Asset Allocation
(% of Net Assets)
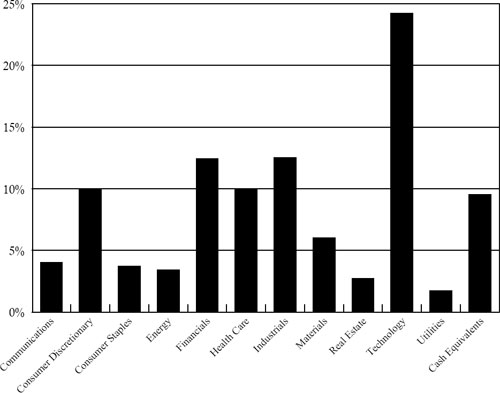
Top Ten Equity Holdings
| Security Description | % of Net Assets |
| NVIDIA Corporation | 6.2% |
| Microsoft Corporation | 4.0% |
| Bio-Techne Corporation | 4.0% |
| JPMorgan Chase & Company | 3.7% |
| Amazon.com, Inc. | 3.6% |
| Lockheed Martin Corporation | 3.5% |
| Apple, Inc. | 3.4% |
| Alphabet, Inc. - Classes A and C | 3.1% |
| Mid-America Apartment Communities, Inc. | 2.7% |
| Honeywell International, Inc. | 2.5% |
| THE GOVERNMENT STREET MID-CAP FUND |
PORTFOLIO INFORMATION
March 31, 2022 (Unaudited) |
Asset Allocation
(% of Net Assets)

Top Ten Equity Holdings
| Security Description | % of Net Assets |
| Mid-America Apartment Communities, Inc. | 4.9% |
| NVIDIA Corporation | 4.4% |
| Bio-Techne Corporation | 2.7% |
| Nasdaq, Inc. | 2.4% |
| Albemarle Corporation | 2.3% |
| Waste Connections, Inc. | 2.3% |
| Brown & Brown, Inc. | 2.2% |
| Teleflex, Inc. | 2.2% |
| Arthur J. Gallagher & Company | 2.2% |
| L3Harris Technologies, Inc. | 2.1% |
| THE GOVERNMENT STREET EQUITY FUND |
| SCHEDULE OF INVESTMENTS |
| March 31, 2022 |
| COMMON STOCKS — 90.6% | | Shares | | | Value | |
| Communications — 4.0% | | | | | | | | |
| Alphabet, Inc. - Class A (a) | | | 200 | | | $ | 556,270 | |
| Alphabet, Inc. - Class C (a) | | | 642 | | | | 1,793,100 | |
| Comcast Corporation - Class A | | | 15,000 | | | | 702,300 | |
| | | | | | | | 3,051,670 | |
| Consumer Discretionary — 9.9% | | | | | | | | |
| Amazon.com, Inc. (a) | | | 850 | | | | 2,770,957 | |
| Home Depot, Inc. (The) | | | 5,000 | | | | 1,496,650 | |
| Lowe’s Companies, Inc. | | | 5,500 | | | | 1,112,045 | |
| McDonald’s Corporation | | | 5,000 | | | | 1,236,400 | |
| NIKE, Inc. - Class B | | | 7,000 | | | | 941,920 | |
| | | | | | | | 7,557,972 | |
| Consumer Staples — 3.7% | | | | | | | | |
| Coca-Cola Company (The) | | | 3,500 | | | | 217,000 | |
| Kroger Company (The) | | | 9,000 | | | | 516,330 | |
| Procter & Gamble Company (The) | | | 4,000 | | | | 611,200 | |
| Walmart, Inc. | | | 10,000 | | | | 1,489,200 | |
| | | | | | | | 2,833,730 | |
| Energy — 3.5% | | | | | | | | |
| Cheniere Energy, Inc. | | | 6,000 | | | | 831,900 | |
| Chevron Corporation | | | 2,500 | | | | 407,075 | |
| Devon Energy Corporation | | | 12,500 | | | | 739,125 | |
| ONEOK, Inc. | | | 7,000 | | | | 494,410 | |
| Phillips 66 | | | 2,000 | | | | 172,780 | |
| | | | | | | | 2,645,290 | |
| Financials — 12.4% | | | | | | | | |
| Aflac, Inc. | | | 16,000 | | | | 1,030,240 | |
| Ares Management Corporation - Class A | | | 5,000 | | | | 406,150 | |
| Blackstone, Inc. | | | 14,000 | | | | 1,777,160 | |
| Brookfield Asset Management, Inc. - Class A | | | 28,000 | | | | 1,583,960 | |
| CME Group, Inc. | | | 3,500 | | | | 832,510 | |
| Goldman Sachs Group, Inc. (The) | | | 700 | | | | 231,070 | |
| Intercontinental Exchange, Inc. | | | 1,500 | | | | 198,180 | |
| JPMorgan Chase & Company | | | 21,000 | | | | 2,862,720 | |
| Marsh & McLennan Companies, Inc. | | | 2,500 | | | | 426,050 | |
| Truist Financial Corporation | | | 2,000 | | | | 113,400 | |
| | | | | | | | 9,461,440 | |
| Health Care — 10.0% | | | | | | | | |
| Abbott Laboratories | | | 9,500 | | | | 1,124,420 | |
| AbbVie, Inc. | | | 11,500 | | | | 1,864,265 | |
| Bio-Techne Corporation | | | 7,000 | | | | 3,031,280 | |
| Edwards Lifesciences Corporation (a) | | | 4,800 | | | | 565,056 | |
| Pfizer, Inc. | | | 4,000 | | | | 207,080 | |
| Thermo Fisher Scientific, Inc. | | | 900 | | | | 531,585 | |
| THE GOVERNMENT STREET EQUITY FUND |
| SCHEDULE OF INVESTMENTS (Continued) |
| COMMON STOCKS — 90.6% (Continued) | | Shares | | | Value | |
| Health Care — 10.0% (Continued) | | | | | | | | |
| UnitedHealth Group, Inc. | | | 600 | | | $ | 305,982 | |
| | | | | | | | 7,629,668 | |
| Industrials — 12.5% | | | | | | | | |
| Emerson Electric Company | | | 6,500 | | | | 637,325 | |
| General Dynamics Corporation | | | 5,200 | | | | 1,254,136 | |
| GXO Logistics, Inc. (a) | | | 3,000 | | | | 214,020 | |
| Honeywell International, Inc. | | | 10,000 | | | | 1,945,800 | |
| Lockheed Martin Corporation | | | 6,000 | | | | 2,648,400 | |
| Quanta Services, Inc. | | | 1,500 | | | | 197,415 | |
| Raytheon Technologies Corporation | | | 13,500 | | | | 1,337,445 | |
| TE Connectivity Ltd. | | | 9,000 | | | | 1,178,820 | |
| XPO Logistics, Inc. (a) | | | 2,500 | | | | 182,000 | |
| | | | | | | | 9,595,361 | |
| Materials — 6.0% | | | | | | | | |
| Albemarle Corporation | | | 5,000 | | | | 1,105,750 | |
| Freeport-McMoRan, Inc. | | | 25,000 | | | | 1,243,500 | |
| Glencore plc - ADR | | | 20,000 | | | | 261,000 | |
| International Paper Company | | | 7,000 | | | | 323,050 | |
| Linde plc | | | 1,500 | | | | 479,145 | |
| Mosaic Company (The) | | | 6,000 | | | | 399,000 | |
| MP Materials Corporation (a) | | | 5,500 | | | | 315,370 | |
| Sylvamo Corporation (a) | | | 636 | | | | 21,166 | |
| Vulcan Materials Company | | | 2,300 | | | | 422,510 | |
| | | | | | | | 4,570,491 | |
| Real Estate — 2.7% | | | | | | | | |
| Mid-America Apartment Communities, Inc. | | | 10,000 | | | | 2,094,500 | |
| | | | | | | | | |
| Technology — 24.2% | | | | | | | | |
| Accenture plc - Class A | | | 4,750 | | | | 1,601,842 | |
| Apple, Inc. | | | 15,000 | | | | 2,619,150 | |
| ASML Holding N.V. | | | 600 | | | | 400,758 | |
| Mastercard, Inc. - Class A | | | 2,000 | | | | 714,760 | |
| Microsoft Corporation | | | 10,000 | | | | 3,083,100 | |
| NVIDIA Corporation | | | 17,250 | | | | 4,706,835 | |
| ON Semiconductor Corporation (a) | | | 4,000 | | | | 250,440 | |
| QUALCOMM, Inc. | | | 6,000 | | | | 916,920 | |
| Skyworks Solutions, Inc. | | | 10,000 | | | | 1,332,800 | |
| Taiwan Semiconductor Manufacturing Company Ltd. -ADR | | | 6,000 | | | | 625,560 | |
| Texas Instruments, Inc. | | | 6,200 | | | | 1,137,576 | |
| Visa, Inc. - Class A | | | 5,000 | | | | 1,108,850 | |
| | | | | | | | 18,498,591 | |
| THE GOVERNMENT STREET EQUITY FUND |
| SCHEDULE OF INVESTMENTS (Continued) |
| COMMON STOCKS — 90.6% (Continued) | | Shares | | | Value | |
| Utilities — 1.7% | | | | | | | | |
| WEC Energy Group, Inc. | | | 13,000 | | | $ | 1,297,530 | |
| | | | | | | | | |
| Total Common Stocks (Cost $24,358,757) | | | | | | $ | 69,236,243 | |
| MONEY MARKET FUNDS — 9.5% | | Shares | | | Value | |
| Fidelity Institutional Money Market Government Portfolio - Class I, 0.12% (b) (Cost $7,243,036) | | | 7,243,036 | | | $ | 7,243,036 | |
| | | | | | | | | |
| Total Investments at Value — 100.1% | | | | | | | | |
| (Cost $31,601,793) | | | | | | $ | 76,479,279 | |
| | | | | | | | | |
| Liabilities in Excess of Other Assets — (0.1%) | | | | | | | (32,992 | ) |
| | | | | | | | | |
| Net Assets — 100.0% | | | | | | $ | 76,446,287 | |
ADR - American Depositary Receipt.
| (a) | Non-income producing security. |
| (b) | The rate shown is the 7-day effective yield as of March 31, 2022. |
See accompanying notes to financial statements.
| THE GOVERNMENT STREET MID-CAP FUND |
| SCHEDULE OF INVESTMENTS |
| March 31, 2022 |
| COMMON STOCKS — 89.3% | | Shares | | | Value | |
| Consumer Discretionary — 4.3% | | | | | | | | |
| Gildan Activewear, Inc. | | | 13,400 | | | $ | 502,232 | |
| Hasbro, Inc. | | | 2,500 | | | | 204,800 | |
| Kontoor Brands, Inc. | | | 1,671 | | | | 69,096 | |
| Macy’s, Inc. | | | 5,000 | | | | 121,800 | |
| NVR, Inc. (a) | | | 135 | | | | 603,081 | |
| Scotts Miracle-Gro Company (The) | | | 2,000 | | | | 245,920 | |
| Service Corporation International | | | 13,000 | | | | 855,660 | |
| VF Corporation | | | 3,000 | | | | 170,580 | |
| | | | | | | | 2,773,169 | |
| Consumer Staples — 2.9% | | | | | | | | |
| Bunge Ltd. | | | 3,000 | | | | 332,430 | |
| Celsius Holdings, Inc. (a) | | | 12,000 | | | | 662,160 | |
| Church & Dwight Company, Inc. | | | 9,000 | | | | 894,420 | |
| | | | | | | | 1,889,010 | |
| Energy — 5.4% | | | | | | | | |
| APA Corporation | | | 3,500 | | | | 144,655 | |
| Continental Resources, Inc. | | | 7,000 | | | | 429,310 | |
| Devon Energy Corporation | | | 10,000 | | | | 591,300 | |
| Enphase Energy, Inc. (a) | | | 6,000 | | | | 1,210,680 | |
| Marathon Oil Corporation | | | 18,000 | | | | 451,980 | |
| Northern Oil and Gas, Inc. | | | 5,000 | | | | 140,950 | |
| ONEOK, Inc. | | | 2,500 | | | | 176,575 | |
| Ovintiv, Inc. | | | 4,000 | | | | 216,280 | |
| Targa Resources Corporation | | | 1,750 | | | | 132,072 | |
| | | | | | | | 3,493,802 | |
| Financials — 19.3% | | | | | | | | |
| Alleghany Corporation (a) | | | 1,190 | | | | 1,007,930 | |
| American Financial Group, Inc. | | | 8,600 | | | | 1,252,332 | |
| Ares Management Corporation - Class A | | | 6,500 | | | | 527,995 | |
| Arthur J. Gallagher & Company | | | 8,000 | | | | 1,396,800 | |
| B. Riley Financial, Inc. | | | 1,500 | | | | 104,940 | |
| Berkley (W.R.) Corporation | | | 16,763 | | | | 1,116,215 | |
| Brown & Brown, Inc. | | | 20,000 | | | | 1,445,400 | |
| CME Group, Inc. | | | 5,000 | | | | 1,189,300 | |
| Intercontinental Exchange, Inc. | | | 9,000 | | | | 1,189,080 | |
| Morgan Stanley | | | 8,565 | | | | 748,581 | |
| Nasdaq, Inc. | | | 8,500 | | | | 1,514,700 | |
| Old Republic International Corporation | | | 24,400 | | | | 631,228 | |
| SoFi Technologies, Inc. (a) | | | 5,000 | | | | 47,250 | |
| Voya Financial, Inc. | | | 4,000 | | | | 265,400 | |
| | | | | | | | 12,437,151 | |
| Health Care — 14.1% | | | | | | | | |
| Bio-Rad Laboratories, Inc. - Class A (a) | | | 1,500 | | | | 844,845 | |
| THE GOVERNMENT STREET MID-CAP FUND |
| SCHEDULE OF INVESTMENTS (Continued) |
| COMMON STOCKS — 89.3% (Continued) | | Shares | | | Value | |
| Health Care — 14.1% (Continued) | | | | | | | | |
| Bio-Techne Corporation | | | 4,000 | | | $ | 1,732,160 | |
| Centene Corporation (a) | | | 6,000 | | | | 505,140 | |
| Charles River Laboratories International, Inc. (a) | | | 4,500 | | | | 1,277,865 | |
| Chemed Corporation | | | 2,500 | | | | 1,266,375 | |
| Laboratory Corporation of America Holdings (a) | | | 2,574 | | | | 678,661 | |
| Penumbra, Inc. (a) | | | 2,000 | | | | 444,260 | |
| ResMed, Inc. | | | 1,200 | | | | 291,012 | |
| Teleflex, Inc. | | | 3,950 | | | | 1,401,579 | |
| Waters Corporation (a) | | | 2,000 | | | | 620,780 | |
| | | | | | | | 9,062,677 | |
| Industrials — 16.8% | | | | | | | | |
| AMETEK, Inc. | | | 2,350 | | | | 312,973 | |
| C.H. Robinson Worldwide, Inc. | | | 4,000 | | | | 430,840 | |
| Donaldson Company, Inc. | | | 13,000 | | | | 675,090 | |
| Expeditors International of Washington, Inc. | | | 8,000 | | | | 825,280 | |
| Fastenal Company | | | 18,000 | | | | 1,069,200 | |
| Graco, Inc. | | | 13,000 | | | | 906,360 | |
| GXO Logistics, Inc. (a) | | | 2,000 | | | | 142,680 | |
| Jacobs Engineering Group, Inc. | | | 8,475 | | | | 1,167,940 | |
| L3Harris Technologies, Inc. | | | 5,400 | | | | 1,341,738 | |
| MasTec, Inc. (a) | | | 5,700 | | | | 496,470 | |
| MSC Industrial Direct Company, Inc. - Class A | | | 5,000 | | | | 426,050 | |
| National Instruments Corporation | | | 12,000 | | | | 487,080 | |
| nVent Electric plc | | | 2,900 | | | | 100,862 | |
| Pentair plc | | | 2,900 | | | | 157,209 | |
| Snap-on, Inc. | | | 1,475 | | | | 303,083 | |
| Waste Connections, Inc. | | | 10,500 | | | | 1,466,850 | |
| Woodward, Inc. | | | 3,900 | | | | 487,149 | |
| | | | | | | | 10,796,854 | |
| Materials — 8.7% | | | | | | | | |
| Albemarle Corporation | | | 6,700 | | | | 1,481,705 | |
| Ashland Global Holdings, Inc. | | | 6,000 | | | | 590,460 | |
| Martin Marietta Materials, Inc. | | | 3,000 | | | | 1,154,670 | |
| Packaging Corporation of America | | | 6,000 | | | | 936,660 | |
| Steel Dynamics, Inc. | | | 14,000 | | | | 1,168,020 | |
| Valvoline, Inc. | | | 9,236 | | | | 291,488 | |
| | | | | | | | 5,623,003 | |
| Real Estate — 5.3% | | | | | | | | |
| Mid-America Apartment Communities, Inc. | | | 15,000 | | | | 3,141,750 | |
| New Residential Investment Corporation | | | 25,000 | | | | 274,500 | |
| | | | | | | | 3,416,250 | |
| Technology — 12.5% | | | | | | | | |
| Advanced Micro Devices, Inc. (a) | | | 1,464 | | | | 160,074 | |
| Analog Devices, Inc. | | | 3,671 | | | | 606,376 | |
| THE GOVERNMENT STREET MID-CAP FUND |
| SCHEDULE OF INVESTMENTS (Continued) |
| COMMON STOCKS — 89.3% (Continued) | | Shares | | | Value | |
| Technology — 12.5% (Continued) | | | | | | | | |
| ANSYS, Inc. (a) | | | 3,000 | | | $ | 952,950 | |
| Arrow Electronics, Inc. (a) | | | 10,100 | | | | 1,198,163 | |
| Broadridge Financial Solutions, Inc. | | | 3,500 | | | | 544,985 | |
| Lam Research Corporation | | | 1,075 | | | | 577,930 | |
| Microchip Technology, Inc. | | | 8,800 | | | | 661,232 | |
| NVIDIA Corporation | | | 10,400 | | | | 2,837,744 | |
| Okta, Inc. (a) | | | 3,500 | | | | 528,360 | |
| | | | | | | | 8,067,814 | |
| | | | | | | | | |
| Total Common Stocks (Cost $16,642,300) | | | | | | $ | 57,559,730 | |
| MONEY MARKET FUNDS — 10.7% | | Shares | | | Value | |
| Fidelity Institutional Money Market Government Portfolio - Class I, 0.12% (b) (Cost $6,875,538) | | | 6,875,538 | | | $ | 6,875,538 | |
| | | | | | | | | |
| Total Investments at Value — 100.0% | | | | | | | | |
| (Cost $23,517,838) | | | | | | $ | 64,435,268 | |
| | | | | | | | | |
| Liabilities in Excess of Other Assets — (0.0%) (c) | | | | | | | (22,626 | ) |
| | | | | | | | | |
| Net Assets — 100.0% | | | | | | $ | 64,412,642 | |
| (a) | Non-income producing security. |
| (b) | The rate shown is the 7-day effective yield as of March 31, 2022. |
| (c) | Percentage rounds to less than 0.1%. |
See accompanying notes to financial statements.
| THE GOVERNMENT STREET FUNDS |
| STATEMENTS OF ASSETS AND LIABILITIES |
| March 31, 2022 |
| | | The | | | The | |
| | | Government | | | Government | |
| | | Street | | | Street | |
| | | Equity | | | Mid-Cap | |
| | | Fund | | | Fund | |
| ASSETS | | | | | | | | |
| Investments in securities: | | | | | | | | |
| At cost | | $ | 31,601,793 | | | $ | 23,517,838 | |
| At value (Note 2) | | $ | 76,479,279 | | | $ | 64,435,268 | |
| Cash | | | 3,332 | | | | — | |
| Dividends receivable | | | 14,180 | | | | 23,038 | |
| Receivable for capital shares sold | | | — | | | | 100 | |
| Other assets | | | 4,442 | | | | 5,120 | |
| TOTAL ASSETS | | | 76,501,233 | | | | 64,463,526 | |
| | | | | | | | | |
| LIABILITIES | | | | | | | | |
| Distributions payable | | | 1,471 | | | | — | |
| Payable for capital shares redeemed | | | 3,510 | | | | — | |
| Accrued investment advisory fees (Note 4) | | | 37,945 | | | | 39,944 | |
| Payable to administrator (Note 4) | | | 6,810 | | | | 5,880 | |
| Other accrued expenses | | | 5,210 | | | | 5,060 | |
| TOTAL LIABILITIES | | | 54,946 | | | | 50,884 | |
| | | | | | | | | |
| NET ASSETS | | $ | 76,446,287 | | | $ | 64,412,642 | |
| | | | | | | | | |
| Net assets consists of: | | | | | | | | |
| Paid-in capital | | $ | 30,669,022 | | | $ | 22,244,237 | |
| Distributable earnings | | | 45,777,265 | | | | 42,168,405 | |
| Net assets | | $ | 76,446,287 | | | $ | 64,412,642 | |
| | | | | | | | | |
| Shares of beneficial interest outstanding (unlimited number of shares authorized, $0.01 par value) | | | 730,960 | | | | 1,626,026 | |
| | | | | | | | | |
| Net asset value, offering price and redemption price per share (Note 2) | | $ | 104.58 | | | $ | 39.61 | |
See accompanying notes to financial statements.
| THE GOVERNMENT STREET FUNDS |
| STATEMENTS OF OPERATIONS |
| For the Year Ended March 31, 2022 |
| | | The | | | The | |
| | | Government | | | Government | |
| | | Street | | | Street | |
| | | Equity | | | Mid-Cap | |
| | | Fund | | | Fund | |
| INVESTMENT INCOME | | | | | | | | |
| Dividends | | $ | 1,060,460 | | | $ | 925,761 | |
| Foreign withholding taxes on dividends | | | (8,961 | ) | | | (2,739 | ) |
| TOTAL INVESTMENT INCOME | | | 1,051,499 | | | | 923,022 | |
| | | | | | | | | |
| EXPENSES | | | | | | | | |
| Investment advisory fees (Note 4) | | | 453,999 | | | | 475,376 | |
| Administration fees (Note 4) | | | 75,618 | | | | 64,120 | |
| Account maintenance fees | | | 23,847 | | | | 21,468 | |
| Trustees’ fees (Note 4) | | | 16,500 | | | | 16,500 | |
| Audit and tax services fees | | | 16,460 | | | | 16,460 | |
| Registration and filing fees | | | 16,449 | | | | 15,774 | |
| Custodian and bank service fees | | | 7,477 | | | | 7,203 | |
| Compliance fees (Note 4) | | | 7,003 | | | | 7,003 | |
| Printing of shareholder reports | | | 5,299 | | | | 5,171 | |
| Legal fees | | | 4,812 | | | | 4,812 | |
| Postage and supplies | | | 4,449 | | | | 4,160 | |
| Other expenses | | | 6,840 | | | | 6,700 | |
| TOTAL EXPENSES | | | 638,753 | | | | 644,747 | |
| | | | | | | | | |
| NET INVESTMENT INCOME | | | 412,746 | | | | 278,275 | |
| | | | | | | | | |
| REALIZED AND UNREALIZED GAINS ON INVESTMENTS | | | | | | | | |
| Net realized gains from investments | | | 5,106,081 | | | | 1,832,823 | |
| Net realized gains from in-kind redemptions (Note 2) | | | 1,999,879 | | | | 1,856,180 | |
| Net change in unrealized appreciation (depreciation) on investments | | | 4,425,800 | | | | 4,612,711 | |
| NET REALIZED AND UNREALIZED GAINS ON INVESTMENTS | | | 11,531,760 | | | | 8,301,714 | |
| | | | | | | | | |
| NET INCREASE IN NET ASSETS RESULTING FROM OPERATIONS | | $ | 11,944,506 | | | $ | 8,579,989 | |
See accompanying notes to financial statements.
| THE GOVERNMENT STREET EQUITY FUND |
| STATEMENTS OF CHANGES IN NET ASSETS |
| | | Year | | | Year | |
| | | Ended | | | Ended | |
| | | March 31, | | | March 31, | |
| | | 2022 | | | 2021 | |
| FROM OPERATIONS | | | | | | | | |
| Net investment income | | $ | 412,746 | | | $ | 458,505 | |
| Net realized gains from investments | | | 5,106,081 | | | | 6,239,187 | |
| Net realized gains from in-kind redemptions (Note 2) | | | 1,999,879 | | | | 1,972,527 | |
| Net change in unrealized appreciation (depreciation) on investments | | | 4,425,800 | | | | 18,331,665 | |
| Net increase in net assets resulting from operations | | | 11,944,506 | | | | 27,001,884 | |
| | | | | | | | | |
| DISTRIBUTIONS TO SHAREHOLDERS (Note 2) | | | (7,830,507 | ) | | | (4,669,253 | ) |
| | | | | | | | | |
| FROM CAPITAL SHARE TRANSACTIONS | | | | | | | | |
| Proceeds from shares sold | | | 187,886 | | | | 271,578 | |
| Net asset value of shares issued in reinvestment of distributions to shareholders | | | 7,692,565 | | | | 4,577,361 | |
| Payments for shares redeemed | | | (5,496,437 | ) | | | (7,213,957 | ) |
| Net increase (decrease) in net assets from capital share transactions | | | 2,384,014 | | | | (2,365,018 | ) |
| | | | | | | | | |
| TOTAL INCREASE IN NET ASSETS | | | 6,498,013 | | | | 19,967,613 | |
| | | | | | | | | |
| NET ASSETS | | | | | | | | |
| Beginning of year | | | 69,948,274 | | | | 49,980,661 | |
| End of year | | $ | 76,446,287 | | | $ | 69,948,274 | |
| | | | | | | | | |
| CAPITAL SHARE ACTIVITY | | | | | | | | |
| Shares sold | | | 1,769 | | | | 3,063 | |
| Shares reinvested | | | 73,460 | | | | 51,915 | |
| Shares redeemed | | | (52,009 | ) | | | (79,055 | ) |
| Net increase (decrease) in shares outstanding | | | 23,220 | | | | (24,077 | ) |
| Shares outstanding, beginning of year | | | 707,740 | | | | 731,817 | |
| Shares outstanding, end of year | | | 730,960 | | | | 707,740 | |
See accompanying notes to financial statements.
| THE GOVERNMENT STREET MID-CAP FUND |
| STATEMENTS OF CHANGES IN NET ASSETS |
| | | Year | | | Year | |
| | | Ended | | | Ended | |
| | | March 31, | | | March 31, | |
| | | 2022 | | | 2021 | |
| FROM OPERATIONS | | | | | | | | |
| Net investment income | | $ | 278,275 | | | $ | 161,401 | |
| Net realized gains from investments | | | 1,832,823 | | | | 3,140,103 | |
| Net realized gains from in-kind redemptions (Note 2) | | | 1,856,180 | | | | 686,630 | |
| Net change in unrealized appreciation (depreciation) on investments | | | 4,612,711 | | | | 18,189,473 | |
| Net increase in net assets resulting from operations | | | 8,579,989 | | | | 22,177,607 | |
| | | | | | | | | |
| DISTRIBUTIONS TO SHAREHOLDERS (Note 2) | | | (2,370,958 | ) | | | (1,863,967 | ) |
| | | | | | | | | |
| FROM CAPITAL SHARE TRANSACTIONS | | | | | | | | |
| Proceeds from shares sold | | | 1,467,336 | | | | 443,216 | |
| Net asset value of shares issued in reinvestment of distributions to shareholders | | | 2,320,422 | | | | 1,824,410 | |
| Payments for shares redeemed | | | (3,872,081 | ) | | | (3,715,335 | ) |
| Net decrease in net assets from capital share transactions | | | (84,323 | ) | | | (1,447,709 | ) |
| | | | | | | | | |
| TOTAL INCREASE IN NET ASSETS | | | 6,124,708 | | | | 18,865,931 | |
| | | | | | | | | |
| NET ASSETS | | | | | | | | |
| Beginning of year | | | 58,287,934 | | | | 39,422,003 | |
| End of year | | $ | 64,412,642 | | | $ | 58,287,934 | |
| | | | | | | | | |
| CAPITAL SHARE ACTIVITY | | | | | | | | |
| Shares sold | | | 36,359 | | | | 16,139 | |
| Shares reinvested | | | 59,110 | | | | 57,068 | |
| Shares redeemed | | | (100,578 | ) | | | (115,670 | ) |
| Net decrease in shares outstanding | | | (5,109 | ) | | | (42,463 | ) |
| Shares outstanding, beginning of year | | | 1,631,135 | | | | 1,673,598 | |
| Shares outstanding, end of year | | | 1,626,026 | | | | 1,631,135 | |
See accompanying notes to financial statements.
| THE GOVERNMENT STREET EQUITY FUND |
| FINANCIAL HIGHLIGHTS |
Selected Per Share Data for a Share Outstanding Throughout Each Year:
| | | Years Ended March 31, | |
| | | 2022 | | | 2021 | | | 2020 | | | 2019 | | | 2018 | |
| Net asset value at beginning of year | | $ | 98.83 | | | $ | 68.30 | | | $ | 73.37 | | | $ | 74.60 | | | $ | 67.08 | |
| | | | | | | | | | | | | | | | | | | | | |
| Income (loss) from investment operations: | | | | | | | | | | | | | | | | | | | | |
| Net investment income | | | 0.58 | | | | 0.64 | | | | 0.80 | | | | 0.69 | | | | 0.66 | |
| Net realized and unrealized gains (losses) on investments | | | 16.42 | | | | 36.33 | | | | (1.82 | ) | | | 3.37 | | | | 9.32 | |
| Total from investment operations | | | 17.00 | | | | 36.97 | | | | (1.02 | ) | | | 4.06 | | | | 9.98 | |
| | | | | | | | | | | | | | | | | | | | | |
| Less distributions from: | | | | | | | | | | | | | | | | | | | | |
| Net investment income | | | (0.58 | ) | | | (0.64 | ) | | | (0.80 | ) | | | (0.68 | ) | | | (0.65 | ) |
| Net realized gains | | | (10.67 | ) | | | (5.80 | ) | | | (3.25 | ) | | | (4.61 | ) | | | (1.81 | ) |
| Total distributions | | | (11.25 | ) | | | (6.44 | ) | | | (4.05 | ) | | | (5.29 | ) | | | (2.46 | ) |
| | | | | | | | | | | | | | | | | | | | | |
| Net asset value at end of year | | $ | 104.58 | | | $ | 98.83 | | | $ | 68.30 | | | $ | 73.37 | | | $ | 74.60 | |
| | | | | | | | | | | | | | | | | | | | | |
| Total return (a) | | | 17.51 | % | | | 55.46 | % | | | (2.04 | %) | | | 5.65 | % | | | 15.08 | % |
| | | | | | | | | | | | | | | | | | | | | |
| Net assets at end of year (000’s) | | $ | 76,446 | | | $ | 69,948 | | | $ | 49,981 | | | $ | 56,180 | | | $ | 62,707 | |
| | | | | | | | | | | | | | | | | | | | | |
| Ratio of total expenses to average net assets | | | 0.84 | % | | | 0.86 | % | | | 0.91 | % | | | 0.89 | % | | | 0.88 | % |
| | | | | | | | | | | | | | | | | | | | | |
| Ratio of net investment income to average net assets | | | 0.55 | % | | | 0.71 | % | | | 1.01 | % | | | 0.92 | % | | | 0.90 | % |
| | | | | | | | | | | | | | | | | | | | | |
| Portfolio turnover rate | | | 14 | % | | | 17 | % | | | 14 | % | | | 9 | % | | | 13 | % |
| (a) | Total return is a measure of the change in value on an investment in the Fund over the periods covered, which assumes any dividends or capital gains distributions are reinvested in shares of the Fund. The returns shown do not reflect the deductions of taxes a shareholder would pay on Fund distributions or the redemption of Fund Shares. |
See accompanying notes to financial statements.
| THE GOVERNMENT STREET MID-CAP FUND |
| FINANCIAL HIGHLIGHTS |
Selected Per Share Data for a Share Outstanding Throughout Each Year:
| | | Years Ended March 31, | |
| | | 2022 | | | 2021 | | | 2020 | | | 2019 | | | 2018 | |
| Net asset value at beginning of year | | $ | 35.73 | | | $ | 23.56 | | | $ | 26.78 | | | $ | 26.64 | | | $ | 24.42 | |
| | | | | | | | | | | | | | | | | | | | | |
| Income (loss) from investment operations: | | | | | | | | | | | | | | | | | | | | |
| Net investment income | | | 0.17 | | | | 0.10 | | | | 0.16 | | | | 0.18 | | | | 0.20 | |
| Net realized and unrealized gains (losses) on investments | | | 5.20 | | | | 13.19 | | | | (2.16 | ) | | | 0.90 | | | | 3.32 | |
| Total from investment operations | | | 5.37 | | | | 13.29 | | | | (2.00 | ) | | | 1.08 | | | | 3.52 | |
| | | | | | | | | | | | | | | | | | | | | |
| Less distributions from: | | | | | | | | | | | | | | | | | | | | |
| Net investment income | | | (0.18 | ) | | | (0.10 | ) | | | (0.16 | ) | | | (0.14 | ) | | | (0.20 | ) |
| Net realized gains | | | (1.31 | ) | | | (1.02 | ) | | | (1.06 | ) | | | (0.80 | ) | | | (1.10 | ) |
| Total distributions | | | (1.49 | ) | | | (1.12 | ) | | | (1.22 | ) | | | (0.94 | ) | | | (1.30 | ) |
| | | | | | | | | | | | | | | | | | | | | |
| Net asset value at end of year | | $ | 39.61 | | | $ | 35.73 | | | $ | 23.56 | | | $ | 26.78 | | | $ | 26.64 | |
| | | | | | | | | | | | | | | | | | | | | |
| Total return (a) | | | 15.11 | % | | | 57.00 | % | | | (8.18 | %) | | | 4.21 | % | | | 14.67 | % |
| | | | | | | | | | | | | | | | | | | | | |
| Net assets at end of year (000’s) | | $ | 64,413 | | | $ | 58,288 | | | $ | 39,422 | | | $ | 46,293 | | | $ | 50,059 | |
| | | | | | | | | | | | | | | | | | | | | |
| Ratio of total expenses to average net assets | | | 1.02 | % | | | 1.07 | % | | | 1.09 | % | | | 1.08 | % | | | 1.06 | % |
| | | | | | | | | | | | | | | | | | | | | |
| Ratio of net investment income to average net assets | | | 0.44 | % | | | 0.32 | % | | | 0.57 | % | | | 0.64 | % | | | 0.78 | % |
| | | | | | | | | | | | | | | | | | | | | |
| Portfolio turnover rate | | | 8 | % | | | 13 | % | | | 2 | % | | | 6 | % | | | 12 | % |
| (a) | Total return is a measure of the change in value on an investment in the Fund over the periods covered, which assumes any dividends or capital gains distributions are reinvested in shares of the Fund. The returns shown do not reflect the deductions of taxes a shareholder would pay on Fund distributions or the redemption of Fund Shares. |
See accompanying notes to financial statements.
| THE GOVERNMENT STREET FUNDS |
NOTES TO FINANCIAL STATEMENTS March 31, 2022 |
The Government Street Equity Fund and The Government Street Mid-Cap Fund (the “Funds”) are each a diversified, no-load series of the Williamsburg Investment Trust (the “Trust”), an open-end management investment company registered under the Investment Company Act of 1940, as amended (the “1940 Act”). The Trust was organized as a Massachusetts business trust on July 18, 1988. Other series of the Trust are not included in this report.
The investment objective of The Government Street Equity Fund is to seek capital appreciation.
The investment objective of The Government Street Mid-Cap Fund is to seek capital appreciation.
| 2. | Significant Accounting Policies |
Each Fund follows accounting and reporting guidance under Financial Accounting Standards Board Accounting Standards Codification Topic 946, “Financial Services – Investment Companies.” The following is a summary of the Funds’ significant accounting policies. The policies are in conformity with accounting principles generally accepted in the United States of America (“GAAP”).
Securities valuation — The Funds’ portfolio securities are valued as of the close of business of the regular session of the New York Stock Exchange (“NYSE”) (normally 4:00 p.m. Eastern time). Securities traded on a national stock exchange, including common stocks and exchange-traded funds (“ETFs”), if any, are valued based upon the closing price on the principal exchange where the security is traded, if available, otherwise, at the last quoted bid price. Securities that are quoted by NASDAQ are valued at the NASDAQ Official Closing Price. Investments representing shares of other open-end investment companies, other than ETFs but including money market funds, are valued at their net asset value (“NAV”) as reported by such companies. When using a quoted price and when the market is considered active, securities will be classified as Level 1 within the fair value hierarchy (see below).
When market quotations are not readily available, if a pricing service cannot provide a price, or if the investment adviser believes the price received from the pricing service is not indicative of fair value, securities will be valued in good faith at fair value using methods consistent with procedures adopted by the Board of Trustees and will be classified as Level 2 or 3 within the fair value hierarchy, depending on the inputs used. Such methods of fair valuation may include, but are not limited to: multiple of earnings, multiple of book value, discount from market of a similar freely traded security, purchase price of the security, subsequent private transactions in the security
| THE GOVERNMENT STREET FUNDS |
| NOTES TO FINANCIAL STATEMENTS (Continued) |
or related securities, or a combination of these and other factors. GAAP establishes a single authoritative definition of fair value, sets out a framework for measuring fair value and requires additional disclosures about fair value measurements.
Various inputs are used in determining the value of each Fund’s investments. These inputs are summarized in the three broad levels listed below:
| ● | Level 1 – quoted prices in active markets for identical securities |
| ● | Level 2 – other significant observable inputs |
| ● | Level 3 – significant unobservable inputs |
The inputs or methodology used for valuing securities are not necessarily an indication of the risks associated with investing in those securities. The inputs used to measure fair value may fall into different levels of the fair value hierarchy. In such cases, for disclosure purposes, the level in the fair value hierarchy within which the fair value measurement falls in its entirety is determined based on the lowest level input that is significant to the fair value measurement.
The following is a summary of the Funds’ investments based on the inputs used to value the investments as of March 31, 2022, by asset type:
| The Government Street Equity Fund: | | Level 1 | | | Level 2 | | | Level 3 | | | Total | |
| Common Stocks | | $ | 69,236,243 | | | $ | — | | | $ | — | | | $ | 69,236,243 | |
| Money Market Funds | | | 7,243,036 | | | | — | | | | — | | | | 7,243,036 | |
| Total | | $ | 76,479,279 | | | $ | — | | | $ | — | | | $ | 76,479,279 | |
| | | | | | | | | | | | | | | | | |
| | | | | | | | | | | | | | | | | |
| The Government Street Mid-Cap Fund: | | Level 1 | | | Level 2 | | | Level 3 | | | Total | |
| Common Stocks | | $ | 57,559,730 | | | $ | — | | | $ | — | | | $ | 57,559,730 | |
| Money Market Funds | | | 6,875,538 | | | | — | | | | — | | | | 6,875,538 | |
| Total | | $ | 64,435,268 | | | $ | — | | | $ | — | | | $ | 64,435,268 | |
| | | | | | | | | | | | | | | | | |
Refer to each Fund’s Schedule of Investments for a listing of the common stocks by sector type. There were no Level 3 securities or derivative instruments held by the Funds as of or during the year ended March 31, 2022.
Foreign currency translation — Investment securities and other assets and liabilities denominated in or expected to settle in foreign currencies, if any, are translated into U.S. dollars based on exchange rates on the following basis:
| A. | The fair values of investment securities and other assets and liabilities are translated as of the close of the NYSE each day. |
| B. | Purchases and sales of investment securities and income and expenses are translated at the rate of exchange prevailing as of 4:00 p.m. Eastern time on the respective date of such transactions. |
| THE GOVERNMENT STREET FUNDS |
| NOTES TO FINANCIAL STATEMENTS (Continued) |
| C. | The Funds do not isolate that portion of the results of operations caused by changes in foreign exchange rates on investments from those caused by changes in market prices of investment securities held. Such fluctuations are included within the net realized and unrealized gains or losses on investments. |
Reported net realized foreign exchange gains or losses arise from 1) purchases and sales of foreign currencies and 2) the difference between the amounts of dividends and foreign withholding taxes recorded on a Fund’s books and the U.S. dollar equivalent of the amounts actually received or paid. Reported net unrealized foreign exchange gains and losses arise from changes in the value of assets and liabilities that result from changes in exchange rates.
Share valuation — The NAV per share of each Fund is calculated daily by dividing the total value of its assets, less liabilities, by the number of shares outstanding. The offering price and redemption price per share of each Fund is equal to the NAV per share.
Investment income — Interest income is accrued as earned. Discounts and premiums on fixed-income securities purchased, if any, are amortized using the interest method. Dividend income is recorded on the ex-dividend date. Non-cash dividends included in dividend income, if any, are recorded at the fair market value of the security received. Withholding taxes on foreign dividends have been recorded in accordance with the Trust’s understanding of the applicable country’s rules and tax rates.
Distributions to shareholders — Dividends arising from net investment income are declared and paid quarterly to shareholders of The Government Street Equity Fund and declared and paid annually to shareholders of The Government Street Mid-Cap Fund. Net realized short-term capital gains, if any, may be distributed throughout the year and net realized long-term capital gains, if any, are distributed at least once each year. Dividends and distributions are recorded on the ex-dividend date. The amount of distributions from net investment income and net realized capital gains are determined in accordance with federal income tax regulations, which may differ from GAAP. These “book/tax” differences are either temporary or permanent in nature.
The tax character of distributions paid during the years ended March 31, 2022 and 2021 was as follows:
| | | Years | | Ordinary | | | Long-Term | | | Total | |
| | | Ended | | Income | | | Capital Gains | | | Distributions | |
| The Government Street Equity Fund | | 03/31/22 | | $ | 414,011 | | | $ | 7,417,115 | | | $ | 7,831,126 | |
| | | 03/31/21 | | $ | 462,537 | | | $ | 4,207,840 | | | $ | 4,670,377 | |
| The Government Street Mid-Cap Fund | | 03/31/22 | | $ | 555,791 | | | $ | 1,815,167 | | | $ | 2,370,958 | |
| | | 03/31/21 | | $ | 178,349 | | | $ | 1,685,618 | | | $ | 1,863,967 | |
| THE GOVERNMENT STREET FUNDS |
| NOTES TO FINANCIAL STATEMENTS (Continued) |
Investment transactions — Investment transactions are accounted for on trade date for financial reporting purposes. Realized gains and losses on investment securities sold are determined on a specific identification basis.
Common expenses — Common expenses of the Trust are allocated among the Funds and the other series of the Trust based on relative net assets of each series or the nature of the services performed and the relative applicability to each series.
Estimates — The preparation of financial statements in conformity with GAAP requires management to make estimates and assumptions that affect the reported amounts of assets and liabilities and the disclosure of contingent assets and liabilities as of the date of the financial statements and the reported amounts of increase (decrease) in net assets from operations during the reporting period. Actual results could differ from those estimates.
Federal income tax — Each Fund has qualified and intends to continue to qualify as a regulated investment company under the Internal Revenue Code of 1986, as amended (the “Code”). Qualification generally will relieve the Funds of liability for federal income taxes to the extent 100% of their net investment income and any net realized capital gains are distributed in accordance with the Code.
In order to avoid imposition of the excise tax applicable to regulated investment companies, it is also each Fund’s intention to declare as dividends in each calendar year at least 98% of its net investment income (earned during the calendar year) and 98.2% of its net realized capital gains (earned during the twelve months ended October 31) plus undistributed amounts from prior years.
The following information is computed on a tax basis for each item as of March 31, 2022:
| | | The Government | | | The Government | |
| | | Street Equity | | | Street Mid-Cap | |
| | | Fund | | | Fund | |
| Cost of portfolio investments | | $ | 31,601,793 | | | $ | 23,517,838 | |
| Gross unrealized appreciation | | $ | 45,003,976 | | | $ | 41,026,860 | |
| Gross unrealized depreciation | | | (126,490 | ) | | | (109,430 | ) |
| Net unrealized appreciation | | | 44,877,486 | | | | 40,917,430 | |
| Undistributed ordinary income | | | 1,882 | | | | — | |
| Undistributed long-term capital gains | | | 899,368 | | | | 1,574,637 | |
| Accumulated capital and other losses | | | — | | | | (323,662 | ) |
| Distributions payable | | | (1,471 | ) | | | — | |
| Total distributable earnings | | $ | 45,777,265 | | | $ | 42,168,405 | |
| | | | | | | | | |
| THE GOVERNMENT STREET FUNDS |
| NOTES TO FINANCIAL STATEMENTS (Continued) |
During the year ended March 31, 2022, The Government Street Equity Fund and The Government Street Mid-Cap Fund realized $1,999,879 and $1,856,180, respectively, of net capital gains resulting from in-kind redemptions (redemptions in which shareholders who redeemed Fund shares received investment securities held by the Fund rather than cash). The Funds recognize a gain on in-kind redemptions to the extent that the value of the distributed investment securities on the date of redemption exceeds the cost of those investment securities. Such gains are not taxable to the Funds and are not required to be distributed to shareholders. The Funds have reclassified these gains against paid-in capital on the Statements of Assets and Liabilities. Such reclassifications, the result of permanent differences between the financial statement and income tax reporting requirements, had no effect on each Fund’s net assets or NAV per share.
Post-October losses, incurred after October 31, 2021 and net qualified late year losses, incurred after December 31, 2021 and within the current taxable year, are deemed to arise on the first day of a Fund’s next taxable year. For the year ended March 31, 2022, The Government Street Mid-Cap Fund deferred $299,284 and $24,378, respectively, of post-October and qualified late year losses, respectively, to April 1, 2022 for federal income tax purposes.
The Funds recognize the tax benefits or expenses of uncertain tax positions only when the position is “more likely than not” to be sustained assuming examination by tax authorities. Management has reviewed the tax positions taken on federal income tax returns for all open tax years (generally, three years) of each Fund and has concluded that no provision for unrecognized tax benefits or expenses is required in these financial statements.
| 3. | Investment Transactions |
Investment transactions, other than short-term investments and U.S. government securities, were as follows for the year ended March 31, 2022:
| | | The Government | | | The Government | |
| | | Street Equity | | | Street Mid-Cap | |
| | | Fund | | | Fund | |
| Purchases of investment securities | | $ | 10,294,677 | | | $ | 4,491,632 | |
| Proceeds from sales of investment securities | | $ | 21,083,709 | | | $ | 11,096,473 | |
| | | | | | | | | |
| 4. | Transactions with Related Parties |
INVESTMENT ADVISORY AGREEMENT
Each Fund’s investments are managed by Leavell Investment Management, Inc. (the “Adviser”) under the terms of an Investment Advisory Agreement. The Government Street Equity Fund pays the Adviser a fee, which is computed and accrued daily and
| THE GOVERNMENT STREET FUNDS |
| NOTES TO FINANCIAL STATEMENTS (Continued) |
paid monthly, at annual rates of 0.60% of its average daily net assets up to $100 million and 0.50% of such assets in excess of $100 million. The Government Street Mid-Cap Fund pays the Adviser a fee, which is computed and accrued daily and paid monthly, at an annual rate of 0.75% of its average daily net assets.
Certain officers of the Trust are also officers of the Adviser.
OTHER SERVICE PROVIDERS
Ultimus Fund Solutions, LLC (“Ultimus”) provides administration, fund accounting, compliance and transfer agent services to the Funds. The Funds pay Ultimus fees in accordance with the agreements for such services. In addition, the Funds pay out-of-pocket expenses including, but not limited to, postage, supplies, and certain costs related to the pricing of the Funds’ portfolio securities. Certain officers of the Trust are also officers of Ultimus, or of Ultimus Fund Distributors, LLC (the “Distributor”), the principal underwriter of each Fund’s shares and an affiliate of Ultimus. The Distributor is compensated by the Adviser (not the Funds) for acting as principal underwriter.
COMPENSATION OF TRUSTEES
Trustees and officers affiliated with the Adviser or Ultimus are not compensated by the Trust for their services. Effective January 1, 2022, each Trustee who is not an affiliated person of the Adviser or Ultimus receives from the Trust an annual retainer of $30,000, payable quarterly; a fee of $2,000 for attendance at each meeting of the Board of Trustees (except that such fee is $3,000 for the independent chair); and a fee of $1,000 for attendance at each meeting of any committee of the Board (except that such fee is $1,500 for the committee chair); plus reimbursement of travel and other expenses incurred in attending meetings. Prior to January 1, 2022, each Trustee who was not an affiliated person of the Adviser or Ultimus received from the Trust an annual retainer of $24,000, payable quarterly; a fee of $2,000 for attendance at each meeting of the Board of Trustees (except that such fee was $3,000 for the independent chair); and a fee of $1,000 for attendance at each meeting of any committee of the Board (except that such fee was $1,500 for the committee chair); plus reimbursement of travel and other expenses incurred in attending meetings. Each series of the Trust pays its proportionate share of such fees.
| 5. | Contingencies and Commitments |
The Funds indemnify the Trust’s officers and Trustees for certain liabilities that might arise from their performance of their duties to the Funds. Additionally, in the normal course of business the Funds enter into contracts that contain a variety of representations and warranties and which provide general indemnifications. The Funds’ maximum exposure under these arrangements is unknown, as this would involve future claims that may be made against the Funds that have not yet occurred. However, based on experience, the Trust expects the risk of loss to be remote.
| THE GOVERNMENT STREET FUNDS |
| NOTES TO FINANCIAL STATEMENTS (Continued) |
If a Fund has significant investments in the securities of issuers in industries within a particular business sector, any development affecting that sector will have a greater impact on the value of the net assets of the Fund than would be the case if the Fund did not have significant investments in that sector. In addition, this may increase the risk of loss of an investment in the Fund and increase the volatility of the Fund’s NAV per share. From time to time, circumstances may affect a particular sector and companies within such sector. For instance, economic or market factors, regulation or deregulation, or other developments may negatively impact all companies in a particular sector and therefore the value of a Fund’s portfolio would be adversely affected. As of March 31, 2022, The Government Street Equity Fund had 24.2% of the value of its net assets invested in common stocks within the Technology sector.
The Funds are required to recognize in the financial statements the effects of all subsequent events that provide additional evidence about conditions that existed as of the date of the Statements of Assets and Liabilities. For non-recognized subsequent events that must be disclosed to keep the financial statements from being misleading, the Funds are required to disclose the nature of the event as well as an estimate of its financial effect, or a statement that such an estimate cannot be made. Management has evaluated subsequent events through the issuance of these financial statements and has noted no such events.
| THE GOVERNMENT STREET FUNDS |
| REPORT OF INDEPENDENT REGISTERED |
| PUBLIC ACCOUNTING FIRM |
To the Shareholders of The Government Street Funds and
Board of Trustees of Williamsburg Investment Trust
Opinion on the Financial Statements
We have audited the accompanying statements of assets and liabilities, including the schedules of investments, of The Government Street Funds, comprising The Government Street Equity Fund and The Government Street Mid-Cap Fund (the “Funds”), each a series of Williamsburg Investment Trust, as of March 31, 2022, the related statements of operations for the year then ended, the statements of changes in net assets for each of the two years in the period then ended, the related notes, and the financial highlights for each of the five years in the period then ended (collectively referred to as the “financial statements”). In our opinion, the financial statements present fairly, in all material respects, the financial position of each of the Funds as of March 31, 2022, the results of their operations for the year then ended, the changes in net assets for each of the two years in the period then ended, and the financial highlights for each of the five years in the period then ended, in conformity with accounting principles generally accepted in the United States of America.
Basis for Opinion
These financial statements are the responsibility of the Funds’ management. Our responsibility is to express an opinion on the Funds’ financial statements based on our audits. We are a public accounting firm registered with the Public Company Accounting Oversight Board (United States) (“PCAOB”) and are required to be independent with respect to the Funds in accordance with the U.S. federal securities laws and the applicable rules and regulations of the Securities and Exchange Commission and the PCAOB.
We conducted our audits in accordance with the standards of the PCAOB. Those standards require that we plan and perform the audit to obtain reasonable assurance about whether the financial statements are free of material misstatement whether due to error or fraud.
Our audits included performing procedures to assess the risks of material misstatement of the financial statements, whether due to error or fraud, and performing procedures that respond to those risks. Such procedures included examining, on a test basis, evidence regarding the amounts and disclosures in the financial statements. Our procedures included confirmation of securities owned as of March 31, 2022, by correspondence with the custodian. Our audits also included evaluating the accounting
| THE GOVERNMENT STREET FUNDS |
| REPORT OF INDEPENDENT REGISTERED |
| PUBLIC ACCOUNTING FIRM (Continued) |
principles used and significant estimates made by management, as well as evaluating the overall presentation of the financial statements. We believe that our audits provide a reasonable basis for our opinion.
We have served as the Funds’ auditor since 2016.
COHEN & COMPANY, LTD.
Milwaukee, Wisconsin
May 26, 2022
| THE GOVERNMENT STREET FUNDS |
| ABOUT YOUR FUNDS’ EXPENSES (Unaudited) |
We believe it is important for you to understand the impact of costs on your investment. All mutual funds have operating expenses. As a shareholder of the Funds, you incur ongoing costs, including management fees and other expenses. These ongoing costs, which are deducted from each Fund’s gross income, directly reduce the investment returns of the Funds.
A mutual fund’s ongoing costs are expressed as a percentage of its average net assets. This figure is known as the expense ratio. The following examples are intended to help you understand the ongoing costs (in dollars) of investing in the Funds and to compare these costs with the ongoing costs of investing in other mutual funds. The examples below are based on an investment of $1,000 made at the beginning of the period shown and held for the entire period (October 1, 2021 through March 31, 2022).
The table below illustrates each Fund’s ongoing costs in two ways:
Actual fund return – This section helps you to estimate the actual expenses that you paid over the period. The “Ending Account Value” shown is derived from each Fund’s actual return, and the fourth column shows the dollar amount of operating expenses that would have been paid by an investor who started with $1,000 in the Funds. You may use the information here, together with the amount you invested, to estimate the expenses that you paid over the period.
To do so, simply divide your account value by $1,000 (for example, an $8,600 account value divided by $1,000 = 8.6), then multiply the result by the number given for the Funds under the heading “Expenses Paid During Period.”
Hypothetical 5% return – This section is intended to help you compare the Funds’ ongoing costs with those of other mutual funds. It assumes that each Fund had an annual return of 5% before expenses during the period shown, but that the expense ratio is unchanged. In this case, because the returns used are not the Funds’ actual returns, the results do not apply to your investment. The example is useful in making comparisons because the U.S. Securities and Exchange Commission (the “SEC”) requires all mutual funds to calculate expenses based on a 5% return. You can assess each Fund’s ongoing costs by comparing this hypothetical example with the hypothetical examples that appear in shareholder reports of other funds.
Note that expenses shown in the table are meant to highlight and help you compare ongoing costs only. The Funds do not charge sales loads or redemption fees.
The calculations assume no shares were bought or sold during the period. Your actual costs may have been higher or lower, depending on the amount of your investment and the timing of any purchases or redemptions.
| THE GOVERNMENT STREET FUNDS |
| ABOUT YOUR FUNDS’ EXPENSES (Unaudited) (Continued) |
More information about the Funds’ expenses, including historical expense ratios, can be found in this report. For additional information on operating expenses and other shareholder costs, please refer to the Funds’ prospectus.
| | | Beginning | | Ending | | | | Expenses |
| | | Account Value | | Account Value | | Expense | | Paid During |
| | | October 1, 2021 | | March 31, 2022 | | Ratio(a) | | Period(b) |
| The Government Street Equity Fund | | | | | | | | |
| Based on Actual Fund Return | | $1,000.00 | | $1,066.10 | | 0.85% | | $4.38 |
| Based on Hypothetical 5% Return (before expenses) | | $1,000.00 | | $1,020.69 | | 0.85% | | $4.28 |
| The Government Street Mid-Cap Fund | | | | | | | | |
| Based on Actual Fund Return | | $1,000.00 | | $1,042.30 | | 1.02% | | $5.19 |
| Based on Hypothetical 5% Return (before expenses) | | $1,000.00 | | $1,019.85 | | 1.02% | | $5.14 |
| (a) | Annualized, based on each Fund’s most recent one-half year expenses. |
| (b) | Expenses are equal to each Fund’s annualized expense ratio multiplied by the average account value over the period, multiplied by 182/365 (to reflect the one-half year period). |
| THE GOVERNMENT STREET FUNDS |
| BOARD OF TRUSTEES AND EXECUTIVE OFFICERS (Unaudited) |
Overall responsibility for management of the Funds rests with the Board of Trustees. The Trustees serve during the lifetime of the Trust and until its termination, or until death, resignation, retirement or removal. The Trustees, in turn, elect the officers of the Funds. The officers have been elected for an annual term. The following are the Trustees and executive officers of the Funds:
| Trustees and Officers | Address | Year of
Birth | Position Held
with the Trust | Length of
Time Served |
| Robert S. Harris, Ph.D. | 225 Pictoria Drive, Suite 450 Cincinnati, OH | 1949 | Chairman and Trustee | Since January 2007 |
| * John P. Ackerly, IV | One James Center 901 E. Cary Street Richmond, VA | 1963 | Trustee and President of The Davenport Funds | Since July 2012 |
| * John T. Bruce | 800 Main Street Lynchburg, VA | 1953 | Trustee and President of The Cantor FBP Mutual Funds | Since September 1988 |
| George K. Jennison | 225 Pictoria Drive, Suite 450 Cincinnati, OH | 1957 | Trustee | Since January 2015 |
| Harris V. Morrissette | 225 Pictoria Drive, Suite 450 Cincinnati, OH | 1959 | Trustee | Since March 1993 |
| Elizabeth W. Robertson | 225 Pictoria Drive, Suite 450 Cincinnati, OH | 1953 | Trustee | Since February 2014 |
| Thomas W. Leavell | 210 St. Joseph Street Mobile, AL | 1943 | President of The Government Street Funds | Since February 2004 |
| Mary Shannon Hope | 210 St. Joseph Street Mobile, AL | 1963 | Vice President of The Government Street Funds | Since August 2008 |
| Timothy S. Healey | 2712 18th Place South Birmingham, AL | 1953 | Vice President of The Government Street Funds | Since January 1995 |
| Mark J. Seger | 225 Pictoria Drive, Suite 450 Cincinnati, OH | 1962 | Treasurer | Since November 2000 |
| David K. James | 225 Pictoria Drive, Suite 450 Cincinnati, OH | 1970 | Secretary | Since November 2018 |
| Michael J. Nanosky | 225 Pictoria Drive, Suite 450 Cincinnati, OH | 1966 | Chief Compliance Officer | Since March 2020 |
| * | Messrs. Ackerly and Bruce, as affiliated persons of investment advisers to the Trust, are “interested persons” of the Trust within the meaning of Section 2(a)(19) of the 1940 Act. |
| THE GOVERNMENT STREET FUNDS |
| BOARD OF TRUSTEES AND EXECUTIVE OFFICERS (Unaudited) (Continued) |
Each Trustee oversees ten portfolios of the Trust, including the Funds. The principal occupations of the Trustees and executive officers of the Funds during the past five years and public directorships held by the Trustees are set forth below:
Robert S. Harris, Ph.D. is the C. Stewart Sheppard Professor of Business Administration at The Darden Graduate School of Business Administration at the University of Virginia. He was previously the dean at Darden. Professor Harris has published widely on corporate finance, financial markets and mergers and acquisitions and has served as a consultant to corporations and government agencies.
John P. Ackerly, IV, is Senior Vice President and Portfolio Manager of Davenport & Company, LLC (a broker-dealer and investment advisory firm).
John T. Bruce is President, Director and member of the Executive Committee of the Flippin, Bruce & Porter division of Cantor Fitzgerald Investment Advisors, L.P. (an investment advisory firm).
George K. Jennison is retired. He previously was President of Oyster Consulting, LLC (a management consulting firm) and a financial adviser with Wells Fargo Advisors, LLC.
Harris V. Morrissette is President of China Doll Rice and Beans, Inc. and Dixie Lily Foods. He is also a Director of Trustmark Corporation (bank holding company).
Elizabeth W. Robertson serves as a Trustee of TowneBank Foundation, TowneBank Corporate Board, TowneBank Audit Committee Chair and TowneBank Community Board since 2015. She previously was Chief Financial Officer of Monument Restaurants LLC.
Thomas W. Leavell is Portfolio Manager of the Adviser.
Mary Shannon Hope is Operations Director and Portfolio Manager of the Adviser.
Timothy S. Healey is Chief Investment Officer and Portfolio Manager of the Adviser.
Mark J. Seger is a Vice Chairman of Ultimus Fund Solutions, LLC and Ultimus Fund Distributors, LLC. He previously was Co-CEO of Ultimus Fund Solutions, LLC (1999 to 2019).
David K. James is an Executive Vice President and Chief Legal and Risk Officer of Ultimus Fund Solutions, LLC (2018 to present). He previously was Managing Director and Managing Counsel at State Street Bank and Trust Company (2009 to 2018).
Michael J. Nanosky is a Senior Compliance Officer of Ultimus Fund Solutions, LLC (2020 to present). He previously was Senior Vice President & Chief Compliance Officer of PNC Funds (2014 to 2019).
Additional information about members of the Board of Trustees and executive officers is available in the Statement of Additional Information (“SAI”). To obtain a free copy of the SAI, please call 1-866-738-1125.
| THE GOVERNMENT STREET FUNDS |
| DISCLOSURE REGARDING APPROVAL OF |
| INVESTMENT ADVISORY AGREEMENTS (Unaudited) |
At a meeting held on February 22, 2022, the Board of Trustees, including a majority of the Independent Trustees, approved the continuance for a one-year period of the Investment Advisory Agreements with the Adviser on behalf of The Government Street Equity Fund and The Government Street Mid-Cap Fund (individually, a “Fund,” collectively, the “Funds”). Below is a discussion of the factors considered by the Board of Trustees along with the conclusions with respect thereto that formed the basis for the Board’s approval.
In approving the continuance of the Investment Advisory Agreements, the Independent Trustees considered all information they deemed reasonably necessary to evaluate the terms of the Agreements. The principal areas of review by the Independent Trustees were the nature, extent and quality of the services provided by the Adviser and the reasonableness of the fees charged for those services. These matters were considered by the Independent Trustees consulting with experienced counsel for the Independent Trustees, who is independent of the Adviser.
The Independent Trustees’ evaluation of the quality of the Adviser’s services took into consideration their knowledge gained through presentations and reports from the Adviser over the course of the preceding year. The Independent Trustees considered that the Adviser had provided its views on the overall conditions of the economy and the markets, including the factors that may have influenced the markets, investor preferences and market sentiment during the past year. The Independent Trustees also considered the security selection process that is applied in the management of the Funds. Both short-term and long-term investment performance of the Funds were considered. Each Fund’s performance was compared to its performance benchmark and a peer group of funds with similar investment objectives and strategies. The Independent Trustees also considered: the scope and quality of the in-house capabilities of the Adviser and other resources that are dedicated to performing services for the Funds; the quality of administrative and other services, including the Adviser’s role in coordinating the activities of the Funds’ other service providers; the Adviser’s compliance with investment policies of the Funds and applicable laws and regulations; information provided by management and the Funds’ independent public accounting firm in periodic meetings with the Trust’s Audit Committee; the business reputation of the Adviser; the qualifications of the Adviser’s key investment and compliance personnel; and the Adviser’s financial resources.
In reviewing the fees payable under the Investment Advisory Agreements, the Independent Trustees compared the advisory fees and overall expense levels of each Fund with those of funds with similar investment objectives and strategies. The Independent Trustees considered information provided by the Adviser concerning the Adviser’s profitability with respect to each Fund, including the assumptions and methodology used in preparing the profitability information, in light of applicable case
| THE GOVERNMENT STREET FUNDS |
| DISCLOSURE REGARDING APPROVAL OF |
| INVESTMENT ADVISORY AGREEMENTS (Unaudited) (Continued) |
law relating to advisory fees. For these purposes, the Independent Trustees considered not only the fees paid by the Funds, but also so-called “fallout” benefits to the Adviser. The Independent Trustees also considered the Adviser’s representations that the Funds’ portfolio trades were executed based on the best available price and execution, and that the Adviser does not participate in any soft dollar or directed brokerage arrangements. The Independent Trustees further considered that the Adviser does not participate in any revenue sharing arrangements relating to the Funds. In evaluating the Funds’ advisory fees, the Trustees considered the complexity and quality of the investment process that is applied in the management of the Funds.
The Independent Trustees considered each Fund’s investment strategy in comparison to the performance to its respective benchmark and peer group, and the services provided by LIM to the respective Fund. Based on the consideration of the foregoing and such other information as was deemed relevant, including the factors and conclusions below, the Independent Trustees concluded that: (i) the performance of each of The Government Street Equity Fund and The Government Street Mid-Cap Fund is satisfactory; (ii) the advisory fee for The Government Street Equity Fund and The Government Street Mid-Cap Fund is higher when compared to the median for similarly managed funds according to statistics derived from Morningstar, Inc., and both Funds’ advisory fees’ are reasonable in relation to the quality of services provided by LIM; (iii) the total operating expense ratios of The Government Street Equity Fund and The Government Street Mid-Cap Fund are reasonable in relation to the average expense ratio for comparably managed funds, according to statistics derived from Morningstar, Inc., and (iv) the level of LIM’s profitability with respect to its management of the Funds is reasonable.
Given the current size of the Funds and their expected growth, the Independent Trustees did not believe that it was relevant to consider the extent to which economies of scale would be realized as the Funds grow, and whether fee levels reflect these economies of scale. The Independent Trustees did consider the “fallout” benefits to the Adviser with respect to the Funds but viewed this as a secondary factor in connection with the evaluation of the reasonableness of the advisory fees paid by the Funds.
No single factor was considered in isolation or to be determinative to the decision of the Independent Trustees to approve the continuance of the Investment Advisory Agreements. Rather the Independent Trustees concluded, after weighing and balancing of all factors considered, that it was in the best interests of each Fund and its respective shareholders to continue its Investment Advisory Agreement without modification to its terms, including the fees charged for services thereunder, for an additional one-year period.
| THE GOVERNMENT STREET FUNDS |
| OTHER INFORMATION (Unaudited) |
A description of the policies and procedures that the Funds use to vote proxies relating to portfolio securities is available without charge upon request by calling toll-free 1-866-738-1125, or on the SEC’s website at www.sec.gov. Information regarding how the Funds voted proxies relating to portfolio securities during the most recent 12-month period ended June 30 is also available without charge upon request by calling toll-free 1-866-738-1125 or on the SEC’s website at www.sec.gov.
The Trust files a complete listing of portfolio holdings for the Funds with the SEC as of the end of the first and third quarters of each fiscal year as an exhibit to its reports on Form N-PORT. The filings are available upon request, by calling 1-866-738-1125. Furthermore, you may obtain a copy of these filings on the SEC’s website at www.sec.gov and the Funds’ website leavellinvestements.com.
| FEDERAL TAX INFORMATION (Unaudited) |
For the fiscal year ended March 31, 2022, The Government Street Equity Fund and The Government Street Mid-Cap Fund designated $7,417,115 and $1,815,167, respectively, as long-term capital gain distributions.
Qualified Dividend Income – The Funds each designate 100%, or up to the maximum amount of such dividends allowable pursuant to the Internal Revenue Code, as qualified dividend income eligible for the reduced tax rate.
Dividends Received Deduction – Corporate shareholders are generally entitled to take the dividends received deduction on the portion of a Fund’s dividend distribution that qualifies under tax law. For the fiscal year ended March 31, 2022, 100% of The Government Street Equity Fund and The Government Street Mid-Cap Fund’s ordinary income dividends qualifies for the corporate dividends received deduction.
This page intentionally left blank.
This page intentionally left blank.
This page intentionally left blank.
| | | | | | | |
| | | | | | | |
| | | | | | | |
| | | | | | | |
| | | | | | | |
| | | | The Government Street Funds | | | |
| | | | | | | |
| | | | | | | |
| | | | No-Load Mutual Funds | | | |
| | | | | | | |
| | | | | | | |
| | | | Investment Adviser Leavell Investment Management, Inc. 210 St. Joseph Street Mobile, AL 36602 Administrator Ultimus Fund Solutions, LLC P.O. Box 46707 Cincinnati, OH 45246-0707 1-866-738-1125 Legal Counsel Sullivan & Worcester LLP 1666 K Street, N.W. Washington, DC 20006 Independent Registered Public Accounting Firm Cohen & Company, Ltd. 342 N Water Street, Suite 830 Milwaukee, WI 53202 Board of Trustees Robert S. Harris, Ph.D., Chairman John P. Ackerly, IV John T. Bruce George K. Jennison Harris V. Morrissette Elizabeth W. Robertson Portfolio Manager Thomas W. Leavell, The Government Street Equity Fund The Government Street Mid-Cap Fund | | | |
| | | | | | | |
| | | | | | | |
| | | | | | | |
| | | | | | | |
| | | | | | | |
| | | | | | | |
| | | | | | | |
| | | | | | | |
| | | | | | | |
| | | | | | | |
| | | | | | | |
| | | | | | | |
| | | | Government Street-AR-22 | | |
| | | | | | | |
| | | | | | | |
| | | | | | | |
| | | | | | | |
| | | | | |
| | | | |
| | | | | |
| | | | | |
| | | | | |
| | | | | |
| | | | | |
| | | THE | | |
| | | JAMESTOWN | | |
| | | EQUITY FUND | | |
| | | | | |
| | | | | |
| | | | | |
| | | | | |
| | | No-Load Fund | | |
| | | | | |
| | | | | |
| | | | | |
| | | | | |
| | | | | |
| | | | | |
| | | | | |
| | | | | |
| | | | | |
| | | | | |
| | | | | |
| | | ANNUAL REPORT | | |
| | | | | |
| | | | | |
| | | | | |
| | | | | |
| | | | | |
| | | | | |
| | | March 31, 2022 | | |
| | | | | |
| | | | | |
| | | | | |
| | | | | |
| | | | | |
| | | | | |
| | | | | |
| | | | | |
| | | | | |
| | | | | |
| | | | | |
| | | | | |
| | | | | |
| | | Investment Adviser | | |
| | | Lowe, Brockenbrough & Company, Inc. | | |
| | | Richmond, Virginia | | |
| | | | | |
| | | | | |
| | | | | |
| | | | | |
| LETTER TO SHAREHOLDERS | April 28, 2022 |
| | |
For the fiscal year ended March 31, 2022, The Jamestown Equity Fund (the “Fund”) returned 12.91% compared to 15.65% for the S&P 500 Index. The S&P Growth Index return of 18.15% outpaced the S&P 500® Value Index return of 12.58% during the fiscal year, despite underperforming during the last quarter. While large capitalization equities represented by the S&P 500 performed well during the fiscal year, broader equity market returns did not keep pace. In the U.S., small and mid-capitalization stocks, as measured by the S&P 600® Small Cap and the S&P 400 Mid Cap Indices, rose 1.23% and 4.59%, respectively. Returns were even more challenging in international markets, as the MSCI All Country World ex-US Index fell -1.48%, and the FTSE Emerging Market Index declined -8.00% for the twelve months.
The Fund underperformed during the fiscal year due to modest negative contributions from both sector allocation and stock selection. On the allocation front, an overweight to the Communications sector and an underweight in the Technology and Real Estate sectors were only partially offset by a positive contribution from being underweight in the Consumer Staples sector. Stock selection was most negative in the Consumer Discretionary, Financial, and Real Estate sectors, while stock selection for the fiscal year was a positive contributor in the Health Care, Industrials, and Technology sectors. The best performing stocks in the Fund for the year were Apple, Microsoft, Chevron, Google, and Ameriprise, all of which remained in the portfolio at the end of the fiscal year. The worst performing stocks were Meta Platforms, Walt Disney, JPMorgan, Dollar Tree and Comcast, of which only Dollar Tree was sold during the year.
The Fund remains focused on owning high-quality securities across all sectors and ended the 3/31/22 quarter overweight in the Finance, Communications and Consumer Discretionary sectors, while underweight the Utilities, Technology and Consumer Staples sectors.
Headwinds for equity markets built throughout the last quarter of the fiscal year: the Federal Reserve (the “Fed”) finally admitted inflation at multi-decade highs is not as transitory as they expected and began a path to remove monetary accommodation; supply chains continued their slow recovery from the COVID-19 shutdown; and Putin commenced his bloody bid in Ukraine. Outside of the energy and commodities sectors, which were already surging on tight supplies, U.S. stock indexes have been volatile, but they haven’t gone anywhere since early last September. It appears the equity markets are more or less taking a wait-and-see approach. Wall Street has some innocuous jargon for this: choppy, consolidation, sideways. But it’s really just collective uncertainty.
Bond prices, on the other hand, have not waited and seen; they reflect meaningful increases in yields (bond prices move inversely to yields). The Bloomberg U.S. Aggregate Bond Index fell -4.15% in the fiscal year. Twelve months ago, real yields (stated yield minus inflation) were historically negative - by definition, a very unusual circumstance - and when the Fed finally abandoned its ill-judged bond buying, there weren’t any other takers, given blaring inflation readings; yields had nowhere else to go but up.
The spike in yields will have consequences. For instance, a 30-yr fixed mortgage is now above 5.25%, up from below 4% just a few months ago. This is another slap to the face of housing affordability. By now, we’ve all heard stories of preposterous bidding wars. The housing shortage is real, but this is certain to take some heat off of it. Housing is 10% of the economy, enough to have a measurable effect on economic growth. How much, though, largely depends upon how the
| LETTER TO SHAREHOLDERS | April 28, 2022 |
| | |
exceptionally large excess savings built up during the pandemic is ultimately spent. Our guess is the glut is sufficiently large to cushion the slowdown in housing. But that’s only a guess; there’s no pandemic playbook, no rule of thumb. However, there is a limit to how high yields can go given debt levels. Too high (not a lot further from here) and the economy slows, taking rates back down. A large debt load is a natural governor on growth and rates.
Markets will remain volatile as we work through these overhangs. We freely admit to not knowing when or even exactly how that’s going to look, but we’re confident the news will eventually improve. The economy is growing, and corporate fundamentals have never been stronger. That’s rear-view, but companies were already battling through COVID-19 (Omicron), supply chain chaos, and spiking inflation. Valuations are reasonable and excesses have been mostly wrung out. Supply chains will recover, and inflation readings will improve as comparisons ease. A recession this year seems a rather remote possibility given pent-up demand and the aforementioned savings glut. Of course, the Fed (ever vigilant) could push us into one next year or after, but it would likely be mild, given there’s been no threatening investment cycle and the banks are in good shape.
| THE JAMESTOWN EQUITY FUND |
| PERFORMANCE INFORMATION (Unaudited) |
| |
Comparison of the Change in Value of a $10,000 Investment in
The Jamestown Equity Fund
and the S&P 500® Index
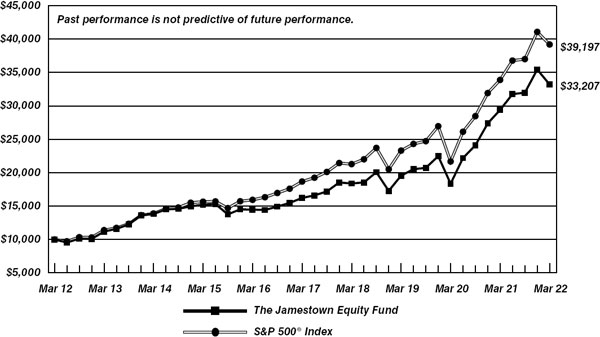
| | | | |
| | | Average Annual Total Returns | |
| | | (for periods ended March 31, 2022) | |
| | | | |
| | | 1 Year | | 5 Years | | 10 Years | |
| | The Jamestown Equity Fund (a) | 12.91% | | 15.41% | | 12.75% | |
| | S&P 500® Index | 15.65% | | 15.99% | | 14.64% | |
| | | | | | | | |
| (a) | Total return is a measure of the change in value of an investment in the Fund over the periods covered, which assumes any dividends or capital gains distributions are reinvested in shares of the Fund. Returns shown do not reflect the deduction of taxes a shareholder would pay on Fund distributions or the redemption of Fund shares. |
| THE JAMESTOWN EQUITY FUND |
PORTFOLIO INFORMATION March 31, 2022 (Unaudited) |
| Asset Allocation (% of Net Assets) |
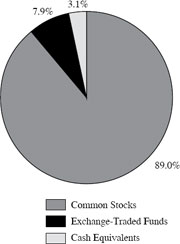
| | % of |
| Ten Largest Equity Holdings | Net Assets |
| Apple, Inc. | 5.7% |
| Alphabet, Inc. - Class A and C | 4.9% |
| Microsoft Corporation | 4.3% |
| Amazon.com, Inc. | 3.9% |
| Meta Platforms, Inc. - Class A | 3.4% |
| Vanguard Information Technology ETF | 3.1% |
| JPMorgan Chase & Company | 2.5% |
| Chevron Corporation | 2.3% |
| Target Corporation | 2.1% |
| Procter & Gamble Company (The) | 2.1% |
| Sector Concentration vs. the S&P 500® Index |
| |
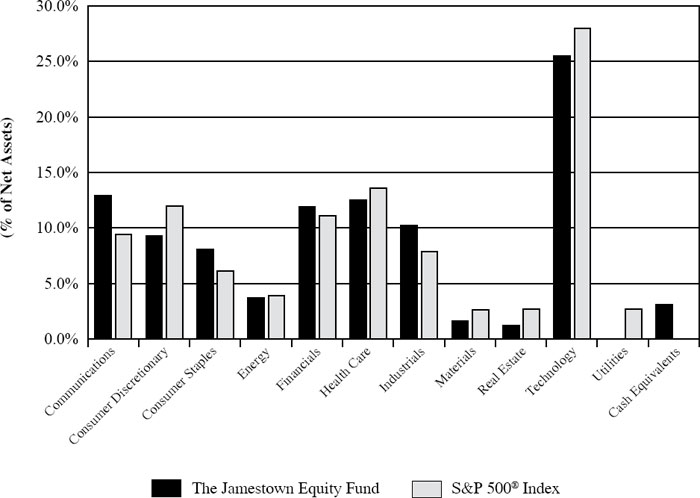 |
| THE JAMESTOWN EQUITY FUND |
SCHEDULE OF INVESTMENTS March 31, 2022 |
| COMMON STOCKS — 89.0% | | Shares | | | Value | |
| Communications — 12.9% | | | | | | | | |
| Alphabet, Inc. - Class A (a) | | | 375 | | | $ | 1,043,006 | |
| Alphabet, Inc. - Class C (a) | | | 500 | | | | 1,396,495 | |
| Booking Holdings, Inc. (a) | | | 420 | | | | 986,349 | |
| Comcast Corporation - Class A | | | 16,000 | | | | 749,120 | |
| Meta Platforms, Inc. - Class A (a) | | | 7,600 | | | | 1,689,936 | |
| Walt Disney Company (The) (a) | | | 4,550 | | | | 624,078 | |
| | | | | | | | 6,488,984 | |
| Consumer Discretionary — 9.3% | | | | | | | | |
| Amazon.com, Inc. (a) | | | 600 | | | | 1,955,970 | |
| Ford Motor Company | | | 27,280 | | | | 461,305 | |
| Home Depot, Inc. (The) | | | 2,400 | | | | 718,392 | |
| Lowe’s Companies, Inc. | | | 4,200 | | | | 849,198 | |
| TJX Companies, Inc. (The) | | | 11,000 | | | | 666,380 | |
| | | | | | | | 4,651,245 | |
| Consumer Staples — 6.8% | | | | | | | | |
| PepsiCo, Inc. | | | 5,200 | | | | 870,376 | |
| Procter & Gamble Company (The) | | | 6,785 | | | | 1,036,748 | |
| Target Corporation | | | 4,960 | | | | 1,052,611 | |
| Walmart, Inc. | | | 3,000 | | | | 446,760 | |
| | | | | | | | 3,406,495 | |
| Energy — 3.7% | | | | | | | | |
| Chevron Corporation | | | 7,200 | | | | 1,172,376 | |
| Exxon Mobil Corporation | | | 2,250 | | | | 185,828 | |
| TotalEnergies SE - ADR | | | 9,500 | | | | 480,130 | |
| | | | | | | | 1,838,334 | |
| Financials — 11.9% | | | | | | | | |
| Ameriprise Financial, Inc. | | | 3,250 | | | | 976,170 | |
| Chubb Ltd. | | | 2,500 | | | | 534,750 | |
| Goldman Sachs Group, Inc. (The) | | | 2,085 | | | | 688,258 | |
| JPMorgan Chase & Company | | | 9,200 | | | | 1,254,144 | |
| Morgan Stanley | | | 8,170 | | | | 714,058 | |
| PNC Financial Services Group, Inc. (The) | | | 4,800 | | | | 885,360 | |
| Truist Financial Corporation | | | 16,000 | | | | 907,200 | |
| | | | | | | | 5,959,940 | |
| Health Care — 12.5% | | | | | | | | |
| Amgen, Inc. | | | 1,800 | | | | 435,276 | |
| Anthem, Inc. | | | 1,650 | | | | 810,513 | |
| CVS Health Corporation | | | 9,000 | | | | 910,890 | |
| Johnson & Johnson | | | 4,465 | | | | 791,332 | |
| Merck & Company, Inc. | | | 8,700 | | | | 713,835 | |
| Pfizer, Inc. | | | 14,000 | | | | 724,780 | |
| Thermo Fisher Scientific, Inc. | | | 1,675 | | | | 989,339 | |
| THE JAMESTOWN EQUITY FUND |
| SCHEDULE OF INVESTMENTS (Continued) |
| COMMON STOCKS — 89.0% (Continued) | | Shares | | | Value | |
| Health Care — 12.5% (Continued) | | | | | | | | |
| UnitedHealth Group, Inc. | | | 1,800 | | | $ | 917,946 | |
| | | | | | | | 6,293,911 | |
| Industrials — 10.2% | | | | | | | | |
| Eaton Corporation plc | | | 6,700 | | | | 1,016,792 | |
| Lockheed Martin Corporation | | | 1,000 | | | | 441,400 | |
| Norfolk Southern Corporation | | | 3,500 | | | | 998,270 | |
| Raytheon Technologies Corporation | | | 5,400 | | | | 534,978 | |
| Southwest Airlines Company (a) | | | 15,540 | | | | 711,732 | |
| Trane Technologies plc | | | 4,300 | | | | 656,610 | |
| United Parcel Service, Inc. - Class B | | | 3,600 | | | | 772,056 | |
| | | | | | | | 5,131,838 | |
| Materials — 1.6% | | | | | | | | |
| Eastman Chemical Company | | | 7,000 | | | | 784,420 | |
| Real Estate — 1.2% | | | | | | | | |
| American Tower Corporation | | | 2,400 | | | | 602,928 | |
| | | | | | | | | |
| Technology — 18.9% | | | | | | | | |
| Apple, Inc. | | | 16,350 | | | | 2,854,873 | |
| Applied Materials, Inc. | | | 6,245 | | | | 823,091 | |
| Broadcom, Inc. | | | 1,400 | | | | 881,552 | |
| Cisco Systems, Inc. | | | 17,750 | | | | 989,740 | |
| Microsoft Corporation | | | 7,000 | | | | 2,158,170 | |
| Oracle Corporation | | | 11,500 | | | | 951,395 | |
| Visa, Inc. - Class A | | | 3,800 | | | | 842,726 | |
| | | | | | | | 9,501,547 | |
| | | | | | | | | |
| Total Common Stocks (Cost $18,346,564) | | | | | | $ | 44,659,642 | |
| | | | | | | | | |
| EXCHANGE-TRADED FUNDS — 7.9% | | Shares | | | Value | |
| Consumer Staples Select Sector SPDR Fund | | | 8,750 | | | $ | 664,038 | |
| iShares Expanded Tech-Software Sector ETF (a) | | | 2,700 | | | | 931,338 | |
| iShares Semiconductor ETF | | | 1,700 | | | | 804,576 | |
| Vanguard Information Technology ETF | | | 3,700 | | | | 1,540,976 | |
| Total Exchange-Traded Funds (Cost $1,756,102) | | | | | | $ | 3,940,928 | |
| THE JAMESTOWN EQUITY FUND |
| SCHEDULE OF INVESTMENTS (Continued) |
| MONEY MARKET FUNDS — 3.2% | | Shares | | | Value | |
| Federated Hermes Government Obligations Fund -Institutional Class, 0.14% (b) (Cost $1,625,110) | | | 1,625,110 | | | $ | 1,625,110 | |
| | | | | | | | | |
| Total Investments at Value — 100.1% (Cost $21,727,776) | | | | | | $ | 50,225,680 | |
| | | | | | | | | |
| Liabilities in Excess of Other Assets — (0.1%) | | | | | | | (34,407 | ) |
| | | | | | | | | |
| Net Assets — 100.0% | | | | | | $ | 50,191,273 | |
ADR - American Depositary Receipt.
| (a) | Non-income producing security. |
| (b) | The rate shown is the 7-day effective yield as of March 31, 2022. |
See accompanying notes to financial statements.
| THE JAMESTOWN EQUITY FUND |
| STATEMENT OF ASSETS AND LIABILITIES |
| March 31, 2022 |
| ASSETS | | | | |
| Investments in securities: | | | | |
| At cost | | $ | 21,727,776 | |
| At value (Note 2) | | $ | 50,225,680 | |
| Dividends receivable | | | 27,234 | |
| Other assets | | | 5,653 | |
| TOTAL ASSETS | | | 50,258,567 | |
| | | | | |
| LIABILITIES | | | | |
| Distributions payable | | | 1,670 | |
| Payable for capital shares redeemed | | | 29,175 | |
| Accrued investment advisory fees (Note 4) | | | 26,845 | |
| Payable to administrator (Note 4) | | | 6,000 | |
| Other accrued expenses | | | 3,604 | |
| TOTAL LIABILITIES | | | 67,294 | |
| | | | | |
| NET ASSETS | | $ | 50,191,273 | |
| | | | | |
| Net assets consist of: | | | | |
| Paid-in capital | | $ | 18,638,220 | |
| Distributable earnings | | | 31,553,053 | |
| Net assets | | $ | 50,191,273 | |
| | | | | |
| Shares of beneficial interest outstanding (unlimited number of shares authorized, $0.01 par value) | | | 1,596,755 | |
| | | | | |
| Net asset value, offering price and redemption price per share (Note 2) | | $ | 31.43 | |
See accompanying notes to financial statements.
| THE JAMESTOWN EQUITY FUND |
| STATEMENT OF OPERATIONS |
| Year Ended March 31, 2022 |
| INVESTMENT INCOME | | | | |
| Dividends | | $ | 756,062 | |
| Foreign withholding taxes on dividends | | | (5,685 | ) |
| TOTAL INVESTMENT INCOME | | | 750,377 | |
| | | | | |
| EXPENSES | | | | |
| Investment advisory fees (Note 4) | | | 334,607 | |
| Administration fees (Note 4) | | | 60,000 | |
| Trustees’ fees (Note 4) | | | 16,500 | |
| Audit and tax services fees | | | 16,460 | |
| Registration and filing fees | | | 14,668 | |
| Compliance service fees (Note 4) | | | 12,000 | |
| Custodian and bank service fees | | | 8,234 | |
| Printing of shareholder reports | | | 7,101 | |
| Postage and supplies | | | 6,295 | |
| Account maintenance fees | | | 5,012 | |
| Legal fees | | | 4,812 | |
| Insurance expense | | | 1,302 | |
| Pricing costs | | | 719 | |
| Other expenses | | | 7,133 | |
| TOTAL EXPENSES | | | 494,843 | |
| Fees voluntarily waived by the Adviser (Note 4) | | | (5,802 | ) |
| NET EXPENSES | | | 489,041 | |
| | | | | |
| NET INVESTMENT INCOME | | | 261,336 | |
| | | | | |
| REALIZED AND UNREALIZED GAINS ON INVESTMENTS | | | | |
| Net realized gains on investment transactions | | | 4,239,158 | |
| Net change in unrealized appreciation (depreciation) on investments | | | 1,661,988 | |
| NET REALIZED AND UNREALIZED GAINS ON INVESTMENTS | | | 5,901,146 | |
| | | | | |
| NET INCREASE IN NET ASSETS RESULTING FROM OPERATIONS | | $ | 6,162,482 | |
See accompanying notes to financial statements.
| THE JAMESTOWN EQUITY FUND |
| STATEMENTS OF CHANGES IN NET ASSETS |
| | | Year | | | Year | |
| | | Ended | | | Ended | |
| | | March 31, | | | March 31, | |
| | | 2022 | | | 2021 | |
| FROM OPERATIONS | | | | | | | | |
| Net investment income | | $ | 261,336 | | | $ | 282,140 | |
| Net realized gains on investment transactions | | | 4,239,158 | | | | 1,585,087 | |
| Net change in unrealized appreciation (depreciation) on investments | | | 1,661,988 | | | | 16,297,627 | |
| Net increase in net assets resulting from operations | | | 6,162,482 | | | | 18,164,854 | |
| | | | | | | | | |
| DISTRIBUTIONS TO SHAREHOLDERS (Note 2) | | | (2,031,746 | ) | | | (2,137,346 | ) |
| | | | | | | | | |
| FROM CAPITAL SHARE TRANSACTIONS | | | | | | | | |
| Proceeds from shares sold | | | 632,455 | | | | 652,616 | |
| Net asset value of shares issued in reinvestment of distributions to shareholders | | | 1,946,154 | | | | 1,984,995 | |
| Payments for shares redeemed | | | (3,917,381 | ) | | | (2,327,927 | ) |
| Net increase (decrease) in net assets from capital share transactions | | | (1,338,772 | ) | | | 309,684 | |
| | | | | | | | | |
| TOTAL INCREASE IN NET ASSETS | | | 2,791,964 | | | | 16,337,192 | |
| | | | | | | | | |
| NET ASSETS | | | | | | | | |
| Beginning of year | | | 47,399,309 | | | | 31,062,117 | |
| End of year | | $ | 50,191,273 | | | $ | 47,399,309 | |
| | | | | | | | | |
| CAPITAL SHARE ACTIVITY | | | | | | | | |
| Shares sold | | | 20,108 | | | | 25,392 | |
| Shares reinvested | | | 61,648 | | | | 81,726 | |
| Shares redeemed | | | (121,490 | ) | | | (98,486 | ) |
| Net increase (decrease) in shares outstanding | | | (39,734 | ) | | | 8,632 | |
| Shares outstanding, beginning of year | | | 1,636,489 | | | | 1,627,857 | |
| Shares outstanding, end of year | | | 1,596,755 | | | | 1,636,489 | |
See accompanying notes to financial statements.
| THE JAMESTOWN EQUITY FUND |
| FINANCIAL HIGHLIGHTS |
| |
| Selected Per Share Data for a Share Outstanding Throughout Each Year: |
| | | Years Ended March 31, | |
| | | 2022 | | | 2021 | | | 2020 | | | 2019 | | | 2018 | |
| Net asset value at beginning of year | | $ | 28.96 | | | $ | 19.08 | | | $ | 21.79 | | | $ | 22.10 | | | $ | 20.89 | |
| | | | | | | | | | | | | | | | | | | | | |
| Income (loss) from investment operations: | | | | | | | | | | | | | | | | | | | | |
| Net investment income (a) | | | 0.16 | | | | 0.17 | | | | 0.22 | | | | 0.24 | | | | 0.19 | |
| Net realized and unrealized gains (losses) on investments | | | 3.57 | | | | 11.05 | | | | (1.35 | ) | | | 1.10 | | | | 2.51 | |
| Total from investment operations | | | 3.73 | | | | 11.22 | | | | (1.13 | ) | | | 1.34 | | | | 2.70 | |
| | | | | | | | | | | | | | | | | | | | | |
| Less distributions from: | | | | | | | | | | | | | | | | | | | | |
| Net investment income | | | (0.16 | ) | | | (0.18 | ) | | | (0.22 | ) | | | (0.24 | ) | | | (0.19 | ) |
| Net realized gains | | | (1.10 | ) | | | (1.16 | ) | | | (1.36 | ) | | | (1.41 | ) | | | (1.30 | ) |
| Total distributions | | | (1.26 | ) | | | (1.34 | ) | | | (1.58 | ) | | | (1.65 | ) | | | (1.49 | ) |
| | | | | | | | | | | | | | | | | | | | | |
| Net asset value at end of year | | $ | 31.43 | | | $ | 28.96 | | | $ | 19.08 | | | $ | 21.79 | | | $ | 22.10 | |
| | | | | | | | | | | | | | | | | | | | | |
| Total return (b) | | | 12.91 | % | | | 60.23 | % | | | (6.17 | %) | | | 6.40 | % | | | 13.35 | % |
| | | | | | | | | | | | | | | | | | | | | |
| Net assets at end of year (000’s) | | $ | 50,191 | | | $ | 47,399 | | | $ | 31,062 | | | $ | 36,658 | | | $ | 37,570 | |
| | | | | | | | | | | | | | | | | | | | | |
| Ratio of total expenses to average net assets (c) | | | 0.96 | % | | | 1.05 | % | | | 1.08 | % | | | 1.03 | % | | | 1.03 | % |
| | | | | | | | | | | | | | | | | | | | | |
| Ratio of net expenses to average net assets (c)(d) | | | 0.95 | % | | | 0.95 | % | | | 0.95 | % | | | 0.95 | % | | | 0.95 | % |
| | | | | | | | | | | | | | | | | | | | | |
| Ratio of net investment income to average net assets (a)(c)(d) | | | 0.51 | % | | | 0.70 | % | | | 0.96 | % | | | 1.10 | % | | | 0.87 | % |
| | | | | | | | | | | | | | | | | | | | | |
| Portfolio turnover rate | | | 8 | % | | | 10 | % | | | 18 | % | | | 18 | % | | | 18 | % |
| (a) | Recognition of net investment income by the Fund is affected by the timing of the declarations of dividends by the underlying investment companies in which the Fund invests. |
| (b) | Total return is a measure of the change in value of an investment in the Fund over the periods covered, which assumes any dividends or capital gains distributions are reinvested in shares of the Fund. Returns shown do not reflect the deduction of taxes a shareholder would pay on Fund distributions or the redemption of Fund shares. |
| (c) | The ratios of expenses and net investment income to average net assets do not reflect the Fund’s proportionate share of expenses of the underlying investment companies in which the Fund invests. Ratios were also determined based on net expenses after expense reimbursements through a previously directed brokerage arrangement. |
| (d) | Ratio was determined after voluntary advisory fee waivers by the Adviser and reimbursed expenses (Note 4). |
See accompanying notes to financial statements.
| THE JAMESTOWN EQUITY FUND |
| NOTES TO FINANCIAL STATEMENTS |
| March 31, 2022 |
The Jamestown Equity Fund (the “Fund”) is a diversified, no-load series of Williamsburg Investment Trust (the “Trust”), an open-end management investment company registered under the Investment Company Act of 1940, as amended (the “1940 Act”). The Trust was organized as a Massachusetts business trust on July 18, 1988. Other series of the Trust are not included in this report.
The investment objective of the Fund is long-term growth of capital.
| 2. | Significant Accounting Policies |
The following is a summary of the Fund’s significant accounting policies. These policies are in conformity with accounting principles generally accepted in the United States of America (“GAAP”). The Fund follows accounting and reporting guidance under Financial Accounting Standards Board Accounting Standards Codification Topic 946, “Financial Services – Investment Companies.”
Securities valuation — The Fund’s portfolio securities are valued as of the close of business of the regular session of the New York Stock Exchange (normally 4:00 p.m., Eastern time). Securities traded on a national stock exchange, including common stocks and exchange-traded funds (“ETFs”), are generally valued based upon the closing price on the principal exchange where the security is traded, if available, otherwise, at the last quoted bid price. Securities that are quoted by NASDAQ are valued at the NASDAQ Official Closing Price. Investments representing shares of other open-end investment companies, other than ETFs but including money market funds, are valued at their net asset value (“NAV”) as reported by such companies. When using a quoted price and when the market is considered active, securities will be classified as Level 1 within the fair value hierarchy (see below).
When market quotations are not readily available, if a pricing service cannot provide a price, or if the investment adviser believes the price received from the pricing service is not indicative of fair value, securities will be valued in good faith at fair value using methods consistent with procedures adopted by the Board of Trustees and will be classified as Level 2 or 3 within the fair value hierarchy, depending on the inputs used. Such methods of fair valuation may include, but are not limited to: multiple of earnings, multiple of book value, discount from market of a similar freely traded security, purchase price of the security, subsequent private transactions in the security or related securities, or a combination of these and other factors.
GAAP establishes a single authoritative definition of fair value, sets out a framework for measuring fair value and requires additional disclosures about fair value measurements.
Various inputs are used in determining the value of the Fund’s investments. These inputs are summarized in the three broad levels listed below:
| ● | Level 1 – quoted prices in active markets for identical securities |
| ● | Level 2 – other significant observable inputs |
| THE JAMESTOWN EQUITY FUND |
| NOTES TO FINANCIAL STATEMENTS (Continued) |
| ● | Level 3 – significant unobservable inputs |
The inputs or methodology used for valuing securities are not necessarily an indication of the risks associated with investing in those securities. The inputs used to measure fair value may fall into different levels of the fair value hierarchy. In such cases, for disclosure purposes, the level in the fair value hierarchy within which the fair value measurement falls in its entirety is determined based on the lowest level input that is significant to the fair value measurement.
The following is a summary of the Fund’s investments based on the inputs used to value the investments as of March 31, 2022, by security type:
| | | Level 1 | | | Level 2 | | | Level 3 | | | Total | |
| Common Stocks | | $ | 44,659,642 | | | $ | — | | | $ | — | | | $ | 44,659,642 | |
| Exchange-Traded Funds | | | 3,940,928 | | | | — | | | | — | | | | 3,940,928 | |
| Money Market Funds | | | 1,625,110 | | | | — | | | | — | | | | 1,625,110 | |
| Total | | $ | 50,225,680 | | | $ | — | | | $ | — | | | $ | 50,225,680 | |
| | | | | | | | | | | | | | | | | |
Refer to the Fund’s Schedule of Investments for a listing of the common stocks by sector type. There were no Level 3 securities or derivative instruments held by the Fund as of or during the year ended March 31, 2022.
Share valuation — The NAV per share of the Fund is calculated daily by dividing the total value of its assets, less liabilities, by the number of shares outstanding. The offering price and redemption price per share of the Fund is equal to the NAV per share.
Investment income — Dividend income is recorded on the ex-dividend date. Non-cash dividends included in dividend income, if any, are recorded at the fair market value of the security received. Withholding taxes on foreign dividends received by the Fund, if any, have been recorded in accordance with the Trust’s understanding of the applicable country’s rules and tax rates.
Distributions to shareholders — Dividends arising from net investment income, if any, are declared and paid quarterly to shareholders of the Fund. Net realized short-term capital gains, if any, may be distributed throughout the year and net realized long-term capital gains, if any, are distributed at least once each year. The amount of distributions from net investment income and net realized capital gains are determined in accordance with federal income tax regulations, which may differ from GAAP. Dividends and distributions are recorded on the ex-dividend date.
The tax character of distributions paid during the years ended March 31, 2021 and 2022 was as follows:
| Years | | Ordinary | | | Long-Term | | | Total | |
| Ended | | Income | | | Capital Gains | | | Distributions | |
| 3/31/2022 | | $ | 288,603 | | | $ | 1,746,016 | | | $ | 2,034,619 | |
| 3/31/2021 | | $ | 390,903 | | | $ | 1,746,789 | | | $ | 2,137,346 | |
| THE JAMESTOWN EQUITY FUND |
| NOTES TO FINANCIAL STATEMENTS (Continued) |
Investment transactions — Investment transactions are accounted for on trade date for financial reporting purposes. Realized gains and losses on investment securities sold are determined on a specific identification basis.
Common expenses — Common expenses of the Trust are allocated among the series of the Trust based on relative net assets of each series or the nature of the services performed and the relative applicability to each series.
Estimates — The preparation of financial statements in conformity with GAAP requires management to make estimates and assumptions that affect the reported amounts of assets and liabilities and the disclosure of contingent assets and liabilities, each as of the date of the financial statements, and the reported amounts of increase (decrease) in net assets from operations during the reporting period. Actual results could differ from those estimates.
Federal income tax — The Fund has qualified and intends to continue to qualify as a regulated investment company under the Internal Revenue Code of 1986, as amended (the “Code”). Qualification generally will relieve the Fund of liability for federal income taxes to the extent 100% of its net investment income and net realized capital gains are distributed in accordance with the Code.
In order to avoid imposition of the excise tax applicable to regulated investment companies, it is also the Fund’s intention to declare as dividends in each calendar year at least 98% of its net investment income (earned during the calendar year) and 98.2% of its net realized capital gains (earned during the twelve months ended October 31) plus undistributed amounts from prior years.
The tax character of accumulated earnings at March 31, 2022 was as follows:
| | | | | |
| Tax cost of portfolio investments | | $ | 21,791,618 | |
| Gross unrealized appreciation | | $ | 28,544,462 | |
| Gross unrealized depreciation | | | (110,400 | ) |
| Net unrealized appreciation | | | 28,434,062 | |
| Undistributed ordinary income | | | 46,642 | |
| Undistributed long-term capital gains | | | 3,074,019 | |
| Distributions payable | | | (1,670 | ) |
| Distributable earnings | | $ | 31,553,053 | |
| | | | | |
The difference between the federal income tax cost of portfolio investments and the financial statement cost of portfolio investments for the Fund is due to certain timing differences in the recognition of capital gains or losses under income tax regulations and GAAP. These “book/tax” differences are temporary in nature and are primarily due to the tax deferral of losses on wash sales.
| THE JAMESTOWN EQUITY FUND |
| NOTES TO FINANCIAL STATEMENTS (Continued) |
The Fund recognizes the tax benefits or expenses of uncertain tax positions only when the position is “more likely than not” to be sustained assuming examination by tax authorities. Management has reviewed the tax positions taken on Federal income tax returns for all open tax years (generally three years) of the Fund and has concluded that no provision for unrecognized tax benefits or expenses is required in these financial statements.
| 3. | Investment Transactions |
Investment transactions, other than short-term investments and U.S. government securities, were as follows for the year ended March 31, 2022:
| | | | | |
| Purchase of investment securities | | $ | 4,090,882 | |
| Proceeds from sales of investment securities | | $ | 7,709,503 | |
| | | | | |
| 4. | Transactions with Related Parties |
INVESTMENT ADVISORY AGREEMENT
The Fund’s investments are managed by Lowe, Brockenbrough & Company, Inc. (the “Adviser”) under the terms of an Investment Advisory Agreement. The Fund pays the Adviser a fee, which is computed and accrued daily and paid monthly, at annual rates of 0.65% of its average daily net assets up to $500 million and 0.55% of such assets in excess of $500 million. Certain officers of the Trust are also officers of the Adviser.
During the year ended March 31, 2022, the Adviser voluntarily limited the total annual operating expenses of the Fund to 0.95% of average daily net assets; accordingly, the Adviser voluntarily waived $5,802 of its investment advisory fees during the year ended March 31, 2022. This amount is not subject to recapture in future periods.
OTHER SERVICE PROVIDERS
Ultimus Fund Solutions, LLC (“Ultimus”) provides administration, fund accounting, compliance and transfer agent services to the Fund. The Fund pays Ultimus fees in accordance with the agreements for such services. In addition, the Fund pays out-of-pocket expenses including, but not limited to, postage, supplies, and certain costs related to the pricing of the Fund’s portfolio securities. Certain officers of the Trust are also officers of Ultimus, or of Ultimus Fund Distributors, LLC (the “Distributor”), the principal underwriter of the Fund and an affiliate of Ultimus. The Distributor is compensated by the Adviser (not the Fund) for acting as principal underwriter.
COMPENSATION OF TRUSTEES
Trustees and officers affiliated with the Adviser or Ultimus are not compensated by the Trust for their services. Effective January 1, 2022, each Trustee who is not an affiliated person of the Adviser or Ultimus receives from the Trust an annual retainer of $30,000, payable quarterly; a fee of $2,000 for attendance at each meeting of the Board of Trustees (except that such fee is $3,000 for the independent chair); and a fee of $1,000 for attendance at each meeting of any committee of the Board (except that such fee is $1,500 for the committee chair); plus reimbursement of
| THE JAMESTOWN EQUITY FUND |
| NOTES TO FINANCIAL STATEMENTS (Continued) |
travel and other expenses incurred in attending meetings. Prior to January 1, 2022, each Trustee who was not an affiliated person of the Adviser or Ultimus received from the Trust an annual retainer of $24,000, payable quarterly; a fee of $2,000 for attendance at each meeting of the Board of Trustees (except that such fee was $3,000 for the independent chair); and a fee of $1,000 for attendance at each meeting of any committee of the Board (except that such fee was $1,500 for the committee chair); plus reimbursement of travel and other expenses incurred in attending meetings. Each series of the Trust pays its proportionate share of such fees.
If a Fund has significant investments in the securities of issuers in industries within a particular business sector, any development affecting that sector will have a greater impact on the value of the net assets of the Fund than would be the case if the Fund did not have significant investments in that sector. In addition, this may increase the risk of loss of an investment in the Fund and increase the volatility of the Fund’s NAV per share. From time to time, circumstances may affect a particular sector and companies within such sector. For instance, economic or market factors, regulation or deregulation, or other developments may negatively impact all companies in a particular sector and therefore the value of a Fund’s portfolio would be adversely affected. As of March 31, 2022, The Jamestown Equity Fund had 25.5% of the value of its net assets invested in common stocks and exchange-traded funds within the Technology sector.
| 6. | Contingencies and Commitments |
The Fund indemnifies the Trust’s officers and Trustees for certain liabilities that might arise from the performance of their duties to the Fund. Additionally, in the normal course of business the Fund enters into contracts that contain a variety of representations and warranties and which provide general indemnifications. The Fund’s maximum exposure under these arrangements is unknown, as this would involve future claims that may be made against the Fund that have not yet occurred. However, based on experience, the Trust expects the risk of loss to be remote.
The Fund is required to recognize in the financial statements the effects of all subsequent events that provide additional evidence about conditions that existed as of the date of the Statement of Assets and Liabilities. For non-recognized subsequent events that must be disclosed to keep the financial statements from being misleading, the Fund is required to disclose the nature of the event as well as an estimate of its financial effect, or a statement that such an estimate cannot be made. Management has evaluated subsequent events through the issuance of these financial statements and has noted no such events.
| THE JAMESTOWN EQUITY FUND |
| REPORT OF INDEPENDENT REGISTERED |
| PUBLIC ACCOUNTING FIRM |
To the Shareholders of The Jamestown Equity Fund and
Board of Trustees of Williamsburg Investment Trust
Opinion on the Financial Statements
We have audited the accompanying statement of assets and liabilities, including the schedule of investments, of The Jamestown Equity Fund (the “Fund”), a series of Williamsburg Investment Trust, as of March 31, 2022, the related statement of operations for the year then ended, the statements of changes in net assets for each of the two years in the period then ended, the related notes, and the financial highlights for each of the five years in the period then ended (collectively referred to as the “financial statements”). In our opinion, the financial statements present fairly, in all material respects, the financial position of the Fund as of March 31, 2022, the results of its operations for the year then ended, the changes in net assets for each of the two years in the period then ended, and the financial highlights for each of the five years in the period then ended, in conformity with accounting principles generally accepted in the United States of America.
Basis for Opinion
These financial statements are the responsibility of the Fund’s management. Our responsibility is to express an opinion on the Fund’s financial statements based on our audits. We are a public accounting firm registered with the Public Company Accounting Oversight Board (United States) (“PCAOB”) and are required to be independent with respect to the Fund in accordance with the U.S. federal securities laws and the applicable rules and regulations of the Securities and Exchange Commission and the PCAOB.
We conducted our audits in accordance with the standards of the PCAOB. Those standards require that we plan and perform the audit to obtain reasonable assurance about whether the financial statements are free of material misstatement whether due to error or fraud.
Our audits included performing procedures to assess the risks of material misstatement of the financial statements, whether due to error or fraud, and performing procedures that respond to those risks. Such procedures included examining, on a test basis, evidence regarding the amounts and disclosures in the financial statements. Our procedures included confirmation of securities owned as of March 31, 2022, by correspondence with the custodian. Our audits also included evaluating the accounting principles used and significant estimates made by management, as well as evaluating the overall presentation of the financial statements. We believe that our audits provide a reasonable basis for our opinion.
We have served as the Fund’s auditor since 2016.

COHEN & COMPANY, LTD.
Milwaukee, Wisconsin
May 26, 2022
| THE JAMESTOWN EQUITY FUND |
| BOARD OF TRUSTEES AND EXECUTIVE OFFICERS |
| (Unaudited) |
Overall responsibility for management of the Fund rests with the Board of Trustees. The Trustees serve during the lifetime of the Trust and until its termination, or until death, resignation, retirement or removal. The Trustees, in turn, elect the officers of the Fund. The officers have been elected for an annual term. The following are the Trustees and executive officers of the Fund:
Trustees
and Officers | Address | Year of
Birth | Position Held
with the Trust | Length of
Time Served |
| Robert S. Harris, Ph.D. | 225 Pictoria Drive, Suite 450 Cincinnati, OH | 1949 | Chairman and Trustee | Since January 2007 |
| * John P. Ackerly, IV | One James Center 901 E. Cary Street Richmond, VA | 1963 | Trustee and President of The Davenport Funds | Since July 2012 |
| * John T. Bruce | 800 Main Street Lynchburg, VA | 1953 | Trustee and President of The Cantor FBP Mutual Funds | Since September 1988 |
| George K. Jennison | 225 Pictoria Drive, Suite 450 Cincinnati, OH | 1957 | Trustee | Since January 2015 |
| Harris V. Morrissette | 225 Pictoria Drive, Suite 450 Cincinnati, OH | 1959 | Trustee | Since March 1993 |
| Elizabeth W. Robertson | 225 Pictoria Drive, Suite 450 Cincinnati, OH | 1953 | Trustee | Since February 2014 |
| Charles M. Caravati, III | 1802 Bayberry Court, Suite 400 Richmond, VA | 1965 | President, The Jamestown Equity Fund | Since January 1996 |
| Mark J. Seger | 225 Pictoria Drive, Suite 450 Cincinnati, OH | 1962 | Treasurer | Since November 2000 |
| David K. James | 225 Pictoria Drive, Suite 450 Cincinnati, OH | 1970 | Secretary | Since November 2018 |
| Michael J. Nanosky | 225 Pictoria Drive, Suite 450 Cincinnati, OH | 1966 | Chief Compliance Officer | Since March 2020 |
| * | Messrs. Ackerly and Bruce, as affiliated persons of investment advisers to the Trust, are “interested persons” of the Trust within the meaning of Section 2(a)(19) of the 1940 Act. |
| THE JAMESTOWN EQUITY FUND |
| BOARD OF TRUSTEES AND EXECUTIVE OFFICERS |
| (Unaudited) (Continued) |
Each Trustee oversees ten portfolios of the Trust, including the Fund. The principal occupations of the Trustees and executive officers of the Funds during the past five years and public directorships held by the Trustees are set forth below:
Robert S. Harris, Ph.D. is the C. Stewart Sheppard Professor of Business Administration at The Darden Graduate School of Business Administration at the University of Virginia. He was previously the dean at Darden. Professor Harris has published widely on corporate finance, financial markets and mergers and acquisitions and has served as a consultant to corporations and government agencies.
John P. Ackerly, IV is Senior Vice President and Portfolio Manager of Davenport & Company LLC. (a broker-dealer and investment adviser)
John T. Bruce is President, Director and member of the Executive Committee of the Flippin, Bruce & Porter division of Cantor Fitzgerald Investment Advisors, L.P. (an investment advisory firm).
George K. Jennison is retired. He previously was President of Oyster Consulting, LLC (a management consulting firm) and a financial adviser with Wells Fargo Advisors, LLC.
Harris V. Morrissette is President of China Doll Rice and Beans, Inc. and Dixie Lily Foods. He is also a Director of Trustmark Corporation (bank holding company).
Elizabeth W. Robertson serves as a Trustee of TowneBank Foundation, TowneBank Corporate Board, TowneBank Audit Committee Chair and TowneBank Community Board since 2015. She previously was Chief Financial Officer of Monument Restaurants LLC.
Charles M. Caravati, III is a Managing Director of the Adviser.
Mark J. Seger is a Vice Chairman of Ultimus Fund Solutions, LLC and Ultimus Fund Distributors, LLC. He previously was Co-CEO of Ultimus Fund Solutions, LLC (1999 to 2019).
David K. James is an Executive Vice President and Chief Legal and Risk Officer of Ultimus Fund Solutions, LLC (2018 to present). He previously was Managing Director and Managing Counsel at State Street Bank and Trust Company (2009 to 2018).
Michael J. Nanosky is a Senior Compliance Officer of Ultimus Fund Solutions, LLC (2020 to present). He previously was Senior Vice President & Chief Compliance Officer of PNC Funds (2014 to 2019).
Additional information about members of the Board of Trustees and executive officers is available in the Statement of Additional Information (“SAI”). To obtain a free copy of the SAI, please call 1-866-738-1126.
| THE JAMESTOWN EQUITY FUND |
| ABOUT YOUR FUND’S EXPENSES (Unaudited) |
We believe it is important for you to understand the impact of costs on your investment. All mutual funds have operating expenses. As a shareholder of the Fund, you incur ongoing costs, including management fees and other expenses. The following examples are intended to help you understand your ongoing costs (in dollars) of investing in the Fund and to compare these costs with the ongoing costs of investing in other mutual funds.
A mutual fund’s ongoing costs are expressed as a percentage of its average net assets. This figure is known as the expense ratio. The expenses in the table below are based on an investment of $1,000 made at the beginning of the period shown and held for the entire period (October 1, 2021 through March 31, 2022).
The table below illustrates the Fund’s costs in two ways:
Actual fund return – This section helps you to estimate the actual expenses that you paid over the period. The “Ending Account Value” shown is derived from the Fund’s actual return, and the fourth column shows the dollar amount of operating expenses that would have been paid by an investor who started with $1,000 in the Fund. You may use the information here, together with the amount you invested, to estimate the expenses that you paid over the period.
To do so, simply divide your account value by $1,000 (for example, an $8,600 account value divided by $1,000 = 8.6), then multiply the result by the number given for the Fund under the heading “Expenses Paid During Period.”
Hypothetical 5% return – This section is intended to help you compare the Fund’s ongoing costs with those of other mutual funds. It assumes that the Fund had an annual return of 5% before expenses during the period shown, but that the expense ratio is unchanged. In this case, because the returns used are not the Fund’s actual returns, the results do not apply to your investment. The example is useful in making comparisons because the U.S. Securities and Exchange Commission (the “SEC”) requires all mutual funds to calculate expenses based on a 5% return. You can assess the Fund’s ongoing costs by comparing this hypothetical example with the hypothetical examples that appear in shareholder reports of other funds.
Note that expenses shown in the table are meant to highlight and help you compare ongoing costs only. The Fund does not charge sales loads or redemption fees.
The calculations assume no shares were bought or sold during the period. Your actual costs may have been higher or lower, depending on the amount of your investment and the timing of any purchases or redemptions.
More information about the Fund’s expenses, including annual expense ratios for the prior five fiscal years, can be found in this report. For additional information on operating expenses and other shareholder costs, please refer to the Fund’s prospectus.
| THE JAMESTOWN EQUITY FUND |
| ABOUT YOUR FUND’S EXPENSES (Unaudited) (Continued) |
| | | Beginning | | Ending | | Net | | Expenses |
| | | Account Value | | Account Value | | Expense | | Paid During |
| | | October 1, 2021 | | March 31, 2022 | | Ratio(a) | | Period(b) |
| Based on Actual Fund Return | | $1,000.00 | | $1,038.30 | | 0.95% | | $4.83 |
| Based on Hypothetical 5% Return (before expenses) | | $1,000.00 | | $1,020.19 | | 0.95% | | $4.78 |
| | | | | | | | | |
| (a) | Annualized, based on the Fund’s most recent one-half year expenses. |
| (b) | Expenses are equal to the Fund’s annualized net expense ratio multiplied by the average account value over the period, multiplied by 182/365 (to reflect the one-half year period). |
| OTHER INFORMATION (Unaudited) |
A description of the policies and procedures that the Fund uses to vote proxies relating to portfolio securities is available without charge upon request by calling toll-free 1-866-738-1126, or on the SEC’s website at www.sec.gov. Information regarding how the Fund voted proxies relating to portfolio securities during the most recent 12-month period ended June 30 is also available without charge upon request by calling toll-free 1-866-738-1126, or on the SEC’s website at www.sec.gov.
The Trust files a complete listing of portfolio holdings of the Fund with the SEC as of the end of the first and third quarters of each fiscal year as an exhibit to its reports on Form N-PORT. The filings are available upon request, by calling 1-866-738-1126. Furthermore, you may obtain a copy of these filings on the SEC’s website at www.sec.gov and on the Fund’s website www.jamestownfunds.com.
| FEDERAL TAX INFORMATION (Unaudited) |
For the fiscal year ended March 31, 2022, the Fund designated $1,746,016 as long-term capital gain distributions.
Qualified Dividend Income — The Fund designates 100% of its ordinary income distributions, or up to the maximum amount of such dividends allowable pursuant to the Internal Revenue Code, as qualified dividend income eligible for the reduced tax rate.
Dividends Received Deduction — Corporate shareholders are generally entitled to take the dividends received deduction on the portion of a Fund’s dividend distributions that qualify under tax law. For the fiscal year ended March 31, 2022, 100% of the Fund’s ordinary income dividends qualifies for the corporate dividends received deduction.
| THE JAMESTOWN EQUITY FUND |
| DISCLOSURE REGARDING APPROVAL OF INVESTMENT |
| ADVISORY AGREEMENT (Unaudited) |
At a meeting held on February 22, 2022, the Board of Trustees, including a majority of the Independent Trustees, approved the continuance for a one-year period of the Investment Advisory Agreement with the Adviser on behalf of The Jamestown Equity Fund (the “Fund”). Below is a discussion of the factors considered by the Board of Trustees along with the conclusions with respect thereto that formed the basis for the Board’s approval.
In approving the continuance of the Investment Advisory Agreement, the Independent Trustees considered all information they deemed reasonably necessary to evaluate the terms of the Agreement. The principal areas of review by the Independent Trustees were the nature, extent and quality of the services provided by the Adviser and the reasonableness of the fees charged for those services. These matters were considered by the Independent Trustees consulting with experienced counsel for the Independent Trustees, who is independent of the Adviser.
The Independent Trustees’ evaluation of the quality of the Adviser’s services took into consideration their knowledge gained through presentations and reports from the Adviser over the course of the preceding year. The Independent Trustees considered that the Adviser had provided its views on the overall conditions of the economy and the markets during the 2021 calendar year. The Fund’s short-term and long-term performance was compared to the performance of its benchmark, a peer group of funds with similar investment objectives and strategies, and to the Adviser’s comparably managed private account. The Independent Trustees also considered: the scope and quality of the in-house capabilities of the Adviser and other resources that it dedicates to performing services for the Fund; the quality of administrative and other services, including the Adviser’s role in coordinating the activities of the Fund’s other service providers; the Adviser’s compliance with investment policies of the Fund and applicable laws and regulations; information provided by management and the Fund’s independent public accounting firm in periodic meetings with the Trust’s Audit Committee; the business reputation of the Adviser; the qualifications of the Adviser’s key investment and compliance personnel; and the Adviser’s financial resources.
In reviewing the fees payable under the Investment Advisory Agreement, the Independent Trustees compared the advisory fees and overall expenses of the Fund with those of funds with similar investment objectives and strategies. The Independent Trustees considered information provided by the Adviser concerning the Adviser’s profitability with respect to the Fund, including the assumptions and methodology used in preparing the profitability information, in light of applicable case law relating to advisory fees. For these purposes, the Independent Trustees considered not only the fees paid by the Fund, but also so-called “fallout” benefits to the Adviser. The Independent Trustees also considered the Adviser’s representations that the Fund’s portfolio trades were executed based on the best available price and execution, and that the Adviser does not participate in any revenue sharing arrangements relating to the Fund. In evaluating the Fund’s advisory fees, the Trustees considered the complexity and quality of the investment process that is applied in the management of the Fund.
The Trustees considered the Fund’s investment strategy in comparison to the performance of its benchmark and peer group average, and the quality of services provided by LB&C to the Fund. Based on the consideration of the foregoing and such other information as was deemed relevant,
| THE JAMESTOWN EQUITY FUND |
| DISCLOSURE REGARDING APPROVAL OF INVESTMENT |
| ADVISORY AGREEMENT (Unaudited) (Continued) |
including the factors and conclusions below, the Independent Trustees concluded that: (i) the performance of the Fund is satisfactory; (ii) the advisory fee for the Fund is higher when compared to the average for similarly managed funds according to statistics derived from Morningstar, Inc., and is reasonable in relation to the quality of services provided by LB&C; (iii) the total operating expense ratio of Fund while higher, remains reasonable, when compared to the average expense ratio for comparable managed funds, according to statistics derived from Morningstar, Inc., and (iv) the level of LB&C’s profitability with respect to its management of the Fund is reasonable.
Given the current size of the Fund and its expected growth, the Independent Trustees did not believe that, it was relevant to consider the extent to which economies of scale would be realized as the Fund grows, and whether fee levels reflect these economies of scale. The Independent Trustees also considered the “fallout” benefits to the Adviser for its management of the Fund, but given the amounts involved viewed these as secondary factors in connection with the evaluation of the reasonableness of the advisory fees paid by the Fund.
No single factor was considered in isolation or to be determinative to the decision of the Independent Trustees to approve the continuance of the Investment Advisory Agreement. Rather the Independent Trustees concluded, after weighing and balancing all factors considered, that it was in the best interests of the Fund and its shareholders to continue the Investment Advisory Agreement without modification to its terms, including the fees charged for services thereunder, for an additional one-year period.
This page intentionally left blank.
This page intentionally left blank.
| | | | | | |
| | | | | | |
| | | | | | |
| | | | | | |
| | | | | | |
| | | | | | |
| | | | | | |
| | | | | | |
| | | | | | |
| | | | | | |
| | | | | | |
| | | | | | |
| | | | | | |
| | | | THE JAMESTOWN EQUITY FUND www.jamestownfunds.com | | |
| | | | | | |
| | | | Investment Adviser | | |
| | | | Lowe, Brockenbrough & Company, Inc. | | |
| | | | 1802 Bayberry Court | | |
| | | | Suite 400 | | |
| | | | Richmond, Virginia 23226 | | |
| | | | | | |
| | | | Administrator | | |
| | | | Ultimus Fund Solutions, LLC | | |
| | | | P.O. Box 46707 | | |
| | | | Cincinnati, Ohio 45246-0707 | | |
| | | | (Toll-Free) 1-866-738-1126 | | |
| | | | | | |
| | | | Independent Registered | | |
| | | | Public Accounting Firm | | |
| | | | Cohen & Company, Ltd. | | |
| | | | 342 N. Water Street | | |
| | | | Suite 830 | | |
| | | | Milwaukee, Wisconsin 53202 | | |
| | | | | | |
| | | | Legal Counsel | | |
| | | | Sullivan & Worcester LLP | | |
| | | | 1666 K Street, N.W. | | |
| | | | Washington, DC 20006 | | |
| | | | | | |
| | | | Board of Trustees | | |
| | | | John P. Ackerly, IV | | |
| | | | John T. Bruce | | |
| | | | George K. Jennison | | |
| | | | Robert S. Harris, Ph.D. | | |
| | | | Harris V. Morrissette | | |
| | | | Elizabeth W. Robertson | | |
| | | | | | |
| | | | | | |
| | | | | | |
| | | | | | |
| | | | | | |
| | | | | | |
| | | | | | |
| | | | | | |
| | | | | | |
| | | | | | |
| | | | | | |
| | | | | | |
| | | | | | |
| | | | Jamestown-AR-22 | | |
| | | | | | |
| | | | | | |
| | | | | | |
| | | | | | |
| | | | | | |
(b) Not applicable
As of the end of the period covered by this report, the registrant has adopted a code of ethics that applies to the registrant’s principal executive officer, principal financial officer, principal accounting officer or controller, or persons performing similar functions, regardless of whether these individuals are employed by the registrant or a third party. Pursuant to Item 13(a)(1), a copy of registrant’s code of ethics is filed as an exhibit to this Form N-CSR. During the period covered by this report, the code of ethics has not been amended, and the registrant has not granted any waivers, including implicit waivers, from the provisions of the code of ethics.
| Item 3. | Audit Committee Financial Expert. |
The registrant’s board of trustees has determined that the registrant has two audit committee financial experts serving on its audit committee. The names of the audit committee financial experts are Dr. Robert S. Harris and Elizabeth W. Robertson. Dr. Harris and Ms. Robertson are “independent” for purposes of this Item.
| Item 4. | Principal Accountant Fees and Services. |
| (a) | Audit Fees. The aggregate fees billed for professional services rendered by the principal accountant for the audit of the registrant’s annual financial statements or for services that are normally provided by the accountant in connection with statutory and regulatory filings or engagements were $129,500 and $129,500 with respect to the registrant’s fiscal years ended March 31, 2022 and 2021, respectively. |
| (b) | Audit-Related Fees. No fees were billed in either of the last two fiscal years for assurance and related services by the principal accountant that are reasonably related to the performance of the audit of the registrant’s financial statements and are not reported under paragraph (a) of this Item. |
| (c) | Tax Fees. The aggregate fees billed for professional services rendered by the principal accountant for tax compliance, tax advice, and tax planning were $30,000 and $30,000 with respect to the registrant’s fiscal years ended March 31, 2022 and 2021, respectively. The services comprising these fees are the preparation of the registrant’s federal income and excise tax returns. |
| (d) | All Other Fees. No fees were billed in either of the last two fiscal years for products and services provided by the principal accountant, other than the services reported in paragraphs (a) through (c) of this Item. |
| (e)(1) | The audit committee has adopted pre-approval policies and procedures described in paragraph (c)(7) of Rule 2-01 of Regulation S-X. Pursuant to the pre-approval policies and procedures, the audit committee has pre-approved certain audit, audit-related and tax services and has established, with respect to each fiscal year of the registrant, the following maximum fee levels for services covered under the pre-approval policies and procedures: |
| · | Services, relating to a new series or class of a series, associated with SEC registration statements, periodic reports and other documents filed by the registrant with the SEC or other documents issued by the registrant in connection with securities offerings and assistance in responding to SEC comment letters—$5,000 |
| · | Consultations with management of the registrant, not in connection with an audit, as to the accounting or disclosure treatment of transactions or events and/or the actual or potential impact of final or proposed rules, standards or interpretations by the SEC, FASB or other regulatory or standard setting bodies—$5,000 |
| · | All tax services provided to the registrant in the aggregate—$5,000 |
| (e)(2) | None of the services described in paragraph (b) through (d) of this Item were approved by the audit committee pursuant to paragraph (c)(7)(i)(C) of Rule 2-01 of Regulation S-X. |
| (f) | Less than 50% of hours expended on the principal accountant’s engagement to audit the registrant’s financial statements for the most recent fiscal year were attributed to work performed by persons other than the principal accountant’s full-time, permanent employees. |
| (g) | With respect to the fiscal years ended March 31, 2022 and 2021, aggregate non-audit fees of $30,000 and $30,000, respectively, were billed by the registrant’s principal accountant for services rendered to the registrant. No non-audit fees were billed in either of the last two fiscal years by the registrant’s principal accountant for services rendered to the registrant’s investment adviser (not including any sub-adviser whose role is primarily portfolio management and is subcontracted with or overseen by another investment adviser), and any entity controlling, controlled by, or under common control with the adviser that provides ongoing services to the registrant. |
| (h) | The principal accountant has not provided any non-audit services to the registrant’s investment adviser (not including any sub-adviser whose role is primarily portfolio management and is subcontracted with or overseen by another investment adviser), and any entity controlling, controlled by, or under common control with the investment adviser that provides ongoing services to the registrant. |
| Item 5. | Audit Committee of Listed Registrants. |
Not applicable
| Item 6. | Schedule of Investments. |
| (a) | Not applicable [schedule filed with Item 1] |
| Item 7. | Disclosure of Proxy Voting Policies and Procedures for Closed-End Management Investment Companies. |
Not applicable
| Item 8. | Portfolio Managers of Closed-End Management Investment Companies. |
Not applicable
| Item 9. | Purchases of Equity Securities by Closed-End Management Investment Company and Affiliated Purchasers. |
Not applicable
| Item 10. | Submission of Matters to a Vote of Security Holders. |
The registrant’s Governance, Nominating, Compensation and QLCC Committee shall review shareholder recommendations to fill vacancies on the registrant’s board of trustees if such recommendations are submitted in writing, addressed to the Committee at the registrant’s offices and meet any minimum qualifications adopted by the Committee. The Committee may adopt, by resolution, a policy regarding its procedures for considering candidates for the board of trustees, including any recommended by shareholders.
| Item 11. | Controls and Procedures. |
(a) Based on their evaluation of the registrant’s disclosure controls and procedures (as defined in Rule 30a-3(c) under the Investment Company Act of 1940) as of a date within 90 days of the filing date of this report, the registrant’s principal executive officers and principal financial officer have concluded that such disclosure controls and procedures are reasonably designed and are operating effectively to ensure that material information relating to the registrant, including its consolidated subsidiaries, is made known to them by others within those entities, particularly during the period in which this report is being prepared, and that the information required in filings on Form N-CSR is recorded, processed, summarized, and reported on a timely basis.
(b) There were no changes in the registrant’s internal control over financial reporting (as defined in Rule 30a-3(d) under the Investment Company Act of 1940) that occurred during the period covered by this report that have materially affected, or are reasonably likely to materially affect, the registrant’s internal control over financial reporting.
| Item 12. | Disclosure of Securities Lending Activities for Closed-End Management Investment Companies. |
Not applicable
File the exhibits listed below as part of this Form. Letter or number the exhibits in the sequence indicated.
(a)(1) Any code of ethics, or amendment thereto, that is the subject of the disclosure required by Item 2, to the extent that the registrant intends to satisfy the Item 2 requirements through filing of an exhibit: Attached hereto
(a)(2) A separate certification for each principal executive officer and principal financial officer of the registrant as required by Rule 30a-2(a) under the Act (17 CFR 270.30a-2(a)): Attached hereto
(a)(3) Any written solicitation to purchase securities under Rule 23c-1 under the Act (17 CFR 270.23c-1) sent or given during the period covered by the report by or on behalf of the registrant to 10 or more persons: Not applicable
(a)(4) Change in the registrant’s independent public accountants: Not applicable
(b) Certifications required by Rule 30a-2(b) under the Act (17 CFR 270.30a-2(b)): Attached hereto
Exhibit 99.CODE ETH Code of Ethics
Exhibit 99.CERT Certifications required by Rule 30a-2(a) under the Act
Exhibit 99.906CERT Certifications required by Rule 30a-2(b) under the Act
SIGNATURES
Pursuant to the requirements of the Securities Exchange Act of 1934 and the Investment Company Act of 1940, the registrant has duly caused this report to be signed on its behalf by the undersigned, thereunto duly authorized.
| (Registrant) | Williamsburg Investment Trust | | |
| | | | |
| By (Signature and Title)* | /s/ David James | |
| | | David James, Secretary | |
| | | | |
| Date | June 6, 2022 | | |
| | | | |
| Pursuant to the requirements of the Securities Exchange Act of 1934 and the Investment Company Act of 1940, this report has been signed below by the following persons on behalf of the registrant and in the capacities and on the dates indicated. |
| | | | |
| By (Signature and Title)* | /s/ John T. Bruce | |
| | | John T. Bruce, President | |
| | | (Cantor FBP Equity & Dividend Plus Fund and Cantor FBP Appreciation & Income Opportunities Fund) | |
| | | | |
| Date | June 6, 2022 | | |
| | | | |
| By (Signature and Title)* | /s/ Thomas W. Leavell | |
| | | Thomas W. Leavell, President | |
| | | (The Government Street Equity Fund, The Government Street Mid-Cap Fund) | |
| | | | |
| Date | June 6, 2022 | | |
| | | | |
| By (Signature and Title)* | /s/ Charles M. Caravati III | |
| | | Charles M. Caravati III, President | |
| | | (The Jamestown Equity Fund) | |
| | | | |
| Date | June 6, 2022 | | |
| | | | |
| By (Signature and Title)* | /s/ John P. Ackerly IV | |
| | | John P. Ackerly IV, President | |
| | | (The Davenport Core Fund, Davenport Value & Income Fund, Davenport Equity Opportunities Fund, Davenport Small Cap Focus Fund and the Davenport Balanced Income Fund) | |
| | | | |
| Date | June 6, 2022 | | |
| | | | |
| By (Signature and Title)* | /s/ Mark J. Seger | |
| | | Mark J. Seger, Treasurer and Principal Financial Officer | |
| | | | |
| Date | June 6, 2022 | | |
* Print the name and title of each signing officer under his or her signature.