UNITED STATES
SECURITIES AND EXCHANGE COMMISSION
Washington, D.C. 20549
FORM N-CSR
CERTIFIED SHAREHOLDER REPORT OF REGISTERED
MANAGEMENT INVESTMENT COMPANIES
| Investment Company Act file number | 811-05685 | |
| Williamsburg Investment Trust |
| (Exact name of registrant as specified in charter) |
| 225 Pictoria Drive, Suite 450 Cincinnati, Ohio | 45246 |
| (Address of principal executive offices) | (Zip code) |
John H. Chilton, Esq.
| Sullivan & Worcester LLP 1666 K Street NW Washington, D.C. 20006 |
| (Name and address of agent for service) |
| Registrant's telephone number, including area code: | (513) 587-3400 | |
| Date of fiscal year end: | March 31 | |
| | | |
| Date of reporting period: | March 31, 2024 | |
Form N-CSR is to be used by management investment companies to file reports with the Commission not later than 10 days after the transmission to stockholders of any report that is required to be transmitted to stockholders under Rule 30e-1 under the Investment Company Act of 1940 (17 CFR 270.30e-1). The Commission may use the information provided on Form N-CSR in its regulatory, disclosure review, inspection, and policymaking roles.
A registrant is required to disclose the information specified by Form N-CSR, and the Commission will make this information public. A registrant is not required to respond to the collection of information contained in Form N-CSR unless the Form displays a currently valid Office of Management and Budget ("OMB") control number. Please direct comments concerning the accuracy of the information collection burden estimate and any suggestions for reducing the burden to the Secretary, Securities and Exchange Commission, 450 Fifth Street, NW, Washington, DC 20549-0609. The OMB has reviewed this collection of information under the clearance requirements of 44 U.S.C. § 3507.
Item 1. Reports to Stockholders.
(a)
| | |
| | |
| | |
| | |
| | |
| | |
| | |
| | |
| | |
| | |
 | Davenport Core Leaders Fund (DAVPX) |
| | |
| | Davenport Value & Income Fund (DVIPX) |
| | |
| | Davenport Equity Opportunities Fund (DEOPX) |
| | |
| | Davenport Small Cap Focus Fund (DSCPX) |
| | |
| | Davenport Balanced Income Fund (DBALX) |
| | |
| | Davenport Insider Buying Fund (DBUYX) |
| | |
| | |
| | |
| | |
| ANNUAL REPORT |
| | |
| | |
| March 31, 2024 |
| | |
| | |
| | |
| | |
| | |
| | |
| | |
| | |
| | |
| | |
| | |
| | |
| | |
| | |
| | |
| | |
| | |
| | |
| | |
| | |
| | |
| | |
| | |
| | |
| | |
| | |
| THE DAVENPORT FUNDS | |
| LETTER TO SHAREHOLDERS (Unaudited) | April 24, 2024 |
Dear Shareholders,
Equity markets continued to be kind to investors as we ended the 2024 fiscal year. Resilient economic growth and reassuring corporate earnings allowed stocks to build upon last year’s gains. Growth-oriented stocks continued to outperform, although market gains were fairly broad. For the final fiscal quarter, the S&P 500® Index gained 10.56% to record highs and the Russell 2000® Index advanced 5.18%. Three primary forces seem to be driving markets: the economy, Federal Reserve (the “Fed”) policy and artificial intelligence (AI).
Let’s take a look at these forces. First and foremost is the economy, which has been a positive surprise. A year ago, calls for a recession or so-called “hard landing” were widespread as investors thought higher interest rates would put the brakes on economic growth. Investors then shifted towards acceptance of a “soft landing” as the economy kept chugging along. Now, many pundits are embracing the notion of “no landing” as the economy continues to surprise to the upside. In fact, third quarter Gross Domestic Product (GDP) grew 3.2% as compared to expectations for 2%. What’s more, growth has surpassed 2% for six straight quarters, defying calls for economic weakness.
Then there’s the Fed’s interest rate policy. Late last year, policymakers indicated the rate hike cycle had ended alongside evidence of cooling inflation. They even signaled the likelihood of interest rate cuts in 2024 in order to stimulate the economy amidst any signs of weakness. The notion of a shift to more accommodative policy helped prompt a violent year-end rally for stocks. Recent economic strength makes such cuts less likely, yet markets have continued rallying anyway. So what gives? For one, it appears investors are prioritizing reduced recession risks over delayed rate cuts. Two, while rate cuts may take longer than thought to come to fruition, the Fed is standing at the ready and providing an implicit backstop to the economy and markets.
Finally there’s the powerful theme of generative artificial intelligence (AI), which stormed onto the scene early last year and continues to captivate market participants. The new era of AI holds tremendous promise and could drive workforce productivity, enable cost savings and lead to a vast array of new products and services. Corporations are spending heavily to incorporate generative AI into their businesses and enablers of the technology, particularly large cap technology companies, continue to lure investors. Case in point is NVIDIA (NVDA), which makes the computing chips with massive power and scale required to support generative AI demand. Shares of NVDA were up an astonishing 82% in the fiscal fourth-quarter after more than tripling last year.
Overall, the current environment does indeed appear to be very supportive of equities. The economy is on firm footing, the policy backdrop is constructive, and a generational technology shift is creating new growth opportunities. The primary negative is that the market’s overall valuation now seems to reflect much of the good news. Many stocks are hitting new highs and the S&P 500® is now trading at 21x earnings estimates for this year, relatively high when compared to recent years (the 10-year average is 18x). As one might expect, investor sentiment has also improved dramatically. We wouldn’t say investors are euphoric, but they are definitely feeling much better versus a year ago when pessimism was widespread.
This all leads us to say the market’s risk/reward profile seems more balanced following a stretch of robust gains. We are still finding deals, many of which fall outside the large cap technology arena. However, we are sensitive to higher valuations and the overall opportunity set is a somewhat smaller than 6-12 months ago. Thank you for your trust and please refer to our Fund letters for performance updates and specific ideas.
Davenport Core Leaders Fund
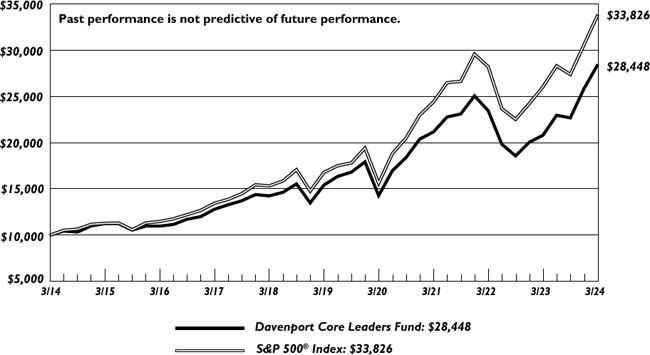
The following chart represents Davenport Core Leaders Fund’s (DAVPX) performance and the performance of the S&P 500® Index*, the Core Leaders Fund’s primary benchmark, for the periods ended March 31, 2024.
| | | | | | | | | | | | | | | Fiscal |
| | | | | | | | | | | | | Since | | Year 2024 |
| | | Fiscal Q4 | | | | | | | | | | Inception | | Expense |
| | | 2023 | | 1 Year | | 3 Years** | | 5 Years** | | 10 Years** | | 1/15/98** | | Ratio |
| Core Leaders Fund | | 10.05% | | 36.76% | | 10.36% | | 13.04% | | 11.02% | | 8.02% | | 0.87% |
| S&P 500® Index* | | 10.56% | | 29.88% | | 11.49% | | 15.05% | | 12.96% | | 8.73% | | |
30-Day SEC Yield: 0.16%; Expense Ratio in current prospectus: 0.87%
Past performance is no guarantee of future results. Investment return and principal value of an investment will fluctuate so that an investor’s shares, when redeemed, may be worth more or less than their original cost. Current performance may be lower or higher than the performance data quoted. Performance data, current to the most recent month-end, may be obtained by calling 1-800-281-3217.
| * | The S&P 500® Index is comprised of 500 U.S. stocks and is an indicator of the performance of the overall U.S. stock market. Standard & Poor’s Financial Services LLC, a division of S&P Global, is the source and owner of the registered trademarks related to the S&P 500® Index. An investor cannot invest in an index and its returns are not indicative of the performance of any specific investment. |
| ** | Returns greater than one year are annualized. |
Fiscal Year-End 2024 Market Review
The Davenport Core Leaders Fund (DAVPX) enjoyed a strong end to the fiscal year, advancing 10.05% in the fiscal fourth-quarter, which slightly lagged the 10.56% gain for the S&P 500® Index. For the fiscal year, the Fund appreciated 36.76% compared to the 29.88% return for the Index. We are pleased to have ended with a strong 2023 fiscal year and note that on a 1-year basis the Fund is up more than 40% with the S&P 500® up roughly 34%.
Fund Update
Contributors: The Fund’s top performers for the period included many of last year’s winners. Front and center was semiconductor juggernaut NVIDIA Corp. (NVDA), which advanced north of 80% during the period alongside strong results and excitement around new product introductions. Despite being one of our best performers, our lower weighting in NVDA actually served as a headwind to relative performance. Meta Platforms, Inc. (META) and Amazon.com, Inc. (AMZN) also continued their momentum with gains of 37% and 19%, respectively. After struggling in 2023, Walt Disney Co. (DIS) was a key contributor, with the shares advancing roughly 35% alongside solid results and increased optimism regarding the potential outcomes of
the ongoing proxy battle and internal strategic initiatives. As you may recall, we added to this position last summer at what has proved to be an attractive price. Despite recent advances, we think Disney has more gas in the tank and it remains one of our top positions.
Detractors: Key detractors for the period included Abobe, Inc. (ADBE), Air Products & Chemicals, Inc. (APD), Apple, Inc. (AAPL) and UnitedHealth Group, Inc. (UNH). Both Adobe and Air Products experienced declines in response to disappointing earnings announcements. We elected to add to each on weakness (see below for more detail). After a near 50% advance in 2023, AAPL shares have struggled this year under the weight of slowing iPhone sales, regulatory challenges and the threat of emerging competition in China. Though we regard Apple as one of the soundest businesses and most valuable brands in the world, we maintain an underweight posture in the name. UnitedHealth, along with other managed care providers, struggled during the quarter due to concerns that increased utilization in the health care system (i.e. more people visiting the doctor and having procedures) might weigh on profitability. Ultimately, we think the business can overcome these near term headwinds and will continue to track to longer term objectives of double-digit earnings growth and significant free cash flow generation.
Fund Activity
We added to positions in Adobe and Air Products amid weakness. Adobe reported Q1 results that broadly exceeded consensus estimates. However, the Q2 guide fell short of expectations and the stock traded lower on the news. While the full year guide requires a stronger second half growth acceleration, management expressed confidence in achieving the full year financial targets. We consider this move a short-term disconnect from our positive long-term fundamental view of the company’s growth trajectory. Air Products (APD) shares weakened materially after the company fell short of quarterly earnings expectations, offered below-consensus guidance and pushed out the timing of large capital projects. Despite significant revisions to estimates, earings per share (EPS) and earnings before interest, taxes, depreciation, and amortization (EBITDA) are still expected to grow high single digits this year. More importantly, the company still expects to achieve long-run growth objectives in the low double digits. With the stock’s valuation contracting nearly 40% over the last year, we believe recent weakness presented a buying opportunity.
We initiated a position in Rockwell Automation, Inc. (ROK) during the fiscal fourth-quarter. Rockwell is a leader in industrial automation and digital transformation. The company is distinguished in its ability to integrate discrete, hybrid, and process manufacturing into a single operating platform known for its flexibility and efficiency. Rockwell has a quality track record of high returns and growth, driven by leveraging technology investments and significantly expanding its global addressable market to over $100 billion. Recent results, however, disappointed investors with both sales and earnings coming in below consensus targets for the first quarter. Longer term, we think the company is favorably aligned with powerful secular growth factors that may support attractive long-term sales and earnings growth. Automation and digital transformation, in particular, could serve to play an important role in enhancing productivity and operating results for the industry for many years to come. Following the first quarter earnings miss, Rockwell shares moved into a valuation range well below historical averages. We believe the current valuation presents an attractive opportunity to establish an investment.
Conclusion
In our third quarter 2023 letter, we cautioned that it would likely prove difficult to replicate the returns of the prior year. While that message remains the same with only a quarter behind us since then, we are pleased to have finished the fiscal year with strong momentum. As we hope to have illustrated, we continue to rigorously apply our process of constant optimization to the strategy, striving to take advantage of attractive opportunities in what we consider the best businesses in the world.
Davenport Value & Income Fund
The following chart represents Davenport Value & Income Fund (DVIPX) performance and the performance of the Russell 1000® Value Index*, the Value & Income Fund’s primary benchmark, the S&P 500® and the Lipper Equity Income Index for the periods ended March 31, 2024.
| | | | | | | | | | | | | | | Fiscal |
| | | | | | | | | | | | | Since | | Year 2024 |
| | | Fiscal Q4 | | | | | | | | | | Inception | | Expense |
| | | 2023 | | 1 Year | | 3 Years** | | 5 Years** | | 10 Years** | | 12/31/10** | | Ratio |
| Value & Income Fund | | 7.26% | | 14.78% | | 4.96% | | 7.50% | | 7.55% | | 9.77% | | 0.87% |
| Russell 1000® Value Index | | 8.99% | | 20.27% | | 8.11% | | 10.32% | | 9.01% | | 10.64% | | |
| S&P 500® Index* | | 10.56% | | 29.88% | | 11.49% | | 15.05% | | 12.96% | | 13.58% | | |
| Lipper Equity Income Index* | | 7.85% | | 18.48% | | 8.77% | | 10.58% | | 9.20% | | 7.67% | | |
30-Day SEC Yield: 1.63%; Expense Ratio in current prospectus: 0.88%
Past performance is no guarantee of future results. Investment return and principal value of an investment will fluctuate so that an investor’s shares, when redeemed, may be worth more or less than their original cost. Current performance may be lower or higher than the performance data quoted. Performance data, current to the most recent month-end, may be obtained by calling 1-800-281-3217.
| * | The Russell 1000® Value Index measures the performance of the Russell 1000 companies with lower price-to-book ratios and lower forecasted growth values. London Stock Exchange Group PLC and its group undertakings (collectively, the “LSE Group”). © LSE Group 2024. FTSE Russell is a trading name of certain LSE Group companies. “Russell®” is a trademark of the relevant LSE Group companies and is used by any other LSE Group company under license. All rights in the FTSE Russell indexes or data vest in relevant LSE Group company which owns the index or the data. Neither LSE Group nor its licensors accept any liability for any errors or omissions in the indexes or data and no party may rely on any indexes or data contained in this communication. No further distribution of data from LSE Group is permitted without the relevant LSE Group company’s express written consent. The LSE Group does not promote/sponsor/endorse the content of this communication. The S&P 500® Index is comprised of 500 U.S. stocks and is an indicator of the performance of the overall U.S. stock market. Standard & Poor’s Financial Services LLC, a division of S&P Global, is the source and owner of the registered trademarks related to the S&P 500® Index. The Lipper Equity Income Index is an unmanaged index of the 30 largest Funds in the Lipper Equity Income Fund category. An investor cannot invest in an index and its returns are not indicative of the performance of any specific investment. |
| ** | Returns greater than one year are annualized. |
Fiscal Year-End 2024 Market Review
The Davenport Value & Income Fund (DVIPX) advanced 7.26% in the fiscal fourth-quarter of 2023, trailing the Russell 1000 Value® Index’s 8.99% return over the same time frame. For the fiscal year, the Fund returned 14.78%, behind the Russell 1000 Value® Index’s 20.27%. The S&P 500® Index returned 29.88% in fiscal 2023. The biggest driver of the Fund’s performance vs. its benchmark came from Consumer Staples and Energy holdings. According to FactSet, momentum and growth factors outperformed for the quarter.
The robust quarter was particularly noteworthy amid flattish earnings estimates. Said another way, the market’s gain was driven by multiple expansion, rather than earnings growth. The gains also came despite expectations for fewer interest rate cuts, as a relatively decent economy has provided wider latitude for The Fed to sit tight. (On the first day of April, strong economic data sent interest rates higher, pushing the market’s expectations for potential interest rate cuts further into the future). To the extent interest rates remain higher for longer, that ought to benefit companies such as those we own in the Value & Income Fund with more near-and-present cash flows vs. newly-public companies whose cash flows are projected to emerge in the distant future.
Fund Update
Contributors: The Fund’s top performer for the fiscal fourth-quarter was Walt Disney Co. (DIS), amid improving fundamentals, greater cost efficiency, and a proxy battle won by Disney. Software and cloud computing provider Oracle Corp. (ORCL) ranked second for the period following strong quarterly results, while several of the Fund’s financial holdings also produced high-teens percentage gains for the quarter, including JPMorgan Chase & Co. (JPM), Wells Fargo & Co. (WFC), Berkshire Hathaway, Inc. (BRK.B), and Fairfax Financial Holdings Ltd. (FRFHF).
Detractors: By contrast, historically defensive sectors underperformed during the quarter, and those sectors had a 100% participation rate among the Fund’s six holdings that produced negative returns for the quarter: Keurig Dr. Pepper, Inc. (KDP), Anheuser-Busch InBev S.A. (BUD), McDonald’s Corp. (MCD), Philip Morris International, Inc. (PM), Sanofi S.A. (SNY), and Comcast Corp. (CMCSA) each dipped by a single-digit percentage for the quarter.
Fund Activity
After making relatively few changes to the Fund in the previous quarter, we were more active in the fiscal fourth-quarter of 2023, exiting five holdings: United Parcel Service, Inc. (UPS), Diageo PLC (DEO), Coterra Energy, Inc. (CTRA), Bunge Global S.A. (BG), and Target Corp. (TGT). Six new positions were added: Johnson Controls International Plc (JCI), Becton Dickinson and Co (BDX), Citigroup, Inc. (C), Genuine Parts Co. (GPC), Intel Corp. (INTC), and HP, Inc. (HPQ). In broad terms, we added companies that we believe have solid control over their own destiny, in the form of strong pricing power, in-flight cost-saving initiatives, and financial flexibility. By contrast, we exited companies with relatively less control of near-term dynamics (e.g. Coterra’s production is relatively unhedged and it doesn’t control the price of natural gas, which sits near 30-year lows). Intel and HP should benefit from the inexorable demand for greater computing power, while Becton should benefit from an ongoing recovery in elective medical procedures. Among our six recent purchases are two dividend achievers (Becton has raised its dividend 52 consecutive years, while Genuine Parts has grown its dividend 68 straight years).
Speaking of dividends, during the fiscal fourth-quarter, 17 of our holdings raised their dividends, led by Fairfax (FRFHF), which increased its dividend +50%; Deere & Co. (DE) +23%, and Brookfield Asset Management Ltd. (BAM) +19%. Several of our companies also deserve special
mention for continuing long-standing stretches of annual dividend increases, including Walmart Inc. (WMT) with 51 straight years of higher dividends, Chevron Corp. (CVX) with 37 years, and NextEra Energy, Inc. (NEE) with 30 years.
Conclusion
The Davenport Value & Income Fund offers a dividend yield and dividend growth rate that are competitive vs. the broad market. We are enthusiastic about owning companies with long dividend track records, as dividends (including reinvestment) have comprised nearly half of the S&P 500® Index’s total return over the past 30 years. We would submit that companies which grow their dividends for 30+ years – through recessions, wars, pandemics, and other global tumult – have demonstrated the strength of their business models. Count on us to stick to our knitting and keep our feet on solid ground by investing in companies that can compound returns for shareholders steadily over time.
Davenport Equity Opportunities Fund
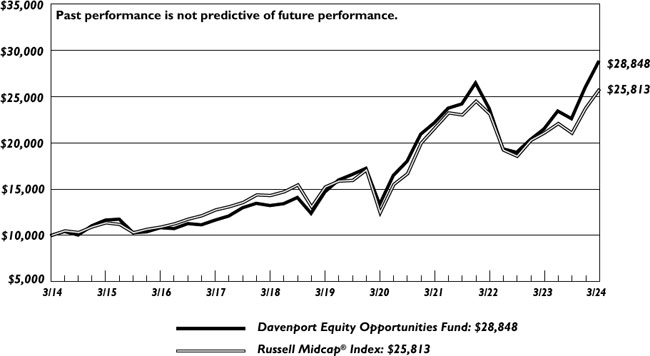
The following chart represents Davenport Equity Opportunities Fund (DEOPX) performance and the performance of the Russell Midcap® Index*, the Fund’s primary benchmark, and the S&P 500® Index* for the periods ended March 31, 2024.
| | | | | | | | | | | | | | | Fiscal |
| | | | | | | | | | | | | Since | | Year 2024 |
| | | Fiscal Q4 | | | | | | | | | | Inception | | Expense |
| | | 2023 | | 1 Year | | 3 Years** | | 5 Years** | | 10 Years** | | 12/31/10** | | Ratio |
| Equity Opportunities Fund | | 10.94% | | 34.01% | | 9.13% | | 14.44% | | 11.18% | | 12.92% | | 0.87% |
| Russell Midcap® Index | | 8.60% | | 22.35% | | 6.07% | | 11.10% | | 9.95% | | 11.36% | | |
| S&P 500® Index* | | 10.56% | | 29.88% | | 11.49% | | 15.05% | | 12.96% | | 13.58% | | |
30-Day SEC Yield: 0.11%; Expense Ratio in current prospectus: 0.89%
Past performance is no guarantee of future results. Investment return and principal value of an investment will fluctuate so that an investor’s shares, when redeemed, may be worth more or less than their original cost. Current performance may be lower or higher than the performance data quoted. Performance data, current to the most recent month-end, may be obtained by calling 1-800-281-3217.
| * | The Russell Midcap® Index measures the performance of the 800 smallest companies in the Russell 1000, which represent approximately 25% of the total market capitalization of the Russell 1000®. London Stock Exchange Group PLC and its group undertakings (collectively, the “LSE Group”). © LSE Group 2024. FTSE Russell is a trading name of certain LSE Group companies. “Russell®” is a trademark of the relevant LSE Group companies and is used by any other LSE Group company under license. All rights in the FTSE Russell indexes or data vest in relevant LSE Group company which owns the index or the data. Neither LSE Group nor its licensors accept any liability for any errors or omissions in the indexes or data and no party may rely on any indexes or data contained in this communication. No further distribution of data from LSE Group is permitted without the relevant LSE Group company’s express written consent. The LSE Group does not promote/sponsor/endorse the content of this communication. The S&P 500® Index is comprised of 500 U.S. stocks and is an indicator of the performance of the overall U.S. stock market. Standard & Poor’s Financial Services LLC, a division of S&P Global, is the source and owner of the registered trademarks related to the S&P 500® Index. An investor cannot invest in an index and its returns are not indicative of the performance of any specific investment. |
| ** | Returns greater than one year are annualized. |
Fiscal Year-End 2024 Market Review
The Davenport Equity Opportunities Fund (DEOPX) experienced a strong end to the fiscal year, advancing 10.94%. This result bested the 8.60% gain for the Russell Midcap® Index, building upon strong performance in 2023. For the fiscal year, the Fund advanced 34.01% compared to the 22.35% return for the Index.
Fund Update
Contributors: One of our newest additions to the Fund, specialty insurer Kinsale Capital Group, Inc. (KNSL), was the strategy’s top contributor for the period. Kinsale posted strong Q4 results that put to bed investor concerns regarding the company’s ability to sustain profitable growth at an above average rate. Though we view the shares as more fairly valued following a 55%+ ytd advance, we believe earnings per share can compound at a 15-20% rate for the foreseeable future driven by market share gains, price increases and rising investment income. Other key contributors for the period included DraftKings, Inc. (DKNG) and Martin Marietta Materials, Inc. (MLM). Each of these positions were strong performers during 2023. While we remain attracted to the long term prospects for each, we elected to trim the positions into strength.
Detractors: Mobileye Global, Inc. (MBLY), American Tower Corp. (AMT) and Etsy, Inc. (ETSY) were key detractors during the period. We elected to use weakness to add to positions in MBLY and ETSY. Etsy, a leading ecommerce retailer of bespoke and craft items, has struggled to grow sales following the pandemic during which sales compounded at a rate of 65%. This has sparked a debate around the cyclical vs. secular nature of the recent soft patch. Bulls argue that the company is enduring a cyclical lull, while bears warn that Etsy permanently pulled forward sales during COVID and that competition from new entrants such as new Chinese ecommerce entrant Temu will remain intense. We believe the former to be true, and argue that Etsy’s differentiated brand offers a niche platform where consumers appreciate the unique/authentic experience of buying non-commoditized wares from artisan sellers. We think this, alongside a large addressable market and ecommerce tailwinds make ETSY a secular grower over time. With the stock trading at half its pre-pandemic valuation, we view the risk/reward favorably.
Fund Activity
We initiated a position in Casey’s General Stores, Inc. (CASY) during the fiscal fourth-quarter. Casey’s is the third largest convenience store chain in the U.S. with roughly 2,500 locations across 16 states in the Midwest. The stock has been an extraordinary value creator over time, averaging earnings before interest, taxes, depreciation, and amortization (EBITDA) and earnings per share (EPS) growth of 11% and 15%, respectively over the last 20 years. While we wish we bought the stock earlier, we think there is significant growth runway. In addition to consistent same-store sales growth and ongoing margin expansion, we think the company can double its store base within its current footprint via new store development and acquisitions – both of which represent high-return uses of capital. With debt/EBITDA at ~1.6x, the company has significant flexibility to support growth initiatives and return excess capital to shareholders via share repurchases. Despite these attributes, we note that the stock is trading at the low end of its 5-year valuation range, resulting in what we believe to be an attractive entry point.
We also initiated a position in Richmond, VA based leading used car retailer CarMax, Inc. (KMX). We have owned KMX in the past and continued to follow the company as it navigated tougher financial conditions, inflation, industry supply issues and difficult comparisons resulting from the COVID induced pull-forward. Though results are likely to remain challenged in the near
term, we think sales and earnings are in the process of bottoming. We also believe the pandemic induced sales volatility obfuscated many improvements in the business model over the last several years. With much of the heavy lifting on its omni-channel investments in the rear view mirror, KMX now boasts a unique combination of digital and physical assets that should result in market share gains as the industry recovers. We also note that the balance sheet is in solid shape, enabling the company to resume activity on its $2.4 billion share repurchase authorization (more than 20% of the current market cap) during the last quarter. While the company is unlikely to repeat its peak pandemic EPS mark of ~$7.00 any time soon, we view the risk/reward profile favorably given the potential for EPS to edge north of $5.00 in a healthier used car environment.
Conclusion
We are pleased with recent results and continue to find compelling opportunities to put capital to work in strong franchises with compelling growth prospects. Despite what may prove to be an unsustainably strong end to the fiscal year, we believe the Fund strikes an attractive balance between growth, value, timeliness and quality.
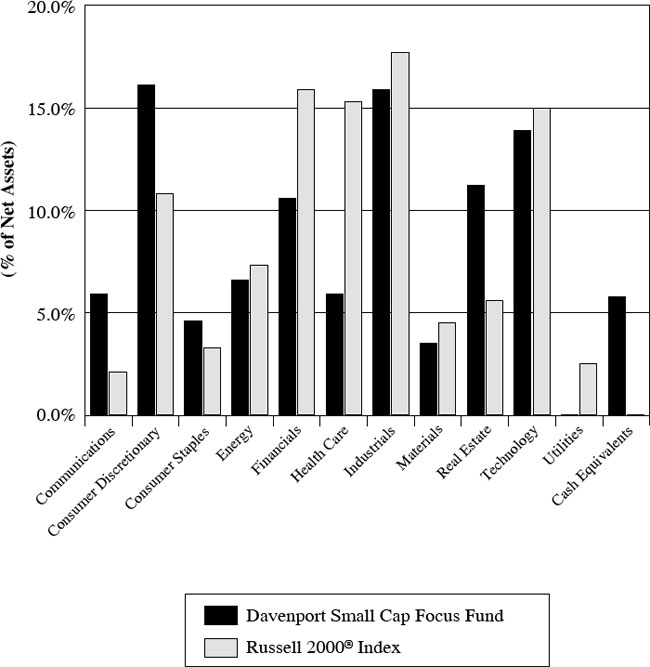
Davenport Small Cap Focus Fund
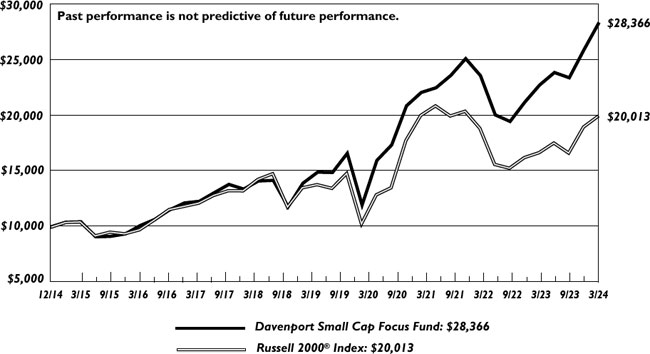
The following chart represents performance of the Davenport Small Cap Focus Fund (DSCPX) and the performance of the Fund’s primary benchmark, the Russell 2000® Index*, for the periods ended March 31, 2024.
| | | | | | | | | | | | | Fiscal |
| | | | | | | | | | | Since | | Year 2024 |
| | | Fiscal Q4 | | | | | | | | Inception | | Expense |
| | | 2023 | | 1 Year | | 3 Years** | | 5 Years** | | 12/31/14** | | Ratio |
| Small Cap Focus Fund | | 9.28% | | 24.59% | | 8.69% | | 15.31% | | 11.94% | | 0.88% |
| Russell 2000® Index* | | 5.18% | | 19.71% | | (0.10)% | | 8.10% | | 7.79% | | |
30-Day SEC Yield: 0.67%; Expense Ratio in current prospectus: 0.91%
Past performance is no guarantee of future results. Investment return and principal value of an investment will fluctuate so that an investor’s shares, when redeemed, may be worth more or less than their original cost. Current performance may be lower or higher than the performance data quoted. Performance data, current to the most recent month-end, may be obtained by calling 1-800-281-3217.
| * | The Russell 2000® Index measures the performance of the 2000 smallest companies in the Russell 3000® Index. Frank Russell Company (“Russell”) is the source and owner of the registered trademarks, service marks, and copyrights related to the Russell Indexes. Russell® is a trademark of Frank Russell Company. An investor cannot invest in an index and index returns are not indicative of the performance of any specific investment. London Stock Exchange Group PLC and its group undertakings (collectively, the “LSE Group”). © LSE Group 2024. FTSE Russell is a trading name of certain LSE Group companies. “Russell®” is a trademark of the relevant LSE Group companies and is used by any other LSE Group company under license. All rights in the FTSE Russell indexes or data vest in relevant LSE Group company which owns the index or the data. Neither LSE Group nor its licensors accept any liability for any errors or omissions in the indexes or data and no party may rely on any indexes or data contained in this communication. No further distribution of data from LSE Group is permitted without the relevant LSE Group company’s express written consent. The LSE Group does not promote/sponsor/endorse the content of this communication. An investor cannot invest in an index and its returns are not indicative of the performance of any specific investment. |
| ** | Returns greater than one year are annualized. |
Fiscal Year-End 2024 Market Review
The Davenport Small Cap Focus Fund (DSCPX) ended the fiscal year on solid footing, producing a gain of 9.28% during the fiscal fourth-quarter. This nicely outpaced the 5.18% gain for the Russell 2000® Index. For the fiscal year, the Fund advanced 24.59% compared to the 19.71% advance for the Index.
Fund Update
Contributors: Kinsale Capital Group, Inc. (KNSL) and HealthEquity, Inc. (HQY) were meaningful contributors during the quarter. We added to both of these positions amid weakness in the prior quarter and were pleased to see quick turnarounds. Kinsale put together an astounding 55% gain during the quarter on the heels of strong results. We consider the shares to be more fairly valued following this recent run; however, remain constructive on the name long-term. HealthEquity also reported solid numbers and subsequently held an investor day that was well received. ESAB Corp. (ESAB) was another top contributor for the period. We have yet to highlight this welding products and consumables business that was formerly part of Colfax Corporation prior to being split from med tech holding Enovis Corp. (ENOV). Though perhaps a “boring” business, ESAB has produced anything but boring results as it has accelerated organic growth, expanded margins, improved free cash flow (FCF) conversion and reduced debt over the years. While the stock is hitting new highs, ESAB still trades at a discount to peers and has a lot of runway for organic growth, mergers and acquisitions (M&A) and capital return through share repurchases.
Detractors: A couple holdings in the cable/telco arena hurt us. Both Cable One, Inc. (CABO) and Shenandoah Telecommunications Co (SHEN) were among our biggest detractors. The industry is broadly struggling with slower subscriber growth and, more recently, the looming expiration of the Affordable Connectivity Program has added another headwind. Both stocks now look very cheap relative to cash flow projections and we think sentiment is nearing a bottom. Outside of cable, convenience store and foodservice snack provider J&J Snack Foods Corp. (JJSF) weighed on results as Q4 earnings came in below expectations. We understand investor disappointment in recent results; however, continue to think the company can leverage its powerful brand portfolio (Icee, Dippin Dots, Hola Churros, etc.), distribution network and debt free balance sheet to produce outsized growth.
Fund Activity
We initiated a position in Vestis Corp. (VSTS) during the quarter. Spun out of Aramark in 2023, Vestis is the 2nd largest provider of uniform rentals and workplace supplies across the United States and Canada. The uniform rental and workplace supply business is an attractive route-based business characterized by a fragmented market, sticky and diverse customer base, and highly recurring revenue streams. After years of underinvestment under Aramark, we believe Vestis is well positioned to benefit from a new management team focused on driving revenue growth and logistics efficiencies. Management is targeting new micro-verticals and increasing cross-selling activities to accelerate revenue growth into the mid-single digits. A new focus on cost discipline, network optimization, and logistics efficiency is anticipated to drive 400-600 basis points (bps) of margin expansion over the next few years. We believe Vestis is undervalued given its potential to significantly improve the fundamental performance of its business over the medium-term. As this occurs, we also believe the shares can re-rate higher.
We also initiated a position in Generac Holdings, Inc. (GNRC). Generac is the leader in home standby generators (HSB) with a burgeoning home energy technology business. Following a boom during the pandemic, GNRC has gone through several quarters of destocking in its HSB business and we think that is nearing an end. The company has grown sales at a 15% compound annual growth rate (CAGR) since its IPO in 2010 and we think significant opportunity remains. Current penetration of home standby generators is ~6.5% (some more mature markets are at 15%+) and each 1% offers a $3B+ market opportunity (GNRC has 70% share). The company is getting little credit for its energy technology business, yet an inflection in profitability should be coming in the 2024/2025 timeframe. Simply getting this business to breakeven (management’s near term target) removes a $300 million earnings before interest, taxes, depreciation, and amortization (EBITDA) drag. Ultimately, we view the risk/reward favorably with the stock at 11x EBITDA vs. a long-term average (and peers) at 16x.
Conclusion
We are pleased with the end of the fiscal year and are grateful for your support as the Davenport Small Cap Focus Fund approaches its 10th year in existence. While we are proud of performance to date, we are confident that our concentrated collection of high-quality businesses can deliver strong risk-adjusted returns into the future. Further, we continue to believe the small cap arena appears timely, with many of the stocks in the asset class having yet to eclipse their 2021 highs.
Davenport Balanced Income Fund
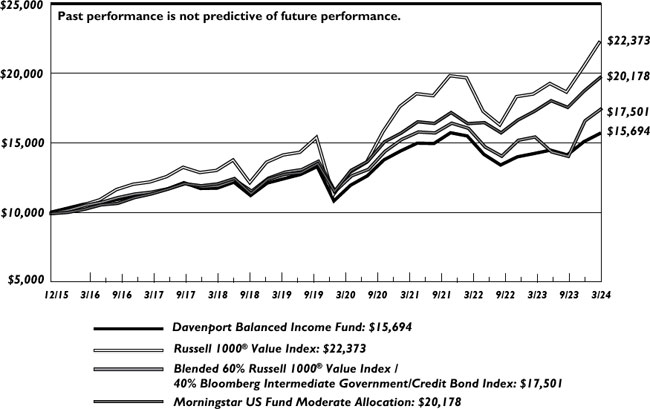
The following chart represents Davenport Balanced Income Fund (DBALX) performance, and performance of the Fund’s primary benchmark, the Russell 1000® Value Index, along with the Morningstar Allocation 50-70% Equity Index, and the blended 60% Russell 1000® Value Index / 40% Bloomberg Intermediate Government/Credit Bond Index for the periods ended March 31, 2024.
| | | | | | | | | | | | | Fiscal |
| | | | | | | | | | | Since | | Year 2024 |
| | | Fiscal Q4 | | | | | | | | Inception | | Expense |
| | | 2023 | | 1 Year | | 3 Years** | | 5 Years** | | 12/31/15** | | Ratio |
| Balanced Income Fund | | 4.07% | | 10.33% | | 2.88% | | 5.33% | | 5.62% | | 0.93% |
| Russell 1000® Value* | | 8.99% | | 20.27% | | 8.11% | | 10.32% | | 10.25% | | |
| Morningstar Moderate Allocation* | | 5.32% | | 15.19% | | 4.05% | | 7.45% | | 7.20% | | |
| 60% Russell 1000® Value/40% BIGC | | 5.28% | | 13.13% | | 4.60% | | 6.95% | | 7.02% | | |
30-Day SEC Yield: 2.70%; Expense Ratio in current prospectus: 0.94%
Past performance is no guarantee of future results. Investment return and principal value of an investment will fluctuate so that an investor’s shares, when redeemed, may be worth more or less than their original cost. Current performance may be lower or higher than the performance data quoted. Performance data, current to the most recent month-end, may be obtained by calling 1-800-281-3217.
| * | The Russell 1000® Value Index measures the performance of the Russell 1000 companies with lower price-to-book ratios and lower forecasted growth values. London Stock Exchange Group PLC and its group undertakings (collectively, the “LSE Group”). © LSE Group 2024. FTSE Russell is a trading name of certain LSE Group companies. “Russell®” is a trademark of the relevant LSE Group companies and is used by any other LSE Group |
company under license. All rights in the FTSE Russell indexes or data vest in relevant LSE Group company which owns the index or the data. Neither LSE Group nor its licensors accept any liability for any errors or omissions in the indexes or data and no party may rely on any indexes or data contained in this communication. No further distribution of data from LSE Group is permitted without the relevant LSE Group company’s express written consent. The LSE Group does not promote/sponsor/endorse the content of this communication. : Morningstar Funds in allocation categories seek to provide both income and capital appreciation by investing in multiple asset classes, including stocks, bonds, and cash. The Morningstar Moderate Allocation portfolios are dominated by domestic holdings and have equity exposures between 50% and 70%. The blended 60% Russell 1000® Value/40% Bloomberg Intermediate Government/Credit Index is included as an additional comparative index because it is representative of a balanced portfolio consisting of 60% equity and 40% fixed income securities. The Bloomberg Intermediate Government/Credit Index measures the non-securitized component of the U.S. Aggregate Bond Index. It includes investment grade, U.S. dollar-denominated, fixed-rate Treasuries, government-related and corporate rate securities. Intermediate maturity bonds include bonds with maturities of 1 to 9.999 years. An investor cannot invest in an index and its returns are not indicative of the performance of any specific investment.
| ** | Returns greater than one year are annualized. |
Fiscal Year-End 2024 Market Review
The Davenport Balanced Income Fund (DBALX) advanced 4.07% in the fiscal fourth-quarter of 2023, compared to 5.28% for the blended 60% Russell 1000 Value® Index and 40% Bloomberg Intermediate Government/Credit Index. For the fiscal year, the Fund advanced 10.33% compared to the 13.13% advance for the Index. The biggest driver of the Fund’s performance vs. its benchmark came from Consumer Staples and Energy equity holdings. According to FactSet, momentum and growth factors outperformed for the quarter.
It was a robust quarter for equities, which was particularly noteworthy amid flattish earnings estimates. Said another way, the stock market’s gain was driven by multiple expansion, rather than earnings growth. The gains also came despite expectations for fewer interest rate cuts, as a relatively decent economy has provided wider latitude for The Fed to sit tight. To the extent interest rates remain higher for longer, that ought to benefit companies such as those we own with more near-and-present cash flows vs. newly-public companies whose cash flows are projected to emerge in the distant future. Higher rates also should enable the fixed income portion of the Fund to invest in bonds with higher prevailing yields.
Fund Update
Contributors: On the equity side of the ledger, the Fund’s top performer for the quarter was Walt Disney Co (DIS), amid improving fundamentals, greater cost efficiency, and a proxy battle won by Disney. Software and cloud computing provider Oracle Corp. (ORCL) ranked second for the period following strong quarterly results, while several of the Fund’s financial holdings also produced high-teens percentage gains for the quarter, including JPMorgan Chase & Co (JPM), Wells Fargo & Co (WFC), Berkshire Hathaway, Inc. (BRK.B), and Fairfax Financial Holdings Ltd. (FRFHF).
Detractors: By contrast, historically defensive sectors underperformed during the quarter, and those sectors had a 100% participation rate among the Fund’s six holdings that produced negative returns for the quarter: Keurig Dr. Pepper, Inc. (KDP), Anheuser-Busch InBev S.A. (BUD), McDonald’s Corp. (MCD), Philip Morris International, Inc. (PM), Sanofi S.A. (SNY), and Comcast Corp. (CMCSA) each dipped by a single-digit percentage for the quarter.
The fixed income portion of the Fund continued to benefit from high interest rates in the final quarter of 2023. Coming into the year, many investors expected inflation to take a backseat to other risk factors such as global tensions in the Middle East, record government debt and a contentious presidential election. Inflation proved sticky and caught many investors flatfooted. In response, the Fed maintained high interest rates in the hopes of driving inflation down.
Fund Activity
During the quarter our bond transactions reflected a continued effort to lock in higher interest rates for longer to reduce reinvestment risk. Sales included American Express 3.375% 05/03/24, Brookfield 4% 04/01/24 and Apple 4.3% 05/10/33. Purchases included HCA Healthcare 5.45% 04/01/31, Keurig Dr Pepper 5.05% 03/15/29 and Wells Fargo 4.811% 01/15/26, which increased the Fund’s yield.
After making relatively few changes to the Fund’s equity holdings in the third quarter of 2023, we were more active in the fiscal fourth-quarter of 2023, exiting five holdings: United Parcel Service, Inc. (UPS), Diageo PLC (DEO), Coterra Energy, Inc. (CTRA), Bunge Global S.A. (BG), and Target Corp. (TGT). We added six new positions: Johnson Controls International Plc (JCI), Becton Dickinson and Co. (BDX), Citigroup, Inc. (C), Genuine Parts Co. (GPC), Intel Corp. (INTC), and HP, Inc. (HPQ). In broad terms, we added companies that we believe have solid control over their own destiny, in the form of strong pricing power, in-flight cost-saving initiatives, and financial flexibility. By contrast, we exited companies with relatively less control of near-term dynamics (e.g. Coterra’s production is relatively unhedged and it doesn’t control the price of natural gas, which sits near 30-year lows). Intel and HP should benefit from the inexorable demand for greater computing power, while Becton should benefit from an ongoing recovery in elective medical procedures. Among our six recent purchases are two dividend achievers (Becton has raised its dividend 52 consecutive years, while Genuine Parts has grown its dividend 68 straight years).
Speaking of dividends, during the quarter, 17 of our holdings raised their dividends, led by Fairfax (FRFHF), which increased its dividend +50%; Deere & Co. (DE) +23%, and Brookfield Asset Management Ltd. (BAM) +19%. Several of our companies also deserve special mention for continuing long-standing stretches of annual dividend increases, including Walmart Inc. (WMT) with 51 straight years of higher dividends, Chevron Corp. (CVX) with 37 years, and NextEra Energy, Inc. (NEE) with 30 years.
Conclusion
The Davenport Balanced Income Fund offers a dividend yield and dividend growth rate that are competitive vs. the broad market. Count on us to stick to our knitting and keep our feet on solid ground by investing in companies that can compound returns for shareholders steadily over time.
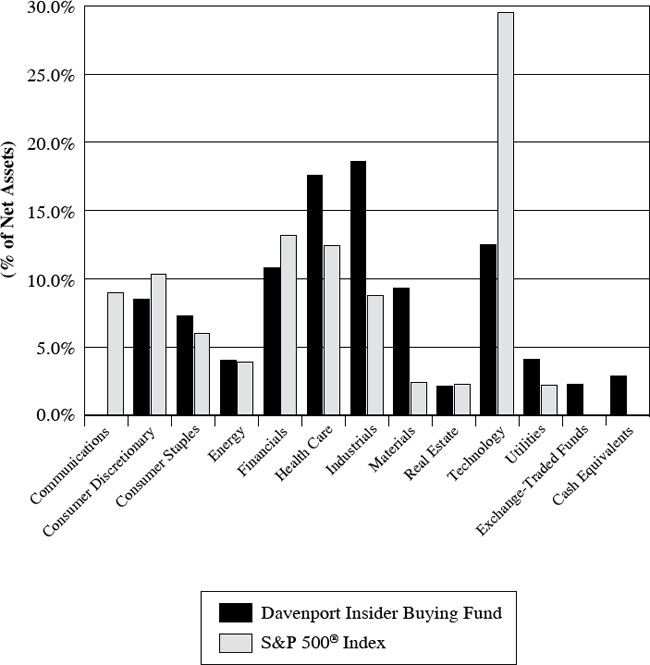
Davenport Insider Buying Fund
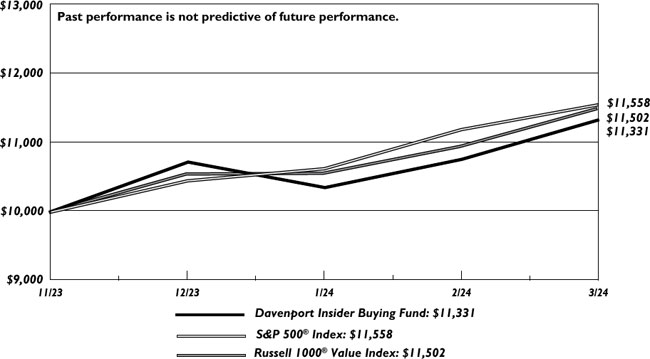
The following chart represents Davenport Insider Buying Fund’s (DBUYX) performance and the performance of the S&P 500® Index*, the Insider Buying Fund’s primary benchmark, for the periods ended March 31, 2024.
| | | | | | | | | | | | | Fiscal |
| | | | | | | | | | | Since | | Year 2024 |
| | | Fiscal Q4 | | | | | | | | Inception | | Expense |
| | | 2023 | | 1 Year | | 3 Years** | | 5 Years** | | 11/30/23 | | Ratio |
| Insider Buying Fund | | 5.72% | | — | | — | | — | | 13.31% | | 1.09% |
| S&P 500® Index* | | 10.56% | | — | | — | | — | | 15.58% | | |
30-Day SEC Yield: 0.65%; Expense Ratio in current prospectus: 1.25%
Past performance is no guarantee of future results. Investment return and principal value of an investment will fluctuate so that an investor’s shares, when redeemed, may be worth more or less than their original cost. Current performance may be lower or higher than the performance data quoted. Performance data, current to the most recent month-end, may be obtained by calling 1-800-281-3217.
| * | The S&P 500® Index is comprised of 500 U.S. stocks and is an indicator of the performance of the overall U.S. stock market. Standard & Poor’s Financial Services LLC, a division of S&P Global, is the source and owner of the registered trademarks related to the S&P 500® Index. An investor cannot invest in an index and its returns are not indicative of the performance of any specific investment. |
Fiscal Year-End 2024 Market Review
The Davenport Insider Buying Fund (DBUYX) increased 5.72% in the fiscal fourth-quarter of 2023 and is up 13.31% since inception on November 30, 2023. This compares to the S&P 500® Index, which increased 10.56% in the final quarter and is up 15.58% since November. While the Fund didn’t keep pace with the growth/tech led market rally (particularly in January), relative performance improved considerably as returns broadened out later in the quarter.
Fund Update
Contributors: The top three contributors this quarter were Emerson Electric Co. (EMR), Charles River Laboratories International (CRL), and Ball Corp. (BALL). Shares of automation equipment-maker Emerson rallied sharply on the heels of a strong earnings report that beat consensus estimates. Core revenue growth was well above peers, orders remained solid, and margins expanded at a healthy rate. With a valuation still below peers, EMR remains a top holding in the Fund. Shares of CRL continued to rally from November lows as investors became increasingly confident that an inflection point was close in terms of pharmaceutical and biotech spending. As a key partner to the industry, CRL should see a nice improvement in earnings growth over the coming quarters. Aluminum can-maker Ball shares rallied on a strong earnings report and the completion of the divestiture of its aerospace division. The sale allows BALL to de-lever its balance sheet and repurchase a significant amount of stock. As can volumes normalize post pandemic, we think BALL can return to the high-quality compounder it has long been known for.
Detractors: The top three detractors were Air Products & Chemicals, Inc. (APD), Nike, Inc. (NKE), and Keurig Dr. Pepper, Inc. (KDP). Air Products disappointed investors with a cut to 2024 guidance as it continues to face headwinds in China. APD remains in the early stages of its heavy capital investments in green hydrogen facilities, which is pressuring near-term results
given expenses with no offsetting income. We continue to believe this is the right strategy and are remaining patient with the stock, which trades near its lowest relative valuation in 15 years. Nike also posted disappointing revenue guidance as the company works to reinvigorate its innovation engine and return to its typical high-single-digit growth rate. With the Paris Olympics upcoming, we think NKE will return to form in the not-too-distant future. KDP continues to struggle with its coffee business as the market normalizes post pandemic. There continues to be a healthy amount of insider buying at KDP and valuation remains well below normal levels. We used weakness to add to our positions in all three names.
Fund Activity
During the fiscal fourth-quarter, we initiated new positions in Everest Group Ltd. (EG), Vestis Corp. (VSTS), and AMN Healthcare Services, Inc. (AMN). Everest is a global reinsurance company whose shares tumbled following disappointing earnings as investors worried about the adequacy of the company’s reserves. However, management reaffirmed its 2024-2026 financial targets and there were six separate insider buys following the stock decline, which we view as a clear indication the company views the stock move as overdone. Vestis is a recent spinoff from Aramark (ARMK) and is a leading provider of uniform services. VSTS trades at a significant discount to its peers and we think should improve operations as a now stand-alone entity. The CEO purchased roughly $300K in stock, which follows a $200K purchase by the Vice Chair of the Board. AMN is a leader in the hospital staffing industry and shares have struggled for nearly two years as the nursing market went from significantly understaffed during the pandemic to a more normal environment today. The key for the stock is the timing of earnings bottoming, which we think is near as evidenced by eight separate insider purchases this year.
During the quarter we sold our positions in American Water Works Company, Inc. (AWK) and Graco, Inc. (GGG). In the case of AWK, our thesis changed as the company received much more scrutiny than usual in rate cases in several key states. Additionally, Pennsylvania (one of AWK’s largest markets), discussed legislation that would make it much more difficult for AWK to acquire new water systems. As such, we harvested a small loss on the position. Graco was a solid performer for the Fund, as the maker of paint spray systems participated in the market rally. Valuation on the stock reached well above average levels and there were several insiders selling shares, so we followed suit.
Conclusion
To close, we are pleased with the absolute performance of our all-cap Fund and encouraged by its relative performance vs. the S&P 500® Index in periods where returns are broad and not dominated by the largest weights in the index. Small cap stocks, as measured by the Russell 2000® Index, generated only half the return of the S&P 500® during the quarter. While we would gladly consider owning a number of the “Magnificent Seven,” there have not been insider buys at those companies for several years and thus they don’t qualify for the Insider Buying Fund at this time. We remain excited about building this new and differentiated strategy and thank you for your interest and support.
As a fellow shareholder of the Davenport Funds, we want to thank you for your continued trust and confidence. Successful investing requires patience and the confidence to stay invested even in times of fear and heightened volatility. It is during times of market stress, we like to remind
shareholders that the 500 employees of Davenport & Company are invested alongside our mutual funds. Our team is always available to share with you our thoughts and strategy and we welcome your questions and comments.
Sincerely,
John P. Ackerly IV, CFA
President, The Davenport Funds
| DAVENPORT CORE LEADERS FUND |
| PERFORMANCE INFORMATION (Unaudited) |
Comparison of the Change in Value of a $10,000 Investment in
Davenport Core Leaders Fund and the S&P 500® Index
| | | | | | | |
| | | | Average Annual Total Returns | |
| | | | (for the year ended March 31, 2024) | |
| | | | | |
| | | | 1 Year | | 5 Years | | 10 Years | |
| | Davenport Core Leaders Fund (a) | | 36.76% | | 13.04% | | 11.02% | |
| | S&P 500® Index | | 29.88% | | 15.05% | | 12.96% | |
| | | | | | | | | |
| (a) | The total returns shown do not reflect the deduction of taxes that a shareholder would pay on Fund distributions or the redemption of Fund shares. |
| DAVENPORT VALUE & INCOME FUND |
| PERFORMANCE INFORMATION (Unaudited) |
Comparison of the Change in Value of a $10,000 Investment in
Davenport Value & Income Fund, the Russell 1000® Value Index
and the Lipper Equity Income Index

| | | | | |
| | | | Average Annual Total Returns | |
| | | | (for the year ended March 31, 2024) | |
| | | | | |
| | | | 1 Year | | 5 Years | | 10 Years | |
| | Davenport Value & Income Fund (a) | | 14.78% | | 7.50% | | 7.55% | |
| | Russell 1000® Value Index | | 20.27% | | 10.32% | | 9.01% | |
| | Lipper Equity Income Index | | 18.48% | | 10.58% | | 9.20% | |
| | | | | | | | | |
| (a) | The total returns shown do not reflect the deduction of taxes that a shareholder would pay on Fund distributions or the redemption of Fund shares. |
| DAVENPORT EQUITY OPPORTUNITIES FUND |
| PERFORMANCE INFORMATION (Unaudited) |
Comparison of the Change in Value of a $10,000 Investment in
Davenport Equity Opportunities Fund and the Russell Midcap® Index
| | | | | |
| | | | Average Annual Total Returns | |
| | | | (for the year ended March 31, 2024) | |
| | | | | |
| | | | 1 Year | | 5 Years | | 10 Years | |
| | Davenport Equity Opportunities Fund (a) | | 34.01% | | 14.44% | | 11.18% | |
| | Russell Midcap® Index | | 22.35% | | 11.10% | | 9.95% | |
| | | | | | | | | |
| (a) | The total returns shown do not reflect the deduction of taxes that a shareholder would pay on Fund distributions or the redemption of Fund shares. |
| DAVENPORT SMALL CAP FOCUS FUND |
| PERFORMANCE INFORMATION (Unaudited) |
Comparison of the Change in Value of a $10,000 Investment in
Davenport Small Cap Focus Fund and the Russell 2000® Index
| | | | | |
| | | | Average Annual Total Returns | |
| | | | (for the year ended March 31, 2024) | |
| | | | | |
| | | | 1 Year | | 5 Years | | Since
Inception(b) | |
| | Davenport Small Cap Focus Fund (a) | | 24.59% | | 15.31% | | 11.94% | |
| | Russell 2000® Index | | 19.71% | | 8.10% | | 7.79% | |
| | | | | | | | | |
| (a) | The total returns shown do not reflect the deduction of taxes that a shareholder would pay on Fund distributions or the redemption of Fund shares. |
| (b) | Commencement of operations was December 31, 2014. |
| DAVENPORT BALANCED INCOME FUND |
| PERFORMANCE INFORMATION (Unaudited) |
Comparison of the Change in Value of a $10,000 Investment in Davenport Balanced
Income Fund, the Russell 1000® Value Index, a Blended 60% Russell 1000® Value
Index / 40% Bloomberg Intermediate Government/Credit Bond Index
and the Morningstar US Fund Moderate Allocation
| | | | | |
| | | | Average Annual Total Returns | |
| | | | (for the year ended March 31, 2024) | |
| | | | | | | | | |
| | | | | | | | Since | |
| | | | 1 Year | | 5 Years | | Inception(b) | |
| | Davenport Balanced Income Fund (a) | | 10.33% | | 5.33% | | 5.62% | |
| | Russell 1000® Value Index | | 20.27% | | 10.32% | | 10.25% | |
| | Blended 60% Russell 1000® Value Index / 40% Bloomberg Intermediate Government/Credit Bond Index | | 13.13% | | 6.95% | | 7.02% | |
| | Morningstar US Fund Moderate Allocation | | 16.22% | | 10.12% | | 8.88% | |
| | | | | | | | | |
| (a) | The total returns shown do not reflect the deduction of taxes that a shareholder would pay on Fund distributions or the redemption of Fund shares. |
| (b) | Commencement of operations was December 31, 2015. |
Davenport Balanced Income Fund (the “Fund”) is not sponsored, endorsed, sold or promoted by Morningstar, Inc. or any of its affiliates (all such entities, collectively, “Morningstar Entities”). The Morningstar Entities make no representation or warranty, express or implied, to the owners of the Fund or any member of the public regarding the advisability of investing in equity securities generally or in the Fund in particular or the ability of the Fund to track general equity market performance. THE MORNINGSTAR ENTITIES DO NOT GUARANTEE THE ACCURACY AND/OR THE COMPLETENESS OF THE FUND OR ANY DATA INCLUDED THEREIN AND MORNINGSTAR ENTITIES SHALL HAVE NO LIABILITY FOR ANY ERRORS, OMISSIONS, OR INTERRUPTIONS THEREIN.
| DAVENPORT INSIDER BUYING FUND |
| PERFORMANCE INFORMATION (Unaudited) |
Comparison of the Change in Value of a $10,000 Investment in
Davenport Insider Buying Fund, the S&P 500® Index and the Russell 1000® Value Index
| | | | | |
| | | | Annual Total Return | |
| | | | (for the period ended March 31, 2024) | |
| | | | | |
| | | | Since | |
| | | | | Inception(b) | | |
| | Davenport Insider Buying Fund (a) | | 13.31% | |
| | S&P 500® Index | | 15.58% | |
| | Russell 1000® Value Index | | 15.02% | |
| | | | | |
| (a) | The total returns shown do not reflect the deduction of taxes that a shareholder would pay on Fund distributions or the redemption of Fund shares. |
| (b) | Commencement of operations was November 30, 2023. |
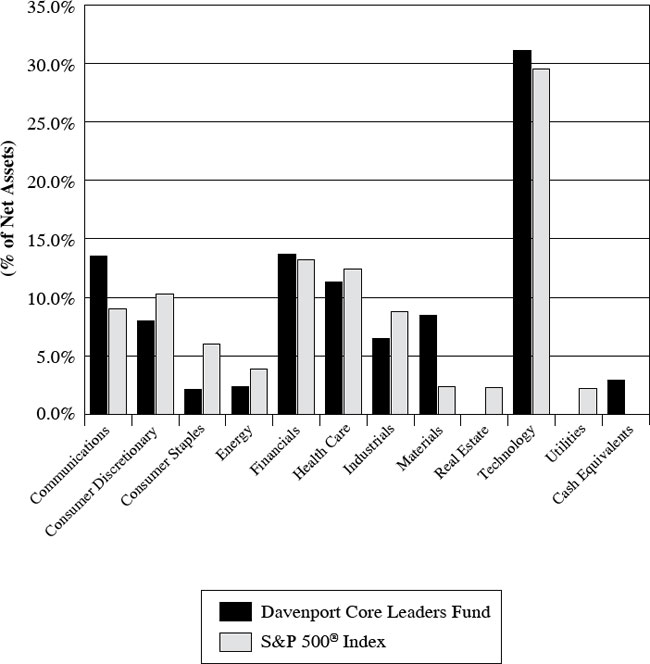
| DAVENPORT CORE LEADERS FUND |
PORTFOLIO INFORMATION March 31, 2024 (Unaudited) |
Sector Allocation vs. the S&P 500® Index
Top 10 Holdings
| Security Description | | % of Net Assets |
| Meta Platforms, Inc. - Class A | | 5.0% |
| Microsoft Corporation | | 4.8% |
| Amazon.com, Inc. | | 4.7% |
| Brookfield Corporation | | 4.0% |
| Walt Disney Company (The) | | 3.7% |
| Alphabet, Inc. - Classes A and C | | 3.2% |
| Martin Marietta Materials, Inc. | | 3.0% |
| Danaher Corporation | | 2.9% |
| Mastercard, Inc. - Class A | | 2.9% |
| Air Products & Chemicals, Inc. | | 2.9% |
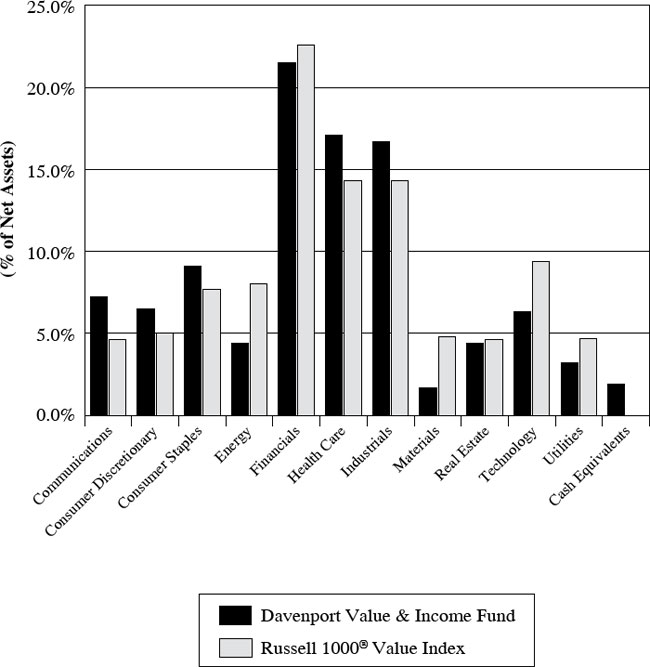
| DAVENPORT VALUE & INCOME FUND |
PORTFOLIO INFORMATION March 31, 2024 (Unaudited) |
Sector Allocation vs. the Russell 1000® Value Index
Top 10 Holdings
| Security Description | | % of Net Assets |
| Johnson & Johnson | | 3.6% |
| Oracle Corporation | | 3.5% |
| Fairfax Financial Holdings Ltd. | | 3.2% |
| NextEra Energy, Inc. | | 3.2% |
| JPMorgan Chase & Company | | 3.0% |
| L3Harris Technologies, Inc. | | 2.9% |
| Anheuser-Busch InBev S.A./N.V. - ADR | | 2.9% |
| Alphabet, Inc. - Class A | | 2.9% |
| Elevance Health, Inc. | | 2.9% |
| Lamar Advertising Company - Class A | | 2.8% |
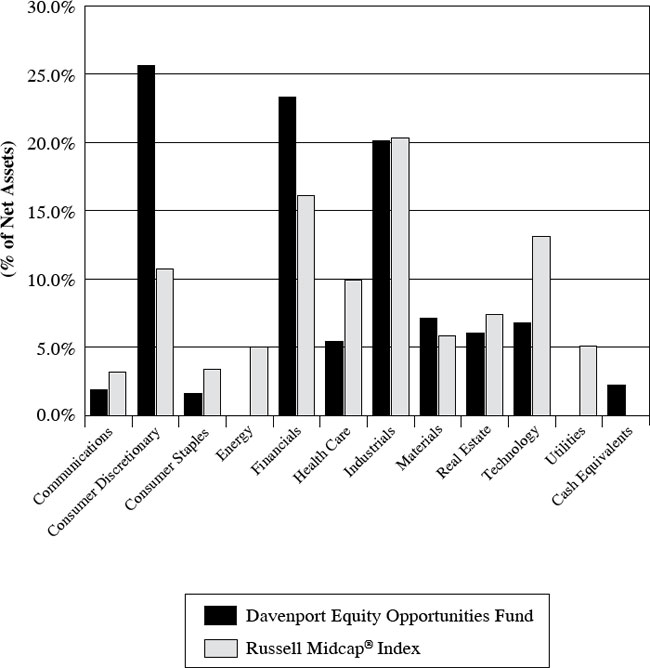
| DAVENPORT EQUITY OPPORTUNITIES FUND |
PORTFOLIO INFORMATION March 31, 2024 (Unaudited) |
Sector Allocation vs. the Russell Midcap® Index
Top 10 Holdings
| Security Description | | % of Net Assets |
| Live Nation Entertainment, Inc. | | 5.0% |
| Brookfield Corporation | | 4.8% |
| Xylem, Inc. | | 4.6% |
| Enovis Corporation | | 4.2% |
| Martin Marietta Materials, Inc. | | 4.1% |
| Fairfax Financial Holdings Ltd. | | 4.0% |
| O’Reilly Automotive, Inc. | | 3.6% |
| Avantor, Inc. | | 3.5% |
| DraftKings, Inc. - Class A | | 3.5% |
| Kinsale Capital Group, Inc. | | 3.5% |
| DAVENPORT SMALL CAP FOCUS FUND |
PORTFOLIO INFORMATION March 31, 2024 (Unaudited) |
Sector Allocation vs. the Russell 2000® Index
Top 10 Holdings
| Security Description | | % of Net Assets |
| Monarch Casino & Resort, Inc. | | 5.1% |
| Kinsale Capital Group, Inc. | | 4.9% |
| Janus International Group, Inc. | | 4.9% |
| Stewart Information Services Corporation | | 4.7% |
| Verra Mobility Corporation | | 4.6% |
| Alight, Inc. - Class A | | 4.2% |
| Enovis Corporation | | 4.2% |
| ESAB Corporation | | 4.1% |
| California Resources Corporation | | 3.4% |
| Perrigo Company plc | | 3.4% |
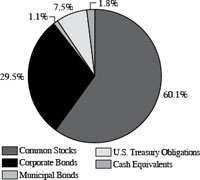
| DAVENPORT BALANCED INCOME FUND |
PORTFOLIO INFORMATION March 31, 2024 (Unaudited) |
Asset Allocation (% of Net Assets)
| Ten Largest Equity Holdings | | % of Net Assets |
| Johnson & Johnson | | 2.0% |
| Oracle Corporation | | 1.9% |
| Fairfax Financial Holdings Ltd. | | 1.8% |
| NextEra Energy, Inc. | | 1.8% |
| JPMorgan Chase & Company | | 1.7% |
| L3Harris Technologies, Inc. | | 1.6% |
| Lamar Advertising Company - Class A | | 1.6% |
| Anheuser-Busch InBev S.A./N.V. - ADR | | 1.6% |
| Alphabet, Inc. - Class A | | 1.6% |
| Elevance Health, Inc. | | 1.6% |
| Equity Sector Concentration vs. the Russell 1000® Value Index (60.1% of Net Assets) |

| Bond Portfolio (38.1% of Net Assets) | | | | Credit Quality | | Composite Quality |
| Number of Fixed-Income Securities | | 29 | | | AAA | | 0.0% |
| Average Quality | | A | | | AA | | 28.8% |
| Effective Maturity | | 4.3 | yrs. | | A | | 33.9% |
| Average Effective Duration | | 3.53 | yrs. | | BBB | | 34.7% |
| | | | | | Ba | | 2.6% |
| | | % of Bond |
| Sector Breakdown | | Portfolio |
| Communications | | | 10.4 | % |
| Consumer Discretionary | | | 1.7 | % |
| Consumer Staples | | | 8.9 | % |
| Energy | | | 11.8 | % |
| Financials | | | 18.8 | % |
| Health Care | | | 14.0 | % |
| Industrials | | | 2.3 | % |
| Technology | | | 6.0 | % |
| Utilities | | | 3.5 | % |
| Municipal | | | 2.9 | % |
| U.S. Treasury | | | 19.7 | % |
| DAVENPORT INSIDER BUYING FUND |
PORTFOLIO INFORMATION March 31, 2024 (Unaudited) |
Sector Allocation vs. the S&P 500® Index
Top 10 Holdings
| Security Description | | % of Net Assets |
| NextEra Energy, Inc. | | 4.1% |
| EOG Resources, Inc. | | 4.0% |
| Emerson Electric Company | | 3.9% |
| Air Products & Chemicals, Inc. | | 3.8% |
| NIKE, Inc. - Class B | | 3.6% |
| Charles River Laboratories International, Inc. | | 3.6% |
| Charles Schwab Corporation (The) | | 3.6% |
| Bristol-Myers Squibb Company | | 3.5% |
| Aon plc - Class A | | 3.5% |
| Mastercard, Inc. - Class A | | 3.3% |
| DAVENPORT CORE LEADERS FUND |
| SCHEDULE OF INVESTMENTS |
| March 31, 2024 |
| COMMON STOCKS — 97.1% | | Shares | | | Value | |
| Communications — 13.5% | | | | | | | | |
| Alphabet, Inc. - Class A (a) | | | 154,884 | | | $ | 23,376,642 | |
| Alphabet, Inc. - Class C (a) | | | 54,011 | | | | 8,223,715 | |
| Electronic Arts, Inc. | | | 124,226 | | | | 16,481,063 | |
| Meta Platforms, Inc. - Class A | | | 100,693 | | | | 48,894,507 | |
| Walt Disney Company (The) | | | 294,330 | | | | 36,014,219 | |
| | | | | | | | 132,990,146 | |
| Consumer Discretionary — 8.0% | | | | | | | | |
| Amazon.com, Inc. (a) | | | 255,092 | | | | 46,013,495 | |
| Home Depot, Inc. (The) | | | 34,304 | | | | 13,159,014 | |
| TJX Companies, Inc. (The) | | | 189,595 | | | | 19,228,725 | |
| | | | | | | | 78,401,234 | |
| Consumer Staples — 2.1% | | | | | | | | |
| Costco Wholesale Corporation | | | 28,093 | | | | 20,581,775 | |
| | | | | | | | | |
| Energy — 2.4% | | | | | | | | |
| EOG Resources, Inc. | | | 184,565 | | | | 23,594,790 | |
| | | | | | | | | |
| Financials — 13.7% | | | | | | | | |
| Aon plc - Class A | | | 59,578 | | | | 19,882,370 | |
| Berkshire Hathaway, Inc. - Class B (a) | | | 48,057 | | | | 20,208,930 | |
| Brookfield Corporation | | | 951,791 | | | | 39,851,489 | |
| Intercontinental Exchange, Inc. | | | 149,247 | | | | 20,511,015 | |
| JPMorgan Chase & Company | | | 102,325 | | | | 20,495,698 | |
| Markel Group, Inc. (a) | | | 8,986 | | | | 13,672,019 | |
| | | | | | | | 134,621,521 | |
| Health Care — 11.3% | | | | | | | | |
| Abbott Laboratories | | | 178,474 | | | | 20,285,355 | |
| Danaher Corporation | | | 115,734 | | | | 28,901,095 | |
| Novo Nordisk A/S - ADR | | | 133,766 | | | | 17,175,554 | |
| UnitedHealth Group, Inc. | | | 50,903 | | | | 25,181,714 | |
| Vertex Pharmaceuticals, Inc. (a) | | | 48,396 | | | | 20,230,012 | |
| | | | | | | | 111,773,730 | |
| Industrials — 6.5% | | | | | | | | |
| Honeywell International, Inc. | | | 84,384 | | | | 17,319,816 | |
| Republic Services, Inc. | | | 78,202 | | | | 14,970,991 | |
| Rockwell Automation, Inc. | | | 53,611 | | | | 15,618,492 | |
| Union Pacific Corporation | | | 66,389 | | | | 16,327,047 | |
| | | | | | | | 64,236,346 | |
| Materials — 8.5% | | | | | | | | |
| Air Products & Chemicals, Inc. | | | 116,306 | | | | 28,177,455 | |
| Martin Marietta Materials, Inc. | | | 48,339 | | | | 29,677,246 | |
| Sherwin-Williams Company (The) | | | 75,910 | | | | 26,365,820 | |
| | | | | | | | 84,220,521 | |
| DAVENPORT CORE LEADERS FUND |
| SCHEDULE OF INVESTMENTS (Continued) |
| COMMON STOCKS — 97.1% (Continued) | | Shares | | | Value | |
| Technology — 31.1% | | | | | | | | |
| Accenture plc - Class A | | | 78,405 | | | $ | 27,175,957 | |
| Adobe, Inc. (a) | | | 51,814 | | | | 26,145,344 | |
| Advanced Micro Devices, Inc. (a) | | | 107,883 | | | | 19,471,803 | |
| Analog Devices, Inc. | | | 61,163 | | | | 12,097,430 | |
| Apple, Inc. | | | 100,802 | | | | 17,285,527 | |
| Broadcom, Inc. | | | 17,498 | | | | 23,192,024 | |
| Intuit, Inc. | | | 41,310 | | | | 26,851,500 | |
| Mastercard, Inc. - Class A | | | 59,798 | | | | 28,796,923 | |
| Microsoft Corporation | | | 112,531 | | | | 47,344,042 | |
| NVIDIA Corporation | | | 25,900 | | | | 23,402,204 | |
| Palo Alto Networks, Inc. (a) | | | 51,428 | | | | 14,612,238 | |
| ServiceNow, Inc. (a) | | | 23,539 | | | | 17,946,133 | |
| Visa, Inc. - Class A | | | 77,660 | | | | 21,673,353 | |
| | | | | | | | 305,994,478 | |
| | | | | | | | | |
| Total Common Stocks (Cost $530,611,856) | | | | | | $ | 956,414,541 | |
| | | | | | | |
| MONEY MARKET FUNDS — 2.9% | | Shares | | | Value | |
| First American Treasury Obligations Fund - Class X, 5.22% (b) (Cost $28,558,341) | | | 28,558,341 | | | $ | 28,558,341 | |
| | | | | | | | | |
| Total Investments at Value — 100.0% (Cost $559,170,197) | | | | | | $ | 984,972,882 | |
| | | | | | | | | |
| Other Assets in Excess of Liabilities — 0.0% (c) | | | | | | | 224,070 | |
| | | | | | | | | |
| Net Assets — 100.0% | | | | | | $ | 985,196,952 | |
| ADR - American Depositary Receipt. |
| (a) | Non-income producing security. |
| (b) | The rate shown is the 7-day effective yield as of March 31, 2024. |
| (c) | Percentage rounds to less than 0.1%. |
See accompanying notes to financial statements.
| DAVENPORT VALUE & INCOME FUND |
| SCHEDULE OF INVESTMENTS |
| March 31, 2024 |
| COMMON STOCKS — 98.1% | | Shares | | | Value | |
| Communications — 7.2% | | | | | | | | |
| Alphabet, Inc. - Class A (a) | | | 164,352 | | | $ | 24,805,647 | |
| Comcast Corporation - Class A | | | 468,949 | | | | 20,328,939 | |
| Walt Disney Company (The) | | | 136,054 | | | | 16,647,568 | |
| | | | | | | | 61,782,154 | |
| Consumer Discretionary — 6.5% | | | | | | | | |
| Genuine Parts Company | | | 83,255 | | | | 12,898,697 | |
| Lowe’s Companies, Inc. | | | 93,014 | | | | 23,693,456 | |
| McDonald’s Corporation | | | 67,919 | | | | 19,149,762 | |
| | | | | | | | 55,741,915 | |
| Consumer Staples — 9.1% | | | | | | | | |
| Anheuser-Busch InBev S.A./N.V. - ADR | | | 413,117 | | | | 25,109,251 | |
| Keurig Dr Pepper, Inc. | | | 601,083 | | | | 18,435,216 | |
| Philip Morris International, Inc. | | | 240,944 | | | | 22,075,289 | |
| Walmart, Inc. | | | 209,055 | | | | 12,578,839 | |
| | | | | | | | 78,198,595 | |
| Energy — 4.4% | | | | | | | | |
| Chevron Corporation | | | 146,647 | | | | 23,132,098 | |
| Enbridge, Inc. | | | 415,078 | | | | 15,017,522 | |
| | | | | | | | 38,149,620 | |
| Financials — 21.5% | | | | | | | | |
| Berkshire Hathaway, Inc. - Class B (a) | | | 42,548 | | | | 17,892,285 | |
| Brookfield Asset Management Ltd. - Class A | | | 416,718 | | | | 17,510,490 | |
| Brookfield Corporation | | | 417,451 | | | | 17,478,673 | |
| Chubb Ltd. | | | 52,287 | | | | 13,549,130 | |
| Citigroup, Inc. | | | 230,835 | | | | 14,598,006 | |
| Fairfax Financial Holdings Ltd. | | | 25,974 | | | | 28,026,985 | |
| Fidelity National Financial, Inc. | | | 268,304 | | | | 14,246,943 | |
| JPMorgan Chase & Company | | | 131,293 | | | | 26,297,988 | |
| Markel Group, Inc. (a) | | | 11,438 | | | | 17,402,688 | |
| Wells Fargo & Company | | | 328,540 | | | | 19,042,178 | |
| | | | | | | | 186,045,366 | |
| Health Care — 17.1% | | | | | | | | |
| Becton, Dickinson and Company | | | 51,267 | | | | 12,686,019 | |
| Bristol-Myers Squibb Company | | | 445,188 | | | | 24,142,545 | |
| Elevance Health, Inc. | | | 47,553 | | | | 24,658,133 | |
| Johnson & Johnson | | | 196,306 | | | | 31,053,646 | |
| Medtronic plc | | | 252,099 | | | | 21,970,428 | |
| Perrigo Company plc | | | 503,824 | | | | 16,218,095 | |
| Sanofi - ADR | | | 349,990 | | | | 17,009,514 | |
| | | | | | | | 147,738,380 | |
| DAVENPORT VALUE & INCOME FUND |
| SCHEDULE OF INVESTMENTS (Continued) |
| COMMON STOCKS — 98.1% (Continued) | | Shares | | | Value | |
| Industrials — 16.7% | | | | | | | | |
| Deere & Company | | | 27,932 | | | $ | 11,472,790 | |
| FedEx Corporation | | | 51,370 | | | | 14,883,944 | |
| Johnson Controls International plc | | | 290,375 | | | | 18,967,295 | |
| L3Harris Technologies, Inc. | | | 119,534 | | | | 25,472,696 | |
| Norfolk Southern Corporation | | | 70,559 | | | | 17,983,372 | |
| RTX Corporation | | | 141,576 | | | | 13,807,907 | |
| TE Connectivity Ltd. | | | 144,697 | | | | 21,015,792 | |
| Watsco, Inc. | | | 48,059 | | | | 20,760,046 | |
| | | | | | | | 144,363,842 | |
| Materials — 1.7% | | | | | | | | |
| Avery Dennison Corporation | | | 67,522 | | | | 15,074,287 | |
| | | | | | | | | |
| Real Estate — 4.4% | | | | | | | | |
| Alexandria Real Estate Equities, Inc. | | | 103,553 | | | | 13,349,017 | |
| Lamar Advertising Company - Class A | | | 205,880 | | | | 24,584,131 | |
| | | | | | | | 37,933,148 | |
| Technology — 6.3% | | | | | | | | |
| HP, Inc. | | | 414,127 | | | | 12,514,918 | |
| Intel Corporation | | | 280,861 | | | | 12,405,631 | |
| Oracle Corporation | | | 238,279 | | | | 29,930,225 | |
| | | | | | | | 54,850,774 | |
| Utilities — 3.2% | | | | | | | | |
| NextEra Energy, Inc. | | | 435,887 | | | | 27,857,538 | |
| | | | | | | | | |
| Total Common Stocks (Cost $640,769,865) | | | | | | $ | 847,735,619 | |
| | | | | | | |
| MONEY MARKET FUNDS — 1.8% | | Shares | | | Value | |
| First American Treasury Obligations Fund - Class X, 5.22% (b) (Cost $15,800,226) | | | 15,800,226 | | | $ | 15,800,226 | |
| | | | | | | | | |
| Total Investments at Value — 99.9% (Cost $656,570,091) | | | | | | $ | 863,535,845 | |
| | | | | | | | | |
| Other Assets in Excess of Liabilities — 0.1% | | | | | | | 417,870 | |
| | | | | | | | | |
| Net Assets — 100.0% | | | | | | $ | 863,953,715 | |
| ADR - American Depositary Receipt. |
| (a) | Non-income producing security. |
| (b) | The rate shown is the 7-day effective yield as of March 31, 2024. |
See accompanying notes to financial statements.
| DAVENPORT EQUITY OPPORTUNITIES FUND |
| SCHEDULE OF INVESTMENTS |
| March 31, 2024 |
| COMMON STOCKS — 97.8% | | Shares | | | Value | |
| Communications — 1.9% | | | | | | | | |
| Take-Two Interactive Software, Inc. (a) | | | 117,637 | | | $ | 17,467,918 | |
| | | | | | | | | |
| Consumer Discretionary — 25.6% | | | | | | | | |
| Cannae Holdings, Inc. (a) | | | 1,055,474 | | | | 23,473,742 | |
| CarMax, Inc. (a) | | | 337,924 | | | | 29,436,559 | |
| DraftKings, Inc. - Class A (a) | | | 691,826 | | | | 31,415,819 | |
| Etsy, Inc. (a) | | | 269,783 | | | | 18,539,488 | |
| Live Nation Entertainment, Inc. (a) | | | 426,648 | | | | 45,126,559 | |
| Mobileye Global, Inc. - Class A (a) | | | 827,625 | | | | 26,608,144 | |
| O’Reilly Automotive, Inc. (a) | | | 28,692 | | | | 32,389,825 | |
| Pool Corporation | | | 56,391 | | | | 22,753,768 | |
| | | | | | | | 229,743,904 | |
| Consumer Staples — 1.6% | | | | | | | | |
| Casey’s General Stores, Inc. | | | 44,634 | | | | 14,213,697 | |
| | | | | | | | | |
| Financials — 23.3% | | | | | | | | |
| Allstate Corporation (The) | | | 160,075 | | | | 27,694,576 | |
| Brookfield Asset Management Ltd. - Class A | | | 450,587 | | | | 18,933,666 | |
| Brookfield Corporation | | | 1,035,707 | | | | 43,365,052 | |
| Fairfax Financial Holdings Ltd. | | | 33,467 | | | | 36,112,231 | |
| Fidelity National Financial, Inc. | | | 517,074 | | | | 27,456,629 | |
| Kinsale Capital Group, Inc. | | | 59,493 | | | | 31,218,357 | |
| Markel Group, Inc. (a) | | | 16,102 | | | | 24,498,871 | |
| | | | | | | | 209,279,382 | |
| Health Care — 5.4% | | | | | | | | |
| Align Technology, Inc. (a) | | | 51,772 | | | | 16,977,074 | |
| Avantor, Inc. (a) | | | 1,240,854 | | | | 31,728,637 | |
| | | | | | | | 48,705,711 | |
| Industrials — 20.1% | | | | | | | | |
| Clean Harbors, Inc. (a) | | | 117,519 | | | | 23,657,750 | |
| Enovis Corporation (a) | | | 609,131 | | | | 38,040,231 | |
| ESAB Corporation | | | 209,524 | | | | 23,167,069 | |
| J.B. Hunt Transport Services, Inc. | | | 134,695 | | | | 26,837,979 | |
| Watsco, Inc. | | | 62,426 | | | | 26,966,159 | |
| Xylem, Inc. | | | 322,702 | | | | 41,706,006 | |
| | | | | | | | 180,375,194 | |
| Materials — 7.1% | | | | | | | | |
| Martin Marietta Materials, Inc. | | | 60,440 | | | | 37,106,533 | |
| Sherwin-Williams Company (The) | | | 76,796 | | | | 26,673,555 | |
| | | | | | | | 63,780,088 | |
| DAVENPORT EQUITY OPPORTUNITIES FUND |
| SCHEDULE OF INVESTMENTS (Continued) |
| COMMON STOCKS — 97.8% (Continued) | | Shares | | | Value | |
| Real Estate — 6.0% | | | | | | | | |
| American Tower Corporation | | | 122,433 | | | $ | 24,191,537 | |
| Lamar Advertising Company - Class A | | | 250,222 | | | | 29,879,009 | |
| | | | | | | | 54,070,546 | |
| Technology — 6.8% | | | | | | | | |
| Alight, Inc. - Class A (a) | | | 3,087,455 | | | | 30,411,432 | |
| Autodesk, Inc. (a) | | | 55,349 | | | | 14,413,987 | |
| PTC, Inc. (a) | | | 84,776 | | | | 16,017,577 | |
| | | | | | | | 60,842,996 | |
| | | | | | | | | |
| Total Common Stocks (Cost $583,719,843) | | | | | | $ | 878,479,436 | |
| | | | | | | |
| MONEY MARKET FUNDS — 2.9% | | Shares | | | Value | |
| First American Treasury Obligations Fund - Class X, 5.22% (b) (Cost $25,708,227) | | | 25,708,227 | | | $ | 25,708,227 | |
| | | | | | | | | |
| Total Investments at Value — 100.7% (Cost $609,428,070) | | | | | | $ | 904,187,663 | |
| | | | | | | | | |
| Liabilities in Excess of Other Assets — (0.7%) | | | | | | | (6,531,649 | ) |
| | | | | | | | | |
| Net Assets — 100.0% | | | | | | $ | 897,656,014 | |
| (a) | Non-income producing security. |
| (b) | The rate shown is the 7-day effective yield as of March 31, 2024. |
See accompanying notes to financial statements.
| DAVENPORT SMALL CAP FOCUS FUND |
| SCHEDULE OF INVESTMENTS |
| March 31, 2024 |
| COMMON STOCKS — 91.7% | | Shares | | | Value | |
| Communications — 5.9% | | | | | | | | |
| Cable One, Inc. | | | 43,984 | | | $ | 18,610,950 | |
| Liberty Latin America Ltd. - Class C (a) | | | 3,495,436 | | | | 24,433,098 | |
| Shenandoah Telecommunications Company | | | 925,781 | | | | 16,080,816 | |
| | | | | | | | 59,124,864 | |
| Consumer Discretionary — 16.1% | | | | | | | | |
| Cannae Holdings, Inc. (a) | | | 1,474,972 | | | | 32,803,377 | |
| DraftKings, Inc. - Class A (a) | | | 365,564 | | | | 16,600,261 | |
| Leslie’s, Inc. (a) | | | 4,324,624 | | | | 28,110,056 | |
| Monarch Casino & Resort, Inc. | | | 679,456 | | | | 50,952,406 | |
| OneSpaWorld Holdings Ltd. (a) | | | 2,548,222 | | | | 33,712,977 | |
| | | | | | | | 162,179,077 | |
| Consumer Staples — 4.6% | | | | | | | | |
| J & J Snack Foods Corporation | | | 217,195 | | | | 31,397,709 | |
| Seaboard Corporation | | | 4,573 | | | | 14,742,986 | |
| | | | | | | | 46,140,695 | |
| Energy — 6.6% | | | | | | | | |
| California Resources Corporation | | | 623,542 | | | | 34,357,164 | |
| CNX Resources Corporation (a) | | | 400,000 | | | | 9,488,000 | |
| Peyto Exploration & Development Corporation | | | 2,020,447 | | | | 22,277,651 | |
| | | | | | | | 66,122,815 | |
| Financials — 10.6% | | | | | | | | |
| Diamond Hill Investment Group, Inc. | | | 69,348 | | | | 10,691,381 | |
| Kinsale Capital Group, Inc. | | | 94,079 | | | | 49,367,015 | |
| Stewart Information Services Corporation | | | 727,371 | | | | 47,322,757 | |
| | | | | | | | 107,381,153 | |
| Health Care — 3.4% | | | | | | | | |
| Perrigo Company plc | | | 1,062,112 | | | | 34,189,385 | |
| | | | | | | | | |
| Industrials — 15.9% | | | | | | | | |
| Chart Industries, Inc. (a) | | | 168,936 | | | | 27,827,138 | |
| Enovis Corporation (a) | | | 672,897 | | | | 42,022,418 | |
| ESAB Corporation | | | 376,545 | | | | 41,634,581 | |
| Generac Holdings, Inc. (a) | | | 226,224 | | | | 28,535,895 | |
| Vestis Corporation | | | 1,031,379 | | | | 19,874,673 | |
| | | | | | | | 159,894,705 | |
| Materials — 3.5% | | | | | | | | |
| NewMarket Corporation | | | 22,736 | | | | 14,428,720 | |
| Trex Company, Inc. (a) | | | 211,261 | | | | 21,073,285 | |
| | | | | | | | 35,502,005 | |
| DAVENPORT SMALL CAP FOCUS FUND |
| SCHEDULE OF INVESTMENTS (Continued) |
| COMMON STOCKS — 91.7% (Continued) | | Shares | | | Value | |
| Real Estate — 11.2% | | | | | | | | |
| FRP Holdings, Inc. (a) | | | 147,944 | | | $ | 9,083,761 | |
| Janus International Group, Inc. (a) | | | 3,239,075 | | | | 49,007,205 | |
| Lamar Advertising Company - Class A | | | 221,922 | | | | 26,499,706 | |
| Outfront Media, Inc. | | | 1,720,326 | | | | 28,884,274 | |
| | | | | | | | 113,474,946 | |
| Technology — 13.9% | | | | | | | | |
| Alight, Inc. - Class A (a) | | | 4,273,948 | | | | 42,098,388 | |
| DoubleVerify Holdings, Inc. (a) | | | 671,709 | | | | 23,617,289 | |
| HealthEquity, Inc. (a) | | | 343,734 | | | | 28,059,006 | |
| Verra Mobility Corporation (a) | | | 1,858,609 | | | | 46,409,467 | |
| | | | | | | | 140,184,150 | |
| | | | | | | | | |
| Total Common Stocks (Cost $771,738,855) | | | | | | $ | 924,193,795 | |
| | | | | | | | | |
| EXCHANGE-TRADED FUNDS — 2.5% | | Shares | | | Value | |
| ALPS Medical Breakthroughs ETF (Cost $22,485,098) | | | 723,402 | | | $ | 25,861,621 | |
| | | | | | | |
| MONEY MARKET FUNDS — 6.2% | | Shares | | | Value | |
| First American Treasury Obligations Fund - Class X, 5.22% (b) (Cost $62,356,981) | | | 62,356,981 | | | $ | 62,356,981 | |
| | | | | | | | | |
| Total Investments at Value — 100.4% (Cost $856,580,934) | | | | | | $ | 1,012,412,397 | |
| | | | | | | | | |
| Liabilities in Excess of Other Assets — (0.4%) | | | | | | | (4,272,934 | ) |
| | | | | | | | | |
| Net Assets — 100.0% | | | | | | $ | 1,008,139,463 | |
| (a) | Non-income producing security. |
| (b) | The rate shown is the 7-day effective yield as of March 31, 2024. |
See accompanying notes to financial statements.
| DAVENPORT BALANCED INCOME FUND |
| SCHEDULE OF INVESTMENTS |
| March 31, 2024 |
| COMMON STOCKS — 60.1% | | Shares | | | Value | |
| Communications — 4.0% | | | | | | | | |
| Alphabet, Inc. - Class A (a) | | | 23,957 | | | $ | 3,615,830 | |
| Comcast Corporation - Class A | | | 67,979 | | | | 2,946,890 | |
| Walt Disney Company (The) | | | 20,518 | | | | 2,510,582 | |
| | | | | | | | 9,073,302 | |
| Consumer Discretionary — 3.5% | | | | | | | | |
| Genuine Parts Company | | | 11,945 | | | | 1,850,639 | |
| Lowe’s Companies, Inc. | | | 13,529 | | | | 3,446,242 | |
| McDonald’s Corporation | | | 9,828 | | | | 2,771,005 | |
| | | | | | | | 8,067,886 | |
| Consumer Staples — 6.0% | | | | | | | | |
| Anheuser-Busch InBev S.A./N.V. - ADR | | | 60,248 | | | | 3,661,873 | |
| Kenvue, Inc. | | | 108,000 | | | | 2,317,680 | |
| Keurig Dr Pepper, Inc. | | | 86,948 | | | | 2,666,695 | |
| Philip Morris International, Inc. | | | 34,859 | | | | 3,193,782 | |
| Walmart, Inc. | | | 31,149 | | | | 1,874,235 | |
| | | | | | | | 13,714,265 | |
| Energy — 3.5% | | | | | | | | |
| Chevron Corporation | | | 21,218 | | | | 3,346,927 | |
| Enbridge, Inc. | | | 60,275 | | | | 2,180,750 | |
| Enterprise Products Partners, L.P. | | | 87,000 | | | | 2,538,660 | |
| | | | | | | | 8,066,337 | |
| Financials — 14.1% | | | | | | | | |
| Berkshire Hathaway, Inc. - Class B (a) | | | 6,141 | | | | 2,582,413 | |
| Brookfield Asset Management Ltd. - Class A | | | 60,284 | | | | 2,533,134 | |
| Brookfield Corporation | | | 60,623 | | | | 2,538,285 | |
| Chubb Ltd. | | | 7,902 | | | | 2,047,645 | |
| Citigroup, Inc. | | | 33,536 | | | | 2,120,817 | |
| Diamond Hill Investment Group, Inc. | | | 11,715 | | | | 1,806,102 | |
| Fairfax Financial Holdings Ltd. | | | 3,758 | | | | 4,055,032 | |
| Fidelity National Financial, Inc. | | | 39,078 | | | | 2,075,042 | |
| JPMorgan Chase & Company | | | 19,077 | | | | 3,821,123 | |
| Markel Group, Inc. (a) | | | 1,665 | | | | 2,533,264 | |
| Stewart Information Services Corporation | | | 50,417 | | | | 3,280,130 | |
| Wells Fargo & Company | | | 47,098 | | | | 2,729,800 | |
| | | | | | | | 32,122,787 | |
| Health Care — 9.4% | | | | | | | | |
| Becton, Dickinson and Company | | | 7,422 | | | | 1,836,574 | |
| Bristol-Myers Squibb Company | | | 64,412 | | | | 3,493,063 | |
| Elevance Health, Inc. | | | 6,879 | | | | 3,567,037 | |
| Johnson & Johnson | | | 28,470 | | | | 4,503,669 | |
| DAVENPORT BALANCED INCOME FUND |
| SCHEDULE OF INVESTMENTS (Continued) |
| COMMON STOCKS — 60.1% (Continued) | | Shares | | | Value | |
| Health Care — 9.4% (Continued) | | | | | | | | |
| Medtronic plc | | | 36,857 | | | $ | 3,212,087 | |
| Perrigo Company plc | | | 73,853 | | | | 2,377,328 | |
| Sanofi - ADR | | | 50,797 | | | | 2,468,734 | |
| | | | | | | | 21,458,492 | |
| Industrials — 9.2% | | | | | | | | |
| Deere & Company | | | 4,232 | | | | 1,738,251 | |
| FedEx Corporation | | | 7,451 | | | | 2,158,853 | |
| Johnson Controls International plc | | | 42,024 | | | | 2,745,008 | |
| L3Harris Technologies, Inc. | | | 17,290 | | | | 3,684,499 | |
| Norfolk Southern Corporation | | | 10,378 | | | | 2,645,041 | |
| RTX Corporation | | | 20,620 | | | | 2,011,068 | |
| TE Connectivity Ltd. | | | 20,730 | | | | 3,010,825 | |
| Watsco, Inc. | | | 7,109 | | | | 3,070,875 | |
| | | | | | | | 21,064,420 | |
| Materials — 1.0% | | | | | | | | |
| Avery Dennison Corporation | | | 9,771 | | | | 2,181,376 | |
| | | | | | | | | |
| Real Estate — 2.5% | | | | | | | | |
| Alexandria Real Estate Equities, Inc. | | | 15,020 | | | | 1,936,228 | |
| Lamar Advertising Company - Class A | | | 30,697 | | | | 3,665,529 | |
| | | | | | | | 5,601,757 | |
| Technology — 3.5% | | | | | | | | |
| HP, Inc. | | | 60,099 | | | | 1,816,192 | |
| Intel Corporation | | | 40,787 | | | | 1,801,562 | |
| Oracle Corporation | | | 35,028 | | | | 4,399,867 | |
| | | | | | | | 8,017,621 | |
| Utilities — 3.4% | | | | | | | | |
| Brookfield Infrastructure Partners, L.P. | | | 61,867 | | | | 1,930,869 | |
| Brookfield Renewable Partners, L.P. | | | 76,999 | | | | 1,788,687 | |
| NextEra Energy, Inc. | | | 63,059 | | | | 4,030,100 | |
| | | | | | | | 7,749,656 | |
| | | | | | | | | |
| Total Common Stocks (Cost $106,998,424) | | | | | | $ | 137,117,899 | |
| DAVENPORT BALANCED INCOME FUND |
| SCHEDULE OF INVESTMENTS (Continued) |
| FIXED RATE CORPORATE BONDS — 29.5% | | Par Value | | | Value | |
| Communications — 3.9% | | | | | | | | |
| Meta Platforms, Inc., 4.950%, due 05/15/2033 | | $ | 4,990,000 | | | $ | 5,054,661 | |
| VeriSign, Inc., 5.250%, due 04/01/2025 | | | 3,950,000 | | | | 3,933,516 | |
| | | | | | | | 8,988,177 | |
| Consumer Discretionary — 0.7% | | | | | | | | |
| Lowe’s Companies, Inc., 4.400%, due 09/08/2025 | | | 1,525,000 | | | | 1,506,673 | |
| | | | | | | | | |
| Consumer Staples — 3.4% | | | | | | | | |
| Keurig Dr Pepper, Inc., 5.050%, due 03/15/2029 | | | 2,500,000 | | | | 2,507,199 | |
| Phillip Morris International, Inc., 5.375%, due 02/15/2033 | | | 2,995,000 | | | | 3,020,152 | |
| Walgreens Boots Alliance, Inc., 3.800%, due 11/18/2024 | | | 2,245,000 | | | | 2,212,190 | |
| | | | | | | | 7,739,541 | |
| Energy — 4.5% | | | | | | | | |
| Boardwalk Pipelines, L.P., 4.450%, due 07/15/2027 | | | 2,200,000 | | | | 2,147,717 | |
| BP Capital Markets America, 4.812%, due 02/13/2033 | | | 2,990,000 | | | | 2,952,472 | |
| MPLX, L.P., 4.125%, due 03/01/2027 | | | 3,250,000 | | | | 3,168,605 | |
| ONEOK, Inc., 5.550%, due 11/01/2026 | | | 1,995,000 | | | | 2,013,983 | |
| | | | | | | | 10,282,777 | |
| Financials — 7.2% | | | | | | | | |
| Bank of Montreal, 5.920%, due 09/25/2025 | | | 3,990,000 | | | | 4,030,854 | |
| BlackRock, Inc., 4.750%, due 05/25/2033 | | | 3,000,000 | | | | 2,986,452 | |
| Charles Schwab Corporation (The), 5.875%, due 08/24/2026 | | | 3,750,000 | | | | 3,812,346 | |
| Royal Bank of Canada, 5.000%, due 05/02/2033 | | | 3,000,000 | | | | 2,990,563 | |
| Wells Fargo & Company, 4.811%, due 01/15/2026 | | | 2,500,000 | | | | 2,487,681 | |
| | | | | | | | 16,307,896 | |
| Health Care — 5.3% | | | | | | | | |
| Bristol-Myers Squibb Company, 5.900%, due 11/15/2033 | | | 3,000,000 | | | | 3,207,362 | |
| HCA, Inc., 5.450%, due 04/01/2031 | | | 3,500,000 | | | | 3,521,304 | |
| Merck & Company, Inc., 4.500%, due 05/17/2033 | | | 2,490,000 | | | | 2,436,336 | |
| Zoetis, Inc., 5.400%, due 11/14/2025 | | | 2,990,000 | | | | 2,993,865 | |
| | | | | | | | 12,158,867 | |
| Industrials — 0.9% | | | | | | | | |
| Waste Management, Inc., 4.875%, due 02/15/2029 | | | 1,995,000 | | | | 2,014,198 | |
| | | | | | | | | |
| Technology — 2.3% | | | | | | | | |
| Fiserv, Inc., 3.200%, due 07/01/2026 | | | 2,325,000 | | | | 2,229,141 | |
| Oracle Corporation, 5.800%, due 11/10/2025 | | | 2,990,000 | | | | 3,015,212 | |
| | | | | | | | 5,244,353 | |
| DAVENPORT BALANCED INCOME FUND |
| SCHEDULE OF INVESTMENTS (Continued) |
| FIXED RATE CORPORATE BONDS — 29.5% (Continued) | | Par Value | | | Value | |
| Utilities — 1.3% | | | | | | | | |
| NextEra Energy Capital Holdings, Inc., 6.051%, due 03/01/2025 | | $ | 2,995,000 | | | $ | 3,006,646 | |
| | | | | | | | | |
| Total Fixed Rate Corporate Bonds (Cost $67,246,731) | | | | | | $ | 67,249,128 | |
| | | | | | | | | |
| MUNICIPAL BONDS — 1.1% | | Par Value | | | Value | |
| Richmond, VA, GO, Public Improvement Bonds, 4.800%, due 03/01/2033 (Cost $2,536,886) | | $ | 2,455,000 | | | $ | 2,468,999 | |
| | | | | | | |
| U.S. TREASURY OBLIGATIONS — 7.5% | | Par Value | | | Value | |
| U.S. Treasury Notes — 7.5% | | | | | | | | |
| 0.250%, due 06/15/2024 | | $ | 4,500,000 | | | $ | 4,452,803 | |
| 2.750%, due 06/30/2025 | | | 4,810,000 | | | | 4,686,180 | |
| 4.750%, due 07/31/2025 | | | 2,000,000 | | | | 1,996,719 | |
| 4.625%, due 09/15/2026 | | | 4,000,000 | | | | 4,010,000 | |
| 3.875%, due 08/15/2033 | | | 2,000,000 | | | | 1,948,750 | |
| Total U.S. Treasury Obligations (Cost $17,140,077) | | | | | | $ | 17,094,452 | |
| | | | | | | |
| MONEY MARKET FUNDS — 1.4% | | Shares | | | Value | |
| First American Treasury Obligations Fund - Class X, 5.22% (b) (Cost $3,177,435) | | | 3,177,435 | | | $ | 3,177,435 | |
| | | | | | | | | |
| Total Investments at Value — 99.6% (Cost $197,099,553) | | | | | | $ | 227,107,913 | |
| | | | | | | | | |
| Other Assets in Excess of Liabilities — 0.4% | | | | | | | 955,301 | |
| | | | | | | | | |
| Net Assets — 100.0% | | | | | | $ | 228,063,214 | |
| ADR - American Depositary Receipt. |
| (a) | Non-income producing security. |
| (b) | The rate shown is the 7-day effective yield as of March 31, 2024. |
See accompanying notes to financial statements.
| DAVENPORT INSIDER BUYING FUND |
| SCHEDULE OF INVESTMENTS |
| March 31, 2024 |
| COMMON STOCKS — 94.8% | | Shares | | | Value | |
| Consumer Discretionary — 8.5% | | | | | | | | |
| Genuine Parts Company | | | 12,045 | | | $ | 1,866,132 | |
| NIKE, Inc. - Class B | | | 30,842 | | | | 2,898,531 | |
| Yum China Holdings, Inc. | | | 50,512 | | | | 2,009,873 | |
| | | | | | | | 6,774,536 | |
| Consumer Staples — 7.3% | | | | | | | | |
| Darling Ingredients, Inc. (a) | | | 30,354 | | | | 1,411,764 | |
| Kenvue, Inc. | | | 103,756 | | | | 2,226,604 | |
| Keurig Dr Pepper, Inc. | | | 71,837 | | | | 2,203,241 | |
| | | | | | | | 5,841,609 | |
| Energy — 4.0% | | | | | | | | |
| EOG Resources, Inc. | | | 24,576 | | | | 3,141,796 | |
| | | | | | | | | |
| Financials — 10.8% | | | | | | | | |
| American Express Company | | | 5,958 | | | | 1,356,577 | |
| Aon plc - Class A | | | 8,274 | | | | 2,761,199 | |
| Charles Schwab Corporation (The) | | | 39,550 | | | | 2,861,047 | |
| Everest Group Ltd. | | | 4,098 | | | | 1,628,955 | |
| | | | | | | | 8,607,778 | |
| Health Care — 17.6% | | | | | | | | |
| Align Technology, Inc. (a) | | | 4,714 | | | | 1,545,815 | |
| Bristol-Myers Squibb Company | | | 51,043 | | | | 2,768,062 | |
| Charles River Laboratories International, Inc. (a) | | | 10,613 | | | | 2,875,592 | |
| DENTSPLY SIRONA, Inc. | | | 73,825 | | | | 2,450,252 | |
| Mettler-Toledo International, Inc. (a) | | | 1,075 | | | | 1,431,137 | |
| Perrigo Company plc | | | 23,067 | | | | 742,526 | |
| Zimmer Biomet Holdings, Inc. | | | 16,708 | | | | 2,205,122 | |
| | | | | | | | 14,018,506 | |
| Industrials — 18.6% | | | | | | | | |
| AMN Healthcare Services, Inc. (a) | | | 20,500 | | | | 1,281,455 | |
| Amphenol Corporation - Class A | | | 14,799 | | | | 1,707,065 | |
| Deere & Company | | | 4,351 | | | | 1,787,130 | |
| Emerson Electric Company | | | 27,649 | | | | 3,135,950 | |
| FedEx Corporation | | | 8,704 | | | | 2,521,897 | |
| Keysight Technologies, Inc. (a) | | | 12,850 | | | | 2,009,483 | |
| Toro Company (The) | | | 7,200 | | | | 659,736 | |
| Vestis Corporation | | | 87,013 | | | | 1,676,740 | |
| | | | | | | | 14,779,456 | |
| Materials — 9.3% | | | | | | | | |
| Air Products & Chemicals, Inc. | | | 12,544 | | | | 3,039,035 | |
| Ball Corporation | | | 35,901 | | | | 2,418,291 | |
| Corteva, Inc. | | | 34,030 | | | | 1,962,510 | |
| | | | | | | | 7,419,836 | |
| DAVENPORT INSIDER BUYING FUND |
| SCHEDULE OF INVESTMENTS (Continued) |
| COMMON STOCKS — 94.8% (Continued) | | Shares | | | Value | |
| Real Estate — 2.1% | | | | | | | | |
| Mid-America Apartment Communities, Inc. | | | 12,546 | | | $ | 1,650,803 | |
| | | | | | | | | |
| Technology — 12.5% | | | | | | | | |
| Genpact Ltd. | | | 62,731 | | | | 2,066,986 | |
| Mastercard, Inc. - Class A | | | 5,529 | | | | 2,662,601 | |
| Maximus, Inc. | | | 19,939 | | | | 1,672,882 | |
| TransUnion | | | 20,948 | | | | 1,671,650 | |
| Zebra Technologies Corporation - Class A (a) | | | 6,168 | | | | 1,859,282 | |
| | | | | | | | 9,933,401 | |
| Utilities — 4.1% | | | | | | | | |
| NextEra Energy, Inc. | | | 50,399 | | | | 3,221,000 | |
| | | | | | | | | |
| Total Common Stocks (Cost $68,692,040) | | | | | | $ | 75,388,721 | |
| | | | | | | | | |
| EXCHANGE-TRADED FUNDS — 2.3% | | Shares | | | Value | |
| iShares Core S&P 500® ETF (Cost $1,617,089) | | | 3,466 | | | $ | 1,822,180 | |
| | | | | | | |
| MONEY MARKET FUNDS — 3.2% | | Shares | | | Value | |
| First American Treasury Obligations Fund - Class X, 5.22% (b) (Cost $2,555,516) | | | 2,555,516 | | | $ | 2,555,516 | |
| | | | | | | | | |
| Total Investments at Value — 100.3% (Cost $72,864,645) | | | | | | $ | 79,766,417 | |
| | | | | | | | | |
| Liabilities in Excess of Other Assets — (0.3%) | | | | | | | (212,643 | ) |
| | | | | | | | | |
| Net Assets — 100.0% | | | | | | $ | 79,553,774 | |
| (a) | Non-income producing security. |
| (b) | The rate shown is the 7-day effective yield as of March 31, 2024. |
See accompanying notes to financial statements.
| THE DAVENPORT FUNDS |
| STATEMENTS OF ASSETS AND LIABILITIES |
| March 31, 2024 |
| | | | | | Davenport | | | Davenport | |
| | | Davenport | | | Value & | | | Equity | |
| | | Core Leaders | | | Income | | | Opportunities | |
| | | Fund | | | Fund | | | Fund | |
| ASSETS | | | | | | | | | |
| Investments in securities: | | | | | | | | | | | | |
| At cost | | $ | 559,170,197 | | | $ | 656,570,091 | | | $ | 609,428,070 | |
| At value (Note 2) | | $ | 984,972,882 | | | $ | 863,535,845 | | | $ | 904,187,663 | |
| Cash | | | 310,053 | | | | 353,922 | | | | 464,163 | |
| Receivable for capital shares sold | | | 430,668 | | | | 95,524 | | | | 432,001 | |
| Dividends receivable | | | 442,412 | | | | 1,124,780 | | | | 284,103 | |
| Tax reclaims receivable | | | 16,170 | | | | — | | | | — | |
| Other assets | | | 15,966 | | | | 15,648 | | | | 16,151 | |
| TOTAL ASSETS | | | 986,188,151 | | | | 865,125,719 | | | | 905,384,081 | |
| | | | | | | | | | | | | |
| LIABILITIES | | | | | | | | | | | | |
| Payable for capital shares redeemed | | | 280,231 | | | | 559,410 | | | | 86,955 | |
| Payable for investment securities purchased | | | — | | | | — | | | | 6,998,713 | |
| Accrued management fees (Note 4) | | | 620,732 | | | | 536,555 | | | | 556,537 | |
| Payable to administrator (Note 4) | | | 71,360 | | | | 65,780 | | | | 68,320 | |
| Other accrued expenses | | | 18,876 | | | | 10,259 | | | | 17,542 | |
| TOTAL LIABILITIES | | | 991,199 | | | | 1,172,004 | | | | 7,728,067 | |
| | | | | | | | | | | | | |
| NET ASSETS | | $ | 985,196,952 | | | $ | 863,953,715 | | | $ | 897,656,014 | |
| | | | | | | | | | | | | |
| Net assets consist of: | | | | | | | | | | | | |
| Paid-in capital | | $ | 533,152,253 | | | $ | 640,107,431 | | | $ | 615,057,094 | |
| Distributable earnings | | | 452,044,699 | | | | 223,846,284 | | | | 282,598,920 | |
| Net assets | | $ | 985,196,952 | | | $ | 863,953,715 | | | $ | 897,656,014 | |
| | | | | | | | | | | | | |
| Shares of beneficial interest outstanding (unlimited number of shares authorized, $0.01 par value) | | | 28,362,228 | | | | 45,206,951 | | | | 35,994,914 | |
| | | | | | | | | | | | | |
| Net asset value, offering price and redemption price per share (Note 2) | | $ | 34.74 | | | $ | 19.11 | | | $ | 24.94 | |
See accompanying notes to financial statements.
| THE DAVENPORT FUNDS |
| STATEMENTS OF ASSETS AND LIABILITIES (Continued) |
| March 31, 2024 |
| | | Davenport | | | Davenport | | | Davenport | |
| | | Small Cap | | | Balanced | | | Insider | |
| | | Focus | | | Income | | | Buying | |
| | | Fund | | | Fund | | | Fund | |
| ASSETS | | | | | | | | | | | | |
| Investments in securities: | | | | | | | | | | | | |
| At cost | | $ | 856,580,934 | | | $ | 197,099,553 | | | $ | 72,864,645 | |
| At value (Note 2) | | $ | 1,012,412,397 | | | $ | 227,107,913 | | | $ | 79,766,417 | |
| Cash | | | — | | | | 98,804 | | | | — | |
| Receivable for capital shares sold | | | 2,592,569 | | | | 1,385 | | | | 112,864 | |
| Receivable for investment securities sold | | | 3,663,783 | | | | 2,510,122 | | | | — | |
| Dividends and interest receivable | | | 665,187 | | | | 1,092,014 | | | | 109,801 | |
| Other assets | | | 36,717 | | | | 11,725 | | | | 14,242 | |
| TOTAL ASSETS | | | 1,019,370,653 | | | | 230,821,963 | | | | 80,003,324 | |
| | | | | | | | | | | | | |
| LIABILITIES | | | | | | | | | | | | |
| Payable for capital shares redeemed | | | 324,599 | | | | 67,824 | | | | — | |
| Payable for investment securities purchased | | | 10,175,085 | | | | 2,520,617 | | | | 380,178 | |
| Accrued management fees (Note 4) | | | 611,586 | | | | 142,163 | | | | 47,872 | |
| Payable to administrator (Note 4) | | | 74,310 | | | | 22,350 | | | | 7,840 | |
| Other accrued expenses | | | 45,610 | | | | 5,795 | | | | 13,660 | |
| TOTAL LIABILITIES | | | 11,231,190 | | | | 2,758,749 | | | | 449,550 | |
| | | | | | | | | | | | | |
| NET ASSETS | | $ | 1,008,139,463 | | | $ | 228,063,214 | | | $ | 79,553,774 | |
| | | | | | | | | | | | | |
| Net assets consist of: | | | | | | | | | | | | |
| Paid-in capital | | $ | 834,293,238 | | | $ | 201,699,791 | | | $ | 72,605,850 | |
| Distributable earnings | | | 173,846,225 | | | | 26,363,423 | | | | 6,947,924 | |
| Net assets | | $ | 1,008,139,463 | | | $ | 228,063,214 | | | $ | 79,553,774 | |
| | | | | | | | | | | | | |
| Shares of beneficial interest outstanding (unlimited number of shares authorized, $0.01 par value) | | | 52,745,393 | | | | 17,693,596 | | | | 7,037,740 | |
| | | | | | | | | | | | | |
| Net asset value, offering price and redemption price per share (Note 2) | | $ | 19.11 | | | $ | 12.89 | | | $ | 11.30 | |
See accompanying notes to financial statements.
| THE DAVENPORT FUNDS |
| STATEMENTS OF OPERATIONS |
| For the Year Ended March 31, 2024 |
| | | | | | Davenport | | | Davenport | |
| | | Davenport | | | Value & | | | Equity | |
| | | Core Leaders | | | Income | | | Opportunities | |
| | | Fund | | | Fund | | | Fund | |
| INVESTMENT INCOME | | | | | | | | | | | | |
| Dividends | | $ | 10,037,219 | | | $ | 20,552,962 | | | $ | 8,518,531 | |
| Foreign withholding taxes on dividends | | | (90,682 | ) | | | (493,958 | ) | | | (208,562 | ) |
| TOTAL INVESTMENT INCOME | | | 9,946,537 | | | | 20,059,004 | | | | 8,309,969 | |
| | | | | | | | | | | | | |
| EXPENSES | | | | | | | | | | | | |
| Management fees (Note 4) | | | 6,203,924 | | | | 6,069,741 | | | | 5,526,298 | |
| Administration fees (Note 4) | | | 724,647 | | | | 729,837 | | | | 700,901 | |
| Registration and filing fees | | | 37,860 | | | | 30,351 | | | | 38,571 | |
| Custodian and bank service fees | | | 51,292 | | | | 49,951 | | | | 45,654 | |
| Compliance service fees and expenses (Note 4) | | | 32,489 | | | | 31,870 | | | | 29,369 | |
| Trustees’ fees and expenses (Note 4) | | | 23,051 | | | | 23,051 | | | | 23,051 | |
| Audit and tax services fees | | | 16,915 | | | | 16,915 | | | | 16,915 | |
| Postage and supplies | | | 23,261 | | | | 17,767 | | | | 17,592 | |
| Insurance expense | | | 12,865 | | | | 14,412 | | | | 11,907 | |
| Legal fees | | | 9,285 | | | | 8,785 | | | | 8,785 | |
| Shareholder reporting expenses | | | 8,770 | | | | 8,271 | | | | 8,158 | |
| Other expenses | | | 11,202 | | | | 12,476 | | | | 11,688 | |
| TOTAL EXPENSES | | | 7,155,561 | | | | 7,013,427 | | | | 6,438,889 | |
| | | | | | | | | | | | | |
| NET INVESTMENT INCOME | | | 2,790,976 | | | | 13,045,577 | | | | 1,871,080 | |
| | | | | | | | | | | | | |
| REALIZED AND UNREALIZED GAINS ON INVESTMENTS AND FOREIGN CURRENCIES | | | | | | | | | | | | |
| Net realized gains from: | | | | | | | | | | | | |
| Investments | | | 53,592,737 | | | | 36,498,496 | | | | 3,583,484 | |
| Foreign currency transactions | | | — | | | | 2,146 | | | | — | |
| Net change in unrealized appreciation (depreciation) on investments | | | 206,587,913 | | | | 63,256,914 | | | | 219,661,532 | |
| NET REALIZED AND UNREALIZED GAINS ON INVESTMENTS AND FOREIGN CURRENCIES | | | 260,180,650 | | | | 99,757,556 | | | | 223,245,016 | |
| | | | | | | | | | | | | |
| NET INCREASE IN NET ASSETS FROM OPERATIONS | | $ | 262,971,626 | | | $ | 112,803,133 | | | $ | 225,116,096 | |
See accompanying notes to financial statements.
| THE DAVENPORT FUNDS |
| STATEMENTS OF OPERATIONS (Continued) |
| For the Year Ended March 31, 2024 (a) |
| | | Davenport | | | Davenport | | | Davenport | |
| | | Small Cap | | | Balanced | | | Insider | |
| | | Focus | | | Income | | | Buying | |
| | | Fund | | | Fund | | | Fund | |
| INVESTMENT INCOME | | | | | | | | | | | | |
| Dividends | | $ | 11,492,458 | | | $ | 3,746,662 | | | $ | 404,807 | |
| Foreign withholding taxes on dividends | | | (260,721 | ) | | | (75,435 | ) | | | — | |
| Interest | | | — | | | | 3,689,653 | | | | — | |
| TOTAL INVESTMENT INCOME | | | 11,231,737 | | | | 7,360,880 | | | | 404,807 | |
| | | | | | | | | | | | | |
| EXPENSES | | | | | | | | | | | | |
| Management fees (Note 4) | | | 5,287,152 | | | | 1,652,542 | | | | 144,288 | |
| Administration fees (Note 4) | | | 684,902 | | | | 249,781 | | | | 24,325 | |
| Registration and filing fees | | | 70,339 | | | | 28,852 | | | | 15,793 | |
| Custodian and bank service fees | | | 44,913 | | | | 15,787 | | | | 5,668 | |
| Compliance service fees and expenses (Note 4) | | | 28,249 | | | | 11,780 | | | | 1,972 | |
| Trustees’ fees and expenses (Note 4) | | | 23,051 | | | | 23,051 | | | | 5,421 | |
| Audit and tax services fees | | | 16,915 | | | | 18,415 | | | | 500 | |
| Postage and supplies | | | 16,796 | | | | 6,991 | | | | 818 | |
| Insurance expense | | | 10,905 | | | | 4,626 | | | | — | |
| Legal fees | | | 9,427 | | | | 8,785 | | | | 2,462 | |
| Shareholder reporting expenses | | | 7,473 | | | | 6,452 | | | | 5,500 | |
| Other expenses | | | 12,448 | | | | 16,903 | | | | 3,686 | |
| TOTAL EXPENSES | | | 6,212,570 | | | | 2,043,965 | | | | 210,433 | |
| | | | | | | | | | | | | |
| NET INVESTMENT INCOME | | | 5,019,167 | | | | 5,316,915 | | | | 194,374 | |
| | | | | | | | | | | | | |
| REALIZED AND UNREALIZED GAINS ON INVESTMENTS AND FOREIGN CURRENCIES | | | | | | | | | | | | |
| Net realized gains from: | | | | | | | | | | | | |
| Investments | | | 26,575,598 | | | | 680,044 | | | | 34,861 | |
| Foreign currency transactions | | | — | | | | 289 | | | | — | |
| Net change in unrealized appreciation (depreciation) on investments | | | 140,358,482 | | | | 15,606,852 | | | | 6,901,772 | |
| NET REALIZED AND UNREALIZED GAINS ON INVESTMENTS AND FOREIGN CURRENCIES | | | 166,934,080 | | | | 16,287,185 | | | | 6,936,633 | |
| | | | | | | | | | | | | |
| NET INCREASE IN NET ASSETS FROM OPERATIONS | | $ | 171,953,247 | | | $ | 21,604,100 | | | $ | 7,131,007 | |
| (a) | Except for Davenport Insider Buying Fund, which represents the period from the commencement of operations (November 30, 2023) through March 31, 2024. |
See accompanying notes to financial statements.
| DAVENPORT CORE LEADERS FUND |
| STATEMENTS OF CHANGES IN NET ASSETS |
| | | Year | | | Year | |
| | | Ended | | | Ended | |
| | | March 31, | | | March 31, | |
| | | 2024 | | | 2023 | |
| FROM OPERATIONS | | | | | | | | |
| Net investment income | | $ | 2,790,976 | | | $ | 4,821,679 | |
| Net realized gains from investment transactions | | | 53,592,737 | | | | 22,404,942 | |
| Net change in unrealized appreciation (depreciation) on investments | | | 206,587,913 | | | | (124,093,570 | ) |
| Net increase (decrease) in net assets from operations | | | 262,971,626 | | | | (96,866,949 | ) |
| | | | | | | | | |
| DISTRIBUTIONS TO SHAREHOLDERS (Note 2) | | | (52,585,924 | ) | | | (33,421,621 | ) |
| | | | | | | | | |
| FROM CAPITAL SHARE TRANSACTIONS | | | | | | | | |
| Proceeds from shares sold | | | 74,132,286 | | | | 38,523,003 | |
| Net asset value of shares issued in reinvestment of distributions to shareholders | | | 48,682,171 | | | | 31,599,447 | |
| Payments for shares redeemed | | | (64,821,183 | ) | | | (68,665,707 | ) |
| Net increase in net assets from capital share transactions | | | 57,993,274 | | | | 1,456,743 | |
| | | | | | | | | |
| TOTAL INCREASE (DECREASE) IN NET ASSETS | | | 268,378,976 | | | | (128,831,827 | ) |
| | | | | | | | | |
| NET ASSETS | | | | | | | | |
| Beginning of year | | | 716,817,976 | | | | 845,649,803 | |
| End of year | | $ | 985,196,952 | | | $ | 716,817,976 | |
| | | | | | | | | |
| CAPITAL SHARE ACTIVITY | | | | | | | | |
| Shares sold | | | 2,429,095 | | | | 1,410,655 | |
| Shares reinvested | | | 1,647,862 | | | | 1,204,906 | |
| Shares redeemed | | | (2,149,294 | ) | | | (2,535,484 | ) |
| Net increase in shares outstanding | | | 1,927,663 | | | | 80,077 | |
| Shares outstanding at beginning of year | | | 26,434,565 | | | | 26,354,488 | |
| Shares outstanding at end of year | | | 28,362,228 | | | | 26,434,565 | |
See accompanying notes to financial statements.
| DAVENPORT VALUE & INCOME FUND |
| STATEMENTS OF CHANGES IN NET ASSETS |
| | | Year | | | Year | |
| | | Ended | | | Ended | |
| | | March 31, | | | March 31, | |
| | | 2024 | | | 2023 | |
| FROM OPERATIONS | | | | | | | | |
| Net investment income | | $ | 13,045,577 | | | $ | 16,588,979 | |
| Net realized gains (losses) from: | | | | | | | | |
| Investments | | | 36,498,496 | | | | (14,205,769 | ) |
| Foreign currency transactions | | | 2,146 | | | | (8,145 | ) |
| Net change in unrealized appreciation (depreciation) on investments | | | 63,256,914 | | | | (110,973,394 | ) |
| Net increase (decrease) in net assets from operations | | | 112,803,133 | | | | (108,598,329 | ) |
| | | | | | | | | |
| DISTRIBUTIONS TO SHAREHOLDERS (Note 2) | | | (13,278,633 | ) | | | (44,814,541 | ) |
| | | | | | | | | |
| FROM CAPITAL SHARE TRANSACTIONS | | | | | | | | |
| Proceeds from shares sold | | | 43,382,234 | | | | 64,176,770 | |
| Net asset value of shares issued in reinvestment of distributions to shareholders | | | 11,840,065 | | | | 41,332,927 | |
| Payments for shares redeemed | | | (94,722,701 | ) | | | (68,222,589 | ) |
| Net increase (decrease) in net assets from capital share transactions | | | (39,500,402 | ) | | | 37,287,108 | |
| | | | | | | | | |
| TOTAL INCREASE (DECREASE) IN NET ASSETS | | | 60,024,098 | | | | (116,125,762 | ) |
| | | | | | | | | |
| NET ASSETS | | | | | | | | |
| Beginning of year | | | 803,929,617 | | | | 920,055,379 | |
| End of year | | $ | 863,953,715 | | | $ | 803,929,617 | |
| | | | | | | | | |
| CAPITAL SHARE ACTIVITY | | | | | | | | |
| Shares sold | | | 2,493,356 | | | | 3,639,179 | |
| Shares reinvested | | | 666,033 | | | | 2,406,658 | |
| Shares redeemed | | | (5,459,707 | ) | | | (3,885,746 | ) |
| Net increase (decrease) in shares outstanding | | | (2,300,318 | ) | | | 2,160,091 | |
| Shares outstanding at beginning of year | | | 47,507,269 | | | | 45,347,178 | |
| Shares outstanding at end of year | | | 45,206,951 | | | | 47,507,269 | |
See accompanying notes to financial statements.
| DAVENPORT EQUITY OPPORTUNITIES FUND |
| STATEMENTS OF CHANGES IN NET ASSETS |
| | | Year | | | Year | |
| | | Ended | | | Ended | |
| | | March 31, | | | March 31, | |
| | | 2024 | | | 2023 | |
| FROM OPERATIONS | | | | | | | | |
| Net investment income | | $ | 1,871,080 | | | $ | 2,577,584 | |
| Net realized gains from investment transactions | | | 3,583,484 | | | | 28,229,925 | |
| Net change in unrealized appreciation (depreciation) on investments | | | 219,661,532 | | | | (100,269,606 | ) |
| Net increase (decrease) in net assets from operations | | | 225,116,096 | | | | (69,462,097 | ) |
| | | | | | | | | |
| DISTRIBUTIONS TO SHAREHOLDERS (Note 2) | | | (37,152,062 | ) | | | (51,814,659 | ) |
| | | | | | | | | |
| FROM CAPITAL SHARE TRANSACTIONS | | | | | | | | |
| Proceeds from shares sold | | | 74,922,250 | | | | 46,895,501 | |
| Net asset value of shares issued in reinvestment of distributions to shareholders | | | 35,103,341 | | | | 49,644,736 | |
| Payments for shares redeemed | | | (54,199,095 | ) | | | (62,893,747 | ) |
| Net increase in net assets from capital share transactions | | | 55,826,496 | | | | 33,646,490 | |
| | | | | | | | | |
| TOTAL INCREASE (DECREASE) IN NET ASSETS | | | 243,790,530 | | | | (87,630,266 | ) |
| | | | | | | | | |
| NET ASSETS | | | | | | | | |
| Beginning of year | | | 653,865,484 | | | | 741,495,750 | |
| End of year | | $ | 897,656,014 | | | $ | 653,865,484 | |
| | | | | | | | | |
| CAPITAL SHARE ACTIVITY | | | | | | | | |
| Shares sold | | | 3,507,025 | | | | 2,374,908 | |
| Shares reinvested | | | 1,686,051 | | | | 2,703,999 | |
| Shares redeemed | | | (2,550,382 | ) | | | (3,226,344 | ) |
| Net increase in shares outstanding | | | 2,642,694 | | | | 1,852,563 | |
| Shares outstanding at beginning of year | | | 33,352,220 | | | | 31,499,657 | |
| Shares outstanding at end of year | | | 35,994,914 | | | | 33,352,220 | |
See accompanying notes to financial statements.
| DAVENPORT SMALL CAP FOCUS FUND |
| STATEMENTS OF CHANGES IN NET ASSETS |
| | | Year | | | Year | |
| | | Ended | | | Ended | |
| | | March 31, | | | March 31, | |
| | | 2024 | | | 2023 | |
| FROM OPERATIONS | | | | | | | | |
| Net investment income | | $ | 5,019,167 | | | $ | 5,427,839 | |
| Net realized gains from investment transactions | | | 26,575,598 | | | | 17,628,605 | |
| Net change in unrealized appreciation (depreciation) on investments | | | 140,358,482 | | | | (42,892,149 | ) |
| Net increase (decrease) in net assets from operations | | | 171,953,247 | | | | (19,835,705 | ) |
| | | | | | | | | |
| DISTRIBUTIONS TO SHAREHOLDERS (Note 2) | | | (29,129,523 | ) | | | (36,020,543 | ) |
| | | | | | | | | |
| FROM CAPITAL SHARE TRANSACTIONS | | | | | | | | |
| Proceeds from shares sold | | | 318,128,012 | | | | 92,278,471 | |
| Net asset value of shares issued in reinvestment of distributions to shareholders | | | 27,543,724 | | | | 34,375,030 | |
| Payments for shares redeemed | | | (68,515,961 | ) | | | (70,204,863 | ) |
| Net increase in net assets from capital share transactions | | | 277,155,775 | | | | 56,448,638 | |
| | | | | | | | | |
| TOTAL INCREASE IN NET ASSETS | | | 419,979,499 | | | | 592,390 | |
| | | | | | | | | |
| NET ASSETS | | | | | | | | |
| Beginning of year | | | 588,159,964 | | | | 587,567,574 | |
| End of year | | $ | 1,008,139,463 | | | $ | 588,159,964 | |
| | | | | | | | | |
| CAPITAL SHARE ACTIVITY | | | | | | | | |
| Shares sold | | | 18,489,577 | | | | 5,901,765 | |
| Shares reinvested | | | 1,676,487 | | | | 2,356,513 | |
| Shares redeemed | | | (4,103,496 | ) | | | (4,487,809 | ) |
| Net increase in shares outstanding | | | 16,062,568 | | | | 3,770,469 | |
| Shares outstanding at beginning of year | | | 36,682,825 | | | | 32,912,356 | |
| Shares outstanding at end of year | | | 52,745,393 | | | | 36,682,825 | |
See accompanying notes to financial statements.
| DAVENPORT BALANCED INCOME FUND |
| STATEMENTS OF CHANGES IN NET ASSETS |
| | | Year | | | Year | |
| | | Ended | | | Ended | |
| | | March 31, | | | March 31, | |
| | | 2024 | | | 2023 | |
| FROM OPERATIONS | | | | | | | | |
| Net investment income | | $ | 5,316,915 | | | $ | 4,186,924 | |
| Net realized gains (losses) from: | | | | | | | | |
| Investments | | | 680,044 | | | | (4,782,134 | ) |
| Foreign currency transactions | | | 289 | | | | (1,075 | ) |
| Net change in unrealized appreciation (depreciation) on investments | | | 15,606,852 | | | | (19,079,430 | ) |
| Net increase (decrease) in net assets from operations | | | 21,604,100 | | | | (19,675,715 | ) |
| | | | | | | | | |
| DISTRIBUTIONS TO SHAREHOLDERS (Note 2) | | | (5,189,358 | ) | | | (9,515,808 | ) |
| | | | | | | | | |
| FROM CAPITAL SHARE TRANSACTIONS | | | | | | | | |
| Proceeds from shares sold | | | 19,677,555 | | | | 30,313,838 | |
| Net asset value of shares issued in reinvestment of distributions to shareholders | | | 4,688,217 | | | | 8,893,677 | |
| Payments for shares redeemed | | | (31,364,831 | ) | | | (27,627,245 | ) |
| Net increase (decrease) in net assets from capital share transactions | | | (6,999,059 | ) | | | 11,580,270 | |
| | | | | | | | | |
| TOTAL INCREASE (DECREASE) IN NET ASSETS | | | 9,415,683 | | | | (17,611,253 | ) |
| | | | | | | | | |
| NET ASSETS | | | | | | | | |
| Beginning of year | | | 218,647,531 | | | | 236,258,784 | |
| End of year | | $ | 228,063,214 | | | $ | 218,647,531 | |
| | | | | | | | | |
| CAPITAL SHARE ACTIVITY | | | | | | | | |
| Shares sold | | | 1,618,082 | | | | 2,463,615 | |
| Shares reinvested | | | 380,685 | | | | 739,617 | |
| Shares redeemed | | | (2,580,435 | ) | | | (2,281,226 | ) |
| Net increase (decrease) in shares outstanding | | | (581,668 | ) | | | 922,006 | |
| Shares outstanding at beginning of year | | | 18,275,264 | | | | 17,353,258 | |
| Shares outstanding at end of year | | | 17,693,596 | | | | 18,275,264 | |
See accompanying notes to financial statements.
| DAVENPORT INSIDER BUYING FUND |
| STATEMENTS OF CHANGES IN NET ASSETS |
| | | Period | |
| | | Ended | |
| | | March 31, | |
| | | 2024(a) | |
| FROM OPERATIONS | | | | |
| Net investment income | | $ | 194,374 | |
| Net realized gains from investment transactions | | | 34,861 | |
| Net change in unrealized appreciation (depreciation) on investments | | | 6,901,772 | |
| Net increase in net assets from operations | | | 7,131,007 | |
| | | | | |
| DISTRIBUTIONS TO SHAREHOLDERS (Note 2) | | | (183,083 | ) |
| | | | | |
| FROM CAPITAL SHARE TRANSACTIONS | | | | |
| Proceeds from shares sold | | | 74,099,997 | |
| Net asset value of shares issued in reinvestment of distributions to shareholders | | | 177,323 | |
| Payments for shares redeemed | | | (1,671,470 | ) |
| Net increase in net assets from capital share transactions | | | 72,605,850 | |
| | | | | |
| TOTAL INCREASE IN NET ASSETS | | | 79,553,774 | |
| | | | | |
| NET ASSETS | | | | |
| Beginning of period | | | — | |
| End of period | | $ | 79,553,774 | |
| | | | | |
| CAPITAL SHARE ACTIVITY | | | | |
| Shares sold | | | 7,175,696 | |
| Shares reinvested | | | 16,298 | |
| Shares redeemed | | | (154,254 | ) |
| Net increase in shares outstanding | | | 7,037,740 | |
| Shares outstanding at beginning of period | | | — | |
| Shares outstanding at end of period | | | 7,037,740 | |
| (a) | Represents the period from the commencement of operations (November 30, 2023) through March 31, 2024. |
See accompanying notes to financial statements.
| DAVENPORT CORE LEADERS FUND |
| FINANCIAL HIGHLIGHTS |
| |
Selected Per Share Data and Ratios for a Share Outstanding Throughout Each Year:
| | | Year Ended | | | Year Ended | | | Year Ended | | | Year Ended | | | Year Ended | |
| | | March 31, | | | March 31, | | | March 31, | | | March 31, | | | March 31, | |
| | | 2024 | | | 2023 | | | 2022 | | | 2021 | | | 2020 | |
| Net asset value at beginning of year | | $ | 27.12 | | | $ | 32.09 | | | $ | 31.48 | | | $ | 21.48 | | | $ | 23.75 | |
| | | | | | | | | | | | | | | | | | | | | |
| Income (loss) from investment operations: | | | | | | | | | | | | | | | | | | | | |
| Net investment income | | | 0.10 | | | | 0.18 | | | | 0.01 | | | | 0.05 | | | | 0.14 | |
| Net realized and unrealized gains (losses) on investments | | | 9.48 | | | | (3.88 | ) | | | 3.38 | | | | 10.27 | | | | (1.80 | ) |
| Total from investment operations | | | 9.58 | | | | (3.70 | ) | | | 3.39 | | | | 10.32 | | | | (1.66 | ) |
| | | | | | | | | | | | | | | | | | | | | |
| Less distributions from: | | | | | | | | | | | | | | | | | | | | |
| Net investment income | | | (0.10 | ) | | | (0.18 | ) | | | (0.00 | ) (a) | | | (0.07 | ) | | | (0.14 | ) |
| Net realized gains | | | (1.86 | ) | | | (1.09 | ) | | | (2.78 | ) | | | (0.25 | ) | | | (0.47 | ) |
| Total distributions | | | (1.96 | ) | | | (1.27 | ) | | | (2.78 | ) | | | (0.32 | ) | | | (0.61 | ) |
| | | | | | | | | | | | | | | | | | | | | |
| Net asset value at end of year | | $ | 34.74 | | | $ | 27.12 | | | $ | 32.09 | | | $ | 31.48 | | | $ | 21.48 | |
| | | | | | | | | | | | | | | | | | | | | |
| Total return (b) | | | 36.76 | % | | | (11.37 | %) | | | 10.89 | % | | | 48.20 | % | | | (7.36 | %) |
| | | | | | | | | | | | | | | | | | | | | |
| Net assets at end of year (000’s) | | $ | 985,197 | | | $ | 716,818 | | | $ | 845,650 | | | $ | 756,050 | | | $ | 486,569 | |
| | | | | | | | | | | | | | | | | | | | | |
| Ratio of total expenses to average net assets | | | 0.87 | % | | | 0.87 | % | | | 0.86 | % | | | 0.87 | % | | | 0.89 | % |
| | | | | | | | | | | | | | | | | | | | | |
| Ratio of net investment income to average net assets | | | 0.34 | % | | | 0.66 | % | | | 0.04 | % | | | 0.17 | % | | | 0.55 | % |
| | | | | | | | | | | | | | | | | | | | | |
| Portfolio turnover rate | | | 22 | % | | | 19 | % | | | 20 | % | | | 30 | % | | | 12 | % |
| | | | | | | | | | | | | | | | | | | | | |
| (a) | Amount rounds to less than $0.01 per share. |
| (b) | Total return is a measure of the change in value of an investment in the Fund over the periods covered, which assumes any dividends or capital gains distributions are reinvested in shares of the Fund. Returns shown do not reflect the deduction of taxes a shareholder would pay on Fund distributions or the redemption of Fund shares. |
See accompanying notes to financial statements.
| DAVENPORT VALUE & INCOME FUND |
| FINANCIAL HIGHLIGHTS |
| |
Selected Per Share Data and Ratios for a Share Outstanding Throughout Each Year:
| | | Year Ended | | | Year Ended | | | Year Ended | | | Year Ended | | | Year Ended | |
| | | March 31, | | | March 31, | | | March 31, | | | March 31, | | | March 31, | |
| | | 2024 | | | 2023 | | | 2022 | | | 2021 | | | 2020 | |
| Net asset value at beginning of year | | $ | 16.92 | | | $ | 20.29 | | | $ | 18.58 | | | $ | 13.04 | | | $ | 16.38 | |
| | | | | | | | | | | | | | | | | | | | | |
| Income (loss) from investment operations: | | | | | | | | | | | | | | | | | | | | |
| Net investment income | | | 0.28 | | | | 0.35 | | | | 0.29 | | | | 0.28 | | | | 0.35 | |
| Net realized and unrealized gains (losses) on investments and foreign currencies | | | 2.20 | | | | (2.75 | ) | | | 2.32 | | | | 5.98 | | | | (3.00 | ) |
| Total from investment operations | | | 2.48 | | | | (2.40 | ) | | | 2.61 | | | | 6.26 | | | | (2.65 | ) |
| | | | | | | | | | | | | | | | | | | | | |
| Less distributions from: | | | | | | | | | | | | | | | | | | | | |
| Net investment income | | | (0.29 | ) | | | (0.35 | ) | | | (0.30 | ) | | | (0.27 | ) | | | (0.36 | ) |
| Net realized gains | | | — | | | | (0.62 | ) | | | (0.60 | ) | | | (0.45 | ) | | | (0.33 | ) |
| Total distributions | | | (0.29 | ) | | | (0.97 | ) | | | (0.90 | ) | | | (0.72 | ) | | | (0.69 | ) |
| | | | | | | | | | | | | | | | | | | | | |
| Net asset value at end of year | | $ | 19.11 | | | $ | 16.92 | | | $ | 20.29 | | | $ | 18.58 | | | $ | 13.04 | |
| | | | | | | | | | | | | | | | | | | | | |
| Total return (a) | | | 14.78 | % | | | (11.81 | %) | | | 14.24 | % | | | 49.55 | % | | | (16.97 | %) |
| | | | | | | | | | | | | | | | | | | | | |
| Net assets at end of year (000’s) | | $ | 863,954 | | | $ | 803,930 | | | $ | 920,055 | | | $ | 789,652 | | | $ | 549,112 | |
| | | | | | | | | | | | | | | | | | | | | |
| Ratio of total expenses to average net assets | | | 0.87 | % | | | 0.87 | % | | | 0.86 | % | | | 0.87 | % | | | 0.88 | % |
| | | | | | | | | | | | | | | | | | | | | |
| Ratio of net investment income to average net assets | | | 1.61 | % | | | 2.00 | % | | | 1.46 | % | | | 1.78 | % | | | 2.07 | % |
| | | | | | | | | | | | | | | | | | | | | |
| Portfolio turnover rate | | | 37 | % | | | 21 | % | | | 20 | % | | | 34 | % | | | 28 | % |
| | | | | | | | | | | | | | | | | | | | | |
| (a) | Total return is a measure of the change in value of an investment in the Fund over the periods covered, which assumes any dividends or capital gains distributions are reinvested in shares of the Fund. Returns shown do not reflect the deduction of taxes a shareholder would pay on Fund distributions or the redemption of Fund shares. |
See accompanying notes to financial statements.
| DAVENPORT EQUITY OPPORTUNITIES FUND |
| FINANCIAL HIGHLIGHTS |
| |
Selected Per Share Data and Ratios for a Share Outstanding Throughout Each Year:
| | | Year Ended | | | Year Ended | | | Year Ended | | | Year Ended | | | Year Ended | |
| | | March 31, | | | March 31, | | | March 31, | | | March 31, | | | March 31, | |
| | | 2024 | | | 2023 | | | 2022 | | | 2021 | | | 2020 | |
| Net asset value at beginning of year | | $ | 19.60 | | | $ | 23.54 | | | $ | 24.54 | | | $ | 16.56 | | | $ | 18.98 | |
| | | | | | | | | | | | | | | | | | | | | |
| Income (loss) from investment operations: | | | | | | | | | | | | | | | | | | | | |
| Net investment income (loss) | | | 0.05 | | | | 0.08 | | | | (0.05 | ) | | | (0.03 | ) | | | (0.00 | ) (a) |
| Net realized and unrealized gains (losses) on investments | | | 6.38 | | | | (2.39 | ) | | | 1.80 | | | | 10.42 | | | | (1.59 | ) |
| Total from investment operations | | | 6.43 | | | | (2.31 | ) | | | 1.75 | | | | 10.39 | | | | (1.59 | ) |
| | | | | | | | | | | | | | | | | | | | | |
| Less distributions from: | | | | | | | | | | | | | | | | | | | | |
| Net investment income | | | (0.06 | ) | | | (0.06 | ) | | | — | | | | — | | | | — | |
| Net realized gains | | | (1.03 | ) | | | (1.57 | ) | | | (2.75 | ) | | | (2.41 | ) | | | (0.83 | ) |
| Total distributions | | | (1.09 | ) | | | (1.63 | ) | | | (2.75 | ) | | | (2.41 | ) | | | (0.83 | ) |
| | | | | | | | | | | | | | | | | | | | | |
| Net asset value at end of year | | $ | 24.94 | | | $ | 19.60 | | | $ | 23.54 | | | $ | 24.54 | | | $ | 16.56 | |
| | | | | | | | | | | | | | | | | | | | | |
| Total return (b) | | | 34.01 | % | | | (9.25 | %) | | | 6.89 | % | | | 66.20 | % | | | (9.13 | %) |
| | | | | | | | | | | | | | | | | | | | | |
| Net assets at end of year (000’s) | | $ | 897,656 | | | $ | 653,865 | | | $ | 741,496 | | | $ | 659,114 | | | $ | 385,163 | |
| | | | | | | | | | | | | | | | | | | | | |
| Ratio of total expenses to average net assets | | | 0.87 | % | | | 0.88 | % | | | 0.87 | % | | | 0.88 | % | | | 0.90 | % |
| | | | | | | | | | | | | | | | | | | | | |
| Ratio of net investment income (loss) to average net assets | | | 0.25 | % | | | 0.40 | % | | | (0.20 | %) | | | (0.13 | %) | | | (0.02 | %) |
| | | | | | | | | | | | | | | | | | | | | |
| Portfolio turnover rate | | | 24 | % | | | 26 | % | | | 22 | % | | | 31 | % | | | 21 | % |
| | | | | | | | | | | | | | | | | | | | | |
| (a) | Amount rounds to less than $0.01 per share. |
| (b) | Total return is a measure of the change in value of an investment in the Fund over the periods covered, which assumes any dividends or capital gains distributions are reinvested in shares of the Fund. Returns shown do not reflect the deduction of taxes a shareholder would pay on Fund distributions or the redemption of Fund shares. |
See accompanying notes to financial statements.
| DAVENPORT SMALL CAP FOCUS FUND |
| FINANCIAL HIGHLIGHTS |
| |
Selected Per Share Data and Ratios for a Share Outstanding Throughout Each Year:
| | | Year Ended | | | Year Ended | | | Year Ended | | | Year Ended | | | Year Ended | |
| | | March 31, | | | March 31, | | | March 31, | | | March 31, | | | March 31, | |
| | | 2024 | | | 2023 | | | 2022 | | | 2021 | | | 2020 | |
| Net asset value at beginning of year | | $ | 16.03 | | | $ | 17.85 | | | $ | 19.37 | | | $ | 11.14 | | | $ | 13.25 | |
| | | | | | | | | | | | | | | | | | | | | |
| Income (loss) from investment operations: | | | | | | | | | | | | | | | | | | | | |
| Net investment income (a) | | | 0.11 | | | | 0.15 | | | | 0.11 | | | | 0.04 | | | | 0.05 | |
| Net realized and unrealized gains (losses) on investments | | | 3.71 | | | | (0.90 | ) | | | 1.20 | | | | 9.28 | | | | (1.84 | ) |
| Total from investment operations | | | 3.82 | | | | (0.75 | ) | | | 1.31 | | | | 9.32 | | | | (1.79 | ) |
| | | | | | | | | | | | | | | | | | | | | |
| Less distributions from: | | | | | | | | | | | | | | | | | | | | |
| Net investment income | | | (0.12 | ) | | | (0.13 | ) | | | (0.13 | ) | | | (0.20 | ) | | | (0.10 | ) |
| Net realized gains | | | (0.62 | ) | | | (0.94 | ) | | | (2.70 | ) | | | (0.89 | ) | | | (0.22 | ) |
| Total distributions | | | (0.74 | ) | | | (1.07 | ) | | | (2.83 | ) | | | (1.09 | ) | | | (0.32 | ) |
| | | | | | | | | | | | | | | | | | | | | |
| Net asset value at end of year | | $ | 19.11 | | | $ | 16.03 | | | $ | 17.85 | | | $ | 19.37 | | | $ | 11.14 | |
| | | | | | | | | | | | | | | | | | | | | |
| Total return (b) | | | 24.59 | % | | | (3.56 | %) | | | 6.85 | % | | | 84.84 | % | | | (14.08 | %) |
| | | | | | | | | | | | | | | | | | | | | |
| Net assets at end of year (000’s) | | $ | 1,008,139 | | | $ | 588,160 | | | $ | 587,568 | | | $ | 491,256 | | | $ | 180,077 | |
| | | | | | | | | | | | | | | | | | | | | |
| Ratio of total expenses to average net assets (c) | | | 0.88 | % | | | 0.89 | % | | | 0.88 | % | | | 0.91 | % | | | 0.95 | % |
| | | | | | | | | | | | | | | | | | | | | |
| Ratio of net investment income to average net assets (c) | | | 0.71 | % | | | 0.99 | % | | | 0.49 | % | | | 0.12 | % | | | 0.40 | % |
| | | | | | | | | | | | | | | | | | | | | |
| Portfolio turnover rate | | | 28 | % | | | 36 | % | | | 44 | % | | | 54 | % | | | 66 | % |
| | | | | | | | | | | | | | | | | | | | | |
| (a) | Recognition of net investment income by the Fund is affected by the timing of declarations of dividends by the underlying investment companies in which the Fund invests. |
| (b) | Total return is a measure of the change in value of an investment in the Fund over the periods covered, which assumes any dividends or capital gains distributions are reinvested in shares of the Fund. Returns shown do not reflect the deduction of taxes a shareholder would pay on Fund distributions or the redemption of Fund shares. |
| (c) | The ratios of expenses and net investment income to average net assets do not reflect the Fund’s proportionate share of expenses of the underlying investment companies in which the Fund invests. |
See accompanying notes to financial statements.
| DAVENPORT BALANCED INCOME FUND |
| FINANCIAL HIGHLIGHTS |
| |
Selected Per Share Data and Ratios for a Share Outstanding Throughout Each Year:
| | | Year Ended | | | Year Ended | | | Year Ended | | | Year Ended | | | Year Ended | |
| | | March 31, | | | March 31, | | | March 31, | | | March 31, | | | March 31, | |
| | | 2024 | | | 2023 | | | 2022 | | | 2021 | | | 2020 | |
| Net asset value at beginning of year | | $ | 11.96 | | | $ | 13.61 | | | $ | 12.85 | | | $ | 9.84 | | | $ | 11.34 | |
| | | | | | | | | | | | | | | | | | | | | |
| Income (loss) from investment operations: | | | | | | | | | | | | | | | | | | | | |
| Net investment income (a) | | | 0.30 | | | | 0.23 | | | | 0.19 | | | | 0.20 | | | | 0.25 | |
| Net realized and unrealized gains (losses) on investments and foreign currencies | | | 0.92 | | | | (1.35 | ) | | | 0.77 | | | | 3.04 | | | | (1.41 | ) |
| Total from investment operations | | | 1.22 | | | | (1.12 | ) | | | 0.96 | | | | 3.24 | | | | (1.16 | ) |
| | | | | | | | | | | | | | | | | | | | | |
| Less distributions from: | | | | | | | | | | | | | | | | | | | | |
| Net investment income | | | (0.29 | ) | | | (0.22 | ) | | | (0.18 | ) | | | (0.23 | ) | | | (0.23 | ) |
| Net realized gains | | | — | | | | (0.31 | ) | | | (0.02 | ) | | | — | | | | (0.08 | ) |
| Return of capital | | | — | | | | — | | | | — | | | | — | | | | (0.03 | ) |
| Total distributions | | | (0.29 | ) | | | (0.53 | ) | | | (0.20 | ) | | | (0.23 | ) | | | (0.34 | ) |
| | | | | | | | | | | | | | | | | | | | | |
| Net asset value at end of year | | $ | 12.89 | | | $ | 11.96 | | | $ | 13.61 | | | $ | 12.85 | | | $ | 9.84 | |
| | | | | | | | | | | | | | | | | | | | | |
| Total return (b) | | | 10.33 | % | | | (8.18 | %) | | | 7.50 | % | | | 33.14 | % | | | (10.59 | %) |
| | | | | | | | | | | | | | | | | | | | | |
| Net assets at end of year (000’s) | | $ | 228,063 | | | $ | 218,648 | | | $ | 236,259 | | | $ | 193,186 | | | $ | 143,897 | |
| | | | | | | | | | | | | | | | | | | | | |
| Ratio of total expenses to average net assets (c) | | | 0.93 | % | | | 0.93 | % | | | 0.92 | % | | | 0.93 | % | | | 0.95 | % |
| | | | | | | | | | | | | | | | | | | | | |
| Ratio of net investment income to average net assets (c) | | | 2.42 | % | | | 1.88 | % | | | 1.42 | % | | | 1.73 | % | | | 2.18 | % |
| | | | | | | | | | | | | | | | | | | | | |
| Portfolio turnover rate | | | 45 | % | | | 24 | % | | | 23 | % | | | 29 | % | | | 29 | % |
| | | | | | | | | | | | | | | | | | | | | |
| (a) | Recognition of net investment income by the Fund is affected by the timing of declarations of dividends by the underlying investment companies in which the Fund invests, if any. |
| (b) | Total return is a measure of the change in value of an investment in the Fund over the periods covered, which assumes any dividends or capital gains distributions are reinvested in shares of the Fund. Returns shown do not reflect the deduction of taxes a shareholder would pay on Fund distributions or the redemption of Fund shares. |
| (c) | The ratios of expenses and net investment income to average net assets do not reflect the Fund’s proportionate share of expenses of the underlying investment companies in which the Fund invests, if any. |
See accompanying notes to financial statements.
| DAVENPORT INSIDER BUYING FUND |
| FINANCIAL HIGHLIGHTS |
| |
Selected Per Share Data and Ratios for a Share Outstanding Throughout the Period:
| | | Period | |
| | | Ended | |
| | | March 31, | |
| | | 2024(a) | |
| Net asset value at beginning of period | | $ | 10.00 | |
| | | | | |
| Income from investment operations: | | | | |
| Net investment income (b) | | | 0.03 | |
| Net realized and unrealized gains on investments | | | 1.30 | |
| Total from investment operations | | | 1.33 | |
| | | | | |
| Less distributions from: | | | | |
| Net investment income | | | (0.03 | ) |
| | | | | |
| Net asset value at end of period | | $ | 11.30 | |
| | | | | |
| Total return (c) | | | 13.31 | % (d) |
| | | | | |
| Net assets at end of period (000’s) | | $ | 79,554 | |
| | | | | |
| Ratio of total expenses to average net assets (e) | | | 1.09 | % (f) |
| | | | | |
| Ratio of net investment income to average net assets (e) | | | 1.00 | % (f) |
| | | | | |
| Portfolio turnover rate | | | 2 | % (d) |
| | | | | |
| (a) | Represents the period from the commencement of operations (November 30, 2023) through March 31, 2024. |
| (b) | Recognition of net investment income by the Fund is affected by the timing of declarations of dividends by the underlying investment companies in which the Fund invests. |
| (c) | Total return is a measure of the change in value of an investment in the Fund over the periods covered, which assumes any dividends or capital gains distributions are reinvested in shares of the Fund. Return shown does not reflect the deduction of taxes a shareholder would pay on Fund distributions or the redemption of Fund shares. |
| (e) | The ratios of expenses and net investment income to average net assets do not reflect the Fund’s proportionate share of expenses of the underlying investment companies in which the Fund invests. |
See accompanying notes to financial statements.
| THE DAVENPORT FUNDS |
| NOTES TO FINANCIAL STATEMENTS |
| March 31, 2024 |
1. Organization
Davenport Core Leaders Fund, Davenport Value & Income Fund, Davenport Equity Opportunities Fund, Davenport Small Cap Focus Fund, Davenport Balanced Income Fund and Davenport Insider Buying Fund (individually, a “Fund,” and, collectively, the “Funds”) are each a no-load series of the Williamsburg Investment Trust (the “Trust”), an open-end management investment company registered under the Investment Company Act of 1940, as amended (the “1940 Act”). The Trust was organized as a Massachusetts business trust on July 18, 1988. Other series of the Trust are not incorporated in this report.
Davenport Core Leaders Fund’s investment objective is long-term growth of capital.
Davenport Value & Income Fund’s investment objective is to achieve long-term growth while generating current income through dividend payments on portfolio securities.
Davenport Equity Opportunities Fund’s investment objective is long-term capital appreciation.
Davenport Small Cap Focus Fund’s investment objective is long-term capital appreciation.
Davenport Balanced Income Fund’s investment objective is current income and an opportunity for long-term growth.
Davenport Insider Buying Fund’s investment objective is long-term growth of capital.
Davenport Core Leaders Fund, Davenport Value & Income Fund, Davenport Small Cap Focus Fund, Davenport Balanced Income Fund and Davenport Insider Buying Fund are each classified as a diversified fund. Davenport Equity Opportunities Fund is classified as a non-diversified fund.
2. Significant Accounting Policies
Each Fund follows accounting and reporting guidance under Financial Accounting Standards Board (“FASB”) Accounting Standards Codification Topic 946, “Financial Services – Investment Companies.” The following is a summary of the Funds’ significant accounting policies. The policies are in conformity with accounting principles generally accepted in the United States of America (“GAAP”).
Regulatory update — Tailored Shareholder Reports for Mutual Funds and Exchange-Traded Funds (“ETFs”) – Effective January 24, 2023, the Securities and Exchange Commission (the “SEC”) adopted rule and form amendments to require mutual funds and ETFs to transmit concise and visually engaging streamlined annual and semiannual reports to shareholders that highlight key information. Other information, including financial statements, will no longer appear in a streamlined shareholder report but must be available online, delivered free of charge upon request, and filed on a semiannual basis on Form N-CSR. The rule and form amendments have a compliance date of July 24, 2024. At this time, management is evaluating the impact of these amendments on the shareholder reports for the Funds.
| THE DAVENPORT FUNDS |
| NOTES TO FINANCIAL STATEMENTS (Continued) |
Securities valuation — All investments in securities are recorded at their estimated fair value. The Funds’ portfolio securities are valued as of the close of business of the regular session of the New York Stock Exchange (the “NYSE”) (normally 4:00 p.m. Eastern time). Securities traded on a national stock exchange, including common stocks and ETFs if any, are valued based upon the closing price on the principal exchange where the security is traded, if available, otherwise, at the last quoted bid price. Securities that are quoted by NASDAQ are valued at the NASDAQ Official Closing Price. Investments representing shares of money market funds and other open-end investment companies, other than ETFs, are valued at their net asset value (“NAV”) as reported by such companies. When using a quoted price and when the market is considered active, securities will be classified as Level 1 within the fair value hierarchy (see below).
Fixed income securities, including corporate bonds, municipal bonds and U.S. Treasury obligations, are typically valued on the basis of prices provided by an independent pricing service. The prices provided by the pricing service are determined with consideration given to institutional bid and last sale prices and take into account securities prices, yields, maturities, call features, ratings, institutional trading in similar groups of securities, and developments related to specific securities. Given the inputs used by the pricing service, these securities are classified as Level 2 within the fair value hierarchy.
When market quotations are not readily available, if a pricing service cannot provide a price, or if the investment adviser believes the price received from the pricing service is not indicative of fair value, securities will be valued in good faith at fair value as determined by Davenport & Company LLC (the “Adviser”) as the Funds’ valuation designee, in accordance with procedures adopted by the Board of Trustees (the “Board” or “Trustees”) pursuant to Rule 2a-5 under the 1940 Act. Under these procedures, the securities will be classified as Level 2 or 3 within the fair value hierarchy, depending on the inputs used. Such methods of fair valuation may include, but are not limited to: multiple of earnings, multiple of book value, discount from market of a similar freely traded security, purchase price of the security, subsequent private transactions in the security or related securities, or a combination of these and other factors.
GAAP establishes a single authoritative definition of fair value, sets out a framework for measuring fair value and requires additional disclosures about fair value measurements.
Various inputs are used in determining the value of the Funds’ investments. These inputs are summarized in the three broad levels listed below:
| ● | Level 1 – quoted prices in active markets for identical securities |
| ● | Level 2 – other significant observable inputs |
| ● | Level 3 – significant unobservable inputs |
The inputs or methodology used for valuing securities are not necessarily an indication of the risks associated with investing in those securities. The inputs used to measure fair value may fall into different levels of the fair value hierarchy. In such cases, for disclosure purposes, the level in the fair value hierarchy within which the fair value measurement falls in its entirety is determined based on the lowest level input that is significant to the fair value measurement.
| THE DAVENPORT FUNDS |
| NOTES TO FINANCIAL STATEMENTS (Continued) |
The following is a summary of the Funds’ investments based on the inputs used to value the investments as of March 31, 2024, by security type:
| Davenport Core Leaders Fund | | Level 1 | | | Level 2 | | | Level 3 | | | Total | |
| Common Stocks | | $ | 956,414,541 | | | $ | — | | | $ | — | | | $ | 956,414,541 | |
| Money Market Funds | | | 28,558,341 | | | | — | | | | — | | | | 28,558,341 | |
| Total | | $ | 984,972,882 | | | $ | — | | | $ | — | | | $ | 984,972,882 | |
| | | | | | | | | | | | | | | | | |
| | | | | | | | | | | | | | | | | |
| Davenport Value & Income Fund | | Level 1 | | | Level 2 | | | Level 3 | | | Total | |
| Common Stocks | | $ | 847,735,619 | | | $ | — | | | $ | — | | | $ | 847,735,619 | |
| Money Market Funds | | | 15,800,226 | | | | — | | | | — | | | | 15,800,226 | |
| Total | | $ | 863,535,845 | | | $ | — | | | $ | — | | | $ | 863,535,845 | |
| | | | | | | | | | | | | | | | | |
| | | | | | | | | | | | | | | | | |
| Davenport Equity Opportunities Fund | | Level 1 | | | Level 2 | | | Level 3 | | | Total | |
| Common Stocks | | $ | 878,479,436 | | | $ | — | | | $ | — | | | $ | 878,479,436 | |
| Money Market Funds | | | 25,708,227 | | | | — | | | | — | | | | 25,708,227 | |
| Total | | $ | 904,187,663 | | | $ | — | | | $ | — | | | $ | 904,187,663 | |
| | | | | | | | | | | | | | | | | |
| | | | | | | | | | | | | | | | | |
| Davenport Small Cap Focus Fund | | Level 1 | | | Level 2 | | | Level 3 | | | Total | |
| Common Stocks | | $ | 924,193,795 | | | $ | — | | | $ | — | | | $ | 924,193,795 | |
| Exchange-Traded Funds | | | 25,861,621 | | | | — | | | | — | | | | 25,861,621 | |
| Money Market Funds | | | 62,356,981 | | | | — | | | | — | | | | 62,356,981 | |
| Total | | $ | 1,012,412,397 | | | $ | — | | | $ | — | | | $ | 1,012,412,397 | |
| | | | | | | | | | | | | | | | | |
| | | | | | | | | | | | | | | | | |
| Davenport Balanced Income Fund | | Level 1 | | | Level 2 | | | Level 3 | | | Total | |
| Common Stocks | | $ | 137,117,899 | | | $ | — | | | $ | — | | | $ | 137,117,899 | |
| Fixed Rate Corporate Bonds | | | — | | | | 67,249,128 | | | | — | | | | 67,249,128 | |
| Municipal Bonds | | | — | | | | 2,468,999 | | | | — | | | | 2,468,999 | |
| U.S. Treasury Obligations | | | — | | | | 17,094,452 | | | | — | | | | 17,094,452 | |
| Money Market Funds | | | 3,177,435 | | | | — | | | | — | | | | 3,177,435 | |
| Total | | $ | 140,295,334 | | | $ | 86,812,579 | | | $ | — | | | $ | 227,107,913 | |
| | | | | | | | | | | | | | | | | |
| | | | | | | | | | | | | | | | | |
| Davenport Insider Buying Fund | | Level 1 | | | Level 2 | | | Level 3 | | | Total | |
| Common Stocks | | $ | 75,388,721 | | | $ | — | | | $ | — | | | $ | 75,388,721 | |
| Exchange-Traded Funds | | | 1,822,180 | | | | — | | | | — | | | | 1,822,180 | |
| Money Market Funds | | | 2,555,516 | | | | — | | | | — | | | | 2,555,516 | |
| Total | | $ | 79,766,417 | | | $ | — | | | $ | — | | | $ | 79,766,417 | |
| | | | | | | | | | | | | | | | | |
| THE DAVENPORT FUNDS |
| NOTES TO FINANCIAL STATEMENTS (Continued) |
Refer to each Fund’s Schedule of Investments for a listing of the securities by sector type. There were no Level 3 securities or derivative instruments held by the Funds as of or during the year/ period ended March 31, 2024.
Foreign currency translation — Investment securities and other assets and liabilities denominated in or expected to settle in foreign currencies, if any, are translated into U.S. dollars based on exchange rates on the following basis:
| A. | The fair values of investment securities and other assets and liabilities are translated as of the close of the NYSE each day. |
| B. | Purchases and sales of investment securities and income and expenses are translated at the rate of exchange prevailing as of 4:00 p.m. Eastern time on the respective date of such transactions. |
| C. | The Funds do not isolate that portion of the results of operations caused by changes in foreign exchange rates on investments from those caused by changes in market prices of securities held. Such fluctuations are included with the net realized and unrealized gains or losses on investments. |
Reported net realized foreign exchange gains or losses arise from 1) purchases and sales of foreign currencies and 2) the difference between the amounts of dividends and foreign withholding taxes recorded on the Fund’s books and the U.S. dollar equivalent of the amounts actually received or paid. Reported net unrealized foreign exchange gains and losses arise from changes in the value of assets and liabilities that result from changes in exchange rates.
Cash — Each Fund’s cash position, if any, is held in a bank account with balances which, at times, may exceed United States federally insured limits set by the amount covered by federal deposit insurance. The Funds maintain these balances with a high quality financial institution and may incur charges on cash overdrafts.
Share valuation — The NAV per share of each Fund is calculated daily by dividing the total value of its assets, less liabilities, by the number of shares outstanding. The offering price and redemption price per share of each Fund is equal to the NAV per share.
Investment income — Interest income is accrued as earned. Discounts and premiums on fixed-income securities are amortized using the effective interest method. Dividend income is recorded on the ex-dividend date. Non-cash dividends included in dividend income, if any, are recorded at the fair market value of the security received. The Funds record distributions received from investments in real estate investment trusts (also known as “REITs”) in excess of income from underlying investments as a reduction of cost of investments and/or realized gain. These amounts are recorded once the issuers provide information about the actual classification of the distributions. Withholding taxes on foreign dividends have been recorded in accordance with the Funds’ understanding of the applicable country’s rules and tax rates.
Investment transactions — Investment transactions are accounted for on trade date for financial reporting purposes. Realized gains and losses on investment securities sold are determined on a specific identification basis.
| THE DAVENPORT FUNDS |
| NOTES TO FINANCIAL STATEMENTS (Continued) |
Common expenses — Common expenses of the Trust are allocated among the Funds and the other series of the Trust based on relative net assets of each series or the nature of the services performed and the relative applicability to each series.
Distributions to shareholders — Dividends arising from net investment income, if any, are declared and paid quarterly to shareholders of Davenport Core Leaders Fund, Davenport Value & Income Fund, Davenport Small Cap Focus Fund, Davenport Balanced Income Fund and Davenport Insider Buying Fund; and declared and paid semi-annually to shareholders of Davenport Equity Opportunities Fund. Net realized short-term capital gains, if any, may be distributed throughout the year and net realized long-term capital gains, if any, are distributed at least once each year. The amount of distributions from net investment income and net realized capital gains are determined in accordance with federal income tax regulations, which may differ from GAAP. Dividends and distributions are recorded on the ex-dividend date.
The tax character of distributions paid during the year/period ended March 31, 2024 and 2023 was as follows:
| | | Year/Period | | Ordinary | | | Long-Term | | | Total | |
| | | Ended | | Income | | | Capital Gains | | | Distributions | |
| Davenport Core Leaders Fund | | 03/31/24 | | $ | 2,775,090 | | | $ | 49,810,834 | | | $ | 52,585,924 | |
| | | 03/31/23 | | $ | 8,616,867 | | | $ | 24,804,754 | | | $ | 33,421,621 | |
| Davenport Value & Income Fund | | 03/31/24 | | $ | 13,047,723 | | | $ | 230,910 | | | $ | 13,278,633 | |
| | | 03/31/23 | | $ | 16,633,912 | | | $ | 28,180,629 | | | $ | 44,814,541 | |
| Davenport Equity Opportunities Fund | | 03/31/24 | | $ | 2,126,237 | | | $ | 35,025,825 | | | $ | 37,152,062 | |
| | | 03/31/23 | | $ | 6,817,160 | | | $ | 44,997,499 | | | $ | 51,814,659 | |
| Davenport Small Cap Focus Fund | | 03/31/24 | | $ | 5,878,538 | | | $ | 23,250,985 | | | $ | 29,129,523 | |
| | | 03/31/23 | | $ | 4,649,484 | | | $ | 31,371,059 | | | $ | 36,020,543 | |
| Davenport Balanced Income Fund | | 03/31/24 | | $ | 5,189,358 | | | $ | — | | | $ | 5,189,358 | |
| | | 03/31/23 | | $ | 5,034,146 | | | $ | 4,481,662 | | | $ | 9,515,808 | |
| Davenport Insider Buying Fund | | 03/31/24 | | $ | 183,083 | | | $ | — | | | $ | 183,083 | |
Estimates — The preparation of financial statements in conformity with GAAP requires management to make estimates and assumptions that affect the reported amounts of assets and liabilities and disclosure of contingent assets and liabilities, each as of the date of the financial statements, and the reported amounts of increase (decrease) in net assets from operations during the reporting period. Actual results could differ from those estimates.
Federal income tax — Each Fund has qualified and intends to continue to qualify as a regulated investment company under the Internal Revenue Code of 1986, as amended (the “Code”). Qualification generally will relieve the Funds of liability for federal income taxes to the extent 100% of their net investment income and net realized capital gains are distributed in accordance with the Code.
| THE DAVENPORT FUNDS |
| NOTES TO FINANCIAL STATEMENTS (Continued) |
In order to avoid imposition of the excise tax applicable to regulated investment companies, it is also each Fund’s intention to declare as dividends in each calendar year at least 98% of its net investment income (earned during the calendar year) and 98.2% of its net realized capital gains (earned during the twelve months ended October 31) plus undistributed amounts from prior years.
The following information is computed on a tax basis for each item as of March 31, 2024:
| | | | | | | | | Davenport | |
| | | Davenport | | | Davenport | | | Equity | |
| | | Core Leaders | | | Value & | | | Opportunities | |
| | | Fund | | | Income Fund | | | Fund | |
| Cost of investments | | $ | 559,288,085 | | | $ | 656,637,321 | | | $ | 609,428,070 | |
| Gross unrealized appreciation | | $ | 428,937,927 | | | $ | 221,798,558 | | | $ | 316,317,631 | |
| Gross unrealized depreciation | | | (3,253,130 | ) | | | (14,900,034 | ) | | | (21,558,038 | ) |
| Net unrealized appreciation | | | 425,684,797 | | | | 206,898,524 | | | | 294,759,593 | |
| Undistributed ordinary income | | | 55,272 | | | | — | | | | 447,249 | |
| Undistributed long-term gains | | | 26,304,630 | | | | 16,947,760 | | | | — | |
| Accumulated capital and other losses | | | — | | | | — | | | | (12,607,922 | ) |
| Distributable earnings | | $ | 452,044,699 | | | $ | 223,846,284 | | | $ | 282,598,920 | |
| | | | | | | | | | | | | |
| | | | | | | | | | | | | |
| | | Davenport | | | Davenport | | | Davenport | |
| | | Small Cap | | | Balanced | | | Insider Buying | |
| | | Focus Fund | | | Income Fund | | | Fund | |
| Cost of investments | | $ | 857,112,890 | | | $ | 196,489,797 | | | $ | 72,864,645 | |
| Gross unrealized appreciation | | $ | 202,583,855 | | | $ | 33,660,334 | | | $ | 7,834,707 | |
| Gross unrealized depreciation | | | (47,284,348 | ) | | | (3,042,218 | ) | | | (932,935 | ) |
| Net unrealized appreciation | | | 155,299,507 | | | | 30,618,116 | | | | 6,901,772 | |
| Undistributed ordinary income | | | 6,136,894 | | | | — | | | | 46,152 | |
| Undistributed long-term gains | | | 12,409,824 | | | | — | | | | — | |
| Accumulated capital and other losses | | | — | | | | (4,254,693 | ) | | | — | |
| Distributable earnings | | $ | 173,846,225 | | | $ | 26,363,423 | | | $ | 6,947,924 | |
| | | | | | | | | | | | | |
The difference between the federal income tax cost of investments and the financial statement cost of investments for Davenport Core Leaders Fund, Davenport Value & Income Fund, Davenport Small Cap Focus Fund and Davenport Balanced Income Fund is due to certain timing differences in the recognition of capital gains and losses under income tax regulations and GAAP. These timing differences are temporary in nature and are due to the tax deferral of losses on wash sales, and adjustments to basis on partnerships.
Post-October losses, incurred after October 31, 2023 and within the current taxable year, are deemed to arise on the first day of a Fund’s next taxable year. For the year ended March 31, 2024, Davenport Equity Opportunities Fund deferred $12,607,922 of post-October losses to April 1, 2024 for federal income tax purposes.
| THE DAVENPORT FUNDS |
| NOTES TO FINANCIAL STATEMENTS (Continued) |
As of March 31, 2024, Davenport Balanced Income Fund had short-term capital loss carryforwards of $2,631,190 and long-term capital loss carryforwards of $1,623,503 for federal income tax purposes. These capital loss carryforwards, which do not expire, may be utilized in future years to offset net realized capital gains, if any.
For the year/period ended March 31, 2024, the following reclassifications were made as a result of permanent differences between the financial statements and income tax reporting requirements:
| | | | | | | | | | | Davenport | |
| | | Davenport | | | Davenport | | | Equity | |
| | | Core Leaders | | | Value & | | | Opportunities | |
| | | Fund | | | Income Fund | | | Fund | |
| Paid-in capital | | $ | — | | | $ | — | | | $ | — | |
| Distributable earnings | | $ | — | | | $ | — | | | $ | — | |
| | | | | | | | | | | | | |
| | | | | | | | | | |
| | | Davenport | | | Davenport | | | Davenport | |
| | | Small Cap | | | Balanced | | | Insider Buying | |
| | | Focus Fund | | | Income Fund | | | Fund | |
| Paid-in capital | | $ | — | | | $ | (136,851 | ) | | $ | — | |
| Distributable earnings | | $ | — | | | $ | 136,851 | | | $ | — | |
| | | | | | | | | | | | | |
Such reclassifications have no effect on each Fund’s total net assets or NAV per share.
The Funds recognize the tax benefits or expenses of uncertain tax positions only when the position is “more likely than not” to be sustained assuming examination by tax authorities. Management has reviewed the tax positions taken on Federal income tax returns for each Fund for all open tax years (generally, three years) and has concluded that no provision for unrecognized tax benefits or expenses is required in these financial statements.
The Funds recognize interest and penalties, if any, related to unrecognized tax benefits as income tax expense on the Statements of Operations. During the year/period ended March 31, 2024, the Funds did not incur any interest or penalties.
| THE DAVENPORT FUNDS |
| NOTES TO FINANCIAL STATEMENTS (Continued) |
3. Investment Transactions
Investment transactions, other than short-term investments and U.S. government securities, were as follows for the year/period ended March 31, 2024:
| | | | | | | | | Davenport | |
| | | Davenport | | | Davenport | | | Equity | |
| | | Core Leaders | | | Value & | | | Opportunities | |
| | | Fund | | | Income Fund | | | Fund | |
| Purchases of investment securities | | $ | 180,262,177 | | | $ | 293,101,368 | | | $ | 206,630,743 | |
| Proceeds from sales of investment securities | | $ | 182,724,069 | | | $ | 320,839,881 | | | $ | 166,064,015 | |
| | | | | | | | | | | | | |
| | | | | | | | | | |
| | | Davenport | | | Davenport | | | Davenport | |
| | | Small Cap | | | Balanced | | | Insider Buying | |
| | | Focus Fund | | | Income Fund | | | Fund | |
| Purchases of investment securities | | $ | 435,930,158 | | | $ | 95,792,389 | | | $ | 71,565,865 | |
| Proceeds from sales of investment securities | | $ | 185,017,481 | | | $ | 90,016,903 | | | $ | 1,291,594 | |
| | | | | | | | | | | | | |
During the year ended March 31, 2024, cost of purchases and proceeds from sales of long-term U.S. government securities for Davenport Balanced Income Fund were $7,815,313 and $2,952,599, respectively.
4. Transactions with Related Parties
INVESTMENT ADVISORY AGREEMENTS
Each Fund’s investments are managed by the Adviser under the terms of an Investment Advisory Agreement. Under the Investment Advisory Agreement, each Fund pays the Adviser a management fee, which is computed and accrued daily and paid monthly, at an annual rate of 0.75% of its average daily net assets. Certain officers and a Trustee of the Trust are also officers of the Adviser.
For the Davenport Insider Buying Fund, pursuant to an Expense Limitation Agreement between the Fund and the Adviser (the “ELA”), the Advisor has agreed, until November 23, 2024, to reduce its management fees and reimburse other expenses to limit total annual operating expenses (exclusive of acquired fund fees and expenses, brokerage costs, taxes, interest, costs to organize the Fund, and extraordinary expenses) to an amount not exceeding 1.25% of the Fund’s average daily net assets.
Under the terms of the ELA, management fee reductions and/or expenses reimbursed by the Advisor are subject to recoupment by the Fund for a period of 3 years from the date such fees and expenses were reduced or reimbursed, provided that the recoupments do not cause total operating expenses of the Fund to exceed the lesser of (i) the expense limitation then in effect, if any, and (ii) the expense limitation in effect at the time the expenses to be repaid were incurred.
| THE DAVENPORT FUNDS |
| NOTES TO FINANCIAL STATEMENTS (Continued) |
For the period ended March 31, 2024 the Adviser did not reduce its management fees. Organizational and/or offering costs incurred, if any, to launch the Fund were paid by the Adviser and not the Fund.
A significant portion of the Funds’ investment trades are executed through an affiliated broker-dealer of the Adviser. No commissions are paid by the Funds to the Adviser or the affiliate for these trades.
OTHER SERVICE PROVIDERS
Ultimus Fund Solutions, LLC (“Ultimus”) provides administration, fund accounting, compliance and transfer agent services to the Funds. The Funds pay Ultimus fees in accordance with the agreements for such services. In addition, the Funds pay out-of-pocket expenses including, but not limited to, postage, supplies, and certain costs related to the pricing of the Funds’ portfolio securities. Certain officers of the Trust are also officers of Ultimus, or of Ultimus Fund Distributors, LLC (the “Distributor”), the principal underwriter of each Fund’s shares and an affiliate of Ultimus. The Distributor is compensated by the Adviser (not the Funds) for acting as principal underwriter.
COMPENSATION OF TRUSTEES
Trustees and officers affiliated with the Adviser or Ultimus are not compensated by the Trust for their services. During the fiscal year, each Trustee who was not an affiliated person of the Adviser or Ultimus received from the Trust an annual retainer of $30,000, payable quarterly; a fee of $2,000 for attendance at each meeting of the Board of Trustees (except that such fee is $3,000 for the independent chair); and a fee of $1,000 for attendance at each meeting of any committee of the Board (except that such fee is $1,500 for the committee chair); plus reimbursement of travel and other expenses incurred in attending meetings. Each series of the Trust paid its proportionate share of such fees.
5. Sector Risk
If a Fund has significant investments in the securities of issuers in industries within a particular business sector, any development affecting that sector will have a greater impact on the value of the net assets of the Fund than would be the case if the Fund did not have significant investments in that sector. In addition, this may increase the risk of loss of an investment in the Fund and increase the volatility of the Fund’s NAV per share. From time to time, circumstances may affect a particular sector and the companies within such sector. For instance, economic or market factors, regulation or deregulation, or other developments may negatively impact all companies in a particular sector and therefore the value of a Fund’s portfolio would be adversely affected. As of March 31, 2024, Davenport Core Leaders Fund had 31.1% of the value of its net assets invested in common stocks within the Technology sector and Davenport Equity Opportunities Fund had 25.6% of the value of its net assets invested in common stocks within the Consumer Discretionary sector.
| THE DAVENPORT FUNDS |
| NOTES TO FINANCIAL STATEMENTS (Continued) |
6. Contingencies and Commitments
The Funds indemnify the Trust’s officers and Trustees for certain liabilities that might arise from the performance of their duties to the Funds. Additionally, in the normal course of business the Funds enter into contracts that contain a variety of representations and warranties and which provide general indemnifications. The Funds’ maximum exposure under these arrangements is unknown, as this would involve future claims that may be made against the Funds that have not yet occurred. However, based on experience, the Funds expect the risk of loss to be remote.
7. Subsequent Events
The Funds are required to recognize in the financial statements the effects of all subsequent events that provide additional evidence about conditions that existed as of the date of the Statements of Assets and Liabilities. For non-recognized subsequent events that must be disclosed to keep the financial statements from being misleading, the Funds are required to disclose the nature of the event as well as an estimate of its financial effect, or a statement that such an estimate cannot be made. Management has evaluated subsequent events through the issuance of these financial statements and has noted no such events, except for the following:
Effective April 1, 2024, each Trustee who is not an affiliated person of the Adviser or Ultimus will receive from the Trust an annual retainer of $41,000, payable quarterly; a fee of $2,000 for attendance at each meeting of the Board of Trustees (except that such fee is $3,000 for the independent chair); and a fee of $1,000 for attendance at each meeting of any committee of the Board (except that such fee is $1,500 for the committee chair); plus reimbursement of travel and other expenses incurred in attending meetings. Each series of the Trust will pay its proportionate share of such fees, based on relative net assets.
| THE DAVENPORT FUNDS |
| REPORT OF INDEPENDENT REGISTERED |
| PUBLIC ACCOUNTING FIRM |
To the Shareholders of The Davenport Funds and
Board of Trustees of Williamsburg Investment Trust
Opinion on the Financial Statements
We have audited the accompanying statements of assets and liabilities, including the schedules of investments, of The Davenport Funds, comprising the funds listed below (the “Funds”), each a series of Williamsburg Investment Trust, as of March 31, 2024, the related statements of operations, the statements of changes in net assets, and the financial highlights for each of the periods indicated below, and the related notes (collectively referred to as the “financial statements”). In our opinion, the financial statements present fairly, in all material respects, the financial position of each of the Funds as of March 31, 2024, the results of their operations, the changes in net assets, and the financial highlights for each of the periods indicated below in conformity with accounting principles generally accepted in the United States of America.
| Fund Name | Statements of
Operations | Statements of
Changes in Net
Assets | Financial
Highlights |
Davenport Core Leaders Fund,
Davenport Value & Income Fund,
Davenport Equity Opportunities Fund,
Davenport Small Cap Focus Fund, and
Davenport Balanced Income Fund | For the year ended March 31, 2024 | For the years ended March 31, 2024 and 2023 | For the years ended March 31, 2024, 2023, 2022, 2021, and 2020 |
| Davenport Insider Buying Fund | For the period from November 30, 2023 (commencement of operations) through March 31, 2024 |
For the years ended March 31, 2024, 2023, 2022, 2021, and 2020
Basis for Opinion
These financial statements are the responsibility of the Funds’ management. Our responsibility is to express an opinion on the Funds’ financial statements based on our audits. We are a public accounting firm registered with the Public Company Accounting Oversight Board (United States) (“PCAOB”) and are required to be independent with respect to the Funds in accordance with the U.S. federal securities laws and the applicable rules and regulations of the Securities and Exchange Commission and the PCAOB.
We conducted our audits in accordance with the standards of the PCAOB. Those standards require that we plan and perform the audit to obtain reasonable assurance about whether the financial statements are free of material misstatement whether due to error or fraud.
Our audits included performing procedures to assess the risks of material misstatement of the financial statements, whether due to error or fraud, and performing procedures that respond to those risks. Such procedures included examining, on a test basis, evidence regarding the amounts and disclosures in the financial statements. Our procedures included confirmation of securities owned as of March 31, 2024, by correspondence with the custodian and brokers; when replies were not received from brokers, we performed other auditing procedures. Our audits also included
| THE DAVENPORT FUNDS |
| REPORT OF INDEPENDENT REGISTERED |
| PUBLIC ACCOUNTING FIRM (Continued) |
evaluating the accounting principles used and significant estimates made by management, as well as evaluating the overall presentation of the financial statements. We believe that our audits provide a reasonable basis for our opinion.
We have served as the Funds’ auditor since 2016.

COHEN & COMPANY, LTD.
Milwaukee, Wisconsin
May 23, 2024
| THE DAVENPORT FUNDS |
| BOARD OF TRUSTEES AND EXECUTIVE OFFICERS (Unaudited) |
Overall responsibility for management of the Funds rests with the Board of Trustees. The Trustees serve during the lifetime of the Trust and until its termination, or until death, resignation, retirement or removal. The Trustees, in turn, elect the officers of the Funds. The officers have been elected for an annual term. The following are the Trustees and executive officers of the Funds:
| Trustees and Officers | Address | Year of
Birth | Position Held
with the Trust | Length of
Time Served |
| | Robert S. Harris, Ph.D. | 225 Pictoria Drive, Suite 450 Cincinnati, OH | 1949 | Chairman and Trustee | Since January 2007 |
| * | John P. Ackerly, IV | One James Center 901 E. Cary Street Richmond, VA | 1963 | Trustee and President of The Davenport Funds | Since July 2012 |
| | George K. Jennison | 225 Pictoria Drive, Suite 450 Cincinnati, OH | 1957 | Trustee | Since January 2015 |
| | Harris V. Morrissette | 225 Pictoria Drive, Suite 450 Cincinnati, OH | 1959 | Trustee | Since March 1993 |
| | Elizabeth W. Robertson | 225 Pictoria Drive, Suite 450 Cincinnati, OH | 1953 | Trustee | Since February 2014 |
| | Cheryl B. Hatcher | One James Center 901 E. Cary Street Richmond, VA | 1957 | Vice President | Since March 2021 |
| | George L. Smith, III | One James Center 901 E. Cary Street Richmond, VA | 1975 | Vice President | Since February 2011 |
| | Mark J. Seger | 225 Pictoria Drive, Suite 450 Cincinnati, OH | 1962 | Treasurer | Since November 2000 |
| | David K. James | 225 Pictoria Drive, Suite 450 Cincinnati, OH | 1970 | Secretary | Since November 2018 |
| | Michael J. Nanosky | 225 Pictoria Drive, Suite 450 Cincinnati, OH | 1966 | Chief Compliance Officer | Since March 2020 |
| * | Mr. Ackerly, as an affiliated person of an investment adviser to the Trust, is an “interested person” of the Trust within the meaning of Section 2(a)(19) of the 1940 Act. |
| THE DAVENPORT FUNDS |
| BOARD OF TRUSTEES AND EXECUTIVE OFFICERS (Unaudited) |
Each Trustee oversees nine portfolios of the Trust, including the Funds. The principal occupations of the Trustees and executive officers of the Funds during the past five years and public directorships held by the Trustees are set forth below:
Robert S. Harris, Ph.D. is the C. Stewart Sheppard Professor of Business Administration at The Darden Graduate School of Business Administration at the University of Virginia. He was previously the dean at Darden. Professor Harris has published widely on corporate finance, financial markets and mergers and acquisitions and has served as a consultant to corporations and government agencies.
John P. Ackerly, IV, is Senior Vice President and Portfolio Manager of Davenport & Company, LLC (a broker-dealer and investment advisory firm).
George K. Jennison is retired. He was President of Oyster Consulting, LLC (a management consulting firm) and a financial adviser with Wells Fargo Advisors, LLC.
Harris V. Morrissette is President of China Doll Rice and Beans, Inc. and Dixie Lily Foods. He is also a Director of Trustmark Corporation (bank holding company).
Elizabeth W. Robertson serves as a Trustee of TowneBank Foundation, TowneBank Corporate Board, TowneBank Audit Committee Chair and TowneBank Community Board since 2015. She previously was Chief Financial Officer of Monument Restaurants LLC.
Cheryl B. Hatcher is Senior Vice President of Davenport & Company LLC and Senior Administrative Officer of Davenport Asset Management.
George L. Smith, III is Senior Vice President and Portfolio Manager of the Adviser.
Mark J. Seger is a Vice Chairman of Ultimus Fund Solutions, LLC and Ultimus Fund Distributors, LLC. He previously was Co-CEO of Ultimus Fund Solutions, LLC (1999 to 2019).
David K. James is an Executive Vice President and Chief Legal and Risk Officer of Ultimus Fund Solutions, LLC (2018 to present). He previously was Managing Director and Managing Counsel at State Street Bank and Trust Company (2009 to 2018).
Michael J. Nanosky is a Senior Compliance Officer of Northern Lights Distributors, LLC (2020 to present). He previously was Senior Vice President & Chief Compliance Officer of PNC Funds (2014 to 2019).
Additional information about members of the Board of Trustees and executive officers is available in the Statement of Additional Information (“SAI”). To obtain a free copy of the SAI, please call 1-800-281-3217.
| THE DAVENPORT FUNDS |
| YOUR FUNDS’ EXPENSES (Unaudited) |
We believe it is important for you to understand the impact of costs on your investment. All mutual funds have operating expenses. As a shareholder of the Funds, you incur ongoing costs, including management fees and other expenses. These ongoing costs, which are deducted from each Fund’s gross income, directly reduce the investment return of the Funds.
A mutual fund’s ongoing costs are expressed as a percentage of its average net assets. This figure is known as the expense ratio. The following examples are intended to help you understand the ongoing costs (in dollars) of investing in the Funds and to compare these costs with the ongoing costs of investing in other mutual funds. The examples below are based on an investment of $1,000 made at the beginning of the period shown and held for the entire period (October 1, 2023 through March 31, 2024) for all Funds except Davenport Insider Buying Fund, which is held for the period (November 30, 2023 through March 31, 2024).
The table below illustrates each Fund’s ongoing costs in two ways:
Actual fund return – This section helps you to estimate the actual expenses that you paid over the period. The “Ending Account Value” shown is derived from each Fund’s actual return, and the fourth column shows the dollar amount of operating expenses that would have been paid by an investor who started with $1,000 in the Funds. You may use the information here, together with the amount you invested, to estimate the expenses that you paid over the period.
To do so, simply divide your account value by $1,000 (for example, an $8,600 account value divided by $1,000 = 8.6), then multiply the result by the number given for the applicable Fund under the heading “Expenses Paid During Period.”
Hypothetical 5% return – This section is intended to help you compare each Fund’s ongoing costs with those of other mutual funds. It assumes that each Fund had an annual return of 5% before expenses during the period shown, but that the expense ratio is unchanged. In this case, because the return used is not each Fund’s actual return, the results do not apply to your investment. The example is useful in making comparisons because the U.S. Securities and Exchange Commission (the “SEC”) requires all mutual funds to calculate expenses based on a 5% return. You can assess each Fund’s ongoing costs by comparing this hypothetical example with the hypothetical examples that appear in shareholder reports of other funds.
Note that expenses shown in the table are meant to highlight and help you compare ongoing costs only. The Funds do not charge sales loads or redemption fees.
The calculations assume no shares were bought or sold during the period. Your actual costs may have been higher or lower, depending on the amount of your investment and the timing of any purchases or redemptions.
More information about each Fund’s expenses, including historical annual expense ratios, can be found in this report. For additional information on operating expenses and other shareholder costs, please refer to the Funds’ prospectus.
| THE DAVENPORT FUNDS |
| YOUR FUNDS’ EXPENSES (Unaudited) (Continued) |
| | | Beginning | | Ending | | | | |
| | | Account Value | | Account Value | | | | |
| | | October 1, | | March 31, | | Expense | | Expenses Paid |
| | | 2023 | | 2024 | | Ratio(a) | | During Period(b) |
| Davenport Core Leaders Fund | | | | | | | | |
| Based on Actual Fund Return | | $1,000.00 | | $1,253.90 | | 0.86% | | $4.85 |
| Based on Hypothetical 5% Return (before expenses) | | $1,000.00 | | $1,020.70 | | 0.86% | | $4.34 |
| Davenport Value & Income Fund | | | | | | | | |
| Based on Actual Fund Return | | $1,000.00 | | $1,154.60 | | 0.87% | | $4.69 |
| Based on Hypothetical 5% Return (before expenses) | | $1,000.00 | | $1,020.65 | | 0.87% | | $4.39 |
| Davenport Equity Opportunities Fund | | | | | | | | |
| Based on Actual Fund Return | | $1,000.00 | | $1,274.60 | | 0.87% | | $4.95 |
| Based on Hypothetical 5% Return (before expenses) | | $1,000.00 | | $1,020.65 | | 0.87% | | $4.39 |
| Davenport Small Cap Focus Fund | | | | | | | | |
| Based on Actual Fund Return | | $1,000.00 | | $1,211.30 | | 0.88% | | $4.86 |
| Based on Hypothetical 5% Return (before expenses) | | $1,000.00 | | $1,020.60 | | 0.88% | | $4.45 |
| Davenport Balanced Income Fund | | | | | | | | |
| Based on Actual Fund Return | | $1,000.00 | | $1,111.10 | | 0.93% | | $4.91 |
| Based on Hypothetical 5% Return (before expenses) | | $1,000.00 | | $1,020.35 | | 0.93% | | $4.70 |
| (a) | Annualized, based on each Fund’s most recent one-half year expenses. |
| (b) | Expenses are equal to each Fund’s annualized expense ratio multiplied by the average account value over the period, multiplied by 183/366 (to reflect the one-half year period). |
| THE DAVENPORT FUNDS |
| YOUR FUNDS’ EXPENSES (Unaudited) (Continued) |
| | | Beginning | | Ending | | | | |
| | | Account Value | | Account Value | | | | |
| | | November 30, | | March 31, | | Net Expense | | Expenses Paid |
| | | 2023(a) | | 2024 | | Ratio(b) | | During Period(c) |
| Davenport Insider Buying Fund | | | | | | | | |
| Based on Actual Fund Return | | $1,000.00 | | $1,057.20 | | 1.09% | | $3.77 |
| Based on Hypothetical 5% Return (before expenses) | | $1,000.00 | | $1,019.55 | | 1.09% | | $5.50 |
| (a) | Beginning Account Value is as of November 30, 2023 (date of commencement of operations) for the Actual Fund Return information. |
| (b) | Annualized, based on the Fund’s expenses for the period since commencement of operations (November 30, 2023). |
| (c) | Expenses are equal to the Fund’s annualized expense ratio multiplied by the average account value over the period, multiplied by 123/366 (to reflect the period since inception) and 183/366 (to reflect the one half year period), for Actual Fund Return and Hypothetical 5% Return information, respectively. |
| THE DAVENPORT FUNDS |
| OTHER INFORMATION (Unaudited) |
A description of the policies and procedures that the Funds use to vote proxies relating to portfolio securities is available without charge upon request by calling toll-free 1-800-281-3217, or on the SEC’s website at www.sec.gov. Information regarding how the Funds voted proxies relating to portfolio securities during the most recent 12-month period ended June 30 is also available without charge upon request by calling toll-free 1-800-281-3217, or on the SEC’s website at www.sec.gov.
The Trust files a complete listing of portfolio holdings for each Fund with the SEC as of the end of the first and third quarters of each fiscal year as an exhibit to its reports on Form N-PORT. These filings are available upon request by calling 1-800-281-3217. Furthermore, you may obtain a copy of these filings on the SEC’s website at www.sec.gov.
A complete listing of portfolio holdings for each Fund is updated daily and can be reviewed at the Funds’ website at www.investdavenport.com.
| FEDERAL TAX INFORMATION (Unaudited) |
Capital Gain Distribution – For the year ended March 31, 2024, the following Funds designated long-term capital gain distributions:
| Davenport Core Leaders Fund | | $ | 49,810,834 | |
| Davenport Value & Income Fund | | | 230,910 | |
| Davenport Equity Opportunities Fund | | | 35,025,825 | |
| Davenport Small Cap Focus Fund | | | 23,250,985 | |
Qualified Dividend Income – The Funds have designated the following of their ordinary income dividends, or up to the maximum amount of such dividends allowable pursuant to the Internal Revenue Code, as qualified dividend income eligible for the reduced tax rate:
| Davenport Core Leaders Fund | | | 100.00 | % |
| Davenport Value & Income Fund | | | 100.00 | % |
| Davenport Equity Opportunities Fund | | | 100.00 | % |
| Davenport Small Cap Focus Fund | | | 48.39 | % |
| Davenport Balanced Income Fund | | | 55.23 | % |
| Davenport Insider Buying Fund | | | 100.00 | % |
Dividends Received Deduction – For corporate shareholders, the following percentages or ordinary dividends paid during the year/period ended March 31, 2024 qualify for the corporate dividends received deduction:
| Davenport Core Leaders Fund | | | 100.00 | % |
| Davenport Value & Income Fund | | | 100.00 | % |
| Davenport Equity Opportunities Fund | | | 100.00 | % |
| Davenport Small Cap Focus Fund | | | 57.10 | % |
| Davenport Balanced Income Fund | | | 43.54 | % |
| Davenport Insider Buying Fund | | | 100.00 | % |
| THE DAVENPORT FUNDS |
| DISCLOSURE REGARDING APPROVAL OF |
| INVESTMENT ADVISORY AGREEMENT (Unaudited) |
At a meeting held on November 14, 2023, the Board of Trustees, including a majority of the Independent Trustees, approved the continuance of the Investment Advisory Agreements with the Adviser for an additional one-year period on behalf of the Davenport Core Leaders Fund, the Davenport Value & Income Fund, the Davenport Equity Opportunities Fund, the Davenport Small Cap Focus Fund, and the Davenport Balanced Income Fund (individually, a “Fund,” collectively, the “Funds”). Below is a discussion of the factors considered by the Board of Trustees along with the conclusions with respect thereto that formed the basis for the Board’s approval of the continuation of the Investment Advisory Agreements.
Prior to the Board meeting, the Adviser provided materials in response to a letter sent by counsel to the Independent Trustees, on their behalf, requesting various information relevant to the Independent Trustees’ consideration of the renewal of the Investment Advisory Agreements with respect to each Fund. In approving the continuance of the Investment Advisory Agreements, the Independent Trustees considered all information they deemed reasonably necessary to evaluate the terms of the Agreements. The principal areas of review by the Independent Trustees were the nature, extent and quality of the services provided by the Adviser and the reasonableness of the fees charged for those services. During a meeting of the Governance, Nomination, Compensation and Qualified Legal Compliance Committee held prior to the Board meeting, the Independent Trustees reviewed the proposed renewal of the Investment Advisory Agreements with experienced independent legal counsel outside the presence of representatives of the Adviser and received materials from counsel discussing the legal standards for their consideration of the proposed renewal of the Investment Advisory Agreements.
No single factor was considered in isolation or to be determinative to the decision of the Independent Trustees to approve the continuance of the Investment Advisory Agreements. Rather the Independent Trustees concluded, after weighing and balancing the factors described below, that it was in the best interests of each Fund and its respective shareholders to continue the Investment Advisory Agreements, in their present form, for an additional one-year period.
Nature, Extent and Quality of Services
The Independent Trustees’ evaluation of the nature, extent and quality of the Adviser’s services took into consideration their knowledge gained through presentations and reports from the Adviser over the course of the twelve-month period ended September 30, 2023, including the Adviser’s views on the overall conditions of the economy and the markets. The Independent Trustees considered various factors that may have influenced the markets, investor preferences and market sentiment during the past year and the efforts of the Adviser to take advantage of opportunities to purchase high-quality companies at attractive prices during periods of market weakness. The Independent Trustees also considered the changes that were made to the portfolio management structure of various funds during the past year; the scope and quality of the in-house capabilities of the Adviser and other resources that it dedicates to performing services for the Funds; the quality of administrative and other services, including the Adviser’s role in coordinating the activities of
| THE DAVENPORT FUNDS |
| DISCLOSURE REGARDING APPROVAL OF |
| INVESTMENT ADVISORY AGREEMENT (Unaudited) (Continued) |
the Funds’ other service providers; the Adviser’s compliance with the investment policies of the Funds and applicable laws and regulations; the business reputation of the Adviser; the experience of the Funds’ portfolio managers, and the Adviser’s financial resources.
Investment Performance
The Independent Trustees considered the performance of each Fund for the 1-year, 3-year, 5-year, and 10-year (or the since inception period with respect to the Davenport Balanced Income Fund) periods ended September 30, 2023, compared to the Fund’s benchmark and one or more peer groups with similar investment objectives and strategies. The Board noted that the Davenport Core Leaders Fund outperformed its benchmark and the Lipper Large Cap Core peer group for the 1-year period, but underperformed the Lipper Large Cap Growth peer group for the 1-year period; and underperformed its benchmark and Lipper peer groups for each of the 5-year and 10-year periods. The Board noted that the Davenport Equity Opportunities Fund outperformed its benchmark and the Lipper Mid Cap Core and the Lipper Mid Cap Value peer groups for the 1-year, 5-year and 10-year periods, but underperformed its benchmark and Lipper peer groups for the 3-year period. The Board noted that the Davenport Value & Income Fund underperformed its benchmark, the Lipper Equity Income Peer Group, and the Morningstar US Active Fund Large Value Peer Group for the 1-year, 3-year, 5-year, and 10-year periods. The Board noted that the Davenport Balanced Income Fund underperformed its benchmarks and the Morningstar US Fund Moderate Allocation peer group for the 1-year, 3-year, 5-year, and since-inception periods. The Board noted that the Davenport Small Cap Focus Fund outperformed its benchmark, the Lipper Small Cap Core Peer Group, and the Morningstar US Active Small Blend Peer Group for the 1-year, 3-year, 5-year, and since-inception periods. The Board took into account management’s discussion of each Fund’s performance relative to the Fund’s benchmark and peer group(s). The Independent Trustees also reviewed a report prepared by the Adviser comparing each Fund’s performance to the composite performance of other accounts (if any) managed by the Adviser using the same investment approach as the Funds.
Fees and Expense Ratios
In reviewing the fees payable under the Investment Advisory Agreements, the Independent Trustees compared the advisory fees and overall expense levels of each Fund with those of funds with similar investment objectives and strategies. The Board noted that while the advisory fee for each Fund was higher than the average of its Morningstar Peer Group Category, each Fund’s total expense ratio was lower than the average for its Morningstar Peer Group Category, with the exception of the total expense ratio of the Davenport Balanced Income Fund. The Independent Trustees considered information about the Adviser’s profitability with respect to each Fund, including the assumptions and methodology the Adviser used in preparing the profitability information, in light of applicable case law relating to advisory fees. For these purposes, the Independent Trustees considered not only the fees paid by the Funds, but also so-called “fallout” benefits to the Adviser. The Independent Trustees also considered the fact that shareholders
| THE DAVENPORT FUNDS |
| DISCLOSURE REGARDING APPROVAL OF |
| INVESTMENT ADVISORY AGREEMENT (Unaudited) (Continued) |
in the Funds do not pay the costs of executing portfolio trades for equity securities through outside brokers or the compensation that is paid to financial intermediaries for the provision of administrative support services.
Economies and Benefits of Scale
The Independent Trustees considered the extent to which economies of scale are being realized as the Funds grow and noted that Davenport & Co. has provided the Funds with opportunities to gather more assets by increasing the visibility of the Funds through various marketing and distribution efforts. The Independent Trustees also considered the “fallout” benefits to Davenport & Co. with respect to the Funds, but given the nature of these benefits viewed them as secondary factors in connection with their evaluation of the continuation of the Funds’ Investment Advisory Agreements with Davenport & Co.
Conclusions
Based on the consideration of the foregoing and such other information as was deemed relevant, the Independent Trustees concluded that (i) the overall performance of each Fund is satisfactory relative to its benchmark and peer group(s); (ii) the advisory fees and total operating expenses for the Funds are reasonable in relation to the services provided by the Adviser; (iii) Davenport & Co., a dually registered investment adviser and broker dealer, has further benefited the Funds’ shareholders by executing all equity trades at no cost to the Funds and paying the compensation to financial intermediaries for the provision of administrative support services; and (iv) the profits of the Adviser with respect to its management of the Funds are reasonable.
| DAVENPORT INSIDER BUYING FUND |
| APPROVAL OF INVESTMENT ADVISORY AGREEMENT (Unaudited) |
The Board of Trustees, including the Independent Trustees voting separately, reviewed and approved the Investment Advisory Agreement with the Adviser on behalf of Davenport Insider Buying Fund (the “Insider Buying Fund” or the “Fund”) at a meeting held on August 15, 2023. Below is a discussion of the factors considered by the Board of Trustees along with the conclusions with respect thereto that formed the basis for the Board’s approval of the Investment Advisory Agreement for the Fund.
Prior to the Board meeting, the Adviser provided materials in response to a letter sent by counsel to the Independent Trustees, on their behalf, requesting various information relevant to the Independent Trustees’ consideration of the approval of the Investment Advisory Agreement with respect to the Fund. In approving the Investment Advisory Agreement, the Independent Trustees considered all information they deemed reasonably necessary to evaluate the terms of the Agreement. The principal areas of review by the Independent Trustees were the nature, extent, and quality of the services to be provided by the Adviser and the reasonableness of the proposed fees to be charged for those services. During a meeting of the Governance, Nomination, Compensation and Qualified Legal Compliance Committee held prior to the Board meeting, the Independent Trustees reviewed the proposed approval of the Investment Advisory Agreement with experienced independent legal counsel outside the presence of representatives of the Adviser and received materials from counsel discussing the legal standards for their consideration of the proposed approval of the Investment Advisory Agreement.
No single factor was considered in isolation or to be determinative to the decision of the Independent Trustees to approve the Investment Advisory Agreement for the Fund. Rather the Independent Trustees concluded, after weighing and balancing the factors described below, that it was in the best interests of the Insider Buying Fund and its shareholders to approve the Investment Advisory Agreement.
Nature, Extent and Quality of Services
The Trustees took into account the investment objective and principal investment strategies of the Insider Buying Fund. The Trustees also considered the research and portfolio management process that would be used in managing the Insider Buying Fund, including the process that will be used to analyze the buying and selling activities of corporate insiders. The Trustees reviewed the background, education, and experience of the two individuals who would manage the Insider Buying Fund on a day-to-day basis, and also considered that one of those individuals had experience managing a separately managed account (“SMA”) that had a similar investment strategy as the one to be used in managing the Insider Buying Fund. The Trustees noted certain differences in the investment strategies of the SMA and the Fund. In evaluating the quality of services to be provided to the Insider Buying Fund by the Adviser, the Board took into account its familiarity with the Adviser’s personnel given the Adviser’s management of multiple funds overseen by the Board. The Board concluded that it was satisfied with the nature, extent, and quality of services to be provided to the Insider Buying Fund by the Adviser under the Investment Advisory Agreement and the Adviser’s ability to furnish those services to the Fund.
| DAVENPORT INSIDER BUYING FUND |
| APPROVAL OF INVESTMENT ADVISORY AGREEMENT (Unaudited) (Continued) |
Investment Performance
The Independent Trustees noted that the Adviser did not currently offer any investment products that had investment strategies similar to those to be used in managing the Fund but had demonstrated its ability to satisfactorily manage other Funds overseen by the Board. The Trustees also were mindful that the Adviser will utilize tenants and strategies similar to those that are currently being applied to its existing products in managing the Insider Buying Fund, but that the Fund’s overall portfolio will be distinctive in certain respects from the Adviser’s other product offerings.
Proposed Fees and Estimated Expense Ratio
The Trustees considered the proposed advisory fee to be paid by the Insider Buying Fund to the Adviser under the Investment Advisory Agreement. The Trustees also took into account the Adviser’s contractual agreement to limit certain operating expenses of the Insider Buying Fund for a period of one year from the commencement of the Fund’s operations. In evaluating the reasonableness of the Fund’s proposed advisory fee and estimated expense ratio, the Independent Trustees compared the advisory fees and estimated net expense ratio of the Fund with those of funds in the Morningstar Large Cap Blend category and Morningstar Mid Cap Blend category. The Independent Trustees noted that both the proposed advisory fee and estimated net expense ratio for the Insider Buying Fund were higher than the average and median of the Morningstar Large Cap Blend category and Morningstar Mid Cap Blend category but were mindful of the Adviser’s commitment to limit the Fund’s operating expenses for the first year as well as the Insider Buying Fund’s unique strategy of focusing on insider buying and selling activity in constructing its investment portfolio. The Independent Trustees also considered information about the Adviser’s financial condition and its anticipated profitability with respect to the Insider Buying Fund, including the assumptions and methodology the Adviser used in preparing the projected profitability information. After considering the foregoing, the Trustees determined that the proposed advisory fees and estimated net expense ratio for the Insider Buying Fund are reasonable as compared to the average and median fees and expense ratios of similarly situated funds and in relation to the nature of the investment program and the level of services that are expected to be provided by the Adviser.
Potential Economies of Scale and Possible “Fallout benefits”
Given that the Insider Buying Fund had not commenced operations, the Independent Trustees did not consider the extent to which economies of scale would be realized as the Fund grows and whether fee levels reflect these economies of scale to be material factors in their decision whether to approve the Investment Advisory Agreement. The Independent Trustees also considered so-called “fallout” benefits that the Adviser might receive from its management of the Fund, but given the amounts involved, did not consider them to be material factors in their decision whether to approve the Investment Advisory Agreement.
| DAVENPORT INSIDER BUYING FUND |
| APPROVAL OF INVESTMENT ADVISORY AGREEMENT (Unaudited) (Continued) |
Conclusions
Based on the consideration of the foregoing and such other information as was deemed relevant, the Independent Trustees concluded that: (i) the Adviser possesses the capability and resources to perform the duties required of it under the Investment Advisory Agreement; (ii) the proposed advisory fee is reasonable in view of the services to be provided to the Fund; and (iii) the estimated net expense ratio of the Fund, while higher than the average and median of comparable funds, is reasonable given the Fund’s investment strategies; and (iv) the Adviser’s anticipated profitability from its management of the Fund is reasonable.
| THE DAVENPORT FUNDS |
| LIQUIDITY RISK MANAGEMENT PROGRAM (Unaudited) |
The Funds have adopted and implemented a written liquidity risk management program as required by Rule 22e-4 (the “Liquidity Rule”) under the Investment Company Act. The program is reasonably designed to assess and manage each Fund’s liquidity risk, taking into consideration, among other factors, the Fund’s investment strategy and the liquidity of its portfolio investments during normal and reasonably foreseeable stressed conditions; its short and long-term cash flow projections; and its cash holdings and access to other funding sources. The Funds’ Board of Trustees approved the appointment of a Liquidity Risk Committee, which includes representatives from Davenport & Company LLC, the Funds’ investment adviser, and Ultimus Fund Solutions, LLC, the Funds’ Administrator. The Liquidity Risk Committee is responsible for the program’s administration and oversight and for reporting to the Board on at least an annual basis regarding the program’s operation and effectiveness. The Liquidity Risk Committee updated its assessment of each Fund’s liquidity risk profile, considering additional data gathered in the 12 months ended November 30, 2023 and the adequacy and effectiveness of the liquidity risk management program’s operation from December 1, 2022 until November 30, 2023 (the “Review Period”) in order to prepare a written report for the Board of Trustees (the “Report”) for consideration at its meeting held on February 27, 2024. During the Review Period, none of the Funds experienced unusual stress or disruption to its operations related to purchase and redemption activity. Also, during the Review Period the Funds held adequate levels of cash and highly liquid investments to meet shareholder redemption activities in accordance with applicable requirements. The Report concluded that (i) the Funds’ liquidity risk management program is reasonably designed to prevent violations of the Liquidity Rule and (ii) the Funds’ liquidity risk management program has been effectively implemented.
| |
| |
| |
| |
| |
| |
| |
| |
| |
| |
| THE DAVENPORT FUNDS |
| |
| Investment Adviser |
| Davenport & Company LLC |
| One James Center |
| 901 East Cary Street |
| Richmond, Virginia 23219-4037 |
| |
| Administrator |
| Ultimus Fund Solutions, LLC |
| P.O. Box 46707 |
| Cincinnati, Ohio 45246-0707 |
| 1-800-281-3217 |
| |
| Custodian |
| U.S. Bank, N.A. |
| 425 Walnut Street |
| Cincinnati, Ohio 45202 |
| |
| Independent Registered Public |
| Accounting Firm |
| Cohen & Company, Ltd. |
| 342 N Water Street, |
| Suite 830 |
| Milwaukee, WI 53202 |
| |
| Legal Counsel |
| Sullivan & Worcester LLP |
| 1666 K Street, N.W. |
| Washington, DC 20006 |
| |
| Board of Trustees |
| Robert S. Harris, Ph.D., Chairman |
| John P. Ackerly, IV |
| George K. Jennison |
| Harris V. Morrissette |
| Elizabeth W. Robertson |
| |
| Officers |
| John P. Ackerly, IV, President |
| Cheryl B. Hatcher, Vice President |
| George L. Smith, III, Vice President |
| |
| |
| |
| |
| |
| |
| |
| |
| |
| Davenport-AR-24 |
| |
| |
| |
| |
| |
| |
| |
| |
| THE |
| GOVERNMENT STREET |
| FUNDS |
| |
| |
| No-Load Mutual Funds |
| |
| Annual Report |
| March 31, 2024 |
| |
| |
| |
| |
| |
| |
| |
| |
| |
 |
| |
| |
| |
| |
| |
| |
| |
| |
| |
The Government Street Equity Fund
The Government Street Opportunities Fund |
| |
| |
| LETTER FROM THE PRESIDENT | April 2024 |
Dear Fellow Shareholders:
We enclose for your review the audited Annual Reports of The Government Street Funds for the fiscal year ended March 31, 2024.
The Government Street Equity Fund
The Government Street Equity Fund (the “Equity Fund”) achieved a total return of 29.25% for the fiscal year ended March 31, 2024. By comparison, the S&P 500® Index and the Morningstar Large Blend categories returned 29.88% and 26.83%, respectively.
The following table depicts the fiscal quarter total returns of our three related measures.
| | Government | | Morningstar |
| | Street Equity Fund | S&P 500® | Large Blend |
| 1 Qtr 2024 | 13.12% | 10.56% | 9.87% |
| 4 Qtr 2023 | 10.51% | 11.69% | 11.29% |
| 3 Qtr 2023 | -3.43% | -3.27% | -3.21% |
| 2 Qtr 2023 | 7.06% | 8.74% | 7.16% |
In fiscal year 2024, both Government Street Funds benefited from an investment made several years back in a relatively small semiconductor hardware company. The company, NVIDIA, rose dramatically in the last year to become one of the largest companies in the world. Its total return in the last twelve months of over 200% made a significant contribution to both funds.
NVIDIA was at the right place, at the right time, with cutting edge semiconductor technology. Their product seems to be two to five years ahead of the competition in the development of a chip which is currently in demand by the majority of the software and hardware computer industry. The growth of the company’s earnings has been so rapid that its price to earnings ratio, a general measure of investment risk, has actually declined in last year.
Going forward, we expect and hope that NVIDIA and our other technology investments will assist the United States in increasing economic productivity and helping to alleviate current inflationary pressure. The technology sector has grown to represent approximately 25% to 50% of many major indices and portfolios. The digital age is upon us.
The top 10 holdings in the Equity Fund as of March 31, 2024 were:
| Security Description | % of Net Assets |
| NVIDIA Corporation | 12.58% |
| JPMorgan Chase & Company | 4.72% |
| Invesco S&P 500® Equal Weight ETF | 4.56% |
| Microsoft Corporation | 4.33% |
| Alphabet, Inc. Classes A & C | 3.50% |
| AbbVie, Inc. | 2.53% |
| Apple, Inc. | 2.46% |
| Blackstone, Inc. | 2.22% |
| Amazon.com, Inc. | 2.18% |
| Bio-Techne Corporation | 2.17% |
While you recognize the top 10 holdings as large well-known companies, there is diversification within the holdings. The Equity Fund represents a large capitalization collection of blended growth and value companies.
The Equity Fund’s best performing economic sector for the fiscal year was Technology, up 29.3%. The second-best sector was Consumer Staples, up 13.4%. The worst performing sector was Materials, -1.1%.
There were significant individual performances during the fiscal year. The holdings with the five highest returns, held for the entire fiscal year, as measured by the internal rate of return for the entire period were:
| | 1 Year |
| Security Description | Performance |
| NVIDIA Corporation | 226.74% |
| Meta Platforms, Inc. Class A | 106.98% |
| Amazon.com, Inc. | 86.42% |
| Phillips 66 Corporation | 67.95% |
| Ares Management Corporation Class A | 64.28% |
The holdings with the five lowest returns, held for the entire fiscal year, as measured by internal rate of return for the entire period were:
| | 1 Year |
| Security Description | Performance |
| Skyworks Solutions, Inc. | -5.84% |
| Mid-American Apartment Communities, Inc. | -9.17% |
| Nike, Inc. Class B | -9.45% |
| WEC Energy Group, Inc. | -10.01% |
| ON Semiconductor Corporation | -10.65% |
Note: The investment performances listed for economic sectors and securities in the three preceding paragraphs are extracted from an in-house independent time-weighted rate of return computation by the Addepar portfolio accounting system. The calculations are gross investment returns. Total investment returns are for the fiscal year April 1, 2023 through March 31, 2024.
Fiscal year 2024 was extremely good for The Government Street Funds. Investment returns, for the 12 months, far exceeded expectations at the beginning of the year. Early on, most discussions focused on how deep and broad a recession was to be expected. The market seems to have gotten it right and the negative pundits, as usual, were generally incorrect since the economy, at this writing, appears very strong.
However, it is very difficult to look at all the variables which are general indicators of a healthy economy and not be perplexed. Inflation rates, while receding for some time, have seemed to level off well above the Federal Reserve’s stated goal and portend difficulty in near term interest rate decreases. Geopolitical problems in Ukraine, Israel, Palestine, Taiwan, our borders, and other areas of interest constantly provide unsettling news. On top of these considerations, we have entered the season of a Presidential election which promises to compete on mud slinging with any that have ever preceded it. If ever there was an example of the old saying “markets climb a wall of worry” fiscal 2024 seems to confirm its veracity.
It is impossible to leave this commentary on the perceptions of the market environment without commenting on the national debt. Though we have been noting its growth in many previous letters, it continues to balloon at unprecedented levels. Currently standing at near 35 billion dollars, the interest payments are becoming staggering. Currently, there are reports that new Treasury offerings are being met with unenthusiastic bidders. Additionally, there is approximately one-third of the debt that has to be refinanced this year. The current level of interest rates at any point, short or long maturities, will be double the expiring rates. It becomes very hard to see how any reduction in interest rates can be justified financially.
The bright spot has to focus on technological developments. Biotech discoveries and applications have promised to confront diseases and health conditions that have previously seemed insurmountable. Increased computer speeds are allowing analysis that historically took years, in a fraction of the time.
The “cherry on top” of all technology seems to be found in the rapid development of artificial intelligence (AI). While acknowledging there are potentially good and bad applications, the possibility that the good may find its way into increased productivity in almost all its applications. It seems to us, that productivity is the only true savior for our economy. The ridiculous and reckless spending of politicians has pretty much eliminated any traditional escape from our national debt.
In summary, there are many reasons to believe that we will have trying times ahead. The answer to that predicament has always been a diversified portfolio of good growth and value common stocks. That is exactly how your investment fund is organized. Hopefully current events will not yield a new historic financial result.
Thank you for your continued confidence in our pursuing those opportunities on your behalf.
As of March 31, 2024, the Equity Fund’s net assets were $82.7 million; net asset value per share was $112.90; and the ratio of expenses to net average assets was 0.87%. Portfolio turnover rate was 23%. Income dividends of $0.8886 per share and capital gain distributions of $4.5159 per share were distributed to shareholders during the year.
The Government Street Opportunities Fund
The Government Street Opportunities Fund (the “Opportunities Fund”) produced a total return of 26.55% during the fiscal year ended March 31, 2024. By comparison the S&P MidCap 400® Index and the Morningstar Mid-Cap Blend category, used as relative performance benchmarks, returned 23.33% and 22.44%, respectively.
The following table depicts the fiscal quarter total returns of our three related measures.
| | | Government Street | | | | |
| | | Opportunities | | | | Morningstar |
| | | Fund | | S&P MidCap 400® | | Mid Cap Blend |
| 1 Qtr 2024 | | 14.49% | | 9.95% | | 9.23% |
| 4 Qtr 2023 | | 8.18% | | 11.67% | | 11.51% |
| 3 Qtr 2023 | | -3.98% | | -4.20% | | -3.90% |
| 2 Qtr 2023 | | 6.42% | | 4.85% | | 4.60% |
The mid-capitalization category of individual companies is usually represented by the S&P MidCap 400®, whose issuers have a market capitalization ranging from approximately $0.3 billion to $12.5 billion. Generally, these companies are considered to have slightly higher risk and return characteristics than the S&P 500® companies, which includes issuers with large capitalization. The mid-cap companies in the index are primarily domestically oriented.
The top 10 holdings in The Government Street Opportunities Fund as of March 31, 2024 were:
| Security Description | % of Net Assets |
| NVIDIA Corporation | 8.64% |
| SPDR S&P Midcap 400® ETF | 4.90% |
| Celsius Holdings, Inc. | 3.20% |
| Steel Dynamics, Inc. | 2.82% |
| Gallagher Arthur J & Company | 2.71% |
| iShares Core S&P MidCap 400® ETF Trust | 2.67% |
| Mid-America Apartment Communities, Inc. | 2.67% |
| Martin Marietta Materials, Inc. | 2.49% |
| Waste Connections, Inc. | 2.44% |
| Brown & Brown, Inc. | 2.37% |
There were significant individual performances during the fiscal year. The holdings with the five highest returns, held for the entire period, as measured by the time weighted rate of return, were:
| | 1 Year |
| Security Description | Performance |
| NVIDIA Corporation | 227.82% |
| Celsius Holdings, Inc. | 166.06% |
| Lam Research, Inc. | 85.28% |
| Advanced Micro Device Corporation | 84.15% |
| nVent Electric plc | 77.84% |
The five holdings with the lowest returns, held for the entire period, as measured by time weighted rate of return, were:
| | 1 Year |
| Security Description | Performance |
| Teleflex, Inc. | -10.19% |
| Penumbra, Inc. | -19.97% |
| CH RobinsonWorldwide Corporation | -21.16% |
| Bio-Rad Laboratories, Inc. | -27.80% |
| Enphase Energy, Inc. | -42.47% |
The Opportunity Fund’s best performing economic sector for the fiscal year was Consumer Staples, up 77.2%. The second-best sector was Technology, up 72.6%. The worst performing sector was Real Estate, -9.2%.
Note: The investment performances listed for economic sectors and securities in the three preceding paragraphs are extracted from an in-house independent time-weighted rate of return computation by the Addepar portfolio accounting system. The calculations are gross investment returns. Total investment returns are for the fiscal year April 1, 2023 through March 31, 2024.
We believe that mid-cap stocks offer an attractive combination of growth and safety as they have successfully overcome startup challenges yet remain nimble enough to generate stronger growth than large-cap stocks. Mid-cap stocks have been able to match the performance of large-cap stocks in down markets while exceeding large-cap performance in up markets, leading to long-term outperformance.
As of March 31, 2024, the net assets of the Opportunities Fund were $73.9 million and the net asset value per share was $44.73. The portfolio turnover rate for the year was 17% and the total number of holdings was 78 as of March 31, 2024. The expense ratio for the Fund was 1.04%. Income dividends of $0.3032 per share and capital gain distributions of $0.4448 per share were distributed to shareholders during the year.
Thank you for your continued confidence in The Government Street Funds. Please call us if we can be of further service to you.
Very truly yours,

Thomas W. Leavell
President
Leavell Investment Management, Inc.
The Government Street Funds
Data presented reflects past performance, which is no guarantee of future results. Investment results and principal value will fluctuate so that shares, when redeemed, may be worth more or less than their original cost. Due to market volatility, current performance may be higher or lower than the performance shown.
This report is submitted for the general information of the shareholders of the Funds. The report is not authorized for distribution to prospective investors in the Funds unless it is accompanied by a current prospectus.
This report reflects our views, opinions and portfolio holdings as of March 31, 2024, the end of the reporting period. These views are subject to change at any time based upon market or other conditions. For more current information throughout the year please visit www.leavellinvestments.com.
| THE GOVERNMENT STREET EQUITY FUND |
| PERFORMANCE INFORMATION (Unaudited) |
The Government Street Equity Fund
Comparison of the Change in Value of a $10,000 Investment in
The Government Street Equity Fund and the S&P 500® Index
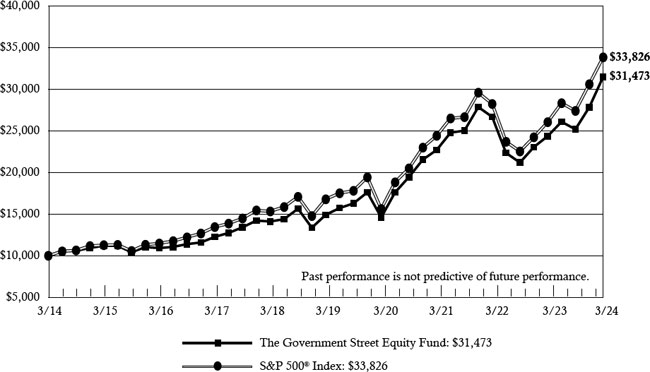
| | | |
| | | Average Annual Total Returns |
| | | (for the year ended March 31, 2024) |
| | | |
| | | 1 Year | | 5 Years | | 10 Years | |
| | The Government Street Equity Fund(a) | 29.25% | | 16.13% | | 12.15% | |
| | S&P 500® Index | 29.88% | | 15.05% | | 12.96% | |
| | | | | | | | |
| (a) | Total return is a measure of the change in value of an investment in the Fund over the periods covered, which assumes any dividends or capital gains distributions are reinvested in shares of the Fund. Returns do not reflect the deduction of taxes a shareholder would pay on Fund distributions or the redemption of Fund shares. |
| THE GOVERNMENT STREET OPPORTUNITIES FUND |
| PERFORMANCE INFORMATION (Unaudited) |
The Government Street Opportunities Fund
Comparison of the Change in Value of a $10,000 Investment in
The Government Street Opportunities Fund and the S&P MidCap 400® Index
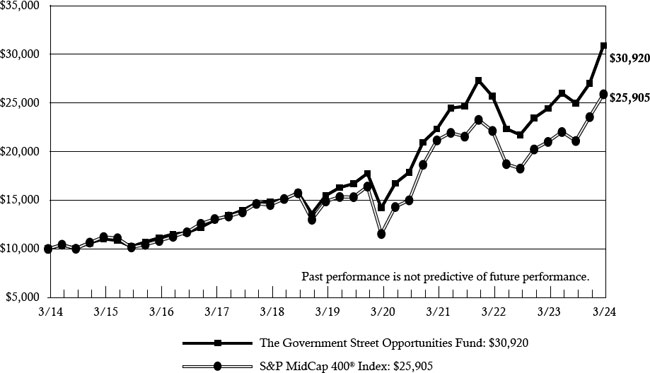
| | | | |
| | | Average Annual Total Returns | |
| | | (for the year ended March 31, 2024) | |
| | | | |
| | | 1 Year | | 5 Years | | 10 Years | |
| | The Government Street Opportunities Fund(a) | 26.55% | | 14.84% | | 11.95% | |
| | S&P MidCap 400® Index | 23.33% | | 11.71% | | 9.99% | |
| | | | | | | | |
| (a) | Total return is a measure of the change in value of an investment in the Fund over the periods covered, which assumes any dividends or capital gains distributions are reinvested in shares of the Fund. Returns do not reflect the deduction of taxes a shareholder would pay on Fund distributions or the redemption of Fund shares. |
| THE GOVERNMENT STREET EQUITY FUND |
| PORTFOLIO INFORMATION |
| March 31, 2024 (Unaudited) |
Asset Allocation
(% of Net Assets)
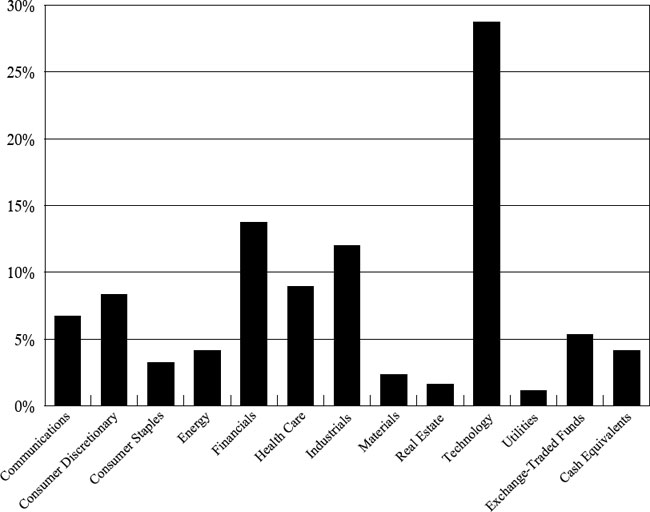
Top 10 Equity Holdings
| Security Description | % of Net Assets |
| NVIDIA Corporation | 12.6% |
| JPMorgan Chase & Company | 4.7% |
| Invesco S&P 500® Equal Weight ETF | 4.6% |
| Microsoft Corporation | 4.3% |
| Alphabet, Inc. - Class A and C | 3.5% |
| AbbVie, Inc. | 2.5% |
| Apple, Inc. | 2.5% |
| Blackstone, Inc. | 2.2% |
| Amazon.com, Inc. | 2.2% |
| Bio-Techne Corporation | 2.2% |
| THE GOVERNMENT STREET OPPORTUNITIES FUND |
| PORTFOLIO INFORMATION |
| March 31, 2024 (Unaudited) |
Asset Allocation
(% of Net Assets)
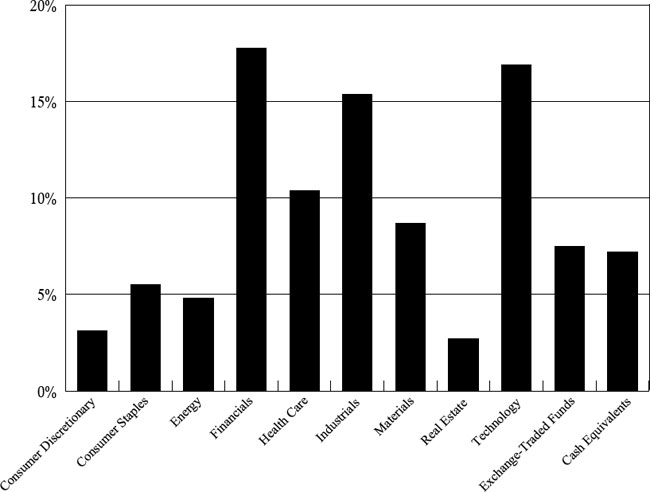
Top 10 Equity Holdings
| Security Description | % of Net Assets |
| NVIDIA Corporation | 8.6% |
| SPDR S&P MidCap 400® ETF | 4.9% |
| Celsius Holdings, Inc. | 3.2% |
| Steel Dynamics, Inc. | 2.8% |
| Arthur J. Gallagher & Company | 2.7% |
| iShares Core S&P MidCap 400® ETF Trust | 2.7% |
| Mid-America Apartment Communities, Inc. | 2.7% |
| Martin Marietta Materials, Inc. | 2.5% |
| Waste Connections, Inc. | 2.4% |
| Brown & Brown, Inc. | 2.4% |
| THE GOVERNMENT STREET EQUITY FUND |
| SCHEDULE OF INVESTMENTS |
| March 31, 2024 |
| COMMON STOCKS — 90.7% | | Shares | | | Value | |
| Communications — 6.8% | | | | | | | | |
| Alphabet, Inc. - Class A (a) | | | 5,700 | | | $ | 860,301 | |
| Alphabet, Inc. - Class C (a) | | | 13,340 | | | | 2,031,148 | |
| Booking Holdings, Inc. | | | 250 | | | | 906,970 | |
| Meta Platforms, Inc. - Class A | | | 3,200 | | | | 1,553,856 | |
| Uber Technologies, Inc. (a) | | | 3,000 | | | | 230,970 | |
| | | | | | | | 5,583,245 | |
| Consumer Discretionary — 8.3% | | | | | | | | |
| Amazon.com, Inc. (a) | | | 10,000 | | | | 1,803,800 | |
| Home Depot, Inc. (The) | | | 3,000 | | | | 1,150,800 | |
| Lowe’s Companies, Inc. | | | 2,500 | | | | 636,825 | |
| McDonald’s Corporation | | | 5,000 | | | | 1,409,750 | |
| NIKE, Inc. - Class B | | | 2,500 | | | | 234,950 | |
| NVR, Inc. (a) | | | 40 | | | | 323,998 | |
| Tesla, Inc. (a) | | | 3,200 | | | | 562,528 | |
| Toyota Motor Corporation - ADR | | | 2,000 | | | | 503,360 | |
| Tractor Supply Company | | | 1,000 | | | | 261,720 | |
| | | | | | | | 6,887,731 | |
| Consumer Staples — 3.2% | | | | | | | | |
| Celsius Holdings, Inc. (a) | | | 1,500 | | | | 124,380 | |
| Coca-Cola Company (The) | | | 3,500 | | | | 214,130 | |
| Procter & Gamble Company (The) | | | 4,000 | | | | 649,000 | |
| Walmart, Inc. | | | 27,000 | | | | 1,624,590 | |
| | | | | | | | 2,612,100 | |
| Energy — 4.1% | | | | | | | | |
| Cheniere Energy, Inc. | | | 5,500 | | | | 887,040 | |
| Chevron Corporation | | | 4,000 | | | | 630,960 | |
| Marathon Petroleum Corporation | | | 2,600 | | | | 523,900 | |
| ONEOK, Inc. | | | 7,000 | | | | 561,190 | |
| Phillips 66 | | | 5,000 | | | | 816,700 | |
| | | | | | | | 3,419,790 | |
| Financials — 13.7% | | | | | | | | |
| Aflac, Inc. | | | 14,000 | | | | 1,202,040 | |
| Apollo Global Management, Inc. | | | 1,000 | | | | 112,450 | |
| Arch Capital Group Ltd. (a) | | | 2,500 | | | | 231,100 | |
| Ares Management Corporation - Class A | | | 5,500 | | | | 731,390 | |
| Berkshire Hathaway, Inc. - Class B (a) | | | 1,500 | | | | 630,780 | |
| Blackstone, Inc. | | | 14,000 | | | | 1,839,180 | |
| Brookfield Reinsurance Ltd. | | | 28,000 | | | | 1,163,680 | |
| CME Group, Inc. | | | 3,500 | | | | 753,515 | |
| Intercontinental Exchange, Inc. | | | 1,500 | | | | 206,145 | |
| THE GOVERNMENT STREET EQUITY FUND |
| SCHEDULE OF INVESTMENTS (Continued) |
| COMMON STOCKS — 90.7% (Continued) | | Shares | | | Value | |
| Financials — 13.7% (Continued) | | | | | | | | |
| JPMorgan Chase & Company | | | 19,500 | | | $ | 3,905,850 | |
| Marsh & McLennan Companies, Inc. | | | 2,500 | | | | 514,950 | |
| | | | | | | | 11,291,080 | |
| Health Care — 8.9% | | | | | | | | |
| Abbott Laboratories | | | 9,500 | | | | 1,079,770 | |
| AbbVie, Inc. | | | 11,500 | | | | 2,094,150 | |
| Bio-Techne Corporation | | | 25,500 | | | | 1,794,945 | |
| CRISPR Therapeutics AG (a) | | | 4,000 | | | | 272,640 | |
| Edwards Lifesciences Corporation (a) | | | 4,800 | | | | 458,688 | |
| GE HealthCare Technologies, Inc. | | | 5,000 | | | | 454,550 | |
| Merck & Company, Inc. | | | 800 | | | | 105,560 | |
| Thermo Fisher Scientific, Inc. | | | 900 | | | | 523,089 | |
| UnitedHealth Group, Inc. | | | 1,000 | | | | 494,700 | |
| Vertex Pharmaceuticals, Inc. (a) | | | 250 | | | | 104,503 | |
| | | | | | | | 7,382,595 | |
| Industrials — 12.0% | | | | | | | | |
| Eaton Corporation plc | | | 1,000 | | | | 312,680 | |
| Emerson Electric Company | | | 4,500 | | | | 510,390 | |
| General Dynamics Corporation | | | 3,700 | | | | 1,045,213 | |
| Honeywell International, Inc. | | | 8,500 | | | | 1,744,625 | |
| Lockheed Martin Corporation | | | 3,500 | | | | 1,592,045 | |
| Parker-Hannifin Corporation | | | 1,300 | | | | 722,527 | |
| Quanta Services, Inc. | | | 4,000 | | | | 1,039,200 | |
| Rockwell Automation, Inc. | | | 1,100 | | | | 320,463 | |
| RTX Corporation | | | 14,000 | | | | 1,365,420 | |
| TE Connectivity Ltd. | | | 9,000 | | | | 1,307,160 | |
| | | | | | | | 9,959,723 | |
| Materials — 2.3% | | | | | | | | |
| Cameco Corporation | | | 3,500 | | | | 151,620 | |
| Freeport-McMoRan, Inc. | | | 25,000 | | | | 1,175,500 | |
| Linde plc | | | 800 | | | | 371,456 | |
| Nucor Corporation | | | 1,000 | | | | 197,900 | |
| | | | | | | | 1,896,476 | |
| Real Estate — 1.6% | | | | | | | | |
| Mid-America Apartment Communities, Inc. | | | 10,000 | | | | 1,315,800 | |
| | | | | | | | | |
| Technology — 28.7% | | | | | | | | |
| Accenture plc - Class A | | | 4,000 | | | | 1,386,440 | |
| Adobe, Inc. (a) | | | 500 | | | | 252,300 | |
| Apple, Inc. | | | 11,900 | | | | 2,040,612 | |
| ASML Holding N.V. | | | 600 | | | | 582,282 | |
| Mastercard, Inc. - Class A | | | 2,000 | | | | 963,140 | |
| Microsoft Corporation | | | 8,500 | | | | 3,576,120 | |
| THE GOVERNMENT STREET EQUITY FUND |
| SCHEDULE OF INVESTMENTS (Continued) |
| COMMON STOCKS — 90.7% (Continued) | | Shares | | | Value | |
| Technology — 28.7% (Continued) | | | | | | | | |
| NVIDIA Corporation | | | 11,500 | | | $ | 10,390,940 | |
| ON Semiconductor Corporation (a) | | | 4,500 | | | | 330,975 | |
| Oracle Corporation | | | 2,000 | | | | 251,220 | |
| Palantir Technologies, Inc. - Class A (a) | | | 5,000 | | | | 115,050 | |
| Palo Alto Networks, Inc. (a) | | | 600 | | | | 170,478 | |
| QUALCOMM, Inc. | | | 3,000 | | | | 507,900 | |
| Skyworks Solutions, Inc. | | | 8,000 | | | | 866,560 | |
| Texas Instruments, Inc. | | | 5,200 | | | | 905,892 | |
| Visa, Inc. - Class A | | | 5,000 | | | | 1,395,400 | |
| | | | | | | | 23,735,309 | |
| Utilities — 1.1% | | | | | | | | |
| WEC Energy Group, Inc. | | | 11,000 | | | | 903,320 | |
| | | | | | | | | |
| Total Common Stocks (Cost $26,219,227) | | | | | | $ | 74,987,169 | |
| | | | | | | |
| EXCHANGE-TRADED FUNDS — 5.3% | | Shares | | | Value | |
| Health Care Select Sector SPDR® Fund (The) | | | 4,000 | | | $ | 590,920 | |
| Invesco S&P 500® Equal Weight ETF | | | 22,300 | | | | 3,776,951 | |
| Total Exchange-Traded Funds (Cost $3,882,810) | | | | | | $ | 4,367,871 | |
| | | | | | | |
| MONEY MARKET FUNDS — 4.0% | | Shares | | | Value | |
| Fidelity Institutional Money Market Government Portfolio - Class I, 5.21% (b) (Cost $3,352,797) | | | 3,352,797 | | | $ | 3,352,797 | |
| | | | | | | | | |
| Total Investments at Value — 100.0% | | | | | | | | |
| (Cost $33,454,834) | | | | | | $ | 82,707,837 | |
| | | | | | | | | |
| Liabilities in Excess of Other Assets — (0.0%) (c) | | | | | | | (16,543 | ) |
| | | | | | | | | |
| Net Assets — 100.0% | | | | | | $ | 82,691,294 | |
| ADR - American Depositary Receipt. |
| (a) | Non-income producing security. |
| (b) | The rate shown is the 7-day effective yield as of March 31, 2024. |
| (c) | Percentage rounds to less than 0.1%. |
See accompanying notes to financial statements.
| THE GOVERNMENT STREET OPPORTUNITIES FUND |
| SCHEDULE OF INVESTMENTS |
| March 31, 2024 |
| COMMON STOCKS — 85.2% | | Shares | | | Value | |
| Consumer Discretionary — 3.1% | | | | | | | | |
| CarMax, Inc. (a) | | | 1,500 | | | $ | 130,665 | |
| Coupang, Inc. (a) | | | 3,000 | | | | 53,370 | |
| Dick’s Sporting Goods, Inc. | | | 1,500 | | | | 337,290 | |
| Gildan Activewear, Inc. | | | 10,000 | | | | 371,300 | |
| NVR, Inc. (a) | | | 10 | | | | 81,000 | |
| Service Corporation International | | | 13,000 | | | | 964,730 | |
| Toll Brothers, Inc. | | | 3,000 | | | | 388,110 | |
| | | | | | | | 2,326,465 | |
| Consumer Staples — 5.5% | | | | | | | | |
| Bunge Global S.A. | | | 3,500 | | | | 358,820 | |
| Celsius Holdings, Inc. (a) | | | 28,500 | | | | 2,363,220 | |
| Church & Dwight Company, Inc. | | | 9,000 | | | | 938,790 | |
| Molson Coors Beverage Company - Class B | | | 5,800 | | | | 390,050 | |
| | | | | | | | 4,050,880 | |
| Energy — 4.8% | | | | | | | | |
| APA Corporation | | | 6,000 | | | | 206,280 | |
| Devon Energy Corporation | | | 9,000 | | | | 451,620 | |
| Enphase Energy, Inc. (a) | | | 6,000 | | | | 725,880 | |
| Exxon Mobil Corporation | | | 1,260 | | | | 146,462 | |
| Marathon Oil Corporation | | | 21,000 | | | | 595,140 | |
| Northern Oil and Gas, Inc. | | | 10,000 | | | | 396,800 | |
| ONEOK, Inc. | | | 3,500 | | | | 280,595 | |
| PBF Energy, Inc. - Class A | | | 9,500 | | | | 546,915 | |
| Targa Resources Corporation | | | 1,750 | | | | 195,983 | |
| | | | | | | | 3,545,675 | |
| Financials — 17.7% | | | | | | | | |
| American Financial Group, Inc. | | | 8,600 | | | | 1,173,728 | |
| Ares Management Corporation - Class A | | | 7,000 | | | | 930,860 | |
| Arthur J. Gallagher & Company | | | 8,000 | | | | 2,000,320 | |
| Berkley (W.R.) Corporation | | | 16,762 | | | | 1,482,431 | |
| Brown & Brown, Inc. | | | 20,000 | | | | 1,750,800 | |
| CME Group, Inc. | | | 5,000 | | | | 1,076,450 | |
| Intercontinental Exchange, Inc. | | | 9,000 | | | | 1,236,870 | |
| Morgan Stanley | | | 9,565 | | | | 900,641 | |
| Nasdaq, Inc. | | | 23,000 | | | | 1,451,300 | |
| Old Republic International Corporation | | | 24,400 | | | | 749,568 | |
| Voya Financial, Inc. | | | 5,000 | | | | 369,600 | |
| | | | | | | | 13,122,568 | |
| Health Care — 10.4% | | | | | | | | |
| Bio-Rad Laboratories, Inc. - Class A (a) | | | 1,500 | | | | 518,805 | |
| Bio-Techne Corporation | | | 15,000 | | | | 1,055,850 | |
| Centene Corporation (a) | | | 4,000 | | | | 313,920 | |
| Charles River Laboratories International, Inc. (a) | | | 4,000 | | | | 1,083,800 | |
| THE GOVERNMENT STREET OPPORTUNITIES FUND |
| SCHEDULE OF INVESTMENTS (Continued) |
| COMMON STOCKS — 85.2% (Continued) | | Shares | | | Value | |
| Health Care — 10.4% (Continued) | | | | | | | | |
| Chemed Corporation | | | 2,500 | | | $ | 1,604,825 | |
| GE HealthCare Technologies, Inc. | | | 4,000 | | | | 363,640 | |
| Laboratory Corporation of America Holdings | | | 2,574 | | | | 562,316 | |
| Penumbra, Inc. (a) | | | 1,500 | | | | 334,770 | |
| ResMed, Inc. | | | 1,200 | | | | 237,636 | |
| Teleflex, Inc. | | | 3,950 | | | | 893,372 | |
| Waters Corporation (a) | | | 2,000 | | | | 688,460 | |
| | | | | | | | 7,657,394 | |
| Industrials — 15.4% | | | | | | | | |
| C.H. Robinson Worldwide, Inc. | | | 4,000 | | | | 304,560 | |
| Donaldson Company, Inc. | | | 13,000 | | | | 970,840 | |
| Expeditors International of Washington, Inc. | | | 8,000 | | | | 972,560 | |
| Fastenal Company | | | 18,000 | | | | 1,388,520 | |
| Graco, Inc. | | | 13,000 | | | | 1,214,980 | |
| Jacobs Solutions, Inc. | | | 8,475 | | | | 1,302,862 | |
| L3Harris Technologies, Inc. | | | 5,250 | | | | 1,118,775 | |
| MSC Industrial Direct Company, Inc. - Class A | | | 5,000 | | | | 485,200 | |
| nVent Electric plc | | | 4,200 | | | | 316,680 | |
| Pentair plc | | | 3,200 | | | | 273,408 | |
| Snap-on, Inc. | | | 1,475 | | | | 436,924 | |
| Waste Connections, Inc. | | | 10,500 | | | | 1,806,105 | |
| Woodward, Inc. | | | 5,000 | | | | 770,600 | |
| | | | | | | | 11,362,014 | |
| Materials — 8.7% | | | | | | | | |
| Ashland, Inc. | | | 6,000 | | | | 584,220 | |
| ATI, Inc. (a) | | | 2,200 | | | | 112,574 | |
| Cameco Corporation | | | 5,000 | | | | 216,600 | |
| Martin Marietta Materials, Inc. | | | 3,000 | | | | 1,841,820 | |
| Packaging Corporation of America | | | 6,000 | | | | 1,138,680 | |
| Ramaco Resources, Inc. - Class A | | | 2,500 | | | | 42,100 | |
| Steel Dynamics, Inc. | | | 14,000 | | | | 2,075,220 | |
| Valvoline, Inc. (a) | | | 9,236 | | | | 411,648 | |
| | | | | | | | 6,422,862 | |
| Real Estate — 2.7% | | | | | | | | |
| Mid-America Apartment Communities, Inc. | | | 15,000 | | | | 1,973,700 | |
| | | | | | | | | |
| Technology — 16.9% | | | | | | | | |
| Advanced Micro Devices, Inc. (a) | | | 1,964 | | | | 354,482 | |
| Analog Devices, Inc. | | | 3,671 | | | | 726,087 | |
| ANSYS, Inc. (a) | | | 3,000 | | | | 1,041,480 | |
| Arrow Electronics, Inc. (a) | | | 8,500 | | | | 1,100,410 | |
| Broadridge Financial Solutions, Inc. | | | 3,500 | | | | 717,010 | |
| InterDigital, Inc. | | | 1,000 | | | | 106,460 | |
| Lam Research Corporation | | | 1,075 | | | | 1,044,438 | |
| THE GOVERNMENT STREET OPPORTUNITIES FUND |
| SCHEDULE OF INVESTMENTS (Continued) |
| COMMON STOCKS — 85.2% (Continued) | | Shares | | | Value | |
| Technology — 16.9% (Continued) | | | | | | | | |
| Microchip Technology, Inc. | | | 8,800 | | | $ | 789,448 | |
| NVIDIA Corporation | | | 7,050 | | | | 6,370,098 | |
| Palantir Technologies, Inc. - Class A (a) | | | 5,000 | | | | 115,050 | |
| Rambus, Inc. (a) | | | 1,500 | | | | 92,715 | |
| StoneCo Ltd. - Class A (a) | | | 1,500 | | | | 24,915 | |
| | | | | | | | 12,482,593 | |
| | | | | | | | | |
| Total Common Stocks (Cost $16,211,176) | | | | | | $ | 62,944,151 | |
| | | | | | | |
| EXCHANGE-TRADED FUNDS — 7.6% | | Shares | | | Value | |
| iShares Core S&P Mid-Cap ETF | | | 32,500 | | | $ | 1,974,050 | |
| SPDR S&P MidCap 400® ETF Trust | | | 6,500 | | | | 3,616,600 | |
| Total Exchange-Traded Funds (Cost $4,782,164) | | | | | | $ | 5,590,650 | |
| | | | | | | |
| MONEY MARKET FUNDS — 7.2% | | Shares | | | Value | |
| Fidelity Institutional Money Market Government Portfolio - Class I, 5.21% (b) (Cost $5,305,870) | | | 5,305,870 | | | $ | 5,305,870 | |
| | | | | | | | | |
| Total Investments at Value — 100.0% | | | | | | | | |
| (Cost $26,299,210) | | | | | | $ | 73,840,671 | |
| | | | | | | | | |
| Other Assets in Excess of Liabilities — 0.0% (c) | | | | | | | 15,639 | |
| | | | | | | | | |
| Net Assets — 100.0% | | | | | | $ | 73,856,310 | |
| (a) | Non-income producing security. |
| (b) | The rate shown is the 7-day effective yield as of March 31, 2024. |
| (c) | Percentage rounds to less than 0.1%. |
See accompanying notes to financial statements.
| THE GOVERNMENT STREET FUNDS |
| STATEMENTS OF ASSETS AND LIABILITIES |
| March 31, 2024 |
| | | The | | | The | |
| | | Government | | | Government | |
| | | Street | | | Street | |
| | | Equity | | | Opportunities | |
| | | Fund | | | Fund | |
| ASSETS | | | | | | |
| Investments in securities: | | | | | | | | |
| At cost | | $ | 33,454,834 | | | $ | 26,299,210 | |
| At value (Note 2) | | $ | 82,707,837 | | | $ | 73,840,671 | |
| Cash | | | 19,995 | | | | 10,560 | |
| Receivable for capital shares purchased | | | — | | | | 457 | |
| Dividends receivable | | | 29,638 | | | | 58,109 | |
| Other assets | | | 3,665 | | | | 4,780 | |
| TOTAL ASSETS | | | 82,761,135 | | | | 73,914,577 | |
| | | | | | | | | |
| LIABILITIES | | | | | | | | |
| Distributions payable | | | 1,335 | | | | — | |
| Payable for capital shares redeemed | | | 13,987 | | | | — | |
| Accrued management fees (Note 4) | | | 41,434 | | | | 46,117 | |
| Payable to administrator (Note 4) | | | 7,460 | | | | 6,680 | |
| Other accrued expenses | | | 5,625 | | | | 5,470 | |
| TOTAL LIABILITIES | | | 69,841 | | | | 58,267 | |
| | | | | | | | | |
| NET ASSETS | | $ | 82,691,294 | | | $ | 73,856,310 | |
| | | | | | | | | |
| Net assets consists of: | | | | | | | | |
| Paid-in capital | | $ | 32,784,849 | | | $ | 25,835,503 | |
| Distributable earnings | | | 49,906,445 | | | | 48,020,807 | |
| Net assets | | $ | 82,691,294 | | | $ | 73,856,310 | |
| | | | | | | | | |
| Shares of beneficial interest outstanding (unlimited number of shares authorized, $0.01 par value) | | | 732,421 | | | | 1,651,243 | |
| | | | | | | | | |
| Net asset value, offering price and redemption price per share (Note 2) | | $ | 112.90 | | | $ | 44.73 | |
See accompanying notes to financial statements.
| THE GOVERNMENT STREET FUNDS |
| STATEMENTS OF OPERATIONS |
| For the Year Ended March 31, 2024 |
| | | The | | | The | |
| | | Government | | | Government | |
| | | Street | | | Street | |
| | | Equity | | | Opportunities | |
| | | Fund | | | Fund | |
| INVESTMENT INCOME | | | | | | | | |
| Dividends | | $ | 1,293,608 | | | $ | 1,153,167 | |
| Foreign withholding taxes on dividends | | | (2,653 | ) | | | (3,434 | ) |
| TOTAL INVESTMENT INCOME | | | 1,290,955 | | | | 1,149,733 | |
| | | | | | | | | |
| EXPENSES | | | | | | | | |
| Management fees (Note 4) | | | 433,981 | | | | 479,424 | |
| Administration fees (Note 4) | | | 72,354 | | | | 63,980 | |
| Shareholder servicing fees (Note 4) | | | 25,669 | | | | 23,684 | |
| Trustees’ fees and expenses (Note 4) | | | 23,051 | | | | 23,051 | |
| Audit and tax services fees | | | 16,915 | | | | 16,915 | |
| Registration and filing fees | | | 15,815 | | | | 17,144 | |
| Legal fees | | | 8,202 | | | | 8,202 | |
| Shareholder reporting expenses | | | 7,319 | | | | 7,364 | |
| Custodian and bank service fees | | | 7,467 | | | | 7,182 | |
| Compliance fees and expenses (Note 4) | | | 7,270 | | | | 7,270 | |
| Postage and supplies | | | 3,500 | | | | 3,542 | |
| Other expenses | | | 8,019 | | | | 8,128 | |
| TOTAL EXPENSES | | | 629,562 | | | | 665,886 | |
| | | | | | | | | |
| NET INVESTMENT INCOME | | | 661,393 | | | | 483,847 | |
| | | | | | | | | |
| REALIZED AND UNREALIZED GAINS ON INVESTMENTS | | | | | | | | |
| Net realized gains from investments | | | 2,459,656 | | | | 491,593 | |
| Net realized gains from in-kind redemptions (Note 2) | | | 1,850,014 | | | | 2,723,959 | |
| Net change in unrealized appreciation (depreciation) on investments | | | 14,174,579 | | | | 12,035,561 | |
| NET REALIZED AND UNREALIZED GAINS ON INVESTMENTS | | | 18,484,249 | | | | 15,251,113 | |
| | | | | | | | | |
| NET INCREASE IN NET ASSETS RESULTING FROM OPERATIONS | | $ | 19,145,642 | | | $ | 15,734,960 | |
See accompanying notes to financial statements.
| THE GOVERNMENT STREET EQUITY FUND |
| STATEMENTS OF CHANGES IN NET ASSETS |
| | | Year | | | Year | |
| | | Ended | | | Ended | |
| | | March 31, | | | March 31, | |
| | | 2024 | | | 2023 | |
| FROM OPERATIONS | | | | | | | | |
| Net investment income | | $ | 661,393 | | | $ | 707,584 | |
| Net realized gains from investments | | | 2,459,656 | | | | 2,034,589 | |
| Net realized gains from in-kind redemptions (Note 2) | | | 1,850,014 | | | | 370,072 | |
| Net change in unrealized appreciation (depreciation) on investments | | | 14,174,579 | | | | (9,799,062 | ) |
| Net increase (decrease) in net assets resulting from operations | | | 19,145,642 | | | | (6,686,817 | ) |
| | | | | | | | | |
| DISTRIBUTIONS TO SHAREHOLDERS (Note 2) | | | (3,953,443 | ) | | | (2,156,116 | ) |
| | | | | | | | | |
| FROM CAPITAL SHARE TRANSACTIONS | | | | | | | | |
| Proceeds from shares sold | | | 730,022 | | | | 318,339 | |
| Net asset value of shares issued in reinvestment of distributions to shareholders | | | 3,911,061 | | | | 2,123,213 | |
| Payments for shares redeemed | | | (4,437,299 | ) | | | (2,749,595 | ) |
| Net increase (decrease) in net assets from capital share transactions | | | 203,784 | | | | (308,043 | ) |
| | | | | | | | | |
| TOTAL INCREASE (DECREASE) IN NET ASSETS | | | 15,395,983 | | | | (9,150,976 | ) |
| | | | | | | | | |
| NET ASSETS | | | | | | | | |
| Beginning of year | | | 67,295,311 | | | | 76,446,287 | |
| End of year | | $ | 82,691,294 | | | $ | 67,295,311 | |
| | | | | | | | | |
| CAPITAL SHARE ACTIVITY | | | | | | | | |
| Shares sold | | | 7,112 | | | | 3,537 | |
| Shares reinvested | | | 40,628 | | | | 24,135 | |
| Shares redeemed | | | (44,069 | ) | | | (29,882 | ) |
| Net increase (decrease) in shares outstanding | | | 3,671 | | | | (2,210 | ) |
| Shares outstanding, beginning of year | | | 728,750 | | | | 730,960 | |
| Shares outstanding, end of year | | | 732,421 | | | | 728,750 | |
See accompanying notes to financial statements.
| THE GOVERNMENT STREET OPPORTUNITIES FUND |
| STATEMENTS OF CHANGES IN NET ASSETS |
| | | Year | | | Year | |
| | | Ended | | | Ended | |
| | | March 31, | | | March 31, | |
| | | 2024 | | | 2023 | |
| FROM OPERATIONS | | | | | | | | |
| Net investment income | | $ | 483,847 | | | $ | 462,409 | |
| Net realized gains from investments | | | 491,593 | | | | 1,548,765 | |
| Net realized gains from in-kind redemptions (Note 2) | | | 2,723,959 | | | | 281,100 | |
| Net change in unrealized appreciation (depreciation) on investments | | | 12,035,561 | | | | (5,411,530 | ) |
| Net increase (decrease) in net assets resulting from operations | | | 15,734,960 | | | | (3,119,256 | ) |
| | | | | | | | | |
| DISTRIBUTIONS TO SHAREHOLDERS (Note 2) | | | (1,252,425 | ) | | | (2,505,818 | ) |
| | | | | | | | | |
| FROM CAPITAL SHARE TRANSACTIONS | | | | | | | | |
| Proceeds from shares sold | | | 2,226,498 | | | | 1,730,992 | |
| Net asset value of shares issued in reinvestment of distributions to shareholders | | | 1,238,230 | | | | 2,458,112 | |
| Payments for shares redeemed | | | (4,670,189 | ) | | | (2,397,436 | ) |
| Net increase (decrease) in net assets from capital share transactions | | | (1,205,461 | ) | | | 1,791,668 | |
| | | | | | | | | |
| TOTAL INCREASE (DECREASE) IN NET ASSETS | | | 13,277,074 | | | | (3,833,406 | ) |
| | | | | | | | | |
| NET ASSETS | | | | | | | | |
| Beginning of year | | | 60,579,236 | | | | 64,412,642 | |
| End of year | | $ | 73,856,310 | | | $ | 60,579,236 | |
| | | | | | | | | |
| CAPITAL SHARE ACTIVITY | | | | | | | | |
| Shares sold | | | 56,411 | | | | 50,213 | |
| Shares reinvested | | | 32,365 | | | | 71,446 | |
| Shares redeemed | | | (118,436 | ) | | | (66,782 | ) |
| Net increase (decrease) in shares outstanding | | | (29,660 | ) | | | 54,877 | |
| Shares outstanding, beginning of year | | | 1,680,903 | | | | 1,626,026 | |
| Shares outstanding, end of year | | | 1,651,243 | | | | 1,680,903 | |
See accompanying notes to financial statements.
| THE GOVERNMENT STREET EQUITY FUND |
| FINANCIAL HIGHLIGHTS |
Selected Per Share Data for a Share Outstanding Throughout Each Year:
| | | Years Ended March 31, | |
| | | 2024 | | | 2023 | | | 2022 | | | 2021 | | | 2020 | |
| Net asset value at beginning of year | | $ | 92.34 | | | $ | 104.58 | | | $ | 98.83 | | | $ | 68.30 | | | $ | 73.37 | |
| | | | | | | | | | | | | | | | | | | | | |
| Income (loss) from investment operations: | | | | | | | | | | | | | | | | | | | | |
| Net investment income (a) | | | 0.90 | | | | 0.97 | | | | 0.58 | | | | 0.64 | | | | 0.80 | |
| Net realized and unrealized gains (losses) on investments | | | 25.07 | | | | (10.23 | ) | | | 16.42 | | | | 36.33 | | | | (1.82 | ) |
| Total from investment operations | | | 25.97 | | | | (9.26 | ) | | | 17.00 | | | | 36.97 | | | | (1.02 | ) |
| | | | | | | | | | | | | | | | | | | | | |
| Less distributions from: | | | | | | | | | | | | | | | | | | | | |
| Net investment income | | | (0.89 | ) | | | (0.98 | ) | | | (0.58 | ) | | | (0.64 | ) | | | (0.80 | ) |
| Net realized gains | | | (4.52 | ) | | | (2.00 | ) | | | (10.67 | ) | | | (5.80 | ) | | | (3.25 | ) |
| Total distributions | | | (5.41 | ) | | | (2.98 | ) | | | (11.25 | ) | | | (6.44 | ) | | | (4.05 | ) |
| | | | | | | | | | | | | | | | | | | | | |
| Net asset value at end of year | | $ | 112.90 | | | $ | 92.34 | | | $ | 104.58 | | | $ | 98.83 | | | $ | 68.30 | |
| | | | | | | | | | | | | | | | | | | | | |
| Total return (b) | | | 29.25 | % | | | (8.68 | %) | | | 17.51 | % | | | 55.46 | % | | | (2.04 | %) |
| | | | | | | | | | | | | | | | | | | | | |
| Net assets at end of year (000’s) | | $ | 82,691 | | | $ | 67,295 | | | $ | 76,446 | | | $ | 69,948 | | | $ | 49,981 | |
| | | | | | | | | | | | | | | | | | | | | |
| Ratio of total expenses to average net assets (c) | | | 0.87 | % | | | 0.87 | % | | | 0.84 | % | | | 0.86 | % | | | 0.91 | % |
| | | | | | | | | | | | | | | | | | | | | |
| Ratio of net investment income to average net assets (c) | | | 0.92 | % | | | 1.07 | % | | | 0.55 | % | | | 0.71 | % | | | 1.01 | % |
| | | | | | | | | | | | | | | | | | | | | |
| Portfolio turnover rate | | | 23 | % | | | 14 | % | | | 14 | % | | | 17 | % | | | 14 | % |
| (a) | Recognition of net investment income by the Fund is affected by the timing of declarations of dividends by the underlying investment companies in which the Fund invests, if any. |
| (b) | Total return is a measure of the change in value on an investment in the Fund over the periods covered, which assumes any dividends or capital gains distributions are reinvested in shares of the Fund. The returns shown do not reflect the deductions of taxes a shareholder would pay on Fund distributions or the redemption of Fund Shares. |
| (c) | The ratios of expenses and net investment income to average net assets do not reflect the Fund’s proportionate share of expenses of the underlying investment companies in which the Fund invests, if any. |
See accompanying notes to financial statements.
| THE GOVERNMENT STREET OPPORTUNITIES FUND |
| FINANCIAL HIGHLIGHTS |
Selected Per Share Data for a Share Outstanding Throughout Each Year:
| | | Years Ended March 31, | |
| | | 2024 | | | 2023 | | | 2022 | | | 2021 | | | 2020 | |
| Net asset value at beginning of year | | $ | 36.04 | | | $ | 39.61 | | | $ | 35.73 | | | $ | 23.56 | | | $ | 26.78 | |
| | | | | | | | | | | | | | | | | | | | | |
| Income (loss) from investment operations: | | | | | | | | | | | | | | | | | | | | |
| Net investment income (a) | | | 0.29 | | | | 0.27 | | | | 0.17 | | | | 0.10 | | | | 0.16 | |
| Net realized and unrealized gains (losses) on investments | | | 9.14 | | | | (2.31 | ) | | | 5.20 | | | | 13.19 | | | | (2.16 | ) |
| Total from investment operations | | | 9.43 | | | | (2.04 | ) | | | 5.37 | | | | 13.29 | | | | (2.00 | ) |
| | | | | | | | | | | | | | | | | | | | | |
| Less distributions from: | | | | | | | | | | | | | | | | | | | | |
| Net investment income | | | (0.30 | ) | | | (0.19 | ) | | | (0.18 | ) | | | (0.10 | ) | | | (0.16 | ) |
| Net realized gains | | | (0.44 | ) | | | (1.34 | ) | | | (1.31 | ) | | | (1.02 | ) | | | (1.06 | ) |
| Total distributions | | | (0.74 | ) | | | (1.53 | ) | | | (1.49 | ) | | | (1.12 | ) | | | (1.22 | ) |
| | | | | | | | | | | | | | | | | | | | | |
| Net asset value at end of year | | $ | 44.73 | | | $ | 36.04 | | | $ | 39.61 | | | $ | 35.73 | | | $ | 23.56 | |
| | | | | | | | | | | | | | | | | | | | | |
| Total return (b) | | | 26.55 | % | | | (4.91 | %) | | | 15.11 | % | | | 57.00 | % | | | (8.18 | %) |
| | | | | | | | | | | | | | | | | | | | | |
| Net assets at end of year (000’s) | | $ | 73,856 | | | $ | 60,579 | | | $ | 64,413 | | | $ | 58,288 | | | $ | 39,422 | |
| | | | | | | | | | | | | | | | | | | | | |
| Ratio of total expenses to average net assets (c) | | | 1.04 | % | | | 1.05 | % | | | 1.02 | % | | | 1.07 | % | | | 1.09 | % |
| | | | | | | | | | | | | | | | | | | | | |
| Ratio of net investment income to average net assets (c) | | | 0.76 | % | | | 0.78 | % | | | 0.44 | % | | | 0.32 | % | | | 0.57 | % |
| | | | | | | | | | | | | | | | | | | | | |
| Portfolio turnover rate | | | 17 | % | | | 9 | % | | | 8 | % | | | 13 | % | | | 2 | % |
| (a) | Recognition of net investment income by the Fund is affected by the timing of declarations of dividends by the underlying investment companies in which the Fund invests, if any. |
| (b) | Total return is a measure of the change in value on an investment in the Fund over the periods covered, which assumes any dividends or capital gains distributions are reinvested in shares of the Fund. The returns shown do not reflect the deductions of taxes a shareholder would pay on Fund distributions or the redemption of Fund Shares. |
| (c) | The ratios of expenses and net investment income to average net assets do not reflect the Fund’s proportionate share of expenses of the underlying investment companies in which the Fund invests, if any. |
See accompanying notes to financial statements.
| THE GOVERNMENT STREET FUNDS |
| NOTES TO FINANCIAL STATEMENTS |
| March 31, 2024 |
1. Organization
The Government Street Equity Fund and The Government Street Opportunities Fund (the “Funds”) are each a diversified, no-load series of the Williamsburg Investment Trust (the “Trust”), an open-end management investment company registered under the Investment Company Act of 1940, as amended (the “1940 Act”). The Trust was organized as a Massachusetts business trust on July 18, 1988. Other series of the Trust are not included in this report.
The investment objective of The Government Street Equity Fund is to seek capital appreciation.
The investment objective of The Government Street Opportunities Fund is to seek capital appreciation.
2. Significant Accounting Policies
Each Fund follows accounting and reporting guidance under Financial Accounting Standards Board Accounting Standards Codification Topic 946, “Financial Services – Investment Companies.” The following is a summary of the Funds’ significant accounting policies. The policies are in conformity with accounting principles generally accepted in the United States of America (“GAAP”).
Regulatory update — Tailored Shareholder Reports for Mutual Funds and Exchange-Traded Funds (“ETFs”) – On January 24, 2023, the Securities and Exchange Commission (the “SEC”) adopted rule and form amendments to require mutual funds and ETFs to transmit concise and visually engaging streamlined annual and semiannual reports to shareholders that highlight key information. Other information, including financial statements, will not appear in a streamlined shareholder report but must be available online, delivered free of charge upon request, and filed on a semiannual basis on Form N-CSR. The rule and form amendments have a compliance date of July 24, 2024. At this time, management is evaluating the impact of these amendments on the shareholder reports for the Funds.
Securities valuation — All investments in securities are recorded at their estimated fair value. The Funds’ portfolio securities are valued as of the close of business of the regular session of the New York Stock Exchange (“NYSE”) (normally 4:00 p.m. Eastern time). Securities traded on a national stock exchange, including common stocks and exchange-traded funds (“ETFs”), if any, are valued based upon the closing price on the principal exchange where the security is traded, if available, otherwise, at the last quoted bid price. Securities that are quoted by NASDAQ are valued at the NASDAQ Official Closing Price. Investments representing shares of other open-end investment companies, other than ETFs but including money market funds, are valued
| THE GOVERNMENT STREET FUNDS |
| NOTES TO FINANCIAL STATEMENTS (Continued) |
at their net asset value (“NAV”) as reported by such companies. When using a quoted price and when the market is considered active, securities will be classified as Level 1 within the fair value hierarchy (see below).
When market quotations are not readily available, if a pricing service cannot provide a price, or if the investment adviser believes the price received from the pricing service is not indicative of fair value, securities will be valued in good faith at fair value as determined by Leavel l Investment Management, Inc. (the “Adviser”), as the Fund’s valuation designee, in accordance with procedures adopted by the Board of Trustees (the “Board” or “Trustees”) pursuant to Rule 2a-5 under the 1940 Act. Under these procedures, the securities will be classified as Level 2 or 3 within the fair value hierarchy, depending on the inputs used. Such methods of fair valuation may include, but are not limited to: multiple of earnings, multiple of book value, discount from market of a similar freely traded security, purchase price of the security, subsequent private transactions in the security or related securities, or a combination of these and other factors. GAAP establishes a single authoritative definition of fair value, sets out a framework for measuring fair value and requires additional disclosures about fair value measurements.
Various inputs are used in determining the value of each Fund’s investments. These inputs are summarized in the three broad levels listed below:
| ● | Level 1 – quoted prices in active markets for identical securities |
| ● | Level 2 – other significant observable inputs |
| ● | Level 3 – significant unobservable inputs |
The inputs or methodology used for valuing securities are not necessarily an indication of the risks associated with investing in those securities. The inputs used to measure fair value may fall into different levels of the fair value hierarchy. In such cases, for disclosure purposes, the level in the fair value hierarchy within which the fair value measurement falls in its entirety is determined based on the lowest level input that is significant to the fair value measurement.
The following is a summary of the Funds’ investments based on the inputs used to value the investments as of March 31, 2024, by asset type:
| The Government Street Equity Fund: | | Level 1 | | | Level 2 | | | Level 3 | | | Total | |
| Common Stocks | | $ | 74,987,169 | | | $ | — | | | $ | — | | | $ | 74,987,169 | |
| Exchange-Traded Funds | | | 4,367,871 | | | | — | | | | — | | | | 4,367,871 | |
| Money Market Funds | | | 3,352,797 | | | | — | | | | — | | | | 3,352,797 | |
| Total | | $ | 82,707,837 | | | $ | — | | | $ | — | | | $ | 82,707,837 | |
| | | | | | | | | | | | | | | | | |
| THE GOVERNMENT STREET FUNDS |
| NOTES TO FINANCIAL STATEMENTS (Continued) |
| The Government Street Opportunities Fund: | | Level 1 | | | Level 2 | | | Level 3 | | | Total | |
| Common Stocks | | $ | 62,944,151 | | | $ | — | | | $ | — | | | $ | 62,944,151 | |
| Exchange-Traded Funds | | | 5,590,650 | | | | — | | | | — | | | | 5,590,650 | |
| Money Market Funds | | | 5,305,870 | | | | — | | | | — | | | | 5,305,870 | |
| Total | | $ | 73,840,671 | | | $ | — | | | $ | — | | | $ | 73,840,671 | |
| | | | | | | | | | | | | | | | | |
Refer to each Fund’s Schedule of Investments for a listing of the common stocks by sector type. There were no Level 3 securities or derivative instruments held by the Funds as of or during the year ended March 31, 2024.
Share valuation — The NAV per share of each Fund is calculated daily by dividing the total value of its assets, less liabilities, by the number of shares outstanding. The offering price and redemption price per share of each Fund is equal to the NAV per share.
Investment income — Interest income is accrued as earned. Discounts and premiums on fixed-income securities purchased, if any, are amortized using the effective interest method. Dividend income is recorded on the ex-dividend date. Non-cash dividends included in dividend income, if any, are recorded at the fair market value of the security received. Withholding taxes on foreign dividends have been recorded in accordance with the Trust’s understanding of the applicable country’s rules and tax rates.
Distributions to shareholders — Dividends arising from net investment income are declared and paid quarterly to shareholders of The Government Street Equity Fund and declared and paid annually to shareholders of The Government Street Opportunities Fund. Net realized short-term capital gains, if any, may be distributed throughout the year and net realized long-term capital gains, if any, are distributed at least once each year. Dividends and distributions are recorded on the ex-dividend date. The amount of distributions from net investment income and net realized capital gains are determined in accordance with federal income tax regulations, which may differ from GAAP. These “book/tax” differences are either temporary or permanent in nature.
The tax character of distributions paid during the years ended March 31, 2024 and 2023 was as follows:
| | | Years | | Ordinary | | | Long-Term | | Total |
| | | Ended | | Income | | | Capital Gains | | Distributions* |
| The Government Street Equity Fund | | 03/31/24 | | $ | 654,277 | | | $3,300,436 | | $3,954,713 |
| | | 03/31/23 | | $ | 708,660 | | | $1,446,322 | | $2,154,982 |
| The Government Street Opportunities Fund | | 03/31/24 | | $ | 509,193 | | | $743,232 | | $1,252,425 |
| | | 03/31/23 | | $ | 326,581 | | | $2,179,237 | | $2,505,818 |
| * | Total Distributions may not tie to the amounts listed on the Statements of Changes in Net Assets due to distributions payable amounts. |
| THE GOVERNMENT STREET FUNDS |
| NOTES TO FINANCIAL STATEMENTS (Continued) |
Investment transactions — Investment transactions are accounted for on trade date for financial reporting purposes. Realized gains and losses on investment securities sold are determined on a specific identification basis.
Common expenses — Common expenses of the Trust are allocated among the Funds and the other series of the Trust based on relative net assets of each series or the nature of the services performed and the relative applicability to each series.
Estimates — The preparation of financial statements in conformity with GAAP requires management to make estimates and assumptions that affect the reported amounts of assets and liabilities and the disclosure of contingent assets and liabilities as of the date of the financial statements and the reported amounts of increase (decrease) in net assets from operations during the reporting period. Actual results could differ from those estimates.
Federal income tax — Each Fund has qualified and intends to continue to qualify as a regulated investment company under the Internal Revenue Code of 1986, as amended (the “Code”). Qualification generally will relieve the Funds of liability for federal income taxes to the extent 100% of their net investment income and any net realized capital gains are distributed in accordance with the Code. In order to avoid imposition of the excise tax applicable to regulated investment companies, it is also each Fund’s intention to declare as dividends in each calendar year at least 98% of its net investment income (earned during the calendar year) and 98.2% of its net realized capital gains (earned during the twelve months ended October 31) plus undistributed amounts from prior years.
The following information is computed on a tax basis for each item as of March 31, 2024:
| | | The Government | | | The Government | |
| | | Street Equity | | | Street Opportunities | |
| | | Fund | | | Fund | |
| Cost of investments | | $ | 33,457,642 | | | $ | 26,299,210 | |
| Gross unrealized appreciation | | $ | 49,413,977 | | | $ | 47,573,907 | |
| Gross unrealized depreciation | | | (163,782 | ) | | | (32,446 | ) |
| Net unrealized appreciation | | | 49,250,195 | | | | 47,541,461 | |
| Undistributed ordinary income | | | 10,730 | | | | 86,104 | |
| Undistributed long-term capital gains | | | 646,855 | | | | 393,242 | |
| Distributions payable | | | (1,335 | ) | | | — | |
| Total distributable earnings | | $ | 49,906,445 | | | $ | 48,020,807 | |
| | | | | | | | | |
The difference between the federal income tax cost of investments and the financial statement cost of investments for The Government Street Equity Fund is due to certain timing differences in the recognition of capital gains or losses under income tax regulations and GAAP. These “book/tax” differences are temporary in nature and are primarily due to adjustments to basis for passive foreign investment companies.
| THE GOVERNMENT STREET FUNDS |
| NOTES TO FINANCIAL STATEMENTS (Continued) |
During the year ended March 31, 2024, The Government Street Equity Fund and The Government Street Opportunities Fund realized $1,850,014 and $2,723,959, respectively, of net capital gains resulting from in-kind redemptions (redemptions in which shareholders who redeemed Fund shares receive investment securities held by the Fund rather than cash). The Funds recognize a gain on in-kind redemptions to the extent that the value of the distributed investment securities on the date of redemption exceeds the cost of those investment securities. Such gains are not taxable to the Funds and are not required to be distributed to shareholders. The Funds have reclassified these gains against paid-in capital on the Statements of Assets and Liabilities. Such reclassifications, the result of permanent differences between the financial statement and income tax reporting requirements, had no effect on the each Fund’s net assets or NAV per share.
The Funds recognize the tax benefits or expenses of uncertain tax positions only when the position is “more likely than not” to be sustained assuming examination by tax authorities. Management has reviewed the tax positions taken on federal income tax returns for all open tax years (generally, three years) of each Fund and has concluded that no provision for unrecognized tax benefits or expenses is required in these financial statements.
The Funds recognize interest and penalties, if any, related to unrecognized tax benefits as income tax expense on the Statements of Operations. During the year ended March 31, 2024, the Funds did not incur any interest or penalties.
3. Investment Transactions
Investment transactions, other than short-term investments and U.S. government securities, were as follows for the year ended March 31, 2024:
| | | | | | The Government | |
| | | The Government | | | Street | |
| | | Street Equity | | | Opportunities | |
| | | Fund | | | Fund | |
| Purchases of investment securities | | $ | 15,579,603 | | | $ | 10,328,034 | |
| Proceeds from sales of investment securities | | $ | 15,811,565 | | | $ | 10,755,491 | |
| | | | | | | | | |
4. Transactions with Related Parties
INVESTMENT ADVISORY AGREEMENT
Each Fund’s investments are managed by the Adviser under the terms of an Investment Advisory Agreement. The Government Street Equity Fund pays the Adviser a management fee, which is computed and accrued daily and paid monthly, at annual rates of 0.60% of its average daily net assets up to $100 million and 0.50%
| THE GOVERNMENT STREET FUNDS |
| NOTES TO FINANCIAL STATEMENTS (Continued) |
of such assets in excess of $100 million. The Government Street Opportunities Fund pays the Adviser a management fee, which is computed and accrued daily and paid monthly, at an annual rate of 0.75% of its average daily net assets.
Certain officers of the Trust are also officers of the Adviser and are not paid by the Funds for serving in such capacities.
OTHER SERVICE PROVIDERS
Ultimus Fund Solutions, LLC (“Ultimus”) provides administration, fund accounting, compliance and transfer agent services to the Funds. The Funds pay Ultimus fees in accordance with the agreements for such services. In addition, the Funds pay out-of-pocket expenses including, but not limited to, postage, supplies, and certain costs related to the pricing of the Funds’ portfolio securities. Certain officers of the Trust are also officers of Ultimus, or of Ultimus Fund Distributors, LLC (the “Distributor”), the principal underwriter of each Fund’s shares and an affiliate of Ultimus. The Distributor is compensated by the Adviser (not the Funds) for acting as principal underwriter.
SHAREHOLDER SERVICING PLAN
The Funds have adopted a Shareholder Servicing Plan (the “Plan”), which allows each Fund to make payments to financial organizations (including payments directly to the Adviser and the distributor) for providing account administration and account maintenance services to Fund shareholders. The annual service fee may not exceed an amount equal to 0.25% of each Fund’s average daily net assets. During the year ended March 31, 2024, The Government Street Equity Fund and The Government Street Opportunities Fund incurred fees of $25,669 and $23,684, respectively, under the Plan.
COMPENSATION OF TRUSTEES
Trustees and officers affiliated with the Adviser or Ultimus are not compensated by the Trust for their services. During the fiscal year, each Trustee who was not an affiliated person of the Adviser or Ultimus received from the Trust an annual retainer of $30,000, payable quarterly; a fee of $2,000 for attendance at each meeting of the Board of Trustees (except that such fee is $3,000 for the independent chair); and a fee of $1,000 for attendance at each meeting of any committee of the Board (except that such fee is $1,500 for the committee chair); plus reimbursement of travel and other expenses incurred in attending meetings. Each series of the Trust paid its proportionate share of such fees.
5. Contingencies and Commitments
The Funds indemnify the Trust’s officers and Trustees for certain liabilities that might arise from their performance of their duties to the Funds. Additionally, in the normal course of business the Funds enter into contracts that contain a variety of representations and warranties and which provide general indemnifications. The
| THE GOVERNMENT STREET FUNDS |
| NOTES TO FINANCIAL STATEMENTS (Continued) |
Funds’ maximum exposure under these arrangements is unknown, as this would involve future claims that may be made against the Funds that have not yet occurred. However, based on experience, the Trust expects the risk of loss to be remote.
6. Sector Risk
If a Fund has significant investments in the securities of issuers in industries within a particular business sector, any development affecting that sector will have a greater impact on the value of the net assets of the Fund than would be the case if the Fund did not have significant investments in that sector. In addition, this may increase the risk of loss of an investment in the Fund and increase the volatility of the Fund’s NAV per share. From time to time, circumstances may affect a particular sector and companies within such sector. For instance, economic or market factors, regulation or deregulation, or other developments may negatively impact all companies in a particular sector and therefore the value of the Fund’s portfolio would be adversely affected. As of March 31, 2024, the Government Street Equity Fund had 28.7% of its net assets invested in securities within the Technology sector.
7. Subsequent Events
The Funds are required to recognize in the financial statements the effects of all subsequent events that provide additional evidence about conditions that existed as of the date of the Statements of Assets and Liabilities. For non-recognized subsequent events that must be disclosed to keep the financial statements from being misleading, the Funds are required to disclose the nature of the event as well as an estimate of its financial effect, or a statement that such an estimate cannot be made. Management has evaluated subsequent events through the issuance of these financial statements and has noted no such events, except for the following:
Effective April 1, 2024, each Trustee who is not an affiliated person of the Adviser or Ultimus will receive from the Trust an annual retainer of $41,000, payable quarterly; a fee of $2,000 for attendance at each meeting of the Board of Trustees (except that such fee is $3,000 for the independent chair); and a fee of $1,000 for attendance at each meeting of any committee of the Board (except that such fee is $1,500 for the committee chair); plus reimbursement of travel and other expenses incurred in attending meetings. Each series of the Trust will pay its proportionate share of such fees, based on relative net assets.
| THE GOVERNMENT STREET FUNDS |
| REPORT OF INDEPENDENT REGISTERED |
| PUBLIC ACCOUNTING FIRM |
To the Shareholders of The Government Street Funds and
Board of Trustees of Williamsburg Investment Trust
Opinion on the Financial Statements
We have audited the accompanying statements of assets and liabilities, including the schedules of investments, of The Government Street Funds, comprising The Government Street Equity Fund and The Government Street Opportunities Fund (the “Funds”), each a series of Williamsburg Investment Trust, as of March 31, 2024, the related statements of operations for the year then ended, the statements of changes in net assets for each of the two years in the period then ended, the financial highlights for each of the five years in the period then ended, and the related notes (collectively referred to as the “financial statements”). In our opinion, the financial statements present fairly, in all material respects, the financial position of each of the Funds as of March 31, 2024, the results of their operations for the year then ended, the changes in net assets for each of the two years in the period then ended, and the financial highlights for each of the five years in the period then ended, in conformity with accounting principles generally accepted in the United States of America.
Basis for Opinion
These financial statements are the responsibility of the Funds’ management. Our responsibility is to express an opinion on the Funds’ financial statements based on our audits. We are a public accounting firm registered with the Public Company Accounting Oversight Board (United States) (“PCAOB”) and are required to be independent with respect to the Funds in accordance with the U.S. federal securities laws and the applicable rules and regulations of the Securities and Exchange Commission and the PCAOB.
We conducted our audits in accordance with the standards of the PCAOB. Those standards require that we plan and perform the audit to obtain reasonable assurance about whether the financial statements are free of material misstatement whether due to error or fraud.
Our audits included performing procedures to assess the risks of material misstatement of the financial statements, whether due to error or fraud, and performing procedures that respond to those risks. Such procedures included examining, on a test basis, evidence regarding the amounts and disclosures in the financial statements. Our procedures included confirmation of securities owned as of March 31, 2024, by correspondence with the custodian. Our audits also included evaluating the accounting
| THE GOVERNMENT STREET FUNDS |
| REPORT OF INDEPENDENT REGISTERED |
| PUBLIC ACCOUNTING FIRM (Continued) |
principles used and significant estimates made by management, as well as evaluating the overall presentation of the financial statements. We believe that our audits provide a reasonable basis for our opinion.
We have served as the Funds’ auditor since 2016.
COHEN & COMPANY, LTD.
Milwaukee, Wisconsin
May 23, 2024
| THE GOVERNMENT STREET FUNDS |
| ABOUT YOUR FUNDS’ EXPENSES (Unaudited) |
We believe it is important for you to understand the impact of costs on your investment. All mutual funds have operating expenses. As a shareholder of the Funds, you incur ongoing costs, including management fees and other expenses. These ongoing costs, which are deducted from each Fund’s gross income, directly reduce the investment returns of the Funds.
A mutual fund’s ongoing costs are expressed as a percentage of its average net assets. This figure is known as the expense ratio. The following examples are intended to help you understand the ongoing costs (in dollars) of investing in the Funds and to compare these costs with the ongoing costs of investing in other mutual funds. The examples below are based on an investment of $1,000 made at the beginning of the period shown and held for the entire period (October 1, 2023 through March 31, 2024).
The table below illustrates each Fund’s ongoing costs in two ways:
Actual fund return – This section helps you to estimate the actual expenses that you paid over the period. The “Ending Account Value” shown is derived from each Fund’s actual return, and the fourth column shows the dollar amount of operating expenses that would have been paid by an investor who started with $1,000 in the Funds. You may use the information here, together with the amount you invested, to estimate the expenses that you paid over the period.
To do so, simply divide your account value by $1,000 (for example, an $8,600 account value divided by $1,000 = 8.6), then multiply the result by the number given for the Funds under the heading “Expenses Paid During Period.”
Hypothetical 5% return – This section is intended to help you compare the Funds’ ongoing costs with those of other mutual funds. It assumes that each Fund had an annual return of 5% before expenses during the period shown, but that the expense ratio is unchanged. In this case, because the returns used are not the Funds’ actual returns, the results do not apply to your investment. The example is useful in making comparisons because the U.S. Securities and Exchange Commission (the “SEC”) requires all mutual funds to calculate expenses based on a 5% return. You can assess each Fund’s ongoing costs by comparing this hypothetical example with the hypothetical examples that appear in shareholder reports of other funds.
Note that expenses shown in the table are meant to highlight and help you compare ongoing costs only. The Funds do not charge sales loads or redemption fees.
The calculations assume no shares were bought or sold during the period. Your actual costs may have been higher or lower, depending on the amount of your investment and the timing of any purchases or redemptions.
| THE GOVERNMENT STREET FUNDS |
| ABOUT YOUR FUNDS’ EXPENSES (Unaudited) (Continued) |
More information about the Funds’ expenses, including historical expense ratios, can be found in this report. For additional information on operating expenses and other shareholder costs, please refer to the Funds’ prospectus.
| | | Beginning | | Ending | | | | Expenses |
| | | Account Value | | Account Value | | Expense | | Paid During |
| | | Oct. 1, 2023 | | March 31, 2024 | | Ratio(a) | | Period(b) |
| The Government Street Equity Fund | | | | | | | | |
| Based on Actual Fund Return | | $1,000.00 | | $1,250.10 | | 0.87% | | $4.89 |
| Based on Hypothetical 5% Return (before expenses) | | $1,000.00 | | $1,020.66 | | 0.87% | | $4.39 |
| The Government Street Opportunities Fund | | | | | | | | |
| Based on Actual Fund Return | | $1,000.00 | | $1,238.50 | | 1.04% | | $5.82 |
| Based on Hypothetical 5% Return (before expenses) | | $1,000.00 | | $1,019.80 | | 1.04% | | $5.25 |
| (a) | Annualized, based on each Fund’s most recent one-half year expenses. |
| (b) | Expenses are equal to each Fund’s annualized expense ratio multiplied by the average account value over the period, multiplied by 183/366 (to reflect the one-half year period). |
| THE GOVERNMENT STREET FUNDS |
| BOARD OF TRUSTEES AND EXECUTIVE OFFICERS (Unaudited) |
Overall responsibility for management of the Funds rests with the Board of Trustees. The Trustees serve during the lifetime of the Trust and until its termination, or until death, resignation, retirement or removal. The Trustees, in turn, elect the officers of the Funds. The officers have been elected for an annual term. The following are the Trustees and executive officers of the Funds:
| Trustees and Officers | Address | Year of
Birth | Position Held
with the Trust | Length of
Time Served |
| | Robert S. Harris, Ph.D. | 225 Pictoria Drive, Suite 450 Cincinnati, OH | 1949 | Chairman and Trustee | Since January 2007 |
| * | John P. Ackerly, IV | One James Center 901 E. Cary Street Richmond, VA | 1963 | Trustee and President of The Davenport Funds | Since July 2012 |
| | George K. Jennison | 225 Pictoria Drive, Suite 450 Cincinnati, OH | 1957 | Trustee | Since January 2015 |
| | Harris V. Morrissette | 225 Pictoria Drive, Suite 450 Cincinnati, OH | 1959 | Trustee | Since March 1993 |
| | Elizabeth W. Robertson | 225 Pictoria Drive, Suite 450 Cincinnati, OH | 1953 | Trustee | Since February 2014 |
| | Thomas W. Leavell | 210 St. Joseph Street Mobile, AL | 1943 | President of The Government Street Funds | Since February 2004 |
| | Mary Shannon Hope | 210 St. Joseph Street Mobile, AL | 1963 | Vice President of The Government Street Funds | Since August 2008 |
| | Timothy S. Healey | 2712 18th Place South Birmingham, AL | 1953 | Vice President of The Government Street Funds | Since January 1995 |
| | Mark J. Seger | 225 Pictoria Drive, Suite 450 Cincinnati, OH | 1962 | Treasurer | Since November 2000 |
| | David K. James | 225 Pictoria Drive, Suite 450 Cincinnati, OH | 1970 | Secretary | Since November 2018 |
| | Michael J. Nanosky | 225 Pictoria Drive, Suite 450 Cincinnati, OH | 1966 | Chief Compliance Officer | Since March 2020 |
| * | Mr. Ackerly, as an affiliated person of an investment adviser to the Trust, is an “interested person” of the Trust within the meaning of Section 2(a)(19) of the 1940 Act. |
| THE GOVERNMENT STREET FUNDS |
| BOARD OF TRUSTEES AND EXECUTIVE OFFICERS (Unaudited) (Continued) |
Each Trustee oversees nine portfolios of the Trust, including the Funds. The principal occupations of the Trustees and executive officers of the Funds during the past five years and public directorships held by the Trustees are set forth below:
Robert S. Harris, Ph.D. is the C. Stewart Sheppard Professor of Business Administration at The Darden Graduate School of Business Administration at the University of Virginia. He was previously the dean at Darden. Professor Harris has published widely on corporate finance, financial markets and mergers and acquisitions and has served as a consultant to corporations and government agencies.
John P. Ackerly, IV, is Senior Vice President and Portfolio Manager of Davenport & Company, LLC (a broker-dealer and investment advisory firm).
George K. Jennison is retired. He previously was President of Oyster Consulting, LLC (a management consulting firm) and a financial adviser with Wells Fargo Advisors, LLC.
Harris V. Morrissette is President of China Doll Rice and Beans, Inc. and Dixie Lily Foods. He is also a Director of Trustmark Corporation (bank holding company).
Elizabeth W. Robertson serves as a Trustee of TowneBank Foundation, TowneBank Corporate Board, TowneBank Audit Committee Chair and TowneBank Community Board since 2015. She previously was Chief Financial Officer of Monument Restaurants LLC.
Thomas W. Leavell is Portfolio Manager of the Adviser.
Mary Shannon Hope is Operations Director and Portfolio Manager of the Adviser.
Timothy S. Healey is Chief Investment Officer and Portfolio Manager of the Adviser.
Mark J. Seger is a Vice Chairman of Ultimus Fund Solutions, LLC and Ultimus Fund Distributors, LLC. He previously was Co-CEO of Ultimus Fund Solutions, LLC (1999 to 2019).
David K. James is an Executive Vice President and Chief Legal and Risk Officer of Ultimus Fund Solutions, LLC (2018 to present). He previously was Managing Director and Managing Counsel at State Street Bank and Trust Company (2009 to 2018).
Michael J. Nanosky is a Senior Compliance Officer of Northern Lights Distributors, LLC (2020 to present). He previously was Senior Vice President & Chief Compliance Officer of PNC Funds (2014 to 2019).
Additional information about members of the Board of Trustees and executive officers is available in the Statement of Additional Information (“SAI”). To obtain a free copy of the SAI, please call 1-866-738-1125.
| THE GOVERNMENT STREET FUNDS |
| DISCLOSURE REGARDING APPROVAL OF |
| INVESTMENT ADVISORY AGREEMENTS (Unaudited) |
At a meeting held on November 14, 2023, the Board of Trustees, including a majority of the Independent Trustees, approved the continuance of the Investment Advisory Agreements with the Adviser for an additional one-year period on behalf of The Government Street Equity Fund and The Government Street Opportunities Fund (individually, a “Fund,” collectively, the “Funds”). Below is a discussion of the factors considered by the Board of Trustees along with the conclusions with respect thereto that formed the basis for the Board’s approval of the continuation of the Investment Advisory Agreements.
Prior to the Board meeting, the Adviser provided materials in response to a letter sent by counsel to the Independent Trustees, on their behalf, requesting various information relevant to the Independent Trustees’ consideration of the renewal of the Investment Advisory Agreements with respect to each Fund. In approving the continuance of the Investment Advisory Agreements, the Independent Trustees considered all information they deemed reasonably necessary to evaluate the terms of the Agreements. The principal areas of review by the Independent Trustees were the nature, extent and quality of the services provided by the Adviser and the reasonableness of the fees charged for those services. During a meeting of the Governance, Nomination, Compensation and Qualified Legal Compliance Committee held prior to the Board meeting, the Independent Trustees reviewed the proposed renewal of the Investment Advisory Agreements with experienced independent legal counsel outside the presence of representatives of the Adviser and received materials from counsel discussing the legal standards for their consideration of the proposed renewal of the Investment Advisory Agreements.
No single factor was considered in isolation or to be determinative to the decision of the Independent Trustees to approve the continuance of the Investment Advisory Agreements. Rather the Independent Trustees concluded, after weighing and balancing the factors described below, that it was in the best interests of each Fund and its respective shareholders to continue the Investment Advisory Agreements, in their present form, for an additional one-year period.
Nature, Extent and Quality of Services
The Independent Trustees’ evaluation of the nature, extent and quality of the Adviser’s services took into consideration their knowledge gained through presentations and reports from the Adviser over the course of the twelve-month period ended September 30, 2023, including the Adviser’s views on the overall conditions of the economy and the markets. The Independent Trustees considered various factors that may have influenced the markets, investor preferences and market sentiment during the past year and the adjustments that have been made by the Adviser to the portfolio management process in response to the narrowing of the markets in favor of technology stocks. The Independent Trustees also considered the scope and quality of the in-house
| THE GOVERNMENT STREET FUNDS |
| DISCLOSURE REGARDING APPROVAL OF |
| INVESTMENT ADVISORY AGREEMENTS (Unaudited) (Continued) |
capabilities of the Adviser and other resources that it dedicates to performing services for the Funds; the quality of administrative and other services, including the Adviser’s role in coordinating the activities of the Funds’ other service providers; the Adviser’s compliance with the investment policies of the Funds and applicable laws and regulations; the business reputation of the Adviser; the experience of the Funds’ portfolio manager, and the Adviser’s financial resources.
Investment Performance
The Independent Trustees considered the performance of each Fund for the 1-year, 3-year, 5-year, and 10-year periods ended September 30, 2023, compared to the Fund’s benchmark and a peer group of funds with similar investment objectives and strategies. The Independent Trustees noted that The Government Street Equity Fund (i) underperformed its benchmark (the S&P 500® Index) during the 1-year, 3-year and 10-year periods ended September 30, 2023, but outperformed its benchmark over the 5-year period; and (ii) underperformed the median of its peer group during the 1-year and 3-year periods ended September 30, 2023, but outperformed the median of its peer group over the 5-year and 10-year periods. The Independent Trustees noted that The Government Street Opportunities Fund (i) slightly underperformed its benchmark (the S&P 400® Index) during the 1-year period ended September 30, 2023, but outperformed its benchmark over the 3-year, 5-year and 10-year periods; and outperformed the median of its peer group during the 1-year, 3-year, 5-year and 10-year periods. In evaluating each Fund’s investment performance, the Board took into account the challenges of navigating the uncertainties in the market that have emerged from the confluence of higher interest rates, high inflation, mounting government debt, and escalating international unrest.
Fees and Expense Ratios
In reviewing the fees payable under the Investment Advisory Agreements, the Independent Trustees compared the advisory fees and overall expense levels of each Fund with those of funds with similar investment objectives and strategies. The Independent Trustees noted that, according to statistics derived from Morningstar, Inc., the advisory fee for each Fund was higher than the median of similarly managed funds and the total expense ratio for each Fund was higher than the average of similarly managed funds. The Independent Trustees considered information about the Adviser’s profitability with respect to each Fund, including the assumptions and methodology the Adviser used in preparing the profitability information, in light of applicable case law relating to advisory fees. For these purposes, the Independent Trustees considered not only the fees paid by the Funds, but also so-called “fallout” benefits to the Adviser. The Independent Trustees also considered the Adviser’s
| THE GOVERNMENT STREET FUNDS |
| DISCLOSURE REGARDING APPROVAL OF |
| INVESTMENT ADVISORY AGREEMENTS (Unaudited) (Continued) |
representations that the Funds’ portfolio trades were executed based on the best available price and execution, and that the Adviser does not participate in any soft dollar or revenue sharing arrangements with respect to the Funds.
Economies and Benefits of Scale
Given the current size of the Funds and their expected growth, the Independent Trustees did not believe that it was relevant to consider the extent to which economies of scale would be realized as the Funds grow, and whether fee levels reflect these economies of scale. The Independent Trustees did consider the “fallout” benefits to the Adviser with respect to the Funds but viewed this as a secondary factor in connection with the evaluation of the reasonableness of the advisory fees paid by the Funds.
Conclusions
Based on the consideration of the foregoing and such other information as was deemed relevant, the Independent Trustees concluded that: (i) the overall performance of each Fund is satisfactory in comparison to the performance to its benchmark and peer group and the Adviser has provided quality services to the Funds; (ii) the advisory fees for each Fund, while higher than the median for similarly managed funds according to statistics derived from Morningstar, Inc., are reasonable in relation to the quality and level of services provided by the Adviser; (iii) the total operating expense ratio of each Fund, while higher than the average for similarly managed funds according to statistics derived from Morningstar, Inc., remains competitive, and (iv) the profits of the Adviser with respect to its management of each Fund is reasonable.
| THE GOVERNMENT STREET FUNDS |
| OTHER INFORMATION (Unaudited) |
A description of the policies and procedures that the Funds use to vote proxies relating to portfolio securities is available without charge upon request by calling toll-free 1-866-738-1125, or on the SEC’s website at www.sec.gov. Information regarding how the Funds voted proxies relating to portfolio securities during the most recent 12-month period ended June 30 is also available without charge upon request by calling toll-free 1-866-738-1125 or on the SEC’s website at www.sec.gov.
The Trust files a complete listing of portfolio holdings for the Funds with the SEC as of the end of the first and third quarters of each fiscal year as an exhibit to its reports on Form N-PORT. The filings are available upon request, by calling 1-866-738-1125. Furthermore, you may obtain a copy of these filings on the SEC’s website at www.sec.gov and the Funds’ website https://funddocs.filepoint.com/govstreet/.
| FEDERAL TAX INFORMATION (Unaudited) |
For the fiscal year ended March 31, 2024 the Government Street Equity Fund and the Government Street Opportunities Fund designated $3,300,436 and $743,232 respectively, as long-term capital gain distributions.
Qualified Dividend Income — The Funds each designate 100%, or up to the maximum amount of such dividends allowable pursuant to the Internal Revenue Code, as qualified dividend income eligible for the reduced tax rate.
Dividends Received Deduction — Corporate shareholders are generally entitled to take the dividends received deduction on the portion of the Fund’s dividend distributions that qualify under tax law. For the fiscal year ended March 31, 2024, 100% of the Government Street Equity Fund and the Government Street Opportunities Fund’s ordinary income dividends qualifies for the corporate dividends received deduction.
This page intentionally left blank.
This page intentionally left blank.
| | | | | | | |
| | | | | | | |
| | | | | | | |
| | | | | | | |
| | | | | | | |
| | | | The Government Street Funds | | | |
| | | | | | | |
| | | | | | | |
| | | | No-Load Mutual Funds | | | |
| | | | | | | |
| | | | | | | |
| | | | Investment Adviser Leavell Investment Management, Inc. 210 St. Joseph Street Mobile, AL 36602 Administrator Ultimus Fund Solutions, LLC P.O. Box 46707 Cincinnati, OH 45246-0707 1-866-738-1125 Legal Counsel Sullivan & Worcester LLP 1666 K Street, N.W. Washington, DC 20006 Independent Registered Public Accounting Firm Cohen & Company, Ltd. 342 N Water Street, Suite 830 Milwaukee, WI 53202 Board of Trustees Robert S. Harris, Ph.D., Chairman John P. Ackerly, IV George K. Jennison Harris V. Morrissette Elizabeth W. Robertson Portfolio Manager Thomas W. Leavell, The Government Street Equity Fund The Government Street Opportunities Fund | | | |
| | | | | | | |
| | | | | | | |
| | | | | | | |
| | | | | | | |
| | | | | | | |
| | | | | | | |
| | | | | | | |
| | | | | | | |
| | | | | | | |
| | | | | | | |
| | | | | | | |
| | | | | | | |
| | | | Government Street-AR-24 | | |
| | | | | | | |
| | | | | | | |
| | | | | | | |
| | | | | | | |
| | | | | |
| | | | |
| | | | | |
| | | | | |
| | | | | |
| | | | | |
| | | | | |
| | | THE | | |
| | | JAMESTOWN | | |
| | | EQUITY FUND | | |
| | | | | |
| | | | | |
| | | | | |
| | | | | |
| | | No-Load Fund | | |
| | | | | |
| | | | | |
| | | | | |
| | | | | |
| | | | | |
| | | | | |
| | | | | |
| | | | | |
| | | | | |
| | | | | |
| | | | | |
| | | ANNUAL REPORT | | |
| | | | | |
| | | | | |
| | | | | |
| | | | | |
| | | | | |
| | | | | |
| | | March 31, 2024 | | |
| | | | | |
| | | | | |
| | | | | |
| | | | | |
| | | | | |
| | | | | |
| | | | | |
| | |  | | |
| | | | | |
| | | | | |
| | | Investment Adviser | | |
| | | Lowe, Brockenbrough & Company, Inc. | | |
| | | Richmond, Virginia | | |
| | | | | |
| | | | | |
| | | | | |
| | | | | |
| LETTER TO SHAREHOLDERS | April 24, 2024 |
For the fiscal year ended March 31, 2024, The Jamestown Equity Fund (the “Fund”) returned 30.48% compared to 29.88% for the S&P 500® Index. Equity markets bounced around in the first half of the fiscal year as investors dealt with several large bank failures early in the fiscal year, and a persistent rise in interest rates during the first half of the year. When interest rates peaked in October 2023, equity markets began a massive rally that continued through the end of the fiscal year.
Large capitalization equities outperformed for the past twelve months with the S&P 500®’s return handily beating the small capitalization Russell 2000® Index’s return of 19.71%. Equity markets were led by the performance of mega capitalization technology-oriented stocks during the fiscal year. The Russell 1000® Growth Index return of 39.00% significantly outperformed the 20.27% return from the Russell 1000® Value Index. International markets were up for the year but continued to lag the performance of U.S. equities.
Sector selection was essentially neutral during the fiscal year with underweights to some of the more defensive sectors like Utilities, Health Care and Real Estate offset by overweight positions in the Energy and Consumer Staples sectors along with the drag from cash holdings in a strong equity market. Security selection drove the Fund’s modest outperformance during the fiscal year. The sectors with the strongest security selection were the Communications, Consumer Discretionary, and Industrial sectors. This was partially offset by below market performance in the Health Care, Technology and Energy sectors. On an absolute basis, the five best performing stocks were NVDIA Corporation, Meta Platforms, Broadcom, Eaton Corporation, and Applied Materials, while the five worst performing stocks were Pfizer, United Parcel Service, Eastman Chemical, The Walt Disney Company, and Cisco Systems. All of these stocks were still held in the Fund at the end of the fiscal year with the exceptions of Disney and Eastman Chemical.
The economy has remained resilient in the face of higher interest rates. Inflation has come down from peak levels but is still not at the Federal Reserve’s (the “Fed”) 2% target. The Fed last hiked interest rates in July 2023 and has been on hold since. Market participants came into 2024 expecting the Fed to cut rates up to six times. With the economy remaining stronger than expected and several recent higher than expected inflation reports, those expectations for rate cuts have moderated to a forecast of three rate cuts by the Fed. So far, equity markets have adjusted well to the expectations for more modest interest rate cuts, as well as a later start to when the Fed may begin those cuts.
Earnings growth was bifurcated over the past four quarters with strong overall growth from the Technology and Communications sectors and slightly positive growth from the rest of the market. As a result, valuations on the overall S&P 500® have moved up to roughly 21X forecasted earnings expectations for the S&P 500®. Earnings growth began to pick up and broaden out slightly at the end of calendar 2023. Analysts currently expect the overall pace and the breadth of earnings growth to accelerate as we move through 2024, and investors will be watching closely to see if those predictions are met.
The S&P 500®’s net profit margin is back at new highs, led by performance in the Technology and Communication Services sectors. Many of these companies are remarkably profitable with huge global market share--borderline monopolies really. This transformation of our human experience has also thoroughly upended the composition of the U.S. stock market, a market that
| LETTER TO SHAREHOLDERS | April 24, 2024 |
was once dominated by slower growing, less profitable cyclical companies like Exxon and GE. The S&P 500® is more profitable, generates more cash flow, is less cyclical and grows faster than it otherwise would have because of tech’s growing influence. The exceptional health of these businesses is also one of the principal reasons that the market continues to ignore the laundry list of problems we face. And we believe it is reasonable to conclude that technological advances will eventually address some of them.
10-year Treasury yields peaked at 5% in early October 2023 and equity markets were under some pressure as interest rates rose toward that peak. Just as quickly as the rose, interest rates came back down with the 10-year Treasury moving below 4% by the end of calendar 2023. Interest rates have moved up this year due to stronger economic reports and stickier than expected inflation, and the 10-year Treasury ended the fiscal year at 4.2%. In addition to the focus of earnings growth throughout the year, investors will be keenly focused on the path of interest rates and the ability of the Federal Reserve to begin cutting short term interest rates at some point this year.
At the end of March 2024, 96.00% of the Fund was invested in a diversified portfolio of equities, while holding 4.00% in cash. The Fund was slightly overweight the Communication, Consumer Staples, Energy and Technology sectors and underweight the Consumer Discretionary, Financials, Health Care, Materials, Utilities and Real Estate sectors at the end of the fiscal year.
| THE JAMESTOWN EQUITY FUND |
| PERFORMANCE INFORMATION (Unaudited) |
Comparison of the Change in Value of a $10,000 Investment in
The Jamestown Equity Fund
and the S&P 500® Index
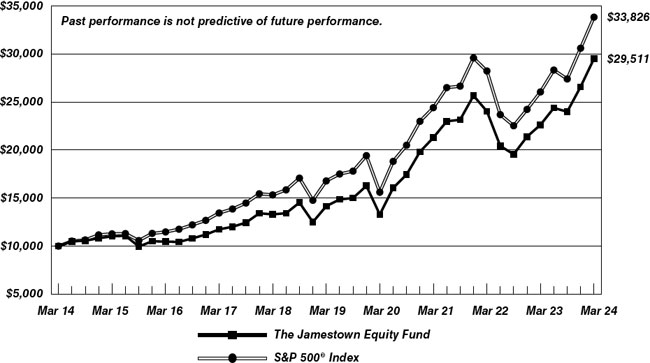
| | | | |
| | | Average Annual Total Returns | |
| | | (for periods ended March 31, 2024) | |
| | | | |
| | | 1 Year | | 5 Years | | 10 Years | |
| | The Jamestown Equity Fund (a) | 30.48% | | 15.83% | | 11.43% | |
| | S&P 500® Index | 29.88% | | 15.05% | | 12.96% | |
| | | | | | | | |
| (a) | Total return is a measure of the change in value of an investment in the Fund over the periods covered, which assumes any dividends or capital gains distributions are reinvested in shares of the Fund. Returns shown do not reflect the deduction of taxes a shareholder would pay on Fund distributions or the redemption of Fund shares. |
| THE JAMESTOWN EQUITY FUND |
| PORTFOLIO INFORMATION |
| March 31, 2024 |
| Asset Allocation (% of Net Assets) |
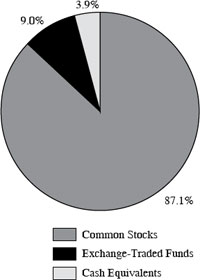
| | % of |
| Ten Largest Equity Holdings | Net Assets |
| Microsoft Corporation | 5.1% |
| Apple, Inc. | 4.7% |
| Meta Platforms, Inc. - Class A | 4.4% |
| NVIDIA Corporation | 3.9% |
| Amazon.com, Inc. | 3.5% |
| Vanguard Information Technology ETF | 3.4% |
| JPMorgan Chase & Company | 3.1% |
| Alphabet, Inc. - Class C | 2.8% |
| Oracle Corporation | 2.3% |
| Ameriprise Financial, Inc. | 2.3% |
| Sector Concentration vs. the S&P 500® Index |
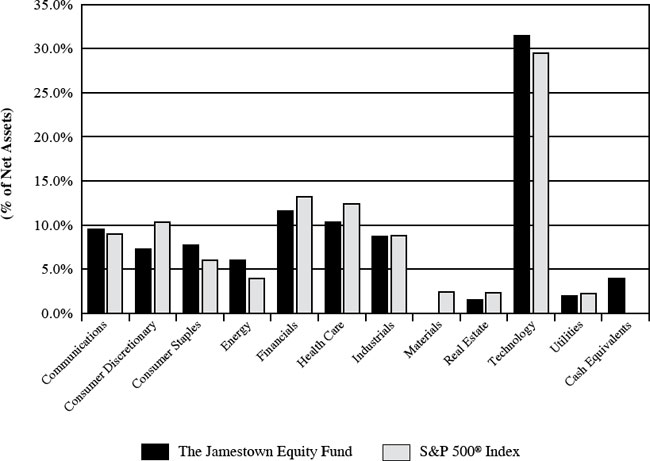
| THE JAMESTOWN EQUITY FUND |
| SCHEDULE OF INVESTMENTS |
| March 31, 2024 |
| COMMON STOCKS — 87.1% | | Shares | | | Value | |
| Communications — 9.5% | | | | | | | | |
| Alphabet, Inc. - Class C (a) | | | 10,000 | | | $ | 1,522,600 | |
| Booking Holdings, Inc. | | | 335 | | | | 1,215,340 | |
| Meta Platforms, Inc. - Class A | | | 4,928 | | | | 2,392,938 | |
| | | | | | | | 5,130,878 | |
| Consumer Discretionary — 7.3% | | | | | | | | |
| Amazon.com, Inc. (a) | | | 10,500 | | | | 1,893,990 | |
| Home Depot, Inc. (The) | | | 1,350 | | | | 517,860 | |
| Lowe’s Companies, Inc. | | | 2,300 | | | | 585,879 | |
| TJX Companies, Inc. (The) | | | 9,100 | | | | 922,922 | |
| | | | | | | | 3,920,651 | |
| Consumer Staples — 6.6% | | | | | | | | |
| PepsiCo, Inc. | | | 2,690 | | | | 470,777 | |
| Procter & Gamble Company (The) | | | 5,100 | | | | 827,475 | |
| Target Corporation | | | 4,300 | | | | 762,003 | |
| Unilever plc - ADR | | | 18,505 | | | | 928,766 | |
| Walmart, Inc. | | | 9,000 | | | | 541,530 | |
| | | | | | | | 3,530,551 | |
| Energy — 6.0% | | | | | | | | |
| Chevron Corporation | | | 7,200 | | | | 1,135,728 | |
| Exxon Mobil Corporation | | | 7,170 | | | | 833,441 | |
| Schlumberger Ltd. | | | 11,545 | | | | 632,781 | |
| TotalEnergies SE - ADR | | | 9,500 | | | | 653,885 | |
| | | | | | | | 3,255,835 | |
| Financials — 10.4% | | | | | | | | |
| Ameriprise Financial, Inc. | | | 2,800 | | | | 1,227,632 | |
| Chubb Ltd. | | | 1,800 | | | | 466,434 | |
| Goldman Sachs Group, Inc. (The) | | | 1,800 | | | | 751,842 | |
| JPMorgan Chase & Company | | | 8,300 | | | | 1,662,490 | |
| Morgan Stanley | | | 7,500 | | | | 706,200 | |
| PNC Financial Services Group, Inc. (The) | | | 4,800 | | | | 775,680 | |
| | | | | | | | 5,590,278 | |
| Health Care — 10.3% | | | | | | | | |
| Amgen, Inc. | | | 1,300 | | | | 369,616 | |
| CVS Health Corporation | | | 8,500 | | | | 677,960 | |
| Elevance Health, Inc. | | | 1,650 | | | | 855,591 | |
| Johnson & Johnson | | | 4,000 | | | | 632,760 | |
| Merck & Company, Inc. | | | 4,000 | | | | 527,800 | |
| Pfizer, Inc. | | | 27,510 | | | | 763,403 | |
| Thermo Fisher Scientific, Inc. | | | 1,400 | | | | 813,694 | |
| UnitedHealth Group, Inc. | | | 1,800 | | | | 890,460 | |
| | | | | | | | 5,531,284 | |
| THE JAMESTOWN EQUITY FUND |
| SCHEDULE OF INVESTMENTS (Continued) |
| COMMON STOCKS — 87.1% (Continued) | | Shares | | | Value | |
| Industrials — 8.7% | | | | | | | | |
| Eaton Corporation plc | | | 2,900 | | | $ | 906,772 | |
| Lockheed Martin Corporation | | | 825 | | | | 375,268 | |
| Norfolk Southern Corporation | | | 3,200 | | | | 815,584 | |
| RTX Corporation | | | 11,740 | | | | 1,145,002 | |
| Trane Technologies plc | | | 3,500 | | | | 1,050,700 | |
| United Parcel Service, Inc. - Class B | | | 2,600 | | | | 386,438 | |
| | | | | | | | 4,679,764 | |
| Real Estate — 1.5% | | | | | | | | |
| American Tower Corporation | | | 4,192 | | | | 828,297 | |
| | | | | | | | | |
| Technology — 24.8% | | | | | | | | |
| Adobe, Inc. (a) | | | 1,400 | | | | 706,440 | |
| Apple, Inc. | | | 14,700 | | | | 2,520,756 | |
| Applied Materials, Inc. | | | 5,650 | | | | 1,165,199 | |
| Broadcom, Inc. | | | 840 | | | | 1,113,344 | |
| Cisco Systems, Inc. | | | 17,750 | | | | 885,903 | |
| Microsoft Corporation | | | 6,500 | | | | 2,734,680 | |
| NVIDIA Corporation | | | 2,305 | | | | 2,082,706 | |
| Oracle Corporation | | | 10,000 | | | | 1,256,100 | |
| Visa, Inc. - Class A | | | 3,175 | | | | 886,079 | |
| | | | | | | | 13,351,207 | |
| Utilities — 2.0% | | | | | | | | |
| Duke Energy Corporation | | | 11,040 | | | | 1,067,679 | |
| | | | | | | | | |
| Total Common Stocks (Cost $17,962,334) | | | | | | $ | 46,886,424 | |
| | | | | | | |
| EXCHANGE-TRADED FUNDS — 9.0% | | Shares | | | Value | |
| Consumer Staples Select Sector SPDR Fund | | | 7,550 | | | $ | 576,518 | |
| Invesco KBW Bank ETF | | | 12,165 | | | | 652,774 | |
| iShares Expanded Tech-Software Sector ETF | | | 8,150 | | | | 694,950 | |
| iShares Semiconductor ETF | | | 4,800 | | | | 1,084,416 | |
| Vanguard Information Technology ETF | | | 3,500 | | | | 1,835,190 | |
| Total Exchange-Traded Funds (Cost $1,932,818) | | | | | | $ | 4,843,848 | |
| THE JAMESTOWN EQUITY FUND |
| SCHEDULE OF INVESTMENTS (Continued) |
| MONEY MARKET FUNDS — 4.0% | | Shares | | | Value | |
| Federated Hermes Government Obligations Fund - Institutional Class, 5.18% (b) (Cost $2,158,937) | | | 2,158,937 | | | $ | 2,158,937 | |
| | | | | | | | | |
| Total Investments at Value — 100.1% | | | | | | | | |
| (Cost $22,054,089) | | | | | | $ | 53,889,209 | |
| | | | | | | | | |
| Liabilities in Excess of Other Assets — (0.1%) | | | | | | | (39,871 | ) |
| | | | | | | | | |
| Net Assets — 100.0% | | | | | | $ | 53,849,338 | |
ADR - American Depositary Receipt.
| (a) | Non-income producing security. |
| (b) | The rate shown is the 7-day effective yield as of March 31, 2024. |
See accompanying notes to financial statements.
| THE JAMESTOWN EQUITY FUND |
| STATEMENT OF ASSETS AND LIABILITIES |
| March 31, 2024 |
| ASSETS | | | | |
| Investments in securities: | | | | |
| At cost | | $ | 22,054,089 | |
| At value (Note 2) | | $ | 53,889,209 | |
| Cash | | | 13,180 | |
| Dividends receivable | | | 28,005 | |
| Other assets | | | 4,003 | |
| TOTAL ASSETS | | | 53,934,397 | |
| | | | | |
| LIABILITIES | | | | |
| Distributions payable | | | 2,033 | |
| Payable for capital shares redeemed | | | 37,069 | |
| Accrued management fees (Note 4) | | | 36,252 | |
| Payable to administrator (Note 4) | | | 6,000 | |
| Other accrued expenses | | | 3,705 | |
| TOTAL LIABILITIES | | | 85,059 | |
| | | | | |
| NET ASSETS | | $ | 53,849,338 | |
| | | | | |
| Net assets consist of: | | | | |
| Paid-in capital | | $ | 20,267,970 | |
| Distributable earnings | | | 33,581,368 | |
| Net assets | | $ | 53,849,338 | |
| | | | | |
| Shares of beneficial interest outstanding (unlimited number of shares authorized, $0.01 par value) | | | 1,667,016 | |
| | | | | |
| Net asset value, offering price and redemption price per share (Note 2) | | $ | 32.30 | |
See accompanying notes to financial statements.
| THE JAMESTOWN EQUITY FUND |
| STATEMENT OF OPERATIONS |
| Year Ended March 31, 2024 |
| INVESTMENT INCOME | | | |
| Dividends | | $ | 906,050 | |
| Foreign withholding taxes on dividends | | | (8,344 | ) |
| TOTAL INVESTMENT INCOME | | | 897,706 | |
| | | | | |
| EXPENSES | | | | |
| Management fees (Note 4) | | | 305,417 | |
| Administration fees (Note 4) | | | 60,000 | |
| Trustees’ fees and expenses (Note 4) | | | 22,977 | |
| Audit and tax services fees | | | 16,915 | |
| Registration and filing fees | | | 13,767 | |
| Compliance service fees and expenses (Note 4) | | | 12,270 | |
| Shareholder reporting expense | | | 9,014 | |
| Legal fees | | | 8,802 | |
| Custodian and bank service fees | | | 7,586 | |
| Shareholder servicing fees (Note 4) | | | 4,820 | |
| Postage and supplies | | | 3,524 | |
| Insurance expense | | | 1,412 | |
| Other expenses | | | 9,146 | |
| TOTAL EXPENSES | | | 475,650 | |
| Fees voluntarily waived by the Adviser (Note 4) | | | (29,271 | ) |
| NET EXPENSES | | | 446,379 | |
| | | | | |
| NET INVESTMENT INCOME | | | 451,327 | |
| | | | | |
| REALIZED AND UNREALIZED GAINS ON INVESTMENTS | | | | |
| Net realized gains on investment transactions | | | 2,103,408 | |
| Net change in unrealized appreciation (depreciation) on investments | | | 10,229,082 | |
| NET REALIZED AND UNREALIZED GAINS ON INVESTMENTS | | | 12,332,490 | |
| | | | | |
| NET INCREASE IN NET ASSETS RESULTING FROM OPERATIONS | | $ | 12,783,817 | |
See accompanying notes to financial statements.
| THE JAMESTOWN EQUITY FUND |
| STATEMENTS OF CHANGES IN NET ASSETS |
| | | Year | | | Year | |
| | | Ended | | | Ended | |
| | | March 31, | | | March 31, | |
| | | 2024 | | | 2023 | |
| FROM OPERATIONS | | | | | | | | |
| Net investment income | | $ | 451,327 | | | $ | 464,146 | |
| Net realized gains on investment transactions | | | 2,103,408 | | | | 3,251,417 | |
| Net change in unrealized appreciation (depreciation) on investments | | | 10,229,082 | | | | (6,891,866 | ) |
| Net increase (decrease) in net assets resulting from operations | | | 12,783,817 | | | | (3,176,303 | ) |
| | | | | | | | | |
| DISTRIBUTIONS TO SHAREHOLDERS (Note 2) | | | (1,789,251 | ) | | | (5,789,948 | ) |
| | | | | | | | | |
| FROM CAPITAL SHARE TRANSACTIONS | | | | | | | | |
| Proceeds from shares sold | | | 205,533 | | | | 341,376 | |
| Net asset value of shares issued in reinvestment of distributions to shareholders | | | 1,752,769 | | | | 5,648,746 | |
| Payments for shares redeemed | | | (2,182,163 | ) | | | (4,136,511 | ) |
| Net increase (decrease) in net assets from capital share transactions | | | (223,861 | ) | | | 1,853,611 | |
| | | | | | | | | |
| TOTAL INCREASE (DECREASE) IN NET ASSETS | | | 10,770,705 | | | | (7,112,640 | ) |
| | | | | | | | | |
| NET ASSETS | | | | | | | | |
| Beginning of year | | | 43,078,633 | | | | 50,191,273 | |
| End of year | | $ | 53,849,338 | | | $ | 43,078,633 | |
| | | | | | | | | |
| CAPITAL SHARE ACTIVITY | | | | | | | | |
| Shares sold | | | 7,226 | | | | 13,459 | |
| Shares reinvested | | | 63,645 | | | | 225,428 | |
| Shares redeemed | | | (78,161 | ) | | | (161,336 | ) |
| Net increase (decrease) in shares outstanding | | | (7,290 | ) | | | 77,551 | |
| Shares outstanding, beginning of year | | | 1,674,306 | | | | 1,596,755 | |
| Shares outstanding, end of year | | | 1,667,016 | | | | 1,674,306 | |
See accompanying notes to financial statements.
| THE JAMESTOWN EQUITY FUND |
| FINANCIAL HIGHLIGHTS |
Selected Per Share Data for a Share Outstanding Throughout Each Year:
| | | Years Ended March 31, | |
| | | 2024 | | | 2023 | | | 2022 | | | 2021 | | | 2020 | |
| Net asset value at beginning of year | | $ | 25.73 | | | $ | 31.43 | | | $ | 28.96 | | | $ | 19.08 | | | $ | 21.79 | |
| | | | | | | | | | | | | | | | | | | | | |
| Income (loss) from investment operations: | | | | | | | | | | | | | | | | | | | | |
| Net investment income (a) | | | 0.27 | | | | 0.28 | | | | 0.16 | | | | 0.17 | | | | 0.22 | |
| Net realized and unrealized gains (losses) on investments | | | 7.37 | | | | (2.38 | ) | | | 3.57 | | | | 11.05 | | | | (1.35 | ) |
| Total from investment operations | | | 7.64 | | | | (2.10 | ) | | | 3.73 | | | | 11.22 | | | | (1.13 | ) |
| | | | | | | | | | | | | | | | | | | | | |
| Less distributions from: | | | | | | | | | | | | | | | | | | | | |
| Net investment income | | | (0.27 | ) | | | (0.28 | ) | | | (0.16 | ) | | | (0.18 | ) | | | (0.22 | ) |
| Net realized gains | | | (0.80 | ) | | | (3.32 | ) | | | (1.10 | ) | | | (1.16 | ) | | | (1.36 | ) |
| Total distributions | | | (1.07 | ) | | | (3.60 | ) | | | (1.26 | ) | | | (1.34 | ) | | | (1.58 | ) |
| | | | | | | | | | | | | | | | | | | | | |
| Net asset value at end of year | | $ | 32.30 | | | $ | 25.73 | | | $ | 31.43 | | | $ | 28.96 | | | $ | 19.08 | |
| | | | | | | | | | | | | | | | | | | | | |
| Total return (b) | | | 30.48 | % | | | (5.89 | %) | | | 12.91 | % | | | 60.23 | % | | | (6.17 | %) |
| | | | | | | | | | | | | | | | | | | | | |
| Net assets at end of year (000’s) | | $ | 53,849 | | | $ | 43,078 | | | $ | 50,191 | | | $ | 47,399 | | | $ | 31,062 | |
| | | | | | | | | | | | | | | | | | | | | |
| Ratio of total expenses to average net assets (c) | | | 1.01 | % | | | 1.04 | % | | | 0.96 | % | | | 1.05 | % | | | 1.08 | % |
| | | | | | | | | | | | | | | | | | | | | |
| Ratio of net expenses to average net assets (c)(d) | | | 0.95 | % | | | 0.95 | % | | | 0.95 | % | | | 0.95 | % | | | 0.95 | % |
| | | | | | | | | | | | | | | | | | | | | |
| Ratio of net investment income to average net assets (a)(c)(d) | | | 0.96 | % | | | 1.08 | % | | | 0.51 | % | | | 0.70 | % | | | 0.96 | % |
| | | | | | | | | | | | | | | | | | | | | |
| Portfolio turnover rate | | | 9 | % | | | 6 | % | | | 8 | % | | | 10 | % | | | 18 | % |
| (a) | Recognition of net investment income by the Fund is affected by the timing of the declarations of dividends by the underlying investment companies in which the Fund invests. |
| (b) | Total return is a measure of the change in value of an investment in the Fund over the periods covered, which assumes any dividends or capital gains distributions are reinvested in shares of the Fund. Returns shown do not reflect the deduction of taxes a shareholder would pay on Fund distributions or the redemption of Fund shares. |
| (c) | The ratios of expenses and net investment income to average net assets do not reflect the Fund’s proportionate share of expenses of the underlying investment companies in which the Fund invests. Ratios were also determined based on net expenses after expense reimbursements through a previously directed brokerage arrangement for the year ended March 31, 2020. |
| (d) | Ratio was determined after voluntary management fee waivers by the Adviser and reimbursed expenses (Note 4). |
See accompanying notes to financial statements.
| THE JAMESTOWN EQUITY FUND |
| NOTES TO FINANCIAL STATEMENTS |
| March 31, 2024 |
1. Organization
The Jamestown Equity Fund (the “Fund”) is a diversified, no-load series of Williamsburg Investment Trust (the “Trust”), an open-end management investment company registered under the Investment Company Act of 1940, as amended (the “1940 Act”). The Trust was organized as a Massachusetts business trust on July 18, 1988. Other series of the Trust are not included in this report.
The investment objective of the Fund is long-term growth of capital.
2. Significant Accounting Policies
The following is a summary of the Fund’s significant accounting policies. These policies are in conformity with accounting principles generally accepted in the United States of America (“GAAP”). The Fund follows accounting and reporting guidance under Financial Accounting Standards Board Accounting Standards Codification Topic 946, “Financial Services – Investment Companies.”
Regulatory update — Tailored Shareholder Reports for Mutual Funds and Exchange-Traded Funds (“ETFs”) — Effective January 24, 2023, the Securities and Exchange Commission (the “SEC”) adopted rule and form amendments to require mutual funds and ETFs to transmit concise and visually engaging streamlined annual and semiannual reports to shareholders that highlight key information. Other information, including financial statements, will no longer appear in a streamlined shareholder report but must be available online, delivered free of charge upon request, and filed on a semiannual basis on Form N-CSR. The rule and form amendments have a compliance date of July 24, 2024. At this time, management is evaluating the impact of these amendments on the shareholder reports for the Fund.
Securities valuation — All investments in securities are recorded at their estimated fair value. The Fund’s portfolio securities are valued as of the close of business of the regular session of the New York Stock Exchange (normally 4:00 p.m., Eastern time). Securities traded on a national stock exchange, including common stocks and exchange-traded funds (“ETFs”), are generally valued based upon the closing price on the principal exchange where the security is traded, if available, otherwise, at the last quoted bid price. Securities that are quoted by NASDAQ are valued at the NASDAQ Official Closing Price. Investments representing shares of other open-end investment companies, other than ETFs but including money market funds, are valued at their net asset value (“NAV”) as reported by such companies. When using a quoted price and when the market is considered active, securities will be classified as Level 1 within the fair value hierarchy (see below).
When market quotations are not readily available, if a pricing service cannot provide a price, or if the investment adviser believes the price received from the pricing service is not indicative of fair value, securities will be valued in good faith at fair value as determined by Lowe, Brockenbrough & Company, Inc., d/b/a Brockenbrough (the “Adviser”), as the Fund’s valuation designee, in accordance with procedures adopted by the Board of Trustees (the “Board” or “Trustees”) pursuant to Rule 2a-5 under the 1940 Act. Under these procedures, the securities will be classified as Level 2 or 3 within the fair value hierarchy, depending on the inputs used. Such methods of fair
| THE JAMESTOWN EQUITY FUND |
| NOTES TO FINANCIAL STATEMENTS (Continued) |
valuation may include, but are not limited to: multiple of earnings, multiple of book value, discount from market of a similar freely traded security, purchase price of the security, subsequent private transactions in the security or related securities, or a combination of these and other factors.
GAAP establishes a single authoritative definition of fair value, sets out a framework for measuring fair value and requires additional disclosures about fair value measurements.
Various inputs are used in determining the value of the Fund’s investments. These inputs are summarized in the three broad levels listed below:
| ● | Level 1 – quoted prices in active markets for identical securities |
| ● | Level 2 – other significant observable inputs |
| ● | Level 3 – significant unobservable inputs |
The inputs or methodology used for valuing securities are not necessarily an indication of the risks associated with investing in those securities. The inputs used to measure fair value may fall into different levels of the fair value hierarchy. In such cases, for disclosure purposes, the level in the fair value hierarchy within which the fair value measurement falls in its entirety is determined based on the lowest level input that is significant to the fair value measurement.
The following is a summary of the Fund’s investments based on the inputs used to value the investments as of March 31, 2024, by security type:
| | | Level 1 | | | Level 2 | | | Level 3 | | | Total | |
| Common Stocks | | $ | 46,886,424 | | | $ | — | | | $ | — | | | $ | 46,886,424 | |
| Exchange-Traded Funds | | | 4,843,848 | | | | — | | | | — | | | | 4,843,848 | |
| Money Market Funds | | | 2,158,937 | | | | — | | | | — | | | | 2,158,937 | |
| Total | | $ | 53,889,209 | | | $ | — | | | $ | — | | | $ | 53,889,209 | |
| | | | | | | | | | | | | | | | | |
Refer to the Fund’s Schedule of Investments for a listing of the common stocks by sector type. There were no Level 3 securities or derivative instruments held by the Fund as of or during the year ended March 31, 2024.
Share valuation — The NAV per share of the Fund is calculated daily by dividing the total value of its assets, less liabilities, by the number of shares outstanding. The offering price and redemption price per share of the Fund is equal to the NAV per share.
Investment income — Dividend income is recorded on the ex-dividend date. Non-cash dividends included in dividend income, if any, are recorded at the fair market value of the security received. Withholding taxes on foreign dividends received by the Fund, if any, have been recorded in accordance with the Trust’s understanding of the applicable country’s rules and tax rates.
Distributions to shareholders — Dividends arising from net investment income, if any, are declared and paid quarterly to shareholders of the Fund. Net realized short-term capital gains, if any, may be distributed throughout the year and net realized long-term capital gains, if any, are
| THE JAMESTOWN EQUITY FUND |
| NOTES TO FINANCIAL STATEMENTS (Continued) |
distributed at least once each year. The amount of distributions from net investment income and net realized capital gains are determined in accordance with federal income tax regulations, which may differ from GAAP. Dividends and distributions are recorded on the ex-dividend date.
The tax character of distributions paid during the years ended March 31, 2024 and 2023 was as follows:
| Years | | Ordinary | | | Long-Term | | | Total | |
| Ended | | Income | | | Capital Gains | | | Distributions* | |
| 3/31/2024 | | $ | 463,284 | | | $ | 1,326,954 | | | $ | 1,790,238 | |
| 3/31/2023 | | $ | 508,007 | | | $ | 5,280,591 | | | $ | 5,788,598 | |
| | | | | | | | | | | | | |
| * | Total Distributions may not tie to the amounts listed on the Statements of Changes in Net Assets due to distributions payable amounts. |
Investment transactions — Investment transactions are accounted for on trade date for financial reporting purposes. Realized gains and losses on investment securities sold are determined on a specific identification basis.
Common expenses — Common expenses of the Trust are allocated among the series of the Trust based on relative net assets of each series or the nature of the services performed and the relative applicability to each series.
Estimates — The preparation of financial statements in conformity with GAAP requires management to make estimates and assumptions that affect the reported amounts of assets and liabilities and the disclosure of contingent assets and liabilities, each as of the date of the financial statements, and the reported amounts of increase (decrease) in net assets from operations during the reporting period. Actual results could differ from those estimates.
Federal income tax — The Fund has qualified and intends to continue to qualify as a regulated investment company under the Internal Revenue Code of 1986, as amended (the “Code”). Qualification generally will relieve the Fund of liability for federal income taxes to the extent 100% of its net investment income and net realized capital gains are distributed in accordance with the Code.
In order to avoid imposition of the excise tax applicable to regulated investment companies, it is also the Fund’s intention to declare as dividends in each calendar year at least 98% of its net investment income (earned during the calendar year) and 98.2% of its net realized capital gains (earned during the twelve months ended October 31) plus undistributed amounts from prior years.
| THE JAMESTOWN EQUITY FUND |
| NOTES TO FINANCIAL STATEMENTS (Continued) |
The tax character of accumulated earnings at March 31, 2024 was as follows:
| | | | | |
| Tax cost of investments | | $ | 22,107,038 | |
| Gross unrealized appreciation | | $ | 32,004,967 | |
| Gross unrealized depreciation | | | (222,796 | ) |
| Net unrealized appreciation | | | 31,782,171 | |
| Undistributed ordinary income | | | 1,748 | |
| Undistributed long-term capital gains | | | 1,799,482 | |
| Distributions payable | | | (2,033 | ) |
| Distributable earnings | | $ | 33,581,368 | |
| | | | | |
The difference between the federal income tax cost of investments and the financial statement cost of investments for the Fund is due to certain timing differences in the recognition of capital gains or losses under income tax regulations and GAAP. These “book/tax” differences are temporary in nature and are primarily due to the tax deferral of losses on wash sales.
The Fund recognizes the tax benefits or expenses of uncertain tax positions only when the position is “more likely than not” to be sustained assuming examination by tax authorities. Management has reviewed the tax positions taken on Federal income tax returns for all open tax years (generally three years) of the Fund and has concluded that no provision for unrecognized tax benefits or expenses is required in these financial statements.
The Fund recognizes interest and penalties, if any, related to unrecognized tax benefits as income tax expense on the Statement of Operations. During the year ended March 31, 2024, the Fund did not incur any interest or penalties.
3. Investment Transactions
Investment transactions, other than short-term investments and U.S. government securities, were as follows for the year ended March 31, 2024:
| | | | | |
| Purchase of investment securities | | $ | 4,044,176 | |
| Proceeds from sales of investment securities | | $ | 4,264,167 | |
| | | | | |
4. Transactions with Related Parties
INVESTMENT ADVISORY AGREEMENT
The Fund’s investments are managed by the Adviser under the terms of an Investment Advisory Agreement. The Fund pays the Adviser a management fee, which is computed and accrued daily and paid monthly, at annual rates of 0.65% of its average daily net assets up to $500 million and 0.55% of such assets in excess of $500 million. Certain officers of the Trust are also officers of the Adviser.
| THE JAMESTOWN EQUITY FUND |
| NOTES TO FINANCIAL STATEMENTS (Continued) |
During the year ended March 31, 2024, the Adviser voluntarily limited the total annual operating expenses of the Fund to 0.95% of average daily net assets; accordingly, the Adviser voluntarily waived $29,271 of its management fees during the year ended March 31, 2024. This amount is not subject to recapture in future periods.
OTHER SERVICE PROVIDERS
Ultimus Fund Solutions, LLC (“Ultimus”) provides administration, fund accounting, compliance and transfer agent services to the Fund. The Fund pays Ultimus fees in accordance with the agreements for such services. In addition, the Fund pays out-of-pocket expenses including, but not limited to, postage, supplies, and certain costs related to the pricing of the Fund’s portfolio securities. Certain officers of the Trust are also officers of Ultimus, or of Ultimus Fund Distributors, LLC (the “Distributor”), the principal underwriter of the Fund and an affiliate of Ultimus. The Distributor is compensated by the Adviser (not the Fund) for acting as principal underwriter.
SHAREHOLDER SERVICING PLAN
The Fund has adopted a Shareholder Servicing Plan (the “Plan”), which allows the Fund to make payments to financial organizations (including payments directly to the Adviser and the distributor) for providing account administration and account maintenance services to Fund shareholders. The annual service fee may not exceed an amount equal to 0.25% of the Fund’s average daily net assets. During the year ended March 31, 2024, the Fund incurred fees of $4,820 under the Plan.
COMPENSATION OF TRUSTEES
Trustees and officers affiliated with the Adviser or Ultimus are not compensated by the Trust for their services. During the fiscal year, each Trustee who was not an affiliated person of the Adviser or Ultimus received from the Trust an annual retainer of $30,000, payable quarterly; a fee of $2,000 for attendance at each meeting of the Board of Trustees (except that such fee is $3,000 for the independent chair); and a fee of $1,000 for attendance at each meeting of any committee of the Board (except that such fee is $1,500 for the committee chair); plus reimbursement of travel and other expenses incurred in attending meetings. Each series of the Trust paid its proportionate share of such fees.
5. Sector Risk
If a Fund has significant investments in the securities of issuers in industries within a particular business sector, any development affecting that sector will have a greater impact on the value of the net assets of the Fund than would be the case if the Fund did not have significant investments in that sector. In addition, this may increase the risk of loss of an investment in the Fund and increase the volatility of the Fund’s NAV per share. From time to time, circumstances may affect a particular sector and companies within such sector. For instance, economic or market factors, regulation or deregulation, or other developments may negatively impact all companies in a
| THE JAMESTOWN EQUITY FUND |
| NOTES TO FINANCIAL STATEMENTS (Continued) |
particular sector and therefore the value of a Fund’s portfolio would be adversely affected. As of March 31, 2024, the Fund had 31.5% of the value of its net assets invested in common stocks and ETFs within the Technology sector.
6. Contingencies and Commitments
The Fund indemnifies the Trust’s officers and Trustees for certain liabilities that might arise from the performance of their duties to the Fund. Additionally, in the normal course of business the Fund enters into contracts that contain a variety of representations and warranties and which provide general indemnifications. The Fund’s maximum exposure under these arrangements is unknown, as this would involve future claims that may be made against the Fund that have not yet occurred. However, based on experience, the Trust expects the risk of loss to be remote.
7. Subsequent Events
The Fund is required to recognize in the financial statements the effects of all subsequent events that provide additional evidence about conditions that existed as of the date of the Statement of Assets and Liabilities. For non-recognized subsequent events that must be disclosed to keep the financial statements from being misleading, the Fund is required to disclose the nature of the event as well as an estimate of its financial effect, or a statement that such an estimate cannot be made. Management has evaluated subsequent events through the issuance of these financial statements and has noted no such events, except for the following:
Effective April 1, 2024, each Trustee who is not an affiliated person of the Adviser or Ultimus will receive from the Trust an annual retainer of $41,000, payable quarterly; a fee of $2,000 for attendance at each meeting of the Board of Trustees (except that such fee is $3,000 for the independent chair); and a fee of $1,000 for attendance at each meeting of any committee of the Board (except that such fee is $1,500 for the committee chair); plus reimbursement of travel and other expenses incurred in attending meetings. Each series of the Trust will pay its proportionate share of such fees, based on relative net assets.
| THE JAMESTOWN EQUITY FUND |
| REPORT OF INDEPENDENT REGISTERED |
| PUBLIC ACCOUNTING FIRM |
To the Shareholders of The Jamestown Equity Fund and
Board of Trustees of Williamsburg Investment Trust
Opinion on the Financial Statements
We have audited the accompanying statement of assets and liabilities, including the schedule of investments, of The Jamestown Equity Fund (the “Fund”), a series of Williamsburg Investment Trust, as of March 31, 2024, the related statement of operations for the year then ended, the statements of changes in net assets for each of the two years in the period then ended, the financial highlights for each of the five years in the period then ended, and the related notes (collectively referred to as the “financial statements”). In our opinion, the financial statements present fairly, in all material respects, the financial position of the Fund as of March 31, 2024, the results of its operations for the year then ended, the changes in net assets for each of the two years in the period then ended, and the financial highlights for each of the five years in the period then ended, in conformity with accounting principles generally accepted in the United States of America.
Basis for Opinion
These financial statements are the responsibility of the Fund’s management. Our responsibility is to express an opinion on the Fund’s financial statements based on our audits. We are a public accounting firm registered with the Public Company Accounting Oversight Board (United States) (“PCAOB”) and are required to be independent with respect to the Fund in accordance with the U.S. federal securities laws and the applicable rules and regulations of the Securities and Exchange Commission and the PCAOB.
We conducted our audits in accordance with the standards of the PCAOB. Those standards require that we plan and perform the audit to obtain reasonable assurance about whether the financial statements are free of material misstatement whether due to error or fraud.
Our audits included performing procedures to assess the risks of material misstatement of the financial statements, whether due to error or fraud, and performing procedures that respond to those risks. Such procedures included examining, on a test basis, evidence regarding the amounts and disclosures in the financial statements. Our procedures included confirmation of securities owned as of March 31, 2024, by correspondence with the custodian. Our audits also included evaluating the accounting principles used and significant estimates made by management, as well as evaluating the overall presentation of the financial statements. We believe that our audits provide a reasonable basis for our opinion.
We have served as the Fund’s auditor since 2016.
COHEN & COMPANY, LTD.
Milwaukee, Wisconsin
May 23, 2024
| THE JAMESTOWN EQUITY FUND |
| BOARD OF TRUSTEES AND EXECUTIVE OFFICERS (Unaudited) |
Overall responsibility for management of the Fund rests with the Board of Trustees. The Trustees serve during the lifetime of the Trust and until its termination, or until death, resignation, retirement or removal. The Trustees, in turn, elect the officers of the Fund. The officers have been elected for an annual term. The following are the Trustees and executive officers of the Fund:
Trustees
and Officers | Address | Year of
Birth | Position Held
with the Trust | Length of Time Served |
| | Robert S. Harris, Ph.D. | 225 Pictoria Drive, Suite 450 Cincinnati, OH | 1949 | Chairman and Trustee | Since January 2007 |
| * | John P. Ackerly, IV | One James Center 901 E. Cary Street Richmond, VA | 1963 | Trustee and President of The Davenport Funds | Since July 2012 |
| | George K. Jennison | 225 Pictoria Drive, Suite 450 Cincinnati, OH | 1957 | Trustee | Since January 2015 |
| | Harris V. Morrissette | 225 Pictoria Drive, Suite 450 Cincinnati, OH | 1959 | Trustee | Since March 1993 |
| | Elizabeth W. Robertson | 225 Pictoria Drive, Suite 450 Cincinnati, OH | 1953 | Trustee | Since February 2014 |
| | Charles M. Caravati, III | 1802 Bayberry Court, Suite 400 Richmond, VA | 1965 | President, The Jamestown Equity Fund | Since January 1996 |
| | Mark J. Seger | 225 Pictoria Drive, Suite 450 Cincinnati, OH | 1962 | Treasurer | Since November 2000 |
| | David K. James | 225 Pictoria Drive, Suite 450 Cincinnati, OH | 1970 | Secretary | Since November 2018 |
| | Michael J. Nanosky | 225 Pictoria Drive, Suite 450 Cincinnati, OH | 1966 | Chief Compliance Officer | Since March 2020 |
| * | Mr. Ackerly, as an affiliated person of an investment adviser to the Trust, is an “interested person” of the Trust within the meaning of Section 2(a)(19) of the 1940 Act. |
| THE JAMESTOWN EQUITY FUND |
| BOARD OF TRUSTEES AND EXECUTIVE OFFICERS (Unaudited) (Continued) |
Each Trustee oversees nine portfolios of the Trust, including the Fund. The principal occupations of the Trustees and executive officers of the Funds during the past five years and public directorships held by the Trustees are set forth below:
Robert S. Harris, Ph.D. is the C. Stewart Sheppard Professor of Business Administration at The Darden Graduate School of Business Administration at the University of Virginia. He was previously the dean at Darden. Professor Harris has published widely on corporate finance, financial markets and mergers and acquisitions and has served as a consultant to corporations and government agencies.
John P. Ackerly, IV is Senior Vice President and Portfolio Manager of Davenport & Company LLC. (a broker-dealer and investment adviser)
George K. Jennison is retired. He previously was President of Oyster Consulting, LLC (a management consulting firm) and a financial adviser with Wells Fargo Advisors, LLC.
Harris V. Morrissette is President of China Doll Rice and Beans, Inc. and Dixie Lily Foods. He is also a Director of Trustmark Corporation (bank holding company).
Elizabeth W. Robertson serves as a Trustee of TowneBank Foundation, TowneBank Corporate Board, TowneBank Audit Committee Chair and TowneBank Community Board since 2015. She previously was Chief Financial Officer of Monument Restaurants LLC.
Charles M. Caravati, III is a Managing Director of the Adviser.
Mark J. Seger is a Vice Chairman of Ultimus Fund Solutions, LLC and Ultimus Fund Distributors, LLC. He previously was Co-CEO of Ultimus Fund Solutions, LLC (1999 to 2019).
David K. James is an Executive Vice President and Chief Legal and Risk Officer of Ultimus Fund Solutions, LLC (2018 to present). He previously was Managing Director and Managing Counsel at State Street Bank and Trust Company (2009 to 2018).
Michael J. Nanosky is a Senior Compliance Officer of Northern Lights Distributors, LLC (2020 to present). He previously was Senior Vice President & Chief Compliance Officer of PNC Funds (2014 to 2019).
Additional information about members of the Board of Trustees and executive officers is available in the Statement of Additional Information (“SAI”). To obtain a free copy of the SAI, please call 1-866-738-1126.
| THE JAMESTOWN EQUITY FUND |
| ABOUT YOUR FUND’S EXPENSES (Unaudited) |
We believe it is important for you to understand the impact of costs on your investment. All mutual funds have operating expenses. As a shareholder of the Fund, you incur ongoing costs, including management fees and other expenses. The following examples are intended to help you understand your ongoing costs (in dollars) of investing in the Fund and to compare these costs with the ongoing costs of investing in other mutual funds.
A mutual fund’s ongoing costs are expressed as a percentage of its average net assets. This figure is known as the expense ratio. The expenses in the table below are based on an investment of $1,000 made at the beginning of the period shown and held for the entire period (October 1, 2023 through March 31, 2024).
The table below illustrates the Fund’s costs in two ways:
Actual fund return – This section helps you to estimate the actual expenses that you paid over the period. The “Ending Account Value” shown is derived from the Fund’s actual return, and the fourth column shows the dollar amount of operating expenses that would have been paid by an investor who started with $1,000 in the Fund. You may use the information here, together with the amount you invested, to estimate the expenses that you paid over the period.
To do so, simply divide your account value by $1,000 (for example, an $8,600 account value divided by $1,000 = 8.6), then multiply the result by the number given for the Fund under the heading “Expenses Paid During Period.”
Hypothetical 5% return – This section is intended to help you compare the Fund’s ongoing costs with those of other mutual funds. It assumes that the Fund had an annual return of 5% before expenses during the period shown, but that the expense ratio is unchanged. In this case, because the returns used are not the Fund’s actual returns, the results do not apply to your investment. The example is useful in making comparisons because the U.S. Securities and Exchange Commission (the “SEC”) requires all mutual funds to calculate expenses based on a 5% return. You can assess the Fund’s ongoing costs by comparing this hypothetical example with the hypothetical examples that appear in shareholder reports of other funds.
Note that expenses shown in the table are meant to highlight and help you compare ongoing costs only. The Fund does not charge sales loads or redemption fees.
The calculations assume no shares were bought or sold during the period. Your actual costs may have been higher or lower, depending on the amount of your investment and the timing of any purchases or redemptions.
More information about the Fund’s expenses, including annual expense ratios for the prior five fiscal years, can be found in this report. For additional information on operating expenses and other shareholder costs, please refer to the Fund’s prospectus.
| THE JAMESTOWN EQUITY FUND |
| ABOUT YOUR FUND’S EXPENSES (Unaudited) (Continued) |
| | | Beginning | | Ending | | Net | | Expenses |
| | | Account Value | | Account Value | | Expense | | Paid During |
| | | October 1, 2023 | | March 31, 2024 | | Ratio(a) | | Period(b) |
| Based on Actual Fund Return | | $1,000.00 | | $1,230.40 | | 0.95% | | $5.30 |
| Based on Hypothetical 5% Return (before expenses) | | $1,000.00 | | $1,020.25 | | 0.95% | | $4.80 |
| (a) | Annualized, based on the Fund’s most recent one-half year expenses. |
| (b) | Expenses are equal to the Fund’s annualized net expense ratio multiplied by the average account value over the period, multiplied by 183/366 (to reflect the one-half year period). |
| OTHER INFORMATION (Unaudited) |
A description of the policies and procedures that the Fund uses to vote proxies relating to portfolio securities is available without charge upon request by calling toll-free 1-866-738-1126, or on the SEC’s website at www.sec.gov. Information regarding how the Fund voted proxies relating to portfolio securities during the most recent 12-month period ended June 30 is also available without charge upon request by calling toll-free 1-866-738-1126, or on the SEC’s website at www.sec.gov.
The Trust files a complete listing of portfolio holdings of the Fund with the SEC as of the end of the first and third quarters of each fiscal year as an exhibit to its reports on Form N-PORT. The filings are available upon request, by calling 1-866-738-1126. Furthermore, you may obtain a copy of these filings on the SEC’s website at www.sec.gov and on the Fund’s website www.jamestownfunds.com.
| FEDERAL TAX INFORMATION (Unaudited) |
For the fiscal year ended March 31, 2024, the Fund designated $1,326,954 as long-term capital gain distributions.
Qualified Dividend Income — The Fund designates 100% of its ordinary income distributions, or up to the maximum amount of such dividends allowable pursuant to the Internal Revenue Code, as qualified dividend income eligible for the reduced tax rate.
Dividends Received Deduction — Corporate shareholders are generally entitled to take the dividends received deduction on the portion of a Fund’s dividend distributions that qualify under tax law. For the fiscal year ended March 31, 2024, 100% of the Fund’s ordinary income dividends qualifies for the corporate dividends received deduction.
| THE JAMESTOWN EQUITY FUND |
| DISCLOSURE REGARDING APPROVAL OF INVESTMENT |
| ADVISORY AGREEMENT (Unaudited) |
At a meeting held on November 14, 2023, the Board of Trustees, including a majority of the Independent Trustees, approved the continuance of the Investment Advisory Agreement with the Adviser on behalf of The Jamestown Equity Fund (the “Fund”). Below is a discussion of the factors considered by the Board of Trustees along with the conclusions with respect thereto that formed the basis for the Board’s approval of the continuation of the Investment Advisory Agreement for an additional one-year period.
Prior to the Board meeting, the Adviser provided materials in response to a letter sent by the counsel to the Independent Trustees, on their behalf, requesting various information relevant to the Independent Trustees’ consideration of the renewal of the Investment Advisory Agreement with respect to the Fund. In approving the continuance of the Investment Advisory Agreement, the Independent Trustees considered all information they deemed reasonably necessary to evaluate the terms of the Agreement. The principal areas of review by the Independent Trustees were the nature, extent and quality of the services provided by the Adviser and the reasonableness of the fees charged for those services. During a meeting of the Governance, Nomination, Compensation and Qualified Legal Compliance Committee held prior to the Board meeting, the Independent Trustees reviewed the proposed renewal of the Investment Advisory Agreement with experienced independent legal counsel outside the presence of representatives of the Adviser and received materials from counsel discussing the legal standards for their consideration of the proposed renewal of the Investment Advisory Agreement.
No single factor was considered in isolation or to be determinative to the decision of the Independent Trustees to approve the continuance of the Investment Advisory Agreement. Rather the Independent Trustees concluded, after weighing and balancing the factors described below, that it was in the best interests of the Fund and its shareholders to continue the Investment Advisory Agreement, in its present form, for an additional one-year period.
Nature, Extent and Quality of Services
The Independent Trustees’ evaluation of the nature, extent and quality of the Adviser’s services took into consideration their knowledge gained through presentations and reports from the Adviser, including the Adviser’s views on the overall conditions of the economy and the markets over the course of the twelve-month period ended September 30, 2023. The Independent Trustees considered the Adviser’s investment management services and the earnings-driven screening process that is applied in the selection of large-cap securities held by the Fund. The Independent Trustees also considered the investment process and philosophy of the Adviser and the education and experience of the Fund’s portfolio managers. The Independent Trustees also considered the scope and quality of the in-house capabilities of the Adviser and other resources that it dedicates to performing services for the Fund; the quality of administrative and other services, including the Adviser’s role in coordinating the activities of the Fund’s other service providers; the Adviser’s compliance with investment policies of the Fund and applicable laws and regulations; the business reputation of the Adviser; and the Adviser’s financial resources.
| THE JAMESTOWN EQUITY FUND |
| DISCLOSURE REGARDING APPROVAL OF INVESTMENT |
| ADVISORY AGREEMENT (Unaudited) (Continued) |
Investment Performance
The Independent Trustees considered the performance of the Fund for the 1-year, 3-year, 5-year, and 10-year periods ended September 30, 2023, compared to the Fund’s benchmark and peer group average of funds with similar investment objectives and strategies, and the Adviser’s comparably managed private account. The Independent Trustees noted that the Fund exceeded the performance of its benchmark (the S&P 500® Index) and the Morningstar Large Cap Blend Peer Group over the 1-year, 3-year and 5-year periods and had underperformed against the S&P 500® Index and its Morningstar Peer Group over the 10-year period. The Independent Trustees noted that as of September 30, 2023, the Fund had an overall 4-star Morningstar rating.
Fees and Expense Ratios
In reviewing the fees payable under the Investment Advisory Agreement, the Independent Trustees compared the advisory fees and overall expenses of the Fund (both before and after voluntary advisory fee waivers) with those of funds in the Morningstar Large Cap Blend category. The Independent Trustees noted that both the advisory fee and projected total expense ratio for Fund were higher than the median of the Morningstar Large Cap Blend category but were mindful of the amount of voluntary advisory fee waivers that had been made by the Adviser over the past several years. The Independent Trustees considered the comparability of fees charged and services provided to the Fund and the fees charged and services provided to the Adviser’s other clients with a similar investment mandate. The Independent Trustees considered information about the Adviser’s financial stability and profitability with respect to the Fund, including the assumptions and methodology the Adviser used in preparing the profitability information, in light of applicable case law relating to advisory fees. For these purposes, the Independent Trustees considered not only the fees paid by the Fund, but also so-called “fallout” benefits to the Adviser. The Independent Trustees also considered the Adviser’s representations that the Fund’s portfolio trades were executed based on the best available price and execution, and that the Adviser does not participate in any revenue sharing arrangements relating to the Fund. In evaluating the Fund’s fees and expenses, the Trustees considered the complexity and quality of the investment process that is applied in the management of the Fund.
Economies and Benefits of Scale
Given the current size of the Fund and its expected growth, the Independent Trustees did not believe that it was relevant to consider the extent to which economies of scale would be realized as the Fund grows, and whether fee levels reflect these economies of scale. However, the Independent Trustees noted the advisory fee schedule for the Fund contains a breakpoint that would reduce the advisory fee rate on assets above the specified level as the Fund’s assets increased. The Independent Trustees also considered the “fallout” benefits to the Adviser for its management of the Fund, but given the amounts involved, viewed these as secondary factors in connection with the evaluation of the reasonableness of the advisory fees paid by the Fund.
| THE JAMESTOWN EQUITY FUND |
| DISCLOSURE REGARDING APPROVAL OF INVESTMENT |
| ADVISORY AGREEMENT (Unaudited) (Continued) |
Conclusions
Based on the consideration of the foregoing and such other information as was deemed relevant, the Independent Trustees concluded that: (i) both the short- and long-term performance of The Jamestown Fund is good in comparison to the performance to its benchmark and peers, and the Adviser has provided quality services to the Fund; (ii) the advisory fee for the Fund, while higher than the average for similarly managed funds according to statistics derived from Morningstar, Inc., is reasonable in relation to the services provided by the Adviser; (iii) the total operating expense ratio of the Fund while higher, remains competitive when compared to the average expense ratio for comparable managed funds, according to statistics derived from Morningstar, Inc., (iv) the Adviser’s commitment to limit overall operating expenses of the Fund by voluntarily waiving a portion of its investment advisory fees has enabled the Fund to increase returns for shareholders; and (v) the level of the Adviser’s profitability with respect to its management of the Fund is reasonable.
| | | | | | |
| | | | | | |
| | | | | | |
| | | | | | |
| | | | | | |
| | | | | | |
| | | | | | |
| | | | | | |
| | | | | | |
| | | | | | |
| | | | | | |
| | | | | | |
| | | | | | |
| | | | THE JAMESTOWN EQUITY FUND www.jamestownfunds.com | | |
| | | | | | |
| | | | Investment Adviser | | |
| | | | Lowe, Brockenbrough & Company, Inc. | | |
| | | | d/b/a Brockenbrough | | |
| | | | 1802 Bayberry Court | | |
| | | | Suite 400 | | |
| | | | Richmond, Virginia 23226 | | |
| | | | | | |
| | | | Administrator | | |
| | | | Ultimus Fund Solutions, LLC | | |
| | | | P.O. Box 46707 | | |
| | | | Cincinnati, Ohio 45246-0707 | | |
| | | | (Toll-Free) 1-866-738-1126 | | |
| | | | | | |
| | | | Independent Registered | | |
| | | | Public Accounting Firm | | |
| | | | Cohen & Company, Ltd. | | |
| | | | 342 N. Water Street | | |
| | | | Suite 830 | | |
| | | | Milwaukee, Wisconsin 53202 | | |
| | | | | | |
| | | | Legal Counsel | | |
| | | | Sullivan & Worcester LLP | | |
| | | | 1666 K Street, N.W. | | |
| | | | Washington, DC 20006 | | |
| | | | | | |
| | | | Board of Trustees | | |
| | | | John P. Ackerly, IV | | |
| | | | George K. Jennison | | |
| | | | Robert S. Harris, Ph.D. | | |
| | | | Harris V. Morrissette | | |
| | | | Elizabeth W. Robertson | | |
| | | | | | |
| | | | | | |
| | | | | | |
| | | | | | |
| | | | | | |
| | | | | | |
| | | | | | |
| | | | | | |
| | | | | | |
| | | | | | |
| | | | | | |
| | | | Jamestown-AR-24 | | |
| | | | | | |
| | | | | | |
| | | | | | |
| | | | | | |
| | | | | | |
(b) Not applicable
As of the end of the period covered by this report, the registrant has adopted a code of ethics that applies to the registrant’s principal executive officer, principal financial officer, principal accounting officer or controller, or persons performing similar functions, regardless of whether these individuals are employed by the registrant or a third party. Pursuant to Item 13(a)(1), a copy of registrant’s code of ethics is filed as an exhibit to this Form N-CSR. During the period covered by this report, the code of ethics has not been amended, and the registrant has not granted any waivers, including implicit waivers, from the provisions of the code of ethics.
| Item 3. | Audit Committee Financial Expert. |
The registrant’s board of trustees has determined that the registrant has two audit committee financial experts serving on its audit committee. The names of the audit committee financial experts are Dr. Robert S. Harris and Elizabeth W. Robertson. Dr. Harris and Ms. Robertson are “independent” for purposes of this Item.
| Item 4. | Principal Accountant Fees and Services. |
| (a) | Audit Fees. The aggregate fees billed for professional services rendered by the principal accountant for the audit of the registrant’s annual financial statements or for services that are normally provided by the accountant in connection with statutory and regulatory filings or engagements were $120,750 and $137,000 with respect to the registrant’s fiscal years ended March 31, 2024 and 2023, respectively. |
| (b) | Audit-Related Fees. No fees were billed in either of the last two fiscal years for assurance and related services by the principal accountant that are reasonably related to the performance of the audit of the registrant’s financial statements and are not reported under paragraph (a) of this Item. |
| (c) | Tax Fees. The aggregate fees billed for professional services rendered by the principal accountant for tax compliance, tax advice, and tax planning were $29,250 and $32,500 with respect to the registrant’s fiscal years ended March 31, 2024 and 2023, respectively. The services comprising these fees are the preparation of the registrant’s federal income and excise tax returns. |
| (d) | All Other Fees. No fees were billed in either of the last two fiscal years for products and services provided by the principal accountant, other than the services reported in paragraphs (a) through (c) of this Item. |
| (e)(1) | The audit committee has adopted pre-approval policies and procedures described in paragraph (c)(7) of Rule 2-01 of Regulation S-X. Pursuant to the pre-approval policies and procedures, the audit committee has pre-approved certain audit, audit-related and tax services and has established, with respect to each fiscal year of the registrant, the following maximum fee levels for services covered under the pre-approval policies and procedures: |
| · | Services, relating to a new series or class of a series, associated with SEC registration statements, periodic reports and other documents filed by the registrant with the SEC or other documents issued by the registrant in connection with securities offerings and assistance in responding to SEC comment letters—$5,000 |
| · | Consultations with management of the registrant, not in connection with an audit, as to the accounting or disclosure treatment of transactions or events and/or the actual or potential impact of final or proposed rules, standards or interpretations by the SEC, FASB or other regulatory or standard setting bodies—$5,000 |
| · | All tax services provided to the registrant in the aggregate—$5,000 |
| (e)(2) | None of the services described in paragraph (b) through (d) of this Item were approved by the audit committee pursuant to paragraph (c)(7)(i)(C) of Rule 2-01 of Regulation S-X. |
| (f) | Less than 50% of hours expended on the principal accountant’s engagement to audit the registrant’s financial statements for the most recent fiscal year were attributed to work performed by persons other than the principal accountant’s full-time, permanent employees. |
| (g) | With respect to the fiscal years ended March 31, 2024 and 2023, aggregate non-audit fees of $29,250 and $32,500, respectively, were billed by the registrant’s principal accountant for services rendered to the registrant. No non-audit fees were billed in either of the last two fiscal years by the registrant’s principal accountant for services rendered to the registrant’s investment adviser (not including any sub-adviser whose role is primarily portfolio management and is subcontracted with or overseen by another investment adviser), and any entity controlling, controlled by, or under common control with the adviser that provides ongoing services to the registrant. |
| (h) | The principal accountant has not provided any non-audit services to the registrant’s investment adviser (not including any sub-adviser whose role is primarily portfolio management and is subcontracted with or overseen by another investment adviser), and any entity controlling, controlled by, or under common control with the investment adviser that provides ongoing services to the registrant. |
(j) Not applicable
| Item 5. | Audit Committee of Listed Registrants. |
Not applicable
| Item 6. | Schedule of Investments. |
| (a) | Not applicable [schedule filed with Item 1] |
| Item 7. | Disclosure of Proxy Voting Policies and Procedures for Closed-End Management Investment Companies. |
Not applicable
| Item 8. | Portfolio Managers of Closed-End Management Investment Companies. |
Not applicable
| Item 9. | Purchases of Equity Securities by Closed-End Management Investment Company and Affiliated Purchasers. |
Not applicable
| Item 10. | Submission of Matters to a Vote of Security Holders. |
The registrant’s Governance, Nominating, Compensation and QLCC Committee shall review shareholder recommendations to fill vacancies on the registrant’s board of trustees if such recommendations are submitted in writing, addressed to the Committee at the registrant’s offices and meet any minimum qualifications adopted by the Committee. The Committee may adopt, by resolution, a policy regarding its procedures for considering candidates for the board of trustees, including any recommended by shareholders.
| Item 11. | Controls and Procedures. |
(a) Based on their evaluation of the registrant’s disclosure controls and procedures (as defined in Rule 30a-3(c) under the Investment Company Act of 1940) as of a date within 90 days of the filing date of this report, the registrant’s principal executive officers and principal financial officer have concluded that such disclosure controls and procedures are reasonably designed and are operating effectively to ensure that material information relating to the registrant, including its consolidated subsidiaries, is made known to them by others within those entities, particularly during the period in which this report is being prepared, and that the information required in filings on Form N-CSR is recorded, processed, summarized, and reported on a timely basis.
(b) There were no changes in the registrant’s internal control over financial reporting (as defined in Rule 30a-3(d) under the Investment Company Act of 1940) that occurred during the period covered by this report that have materially affected, or are reasonably likely to materially affect, the registrant’s internal control over financial reporting.
Item 12. Disclosure of Securities Lending Activities for Closed-End Management Investment Companies.
Not applicable
File the exhibits listed below as part of this Form. Letter or number the exhibits in the sequence indicated.
(a)(1) Any code of ethics, or amendment thereto, that is the subject of the disclosure required by Item 2, to the extent that the registrant intends to satisfy the Item 2 requirements through filing of an exhibit: Attached hereto
(a)(2) A separate certification for each principal executive officer and principal financial officer of the registrant as required by Rule 30a-2(a) under the Act (17 CFR 270.30a-2(a)): Attached hereto
(1) Not applicable
(2) Change in the registrant’s independent public accountants: Not applicable
(b) Certifications required by Rule 30a-2(b) under the Act (17 CFR 270.30a-2(b)): Attached hereto
Exhibit 99.CODE ETH Code of Ethics
Exhibit 99.CERT Certifications required by Rule 30a-2(a) under the Act
Exhibit 99.906CERT Certifications required by Rule 30a-2(b) under the Act
SIGNATURES
Pursuant to the requirements of the Securities Exchange Act of 1934 and the Investment Company Act of 1940, the registrant has duly caused this report to be signed on its behalf by the undersigned, thereunto duly authorized.
| (Registrant) | Williamsburg Investment Trust | | |
| | | | |
| By (Signature and Title)* | /s/ David K. James | |
| | | David James, Secretary | |
| | | | |
| Date | May 31, 2024 | | |
| | | | |
| Pursuant to the requirements of the Securities Exchange Act of 1934 and the Investment Company Act of 1940, this report has been signed below by the following persons on behalf of the registrant and in the capacities and on the dates indicated. |
| | | | |
| By (Signature and Title)* | /s/ Thomas W. Leavell | |
| | | Thomas W. Leavell, President & Principal Executive Officer | |
| | | (The Government Street Equity Fund, The Government Street Opportunities Fund) | |
| | | | |
| Date | May 31, 2024 | | |
| | | | |
| By (Signature and Title)* | /s/ Charles M. Caravati III | |
| | | Charles M. Caravati III, President & Principal Executive Officer | |
| | | (The Jamestown Equity Fund) | |
| | | | |
| Date | May 31, 2024 | | |
| | | | |
| By (Signature and Title)* | /s/ John P. Ackerly IV | |
| | | John P. Ackerly IV, President & Principal Executive Officer | |
| | | (The Davenport Core Leaders Fund, Davenport Value & Income Fund, Davenport Equity Opportunities Fund, Davenport Small Cap Focus Fund, the Davenport Balanced Income Fund and the Davenport Insider Buying Fund) | |
| | | | |
| Date | May 31, 2024 | | |
| | | | |
| By (Signature and Title)* | /s/ Mark J. Seger | |
| | | Mark J. Seger, Treasurer and Principal Financial Officer | |
| | | | |
| Date | May 31, 2024 | | |
* Print the name and title of each signing officer under his or her signature.