| OMB APPROVAL |
OMB Number: 3235-0570 Expires: January 31, 2014 Estimated average burden hours per response: 20.6 |
UNITED STATES
SECURITIES AND EXCHANGE COMMISSION
Washington, D.C. 20549
FORM N-CSR
CERTIFIED SHAREHOLDER REPORT OF REGISTERED
MANAGEMENT INVESTMENT COMPANIES
Investment Company Act file number 811-05685
Williamsburg Investment Trust
(Exact name of registrant as specified in charter)
| 225 Pictoria Drive, Suite 450 Cincinnati, Ohio | 45246 |
| (Address of principal executive offices) | (Zip code) |
W. Lee H. Dunham, Esq.
Sullivan & Worcester LLP One Post Office Square Boston, Massachusetts 02109
(Name and address of agent for service)
Registrant's telephone number, including area code: (513) 587-3400
Date of fiscal year end: March 31, 2011
Date of reporting period: March 31, 2011
Form N-CSR is to be used by management investment companies to file reports with the Commission not later than 10 days after the transmission to stockholders of any report that is required to be transmitted to stockholders under Rule 30e-1 under the Investment Company Act of 1940 (17 CFR 270.30e-1). The Commission may use the information provided on Form N-CSR in its regulatory, disclosure review, inspection, and policymaking roles.
A registrant is required to disclose the information specified by Form N-CSR, and the Commission will make this information public. A registrant is not required to respond to the collection of information contained in Form N-CSR unless the Form displays a currently valid Office of Management and Budget ("OMB") control number. Please direct comments concerning the accuracy of the information collection burden estimate and any suggestions for reducing the burden to Secretary, Securities and Exchange Commission, 450 Fifth Street, NW, Washington, DC 20549-0609. The OMB has reviewed this collection of information under the clearance requirements of 44 U.S.C. § 3507.
| Item 1. | Reports to Stockholders. |
ANNUAL REPORT
March 31, 2011 |
THE DAVENPORT FUNDS LETTER TO SHAREHOLDERS | |
Dear Shareholders,
Equity markets remained strong in the first quarter of 2011. The S&P 500 Index and Russell 2000 Index advanced 5.92% and 7.94%, respectively. However, it wasn’t exactly a smooth ride. Investors were first hit with unrest in the Middle East, causing oil prices to jump and raising fears of cost pressures for both consumers and corporations. Then, the world witnessed a tragic series of events in Japan involving an earthquake, tsunami, and disaster at a nuclear facility. Japan is the world’s third biggest economy and many have suggested this crisis could push the country’s already fragile economy into recession. Clearly, this would also have an impact on the many companies that export to Japan. Ultimately, fear subsided and U.S. markets were able to put together a strong showing. In fact, the Dow Jones Industrial Average closed the quarter right near a high for the year and the Russell 2000 Index was near 2007 highs.
There’s always something to worry about. Do massive fiscal deficits mean imminent doom? What will happen when Quantitative Easing Part 2 (QE2) ends this summer? Are profit margins peaking? Will higher interest rates crimp growth and asset values? Will high energy prices derail a consumer recovery? These questions can’t be answered precisely and are cause for pause, especially when considering the dramatic run stocks have enjoyed. Indeed, investors have been living in a QE driven utopia since this past August. As far as Japan goes, the recent disaster will undoubtedly have a material impact on the country’s companies and consumers in the near-term. While we don’t minimize this tragedy and the impact it will have on Japan’s people, events like this can sometimes give way to rebuilding efforts that support economic growth. We are reminded of Hurricane Katrina. The storm had a devastating short-term impact, but companies doing business on the Gulf Coast ultimately rebounded sharply.
We wouldn’t be surprised to see a little risk aversion creep back into the market. Still, we won’t make efforts to time market pullbacks. We sometimes sell a stock if it appears far overvalued and/or we see a better opportunity elsewhere. However, we typically don’t sell just for the sake of getting “defensive.” Barring a 2008-like meltdown, selling a good company as part of a hedging strategy rarely makes sense for long-term investors. It may look smart for a period of weeks or months in the event of market weakness; however, it generally proves to have been foolish a year or so after the fact. With a fresh financial crisis under our belt, we hope our stubbornness will be rewarded. Also, remember we are coming out of a recession, not going into one. Steady decreases in unemployment should provide a tailwind.
Commodities have been all the rage. Easy monetary policy, gigantic fiscal deficits, rising demand, and now, tension in the Middle East have coalesced to put upward pressure on oil, metals and agricultural commodities. At times, we’ve seen investors divide the market into haves and have-nots, with the haves being commodity producers and have-nots being any company feeling the pressure of rising input costs. We understand the inflationary forces that are upon us and have added to positions in commodity producers where there is a story of value creation beyond just hoping for higher prices. We are particularly attracted to natural gas producers, which we think will ultimately benefit from broader exploitation of our gas resources. We are also attracted to hard asset/infrastructure stories where pricing power provides us inflation protection. All this said, we hesitate to be too
aggressive in the commodity world for a couple of reasons: the space seems a little too popular and filled with momentum-oriented investors, and if monetary easing ends and/or fiscal austerity sets in, we could see the commodity complex take a breather alongside more subdued inflation expectations.
Over the past quarter, we have purchased shares in a few contrarian situations. In other words, a few of our recent buys have obvious headwinds and were very out of favor at the time of purchase. While we don’t classify ourselves strictly as deep value investors, we think it sometimes pays to look for opportunities in areas that others are shunning.
We have continued to emphasize the “when, not if” theme discussed in our fourth quarter letter. In our view, there has been significant deferral of spending in many industries ranging from aerospace to air conditioning. Such deferral has led to pent-up demand and, in a number of cases, we aren’t taking on much risk while we wait for demand to increase. Housing, also a “when, not if” situation, is more a story of recovery from a depressed base. Many housing data points remain fairly discouraging. New home sales for February 2011 fell 16.9% to an annualized rate of 250,000, which was the lowest level since the data series began nearly 50 years ago. As one member of our Investment Policy Committee recently noted, “you have to ignore a lot of facts to be bullish on housing.” We think we are in the process of building a bottom and suspect markets for home lots and building products could tighten.
We discuss the Davenport Funds in more detail below. As you will read, we are enjoying solid results thus far in 2011 and are excited about many new ideas.
Davenport Core Fund
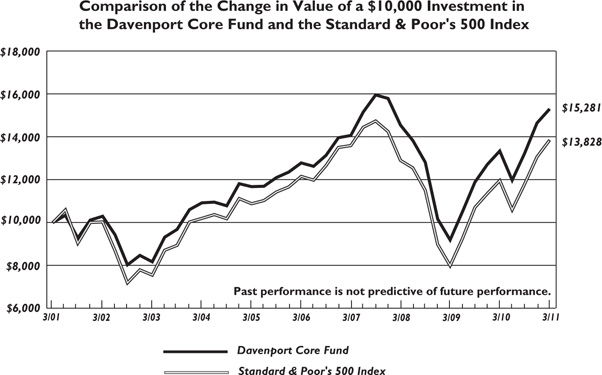
The following chart represents Davenport Core Fund (the “Core Fund”) performance and the performance of the S&P 500 Index*, the Core Fund’s primary benchmark, for the periods ended March 31, 2011.
| | | | | | | Since Inception** (1/15/98) | Fiscal Year 2011 Gross Expense Ratio |
| Core Fund | 4.40% | 14.61% | 1.67% | 3.65% | 4.33% | 4.42% | 0.99% |
| S&P 500 | 5.92% | 15.65% | 2.35% | 2.62% | 3.29% | 4.37% | |
Past performance is no guarantee of future results. Investment return and principal value of an investment will fluctuate so that an investor’s shares, when redeemed, may be worth more or less than their original cost. Current performance may be lower or higher than the performance data quoted. Performance data, current to the most recent month end, may be obtained by calling 1-800-281-3217.
| * | The S&P 500 Index is comprised of 500 U.S. stocks and is an indicator of the performance of the overall U.S. stock market. An investor cannot invest in an index and its returns are not indicative of the performance of any specific investment. |
The Core Fund enjoyed a strong fiscal year returning 14.61%, slightly lagging the 15.65% gain for the S&P 500 Index. There were many points throughout the year when it was easy to be pessimistic. Fortunately, we took advantage of market swoons to add to higher conviction ideas. At the end of the year, larger cap stocks started to close a performance gap with smaller companies. While tragic events in Japan held large caps in check late in the year, we still believe global exposure is a good thing and think shares of larger companies appear cheap.
The Financials sector was one of our best performing categories during the fiscal year. This was due in large part to our exposure to high quality asset managers such as T. Rowe Price (TROW) and Brookfield Asset Management (BAM) and less meaningful exposure to the banking sector. While being underweight in banks helped this past year, we think 2011 will be a better year for the sector as credit losses abate, loan demand approaches a bottom and dividend payments resume. We initiated a position in Bank of America (BAC) at the end of December. Bank of America is clearly among the riskier plays given well-publicized mortgage putback and foreclosure issues. However, the stock looks very cheap relative to long-term earnings power (could approach $2.00) and could work higher as headlines abate. Though we realize near-term news flow could be rough, we felt the risk/reward profile was too compelling to ignore.
Housing and autos are also areas where it seems suppressed demand will have to resurface in the event of an extended recovery. Throughout the year we have participated in improving sentiment in the auto sector via stocks such as CarMax (KMX) and AutoZone (AZO).We increased our housing exposure by adding to Lowe’s (LOW) and initiating a new position in leading homebuilder, NVR, Inc. (NVR). In our view, Lowe’s is a cheap stock that seems poised to benefit from an up-tick in remodeling demand. NVR is exposed to some of the most resilient housing markets in the country (Mid-Atlantic/Washington D.C.) and its practice of optioning lots (i.e. putting up as little capital as possible) helped the company maintain profitability throughout the entire downturn (something no other homebuilder can say). While we do not know when housing will turn, we think it will be difficult for things to get much worse. As such, we believe there shouldn’t be much downside from here for either stock. When things do improve however, earnings power should be markedly higher than current levels.
Energy stocks posted a strong quarter and were up nicely on the year. Schlumberger (SLB), Exxon Mobil (XOM) and Chevron (CVX) were standouts in the group. Throughout the year we began to warm up to companies with natural gas exposure. We realize it is tough to get excited about gas given high storage levels, elevated rig counts and anemic demand; however, we also think it is difficult to imagine things getting much worse. In November, we added to Exxon Mobil (XOM) and EOG Resources (EOG). While each company has taken steps to diversify their production mix (XOM out of oil to gas and EOG out of gas to oil), both have been criticized for their exposure to gas production. Over time, each of these companies has proven to be an excellent steward of shareholder capital, generating impressive multi-year returns. As the outlook for gas improves, we expect each of these stocks will recapture the premium valuations they once carried.
As one would expect in a strong market environment, the Consumer Staples and Health Care sectors underperformed recently. The Health Care sector’s relative performance benefited, thanks to robust gains in Novo Nordisk (NVO), LabCorp (LH) and WellPoint (WLP). However, our Consumer Staples holdings were a drag on both relative and absolute performance as the sector dealt with fears surrounding higher input costs. In both cases, the sectors’ generally defensive characteristics caused many investors to look elsewhere. While this sluggishness is frustrating in the context of a rising market, we still think it makes sense to have exposure to these areas. For many of these companies, underperformance has been a result of simply being out of favor rather than some deterioration in long term prospects.
In closing, we want to reiterate our dedication to delivering competitive returns while taking on less risk. While some of our recent actions could be deemed contrarian, we feel the potential returns from these investments significantly outweigh the risks. Furthermore, we continue to believe quality large-cap equities offer a compelling value proposition.
New Positions
The Boeing Company (BA) is the world’s largest manufacturer of commercial jetliners and military aircraft. The stock has stalled over the last couple of months due to setbacks and uncertainty in the 787 production process in addition to ongoing concerns surrounding the company’s defense segment. While headline risk associated with the 787 program will be an issue moving forward, we point out that the company’s 737 and 777 platforms are expected to deliver strong results and be the main drivers of earnings over the next few years. Furthermore, expectations for the defense business already seem to be at a low point despite many product lines positioning within the pentagon mandate of “cheaper but fully capable.” We believe more clarity on the outlook for the 787 should remove an overhang on the stock, redirecting attention to the company’s strong product franchises and significant earnings power.
Capital One Financial Corp. (COF) is the 5th largest U.S. credit card provider, with operations in auto lending, consumer installment lending, small business lending and deposit taking activities. After lagging in 2010, we think 2011 could be a better year for credit sensitive financials as the economy improves, credit losses abate and loan demand bottoms. Some of these developments have already started to shine through at COF in the form of net charge off declines and a slowdown in the rate of loan contraction. While we are not out of the woods yet we believe these trends should continue, leading to EPS well north of $5.00 over the next couple years. With the stock trading for less than 10x consensus EPS projections, we believe the risk reward profile is attractive.
Discovery Communications, Inc. (DISCK) is a leading global media and entertainment company whose 100+ channels include flagship properties such as the Discovery Channel, Animal Planet and TLC. We believe recent weakness in the name has yielded an opportunity to gain exposure to a well run company, with attractive assets and multiple long term growth drivers. The company’s core assets should continue to deliver a solid earnings stream as key channels close the gap with peers on a per-household affiliate and advertising revenue basis. Emerging networks should become more meaningful drivers of earnings growth as audience sizes reach a critical mass for advertisers. Furthermore, efforts to leverage the company’s popular (and easily translatable) content across international markets should lead to above average growth and support a higher multiple for the shares over time. We believe DISCK has a solid balance sheet and uses its strong cash flows to buy back stock and reinvest in the business.
WellPoint, Inc. (WLP) is one of the largest managed care companies in the U.S., operating the Blue Cross & Blue Shield plans in 14 states and covering roughly 34 million medical members in total. This is clearly a contrarian/value oriented investment that faces some well documented headwinds. However, we find the risk/reward to be appealing at current levels. While the stock has been held in check for some time, we believe that it could have solid upside as subscriber rates improve, investment income benefits from higher interest rates, and political rhetoric subsides.
Increased Positions
Brookfield Asset Management, Inc. (BAM) ** is a specialty asset manager with a concentration in property, power and infrastructure assets. Since the financial crisis, the company has utilized its strong balance sheet and liquidity to opportunistically purchase high quality assets at great values. Going forward, we are encouraged by recent third party asset gathering momentum and the potential for further value enhancing investments. Given management’s impressive track record of value creation, we are comfortable with their ability to allocate capital wisely and grow the entity at an above average pace for an extended period of time.
NVR, Inc. (NVR) is a leading homebuilder that operates primarily under the name Ryan Homes. The Mid-Atlantic is its biggest market. We aren’t expecting housing markets to improve materially anytime soon and could indeed be early to the stock; however, there shouldn’t be much downside from here and this company’s earnings power will be markedly higher than current levels when things do improve. We also note the company has $1 billion of excess cash (vs. its $3.8 billion market cap). Lastly, we note that we initiated the position at 1.0% in the previous quarter due to the stock’s limited trading liquidity.
Transocean Ltd. (RIG)** is the largest and most geographically diverse offshore oil & gas drilling company in the world. It is positioned to benefit from an increasing reliance on offshore/deepwater sources of supply to meet rising global demand. Given the stocks cheap valuation and small size relative to other holdings, we felt adding to the position was a good way to add high quality exposure to the sector. In addition to rising oil prices and a less restrictive regulatory approach in the Gulf of Mexico, we believe the company’s recent dividend announcement should provide support to the shares.
Davenport Value & Income Fund
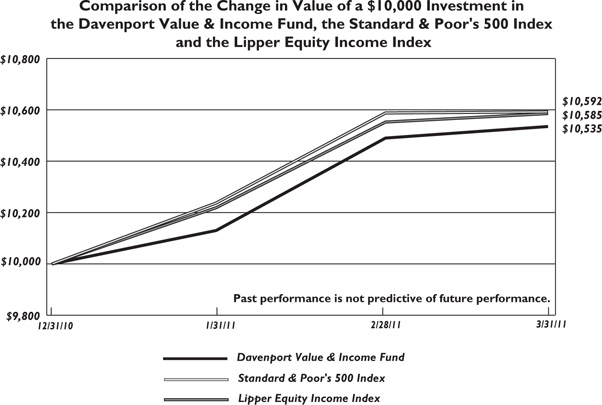
The following chart represents Davenport Value & Income Fund (the “Value & Income Fund”) performance and the performance of the S&P 500 Index*, the Fund’s primary benchmark, and the Lipper Equity Income Index for the periods ended March 31, 2011.
| | | Since Inception (12/31/2010) | |
| Value & Income Fund | 5.35% | 5.35% | 1.25% |
| S&P 500 Index* | 5.92% | 4.37% | |
| Lipper Equity Income Index* | 5.85% | 5.85% | |
Past performance is no guarantee of future results. Investment return and principal value of an investment will fluctuate so that an investor’s shares, when redeemed, may be worth more or less than their original cost. Current performance may be lower or higher than the performance data quoted. Performance data, current to the most recent month end, may be obtained by calling 1-800-281-3217.
| * | The S&P 500 Index is comprised of 500 U.S. stocks and is an indicator of the performance of the overall U.S. stock market. The Lipper Equity Income Fund Index is an unmanaged index of the 30 largest funds, based on total year-end net asset value, in the Lipper Equity Income Fund category. An investor cannot invest in an index and its returns are not indicative of the performance of any specific investment. |
The Value & Income Fund had a strong quarter, returning 5.35%, roughly in line with the 5.92 % gain for the S&P 500 Index and the 5.85% gain for the Lipper Equity Income Index. During the quarter, we saw companies increase or institute dividends at an accelerating pace. According to S&P Research, roughly 117 companies in the S&P 500 Index indicated an intention to either raise or start paying a dividend since the start of the calendar year 2011 compared to 78 companies who raised their dividends during the same period last year. Given record cash balances (and near record cash flows), a firmer economic backdrop, and historically low distribution levels (quarterly dividends by S&P 500 Index companies are still 13% below 2008 peak levels according to S&P Research), we expect to continue seeing businesses return
capital to shareholders in the form of dividends. As such, we believe this is an exciting time for the Value & Income Fund, which has many attractive opportunities for capital appreciation in addition to continued dividend growth.
One of the sectors that saw the greatest amount of dividend increases during the quarter was Financials. Much of this was due to the conclusion of the Fed’s stress test process, which paved the way for meaningful dividend increases for bank holdings such as JPMorgan (JPM) (quarterly dividend increased 5x to $0.25) and Wells Fargo (WFC) (quarterly dividend increased 2.4x to $0.12). Ironically, non-bank holdings such as Plum Creek Timber (PCL) and Willis Group Holdings (WSH) were our largest contributors to performance in the sector. High teens gains in these names helped to offset weakness in others such as Walter Investment Management (WAC) and Bank of America (BAC). We initiated a position in BAC at the beginning of the period, following the company’s settlement on rep and warranty claims with the Government Sponsored Entities (GSEs). The stock suffered some weakness after the Fed rejected its proposal for a modest dividend, likely due to legacy issues and concerns regarding internal capital generation. While we were disappointed to learn of this ruling, we still believe BAC is capable of paying a meaningful dividend as it moves towards its goal of a 30% payout ratio on earnings power that could approach $2.00 in coming years. Given this prospect, and considering that the stock trades at only a slight premium to tangible book value, we feel the shares offer a compelling risk/reward proposition.
A few of our commodity-related holdings stand to benefit from ongoing commodity inflation. Needless to say, as incremental factors such as the escalating unrest in the Middle East entered the equation, most of these names exhibited significant strength. Energy holdings Chevron (CVX), Exxon Mobil (XOM) and Encana (ECA) were top performers during the quarter; however, recent additions to the portfolio within the category also helped absolute performance.
We might look to lighten our exposure in the Consumer Staples and Health Care sectors and focus on a few more cyclical names. Throughout the quarter we acted on this inclination and, while Consumer Staples and Health Care continued to serve as a drag on performance, we feel much more comfortable with the Value & Income Fund’s positioning. In one instance, we sold our position in McCormick (MKC) and added to positions in ECA and Norfolk Southern (NSC). Relative to MKC, both of these companies are more cyclical, appear to have more EPS upside and could benefit from higher commodity prices. They are also quality franchises that pay solid dividends and can fare well in a variety of scenarios.
Also in the Energy category, we initiated positions in ConocoPhillips (COP) and Royal Dutch Shell (RDS.B). Each of these companies is a leading integrated energy company that pays an attractive dividend. In coming years, we believe both entities will begin to reap the benefits of elevated levels of capital spending from prior years. Ultimately, new projects, lower capital requirements and elevated commodity prices should lead to sustainable periods of cash flow and dividend growth.
As indicated by the actions highlighted above, the cyclicality of the Value & Income Fund has ticked up a bit. However, the actions taken were done with a focus on high quality franchises with cheap valuations and attractive dividends that can grow. As such, we feel comfortable with the portfolio’s risk profile and feel well positioned to participate as the economy gradually strengthens and corporate cash flows expand.
New Positions
Bank of America Corp. (BAC) is the nation’s largest consumer and small business bank, with nearly $1 trillion in deposits. The bank has offices in 32 states, Washington D.C., and over 30 countries. The company’s massive deposit base and geographic presence should serve as a valuable and stable source of low-cost funding. Moving forward, we believe the shares should exhibit significant earnings power as the economy recovers.
ConocoPhillips (COP) is an international integrated energy company created through the 2002 merger of Phillips Petroleum and Conoco Corp. In light of a few ill-timed acquisitions and difficulties replacing production, the stock now trades at a meaningful discount to its NAV. Looking ahead, we think the stock is at an inflection point and that a variety of developments could cause this discount to erode. As is the case for many peers, upstream results should benefit from higher commodity prices in addition to a shift to higher margin liquids production. Downstream/refining operations should also benefit from widening spreads. Alongside this improvement in cash flows, we expect management to continue to high grade the company’s asset portfolio through selective asset sales and prudent reinvestment. This activity should bolster the company’s already strong balance sheet ($10 billion in cash), allowing stock buybacks and further increases to the dividend (yields 3.5%).
Royal Dutch Shell plc (RDS.B)** is a leading energy integrated company and the largest producer of liquid natural gas (LNG). Amid seven straight years of production declines and a 2004 reserve downgrade, the company continued to invest heavily in value-creating projects. 2010 marked the first year of upstream production growth in 7 years, beginning what we believe to be a multi-year period of outsized production, free cash flow and dividend growth. Beyond meaningful new projects, increased production and higher commodity prices, we expect results to benefit from an above average earnings exposure to refining and chemicals (yields 5.0%).
Watsco, Inc. (WSO) is the largest independent distributor of heating, ventilation, air conditioning (HVAC) and refrigeration equipment, parts, and supplies in the U.S. Headquartered in Coconut Grove, Florida, the company was founded in 1947 as a parts manufacturer and entered the distribution business in 1989. Most of the executives have been with the company for an extended period of time and the company has about 23% ownership by insiders. WSO is still led by the CEO that bought the company in 1973. WSO has an estimated 7% market share in a $26 billion market and has 18 employees at its headquarters (yields 3.2%).
Increased Positions
Encana Corp. (ECA)** is one of the largest independent natural gas Exploration & Production (E&P) companies in North America, with a diverse portfolio of high quality/low cost assets across Canada and the U.S. ECA continues to lower its cost of production, enabling dividend coverage and sustainable production in even more draconian price environments. This intense focus on costs, in addition to management’s more efficient deployment of capital, should help generate attractive long-term returns as the company exploits its 20+ year drilling inventory. Management appears to be committed to the current $0.80 dividend (yields 2.8%).
Norfolk Southern Corp. (NSC) is the fourth largest rail network in North America, operating approximately 21,000 route miles of track. Over the past year, results have improved significantly alongside increasing industrial demand and firmer commodity prices. While we expect more earnings leverage to result from a continuation of these trends, we also believe the company
is well positioned to benefit from secular/structural developments that should make rails an increasingly attractive logistical alternative over time. NSC has a well respected and experienced management team, a solid balance sheet and an attractive dividend (yields 2.5%).
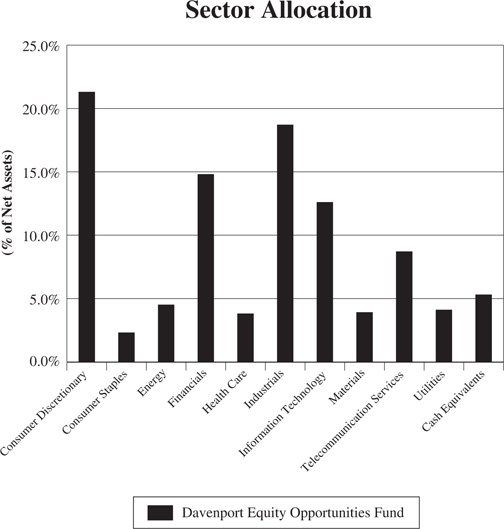
Davenport Equity Opportunities Fund
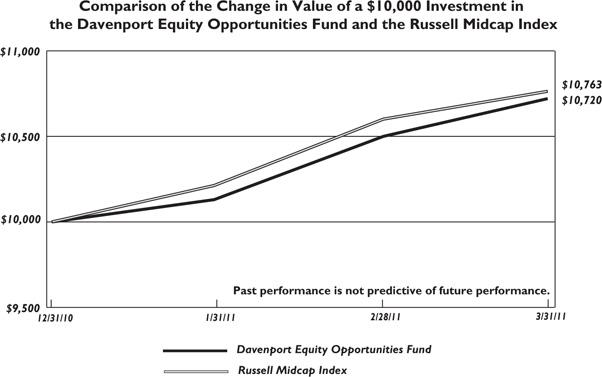
The following chart represents Davenport Equity Opportunities Fund (the “Equity Opportunities Fund”) performance and the performance of the Russell Midcap Index*, the Equity Opportunities Fund’s primary benchmark, and the S&P 500 Index, for the periods ended March 31, 2011.
| | | Since Inception (12/31/2010) | |
| Equity Opportunities Fund | 7.20% | 7.20% | 1.25% |
| Russell Midcap Index* | 7.63% | 7.63% | |
| S&P 500 Index* | 5.92% | 5.92% | |
Past performance is no guarantee of future results. Investment return and principal value of an investment will fluctuate so that an investor’s shares, when redeemed, may be worth more or less than their original cost. Current performance may be lower or higher than the performance data quoted. Performance data, current to the most recent month end, may be obtained by calling 1-800-281-3217.
| * | The Russell Midcap Index measures the performance of the 800 smallest companies in the Russell 1000, which represent approximately 25% of the total market capitalization of the Russell 1000. The S&P 500 Index is comprised of 500 U.S. stocks and is an indicator of the performance of the overall U.S. stock market. An investor cannot invest in an index and its returns are not indicative of the performance of any specific investment. |
The Equity Opportunities Fund enjoyed a strong quarter with a gain of 7.20%. This compares to a 7.63% advance for the Russell Midcap Index and a 5.92% gain for the S&P 500 Index. We don’t put much emphasis on short-term performance, but are pleased to have started on a good note.
Acacia Research (ACTG), a patent licensing company, was our top overall contributor. The shares have acted very well alongside new licensing agreements and additional analyst coverage. While a 30%+ return in one quarter is unusual, we were happy to see lighting strike. Construction equipment rental company RSC Holdings (RRR) was our biggest percentage gainer. We reduced our position in this cyclical company after an impressive run. Richmond-based NewMarket (NEU) was also a strong performer. The shares garnered significant attention when Berkshire Hathaway (BRK) agreed to buy Lubrizol (LZ), which is NEU’s closest comparable. Consumer related stocks such as Expedia (EXPE), Lamar (LAMR), and O’Reilly (ORLY) were among our weaker performers for the quarter. LAMR and ORLY seemed to take a timeout after strong gains in 2010. EXPE, which was already cheap, became even cheaper due to a dispute with American Airlines and disappointing earnings guidance. Given the company’s substantial cash generation and prospects for a resolution with American, we think the stock can bounce back. Also of note, our cash position was a modest drag during the quarter. We like having some fire power, but it can weigh on results in hot markets.
We believe in owning meaningful positions in companies we really like and understand. To that end, we opportunistically added to a number of existing positions during the quarter. ACTG had a sharp pullback, creating a great buying opportunity, and, as evidenced by our earlier remarks, weakness proved to be short-lived. We added to Hanesbrands (HBI) when rising cotton prices kept pressuring the shares and allowed us to make this a more meaningful position. HBI has since rallied as investors have become more comfortable with the company’s ability to pass through costs. CoreLogic (CLGX) provides real estate data and analytics to financial institutions. Prospects of weak short-term results, which can be attributed to a slow real estate market, pressured the shares. We were able to pick up shares at a very cheap price, especially when considering current results could mark the trough for this company.
During the quarter, we established a position in Watsco (WSO), the largest distributor of heating, ventilation and air conditioning (HVAC) equipment in the U.S. Over the last 20 years, the company has created significant value by purchasing small/family-owned businesses, giving them access to capital, and aligning them with WSO’s lean/entrepreneurial culture. Recently, the company has started doing this on a grander scale by purchasing majority stakes in a number of store locations from Carrier Corp. We think WSO can create value by changing the product mix, pricing, and cost structure at these locations. Perhaps more significant, we think pent-up demand could yield a major HVAC equipment replacement cycle. There are over 74 million units on the market over 10 years old, an all-time high. This strikes us as another “when, not if” situation, and we are being paid a 3% dividend yield while we wait. Additionally, Albert Nahmad has served as Chairman of the Board, President and CEO since 1973 and owns 10% of the company. We like it when managers are also meaningful owners.
We love stories of smart capital allocation and above average growth in cash flow per share and/or book value. Assuming a fair entry price, these ingredients tend to yield impressive value creation over time. The Fund is anchored by companies, like Brookfield (BAM), CarMax (KMX), Markel (MKL), ORLY and American Tower (AMT), that fit the bill. We can now add WSO to the team. Occasionally, we will consider a special situation that may be a turnaround story or a case of overlooked asset value. For example, we recently purchased a position in Sprint (S). Sprint provides telecommunications services and stands in the shadows of giants like AT&T (T) and Verizon (VZ). Its customer trends seem to be improving and the company is embarking on a network overhaul that could dramatically lower costs over time. There’s also an asset value story here. When considering the company’s majority stake in Clearwire (CLWR), Sprint owns a significant amount of wireless spectrum - a finite resource that is becoming scarce as wireless usage rises. We think this asset gives the company strategic options and provides valuation support. Since our purchase, AT&T announced plans to acquire T-Mobile. While this was an unforeseen development and takes a T-Mobile/Sprint combo off the table, we still think Sprint has upside and point out the stock is hovering around our initial purchase price even with this negative news having surprised investors.
No quarter would be complete without some regrets. Our most recent frustrations have involved selling positions in good companies, only to see them keep rising; no surprise in a strong market. We often use the proceeds from a sale to buy something else that seems to offer a more compelling risk/reward profile. Similar to what a company should do, we try to allocate our resources to the best opportunities we can find. Thank you for your trust. We look forward to reporting back as we progress through the year.
New Positions
Sprint Nextel Corp. (S) is the 3rd largest carrier in the U.S., serving over 45 million customers. The company spun off its fixed-line local phone business in 2006, acquired Virgin Mobile in 2009, and owns roughly 56% in Clearwire Corporation (CLWR). Sprint has lagged wireless peers for many years, but new network initiatives and an enviable spectrum position could put this company in a good spot going forward. Furthermore, the valuation is not very demanding and downside risk seems to be manageable relative to the potential upside.
Watsco, Inc. (WSO) is the largest independent distributor of heating, ventilation, air conditioning (HVAC) and refrigeration equipment, parts, and supplies in the U.S. Headquartered in Coconut Grove, Florida, the company was founded in 1947 as a parts manufacturer and entered the distribution business in 1989. Most of the executives have been with the company for an extended period of time and the company has about 23% ownership by insiders. WSO is still led by the CEO that bought the company in 1973. WSO has an estimated 7% market share in a $26 billion market and has 18 employees at its headquarters. We initiated and added to this position during the quarter.
Increased Positions
Acacia Research Corp. (ACTG) is a leader in the fast growing business of patent licensing. ACTG partners with patent owners, licenses the patents to corporate users and shares the revenues 50/50 with the patent owners. We are excited by some of the new developments and emerging opportunities at the company that should give way to significant earnings power over time.
CarMax, Inc. (KMX) is the largest retailer of used cars in the U.S.; however, it only controls 2% of the $275 billion market for 1-6 year old cars. This immense market opportunity, coupled with the company’s superior business model and solid track record of execution and constant improvement has always attracted us to this story. More recently, the company resumed its growth strategy and has begun to see the benefits of increased traffic and pricing. Over time we believe earnings power is substantial as the company takes its business model to various other markets.
CoreLogic, Inc. (CLGX) provides real estate data and analytics to financial institutions. While we do not expect numbers in the company’s housing transaction related businesses to recover immediately, management has set the bar low with its 2011 guidance. Over time, we expect a recovery in housing in addition to long term tail winds in the company’s core data and analytics franchise to be augmented by acquisitions and stock buybacks.
Expedia, Inc. (EXPE) is the largest online travel agency in the world and operates a diverse portfolio of travel properties, including Expedia.com, Hotels.com, Hotwire.com and TripAdvisor. In addition to benefiting from secular tailwinds as the travel industry moves online, the company continues to take market share and emphasize higher margin businesses. All of these factors coupled with the company’s scalable online platform suggest significant cash flow and earnings leverage in years to come.
Hanesbrands, Inc. (HBI) is an international consumer goods company that designs, manufactures, and sells high-volume, value-focused apparel essentials under brand names such as Hanes, Bali, Champion, and Playtex. Despite recent successes in restructuring/deleveraging initiatives and market share gains the stock has been a laggard due to concerns regarding the company’s exposure to rising cotton prices. We think this has provided a good entry point into the stock which could experience a lift as the “mania” surrounding cotton prices wanes.
Rockwell Collins, Inc. (COL) is a leading provider of communications equipment and aviation electronics for military and commercial aerospace customers. The company’s extremely attractive balance sheet (near net debt free), well above average returns on capital, cash flow generation (FCF/share next year could exceed $5), and stewardship of capital makes COL one of our most attractive picks in the sector. COL has exposure on every known growth platform (both military and civilian) scheduled to be delivered or upgraded in the next decade and double digit EPS growth seems doable for the foreseeable future.
We are pleased that The Davenport Funds are off to a good start thus far in 2011 and are particularly excited about the two new additions, the Value & Income Fund and the Equity Opportunities Fund. We thank you for your trust and look forward to reporting back as we proceed through the year.
Sincerely,
John P. Ackerly, IV
President, The Davenport Funds
DAVENPORT CORE FUND PERFORMANCE INFORMATION (Unaudited) |
| | Average Annual Total Returns(a) (for periods ended March 31, 2011) | |
| | 1 Year | 5 Years | 10 Years | |
| Davenport Core Fund | 14.61% | 3.65% | 4.33% | |
| Standard & Poor’s 500 Index | 15.65% | 2.62% | 3.29% | |
(a) The total returns shown do not reflect the deduction of taxes that a shareholder would pay on Fund distributions or the redemption of Fund shares. |
DAVENPORT VALUE & INCOME FUND PERFORMANCE INFORMATION (Unaudited) |
| | Total Returns(a) (for period ended March 31, 2011) | |
| | Since Inception(b) | |
| Davenport Value & Income Fund | 5.35% | |
| Standard & Poor’s 500 Index | 5.92% | |
| Lipper Equity Income Index | 5.85% | |
(a) The total returns shown do not reflect the deduction of taxes that a shareholder would pay on Fund distributions or the redemption of Fund shares. |
(b) Commencement of operations was December 31, 2010. |
DAVENPORT EQUITY OPPORTUNITIES FUND PERFORMANCE INFORMATION (Unaudited) |
| | Total Returns(a) (for period ended March 31, 2011) | |
| | Since Inception(b) | |
| Davenport Equity Opportunities Fund | 7.20% | |
| Russell Midcap Index | 7.63% | |
(a) The total returns shown do not reflect the deduction of taxes that a shareholder would pay on Fund distributions or the redemption of Fund shares. |
(b) Commencement of operations was December 31, 2010. |
DAVENPORT CORE FUND PORTFOLIO INFORMATION March 31, 2011 (Unaudited) |
Top Ten Equity Holdings
| Security Description | % of Net Assets |
| Exxon Mobil Corporation | 2.7% |
| Schlumberger Ltd. | 2.5% |
| Brookfield Asset Management, Inc. - Class A | 2.4% |
| QUALCOMM, Inc. | 2.4% |
| Markel Corporation | 2.3% |
| Chevron Corporation | 2.3% |
| Danaher Corporation | 2.1% |
| United Technologies Corporation | 2.1% |
| International Business Machines Corporation | 2.1% |
| Apple, Inc. | 2.0% |
DAVENPORT VALUE & INCOME FUND PORTFOLIO INFORMATION March 31, 2011 (Unaudited) |
Top Ten Equity Holdings
| Security Description | % of Net Assets |
| Tortoise Energy Infrastructure Corporation | 2.8% |
| Chevron Corporation | 2.5% |
| Plum Creek Timber Company, Inc. | 2.4% |
| VF Corporation | 2.3% |
| Willis Group Holdings plc | 2.3% |
| Altria Group, Inc. | 2.3% |
| Vodafone Group plc - ADR | 2.2% |
| GlaxoSmithKline plc - ADR | 2.2% |
| Wells Fargo & Company | 2.2% |
| Exxon Mobil Corporation | 2.2% |
DAVENPORT EQUITY OPPORTUNITIES FUND PORTFOLIO INFORMATION March 31, 2011 (Unaudited) |
Top Ten Equity Holdings
| Security Description | % of Net Assets |
| Acacia Research Corporation | 4.7% |
| Millicom International Cellular S.A. | 4.5% |
| Penn National Gaming, Inc. | 4.2% |
| CarMax, Inc. | 3.9% |
| Markel Corporation | 3.7% |
| Hanesbrands, Inc. | 3.4% |
| Lamar Advertising Company - Class A | 3.1% |
| Fidelity National Financial, Inc. - Class A | 3.1% |
| NCR Corporation | 3.0% |
| Safety Insurance Group, Inc. | 3.0% |
DAVENPORT CORE FUND SCHEDULE OF INVESTMENTS March 31, 2011 | |
| | | | | | |
| Consumer Discretionary — 11.1% | | | | | | |
CarMax, Inc. (a) | | | 89,180 | | | $ | 2,862,678 | |
Discovery Communications, Inc. - Class C (a) | | | 65,880 | | | | 2,319,635 | |
Ford Motor Company (a) | | | 144,488 | | | | 2,154,316 | |
Lowe's Companies, Inc. | | | 118,639 | | | | 3,135,628 | |
McDonald's Corporation | | | 27,522 | | | | 2,094,149 | |
NVR, Inc. (a) | | | 2,972 | | | | 2,246,832 | |
Walt Disney Company (The) | | | 67,332 | | | | 2,901,336 | |
| | | | | | | | 17,714,574 | |
| Consumer Staples — 7.9% | | | | | | | | |
Anheuser-Busch InBev SA/NV - ADR | | | 33,873 | | | | 1,936,519 | |
PepsiCo, Inc. | | | 43,611 | | | | 2,808,985 | |
Procter & Gamble Company (The) | | | 36,064 | | | | 2,221,542 | |
SABMiller plc - ADR | | | 81,834 | | | | 2,928,839 | |
Wal-Mart Stores, Inc. | | | 52,016 | | | | 2,707,433 | |
| | | | | | | | 12,603,318 | |
| Energy — 12.5% | | | | | | | | |
Chevron Corporation | | | 34,412 | | | | 3,696,881 | |
EOG Resources, Inc. | | | 22,970 | | | | 2,722,175 | |
Exxon Mobil Corporation | | | 52,026 | | | | 4,376,947 | |
Occidental Petroleum Corporation | | | 27,511 | | | | 2,874,625 | |
Schlumberger Ltd. | | | 42,023 | | | | 3,919,065 | |
Transocean Ltd. (a) | | | 30,533 | | | | 2,380,047 | |
| | | | | | | | 19,969,740 | |
| Financials — 15.2% | | | | | | | | |
Bank of America Corporation | | | 133,638 | | | | 1,781,395 | |
Berkshire Hathaway, Inc. - Class B (a) | | | 31,491 | | | | 2,633,592 | |
| Brookfield Asset Management, Inc. - Class A | | | 117,220 | | | | 3,804,961 | |
Capital One Financial Corporation | | | 48,692 | | | | 2,530,036 | |
CME Group, Inc. | | | 4,657 | | | | 1,404,318 | |
JPMorgan Chase & Company | | | 51,423 | | | | 2,370,600 | |
Markel Corporation (a) | | | 8,997 | | | | 3,728,807 | |
T. Rowe Price Group, Inc. | | | 42,680 | | | | 2,834,806 | |
Wells Fargo & Company | | | 98,178 | | | | 3,112,243 | |
| | | | | | | | 24,200,758 | |
| Health Care — 11.3% | | | | | | | | |
Becton, Dickinson and Company | | | 31,491 | | | | 2,507,314 | |
Johnson & Johnson | | | 42,648 | | | | 2,526,894 | |
Laboratory Corporation of America Holdings (a) | | | 28,760 | | | | 2,649,659 | |
Medco Health Solutions, Inc. (a) | | | 27,945 | | | | 1,569,391 | |
Merck & Company, Inc. | | | 62,982 | | | | 2,079,036 | |
Novo Nordisk A/S - ADR | | | 19,318 | | | | 2,419,193 | |
Teva Pharmaceutical Industries Ltd. - ADR | | | 33,608 | | | | 1,686,113 | |
WellPoint, Inc. | | | 37,842 | | | | 2,640,993 | |
| | | | | | | | 18,078,593 | |
DAVENPORT CORE FUND SCHEDULE OF INVESTMENTS (Continued) |
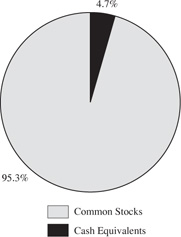
COMMON STOCKS — 95.3% (Continued) | | | | | | |
| Industrials — 9.7% | | | | | | |
Boeing Company (The) | | | 32,020 | | | $ | 2,367,239 | |
Caterpillar, Inc. | | | 19,284 | | | | 2,147,273 | |
Danaher Corporation | | | 65,840 | | | | 3,417,096 | |
General Dynamics Corporation | | | 25,669 | | | | 1,965,219 | |
Illinois Tool Works, Inc. | | | 42,341 | | | | 2,274,558 | |
United Technologies Corporation | | | 39,694 | | | | 3,360,097 | |
| | | | | | | | 15,531,482 | |
| Information Technology — 18.8% | | | | | | | | |
Accenture plc - Class A | | | 52,111 | | | | 2,864,542 | |
Apple, Inc. (a) | | | 9,378 | | | | 3,267,764 | |
Automatic Data Processing, Inc. | | | 46,480 | | | | 2,384,889 | |
Check Point Software Technologies Ltd. (a) | | | 50,809 | | | | 2,593,800 | |
Fiserv, Inc. (a) | | | 50,703 | | | | 3,180,092 | |
Google, Inc. - Class A (a) | | | 3,864 | | | | 2,265,115 | |
Intel Corporation | | | 103,481 | | | | 2,087,212 | |
| International Business Machines Corporation | | | 20,218 | | | | 3,296,949 | |
Microsoft Corporation | | | 97,733 | | | | 2,478,509 | |
QUALCOMM, Inc. | | | 69,333 | | | | 3,801,528 | |
Visa, Inc. - Class A | | | 25,140 | | | | 1,850,807 | |
| | | | | | | | 30,071,207 | |
| Materials — 5.0% | | | | | | | | |
Albemarle Corporation | | | 51,402 | | | | 3,072,297 | |
International Flavors & Fragrances, Inc. | | | 39,694 | | | | 2,472,936 | |
Praxair, Inc. | | | 24,568 | | | | 2,496,109 | |
| | | | | | | | 8,041,342 | |
| Telecommunication Services — 3.8% | | | | | | | | |
American Tower Corporation - Class A (a) | | | 61,574 | | | | 3,190,765 | |
Millicom International Cellular S.A. | | | 30,147 | | | | 2,899,237 | |
| | | | | | | | 6,090,002 | |
| | | | | | | | | |
Total Common Stocks (Cost $117,419,104) | | | | | | $ | 152,301,016 | |
U.S. GOVERNMENT AGENCY OBLIGATIONS — 0.9% | | | | | | |
Federal Home Loan Bank, discount note, 0.01% (b), due 04/11/2011 (Cost $1,399,996) | | $ | 1,400,000 | | | $ | 1,399,992 | |
DAVENPORT CORE FUND SCHEDULE OF INVESTMENTS (Continued) |
MONEY MARKET FUNDS — 3.1% | | | | | | |
First American Treasury Obligations Fund - Class Z, 0.00% (c) (Cost $4,995,911) | | | 4,995,911 | | | $ | 4,995,911 | |
| | | | | | | | | |
Total Investments at Value — 99.3% (Cost $123,815,011) | | | | | | $ | 158,696,919 | |
| | | | | | | | | |
| Other Assets in Excess of Liabilities — 0.7% | | | | | | | 1,197,529 | |
| | | | | | | | | |
Net Assets — 100.0% | | | | | | $ | 159,894,448 | |
| ADR - American Depositary Receipt. |
| (a) | Non-income producing security. |
| (b) | Rate shown is the annualized yield at time of purchase, not a coupon rate. |
| (c) | Variable rate security. The rate shown is the 7-day effective yield as of March 31, 2011. |
| See accompanying notes to financial statements. |
DAVENPORT VALUE & INCOME FUND SCHEDULE OF INVESTMENTS March 31, 2011 |
| | | | | | |
| Consumer Discretionary — 8.3% | | | | | | |
Home Depot, Inc. (The) | | | 26,450 | | | $ | 980,237 | |
Leggett & Platt, Inc. | | | 38,737 | | | | 949,056 | |
McDonald's Corporation | | | 12,820 | | | | 975,474 | |
VF Corporation | | | 11,500 | | | | 1,133,095 | |
| | | | | | | | 4,037,862 | |
| Consumer Staples — 14.9% | | | | | | | | |
Altria Group, Inc. | | | 42,548 | | | | 1,107,524 | |
Anheuser-Busch InBev SA/NV - ADR | | | 16,905 | | | | 966,459 | |
Coca-Cola Company (The) | | | 15,560 | | | | 1,032,406 | |
Diageo plc - ADR | | | 11,880 | | | | 905,494 | |
H.J. Heinz Company | | | 13,050 | | | | 637,101 | |
Philip Morris International, Inc. | | | 16,225 | | | | 1,064,847 | |
Procter & Gamble Company (The) | | | 12,820 | | | | 789,712 | |
Sysco Corporation | | | 28,405 | | | | 786,818 | |
| | | | | | | | 7,290,361 | |
| Energy — 12.9% | | | | | | | | |
Chevron Corporation | | | 11,551 | | | | 1,240,924 | |
ConocoPhillips | | | 12,390 | | | | 989,465 | |
Encana Corporation | | | 29,830 | | | | 1,030,030 | |
Exxon Mobil Corporation | | | 12,694 | | | | 1,067,946 | |
Royal Dutch Shell plc - ADR | | | 13,605 | | | | 996,430 | |
Spectra Energy Corporation | | | 35,465 | | | | 963,939 | |
| | | | | | | | 6,288,734 | |
| Financials — 16.1% | | | | | | | | |
Bank of America Corporation | | | 47,045 | | | | 627,110 | |
Fidelity National Financial, Inc. - Class A | | | 47,351 | | | | 669,070 | |
JPMorgan Chase & Company | | | 22,265 | | | | 1,026,417 | |
Plum Creek Timber Company, Inc. | | | 26,385 | | | | 1,150,650 | |
Royal Bank of Canada | | | 10,640 | | | | 659,361 | |
Travelers Companies, Inc. (The) | | | 15,665 | | | | 931,754 | |
| Walter Investment Management Corporation | | | 36,818 | | | | 593,874 | |
Wells Fargo & Company | | | 33,770 | | | | 1,070,509 | |
Willis Group Holdings plc | | | 27,751 | | | | 1,120,030 | |
| | | | | | | | 7,848,775 | |
| Health Care — 7.1% | | | | | | | | |
Abbott Laboratories | | | 13,785 | | | | 676,154 | |
GlaxoSmithKline plc - ADR | | | 28,370 | | | | 1,089,692 | |
Johnson & Johnson | | | 15,565 | | | | 922,226 | |
Merck & Company, Inc. | | | 23,410 | | | | 772,764 | |
| | | | | | | | 3,460,836 | |
| Industrials — 14.5% | | | | | | | | |
3M Company | | | 10,305 | | | | 963,517 | |
Emerson Electric Company | | | 16,220 | | | | 947,735 | |
DAVENPORT VALUE & INCOME FUND SCHEDULE OF INVESTMENTS (Continued) |
COMMON STOCKS — 87.8% (Continued) | | | | | | |
| Industrials — 14.5% (Continued) | | | | | | |
General Dynamics Corporation | | | 13,660 | | | $ | 1,045,810 | |
General Electric Company | | | 50,111 | | | | 1,004,725 | |
Illinois Tool Works, Inc. | | | 13,785 | | | | 740,530 | |
Norfolk Southern Corporation | | | 14,780 | | | | 1,023,811 | |
Waste Management, Inc. | | | 23,638 | | | | 882,643 | |
Watsco, Inc. | | | 7,235 | | | | 504,352 | |
| | | | | | | | 7,113,123 | |
| Information Technology — 5.6% | | | | | | | | |
Automatic Data Processing, Inc. | | | 19,170 | | | | 983,613 | |
Intel Corporation | | | 43,265 | | | | 872,655 | |
Microsoft Corporation | | | 35,115 | | | | 890,516 | |
| | | | | | | | 2,746,784 | |
| Materials — 2.1% | | | | | | | | |
E.I. du Pont de Nemours and Company | | | 18,688 | | | | 1,027,279 | |
| | | | | | | | | |
| Telecommunication Services — 4.3% | | | | | | | | |
Telefonica S.A. - ADR | | | 40,195 | | | | 1,013,718 | |
Vodafone Group plc - ADR | | | 38,010 | | | | 1,092,788 | |
| | | | | | | | 2,106,506 | |
| Utilities — 2.0% | | | | | | | | |
Dominion Resources, Inc. | | | 21,635 | | | | 967,085 | |
| | | | | | | | | |
Total Common Stocks (Cost $41,694,567) | | | | | | $ | 42,887,345 | |
| | | | | | |
| Tortoise Energy Infrastructure Corporation (Cost $1,302,951) | | | 33,332 | | | $ | 1,339,613 | |
MONEY MARKET FUNDS — 2.2% | | | | | | |
First American Treasury Obligations Fund - Class Z, 0.00% (a) (Cost $1,089,726) | | | 1,089,726 | | | $ | 1,089,726 | |
| | | | | | | | | |
Total Investments at Value — 92.8% (Cost $44,087,244) | | | | | | $ | 45,316,684 | |
| | | | | | | | | |
| Other Assets in Excess of Liabilities — 7.2% | | | | | | | 3,513,846 | |
| | | | | | | | | |
Net Assets — 100.0% | | | | | | $ | 48,830,530 | |
| ADR- American Depositary Receipt. |
| (a) | Variable rate security. The rate shown is the 7-day effective yield as of March 31, 2011. |
| See accompanying notes to financial statements. |
DAVENPORT EQUITY OPPORTUNITIES FUND SCHEDULE OF INVESTMENTS March 31, 2011 |
| | | | | | |
| Consumer Discretionary — 21.3% | | | | | | |
CarMax, Inc. (a) | | | 42,280 | | | $ | 1,357,188 | |
Expedia, Inc. | | | 38,435 | | | | 870,937 | |
Hanesbrands, Inc. (a) | | | 43,455 | | | | 1,175,023 | |
Lamar Advertising Company - Class A (a) | | | 29,110 | | | | 1,075,323 | |
NVR, Inc. (a) | | | 877 | | | | 663,012 | |
O'Reilly Automotive, Inc. (a) | | | 12,624 | | | | 725,375 | |
Penn National Gaming, Inc. (a) | | | 38,825 | | | | 1,438,855 | |
| | | | | | | | 7,305,713 | |
| Consumer Staples — 2.3% | | | | | | | | |
Church & Dwight Company, Inc. | | | 9,750 | | | | 773,565 | |
| | | | | | | | | |
| Energy — 4.5% | | | | | | | | |
Plains Exploration & Production Company (a) | | | 21,150 | | | | 766,265 | |
Ultra Petroleum Corporation (a) | | | 15,510 | | | | 763,867 | |
| | | | | | | | 1,530,132 | |
| Financials — 14.8% | | | | | | | | |
| Brookfield Asset Management, Inc. - Class A | | | 23,360 | | | | 758,265 | |
Fidelity National Financial, Inc. - Class A | | | 74,515 | | | | 1,052,897 | |
Lazard Ltd. - Class A | | | 14,945 | | | | 621,413 | |
Markel Corporation (a) | | | 3,105 | | | | 1,286,867 | |
Safety Insurance Group, Inc. | | | 22,170 | | | | 1,022,259 | |
| Union First Market Bankshares Corporation | | | 30,255 | | | | 340,369 | |
| | | | | | | | 5,082,070 | |
| Health Care — 3.8% | | | | | | | | |
Henry Schein, Inc. (a) | | | 9,985 | | | | 700,648 | |
Laboratory Corporation of America Holdings (a) | | | 6,500 | | | | 598,845 | |
| | | | | | | | 1,299,493 | |
| Industrials — 18.7% | | | | | | | | |
Acacia Research Corporation (a) | | | 47,035 | | | | 1,609,538 | |
Babcock & Wilcox Company (a) | | | 11,389 | | | | 380,165 | |
Cooper Industries plc | | | 12,340 | | | | 800,866 | |
Foster Wheeler AG (a) | | | 19,845 | | | | 746,569 | |
Republic Services, Inc. | | | 24,930 | | | | 748,897 | |
Rockwell Collins, Inc. | | | 13,630 | | | | 883,633 | |
RSC Holdings, Inc. (a) | | | 38,620 | | | | 555,355 | |
Watsco, Inc. | | | 10,125 | | | | 705,814 | |
| | | | | | | | 6,430,837 | |
| Information Technology — 12.6% | | | | | | | | |
Check Point Software Technologies Ltd. (a) | | | 14,035 | | | | 716,487 | |
CoreLogic, Inc. | | | 46,880 | | | | 867,280 | |
Fiserv, Inc. (a) | | | 13,390 | | | | 839,821 | |
Intuit, Inc. (a) | | | 16,470 | | | | 874,557 | |
NCR Corporation (a) | | | 55,296 | | | | 1,041,776 | |
| | | | | | | | 4,339,921 | |
DAVENPORT EQUITY OPPORTUNITIES FUND SCHEDULE OF INVESTMENTS (Continued) |
COMMON STOCKS — 94.7% (Continued) | | | | | | |
| Materials — 3.9% | | | | | | |
Albemarle Corporation | | | 9,830 | | | $ | 587,539 | |
NewMarket Corporation | | | 4,825 | | | | 763,412 | |
| | | | | | | | 1,350,951 | |
| Telecommunication Services — 8.7% | | | | | | | | |
American Tower Corporation - Class A (a) | | | 14,945 | | | | 774,450 | |
Millicom International Cellular S.A. | | | 15,985 | | | | 1,537,277 | |
Sprint Nextel Corporation (a) | | | 149,970 | | | | 695,861 | |
| | | | | | | | 3,007,588 | |
| Utilities — 4.1% | | | | | | | | |
AES Corporation (The) (a) | | | 55,185 | | | | 717,405 | |
ITC Holdings Corporation | | | 10,050 | | | | 702,495 | |
| | | | | | | | 1,419,900 | |
| | | | | | | | | |
Total Common Stocks (Cost $31,209,526) | | | | | | $ | 32,540,170 | |
MONEY MARKET FUNDS — 2.5% | | | | | | |
First American Treasury Obligations Fund - Class Z, 0.00% (b) (Cost $866,058) | | | 866,058 | | | $ | 866,058 | |
| | | | | | | | | |
Total Investments at Value — 97.2% (Cost $32,075,584) | | | | | | $ | 33,406,228 | |
| | | | | | | | | |
| Other Assets in Excess of Liabilities — 2.8% | | | | | | | 969,193 | |
| | | | | | | | | |
Net Assets — 100.0% | | | | | | $ | 34,375,421 | |
| (a) | Non-income producing security. |
| (b) | Variable rate security. The rate shown is the 7-day effective yield as of March 31, 2011. |
| See accompanying notes to financial statements. |
THE DAVENPORT FUNDS STATEMENTS OF ASSETS AND LIABILITIES March 31, 2011 |
| | | | | Davenport Value & Income Fund | | | Davenport Equity Opportunities Fund | |
| ASSETS | | | | | | | | | |
| Investments in securities: | | | | | | | | | |
At acquisition cost | | $ | 123,815,011 | | | $ | 44,087,244 | | | $ | 32,075,584 | |
At market value (Note 1) | | $ | 158,696,919 | | | $ | 45,316,684 | | | $ | 33,406,228 | |
Cash | | | — | | | | 2,808,044 | | | | 1,805,841 | |
Dividends receivable | | | 150,792 | | | | 99,754 | | | | 10,951 | |
Receivable for investment securities sold | | | 3,129,169 | | | | — | | | | — | |
Receivable for capital shares sold | | | 759,650 | | | | 3,137,673 | | | | 842,704 | |
Other assets | | | 8,817 | | | | 6,655 | | | | 6,488 | |
TOTAL ASSETS | | | 162,745,347 | | | | 51,368,810 | | | | 36,072,212 | |
| | | | | | | | | | | | | |
| LIABILITIES | | | | | | | | | | | | |
Payable for investment securities purchased | | | 2,298,290 | | | | 2,460,445 | | | | 1,660,594 | |
Payable for capital shares redeemed | | | 417,638 | | | | 32,947 | | | | 5,000 | |
Accrued investment advisory fees (Note 3) | | | 111,262 | | | | 31,132 | | | | 24,833 | |
Accrued administration fees (Note 3) | | | 18,000 | | | | 5,300 | | | | 4,000 | |
Accrued compliance fees (Note 3) | | | 1,200 | | | | 750 | | | | 700 | |
Other accrued expenses | | | 4,509 | | | | 7,706 | | | | 1,664 | |
TOTAL LIABILITIES | | | 2,850,899 | | | | 2,538,280 | | | | 1,696,791 | |
| | | | | | | | | | | | | |
NET ASSETS | | $ | 159,894,448 | | | $ | 48,830,530 | | | $ | 34,375,421 | |
| | | | | | | | | | | | | |
| Net assets consist of: | | | | | | | | | | | | |
Paid-in capital | | $ | 135,737,614 | | | $ | 47,520,326 | | | $ | 32,881,980 | |
Undistributed net investment income | | | 21,810 | | | | 9,030 | | | | — | |
Accumulated net realized gains (losses)
from security transactions | | | (10,746,884 | ) | | | 71,734 | | | | 162,797 | |
Net unrealized appreciation on investments | | | 34,881,908 | | | | 1,229,440 | | | | 1,330,644 | |
Net assets | | $ | 159,894,448 | | | $ | 48,830,530 | | | $ | 34,375,421 | |
| | | | | | | | | | | | | |
Shares of beneficial interest outstanding
(unlimited number of shares authorized,
$0.01 par value) | | | 11,645,986 | | | | 4,651,554 | | | | 3,207,695 | |
| | | | | | | | | | | | | |
Net asset value, offering price and redemption
price per share (Note 1) | | $ | 13.73 | | | $ | 10.50 | | | $ | 10.72 | |
| See accompanying notes to financial statements. |
THE DAVENPORT FUNDS STATEMENTS OF OPERATIONS Year Ended March 31, 2011 (a) |
| | | | | Davenport Value & Income Fund | | | Davenport Equity Opportunities Fund | |
| INVESTMENT INCOME | | | | | | | | | |
Dividends | | $ | 2,171,996 | | | $ | 229,391 | | | $ | 45,704 | |
Foreign withholding taxes on dividends | | | (49,212 | ) | | | — | | | | (285 | ) |
Interest | | | 33 | | | | — | | | | — | |
TOTAL INVESTMENT INCOME | | | 2,122,817 | | | | 229,391 | | | | 45,419 | |
| | | | | | | | | | | | | |
| EXPENSES | | | | | | | | | | | | |
Investment advisory fees (Note 3) | | | 1,017,360 | | | | 53,111 | | | | 40,175 | |
Administration fees (Note 3) | | | 190,932 | | | | 13,493 | | | | 12,052 | |
Custodian and bank service fees | | | 20,553 | | | | 11,399 | | | | 8,199 | |
Registration fees | | | 16,395 | | | | — | | | | — | |
Professional fees | | | 19,822 | | | | 1,075 | | | | 1,075 | |
Trustees’ fees and expenses | | | 14,531 | | | | 3,256 | | | | 3,256 | |
Compliance service fees (Note 3) | | | 16,986 | | | | 1,963 | | | | 1,873 | |
Insurance expense | | | 12,680 | | | | — | | | | — | |
Printing of shareholder reports | | | 11,893 | | | | 360 | | | | — | |
Postage and supplies | | | 10,235 | | | | 973 | | | | — | |
Other expenses | | | 9,673 | | | | 2,889 | | | | 328 | |
TOTAL EXPENSES | | | 1,341,060 | | | | 88,519 | | | | 66,958 | |
| | | | | | | | | | | | | |
NET INVESTMENT INCOME (LOSS) | | | 781,757 | | | | 140,872 | | | | (21,539 | ) |
| | | | | | | | | | | | | |
REALIZED AND UNREALIZED
GAINS ON INVESTMENTS | | | | | | | | | | | | |
Net realized gains from security transactions | | | 2,762,416 | | | | 71,734 | | | | 184,336 | |
Net change in unrealized appreciation/
depreciation on investments | | | 15,587,706 | | | | 1,229,440 | | | | 1,330,644 | |
| | | | | | | | | | | | | |
NET REALIZED AND UNREALIZED
GAINS ON INVESTMENTS | | | 18,350,122 | | | | 1,301,174 | | | | 1,514,980 | |
| | | | | | | | | | | | | |
NET INCREASE IN NET ASSETS
FROM OPERATIONS | | $ | 19,131,879 | | | $ | 1,442,046 | | | $ | 1,493,441 | |
| (a) | Except for Davenport Value & Income Fund and Davenport Equity Opportunities Fund, which represents the period from commencement of operations (December 31, 2010) through March 31, 2011. |
| | |
| See accompanying notes to financial statements. |
THE DAVENPORT FUNDS STATEMENTS OF CHANGES IN NET ASSETS |
| | | | |
| | | | | | |
| FROM OPERATIONS | | | | | | |
Net investment income | | $ | 781,757 | | | $ | 872,940 | |
Net realized gains (losses) from security transactions | | | 2,762,416 | | | | (1,188,524 | ) |
Net change in unrealized appreciation/
depreciation on investments | | | 15,587,706 | | | | 42,183,572 | |
Net increase in net assets from operations | | | 19,131,879 | | | | 41,867,988 | |
| | | | | | | | | |
| DISTRIBUTIONS TO SHAREHOLDERS | | | | | | | | |
From net investment income | | | (780,857 | ) | | | (865,302 | ) |
| | | | | | | | | |
| FROM CAPITAL SHARE TRANSACTIONS | | | | | | | | |
Proceeds from shares sold | | | 27,476,146 | | | | 11,590,012 | |
Net asset value of shares issued in reinvestment
of distributions to shareholders | | | 741,331 | | | | 821,362 | |
Payments for shares redeemed | | | (19,335,638 | ) | | | (13,110,640 | ) |
Net increase (decrease) in net assets from
capital share transactions | | | 8,881,839 | | | | (699,266 | ) |
| | | | | | | | | |
TOTAL INCREASE IN NET ASSETS | | | 27,232,861 | | | | 40,303,420 | |
| | | | | | | | | |
| NET ASSETS | | | | | | | | |
Beginning of year | | | 132,661,587 | | | | 92,358,167 | |
End of year | | $ | 159,894,448 | | | $ | 132,661,587 | |
| | | | | | | | | |
UNDISTRIBUTED NET INVESTMENT INCOME | | $ | 21,810 | | | $ | 20,910 | |
| | | | | | | | | |
| CAPITAL SHARE ACTIVITY | | | | | | | | |
Shares sold | | | 2,149,143 | | | | 1,095,709 | |
Shares reinvested | | | 61,329 | | | | 76,595 | |
Shares redeemed | | | (1,570,298 | ) | | | (1,220,427 | ) |
Net increase (decrease) in shares outstanding | | | 640,174 | | | | (48,123 | ) |
Shares outstanding at beginning of year | | | 11,005,812 | | | | 11,053,935 | |
Shares outstanding at end of year | | | 11,645,986 | | | | 11,005,812 | |
| See accompanying notes to financial statements. |
DAVENPORT VALUE & INCOME FUND DAVENPORT EQUITY OPPORTUNITIES FUND STATEMENTS OF CHANGES IN NET ASSETS Period Ended March 31, 2011 (a) |
| | Davenport Value & Income Fund | | | Davenport Equity Opportunities Fund | |
| FROM OPERATIONS | | | | | | |
Net investment income (loss) | | $ | 140,872 | | | $ | (21,539 | ) |
Net realized gains from security transactions | | | 71,734 | | | | 184,336 | |
Net change in unrealized appreciation/
depreciation on investments | | | 1,229,440 | | | | 1,330,644 | |
Net increase in net assets from operations | | | 1,442,046 | | | | 1,493,441 | |
| | | | | | | | | |
| DISTRIBUTIONS TO SHAREHOLDERS | | | | | | | | |
From net investment income | | | (131,842 | ) | | | — | |
| | | | | | | | | |
| FROM CAPITAL SHARE TRANSACTIONS | | | | | | | | |
Proceeds from shares sold | | | 47,565,809 | | | | 34,425,550 | |
Net asset value of shares issued in reinvestment
of distributions to shareholders | | | 110,894 | | | | — | |
Payments for shares redeemed | | | (156,377 | ) | | | (1,543,570 | ) |
Net increase in net assets from capital share transactions | | | 47,520,326 | | | | 32,881,980 | |
| | | | | | | | | |
TOTAL INCREASE IN NET ASSETS | | | 48,830,530 | | | | 34,375,421 | |
| | | | | | | | | |
| NET ASSETS | | | | | | | | |
Beginning of period | | | — | | | | — | |
End of period | | $ | 48,830,530 | | | $ | 34,375,421 | |
| | | | | | | | | |
UNDISTRIBUTED NET INVESTMENT INCOME | | $ | 9,030 | | | $ | — | |
| | | | | | | | | |
| CAPITAL SHARE ACTIVITY | | | | | | | | |
Shares sold | | | 4,655,581 | | | | 3,357,207 | |
Shares reinvested | | | 10,830 | | | | — | |
Shares redeemed | | | (14,857 | ) | | | (149,512 | ) |
Net increase in shares outstanding | | | 4,651,554 | | | | 3,207,695 | |
Shares outstanding at beginning of period | | | — | | | | — | |
Shares outstanding at end of period | | | 4,651,554 | | | | 3,207,695 | |
| (a) | Represents the period from commencement of operations (December 31, 2010) through March 31, 2011. |
| | |
| See accompanying notes to financial statements. |
DAVENPORT CORE FUND FINANCIAL HIGHLIGHTS |
Selected Per Share Data and Ratios for a Share Outstanding Throughout Each Year | |
| | | | |
| | | | | | | | | | | | | | | |
| Net asset value at beginning of year | | $ | 12.05 | | | $ | 8.36 | | | $ | 13.82 | | | $ | 14.75 | | | $ | 13.99 | |
| | | | | | | | | | | | | | | | | | | | | |
| Income (loss) from investment operations: | | | | | | | | | | | | | | | | | | | | |
Net investment income | | | 0.07 | | | | 0.08 | | | | 0.11 | | | | 0.10 | | | | 0.10 | |
Net realized and unrealized gains
(losses) on investments | | | 1.68 | | | | 3.69 | | | | (5.17 | ) | | | 0.53 | | | | 1.28 | |
| Total from investment operations | | | 1.75 | | | | 3.77 | | | | (5.06 | ) | | | 0.63 | | | | 1.38 | |
| | | | | | | | | | | | | | | | | | | | | |
| Less distributions: | | | | | | | | | | | | | | | | | | | | |
| Dividends from net investment income | | | (0.07 | ) | | | (0.08 | ) | | | (0.11 | ) | | | (0.10 | ) | | | (0.10 | ) |
| Distributions from net realized gains | | | — | | | | — | | | | (0.29 | ) | | | (1.46 | ) | | | (0.52 | ) |
Total distributions | | | (0.07 | ) | | | (0.08 | ) | | | (0.40 | ) | | | (1.56 | ) | | | (0.62 | ) |
| | | | | | | | | | | | | | | | | | | | | |
| Net asset value at end of year | | $ | 13.73 | | | $ | 12.05 | | | $ | 8.36 | | | $ | 13.82 | | | $ | 14.75 | |
| | | | | | | | | | | | | | | | | | | | | |
Total return (a) | | | 14.61% | | | | 45.20% | | | | (36.85% | ) | | | 3.44% | | | | 10.02% | |
| | | | | | | | | | | | | | | | | | | | | |
| Net assets at end of year (000’s) | | $ | 159,894 | | | $ | 132,662 | | | $ | 92,358 | | | $ | 155,799 | | | $ | 151,655 | |
| | | | | | | | | | | | | | | | | | | | | |
| Ratio of expenses to average net assets | | | 0.99% | | | | 1.00% | | | | 1.00% | | | | 0.96% | | | | 0.98% | |
| | | | | | | | | | | | | | | | | | | | | |
Ratio of net investment income
to average net assets | | | 0.58% | | | | 0.75% | | | | 0.98% | | | | 0.60% | | | | 0.67% | |
| | | | | | | | | | | | | | | | | | | | | |
Portfolio turnover rate | | | 34% | | | | 25% | | | | 39% | | | | 37% | | | | 26% | |
| (a) | Total return is a measure of the change in value of an investment in the Fund over the periods covered, which assumes any dividends or capital gains distributions are reinvested in shares of the Fund. Returns shown do not reflect the deduction of taxes a shareholder would pay on Fund distributions or the redemption of Fund shares. |
| See accompanying notes to financial statements. |
DAVENPORT VALUE & INCOME FUND DAVENPORT EQUITY OPPORTUNITIES FUND FINANCIAL HIGHLIGHTS |
Selected Per Share Data and Ratios for a Share Outstanding Throughout the Period Ended March 31, 2011 (a) | |
| | Davenport Value & Income Fund | | | Davenport Equity Opportunities Fund | |
| Net asset value at beginning of period | | $ | 10.00 | | | $ | 10.00 | |
| | | | | | | | | |
| Income (loss) from investment operations: | | | | | | | | |
| Net investment income (loss) | | | 0.04 | | | | (0.01 | ) |
| Net realized and unrealized gains on investments | | | 0.49 | | | | 0.73 | |
| Total from investment operations | | | 0.53 | | | | 0.72 | |
| | | | | | | | | |
| Less distributions: | | | | | | | | |
| Dividends from net investment income | | | (0.03 | ) | | | — | |
| | | | | | | | | |
| Net asset value at end of period | | $ | 10.50 | | | $ | 10.72 | |
| | | | | | | | | |
Total return (b) (c) | | | 5.35% | | | | 7.20% | |
| | | | | | | | | |
| Net assets at end of period (000’s) | | $ | 48,831 | | | $ | 34,375 | |
| | | | | | | | | |
Ratio of total expenses to average net assets (d) | | | 1.25% | | | | 1.25% | |
| | | | | | | | | |
Ratio of net investment income (loss) to average net assets (d) | | | 1.99% | | | | (0.40% | ) |
| | | | | | | | | |
Portfolio turnover rate (c) | | | 10% | | | | 6% | |
| (a) | Represents the period from commencement of operations (December 31, 2010) through March 31, 2011. |
| (b) | Total return is a measure of the change in value of an investment in the Fund over the period covered, which assumes any dividends or capital gains distributions are reinvested in shares of the Fund. Returns shown do not reflect the deduction of taxes a shareholder would pay on Fund distributions or the redemption of Fund shares. |
| See accompanying notes to financial statements. |
THE DAVENPORT FUNDS NOTES TO FINANCIAL STATEMENTS March 31, 2011 |
1. Organization and Significant Accounting Policies
Davenport Core Fund, Davenport Value & Income Fund and Davenport Equity Opportunities Fund (individually, a “Fund,” and, collectively, the “Funds”) are each a no-load, diversified series of the Williamsburg Investment Trust (the “Trust”), an open-end management investment company registered under the Investment Company Act of 1940. The Trust was organized as a Massachusetts business trust on July 18, 1988. Other series of the Trust are not incorporated in this report. Davenport Core Fund began operations on January 15, 1998. Davenport Value & Income Fund and Davenport Equity Opportunities Fund began operations on December 31, 2010.
Davenport Core Fund’s investment objective is long term growth of capital.
Davenport Value & Income Fund’s investment objective is to achieve long term growth while generating current income through dividend payments on portfolio securities.
Davenport Equity Opportunities Fund’s investment objective is long term capital appreciation.
The following is a summary of the Funds’ significant accounting policies:
Securities valuation — The Funds’ portfolio securities are valued as of the close of business of the regular session of the New York Stock Exchange (normally 4:00 p.m., Eastern time). Securities traded on a national stock exchange are valued based upon the closing price on the principal exchange where the security is traded. Securities which are quoted by NASDAQ are valued at the NASDAQ Official Closing Price. Securities which are traded over-the-counter are valued at the last sales price, if available, otherwise, at the last quoted bid price. Fixed income securities will ordinarily be traded in the over-the-counter market and common stocks will ordinarily be traded on a national securities exchange, but may also be traded in the over-the-counter market. Short-term instruments (those with remaining maturities of 60 days or less) may be valued at amortized cost, which approximates market value.
When market quotations are not readily available, securities may be valued on the basis of prices provided by an independent pricing service. The prices provided by the pricing service are determined with consideration given to institutional bid and last sale prices and take into account securities prices, yields, maturities, call features, ratings, institutional trading in similar groups of securities and developments related to specific securities. If a pricing service cannot provide a valuation, securities will be valued in good faith at fair value using methods consistent with those determined by the Board of Trustees and will be classified as Level 2 or 3 within the fair value hierarchy, depending on the inputs used. Such methods of fair valuation may include, but are not limited to: multiple of earnings, multiple of book value, discount from market of a similar freely traded security, purchase price of the security, subsequent private transactions in the security or related securities, or a combination of these and other factors.
Accounting principles generally accepted in the United States (“GAAP”) establish a single authoritative definition of fair value, set out a framework for measuring fair value and require additional disclosures about fair value measurements.
THE DAVENPORT FUNDS NOTES TO FINANCIAL STATEMENTS (Continued) |
Various inputs are used in determining the value of the Funds’ investments. These inputs are summarized in the three broad levels listed below:
• Level 1 – quoted prices in active markets for identical securities
• Level 2 – other significant observable inputs
• Level 3 – significant unobservable inputs
For example, U.S. Government Agency Obligations held by the Funds are classified as Level 2 since values are based on prices provided by an independent pricing service that utilizes various “other significant observable inputs” including bid and ask quotations, prices of similar securities and interest rates, among other factors.
The inputs or methodology used for valuing securities are not necessarily an indication of the risks associated with investing in those securities. The inputs used to measure fair value may fall into different levels of the fair value hierarchy. In such cases, for disclosure purposes, the level in the fair value hierarchy within which the fair value measurement falls in its entirety is determined based on the lowest level input that is significant to the fair value measurement.
The following is a summary of the inputs used to value the Funds’ investments as of March 31, 2011 by security type:
| | | | | | | | | | | | |
Common Stocks | | $ | 152,301,016 | | | $ | — | | | $ | — | | | $ | 152,301,016 | |
U.S. Government Agency Obligations | | | — | | | | 1,399,992 | | | | — | | | | 1,399,992 | |
Money Market Funds | | | 4,995,911 | | | | — | | | | — | | | | 4,995,911 | |
Total | | $ | 157,296,927 | | | $ | 1,399,992 | | | $ | — | | | $ | 158,696,919 | |
Davenport Value & Income Fund | | | | | | | | | | | | |
Common Stocks | | $ | 42,887,345 | | | $ | — | | | $ | — | | | $ | 42,887,345 | |
Closed-End Funds | | | 1,339,613 | | | | — | | | | — | | | | 1,339,613 | |
Money Market Funds | | | 1,089,726 | | | | — | | | | — | | | | 1,089,726 | |
Total | | $ | 45,316,684 | | | $ | — | | | $ | — | | | $ | 45,316,684 | |
Davenport Equity Opportunities Fund | | | | | | | | | | | | |
Common Stocks | | $ | 32,540,170 | | | $ | — | | | $ | — | | | $ | 32,540,170 | |
Money Market Funds | | | 866,058 | | | | — | | | | — | | | | 866,058 | |
Total | | $ | 33,406,228 | | | $ | — | | | $ | — | | | $ | 33,406,228 | |
Refer to each Fund’s Schedules of Investments for a listing of the securities valued using Level 1 inputs by sector type. During the year ended March 31, 2011, the Funds did not have any significant transfers in and out of Level 1 or Level 2. There were no Level 3 securities or derivative instruments held by the Funds during the year ended or as of March 31, 2011.
THE DAVENPORT FUNDS NOTES TO FINANCIAL STATEMENTS (Continued) |
Repurchase agreements — The Funds may enter into repurchase agreements. The repurchase agreement, which is collateralized by U.S. Government obligations, is valued at cost which, together with accrued interest, approximates market. At the time the Funds enter into the repurchase agreement, the Fund takes possession of the underlying securities and the seller agrees that the value of the underlying securities, including accrued interest, will at all times be equal to or exceed the face amount of the repurchase agreement. In addition, the Funds actively monitor and seek additional collateral, as needed. If the seller defaults, the fair value of the collateral may decline and realization of the collateral by the Funds may be delayed or limited.
Share valuation — The net asset value per share of each Fund is calculated daily by dividing the total value of its assets, less liabilities, by the number of shares outstanding. The offering price and redemption price per share of each Fund is equal to the net asset value per share.
Investment income — Interest income is accrued as earned. Dividend income is recorded on the ex-dividend date. Discounts and premiums on fixed-income securities purchased are amortized using the interest method.
Security transactions — Security transactions are accounted for on trade date. Gains and losses on securities sold are determined on a specific identification basis.
Common expenses — Common expenses of the Trust are allocated among the funds within the Trust based on relative net assets of each fund or the nature of the services performed and the relative applicability to each fund.
Distributions to shareholders — Dividends arising from net investment income are declared and paid quarterly to shareholders of Davenport Core Fund and Davenport Value & Income Fund; and declared and paid annually to shareholders of Davenport Equity Opportunities Fund. Net realized short-term capital gains, if any, may be distributed throughout the year and net realized long-term capital gains, if any, are distributed at least once each year. The amount of distributions from net investment income and net realized gains are determined in accordance with federal income tax regulations which may differ from GAAP. Dividends and distributions are recorded on the ex-dividend date. The tax character of distributions paid during the years ended March 31, 2011 and March 31, 2010 by Davenport Core Fund was ordinary income. The tax character of distributions paid during the period ended March 31, 2011 by Davenport Value & Income Fund was ordinary income. There were no distributions paid to shareholders during the period ended March 31, 2011 by Davenport Equity Opportunities Fund.
Estimates — The preparation of financial statements in conformity with GAAP requires management to make estimates and assumptions that affect the reported amounts of assets and liabilities and disclosure of contingent assets and liabilities at the date of the financial statements and the reported amounts of income and expenses during the reporting period. Actual results could differ from those estimates.
THE DAVENPORT FUNDS NOTES TO FINANCIAL STATEMENTS (Continued) |
Federal income tax — It is each Fund’s policy to comply with the special provisions of Subchapter M of the Internal Revenue Code applicable to regulated investment companies. As provided therein, in any fiscal year in which a Fund so qualifies and distributes at least 90% of its taxable net income, the Fund (but not the shareholders) will be relieved of federal income tax on the income distributed. Accordingly, no provision for income taxes has been made.
In order to avoid imposition of the excise tax applicable to regulated investment companies, it is also each Fund’s intention to declare as dividends in each calendar year at least 98% of its net investment income (earned during the calendar year) and 98.2% of its net realized capital gains (earned during the twelve months ended October 31) plus undistributed amounts from prior years.
The following information is computed on a tax basis for each item as of March 31, 2011:
| | | | | Davenport Value & Income Fund | | | Davenport Equity Opportunities Fund | |
Cost of portfolio investments | | $ | 124,162,858 | | | $ | 44,087,244 | | | $ | 32,075,584 | |
Gross unrealized appreciation | | $ | 36,621,266 | | | $ | 1,717,712 | | | $ | 1,704,122 | |
Gross unrealized depreciation | | | (2,087,205 | ) | | | (488,272 | ) | | | (373,478 | ) |
Net unrealized appreciation | | | 34,534,061 | | | | 1,229,440 | | | | 1,330,644 | |
Undistributed ordinary income | | | 21,810 | | | | 80,764 | | | | 162,797 | |
Capital loss carryforward | | | (10,399,037 | ) | | | — | | | | — | |
Total distributable earnings | | $ | 24,156,834 | | | $ | 1,310,204 | | | $ | 1,493,441 | |
The difference between the federal income tax cost and the financial statement cost for Davenport Core Fund is due to certain timing differences in the recognition of capital gains and losses under income tax regulations and GAAP. These timing differences are temporary in nature and are due to the tax deferral of losses on wash sales.
During the year ended March 31, 2011, Davenport Core Fund utilized capital loss carryforwards of $2,805,945 to offset current year net realized gains.
As of March 31, 2011, Davenport Core Fund had a capital loss carryforward of $10,399,037 which expires March 31, 2018. This capital loss carryforward may be utilized in future years to offset net realized capital gains, if any, prior to distributing such gains to shareholders.
For the period ended March 31, 2011, Davenport Equity Opportunities Fund reclassified $21,539 of net investment loss against accumulated net realized gains from security transactions on the Statements of Assets and Liabilities. Such reclassification, the result of permanent differences between the financial statement and income tax reporting requirements, has no effect on the Fund’s net assets or net asset value per share.
THE DAVENPORT FUNDS NOTES TO FINANCIAL STATEMENTS (Continued) |
The Funds recognize the tax benefits or expenses of uncertain tax positions only when the position is “more likely than not” to be sustained assuming examination by tax authorities. Management has reviewed the tax positions taken on Federal income tax returns for all applicable open tax years (tax years ended March 31, 2008 through March 31, 2011) of each Fund and has concluded that no provision for unrecognized tax benefits or expenses is required in these financial statements.
2. Investment Transactions
During the year ended March 31, 2011, the cost of purchases and proceeds from sales and maturities of investment securities, other than short-term investments and U.S. Government securities, totaled $47,100,478 and $44,547,300, respectively, for Davenport Core Fund; $46,317,972 and $3,392,188, respectively, for Davenport Value & Income Fund; and $32,583,719 and $1,558,528, respectively, for Davenport Equity Opportunities Fund.
3. Transactions with Affiliates
INVESTMENT ADVISORY AGREEMENT
Each Fund’s investments are managed by Davenport & Company LLC (the “Adviser”) under the terms of an Investment Advisory Agreement. Under the Investment Advisory Agreement, each Fund pays the Adviser a fee, which is computed and accrued daily and paid monthly, at an annual rate of .75% on its average daily net assets.
Certain officers of the Trust are also officers of the Adviser.
MUTUAL FUND SERVICES AGREEMENT
Under the terms of a Mutual Fund Services Agreement between the Trust and Ultimus Fund Solutions, LLC (“Ultimus”), Ultimus provides administrative, pricing, accounting, dividend disbursing, shareholder servicing and transfer agent services for the Funds. For these services, Ultimus receives a monthly fee from each Fund at an annual rate of .15% on its average daily net assets up to $25 million, .125% on the next $25 million of such assets and .10% on such assets in excess of $50 million, subject to a minimum monthly fee of $4,000, plus a shareholder recordkeeping fee at the annual rate of $10 per shareholder account in excess of 1,000 accounts. In addition, the Funds pay out-of-pocket expenses including, but not limited to, postage, supplies and costs of pricing the Funds’ portfolio securities.
Certain officers of the Trust are also officers of Ultimus, or of Ultimus Fund Distributors, LLC (the “Distributor”), the principal underwriter of the Funds’ shares and an affiliate of Ultimus. The Distributor receives no compensation from the Funds for acting as principal underwriter.
COMPLIANCE CONSULTING AGREEMENT
Under the terms of a Compliance Consulting Agreement between the Trust and Ultimus, Ultimus provides an individual to serve as the Trust’s Chief Compliance Officer and to administer the Trust’s compliance policies and procedures. For these services, the Funds pay Ultimus an annual base fee of $18,600 plus an asset-based fee equal to 0.01% per annum on the Funds’ average net assets in excess of $100 million. In addition, the Funds reimburse Ultimus for any reasonable out-of-pocket expenses, if any, incurred in providing these services.
THE DAVENPORT FUNDS NOTES TO FINANCIAL STATEMENTS (Continued) |
4. Contingencies and Commitments
The Funds indemnify the Trust’s officers and Trustees for certain liabilities that might arise from their performance of their duties to the Funds. Additionally, in the normal course of business the Funds enter into contracts that contain a variety of representations and warranties and which provide general indemnifications. The Funds’ maximum exposure under these arrangements is unknown, as this would involve future claims that may be made against the Funds that have not yet occurred. However, based on experience, the Funds expect the risk of loss to be remote.
5. Subsequent Events
The Funds are required to recognize in the financial statements the effects of all subsequent events that provide additional evidence about conditions that existed as of the date of the Statements of Assets and Liabilities. For non-recognized subsequent events that must be disclosed to keep the financial statements from being misleading, the Funds are required to disclose the nature of the event as well as an estimate of its financial effect, or a statement that such an estimate cannot be made. Management has evaluated subsequent events through the issuance of these financial statements and has noted no such events.
THE DAVENPORT FUNDS REPORT OF INDEPENDENT REGISTERED PUBLIC ACCOUNTING FIRM |
The Board of Trustees and Shareholders of
The Davenport Core Fund,
The Davenport Value & Income Fund, and
The Davenport Equity Opportunities Fund of the Williamsburg Investment Trust
We have audited the accompanying statements of assets and liabilities, including the schedules of investments, of The Davenport Funds, comprised of The Davenport Core Fund, The Davenport Value & Income Fund and The Davenport Equity Opportunities Fund (the “Funds”) (each a series of the Williamsburg Investment Trust) as of March 31, 2011, and the related statements of operations for the year or period then ended, and the statements of changes in net assets and the financial highlights for each of the years or periods indicated therein. These financial statements and financial highlights are the responsibility of the Funds’ management. Our responsibility is to express an opinion on these financial statements and financial highlights based on our audits.
We conducted our audits in accordance with the standards of the Public Company Accounting Oversight Board (United States). Those standards require that we plan and perform the audits to obtain reasonable assurance about whether the financial statements and financial highlights are free of material misstatement. We were not engaged to perform an audit of the Funds’ internal control over financial reporting. Our audits included consideration of internal control over financial reporting as a basis for designing audit procedures that are appropriate in the circumstances, but not for the purpose of expressing an opinion on the effectiveness of the Funds’ internal control over financial reporting. Accordingly, we express no such opinion. An audit also includes examining, on a test basis, evidence supporting the amounts and disclosures in the financial statements and financial highlights, assessing the accounting principles used and significant estimates made by management, and evaluating the overall financial statement presentation. Our procedures included confirmation of securities owned as of March 31, 2011, by correspondence with the custodian. We believe that our audits provide a reasonable basis for our opinion.
In our opinion, the financial statements and financial highlights referred to above present fairly, in all material respects, the financial position of each of the respective Funds comprising The Davenport Funds at March 31, 2011, the results of its operations for the year or period then ended, and the changes in their net assets and the financial highlights for each of the years or periods in the period then ended indicated above, in conformity with U.S. generally accepted accounting principles.
Cincinnati, Ohio
May 20, 2011
THE DAVENPORT FUNDS BOARD OF TRUSTEES AND EXECUTIVE OFFICERS (Unaudited) |
Overall responsibility for management of the Funds rests with the Board of Trustees. The Trustees serve during the lifetime of the Trust and until its termination, or until death, resignation, retirement or removal. The Trustees, in turn, elect the officers of the Funds. The officers have been elected for an annual term. The following are the Trustees and executive officers of the Funds:
| | Trustee | Address | Age | Position Held with the Trust | Length of Time Served |
| * | Charles M. Caravati, Jr. | 931 Broad Street Road Manakin-Sabot, VA | 74 | Chairman and Trustee | Since June 1991 |
| * | Austin Brockenbrough III | 1802 Bayberry Court, Suite 400 Richmond, VA | 74 | Trustee | Since September 1988 |
| * | John T. Bruce | 800 Main Street Lynchburg, VA | 57 | Trustee | Since September 1988 |
| | Robert S. Harris | 100 Darden Boulevard Charlottesville, VA | 61 | Trustee | Since January 2007 |
| | J. Finley Lee, Jr. | 448 Pond Apple Drive North Naples, FL | 71 | Trustee | Since September 1988 |
| | Richard L. Morrill | University of Richmond Richmond, VA | 71 | Trustee | Since March 1993 |
| | Harris V. Morrissette | 100 Jacintoport Boulevard Saraland, AL | 51 | Trustee | Since March 1993 |
| | Samuel B. Witt III | 302 Clovelly Road Richmond, VA | 75 | Trustee | Since November 1988 |
| | John P. Ackerly IV | One James Center 901 E. Cary Street Richmond, VA | 47 | President | Since November 1997 |
| | I. Lee Chapman, IV | One James Center 901 E. Cary Street Richmond, VA | 40 | Vice President | Since November 2010 |
| | George L. Smith, III | One James Center 901 E. Cary Street Richmond, VA | 35 | Vice President | Since February 2011 |
| | Robert G. Dorsey | 225 Pictoria Drive, Suite 450 Cincinnati, OH | 54 | Vice President | Since November 2000 |
| | Mark J. Seger | 225 Pictoria Drive, Suite 450 Cincinnati, OH | 49 | Treasurer | Since November 2000 |
| | Tina H. Bloom | 225 Pictoria Drive, Suite 450 Cincinnati, OH | 42 | Secretary and Chief Compliance Officer | Since August 2006 |
| * | Messrs. Bruce and Brockenbrough, as affiliated persons of investment advisers to the Trust, are “interested persons” of the Trust within the meaning of Section 2(a)(19) of the Investment Company Act of 1940. Charles M. Caravati, Jr. is the father of Charles M. Caravati III, an officer of The Jamestown Funds, which are other portfolios of the Trust. |
THE DAVENPORT FUNDS BOARD OF TRUSTEES AND EXECUTIVE OFFICERS (Unaudited) (Continued) |
Each Trustee oversees eleven portfolios of the Trust, including the Funds. The principal occupations of the Trustees and executive officers of the Funds during the past five years and public directorships held by the Trustees are set forth below:
Charles M. Caravati, Jr. is a retired physician. He is also the retired President of Dermatology Associates of Virginia, P.C.
Austin Brockenbrough III is President and Managing Director of Lowe, Brockenbrough & Company, Inc. (an investment advisory firm). He is a member of the Board of Directors of Tredegar Corporation (a plastics manufacturer) and Wilkinson O’Grady & Co., Inc. (a global asset manager).
John T. Bruce is a President, Director and member of the Executive Committee of Flippin, Bruce & Porter, Inc. (an investment advisory firm).
Robert S. Harris is the C. Stewart Sheppard Professor of Business Administration at The Darden Graduate School of Business Administration at the University of Virginia. He was previously the dean at Darden. Professor Harris has published widely on corporate finance, financial markets and mergers and acquisitions and has served as a consultant to corporations and government agencies.
J. Finley Lee, Jr. is the retired Julian Price Professor Emeritus at the University of North Carolina.
Richard L. Morrill serves as President of the Teagle Foundation (charitable foundation) and Chancellor of the University of Richmond. He is also a member of the Board of Directors of Tredegar Corporation and Albemarle Corporation (specialty chemical manufacturer).
Harris V. Morrissette is President of China Doll Rice and Beans Inc. and Dixie Lily Foods. He is a member of the Board of Directors of BancTrust Financial Group, Inc. (a bank holding company) and International Shipholding Corporation (cargo transportation). In addition, he is Chairman of Azalea Aviation, Inc. (an airplane fueling company).
Samuel B. Witt III is the retired Senior Vice President and General Counsel of Stateside Associates, Inc. He is also a member of the Board of Directors of The Swiss Helvetia Fund, Inc. (a closed-end investment company).
John P. Ackerly IV is Senior Vice President and Portfolio Manager of the Adviser.
I. Lee Chapman, IV is Senior Vice President and Portfolio Manager of the Adviser.
George L. Smith, III is Senior Vice President and Portfolio Manager of the Adviser.
Robert G. Dorsey is a Managing Director of Ultimus Fund Solutions, LLC and Ultimus Fund Distributors, LLC.
Mark J. Seger is a Managing Director of Ultimus Fund Solutions, LLC and Ultimus Fund Distributors, LLC.
Tina H. Bloom is Director of Fund Administration of Ultimus Fund Solutions, LLC.
Additional information about members of the Board of Trustees and executive officers is available in the Statement of Additional Information (“SAI”). To obtain a free copy of the SAI, please call 1-800-281-3217.
THE DAVENPORT FUNDS YOUR FUND’S EXPENSES (Unaudited) |
We believe it is important for you to understand the impact of costs on your investment. All mutual funds have operating expenses. As a shareholder of the Funds, you incur ongoing costs, including management fees and other expenses. These ongoing costs, which are deducted from each Fund’s gross income, directly reduce the investment return of the Funds.
A mutual fund’s ongoing costs are expressed as a percentage of its average net assets. This figure is known as the expense ratio. The following examples are intended to help you understand the ongoing costs (in dollars) of investing in the Funds and to compare these costs with the ongoing costs of investing in other mutual funds. The examples below are based on an investment of $1,000 made at the beginning of the most recent semi-annual period (October 1, 2010 for Davenport Core Fund and December 31, 2010 for Davenport Value & Income Fund and Davenport Equity Opportunities Fund) and held until the end of the period (March 31, 2011).
The table below illustrates each Fund’s ongoing costs in two ways:
Actual fund return – This section helps you to estimate the actual expenses that you paid over the period. The “Ending Account Value” shown is derived from each Fund’s actual return, and the third column shows the dollar amount of operating expenses that would have been paid by an investor who started with $1,000 in the Funds. You may use the information here, together with the amount you invested, to estimate the expenses that you paid over the period.
To do so, simply divide your account value by $1,000 (for example, an $8,600 account value divided by $1,000 = 8.6), then multiply the result by the number given for the Funds under the heading “Expenses Paid During Period.”
Hypothetical 5% return – This section is intended to help you compare each Fund’s ongoing costs with those of other mutual funds. It assumes that each Fund had an annual return of 5% before expenses during the period shown, but that the expense ratio is unchanged. In this case, because the return used is not each Fund’s actual return, the results do not apply to your investment. The example is useful in making comparisons because the Securities and Exchange Commission (“SEC”) requires all mutual funds to calculate expenses based on a 5% return. You can assess each Fund’s ongoing costs by comparing this hypothetical example with the hypothetical examples that appear in shareholder reports of other funds.
Note that expenses shown in the table are meant to highlight and help you compare ongoing costs only. The Funds do not charge transaction fees, such as purchase or redemption fees, nor do they carry a “sales load.”
The calculations assume no shares were bought or sold during the period. Your actual costs may have been higher or lower, depending on the amount of your investment and the timing of any purchases or redemptions.
More information about each Fund’s expenses, including historical annual expense ratios, can be found in this report. For additional information on operating expenses and other shareholder costs, please refer to the Funds’ prospectus.
THE DAVENPORT FUNDS YOUR FUND’S EXPENSES (Unaudited) (Continued) |
| Beginning Account Value October 1, 2010 | Ending Account Value March 31, 2011 | Expenses Paid During Period* |
Based on Actual Fund Return | $1,000.00 | $1,156.10 | $5.32 |
| Based on Hypothetical 5% Return (before expenses) | $1,000.00 | $1,020.00 | $4.99 |
| * | Expenses are equal to the Fund’s annualized expense ratio of 0.99% for the period, multiplied by the average account value over the period, multiplied by 182/365 (to reflect the one-half year period). |
Davenport Value & Income Fund | Beginning Account Value December 31, 2010 | Ending Account Value March 31, 2011 | Expenses Paid During Period* |
Based on Actual Fund Return | $1,000.00 | $1,053.50 | $3.20 |
| * | Expenses are equal to the Fund’s annualized expense ratio of 1.25% for the period, multiplied by the average account value over the period, multiplied by 91/365 (to reflect the period since inception). |
Davenport Value & Income Fund | Beginning Account Value October 1, 2010 | Ending Account Value March 31, 2011 | Expenses Paid During Period* |
| Based on Hypothetical 5% Return (before expenses) | $1,000.00 | $1,018.70 | $6.29 |
| * | Expenses are equal to the Fund’s annualized expense ratio of 1.25% for the period, multiplied by the average account value over the period, multiplied by 182/365 (to reflect the one-half year period). |
Davenport Equity Opportunities Fund | Beginning Account Value December 31, 2010 | Ending Account Value March 31, 2011 | Expenses Paid During Period* |
Based on Actual Fund Return | $1,000.00 | $1,072.00 | $3.23 |
| * | Expenses are equal to the Fund’s annualized expense ratio of 1.25% for the period, multiplied by the average account value over the period, multiplied by 91/365 (to reflect the period since inception). |
Davenport Equity Opportunities Fund | Beginning Account Value October 1, 2010 | Ending Account Value March 31, 2011 | Expenses Paid During Period* |
| Based on Hypothetical 5% Return (before expenses) | $1,000.00 | $1,018.70 | $6.29 |
| * | Expenses are equal to the Fund’s annualized expense ratio of 1.25% for the period, multiplied by the average account value over the period, multiplied by 182/365 (to reflect the one-half year period). |
THE DAVENPORT FUNDS OTHER INFORMATION (Unaudited) |
A description of the policies and procedures that the Funds use to vote proxies relating to portfolio securities is available without charge upon request by calling toll-free 1-800-281-3217, or on the SEC’s website at http://www.sec.gov. Information regarding how the Funds voted proxies relating to portfolio securities during the most recent 12-month period ended June 30 is also available without charge upon request by calling toll-free 1-800-281-3217, or on the SEC’s website at http://www.sec.gov.
The Trust files a complete listing of portfolio holdings for the Funds with the SEC as of the first and third quarters of each fiscal year on Form N-Q. These filings are available upon request by calling 1-800-281-3217. Furthermore, you may obtain a copy of these filings on the SEC’s website at http://www.sec.gov. The Trust’s Forms N-Q may also be reviewed and copied at the SEC’s Public Reference Room in Washington, DC, and information on the operation of the Public Reference Room may be obtained by calling 1-800-SEC-0330.
A complete listing of portfolio holdings for the Funds is updated daily and can be reviewed at the Funds’ website at http://www.investdavenport.com.
FEDERAL TAX INFORMATION (Unaudited)
For the fiscal year ended March 31, 2011, certain dividends paid by the Funds may be subject to a maximum tax rate of 15%, as provided by the Jobs and Growth Tax Relief Reconciliation Act of 2003. Davenport Core Fund intends to designate up to a maximum amount of $780,857 as taxed at a maximum rate of 15%. Davenport Value & Income Fund intends to designate up to a maximum amount of $131,842 as taxed at a maximum rate of 15%. For the fiscal year ended March 31, 2011, 100% of the dividends paid from ordinary income by the Funds qualified for the dividends received deduction for corporations. Complete information will be computed and reported in conjunction with your 2011 Form 1099-DIV.
THE DAVENPORT FUNDS DISCLOSURE REGARDING APPROVAL OF INVESTMENT ADVISORY AGREEMENTS (Unaudited) |
Davenport Core Fund
At an in-person meeting held on February 8, 2011, the Board of Trustees, including a majority of the Independent Trustees, approved the continuance for a one-year period of the Investment Advisory Agreement with the Adviser on behalf of Davenport Core Fund (the “Core Fund”). Below is a discussion of the factors considered by the Board of Trustees along with the conclusions with respect thereto that formed the basis for the Board’s approval.
In selecting the Adviser and approving the continuance of the Investment Advisory Agreement, the Trustees considered all information they deemed reasonably necessary to evaluate the terms of the Agreement. The principal areas of review by the Trustees were the nature, extent and quality of the services provided by the Adviser and the reasonableness of the fees charged for those services. These matters were considered by the Independent Trustees consulting with experienced counsel for the Independent Trustees, who is independent of the Adviser.
The Trustees’ evaluation of the quality of the Adviser’s services took into account their knowledge and experience gained through meetings with and reports of the Adviser’s senior management over the course of the preceding year. Both short-term and long-term investment performance of the Fund was considered. The Core Fund’s performance was compared to its performance benchmark and to that of competitive funds with similar investment objectives and to the Adviser’s comparably managed private accounts. The Trustees also considered the scope and quality of the in-house capabilities of the Adviser and other resources dedicated to performing services for the Core Fund. The quality of administrative and other services, including the Adviser’s role in coordinating the activities of the Core Fund’s other service providers, were considered in light of the Fund’s compliance with investment policies and applicable laws and regulations and of related reports by management and the Fund’s independent public accounting firm in periodic meetings with the Trust’s Audit Committee. The Trustees also considered the business reputation of the Adviser, the qualifications of its key investment and compliance personnel, and its financial resources.
In reviewing the fees payable under the Investment Advisory Agreement, the Trustees compared the advisory fees and overall expense levels of the Core Fund with those of competitive funds with similar investment objectives as well as the private accounts managed by the Adviser. The Trustees considered information provided by the Adviser concerning the Adviser’s profitability with respect to the Core Fund, including the assumptions and methodology used in preparing the profitability information, in light of applicable case law relating to advisory fees. For these purposes, the Trustees took into account not only the fees paid by the Core Fund, but also so-called “fallout” benefits to the Adviser. The Trustees also considered the fact that all of the Core Fund’s portfolio trades were executed by the Adviser at no cost to the Fund. In evaluating the Core Fund’s advisory fees, the Trustees took into account the complexity and quality of the investment management of the Fund.
THE DAVENPORT FUNDS DISCLOSURE REGARDING APPROVAL OF INVESTMENT ADVISORY AGREEMENTS (Unaudited) (Continued) |
Based upon their review of this information, the Independent Trustees concluded that: (i) based on the performance of the Core Fund, which exceeded the returns of its primary benchmark (the S&P 500 Index) and the Lipper average for comparably managed funds for the one year, three year, five year and ten year periods ended December 31, 2010, and the other services provided to shareholders, the Adviser has provided quality services to the Fund; (ii) although the advisory fees payable to the Adviser are in the higher range of fees for other comparably managed funds, the Independent Trustees believe the fees to be reasonable given the scope and quality of services provided by the Adviser and the resources that are dedicated to its investment process; (iii) the total operating expense ratio of the Core Fund is lower than the average expense ratio for comparably managed funds, according to statistics derived from Morningstar, Inc., and (iv) the Adviser has further benefited the Fund’s shareholders by executing portfolio transactions at no cost to the Fund.
Given the current size of the Core Fund and its expected growth, the Independent Trustees did not believe that at the present time it would be relevant to consider the extent to which economies of scale would be realized as the Fund grows, and whether fee levels reflect these economies of scale. The Independent Trustees also considered the “fallout” benefits to, and the profitability of, the Adviser with respect to the Core Fund, but given the amounts involved viewed these as secondary factors in connection with the evaluation of the reasonableness of the advisory fees paid by the Fund.
No single factor was considered in isolation or to be determinative to the decision of the Trustees to approve continuance of the Investment Advisory Agreement. Rather the Trustees concluded, in light of a weighing and balancing of all factors considered, that it was in the best interests of the Core Fund and its shareholders to continue the Investment Advisory Agreement without modification to its terms, including the fees charged for services thereunder.
Davenport Value & Income Fund and Davenport Equity Opportunities Fund
The Board of Trustees, including the Independent Trustees voting separately, reviewed and approved Investment Advisory Agreements with the Adviser on behalf of Davenport Value & Income Fund (the “Value & Income Fund”) and Davenport Equity Opportunities Fund (the “Equity Opportunities Fund” and, together with the Value & Income Fund, the “New Davenport Funds”) at an in-person meeting held on November 22, 2010. The Trustees were advised by independent counsel of their fiduciary obligations in approving the Investment Advisory Agreements and the Trustees requested such information from the Adviser as they deemed reasonably necessary to evaluate the terms of the Investment Advisory Agreements and whether the Agreements are in the best interests of the New Davenport Funds.
The Trustees considered the investment objective of the Value & Income Fund and were informed by the Adviser that the Value & Income Fund will be modeled after the “Value & Income” strategy that has been used by the Adviser to manage separate accounts since December 31, 2001. The Trustees reviewed reports describing the portfolio strategies, current portfolio holdings,
THE DAVENPORT FUNDS DISCLOSURE REGARDING APPROVAL OF INVESTMENT ADVISORY AGREEMENTS (Unaudited) (Continued) |
current sector weightings, and risk characteristics of the Adviser’s Value & Income composite. They also reviewed the historical returns of the Value & Income composite for various periods ended September 30, 2010 and compared those returns to relevant indices. The Trustees noted that the Value & Income composite has performed well relative to both the S&P 500 Index and the Lipper Equity Income Fund Index. They took into account that the Value & Income Fund will be managed by the Adviser’s Investment Policy Committee, which is also responsible for managing the Core Fund.
The Trustees then reviewed the investment objective and principal investment strategies of the Equity Opportunities Fund. The Adviser informed the Trustees that the Equity Opportunities Fund will be managed according to the Adviser’s “Mid Cap” strategy, which attempts to identify small to medium-sized companies that have the potential for above average, long-term returns. The Trustees considered the security selection process for the Equity Opportunities Fund and noted that the Fund will not be limited to a particular investment style (i.e., “growth” or “value”), nor will it typically be as widely diversified as the Core Fund or the Value & Income Fund. The Trustees reviewed reports showing the current sector weightings and portfolio holdings for the Adviser’s “Mid-Cap” investment strategy. They also reviewed the historical performance of the Adviser’s Mid Cap composite as compared to relevant indices and the Mid Cap composite’s historical volatility as measured by several statistics. The Trustees reviewed the background, education and experience of Messrs. George L. Smith, III and I. Lee Chapman, IV, who will manage the Equity Opportunities Fund on a day-to-day basis, subject to the oversight of the Adviser’s Investment Policy Committee.
The Trustees were provided with copies of the proposed Investment Advisory Agreements for the New Davenport Funds and reviewed the services provided by the Adviser and the responsibilities of the Adviser under such Agreements. The Adviser proposed that the advisory fee for each of the New Davenport Funds be 0.75% per annum of its average daily net assets, and the Trustees noted that this is the same advisory fee rate paid by the Core Fund.
The Trustees evaluated and discussed the background, duties and responsibilities of the members of the Adviser’s Investment Policy Committee and other personnel who will perform services for the New Davenport Funds; the financial condition of the Adviser as of August 31, 2010 and its insurance coverage; the Adviser’s projected profitability from the Investment Advisory Agreements; the proposed advisory fees for each of the New Davenport Funds as compared to similarly managed mutual funds and the Adviser’s comparably managed separate accounts; the New Davenport Funds’ projected expense ratios as compared to similarly managed mutual funds; the Adviser’s plans for marketing and distributing shares of the New Davenport Funds; and the indirect benefits that the Adviser expects to receive as a result of the Investment Advisory Agreements. The Adviser represented that it has no revenue sharing arrangements with financial intermediaries, as the New Davenport Funds will be sold exclusively through registered representatives of the Adviser. The Trustees discussed the nature, extent and quality of the services to be provided by the Adviser and noted that they are familiar with the Adviser’s qualifications
THE DAVENPORT FUNDS DISCLOSURE REGARDING APPROVAL OF INVESTMENT ADVISORY AGREEMENTS (Unaudited) (Continued) |
and responsibilities as a mutual fund investment manager and that the Adviser has established a history of care and consistency in its investment approach. The Trustees were mindful that the investment processes that will be used by the Adviser in managing each of the New Davenport Funds are similar to those used to manage certain of the Adviser’s separately managed accounts. They indicated that, having reviewed detailed information about the performance results and investment processes for such separately managed accounts, they are satisfied with the Adviser’s investment approach and performance results. The Board concluded that it was satisfied with the nature, extent and quality of the investment advisory services that will be provided by the Adviser to each of the New Davenport Funds.
After considering the comparative information regarding advisory fees and expense ratios for the Morningstar universe of Large Cap Value funds (with respect to the Value & Income Fund) and Mid Cap Blend funds (with respect to the Equity Opportunities Fund), it was the consensus of the Trustees that the proposed investment advisory fees and projected total expense ratios for the New Davenport Funds are reasonable as compared to the average fees and expense ratios of similarly situated funds. The Board concluded that the proposed advisory fee for each of the New Davenport Funds is reasonable in relation to the nature of the investment programs and the level of services to be provided by the Adviser.
No single factor was considered in isolation or to be determinative to the decision of the Trustees to approve the Investment Advisory Agreements. Rather, the Trustees concluded, in light of a weighing and balancing of all factors considered, that approval of the Investment Advisory Agreements would be in the best interests of the Value & Income Fund and the Equity Opportunities Fund.
This page intentionally left blank.
This page intentionally left blank.
| | THE DAVENPORT FUNDS Investment Adviser Davenport & Company LLC One James Center 901 East Cary Street Richmond, Virginia 23219-4037 Administrator Ultimus Fund Solutions, LLC P.O. Box 46707 Cincinnati, Ohio 45246-0707 1-800-281-3217 Custodian US Bank NA 425 Walnut Street Cincinnati, Ohio 45202 Independent Registered Public Accounting Firm Ernst & Young LLP 1900 Scripps Center 312 Walnut Street Cincinnati, Ohio 45202 Legal Counsel Sullivan & Worcester LLP One Post Office Square Boston, Massachusetts 02109 Board of Trustees Austin Brockenbrough III John T. Bruce Charles M. Caravati, Jr. Robert S. Harris J. Finley Lee, Jr. Richard L. Morrill Harris V. Morrissette Samuel B. Witt III Officers John P. Ackerly IV, President I. Lee Chapman IV, Vice President George L. Smith, III, Vice President |
Davenport & Company LLC
One James Center
901 East Cary Street
Richmond, VA 23219
Member: NYSE • SIPC
Toll Free: (800) 846-6666
www.investdavenport.com
| | | | | | |
| | | | | | | |
| | | | | | | |
| | | |
Annual Report March 31, 2011
No-Load Funds | | | |
| | | | | | | |
| | | | | | | |
| | | | | | |
We are pleased to report on your Funds and their investments for the annual period ended March 31, 2011.
The investment climate continued to be hospitable this past year, just as history would have predicted for the second year of a market recovery. The S&P 500 Index’s return of 15.65% for the fiscal year ended March 31st reflected improving earnings and the expectation that the economic recovery from the lows of 2008 would continue. Fixed income markets also performed well, as indicated by the 5.24% return of the Barclays Government Credit Index.
Surely one would not have expected such positive equity returns by merely reading and listening to the news on a macro level. Last spring’s European debt crisis created heightened fears and generated a correction in the market from April through mid-August. We have witnessed higher prices for food, oil and many other commodities. Unrest in the Middle East surfaced in several countries, toppling governments and causing uncertainty. The devastating earthquake and tsunami in Japan this past March created supply disruptions and fears of an economic pause. And on top of these potential negative events, the U.S. is dealing with budget problems on the national, state and local levels.
The markets, however, have powered through these unfortunate scenarios for several reasons. The Federal Reserve has continued to support the recovery with stimulative policies, the most recent being a quantitative easing program announced last August. While the housing market is still depressed, consumers have gradually improved their collective balance sheets and have been able to help the economy through increased retail and auto sales. More importantly, in our opinion, is the operating performance of the individual companies that comprise the “market.” In general, companies restructured operations during the downturn in the global recession and came out much stronger. As the economy has begun to recover, companies have executed by generating improving earnings and generating excess cash. As investors, we are seeing increasing confidence by managements, increased dividends and a return of capital to shareholders through share repurchases.
The FBP Value Fund and the FBP Balanced Fund returned 7.40% and 7.35%, respectively, over the annual period ended March 31, 2011. While performing quite well on a relative basis since the March 2008 lows, the Funds’ past year returns were modest compared to the S&P 500 Index (the “Index”). In general, smaller and more cyclical companies did very well over the last year while larger and more established companies tended to lag. More specifically the Funds’ holdings in the Information Technology sector were the major detractor. Nice gains in IBM (+27.2%) and Western Union (+22.5%) were not enough to offset losses in Hewlett Packard (-22.9%), Cisco (-34.1%) and Computer Sciences (-10.6%). Not owning Apple Computer nor some of the smaller technology stocks in the Index, none of which would meet our value discipline, also contributed to the Funds’ lagging the Index. Additionally, SUPERVALU (-44.5%) was a disappointing performer. The grocery retailer and food distributor is currently working its way through a restructuring designed to reverse sales and market share declines. We believe the outlook for the company should improve as their restructuring plans gain traction. Also the industry should benefit from food inflation in the period ahead. The top contributor to positive returns was the Energy sector, where Chevron (+41.8%), Devon Energy (+ 42.4%) and Pioneer Natural Resources (+ 36.8%) benefited from much higher oil prices. We believe the commodity advanced due to increased global demand, investor speculation and fears over unrest in the Middle East.
Recent changes to the Funds include increasing our holdings in Cisco as the stock weakened following a disappointing earnings report. The company generates significant free cash flow and has leading market share in many of its product categories. We believe it offers excellent return potential in the coming years. We reduced weightings in several stocks, Walgreen and Home Depot for example, as they approached our target prices. We also eliminated Amgen from the portfolio as we believed the market was overly optimistic about revenue expectations from denosumab, its most promising new drug compound. Three new stocks were identified for purchase: Philips Electronics, Whirlpool and CVS Caremark. Philips is a global leader in electronics, health care and lighting. We believe management has a very appealing strategic plan that will produce strong growth in the value of the business over the next several years. The company is focusing in emerging markets, where it expects to generate 40% of its revenues in the next four years, and alternatively, it intends to reduce the commitment of resources it devotes to the very competitive and mature consumer television product line. Our research indicated that Whirlpool and CVS Caremark were also trading at a significant discount to their values. We are excited about the return opportunities these new stocks bring to the Funds’ portfolios.
The bond portion of the Balanced Fund continues to be invested defensively. We have been positioned in investment grade corporate bonds with short-to-intermediate maturities. As the economy continues to improve and in particular once the Federal Reserve ceases its bond purchase program, the potential for interest rates to rise is quite likely. This would offer an unattractive return profile for bonds, whose prices move inversely to interest rates. Our strategy is to continue to maintain short maturities to protect principal value. With government yields low, our focus will continue on opportunities in investment-grade corporate bonds through which we can generate higher income for the Balanced Fund.
In our opinion the market strength experienced over the past eight months is a reflection of increased investor confidence surrounding the condition of the economy. Fourth quarter 2010 GDP growth was 3.1%, the sixth consecutive quarter of expanding economic conditions. The six quarters prior to that were all negative or near negative for GDP. We acknowledge that the Japanese disaster coupled with Middle East geopolitical issues will likely have a dampening effect on worldwide growth. In spite of these disruptions, we believe the global economic expansion is moving forward. Longer term, the economy faces headwinds from continuing high levels of unemployment. Furthermore, deficit reduction has become a political priority, so a reduction of fiscal stimulus going forward is virtually certain.
Looking back into 2008 and early 2009, shareholders who stayed the course and patiently awaited a recovery have been well rewarded. Our view has been that in an expanding U.S. and global economy, equity investments would provide the best returns and fixed income investments would be challenged. After the first calendar quarter of 2011, which saw good equity performance and bond market returns near zero, we remain confident in our outlook. Corrections in the equity market are always possible and after two years of appreciation from the March 2009 lows, it would not be surprising to see the market pause. However, global growth is the engine that will power markets for years to come. We want to be part of that growth by investing on a company by company basis, seeking companies at a price discount to our estimated values and where the company is generating excess cash and rewarding shareholders by growing earnings, increasing dividends and/or repurchasing shares.
Please visit our website at www.fbpfunds.com for information on your Funds and the investment philosophy and process we utilize to achieve their investment objectives.
John T. Bruce, CFA
President - Portfolio Manager
May 4, 2011
Data presented reflects past performance, which is no guarantee of future results. Investment results and principal value will fluctuate so that shares, when redeemed, may be worth more or less than their original cost. Due to market volatility, current performance may be higher or lower than the performance shown. Updated performance information, current through the most recent month-end, is available by contacting the Funds at 1-866-738-1127.
This report is submitted for the general information of the shareholders of the Funds. It reflects our views, opinions and portfolio holdings as of March 31, 2011, the end of the reporting period. These views are subject to change at any time based upon market or other conditions. For more current information throughout the year please visit www.fbpfunds.com or call the Funds at 1-866-738-1127. This report is not authorized for distribution to prospective investors in the Funds unless accompanied by a current prospectus. Distributed by Ultimus Fund Distributors, LLC
THE FLIPPIN, BRUCE & PORTER FUNDS COMPARATIVE PERFORMANCE CHARTS (Unaudited) |
Performance for each Fund is compared to the most appropriate broad-based index, the S&P 500 Index, an unmanaged index of 500 large common stocks. Over time, this index has the potential to outpace FBP Balanced Fund, which normally maintains at least 25% of its net assets in fixed income securities. Balanced funds have the growth potential to outpace inflation, but they will typically lag a 100% stock index over the long term because of the fixed income portion of their portfolios. However, the advantage of the fixed income portion is that it can make the return and principal of a balanced fund more stable than a portfolio completely invested in stocks. Results are also compared to the Consumer Price Index, a measure of inflation.
THE FLIPPIN, BRUCE & PORTER FUNDS COMPARATIVE PERFORMANCE CHARTS (Unaudited) (Continued) |
Average Annual Total Returns(a) (for periods ended March 31, 2011) |
| | 1 Year | 5 Years | 10 Years |
| FBP Value Fund | 7.40% | (1.01%) | 2.73% |
| FBP Balanced Fund | 7.35% | 1.74% | 3.95% |
| Standard & Poor’s 500 Index | 15.65% | 2.62% | 3.29% |
| Consumer Price Index | 2.10% | 2.17% | 2.41% |
| (a) | Total returns are a measure of the change in value of an investment in the Funds over the periods covered, which assumes any dividends or capital gains distributions are reinvested in shares of the Funds. Returns do not reflect the deduction of taxes a shareholder would pay on the Funds’ distributions or the redemption of Fund shares. |
FBP VALUE FUND PORTFOLIO INFORMATION March 31, 2011 (Unaudited) |
| General Information | | | Asset Allocation (% of Net Assets) |
| Net Asset Value Per Share | $20.70 | |
| Total Net Assets (Millions) | $27.4 |
| Current Expense Ratio | 1.07% |
| Portfolio Turnover | 25% |
| Fund Inception Date | 7/30/1993 |
| | | |
| Stock Characteristics | FBP Value Fund | S&P 500 Index |
| Number of Stocks | 47 | 500 |
| Weighted Avg Market apitalization (Billions) | $66.0 | $91.5 |
| Price-to-Earnings Ratio (IBES 1 Yr. Forecast EPS) | 12.3 | 13.2 |
Price-to-Book Value | 1.8 | 2.4 |
| Sector Diversification vs. the S&P 500 Index |
| Ten Largest Equity Holdings | % of Net Assets |
| JPMorgan Chase & Company | 5.0% |
| Devon Energy Corporation | 4.0% |
| Computer Sciences Corporation | 3.6% |
| Willis Group Holdings plc | 3.1% |
| Bank of America Corporation | 3.1% |
| McGraw-Hill Companies, Inc. (The) | 3.0% |
| Western Union Company (The) | 3.0% |
| Sealed Air Corporation | 2.9% |
| Kimberly-Clark Corporation | 2.7% |
| H&R Block, Inc. | 2.7% |
FBP BALANCED FUND PORTFOLIO INFORMATION March 31, 2011 (Unaudited) |
| General Information | | Asset Allocation (% of Net Assets) |
| Net Asset Value Per Share | $16.35 | |
| Total Net Assets (Millions) | $46.4 |
| Current Expense Ratio | 1.00% |
| Portfolio Turnover | 24% |
| Fund Inception Date | 7/3/1989 |
| | |
| | |
| | |
| | |
| | |
| |
| Common Stock Portfolio (72.6% of Fund) |
| Number of Stocks | 52 |
| Weighted Avg Market Capitalization (Billions) | $65.0 |
| Price-to-Earnings Ratio (IBES 1 Yr. Forecast EPS) | 12.5 |
| Price-to-Book Value | 1.8 |
Ten Largest Equity Holdings | |
| JPMorgan Chase & Company | 3.1% |
| Devon Energy Corporation | 3.0% |
| Computer Sciences Corporation | 2.4% |
| ConocoPhillips | 2.2% |
| E.I. du Pont Nemours and Company | 2.1% |
| International Business Machines Corporation | 2.1% |
| Travelers Companies, Inc. (The) | 2.1% |
| Western Union Company (The) | 2.0% |
| Bank of America Corporation | 2.0% |
| Sealed Air Corporation | 2.0% |
| |
| Financials | 14.6% |
| Information Technology | 13.2% |
| Industrials | 8.6% |
| Consumer Discretionary | 8.6% |
| Energy | 8.3% |
| Fixed-Income Portfolio (17.0% of Fund) |
| Number of Fixed-Income Securities | 10 |
| Average Quality | BBB+ |
| Average Weighted Maturity | 2.0 yrs. |
| Average Effective Duration | 1.9 yrs. |
FBP VALUE FUND SCHEDULE OF INVESTMENTS March 31, 2011 |
| | | | | | |
| Consumer Discretionary — 13.0% | | | | | | |
H&R Block, Inc. (a) | | | 44,700 | | | $ | 748,278 | |
Home Depot, Inc. (The) | | | 5,500 | | | | 203,830 | |
KB Home (a) | | | 23,000 | | | | 286,120 | |
Kohl's Corporation | | | 8,000 | | | | 424,320 | |
Macy's, Inc. | | | 20,800 | | | | 504,608 | |
McGraw-Hill Companies, Inc. (The) | | | 20,900 | | | | 823,460 | |
Whirlpool Corporation | | | 6,700 | | | | 571,912 | |
| | | | | | | | 3,562,528 | |
| Consumer Staples — 10.7% | | | | | | | | |
Avon Products, Inc. | | | 15,000 | | | | 405,600 | |
CVS Caremark Corporation | | | 15,000 | | | | 514,800 | |
Kimberly-Clark Corporation | | | 11,500 | | | | 750,605 | |
SUPERVALU, Inc. | | | 52,000 | | | | 464,360 | |
Walgreen Company | | | 13,300 | | | | 533,862 | |
Wal-Mart Stores, Inc. | | | 4,900 | | | | 255,045 | |
| | | | | | | | 2,924,272 | |
| Energy — 9.0% | | | | | | | | |
Chevron Corporation | | | 6,000 | | | | 644,580 | |
Devon Energy Corporation (a) | | | 12,000 | | | | 1,101,240 | |
Royal Dutch Shell plc - Class A - ADR | | | 10,000 | | | | 728,600 | |
| | | | | | | | 2,474,420 | |
| Financials — 21.1% | | | | | | | | |
Bank of America Corporation | | | 63,000 | | | | 839,790 | |
Bank of New York Mellon Corporation (The) | | | 18,000 | | | | 537,660 | |
Comerica, Inc. | | | 7,000 | | | | 257,040 | |
First American Financial Corporation | | | 4,000 | | | | 66,000 | |
JPMorgan Chase & Company | | | 30,000 | | | | 1,383,000 | |
Lincoln National Corporation | | | 23,000 | | | | 690,920 | |
MetLife, Inc. | | | 9,900 | | | | 442,827 | |
Travelers Companies, Inc. (The) (a) | | | 12,001 | | | | 713,819 | |
Willis Group Holdings plc | | | 21,000 | | | | 847,560 | |
| | | | | | | | 5,778,616 | |
| Health Care — 8.3% | | | | | | | | |
Johnson & Johnson | | | 12,500 | | | | 740,625 | |
Merck & Company, Inc. | | | 15,000 | | | | 495,150 | |
Pfizer, Inc. | | | 30,000 | | | | 609,300 | |
WellPoint, Inc. (a) | | | 6,300 | | | | 439,677 | |
| | | | | | | | 2,284,752 | |
| Industrials — 12.9% | | | | | | | | |
Avery Dennison Corporation | | | 16,700 | | | | 700,732 | |
FedEx Corporation | | | 4,600 | | | | 430,330 | |
General Electric Company | | | 15,100 | | | | 302,755 | |
Huntington Ingalls Industries, Inc. (b) | | | 667 | | | | 27,667 | |
FBP VALUE FUND SCHEDULE OF INVESTMENTS (Continued) |
COMMON STOCKS — 97.6% (Continued) | | | | | | |
| Industrials — 12.9% (Continued) | | | | | | |
Ingersoll-Rand plc (b) | | | 12,200 | | | $ | 589,382 | |
Koninklijke Philips Electronics N.V. - ADR | | | 8,000 | | | | 257,360 | |
Lockheed Martin Corporation | | | 7,900 | | | | 635,160 | |
Masco Corporation | | | 24,400 | | | | 339,648 | |
Northrop Grumman Corporation | | | 4,000 | | | | 250,840 | |
| | | | | | | | 3,533,874 | |
| Information Technology — 19.7% | | | | | | | | |
Cisco Systems, Inc. | | | 30,000 | | | | 514,500 | |
Computer Sciences Corporation (a) | | | 20,000 | | | | 974,600 | |
Dell, Inc. (b) | | | 35,000 | | | | 507,850 | |
Flextronics International Ltd. (b) | | | 82,000 | | | | 612,540 | |
Hewlett-Packard Company | | | 18,000 | | | | 737,460 | |
International Business Machines Corporation (a) | | | 4,500 | | | | 733,815 | |
Microsoft Corporation | | | 20,000 | | | | 507,200 | |
Western Union Company (The) (a) | | | 39,000 | | | | 810,030 | |
| | | | | | | | 5,397,995 | |
| Materials — 2.9% | | | | | | | | |
Sealed Air Corporation | | | 30,000 | | | | 799,800 | |
| | | | | | | | | |
Total Common Stocks (Cost $21,065,452) | | | | | | $ | 26,756,257 | |
MONEY MARKET FUNDS — 2.6% | | | | | | |
Fidelity Institutional Money Market Government Portfolio - Class I, 0.01% (c) (Cost $709,363) | | | 709,363 | | | $ | 709,363 | |
| | | | | | | | | |
Total Investments at Value — 100.2% (Cost $21,774,815) | | | | | | $ | 27,465,620 | |
| | | | | | | | | |
| Liabilities in Excess of Other Assets — (0.2%) | | | | | | | (58,874 | ) |
| | | | | | | | | |
Net Assets — 100.0% | | | | | | $ | 27,406,746 | |
| ADR - American Depositary Receipt. |
| |
| (a) | Security covers a written call option. |
| | |
| (b) | Non-income producing security. |
| | |
| (c) | Variable rate security. The rate shown is the 7-day effective yield as of March 31, 2011. |
| | |
| See accompanying notes to financial statements. |
FBP VALUE FUND SCHEDULE OF OPEN OPTION CONTRACTS March 31, 2011 |
| | | | | | | | | |
| Computer Sciences Corporation, | | | | | | | | | | |
01/21/2012 at $60 | | | 40 | | | | $ | 5,200 | | | $ | 14,679 | |
| Devon Energy Corporation, | | | | | | | | | | | | | |
01/21/2012 at $100 | | | 20 | | | | | 12,000 | | | | 9,240 | |
| H&R Block, Inc., | | | | | | | | | | | | | |
10/22/2011 at $17 | | | 100 | | | | | 16,000 | | | | 14,698 | |
| International Business Machines Corporation, | | | | | | | | | | | | | |
01/21/2012 at $175 | | | 10 | | | | | 6,660 | | | | 6,320 | |
| KB Home, | | | | | | | | | | | | | |
07/16/2011 at $15 | | | 100 | | | | | 3,600 | | | | 18,486 | |
| Travelers Companies, Inc. (The), | | | | | | | | | | | | | |
07/16/2011 at $60 | | | 25 | | | | | 5,000 | | | | 5,924 | |
| WellPoint, Inc., | | | | | | | | | | | | | |
09/17/2011 at $70 | | | 20 | | | | | 9,400 | | | | 8,140 | |
| Western Union Company (The), | | | | | | | | | | | | | |
08/20/2011 at $22 | | | 120 | | | | | 12,240 | | | | 12,914 | |
| | | | | | | | $ | 70,100 | | | $ | 90,401 | |
| See accompanying notes to financial statements. |
FBP BALANCED FUND SCHEDULE OF INVESTMENTS March 31, 2011 |
| | | | | | |
| Consumer Discretionary — 8.6% | | | | | | |
H&R Block, Inc. (a) | | | 53,000 | | | $ | 887,220 | |
Home Depot, Inc. (The) | | | 6,000 | | | | 222,360 | |
KB Home (a) | | | 26,000 | | | | 323,440 | |
Kohl's Corporation | | | 7,500 | | | | 397,800 | |
Macy's, Inc. | | | 23,000 | | | | 557,980 | |
McGraw-Hill Companies, Inc. (The) | | | 23,000 | | | | 906,200 | |
Whirlpool Corporation | | | 8,000 | | | | 682,880 | |
| | | | | | | | 3,977,880 | |
| Consumer Staples — 7.9% | | | | | | | | |
Avon Products, Inc. | | | 17,000 | | | | 459,680 | |
CVS Caremark Corporation | | | 18,000 | | | | 617,760 | |
Kimberly-Clark Corporation | | | 12,300 | | | | 802,821 | |
Philip Morris International, Inc. | | | 6,500 | | | | 426,595 | |
SUPERVALU, Inc. | | | 54,000 | | | | 482,220 | |
Walgreen Company | | | 15,000 | | | | 602,100 | |
Wal-Mart Stores, Inc. | | | 5,500 | | | | 286,275 | |
| | | | | | | | 3,677,451 | |
| Energy — 8.3% | | | | | | | | |
Chevron Corporation | | | 7,000 | | | | 752,010 | |
ConocoPhillips (a) | | | 12,500 | | | | 998,250 | |
Devon Energy Corporation (a) | | | 15,000 | | | | 1,376,550 | |
Royal Dutch Shell plc - Class A - ADR | | | 10,000 | | | | 728,600 | |
| | | | | | | | 3,855,410 | |
| Financials — 14.6% | | | | | | | | |
Bank of America Corporation | | | 69,000 | | | | 919,770 | |
Bank of New York Mellon Corporation (The) | | | 21,000 | | | | 627,270 | |
Comerica, Inc. | | | 15,000 | | | | 550,800 | |
First American Financial Corporation | | | 9,000 | | | | 148,500 | |
JPMorgan Chase & Company | | | 31,000 | | | | 1,429,100 | |
Lincoln National Corporation | | | 25,000 | | | | 751,000 | |
MetLife, Inc. | | | 11,000 | | | | 492,030 | |
Travelers Companies, Inc. (The) (a) | | | 16,000 | | | | 951,680 | |
Willis Group Holdings plc | | | 22,000 | | | | 887,920 | |
| | | | | | | | 6,758,070 | |
| Health Care — 5.2% | | | | | | | | |
Johnson & Johnson | | | 14,000 | | | | 829,500 | |
Merck & Company, Inc. | | | 15,600 | | | | 514,956 | |
Pfizer, Inc. | | | 31,000 | | | | 629,610 | |
WellPoint, Inc. (a) | | | 6,500 | | | | 453,635 | |
| | | | | | | | 2,427,701 | |
| Industrials — 8.6% | | | | | | | | |
Avery Dennison Corporation | | | 18,000 | | | | 755,280 | |
FedEx Corporation | | | 6,400 | | | | 598,720 | |
FBP BALANCED FUND SCHEDULE OF INVESTMENTS (Continued) |
COMMON STOCKS — 72.6% (Continued) | | | | | | |
| Industrials — 8.6% (Continued) | | | | | | |
General Electric Company | | | 17,000 | | | $ | 340,850 | |
Huntington Ingalls Industries, Inc. (b) | | | 833 | | | | 34,583 | |
Ingersoll-Rand plc (b) | | | 13,000 | | | | 628,030 | |
Koninklijke Philips Electronics N.V. - ADR | | | 10,000 | | | | 321,700 | |
Lockheed Martin Corporation | | | 8,400 | | | | 675,360 | |
Masco Corporation | | | 25,000 | | | | 348,000 | |
Northrop Grumman Corporation | | | 5,000 | | | | 313,550 | |
| | | | | | | | 4,016,073 | |
| Information Technology — 13.2% | | | | | | | | |
Cisco Systems, Inc. | | | 35,000 | | | | 600,250 | |
Computer Sciences Corporation (a) | | | 23,000 | | | | 1,120,790 | |
Dell, Inc. (b) | | | 35,000 | | | | 507,850 | |
Flextronics International Ltd. (b) | | | 85,000 | | | | 634,950 | |
Hewlett-Packard Company | | | 20,000 | | | | 819,400 | |
International Business Machines Corporation (a) | | | 6,000 | | | | 978,420 | |
Microsoft Corporation | | | 21,000 | | | | 532,560 | |
Western Union Company (The) (a) | | | 45,000 | | | | 934,650 | |
| | | | | | | | 6,128,870 | |
| Materials — 4.1% | | | | | | | | |
E.I. du Pont de Nemours and Company (a) | | | 18,000 | | | | 989,460 | |
Sealed Air Corporation | | | 34,000 | | | | 906,440 | |
| | | | | | | | 1,895,900 | |
| Utilities — 2.1% | | | | | | | | |
American Electric Power Company, Inc. | | | 14,000 | | | | 491,960 | |
Duke Energy Corporation | | | 26,000 | | | | 471,900 | |
| | | | | | | | 963,860 | |
Total Common Stocks (Cost $24,609,088) | | | | | | $ | 33,701,215 | |
| | | | | | |
BB&T Capital Trust VII (Cost $550,000) | | | 22,000 | | | $ | 592,900 | |
| | | | | | |
| Consumer Discretionary — 1.7% | | | | | | |
| Anheuser-Busch InBev SA/NV, 3.00%, due 10/15/2012 | | $ | 750,000 | | | $ | 771,485 | |
| | | | | | | | | |
| Consumer Staples — 1.7% | | | | | | | | |
Kraft Foods, Inc., 5.625%, due 11/01/2011 | | | 750,000 | | | | 770,728 | |
FBP BALANCED FUND SCHEDULE OF INVESTMENTS (Continued) |
CORPORATE BONDS — 17.0% (Continued) | | | | | | |
| Financials — 5.1% | | | | | | |
| American Express Company, 4.875%, due 07/15/2013 | | $ | 750,000 | | | $ | 799,531 | |
| Berkley (W.R.) Corporation, 5.60%, due 05/15/2015 | | | 750,000 | | | | 793,194 | |
| Prudential Financial, Inc., 5.80%, due 06/15/2012 | | | 750,000 | | | | 788,047 | |
| | | | | | | | 2,380,772 | |
| Industrials — 5.1% | | | | | | | | |
| Donnelly (R.R.) & Sons Company, 4.95%, due 04/01/2014 | | | 750,000 | | | | 777,758 | |
Eaton Corporation, 5.95%, due 03/20/2014 | | | 750,000 | | | | 837,080 | |
Ryder System, Inc., 5.00%, due 04/01/2011 | | | 750,000 | | | | 750,000 | |
| | | | | | | | 2,364,838 | |
| Information Technology — 1.7% | | | | | | | | |
Analog Devices, Inc., 5.00%, due 07/01/2014 | | | 750,000 | | | | 815,127 | |
| | | | | | | | | |
| Utilities — 1.7% | | | | | | | | |
| SBC Communications, Inc., 5.875%, due 02/01/2012 | | | 750,000 | | | | 781,890 | |
| | | | | | | | | |
Total Corporate Bonds (Cost $7,587,572) | | | | | | $ | 7,884,840 | |
MONEY MARKET FUNDS — 4.9% | | | |
Fidelity Institutional Money Market Government Portfolio - Class I, 0.01% (c) (Cost $2,288,835) | | | 2,288,835 | | | $ | 2,288,835 | |
REPURCHASE AGREEMENTS — 4.3% | | | | | | |
U.S. Bank N.A., 0.01%, dated 03/31/2011, due 04/01/2011, repurchase proceeds: $1,993,212 (Cost $1,993,211) (d) | | $ | 1,993,211 | | | $ | 1,993,211 | |
| | | | | | | | | |
Total Investments at Value — 100.1% (Cost $37,028,706) | | | | | | $ | 46,461,001 | |
| | | | | | | | | |
| Liabilities in Excess of Other Assets — (0.1%) | | | | | | | (54,698 | ) |
| | | | | | | | | |
Net Assets — 100.0% | | | | | | $ | 46,406,303 | |
| ADR - American Depositary Receipt. |
| |
| (a) | Security covers a written call option. |
| | |
| (b) | Non-income producing security. |
| | |
| (c) | Variable rate security. The rate shown is the 7-day effective yield as of March 31, 2011. |
| | |
| (d) | Repurchase agreement is fully collateralized by $2,009,398 Freddie Mac, Series #3448, Class FA, floating rate, 1.205%, due 05/15/2038. The aggregate market value of the collateral at March 31, 2011 was $2,033,187. |
| | |
| See accompanying notes to financial statements. |
FBP BALANCED FUND SCHEDULE OF OPEN OPTION CONTRACTS March 31, 2011 |
| | | | | | | | | |
| Computer Sciences Corporation, | | | | | | | | | | |
01/21/2012 at $60 | | | 50 | | | | $ | 6,500 | | | $ | 18,349 | |
| ConocoPhillips, | | | | | | | | | | | | | |
01/21/2012 at $85 | | | 40 | | | | | 19,200 | | | | 17,279 | |
| Devon Energy Corporation, | | | | | | | | | | | | | |
01/21/2012 at $100 | | | 20 | | | | | 12,000 | | | | 9,240 | |
| E.I. Du Pont De Nemours and Company, | | | | | | | | | | | | | |
01/21/2012 at $55 | | | 90 | | | | | 41,400 | | | | 30,448 | |
| H&R Block, Inc., | | | | | | | | | | | | | |
10/22/2011 at $17 | | | 150 | | | | | 24,000 | | | | 22,047 | |
International Business Machines Corporation, | | | | | | | | | | | | | |
01/21/2012 at $175 | | | 20 | | | | | 13,320 | | | | 12,639 | |
| KB Home, | | | | | | | | | | | | | |
07/16/2011 at $15 | | | 130 | | | | | 4,680 | | | | 24,032 | |
| Travelers Companies, Inc. (The), | | | | | | | | | | | | | |
07/16/2011 at $60 | | | 50 | | | | | 10,000 | | | | 11,849 | |
| WellPoint, Inc., | | | | | | | | | | | | | |
09/17/2011 at $70 | | | 20 | | | | | 9,400 | | | | 8,140 | |
| Western Union Company (The), | | | | | | | | | | | | | |
08/20/2011 at $22 | | | 150 | | | | | 15,300 | | | | 16,142 | |
| | | | | | | | $ | 155,800 | | | $ | 170,165 | |
| See accompanying notes to financial statements. |
THE FLIPPIN, BRUCE & PORTER FUNDS STATEMENTS OF ASSETS AND LIABILITIES March 31, 2011 |
| | | | | | |
| ASSETS | | | | | | |
| Investments in securities: | | | | | | |
At acquisition cost | | $ | 21,774,815 | | | $ | 37,028,706 | |
At value (Note 1) | | $ | 27,465,620 | | | $ | 46,461,001 | |
Dividends and interest receivable | | | 40,548 | | | | 168,797 | |
Receivable for capital shares sold | | | 1,840 | | | | 10,225 | |
Other assets | | | 6,046 | | | | 4,557 | |
TOTAL ASSETS | | | 27,514,054 | | | | 46,644,580 | |
| | | | | | | | | |
| LIABILITIES | | | | | | | | |
Covered call options, at value (Notes 1 and 4)
(premiums received $90,401 and $170,165, respectively) | | | 70,100 | | | | 155,800 | |
Distributions payable | | | 1,417 | | | | 22,145 | |
Payable for capital shares redeemed | | | 317 | | | | 7,630 | |
Accrued investment advisory fees (Note 3) | | | 15,644 | | | | 29,076 | |
Payable to administrator (Note 3) | | | 4,700 | | | | 6,200 | |
Other accrued expenses | | | 15,130 | | | | 17,426 | |
TOTAL LIABILITIES | | | 107,308 | | | | 238,277 | |
| | | | | | | | | |
NET ASSETS | | $ | 27,406,746 | | | $ | 46,406,303 | |
| | | | | | | | | |
| Net assets consist of: | | | | | | | | |
Paid-in capital | | $ | 24,529,941 | | | $ | 37,879,902 | |
Undistributed net investment income | | | 7,010 | | | | 14,488 | |
| Accumulated net realized losses from security transactions | | | (2,841,311 | ) | | | (934,747 | ) |
Net unrealized appreciation on investments | | | 5,711,106 | | | | 9,446,660 | |
Net assets | | $ | 27,406,746 | | | $ | 46,406,303 | |
| | | | | | | | | |
Shares of beneficial interest outstanding
(unlimited number of shares authorized, $0.01 par value) | | | 1,323,988 | | | | 2,838,208 | |
| | | | | | | | | |
Net asset value, offering price and
redemption price per share (Note 1) | | $ | 20.70 | | | $ | 16.35 | |
| See accompanying notes to financial statements. |
THE FLIPPIN, BRUCE & PORTER FUNDS STATEMENTS OF OPERATIONS Year Ended March 31, 2011 |
| | | | | | |
| INVESTMENT INCOME | | | | | | |
Dividends | | $ | 499,155 | | | $ | 731,198 | |
Foreign withholding taxes on dividends | | | (5,040 | ) | | | (5,040 | ) |
Interest | | | — | | | | 426,050 | |
TOTAL INVESTMENT INCOME | | | 494,115 | | | | 1,152,208 | |
| | | | | | | | | |
| EXPENSES | | | | | | | | |
Investment advisory fees (Note 3) | | | 187,272 | | | | 311,745 | |
Administration fees (Note 3) | | | 48,000 | | | | 61,933 | |
Professional fees | | | 19,722 | | | | 21,222 | |
Trustees’ fees and expenses | | | 14,531 | | | | 14,531 | |
Registration fees | | | 12,696 | | | | 8,671 | |
| Compliance service fees and expenses (Note 3) | | | 8,755 | | | | 8,755 | |
Custodian and bank service fees | | | 7,416 | | | | 9,061 | |
Printing of shareholder reports | | | 5,081 | | | | 3,502 | |
Postage and supplies | | | 5,660 | | | | 4,915 | |
Insurance expense | | | 3,458 | | | | 5,006 | |
Other expenses | | | 6,931 | | | | 8,878 | |
TOTAL EXPENSES | | | 319,522 | | | | 458,219 | |
| Fees voluntarily waived by the Adviser (Note 3) | | | (33,264 | ) | | | (12,868 | ) |
NET EXPENSES | | | 286,258 | | | | 445,351 | |
| | | | | | | | | |
NET INVESTMENT INCOME | | | 207,857 | | | | 706,857 | |
| | | | | | | | | |
REALIZED AND UNREALIZED GAINS
ON INVESTMENTS | | | | | | | | |
| Net realized gains from: | | | | | | | | |
Security transactions | | | 1,451,330 | | | | 1,379,317 | |
Option contracts (Note 4) | | | 31,408 | | | | 38,134 | |
| Net change in unrealized appreciation/depreciation on: | | | | | | | | |
Investments | | | 127,937 | | | | 1,106,506 | |
Option contracts (Note 4) | | | 20,301 | | | | 14,365 | |
| | | | | | | | | |
NET REALIZED AND UNREALIZED
GAINS ON INVESTMENTS | | | 1,630,976 | | | | 2,538,322 | |
| | | | | | | | | |
NET INCREASE IN NET ASSETS
FROM OPERATIONS | | $ | 1,838,833 | | | $ | 3,245,179 | |
| See accompanying notes to financial statements. |
THE FLIPPIN, BRUCE & PORTER FUNDS STATEMENTS OF CHANGES IN NET ASSETS |
| | | | | | | |
| | | | | | | | | | | | |
| FROM OPERATIONS | | | | | | | | | | | | |
Net investment income | | $ | 207,857 | | | $ | 193,366 | | | $ | 706,857 | | | $ | 797,205 | |
| Net realized gains from: | | | | | | | | | | | | | | | | |
Security transactions | | | 1,451,330 | | | | 1,048,186 | | | | 1,379,317 | | | | 1,458,838 | |
Option contracts (Note 4) | | | 31,408 | | | | 28,944 | | | | 38,134 | | | | 32,808 | |
Net change in unrealized
appreciation/depreciation on: | | | | | | | | | | | | | | | | |
Investments | | | 127,937 | | | | 10,893,329 | | | | 1,106,506 | | | | 12,459,369 | |
Option contracts (Note 4) | | | 20,301 | | | | — | | | | 14,365 | | | | — | |
Net increase in net assets
from operations | | | 1,838,833 | | | | 12,163,825 | | | | 3,245,179 | | | | 14,748,220 | |
| | | | | | | | | | | | | | | | | |
| DISTRIBUTIONS TO SHAREHOLDERS | | | | | | | | | | | | | | | | |
From net investment income | | | (199,622 | ) | | | (205,334 | ) | | | (740,442 | ) | | | (838,744 | ) |
| | | | | | | | | | | | | | | | | |
| FROM CAPITAL SHARE TRANSACTIONS | | | | | | | | | | | | | | | | |
Proceeds from shares sold | | | 1,031,474 | | | | 811,111 | | | | 3,258,609 | | | | 1,129,444 | |
Net asset value of shares issued
in reinvestment of distributions
to shareholders | | | 193,658 | | | | 199,289 | | | | 650,777 | | | | 747,349 | |
Payments for shares redeemed | | | (4,074,197 | ) | | | (4,957,268 | ) | | | (5,514,554 | ) | | | (4,478,899 | ) |
Net decrease in net assets from
capital share transactions | | | (2,849,065 | ) | | | (3,946,868 | ) | | | (1,605,168 | ) | | | (2,602,106 | ) |
| | | | | | | | | | | | | | | | | |
TOTAL INCREASE (DECREASE)
IN NET ASSETS | | | (1,209,854 | ) | | | 8,011,623 | | | | 899,569 | | | | 11,307,370 | |
| | | | | | | | | | | | | | | | | |
| NET ASSETS | | | | | | | | | | | | | | | | |
Beginning of year | | | 28,616,600 | | | | 20,604,977 | | | | 45,506,734 | | | | 34,199,364 | |
End of year | | $ | 27,406,746 | | | $ | 28,616,600 | | | $ | 46,406,303 | | | $ | 45,506,734 | |
| | | | | | | | | | | | | | | | | |
UNDISTRIBUTED (DISTRIBUTIONS
IN EXCESS OF) NET
INVESTMENT INCOME | | $ | 7,010 | | | $ | (1,225 | ) | | $ | 14,488 | | | $ | 4,877 | |
| | | | | | | | | | | | | | | | | |
| CAPITAL SHARE ACTIVITY | | | | | | | | | | | | | | | | |
Shares sold | | | 53,032 | | | | 50,497 | | | | 211,833 | | | | 83,529 | |
Shares reinvested | | | 10,307 | | | | 12,030 | | | | 42,971 | | | | 53,343 | |
Shares redeemed | | | (213,062 | ) | | | (303,238 | ) | | | (354,412 | ) | | | (317,389 | ) |
Net decrease in shares outstanding | | | (149,723 | ) | | | (240,711 | ) | | | (99,608 | ) | | | (180,517 | ) |
| Shares outstanding at beginning of year | | | 1,473,711 | | | | 1,714,422 | | | | 2,937,816 | | | | 3,118,333 | |
Shares outstanding at end of year | | | 1,323,988 | | | | 1,473,711 | | | | 2,838,208 | | | | 2,937,816 | |
| See accompanying notes to financial statements. |
FBP VALUE FUND FINANCIAL HIGHLIGHTS |
Selected Per Share Data and Ratios for a Share Outstanding Throughout Each Year | |
| | | | |
| | | | | | | | | | | | | | | |
| Net asset value at beginning of year | | $ | 19.42 | | | $ | 12.02 | | | $ | 20.99 | | | $ | 27.30 | | | $ | 26.60 | |
| | | | | | | | | | | | | | | | | | | | | |
| Income (loss) from investment operations: | | | | | | | | | | | | | | | | | | | | |
| Net investment income | | | 0.15 | | | | 0.12 | | | | 0.27 | | | | 0.32 | | | | 0.33 | |
Net realized and unrealized gains
(losses) on investments | | | 1.27 | | | | 7.41 | | | | (8.98 | ) | | | (4.43 | ) | | | 2.71 | |
| Total from investment operations | | | 1.42 | | | | 7.53 | | | | (8.71 | ) | | | (4.11 | ) | | | 3.04 | |
| | | | | | | | | | | | | | | | | | | | | |
| Less distributions: | | | | | | | | | | | | | | | | | | | | |
| Dividends from net investment income | | | (0.14 | ) | | | (0.13 | ) | | | (0.26 | ) | | | (0.32 | ) | | | (0.33 | ) |
| Distributions from net realized gains | | | — | | | | — | | | | — | | | | (1.68 | ) | | | (2.01 | ) |
Return of capital | | | — | | | | — | | | | — | | | | (0.20 | ) | | | — | |
Total distributions | | | (0.14 | ) | | | (0.13 | ) | | | (0.26 | ) | | | (2.20 | ) | | | (2.34 | ) |
| | | | | | | | | | | | | | | | | | | | | |
| Net asset value at end of year | | $ | 20.70 | | | $ | 19.42 | | | $ | 12.02 | | | $ | 20.99 | | | $ | 27.30 | |
| | | | | | | | | | | | | | | | | | | | | |
Total return (a) | | | 7.40% | | | | 62.84% | | | | (41.78% | ) | | | (16.33% | ) | | | 11.57% | |
| | | | | | | | | | | | | | | | | | | | | |
| Net assets at end of year (000’s) | | $ | 27,407 | | | $ | 28,617 | | | $ | 20,605 | | | $ | 43,072 | | | $ | 60,233 | |
| | | | | | | | | | | | | | | | | | | | | |
| Ratio of net expenses to average net assets | | | 1.07% | (b) | | | 1.07% | (b) | | | 1.07% | (b) | | | 1.01% | | | | 1.01% | |
| | | | | | | | | | | | | | | | | | | | | |
Ratio of net investment income
to average net assets | | | 0.78% | | | | 0.74% | | | | 1.59% | | | | 1.21% | | | | 1.19% | |
| | | | | | | | | | | | | | | | | | | | | |
Portfolio turnover rate | | | 25% | | | | 21% | | | | 16% | | | | 26% | | | | 16% | |
| (a) | Total return is a measure of the change in value of an investment in the Fund over the periods covered, which assumes any dividends or capital gains distributions are reinvested in shares of the Fund. Returns shown do not reflect the deduction of taxes a shareholder would pay on Fund distributions or the redemption of Fund shares. |
| | |
| (b) | Absent investment advisory fees voluntarily waived by the Adviser, the ratio of expenses to average net assets would have been 1.19%, 1.19% and 1.18% for the years ended March 31, 2011, 2010 and 2009, respectively (Note 3). |
| | |
| See accompanying notes to financial statements. |
FBP BALANCED FUND FINANCIAL HIGHLIGHTS |
Selected Per Share Data and Ratios for a Share Outstanding Throughout Each Year | |
| | | | |
| | | | | | | | | | | | | | | |
| Net asset value at beginning of year | | $ | 15.49 | | | $ | 10.97 | | | $ | 15.84 | | | $ | 18.95 | | | $ | 18.39 | |
| | | | | | | | | | | | | | | | | | | | | |
| Income (loss) from investment operations: | | | | | | | | | | | | | | | | | | | | |
| Net investment income | | | 0.24 | | | | 0.27 | | | | 0.32 | | | | 0.38 | | | | 0.37 | |
Net realized and unrealized gains
(losses) on investments | | | 0.88 | | | | 4.53 | | | | (4.89 | ) | | | (2.01 | ) | | | 1.39 | |
| Total from investment operations | | | 1.12 | | | | 4.80 | | | | (4.57 | ) | | | (1.63 | ) | | | 1.76 | |
| | | | | | | | | | | | | | | | | | | | | |
| Less distributions: | | | | | | | | | | | | | | | | | | | | |
| Dividends from net investment income | | | (0.26 | ) | | | (0.28 | ) | | | (0.30 | ) | | | (0.39 | ) | | | (0.37 | ) |
| Distributions from net realized gains | | | — | | | | — | | | | — | | | | (1.02 | ) | | | (0.83 | ) |
Return of capital | | | — | | | | — | | | | — | | | | (0.07 | ) | | | — | |
Total distributions | | | (0.26 | ) | | | (0.28 | ) | | | (0.30 | ) | | | (1.48 | ) | | | (1.20 | ) |
| | | | | | | | | | | | | | | | | | | | | |
| Net asset value at end of year | | $ | 16.35 | | | $ | 15.49 | | | $ | 10.97 | | | $ | 15.84 | | | $ | 18.95 | |
| | | | | | | | | | | | | | | | | | | | | |
Total return (a) | | | 7.35% | | | | 44.01% | | | | (29.15% | ) | | | (9.27% | ) | | | 9.70% | |
| | | | | | | | | | | | | | | | | | | | | |
| Net assets at end of year (000’s) | | $ | 46,406 | | | $ | 45,507 | | | $ | 34,199 | | | $ | 54,995 | | | $ | 66,358 | |
| | | | | | | | | | | | | | | | | | | | | |
| Ratio of net expenses to average net assets | | | 1.00% | (b) | | | 1.00% | (b) | | | 1.00% | (b) | | | 0.96% | | | | 0.97% | |
| | | | | | | | | | | | | | | | | | | | | |
Ratio of net investment income
to average net assets | | | 1.59% | | | | 1.90% | | | | 2.36% | | | | 2.05% | | | | 1.95% | |
| | | | | | | | | | | | | | | | | | | | | |
Portfolio turnover rate | | | 24% | | | | 24% | | | | 24% | | | | 29% | | | | 17% | |
| (a) | Total return is a measure of the change in value of an investment in the Fund over the periods covered, which assumes any dividends or capital gains distributions are reinvested in shares of the Fund. Returns shown do not reflect the deduction of taxes a shareholder would pay on Fund distributions or the redemption of Fund shares. |
| | |
| (b) | Absent investment advisory fees voluntarily waived by the Adviser, the ratio of expenses to average net assets would have been 1.03%, 1.03% and 1.05% for the years ended March 31, 2011, 2010 and 2009, respectively (Note 3). |
| | |
| See accompanying notes to financial statements. |
THE FLIPPIN, BRUCE & PORTER FUNDS NOTES TO FINANCIAL STATEMENTS March 31, 2011 |
1. Organization and Significant Accounting Policies
FBP Value Fund and FBP Balanced Fund (the “Funds”) are no-load, diversified series of the Williamsburg Investment Trust (the “Trust”), an open-end management investment company registered under the Investment Company Act of 1940. The Trust was organized as a Massachusetts business trust on July 18, 1988. Other series of Williamsburg Investment Trust are not included in this report.
FBP Value Fund seeks long term growth of capital with current income as a secondary objective.
FBP Balanced Fund seeks long term capital appreciation and current income, assuming a moderate level of investment risk.
The following is a summary of the Funds’ significant accounting policies:
Securities valuation — The Funds’ portfolio securities are valued as of the close of business of the regular session of the New York Stock Exchange (normally 4:00 p.m., Eastern time). Securities traded on a national stock exchange are valued based upon the closing price on the principal exchange where the security is traded. Securities which are quoted by NASDAQ are valued at the NASDAQ Official Closing Price. Securities which are traded over-the-counter are valued at the last sales price, if available, otherwise, at the last quoted bid price. It is expected that fixed income securities will ordinarily be traded in the over-the-counter market, and common stocks will ordinarily be traded on a national securities exchange, but may also be traded in the over-the-counter market. Call options written by the Funds are valued at the then current market quotation, using the ask price as of the close of each day on the principal exchanges on which they are traded. Short-term instruments (those with remaining maturities of 60 days or less) may be valued at amortized cost, which approximates market value.
When market quotations are not readily available, securities may be valued on the basis of prices provided by an independent pricing service. The prices provided by the pricing service are determined with consideration given to institutional bid and last sale prices and take into account securities prices, yields, maturities, call features, ratings, institutional trading in similar groups of securities and developments related to specific securities. If a pricing service cannot provide a valuation, securities will be valued in good faith at fair value using methods consistent with those determined by the Board of Trustees and will be classified as Level 2 or 3 within the fair value hierarchy, depending on the inputs used. Such methods of fair valuation may include, but are not limited to: multiple of earnings, multiple of book value, discount from market of a similar freely traded security, purchase price of the security, subsequent private transactions in the security or related securities, or a combination of these and other factors.
Accounting principles generally accepted in the United States (“GAAP”) establish a single authoritative definition of fair value, set out a framework for measuring fair value and require additional disclosures about fair value measurements. Various inputs are used in determining the value of each Fund’s investments. These inputs are summarized in the three broad levels listed below:
• Level 1 – quoted prices in active markets for identical securities
• Level 2 – other significant observable inputs
• Level 3 – significant unobservable inputs
THE FLIPPIN, BRUCE & PORTER FUNDS NOTES TO FINANCIAL STATEMENTS (Continued) |
For example, Corporate Bonds and Repurchase Agreements held by FBP Balanced Fund are classified as Level 2 since values are based on prices provided by an independent pricing service that utilizes various “other significant observable inputs” including bid and ask quotations, prices of similar securities and interest rates, among other factors.
The inputs or methodology used for valuing securities are not necessarily an indication of the risks associated with investing in those securities. The inputs used to measure fair value may fall into different levels of the fair value hierarchy. In such cases, for disclosure purposes, the level in the fair value hierarchy within which the fair value measurement falls in its entirety is determined based on the lowest level input that is significant to the fair value measurement.
The following is a summary of the inputs used to value each Fund’s investments and other financial instruments as of March 31, 2011 by security type:
| | | | | | | | | | | | |
Common Stocks | | $ | 26,756,257 | | | $ | — | | | $ | — | | | $ | 26,756,257 | |
Money Market Funds | | | 709,363 | | | | — | | | | — | | | | 709,363 | |
Covered Call Options | | | (70,100 | ) | | | — | | | | — | | | | (70,100 | ) |
Total | | $ | 27,395,520 | | | $ | — | | | $ | — | | | $ | 27,395,520 | |
| | | | | | | | | | | | |
Common Stocks | | $ | 33,701,215 | | | $ | — | | | $ | — | | | $ | 33,701,215 | |
Preferred Stocks | | | 592,900 | | | | — | | | | — | | | | 592,900 | |
Corporate Bonds | | | — | | | | 7,884,840 | | | | — | | | | 7,884,840 | |
Money Market Funds | | | 2,288,835 | | | | — | | | | — | | | | 2,288,835 | |
Repurchase Agreements | | | — | | | | 1,993,211 | | | | — | | | | 1,993,211 | |
Covered Call Options | | | (155,800 | ) | | | — | | | | — | | | | (155,800 | ) |
Total | | $ | 36,427,150 | | | $ | 9,878,051 | | | $ | — | | | $ | 46,305,201 | |
Refer to each Fund’s Schedule of Investments for a listing of the common stocks and corporate bonds valued using Level 1 and Level 2 inputs by sector type. During the year ended March 31, 2011, the Funds did not have any significant transfers in and out of Level 1 or Level 2. There were no Level 3 securities held by the Funds during the year ended or as of March 31, 2011.
Share valuation — The net asset value per share of each Fund is calculated daily by dividing the total value of its assets, less liabilities, by the number of shares outstanding. The offering price and redemption price per share of each Fund is equal to its net asset value per share.
Investment income — Interest income is accrued as earned. Dividend income is recorded on the ex-dividend date. Discounts and premiums on fixed income securities purchased are amortized using the interest method.
Repurchase agreements — Each Fund may enter into repurchase agreements. A repurchase agreement, which is collateralized by U.S. Government obligations, is valued at cost which, together with accrued interest, approximates market value. At the time a Fund enters into a repurchase agreement, the Fund takes possession of the underlying securities and the seller agrees that the value of the underlying securities, including accrued interest, will at all times be equal to or exceed the face amount of the repurchase agreement. In addition, the
THE FLIPPIN, BRUCE & PORTER FUNDS NOTES TO FINANCIAL STATEMENTS (Continued) |
Funds actively monitor and seek additional collateral, as needed. If the seller defaults, the fair value of the collateral may decline and realization of the collateral by the Funds may be delayed or limited.
Distributions to shareholders — Dividends arising from net investment income are declared and paid quarterly to shareholders of each Fund. Net realized short-term capital gains, if any, may be distributed throughout the year and net realized long-term capital gains, if any, are distributed at least once each year. The amount of distributions from net investment income and net realized gains are determined in accordance with federal income tax regulations, which may differ from GAAP. These “book/tax” differences are either temporary or permanent in nature.
The tax character of distributions paid by each Fund during the years ended March 31, 2011 and March 31, 2010 is ordinary income.
Security transactions — Security transactions are accounted for on trade date. Gains and losses on securities sold are determined on a specific identification basis.
Common expenses — Common expenses of the Trust are allocated among the funds of the Trust based on relative net assets of each fund or the nature of the services performed and the relative applicability to each fund.
Options transactions — When the Funds’ investment adviser believes that individual portfolio securities held by the Funds are approaching the top of the adviser’s growth and price expectations, the Funds may write covered call options for which premiums are received and are recorded as liabilities, and are subsequently valued daily at the closing prices on their primary exchanges. Premiums received from writing options which expire are treated as realized gains. Premiums received from writing options which are exercised increase the proceeds used to calculate the realized gain or loss on the sale of the security. If a closing purchase transaction is used to terminate a Fund’s obligation on a call option, a gain or loss will be realized, depending upon whether the price of the closing purchase transaction is more or less than the premium previously received on the call option written.
Estimates — The preparation of financial statements in conformity with GAAP requires management to make estimates and assumptions that affect the reported amounts of assets and liabilities and the disclosure of contingent assets and liabilities as of the date of the financial statements and the reported amounts of income and expenses during the reporting period. Actual results could differ from those estimates.
Federal income tax — It is each Fund’s policy to comply with the special provisions of Subchapter M of the Internal Revenue Code applicable to regulated investment companies. As provided therein, in any fiscal year in which a Fund so qualifies and distributes at least 90% of its taxable net income, the Fund (but not the shareholders) will be relieved of federal income tax on the income distributed. Accordingly, no provision for income taxes has been made.
In order to avoid imposition of the excise tax applicable to regulated investment companies, it is also each Fund’s intention to declare as dividends in each calendar year at least 98% of its net investment income (earned during the calendar year) and 98.2% of its net realized capital gains (earned during the twelve months ended October 31) plus undistributed amounts from prior years.
THE FLIPPIN, BRUCE & PORTER FUNDS NOTES TO FINANCIAL STATEMENTS (Continued) |
The following information is computed on a tax basis for each item as of March 31, 2011:
| | | | | | |
| Cost of portfolio investments and option contracts | | $ | 21,684,414 | | | $ | 36,853,890 | |
| Gross unrealized appreciation | | $ | 7,154,022 | | | $ | 10,804,352 | |
| Gross unrealized depreciation | | | (1,442,916 | ) | | | (1,353,041 | ) |
| Net unrealized appreciation | | | 5,711,106 | | | | 9,451,311 | |
| Undistributed ordinary income | | | 8,427 | | | | 31,982 | |
| Capital loss carryforwards | | | (2,841,311 | ) | | | (934,747 | ) |
| Other temporary differences | | | (1,417 | ) | | | (22,145 | ) |
| Total distributable earnings | | $ | 2,876,805 | | | $ | 8,526,401 | |
The difference between the federal income tax cost of portfolio investments and the financial statement cost for FBP Balanced Fund is due to certain differences in the recognition of capital gains and losses under income tax regulations and GAAP. These “book/tax” differences are temporary in nature and are primarily due to differing methods in the amortization of discounts and premiums on fixed income securities.
During the year ended March 31, 2011, FBP Value Fund and FBP Balanced Fund utilized capital loss carryforwards of $1,482,738 and $1,374,255, respectively, to offset current year realized gains.
As of March 31, 2011, the Funds had the following capital loss carryforwards for federal income tax purposes:
| | | | | | |
| 2017 | | $ | 992,878 | | | $ | 449,077 | |
| 2018 | | | 1,848,433 | | | | 485,670 | |
| | | $ | 2,841,311 | | | $ | 934,747 | |
These capital loss carryforwards may be utilized in future years to offset net realized capital gains, if any, prior to distributing such gains to shareholders.
For the year ended March 31, 2011, FBP Balanced Fund reclassified accumulated net realized gains from security transactions of $43,196 against accumulated undistributed net investment income on the Statements of Assets and Liabilities. Such reclassification, the result of permanent differences between the financial statement and income tax reporting requirements, has no effect on the Fund’s net assets or net asset value per share.
The Funds recognize the tax benefits or expenses of uncertain tax positions only when the position is “more likely than not” to be sustained assuming examination by tax authorities. Management has reviewed the tax positions taken on federal income tax returns for all open tax years (tax years ended March 31, 2008 through March 31, 2011) of each Fund and has concluded that no provision for unrecognized tax benefits or expenses is required in these financial statements.
THE FLIPPIN, BRUCE & PORTER FUNDS NOTES TO FINANCIAL STATEMENTS (Continued) |
2. Investment Transactions
During the year ended March 31, 2011, cost of purchases and proceeds from sales and maturities of investment securities, other than short-term investments and U.S. Government securities, totaled $6,446,514 and $8,810,188, respectively, for FBP Value Fund and $10,003,321 and $11,709,209, respectively, for FBP Balanced Fund.
3. Transactions with Affiliates
INVESTMENT ADVISORY AGREEMENT
The Funds’ investments are managed by Flippin, Bruce & Porter, Inc. (the “Adviser”) under the terms of an Investment Advisory Agreement. Under the Investment Advisory Agreement, each Fund pays the Adviser a fee, which is computed and accrued daily and paid monthly, at an annual rate of .70% of its average daily net assets up to $250 million; .65% of the next $250 million of such assets; and .50% of such assets in excess of $500 million.
During the year ended March 31, 2011, the Adviser voluntarily waived $33,264 and $12,868 of its investment advisory fees from FBP Value Fund and FBP Balanced Fund, respectively.
Certain officers of the Trust are also officers of the Adviser.
MUTUAL FUND SERVICES AGREEMENT
Under the terms of a Mutual Fund Services Agreement between the Trust and Ultimus Fund Solutions, LLC (“Ultimus”), Ultimus provides administrative, pricing, accounting, dividend disbursing, shareholder servicing and transfer agent services for the Funds. For these services, Ultimus receives a monthly fee from each Fund at an annual rate of .15% of its average daily net assets up to $25 million, .125% of the next $25 million of such assets, and .10% of such assets in excess of $50 million, subject to a minimum monthly fee of $4,000; plus a shareholder recordkeeping fee at the annual rate of $10 per shareholder account in excess of 1,000 accounts. In addition, each Fund pays out-of-pocket expenses including, but not limited to, postage, supplies and costs of pricing portfolio securities.
Certain officers of the Trust are also officers of Ultimus, or of Ultimus Fund Distributors, LLC (the “Distributor”), the principal underwriter of each Fund’s shares. The Distributor is compensated by the Adviser (not the Funds) for acting as principal underwriter.
COMPLIANCE CONSULTING AGREEMENT
Under the terms of a Compliance Consulting Agreement between the Trust and Ultimus, Ultimus provides an individual to serve as the Trust’s Chief Compliance Officer and to administer the Funds’ compliance policies and procedures. For these services, the Funds pay Ultimus an annual base fee of $16,800 plus an asset-based fee equal to 0.01% per annum on the Funds’ aggregate net assets in excess of $100 million. In addition, the Funds reimburse Ultimus for reasonable out-of-pocket expenses, if any, incurred in connection with these services.
THE FLIPPIN, BRUCE & PORTER FUNDS NOTES TO FINANCIAL STATEMENTS (Continued) |
4. Derivatives Transactions
Transactions in option contracts written by the Funds during the year ended March 31, 2011 were as follows:
| | | | | | | |
| | | | | | | | | | | | |
| Options outstanding at beginning of year | | | — | | | $ | — | | | | — | | | $ | — | |
Options written | | | 566 | | | | 138,375 | | | | 930 | | | | 250,431 | |
| Options cancelled in a closing purchase transaction | | | (28 | ) | | | (15,315 | ) | | | (110 | ) | | | (49,068 | ) |
Options expired | | | (70 | ) | | | (16,589 | ) | | | (70 | ) | | | (16,589 | ) |
Options exercised | | | (33 | ) | | | (16,070 | ) | | | (30 | ) | | | (14,609 | ) |
| Options outstanding at end of year | | | 435 | | | $ | 90,401 | | | | 720 | | | $ | 170,165 | |
The location in the Statements of Assets and Liabilities of FBP Value Fund’s derivative positions is as follows:
| | | | | | | | |
| | | | | | | | | Gross Notional Amount Outstanding March 31, 2011 | |
| Covered call options written | Covered call options, at value | | | — | | | $ | (70,100 | ) | | $ | (1,489,000 | ) |
The average monthly notional amount of option contracts during the year ended March 31, 2011 was $563,375 for FBP Value Fund.
The location in the Statements of Assets and Liabilities of FBP Balanced Fund’s derivative positions is as follows:
| | | | | | | | |
| | | | | | | | | Gross Notional Amount Outstanding March 31, 2011 | |
| Covered call options written | Covered call options, at value | | | — | | | $ | (155,800 | ) | | $ | (2,905,000 | ) |
The average monthly notional amount of option contracts during the year ended March 31, 2011 was $820,833 for FBP Balanced Fund.
THE FLIPPIN, BRUCE & PORTER FUNDS NOTES TO FINANCIAL STATEMENTS (Continued) |
Transactions in derivative instruments during the year ended March 31, 2011 by FBP Value Fund are recorded in the following location in the Statements of Operations:
| | | | | | | Change in Unrealized Gains (Losses) | |
| Covered call options written | Net realized gains from option contracts | | $ | 31,408 | | Net change in unrealized appreciation/ depreciation on option contracts | | $ | 20,301 | |
Transactions in derivative instruments during the year ended March 31, 2011 by FBP Balanced Fund are recorded in the following location in the Statements of Operations:
| | | | | | | Change in Unrealized Gains (Losses) | |
| Covered call options written | Net realized gains from option contracts | | $ | 38,134 | | Net change in unrealized appreciation/depreciation on option contracts | | $ | 14,365 | |
5. Contingencies and Commitments
The Funds indemnify the Trust’s officers and Trustees for certain liabilities that might arise from their performance of their duties to the Funds. Additionally, in the normal course of business the Funds enter into contracts that contain a variety of representations and warranties and which provide general indemnifications. The Funds’ maximum exposure under these arrangements is unknown, as this would involve future claims that may be made against the Funds that have not yet occurred. However, based on experience, the Funds expect the risk of loss to be remote.
6. Subsequent Events
The Funds are required to recognize in the financial statements the effects of all subsequent events that provide additional evidence about conditions that existed as of the date of the Statements of Assets and Liabilities. For non-recognized subsequent events that must be disclosed to keep the financial statements from being misleading, the Funds are required to disclose the nature of the event as well as an estimate of its financial effect, or a statement that such an estimate cannot be made. Management has evaluated subsequent events through the issuance of these financial statements and has noted no such events.
THE FLIPPIN, BRUCE & PORTER FUNDS REPORT OF INDEPENDENT REGISTERED PUBLIC ACCOUNTING FIRM |
The Board of Trustees and Shareholders of
the FBP Value Fund and the FBP Balanced Fund
of the Williamsburg Investment Trust
We have audited the accompanying statements of assets and liabilities, including the schedules of investments, of the FBP Value Fund and the FBP Balanced Fund (the “Funds”) (each a series of the Williamsburg Investment Trust) as of March 31, 2011, and the related statements of operations for the year then ended, the statements of changes in net assets for each of the two years in the period then ended, and the financial highlights for each of the five years in the period then ended. These financial statements and financial highlights are the responsibility of the Funds’ management. Our responsibility is to express an opinion on these financial statements and financial highlights based on our audits.
We conducted our audits in accordance with the standards of the Public Company Accounting Oversight Board (United States). Those standards require that we plan and perform the audits to obtain reasonable assurance about whether the financial statements and financial highlights are free of material misstatement. We were not engaged to perform an audit of the Funds’ internal control over financial reporting. Our audits included consideration of internal control over financial reporting as a basis for designing audit procedures that are appropriate in the circumstances, but not for the purpose of expressing an opinion on the effectiveness of the Funds’ internal control over financial reporting. Accordingly, we express no such opinion. An audit also includes examining, on a test basis, evidence supporting the amounts and disclosures in the financial statements and financial highlights, assessing the accounting principles used and significant estimates made by management, and evaluating the overall financial statement presentation. Our procedures included confirmation of securities owned as of March 31, 2011, by correspondence with the custodian and brokers. We believe that our audits provide a reasonable basis for our opinion.
In our opinion, the financial statements and financial highlights referred to above present fairly, in all material respects, the financial position of the FBP Value Fund and the FBP Balanced Fund at March 31, 2011, the results of their operations for the year then ended, the changes in their net assets for each of the two years in the period then ended, and the financial highlights for each of the five years in the period then ended, in conformity with U.S. generally accepted accounting principles.
Cincinnati, Ohio
May 20, 2011
��
THE FLIPPIN, BRUCE & PORTER FUNDS BOARD OF TRUSTEES AND EXECUTIVE OFFICERS (Unaudited) |
Overall responsibility for management of the Funds rests with the Board of Trustees. The Trustees serve during the lifetime of the Trust and until its termination, or until death, resignation, retirement or removal. The Trustees, in turn, elect the officers of the Funds. The officers have been elected for an annual term. The following are the Trustees and executive officers of the Funds:
| | Trustee | Address | Age | Position Held with the Trust | Length of Time Served |
| * | Charles M. Caravati, Jr. | 931 Broad Street Road Manakin-Sabot, VA | 74 | Chairman and Trustee | Since June 1991 |
| * | Austin Brockenbrough III | 1802 Bayberry Court, Suite 400 Richmond, VA | 74 | Trustee | Since September 1988 |
| * | John T. Bruce | 800 Main Street Lynchburg, VA | 57 | Trustee and President | Since September 1988 |
| | Robert S. Harris | 100 Darden Boulevard Charlottesville, VA | 61 | Trustee | Since January 2007 |
| | J. Finley Lee, Jr. | 448 Pond Apple Drive North Naples, FL | 71 | Trustee | Since September 1988 |
| | Richard L. Morrill | University of Richmond Richmond, VA | 71 | Trustee | Since March 1993 |
| | Harris V. Morrissette | 100 Jacintoport Boulevard Saraland, AL | 51 | Trustee | Since March 1993 |
| | Samuel B. Witt III | 302 Clovelly Road Richmond, VA | 75 | Trustee | Since November 1988 |
| | John M. Flippin | 800 Main Street Lynchburg, VA | 69 | Vice President | Since September 1988 |
| | R. Gregory Porter III | 800 Main Street Lynchburg, VA | 69 | Vice President | Since September 1988 |
| | John H. Hanna IV | 800 Main Street Lynchburg, VA | 55 | Vice President | Since February 2007 |
| | David J. Marshall | 800 Main Street Lynchburg, VA | 54 | Vice President | Since February 2007 |
| | Robert G. Dorsey | 225 Pictoria Drive, Suite 450 Cincinnati, OH | 54 | Vice President | Since November 2000 |
| | Mark J. Seger | 225 Pictoria Drive, Suite 450 Cincinnati, OH | 49 | Treasurer | Since November 2000 |
| | Tina H. Bloom | 225 Pictoria Drive, Suite 450 Cincinnati, OH | 42 | Secretary and Chief Compliance Officer | Since August 2006 |
| * | Messrs. Bruce and Brockenbrough, as affiliated persons of investment advisers to the Trust, are “interested persons” of the Trust within the meaning of Section 2(a)(19) of the Investment Company Act of 1940. Charles M. Caravati, Jr. is the father of Charles M. Caravati III, an officer of The Jamestown Funds, which are other series of the Trust. |
THE FLIPPIN, BRUCE & PORTER FUNDS BOARD OF TRUSTEES AND EXECUTIVE OFFICERS (Unaudited) (Continued) |
Each Trustee oversees eleven portfolios of the Trust, including the Funds. The principal occupations of the Trustees and executive officers of the Funds during the past five years and public directorships held by the Trustees are set forth below:
Charles M. Caravati, Jr. is a retired physician. He is also the retired President of Dermatology Associates of Virginia, P.C.
Austin Brockenbrough III is President and Managing Director of Lowe, Brockenbrough & Company, Inc. (an investment advisory firm). He is a member of the Board of Directors of Tredegar Corporation (a plastics manufacturer) and Wilkinson O’Grady & Co., Inc. (a global asset manager).
John T. Bruce is President, Director and member of the Executive Committee of Flippin, Bruce & Porter, Inc. (an investment advisory firm).
Robert S. Harris is the C. Stewart Sheppard Professor of Business Administration at The Darden Graduate School of Business Administration at the University of Virginia. He was previously the dean at Darden. Professor Harris has published widely on corporate finance, financial markets and mergers and acquisitions and has served as a consultant to corporations and government agencies.
J. Finley Lee, Jr. is the retired Julian Price Professor Emeritus at the University of North Carolina.
Richard L. Morrill serves as President of the Teagle Foundation (charitable foundation) and Chancellor of the University of Richmond. He is also a member of the Board of Directors of Tredegar Corporation and Albemarle Corporation (specialty chemical manufacturer).
Harris V. Morrissette is President of China Doll Rice and Beans Inc. and Dixie Lily Foods. He is a member of the Board of Directors of BancTrust Financial Group, Inc. (a bank holding company) and International Shipholding Corporation (cargo transportation). In addition, he is Chairman of Azalea Aviation, Inc. (an airplane fueling company).
Samuel B. Witt III is the retired Senior Vice President and General Counsel of Stateside Associates, Inc. He is also a member of the Board of Directors of The Swiss Helvetia Fund, Inc. (a closed-end investment company).
John M. Flippin is a Director of the Adviser.
R. Gregory Porter III is a Director of the Adviser.
John H. Hanna IV is a Vice President, Director and member of the Executive Committee of the Adviser.
David J. Marshall is Secretary, Director and member of the Executive Committee of the Adviser.
Robert G. Dorsey is a Managing Director of Ultimus Fund Solutions, LLC and Ultimus Fund Distributors, LLC.
Mark J. Seger is a Managing Director of Ultimus Fund Solutions, LLC and Ultimus Fund Distributors, LLC.
Tina H. Bloom is Director of Fund Administration of Ultimus Fund Solutions, LLC.
Additional information about members of the Board of Trustees and executive officers is available in the Statement of Additional Information (“SAI”). To obtain a free copy of the SAI, please call 1-800-281-3217.
THE FLIPPIN, BRUCE & PORTER FUNDS ABOUT YOUR FUNDS’ EXPENSES (Unaudited) |
We believe it is important for you to understand the impact of costs on your investment. All mutual funds have operating expenses. As a shareholder of the Funds, you incur ongoing costs, including management fees and other operating expenses. These ongoing costs, which are deducted from each Fund’s gross income, directly reduce the investment return of the Funds.
A mutual fund’s ongoing costs are expressed as a percentage of its average net assets. This figure is known as the expense ratio. The following examples are intended to help you understand the ongoing costs (in dollars) of investing in the Funds and to compare these costs with the ongoing costs of investing in other mutual funds. The examples below are based on an investment of $1,000 made at the beginning of the period shown and held for the entire period (October 1, 2010 through March 31, 2011).
The table below illustrates each Fund’s ongoing costs in two ways:
Actual fund return – This section helps you to estimate the actual expenses that you paid over the period. The “Ending Account Value” shown is derived from each Fund’s actual return, and the third column shows the dollar amount of operating expenses that would have been paid by an investor who started with $1,000 in the Funds. You may use the information here, together with the amount you invested, to estimate the expenses that you paid over the period.
To do so, simply divide your account value by $1,000 (for example, an $8,600 account value divided by $1,000 = 8.6), then multiply the result by the number given for the Funds under the heading “Expenses Paid During Period.”
Hypothetical 5% return – This section is intended to help you compare the Funds’ ongoing costs with those of other mutual funds. It assumes that each Fund had an annual return of 5% before expenses during the period shown, but that the expense ratio is unchanged. In this case, because the returns used are not the Funds’ actual returns, the results do not apply to your investment. The example is useful in making comparisons because the Securities and Exchange Commission (“SEC”) requires all mutual funds to calculate expenses based on a 5% return. You can assess each Fund’s ongoing costs by comparing this hypothetical example with the hypothetical examples that appear in shareholder reports of other funds.
Note that expenses shown in the table are meant to highlight and help you compare ongoing costs only. The Funds do not charge sales loads or redemption fees, nor do they carry a “sales load.”
The calculations assume no shares were bought or sold during the period. Your actual costs may have been higher or lower, depending on the amount of your investment and the timing of any purchases or redemptions.
More information about the Funds’ expenses, including annual expense ratios for the past five fiscal years, can be found in this report. For additional information on operating expenses and other shareholder costs, please refer to the Funds’ prospectus.
FBP Value Fund
| | Beginning Account Value October 1, 2010 | Ending Account Value March 31, 2011 | Expenses Paid During Period* |
| Based on Actual Fund Return | $1,000.00 | $1,142.50 | $5.72 |
| Based on Hypothetical 5% Return (before expenses) | $1,000.00 | $1,019.60 | $5.39 |
| * | Expenses are equal to the FBP Value Fund’s annualized expense ratio of 1.07% for the period, multiplied by the average account value over the period, multiplied by 182/365 (to reflect the one-half year period). |
THE FLIPPIN, BRUCE & PORTER FUNDS ABOUT YOUR FUNDS’ EXPENSES (Unaudited) (Continued) |
FBP Balanced Fund
| | Beginning Account Value October 1, 2010 | Ending Account Value March 31, 2011 | Expenses Paid During Period* |
| Based on Actual Fund Return | $1,000.00 | $1,106.80 | $5.25 |
| Based on Hypothetical 5% Return (before expenses) | $1,000.00 | $1,019.95 | $5.04 |
| * | Expenses are equal to the FBP Balanced Fund’s annualized expense ratio of 1.00% for the period, multiplied by the average account value over the period, multiplied by 182/365 (to reflect the one-half year period). |
OTHER INFORMATION (Unaudited) |
The Trust files a complete listing of portfolio holdings for the Funds with the SEC as of the first and third quarters of each fiscal year on Form N-Q. The filings are available upon request, by calling 1-800-327-9375. Furthermore, you may obtain a copy of these filings on the SEC’s website at http://www.sec.gov. The Trust’s Forms N-Q may also be reviewed and copied at the SEC’s Public Reference Room in Washington, DC, and information on the operation of the Public Reference Room may be obtained by calling 1-800-SEC-0330.
A description of the policies and procedures that the Funds use to determine how to vote proxies relating to portfolio securities is available without charge upon request by calling toll-free 1-800-327-9375, or on the SEC’s website at http://www.sec.gov. Information regarding how the Funds voted proxies relating to portfolio securities during the most recent 12-month period ended June 30 is also available without charge upon request by calling toll-free 1-800-327-9375, or on the SEC’s website at http://www.sec.gov.
FEDERAL TAX INFORMATION (Unaudited) |
In accordance with federal tax requirements, the following provides shareholders with information concerning distributions from ordinary income and net realized gains made by the Funds during the year ended March 31, 2011. For the fiscal year ended March 31, 2011, certain dividends paid by the Funds may be subject to a maximum tax rate of 15%, as provided by the Jobs and Growth Tax Relief Reconciliation Act of 2003. FBP Value Fund and FBP Balanced Fund intend to designate up to a maximum amount of $199,622 and $740,442, respectively, as taxed at a maximum rate of 15%. Additionally, for the fiscal year ended March 31, 2011, 100% and 94% of the dividends paid from ordinary income by FBP Value Fund and FBP Balanced Fund, respectively, qualified for the dividends received deduction for corporations. As required by federal regulations, complete information will be computed and reported in conjunction with your 2011 Form 1099-DIV.
THE FLIPPIN, BRUCE & PORTER FUNDS DISCLOSURE REGARDING APPROVAL OF INVESTMENT ADVISORY AGREEMENT (Unaudited) |
At an in-person meeting held on February 8, 2011, the Board of Trustees, including a majority of the Independent Trustees, approved the continuance for a one-year period of the Investment Advisory Agreements with the Adviser on behalf of the FBP Value Fund and the FBP Balanced Fund. Below is a discussion of the factors considered by the Board of Trustees along with their conclusions with respect thereto that formed the basis for the Board’s approvals.
In selecting the Adviser and approving the continuance of the Investment Advisory Agreements, the Trustees considered all information they deemed reasonably necessary to evaluate the terms of the Agreements. The principal areas of review by the Trustees were the nature, extent and quality of the services provided by the Adviser and the reasonableness of the fees charged for those services. These matters were considered by the Independent Trustees consulting with experienced counsel for the Independent Trustees, who is independent of the Adviser.
The Trustees’ evaluation of the quality of the Adviser’s services took into account their knowledge and experience gained through meetings with and reports of the Adviser’s senior management over the course of the preceding year. Both short-term and long-term investment performance of the Funds was considered. Each Fund’s performance was compared to its performance benchmark and to that of competitive funds with similar investment objectives and to the Adviser’s comparably managed private accounts. The Trustees also considered the scope and quality of the in-house capabilities of the Adviser and other resources dedicated to performing services for the Funds. The quality of administrative and other services, including the Adviser’s role in coordinating the activities of the Funds’ other service providers, were considered in light of the Funds’ compliance with investment policies and applicable laws and regulations and of related reports by management and the Funds’ independent public accounting firm in periodic meetings with the Trust’s Audit Committee. The Trustees also considered the business reputation of the Adviser, the qualifications of its key investment and compliance personnel, and its financial resources.
In reviewing the fees payable under the Investment Advisory Agreements, the Trustees compared the advisory fees and overall expense levels of each Fund with those of competitive funds with similar investment objectives as well as the private accounts managed by the Adviser. The Trustees considered information provided by the Adviser concerning the Adviser’s profitability with respect to each Fund, including the assumptions and methodology used in preparing the profitability information, in light of applicable case law relating to advisory fees. For these purposes, the Trustees took into account not only the fees paid by the Funds, but also so-called “fallout” benefits to the Adviser, such as the benefits of research made available to the Adviser by reason of brokerage commissions generated by the Funds’ securities transactions. The Trustees also reviewed the revenue sharing arrangements relating to the Funds, whereby fees are paid by the Adviser to various intermediaries that direct assets to the Funds. In evaluating the Funds’ advisory fees, the Trustees took into account the complexity and quality of the investment management of the Funds.
Based upon their review of this information, the Independent Trustees concluded that: (i) upon consideration of the 2010 performance and the longer term performance of each Fund, in light of the Adviser’s investment approach and each Fund’s investment objective, as well as the services provided to shareholders, the Adviser has provided satisfactory services to the Funds as compared to similarly managed funds; (ii) although the contractual advisory fee rates for each Fund are in the higher range of fees for other comparably managed funds, the Independent Trustees believe the fees to be reasonable given the scope and quality of services
THE FLIPPIN, BRUCE & PORTER FUNDS DISCLOSURE REGARDING APPROVAL OF INVESTMENT ADVISORY AGREEMENT (Unaudited) (Continued) |
provided by the Adviser; (iii) the total operating expense ratio of each Fund, after fee waivers, is lower than the average expense ratio for comparably managed funds, according to statistics derived from Morningstar, Inc.; and (iv) the Adviser’s decision to cap overall operating expenses of the Funds by voluntarily waiving a portion of its advisory fees has enabled each Fund to increase returns for shareholders and to maintain an overall expense ratio that is competitive with the average for similarly managed funds, despite the small size of the Funds. The Board noted that the Adviser’s profitability analysis indicated that the Adviser did not derive any profits from its management of the Funds over the past year. Given the current size of the Funds and their expected growth, the Independent Trustees did not believe that at the present time it would be relevant to consider the extent to which economies of scale would be realized as the Funds grow, and whether fee levels reflect these economies of scale. The Independent Trustees also considered the “fallout” benefits to the Adviser with respect to the Funds, but given the amounts involved viewed these as secondary factors in connection with the evaluation of the reasonableness of the advisory fees paid by the Funds.
No single factor was considered in isolation or to be determinative to the decision of the Trustees to approve continuance of the Investment Advisory Agreements. Rather the Trustees concluded, in light of a weighing and balancing of all factors considered, that it was in the best interests of each Fund and its shareholders to continue its Investment Advisory Agreement without modification to its terms, including the fees charged for services thereunder.
| | | | | | |
| | | | | | | |
| | | | | | | |
| | | | | | | |
| | | | Investment Adviser Flippin, Bruce & Porter, Inc. 800 Main Street, Second Floor P.O. Box 6138 Lynchburg, Virginia 24505 Toll-Free 1-800-327-9375 www.fbpinc.com Administrator Ultimus Fund Solutions, LLC P.O. Box 46707 Cincinnati, Ohio 45246-0707 Toll-Free 1-866-738-1127 Custodian US Bank NA 425 Walnut Street Cincinnati, Ohio 45202 Independent Registered Public Accounting Firm Ernst & Young LLP 1900 Scripps Center 312 Walnut Street Cincinnati, Ohio 45202 | Legal Counsel Sullivan & Worcester LLP One Post Office Square Boston, Massachusetts 02109 Officers John T. Bruce, President and Portfolio Manager John M. Flippin, Vice President R. Gregory Porter, III, Vice President John H. Hanna, IV, Vice President David J. Marshall, Vice President Trustees Austin Brockenbrough, III John T. Bruce Charles M. Caravati, Jr. Robert S. Harris J. Finley Lee, Jr. Richard L. Morrill Harris V. Morrissette Samuel B. Witt, III
| | | |
| | | | | | | |
| | | | | | | |
| | | | | | |
THE GOVERNMENT STREET FUNDS No-Load Mutual Funds Annual Report March 31, 2011 |
The Government Street Equity Fund The Government Street Mid-Cap Fund The Alabama Tax Free Bond Fund |
| LETTER FROM THE PRESIDENT | May 10, 2011 |
Dear Fellow Shareholders:
We are enclosing for your review the audited Annual Reports of The Government Street Funds for the year ended March 31, 2011.
The Government Street Equity Fund
The Government Street Equity Fund had a positive 18.69% total return for the fiscal year ended March 31, 2011. By comparison, the S&P 500 Index and the Morningstar Large Blend Equity category were up 15.65% and 14.52%, respectively. The positive portfolio returns were a continuation of the recovery experienced in fiscal 2010 where the Fund had a 54.71% total return. While not a complete recovery to the market highs reached in 2007, prior to the recessionary decline that took the S&P 500 Index down more than 50% at its lowest point, the rebound has been substantial. Hopefully the rebound in the equity markets will contribute to a sustained economic recovery.
A list of current economic components, by almost every measure, looks to have significantly better prospects than this time last year. However, the absolute levels of unemployment, housing starts, National debt and deficit have not shown improvements that demonstrate significant recovery. In fact, the lack of ability of the Federal Government to deal with its part of these issues has created an uncertainty that we believe will act as a constraint on continued general positive performance of the stock market. This is an element that we believe will make investors much more discriminating going forward. The powerful lift, “A rising tide lifting all ships,” which we cited in the last year’s letter, has now passed.
Last year, we wrote of The Government Street Equity Funds’ focus more on risk control than return production. As we expected, the Fund’s return proved to be competitive, on a relative basis, using that strategy. Broad diversification of investments is the tactic we utilize to implement our strategy. You will find that we continue to invest your Fund across all capitalization ranges, into growth and value categories, into international and emerging market economies, into real estate investment trusts and commodity related securities. This is accomplished using individual corporate securities, exchange-traded funds, master limited partnerships, writing covered call options and using short-term bond substitutes for money market funds.
The 10 largest holdings in The Government Street Equity Fund as of March 31, 2011 were:
| Security Description | % of Net Assets |
| Vanguard Mid-Cap ETF | 3.0% |
| Vanguard Emerging Markets ETF | 2.9% |
| Philip Morris International, Inc. | 2.8% |
| Caterpillar, Inc. | 2.7% |
| Apple, Inc. | 2.6% |
| Chevron Corporation | 2.3% |
| ConocoPhillips | 2.2% |
| United Technologies Corporation | 2.0% |
| International Business Machines Corporation | 2.0% |
| Walt Disney Company (The) | 1.9% |
Exchange-traded funds have continued a prominent role in the Fund’s investment holdings, as evidenced by 2 of the top 10 holdings. Each ETF represents a composite holding of an extensive number of securities that have some common characteristic.
The Vanguard Mid-Cap ETF represents an investment in over 450 individual securities that meet Vanguard’s definition of mid capitalization corporate equities. The inclusion of this one security in the portfolio provides the Fund with broad diversification that would be impossible to achieve individually in a fund with the total value of The Government Street Equity Fund. The ability to achieve diversification utilizing ETFs has allowed us an opportunity for risk control that would be otherwise unattainable. Exchange-traded funds, as a whole, represented 17.7% of your Fund’s net assets as of March 31, 2011.
There were significant individual performances during the fiscal year. The 5 highest returns as measured by the internal rate of return for the entire period were:
| American Capital Ltd. | 113.51% |
| Caterpillar, Inc. | 80.90% |
| Manitowoc Company, Inc. (The) | 69.80% |
| Computer Programs & Systems, Inc. | 69.25% |
| Stericycle, Inc. | 62.70% |
The 5 worst individual performances during the fiscal year as measured by internal rate of return for the entire period were:
| Market Vectors Steel Index ETF | -5.40% |
| Adobe Systems, Inc. | -6.25% |
| Elan Corporation plc - ADR | -9.23% |
| Teva Pharmaceutical Industries Ltd. - ADR | -19.36% |
| Hewlett-Packard Company | -21.25% |
The Fund’s best performing economic sector for the fiscal year was Energy, up at 32.57%. The two best performing stocks in this sector, held for the entire year, were ConocoPhillips and Chevron with total returns of 61.70% and 45.64%, respectively. The second best performing sector was Industrials at 30.84%. The two best performing stocks in this sector, held for the entire year, were Caterpillar and Manitowoc with total returns of 80.90% and 69.80%, respectively.
Note: The investment performances listed for economic sectors and securities in the two preceding paragraphs are extracted from an in-house independent internal rate of return computation by the Advent Axys portfolio accounting system. The calculations are gross investment returns. Total investment returns are for the fiscal year April 1, 2010 through March 31, 2011.
Our statement of last year is repeated here due to our continued, consistent perception of the markets and the economy:
“We believe that continued upward movement of markets and economies worldwide are highly dependent on Governments getting their financial balance sheets in order. There has been unparalleled deficit spending around the world. Those economies not directly participating in the credit shortfalls will be indirectly
impacted by lower import/export activities brought on by significant debt imposed slowdown. This will occur domestically and internationally as economies have become more highly correlated in their economic cycles.
In response to this perceived scenario, risk management takes precedent over return pursuits in the near term. Your Fund remains essentially fully invested to capture returns, but highly diversified to mitigate the risks associated with that position.”
Having acknowledged the risks, it is only proper to comment on prospects for returns. We continue to believe that direct and indirect investments in international markets have great prospects for the future. The indirect investments come through domestic securities that have significant international operations or markets. It is estimated that approximately 40% of the S&P 500 Index’s earnings come from international sources.
While significant risks exist, we believe that investors have prospects for one of the greatest investment environments for generations. There are over 6½ billion people in the world today. (USA population is approximately 311 million.) Many of these potential consumers are moving into middle class ranks. In our opinion, the demand for goods and services for the future is tremendous. Remember that, in our own economy, approximately 60% of GDP is tied to consumers. With the business advantages that the USA enjoys in manufacturing know-how, technology, intellectual content, productivity and numerous other characteristics, if Government will provide a competitive framework for operating, the benefits could be the best ever.
As of March 31, 2011, the Fund���s net assets were $66,372,571, up from $57,766,328 at the beginning of the fiscal year; net asset value per share was $48.00; and the ratio of expenses to net average assets was .88%. Portfolio turnover rate during the year was 26%. Income dividends of $0.3840 per share and capital gains of $0.0817 per share were distributed to shareholders during the year.
The Government Street Mid-Cap Fund
The Government Street Mid-Cap Fund completed its seventh year on March 31, 2011. The Fund produced a one year return of 23.80% while the Fund’s benchmark, the S&P MidCap 400 Index (the “S&P 400”), produced a one year return of 26.95%. The S&P 400 is an index maintained by the Standard & Poor’s Index Committee that selects companies with market capitalizations between $1 billion and $4.4 billion. The goal of the S&P 400 is to identify companies that represent the risk and reward characteristics of mid-sized companies. During the year ended March 31, 2011, mid-cap stocks significantly outperformed large-cap stocks while also outperforming small-cap stocks. The top performing sectors in the S&P 400 were Energy and Information Technology. The Government Street Mid-Cap Fund tracked the index well over the past year with the slight underperformance attributable to cash held at times over the year as well as fees and expenses. The S&P 400 does not have to incur operational fees and expenses or manage cash contributions and withdrawals like mutual funds must accommodate. The Government Street Mid-Cap Fund’s performance benefitted from underweighting Financials stocks as compared to the S&P 400 since the Financials
sector was the worst performing sector in the S&P 400. Some of the biggest individual contributors to the Fund’s performance over the past year were Netflix (+222%), HealthSpring, (+112%), BorgWarner (+111%) and priceline.com (+103%).
The longer term performance of the Fund has been very competitive when compared to the S&P 400, as well as large-cap stocks as measured by the S&P 500 Index and small-cap stocks as measured by the Russell 2000 Index. The average annual total returns for the past 3 years and 5 years ended March 31, 2011 are shown in the following table:
| | 3 YEAR AVERAGE ANNUAL TOTAL RETURN | 5 YEAR AVERAGE ANNUAL TOTAL RETURN |
| The Government Street Mid-Cap Fund | 9.45% | 5.50% |
| S&P 400 Index | 10.00% | 6.07% |
| S&P 500 Index | 2.35% | 2.62% |
| Russell 2000 Index | 8.57% | 3.35% |
Mid-cap stocks as measured by the S&P 400 have outperformed large-cap stocks (S&P 500 Index) and small-cap stocks (Russell 2000 Index) over the past one, three, five, ten and fifteen years. Over the past fifteen years, the S&P 400 has an annualized return of 11.63%, compared to 6.80% for the S&P 500 Index and 7.83% for the Russell 2000 Index. We believe this helps to validate our view that mid-cap stocks are in the “sweet spot” of being more stable than small-cap stocks while also offering better growth prospects than large-cap stocks. In our view, mid-cap stocks should continue to offer attractive relative returns.
The stock market has continued its strong momentum into the first quarter of 2011, as record government spending and accommodative monetary policy along with private sector cost cutting have led to strong corporate earnings and resumed growth in the U.S. economy. Manufacturing has continued to improve while employment has just begun to show signs of improvement through lower jobless claims. Officially, inflation has been benign although consumers are personally feeling the pinch with the prices of oil, food, and other commodities up substantially. Near-term concerns for the economy include housing which continues to suffer from reduced prices and sales volume as well as from uncertainty as to how the reduction of government stimulus will affect the sustainability of economic growth. Longer-term, the U.S. is struggling with a government deficit that we believe is unsustainable at current levels. Currently, all we have is a lot of political wrangling and finger pointing as it relates to the budget deficit. But one thing is certain and that is that the government is going to have to pay its debts whether they can agree to take proactive measures to control the debt now or wait until a “tipping point” where options are reduced and action is mandatory.
As of March 31, 2011, the net assets of The Government Street Mid-Cap Fund were $39,983,388 and the net asset value per share was $15.89. The turnover rate for the year ended March 31, 2011 was 20% and the total number of holdings was 170 as of March 31, 2011. The ratio of expenses to average net assets was 1.13%.
The Alabama Tax Free Bond Fund
The municipal bond market experienced volatility during the past year that is rarely seen in this fixed income asset class. Although rates had been generally trending lower for much of 2010, reaching a low point in the early fall of the year, the fourth quarter proved to be particularly tumultuous as investors had to contend with several significant events. First and foremost was the uncertainty surrounding the expiration of the popular bond subsidy program known as Build America Bonds. Through this program, state and local governments issued federally subsidized taxable bonds, almost always in conjunction with a tax-exempt issue. With the pending December 31, 2010 expiration of this attractive debt option for state and local municipalities, there was a flood of new issues as year end approached which exceeded the ability of the market to absorb the bonds in such a short period. This abundant supply in the market, coupled with a significant upward move in yields on United States Treasury securities, led to meaningful price erosion and higher yields in the municipal bond market during the fourth quarter of 2010.
In addition to these technical factors, the market also had to contend with market commentary from some analysts that suggested that the municipal bond market was vulnerable to an unprecedented wave of defaults totaling hundreds of billions of dollars. This alarming rhetoric, coupled with weakening bond prices, led to enormous outflows from municipal bond funds. There can be no question that state and local governments are facing major issues as revenues from their most significant tax sources have declined with the weakened economy. Additionally, they will have to do without the federal stimulus dollars which helped cities and states through the financial crisis. In most instances, the reaction to the situation on behalf of state and local governments has been swift. Across-the-board budget cuts from education to transportation have been widespread, as have increased sales and use taxes in many localities. While isolated defaults cannot be ruled out, and in fact should be anticipated, the number and dollar volume of such instances should be limited to the non-rated and the very lowest rated issuers.
The first quarter of 2011 has seen a significant decline in new issuance of municipal bonds, to a level not seen in more than 10 years. Alabama has been no exception to this as the unsettled market conditions and strained budgets have caused many issuers to take a wait-and-see attitude. Prices have stabilized in the market as the fiscal year concludes and the pace of outflows from mutual funds has declined. The municipal bond market will remain vulnerable to headline risk while states and local governments continue to grapple with budget issues. For now, investors will be focused on the outlook for inflation and the commensurate actions of the Federal Reserve Board as the year progresses.
We have continued to focus on the higher end of the quality spectrum in acquiring bonds for the Fund. 92.5% of the Fund’s holdings are rated AA or AAA by Moody’s or Standard and Poor’s. The duration of the Fund remained virtually unchanged from the prior year, standing at 3.5 years as of March 31, 2011. The Fund’s generally defensive posture remains in place with a laddered portfolio of short and intermediate Alabama municipal bonds. For the year ended March 31 2011, the Fund had a total
return of 1.78%, as compared to returns of 2.31% for the Barclays Capital 3-Year Municipal Bond Index, 3.93% for the Barclays Capital 7-Year Municipal Bond Index and 2.02% for the Lipper Intermediate Municipal Fund Index. It should be noted that The Alabama Tax Free Bond Fund has a shorter average maturity than the Lipper Intermediate Municipal Fund Index and the Barclays Capital 7-Year Municipal Bond Index and consistently maintains a portfolio of higher rated securities, on average, than the holdings comprising the comparable indices. Additionally, while the Fund holds securities with maturities ranging from less than one year to more than nine years, the Barclays Capital 3-Year Municipal Bond Index holds only securities with maturities of approximately three years and the Barclays Capital 7-Year Municipal Bond Index only maintains securities with maturities ranging between six and eight years. Also, the Barclays Capital indices include zero coupon bonds as well as bonds which are subject to the alternative minimum tax. The Fund holds neither of these types of securities.
As of March 31, 2011, the weighted average maturity of the portfolio was 3.9 years, down slightly from 4.1 years at the start of the fiscal year. The net assets of the Fund as of March 31, 2011, were $27,026,489 and the net asset value per share was $10.45. The ratio of net investment income to average net assets during the fiscal year was 2.51% and the ratio of net expenses to average net assets was .65%.
Thank you for your continued confidence in The Government Street Funds. Please call us if we can be of further service to you.
Very truly yours,
Thomas W. Leavell
President
Leavell Investment Management, Inc.
The Government Street Funds
Data presented reflects past performance, which is no guarantee of future results. Investment results and principal value will fluctuate so that shares, when redeemed, may be worth more or less than their original cost. Due to market volatility, current performance may be higher or lower than the performance shown.
This report is submitted for the general information of the shareholders of the Funds. The report is not authorized for distribution to prospective investors in the Funds unless it is accompanied by a current prospectus.
This report reflects our views, opinions and portfolio holdings as of March 31, 2011, the end of the reporting period. These views are subject to change at any time based upon market or other conditions. For more current information throughout the year please visit www.leavellinvestments.com.
THE GOVERNMENT STREET EQUITY FUND PERFORMANCE INFORMATION (Unaudited) |
| | Average Annual Total Returns(a) (for periods ended March 31, 2011) |
| | 1 Year | 5 Years | 10 Years |
| The Government Street Equity Fund | 18.69% | 2.81% | 3.34% |
| Standard & Poor’s 500 Index | 15.65% | 2.62% | 3.29% |
| (a) | Total return is a measure of the change in value of an investment in the Fund over the periods covered, which assumes any dividends or capital gains distributions are reinvested in shares of the Fund. Returns do not reflect the deduction of taxes a shareholder would pay on Fund distributions or the redemption of Fund shares. |
THE GOVERNMENT STREET MID-CAP FUND PERFORMANCE INFORMATION (Unaudited) |
| | Average Annual Total Returns(a) (for periods ended March 31, 2011) |
| | 1 Year | 5 Years | Since Inception* |
| The Government Street Mid-Cap Fund | 23.80% | 5.50% | 8.77% |
| Standard & Poor’s MidCap 400 Index | 26.95% | 6.07% | 9.69% |
| (a) | Total return is a measure of the change in value of an investment in the Fund over the periods covered, which assumes any dividends or capital gains distributions are reinvested in shares of the Fund. Returns do not reflect the deduction of taxes a shareholder would pay on Fund distributions or the redemption of Fund shares. |
| * | Initial public offering of shares was November 17, 2003. |
THE ALABAMA TAX FREE BOND FUND PERFORMANCE INFORMATION (Unaudited) |
| | Average Annual Total Returns(a) (for periods ended March 31, 2011) |
| | 1 Year | 5 Years | 10 Years |
| The Alabama Tax Free Bond Fund | 1.78% | 3.30% | 3.27% |
| Barclays Capital 7-Year Municipal Bond Index | 3.93% | 5.31% | 4.94% |
| Barclays Capital 3-Year Municipal Bond Index | 2.31% | 4.36% | 3.77% |
| Lipper Intermediate Municipal Fund Index | 2.02% | 3.73% | 3.87% |
| (a) | Total return is a measure of the change in value of an investment in the Fund over the periods covered, which assumes any dividends or capital gains distributions are reinvested in shares of the Fund. Returns do not reflect the deduction of taxes a shareholder would pay on Fund distributions or the redemption of Fund shares. |
THE GOVERNMENT STREET EQUITY FUND PORTFOLIO INFORMATION March 31, 2011 (Unaudited) |
Sector Concentration (% of Net Assets) |
| |
| Vanguard Mid-Cap ETF | 3.0% |
| Vanguard Emerging Markets ETF | 2.9% |
| Philip Morris International, Inc. | 2.8% |
| Caterpillar, Inc. | 2.7% |
| Apple, Inc. | 2.6% |
| Chevron Corporation | 2.3% |
| ConocoPhillips | 2.2% |
| United Technologies Corporation | 2.0% |
| International Business Machines Corporation | 2.0% |
| Walt Disney Company (The) | 1.9% |
THE GOVERNMENT STREET MID-CAP FUND PORTFOLIO INFORMATION March 31, 2011 (Unaudited) |
Sector Concentration (% of Net Assets) |
| |
| iShares S&P MidCap 400 Index Fund | 4.2% |
| iShares Russell 2000 Index Fund | 3.2% |
| Cerner Corporation | 1.7% |
| Stericycle, Inc. | 1.7% |
| priceline.com, Inc. | 1.4% |
| AMETEK, Inc. | 1.2% |
| Cognizant Technology Solutions Corporation - Class A | 1.2% |
| Albemarle Corporation | 1.2% |
| Rayonier, Inc. | 1.1% |
| Edwards Lifesciences Corporation | 1.1% |
THE ALABAMA TAX FREE BOND FUND PORTFOLIO INFORMATION March 31, 2011 (Unaudited) |
Asset Allocation (% of Net Assets) |
|
| | |
| AAA | | 20.9% |
| AA | | 71.6% |
| A | | 2.0% |
| Not Rated | | 5.5% |
GOVERNMENT STREET EQUITY FUND SCHEDULE OF INVESTMENTS March 31, 2011 |
| | | | | | |
| Consumer Discretionary — 6.4% | | | | | | |
Darden Restaurants, Inc. | | | 5,000 | | | $ | 245,650 | |
Ford Motor Company (a) | | | 2,000 | | | | 29,820 | |
Home Depot, Inc. (The) | | | 17,500 | | | | 648,550 | |
ITT Educational Services, Inc. (a) | | | 1,600 | | | | 115,440 | |
Johnson Controls, Inc. | | | 20,000 | | | | 831,400 | |
McDonald's Corporation | | | 5,500 | | | | 418,495 | |
NIKE, Inc. - Class B | | | 7,525 | | | | 569,642 | |
Urban Outfitters, Inc. (a) | | | 4,000 | | | | 119,320 | |
Walt Disney Company (The) | | | 30,000 | | | | 1,292,700 | |
| | | | | | | | 4,271,017 | |
| Consumer Staples — 8.3% | | | | | | | | |
Altria Group, Inc. | | | 33,000 | | | | 858,990 | |
Coca-Cola Company (The) | | | 6,500 | | | | 431,275 | |
Kraft Foods, Inc. - Class A | | | 22,836 | | | | 716,137 | |
McCormick & Company, Inc. - Non-Voting Shares | | | 7,000 | | | | 334,810 | |
Mead Johnson Nutrition Company | | | 12,000 | | | | 695,160 | |
Philip Morris International, Inc. | | | 28,000 | | | | 1,837,640 | |
Procter & Gamble Company (The) | | | 10,000 | | | | 616,000 | |
| | | | | | | | 5,490,012 | |
| Energy — 9.2% | | | | | | | | |
Apache Corporation | | | 5,089 | | | | 666,252 | |
Chesapeake Energy Corporation | | | 3,500 | | | | 117,320 | |
Chevron Corporation | | | 14,000 | | | | 1,504,020 | |
ConocoPhillips | | | 18,500 | | | | 1,477,410 | |
Ensco plc - ADR | | | 12,000 | | | | 694,080 | |
Murphy Oil Corporation | | | 5,000 | | | | 367,100 | |
Pioneer Natural Resources Company | | | 5,000 | | | | 509,600 | |
Plains Exploration & Production Company (a) | | | 9,000 | | | | 326,070 | |
TransCanada Corporation | | | 11,000 | | | | 445,830 | |
| | | | | | | | 6,107,682 | |
| Financials — 7.5% | | | | | | | | |
Aegon N.V. - ARS | | | 30,900 | | | | 231,750 | |
Aflac, Inc. | | | 15,538 | | | | 820,096 | |
American Capital Ltd. (a) | | | 9,990 | | | | 98,901 | |
American International Group, Inc. (a) | | | 4,500 | | | | 158,130 | |
Brookfield Asset Management, Inc. - Class A | | | 19,000 | | | | 616,740 | |
Colonial Properties Trust | | | 65,000 | | | | 1,251,250 | |
Hartford Financial Services Group, Inc. | | | 25,000 | | | | 673,250 | |
JPMorgan Chase & Company | | | 5,000 | | | | 230,500 | |
U.S. Bancorp | | | 25,000 | | | | 660,750 | |
Willis Group Holdings plc | | | 5,000 | | | | 201,800 | |
| | | | | | | | 4,943,167 | |
GOVERNMENT STREET EQUITY FUND SCHEDULE OF INVESTMENTS (Continued) |
COMMON STOCKS — 80.2% (Continued) | | | | | | |
| Health Care — 10.4% | | | | | | |
Abbott Laboratories | | | 3,000 | | | $ | 147,150 | |
Alexion Pharmaceuticals, Inc. (a) | | | 8,000 | | | | 789,440 | |
Cardinal Health, Inc. | | | 8,515 | | | | 350,222 | |
CareFusion Corporation (a) | | | 6,000 | | | | 169,200 | |
Cerner Corporation (a) | | | 7,500 | | | | 834,000 | |
Computer Programs & Systems, Inc. | | | 9,100 | | | | 584,948 | |
Covidien plc | | | 5,000 | | | | 259,700 | |
Elan Corporation plc - ADR (a) | | | 20,000 | | | | 137,600 | |
Fresenius Medical Care AG & Company KGaA - ADR | | | 6,000 | | | | 405,120 | |
Questcor Pharmaceuticals, Inc. (a) | | | 20,000 | | | | 288,200 | |
Shire plc - ADR | | | 7,000 | | | | 609,700 | |
Techne Corporation | | | 10,000 | | | | 716,000 | |
Teva Pharmaceutical Industries Ltd. - ADR | | | 8,000 | | | | 401,360 | |
Waters Corporation (a) | | | 14,000 | | | | 1,216,600 | |
| | | | | | | | 6,909,240 | |
| Industrials — 13.4% | | | | | | | | |
C.H. Robinson Worldwide, Inc. | | | 3,000 | | | | 222,390 | |
Caterpillar, Inc. | | | 16,000 | | | | 1,781,600 | |
Emerson Electric Company | | | 20,000 | | | | 1,168,600 | |
General Dynamics Corporation | | | 15,000 | | | | 1,148,400 | |
General Electric Company | | | 20,000 | | | | 401,000 | |
Ingersoll-Rand plc | | | 13,500 | | | | 652,185 | |
Manitowoc Company, Inc. (The) | | | 14,000 | | | | 306,320 | |
Norfolk Southern Corporation | | | 10,000 | | | | 692,700 | |
Quanta Services, Inc. (a) | | | 20,000 | | | | 448,600 | |
Stericycle, Inc. (a) | | | 8,000 | | | | 709,360 | |
United Technologies Corporation | | | 16,000 | | | | 1,354,400 | |
| | | | | | | | 8,885,555 | |
| Information Technology — 15.8% | | | | | | | | |
Accenture plc - Class A | | | 9,500 | | | | 522,215 | |
Adobe Systems, Inc. (a) | | | 25,000 | | | | 829,000 | |
ADTRAN, Inc. | | | 15,000 | | | | 636,900 | |
Apple, Inc. (a) | | | 5,000 | | | | 1,742,250 | |
Automatic Data Processing, Inc. | | | 20,000 | | | | 1,026,200 | |
Broadridge Financial Solutions, Inc. | | | 5,000 | | | | 113,450 | |
Corning, Inc. | | | 28,000 | | | | 577,640 | |
eBay, Inc. (a) | | | 4,000 | | | | 124,160 | |
Google, Inc. - Class A (a) | | | 500 | | | | 293,105 | |
Hewlett-Packard Company | | | 20,000 | | | | 819,400 | |
International Business Machines Corporation | | | 8,000 | | | | 1,304,560 | |
Lam Research Corporation (a) | | | 3,000 | | | | 169,980 | |
MasterCard, Inc. - Class A | | | 3,000 | | | | 755,160 | |
NetApp, Inc. (a) | | | 13,000 | | | | 626,340 | |
Oracle Corporation | | | 10,000 | | | | 333,700 | |
GOVERNMENT STREET EQUITY FUND SCHEDULE OF INVESTMENTS (Continued) |
COMMON STOCKS — 80.2% (Continued) | | | | | | |
| Information Technology — 15.8% (Continued) | | | | | | |
TE Connectivity Ltd. | | | 7,000 | | | $ | 243,740 | |
Texas Instruments, Inc. | | | 10,000 | | | | 345,600 | |
| | | | | | | | 10,463,400 | |
| Materials — 4.8% | | | | | | | | |
Airgas, Inc. | | | 3,000 | | | | 199,260 | |
Albemarle Corporation | | | 8,000 | | | | 478,160 | |
Dow Chemical Company (The) | | | 17,000 | | | | 641,750 | |
Freeport-McMoRan Copper & Gold, Inc. | | | 9,932 | | | | 551,723 | |
Nucor Corporation | | | 11,000 | | | | 506,220 | |
Praxair, Inc. | | | 8,000 | | | | 812,800 | |
| | | | | | | | 3,189,913 | |
| Telecommunication Services — 0.7% | | | | | | | | |
América Móvil S.A.B. de C.V. - Series L - ADR | | | 6,000 | | | | 348,600 | |
NII Holdings, Inc. (a) | | | 3,000 | | | | 125,010 | |
| | | | | | | | 473,610 | |
| Utilities — 3.7% | | | | | | | | |
Duke Energy Corporation | | | 65,980 | | | | 1,197,537 | |
FirstEnergy Corporation | | | 21,000 | | | | 778,890 | |
Southern Company (The) | | | 2,000 | | | | 76,220 | |
Wisconsin Energy Corporation | | | 14,000 | | | | 427,000 | |
| | | | | | | | 2,479,647 | |
| | | | | | | | | |
Total Common Stocks (Cost $29,462,131) | | | | | | $ | 53,213,243 | |
EXCHANGE-TRADED FUNDS — 17.7% | | | | | | |
iShares MSCI BRIC Index Fund | | | 18,000 | | | $ | 905,580 | |
iShares Russell 2000 Index Fund | | | 14,600 | | | | 1,228,882 | |
iShares S&P MidCap 400 Index Fund | | | 7,000 | | | | 691,180 | |
Market Vectors Agribusiness ETF | | | 12,000 | | | | 672,480 | |
Market Vectors Coal ETF | | | 20,000 | | | | 1,014,400 | |
Market Vectors Gold Miners ETF | | | 10,500 | | | | 630,630 | |
Market Vectors Steel Index ETF | | | 6,000 | | | | 445,500 | |
ProShares Credit Suisse 130/30 ETF | | | 17,000 | | | | 1,043,358 | |
Vanguard Emerging Markets ETF | | | 40,000 | | | | 1,956,800 | |
Vanguard Mid-Cap ETF | | | 24,600 | | | | 1,981,530 | |
Vanguard Small-Cap ETF | | | 15,000 | | | | 1,184,850 | |
Total Exchange-Traded Funds (Cost $7,947,703) | | | | | | $ | 11,755,190 | |
GOVERNMENT STREET EQUITY FUND SCHEDULE OF INVESTMENTS (Continued) |
EXCHANGE-TRADED NOTES — 1.1% | | | | | | |
JPMorgan Alerian MLP Index ETN (Cost $611,920) | | | 19,000 | | | $ | 721,430 | |
| | | | | | |
| American International Group, Inc., 01/19/2021 at $45 (Cost $10,290) | | | 800 | | | $ | 8,904 | |
| | | | | | |
U.S. Bank, N.A., discount, 0.05% (b), due 04/01/2011 (Cost $639,000) | | $ | 639,000 | | | $ | 639,000 | |
MONEY MARKET FUNDS — 0.0% | | | | | | |
AIM STIT - STIC Prime Portfolio - Institutional Class, 0.12% (c) (Cost $288) | | | 288 | | | $ | 288 | |
| | | | | | | | | |
Total Investments at Value — 99.9% (Cost $38,671,332) | | | | | | $ | 66,338,055 | |
| | | | | | | | | |
Other Assets in Excess of Liabilities — 0.1% | | | | | | | 34,516 | |
| | | | | | | | | |
Net Assets — 100.0% | | | | | | $ | 66,372,571 | |
| ADR - American Depositary Receipt. |
| |
| ARS - American Registered Shares. |
| |
| (a) | Non-income producing security. |
| | |
| (b) | Rate shown is the annualized yield at time of purchase, not a coupon rate. |
| | |
| (c) | Variable rate security. The rate shown is the 7-day effective yield as of March 31, 2011. |
| | |
| See accompanying notes to financial statements. |
THE GOVERNMENT STREET MID-CAP FUND SCHEDULE OF INVESTMENTS March 31, 2011 |
| | | | | | |
| Consumer Discretionary — 13.6% | | | | | | |
BorgWarner, Inc. (a) | | | 2,550 | | | $ | 203,210 | |
Buffalo Wild Wings, Inc. (a) | | | 2,400 | | | | 130,632 | |
Chico's FAS, Inc. | | | 7,100 | | | | 105,790 | |
Coach, Inc. | | | 5,550 | | | | 288,822 | |
Darden Restaurants, Inc. | | | 2,575 | | | | 126,510 | |
DeVry, Inc. | | | 1,850 | | | | 101,879 | |
Dollar Tree, Inc. (a) | | | 2,100 | | | | 116,592 | |
DreamWorks Animation SKG, Inc. - Class A (a) | | | 2,300 | | | | 64,239 | |
Family Dollar Stores, Inc. | | | 2,800 | | | | 143,696 | |
Gildan Activewear, Inc. - Class A | | | 7,500 | | | | 245,775 | |
Guess?, Inc. | | | 5,975 | | | | 235,116 | |
Hasbro, Inc. | | | 2,525 | | | | 118,271 | |
ITT Educational Services, Inc. (a) | | | 905 | | | | 65,296 | |
Jarden Corporation | | | 5,650 | | | | 200,971 | |
John Wiley & Sons, Inc. - Class A | | | 1,800 | | | | 91,512 | |
Liberty Global, Inc. - Class A (a) | | | 3,825 | | | | 158,393 | |
Netflix, Inc. (a) | | | 1,425 | | | | 338,195 | |
Nordstrom, Inc. | | | 3,900 | | | | 175,032 | |
O'Reilly Automotive, Inc. (a) | | | 5,050 | | | | 290,173 | |
Panera Bread Company - Class A (a) | | | 1,100 | | | | 139,700 | |
PetSmart, Inc. | | | 3,500 | | | | 143,325 | |
Phillips-Van Heusen Corporation | | | 3,400 | | | | 221,102 | |
priceline.com, Inc. (a) | | | 1,130 | | | | 572,277 | |
Ross Stores, Inc. | | | 3,000 | | | | 213,360 | |
Service Corporation International | | | 13,700 | | | | 151,522 | |
Tiffany & Company | | | 3,175 | | | | 195,072 | |
True Religion Apparel, Inc. (a) | | | 8,250 | | | | 193,627 | |
Urban Outfitters, Inc. (a) | | | 5,600 | | | | 167,048 | |
Vail Resorts, Inc. (a) | | | 2,700 | | | | 131,652 | |
VF Corporation | | | 1,175 | | | | 115,773 | |
| | | | | | | | 5,444,562 | |
| Consumer Staples — 3.0% | | | | | | | | |
Church & Dwight Company, Inc. | | | 5,400 | | | | 428,436 | |
Hormel Foods Corporation | | | 12,000 | | | | 334,080 | |
J.M. Smucker Company (The) | | | 4,700 | | | | 335,533 | |
Mead Johnson Nutrition Company | | | 1,000 | | | | 57,930 | |
Tyson Foods, Inc. - Class A | | | 2,000 | | | | 38,380 | |
| | | | | | | | 1,194,359 | |
| Energy — 8.5% | | | | | | | | |
Cameron International Corporation (a) | | | 6,610 | | | | 377,431 | |
Cimarex Energy Company | | | 2,750 | | | | 316,910 | |
FMC Technologies, Inc. (a) | | | 4,030 | | | | 380,754 | |
Murphy Oil Corporation | | | 3,740 | | | | 274,591 | |
Newfield Exploration Company (a) | | | 2,800 | | | | 212,828 | |
THE GOVERNMENT STREET MID-CAP FUND SCHEDULE OF INVESTMENTS (Continued) |
COMMON STOCKS — 89.3% (Continued) | | | | | | |
| Energy — 8.5% (Continued) | | | | | | |
Noble Corporation (a) | | | 5,360 | | | $ | 244,523 | |
Overseas Shipholding Group, Inc. | | | 3,600 | | | | 115,704 | |
Peabody Energy Corporation | | | 4,800 | | | | 345,408 | |
Pioneer Natural Resources Company | | | 2,680 | | | | 273,146 | |
Pride International, Inc. (a) | | | 5,000 | | | | 214,750 | |
Range Resources Corporation | | | 3,500 | | | | 204,610 | |
Schlumberger Ltd. | | | 3,134 | | | | 292,277 | |
Valero Energy Corporation | | | 4,950 | | | | 147,609 | |
| | | | | | | | 3,400,541 | |
| Financials — 13.5% | | | | | | | | |
Alleghany Corporation (a) | | | 765 | | | | 253,200 | |
American Financial Group, Inc. | | | 8,400 | | | | 294,168 | |
Annaly Capital Management, Inc. | | | 8,500 | | | | 148,325 | |
Arch Capital Group Ltd. (a) | | | 2,650 | | | | 262,854 | |
Arthur J. Gallagher & Company | | | 6,750 | | | | 205,267 | |
Axis Capital Holdings Ltd. | | | 5,000 | | | | 174,600 | |
Bank of Hawaii Corporation | | | 6,000 | | | | 286,920 | |
Berkley (W.R.) Corporation | | | 10,050 | | | | 323,711 | |
Cullen/Frost Bankers, Inc. | | | 5,600 | | | | 330,512 | |
Eaton Vance Corporation | | | 10,250 | | | | 330,460 | |
Hudson City Bancorp, Inc. | | | 13,000 | | | | 125,840 | |
IntercontinentalExchange, Inc. (a) | | | 1,850 | | | | 228,549 | |
Jones Lang LaSalle, Inc. | | | 2,800 | | | | 279,272 | |
Legg Mason, Inc. | | | 3,780 | | | | 136,420 | |
Liberty Property Trust | | | 4,600 | | | | 151,340 | |
New York Community Bancorp, Inc. | | | 10,270 | | | | 177,260 | |
Old Republic International Corporation | | | 16,400 | | | | 208,116 | |
Potlatch Corporation | | | 6,941 | | | | 279,028 | |
Rayonier, Inc. | | | 7,000 | | | | 436,170 | |
SEI Investments Company | | | 10,000 | | | | 238,800 | |
St. Joe Company (The) (a) | | | 7,000 | | | | 175,490 | |
Unitrin, Inc. | | | 6,200 | | | | 191,456 | |
Westamerica Bancorporation | | | 3,300 | | | | 169,521 | |
| | | | | | | | 5,407,279 | |
| Health Care — 11.4% | | | | | | | | |
Alexion Pharmaceuticals, Inc. (a) | | | 800 | | | | 78,944 | |
Almost Family, Inc. (a) | | | 1,000 | | | | 37,640 | |
Bio-Rad Laboratories, Inc. - Class A (a) | | | 2,500 | | | | 300,350 | |
C.R. Bard, Inc. | | | 1,000 | | | | 99,310 | |
Cantel Medical Corporation | | | 2,000 | | | | 51,500 | |
Cephalon, Inc. (a) | | | 2,000 | | | | 151,560 | |
Cerner Corporation (a) | | | 6,000 | | | | 667,200 | |
Charles River Laboratories International, Inc. (a) | | | 3,000 | | | | 115,140 | |
Computer Programs & Systems, Inc. | | | 1,800 | | | | 115,704 | |
Covance, Inc. (a) | | | 4,000 | | | | 218,880 | |
THE GOVERNMENT STREET MID-CAP FUND SCHEDULE OF INVESTMENTS (Continued) |
COMMON STOCKS — 89.3% (Continued) | | | | | | |
| Health Care — 11.4% (Continued) | | | | | | |
Covidien plc | | | 1,500 | | | $ | 77,910 | |
Edwards Lifesciences Corporation (a) | | | 5,000 | | | | 435,000 | |
Ensign Group, Inc. (The) | | | 3,000 | | | | 95,790 | |
Fresenius Medical Care AG & Company KGaA - ADR | | | 4,000 | | | | 270,080 | |
Gilead Sciences, Inc. (a) | | | 150 | | | | 6,366 | |
Hanger Orthopedic Group, Inc. (a) | | | 4,000 | | | | 104,120 | |
HealthSpring, Inc. (a) | | | 2,500 | | | | 93,425 | |
Henry Schein, Inc. (a) | | | 2,000 | | | | 140,340 | |
Illumina, Inc. (a) | | | 1,000 | | | | 70,070 | |
Intuitive Surgical, Inc. (a) | | | 200 | | | | 66,692 | |
Life Technologies Corporation (a) | | | 2,891 | | | | 151,546 | |
Myrexis, Inc. (a) | | | 250 | | | | 965 | |
Myriad Genetics, Inc. (a) | | | 1,000 | | | | 20,150 | |
PSS World Medical, Inc. (a) | | | 2,000 | | | | 54,300 | |
Questcor Pharmaceuticals, Inc. (a) | | | 3,000 | | | | 43,230 | |
ResMed, Inc. (a) | | | 6,000 | | | | 180,000 | |
Shire plc - ADR | | | 1,500 | | | | 130,650 | |
Techne Corporation | | | 4,500 | | | | 322,200 | |
Teleflex, Inc. | | | 3,000 | | | | 173,940 | |
Teva Pharmaceutical Industries Ltd. - ADR | | | 2,163 | | | | 108,518 | |
Waters Corporation (a) | | | 2,000 | | | | 173,800 | |
| | | | | | | | 4,555,320 | |
| Industrials — 14.9% | | | | | | | | |
Alexander & Baldwin, Inc. | | | 3,000 | | | | 136,950 | |
AMETEK, Inc. | | | 11,250 | | | | 493,537 | |
C.H. Robinson Worldwide, Inc. | | | 5,000 | | | | 370,650 | |
Deluxe Corporation | | | 5,000 | | | | 132,700 | |
Donaldson Company, Inc. | | | 6,000 | | | | 367,740 | |
Expeditors International of Washington, Inc. | | | 6,000 | | | | 300,840 | |
Fastenal Company | | | 6,000 | | | | 388,980 | |
Goodrich Corporation | | | 3,500 | | | | 299,355 | |
Graco, Inc. | | | 6,000 | | | | 272,940 | |
Jacobs Engineering Group, Inc. (a) | | | 4,475 | | | | 230,149 | |
Joy Global, Inc. | | | 2,000 | | | | 197,620 | |
L-3 Communications Holdings, Inc. | | | 3,000 | | | | 234,930 | |
Manpower, Inc. | | | 4,000 | | | | 251,520 | |
MSC Industrial Direct Company, Inc. - Class A | | | 5,000 | | | | 342,350 | |
Oshkosh Corporation (a) | | | 5,000 | | | | 176,900 | |
Snap-on, Inc. | | | 3,575 | | | | 214,715 | |
SPX Corporation | | | 5,000 | | | | 396,950 | |
Stericycle, Inc. (a) | | | 7,500 | | | | 665,025 | |
Timken Company | | | 4,000 | | | | 209,200 | |
Waste Connections, Inc. | | | 6,000 | | | | 172,740 | |
WESCO International, Inc. (a) | | | 1,850 | | | | 115,625 | |
| | | | | | | | 5,971,416 | |
THE GOVERNMENT STREET MID-CAP FUND SCHEDULE OF INVESTMENTS (Continued) |
COMMON STOCKS — 89.3% (Continued) | | | | | | |
| Information Technology — 14.2% | | | | | | |
Activision Blizzard, Inc. | | | 16,000 | | | $ | 175,520 | |
ADTRAN, Inc. | | | 6,000 | | | | 254,760 | |
Advent Software, Inc. (a) | | | 8,000 | | | | 229,360 | |
Alliance Data Systems Corporation (a) | | | 5,000 | | | | 429,450 | |
Arrow Electronics, Inc. (a) | | | 8,600 | | | | 360,168 | |
Cognizant Technology Solutions Corporation - Class A (a) | | | 6,000 | | | | 488,400 | |
Cree, Inc. (a) | | | 4,820 | | | | 222,491 | |
DST Systems, Inc. | | | 4,000 | | | | 211,280 | |
Harris Corporation | | | 6,000 | | | | 297,600 | |
IAC/InterActiveCorporation (a) | | | 3,000 | | | | 92,670 | |
Integrated Device Technology, Inc. (a) | | | 10,000 | | | | 73,700 | |
Jack Henry & Associates, Inc. | | | 9,000 | | | | 305,010 | |
Lam Research Corporation (a) | | | 6,000 | | | | 339,960 | |
Linear Technology Corporation | | | 6,000 | | | | 201,780 | |
Microchip Technology, Inc. | | | 5,000 | | | | 190,050 | |
National Instruments Corporation | | | 12,000 | | | | 393,240 | |
NetApp, Inc. (a) | | | 5,000 | | | | 240,900 | |
OpenTable, Inc. (a) | | | 400 | | | | 42,540 | |
Plantronics, Inc. | | | 900 | | | | 32,958 | |
Polycom, Inc. (a) | | | 4,000 | | | | 207,400 | |
Rovi Corporation (a) | | | 6,000 | | | | 321,900 | |
SanDisk Corporation (a) | | | 5,000 | | | | 230,450 | |
Xilinx, Inc. | | | 7,000 | | | | 229,600 | |
Zebra Technologies Corporation - Class A (a) | | | 3,000 | | | | 117,720 | |
| | | | | | | | 5,688,907 | |
| Materials — 6.0% | | | | | | | | |
Airgas, Inc. | | | 4,000 | | | | 265,680 | |
Albemarle Corporation | | | 8,000 | | | | 478,160 | |
Ashland, Inc. | | | 3,000 | | | | 173,280 | |
Cabot Corporation | | | 4,000 | | | | 185,160 | |
Martin Marietta Materials, Inc. | | | 2,500 | | | | 224,175 | |
Packaging Corporation of America | | | 5,000 | | | | 144,450 | |
Scotts Miracle-Gro Company (The) - Class A | | | 4,000 | | | | 231,400 | |
Sonoco Products Company | | | 5,000 | | | | 181,150 | |
Steel Dynamics, Inc. | | | 12,000 | | | | 225,240 | |
Valspar Corporation (The) | | | 7,000 | | | | 273,700 | |
| | | | | | | | 2,382,395 | |
| Telecommunication Services — 0.1% | | | | | | | | |
Telephone and Data Systems, Inc. | | | 1,000 | | | | 33,700 | |
| | | | | | | | | |
| Utilities — 4.1% | | | | | | | | |
AGL Resources, Inc. | | | 8,400 | | | | 334,656 | |
Great Plains Energy, Inc. | | | 9,050 | | | | 181,181 | |
ONEOK, Inc. | | | 5,750 | | | | 384,560 | |
Pepco Holdings, Inc. | | | 7,900 | | | | 147,335 | |
THE GOVERNMENT STREET MID-CAP FUND SCHEDULE OF INVESTMENTS (Continued) |
COMMON STOCKS — 89.3% (Continued) | | | | | | |
| Utilities — 4.1% (Continued) | | | | | | |
SCANA Corporation | | | 7,530 | | | $ | 296,456 | |
Vectren Corporation | | | 10,600 | | | | 288,320 | |
| | | | | | | | 1,632,508 | |
| | | | | | | | | |
Total Common Stocks (Cost $22,044,326) | | | | | | $ | 35,710,987 | |
EXCHANGE-TRADED FUNDS — 8.8% | | | | | | |
First Trust NYSE Arca Biotechnology Index Fund (a) | | | 8,000 | | | $ | 329,600 | |
iShares Dow Jones U.S. Home Construction Index Fund | | | 3,600 | | | | 47,664 | |
iShares Nasdaq Biotechnology Index Fund | | | 2,000 | | | | 200,320 | |
iShares Russell 2000 Index Fund | | | 15,000 | | | | 1,262,550 | |
iShares S&P MidCap 400 Index Fund | | | 17,000 | | | | 1,678,580 | |
Total Exchange-Traded Funds (Cost $2,538,937) | | | | | | $ | 3,518,714 | |
EXCHANGE-TRADED NOTES — 0.8% | | | | | | |
JPMorgan Alerian MLP Index ETN (Cost $252,899) | | | 8,000 | | | $ | 303,760 | |
| | | | | | |
U.S. Bank, N.A., discount, 0.05% (b), due 04/01/2011 (Cost $431,000) | | $ | 431,000 | | | $ | 431,000 | |
MONEY MARKET FUNDS — 0.0% | | | | | | |
AIM STIT - STIC Prime Portfolio - Institutional Class, 0.12% (c) (Cost $507) | | | 507 | | | $ | 507 | |
| | | | | | | | | |
Total Investments at Value — 100.0% (Cost $25,267,669) | | | | | | $ | 39,964,968 | |
| | | | | | | | | |
Other Assets in Excess of Liabilities — 0.0% | | | | | | | 18,420 | |
| | | | | | | | | |
Net Assets — 100.0% | | | | | | $ | 39,983,388 | |
| ADR - American Depositary Receipt. |
| |
| (a) | Non-income producing security. |
| | |
| (b) | Rate shown is the annualized yield at time of purchase, not a coupon rate. |
| | |
| (c) | Variable rate security. The rate shown is the 7-day effective yield as of March 31, 2011. |
| | |
| See accompanying notes to financial statements. |
THE ALABAMA TAX FREE BOND FUND SCHEDULE OF INVESTMENTS March 31, 2011 |
ALABAMA FIXED RATE REVENUE AND GENERAL OBLIGATION (GO) BONDS — 97.0% | | | | | | |
| Alabama Drinking Water Financing Auth., Rev., | | | | | | |
4.00%, due 08/15/2014 | | $ | 250,000 | | | $ | 262,170 | |
5.00%, due 08/15/2018 | | | 400,000 | | | | 422,352 | |
| Alabama Special Care Facilities Financing Auth., Birmingham, Rev., | | | | | | | | |
5.375%, due 11/01/2012, ETM | | | 400,000 | | | | 401,524 | |
| Alabama State Federal Highway Financing Auth., Rev., | | | | | | | | |
5.00%, due 03/01/2016 | | | 300,000 | | | | 310,665 | |
| Alabama State Public School & College Auth., Capital Improvements, Rev., | | | | | | | | |
5.00%, due 12/01/2011 | | | 350,000 | | | | 360,819 | |
5.00%, due 12/01/2017 | | | 300,000 | | | | 340,830 | |
| Alabama State Public School & College Auth., Capital Improvements, Series A, Rev., | | | | | | | | |
4.00%, due 02/17/2017 | | | 250,000 | | | | 269,385 | |
| Alabama State, GO, | | | | | | | | |
5.00%, due 09/01/2015 | | | 300,000 | | | | 304,002 | |
5.00%, due 02/01/2016 | | | 575,000 | | | | 638,221 | |
5.00%, due 09/01/2016 | | | 300,000 | | | | 303,981 | |
5.00%, due 09/01/2017 | | | 300,000 | | | | 321,699 | |
| Alabama Water Pollution Control Auth., Rev., | | | | | | | | |
5.375%, due 08/15/2014 | | | 225,000 | | | | 230,065 | |
| Anniston, AL, Waterworks & Sewer Board, Water & Sewer, Rev., | | | | | | | | |
| 3.50%, due 06/01/2016 | | | 500,000 | | | | 522,575 | |
| Athens, AL, Electric Rev., Warrants, | | | | | | | | |
3.00%, due 06/01/2011 | | | 500,000 | | | | 502,040 | |
| Athens, AL, Warrants, | | | | | | | | |
4.00%, due 09/01/2018 | | | 300,000 | | | | 321,792 | |
| Auburn University, AL, General Fee Rev., | | | | | | | | |
5.25%, due 06/01/2015 | | | 400,000 | | | | 418,064 | |
| Auburn, AL, GO, Warrants, | | | | | | | | |
5.00%, due 08/01/2012 | | | 225,000 | | | | 237,996 | |
| Auburn, AL, School, Series A, GO, Warrants, | | | | | | | | |
5.00%, due 08/01/2018 | | | 500,000 | | | | 564,735 | |
| Auburn, AL, Waterworks Board, Rev., | | | | | | | | |
5.00%, due 07/01/2015 | | | 335,000 | | | | 342,216 | |
| Baldwin Co., AL, GO, Warrants, | | | | | | | | |
5.00%, due 02/01/2015 | | | 200,000 | | | | 218,486 | |
| Baldwin Co., AL, Series A, GO, Warrants, | | | | | | | | |
5.00%, due 02/01/2017 | | | 320,000 | | | | 365,232 | |
THE ALABAMA TAX FREE BOND FUND SCHEDULE OF INVESTMENTS (Continued) |
ALABAMA FIXED RATE REVENUE AND GENERAL OBLIGATION (GO) BONDS — 97.0% (Continued) | | | | | | |
| Calhoun Co., AL, Gas Tax Anticipation, Series A, Rev., Warrants, | | | | | | |
4.00%, due 03/01/2016 | | $ | 445,000 | | | $ | 475,314 | |
| Chelsea, AL, GO, | | | | | | | | |
4.00%, due 05/01/2015 | | | 260,000 | | | | 278,608 | |
| Enterprise, AL, GO, School Warrants, | | | | | | | | |
4.00%, due 02/01/2016 | | | 400,000 | | | | 431,976 | |
| Florence, AL, Electric Rev., Warrants, | | | | | | | | |
3.10%, due 06/01/2015 | | | 300,000 | | | | 309,756 | |
3.50%, due 06/01/2017 | | | 515,000 | | | | 528,946 | |
| Foley, AL, GO, Warrants, | | | | | | | | |
4.00%, due 01/01/2015 | | | 315,000 | | | | 338,590 | |
| Foley, AL, Utilities Board, Utilities Rev., | | | | | | | | |
4.00%, due 11/01/2018 | | | 710,000 | | | | 760,460 | |
4.50%, due 11/01/2019 | | | 250,000 | | | | 259,882 | |
| Homewood, AL, GO, Warrants, | | | | | | | | |
| 5.00%, due 09/01/2014, | | | | | | | | |
Prerefunded 09/01/2011 @ 101 | | | 500,000 | | | | 514,730 | |
5.00%, due 09/01/2015 | | | 250,000 | | | | 282,375 | |
| Hoover, AL, Special Tax Rev., Warrants, | | | | | | | | |
| 5.00%, due 02/15/2015 | | | | | | | | |
Prerefunded 02/15/2012 @ 100 | | | 370,000 | | | | 384,785 | |
| Houston Co., AL, Board of Education, GO, Capital Outlay Warrants, | | | | | | | | |
4.00%, due 12/01/2013 | | | 545,000 | | | | 582,709 | |
| Houston Co., AL, GO, | | | | | | | | |
4.75%, due 10/15/2016 | | | 500,000 | | | | 534,160 | |
| Huntsville, AL, Capital Improvements, Series C, GO, Warrants, | | | | | | | | |
5.00%, due 11/01/2017 | | | 300,000 | | | | 324,819 | |
| Huntsville, AL, Electric Systems, Rev., | | | | | | | | |
4.00%, due 12/01/2013 | | | 300,000 | | | | 322,764 | |
| Huntsville, AL, GO, | | | | | | | | |
5.00%, due 08/01/2011 | | | 500,000 | | | | 507,840 | |
4.00%, due 09/01/2018 | | | 500,000 | | | | 544,680 | |
| 5.125%, due 05/01/2020 | | | | | | | | |
Prerefunded 05/01/2012 @ 102 | | | 300,000 | | | | 321,123 | |
| Huntsville, AL, GO, Refunding and Capital Improvement Warrants, | | | | | | | | |
4.00%, due 09/01/2016 | | | 500,000 | | | | 551,790 | |
| Macon Co., AL, GO, Warrants, | | | | | | | | |
| 4.25%, due 10/01/2027, | | | | | | | | |
Prerefunded 10/01/2017 @ 100 | | | 200,000 | | | | 227,106 | |
THE ALABAMA TAX FREE BOND FUND SCHEDULE OF INVESTMENTS (Continued) |
ALABAMA FIXED RATE REVENUE AND GENERAL OBLIGATION (GO) BONDS — 97.0% (Continued) | | | | | | |
| Mobile Co., AL, GO, | | | | | | |
5.25%, due 08/01/2015 | | $ | 400,000 | | | $ | 442,948 | |
| Mobile, AL, GO, | | | | | | | | |
4.50%, due 08/01/2013 | | | 100,000 | | | | 108,058 | |
4.75%, due 02/15/2014 | | | 400,000 | | | | 409,044 | |
| 5.50%, due 08/15/2015, | | | | | | | | |
Prerefunded 08/15/2011 @ 102 | | | 500,000 | | | | 519,515 | |
| 5.20%, due 08/15/2018, | | | | | | | | |
Prerefunded 08/15/2011 @ 102 | | | 725,000 | | | | 752,492 | |
| Mobile, AL, Water & Sewer, Rev., | | | | | | | | |
5.25%, due 01/01/2012 | | | 205,000 | | | | 211,884 | |
| 5.25%, due 01/01/2014 | | | | | | | | |
Prerefunded 01/01/2012 @ 100 | | | 300,000 | | | | 310,884 | |
| 5.25%, due 01/01/2020 | | | | | | | | |
Prerefunded 01/01/2012 @ 100 | | | 400,000 | | | | 414,512 | |
| Montgomery, AL, GO, | | | | | | | | |
3.00%, due 11/01/2014 | | | 500,000 | | | | 522,605 | |
| Montgomery, AL, Waterworks & Sanitation, Rev., | | | | | | | | |
5.25%, due 09/01/2011 | | | 350,000 | | | | 357,179 | |
5.00%, due 09/01/2017 | | | 250,000 | | | | 282,812 | |
| Oxford, AL, Waterworks & Sewer Board, Rev., | | | | | | | | |
3.00%, due 12/01/2011 | | | 415,000 | | | | 420,266 | |
| Prattville, AL, Waterworks Board, Rev., | | | | | | | | |
3.00%, due 08/01/2017 | | | 290,000 | | | | 292,413 | |
| Sheffield, AL, Electric Rev., | | | | | | | | |
4.00%, due 07/01/2017 | | | 600,000 | | | | 632,892 | |
| Smiths, AL, Water & Sewer Auth., Rev., | | | | | | | | |
4.00%, due 06/01/2013 | | | 200,000 | | | | 210,152 | |
| St. Clair Co., AL, GO, | | | | | | | | |
4.00%, due 08/01/2013 | | | 145,000 | | | | 154,119 | |
4.00%, due 08/01/2014 | | | 205,000 | | | | 220,884 | |
| Sumter Co., AL, School Rev., Warrants, | | | | | | | | |
| 4.50%, due 02/01/2031, | | | | | | | | |
Prerefunded 02/01/2016 @ 100 | | | 500,000 | | | | 565,955 | |
| Tuscaloosa, AL, Public Building Auth., Student Housing Rev., | | | | | | | | |
4.00%, due 07/01/2013 | | | 350,000 | | | | 368,372 | |
| University of Alabama, AL, Birmingham, Series A, Hospital Rev., | | | | | | | | |
5.00%, due 09/01/2011 | | | 100,000 | | | | 101,706 | |
5.00%, due 09/01/2012 | | | 180,000 | | | | 187,790 | |
| University of Alabama, AL, General Fee Rev., | | | | | | | | |
4.10%, due 12/01/2013 | | | 240,000 | | | | 249,019 | |
THE ALABAMA TAX FREE BOND FUND SCHEDULE OF INVESTMENTS (Continued) |
ALABAMA FIXED RATE REVENUE AND GENERAL OBLIGATION (GO) BONDS — 97.0% (Continued) | | | | | | |
| University of Alabama, AL, Rev., | | | | | | |
4.00%, due 10/01/2014 | | $ | 500,000 | | | $ | 542,375 | |
| University of Alabama, AL, Series A, Rev., | | | | | | | | |
3.00%, due 07/01/2016 | | | 340,000 | | | | 353,409 | |
5.00%, due 07/01/2017 | | | 245,000 | | | | 279,026 | |
| Vestavia Hills, AL, Series A, GO, Warrants, | | | | | | | | |
5.00%, due 02/01/2012 | | | 565,000 | | | | 578,419 | |
3.00%, due 02/01/2018 | | | 240,000 | | | | 242,186 | |
| Wetumpka, AL, Waterworks & Sewer, Rev., | | | | | | | | |
4.00%, due 03/01/2018 | | | 320,000 | | | | 329,875 | |
| | | | | | | | | |
Total Alabama Fixed Rate Revenue and General Obligation (GO) Bonds (Cost $25,721,747) | | | | | | $ | 26,202,053 | |
MONEY MARKET FUNDS — 1.1% | | | | | | |
Alpine Municipal Money Market Fund - Class I, 0.22% (a) (Cost $310,459) | | | 310,459 | | | $ | 310,459 | |
| | | | | | | | | |
Total Investments at Value — 98.1% (Cost $26,032,206) | | | | | | $ | 26,512,512 | |
| | | | | | | | | |
Other Assets in Excess of Liabilities — 1.9% | | | | | | | 513,977 | |
| | | | | | | | | |
Net Assets — 100.0% | | | | | | $ | 27,026,489 | |
| ETM - Escrowed to Maturity. |
| |
| (a) | Variable rate security. The rate shown is the 7-day effective yield as of March 31, 2011. |
| | |
| See accompanying notes to financial statements. |
THE GOVERNMENT STREET FUNDS STATEMENTS OF ASSETS AND LIABILITIES March 31, 2011 |
| | Government Street Equity Fund | | | Government Street Mid-Cap Fund | | | | |
| ASSETS | | | | | | | | | |
| Investments in securities: | | | | | | | | | |
At acquisition cost | | $ | 38,671,332 | | | $ | 25,267,669 | | | $ | 26,032,206 | |
At value (Note 1) | | $ | 66,338,055 | | | $ | 39,964,968 | | | $ | 26,512,512 | |
Dividends and interest receivable | | | 85,212 | | | | 33,854 | | | | 242,947 | |
Receivable for capital shares sold | | | 6,077 | | | | 16,055 | | | | 300,000 | |
Other assets | | | 3,072 | | | | 1,917 | | | | 1,783 | |
TOTAL ASSETS | | | 66,432,416 | | | | 40,016,794 | | | | 27,057,242 | |
| | | | | | | | | | | | | |
| LIABILITIES | | | | | | | | | | | | |
Distributions payable | | | 4,508 | | | | — | | | | 11,020 | |
Payable for capital shares redeemed | | | 10,375 | | | | — | | | | 4,768 | |
Accrued investment advisory fees (Note 3) | | | 33,184 | | | | 24,678 | | | | 6,770 | |
Payable to adminstrator (Note 3) | | | 7,740 | | | | 5,190 | | | | 4,070 | |
Other accrued expenses | | | 4,038 | | | | 3,538 | | | | 4,125 | |
TOTAL LIABILITIES | | | 59,845 | | | | 33,406 | | | | 30,753 | |
| | | | | | | | | | | | | |
NET ASSETS | | $ | 66,372,571 | | | $ | 39,983,388 | | | $ | 27,026,489 | |
| | | | | | | | | | | | | |
| Net assets consist of: | | | | | | | | | | | | |
Paid-in capital | | $ | 38,667,635 | | | $ | 25,725,203 | | | $ | 26,598,862 | |
Undistributed net investment income | | | 6,384 | | | | — | | | | 1,304 | |
Accumulated net realized gains (losses)
from security transactions | | | 31,829 | | | | (439,114 | ) | | | (53,983 | ) |
Net unrealized appreciation on investments | | | 27,666,723 | | | | 14,697,299 | | | | 480,306 | |
| | | | | | | | | | | | | |
Net assets | | $ | 66,372,571 | | | $ | 39,983,388 | | | $ | 27,026,489 | |
| | | | | | | | | | | | | |
Shares of beneficial interest outstanding
(unlimited number of shares authorized,
$0.01 par value) | | | 1,382,630 | | | | 2,515,998 | | | | 2,585,435 | |
| | | | | | | | | | | | | |
Net asset value, offering price and
redemption price per share (Note 1) | | $ | 48.00 | | | $ | 15.89 | | | $ | 10.45 | |
| See accompanying notes to financial statements. |
THE GOVERNMENT STREET FUNDS STATEMENTS OF OPERATIONS Year Ended March 31, 2011 |
| | Government Street Equity Fund | | | Government Street Mid-Cap Fund | | | | |
| INVESTMENT INCOME | | | | | | | | | |
Interest | | $ | 1,256 | | | $ | 939 | | | $ | 902,227 | |
Dividends | | | 1,066,877 | | | | 452,561 | | | | 2,167 | |
Foreign withholding taxes on dividends | | | (5,878 | ) | | | (1,068 | ) | | | — | |
TOTAL INVESTMENT INCOME | | | 1,062,255 | | | | 452,432 | | | | 904,394 | |
| | | | | | | | | | | | | |
| EXPENSES | | | | | | | | | | | | |
Investment advisory fees (Note 3) | | | 353,570 | | | | 254,028 | | | | 100,293 | |
Administration fees (Note 3) | | | 76,930 | | | | 49,787 | | | | 42,644 | |
Professional fees | | | 21,722 | | | | 18,872 | | | | 17,422 | |
Trustees’ fees and expenses | | | 14,531 | | | | 14,531 | | | | 14,531 | |
Custodian and bank service fees | | | 10,521 | | | | 8,150 | | | | 5,338 | |
Compliance fees (Note 3) | | | 7,270 | | | | 6,810 | | | | 6,704 | |
Pricing costs | | | 2,343 | | | | 3,681 | | | | 12,299 | |
Printing of shareholder reports | | | 6,034 | | | | 3,166 | | | | 3,058 | |
Account maintenance fees | | | 6,332 | | | | 6,165 | | | | 1,653 | |
Insurance expense | | | 6,183 | | | | 3,745 | | | | 3,546 | |
Registration fees | | | 5,315 | | | | 4,404 | | | | 3,684 | |
Postage and supplies | | | 4,566 | | | | 3,581 | | | | 3,431 | |
Other expenses | | | 5,209 | | | | 5,696 | | | | 5,331 | |
TOTAL EXPENSES | | | 520,526 | | | | 382,616 | | | | 219,934 | |
| Fees voluntarily waived by the Adviser (Note 3) | | | — | | | | — | | | | (33,675 | ) |
NET EXPENSES | | | 520,526 | | | | 382,616 | | | | 186,259 | |
| | | | | | | | | | | | | |
NET INVESTMENT INCOME | | | 541,729 | | | | 69,816 | | | | 718,135 | |
| | | | | | | | | | | | | |
REALIZED AND UNREALIZED GAINS
(LOSSES) ON INVESTMENTS | | | | | | | | | | | | |
| Net realized gains (losses) from: | | | | | | | | | | | | |
Security transactions | | | 171,715 | | | | 190,129 | | | | (28,038 | ) |
Option contracts | | | 82 | | | | — | | | | — | |
Net realized gains from in-kind
redemptions (Note 1) | | | 917,000 | | | | 146,992 | | | | — | |
Net change in unrealized appreciation
(depreciation) on: | | | | | | | | | | | | |
Investments | | | 9,016,833 | | | | 7,240,335 | | | | (166,272 | ) |
Option contracts | | | 9,402 | | | | — | | | | — | |
| | | | | | | | | | | | | |
NET REALIZED AND UNREALIZED
GAINS (LOSSES) ON INVESTMENTS | | | 10,115,032 | | | | 7,577,456 | | | | (194,310 | ) |
| | | | | | | | | | | | | |
NET INCREASE IN NET ASSETS
FROM OPERATIONS | | $ | 10,656,761 | | | $ | 7,647,272 | | | $ | 523,825 | |
| See accompanying notes to financial statements. |
THE GOVERNMENT STREET FUNDS STATEMENTS OF CHANGES IN NET ASSETS |
| | | Government Street Equity Fund | | | Government Street Mid-Cap Fund | |
| | | | | | | | | | | | |
| FROM OPERATIONS | | | | | | | | | | | | |
Net investment income | | $ | 541,729 | | | $ | 566,056 | | | $ | 69,816 | | | $ | 132,379 | |
| Net realized gains from: | | | | | | | | | | | | | | | | |
Security transactions | | | 171,715 | | | | 148,167 | | | | 190,129 | | | | 34,204 | |
Option contracts | | | 82 | | | | — | | | | — | | | | — | |
Net realized gains from in-kind
redemptions (Note 1) | | | 917,000 | | | | 1,241,775 | | | | 146,992 | | | | 309,466 | |
Net change in unrealized
appreciation (depreciation) on: | | | | | | | | | | | | | | | | |
Investments | | | 9,016,833 | | | | 18,422,393 | | | | 7,240,335 | | | | 10,895,821 | |
Option contracts | | | 9,402 | | | | (9,402 | ) | | | — | | | | — | |
Net increase in net assets from operations | | | 10,656,761 | | | | 20,368,989 | | | | 7,647,272 | | | | 11,371,870 | |
| | | | | | | | | | | | | | | | | |
| DISTRIBUTIONS TO SHAREHOLDERS | | | | | | | | | | | | | | | | |
From net investment income | | | (536,110 | ) | | | (566,303 | ) | | | (82,215 | ) | | | (119,980 | ) |
From realized capital gains on
security transactions | | | (114,767 | ) | | | — | | | | — | | | | — | |
In excess of net investment income | | | — | | | | — | | | | (17,375 | ) | | | — | |
Decrease in net assets from
distributions to shareholders | | | (650,877 | ) | | | (566,303 | ) | | | (99,590 | ) | | | (119,980 | ) |
| | | | | | | | | | | | | | | | | |
FROM CAPITAL SHARE
TRANSACTIONS | | | | | | | | | | | | | | | | |
Proceeds from shares sold | | | 2,186,479 | | | | 5,064,427 | | | | 1,485,972 | | | | 1,574,608 | |
Net asset value of shares issued
in reinvestment of distributions
to shareholders | | | 623,340 | | | | 542,448 | | | | 92,758 | | | | 112,182 | |
Payments for shares redeemed | | | (4,209,460 | ) | | | (5,299,606 | ) | | | (1,340,996 | ) | | | (2,262,835 | ) |
Net increase (decrease) in net assets
from capital share transactions | | | (1,399,641 | ) | | | 307,269 | | | | 237,734 | | | | (576,045 | ) |
| | | | | | | | | | | | | | | | | |
TOTAL INCREASE IN NET ASSETS | | | 8,606,243 | | | | 20,109,955 | | | | 7,785,416 | | | | 10,675,845 | |
| | | | | | | | | | | | | | | | | |
| NET ASSETS | | | | | | | | | | | | | | | | |
Beginning of year | | | 57,766,328 | | | | 37,656,373 | | | | 32,197,972 | | | | 21,522,127 | |
End of year | | $ | 66,372,571 | | | $ | 57,766,328 | | | $ | 39,983,388 | | | $ | 32,197,972 | |
| | | | | | | | | | | | | | | | | |
UNDISTRIBUTED NET
INVESTMENT INCOME | | $ | 6,384 | | | $ | 765 | | | $ | — | | | $ | 12,399 | |
| | | | | | | | | | | | | | | | | |
| CAPITAL SHARE ACTIVITY | | | | | | | | | | | | | | | | |
Shares sold | | | 52,290 | | | | 135,218 | | | | 105,919 | | | | 147,313 | |
Shares reinvested | | | 14,753 | | | | 14,817 | | | | 6,310 | | | | 9,427 | |
Shares redeemed | | | (97,293 | ) | | | (146,410 | ) | | | (98,065 | ) | | | (199,510 | ) |
Net increase (decrease) in
shares outstanding | | | (30,250 | ) | | | 3,625 | | | | 14,164 | | | | (42,770 | ) |
Shares outstanding, beginning of year | | | 1,412,880 | | | | 1,409,255 | | | | 2,501,834 | | | | 2,544,604 | |
Shares outstanding, end of year | | | 1,382,630 | | | | 1,412,880 | | | | 2,515,998 | | | | 2,501,834 | |
| See accompanying notes to financial statements. |
THE GOVERNMENT STREET FUNDS STATEMENTS OF CHANGES IN NET ASSETS |
| | | Alabama Tax Free Bond Fund | |
| | | | | | |
| FROM OPERATIONS | | | | | | |
Net investment income | | $ | 718,135 | | | $ | 853,644 | |
| Net realized gains (losses) from security transactions | | | (28,038 | ) | | | 51,774 | |
| Net change in unrealized appreciation (depreciation) on investments | | | (166,272 | ) | | | (64,236 | ) |
Net increase in net assets from operations | | | 523,825 | | | | 841,182 | |
| | | | | | | | | |
| DISTRIBUTIONS TO SHAREHOLDERS | | | | | | | | |
From net investment income | | | (724,106 | ) | | | (850,484 | ) |
| From realized capital gains on security transactions | | | (1,181 | ) | | | (29,128 | ) |
| Decrease in net assets from distributions to shareholders | | | (725,287 | ) | | | (879,612 | ) |
| | | | | | | | | |
| FROM CAPITAL SHARE TRANSACTIONS | | | | | | | | |
Proceeds from shares sold | | | 4,182,345 | | | | 5,264,512 | |
Net asset value of shares issued in reinvestment
of distributions to shareholders | | | 550,393 | | | | 598,837 | |
Payments for shares redeemed | | | (7,221,053 | ) | | | (4,466,191 | ) |
| Net increase (decrease) in net assets from capital share transactions | | | (2,488,315 | ) | | | 1,397,158 | |
| | | | | | | | | |
| TOTAL INCREASE (DECREASE) IN NET ASSETS | | | (2,689,777 | ) | | | 1,358,728 | |
| | | | | | | | | |
| NET ASSETS | | | | | | | | |
Beginning of year | | | 29,716,266 | | | | 28,357,538 | |
End of year | | $ | 27,026,489 | | | $ | 29,716,266 | |
| | | | | | | | | |
| UNDISTRIBUTED NET INVESTMENT INCOME | | $ | 1,304 | | | $ | 7,280 | |
| | | | | | | | | |
| CAPITAL SHARE ACTIVITY | | | | | | | | |
Shares sold | | | 396,218 | | | | 498,641 | |
Shares reinvested | | | 52,037 | | | | 56,622 | |
Shares redeemed | | | (685,046 | ) | | | (422,233 | ) |
| Net increase (decrease) in shares outstanding | | | (236,791 | ) | | | 133,030 | |
Shares outstanding, beginning of year | | | 2,822,226 | | | | 2,689,196 | |
Shares outstanding, end of year | | | 2,585,435 | | | | 2,822,226 | |
| See accompanying notes to financial statements. |
THE GOVERNMENT STREET EQUITY FUND FINANCIAL HIGHLIGHTS |
Selected Per Share Data and Ratios for a Share Outstanding Throughout Each Year | |
| | | | |
| | | | | | | | | | | | | | | |
Net asset value at beginning of year | | $ | 40.89 | | | $ | 26.72 | | | $ | 44.76 | | | $ | 48.37 | | | $ | 52.42 | |
| | | | | | | | | | | | | | | | | | | | | |
| Income (loss) from investment operations: | | | | | | | | | | | | | | | | | | | | |
Net investment income | | | 0.39 | | | | 0.40 | | | | 0.55 | | | | 0.57 | | | | 0.48 | |
Net realized and unrealized
gains (losses) on investments | | | 7.19 | | | | 14.17 | | | | (18.07 | ) | | | (2.12 | ) | | | 2.90 | |
Total from investment operations | | | 7.58 | | | | 14.57 | | | | (17.52 | ) | | | (1.55 | ) | | | 3.38 | |
| | | | | | | | | | | | | | | | | | | | | |
| Less distributions: | | | | | | | | | | | | | | | | | | | | |
Dividends from net investment income | | | (0.39 | ) | | | (0.40 | ) | | | (0.52 | ) | | | (0.57 | ) | | | (0.48 | ) |
Distributions from net realized gains | | | (0.08 | ) | | | — | | | | — | | | | (1.31 | ) | | | (6.95 | ) |
Return of capital | | | — | | | | — | | | | — | | | | (0.18 | ) | | | — | |
Total distributions | | | (0.47 | ) | | | (0.40 | ) | | | (0.52 | ) | | | (2.06 | ) | | | (7.43 | ) |
| | | | | | | | | | | | | | | | | | | | | |
Net asset value at end of year | | $ | 48.00 | | | $ | 40.89 | | | $ | 26.72 | | | $ | 44.76 | | | $ | 48.37 | |
| | | | | | | | | | | | | | | | | | | | | |
Total return (a) | | | 18.69% | | | | 54.71% | | | | (39.43% | ) | | | (3.51% | ) | | | 7.04% | |
| | | | | | | | | | | | | | | | | | | | | |
Net assets at end of year (000’s) | | $ | 66,373 | | | $ | 57,766 | | | $ | 37,656 | | | $ | 67,267 | | | $ | 87,757 | |
| | | | | | | | | | | | | | | | | | | | | |
Ratio of expenses to average net assets | | | 0.88% | | | | 0.90% | | | | 0.91% | | | | 0.84% | | | | 0.84% | |
| | | | | | | | | | | | | | | | | | | | | |
Ratio of net investment income
to average net assets | | | 0.92% | | | | 1.14% | | | | 1.47% | | | | 1.12% | | | | 0.96% | |
| | | | | | | | | | | | | | | | | | | | | |
Portfolio turnover rate | | | 26% | | | | 30% | | | | 35% | | | | 12% | | | | 15% | |
| (a) | Total return is a measure of the change in value of an investment in the Fund over the period covered, which assumes any dividends or capital gains distributions are reinvested in shares of the Fund. Returns do not reflect the deduction of taxes a shareholder would pay on Fund distributions or the redemption of Fund shares. |
| | |
| See accompanying notes to financial statements. |
THE GOVERNMENT STREET MID-CAP FUND FINANCIAL HIGHLIGHTS |
Selected Per Share Data and Ratios for a Share Outstanding Throughout Each Year | |
| | | | |
| | | | | | | | | | | | | | | |
Net asset value at beginning of year | | $ | 12.87 | | | $ | 8.46 | | | $ | 12.28 | | | $ | 13.13 | | | $ | 13.71 | |
| | | | | | | | | | | | | | | | | | | | | |
| Income (loss) from investment operations: | | | | | | | | | | | | | | | | | | | | |
Net investment income | | | 0.03 | | | | 0.05 | | | | 0.05 | | | | 0.03 | | | | 0.04 | |
Net realized and unrealized gains
(losses) on investments | | | 3.03 | | | | 4.41 | | | | (3.82 | ) | | | (0.53 | ) | | | 0.45 | |
Total from investment operations | | | 3.06 | | | | 4.46 | | | | (3.77 | ) | | | (0.50 | ) | | | 0.49 | |
| | | | | | | | | | | | | | | | | | | | | |
| Less distributions: | | | | | | | | | | | | | | | | | | | | |
Dividends from net investment income | | | (0.03 | ) | | | (0.05 | ) | | | (0.05 | ) | | | (0.05 | ) | | | (0.05 | ) |
In excess of net investment income | | | (0.01 | ) | | | — | | | | (0.00 | )(a) | | | — | | | | — | |
Distributions from net realized gains | | | — | | | | — | | | | (0.00 | )(a) | | | (0.30 | ) | | | (1.02 | ) |
Total distributions | | | (0.04 | ) | | | (0.05 | ) | | | (0.05 | ) | | | (0.35 | ) | | | (1.07 | ) |
| | | | | | | | | | | | | | | | | | | | | |
Net asset value at end of year | | $ | 15.89 | | | $ | 12.87 | | | $ | 8.46 | | | $ | 12.28 | | | $ | 13.13 | |
| | | | | | | | | | | | | | | | | | | | | |
Total return (b) | | | 23.80% | | | | 52.73% | | | | (30.65% | ) | | | (3.99% | ) | | | 3.83% | |
| | | | | | | | | | | | | | | | | | | | | |
Net assets at end of year (000’s) | | $ | 39,983 | | | $ | 32,198 | | | $ | 21,522 | | | $ | 31,424 | | | $ | 33,961 | |
| | | | | | | | | | | | | | | | | | | | | |
Ratio of net expenses to average net assets | | | 1.13% | | | | 1.13% | (c) | | | 1.10% | (c) | | | 1.10% | (c) | | | 1.10% | (c) |
| | | | | | | | | | | | | | | | | | | | | |
Ratio of net investment income
to average net assets | | | 0.21% | | | | 0.47% | | | | 0.47% | | | | 0.25% | | | | 0.26% | |
| | | | | | | | | | | | | | | | | | | | | |
Portfolio turnover rate | | | 20% | | | | 10% | | | | 14% | | | | 11% | | | | 11% | |
| (a) | Amount rounds to less than $0.01 per share. |
| | |
| (b) | Total return is a measure of the change in value of an investment in the Fund over the period covered, which assumes any dividends or capital gains distributions are reinvested in shares of the Fund. Returns do not reflect the deduction of taxes a shareholder would pay on Fund distributions or the redemption of Fund shares. |
| | |
| (c) | Absent investment advisory fees voluntarily waived by the Adviser, the ratios of expenses to average net assets would have been 1.18%, 1.23%, 1.12% and 1.12% for the years ended March 31, 2010, 2009, 2008 and 2007, respectively (Note 3). |
| | |
| See accompanying notes to financial statements. |
THE ALABAMA TAX FREE BOND FUND FINANCIAL HIGHLIGHTS |
Selected Per Share Data and Ratios for a Share Outstanding Throughout Each Year | |
| | | | |
| | | | | | | | | | | | | | | |
Net asset value at beginning of year | | $ | 10.53 | | | $ | 10.54 | | | $ | 10.50 | | | $ | 10.39 | | | $ | 10.40 | |
| | | | | | | | | | | | | | | | | | | | | |
| Income (loss) from investment operations: | | | | | | | | | | | | | | | | | | | | |
Net investment income | | | 0.26 | | | | 0.28 | | | | 0.35 | | | | 0.36 | | | | 0.36 | |
Net realized and unrealized gains
(losses) on investments | | | (0.07 | ) | | | (0.00 | )(a) | | | 0.04 | | | | 0.12 | | | | (0.01 | ) |
Total from investment operations | | | 0.19 | | | | 0.28 | | | | 0.39 | | | | 0.48 | | | | 0.35 | |
| | | | | | | | | | | | | | | | | | | | | |
| Less distributions: | | | | | | | | | | | | | | | | | | | | |
Dividends from net investment income | | | (0.27 | ) | | | (0.28 | ) | | | (0.35 | ) | | | (0.36 | ) | | | (0.36 | ) |
Distributions from net realized gains | | | (0.00 | )(a) | | | (0.01 | ) | | | (0.00 | )(a) | | | (0.01 | ) | | | — | |
Total distributions | | | (0.27 | ) | | | (0.29 | ) | | | (0.35 | ) | | | (0.37 | ) | | | (0.36 | ) |
| | | | | | | | | | | | | | | | | | | | | |
Net asset value at end of year | | $ | 10.45 | | | $ | 10.53 | | | $ | 10.54 | | | $ | 10.50 | | | $ | 10.39 | |
| | | | | | | | | | | | | | | | | | | | | |
Total return (b) | | | 1.78% | | | | 2.88% | | | | 3.80% | | | | 4.66% | | | | 3.38% | |
| | | | | | | | | | | | | | | | | | | | | |
Net assets at end of year (000’s) | | $ | 27,026 | | | $ | 29,716 | | | $ | 28,358 | | | $ | 25,426 | | | $ | 25,968 | |
| | | | | | | | | | | | | | | | | | | | | |
Ratio of net expenses to
average net assets (c) | | | 0.65% | | | | 0.65% | | | | 0.65% | | | | 0.65% | | | | 0.65% | |
| | | | | | | | | | | | | | | | | | | | | |
Ratio of net investment income to
average net assets | | | 2.51% | | | | 2.85% | | | | 3.36% | | | | 3.46% | | | | 3.44% | |
| | | | | | | | | | | | | | | | | | | | | |
Portfolio turnover rate | | | 21% | | | | 32% | | | | 8% | | | | 6% | | | | 15% | |
| (a) | Amount rounds to less than $0.01 per share. |
| | |
| (b) | Total return is a measure of the change in value of an investment in the Fund over the period covered, which assumes any dividends or capital gains distributions are reinvested in shares of the Fund. Returns do not reflect the deduction of taxes a shareholder would pay on Fund distributions or the redemption of Fund shares. |
| | |
| (c) | Absent investment advisory fees voluntarily waived by the Adviser, the ratios of expenses to average net assets would have been 0.77%, 0.75%, 0.79%, 0.78% and 0.76% for the years ended March 31, 2011, 2010, 2009, 2008 and 2007, respectively (Note 3). |
| | |
| See accompanying notes to financial statements. |
THE GOVERNMENT STREET FUNDS NOTES TO FINANCIAL STATEMENTS March 31, 2011 |
1. Organization and Significant Accounting Policies
The Government Street Equity Fund, The Government Street Mid-Cap Fund and The Alabama Tax Free Bond Fund (the “Funds”) are each a no-load series of the Williamsburg Investment Trust (the “Trust”), an open-end management investment company registered under the Investment Company Act of 1940. The Trust was organized as a Massachusetts business trust on July 18, 1988. Other series of the Trust are not included in this report.
The Government Street Equity Fund’s investment objective is to seek capital appreciation.
The Government Street Mid-Cap Fund’s investment objective is to seek capital appreciation.
The Alabama Tax Free Bond Fund’s investment objectives are to provide current income exempt from federal income taxes and from the personal income taxes of Alabama and to preserve capital.
The following is a summary of the Funds’ significant accounting policies:
Securities valuation — The Funds’ portfolio securities are valued as of the close of business of the regular session of the New York Stock Exchange (normally 4:00 p.m., Eastern time). Securities traded on a national stock exchange are valued based upon the closing price on the principal exchange where the security is traded. Securities which are quoted by NASDAQ are valued at the NASDAQ Official Closing Price. Securities which are traded over-the-counter are valued at the last sales price, if available, otherwise, at the last quoted bid price. It is expected that fixed income securities will ordinarily be traded in the over-the-counter market, and common stocks will ordinarily be traded on a national securities exchange, but may also be traded in the over-the-counter market. Call options written by the Funds are valued at the then current market quotation, using the ask price as of the close of each day on the principal exchanges on which they are traded.
When market quotations are not readily available, securities may be valued on the basis of prices provided by an independent pricing service. The prices provided by the pricing service are determined with consideration given to institutional bid and last sale prices and take into account securities prices, yields, maturities, call features, ratings, institutional trading in similar groups of securities and developments related to specific securities. If a pricing service cannot provide a valuation, securities will be valued in good faith at fair value using procedures established by and under the general supervision of the Board of Trustees and will be classified as Level 2 or 3 within the fair value hierarchy, depending on the inputs used. Such methods of fair valuation may include, but are not limited to: multiple of earnings, multiple of book value, discount from market of a similar freely traded security, purchase price of the security,
THE GOVERNMENT STREET FUNDS NOTES TO FINANCIAL STATEMENTS (Continued) |
subsequent private transactions in the security or related securities, or a combination of these and other factors. Short-term instruments (those with remaining maturities of 60 days or less) may be valued at amortized cost, which approximates market value.
Accounting principles generally accepted in the United States (“GAAP”) establish a single authoritative definition of fair value, set out a framework for measuring fair value and require additional disclosures about fair value measurements.
Various inputs are used in determining the value of each of the Fund’s investments. These inputs are summarized in the three broad levels listed below:
• Level 1 – quoted prices in active markets for identical securities
• Level 2 – other significant observable inputs
• Level 3 – significant unobservable inputs
The inputs or methodology used for valuing securities are not necessarily an indication of the risks associated with investing in those securities. The inputs used to measure fair value may fall into different levels of the fair value hierarchy. In such cases, for disclosure purposes, the level in the fair value hierarchy within which the fair value measurement falls in its entirety is determined based on the lowest level input that is significant to the fair value measurement.
The following is a summary of the inputs used to value each Fund’s investments as of March 31, 2011 by security type:
The Government Street Equity Fund: | | | | | | | | | | | | |
Common Stocks | | $ | 53,213,243 | | | $ | — | | | $ | — | | | $ | 53,213,243 | |
Exchange-Traded Funds | | | 11,755,190 | | | | — | | | | — | | | | 11,755,190 | |
Exchange-Traded Notes | | | 721,430 | | | | — | | | | — | | | | 721,430 | |
Warrants | | | 8,904 | | | | — | | | | — | | | | 8,904 | |
Commercial Paper | | | — | | | | 639,000 | | | | — | | | | 639,000 | |
Money Market Funds | | | 288 | | | | — | | | | — | | | | 288 | |
Total | | $ | 65,699,055 | | | $ | 639,000 | | | $ | — | | | $ | 66,338,055 | |
The Government Street Mid-Cap Fund: | | | | | | | | | | | | |
Common Stocks | | $ | 35,710,987 | | | $ | — | | | $ | — | | | $ | 35,710,987 | |
Exchange-Traded Funds | | | 3,518,714 | | | | — | | | | — | | | | 3,518,714 | |
Exchange-Traded Notes | | | 303,760 | | | | — | | | | — | | | | 303,760 | |
Commercial Paper | | | — | | | | 431,000 | | | | — | | | | 431,000 | |
Money Market Funds | | | 507 | | | | — | | | | — | | | | 507 | |
Total | | $ | 39,533,968 | | | $ | 431,000 | | | $ | — | | | $ | 39,964,968 | |
THE GOVERNMENT STREET FUNDS NOTES TO FINANCIAL STATEMENTS (Continued) |
The Alabama Tax Free Bond Fund: | | | | | | | | | | | | |
| Alabama Fixed Rate Revenue and General Obligation Bonds | | $ | — | | | $ | 26,202,053 | | | $ | — | | | $ | 26,202,053 | |
Money Market Funds | | | 310,459 | | | | — | | | | — | | | | 310,459 | |
Total | | $ | 310,459 | | | $ | 26,202,053 | | | $ | — | | | $ | 26,512,512 | |
Refer to The Government Street Equity Fund’s and The Government Street Mid-Cap Fund’s Schedules of Investments for a listing of the common stocks valued using Level 1 inputs by sector type. During the year ended March 31, 2011, the Funds did not have any significant transfers in and out of Level 1 or Level 2. There were no Level 3 securities held by the Funds as of or during the year ended March 31, 2011.
Share valuation — The net asset value per share of each Fund is calculated daily by dividing the total value of each Fund’s assets, less liabilities, by the number of shares outstanding. The offering price and redemption price per share of each Fund is equal to the net asset value per share.
Investment income — Interest income is accrued as earned. Dividend income is recorded on the ex-dividend date. Discounts and premiums on fixed-income securities purchased are amortized using the interest method.
Repurchase agreements — The Funds may enter into repurchase agreements. A repurchase agreement, which is collateralized by U.S. Government obligations, is valued at cost which, together with accrued interest, approximates market value. At the time a Fund enters into a repurchase agreement, the seller agrees that the value of the underlying securities, including accrued interest, will at all times be equal to or exceed the face amount of the repurchase agreement. In addition, the Funds actively monitor and seek additional collateral, as needed. If the seller defaults, the fair value of the collateral may decline and realization of the collateral by the Funds may be delayed or limited. The Funds did not enter into any repurchase agreements during the year ended March 31, 2011.
Distributions to shareholders — Dividends arising from net investment income are declared and paid quarterly to shareholders of The Government Street Equity Fund; declared and paid annually to shareholders of The Government Street Mid-Cap Fund; and declared daily and paid monthly to shareholders of The Alabama Tax Free Bond Fund. Net realized short-term capital gains, if any, may be distributed throughout the year and net realized long-term capital gains, if any, are distributed at least once each year. The amount of distributions from net investment income and net realized gains are determined in accordance with federal income tax regulations, which may differ from GAAP. These “book/tax” differences are either temporary or permanent in nature.
THE GOVERNMENT STREET FUNDS NOTES TO FINANCIAL STATEMENTS (Continued) |
The tax character of distributions paid during the years ended March 31, 2011 and March 31, 2010 is as follows:
| | | | | | | | | | | | | | |
| The Government Street Equity Fund | 3/31/11 | | $ | 536,219 | | | $ | — | | | $ | 114,658 | | | $ | 650,877 | |
| | 3/31/10 | | $ | 566,303 | | | $ | — | | | $ | — | | | $ | 566,303 | |
| The Government Street Mid-Cap Fund | 3/31/11 | | $ | 99,590 | | | $ | — | | | $ | — | | | $ | 99,590 | |
| | 3/31/10 | | $ | 119,980 | | | $ | — | | | $ | — | | | $ | 119,980 | |
| The Alabama Tax Free Bond Fund | 3/31/11 | | $ | 1,634 | | | $ | 722,479 | | | $ | 1,174 | | | $ | 725,287 | |
| | 3/31/10 | | $ | 27,129 | | | $ | 850,484 | | | $ | 1,999 | | | $ | 879,612 | |
Security transactions — Security transactions are accounted for on trade date. Gains and losses on securities sold are determined on a specific identification basis.
Common expenses — Common expenses of the Trust are allocated among the series of the Trust based on relative net assets of each series or the nature of the services performed and the relative applicability to each series.
Options transactions — With the intent of increasing the total returns of the investment portfolios of The Government Street Equity Fund and The Government Street Mid-Cap Fund, the Funds may write covered call options, primarily against highly appreciated, low basis securities to increase income. When the Funds write a covered call option contract, premiums are received and are recorded as liabilities, and are subsequently valued daily at the closing prices on their primary exchanges. Premiums received from writing options which expire are treated as realized gains. Premiums received from writing options which are exercised increase the proceeds used to calculate the realized gain or loss on the sale of the security. If a closing purchase transaction is used to terminate a Fund’s obligation on a written call option contract, a gain or loss will be realized, depending upon whether the price of the closing purchase transaction is more or less than the premium previously received on the call option written.
Estimates — The preparation of financial statements in conformity with GAAP requires management to make estimates and assumptions that affect the reported amounts of assets and liabilities and the disclosure of contingent assets and liabilities as of the date of the financial statements and the reported amounts of income and expenses during the reporting period. Actual results could differ from those estimates.
Federal income tax — It is each Fund’s policy to comply with the special provisions of Subchapter M of the Internal Revenue Code applicable to regulated investment companies. As provided therein, in any fiscal year in which a Fund so qualifies, and distributes at least 90% of its taxable net income, the Fund (but not the shareholders) will be relieved of federal income tax on the income distributed. Accordingly, no provision for income taxes has been made.
THE GOVERNMENT STREET FUNDS NOTES TO FINANCIAL STATEMENTS (Continued) |
In order to avoid imposition of the excise tax applicable to regulated investment companies, it is also each Fund’s intention to declare as dividends in each calendar year at least 98% of its net investment income (earned during the calendar year) and 98.2% of its net realized capital gains (earned during the twelve months ended October 31) plus undistributed amounts from prior years.
The following information is computed on a tax basis for each item as of March 31, 2011:
| | | The Government Street Equity Fund | | | The Government Street Mid-Cap Fund | | | The Alabama Tax Free Bond Fund | |
Cost of portfolio investments | | $ | 38,671,332 | | | $ | 25,267,669 | | | $ | 26,053,929 | |
Gross unrealized appreciation | | $ | 28,495,352 | | | $ | 15,211,427 | | | $ | 547,355 | |
Gross unrealized depreciation | | | (828,629 | ) | | | (514,128 | ) | | | (88,772 | ) |
Net unrealized appreciation | | | 27,666,723 | | | | 14,697,299 | | | | 458,583 | |
Undistributed ordinary income | | | 81,339 | | | | — | | | | — | |
Undistributed tax exempt income | | | — | | | | — | | | | 11,013 | |
Capital loss carryforward | | | — | | | | (393,825 | ) | | | — | |
Post-October losses | | | (38,618 | ) | | | (45,289 | ) | | | (30,949 | ) |
Other temporary differences | | | (4,508 | ) | | | — | | | | (11,020 | ) |
Total distributable earnings | | $ | 27,704,936 | | | $ | 14,258,185 | | | $ | 427,627 | |
The difference between the federal income tax cost of portfolio investments and the financial statement cost for The Alabama Tax Free Bond Fund is due to certain timing differences in the recognition of capital gains or losses under income tax regulations and GAAP. These “book/tax” differences are temporary in nature and are primarily due to the tax deferral of losses on wash sales and differing methods in the amortization of market discount and premium on fixed income securities.
During the year ended March 31, 2011, The Government Street Mid-Cap Fund and The Alabama Tax Free Bond Fund utilized capital loss carryforwards of $235,418 and $1,742, respectively, to offset current year realized gains.
As of March 31, 2011, The Government Street Mid-Cap Fund had a capital loss carryforward for federal income tax purposes of $393,825 which expires on March 31, 2018. In addition, The Government Street Equity Fund, The Government Street Mid-Cap Fund, and The Alabama Tax Free Bond Fund had net realized capital losses of $38,618, $45,289, and $30,949, respectively, during the period November 1, 2010 through March 31, 2011, which are treated for federal income tax purposes as arising during each Fund’s tax year ending March 31, 2012. The capital loss carryforward and “post-October” losses may be utilized in future years to offset net realized capital gains, if any, prior to distribution to shareholders.
THE GOVERNMENT STREET FUNDS NOTES TO FINANCIAL STATEMENTS (Continued) |
During the year ended March 31, 2011, The Government Street Equity Fund and The Government Street Mid-Cap Fund realized $917,000 and $146,992, respectively, of net capital gains resulting from in-kind redemptions (redemptions in which shareholders who redeemed Fund shares received securities held by the Fund rather than cash). The Funds recognize a gain on in-kind redemptions to the extent that the value of the distributed securities on the date of redemption exceeds the cost of those securities. Such gains are not taxable to the Funds and are not required to be distributed to shareholders. The Funds have reclassified these amounts against paid-in capital. These reclassifications are reflected on the Statements of Assets and Liabilities. Such reclassifications, the result of permanent differences between the financial statement and income tax reporting requirements, had no effect on each Fund’s net assets or net asset value per share.
For the year ended March 31, 2011, The Government Street Mid-Cap Fund reclassified $17,375 of distributions in excess of net investment income against paid-in capital on the Statements of Assets and Liabilities. Such reclassification, the result of permanent differences between the financial statements and income tax reporting requirements, had no effect on the Fund’s net assets or net asset value per share.
For the year ended March 31, 2011, The Alabama Tax Free Bond Fund reclassified $5 of undistributed net investment income against accumulated net realized losses on the Statements of Assets and Liabilities. Such reclassification, the result of permanent differences between the financial statement and income tax reporting requirements, had no effect on the Fund’s net assets or net asset value per share.
The Funds recognize the tax benefits or expenses of uncertain tax positions only when the position is “more likely than not” to be sustained assuming examination by tax authorities. Management has reviewed the tax positions taken on Federal income tax returns for all open tax years (tax years ended March 31, 2008 through March 31, 2011) of each Fund and has concluded that no provision for unrecognized tax benefits or expenses is required in these financial statements.
2. Investment Transactions
During the year ended March 31, 2011, cost of purchases and proceeds from sales and maturities of investment securities, other than short-term investments and U.S. government securities, totaled $14,790,945 and $15,447,517, respectively, for The Government Street Equity Fund; $6,546,103 and $6,628,249, respectively, for The Government Street Mid-Cap Fund; and $5,815,446 and $7,627,606, respectively, for The Alabama Tax Free Bond Fund.
THE GOVERNMENT STREET FUNDS NOTES TO FINANCIAL STATEMENTS (Continued) |
3. Transactions with Affiliates
INVESTMENT ADVISORY AGREEMENT
The Funds’ investments are managed by Leavell Investment Management, Inc. (the “Adviser”) under the terms of an Investment Advisory Agreement. The Government Street Equity Fund pays the Adviser a fee, which is computed and accrued daily and paid monthly, at an annual rate of .60% of its average daily net assets up to $100 million and .50% of such assets in excess of $100 million. The Government Street Mid-Cap Fund pays the Adviser a fee at an annual rate of .75% of its average daily net assets. The Alabama Tax Free Bond Fund pays the Adviser a fee at an annual rate of .35% of its average daily net assets up to $100 million and .25% of such assets in excess of $100 million.
During the year ended March 31, 2011, the Adviser voluntarily undertook to limit the total operating expenses of The Alabama Tax Free Bond Fund to .65% of the Fund’s average daily net assets. Accordingly, the Adviser waived $33,675 of its investment advisory fees from The Alabama Tax Free Bond Fund during the year ended March 31, 2011.
Certain officers of the Trust are also officers of the Adviser.
MUTUAL FUND SERVICES AGREEMENT
Under the terms of a Mutual Fund Services Agreement between the Trust and Ultimus Fund Solutions, LLC (“Ultimus”), Ultimus provides administrative, pricing, accounting, dividend disbursing, shareholder servicing and transfer agent services for the Funds. For these services, Ultimus receives a monthly fee from each Fund at an annual rate of .15% of the Fund’s average daily net assets up to $25 million, .125% of the next $25 million of such assets, and .10% of such assets in excess of $50 million. The minimum monthly fee payable to Ultimus is $4,000 with respect to The Government Street Equity Fund and The Government Street Mid-Cap Fund and $3,500 with respect to The Alabama Tax Free Bond Fund. In addition, each Fund pays out-of-pocket expenses including, but not limited to, postage, supplies and costs of pricing portfolio securities. Certain officers of the Trust are also officers of Ultimus, or of Ultimus Fund Distributors, LLC (the “Distributor”), the principal underwriter of each Fund’s shares and an affiliate of Ultimus. The Distributor is compensated by the Adviser (not the Funds) for acting as principal underwriter.
COMPLIANCE CONSULTING AGREEMENT
Under the terms of a Compliance Consulting Agreement between the Trust and Ultimus, Ultimus provides an individual to serve as the Trust’s Chief Compliance Officer and to administer the Funds’ compliance policies and procedures. For these services, the Funds pay Ultimus an annual base fee of $18,600 plus an asset-based fee equal to 0.01% per annum on the Funds’ aggregate net assets in excess of $100 million. In addition, the Funds reimburse Ultimus for reasonable out-of-pocket expenses, if any, incurred in connection with these services.
THE GOVERNMENT STREET FUNDS NOTES TO FINANCIAL STATEMENTS (Continued) |
4. Derivatives Transactions
Transactions in option contracts written by The Government Street Equity Fund during the year ended March 31, 2011 were as follows:
| | | | | | |
Options outstanding at beginning of year | | | 166 | | | $ | 12,478 | |
Options written | | | 266 | | | | 42,831 | |
| Options cancelled in a closing purchase transaction | | | (266 | ) | | | (21,970 | ) |
Options expired | | | (166 | ) | | | (33,339 | ) |
Options outstanding at end of year | | | — | | | $ | — | |
The average monthly notional amount of option contracts during the year ended March 31, 2011 was $569,807 for The Government Street Equity Fund.
The Government Street Equity Fund did not have any open option contracts at March 31, 2011.
Transactions in derivative instruments during the year ended March 31, 2011 by The Government Street Equity Fund are recorded in the following location in the Statements of Operations:
| | | | | | | Change in Unrealized Gains (Losses) | |
| Covered call options written | Net realized gains (losses) from option contracts | | $ | 82 | | Net change in unrealized appreciation (depreciation) on option contracts | | $ | 9,402 | |
No option contracts were written by The Government Street Mid-Cap Fund during the year ended March 31, 2011.
5. Contingencies and Commitments
The Funds indemnify the Trust’s officers and Trustees for certain liabilities that might arise from their performance of their duties to the Funds. Additionally, in the normal course of business the Funds enter into contracts that contain a variety of representations and warranties and which provide general indemnifications. The Funds’ maximum exposure under these arrangements is unknown, as this would involve future claims that may be made against the Funds that have not yet occurred. However, based on experience, the Funds expect the risk of loss to be remote.
THE GOVERNMENT STREET FUNDS NOTES TO FINANCIAL STATEMENTS (Continued) |
6. Concentration of Credit Risk
The Alabama Tax Free Bond Fund invests primarily in debt instruments of municipal issuers in the state of Alabama. The issuers’ abilities to meet their obligations may be affected by economic developments in the state or its region, as well as disruptions in the credit markets and the economy, generally.
7. Subsequent Events
The Funds are required to recognize in the financial statements the effects of all subsequent events that provide additional evidence about conditions that existed as of the date of the Statements of Assets and Liabilities. For non-recognized subsequent events that must be disclosed to keep the financial statements from being misleading, the Funds are required to disclose the nature of the event as well as an estimate of its financial effect, or a statement that such an estimate cannot be made. Management has evaluated subsequent events through the issuance of these financial statements and has noted no such events.
THE GOVERNMENT STREET FUNDS REPORT OF INDEPENDENT REGISTERED PUBLIC ACCOUNTING FIRM |
The Board of Trustees and Shareholders of
The Government Street Equity Fund,
The Government Street Mid-Cap Fund, and
The Alabama Tax-Free Bond Fund of the Williamsburg Investment Trust
We have audited the accompanying statements of assets and liabilities, including the schedules of investments, of The Government Street Equity Fund, The Government Street Mid-Cap Fund, and The Alabama Tax-Free Bond Fund (the “Funds”) (each a series of the Williamsburg Investment Trust) as of March 31, 2011, and the related statements of operations for the year then ended, the statements of changes in net assets for each of the two years in the period then ended, and the financial highlights for each of the five years in the period then ended. These financial statements and financial highlights are the responsibility of the Funds’ management. Our responsibility is to express an opinion on these financial statements and financial highlights based on our audits.
We conducted our audits in accordance with the standards of the Public Company Accounting Oversight Board (United States). Those standards require that we plan and perform the audits to obtain reasonable assurance about whether the financial statements and financial highlights are free of material misstatement. We were not engaged to perform an audit of the Funds’ internal control over financial reporting. Our audits included consideration of internal control over financial reporting as a basis for designing audit procedures that are appropriate in the circumstances, but not for the purpose of expressing an opinion on the effectiveness of the Funds’ internal control over financial reporting. Accordingly, we express no such opinion. An audit also includes examining, on a test basis, evidence supporting the amounts and disclosures in the financial statements and financial highlights, assessing the accounting principles used and significant estimates made by management, and evaluating the overall financial statement presentation. Our procedures included confirmation of securities owned as of March 31, 2011, by correspondence with the custodian and brokers. We believe that our audits provide a reasonable basis for our opinion.
In our opinion, the financial statements and financial highlights referred to above present fairly, in all material respects, the financial position of The Government Street Equity Fund, The Government Street Mid-Cap Fund and The Alabama Tax-Free Bond Fund at March 31, 2011, the results of their operations for the year then ended, the changes in their net assets for each of the two years in the period then ended, and the financial highlights for each of the five years in the period then ended, in conformity with U.S. generally accepted accounting principles.
Cincinnati, Ohio
May 20, 2011
THE GOVERNMENT STREET FUNDS ABOUT YOUR FUNDS’ EXPENSES (Unaudited) |
We believe it is important for you to understand the impact of costs on your investment. All mutual funds have operating expenses. As a shareholder of the Funds, you incur ongoing costs, including management fees and other expenses. These ongoing costs, which are deducted from each Fund’s gross income, directly reduce the investment returns of the Funds.
A mutual fund’s ongoing costs are expressed as a percentage of its average net assets. This figure is known as the expense ratio. The following examples are intended to help you understand the ongoing costs (in dollars) of investing in the Funds and to compare these costs with the ongoing costs of investing in other mutual funds. The examples below are based on an investment of $1,000 made at the beginning of the period shown and held for the entire period (October 1, 2010 through March 31, 2011).
The table below illustrates each Fund’s ongoing costs in two ways:
Actual fund return – This section helps you to estimate the actual expenses that you paid over the period. The “Ending Account Value” shown is derived from each Fund’s actual return, and the third column shows the dollar amount of operating expenses that would have been paid by an investor who started with $1,000 in the Funds. You may use the information here, together with the amount you invested, to estimate the expenses that you paid over the period.
To do so, simply divide your account value by $1,000 (for example, an $8,600 account value divided by $1,000 = 8.6), then multiply the result by the number given for the Funds under the heading “Expenses Paid During Period.”
Hypothetical 5% return – This section is intended to help you compare the Funds’ ongoing costs with those of other mutual funds. It assumes that each Fund had an annual return of 5% before expenses during the period shown, but that the expense ratio is unchanged. In this case, because the returns used are not the Funds’ actual returns, the results do not apply to your investment. The example is useful in making comparisons because the Securities and Exchange Commission (the “SEC”) requires all mutual funds to calculate expenses based on a 5% return. You can assess each Fund’s ongoing costs by comparing this hypothetical example with the hypothetical examples that appear in shareholder reports of other funds.
Note that expenses shown in the table are meant to highlight and help you compare ongoing costs only. The Funds do not charge sales loads or redemption fees.
The calculations assume no shares were bought or sold during the period. Your actual costs may have been higher or lower, depending on the amount of your investment and the timing of any purchases or redemptions.
THE GOVERNMENT STREET FUNDS ABOUT YOUR FUNDS’ EXPENSES (Unaudited) (Continued) |
More information about the Funds’ expenses, including historical expense ratios, can be found in this report. For additional information on operating expenses and other shareholder costs, please refer to the Funds’ prospectus.
| Beginning Account Value October 1, 2010 | Ending Account Value March 31, 2011 | Expenses Paid During Period* |
The Government Street Equity Fund |
Based on Actual Fund Return | $1,000.00 | $1,187.60 | $4.80 |
| Based on Hypothetical 5% Return (before expenses) | $1,000.00 | $1,020.54 | $4.43 |
The Government Street Mid-Cap Fund |
| Based on Actual Fund Return | $1,000.00 | $1,210.70 | $6.12 |
| Based on Hypothetical 5% Return (before expenses) | $1,000.00 | $1,019.40 | $5.59 |
The Alabama Tax Free Bond Fund |
| Based on Actual Fund Return | $1,000.00 | $989.70 | $3.22 |
| Based on Hypothetical 5% Return (before expenses) | $1,000.00 | $1,021.69 | $3.28 |
| * | Expenses are equal to the Funds’ annualized expense ratios for the period as stated below, multiplied by the average account value over the period, multiplied by 182/365 (to reflect the one-half year period). |
| The Government Street Equity Fund | 0.88% |
| The Government Street Mid-Cap Fund | 1.11% |
| The Alabama Tax Free Bond Fund | 0.65% |
THE GOVERNMENT STREET FUNDS BOARD OF TRUSTEES AND EXECUTIVE OFFICERS (Unaudited) |
Overall responsibility for management of the Funds rests with the Board of Trustees. The Trustees serve during the lifetime of the Trust and until its termination, or until death, resignation, retirement or removal. The Trustees, in turn, elect the officers of the Funds. The officers have been elected for an annual term. The following are the Trustees and executive officers of the Funds:
| Trustee | Address | Age | Position Held with the Trust | Length of Time Served |
| * | Charles M. Caravati, Jr. | 931 Broad Street Road Manakin-Sabot, VA | 74 | Chairman and Trustee | Since June 1991 |
| * | Austin Brockenbrough III | 1802 Bayberry Court, Suite 400 Richmond, VA | 74 | Trustee | Since September 1988 |
| * | John T. Bruce | 800 Main Street Lynchburg, VA | 57 | Trustee | Since September 1988 |
| | Robert S. Harris | 100 Darden Boulevard Charlottesville, VA | 61 | Trustee | Since January 2007 |
| | J. Finley Lee, Jr. | 448 Pond Apple Drive North Naples, FL | 71 | Trustee | Since September 1988 |
| | Richard L. Morrill | University of Richmond Richmond, VA | 71 | Trustee | Since March 1993 |
| | Harris V. Morrissette | 100 Jacintoport Boulevard Saraland, AL | 51 | Trustee | Since March 1993 |
| | Samuel B. Witt III | 302 Clovelly Road Richmond, VA | 75 | Trustee | Since November 1988 |
| | Thomas W. Leavell | P.O. Box 1307 Mobile, AL | 67 | President | Since February 2004 |
| | Mary Shannon Hope | P.O. Box 1307 Mobile, AL | 47 | Vice President | Since August 2008 |
| | Timothy S. Healey | 600 Luckie Drive Suite 305 Birmingham, AL | 58 | Vice President of The Government Street Mid-Cap Fund and The Alabama Tax Free Bond Fund | Since January 1995 |
| | Robert G. Dorsey | 225 Pictoria Drive, Suite 450 Cincinnati, OH | 54 | Vice President | Since November 2000 |
| | Mark J. Seger | 225 Pictoria Drive, Suite 450 Cincinnati, OH | 49 | Treasurer | Since November 2000 |
| | Tina H. Bloom | 225 Pictoria Drive, Suite 450 Cincinnati, OH | 42 | Secretary and Chief Compliance Officer | Since August 2006 |
| * | Messrs. Bruce, Brockenbrough and Caravati are “interested persons” of the Trust within the meaning of Section 2(a)(19) of the Investment Company Act of 1940. Messrs. Bruce and Brockenbrough are “interested persons” of the Trust by virtue of their affiliation with investment advisers to other series of the Trust. Charles M. Caravati, Jr. is the father of Charles M. Caravati III, an officer of The Jamestown Funds, which are other series of the Trust. |
THE GOVERNMENT STREET FUNDS BOARD OF TRUSTEES AND EXECUTIVE OFFICERS (Unaudited) (Continued) |
Each Trustee oversees eleven portfolios of the Trust, including the Funds. The principal occupations of the Trustees and executive officers of the Funds during the past five years and public directorships held by the Trustees are set forth below:
Charles M. Caravati, Jr. is a retired physician. He is also the retired President of Dermatology Associates of Virginia, P.C.
Austin Brockenbrough III is President and Managing Director of Lowe, Brockenbrough & Company, Inc. (an investment advisory firm). He is a member of the Board of Directors of Tredegar Corporation (a plastics manufacturer) and Wilkinson O’Grady & Co., Inc. (a global asset manager).
John T. Bruce is a President, Director and member of the Executive Committee of Flippin, Bruce & Porter, Inc. (an investment advisory firm).
Robert S. Harris is the C. Stewart Sheppard Professor of Business Administration at The Darden Graduate School of Business Administration at the University of Virginia. He was previously the dean at Darden. Professor Harris has published widely on corporate finance, financial markets and mergers and acquisitions and has served as a consultant to corporations and government agencies.
J. Finley Lee, Jr. is the retired Julian Price Professor Emeritus at the University of North Carolina.
Richard L. Morrill serves as President of the Teagle Foundation (charitable foundation) and Chancellor of the University of Richmond. He is also a member of the Board of Directors of Tredegar Corporation and Albemarle Corporation (specialty chemical manufacturer).
Harris V. Morrissette is President of China Doll Rice and Beans Inc. and Dixie Lily Foods. He is a member of the Board of Directors of BancTrust Financial Group, Inc. (a bank holding company) and International Shipholding Corporation (cargo transportation). In addition, he is Chairman of Azalea Aviation, Inc. (an airplane fueling company).
Samuel B.Witt III is the retired Senior Vice President and General Counsel of Stateside Associates, Inc. He is also a member of the Board of Directors of The Swiss Helvetia Fund, Inc. (a closed-end investment company).
Thomas W. Leavell is a President and Chief Executive Officer of the Adviser.
Mary Shannon Hope is a Vice President and Portfolio Manager of the Adviser.
Timothy S. Healey is an Executive Vice President and Chief Investment Officer of the Adviser.
Robert G. Dorsey is a Managing Director of Ultimus Fund Solutions, LLC and Ultimus Fund Distributors, LLC.
THE GOVERNMENT STREET FUNDS BOARD OF TRUSTEES AND EXECUTIVE OFFICERS (Unaudited) (Continued) |
Mark J. Seger is a Managing Director of Ultimus Fund Solutions, LLC and Ultimus Fund Distributors, LLC.
Tina H. Bloom is Director of Fund Administration of Ultimus Fund Solutions, LLC and Ultimus Fund Distributors, LLC.
Additional information about members of the Board of Trustees and executive officers is available in the Statement of Additional Information (“SAI”). To obtain a free copy of the SAI, please call 1-800-281-3217.
FEDERAL TAX INFORMATION (Unaudited)
In accordance with federal tax requirements, the following provides shareholders with information concerning distributions from ordinary income and net realized gains made by the Funds during the fiscal year ended March 31, 2011. Certain dividends paid by the Funds may be subject to a maximum tax rate of 15%, as provided by the Jobs and Growth Tax Relief Reconciliation Act of 2003. The Government Street Equity Fund and The Government Street Mid-Cap Fund intend to designate up to a maximum amount of $536,219 and $99,590, respectively, as taxed at a maximum rate of 15%. Additionally, The Government Street Equity Fund and The Alabama Tax Free Bond Fund intend to designate $114,658 and $1,174, respectively, as a long-term gain distributions. For the fiscal year ended March 31, 2011, 100% of the dividends paid from ordinary income by The Government Street Equity Fund and The Government Street Mid-Cap Fund qualified for the dividends received deduction for corporations.
As required by federal regulations, complete information will be computed and reported in conjunction with your 2011 Form 1099-DIV.
THE GOVERNMENT STREET FUNDS OTHER INFORMATION (Unaudited) |
A description of the policies and procedures that the Funds use to vote proxies relating to portfolio securities is available without charge upon request by calling toll-free 1-866-738-1125, or on the SEC’s website at http://www.sec.gov. Information regarding how the Funds voted proxies relating to portfolio securities during the most recent 12-month period ended June 30 is also available without charge upon request by calling toll-free 1-866-738-1125 or on the SEC’s website at http://www.sec.gov.
The Trust files a complete listing of portfolio holdings for the Funds with the SEC as of the end of the first and third quarters of each fiscal year on Form N-Q. The filings are available upon request, by calling 1-866-738-1125. Furthermore, you may obtain a copy of these filings on the SEC’s website at http://www.sec.gov. The Trust’s Forms N-Q may also be reviewed and copied at the SEC’s Public Reference Room in Washington, DC, and information on the operation of the Public Reference Room may be obtained by calling 1-800-SEC-0330.
THE GOVERNMENT STREET FUNDS DISCLOSURE REGARDING APPROVAL OF INVESTMENT ADVISORY AGREEMENTS (Unaudited) |
At an in-person meeting held on February 8, 2011, the Board of Trustees, including a majority of the Independent Trustees, approved the continuance for a one-year period of the Investment Advisory Agreements with the Adviser on behalf of The Government Street Equity Fund, The Government Street Mid-Cap Fund and The Alabama Tax Free Bond Fund. Below is a discussion of the factors considered by the Board of Trustees along with the conclusions with respect thereto that formed the basis for the Board’s approvals.
In selecting the Adviser and approving the continuance of the Investment Advisory Agreements, the Trustees considered all information they deemed reasonably necessary to evaluate the terms of the Agreements. The principal areas of review by the Trustees were the nature, extent and quality of the services provided by the Adviser and the reasonableness of the fees charged for those services. These matters were considered by the Independent Trustees consulting with experienced counsel for the Independent Trustees, who is independent of the Adviser.
The Trustees’ evaluation of the quality of the Adviser’s services took into account their knowledge and experience gained through meetings with and reports of the Adviser’s senior management over the course of the preceding year. Both short-term and long-term investment performance of the Funds was considered. Each Fund’s performance was compared to its performance benchmark and to that of competitive funds with similar investment objectives. The Trustees also considered the scope and quality of the in-house capabilities of the Adviser and other resources dedicated to performing services for the Funds. The quality of administrative and other services, including the Adviser’s role in coordinating the activities of the Funds’ other service providers, were considered in light of the Funds’ compliance with investment policies and applicable laws and regulations and of related reports by management and the Funds’ independent public accounting firm in periodic meetings with the Trust’s Audit Committee. The Trustees also considered the business reputation of the Adviser, the qualifications of its key investment and compliance personnel, and its financial resources.
In reviewing the fees payable under the Investment Advisory Agreements, the Trustees compared the advisory fees and overall expense levels of each Fund with those of competitive funds with similar investment objectives. The Trustees considered information provided by the Adviser concerning the Adviser’s profitability with respect to each Fund, including the assumptions and methodology used in preparing the profitability information, in light of applicable case law relating to advisory fees. For these purposes, the Trustees took into account not only the fees paid by the Funds, but also so-called “fallout” benefits to the Adviser. The Trustees also considered the Adviser’s representations that all of the Funds’ portfolio trades were executed based on the best price and execution available, and that the Adviser does not participate in any soft dollar or directed brokerage arrangements. The Trustees further considered
THE GOVERNMENT STREET FUNDS DISCLOSURE REGARDING APPROVAL OF INVESTMENT ADVISORY AGREEMENTS (Unaudited) (Continued) |
that neither the Funds nor the Adviser participate in any revenue sharing arrangements on behalf of the Funds. In evaluating the Funds’ advisory fees, the Trustees took into account the complexity and quality of the investment management of the Funds.
Based upon their review of this information, the Independent Trustees concluded that: (i) based upon the performance of The Government Street Equity Fund during 2010, which exceeded the returns of the S&P 500 Index and its Lipper peer group, as well as the longer term performance of the Fund, the Adviser has provided quality services to the Fund; (ii) although The Government Street Mid-Cap Fund underperformed the S&P MidCap 400 Index and the average of its Lipper peer group during 2010, such Fund’s overall performance has been very competitive and the Fund has earned a 4-star overall rating from Morningstar, Inc.; (iii) although the short-term and long-term performance of The Alabama Tax Free Bond Fund has lagged its benchmark index and the average returns for comparably managed funds, such Fund is managed in a conservative investment style and is not managed to correlate to any particular index, and the Independent Trustees believe that the Fund has satisfactorily met the goal of providing tax-exempt income with limited exposure to credit and maturity risks; (iv) the investment advisory fees payable to the Adviser by each Fund are competitive with similarly managed funds, and the Independent Trustees believe the fees to be reasonable given the scope and quality of investment advisory services provided by the Adviser and other services provided to shareholders; (v) the total operating expense ratio of each Fund is less than the average expense ratio for comparably managed funds, according to statistics derived from Morningstar, Inc.; and (vi) the Adviser’s voluntary commitment to cap overall operating expenses of The Alabama Tax Free Bond Fund through advisory fee waivers has enabled that Fund to further increase returns for shareholders; and (vii) the level of the Adviser’s profitability with respect to its management of the Funds is reasonable. Given the current size of the Funds and their expected growth, the Independent Trustees did not believe that at the present time it would be relevant to consider the extent to which economies of scale would be realized as the Funds grow, and whether fee levels reflect these economies of scale. The Independent Trustees also considered the “fallout” benefits to the Adviser with respect to the Funds, but given the amounts involved viewed these as secondary factors in connection with the evaluation of the reasonableness of the advisory fees paid by the Funds.
No single factor was considered in isolation or to be determinative to the decision of the Trustees to approve continuance of the Investment Advisory Agreements. Rather the Trustees concluded, in light of a weighing and balancing of all factors considered, that it was in the best interests of each Fund and its shareholders to continue its Investment Advisory Agreement without modification to its terms, including the fees charged for services thereunder.
| | | | | | | | |
| | | | | | | | | |
| | | | | | | | | |
| | | | | The Government Street Funds | | | | |
| | | | |
Investment Adviser Leavell Investment Management, Inc. Post Office Box 1307 Mobile, AL 36633
Administrator Ultimus Fund Solutions, LLC P.O. Box 46707 Cincinnati, OH 45246-0707 1-866-738-1125
Legal Counsel Sullivan & Worcester LLP One Post Office Square Boston, MA 02109
Independent Registered Public Accounting Firm Ernst & Young LLP 1900 Scripps Center 312 Walnut Street Cincinnati, OH 45202
Board of Trustees Austin Brockenbrough, III John T. Bruce Charles M. Caravati, Jr. Robert S. Harris J. Finley Lee, Jr. Richard L. Morrill Harris V. Morrissette Samuel B. Witt, III
Portfolio Managers Thomas W. Leavell, The Government Street Equity Fund The Government Street Mid-Cap Fund Timothy S. Healey, The Government Street Mid-Cap Fund The Alabama Tax Free Bond Fund Richard E. Anthony, Jr., CFA, The Government Street Mid-Cap Fund Michael J. Hofto, CFA, The Government Street Mid-Cap Fund | | | | |
| | | | | | | | | |
| | | | | | | | | |
| | | | | | | | | |
| | | | | | | | |
| | | | | | | | |
| | | | | | | | | |
| | | | | | | | | |
| | | | | THE JAMESTOWN FUNDS
No-Load Funds
The Jamestown Balanced Fund The Jamestown Equity Fund The Jamestown Tax Exempt Virginia Fund
ANNUAL REPORT
March 31, 2011
Investment Adviser Lowe, Brockenbrough & Company, Inc. Richmond, Virginia | | | | |
| | | | | | | | | |
| | | | | | | | | |
| | | | | | | | |
| LETTER TO SHAREHOLDERS | May 5, 2011 |
The Jamestown Balanced Fund
For the fiscal year ended March 31, 2011, The Jamestown Balanced Fund returned 10.24% compared to 11.72% for a blend of 60% S&P 500 Index and 40% Barclays Capital U.S. Intermediate Government/Credit Bond Index. In the equity portion of the Fund, performance lagged the S&P 500 Index due to stock selection as more volatile, highly leveraged companies continue to outperform companies with steadier earnings growth and more reasonable valuations. Our expectation remains that as the economic recovery and the upward trajectory of the equity markets slow, investors will begin to migrate back to higher quality companies with more durable earnings growth. We believe that the types of companies that we invest in on your behalf will benefit in this scenario. We have begun to see some tentative signs that this is beginning to occur in the market as The Jamestown Balanced Fund has performed better, on a relative basis, in the past three months. During the last quarter of the fiscal year, the Fund was up 4.55% compared to 3.69% for a 60%/40% blend of the S&P 500 Index/Barclays Capital U.S. Intermediate Government/Credit Bond Index.
Stock selection in the Fund was hurt primarily in the Consumer Staples, Health Care, and Information Technology sectors. Strong stock selection in the Materials sector was a partial offset as Eastman Chemical was one of the Fund’s best performing stocks during the fiscal year. Other portfolio winners included Marathon Oil, ConocoPhillips, Apple, and EMC.
Several notable underperforming stocks were Cisco Systems, Symantec, Teva Pharmaceuticals, and Hewlett Packard.
Sector selection was positive during the fiscal year, as the Fund benefited from our overweight positions in the Energy and Industrials sectors along with our underweight position in the Consumer Staples and Financials sectors. The primary negative impact from sector selection was our underweight position in the Telecommunications sector.
The equity market continues to get support from strong corporate earnings. Earnings are forecast to return to previous period records with a little over 13% growth expected this year. Valuations on stocks are reasonable given this level of expected earnings growth with the S&P 500 Index trading at 13.2X expected earnings. Over the longer term, stock valuations have fluctuated around an average price/earnings ratio of 15X expected earnings. The companies in the Fund are trading at 12.4X expected earnings for this year.
In addition to valuations, the overall macro economic environment continues to point toward further growth, albeit modest in developed economies and faster in developing international countries. Interest rates have moved up from historical lows, but are not yet at levels that suggest robust competition for stocks. We continue to monitor the sentiment situation closely as investors have become increasingly optimistic given the rally in equities.
The Federal Reserve maintained its extremely accommodative monetary policy and kept short-term interest rates near zero percent to foster the U.S. economic recovery. The much anticipated unwinding of monetary accommodation was pushed further in the future, and the Fed commenced a second round of quantitative easing in November. Consequently credit markets performed better than expected, though low starting yields caused returns to be subdued in the short maturity range. Corporate bonds continued to outperform government bonds as investors perceived greater creditworthiness and liquidity in credit sectors while the turmoil of the financial crisis became more distant.
The performance of the fixed income portion of the Fund was in-line with that of the benchmark for the fiscal year. The Fund’s duration strategy has been defensive, with duration shorter than that of the benchmark, in anticipation of higher yields. However, yields on government bonds peaked at the start of the Fund’s fiscal year and declined sharply through the summer months on worries about the sustainability of the economic recovery. Although the bond market rally stalled in October, the selloff in bonds during the fourth quarter was not severe enough for our defensive duration stance to enhance relative performance for the full fiscal year.
Sector allocation to corporate bonds aided performance as the yield premium narrowed during the fiscal year. Several credits that contributed to fixed income performance during the year include Coca Cola, DuPont, GlaxoSmithKline, General Mills, and Virginia Electric & Power.
Effective duration of the bond portfolio was 3.75 years as of March 31, 2011 and the average maturity was 4.35 years. Sector strategy of the fixed income portion of the Fund continues to overweight investment grade corporate bonds in the intermediate maturity range relative to the benchmark.
As of March 31, 2011, the Fund had 7.0% in cash, 24.6% in fixed income, and 68.4% in equities. Asset allocation contributed positively to performance as the Fund maintained a greater weight in equities throughout the fiscal year. We continue to see more value in equities than fixed income, although given optimistic short-term sentiment, the equity market may be due for a pause. Currently, the Fund is overweight in the Consumer Discretionary and Industrials sectors. Telecommunications, Utilities, and Consumer Staples are the largest sector underweights in the portfolio.
The Jamestown Equity Fund
For the fiscal year ended March 31, 2011, The Jamestown Equity Fund returned 13.48% compared to 15.65% for the S&P 500 Index and 13.17% for the Lipper Large Cap Core Index. The Fund lagged the S&P 500 Index due to stock selection as more volatile, highly leveraged companies continue to outperform companies with steadier earnings growth and more reasonable valuations. Our expectation remains that as the economic recovery and the upward trajectory of the equity markets slow, investors will begin to migrate back to higher quality companies with more durable earnings growth. We believe that the types of companies that we invest in on your behalf will benefit in this scenario. We have begun to see some tentative signs that this is beginning to occur in the market as The Jamestown Equity Fund has performed better, on a relative basis, in the past three months. During the last quarter of the fiscal year, the Fund was up 6.64% compared to 5.92% for the S&P 500 Index and 5.20% for the Lipper Large Cap Core Index.
Stock selection in the Fund was hurt primarily in the Consumer Staples, Health Care, and Information Technology sectors. Strong stock selection in the Materials sector was a partial offset as Eastman Chemical was one of the Fund’s best performing stocks during the fiscal year. Other portfolio winners included Marathon Oil, ConocoPhillips, Apple, and EMC. Several notable underperforming stocks were Cisco Systems, Symantec, Teva Pharmaceuticals, and Hewlett Packard.
Sector selection was positive during the fiscal year, as the Fund benefited from our overweight positions in the Energy and Industrials sectors along with our underweight position in the Consumer Staples and Financials sectors. The primary negative impact from sector selection was our underweight position in the Telecommunications sector.
The equity market continues to get support from strong corporate earnings. Earnings are forecast to return to previous period records with a little over 13% growth expected this year. Valuations on stocks are reasonable given this level of expected earnings growth with the S&P 500 Index trading at 13.2X expected earnings. Over the longer term, stock valuations have fluctuated around an average price/earnings ratio of 15X expected earnings. The companies in the Fund are trading at 12.4X expected earnings for this year.
In addition to valuations, the overall macro economic environment continues to point toward further growth, albeit modest in developed economies and faster in developing international countries. Interest rates have moved up from historical lows, but are not yet at levels that suggest robust competition for stocks. We continue to monitor the sentiment situation closely as investors have become increasingly optimistic given the rally in equities.
As of March 31, 2011, the Fund had 4.7% in cash and 95.3% in equities. Currently, the Fund is overweight in the Consumer Discretionary and Industrials sectors. Telecommunications, Utilities, and Consumer Staples are the largest sector underweights in the portfolio.
The Jamestown Tax Exempt Virginia Fund
For the fiscal year ended March 31, 2011, The Jamestown Tax Exempt Virginia Fund earned a total return of 2.26%, compared to 3.24% for the Barclays Capital 5-year Municipal Bond Index and 2.02% for the Lipper Intermediate Municipal Fund Index. The portfolio had an average stated maturity of 6.3 years and an average effective duration of 4.6 years. As of March 31, 2011, the Fund’s SEC 30-day yield was 2.20%, which results in a tax equivalent yield of 3.38% for investors in the 35% federal tax bracket. The Fund held no issues subject to Alternative Minimum Tax during the fiscal year.
The Federal Reserve maintained its extremely accommodative monetary policy and kept short-term interest rates near zero percent to foster the U.S. economic recovery. Demand for tax-exempt bonds was strong through the first half of the fiscal year. The tax-exempt bond rally peaked in August as yields dropped to a 40-year low. However, a confluence of factors led to poor performance for municipal bonds during the second half of the fiscal year. Heavy issuance of new municipal debt in the fourth quarter of 2010 resulted in higher yields and dragged prices lower. Worries over state and local budget gaps and pension fund shortfalls elicited a few widely publicized predictions of greater defaults. The extension of the Bush-era income tax rates may have diminished the demand for tax-free bonds as many market participants were anticipating higher marginal tax rates. A reversal of flows into tax-exempt bond mutual funds also weighed on bond prices as fund managers were forced to sell holdings to meet redemptions. Through mid-April, municipal bond mutual funds experienced 23 straight weeks of net outflows. Strong equity market performance also prompted some investors to shift to riskier asset classes in order to seek greater returns.
Performance attribution shows that net investment income generated by the Fund’s holdings contributed about 2.8% while the net decline in market value subtracted about 0.6% for the fiscal year. While municipal bonds experienced a robust rally from April through August 2010, the market reversed direction in September and yields moved up sharply for the remainder of the fiscal year. To illustrate, the representative yield-to-maturity of a “AAA” rated general obligation bond with a 5-year maturity moved from 1.77% at March 31, 2010 to 1.06% at August 31, 2010 and back to 1.77% by March 31, 2011. With a steep yield curve, bonds also benefit from “roll down” as the passage of time allows bonds to re-price to lower yields as the maturity shortens.
Quality spreads widened during the year, with a more pronounced widening for “A” rated credits. The Fund remains positioned in predominantly “AA” and “AAA” rated credits, so the widening of quality spreads did not have a material impact on performance.
The Fund’s relative performance can be attributed to its intermediate maturity structure and its emphasis on high credit quality. The municipal yield curve experienced a bear steepening during the period, with yields on long maturities rising far more than yields on short and intermediate maturities. The expiration of the Build America Bond program at year-end removed a factor that had significantly curtailed supply of longer maturity tax-exempt bonds. With more supply anticipated in the long-end of the yield curve, yields moved higher, and prices retreated for the longest maturities. Funds that emphasize intermediate maturities generally outperformed funds that concentrate on long maturities.
Despite lingering headlines of budget gaps and pension fund shortfalls, state and local tax revenue has started to rebound in a majority of the states, led by sales and income tax receipts. Most state and local governments responded to the downturn by cutting expenditures as well as deferring capital projects. Virginia is among the states reporting increased tax receipts, which will help offset the decrease in federal government assistance. Virginia has emerged from the recession in better fiscal health than many states, and the debt of the state and most of its local governments remains regarded as high quality.
|  |
Charles M. Caravati, III, CFA President Jamestown Balanced Fund Jamestown Equity Fund | Joseph A. Jennings, III, CFA President Jamestown Tax Exempt Virginia Fund |
Data presented reflects past performance, which is no guarantee of future results. Investment results and principal value will fluctuate so that shares, when redeemed, may be worth more or less than their original cost. Due to market volatility, current performance may be higher or lower than the performance shown.
This report is submitted for the general information of the shareholders of the Funds. The report is not authorized for distribution to prospective investors in the Funds unless it is accompanied by a current prospectus.
This report reflects our views, opinions and portfolio holdings as of March 31, 2011, the end of the reporting period. These views are subject to change at any time based upon market or other conditions. For more current information throughout the year please visit www.jamestownfunds.com. The Funds are distributed by Ultimus Fund Distributors, LLC.
THE JAMESTOWN BALANCED FUND PERFORMANCE INFORMATION (Unaudited) |
| | Average Annual Total Returns(a) (for periods ended March 31, 2011) | |
| | 1 Year | 5 Years | 10 Years | |
| The Jamestown Balanced Fund | 10.24% | 3.28% | 3.28% | |
| Standard & Poor’s 500 Index | 15.65% | 2.62% | 3.29% | |
| 60% S&P 500 Index / 40% Barclays Capital U.S. Intermediate Government/Credit Bond Index | 11.72% | 4.38% | 4.56% | |
| (a) | Total return is a measure of the change in value of an investment in the Fund over the periods covered, which assumes any dividends or capital gains distributions are reinvested in shares of the Fund. Returns shown do not reflect the deduction of taxes a shareholder would pay on Fund distributions or the redemption of Fund shares. |
THE JAMESTOWN EQUITY FUND PERFORMANCE INFORMATION (Unaudited) |
| | Average Annual Total Returns(a) (for periods ended March 31, 2011) | |
| | 1 Year | 5 Years | 10 Years | |
| The Jamestown Equity Fund | 13.48% | 1.72% | 1.97% | |
| Standard & Poor’s 500 Index | 15.65% | 2.62% | 3.29% | |
| (a) | Total return is a measure of the change in value of an investment in the Fund over the periods covered, which assumes any dividends or capital gains distributions are reinvested in shares of the Fund. Returns shown do not reflect the deduction of taxes a shareholder would pay on Fund distributions or the redemption of Fund shares. |
THE JAMESTOWN TAX EXEMPT VIRGINIA FUND PERFORMANCE INFORMATION (Unaudited) |
| | Average Annual Total Returns(a) (for periods ended March 31, 2011) | |
| | 1 Year | 5 Years | 10 Years | |
| The Jamestown Tax Exempt Virginia Fund | 2.26% | 3.80% | 3.57% | |
| Barclays Capital 5-Year Municipal Bond Index | 3.24% | 5.13% | 4.58% | |
| Lipper Intermediate Municipal Fund Index | 2.02% | 3.73% | 3.87% | |
| Barclays Capital Municipal Bond Index | 1.63% | 4.14% | 4.66% | |
| (a) | Total return is a measure of the change in value of an investment in the Fund over the periods covered, which assumes any dividends or capital gains distributions are reinvested in shares of the Fund. Returns shown do not reflect the deduction of taxes a shareholder would pay on Fund distributions or the redemption of Fund shares. |
| * | The Barclays Capital 5-Year Municipal Bond Index is an unmanaged index generally representative of 5-year tax-exempt bonds. Because the Fund is typically classified as an intermediate-term fund (with an average duration of between 2 and 10 years), this index is believed to be the most appropriate broad-based securities market index against which to compare the Fund’s performance. |
THE JAMESTOWN BALANCED FUND PORTFOLIO INFORMATION March 31, 2011 (Unaudited) |
Asset Allocation (% of Net Assets) | Ten Largest Equity Holdings | |
| Apple, Inc. | 2.2% |
| PepsiCo, Inc. | 1.7% |
| Wal-Mart Stores, Inc. | 1.6% |
| Marathon Oil Corporation | 1.6% |
| Hess Corporation | 1.6% |
| Hewlett-Packard Company | 1.6% |
| Chevron Corporation | 1.6% |
| Noble Corporation | 1.6% |
| General Electric Company | 1.6% |
| AmerisourceBergen Corporation | 1.5% |
| |
Equity Sector Concentration vs. the S&P 500 Index (68.4% of Net Assets) |
Fixed-Income Portfolio (24.6% of Net Assets) | | | % of Fixed Income Portfolio |
| Average Stated Maturity (Years) | 4.35 | | AAA | 48% |
| Average Duration (Years) | 3.75 | | AA | 5% |
| Average Coupon | 5.30% | | A | 39% |
| Average Yield to Maturity | 2.41% | | BBB | 8% |
| | | | | |
| % of Fixed Income Portfolio | | | |
| U.S. Treasury Obligations | 18.7% | | | |
| U.S. Government Agency Obligations | 10.8% | | | |
| Mortgage-Backed Securities | 17.0% | | | |
| Municipal Bonds | 1.8% | | | |
| Corporate Bonds | 51.7% | | | |
THE JAMESTOWN EQUITY FUND PORTFOLIO INFORMATION March 31, 2011 (Unaudited) |
Asset Allocation (% of Net Assets) | Ten Largest Equity Holdings | |
| Apple, Inc. | 3.0% |
| Hewlett-Packard Company | 2.3% |
| PepsiCo, Inc. | 2.3% |
| Wal-Mart Stores, Inc. | 2.3% |
| Marathon Oil Corporation | 2.3% |
| Hess Corporation | 2.2% |
| Noble Corporation | 2.2% |
| Apache Corporation | 2.2% |
| Chevron Corporation | 2.2% |
| Aetna, Inc. | 2.1% |
| |
Sector Concentration vs. the S&P 500 Index |
THE JAMESTOWN TAX EXEMPT VIRGINIA FUND PORTFOLIO INFORMATION March 31, 2011 (Unaudited) |
Characteristics (Weighted Average) | | Maturity Breakdown (%of Portfolio) |
| 30-day SEC Yield | 2.20% | | |
| Tax-Equivalent Yield | 3.38%* |
| Average Maturity (years) | 6.3 |
| Average Duration (years) | 4.6 |
| Average Quality | AA |
| Number of Issues | 52 |
| | |
* Assumes a maximum 35.0% federal tax rate. |
Credit Quality (%of Portfolio) | | Sector Diversification (%of Portfolio) |
| | |
THE JAMESTOWN BALANCED FUND SCHEDULE OF INVESTMENTS March 31, 2011 |
| | | | | | |
| Consumer Discretionary — 8.9% | | | | | | |
Comcast Corporation - Class A | | | 11,700 | | | $ | 289,224 | |
Dollar Tree, Inc. (a) | | | 5,400 | | | | 299,808 | |
Ford Motor Company (a) | | | 18,000 | | | | 268,380 | |
McDonald's Corporation | | | 3,900 | | | | 296,751 | |
TJX Companies, Inc. (The) | | | 4,500 | | | | 223,785 | |
Viacom, Inc. - Class B | | | 6,600 | | | | 307,032 | |
Yum! Brands, Inc. | | | 4,200 | | | | 215,796 | |
| | | | | | | | 1,900,776 | |
| Consumer Staples — 5.8% | | | | | | | | |
CVS Caremark Corporation | | | 8,500 | | | | 291,720 | |
Kimberly-Clark Corporation | | | 3,900 | | | | 254,553 | |
PepsiCo, Inc. | | | 5,500 | | | | 354,255 | |
Wal-Mart Stores, Inc. | | | 6,700 | | | | 348,735 | |
| | | | | | | | 1,249,263 | |
| Energy — 10.2% | | | | | | | | |
Apache Corporation | | | 2,500 | | | | 327,300 | |
Chevron Corporation | | | 3,100 | | | | 333,033 | |
ConocoPhillips | | | 4,100 | | | | 327,426 | |
Exxon Mobil Corporation | | | 2,000 | | | | 168,260 | |
Hess Corporation | | | 4,000 | | | | 340,840 | |
Marathon Oil Corporation | | | 6,400 | | | | 341,184 | |
Noble Corporation (a) | | | 7,300 | | | | 333,026 | |
| | | | | | | | 2,171,069 | |
| Financials — 10.2% | | | | | | | | |
Aflac, Inc. | | | 3,000 | | | | 158,340 | |
American Express Company | | | 4,600 | | | | 207,920 | |
Ameriprise Financial, Inc. | | | 4,700 | | | | 287,076 | |
Bank of America Corporation | | | 1,500 | | | | 19,995 | |
Franklin Resources, Inc. | | | 2,450 | | | | 306,446 | |
JPMorgan Chase & Company | | | 6,500 | | | | 299,650 | |
MetLife, Inc. | | | 6,700 | | | | 299,691 | |
PNC Financial Services Group, Inc. | | | 4,800 | | | | 302,352 | |
Prudential Financial, Inc. | | | 4,900 | | | | 301,742 | |
| | | | | | | | 2,183,212 | |
| Health Care — 8.6% | | | | | | | | |
Abbott Laboratories | | | 6,200 | | | | 304,110 | |
Aetna, Inc. | | | 8,600 | | | | 321,898 | |
AmerisourceBergen Corporation | | | 8,300 | | | | 328,348 | |
Medco Health Solutions, Inc. (a) | | | 5,400 | | | | 303,264 | |
Teva Pharmaceutical Industries Ltd. - ADR | | | 5,600 | | | | 280,952 | |
Thermo Fisher Scientific, Inc. (a) | | | 5,400 | | | | 299,970 | |
| | | | | | | | 1,838,542 | |
| Industrials — 9.0% | | | | | | | | |
Dover Corporation | | | 4,800 | | | | 315,552 | |
General Dynamics Corporation | | | 4,100 | | | | 313,896 | |
General Electric Company | | | 16,500 | | | | 330,825 | |
THE JAMESTOWN BALANCED FUND SCHEDULE OF INVESTMENTS (Continued) |
COMMON STOCKS — 68.4% (Continued) | | | | | | |
| Industrials — 9.0% (Continued) | | | | | | |
Illinois Tool Works, Inc. | | | 5,900 | | | $ | 316,948 | |
Norfolk Southern Corporation | | | 4,500 | | | | 311,715 | |
United Technologies Corporation | | | 3,800 | | | | 321,670 | |
| | | | | | | | 1,910,606 | |
| Information Technology — 14.3% | | | | | | | | |
Apple, Inc. (a) | | | 1,325 | | | | 461,696 | |
Cisco Systems, Inc. | | | 15,300 | | | | 262,395 | |
EMC Corporation (a) | | | 11,400 | | | | 302,670 | |
Google, Inc. - Class A (a) | | | 525 | | | | 307,760 | |
Hewlett-Packard Company | | | 8,200 | | | | 335,954 | |
Intel Corporation | | | 13,450 | | | | 271,287 | |
International Business Machines Corporation | | | 1,450 | | | | 236,451 | |
Microsoft Corporation | | | 11,000 | | | | 278,960 | |
Oracle Corporation | | | 9,200 | | | | 307,004 | |
QUALCOMM, Inc. | | | 5,200 | | | | 285,116 | |
| | | | | | | | 3,049,293 | |
| Materials — 1.4% | | | | | | | | |
Eastman Chemical Company | | | 3,000 | | | | 297,960 | |
| | | | | | | | | |
Total Common Stocks (Cost $10,412,813) | | | | | | $ | 14,600,721 | |
U.S. TREASURY OBLIGATIONS — 4.6% | | | | | | |
| U.S. Treasury Notes — 4.6% | | | | | | |
4.25%, 11/15/2014 | | $ | 350,000 | | | $ | 383,387 | |
4.25%, 11/15/2017 | | | 400,000 | | | | 436,062 | |
2.625%, 08/15/2020 | | | 175,000 | | | | 164,172 | |
Total U.S. Treasury Obligations (Cost $930,136) | | | | | | $ | 983,621 | |
U.S. GOVERNMENT AGENCY OBLIGATIONS — 2.7% | | | | | | |
| Federal Home Loan Mortgage Corporation — 2.7% | | | | | | |
5.25%, due 04/18/2016 (Cost $495,423) | | $ | 500,000 | | | $ | 565,878 | |
| | | | | | |
| Virginia — 0.4% | | | | | | |
| Virginia State, Build America Bonds, Taxable, General Obligation, | | | | | | |
2.95%, due 06/01/2019 (Cost $99,924) | | $ | 100,000 | | | $ | 93,134 | |
THE JAMESTOWN BALANCED FUND SCHEDULE OF INVESTMENTS (Continued) |
MORTGAGE-BACKED SECURITIES — 4.2% | | | | | | |
| Federal Home Loan Mortgage Corporation — 0.7% | | | | | | |
Pool #E90624, 6.00%, due 08/01/2017 | | $ | 9,767 | | | $ | 10,603 | |
Pool #A43942, 5.50%, due 03/01/2036 | | | 133,436 | | | | 142,878 | |
| | | | | | | | 153,481 | |
| Federal National Mortgage Association — 3.4% | | | | | | | | |
Pool #618465, 5.00%, due 12/01/2016 | | | 73,648 | | | | 78,441 | |
Pool #684231, 5.00%, due 01/01/2018 | | | 110,690 | | | | 117,893 | |
Pool #255455, 5.00%, due 10/01/2024 | | | 125,443 | | | | 133,762 | |
Pool #255702, 5.00%, due 05/01/2025 | | | 192,042 | | | | 204,779 | |
Pool #808413, 5.50%, due 01/01/2035 | | | 168,159 | | | | 180,026 | |
| | | | | | | | 714,901 | |
| Government National Mortgage Association — 0.1% | | | | | | | | |
Pool #781344, 6.50%, due 10/15/2031 | | | 18,493 | | | | 20,868 | |
| | | | | | | | | |
Total Mortgage-Backed Securities (Cost $830,359) | | | | | | $ | 889,250 | |
| | | | | | |
| Consumer Discretionary — 0.5% | | | | | | |
| Anheuser-Busch Companies, Inc., | | | | | | |
4.50%, due 04/01/2018 | | $ | 100,000 | | | $ | 103,628 | |
| | | | | | | | | |
| Consumer Staples — 1.8% | | | | | | | | |
| General Mills, Inc., | | | | | | | | |
5.70%, due 02/15/2017 | | | 150,000 | | | | 168,326 | |
| PepsiCo, Inc., | | | | | | | | |
4.65%, due 02/15/2013 | | | 200,000 | | | | 213,250 | |
| | | | | | | | 381,576 | |
| Energy — 0.5% | | | | | | | | |
| Shell International Finance B.V., | | | | | | | | |
4.30%, due 09/22/2019 | | | 100,000 | | | | 102,975 | |
| | | | | | | | | |
| Financials — 4.9% | | | | | | | | |
| American Express Company, | | | | | | | | |
4.875%, due 07/15/2013 | | | 150,000 | | | | 159,906 | |
| BB&T Corporation, | | | | | | | | |
6.50%, due 08/01/2011 | | | 325,000 | | | | 331,157 | |
| Morgan Stanley, | | | | | | | | |
5.30%, due 03/01/2013 | | | 250,000 | | | | 265,717 | |
| Northern Trust Corporation, | | | | | | | | |
4.625%, due 05/01/2014 | | | 150,000 | | | | 161,982 | |
| PNC Funding Corporation, | | | | | | | | |
5.125%, due 02/08/2020 | | | 110,000 | | | | 115,783 | |
| | | | | | | | 1,034,545 | |
| Health Care — 1.9% | | | | | | | | |
| Amgen, Inc., | | | | | | | | |
5.85%, due 06/01/2017 | | | 150,000 | | | | 170,699 | |
| GlaxoSmithKline plc, | | | | | | | | |
5.65%, due 05/15/2018 | | | 200,000 | | | | 224,770 | |
| | | | | | | | 395,469 | |
THE JAMESTOWN BALANCED FUND SCHEDULE OF INVESTMENTS (Continued) |
CORPORATE BONDS — 12.7% (Continued) | | | | | | |
| Industrials — 1.2% | | | | | | |
| United Technologies Corporation, | | | | | | |
6.10%, due 05/15/2012 | | $ | 250,000 | | | $ | 265,447 | |
| | | | | | | | | |
| Materials — 0.1% | | | | | | | | |
| E.I. du Pont de Nemours and Company, | | | | | | | | |
5.875%, due 01/15/2014 | | | 26,000 | | | | 28,822 | |
| | | | | | | | | |
| Telecommunication Services — 1.2% | | | | | | | | |
| AT&T, Inc., | | | | | | | | |
4.95%, due 01/15/2013 | | | 250,000 | | | | 266,277 | |
| | | | | | | | | |
| Utilities — 0.6% | | | | | | | | |
| Virginia Electric & Power Company, | | | | | | | | |
5.00%, due 06/30/2019 | | | 125,000 | | | | 133,202 | |
| | | | | | | | | |
Total Corporate Bonds (Cost $2,579,427) | | | | | | $ | 2,711,941 | |
MONEY MARKET FUNDS — 2.2% | | | | | | |
Fidelity Institutional Money Market Portfolio - Select Class, 0.16% (b) (Cost $465,785) | | | 465,785 | | | $ | 465,785 | |
REPURCHASE AGREEMENTS — 3.7% | | | | | | |
U.S. Bank N.A., 0.01%, dated 03/31/2011, due 04/01/2011, repurchase proceeds: $788,482 (Cost $788,482) (c) | | $ | 788,482 | | | $ | 788,482 | |
| | | | | | | | | |
Total Investments at Value — 98.9% (Cost $16,602,349) | | | | | | $ | 21,098,812 | |
| | | | | | | | | |
Other Assets in Excess of Liabilities — 1.1% | | | | | | | 232,289 | |
| | | | | | | | | |
Net Assets — 100.0% | | | | | | $ | 21,331,101 | |
| ADR - American Depositary Receipt. |
| |
| (a) | Non-income producing security. |
| | |
| (b) | Variable rate security. The rate shown is the 7-day effective yield as of March 31, 2011. |
| | |
| (c) | Repurchase agreement is fully collateralized by $255,117 FNCL #695167, 5.00%, due 05/01/2033 and $509,229 FNCI #739797, 4.00%, due 09/01/2018. The aggregate market value of the collateral at March 31, 2011 was $804,506. |
| | |
| See accompanying notes to financial statements. |
THE JAMESTOWN EQUITY FUND SCHEDULE OF INVESTMENTS March 31, 2011 |
| | | | | | |
| Consumer Discretionary — 12.3% | | | | | | |
Comcast Corporation - Class A | | | 21,600 | | | $ | 533,952 | |
Dollar Tree, Inc. (a) | | | 9,800 | | | | 544,096 | |
Ford Motor Company (a) | | | 34,000 | | | | 506,940 | |
McDonald's Corporation | | | 7,100 | | | | 540,239 | |
TJX Companies, Inc. (The) | | | 8,000 | | | | 397,840 | |
Viacom, Inc. - Class B | | | 12,200 | | | | 567,544 | |
Yum! Brands, Inc. | | | 7,700 | | | | 395,626 | |
| | | | | | | | 3,486,237 | |
| Consumer Staples — 8.2% | | | | | | | | |
CVS Caremark Corporation | | | 15,900 | | | | 545,688 | |
Kimberly-Clark Corporation | | | 7,500 | | | | 489,525 | |
PepsiCo, Inc. | | | 10,000 | | | | 644,100 | |
Wal-Mart Stores, Inc. | | | 12,300 | | | | 640,215 | |
| | | | | | | | 2,319,528 | |
| Energy — 14.1% | | | | | | | | |
Apache Corporation | | | 4,700 | | | | 615,324 | |
Chevron Corporation | | | 5,700 | | | | 612,351 | |
ConocoPhillips | | | 7,500 | | | | 598,950 | |
Exxon Mobil Corporation | | | 3,700 | | | | 311,281 | |
Hess Corporation | | | 7,300 | | | | 622,033 | |
Marathon Oil Corporation | | | 12,000 | | | | 639,720 | |
Noble Corporation (a) | | | 13,500 | | | | 615,870 | |
| | | | | | | | 4,015,529 | |
| Financials — 14.1% | | | | | | | | |
Aflac, Inc. | | | 5,500 | | | | 290,290 | |
American Express Company | | | 8,350 | | | | 377,420 | |
Ameriprise Financial, Inc. | | | 8,900 | | | | 543,612 | |
Franklin Resources, Inc. | | | 4,450 | | | | 556,606 | |
JPMorgan Chase & Company | | | 12,000 | | | | 553,200 | |
MetLife, Inc. | | | 12,600 | | | | 563,598 | |
PNC Financial Services Group, Inc. | | | 8,800 | | | | 554,312 | |
Prudential Financial, Inc. | | | 9,000 | | | | 554,220 | |
| | | | | | | | 3,993,258 | |
| Health Care — 12.1% | | | | | | | | |
Abbott Laboratories | | | 11,700 | | | | 573,885 | |
Aetna, Inc. | | | 16,200 | | | | 606,366 | |
AmerisourceBergen Corporation | | | 15,300 | | | | 605,268 | |
Medco Health Solutions, Inc. (a) | | | 10,000 | | | | 561,600 | |
Teva Pharmaceutical Industries Ltd. - ADR | | | 10,500 | | | | 526,785 | |
Thermo Fisher Scientific, Inc. (a) | | | 9,900 | | | | 549,945 | |
| | | | | | | | 3,423,849 | |
| Industrials — 12.3% | | | | | | | | |
Dover Corporation | | | 8,700 | | | | 571,938 | |
General Dynamics Corporation | | | 7,300 | | | | 558,888 | |
General Electric Company | | | 30,000 | | | | 601,500 | |
Illinois Tool Works, Inc. | | | 10,500 | | | | 564,060 | |
THE JAMESTOWN EQUITY FUND SCHEDULE OF INVESTMENTS (Continued) |
COMMON STOCKS — 95.3% (Continued) | | | | | | |
| Industrials — 12.3% (Continued) | | | | | | |
Norfolk Southern Corporation | | | 8,700 | | | $ | 602,649 | |
United Technologies Corporation | | | 7,000 | | | | 592,550 | |
| | | | | | | | 3,491,585 | |
| Information Technology — 20.2% | | | | | | | | |
Apple, Inc. (a) | | | 2,450 | | | | 853,703 | |
Cisco Systems, Inc. | | | 29,200 | | | | 500,780 | |
EMC Corporation (a) | | | 21,500 | | | | 570,825 | |
Google, Inc. - Class A (a) | | | 950 | | | | 556,899 | |
Hewlett-Packard Company | | | 16,000 | | | | 655,520 | |
Intel Corporation | | | 25,000 | | | | 504,250 | |
International Business Machines Corporation | | | 2,700 | | | | 440,289 | |
Microsoft Corporation | | | 20,300 | | | | 514,808 | |
Oracle Corporation | | | 17,500 | | | | 583,975 | |
QUALCOMM, Inc. | | | 9,950 | | | | 545,558 | |
| | | | | | | | 5,726,607 | |
| Materials — 2.0% | | | | | | | | |
Eastman Chemical Company | | | 5,800 | | | | 576,056 | |
| | | | | | | | | |
Total Common Stocks (Cost $19,787,724) | | | | | | $ | 27,032,649 | |
MONEY MARKET FUNDS — 0.6% | | | | | | |
Fidelity Institutional Money Market Portfolio - Select Class, 0.16% (b) (Cost $179,821) | | | 179,821 | | | $ | 179,821 | |
REPURCHASE AGREEMENTS — 2.5% | | | | | | |
U.S. Bank N.A., 0.01%, dated 03/31/2011, due 04/01/2011, repurchase proceeds: $703,349 (Cost $703,349) (c) | | $ | 703,349 | | | $ | 703,349 | |
| | | | | | | | | |
Total Investments at Value — 98.4% (Cost $20,670,894) | | | | | | $ | 27,915,819 | |
| | | | | | | | | |
Other Assets in Excess of Liabilities — 1.6% | | | | | | | 443,574 | |
| | | | | | | | | |
Net Assets — 100.0% | | | | | | $ | 28,359,393 | |
| ADR - American Depositary Receipt. |
| |
| (a) | Non-income producing security. |
| | |
| (b) | Variable rate security. The rate shown is the 7-day effective yield as of March 31, 2011. |
| | |
| (c) | Repurchase agreement is fully collateralized by $703,057 FGLMC #A87842, 4.50%, due 08/01/2039. The aggregate market value of the collateral at March 31, 2011 was $718,094. |
| | |
| See accompanying notes to financial statements. |
THE JAMESTOWN TAX EXEMPT VIRGINIA FUND SCHEDULE OF INVESTMENTS MARCH 31, 2011 |
VIRGINIA REVENUE AND GENERAL OBLIGATION (GO) BONDS — 92.7% | | | | | | |
| Arlington Co., Virginia, GO, | | | | | | |
4.10%, due 11/01/2018 | | $ | 500,000 | | | $ | 525,370 | |
| Capital Region Airport Commission, Virginia, Airport Revenue, | | | | | | | | |
4.50%, due 07/01/2016 | | | 520,000 | | | | 567,642 | |
| Chesterfield Co., Virginia, GO, | | | | | | | | |
5.00%, due 01/01/2020 | | | 700,000 | | | | 776,132 | |
| Fairfax Co., Virginia, Economic Dev. Authority, Revenue, | | | | | | | | |
5.00%, due 06/01/2018 | | | 1,000,000 | | | | 1,080,080 | |
| Fairfax Co., Virginia, Industrial Dev. Authority, Revenue, | | | | | | | | |
5.00%, due 05/15/2022 | | | 750,000 | | | | 795,293 | |
| Fauquier Co., Virginia, GO, | | | | | | | | |
5.00%, due 07/01/2017 | | | 500,000 | | | | 567,870 | |
| Hampton Roads Sanitation District, Virginia, Wastewater, Revenue, | | | | | | | | |
5.00%, due 04/01/2022 | | | 400,000 | | | | 435,100 | |
| Hampton, Virginia, GO, | | | | | | | | |
| 5.00%, due 04/01/2020, | | | | | | | | |
prerefunded 04/01/2015 @ 100 | | | 500,000 | | | | 568,010 | |
| Henrico Co., Virginia, Public Improvement, Series A, GO, | | | | | | | | |
5.00%, due 12/01/2015 | | | 250,000 | | | | 288,388 | |
| Henrico Co., Virginia, Water & Sewer, Revenue, | | | | | | | | |
5.00%, due 05/01/2020 | | | 350,000 | | | | 396,522 | |
5.00%, due 05/01/2022 | | | 430,000 | | | | 476,143 | |
| James City, Virginia, School District, GO, | | | | | | | | |
5.00%, due 12/15/2018 | | | 500,000 | | | | 560,535 | |
| James City, Virginia, Service Authority, Water & Sewer, Revenue, | | | | | | | | |
5.125%, due 01/15/2017 | | | 1,000,000 | | | | 1,058,110 | |
| Leesburg, Virginia, GO, | | | | | | | | |
5.00%, due 09/15/2016 | | | 500,000 | | | | 574,315 | |
| Loudoun Co., Virginia, Industrial Dev. Authority, Public Facility Lease, Revenue, | | | | | | | | |
| 5.00%, due 03/01/2019, | | | | | | | | |
prerefunded 3/1/2013 @ 100 | | | 215,000 | | | | 232,669 | |
5.00%, due 03/01/2019 | | | 785,000 | | | | 831,079 | |
| Lynchburg, Virginia, GO, | | | | | | | | |
5.00%, due 06/01/2015 | | | 500,000 | | | | 568,965 | |
| Lynchburg, Virginia, Public Improvement, Series A, GO, | | | | | | | | |
5.00%, due 08/01/2019 | | | 625,000 | | | | 718,475 | |
| Manassas, Virginia, Public Improvement, Series D, GO, | | | | | | | | |
5.00%, due 07/01/2019 | | | 250,000 | | | | 290,355 | |
| New Kent Co., Virginia, Economic Dev. Authority, Revenue, | | | | | | | | |
5.00%, due 02/01/2019 | | | 500,000 | | | | 542,070 | |
| Norfolk, Virginia, GO, | | | | | | | | |
4.50%, due 06/01/2015 | | | 500,000 | | | | 544,215 | |
THE JAMESTOWN TAX EXEMPT VIRGINIA FUND SCHEDULE OF INVESTMENTS (Continued) |
VIRGINIA REVENUE AND GENERAL OBLIGATION (GO) BONDS — 92.7% (Continued) | | | | | | |
| Norfolk, Virginia, Water, Revenue, | | | | | | |
5.00%, due 11/01/2016 | | $ | 1,000,000 | | | $ | 1,023,130 | |
| Portsmouth, Virginia, Series A, GO, | | | | | | | | |
5.00%, due 04/01/2016 | | | 500,000 | | | | 558,100 | |
| Portsmouth, Virginia, Series D, GO, | | | | | | | | |
4.00%, due 12/01/2017 | | | 215,000 | | | | 234,339 | |
| Prince William Co., Virginia, Lease Participation Certificates, | | | | | | | | |
5.00%, due 10/01/2020 | | | 500,000 | | | | 545,055 | |
| Richmond, Virginia, Metropolitan Authority, Revenue, | | | | | | | | |
5.25%, due 07/15/2014 | | | 1,000,000 | | | | 1,093,960 | |
| Southeastern Public Service Authority, Virginia, Revenue, | | | | | | | | |
5.00%, due 07/01/2015, ETM | | | 1,000,000 | | | | 1,113,931 | |
| Spotsylvania Co., Virginia, GO, | | | | | | | | |
5.00%, due 01/15/2016 | | | 500,000 | | | | 540,800 | |
| Spotsylvania Co., Virginia, Water & Sewer, Revenue, | | | | | | | | |
5.00%, due 06/01/2026 | | | 500,000 | | | | 501,645 | |
| Suffolk, Virginia, Public Improvement, Series A, GO, | | | | | | | | |
4.00%, due 08/01/2018 | | | 250,000 | | | | 270,930 | |
| University of Virginia, Revenue, | | | | | | | | |
5.00%, due 06/01/2013 | | | 585,000 | | | | 638,697 | |
| Upper Occoquan, Virginia, Sewer Authority, Revenue, | �� | | | | | | | |
5.15%, due 07/01/2020 | | | 250,000 | | | | 285,245 | |
| Virginia Beach, Virginia, Public Improvement, GO, | | | | | | | | |
5.00%, due 06/01/2021 | | | 250,000 | | | | 294,448 | |
| Virginia Biotechnology Research Partnership Authority, Lease Revenue, | | | | | | | | |
5.00%, due 09/01/2020 | | | 500,000 | | | | 557,420 | |
| Virginia College Building Authority, Educational Facilities, Revenue, | | | | | | | | |
| 5.00%, due 02/01/2017, | | | | | | | | |
prerefunded 02/01/2014 @ 100 | | | 500,000 | | | | 557,440 | |
5.00%, due 04/01/2017 | | | 500,000 | | | | 544,180 | |
5.00%, due 03/01/2019 | | | 250,000 | | | | 279,188 | |
| Virginia Commonwealth Transportation Board, Federal Highway Reimbursement Anticipation Note, Revenue, | | | | | | | | |
5.00%, due 09/28/2015 | | | 500,000 | | | | 571,225 | |
| Virginia Polytechnic Institute & State University, Revenue, | | | | | | | | |
5.00%, due 06/01/2016 | | | 500,000 | | | | 549,430 | |
| Virginia Small Business Financing Authority, Healthcare Facilities Revenue, | | | | | | | | |
5.00%, due 11/01/2017 | | | 250,000 | | | | 277,770 | |
| Virginia State Public Building Authority, Public Facilities, Series D, Revenue, | | | | | | | | |
5.00%, due 08/01/2016 | | | 1,000,000 | | | | 1,094,050 | |
| Virginia State Public Building Authority, Revenue, | | | | | | | | |
5.00%, due 08/01/2012 | | | 635,000 | | | | 673,100 | |
| Virginia State Public School Authority, Series A, Revenue, | | | | | | | | |
5.00%, due 08/01/2020 | | | 585,000 | | | | 626,722 | |
THE JAMESTOWN TAX EXEMPT VIRGINIA FUND SCHEDULE OF INVESTMENTS (Continued) |
VIRGINIA REVENUE AND GENERAL OBLIGATION (GO) BONDS — 92.7% (Continued) | | | | | | |
| Virginia State Public School Authority, Series B, Revenue, | | | | | | |
4.00%, due 08/01/2014 | | $ | 400,000 | | | $ | 436,688 | |
| Virginia State Public School Authority, Series B-1, Revenue, | | | | | | | | |
5.00%, due 08/01/2018 | | | 500,000 | | | | 574,520 | |
| Virginia State Resources Authority, Clean Water, Revenue, | | | | | | | | |
5.00%, due 10/01/2021 | | | 500,000 | | | | 560,315 | |
Virginia State Resources Authority, Infrastructure, Series B, Revenue, | | | | | | | | |
5.00%, due 11/01/2024 | | | 500,000 | | | | 539,705 | |
| Virginia State, Series B, GO, | | | | | | | | |
5.00%, due 06/01/2012 | | | 500,000 | | | | 526,860 | |
5.00%, due 06/01/2017 | | | 250,000 | | | | 290,357 | |
| | | | | | | | | |
Total Virginia Revenue and General Obligation (GO) Bonds (Cost $27,024,310) | | | | | | $ | 28,156,588 | |
WASHINGTON, D.C. REVENUE BONDS — 1.8% | | | | | | |
| Metropolitan Washington Airports Authority, Series C, Revenue, | | | | | | |
5.00%, due 10/01/2022 (Cost $509,325) | | $ | 500,000 | | | $ | 527,220 | |
EXCHANGE-TRADED FUNDS — 0.8% | | | | | | |
SPDR Nuveen Barclays Capital Short Term Municipal Bond ETF (Cost $241,000) | | | 10,000 | | | $ | 238,300 | |
MONEY MARKET FUNDS — 3.6% | | | | | | |
Fidelity Tax Exempt Portfolio - Class I, 0.06% (a) (Cost $1,105,135) | | | 1,105,135 | | | $ | 1,105,135 | |
| | | | | | | | | |
Total Investments at Value — 98.9% (Cost $28,879,770) | | | | | | $ | 30,027,243 | |
| | | | | | | | | |
Other Assets in Excess of Liabilities — 1.1% | | | | | | | 341,231 | |
| | | | | | | | | |
Net Assets — 100.0% | | | | | | $ | 30,368,474 | |
| ETM - Escrowed to Maturity. |
| |
| (a) | Variable rate security. The rate shown is the 7-day effective yield as of March 31, 2011. |
| | |
| See accompanying notes to financial statements. |
THE JAMESTOWN FUNDS STATEMENTS OF ASSETS AND LIABILITIES March 31, 2011 |
| | | | | | | | The Jamestown Tax Exempt Virginia Fund | |
| ASSETS | | | | | | | | | |
| Investments in securities: | | | | | | | | | |
At acquisition cost | | $ | 16,602,349 | | | $ | 20,670,894 | | | $ | 28,879,770 | |
At value (Note 1) | | $ | 21,098,812 | | | $ | 27,915,819 | | | $ | 30,027,243 | |
Dividends and interest receivable | | | 75,842 | | | | 26,484 | | | | 378,922 | |
Receivable for investment securities sold | | | 206,904 | | | | 254,750 | | | | — | |
Receivable for capital shares sold | | | — | | | | 238,322 | | | | — | |
Other assets | | | 1,964 | | | | 2,725 | | | | 2,178 | |
TOTAL ASSETS | | | 21,383,522 | | | | 28,438,100 | | | | 30,408,343 | |
| | | | | | | | | | | | | |
| LIABILITIES | | | | | | | | | | | | |
Distributions payable | | | 6,113 | | | | — | | | | 10,218 | |
Payable for investment securities purchased | | | — | | | | 38,335 | | | | — | |
Payable for capital shares redeemed | | | 10,847 | | | | 17,712 | | | | 14,950 | |
Accrued investment advisory fees (Note 3) | | | 11,766 | | | | 15,323 | | | | 8,289 | |
Payable to administrator (Note 3) | | | 4,515 | | | | 4,515 | | | | 4,315 | |
Other accrued expenses | | | 19,180 | | | | 2,822 | | | | 2,097 | |
TOTAL LIABILITIES | | | 52,421 | | | | 78,707 | | | | 39,869 | |
| | | | | | | | | | | | | |
NET ASSETS | | $ | 21,331,101 | | | $ | 28,359,393 | | | $ | 30,368,474 | |
| | | | | | | | | | | | | |
| Net assets consist of: | | | | | | | | | | | | |
Paid-in capital | | $ | 17,250,089 | | | $ | 22,746,403 | | | $ | 29,220,269 | |
| Undistributed (overdistributed) net investment income | | | (27,043 | ) | | | 25,615 | | | | — | |
Accumulated net realized gains (losses)
from security transactions | | | (388,408 | ) | | | (1,657,550 | ) | | | 732 | |
Net unrealized appreciation on investments | | | 4,496,463 | | | | 7,244,925 | | | | 1,147,473 | |
Net assets | | $ | 21,331,101 | | | $ | 28,359,393 | | | $ | 30,368,474 | |
| | | | | | | | | | | | | |
Shares of beneficial interest outstanding (unlimited number
of shares authorized, $0.01 par value) | | | 1,620,536 | | | | 1,715,084 | | | | 2,962,802 | |
| | | | | | | | | | | | | |
Net asset value, offering price and
redemption price per share | | $ | 13.16 | | | $ | 16.54 | | | $ | 10.25 | |
See accompanying notes to financial statements.
THE JAMESTOWN FUNDS STATEMENTS OF OPERATIONS Year Ended March 31, 2011 |
| | | | | | | | The Jamestown Tax Exempt Virginia Fund | |
| INVESTMENT INCOME | | | | | | | | | |
Dividends | | $ | 240,547 | | | $ | 430,447 | | | $ | 3,480 | |
Foreign withholding taxes on dividends | | | (1,416 | ) | | | (2,562 | ) | | | — | |
Interest | | | 284,891 | | | | 68 | | | | 1,091,390 | |
TOTAL INVESTMENT INCOME | | | 524,022 | | | | 427,953 | | | | 1,094,870 | |
| | | | | | | | | | | | | |
| EXPENSES | | | | | | | | | | | | |
Investment advisory fees (Note 3) | | | 136,446 | | | | 168,610 | | | | 126,073 | |
Administration fees (Note 3) | | | 48,000 | | | | 48,000 | | | | 45,759 | |
Professional fees | | | 22,522 | | | | 19,822 | | | | 16,922 | |
Trustees’ fees and expenses | | | 14,531 | | | | 14,531 | | | | 14,531 | |
Custodian and bank service fees | | | 6,788 | | | | 10,290 | | | | 5,766 | |
Compliance fees and expenses (Note 3) | | | 6,384 | | | | 6,384 | | | | 6,384 | |
Pricing costs | | | 5,545 | | | | 1,121 | | | | 8,383 | |
Printing of shareholder reports | | | 3,050 | | | | 5,150 | | | | 2,057 | |
Registration fees | | | 3,946 | | | | 4,567 | | | | 2,154 | |
Postage and supplies | | | 3,786 | | | | 3,844 | | | | 3,248 | |
Insurance expense | | | 2,748 | | | | 3,290 | | | | 3,801 | |
Other expenses | | | 6,343 | | | | 8,202 | | | | 5,860 | |
TOTAL EXPENSES | | | 260,089 | | | | 293,811 | | | | 240,938 | |
Fees voluntarily waived by the Adviser (Note 3) | | | — | | | | — | | | | (23,462 | ) |
Expenses reimbursed through a directed brokerage
arrangement (Note 4) | | | (12,000 | ) | | | (12,000 | ) | | | — | |
NET EXPENSES | | | 248,089 | | | | 281,811 | | | | 217,476 | |
| | | | | | | | | | | | | |
NET INVESTMENT INCOME | | | 275,933 | | | | 146,142 | | | | 877,394 | |
| | | | | | | | | | | | | |
REALIZED AND UNREALIZED GAINS
(LOSSES) ON INVESTMENTS | | | | | | | | | | | | |
Net realized gains on security transactions | | | 1,442,653 | | | | 2,063,344 | | | | 53,155 | |
Net change in unrealized appreciation/
depreciation on investments | | | 297,662 | | | | 1,218,908 | | | | (171,596 | ) |
| | | | | | | | | | | | | |
NET REALIZED AND UNREALIZED GAINS
(LOSSES) ON INVESTMENTS | | | 1,740,315 | | | | 3,282,252 | | | | (118,441 | ) |
| | | | | | | | | | | | | |
NET INCREASE IN NET ASSETS
FROM OPERATIONS | | $ | 2,016,248 | | | $ | 3,428,394 | | | $ | 758,953 | |
See accompanying notes to financial statements.
THE JAMESTOWN FUNDS STATEMENTS OF CHANGES IN NET ASSETS |
| | | The Jamestown Balanced Fund | | | | |
| | | | | | | | | | | | |
| FROM OPERATIONS | | | | | | | | | | | | |
Net investment income | | $ | 275,933 | | | $ | 442,944 | | | $ | 146,142 | | | $ | 177,984 | |
| Net realized gains (losses) on security transactions | | | 1,442,653 | | | | (520,906 | ) | | | 2,063,344 | | | | (1,004,607 | ) |
Net change in unrealized appreciation/
depreciation on investments | | | 297,662 | | | | 4,616,015 | | | | 1,218,908 | | | | 7,294,861 | |
Net increase in net assets from operations | | | 2,016,248 | | | | 4,538,053 | | | | 3,428,394 | | | | 6,468,238 | |
| | | | | | | | | | | | | | | | | |
| DISTRIBUTIONS TO SHAREHOLDERS | | | | | | | | | | | | | | | | |
From net investment income | | | (294,842 | ) | | | (464,931 | ) | | | (163,723 | ) | | | (134,788 | ) |
| | | | | | | | | | | | | | | | | |
| FROM CAPITAL SHARE TRANSACTIONS | | | | | | | | | | | | | | | | |
Proceeds from shares sold | | | 35,385 | | | | 246,821 | | | | 2,712,183 | | | | 4,602,946 | |
Net asset value of shares
issued in reinvestment of
distributions to shareholders | | | 260,251 | | | | 400,602 | | | | 156,040 | | | | 128,492 | |
Payments for shares redeemed | | | (2,869,410 | ) | | | (3,608,673 | ) | | | (4,307,138 | ) | | | (3,321,397 | ) |
Net increase (decrease) in net assets
from capital share transactions | | | (2,573,774 | ) | | | (2,961,250 | ) | | | (1,438,915 | ) | | | 1,410,041 | |
| | | | | | | | | | | | | | | | | |
TOTAL INCREASE (DECREASE)
IN NET ASSETS | | | (852,368 | ) | | | 1,111,872 | | | | 1,825,756 | | | | 7,743,491 | |
| | | | | | | | | | | | | | | | | |
| NET ASSETS | | | | | | | | | | | | | | | | |
Beginning of year | | | 22,183,469 | | | | 21,071,597 | | | | 26,533,637 | | | | 18,790,146 | |
End of year | | $ | 21,331,101 | | | $ | 22,183,469 | | | $ | 28,359,393 | | | $ | 26,533,637 | |
| | | | | | | | | | | | | | | | | |
UNDISTRIBUTED
(OVERDISTRIBUTED) NET
INVESTMENT INCOME | | $ | (27,043 | ) | | $ | (25,209 | ) | | $ | 25,615 | | | $ | 43,196 | |
| | | | | | | | | | | | | | | | | |
| CAPITAL SHARE ACTIVITY | | | | | | | | | | | | | | | | |
Shares sold | | | 2,932 | | | | 21,848 | | | | 180,359 | | | | 336,642 | |
Shares reinvested | | | 21,529 | | | | 35,858 | | | | 10,779 | | | | 9,198 | |
Shares redeemed | | | (235,155 | ) | | | (315,673 | ) | | | (284,981 | ) | | | (243,780 | ) |
Net increase (decrease) in shares
outstanding | | | (210,694 | ) | | | (257,967 | ) | | | (93,843 | ) | | | 102,060 | |
Shares outstanding, beginning of year | | | 1,831,230 | | | | 2,089,197 | | | | 1,808,927 | | | | 1,706,867 | |
Shares outstanding, end of year | | | 1,620,536 | | | | 1,831,230 | | | | 1,715,084 | | | | 1,808,927 | |
See accompanying notes to financial statements.
THE JAMESTOWN FUNDS STATEMENTS OF CHANGES IN NET ASSETS |
| | | The Jamestown Tax Exempt
Virginia Fund | |
| | Year Ended March 31, 2011 | | | Year Ended March 31, 2010 | |
| FROM OPERATIONS | | | | | | |
Net investment income | | $ | 877,394 | | | $ | 965,888 | |
Net realized gains on security transactions | | | 53,155 | | | | 54,035 | |
| Net change in unrealized appreciation/depreciation on investments | | | (171,596 | ) | | | 294,919 | |
Net increase in net assets from operations | | | 758,953 | | | | 1,314,842 | |
| | | | | | | | | |
| DISTRIBUTIONS TO SHAREHOLDERS | | | | | | | | |
From net investment income | | | (877,910 | ) | | | (991,361 | ) |
| From net realized gains from security transactions | | | (71,952 | ) | | | (40,804 | ) |
| Decrease in net assets from distributions to shareholders | | | (949,862 | ) | | | (1,032,165 | ) |
| | | | | | | | | |
| FROM CAPITAL SHARE TRANSACTIONS | | | | | | | | |
Proceeds from shares sold | | | 1,686,867 | | | | 1,899,062 | |
Net asset value of shares issued in reinvestment of
distributions to shareholders | | | 806,846 | | | | 876,547 | |
Payments for shares redeemed | | | (4,838,925 | ) | | | (2,883,645 | ) |
| Net decrease in net assets from capital share transactions | | | (2,345,212 | ) | | | (108,036 | ) |
| | | | | | | | | |
| TOTAL INCREASE (DECREASE) IN NET ASSETS | | | (2,536,121 | ) | | | 174,641 | |
| | | | | | | | | |
| NET ASSETS | | | | | | | | |
Beginning of year | | | 32,904,595 | | | | 32,729,954 | |
End of year | | $ | 30,368,474 | | | $ | 32,904,595 | |
| | | | | | | | | |
| UNDISTRIBUTED NET INVESTMENT INCOME | | $ | — | | | $ | 393 | |
| | | | | | | | | |
| CAPITAL SHARE ACTIVITY | | | | | | | | |
Shares sold | | | 161,718 | | | | 184,087 | |
Shares reinvested | | | 77,402 | | | | 84,650 | |
Shares redeemed | | | (462,738 | ) | | | (277,154 | ) |
Net decrease in shares outstanding | | | (223,618 | ) | | | (8,417 | ) |
Shares outstanding, beginning of year | | | 3,186,420 | | | | 3,194,837 | |
Shares outstanding, end of year | | | 2,962,802 | | | | 3,186,420 | |
See accompanying notes to financial statements.
THE JAMESTOWN BALANCED FUND FINANCIAL HIGHLIGHTS |
Selected Per Share Data and Ratios for a Share Outstanding Throughout Each Year | |
| | | | |
| | | | | | | | | | | | | | | |
Net asset value at beginning of year | | $ | 12.11 | | | $ | 10.09 | | | $ | 12.95 | | | $ | 14.53 | | | $ | 14.97 | |
| | | | | | | | | | | | | | | | | | | | | |
| Income (loss) from investment operations: | | | | | | | | | | | | | | | | | | | | |
Net investment income | | | 0.16 | | | | 0.22 | | | | 0.25 | | | | 0.26 | | | | 0.27 | |
Net realized and unrealized gains
(losses) on investments | | | 1.06 | | | | 2.04 | | | | (2.91 | ) | | | 0.27 | | | | 0.69 | |
Total from investment operations | | | 1.22 | | | | 2.26 | | | | (2.66 | ) | | | 0.53 | | | | 0.96 | |
| | | | | | | | | | | | | | | | | | | | | |
| Less distributions: | | | | | | | | | | | | | | | | | | | | |
| Dividends from net investment income | | | (0.17 | ) | | | (0.24 | ) | | | (0.20 | ) | | | (0.28 | ) | | | (0.29 | ) |
Distributions from net realized gains | | | — | | | | — | | | | — | | | | (1.83 | ) | | | (1.11 | ) |
Total distributions | | | (0.17 | ) | | | (0.24 | ) | | | (0.20 | ) | | | (2.11 | ) | | | (1.40 | ) |
| | | | | | | | | | | | | | | | | | | | | |
Net asset value at end of year | | $ | 13.16 | | | $ | 12.11 | | | $ | 10.09 | | | $ | 12.95 | | | $ | 14.53 | |
| | | | | | | | | | | | | | | | | | | | | |
Total return (a) | | | 10.24% | | | | 22.56% | | | | (20.75% | ) | | | 2.97% | | | | 6.57% | |
| | | | | | | | | | | | | | | | | | | | | |
Net assets at end of year (000’s) | | $ | 21,331 | | | $ | 22,183 | | | $ | 21,072 | | | $ | 32,058 | | | $ | 45,460 | |
| | | | | | | | | | | | | | | | | | | | | |
| Ratio of total expenses to average net assets | | | 1.24% | | | | 1.20% | | | | 1.14% | | | | 1.01% | | | | 0.94% | |
| | | | | | | | | | | | | | | | | | | | | |
Ratio of net expenses to average net assets (b) | | | 1.18% | | | | 1.11% | | | | 1.05% | | | | 0.95% | | | | 0.89% | |
| | | | | | | | | | | | | | | | | | | | | |
Ratio of net investment income to
average net assets | | | 1.31% | | | | 1.98% | | | | 2.10% | | | | 1.71% | | | | 1.80% | |
| | | | | | | | | | | | | | | | | | | | | |
Portfolio turnover rate | | | 30% | | | | 40% | | | | 43% | | | | 30% | | | | 40% | |
| (a) | Total return is a measure of the change in value of an investment in the Fund over the period covered, which assumes any dividends or capital gains distributions are reinvested in shares of the Fund. Returns do not reflect the deduction of taxes a shareholder would pay on Fund distributions or the redemption of Fund shares. |
| | |
| (b) | Ratios were determined based on net expenses after expense reimbursements through a directed brokerage arrangement (Note 4). |
| | |
| See accompanying notes to financial statements. |
THE JAMESTOWN EQUITY FUND FINANCIAL HIGHLIGHTS |
Selected Per Share Data and Ratios for a Share Outstanding Throughout Each Year | |
| | | | |
| | | | | | | | | | | | | | | |
Net asset value at beginning of year | | $ | 14.67 | | | $ | 11.01 | | | $ | 16.68 | | | $ | 18.12 | | | $ | 18.45 | |
| | | | | | | | | | | | | | | | | | | | | |
| Income (loss) from investment operations: | | | | | | | | | | | | | | | | | | | | |
Net investment income | | | 0.09 | | | | 0.10 | | | | 0.08 | | | | 0.08 | | | | 0.10 | |
Net realized and unrealized gains
(losses) on investments | | | 1.87 | | | | 3.64 | | | | (5.68 | ) | | | 0.20 | | | | 1.15 | |
Total from investment operations | | | 1.96 | | | | 3.74 | | | | (5.60 | ) | | | 0.28 | | | | 1.25 | |
| | | | | | | | | | | | | | | | | | | | | |
| Less distributions: | | | | | | | | | | | | | | | | | | | | |
| Dividends from net investment income | | | (0.09 | ) | | | (0.08 | ) | | | — | | | | (0.08 | ) | | | (0.10 | ) |
Distributions from net realized gains | | | — | | | | — | | | | — | | | | (1.50 | ) | | | (1.48 | ) |
Return of capital | | | — | | | | — | | | | (0.07 | ) | | | (0.14 | ) | | | — | |
Total distributions | | | (0.09 | ) | | | (0.08 | ) | | | (0.07 | ) | | | (1.72 | ) | | | (1.58 | ) |
| | | | | | | | | | | | | | | | | | | | | |
Net asset value at end of year | | $ | 16.54 | | | $ | 14.67 | | | $ | 11.01 | | | $ | 16.68 | | | $ | 18.12 | |
| | | | | | | | | | | | | | | | | | | | | |
Total return (a) | | | 13.48% | | | | 33.96% | | | | (33.63% | ) | | | 0.94% | | | | 6.92% | |
| | | | | | | | | | | | | | | | | | | | | |
Net assets at end of year (000’s) | | $ | 28,359 | | | $ | 26,534 | | | $ | 18,790 | | | $ | 32,317 | | | $ | 37,128 | |
| | | | | | | | | | | | | | | | | | | | | |
| Ratio of total expenses to average net assets | | | 1.13% | | | | 1.16% | | | | 1.15% | | | | 0.99% | | | | 0.97% | |
| | | | | | | | | | | | | | | | | | | | | |
Ratio of net expenses to average net assets (b) | | | 1.09% | | | | 1.12% | | | | 1.10% | | | | 0.95% | | | | 0.91% | |
| | | | | | | | | | | | | | | | | | | | | |
Ratio of net investment income to
average net assets | | | 0.56% | | | | 0.78% | | | | 0.56% | | | | 0.38% | | | | 0.52% | |
| | | | | | | | | | | | | | | | | | | | | |
Portfolio turnover rate | | | 49% | | | | 59% | | | | 69% | | | | 46% | | | | 53% | |
| (a) | Total return is a measure of the change in value of an investment in the Fund over the period covered, which assumes any dividends or capital gains distributions are reinvested in shares of the Fund. Returns do not reflect the deduction of taxes a shareholder would pay on Fund distributions or the redemption of Fund shares. |
| | |
| (b) | Ratios were determined based on net expenses after expense reimbursements through a directed brokerage arrangement (Note 4). |
| | |
| See accompanying notes to financial statements. |
THE JAMESTOWN TAX EXEMPT VIRGINIA FUND FINANCIAL HIGHLIGHTS |
Selected Per Share Data and Ratios for a Share Outstanding Throughout Each Year | |
| | | | |
| | | | | | | | | | | | | | | |
Net asset value at beginning of year | | $ | 10.33 | | | $ | 10.24 | | | $ | 10.10 | | | $ | 10.06 | | | $ | 10.05 | |
| | | | | | | | | | | | | | | | | | | | | |
| Income (loss) from investment operations: | | | | | | | | | | | | | | | | | | | | |
Net investment income | | | 0.29 | | | | 0.30 | | | | 0.34 | | | | 0.36 | | | | 0.37 | |
Net realized and unrealized gains
(losses) on investments | | | (0.06 | ) | | | 0.11 | | | | 0.13 | | | | 0.05 | | | | 0.01 | |
Total from investment operations | | | 0.23 | | | | 0.41 | | | | 0.47 | | | | 0.41 | | | | 0.38 | |
| | | | | | | | | | | | | | | | | | | | | |
| Less distributions: | | | | | | | | | | | | | | | | | | | | |
| Dividends from net investment income | | | (0.29 | ) | | | (0.31 | ) | | | (0.33 | ) | | | (0.36 | ) | | | (0.36 | ) |
Distributions from net realized gains | | | (0.02 | ) | | | (0.01 | ) | | | (0.00 | )(a) | | | (0.01 | ) | | | (0.01 | ) |
Total distributions | | | (0.31 | ) | | | (0.32 | ) | | | (0.33 | ) | | | (0.37 | ) | | | (0.37 | ) |
| | | | | | | | | | | | | | | | | | | | | |
Net asset value at end of year | | $ | 10.25 | | | $ | 10.33 | | | $ | 10.24 | | | $ | 10.10 | | | $ | 10.06 | |
| | | | | | | | | | | | | | | | | | | | | |
Total return (b) | | | 2.26% | | | | 4.04% | | | | 4.77% | | | | 4.09% | | | | 3.85% | |
| | | | | | | | | | | | | | | | | | | | | |
Net assets at end of year (000’s) | | $ | 30,368 | | | $ | 32,905 | | | $ | 32,730 | | | $ | 29,093 | | | $ | 28,981 | |
| | | | | | | | | | | | | | | | | | | | | |
| Ratio of total expenses to average net assets | | | 0.76% | | | | 0.75% | | | | 0.77% | | | | 0.77% | | | | 0.75% | |
| | | | | | | | | | | | | | | | | | | | | |
| Ratio of net expenses to average net assets | | | 0.69% | | | | 0.69% | | | | 0.69% | | | | 0.69% | | | | 0.69% | |
| | | | | | | | | | | | | | | | | | | | | |
Ratio of net investment income to
average net assets | | | 2.78% | | | | 2.89% | | | | 3.31% | | | | 3.54% | | | | 3.66% | |
| | | | | | | | | | | | | | | | | | | | | |
Portfolio turnover rate | | | 8% | | | | 16% | | | | 10% | | | | 13% | | | | 10% | |
| (a) | Amount rounds to less than a penny per share. |
| | |
| (b) | Total return is a measure of the change in value of an investment in the Fund over the period covered, which assumes any dividends or capital gains distributions are reinvested in shares of the Fund. Returns do not reflect the deduction of taxes a shareholder would pay on Fund distributions or the redemption of Fund shares. |
| | |
| See accompanying notes to financial statements. |
THE JAMESTOWN FUNDS NOTES TO FINANCIAL STATEMENTS March 31, 2011 |
1. Organization and Significant Accounting Policies
The Jamestown Balanced Fund, The Jamestown Equity Fund and The Jamestown Tax Exempt Virginia Fund (individually, a “Fund,” and, collectively, the “Funds”) are each a no-load series of Williamsburg Investment Trust (the “Trust”), an open-end management investment company registered under the Investment Company Act of 1940. The Trust was organized as a Massachusetts business trust on July 18, 1988. Other series of the Trust are not included in this report.
The Jamestown Balanced Fund’s investment objectives are long-term growth of capital and income.
The Jamestown Equity Fund’s investment objective is long-term growth of capital.
The Jamestown Tax Exempt Virginia Fund’s investment objectives are to provide current income exempt from federal income taxes and from the personal income taxes of Virginia, to preserve capital, to limit credit risk and to take advantage of opportunities to increase and enhance the value of a shareholder’s investment.
The following is a summary of the Funds’ significant accounting policies:
Securities valuation — The Funds’ portfolio securities are valued as of the close of business of the regular session of the New York Stock Exchange (normally 4:00 p.m., Eastern time). Securities traded on a national stock exchange are generally valued based upon the closing price on the principal exchange where the security is traded. Securities which are quoted by NASDAQ are valued at the NASDAQ Official Closing Price. Securities which are traded over-the-counter are valued at the last sales price, if available, otherwise, at the last quoted bid price. It is expected that fixed income securities will ordinarily be traded in the over-the-counter market, and common stocks will ordinarily be traded on a national securities exchange, but may also be traded in the over-the-counter market. Short-term instruments (those with remaining maturities of 60 days or less) may be valued at amortized cost, which approximates market value.
When market quotations are not readily available, securities may be valued on the basis of prices provided by an independent pricing service. The prices provided by the pricing service are determined with consideration given to institutional bid and last sale prices and take into account securities prices, yields, maturities, call features, ratings, institutional trading in similar groups of securities and developments related to specific securities. If a pricing service cannot provide a valuation, securities will be valued in good faith at fair value using methods consistent with those established by and under the general supervision of the Board of Trustees and will be classified as Level 2 or 3 within the fair value hierarchy, depending on the inputs used. Such methods of fair valuation may include, but are not limited to: multiple of earnings, multiple of book value, discount from market of a similar freely traded security, purchase price of the security, subsequent private transactions in the security or related securities, or a combination of these and other factors.
THE JAMESTOWN FUNDS NOTES TO FINANCIAL STATEMENTS (Continued) |
Accounting principles generally accepted in the United States (“GAAP”) establish a single authoritative definition of fair value, set out a framework for measuring fair value and require additional disclosures about fair value measurements.
Various inputs are used in determining the value of each Fund’s investments. These inputs are summarized in the three broad levels listed below:
• Level 1 – quoted prices in active markets for identical securities
• Level 2 – other significant observable inputs
• Level 3 – significant unobservable inputs
For example, fixed income securities and repurchase agreements held by the Funds are classified as Level 2 since values are based on prices provided by an independent pricing service that utilizes various “other significant observable inputs” including bid and ask quotations, prices of similar securities and interest rates, among other factors.
The inputs or methodology used for valuing securities are not necessarily an indication of the risks associated with investing in those securities. The inputs used to measure fair value may fall into different levels of the fair value hierarchy. In such cases, for disclosure purposes, the level in the fair value hierarchy within which the fair value measurement falls in its entirety is determined based on the lowest level input that is significant to the fair value measurement.
The following is a summary of the inputs used to value each Fund’s investments as of March 31, 2011 by security type:
The Jamestown Balanced Fund | | | | | | | | | | | | |
Common Stocks | | $ | 14,600,721 | | | $ | — | | | $ | — | | | $ | 14,600,721 | |
U.S. Treasury & Government Agency Obligations | | | — | | | | 1,549,499 | | | | — | | | | 1,549,499 | |
Municipal Bonds | | | — | | | | 93,134 | | | | — | | | | 93,134 | |
Mortgage-Backed Securities | | | — | | | | 889,250 | | | | — | | | | 889,250 | |
Corporate Bonds | | | — | | | | 2,711,941 | | | | — | | | | 2,711,941 | |
Money Market Funds | | | 465,785 | | | | — | | | | — | | | | 465,785 | |
Repurchase Agreements | | | — | | | | 788,482 | | | | — | | | | 788,482 | |
Total | | $ | 15,066,506 | | | $ | 6,032,306 | | | $ | — | | | $ | 21,098,812 | |
The Jamestown Equity Fund | | | | | | | | | | | | |
Common Stocks | | $ | 27,032,649 | | | $ | — | | | $ | — | | | $ | 27,032,649 | |
Money Market Funds | | | 179,821 | | | | — | | | | — | | | | 179,821 | |
Repurchase Agreements | | | — | | | | 703,349 | | | | — | | | | 703,349 | |
Total | | $ | 27,212,470 | | | $ | 703,349 | | | $ | — | | | $ | 27,915,819 | |
THE JAMESTOWN FUNDS NOTES TO FINANCIAL STATEMENTS (Continued) |
The Jamestown Tax Exempt Virginia Fund | | | | | | | | | | | | |
Municipal Bonds | | $ | — | | | $ | 28,683,808 | | | $ | — | | | $ | 28,683,808 | |
Exchange-Traded Funds | | | 238,300 | | | | — | | | | — | | | | 238,300 | |
Money Market Funds | | | 1,105,135 | | | | — | | | | — | | | | 1,105,135 | |
Total | | $ | 1,343,435 | | | $ | 28,683,808 | | | $ | — | | | $ | 30,027,243 | |
Refer to The Jamestown Balanced Fund’s and The Jamestown Equity Fund’s Schedules of Investments for a listing of the common stocks and corporate bonds valued using Level 1 and Level 2 inputs by sector type. During the year ended March 31, 2011, the Funds did not have any significant transfers in and out of Level 1 or Level 2. There were no Level 3 securities or derivative instruments held by the Funds during the year ended or as of March 31, 2011.
Repurchase agreements — The Funds may enter into repurchase agreements. A repurchase agreement, which is collateralized by U.S. Government obligations, is valued at cost which, together with accrued interest, approximates market value. At the time a Fund enters into a repurchase agreement, the seller agrees that the value of the underlying securities, including accrued interest, will at all times be equal to or exceed the face amount of the repurchase agreement. In addition, the Funds actively monitor and seek additional collateral, as needed. If the seller defaults, the fair value of the collateral may decline and realization of the collateral by the Funds may be delayed or limited.
Share valuation — The net asset value per share of each Fund is calculated daily by dividing the total value of each Fund’s assets, less liabilities, by the number of shares outstanding. The offering price and redemption price per share of each Fund is equal to the net asset value per share.
Investment income — Interest income is accrued as earned. Dividend income is recorded on the ex-dividend date. Discounts and premiums on fixed income securities purchased are amortized using the interest method.
Distributions to shareholders — Dividends arising from net investment income, if any, are declared and paid quarterly to shareholders of The Jamestown Balanced Fund and The Jamestown Equity Fund. Dividends arising from net investment income are declared daily and paid monthly to shareholders of The Jamestown Tax Exempt Virginia Fund. Net realized short-term capital gains, if any, may be distributed throughout the year and net realized long-term capital gains, if any, are distributed at least once each year. The amount of distributions from net investment income and net realized gains are determined in accordance with federal income tax regulations which may differ from GAAP. These “book/tax” differences are either temporary or permanent in nature.
THE JAMESTOWN FUNDS NOTES TO FINANCIAL STATEMENTS (Continued) |
The tax character of distributions paid during the years ended March 31, 2011 and March 31, 2010 was as follows:
| | | | | | | | | Exempt- Interest Dividends | | | | |
| The Jamestown Balanced Fund | 3/31/11 | | $ | 294,842 | | | $ | — | | | $ | — | | | $ | 294,842 | |
| | 3/31/10 | | $ | 464,931 | | | $ | — | | | $ | — | | | $ | 464,931 | |
| The Jamestown Equity Fund | 3/31/11 | | $ | 163,723 | | | $ | — | | | $ | — | | | $ | 163,723 | |
| | 3/31/10 | | $ | 134,788 | | | $ | — | | | $ | — | | | $ | 134,788 | |
| The Jamestown Tax Exempt Virginia Fund | 3/31/11 | | $ | — | | | $ | 71,952 | | | $ | 877,910 | | | $ | 949,862 | |
| | 3/31/10 | | $ | 2,107 | | | $ | 38,697 | | | $ | 991,361 | | | $ | 1,032,165 | |
Security transactions — Security transactions are accounted for on trade date for financial reporting purposes. Gains and losses on securities sold are determined on a specific identification basis.
Securities traded on a “to-be-announced” basis — The Jamestown Balanced Fund may trade securities on a “to-be-announced” (“TBA”) basis. In a TBA transaction, the Fund has committed to purchase securities for which all specific information is not yet known at the time of the trade, particularly the face amount in mortgage-backed securities transactions. Securities purchased on a TBA basis are not settled until they are delivered to the Fund, normally 15 to 45 days later. These transactions are subject to market fluctuations and their current value is determined in the same manner as for other portfolio securities.
Common expenses — Common expenses of the Trust are allocated among the series of the Trust based on relative net assets of each series or the nature of the services performed and the relative applicability to each series.
Estimates — The preparation of financial statements in conformity with GAAP requires management to make estimates and assumptions that affect the reported amounts of assets and liabilities and the disclosure of contingent assets and liabilities as of the date of the financial statements and the reported amounts of income and expenses during the reporting period. Actual results could differ from those estimates.
Federal income tax — It is each Fund’s policy to comply with the special provisions of Subchapter M of the Internal Revenue Code applicable to regulated investment companies. As provided therein, in any fiscal year in which a Fund so qualifies and distributes at least 90% of its taxable net income, the Fund (but not the shareholders) will be relieved of federal income tax on the income distributed. Accordingly, no provision for income taxes has been made.
In order to avoid imposition of the excise tax applicable to regulated investment companies, it is also each Fund’s intention to declare as dividends in each calendar year at least 98% of its net investment income (earned during the calendar year) and 98.2% of its net realized capital gains (earned during the twelve months ended October 31) plus undistributed amounts from prior years.
THE JAMESTOWN FUNDS NOTES TO FINANCIAL STATEMENTS (Continued) |
The tax character of distributable earnings at March 31, 2011 was as follows:
| | The Jamestown Balanced Fund | | | | | | The Jamestown Tax Exempt Virginia Fund | |
Cost of portfolio investments | | $ | 16,648,145 | | | $ | 20,760,305 | | | $ | 28,879,770 | |
Gross unrealized appreciation | | $ | 4,597,288 | | | $ | 7,398,000 | | | $ | 1,229,656 | |
Gross unrealized depreciation | | | (146,621 | ) | | | (242,486 | ) | | | (82,183 | ) |
| Net unrealized appreciation on investments | | | 4,450,667 | | | | 7,155,514 | | | | 1,147,473 | |
| Accumulated undistributed ordinary income | | | 7,337 | | | | 25,615 | | | | 121 | |
| Accumulated undistributed tax exempt income | | | — | | | | — | | | | 10,218 | |
Undistributed long-term gains | | | — | | | | — | | | | 611 | |
Capital loss carryforward | | | (370,879 | ) | | | (1,568,139 | ) | | | — | |
Other temporary differences | | | (6,113 | ) | | | — | | | | (10,218 | ) |
Total distributable earnings | | $ | 4,081,012 | | | $ | 5,612,990 | | | $ | 1,148,205 | |
The difference between the federal income tax cost of portfolio investments and the financial statement cost for The Jamestown Balanced Fund and The Jamestown Equity Fund is due to certain timing differences in the recognition of capital gains or losses under income tax regulations and GAAP. These “book/tax” differences are temporary in nature and are primarily due to the tax deferral of losses on wash sales and/or differing methods in the amortization of market discount and premium on fixed income securities.
During the year ended March 31, 2011, The Jamestown Balanced Fund and The Jamestown Equity Fund utilized capital loss carryforwards of $1,310,435 and $1,666,276, respectively, to offset current year realized gains.
As of March 31, 2011, The Jamestown Balanced Fund and The Jamestown Equity Fund had the following capital loss carryforward for federal income tax purposes:
| | | | | | |
| The Jamestown Balanced Fund | | $ | 370,879 | | | | 2018 | |
| The Jamestown Equity Fund | | $ | 1,568,139 | | | | 2018 | |
These capital loss carryforwards may be utilized in future years to offset net realized capital gains, if any, prior to distribution to shareholders.
For the year ended March 31, 2011, The Jamestown Balanced Fund reclassified $17,075 of overdistributed net investment income against accumulated net realized losses on the Statements of Assets and Liabilities due to permanent differences in the recognition of capital gains or losses under income tax regulations and GAAP. These differences are primarily due to the tax treatment of certain debt obligations and paydown adjustments. Such reclassification had no effect on the Fund’s net assets or net asset value per share.
THE JAMESTOWN FUNDS NOTES TO FINANCIAL STATEMENTS (Continued) |
For the year ended March 31, 2011, The Jamestown Tax Exempt Virginia Fund reclassified $123 of undistributed net investment income against accumulated net realized gains on the Statements of Assets and Liabilities due to permanent differences in the recognition of capital gains or losses under income tax regulations and GAAP. These differences are primarily due to the tax treatment of certain debt obligations. Such reclassification had no effect on the Fund’s net assets or net asset value per share.
The Funds recognize the tax benefits or expenses of uncertain tax positions only when the position is “more likely than not” to be sustained assuming examination by tax authorities. Management has reviewed the tax positions taken on Federal income tax returns for all open tax years (tax years ended March 31, 2007 through March 31, 2011) of each Fund and has concluded that no provision for unrecognized tax benefits or expenses is required in these financial statements.
2. Investment Transactions
Investment transactions, other than short-term investments and U.S. government securities, were as follows for the year ended March 31, 2011:
| | The Jamestown Balanced Fund | | | | | | The Jamestown Tax Exempt Virginia Fund | |
Purchase of investment securities | | $ | 5,809,580 | | | $ | 12,110,080 | | | $ | 2,320,518 | |
Proceeds from sales and maturities of investment securities | | $ | 9,507,392 | | | $ | 14,158,535 | | | $ | 4,751,343 | |
3. Transactions with Affiliates
INVESTMENT ADVISORY AGREEMENT
Each Fund’s investments are managed by Lowe, Brockenbrough & Company, Inc. (the “Adviser”) under the terms of an Investment Advisory Agreement. The Jamestown Balanced Fund pays the Adviser a fee, which is computed and accrued daily and paid monthly, at an annual rate of .65% of its average daily net assets up to $250 million, .60% of the next $250 million of such assets and .55% of such assets in excess of $500 million. The Jamestown Equity Fund pays the Adviser a fee at an annual rate of .65% of its average daily net assets up to $500 million and .55% of such assets in excess of $500 million. The Jamestown Tax Exempt Virginia Fund pays the Adviser a fee at an annual rate of .40% of its average daily net assets up to $250 million, .35% of the next $250 million of such assets and .30% of such assets in excess of $500 million. Certain Trustees and officers of the Trust are also officers of the Adviser.
During the year ended March 31, 2011, the Adviser voluntarily undertook to limit the total annual operating expenses of The Jamestown Tax Exempt Virginia Fund to .69% of average daily net assets. Accordingly, the Adviser voluntarily waived $23,462 of its investment advisory fees during the year ended March 31, 2011.
THE JAMESTOWN FUNDS NOTES TO FINANCIAL STATEMENTS (Continued) |
MUTUAL FUND SERVICES AGREEMENT
Under the terms of a Mutual Fund Services Agreement between the Trust and Ultimus Fund Solutions, LLC (“Ultimus”), Ultimus provides administrative, pricing, accounting, dividend disbursing, shareholder servicing and transfer agent services for the Funds. For these services, Ultimus receives a monthly fee from each Fund at an annual rate of .15% of its average daily net assets up to $25 million; .125% of the next $25 million of such assets; and .10% of such assets in excess of $50 million. The Jamestown Balanced Fund and The Jamestown Equity Fund are each subject to a minimum monthly fee of $4,000. The Jamestown Tax Exempt Virginia Fund is subject to a minimum monthly fee of $3,500. In addition, each Fund pays out-of-pocket expenses including, but not limited to, postage, supplies and costs of pricing portfolio securities. Certain officers of the Trust are also officers of Ultimus, or of Ultimus Fund Distributors, LLC (the “Distributor”), the principal underwriter of each Fund’s shares and an affiliate of Ultimus. The Distributor is compensated by the Adviser (not the Funds) for acting as principal underwriter.
COMPLIANCE CONSULTING AGREEMENT
Under the terms of a Compliance Consulting Agreement between the Trust and Ultimus, Ultimus provides an individual to serve as the Trust’s Chief Compliance Officer and to administer the Funds’ compliance policies and procedures. For these services, the Funds pay Ultimus an annual base fee of $18,600 plus an asset-based fee equal to 0.01% per annum on the Funds’ aggregate net assets in excess of $100 million. In addition, the Funds reimburse Ultimus for reasonable out-of-pocket expenses, if any, incurred in connection with these services.
4. Brokerage Arrangement
In order to reduce the total operating expenses of The Jamestown Balanced Fund and The Jamestown Equity Fund, a portion of each Fund’s operating expenses have been paid through an arrangement with a third-party broker-dealer who is compensated through commission trades. Payment of expenses by the broker-dealer is based on a percentage of commissions earned.
Expenses reimbursed through the brokerage arrangement totaled $12,000 for each Fund for the year ended March 31, 2011.
5. Contingencies and Commitments
The Funds indemnify the Trust’s officers and Trustees for certain liabilities that might arise from their performance of their duties to the Funds. Additionally, in the normal course of business the Funds enter into contracts that contain a variety of representations and warranties and which provide general indemnifications. The Funds’ maximum exposure under these arrangements is unknown, as this would involve future claims that may be made against the Funds that have not yet occurred. However, based on experience, the Funds expect the risk of loss to be remote.
THE JAMESTOWN FUNDS NOTES TO FINANCIAL STATEMENTS (Continued) |
6. Concentration of Credit Risk
The Jamestown Tax Exempt Virginia Fund invests primarily in debt instruments of municipal issuers in the Commonwealth of Virginia. The issuers’ abilities to meet their obligations may be affected by economic developments in the Commonwealth or its region, as well as disruptions in the credit markets and the economy, generally.
7. Subsequent Events
The Funds are required to recognize in the financial statements the effects of all subsequent events that provide additional evidence about conditions that existed as of the date of the Statements of Assets and Liabilities. For non-recognized subsequent events that must be disclosed to keep the financial statements from being misleading, the Funds are required to disclose the nature of the event as well as an estimate of its financial effect, or a statement that such an estimate cannot be made. Management has evaluated subsequent events through the issuance of these financial statements and has noted no such events.
THE JAMESTOWN FUNDS REPORT OF INDEPENDENT REGISTERED PUBLIC ACCOUNTING FIRM |
The Board of Trustees and Shareholders of
The Jamestown Balanced Fund,
The Jamestown Equity Fund,
and The Jamestown Tax Exempt Virginia Fund of the Williamsburg Investment Trust
We have audited the accompanying statements of assets and liabilities, including the schedules of investments, of The Jamestown Balanced Fund, The Jamestown Equity Fund, and The Jamestown Tax Exempt Virginia Fund (the “Funds”) (each a series of the Williamsburg Investment Trust) as of March 31, 2011, and the related statements of operations for the year then ended, the statements of changes in net assets for each of the two years in the period then ended, and the financial highlights for each of the five years in the period then ended. These financial statements and financial highlights are the responsibility of the Funds’ management. Our responsibility is to express an opinion on these financial statements and financial highlights based on our audits.
We conducted our audits in accordance with the standards of the Public Company Accounting Oversight Board (United States). Those standards require that we plan and perform the audits to obtain reasonable assurance about whether the financial statements and financial highlights are free of material misstatement. We were not engaged to perform an audit of the Funds’ internal control over financial reporting. Our audits included consideration of internal control over financial reporting as a basis for designing audit procedures that are appropriate in the circumstances, but not for the purpose of expressing an opinion on the effectiveness of the Funds’ internal control over financial reporting. Accordingly, we express no such opinion. An audit also includes examining, on a test basis, evidence supporting the amounts and disclosures in the financial statements and financial highlights, assessing the accounting principles used and significant estimates made by management, and evaluating the overall financial statement presentation. Our procedures included confirmation of securities owned as of March 31, 2011, by correspondence with the custodian. We believe that our audits provide a reasonable basis for our opinion.
In our opinion, the financial statements and financial highlights referred to above present fairly, in all material respects, the financial position of The Jamestown Balanced Fund, The Jamestown Equity Fund, The Jamestown Tax Exempt Virginia Fund, and The Jamestown Select Fund at March 31, 2011, the results of their operations for the year then ended, the changes in their net assets for each of the two years in the period then ended, and the financial highlights for each of the five years in the period then ended, in conformity with U.S. generally accepted accounting principles.
Cincinnati, Ohio
May 20, 2011
THE JAMESTOWN FUNDS BOARD OF TRUSTEES AND EXECUTIVE OFFICERS (Unaudited) |
Overall responsibility for management of the Funds rests with the Board of Trustees. The Trustees serve during the lifetime of the Trust and until its termination, or until death, resignation, retirement or removal. The Trustees, in turn, elect the officers of the Funds. The officers have been elected for an annual term. The following are the Trustees and executive officers of the Funds:
| Trustee | Address | Age | Position Held with the Trust | Length of Time Served |
| * | Charles M. Caravati, Jr. | 931 Broad Street Road Manakin-Sabot, VA | 74 | Chairman and Trustee | Since June 1991 |
| * | Austin Brockenbrough III | 1802 Bayberry Court, Suite 400 Richmond, VA | 74 | Trustee and Vice President | Since September 1988 |
| * | John T. Bruce | 800 Main Street Lynchburg, VA | 57 | Trustee | Since September 1988 |
| | Robert S. Harris | 100 Darden Boulevard Charlottesville, VA | 61 | Trustee | Since January 2007 |
| | J. Finley Lee, Jr. | 448 Pond Apple Drive North Naples, FL | 71 | Trustee | Since September 1988 |
| | Richard L. Morrill | University of Richmond Richmond, VA | 71 | Trustee | Since March 1993 |
| | Harris V. Morrissette | 100 Jacintoport Boulevard Saraland, AL | 51 | Trustee | Since March 1993 |
| | Samuel B. Witt III | 302 Clovelly Road Richmond, VA | 75 | Trustee | Since November 1988 |
| | Charles M. Caravati III | 1802 Bayberry Court, Suite 400 Richmond, VA | 46 | President, Jamestown Balanced Fund and Jamestown Equity Fund | Since January 1996 |
| | Joseph A. Jennings, III | 1802 Bayberry Court, Suite 400 Richmond, VA | 48 | President, Jamestown Tax Exempt Virginia Fund | Since July 2005 |
| | Lawrence B. Whitlock, Jr. | 1802 Bayberry Court, Suite 400 Richmond, VA | 63 | Vice President, Jamestown Balanced Fund and Jamestown Equity Fund | Since February 2002 |
| | Connie R. Taylor | 1802 Bayberry Court, Suite 400 Richmond, VA | 61 | Vice President, Jamestown Balanced Fund and Jamestown Equity Fund | Since March 1993 |
| | Robert G. Dorsey | 225 Pictoria Drive, Suite 450 Cincinnati, OH | 54 | Vice President | Since November 2000 |
| | Mark J. Seger | 225 Pictoria Drive, Suite 450 Cincinnati, OH | 49 | Treasurer | Since November 2000 |
| | Tina H. Bloom | 225 Pictoria Drive, Suite 450 Cincinnati, OH | 42 | Secretary and Chief Compliance Officer | Since August 2006 |
| * | Messrs. Bruce and Brockenbrough, as affiliated persons of investment advisers to the Trust, are “interested persons” of the Trust within the meaning of Section 2(a)(19) of the Investment Company Act of 1940. Charles M. Caravati, Jr. is the father of Charles M. Caravati III. |
THE JAMESTOWN FUNDS BOARD OF TRUSTEES AND EXECUTIVE OFFICERS (Unaudited) (Continued) |
Each Trustee oversees eleven series of the Trust, including the Funds. The principal occupations of the Trustees and executive officers of the Funds during the past five years and public directorships held by the Trustees are set forth below:
Charles M. Caravati, Jr. is a retired physician. He is also the retired President of Dermatology Associates of Virginia, P.C.
Austin Brockenbrough III is President and Managing Director of the Adviser. He is a member of the Board of Directors of Tredegar Corporation (a plastics manufacturer) and Wilkinson O’Grady & Co., Inc. (a global asset manager).
John T. Bruce is President, Director and member of the Executive Committee of Flippin, Bruce & Porter, Inc. (an investment advisory firm).
Robert S. Harris is the C. Stewart Sheppard Professor of Business Administration at The Darden Graduate School of Business Administration at the University of Virginia. He was previously the dean at Darden. Professor Harris has published widely on corporate finance, financial markets and mergers and acquisitions and has served as a consultant to corporations and government agencies.
J. Finley Lee, Jr. is the retired Julian Price Professor Emeritus at the University of North Carolina.
Richard L. Morrill serves as President of the Teagle Foundation (charitable foundation) and Chancellor of the University of Richmond. He is also a member of the Board of Directors of Tredegar Corporation and Albemarle Corporation (specialty chemicals manufacturer).
Harris V. Morrissette is President of China Doll Rice and Beans Inc. and Dixie Lily Foods. He is a member of the Board of Directors of BancTrust Financial Group, Inc. (a bank holding company) and International Shipholding Corporation (cargo transportation). In addition, he is Chairman of Azalea Aviation, Inc. (an airplane fueling company).
Samuel B. Witt III is the retired Senior Vice President and General Counsel of Stateside Associates, Inc. He is also a member of the Board of Directors of The Swiss Helvetia Fund, Inc. (a closed-end investment company).
Charles M. Caravati III is a Managing Director of the Adviser.
Joseph A. Jennings, III is a Portfolio Manager of the Adviser.
Lawrence B. Whitlock, Jr. is a Managing Director of the Adviser.
Connie R. Taylor is Account Administrator of the Adviser.
Robert G. Dorsey is a Managing Director of Ultimus Fund Solutions, LLC and Ultimus Fund Distributors, LLC.
Mark J. Seger is a Managing Director of Ultimus Fund Solutions, LLC and Ultimus Fund Distributors, LLC.
THE JAMESTOWN FUNDS BOARD OF TRUSTEES AND EXECUTIVE OFFICERS (Unaudited) (Continued) |
Tina H. Bloom is Director of Fund Administration of Ultimus Fund Solutions, LLC and Ultimus Fund Distributors, LLC.
Additional information about members of the Board of Trustees and executive officers is available in the Statement of Additional Information (“SAI”). To obtain a free copy of the SAI, please call 1-866-738-1126.
| FEDERAL TAX INFORMATION (Unaudited) |
In accordance with federal tax requirements, the following provides shareholders with information concerning distributions from ordinary income and net realized gains made by the Funds during the year ended March 31, 2011. For the fiscal year ended March 31, 2011, certain dividends paid by the Funds may be subject to a maximum tax rate of 15%, as provided by the Jobs and Growth Tax Relief Reconciliation Act of 2003. The Jamestown Balanced Fund and The Jamestown Equity Fund intend to designate up to a maximum amount of $294,842 and $163,723, respectively, as taxed at a maximum rate of 15%. For the fiscal year ended March 31, 2011, The Jamestown Tax Exempt Virginia Fund designates $71,952 as long-term gain distributions. For the fiscal year ended March 31, 2011, 77% and 100% of the dividends paid from ordinary income by The Jamestown Balanced Fund and The Jamestown Equity Fund, respectively, qualified for the dividends received deduction for corporations. As required by federal regulations, complete information will be computed and reported in conjunction with your 2011 Form 1099-DIV.
THE JAMESTOWN FUNDS ABOUT YOUR FUNDS’ EXPENSES (Unaudited) |
We believe it is important for you to understand the impact of costs on your investment. As a shareholder of the Funds, you may incur two types of costs: (1) transaction costs; and (2) ongoing costs, including management fees and other Fund expenses. The following examples are intended to help you understand your ongoing costs (in dollars) of investing in the Funds and to compare these costs with the ongoing costs of investing in other mutual funds.
A mutual fund’s ongoing costs are expressed as a percentage of its average net assets. This figure is known as the expense ratio. The expenses in the table below are based on an investment of $1,000 made at the beginning of the period shown and held for the entire period (October 1, 2010 through March 31, 2011).
The table below illustrates each Fund’s costs in two ways:
Actual fund return – This section helps you to estimate the actual expenses that you paid over the period. The “Ending Account Value” shown is derived from each Fund’s actual return, and the third column shows the dollar amount of operating expenses that would have been paid by an investor who started with $1,000 in the Funds. You may use the information here, together with the amount you invested, to estimate the expenses that you paid over the period.
To do so, simply divide your account value by $1,000 (for example, an $8,600 account value divided by $1,000 = 8.6), then multiply the result by the number given for the Funds under the heading “Expenses Paid During Period.”
Hypothetical 5% return – This section is intended to help you compare the Funds’ ongoing costs with those of other mutual funds. It assumes that each Fund had an annual return of 5% before expenses during the period shown, but that the expense ratio is unchanged. In this case, because the returns used are not the Funds’ actual returns, the results do not apply to your investment. The example is useful in making comparisons because the Securities and Exchange Commission (“SEC”) requires all mutual funds to calculate expenses based on a 5% return. You can assess each Fund’s ongoing costs by comparing this hypothetical example with the hypothetical examples that appear in shareholder reports of other funds.
Note that expenses shown in the table are meant to highlight and help you compare ongoing costs only. The Funds do not charge sales loads or redemption fees.
The calculations assume no shares were bought or sold during the period. Your actual costs may have been higher or lower, depending on the amount of your investment and the timing of any purchases or redemptions.
More information about the Funds’ expenses, including annual expense ratios for the prior five fiscal years, can be found in this report. For additional information on operating expenses and other shareholder costs, please refer to the Funds’ prospectus.
THE JAMESTOWN FUNDS ABOUT YOUR FUNDS’ EXPENSES (Unaudited) (Continued) |
| | Beginning Account Value October 1, 2010 | Ending Account Value March 31, 2011 | Expenses Paid During Period* |
The Jamestown Balanced Fund |
| Based on Actual Fund Return | $1,000.00 | $1,106.50 | $6.25 |
| Based on Hypothetical 5% Return (before expenses) | $1,000.00 | $1,019.00 | $5.99 |
The Jamestown Equity Fund |
| Based on Actual Fund Return | $1,000.00 | $1,163.60 | $5.88 |
| Based on Hypothetical 5% Return (before expenses) | $1,000.00 | $1,019.50 | $5.49 |
The Jamestown Tax Exempt Virginia Fund |
| Based on Actual Fund Return | $1,000.00 | $981.70 | $3.41 |
| Based on Hypothetical 5% Return (before expenses) | $1,000.00 | $1,021.49 | $3.48 |
| * | Expenses are equal to the Funds’ annualized expense ratios for the period as stated below, multiplied by the average account value over the period, multiplied by 182/365 (to reflect the one-half year period). |
| The Jamestown Balanced Fund | 1.19% |
| The Jamestown Equity Fund | 1.09% |
| The Jamestown Tax Exempt Virginia Fund | 0.69% |
| OTHER INFORMATION (Unaudited) |
A description of the policies and procedures that the Funds use to vote proxies relating to portfolio securities is available without charge upon request by calling toll-free 1-866-738-1126, or on the SEC’s website at http://www.sec.gov. Information regarding how the Funds voted proxies relating to portfolio securities during the most recent 12-month period ended June 30 is also available without charge upon request by calling toll-free 1-866-738-1126, or on the SEC’s website at http://www.sec.gov.
The Trust files a complete listing of portfolio holdings of the Funds with the SEC as of the end of the first and third quarters of each fiscal year on Form N-Q. The filings are available upon request, by calling 1-866-738-1126. Furthermore, you may obtain a copy of these filings on the SEC’s website at http://www.sec.gov. The Trust’s Forms N-Q may also be reviewed and copied at the SEC’s Public Reference Room in Washington, DC, and information on the operation of the Public Reference Room may be obtained by calling 1-800-SEC-0330.
THE JAMESTOWN FUNDS DISCLOSURE REGARDING APPROVAL OF INVESTMENT ADVISORY AGREEMENTS (Unaudited) |
At an in-person meeting held on February 8, 2011, the Board of Trustees, including a majority of the Independent Trustees, approved the continuance for a one-year period of the Investment Advisory Agreements with the Adviser on behalf of The Jamestown Balanced Fund, The Jamestown Equity Fund and The Jamestown Tax Exempt Virginia Fund. Below is a discussion of the factors considered by the Board of Trustees along with their conclusions with respect thereto that formed the basis for the Board’s approvals.
In selecting the Adviser and approving the continuance of the Investment Advisory Agreements, the Trustees considered all information they deemed reasonably necessary to evaluate the terms of the Agreements. The principal areas of review by the Trustees were the nature, extent and quality of the services provided by the Adviser and the reasonableness of the fees charged for those services. These matters were considered by the Independent Trustees consulting with experienced counsel for the Independent Trustees, who is independent of the Adviser.
The Trustees’ evaluation of the quality of the Adviser’s services took into account their knowledge and experience gained through meetings with and reports of the Adviser’s senior management over the course of the preceding year. Both short-term and long-term investment performance of the Funds was considered. Each Fund’s performance was compared to its performance benchmark and to that of competitive funds with similar investment objectives and to the Adviser’s comparably managed private accounts. The Trustees also considered the scope and quality of the in-house capabilities of the Adviser and other resources dedicated to performing services for the Funds. The quality of administrative and other services, including the Adviser’s role in coordinating the activities of the Funds’ other service providers, were considered in light of the Funds’ compliance with investment policies and applicable laws and regulations and of related reports by management and the Funds’ independent public accounting firm in periodic meetings with the Trust’s Audit Committee. The Trustees also considered the business reputation of the Adviser, the qualifications of its key investment and compliance personnel, and its financial resources.
In reviewing the fees payable under the Investment Advisory Agreements, the Trustees compared the advisory fees and overall expense levels of each Fund with those of competitive funds with similar investment objectives as well as the private accounts managed by the Adviser. The Trustees considered information provided by the Adviser concerning the Adviser’s profitability with respect to each Fund, including the assumptions and methodology used in preparing the profitability information, in light of applicable case law relating to advisory fees. For these purposes, the Trustees took into account not only the fees paid by the Funds, but also so-called “fallout” benefits to the Adviser, such as the benefits of research made available to the Adviser by reason of brokerage commissions generated by the Funds’ securities transactions. The Trustees also reviewed the revenue sharing arrangements relating to the Funds, whereby fees are paid by the Adviser to various intermediaries that direct assets to the Funds. In evaluating the Funds’ advisory fees, the Trustees took into account the complexity and quality of the investment management of the Funds.
THE JAMESTOWN FUNDS DISCLOSURE REGARDING APPROVAL OF INVESTMENT ADVISORY AGREEMENTS (Unaudited) |
Based upon their review of this information, the Independent Trustees concluded that: (i) upon consideration of the 2010 performance and the longer term performance of each Fund, in light of the Adviser’s investment approach and each Fund’s investment objective, as well as the services provided to shareholders, the Adviser has provided satisfactory services to the Funds as compared to similarly managed funds; (ii) the investment advisory fees of each Fund are competitive with comparably managed funds and each Fund’s total operating expense ratio is competitive with (and, in the case of The Jamestown Equity Fund and The Jamestown Tax Exempt Virginia Fund, significantly lower than) the average expense ratio for comparably managed funds, according to statistics derived from Morningstar, Inc.; (iii) the Adviser’s commitment to cap overall operating expenses of The Jamestown Tax-Exempt Virginia Fund by voluntarily waiving a portion of its investment advisory fees has enabled such Fund to increase returns for its shareholders and to maintain an overall expense ratio that is competitive with the average for similarly managed funds, despite the small size of the Fund; and (iv) the Adviser’s profitability with respect to The Jamestown Balanced Fund and The Jamestown Equity Fund is reasonable and the Adviser did not realize any profits with respect to its management of The Jamestown Tax Exempt Virginia Fund. Given the current size of each Fund and its expected growth, the Independent Trustees did not believe that at the present time it would be relevant to consider the extent to which economies of scale would be realized as the Funds grow, and whether fee levels reflect these economies of scale. The Independent Trustees also considered the “fallout” benefits to, and the profitability of, the Adviser with respect to the Funds, but given the amounts involved viewed these as secondary factors in connection with the evaluation of the reasonableness of the advisory fees paid by the Funds.
No single factor was considered in isolation or to be determinative to the decision of the Trustees to approve continuance of the Investment Advisory Agreements. Rather the Trustees concluded, in light of a weighing and balancing of all factors considered, that it was in the best interests of each Fund and its shareholders to continue its Investment Advisory Agreement without modification to its terms, including the fees charged for services thereunder.
| | | | | | | | |
| | | | | | | | | |
| | | | | | | | | |
| | | | | THE JAMESTOWN FUNDS Investment Adviser Lowe, Brockenbrough & Company, Inc. 1802 Bayberry Court Suite 400 Richmond, Virginia 23226 www.jamestownfunds.com Administrator Ultimus Fund Solutions, LLC P.O. Box 46707 Cincinnati, Ohio 45246-0707 (Toll-Free) 1-866-738-1126 Independent Registered Public Accounting Firm Ernst & Young LLP 1900 Scripps Center 312 Walnut Street Cincinnati, Ohio 45202 Legal Counsel Sullivan & Worcester LLP One Post Office Square Boston, Massachusetts 02109 Board of Trustees Austin Brockenbrough, III John T. Bruce Charles M. Caravati, Jr. Robert S. Harris J. Finley Lee, Jr. Richard L. Morrill Harris V. Morrissette Samuel B. Witt, III | | | | |
| | | | | | | | | |
| | | | | | | | | |
| | | | | | | | |
As of the end of the period covered by this report, the registrant has adopted a code of ethics that applies to the registrant’s principal executive officer, principal financial officer, principal accounting officer or controller, or persons performing similar functions, regardless of whether these individuals are employed by the registrant or a third party. Pursuant to Item 12(a)(1), a copy of registrant’s code of ethics is filed as an exhibit to this Form N-CSR. During the period covered by this report, the code of ethics has not been amended, and the registrant has not granted any waivers, including implicit waivers, from the provisions of the code of ethics.
| Item 3. | Audit Committee Financial Expert. |
The registrant’s board of trustees has determined that the registrant has at least one audit committee financial expert serving on its audit committee. The name of the audit committee financial expert is Dr. Robert S. Harris. Dr. Harris is “independent” for purposes of this Item.
| Item 4. | Principal Accountant Fees and Services. |
| | (a) | Audit Fees. The aggregate fees billed for professional services rendered by the principal accountant for the audit of the registrant’s annual financial statements or for services that are normally provided by the accountant in connection with statutory and regulatory filings or engagements were $151,700 and $125,200 with respect to the registrant’s fiscal years ended March 31, 2011 and 2010, respectively. |
| | (b) | Audit-Related Fees. No fees were billed in either of the last two fiscal years for assurance and related services by the principal accountant that are reasonably related to the performance of the audit of the registrant’s financial statements and are not reported under paragraph (a) of this Item. |
| | (c) | Tax Fees. No fees were billed in either of the last two fiscal years for professional services rendered by the principal accountant for tax compliance, tax advice, and tax planning. |
| | (d) | All Other Fees. No fees were billed in either of the last two fiscal years for products and services provided by the principal accountant, other than the services reported in paragraphs (a) through (c) of this Item. |
| | (e)(1) | The audit committee has adopted pre-approval policies and procedures described in paragraph (c)(7) of Rule 2-01 of Regulation S-X. Pursuant to the pre-approval policies and procedures, the audit committee has pre-approved certain audit, audit-related and tax services and has established, with respect to each fiscal year of the registrant, the following maximum fee levels for services covered under the pre-approval policies and procedures: |
| | · | Services, relating to a new series or class of a series, associated with SEC registration statements, periodic reports and other documents filed by the registrant with the SEC or other documents issued by the registrant in connection with securities offerings and assistance in responding to SEC comment letters—$5,000 |
| | · | Consultations with management of the registrant, not in connection with an audit, as to the accounting or disclosure treatment of transactions or events and/or the actual or potential impact of final or proposed rules, standards or interpretations by the SEC, FASB or other regulatory or standard setting bodies—$5,000 |
| | · | All tax services provided to the registrant in the aggregate—$5,000 |
| | (e)(2) | None of the services described in paragraph (b) through (d) of this Item were approved by the audit committee pursuant to paragraph (c)(7)(i)(C) of Rule 2-01 of Regulation S-X. |
| | (f) | Less than 50% of hours expended on the principal accountant’s engagement to audit the registrant’s financial statements for the most recent fiscal year were attributed to work performed by persons other than the principal accountant’s full-time, permanent employees. |
| | (g) | No non-audit fees were billed in either of the last two fiscal years by the registrant’s principal accountant for services rendered to the registrant, and rendered to the registrant’s investment adviser (not including any sub-adviser whose role is primarily portfolio management and is subcontracted with or overseen by another investment adviser), and any entity controlling, controlled by, or under common control with the adviser that provides ongoing services to the registrant. |
| | (h) | The principal accountant has not provided any non-audit services to the registrant’s investment adviser (not including any sub-adviser whose role is primarily portfolio management and is subcontracted with or overseen by another investment adviser), and any entity controlling, controlled by, or under common control with the investment adviser that provides ongoing services to the registrant. |
| Item 5. | Audit Committee of Listed Registrants. |
Not applicable
| Item 6. | Schedule of Investments. |
| (a) | Not applicable [schedule filed with Item 1] |
| Item 7. | Disclosure of Proxy Voting Policies and Procedures for Closed-End Management Investment Companies. |
Not applicable
| Item 8. | Portfolio Managers of Closed-End Management Investment Companies. |
Not applicable
| Item 9. | Purchases of Equity Securities by Closed-End Management Investment Company and Affiliated Purchasers. |
Not applicable
| Item 10. | Submission of Matters to a Vote of Security Holders. |
The registrant’s Nominating Committee shall review shareholder recommendations to fill vacancies on the registrant’s board of trustees if such recommendations are submitted in writing, addressed to the Committee at the registrant’s offices and meet any minimum qualifications adopted by the Committee. The Committee may adopt, by resolution, a policy regarding its procedures for considering candidates for the board of trustees, including any recommended by shareholders.
| Item 11. | Controls and Procedures. |
(a) Based on their evaluation of the registrant’s disclosure controls and procedures (as defined in Rule 30a-3(c) under the Investment Company Act of 1940) as of a date within 90 days of the filing date of this report, the registrant’s principal executive officers and principal financial officer have concluded that such disclosure controls and procedures are reasonably designed and are operating effectively to ensure that material information relating to the registrant, including its consolidated subsidiaries, is made known to them by others within those entities, particularly during the period in which this report is being prepared, and that the information required in filings on Form N-CSR is recorded, processed, summarized, and reported on a timely basis.
(b) There were no changes in the registrant’s internal control over financial reporting (as defined in Rule 30a-3(d) under the Investment Company Act of 1940) that occurred during the second fiscal quarter of the period covered by this report that have materially affected, or are reasonably likely to materially affect, the registrant’s internal control over financial reporting.
File the exhibits listed below as part of this Form. Letter or number the exhibits in the sequence indicated.
(a)(1) Any code of ethics, or amendment thereto, that is the subject of the disclosure required by Item 2, to the extent that the registrant intends to satisfy the Item 2 requirements through filing of an exhibit: Attached hereto
(a)(2) A separate certification for each principal executive officer and principal financial officer of the registrant as required by Rule 30a-2(a) under the Act (17 CFR 270.30a-2(a)): Attached hereto
(a)(3) Any written solicitation to purchase securities under Rule 23c-1 under the Act (17 CFR 270.23c-1) sent or given during the period covered by the report by or on behalf of the registrant to 10 or more persons: Not applicable
(b) Certifications required by Rule 30a-2(b) under the Act (17 CFR 270.30a-2(b)): Attached hereto
| Exhibit 99.CODE ETH | Code of Ethics |
| Exhibit 99.CERT | Certifications required by Rule 30a-2(a) under the Act |
| Exhibit 99.906CERT | Certifications required by Rule 30a-2(b) under the Act |
SIGNATURES
Pursuant to the requirements of the Securities Exchange Act of 1934 and the Investment Company Act of 1940, the registrant has duly caused this report to be signed on its behalf by the undersigned, thereunto duly authorized.
(Registrant) Williamsburg Investment Trust
| By (Signature and Title)* | /s/ Tina H. Bloom | |
| | Tina H. Bloom, Secretary and Chief Compliance Officer | |
| | | |
| Date | May 26, 2011 | | |
Pursuant to the requirements of the Securities Exchange Act of 1934 and the Investment Company Act of 1940, this report has been signed below by the following persons on behalf of the registrant and in the capacities and on the dates indicated.
| By (Signature and Title)* | /s/ John T. Bruce | |
| | John T. Bruce, President (FBP Value Fund and FBP Balanced Fund) | |
| | | |
| Date | May 26, 2011 | | |
| | | |
| By (Signature and Title)* | /s/ Thomas W. Leavell | |
| | Thomas W. Leavell, President (The Government Street Equity Fund, The Government Street Mid-Cap Fund and The Alabama Tax Free Bond Fund) | |
| Date | May 26, 2011 | | |
| | | |
| By (Signature and Title)* | /s/ Charles M. Caravati III | |
| | Charles M. Caravati III, President (The Jamestown Balanced Fund and The Jamestown Equity Fund) | |
| | | | |
| Date | May 26, 2011 | | |
| | | |
| By (Signature and Title)* | /s/ Joseph A. Jennings III | |
| | Joseph A. Jennings III, President (The Jamestown Tax Exempt Virginia Fund) | |
| | | | |
| Date | May 26, 2011 | | |
| | | |
| By (Signature and Title)* | /s/ John P. Ackerly IV | |
| | John P. Ackerly IV, President (The Davenport Core Fund, Davenport Value & Income Fund and Davenport Equity Opportunities Fund) | |
| | | | |
| Date | May 26, 2011 | | |
| | | |
| By (Signature and Title)* | /s/ Mark J. Seger | |
| | Mark J. Seger, Treasurer | |
| | | | |
| Date | May 26, 2011 | | |
* Print the name and title of each signing officer under his or her signature.