Item 1: Report to Shareholders| Institutional Foreign Equity Fund | April 30, 2007 |
The views and opinions in this report were current as of April 30, 2007. They are not guarantees of performance or investment results and should not be taken as investment advice. Investment decisions reflect a variety of factors, and the managers reserve the right to change their views about individual stocks, sectors, and the markets at any time. As a result, the views expressed should not be relied upon as a forecast of the fund’s future investment intent. The report is certified under the Sarbanes-Oxley Act, which requires mutual funds and other public companies to affirm that, to the best of their knowledge, the information in their financial reports is fairly and accurately stated in all material respects.
Manager’s Letter
T. Rowe Price Institutional Foreign Equity Fund
Dear Investor
International stocks delivered excellent results during the past six months, following a stunning reversal at the end of February. Non-U.S. equities overall were stronger than their U.S. counterparts, and Latin American shares were especially robust. Value stocks topped growth for the most part, while small-cap shares were generally more buoyant than large-caps.
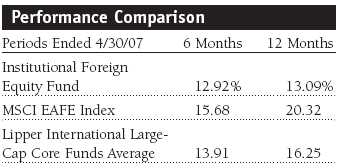
Your fund’s return was impressive during the 12 months ended April 30, 2007, with most of the gains occurring during the past six months. Fund results lagged the benchmark due primarily to our sector allocation and stock selection within various sectors.
It is worth saying that no one is more cognizant than we are of the fund’s lagging performance versus the MSCI EAFE Index, which can be partially attributed to the fund’s investment strategy. The fund is heavily oriented toward large-cap growth stocks, which fit better with our goal of providing long-term growth with relatively moderate risk exposure. International value stocks, however, have been outperforming growth stocks in recent years. Needless to say, we are not content with these results and have taken steps to address the situation, which we hope will lead to better performance for our shareholders going forward. More on this at the end of this letter.
• Despite a sharp downturn in February, non-U.S. stocks posted strong results during the past six months.
• The fund trailed the MSCI EAFE Index for the period primarily because of sector allocation and stock selection.
• Japanese financials hurt fund performance as the portfolio was positioned in companies linked to domestic strength, which did not occur; telecom shares were among the positive contributors to results.
• The global economy is less dependent now on the U.S. consumer and should enjoy continued growth in coming months.
MARKET REVIEW
The global economy has been characterized by substantial expansion with reasonably contained inflation. Despite a bout of volatility in late February and early March, triggered by a precipitous decline in the Shanghai stock market, most non-U.S. markets posted respectable gains for the past six months. Fears that a troubling number of defaults in the U.S. subprime mortgage market would spill over into the broad U.S. economy—and, consequently, into the international arena—weighed heavily on the markets. Notwithstanding these concerns, we believe the worst in the housing market is now behind us and that the global economies will remain on track.
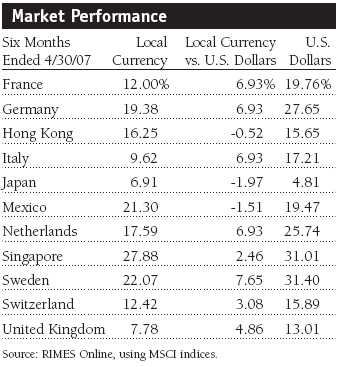
Solid economic news and a series of mergers and acquisitions helped European markets. Except for Japan, developed Asian markets performed well. Investors brushed aside fears that emerging markets had peaked, and bullish sentiment boosted many emerging market indices by the end of April. With investors regaining their tolerance for risk, small-caps delivered good results. The dollar continued to lose ground against the euro and pound sterling and recently slipped versus the yen as well.
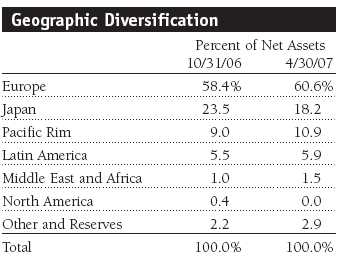
Growth in Japan remained the major concern in developed markets as the Bank of Japan has been slow to respond to the sluggish economy. In Europe, the U.K. was our heaviest weighting, and we also focused heavily on Continental markets. International stock valuations still appeared more attractive than those in the U.S. at the end of the period.
PORTFOLIO PERFORMANCE AND STRATEGY
As we have mentioned previously, our primary focus is on individual stock selection rather than on sector and regional allocation. We remained disciplined about selecting stocks of companies in which we have a high level of conviction. We were encouraged by continuing merger activity in several sectors, although portfolio results were restrained by our holdings in materials and Japanese financials.
The major detractors to the fund’s absolute performance were Japanese financial stocks. We had positioned the portfolio with the view that the Japanese economy would recover, benefiting companies linked to domestic strength. The economy has done reasonably well, but unfortunately the wage and consumer growth we were looking for did not materialize. Sumitomo Mitsui Financial Group, whose earnings grew more slowly than expected in a flat interest rate environment, suffered from an earnings decline that reflected the company’s poor revenues from its market operations. Resona Holdings was also weak because of flat interest rates in the sluggish Japanese economy, as Japanese banks have typically prospered when interest rates moved higher. Mitsubishi UFJ Financial, another banking stock, continued its poor performance over the past six months. The company was ordered to suspend some operations and strengthen its internal controls, resulting in cost increases and a possible slump in overall operations. (Please refer to the fund’s portfolio of investments for a detailed list of holdings and the amount each represents in the portfolio.)
We have begun to look for opportunities to reduce our weighting in Japan since we believe we were a bit premature in our outlook for domestic strength. Over the longer term, however, we think there will be serious attempts to restructure corporate balance sheets that will benefit investors, and we intend to take advantage of such opportunities when they arise.
The materials sector detracted the most from relative performance since we were underweight in the best-performing sector within the MSCI EAFE benchmark during the past six months. Stock selection within the group was unfavorable as well, particularly our holdings in U.K. industrial company Wolseley, the world’s number one distributor of heating and plumbing supplies to the professional market. Wolseley is highly sensitive to economic conditions, and the shares were hurt by the downturn in the U.S. housing market.

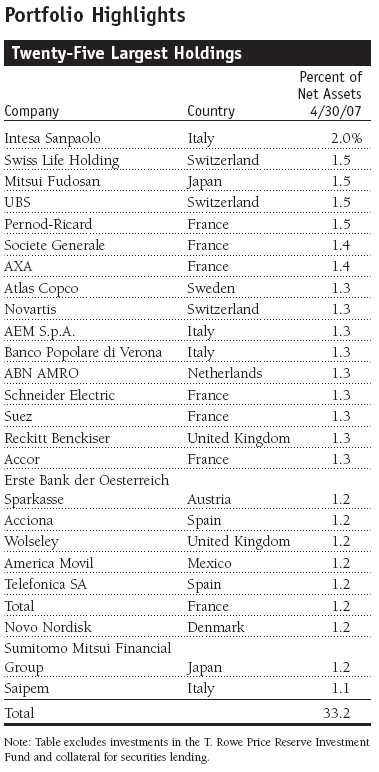
The portfolio contained its positive contributors as well during the reporting period. Among them were Accor of France, Bharti Airtel in India, and AEM in Italy. Accor is the European leader in hotels and a global leader in corporate services. The company’s earnings were surprisingly strong, and we believe its revenue stream will continue its encouraging trend through the rest of 2007. Bharti Airtel is the third-largest and fastest-growing mobile market in the world, while Italian utility AEM advanced due to merger speculation.
Overall, our stock selection among telecom shares was beneficial. In addition to Bharti Airtel, portfolio performance benefited from Mexican telecommunications giant America Movil, the leading wireless services provider in Latin America and the fifth-largest in the world. Energy stock selection was also good, including strong results from Italian oil company Saipem and Brazilian power-house Petroleo Brasileiro. The latter benefited from surging oil prices, although it struggled a bit in the first quarter of 2007. Health care stock Novo Nordisk posted strong earnings results last year and continued to boost portfolio performance. Nobel Biocare was another excellent performer due to its solid growth in European markets. On a regional basis, our exposure to emerging markets has been beneficial, and our stock selection in those markets was helpful as well.
During the period, we initiated our position in Wolseley on expectations that the share price will pick up over time as the housing market strengthens again. The European market for the company remains attractive, given the outlook for European economic growth. We also staked out a position in Schneider Electric, a leader in the field of electrical equipment distribution with exposure to the European construction industry at a time when the macroeconomic background looks attractive. We acquired Banco Popolare di Verona, a stock that has advanced only moderately relative to other European banks. The downside risk is limited, in our view, and the share price looks attractive.
Among our sales was the French leader in luxury brands, LVMH, which enjoyed a strong first quarter above expectations. We sold Italian bank UniCredito Italiano after a prolonged period of strong performance; Veolia Environnement, a French utility that was fairly valued, to fund the purchase of another stock with better upside potential; and Belgium’s SES Global, one of the world’s preeminent satellite companies, following a good run in the share price. The company’s earnings have been excellent, but we grew concerned that a large acquisition by SES Global could lead the company to abandon its share-buyback and rising-dividend programs, which have underpinned the share price.
INVESTMENT OUTLOOK
We have positioned the portfolio for a healthy global economy, with strength in non-U.S. regions offsetting some of the weakness in the U.S. The international markets are not as dependent on the U.S. consumer as they were in the past. In particular, we are focused on the capital goods area, on companies that have begun to increase their capital expenditures. Within Europe, we are seeing more cross-border consolidation, primarily in the financial arena with major banks buying other financial institutions. In addition, considerable momentum has built up in the emerging markets, which are increasingly becoming a source of growth independent of the U.S.; strength in China, Russia, India, Latin America, and other regions looks promising. Stock valuations there are not as cheap as they were, but they are still largely appealing. Corporate earnings are continuing to outpace price/earnings multiples.
Technological advances, economic reforms, and converging business practices have fostered extended periods of synchronized growth, led by fast-growing economies like China and India. However, the global equity sell-off at the end of February served as a reminder of the risks arising from a significant global slowdown, or a sudden reduction in investors’ risk appetite. A rise in interest rates remains among the largest risks for global economic growth. Nevertheless, we remain positive about the outlook for international equities against the backdrop of a reasonably strong economy and contained inflation.
We would like to take this opportunity to inform you of a change in portfolio management that will be taking place on October 1 of this year. We are delighted to inform you that Robert W. Smith will become the lead portfolio manager of the Institutional Foreign Equity Fund and chairman of the fund’s Investment Advisory Committee on that date. Bob’s investment track record, his history of investing in global markets, and his strong interest in this assignment make him an ideal choice for his new role. Bob has managed the T. Rowe Price Growth Stock Fund over the last 10 years. Managing the Institutional Foreign Equity Fund represents a great match for his skills and interests, and we are confident that he will do an excellent job for our shareholders.
Bob will be ably assisted by Mark Bickford-Smith, current lead portfolio manager for the Institutional Foreign Equity Fund, who will continue to work from London as a dedicated resource to Bob, assisting in the idea-generation and research process. He will remain on the Investment Advisory Committee. We anticipate a seamless transition over the next few months and will keep you informed of any changes in investment strategy in our next report to shareholders.
Respectfully submitted,

David J.L. Warren
President, T. Rowe Price International Funds, Inc.
May 18, 2007

Performance and Expenses
T. Rowe Price Institutional Foreign Equity Fund
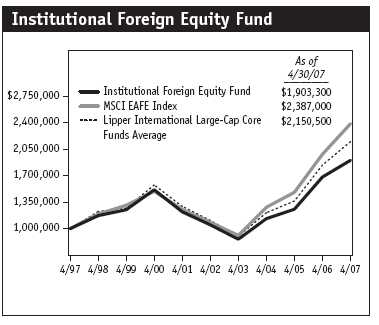
This chart shows the value of a hypothetical $1 million investment in the fund over the past 10 fiscal year periods or since inception (for funds lacking 10-year records). The result is compared with benchmarks, which may include a broad-based market index and a peer group average or index. Market indexes do not include expenses, which are deducted from fund returns as well as mutual fund averages and indexes.
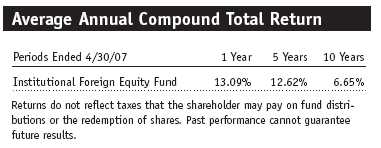
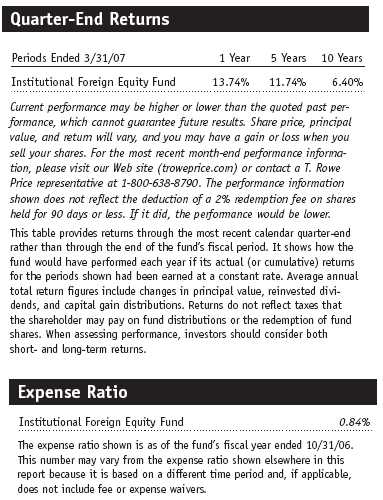
This table shows how the fund would have performed each year if its actual (or cumulative) returns for the periods shown had been earned at a constant rate.
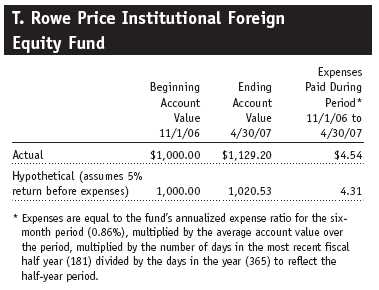
Fund Expense Example
As a mutual fund shareholder, you may incur two types of costs: (1) transaction costs, such as redemption fees or sales loads, and (2) ongoing costs, including management fees, distribution and service (12b-1) fees, and other fund expenses. The following example is intended to help you understand your ongoing costs (in dollars) of investing in the fund and to compare these costs with the ongoing costs of investing in other mutual funds. The example is based on an investment of $1,000 invested at the beginning of the most recent six-month period and held for the entire period.
Actual Expenses
The first line of the following table (“Actual”) provides information about actual account values and actual expenses. You may use the information in this line, together with your account balance, to estimate the expenses that you paid over the period. Simply divide your account value by $1,000 (for example, an $8,600 account value divided by $1,000 = 8.6), then multiply the result by the number in the first line under the heading “Expenses Paid During Period” to estimate the expenses you paid on your account during this period.
Hypothetical Example for Comparison Purposes
The information on the second line of the table (“Hypothetical”) is based on hypothetical account values and expenses derived from the fund’s actual expense ratio and an assumed 5% per year rate of return before expenses (not the fund’s actual return). You may compare the ongoing costs of investing in the fund with other funds by contrasting this 5% hypothetical example and the 5% hypothetical examples that appear in the shareholder reports of the other funds. The hypothetical account values and expenses may not be used to estimate the actual ending account balance or expenses you paid for the period.
You should also be aware that the expenses shown in the table highlight only your ongoing costs and do not reflect any transaction costs, such as redemption fees or sales loads. Therefore, the second line of the table is useful in comparing ongoing costs only and will not help you determine the relative total costs of owning different funds. To the extent a fund charges transaction costs, however, the total cost of owning that fund is higher.
Financial Highlights
T. Rowe Price Institutional Foreign Equity Fund
(Unaudited)
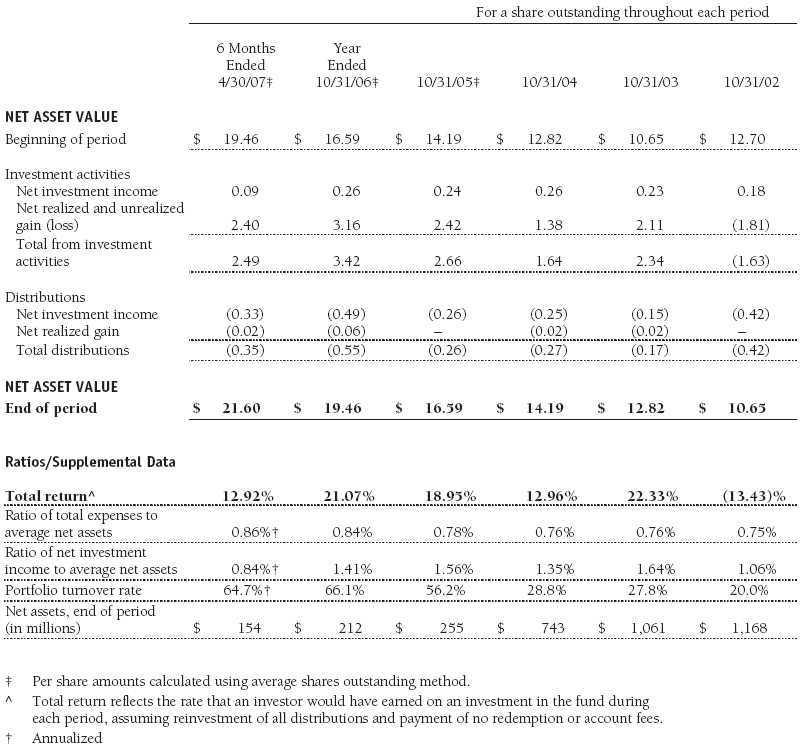
The accompanying notes are an integral part of these financial statements.
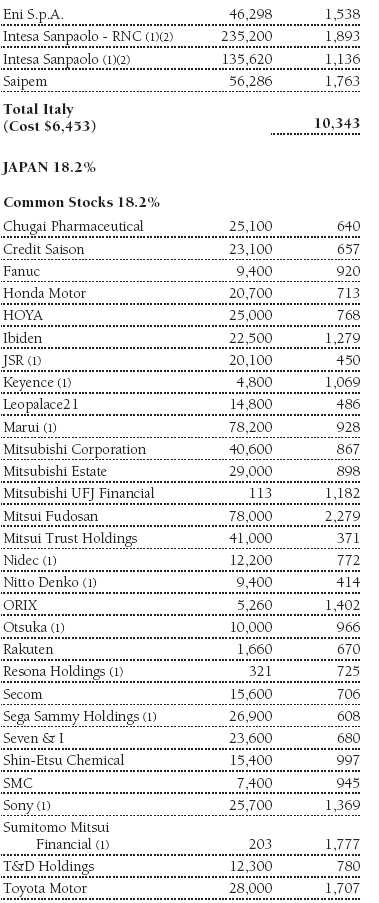
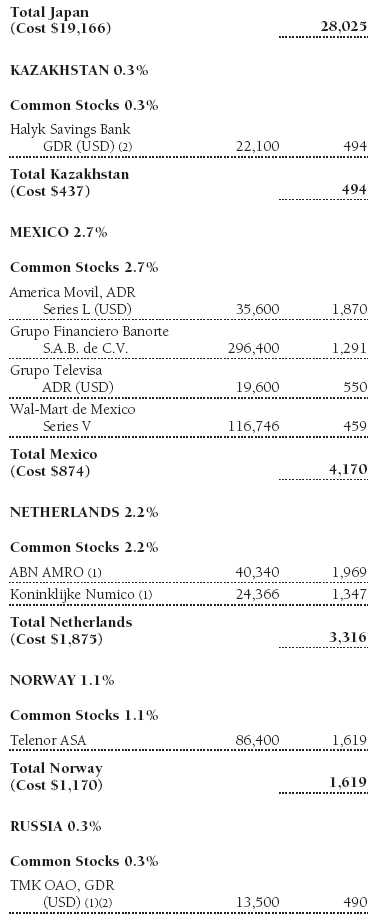
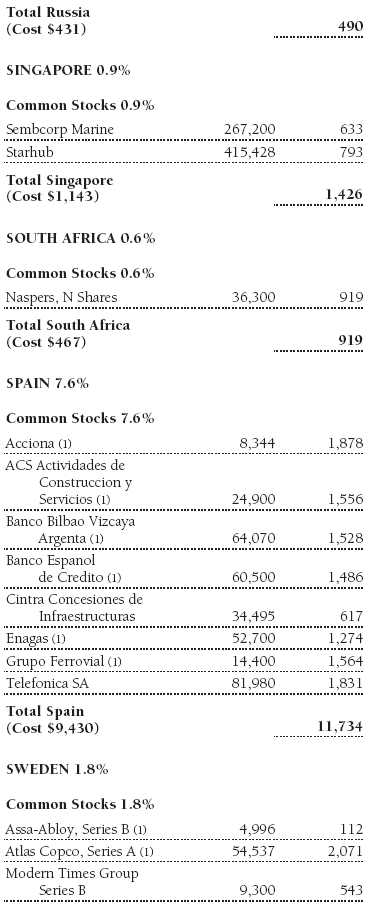
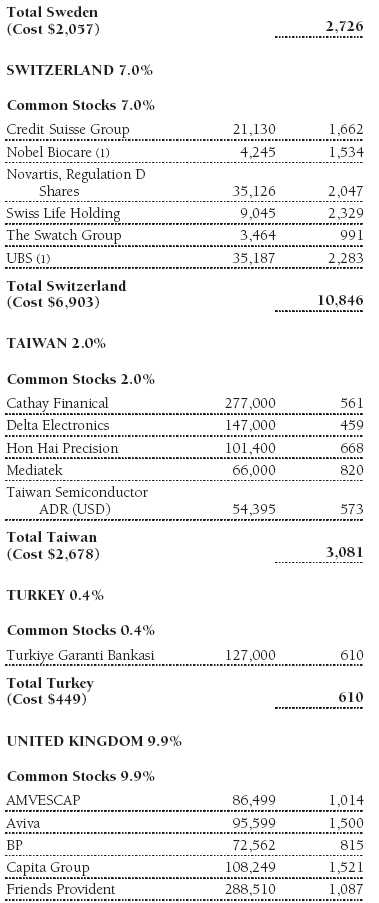
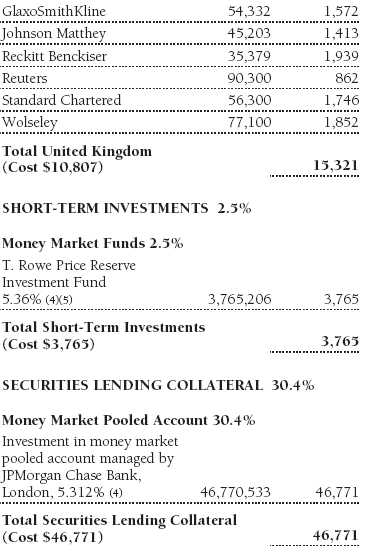
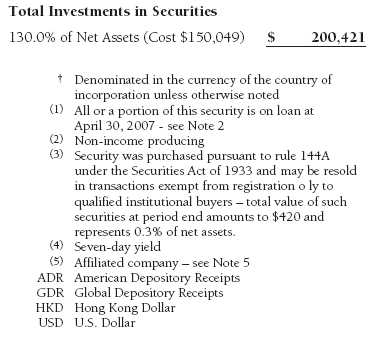
Portfolio of Investments †
T. Rowe Price Institutional Foreign Equity Fund
April 30, 2007 (Unaudited)

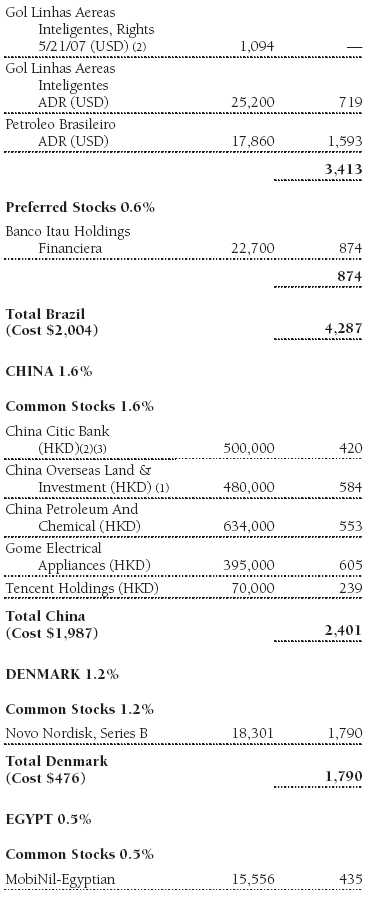


The accompanying notes are an integral part of these financial statements.
Statement of Assets and Liabilities
T. Rowe Price Institutional Foreign Equity Fund
April 30, 2007 (Unaudited)
(In thousands except shares and per share amounts)

The accompanying notes are an integral part of these financial statements.
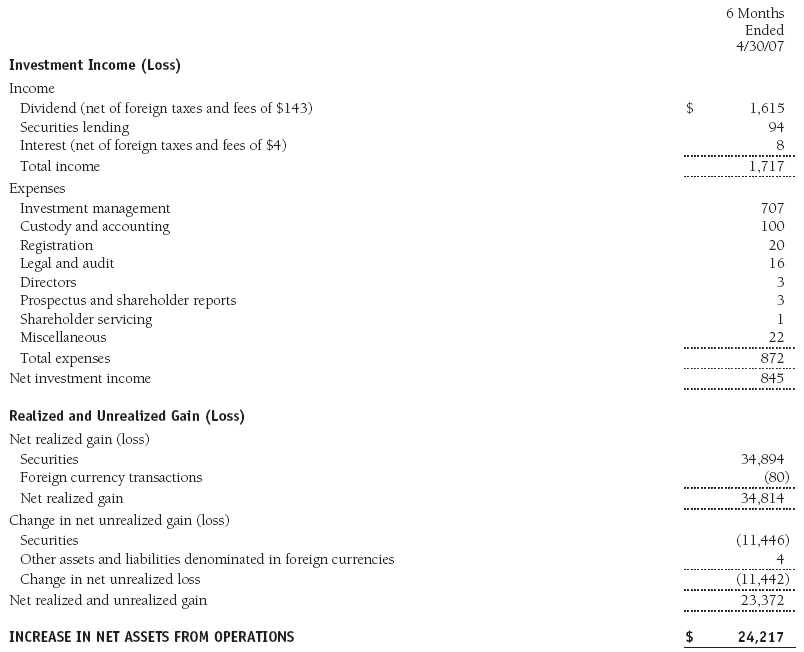
Statement of Operations
T. Rowe Price Institutional Foreign Equity Fund
(Unaudited)
($ 000s)
The accompanying notes are an integral part of these financial statements.
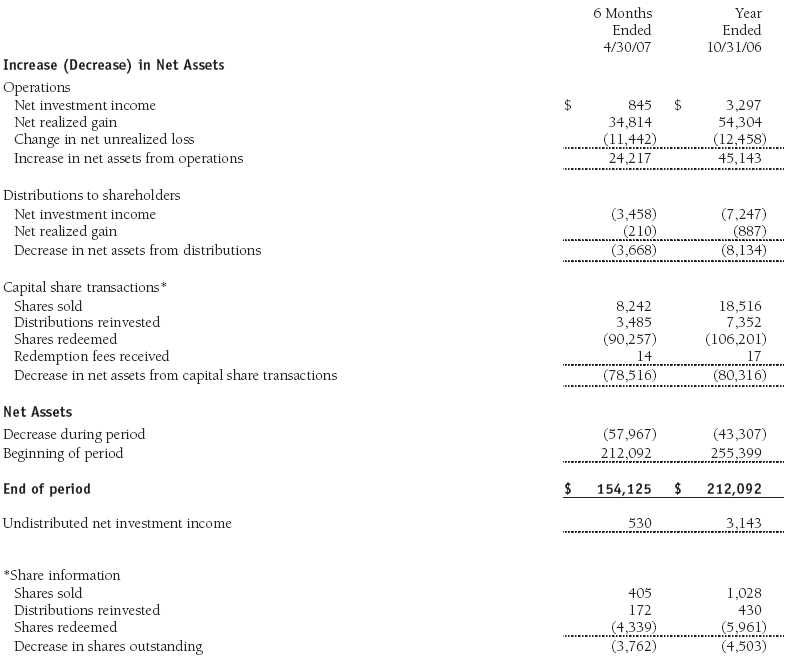
Statement of Changes in Net Assets
T. Rowe Price Institutional Foreign Equity Fund
(Unaudited)
($ 000s)
The accompanying notes are an integral part of these financial statements.
Notes to Financial Statements
T. Rowe Price Institutional Foreign Equity Fund
April 30, 2007 (Unaudited)
NOTE 1 - SIGNIFICANT ACCOUNTING POLICIES
T. Rowe Price Institutional International Funds, Inc. (the corporation), is registered under the Investment Company Act of 1940 (the 1940 Act). The Institutional Foreign Equity Fund (the fund), a diversified, open-end management investment company, is one portfolio established by the corporation. The fund commenced operations on September 7, 1989. The fund seeks long-term growth of capital through investments primarily in the common stocks of established, non-U.S. companies.
The accompanying financial statements were prepared in accordance with accounting principles generally accepted in the United States of America, which require the use of estimates made by fund management. Fund management believes that estimates and security valuations are appropriate; however, actual results may differ from those estimates, and the security valuations reflected in the financial statements may differ from the value the fund ultimately realizes upon sale of the securities.
Valuation The fund values its investments and computes its net asset value per share at the close of the New York Stock Exchange (NYSE), normally 4 p.m. ET, each day that the NYSE is open for business. Equity securities listed or regularly traded on a securities exchange or in the over-the-counter (OTC) market are valued at the last quoted sale price or, for certain markets, the official closing price at the time the valuations are made, except for OTC Bulletin Board securities, which are valued at the mean of the latest bid and asked prices. A security that is listed or traded on more than one exchange is valued at the quotation on the exchange determined to be the primary market for such security. Listed securities not traded on a particular day are valued at the mean of the latest bid and asked prices for domestic securities and the last quoted sale price for international securities.
Investments in mutual funds are valued at the mutual fund’s closing net asset value per share on the day of valuation.
Other investments, including restricted securities, and those for which the above valuation procedures are inappropriate or are deemed not to reflect fair value are stated at fair value as determined in good faith by the T. Rowe Price Valuation Committee, established by the fund’s Board of Directors.
Most foreign markets close before the close of trading on the NYSE. If the fund determines that developments between the close of a foreign market and the close of the NYSE will, in its judgment, materially affect the value of some or all of its portfolio securities, which in turn will affect the fund’s share price, the fund will adjust the previous closing prices to reflect the fair value of the securities as of the close of the NYSE, as determined in good faith by the T. Rowe Price Valuation Committee, established by the fund’s Board of Directors. A fund may also fair value securities in other situations, such as when a particular foreign market is closed but the fund is open. In deciding whether to make fair value adjustments, the fund reviews a variety of factors, including developments in foreign markets, the performance of U.S. securities markets, and the performance of instruments trading in U.S. markets that represent foreign securities and baskets of foreign securities. The fund uses outside pricing services to provide it with closing market prices and information used for adjusting those prices. The fund cannot predict when and how often it will use closing prices and when it will adjust those prices to reflect fair value. As a means of evaluating its fair value process, the fund routinely compares closing market prices, the next day’s opening prices in the same markets, and adjusted prices.
Currency Translation Assets, including investments, and liabilities denominated in foreign currencies are translated into U.S. dollar values each day at the prevailing exchange rate, using the mean of the bid and asked prices of such currencies against U.S. dollars as quoted by a major bank. Purchases and sales of securities, income, and expenses are translated into U.S. dollars at the prevailing exchange rate on the date of the transaction. The effect of changes in foreign currency exchange rates on realized and unrealized security gains and losses is reflected as a component of security gains and losses.
Rebates and Credits Subject to best execution, the fund may direct certain security trades to brokers who have agreed to rebate a portion of the related brokerage commission to the fund in cash. Commission rebates are reflected as realized gain on securities in the accompanying financial statements.
Redemption Fees A 2% fee is assessed on redemptions of fund shares held for 90 days or less to deter short-term trading and to protect the interests of long-term shareholders. Redemption fees are withheld from proceeds that shareholders receive from the sale or exchange of fund shares. The fees are paid to the fund, and are recorded as an increase to paid-in capital. The fees may cause the redemption price per share to differ from the net asset value per share.
Investment Transactions, Investment Income, and Distributions Income and expenses are recorded on the accrual basis. Dividends received from mutual fund investments are reflected as dividend income; capital gain distributions are reflected as realized gain/loss. Dividend income and capital gain distributions are recorded on the ex-dividend date. Investment transactions are accounted for on the trade date. Realized gains and losses are reported on the identified cost basis. Distributions to shareholders are recorded on the ex-dividend date. Income distributions are declared and paid on an annual basis. Capital gain distributions, if any, are declared and paid by the fund, typically on an annual basis.
New Accounting Pronouncements In June 2006, the Financial Accounting Standards Board (“FASB”) issued FASB Interpretation No. 48 (“FIN 48”), Accounting for Uncertainty in Income Taxes, a clarification of FASB Statement No. 109, Accounting for Income Taxes. FIN 48 establishes financial reporting rules regarding recognition and measurement of tax positions taken or expected to be taken on a tax return. Management is evaluating the anticipated impact, if any, that FIN 48 will have on the fund upon adoption, which, pursuant to a delay granted by the U.S. Securities and Exchange Commission, is expected to be on the last business day of the fund’s semiannual period, April 30, 2008.
In September 2006, the FASB released the Statement of Financial Accounting Standard No. 157 (“FAS 157”), Fair Value Measurements. FAS 157 clarifies the definition of fair value and establishes the framework for measuring fair value, as well as proper disclosure of this methodology in the financial statements. It will be effective for the fund’s fiscal year beginning November 1, 2008. Management is evaluating the effects of FAS 157; however, it is not expected to have a material impact on the fund’s net assets or results of operations.
NOTE 2 - INVESTMENT TRANSACTIONS
Consistent with its investment objective, the fund engages in the following practices to manage exposure to certain risks or to enhance performance. The investment objective, policies, program, and risk factors of the fund are described more fully in the fund’s prospectus and Statement of Additional Information.
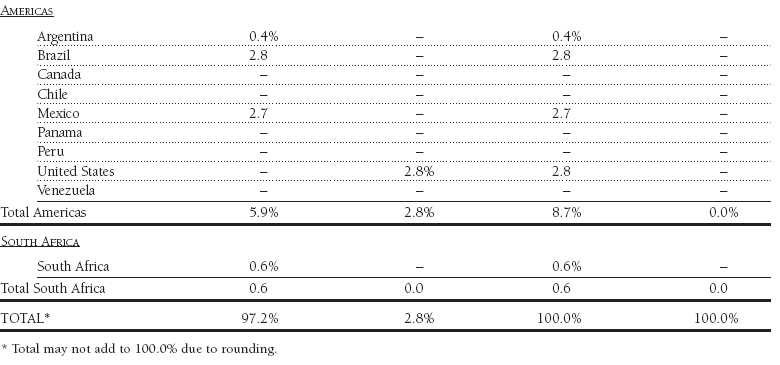
Emerging Markets At April 30, 2007, approximately 16% of the fund’s net assets were invested in securities of companies located in emerging markets or denominated in or linked to the currencies of emerging market countries. Future economic or political developments could adversely affect the liquidity or value, or both, of such securities.
Restricted Securities The fund may invest in securities that are subject to legal or contractual restrictions on resale. Although certain of these securities may be readily sold, for example, under Rule 144A, others may be illiquid, their sale may involve substantial delays and additional costs, and prompt sale at an acceptable price may be difficult.
Securities Lending The fund lends its securities to approved brokers to earn additional income. It receives as collateral cash and U.S. government securities valued at 102% to 105% of the value of the securities on loan. Cash collateral is invested in a money market pooled account managed by the fund’s lending agent in accordance with investment guidelines approved by fund management. Collateral is maintained over the life of the loan in an amount not less than the value of loaned securities, as determined at the close of fund business each day; any additional collateral required due to changes in security values is delivered to the fund the next business day. Although risk is mitigated by the collateral, the fund could experience a delay in recovering its securities and a possible loss of income or value if the borrower fails to return the securities. Securities lending revenue recognized by the fund consists of earnings on invested collateral and borrowing fees, net of any rebates to the borrower and compensation to the lending agent. At April 30, 2007, the value of loaned securities was $45,131,000; aggregate collateral consisted of $46,771,000 in the money market pooled account and U.S. government securities valued at $827,000.
Other Purchases and sales of portfolio securities, other than short-term securities, aggregated $61,555,000 and $142,582,000, respectively, for the six months ended April 30, 2007.
NOTE 3 - FEDERAL INCOME TAXES
No provision for federal income taxes is required since the fund intends to continue to qualify as a regulated investment company under Subchapter M of the Internal Revenue Code and distribute to shareholders all of its taxable income and gains. Federal income tax regulations differ from generally accepted accounting principles; therefore, distributions determined in accordance with tax regulations may differ in amount or character from net investment income and realized gains for financial reporting purposes. Financial reporting records are adjusted for permanent book/tax differences to reflect tax character. Financial records are not adjusted for temporary differences. The amount and character of tax-basis distributions and composition of net assets are finalized at fiscal year-end; accordingly, tax-basis balances have not been determined as of April 30, 2007.
The fund intends to retain realized gains to the extent of available capital loss carryforwards. As of October 31, 2006, the fund had $86,683,000 of unused capital loss carryforwards, of which $47,256,000 expire in fiscal 2010, and $39,427,000 expire in fiscal 2011.
At April 30, 2007, the cost of investments for federal income tax purposes was $150,049,000. Net unrealized gain aggregated $50,378,000 at period-end, of which $52,072,000 related to appreciated investments and $1,694,000 related to depreciated investments.
NOTE 4 - FOREIGN TAXES
The fund is subject to foreign income taxes imposed by certain countries in which it invests. Additionally, capital gains realized by the fund upon disposition of securities issued in or by certain foreign countries are subject to capital gains tax imposed by those countries. Similarly, a tax on net profits, including interest income and realized and unrealized capital gains, is imposed by certain other countries. All taxes are computed in accordance with the applicable foreign tax law, and, to the extent permitted, capital losses are used to offset capital gains. Tax expense attributable to income is accrued by the fund as a reduction of income. Current and deferred tax expense attributable to net capital gains is reflected as a component of realized and/or change in unrealized gain/loss on securities in the accompanying financial statements. At April 30, 2007, the fund had no taxes payable attributable to foreign securities, no deferred tax liability attributable to foreign securities, and $26,357,000 of foreign capital loss carryforwards, including $1,276,000 that expire in 2009, $17,228,000 that expire in 2010, $4,022 that expire in 2011, $3,790 that expire in 2012, and $41 that expire in 2013.
NOTE 5 - RELATED PARTY TRANSACTIONS
The fund is managed by T. Rowe Price International, Inc. (the manager), a wholly owned subsidiary of T. Rowe Price Associates, Inc. (Price Associates), which is wholly owned by T. Rowe Price Group, Inc. The investment management agreement between the fund and the manager provides for an annual investment management fee equal to 0.70% of the fund’s average daily net assets. The fee is computed daily and paid monthly.
In addition, the fund has entered into service agreements with Price Associates and a wholly owned subsidiary of Price Associates (collectively, Price). Price Associates computes the daily share price and provides certain other administrative services to the fund. T. Rowe Price Services, Inc., provides shareholder and administrative services in its capacity as the fund’s transfer and dividend disbursing agent. For the six months ended April 30, 2007, expenses incurred pursuant to these service agreements were $60,000 for Price Associates and $1,000 for T. Rowe Price Services. The total amount payable at period-end pursuant to these service agreements is reflected as Due to Affiliates in the accompanying financial statements.
The fund may invest in the T. Rowe Price Reserve Investment Fund and the T. Rowe Price Government Reserve Investment Fund (collectively, the T. Rowe Price Reserve Funds), open-end management investment companies managed by Price Associates and affiliates of the fund. The T. Rowe Price Reserve Funds are offered as cash management options to mutual funds, trusts, and other accounts managed by Price Associates and/ or its affiliates, and are not available for direct purchase by members of the public. The T. Rowe Price Reserve Funds pay no investment management fees. During the six months ended April 30, 2007, dividend income from the T. Rowe Price Reserve Funds totaled $115,000, and the value of shares of the T. Rowe Price Reserve Funds held at April 30, 2007, and October 31, 2006, was $3,765,000 and $6,132,000, respectively.
| Information on Proxy Voting Policies, Procedures, and Records |
A description of the policies and procedures used by T. Rowe Price funds and portfolios to determine how to vote proxies relating to portfolio securities is available in each fund’s Statement of Additional Information, which you may request by calling 1-800-225-5132 or by accessing the SEC’s Web site, www.sec.gov. The description of our proxy voting policies and procedures is also available on our Web site, www.troweprice.com. To access it, click on the words “Company Info” at the top of our homepage for individual investors. Then, in the window that appears, click on the “Proxy Voting Policy” navigation button in the top left corner.
Each fund’s most recent annual proxy voting record is available on our Web site and through the SEC’s Web site. To access it through our Web site, follow the directions above, then click on the words “Proxy Voting Record” at the bottom of the Proxy Voting Policy page.
| How to Obtain Quarterly Portfolio Holdings |
The fund files a complete schedule of portfolio holdings with the Securities and Exchange Commission for the first and third quarters of each fiscal year on Form N-Q. The fund’s Form N-Q is available electronically on the SEC’s Web site (www.sec.gov); hard copies may be reviewed and copied at the SEC’s Public Reference Room, 450 Fifth St. N.W., Washington, DC 20549. For more information on the Public Reference Room, call 1-800-SEC-0330.
| Approval of Investment Management Agreement |
On March 7, 2007, the fund’s Board of Directors unanimously approved the investment advisory contract (Contract) between the fund and its investment manager, T. Rowe Price International, Inc. (Manager). The Board considered a variety of factors in connection with its review of the Contract, also taking into account information provided by the Manager during the course of the year, as discussed below:
Services Provided by the Manager
The Board considered the nature, quality, and extent of the services provided to the fund by the Manager. These services included, but were not limited to, management of the fund’s portfolio and a variety of activities related to portfolio management. The Board also reviewed the background and experience of the Manager’s senior management team and investment personnel involved in the management of the fund. The Board concluded that it was satisfied with the nature, quality, and extent of the services provided by the Manager.
Investment Performance of the Fund
The Board reviewed the fund’s average annual total return over the 1-, 3-, 5-, and 10-year periods as well as the fund’s year-by-year returns and compared these returns with a wide variety of previously agreed upon comparable performance measures and market data, including those supplied by Lipper, an independent provider of mutual fund data. The information indicated that the fund’s results for certain time periods were less than satisfactory. The Manager provided its assessment of the fund’s investment results and reviewed steps taken to address issues raised by the Board. The Board concluded that the Manager’s response was appropriate.
Costs, Benefits, Profits, and Economies of Scale
The Board was provided with detailed information regarding the revenues received by the Manager under the Contract and other benefits that the Manager (and its affiliates) may have realized from its relationship with the fund, including research received under “soft dollar” agreements. The Board noted that soft dollars were not used to pay for third-party, non-broker research. The Board also received information on the estimated costs incurred and profits realized by the Manager and its affiliates from advising T. Rowe Price mutual funds, as well as estimates of the gross profits realized from managing the fund in particular. The Board concluded that the Manager’s profits were reasonable in light of the services provided to the fund. The Board also considered the extent to which economies of scale were being realized by the Manager and whether the fund or other funds benefit from any such economies of scale under the fee levels set forth in the Contract. The Board concluded that the advisory fee structure for the fund continued to provide for a reasonable sharing of benefits from economies of scale with the fund’s investors.
Fees
The Board reviewed the fund’s management fee rate, operating expenses, and total expense ratio and compared them with fees and expenses of other comparable funds based on information and data supplied by Lipper. The information provided to the Board showed that the fund’s management fee and expense ratio were generally at or below the median for comparable funds. The Board also reviewed the fee schedules for comparable privately managed accounts of the Manager and its affiliates. Management informed the Board that the Manager’s responsibilities for privately managed accounts are more limited than its responsibilities for the fund and other T. Rowe Price mutual funds that it or its affiliates advise. On the basis of the information provided, the Board concluded that the fees paid by the fund under the Contract were reasonable.
Approval of the Contract
As noted, the Board approved the continuation of the Contract. No single factor was considered in isolation or to be determinative to the decision. Rather, the Board concluded, in light of a weighting and balancing of all factors considered, that it was in the best interests of the fund to approve the continuation of the Contract, including the fees to be charged for services thereunder.
Item 2. Code of Ethics.
A code of ethics, as defined in Item 2 of Form N-CSR, applicable to its principal executive officer, principal financial officer, principal accounting officer or controller, or persons performing similar functions is filed as an exhibit to the registrant’s annual Form N-CSR. No substantive amendments were approved or waivers were granted to this code of ethics during the registrant’s most recent fiscal half-year.
Item 3. Audit Committee Financial Expert.
Disclosure required in registrant’s annual Form N-CSR.
Item 4. Principal Accountant Fees and Services.
Disclosure required in registrant’s annual Form N-CSR.
Item 5. Audit Committee of Listed Registrants.
Not applicable.
Item 6. Schedule of Investments.
Not applicable. The complete schedule of investments is included in Item 1 of this Form N-CSR.
Item 7. Disclosure of Proxy Voting Policies and Procedures for Closed-End Management Investment Companies.
Not applicable.
Item 8. Portfolio Managers of Closed-End Management Investment Companies.
Not applicable.
Item 9. Purchases of Equity Securities by Closed-End Management Investment Company and Affiliated Purchasers.
Not applicable.
Item 10. Submission of Matters to a Vote of Security Holders.
Not applicable.
Item 11. Controls and Procedures.
(a) The registrant’s principal executive officer and principal financial officer have evaluated the registrant’s disclosure controls and procedures within 90 days of this filing and have concluded that the registrant’s disclosure controls and procedures were effective, as of that date, in ensuring that information required to be disclosed by the registrant in this Form N-CSR was recorded, processed, summarized, and reported timely.
(b) The registrant’s principal executive officer and principal financial officer are aware of no change in the registrant’s internal control over financial reporting that occurred during the registrant’s second fiscal quarter covered by this report that has materially affected, or is reasonably likely to materially affect, the registrant’s internal control over financial reporting.
Item 12. Exhibits.(a)(1) The registrant’s code of ethics pursuant to Item 2 of Form N-CSR is filed with the registrant’s annual Form N-CSR.
(2) Separate certifications by the registrant's principal executive officer and principal financial officer, pursuant to Section 302 of the Sarbanes-Oxley Act of 2002 and required by Rule 30a-2(a) under the Investment Company Act of 1940, are attached.
(3) Written solicitation to repurchase securities issued by closed-end companies: not applicable.
(b) A certification by the registrant's principal executive officer and principal financial officer, pursuant to Section 906 of the Sarbanes-Oxley Act of 2002 and required by Rule 30a-2(b) under the Investment Company Act of 1940, is attached.
| | |
SIGNATURES |
| |
| | Pursuant to the requirements of the Securities Exchange Act of 1934 and the Investment |
| Company Act of 1940, the registrant has duly caused this report to be signed on its behalf by the |
| undersigned, thereunto duly authorized. |
| |
| T. Rowe Price Institutional International Funds, Inc. |
| |
| |
| By | /s/ Edward C. Bernard |
| | Edward C. Bernard |
| | Principal Executive Officer |
| |
| Date | June 28, 2007 |
| |
| |
| | Pursuant to the requirements of the Securities Exchange Act of 1934 and the Investment |
| Company Act of 1940, this report has been signed below by the following persons on behalf of |
| the registrant and in the capacities and on the dates indicated. |
| |
| |
| By | /s/ Edward C. Bernard |
| | Edward C. Bernard |
| | Principal Executive Officer |
| |
| Date | June 28, 2007 |
| |
| |
| |
| By | /s/ Joseph A. Carrier |
| | Joseph A. Carrier |
| | Principal Financial Officer |
| |
| Date | June 28, 2007 |