| UNITED STATES |
| SECURITIES AND EXCHANGE COMMISSION |
| Washington, D.C. 20549 |
| |
FORM N-CSR |
| |
CERTIFIED SHAREHOLDER REPORT OF REGISTERED |
MANAGEMENT INVESTMENT COMPANIES |
| |
| |
| |
| Investment Company Act File Number: 811-5833 |
|
| |
| T. Rowe Price Institutional International Funds, Inc. |
|
| (Exact name of registrant as specified in charter) |
| |
| 100 East Pratt Street, Baltimore, MD 21202 |
|
| (Address of principal executive offices) |
| |
| David Oestreicher |
| 100 East Pratt Street, Baltimore, MD 21202 |
|
| (Name and address of agent for service) |
| |
| |
| Registrant’s telephone number, including area code: (410) 345-2000 |
| |
| |
| Date of fiscal year end: October 31 |
| |
| |
| Date of reporting period: April 30, 2008 |
Item 1: Report to Shareholders| Institutional Emerging Markets Equity Fund | April 30, 2008 |
The views and opinions in this report were current as of April 30, 2008. They are not guarantees of performance or investment results and should not be taken as investment advice. Investment decisions reflect a variety of factors, and the managers reserve the right to change their views about individual stocks, sectors, and the markets at any time. As a result, the views expressed should not be relied upon as a forecast of the fund’s future investment intent. The report is certified under the Sarbanes-Oxley Act, which requires mutual funds and other public companies to affirm that, to the best of their knowledge, the information in their financial reports is fairly and accurately stated in all material respects.
Manager’s Letter
T. Rowe Price Institutional Emerging Markets Equity Fund
Dear Investor
Emerging markets stocks and your fund declined in the six months ended April 30, 2008, a period marked by increased volatility stemming from the U.S. credit crisis. Investors turned cautious during the period, and looked to investments perceived to be safer. Inflationary pressures are rising across the emerging markets universe, particularly in food prices, which has resulted in tighter monetary policies. Latin America was a bright spot, as it continues to enjoy solid economic growth, accelerating commodity prices, and strong currency appreciation.
• Emerging markets suffered significant declines in the past six months, as investors became risk averse due to the U.S. credit crisis.
• Asia was the worst-performing region, with China turning in the steepest decline, while Latin America was the best performer.
• We have reduced our allocation to Asia and added to our exposure in the Emerging Europe, Middle East, and Africa (EMEA) region, which offers strong economic growth and expansion.
• We believe that individual wealth will drive long-term growth in emerging markets, and, as a result, we favor financial, consumer-oriented, and infrastructure firms.
Performance Review
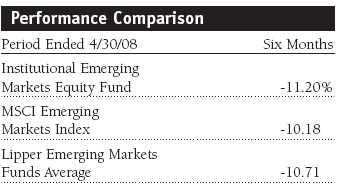
Emerging markets were not immune to the turbulence in the credit markets or the U.S. economic slowdown, particularly among heavy exporting countries. As shown in the table above, your fund returned -11.20%, which lagged the MSCI Emerging Markets Index and the Lipper Emerging Markets Funds Average.
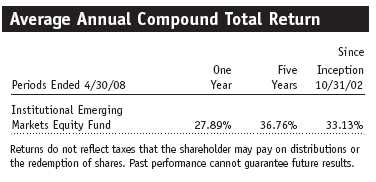
Longer-term performance remains good. Indeed, your fund has generated very strong gains over the past five years, averaging 36.76% a year during the period, and 33.13% a year since the fund’s inception in 2002, as shown in the table on page 6. As demonstrated by the last six months, emerging markets can be volatile, which makes them appropriate for only a portion of an investor’s portfolio. Yet the picture for developing countries remains positive due to strong economic growth, increased trade among emerging countries, and record commodity prices.
Market and Portfolio Review
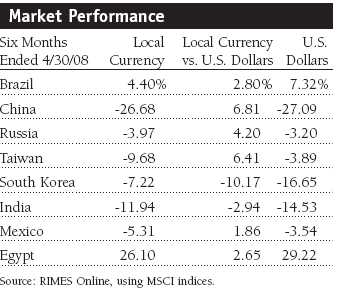
The fallout over U.S. economic uncertainty reverberated throughout the emerging markets, particularly those in Asia and the Far East. Losses reached double-digits. Some of the previous top performers—notably China and India—saw the steepest losses as the appetite for risk diminished and investors pocketed gains. The markets regained some of their footing in April, with the worst conditions in the U.S. abating somewhat. But the pressures from the credit crisis abroad and increasing worries in some emerging countries put downward pressure on equities. The Chinese stock market declined to a nine-month low at the end of March due to worries over corporate profits, a 12-year high in inflation, and an oversupply of new companies coming to market. Brazil, on the other hand, showed resilience due to high commodity prices and helped make Latin America the only region to post a gain for the period.
Among sectors in the MSCI Emerging Markets Index, only energy and materials were positive due to the unprecedented price increases in raw materials. Industrials and business services was the worst-performing sector, as many companies have considerable debt and have suffered due to rising financing costs from higher interest rates. Financials also suffered globally due to the credit crunch and fears of a global slowdown. Utilities lost ground from higher fuel costs associated with power generation. Consumer discretionary felt the impact of tighter monetary policy to counter inflation.
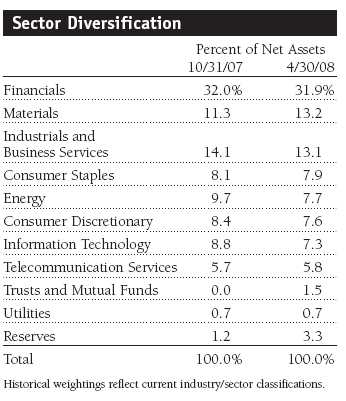
Within the portfolio, few sectors contributed positively. Materials and energy holdings benefited from commodity and oil price strength and the continued strong demand from China. However, we remain underweight in both sectors, given their recent run-up in value. Financials, the fund’s largest sector weighting and more than one-third of net assets, declined from global financial stress brought on by the U.S. subprime housing crisis and the deteriorating near-term outlook in some real estate markets such as India. Information technology performed poorly due to slowing economic activity, as did industrials.
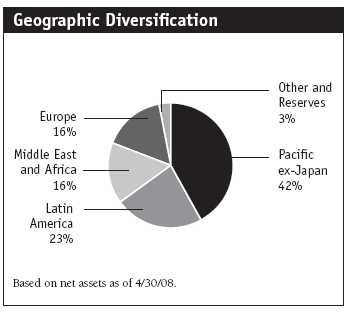
Far East
Emerging Asian markets remained our largest regional allocation, though we repositioned money into the Middle East, where we believe growth prospects are strong. Asian markets overall fell in line with the MSCI Emerging Markets Index for the past six months. The market sell-off in the first quarter of 2008 was prompted in part by the exodus of risk-averse investors reacting to concerns that the U.S. credit crisis could spread and weaken export-heavy nations. But other risk factors emerged, including inflation, which has prompted forecasts of monetary tightening. China fell the most in the index, declining 27%. Export-heavy South Korea also was down sharply due to a slowing economy, disappointing earnings guidance, and a lackluster housing market. Building materials concern KCC fell due to the slowing construction sector, as did Hyundai Development. We added DC Chemical, as company expansion plans are running ahead of schedule and there is strong demand for its products. Mediatek, Taiwan’s largest chip designer and an integral player in China’s third-generation telecommunications market, slid due to increasing competition and excess capacity. Taiwan’s market fell amid concerns over its unresolved political situation, though the market rebounded in April after the election of a pro-China president. Taiwan’s economic health remains closely correlated to its relationship with China. (Please refer to the fund’s portfolio of investments for a detailed listing of holdings and the amount each represents in the portfolio.)
We are neutral on China, including Hong Kong listings, relative to the index. The largest detractors were Beijing Enterprises, an industrial conglomerate that suffered in the broader market sell-off, and Ping An Insurance. Our positions are focused on the strong consumer and increasing levels of wealth, particularly in banking, insurance, retailing, telecommunications, and real estate. Infrastructure remains popular, too, with capital goods, materials, and transport stock offering attractive values. We eliminated positions in energy giants PetroChina, after the stock enjoyed a strong run thanks to record oil prices, and in China Shenhua Energy. We eliminated Sinofert Holdings, the fertilizer company that also had a strong run, as we prefer the growth prospects of Russia’s Uralkali, the fund’s fifth-largest holding.
In South Asia, we retain our overweight in India, where we believe that the country’s focus on infrastructure spending will provide attractive opportunities. Aside from two Malaysian stocks, we hold nothing in the smaller, higher-risk markets such as Indonesia and Thailand. In India, we sold Reliance Industries, an energy company that had booked strong gains.
Latin America
Latin America was the best-performing region among emerging markets in the last six months. Record-breaking commodity prices are supporting solid economic growth, and a burgeoning middle class has become a significant growth engine. The fund remains overweight in the region, though we are reducing our exposure after the region’s extraordinary gains in recent years. Indeed, the Latin America region was up 3.5% for the period, in contrast to the double-digit swoons of other emerging market regions. It is up about 46% in the last 12 months and has seen annualized returns in the 50% range for the past five years.
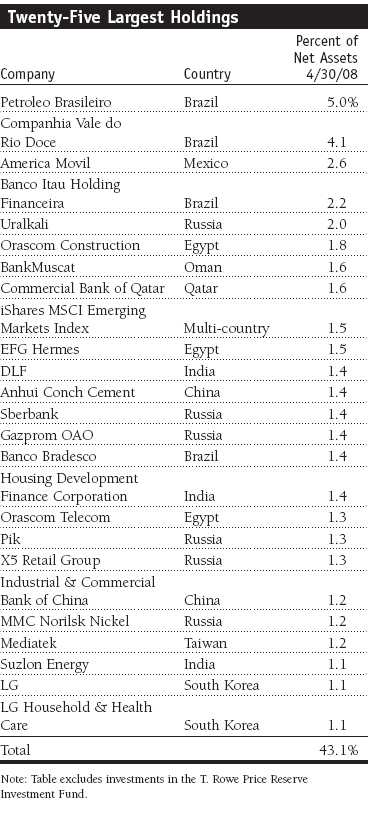
Our largest positions are in the region’s two major markets, Brazil and Mexico, which are generating strong growth and have proreform presidents. Brazil remains a compelling story. The country boasts strong exports and growing domestic demand. Oil exploration and production company Petroleo Brasileiro, the fund’s top holding, was a major contributor for the period. Companhia Vale do Rio Doce is our second-largest holding, and the mining firm continues to benefit from China’s extraordinary demand. Perdigao, a major producer of poultry, pork, and processed food, should profit from rising prices due to global food demand. Brazil’s extraordinary growth and falling interest rates have fueled a burgeoning middle class and greater consumption. For that reason our holdings have a domestic focus. We favor the banking sector, and have substantially increased our position in Banco Itau, a fundamentally sound institution with good loan growth.
The Mexican economy is currently weathering the U.S. slowdown well, and anecdotal evidence suggests there has been little impact on Mexican businesses. Stocks benefited from relaxed pension policies, which now allow Mexican firms to double their allocation to equities. Our holdings have a domestic accent. We favor telecommunication services, banks, and consumer stocks. Some of them had setbacks, including telecommunications giant America Movil, which suffered from easing revenues as tariffs were driven lower, and Grupo Aeroportuario, which slid due to increased competition, rising fuel costs, and easing domestic traffic. However, we are well positioned in a climate of improved credit and lower unemployment. Other holdings include retailer Wal-Mart de Mexico, which enjoys a leading industry position, and Grupo Financiero Banorte.
In Argentina, we eliminated our position in Tenaris, the oil services producer of seamless steel pipes, as the company is suffering from cost pressures and competition from China. This was our only position in Argentina.
Europe, the Middle East, and Africa
The MSCI Emerging Europe, Middle East, and Africa Index posted a -7.59% return for the past six months, which was better than the overall emerging markets return. In the fund, the EMEA was by far the greatest contributor to outperformance, with stock selection very strong. EMEA is the fund’s largest regional overweight, and has become more so over the first quarter of 2008, primarily due to performance and trading within the Middle East. Nine of our 10 largest purchases were in the EMEA. Within the region we remain bullish on the Middle East and North Africa where our exposure represents a substantial overweight, as only Egypt is represented in the MSCI Emerging Markets Index. The fund’s five largest country overweights all come from EMEA (Egypt, Qatar, Russia, Oman, and the United Arab Emirates (UAE)). We believe the investment picture in the Middle East remains solid due to fast-growing economies, negative real interest rates, high oil prices, booming construction, and increasing foreign investor interest. We added to our positions in Egypt that have exposure to growth across the region. We have become concerned, however, about the economy, especially inflationary pressures.
We added considerably to Emaar Properties, the Dubai-based developer that is positioned to benefit from the demand-and-supply gap. Demand is underpinned by population growth and government liberalization that allows foreign ownership in Dubai. Construction is also constrained by shortages of labor and materials, as well as minimal competition, which allows developers to control and limit supply.
Elsewhere in the Middle East, we have initiated positions in National Bank of Oman and Qatar National Bank, which should benefit from strong economic growth and high levels of liquidity. Other Qatari stocks include Industries Qatar, a holding company with four business lines in fertilizers, petrochemicals, steel, and fuels—all of which are enjoying robust demand growth—and Qatar Islamic Bank, which should benefit from Qatar’s strong macroeconomic climate. We also initiated a position in UAE’s Dubai Financial Markets, the only listed exchange in the region and the fifth-largest exchange by market capitalization in the world. Key drivers for the exchange include strong momentum in trading volumes due to the region’s solid economy, additional listings on exchanges, the long initial public offering pipeline, and ever-increasing foreign investments.
We increased our weight in Russia with a number of large purchases. We added to Gazprom, the Russian energy giant, as gas prices in Russia remain high, and in Uralkali, the Russian potash producer and the fund’s top absolute contributor that had its initial public offering last October. Intense agricultural demands have rallied potash prices. Moreover, the industry is benefiting from a supply bottleneck due to industry consolidation and the long period (six to seven years) required to build the necessary infrastructure to extract potash. We initiated a position in Kazakhstan-based diversified miner Eurasian Natural Resources, which enjoys high margins and strong growth and is a large global producer and exporter of metals. It has a competitive advantage from a fully integrated position in power and logistics, large reserves, and a strong balance sheet.
Outlook
In general the underlying economies in our investing universe are strong, and the emerging market corporate world is, for the most part, less indebted than in the developed markets. Strong corporate performance in many emerging markets has been supported by growing consumer wealth and high commodity prices. We expect sales and earnings growth for the asset class to remain resilient, though not at the level seen in recent years. Valuations in the major markets remain reasonable.
We believe emerging markets will decouple from developed markets and take center stage in the global economy and financial markets. The key reasons include the integration of emerging markets labor into the global economy and the superior demographics in the developing world, the continuing shift from debtor to creditor status in most countries, ongoing development of financial services, further global outsourcing, and consolidation among emerging companies.
Key risks remain the U.S. economic slowdown and accelerated inflation among major developing countries, which has already prompted tighter monetary policies in China and India. Rising prices could weaken company performance and put additional pressure on the consumer, possibly resulting in social unrest. We are monitoring closely the impact of inflation on the companies we own.
We believe increasing individual wealth and consumer spending will drive long-term growth in emerging markets. With gross domestic product growth generally high and interest rates low in many emerging countries, sectors and industries that are sensitive to improving consumption represent good investment opportunities. Consequently, we favor areas such as consumer discretionary and staples, financials, and even infrastructure focused on transportation and construction.
Against a backdrop of slowing global growth, rising inflation, and increased risk aversion, we believe that emerging market fundamentals remain largely intact and that the markets are well placed to withstand significant slowdown.
Respectfully submitted,

Christopher D. Alderson
Lead Portfolio Manager, Institutional Emerging Markets Equity Fund
May 21, 2008
The lead portfolio manager has day-to-day responsibility for managing the portfolio and works with committee members in developing and executing the fund’s investment program.
| Risks of International Investing |
Funds that invest overseas generally carry more risk than funds that invest strictly in U.S. assets. Funds investing in a single country or in a limited geographic region tend to be riskier than more diversified funds. Risks can result from varying stages of economic and political development; differing regulatory environments, trading days, and accounting standards; and higher transaction costs of non-U.S. markets. Non-U.S. investments are also subject to currency risk, or a decline in the value of a foreign currency versus the U.S. dollar, which reduces the dollar value of securities denominated in that currency.
Gross domestic product (GDP): GDP is the total market value of all goods and services produced in a country in a given year.
Lipper averages: The averages of available mutual fund performance returns for specified time periods in defined categories as tracked by Lipper Inc.
MSCI Emerging Markets Index: A capitalization-weighted index of stocks from 26 emerging market countries that only includes securities that may be traded by foreign investors.
Portfolio Highlights
Performance and Expenses
T. Rowe Price Institutional Emerging Markets Equity Fund
This chart shows the value of a hypothetical $1 million investment in the fund over the past 10 fiscal year periods or since inception (for funds lacking 10-year records). The result is compared with benchmarks, which may include a broad-based market index and a peer group average or index. Market indexes do not include expenses, which are deducted from fund returns as well as mutual fund averages and indexes.

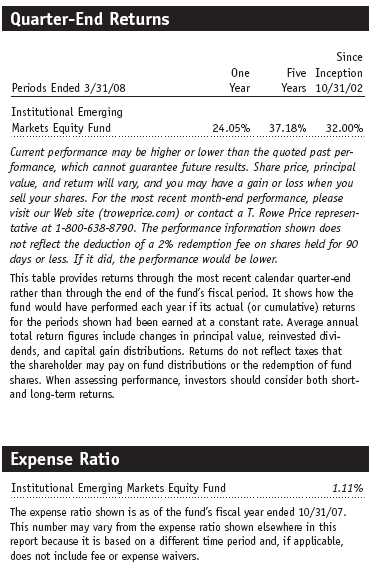
This table shows how the fund would have performed each year if its actual (or cumulative) returns for the periods shown had been earned at a constant rate.
Fund Expense Example
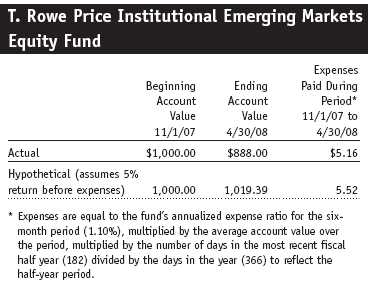
As a mutual fund shareholder, you may incur two types of costs: (1) transaction costs, such as redemption fees or sales loads, and (2) ongoing costs, including management fees, distribution and service (12b-1) fees, and other fund expenses. The following example is intended to help you understand your ongoing costs (in dollars) of investing in the fund and to compare these costs with the ongoing costs of investing in other mutual funds. The example is based on an investment of $1,000 invested at the beginning of the most recent six-month period and held for the entire period.
Actual Expenses
The first line of the following table (“Actual”) provides information about actual account values and actual expenses. You may use the information in this line, together with your account balance, to estimate the expenses that you paid over the period. Simply divide your account value by $1,000 (for example, an $8,600 account value divided by $1,000 = 8.6), then multiply the result by the number in the first line under the heading “Expenses Paid During Period” to estimate the expenses you paid on your account during this period.
Hypothetical Example for Comparison Purposes
The information on the second line of the table (“Hypothetical”) is based on hypothetical account values and expenses derived from the fund’s actual expense ratio and an assumed 5% per year rate of return before expenses (not the fund’s actual return). You may compare the ongoing costs of investing in the fund with other funds by contrasting this 5% hypothetical example and the 5% hypothetical examples that appear in the shareholder reports of the other funds. The hypothetical account values and expenses may not be used to estimate the actual ending account balance or expenses you paid for the period.
You should also be aware that the expenses shown in the table highlight only your ongoing costs and do not reflect any transaction costs, such as redemption fees or sales loads. Therefore, the second line of the table is useful in comparing ongoing costs only and will not help you determine the relative total costs of owning different funds. To the extent a fund charges transaction costs, however, the total cost of owning that fund is higher.
Financial Highlights
T. Rowe Price Institutional Emerging Markets Equity Fund
(Unaudited)
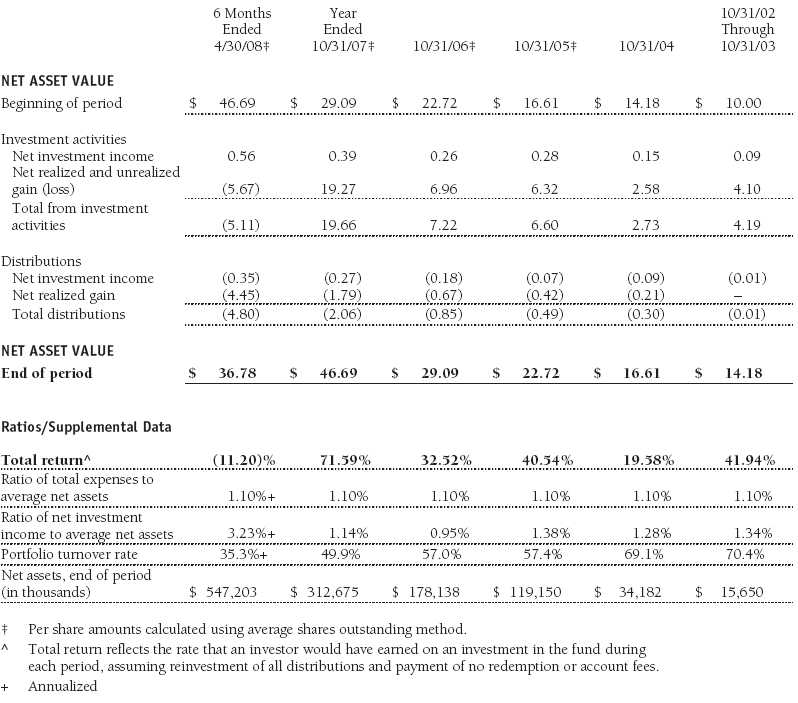
The accompanying notes are an integral part of these financial statements.
Portfolio of Investments ‡
T. Rowe Price Institutional Emerging Markets Equity Fund
April 30, 2008 (Unaudited)
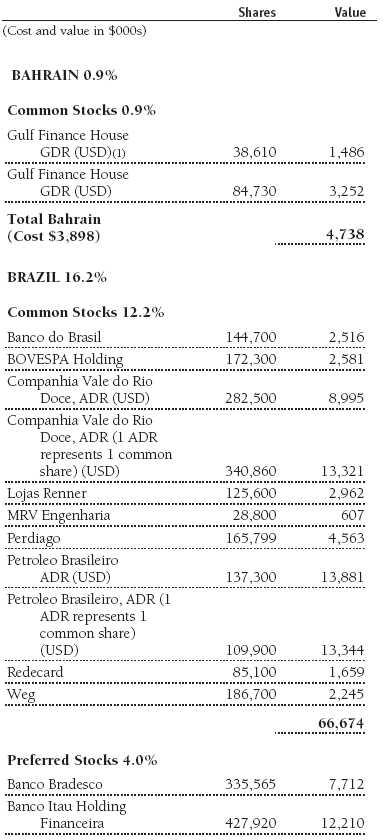
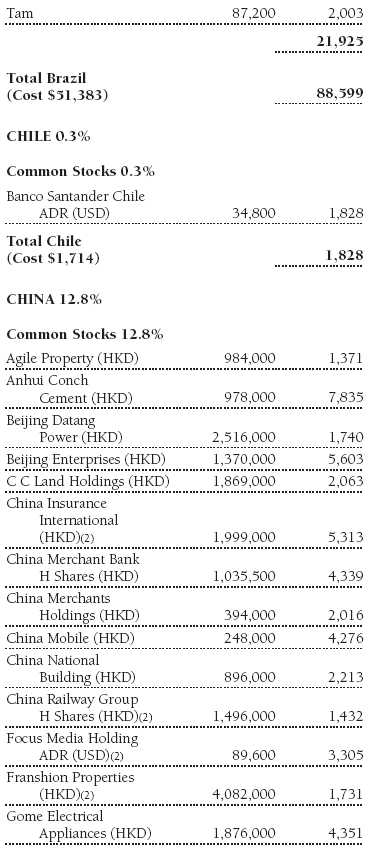
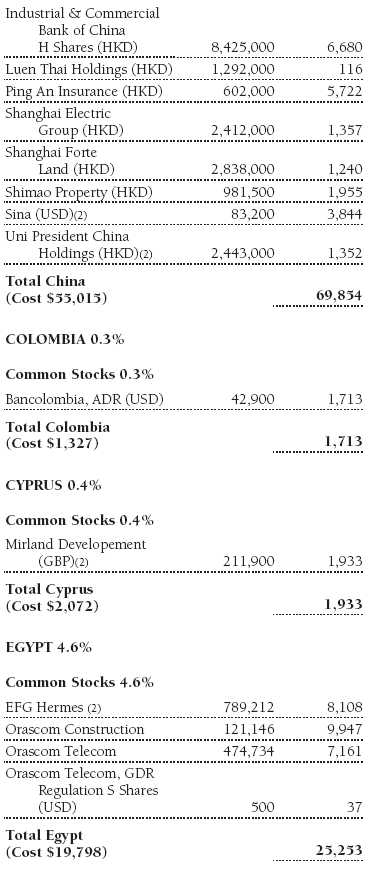

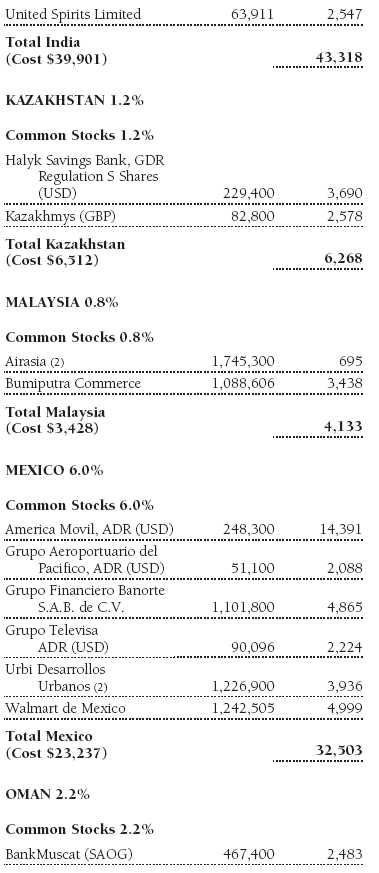
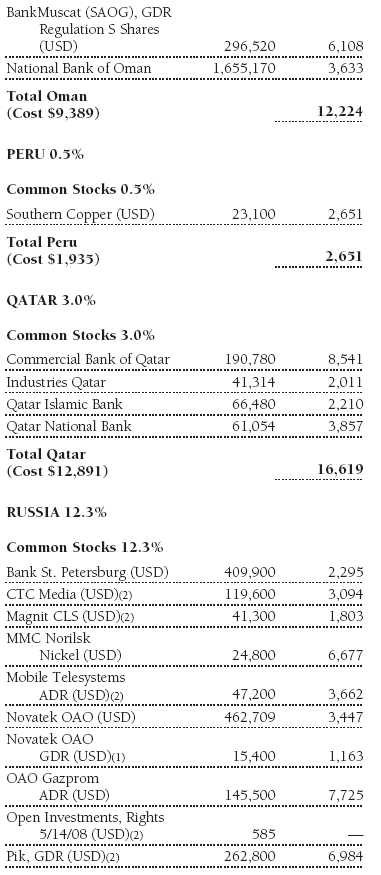
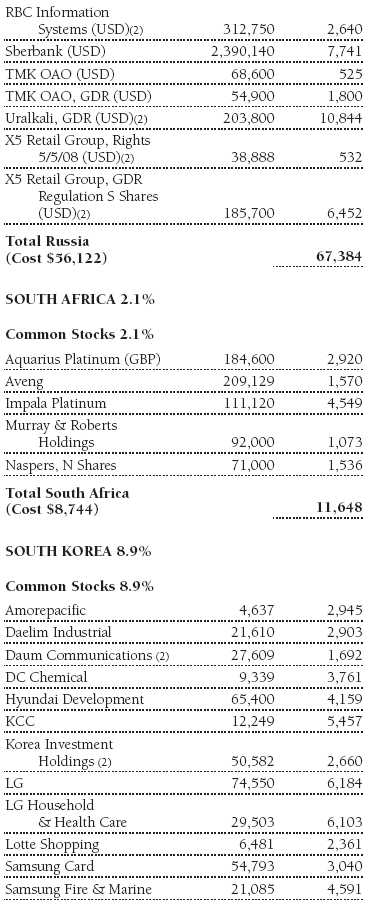
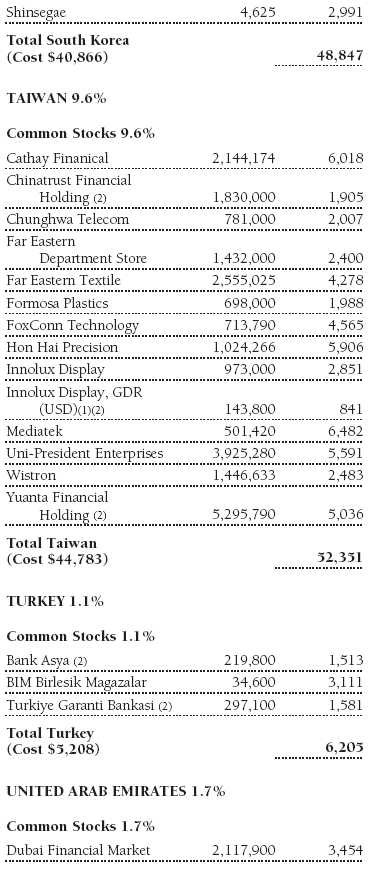
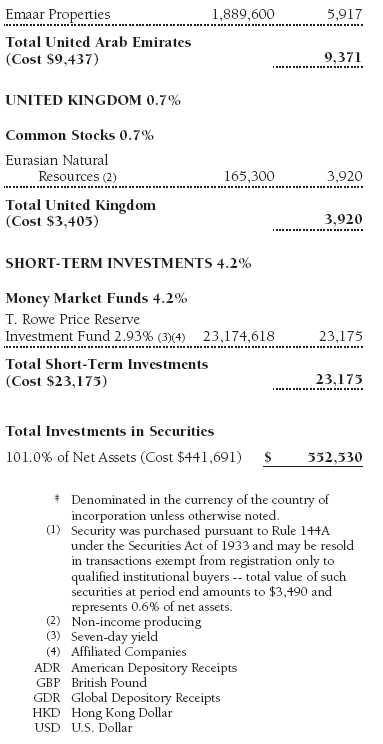
The accompanying notes are an integral part of these financial statements.
Statement of Assets and Liabilities
T. Rowe Price Institutional Emerging Markets Equity Fund
April 30, 2008 (Unaudited)
($000s except shares and per share amounts)
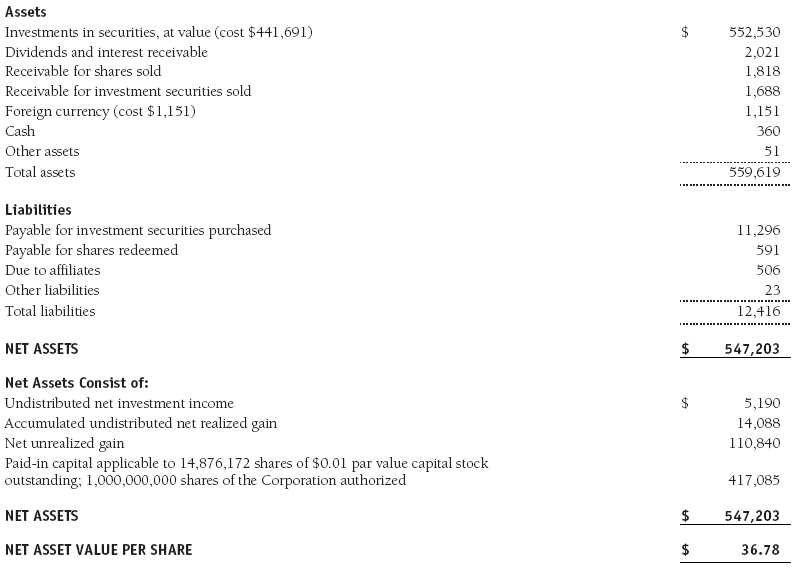
The accompanying notes are an integral part of these financial statements.
Statement of Operations
T. Rowe Price Institutional Emerging Markets Equity Fund
(Unaudited)
($000s)
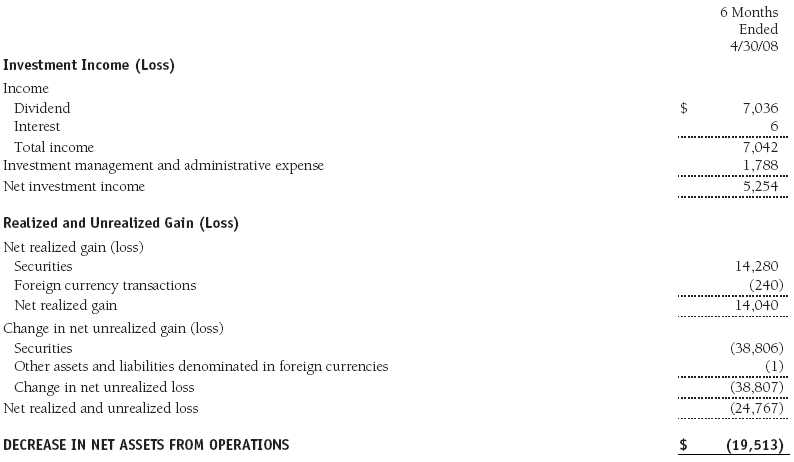
The accompanying notes are an integral part of these financial statements.
Statement of Changes in Net Assets
T. Rowe Price Institutional Emerging Markets Equity Fund
(Unaudited)
($000s)
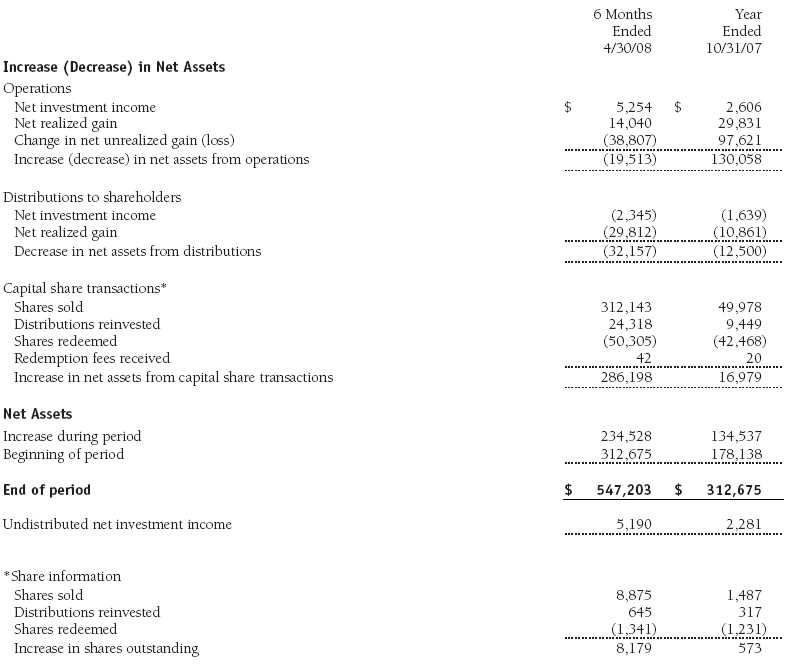
The accompanying notes are an integral part of these financial statements.
Notes to Financial Statements
T. Rowe Price Institutional Emerging Markets Equity Fund
April 30, 2008 (Unaudited)
T. Rowe Price Institutional International Funds, Inc. (the corporation), is registered under the Investment Company Act of 1940 (the 1940 Act). The Institutional Emerging Markets Equity Fund (the fund), a diversified, open-end management investment company, is one portfolio established by the corporation. The fund commenced operations on October 31, 2002. The fund seeks long-term growth of capital through investments primarily in the common stocks of companies located (or with primary operations) in emerging markets.
NOTE 1 - SIGNIFICANT ACCOUNTING POLICIES
Basis of Preparation The accompanying financial statements were prepared in accordance with accounting principles generally accepted in the United States of America, which require the use of estimates made by fund management. Fund management believes that estimates and security valuations are appropriate; however, actual results may differ from those estimates, and the security valuations reflected in the financial statements may differ from the value the fund ultimately realizes upon sale of the securities.
Investment Transactions, Investment Income, and Distributions Income and expenses are recorded on the accrual basis. Dividends received from mutual fund investments are reflected as dividend income; capital gain distributions are reflected as realized gain/loss. Dividend income and capital gain distributions are recorded on the ex-dividend date. Income tax-related interest and penalties, if incurred, would be recorded as income tax expense. Investment transactions are accounted for on the trade date. Realized gains and losses are reported on the identified cost basis. Distributions to shareholders are recorded on the ex-dividend date. Income distributions are declared and paid on an annual basis. Capital gain distributions, if any, are declared and paid by the fund, typically on an annual basis.
Currency Translation Assets, including investments, and liabilities denominated in foreign currencies are translated into U.S. dollar values each day at the prevailing exchange rate, using the mean of the bid and asked prices of such currencies against U.S. dollars as quoted by a major bank. Purchases and sales of securities, income, and expenses are translated into U.S. dollars at the prevailing exchange rate on the date of the transaction. The effect of changes in foreign currency exchange rates on realized and unrealized security gains and losses is reflected as a component of security gains and losses.
Redemption Fees A 2% fee is assessed on redemptions of fund shares held for 90 days or less to deter short-term trading and to protect the interests of long-term shareholders. Redemption fees are withheld from proceeds that shareholders receive from the sale or exchange of fund shares. The fees are paid to the fund, and are recorded as an increase to paid-in capital. The fees may cause the redemption price per share to differ from the net asset value per share.
New Accounting Pronouncements Effective November 1, 2007, the fund adopted Financial Accounting Standards Board (FASB) Interpretation No. 48 (FIN 48), Accounting for Uncertainty in Income Taxes, a clarification of FASB Statement No. 109, Accounting for Income Taxes. FIN 48 establishes financial accounting and disclosure requirements for recognition and measurement of tax positions taken or expected to be taken on an income tax return. The adoption of FIN 48 had no impact on the fund’s net assets or results of operations.
In September 2006, the Financial Accounting Standards Board (FASB) released Statement of Financial Accounting Standards No. 157 (FAS 157), Fair Value Measurements. FAS 157 defines fair value, establishes the framework for measuring fair value, and expands the disclosure of fair value measurements in the financial statements. It is effective for the fund’s fiscal year beginning November 1, 2008. Management expects adoption of FAS 157 will have no material impact on the fund’s net assets or results of operations.
NOTE 2 - VALUATION
The fund values its investments and computes its net asset value per share at the close of the New York Stock Exchange (NYSE), normally 4 p.m. ET, each day that the NYSE is open for business.
Equity securities listed or regularly traded on a securities exchange or in the over-the-counter (OTC) market are valued at the last quoted sale price or, for certain markets, the official closing price at the time the valuations are made, except for OTC Bulletin Board securities, which are valued at the mean of the latest bid and asked prices. A security that is listed or traded on more than one exchange is valued at the quotation on the exchange determined to be the primary market for such security. Listed securities not traded on a particular day are valued at the mean of the latest bid and asked prices for domestic securities and the last quoted sale price for international securities.
Investments in mutual funds are valued at the mutual fund’s closing net asset value per share on the day of valuation.
Other investments, including restricted securities, and those for which the above valuation procedures are inappropriate or are deemed not to reflect fair value are stated at fair value as determined in good faith by the T. Rowe Price Valuation Committee, established by the fund’s Board of Directors.
For valuation purposes, the last quoted prices of non-U.S. equity securities may be adjusted under the circumstances described below. If the fund determines that developments between the close of a foreign market and the close of the NYSE will, in its judgment, materially affect the value of some or all of its portfolio securities, the fund will adjust the previous closing prices to reflect what it believes to be the fair value of the securities as of the close of the NYSE. In deciding whether it is necessary to adjust closing prices to reflect fair value, the fund reviews a variety of factors, including developments in foreign markets, the performance of U.S. securities markets, and the performance of instruments trading in U.S. markets that represent foreign securities and baskets of foreign securities. A fund may also fair value securities in other situations, such as when a particular foreign market is closed but the fund is open. The fund uses outside pricing services to provide it with closing prices and information to evaluate and/or adjust those prices. The fund cannot predict how often it will use closing prices and how often it will determine it necessary to adjust those prices to reflect fair value. As a means of evaluating its security valuation process, the fund routinely compares closing prices, the next day’s opening prices in the same markets, and adjusted prices.
NOTE 3 - INVESTMENT TRANSACTIONS
Consistent with its investment objective, the fund engages in the following practices to manage exposure to certain risks or to enhance performance. The investment objective, policies, program, and risk factors of the fund are described more fully in the fund’s prospectus and Statement of Additional Information.
Emerging Markets At April 30, 2008, approximately 93% of the fund’s net assets were invested, directly or through its investments in T. Rowe Price institutional funds, in securities of companies located in emerging markets or denominated in or linked to the currencies of emerging market countries. Future economic or political developments could adversely affect the liquidity or value, or both, of such securities.
Restricted Securities The fund may invest in securities that are subject to legal or contractual restrictions on resale. Prompt sale of such securities at an acceptable price may be difficult and may involve substantial delays and additional costs.
Other Purchases and sales of portfolio securities, other than short-term securities, aggregated $301,657,000 and $56,725,000, respectively, for the six months ended April 30, 2008.
NOTE 4 - FEDERAL INCOME TAXES
No provision for federal income taxes is required since the fund intends to continue to qualify as a regulated investment company under Subchapter M of the Internal Revenue Code and distribute to shareholders all of its taxable income and gains. Federal income tax regulations differ from generally accepted accounting principles; therefore, distributions determined in accordance with tax regulations may differ in amount or character from net investment income and realized gains for financial reporting purposes. Financial reporting records are adjusted for permanent book/tax differences to reflect tax character. Financial records are not adjusted for temporary differences. The amount and character of tax-basis distributions and composition of net assets are finalized at fiscal year-end; accordingly, tax-basis balances have not been determined as of April 30, 2008.
At April 30, 2008, the cost of investments for federal income tax purposes was $441,691,000. Net unrealized gain aggregated $110,840,000 at period-end, of which $119,926,000 related to appreciated investments and $9,086,000 related to depreciated investments.
NOTE 5 - FOREIGN TAXES
The fund is subject to foreign income taxes imposed by certain countries in which it invests. Additionally, capital gains realized by the fund upon disposition of securities issued in or by certain foreign countries are subject to capital gains tax imposed by those countries. All taxes are computed in accordance with the applicable foreign tax law, and, to the extent permitted, capital losses are used to offset capital gains. Tax expense attributable to income is accrued by the fund as a reduction of income. Current and deferred tax expense attributable to net capital gains is reflected as a component of realized and/or change in unrealized gain/loss on securities in the accompanying financial statements. At April 30, 2008, the fund had no deferred tax liability attributable to foreign securities and $266,000 of foreign capital loss carryforwards that expire in 2016.
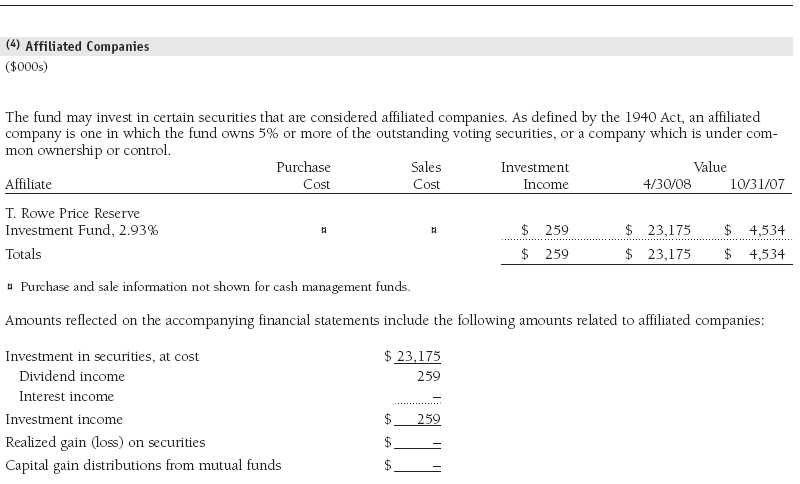
NOTE 6 - RELATED PARTY TRANSACTIONS
The fund is managed by T. Rowe Price International, Inc. (the manager), a wholly owned subsidiary of T. Rowe Price Associates, Inc. (Price Associates), which is wholly owned by T. Rowe Price Group, Inc. The investment management and administrative agreement between the fund and the manager provides for an all-inclusive annual fee equal to 1.10% of the fund’s average daily net assets. The fee is computed daily and paid monthly. The agreement provides that investment management, shareholder servicing, transfer agency, accounting, custody services, and directors’ fees and expenses are provided to the fund, and interest, taxes, brokerage commissions, and extraordinary expenses are paid directly by the fund.
The fund may invest in the T. Rowe Price Reserve Investment Fund and the T. Rowe Price Government Reserve Investment Fund (collectively, the T. Rowe Price Reserve Investment Funds), open-end management investment companies managed by Price Associates and considered affiliates of the fund. The T. Rowe Price Reserve Investment Funds are offered as cash management options to mutual funds, trusts, and other accounts managed by Price Associates and/or its affiliates and are not available for direct purchase by members of the public. The T. Rowe Price Reserve Investment Funds pay no investment management fees.
Mutual funds and other accounts managed by T. Rowe Price and its affiliates (collectively, T. Rowe Price funds) may invest in the fund; however, no T. Rowe Price fund may invest for the purpose of exercising management or control over the fund. At April 30, 2008, approximately 9% of the fund’s outstanding shares were held by T. Rowe Price funds.
As of April 30, 2008, T. Rowe Price Group, Inc., and/or its wholly owned subsidiaries owned 261,926 shares of the fund, representing 2% of the fund’s net assets.
| Information on Proxy Voting Policies, Procedures, and Records |
A description of the policies and procedures used by T. Rowe Price funds and portfolios to determine how to vote proxies relating to portfolio securities is available in each fund’s Statement of Additional Information, which you may request by calling 1-800-225-5132 or by accessing the SEC’s Web site, www.sec.gov. The description of our proxy voting policies and procedures is also available on our Web site, www.troweprice.com. To access it, click on the words “Company Info” at the top of our homepage for individual investors. Then, in the window that appears, click on the “Proxy Voting Policy” navigation button in the top left corner.
Each fund’s most recent annual proxy voting record is available on our Web site and through the SEC’s Web site. To access it through our Web site, follow the directions above, then click on the words “Proxy Voting Record” at the bottom of the Proxy Voting Policy page.
| How to Obtain Quarterly Portfolio Holdings |
The fund files a complete schedule of portfolio holdings with the Securities and Exchange Commission for the first and third quarters of each fiscal year on Form N-Q. The fund’s Form N-Q is available electronically on the SEC’s Web site (www.sec.gov); hard copies may be reviewed and copied at the SEC’s Public Reference Room, 450 Fifth St. N.W., Washington, DC 20549. For more information on the Public Reference Room, call 1-800-SEC-0330.
| Approval of Investment Management Agreement |
On March 4, 2008, the fund’s Board of Directors (Board) unanimously approved the investment advisory contract (Contract) between the fund and its investment manager, T. Rowe Price International, Inc. (Manager). The Board considered a variety of factors in connection with its review of the Contract, also taking into account information provided by the Manager during the course of the year, as discussed below:
Services Provided by the Manager
The Board considered the nature, quality, and extent of the services provided to the fund by the Manager. These services included, but were not limited to, management of the fund’s portfolio and a variety of related activities as well as financial and administrative services, reporting, and communications. The Board also reviewed the background and experience of the Manager’s senior management team and investment personnel involved in the management of the fund. The Board concluded that it was satisfied with the nature, quality, and extent of the services provided by the Manager.
Investment Performance of the Fund
The Board reviewed the fund’s annual total returns over the one-, three-, and five-year and since-inception periods as well as the fund’s year-by-year returns and compared these returns with a wide variety of previously agreed upon comparable performance measures and market data, including those supplied by Lipper, an independent provider of mutual fund data. On the basis of this evaluation and the Board’s ongoing review of investment results, the Board concluded that the fund’s performance was satisfactory.
Costs, Benefits, Profits, and Economies of Scale
The Board reviewed detailed information regarding the revenues received by the Manager under the Contract and other benefits that the Manager (and its affiliates) may have realized from its relationship with the fund, including research received under “soft dollar” agreements. The Board noted that soft dollars were not used to pay for third-party, non-broker research. The Board also received information on the estimated costs incurred and profits realized by the Manager and its affiliates from advising T. Rowe Price mutual funds, as well as estimates of the gross profits realized from managing the fund in particular. The Board concluded that the Manager’s profits were reasonable in light of the services provided to the fund. The Board also considered the extent to which economies of scale were being realized by the Manager and whether the fund or other funds benefit from any such economies of scale under the fee levels set forth in the Contract. The Board noted that, under the Contract, the fund pays the Manager a single fee based on the fund’s assets and that the Manager, in turn, pays all expenses of the fund, with certain exceptions. The Board concluded that, based on the profitability data it reviewed and consistent with this single fee structure, the Contract provided for a reasonable sharing of any benefits from economies of scale with the fund.
Fees
The Board reviewed the fund’s single-fee structure and compared it with fees and expenses of other comparable funds based on information and data supplied by Lipper. The information provided to the Board showed that the fund’s management fee and expense ratio were generally at or below the median for comparable funds. (For these purposes, the Board assumed the management fee was equal to the single fee less the fund’s operating expenses.) The Board also reviewed the fee schedules for comparable privately managed accounts of the Manager and its affiliates. Management informed the Board that the Manager’s responsibilities for privately managed accounts are more limited than its responsibilities for the fund and other T. Rowe Price mutual funds that it or its affiliates advise. On the basis of the information provided, the Board concluded that the fees paid by the fund under the Contract were reasonable.
Approval of the Contract
As noted, the Board approved the continuation of the Contract. No single factor was considered in isolation or to be determinative to the decision. Rather, the Board concluded, in light of a weighting and balancing of all factors considered, that it was in the best interests of the fund to approve the continuation of the Contract, including the fees to be charged for services thereunder.
Item 2. Code of Ethics.
A code of ethics, as defined in Item 2 of Form N-CSR, applicable to its principal executive officer, principal financial officer, principal accounting officer or controller, or persons performing similar functions is filed as an exhibit to the registrant’s annual Form N-CSR. No substantive amendments were approved or waivers were granted to this code of ethics during the registrant’s most recent fiscal half-year.
Item 3. Audit Committee Financial Expert.
Disclosure required in registrant’s annual Form N-CSR.
Item 4. Principal Accountant Fees and Services.
Disclosure required in registrant’s annual Form N-CSR.
Item 5. Audit Committee of Listed Registrants.
Not applicable.
Item 6. Investments.
(a) Not applicable. The complete schedule of investments is included in Item 1 of this Form N-CSR.
(b) Not applicable.
Item 7. Disclosure of Proxy Voting Policies and Procedures for Closed-End Management Investment Companies.
Not applicable.
Item 8. Portfolio Managers of Closed-End Management Investment Companies.
Not applicable.
Item 9. Purchases of Equity Securities by Closed-End Management Investment Company and Affiliated Purchasers.
Not applicable.
Item 10. Submission of Matters to a Vote of Security Holders.
Not applicable.
Item 11. Controls and Procedures.
(a) The registrant’s principal executive officer and principal financial officer have evaluated the registrant’s disclosure controls and procedures within 90 days of this filing and have concluded that the registrant’s disclosure controls and procedures were effective, as of that date, in ensuring that information required to be disclosed by the registrant in this Form N-CSR was recorded, processed, summarized, and reported timely.
(b) The registrant’s principal executive officer and principal financial officer are aware of no change in the registrant’s internal control over financial reporting that occurred during the registrant’s second fiscal quarter covered by this report that has materially affected, or is reasonably likely to materially affect, the registrant’s internal control over financial reporting.
Item 12. Exhibits.
(a)(1) The registrant’s code of ethics pursuant to Item 2 of Form N-CSR is filed with the registrant’s annual Form N-CSR.
(2) Separate certifications by the registrant's principal executive officer and principal financial officer, pursuant to Section 302 of the Sarbanes-Oxley Act of 2002 and required by Rule 30a-2(a) under the Investment Company Act of 1940, are attached.
(3) Written solicitation to repurchase securities issued by closed-end companies: not applicable.
(b) A certification by the registrant's principal executive officer and principal financial officer, pursuant to Section 906 of the Sarbanes-Oxley Act of 2002 and required by Rule 30a-2(b) under the Investment Company Act of 1940, is attached.
| | |
SIGNATURES |
| |
| | Pursuant to the requirements of the Securities Exchange Act of 1934 and the Investment |
| Company Act of 1940, the registrant has duly caused this report to be signed on its behalf by the |
| undersigned, thereunto duly authorized. |
| |
| T. Rowe Price Institutional International Funds, Inc. |
| |
| |
| |
| By | /s/ Edward C. Bernard |
| | Edward C. Bernard |
| | Principal Executive Officer |
| |
| Date | June 17, 2008 |
| |
| |
| |
| | Pursuant to the requirements of the Securities Exchange Act of 1934 and the Investment |
| Company Act of 1940, this report has been signed below by the following persons on behalf of |
| the registrant and in the capacities and on the dates indicated. |
| |
| |
| By | /s/ Edward C. Bernard |
| | Edward C. Bernard |
| | Principal Executive Officer |
| |
| Date | June 17, 2008 |
| |
| |
| |
| By | /s/ Gregory K. Hinkle |
| | Gregory K. Hinkle |
| | Principal Financial Officer |
| |
| Date | June 17, 2008 |