| UNITED STATES |
| SECURITIES AND EXCHANGE COMMISSION |
| Washington, D.C. 20549 |
| |
FORM N-CSR |
| |
CERTIFIED SHAREHOLDER REPORT OF REGISTERED |
MANAGEMENT INVESTMENT COMPANIES |
| |
| |
| |
| Investment Company Act File Number: 811-5833 |
|
| |
| T. Rowe Price Institutional International Funds, Inc. |
|
| (Exact name of registrant as specified in charter) |
| |
| 100 East Pratt Street, Baltimore, MD 21202 |
|
| (Address of principal executive offices) |
| |
| David Oestreicher |
| 100 East Pratt Street, Baltimore, MD 21202 |
|
| (Name and address of agent for service) |
| |
| |
| Registrant’s telephone number, including area code: (410) 345-2000 |
| |
| |
| Date of fiscal year end: October 31 |
| |
| |
| Date of reporting period: April 30, 2009 |
Item 1: Report to Shareholders| Institutional Africa & Middle East Fund | April 30, 2009 |
• Emerging markets in Africa and the Middle East declined in the six-month period ended April 30, 2009, but losses were pared by a significant rally in the last two months.
• Your fund fared worse than its benchmark in the last six months, reflecting the poor performance of financial stocks and our low exposure to the strong South African market. We believe there are better long-term growth opportunities beyond this relatively closed economy.
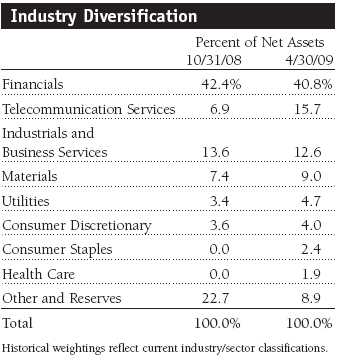
• We have been attempting to increase the fund’s diversification by adding to the number of portfolio holdings, by entering the Saudi market that was previously inaccessible, and by reducing the fund’s emphasis on financial stocks.
• We remain optimistic about the prospects for markets and companies in Africa and the Middle East. We believe that the portfolio is poised to perform better when rationality returns to the markets and stock prices begin to reflect the fundamental strengths of corporations.
The views and opinions in this report were current as of April 30, 2009. They are not guarantees of performance or investment results and should not be taken as investment advice. Investment decisions reflect a variety of factors, and the managers reserve the right to change their views about individual stocks, sectors, and the markets at any time. As a result, the views expressed should not be relied upon as a forecast of the fund’s future investment intent. The report is certified under the Sarbanes-Oxley Act, which requires mutual funds and other public companies to affirm that, to the best of their knowledge, the information in their financial reports is fairly and accurately stated in all material respects.
Manager’s Letter
T. Rowe Price Institutional Africa & Middle East Fund
Dear Investor
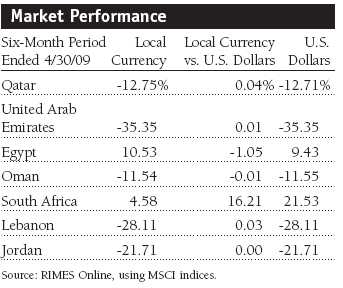
Emerging markets in Africa and the Middle East declined and were very volatile in the six-month period ended April 30, 2009, but losses were pared by a significant rally in the last two months. Persian Gulf markets declined as oil prices and real estate markets weakened and foreign investors withdrew their capital from the region. However, equities in Egypt bucked the negative trend with moderate gains, helped by the government’s announcement of a stimulus package and the possible acquisition of a major telecommunication services company. South African stocks were the best performers in U.S. dollar terms, as the market has been less impacted by foreign investor outflows than other parts of our opportunity set.
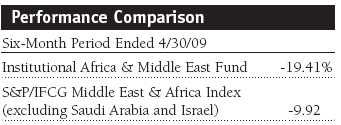
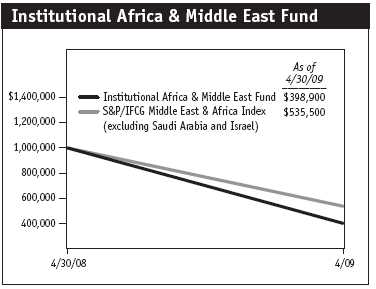
Your fund returned -19.41% in the last six months and fared much worse than its benchmark, as shown in the Performance Comparison table. Relative performance in the last six months reflects our low exposure to South Africa, which represents about half of the benchmark and which we significantly underweight because we believe that there are better long-term growth opportunities in other markets. Significant exposure to the financials sector, the worst-performing segment in the last six months, also worked against us. Factors that helped our performance included relatively good stock selection in Qatar and the United Arab Emirates (UAE), very low exposure to Nigeria, and strong performance of our telecommunication services holdings.
Why Invest in Africa and the Middle East?
The continued weakness among African and Middle Eastern markets is discouraging. We were disappointed to see equities in these regions moving in tandem with stocks in other emerging and developed markets much more than in the past, despite the strong fundamentals the region continues to offer. We still believe that these regions offer excellent long-term prospects and, in a more normal environment, will once again move independently of other global markets. We would like to welcome new investors to the fund and briefly review for all investors the case for investing in African and Middle Eastern markets.
Africa
• Excluding South Africa, growth in the sub-Saharan part of the continent has been strong for much of this decade, a marked turnaround from the 1980–1999 period, when the region’s expansion lagged the rest of the world.
• The boom in commodity prices earlier in this decade has improved the terms of trade for many African countries that export oil, precious metals, bulk commodities, and agricultural produce. In addition, China has actively pursued bilateral agreements to secure supplies for its resource-hungry economy, and it is likely to remain a long-term trade partner.
• Many African countries have been able to reduce their debt obligations, thanks in part to favorable cancellation terms offered by creditor nations in the West and by global institutions. This has enabled them to accumulate exchange reserves that help promote currency stability and, in some cases, currency appreciation.
• Many African nations are implementing economic policies that emphasize fiscal restraint and help lower inflation, while the spread of democracy has helped to build political, social, and economic accountability. All of these developments have stimulated investment.
Middle East
• Since oil prices bottomed in the late 1990s, increased revenues from oil have fueled the economic growth of countries in the Gulf Cooperation Council (GCC): Bahrain, Kuwait, Oman, Qatar, Saudi Arabia, and the UAE.
• GCC countries have robust economic fundamentals and substantial current account surpluses that we believe are likely to continue expanding, unless the recent decline in oil prices is sustained.
• Although the region has had oil-driven booms in the 1970s and 1980s, what’s different this time is that GCC countries are opening their economies in an attempt to decrease their dependence on crude oil. Specifically, governments are trying to increase non-oil revenues through government-led investment.
• After years of underinvestment in areas such as housing, numerous infrastructure projects in the region are under way. Such projects are encouraging improvements in the political and legislative climate of other GCC countries.
Relative to the rest of the world, economies in our target regions are strong, and many countries have amassed vast reserves during years of high commodity and oil prices. Slower global growth and lower commodity prices are having an impact on Africa and the Middle East, but regional growth is likely to be underpinned by government spending on infrastructure and investments in many sectors. In addition, many central banks have been proactive in attempting to stem the economic slowdown by announcing fiscal stimulus packages or providing capital to the banking system.
Portfolio Review
Middle East
Gulf Cooperation Council
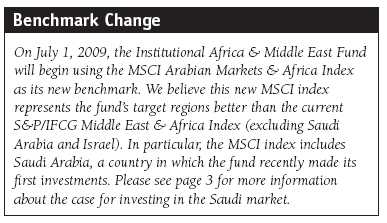
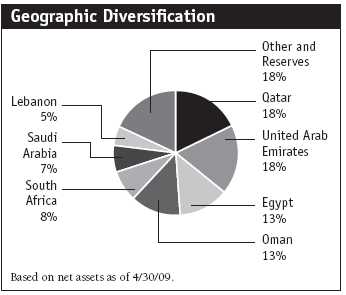
The portfolio remains heavily concentrated in the GCC countries, which represented about 59% of fund assets at the end of our reporting period. We have been attempting to increase the fund’s diversification over the last six months by adding to the number of portfolio holdings, by entering the Saudi market that was previously inaccessible (see page 3 for more information), and by reducing the fund’s emphasis on financial stocks.
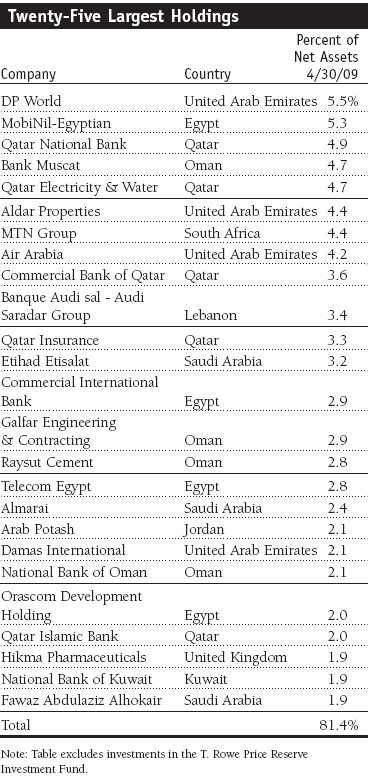
Unfortunately, the poor performance of financial stocks was a major reason for the fund’s underperformance. Financial companies feature prominently in many Middle East markets, especially in the UAE, whose market plunged 35% in the last six months as the country’s real estate bubble burst. We took advantage of the UAE market’s weakness and added to our positions in DP World, a leading global port operator, and Air Arabia. (Please refer to the fund’s portfolio of investments for a complete listing of holdings and the amount each represents in the portfolio.)
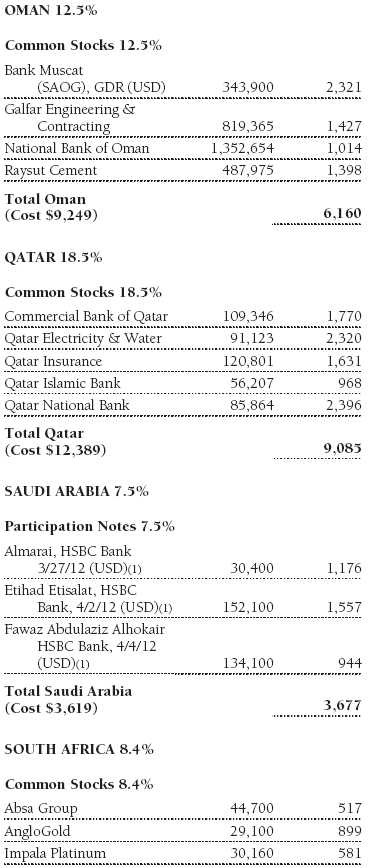
Qatar and Oman, which together represent about 31% of the fund’s assets, still have strong economies, and their stock markets held up much better than the UAE in the last six months. Qatar is especially attractive: The government has intervened decisively to support the banking system by purchasing banks’ investment portfolios; also, while it has vast oil reserves, it is developing its liquid gas reserves in order to have a secondary revenue source. One of our better-performing holdings was Qatar Electricity & Water, a power generator and water desalination company that operates primarily in Qatar but is benefiting from infrastructure improvements that are enabling the company to export electricity to other GCC countries. We continue to favor financial and construction companies in these two countries, such as Commercial Bank of Qatar, National Bank of Oman, Raysut Cement, and Galfar Engineering & Contracting. We still believe that these companies are well positioned to benefit from the long-term growth of wealth and infrastructure development in the Middle East.
As discussed in the shaded box on the next page, the fund made its first investments in Saudi Arabia earlier this year. We own P-Notes representing three Saudi companies: wireless telecommunications company Etihad Etisalat; Almarai, the largest integrated food and dairy producer in the Gulf region; and specialty retailer Fawaz Abdulaziz Alhokair. As new investment opportunities become available, we will look to add to our Saudi exposure.
| Saudi Arabian Market Opens to Foreign Investors |
We are excited to report that the fund made its first investments in the Kingdom of Saudi Arabia earlier this year. For some time, only residents of the GCC countries have been allowed to own Saudi equities directly. However, the Capital Market Authority, the country’s regulator, has taken steps toward reform and liberalization in recent years. The latest move to open the market partially to outside investors, which was announced in August 2008, allows licensed, locally domiciled brokers to provide foreigners with access to the Saudi market through Participation Notes (P-Notes).
P-Notes are tradable through a counterparty—a global investment bank or broker-dealer with a Saudi-domiciled operation. Their return is linked to a particular underlying stock, and they require no collateral. While foreign investors would benefit from all the dividends and corporate actions of the companies in which they invest, they have no voting rights because legal ownership of the stock remains with the counterparty.
Investing in Saudi Arabia increases the fund’s diversification and provides our shareholders with access to a large and growing economy and a greater number of investment opportunities in the fund’s target regions. Saudi Arabia is the region’s dominant market: It is the world’s largest oil producer and has the world’s largest proven oil reserves—over 20% of the global total. It is the largest economy in the Middle East and North Africa region, and its population of 25 million residents—two thirds of whom are under the age of 30—is by far the largest of any GCC country. In addition, the Saudi Arabian stock market is the largest in this region, with a market capitalization of approximately $230 billion.
Under King Abdullah, Saudi Arabia has undergone a period of economic reform, including privatization and deregulation, which has promoted growth and encouraged investment from overseas. The political outlook for the country is relatively stable and, while geopolitics is always a risk in the region, Saudi Arabia has strong strategic alliances with the West and a pro-U.S. foreign policy. The oil boom of recent years has enabled the country to build extensive financial reserves and to grow GDP at an annual rate of around 5%. Growth beyond the energy sector has been extremely strong, led by new industries and infrastructure spending. While financial services and real estate have also grown, these sectors are underdeveloped compared with other parts of the region. Consumer-related companies, which can be hard to find elsewhere in the Gulf region, are fairly prominent in Saudi Arabia.
Other Middle East Countries
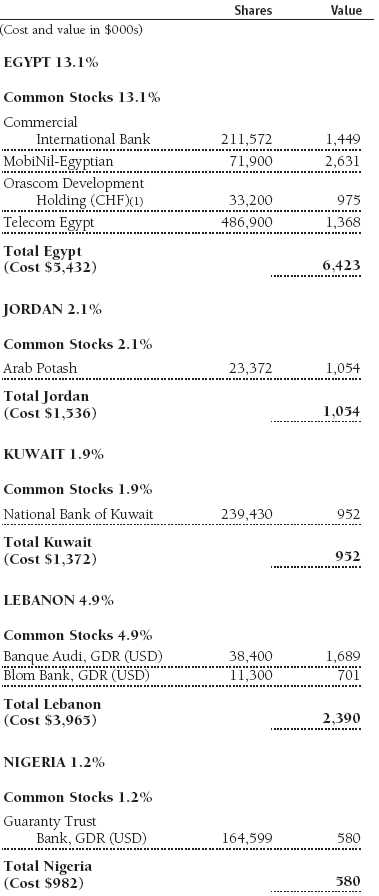
Egypt, Jordan, and Lebanon collectively represented 20% of the fund’s assets at the end of April. Stocks in Jordan and Lebanon fell more than 20%; fortunately, we had very few holdings in these countries. In contrast, the Egyptian market—in which we have more significant investments—rose more than 9% in the last six months and was one of the best-performing markets in our target regions.Two of our top performers in the portfolio were MobiNil-Egyptian, which is likely to be acquired by France Telecom, and Telecom Egypt, one of the oldest and largest landline telecom companies in the Middle East. The company’s financial stability and steady revenue growth should help it endure the economic slowdown. Orascom Telecom performed poorly, however, and we eliminated it because of its high debt levels and the deteriorating outlook in some markets into which it has expanded, such as Pakistan.
The long-term Middle East infrastructure story is still intact, with many countries committing significant amounts of capital to improving their infrastructure networks. However, we sold our positions in construction and fertilizer company Orascom Construction, partly due to a deteriorating order book and deteriorating fundamentals in its fertilizer business, where increased supply has driven prices down. In the infrastructure space, we eliminated El Sewedy Cables, as the company is shifting strategy and moving into renewable energy. We believe the company is expanding too quickly, and the strategy is becoming quite complex.
Africa
The South African stock market fared best in our target regions, surging more than 21% in dollar terms. As shown in the Market Performance table on page 3, the market’s moderate gains were magnified by a rally in the rand versus the U.S. dollar. Our low exposure to the country (8.4% of assets as of April 30, 2009), which is based on our belief that there are better long-term growth opportunities beyond this relatively closed economy, was a significant reason for the fund’s underperformance versus its benchmark. Still, our holdings—AngloGold, Impala Platinum, and telecom company MTN Group—produced strong returns and were among our largest positive contributors to performance.
In sub-Saharan Africa, we continued to own only one other stock—Nigerian bank Guaranty Trust Bank. We remain optimistic that additional African investment opportunities will become available over time. At present, however, low liquidity is discouraging us from increasing our allocation to the continent.
Outlook
We believe that the recent rebound in emerging markets equities is a sign that they will lead developed markets in an upturn. Many emerging market stocks experienced indiscriminate selling over the last year, regardless of their fundamentals. As a result, we believe there are excellent investment opportunities in emerging markets, especially companies trading at valuations that, in our opinion, do not accurately reflect their long-term fundamentals.
We remain optimistic about the prospects for markets, economies, and companies in Africa and the Middle East. Infrastructure spending is continuing in the region, albeit at a slower pace than in the recent past, and most countries are supported by vast foreign-exchange reserves accumulated during the recent boom years. Steadying oil prices is also a positive: Most oil-producing nations in the region should be able to balance their budgets comfortably with oil prices around $50 per barrel, and higher prices could dramatically improve liquidity and sentiment toward the region. We anticipate a gradual pickup in oil prices over time. In addition, economic growth generally is better than in the rest of the world, although it is not uniform. For example, Qatar and Egypt are still doing well and enjoying robust growth, but places such as Dubai in the UAE are slowing sharply due to the bursting property bubble.
We believe that the portfolio is poised to perform better when rationality returns to the markets and stock prices begin to reflect the fundamental strengths of corporations. We continue to visit many companies and perform our own rigorous analysis of current and potential investment candidates. We favor companies with strong management teams enjoying good competitive positions in their respective industries and that are likely to emerge from the global downturn in a stronger position.
As global economies weakened and investors turned risk averse in the second half of 2008, significant amounts of capital left these regions. As a result, stock valuations in African and Middle East markets are now trading at a discount relative to equities in other emerging regions; previously, their valuations were at a premium. As investors return to the capital markets and once again seek higher returns from riskier investments, we anticipate that stocks of companies in Africa and the Middle East will begin to reflect their fundamentals again.
Respectfully submitted,

Joseph Rohm
Portfolio Manager
May 19, 2009
The portfolio manager has day-to-day responsibility for managing the portfolio and works with committee members in developing and executing the fund’s investment program.
| Risks of International Investing |
Funds that invest overseas generally carry more risk than funds that invest strictly in U.S. assets. Funds investing in a single country, limited geographic region, or emerging markets tend to be riskier than more diversified funds. Risks can result from varying stages of economic and political development; differing regulatory environments, trading days, and accounting standards; and higher transaction costs of non-U.S. markets. Non-U.S. investments are also subject to currency risk, or a decline in the value of a foreign currency versus the U.S. dollar, which reduces the dollar value of securities denominated in that currency.
MSCI Arabian Markets & Africa Index: An index created by MSCI that measures the performance of various equity markets in the Middle East, in Africa, and along the Persian Gulf.
S&P/IFCG Middle East & Africa Index (excluding Saudi Arabia and Israel): An index created by Standard & Poor’s that measures the performance of the most active stocks in emerging Middle East and African markets. S&P uses data from the International Finance Corporation to create this capitalization-weighted index.
Portfolio Highlights
Performance and Expenses
T. Rowe Price Institutional Africa & Middle East Fund
This chart shows the value of a hypothetical $1 million investment in the fund over the past 10 fiscal year periods or since inception (for funds lacking 10-year records). The result is compared with benchmarks, which may include a broad-based market index and a peer group average or index. Market indexes do not include expenses, which are deducted from fund returns as well as mutual fund averages and indexes.
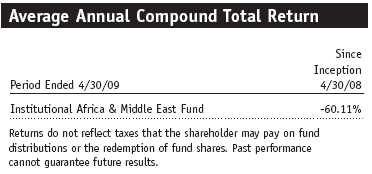
This table shows how the fund would have performed each year if its actual (or cumulative) returns for the periods shown had been earned at a constant rate.
Fund Expense Example
As a mutual fund shareholder, you may incur two types of costs: (1) transaction costs, such as redemption fees or sales loads, and (2) ongoing costs, including management fees, distribution and service (12b-1) fees, and other fund expenses. The following example is intended to help you understand your ongoing costs (in dollars) of investing in the fund and to compare these costs with the ongoing costs of investing in other mutual funds. The example is based on an investment of $1,000 invested at the beginning of the most recent six-month period and held for the entire period.
Actual Expenses
The first line of the following table (“Actual”) provides information about actual account values and actual expenses. You may use the information in this line, together with your account balance, to estimate the expenses that you paid over the period. Simply divide your account value by $1,000 (for example, an $8,600 account value divided by $1,000 = 8.6), then multiply the result by the number in the first line under the heading “Expenses Paid During Period” to estimate the expenses you paid on your account during this period.
Hypothetical Example for Comparison Purposes
The information on the second line of the table (“Hypothetical”) is based on hypothetical account values and expenses derived from the fund’s actual expense ratio and an assumed 5% per year rate of return before expenses (not the fund’s actual return). You may compare the ongoing costs of investing in the fund with other funds by contrasting this 5% hypothetical example and the 5% hypothetical examples that appear in the shareholder reports of the other funds. The hypothetical account values and expenses may not be used to estimate the actual ending account balance or expenses you paid for the period.
You should also be aware that the expenses shown in the table highlight only your ongoing costs and do not reflect any transaction costs, such as redemption fees or sales loads. Therefore, the second line of the table is useful in comparing ongoing costs only and will not help you determine the relative total costs of owning different funds. To the extent a fund charges transaction costs, however, the total cost of owning that fund is higher.


Financial Highlights
T. Rowe Price Institutional Africa & Middle East Fund
(Unaudited)
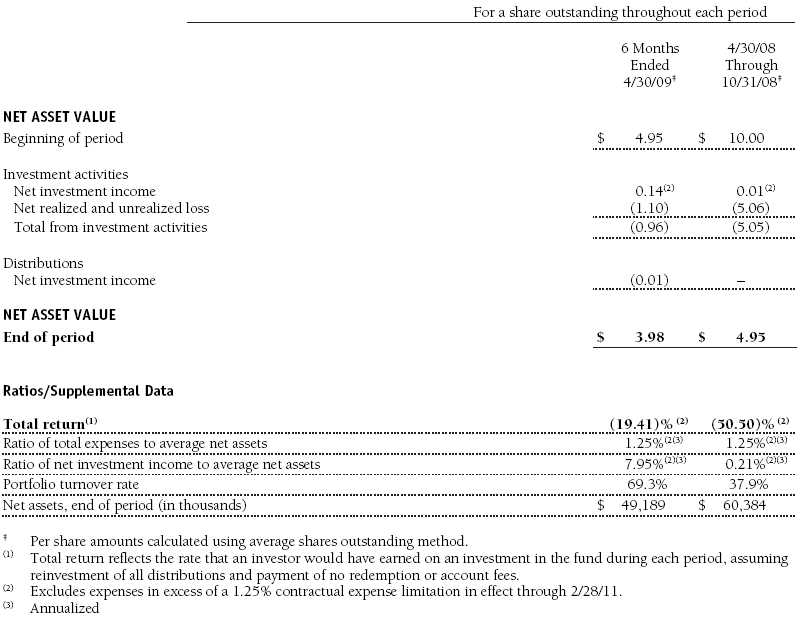
The accompanying notes are an integral part of these financial statements.
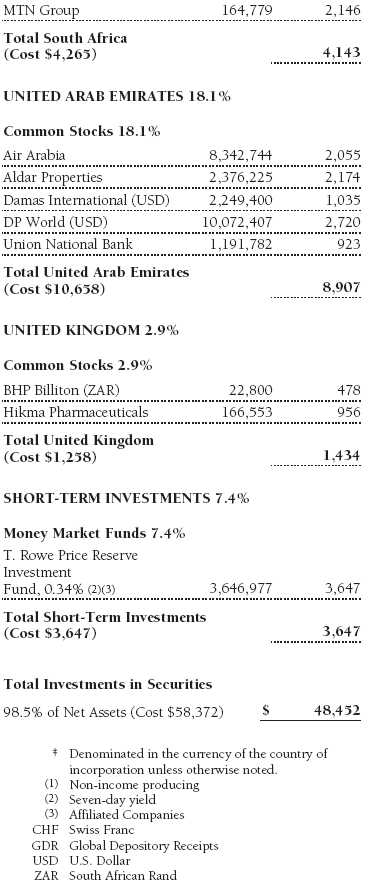
Portfolio of Investments ‡
T. Rowe Price Institutional Africa & Middle East Fund
April 30, 2009 (Unaudited)

The accompanying notes are an integral part of these financial statements.
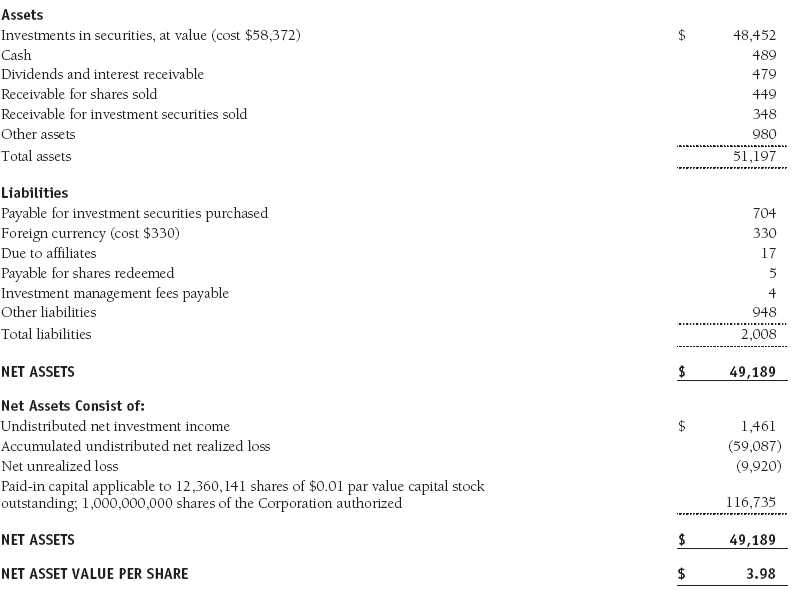
Statement of Assets and Liabilities
T. Rowe Price Institutional Africa & Middle East Fund
April 30, 2009 (Unaudited)
($000s, except shares and per share amounts)
The accompanying notes are an integral part of these financial statements.
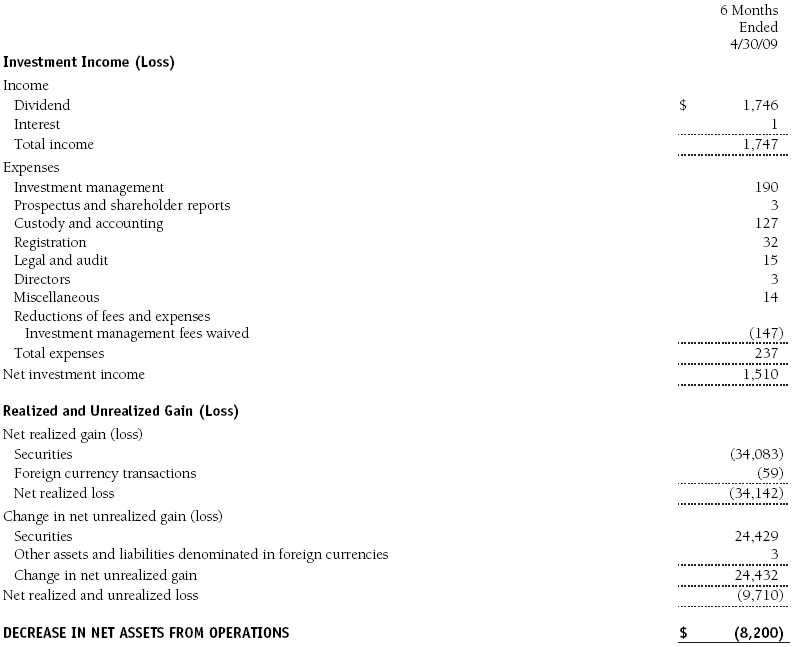
Statement of Operations
T. Rowe Price Institutional Africa & Middle East Fund
(Unaudited)
($000s)
The accompanying notes are an integral part of these financial statements.
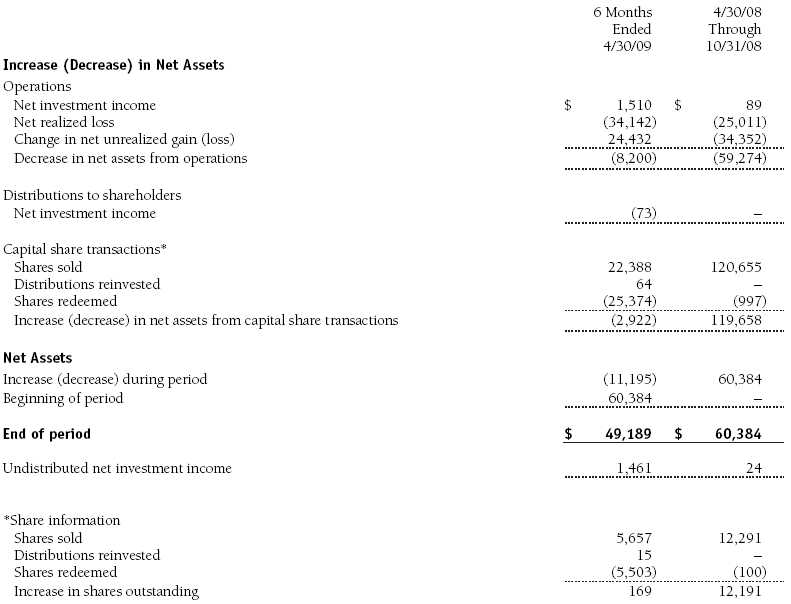
Statement of Changes in Net Assets
T. Rowe Price Institutional Africa & Middle East Fund
(Unaudited)
($000s)
The accompanying notes are an integral part of these financial statements.
Notes to Financial Statements
T. Rowe Price Institutional Africa & Middle East Fund
April 30, 2009 (Unaudited)
T. Rowe Price Institutional International Funds, Inc. (the corporation), is registered under the Investment Company Act of 1940 (the 1940 Act). The Institutional Africa & Middle East Fund (the fund), a nondiversified, open-end management investment company, is one portfolio established by the corporation. The fund commenced operations on April 30, 2008. The fund seeks long-term growth of capital by investing primarily in the common stocks of companies located (or with primary operations) in Africa and the Middle East.
NOTE 1 - SIGNIFICANT ACCOUNTING POLICIES
Basis of Preparation The accompanying financial statements were prepared in accordance with accounting principles generally accepted in the United States of America, which require the use of estimates made by fund management. Fund management believes that estimates and security valuations are appropriate; however, actual results may differ from those estimates, and the security valuations reflected in the financial statements may differ from the value the fund ultimately realizes upon sale of the securities.
Investment Transactions, Investment Income, and Distributions Income and expenses are recorded on the accrual basis. Dividends received from mutual fund investments are reflected as dividend income; capital gain distributions are reflected as realized gain/loss. Dividend income and capital gain distributions are recorded on the ex-dividend date. Income tax-related interest and penalties, if incurred, would be recorded as income tax expense. Investment transactions are accounted for on the trade date. Realized gains and losses are reported on the identified cost basis. Distributions to shareholders are recorded on the ex-dividend date. Income distributions are declared and paid on an annual basis. Capital gain distributions, if any, are declared and paid by the fund, typically on an annual basis.
Currency Translation Assets, including investments, and liabilities denominated in foreign currencies are translated into U.S. dollar values each day at the prevailing exchange rate, using the mean of the bid and asked prices of such currencies against U.S. dollars as quoted by a major bank. Purchases and sales of securities, income, and expenses are translated into U.S. dollars at the prevailing exchange rate on the date of the transaction. The effect of changes in foreign currency exchange rates on realized and unrealized security gains and losses is reflected as a component of security gains and losses.
Redemption Fees A 2% fee is assessed on redemptions of fund shares held for 90 days or less to deter short-term trading and to protect the interests of long-term shareholders. Redemption fees are withheld from proceeds that shareholders receive from the sale or exchange of fund shares. The fees are paid to the fund, and are recorded as an increase to paid-in capital. The fees may cause the redemption price per share to differ from the net asset value per share.
New Accounting Pronouncements On November 1, 2008, the fund adopted Statement of Financial Accounting Standards No. 157 (FAS 157), Fair Value Measurements. FAS 157 defines fair value, establishes the framework for measuring fair value, and expands the disclosures of fair value measurements in the financial statements. Adoption of FAS 157 did not have a material impact on the fund’s net assets or results of operations.
In March 2008, the Financial Accounting Standards Board issued Statement of Financial Accounting Standards No. 161 (FAS 161), Disclosures about Derivative Instruments and Hedging Activities, which is effective for fiscal years and interim periods beginning after November 15, 2008. FAS 161 requires enhanced disclosures about derivative and hedging activities, including how such activities are accounted for and their effect on financial position, performance and cash flows. Management is currently evaluating the impact the adoption of FAS 161 will have on the fund’s financial statements and related disclosures; however, it is expected to have no material impact on the fund’s net assets or results of operations.
NOTE 2 - VALUATION
The fund’s investments are reported at fair value as defined under FAS 157. The fund values its investments and computes its net asset value per share at the close of the New York Stock Exchange (NYSE), normally 4 p.m. ET, each day that the NYSE is open for business.
Valuation Methods Equity securities listed or regularly traded on a securities exchange or in the over-the-counter (OTC) market are valued at the last quoted sale price or, for certain markets, the official closing price at the time the valuations are made, except for OTC Bulletin Board securities, which are valued at the mean of the latest bid and asked prices. A security that is listed or traded on more than one exchange is valued at the quotation on the exchange determined to be the primary market for such security. Listed securities not traded on a particular day are valued at the mean of the latest bid and asked prices for domestic securities and the last quoted sale price for international securities.
Investments in mutual funds are valued at the mutual fund’s closing net asset value per share on the day of valuation.
Other investments, including restricted securities, and those for which the above valuation procedures are inappropriate or are deemed not to reflect fair value are stated at fair value as determined in good faith by the T. Rowe Price Valuation Committee, established by the fund’s Board of Directors.
For valuation purposes, the last quoted prices of non-U.S. equity securities may be adjusted under the circumstances described below. If the fund determines that developments between the close of a foreign market and the close of the NYSE will, in its judgment, materially affect the value of some or all of its portfolio securities, the fund will adjust the previous closing prices to reflect what it believes to be the fair value of the securities as of the close of the NYSE. In deciding whether it is necessary to adjust closing prices to reflect fair value, the fund reviews a variety of factors, including developments in foreign markets, the performance of U.S. securities markets, and the performance of instruments trading in U.S. markets that represent foreign securities and baskets of foreign securities. A fund may also fair value securities in other situations, such as when a particular foreign market is closed but the fund is open. The fund uses outside pricing services to provide it with closing prices and information to evaluate and/or adjust those prices. The fund cannot predict how often it will use closing prices and how often it will determine it necessary to adjust those prices to reflect fair value. As a means of evaluating its security valuation process, the fund routinely compares closing prices, the next day’s opening prices in the same markets, and adjusted prices.
Valuation Inputs Various inputs are used to determine the value of the fund’s investments. These inputs are summarized in the three broad levels listed below:
Level 1 – quoted prices in active markets for identical securities
Level 2 – observable inputs other than Level 1 quoted prices (including, but not limited to, quoted prices for similar securities, interest rates, prepayment speeds, credit risk)
Level 3 – unobservable inputs
Observable inputs are those based on market data obtained from sources independent of the fund, and unobservable inputs reflect the fund’s own assumptions based on the best information available. The input levels are not necessarily an indication of the risk or liquidity associated with investments at that level. For example, non-U.S. equity securities actively traded in foreign markets generally are reflected in Level 2 despite the availability of closing prices, because the fund evaluates and determines whether those closing prices reflect fair value at the close of the NYSE or require adjustment, as described above. The following table summarizes the fund’s investments, based on the inputs used to determine their values on April 30, 2009:

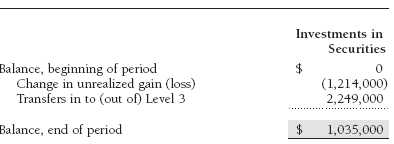
Following is a reconciliation of the fund’s Level 3 investments for the six months ended April 30, 2009:
NOTE 3 - INVESTMENT TRANSACTIONS
Consistent with its investment objective, the fund engages in the following practices to manage exposure to certain risks or to enhance performance. The investment objective, policies, program, and risk factors of the fund are described more fully in the fund’s prospectus and Statement of Additional Information.
Emerging Markets At April 30, 2009, approximately 88% of the fund’s net assets were invested, directly or indirectly, in securities of companies located in emerging markets or denominated in or linked to the currencies of emerging market countries. Future economic or political developments could adversely affect the liquidity or value, or both, of such securities.
Participation Notes During the six months ended April 30, 2009, the fund was a party to participation notes through which it gains exposure to common stock in markets where direct investment by the fund is not permitted. Participation notes provide the economic benefit of common stock ownership to the fund, while legal ownership is retained by the counterparty. Although each participation note is structured with a defined maturity date, early redemption may be possible. In addition to risks associated with equity investments, risks of participation notes arise from the possible failure of a counterparty to perform in accordance with the terms of the agreements and from possible delays in early redemption due to certain market conditions.
Other Purchases and sales of portfolio securities, other than short-term securities, aggregated $33,376,000 and $25,620,000, respectively, for the six months ended April 30, 2009.
NOTE 4 - FEDERAL INCOME TAXES
No provision for federal income taxes is required since the fund intends to continue to qualify as a regulated investment company under Subchapter M of the Internal Revenue Code and distribute to shareholders all of its taxable income and gains. Distributions are determined in accordance with Federal income tax regulations, which differ from generally accepted accounting principles, and, therefore, may differ in amount or character from net investment income and realized gains for financial reporting purposes. Financial reporting records are adjusted for permanent book/tax differences to reflect tax character but are not adjusted for temporary differences. The amount and character of tax-basis distributions and composition of net assets are finalized at fiscal year-end; accordingly, tax-basis balances have not been determined as of April 30, 2009.
The fund intends to retain realized gains to the extent of available capital loss carryforwards. As of October 31, 2008, the fund had $24,505,000 of unused capital loss carryforwards, of which $24,505,000 expire in fiscal 2016.
At April 30, 2009, the cost of investments for federal income tax purposes was $58,372,000. Net unrealized loss aggregated $9,920,000 at period-end, of which $1,913,000 related to appreciated investments and $11,833,000 related to depreciated investments.
NOTE 5 - RELATED PARTY TRANSACTIONS
The fund is managed by T. Rowe Price International, Inc. (the manager), a wholly owned subsidiary of T. Rowe Price Associates, Inc. (Price Associates), which is wholly owned by T. Rowe Price Group, Inc. The investment management agreement between the fund and the manager provides for an annual investment management fee equal to 1.00% of the fund’s average daily net assets. The fee is computed daily and paid monthly.
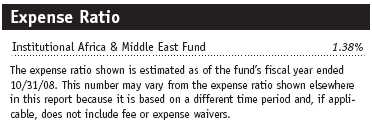
The fund is also subject to a contractual expense limitation through February 28, 2011. During the limitation period, the manager is required to waive its management fee and reimburse the fund for any expenses, excluding interest, taxes, brokerage commissions, and extraordinary expenses, that would otherwise cause the fund’s ratio of annualized total expenses to average net assets (expense ratio) to exceed its expense limitation of 1.25%. For a period of three years after the date of any reimbursement or waiver, the fund is required to repay the manager for expenses previously reimbursed and management fees waived to the extent its net assets have grown or expenses have declined sufficiently to allow repayment without causing the fund’s expense ratio to exceed its expense limitation. Pursuant to this agreement, management fees in the amount of $147,000 were waived during the six months ended April 30, 2009. Including these amounts, management fees waived in the amount of $203,000 remain subject to repayment at April 30, 2009.
In addition, the fund has entered into service agreements with Price Associates and a wholly owned subsidiary of Price Associates (collectively, Price). Price Associates computes the daily share price and provides certain other administrative services to the fund. T. Rowe Price Services, Inc., provides shareholder and administrative services in its capacity as the fund’s transfer and dividend disbursing agent. For the six months ended April 30, 2009, expenses incurred pursuant to these service agreements were $103,000 for Price Associates and less than $1,000 for T. Rowe Price Services, Inc. The total amount payable at period-end pursuant to these service agreements is reflected as Due to Affiliates in the accompanying financial statements.
The fund may invest in the T. Rowe Price Reserve Investment Fund and the T. Rowe Price Government Reserve Investment Fund (collectively, the T. Rowe Price Reserve Investment Funds), open-end management investment companies managed by Price Associates and considered affiliates of the fund. The T. Rowe Price Reserve Investment Funds are offered as cash management options to mutual funds, trusts, and other accounts managed by Price Associates and/or its affiliates and are not available for direct purchase by members of the public. The T. Rowe Price Reserve Investment Funds pay no investment management fees.
| Information on Proxy Voting Policies, Procedures, and Records |
A description of the policies and procedures used by T. Rowe Price funds and portfolios to determine how to vote proxies relating to portfolio securities is available in each fund’s Statement of Additional Information, which you may request by calling 1-800-225-5132 or by accessing the SEC’s Web site, www.sec.gov. The description of our proxy voting policies and procedures is also available on our Web site, www.troweprice.com. To access it, click on the words “Our Company” at the top of our corporate homepage. Then, when the next page appears, click on the words “Proxy Voting Policies” on the left side of the page.
Each fund’s most recent annual proxy voting record is available on our Web site and through the SEC’s Web site. To access it through our Web site, follow the directions above, then click on the words “Proxy Voting Records” on the right side of the Proxy Voting Policies page.
| How to Obtain Quarterly Portfolio Holdings |
The fund files a complete schedule of portfolio holdings with the Securities and Exchange Commission for the first and third quarters of each fiscal year on Form N-Q. The fund’s Form N-Q is available electronically on the SEC’s Web site (www.sec.gov); hard copies may be reviewed and copied at the SEC’s Public Reference Room, 450 Fifth St. N.W., Washington, DC 20549. For more information on the Public Reference Room, call 1-800-SEC-0330.
| Approval of Investment Management Agreement |
On March 10, 2009, the fund’s Board of Directors (Board) unanimously approved the investment advisory contract (Contract) between the fund and its investment manager, T. Rowe Price International, Inc. (Manager). The Board considered a variety of factors in connection with its review of the Contract, also taking into account information provided by the Manager during the course of the year, as discussed below:
Services Provided by the Manager
The Board considered the nature, quality, and extent of the services provided to the fund by the Manager. These services included, but were not limited to, management of the fund’s portfolio and a variety of activities related to portfolio management. The Board also reviewed the background and experience of the Manager’s senior management team and investment personnel involved in the management of the fund. The Board concluded that it was satisfied with the nature, quality, and extent of the services provided by the Manager.
Investment Performance of the Fund
The Board reviewed the fund’s total returns over the three-month and since-inception periods and compared these returns with a wide variety of previously agreed upon comparable performance measures and market data, including those supplied by Lipper, an independent provider of mutual fund data. On the basis of this evaluation and the Board’s ongoing review of investment results, and factoring in the severity of market turmoil in 2008, the Board concluded that the fund’s performance was satisfactory.
Costs, Benefits, Profits, and Economies of Scale
The Board reviewed detailed information regarding the revenues received by the Manager under the Contract and other benefits that the Manager (and its affiliates) may have realized from its relationship with the fund, including research received under “soft dollar” agreements. The Board noted that soft dollars were not used to pay for third-party, non-broker research during 2008. The Board also received information on the estimated costs incurred and profits realized by the Manager and its affiliates from advising T. Rowe Price mutual funds. The Board did not review information regarding profits realized from managing the fund in particular because the fund had not achieved sufficient scale in terms of portfolio asset size to produce meaningful profit margin percentages. The Board concluded that the Manager’s profits were reasonable in light of the services provided to the fund. In this regard, the Board noted that a portion of the advisory fees were being waived. The Board also considered the extent to which economies of scale were being realized by the Manager and whether the fund or other funds benefit from any such economies of scale under the fee levels set forth in the Contract. The Board concluded that the advisory fee structure for the fund continued to provide for a reasonable sharing of benefits from economies of scale with the fund’s investors.
Fees
The Board reviewed the fund’s management fee rate, operating expenses, and total expense ratio and compared them with fees and expenses of other comparable funds based on information and data supplied by Lipper. The information provided to the Board indicated that the fund’s management fee rate (after including any applicable fee waivers or expenses paid by the Manager or reimbursements by the fund) and expense ratio were generally at or below the median for comparable funds. The Board also reviewed the fee schedules for comparable privately managed accounts of the Manager and its affiliates. Management informed the Board that the Manager’s responsibilities for privately managed accounts are more limited than its responsibilities for the fund and other T. Rowe Price mutual funds that it or its affiliates advise. On the basis of the information provided, the Board concluded that the fees paid by the fund under the Contract were reasonable.
Approval of the Contract
As noted, the Board approved the continuation of the Contract. No single factor was considered in isolation or to be determinative to the decision. Rather, the Board concluded, in light of a weighting and balancing of all factors considered, that it was in the best interests of the fund to approve the continuation of the Contract, including the fees to be charged for services thereunder.
Item 2. Code of Ethics.
A code of ethics, as defined in Item 2 of Form N-CSR, applicable to its principal executive officer, principal financial officer, principal accounting officer or controller, or persons performing similar functions is filed as an exhibit to the registrant’s annual Form N-CSR. No substantive amendments were approved or waivers were granted to this code of ethics during the registrant’s most recent fiscal half-year.
Item 3. Audit Committee Financial Expert.
Disclosure required in registrant’s annual Form N-CSR.
Item 4. Principal Accountant Fees and Services.
Disclosure required in registrant’s annual Form N-CSR.
Item 5. Audit Committee of Listed Registrants.
Not applicable.
Item 6. Investments.
(a) Not applicable. The complete schedule of investments is included in Item 1 of this Form N-CSR.
(b) Not applicable.
Item 7. Disclosure of Proxy Voting Policies and Procedures for Closed-End Management Investment Companies.
Not applicable.
Item 8. Portfolio Managers of Closed-End Management Investment Companies.
Not applicable.
Item 9. Purchases of Equity Securities by Closed-End Management Investment Company and Affiliated Purchasers.
Not applicable.
Item 10. Submission of Matters to a Vote of Security Holders.
Not applicable.
Item 11. Controls and Procedures.
(a) The registrant’s principal executive officer and principal financial officer have evaluated the registrant’s disclosure controls and procedures within 90 days of this filing and have concluded that the registrant’s disclosure controls and procedures were effective, as of that date, in ensuring that information required to be disclosed by the registrant in this Form N-CSR was recorded, processed, summarized, and reported timely.
(b) The registrant’s principal executive officer and principal financial officer are aware of no change in the registrant’s internal control over financial reporting that occurred during the registrant’s second fiscal quarter covered by this report that has materially affected, or is reasonably likely to materially affect, the registrant’s internal control over financial reporting.
Item 12. Exhibits.
(a)(1) The registrant’s code of ethics pursuant to Item 2 of Form N-CSR is filed with the registrant’s annual Form N-CSR.
(2) Separate certifications by the registrant's principal executive officer and principal financial officer, pursuant to Section 302 of the Sarbanes-Oxley Act of 2002 and required by Rule 30a-2(a) under the Investment Company Act of 1940, are attached.
(3) Written solicitation to repurchase securities issued by closed-end companies: not applicable.
(b) A certification by the registrant's principal executive officer and principal financial officer, pursuant to Section 906 of the Sarbanes-Oxley Act of 2002 and required by Rule 30a-2(b) under the Investment Company Act of 1940, is attached.
| | |
SIGNATURES |
| |
| | Pursuant to the requirements of the Securities Exchange Act of 1934 and the Investment |
| Company Act of 1940, the registrant has duly caused this report to be signed on its behalf by the |
| undersigned, thereunto duly authorized. |
| T. Rowe Price Institutional International Funds, Inc. |
| |
| By | /s/ Edward C. Bernard |
| | Edward C. Bernard |
| | Principal Executive Officer |
| Date | June 16, 2009 |
| |
| | Pursuant to the requirements of the Securities Exchange Act of 1934 and the Investment |
| Company Act of 1940, this report has been signed below by the following persons on behalf of |
| the registrant and in the capacities and on the dates indicated. |
| |
| By | /s/ Edward C. Bernard |
| | Edward C. Bernard |
| | Principal Executive Officer |
| Date | June 16, 2009 |
| |
| By | /s/ Gregory K. Hinkle |
| | Gregory K. Hinkle |
| | Principal Financial Officer |
| Date | June 16, 2009 |