| UNITED STATES |
| SECURITIES AND EXCHANGE COMMISSION |
| Washington, D.C. 20549 |
| |
FORM N-CSR |
| |
CERTIFIED SHAREHOLDER REPORT OF REGISTERED |
MANAGEMENT INVESTMENT COMPANIES |
| |
| |
| |
| Investment Company Act File Number: 811-5833 |
|
| |
| T. Rowe Price Institutional International Funds, Inc. |
|
| (Exact name of registrant as specified in charter) |
| |
| 100 East Pratt Street, Baltimore, MD 21202 |
|
| (Address of principal executive offices) |
| |
| David Oestreicher |
| 100 East Pratt Street, Baltimore, MD 21202 |
|
| (Name and address of agent for service) |
| |
| |
| Registrant’s telephone number, including area code: (410) 345-2000 |
| |
| |
| Date of fiscal year end: October 31 |
| |
| |
| Date of reporting period: April 30, 2009 |
Item 1: Report to Shareholders| Institutional Foreign Equity Fund | April 30, 2009 |
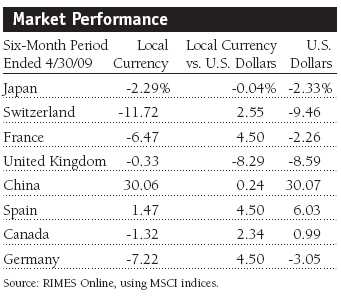
• International stock markets were volatile in the six-month period ended April 30, 2009, plunging in the first part of the reporting period and surging at the end.
• Your fund posted a modest gain, aided by holdings in information technology and industrials and business services.
• We opportunistically added to holdings in China and Brazil and continue to favor companies in the Internet software and services industry.
• International markets remain significantly below year-ago levels. We remain focused on owning businesses that can maintain their earnings and those companies that over time should have solid growth but have already priced in lower earnings expectations.
The views and opinions in this report were current as of April 30, 2009. They are not guarantees of performance or investment results and should not be taken as investment advice. Investment decisions reflect a variety of factors, and the managers reserve the right to change their views about individual stocks, sectors, and the markets at any time. As a result, the views expressed should not be relied upon as a forecast of the fund’s future investment intent. The report is certified under the Sarbanes-Oxley Act, which requires mutual funds and other public companies to affirm that, to the best of their knowledge, the information in their financial reports is fairly and accurately stated in all material respects.
Manager’s Letter
T. Rowe Price Institutional Foreign Equity Fund
Dear Investor
We are pleased to report positive results for the six months ended April 30, 2009, which was entirely due to a stellar rally in virtually all stock markets at the end of the reporting period. Stock markets worldwide have experienced extreme volatility due to heightened credit market turmoil and the global economic slowdown. The portfolio’s information technology and industrials and business services stocks generated the best results in the first half of our fiscal year. Health care and financials were our largest detractors in the period. While there is a long way to go to recover from last year’s devastating losses, the recent stock market rally leads us to believe that the light in the tunnel is not an oncoming train.
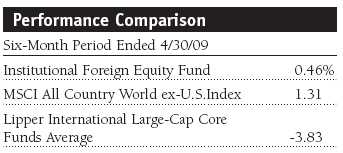
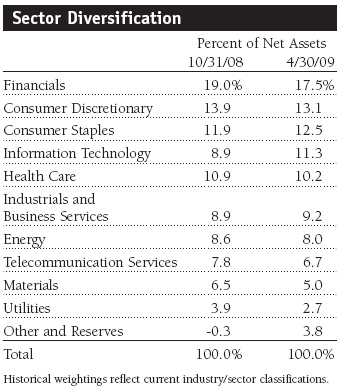
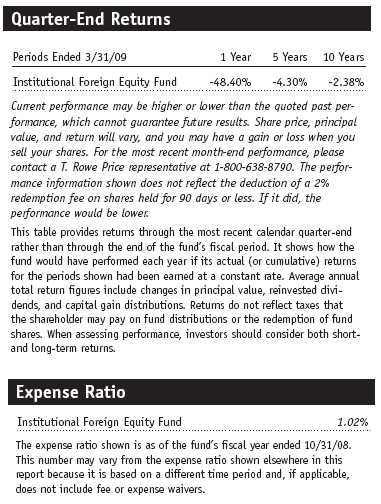
The Institutional Foreign Equity Fund posted a 0.46% gain for the six-month period ended April 30, 2009. As shown in the Performance Comparison table, the fund outperformed the Lipper International Large-Cap Core Funds Average and lagged the return for its benchmark, the MSCI All Country World ex-U.S. Index. Our performance versus the MSCI index benefited from stock selection, especially in industrials and business services and consumer staples. However, sector allocation detracted due to our overweight in health care stocks and an underweight in materials. In general, the portfolio’s emerging markets holdings were good contributors.
Shareholders may have noticed that the fund’s expense ratio has been rising in the last few months. This does not reflect a decision by T. Rowe Price to raise its management fee. Rather, the rising expense ratio is a result of the fund’s declining assets due to the market downturn—the smaller asset base increases the fund’s expense ratio.
In response, T. Rowe Price International has contractually obligated itself (through February 28, 2011) to waive its fees and/or bear any expenses that would cause the fund’s ratio of expenses to average net assets to exceed 1.50%. This expense limitation is effective May 1, 2009. For more information, please see the prospectus supplement that we recently mailed to your address of record. The supplement is also available with the fund’s prospectus on our Web site, troweprice.com.
Portfolio Strategy
Given the ongoing tumult, we think it is appropriate to review our strategy. We believe that stock prices move with earnings and cash flow growth over time, meaning simply that if a company grows free cash flow by 15% a year, its stock should appreciate at roughly the same rate. We search for companies we think can generate double-digit earnings growth over time by participating in expanding markets, taking market share, or improving profitability at a rate much faster than sales. We think that if we can find those companies and pay a fair price for their stock, we can compound absolute returns at double-digit levels and provide solid long-term relative returns.
With this objective in mind, our industry analysts, as well as other T. Rowe Price portfolio managers, travel the world to find companies that fit these criteria. We look for the best non-U.S. stocks wherever we may find them rather than employing a regional or country focus. Although we consider broad economic conditions in regions and countries, the portfolio composition is primarily determined by individual stock considerations.
Market Review
As I reflect on the extraordinary events in the world’s markets over the past several months, it reminds me of a trip I took with a friend to the Grand Canyon several decades ago. I stood looking over the South Rim of the canyon with my camera in hand, but after contemplating the picture for a time, I put the camera away. I could not capture the enormity of what I saw with a snapshot; you had to see it, feel it, and experience it for yourself. I feel a little like that now—looking at a small, albeit positive, six-month result for the fund in the period masks several titanic shifts and a plethora of events. Perhaps it is better to describe the period in several smaller stories.
Between November and the first part of March, many businesses and, to some extent, entire industries came to a virtual standstill. In China, for example, several of the busiest ports practically shut down as shipping demand came to a screeching halt—import and export traffic had effectively dried up. Banks around the globe stopped lending and borrowing. Because of the widespread uncertainty, many companies stopped providing future sales and earnings guidance. I’ve seen a lot of sales and earnings shortfalls over the years, but one of the most extreme examples I can recall happened late last year at Volvo. The company, one of the world’s largest truck makers (it also produces autos and heavy-duty construction equipment), reported that its third-quarter orders for trucks in Europe fell to 115, a 99.7% decline from 41,970 in the year-earlier period.
As worries about a new Great Depression escalated, the fear spilled over from Wall Street onto Main Street. I know this firsthand because my mother called me on several occasions to ask whether she should move her money out of her bank (a well-known, established U.S. institution) even though she had far less than the $250,000 that would have been covered by FDIC insurance in the event of her bank’s bankruptcy. I knew that the fear was rampant when my wife suggested that we stash some cash in a jar in the basement.
It has been said that investors make decisions based on two primary emotions: fear and greed—and fear clearly had the upper hand for the first part of the reporting period. The fear of owning stocks continued across equity markets into March. However, positive signs began to emerge in the fixed-income market a bit sooner. Dribs and drabs of liquidity began to appear, coined “green shoots” by the media, which many hoped was signaling the beginning of the end of the recession. Banks began to lend—if only a little—and the yields on non-Treasury debt instruments began to fall.
While we can’t know for certain, equities appear to have bottomed in early March, and as stocks began to rebound, we witnessed an abrupt shift in investor sentiment—fear of owning stocks turned into fear of not owning stocks and missing the rebound. While we are relieved and relatively satisfied that the worst of the markets’ performance is behind us, the economic recovery is likely to progress in fits and starts, as will any rebound in stock prices. We think that markets will likely face some resistance after the “relief rally;” the next up-leg will require tangible economic and earnings improvement from currently depressed levels. While we are pleased to be above water for the past six months, stocks in general remain significantly below year-ago levels.
Portfolio Review
In our last shareholder letter (dated October 31, 2008), we talked about our rationale for having an oversized position in emerging markets stocks and that it hurt our performance as global growth slowed dramatically. We said, “While we cannot predict the future, it is safe to say the market is forecasting a very bleak one. We think economies will continue to slow and unemployment will rise, but we believe that prices already discount this scenario. However, we see some signs of the credit crisis bottoming, and we think most governments are putting concerted efforts into lowering interest rates and providing liquidity, which gives us reasons for optimism about where stocks will go from here.”
We continue to believe it makes sense to remain overweight in emerging markets. Liquidity and a modicum of optimism are now evident. We benefited from sticking with our developing markets holdings but did not take full advantage by aggressively adding to stocks in South Korea and Taiwan—both performed exceptionally well in the past six months. Our Chinese and Indian holdings rallied nicely, but our overall performance grade in emerging markets for the period was pedestrian. Our rotation out of several high-risk stocks generated mixed results. Although we generally produced good returns on new investments, in cases such as Shimao Property, which we eliminated and then moved the proceeds to other Chinese companies, we left money on the table. (Please refer to the portfolio of investments for a complete listing of holdings and the amount each represents in the portfolio.)
Where We Were Positioned and Why
While we are happy to report improved performance in the last six months, we are not entirely satisfied with the results and several of our decisions. The first issue was that we underestimated the severity and effect of the liquidity crisis and the depth of the economic carnage that followed. In addition, although we made several opportunistic purchases in January and February, we did not fully take advantage of fire-sale prices in the heat of the panic sell-off. This criticism aside, we are always trying to improve the quality of the companies that we own, and we remain vigilant in managing portfolio risks and the potential return trade-off of our holdings.
In the last six months, we opportunistically bought several well-positioned companies in China and Brazil. In addition, we took advantage of investors’ fear of owning companies with a large amount of debt, such as Anheuser-Busch InBev. During the period, we made significant additions to the Belgium-based brewer, and it generated good results for the portfolio. We also bought financials companies that were raising capital through new issuance at what we viewed as extremely favorable prices. One of the most prominent examples was U.K.-based Standard Chartered, a multinational commercial bank offering specialized banking products to corporations and institutions in Asia, Africa, Europe, the Middle East, and the Americas.
Notable Portfolio Contributors and Detractors
Our information technology holdings were the best contributors to six-month results, led by Internet software and services industry stocks. There are several reasons why we view Internet companies as appealing. First, they have a low fixed-cost base that eliminates some of the worry about high capital costs and servicing a debt-laden balance sheet. In general, Internet companies have strong balance sheets because they generate steady cash flow. Finally, if the companies miss their earnings and revenue forecasts, it is generally by a little, not a giant shortfall that could send the stock plunging.
We have aggressively increased our allocation in Chinese Internet software and services companies because we believe China will be one of the first countries to recover from this recessionary period and can generate durable economic growth. We believe the government has the resources and will take the necessary steps to revive its ailing economy. It made sense to buy these companies in a slow period and when investors were fearful—an example of our willingness to buy solid growth stocks at depressed prices.
We established new positions in Chinese companies Baidu (Internet search) and Sina (Internet portal), which posted strong gains. One of our largest concerns about our Chinese Internet holdings is the level of government control. However, in Baidu’s case, we think the government is an ally of sorts because it wants its people to use a domestic search engine like Baidu rather than Google or an alternative where it has less control. In the case of Sina, the portal company (much like Yahoo!), we like its stable and growing advertising-based revenue stream. However, Sina announced that it was combining with Focus Media’s outdoor business in December, and the market didn’t like the merger. Investors dumped the stock, sending Sina sharply lower. We think it is a reasonable deal—Sina bought the assets at a good price, and Focus has good businesses. Despite the company’s first-quarter earnings miss, we think the merger will increase earnings and provide a more stable revenue base over the long term. Over time, the growth potential for Baidu and Sina is huge; they have great business models, and there is little chance of either going bankrupt.
We also added to our position in Tencent Holdings. The firm was already a sizable position, and it generated a strong contribution, but we didn’t add as aggressively as we did in Baidu and Sina. Tencent, also referred to as QQ, is the most popular free instant messaging service in China and one of the most popular in the world.
The next-best sector contribution came from our holdings in the industrials and business services segment. Jaiprakash Associates (an industrial conglomerate), a new holding that we reported on in our October shareholder report, generated standout results. This infrastructure construction conglomerate has been a prime beneficiary of the lower interest rate environment and liquidity coming back in India. The stock moved sharply higher in the March/April rally. Jaiprakash is primarily involved in infrastructure and power plant construction and real estate. However, all of its projects are longer term, which means it needs a large amount of financing. When liquidity in India became scarce during the credit crisis, the stock sold off dramatically last year. Jaiprakash has very good business opportunities, but funding them is the issue. The stock gained more than 100% in the last six weeks of the reporting period, but we are still significantly under water in the position. We believe the company has solid growth potential and is well managed. As a more enduring recovery takes hold, we think the stock should continue its ascent.
Health care was our worst-performing sector since last October, and the pharmaceuticals segment posted the largest losses. Switzerland-based Roche Holding and Novartis, our largest health care holdings at the start of the reporting period, were among the portfolio’s poorest performers. During the period, we cut back our position in Novartis and redeployed the proceeds in other health care holdings that offered better prospects. Roche is now the portfolio’s largest holding, and we still like the company’s prospects. We think its decision to purchase Genentech was a sound decision and should help the drug maker increase earnings. The combined company should generate solid double-digit growth, and we think the stock is significantly undervalued.
Financials were also significant detractors during the period. Our commercial bank holdings suffered over the past six months, and although they rallied sharply in April, the enormous damage from early in the period could not be undone. Allied Irish Banks and Intesa Sanpaolo were the sector’s poorest performers. Switzerland-based Julius Baer Holding remains our largest position in the sector, and Banco Santander, a recent portfolio addition and positive portfolio contributor, were among our largest holdings at the end of the period as shown in the table on page 6.
Among our other large holdings, the Spanish diversified telecommunications services provider Telefonica posted modest gains. Although we have trimmed the size of the position over the past six months, we like the company’s long-term prospects. Other telecommunication services providers, including Mexico’s America Movil and India’s Bharti Airtel, also generated above-average results.
As oil prices retreated during the period, the portfolio’s largest energy sector holdings produced diverging results. Total, a large integrated oil company based in France, had generated good results at the beginning of the oil price collapse largely because the biggest companies in the sector were viewed as the safest. However, it tumbled during the past six months as fear abated. Petroleo Brasileiro generated top-tier performance in the past six months. Brazil’s largest oil exploration and production company is benefiting from less investor caution, strong results posted by Brazil’s market, and the potentially huge oil discovery off its coast. By some estimates, the new oil find could represent 30 billion to 50 billion barrels of oil, two to four times the company’s current reserves.
Investment Outlook
The opportunity to load up the truck with risky, high-return prospects is behind us, as is the time for panic. Now is a time to sift and filter. It is neither a time to be too aggressive, nor overly risk averse. We believe that there are exceptional opportunities in lower-risk, solidly managed consumer staples companies such as Nestle and Groupe Danone, but we also intend to maintain some exposure to higher-risk and potentially higher-return stocks such as Jaiprakash, Hon Hai Industries, WPP Group, and Nextel International. Overall, we have slightly moderated the portfolio’s risk characteristics as we move into the second half of our fiscal year and after the significant rebound in stocks worldwide.
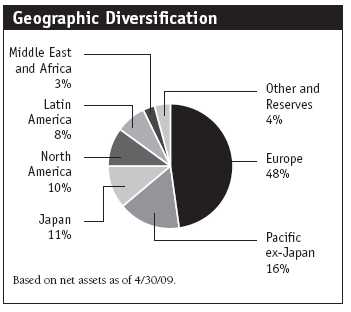
The economic backdrop appears to have stopped getting worse, and the markets have rallied since mid-March on “less bad” news. However, as we stated earlier in this report, an enduring economic recovery will likely come slowly and in fits and starts. For those reasons, we intend to stick to our knitting. For us, that means doing the research and legwork to find great growth stocks that can take market share no matter how roiled the economic environment. We also want to ensure that we maintain a diverse portfolio of holdings across geographies as well as sectors. Key tenets of our investment analysis include challenging the assumptions and opinions we made as recently as three months ago, tactically taking advantage of overly fearful or optimistic markets, and remaining objective and skeptical of consensus opinion.
We have witnessed and endured extreme conditions during the past few reporting cycles; it has been a challenging and humbling experience. Our focus throughout this period and for the long term is to target companies with good global franchises and attempt to buy them at reasonable prices or when they are out of favor. We have been buying companies that have solid management teams, businesses that can maintain their earnings, and those companies that over time should have solid growth but have already priced in lower earnings expectations. Ultimately, the goals of identifying the best long-term investment opportunities and delivering superior long-run returns for our clients are at the forefront of all our investment decisions.
Respectfully submitted,

Robert W. Smith
Chairman of the Investment Advisory Committee
May 13, 2009
The committee chairman has day-to-day responsibility for managing the portfolio and works with committee members in developing and executing the fund’s investment program.
| Risks of International Investing |
Funds that invest overseas generally carry more risk than funds that invest strictly in U.S. assets. Funds investing in a single country or in a limited geographic region tend to be riskier than more diversified funds. Risks can result from varying stages of economic and political development; differing regulatory environments, trading days, and accounting standards; and higher transaction costs of non-U.S. markets. Non-U.S. investments are also subject to currency risk, or a decline in the value of a foreign currency versus the U.S. dollar, which reduces the dollar value of securities denominated in that currency.
Lipper averages: The averages of available mutual fund performance returns for specified periods in defined categories as tracked by Lipper Inc.
MSCI All Country World ex-U.S. Index: An index that measures equity market performance of developed and emerging countries, excluding the U.S.
Portfolio Highlights

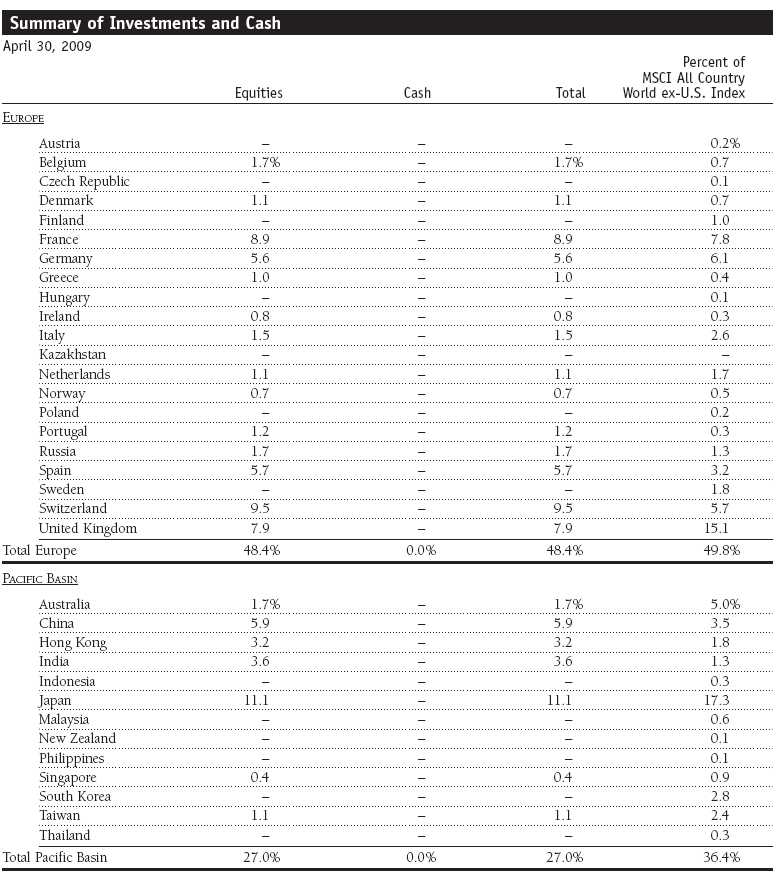
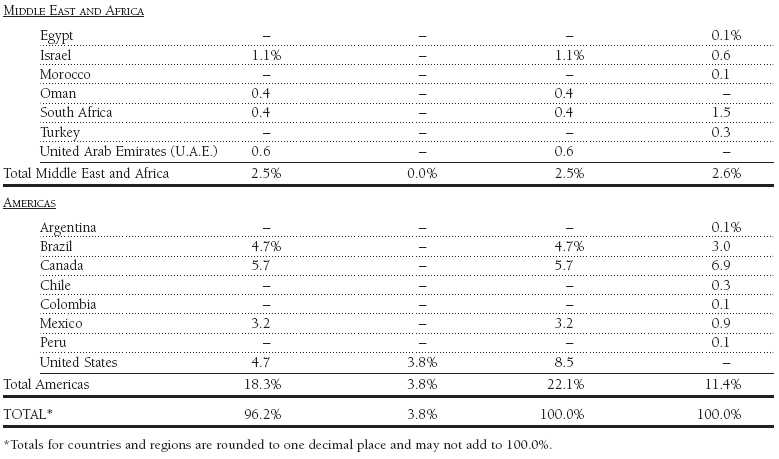
Performance and Expenses
T. Rowe Price Institutional Foreign Equity Fund
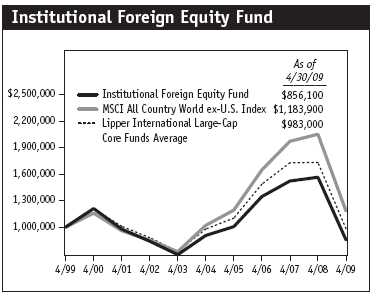
This chart shows the value of a hypothetical $1 million investment in the fund over the past 10 fiscal year periods or since inception (for funds lacking 10-year records). The result is compared with benchmarks, which may include a broad-based market index and a peer group average or index. Market indexes do not include expenses, which are deducted from fund returns as well as mutual fund averages and indexes.
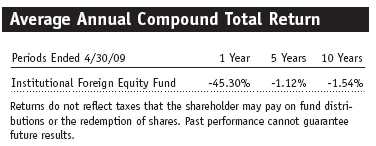
This table shows how the fund would have performed each year if its actual (or cumulative) returns for the periods shown had been earned at a constant rate.
Fund Expense Example
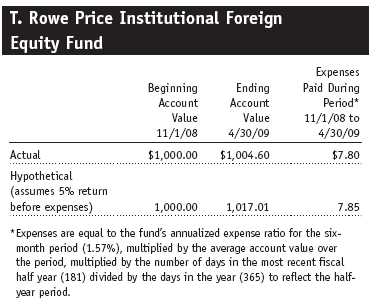
As a mutual fund shareholder, you may incur two types of costs: (1) transaction costs, such as redemption fees or sales loads, and (2) ongoing costs, including management fees, distribution and service (12b-1) fees, and other fund expenses. The following example is intended to help you understand your ongoing costs (in dollars) of investing in the fund and to compare these costs with the ongoing costs of investing in other mutual funds. The example is based on an investment of $1,000 invested at the beginning of the most recent six-month period and held for the entire period.
Actual Expenses
The first line of the following table (“Actual”) provides information about actual account values and actual expenses. You may use the information in this line, together with your account balance, to estimate the expenses that you paid over the period. Simply divide your account value by $1,000 (for example, an $8,600 account value divided by $1,000 = 8.6), then multiply the result by the number in the first line under the heading “Expenses Paid During Period” to estimate the expenses you paid on your account during this period.
Hypothetical Example for Comparison Purposes
The information on the second line of the table (“Hypothetical”) is based on hypothetical account values and expenses derived from the fund’s actual expense ratio and an assumed 5% per year rate of return before expenses (not the fund’s actual return). You may compare the ongoing costs of investing in the fund with other funds by contrasting this 5% hypothetical example and the 5% hypothetical examples that appear in the shareholder reports of the other funds. The hypothetical account values and expenses may not be used to estimate the actual ending account balance or expenses you paid for the period.
You should also be aware that the expenses shown in the table highlight only your ongoing costs and do not reflect any transaction costs, such as redemption fees or sales loads. Therefore, the second line of the table is useful in comparing ongoing costs only and will not help you determine the relative total costs of owning different funds. To the extent a fund charges transaction costs, however, the total cost of owning that fund is higher.
Financial Highlights
T. Rowe Price Institutional Foreign Equity Fund
(Unaudited)
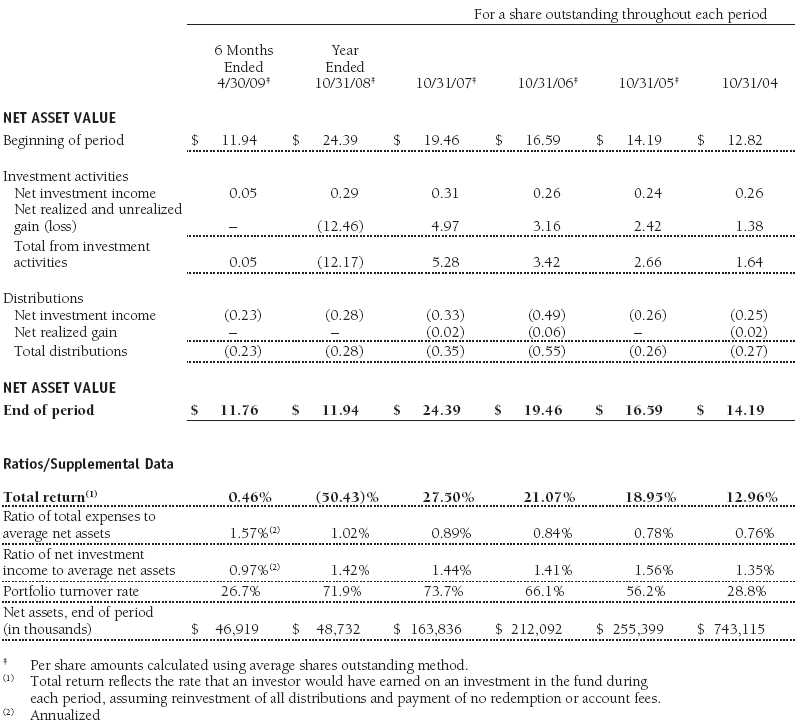
The accompanying notes are an integral part of these financial statements.
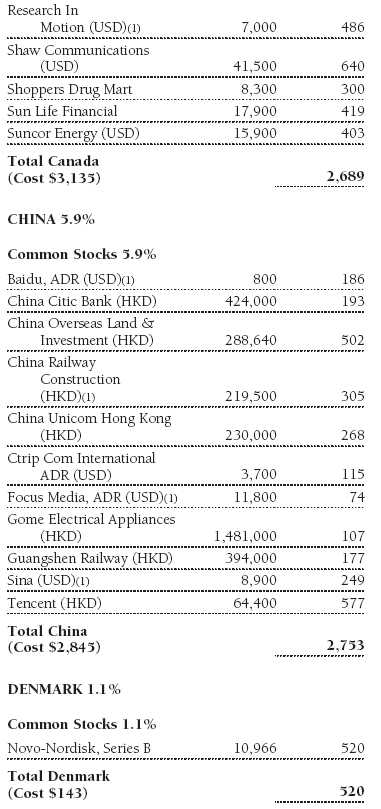
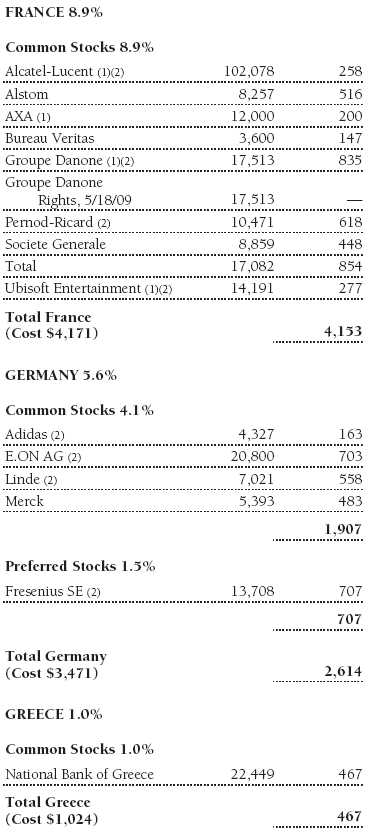
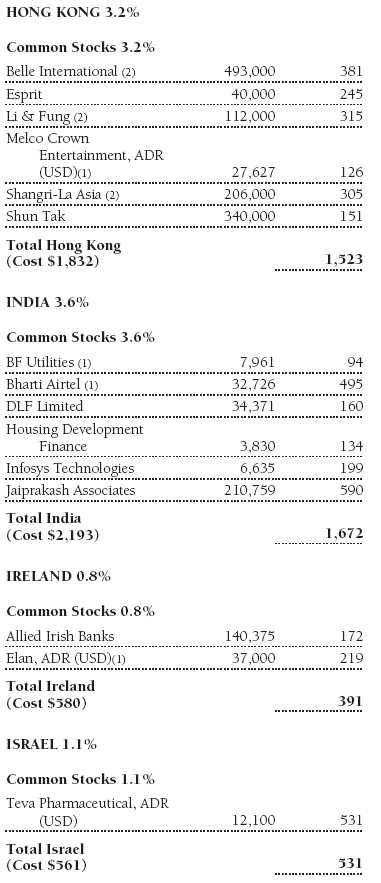
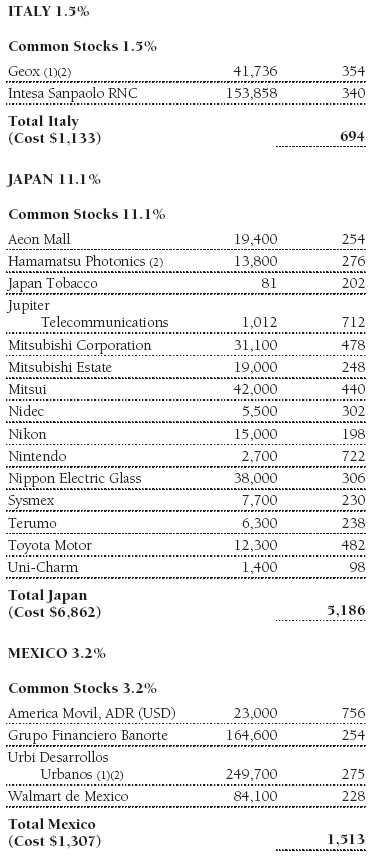
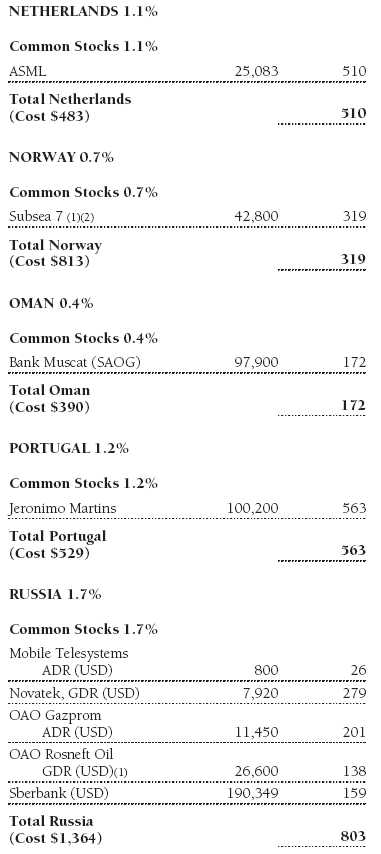
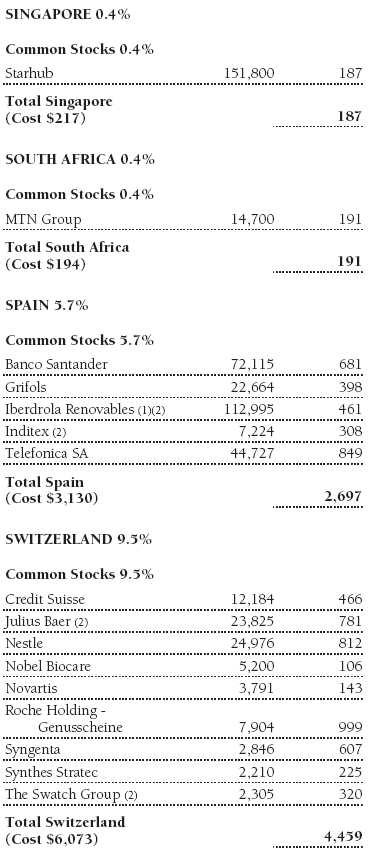
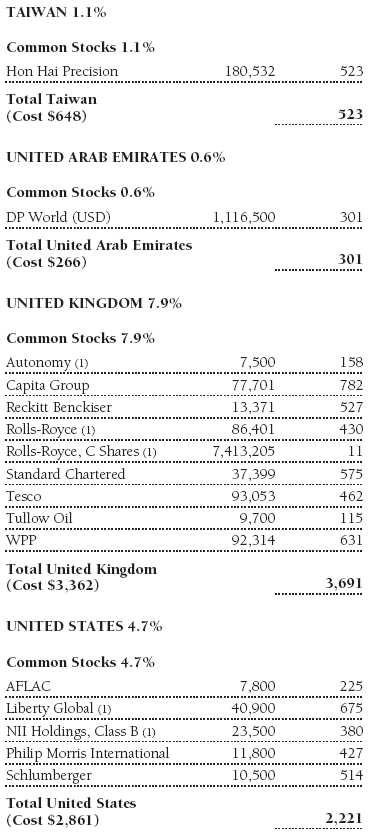
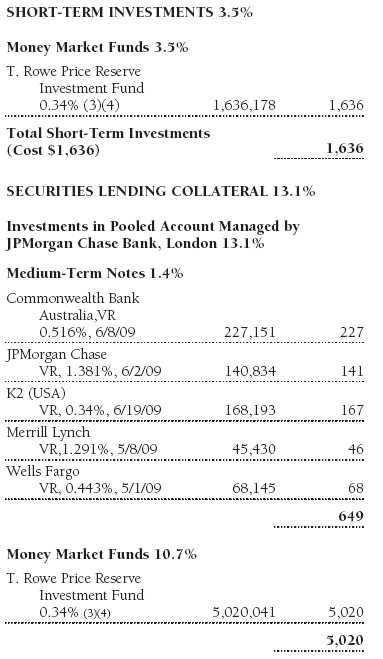
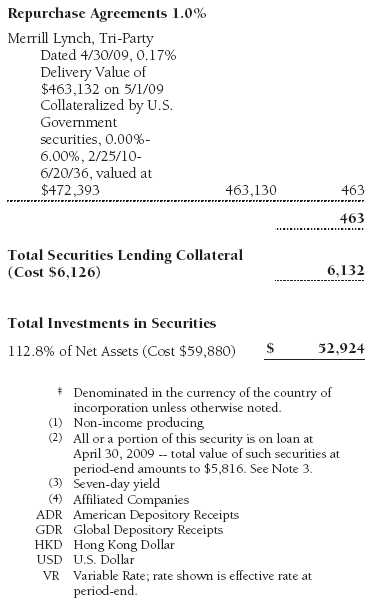
Portfolio of Investments ‡
T. Rowe Price Institutional Foreign Equity Fund
April 30, 2009
(Unaudited)
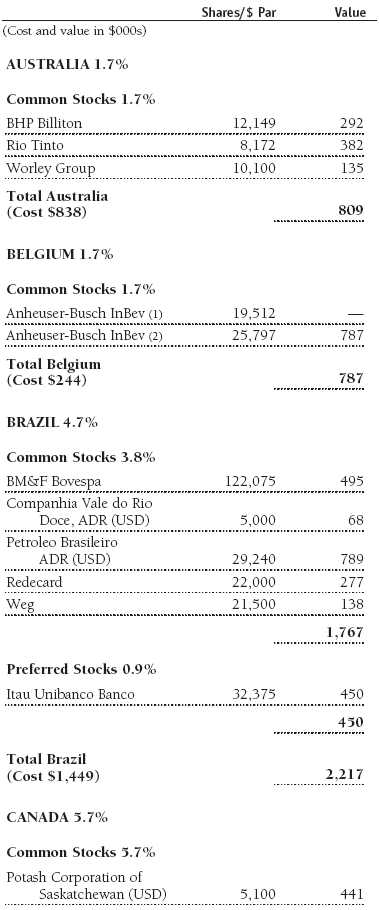
The accompanying notes are an integral part of these financial statements.
Statement of Assets and Liabilities
T. Rowe Price Institutional Foreign Equity Fund
April 30, 2009 (Unaudited)
($000s, except shares and per share amounts)
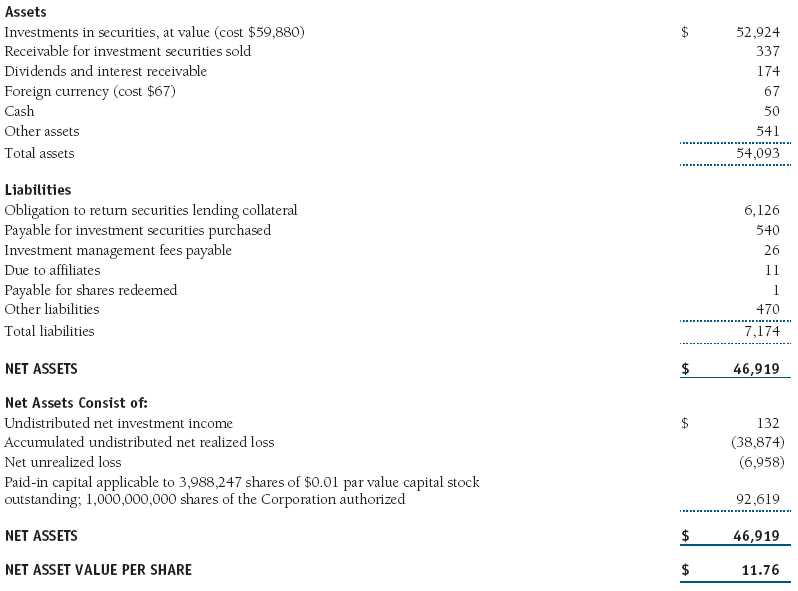
The accompanying notes are an integral part of these financial statements.
Statement of Operations
T. Rowe Price Institutional Foreign Equity Fund
(Unaudited)
($000s)
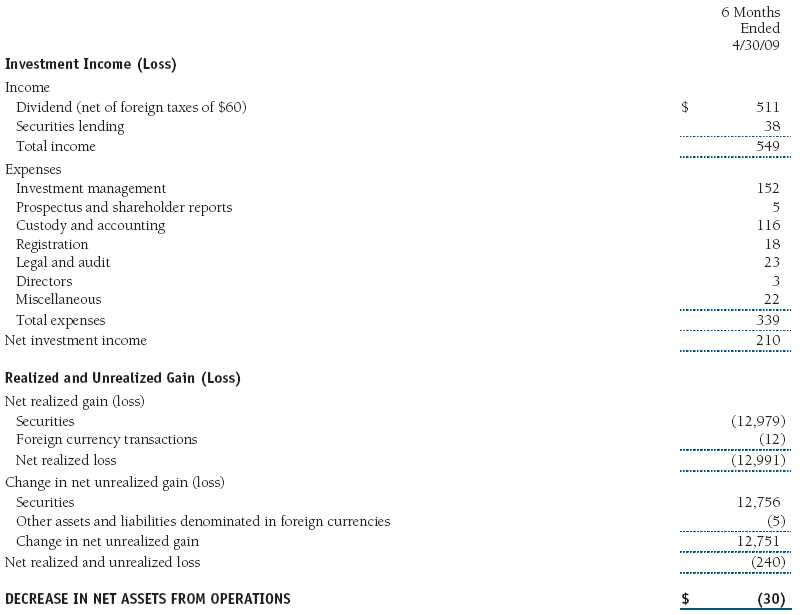
The accompanying notes are an integral part of these financial statements.
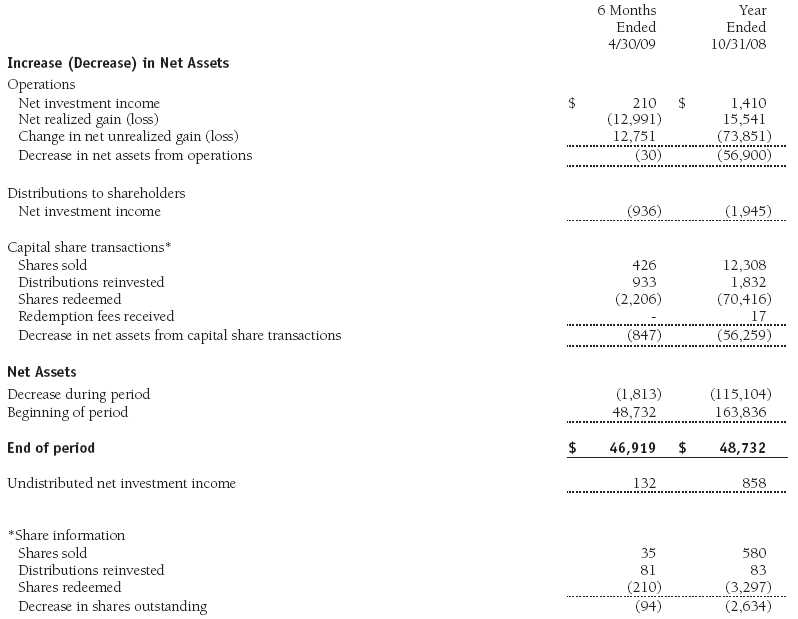
Statement of Changes in Net Assets
T. Rowe Price Institutional Foreign Equity Fund
(Unaudited)
($000s)
The accompanying notes are an integral part of these financial statements.
Notes to Financial Statements
T. Rowe Price Institutional Foreign Equity Fund
April 30, 2009 (Unaudited)
T. Rowe Price Institutional International Funds, Inc. (the corporation), is registered under the Investment Company Act of 1940 (the 1940 Act). The Institutional Foreign Equity Fund (the fund), a diversified, open-end management investment company, is one portfolio established by the corporation. The fund commenced operations on September 7, 1989. The fund seeks long-term growth of capital through investments primarily in the common stocks of established, non-U.S. companies.
NOTE 1 - SIGNIFICANT ACCOUNTING POLICIES
Basis of Preparation The accompanying financial statements were prepared in accordance with accounting principles generally accepted in the United States of America, which require the use of estimates made by fund management. Fund management believes that estimates and security valuations are appropriate; however, actual results may differ from those estimates, and the security valuations reflected in the financial statements may differ from the value the fund ultimately realizes upon sale of the securities.
Investment Transactions, Investment Income, and Distributions Income and expenses are recorded on the accrual basis. Premiums and discounts on debt securities are amortized for financial reporting purposes. Dividends received from mutual fund investments are reflected as dividend income; capital gain distributions are reflected as realized gain/loss. Dividend income and capital gain distributions are recorded on the ex-dividend date. Income tax-related interest and penalties, if incurred, would be recorded as income tax expense. Investment transactions are accounted for on the trade date. Realized gains and losses are reported on the identified cost basis. Distributions to shareholders are recorded on the ex-dividend date. Income distributions are declared and paid on an annual basis. Capital gain distributions, if any, are declared and paid by the fund, typically on an annual basis.
Currency Translation Assets, including investments, and liabilities denominated in foreign currencies are translated into U.S. dollar values each day at the prevailing exchange rate, using the mean of the bid and asked prices of such currencies against U.S. dollars as quoted by a major bank. Purchases and sales of securities, income, and expenses are translated into U.S. dollars at the prevailing exchange rate on the date of the transaction. The effect of changes in foreign currency exchange rates on realized and unrealized security gains and losses is reflected as a component of security gains and losses.
Credits The fund earns credits on temporarily uninvested cash balances at the custodian that reduce the fund’s custody charges. Custody expense in the accompanying financial statements is presented before reduction for credits.
Redemption Fees A 2% fee is assessed on redemptions of fund shares held for 90 days or less to deter short-term trading and to protect the interests of long-term shareholders. Redemption fees are withheld from proceeds that shareholders receive from the sale or exchange of fund shares. The fees are paid to the fund, and are recorded as an increase to paid-in capital. The fees may cause the redemption price per share to differ from the net asset value per share.
New Accounting Pronouncements On November 1, 2008, the fund adopted Statement of Financial Accounting Standards No. 157 (FAS 157), Fair Value Measurements. FAS 157 defines fair value, establishes the framework for measuring fair value, and expands the disclosures of fair value measurements in the financial statements. Adoption of FAS 157 did not have a material impact on the fund’s net assets or results of operations.
In March 2008, the Financial Accounting Standards Board issued Statement of Financial Accounting Standards No. 161 (FAS 161), Disclosures about Derivative Instruments and Hedging Activities, which is effective for fiscal years and interim periods beginning after November 15, 2008. FAS 161 requires enhanced disclosures about derivative and hedging activities, including how such activities are accounted for and their effect on financial position, performance and cash flows. Management is currently evaluating the impact the adoption of FAS 161 will have on the fund’s financial statements and related disclosures; however, it is expected to have no material impact on the fund’s net assets or results of operations.
NOTE 2 - VALUATION
The fund’s investments are reported at fair value as defined under FAS 157. The fund values its investments and computes its net asset value per share at the close of the New York Stock Exchange (NYSE), normally 4 p.m. ET, each day that the NYSE is open for business.
Valuation Methods Equity securities listed or regularly traded on a securities exchange or in the over-the-counter (OTC) market are valued at the last quoted sale price or, for certain markets, the official closing price at the time the valuations are made, except for OTC Bulletin Board securities, which are valued at the mean of the latest bid and asked prices. A security that is listed or traded on more than one exchange is valued at the quotation on the exchange determined to be the primary market for such security. Listed securities not traded on a particular day are valued at the mean of the latest bid and asked prices for domestic securities and the last quoted sale price for international securities. Debt securities with remaining maturities of less than one year at the time of acquisition generally use amortized cost in local currency to approximate fair value. However, if amortized cost is deemed not to reflect fair value or the fund holds a significant amount of such securities with remaining maturities of more than 60 days, the securities are valued at prices furnished by dealers who make markets in such securities or by an independent pricing service.
Investments in mutual funds are valued at the mutual fund’s closing net asset value per share on the day of valuation.
Other investments, including restricted securities, and those for which the above valuation procedures are inappropriate or are deemed not to reflect fair value are stated at fair value as determined in good faith by the T. Rowe Price Valuation Committee, established by the fund’s Board of Directors.
For valuation purposes, the last quoted prices of non-U.S. equity securities may be adjusted under the circumstances described below. If the fund determines that developments between the close of a foreign market and the close of the NYSE will, in its judgment, materially affect the value of some or all of its portfolio securities, the fund will adjust the previous closing prices to reflect what it believes to be the fair value of the securities as of the close of the NYSE. In deciding whether it is necessary to adjust closing prices to reflect fair value, the fund reviews a variety of factors, including developments in foreign markets, the performance of U.S. securities markets, and the performance of instruments trading in U.S. markets that represent foreign securities and baskets of foreign securities. A fund may also fair value securities in other situations, such as when a particular foreign market is closed but the fund is open. The fund uses outside pricing services to provide it with closing prices and information to evaluate and/or adjust those prices. The fund cannot predict how often it will use closing prices and how often it will determine it necessary to adjust those prices to reflect fair value. As a means of evaluating its security valuation process, the fund routinely compares closing prices, the next day’s opening prices in the same markets, and adjusted prices.
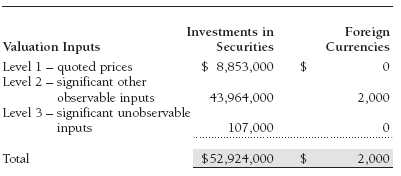
Valuation Inputs Various inputs are used to determine the value of the fund’s investments. These inputs are summarized in the three broad levels listed below:
Level 1 – quoted prices in active markets for identical securities
Level 2 – observable inputs other than Level 1 quoted prices (including, but not limited to, quoted prices for similar securities, interest rates, prepayment speeds, credit risk)
Level 3 – unobservable inputs
Observable inputs are those based on market data obtained from sources independent of the fund, and unobservable inputs reflect the fund’s own assumptions based on the best information available. The input levels are not necessarily an indication of the risk or liquidity associated with investments at that level. For example, non-U.S. equity securities actively traded in foreign markets generally are reflected in Level 2 despite the availability of closing prices, because the fund evaluates and determines whether those closing prices reflect fair value at the close of the NYSE or require adjustment, as described above. The following table summarizes the fund’s investments, based on the inputs used to determine their values on April 30, 2009:
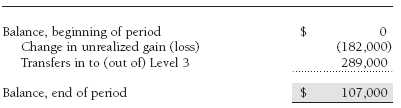
Following is a reconciliation of the fund’s Level 3 investments for the six months ended April 30, 2009:
NOTE 3 - INVESTMENT TRANSACTIONS
Consistent with its investment objective, the fund engages in the following practices to manage exposure to certain risks or to enhance performance. The investment objective, policies, program, and risk factors of the fund are described more fully in the fund’s prospectus and Statement of Additional Information.
Emerging Markets At April 30, 2009, approximately 23% of the fund’s net assets were invested, directly or indirectly, in securities of companies located in emerging markets or denominated in or linked to the currencies of emerging market countries. Future economic or political developments could adversely affect the liquidity or value, or both, of such securities.
Repurchase Agreements All repurchase agreements are fully collateralized by U.S. government securities. Collateral is in the possession of the fund’s custodian or, for tri-party agreements, the custodian designated by the agreement. Collateral is evaluated daily to ensure that its market value exceeds the delivery value of the repurchase agreements at maturity. Although risk is mitigated by the collateral, the fund could experience a delay in recovering its value and a possible loss of income or value if the counterparty fails to perform in accordance with the terms of the agreement.
Securities Lending The fund lends its securities to approved brokers to earn additional income. It receives as collateral cash and U.S. government securities valued at 102% to 105% of the value of the securities on loan. Cash collateral is invested by the fund’s lending agent(s) in accordance with investment guidelines approved by fund management. Although risk is mitigated by the collateral, the fund could experience a delay in recovering its securities and a possible loss of income or value if the borrower fails to return the securities or if collateral investments decline in value. Securities lending revenue recognized by the fund consists of earnings on invested collateral and borrowing fees, net of any rebates to the borrower and compensation to the lending agent. On April 30, 2009, the value of loaned securities was $5,816,000.
Other Purchases and sales of portfolio securities, other than short-term securities, aggregated $11,532,000 and $15,047,000, respectively, for the six months ended April 30, 2009.
NOTE 4 - FEDERAL INCOME TAXES
No provision for federal income taxes is required since the fund intends to continue to qualify as a regulated investment company under Subchapter M of the Internal Revenue Code and distribute to shareholders all of its taxable income and gains. Distributions are determined in accordance with Federal income tax regulations, which differ from generally accepted accounting principles, and, therefore, may differ in amount or character from net investment income and realized gains for financial reporting purposes. Financial reporting records are adjusted for permanent book/tax differences to reflect tax character but are not adjusted for temporary differences. The amount and character of tax-basis distributions and composition of net assets are finalized at fiscal year-end; accordingly, tax-basis balances have not been determined as of April 30, 2009.
The fund intends to retain realized gains to the extent of available capital loss carryforwards. As of October 31, 2008, the fund had $24,716,000 of unused capital loss carryforwards, of which all expire in fiscal 2011.
At April 30, 2009, the cost of investments for federal income tax purposes was $59,880,000. Net unrealized loss aggregated $6,958,000 at period-end, of which $6,060,000 related to appreciated investments and $13,018,000 related to depreciated investments.
NOTE 5 - FOREIGN TAXES
The fund is subject to foreign income taxes imposed by certain countries in which it invests. Additionally, capital gains realized by the fund upon disposition of securities issued in or by certain foreign countries are subject to capital gains tax imposed by those countries. All taxes are computed in accordance with the applicable foreign tax law, and, to the extent permitted, capital losses are used to offset capital gains. Tax expense attributable to income is accrued by the fund as a reduction of income. Current and deferred tax expense attributable to net capital gains is reflected as a component of realized and/or change in unrealized gain/loss on securities in the accompanying financial statements. At April 30, 2009, the fund had no deferred tax liability attributable to foreign securities and $20,938,000 of foreign capital loss carryforwards, including $14,133,000 that expire in 2010, $3,299,000 that expire in 2011, $3,109,000 that expire in 2012, $34,000 that expire in 2013, $31,000 that expire in 2016, $192,000 that expire in 2017, and $140,000 that expire in 2018.
NOTE 6 - RELATED PARTY TRANSACTIONS
The fund is managed by T. Rowe Price International, Inc. (the manager), a wholly owned subsidiary of T. Rowe Price Associates, Inc. (Price Associates), which is wholly owned by T. Rowe Price Group, Inc. The investment management agreement between the fund and the manager provides for an annual investment management fee equal to 0.70% of the fund’s average daily net assets. The fee is computed daily and paid monthly.
Effective May 1, 2009, and through February 28, 2011, the fund will be subject to a contractual expense limitation of 1.50% of average net assets. Any expenses reimbursed and management fees waived by the manager pursuant to this limitation will be subject to later repayment by the fund for a period of three years.
In addition, the fund has entered into service agreements with Price Associates and a wholly owned subsidiary of Price Associates (collectively, Price). Price Associates computes the daily share price and provides certain other administrative services to the fund. T. Rowe Price Services, Inc., provides shareholder and administrative services in its capacity as the fund’s transfer and dividend disbursing agent. For the six months ended April 30, 2009, expenses incurred pursuant to these service agreements were $69,000 for Price Associates and $0 for T. Rowe Price Services, Inc. The total amount payable at period-end pursuant to these service agreements is reflected as Due to Affiliates in the accompanying financial statements.
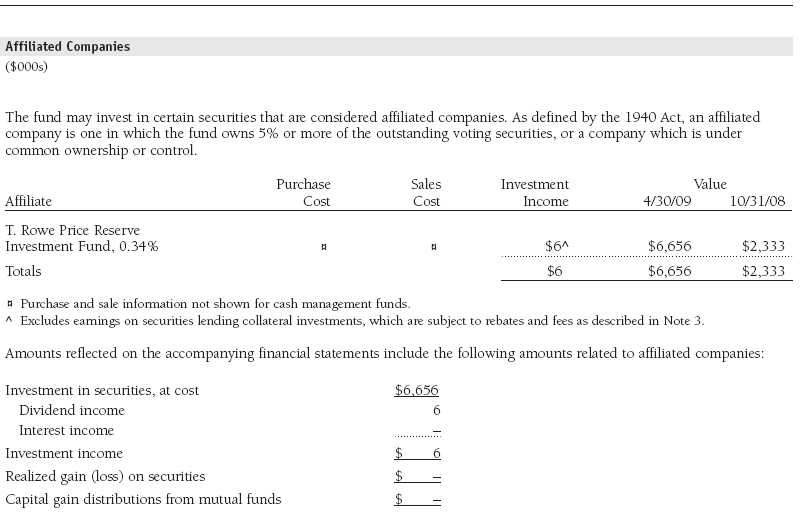
The fund may invest in the T. Rowe Price Reserve Investment Fund and the T. Rowe Price Government Reserve Investment Fund (collectively, the T. Rowe Price Reserve Investment Funds), open-end management investment companies managed by Price Associates and considered affiliates of the fund. The T. Rowe Price Reserve Investment Funds are offered as cash management options to mutual funds, trusts, and other accounts managed by Price Associates and/or its affiliates and are not available for direct purchase by members of the public. The T. Rowe Price Reserve Investment Funds pay no investment management fees.
| Information on Proxy Voting Policies, Procedures, and Records |
A description of the policies and procedures used by T. Rowe Price funds and portfolios to determine how to vote proxies relating to portfolio securities is available in each fund’s Statement of Additional Information, which you may request by calling 1-800-225-5132 or by accessing the SEC’s Web site, www.sec.gov. The description of our proxy voting policies and procedures is also available on our Web site, www.troweprice.com. To access it, click on the words “Our Company” at the top of our corporate homepage. Then, when the next page appears, click on the words “Proxy Voting Policies” on the left side of the page.
Each fund’s most recent annual proxy voting record is available on our Web site and through the SEC’s Web site. To access it through our Web site, follow the directions above, then click on the words “Proxy Voting Records” on the right side of the Proxy Voting Policies page.
| How to Obtain Quarterly Portfolio Holdings |
The fund files a complete schedule of portfolio holdings with the Securities and Exchange Commission for the first and third quarters of each fiscal year on Form N-Q. The fund’s Form N-Q is available electronically on the SEC’s Web site (www.sec.gov); hard copies may be reviewed and copied at the SEC’s Public Reference Room, 450 Fifth St. N.W., Washington, DC 20549. For more information on the Public Reference Room, call 1-800-SEC-0330.
| Approval of Investment Management Agreement |
On March 10, 2009, the fund’s Board of Directors (Board) unanimously approved the investment advisory contract (Contract) between the fund and its investment manager, T. Rowe Price International, Inc. (Manager). The Board considered a variety of factors in connection with its review of the Contract, also taking into account information provided by the Manager during the course of the year, as discussed below:
Services Provided by the Manager
The Board considered the nature, quality, and extent of the services provided to the fund by the Manager. These services included, but were not limited to, management of the fund’s portfolio and a variety of related activities as well as financial and administrative services, reporting, and communications. The Board also reviewed the background and experience of the Manager’s senior management team and investment personnel involved in the management of the fund. The Board concluded that it was satisfied with the nature, quality, and extent of the services provided by the Manager.
Investment Performance of the Fund
The Board reviewed the fund’s average annual total returns over the 1-, 3-, 5-, and 10-year periods as well as the fund’s year-by-year returns and compared these returns with a wide variety of previously agreed upon comparable performance measures and market data, including those supplied by Lipper, an independent provider of mutual fund data. This information, combined with the Board’s ongoing review of investment results and outlook, indicated that, in the Board’s view, the fund’s results for certain time periods were less than satisfactory. The Manager provided its assessment of the fund’s investment results and outlook, and the Board concluded that it was satisfied with the Manager’s response.
Costs, Benefits, Profits, and Economies of Scale
The Board reviewed detailed information regarding the revenues received by the Manager under the Contract and other benefits that the Manager (and its affiliates) may have realized from its relationship with the fund, including research received under “soft dollar” agreements. The Board noted that soft dollars were not used to pay for third-party, non-broker research during 2008. The Board also received information on the estimated costs incurred and profits realized by the Manager and its affiliates from advising T. Rowe Price mutual funds. The Board did not review information regarding profits realized from managing the fund in particular because the fund had not achieved sufficient scale in terms of portfolio asset size to produce meaningful profit margin percentages. The Board concluded that the Manager’s profits were reasonable in light of the services provided to the fund. The Board also considered the extent to which economies of scale were being realized by the Manager and whether the fund or other funds benefit from any such economies of scale under the fee levels set forth in the Contract. The Board concluded that the advisory fee structure for the fund continued to provide for a reasonable sharing of benefits from economies of scale with the fund’s investors.
Fees
The Board reviewed the fund’s management fee rate, operating expenses, and total expense ratio and compared them with fees and expenses of other comparable funds based on information and data supplied by Lipper. The information provided to the Board showed that the fund’s management fee rate and expense ratio were generally at or below the median for comparable funds. The Board also reviewed the fee schedules for comparable privately managed accounts of the Manager and its affiliates. Management informed the Board that the Manager’s responsibilities for privately managed accounts are more limited than its responsibilities for the fund and other T. Rowe Price mutual funds that it or its affiliates advise. On the basis of the information provided, the Board concluded that the fees paid by the fund under the Contract were reasonable.
Approval of the Contract
As noted, the Board approved the continuation of the Contract. No single factor was considered in isolation or to be determinative to the decision. Rather, the Board concluded, in light of a weighting and balancing of all factors considered, that it was in the best interests of the fund to approve the continuation of the Contract, including the fees to be charged for services thereunder.
Item 2. Code of Ethics.
A code of ethics, as defined in Item 2 of Form N-CSR, applicable to its principal executive officer, principal financial officer, principal accounting officer or controller, or persons performing similar functions is filed as an exhibit to the registrant’s annual Form N-CSR. No substantive amendments were approved or waivers were granted to this code of ethics during the registrant’s most recent fiscal half-year.
Item 3. Audit Committee Financial Expert.
Disclosure required in registrant’s annual Form N-CSR.
Item 4. Principal Accountant Fees and Services.
Disclosure required in registrant’s annual Form N-CSR.
Item 5. Audit Committee of Listed Registrants.
Not applicable.
Item 6. Investments.
(a) Not applicable. The complete schedule of investments is included in Item 1 of this Form N-CSR.
(b) Not applicable.
Item 7. Disclosure of Proxy Voting Policies and Procedures for Closed-End Management Investment Companies.
Not applicable.
Item 8. Portfolio Managers of Closed-End Management Investment Companies.
Not applicable.
Item 9. Purchases of Equity Securities by Closed-End Management Investment Company and Affiliated Purchasers.
Not applicable.
Item 10. Submission of Matters to a Vote of Security Holders.
Not applicable.
Item 11. Controls and Procedures.
(a) The registrant’s principal executive officer and principal financial officer have evaluated the registrant’s disclosure controls and procedures within 90 days of this filing and have concluded that the registrant’s disclosure controls and procedures were effective, as of that date, in ensuring that information required to be disclosed by the registrant in this Form N-CSR was recorded, processed, summarized, and reported timely.
(b) The registrant’s principal executive officer and principal financial officer are aware of no change in the registrant’s internal control over financial reporting that occurred during the registrant’s second fiscal quarter covered by this report that has materially affected, or is reasonably likely to materially affect, the registrant’s internal control over financial reporting.
Item 12. Exhibits.
(a)(1) The registrant’s code of ethics pursuant to Item 2 of Form N-CSR is filed with the registrant’s annual Form N-CSR.
(2) Separate certifications by the registrant's principal executive officer and principal financial officer, pursuant to Section 302 of the Sarbanes-Oxley Act of 2002 and required by Rule 30a-2(a) under the Investment Company Act of 1940, are attached.
(3) Written solicitation to repurchase securities issued by closed-end companies: not applicable.
(b) A certification by the registrant's principal executive officer and principal financial officer, pursuant to Section 906 of the Sarbanes-Oxley Act of 2002 and required by Rule 30a-2(b) under the Investment Company Act of 1940, is attached.
| | |
SIGNATURES |
| |
| | Pursuant to the requirements of the Securities Exchange Act of 1934 and the Investment |
| Company Act of 1940, the registrant has duly caused this report to be signed on its behalf by the |
| undersigned, thereunto duly authorized. |
| |
| T. Rowe Price Institutional International Funds, Inc. |
| |
| By | /s/ Edward C. Bernard |
| | Edward C. Bernard |
| | Principal Executive Officer |
| | |
| Date | June 16, 2009 |
| |
| | Pursuant to the requirements of the Securities Exchange Act of 1934 and the Investment |
| Company Act of 1940, this report has been signed below by the following persons on behalf of |
| the registrant and in the capacities and on the dates indicated. |
| |
| By | /s/ Edward C. Bernard |
| | Edward C. Bernard |
| | Principal Executive Officer |
| | |
| Date | June 16, 2009 |
| |
| By | /s/ Gregory K. Hinkle |
| | Gregory K. Hinkle |
| | Principal Financial Officer |
| | |
| Date | June 16, 2009 |