| UNITED STATES |
| SECURITIES AND EXCHANGE COMMISSION |
| Washington, D.C. 20549 |
| |
FORM N-CSR |
| |
CERTIFIED SHAREHOLDER REPORT OF REGISTERED |
MANAGEMENT INVESTMENT COMPANIES |
| |
| |
| |
| Investment Company Act File Number: 811-5833 |
|
| |
| T. Rowe Price Institutional International Funds, Inc. |
|
| (Exact name of registrant as specified in charter) |
| |
| 100 East Pratt Street, Baltimore, MD 21202 |
|
| (Address of principal executive offices) |
| |
| David Oestreicher |
| 100 East Pratt Street, Baltimore, MD 21202 |
|
| (Name and address of agent for service) |
| |
| |
| Registrant’s telephone number, including area code: (410) 345-2000 |
| |
| |
| Date of fiscal year end: October 31 |
| |
| |
| Date of reporting period: April 30, 2009 |
Item 1: Report to Shareholders| Institutional Emerging Markets Equity Fund | April 30, 2009 |
• Emerging markets stocks rebounded in the last six months, as risk appetite returned late in the period.
• The Institutional Emerging Markets Equity Fund posted a double-digit gain during a tumultuous period.
• We increased our Latin America allocation, using the sell-off as an opportunity to buy quality positions in retail, banks, and telecoms.
• We believe emerging markets are well positioned amid the global economic recession, and we are buying shares of well-positioned, fundamentally strong companies.
The views and opinions in this report were current as of April 30, 2009. They are not guarantees of performance or investment results and should not be taken as investment advice. Investment decisions reflect a variety of factors, and the managers reserve the right to change their views about individual stocks, sectors, and the markets at any time. As a result, the views expressed should not be relied upon as a forecast of the fund’s future investment intent. The report is certified under the Sarbanes-Oxley Act, which requires mutual funds and other public companies to affirm that, to the best of their knowledge, the information in their financial reports is fairly and accurately stated in all material respects.
Manager’s Letter
T. Rowe Price Institutional Emerging Markets Equity Fund
Dear Investor
The last six months have been marked by one of the most volatile periods for stocks on record. The global sell-off that began in September accelerated early in the period before taking a respite in December. Massive deleveraging among financial institutions gave no cover to virtually any sector or region, as investors fled riskier assets and sought the low yields of money funds and Treasury securities. However, beaten-down stocks rallied in March and April, as several economic indicators suggested the constant grind of bad news was easing. Aggressive monetary policy among central banks and massive government spending, from the United States to China, encouraged investors to take on greater risk.
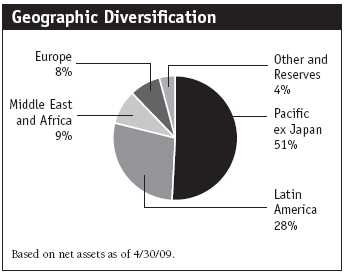
Emerging markets in general rose more than developed markets. But the dramatic swing was uneven, both by region and sector. Asia staged a comeback in the last six months, and Latin America also rebounded sharply, in part on improved demand for commodities and materials from Brazil and elsewhere in the region. But economic problems continued to beset Eastern Europe, while the Middle East and Africa saw faltering growth as a result of the shrinking availability of loans, weakening currencies, and a contraction in demand for raw materials.
Performance Review
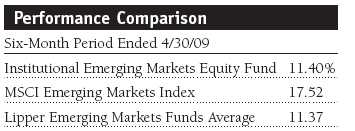
Your fund rebounded in the last six months, particularly in the final two months of the period, but results lagged the MSCI Emerging Markets Index and were roughly in line with the Lipper Emerging Markets Funds Average. The shortfall against the MSCI index was due in large measure to our holdings in the Middle East and Africa, which was hard hit by the plunge in oil prices and the severe recession. Financials holdings were also battered by the slowdown.
Over the past six months, materials, industrials, and energy stocks were the best performers. Telecoms were among the worst performers due to renewed regulatory concerns and the expected slowdown in growth within the emerging markets universe. Information technology was hurt by the economic slowdown, as many companies decreased inventory levels for IT products.

Market and Portfolio Review
Every emerging region performed well, with the exception of Europe, the Middle East, and Africa, which was hamstrung on multiple fronts. Russia is facing a major economic slowdown and a growing budget deficit that has worsened from lower oil prices. Hungary, Poland, and the Czech Republic have relied on foreign lending to fuel growth. Asia delivered the best gains, led by China, which has used its large reserves to underpin the economy and spur domestic demand. As investors became more willing to consider riskier appetites, stocks in India rallied. Brazil responded positively to the late-period rise in commodity prices. Mexico, however, was hampered by the slowdown in the U.S., as well as the fallout from the swine flu pandemic.
Pacific ex Japan
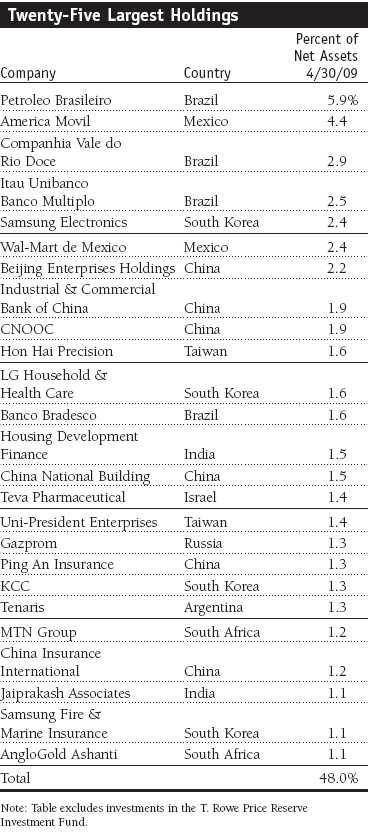
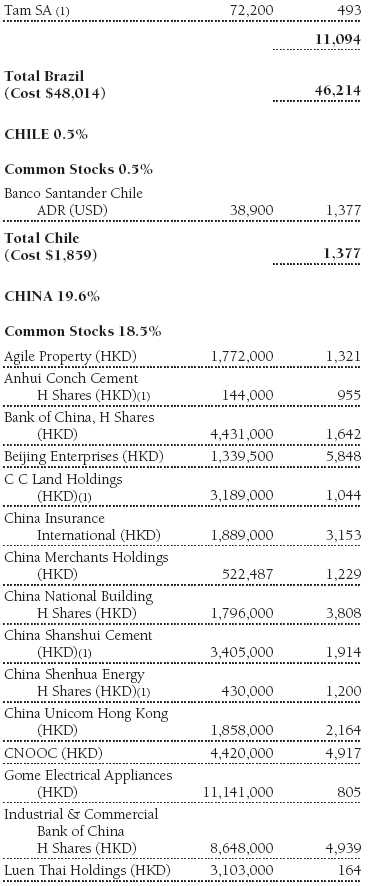
Emerging Asian markets increased about 23% in dollar terms over the past six months. Investors cheered China’s aggressive stimulus moves to backstop the economic slide. What’s more, China appears to be one of the few economies in the world to enjoy positive growth in 2009. We increased our exposure to the region, particularly China, and, as a result, North Asia contributed the most in absolute terms to the fund’s performance. Positions in construction and cement companies proved beneficial, as share prices rose in response to the massive amounts of money the government is spending on infrastructure projects to sustain growth. China National Building, Anhui Conch Cement, and China Shanshui Cement were among our prominent holdings. China Insurance International saw losses in premium sales. One notable purchase was China Unicom, the second-largest mobile operator in China, which is likely to gain considerable market share in the long term. (Please refer to the portfolio of investments for a complete listing of holdings and the amount each represents in the portfolio.)
The other Asian giant, India, also posted a solid gain. We are overweight in the burgeoning economy because we believe the country’s domestic growth story remains largely intact, even after accounting for a sluggish global backdrop. We have a number of holdings in infrastructure companies such as GMR Infrastructure, Container Corporation, and Jaiprakash Associates, which are benefiting from stimulus spending and have rebounded from distressed levels. We also favor port operators such as Mundra Ports, which stands to benefit when global trade improves.
South Korea may be among the countries least “de-coupled” from the developed world because it relies heavily on exports. Yet the sharp rally late in the period lifted South Korean stocks, and our underweight to the country hurt overall results. However, we continue to have lighter exposure there—and in Taiwan—because we believe these markets are vulnerable to a sustained global downturn.
Europe, the Middle East, and Africa (EMEA)
The EMEA region advanced approximately 5% in the past six months. We reduced our exposure to the region during the period, as it has been hit particularly hard by the credit crisis. But stock selection in the region proved the most costly to fund performance. At the epicenter of the storm was Russia, where a strong economic growth story was turned on its head late last year. Russia’s conflict with neighboring Georgia, plunging oil prices, and a banking liquidity squeeze eroded investor confidence. Even the strongest players in their respective industries were hurt by the dynamic. Uralkali, a low-cost potash producer, plunged due to falling fertilizer prices and a large government fine for a 2006 potash mine collapse. We eliminated our position in the company. Real estate developer Pik performed poorly amid difficulty refinancing its short-term debt, falling property prices, and the government’s decision to renegotiate a contract with the company on very unfavorable terms. We sold Bank of St. Petersburg and reduced our position in Sberbank due to the slowing economy and tight liquidity. Energy giant Gazprom also suffered from the global slowdown.
Our Oman and Qatar positions were also costly. These markets are not included in our market index, and they underperformed the wider emerging markets index. Our financials holdings in these countries lost value as weakening economies led to slowing loan growth. Investors also were concerned over exposure to the rapidly deteriorating real estate market in parts of the region. One such position was Bank Muscat of Oman. We sold our position in Egypt’s Orascom Construction, which fell due to declining demand for fertilizer and a weaker outlook for construction across the region. We also eliminated our position in Orascom Telecom due to faltering growth and exposure to weakening currency in some key markets such as Pakistan and Algeria.
Despite the setbacks on multiple fronts, we believe the region offers real long-term investment opportunities, as the economies become more diverse and reforms take root. We made several purchases, including South African miner AngloGold Ashanti, based on a positive outlook for gold prices and an improved strategy, and MTN, a pan-African mobile telephone company that is enjoying solid growth in underpenetrated markets. South Africa is struggling from a slowing economy and a large current account deficit. We have no holdings in Central Africa, where there is precious little liquidity and an abundance of corporate governance issues. Our largest purchase during the period was Israel’s Teva Pharmaceutical, a leading maker of generic drugs that is expanding beyond North Africa and Western Europe into higher growth areas such as Latin America and Central and Eastern Europe.

Latin America
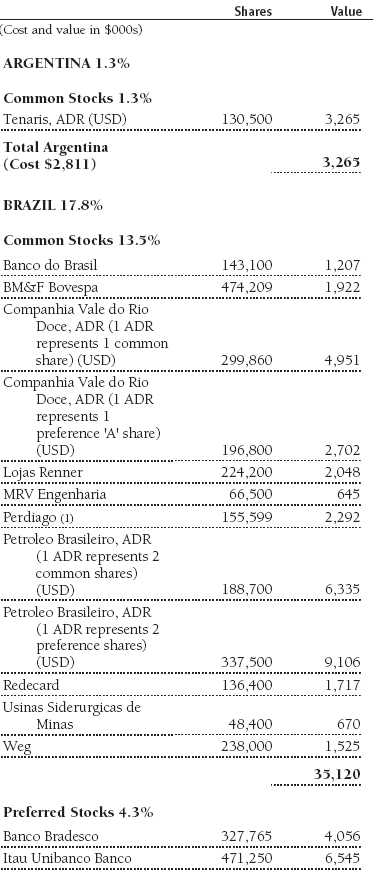
The region rallied approximately 19% in the last six months in dollar terms. The fourth-quarter sell-off prompted us to increase our Latin America positions, which helped performance. It is now the fund’s largest overweight. We believe that the region’s economic strides will continue, driven by sensible fiscal management and sound fundamentals. We’re focused on the region’s largest markets, Mexico and Brazil, and emphasizing domestic retail, banks, and telecom stocks.
Of course, Latin America was not immune to the deteriorating equity market climate over the past six months. Mexico in particular was hurt by the U.S. economic crisis. Homebuilder Urbi Desarrollos was hit by the economic slowdown, as was Grupo Banorte. Regional telecom heavyweight America Movil—one of the fund’s larger positions—declined. While telecoms were among the fund’s worst performers, we believe their long-term prospects are strong. For that reason, America Movil remains a top holding. Petrobras, a Brazilian oil company, was a top performer. It enjoys strong production growth and is attractively valued. Wal-Mart de Mexico, a Mexican discount retailer, has a strong competitive position and should prosper in a weaker economic environment. Banco Itau of Brazil is well run and has a solid balance sheet. In sum, we are confident that these and other well-managed companies with a strong domestic presence are positioned to benefit as economic growth picks up.
Outlook
Emerging stock markets suffered devastating losses last year, and it’s too soon to know if the recent rally can be sustained, but, overall, the developing markets appear well positioned amid the global economic recession. The return on capital in many areas, particularly Asia and Latin America, is significantly higher than most of the developed world. High productivity, strong domestic demand, and young populations should fuel solid economic growth. In addition, many countries have illustrated a willingness and ability to respond quickly and forcefully to the economic crisis. China and many other countries have announced significant stimulus measures, and interest rates are also being cut across the emerging markets universe. Banking systems in general are much healthier than in the developed world, with little or no impact from the subprime mortgage crisis. Consumers and corporations are significantly less indebted than their developed market peers. Consumption is a key theme in emerging markets, and domestic economies remain strong.
We believe that infrastructure spending among emerging markets and the largest developed countries will lead the economic recovery. That bodes well for emerging economies, given their high exposure to the materials, industrials, technology, and energy sectors. In fact, the relative resilience of emerging markets gives us confidence that the asset class will fare better and lead developed markets in an upturn. Emerging markets have arguably suffered indiscriminately in the sell-off, regardless of their fundamentals. We believe this discrepancy between market psychology and long-term fundamentals and valuations has created favorable investment opportunities. Prospects vary widely among the regions, but we believe many stock-specific opportunities remain.
Respectfully submitted,

Gonzalo Pangaro
Chairman of the fund’s Investment Advisory Committee
May 20, 2009
The chairman of the fund’s Investment Advisory Committee has day-to-day responsibility for managing the portfolio and works with committee members in developing and executing the fund’s investment program.
| Risks of International Investing |
Funds that invest overseas generally carry more risk than funds that invest strictly in U.S. assets. Funds investing in a single country or in a limited geographic region tend to be riskier than more diversified funds. Risks can result from varying stages of economic and political development; differing regulatory environments, trading days, and accounting standards; and higher transaction costs of non-U.S. markets. Non-U.S. investments are also subject to currency risk, or a decline in the value of a foreign currency versus the U.S. dollar, which reduces the dollar value of securities denominated in that currency.
Lipper averages: The averages of available mutual fund performance returns for specified time periods in defined categories as tracked by Lipper Inc.
MSCI Emerging Markets Index: A capitalization-weighted index of emerging market stocks that only includes securities that may be traded by foreign investors.
Portfolio Highlights
Performance and Expenses
T. Rowe Price Institutional Emerging Markets Equity Fund
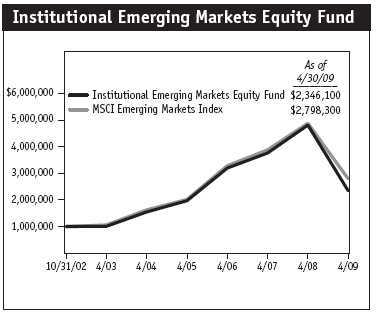
This chart shows the value of a hypothetical $1 million investment in the fund over the past 10 fiscal year periods or since inception (for funds lacking 10-year records). The result is compared with benchmarks, which may include a broad-based market index and a peer group average or index. Market indexes do not include expenses, which are deducted from fund returns as well as mutual fund averages and indexes.
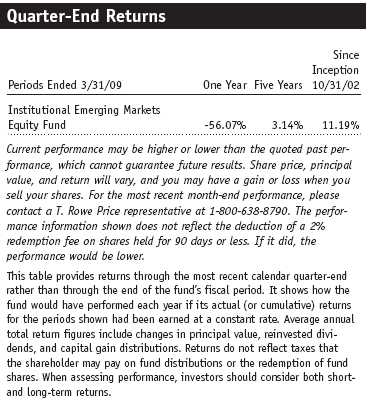
This table shows how the fund would have performed each year if its actual (or cumulative) returns for the periods shown had been earned at a constant rate.

Fund Expense Example
As a mutual fund shareholder, you may incur two types of costs: (1) transaction costs, such as redemption fees or sales loads, and (2) ongoing costs, including management fees, distribution and service (12b-1) fees, and other fund expenses. The following example is intended to help you understand your ongoing costs (in dollars) of investing in the fund and to compare these costs with the ongoing costs of investing in other mutual funds. The example is based on an investment of $1,000 invested at the beginning of the most recent six-month period and held for the entire period.
Actual Expenses
The first line of the following table (“Actual”) provides information about actual account values and actual expenses. You may use the information in this line, together with your account balance, to estimate the expenses that you paid over the period. Simply divide your account value by $1,000 (for example, an $8,600 account value divided by $1,000 = 8.6), then multiply the result by the number in the first line under the heading “Expenses Paid During Period” to estimate the expenses you paid on your account during this period.
Hypothetical Example for Comparison Purposes
The information on the second line of the table (“Hypothetical”) is based on hypothetical account values and expenses derived from the fund’s actual expense ratio and an assumed 5% per year rate of return before expenses (not the fund’s actual return). You may compare the ongoing costs of investing in the fund with other funds by contrasting this 5% hypothetical example and the 5% hypothetical examples that appear in the shareholder reports of the other funds. The hypothetical account values and expenses may not be used to estimate the actual ending account balance or expenses you paid for the period.
You should also be aware that the expenses shown in the table highlight only your ongoing costs and do not reflect any transaction costs, such as redemption fees or sales loads. Therefore, the second line of the table is useful in comparing ongoing costs only and will not help you determine the relative total costs of owning different funds. To the extent a fund charges transaction costs, however, the total cost of owning that fund is higher.


Financial Highlights
T. Rowe Price Institutional Emerging Markets Equity Fund
(Unaudited)
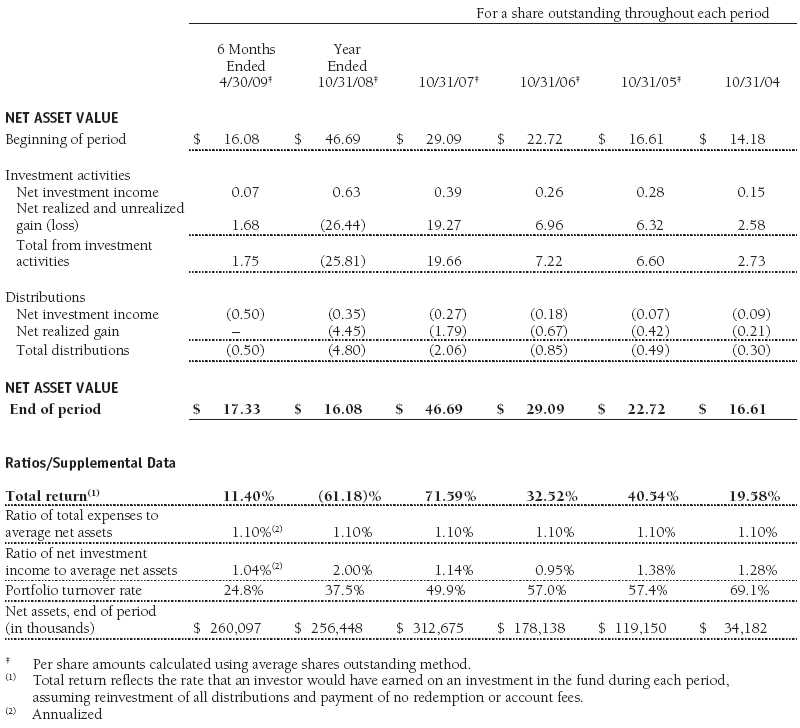
The accompanying notes are an integral part of these financial statements.
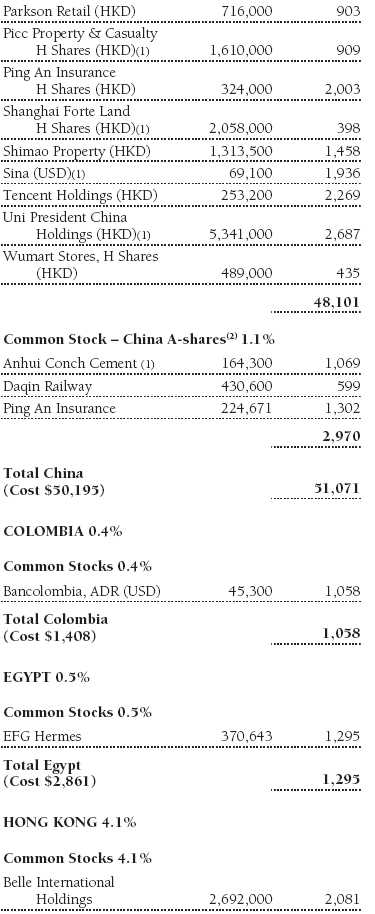
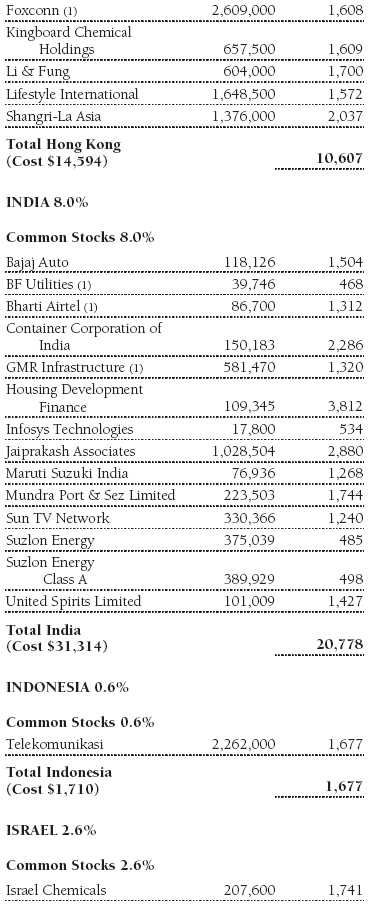
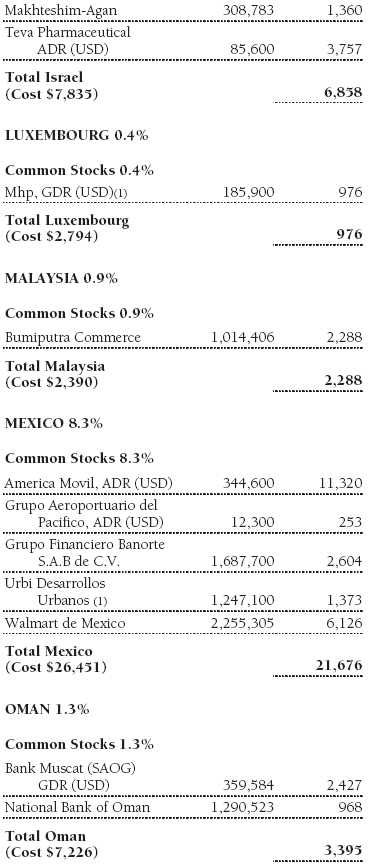
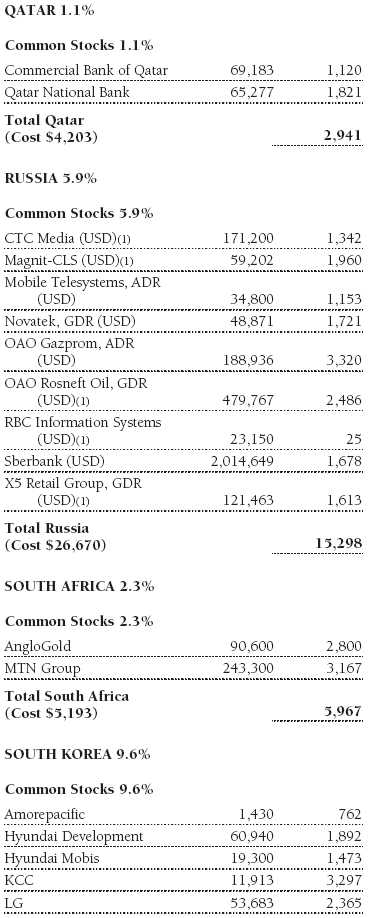
Portfolio of Investments ‡
T. Rowe Price Institutional Emerging Markets Equity Fund
April 30, 2009 (Unaudited)

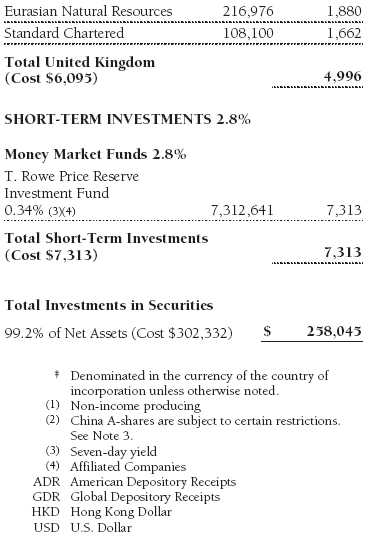
The accompanying notes are an integral part of these financial statements.
Statement of Assets and Liabilities
T. Rowe Price Institutional Emerging Markets Equity Fund
April 30, 2009 (Unaudited)
($000s except shares and per share amounts)
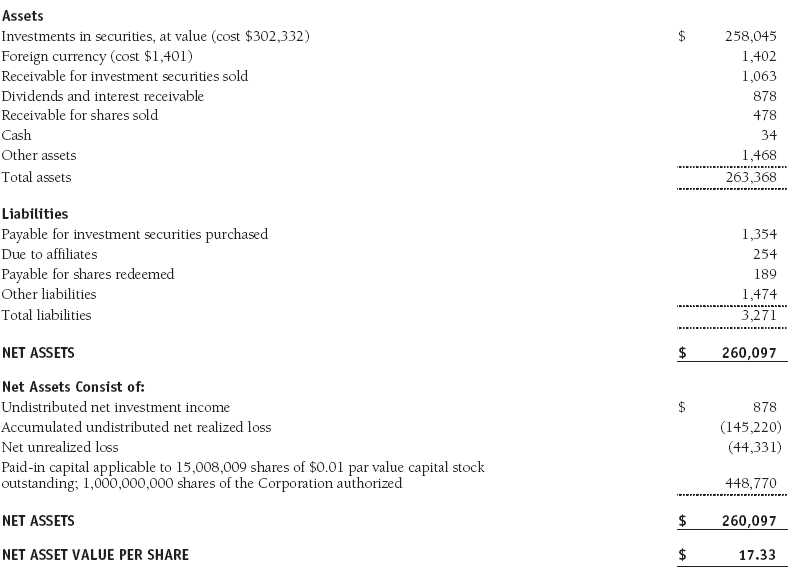
The accompanying notes are an integral part of these financial statements.
Statement of Operations
T. Rowe Price Institutional Emerging Markets Equity Fund
(Unaudited)
($000s)
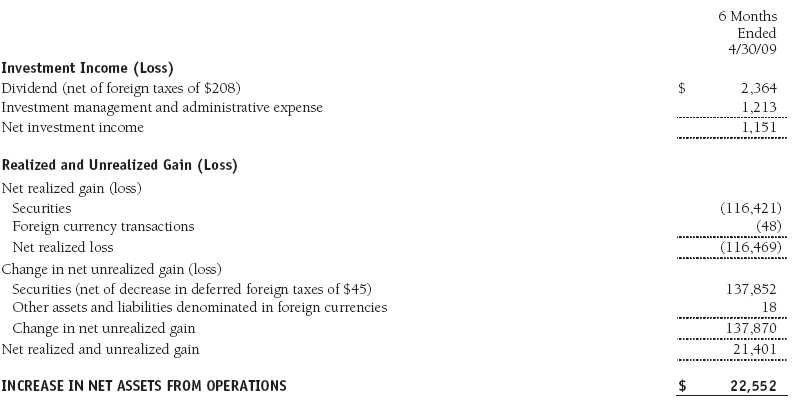
The accompanying notes are an integral part of these financial statements.
Statement of Changes in Net Assets
T. Rowe Price Institutional Emerging Markets Equity Fund
(Unaudited)
($000s)
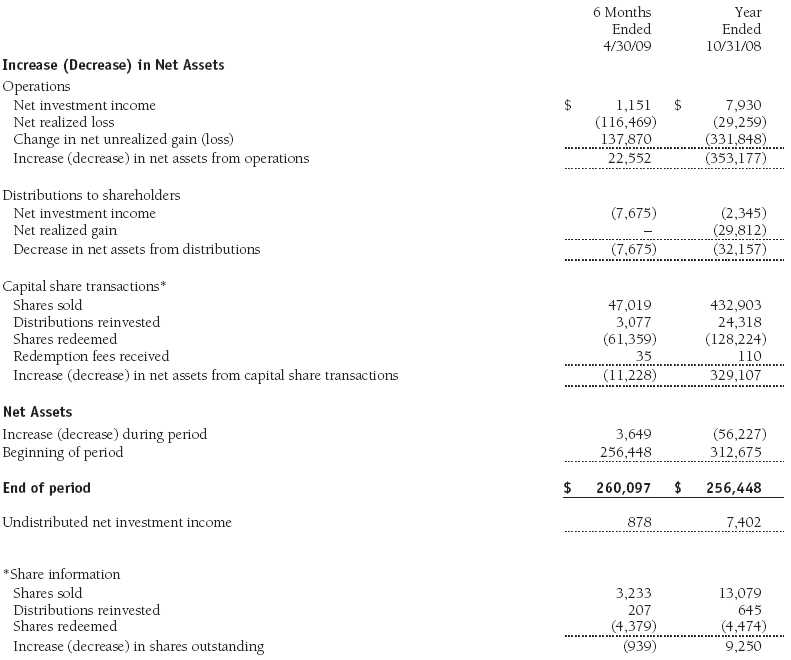
The accompanying notes are an integral part of these financial statements.
Notes to Financial Statements
T. Rowe Price Institutional Emerging Markets Equity Fund
April 30, 2009 (Unaudited)
T. Rowe Price Institutional International Funds, Inc. (the corporation), is registered under the Investment Company Act of 1940 (the 1940 Act). The Institutional Emerging Markets Equity Fund (the fund), a diversified, open-end management investment company, is one portfolio established by the corporation. The fund commenced operations on October 31, 2002. The fund seeks long-term growth of capital through investments primarily in the common stocks of companies located (or with primary operations) in emerging markets.
NOTE 1 - SIGNIFICANT ACCOUNTING POLICIES
Basis of Preparation The accompanying financial statements were prepared in accordance with accounting principles generally accepted in the United States of America, which require the use of estimates made by fund management. Fund management believes that estimates and security valuations are appropriate; however, actual results may differ from those estimates, and the security valuations reflected in the financial statements may differ from the value the fund ultimately realizes upon sale of the securities.
Investment Transactions, Investment Income, and Distributions Income and expenses are recorded on the accrual basis. Dividends received from mutual fund investments are reflected as dividend income; capital gain distributions are reflected as realized gain/loss. Dividend income and capital gain distributions are recorded on the ex-dividend date. Income tax-related interest and penalties, if incurred, would be recorded as income tax expense. Investment transactions are accounted for on the trade date. Realized gains and losses are reported on the identified cost basis. Distributions to shareholders are recorded on the ex-dividend date. Income distributions are declared and paid on an annual basis. Capital gain distributions, if any, are declared and paid by the fund, typically on an annual basis.
Currency Translation Assets, including investments, and liabilities denominated in foreign currencies are translated into U.S. dollar values each day at the prevailing exchange rate, using the mean of the bid and asked prices of such currencies against U.S. dollars as quoted by a major bank. Purchases and sales of securities, income, and expenses are translated into U.S. dollars at the prevailing exchange rate on the date of the transaction. The effect of changes in foreign currency exchange rates on realized and unrealized security gains and losses is reflected as a component of security gains and losses.
Redemption Fees A 2% fee is assessed on redemptions of fund shares held for 90 days or less to deter short-term trading and to protect the interests of long-term shareholders. Redemption fees are withheld from proceeds that shareholders receive from the sale or exchange of fund shares. The fees are paid to the fund, and are recorded as an increase to paid-in capital. The fees may cause the redemption price per share to differ from the net asset value per share.
New Accounting Pronouncements On November 1, 2008, the fund adopted Statement of Financial Accounting Standards No. 157 (FAS 157), Fair Value Measurements. FAS 157 defines fair value, establishes the framework for measuring fair value, and expands the disclosures of fair value measurements in the financial statements. Adoption of FAS 157 did not have a material impact on the fund’s net assets or results of operations.
In March 2008, the Financial Accounting Standards Board issued Statement of Financial Accounting Standards No. 161 (FAS 161), Disclosures about Derivative Instruments and Hedging Activities, which is effective for fiscal years and interim periods beginning after November 15, 2008. FAS 161 requires enhanced disclosures about derivative and hedging activities, including how such activities are accounted for and their effect on financial position, performance and cash flows. Management is currently evaluating the impact the adoption of FAS 161 will have on the fund’s financial statements and related disclosures; however, it is expected to have no material impact on the fund’s net assets or results of operations.
NOTE 2 - VALUATION
The fund��s investments are reported at fair value as defined under FAS 157. The fund values its investments and computes its net asset value per share at the close of the New York Stock Exchange (NYSE), normally 4 p.m. ET, each day that the NYSE is open for business.
Valuation Methods Equity securities listed or regularly traded on a securities exchange or in the over-the-counter (OTC) market are valued at the last quoted sale price or, for certain markets, the official closing price at the time the valuations are made, except for OTC Bulletin Board securities, which are valued at the mean of the latest bid and asked prices. A security that is listed or traded on more than one exchange is valued at the quotation on the exchange determined to be the primary market for such security. Listed securities not traded on a particular day are valued at the mean of the latest bid and asked prices for domestic securities and the last quoted sale price for international securities.
Investments in mutual funds are valued at the mutual fund’s closing net asset value per share on the day of valuation.
Other investments, including restricted securities, and those for which the above valuation procedures are inappropriate or are deemed not to reflect fair value are stated at fair value as determined in good faith by the T. Rowe Price Valuation Committee, established by the fund’s Board of Directors.
For valuation purposes, the last quoted prices of non-U.S. equity securities may be adjusted under the circumstances described below. If the fund determines that developments between the close of a foreign market and the close of the NYSE will, in its judgment, materially affect the value of some or all of its portfolio securities, the fund will adjust the previous closing prices to reflect what it believes to be the fair value of the securities as of the close of the NYSE. In deciding whether it is necessary to adjust closing prices to reflect fair value, the fund reviews a variety of factors, including developments in foreign markets, the performance of U.S. securities markets, and the performance of instruments trading in U.S. markets that represent foreign securities and baskets of foreign securities. A fund may also fair value securities in other situations, such as when a particular foreign market is closed but the fund is open. The fund uses outside pricing services to provide it with closing prices and information to evaluate and/or adjust those prices. The fund cannot predict how often it will use closing prices and how often it will determine it necessary to adjust those prices to reflect fair value. As a means of evaluating its security valuation process, the fund routinely compares closing prices, the next day’s opening prices in the same markets, and adjusted prices.
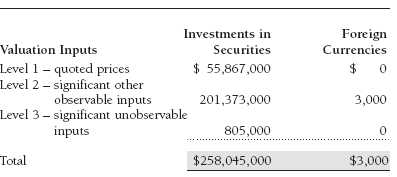
Valuation Inputs Various inputs are used to determine the value of the fund’s investments. These inputs are summarized in the three broad levels listed below:
Level 1 – quoted prices in active markets for identical securities
Level 2 – observable inputs other than Level 1 quoted prices (including, but not limited to, quoted prices for similar securities, interest rates, prepayment speeds, credit risk)
Level 3 – unobservable inputs
Observable inputs are those based on market data obtained from sources independent of the fund, and unobservable inputs reflect the fund’s own assumptions based on the best information available. The input levels are not necessarily an indication of the risk or liquidity associated with investments at that level. For example, non-U.S. equity securities actively traded in foreign markets generally are reflected in Level 2 despite the availability of closing prices, because the fund evaluates and determines whether those closing prices reflect fair value at the close of the NYSE or require adjustment, as described above. The following table summarizes the fund’s investments, based on the inputs used to determine their values on April 30, 2009:
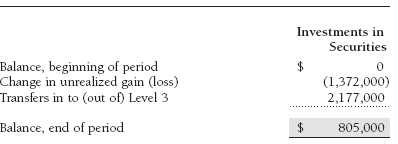
Following is a reconciliation of the fund’s Level 3 investments for the six months ended April 30, 2009:
NOTE 3 - INVESTMENT TRANSACTIONS
Consistent with its investment objective, the fund engages in the following practices to manage exposure to certain risks or to enhance performance. The investment objective, policies, program, and risk factors of the fund are described more fully in the fund’s prospectus and Statement of Additional Information.
Emerging Markets At April 30, 2009, approximately 91% of the fund’s net assets were invested, directly or indirectly, in securities of companies located in emerging markets or denominated in or linked to the currencies of emerging market countries. Future economic or political developments could adversely affect the liquidity or value, or both, of such securities.
China A-shares During the six months ended April 30, 2009, the fund invested in certain Chinese equity securities (A-shares) available only to local Chinese investors and Qualified Foreign Institutional Investors (QFII). The fund gains access to the A-share market through T. Rowe Price International, Inc. (TRPI), which serves as the registered QFII for all participating T. Rowe Price-sponsored investment companies. Investment decisions related to A-shares are specific to each participating fund, and each fund bears the resultant economic and tax consequences of its holdings and transactions in A-shares. The fund is subject to certain restrictions and administrative processes relating to its ability to repatriate cash balances, investment proceeds, and earnings associated with its A-shares and may incur substantial delays in gaining access to its assets or a loss of value in the event of noncompliance with applicable Chinese rules or requirements. Current Chinese tax law is unclear whether capital gains realized on the fund’s investments in A-shares will be subject to tax. Because management believes it more likely than not that Chinese capital gains taxes will be imposed, accrued taxes are reflected in the accompanying financial statements.
Other Purchases and sales of portfolio securities, other than short-term securities, aggregated $54,535,000 and $71,619,000, respectively, for the six months ended April 30, 2009.
NOTE 4 - FEDERAL INCOME TAXES
No provision for federal income taxes is required since the fund intends to continue to qualify as a regulated investment company under Subchapter M of the Internal Revenue Code and distribute to shareholders all of its taxable income and gains. Distributions are determined in accordance with Federal income tax regulations, which differ from generally accepted accounting principles, and, therefore, may differ in amount or character from net investment income and realized gains for financial reporting purposes. Financial reporting records are adjusted for permanent book/tax differences to reflect tax character but are not adjusted for temporary differences. The amount and character of tax-basis distributions and composition of net assets are finalized at fiscal year-end; accordingly, tax-basis balances have not been determined as of April 30, 2009.
The fund intends to retain realized gains to the extent of available capital loss carryforwards. As of October 31, 2008, the fund had $24,548,000 of unused capital loss carryforwards which expire in fiscal 2016.
At April 30, 2009, the cost of investments for federal income tax purposes was $302,332,000. Net unrealized loss aggregated $44,331,000 at period-end, of which $21,431,000 related to appreciated investments and $65,762,000 related to depreciated investments.
NOTE 5 - FOREIGN TAXES
The fund is subject to foreign income taxes imposed by certain countries in which it invests. Additionally, capital gains realized by the fund upon disposition of securities issued in or by certain foreign countries are subject to capital gains tax imposed by those countries. All taxes are computed in accordance with the applicable foreign tax law, and, to the extent permitted, capital losses are used to offset capital gains. Tax expense attributable to income is accrued by the fund as a reduction of income. Current and deferred tax expense attributable to net capital gains is reflected as a component of realized and/or change in unrealized gain/loss on securities in the accompanying financial statements. At April 30, 2009, the fund had deferred tax liability of $45,000 attributable to foreign securities and $5,369,000 of foreign capital loss carryforwards, including $323,000 that expire in 2016 and $5,046,000 that expire in 2017.
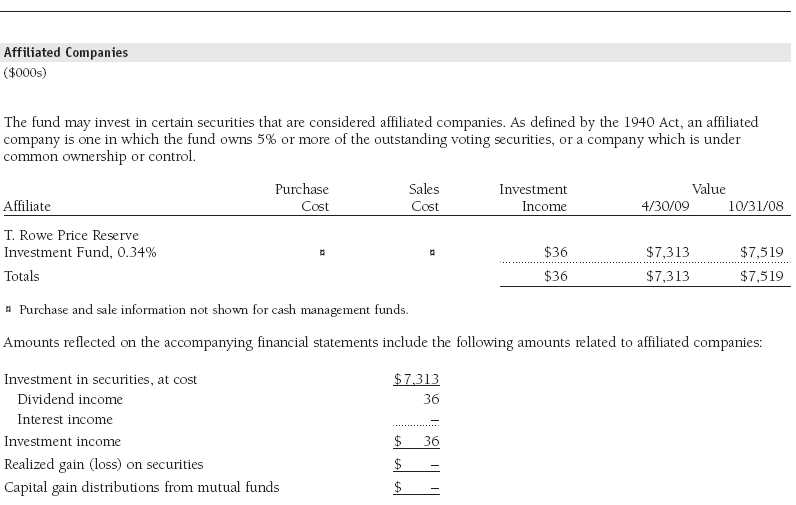
NOTE 6 - RELATED PARTY TRANSACTIONS
The fund is managed by T. Rowe Price International, Inc. (the manager), a wholly owned subsidiary of T. Rowe Price Associates, Inc. (Price Associates), which is wholly owned by T. Rowe Price Group, Inc. The investment management and administrative agreement between the fund and the manager provides for an all-inclusive annual fee equal to 1.10% of the fund’s average daily net assets. The fee is computed daily and paid monthly. The agreement provides that investment management, shareholder servicing, transfer agency, accounting, custody services, and directors’ fees and expenses are provided to the fund, and interest, taxes, brokerage commissions, and extraordinary expenses are paid directly by the fund.
The fund may invest in the T. Rowe Price Reserve Investment Fund and the T. Rowe Price Government Reserve Investment Fund (collectively, the T. Rowe Price Reserve Investment Funds), open-end management investment companies managed by Price Associates and considered affiliates of the fund. The T. Rowe Price Reserve Investment Funds are offered as cash management options to mutual funds, trusts, and other accounts managed by Price Associates and/or its affiliates and are not available for direct purchase by members of the public. The T. Rowe Price Reserve Investment Funds pay no investment management fees.
As of April 30, 2009, T. Rowe Price Group, Inc., and/or its wholly owned subsidiaries owned 261,926 shares of the fund, representing 2% of the fund’s net assets.
| Information on Proxy Voting Policies, Procedures, and Records |
A description of the policies and procedures used by T. Rowe Price funds and portfolios to determine how to vote proxies relating to portfolio securities is available in each fund’s Statement of Additional Information, which you may request by calling 1-800-225-5132 or by accessing the SEC’s Web site, www.sec.gov. The description of our proxy voting policies and procedures is also available on our Web site, www.troweprice.com. To access it, click on the words “Our Company” at the top of our corporate homepage. Then, when the next page appears, click on the words “Proxy Voting Policies” on the left side of the page.
Each fund’s most recent annual proxy voting record is available on our Web site and through the SEC’s Web site. To access it through our Web site, follow the directions above, then click on the words “Proxy Voting Records” on the right side of the Proxy Voting Policies page.
| How to Obtain Quarterly Portfolio Holdings |
The fund files a complete schedule of portfolio holdings with the Securities and Exchange Commission for the first and third quarters of each fiscal year on Form N-Q. The fund’s Form N-Q is available electronically on the SEC’s Web site (www.sec.gov); hard copies may be reviewed and copied at the SEC’s Public Reference Room, 450 Fifth St. N.W., Washington, DC 20549. For more information on the Public Reference Room, call 1-800-SEC-0330.
| Approval of Investment Management Agreement |
On March 10, 2009, the fund’s Board of Directors (Board) unanimously approved the investment advisory contract (Contract) between the fund and its investment manager, T. Rowe Price International, Inc. (Manager). The Board considered a variety of factors in connection with its review of the Contract, also taking into account information provided by the Manager during the course of the year, as discussed below:
Services Provided by the Manager
The Board considered the nature, quality, and extent of the services provided to the fund by the Manager. These services included, but were not limited to, management of the fund’s portfolio and a variety of related activities as well as financial and administrative services, reporting, and communications. The Board also reviewed the background and experience of the Manager’s senior management team and investment personnel involved in the management of the fund. The Board concluded that it was satisfied with the nature, quality, and extent of the services provided by the Manager.
Investment Performance of the Fund
The Board reviewed the fund’s annual total returns over the one-, three-, and five-year and since-inception periods as well as the fund’s year-by-year returns and compared these returns with a wide variety of previously agreed upon comparable performance measures and market data, including those supplied by Lipper, an independent provider of mutual fund data. On the basis of this evaluation and the Board’s ongoing review of investment results, and factoring in the severity of market turmoil in 2008, the Board concluded that the fund’s performance was satisfactory.
Costs, Benefits, Profits, and Economies of Scale
The Board reviewed detailed information regarding the revenues received by the Manager under the Contract and other benefits that the Manager (and its affiliates) may have realized from its relationship with the fund, including research received under “soft dollar” agreements. The Board noted that soft dollars were not used to pay for third-party, non-broker research during 2008. The Board also received information on the estimated costs incurred and profits realized by the Manager and its affiliates from advising T. Rowe Price mutual funds, as well as estimates of the gross profits realized from managing the fund in particular. The Board concluded that the Manager’s profits were reasonable in light of the services provided to the fund. The Board also considered the extent to which economies of scale were being realized by the Manager and whether the fund or other funds benefit from any such economies of scale under the fee levels set forth in the Contract. The Board noted that, under the Contract, the fund pays the Manager a single fee based on the fund’s assets and that the Manager, in turn, pays all expenses of the fund, with certain exceptions. The Board concluded that, based on the profitability data it reviewed and consistent with this single-fee structure, the Contract provided for a reasonable sharing of any benefits from economies of scale with the fund.
Fees
The Board reviewed the fund’s single-fee structure and compared it with fees and expenses of other comparable funds based on information and data supplied by Lipper. The information provided to the Board indicated that the fund’s management fee was above the median for comparable funds. (For these purposes, the Board assumed the management fee rate was equal to the single fee less the fund’s operating expenses.) The information also indicated that the fund’s expense ratio was at or below the median for comparable funds. The Board also reviewed the fee schedules for comparable privately managed accounts of the Manager and its affiliates. Management informed the Board that the Manager’s responsibilities for privately managed accounts are more limited than its responsibilities for the fund and other T. Rowe Price mutual funds that it or its affiliates advise. On the basis of the information provided, the Board concluded that the fees paid by the fund under the Contract were reasonable.
Approval of the Contract
As noted, the Board approved the continuation of the Contract. No single factor was considered in isolation or to be determinative to the decision. Rather, the Board concluded, in light of a weighting and balancing of all factors considered, that it was in the best interests of the fund to approve the continuation of the Contract, including the fees to be charged for services thereunder.
Item 2. Code of Ethics.
A code of ethics, as defined in Item 2 of Form N-CSR, applicable to its principal executive officer, principal financial officer, principal accounting officer or controller, or persons performing similar functions is filed as an exhibit to the registrant’s annual Form N-CSR. No substantive amendments were approved or waivers were granted to this code of ethics during the registrant’s most recent fiscal half-year.
Item 3. Audit Committee Financial Expert.
Disclosure required in registrant’s annual Form N-CSR.
Item 4. Principal Accountant Fees and Services.
Disclosure required in registrant’s annual Form N-CSR.
Item 5. Audit Committee of Listed Registrants.
Not applicable.
Item 6. Investments.
(a) Not applicable. The complete schedule of investments is included in Item 1 of this Form N-CSR.
(b) Not applicable.
Item 7. Disclosure of Proxy Voting Policies and Procedures for Closed-End Management Investment Companies.
Not applicable.
Item 8. Portfolio Managers of Closed-End Management Investment Companies.
Not applicable.
Item 9. Purchases of Equity Securities by Closed-End Management Investment Company and Affiliated Purchasers.
Not applicable.
Item 10. Submission of Matters to a Vote of Security Holders.
Not applicable.
Item 11. Controls and Procedures.
(a) The registrant’s principal executive officer and principal financial officer have evaluated the registrant’s disclosure controls and procedures within 90 days of this filing and have concluded that the registrant’s disclosure controls and procedures were effective, as of that date, in ensuring that information required to be disclosed by the registrant in this Form N-CSR was recorded, processed, summarized, and reported timely.
(b) The registrant’s principal executive officer and principal financial officer are aware of no change in the registrant’s internal control over financial reporting that occurred during the registrant’s second fiscal quarter covered by this report that has materially affected, or is reasonably likely to materially affect, the registrant’s internal control over financial reporting.
Item 12. Exhibits.
(a)(1) The registrant’s code of ethics pursuant to Item 2 of Form N-CSR is filed with the registrant’s annual Form N-CSR.
(2) Separate certifications by the registrant's principal executive officer and principal financial officer, pursuant to Section 302 of the Sarbanes-Oxley Act of 2002 and required by Rule 30a-2(a) under the Investment Company Act of 1940, are attached.
(3) Written solicitation to repurchase securities issued by closed-end companies: not applicable.
(b) A certification by the registrant's principal executive officer and principal financial officer, pursuant to Section 906 of the Sarbanes-Oxley Act of 2002 and required by Rule 30a-2(b) under the Investment Company Act of 1940, is attached.
| | |
SIGNATURES |
| |
| | Pursuant to the requirements of the Securities Exchange Act of 1934 and the Investment |
| Company Act of 1940, the registrant has duly caused this report to be signed on its behalf by the |
| undersigned, thereunto duly authorized. |
| T. Rowe Price Institutional International Funds, Inc. |
| |
| By | /s/ Edward C. Bernard |
| | Edward C. Bernard |
| | Principal Executive Officer |
| | |
| Date | June 16, 2009 |
| |
| | Pursuant to the requirements of the Securities Exchange Act of 1934 and the Investment |
| Company Act of 1940, this report has been signed below by the following persons on behalf of |
| the registrant and in the capacities and on the dates indicated. |
| |
| By | /s/ Edward C. Bernard |
| | Edward C. Bernard |
| | Principal Executive Officer |
| | |
| Date | June 16, 2009 |
| |
| By | /s/ Gregory K. Hinkle |
| | Gregory K. Hinkle |
| | Principal Financial Officer |
| | |
| Date | June 16, 2009 |